Getting Started with the PTC System Monitor June 2012

Welcome message from author
This document is posted to help you gain knowledge. Please leave a comment to let me know what you think about it! Share it to your friends and learn new things together.
Transcript

Getting Started with the
PTC System Monitor
June 2012

Getting Started with the PTC System
Monitor
This course is a subset of content from:
• TRN-3171 Monitoring Windchill Performance using the PTC System Monitor

3
Learn the fundamentals of the PTC System Monitor
Plan PTC System Monitor architecture and deployment
Review the installation procedure
Learn the basics of the PTC System Monitor client
Use Export Session to capture data for diagnosis by PTC or others
Use Fastpacks
(Optional) advanced diagnostic options
Course Objectives

4
0
5
10
15
20
25
30
35
Time
People
Purpose: Reduce Turnaround Time and
Escalations
© 2006 PTC
days*people*involved=209
Resolved
11 Days
31 People
How long would this incident take to troubleshoot with the new System Monitor?

5
0
5
10
15
20
25
30
35
Time
People
Reduce Mean Time To Resolution (MTTR)
© 2006 PTC
5
20
fe
we
r p
eo
ple
Customer sees 7 fewer days or 63% reduction in MTTR
days*people*involved=29
Actual
11 Days
31 People
Expected
4 Days
11 People
And … reduced 200
days*people*involved
within PTC alone
Answer: Estimate 7 fewer days and almost 10 times fewer people*days*involved.

6
PSM is a separate server-client system powered by dynaTrace that
monitors Windchill and/or Sharepoint – stays on if Windchill/Sharepoint is down
– Licensed for PTC software monitoring only, but can be expanded to monitor other systems with
further license purchases from dynaTrace
It continuously gathers Java/.NET method data and samples O/S
metrics directly on the production system– “flight data recorder”
A separate database stores a subset of collected data depending on
configurable parameters (for example: incident definitions)
Dashboards are accessible via http URL for remote monitoring
Easily or automatically store and export incident data for use by PTC for
diagnostic analysis
It is customizable for customer requirements and custom source code
PTC System Monitor Fundamentals
How the PSM functions

7
PSM: uses PurePath Technology from dynaTrace
Web Server Client Application Tier: Java or .NET Database
Performance
Warehouse
PurePath
Collector
Monitoring
Collector
dynaTrace
Server
dynaTrace
Client
Sessions
Store
Exported
Session
Offline
Session Analysis
Optional
Instrumentation
(UEM or AJAX
edition)

8
Use PurePaths data as source for monitoring
Capture Data
Monitor Captured Data Define Data to be Monitored
(Subscribe Measures and
Define Incidents)
Analyze Data

9
Architecture and Deployment Planning
PSM can be deployed over LAN and WAN environments
Remote File Server(s) WAN
Main Site Server LAN
Windchill Application Servers
Agents
Collector
Server
Client
collector
System Monitoring Server

10
Components (memory) – Server (Xmx minimum 768Mb recommended 8 Gb)
– Performance Warehouse (Oracle or SQL Server, 20 Gb)
– Collector (Xmx recommended 1Gb per 50 agents)
– Agents (for Windchill JVMs)
– Client (local install or java web start)
– (optional) Analysis Server
Client - Windows/Linux 32 bit only. There is no Unix client
Server/Collector/Analysis Server – Windows/Linux/Solaris/AIX, 64 bit only
Agents – all platforms (including HP), both 32 bit and 64 bit
Required Components
What is installed?

11
Installation of non-agent PSM components on separate
hardware from Windchill is recommended on production
systems. This allows PSM to operate when Windchill
hardware is down.
Disk space requirement over 2 year window for Performance
Warehouse (or Repository) database is estimated as 20 Gb
using default configuration of subscribed measures.
It is recommended use one or more standalone collector
processes rather than using the built-in (embedded) collector
in the Server process.
Deployment Planning Rules of Thumb
Placement, Memory, Performance Warehouse Disk Space

12
CPU: recommend 4 cores or more dedicated to Server
Memory: – Server JVM Heap size: 8 to 16 Gb
Storage Space: – Varies widely. Start with 100 Gb, depending on frequency of stored session creation.
– Session storage can take significant disk space over time.
– Note: Sessions are not stored in the Performance Warehouse database.
– Sizing for the Performance Warehouse datafiles is addressed separately because the
Performance Warehouse is often located on a separate host.
In default deployments, the main site Collector JVM (heap size 1 to 2 Gb)
is usually running as a separate process on the same host as the PSM
Server, so add this to memory requirement when needed.
If optional Analysis Server is located on Server host, additional CPU and
memory resources must be added
Server and Collector
Sizing CPU, Memory and Storage space

13
Download PSMInstaller.jar and the fastpack (*.dtp) file to hosts that will run
components of the PSM or Windchill.
Start a Cmd Shell (using “run as administrator” option on windows 7)
Execute “java –jar PSMInstaller.jar” to start the Installer GUI
Installation Step 1: Download and Start the
Installer

14
Select the Component(s) to install on the host. Repeat steps 1 and 2 on
each host containing either the Server, Collector, Agent (Windchill) or
Analysis Server.
Installation Step 2: Select the Component(s)

15
Options for the Server: – Installation directory
– Bind Address
– Port for Web Start Client
– Port for Collector
– “admin” password
Options for Collector: – Installation directory
– Bind Address
– Port for Agent
– Server host and port
Options for Agents – Windchill component directories
– Collector host and port
Hint: Keep default values for ports and the “open” Bind Address (0.0.0.0)
unless required to change them by your IT department.
Installation Step 3: Set values for component(s)

16
Client-to-Server Port 2020 (ssl 2021) TCP
Collector-to-Server Port 6698 (ssl 6699) TCP (Note: this must be open
prior to collector installation for validation purposes)
Agent-to-Collector Port 9999 TCP
Server Default Webpage Port 8020 (ssl 8021) TCP
Installation: Open TCP Ports
The following list shows the default communication ports for dynaTrace. Firewalls
between components must be configured to allow communication to pass through.

17
Installation Directory will be shared with Collector if both are being
installed.
Set password for the “admin” user account.
Installation: Server Configuration Parameters

18
Installation Directory will be shared with Server if both are being installed.
Set hostname/IP address or “localhost” for the Server
Set Port to match the Server if that was changed.
Installation: Collector Configuration Parameters
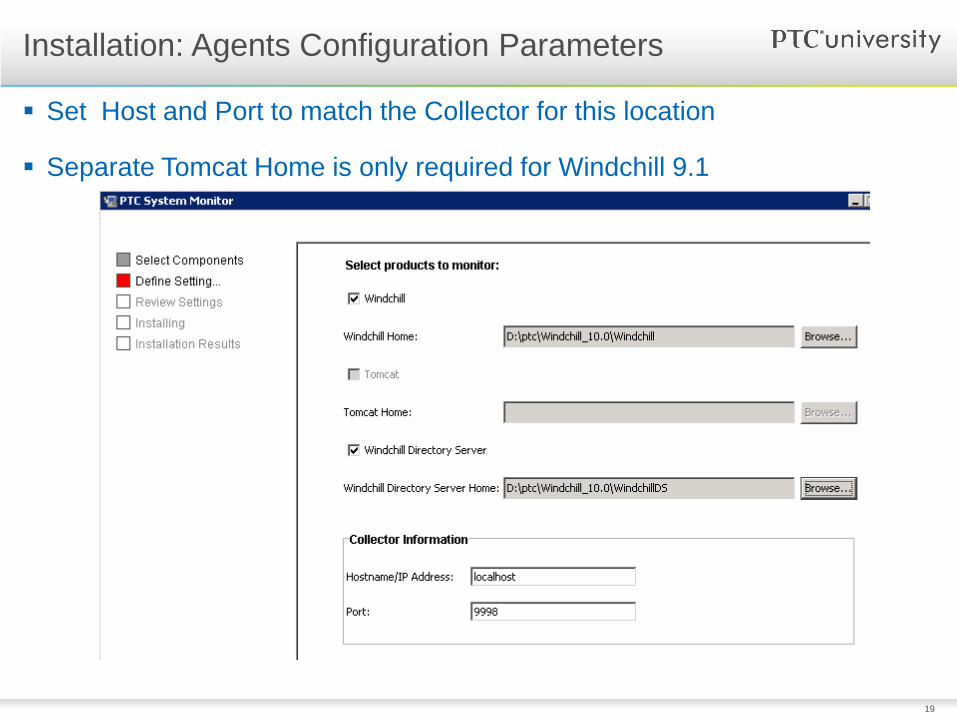
19
Set Host and Port to match the Collector for this location
Separate Tomcat Home is only required for Windchill 9.1
Installation: Agents Configuration Parameters

20
Windows – Services: dynaTrace Server, dynaTrace Analysis Server, dynaTrace Collector
– Client: web start command: http://<host>:8020/webstart/Client/client.jnlp
Linux/Unix – Note: Installing or running as root is not recommended.
– Server: In <DTHOME>, execute ./dtserver
– Analysis Server: In <DTHOME>, execute ./dtanalysisserver
– Collector: In <DTHOME>, execute ./dtcollector
– Stop server: ./dtcmd –shutdown
– Stop collector: ./dtcmd –shutdown -collector <name of collector>
– Client (Linux): web start command: http://<host>:8020/webstart/Client/client.jnlp
Installation Step 4: Start the Server and Collector
Use the commands below to start (or stop) components

21
Installation Step 5: Web Start the Client
http://<host>:8020/ or https://<host>:8021/ gives access to server tools and Client

22
Initially the License key is not set, but do not select Import License File.
The license is contained in the FastPack plugin instead.
Close the Start Center and select Settings/dynaTrace Server .
Installation Step 6: Initial Configuration
The Start Center screen is given on initial startup of the client.

23
The License key is included in the “FastPack” file (Windchill_9_1.dtp or
PTCFastpack.10.0.dtp).
Go to Settings/dynaTrace Server/Plugins/Install Plugin and import the
<fastpack>.dtp file.
Initial Configuration: Install FastPack (and
License)

24
Initial Configuration: Install FastPack (and
License)
Verify under License that Status is “ok”:

25
Initial Configuration: Performance Warehouse
An embedded performance warehouse database is configured by default, but a
production database such as SQL Server or Oracle is recommended.

26
Set memory size for dynaTrace
server. Production
recommendation is 6 to 18 Gb,
but demo can be 1 Gb.
Set administrator alerts email
address.
Enable Self-Monitoring in order
to track the impact of different
dynaTrace sensor configurations
on overall performance.
Set smtp server hostname.
Deselect the Agent Service under
Services in order to just run a
standalone collector.
Initial Configuration: Other Settings
Accessed through Settings/dynaTrace Server settings

27
Enable continuous transaction storage and set the directory and disk quota
for the rotating Stored Sessions (this will allow X days of automatic storage,
dependent on the quota and the size of your deployment)
Initial Configuration: Continuous Transaction
Storage
Accessed through Settings/dynaTrace Server settings

28
Restart Windchill after applying the Agents.
Check in Cockpit/Status Overview/Agents Overview to see that the list
contains agents from all Windchill JVMs with “license ok”
Validation: Agents Overview Dashboard

29
Validation: Start Center Page
When correctly configured,
the Start Center/
Administration page should
look like this (optional
Analysis Server is not
installed and the
Geographical Locations
Database is not relevant
without UEM)

30
Check for creation of <windchill>/opt/psm directory
Check for additional href in <windchill>/declarations.xconf: <ConfigurationRef xlink:href="opt/psm/psm-override.xconf"/>
Check for “psm” settings in wt.properties: – psm.home=$(wt.home)$(dir.sep)opt$(dir.sep)psm$(dir.sep)agent
– psm.lib.bit.dir=64
– psm.lib.dir=lib64
– psm.log.level=info
– psm.name=ptc.wt
– psm.profile.instance.name=$(psm.name).{1}-$(psm.windchill.version) -$(wt.httpgw.hostname)-
$(wt.webserver.port)-$(wt.webapp.name)-{0}
– psm.server.hostname=myhost.ptcnet.ptc.com
– psm.server.port=9999
– psm.startup.library=dtagent.dll
– psm.windchill.version=v10.0
Validation: Windchill with Agent Deployment

31
Exercise 1: Installation Validation (15 min)

32
Cockpit - used to select Profile, Session, live
“Diagnose” dashlets
Status Line - “breadcrumb” trail shows source and
time frame for the currently selected object.
Menus - give access to dashboards and
server/client settings. Many of these are accessible
as right-click context picks from the Cockpit or
Dashlets.
Client Navigation

33
Dashlet: Graphical or Tabular object to display captured data
Dashboards: A collection of dashlets configured and saved for reuse
Drilldowns and Details available (varies depending on dashlet/dashboard)
Dashboards accessible via services URL when saved to Server 1) Use http://<dtServer>:8020/rest/management/reports/create/<dashboardName> or
2) Select from full list at http://<dtServer>:8020/rest/html/management/dashboards
Dashlets are customizable in many ways
Can be configured with multiple sources to monitor many systems
Client Navigation: Dashboards and Dashlets

34
The lists depend on user
permissions.
3 sources: – Recent
– <server>
– computer (xml files)
Most used: – PTC.WT System Health
– PTC.WT MS Status
– PTC.WT Environment Status
– PTC.WT JVM Health
– Common Operations
– Workspace Operations
Client Navigation: Dashboards
Dashboards menu

35
System Health Dashboard

36
System Health Dashboard - Indicator
Indicators are driven from a set of incidents unique to each JVM group.

37
System Health Dashboard - Indicators
1) Initial occurrence show full red (or yellow, depending)
2) Incident has ended because a new tomcat was started, but red bar indicates it is still
in the incidents list for the given time period. Either wait it out or delete it.
Note: Confirmation of the incident doesn’t affect the indicator.

38
How to Clear MS/SM/BMS Availability Indicators
Due to agent name iteration, MS/SM/BMS Availability incidents must be deleted.
MS, SM and BMS have iterated agent
names because multiple JVMs of the
same name can be running at the same
time in Windchill.

39
Working with Incidents
Default Incidents display includes configured incidents as well as current ones.

40
Confirming an Incident
Mostly relevant to Smart Alerting, which we don’t currently have configured.

41
Drill down from Health Indicator or Switch to Chart
Double-click on the header of
the dashlet to expand it (if
header is not displayed, first
use Right-click/Toggle Header).
Next select Display Mode/Chart
+ Table to see the Tabular
values as well.

42
Chart + Table Display

43
Charting Measures
Select the Chart dashlet to add it to a new or existing dashboard. The Add Series
button allows you to add Measures to the chart.

44
Charting Measures (continued)
Select from any existing measures.

45
Charting Measures (continued)
The chart will show all data from within the selected time window.
Note: This chart shows 3 traces
for 2 method servers. One MS
process stopped and restarted
within the time window.

46
Resize Dashlets
Hold cursor on edge until double arrow appears, then click and drag

47
MS Status Dashboard

48
JVM Health Dashboard

49
Profiles, Sessions, Plugins
Access dynaTrace Server
settings
Client Navigation: Tools and Settings
Tools and Settings menu

50
Exercise 2: Client Navigation (15 min)

51
There are drill down menus
available by right-clicking on
most places in the client.
Some often accessed include
the following: Details,
Purepaths, Layer Breakdown,
API Breakdown, Sequence
Diagram, Database,
Exceptions, Incidents
Drill Downs

52
A “session” in PSM is a set of diagnostic data captured from a system
profile.
Sessions are not stored in the Performance Warehouse, but are locally
stored on the Server or web-start client.
Information types contained in a sessions can include: – PurePath Session: represents the combined information about PurePaths and Time Series
(sampled data) within a given time period
– Memory Dump: contains analysis data about the number, size and class of allocated objects
and their references
– Thread Dump: is a collection of data for thread analysis including CPU time information
– Sampling (CPU): provides statistical data of all threads currently being serviced by the CPU
There are 3 types of session: – Live: a Purepath session performed on live data in the server cache
– Stored: any of the 4 information types above, stored on the client or Server
– Offline: A session that was stored on the client, and can be accessed without the server.
Sessions

53
Types of Session Storage
Live Session (Continuous Transaction Storage):
Latest N PurePaths & 1 hour measures for X days
Stored Session: PurePaths + Measures persistently
stored on Server
Offline Session: PurePaths + Measures persistently
stored on Client; no Server needed
Exported Session: A zipped stored/offline session
Manual and/or automatic
session storage
CallPaymentService.transferCash
menu.do, user = Joe, action = lastMinute
sale.do, user = Jane, action = doBuy
query.do, user = Bob, action = showAll
menu.do, user = Bob, action = lastMinute
menu.do, user = Joe, action = pay
PurePaths

54
Dump – create a snapshot – Live (or continuously recorded) PurePath Session can be transferred to a specific Stored
Session file by selecting Store Session (or Export Session) out of the live session's context
menu (submenu Session Storage)
– A Memory Dump or a Thread Dump can be manually created via Total Memory, Selective
Memory or Threads dashlets, or created automatically using an Incident action.
Download – A Stored Session can be downloaded from dynaTrace Server to a dynaTrace Client by the
command Make Available Offline which can be found within the context menu of a Stored
Session.
Task – A schedule task can be set to create a stored session.
How to Create a Stored Session
Each stored session contains a copy of the System Profile active at the time.
Note: File type created is *.dts

55
Packaging Data for offline analysis
Method 1: Sending the entire session over a period of time
• Pros: All session data is collected for all PurePath’s for the given time as well.
• Cons: Export can be very large depending on how long of a time frame is specified. Best to use a 4
hour window around a time of interest.

56
Packaging Data for offline analysis
Method 2: Exporting a specific PurePath
• Pros: allows the export of a single PurePath for Analysis. Usually very small export file
• Cons: No other data collected about any other transaction.

57
Packaging Data for offline analysis
Method 3: Exporting on a specific incident
• Pros: Allows a finite session around the time an incident occurred
• Cons: Since it only collects data around an incident, it may not show the root cause of the incident
occurring for certain types.

58
Exercise 3: Create and Export a Stored Session
(5 min)

59
Infrastructure Monitoring requires configuration of O/S specific Monitors
and Measures.
Can monitor Unix or Windows system performance
URL monitoring (availability) and Web Transaction monitoring (automatic
performance check) can be configured
VMware – Compute Resource
– Host System Performance
– Resource Pool
– Virtual Machine Performance
Monitors
Collect cyclic measures from hosts (performance and resources) or URLs

60
Configured per System Profile
Based on thresholds for subscribed Measures or Business Transactions
Single or multiple conditions
Can execute actions for incident
Can have Linked Dashboard (default is Incident Dashboard)
Incidents and Alerting

61
Can configure Smart Alerting (confirmation required), Severity and Execution time
(delayed or not) for each action listed.
Activate Configuration Action: select from predefined sensor configurations
Email Notification: notifications are sent via SMTP to configured users.
Sampling Action: triggers CPU Sampling session.
Memory Dump Action: triggers memory dump(s) for configured agent(s).
Thread Dump Action: triggers thread dump(s) for the configured agent(s).
Advanced Actions for Incidents
The following Advanced actions can be configured for an incident

62
A “FastPack” is a dynaTrace transferrable archive of the following server
information: – Dashboards
– License
– System Profiles
– Sensor Packs
Use the Plugins menu to apply (import) a FastPack – Note that the FastPack is NOT listed separately in plugins list
– For this reason, FastPacks can not be used to do version management for configurations
Patches from dynaTrace are a plugin (subset of FastPack)
FastPacks

63
We recommend copying the default profile created by the FastPack to a
new name, then apply your customizations to the new profile while
disabling the default profile (to allow duplicate agent definitions). – This will allow you to install new fastpacks without overwriting your existing, customized profile.
Use the commands below to move information between profiles. – Sensor Packs
• Use Export/Import commands
– System Profiles
• Use Export (right-click on a profile) and Import (right-click on System Profiles in Cockpit)
– Dashboards
• Use Dashboard/Save As command and select the My Computer icon to save locally as xml file.
• Use Dashboard/Open command and select the My Computer icon to open from local xml file.
– Measures & Business Transactions
• Use Copy in the Edit System Profile/Measures (or Business Transactions) UI to copy and paste
between profiles.
Copying Information between FastPacks

64
Active Profile with new name will not be
overwritten by a FastPack
Inactive Profiles can be overwritten by a
FastPack.
Example: Combined 10.0 and 9.1 on same PSM

65
How to Obtain System Information
Use checkboxes to pick and
choose the information, then
right-click and Package
Files

66
CPU Profiling
Thread Dumps
Memory Trending Dumps
Memory Leak Dumps
Purepath Comparison
Session Comparison
Advanced Diagnostic Features
PSM has several advanced diagnostic capabilities. PTC Technical Support will guide
customers regarding when these are recommended for use in response to any given
issue.
Although customers are not required to become proficient in using these features, we
will quickly review them in order to further show the value of the new monitoring tool.

67
Featured Products – Best Practice Academy
– LearningConnector
– LearningExchange
– Precision LMS 3.0
– Expert Model Analysis (XMA)
At the Conference – eLearning Lab (St. John’s 24)
– Usability Lab (St. John’s 33-34)
– PTC University Booth (Solutions Expo)
Be an Engineering Superhero

This course is a subset of content from:
• TRN-3171 Monitoring Windchill Performance using the PTC System Monitor
Related Documents