Get Your Price Right Presented by: Dawie Roodt 24 July 2007.
Dec 27, 2015
Welcome message from author
This document is posted to help you gain knowledge. Please leave a comment to let me know what you think about it! Share it to your friends and learn new things together.
Transcript


Get Your Price Right
Presented by:Dawie Roodt24 July 2007

Price of Building a Name
Source: The Economist
January 20-26, 2007
Full page advertisements
(Est. Cost: £87,500)

The Oppositionp. 15


The Home Teamp. 17


Value for Money?
Macedonia South Africa
Taxes
Efficiency
Competitive labour
Access to markets
Stability
Infrastructure
Property rights -
But why say it?

Price of Growth

2006 2007
M3 (end of year) 23.1% 23.7%PSCE (adj. end of year) 27.6% 21.5%CPIX (average) 4.6% 5.8%Prime (full year) 12.5% 13.5%Current Account: GDP -6.4% -5.5%R/$ (end of year) 7.04 6.78Unemployment (strict definition) 26.0%GDP (full year) 5.0% 5.4%
Economic Overview
The Price of Fiscal Stability
Higher Growth = Higher Taxes?

Background
State Debt:GDP
25
30
35
40
45
50
1980 1982 1984 1986 1988 1990 1992 1994 1996 1998 2000 2002 2004 2006 2008
%
Good/Stable
Debt Trap Recovery
Source: SARB and own calculations

Revenue Sources (Est. 2006/07)
29%
25%28%
4%
4%
10%
Individual Tax
Company Tax
VAT
Excise Duties
Fuel Levy
Other
Contribution to Fiscus

Budget Revenues (per $ GDP) by Country, 2006
Dollar Revenue per Dollar GDP
0.0
0.2
0.4
0.6
0.8
1.0
1.2
0 20 40 60 80 100 120 140 160Countries
$
Source: Nationmaster: CIA, World Factbook
Libya
Kuwait
Afghanistan
South Africa
Average: 0.32
Median: 0.29
Collection cost: 1.3% of revenue; US 0.5%

Company Tax Rate, per Country (2006)
Company Tax Rates
0
5
10
15
20
25
30
35
40
45
0 10 20 30 40 50 60
Countries
%
Source: worldwide-tax.com
South Africa
Bulgaria
Egypt
Average: 26.6%
Median: 29.0%
Ireland
USA
South Africa + STC (’06)
South Africa + STC (’07)

Individual Tax Rate, per Country (2006)
Individual Marginal Tax Rates
10
20
30
40
50
60
0 10 20 30 40 50
Countries
%
Source: worldwide-tax.com
South Africa
Russia
Denmark
Average: 35.4%
Median: 36.0%
USA
Ireland

VAT Rate, per Country (2006)
VAT Rates
0
10
20
30
0 10 20 30 40 50
Countries
%
South Africa
Ireland
Denmark
Singapore
Source: worldwide-tax.com
Average: 16.7%
Median: 18.0%
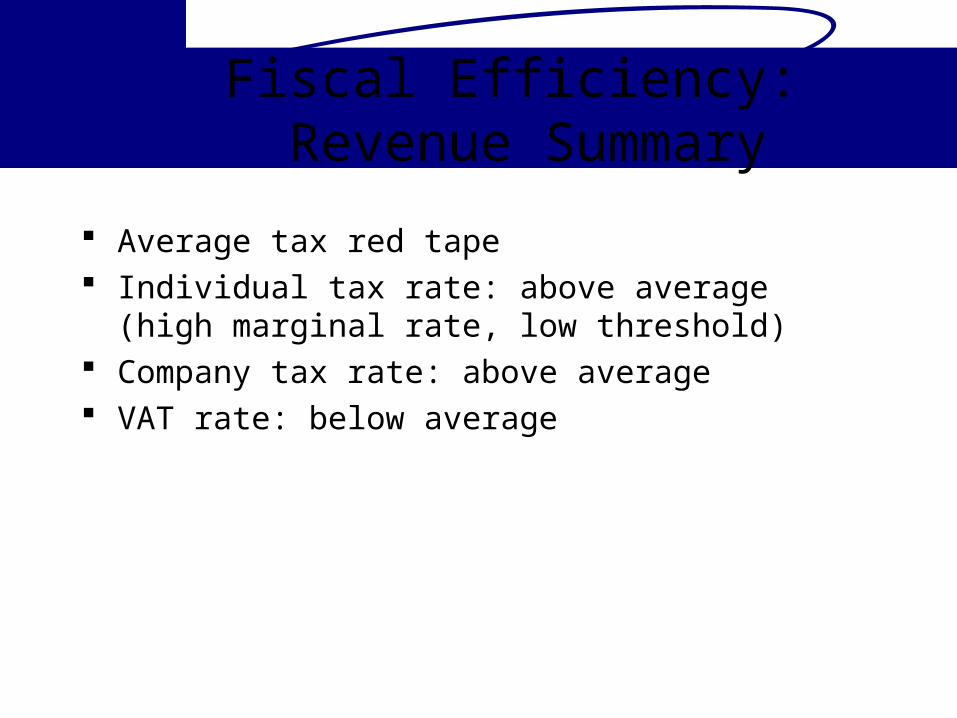
Fiscal Efficiency: Revenue Summary
Average tax red tape Individual tax rate: above average (high marginal rate, low
threshold) Company tax rate: above average VAT rate: below average

But the Result is…

GDP at Market Prices
GDP market prices, q:q seasonal
-1
0
1
2
3
4
5
6
7
8
1994 1996 1998 2000 2002 2004 2006
%
Source: StatsSA / Own forecast

Price Theory

Functions of Price
Co-ordinates customer demands and supplier constraints Signals changes in demand and supply Ensures economic efficiency Optimal allocation of resources
Source: Kaplan Schweser, CFA Institute Notes, Economics

Market Forms
1. Perfect competition (identical products)2. Monopolistic competition (product differentiation)3. Oligopoly (similar or differentiated)4. Monopoly (single seller)

Obstacles to Efficient Allocation of Productive Resources (Market Distortions)
Price controls, such as price ceilings and floors (rent control, minimum wages)
Taxes and trade restrictions (subsidies and quotas) Monopoly External(ities) (e.g. pollution) Public goods and common resources Price Discrimination A Black market Illegal Goods (e.g. drugs)

Perfect Competition
“The point is, ladies and gentleman, that greed – for a lack of a better word
– is good.”
-Gordon Gecko, Wall Street (1987)

Perfect Competition- The way the world should work…
A Price-taker market Assumes:
Identical products Large number, independent firms Small relative to total market No barriers to entry/exit
E.g. Road transport (containers), Air transport (excluding SAA)
Definition Source: Kaplan Schweser, CFA Institute Notes, Economics

Consumer and Producer Surplus at Equilibrium
Price
Quantity
Market Supply (MSC)
Market Demand (MSB)
Equilibrium Price
Equilibrium Quantity
Consumer surplus
Producer surplus
- Optimal allocation of resources
- Maximum social
gains
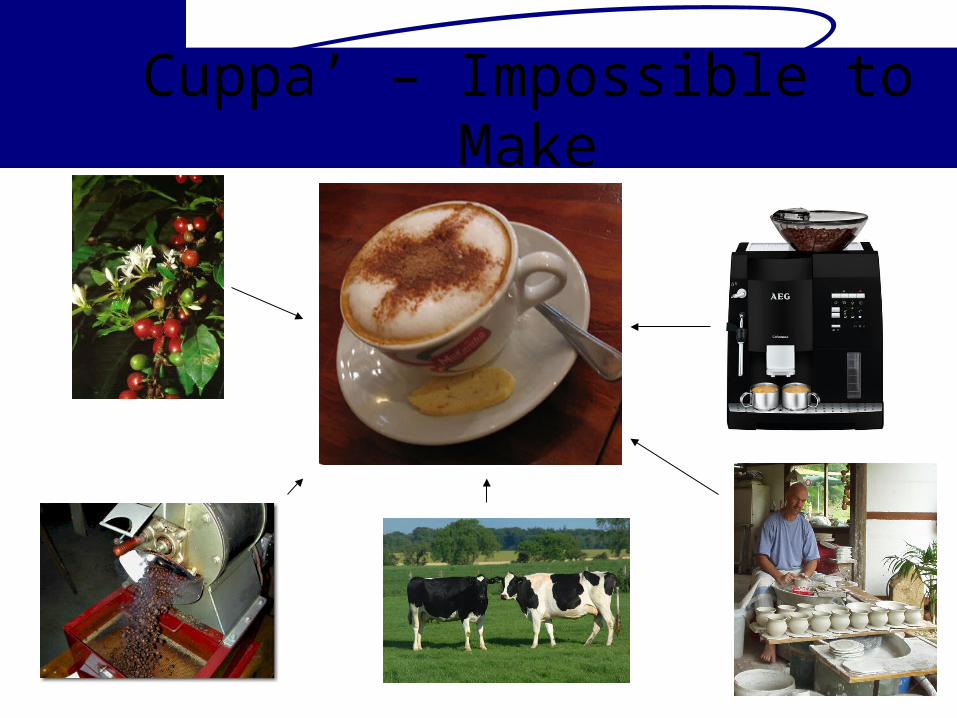
Cuppa’ – Impossible to Make

Price of Cappuccino- With Cream
Price of Cappuccino with Cream
9.09.5
10.010.511.011.512.0
R
Source: www.ideate.co.za / Own Research

Price of Cappuccino
Price: Maximum 12.00 Minimum 10.00 Mean 10.94 Standard Dev 0.87 Price differential: 20.0%
Production costs example: Estimated mark up of 150% on coffee (US) 40c to make $1 cup of drip coffee <$1 to make latte that sells for $2.5
Source: Tim Harford. The Undercover Economist / Own Research

Self Discrimination “I love it when you talk foreign”
Cappuccino R11.50
Hot Chocolate R10.50
Caffe Mocha R12.50
White Hot Chocolate R16.90
Caramel Hot Shot R19.90
Cappuccino – no frills R11.50
Hot Chocolate – no frills R10.50
Mix them together – I feel special R12.50
Use different powder – I feel very special R16.90
Use different powder – I feel greedy R19.90
Translation:
Source: Tim Harford. The Undercover Economist / www.muggandbean.co.za

Do You Have a Light…?
Suppliers want to decrease consumer surplus, without lower sales volumes
How? - Choice of luxury I.e. Smoke out customers less sensitive to price

Price of Milk - Clover Full Cream
Price of Milk, 2L Full Cream (Plastic Bottle)
12.5
13.0
13.5
14.0
14.5
15.0
15.5R
Source: Own Research

Price of Milk - Clover Full Cream
Price (2L, plastic): Maximum 15.45 Minimum 12.99 Mean 14.28 Standard Dev 0.88 Price Differential: 18.9%
Producer: Average price received by farmer between R2.60 and R2.80
per litre (Eastern Cape) National Average around R3.0 per litre – Clover CE
Source: Landbouweekblad / Own Research

Rare Delicacies Uisce Beatha “water of life” (Gaelic)
Age Price (R) % Increase
12 years 229
15 years 380 65.9%
18 years 546 43.7%
21 years 1,058 93.8%
30 years 2,152 103.4%
Malt whiskey must contain no grain other than malted barley
Only differentiated by age (storage cost)
Source: www.makro.co.za / glenfiddich.com

Administered Price

Parastatals
Eskom Transnet:
Rail (Spoornet and Transwerk) Ports (Sapo and NPA) Pipelines (Petronet)
Telkom Acsa South African Airways (SAA) Sasol DWAF SA Post Office

White Elephants
Dead Elephant #1: SAA Financial Results: Net profit (loss) for the year:
2002: R2.1bn 2005: R0.6bn 2003: (R5.9bn) 2006: R0.07bn 2004: (R8.6bn) 2007 (interim): (R0.6bn)
Bailout 1: 2004: R6bn from Transnet Bailout 2: 2007: Seeking between R2bn – R4bn? CE salary 2006: (including contributions and bonuses): R6.8m NO JUSTIFICATION FOR MANGO – IMMORAL!

White Elephants
Dead Elephant #2: Sentech Another bail out – needs R1bn! CEO spend R10m on golf sponsorship
Dead Elephant #3: Denel Recorded losses for 10 years, should break even from 2009 – Shaun
Liebenberg, Denel CEO Asked state for R5.0bn cash injection Another bail out?

White Elephants
Predatory Elephant: Telkom Telecoms cost major obstacle to GDP growth! Sate should consider selling 37% stake in the group!
What happened to privatization? Telkom value – R52bn ACSA value – R50bn+

Acsa Shareholders:
State – 80.0% Public Investment Corporation (PIC) – 20.0%
Parking and landing fees to increase at average 11.4% p.a. between 2007-2011
Passenger Service Fees to rise between 46.0% - 50.0% y:y on 1 October 2007
Capital Expenditure of R20bn towards 2010 New King Shaka Airport (Durban) to cost R7.0bn (Existing airport can
be sufficiently upgraded for R1.0bn) O R Tambo expansions of R4.0bn
Source: Acsa, Financial Mail, June 2007

Monopoly

Monopoly
Barriers to Entry: Legal Barriers
Patents, copyrights, government granted franchises Natural Barriers
Average cost falls throughout range of consumer demand Large economies of scale
E.g. Eskom/Spoornet/Telkom
Definition Source: Kaplan Schweser, CFA Institute Notes, Economics

Monopolistic Competition

Monopolistic Competition
Large number of independent sellers Differentiated products (at least in the minds of consumers!) Firms compete on price, quality and marketing Products are perceived by consumers as close substitutes
E.g.. Telkom and Neotel when it enters market
Definition Source: Kaplan Schweser, CFA Institute Notes, Economics

Oligopoly

Oligopoly
Small Number of Sellers Interdependence among competitors (Cheat or not to cheat -
Prisoner’s Dilemma) Significant barriers to entry (often large economies of scale) Products similar or differentiated
Eg. Mobile Phone market (Vodacom & MTN control 90%)
Definition Source: Kaplan Schweser, CFA Institute Notes, Economics

Oligopolistic Markets in South Africa, in 1990
Product Number of firms supplying over 75 % of the market
Aspirin 2
Sugar 2
Breakfast oats 3
Cement 3
Mealie meal 3
Fertiliser 3
Washing Powder 4
Petrol 5
Toothpaste 5
Source: Mohr P. and Fourie L. Economics for South African Students, 1998

Prisoner’s Dilemma
Prisoner B is silent Prisoner B confesses
Prisoner A is silent A gets 6 monthsB gets 6 months
A gets 10 yearsB goes free
Prisoner A confesses A goes freeB gets 10 years
A gets 2 yearsB gets 2 years
Actual

Oligopoly Application
Firm B honours Firm B cheats
Firm A honours A earns eco profitB earns eco profit
A has eco lossB earns higher eco
profit
Firm A cheats A earns higher eco profit
B has eco loss
A zero eco profitB zero eco profit
Actual

Other Rare Delicacies

Know Your Choices…
Name Perks Price (R), All night
Zelna Montana 2,000
Air Hostess Mile High Club… 1,800
Dirk’s Debbie ? 1,300
Chinese Queen 24-7 1,300
Cute Jade Boeremeisie, hunting weekends
1,200
Natasha Not Nights (Married?) 800
Source: Own Research
Pretoria and Surrounding Areas

Get Your Price Right!
Price (R): Maximum 2000.0 Minimum 800.0 Mean 1400.0 Standard Dev 433.6 Price differential: 150.0%!
Married Men's Saving: R1400 * 3 * 4 = R16,800 p.m. Medical Treatment: doctor(R250), STD (R240*3), HIV (R700 p.m. ARV’s life
long), pathologists (R1000+), antibiotics, related sickness, hospitalisation, etc…
Source: Jhb pharmacy, medical practitioner Price may vary

Asset Allocation
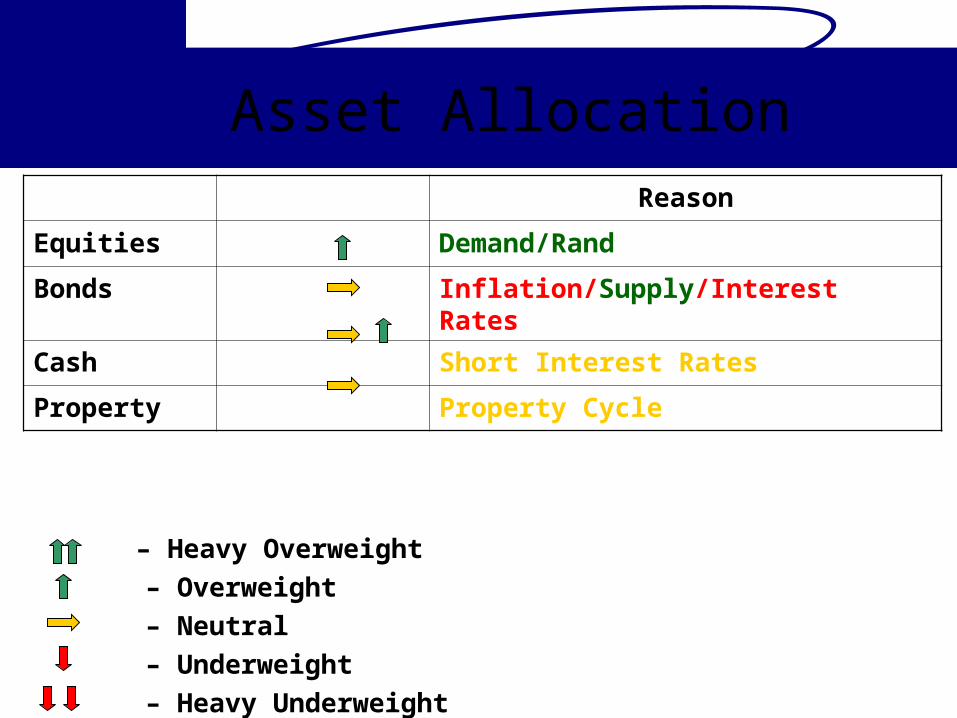
Asset Allocation Reason
Equities Demand/Rand
Bonds Inflation/Supply/Interest Rates
Cash Short Interest Rates
Property Property Cycle
– Heavy Overweight
– Overweight
– Neutral
– Underweight
– Heavy Underweight

Local Equities, 2006Economic Sector MC EAA JSE Sector
Mining and Quarrying 32% 33% Mining, Platinum, Gold, Coal
Finance, prop and bus. serv 30% 25%Banks, Insurance, Life Ass, Media & Pht, IT, Property, Support Serv
Manufacturing 12% 18%Auto, Basic Ind, Beverages, Chem, Elect, IT Hard, Pharm & Bio, Steel & Other
Personal Service 6% 5%Cyc Serv, Health, Leisure Ent, Non-cyc Serv, Person Care
Transport, storage and comm. 6% 6% Telecomm, Transport
Trade, hotels and restaurants 6% 4%Cyc Cons, Food & Drug, Gen Retail, House Goods, Non-cyc Cons
Electricity, gas and water 4% 3% Oil & Gas
Agri, Forestry and Fishing 3% 1% Food Prod
Construction 2% 5% Const & Build
100% 100%

www.efgroup.co.za
Related Documents