GET STARTED WITH DATA SCIENCE BY ANALYZING TRAFFIC DATA FROM CALIFORNIA HIGHWAYS Cirrus Shakeri, Ph.D. Inventurist LLC 1 With contribution and support from: • Aerospike Team: Brian Bulkowski, Monica Pal, Dash Desai, and Ondrej Jaura • GraphLab Team: Danny Bickson and Eduardo Rosini

Get Started with Data Science by Analyzing Traffic Data from California Highways
Jul 15, 2015
Welcome message from author
This document is posted to help you gain knowledge. Please leave a comment to let me know what you think about it! Share it to your friends and learn new things together.
Transcript

GET STARTED WITH DATA SCIENCE BY ANALYZING TRAFFIC DATA FROM CALIFORNIA HIGHWAYS
Cirrus Shakeri, Ph.D. Inventurist LLC
1
With contribution and support from:
• Aerospike Team: Brian Bulkowski, Monica Pal, Dash Desai, and Ondrej Jaura
• GraphLab Team: Danny Bickson and Eduardo Rosini

The Short Story • What we wanted to achieve
• To understand how data science works and what results can be achieved • How repeatable and reusable the data science techniques can be • Broaden the use of Aerospike in Realtime Analytics
• The starting point: data • Hard to find the right dataset • Datasets from California highways • Application example: realtime detection of traffic incidents (a hypothesis)
• The non-glamorous part of data science • Understanding the data and the domain in reasonable depth • Data cleansing and preparation
• The glamorous part • The algorithms– can we treat machine learning as a black box? • The reality of Data Science hits: We need a data scientist!
• Glimpses of hope • Some promising results but the hard work still remains—please join the effort
2

THE LONGER STORY Our lessons learned and how you can apply these techniques in your applications
3

DATA
4

Search for the right dataset • Criteria
• Open, realtime, interesting, not-a-toy dataset, and not-creepy!
• California highways sensor data • 16,490 stations, 41,470 sensors across California highways
5
Courtesy of California Department of Transportation
Start from Data
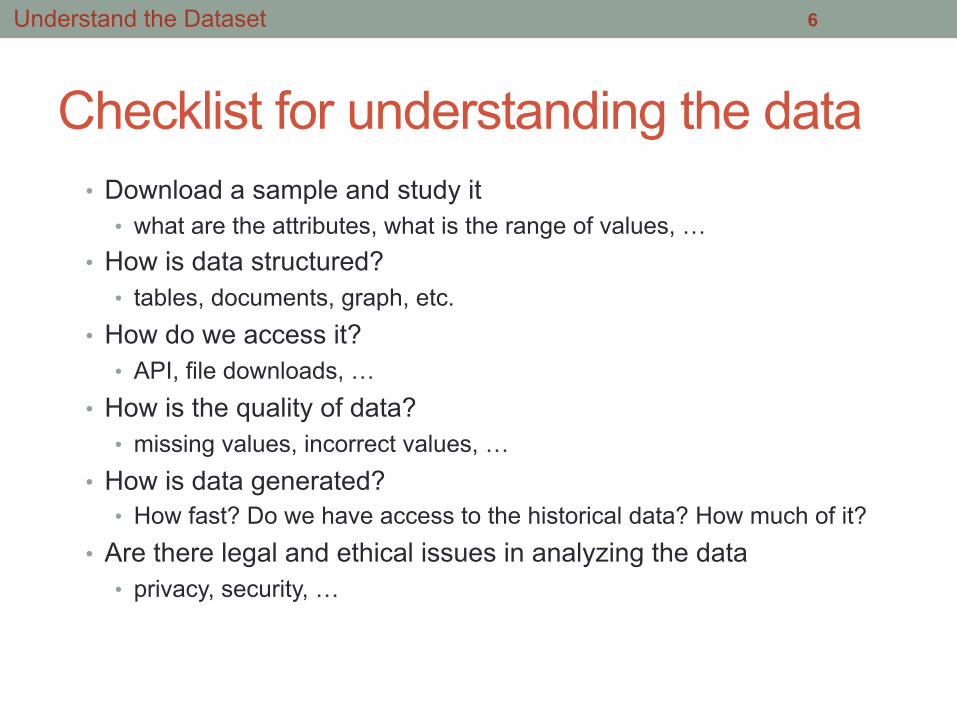
Checklist for understanding the data • Download a sample and study it
• what are the attributes, what is the range of values, … • How is data structured?
• tables, documents, graph, etc. • How do we access it?
• API, file downloads, … • How is the quality of data?
• missing values, incorrect values, … • How is data generated?
• How fast? Do we have access to the historical data? How much of it? • Are there legal and ethical issues in analyzing the data
• privacy, security, …
6 Understand the Dataset

Data format and structure “d04_text_station_raw_2014_10_29.txt”
7
CSV format 8,403,282 lines 565.5 MB
Understand the Dataset

What exactly is in the data
8
station ID
Average speed for lane 1: 44 miles per hour
lane 2 lane 3 lane 4 lane 5
vehicle flow for lane 1: 17 vehicles passed in 30 sec on lane 1
average occupancy for lane 1 lane 1 was occupied 18% of time in 30 sec
Understand the Dataset

Deeper study of the data • GraphLab + iPython Notebook
• Both open source and free
9
www.dato.com ipython.org/notebook.html
Pick Tools

Load Sample Data
10
graphlab.SFrame.read_csv(url_d04_text_station_raw_2014_10_29, ...) ... PROGRESS: Unable to parse line "10/29/2014 00:44:36,400728,2,... PROGRESS: Unable to parse line "10/29/2014 00:00:05,400402,2,... PROGRESS: Unable to parse line "10/29/2014 01:29:57,401542,1,... PROGRESS: Unable to parse line "10/29/2014 00:44:36,401211,0,... PROGRESS: Read 778502 lines. Lines per second: 174789 PROGRESS: Read 3707451 lines. Lines per second: 340087 PROGRESS: Read 6514640 lines. Lines per second: 377548 PROGRESS: 577297 lines failed to parse correctly PROGRESS: Finished parsing file /Users/cirrus/Documents/Aerospike/... PROGRESS: Parsing completed. Parsed 7825984 lines in 19.8226 secs.
Understand the Dataset

Study Range of Values in the Dataset
11
!
Understand the Dataset
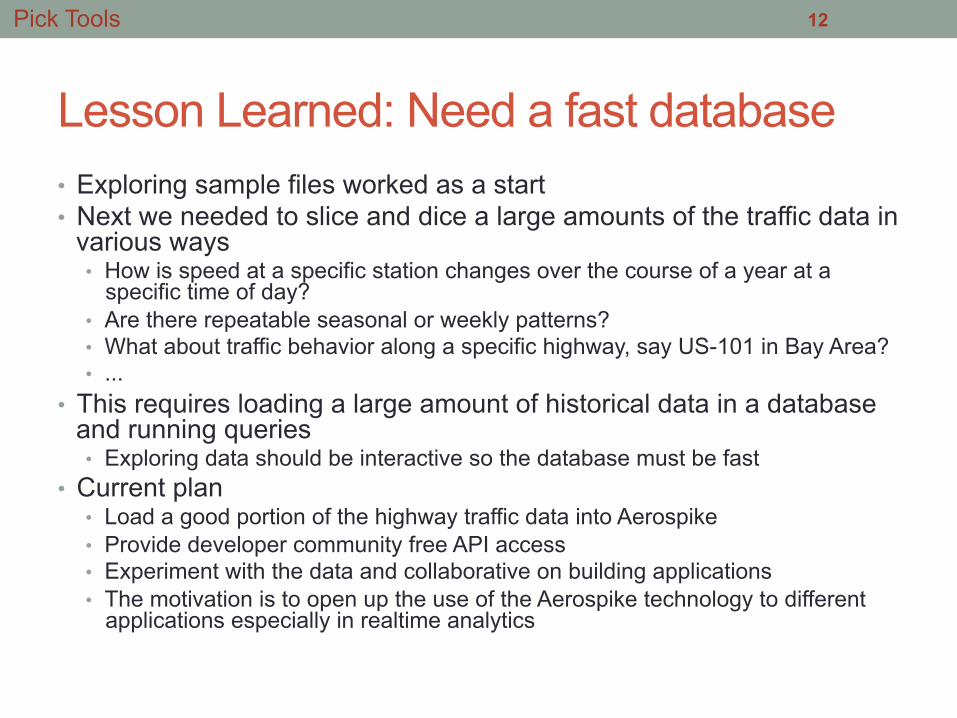
Lesson Learned: Need a fast database • Exploring sample files worked as a start • Next we needed to slice and dice a large amounts of the traffic data in
various ways • How is speed at a specific station changes over the course of a year at a
specific time of day? • Are there repeatable seasonal or weekly patterns? • What about traffic behavior along a specific highway, say US-101 in Bay Area? • ...
• This requires loading a large amount of historical data in a database and running queries • Exploring data should be interactive so the database must be fast
• Current plan • Load a good portion of the highway traffic data into Aerospike • Provide developer community free API access • Experiment with the data and collaborative on building applications • The motivation is to open up the use of the Aerospike technology to different
applications especially in realtime analytics
12 Pick Tools

Good Data vs. Bad Data
13 Check the Data Quality

Imputed Data: 5-min aggregate
14 Check the Data Quality

Two more datasets • Station locations
• Incident data
15 Add More Datasets

Detecting Incidents in Realtime • Can we detect accidents based on sensor data?
• Is there a value in such a prediction? • Can we detect accidents faster than the way they are reported
now? • Is it doable? Has been done before?
• Can we ‘predict’ accidents?
• A better understanding of the domain is needed
16 Generate Application Ideas

STUDY THE DOMAIN
17

Literature Survey • Types of incidents: Collision, Debris, Break-down
18 Study the Domain
Reference: “REAL-TIME DETECTION OF ROAD TRAFFIC INCIDENTS”, by PERO ŠKORPUT, et al

Literature Survey
19 Study the Domain
Reference: “REAL-TIME DETECTION OF ROAD TRAFFIC INCIDENTS”, by PERO ŠKORPUT, et al

Can incidents be detected in near realtime? (under 1 minute)
20
“The survey responses point to a general consensus that the unacceptably high rates of false alarms generated by available incident detection algorithms is the major deterrent.”
Study the Domain

Algorithmic Approaches • Comparative algorithms
• Current traffic data is compared with the ‘normal’ threshold
• Statistical algorithms • Current traffic data is compared with forecasted data
• Traffic theory based algorithms • Rapid change in speed while flow or occupancy do not change
considerably (based on ‘catastrophe theory’)
• Advanced algorithms • AI and neural networks
21 Study the Domain
Reference: “OVERVIEW TO SOME INCIDENT DETECTION ALGORITHMS: A COMPARATIVE EVALUATION WITH ISTANBUL FREEWAY DATA” by Onur Deniz, et al

EXPLORE THE DATA
22

Study Patterns and Correlations
23 Explore the Data

Exploring the Data – Speed
24 Explore the Data

Exploring the Data – Occupancy
25 Explore the Data

Exploring the Data – Flow
26 Explore the Data

FORMULATE THE DATA SCIENCE APPROACH
27

Detecting Incidents as a Classification Problem
• Features • Started simple: Flow, occupancy and speed
• Next: prepare training data
28
Any individual record classified as incident or no-incident:
Prototype the Solution

Classifiers in GraphLab • Classification models supported in GraphLab
• support vector machines (SVM) • classify instances based on a linear function of the features
• logistic regression • estimates the probability of instances belonging to a class as a
logistic function of a linear combination of features • boosted trees
• combines the results of a set of base classification decision trees
• neural networks • middle layers of the network compute composite, intermediary
features
• Also, a smart interface that selects the right model based on the data
29 Prototype the Solution

PREPARE TRAINING DATA TRAIN THE MODEL EVALUATE THE MODEL
30

Why do we need training data? • Supervised learning: a classifier is trained via a dataset
that is labeled with positive and negative instances
31
downstream occupancy / speed
upst
ream
occ
upan
cy /
spee
d
incident
no-incident
?
Prototype the Solution
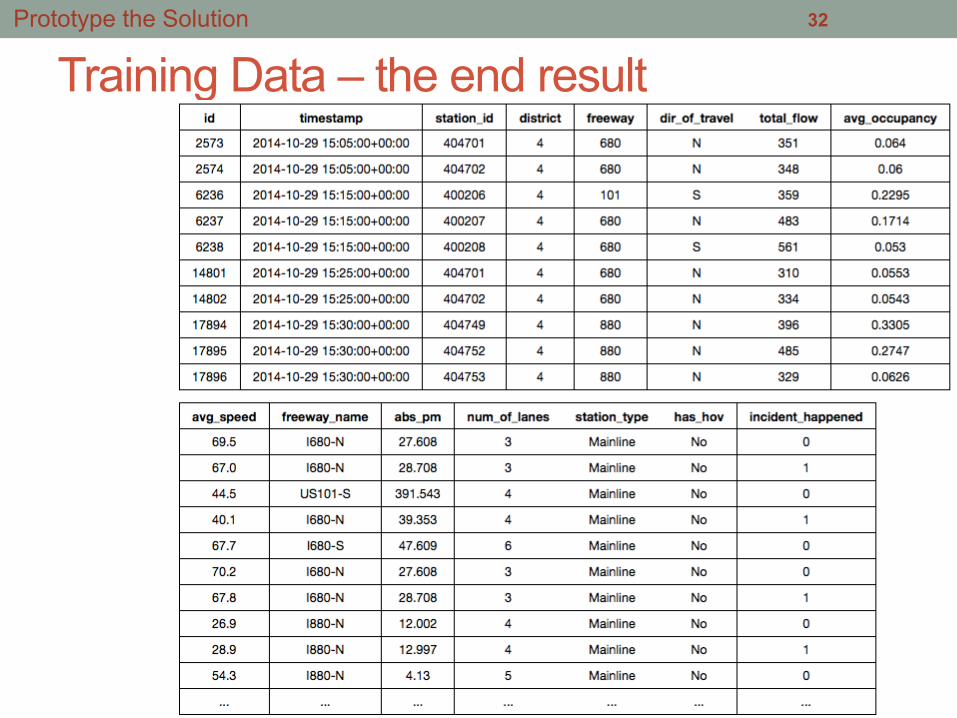
Training Data – the end result 32 Prototype the Solution

Train the Classifier
• This is the ‘smart interface’ where GraphLab decides which classifier to us
• Note that the features are simply flow, speed and occupancy
• Is this model oversimplified?
33
model = graphlab.classifier.create(final_training_data_d0_2014_10_29, target='incident_happened’, features=['total_flow', 'avg_speed', 'avg_occupancy'])
Prototype the Solution
First results were embarrassing! • Basically no incident could be detected in the test data • The reality of data science hit!
• Leveraged the GraphLab on-line community • Worked with GraphLab Data Scientist: Danny Bickson
• Made some changes • Added more features
• Station id, Num of lanes, Direction of travel, Absolute postmile, Hour/Min/Day that incident occurred
• Balanced the negative and positive examples • Tagged station data in a 3-mile vicinity of an incident as positive
instances • Created classifiers for specific highways (e.g., US-101) • …
34 Prototype the Solution
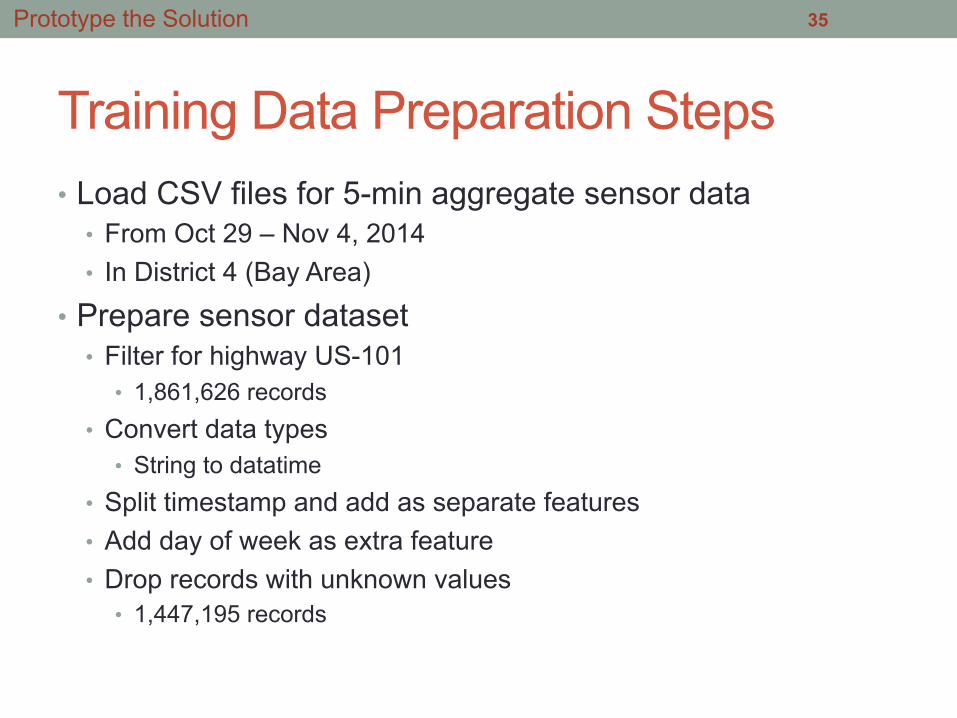
Training Data Preparation Steps • Load CSV files for 5-min aggregate sensor data
• From Oct 29 – Nov 4, 2014 • In District 4 (Bay Area)
• Prepare sensor dataset • Filter for highway US-101
• 1,861,626 records • Convert data types
• String to datatime • Split timestamp and add as separate features • Add day of week as extra feature • Drop records with unknown values
• 1,447,195 records
35 Prototype the Solution

Training Data Preparation Steps • Load CSV file for sensor locations
• 920 sensor locations for US101S in District 4
• Convert highway data to match sensor data • SR101S à highway = 101, direction of travel = ‘S’
• Join with sensor data • Load CSV file for incidents from Oct 29 – Nov 4
• Covert datatypes, drop records with unknown values, … • Find sections of highways 101 in District 4 • Filter for incident data for 101S in District 4
• 176 incidents
• Create a nearest neighbor model for sensor locations • To query the nearest sensors to an incident
36 Prototype the Solution

Training Data Preparation Steps • For each incident on highway 101S in Bay Area between Oct
29 and Nov 4: • Find the sensor stations in the 3-miles radius • For each sensor in the 3 miles radius
• Extract the sensor data for any timestamp that falls within the ‘duration of the incident’
• Add sensor data to the ‘positive examples’ in the training data • 28,460 records
• Note: upstream/downstream stations not taken into account
• ‘Negative Examples’ data (no incidents) is un-proportionally larger (10 times) • Extract a 10% sample of the negative examples data
• 24,026 records • Add sampled sensor data for negative examples to the training data
• 52,486 records
37 Prototype the Solution

SVM – Results
38
Data: +--------------+-----------------+-------+ | target_label | predicted_label | count | +--------------+-----------------+-------+ | 0 | 0 | 3746 | | 0 | 1 | 12330 | | 1 | 0 | 3522 | | 1 | 1 | 3711 | +--------------+-----------------+-------+ [4 rows x 3 columns] , 'accuracy': 0.31991934445922177}
Prototype the Solution

Boosted Trees – Results
39
Data: +--------------+-----------------+-------+ | target_label | predicted_label | count | +--------------+-----------------+-------+ | 0 | 0 | 15082 | | 0 | 1 | 994 | | 1 | 0 | 5574 | | 1 | 1 | 1659 | +--------------+-----------------+-------+ [4 rows x 3 columns] , 'accuracy': 0.7182204298768716}
Prototype the Solution

Ideas for further improving the results • Work with ‘raw’ station data instead of 5-min aggregates • Further explore the data for entire 2014 and entire California highways
• It’s not easy when you are dealing with files: load into Aerospike to rescue • Add more features
• difference between values in neighboring stations • difference between consecutive times at the same location • ...
• Try different models for rush-hour and off-peak hours • Take into account seasonal effects • Validate the actual time of incident in training data • Include upstream and downstream data as separate features • Investigate causality
• Is an incident causing slow-down or is it the other way around?
• Stretch goal: Can we ‘predict’ incidents before happening? • Leading indicators for accidents • Improve safety of self-driving cars
40 Prototype the Solution

THE LAST WORD(S)
41

Data Science – it’s iterative
42
Data
Domain
Problem
Data Science
Prototype
Product
Last Word

43 Last Word

Take Away 1: Realtime Analytics • Realtime (fast) vs. offline
analytics (slow) • Getting closer to how human brain
makes decisions
The next big thing: • The line between capturing and
analyzing data is disappearing • And technologies such as Aerospike
and GraphLab are helping!
44 Last Word

Take Away 2: Where does all this lead? 1. More intelligence for us
• ‘Augmenting Human Intellect’ • Doug Engelbart
2. More automation for machines • ‘The Second Machine Age’
• Erik Brynjolfsson, Andrew McAfee
45 Last Word

THANK YOU Cirrus Shakeri, Ph.D. Co-Founder, Inventurist +1 650-380-9794 twitter.com/cirrus_shakeri www.linkedin.com/in/cshakeri/ [email protected]
46

Location (mile) (Abs PM)
Time
00:00:00
23:55:00
0.0 5.0 10.0
Incident
Incident start time In
cide
nt
loc
atio
n
Stat
ion
loc
atio
n 5-min aggregate end timestamp
5 min
Distance bet stations
5-min aggregate start timestamp
Visualize an incident at a time and location
47
Related Documents


