Get out your Standard Normal WS ! You will be able to use a four- step method to solve Normal distribution problems. oday’s Objectives:

Get out your Standard Normal WS! You will be able to use a four-step method to solve Normal distribution problems. Today’s Objectives:
Dec 16, 2015
Welcome message from author
This document is posted to help you gain knowledge. Please leave a comment to let me know what you think about it! Share it to your friends and learn new things together.
Transcript
Get out your Standard Normal WS!
You will be able to use a four-step method to solve Normal distribution problems.
Today’s Objectives:
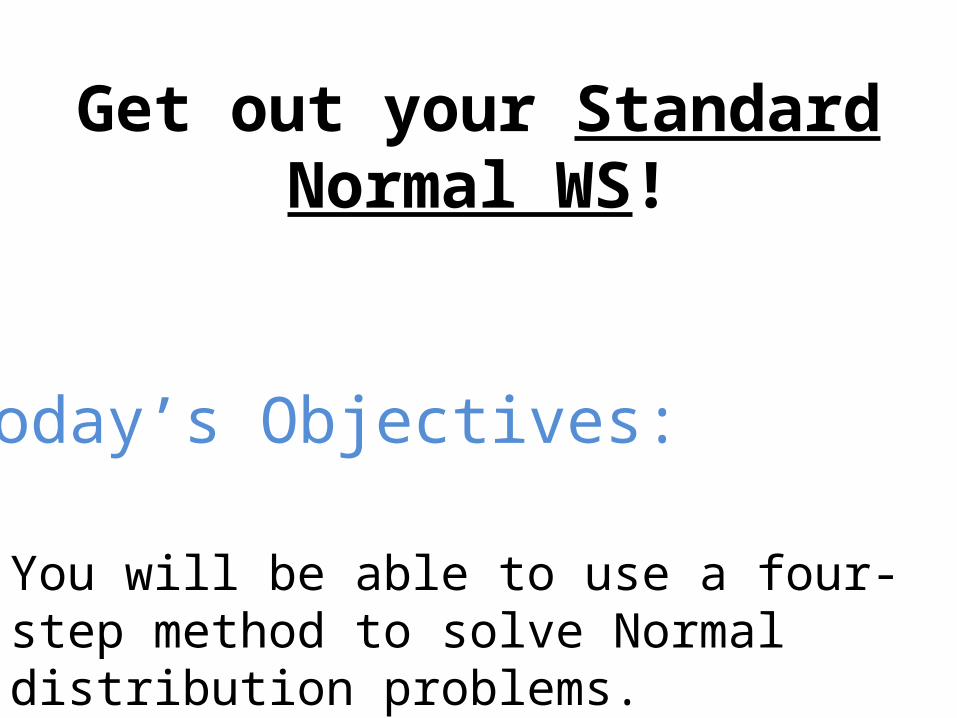
Warm UpUse Table A to answer the following questions.1. is between -1.24 and -0.32
Use Table A to answer the following questions. In each case sketch a standard Normal curve with your value of marked on the axis.2. The 63rd percentile of the standard Normal
distribution.
3. 75% of all observations are greater than .

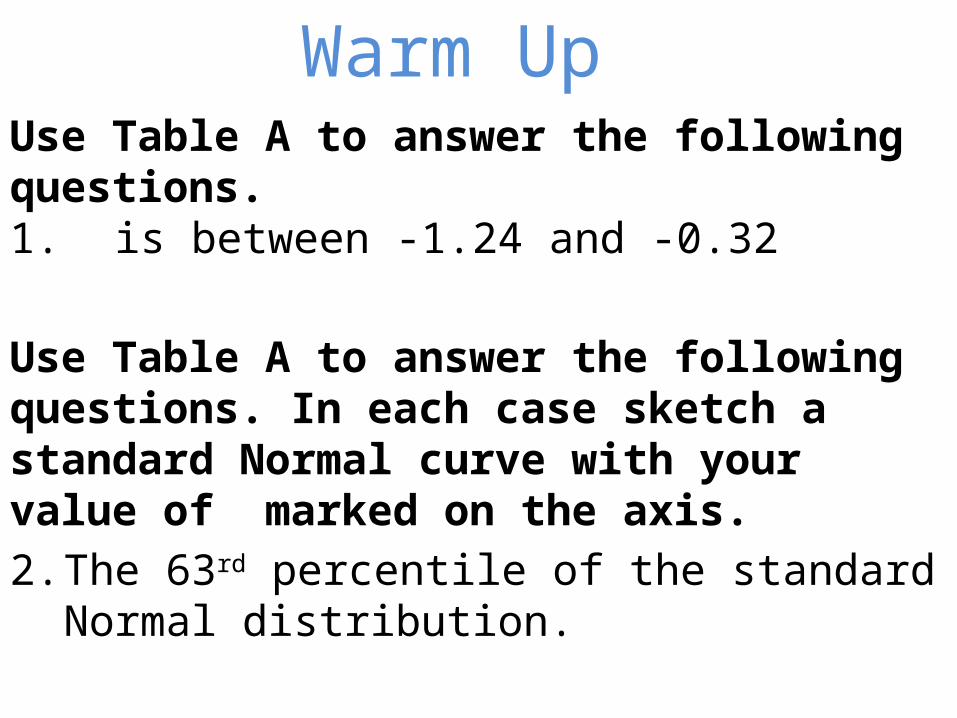
Homework Check
Homework Check
Normal Distribution Calculations
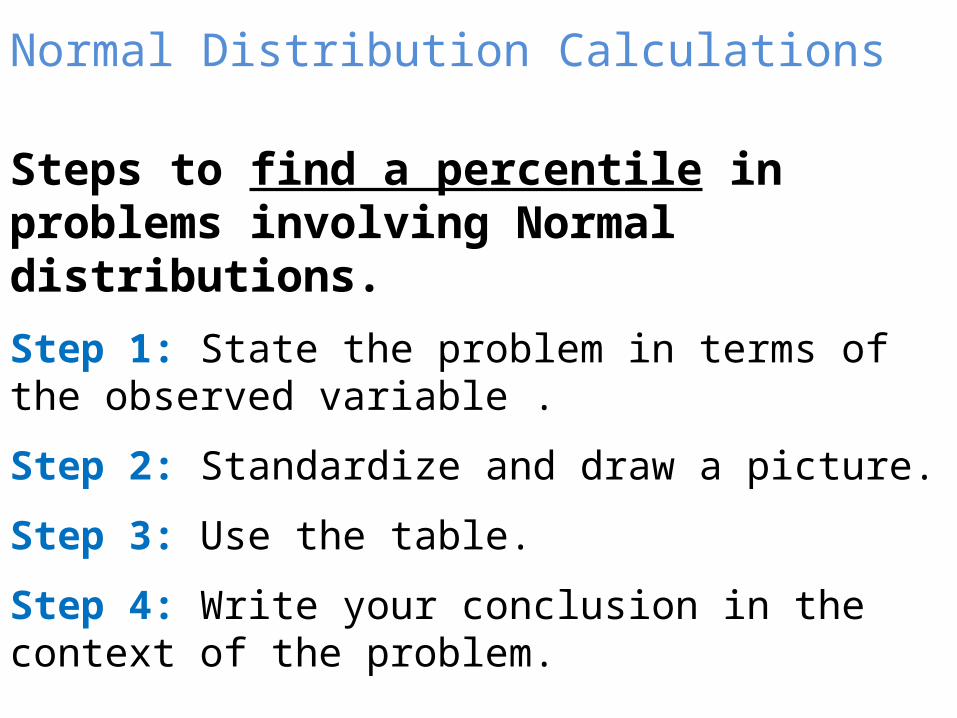
Steps to find a percentile in problems involving Normal distributions.
Step 1: State the problem in terms of the observed variable .
Step 2: Standardize and draw a picture.
Step 3: Use the table.
Step 4: Write your conclusion in the context of the problem.

Normal Method Example
When Tiger Woods hits his driver, the distance the ball travels follows a Normal distribution with mean 304 yards and standard deviation 8 yards.
What percent of Tiger’s drives travel at least 290 yards?
Step 1: State the problem
Let
We want the proportion of drives with .
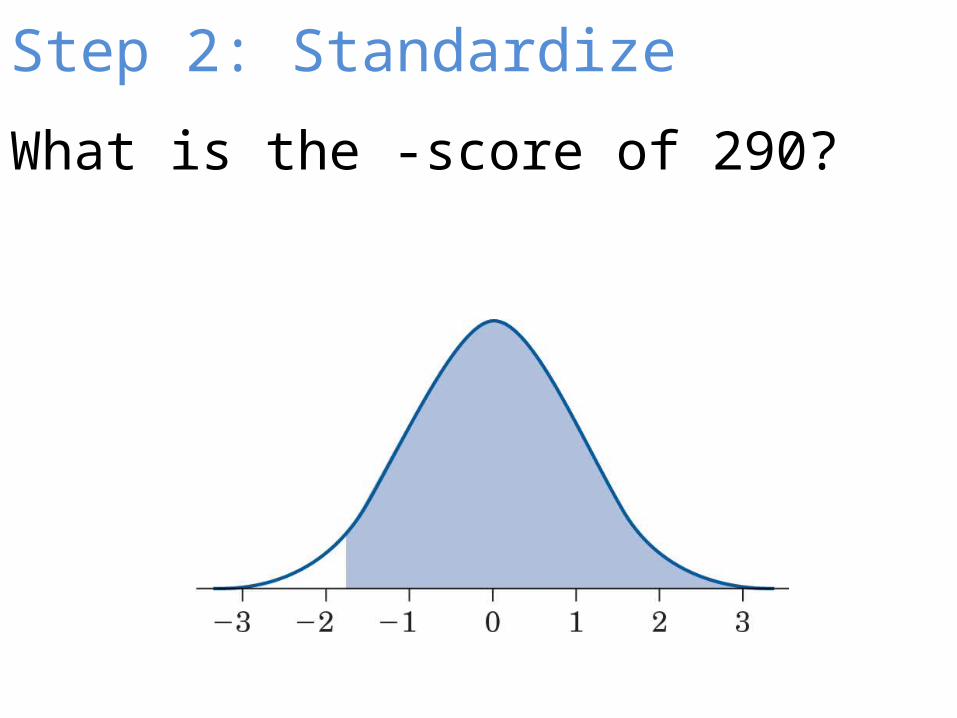
Step 2: Standardize
What is the -score of 290?
Step 3: Use Table A
Find the proportion of observations less than (to the left of) -1.75 and then find the area to the right to answer the question.
Convert this decimal to a percent.
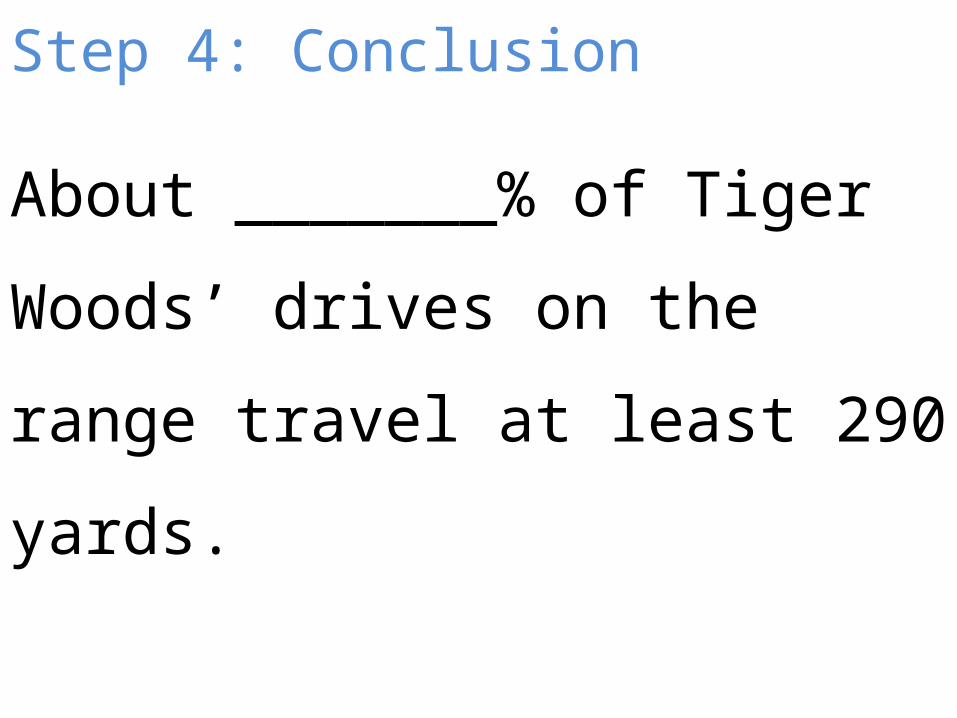
Step 4: Conclusion
About _______% of Tiger Woods’
drives on the range travel at least
290 yards.

Tiger Example Part 2
What percent of Tiger’s drive travel between 305 and 325 yards?
Follow the four-step method.

Table A—In Reverse
Steps to find a variable (x) in problems involving Normal distributions where the percentile is given.
Step 1: State the problem and draw a picture
Step 2: Use Table A
Step 3: “Un-standardize”
Step 4: Conclusion
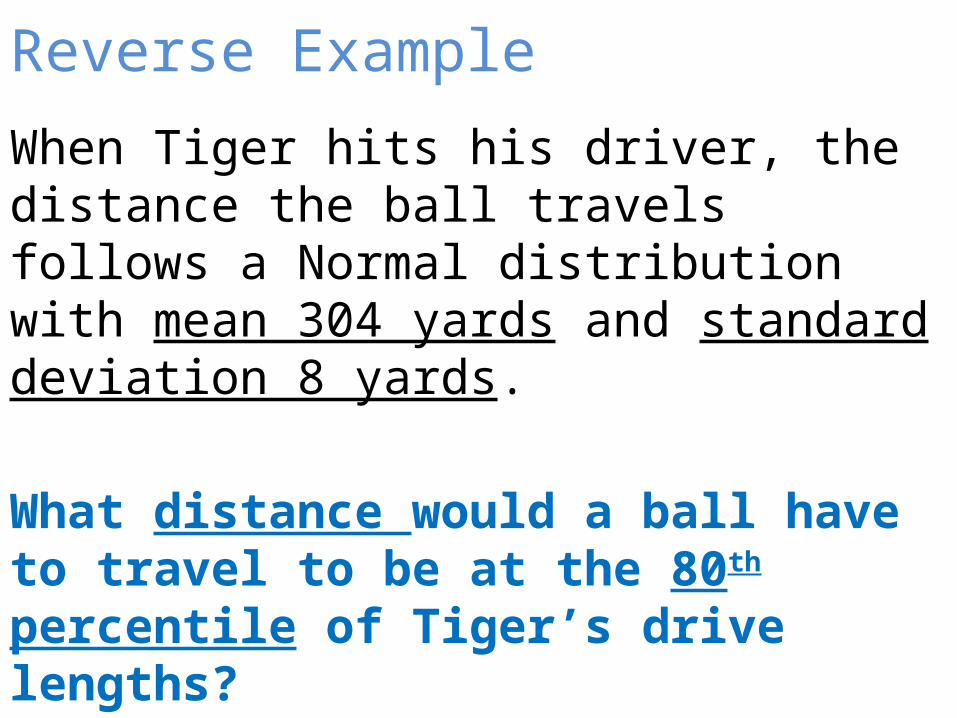
Reverse Example
When Tiger hits his driver, the distance the ball travels follows a Normal distribution with mean 304 yards and standard deviation 8 yards.
What distance would a ball have to travel to be at the 80th percentile of Tiger’s drive lengths?

Step 1: State and Draw
Let
We want to find the drive distance .
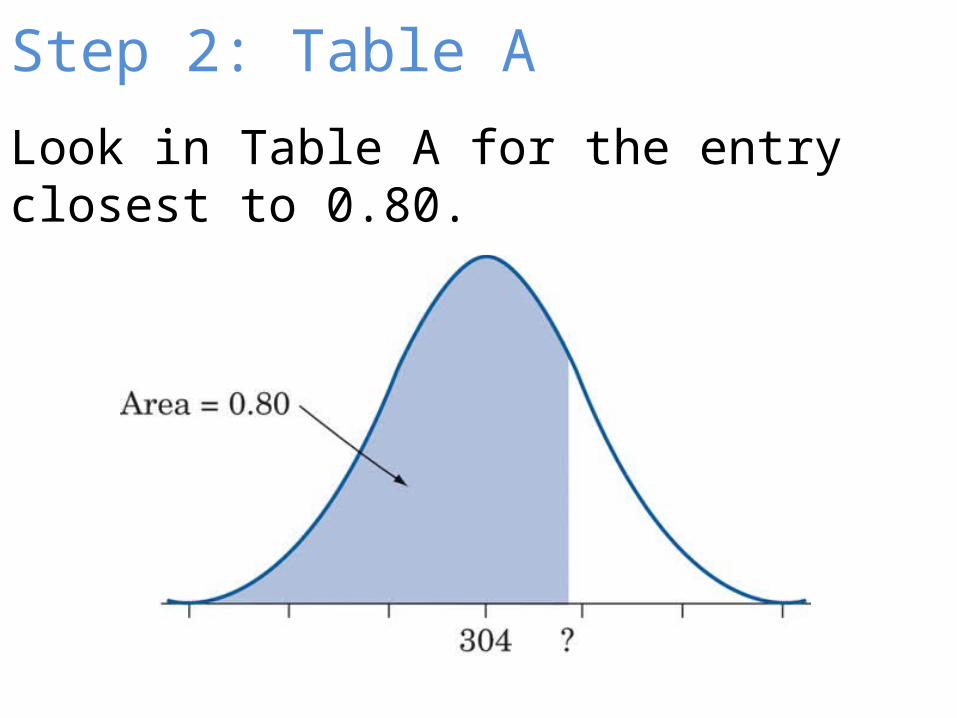
Step 2: Table A
Look in Table A for the entry closest to 0.80.
Step 3: “Un-Standardize”

Step 4: Conclusion
A golf ball would have to travel
____________ yards to be at the 80th
percentile of Tiger’s drive length
distribution.

Running a Mile—Try One!
During World War II, physical training was required for male students in many colleges, as preparation for military service. A study of 12,000 able-bodied male students at the University of Illinois found that their times for the mile run had mean 7.11 minutes and standard deviation 0.739 minutes. The distribution of times was roughly Normal.
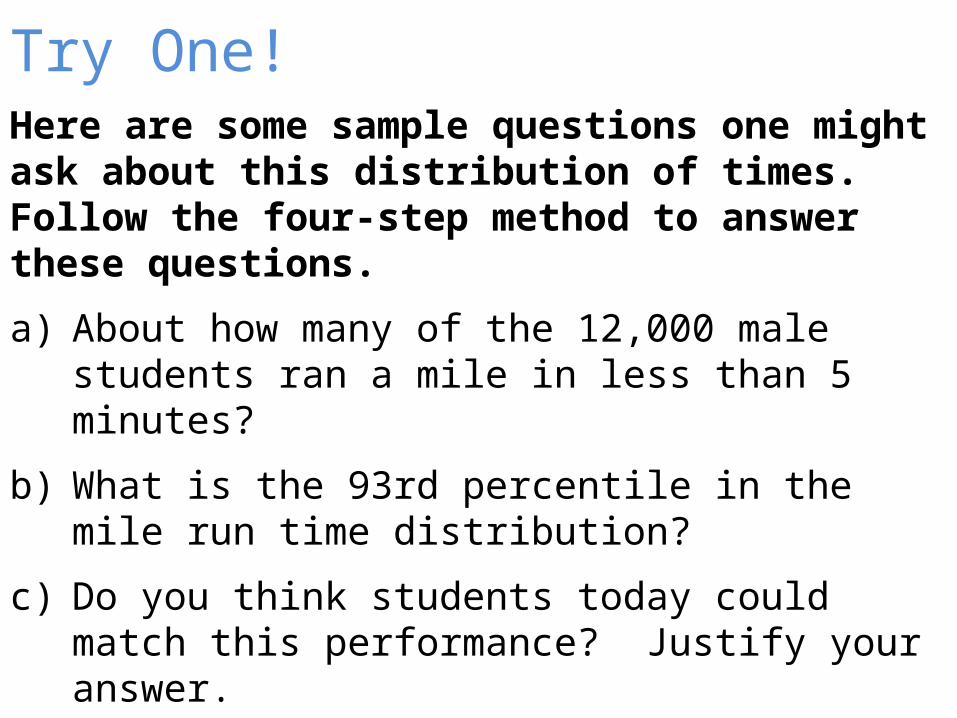
Try One!Here are some sample questions one might ask about this distribution of times. Follow the four-step method to answer these questions.
a) About how many of the 12,000 male students ran a mile in less than 5 minutes?
b) What is the 93rd percentile in the mile run time distribution?
c) Do you think students today could match this performance? Justify your answer.
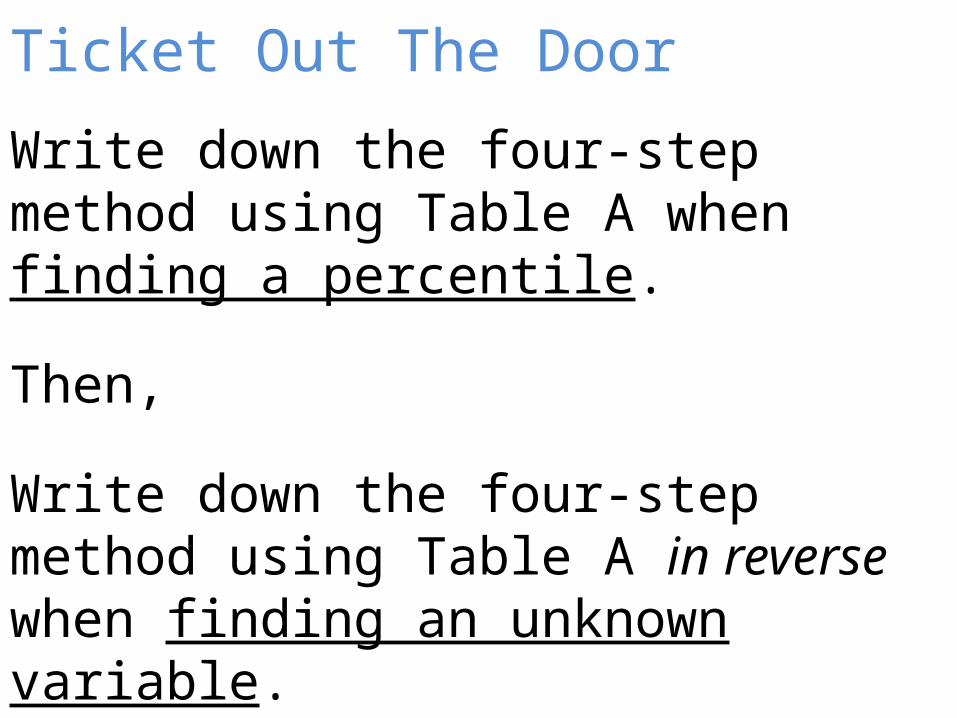
Ticket Out The Door
Write down the four-step method using Table A when finding a percentile.
Then,
Write down the four-step method using Table A in reverse when finding an unknown variable.
Homework
Four-Step Method WorksheetDue Friday
Related Documents


![TFH 2005 WS. LCGC Adsorption/VerteilungPacked/Verteilung Normal Phase [pol-unp] Reversed Phase [unp-pol] Kapillare Glas / FS OF Modifizierung/HTS Irregular.](https://static.cupdf.com/doc/110x72/5514b60055034640138b5339/tfh-2005-ws-lcgc-adsorptionverteilungpackedverteilung-normal-phase-pol-unp-reversed-phase-unp-pol-kapillare-glas-fs-of-modifizierunghts-irregular.jpg)