GET IN LINE: CHAPTER 11 RESTRUCTURING IN CROWDED BANKRUPTCY COURTS Benjamin Iverson KELLOGG SCHOOL OF MANAGEMENT NORTHWESTERN UNIVERSITY March 2017 Bankruptcy costs depend not only on the laws that govern financial distress but also on the ability of the court to rehabilitate distressed firms. This paper tests whether Chapter 11 restructuring outcomes are affected by time constraints in busy bankruptcy courts. Using the passage of the Bankruptcy Abuse Prevention and Consumer Protection Act as an exogenous shock to caseloads, I find that commercial banks report lower charge-offs on business lending when court caseloads decline, suggesting that the costs of financial distress are lower in less-congested courts. Further, court caseload affects how restructuring takes place. Less-busy bankruptcy judges liquidate fewer small firms, but more large firms. When caseload declines, large firms spend less time in court and firms that are dismissed from court are less likely to re-file for bankruptcy. In addition, firms are less likely to sell assets or obtain debtor-in- possession financing in less-busy courts. Keywords: Financial Distress; Bankruptcy; Chapter 11 JEL classification: G33; G34; K22 __________________________________________________________________ The author can be contacted at: [email protected]. Additional information is available in the online appendix available at: http://kellogg.northwestern.edu/faculty/iverson/papers.html. I am grateful to Jonathan Carson, Judge Joan Feeney, Judge Geraldine Mund, and Bill Norton for helpful conversations about the bankruptcy process when courts are busy. I thank Bo Becker, Shai Bernstein, Lauren Cohen, Stu Gilson, Robin Greenwood, Sam Hanson, Victoria Ivashina, Howell Jackson, Chris Malloy, Mark Roe, David Scharfstein, Andrei Shleifer, David Smith, Jeremy Stein, Adi Sunderam and seminar participants at Brigham Young University, Columbia University, Dartmouth College, Duke University, the Federal Reserve Bank of New York, Harvard Business School, London Business School, New York University, Northwestern University, Ohio State University, University of California at Berkeley, University of Chicago, University of Southern California and Yale University for their insightful comments. Robert Liu provided excellent research assistance.

Welcome message from author
This document is posted to help you gain knowledge. Please leave a comment to let me know what you think about it! Share it to your friends and learn new things together.
Transcript

GET IN LINE: CHAPTER 11 RESTRUCTURING IN
CROWDED BANKRUPTCY COURTS
Benjamin Iverson KELLOGG SCHOOL OF MANAGEMENT
NORTHWESTERN UNIVERSITY
March 2017
Bankruptcy costs depend not only on the laws that govern financial distress but also on the ability of the
court to rehabilitate distressed firms. This paper tests whether Chapter 11 restructuring outcomes are
affected by time constraints in busy bankruptcy courts. Using the passage of the Bankruptcy Abuse
Prevention and Consumer Protection Act as an exogenous shock to caseloads, I find that commercial
banks report lower charge-offs on business lending when court caseloads decline, suggesting that the
costs of financial distress are lower in less-congested courts. Further, court caseload affects how
restructuring takes place. Less-busy bankruptcy judges liquidate fewer small firms, but more large firms.
When caseload declines, large firms spend less time in court and firms that are dismissed from court are
less likely to re-file for bankruptcy. In addition, firms are less likely to sell assets or obtain debtor-in-
possession financing in less-busy courts.
Keywords: Financial Distress; Bankruptcy; Chapter 11
JEL classification: G33; G34; K22
__________________________________________________________________ The author can be contacted at: [email protected]. Additional information is available in the
online appendix available at: http://kellogg.northwestern.edu/faculty/iverson/papers.html.
I am grateful to Jonathan Carson, Judge Joan Feeney, Judge Geraldine Mund, and Bill Norton for helpful
conversations about the bankruptcy process when courts are busy. I thank Bo Becker, Shai Bernstein, Lauren
Cohen, Stu Gilson, Robin Greenwood, Sam Hanson, Victoria Ivashina, Howell Jackson, Chris Malloy, Mark Roe,
David Scharfstein, Andrei Shleifer, David Smith, Jeremy Stein, Adi Sunderam and seminar participants at Brigham
Young University, Columbia University, Dartmouth College, Duke University, the Federal Reserve Bank of New
York, Harvard Business School, London Business School, New York University, Northwestern University, Ohio
State University, University of California at Berkeley, University of Chicago, University of Southern California and
Yale University for their insightful comments. Robert Liu provided excellent research assistance.

1
I. Introduction
The purpose of Chapter 11 bankruptcy is to protect the assets of financially distressed firms from
seizure by creditors while the restructuring options available to the firm can be considered. The laws that
govern this process play an important role in determining the costs of financial distress and the eventual
allocation of capital in an economy, as shown by prior research.1 However, the efficiency of the
institution that governs this process – the bankruptcy court – could also affect bankruptcy outcomes.
Indeed, organizational efficiency and time constraints have been shown in other contexts to play a key
role in decisions made by private firms.2 The main contribution of this paper is to show that the
efficiency of the court itself, and not just the laws that govern the court, has an important impact on the
costs of financial distress and on the ultimate outcome of the bankruptcy.
In particular, I focus on the total caseload that bankruptcy judges must deal with. Judge workload
fluctuates widely as economic conditions change. By definition, judges become busiest when financial
distress is most prevalent—when a large number of firms and individuals are facing financial distress.
For example, total bankruptcy filings nationwide rise on average by 32% during economic recessions.
Large differences in workload are also common cross-sectionally, as local economic deteriorations lead to
increasing caseloads for judges in those areas.3 Court congestion, then, is potentially an important source
of inefficiency because it occurs when the bankruptcy system is most needed: during economic downturns
when failing firms have the fewest outside options for restructuring and when the value of correctly
allocating capital is the highest (Eisfeldt and Rampini 2006).
It is natural to expect that time constraints might limit the ability of the court to manage cases
effectively, thereby leading to an increase in the costs of financial distress. But it is less clear through
which channel court congestion might do this. On the one hand, a busy judge may look to free up time by
1 See Hotchkiss et al. (2008) for a review of this literature.
2 For example, Agarwal et al.(2016) show that banks with more loans per employee and longer phone waiting times
were significantly less likely to modify mortgage contracts in the wake of the financial crisis. 3 For example, following the collapse in house prices in 2007 and 2008, judge caseload doubled in Arizona relative
to Texas, where the house price drop was not as severe.

2
liquidating more firms or dismissing them from court altogether, since once this action is taken the judge
has less to do in managing the case. This action could reduce overall recovery rates by forcing
liquidations of viable firms, potentially at fire-sale prices. Alternatively, a time-pressured judge may fear
making errors in judgment due to an inability to gather and consider information about each case. Given
this, a busy judge may be reluctant to liquidate a distressed firm, preferring instead to allow the firm to
reorganize and preserving the option to liquidate the firm at a future date. In addition, reorganization may
be the path of least resistance for the judge in many cases, since the debtor’s management, who typically
seeks to have the firm reorganized, retains control of the firm by default (Franks, Nyborg, and Torous
1996). Under this hypothesis, high caseloads could harm creditors by leading to either lengthy stays in
bankruptcy or the inefficient continuation of firms.4
To empirically test the impact of busy courts on financially distressed firms, I use a natural
experiment that exogenously impacted the caseload of bankruptcy courts. In 2005, Congress passed the
Bankruptcy Abuse Protection and Consumer Protection Act (BAPCPA), which made it substantially more
difficult for households to file for bankruptcy protection. After BAPCPA’s passage, non-business
bankruptcy filings dropped dramatically, and stayed at extremely low levels until the onset of the
financial crisis (Figure 1, Panel A). Since bankruptcy judges rule on both business and non-business
cases (i.e., there is no specialization among bankruptcy judges), BAPCPA created a large shock to the
workload of bankruptcy judges across the nation, cutting average caseloads in half. BAPCPA did not
impact all districts equally, however. In particular, courts that handled a relatively higher share of
personal bankruptcy cases saw caseloads drop by larger amounts after BAPCPA took effect. For
example, caseload in the District of Oregon decreased by 62% after BAPCPA, while just to the south
caseload only fell by 39% in the relatively more business-centric Northern District of California. Using
4 In addition, as judges become busier it can change the incentives of both creditors and debtors, which will then
also affect bankruptcy outcomes. For example, if a busy judge is more likely to approve an asset sale, then
petitioners have a larger incentive to ask for the asset sale in the first place.
3
difference-in-differences specifications, I exploit this exogenous variation to estimate the causal effect of
total judge caseload on a variety of firm outcomes.
[FIGURE 1]
I first test how court caseload is related to default costs. Because the equity value of the bankrupt
firm is negative or close to zero, additional costs of financial distress are principally borne by the
unsecured creditors of the firm. Using regulatory data reported by commercial banks, I indirectly
measure the default costs passed on to creditors by examining the net charge-off rate of commercial and
industrial (C&I) loans held by banks that were particularly exposed to the BAPCPA caseload shock.
Because local banks are the predominant source of funding for small businesses (Petersen and Rajan
1994), they should bear the brunt of higher bankruptcy costs when these firms default. Consistent with
the intuition that time constraints cause higher default costs, I find that banks that are located in
bankruptcy districts with exogenously lower caseloads report significantly lower C&I loan charge-off
rates. Specifically, I estimate that a 64-hour reduction of bankruptcy caseload per year (equivalent to one
standard deviation within the context of the BAPCPA natural experiment, but only a 6% decline from the
mean caseload), reduces loss given default on C&I loans by 3.9 percentage points, an 11% decline from
the mean.
I then use information on 3,236 Chapter 11 bankruptcies filed between 2004 and 2007 to test how
court caseload affects bankruptcy outcomes. I find that an exogenous decline in court caseload leads to
an increase in case dismissals, thereby denying some firms bankruptcy protection. In addition, I also
show that larger firms, which are most likely to tax busy judges, are more likely to be liquidated in less-
busy courts, and correspondingly less likely to reorganize and emerge from bankruptcy. Put differently, a
decline in caseload changes the outcomes of marginal bankruptcy cases by pushing firms away from
reorganization and towards dismissal (for smaller firms) or liquidation (for larger firms).
While these results show that caseload affects case outcomes, it is not clear how this might
translate into reduced bankruptcy costs. One possibility is that less-busy courts have lower recidivism

4
rates – the probability that a firm re-enters bankruptcy within three years of its original filing.5 I find that
firms which successfully reorganize in busy bankruptcy courts are no more likely to re-file for bankruptcy
than firms that reorganize in less busy courts. However, firms which are dismissed from less-busy courts
have substantially lower recidivism rates, and this lower recidivism likely lowers the costs of financial
distress for these firms as it eliminates direct and indirect bankruptcy costs incurred the second time in
court. 6
Court caseload also impacts other aspects of restructuring that relate to bankruptcy costs. I find
that large firms spend less time in bankruptcy when caseload decreases, particularly when the firm is
eventually liquidated. This is consistent with busy judges being hesitant to push large firms into
liquidation, instead allowing them to remain in bankruptcy longer. Meanwhile, smaller firms are
liquidated more quickly in busy courts. In addition, I find that firms that file in less-busy courts are less
likely to sell assets, which could reduce bankruptcy costs by eliminating fire sales (Shleifer and Vishny
1992). Further, debtors are less likely to obtain debtor-in-possession (DIP) financing when caseload
declines. This is consistent with the idea that firms do not need to obtain as much outside cash (e.g. via
asset sales or DIP loans) when courts are less crowded.
Taken together, my results show that overall costs of financial distress are lower when court
caseload declines, and that court caseload has a significant impact on how capital is reallocated in
bankruptcy. These findings relate to a large literature on the costs of financial distress (Warner 1977;
Andrade and Kaplan 1998; Elkamhi, Ericsson, and Parsons 2012) as well as investigations into the design
of bankruptcy systems and their impact on debt contracts (Gertner and Scharfstein 1991; Aghion, Hart,
and Moore 1992; Bolton and Scharfstein 1996; Stromberg 2000). Much of the research in this area has
focused on the design of bankruptcy institutions, but a growing literature points to the judge as having a
large effect on bankruptcy outcomes (Bris, Welch, and Zhu 2006; Gennaioli and Rossi 2010; Chang and
5 Gilson (1997) and Hotchkiss (1995) use recidivism as a measure of inefficient restructuring. However, because the
optimal recidivism rate is likely not zero, an increase in recidivism is not necessarily inefficient. 6 Section V.C discusses more fully why dismissed firms, but not reorganized firms, have higher recidivism rates in
busy courts.
5
Schoar 2013; Bernstein, Colonnelli, and Iverson 2016). However, to date this line of research has treated
judge characteristics as fixed. This paper contributes to this line of research by showing that distress costs
and firm outcomes are significantly affected by time constraints faced by the judge, and not just the
Bankruptcy Code or a judge’s own fixed biases.7
In addition, this paper broadly relates to the literature on complexity costs and bounded
rationality (Hong and Stein 1999; Hirshleifer and Teoh 2003; Cohen and Lou 2012). In this vein,
research that examines job performance and decision-making under time constraints is particularly
relevant to my research, and in recent years a growing literature has pointed to time constraints as playing
an important role in decision making.8 Agarwal et al. (2016) show that banks with fewer employees per
loan, less training for staff, and longer wait times for phone calls were significantly less likely to modify
mortgages to avoid costly foreclosures. Fich & Shivdasani (2006) show that busy boards are associated
with weak corporate governance. Coviello, Ichino, and Persico (2014) show that judges who juggle too
many cases at once have decreased productivity, and Ponticelli and Alencar (2016) show that congested
courts were less effective at incorporating reforms in the Brazilian bankruptcy system.
Perhaps most closely related to this paper is Huang (2011), who uses an empirical methodology
similar to mine to show that busy appellate court judges exhibit lightened scrutiny over district court
decisions. This paper builds on his work by examining the effect of time constraints in bankruptcy courts,
where the effect of time constraints is theoretically ambiguous since dismissing or liquidating a case
could be less work for the judge, but doing so is not the default option for the judge. Further, bankruptcy
court caseload naturally fluctuates over the business cycle and thus these effects arise systematically,
making it important from a policy perspective to understand the effects of caseload on bankruptcy courts
in particular.
7 Legal researchers have long been concerned about the effect of heavy caseloads on federal judges’ decision-
making. See, for example, Friendly (1973) and Ginsburg (1983). 8 See (Jex 1998) for an overview of the psychological research in this area.

6
The rest of the paper proceeds as follows. Section II gives more background about the role of the
judge in Chapter 11 bankruptcy and measures of judge caseload. Section III describes the impact of
BAPCPA on court caseload and develops my empirical strategy. Section IV describes the data in my
sample. Section V analyses the impact of caseload shocks on restructuring firms. Section VI concludes.
II. Bankruptcy process
A. The role of the bankruptcy judge
When a corporation files for Chapter 11 bankruptcy protection, it is randomly assigned to one of
the bankruptcy judges in the district in which it files.9 From the first-day motions until the end of the
bankruptcy case, the judge’s main role is to review motions that are brought before the court and to
determine whether to grant those motions. The bankruptcy judge therefore plays an integral role in
Chapter 11 restructuring, with the judge being responsible for setting corporate operating policies and,
ultimately, determining whether a debtor firm should be liquidated or reorganized.
Among the most important motions brought before the judge are petitions to dismiss a bankruptcy
case or convert it to Chapter 7 liquidation. While conversion to Chapter 7 almost certainly means the
death of the firm, motions for dismissal are less clear. Dismissal from court essentially means that the
firm remains as if no bankruptcy had ever been filed, and thus creditors have power to seize assets or seek
legal action against the debtor. Dismissed firms can re-file for bankruptcy, but they must show that they
are in need of bankruptcy protection and have potential to be successfully rehabilitated; otherwise, the
case will either be dismissed again or converted to Chapter 7, potentially with legal consequences for a
bad-faith filing. Dismissal typically leads to either liquidation or a subsequent bankruptcy filing because
9 Corporations can file for bankruptcy either (1) where they are incorporated, (2) where they are headquartered, or
(3) where they do the bulk of their business. This gives the largest, nationwide firms substantial leeway in the
choice of bankruptcy venue, but for most corporations these three locations are one and the same and therefore they
are not able to “shop” for a more suitable bankruptcy venue. In my sample, 295 firms (8.9%) filed in bankruptcy
districts different from the address they reported on their petitions. Excluding these firms from the sample does not
change any of my conclusions.
7
the firm has not been restructured in any way (Morrison 2007).10
This is particularly true for smaller
firms, which have less ability to fight lawsuits in court or negotiate with creditors outside of court.
Another key role of the bankruptcy judge is to rule on the feasibility of a Chapter 11 plan of
reorganization. The plan of reorganization outlines how the operations and capital structure of the firm
will be restructured and how the creditors of the firm will be repaid. The plan must also estimate the
enterprise value of the firm under Chapter 11 continuation, and show that this value is greater than the
expected value if the firm were to be liquidated under Chapter 7. While creditors must vote to accept a
plan, even after it has been accepted by the creditors the judge has the responsibility to determine if
“confirmation of the plan is not likely to be followed by liquidation or the need for further financial
reorganization” (United States Courts 2011). In short, the judge must agree that the plan does enough to
ensure that the firm will be viable going forward. While this objective is specifically laid out for the
judge in the Bankruptcy Code, there are no direct monetary consequences for a judge who allows an
unviable firm to reorganize, since in practice it is nearly impossible to determine when this occurs.
However, there are reputational concerns for bankruptcy judges, who are well-known within legal
communities (LoPucki 2005) and whose decisions are part of the public record.
Aside from direct decisions that determine whether a firm is allowed to reorganize, judges also
rule on motions which alter other important aspects of the bankruptcy process. One of the most important
of these is the motion to sell assets in so-called “Section 363” sales (named after the section of the
Bankruptcy Code that governs the sales). Asset sales can bring much-needed cash into the firm, allowing
it to continue operations during bankruptcy or to pay off creditors who are holding up negotiations.
However, Pulvino (1999) shows that assets sold in Chapter 11 restructuring are typically sold at deeply
discounted prices, indicating that these sales could hurt recovery rates for creditors. It is up to the judge
to determine whether these sales should be allowed to take place and to ensure that the auction process is
fair.
10
In Appendix A I provide more detail about why firms are dismissed from court and what happens to them after
they leave court.

8
Other motions that judges consider include petitions to lift the automatic stay and allow creditors
to seize certain assets, to extend the exclusivity period, or to allow the use of cash collateral. A growing
body of literature shows that judges have a significant amount of discretion in their rulings and are
important players in the restructuring process. For example, Bris, Welch, and Zhu (2006) show that judge
fixed effects account for 19% of the variation in bankruptcy durations and 10% of the variation in
unsecured creditor recovery rates.
Finally, it is important to keep in mind is that the perceived likelihood that a judge will rule a
given way will affect how debtors and creditors behave during the bankruptcy. In equilibrium, a debtor is
likely to be more aggressive if they perceive that the judge is sympathetic to their cause, and vice versa
for pro-creditor judges. Thus, if busy judges rule differently, it will also affect the set of motions filed in
court and other actions taken by debtors and creditors. The outcomes I observe in this paper are the net
result of all of these actions after a shock to court caseload, and are thus not solely attributable to actions
taken by the judge alone.
B. Measuring bankruptcy court caseload
The number of bankruptcy judgeships in the United States is determined by Congress, and the
creation of new judgeships requires the passage of a bill by both the House of Representatives and the
Senate. Every other year, the Judicial Conference of the United States conducts a study of the caseload of
bankruptcy judges and recommends to Congress the number of new judgeships that are needed for each
bankruptcy district. Despite consistent pleas for more judges from the Judicial Conference, the last time
Congress approved new permanent judgeships was in 1992.11
As a result, judge workloads have
increased dramatically. From 1980 to 2010, total bankruptcy filings rose by 381% while the total number
of bankruptcy judges only increased by 53%. Put differently, the average bankruptcy judge in 2010
handled 3.1 times more cases than the average judge in 1980.
11
In 2005, 28 new temporary judgeships were created in conjunction with BAPCPA, although the Judicial
Conference had requested 47 permanent positions. Section III discusses BAPCPA in more detail.
9
But each bankruptcy case does not demand an equal amount of the judge’s time. Personal
Chapter 7 cases rarely go before a judge, while a complex Chapter 11 filing will take many hours of court
time. Because of these differences, the Judicial Conference uses a weighting system to calculate the
caseload for each bankruptcy district. The weights come from a judge time study conducted in 1989
(Bermant, Lombard, and Wiggins 1991), and indicate the number of hours a judge spends on each of six
types of bankruptcy cases (see Appendix Table A.3 for weights): non-business Chapter 7, business
Chapter 7, Chapter 11, Chapter 12, Chapter 13, and other. While non-business Chapter 7 cases on
average take only 6 minutes of a judge’s time, the average Chapter 11 case uses up nearly 8 hours.12
Following the Judicial Conference, I measure caseload as the weighted number of cases filed per judge in
each bankruptcy district. Because the weights are expressed in the number of hours the judge is expected
to spend on the case, weighted caseload can be interpreted as the number of hours (per year) the judge
would spend administering the particular mix of six bankruptcy case types filed in his bankruptcy district.
Importantly, weighted caseload measures only the time spent by a judge administering bankruptcy cases,
and is therefore not a measure of the total workload of a bankruptcy judge. Specifically, it omits time
spent on adversary proceedings, court administration, and travel. Bermant, Lombard, and Wiggins (1991)
show that case-related work and adversary proceedings together consume about 57% of a judge’s total
time, but do not break out the percentages for case work alone. Roughly speaking, if case work alone
consumes 50% of a judge’s time (and adversary proceedings the remaining 7%), then a judge with a
weighted caseload of 1,000 hours per year (the average in my sample) has a total workload of about 2,000
hours, equivalent to a 40-hour work week with no vacation time. Because I cannot measure total
workload, in this paper I focus only on weighted caseload as a proxy for the total amount of work a judge
must do.
On a weighted basis, judges in 1980 had, on average, a total caseload of 503 hours per year. By
2010, that workload had more than doubled to 1,141 hours per year. However, much of that increase
12
This is an average across all Chapter 11 cases filed, and is thus not a reflection of “mega” Chapter 11 cases which
cost judges significantly more time.

10
came in the first few years of the 1980s, when business bankruptcy filings rose quickly in the aftermath of
two closely-spaced economic recessions. Since 1983 total weighted caseload has fluctuated around 1,000
hours per year (Figure 2). In general, total bankruptcy caseload rises during or shortly after economic
recessions, and often these increases can be substantial. The average peak-to-trough change in caseload
since 1983 is 264 hours, or 25% of the mean caseload per year.
[FIGURE 2]
Moreover, there is wide variation in caseload across the 89 bankruptcy districts in the U.S.13
Taking the average weighted caseload for each district from 1983 – 2011, I find that the standard
deviation across districts is 311 hours, or 7.8 40-hour work weeks. At the extremes, the bankruptcy judge
in Vermont had an average total workload of 305 hours per year, while the judges of the Western District
of Tennessee averaged 1,664 hours per year. More recently, areas that have experienced particularly
difficult economic recessions have seen dramatic increases in the caseload required of each judge. For
example, since 2009, bankruptcy districts in Nevada (2,161 hours), Middle District of Florida (2,041
hours), Eastern Michigan (1,865 hours), Northern Mississippi (1,833 hours) and Northern Georgia (1,771
hours) have been particularly stressed.
III. Identification strategy
Bankruptcy filings typically rise when economic conditions deteriorate, leaving judges with the
heaviest workloads during economic recessions. Because of this, a simple comparison of the bankruptcy
outcomes of firms that file in busy courts versus those that file in non-busy courts would be confounded
by multiple other factors. In particular, during recessions firms have worse outside options for dealing
with financial distress. Raising new capital is difficult because credit is tight, asset sales would likely
yield lower proceeds due to fire sale pricing, and negotiations with creditors might be more difficult as
creditors are potentially facing their own financial issues during recessions. Further, there are selection
13
There are a total of 94 bankruptcy districts in the U.S. Courts system, but I exclude the Northern Marianas Islands,
the Virgin Islands, Guam, and Puerto Rico from my study. In addition, the Western and Eastern Districts of
Arkansas share bankruptcy judges, and so I treat them as a single district for this study.
11
effects, as high-beta firms are more likely to go bankrupt in recessions. For these reasons, I cannot
simply compare firms that file during busy times to those that file when judges have more time available.
In order to identify the causal effect of caseloads on restructuring, I use difference-in-difference
specifications that exploit an exogenous shock to caseloads that affected some bankruptcy districts more
than others. On April 20, 2005, the Bankruptcy Abuse Prevention and Consumer Protection Act was
signed into law, although most of the provisions of the Act only applied to bankruptcy cases that were
filed on or after October 17 of that same year. BAPCPA was focused mainly on non-business
bankruptcies, and, as its name suggests, its primary aim was to prevent abuse of the bankruptcy system by
individual filers.
Prior to BAPCPA, individual filers could choose the chapter of bankruptcy under which they
filed. BAPCPA prevents high-income filers from filing for Chapter 7 bankruptcy and instead forces them
to file for Chapter 13 bankruptcy, where less debt is discharged and future income must be pledged
towards paying back creditors. In addition, BAPCPA increased the costs of filing for bankruptcy by
between 50-70% because of increases in filing fees, lawyer fees, and required debt counseling (United
States Government Accountability Office 2008). Finally, BAPCPA also capped the amount of homestead
exemptions at $125,000, which impacted filers in states that traditionally allowed home owners to protect
large amounts of home equity.
Because the law was passed in April but not effective until October, there was a window within
which individuals could still file under the old law, and this explains the large spike in filings in mid-2005
as individuals rushed to file before the October 17th effective date (Figure 1, Panel A). More importantly,
once the law took effect, personal bankruptcy filings dropped to the lowest levels on record, and remained
depressed for some time, leaving judges with substantially fewer cases on their dockets. Bankruptcy
judges do not specialize in a particular type of bankruptcy. Because of this, all judges were affected by
the rush to file and subsequent dearth of consumer bankruptcy filings. In effect, BAPCPA created a
natural shock to bankruptcy caseloads faced by courts across the nation.

12
The drop in personal bankruptcy filings was both large and long-lasting. In 2004-2005, before
BAPCPA took effect, the average caseload for bankruptcy judges was 1,059 hours, while in the two years
after BAPCPA average caseload was only 566 hours (Table I). In essence, BAPCPA halved the
caseloads faced by bankruptcy courts, and filings stayed low well into 2008 (Figure 1, Panel A).
[TABLE I]
Although BAPCPA was focused on personal bankruptcy, it included three main provisions that
affected Chapter 11 restructuring as well. First, the law capped extensions of the exclusivity period – the
amount of time that the debtor has the exclusive right to file a plan of reorganization – at 18 months total,
while previously extensions were unlimited. It also limited the window within which the debtor has to
decide whether it will assume or reject leases on commercial property. Second, BAPCPA imposed
penalties on repeat filers. Firms that re-file for bankruptcy within one year after reorganizing have the
automatic stay lifted after 30 days unless the court grants an extension. Third, BAPCPA made “pre-
packaged” bankruptcy filings more attractive by allowing the solicitation of votes on the prearranged plan
to continue while the firm formally files for bankruptcy.
These alterations to the law do not appear to have altered the Chapter 11 filing rate in an
economically significant way (Figure 1, Panel B). By the first quarter of 2006 the number of filings was
nearly identical to the number in the third quarter of 2005. While a few firms rushed to file just before the
October deadline,14
they tended to be very small firms that were also affected by the changes to personal
bankruptcy laws. These firms are excluded from my sample (see Section IV). In my sample, there is no
observable change in the Chapter 11 bankruptcy filing rate around the passage of BAPCPA.
Because BAPCPA affected some aspects of the Chapter 11 process, and to avoid possible impacts
of time effects,15
I do not simply compare cases that were filed before and after the law to test the impact
of caseload on bankruptcy outcomes. Instead, I employ a difference-in-differences framework that
14
This is apparent in the 1-quarter increase in the Chapter 11 filing rate in 2005Q4 in Figure 1, Panel B. 15
Baird & Rasmussen (2002) and Bharath, Panchapegesan, & Werner (2010) explore how Chapter 11 is changing
over time. My empirical strategy nets out any time effects by comparing firms that filed in the same month to each
other.

13
focuses on bankruptcy districts that were disproportionately affected by the law. Because of BAPCPA’s
focus on consumer bankruptcies, its passage caused a disproportionately larger drop in caseload in those
districts that spend more of their time on non-business bankruptcy filings. I use the share of caseload that
stems from non-business filings in 2003 as a measure of how consumer-oriented each court is.16
A
bankruptcy district that spends the majority of its time on personal bankruptcies saw its workload drop by
more because of BAPCPA.
For example, Figure 3, Panel A shows the differential impact of BAPCPA in two bordering
bankruptcy districts, the Western and Middle Districts of Pennsylvania. Because Western Pennsylvania
takes in Pittsburgh, its bankruptcy court is more business-oriented. In 2003, non-business bankruptcies
accounted for 67% of total caseload in Western Pennsylvania, while the non-business share of caseload in
the Middle District was 83%. Because of this, when BAPCPA passed and the non-business filing rate
dropped, caseload dropped by more in the consumer-centric Middle District than in the Western district.
Specifically, caseload in the Middle District dropped by about 800 hours after BAPCPA, as compared to a
drop of only 485 hours in the Western District.
[FIGURE 3]
This pattern holds across for the full sample. Panel B of Figure 3 plots the average caseload of
consumer-centric bankruptcy districts – defined as those districts that had an above-median non-business
share of caseload in 2003 – versus the caseload of the more business-centric courts. Importantly, the two
sets have parallel trends before and after BAPCPA, but the consumer-centric courts experienced a larger
drop in caseload when BAPCPA took effect. This can be seen even more clearly in Figure 4, which
shows a scatter plot comparing the drop in caseload from before BAPCPA (2004-2005) to after BAPCPA
(2006-2007) against the non-business share of 2003 bankruptcy caseload in each district. The positive
16
The non-business share of caseload is quite static over time. For example, the cross-sectional correlation between
this measure in 1995 and 2003 is 0.76 and significant at the 1% level. Appendix Figure A.2 displays a map of the
non-business share of caseload in 2003.
14
relationship between non-business caseload and the impact of BAPCPA is quite robust.17
This is formally
tested in a regression setting in Table II. Without accounting for any other variables, a one standard
deviation increase in the non-business share of caseload (increase of 11.5 percentage points) results in an
additional caseload decrease of 64 hours following BAPCPA, a drop of 12%. This effect persists after
controlling for other factors that impacted caseloads. Aside from affecting filing rates for personal
bankruptcy, BAPCPA also created 28 new judgeships, which resulted in decreased caseloads per judge in
20 affected districts. Including a control for the number of new judges appointed following BAPCPA
strengthens the relationship between non-business caseload share and the decrease in workload.18
In this
specification, a bankruptcy district with a one standard deviation higher share of non-business caseload
experienced an additional caseload drop of 90 hours following BAPCPA, or more than 2 full work weeks.
Controlling for changes in unemployment, house prices, per capita income, and population in each
bankruptcy district does not affect the relationship between non-business caseload and the BAPCPA
shock. This is important, as it shows that, although caseload is affected by changes in economic
conditions (e.g. changes in house prices), the variable that I use to identify the effect of BAPCPA is
orthogonal to these factors.
[FIGURE 4 & TABLE II]
The identification of particular bankruptcy districts that were disproportionately affected by
BAPCPA allows me to estimate difference-in-differences regressions of the form:
𝑌𝑖 = 𝛽(𝑃𝑜𝑠𝑡𝐵𝐴𝑃𝐶𝑃𝐴𝑡 ×𝑁𝑜𝑛𝐵𝑢𝑠𝐶𝑎𝑠𝑒𝑙𝑜𝑎𝑑𝑑) + 𝛾𝑋𝑖 + 𝜏𝑑 + 𝜇𝑡 + 𝜀𝑖,
where 𝑌𝑖 is the outcome of interest for bankruptcy filing i, in bankruptcy district d, in month t, and 𝑋𝑖 is a
vector of firm characteristics, 𝜏𝑑 is a bankruptcy district fixed effect, and 𝜇𝑡 is a time fixed effect. The
17
Delaware and the Southern District of New York show up as clear outliers in Figure 4. In Appendix C, I provide
results where these two districts are “winsorized” to match the non-business caseload of Alaska. Doing so does not
affect my results. Further, while there is some geographic clustering of consumer-centric courts (see Appendix
Figure A.2), Appendix C contains robustness checks that verify that this clustering has no effect on the results. 18
One might be concerned that some of the results in Section V are influenced by the introduction of these new
judges. Removing all cases assigned to the new judges does not affect the conclusions in any significant way.

15
coefficient of interest is 𝛽, which captures the impact of filing in the post-BAPCPA period when
bankruptcy caseloads were low, in districts which experienced the largest declines in bankruptcy
caseload. For ease of explanation, I will refer to the interaction term
𝑃𝑜𝑠𝑡𝐵𝐴𝑃𝐶𝑃𝐴𝑡 × 𝑁𝑜𝑛𝐵𝑢𝑠𝐶𝑎𝑠𝑒𝑙𝑜𝑎𝑑𝑑 as “low caseload court” in the remainder of the paper.
𝑃𝑜𝑠𝑡𝐵𝐴𝑃𝐶𝑃𝐴𝑡 and 𝑁𝑜𝑛𝐵𝑢𝑠𝐶𝑎𝑠𝑒𝑙𝑜𝑎𝑑𝑑 are not included separately in the regression because their effects
are absorbed completely by the time and bankruptcy district fixed effects.
I include in my sample firms that filed for Ch. 11 between January 1, 2004 and December 31,
2007, a time period centered on the passage of BAPCPA that ends before the main increase in caseload
due to the onset of the financial crisis in 2008. Following Bertrand, Duflo, & Mullainathan (2004), in all
specifications I cluster standard errors by bankruptcy district in order to account for serial correlation
within bankruptcy courts.19
While the above specification captures the overall effect of BAPCPA, one would expect that the
impact of a drop in caseload varies depending on the complexity and relative bargaining power of the
bankrupt firm. Large firms in particular are more complex and have a stronger presence in court because
they are better able to hire top-notch lawyers, demand more of their creditors and suppliers, and are also
more likely to get press coverage should they fail. To empirically test whether caseload fluctuations
differ by the size of the firm, I add another interaction term to the regression equation:
𝑌𝑖 = 𝛽0(𝑃𝑜𝑠𝑡𝐵𝐴𝑃𝐶𝑃𝐴𝑡 × 𝑁𝑜𝑛𝐵𝑢𝑠𝐶𝑎𝑠𝑒𝑙𝑜𝑎𝑑𝑑)
+ 𝛽1(𝑃𝑜𝑠𝑡𝐵𝐴𝑃𝐶𝑃𝐴𝑡 × 𝑁𝑜𝑛𝐵𝑢𝑠𝐶𝑎𝑠𝑒𝑙𝑜𝑎𝑑𝑑 × ln(𝑆𝑖𝑧𝑒𝑖)) + 𝛾𝑋𝑖 + 𝜏𝑑 + 𝜇𝑡 + 𝜀𝑖,
where 𝑆𝑖𝑧𝑒𝑖 is the assets or liabilities of the firm (whichever is largest) at filing.20
Here, the coefficient 𝛽1
captures the differential effect that the law had on large firms, while 𝛽0 captures the estimated impact of
BAPCPA on a firm of 𝑆𝑖𝑧𝑒𝑖 = $1𝑀. In order to isolate the true impact of the triple interaction term, in
19
Clustering at the state level, or double-clustering by bankruptcy district and time do not affect the significance of
my results. 20
In the bank charge-off analysis of Table IV, I interact with ln(bank assets) rather than firm size to test if the
impact is larger for small banks.

16
these regressions I include 𝑃𝑜𝑠𝑡𝐵𝐴𝑃𝐶𝑃𝐴𝑡 × ln(𝑆𝑖𝑧𝑒𝑖) and 𝑁𝑜𝑛𝐵𝑢𝑠𝐶𝑎𝑠𝑒𝑙𝑜𝑎𝑑𝑑 × ln(𝑆𝑖𝑧𝑒𝑖) as additional
controls in 𝑋𝑖.
The difference-in-differences estimator shows the causal impact of caseload on bankruptcy
outcomes only if two conditions hold: (i) there are parallel trends across bankruptcy districts prior to
BAPCPA and (ii) the exclusion restriction is not violated. I test for parallel trends in Appendix Figure
A.3 by regressing each 𝑌𝑖 on interactions between 𝑁𝑜𝑛𝐵𝑢𝑠𝐶𝑎𝑠𝑒𝑙𝑜𝑎𝑑𝑑 and year-quarter dummies for
each quarter before and after BAPCPA. I then plot the coefficients from these interactions for each
quarter in my sample period in the figure. Similarly, I display the coefficients on interactions between
𝑁𝑜𝑛𝐵𝑢𝑠𝐶𝑎𝑠𝑒𝑙𝑜𝑎𝑑𝑑 × ln(𝑆𝑖𝑧𝑒𝑖) and year-quarter dummies to test for pre-trends that vary by firm size.
In all cases there do not appear to be significant pre-trends.
In terms of the exclusion restriction, the confound that one worries about is whether firms that file
in consumer-centric bankruptcy districts all changed in a particular way after BAPCPA, and that this
change was unrelated to judge caseload. I directly examine how firm characteristics evolved around
BAPCPA in both business-centric and consumer-centric districts in Table III Panel D.21
The table
confirms that, consistent with intuition, larger and more complex firms tend to file in business-centric
districts. Further, it shows that average size declines after BAPCPA. Importantly, this trend is present in
both business-centric and consumer-centric districts. Similarly, public firms and firms with multiple
filings make up a smaller portion of the sample after BAPCPA in all districts. The only characteristic that
does not show a similar trend across the two district types is firm leverage. In consumer-centric districts
the share of firms that has liabilities > assets when filing for bankruptcy dropped from 68.2% to 60.0%
after BAPCPA, while in business-centric districts it remained constant at 60.0% in both time periods. In
all regressions I control for all firm characteristics, including leverage, in order to account for any
differences along these dimensions.
21
Table III contains summary statistics and is fully described in Section IV below.

17
Further, I test for correlation between firm characteristics and
𝑃𝑜𝑠𝑡𝐵𝐴𝑃𝐶𝑃𝐴𝑡 × 𝑁𝑜𝑛𝐵𝑢𝑠𝐶𝑎𝑠𝑒𝑙𝑜𝑎𝑑𝑑 by using each firm characteristic in 𝑋𝑖 as the dependent variable in
regressions similar to those described above. These tests determine whether the composition of Ch. 11
filers changed after BAPCPA in a systematic way that is directly related to my main cross-sectional
variable. As shown in Appendix C, all firm characteristics are unrelated to 𝑃𝑜𝑠𝑡𝐵𝐴𝑃𝐶𝑃𝐴𝑡 ×
𝑁𝑜𝑛𝐵𝑢𝑠𝐶𝑎𝑠𝑒𝑙𝑜𝑎𝑑𝑑. Moreover, including the interaction of all variables in 𝑋𝑖 and 𝑃𝑜𝑠𝑡𝐵𝐴𝑃𝐶𝑃𝐴𝑡 as
additional controls, which allows the effect of any firm characteristic to vary after BAPCPA, does not
impact any of my estimates.
In Appendix C, I discuss further tests for violations of the exclusion restriction such as including
size-by-time fixed effects and industry-by-time fixed effects. These additional controls allow for there to
be varying trends over time for different firm sizes or industries, thus ruling out alternative stories that
relate to the composition of firms filing in particular bankruptcy districts. In all cases including these
controls do not affect my estimates. I also present evidence that consumer-centric and business-centric
courts imposed new deadlines set by BAPCPA similarly, thereby ruling out the possibility that my effects
are driven by different interpretations of the bankruptcy reform across bankruptcy courts.
The exclusion restriction would also be violated if economic conditions in consumer-centric
bankruptcy districts varied differently from business-centric districts after BAPCPA in a way that altered
the outcomes of bankruptcies in those districts, either because the firms themselves are different or
because judges treat them differently because economic conditions have changed (Ichino, Polo, and
Rettore 2003). In particular, one might be concerned that BAPCPA itself might have altered economic
conditions in areas with more household bankruptcies by limiting the ability of consumers to enter
bankruptcy. If this were the case, one would expect there to be a significant correlation between my
difference-in-difference estimator and measures of local economic conditions. However, as mentioned
above, including controls for unemployment, house price changes, and per capita income in Table II does
not affect the relationship between 𝑁𝑜𝑛𝐵𝑢𝑠𝐶𝑎𝑠𝑒𝑙𝑜𝑎𝑑𝑑 and the drop in caseload after BAPCPA. Further,
I explicitly test for significant correlation between these economic indicators and 𝑃𝑜𝑠𝑡𝐵𝐴𝑃𝐶𝑃𝐴𝑡 ×

18
𝑁𝑜𝑛𝐵𝑢𝑠𝐶𝑎𝑠𝑒𝑙𝑜𝑎𝑑𝑑 by using the economic variables as dependent variables in regressions similar to
those outlined above. The coefficient on 𝑃𝑜𝑠𝑡𝐵𝐴𝑃𝐶𝑃𝐴𝑡 × 𝑁𝑜𝑛𝐵𝑢𝑠𝐶𝑎𝑠𝑒𝑙𝑜𝑎𝑑𝑑 is insignificant in all
cases. Finally, including them as controls in the regressions presented in Section V does not affect my
estimates.22
A final concern relates to forum shopping. Some firms do have discretion in choosing the
bankruptcy district where they file, and therefore they could move to a different venue if low or high
caseloads in a particular court will adversely affect their outcome. This selection effect could potentially
bias my estimates. As described in Section IV below, my sample consists mostly of mid-size firms that
do not have a choice in venue. Regardless, I can use the address of the firm to identify debtors that file in
non-local bankruptcy districts, and take that as an indicator of firms that picked an alternate venue. I find
that 8.7% of the filings in my sample occurred in states other than the home state of the debtor. Omitting
these firms from the sample does not alter my results.
IV. Data
I gather information on Chapter 11 bankruptcy filings from LexisNexis Law, which obtains
bankruptcy filing data from the U.S. Courts system. I focus on a four-year period surrounding the
passage of BAPCPA, from 2004-2007. I end the sample in 2007 to avoid the sharp uptick in caseload
that resulted from the financial crisis in 2008 and 2009, and also to have a 3-year period (2008-2010) in
which I can examine recidivism into bankruptcy for firms that file near the end of my sample. During this
period, LexisNexis has legal information on 14,825 separate business Chapter 11 bankruptcy filings in the
50 states and the District of Columbia.
Because LexisNexis’ data comes directly from the U.S. Courts,
there is essentially 100% coverage of Chapter 11 cases in my data. The benefit of using data from
LexisNexis is that it is more easily obtained for the entire, nationwide set of bankruptcies. While several
22
A variant of this concern is that BAPCPA may have impacted businesses by limiting the ability of their owners to
file for personal bankruptcy, as there are cases where entrepreneurs use personal bankruptcy to discharge business
debts (Fan and White 2003). This is unlikely to affect my estimates because my data does not include the smallest
businesses where these personal loan guarantees are likely to occur. Further, even if this is the case, it should apply
in both consumer-centric and business-centric courts, and would thus be differenced out in my estimates.

19
previous bankruptcy studies have used court records to compile data on bankruptcies, due to the difficulty
of obtaining this data directly from the U.S. Courts these studies have been limited in scope, typically
focusing only on a subset of bankruptcy districts or only on public firms, which have more information
readily available. To my knowledge, this is the first study to make use of LexisNexis’ universal coverage.
The LexisNexis data contains legal information from the U.S. Courts system, including the date
the case was filed, the court in which it was filed, the judge assigned to the case, a flag indicating whether
the debtor has distributable assets, and information on the outcome of the case: whether it was dismissed
from court, converted to Chapter 7, transferred to another court, or reorganized.
I augment this legal information with financial data obtained from Capital IQ and The Deal
Pipeline. From these two sources, I obtain the full list of firms that filed for Chapter 11 bankruptcy in
their databases, and match them to LexisNexis using bankruptcy case number, filing date, company name,
and address. Using this information, I am able to match over 99% of Chapter 11 cases in Capital IQ and
The Deal Pipeline during my sample period. From Capital IQ and The Deal Pipeline, I obtain the assets
and liabilities reported by the firm at the time of the bankruptcy filing, the industry of the firm, and a flag
indicating whether the firm obtained debtor-in-possession (DIP) financing. I also use the text in the
description of the bankruptcy to determine whether the firm filed with a pre-arranged or “pre-packaged”
bankruptcy plan.
Between Capital IQ and The Deal Pipeline, I match a total of 7,223 firms to LexisNexis, which
makes up 49% of the 14,825 total bankruptcy filings between 2004 and 2007. To get the final sample, I
remove firms which are transferred to other courts, for which there is no exit information in LexisNexis,
or which were involuntary bankruptcy filings (706 firms).23
Finally, about half of the filings recorded in
Capital IQ or The Deal Pipeline are missing information on industry, assets, or liabilities, reducing my
final sample to 3,282 firms, or 22% of all firms that filed for bankruptcy during the sample period.
23
A “voluntary” filing is one in which the debtor filed the petition, while “involuntary” filings are instigated by a
creditor or creditors. Involuntary filings compose less than 2% of the sample.
20
Because I rely on financial information in Capital IQ and The Deal Pipeline, which do not have
information on the smallest firms, the sample used in this study is composed of larger, more complex
firms than the overall sample of Chapter 11 filers. For example, 14.1% of the firms in my sample filed
jointly with related entities, while only 6.9% of the out-of-sample firms did so. The larger firms in my
sample are precisely the cases in which judges are needed to mediate complex negotiations, determine
just outcomes, and discern when liquidation is the optimal path for a firm. In addition, these larger firms
are those that are least likely to be directly affected by changes to personal bankruptcy laws enacted by
BAPCPA (Fan and White 2003). As a result, there is no “rush to file” before BAPCPA among firms in
my sample; the filing rate is completely flat through 2005 and 2006.
Although my sample is limited only to those firms that are in Capital IQ or The Deal Pipeline, it
still contains a significant number of smaller firms. Table III provides summary statistics on the bankrupt
firms in my sample. The median firm reports $2.06 million in assets and $3.5 million in liabilities at
filing, while roughly 10% of my sample has either assets or liabilities of less than $1 million. On the
other extreme the firm at the 90th percentile has assets or liabilities of about $50 million.
[TABLE III]
Firms may try to under-report the true value of their assets in order to appear more in need of
bankruptcy protection than they really are. Because of this, for many debtor firms total liabilities is likely
a better measure of the size of the firm than total assets. To overcome this issue, I define a new variable
size, equal to the maximum of either assets or liabilities at filing, to capture the true scale of the firm. The
median firm has a size of $4.4 million, but the distribution contains a few outliers (e.g. Delta Airlines) that
skew the average size to a much larger $156.7 million. In all regressions I use the natural log of size to
decrease the influence of these outliers, and in Appendix C I describe robustness checks that verify that
these outliers are not driving my results.24
24
Including ln(assets) and ln(liabilities) as controls instead of ln(size) does not affect my results.
21
Based on the description of the bankruptcy in Capital IQ or The Deal Pipeline, I only find that 47
(1.4%) of the firms in my sample filed pre-packaged plans. When a firm has a pre-packaged plan, the
judge has very little to do in the case, and so in most of my empirical results I omit these firms from the
sample. Unconditionally, debtors are a bit more likely to be liquidated (36.1%) or dismissed (34.1%) than
reorganized (29.8%). Liquidation can come in three different forms, however: conversion to Chapter 7
(28.1%), liquidation directly from Chapter 11 via a “liquidating plan”25
(4.4%), or the sale of substantially
all assets of the firm via a section 363 sale (6.9%). These are not necessarily mutually exclusive; a firm
that sells all of its assets in a section 363 sale is often subsequently liquidated via Chapter 7 or a Chapter
11 liquidating plan.
I measure recidivism rates as the propensity to file for either Chapter 7 or Chapter 11 bankruptcy
within three years of the original filing date of the bankruptcy. To identify repeat filers, I use information
on all business bankruptcy filings (either Chapter 7 or Chapter 11) from LexisNexis from 2004-2010, and
match the original Chapter 11 filings to future Chapter 7 or 11 filings using tax ids, firm names and
aliases, and addresses of the bankrupt firms. Limiting to a 3-year window avoids time effects; firms that
file for bankruptcy in 2004 have a much longer time period in which to re-file than those that file in 2007,
and will thus naturally have a higher recidivism rate if the whole time period is examined. Also, I do not
count firms that re-file within 3 months of their original filing as having re-filed, since these can hardly be
considered “separate” bankruptcies; these firms likely exited court due to unusual circumstances (e.g.
they were dismissed for failing to file the proper paperwork) and quickly re-filed once the issue was
resolved. The 3-month cutoff is somewhat arbitrary; my results are identical if I use a 2-month or 4-
month cutoff instead. On average, 2.5% of reorganized firms and 7.4% of dismissed firms re-file for
bankruptcy within 3 years of their original filing in my sample.26
It is important to note that I can only
25
Liquidating plans in Chapter 11 function just like reorganizing plans: they are proposed, voted on, and approved
in the same manner. The only difference is that there is no expectation that the debtor will continue operations after
exiting. 26
I do not consider firms that are liquidated in my analyses of recidivism, since these firms cease to exist after their
original bankruptcy and cannot re-file.

22
measure recidivism into bankruptcy; firms that exit bankruptcy and then liquidate are not observed and
therefore not included in the rate, although this could also be viewed as a failure of the bankruptcy
process. I cannot test whether firms that file in busy bankruptcy courts are more likely to liquidate outside
of court following their restructuring, only whether their recidivism rate is higher. Appendix A compares
my recidivism rate to that found in other studies.
Both Capital IQ and The Deal Pipeline maintain databases of bankruptcy sales transactions. I use
these databases to identify firms which sell assets during the course of bankruptcy, and find that 13% of
the firms in my sample have an asset sale recorded. In many cases it is difficult to determine exactly
which assets were sold in the auction; the transaction might list a particular piece of property or a division
of the company, or it might just list the name of the company. In 53% of the sales (228 cases), however,
the phrase “substantially all assets” is used in the description of the asset, signifying that in these cases the
entire firm was sold. I mark these firms have having been liquidated completely.
Loan-level and firm-level recovery rates are not available for private companies, which comprise
the majority of my sample. Instead, I turn to regulatory data reported by U.S. commercial banks in the
Consolidated Report of Condition and Income (commonly known as the Call Reports). From the end-of-
year Call Reports from 2004-2007, I obtain information on the net charge-offs reported by each bank on
its commercial and industrial (C&I). Net charge-offs are calculated as the total amount written off during
the year less any recoveries received and hence represent the aggregate loss sustained by the bank. In
addition to this main dependent variable, I also collect information on asset growth and the net charge-off
rate on all other lending at the bank. To avoid undue influence of outliers, I winsorize each of these
variables at the 1st and 99
th percentiles. Summary statistics on the banks used in my sample are presented
in Table III, Panel C.
The exposure of each bank to the BAPCPA shock depends on its location; banks in consumer-
centric districts saw caseloads drop by more after BAPCPA than those located in business-centric
districts. Using the FDIC’s Summary of Deposits data from 2003, I first determine the share of a bank’s
deposits that were located in each bankruptcy district in that year. I then calculate the weighted average

23
non-business share of caseload across all bankruptcy districts in which a bank has deposits, using the
share of deposits in each district as a weight. This weighted average of non-business caseload then acts as
a proxy for the size of the caseload shock experienced by the bank following BAPCPA.27
Finally, as outlined above, Panel D of Table III shows summary statistics separately for firms in
business-centric and consumer-centric districts both before and after BAPCPA. These are provided to
show how firm characteristics change in relation to the identification strategy used in Section V.
V. The effect of caseload on Chapter 11 restructuring
In this section, I test how court caseload affects bankruptcy outcomes, focusing on its effect on
default costs in Section A, and then on the channel through which those costs are reduced in the
remaining sections.
A. Bank charge-offs
If less busy courts reduce the costs of restructuring, these cost savings will be largely passed on to
creditors, since bankrupt firms have little or no equity. Because banks are the main creditors for many
small and mid-sized businesses (Petersen and Rajan 1994), I examine net charge-offs on commercial and
industrial (C&I) loans reported by commercial banks as measures of the default costs borne by creditors.
Importantly, since the majority of C&I loans are unsecured, one would expect losses to be concentrated in
this lending.28
As described in Section IV, I use a bank’s exposure to bankruptcy districts with higher non-
business caseload as a proxy for banks whose clients experienced exogenously lower caseloads post-
BAPCPA. Banks whose branches are located in more consumer-centric bankruptcy districts are likely to
27
Appendix B contains more detail on LexisNexis’ coverage of bankruptcy filings and the variables derived from
the data, and the dispersion of cases by industry and bankruptcy district. 28
According to the Survey of Terms of Business Lending, produced by the Federal Reserve Board of Governors,
about 60% of C&I lending is unsecured.
24
lend to businesses that are also located in those districts, and thus these banks would have seen caseloads
drop by the largest amount after BAPCPA.29
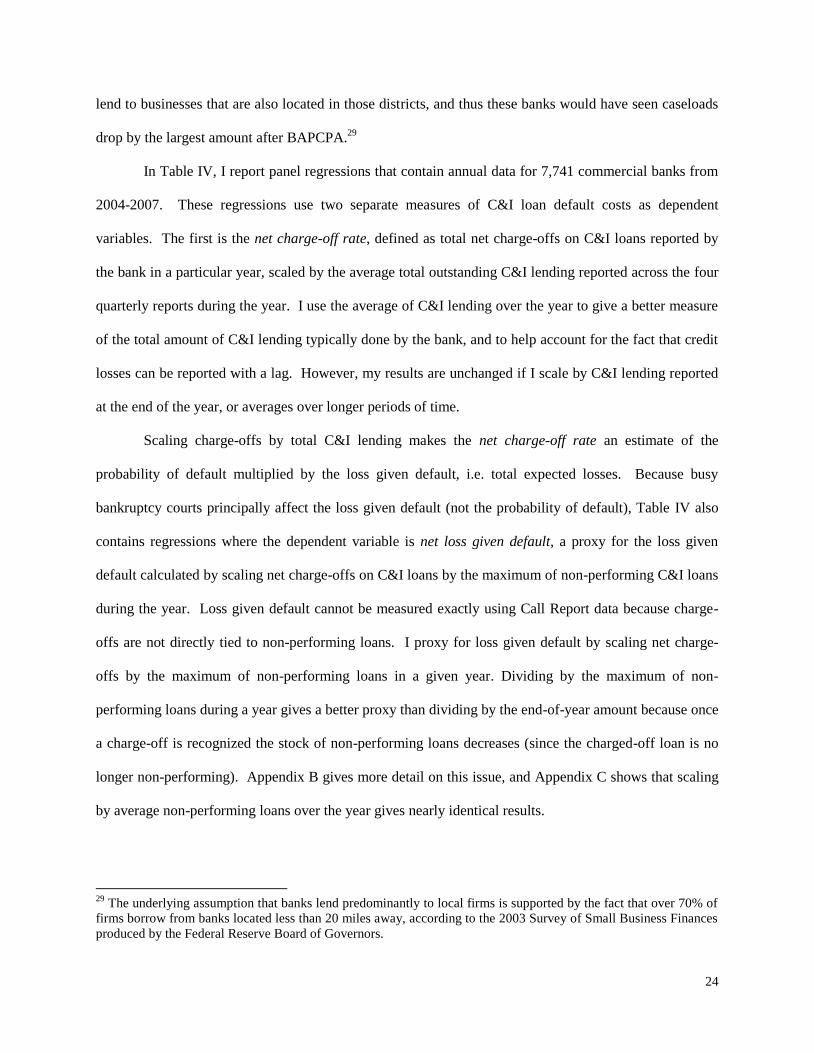
In Table IV, I report panel regressions that contain annual data for 7,741 commercial banks from
2004-2007. These regressions use two separate measures of C&I loan default costs as dependent
variables. The first is the net charge-off rate, defined as total net charge-offs on C&I loans reported by
the bank in a particular year, scaled by the average total outstanding C&I lending reported across the four
quarterly reports during the year. I use the average of C&I lending over the year to give a better measure
of the total amount of C&I lending typically done by the bank, and to help account for the fact that credit
losses can be reported with a lag. However, my results are unchanged if I scale by C&I lending reported
at the end of the year, or averages over longer periods of time.
Scaling charge-offs by total C&I lending makes the net charge-off rate an estimate of the
probability of default multiplied by the loss given default, i.e. total expected losses. Because busy
bankruptcy courts principally affect the loss given default (not the probability of default), Table IV also
contains regressions where the dependent variable is net loss given default, a proxy for the loss given
default calculated by scaling net charge-offs on C&I loans by the maximum of non-performing C&I loans
during the year. Loss given default cannot be measured exactly using Call Report data because charge-
offs are not directly tied to non-performing loans. I proxy for loss given default by scaling net charge-
offs by the maximum of non-performing loans in a given year. Dividing by the maximum of non-
performing loans during a year gives a better proxy than dividing by the end-of-year amount because once
a charge-off is recognized the stock of non-performing loans decreases (since the charged-off loan is no
longer non-performing). Appendix B gives more detail on this issue, and Appendix C shows that scaling
by average non-performing loans over the year gives nearly identical results.
29
The underlying assumption that banks lend predominantly to local firms is supported by the fact that over 70% of
firms borrow from banks located less than 20 miles away, according to the 2003 Survey of Small Business Finances
produced by the Federal Reserve Board of Governors.

25
In all specifications I include both bank and year fixed effects, and cluster the standard errors by
bank in order to account for serial correlation within each bank. I also control for the asset growth at each
bank and the net charge off rate on all other loans, as well as general economic conditions in the area that
might affect loan performance.30
I winsorize all bank-level variables at the 1st and 99
th percentiles to
prevent undue influence from outliers.
[TABLE IV]
Consistent with the idea that busy bankruptcy courts impose higher restructuring costs, in Table
IV I find that banks that were located in bankruptcy courts with exogenously lower caseloads experience
lower C&I loan charge-offs relative to banks in busier courts. The interaction term low caseload court *
ln(bank assets) indicates that the effect is strongest for smaller banks, especially when default costs are
measured using net loss given default, consistent with the idea that smaller banks are most likely to lend
to local firms.
The analysis in Table IV focuses on C&I loan charge-offs. In Appendix Table A.6, I show that
caseload does not affect commercial real estate (CRE) loan charge-off rates. Because CRE loans are
secured, they should be more insulated from default costs, and thus these tests serve as a placebo test to
verify that it is not the case that commercial loan performance in general is declining in consumer-centric
courts after BAPCPA. Instead, lender losses appear to be concentrated among junior and unsecured loans,
such as C&I lending.
There are several ways to quantify the economic magnitude of the effect of court caseload on
C&I loan charge-off rates. As described in Section III, a one standard deviation increase in the non-
business share of caseload (11.5%) is associated with an additional 64.1 hour drop in caseload following
BAPCPA. Thus, I estimate that on average, a 64-hour decrease in caseload reduces net charge-off rate by
an average of 5 basis points (11.5% ∗ −0.437 = 5.03), a 10% decline from the unconditional mean of 51
30
Economic indicators are all first calculated for each bankruptcy district using county-level data weighted by the
population of each county. Then for each bank, I take the weighted average across all bankruptcy districts in which
the bank had deposits, using the amount of deposits in each district as the weight.

26
basis points. The same reduction in caseload causes the net loss given default to fall by 3.9 percentage
points, an 11% decline relative to its mean of 36 percent. The fact that the estimated gains are nearly
identical across the two measures also shows that nearly all of the effect is due to a decrease in loss given
default, rather than a decline in the probability of default, as expected.
A 10% decline in charge-offs is a relatively large effect for a 64-hour decline in caseload.
However, a few factors are important to keep in mind. First, the regressions in Table IV give equal
weight to all banks, but also show that the largest banks are less affected by court caseload. In unreported
regressions, I find that the effect size is about 15% smaller if the regressions are value-weighted. Further,
this is the effect on C&I loan charge-offs only. Indeed, as I argue above, C&I loans should be among the
most sensitive to caseload changes because they are typically unsecured and thus in the middle of the
capital structure. Meanwhile, recovery rates for other creditors, such as CRE or equity, are likely
unaffected by court caseload, and thus the effect of court congestion on overall recovery rates is likely
substantially smaller.
On the other hand, a 64-hour shock is relatively small compared to many of the caseload changes
that occur in bankruptcy courts. Nationwide, weighted caseload per judge has risen on average by 305.6
hours in the two years following the mid-point of an economic recession (as defined by the National
Bureau of Economic Research). Meanwhile, variation across bankruptcy districts tends to be more
substantial. If one ranks the 89 districts by their average caseload since 1980, moving from the district at
the 25th percentile (Hawaii) to the 75
th percentile (Utah) results in an increased caseload of 457 hours.
The standard deviation across all 89 districts is 361 hours.
While caseload changes on the order of 300 hours are commonly observed, a shock of this size is
outside the context of the difference-in-differences regressions using BAPCPA. If I assume that the
impact of caseload scales linearly, then a rough estimate is that a 300-hour decline in caseload, which is
4.7 times larger than the 64-hour decline mentioned above, would reduce loan losses by about 50%
relative to their mean levels. However, it is difficult to say whether a nonlinearity in the relationship

27
between caseload and bankruptcy outcomes might affect the estimates when extrapolating in this way.31
Thus, to be conservative I will focus on a caseload change of 64 hours to discuss the economic magnitude
of my estimates in the remainder of the paper. But I will also occasionally refer to a change of 300 hours
to put the results into context of the typical variation in caseload.
B. Bankruptcy outcomes: reorganization, liquidation, or dismissal
I now focus on how caseload is related to the restructuring process, using 3,326 bankruptcy
filings in the LexisNexis dataset. In this section, I first focus on estimating the effect that decreased
caseloads following BAPCPA had on the outcome for firms in Chapter 11. In general, a firm that files for
Chapter 11 bankruptcy can have one of three outcomes:
1. Reorganization: a restructuring plan is formed and accepted, previous debtors are paid
according to the plan, a new capital structure is put in place, and the debtor emerges from
bankruptcy
2. Liquidation: the debtor’s case is converted to Chapter 7, the debtor is liquidated directly
from Chapter 11, or the debtor’s assets are sold as part of a Chapter 11 bankruptcy auction
3. Dismissal: the case is dismissed and the debtor remains as if no bankruptcy filing had
occurred.
I exclude from these regressions firms that filed with pre-packaged bankruptcy plans, since the
outcome of these cases is usually pre-determined, leaving the court with little to do. In these models, I
also control for firm size, leverage,32
whether multiple subsidiaries filed jointly, public/private status,
whether the firm received a DIP loan, and month, industry, and bankruptcy district fixed effects. These
control variables are described in Appendix Table A.4.
31
One should also keep in mind that typical increases in caseload occur when economic conditions deteriorate, when
outside factors other than caseload will also affect the outcome variables. The concluding section discusses this
further. 32
I control for leverage using a dummy equal to 1 if the firm had liabilities > assets at the time of filing. Results are
unchanged if I instead control using a continuous leverage ratio.

28
In the results presented in Table V, there are two main coefficients of interest. First, the variable
low caseload court, defined as the interaction of a post-BAPCPA dummy and the non-business share of
caseload in the bankruptcy district, captures the effect of filing in districts which experienced the largest
decreases in caseload following BAPCPA. Because my estimates include both industry and month fixed
effects, the coefficient on low caseload court effectively compares two firms from the same industry that
filed for bankruptcy in the same month but in districts that had exogenously different caseload due to
BAPCPA. The estimates show that Chapter 11 debtors that file in districts with the lightest caseloads are
significantly more likely to be dismissed from court. As explained in Section II.A and in Appendix A,
dismissal favors creditors by allowing them to seize assets and in most cases is akin to liquidation,
especially for small firms. My results show that less busy judges are more likely to force firms out of
court, denying them bankruptcy protection. To the extent that dismissal is equivalent to liquidation for
small firms, it is likely less costly than conversion to Chapter 7 because it avoids further direct court and
lawyer fees.
[TABLE V]
The second coefficient of interest in Table V is that of the interaction term low caseload
court*ln(size), which tests whether these effects differ by the size of the firm. I find that a decline in
caseload significantly decreases the likelihood of reorganization for larger firms, while the smallest firms
are perhaps more likely to reorganize in less busy courts (although the coefficient on low caseload court
is insignificant). Meanwhile, larger firms are relatively more likely to liquidate when caseload declines
and smaller firms are less likely to do so. The differential impact on larger firms is consistent with the
idea that it is costly for a busy judge to determine the viability of the largest, most complex bankrupt
firms, making them relatively more likely to allow a large firm to reorganize rather than liquidate. In
addition, larger firms are likely better able to lobby a busy judge to allow reorganization: they can better
afford high-quality lawyers, and the (likely negative) publicity for the judge will be much larger if a large

29
firm is liquidated.33
While these tests do not specifically identify the channel for this effect, it is clear that
as caseload declines judges are more likely to push larger firms to liquidation, while smaller firms are
somewhat less likely to liquidate.
It may seem surprising that busier judges are more likely to reorganize large firms, when these
reorganizations on average require more negotiation, spend longer in court, and hence may entail more
overall work for the busy judge. It is important to keep in mind that, while reorganizations are likely
more work for a bankruptcy judge on average, this is not necessarily true on the margin. That is, should a
busy judge attempt to liquidate or dismiss a marginal firm that in the judge’s view just misses the
threshold for reorganization, he is likely to meet with significant resistance from the debtor’s
management, particularly the management of a large, sophisticated firm. Thus, it is possible that pushing
marginal firms into dismissal or liquidation increases the judge’s workload, and hence one would expect
judges to dismiss more firms as caseload declines.34
I estimate that on average, a 64-hour decrease in caseload increases the probability of dismissal
by 11.5% ∗ 15.1% = 1.7%, a modest increase from the unconditional mean of 34.3%. Meanwhile, a
back-of-the-envelope estimate of the effect of a 300-hour decline in caseload is that it would increase the
probability of dismissal by 1.7% ∗ 4.77 = 8.2%.35
Further, the effect differs substantially by the size of
firm. The firm at the 10th percentile in my sample has size equal to $1 million, the median firm has size of
$4.42 million, and the firm at the 90th percentile has size of $48.9 million. Using this as a guideline, I use
firms of size $1 million, $5 million, and $50 million to give an idea of how the change in caseloads affects
firms of varying sizes. Based on the coefficients in Table V, a 64-hour decrease in bankruptcy caseloads
would have the following impact on the probability of each bankruptcy outcome:
33
Judge career concerns have received a fair amount of attention in the academic literature as a possible reason why
judges are reluctant to liquidate large firms. Recent examples include LoPucki (2005) and Gennaioli & Rossi
(2010). 34
Appendix B contains more information about time in court and the workload required of judges across bankruptcy
outcomes for a random subsample of 150 firms. 35
This magnitude is comparable in size to Bernstein, Colonnelli, and Iverson (2016), who examine a judge’s fixed
bias towards converting to Chapter 7. They estimate that a one standard deviation increase in a judge’s conversion
bias increases the likelihood that a given case will be converted by 7.5%.
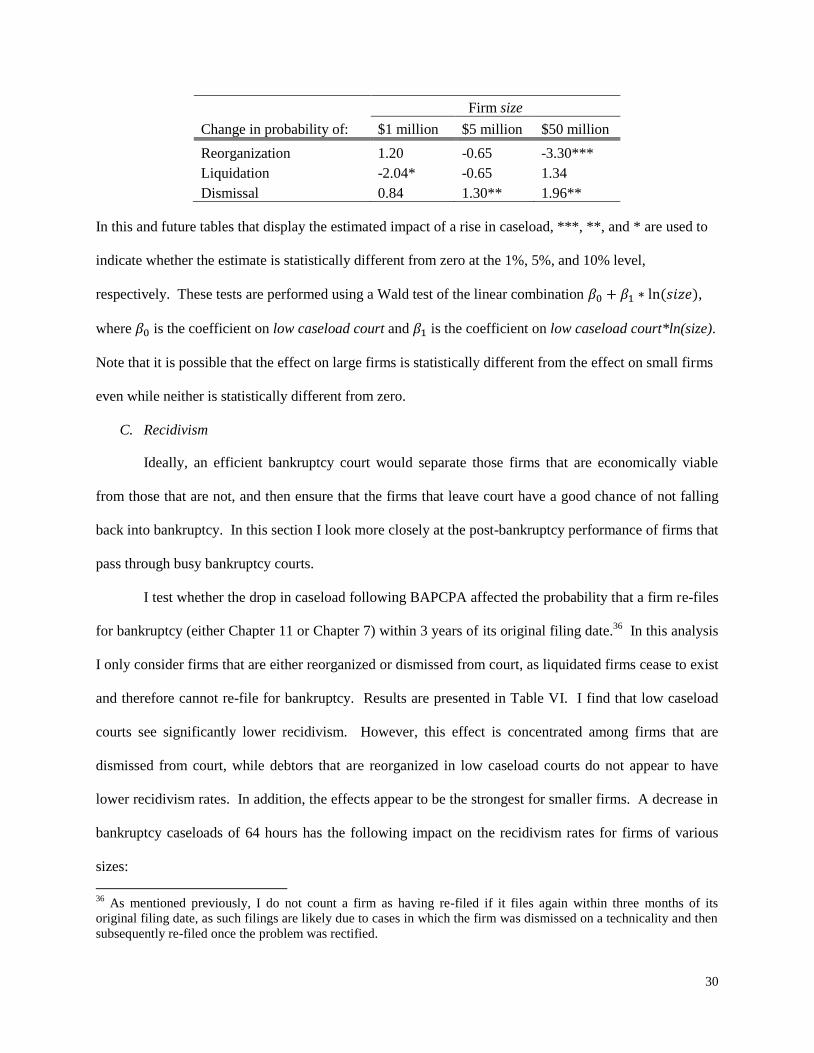
30
Firm size
Change in probability of: $1 million $5 million $50 million
Reorganization 1.20 -0.65 -3.30***
Liquidation -2.04* -0.65 1.34
Dismissal 0.84 1.30** 1.96**
In this and future tables that display the estimated impact of a rise in caseload, ***, **, and * are used to
indicate whether the estimate is statistically different from zero at the 1%, 5%, and 10% level,
respectively. These tests are performed using a Wald test of the linear combination 𝛽0 + 𝛽1 ∗ ln(𝑠𝑖𝑧𝑒),
where 𝛽0 is the coefficient on low caseload court and 𝛽1 is the coefficient on low caseload court*ln(size).
Note that it is possible that the effect on large firms is statistically different from the effect on small firms
even while neither is statistically different from zero.
C. Recidivism
Ideally, an efficient bankruptcy court would separate those firms that are economically viable
from those that are not, and then ensure that the firms that leave court have a good chance of not falling
back into bankruptcy. In this section I look more closely at the post-bankruptcy performance of firms that
pass through busy bankruptcy courts.
I test whether the drop in caseload following BAPCPA affected the probability that a firm re-files
for bankruptcy (either Chapter 11 or Chapter 7) within 3 years of its original filing date.36
In this analysis
I only consider firms that are either reorganized or dismissed from court, as liquidated firms cease to exist
and therefore cannot re-file for bankruptcy. Results are presented in Table VI. I find that low caseload
courts see significantly lower recidivism. However, this effect is concentrated among firms that are
dismissed from court, while debtors that are reorganized in low caseload courts do not appear to have
lower recidivism rates. In addition, the effects appear to be the strongest for smaller firms. A decrease in
bankruptcy caseloads of 64 hours has the following impact on the recidivism rates for firms of various
sizes:
36
As mentioned previously, I do not count a firm as having re-filed if it files again within three months of its
original filing date, as such filings are likely due to cases in which the firm was dismissed on a technicality and then
subsequently re-filed once the problem was rectified.

31
Change in probability of
re-filing within 3 years
Firm size
$1 million $5 million $50 million
All cases -1.58*** -1.04** -0.27
Reorganizations -0.22 0.06 0.46
Dismissals -3.54*** -2.01 0.19
These estimated impacts are quite large; the unconditional probability of a dismissed firm re-filing for
bankruptcy within 3 years is only 7.4%, suggesting that the 64-hour shock to caseload decreases the
recidivism rate by nearly 27% for the median firm.
[TABLE VI]
The fact that caseload does not appear to affect the recidivism rate for firms that reorganize is
somewhat surprising given that Section V.B shows that caseload affects bankruptcy outcomes. In
particular, larger firms are less likely to be reorganized when caseload is low. If fewer large firms are
reorganized in less-busy courts, one might expect that those firms that do reorganize are on average more
financially secure and would therefore end up back in bankruptcy less often. One possibility is that the 3-
year horizon is too short to find an effect for reorganized firms, which likely take longer to re-enter
financial distress than dismissed firms.37
It is also possible that a high percentage of reorganized firms
continue to experience financial distress outside of court, even if they do not file for bankruptcy again, as
documented in previous research (Hotchkiss 1995; Gilson 1997; Chang and Schoar 2013; Morrison
2007). Both of these possibilities are particularly likely for larger firms. On the other hand, it may be
that the quality of restructurings in busy courts is equally as high as that of less busy courts, albeit at
elevated costs because bankruptcy proceedings take longer to complete. Regardless, within a 3-year
window, it does not appear that the exogenous shock to caseload resulted in higher recidivism for firms
that reorganize in busier courts.
Meanwhile, dismissed firms re-file at significantly lower rates when caseload falls. There are at
least two factors that may be driving this result. First, if less-busy judges tend to scrutinize cases more
37
I cannot test longer horizons, as my data end in December 2010.

32
closely, then a firm which is correctly dismissed might be less willing to try re-filing in the low caseload
court since it will likely be dismissed again. Meanwhile, when caseloads are high judges may be
unwilling or unable to spend the time necessary to find proper cause for dismissal, thereby making it
easier for debtors to appeal the decision or fix the issue that led to the initial dismissal and re-file for
bankruptcy protection. Second, it is possible that a higher portion of the firms that busy judges dismiss
from court are actually viable entities in need of Chapter 11 protection in order to restructure.
Two further tests can shed some light on the mechanism that drives higher recidivism in busy
courts. First, defining recidivism to only include re-filings that occur more than 12 months (but still less
than 3 years) after the initial filing does not alter the economic magnitude or statistical significance of the
results. Thus, the high recidivism rate among firms dismissed from busy courts is not due to quick re-
filings that occur less than a year after the initial filing, which casts doubt on the idea that the recidivism
effect is driven by easily-fixed technicalities or firms that quickly re-file in busy courts in hopes of getting
a more lenient judge the second time through. Second, the recidivism effect is driven completely by re-
filings for Chapter 11 (so-called “Chapter 22” bankruptcies, which account for a little more than half of
the re-filings in my sample), rather than firms who file for Chapter 7 in their second filing. This shows
that the effect is not being driven by unviable firms that choose to liquidate in court after being initially
dismissed from busy courts.38
Rather, elevated recidivism in busy courts comes from dismissed firms that
survive for at least a few months and then attempt to restructure in Chapter 11 once again.
Regardless of whether high recidivism among dismissed firms in busy courts reflects debtors
seeking to take advantage of pro-debtor courts or firms which were initially dismissed that could truly
benefit from bankruptcy protection, increased recidivism likely drives up both direct and indirect costs of
financial distress for these firms, since it drags out the legal process as well as the period of financial
distress. However, I note that while it is ex post efficient to reduce recidivism, it is not necessarily ex
ante efficient. The optimal recidivism rate is not zero, and therefore it is not necessarily welfare-
38
For brevity, the results from these two tests are unreported, but are available from the author by request.

33
enhancing that the recidivism rate is lower when court caseloads decrease. For example, if courts become
too strict when caseloads are low, thereby discouraging some firms from optimally re-filing, the decline
in recidivism would be welfare reducing.
D. Time in bankruptcy
Several previous studies have used time in bankruptcy as an indirect measure of total bankruptcy
costs, including Bris et al. (2006), Franks & Torous (1989) and Thorburn (2000). To the extent that
increases in caseload force courts to stretch out the proceedings for each bankruptcy case, filings in busier
courts could be substantially more costly than those in less-busy courts. On the other hand, when courts
are busy, judges, debtors, and creditors may take actions to speed up the bankruptcy process to
compensate for the congested court, thereby leaving time in bankruptcy relatively unaffected.
Importantly, Bris et al. (2006) find that judges are particularly important determinants of the length of the
bankruptcy case, suggesting that judges have large amounts of leeway in determining the speed at which
cases resolve. In Table VII, I test whether a drop in caseload allows Chapter 11 debtors to spend a shorter
amount of time in bankruptcy. For these regressions, I define time in bankruptcy as the number of
months between the filing date of the case and the date that a resolution was reached. For reorganizations
and dismissals, the resolution date corresponds to the date on which the case was discharged from court.
For liquidations, the resolution date is the date on which the case is converted to Chapter 7. Converted
cases will remain in court for several months after this date while the trustee oversees the liquidation of
the assets, but at this point the judge has little left to do on the case, as the decision to liquidate has
already been made.39
[TABLE VII]
39
For reorganizations, the data from LexisNexis does not contain the date the plan of reorganization is confirmed,
which could be viewed as the “resolution” of the case, although the case remains in court for several months after a
plan is confirmed. Because this date is not available, I use the date the case was closed as the terminal date for these
cases. Appendix B, which more fully discusses this issue, gives evidence that this data limitation does not affect the
estimates in Table VII.

34
In Table VII, I find that there is no average effect of caseload on time in bankruptcy. This is
remarkable, as it suggests that bankruptcy cases in exogenously busier courts are resolved as quickly as
cases in less busy courts, either through judges working longer hours, working more efficiently, or simply
spending less time per case. Importantly, if judges are spending less time per case, this could be because
judges are simply making decisions faster or because other participants in the bankruptcy, knowing there
could be a delay in ruling due to court congestion, decide bring fewer issues before the busy judge.
While there is no average effect on time in bankruptcy, there is a significant difference between
large and small firms, as shown in the second column of Table VII. In particular, in low caseload districts
smaller firms remain in court longer while larger firms are in court a shorter amount of time. This is
consistent with busy judges adjusting their workflow by resolving smaller cases more quickly, while
taking more time on complex cases. In terms of economic magnitude, I estimate that a 64-hour decrease
in caseload lengthens the time in bankruptcy by 0.76 months for a $1 million firm, but decreases time in
bankruptcy by 0.5 months for a $50 million firm. The 1.26 month difference between these two extremes
is equivalent to a 6.9% change from the mean of 18.3 months.40
E. Bankruptcy Sales and DIP Financing
Asset sales are an important feature of the bankruptcy process. Through Section 363 of the
Bankruptcy Code, the debtor firm is able to sell some or all of its assets to a third party without the need
of creating a plan of reorganization and going through the voting process, although these sales must still
be approved by the court. In general, the judge must verify that there is a “good business reason” for the
sale (Wolf, Charles & Lees, 2010).
One of the main benefits of 363 sales is that they bring cash to the firm much more quickly than a
traditional reorganization plan. Because of this, 363 sales occur more often under emergency
40
Appendix Table A.7 shows results separately for reorganized, liquidated, or dismissed cases. These results show
that in high caseload courts, large firms are particularly slow to be liquidated, while small firms are liquidated more
quickly. Meanwhile, both large and small firms take slightly longer to reorganize in congested courts.
35
circumstances when firms need cash quickly and cannot bring in outside capital through DIP lending.41
Thus, when the bankruptcy process is expected to be drawn out, such as when bankruptcy caseloads are
high, more asset sales should be expected. Further, busy judges are also more likely to approve asset
sales, since they typically speed up the bankruptcy process by removing the need for complex debtor-
creditor negotiations and detailed reorganization plans. Indeed, if high caseloads are associated with
increased asset sales, this could explain why there is not a large effect of court congestion on bankruptcy
durations, as shown in the previous section.
Table VIII shows that this is the case. After BAPCPA, the courts that experienced the largest
drop in caseload also had the largest decrease in the share of cases that had 363 sales. My estimates
suggest that a 64-hour decline in caseload reduces asset sales by 1.1 percentage points, an 8.3% decrease
from the unconditional mean of 13%. The impact does not vary much depending on the size of the firm,
although it appears to be slightly larger for small firms. This makes sense, since small firms have a
harder time accessing outside capital and therefore would more likely have to resort to asset sales in cases
when the bankruptcy filing drags on for a long period of time.
[TABLE VIII]
While data from Capital IQ and The Deal Pipeline does contain prices on the bankruptcy
transactions, it is difficult to measure whether these prices are discounted from full value because I cannot
observe exactly which assets are sold. As a proxy, I scale the selling price by the total assets of the firm,
and test whether 363 sales that take place in low caseload courts have higher price-to-asset ratios than
those that are in busier courts. This is a very rough proxy, as it is driven not only by “fire sale” prices but
also by the amount of assets the firm is selling. For example, a firm that is selling substantially all of its
assets will have a higher price-to-asset ratio than a firm that is selling only a small piece of the business,
regardless of whether either firm is selling at discounted prices. I control for this to the extent possible by
41
Lehman Brothers, Chrysler and General Motors are examples of this motive. In each case the judge approved a
quick asset sale because the firms’ value as a going concern was diminishing like a “melting ice cube,” and they had
little access to outside funding at the time.
36
including a dummy variable indicating whether the transaction noted that the firm is selling substantially
all assets.42
In Table VIII I test whether the sale price-to-asset ratio is affected by bankruptcy caseload for
the 422 sales in my sample. I fail to find a strong relationship between sale prices and court caseload,
likely due to a lack of statistical power and imprecise measurement. However, the estimates are in the
anticipated direction: small firms, whose likelihood of selling assets declines the most with a caseload
drop, also sell at higher prices when courts are less busy. Large firms do not reap the same benefits.
Although my data do not allow me to estimate a tight relationship between caseload and sale
prices, previous work has shown that forced asset sales typically occur at sharply reduced prices (Pulvino
1998; Campbell, Giglio, and Pathak 2011). Further, Pulvino (1999) shows that bankruptcy does not
prevent fire sales. Thus, to the extent that high caseloads lead to more asset sales, it is likely that these
asset sales reduce recovery rates to creditors.
Selling assets is one way that cash-strapped debtors can raise capital. An alternative method of
gaining cash is through the issuance of a DIP loan, which can provide the working capital necessary to
maintain operations through the bankruptcy process. The final two columns of Table VIII test whether
firms in busy bankruptcy courts are more likely to obtain DIP financing. Here we again see the same
relationship: as caseload declines, firms are less likely to use DIP loans. Interestingly, the effect is
strongest for larger firms. Thus, while smaller firms reduce asset sales as caseload declines, larger firms –
those that are more likely to have access to the DIP loan market – tend to reduce DIP loan borrowing. In
both cases, the need for raising external cash is lower when courts are less busy, and these results
highlight the different ways in which large and small firms tend to raise that cash.
A summary of the impact of a 64-hour decrease in bankruptcy caseloads on the propensity to sell
assets, on the sale price / asset ratio and on the propensity of obtain DIP financing is as follows:
42
If I restrict the regression to the subsample of sales in which substantially all assets are sold I find similar
coefficient estimates.

37
Firm size
$1 million $5 million $50 million
Increase in probability of
having asset sale -1.28 -0.94* -0.47
Change in price / asset
ratio 0.38 0.13 -0.24
Increase in probability of
DIP financing -0.03 -0.94 -2.24***
It is important to keep in mind that my sample period is 2004-2007, a time when it was relatively
easy to obtain credit and when merger & acquisition activity was quite robust. Using BAPCPA for
identification is useful because it allows me to focus directly on an exogenous shock to judge time
constraints. However, typically courts become crowded during economic recessions, when credit is tight
and M&A activity is depressed. In my sample, I find that firms are able to compensate for busier courts
by selling assets or obtaining DIP financing, but in recessionary periods they may not be able to find a
willing buyer for their assets or a DIP lender. If this is the case, then the impact of heavy caseloads in
recessions is likely larger than I have estimated. Rather than obtaining DIP financing, firms could well be
forced to sell assets in 363 sales (as Chrysler and General Motors did in 2009) or simply liquidate
completely. Further, asset sales in recessions are also affected by fire sale prices and a lack of buyers
who can best use the assets (Shleifer and Vishny 1992; Bernstein, Colonnelli, and Iverson 2016). In this
way, difficult credit and M&A environments during recessions likely exacerbate the costs of busy
bankruptcy courts.
VI. Discussion and Conclusions
This paper has shown that time constraints on bankruptcy judges alter the outcomes of firms that
restructure in busy courts. When caseload falls larger firms are less likely to be reorganized and more
likely to either be liquidated or dismissed from court. Smaller firms, meanwhile, are actually slightly
more likely to be reorganized and less likely to be liquidated when courts are less busy. These results are
consistent with the idea that busy judges optimize their time by spending relatively less time on smaller

38
firms while stretching out the proceedings for larger firms. In support of this idea, I find that larger firms
spend less time in court as caseloads decline, relative to smaller firms.
In addition, my findings have important implications for the costs of financial distress. As direct
evidence of this, I find that banks experience fewer charge-offs as local bankruptcy courts become less
busy. Although my data do not allow me to pin down the precise channel through which charge-offs are
reduced, there are several possible avenues, including reduced recidivism of dismissed firms, lower
likelihood of asset sales, and shorter spells in bankruptcy.
While my evidence shows that the costs of financial distress are lower in less-busy bankruptcy
courts, the overall welfare implications are less clear. In particular, the fact that more firms are dismissed
or liquidated when caseloads decline does not necessarily mean that this is socially optimal, despite the
fact that bank charge-offs are lower. In theory, somewhere between the extremes of liquidating all firms
or none of them, there is some optimal level of “pro-debtor-ness” for a bankruptcy judge that balances ex
post efficiency and ex ante incentives (Aghion, Hart, and Moore 1992; Hart 2000; Bernhardt and Nosal
2004; Gennaioli and Rossi 2010). While several previous papers have argued that the Chapter 11 process
is biased towards inefficient continuation of firms (Baird 1986; Weiss and Wruck 1998; LoPucki and
Kalin 2001), Morrison (2007) shows that many smaller firms are liquidated and argues that there is no
continuation bias. The location of Chapter 11 on this liquidation-continuation spectrum remains an open
question due to difficulties in finding clean empirical identification. However, both Chang and Schoar
(2013) and Becker and Strömberg (2012) use natural experiments to show that pro-creditor shifts in the
interpretation of the bankruptcy code tend to enhance firm value. This evidence suggests that busy
bankruptcy courts, which tend to allow more continuation, are likely to reduce overall firm value.43
This paper uses the passage of BAPCPA as an exogenous shock to bankruptcy caseloads. While
this identification allows me to make causal estimates of the impact of changes in court caseload, it is
43
On the other hand, Bernstein, Colonnelli, and Iverson (2016) show that liquidation is often costly due to
difficulties in reallocating assets of bankrupt firms. Importantly, their study focuses mainly on small firms, which
are least likely to have a continuation bias.

39
important to keep in mind the external validity of the experiment. BAPCPA occurred during relatively
good economic times, but typically bankruptcy filings spike during economic recessions, and it is possible
that the effects I have identified are either tempered or exacerbated by these poor market conditions. In
particular, during recessions distressed firms have less ability to roll over previous debts, obtain DIP
financing or sell assets at reasonable (not fire sale) prices—actions which would help these firms avoid
bankruptcy or handle longer bankruptcy proceedings. If this is the case, this would likely exacerbate the
costs of financial distress due to busy courts.
This is true both nationwide and on a more local level. Court caseloads vary more cross-
sectionally than they do over time. While I have couched most of my results in terms of nationwide
economic recessions, it is also true that local economic conditions can be quite different across the United
States. Localized economic malaise will have the same impact on caseloads in affected bankruptcy
districts as nation-wide recessions will. In terms of bankruptcy caseload, where a case is filed can matter
as much as when it is filed.

40
WORKS CITED
Agarwal, Sumit, Gene Amromin, Itzhak Ben-David, Souphala Chomsisengphet, Tomasz Piskorski, and
Amit Seru. 2016. “Policy Intervention in Debt Renegotiation: Evidence from the Home Affordable
Modification Program.” Journal of Political Economy Forthcomin. doi:10.2139/ssrn.2138314.
Aghion, Philippe, Oliver Hart, and John Moore. 1992. “The Economics of Bankruptcy Reform.” Journal
of Law, Economics, and Organization 8 (3): 523–46.
Andrade, Gregor, and Steven N. Kaplan. 1998. “How Costly Is Financial (Not Economic) Distress?
Evidence from Highly Leveraged Transactions That Became Distressed.” The Journal of Finance 53
(5): 1443–93.
Baird, Douglas G. 1986. “The Uneasy Case for Corporate Reorganizations.” The Journal of Legal Studies
15 (1): 127–47.
Baird, Douglas G., and Robert K. Rasmussen. 2002. “The End of Bankruptcy.” Stanford Law Review 55
(3): 751–89.
Becker, Bo, and Per Stromberg. 2012. “Fiduciary Duties and Equity-Debtholder Conflicts.” Review of
Financial Studies 25 (6): 1931–69.
Bermant, Gordon, Patricia A. Lombard, and Elizabeth C. Wiggins. 1991. “A Day in the Life: The Federal
Judicial Center’s 1988-1989 Bankruptcy Court Time Study.” American Bankruptcy Law Journal 65:
491–524.
Bernhardt, Dan, and Ed Nosal. 2004. “Near-�sighted Justice.” The Journal of Finance 59 (6): 2655–85.
Bernstein, Shai, Emanuele Colonnelli, and Benjamin Iverson. 2016. “Asset Allocation in Bankruptcy.”
Working Paper.
Bertrand, Marianne, Esther Duflo, and Sendhil Mullainathan. 2004. “How Much Should We Trust
Differences-in-Differences Estimates?” The Quarterly Journal of Economics 119 (1): 249–75.
Bharath, Sreedhar T., Venky Panchapegesan, and Ingrid M. Werner. 2010. “The Changing Nature of
Chapter 11.” WP 2008-4. Working Paper Series.
Bolton, Patrick, and David S. Scharfstein. 1996. “Optimal Debt Structure and the Number of Creditors.”
The Journal of Political Economy 104 (1): 1–25.
Bris, Arturo, Ivo Welch, and Ning Zhu. 2006. “The Costs of Bankruptcy : Chapter 7 Liquidation versus
Chapter 11 Reorganization.” The Journal of Finance 61 (3): 1253–1303.
Campbell, John Y, Stefano Giglio, and Parag Pathak. 2011. “Forced Sales and House Prices.” American
Economic Review 101 (August): 2108–31.
Chang, Tom, and Antoinette Schoar. 2013. “Judge Specific Differences in Chapter 11 and Firm
Outcomes.”
Cohen, Lauren, and Dong Lou. 2012. “Complicated Firms.” Journal of Financial Economics 104 (2):
383–400.
Coviello, Decio, Andrea Ichino, and Nicola Persico. 2014. “Time Allocation and Task Juggling.”
American Economic Review Forthcomin.
Dahiya, Sandeep, Kose John, Manju Puri, and Gabriel Ramı́rez. 2003. “Debtor-in-Possession Financing
and Bankruptcy Resolution: Empirical Evidence.” Journal of Financial Economics 69 (1): 259–80.
Eisfeldt, Andrea L., and Adriano a. Rampini. 2006. “Capital Reallocation and Liquidity.” Journal of

41
Monetary Economics 53 (3): 369–99. doi:10.1016/j.jmoneco.2005.04.006.
Elkamhi, Redouane, Jan Ericsson, and Christopher A. Parsons. 2012. “The Cost and Timing of Financial
Distress.” Journal of Financial Economics 105: 62–81.
Fan, Wei, and Michelle J. White. 2003. “Personal Bankruptcy and the Level of Entrepreneurial Activity.”
Journal of Law and Economics 46 (October): 543–67.
Fich, Eliezer M., and Anil Shivdasani. 2006. “Are Busy Boards Effective Monitors?” The Journal of
Finance 61 (2): 689–724.
Franks, Julian R., Kjell G. Nyborg, and Walter N. Torous. 1996. “A Comparison of US, UK and German
Insolvency Codes.” Financial Management 25 (3): 86–101.
Franks, Julian R., and Walter N. Torous. 1989. “An Empirical Investigation of U.S. Firms in
Reorganization.” The Journal of Finance 44 (3): 747–70.
Friendly, Henry J. 1973. “Averting the Flood by Lessening the Flow.” Cornell Law Review 59 (4): 634–
57.
Gennaioli, Nicola, and Stefano Rossi. 2010. “Judicial Discretion in Corporate Bankruptcy.” Review of
Financial Studies 23 (11): 4078–4114.
Gertner, Robert, and David S. Scharfstein. 1991. “A Theory of Workouts and the Effects of
Reorganization Law.” The Journal of Finance 46 (4): 1189–1222.
Gilson, Stuart C. 1997. “Transactions Costs and Capital Structure Choice: Evidence from Financially
Distressed Firms.” The Journal of Finance 52 (1): 161–96.
Ginsburg, Ruth Bader. 1983. “Reflections on the Independence, Good Behavior, and Workload of Federal
Judges.” University of Colorado Law Review 55 (1): 1–20.
Hart, Oliver. 2000. “Different Approaches to Bankruptcy.” NBER Working Paper 7921.
Hirshleifer, David, and Siew Hong Teoh. 2003. “Limited Attention, Information Disclosure, and
Financial Reporting.” Journal of Accounting and Economics 36 (1–3): 337–86.
Hong, Harrison, and Jeremy C. Stein. 1999. “A Unified Theory of Underreaction, Momentum Trading,
and Overreaction in Asset Markets.” The Journal of Finance 54 (6): 2143–84.
Hotchkiss, Edith S. 1995. “Postbankruptcy Performance and Management Turnover.” The Journal of
Finance 50 (1): 3–21.
Hotchkiss, Edith S, Kose John, Robert M. Mooradian, and Karin S. Thorburn. 2008. “Bankruptcy and
Resolution of Financial Distress.” In Handbook of Corporate Finance: Empirical Corporate
Finance. Vol. 2.
Huang, Bert I. 2011. “Lightened Scrutiny.” Harvard Law Review 124 (5): 1109–52.
Ichino, Andrea, Michele Polo, and Enrico Rettore. 2003. “Are Judges Biased by Labor Market
Conditions?” European Economic Review 47 (5): 913–44.
Jex, Steve M. 1998. Stress and Job Performance: Theory, Research, and Implications for Managerial
Practice. Thousand Oaks: Sage.
LoPucki, Lynn M. 2005. Courting Failure: How Competition for Big Cases Is Corrupting the Bankruptcy
Courts. Ann Arbor: The University of Michigan Press.
LoPucki, Lynn M., and Sara D. Kalin. 2001. “The Failure of Public Company Bankruptcies in Delaware
and New York : Empirical Evidence of a ‘Race to the Bottom.’” Vanderbilt Law Review 54 (2):

42
231–82.
Morrison, Edward R. 2007. “Bankruptcy Decision Making : An Empirical Study of Continuation Bias in
Small-Business Bankruptcies.” Journal of Law and Economics 50 (2): 381–419.
Petersen, Mitchell A., and Raghuram G. Rajan. 1994. “The Benefits of Lending Relationships: Evidence
from Small Business Data.” The Journal of Finance 49 (1): 3–37.
Ponticelli, Jacopo, and Leonardo Alencar. 2016. “Court Enforcement and Firm Productivity: Evidence
from a Bankruptcy Reform in Brazil.” The Quarterly Journal of Economics 131 (3): 1365–1413.
Pulvino, Todd C. 1998. “Do Asset Fire Sales Exist? An Empirical Investigation of Commercial Aircraft
Transactions.” Journal of Finance 53 (3): 939–78. doi:10.1111/0022-1082.00040.
———. 1999. “Effects of Bankruptcy Court Protection on Asset Sales.” Journal of Financial Economics
52: 151–86.
Shleifer, Andrei, and Robert W. Vishny. 1992. “Liquidation Values and Debt Capacity: A Market
Equilibrium Approach.” The Journal of Finance 47 (4): 1343–66.
Stromberg, Per. 2000. “Conflicts of Interest and Market Illiquidity in Bankruptcy Auctions : Theory and
Tests.” The Journal of Finance 55 (6): 2641–92.
Thorburn, Karin S. 2000. “Bankruptcy Auctions : Costs , Debt Recovery , and Firm Survival.” Journal of
Financial Economics 58: 337–68.
United States Courts. 2011. “Bankruptcy Basics.”
http://www.uscourts.gov/Viewer.aspx?doc=/uscourts/FederalCourts/BankruptcyResources/bankbasi
cs2011.pdf.
United States Government Accountability Office. 2008. “Bankruptcy Reform: Dollar Costs Associated
with the Bankruptcy Abuse Prevention and Consumer Protection Act of 2005.” Washington D.C.
Warner, Jerold B. 1977. “Bankruptcy Costs : Some Evidence.” The Journal of Finance 32 (2): 337–47.
Weiss, Lawrence A., and Karen H. Wruck. 1998. “Information Problems, Conflicts of Interest, and Asset
Stripping: Chapter 11’s Failure in the Case of Eastern Airlines.” Journal of Financial Economics 48:
55–97.
Wolf, Amy R., Scott K. Charles, and Alexander B. Lees. 2010. “Recent Developments in Bankruptcy
Code Section 363.” The Review of Banking & Financial Services 26: 1–9.

43
TABLE I
CASELOAD SUMMARY STATISTICS This table reports the distribution of caseload for the eight quarters before and after BAPCPA, as well as the
distribution of the non-business share of caseload in 2003 for the 89 bankruptcy districts in my sample. Caseload is
measured as the weighted number of filings in each district per quarter per bankruptcy judge, using the weights in
Appendix Table A.3. I multiply caseload by four in order to annualize the figures. The weights in Appendix Table
A.3 represent the number of hours a judge is expected to spend on a bankruptcy case, and therefore the caseload
statistics presented in this table can be interpreted as the total number of hours a judge will spend administering
cases per year. BAPCPA Caseload Drop is defined as the difference in the average caseload from 2004Q1-2005Q4
and the average caseload from 2006Q1-2007Q4 for each district. In the last two lines of the table, the sample is split
into those firms that had below- and above-median share of non-business caseload in 2003, to show that the drop
was significantly larger in those districts that had fewer business bankruptcy filings.
Obs. Mean
Std.
Dev.
5th
Percentile Median
95th
Percentile
Non-business Share of Caseload (2003) 89 79.4% 11.5% 63.2% 81.6% 92.3%
Avg. caseload 2004-2005 (pre-BAPCPA) 89 1095.05 429.90 425.07 1107.66 1842.90
Avg. caseload 2006-2007 (post-BAPCPA) 89 565.54 267.99 165.76 543.23 1063.19
BAPCPA Caseload Drop 89 529.51 215.27 207.77 528.87 908.77
Below-median non-business caseload 45 456.54 196.30 170.56 484.20 792.15
Above-median non-business caseload 44 604.14 210.08 321.32 566.18 1000.40

44
TABLE II
DECREASE IN CASELOAD DUE TO BAPCPA IN CONSUMER-CENTRIC DISTRICTS This table shows that bankruptcy districts that had a higher share of non-business cases in 2003 experienced larger
declines in caseload following BAPCPA. In each regression, the dependent variable is the drop in caseload
following BAPCPA, defined as the difference in the average caseload from 2004Q1-2005Q4 and the average
caseload from 2006Q1-2007Q4 for each bankruptcy district. Non-Business Caseload (2003) is the share of
weighted caseload in 2003 that was attributable to non-business bankruptcy filings. In the second column, I control
for the number of new judgeships that were created by BAPCPA (28 judgeships in 20 districts). In the final column,
controls are added for changes in economic conditions and total population from the pre-BAPCPA period (2004-
2005) to the post-BAPCPA period (2006-2007). All regressions are estimated by regular OLS, and robust standard
errors are reported in parentheses. ***, ** and * indicate statistical significance at 1%, 5%, and 10% level,
respectively.
Dependent variable: BAPCPA Caseload drop
Non-Business Caseload (2003) 555.076** 772.055*** 714.222***
(257.969) (218.711) (229.337)
# of new judges -- 108.906** 146.058***
(44.580) (38.557)
Change in unemployment rate -- -- 4.907
(51.278)
Change in house price appreciation -- -- -1,037.417***
(252.373)
Growth in per capita income -- -- 200.056
(1,000.379)
Population growth -- -- 1,043.399
(979.314)
Observations 89 89 89
R-squared 0.089 0.204 0.325
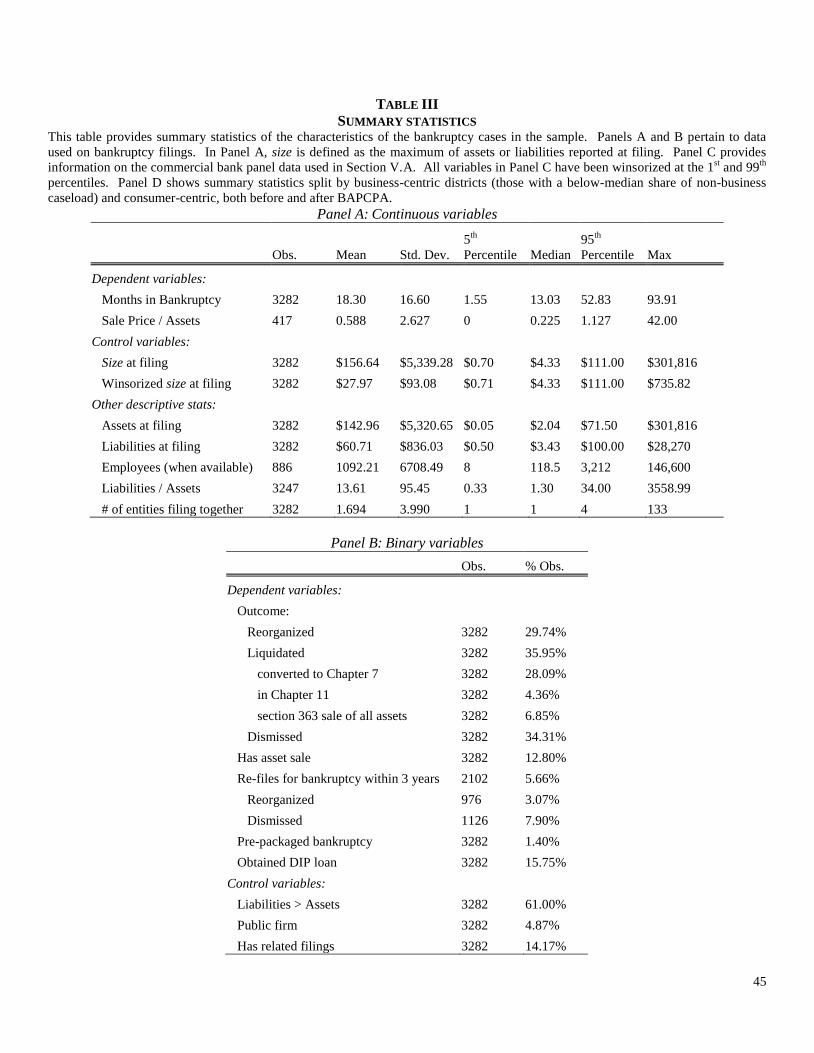
45
TABLE III
SUMMARY STATISTICS This table provides summary statistics of the characteristics of the bankruptcy cases in the sample. Panels A and B pertain to data
used on bankruptcy filings. In Panel A, size is defined as the maximum of assets or liabilities reported at filing. Panel C provides
information on the commercial bank panel data used in Section V.A. All variables in Panel C have been winsorized at the 1st and 99
th
percentiles. Panel D shows summary statistics split by business-centric districts (those with a below-median share of non-business
caseload) and consumer-centric, both before and after BAPCPA. Panel A: Continuous variables
Obs. Mean Std. Dev.
5th
Percentile Median
95th
Percentile Max
Dependent variables:
Months in Bankruptcy 3282 18.30 16.60 1.55 13.03 52.83 93.91
Sale Price / Assets 417 0.588 2.627 0 0.225 1.127 42.00
Control variables:
Size at filing 3282 $156.64 $5,339.28 $0.70 $4.33 $111.00 $301,816
Winsorized size at filing 3282 $27.97 $93.08 $0.71 $4.33 $111.00 $735.82
Other descriptive stats:
Assets at filing 3282 $142.96 $5,320.65 $0.05 $2.04 $71.50 $301,816
Liabilities at filing 3282 $60.71 $836.03 $0.50 $3.43 $100.00 $28,270
Employees (when available) 886 1092.21 6708.49 8 118.5 3,212 146,600
Liabilities / Assets 3247 13.61 95.45 0.33 1.30 34.00 3558.99
# of entities filing together 3282 1.694 3.990 1 1 4 133
Panel B: Binary variables
Obs. % Obs.
Dependent variables:
Outcome:
Reorganized 3282 29.74%
Liquidated 3282 35.95%
converted to Chapter 7 3282 28.09%
in Chapter 11 3282 4.36%
section 363 sale of all assets 3282 6.85%
Dismissed 3282 34.31%
Has asset sale 3282 12.80%
Re-files for bankruptcy within 3 years 2102 5.66%
Reorganized 976 3.07%
Dismissed 1126 7.90%
Pre-packaged bankruptcy 3282 1.40%
Obtained DIP loan 3282 15.75%
Control variables:
Liabilities > Assets 3282 61.00%
Public firm 3282 4.87%
Has related filings 3282 14.17%

46
TABLE III – continued
Panel C: Commercial Banks
Obs. Mean
Std.
Dev.
5th
Percentile Median
95th
Percentile Max
Dependent variables:
Net C&I loan charge-offs:
% of total C&I loans 29012 0.51% 1.43% -0.33% 0.02% 2.92% 9.33%
% of max. C&I non-performing loans 22008 36.41% 108.86% -36.79% 8.47% 182.61% 704.17%
Control variables:
Annual asset growth 29012 7.67% 12.00% -6.32% 5.42% 30.12% 63.27%
Net charge-off rate on all other lending
% of total loans 29012 0.16% 0.34% -0.43% 0.06% 0.70% 2.44%
% of max. non-performing loans 22008 20.51% 43.23% -5.28% 8.87% 84.29% 350.00%
Panel D: Firm Characteristics Across Districts
Business-centric
districts
Consumer-centric
districts
Pre-
BAPCPA
Post-
BAPCPA
Pre-
BAPCPA
Post-
BAPCPA
Observations 498 1132 443 1209
Dependent variables:
Months in Bankruptcy 23.81 16.17 23.71 16.04
Outcome:
Reorganized 36.55% 27.39% 35.89% 26.88%
Liquidated 36.75% 38.25% 35.67% 33.58%
Dismissed 26.71% 34.36% 28.44% 39.54%
Has asset sale 18.07% 12.10% 15.58% 10.26%
Re-files for bankruptcy within 3 years 6.67% 5.72% 3.51% 5.98%
Reorganized 3.30% 4.19% 1.89% 2.46%
Dismissed 11.28% 6.94% 5.56% 8.37%
Pre-packaged bankruptcy 4.42% 1.50% 0.68% 0.33%
Obtained DIP loan 23.29% 14.84% 21.67% 11.33%
Control variables:
Ln(Size) 2.49 1.48 2.11 1.30
Liabilities > Assets 59.84% 59.89% 68.17% 59.88%
Public firm 10.84% 3.55% 8.14% 2.45%
Has related filings 22.09% 12.99% 19.41% 10.09%

47
TABLE IV
THE EFFECT OF CASELOAD ON C&I LOAN CHARGE-OFFS This table shows how changes in caseload affected the performance of commercial and industrial (C&I) and
commercial real estate (CRE) loans held by commercial banks. These panel regressions use regulatory data reported
by commercial banks at year-end from 2004-2007. The dependent variable is defined as the total charge-offs on
C&I loans reported by the bank during the calendar year less any recoveries received on C&I loans, as a percentage
of the average total outstanding balance of C&I loans held by the bank over the year or the maximum reported non-
performing C&I loans during the year. Low caseload court is defined as the interaction of a post-BAPCPA dummy,
equal to one for all 2006 and 2007 observations, and non-business caseload. Because some banks have branches in
multiple bankruptcy districts, non-business caseload in this table is defined as the weighted average non-business
share of court caseload across all districts in which the bank had deposits in 2003. The share of deposits held in
each bankruptcy district serves as the weight in this average. Asset growth is defined as the log difference in assets
from the previous year. Net charge-off rate on all other loans is defined similarly to the dependent variable. All
regressions include fixed effects for the 7,741 banks included in the sample as well as year fixed effects. All models
are estimated by OLS. Standard errors are clustered by bank to account for serial correlation across years, and are
reported in parentheses. ***, **, and * indicate statistical significance at the 1%, 5%, and 10% level, respectively.
Panel A: Commercial and Industrial (C&I) Loans
Dependent Variable:
Net charge-offs on C&I loans
% of total C&I loans % of maximum non-
performing C&I loans
Low caseload court -0.437** -1.099 -34.219* -139.705***
(0.194) (0.730) (20.065) (50.420)
Low caseload court * ln(bank assets) -- 0.110 -- 17.145**
(0.121) (7.583)
Post BAPCPA * ln(bank assets) -- -0.088 -- -11.576*
(0.095) (5.967)
Non-business caseload share * ln(bank assets) -- 0.162* -- 17.735**
(0.098) (8.150)
Asset growth -0.382*** -0.438*** -6.518 -12.365
(0.097) (0.099) (8.498) (8.919)
Net charge-off rate on all other loans 0.664*** 0.660*** 0.034 0.034
(0.068) (0.068) (0.030) (0.030)
Ln(per capita income) -0.822 -0.945* 23.156 1.043
(0.549) (0.555) (50.522) (51.329)
Ln(population) -2.336*** -2.625*** -65.803 -99.808
(0.756) (0.773) (79.089) (80.310)
Unemployment rate 0.067** 0.068** 2.037 2.249
(0.030) (0.030) (2.796) (2.809)
House price appreciation -0.194 -0.160 -84.947*** -72.291***
(0.226) (0.228) (26.195) (26.662)
Fixed effects:
Bank Yes Yes Yes Yes
Year Yes Yes Yes Yes
Observations 29,012 29,012 22,008 22,008
Adjusted R-squared 0.187 0.187 0.099 0.100

48
TABLE V
THE EFFECT OF CASELOAD ON BANKRUPTCY OUTCOME This table explores the relation between the change in caseload due to BAPCPA and whether the bankrupt firm was
reorganized, liquidated, or dismissed from court. Low caseload court is defined as the interaction of a post-BAPCPA
dummy, equal to one if the firm filed on or after 17 October 2005, and non-business caseload, the share of caseload in
2003 that was derived from non-business filings. Size is the maximum of either assets or liabilities reported at the time
of filing. The other control variables indicate whether the firm reported liabilities > assets at filing, if the firm had
other related entities that filed jointly, if the firm had assets available for distribution to creditors, if the firm was
public, and if the firm obtained DIP financing. 47 firms that filed with pre-packaged plans are omitted from the
sample. All regressions include 89 district fixed effects, 48 month fixed effects, and 30 industry fixed effects. All
models are estimated using linear least squares. Standard errors are clustered by bankruptcy district and reported in
parenthesis. ***, ** and * indicate statistical significance at 1%, 5%, and 10% level, respectively.
Dependent Variable: Reorganized Liquidated Dismissed
Low caseload court -0.099 0.104 -0.052 -0.177* 0.151*** 0.073
(0.091) (0.134) (0.068) (0.100) (0.050) (0.089)
Low caseload court * ln(size) -- -0.100** -- 0.075** -- 0.025
(0.042) (0.032) (0.032)
Post BAPCPA * ln(size) -- 0.052** -- -0.041*** -- -0.011
(0.024) (0.015) (0.019)
Non-business caseload share * ln(size) -- 0.050 -- 0.006 -- -0.056*
(0.033) (0.025) (0.032)
Ln(size) 0.012** -0.009 0.017** 0.003 -0.029*** 0.006
(0.006) (0.017) (0.008) (0.013) (0.006) (0.021)
Liabilities > assets at filing -0.021 -0.020 0.082*** 0.082*** -0.061*** -0.062***
(0.019) (0.019) (0.018) (0.018) (0.020) (0.020)
Group filing 0.038 0.034 0.028 0.033 -0.066** -0.067**
(0.031) (0.031) (0.024) (0.024) (0.028) (0.028)
Public firm -0.036 -0.042 0.102* 0.111* -0.066** -0.070**
(0.047) (0.046) (0.060) (0.059) (0.030) (0.030)
Got DIP loan 0.071** 0.068** 0.053** 0.053** -0.123*** -0.121***
(0.029) (0.029) (0.025) (0.025) (0.020) (0.020)
Month, industry, and district fixed effects Yes Yes Yes Yes Yes Yes
Observations 3,236 3,236 3,236 3,236 3,236 3,236
Adjusted R-squared 0.055 0.056 0.064 0.065 0.125 0.125

49
TABLE VI
THE EFFECT OF CASELOAD ON RECIDIVISM This table explores the relation between the change in caseload due to BAPCPA and the likelihood a firm re-files for
bankruptcy. The dependent variable is equal to one if the firm filed for either Chapter 11 or Chapter 7 bankruptcy
within three years of its original bankruptcy filing, but more than 3 months after that date. All independent variables
are defined as in Table V. For clarity, the key variables that identify the impact of caseload are shaded. All
regressions include 89 district fixed effects, 48 month fixed effects, and 30 industry fixed effects. All models are
estimated using linear least squares. Standard errors are clustered by bankruptcy district and reported in parenthesis.
***, ** and * indicate statistical significance at 1%, 5%, and 10% level, respectively.
Dependent Variable: Re-filed for bankruptcy within 3 years
Sample: Reorganized Dismissed
Low caseload court 0.002 -0.019 -0.227** -0.308**
(0.050) (0.055) (0.102) (0.120)
Low caseload court * ln(size) -- 0.015 -- 0.083
(0.022) (0.060)
Post BAPCPA * ln(size) -- 0.007 -- -0.087*
(0.008) (0.044)
Non-business caseload share * ln(size) -- -0.011 -- 0.004
(0.010) (0.050)
Ln(size) 0.006 0.003 0.004 0.020
(0.008) (0.006) (0.005) (0.031)
Liabilities > assets at filing 0.005 0.006 -0.026* -0.024
(0.011) (0.012) (0.014) (0.015)
Group filing 0.014 0.015 -0.022 -0.021
(0.017) (0.016) (0.028) (0.028)
Public firm -0.045** -0.038** -0.029 -0.027
(0.019) (0.016) (0.042) (0.041)
Got DIP loan 0.017 0.020 0.031 0.029
(0.025) (0.026) (0.054) (0.052)
Month, industry, and district fixed effects Yes Yes Yes Yes
Observations 938 938 1,125 1,125
Adjusted R-squared -0.018 -0.015 0.040 0.043

50
TABLE VII
THE EFFECT OF CASELOAD ON TIME IN BANKRUPTCY This table explores the relation between the change in caseload due to BAPCPA and the duration of the firm’s time
in bankruptcy. The dependent variable is the number of months between the bankruptcy filing and the resolution
date of the bankruptcy. All independent variables are defined as in Table V. For clarity, the key variables that
identify the effect of caseload on time in bankruptcy are shaded. All regressions include 89 district fixed effects, 48
month fixed effects, and 30 industry fixed effects. All models are estimated using linear least squares. Standard
errors are clustered by bankruptcy district and reported in parenthesis. ***, ** and * indicate statistical significance
at 1%, 5%, and 10% level, respectively.
Dependent variable: Months in bankruptcy
Low caseload court -0.051 7.448
(4.258) (5.038)
Low caseload court * ln(size) -- -3.868***
(1.119)
Post BAPCPA * ln(size) -- 1.105**
(0.529)
Non-business caseload share * ln(size) -- 2.848***
(1.077)
Ln(size) 1.785*** 0.977
(0.278) (0.650)
Liabilities > assets at filing -0.391 -0.344
(0.616) (0.617)
Group filing 0.467 0.207
(0.968) (0.947)
Public firm 0.482 0.109
(1.682) (1.611)
Got DIP loan 5.106*** 4.840***
(1.070) (1.075)
Month, industry, and district fixed effects Yes Yes
Observations 3,236 3,236
Adjusted R-squared 0.151 0.155

51
TABLE VIII
THE EFFECT OF CASELOAD ON ASSET SALES AND DIP LENDING This table explores the relation between the change in caseload due to BAPCPA and the need to raise capital during
bankruptcy. In the first two columns, the dependent variable is equal to one if the firm sold any assets in
bankruptcy. In the middle two columns the dependent variable is the sale price scaled by the assets of the firm, for
this firms that had at least one asset sale. In the final two columns the dependent variable is equal to one if the firm
obtained debtor-in-possession financing. All control variables are defined as in Table V, with the addition of a
control for whether the asset sale was for substantially all of the assets of the firm. For clarity, the key variables that
identify the impact of caseload are shaded. All regressions include 89 district fixed effects, 48 month fixed effects,
and 30 industry fixed effects. All models are estimated using linear least squares. Standard errors are clustered by
bankruptcy district and reported in parenthesis. ***, ** and * indicate statistical significance at 1%, 5%, and 10%
level, respectively.
Dependent Variable: Has asset sale Sale price / assets Obtained DIP Loan
Low caseload court -0.094** -0.111 -0.206 3.301 -0.112** -0.003
(0.047) (0.068) (0.895) (2.882) (0.052) (0.079)
Low caseload court * ln(size) -- 0.018 -- -1.373 -- -0.049**
(0.027) (1.008) (0.021)
Post BAPCPA * ln(size) -- 0.004 -- 0.135 -- 0.008
(0.017) (0.264) (0.015)
Non-business caseload share * ln(size) -- -0.003 -- 0.245 -- 0.069***
(0.035) (0.283) (0.019)
Ln(size) 0.050*** 0.040 -0.491* -0.255* 0.085*** 0.055***
(0.005) (0.027) (0.284) (0.136) (0.005) (0.011)
Liabilities > assets at filing -0.004 -0.004 -0.596 -0.638 0.021* 0.022**
(0.012) (0.012) (0.580) (0.578) (0.011) (0.011)
Group filing 0.075*** 0.078*** 0.240 0.154 0.090*** 0.087***
(0.019) (0.020) (0.337) (0.321) (0.017) (0.017)
Distributable assets 0.139*** 0.144*** 0.081 -0.065 0.239*** 0.236***
(0.044) (0.044) (0.234) (0.234) (0.043) (0.043)
Got DIP loan 0.248*** 0.250*** 0.208 0.360 -- --
(0.029) (0.028) (0.371) (0.424)
Substantially all assets sold -- -- 0.463 0.597 -- --
(0.387) (0.418)
Prepackaged bankruptcy -- -- -- -- 0.180*** 0.191***
(0.061) (0.061)
Month, industry, and district FE Yes Yes Yes Yes Yes Yes
Observations 3,236 3,236 409 409 3,282 3,282
Adjusted R-squared 0.296 0.297 -0.065 -0.028 0.334 0.337

52
FIGURE 1
BANKRUPTCY CASES FILED PER QUARTER – NON-BUSINESS AND CH. 11 Panel A shows the total number of non-business bankruptcy filings per quarter in the U.S. Courts system from
1980Q2 – 2011Q2, while Panel B shows the total number of Business Chapter 11 cases filed. In both charts, the
vertical line identifies the passage of BAPCPA in October 2005, while light-gray shading indicates NBER
recessions.
Panel A: Non-business case filings (number of filings)
Panel B: Business Chapter 11 case filings
0
100,000
200,000
300,000
400,000
500,000
600,000
700,000
19
80Q
2
19
81Q
4
19
83Q
2
19
84Q
4
19
86Q
2
19
87Q
4
19
89Q
2
19
90Q
4
19
92Q
2
19
93Q
4
19
95Q
2
19
96Q
4
19
98Q
2
19
99Q
4
20
01Q
2
20
02Q
4
20
04Q
2
20
05Q
4
20
07Q
2
20
08Q
4
20
10Q
2
0
1,000
2,000
3,000
4,000
5,000
6,000
7,000
19
80Q
2
19
81Q
4
19
83Q
2
19
84Q
4
19
86Q
2
19
87Q
4
19
89Q
2
19
90Q
4
19
92Q
2
19
93Q
4
19
95Q
2
19
96Q
4
19
98Q
2
19
99Q
4
20
01Q
2
20
02Q
4
20
04Q
2
20
05Q
4
20
07Q
2
20
08Q
4
20
10Q
2
BAPCPA
Oct. 2005
BAPCPA
Oct. 2005

53
FIGURE 2
CASELOAD PER JUDGE This figure displays the total weighted caseload per judge across the U.S. courts system from 1980Q2 – 2011Q2.
The y-axis can be interpreted as the total expected hours a judge will spend on case-work annually. The vertical line
identifies the passage of BAPCPA in October 2005, while light-gray shading indicates NBER recessions.
0
200
400
600
800
1,000
1,200
1,400
19
80Q
2
19
81Q
4
19
83Q
2
19
84Q
4
19
86Q
2
19
87Q
4
19
89Q
2
19
90Q
4
19
92Q
2
19
93Q
4
19
95Q
2
19
96Q
4
19
98Q
2
19
99Q
4
20
01Q
2
20
02Q
4
20
04Q
2
20
05Q
4
20
07Q
2
20
08Q
4
20
10Q
2
BAPCPA
Oct. 2005

54
FIGURE 3
BAPCPA’S EFFECT ON CONSUMER- AND BUSINESS-CENTRIC BANKRUPTCY DISTRICTS This figure shows how court caseload evolved in consumer- and business-centric districts from 2004-2007. Panel A
uses an example of two neighboring bankruptcy districts: the Western and Middle Districts of Pennsylvania. The
Middle District of Pennsylvania spends about 83% of its time on consumer bankruptcy cases, as compared to 67% in
the Western District. BAPCPA decreased caseload by substantially more in the consumer-centric Middle District.
Panel B shows a similar pattern for all 89 bankruptcy districts. In this chart, districts with an above-median non-
business share of caseload are classified as “consumer-centric,” while the remaining districts are “business-centric.”
The average caseload for each group is then plotted in the solid and dotted lines over time. Because BAPCPA
disproportionately impacted the consumer-centric groups, the difference between the two lines (indicated by the
arrows) shrinks by nearly half after its passage.
Panel A: Western and Middle Districts of Pennsylvania
Panel B: Average across all business- and consumer-centric districts
0
200
400
600
800
1000
1200
1400
1600
1800
2000
2004q1 2004q3 2005q1 2005q3 2006q1 2006q3 2007q1 2007q3
Ca
selo
ad
ho
urs
Western Pennsylvania Middle Pennsylvania
BAPCPA
Oct. 2005
0
200
400
600
800
1000
1200
1400
1600
2004q1 2004q3 2005q1 2005q3 2006q1 2006q3 2007q1 2007q3
Ca
selo
ad
ho
urs
Business-centric districts Consumer-centric districts
BAPCPA
Oct. 2005
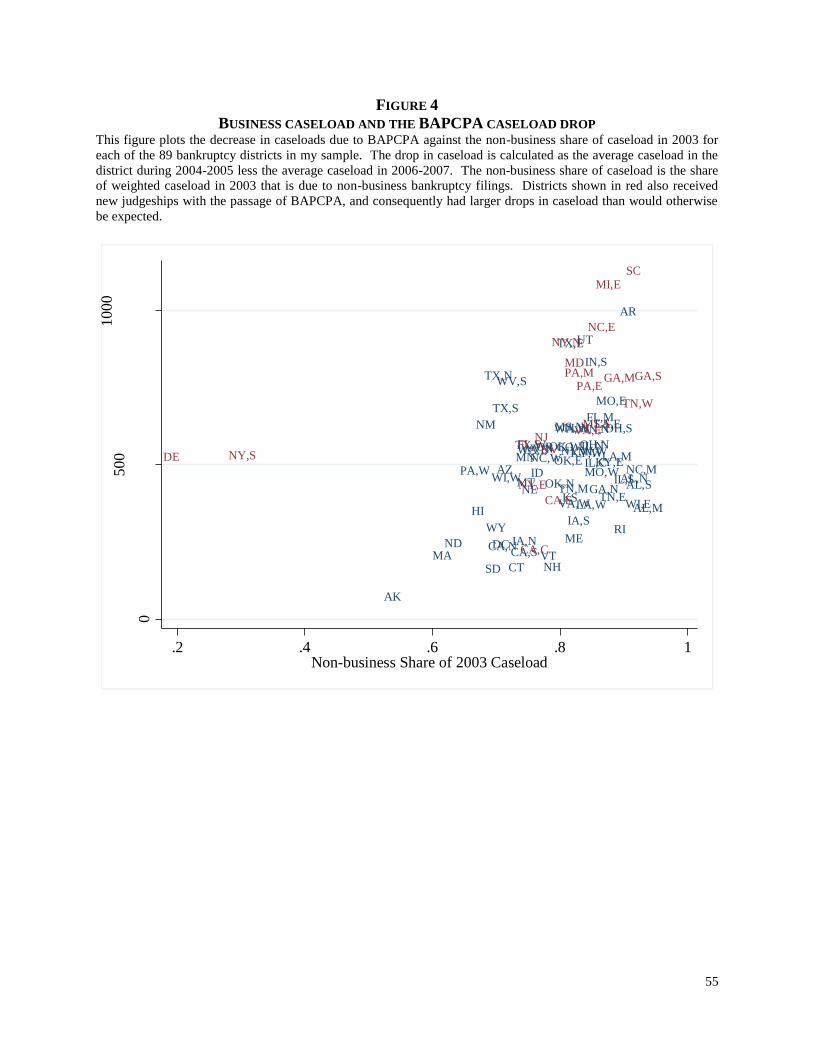
55
FIGURE 4
BUSINESS CASELOAD AND THE BAPCPA CASELOAD DROP This figure plots the decrease in caseloads due to BAPCPA against the non-business share of caseload in 2003 for
each of the 89 bankruptcy districts in my sample. The drop in caseload is calculated as the average caseload in the
district during 2004-2005 less the average caseload in 2006-2007. The non-business share of caseload is the share
of weighted caseload in 2003 that is due to non-business bankruptcy filings. Districts shown in red also received
new judgeships with the passage of BAPCPA, and consequently had larger drops in caseload than would otherwise
be expected.
AK
AL,M
AL,NAL,S
AR
AZ
CA,NCA,S
CO
CT
DC
FL,MFL,N
GA,N
HI
IA,N
IA,S
IDIL,C
IL,N
IL,S
IN,N
IN,S
KS
KY,EKY,W
LA,E
LA,M
LA,W
MA
ME
MI,WMN
MO,E
MO,W
MS,N
MTNC,M
NC,W
ND
NE
NH
NM
NY,WOH,N
OH,S
OK,E
OK,N
OK,WOR
PA,W
RI
SD
TN,ETN,M
TX,E
TX,N
TX,S
TX,W
UT
VA,W
VT
WA,E
WA,W
WI,E
WI,W
WV,N
WV,S
WY
CA,C
CA,E
DEFL,S
GA,MGA,SMD
MI,E
MS,S
NC,E
NJNV
NY,E
NY,N
NY,S
PA,EPA,M
SC
TN,W
VA,E
0
50
01
00
0
Cas
elo
ad D
rop
fro
m B
AP
CP
A
.2 .4 .6 .8 1Non-business Share of 2003 Caseload
Related Documents