Germany last 10 year economy report
Aug 04, 2015
Welcome message from author
This document is posted to help you gain knowledge. Please leave a comment to let me know what you think about it! Share it to your friends and learn new things together.
Transcript

Country name
Conventional long form: Federal Republic of Germany Conventional short form: Germany local long form: Bundesrepublik Deutschland local short form: Deutschland Former: German Empire, German Republic, German Reich
Capital Name: Berlin
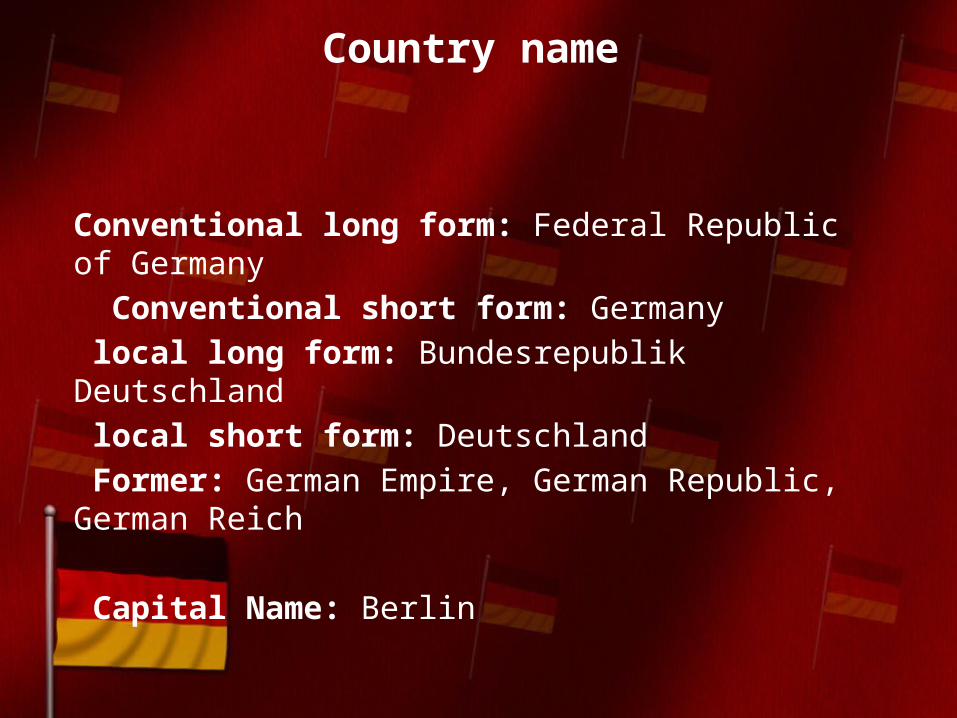
GDP and GNP figures
2003 2004 2005 2006 2007 2008 2009 2010 2011 2012 2013$2,500,000,000,000.00
$2,600,000,000,000.00
$2,700,000,000,000.00
$2,800,000,000,000.00
$2,900,000,000,000.00
$3,000,000,000,000.00
$3,100,000,000,000.00
$3,200,000,000,000.00
$3,300,000,000,000.00
2,780,807,580,743.41
2,859,065,847,946.452,886,049,345,868.78
3,018,953,490,596.36
3,111,072,574,315.763,130,080,004,599.97
2,988,684,683,618.32
3,101,189,905,518.74
3,226,447,686,429.893,240,149,417,275.363,242,294,344,062.77
2,837,509,796,423.412,857,558,573,347.26
2,963,574,090,061.19
3,060,476,525,394.223,092,676,077,451.13
2,918,312,449,758.74
3,037,693,821,693.28
3,146,747,032,283.743,158,594,040,566.093,161,935,501,293.33
GDP GNP

Economic growth for the last 10 years
2003 2004 2005 2006 2007 2008 2009 2010 2011 2012 2013 2014
-8
-6
-4
-2
0
2
4
6
-0.72
1.180.71
3.713.27
1.05
-5.64
4.093.59
0.380.11 0.00
GDP growth (annual %)
GDP growth (annual %)

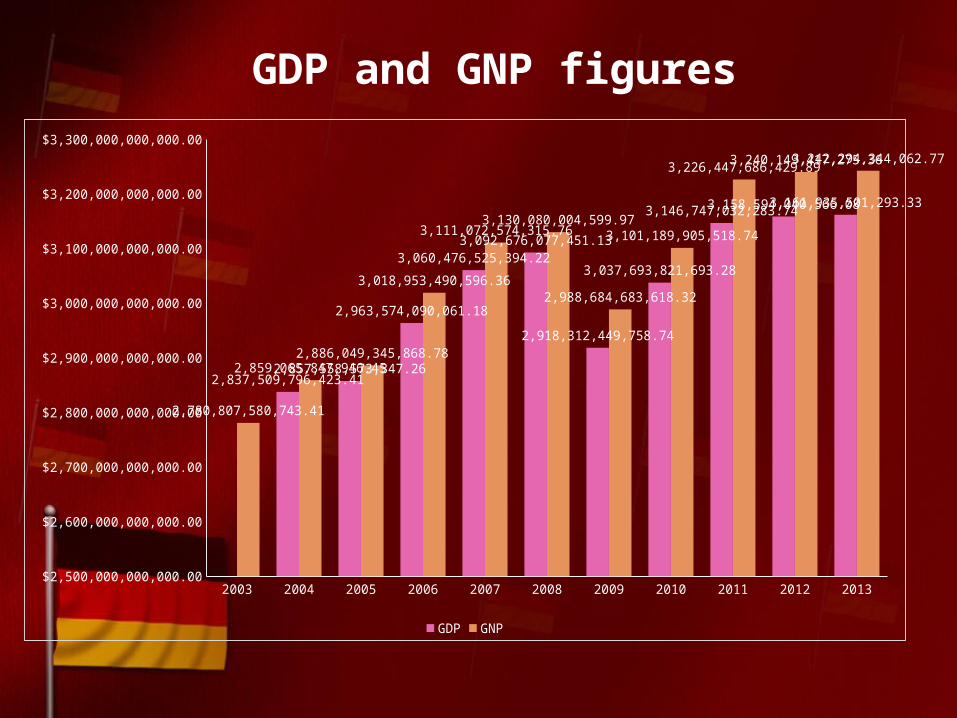
Components of GDP(C+I+G+X-M)
$0.00
$500,000,000,000.00
$1,000,000,000,000.00
$1,500,000,000,000.00
$2,000,000,000,000.00
$2,500,000,000,000.002,159,746,383,126.90
527,863,388,797.69
908,397,051,559.47819,121,428,518.13
2,168,166,011,291.85
523,734,000,149.23
1,012,410,966,522.41884,079,868,054.52
2,177,040,740,188.03
526,234,890,314.88
1,079,807,740,138.29935,217,380,490.47
2003 2004 2005

$0.00
$500,000,000,000.00
$1,000,000,000,000.00
$1,500,000,000,000.00
$2,000,000,000,000.00
$2,500,000,000,000.002,207,533,418,395.26
531,469,323,484.06
1,212,478,552,454.861,039,335,177,958.51
2,214,132,584,813.21
539,379,139,307.57
1,325,381,413,843.70
1,104,178,442,769.74
2,240,984,339,650.80
557,525,168,880.27
1,351,119,550,688.95
1,128,940,975,351.94
2006 2007 2008

$0.00
$500,000,000,000.00
$1,000,000,000,000.00
$1,500,000,000,000.00
$2,000,000,000,000.00
$2,500,000,000,000.002,258,051,140,377.05
574,159,032,109.64
1,158,348,859,996.021,020,561,722,628.46
2,275,573,053,773.07
581,603,554,320.25
1,326,708,123,165.701,151,745,536,487.09
2,318,126,271,825.10
585,500,302,069.34
1,432,977,437,944.591,234,095,345,968.26
2009 2010 2011
$0.00
$500,000,000,000.00
$1,000,000,000,000.00
$1,500,000,000,000.00
$2,000,000,000,000.00
$2,500,000,000,000.002,337,013,522,732.93
592,770,343,481.07
1,473,309,365,393.22
1,233,864,996,393.57
2,355,445,672,785.16
597,074,212,928.42
1,496,526,760,558.13
1,272,448,468,263.44
2012 2013
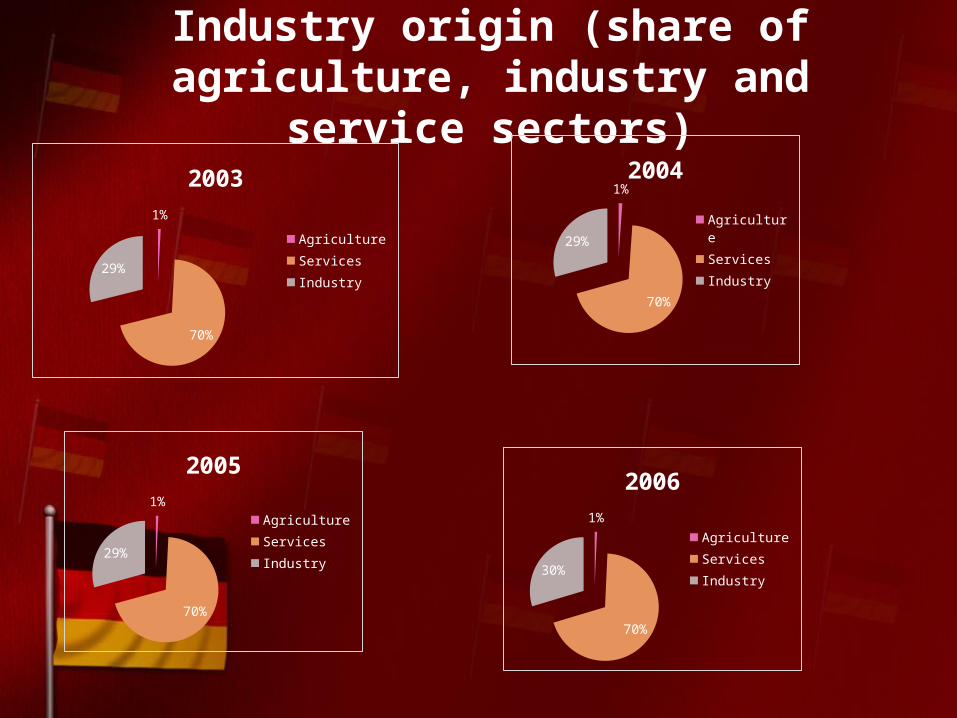
Industry origin (share of agriculture, industry and
service sectors)
1%
70%
29%
2003
AgricultureServicesIndustry
1%
70%
29%
2004
AgricultureServicesIndustry
1%
70%
29%
2005
AgricultureServicesIndustry
1%
70%
30%
2006
AgricultureServicesIndustry

1%
69%
30%
2007
AgricultureServicesIndustry
1%
70%
29%
2008
AgricultureServicesIndustry
1%
72%
27%
2009
AgricultureServicesIndustry
1%
70%
29%
2010
AgricultureServicesIndustry

1%
70%
30%
2011
AgricultureServicesIndustry
1%
69%
30%
2012
AgricultureServicesIndustry
1%
69%
30%
2013
AgricultureServicesIndustry
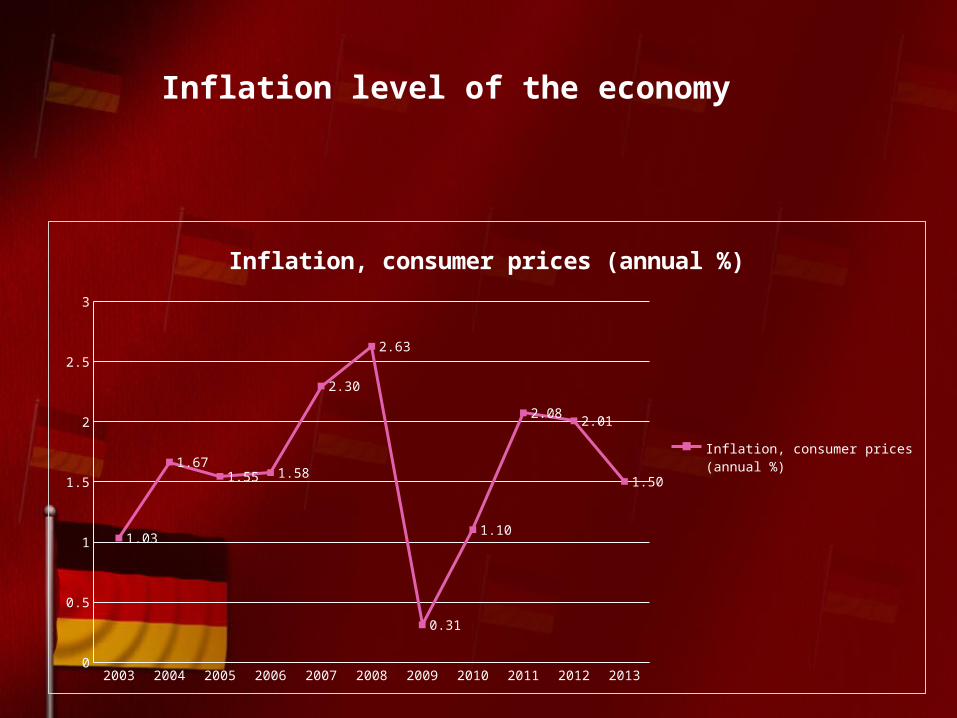
Inflation level of the economy
2003 2004 2005 2006 2007 2008 2009 2010 2011 2012 20130
0.5
1
1.5
2
2.5
3
1.03
1.671.55 1.58
2.30
2.63
0.31
1.10
2.082.01
1.50
Inflation, consumer prices (annual %)
Inflation, consumer prices (annual %)

CPI
2003 2004 2005 2006 2007 2008 2009 2010 2011 2012 201380
85
90
95
100
105
110
89.56
91.0592.46
93.92
96.07
98.60 98.91100.00
102.08
104.13
105.69
CPI
CPI

WPI
2003 2004 2005 2006 2007 2008 2009 2010 2011 2012 20130
20
40
60
80
100
120
86.03 87.4491.24
96.18 97.46102.79
98.50 100.00105.25 106.95 106.88
WPI
WPI

2013 2014
13 14
Ease of doing business RANKING
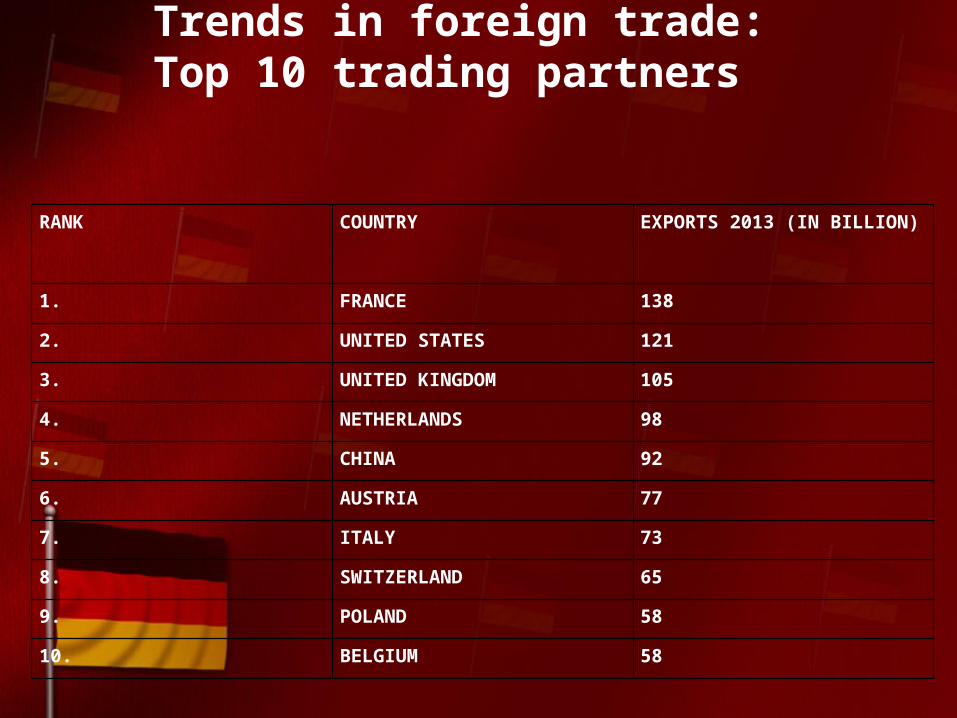
Trends in foreign trade: Top 10 trading partners
RANK COUNTRY EXPORTS 2013 (IN BILLION)
1. FRANCE 138
2. UNITED STATES 121
3. UNITED KINGDOM 105
4. NETHERLANDS 98
5. CHINA 92
6. AUSTRIA 77
7. ITALY 73
8. SWITZERLAND 65
9. POLAND 58
10. BELGIUM 58
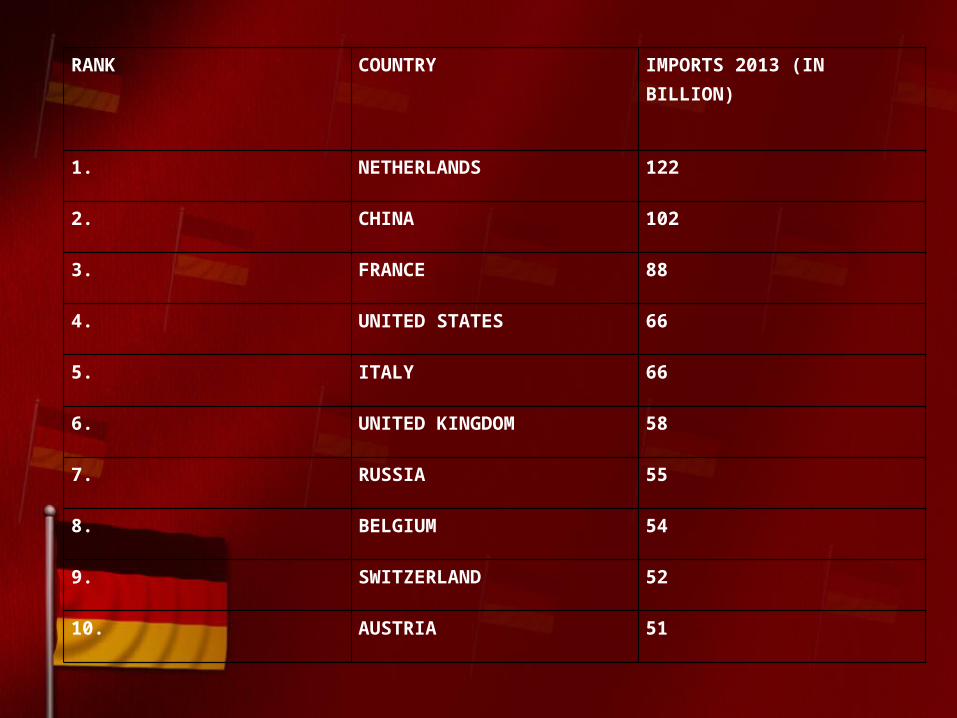
RANK COUNTRY IMPORTS 2013 (IN BILLION)
1. NETHERLANDS 122
2. CHINA 102
3. FRANCE 88
4. UNITED STATES 66
5. ITALY 66
6. UNITED KINGDOM 58
7. RUSSIA 55
8. BELGIUM 54
9. SWITZERLAND 52
10. AUSTRIA 51
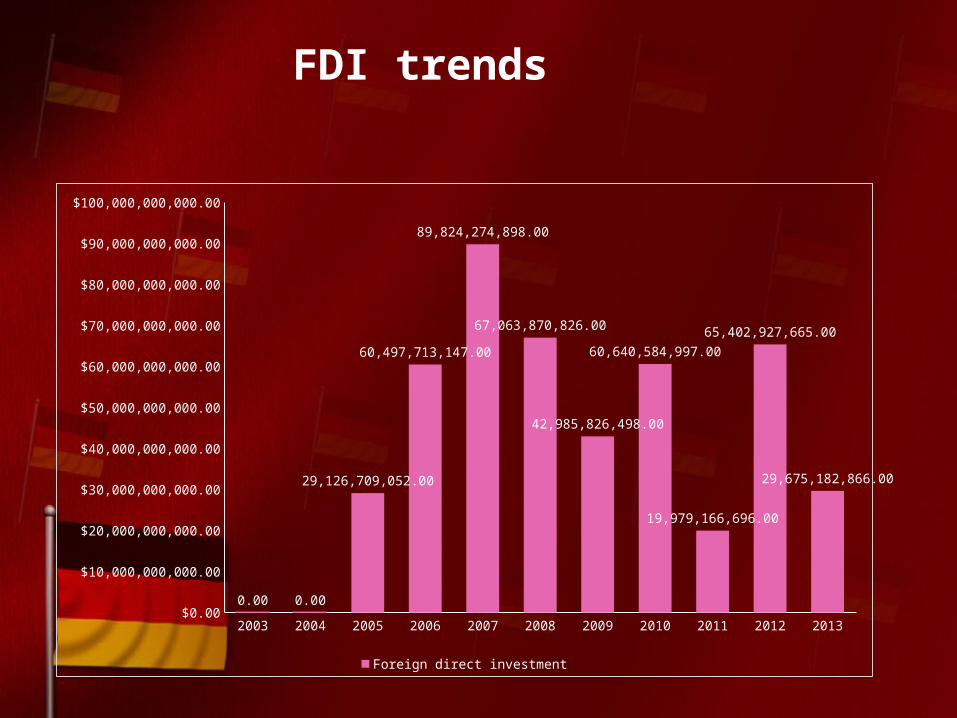
FDI trends
2003 2004 2005 2006 2007 2008 2009 2010 2011 2012 2013$0.00
$10,000,000,000.00
$20,000,000,000.00
$30,000,000,000.00
$40,000,000,000.00
$50,000,000,000.00
$60,000,000,000.00
$70,000,000,000.00
$80,000,000,000.00
$90,000,000,000.00
$100,000,000,000.00
0.00 0.00
29,126,709,052.00
60,497,713,147.00
89,824,274,898.00
67,063,870,826.00
42,985,826,498.00
60,640,584,997.00
19,979,166,696.00
65,402,927,665.00
29,675,182,866.00
Foreign direct investment
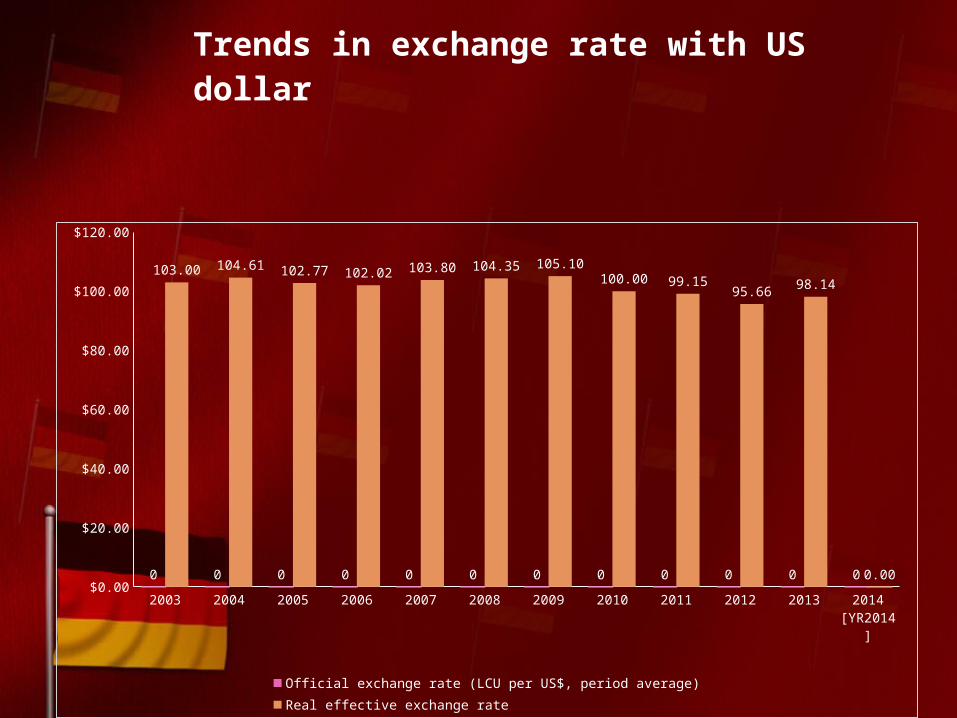
Trends in exchange rate with US dollar
2003 2004 2005 2006 2007 2008 2009 2010 2011 2012 2013 2014 [YR2014]
$0.00
$20.00
$40.00
$60.00
$80.00
$100.00
$120.00
0 0 0 0 0 0 0 0 0 0 0 0
103.00 104.61 102.77 102.02 103.80 104.35 105.10100.00 99.15
95.6698.14
0.00
Official exchange rate (LCU per US$, period average) Real effective exchange rate
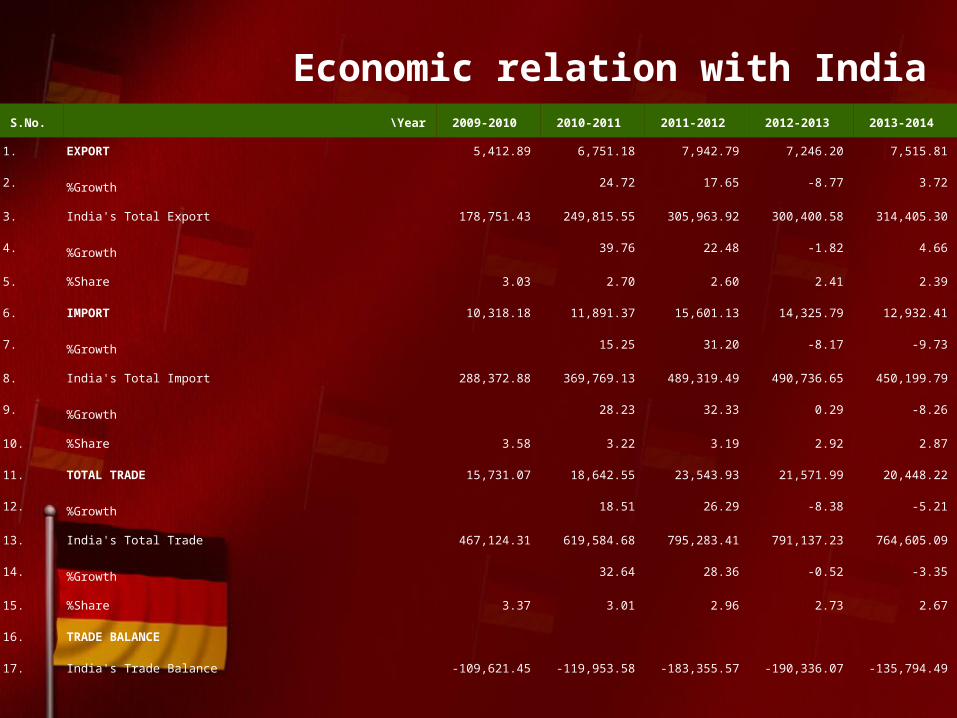
Economic relation with IndiaS.No. \Year 2009-2010 2010-2011 2011-2012 2012-2013 2013-2014
1. EXPORT 5,412.89 6,751.18 7,942.79 7,246.20 7,515.81
2. %Growth 24.72 17.65 -8.77 3.72
3. India's Total Export 178,751.43 249,815.55 305,963.92 300,400.58 314,405.30
4. %Growth 39.76 22.48 -1.82 4.66
5. %Share 3.03 2.70 2.60 2.41 2.39
6. IMPORT 10,318.18 11,891.37 15,601.13 14,325.79 12,932.41
7. %Growth 15.25 31.20 -8.17 -9.73
8. India's Total Import 288,372.88 369,769.13 489,319.49 490,736.65 450,199.79
9. %Growth 28.23 32.33 0.29 -8.26
10. %Share 3.58 3.22 3.19 2.92 2.87
11. TOTAL TRADE 15,731.07 18,642.55 23,543.93 21,571.99 20,448.22
12. %Growth 18.51 26.29 -8.38 -5.21
13. India's Total Trade 467,124.31 619,584.68 795,283.41 791,137.23 764,605.09
14. %Growth 32.64 28.36 -0.52 -3.35
15. %Share 3.37 3.01 2.96 2.73 2.67
16. TRADE BALANCE
17. India's Trade Balance -109,621.45 -119,953.58 -183,355.57 -190,336.07 -135,794.49

Thank you
Related Documents