EN EN EUROPEAN COMMISSION Brussels, 7.3.2018 SWD(2018) 204 final COMMISSION STAFF WORKING DOCUMENT Country Report Germany 2018 Including an In-Depth Review on the prevention and correction of macroeconomic imbalances Accompanying the document COMMUNICATION FROM THE COMMISSION TO THE EUROPEAN PARLIAMENT, THE COUNCIL, THE EUROPEAN CENTRAL BANK AND THE EUROGROUP 2018 European Semester: Assessment of progress on structural reforms, prevention and correction of macroeconomic imbalances, and results of in-depth reviews under Regulation (EU) No 1176/2011 {COM(2018) 120 final}

Welcome message from author
This document is posted to help you gain knowledge. Please leave a comment to let me know what you think about it! Share it to your friends and learn new things together.
Transcript
EN EN
EUROPEAN COMMISSION
Brussels, 7.3.2018
SWD(2018) 204 final
COMMISSION STAFF WORKING DOCUMENT
Country Report Germany 2018
Including an In-Depth Review on the prevention and correction of macroeconomic
imbalances
Accompanying the document
COMMUNICATION FROM THE COMMISSION TO THE EUROPEAN
PARLIAMENT, THE COUNCIL, THE EUROPEAN CENTRAL BANK AND THE
EUROGROUP
2018 European Semester: Assessment of progress on structural reforms, prevention and
correction of macroeconomic imbalances, and results of in-depth reviews under
Regulation (EU) No 1176/2011
{COM(2018) 120 final}

Executive summary 1
1. Economic situation and outlook 4
2. Progress with country-specific recommendations 11
3. Summary of the main findings from the Macroeconomic Imbalances Procedure
in-depth review 14
4. Reform priorities 19
4.1. Public finances, fiscal frameworks and taxation* 19
4.2. Financial sector* 23
4.3. Labour market, education and social policies 26
4.4. Beyond the aggregate: ageing, inequality and savings* 35
4.5. Investment 38
4.6. Sectoral policies 46
Annex A: Overview table 53
Annex B: Macroeconomic Imbalances Procedure Scoreboard 58
Annex C: Standard tables 59
References 65
LIST OF TABLES
Table 1.1: Key economic and financial indicators – Germany 10
Table 2.1: Summary table on 2017 CSR assessment 12
Table 3.1: MIP assessment matrix – Germany 18
Table 4.2.1: Financial soundness indicators, all banks in Germany 23
Table B.1: The MIP Scoreboard for Germany (AMR 2018) 58
Table C.1: Financial market indicators 59
Table C.2: Headline Social Scoreboard indicators 60
Table C.3: Labour market and education indicators 61
Table C.4: Social inclusion and health indicators 62
Table C.5: Product market performance and policy indicators 63
Table C.6: Green growth 64
CONTENTS

LIST OF GRAPHS
Graph 1.1: Demand components of GDP growth 4
Graph 1.2: Contributions to headline inflation 6
Graph 1.3: Sectoral net lending 6
Graph 1.4: Determinants of household disposable income 6
Graph 1.5: Current account and component balances 7
Graph 1.6: Balance of goods by broad economic category 7
Graph 1.7: Current account balance and components of the financial account 7
Graph 1.8: Factors explaining the current account surplus 8
Graph 1.9: General government budget balance and gross debt 9
Graph 1.10: Tax wedge - 2016 9
Graph 2.1: Overall multiannual implementation of 2011-2017 CSRs to date 11
Graph 4.1.1: Government balance and trends in selected revenues and expenditures 19
Graph 4.1.2: Taxes by economic function 19
Graph 4.2.1: Mortgages and corporate loans in billion EUR and in % of GDP 24
Graph 4.2.2: Annual change of different household loan categories 24
Graph 4.2.3: Funding sources of non-financial corporations 25
Graph 4.3.1: Phillips curve in Germany: compensation growth and unemployment rate 26
Graph 4.3.2: Trends in labour costs and its components 29
Graph 4.3.3: Employment rate by citizenship 30
Graph 4.3.4: Gini coefficient and poverty risk 31
Graph 4.4.1: Dependency ratios (2036 population forecast) and savings rates of DE 36
Graph 4.4.2: Savings rates by age groups – measured in 2015 37
Graph 4.5.1: Capital stock 38
Graph 4.5.2: Gross fixed capital formation in the private sector 38
Graph 4.5.3: Potential growth and contributions 39
Graph 4.5.4: Productivity developments 40
Graph 4.5.5: Housing overvaluation gap 40
Graph 4.5.6: Gross fixed capital formation in the public sector 41
Graph 4.5.7: Net public investment by level of government 42
Graph 4.5.8: Net capital stock by type of activity 43
Graph 4.6.1: Business expenditure on R&D (BERD) performed by SMEs 47
Graph 4.6.2: Venture capital investment (market statistics) in 2016 47

LIST OF BOXES
Box 2.1: Tangible results delivered through EU support to structural change in Germany 13
Box 3.1: Euro area spillovers 17
Box 4.3.1: Monitoring performance in light of the European Pillar of Social Rights 27
Box 4.3.2: Policy highlights: The introduction of the general minimum wage 28
Box 4.5.1: Investment challenges and reforms in Germany 44
Box 4.6.1: Collaborative economy 50

1
Germany’s enduring economic upswing offers
an opportunity for policy action aimed at
fostering higher potential growth, which can
prepare the country for future challenges.
Boosting public and private investment, where
gaps have been clearly identified, can help
maintain the efficiency of the capital stock and
raise productivity to prepare for future challenges
such as new digital business models, low-emission
transport and decentralised (renewable) energy
production. Better involvement of the
underrepresented groups in the labour market can
help address the looming shortage of skilled labour
stemming from demographic change. Boosting
investment and expenditure in education, including
lifelong learning, and in research and development
are also key in raising long-term growth
potential.(1)
The German economy showed robust growth in
2015-2017, driven by domestic demand. Real
GDP growth was at 1.9 % in 2016 and 2.2 % in
2017. In 2017, private consumption grew for the
second year running by 2 %. Underpinned by the
continued economic expansion, unemployment fell
to a record low of 3.6 % by the fourth quarter of
2017, despite the growing labour force.
Employment growth continued, with the
employment rate reaching 79.1 % in the third
quarter of 2017, as both demand for labour and the
labour supply increased. Despite record low
unemployment and high job vacancy rates, wage
growth remains moderate. The positive output gap
and high capacity utilisation are expected to spur
investment. Inflation rose from 0.4 % in 2016 to an
average of 1.7 % in 2017 on the back of rising
energy prices.
The budget balance continues to improve, while
government debt remains on a downward path.
In 2016, the government surplus reached 0.8 % of
(1) This report assesses Germany’s economy in the light of the
European Commission’s Annual Growth Survey published
on 22 November 2017. In the survey, the Commission calls
on EU Member States to implement reforms to make the
European economy more productive, resilient and
inclusive. In so doing, Member States should focus their
efforts on the three elements of the virtuous triangle of
economic policy - boosting investment, pursuing structural
reforms and ensuring responsible fiscal policies. At the
same time, the Commission published the Alert
Mechanism Report (AMR) that initiated the seventh round
of the macroeconomic imbalance procedure. The AMR
found that Germany warranted an in-depth review, which is
presented in this report.
GDP, higher than in 2015, rising further to a
record high of 1.2 % of GDP in 2017, partly due to
lower interest payments on public debt. The budget
is expected to remain in surplus in headline and
structural terms in 2018 and 2019 as well. The
gross debt-to-GDP ratio is set to fall further from
68.1 % in 2016 to below the 60 % Maastricht
threshold over the next couple of years, possibly
by 2019.
Given its economic importance and strong
integration in EU value chains, Germany is a
source of potentially significant spillovers to
other EU countries. A further rise in domestic
demand, including through higher public
investment in R&D and education, would increase
Germany’s actual and potential growth. It would
also stimulate demand and GDP growth in other
EU countries, including those that need to bring
debt down.
Germany has made limited progress in
addressing the 2017 country-specific
recommendations. Limited progress has been
made towards achieving a sustainable upward
trend in public investment, including public
spending on education, research and innovation.
Some progress has been made in addressing
capacity and planning constraints on infrastructure
investment. There has been limited progress
towards stimulating competition in the business
services and regulated professions, reducing
disincentives to work for second earners and
helping them to move into standard employment,
promoting higher real wage growth, and reducing
the high tax wedge for low-wage earners. No
progress has been achieved in making the tax
system more efficient and conducive to
investment.
Regarding progress in reaching the national targets
under the Europe 2020 strategy, Germany is
performing well on the employment rate, early
school leaving and poverty, improving tertiary
education attainment, investment in research and
development (R&D), and increasing the share of
renewable energy. However, it is unlikely to reach
its national indicative energy efficiency and
climate targets by 2020.
Germany performs relatively well on the
indicators of the Social Scoreboard supporting
the European Pillar of Social Rights. It has very
EXECUTIVE SUMMARY

Executive summary
2
low unemployment but a large gender employment
gap. Strong social dialogue and a relatively
advanced welfare model underpin Germany's
competitive economy.
The main findings of the in-depth review set out in
this report, and the related policy challenges, are as
follows:
The current account surplus is expected to
edge down further in the future, but to
remain high. Strong domestic demand is
expected to keep import growth above export
growth, further easing the current account
surplus. The domestic saving-investment
imbalance, which has been growing since
2008, may have reached a turning point in
2016. However, the factors keeping investment
low relative to savings remain in place.
Demographic change and rising income
inequality up to 2014 partly explain the rise
and persistence of the current account
surplus. Rising income inequality, linked to
demographic and labour market changes, may
have constrained private consumption and
increased the trade balance. In addition,
population ageing and concerns about the
adequacy of future pension levels and old-age
poverty could explain a rise in domestic
savings. According to economic theory and
model estimates, the demographic transition is
currently pushing up the current account
surplus by a substantial amount, but should
lower savings in the long run.
Private investment has picked up, but
business investment remains subdued as a
proportion of GDP, suggesting that obstacles
to investment persist. Housing seems to
account for most of the increase in private
investment, while investment in non-residential
construction is slow to pick up. Though
investment in machinery and equipment has
increased to pre-crisis levels, as a share of GDP
it remains subdued. On average, investment in
intangible assets, such as R&D, has grown in
importance. However, it is largely concentrated
in medium-high tech sectors and in larger
firms, while small and medium-sized
enterprises and the services sector in general
are tending to under-invest. This explains large
productivity gaps between manufacturing and
services, which are likely to dampen potential
growth. Despite favourable financing
conditions, non-financial corporations remain
net lenders. Barriers to investment include
demographic trends resulting in shortages of
skilled labour, taxation and administrative
burden, regulatory restrictiveness in the
services sectors and the shortfall in very-high-
capacity broadband.
While public investment increased recently,
the public investment gap remains large,
particularly as regards investment in
infrastructure and education. Real public
investment growth turned positive in 2015,
after showing negative growth rates in the
years before. This improvement reflects
government efforts to boost investment. The
accumulated investment backlog at municipal
level fell to some extent in 2016, but remains
large at an estimated 4 % of GDP. The biggest
shortfalls are in education, where the national
spending target has not been met, and in
infrastructure. While the Federal Government
and the Länder kept their construction
investment stable, such investment by
municipalities fell steadily, with negative net
investment also in 2017. Investment in public
infrastructure is still held back by capacity and
planning constraints at municipal level.
Measures to overcome these have yet to show
results. In addition, there is scope for
enhancing digital public services and
improving public procurement.
Germany is lagging behind on very-high-
capacity broadband deployment, and the
digital divide between urban and rural areas
remains a particular challenge. Only a
comparatively small proportion of German
territory is covered by fibre-based access
networks. Instead, upgrading existing copper
cable networks continues to be the dominating
incumbent's preferred technological solution.
However, many services rely on very high
connectivity. Lack of such connectivity holds
back investment, especially by small and
medium-sized businesses, many of which are
located in semi-rural and rural areas.
Executive summary
3
Germany's tax and social security systems
are not particularly progressive or
supportive of employment and private
investment. There is a relatively strong
emphasis on more distortive direct taxes,
notably on labour income, while revenues from
consumption and environmental taxes are
lower. Household income and consumption are
restrained by the high tax wedge on labour,
especially for low earners. The statutory
corporate tax rate is among the EU's highest.
Taxes on inheritance and gifts allow large-scale
transfer of wealth from one generation to the
next and preserve the high wealth inequality.
Healthcare efficiency could be improved by
better integrating primary, ambulatory
specialist and in-patient care and making better
use of eHealth.
The banking sector is not very profitable,
but the equity and leverage situation
remains acceptable. Nationally aggregated
profitability seems low, and ongoing
consolidation is improving efficiency relatively
slowly. Still, capitalisation ratios are
satisfactory, and the non-performing loans'
ratio is low, in the context of a relatively small
loan stock, particularly for non-financial
corporations. While the housing market
continues to be buoyant, overall house price
developments are not causing macro or
financial stability risks. The venture capital
market remains less developed than that of
other international innovation leaders.
Wage growth remains moderate, despite
record low unemployment and high job
vacancy rates. The German labour market is
performing well on aggregate, with strong
employment growth and low unemployment.
However, the prevalence of part-time work
especially among women, and a large low-
wage sector present structural challenges.
Moderate recent wage growth is partly
attributable to slow productivity increases in
services, weak inflation expectations, low
collective bargaining coverage in some sectors,
and a reduction in structural unemployment.
Despite growing skilled labour force
shortages, the labour market potential of
certain groups remains underused.
Disincentives to work persist, particularly for
second earners and the low-waged; they
include the substantial tax wedge, tax rules, and
the lock-in effects of the mini-job earning
threshold. Long-term unemployment, though
falling, remains sizable. An ageing population
poses further challenges to the labour market,
social policy and education in the medium to
long term. Improvements in family and
education policies, adult learning and in the
integration of people with a migrant
background into education and employment
could reduce inactivity and in-work poverty,
improve social cohesion and potential growth
alike.
Germany has a solid social protection
system overall, but there are concerns about
the future. In 2015, the rise in the risk of
poverty and inequality has halted and the
income position of low income households
improved. Nevertheless, future deterioration of
pension adequacy in the statutory first pillar is
expected to increase the risk of poverty in old
age, especially for low-wage earners or people
with atypical work and interrupted employment
history. The gender pension gap is one of the
highest in the EU. Social outcomes for
migrants and their children remain a concern.
Other key economic issues analysed in this report
which highlight particular challenges facing
Germany’s economy are as follows:
Germany's electricity networks are adapting
to renewables production at a slow rate, and
significant investment in transmission and
distribution grids is still lacking. Substantial
delays in carrying out many projects have
incurred considerable costs to German and
European electricity networks and electricity
markets. The lack of north-south internal lines
strains the electricity trade with Germany's
neighbours, as domestic congestion tends to be
pushed to the borders. Moreover, there is scope
for higher energy efficiency in transport.
Progress on emissions reduction has been
slow. Germany is expected to miss its Europe
2020 Effort Sharing Decision target for
greenhouse gas emissions. The transport sector
has been particularly slow to cut emissions of
both greenhouse gases and local air pollutants.

4
GDP growth
The German economy continued to grow
strongly in 2017. Germany’s real GDP growth
rate was a solid 2.2 % driven by private
consumption and investment. Export growth
picked up amid a strengthening euro area recovery
while the strong domestic demand caused imports
to accelerate. On balance, foreign trade had a small
positive contribution to growth.
Economic sentiment continues to improve
across sectors, suggesting continued expansion
in the coming quarters. Survey data show
expectations of improving orders, higher output
and greater demand. Capacity utilisation has
continued to increase, which bodes well for
investment. The strong labour market, favourable
world trade developments the expansion in the
euro area should help to sustain the enduring
upswing. Overall, real GDP growth is expected to
strengthen to 2.3% in 2018 and remain above 2%
in 2019 (see Graph 1.1).
Graph 1.1: Demand components of GDP growth
(1)Note: GDP growth and contributions to annual growth
Source: European Commission
Potential growth is benefiting from the
sustained rise in labour supply and total factor
productivity while capital accumulation is
lagging behind. Potential GDP growth has
strengthened in recent years reaching around 2 %
in 2016 (see Graph 4.5.3). It was driven by
expanding labour supply on the back of improving
participation and recent high net migration. The
number of foreign nationals in the labour force
increased from 3.5 million in 2011 to 4.8 million
in 2016. In addition, total factor productivity
growth has been strong, consistently exceeding the
euro area average (see ‘Labour market’ below and
Sections 4.3 and 4.5). Capital accumulation, on the
other hand, has made a relatively small
contribution to potential growth. In the medium to
long term, labour input is unlikely to grow as
strongly along the extensive margin. Therefore, to
sustain potential growth, it will be important to
enhance capital accumulation by stepping up
productive investment.
Investment
The positive demand outlook and high capacity
utilisation are expected to boost investment.
Private investment in equipment has been
recovering since the soft patch of 2016; it has
grown strongly last year, returning to the pre-crisis
levels. Further increases are likely amid favourable
demand prospects, not least from the euro area and
the rest of the EU. Consistently rising capacity
utilisation should also boost the efforts to renew
and expand the capital stock. Housing investment
grew strongly in the first two quarters of 2017 and
is expected to continue growing, though more
slowly. This booming sector is sustained by ample
order book backlogs and a steady flow of building
permits. Non-residential construction has
continued to stagnate to some extent, casting doubt
on firms' long-term expansion strategies. Public
investment in 2017 increased by around 5.1 %
nominally and 2.9 % in real terms posting robust
growth for a third year in a row (see Section 4.5).
Labour market
Employment growth continued, spurred by
increased labour demand and supply.
Employment grew by 1.3 % in 2016 and 1.5 % in
2017, and by the third quarter of 2017 the
employment rate climbed to 79.1% for those aged
20-64. This brought the unemployment rate for the
age group 15-74 down further to a new post-
unification low of 3.8 % in 2017. Youth
unemployment at 6.7% in 2017 was one of the
lowest in the EU. Despite population ageing, the
labour supply increased mainly driven by
increasing labour market participation of women,
older workers and incoming workers from other
EU countries.
-6
-4
-2
0
2
4
6
10 11 12 13 14 15 16 17 18 19
Inventories Gov. consumption Priv. consumption
Investment Net exports Real GDP (y-o-y%)
forecast
pps.
1. ECONOMIC SITUATION AND OUTLOOK
1. Economic situation and outlook
5
Although the labour market tightens and the
output gap closes, wages continue to grow at a
moderate pace. Although nominal compensation
per employee increased by 2.4 % in 2017, slightly
above their growth rate of 2.2 % in 2016, real
compensation growth decelerated from 1.8 % to
0.7 %. Several factors have kept wage increases
moderate so far. These include increased labour
supply; relatively limited collective bargaining
coverage in some sectors; and a stronger role of
non-wage components in collective bargaining
(see Section 4.3).
The large proportion of part time work,
particularly among women, prevents the full
use of workers’ labour market potential.
Despite high employment rates for women (74.5 %
in 2016), the equivalent in full-time employment is
only 58.1 % as part-time employment remains
among the highest in the EU. Women with a
migrant background and women with caring
responsibilities are more often in part-time work.
The current arrangement of joint taxation of
income for married couples (Ehegattensplitting),
non-contributory health insurance coverage for
non-working spouses, and the high marginal tax
rates just above the earnings threshold of a mini
job, create disincentives to work more hours. This
lower labour market attachment is combined with
a large gender pay gap (22.0 % compared to an
EU-average of 16.3 % in 2015).
In addition, the labour market potential of
people with a migrant background is not being
fully used. In the third quarter of 2017, the
employment rate of non-EU nationals (aged 20-64)
was 54.6 %, just slightly below the EU average for
non-EU nationals (58.0 %) but 27.2 pps. lower
than the rate for German nationals. Women with a
non-EU nationality had an employment rate of
45.4 % 32.9 pps. lower than for women of German
nationality.
Social developments
Income inequality has begun to decline (see
Annex C). This reverses a decade-long trend of
increasing inequality of disposable income
distribution, which peaked in 2014 at close to the
EU average. The latest figures show a modest
reduction in the S80/S20 ratio, which measures the
income of the richest 20 % of households in
relation to that of the poorest 20 %. For Germany,
the share fell to 4.6 in 2016, owing to an
improvement in the incomes of poorer households.
This trend is believed to have continued in 2017.
The improvement reflects rising wages, which
have also reduced the amount of in-work poverty.
The share of income of the richest 20 % has fallen
slightly. This may reflect a slowing of the wage
premium on skills, as the incomes of the low and
medium-skilled rose faster in 2016 than those of
the highly skilled.
However, wealth inequality in Germany is high
in international comparison. In 2014, the Gini
coefficient for net wealth in Germany at 0.76 was
the second highest in the euro area (whose Gini
coefficient, calculated on the basis of data from the
second wave of the ECB’s Household Finance and
Consumption Survey, was 0.69). (2) For Germany,
the P90/50 ratio was 7.7, meaning that a person
who fell just within the richest 10 % of the
population had roughly 8 times the wealth of a
person in the middle of the wealth distribution.
Like wealth as a whole, financial and real assets
were distributed unevenly.
Inequality of opportunity also remains a
concern. While overall the risk of poverty has
begun to decline modestly (see Section 4.3 on
social policy), the poverty risk faced by the
children of low-skilled parents has continued to
rise reaching 64.7 % in 2016. PISA results also
showed a strong link between socioeconomic
status and educational performance, partly
explaining the underperformance of children with
a migrant background. (see Section 4.3).
Inflation
Inflation is expected to remain moderate. HICP
picked up from 0.4 % in 2016 to an average of
1.7 % in 2017 on the back of rebounding energy
prices and related second round effects (see
Graph 1.2). Core inflation (excluding energy and
unprocessed food) has increased from just above
1 % over 2015-16, to 1.5 % in 2017 and is
expected to rise to 1.7 % over this year and next, in
the context of strong demand and higher wage
growth. Overall headline inflation dynamics are
(2) The high wealth Gini is partly explained by the fact that
pension entitlements are not included. Germany’s rather
well-developed pension system reduces the need to
accumulate private wealth (see Frick and Grabka, 2010).

1. Economic situation and outlook
6
projected to be in line with the euro area’s and to
oscillate around 1.6 %. Dampened by the expected
stable energy prices, this moderate inflation should
support household purchasing power.
Graph 1.2: Contributions to headline inflation
Source: European Commission
Sectoral balances
The widening of domestic saving-investment
balance, reflected in the increasing current
account surplus, may have reached a turning
point in 2016. Private borrowing increased further
in 2016 slightly above GDP growth and the rate of
net asset accumulation by the private sector
stabilised. Nominal corporate investment increased
in 2016, with a further significant rise in 2017,
while corporate savings are set to fall slightly as a
share of GDP. As a result, corporations, whose
indebtedness is among the lowest in the euro area,
contributed to the slight reduction in the savings
surplus. The household savings rate increased to
17.1 % in 2016, propped up by low consumer price
inflation, but is forecast to have declined to 16.6 %
in 2017, as consumer demand remained robust and
inflation rose. Still, the household savings rate will
likely remain the highest in the euro area (which
averages 12.3 %). After rebounding in 2016,
household investment is expected to have grown
strongly in 2017, lowering the net lending balance
further. A further fall in public sector indebtedness
is expected, thanks to the favourable
macroeconomic outlook (see ‘Public finances’
below).
Graph 1.3: Sectoral net lending
Source: European Commission
However, the consumption share of GDP
remains relatively low, as the high household
saving rate is being sustained. The GDP share of
labour income has increased since 2011, but so
have the shares of income tax and social security
deductions. The share of property income has been
falling as a result of less generous dividend pay-
outs by corporations and lower interest income.
The saving rate has nevertheless remained stable,
while consumption has declined in parallel with
household disposable income as a proportion of
GDP. Nonetheless, real consumption has actually
increased as purchasing power has been boosted
by low inflation. Even so, the consumption share
of GDP (53 % in 2016 and 2017) has remained
low from an historical perspective.
Graph 1.4: Determinants of household disposable income
Note: Cumulated change in pps of GDP since 2000
Source: European Commission
-1.5
-1.0
-0.5
0.0
0.5
1.0
1.5
2.0
2.5
3.0
10Q1 11Q1 12Q1 13Q1 14Q1 15Q1 16Q1 17Q1
y-o-y % change
ServicesProcessed food incl.alcohol, tobaccoUnprocessed foodNon-energy industrial goodsEnergyHICP all items
-8
-6
-4
-2
0
2
4
6
8
10
12
00 01 02 03 04 05 06 07 08 09 10 11 12 13 14 15 16 17 18 19
% of GDP
Households
General government
Financial corporations
Non-financial corporations
Surplus savings/current account balance
Forecast
-6
-5
-4
-3
-2
-1
0
1
2
3
01 02 03 04 05 06 07 08 09 10 11 12 13 14 15 16
% of GDP
Wages and salaries Net property income
Taxes and soc. contributions Disp. income
Consumption
1. Economic situation and outlook
7
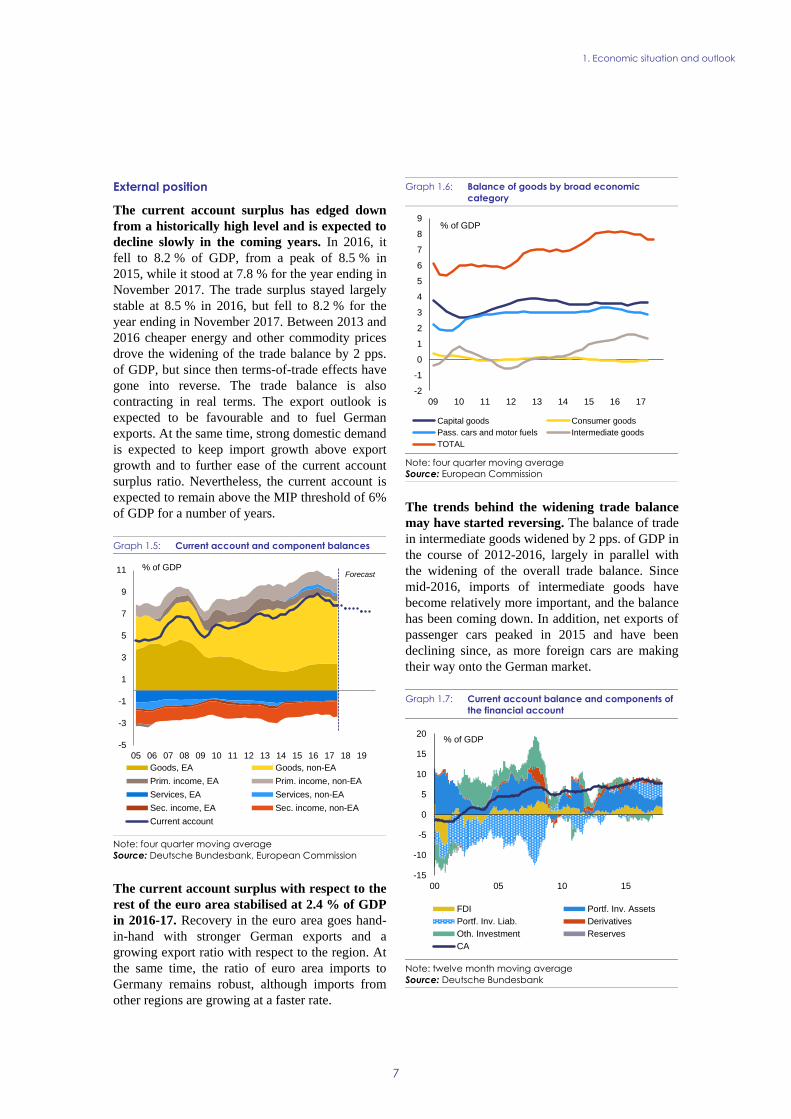
External position
The current account surplus has edged down
from a historically high level and is expected to
decline slowly in the coming years. In 2016, it
fell to 8.2 % of GDP, from a peak of 8.5 % in
2015, while it stood at 7.8 % for the year ending in
November 2017. The trade surplus stayed largely
stable at 8.5 % in 2016, but fell to 8.2 % for the
year ending in November 2017. Between 2013 and
2016 cheaper energy and other commodity prices
drove the widening of the trade balance by 2 pps.
of GDP, but since then terms-of-trade effects have
gone into reverse. The trade balance is also
contracting in real terms. The export outlook is
expected to be favourable and to fuel German
exports. At the same time, strong domestic demand
is expected to keep import growth above export
growth and to further ease of the current account
surplus ratio. Nevertheless, the current account is
expected to remain above the MIP threshold of 6%
of GDP for a number of years.
Graph 1.5: Current account and component balances
Note: four quarter moving average
Source: Deutsche Bundesbank, European Commission
The current account surplus with respect to the
rest of the euro area stabilised at 2.4 % of GDP
in 2016-17. Recovery in the euro area goes hand-
in-hand with stronger German exports and a
growing export ratio with respect to the region. At
the same time, the ratio of euro area imports to
Germany remains robust, although imports from
other regions are growing at a faster rate.
Graph 1.6: Balance of goods by broad economic
category
Note: four quarter moving average
Source: European Commission
The trends behind the widening trade balance
may have started reversing. The balance of trade
in intermediate goods widened by 2 pps. of GDP in
the course of 2012-2016, largely in parallel with
the widening of the overall trade balance. Since
mid-2016, imports of intermediate goods have
become relatively more important, and the balance
has been coming down. In addition, net exports of
passenger cars peaked in 2015 and have been
declining since, as more foreign cars are making
their way onto the German market.
Graph 1.7: Current account balance and components of
the financial account
Note: twelve month moving average
Source: Deutsche Bundesbank
-5
-3
-1
1
3
5
7
9
11
05 06 07 08 09 10 11 12 13 14 15 16 17 18 19
% of GDP
Goods, EA Goods, non-EA
Prim. income, EA Prim. income, non-EA
Services, EA Services, non-EA
Sec. income, EA Sec. income, non-EA
Current account
Forecast
-2
-1
0
1
2
3
4
5
6
7
8
9
09 10 11 12 13 14 15 16 17
% of GDP
Capital goods Consumer goods
Pass. cars and motor fuels Intermediate goods
TOTAL
-15
-10
-5
0
5
10
15
20
00 05 10 15
% of GDP
FDI Portf. Inv. Assets
Portf. Inv. Liab. Derivatives
Oth. Investment Reserves
CA
1. Economic situation and outlook
8
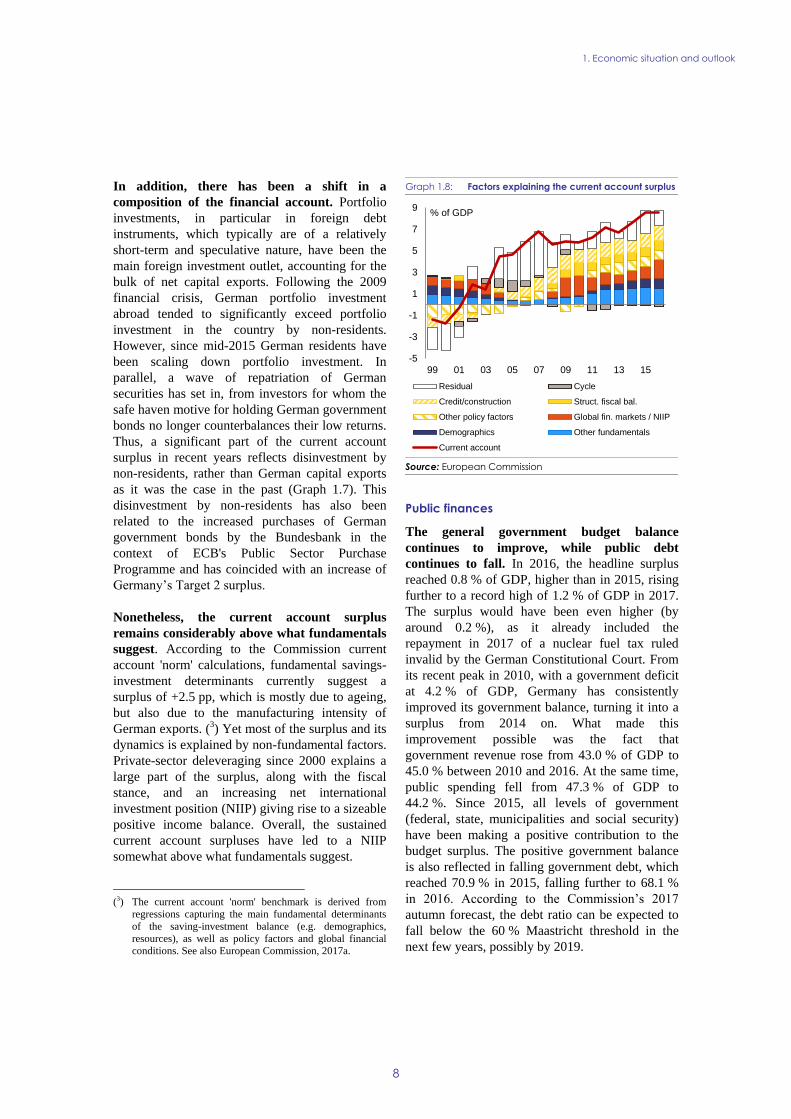
In addition, there has been a shift in a
composition of the financial account. Portfolio
investments, in particular in foreign debt
instruments, which typically are of a relatively
short-term and speculative nature, have been the
main foreign investment outlet, accounting for the
bulk of net capital exports. Following the 2009
financial crisis, German portfolio investment
abroad tended to significantly exceed portfolio
investment in the country by non-residents.
However, since mid-2015 German residents have
been scaling down portfolio investment. In
parallel, a wave of repatriation of German
securities has set in, from investors for whom the
safe haven motive for holding German government
bonds no longer counterbalances their low returns.
Thus, a significant part of the current account
surplus in recent years reflects disinvestment by
non-residents, rather than German capital exports
as it was the case in the past (Graph 1.7). This
disinvestment by non-residents has also been
related to the increased purchases of German
government bonds by the Bundesbank in the
context of ECB's Public Sector Purchase
Programme and has coincided with an increase of
Germany’s Target 2 surplus.
Nonetheless, the current account surplus
remains considerably above what fundamentals
suggest. According to the Commission current
account 'norm' calculations, fundamental savings-
investment determinants currently suggest a
surplus of +2.5 pp, which is mostly due to ageing,
but also due to the manufacturing intensity of
German exports. (3) Yet most of the surplus and its
dynamics is explained by non-fundamental factors.
Private-sector deleveraging since 2000 explains a
large part of the surplus, along with the fiscal
stance, and an increasing net international
investment position (NIIP) giving rise to a sizeable
positive income balance. Overall, the sustained
current account surpluses have led to a NIIP
somewhat above what fundamentals suggest.
(3) The current account 'norm' benchmark is derived from
regressions capturing the main fundamental determinants
of the saving-investment balance (e.g. demographics,
resources), as well as policy factors and global financial
conditions. See also European Commission, 2017a.
Graph 1.8: Factors explaining the current account surplus
Source: European Commission
Public finances
The general government budget balance
continues to improve, while public debt
continues to fall. In 2016, the headline surplus
reached 0.8 % of GDP, higher than in 2015, rising
further to a record high of 1.2 % of GDP in 2017.
The surplus would have been even higher (by
around 0.2 %), as it already included the
repayment in 2017 of a nuclear fuel tax ruled
invalid by the German Constitutional Court. From
its recent peak in 2010, with a government deficit
at 4.2 % of GDP, Germany has consistently
improved its government balance, turning it into a
surplus from 2014 on. What made this
improvement possible was the fact that
government revenue rose from 43.0 % of GDP to
45.0 % between 2010 and 2016. At the same time,
public spending fell from 47.3 % of GDP to
44.2 %. Since 2015, all levels of government
(federal, state, municipalities and social security)
have been making a positive contribution to the
budget surplus. The positive government balance
is also reflected in falling government debt, which
reached 70.9 % in 2015, falling further to 68.1 %
in 2016. According to the Commission’s 2017
autumn forecast, the debt ratio can be expected to
fall below the 60 % Maastricht threshold in the
next few years, possibly by 2019.
-5
-3
-1
1
3
5
7
9
99 01 03 05 07 09 11 13 15
% of GDP
Residual Cycle
Credit/construction Struct. fiscal bal.
Other policy factors Global fin. markets / NIIP
Demographics Other fundamentals
Current account
1. Economic situation and outlook
9
Graph 1.9: General government budget balance and
gross debt
Source: European Commission
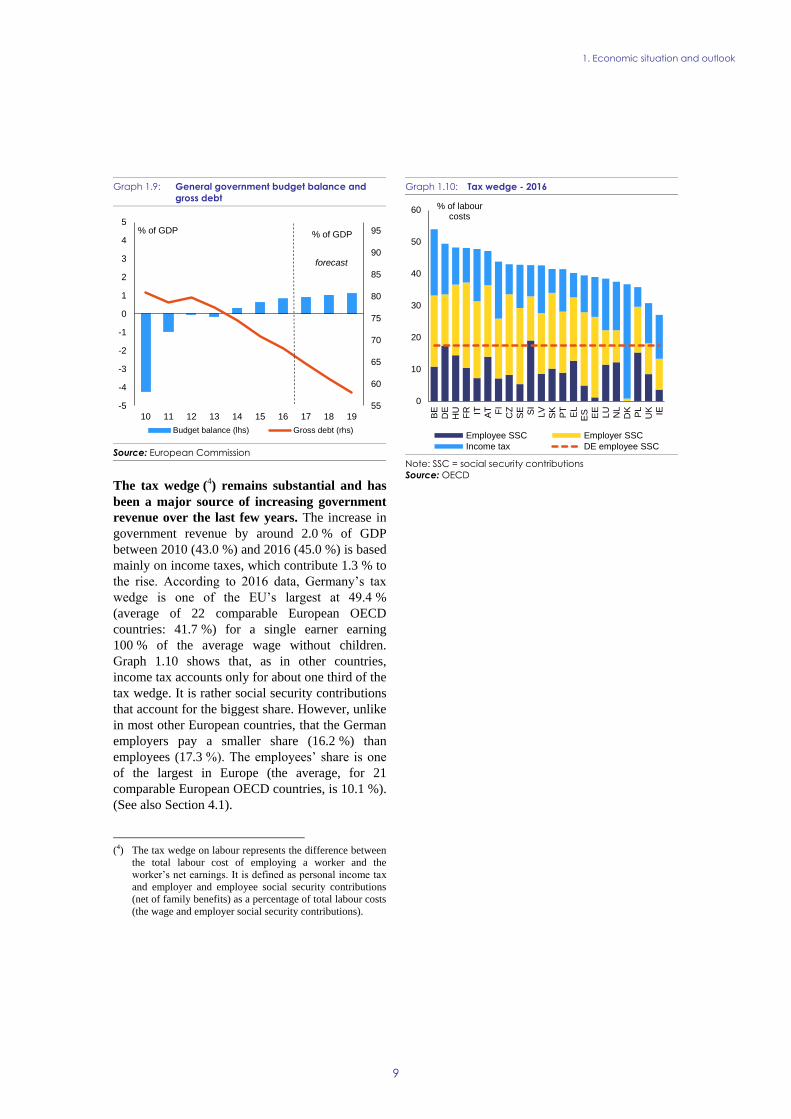
The tax wedge (4) remains substantial and has
been a major source of increasing government
revenue over the last few years. The increase in
government revenue by around 2.0 % of GDP
between 2010 (43.0 %) and 2016 (45.0 %) is based
mainly on income taxes, which contribute 1.3 % to
the rise. According to 2016 data, Germany’s tax
wedge is one of the EU’s largest at 49.4 %
(average of 22 comparable European OECD
countries: 41.7 %) for a single earner earning
100 % of the average wage without children.
Graph 1.10 shows that, as in other countries,
income tax accounts only for about one third of the
tax wedge. It is rather social security contributions
that account for the biggest share. However, unlike
in most other European countries, that the German
employers pay a smaller share (16.2 %) than
employees (17.3 %). The employees’ share is one
of the largest in Europe (the average, for 21
comparable European OECD countries, is 10.1 %).
(See also Section 4.1).
(4) The tax wedge on labour represents the difference between
the total labour cost of employing a worker and the
worker’s net earnings. It is defined as personal income tax
and employer and employee social security contributions
(net of family benefits) as a percentage of total labour costs
(the wage and employer social security contributions).
Graph 1.10: Tax wedge - 2016
Note: SSC = social security contributions
Source: OECD
55
60
65
70
75
80
85
90
95
-5
-4
-3
-2
-1
0
1
2
3
4
5
10 11 12 13 14 15 16 17 18 19
% of GDP
Budget balance (lhs) Gross debt (rhs)
forecast
% of GDP
0
10
20
30
40
50
60
BE
DE
HU
FR IT AT FI
CZ
SE SI
LV
SK
PT
EL
ES EE
LU
NL
DK
PL
UK IE
% of labour costs
Employee SSC Employer SSC
Income tax DE employee SSC

1. Economic situation and outlook
10
Table 1.1: Key economic and financial indicators – Germany
(1) (1) NIIP excluding direct investment and portfolio equity shares. (2) Domestic banking groups and stand-alone banks, EU
and non-EU foreign-controlled subsidiaries and EU and non-EU foreign-controlled branches.
Source: Eurostat and ECB as of 30 Jan 2018, where available; European Commission for forecast figures (Winter forecast 2018
for real GDP and HICP, Autumn forecast 2017 otherwise)
2004-07 2008-12 2013-14 2015 2016 2017 2018 2019
Real GDP (y-o-y) 2.2 0.7 1.2 1.7 1.9 2.2 2.3 2.1
Potential growth (y-o-y) 1.3 0.9 1.4 1.7 1.9 1.9 1.9 1.9
Private consumption (y-o-y) 0.7 0.8 0.8 1.7 2.1 . . .
Public consumption (y-o-y) 0.5 1.9 1.5 2.9 3.7 . . .
Gross fixed capital formation (y-o-y) 3.1 0.5 1.2 1.5 3.1 . . .
Exports of goods and services (y-o-y) 9.9 2.2 3.2 5.2 2.6 . . .
Imports of goods and services (y-o-y) 7.7 2.2 3.3 5.6 3.9 . . .
Contribution to GDP growth:
Domestic demand (y-o-y) 1.1 0.9 1.0 1.8 2.4 . . .
Inventories (y-o-y) 0.0 -0.3 0.1 -0.3 -0.2 . . .
Net exports (y-o-y) 1.2 0.2 0.1 0.2 -0.3 . . .
Contribution to potential GDP growth:
Total Labour (hours) (y-o-y) 0.1 0.0 0.5 0.6 0.8 0.7 0.6 0.4
Capital accumulation (y-o-y) 0.3 0.3 0.2 0.3 0.3 0.4 0.4 0.5
Total factor productivity (y-o-y) 0.9 0.7 0.7 0.8 0.8 0.9 0.9 0.9
Output gap -0.5 -0.9 -0.5 -0.3 -0.2 0.0 0.2 0.3
Unemployment rate 10.1 6.6 5.1 4.6 4.1 3.7 3.5 3.2
GDP deflator (y-o-y) 0.9 1.2 1.9 2.0 1.3 1.5 1.9 1.6
Harmonised index of consumer prices (HICP, y-o-y) 1.9 1.7 1.2 0.1 0.4 1.7 1.6 1.6
Nominal compensation per employee (y-o-y) 0.6 2.1 2.3 2.7 2.2 2.5 2.7 3.0
Labour productivity (real, person employed, y-o-y) 1.5 -0.2 0.5 0.8 0.6 0.8 . .
Unit labour costs (ULC, whole economy, y-o-y) -0.9 2.2 1.8 1.8 1.6 1.8 1.6 1.9
Real unit labour costs (y-o-y) -1.8 1.0 -0.1 -0.2 0.2 0.2 -0.2 0.2
Real effective exchange rate (ULC, y-o-y) -2.0 -0.4 2.9 -2.6 1.3 2.3 2.4 0.1
Real effective exchange rate (HICP, y-o-y) 0.0 -1.6 1.5 -4.3 1.6 0.6 2.0 .
Savings rate of households (net saving as percentage of net
disposable income) 10.1 9.9 9.2 9.6 9.7 . . .
Private credit flow, consolidated (% of GDP) 0.3 0.5 1.3 3.0 3.8 . . .
Private sector debt, consolidated (% of GDP) 115.2 106.7 101.1 98.7 99.3 . . .
of which household debt, consolidated (% of GDP) 65.6 58.7 54.7 53.3 53.1 . . .
of which non-financial corporate debt, consolidated (% of GDP) 49.6 48.1 46.4 45.4 46.2 . . .
Gross non-performing debt (% of total debt instruments and total
loans and advances) (2) . 2.1 2.1 2.0 1.8 . . .
Corporations, net lending (+) or net borrowing (-) (% of GDP) 1.7 2.4 2.2 2.7 2.6 2.4 2.0 1.7
Corporations, gross operating surplus (% of GDP) 26.9 25.8 24.8 25.2 25.0 24.8 25.0 24.9
Households, net lending (+) or net borrowing (-) (% of GDP) 5.8 5.4 4.8 5.2 5.1 4.6 4.4 4.4
Deflated house price index (y-o-y) -2.0 0.7 2.1 4.1 5.4 . . .
Residential investment (% of GDP) 5.1 5.3 5.9 5.7 5.9 6.0 . .
Current account balance (% of GDP), balance of payments 5.4 6.0 7.1 8.5 8.2 7.8 7.5 7.2
Trade balance (% of GDP), balance of payments 5.5 5.4 6.5 8.0 7.9 . . .
Terms of trade of goods and services (y-o-y) -0.8 -0.5 1.2 2.6 1.5 -0.9 0.5 -0.2
Capital account balance (% of GDP) -0.1 0.0 0.0 0.0 0.0 . . .
Net international investment position (% of GDP) 14.1 24.1 37.7 48.6 54.4 . . .
Net marketable external debt (% of GDP) (1) 9.6 18.9 30.5 36.9 41.6 . . .
Gross marketable external debt (% of GDP) (1) 125.3 163.4 157.4 150.6 147.9 . . .
Export performance vs. advanced countries (% change over 5 years) 14.8 0.0 -4.0 -1.1 -0.3 . . .
Export market share, goods and services (y-o-y) -0.3 -3.5 2.0 0.0 3.3 . . .
Net FDI flows (% of GDP) 1.7 1.2 1.6 1.8 0.7 . . .
General government balance (% of GDP) -2.2 -1.7 0.1 0.6 0.8 0.9 1.0 1.1
Structural budget balance (% of GDP) . . 0.5 0.8 0.9 0.9 0.9 1.0
General government gross debt (% of GDP) 65.5 75.4 76.0 70.9 68.1 64.7 61.1 57.9
Tax-to-GDP ratio (%) 38.7 39.0 39.6 39.8 40.4 40.6 40.5 40.6
Tax rate for a single person earning the average wage (%) 42.3 40.4 39.5 39.6 39.7 . . .
Tax rate for a single person earning 50% of the average wage (%) 31.8 31.2 30.8 30.9 31.0 . . .
forecast

11
Progress with implementing the
recommendations addressed to Germany in
2017 has to be seen in a longer term perspective
since the introduction of the European Semester
process in 2011. (5) Looking at the multi-annual
assessment of the implementation of the CSRs
since these were first adopted, 38 % of all the
CSRs addressed to Germany have recorded at least
'some progress'. 62 % of CSRs recorded 'limited'
or 'no progress' (see Graph 2.1). Overall, for every
Semester cycle, multi-annual implementation in
Germany has remained relatively weak, remaining
below the average of the progress made by other
Member States. Moreover, the gap in reform
implementation between Germany and other
countries has widened over time, despite the fact
that since 2014 Germany has been subject to in-
depth monitoring under the Macroeconomic
Imbalances Procedure (MIP).
Graph 2.1: Overall multiannual implementation of 2011-
2017 CSRs to date
* The overall assessment of the country-specific
recommendations related to fiscal policy exclude
compliance with the Stability and Growth Pact.
** 2011-2012: Different CSR assessment categories.
***The multiannual CSR assessment looks at the
implementation since the CSRs were first adopted until the
February 2018 Country report.
Source: European Commission
A sound fiscal position masks missed fiscal and
structural reform opportunities. Germany has
managed to preserve a sound fiscal position since
2011, ensuring compliance with its medium-term
budgetary objective and keeping debt on a
downward path. It has also taken some first steps
to improve fiscal governance, which involves
matching fiscal capacity and responsibilities better
at federal and Länder level. Reforming efforts to
make the tax system more efficient and modernise
the tax administration have however remained
(5) For the assessment of other reforms implemented in the
past, see in particular section 4.1, 4.2, 4.3, 4.5 and 4.6.
limited in scope, and no measures have yet been
taken to comprehensively review corporate
taxation and the local trade tax (Gewerbesteuer).
While the effects of some recent measures such as
steps to increase funding and planning capacity at
municipal level will be visible later, public
investment has expanded only to a small extent,
despite the good financial situation. This may have
meant missing out on possibilities to improve
potential growth, especially given the low-interest-
rate environment.
The good labour market outcomes result mainly
from earlier reforms and institutional strengths,
rather than recent measures. High employment
growth and low unemployment reflect the strong
cyclical upturn combined with the favourable
impact of past labour market reforms, employment
friendly social dialogue, and a competitive export
industry. Between 2011 and 2016, the tax wedge
for workers earning two-thirds of the average wage
was cut by only 0.3 pps., to 45.3 %. During the
same period, the EU-28 average fell by 0.9 pps. to
36.8 %. While the 2014 pension reform facilitated
earlier retirement, it is not yet clear whether
measures to incentivise later retirement through
greater flexibility will have the intended effect. In
addition, fiscal disincentives for second earners
and people with mini-jobs remained largely
unchanged. Policy inertia contributes to some
lock-in of productive capacity, thus hindering
further increases in productivity and potential
growth. Even if the introduction of the statutory
general minimum wage in 2015 had an impact,
wage increases remained moderate. This also
reflected that, despite some government efforts to
improve bargaining coverage, coverage of
collective agreements stagnated.
Education spending has remained subdued.
Education spending remained well below the EU
average as a share of GDP (2011 4.3 %, 2015:
4.2 %, against an EU average of 4.9 %). While
availability of full-time childcare facilities and all-
day schools improved, the attendance of children
under 3 years of age remained slightly below the
Barcelona objectives. It even fell by 0.2 pps. to
32.7 % in 2016 as demand expanded as a result of
immigration. Despite some measures, the
education system remains marked by
socioeconomic inequalities, and across the Länder
significant performance differences persist.
3%
59%
22%
8%
8%
No Progress
Limited Progress
Some Progress
Substantial Progress
Full Implementation
2. PROGRESS WITH COUNTRY-SPECIFIC RECOMMENDATIONS
2. Progress with country-specific recommendations
12
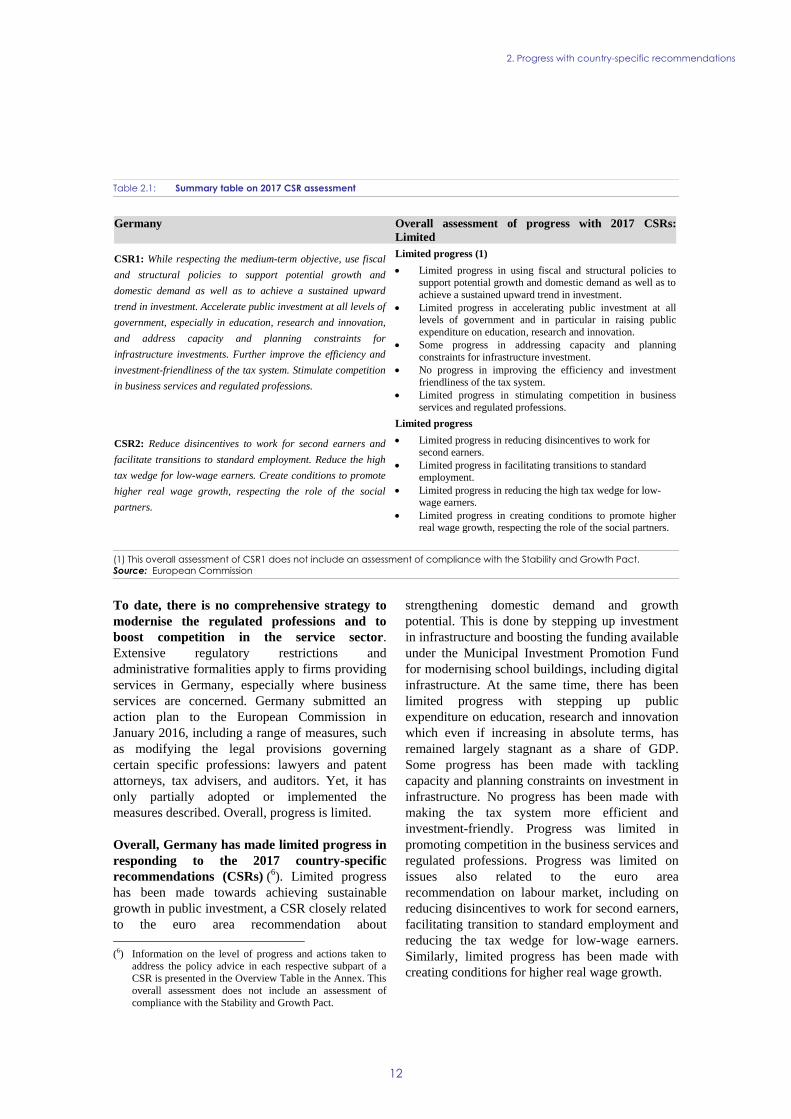
To date, there is no comprehensive strategy to
modernise the regulated professions and to
boost competition in the service sector.
Extensive regulatory restrictions and
administrative formalities apply to firms providing
services in Germany, especially where business
services are concerned. Germany submitted an
action plan to the European Commission in
January 2016, including a range of measures, such
as modifying the legal provisions governing
certain specific professions: lawyers and patent
attorneys, tax advisers, and auditors. Yet, it has
only partially adopted or implemented the
measures described. Overall, progress is limited.
Overall, Germany has made limited progress in
responding to the 2017 country-specific
recommendations (CSRs) (6). Limited progress
has been made towards achieving sustainable
growth in public investment, a CSR closely related
to the euro area recommendation about
(6) Information on the level of progress and actions taken to
address the policy advice in each respective subpart of a
CSR is presented in the Overview Table in the Annex. This
overall assessment does not include an assessment of
compliance with the Stability and Growth Pact.
strengthening domestic demand and growth
potential. This is done by stepping up investment
in infrastructure and boosting the funding available
under the Municipal Investment Promotion Fund
for modernising school buildings, including digital
infrastructure. At the same time, there has been
limited progress with stepping up public
expenditure on education, research and innovation
which even if increasing in absolute terms, has
remained largely stagnant as a share of GDP.
Some progress has been made with tackling
capacity and planning constraints on investment in
infrastructure. No progress has been made with
making the tax system more efficient and
investment-friendly. Progress was limited in
promoting competition in the business services and
regulated professions. Progress was limited on
issues also related to the euro area
recommendation on labour market, including on
reducing disincentives to work for second earners,
facilitating transition to standard employment and
reducing the tax wedge for low-wage earners.
Similarly, limited progress has been made with
creating conditions for higher real wage growth.
Table 2.1: Summary table on 2017 CSR assessment
(1) This overall assessment of CSR1 does not include an assessment of compliance with the Stability and Growth Pact.
Source: European Commission
Germany Overall assessment of progress with 2017 CSRs:
Limited
CSR1: While respecting the medium-term objective, use fiscal
and structural policies to support potential growth and
domestic demand as well as to achieve a sustained upward
trend in investment. Accelerate public investment at all levels of
government, especially in education, research and innovation,
and address capacity and planning constraints for
infrastructure investments. Further improve the efficiency and
investment-friendliness of the tax system. Stimulate competition
in business services and regulated professions.
Limited progress (1)
Limited progress in using fiscal and structural policies to
support potential growth and domestic demand as well as to
achieve a sustained upward trend in investment.
Limited progress in accelerating public investment at all levels of government and in particular in raising public
expenditure on education, research and innovation.
Some progress in addressing capacity and planning
constraints for infrastructure investment.
No progress in improving the efficiency and investment
friendliness of the tax system.
Limited progress in stimulating competition in business
services and regulated professions.
CSR2: Reduce disincentives to work for second earners and
facilitate transitions to standard employment. Reduce the high
tax wedge for low-wage earners. Create conditions to promote
higher real wage growth, respecting the role of the social
partners.
Limited progress
Limited progress in reducing disincentives to work for
second earners.
Limited progress in facilitating transitions to standard employment.
Limited progress in reducing the high tax wedge for low-wage earners.
Limited progress in creating conditions to promote higher real wage growth, respecting the role of the social partners.

2. Progress with country-specific recommendations
13
Box 2.1: Tangible results delivered through EU support to structural change in Germany
Germany is a beneficiary of significant European Structural and Investment Funds (ESI Funds)
support and can receive up to EUR 28 billion until 2020. This represents around 4% of public
investment (1) annually over the period 2014-2018. By 31 December 2017, an estimated EUR 14.9 billion
(53 % of the total) was allocated to projects on the ground. These investments help creating 1 500 new
research jobs in supported public and private research facilities. Another 8 100 researchers benefit from
investments in their institutions. More than 100 interactive innovation partnerships have been launched
boosting the innovation culture in the agricultural and forestry sector in Germany. 1 600 children enjoy
improved childcare facilities or schools in North Rhine-Westphalia. In rural areas, more than 20 million
rural inhabitants benefit from supported investment in basic services and infrastructures.
ESI Funds help address structural policy challenges and implement country-specific
recommendations. Investments in research and development in the private sector are stimulated, among
others, by the enhanced use of financial instruments such as loans, grants or guarantees for public
interventions. The Funds invest in coaching for people with a distance to the labour market which in turn
helps enhance the overall labour market participation with specific measures aimed at improving the job
prospects of older workers.
Various reforms were undertaken already as precondition for ESI Funds support (2). For example, all
German regions developed or updated Smart Specialisation Strategies for research and innovation.
Remarkable in a European context is the strong focus of the strategies on the productive environment and
materials, reflecting the structure of the German economy.
Germany is advancing the take up of the European Fund for Strategic Investments (EFSI). As of
December 2017, overall financing volume of operations approved under the EFSI amounted to EUR 5
billion, which is expected to trigger total private and public investment of EUR 21.9 billion. More
specifically, 53 projects involving Germany have been approved so far under the Infrastructure and
Innovation Window (including 26 multi-country projects), amounting to EUR 4.4 billion in EIB financing
under the EFSI. This is expected to trigger about EUR 17 billion in investments. Under the SME Window,
21 agreements with financial intermediaries have been approved so far. European Investment Fund
financing enabled by the EFSI amounts to EUR 632 million, which is expected to mobilise approximatively
EUR 4.9 billion in total investment. Over 28 800 smaller companies or start-ups will benefit from this
support. RDI ranks first in terms of operations and volume approved, followed by energy, transport and
SMEs.
Funding under Horizon 2020, the Connecting Europe Facility and other directly managed EU funds is
additional to the ESI Funds. By the end of 2017, Germany has signed agreements for EUR 2.1 billion for
projects under the Connecting Europe Facility.
https://cohesiondata.ec.europa.eu/countries/DE
(1) Public investment is defined as gross fixed capital formation + investment grants + national expenditure on agriculture
and fisheries.
(2) Before programmes are adopted, Member States are required to comply with a number of so-called ex-ante
conditionalities, which aim at improving conditions for the majority of public investments areas.
European Structural and Investment Funds
help address challenges to inclusive growth and
convergence. Notably, they contribute by
coaching people so that they can re-enter the
labour market thereby enhancing overall labour
market participation. For example, they offer
specific measures for older workers in order to
improve their job prospects. Investments in R&D
in the private and the public sector are stimulated,
also through the use of financial instruments (see
Box 2.1).
14
The in-depth review for the German economy is
presented in this report. In spring 2017,
Germany was identified as having macroeconomic
imbalances, in particular relating to its large
current account surplus reflecting excess savings
and subdued investment. The 2018 Alert
Mechanism Report (European Commission,
2017d) concluded that a new in-depth review
should be undertaken for Germany to assess
developments relating to identified imbalances.
Analyses relevant for the in-depth review can be
found in the following sections: public finances in
section 4.1; the financial sector in section 4.2; the
labour market and social policy, in the respective
subsections of section 4.3; inequality and
demographics in section 4.4, public and private
investment, the housing market and public
procurement in the respective subsections of
section 4.5. (7).
Imbalances and their gravity
Germany's large and persistent current account
surplus stems from the successful export
performance of its manufacturing sector not
being matched by corresponding domestic
investment and consumption, despite a pick-up
since 2015. Although a surplus on the current
account is consistent with the German economy's
structural characteristics, its current high level and
persistence are not attributable to fundamental
factors alone (see section 1 on current account
'norm' discussion). Rather, it has resulted from the
interaction of various domestic and external
factors. Chief among these are the two negative
private investment shocks, which ensued from the
bursting of the dotcom and financial market
bubbles, and the relative disadvantage of German
debt securities in terms of returns coupled with the
limited flexibility of households' investment
strategies. Also, it cannot be ruled out that
concerns about pension adequacy push up the
aggregate saving rate that would be expected in
view of the strong age cohorts approaching
retirement age (‘baby boomers’). Moreover,
significant positive terms-of-trade effects - in view
(7) An asterisk indicates that the analysis in the section
contributes to the in-depth review under the MIP.
of cheaper imports and despite the depreciation of
the euro and low inflation - have served to amplify
the surplus in nominal terms in 2014-2016. Over
time, these various factors have pushed up net
savings across all sectors of the economy, while at
the same time depressing the consumption and
investment ratios.
Given its size and strong trade and financial
linkages with the rest of the euro area, the
existing economic challenges of the German
economy also have wider implications for the
euro area. Thus, implementing policies that
increase potential growth in Germany can help to
support the ongoing euro area recovery and, in
turn, ease debt reduction needs faced by highly
indebted Member States. Box 3.1 illustrates the
effects on domestic and foreign GDP of an
increase in spending on R&D and education. The
two simulations presented therein follow the spirit
of the euro area recommendation 1(8), in particular
as regards improving growth potential and
supporting the creation of quality jobs.
Evolution, prospects, and policy responses
The current account surplus has been falling
since 2015 but remains above the rate suggested
by fundamental factors and is expected to
remain above the MIP threshold. For the 12
months ending in November 2017, it stood at
7.8 % of GDP, suggesting a further decline
compared to 2015 (8.5 %) and 2016 (8.2 %). This
correction was mainly driven by the trade balance,
which declined to 8.2 % for the 12 months ending
November after hovering at around 8.5 % in 2015
and 2016. In particular, imports have strengthened
in line with domestic demand benefitting all major
trading partner areas, including the euro area. In
addition, contributing to a gradual correction of the
current account surplus, the negative secondary
income balance has widened (from -1.3 % of GDP
in 2016 to -1.6 % for the 12 months ending in
November 2017) as a result of higher private
sector transfers (notably remittances) abroad.
However, net capital exports have remained high
(8) European Commission recommendation for a Council
recommendation on the economic policy of the euro area
(22.11.2017).
3. SUMMARY OF THE MAIN FINDINGS FROM THE
MACROECONOMIC IMBALANCES PROCEDURE IN-DEPTH
REVIEW

3. Summary of the main findings from the MIP in-depth review
15
although their composition has changed. In recent
quarters, they have been driven by recalling
German bonds rather than by acquiring foreign
debt securities. The former has also coincided with
a mounting TARGET 2 balance. Outward foreign
direct investment abroad saw some recovery in
comparison to 2016. All in all, accumulated
current account surpluses have resulted in a large
positive net international investment position,
which reached 55.1% in 2016, somewhat above
what fundamental factors would suggest.
The private saving-investment balance did not
widen further in 2016. Private borrowing rose
further in 2016 slightly above GDP growth, while
the rate of net asset accumulation by the private
sector stabilised. Nominal corporate investment
increased in 2016 and further in 2017, while
corporate savings are projected to have fallen
slightly as a proportion of GDP. This implies that
companies, which are among the least indebted in
the euro area, have helped bring down the savings
surplus. The household savings rate rose to 17.1 %
in 2016, propped up by low consumer price
inflation, but is projected to have fallen to 16.6 %
in 2017, in line with robust consumer and rising
inflation. However, the household savings rate is
likely to remain the highest in the euro area (whose
average is 12.3 %). In 2016, the household
investment growth rebounded and households’ net
lending position weakened marginally. Household
investment is expected to have grown strongly in
2017, lowering the net lending balance further.
Until recently, corporate investment has been
held back, despite the low interest rate
environment. While private investment has
recovered to pre-crisis levels, business investment
has remained largely flat as a share of GDP.
Moreover, in view of the favourable financing
conditions and low interest rate environment, a
more forceful pick-up could have been expected.
Uncertainty over long-term business prospects is
often mentioned as a probable contributory factor
in domestic investment restraint in recent years. In
terms of its components, non-residential
construction (e.g. infrastructure) investment has
stagnated after years of decline before the crisis.
By contrast, investment in residential construction
has recently seen strong growth, partly reflecting a
sizable accumulated housing supply shortage.
While private infrastructure investment continued
to stagnate in 2017, foreign direct investment
(reinforcing foreign production locations) picked
up. This suggests it may be useful to review
potential obstacles other than uncertainty to private
investment. They include: inefficiency in corporate
taxation; the high administrative burden; the less
developed venture capital market compared to
international innovation leaders; regulatory
restrictiveness in the services sector; and delays in
implementation of electricity and broadband
infrastructure projects.
Public investment, which has been muted, has
fallen short of depreciation. As mentioned in
Section 4.5, net public investment turned negative
in 2003. This outcome reflects a gradual scaling
back of investment in maintaining and expanding
public infrastructure. The design of federal fiscal
relations may also have contributed to protracted
underinvestment, especially at municipal level,
where net investment has been markedly negative
since 2003. It is also partly a reaction to the post-
unification investment boom in eastern Germany
and the consolidation needs in western Germany,
notably at municipal level. An additional annual
public investment of 0.3 % of GDP over the next
decade would be needed to close the investment
backlog at the municipal level. The latter is
estimated at EUR 126 bn in 2017, according to the
yearly survey conducted by the public
development bank KfW (2017a).
Years of restrained growth in consumption
have also dampened domestic demand and
contributed to the building up of the external
surplus. High unemployment, a long period of
wage moderation and a fall in the total number of
hours worked in the first half of the 2000s resulted
in low growth in disposable incomes, even if
consumer price inflation was supportive of
purchasing power. Wage growth picked up from
2014, but not to the extent the tightening labour
market situation and unit labour costs in relation to
the euro area average would suggest. Since 2014,
nominal wage growth remained roughly stable
even as inflation picked up in 2017, resulting in the
slowing down of real wage growth. Disincentives
to work for certain groups are constraining labour
participation, disposable income and consumption
opportunities. These include a high tax wedge for
low-wage earners, disincentives for second earners
to increase working hours and the fiscal treatment
of mini-jobs that creates lock-in effects.
3. Summary of the main findings from the MIP in-depth review
16
The adjustment of the current account surplus
is expected to be only gradual in the medium
term. Both export and import growth is expected
to remain strong, while terms of trade effects are
set to have an only limited impact. Stronger import
growth is expected to be driven by a pick-up in
equipment investment and demand for foreign
inputs along the value chain amidst stable
domestic and foreign demand growth. As a result
of stronger growth of imports as compared to
exports, Germany’s trade surplus should continue
to ease leading to a gradual decline in the current
account surplus. Over a longer period of time, the
large-scale demographic shift from working to
retirement age is expected to start to lower the
aggregate savings rate and thus the current account
surplus. However, in the medium term, the current
account surplus is expected to remain above the
MIP threshold and to decline only gradually.
(European Commission, 2017b)
The policy response to address the imbalances
has remained limited so far. Although the federal
fiscal reform and the relieving of municipalities
from certain social spending obligations will
strengthen the fiscal position of the Länder and
municipalities, it remains to be seen to what extent
this additional fiscal space will actually be used for
additional public investment. The consultancy and
the federal transport infrastructure company, set up
in the context of the reform of fiscal relations to
support the local governments in planning and
implementing investment projects, can be expected
to accelerate public investment. Yet, this reform
falls short of increasing the tax autonomy of the
Länder and municipalities, which could have
further increased the scope for public investment.
Efforts to improve the business environment for
private investment have remained limited. The
same holds for efforts to reduce the high tax wedge
for low earners and work disincentives for second
earners, with a view to supporting labour market
participation, disposable income and consumption.
Overall assessment
The German economy displays a persistently
large current account surplus, which reflects a
subdued level of investment relative to saving.
The size and persistence of the surplus can only be
partly explained by the country's industrial
structure (e.g. the highly competitive
manufacturing sector) and other characteristics of
the German economy and society. Hence, it is
significantly higher than empirical benchmarks,
taking into account these factors in explaining
cross-country differences, and much above the
level that would be required to stabilise the already
high net international investment position (i.e.
above the NIIP benchmark) (9). Subdued
investment and private consumption, resulting in
an excess of saving over investment, have also
contributed to the build-up of the external surplus.
This can be partly explained by necessary
adjustments in the aftermath of the post-unification
boom, including prolonged wage moderation,
labour market reforms and significant scaling back
of construction activity. While there is currently a
clear and robust shift towards more domestic
demand-driven growth, both consumption and
investment remain relatively low, given the
favourable cyclical, labour market, financing
conditions and infrastructure investment needs.
Continued relatively subdued investment as a
share of GDP also undermines Germany’s
future growth potential, and has implications
for the euro area. While private consumption has
picked up, private investment has remained
restrained, despite favourable financing conditions.
Public investment has picked up, though budget
projections indicate scope under EU and national
fiscal rules for further increases. Persistently low
investment could hamper Germany’s economic
growth in the long term. Stronger capital
accumulation would be needed to sustain potential
growth in the future, especially if population
ageing intensifies and immigration slows down.
Given Germany's size and strong trade and
financial linkages with the rest of the euro area,
expanding investment could also ease deleveraging
needs faced by highly indebted Member States.
Overall, the policy response to address the
imbalances has so far remained limited. The
federal fiscal reform and associated measures led
to a moderate improvement of fiscal space and
investment capacity for municipalities. Efforts to
improve the business environment for private
investment have remained limited. The same holds
for efforts to reduce the high tax wedge for low
earners and work disincentives for second earners.
(9) Work on the methodology for estimating current account
benchmark is ongoing in cooperation with the Economic
Policy Committee.
3. Summary of the main findings from the MIP in-depth review
17
Box 3.1: Euro area spillovers
Based on the European Commission’s QUEST model (1), this box compares the effect of an increase in
expenditure on R&D and education (2). These scenarios specifically aim at improving potential growth,
thereby addressing long-term challenges of the German economy and complementing earlier simulations
that aimed at a more immediate economic boost, including an increase in public investment and a reduction
in personal income tax (European Commission, 2017c).
Not surprisingly, the overall effects are relatively limited in the short-run. Based on model assumptions,
education reforms lead to only very gradual changes in aggregate skill levels due to cohort effects, as it takes
time for the new, better-skilled cohorts to enter to the labour force (3).R&D subsidies may be even
accompanied by a slight decline of GDP, as stronger R&D activity detracts high-skilled labour from other
sectors of the economy. Fostering R&D should therefore ideally be combined with policies that increase the
supply of high-skilled workers, e.g. investment in tertiary education, in order to dampen the competition for
high-skilled labour.
While the reforms already generate certain positive spillovers in the short run, their impact increases
considerably over time. Both simulated reforms together positively contribute to GDP and employment in
the rest of the euro area in the longer term. For an identical amount of fiscal spending, the long-term positive
spillovers are particularly high for the R&D expenditure, while also being significant for the education
measures. It is estimated that increasing R&D expenditure by 1 % of GDP will raise GDP in the rest of the
euro area by about 0.4 % in 15 years and by 0.6% in 20 years. This will be achieved through increased
domestic output and thanks to knowledge spillovers, resulting from the international dissemination of
innovations that foster intangible capital formation and productivity gains abroad. Increasing education
expenditure by 1 % of GDP across-the-board of education institutions is expected to increase the GDP of the
rest of the euro area by 0.15 % after 20 years through the trade channel; spillovers in the form of cross-
border knowledge dissemination are absent in the scenario of higher domestic spending on education.
Spillovers are further mitigated by the fact that domestic competitiveness gains (more net exports) partly
offset positive demand spillovers (more net imports) to the rest of the euro area.
Table 1: Impact of the reform scenarios in Germany and in the rest of the euro area
(1) To illustrate the reading of the table: increasing expenditure on education by 1% of GDP (about EUR 30 bn)
increases German GDP by 0.42% of GDP in the first year following the measure and by 2.86% in the twentieth year
following the measure.
Source: European Commission
(1) Detailed information on the QUEST model and applications is available at:
http://ec.europa.eu/economy_finance/research/macroeconomic_models_en.htm.
(2) For illustration, the expenditure increase on R&D and education is assumed to be permanent and scaled to 1 % of GDP
in both cases. The budgetary-closure rule is deactivated during 20 years, so that the scenarios correspond to debt-
financed fiscal expansions. Monetary policy rates are assumed to remain unchanged, not responding to the increase in
public investment during the first two years.
(3) The simulation scenario assumes that the additional spending increases productivity of employees at all skill-levels.
Though the model cannot differentiate different types of education, one could assume that increased spending on adult
education would be effective in the short to medium-term, while general education has rather long-term effects.
Years 1 2 3 4 5 10 15 20 1 2 3 4 5 10 15 20
GDP -0.10 -0.55 -0.66 -0.54 -0.29 1.46 3.25 4.39 0.02 -0.01 0.00 0.02 0.04 0.15 0.39 0.61
Employment 0.33 0.43 0.42 0.39 0.38 0.38 0.37 0.36 0.01 0.00 0.02 0.05 0.08 0.20 0.33 0.41
Trade balance (% GDP) -0.09 -0.12 -0.06 -0.01 0.02 0.06 0.07 0.07 0.12 0.17 0.17 0.16 0.15 0.14 0.06 0.04
Government balance (% GDP) -0.55 -0.55 -0.61 -0.64 -0.63 -0.39 -0.07 0.20
GDP 0.42 0.45 0.56 0.70 0.84 1.54 2.30 2.86 0.01 0.01 0.02 0.02 0.03 0.06 0.11 0.15
Employment 0.16 0.15 0.11 0.09 0.07 0.00 -0.13 -0.26 0.01 0.02 0.02 0.03 0.03 0.07 0.11 0.13
Trade balance (% GDP) -0.17 -0.15 -0.12 -0.10 -0.10 -0.08 -0.06 -0.06 0.03 0.03 0.03 0.03 0.03 0.02 0.02 0.02
Government balance (% GDP) -0.29 -0.34 -0.35 -0.35 -0.35 -0.33 -0.31 -0.31
Germany Rest of euro area
R&D subsidy (1 % GDP)
Education subsidy (1 % GDP)

18
Table 3.1: MIP assessment matrix – Germany
Source: European Commission
Gravity of the challenge Evolution and prospects Policy response
Imbalances (unsustainable trends, vulnerabilities and associated risks)
External
balance
Germany has a persistently large
current account surplus, which
came down marginally to 8.2 %
of GDP in 2016 and recently
decreased to 7.8% for the year
ending in November 2017.
Accumulated surpluses have
resulted in a large positive net
international investment position,
which reached 55.1 % of GDP in
2016.
The surplus reflects saving and
deleveraging by all sectors of the
economy: households, firms, and
the public sector. High corporate
savings and low investment have
contributed most significantly to
the widening of the savings
surplus in recent years.
Weak domestic investment poses
risks to Germany’s potential
growth in the future. In addition,
as deleveraging pressures still
weigh on EU growth,
strengthening investment in
Germany would benefit both
Germany and its euro area and
EU partners.
The German surplus is projected to decline but to
persist at more than 7 % of GDP in the medium
term. Imports have been increasing, including
relative to exports and GDP, over the recent
quarters. Net capital exports have remained
significant on account of repatriation of German
bonds while investment in foreign debt securities
slowed down.
Real private consumption has strengthened, by
2.1 % in 2016 and 2017, and is expected to slow
down only marginally. The low interest rates
have not translated into significant changes in
household consumption patterns, but rather
reinforced the propensity to save. An extended
period of dynamic wage growth would support
private consumption, provided it also translates
fully into disposable income.
At its current level, investment contributes little
to potential growth. Private sector investment has
increased recently but as a share of GDP it
remains sluggish at 17.9 % in 2016. Importantly,
investment in infrastructure has barely reacted to
supportive growth and funding conditions,
casting doubt on the evolution of the economy's
future productive capacity.
Public investment picked up in 2016 and 2017.
However, there has been no reversal of the
markedly negative net investment at municipal
level. Public investment is set to grow at a
stronger pace, once financial relief and planning
support that has been granted to federal states and
municipalities is starting to bear fruit.
The policy response so far has remained
limited. Important steps have been taken
to increase public investment, but they
have not yet resulted in a clear upward
trend in the public investment-to-GDP
ratio.
Germany has used its available fiscal
space only to a limited extent and has not
taken full advantage of exceptionally
favourable financing conditions to meet
its investment needs and improve
conditions for private investment
Relieving municipalities of social
expenditure obligations will increase
their scope for public investment. The
additional revenue of 0.3 % of GDP
allocated to the federal states as part of
the agreed reform of federal fiscal
relations could also facilitate public
investment at all government levels. A
consulting service for municipalities has
been put in place and may alleviate
administrative constraints on public
infrastructure investment.
Limited efforts have been made in 2017
to stimulate competition in the services
sector, improve the efficiency of the tax
system, reduce the high tax wedge
(especially for low wage earners),
reducing disincentives for second
earners, facilitating the transition to
standard employment and creating
conditions to promote higher real wage
growth, respecting the role of the social
partners.
Conclusions from IDR analysis
Germany is running a persistently large current account surplus reflecting subdued investment relative to savings in both the private
and public sector. Persistently weak domestic investment could constrain potential growth in the long term. This could entail
macroeconomic risks and affect the rebalancing and growth prospects of the rest of the euro area, when deleveraging pressures in
several Member States persist.
While private consumption has strengthened, business investment has remained restrained, despite the favourable financing
conditions. An even stronger increase in private consumption is hampered by only moderately rising wages despite a rather tight
labour market as well as a persistently high tax burden and disincentives to work for certain groups. Public investment has picked up,
though the available fiscal space has not been fully used.
Steps taken to increase public investment have not yet resulted in a clear upward trend in the public investment-to-GDP ratio that
appears required to close the infrastructure investment gap. Efforts to improve the business environment for private investment have
remained very limited. Regulatory restrictiveness in the services sector remains high and inefficiency in corporate taxation persists.
Disincentives to work for certain groups continue to reduce labour supply, disposable income and consumption opportunities.

19
Public finances
Germany’s public finances are robust, and the
debt-to-GDP ratio is improving. Since its bottom
in 2010 (-4.2 % of GDP) in the aftermath of the
financial crisis, the budgetary balance has
consistently improved, becoming positive in 2014,
and rising to +0.8 % in 2016 and to 1.2 % in 2017.
Likewise, overall government debt, which peaked
at 81.0 % of GDP in 2010, has fallen continuously,
reaching 68.1 % in 2016. According to the
Commission's 2017 autumn forecast, it is expected
to fall below the 60 % Maastricht threshold by
2019 (European Commission, 2017b). While
government revenues increased by 2.0 pps. of
GDP between 2007 and 2016, mainly owing to
higher income taxes and social security
contributions (see graph 4.1.1), government
expenditure increased by only 1.3 pps. of GDP.
Graph 4.1.1: Government balance and trends in selected
revenues and expenditures
Source: European Commission
(10) An asterisk shows that the analysis in the section
contributes to the in-depth review under the MIP (see
Section 3 for an overall summary of main findings).
Taxation
The overall level of taxation corresponds to the
average among the Member States, but the tax
wedge is high. The overall level of taxation at
39 % of GDP in 2016 lies between the euro area
average of 40.1 % and the EU average of 38.9 %.
The tax wedge for low earners (at 50% of the
average wage) is high and only 9.2 pps. lower than
the tax wedge for high wage earners (at 167% of
the average wage), indicating relatively low
progressivity compared to other EU countries.
Social security contributions account for about
two thirds of the tax wedge, while income tax
accounts for only one third. Importantly,
employees contribute well above average to the
security systems, while employers' contributions
are still below average (see also Box 4.1 which
displays various possible scenarios to remedy this
state of affairs).
Graph 4.1.2: Taxes by economic function
Source: European Commission, 2017c
By comparison with other EU countries,
Germany places a relatively strong emphasis on
more distortive direct taxes, notably on labour,
to raise revenues. Taxes on income from
employment amounted to 19.3 % of GDP in 2015,
the 6th highest figure in the EU-28. By contrast,
revenue from taxes on consumption and capital fall
at the lower end of the distribution, ranking 23rd
and 15th out of 28 countries. In 2015, revenues
from recurrent property taxes came to 0.4 % of
-120-100-80-60-40-20020406080100120140160180
-40
-30
-20
-10
0
10
20
30
40
50
60
01 02 03 04 05 06 07 08 09 10 11 12 13 14 15 16
bn EURbn EUR,y-o-y
change
Interest (reversed sign)
Social contributions
Current taxes on income and wealth
Taxes on production and imports
Net lending(=)/net borrowing(-) (rhs)
0
2
4
6
8
10
12
DE EU28 EA19
Capital
Consumption
Labour - Paid by employers
Labour - Paid by employees
Labour - Paid by non-employed
% of GDP
4. REFORM PRIORITIES
4.1. PUBLIC FINANCES, FISCAL FRAMEWORKS AND
TAXATION*(10)

4.1. Public finances, fiscal frameworks and taxation*
20
GDP, which is well below the EU average of
4.3 %. All in all, taxes on labour contribute above
average to government revenue in Germany, by
comparison with other EU countries, while capital
taxes are much lower.
Over the past ten years, transfer property taxes
have become increasingly important in the
financing of states' budgets. All the Länder,
except Bavaria and Saxony have increased their
tax rates on property transfers since 2007. In a
number of cases, the rate almost doubled. Overall,
almost all Länder now apply rates between 5 %
and 6.5 %, up from a uniform 3.5 % in 2007. In
combination with higher real estate prices, the
increased rates have boosted tax revenue
considerably. This trend is expected to continue
(IW Köln, 2017).
There is potential for shifting taxation from
labour to other tax bases less detrimental to
growth, including environmental taxes. At 1.9 %
of GDP, the overall level of environmental taxes is
quite low in Germany compared with the EU
average of 2.4 % of GDP.(11) In 2004, the level
was still at the EU average, but since then it has
fallen steadily. This decrease was driven mainly by
a decrease in transport fuel taxes. The tax rates on
motor fuels have not been adjusted since 2003. As
a result, they have been eroded by inflation to the
level before the ecological tax reform. The tax
advantage on marginal rates on diesel compared to
petrol is among the highest in the EU, although
diesel has a more harmful impact on ambient air
quality than unleaded petrol. Exemptions from the
energy tax for specific energy-intensive processes
were introduced in 2006, when the energy tax law
was introduced. In recent years, no measures have
been taken to broaden the tax base by reducing
environmentally harmful tax incentives, such as
energy tax reductions and the favourable taxation
of company cars. Such measures would allow a
shift to tax sources less detrimental to growth and
help to resolve environmental issues (see also
Section 4.6).
Germany's tax system is still not very conducive
to investment. Its statutory corporate tax rate of
(11) The renewable energy surcharge (EEG-Umlage), which
comes to about 0.8 % of GDP is not included in this
statistic as it not a tax in the legal sense.
31 % is among the EU's highest and it is also high
in comparison with other major economies (ZEW,
2017a).(12) Apart from inefficiencies arising from
the inclusion of some non-profit elements in the
local trade tax base, the system is susceptible to
special tax planning to minimise tax payments.(13)
Similarly, the effective average tax rate stands at
28.2 %, significantly above the EU average
20.9 %. Moreover, the debt bias in corporate
taxation also remains high 7th highest in the EU.
This is because debt financing costs are deductible
from the corporate income tax base, whereas the
same treatment is not extended to equity financing
costs. In the ‘International Tax Competitiveness
Ranking’ of 35 OECD countries (Pomerlo, 2017),
Germany’s system ranks 21st overall and 14th as
regards corporate tax. The low ranking, in 29th
position of personal income taxation, also
applicable to transparent entities as partnerships, is
a result of the system's complexity and the high tax
rates. Moreover, loss-carry forward provisions are
relatively strict, limiting the amount to 60 % of the
taxable income for a given year. Finally, Germany
also ranks very low (31st out of 33 countries
examined,) as regards attractiveness to businesses
engaged in digital activities (ZEW, 2017b).
In the past few years, a number of targeted
measures have been taken to make the tax
framework more conducive to investment. The
INVEST grant programme, set up in 2013,
supports private investors wishing to acquire a
stake in innovative new companies. Under this
programme, investors in start-ups receive a tax free
grant worth 20 % of the sum invested. The
programme was expanded as of January 2017 (see
section 4.6 on venture capital) and the maximum
grant was doubled. An exit grant for individuals
selling their shares was introduced, amounting to
25 % on the capital gains, which roughly covers
the tax due on the sale. (14) A recent study notes
that some of the INVEST scheme's features
constitute good practice, such as the use of upfront
relief administered outside the tax system, and the
(12) This is the result of a local trade tax (Gewerbesteuer) added
to the corporate income tax as well as the solidarity
surcharge.
(13) Entschließung des Bundesrates zur Verhinderung von
Gestaltungsmodellen zur Minderung der Gewerbesteuer
mittels Lizenzzahlungen – 'Gerechte Verteilung der
Gewerbesteuer zwischen den Gemeinden gewährleisten'
(14) Furthermore, shares can now be held by either a natural
person or by an associated company and follow-up
financing support was introduced.
4.1. Public finances, fiscal frameworks and taxation*
21
scheme's transparent cost and impact monitoring
of the scheme (PWC and IHS, 2017). Other
measures taken in 2016 include: simplified
taxation of investment funds, revisions to the rules
for tax loss carry forwards and measures to
modernise tax administration procedures (see
European Commission, 2017c).
Reducing tax exemptions from inheritance tax
can help address the highly unequal
distribution of wealth and broaden the tax base
to allow reducing the burden on smaller family
businesses. With 0.16 % of GDP inheritance tax
accounts for only 0.41 % of total tax revenue,
according to 2012 data. Estimates suggest that a
total of about EUR 200 to 300 billion (around 6-
10 % of GDP) is given as a gift or inherited in
Germany every year (Bach and Thiemann, 2016).
These capital transfers are highly concentrated at
the top of the wealth distribution: one third of the
total amount of inheritances and gifts is transferred
to just 1.5 % of beneficiaries, who receive
inheritances of over EUR 500 000. The 0.08 % of
cases involving transfers exceeding EUR 5 million
received 14 % of the transfer volume and more
than half of corporate transfers, which are
currently largely exempt from inheritance tax. The
2016 reform of the inheritance tax is expected to
change little in this regard. A reduction of the tax
exemptions would significantly broaden the tax
base, which would make it possible to reduce tax
rates and lower the burden on smaller family
businesses (Bach and Thiemann, 2016).
Low recurrent taxes on property and
inheritance should be seen in the context of
substantial wealth inequality. At 0.76, the 2014
Gini coefficient for net wealth in Germany was the
second highest in the euro area (whose overall Gini
coefficient was 0.69, based on data from the
second wave of the European Central Bank's
Household Finance and Consumption Survey). The
wealthiest 10 % of the population hold about 60 %
of total wealth, while the lower half of all
households holds only around 1 %. Real estate
ownership and business assets were strongly
concentrated among the wealthier households, with
only 10 % holding shares or business assets, and
13 % holding mutual investment funds. In the
absence of a wealth tax, higher and more targeted
inheritance taxes applied to the wealthiest strata of
society could help reducing wealth inequality. In a
recently published report on wealth and poverty by
the German government (Federal Ministry for
Labour and Social Affairs, 2017a), two thirds of
respondents said inheritances were their main
source of wealth, rather than savings.
Healthcare
The German health system is performing well,
although it is costly and there is scope for
efficiency gains. Health expenditure as a
percentage of GDP, 11.3 % in 2016, is the highest
in the EU and the ratio has increased by 1.2 pps.
However, over the period 2016-2070, the expected
increase of 0.7% in the public expenditure on
health care (7.4% of GDP in 2016 excluding
expenditure on long-term nursing care but
including capital formation), appears moderate
compared to 0.9% for the EU also in light of the
ageing population in Germany (European
Commission, 2018). Germany provides 813 beds
per 100 000 population, the highest ratio in the EU
(515). However, bed capacity has been reduced by
3.9 % since 2005, which is less than the EU
average of 11.9 %. The average length of a
hospital stay in 2015 (9 days) was among the EU's
highest. France, for instance, is at the lower end of
the distribution with only 5.5 days. High rates of
avoidable hospital admissions for chronic diseases
also suggest over-provision of hospital care and
room for better integration of primary care,
ambulatory specialist care and in-patient care
(OECD and European Observatory on Health
Systems and Policies, 2017).
Expenditure on pharmaceuticals is high and
growing. Germans spend the most per capita on
retail pharmaceuticals in the EU. The consumption
of prescribed defined daily doses rose by over
50 % between 2004 and 2015. Overall,
pharmaceutical expenditure has increased by about
70 % since 2000 — more than any other cost item
covered by statutory health insurance (SHI). The
main reason for this is patent-protected new
originator products, though generics account for a
substantial share of the total (81 % in 2016). The
daily treatment costs of patented medicines are on
average 16 times higher than for generics.
(Schwabe et al, 2017)
The legal framework for statutory health
insurance (SHI) and private health insurance
(PHI) creates inefficiencies and challenges the
solidarity principle in health care. The SHI is
4.1. Public finances, fiscal frameworks and taxation*
22
based on the principle of ability to pay (risk- and
income based solidarity), while the PHI is financed
through risk-related premiums. SHI contributions
are independent of risk and based on income up to
a certain threshold, and non-earning spouses and
children are covered without any surcharges. PHI
premiums are risk dependent and separate
premiums have to be paid for spouses and
children. Although several reforms have been
made, the current legal framework, which allows
people on higher incomes, civil servants and the
self-employed to opt out of SHI, undermines the
risk- and income-based solidarity principle in
health care (Busse et al., 2017). Moreover, doctors
can charge PHI patients more than those covered
by SHI. This creates inequalities in waiting times
and accessibility for medical services, as well as
incentives for overprovision of health services to
PHI patients (see also Chapter 4.3).
Fiscal framework
The Federal Government has implemented an
endorsement process to guarantee the
independence of the macroeconomic forecast
underlying the budgetary projections. The
Commission's Opinion on Germany’s Draft
Budgetary Plan for 2017 (European Commission,
2017d) noted that there is still no procedure to
have an independent body produce or endorse the
macroeconomic forecast, as stipulated in
Regulation (EU) No 473/2013. The German
legislator adopted a law that defines the process for
the preparation of macroeconomic forecasts by the
government and the process for their endorsement
by an independent body. The law came into effect
on 4 July 2017. In September 2017, the ordinance
governing the appointment of an independent body
("Vorausschätzungsverordnung") was published.
In accordance with Regulation (EU) No 473/2013,
the "Gemeinschaftsdiagnose", an association of
several economic research institutes, is appointed
as an independent body tasked with assessing and
confirming the forecast released by the Federal
Government. The ordinance will come into effect
on 1 July 2018. As regards the compliance with the
upper limit on the general government structural
deficit of 0.5 % of nominal GDP, the Advisory
Board of the Stability Council provides a
favourable assessment in its report of December
2017 (Stability Council, 2017).
Since 2015-2016, the Federal Ministry of
Finance conducted spending reviews designed
to make federal budget spending more effective.
The first cycles of spending reviews focused on the
following policy programmes: ‘support of
combined traffic (15)’, ‘support for the professional
mobility of young people seeking vocational
training in Germany’, ‘housing’, and ‘energy and
climate’. The ongoing review cycle for 2017/2018
covers the topics ‘procurement of standardised
bulk articles’ and ‘humanitarian aid and transition
aid including crisis prevention, crisis response,
peace-keeping and development cooperation’.
(15) Combined traffic is a special form of freight transport in
which semi-trailers, trucks or containers are transported
along the main part of the transport route by rail or by
inland waterway, while lorries are used to pick up and
deliver loaded units from the loading and unloading points.
The aim of combined traffic is to promote environmentally
friendly means of transport.

23
Banking sector
The main challenges facing the industry are
squeezed revenues from the low-interest-rate
environment and costs incurred owing to
digitalisation and regulatory requirements.
Heavy dependence on interest income (more than
73 % of aggregate revenue) and the large number
of small institutions make German banks
particularly vulnerable to these challenges. At a
time when they have very high operating costs —
in 2016 the cost-to-income ratio exceeded 69 % —
banks may need a strategic vision to address these
challenges. This could involve adapting their
business model, considering mergers, and cutting
costs.
Maintaining positive profitability through
realising hidden reserves, increasing the
maturity transformation, and more risk-taking
does not appear to be sustainable. The survey on
low interest rates (German Central Bank, 2017)
indicated that structural adjustments are necessary
to maintain profitability. If interest rates stay at
current levels, small and medium-sized banks
expect their profits to fall further between 2016
and 2021. This would imply a drop of 16 % in
their return on total capital. Moreover, keeping up
with regulatory developments has a large fixed
cost component.
Profitability remains very low. ECB data shows
that Return on Equity (RoE) stood at 0.6 % in
March 2017, amongst the lowest in the EU.
Lacklustre performances by several medium-sized
banks, low intermediation margins, and a weaker
capacity to generate non-interest income all weigh
on profits. While overall employment expanded
strongly in Germany, in the banking and insurance
sectors it fell by 10 000 in the first half of 2017,
according to the federal employment service.
Significant headcount reduction usually has up-
front costs and lead to cost savings only in the
medium term. The number of branches decreased
by only 14.4 % between 2007- and 2016, keeping
Germany in the top third of EU countries with the
highest branch density.
At the same time, the equity and leverage
situation remains acceptable. Banks’ June 2017
Tier 1 ratio stands at an acceptable level (16.0 %),
slightly above the EU average (15.4 %). Yet, the
leverage ratio is the lowest in the EU in
percentage. Compared to most member states,
German capitalisation ratios increased less, as
most banks in Germany are not listed on the stock
exchange and therefore rely more on organic
capital generation instead of issuing shares. Asset
quality is very strong. End June 2017, non-
performing loans (NPL) amount to 1.6 % of total
gross loans, compared to 1.9 % twelve months
earlier and significantly below the euro area’s
average of 4.5 %. Loan-loss provisions went from
42.4 % to 43.6 % between June 2016 and June
2017.
Housing market developments do not yet give
rise to neither macro- nor financial stability
risks. House price increases are particularly
pronounced in some cities, yet overall the process
can still be considered (the end of) a normalisation
process across time and countries (see Chapter 4.5,
IMF 2017a). Housing loans’ growth keeps on
accelerating, 4.2 % year-on-year in September
2017 compared to 3.8 % in September 2016. The
overall outstanding stock of mortgages now stands
20 % above its January 2011 value (Table 4.2.1).
Nonetheless as nominal GDP grew at a similar
pace, aggregate mortgages hover around 36 % of
4.2. FINANCIAL SECTOR*
Table 4.2.1: Financial soundness indicators, all banks in Germany
*ECB aggregated balance sheet: loans excl to gov and MFI / deposits excl from gov and MFI **For comparability only annual
values are presented
Source: ECB
(%) 2010 2011 2012 2013 2014 2015 2016 2017Q2
Non-performing debt 2.4 1.6 1.7 1.8 2.5 2.0 1.8 1.6
Non-performing loans - - - - 3.9 3.0 2.6 2.3
Non-performing loans NFC - - - - 8.9 6.5 6.4 6.0
Non-performing loans HH - - - - 2.9 2.3 1.8 1.8
Coverage ratio 35.0 40.1 38.3 42.8 34.8 36.7 36.9 38.4
Loan to deposit ratio* 84.7 83.4 82.5 80.1 79.2 78.4 78.5 78.4
Tier 1 ratio 11.4 11.7 13.8 15.2 14.8 15.4 15.6 16.0
Capital adequacy ratio 15.3 15.8 17.4 18.7 17.3 17.9 18.1 18.4
Return on equity** 1.9 2.2 1.1 1.3 2.5 1.7 2.2 -
Return on assets** 0.1 0.1 0.0 0.1 0.1 0.1 0.1 -

4.2. Financial sector*
24
GDP over the past 6 years, which lends further
evidence to the assessment that current real estate
price increases are not primarily driven by
mortgage lending.
Graph 4.2.1: Mortgages and corporate loans in billion EUR
and in % of GDP
Source: ECB
Corporate loans continue to accelerate in line
with economic developments and slightly lower
credit standards. Outstanding corporate loans
have increased by 4.1 % over the 12 months
preceding September 2017. This represents an
acceleration from 3.2 % one year earlier. The main
drivers were the services sector (including real
estate) and to a lesser extent manufacturing (e.g.
machinery, chemicals). Particularly strong credit
growth for longer maturities may indicate a more
positive outlook for companies. Still, in relative
terms, corporate loans barely amount to 30 % of
GDP (Graph 4.2.1). This stands below European
Commission fundamentals-based benchmarks for
Germany, and reflects more than a decade of
deleveraging (16).
New leasing contracts are on track for another
record-year. The leasing market Europe-wide
amounted to EUR 164 billion in the first half of
2017 — out of which EUR 59 billion stemmed
from Germany. Leasing in Europe grew by
(16) Fundamental-based benchmarks are derived from
regressions capturing the main determinants of credit
growth and taking into account a given initial stock of debt.
See also European Commission (2017), "Benchmarks for
the assessment of private debt", Note for the Economic
Policy Committee"
10.5 %, while the German market grew 5.7 %,
pulled by vehicle leasing which grew 6.3 %.
Despite offering one of the lowest yields in the
euro area, German private sector deposits grew
3.6 % annually. ECB statistics show that
corporates’ new overnight deposits bear negative
interest rates on average, i.e. -0.01 % since March
2017. Household deposits with maturities up to 2
years yield 0.28 % — the euro area’s lowest
returns. Private sector deposits grew 3.6 % yoy in
November 2017 totalling EUR 3 531 billion
(109 % of GDP – 67% coming from households,
18% from corporates and 24% from the non-bank
financial sector), which exceeds the rather low
level of private sector loans (EUR 2 777 billion)
by 23 pps. of GDP.
Overall, deposits have increased slightly above
nominal GDP growth, at times when the
German private sector debt grows at moderate
pace. As both household and corporate
indebtedness decline slightly as percentage of
GDP, passive deleveraging continues despite
Germany's private sector debt being amongst the
lowest in the euro area.
Graph 4.2.2: Annual change of different household loan
categories
Source: ECB
The economy is strongly financed through own
funds, while both debt and equity finance is
below EU average. Unlike companies in other big
member states that rely more on capital markets,
the classic German Mittelstand (medium-sized
enterprises) relies more on internally generated
funds as evidenced by the slightly above EU-
25
27
29
31
33
35
37
39
41
43
600
700
800
900
1000
1100
1200
2004 2006 2008 2010 2012 2014 2016
% of GDPbn EUR
Lending for house purchase bn EUR
Non-financial corporations bn EUR
Lending for house purchase % of GDP (rhs)
Non-financial corporations % of GDP (rhs)
-2
-1
0
1
2
3
4
5
Total private Non-financial corporations
Households Mortgage credit
y-o-y % ch.

4.2. Financial sector*
25
average gross operating surplus (25.0 % and
22.7 % respectively, cf. Graph 4.2.3).
Graph 4.2.3: Funding sources of non-financial corporations
(1) Listed shares and debt securities represent total liabilities
based on national accounts (Eurostat), loans by Monetary
financial institutions (MFI, including banks) represent
outstanding amounts (ECB BSI). In addition, gross operating
surplus derives from national accounts.
Source: ECB, European Commission, Invest Europe
Listed shares represent the largest funding
source to corporations. They amount to 46.7 % of
GDP, 7.3 percentage points below EU average.
Since the turn of the century German companies
have embarked on a long-lasting deleveraging
trend. While German corporates traditionally relied
strongly on bank financing, now the importance of
bank loans is considerably below EU average
(29.8 % versus 35.8 %). After a decade of net
negative debt issuance, German companies’ net
bond stock has stabilised in early 2016. Debt
securities amount to barely 5.0 % of German GDP
versus an EU average of 12.3 %. In addition to
debt securities, many public entities and small and
medium sized enterprises in Germany rather use a
promissory note (Schuldschein), which is a
mixture between a bond and a loan. Their set-up
cost is a fraction of normal debentures as for
instance no prospectus has to be drawn up.
Between January and August already EUR 21
billion were emitted with an average interest rate
of 1.23 % compared to EUR 25.4 billion in new
emissions for 2016 adding up to a total outstanding
of EUR 86 billion (2.7 % of German GDP). 40 %
of emitters are foreign (mainly Austrian)
companies. As some notes qualify for deposit
guarantee scheme protection they are not
accounted under debt securities. The role of
venture capital remains relatively limited (see
Chapter 4.6 for more in-depth discussion).
Overall, banks display healthy stability ratios
and ample liquidity. Cost cutting still has a long
way to go in times where challenges of digitisation
have to be addressed. Banks will have to re-orient
their business strategy to reduce dependence on
interest margins. Yet, smaller margins are
somewhat counterbalanced through growing loan
volumes as liquidity is amply available. The real
economy is thus benefiting from the high liquidity
position and competition in the sector. Only 11 %
of companies surveyed in Germany in spring 2017
cite financing difficulties as a restraining factor,
4 pp less than in 2014. Most companies do not
claim any financing constraints and agree that it's’
the least important factor hampering investment
(59 %) (Cologne Institute for Economic Research,
2017; German Savings Banks Association, DSGV,
2018).
0
10
20
30
40
50
60
Listed shares Debt securities MFI loans Grossoperatingsurplus:
corporations
DE EU
% of GDP
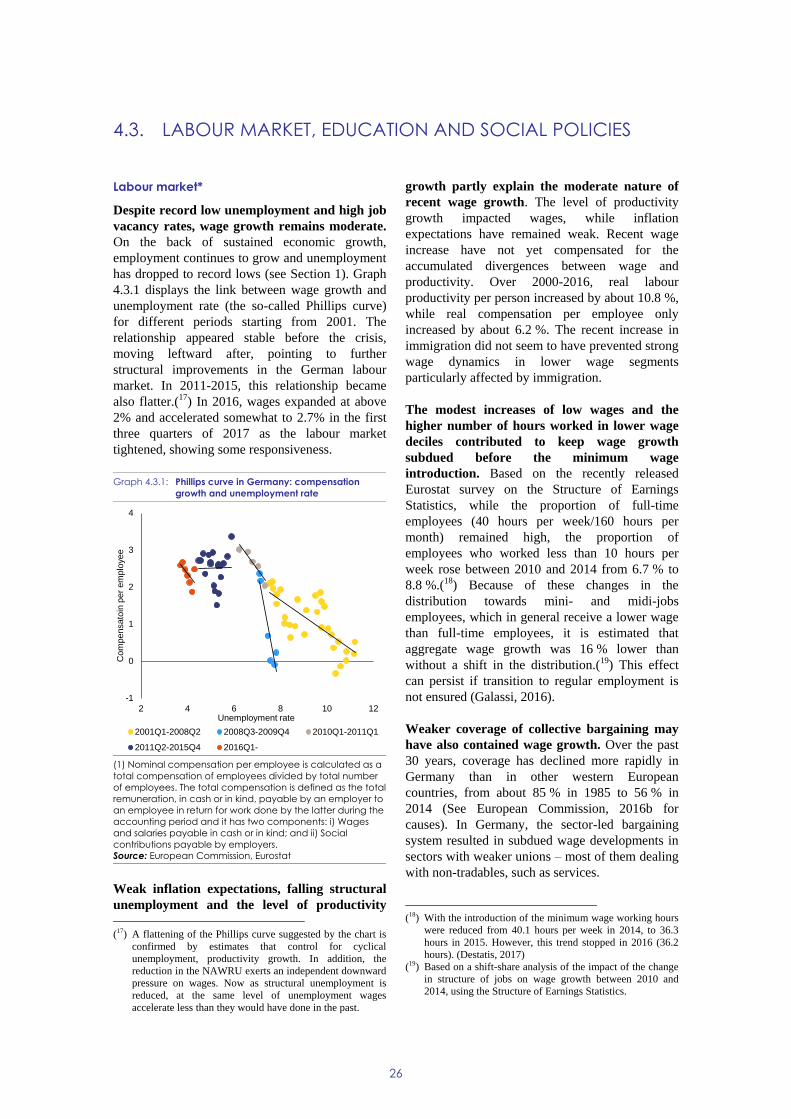
26
Labour market*
Despite record low unemployment and high job
vacancy rates, wage growth remains moderate.
On the back of sustained economic growth,
employment continues to grow and unemployment
has dropped to record lows (see Section 1). Graph
4.3.1 displays the link between wage growth and
unemployment rate (the so-called Phillips curve)
for different periods starting from 2001. The
relationship appeared stable before the crisis,
moving leftward after, pointing to further
structural improvements in the German labour
market. In 2011-2015, this relationship became
also flatter.(17) In 2016, wages expanded at above
2% and accelerated somewhat to 2.7% in the first
three quarters of 2017 as the labour market
tightened, showing some responsiveness.
Graph 4.3.1: Phillips curve in Germany: compensation
growth and unemployment rate
(1) Nominal compensation per employee is calculated as a
total compensation of employees divided by total number
of employees. The total compensation is defined as the total
remuneration, in cash or in kind, payable by an employer to
an employee in return for work done by the latter during the
accounting period and it has two components: i) Wages
and salaries payable in cash or in kind; and ii) Social
contributions payable by employers.
Source: European Commission, Eurostat
Weak inflation expectations, falling structural
unemployment and the level of productivity
(17) A flattening of the Phillips curve suggested by the chart is
confirmed by estimates that control for cyclical
unemployment, productivity growth. In addition, the
reduction in the NAWRU exerts an independent downward
pressure on wages. Now as structural unemployment is
reduced, at the same level of unemployment wages
accelerate less than they would have done in the past.
growth partly explain the moderate nature of
recent wage growth. The level of productivity
growth impacted wages, while inflation
expectations have remained weak. Recent wage
increase have not yet compensated for the
accumulated divergences between wage and
productivity. Over 2000-2016, real labour
productivity per person increased by about 10.8 %,
while real compensation per employee only
increased by about 6.2 %. The recent increase in
immigration did not seem to have prevented strong
wage dynamics in lower wage segments
particularly affected by immigration.
The modest increases of low wages and the
higher number of hours worked in lower wage
deciles contributed to keep wage growth
subdued before the minimum wage
introduction. Based on the recently released
Eurostat survey on the Structure of Earnings
Statistics, while the proportion of full-time
employees (40 hours per week/160 hours per
month) remained high, the proportion of
employees who worked less than 10 hours per
week rose between 2010 and 2014 from 6.7 % to
8.8 %.(18) Because of these changes in the
distribution towards mini- and midi-jobs
employees, which in general receive a lower wage
than full-time employees, it is estimated that
aggregate wage growth was 16 % lower than
without a shift in the distribution.(19) This effect
can persist if transition to regular employment is
not ensured (Galassi, 2016).
Weaker coverage of collective bargaining may
have also contained wage growth. Over the past
30 years, coverage has declined more rapidly in
Germany than in other western European
countries, from about 85 % in 1985 to 56 % in
2014 (See European Commission, 2016b for
causes). In Germany, the sector-led bargaining
system resulted in subdued wage developments in
sectors with weaker unions – most of them dealing
with non-tradables, such as services.
(18) With the introduction of the minimum wage working hours
were reduced from 40.1 hours per week in 2014, to 36.3
hours in 2015. However, this trend stopped in 2016 (36.2
hours). (Destatis, 2017)
(19) Based on a shift-share analysis of the impact of the change
in structure of jobs on wage growth between 2010 and
2014, using the Structure of Earnings Statistics.
-1
0
1
2
3
4
2 4 6 8 10 12
Com
pensato
in p
er
em
plo
yee
Unemployment rate
2001Q1-2008Q2 2008Q3-2009Q4 2010Q1-2011Q1
2011Q2-2015Q4 2016Q1-
4.3. LABOUR MARKET, EDUCATION AND SOCIAL POLICIES
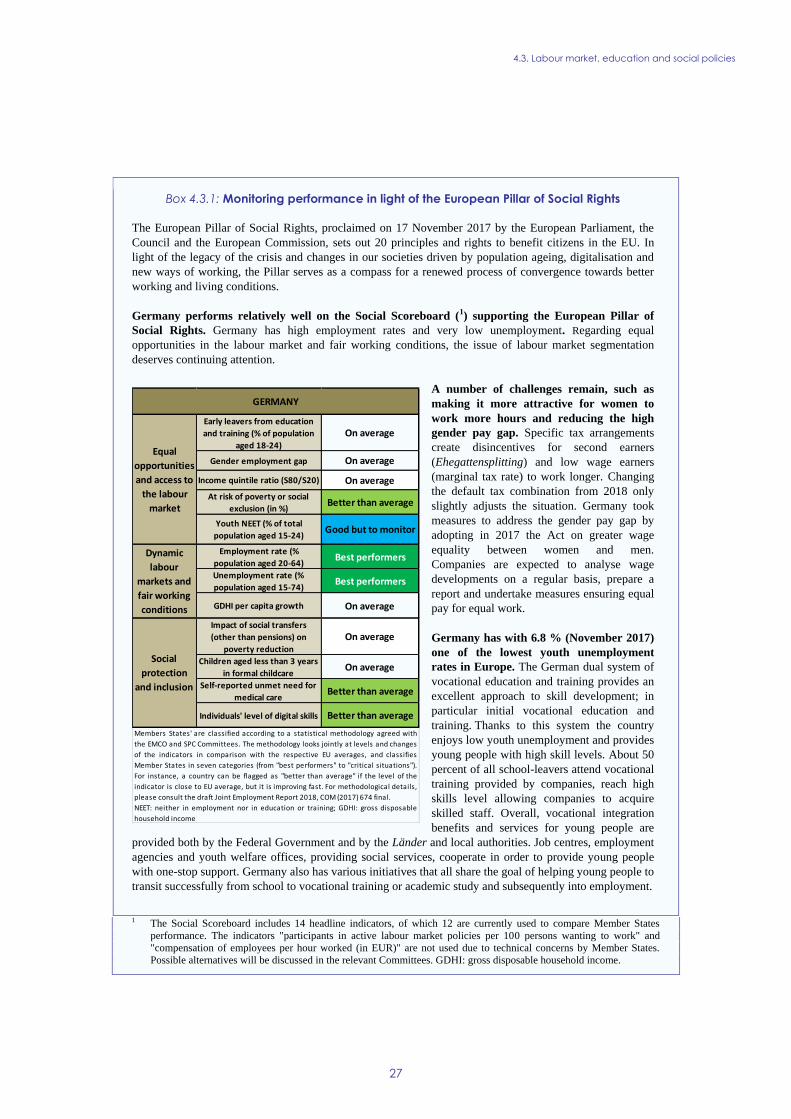
4.3. Labour market, education and social policies
27
Box 4.3.1: Monitoring performance in light of the European Pillar of Social Rights
The European Pillar of Social Rights, proclaimed on 17 November 2017 by the European Parliament, the
Council and the European Commission, sets out 20 principles and rights to benefit citizens in the EU. In
light of the legacy of the crisis and changes in our societies driven by population ageing, digitalisation and
new ways of working, the Pillar serves as a compass for a renewed process of convergence towards better
working and living conditions.
Germany performs relatively well on the Social Scoreboard (1) supporting the European Pillar of
Social Rights. Germany has high employment rates and very low unemployment. Regarding equal
opportunities in the labour market and fair working conditions, the issue of labour market segmentation
deserves continuing attention.
A number of challenges remain, such as
making it more attractive for women to
work more hours and reducing the high
gender pay gap. Specific tax arrangements
create disincentives for second earners
(Ehegattensplitting) and low wage earners
(marginal tax rate) to work longer. Changing
the default tax combination from 2018 only
slightly adjusts the situation. Germany took
measures to address the gender pay gap by
adopting in 2017 the Act on greater wage
equality between women and men.
Companies are expected to analyse wage
developments on a regular basis, prepare a
report and undertake measures ensuring equal
pay for equal work.
Germany has with 6.8 % (November 2017)
one of the lowest youth unemployment
rates in Europe. The German dual system of
vocational education and training provides an
excellent approach to skill development; in
particular initial vocational education and
training. Thanks to this system the country
enjoys low youth unemployment and provides
young people with high skill levels. About 50
percent of all school-leavers attend vocational
training provided by companies, reach high
skills level allowing companies to acquire
skilled staff. Overall, vocational integration
benefits and services for young people are
provided both by the Federal Government and by the Länder and local authorities. Job centres, employment
agencies and youth welfare offices, providing social services, cooperate in order to provide young people
with one-stop support. Germany also has various initiatives that all share the goal of helping young people to
transit successfully from school to vocational training or academic study and subsequently into employment.
1 The Social Scoreboard includes 14 headline indicators, of which 12 are currently used to compare Member States
performance. The indicators "participants in active labour market policies per 100 persons wanting to work" and
"compensation of employees per hour worked (in EUR)" are not used due to technical concerns by Member States.
Possible alternatives will be discussed in the relevant Committees. GDHI: gross disposable household income.
Early leavers from education
and training (% of population
aged 18-24)
On average
Gender employment gap On average
Income quintile ratio (S80/S20) On average
At risk of poverty or social
exclusion (in %)Better than average
Youth NEET (% of total
population aged 15-24)Good but to monitor
Employment rate (%
population aged 20-64)Best performers
Unemployment rate (%
population aged 15-74)Best performers
GDHI per capita growth On average
Impact of social transfers
(other than pensions) on
poverty reduction
On average
Children aged less than 3 years
in formal childcareOn average
Self-reported unmet need for
medical care Better than average
Individuals' level of digital skills Better than average
Social
protection
and inclusion
Dynamic
labour
markets and
fair working
conditions
Equal
opportunities
and access to
the labour
market
GERMANY
Members States' are classified according to a statistical methodology agreed with
the EMCO and SPC Committees. The methodology looks jointly at levels and changes
of the indicators in comparison with the respective EU averages, and classifies
Member States in seven categories (from "best performers" to "critical situations").
For instance, a country can be flagged as "better than average" if the level of the
indicator is close to EU average, but it is improving fast. For methodological details,
please consult the draft Joint Employment Report 2018, COM (2017) 674 final.
NEET: neither in employment nor in education or training; GDHI: gross disposable
household income

4.3. Labour market, education and social policies
28
Box 4.3.2: Policy highlights: The introduction of the general minimum wage
Germany introduced on 1 January 2015 a statutory general minimum wage of 8.50 EUR per hour.
This was seen also as a response by German legislators to the continued erosion of the collective bargaining
system and declining bargaining coverage, which resulted in a high share of low paid workers. Now a
commission (Mindestlohnkommission), which represents employers and employees, and includes labour
market researchers as observers, is responsible for recommending adjustments of the minimum wage, based
on comprehensive analysis of the labour market. The government either accepts the recommendation or
leaves the minimum wage unchanged. The minimum wage was first increased as of 1 January 2017 to 8.84
euros, where the Commission took into account in particular recent developments of collectively agreed
wages. In general the minimum wage is applicable in all branches of activity and all regions, with exceptions
for apprentices, certain interns, people aged below 18 years and long-term unemployed people during their
first six months of employment. Temporarily further exemptions were allowed for collectively agreed
sectoral minimum wage floors, which incentivised collective bargaining and may have allowed mitigating
negative employment consequences. In addition to the statutory general minimum wage, branch-specific
minimum wages may be applied.
Fears that the introduction of the minimum wage would lead to significant employment losses have
not materialised. Helped by the expansion phase of the business cycle, employment creation remained
strongly positive, even in East Germany where wage increases were particularly pronounced due to the low
initial wage level. Only so-called mini-jobs (marginal part-time employment) declined noticeably at the start
of 2015. Many of these lost mini-jobs were upgraded to regular, socially insured employment. An evaluation
of the effects of the minimum wage is planned for 2020.
Beyond workers's wages, work satisfaction also improved. The introduction helped to increase lower
wages at the bottom of the distribution, as expected. Moreover, it also incentivised employers to invest in
human capital, improve working conditions, and thus increased employees' satisfaction at the workplace
(Pusch and Rehm, 2017)
Some aspects of the minimum wage setting may merit fine-tuning. Continuous assessment of the impact
of the minimum wage remains an important task for the Commission, and the system may be tested when
the economic cycle will worsen. In addition, it is not clear whether the resources available for enforcing the
minimum wage are adequate to tackle non-enforcement. Out of the 27,323 investigations conducted in the
first half of 2017, about 10 % (2,433) found non-compliance, primarily in construction and the hospitality
industry. Early 2016, still a significant number of workers were earning below the minimum wage, with
estimations ranging from 750 000 workers based on a survey of firms (Destatis, 2017) to nearly 2 million
workers based on the SOEP survey of individuals (Burauel et al, 2017).
As a result, service sector wages are the lowest
in the EU relative to manufacturing wages
(80 % in Germany, 91 % in the euro area, 103 % in
the EU-28). Moreover, while collective
agreements could have been extended, thereby
partly remedying the reduction in the coverage of
original agreements, this was done only a very few
cases. Although the law introducing the general
minimum wage provided for an easing of the
conditions for general extensions(20), the number
of general extensions remained similar to that in
previous years, with 447 extensions in July 2017.
(Federal Ministry for Labour and Social Affairs,
2017b)
(20) The condition for the original agreement to cover 50 % of
employees in the sector was abolished.
The introduction of the statutory general
minimum wage helped to increase lower wages.
The introduction of the statutory general minimum
wage in 2015 increased wages at the bottom of the
distribution, as expected (see Box 4.3.2).
The current round of wage negotiations has a
strong focus on working time flexibility, on top
of wage increases. The 2017-2018 wage
negotiation round covers 9.7 million employees in
the metal and electronics industries, the civil
service, and the construction industry. IG Metall,
the trade union of workers in the metal and
electronics industries called at the start of the
negotiations for the possibility of opting for a 28-
hour working week rather than a 35-hour one. This

4.3. Labour market, education and social policies
29
was also the outcome of the ‘choice’ model agreed
between Deutsche Bahn and trade unions, which
allowed employees to choose between a wage rise
of 2.6 %, six more days of annual leave, or a one-
hour reduction in weekly working hours (21).
External price competitiveness remains strong.
As a result of wage growth and moderate
productivity gains, the nominal unit labour cost
increased 1.7 % in the first three quarters of 2017,
above that in the euro area, indicating a slight loss
in the external competitive position. As inflation
rose, real earnings growth decelerated, from 1.8 %
in 2016 as a whole to 0.7 % in Q3 2017. (Graph
4.3.2)
Graph 4.3.2: Trends in labour costs and its components
* Forecast values taken from European Commission autumn
2017 Forecast
Source: European Commission
A tight labour market and ageing population
call for fully utilising the labour force.
Vacancies registered by the public employment
service have been rising steadily, reaching 770 000
by November 2017. Demographic ageing means
that cohorts entering the labour market are smaller
and immigration can only partially offset this trend
(see also Section 4.4). At the same time, there was
still substantial long-term unemployment 862 000
in November 2017, (for further discussion see also
European Commission, 2017c). The high female
part-time employment rate is accompanied by the
second highest gender gap in part-time
employment (37.5 % as compared with an EU
(21) 56 % of employees have opted for more annual leave, 2 %
for shorter working hours and 42 % for higher wages.
average of 23.1 %). As a result, Germany has a
very wide gender pay gap(22). To reduce the
gender pay gap, the Parliament adopted a law to
promote transparency in wage structures between
women and men in March 2017. Under this law,
companies with over 500 employees are expected
to assess wage developments regularly, report on
them, and take action to make sure that women and
men earn equal pay for equal work.
Disincentives to working longer hours, coupled
with the lack of sufficient childcare and all-day
school facilities are key reasons for women’s
lower attachment to the labour market.
Germany has one of the highest tax wedges (23) for
low earners, which creates disincentives to
working or to working longer hours. About 60 %
of low earners in 2015 were women (Kalina and
Weinkopf, 2017). The impact of parenthood on
employment is also higher in Germany: the
employment rate of women with children under 6
is 16.1 pp. lower than that of women without
children, versus an EU average of 8.8 pp. (See also
Box 4.3.1)
With increased demand for childcare and more
places in all-day schools, it remains key to
improve quality in early childhood education
and care. In 2015, 97.4 % of 4 to 6-year-olds'
were enrolled in early childhood education and
care establishments. The rate is markedly lower for
the under-threes. The participation rate in daycare
of school children up to 11 rose from 10.6% to
16.1% between 2006 and 2015, while the
participation rate in all-day schools rose from 9.8%
to 39 % (Conference of Ministers of Culture,
2016). However, in early childhood education and
care alone, unsatisfied demand and demographic
changes necessitate more than 600 000 additional
places until 2025 for children up to school age
(German Youth Institute, 2017). Issues persist around
service quality and flexibility. In 2017, additional
(22) In 2015, the unadjusted gender pay gap was 22% as
compared with an EU average of 16.3%. Much of this
disparity can be explained by working time, economic
activity and occupation (men work longer hours, in better
paid NACE sectors and occupations, and take fewer career
breaks compared with women). However, an unexplained
gender pay gap of 7.7% remains (Boll et al., 2016).
(23) The tax wedge on labour represents the difference between
the total labour cost of employing a worker and the
worker’s net earnings. It is defined as personal income tax
and employer and employee social security contributions
(net of family benefits) as a percentage of total labour costs
(the wage and employer social security contributions).
-6
-4
-2
0
2
4
6
8
10
02 03 04 05 06 07 08 09 10 11 12 13 14 15 16 17*18*19*
Rate
of
change y
-o-y
(%
)
Inflation (GDP deflator growth)Real compensation per employeeProductivity contribution (negative sign)Nominal unit labour costULC in Euro Area
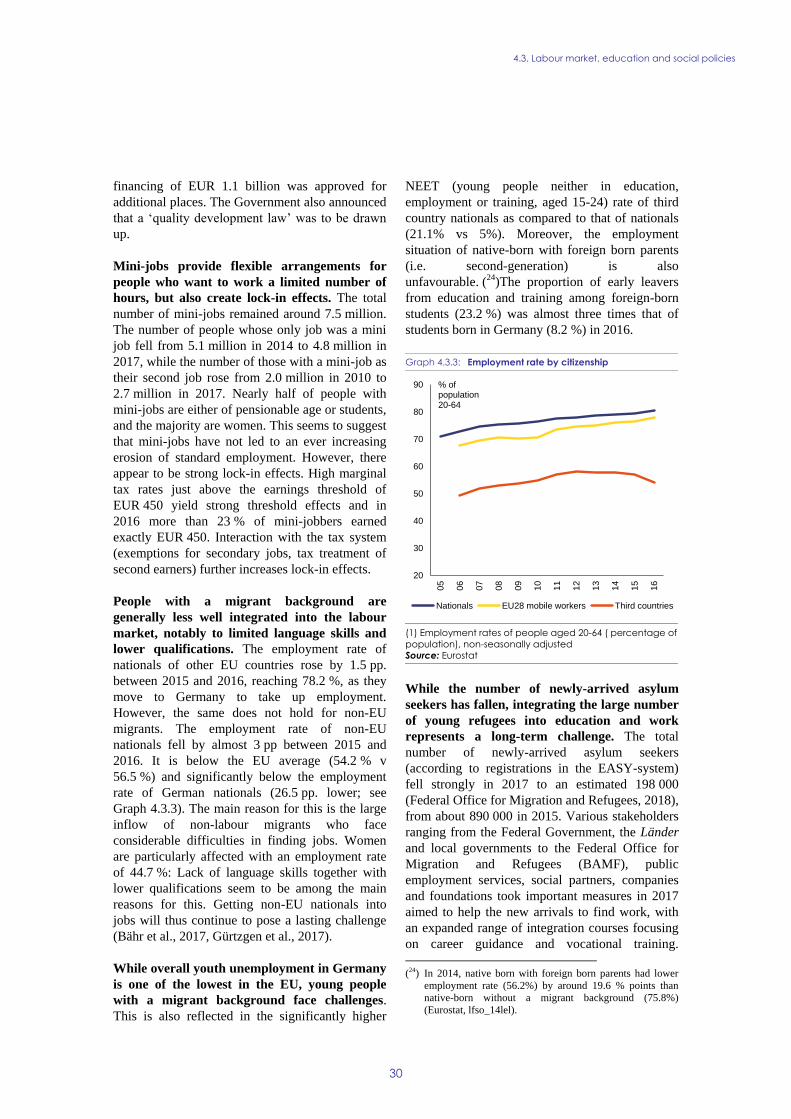
4.3. Labour market, education and social policies
30
financing of EUR 1.1 billion was approved for
additional places. The Government also announced
that a ‘quality development law’ was to be drawn
up.
Mini-jobs provide flexible arrangements for
people who want to work a limited number of
hours, but also create lock-in effects. The total
number of mini-jobs remained around 7.5 million.
The number of people whose only job was a mini
job fell from 5.1 million in 2014 to 4.8 million in
2017, while the number of those with a mini-job as
their second job rose from 2.0 million in 2010 to
2.7 million in 2017. Nearly half of people with
mini-jobs are either of pensionable age or students,
and the majority are women. This seems to suggest
that mini-jobs have not led to an ever increasing
erosion of standard employment. However, there
appear to be strong lock-in effects. High marginal
tax rates just above the earnings threshold of
EUR 450 yield strong threshold effects and in
2016 more than 23 % of mini-jobbers earned
exactly EUR 450. Interaction with the tax system
(exemptions for secondary jobs, tax treatment of
second earners) further increases lock-in effects.
People with a migrant background are
generally less well integrated into the labour
market, notably to limited language skills and
lower qualifications. The employment rate of
nationals of other EU countries rose by 1.5 pp.
between 2015 and 2016, reaching 78.2 %, as they
move to Germany to take up employment.
However, the same does not hold for non-EU
migrants. The employment rate of non-EU
nationals fell by almost 3 pp between 2015 and
2016. It is below the EU average (54.2 % v
56.5 %) and significantly below the employment
rate of German nationals (26.5 pp. lower; see
Graph 4.3.3). The main reason for this is the large
inflow of non-labour migrants who face
considerable difficulties in finding jobs. Women
are particularly affected with an employment rate
of 44.7 %: Lack of language skills together with
lower qualifications seem to be among the main
reasons for this. Getting non-EU nationals into
jobs will thus continue to pose a lasting challenge
(Bähr et al., 2017, Gürtzgen et al., 2017).
While overall youth unemployment in Germany
is one of the lowest in the EU, young people
with a migrant background face challenges.
This is also reflected in the significantly higher
NEET (young people neither in education,
employment or training, aged 15-24) rate of third
country nationals as compared to that of nationals
(21.1% vs 5%). Moreover, the employment
situation of native-born with foreign born parents
(i.e. second-generation) is also
unfavourable. (24)The proportion of early leavers
from education and training among foreign-born
students (23.2 %) was almost three times that of
students born in Germany (8.2 %) in 2016.
Graph 4.3.3: Employment rate by citizenship
(1) Employment rates of people aged 20-64 ( percentage of
population), non-seasonally adjusted
Source: Eurostat
While the number of newly-arrived asylum
seekers has fallen, integrating the large number
of young refugees into education and work
represents a long-term challenge. The total
number of newly-arrived asylum seekers
(according to registrations in the EASY-system)
fell strongly in 2017 to an estimated 198 000
(Federal Office for Migration and Refugees, 2018),
from about 890 000 in 2015. Various stakeholders
ranging from the Federal Government, the Länder
and local governments to the Federal Office for
Migration and Refugees (BAMF), public
employment services, social partners, companies
and foundations took important measures in 2017
aimed to help the new arrivals to find work, with
an expanded range of integration courses focusing
on career guidance and vocational training.
(24) In 2014, native born with foreign born parents had lower
employment rate (56.2%) by around 19.6 % points than
native-born without a migrant background (75.8%)
(Eurostat, lfso_14lel).
20
30
40
50
60
70
80
90
05
06
07
08
09
10
11
12
13
14
15
16
% of population 20-64
Nationals EU28 mobile workers Third countries

4.3. Labour market, education and social policies
31
(Federal Ministry of Education and Research,
2017) Considering difficulties in labour market
integration, demand for training and active labour
market policies is expected to remain strong in
2018.
Social policy*
The steady rise in the at-risk of poverty rate
and inequality seen since the crisis slightly
reversed. In 2016, the percentage of the
population at risk of poverty or social exclusion
continued to fall, owing to improvements in all of
its three components. The at-risk of poverty rate
has fallen slightly, from 16.7 % to 16.5 %, the first
decline since the crisis. Following a steady
increase since the crisis, in-work poverty also fell
slightly in 2016. However, this improvement
remains modest (and only benefits men, as in-work
poverty among women increased further). Further
improvements are held back by disincentives to
work longer (second earners, mini-jobs lock-in
effect, see above) and the moderate wage dynamic.
Positive economic and labour market
developments are only recently accompanied by
reduced income inequality. In 2016, the richest
20 % of households had 4.6 times as much income
as the poorest 20 %, a decline of 0.2 from the
previous year. Germany currently lies somewhere
in the middle of the EU countries, according to the
Gini index of equivalised disposable income (25).
However, income inequality worsened in the early
2000s, and the Gini coefficient subsequently
hovered around this higher level (see Graph 4.3.4).
The recent declines in inequality and poverty risk
may be explained by the positive labour market
developments, plus the new national minimum
wage. Improvements in the income position of low
income households have helped reduce rising
disposable income inequality. Germany ranks well
above or close to EU average for indicators related
to coverage and adequacy of unemployment
benefits.(26) Still, duration for a one year work
record is comparatively low and unemployed
(25) The Gini coefficient of equivalised disposable income
takes values between 0 and 1 and is a measure of equal or
unequal distribution. Higher values show a higher level of
inequality.
(26) According to the benchmarking exercise in the area of
unemployment benefits and active labour market policies
conducted within the EMCO Committee. See the draft
Joint Employment Report 2018 for details.
overall have a high at-risk of poverty rate.
Germany also performs well for the indicators
related to adequacy of minimum income benefits,
which play a major role as the last safety net.
Graph 4.3.4: Gini coefficient and poverty risk
* Break in time series in SOEP due to a change in sampling
methods
** Values take owner-occupied living space into account
1) At risk of poverty rate: proportion of people with an
equivalised net income below 60 % of the median income
Source: Federal Ministry for Labour and Social Affairs, 2017
The declining replacement rate in the statutory
first pillar has a negative effect on pension
adequacy and increases the risk of poverty in
old age. At 17.6 % in 2016, the risk of poverty in
old age (i.e. above 65) was above the EU average
of 14.7 % and higher than the average for the total
population (16.5 %). The risk of poverty in old age
applies particularly to former low-wage earners or
people with atypical jobs, self-employed people
without employees or those with an interrupted
employment history (temporary agency workers).
Moreover, Germany has the second widest gender
pension gap in the EU (45.7 %). In addition, the
replacement rate of the statutory pension scheme is
expected to decline (see Chapter 4.4). In response,
in June 2017 the Bundestag enacted three bills on
the pension reform which also address old-age
poverty. They include tax credits for low earners,
an increase in basic public allowances and
additional incentives for employers offering
occupational pension schemes. Even if fiscal
sustainability risks are currently low in Germany,
making it more attractive to work more and longer,
can help increase old-age income, boost potential
0,2
0,22
0,24
0,26
0,28
0,3
0,32
0,34
0,36
0
2
4
6
8
10
12
14
16
18
95 00 05 10 11 12 13* 14 15 16
%
At risk of poverty rate (SOEP)
At risk of poverty rate (SILC)
Gini (SOEP, rhs)
Gini (SILC, rhs)
4.3. Labour market, education and social policies
32
output, improve the fiscal outlook, and reduce the
need to save for retirement.
Self-employed people may be particularly at
risk of old age poverty as a result of limited
social protection. Those self-employed people
who do not have compulsory pension schemes for
the free professions and who do not have
considerable personal means have little protection
on retirement. Inadequate pension entitlements for
the self-employed will make them dependent on
means-tested pension supplements in old age or if
their earnings capacity is reduced (Bäcker, 2014;
Geyer, 2014; Brettschneider and Klammer, 2016).
Former self-employed people already account for a
high share of recipients of this benefit (Federal
Ministry for Labour and Social Affairs, 2017c).
The young are more vulnerable than the elderly
in some respects. In 2016, the material
deprivation rate of people over 65 was
considerably lower, at 7.0 %, than that of children
below 18 (10.6 %). Persistent generational
inequalities may have a severe impact on
intergenerational fairness. (European Commission,
2017e). Moreover, Germany a high gap in the EU
between people with disabilities and those without
as regards being at risk of poverty or social
exclusion (15.6 pps. vs the EU average of
10.1 pps. The rising cost of housing has a
considerable impact on the poor. In 2016, despite
an overall declining trend, the housing cost
overburden rate of people at risk of poverty was
still significantly above the EU average (15.6 %
vs. 11.1 %) .
Social outcomes for migrants and their children
remain a concern. Foreign workers have not
benefited from the recent fall in the rate of in-work
poverty. Their poverty risk rose from 16.8 % in
2015 to 17.7 % in 2016, while the situation
improved for German workers (falling from 8.8 %
to 8.4 %). Although the poverty risk for children of
foreign nationals improved considerably in 2016
(20.9 %, vs. 23.5 % in 2015), they are still at a
much higher risk than the children of German
parents (14.5 %, vs 13.7 % in 2015).
Access to health remains good, though
inequalities persist between regions and groups.
While operating at high cost and with certain
inequalities in access (see Section 4.1.), unmet
medical needs for medical care are very low in
Germany (0.5 % of the population) and the density
of physicians, nurses and hospitals in Germany is
among the highest in the EU. However, Germany
is among the four OECD countries with the largest
regional differences in the number of hospital beds
per 10 000 inhabitants (OECD, 2016d). National
data show that some rural areas, particularly in the
eastern Länder are short of doctors, while some
regions in the west lack enough nurses. Despite the
growing number of nursing graduates, national
studies predict considerable future shortages in the
profession, owing to demographic ageing.
Education and skills
Spending on education remains below the EU
average and the government target with
possible negative implications for potential
growth. Public expenditure on education remained
at flat as a share of GDP in 2015 and below the EU
average (see Section 4.5). This gives cause for
concern in view of the numerous new challenges,
including the integration of newly arrived
migrants, growing student numbers and
digitisation. Distribution constraints on public
spending in education due limited cooperation
possibilities between central and federal level
remain largely in place; despite a change in the
Base Law. Support from the federal government
due to the constitutional changes, in force since
June 2017, are at present restricted to investments
in school infrastructure for financially weak
municipalities (Federal Ministry for Economic
Affairs and Energy, 2017a).
Educational outcomes are stable overall but
remain considerably influenced by socio-
economic background. According to the 2015
OECD Programme for International Student
Assessment (PISA), the share of top performers in
the highest socio-economic quartile is above the
OECD average in science, mathematics and
reading, while the share of weak performers in that
group is below average. In science, the difference
in the rate of low achievers between the lowest and
highest social quartiles is 23 pp., equivalent to a
difference of almost 3 years of schooling(27).
While these results mark an improvement in the
equity of the German education system since PISA
(27) The difference between mean scores equals 103 score
points; a score difference of 38 points is associated with 1
year of schooling.
4.3. Labour market, education and social policies
33
2006 (OECD, 2016b), they show that considerable
disparities remain. A national survey on linguistic
and mathematical competences of 4th graders
marks little progress in lessening the influence of
socioeconomic factors on educational success
compared to earlier studies (Institute for
Educational Quality Improvement, 2017).
There is a wide performance gap between
native-born and foreign-born students. In PISA
2015 low performance in science was 11.8 % for
children without a migrant background versus
42.2 % for immigrants. Children of immigrants
(second generation) closed the gap only partially at
31.1 % (European Commission, 2016c). This is of
concern given the very substantial share of second
generation students in Germany (13.2 % compared
to 6.5 % across the EU).
Renewing the teaching workforce raises
challenges. In Germany, 45 % of primary and
secondary teachers are aged 50 or above,
compared with 35 % in the rest of the EU. The
necessary replacement of retired teachers has
already led to general supply gaps in some regions
and subject areas such as mathematics and
sciences (Standing Conference of the Ministers of
Education and Cultural Affairs, 2013). To alleviate
the situation, pensioned teachers are reactivated,
teachers from abroad are recruited and more and
more career changers are being accepted into the
profession, often without prior pedagogical
training but with tailored accompanying support
after they take up teaching(28). Flexible provisions
are necessary to address the growing demand for
teachers with even higher than expected student
numbers (Klemm and Zorn, 2017), but they do not
provide a permanent solution. Commonly agreed
standards for career changers and measures to
increase the attractiveness of the teaching
profession might contribute to further raise the
teacher supply.
University education is becoming more
widespread but is more difficult to accomplish
for students with a migrant background. The
rate of people obtaining a tertiary degree has
reached 33.2 % in 2016(29). Upward mobility, i.e.
(28) Estimates find that this concern up to 10 % of all teachers
hired in 2016, and in some federal states as much as one
third of newly hired primary teachers (BDK, 2017).
(29) The national target of 42%, which includes ISCED level 4
qualifications, has been passed and reached 46.8 % in 2016
young people earning tertiary degrees, above the
education level of their parents, is lower in
Germany than the OECD average. This might be
partially explained by the traditionally strong
prevalence of Vocational Education and Training
(VET) (OECD, 2016b) and its good employment
prospects. Students with a migrant background
face much bigger hurdles to complete their tertiary
studies: they experience dropout rates of 43 %
versus 29 % for the student population without a
migrant background (Ebert and Heublein, 2017).
Employment rates for VET graduates continue
to be high but fewer people are choosing this
education path. The proportion of Germany’s
upper secondary VET students (ISCED 3) slightly
decreased in 2015 to 46.8 %, just below the EU
average of 47.3 %. The employment rate of recent
VET graduates in 2016 was at 90.1 % markedly
higher than the EU average of 75 %. In 2016, the
number of unfilled apprenticeship positions
registered by the Federal Employment Agency
reached a new record high of 43 500, while 20 600
registered applicants did not find a suitable
apprenticeship. This points to a significant
mismatch in qualifications and at sectoral and
regional levels (Federal Ministry of Education and
Research, 2017). Efforts to better advertise the
VET system include orientation and information
campaigns at secondary schools, outreach to
higher education dropouts and improvements in
VET training, for example, through experience
abroad. Digitalisation in VET focuses on inter-
company vocational training, competence centres
speeding-up the digitalisation in training and
funding for digital equipment of SMEs.
Adult learning is below the EU average and
remains a particular challenge for the low-
skilled. Adult participation in learning remained at
8.5 % in 2016, practically unchanged and below
the EU average of 10.8 %. Reaching the low-
skilled and unskilled, the long-term unemployed
and older people is especially difficult. In the
context of the Upskilling Pathways: New
Opportunities for Adults recommendation
(European Commission, 2016d) several steps are
being undertaken in Germany to address the low-
skilled adult population of 7.5 million adults —
(Federal Ministry for Economic Affairs and Energy,
2017a).

4.3. Labour market, education and social policies
34
many of them in employment — who lack basic
reading and writing skills (Grotlüschen, 2016).
35
Inequality
Income inequality increased in Germany in the
early 2000s, and wealth inequality is high in
international comparison. These facts are
summarised in the recent Poverty and Wealth
Report and were largely confirmed by a previous
country report and an in-depth review which
argued that high income inequality may result in a
high overall propensity to save (Federal Ministry
for Labour and Social Affairs, 2017; European
Commission, 2017c and 2014a).
Rising inequality may be linked to demographic
and labour market changes. The real incomes of
the lowest income decile fell by 8 % between 1991
and 2014, owing to the expansion of the low wage
sector, population ageing and lagging adjustments
of transfers (Grabka and Goebel, 2017). Structural
changes in the labour market, such as the increase
in low wage employment, atypical employment,
and decreasing unionisation, contributed to
divergent real wage developments (Federal
Ministry for Labour and Social Affairs, 2017).
However, this result needs to be seen in the light of
labour market reforms and other factors which
changed the composition of the employed labour
force during the period in question (30). With the
improved employment rate, inequality of earned
income among the whole population has decreased
from 2005 onwards, and has even gone down
below the level of the year 2000 (Felbermayer et
al., 2016).
Theoretical literature suggests that inequality
may have a dampening effect on
macroeconomic developments. The theoretical
literature on the impact of inequality on
macroeconomic developments has identified
several channels: i) the growth channel: high
income inequality implies that a large proportion
of income is channelled to high-income groups,
which have a higher propensity to save. This could
dampen private consumption and consequently
growth; ii) the incentive channel: high income
inequality increases the incentives for low-income
groups to achieve higher income gains, which
could have a positive effect on productivity
(Mirrlees, 1971; Lazear and Rosen, 1981); iii) the
human capital channel: high income inequality
(30) For instance, employment grew from 39 million in 2005 to
43 million people in 2014.
reduces opportunities for private investment in
education. This could reduce the human capital
base in the medium to long run, with a
corresponding negative effect on productivity
(Galor and Zeira, 1993).
Recent empirical evidence for Germany is
consistent with the theoretical literature
suggesting that inequality may have an effect on
growth, its components and the trade
balances. (31
) Recent empirical studies by the
OECD find a negative impact of income inequality
on growth (Cingano, 2014; OECD, 2015). (32) The
study by Albig et al (2017) hints at the possibility
that Germany's cumulative real GDP growth rate
over 1991-2015 could have been higher if income
inequality had stayed constant. The study identifies
the human capital channel as the main driver of
this result, whose negative impact kicks in with a
delay of one decade. This illustrates the case for
timely anticipatory policy action, especially in the
field of equality of opportunity in education (see
Chapter 4.3). Furthermore, the share of
consumption in disposable household income
decreases substantially with increasing monthly
income, suggesting that there is a significant
difference in savings rates across the income
distribution (33). The study by Albig et al (2017)
indicates that the savings rate might have risen
more and that private consumption was somewhat
weaker between 1991 and 2015 compared to the
case where the Gini coefficient had remained
constant. It also points out that the trade and
current account surplus may have increased due to
a stronger effect of rising inequality on imports
than on exports.
Population ageing
As a result of increasing life expectancy and
lower birth rates, the share of elderly people in
the population has increased. Apart from the
standard population ageing, there are some specific
features characterising the German age
(31) There is no general consensus in the literature about the
direction or the size of the effect of inequality on growth.
For more details, see the meta-analysis described in Neves
et al. (2016).
(32) For a review of these studies, see Federal Ministry for
Economic Affairs and Energy (2017b).
(33) See also Brenke and Wagner (2013), who show that the
savings rate for the first quartile of the income distribution
is significantly lower than that for the fourth quartile, and
that this gap widened significantly over 1995-2007.
4.4. BEYOND THE AGGREGATE: AGEING, INEQUALITY AND
SAVINGS*

4.4. Beyond the aggregate: ageing, inequality and savings*
36
distribution. First, there is the large group of 'baby-
boomers' born between the mid-1950s and mid-
1960s. Second, the birth cohort following the
'baby-boomers' (born since the mid-1970s) had
particularly low levels of births per year.
The consequences of this pattern are significant
for the German economy and the current
account. The 'baby-boomers' are currently in their
prime working age, where work income and
savings are highest. However, when most of this
group reaches pensionable age, the German labour
force will shrink substantially, while the group of
pensioners will grow strongly. This cohort effect
of the 'baby-boomers' will also affect
macroeconomic variables, such as overall savings,
the sum of income tax payments (34), and overall
social security contributions.
According to economic theory, demographics
are currently contributing to the German
surplus, but should lower savings in the long
run, thereby balancing the current account.
Anticipation of ageing can be a key driver of
higher savings. This may help explain the very
high German current account surplus. However,
the current account increase implied by theory
(e.g. Buiter, 1981; Obstfeld and Rogoff, 1995) is
always temporary. In particular, the current
account position should increase when larger
cohorts pass through high saving stages of the life
cycle and are faced with 'ageing news' (positive
cohort effect). It should then decrease when a
larger proportion of the population grows older
and their savings rate is lower (negative cohort
effect).
Moreover, population ageing also provides a
rationale for Germans to invest a significant
share of savings abroad. An ageing population
may also be affecting domestic investment
patterns, resulting in rather subdued investment
growth at home and higher investment abroad. The
prospect of shrinking domestic labour supply and
waning domestic demand are depressing returns on
domestic investment. Yields on assets abroad are
likely to be higher, owing to a more favourable age
structure (e.g. Barro and Sala-i-Martin, 2003). This
(34) The effect on income taxes is aggravated by the transition
in the tax treatment of pension payments towards taxing
them when paid out. For details, see Beznoska and Hentze;
2016.
theoretical pattern leads to a positive and
increasing NIIP, as can be observed in the German
case.
Graph 4.4.1: Dependency ratios (2036 population forecast)
and savings rates of DE
Source: Eurostat
However, there seem to be also other factors at
play that influence the structurally high
German saving rate. German saving rates have
recently fluctuated at around 15 to 17 %,
significantly above the rates of most other
European countries. This is sometimes explained
by a specific German propensity to save (European
Commission, 2014a). Moreover, elderly and young
households in Germany depart from economic
theory in that they do not dissave on average (see
Graph 4.4.2). The result is known as the ‘German
savings puzzle’ (see, for instance, Belke et al.,
2015; Boersch-Supan et al., 2001) (35), which
contrasts with Modigliani's standard economic
theory of the life-cycle model of income and
consumption smoothing (Ando and Modigliani,
1963). As a result, the adjusted German version of
the life cycle savings pattern appears structurally
higher across all age cohorts than what one would
expect in the light of standard theory.
(35) The pattern characteristic of the 'German savings puzzle'
can, however, be observed in some other EU member states
as well.
14
15
16
17
18
0
0.1
0.2
0.3
0.4
0.5
0.6
1991
1994
1997
2000
2003
2006
2009
2012
2015
2018
2021
2024
2027
2030
2033
2036
Germany
Old age dependency ratio 65+
Old age dependency ratio 70+
Savings rate (rhs)
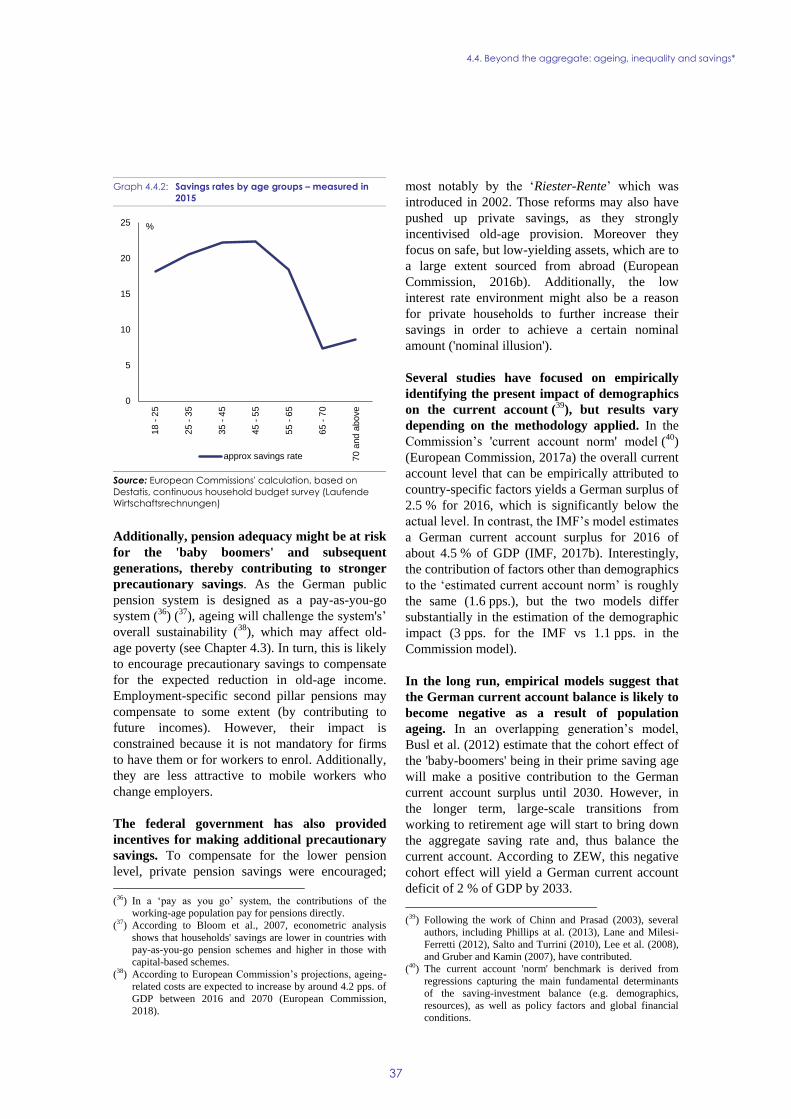
4.4. Beyond the aggregate: ageing, inequality and savings*
37
Graph 4.4.2: Savings rates by age groups – measured in
2015
Source: European Commissions' calculation, based on
Destatis, continuous household budget survey (Laufende
Wirtschaftsrechnungen)
Additionally, pension adequacy might be at risk
for the 'baby boomers' and subsequent
generations, thereby contributing to stronger
precautionary savings. As the German public
pension system is designed as a pay-as-you-go
system (36) (37), ageing will challenge the system's’
overall sustainability (38), which may affect old-
age poverty (see Chapter 4.3). In turn, this is likely
to encourage precautionary savings to compensate
for the expected reduction in old-age income.
Employment-specific second pillar pensions may
compensate to some extent (by contributing to
future incomes). However, their impact is
constrained because it is not mandatory for firms
to have them or for workers to enrol. Additionally,
they are less attractive to mobile workers who
change employers.
The federal government has also provided
incentives for making additional precautionary
savings. To compensate for the lower pension
level, private pension savings were encouraged;
(36) In a ‘pay as you go’ system, the contributions of the
working-age population pay for pensions directly.
(37) According to Bloom et al., 2007, econometric analysis
shows that households' savings are lower in countries with
pay-as-you-go pension schemes and higher in those with
capital-based schemes.
(38) According to European Commission’s projections, ageing-
related costs are expected to increase by around 4.2 pps. of
GDP between 2016 and 2070 (European Commission,
2018).
most notably by the ‘Riester-Rente’ which was
introduced in 2002. Those reforms may also have
pushed up private savings, as they strongly
incentivised old-age provision. Moreover they
focus on safe, but low-yielding assets, which are to
a large extent sourced from abroad (European
Commission, 2016b). Additionally, the low
interest rate environment might also be a reason
for private households to further increase their
savings in order to achieve a certain nominal
amount ('nominal illusion').
Several studies have focused on empirically
identifying the present impact of demographics
on the current account (39
), but results vary
depending on the methodology applied. In the
Commission’s 'current account norm' model (40)
(European Commission, 2017a) the overall current
account level that can be empirically attributed to
country-specific factors yields a German surplus of
2.5 % for 2016, which is significantly below the
actual level. In contrast, the IMF’s model estimates
a German current account surplus for 2016 of
about 4.5 % of GDP (IMF, 2017b). Interestingly,
the contribution of factors other than demographics
to the ‘estimated current account norm’ is roughly
the same (1.6 pps.), but the two models differ
substantially in the estimation of the demographic
impact (3 pps. for the IMF vs 1.1 pps. in the
Commission model).
In the long run, empirical models suggest that
the German current account balance is likely to
become negative as a result of population
ageing. In an overlapping generation’s model,
Busl et al. (2012) estimate that the cohort effect of
the 'baby-boomers' being in their prime saving age
will make a positive contribution to the German
current account surplus until 2030. However, in
the longer term, large-scale transitions from
working to retirement age will start to bring down
the aggregate saving rate and, thus balance the
current account. According to ZEW, this negative
cohort effect will yield a German current account
deficit of 2 % of GDP by 2033.
(39) Following the work of Chinn and Prasad (2003), several
authors, including Phillips at al. (2013), Lane and Milesi-
Ferretti (2012), Salto and Turrini (2010), Lee et al. (2008),
and Gruber and Kamin (2007), have contributed.
(40) The current account 'norm' benchmark is derived from
regressions capturing the main fundamental determinants
of the saving-investment balance (e.g. demographics,
resources), as well as policy factors and global financial
conditions.
0
5
10
15
20
25
18 -
25
25 -
35
35 -
45
45 -
55
55 -
65
65 -
70
70 a
nd a
bove
%
approx savings rate

38
Despite the recent pick-up in investment
growth, important asset types still need to catch
up. Despite a strong economic performance in the
wake of the crisis, Germany’s capital stock
increased much more slowly than that of the rest of
the EU-15, with potentially negative effects on the
long-term potential growth (Graph 4.5.1). As
regards the various asset types, investment in
machinery and equipment has started to respond to
the economic upswing; investment in intellectual
property products has grown consistently and is
gradually increasing in importance; and investment
in residential construction is picking up too,
although supply is still lagging behind housing
needs in certain areas. On the other hand,
investment in other construction is stagnating,
possibly affecting essential infrastructure.
Graph 4.5.1: Capital stock
Index 2010=100
Source: European Commission
Private investment development*
Private investment has picked up and is
expected to grow briskly in the short to medium
term, but business investment intensity remains
weak. Investment in machinery and equipment has
posted strong real increases in the course of 2017
reacting to record high orders, high capacity-
utilisation rates and a favourable outlook. It has
reached pre-crisis levels, but its intensity remains
subdued against the backdrop of favourable
financing conditions and declining relative prices
for machinery and equipment. On the other hand
investment in non-residential construction (NRC)
is stagnating. Investment in intangible assets has
continued to gain importance on aggregate, but
disparities across sectors and firm sizes are
persistent. The private investment share of GDP
seems to be rising mainly on account of housing
investment, driven by both real increases and price
inflation (Graph 4.5.2).
Graph 4.5.2: Gross fixed capital formation in the private
sector
Source: Destatis, European Commission
Private investment in intangible assets appears
to be concentrated in some sectors and
restrained in others. Investment in intangible
assets(41) is crucial to promoting productivity
growth (Thum et al., 2017). This includes
investment in R&D and software, and vocational
and life-long learning. A particular need is
investment in digital skills, essential for innovation
and the dissemination of technology. While large
technology-intensive corporations, particularly in
the automotive sector, are investing in intangible
assets, the services sector and small and-medium-
sized enterprises (SMEs) are lagging behind by
comparison with other advanced economies
(OECD, 2016c). Investment appears to be strongly
concentrated in only a few sectors, with often
fewer than half of the companies in those sectors
investing in intangible assets (Belitz et al., 2017).
(41) The System of National Accounts (SNA) currently captures
R&D, mineral exploration, computer software and
databases, entertainment, literary and artistic originals
under the asset category "intellectual property products",
while the broader term "intangible assets", synonymously
termed also "knowledge based capital", can include also
assets which are not captured by the SNA.
60
70
80
90
100
110
120
91 93 95 97 99 01 03 05 07 09 11 13 15 17
2010=100
DE FR UK IT EU 15 w.o. DE
15
16
17
18
19
20
21
22
0
1
2
3
4
5
6
7
8
9
00 01 02 03 04 05 06 07 08 09 10 11 12 13 14 15 16 17
% of GDP
Equipment Housing NRC
Intang. andoth. assets
Total (rhs)
4.5. INVESTMENT

4.5. Investment
39
Furthermore, recent data suggest that the share of
SMEs in business R&D expenditure has been
gradually declining in recent years (See also
Section 4.6). All this points towards a considerable
sector and company-size specific concentration of
investment in intangible assets and possibly
underinvestment in SMEs and other sectors, such
as services, which can dampen potential growth.
The increasing average age of firm owners,
especially where SMEs are concerned, could be
one of the reasons for their lower research and
innovation activity, as older entrepreneurs are
typically more risk-averse towards investments in
innovation.
Despite favourable financing conditions, non-
financial corporations remain net lenders.
While SMEs have positive net investment
(EUR 44 billion in 2016), larger companies
continue to invest at a lower rate than capital
depreciation (KfW, 2017b). With a good self-
financing capacity and an equity ratio of 30 %,
German companies rely less on external finance. In
this context, the standard push factor, low interest
rates, appears to have hardly any impact on firms'
investment decisions.
Obstacles to investment, according to company
surveys include shortages of skilled labour
administrative and infrastructure constraints
and the tax treatment of innovation activity.
According to a recent company survey (DIHK,
2018), 68% of businesses report a lack of skilled
personnel as a bottleneck to investment and
according to a different survey (DIHK, 2017), an
even larger share, 82% of businesses, report
shortages of skilled human resources as an
obstacle to their innovation activities.. This affects
SMEs more than big business. Substitution of
capital for labour is considered to have limitations
(where capital and labour are complementary),
especially for SMEs. The prospect of a shrinking
labour force is thus likely to put a lid on domestic
investment growth in the medium and long run.
Improving human capital, investing more in
education and skills of the workforce, could help
offset this risk and contribute to higher investment.
Other obstacles to business innovation include the
administrative burden and the lack of broadband
internet (an obstacle reported by 65% and 58% of
businesses respectively).
Productivity*
Labour productivity and total factor
productivity are growing faster than the euro
area average, but sector-specific challenges
remain. Productivity growth is the most important
driver of long-term growth and a prerequisite for
maintaining Germany’s high living standards.
Overall, labour productivity is growing faster than
the euro area average, especially in medium-high
technology sectors, such as motor vehicles,
chemicals or machinery and equipment. In
contrast, labour productivity growth in the services
sector has been a long way below that of the
manufacturing sector over the last decade (Graph
4.5.4). While total factor productivity shows a
stronger increase than the euro area average, the
annual growth rate for the last three years for
which records are available has remained stable
and below pre-crisis growth levels.
Graph 4.5.3: Potential growth and contributions
Source: European Commission
Available firm-level data show that the gap
between the most and the least productive
companies has widened over the last decade.
This applies to both labour productivity and total
factor productivity, suggesting that there are
obstacles preventing resources from being
efficiently reallocated to their most productive uses
(42). Recent research by the OECD further suggests
that about 12 % of capital is sunk in “zombie
(42) Data from the Competitiveness Research Network
(CompNet), available up to 2012. Update with more recent
data currently under progress, but not yet available.
-0.5
0.0
0.5
1.0
1.5
2.0
2.5
00 01 02 03 04 05 06 07 08 09 10 11 12 13 14 15 16
%, pps
TFP Capital accumulation
Labour Potential growth
TFP - EA
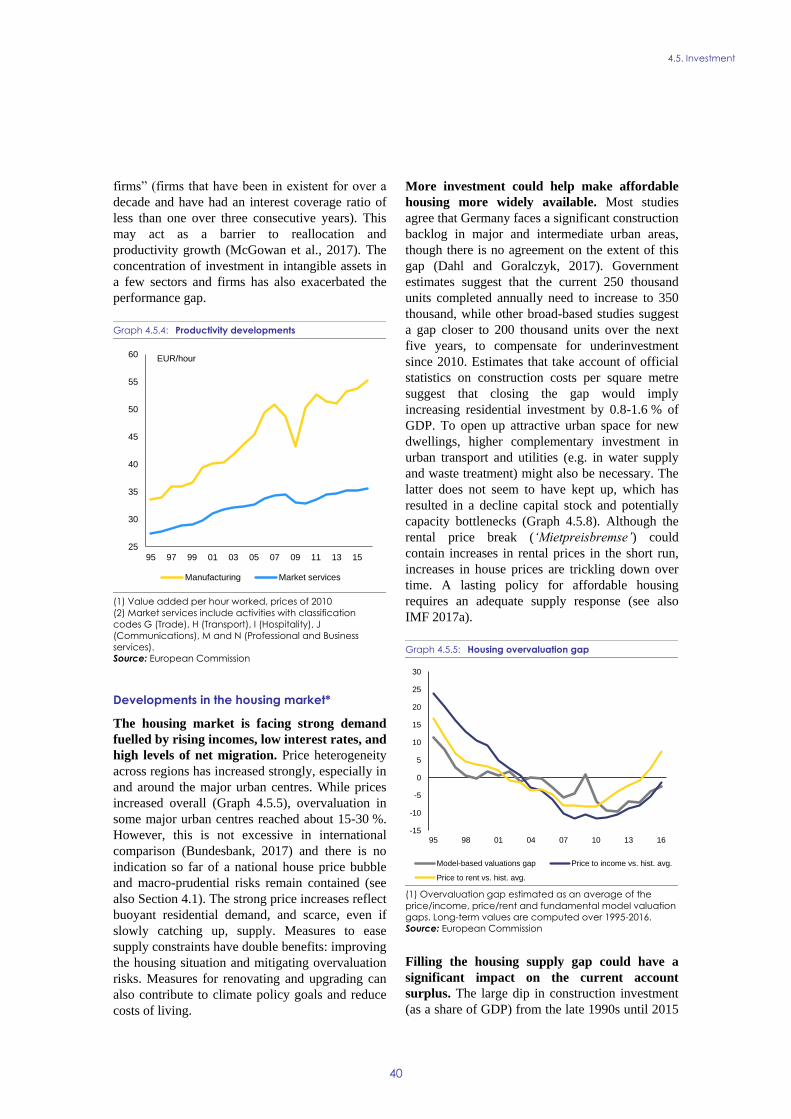
4.5. Investment
40
firms” (firms that have been in existent for over a
decade and have had an interest coverage ratio of
less than one over three consecutive years). This
may act as a barrier to reallocation and
productivity growth (McGowan et al., 2017). The
concentration of investment in intangible assets in
a few sectors and firms has also exacerbated the
performance gap.
Graph 4.5.4: Productivity developments
(1) Value added per hour worked, prices of 2010
(2) Market services include activities with classification
codes G (Trade), H (Transport), I (Hospitality), J
(Communications), M and N (Professional and Business
services).
Source: European Commission
Developments in the housing market*
The housing market is facing strong demand
fuelled by rising incomes, low interest rates, and
high levels of net migration. Price heterogeneity
across regions has increased strongly, especially in
and around the major urban centres. While prices
increased overall (Graph 4.5.5), overvaluation in
some major urban centres reached about 15-30 %.
However, this is not excessive in international
comparison (Bundesbank, 2017) and there is no
indication so far of a national house price bubble
and macro-prudential risks remain contained (see
also Section 4.1). The strong price increases reflect
buoyant residential demand, and scarce, even if
slowly catching up, supply. Measures to ease
supply constraints have double benefits: improving
the housing situation and mitigating overvaluation
risks. Measures for renovating and upgrading can
also contribute to climate policy goals and reduce
costs of living.
More investment could help make affordable
housing more widely available. Most studies
agree that Germany faces a significant construction
backlog in major and intermediate urban areas,
though there is no agreement on the extent of this
gap (Dahl and Goralczyk, 2017). Government
estimates suggest that the current 250 thousand
units completed annually need to increase to 350
thousand, while other broad-based studies suggest
a gap closer to 200 thousand units over the next
five years, to compensate for underinvestment
since 2010. Estimates that take account of official
statistics on construction costs per square metre
suggest that closing the gap would imply
increasing residential investment by 0.8-1.6 % of
GDP. To open up attractive urban space for new
dwellings, higher complementary investment in
urban transport and utilities (e.g. in water supply
and waste treatment) might also be necessary. The
latter does not seem to have kept up, which has
resulted in a decline capital stock and potentially
capacity bottlenecks (Graph 4.5.8). Although the
rental price break (‘Mietpreisbremse’) could
contain increases in rental prices in the short run,
increases in house prices are trickling down over
time. A lasting policy for affordable housing
requires an adequate supply response (see also
IMF 2017a).
Graph 4.5.5: Housing overvaluation gap
(1) Overvaluation gap estimated as an average of the
price/income, price/rent and fundamental model valuation
gaps. Long-term values are computed over 1995-2016.
Source: European Commission
Filling the housing supply gap could have a
significant impact on the current account
surplus. The large dip in construction investment
(as a share of GDP) from the late 1990s until 2015
25
30
35
40
45
50
55
60
95 97 99 01 03 05 07 09 11 13 15
EUR/hour
Manufacturing Market services
-15
-10
-5
0
5
10
15
20
25
30
95 98 01 04 07 10 13 16
Model-based valuations gap Price to income vs. hist. avg.
Price to rent vs. hist. avg.

4.5. Investment
41
was the most significant change in German
investment during the emergence of the current
account surplus. Remedying the sizeable
accumulated shortage of housing, would have a
significant impact on the current account. Given
historical elasticities and input-output estimates,
the main impact of increasing investment in
housing would be to push up domestic nominal
GDP. In addition such a change would also result
in spillovers, strong effects in nominal demand in
the rest of the euro area, based on latest estimates
of international inter-industry technology
coefficients. Raising construction investment –
including also renovation and upgrading - by
EUR 30-60 billion over five years (i.e. 1-2 % of
GDP) to close the supply gap, would thus translate
into a 0.25-0.5 pps. reduction in the current
account surplus, not taking secondary effects on
labour markets, wages, etc. into account.
Eradicating the entire construction backlog within
five years would probably require an increase in
construction investment of more than 3 pps. from
its current share of 10 % of GDP.
The Federal Government has introduced a
number of measures aimed at alleviating the
shortage of dwellings. First, it introduced
Housing Construction Campaign, a package of
measures designed to tackle housing shortages and
rising house prices. Second, it has committed to
contributing an annual EUR 1 billion over 2016 –
2019 to social housing projects supporting
families, students, pensioners and refugees. Third,
to deal with the ongoing refugee crisis, KfW has
made EUR 1 billion available since 2015 for
municipal authorities to provide housing for
refugees. Fourth, the urban development assistance
programme “Social City” focuses on stabilising
and upgrading economically and socially deprived
urban areas and is an example of successful
collaboration among various bodies at federal and
Länder level. For 2017, EUR 190 million of
funding was made available for this programme.
Graph 4.5.6: Gross fixed capital formation in the public
sector
Source: Destatis, European Commission
Public investment including knock-on effects
on private investment*
Public investment is picking up but a significant
backlog has largely remained in place. Real
public investment increased robustly in 2015-2017
in comparison to the sometimes negative growth
rates in the years before (Graph 4.5.6). This trend
reflects the efforts by the government to strengthen
investment, but the public capital stock as a share
of GDP is still declining. Investment as a
percentage of capital stock in the government
sector and also public investment as a percentage
of public expenditure are lower in Germany than in
other EU-15 countries and the euro area average
(43). The biggest fall since the crisis has been
recorded in construction and the only sector, which
has expanded in line with GDP over the years, is
intellectual property.
(43) With specific regard to government investment, the gross
fixed capital formation recorded for the general
government depends on the classification of units and in
some cases specific transactions (European Commission,
2016e).
0.9
1.1
1.3
1.5
1.7
1.9
2.1
2.3
2.5
0.0
0.2
0.4
0.6
0.8
1.0
1.2
1.4
1.6
00 01 02 03 04 05 06 07 08 09 10 11 12 13 14 15 16 17
% of GDP
Equipment Housing NRC
Intang. andoth. assets
Total (rhs)

4.5. Investment
42
Graph 4.5.7: Net public investment by level of government
Source: European commission
Local authorities' net investment in
infrastructure has been falling for years,
resulting in a large investment backlog.
Municipal authorities are responsible for over half
of public investment, so it is vital to address the
challenges facing this level of government. While
the federal government and the Länder have
managed to keep their construction investment
stable, the municipalities suffered from a
continuous decline. In the early 1990s, about 17 %
of their expenditure went on infrastructure. The
figure had dropped to 13 % by 2000 and 10 % by
2010, falling further to 8 % by 2016. The gravity
of the reduction in investment can also be seen by
the continuously negative net investment of
municipalities (around EUR 6 billion annually
over 2010-2016, 0.2 % of GDP), as new
investments only replace about 80 % of the capital
stock lost through depreciation each year (Graph
4.5.7). According to the yearly survey conducted
by the public development bank KfW (2017a), the
municipal investment backlog had reached about
EUR 126 billion (4 % of GDP) by 2017. Within
this backlog, the areas with the biggest shortfall
are: ‘Infrastructure and streets’ (27 %) and
‘Schools and education’ (26 %). Closing the
investment backlog at municipal level would
require an additional annual public investment of
0.3 % of GDP over the next decade.
Measures to bridge the gaps in the skills and
planning capacity needed for public investment
have yet to yield results. Two of the main factors
holding back public investment are staff shortages
and a lack of engineering expertise; funding is less
of a problem. Staff reductions in recent years,
particularly at municipal level, have contributed to
a loss of skills and the capacity to plan, organise
and manage investment projects, particularly
relatively large-scale ones. The government has
now responded to this challenge by setting up a
service agency (PD – Berater der öffentlichen
Hand GmbH) that offers assistance in managing
investment projects to Germany's 11 000
municipalities. However, it was not until 2017 that
the agency became operational, and the take-up
rate has been rather low so far. Time will tell how
effective it will prove to be; one issue is the large
number of municipalities, which could create
capacity bottlenecks at the agency itself. The new
Infrastructure Company for Transport
(Infrastrukturgesellschaft Verkehr) is being set up
in order to concentrate knowledge and staff at
federal level, so as to manage large-scale
investment projects more effectively. It is
scheduled to be set up in 2018 and become fully
operational by 2021. A comprehensive long-term
investment strategy could also help incentivise
more investment by providing clarity and certainty
about future developments.
Public investment in education, R&D and
digital infrastructure can have long-term
crowding-in effects on private investment. A
recent study suggests that public investment, e.g.
in digital infrastructure and education, can have
positive long-term effects on private investment
(crowding-in effects) (Krebs and Scheffel, 2016) –
the positive effects are also shown in the QUEST
simulations shown in Box 3.1. Public expenditure
on education has remained at 4.2 % of GDP in
2015 and below the EU average (44) of 4.8 %
across the EU. The national target of 10 % of GDP
for spending on education and research by 2015
was not met and spending remained at 9.1 % of
GDP in 2015. This corresponds to an investment
gap estimated at EUR 27.2 billion (0.9 % of GDP;
German Trade Union Confederation, 2017).
In contrast, public investment can be expected
to crowd out some private investment in the
(44) Complete comparability of public education expenditure
can however not be achieved because of the different
organisation of work-based components in VET in
different Member States, where (private) expenditure by
companies in Germany is considerable.
-0.3
-0.2
-0.1
0.0
0.1
0.2
00 05 10 15
% of GDP
Federal State Local
SSF General
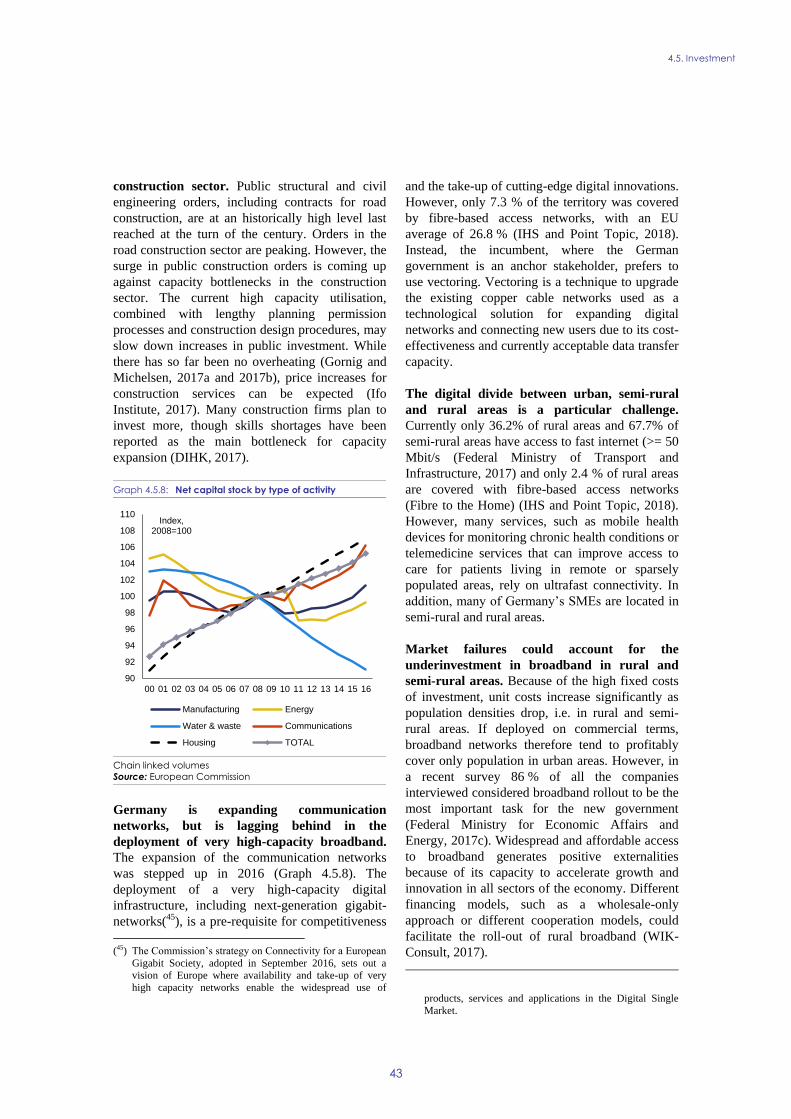
4.5. Investment
43
construction sector. Public structural and civil
engineering orders, including contracts for road
construction, are at an historically high level last
reached at the turn of the century. Orders in the
road construction sector are peaking. However, the
surge in public construction orders is coming up
against capacity bottlenecks in the construction
sector. The current high capacity utilisation,
combined with lengthy planning permission
processes and construction design procedures, may
slow down increases in public investment. While
there has so far been no overheating (Gornig and
Michelsen, 2017a and 2017b), price increases for
construction services can be expected (Ifo
Institute, 2017). Many construction firms plan to
invest more, though skills shortages have been
reported as the main bottleneck for capacity
expansion (DIHK, 2017).
Graph 4.5.8: Net capital stock by type of activity
Chain linked volumes
Source: European Commission
Germany is expanding communication
networks, but is lagging behind in the
deployment of very high-capacity broadband.
The expansion of the communication networks
was stepped up in 2016 (Graph 4.5.8). The
deployment of a very high-capacity digital
infrastructure, including next-generation gigabit-
networks(45), is a pre-requisite for competitiveness
(45) The Commission’s strategy on Connectivity for a European
Gigabit Society, adopted in September 2016, sets out a
vision of Europe where availability and take-up of very
high capacity networks enable the widespread use of
and the take-up of cutting-edge digital innovations.
However, only 7.3 % of the territory was covered
by fibre-based access networks, with an EU
average of 26.8 % (IHS and Point Topic, 2018).
Instead, the incumbent, where the German
government is an anchor stakeholder, prefers to
use vectoring. Vectoring is a technique to upgrade
the existing copper cable networks used as a
technological solution for expanding digital
networks and connecting new users due to its cost-
effectiveness and currently acceptable data transfer
capacity.
The digital divide between urban, semi-rural
and rural areas is a particular challenge.
Currently only 36.2% of rural areas and 67.7% of
semi-rural areas have access to fast internet (>= 50
Mbit/s (Federal Ministry of Transport and
Infrastructure, 2017) and only 2.4 % of rural areas
are covered with fibre-based access networks
(Fibre to the Home) (IHS and Point Topic, 2018).
However, many services, such as mobile health
devices for monitoring chronic health conditions or
telemedicine services that can improve access to
care for patients living in remote or sparsely
populated areas, rely on ultrafast connectivity. In
addition, many of Germany’s SMEs are located in
semi-rural and rural areas.
Market failures could account for the
underinvestment in broadband in rural and
semi-rural areas. Because of the high fixed costs
of investment, unit costs increase significantly as
population densities drop, i.e. in rural and semi-
rural areas. If deployed on commercial terms,
broadband networks therefore tend to profitably
cover only population in urban areas. However, in
a recent survey 86 % of all the companies
interviewed considered broadband rollout to be the
most important task for the new government
(Federal Ministry for Economic Affairs and
Energy, 2017c). Widespread and affordable access
to broadband generates positive externalities
because of its capacity to accelerate growth and
innovation in all sectors of the economy. Different
financing models, such as a wholesale-only
approach or different cooperation models, could
facilitate the roll-out of rural broadband (WIK-
Consult, 2017).
products, services and applications in the Digital Single
Market.
90
92
94
96
98
100
102
104
106
108
110
00 01 02 03 04 05 06 07 08 09 10 11 12 13 14 15 16
Index, 2008=100
Manufacturing Energy
Water & waste Communications
Housing TOTAL
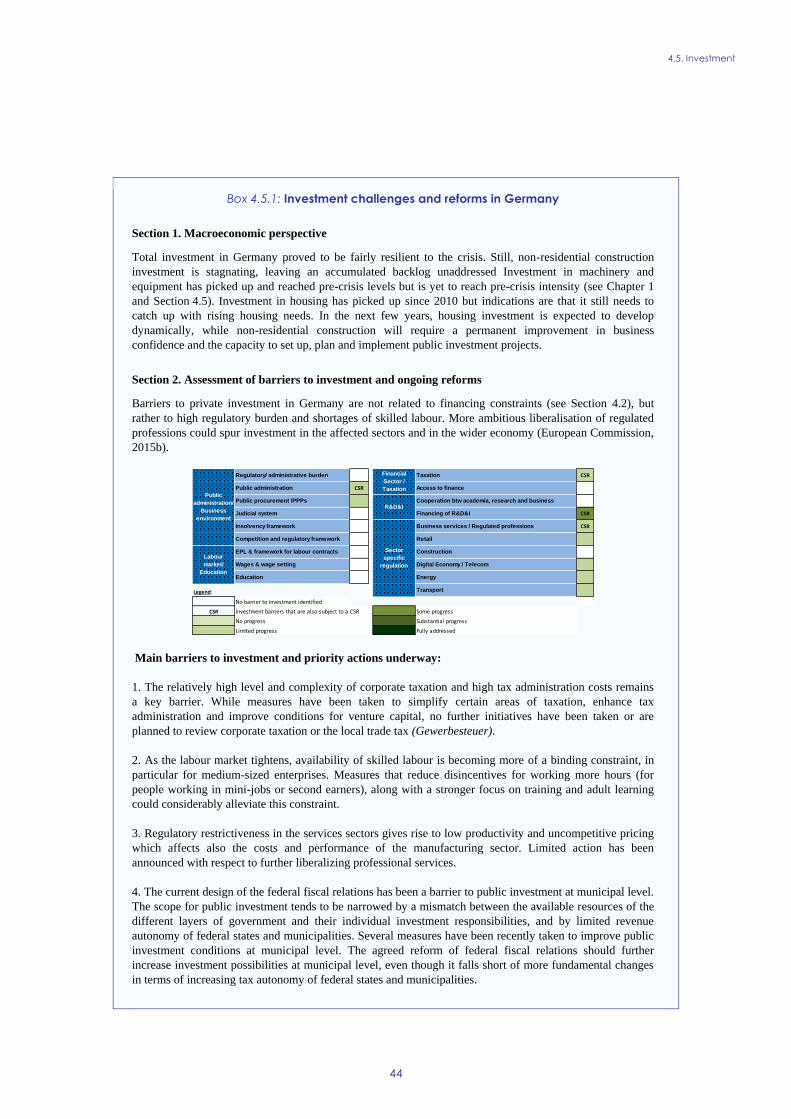
4.5. Investment
44
Box 4.5.1: Investment challenges and reforms in Germany
Section 1. Macroeconomic perspective
Total investment in Germany proved to be fairly resilient to the crisis. Still, non-residential construction
investment is stagnating, leaving an accumulated backlog unaddressed Investment in machinery and
equipment has picked up and reached pre-crisis levels but is yet to reach pre-crisis intensity (see Chapter 1
and Section 4.5). Investment in housing has picked up since 2010 but indications are that it still needs to
catch up with rising housing needs. In the next few years, housing investment is expected to develop
dynamically, while non-residential construction will require a permanent improvement in business
confidence and the capacity to set up, plan and implement public investment projects.
Section 2. Assessment of barriers to investment and ongoing reforms
Barriers to private investment in Germany are not related to financing constraints (see Section 4.2), but
rather to high regulatory burden and shortages of skilled labour. More ambitious liberalisation of regulated
professions could spur investment in the affected sectors and in the wider economy (European Commission,
2015b).
Main barriers to investment and priority actions underway:
1. The relatively high level and complexity of corporate taxation and high tax administration costs remains
a key barrier. While measures have been taken to simplify certain areas of taxation, enhance tax
administration and improve conditions for venture capital, no further initiatives have been taken or are
planned to review corporate taxation or the local trade tax (Gewerbesteuer).
2. As the labour market tightens, availability of skilled labour is becoming more of a binding constraint, in
particular for medium-sized enterprises. Measures that reduce disincentives for working more hours (for
people working in mini-jobs or second earners), along with a stronger focus on training and adult learning
could considerably alleviate this constraint.
3. Regulatory restrictiveness in the services sectors gives rise to low productivity and uncompetitive pricing
which affects also the costs and performance of the manufacturing sector. Limited action has been
announced with respect to further liberalizing professional services.
4. The current design of the federal fiscal relations has been a barrier to public investment at municipal level.
The scope for public investment tends to be narrowed by a mismatch between the available resources of the
different layers of government and their individual investment responsibilities, and by limited revenue
autonomy of federal states and municipalities. Several measures have been recently taken to improve public
investment conditions at municipal level. The agreed reform of federal fiscal relations should further
increase investment possibilities at municipal level, even though it falls short of more fundamental changes
in terms of increasing tax autonomy of federal states and municipalities.
Regulatory/ administrative burden Taxation CSR
Public administration CSR Access to finance
Public procurement /PPPs Cooperation btw academia, research and business
Judicial system Financing of R&D&I CSR
Insolvency framework Business services / Regulated professions CSR
Competition and regulatory framework Retail
EPL & framework for labour contracts Construction
Wages & wage setting Digital Economy / Telecom
Education Energy
Legend: Transport
No barrier to investment identified
CSR Investment barriers that are also subject to a CSR Some progress
No progress Substantial progress
Limited progress Fully addressed
Public
administration/
Business
environment
Financial
Sector /
Taxation
R&D&I
Sector
specific
regulation
Labour
market/
Education
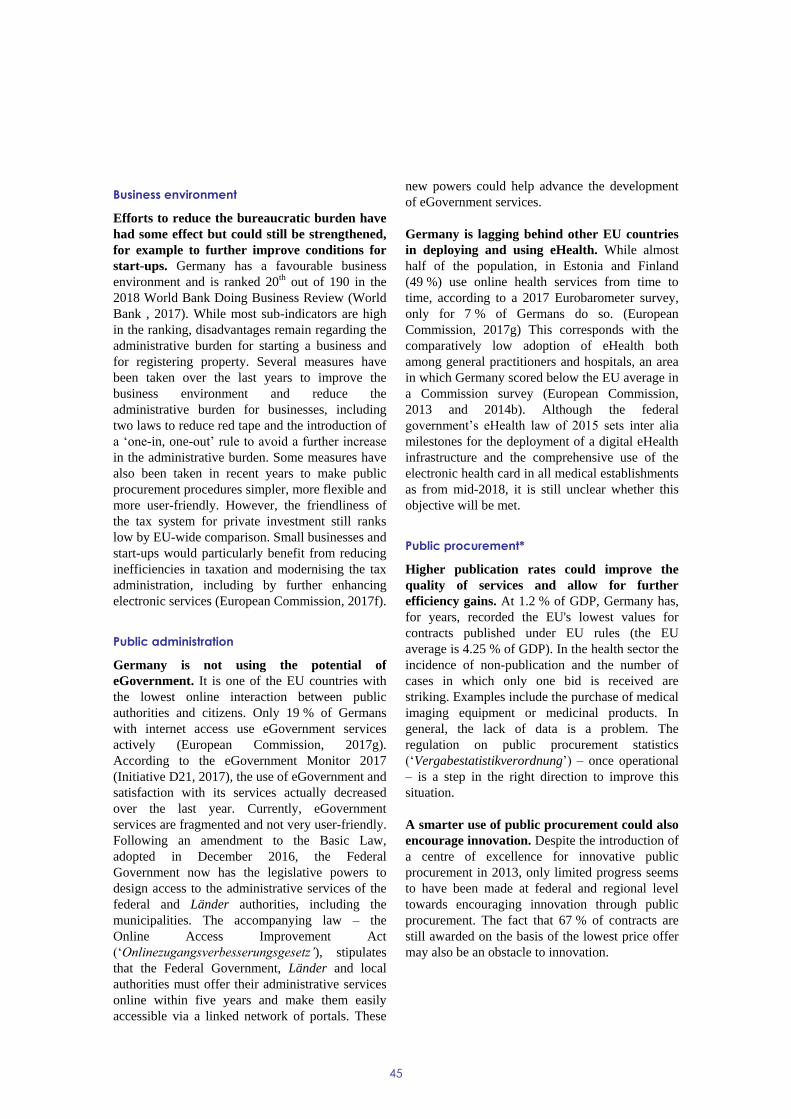
45
Business environment
Efforts to reduce the bureaucratic burden have
had some effect but could still be strengthened,
for example to further improve conditions for
start-ups. Germany has a favourable business
environment and is ranked 20th out of 190 in the
2018 World Bank Doing Business Review (World
Bank , 2017). While most sub-indicators are high
in the ranking, disadvantages remain regarding the
administrative burden for starting a business and
for registering property. Several measures have
been taken over the last years to improve the
business environment and reduce the
administrative burden for businesses, including
two laws to reduce red tape and the introduction of
a ‘one-in, one-out’ rule to avoid a further increase
in the administrative burden. Some measures have
also been taken in recent years to make public
procurement procedures simpler, more flexible and
more user-friendly. However, the friendliness of
the tax system for private investment still ranks
low by EU-wide comparison. Small businesses and
start-ups would particularly benefit from reducing
inefficiencies in taxation and modernising the tax
administration, including by further enhancing
electronic services (European Commission, 2017f).
Public administration
Germany is not using the potential of
eGovernment. It is one of the EU countries with
the lowest online interaction between public
authorities and citizens. Only 19 % of Germans
with internet access use eGovernment services
actively (European Commission, 2017g).
According to the eGovernment Monitor 2017
(Initiative D21, 2017), the use of eGovernment and
satisfaction with its services actually decreased
over the last year. Currently, eGovernment
services are fragmented and not very user-friendly.
Following an amendment to the Basic Law,
adopted in December 2016, the Federal
Government now has the legislative powers to
design access to the administrative services of the
federal and Länder authorities, including the
municipalities. The accompanying law – the
Online Access Improvement Act
(‘Onlinezugangsverbesserungsgesetz’), stipulates
that the Federal Government, Länder and local
authorities must offer their administrative services
online within five years and make them easily
accessible via a linked network of portals. These
new powers could help advance the development
of eGovernment services.
Germany is lagging behind other EU countries
in deploying and using eHealth. While almost
half of the population, in Estonia and Finland
(49 %) use online health services from time to
time, according to a 2017 Eurobarometer survey,
only for 7 % of Germans do so. (European
Commission, 2017g) This corresponds with the
comparatively low adoption of eHealth both
among general practitioners and hospitals, an area
in which Germany scored below the EU average in
a Commission survey (European Commission,
2013 and 2014b). Although the federal
government’s eHealth law of 2015 sets inter alia
milestones for the deployment of a digital eHealth
infrastructure and the comprehensive use of the
electronic health card in all medical establishments
as from mid-2018, it is still unclear whether this
objective will be met.
Public procurement*
Higher publication rates could improve the
quality of services and allow for further
efficiency gains. At 1.2 % of GDP, Germany has,
for years, recorded the EU's lowest values for
contracts published under EU rules (the EU
average is 4.25 % of GDP). In the health sector the
incidence of non-publication and the number of
cases in which only one bid is received are
striking. Examples include the purchase of medical
imaging equipment or medicinal products. In
general, the lack of data is a problem. The
regulation on public procurement statistics
(‘Vergabestatistikverordnung’) – once operational
– is a step in the right direction to improve this
situation.
A smarter use of public procurement could also
encourage innovation. Despite the introduction of
a centre of excellence for innovative public
procurement in 2013, only limited progress seems
to have been made at federal and regional level
towards encouraging innovation through public
procurement. The fact that 67 % of contracts are
still awarded on the basis of the lowest price offer
may also be an obstacle to innovation.

46
Innovation, venture capital, entrepreneurial
activity and digital economy*
Research and Innovation
Germany is one of the EU’s innovation leaders,
but in a context of slow productivity growth
and negative demographic trends, the challenge
is to secure its competitive position at the
forefront of research and innovation. With
2.94 % of GDP in 2016, Germany has the 3rd
highest R&D intensity in the EU, but there are
significant disparities at regional level. There has
been a consistent upward trend in total public and
private R&D expenditure in the last decade. While
business R&D intensity increased by 0.3 pps.
between 2007 and 2016, public R&D intensity rose
by only 0.2 pps. A more ambitious R&D intensity
target of 3.5 % was proposed by the Expert
Commission on Research and Innovation.
Over the last few years Germany has taken
measures to further strengthen its already solid
research and science base, but there is scope for
scientific excellence to improve. Germany has a
solid science base, supported by initiatives such as
the Pact for Research and Innovation, which funds
science and research institutes; the Higher
Education Pact, which supports higher education
institutes in providing quality education; the
Excellence Strategy, a successor programme to the
Excellence Initiative; and the tenure-track
programme to support young scientists. However,
Germany currently ranks only 8th in the EU on the
key indicator reflecting scientific excellence. (46)
This suggests there is scope for further progress.
Though overall cooperation between public
research institutes and firms is strong, SMEs
still face challenges in benefiting from it.
Germany's policies to encourage science-business
cooperation (e.g. the Fraunhofer Society) are often
taken as examples of worldwide best practice.
However, the country's high scores on the relevant
indicators (47), are often the result of strong
(46) The proportion of the country's scientific publications that
rank among the top 10 % most cited scientific publications
worldwide.
(47) With a volume of public R&D financed by business
enterprises representing 0.12 % of GDP in 2014 (EU
average: 0.052 %), Germany ranks first among EU
countries. It ranks 3rd in public-private scientific co-
publication as a share of the total number of publications,
with 3.5 % in 2015 (EU average: 2.8 %).
cooperation between mainly large manufacturing
companies and public research institutes. As
regards the rate of cooperation between SMEs and
academia or research institutes, Germany scores
only slightly above the EU average, according to
the Community Innovation Survey 2014.
Private investment in R&D has been
increasingly concentrated in large firms and in
medium-high tech manufacturing. While overall
business expenditure on R&D shows strong
growth rates, R&D has become increasingly
concentrated in large firms and in medium-high-
tech manufacturing sectors, particularly the
automotive sector. While SMEs' R&D intensity
has remained static over the past decade (Graph
4.6.1), the R&D intensity of large companies has
increased considerably (KfW, 2017b; ZEW,
2017c). SMEs' expenditure on R&D at 0.17 % of
GDP is also much lower than the EU average in
2015 (0.30 %). Political discussion has returned to
considering tax incentives for business R&D,
which, if appropriately designed, could foster
R&D investment also in young and innovative
firms.
Employment in fast-growing firms in innovative
sectors (48
) has fallen, as has the share of
innovative firms and entrepreneurship overall.
The latest data show that the proportion of total
jobs for which high-growth innovative firms
account has fallen and that Germany's score is
below the EU average. (49) Similarly, the share of
innovative businesses as a percentage of the total
has fallen, although it continues to be the highest
in the EU (50) (KfW, 2017b; ZEW, 2017c).
Moreover, though there are some very dynamic
start-up environments in large cities such as Berlin,
the overall trend in entrepreneurship is negative.
This applies to all sectors, including knowledge-
(48) Number of employees in high-growth enterprises (HGEs)
in the 50 % most innovative sectors, as a share of total
employment for enterprises with 10 or more employees.
HGEs are defined as enterprises with an average annual
growth in employees greater than 10 % a year, over a
three-year period, and with 10 or more employees at the
beginning of the observation period.
(49) The share of employment in fast-growing enterprises in
innovative sectors fell from 5.9 % in 2012 to 4.5 % in 2014
(EU average: 4.8 %).
(50) According to the Community Innovation Survey,
innovative enterprises with ten employees or more
accounted for 79 % of the total in 2010, falling to 67 % by
2014 (whereas the EU-average share fell from 53 % in
2010 to 49 % in 2014).
4.6. SECTORAL POLICIES
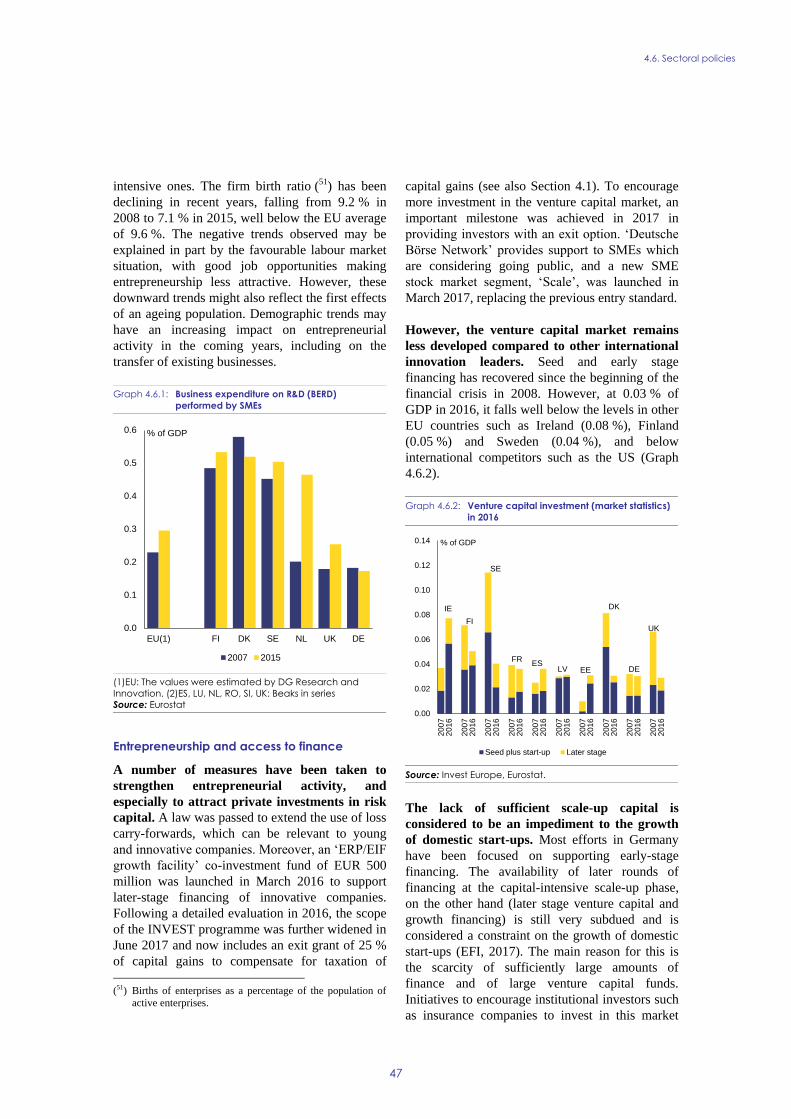
4.6. Sectoral policies
47
intensive ones. The firm birth ratio (51) has been
declining in recent years, falling from 9.2 % in
2008 to 7.1 % in 2015, well below the EU average
of 9.6 %. The negative trends observed may be
explained in part by the favourable labour market
situation, with good job opportunities making
entrepreneurship less attractive. However, these
downward trends might also reflect the first effects
of an ageing population. Demographic trends may
have an increasing impact on entrepreneurial
activity in the coming years, including on the
transfer of existing businesses.
Graph 4.6.1: Business expenditure on R&D (BERD)
performed by SMEs
(1)EU: The values were estimated by DG Research and
Innovation. (2)ES, LU, NL, RO, SI, UK: Beaks in series
Source: Eurostat
Entrepreneurship and access to finance
A number of measures have been taken to
strengthen entrepreneurial activity, and
especially to attract private investments in risk
capital. A law was passed to extend the use of loss
carry-forwards, which can be relevant to young
and innovative companies. Moreover, an ‘ERP/EIF
growth facility’ co-investment fund of EUR 500
million was launched in March 2016 to support
later-stage financing of innovative companies.
Following a detailed evaluation in 2016, the scope
of the INVEST programme was further widened in
June 2017 and now includes an exit grant of 25 %
of capital gains to compensate for taxation of
(51) Births of enterprises as a percentage of the population of
active enterprises.
capital gains (see also Section 4.1). To encourage
more investment in the venture capital market, an
important milestone was achieved in 2017 in
providing investors with an exit option. ‘Deutsche
Börse Network’ provides support to SMEs which
are considering going public, and a new SME
stock market segment, ‘Scale’, was launched in
March 2017, replacing the previous entry standard.
However, the venture capital market remains
less developed compared to other international
innovation leaders. Seed and early stage
financing has recovered since the beginning of the
financial crisis in 2008. However, at 0.03 % of
GDP in 2016, it falls well below the levels in other
EU countries such as Ireland (0.08 %), Finland
(0.05 %) and Sweden (0.04 %), and below
international competitors such as the US (Graph
4.6.2).
Graph 4.6.2: Venture capital investment (market statistics)
in 2016
Source: Invest Europe, Eurostat.
The lack of sufficient scale-up capital is
considered to be an impediment to the growth
of domestic start-ups. Most efforts in Germany
have been focused on supporting early-stage
financing. The availability of later rounds of
financing at the capital-intensive scale-up phase,
on the other hand (later stage venture capital and
growth financing) is still very subdued and is
considered a constraint on the growth of domestic
start-ups (EFI, 2017). The main reason for this is
the scarcity of sufficiently large amounts of
finance and of large venture capital funds.
Initiatives to encourage institutional investors such
as insurance companies to invest in this market
0.0
0.1
0.2
0.3
0.4
0.5
0.6
EU(1) FI DK SE NL UK DE
% of GDP
2007 2015
IE
FI
SE
FRES
LV EE
DK
DE
UK
0.00
0.02
0.04
0.06
0.08
0.10
0.12
0.14
2007
2016
2007
2016
2007
2016
2007
2016
2007
2016
2007
2016
2007
2016
2007
2016
2007
2016
2007
2016
% of GDP
Seed plus start-up Later stage
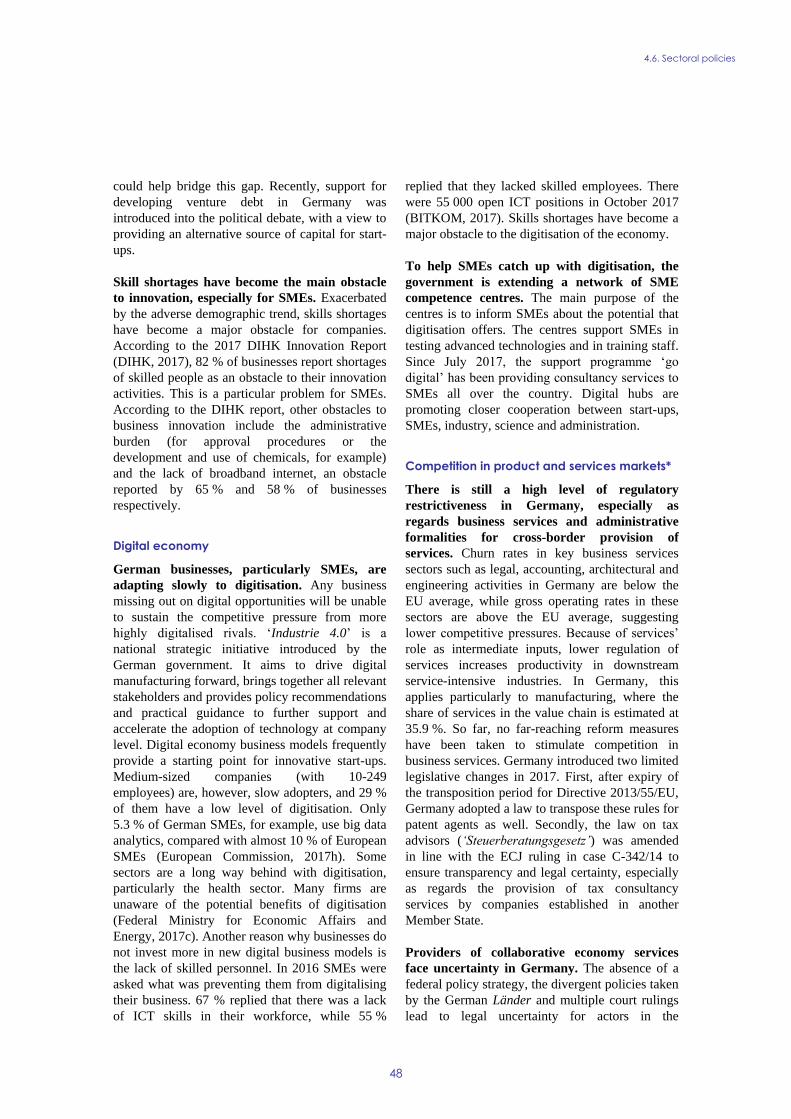
4.6. Sectoral policies
48
could help bridge this gap. Recently, support for
developing venture debt in Germany was
introduced into the political debate, with a view to
providing an alternative source of capital for start-
ups.
Skill shortages have become the main obstacle
to innovation, especially for SMEs. Exacerbated
by the adverse demographic trend, skills shortages
have become a major obstacle for companies.
According to the 2017 DIHK Innovation Report
(DIHK, 2017), 82 % of businesses report shortages
of skilled people as an obstacle to their innovation
activities. This is a particular problem for SMEs.
According to the DIHK report, other obstacles to
business innovation include the administrative
burden (for approval procedures or the
development and use of chemicals, for example)
and the lack of broadband internet, an obstacle
reported by 65 % and 58 % of businesses
respectively.
Digital economy
German businesses, particularly SMEs, are
adapting slowly to digitisation. Any business
missing out on digital opportunities will be unable
to sustain the competitive pressure from more
highly digitalised rivals. ‘Industrie 4.0’ is a
national strategic initiative introduced by the
German government. It aims to drive digital
manufacturing forward, brings together all relevant
stakeholders and provides policy recommendations
and practical guidance to further support and
accelerate the adoption of technology at company
level. Digital economy business models frequently
provide a starting point for innovative start-ups.
Medium-sized companies (with 10-249
employees) are, however, slow adopters, and 29 %
of them have a low level of digitisation. Only
5.3 % of German SMEs, for example, use big data
analytics, compared with almost 10 % of European
SMEs (European Commission, 2017h). Some
sectors are a long way behind with digitisation,
particularly the health sector. Many firms are
unaware of the potential benefits of digitisation
(Federal Ministry for Economic Affairs and
Energy, 2017c). Another reason why businesses do
not invest more in new digital business models is
the lack of skilled personnel. In 2016 SMEs were
asked what was preventing them from digitalising
their business. 67 % replied that there was a lack
of ICT skills in their workforce, while 55 %
replied that they lacked skilled employees. There
were 55 000 open ICT positions in October 2017
(BITKOM, 2017). Skills shortages have become a
major obstacle to the digitisation of the economy.
To help SMEs catch up with digitisation, the
government is extending a network of SME
competence centres. The main purpose of the
centres is to inform SMEs about the potential that
digitisation offers. The centres support SMEs in
testing advanced technologies and in training staff.
Since July 2017, the support programme ‘go
digital’ has been providing consultancy services to
SMEs all over the country. Digital hubs are
promoting closer cooperation between start-ups,
SMEs, industry, science and administration.
Competition in product and services markets*
There is still a high level of regulatory
restrictiveness in Germany, especially as
regards business services and administrative
formalities for cross-border provision of
services. Churn rates in key business services
sectors such as legal, accounting, architectural and
engineering activities in Germany are below the
EU average, while gross operating rates in these
sectors are above the EU average, suggesting
lower competitive pressures. Because of services’
role as intermediate inputs, lower regulation of
services increases productivity in downstream
service-intensive industries. In Germany, this
applies particularly to manufacturing, where the
share of services in the value chain is estimated at
35.9 %. So far, no far-reaching reform measures
have been taken to stimulate competition in
business services. Germany introduced two limited
legislative changes in 2017. First, after expiry of
the transposition period for Directive 2013/55/EU,
Germany adopted a law to transpose these rules for
patent agents as well. Secondly, the law on tax
advisors (‘Steuerberatungsgesetz’) was amended
in line with the ECJ ruling in case C-342/14 to
ensure transparency and legal certainty, especially
as regards the provision of tax consultancy
services by companies established in another
Member State.
Providers of collaborative economy services
face uncertainty in Germany. The absence of a
federal policy strategy, the divergent policies taken
by the German Länder and multiple court rulings
lead to legal uncertainty for actors in the
4.6. Sectoral policies
49
collaborative economy (see Box 4.6.1 for further
details). For example, the Berlin legislation on
short-term accommodation services has been
challenged in several (partly) pending court
proceedings. This has caused doubt on whether
and how to apply the rules. In the passenger
transport sector, certain services were prohibited
by court decisions; but appeals were brought
before the Federal Court which requested a
preliminary ruling regarding compliance with
Union law.
Germany displays a high level of regulatory
restrictiveness as regards both retail
establishments and retailers' daily operations.
Restrictive spatial planning rules in some Länder
are having a negative impact on retail market
dynamics, hampering the establishment of certain
retail formats which offer a wider range of
complementary products (Holland van Gijzen
Advocaten, 2016).
Railways
The market share of new entrants in the long-
distance passenger train services market
remains below 1 %. One of the key factors
hindering market entry is the restricted access to
ticket distribution channels. The German
Monopolies Commission recommends that, since
using the distribution channels of Deutsche Bahn
AG is crucial for its competitors, the company
should not be allowed to refuse unilaterally to
cooperate on tariffs and ticket sales (German
Monopolies Commission, 2017). In addition, high
track access charges result in very high operating
costs of railway undertakings.
The existing legal framework may also be
impeding competition. In June 2017, the
European Court of Justice found that Deutsche
Bahn's accounting rules are such that it is
impossible to monitor compliance with the
prohibition on transferring public funds earmarked
for infrastructure management to the branch of
Deutsche Bahn offering transport services. The
Court underlined the need for these accounts to be
published, to ensure external transparency in the
use of public funds.
Energy, resources and climate change*
The adaptation of electricity networks to
renewables production in Germany is
progressing, but at a slow pace, and significant
investment in transmission and distribution
grids remains outstanding. Substantial delays in
carrying out many projects have occurred due to
delays in planning procedures, the need to further
promote the synchronisation of network and
renewables development, as well as outstanding
decisions in relation to network development and
investment expected to be made with the network
development plan in 2019. These delays have
resulted in considerable costs for German and
European electricity networks and electricity
markets. Market intervention by system operators
remains significant, although both redispatch costs
and feed-in management measures (curtailment of
renewable generation) decreased in 2016
compared to 2015: EUR 220 million redispatch
costs (2015: EUR 412 million), EUR 373 million
for feed-in management measures (2015: EUR 478
million).
The lack or shortage of north-south internal
lines constrain the trade in electricity with
neighbouring countries, as cross-border
relevant domestic congestions tend to be pushed
to the borders. The current congestion
management and price-zone definition in Germany
and in Central Europe do not always address
congestion appropriately, thus limiting cross-
border flows of electricity. While the bilateral
agreement between Germany and Austria and
Germany and Denmark, respectively, on an interim
solution to this problem is a step in the right
direction, further discussions with neighbouring
countries are needed if the agreement is to be
implemented smoothly.

4.6. Sectoral policies
50
Box 4.6.1: Collaborative economy
The German government encourages a broad discussion on digital economy and platforms. It launched a
'Digital Strategy 2025' in 2016, and in 2017 published a 'White Book on Digital Platforms', which presents
practical proposals for "digital governance". Although a number of measures and projects have been
initiated, these efforts have not yet translated into a strategy on the collaborative economy, which could
generate opportunities for citizens, as users of new and innovative services or as micro entrepreneurs, as
well as for traditional service providers in terms of new business channels.
Currently, policy and regulation differ because of the federal system considerably across regions and cities,
for example regarding short-term accommodation and passenger transport. In Berlin, regional legislation de
facto prohibits all use of residential property for any other purposes than long-term housing. As of the
second time, renting out more than 50% of a property for a period of less than two months is subject to prior
authorisation. Exceptions are possible but are subject to strict criteria (e.g. an equivalent property has to be
made newly available to the property market or the host's personal livelihood is directly at risk). Also in
Munich, short-term rental of entire properties is subject to authorisation, namely where more than 50% of
the main residence is rented out, or the property is rented out for longer than eight weeks in a calendar year.
This could be the case where less than 50% of the property is rented out for a maximum period of eight
weeks per year. In the field of passenger transport, services may only be provided as 1) traditional taxi, 2)
hire cars with drivers, or 3) non-profit ridesharing. Due to the level of restrictiveness in the first category,
collaborative economy services would mostly be offered as hire cars with drivers. There is no maximum
number of licences. However, even if all criteria are met, local authorities can still deny the license on
various grounds (including the protection of local taxi trade).
The German Monopoly Commission already in 2014 expected particular economic and efficiency gains in
the taxi market. A recent Commission Study on passenger transport (European Commission, 2016a)
suggests that so far only 2-3 % of mediated taxi rides were set up via smart-phone apps. This represents only
0.4 % on the entire taxi market and indicates further potential.
Retail electricity prices in Germany remain
among the highest in the EU, despite
competitive wholesale markets and falling
wholesale prices. Although wholesale prices are
relatively low (about 25 % below the EU average)
and falling (-23.4 % between 2013 and 2016), and
despite competitive retail markets with high
switching rates, household electricity prices rose in
the same period by 1.9 %, to 29.8 cents/kwh. This
is about 45 % above the EU average. Prices on
wholesale markets fell by 3 % on spot markets and
by 12 % on future markets. The decoupling of
developments on the German wholesale and retail
markets could hamper active consumer
participation through demand-side flexibility, e.g.
through more real-time electricity contracts. The
activation of such services requires price signals
from the wholesale market to be passed on to
consumers, to incentivise them to react to
scarcities in the market.
The huge discrepancy between developments in
the wholesale and the retail sector can be
explained by the large shares of taxes and
levies, with exemptions of some sectors, for
example from the renewable surcharge. At 53.6
% of the household electricity price, taxes and
levies are substantially higher than the EU average
(36 %) imposing on households both the costs
resulting from support schemes for generation
capacity and the exemptions of energy intensive
sectors.
Germany is not on track to reach its national
indicative energy efficiency targets by 2020. Up
to 2015, energy-intensity decreased in parallel with
the EU average. However, there appears to be a
considerable risk that Germany will not meet its
target. It needs to make considerable further efforts
to reduce energy consumption in the run-up to
2020.
While the German Federal Government
adopted a National Action Plan on Energy
Efficiency, further measures to improve energy
efficiency in transport have untapped potential.
Germany's efficiency policies are subject to
continuous review, also in the light of the
development of a national energy and climate plan
on which Germany is advanced. Germany has
4.6. Sectoral policies
51
launched a ‘green paper’ process, designed to
establish the ‘efficiency first’ principle, and
involving stakeholders. Given the increased
urbanisation and population density of urban areas
in Germany, and since the share of collective
passenger transport has increased only slightly,
measures to promote public transport - as opposed
to individual, fossil-fuelled transport - could
represent a fresh opportunity for more energy-
efficient transport.
Germany has made substantial efforts to make
its building stock more energy-efficient. Since
the political push to decarbonise the economy,
Germany has set a comprehensive regulatory and
policy framework. Between 2006 and 2016,
4.6 million dwellings were either refurbished, or
designed and built to be energy-efficient.
Germany appears on track to meet its
Europe2020 renewable energy target. With a
renewables share in final energy consumption of
14.8 % in 2016, Germany was above its indicative
trajectory of 11.3 % for 2015-2016 and 3.2
percentage points below its 2020 target of 18 %.
Germany aims to increase the proportion of
electricity from renewable sources in its energy
mix from 32.2 % in 2016 to 40-45 % in 2025 and
55-60 % in 2035. A revised renewable energy
sources act adopted in July 2016 (Erneuerbare
Energien Gesetz, EEG 2017) governs the support
system for most renewable electricity generation in
Germany. Among other things, the new law
stipulates that levels of support for more renewable
energy projects must be determined by competitive
auctions.
Germany is expected to miss its nationally set
emissions reduction target for 2020 by 4 pps.
Germany has set itself the target of cutting
greenhouse gas emissions by 40 % between 1990
and 2020. Thus, the Climate Action Programme
2020 and the NAPE were developed. In 2016,
emissions were estimated at 27.3 % below 1990
levels. A projection report submitted under the
Monitoring Mechanism Regulation
(Projektionsbericht 2017) concluded that current
(as of July 2016) and planned policies do not yield
the required additional emissions reduction by
2020, as the results of the planned measures are
expected to materialise only after 2025. As a
result, emissions in 2020 are expected to be 36 %
below 1990 levels.
Germany is expected to miss its EU 2020 Effort
Sharing Decision (ESD) target. EU law requires
a reduction in greenhouse gas emissions in sectors
that are not covered by the EU Emission Trading
System (e.g. the agricultural, residential,
commercial, transport, and waste management
sectors) by 14 % between 2005 and 2020.
Preliminary data indicates that Germany reached
its Effort Sharing Decision target for 2016.
However, Germany’s projection report indicates
that, under current policies, the 2020 ESD
emission reduction target will be missed by a
margin of 3.3 pps.
The transport sector is expected to achieve
relatively limited emission reductions. Under
current policies, Germany’s projection report
concludes that emissions in the transport sector are
expected to fall by 1 % between 2005 and 2020.
As total emissions in Germany are expected to fall
faster over the same period, transport sector
emissions as a proportion of total emissions in
Germany are expected to rise to 20 % (an increase
of 3 pps.) Despite efforts to support and increase
the use of electric vehicles in Germany, the target
of 1 million electric cars on German roads by 2020
is unlikely to be met.
Despite an ambitious policy approach and the
various measures already in place, there is a
risk that Germany will miss its own resource
productivity objectives. As early as 2002, the
Federal Government adopted a sustainable
development strategy which included the objective
of doubling German resource productivity by
2020, compared with 1994. The latest figures show
that improvements in resource productivity during
the last five years suggest that the indicator will
just reach 60 % of the set goal (Federal Ministry
for the Environment, Nature Conservation,
Building and Nuclear Safety, 2015).
Emissions of several air pollutants are above
legal limits and water pollution remains a
serious concern. Despite significant emission
reductions in recent years, total emissions for
nitrogen oxides, volatile organic compounds and
ammonia are above the current ceilings for
acceptable levels. Nitrogen oxide limits are being
exceeded partly as a result of pollutants emitted by
diesel vehicles. Over the last years, newly-
registered diesel passenger cars did not perform as
aimed at by regulators as some of them were

4.6. Sectoral policies
52
equipped with software that disactivated built-in
powerful emission-reduction technologies while
the cars were in normal use. The economic costs
related to air pollution are estimated to include
27 million working days lost each year because of
illness, with associated costs to employers of
EUR 3 500 million/year, and healthcare costs of
above EUR 240-466 million/year (European
Commission, 2017i). There is evidence of
significant unsolved water pollution problems
caused by nitrates, especially in areas with
intensive farming. In the long term this will lead to
higher costs for water treatment. Experts estimate
that the consumer price will rise by at least 32 %
per year to ensure that drinking water meets
sufficiently high quality standards
(Umweltbundesamt, 2017).

53
Commitments Summary assessment (52
)
2017 country-specific recommendations (CSRs)
CSR1: While respecting the medium-term
objective, use fiscal and structural policies to
support potential growth and domestic demand
as well as to achieve a sustained upward trend in
investment. Accelerate public investment at all
levels of government, especially in education,
research and innovation, and address capacity
and planning constraints for infrastructure
investments. Further improve the efficiency and
investment-friendliness of the tax system.
Stimulate competition in business services and
regulated professions.
Germany has made limited progress in addressing
CSR 1 (this overall assessment of CSR 1 does not
include an assessment of compliance with the
Stability and Growth Pact):
…use fiscal and structural policies to support
potential growth and domestic demand as well
as to achieve a sustained upward trend in
investment.
Limited progress has been made in achieving a
sustained upward trend in investment. The public
investment share of GDP for 2017 remained
largely unchanged compared to the two years
before.
June 2017: The federal government decided to
invest additional funds in transport infrastructure
in 2018.
(52) The following categories are used to assess progress in implementing the 2017 country-specific recommendations (CSRs):
No progress: The Member State has not credibly announced nor adopted any measures to address the CSR. This category covers a
number of typical situations, to be interpreted on a case-by-case basis taking into account country-specific conditions. They
include the following:
no legal, administrative, or budgetary measures have been announced in the national reform programme, in any other
official communication to the national Parliament/relevant parliamentary committees or the European Commission,
publicly (e.g. in a press statement or on the government's website);
no non-legislative acts have been presented by the governing or legislative body;
the Member State has taken initial steps in addressing the CSR, such as commissioning a study or setting up a study group
to analyse possible measures to be taken (unless the CSR explicitly asks for orientations or exploratory actions). However,
it has not proposed any clearly-specified measure(s) to address the CSR.
Limited progress: The Member State has:
announced certain measures but these address the CSR only to a limited extent; and/or
presented legislative acts in the governing or legislative body but these have not been adopted yet and substantial further,
non-legislative work is needed before the CSR is implemented;
presented non-legislative acts, but has not followed these up with the implementation needed to address the CSR.
Some progress: The Member State has adopted measures:
that partly address the CSR; and/or
that address the CSR, but a fair amount of work is still needed to address the CSR fully as only a few of the measures
have been implemented. For instance, a measure or measures have been adopted by the national Parliament or by
ministerial decision, but no implementing decisions are in place.
Substantial progress: The Member State has adopted measures that go a long way towards addressing the CSR and most of them
have been implemented.
Full implementation: The Member State has implemented all measures needed to address the CSR appropriately.
ANNEX A
OVERVIEW TABLE

A. Overview table
54
August 2017: Additional funding of the
Municipal Investment Promotion Fund for
modernizing school buildings including digital
infrastructure.
Accelerate public investment at all levels of
government, especially in education …
Limited progress has been made in increasing
public expenditure on education and no additional
measures have been taken in this regard. Despite
more spending by the Federal Government,
expenditure on education as a proportion of GDP
at the level of general government has remained
stable in recent years and well below the EU
average. Overall public and private education and
research expenditure has increased only slightly
in recent years and may have fallen short of the
national target of 10 % of GDP.
The reallocation of financial responsibilities
between the state and the federal levels can
somewhat improve the availability of funding at
the state level where direct responsibility for
investment lies.
June 2017: The base law was modified to adjust
the allocation of responsibilities and funding
between the state vs the federal level, from 2020.
…research and innovation,
… and address capacity and planning
constraints for infrastructure investments.
Further improve the efficiency and investment-
friendliness of the tax system.
Limited progress has been made in increasing
public expenditure on research and innovation
and no additional measures have been taken in
this regard. Despite some nominal increases,
public expenditure on R&D has remained at
around 0.9 % of GDP in recent years and total
public and private expenditure remained at around
2.9 % of GDP in 2015 and 2016.
Some progress has been made:
Spring 2017: To support public investment on
municipal level, the service agency
("Partnerschaft Deutschland – Berater der
öffentlichen Hand GmbH") did take up its
operational work in 2017.
No progress. No additional measures have been
taken to improve the efficiency and investment-
friendliness of the tax system. Implementation of
measures taken in the past is on-going. On 1
January 2017 most provisions of the Act on the
Modernisation of Taxation Procedures became

A. Overview table
55
Stimulate competition in business services and
regulated professions
effective (Federal Law Gazette I 2016 no. 35, p.
1679). It has the potential to enhance the role of
IT and automated procedures relieving
administrative and compliance burden of tax
administrations and taxpayers. It is too early to
assess the actual impact of the new law. Its full
roll-out will stretch over a period of six years.
Limited progress has been made regarding
measures to stimulate competition in business
services and regulated professions.
CSR2: Reduce disincentives to work for second
earners and facilitate transitions to standard
employment. Reduce the high tax wedge for
low-wage earners. Create conditions to promote
higher real wage growth, respecting the role of
the social partners.
Germany has made limited progress in addressing
CSR 2:
Reduce disincentives to work for second earners
…facilitate transitions to standard employment
Reduce the high tax wedge for low-wage
earners
Limited progress has been made in reducing
disincentives to work for second earners and
facilitate transition to standard employment. The
Act for Combating Tax Avoidance was adopted
in June 2017 and entered into force as of 1
January 2018 (Federal Law Gazette I p. 1682).
Tax brackets IV/IV become the standard tax
bracket for married couples. Further work is also
done to raise awareness of the factor-based
method.
Limited progress. No further measures were
taken - though the law on temporary agency work
and work contracts entered into force in April
2017, after its adoption autumn 2016. This
provides equal pay after nine months of working
in the sector and the introduction of a maximum
transitional period of 18 months after which
temporary agency workers must be hired by the
company
Limited progress has been made with reducing
the high tax wedge for low-wage earners, that was
due to the good economic situation, without
further specific action. In October 2017, it was
decided to reduce the supplementary contribution
rate to the regular health insurance system by
0.1 pp to 1.0 %, from 2018. In November 2017, it
was decided to reduce employee's pension

A. Overview table
56
Create conditions to promote higher real wage
growth, respecting the role of the social
partners.
contributions by 0.1 pp to 18.6 % from 2018, a
small decrease due to higher revenues in the
currently good economic situation, not a
structural change. Measures reducing the tax
wedge in general were adopted in 2016 and
entered into force on 1 January 2017 and
1 January 2018. These comprise successive
increases in the tax-free basic and child
allowances, the child benefit and the
supplementary child allowance, as well as
measures to contain the fiscal drag, from which
low wage earner benefit below average.
Limited progress regarding promoting real wage
growth.
May 2017: The federal government adopted an
ordinance, setting out minimum wages for agency
workers, following up on earlier rules, with entry
into force from June 2017.
July 2017: The federal government adopted an
ordinance setting out minimum working
conditions including minimum wages in the long
term care sector, updating the existing regulation,
with entry into force from November 2017.
Europe 2020 (national targets and progress)
Employment rate of the population aged 20-64
years: 77 %
79.1 % in the year ending September 2017.
Employment rate of the population aged 55-64
years: 60 %
69.7 % in the year ending September 2017.
Employment rate of women: 73 % 75.0 % in the year ending September 2017.
R&D target: 3.0 % of GDP 2.94 % (2016)
Germany is close to reaching its target, but only
small progress in 2016: R&D intensity increased
slightly from 2.92 % of GDP in 2015 to 2.94 % in
2016 (the third highest in the EU). In 2016 R&D
intensity in Germany was composed of 0.94 % public
expenditure and 2 % business expenditure.
National greenhouse gas emissions (GHG)
target:
-14 % in 2020 compared to 2005 (in sectors not
According to the latest national projections submitted
to the Commission and taking into account existing
measures, the non-ETS greenhouse gas emissions
between 2005 and 2020 are expected to decrease by
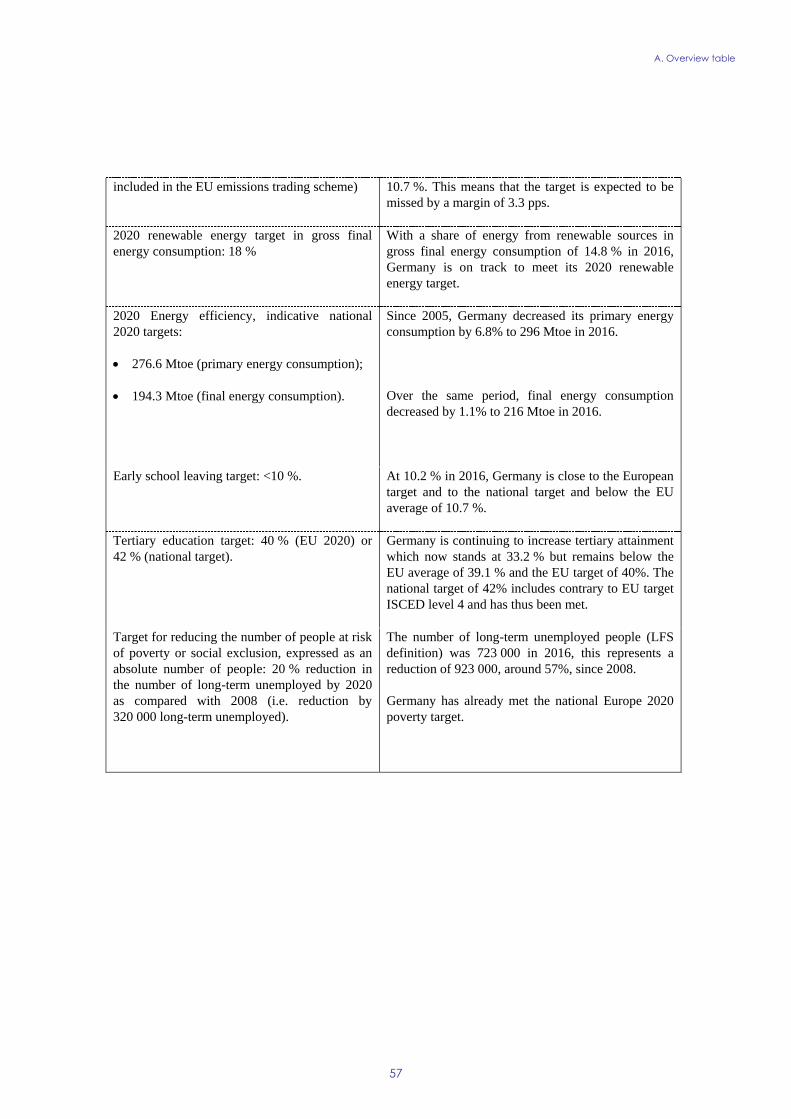
A. Overview table
57
included in the EU emissions trading scheme) 10.7 %. This means that the target is expected to be
missed by a margin of 3.3 pps.
2020 renewable energy target in gross final
energy consumption: 18 %
With a share of energy from renewable sources in
gross final energy consumption of 14.8 % in 2016,
Germany is on track to meet its 2020 renewable
energy target.
2020 Energy efficiency, indicative national
2020 targets:
276.6 Mtoe (primary energy consumption);
194.3 Mtoe (final energy consumption).
Since 2005, Germany decreased its primary energy
consumption by 6.8% to 296 Mtoe in 2016.
Over the same period, final energy consumption
decreased by 1.1% to 216 Mtoe in 2016.
Early school leaving target: <10 %. At 10.2 % in 2016, Germany is close to the European
target and to the national target and below the EU
average of 10.7 %.
Tertiary education target: 40 % (EU 2020) or
42 % (national target).
Germany is continuing to increase tertiary attainment
which now stands at 33.2 % but remains below the
EU average of 39.1 % and the EU target of 40%. The
national target of 42% includes contrary to EU target
ISCED level 4 and has thus been met.
Target for reducing the number of people at risk
of poverty or social exclusion, expressed as an
absolute number of people: 20 % reduction in
the number of long-term unemployed by 2020
as compared with 2008 (i.e. reduction by
320 000 long-term unemployed).
The number of long-term unemployed people (LFS
definition) was 723 000 in 2016, this represents a
reduction of 923 000, around 57%, since 2008.
Germany has already met the national Europe 2020
poverty target.

58
ANNEX B
MACROECONOMIC IMBALANCES PROCEDURE SCOREBOARD
Table B.1: The MIP Scoreboard for Germany (AMR 2018)
Flags: b: Break in series.
1) This table provides data as published under the Alert Mechanism Report 2018, which reports data as of 24 Oct 2017. Please
note that figures reported in this table may therefore differ from more recent data elsewhere in this document. 2) Figures
highlighted are those falling outside the threshold established in the European Commission's Alert Mechanism Report.
Source: European Commission 2017, Statistical Annex to the Alert Mechanism Report 2018, SWD(2017) 661.
Thresholds 2011 2012 2013 2014 2015 2016
Current account balance, % of GDP 3 year average -4%/6% 5.8 6.2 6.6 7.1 7.6 8.1
Net international investment position % of GDP -35% 23.2 28.5 34.5 40.9 48.6 54.4
Real effective exchange rate - 42 trading
partners, HICP deflator3 year % change
±5% (EA)
±11% (Non-EA)-4.8 -9.0 -1.8 -0.4 -2.1 -2.6
Export market share - % of world exports 5 year % change -6% -9.0 -16.2 -12.1 -8.6 -2.5 2.8
Nominal unit labour cost index
(2010=100)3 year % change
9% (EA)
12% (Non-EA)5.7 2.7 5.9 7.0 5.6 5.2
House price index (2015=100), deflated 1 year % change 6% 1.4 1.9 2.1 2.2 4.1 5.4
Private sector credit flow, consolidated % of GDP 14% 1.6 1.3 2.0 0.5 3.0 3.8
Private sector debt, consolidated % of GDP 133% 102.5 101.8 102.9 99.4 98.7 99.3
General government gross debt % of GDP 60% 78.6 79.8 77.4 74.6 70.9 68.1
Unemployment rate 3 year average 10% 6.8 6.1 5.5 5.2 4.9 4.6
Total financial sector liabilities, non-
consolidated1 year % change 16.5% 2.9 3.3 -6.2 4.5 2.9 5.2
Activity rate - % of total population aged
15-643 year change in pp -0.2 pp 1.4b 0.9 0.9b 0.4b 0.4 0.3
Long-term unemployment rate - % of
active population aged 15-743 year change in pp 0.5 pp -1.1b -1.1 -1.0 -0.6 -0.4 -0.6
Youth unemployment rate - % of active
population aged 15-243 year change in pp 2 pp -1.9 -3.1 -2.0 -0.8 -0.8 -0.7
Ex
tern
al
imb
ala
nc
es
an
d c
om
pe
titi
ve
ne
ss
Inte
rna
l im
ba
lan
ce
sE
mp
loy
me
nt
ind
ica
tors
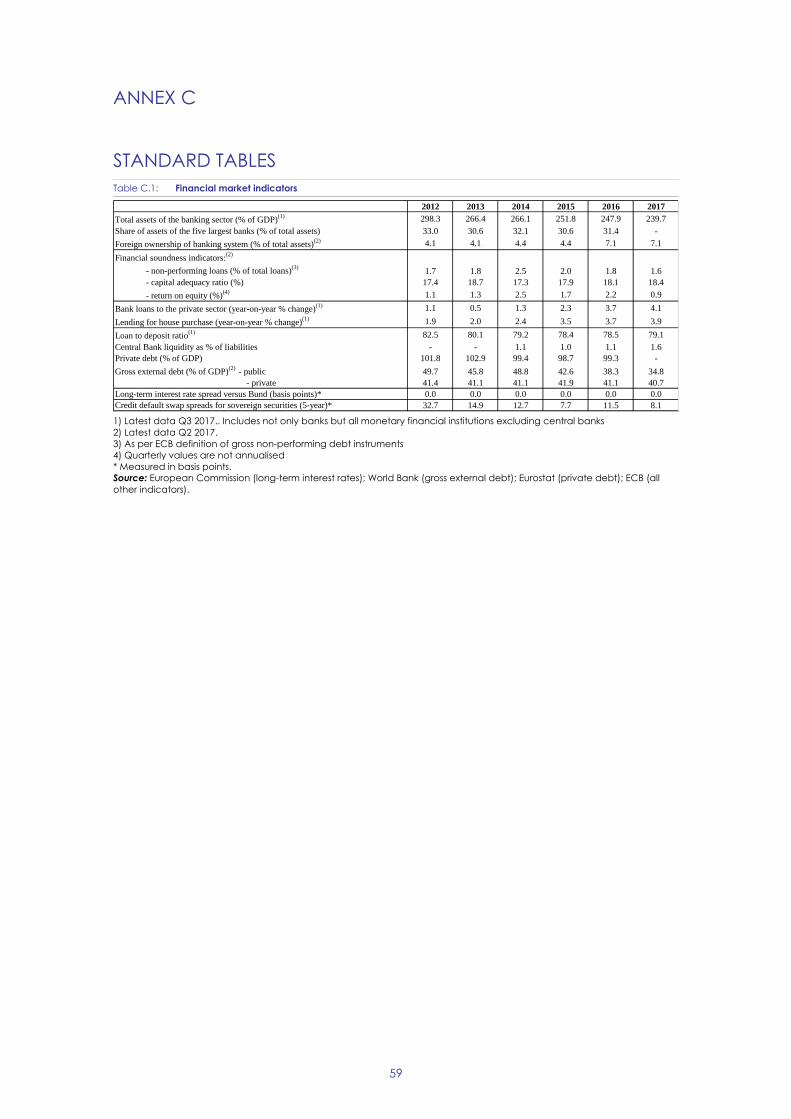
59
ANNEX C
STANDARD TABLES
Table C.1: Financial market indicators
1) Latest data Q3 2017.. Includes not only banks but all monetary financial institutions excluding central banks
2) Latest data Q2 2017.
3) As per ECB definition of gross non-performing debt instruments
4) Quarterly values are not annualised
* Measured in basis points.
Source: European Commission (long-term interest rates); World Bank (gross external debt); Eurostat (private debt); ECB (all
other indicators).
2012 2013 2014 2015 2016 2017
Total assets of the banking sector (% of GDP)(1) 298.3 266.4 266.1 251.8 247.9 239.7
Share of assets of the five largest banks (% of total assets) 33.0 30.6 32.1 30.6 31.4 -
Foreign ownership of banking system (% of total assets)(2) 4.1 4.1 4.4 4.4 7.1 7.1
Financial soundness indicators:(2)
- non-performing loans (% of total loans)(3)
1.7 1.8 2.5 2.0 1.8 1.6
- capital adequacy ratio (%) 17.4 18.7 17.3 17.9 18.1 18.4
- return on equity (%)(4) 1.1 1.3 2.5 1.7 2.2 0.9
Bank loans to the private sector (year-on-year % change)(1) 1.1 0.5 1.3 2.3 3.7 4.1
Lending for house purchase (year-on-year % change)(1) 1.9 2.0 2.4 3.5 3.7 3.9
Loan to deposit ratio(1) 82.5 80.1 79.2 78.4 78.5 79.1
Central Bank liquidity as % of liabilities - - 1.1 1.0 1.1 1.6
Private debt (% of GDP) 101.8 102.9 99.4 98.7 99.3 -
Gross external debt (% of GDP)(2)
- public 49.7 45.8 48.8 42.6 38.3 34.8
- private 41.4 41.1 41.1 41.9 41.1 40.7
Long-term interest rate spread versus Bund (basis points)* 0.0 0.0 0.0 0.0 0.0 0.0
Credit default swap spreads for sovereign securities (5-year)* 32.7 14.9 12.7 7.7 11.5 8.1
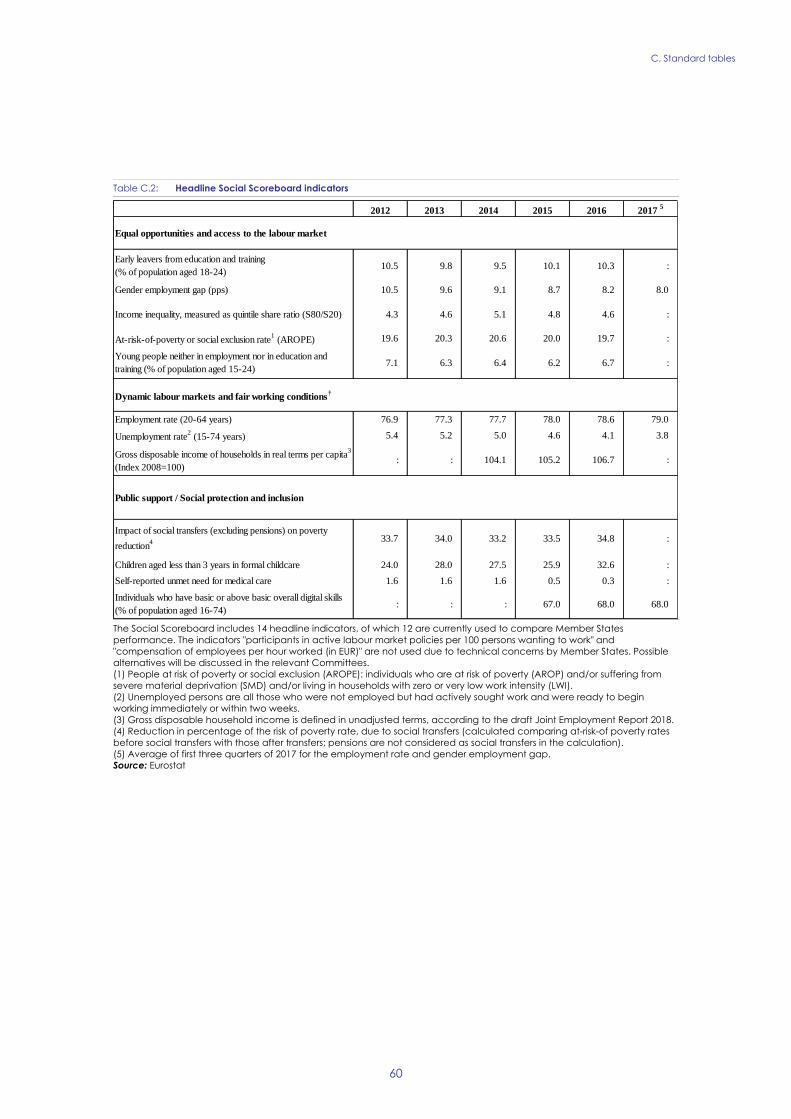
C. Standard tables
60
Table C.2: Headline Social Scoreboard indicators
The Social Scoreboard includes 14 headline indicators, of which 12 are currently used to compare Member States
performance. The indicators "participants in active labour market policies per 100 persons wanting to work" and
"compensation of employees per hour worked (in EUR)" are not used due to technical concerns by Member States. Possible
alternatives will be discussed in the relevant Committees.
(1) People at risk of poverty or social exclusion (AROPE): individuals who are at risk of poverty (AROP) and/or suffering from
severe material deprivation (SMD) and/or living in households with zero or very low work intensity (LWI).
(2) Unemployed persons are all those who were not employed but had actively sought work and were ready to begin
working immediately or within two weeks.
(3) Gross disposable household income is defined in unadjusted terms, according to the draft Joint Employment Report 2018.
(4) Reduction in percentage of the risk of poverty rate, due to social transfers (calculated comparing at-risk-of poverty rates
before social transfers with those after transfers; pensions are not considered as social transfers in the calculation).
(5) Average of first three quarters of 2017 for the employment rate and gender employment gap.
Source: Eurostat
2012 2013 2014 2015 2016 2017 5
Equal opportunities and access to the labour market
Early leavers from education and training
(% of population aged 18-24)10.5 9.8 9.5 10.1 10.3 :
Gender employment gap (pps) 10.5 9.6 9.1 8.7 8.2 8.0
Income inequality, measured as quintile share ratio (S80/S20) 4.3 4.6 5.1 4.8 4.6 :
At-risk-of-poverty or social exclusion rate1 (AROPE) 19.6 20.3 20.6 20.0 19.7 :
Young people neither in employment nor in education and
training (% of population aged 15-24)7.1 6.3 6.4 6.2 6.7 :
Dynamic labour markets and fair working conditions†
Employment rate (20-64 years) 76.9 77.3 77.7 78.0 78.6 79.0
Unemployment rate2 (15-74 years) 5.4 5.2 5.0 4.6 4.1 3.8
Gross disposable income of households in real terms per capita3
(Index 2008=100) : : 104.1 105.2 106.7 :
Public support / Social protection and inclusion
Impact of social transfers (excluding pensions) on poverty
reduction4 33.7 34.0 33.2 33.5 34.8 :
Children aged less than 3 years in formal childcare 24.0 28.0 27.5 25.9 32.6 :
Self-reported unmet need for medical care 1.6 1.6 1.6 0.5 0.3 :
Individuals who have basic or above basic overall digital skills
(% of population aged 16-74): : : 67.0 68.0 68.0

C. Standard tables
61
Table C.3: Labour market and education indicators
* Non-scoreboard indicator
(1) Long-term unemployed are people who have been unemployed for at least 12 months.
(2) Difference between the average gross hourly earnings of male paid employees and of female paid employees as a
percentage of average gross hourly earnings of male paid employees. It is defined as "unadjusted", as it does not correct for
the distribution of individual characteristics (and thus gives an overall picture of gender inequalities in terms of pay). All
employees working in firms with ten or more employees, without restrictions for age and hours worked, are included.
(3) PISA (OECD) results for low achievement in mathematics for 15 year-olds.
(4) Impact of socio-economic and cultural status on PISA (OECD) scores. Values for 2012 and 2015 refer respectively to
mathematics and science.
(5) Average of first three quarters of 2017, unless for the youth unemployment rate (annual figure).
Source: Eurostat, OECD
Labour market indicators 2012 2013 2014 2015 2016 2017 5
Activity rate (15-64) 77.2 77.6 77.7 77.6 77.9 :
Employment in current job by duration
From 0 to 11 months 12.9 12.1 12.0 12.2 12.4 :
From 12 to 23 months 9.0 9.2 8.8 8.9 9.0 :
From 24 to 59 months 15.3 15.5 16.2 15.9 15.3 :
60 months or over 60.4 60.8 60.7 60.6 59.9 :
Employment growth*
(% change from previous year) 1.2 0.6 0.8 0.9 1.3 1.5
Employment rate of women
(% of female population aged 20-64) 71.6 72.5 73.1 73.6 74.5 75.0
Employment rate of men
(% of male population aged 20-64)82.1 82.1 82.2 82.3 82.7 83.0
Employment rate of older workers*
(% of population aged 55-64)61.6 63.6 65.6 66.2 68.6 69.8
Part-time employment*
(% of total employment, aged 15-64)25.8 26.6 26.5 26.8 26.7 26.7
Fixed-term employment*
(% of employees with a fixed term contract, aged 15-64)13.8 13.4 13.1 13.2 13.2 12.8
Transition rate from temporary to permanent employment
(3-year average)40.6 36.1 32.9 29.1 : :
Long-term unemployment rate1 (% of labour force) 2.4 2.3 2.2 2.0 1.7 1.6
Youth unemployment rate
(% active population aged 15-24)8.0 7.8 7.7 7.2 7.1 6.8
Gender gap in part-time employment 36.4 37.6 37.1 37.3 37.1 36.7
Gender pay gap2 (in undadjusted form) 22.7 22.1 22.3 22.0 : :
Education and training indicators 2012 2013 2014 2015 2016 2017
Adult participation in learning
(% of people aged 25-64 participating in education and training)7.9 7.9 8.0 8.1 8.5 :
Underachievement in education3 17.7 : : 17.2 : :
Tertiary educational attainment (% of population aged 30-34 having
successfully completed tertiary education)31.8 32.9 31.4 32.3 33.2 :
Variation in performance explained by students' socio-economic
status4 16.9 : : 15.8 : :

C. Standard tables
62
Table C.4: Social inclusion and health indicators
* Non-scoreboard indicator
(1) At-risk-of-poverty rate (AROP): proportion of people with an equivalised disposable income below 60 % of the national
equivalised median income.
(2) Proportion of people who experience at least four of the following forms of deprivation: not being able to afford to i) pay
their rent or utility bills, ii) keep their home adequately warm, iii) face unexpected expenses, iv) eat meat, fish or a protein
equivalent every second day, v) enjoy a week of holiday away from home once a year, vi) have a car, vii) have a washing
machine, viii) have a colour TV, or ix) have a telephone.
(3) Percentage of total population living in overcrowded dwellings and exhibiting housing deprivation.
(4) People living in households with very low work intensity: proportion of people aged 0-59 living in households where the
adults (excluding dependent children) worked less than 20 % of their total work-time potential in the previous 12 months.
(5) Ratio of the median individual gross pensions of people aged 65-74 relative to the median individual gross earnings of
people aged 50-59.
(6) Fixed broadband take up (33%), mobile broadband take up (22%), speed (33%) and affordability (11%), from the Digital
Scoreboard.Source: Eurostat, OECD
2012 2013 2014 2015 2016 2017
Expenditure on social protection benefits* (% of GDP)
Sickness/healthcare 9.3 9.5 9.6 9.7 : :
Disability 2.2 2.2 2.2 2.3 : :
Old age and survivors 11.0 10.9 10.9 10.9 : :
Family/children 3.1 3.1 3.1 3.2 : :
Unemployment 1.1 1.1 1.1 1.0 : :
Housing 0.6 0.6 0.6 0.6 : :
Social exclusion n.e.c. 0.2 0.2 0.2 0.3 : :
Total 27.4 27.7 27.7 27.9 : :
of which: means-tested benefits 3.3 3.3 3.4 3.5 : :
General government expenditure by function (% of GDP, COFOG)
Social protection 18.8 18.9 18.7 18.9 : :
Health 6.8 7.0 7.1 7.1 : :
Education 4.2 4.3 4.2 4.2 : :
Out-of-pocket expenditure on healthcare (% of total health expenditure) 13.9 13.2 12.7 12.5 : :
Children at risk of poverty or social exclusion (% of people
aged 0-17)*18.4 19.4 19.6 18.5 19.3 :
At-risk-of-poverty rate1 (% of total population) 16.1 16.1 16.7 16.7 16.5 :
In-work at-risk-of-poverty rate (% of persons employed) 7.8 8.6 9.9 9.7 9.5 :
Severe material deprivation rate2 (% of total population) 4.9 5.4 5.0 4.4 3.7 :
Severe housing deprivation rate3, by tenure status
Owner, with mortgage or loan 0.5 0.5 0.3 0.7 0.2 :
Tenant, rent at market price 3.5 3.0 3.6 3.2 3.8 :
Proportion of people living in low work intensity households4
(% of people aged 0-59)9.9 9.9 10.0 9.8 9.6 :
Poverty thresholds, expressed in national currency at constant prices* 10772 10544 10454 10862 11169 :
Healthy life years (at the age of 65)
Females 6.9 7.0 6.7 12.3 : :
Males 6.7 7.0 6.8 11.4 : :
Aggregate replacement ratio for pensions5 (at the age of 65) 0.5 0.5 0.5 0.5 0.5 :
Connectivity dimension of the Digital Economy and Society Inedex
(DESI)6
: : 62.1 66.9 69.1 71.5
GINI coefficient before taxes and transfers* 50.5 51.7 51.6 : 50.8 :
GINI coefficient after taxes and transfers* 28.5 29.7 30.7 : 29.5 :

C. Standard tables
63
Table C.5: Product market performance and policy indicators
(1) The methodologies, including the assumptions, for this indicator are shown in detail at:
http://www.doingbusiness.org/methodology.
(2) Average of the answer to question Q7B_a. '[Bank loan]: If you applied and tried to negotiate for this type of financing over
the past six months, what was the outcome?'. Answers were scored as follows: zero if received everything, one if received
most of it, two if only received a limited part of it, three if refused or rejected and treated as missing values if the application is
still pending or if the outcome is not known.
(3) Percentage population aged 15-64 having completed tertiary education.
(4) Percentage population aged 20-24 having attained at least upper secondary education.
(5) Index: 0 = not regulated; 6 = most regulated. The methodologies of the OECD product market regulation indicators are
shown in detail at: http://www.oecd.org/competition/reform/indicatorsofproductmarketregulationhomepage.htm
(6) Aggregate OECD indicators of regulation in energy, transport and communications.
Source: European Commission; World Bank — Doing Business (for enforcing contracts and time to start a business); OECD (for
the product market regulation indicators); SAFE (for outcome of SMEs' applications for bank loans).
Performance indicators 2010 2011 2012 2013 2014 2015 2016
Labour productivity (real, per person employed, year-on-year %
change)
Labour productivity in industry 12.57 1.83 -0.34 -1.11 3.88 1.52 2.53
Labour productivity in construction 5.60 2.10 -0.98 -1.16 1.90 0.45 1.44
Labour productivity in market services -0.61 1.85 2.53 1.47 0.44 0.08 1.33
Unit labour costs (ULC) (whole economy, year-on-year % change)
ULC in industry -11.80 -0.34 3.63 4.00 -2.12 0.88 0.43
ULC in construction -5.20 0.79 4.67 2.82 0.75 3.26 1.46
ULC in market services 2.38 1.11 2.65 0.91 3.14 3.20 1.77
Business environment 2010 2011 2012 2013 2014 2015 2016
Time needed to enforce contracts(1)
(days) 394.0 394.0 394.0 394.0 459.0 479.0 499.0
Time needed to start a business(1)
(days) 14.5 14.5 14.5 14.5 14.5 10.5 10.5
Outcome of applications by SMEs for bank loans(2) 0.55 0.49 0.28 0.17 0.58 0.35 0.38
Research and innovation 2010 2011 2012 2013 2014 2015 2016
R&D intensity 2.71 2.80 2.87 2.82 2.87 2.92 2.94
General government expenditure on education as % of GDP 4.40 4.30 4.20 4.30 4.20 4.20 na
Persons with tertiary education and/or employed in science and
technology as % of total employment42 41 43 43 44 44 45
Population having completed tertiary education(3) 23 24 25 25 23 24 24
Young people with upper secondary level education(4) 75 76 76 77 77 77 78
Trade balance of high technology products as % of GDP 0.35 0.59 1.05 1.05 0.90 0.97 na
Product and service markets and competition 2003 2008 2013
OECD product market regulation (PMR)(5)
, overall 1.80 1.41 1.29
OECD PMR(5)
, retail 3.38 2.88 2.71
OECD PMR(5)
, professional services 3.03 2.82 2.65
OECD PMR(5)
, network industries(6) 1.87 1.33 1.27

C. Standard tables
64
Table C.6: Green growth
All macro intensity indicators are expressed as a ratio of a physical quantity to GDP (in 2010 prices)
Energy intensity: gross inland energy consumption (in kgoe) divided by GDP (in EUR)
Carbon intensity: greenhouse gas emissions (in kg CO2 equivalents) divided by GDP (in EUR)
Resource intensity: domestic material consumption (in kg) divided by GDP (in EUR)
Waste intensity: waste (in kg) divided by GDP (in EUR)
Energy balance of trade: the balance of energy exports and imports, expressed as % of GDP
Weighting of energy in HICP: the proportion of 'energy' items in the consumption basket used for the construction of the HICP
Difference between energy price change and inflation: energy component of HICP, and total HICP inflation (annual %
change)
Real unit energy cost: real energy costs as % of total value added for the economy
Industry energy intensity: final energy consumption of industry (in kgoe) divided by gross value added of industry (in 2010 EUR)
Real unit energy costs for manufacturing industry excluding refining : real costs as % of value added for manufacturing
sectors
Share of energy-intensive industries in the economy: share of gross value added of the energy-intensive industries in GDP
Electricity and gas prices for medium-sized industrial users: consumption band 500–20 00MWh and 10 000–100 000 GJ; figures
excl. VAT.
Recycling rate of municipal waste: ratio of recycled and composted municipal waste to total municipal waste
Public R&D for energy or for the environment: government spending on R&D for these categories as % of GDP
Proportion of GHG emissions covered by EU emissions trading system (ETS) (excluding aviation): based on GHG emissions
(excl land use, land use change and forestry) as reported by Member States to the European Environment Agency.
Transport energy intensity: final energy consumption of transport activity (kgoe) divided by transport industry gross value
added (in 2010 EUR)
Transport carbon intensity: GHG emissions in transport activity divided by gross value added of the transport sector
Energy import dependency: net energy imports divided by gross inland energy consumption incl. consumption of
international bunker fuels
Aggregated supplier concentration index: covers oil, gas and coal. Smaller values indicate larger diversification and hence
lower risk.
Diversification of the energy mix: Herfindahl index covering natural gas, total petrol products, nuclear heat, renewable
energies and solid fuels
* European Commission and European Environment Agency
Source: European Commission and European Environment Agency (Share of GHG emissions covered by ETS); European
Commission (Environmental taxes over labour taxes and GDP); Eurostat (all other indicators)
Green growth performance 2011 2012 2013 2014 2015 2016
Macroeconomic
Energy intensity kgoe / € 0.12 0.12 0.12 0.11 0.11 0.11
Carbon intensity kg / € 0.34 0.34 0.35 0.33 0.32 -
Resource intensity (reciprocal of resource productivity) kg / € 0.51 0.49 0.49 0.49 0.46 0.45
Waste intensity kg / € - 0.14 - 0.14 - -
Energy balance of trade % GDP -3.6 -3.6 -3.4 -2.8 -2.0 -
Weighting of energy in HICP % 12.30 12.55 12.40 11.94 11.78 10.36
Difference between energy price change and inflation % 7.0 3.6 3.2 -1.6 -5.5 -5.0
Real unit of energy cost% of value
added10.5 10.4 9.9 9.9 - -
Ratio of environmental taxes to labour taxes ratio 0.10 0.10 0.09 0.09 0.09 -
Environmental taxes % GDP 2.2 2.1 2.1 2.0 1.9 1.9
Sectoral
Industry energy intensity kgoe / € 0.10 0.10 0.10 0.09 0.09 0.09
Real unit energy cost for manufacturing industry excl.
refining
% of value
added12.9 12.8 12.4 12.2 - -
Share of energy-intensive industries in the economy % GDP 10.45 10.61 10.45 10.50 10.38 -
Electricity prices for medium-sized industrial users € / kWh 0.12 0.13 0.14 0.16 0.15 0.15
Gas prices for medium-sized industrial users € / kWh 0.04 0.04 0.05 0.04 0.04 0.03
Public R&D for energy % GDP 0.03 0.04 0.05 0.05 0.04 0.04
Public R&D for environmental protection % GDP 0.02 0.02 0.03 0.03 0.03 0.03
Municipal waste recycling rate % 63.0 65.2 63.8 65.6 66.7 66.1
Share of GHG emissions covered by ETS* % 51.6 51.5 51.1 51.4 50.3 50.0
Transport energy intensity kgoe / € 0.56 0.56 0.55 0.57 0.59 0.60
Transport carbon intensity kg / € 1.42 1.40 1.41 1.44 1.51 -
Security of energy supply
Energy import dependency % 61.9 61.5 62.7 61.8 61.9 63.5
Aggregated supplier concentration index HHI 13.9 13.8 15.0 15.2 18.1 -
Diversification of energy mix HHI 0.24 0.24 0.25 0.24 0.24 0.25

65
Albig, H., Clemens, M., Fichtner, F., Gebauer, S., Junker, S. and Kholodilin, K. (2017), How rising
income inequality influenced economic growth in Germany, DIW Economic Bulletin 10.2017, Deutsches
Institut für Wirtschaftsforschung e.V. (DIW Berlin), Berlin
Ando, A. and Modigliani, F. (1963), The "Life Cycle" Hypothesis of Saving: Aggregate Implications and
Tests, The American Economic Review, Vol. 53, No. 1, Part 1 (Mar., 1963), pp. 55-84
Bäcker, G. (2014), Niedrigrenten, Arbeitsmarkt und Rentenversicherung: Erfordernis einer integrierten
Ursachenanalyse und Reformstrategie, in: Kistler, Ernst, Trischler, Falko (Hrsg.), Reformen auf dem
Arbeitsmarkt und in der Alterssicherung – Folgen für die Einkunftslage im Alter. Düsseldorf.
Bähr, S.; Beste, J. and Wenzig, C. (2017), Arbeitsmarktintegration von Geflüchteten im SGB II:
Hemmnisse abbauen und Potenziale nutzen, IAB-Kurzbericht, 23/2017, Institute for Employment
Research, Nürnberg.
Barro, R. and Sala-i-Martin, X. (2003), Economic Growth, 2nd Edition, The MIT Press Cambridge,
Mass., USA.
BDK (2017), Pressemitteilung zur Lehrerversorgung an den deutschen Schulen,
Bundesdirektorenkonferenz.
Bach, S. and Thiemann, A. (2016), Inheritance Tax Revenue Low Despite Surge in Inheritances, DIW
Economic Bulletin 4+5 2016, The German Economic Research Institute (DIW Berlin), Berlin.
Belitz H., Eickelpasch A., Le Mouel M., and Schiersch A. (2017), Wissensbasiertes Kapital in
Deutschland: Analyse zu Produktivitäts- und Wachstumseffekten und Erstellung eines Indikatorsystems,
The German Economic Research Institute (DIW Berlin), Berlin.
Belke, A., Dreger, C. and Ochmann, R., (2015), Do wealthier households save more? The impact of the
demographic factor, International Economics and Economic Policy, 12(2), pp.163-173.
Bitkom (2017), 55.000 Jobs für IT-Spezialisten sind unbesetzt, Presseinformation, 07.11.2015, Berlin.
Bloom, D., Canning, D., Mansfield, R. and Moore, M. (2007), Demographic change, social security
systems, and savings, Journal of Monetary Economics, Volume 54, Issue 1, pp 92-114.
Börsch-Supan, A., Ludwig, A. and Winter, J. (2002), Ageing and international capital flows, In Ageing,
financial markets and monetary policy (pp. 55-83) , Springer, Berlin, Heidelberg.
Boll, C., Leppin, J., Rossen, A., and Wolf, A. (2016), Magnitude and impact factors of the gender pay
gap in EU countries, Report prepared for and financed by the European Commission–Directorate-General
for Justice, European Union (ed.).
Brenke, K. and Wagner, G. G. (2013), Ungleiche Verteilung der Einkommen bremst das
Wirtschaftswachstum, Wirtschaftsdienst, 93(2).
Breitbandatlas (2017), Aktuelle Breitbandverfügbarkeit in Deutschland – Stand Mitte 2017, Federal
Ministry of Transport and Infrastructure, Berlin.
Brettschneider, A. and Klammer, U. (2016), Lebenswege in die Altersarmut, Biografische Analysen und
sozialpolitische Perspektiven, Duncker & Humblot, Berlin.
REFERENCES

References
66
Buiter, W.H. (1981), Time preference and international lending and borrowing in an overlapping-
generations model, Journal of political economy, 89(4), pp.769-797.
Burauel, P. (2017), Mindestlohn noch längst nicht für alle – Zur Entlohnung anspruchsberechtigter
Erwerbstätiger vor und nach der Mindestlohnreform aus der Perspektive Beschäftigter, DIW Berlin
Wochenbericht Nr. 2017/49, Deutsches Institut für Wirtschaftsforschung e.V. (DIW Berlin), Berlin.
Busl, C., Jokisch, S. and Schleer, F. (2012), Sparen und Investieren vor dem Hintergrund des
demografischen Wandels, ZEW Wachstums-und Konjunkturanalysen, 15(3), 6-7.
Busse, R., Blümel, M., Knieps, F. and Bärnighausen, T. (2017), Statutory health insurance in Germany: a
health system shaped by 135 years of solidarity, self-governance and competition, The Lancet, Volume
390, Issue 10097, pp 882 - 897.
Chinn, M.D. and E.S. Prasad (2003), Medium-term determinants of current accounts in industrial and
developing countries: an empirical exploration, Journal of International Economics 59(1), pp. 47-76.
Cingano, F. (2014), Trends in income inequality and its impact on economic growth, OECD Social,
Employment and Migration Working Papers, No. 163, OECD Publishing, Paris.
Cologne Institute for Economic Research, (2017), Investieren Staat und Unternehmen in Deutschland zu
wenig? – Bestandsaufnahme und Handlungsbedarf, IW-Analysen Nr. 118, Institut der deutschen
Wirtschaft, Köln.
Dahl, J. and Goralczyk, M. (2017), Recent Supply and Demand Developments in the German Housing
Market, European Economy, Economic Brief 025, May 2017, European Commission, Brussels.
Destatis (2017), Verdiensterhebung 2016 - Erhebung über die Wirkung des gesetzlichen Mindestlohns auf
die Verdienste und Arbeitszeiten der abhängig Beschäftigten, Statistisches Bundesamt (Destatis).
Digital Scoreboard (2017), https://ec.europa.eu/digital-single-market/en/scoreboard/germany,
DIHK (2017), DIHK-Innovationsreport 2017 - Innovationsdynamik rückläufig - Ergebnisse einer
Befragung der IHK-Organisation bei 1.700 Unternehmen, German Chambers of Industry and Commerce,
Berlin.
DIHK (2018), DIHK-Konjunkturumfrage zu Jahresbeginn 2018, German Chambers of Industry and
Commerce, Berlin.
Ebert, J. and Heublein, U. (2017), Ursachen des Studienabbruchs bei Studierenden mit
Migrationshintergrund, Deutsches Zentrum für Hochschul- und Wissenschaftsforschung GmbH and
Stiftung Mercator, Hannover.
EFI (2017), Report on research, innovation and technological performance in Germany 2017,
Commission of Experts for Research and Innovation (EFI), Berlin.
European Commission (2013), Benchmarking Deployment of eHealth Among General Practitioners,
Final Report, European Commission, Brussels.
European Commission (2014a), Macroeconomic imbalances Germany 2014, European Economy,
Occasional Papers 174, European Commission, Brussels.
References
67
European Commission (2014b), European Hospital Survey: Benchmarking Deployment of eHealth
Services, Publications Office of the European Union, Luxembourg.
European Commission (2015a), Macroeconomic imbalances Country Report Germany 2015, European
Economy, Occasional Papers 214, European Commission, Brussels.
European Commission (2015b), Challenges to Member States Investment Environments, Commission
Staff Working Document (2015) 400, Publications Office of the European Union, Luxembourg.
European Commission (2015c), A Single Market Strategy for Europe – analysis and evidence,
SWD(2015) 202 final, European Commission, Brussels.
European Commission (2016a), Study on passenger transport by taxi, hire car with driver and
ridesharing in the EU, European Commission, Brussels.
European Commission (2016b), Country Report Germany 2016 - Including an In-Depth Review on the
prevention and correction of macroeconomic imbalances, SWD(2016) 75, European Commission,
Brussels.
European Commission (2016c), PISA 2015, EU performance and initial conclusions regarding education
policies in Europe, European Commission, Brussels.
European Commission (2016d), COUNCIL RECOMMENDATION of 19 December 2016 on Upskilling
Pathways: New Opportunities for Adults, 2016/C 484/01, European Commission, Brussels.
European Commission (2016e), Report on Public Finances in EMU 201, European Commission,
Brussels, Belgium.
European Commission (2017a), Empirical current account benchmarks: modelling the impact of
demographic variables, LIME Working Group, 24 April 2017
European Commission (2017b), European Economic Forecast, Autumn 2017, European Economy,
Institutional Paper 063, November 2017, European Commission, Brussels.
European Commission (2017c), Country Report Germany 2017 - Including an In-Depth Review on the
prevention and correction of macroeconomic imbalances, SWD(2017) 71, European Commission,
Brussels.
European Commission (2017d), COMMISSION OPINION of 22.11.2017 on the Draft Budgetary Plan of
Germany, SWD(2017) 513 final, European Commission, Brussels.
European Commission (2017e), Employment and Social Developments in Europe 2017, European
Commission, Brussels.
European Commission (2017f), 2017 SBA Factsheet Germany, European Commission, Brussels.
European Commission (2017g), Attitudes towards the impact of digitisation and automation on daily life-
Special Eurobarometer 460, European Commission, Brussels.
European Commission (2017h), Digital Scoreboard 2017, European Commission, Brussels.
European Commission (2017i), The EU Environmental Implementation Review Country Report –
GERMANY, SWD(2017) 38 final
References
68
European Commission (2018), 2018 Ageing Report: Economic and Budgetary Projections for the EU
Member States (2016-2070), European Commission (DG ECFIN) – Economic Policy Committee (AWG),
(forthcoming).
Federal Ministry for Economic Affairs and Energy (2017a), Nationales Reformprogramm 2017, Federal
Ministry for Economic Affairs and Energy, Berlin.
Federal Ministry for Economic Affairs and Energy (2017b), Ökonomische Bewertung verschiedener
Vermögensteuerkonzepte, Project-Number 012/17, Expertise for the Federal Ministry for Economic
Affairs and Energy prepared by Ernst & Young GmbH and ifo Institut.
Federal Ministry for Economic Affairs and Energy (2017c), Monitoring-Report Kompakt Wirtschaft
DIGITAL 2017, Federal Ministry for Economic Affairs and Energy, Berlin.
Federal Ministry for Labour and Social Affairs (BMAS) (2017a), Lebenslagen in Deutschland, der
Fuenfte Armuts- und Reichtumsbericht der Bundesregierung, Federal Ministry for Labour and Social
Affairs, Berlin.
Federal Ministry for Labour and Social Affairs (BMAS) (2017b), Verzeichnis der für
allgemeinverbindlich erklärten Tarifverträge, Stand: 1. Juli 2017, Federal Ministry for Labour and Social
Affairs, Berlin.
Federal Ministry for Labour and Social Affairs (BMAS) (2017c), Lebenslagen in Deutschland. Der
Fünfte Armuts- und Reichtumsberichterstattung der Bundesregierung, Federal Ministry for Labour and
Social Affairs, Berlin.
Federal Ministry of Education and Research (2017), Report on Vocational Education and Training 2017,
Federal Ministry of Education and Research, Berlin.
Federal Ministry of Transport and Infrastructure (2017), Breitbandatlas - Aktuelle Breitbandverfügbarkeit
in Deutschland (Stand Mitte 2017), Federal Ministry of Transport and Infrastructure, Berlin.
Federal Office for Migration and Refugees (2018), Aktuelle Zahlen zu Asyl (12/2017), Federal Office for
Migration and Refugees, Berlin.
Felbermayr, G., Battisti, M. and Lehwald, S. (2016), Einkommensungleichheit in Deutschland, Teil 1:
Gibt es eine Trendumkehr?, ifo Schnelldienst, Vol. 69, Issue 13, pages 28–37.
Frick, J. and Grabka, M. (2010), Old-age pension entitlements mitigate inequality—but concentration of
wealth remains high, DIW Berlin Weekly Report, No. 8/2010, Volume 6, Deutsches Institut für
Wirtschaftsforschung e.V. (DIW Berlin), Berlin.
German Youth Institute, DJI (2017), Plätze. Personal. Finanzen – der Kita-Ausbau geht weiter.
Zukunftsszenarien zur Kindertages- und Grundschulbetreuung in Deutschland, Version 2-2017.
Galor, O. and Zeira, J. (1993), Income distribution and macroeconomics, The review of economic studies,
Volume 60, Issue 1, pp 35-52.
Galassi, G. (2016), The German Mini-Job Reform: Intended and Unintended Consequences, European
University Institute, February 15, 2016, San Domenico di Fiesole.
German Central Bank (2017), Results of the 2017 low-interest-rate survey, Press release, 30.08.2017,
German Central Bank, Frankfurt am Main.
References
69
German Monopolies Commission (2017), Bahn 2017: Wettbewerbspolitische Baustellen,
Sondergutachten 76, p. 90. See also: http://www.monopolkommission.de/index.php/en/press-releases/64-
railways-2017
German Savings Banks Association (DSGV) (2018), Diagnose Mittelstand 2018. Forthcoming on 18
May 2018, related press release published on 18 December, 2017 (
https://www.dsgv.de/de/presse/pressemitteilungen/171218_PM_Diagnose-Mittelstand_64.html)
German Trade Union Confederation (2017), Bildungsgipfel-Bilanz. Studie zur Wirkung des Dresdner
Bildungsgipfels vom 22. Oktober 2008, Deutscher Gewerkschaftsbund, Berlin.
Geyer, J.(2014), Zukünftige Altersarmut, DIW Roundup Politik im Fokus, No. 25, Berlin.
Gornig, M. and Michelsen C. (2017a), Kommunale Investitionsschwäche: Engpässe bei Planungs- und
Baukapazitäten bremsen Städte und Gemeinden aus, DIW Wochenbericht Nr. 11.2017, The German
Economic Research Institute (DIW Berlin), Berlin.
Gornig, M. and Michelsen, C. (2017b), Bauwirtschaft: volle Auftragsbücher und gute
Wachstumsaussichten, DIW Wochenbericht Nr. 1+2.2017, The German Economic Research Institute
(DIW Berlin), Berlin.
Grabka M. and J. Goebel (2017), Real income rose significantly between 1991 and 2014 – first indication
of return to increased income inequality, DIW Economic Bulletin 5.2017, Deutsches Institut für
Wirtschaftsforschung e.V. (DIW Berlin), Berlin.
Grotlüschen, A. (2016), UNESCO country profiles of formal and nonformal adult education opportunities
in literacy, numeracy and other skills: Germany, ED/GEMR/MRT/2016/P1/35, Paper commissioned for
the Global Education Monitoring Report 2016, Education for people and planet: Creating sustainable
futures for all.
Gruber, J. W. and Kamin, S. B. (2007). Explaining the global pattern of current account imbalances.
Journal of International Money and Finance, 26(4), 500-522.
Gürtzgen, N., Kubis, A. and Rebien, M. (2017), IAB-Stellenerhebung: Geflüchtete kommen mehr und
mehr am Arbeitsmarkt an, IAB-Kurzbericht, 14/2017, Institute for Employment Research, Nürnberg
Holland van Gijzen Advocaten (2016), Legal study on retail establishment through the 28 Member
States: Restrictions and freedom of establishment carried out for the European Commission,
http://ec.europa.eu/DocsRoom/documents/16127.
Ifo Institute (2017), Ifo Konjunkturperspektiven 06/2017, ifo Institut, München.
IHS and Point Topic (2018), Broadband coverage in Europe in 2017 - Mapping progress towards the
coverage objectives of the Digital Agenda, forthcoming study prepared for the European Commission,
DG Communications Networks, Content and Technology by IHS Markit and Point Topic, European
Commission, Brussels.
IMF (2017a), Staff Report For The 2017 Article IV Consultation, International Monetary Fund,
Washington D.C.
IMF (2017b), 2017 External Sector Report, IMF policy paper, International Monetary Fund, Washington
D.C.

References
70
Initiative D21 (2017), eGovernment MONITOR 2017 - Nutzung und Akzeptanz digitaler
Verwaltungsangebote – Deutschland, Österreich und Schweiz im Vergleich, Initiative D21 e. V. and
fortiss GmbH, Berlin and Muenchen.
INSM (2017), Bildungsmonitor 2017 – Eine Bildungsagenda für mehr Wachstum und Gerechtigkeit,
Study commissioned by Initiative Neue Soziale Marktwirtschaft, Cologne.
Institute for Educational Quality Improvement (IQB) (2017), IQB-Bildungstrend 2016. Institute for
Educational Quality Improvement, Berlin.
IW Köln (2017), Reform der Grunderwerbsteuer – Studie fuer die FDP Fraktionsvorsitzendenkonferenz,
Institut der deutschen Wirtschaft, Köln.
Kalina, T. and Weinkopf, C. (2017), Niedriglohn Beschäftigung 2015 - bislang kein Rückgang im Zuge
der Mindestlohneinführung, IAQ-Report, University Duisburg Essen.
KFW (2017a), KfW-Kommunalpanel 2017, KfW Bankengruppe, Frankfurt am Main.
KfW (2017b), KfW-Mittelstandspanel 2017. Rekordjagd im Inland geht ungebremst weiter – neue
Herausforderungen durch sektoralen Wandel, KfW Bankengruppe, Frankfurt am Main.
KfW (2017c), KfW-Innovationsbericht Mittelstand 2016: Innovationen konzentrieren sich auf immer
weniger Unternehmen, KfW Bankengruppe, Frankfurt am Main.
Klemm, K. and Zorn, D. (2017), Demographische Rendite adé - Aktuelle Bevölkerungsentwicklung und
Folgen für die allgemeinbildenden Schulen, Bertelsmann Foundation, Gütersloh.
Krebs, T. and Scheffel, M. (2016), Quantifizierung der gesamtwirtschaftlichen und fiskalischen Effekte
ausgewählter Infrastruktur- und Bildungsinvestitionen in Deutschland, Studie im Auftrag des
Bundesministeriums für Wirtschaft und Energie (BMWi).
Lane, P. R., and Milesi-Ferretti, G. M. (2012), External adjustment and the global crisis, Journal of
International Economics, 88(2), 252-265.
Lazear, P. and Rosen. S. (1981), Rank-Order Tournaments as Optimum Labor Contracts, Journal of
Political Economy, Vol. 89, No. 5, pp 841-64
Lee, J., J. D. Ostry, G.M. Milesi-Ferretti, L.A. Ricci and A. Prati (2008), Exchange rate assessments:
CGER methodologies, International Monetary Fund, Washington D.C.
McGowan M. A., Andrews D. and Millot V. (2017), The walking dead? Zombie firms and productivity
performance in OECD countries, OECD Economics Department, Working Papers No. 1372, OECD,
Paris.
Mirrlees, J. (1971), An Exploration in the Theory of Optimum Income Taxation, The Review of Economic
Studies, Vol. 38, No. 2, pp. 175-208.
Neves, P.C., Afonso, O. and Silva, S. T. (2016), A Meta-Analytic Reassessment of the Effects of
Inequality on Growth, World Development, Volume 78, 2016.
Obstfeld, M. and Rogoff, K. (1995), The intertemporal approach to the current account, Handbook of
international economics, 3, pp.1731-1799.

References
71
OECD (2015), In it together: Why less inequality benefits all, OECD Publishing, Paris.
OECD (2016a), PISA 2015, Country Note Germany, OECD Publishing, Paris.
OECD (2016b), Education at a Glance 2016: OECD Indicators, OECD Publishing, Paris.
OECD (2016c), OECD Economic Surveys: Germany 2016, OECD Publishing, Paris.
OECD (2016d), Regions at a Glance 2016, OECD Publishing, Paris.
OECD and European Observatory on Health Systems and Policies (2017), Germany: Country Health
Profile 2017, State of Health in the EU, OECD Publishing, Paris/European Observatory on Health
Systems and Policies, Brussels.
Phillips, S., L. Catão, L. Ricci, R. Bems, M. Das, J. Di Giovanni, F. Unsal, M. Castillo, J. Lee, J.
Rodriguez, and M. Vargas (2013), The External Balance Assessment (EBA) methodology, IMF Working
Paper, WP/13/272, IMF, Washington, D.C..
Pomerlo, K. (2017), International Tax Competitiveness Index 2016, Tax Foundation, Washington,
D.C..Pusch, T., and Rehm, M. (2017), Positive Effects of the German Minimum Wage on Job Quality and
Employee Job Satisfaction, Wirtschaftsdienst, 97(6), 409-414.
PWC and IHS (2017), Effectiveness of tax incentives for venture capital and business angels to foster the
investment of SMEs and start-ups – Final report, PricewaterhouseCoopers LLP and Institute for
Advanced Studies (HIS), Study for the European Commission, TAXUD/2015/DE/330, European
Commission, Brussels.
Salto, M. and Turrini, A. (2010), Comparing alternative methodologies for real exchange rate
assessment, European Commission, Directorate-General for Economic and Financial Affairs, European
Commission, Brussels.
Schwabe, U. et al (eds.) (2017), Arzneimittelverordnungsreport 2017, Springer, Berlin, Heidelberg
Stability Council (2017), Eighth Statement on compliance with the upper limit for the structural general
government budget deficit pursuant to Section 51 (2) of the Budgetary Principles Act (HGrG),
Stabilitätsrat, December 2017, Berlin.
Standing Conference of the Ministers of Education and Cultural Affairs (2013),
Lehrereinstellungsbedarf- und angebot in der Bundesrepublik Deutschland, Modellrechnung 2012-2025,
Statistische Veröffentlichungen der Kultusministerkonferenz, Dokumentation Nr. 201 – Juni 2013,
Berlin.
Standing Conference of the Ministers of Education and Cultural Affairs (2016), Allgemeinbildende
Schulen in Ganztagsform in den Ländern in der Bundesrepublik Deutschland, Statistik 2011 bis 2015.
Thum-Thysen, A., Voigt, P., Bilbao, B., Maier, C. and Ognyanova, D. (2017), Unlocking investment in
Intangible Assets, Discussion paper 047. May 2017. Brussels
Umweltbundesamt, (2017), Quantifizierung der landwirtschaftlich verursachten Kosten zur Sicherung
der Trinkwasserbereitstellung, Dessau-Roßlau.
WIK-Consult (2017), Ansätze zur Glasfaser-Erschließung unterversorgter Gebiete, Studie für den DIHK,
WIK-Consult GmbH, Bad Honnef.

References
72
World Bank (2017), Doing Business 2018 - Reforming to Create Jobs, A World Bank Group Flagship
Report, International Bank for Reconstruction and Development / The World Bank, Washington DC,
USA.
ZEW (2017a), Effective Tax Levels Using the Devereux/Griffith Methodology – Final report 2016,
Project for the European Commission, TAXUD/2013/CC/120, Centre for European Economic Research,
Mannheim.
ZEW (2017b), Steuerlicher Digitalisierungsindex, ZEW (Centre for European Economic Research),
University of Mannheim and PWC.
ZEW (2017c), Innovationsverhalten der deutschen Wirtschaft: Indikatorenbericht zur
Innovationserhebung 2016, Centre for European Economic Research (ZEW), Mannheim.
Related Documents