Poster number: 775 Geriatric LUMC brain template Faiza Admiraal-Behloul*, Nicole Schmitz†, Dominique M J van den Heuvel†, Hans Olofsen*, Johannes H C Reiber †, Mark A van Buchem † *Leiden University Medical Center, Division of ImageProcessing, Leiden, The Netherlands †Leiden University Medical Center, Department of NeuroRadiology, Leiden, The Netherlands Modeling & Analysis Abstract Introduction MR images of geriatric subjects do no match properly with the Montreal Neurological Institute (MNI) templates for three main reasons: brain atrophy, presence of large white matter lesions and lower contrast between white and grey matter. Most of the automatic brain image segmentation algorithms are using the MNI templates, which have been generated from MR images of young healthy individuals (mean age 23.4+- 4.1 years). The aim of this work was to generate new Leiden University Medical Center (LUMC) templates that represent the geriatric subjects in the perspective of improving subsequent automatic image segmentation techniques. Methods 527 healthy elderly subjects, aged between 70-83 years, were recruited for the PROspective Study Of Pravastatin in the Elderly at Risk (PROSPER) at the LUMC. MRI was performed with a 1.5 Tesla Philips system (Best, The Netherlands). Dual fast spin-echo imaging (TE 27/120ms, TR 3000 ms, echo train length factor 10, 48 contiguous 3mm slices, matrix 256x256, FOV 220) were obtained. All scans were semi-automatically segmented using in-house software. Binary masks of Intra-Cranial (IC), CSF Peri-Venticular Lesion (PVL) and SubCortical Lesions (SCL) where generated and manually corrected. LUMC template generation consisted of three steps. (1) Normalization: Proton Density (PD) weighted images were automatically registered to the MNI PD template using a 12 parameter affine transformation1; for each patient, the transformation matrix resulting from this affine registration was applied to reslice the corresponding PD and T2 weighted images as well as the IC,CSF, PVL and SCL masks. Tri-cubic interpolation was used while reslicing the images. (2) Expert quality control: Normalized PD images (n=527) were reviewed by an expert. Brains that were not properly reoriented in standard space were excluded. 432 brains were averaged for the LUMC template. (3) Template generation: Average PD and T2 images as well as prior distribution maps of CSF, PVL and SCL were computed for the categories (i) whole database; (ii) gender; (iii) age-intervals for the whole data base and (iv) age- intervals for each gender. Results In an elderly population, the LUMC template compared to the MNI template accounts for (i) enlarged ventricle size (~260% compared to the MNI template) in elderly subjects. (ii) reduced grey-white matter contrast in the elderly, (iii) atrophy ( 0.73 for the LUMC template and 0.98 for the MNI template) and (iv) higher lesion loads in females in the gender specific templates. Abstracts presented at the 9th International Conference on Functional Mapping of the Human Brain, June 19OE22, 2003, New York, NY e1485

Welcome message from author
This document is posted to help you gain knowledge. Please leave a comment to let me know what you think about it! Share it to your friends and learn new things together.
Transcript
Poster number: 775
Geriatric LUMC brain template
Faiza Admiraal-Behloul*, Nicole Schmitz†, Dominique M J van den Heuvel†, Hans Olofsen*, Johannes H C Reiber †, Mark A van Buchem †
*Leiden University Medical Center, Division of ImageProcessing, Leiden, The Netherlands†Leiden University Medical Center, Department of NeuroRadiology, Leiden, The Netherlands
Modeling & Analysis
Abstract
Introduction
MR images of geriatric subjects do no match properly with the Montreal Neurological Institute (MNI) templatesfor three main reasons: brain atrophy, presence of large white matter lesions and lower contrast between whiteand grey matter. Most of the automatic brain image segmentation algorithms are using the MNI templates, whichhave been generated from MR images of young healthy individuals (mean age 23.4+- 4.1 years). The aim of thiswork was to generate new Leiden University Medical Center (LUMC) templates that represent the geriatricsubjects in the perspective of improving subsequent automatic image segmentation techniques.
Methods
527 healthy elderly subjects, aged between 70-83 years, were recruited for the PROspective Study Of Pravastatinin the Elderly at Risk (PROSPER) at the LUMC. MRI was performed with a 1.5 Tesla Philips system (Best, TheNetherlands). Dual fast spin-echo imaging (TE 27/120ms, TR 3000 ms, echo train length factor 10, 48 contiguous3mm slices, matrix 256x256, FOV 220) were obtained. All scans were semi-automatically segmented usingin-house software. Binary masks of Intra-Cranial (IC), CSF Peri-Venticular Lesion (PVL) and SubCorticalLesions (SCL) where generated and manually corrected.
LUMC template generation consisted of three steps.
(1) Normalization: Proton Density (PD) weighted images were automatically registered to the MNI PD templateusing a 12 parameter affine transformation1; for each patient, the transformation matrix resulting from this affineregistration was applied to reslice the corresponding PD and T2 weighted images as well as the IC,CSF, PVL andSCL masks. Tri-cubic interpolation was used while reslicing the images.
(2) Expert quality control: Normalized PD images (n=527) were reviewed by an expert. Brains that were notproperly reoriented in standard space were excluded. 432 brains were averaged for the LUMC template.
(3) Template generation: Average PD and T2 images as well as prior distribution maps of CSF, PVL and SCLwere computed for the categories (i) whole database; (ii) gender; (iii) age-intervals for the whole data base and(iv) age- intervals for each gender.
Results
In an elderly population, the LUMC template compared to the MNI template accounts for (i) enlarged ventriclesize (~260% compared to the MNI template) in elderly subjects. (ii) reduced grey-white matter contrast in theelderly, (iii) atrophy ( 0.73 for the LUMC template and 0.98 for the MNI template) and (iv) higher lesion loads infemales in the gender specific templates.
e1485
Abstracts presented at the 9th International Conference on Functional Mapping of the Human Brain, June 19Œ22, 2003, New York, NY
e1485
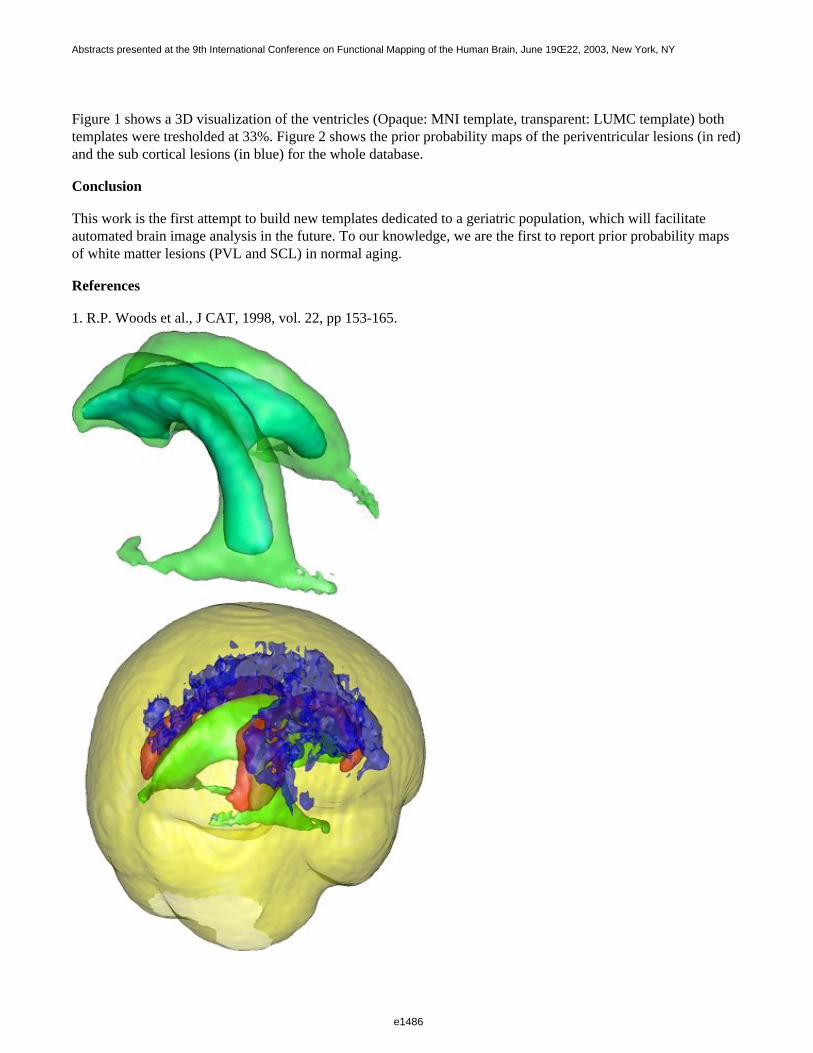
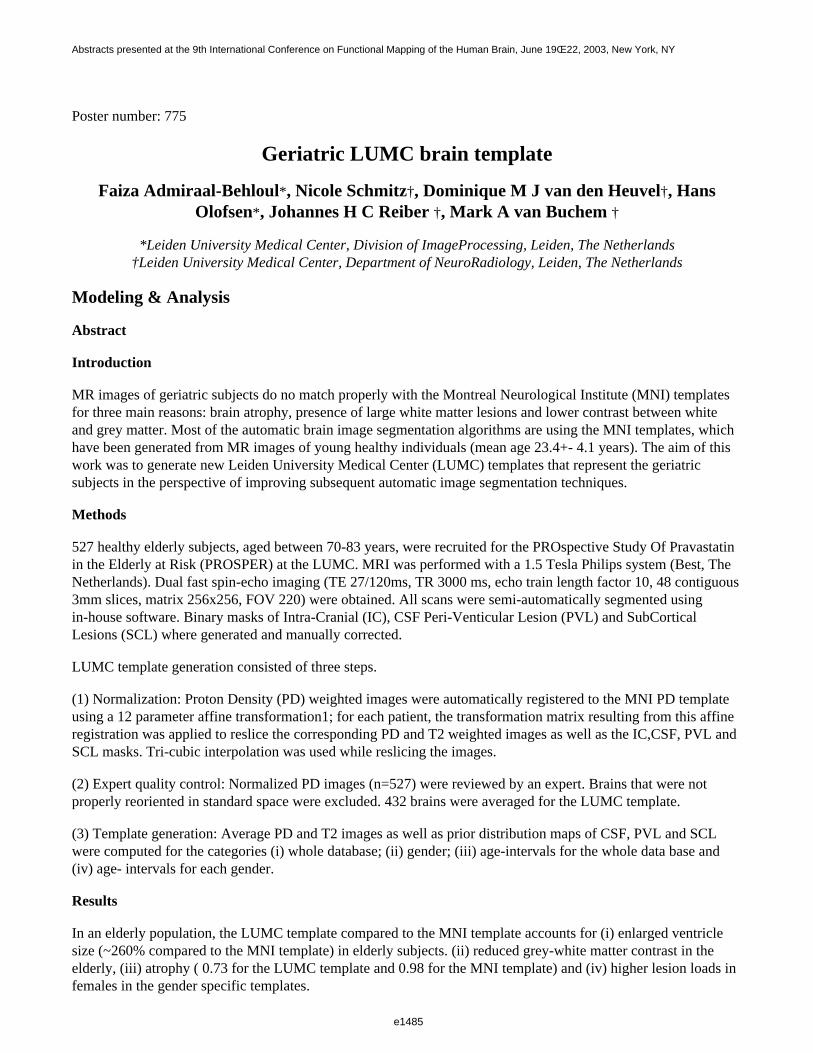
Figure 1 shows a 3D visualization of the ventricles (Opaque: MNI template, transparent: LUMC template) bothtemplates were tresholded at 33%. Figure 2 shows the prior probability maps of the periventricular lesions (in red)and the sub cortical lesions (in blue) for the whole database.
Conclusion
This work is the first attempt to build new templates dedicated to a geriatric population, which will facilitateautomated brain image analysis in the future. To our knowledge, we are the first to report prior probability mapsof white matter lesions (PVL and SCL) in normal aging.
References
1. R.P. Woods et al., J CAT, 1998, vol. 22, pp 153-165.
e1486
Abstracts presented at the 9th International Conference on Functional Mapping of the Human Brain, June 19Œ22, 2003, New York, NY
e1486

Order of appearance: 769
AbsTrak ID: 17228
e1487
Abstracts presented at the 9th International Conference on Functional Mapping of the Human Brain, June 19Œ22, 2003, New York, NY
e1487
Poster number: 776
Permutation tests for perfusion fMRI
Geoffrey Aguirre*, Thomas Nichols†, Jiongjiong Wang*
*University of Pennsylvania†University of Michigan
Modeling & Analysis
Abstract
Introduction
Non-parametric permutation tests offer some advantages over traditional parametric methods [1]. Analyses ofperfusion fMRI time-series suggest that, unlike BOLD fMRI, these data do not posses significant temporalautocorrelation under the null-hypothesis [2], and therefore might be approached with permutation methods.
Tests upon null-hypothesis, perfusion fMRI data
Null-hypothesis data (resting quietly, eyes open) were obtained from 10 subjects. Each subject was scanned for 8minutes (TR=3 sec, 8 slices, 1.5 Tesla) using modified FAIR/EPI [3]. Data were pre-processed as previouslydescribed [2].
Test for independence
The Durbin-Watson statistic was used to test for first-order autoregressive noise in the perfusion data. Nosignificant autocorrelation was found, although substantial positive autocorrelation was seen in simultaneouslycollected BOLD data.
Distribution of p-values
We examined three hypothetical, box-car experimental designs, with 4 minute epochs, 2 minute epochs, and 30second epochs. General linear models were constructed using these designs and movement covariates ofno-interest were included. Permutation analyses consisted of 1000 random permutations of the data, each yieldinga t-statistic map. The p value for each voxel was the obtained by comparing the t-statistic for the originaltime-series to the distribution of t-statistics for the permuted time-series. Uniform distributions of p values wereobserved for all three designs, again supporting the validity of the method. Non-uniform distributions wereobtained when movement covariates were not included.
Map-wise false-positive rate
The maximum map t-value was obtained for each permutation, and a critical map-wise t threshold correspondingto an alpha=0.05 was obtained. For the 30 second epoch hypothetical design, there were 0/10 false positive maps,while for the 2 minute and 4 minute epoch designs there were 1/10 and 2/10 false positive maps respectively. Ineach case, one or two voxels in areas of high susceptibility were responsible for the false-positive result.Therefore, while the false positive rate exceeded tabular values for the lowest frequency designs, thesupra-threshold voxels would be unlikely to be mistaken for true experimental effect.
Tests upon experimental, perfusion fMRI data
e1488
Abstracts presented at the 9th International Conference on Functional Mapping of the Human Brain, June 19Œ22, 2003, New York, NY
e1488
Five, 8 minute scans were obtained from each of ten subjects using CASL perfusion. During scanning, subjectsexperienced alternating 31 second periods of darkness and visual stimulation (data previously reported in [2]).Permutation analyses conducted as above.
The average map-wise threshold (for alpha=0.05, 3 voxel FWHM smooth) was 4.06 for the permutation method,4.40 for random field theory [4] and 4.36 for Bonferroni correction. On average, 20 more voxels (16% ofactivated volume) were identified using the permutation test.
Conclusions
Non-parametric permutation tests appear valid for application to perfusion fMRI data that have been appropriatelypre-processed, although the elevated map-wise false positive rate seen for very low hypothetical designs isconcerning. The permutation approach afforded greater statistical power in the example, experimental dataset.
References
1. Nichols and Holmes, HBM 2001, 1-252. Aguirre et. al., NeuroImage, 2002, 488-5003. Wang et al., MRM, 2003, in press4. Worsley et al.,, MRM, 1996, 58-73
Order of appearance: 770
AbsTrak ID: 18079
e1489
Abstracts presented at the 9th International Conference on Functional Mapping of the Human Brain, June 19Œ22, 2003, New York, NY
e1489
Poster number: 777
COHERENCE SPECTRA AS A TOOL FOR fMRI DATA ANALYSIS
Alexandre Andrade*, Christian Schwarzbauer†‡, Wolfgang Heinke§, Matthew Brett‡
*Instituto de Biofísica e Engenharia Biomédica, FCUL, Lisboa, Portugal†Max Planck Institute, Leipzig, Germany
‡Medical Research Council, Cognition and Brain Sciences Unit, Cambridge, UK§Department of Anesthesiology, University of Leipzig, Germany
Modeling & Analysis
Abstract
Introduction
This study aimed at merging approaches based on (very) low frequency correlation analysis and spectralcoherence analysis. Typical correlation studies (1) involve low-pass filtering fMRI time series (e.g. 0.08 Hz), andcomputing correlation coefficients between the time series of an ROI and the remaining brain voxels, yieldingplausible connectivity patterns.
Studies involving coherence spectra, common in EEG/MEG litterature, have seldom been applied to fMRI (2).This approach amounts to computing phase-free correlations at any chosen frequency, eliminating the need toapply temporal filtering; moreover, information about phase can be retrieved. A key feature of the present study isthe ability to detect statistically significant departures from white noise in the fMRI spectrum (using the Lombperiodogram), and to apply coherence analysis to frequencies of interest thus selected.
Methods
Eight subjects were scanned while performing a task that involved hearing a sentence and making a syntax-relateddecision. (This acquisition was part of a wider study whose aim was to assess the effect of an anesthetic; only datafrom control subjects were used in the study described herein.) An SPM99 analysis (3) was performed to detectregions engaged by this paradigm. 7x7x7 (mm3) cubic boxes centered at the SPM maxima were chosen as ROIsfor a subsequent coherence analysis. The functional data were spatially smoothed (6.5 mm FWHM). Lowfrequencies associated with statistically significant signal power were chosen as frequencies of interest. Maps ofcoherence values and phase shifts between the ROIs and the remaining brain voxels were created.
Results
The SPM99 analysis yielded highly significant bilateral superior temporal activations, as expected. A strongcoherence (at the paradigm frequency) was observed between the ROIs and the contralateral homologous region.Compared with the SPM analysis, additional activations were highlighted, e.g. occipital cortex. At lowerfrequencies, coherence maps showed a similar bilateral pattern, but involving also other structures (e.g. ant.cingulate gyrus, precuneus).
Joint analysis of the coherence maps and phase maps showed, in 5 subjects, a phase gradient that suggestssub-second spread of activation-related hemodynamic response across the superior temporal lobes.
Conclusions
e1490
Abstracts presented at the 9th International Conference on Functional Mapping of the Human Brain, June 19Œ22, 2003, New York, NY
e1490

i) Coherence analysis is a more versatile technique than simple correlation plus low-pass filtering approaches,allowing phase and phase-free frequency relationships to be analyzed, and thus providing a way to gain insightabout low frequency fluctuations underlying correlation between functionally related brain regions.
ii) Coherence analysis highlights paradigm-activated regions undetected by the SPM99 analysis, probably due to asignificant time lag that precludes detection by SPM without affecting coherence.
iii) Phase analysis provides information about the temporal sequences of cortical events. This study indicatesspread of BOLD-related activity consistent with the distinction between primary and association auditory areas.These results are in agreement with previous findings (4) that relied on time domain frequencies.
References
(1) Hampson et al. (2002), Human Brain Mapping, 15:247-262(2) Müller et al.(2001), NeuroImage, 14:347-356(3) Friston et al., http://www.fil.ion.ucl.ac.uk/spm/(4) Kruggel & von Cramon (1999), Human Brain Mapping, 8:259-271
Order of appearance: 771
AbsTrak ID: 17719
e1491
Abstracts presented at the 9th International Conference on Functional Mapping of the Human Brain, June 19Œ22, 2003, New York, NY
e1491
Poster number: 778
FREQUENCY AND TISSUE SPECIFICITY OF fMRI VERY LOWFREQUENCY FLUCTUATIONS
Alexandre Andrade*, Rhodri Cusack†, Matthew Brett†
*Instituto de Biofísica e Engenharia Biomédica, FCUL, Lisboa, Portugal†Medical Research Council, Cognition and Brain Sciences Unit, Cambridge, UK
Modeling & Analysis
Abstract
Introduction
The frequency profile of fMRI noise is still not well understood. Notably, high power at very low frequencies(below 0.1 Hz) cannot be explained only by physiological artefacts (1). Possible causes for very low frequencydrifts are movement-related noise, instrumental instability, magnetic field changes; metabolic, vascular andneuronal causes have also been suggested. Whereas attempts have been made to probe deeper into the nature ofthese drifts (2), knowledge about their tissue and frequency specificity is still very limited. The main goal of thisstudy was to investigate the tissue specificity of noise frequency profiles.
Methods
Resting state EPI functional acquisitions were performed in two volunteers (3 10-minute runs per subject, TR=2 sor 2.3 s, 64x64 matrix, 17 contiguous slices). Structural (SPGR) images and field maps (needed to assess EPIdistortion) were also acquired. The functional images were realigned using SPM99 (3).
The anatomical images were segmented into grey matter (GM), white matter (WM) and cerebrospinal fluid (CSF)using SPM99. The EPI undistortion tool described in (4) was applied in reverse, so that the estimated distortionparameters were applied to the probabilistic images resulting from segmentation, yielding spatially matching EPIand anatomical segmented images.
Power spectra were computed for all voxels. Statistically significant departures from white noise were detectedthrough the use of Lomb periodograms. Frequency ranges of interest were thus selected, notably a “very lowfrequency” (VLF) and a “low-frequency” (LF) range (0-0.01 Hz and 0.01-0.05 Hz respectively). Voxel-by-voxelvalues of power in frequencies of interest were saved as images.
Results
The global frequency for each tissue type was similar; however, power at the LF range was considerably lower inWM when compared with other tissues.
The distribution of high-power voxels was fairly uniform in WM, across all frequency ranges. In contrast, in GMthere was a clear spatial segregation between voxels with high power at the VLF range (mainly frontal regions)and voxels with high power at the LF range (left occipital and temporal structures), in both subjects. Higherfrequencies did not show significant spatial segregation.
Conclusions
e1492
Abstracts presented at the 9th International Conference on Functional Mapping of the Human Brain, June 19Œ22, 2003, New York, NY
e1492

Clearly, further studies are needed to substantiate the present findings. However, these results strongly suggestthat several sources play an important role in fMRI low-frequency drifts. The main observation (spatial and tissuespecificity of different frequency ranges within the typical “1/f” profile) hints at an important physiologicalcomponent, and provides a link with connectivity studies based on low-frequency drifts (5), and the considerablebody of work related to residual activity during rest due to involuntary cognitive processing.
References
(1) Biswal et al. (1996), Magnetic Resonance in Medicine, 35:107-113(2) Smith et al. (1999), NeuroImage, 9:526-533(3) Friston et al., http://www.fil.ion.ucl.ac.uk/spm/(4) Cusack et al. (2003), NeuroImage, 18:127-142(5) Hampson et al. (2002), Human Brain Mapping, 15:247-262
Order of appearance: 772
AbsTrak ID: 17726
e1493
Abstracts presented at the 9th International Conference on Functional Mapping of the Human Brain, June 19Œ22, 2003, New York, NY
e1493
Poster number: 779
A myelo-architectonic method for the structural classification of cortical areas
Jacopo Annese*†, Alain Pitiot*‡, Ivo Dinov*§, Arthur W. Toga*
*Laboratory of Neuro Imaging, UCLA School of Medicine, Los Angeles, USA.†Center for Cognitive Neuroscience, Dartmouth College, Hanover, USA
‡EPIDAURE Laboratory, INRIA, Sophia Antipolis, France§Department of Statistics, UCLA, Los Angeles, USA
Modeling & Analysis
Abstract
The cerebral cortex is not a uniform layer of gray matter, but is striped by a distinct internal lamination. Suchstratified structural design can be shown to vary locally on the surface of the hemispheres and can be related tospecific function.
We describe an automatic and reproducible method to analyze the histological design of the cortex as applied tosections stained to reveal myelinated fibers. The technique provides an evaluation of the distribution ofmyelination across the width of the cortical mantle in accordance with a model of its curvature and its intrinsicgeometry. The profile lines along which the density of staining is measured are generated from the solution of apartial differential equation that models the intermediate layers of the cortex. Cortical profiles are classifiedaccording to significant components that emerge from wavelet analysis.
The borders between several visual areas (V1, V2, V3 and V5) were adequately localized by our automatedclassification algorithm and validated by a blinded rater. The intensity profiles that are grouped into distinctarchitectonic classes are normalized and averaged to produce area-specific templates of cortical myelo-architecture.
Understanding the relationship between structure and function in the cerebral cortex is both a classification and alocalization problem. The definition of unambiguous architectonic templates is the prerequisite for topographichistological surveys and hence for comparative studies and for the generalization of architectonic maps to a population.
Order of appearance: 773
AbsTrak ID: 17139
e1494
Abstracts presented at the 9th International Conference on Functional Mapping of the Human Brain, June 19Œ22, 2003, New York, NY
e1494
Poster number: 780
Ranking of SICA components from fMRI data using a novel distance measure
Rakesh Arya*†, Steve Roys*, Vince Calhoun‡, Tulay Adali†, Joel Greenspan§, Rao Gullapalli*
*Dept of Radiology, Univ of Maryland†Dept of Electrical Engg, Univ of Maryland‡Inst of Living/Dept of Psychiatry, Yale Univ
§Dept of Oral & Cranial Biol Sciences, Univ of Maryland
Modeling & Analysis
Abstract
Introduction
Independent component analysis(ICA) is a valuable tool in determining time courses and corresponding spatialmaps that result from fMRI data. We propose here a distance measure based on variance, skewness, kurtosis andnegentropy for selection and interpretation of meaningful components.
Methods
A digital phantom containing four signal sources chosen from four skewed or kurtotic distributions, representingcardiac, respiratory, transient task related, and the task waveform, was generated. These were then overlaid onlarge intensity baseline image with an additive white gaussian noise[N(0, 1)]. The standard deviation of the noisewas increased in small steps to study the performance of this technique at various levels of signal to noise. ICAalgorithm was used to separate each fMRI data set into 50 spatially independent components. 1 We computed thevariance as the variance of the time course multiplied by the corresponding spatial map to remove any scalingdifferences. Histograms were used to obtain skewness (ξ y
3 ) kurtosis (ξ y4 )and entropy (Hy =-∑ipy (i)logpy (i)),
where, i corresponds to the i th bin and py (i)is the probability in the i th bin.2 Since the distance measure looks for
maxima, negentropy was used. The distance measure was defined as, d2 =α*(ξ y3 )2
norm + β*(ξ y4 )2
norm +
γ*(σy2 )2
norm + δ*(Gy -Hy )2norm where, Gy is the maximum entropy among all the 50 components. α,β,γ and δ
are the weights applied to individual parameters. Graphs were generated between distance measure andcomponent number, both with unity weights and scaled weights based on best performing individual parameter.Six, high temporal resolution fMRI data were obtained from volunteers using a Philips Eclipse 1.5 T scanner. Afinger-thumb opposition motor paradigm with 8 cycles of 20s on and 20s off, was used to cover 3 slices at a TR320 ms to verify the validity of the distance measure in delineating the relevant components.
Results
At high signal to noise ratio(SNR), all the individual parameters contributed equally to the distance measure. AsSNR decreased each parameter’s contribution varied as seen in Fig.1a. Providing weights based on the bestperforming parameter minimized the effect of noise in the distance measure(Fig.1b). No significant changes wereobserved in the distance measure from all six motor paradigm datasets, after about 10 components(Fig.2a). Fig.2bshows a 3D plot of kurtosis, skewness and entropy for the individual components. Two distinct clusters, one withhigh skewness and kurtosis corresponding to cardiac and respiratory activity, and the other with high skewnessbut low kurtosis corresponding to paradigm related activity, were observed. The cardiac and respiratorycomponents were identified after verification with the prospectively acquired respiratory and cardiac information
e1495
Abstracts presented at the 9th International Conference on Functional Mapping of the Human Brain, June 19Œ22, 2003, New York, NY
e1495
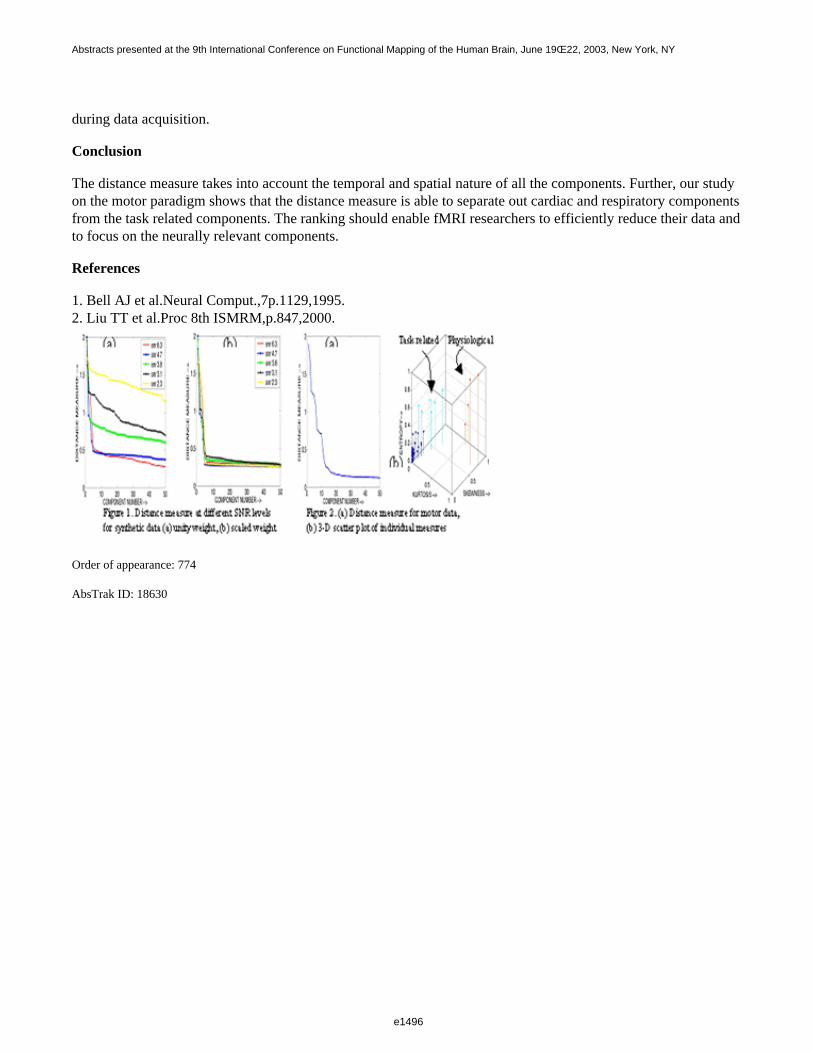
during data acquisition.
Conclusion
The distance measure takes into account the temporal and spatial nature of all the components. Further, our studyon the motor paradigm shows that the distance measure is able to separate out cardiac and respiratory componentsfrom the task related components. The ranking should enable fMRI researchers to efficiently reduce their data andto focus on the neurally relevant components.
References
1. Bell AJ et al.Neural Comput.,7p.1129,1995.2. Liu TT et al.Proc 8th ISMRM,p.847,2000.
Order of appearance: 774
AbsTrak ID: 18630
e1496
Abstracts presented at the 9th International Conference on Functional Mapping of the Human Brain, June 19Œ22, 2003, New York, NY
e1496
Poster number: 781
The relation between neural activity and neuroimaging signals studiedusing a mathematical model of compartmentalized energy metabolism
between astrocytes and neurons
Agnès Aubert*‡, Robert Costalat†
*IFR 49 and INSERM U 494, 91 boulevard de l’Hôpital, 75634 Paris Cedex 13, France†IFR 49 and INSERM U 483, Paris, France
Modeling & Analysis
Abstract
Introduction
The understanding and quantifying of cerebral energy metabolism coupling between neurons and astrocytes arenecessary to the interpretation of functional brain imaging data, especially fMRI, MRS and PET. Furthermore, thebalance of oxidative and non-oxidative metabolism, two mechanisms involved in the ATP regeneration duringneural activation, may be correlated to the kind of information processing (pre- or post-synaptic) executed in thebrain (Gjedde et al., J. Cereb. Blood Flow Metab. 22: 1-14, 2002). We develop a previous mathematical model ofthe coupling between brain electrical activity, metabolism, and hemodynamics (Aubert and Costalat, NeuroImage,17: 1162-1181, 2002), by taking into account the compartmentalization between neurons and astrocytes.
Method
The model includes two cellular compartments, neuron and astrocyte (refered to as glial cell), and an extracellularcompartment which exchanges both with the cells and a capillary compartment. Furthermore, venous dilatationprocesses are taken into account using the Balloon model of Buxton et al. (Magn. Reson. Med. 39: 855-864,1998). The model describes the possible disparities of metabolic fluxes magnitudes between neurons andastrocytes, including regeneration of ATP via phosphocreatine buffer effect, consumption of glucose, productionof lactate, consumption of pyruvate by mitochondria, and lactate exchanges through cell membranes.
The increase of ATP consumption during neural activation is assumed to result from:
(i) the activation of the Na+,K+-ATPase in response to the sodium-glutamate cotransport in astrocytes, excitatorypost-synaptic potentials and action potentials in neurons;
(ii) to a lesser extent, ATP-consuming metabolic reactions, especially synthesis of glutamine from glutamate in astrocytes.
Results and Discussion
The model allows to test specific hypotheses. At steady state, we can assume that (1) neurons have a netproduction of lactate which is released in extracellular space, (2) neurons consume lactate produced by astrocytes,(3) neurons globally neither produce nor consume lactate. During a stimulation, the extra pyruvate consumed byneuronal mitochondria can be issued from the lactate produced by astrocytes (Magistretti et al., Science 283:496-497, 1999) or from neuronal glycolysis (Gjedde and Marrett, J. Cereb. Blood Flow Metab. 21: 1384-1392,2001; Chih et al., Trends in Neurosciences 24: 573-578, 2001), depending on critical parameters pertaining to theregulation of glycolysis and cell respiration, lactate transport and possibly lactate dehydrogenase catalyticproperties. Our results show that the orientation of LDH-catalysed reactions and lactate transport can change
e1497
Abstracts presented at the 9th International Conference on Functional Mapping of the Human Brain, June 19Œ22, 2003, New York, NY
e1497

during a sustained stimulation.
Order of appearance: 775
AbsTrak ID: 17496
e1498
Abstracts presented at the 9th International Conference on Functional Mapping of the Human Brain, June 19Œ22, 2003, New York, NY
e1498
Poster number: 782
Quantification of the relationship between MEG and fMRI datasetsthrough measures of mutual information
Gareth Barnes, Arjan Hillebrand, Krish Singh
*The Wellcome Trust Laboratory for MEG studies, Neurosciences Research Institute, Aston University, U.K.†
Modeling & Analysis
Abstract
Recent studies have shown a spatial correspondence between functional magnetic resonance (fMR) images ofblood oxygenation dependent (BOLD) signal change and magnetoencephalograhic (MEG) measures of inducedoscillatory power changes [1]. In this work we examine measures with which to quantify this similarity.Typically, we wish to compare images of BOLD signal change with Synthetic Aperture Magnetometry (SAM)images of band-limited power change [2] for the same subject in the same experimental paradigm. Electrically,these changes can be decreases in power, termed event related desynchronistaion (ERD), or increases, termedevent related synchronisation (ERS), with respect to baseline; a typical activation time-series will consist of bothERD and ERS phases [3]. The time-courses of these power changes are however not homogeneous (ranging overthe order of seconds) across frequency bands, nor across the cortex. That is, for a given time-window it is notuncommon to see significant ERD in one active area of cortex and ERS in another; both areas will however showpositive BOLD signal change. In such cases, linear measures of similarity such as correlation fail to show the truedependence between images from the two modalities. We examine measures of mutual information and entropyas an objective way of quantifying the relationship between image sets. For example, initial results, based onbiological motion data for a single subject, suggest that the mutual information between the fMRI and MEG datasets is maximal in the 5-15Hz band. We suggest this method may be extended further to the examination of thesimilarity between fMRI and MEG (beamformer estimates of) voxel time-series.
References
1. Singh, K.D., Barnes, G.R., Hillebrand, A., Forde, E.M.E, Williams, A.L. (2002) Task-related changes incortical synchronisation are spatially coincident with the haemodynamic response. NeuroImage 16, 103-114.2. Robinson, S. E., and Vrba, J. 1999. Functional neuroimaging by synthetic aperture magnetometry (SAM). InRecent Advances in Biomagnetism, pp. 302-305. Tohoku Univ. Press, Sendai.3. Pfurtscheller G, Lopes da Silva FH. 1999. Event-related EEG/MEG synchronization and desynchronization:basic principles. Clin. Neurophysiol. 110(11):1842-57
Order of appearance: 776
AbsTrak ID: 18705
e1499
Abstracts presented at the 9th International Conference on Functional Mapping of the Human Brain, June 19Œ22, 2003, New York, NY
e1499
Poster number: 783
Application of a Visual segmentation Algorithm to MRI Images
Paolo Belardinelli*‡§, Antonio Mastacchi§, Alessandro Londei§, Vittorio Pizzella*‡,GianLuca Romani *‡
*1Institute of Advanced Biomedical Technologies, Università "G. D’Annunzio", Chieti, Italy.†
‡2.INFM, L’Aquila, Italy§
¶3.ECONA Interuniversity Center for Research on Cognitive Processing, University "La Sapienza", Rome, Italy
Modeling & Analysis
Abstract
A new neural network algorithm has been developed for the automatic visual segmentation of T1-weighted 3-Dhead magnetic resonance images. Our first experiments give good performances in segmenting skull, brain in allits ramifications, as other structures within the skull, like cerebellum and brain stem. The network is effective insegmenting gray and white matter too.
The 3-D segmentation results can be used to generate surface and volume tessellations suitable for FEM (FiniteElement Method) forward field calculations, such as, for instance, in magnetoencephalography source modeling.
We have applied the algorithm to several MRI Data Sets. Despite the diversity of the images the neural networkshows good robustness.
Order of appearance: 777
AbsTrak ID: 18865
e1500
Abstracts presented at the 9th International Conference on Functional Mapping of the Human Brain, June 19Œ22, 2003, New York, NY
e1500
Poster number: 784
Using ICA on fMRI : does independence matter ?
Michael S. Benharrosh*, Sylvain Takerkart*, Jonathan D. Cohen*†, Ingrid C. Daubeschies*‡, Wolfgang Richter*§
*Center for the Study of the Brain, Mind and Behavior, Princeton University†Department of Psychology,Princeton University
‡Program in Applied and Computational Mathematics, Princeton University§Department of Chemistry, Princeton University
Modeling & Analysis
Abstract
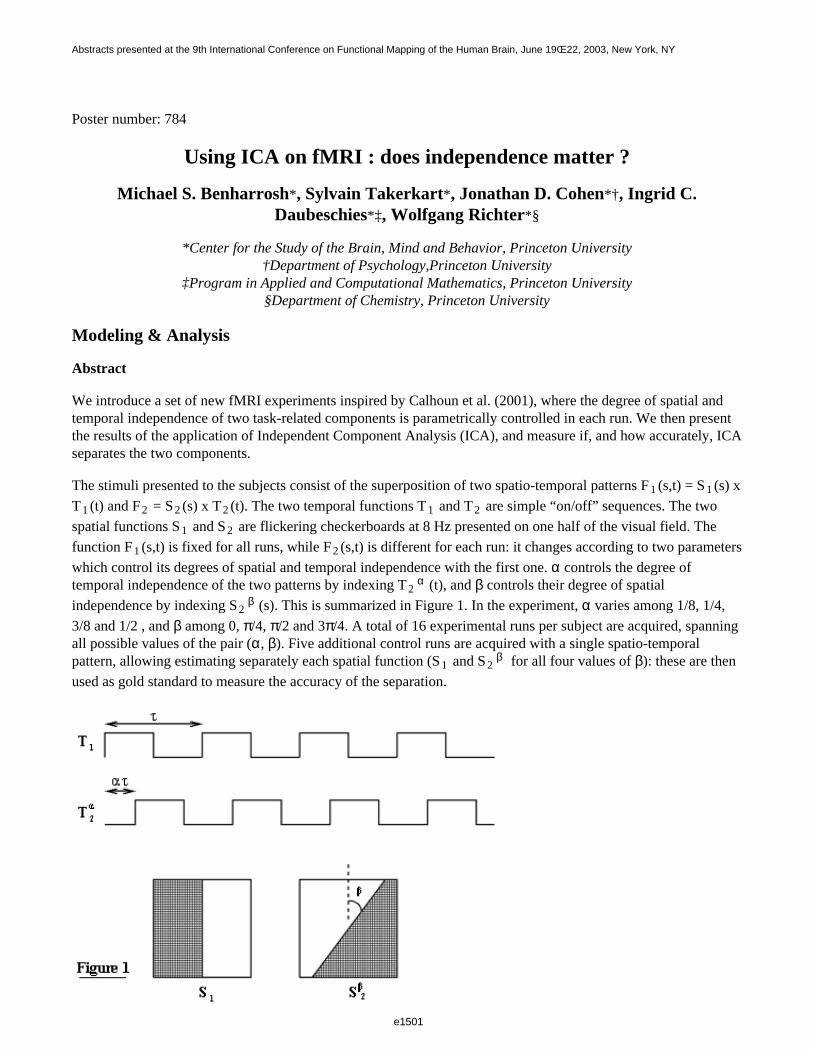
We introduce a set of new fMRI experiments inspired by Calhoun et al. (2001), where the degree of spatial andtemporal independence of two task-related components is parametrically controlled in each run. We then presentthe results of the application of Independent Component Analysis (ICA), and measure if, and how accurately, ICAseparates the two components.
The stimuli presented to the subjects consist of the superposition of two spatio-temporal patterns F1 (s,t) = S1 (s) x
T1 (t) and F2 = S2 (s) x T2 (t). The two temporal functions T1 and T2 are simple “on/off” sequences. The two
spatial functions S1 and S2 are flickering checkerboards at 8 Hz presented on one half of the visual field. The
function F1 (s,t) is fixed for all runs, while F2 (s,t) is different for each run: it changes according to two parameters
which control its degrees of spatial and temporal independence with the first one. α controls the degree oftemporal independence of the two patterns by indexing T2
α (t), and β controls their degree of spatial
independence by indexing S2β (s). This is summarized in Figure 1. In the experiment, α varies among 1/8, 1/4,
3/8 and 1/2 , and β among 0, π/4, π/2 and 3π/4. A total of 16 experimental runs per subject are acquired, spanningall possible values of the pair (α, β). Five additional control runs are acquired with a single spatio-temporalpattern, allowing estimating separately each spatial function (S1 and S2
β for all four values of β): these are then
used as gold standard to measure the accuracy of the separation.
e1501
Abstracts presented at the 9th International Conference on Functional Mapping of the Human Brain, June 19Œ22, 2003, New York, NY
e1501

The different values of α result in the following temporal properties of the two mixed components: thetime-courses are statistically independent for α=1/4, and present different degrees of dependence for the othervalues, with full dependence (anti-correlation) for α=1/2. Although the time-courses exhibited in the fMRI dataare not strictly identical to the ones presented on Figure 1 because of the hemodynamic delay, these properties arestrictly conserved. That is not the case in the spatial domain since there is not a one-to-one mapping of the visualfield onto the entire cortex. The best approximation of statistical independence of the two spatial components inthe data is achieved for β=π/4, where the overlapping of the two activated regions is small. The case β=0 resultsin a full separation of the two activated region, which is a good approximation for statistical independence if theseregions are small compared to the full brain. The two patterns are more spatially dependent for the larger valuesof β.
Results show that ICA generates a good separation when the underlying components are statistically independent.It performs reasonably well when components are separated (non-overlapping). Finally a strong degradation ofthe performances occurs when components are increasingly dependent.
References
Calhoun et al, 2001. Human Brain Mapping 13:43-53
Order of appearance: 778
AbsTrak ID: 18592
e1502
Abstracts presented at the 9th International Conference on Functional Mapping of the Human Brain, June 19Œ22, 2003, New York, NY
e1502
Poster number: 785
How experimental design and first-level filtering influence efficiency insecond-level analysis of event-related fMRI data
Marta Bianciardi, Antonio Cerasa, Gisela Hagberg
Laboratory of Neuroimaging, Foundation Santa Lucia, Rome, Italy
Modeling & Analysis
Abstract
Introduction
In classical second-level analysis, the choice of experimental design and filtering strategy are not consideredimportant for the outcome, since it is assumed that the inter-subject variance (random effect) dominates the mixedeffect variance [1]. If this assumption is to hold then the efficiency at the second-level should be independent ofdifferences in design and first-level filtering. In the present work we set out to analyse these assumptions moreclosely. We acquired event-related fMRI data for designs with various first-level efficiencies and analysed thesewith different filtering strategies. The resulting data were evaluated in terms of first- and second-level efficiencyand the ratio between intra-subject and inter-subject variance.
MATERIALS AND METHODS
Five healthy, right-handed volunteers (22–26y) underwent fMRI (Siemens Vision 1.5T, 270 EPI volumes, TR: 1s,TE: 60ms, flip angle: 60°, pixel size: 3x3x4.4mm, number of slices: 11). Task: button-press with right hand indexat time points indicated by green dot (2Hz flicker, duration 1s). Stimulus timing adjusted according to bimodal(Bm), geometric (Go), latin square (Lq), and binomial (Bn) probability distributions [2](2repetitions/examination, 2examinations/subject); block design (30s ON-OFF periods; 1examination/subject).First-level fixed effect analysis were performed, after image motion correction and normalisation, with: SPM99(filtering: high-pass with wcut-off: 1/85.333Hz and Gaussian low-pass, 4s FWHM) [3]; and FSL v5.0 (high-passcut-off: 1/85.333Hz; whitening filter [4]). Second-level analysis was performed by SPM99 for both data-sets,hence the mixed effect variance was estimated directly from the first-level parameter estimates. The data from theblocked design were used to identify activated voxels (corrected p-level<0.01, cluster-size: 15), yielding a 9.5cm3(148voxels) region of interest located in primary and supplementary motor cortex. For each design, filteringstrategy (SPM99, FSL) and analysis-level we extracted the variance within this region and calculated thedetection efficiency (DE), defined as the inverse of the square-root of the variance (fixed and mixed effect).
Results and Discussion
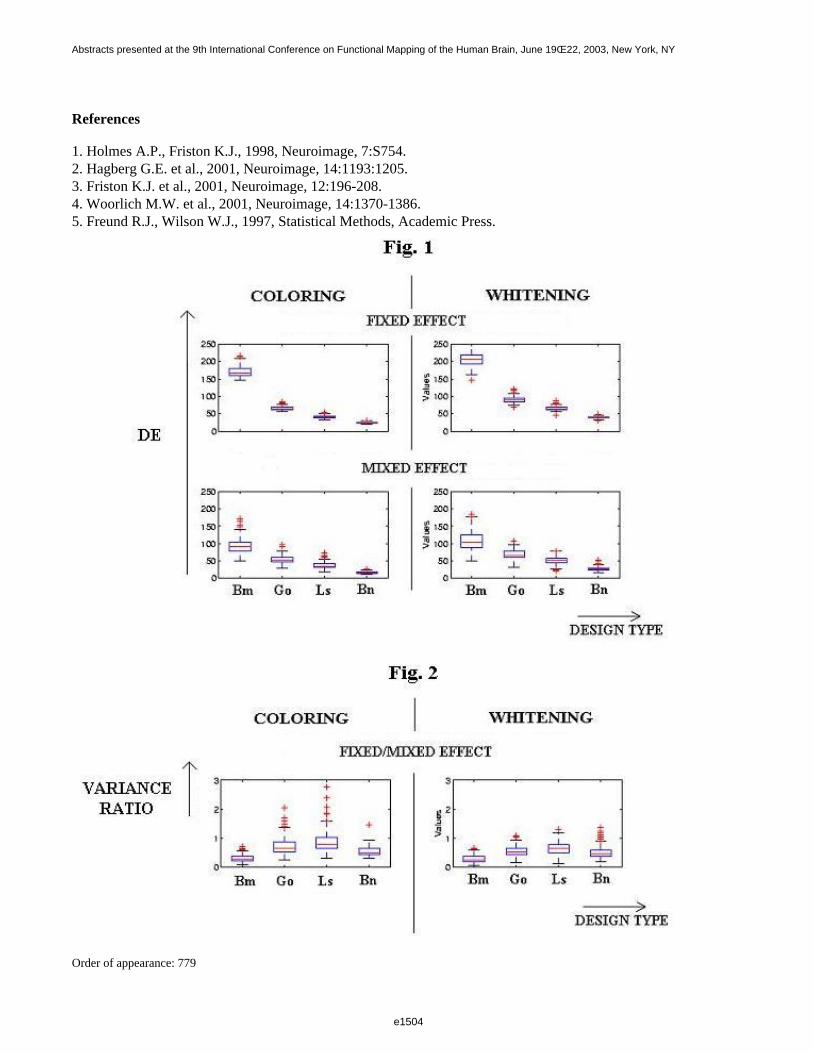
In Fig. 1, the DE observed for the various designs after coloring (SPM99, left column) and after whitening (FSL,right column) are depicted. These result show that designs with greater first-level efficiency (first row) alsoshowed greater second-level efficiency (second row), although the difference was slightly attenuated at the higherlevel. With respect to the adopted filtering strategy, the average mixed effect detection efficiencies were higherafter whitening than coloring for all the considered designs (second row). The intra-subject/inter-subject varianceratio should always be less than 1, except in presence of special problems, such as residual correlation [5]. In thisrespect, as expected, whitening was more robust (Fig. 2). In conclusion, the experimental design and first-levelfiltering strategy both affect the outcome of second-level analysis. Most likely, refined methods that also take intoaccount fixed effect (intra-subject) variance at the second-level may overcome this limit.
e1503
Abstracts presented at the 9th International Conference on Functional Mapping of the Human Brain, June 19Œ22, 2003, New York, NY
e1503
References
1. Holmes A.P., Friston K.J., 1998, Neuroimage, 7:S754.2. Hagberg G.E. et al., 2001, Neuroimage, 14:1193:1205.3. Friston K.J. et al., 2001, Neuroimage, 12:196-208.4. Woorlich M.W. et al., 2001, Neuroimage, 14:1370-1386.5. Freund R.J., Wilson W.J., 1997, Statistical Methods, Academic Press.
Order of appearance: 779
e1504
Abstracts presented at the 9th International Conference on Functional Mapping of the Human Brain, June 19Œ22, 2003, New York, NY
e1504

AbsTrak ID: 18291
e1505
Abstracts presented at the 9th International Conference on Functional Mapping of the Human Brain, June 19Œ22, 2003, New York, NY
e1505
Poster number: 786
A Mathematical Approach to the Temporal Stationarity of theBackground Activity in MEG/EEG-measurements
Fetsje Bijma*, Jan C. De Munck*, Hilde M. Huizenga†, Rob M. Heethaar*
*VU University Medical Center, MEG Center, Dep. PMT, De Boelelaan 1118, 1081 HZ, Amsterdam, The Netherlands
†Department of Developmental Psychology, University of Amsterdam, Roeterstraat 15, 1018 WB, Amsterdam,The Netherlands
Modeling & Analysis
Abstract
Background noise in MEG/EEG-measurements is correlated both in space and in time. Incorporating the spatialcovariance into the localization of equivalent current dipole sources improves in general the accuracy of theestimated source parameters. Models for this spatial covariance have been developed [1].
Recently it has been shown that also the temporal covariance yields an improvement of the parameters when thiscovariance is taken into account in the source localization [2,3]. In these recent approaches the spatiotemporalcovariance matrix was modeled as a Kronecker Product of a spatial and a temporal covariance matrix in order toreduce its dimensionality. Furthermore the two matrices are estimated in an iterative Maximum Likelihood (ML)procedure. When the number of time samples is larger than say T=500, this ML-estimation is too time consumingto be useful on a routine basis (typically 46 hours for 151 channels, 1000 time samples and 500 trials on aP3-800MHz). For that reason we studied several temporal covariance matrices of different kinds of MEG-data ofdifferent subjects to see if, similar to the spatial covariance, further parameterization beyond the Kroneckerproduct is possible.
The temporal covariance vanishes for large time lag. Moreover it shows a clear alpha oscillation, which gives riseto separating the temporal background noise into two components: alpha activity and remaining random noise.The alpha activity is modeled as randomly occurring waves with random phase in each trial and the covariance ofthe random noise is modeled as exponentially decreasing with lag. This model requires only six parameters (threenon-linear) instead of T(T+1)/2.
Theoretically, this model is stationary but in practice the stationarity of the matrix is hampered by the baselinecorrection (BC). This effect is illustrated in figure 1: when the average alpha activity over the BC-window is notzero, the correction introduces a vertical shift in the signals. This yields an extra variance that varies over time(i.e. non-stationarity). To obtain a stationary structure the length of the BC-window should equal a multiple ofalpha periods.
e1506
Abstracts presented at the 9th International Conference on Functional Mapping of the Human Brain, June 19Œ22, 2003, New York, NY
e1506
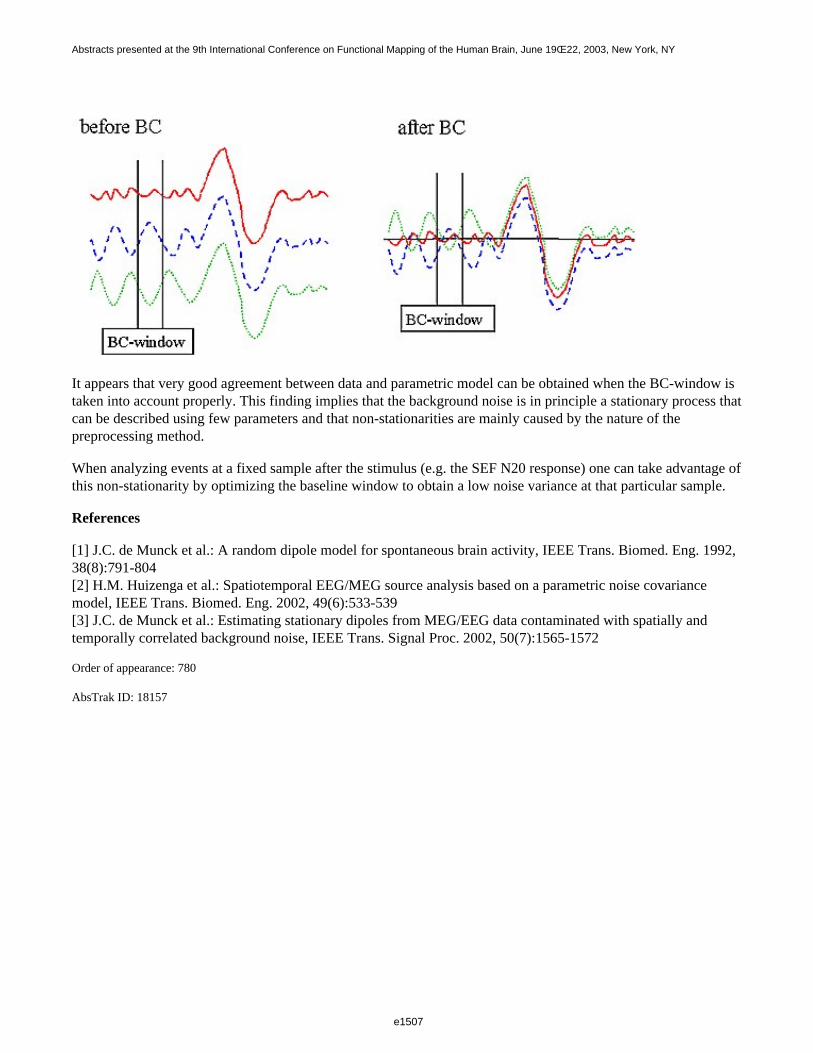
It appears that very good agreement between data and parametric model can be obtained when the BC-window istaken into account properly. This finding implies that the background noise is in principle a stationary process thatcan be described using few parameters and that non-stationarities are mainly caused by the nature of thepreprocessing method.
When analyzing events at a fixed sample after the stimulus (e.g. the SEF N20 response) one can take advantage ofthis non-stationarity by optimizing the baseline window to obtain a low noise variance at that particular sample.
References
[1] J.C. de Munck et al.: A random dipole model for spontaneous brain activity, IEEE Trans. Biomed. Eng. 1992, 38(8):791-804[2] H.M. Huizenga et al.: Spatiotemporal EEG/MEG source analysis based on a parametric noise covariancemodel, IEEE Trans. Biomed. Eng. 2002, 49(6):533-539[3] J.C. de Munck et al.: Estimating stationary dipoles from MEG/EEG data contaminated with spatially andtemporally correlated background noise, IEEE Trans. Signal Proc. 2002, 50(7):1565-1572
Order of appearance: 780
AbsTrak ID: 18157
e1507
Abstracts presented at the 9th International Conference on Functional Mapping of the Human Brain, June 19Œ22, 2003, New York, NY
e1507
Poster number: 787
An Integrated Model for Multiple MEG Data Sets within Subjects
Fetsje Bijma*, Jan C. De Munck*, Koen B.E. Böcker†, Ruurd Schoonhoven*, Rob M. Heethaar*
*VU University Medical Center, MEG Center, Dep. PMT, De Boelelaan 1118, 1081 HZ, Amsterdam, The Netherlands
†Utrecht University, Dep. of Psychopharmacology, PO Box 80082, 3508 TB, Utrecht, The Netherlands
Modeling & Analysis
Abstract
In general the inverse problem (IP) in MEG is ill posed: extra constraints are necessary to solve and stabilize theIP. One way of solving this problem is to make extra assumptions in order to reduce the dimensionality of theparameter space. Another way is adding more data sets and assuming some parameters to have fixed values in alldata sets. This second idea leads to an integrated model, in which multiple data sets are investigated simultaneously.
When the same sources are active in several MEG data sets within one subject, the source localization on thesedata sets can be performed in such an integrated model. We designed a model that uses a basic set of equivalentcurrent dipoles as sources and a basic set of source time functions (stf). These basic sets yield a basic lead fieldmatrix P and a basic stf-matrix F.
For each single data set q a coding matrix Cq is specified such that the corresponding dipole model Rq for that
data set is the matrix product
Rq = P Cq F.
The two matrices P and F are normalized so that the amplitudes of the sources are determined in the codingmatrices Cq . The number of basic dipoles, the number of basic stfs and the zeroes in the coding matrices have to
be set by the user. In this formalism the different data sets can be modeled in a clear and flexibel way.
This integrated way of modeling decreases the total number of dipoles and stfs to be fitted in the data sets.Moreover, in this way different sources can have the same stf within one dataset (e.g. sources in left and righthemisphere may have the same stf) and conversely, the same source can have different stfs in different data sets(e.g. one source can be activated at a different stimulation rate which in general results in a different stf).
Maximum Likelihood (ML) estimates were derived for the parameters of the basic dipoles, the basic stfs and theamplitudes in the coding matrices. Furthermore ML-estimates for the spatial and the temporal covariance matriceswere calculated according to the Kronecker Product model as described in [1].
We applied this integrated model to visually evoked MEG data. The visual stimulus was presented in either theright or the left or both visual hemifields with either low, middle or high spatial frequency. In this way nine datasets per subject can be investigated simultaneously in our integrated model using only four dipoles.
References
[1] J.C. de Munck et al.: Estimating stationary dipoles from MEG/EEG data contaminated with spatially andtemporally correlated background noise, IEEE Trans. Signal Proc. 2002, 50(7):1565-1572
e1508
Abstracts presented at the 9th International Conference on Functional Mapping of the Human Brain, June 19Œ22, 2003, New York, NY
e1508

Order of appearance: 781
AbsTrak ID: 18204
e1509
Abstracts presented at the 9th International Conference on Functional Mapping of the Human Brain, June 19Œ22, 2003, New York, NY
e1509
Poster number: 788
Quantitative comparison of three brain extraction algorithms
Kristi Boesen*, Kelly Rehm†, Kirt Schaper*, Sarah Stoltzner‡, Roger Woods‡, David Rottenberg*†
*University of Minnesota, Department of Neurology†University of Minnesota, Department of Radiology
‡UCLA, Department of Neurology
Modeling & Analysis
Abstract
Segmentation of brain/non-brain tissue is traditionally one of the more time-consuming preprocessing stepsperformed in neuroimaging laboratories. Several brain extraction algorithms (BEAs) have been developedrecently to perform this step automatically. While automated BEAs speed up overall image processing, theiroutput can greatly affect the results of image analysis. We therefore compared the performance of three BEAsagainst manual brain extraction using a high-resolution set of T1-weighted MRI brain volumes.
Methods
Sixteen T1-weighted MRI scans of normal subjects were acquired during an fMRI static force experiment [1];voxel dimensions were 0.86 x 0.86 x 1mm. Three algorithms for brain/non-brain segmentation were evaluated: (i)Brain Surface Extractor (BSE), v. 2.99.8 [2], (ii) Brain Extraction Tool (BET), v. 1.2 [3], and (iii) MinneapolisConsensus Strip (MCS) [4]. Manual brain extraction was performed by one of the authors (KR). BSE and BETare software packages with parameters that may be adjusted by the user; for each algorithm parameters weretuned on two training volumes, and the set resulting in the "best" strip (removal of skull, CSF and dura withpreservation of brain tissue) was applied to all 16 brain volumes. In order to perform adequately, BSE requiredmanual cropping of the brain with a bounding cube. MCS was initialized with a warp mask and incorporated bothintensity thresholding and BSE. MCS masks were created in a separate experiment and were optimized for theentire 16-volume dataset. The following performance metrics were calculated: (i) processing time and (ii) numberof misclassified voxels relative to the manually-stripped "gold standard." In order to assess the influence of edgeeffects on the misclassification metrics the manual mask was dilated
and eroded by 1 (thin) and 2 (thick) voxels.
Results and Conclusions
The average time required to process a single brain volume was 1 minute for BSE (exclusive of manual cropping),40 seconds for BET, and 75 minutes for MCS on a 500 MHz Linux workstation. The performance of eachalgorithm with respect to the gold standard is summarized in Table 1. "Missed" voxels are voxels classified asbrain by the manual strip and non-brain by the candidate algorithm, whereas "extra" voxels are voxels classifiedas non-brain by the manual strip and brain by the candidate algorithm. Misclassified voxels are expressed as apercentage of total brain voxels. One volume that could not be satisfactorily stripped by any of the BEAs wasexcluded from the averages reported in Table 1. MCS, though slower, consistently outperformed BSE and BET(see Table 1 and Figure 1). In the future, we will develop additional metrics, including the effect of masking onsubsequent data analysis and will extend our evaluation to include additional algorithms.
e1510
Abstracts presented at the 9th International Conference on Functional Mapping of the Human Brain, June 19Œ22, 2003, New York, NY
e1510
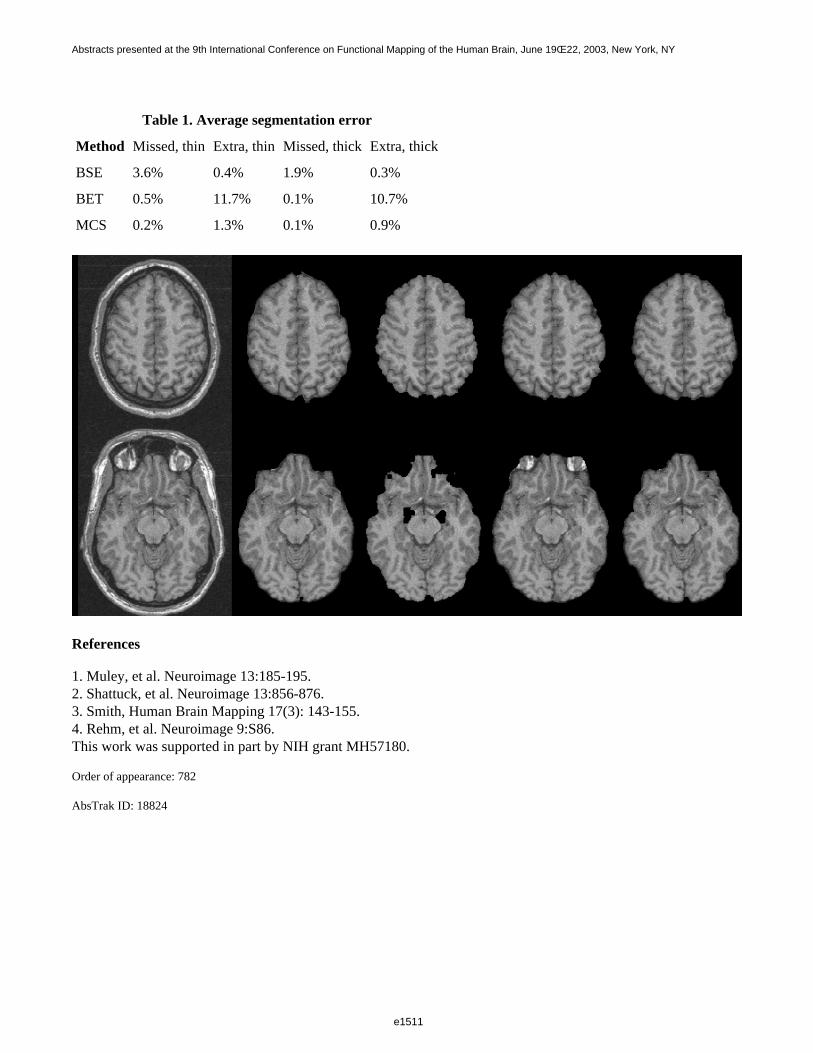
Table 1. Average segmentation error
Method Missed, thin Extra, thin Missed, thick Extra, thick
BSE 3.6% 0.4% 1.9% 0.3%
BET 0.5% 11.7% 0.1% 10.7%
MCS 0.2% 1.3% 0.1% 0.9%
References
1. Muley, et al. Neuroimage 13:185-195.2. Shattuck, et al. Neuroimage 13:856-876.3. Smith, Human Brain Mapping 17(3): 143-155.4. Rehm, et al. Neuroimage 9:S86.This work was supported in part by NIH grant MH57180.
Order of appearance: 782
AbsTrak ID: 18824
e1511
Abstracts presented at the 9th International Conference on Functional Mapping of the Human Brain, June 19Œ22, 2003, New York, NY
e1511
Poster number: 789
Quantifying time-dependent functional interactions of a neural network
Arun Bokde*, Stefan Teipel*, Wentian Dong*, Christina Maier*, Gerda Leinsinger†,Christine Born†, Hans-Juergen Moeller*, Harald Hampel*
*Alzheimer Memorial Center and Geriatric Psychiatry Branch, Dementia and Neuroimaging Section, Departmentof Psychiatry, Ludwig-Maximilian University, Station D2, Nussbaumstr.7, 80336 Munich, Germany
†Institute for Diagnostic Radiology, Ludwig-Maximilian University, Ziemssenstr. 1, 80336 Munich, Germany
Modeling & Analysis
Abstract
The analysis of imaging data, from PET or functional MRI, involves the detection of which areas of the brainactivate during a cognitive task of interest. In addition, it is possible through various techniques, such asfunctional and effective connectivity, to calculate the interaction between two regions involved in a cognitivetask. The computation of the functional interactions through correlation coefficients (functional connectivity) orthrough linear regression (effective connectivity) are based on an average over many subjects (in the case ofpositron emission tomography data) or an average over a run (as can be the case with functional MRI data sets). Anew method is developed using Kalman filters to quantify the interaction between regions of a neural networkwith functional MRI data. The Kalman filter is a recursive process where new information (such as a data pointfrom an functional MRI time series) is added to estimate the linear interaction between two regions. The Kalmanfilter allows one to calculate the linear interaction between two regions at each time point in the functional MRItime series or as an average value over the entire time series. The filter is modified with a diffuse filter to optimizethe estimates of the linear relationship at the beginning of the time series. In addition, the filter is modified with asmoothing step, so that information from later periods of the time series can be used in quantifying the linearrelationship. The Kalman filter is embedded within a maximum likelihood estimator to optimize the varianceestimates of the linear relationship. The method is demonstrated through (a) simulation studies and (b) a taskusing attention to modulate the interaction between regions. Supported by the Volkswagen Stiftung.
Order of appearance: 783
AbsTrak ID: 18324
e1512
Abstracts presented at the 9th International Conference on Functional Mapping of the Human Brain, June 19Œ22, 2003, New York, NY
e1512
Poster number: 790
Characterizing functional connectivity and estimating backgroundspatio-temporal correlations in brain imaging data: A wavelet approach
Michael Breakspear*†‡, Mick Brammer§, Ed Bullmore§, Pritha Das*, Leanne M. Williams*
*Brain Dynamics Centre, Westmead Hospital and University of Sydney, Australia.†School of Physics, University of Sydney, Australia.
‡NSW Institute of Psychiatry, Australia§Institute of Psychiatry, King’s College, London, U.K
¶Brain Mapping Unit, University of Cambridge, Cambridge UK
Modeling & Analysis
Abstract
Objectives: Elucidating the nature of dynamic interactions between brain regions requires the accurate descriptionof functional correlations in brain imaging data [1]. Two steps are required: 1. A suitable method of quantifyingcorrelations in spatio-temporal data, and 2. A technique of estimating the distribution of such correlations underthe null hypothesis that they reflect only trivial (stochastic) correlations in the data [2]. The aim of the presentstudy was to extend existing wavelet-based methods [3] in order to achieve this objective.
Method
Both steps require multi-scale transformation of the (four-dimensional) data into the wavelet domain. For the firststep a ‘coarse-grained representation’ [4] of the data is obtained. Correlations between different spatial locationswithin the same, or across different scales, are calculated by integrating the inner product of their coarse-grainedfields with respect to time. The second step repeats this procedure on ‘surrogate data’ obtained by extendingwavelet resampling techniques [3] from the temporal to the spatio-temporal domain with constraints so that 1.Only intracranial data are permuted, 2. Spatio-temporal correlations between planar slices are preserved, and 3.Spatial scales influenced predominantly by extracranial artefact can be excluded. A non-parametric test allowsidentification of statistically significant correlations in the experimental data. The method is demonstrated instandard IEEE test images and then applied to motion-corrected fMRI data collected from 8 healthy subjectsviewing block-design checkerboard stimuli [5].
Results
Step 1: Strong positive correlations between right and left extrastriate visual cortex were observed to occur withinthe same scale and across scales. Strong negative correlations between signal fluctuations on different scales werealso observed. Strong correlations were maximum with zero time-difference. Step 2: Fig. 1 presents a standardIEEE test image (panel a), surrogate data constructed by resampling only the finer scales of this image (panel b),only the coarse-grained scales (panel c) and all scales, but constrained to a central ellipse (panel d). Spectralanalysis revealed that each surrogate image contained the same correlations as the original data. Extension tomultiple images and irregular intracranial domains was also achieved. When applied to fMRI data, this allowedidentification of which of the correlations calculated in step 1 were statistically significant.
Conclusion:
e1513
Abstracts presented at the 9th International Conference on Functional Mapping of the Human Brain, June 19Œ22, 2003, New York, NY
e1513

This method permits identification of functional correlations in fMRI data occurring between sites at the same, ordifferent scales, with or without time delays, and with linear or nonlinear structure. Modification of the technique(e.g. Spatial integration of the inner product, decomposition of the correlation matrix into symmetric andanti-symmetric parts) permits analysis of information ‘flow’ across scales and between brain regions. The methodmay be superior to existing techniques in that the data, rather than the design of the scanner, ‘chooses’ the spatialscale at which the analysis is optimized.
References
1. Friston (1994) HBM 2:56.2. Breakspear (2002) HBM 15:175, Breakspear & Terry (2002) NeuroImage 16:822.3. Brammer (1998) HBM 6:378. Bullmore et al.(2001) HBM 12:61.4. Nakao et al. (2001) IJBC 11:1483.5. Williams et al. (2000) Neuroreport 11:3011.
e1514
Abstracts presented at the 9th International Conference on Functional Mapping of the Human Brain, June 19Œ22, 2003, New York, NY
e1514

Order of appearance: 784
AbsTrak ID: 17464
e1515
Abstracts presented at the 9th International Conference on Functional Mapping of the Human Brain, June 19Œ22, 2003, New York, NY
e1515
Poster number: 791
Model fitting and power in fast event related designs
Matthew Brett*, Ian Nimmo-Smith*, Katja Osswald*, Edward Bullmore†‡
*MRC Cognition and Brain Sciences Unit, Cambridge, UK†Brain Mapping Unit,
‡Cambridge University Department of Psychiatry, Cambridge, UK
Modeling & Analysis
Abstract
Event related (ER) designs have become standard in recent FMRI studies. Although they have major benefits interms of the range of phenomena that can be studied, they can be complicated to analyze and interpret. Recenttheoretical studies have addressed power in ER studies, and have suggested that frequent events with randominter-stimulus intervals (ISIs) give high power. However, these simulations have required several assumptions,including independence between events. Therefore we have attempted to replicate the results of these simulationsin a real FMRI study.
Methods
6 Subjects were scanned on a 3T Bruker scanner at the Wolfson Brain Imaging Centre in Cambridge, using astandard EPI protocol, collecting 16 slices with a 2 second TR. Events were flashes of a visual checkerboardlasting 0.5 sec, to which the subject had to respond with a button press with the right hand. ISIs were generatedfrom an exponential distribution with a minimum of 0.6 sec, and means of 1, 2, 3, 4, 6, 8 and 10 seconds, to give7 different stimulus sets. Subjects were scanned in each of the 7 ISI conditions, for 280 seconds per session. Theorder of the ISI conditions was randomized across subjects. We used SPM99 to correct the images for slice timeoffset, realign to the first image in the series, and smooth to 8mm FWHM. In order to identify the visual cortexwe performed a standard SPM analysis of the mean ISI=3 session (60s high pass filter, haemodynamic responsefunction (HRF) low-pass filter). We used HRF and temporal derivative (TD) convolution for event modeling, andan F test on both parameters to test for task effects. From this analysis we selected the maximum activated clusterin the occipital cortex with voxels at p<0.0001 uncorrected. The region thus identified was used to extract meantime courses in the other ISI sessions. We analyzed these time courses with a similar model, but without low-passfiltering, using the MarsBar SPM toolbox.
Results
To study the effect of different ISIs, we analyzed the model parameters for the HRF and TD regressors. We alsocalculated the F statistic for the two regressors, the t statistic for the HRF only, and the root mean squared residualerror (RMSE). There was a significant linear trend for the estimated HRF parameter to increase with longer ISI,reflecting apparent greater effect size with longer ISI (p<0.001); the effect size for ISI=1 was 60% of that foreffect size of ISI=10. The parameter for the temporal derivative showed a complex effect of ISI (p<0.05), whichwas mainly quadratic, with higher values for intermediate ISIs. As for the simulations, there was a trend for F andt statistics to decrease linearly with increasing ISI. The RMSE increased linearly with increasing ISI.
Conclusion
These results suggest that very short ISIs do result in an increase in detection power, but with a reduction inmeasured effect size. Error appears to increase with longer ISI. We will discuss the implications of these resultsfor the design and analysis of ER FMRI.
e1516
Abstracts presented at the 9th International Conference on Functional Mapping of the Human Brain, June 19Œ22, 2003, New York, NY
e1516

Order of appearance: 785
AbsTrak ID: 18925
e1517
Abstracts presented at the 9th International Conference on Functional Mapping of the Human Brain, June 19Œ22, 2003, New York, NY
e1517
Poster number: 793
Toward 2D Morphometry of the Cortical Surface
A. Cachia*†‡, D. Rivière*†, Yann Cointepas*†, S. Robbins§, I. Bloch†‡, J. Régis§, A. Evans§, D. L. Collins§, J.-F. Mangin*†
*SHFJ, CEA, Orsay, France†IFR 49, Paris
‡Département Signal et Images, ENST Paris§McConnel Brain Imaging Centre, MNI, Montreal
¶Service de Neurochirurgie Fonctionnelle et Stéréotaxique, La Timone, Marseille
Modeling & Analysis
Abstract
A key point underlying brain mapping is the study of inter-individual variability of various structures after spatialnormalization, leading to the development of Statistical Parametric Anatomical Maps (SPAM) [1]. Usually, thesemaps rely on a 3D coordinate system related to the Talairach atlas. More recently, lineic maps have beenproposed to study the variability of the localization of the trace of some cortical sulci in the 3D proportionalsystem [2]. In this abstract, we propose the development of surfacic SPAMs of the sulcus bottoms embedded intoa 2D coordinate system based on the cortical surface. We propose also an algorithm providing automaticparcellation of the cortex into surfaces of interest (SOI) related to gyri, in order to extend the standard Volume ofInterest (VOI) approaches to morphometric studies.
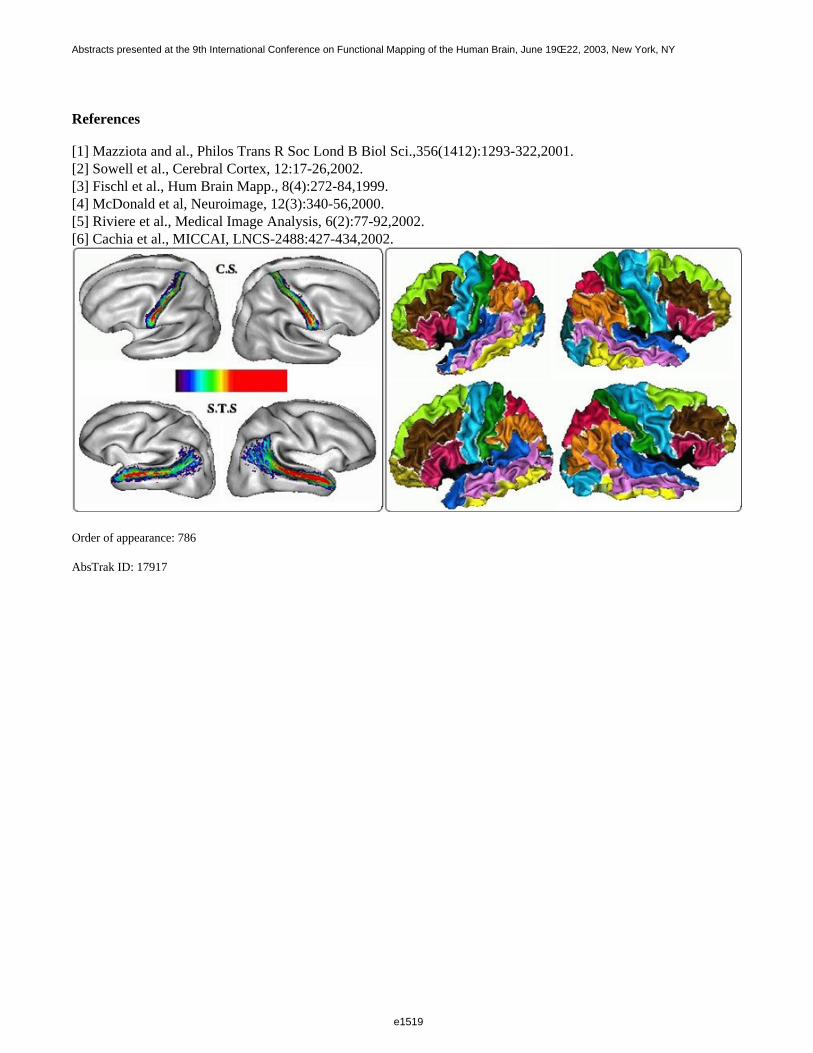
Cortical thickness analysis is the 2D analog of Voxel Based Morphometry on tissue density maps. It relies on aone-to-one mapping between individual cortical surfaces and a spherical coordinate system [3,4]. Variousmapping strategies can be devised. In the following, each brain is first 3D normalized using the MNI 305 averagetemplate. Then the grey/white interface is extracted via the iterative deformations of a spherical mesh, whichprovides the mapping [4]. For each brain, the main cortical sulci are automatically extracted and recognized usinga set of processing tools freely available on "http://anatomist.info" [5]. Then, the sulcus bottom lines aretopologically defined and projected onto the spherical mesh [6]. The subjects processed were 151 unselectednormal volunteers used to compute the MNI template. The surfacic SPAMs of the localization of the bottom lineswere computed sulcus-by-sulcus and mapped on the average cortical mesh [4] (see Fig.left). These SPAMsprovide the remaining inter-individual variability after the spherical mapping. Therefore, their dispersion could beused to drive some improvements of the spherical mapping algorithms. Moreover they can be compared acrosspopulations or hemispheres. For instance, the dispersion of the superior temporal sulcus is more important in theleft hemisphere, which may be a clue to higher variability of the left sulcus related to the development oflanguage areas.
Once the sulcus bottom lines have been projected, they can be used to define gyral based SOIs, using thecomputation of Voronoi diagrams, which stem from successive dilations of a set of seeds aiming at filling adomain. A first diagram is computed for the projected sulcal lines, which parcellates the cortical surface intosulcal areas. Some boundaries of this first diagram are used as gyral seeds for the computation of a seconddiagram related to the standard anatomical gyri (see Fig.right). The gyral parcellations can be used formorphometric studies of the gyral areas or more complex descriptors. Gyral SPAMs could also be computed forsome applications.
e1518
Abstracts presented at the 9th International Conference on Functional Mapping of the Human Brain, June 19Œ22, 2003, New York, NY
e1518
References
[1] Mazziota and al., Philos Trans R Soc Lond B Biol Sci.,356(1412):1293-322,2001.[2] Sowell et al., Cerebral Cortex, 12:17-26,2002.[3] Fischl et al., Hum Brain Mapp., 8(4):272-84,1999.[4] McDonald et al, Neuroimage, 12(3):340-56,2000.[5] Riviere et al., Medical Image Analysis, 6(2):77-92,2002.[6] Cachia et al., MICCAI, LNCS-2488:427-434,2002.
Order of appearance: 786
AbsTrak ID: 17917
e1519
Abstracts presented at the 9th International Conference on Functional Mapping of the Human Brain, June 19Œ22, 2003, New York, NY
e1519
Poster number: 794
CPCA2: The Neural Systems Underlying Encoding, Maintenance andRetrieval in Working Memory
Tara A. Cairo*, Todd S. Woodward†‡, Christian C. Ruff§, Yoshio Takane||, Michael A. Hunter§, Izabella Patyk *, Elton T.C. Ngan*
*Department of Psychiatry, University of British Columbia, Vancouver, Canada†Department of Psychology, University of British Columbia, Vancouver, Canada
‡Department of Medicine and Research, Riverview Hospital, Port Coquitlam, Canada§Institute of Cognitive Neuroscience, University College, London, UK¶Department of Psychology, University of Victoria, Victoria, Canada
||Department of Psychology, McGill University, Montreal, Canada
Modeling & Analysis
Abstract
Constrained Principal Component Analysis (CPCA) is introduced as a correlation-based method of identifying (a)connectivity between neuronal structures and (b) functional interactions between neuronal systems. As for typicalprincipal component analyses (PCA), this method derives eigenimages from singular-value decomposition ofvoxel-level correlation matrices of brain activations. However, in contrast with typical PCA methods, CPCAallows the separate analysis of portions of the overall variance, defined by contrasts of interest. In the presentanalysis, we employed CPCA to identify the brain systems involved in general and load-dependent workingmemory operations. We employed a visually presented digit-working-memory task with encoding, maintenance,and retrieval epochs under four different load conditions. Three separate analyses were conducted, in which thevariance submitted to CPCA was constrained to the activation elicited by encoding and maintenance, retrieval andmaintenance, and all three classes of operations, respectively. Across analyses, we identified a load-dependentoccipital/parietal/premotor system active during encoding, but not during maintenance and retrieval. In addition,the results showed that parietal activity was negatively correlated with occipital activity. During maintenance andretrieval, but not during encoding, a superior parietal/anterior cingulate system was activated and again negativelycorrelated with occipital activity. These findings are consistent with the results of conventional image analysis(SPM99), and they demonstrate that CPCA is a robust method for the examination of the connectivity within, andthe interactions between, neuronal systems.
Order of appearance: 787
AbsTrak ID: 18862
e1520
Abstracts presented at the 9th International Conference on Functional Mapping of the Human Brain, June 19Œ22, 2003, New York, NY
e1520
Poster number: 795
Latency (in)sensitive Group Independent Component Analysis of fMRIData in the Temporal Frequency Domain
Vince Calhoun*†‡, Tulay Adali§||, James Pekar§§, Godfrey Pearlson*†‡
*Olin Neuropsychiatry Research Center, Institute of Living, Hartford, CT.†Dept. of Psychiatry, Yale University, New Haven, CT.
‡Dept. of Psychiatry, Johns Hopkins University, Baltimore, MD.§Dept. of Radiology, Johns Hopkins University, Baltimore, MD
¶FM Kirby Research Center for Functional Brain Imaging, Kennedy Krieger Institute, Baltimore, MD||University of Maryland Baltimore County, Dept. of CSEE, Baltimore, MD
Modeling & Analysis
Abstract
Introduction
Independent component analysis (ICA) has been shown to be useful for characterizing data sets for which aspecific a priori model is not available [1]. A limitation of ICA of fMRI models is that a given component’sassociated time course is required to be identical (except in magnitude) for each and every voxel in the brain.Considerable variability of hemodynamic delays has been observed across different brain locations [2]. Suchobservations can only be captured by a model which allows for spatially varying delays. If they are insteadmodeled with a standard ICA approach, a large delay can result in regions being artifactually split into differentcomponents. We previously proposed a straightforward but effective approach for incorporating delays into anICA model by performing the analysis in the frequency domain, on the power spectrum and we now extend thisapproach for use on multiple subjects [3].
Method
Using a Philips NT 1.5 T scanner, BOLD scans were acquired (EPI, TR=1s, TE=39ms, fov=24cm, 64×64, st=5.5mm, 18 slices) on eight subjects over a 3-min, 40-sec period. We designed a paradigm containing two identical,periodic, visual stimuli, shifted by 25 seconds from one another. This paradigm, when analyzed with standardICA, separates into two different task-related components (one in left visual cortex, one in right visual cortex) [3].The images were imported into SPM99 and normalized into a Tailarach template [4,5]. The power spectrum wascalculated for the time course of each subjects’ data, followed by single subject principle component analysis,then a second level group PCA, and (spatial) ICA estimation.
Results
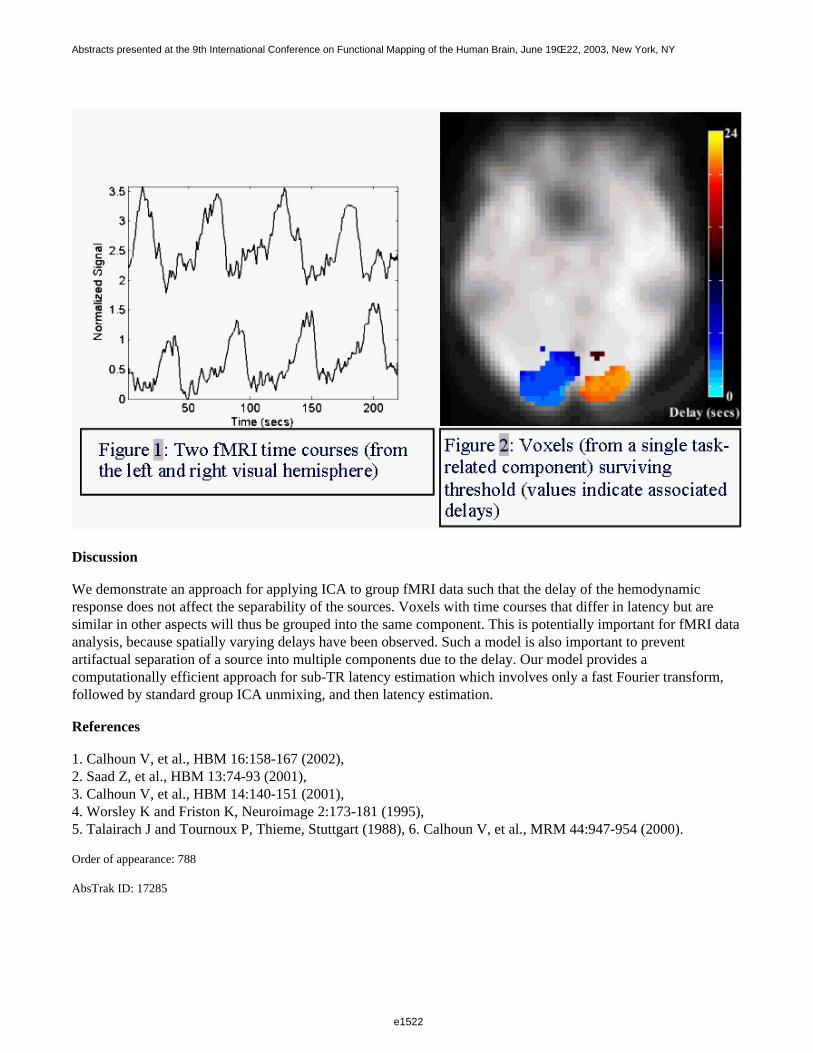
Figure 1 shows two fMRI time courses from a single subject, one taken from the left visual cortex, one from theright visual cortex, with vastly different delays, but otherwise quite similar. Using our approach, a single ICAcomponent captures both hemispheres into the same component. The latencies of these regions are then estimated [6] relative to the component voxel with the largest amplitude. The estimated latencies are depicted in Figure 2.
e1521
Abstracts presented at the 9th International Conference on Functional Mapping of the Human Brain, June 19Œ22, 2003, New York, NY
e1521
Discussion
We demonstrate an approach for applying ICA to group fMRI data such that the delay of the hemodynamicresponse does not affect the separability of the sources. Voxels with time courses that differ in latency but aresimilar in other aspects will thus be grouped into the same component. This is potentially important for fMRI dataanalysis, because spatially varying delays have been observed. Such a model is also important to preventartifactual separation of a source into multiple components due to the delay. Our model provides acomputationally efficient approach for sub-TR latency estimation which involves only a fast Fourier transform,followed by standard group ICA unmixing, and then latency estimation.
References
1. Calhoun V, et al., HBM 16:158-167 (2002),2. Saad Z, et al., HBM 13:74-93 (2001),3. Calhoun V, et al., HBM 14:140-151 (2001),4. Worsley K and Friston K, Neuroimage 2:173-181 (1995),5. Talairach J and Tournoux P, Thieme, Stuttgart (1988), 6. Calhoun V, et al., MRM 44:947-954 (2000).
Order of appearance: 788
AbsTrak ID: 17285
e1522
Abstracts presented at the 9th International Conference on Functional Mapping of the Human Brain, June 19Œ22, 2003, New York, NY
e1522

Poster number: 796
Analysis of Complex Valued fMRI Data with Group ICA
Vince Calhoun*†‡
*Olin Neuropsychiatry Research Center, Institute of Living, Hartford, CT†Yale University, New Have, CT
‡Johns Hopkins University, Baltimore, MD
Modeling & Analysis
Abstract
Order of appearance: 789
AbsTrak ID: 17527
e1523
Abstracts presented at the 9th International Conference on Functional Mapping of the Human Brain, June 19Œ22, 2003, New York, NY
e1523
Poster number: 797
Simple methods for the analysis of fMRI series: validation with tappingand visual stimuli experiments
Michela Canfora§, Michele Dicerto*, Michele Piana†, Massimo Riani‡
*INFM and DISI, Universita di Genova, Italy†INFM and DIMA, Universita di Genova, Italy‡INFM and DIFI, Universita di Genova, Italy§INFM and DFC, Universita di Firenze, Italy
Modeling & Analysis
Abstract
Background
Magnetic resonance may provide image series describing cerebral functionalities correlated with external stimuli[1]. In particular brain activation is observed as a localized signal enhancement corresponding to a
local increase in blood oxygenation [2]. The reliability of this signal variation may be assessed by means ofdifferent statistical approaches. By instance, SPM99 [3] performs voxel-based hypothesis tests where statisticalparametric maps are image processes with voxel values that are, under the null hypothesis, distributed accordingto a gaussian density function.
Here we apply two different statistical approaches to the analysis of functional volumes. The first methodinvolves thresholding over correlation coefficients of the data with respect to a reference waveform followed byformation of a cross-correlation image [4]. A second even easier approach tests the independence of differentvoxel populations by means of a rank comparison approach where the computed test statistic is assessedaccording to the Spearman distribution [5].
Motivations
We perform two simple fMRI experiments to validate the effectiveness of a software tool performing the analysisof dynamical scans by means of cross-correlation and rank comparison approaches. In the first experiment atapping task is alternated with a rest period while in the second experiment the subjects are presented visual shortmeaningful words alternated with a uniformly grey control.
Experimentsm
The experiments are performed in the 1.5 T Philips Gyroscan at the Dipartimento di Fisiopatologia Clinica,Universita di Firenze. In the tapping experiment a rest epoch of 24 seconds is followed by a 24 seconds epoch ofone-hand tapping task. This period is repeated six times; 48 functional volumes with 20 slices each (2x2x4.96 mmper voxel, 1 mm gap) are registered together with a high-resolution structural volume of 40
slices for each subject (1x1x2.96 mm per voxel, no gap). In the visual stimuli experiment, the subjects arepresented patterns of stylized meaningful italian words according to an experimental paradigm based on fourperiods of two epochs each (control-word). The acquisition time for each volume is again 6 seconds and 4volumes are acquired for each epoch; 32 dynamical
e1524
Abstracts presented at the 9th International Conference on Functional Mapping of the Human Brain, June 19Œ22, 2003, New York, NY
e1524

volumes of 20 slices are scanned together with a full anatomical volume. For both experiments we used eightcollaborative italian speaking healthy subjects.
Analysis And Results
The functional volumes are analyzed by means of our software package and the activated clusters areneuroanatomically recognized in order to compare our
results with the ones described in the vast tapping and reading tasks literature. A final assessment is performed byanalyzing the same series by using a standard SPM99 approach.
References
[1] Liang Z, and Lauterbur P C, 2000 “Principles of Magnetic Resonance Imaging’’ (SPIE Press)[2] Fox P T and Raichle M E, 1986 “Proc. Natl. Acad. Sci’’ (USA) 83 1140[3] http://www.fil.ion.ucl.ac.uk/spm[4] Bandettini P A, Jesmanowicc A, Wong E C and Hyde J S, 1993 “Magn. Reson. Med.’’ 30 161-173[5] Lehman E L, D’Abrera H J M, 1975 “Nonparametrics: statistical methods based on ranks’’ (McGraw-Hill)
Order of appearance: 790
AbsTrak ID: 17200
e1525
Abstracts presented at the 9th International Conference on Functional Mapping of the Human Brain, June 19Œ22, 2003, New York, NY
e1525
Poster number: 798
CORTICAL SITE LOCALIZATION IN ABSENCE OF INDIVIDUALMRIs USING A WARPED MRI-CONSTRUCTED BRAIN TEMPLATE
Filippo Carducci*†, Pasquale A. Varì*, Claudio Babiloni*, Fabio Babiloni*, Febo Cincotti*, Cosimo Del Gratta†, Gian Luca Romani†, Paolo M. Rossini‡§§
*Dip. Fisiologia Umana e Farmacologia - Università di Roma†Istituto di Tecnologie Avanzate Biomediche - Università di Chieti, Chieti Italy
‡A.Fa.R. CRCCS- Dip. di Neurologia, Osp. FBF Isola Tiberina, Roma Italy§ IRCCS "S. Giovanni di Dio", Brescia Italy
¶
Modeling & Analysis
Abstract
Introduction.
In this study, a warped MRI-constructed brain template is used to localize cortical sites underlying (digitized)scalp points in subjects not having MR head images. Warping transformation of brain template is computed using69 fiducial points from International 10-10 System, to preserve relationship between scalp point and underlyingcortical structures and areas.
Methods.
About 50 scalp points and 4 skull landmarks (Nasion, Inion, left and right preauricolar points) digitized in thesubject’s head are used to determine 69 fiducial scalp points, distributed on a virtual reconstruction of thesubject’s scalp (spherical Spline interpolation), considering percentages distances between skull landmarks (S.I.10-10) by means of an automatic procedure [1]. Analogously, 69 fiducial scalp points are computed on 21MRI-construted scalp templates (including an “averaged” ones reconstructed using a set of MRIs of 152 subjectsfrom Montréal Neurological Institute) and perpendicularly projected on the corresponding brain template, whichis coded into the Talairach space. Most similar scalp template respect to subject’s scalp is individuated on thebasis of templates and subject fiducial data. Then, the most similar scalp template is warped to fit subject’s scalpon the basis of fiducial data. The warping transformation is applied on the corresponding brain template. Finally,The warped brain template is used as reference to localize cortical structures and areas underlying digitized scalp point.
The accuracy of the method was tested using individual 21 realistic MRI-constructed head models as goldstandard. Talairach coordinates of scalp points projected into the realistic brain model were confronted withanalogous coordinates obtained using warped brain template.
Results and Conclusions.
The mean difference between Talairach’s coordinates computed into the realistic brain model and into the warpedbrain template model was less than 4,26 cm (SD ± 1,42 cm) in all subjects evaluated (Fig. 1). The proposedmethod can be used in TMS studies to localize the stimulated cortical sites, and in high resolution EEG and MEGstudies to supply tentative localization into Talairach space of source solutions obtained in subjects not havingrealistic MRI-constructed head models.
e1526
Abstracts presented at the 9th International Conference on Functional Mapping of the Human Brain, June 19Œ22, 2003, New York, NY
e1526
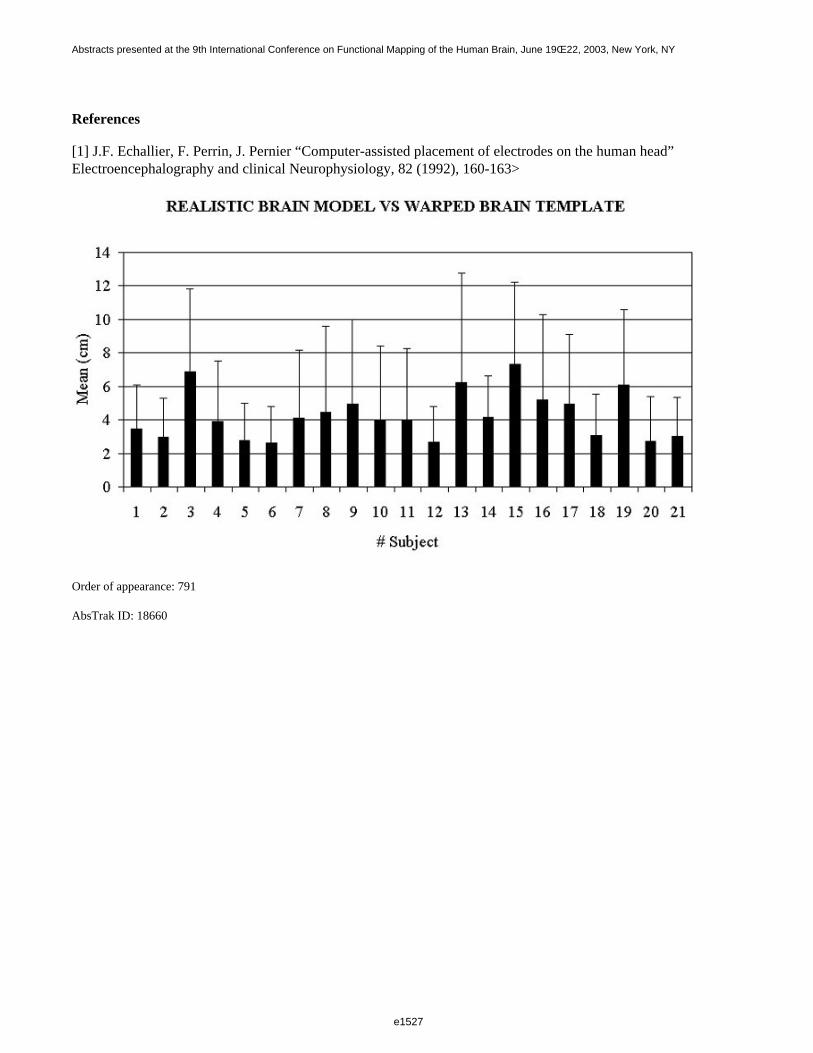
References
[1] J.F. Echallier, F. Perrin, J. Pernier “Computer-assisted placement of electrodes on the human head”Electroencephalography and clinical Neurophysiology, 82 (1992), 160-163>
Order of appearance: 791
AbsTrak ID: 18660
e1527
Abstracts presented at the 9th International Conference on Functional Mapping of the Human Brain, June 19Œ22, 2003, New York, NY
e1527
Poster number: 799
Empirical Study of Error in ICA of FMRI Data
John Carew*, Baxter Rogers†, Beth Meyerand†
*Department of Statistics, University of Wisconsin--Madison†Department of Medical Physics, University of Wisconsin--Madison
Modeling & Analysis
Abstract
INTRODUCTION
With linear regression models of fMRI time series (e.g., SPM99), the asymptotic theory has been well studied. Anasymptotic theory for convergence of Z-maps, which are commonly used in ICA of fMRI data, is unknown.Information about the rate of convergence of Z-maps is important. Convergence rates will help to answerquestions such as, “How many time points will give a reasonable estimate of the true Z-map?” In this study, weempirically assess the convergence of Z-maps by investigating the effect of the number of trials in a simple motorparadigm on the Z-map error.
MATERIALS AND METHODS
The scan parameters: 1.5T GE Signa LX; standard head coil, single-shot gradient-recalled EPI pulse sequence forBOLD contrast; TR/TE 2000/40 ms; FOV 24cm; 64x64 pixel matrix; 22 coronal slices 6mm/1mm gap (wholebrain coverage). During the fMRI experiment a healthy subject performed 15 bilateral finger tapping blocks. Eachblock consisted of 20s rest followed by 20s of tapping. The images were corrected for motion with SPM99(WDCN). The data were then analyzed with spatial ICA (Bell and Sejnowski) a total of 15 times. The firstanalysis included only data from the first block. The second analysis included the first and second blocks, and soon up to the last analysis, which included all 15 blocks. In each analysis, the task component was identified andconverted to a Z-map. Since it is impossible to know the true Z-map for this task, we assumed that the Z-mapcomputed from 15 blocks represents the “truth.” Then, we defined an error measure $E_i = \sum_j=1^v(Z_i,j - Z_15,j)^2 / \sum_j=1^v Z_15,j^2$, where i indexes the Z-map with i blocks and j indexes thevoxels in the Z-map, to compute the error as a function of the number of motor blocks included in the analysis.
RESULTS
An independent component corresponding to the bilateral finger tapping was identified in all 15 analyses. Evenwith just one block, a motor map was identified. The error decreases quite rapidly with an increasing number ofblocks (Fig. 1A). The red line shows a plot of 1/n (Fig. 1A). The error follows this trend closely. Z-maps for 1, 7,and 15 blocks illustrate the rapid convergence of the maps (Fig. 1B).
DISCUSSION
We demonstrate that error in Z-map estimates decreases rapidly (possibly 1/n) for a block paradigm. The errorsappear to slightly differ from 1/n in a systematic way—possibly due to assuming that there is no error in Z_15,thereby forcing our error measure to zero for 15 blocks. One implication of our results is that a large number ofblocks may not be necessary to obtain a good estimate of the true Z-map. We are currently repeating this analysisfor random event-related and single trial designs. Preliminary results from a analogous study of an event-relatedmotor paradigm suggest that 1/n does not fit the empirical data as well as the block data. A mathematicalinvestigation of the asymptotics of Z-map estimates is a next logical step.
e1528
Abstracts presented at the 9th International Conference on Functional Mapping of the Human Brain, June 19Œ22, 2003, New York, NY
e1528
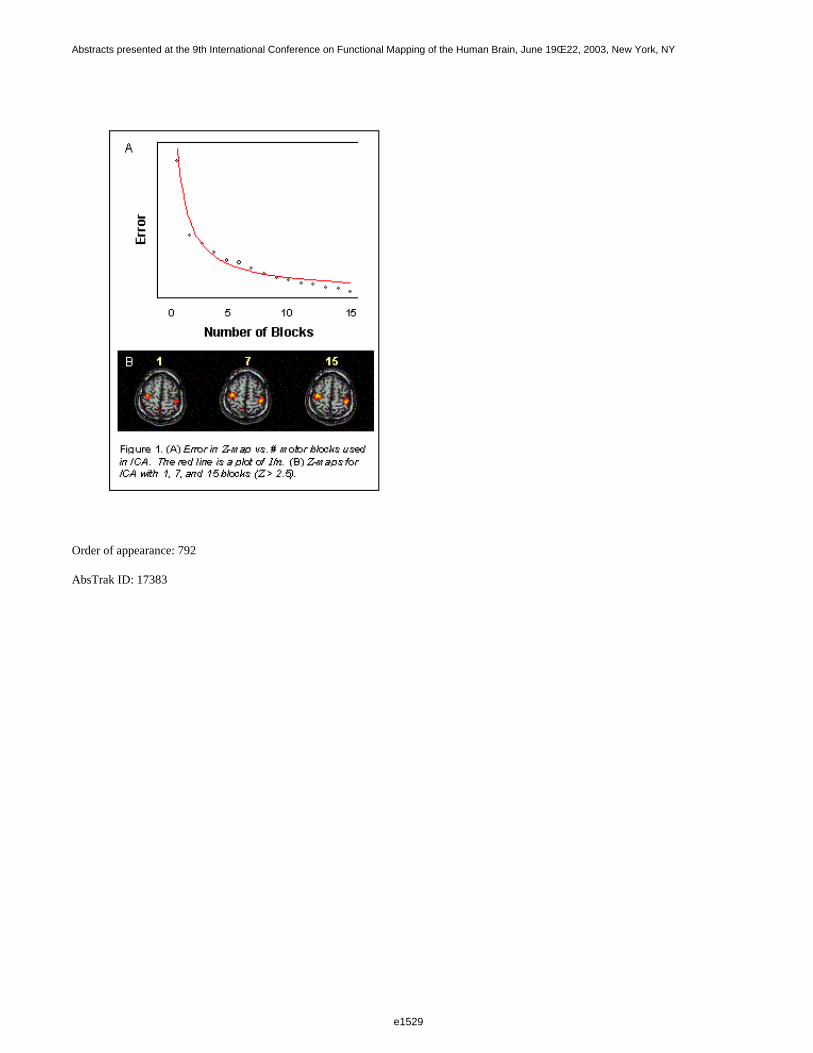
Order of appearance: 792
AbsTrak ID: 17383
e1529
Abstracts presented at the 9th International Conference on Functional Mapping of the Human Brain, June 19Œ22, 2003, New York, NY
e1529
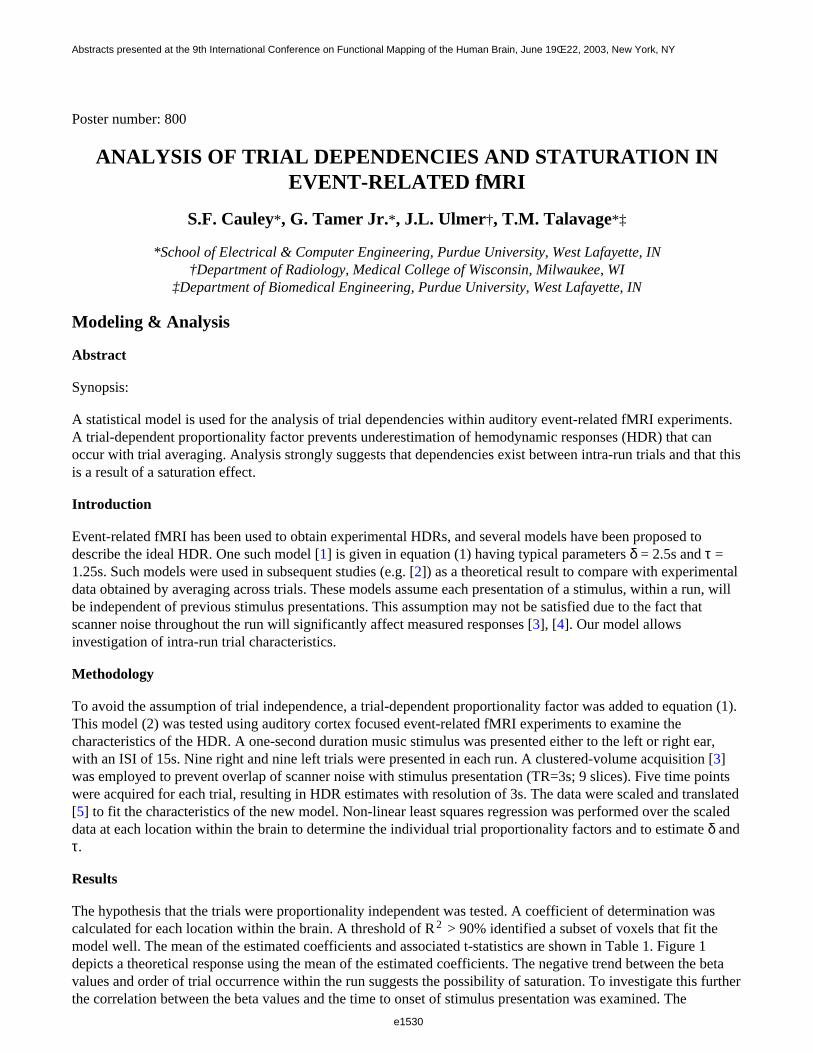
Poster number: 800
ANALYSIS OF TRIAL DEPENDENCIES AND STATURATION INEVENT-RELATED fMRI
S.F. Cauley*, G. Tamer Jr.*, J.L. Ulmer†, T.M. Talavage*‡
*School of Electrical & Computer Engineering, Purdue University, West Lafayette, IN†Department of Radiology, Medical College of Wisconsin, Milwaukee, WI
‡Department of Biomedical Engineering, Purdue University, West Lafayette, IN
Modeling & Analysis
Abstract
Synopsis:
A statistical model is used for the analysis of trial dependencies within auditory event-related fMRI experiments.A trial-dependent proportionality factor prevents underestimation of hemodynamic responses (HDR) that canoccur with trial averaging. Analysis strongly suggests that dependencies exist between intra-run trials and that thisis a result of a saturation effect.
Introduction
Event-related fMRI has been used to obtain experimental HDRs, and several models have been proposed todescribe the ideal HDR. One such model [1] is given in equation (1) having typical parameters δ = 2.5s and τ =1.25s. Such models were used in subsequent studies (e.g. [2]) as a theoretical result to compare with experimentaldata obtained by averaging across trials. These models assume each presentation of a stimulus, within a run, willbe independent of previous stimulus presentations. This assumption may not be satisfied due to the fact thatscanner noise throughout the run will significantly affect measured responses [3], [4]. Our model allowsinvestigation of intra-run trial characteristics.
Methodology
To avoid the assumption of trial independence, a trial-dependent proportionality factor was added to equation (1).This model (2) was tested using auditory cortex focused event-related fMRI experiments to examine thecharacteristics of the HDR. A one-second duration music stimulus was presented either to the left or right ear,with an ISI of 15s. Nine right and nine left trials were presented in each run. A clustered-volume acquisition [3]was employed to prevent overlap of scanner noise with stimulus presentation (TR=3s; 9 slices). Five time pointswere acquired for each trial, resulting in HDR estimates with resolution of 3s. The data were scaled and translated [5] to fit the characteristics of the new model. Non-linear least squares regression was performed over the scaleddata at each location within the brain to determine the individual trial proportionality factors and to estimate δ and τ.
Results
The hypothesis that the trials were proportionality independent was tested. A coefficient of determination wascalculated for each location within the brain. A threshold of R2 > 90% identified a subset of voxels that fit themodel well. The mean of the estimated coefficients and associated t-statistics are shown in Table 1. Figure 1depicts a theoretical response using the mean of the estimated coefficients. The negative trend between the betavalues and order of trial occurrence within the run suggests the possibility of saturation. To investigate this furtherthe correlation between the beta values and the time to onset of stimulus presentation was examined. The
e1530
Abstracts presented at the 9th International Conference on Functional Mapping of the Human Brain, June 19Œ22, 2003, New York, NY
e1530

correlation for both right and left stimulus presentations of both subjects is shown in Table 2. It can be seen fromthe data that a strong (negative) correlation exists between the proportionality constant and stimulus onset time(Figure 2).
Conclusions
Dependencies exist between intra-run trials. Consequently, use of averaging techniques would underestimate theHDR. Our results strongly suggest that the presented analytic approach can serve as a basis for improvedunderstanding of the effects of acoustic scanner noise on HDRs in auditory event-related fMRI.
References
[1] G. M. Boynton et al. J Neurosci. 16, 4207-04221(1996)[2] A. M. Dale et al. Hum Brain Map. 5, 329-340 (1997)[3] W. B. Edmister et al. Hum Brain Map. 7, 89-97 (1999)[4] T. M. Talavage et al. Hum Brain Map. 7, 79-98 (1999)[5] S. F. Cauley et al. IEEE EMBS-BMES 1059 (2002)
e1531
Abstracts presented at the 9th International Conference on Functional Mapping of the Human Brain, June 19Œ22, 2003, New York, NY
e1531
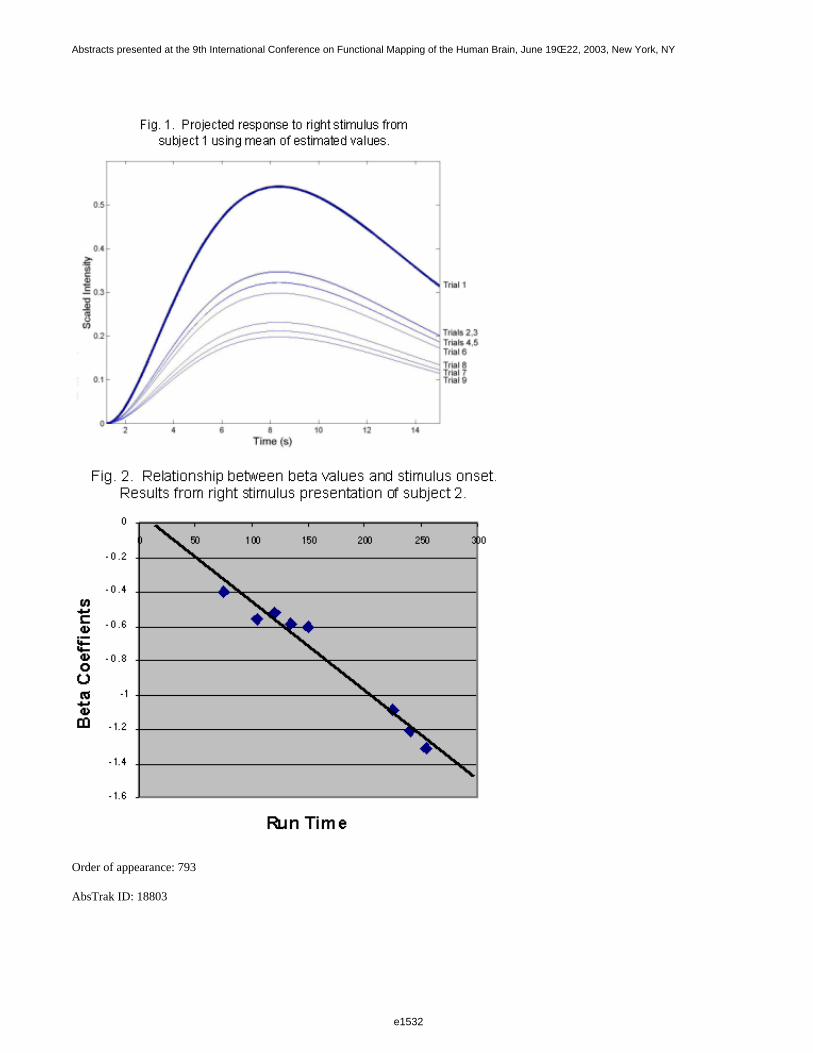
Order of appearance: 793
AbsTrak ID: 18803
e1532
Abstracts presented at the 9th International Conference on Functional Mapping of the Human Brain, June 19Œ22, 2003, New York, NY
e1532
Poster number: 801
Voxel based morphometric analysis of neuroanatomy in Chinese withstrabismic amblyopia
Suk-tak Chan*, Kwok-wing Tang†, Ben L.K. Chan*, Andrew K.C. Lam*, Kenneth K. Kwong‡
*Department of Optometry and Radiography, Hong Kong Polytechnic University, Hong Kong†Department of Diagnostic Radiology and Imaging, Queen Elizabeth Hospital, Hong Kong
‡Department of Radiology, Massachusetts General Hospital, Harvard Medical School, Boston, MA, U.S.A.
Modeling & Analysis
Abstract
Introduction
Strabismic amblyopia is one of the main visual disorders in Hong Kong in which patients suffer frommisalignment of the eyes and abnormally low visual acuity. It will lead to the loss of depth and motion perceptionif left untreated. Previous studies suggested that cerebral cortex is involved in the genesis of the strabismicamblyopia. The purpose of this study was to investigate the possible difference in gray matter of the visual systemin adults with strabismic amblyopia and in controls.
Materials and Method
Twenty-two adults were included: 11 patients with severe strabismic amblyopia (mean age: 27.9 years) and 11controls without strabismic amblyopia (mean age: 28.2 years). MRI brain images were acquired on a 1.0 Teslascanner using the standard neuro-anatomical pulse sequences (T2-weighted and 3D-FLASH). The images werethen analysed using automated morphometric analysis softwares (SPM-VBM).
Results
The gray matter concentration at the calcarian sulci, V1 areas, on both left and right sides was lower in strabismicamblyopic patients than in controls. Lower gray matter concentration was also found in patient group at the rightsuperior temporal sulcus and the left intraparietal sulcus, which were reported to functionally interact with theprimary visual area V1 in the analysis of complex motion patterns. These findings are consistent with those inanatomical studies of animals and in functional studies in humans.
Conclusion
The present findings suggest that the structural changes in the primary visual cortex V1, as well as extrastriatevisual areas in strabismic amblyopia. While such anatomical differences in gray matter concentration betweenstrabismic amblyopic patients and adults without strabismic amblyopia could not be identified from MR imagesby simple visual inspection done, they were measurable with morphometric softwares. The application of theobjective morphometric analysis methods will enhance the development of MR diagnosis in detecting subtlepathological changes of brain anatomy.
Order of appearance: 794
e1533
Abstracts presented at the 9th International Conference on Functional Mapping of the Human Brain, June 19Œ22, 2003, New York, NY
e1533

AbsTrak ID: 17922
e1534
Abstracts presented at the 9th International Conference on Functional Mapping of the Human Brain, June 19Œ22, 2003, New York, NY
e1534
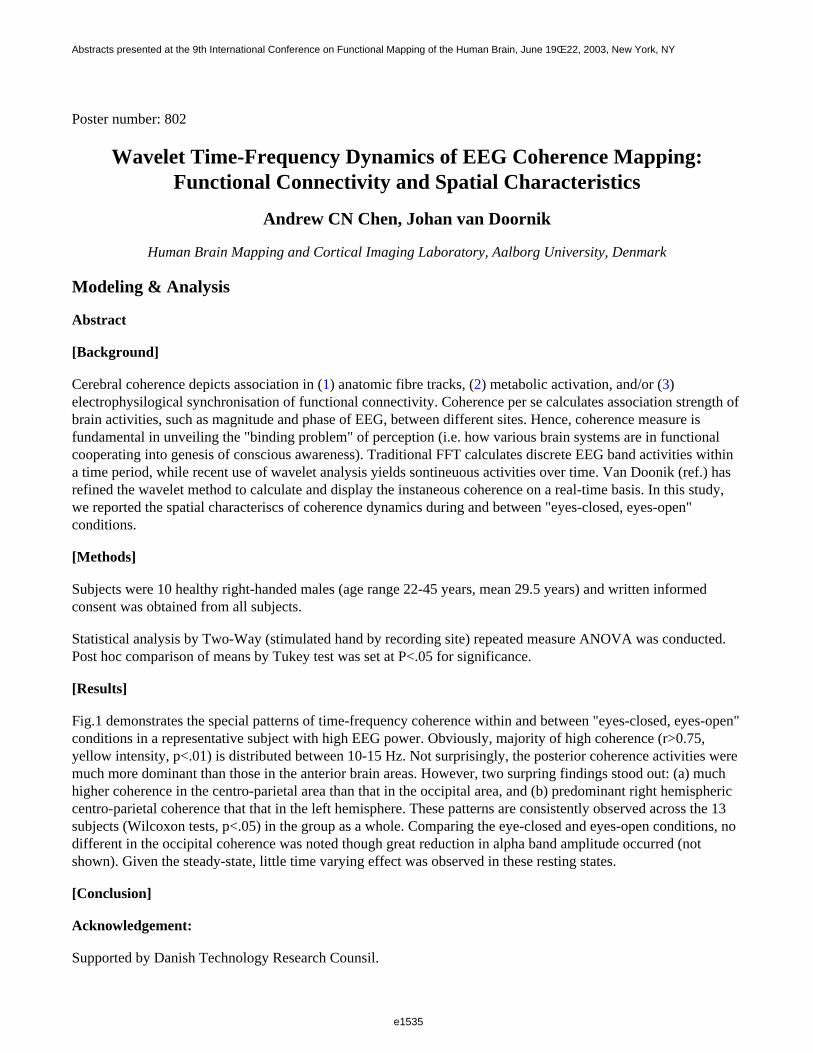
Poster number: 802
Wavelet Time-Frequency Dynamics of EEG Coherence Mapping:Functional Connectivity and Spatial Characteristics
Andrew CN Chen, Johan van Doornik
Human Brain Mapping and Cortical Imaging Laboratory, Aalborg University, Denmark
Modeling & Analysis
Abstract
[Background]
Cerebral coherence depicts association in (1) anatomic fibre tracks, (2) metabolic activation, and/or (3)electrophysilogical synchronisation of functional connectivity. Coherence per se calculates association strength ofbrain activities, such as magnitude and phase of EEG, between different sites. Hence, coherence measure isfundamental in unveiling the "binding problem" of perception (i.e. how various brain systems are in functionalcooperating into genesis of conscious awareness). Traditional FFT calculates discrete EEG band activities withina time period, while recent use of wavelet analysis yields sontineuous activities over time. Van Doonik (ref.) hasrefined the wavelet method to calculate and display the instaneous coherence on a real-time basis. In this study,we reported the spatial characteriscs of coherence dynamics during and between "eyes-closed, eyes-open" conditions.
[Methods]
Subjects were 10 healthy right-handed males (age range 22-45 years, mean 29.5 years) and written informedconsent was obtained from all subjects.
Statistical analysis by Two-Way (stimulated hand by recording site) repeated measure ANOVA was conducted.Post hoc comparison of means by Tukey test was set at P<.05 for significance.
[Results]
Fig.1 demonstrates the special patterns of time-frequency coherence within and between "eyes-closed, eyes-open"conditions in a representative subject with high EEG power. Obviously, majority of high coherence (r>0.75,yellow intensity, p<.01) is distributed between 10-15 Hz. Not surprisingly, the posterior coherence activities weremuch more dominant than those in the anterior brain areas. However, two surpring findings stood out: (a) muchhigher coherence in the centro-parietal area than that in the occipital area, and (b) predominant right hemisphericcentro-parietal coherence that that in the left hemisphere. These patterns are consistently observed across the 13subjects (Wilcoxon tests, p<.05) in the group as a whole. Comparing the eye-closed and eyes-open conditions, nodifferent in the occipital coherence was noted though great reduction in alpha band amplitude occurred (notshown). Given the steady-state, little time varying effect was observed in these resting states.
[Conclusion]
Acknowledgement:
Supported by Danish Technology Research Counsil.
e1535
Abstracts presented at the 9th International Conference on Functional Mapping of the Human Brain, June 19Œ22, 2003, New York, NY
e1535
Order of appearance: 795
AbsTrak ID: 17798
e1536
Abstracts presented at the 9th International Conference on Functional Mapping of the Human Brain, June 19Œ22, 2003, New York, NY
e1536
Poster number: 803
Brain mapping of cold/pain vs. heat/pain: A 3D VRTM analyses on thepublished PET/fMRI data
Andrew CN Chen*, Jørgen Kold*, Lars Arendt-Nielsen*, Lars Kai Hansen†, Finn A Nielsen†
*Human Brain Mapping and Cortical Imaging Laboratory, Aalborg University, Denmark†Thorn Institute of Neuroinformatics, Technology University of Denmark, Denmark
‡§
Modeling & Analysis
Abstract
[Background]
We have advocated the use of 3D virtual reality Talairach modeling (VRTM) for topographic mapping ofEEG/ERP activation and tomographic registration of PET/fMRI responses based on Talairach coordinates as acommon anatomical standard. This 3D VRTM can facilitate visualization of (a) brain activation and (b) dataorganization for statistical evaluation. In this report, we carried out a systematic evaluation on the brain activationpatterns between somatosensory perception of cold vs. heat as well as cold-pain vs. heat-pain. This workillustrates the use of this 3D Brain Model in examination of brain loci and organization associated with human pain.
[Methods]
We compiled activated loci from published PET and fMRI studies of heat and heat-pain (N= 18 reports, Ss= 163subjects) vs. cold and cold-pain (N=7 reports, Ss= 83 subjects), systematically retrieved from Medline IndexMedicus (Jan. 1991 to Dec. 2002) . This covered the first decade since the neuroimaging of human pain in thebrain. This study was carried out not for stringent meta-analysis, but toward a 3D visualisation and datacharacterisation of their differential brain activations. Thus, it was inclusive than exclusively fully on"double-blind, placebo-controlled" experiments. A-priori defined ROI set included the major brain matrix insomatosensory and pain perception: Brain-Stem, SI, SII, Thalamus, Insular, Cingulate, Hippocampus/Amygdala,Temporal Lobe, Parietal Lobe, and Prefontal Lobe. Only reports with Talairach coordinates specified in thesebrain sites were included in the analyses. Statistics were carried out to (1) examine the magnitude % of activationin each ROI across the literature, (2) isolate the outliers, (3) characterize the central norms in and size/shape ineach ROI, (4) compare the parameters between cold vs. heat as well as cold-pain vs. heat pain, and finally (5)identify brain regions of pain activation common to cold and heat modalities. For illustration, the site of activation(increased voxals only) for cold is denoted in blue: round as cold, diamond as cold-pain; head in red: round asheat, diamond as heat-pain for 4 conditions.
[Results]
As shown in Fig. 1, w observed: (a) only less than 30% of reports showed non-painful cold and heat activation inbrain areas, (b) above 60% of reports showed activation in thalamus, insular, cingulated, and frontal cortex underpainful conditions, (c) SI and SII in about 40% of reports, and (d) brain-stem, hippocampus, and amygdalaaccounted to about 10% of reports under painful conditions. The major difference between cold-pain andheat-pain was in the thalamus, cingular and frontal cortex by the % of reports. For the Talairach coordinates ateach condition/site, some outliers at the values of 2.5 s.d. was noted and these values were excluded from further
e1537
Abstracts presented at the 9th International Conference on Functional Mapping of the Human Brain, June 19Œ22, 2003, New York, NY
e1537
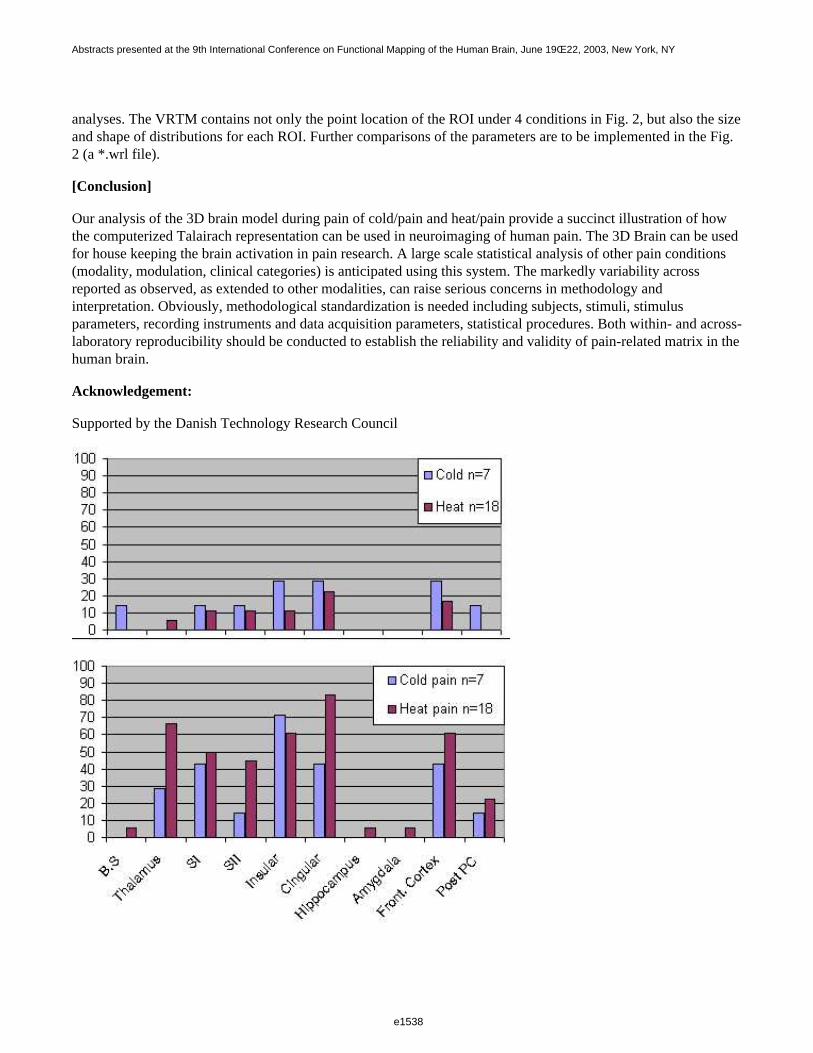
analyses. The VRTM contains not only the point location of the ROI under 4 conditions in Fig. 2, but also the sizeand shape of distributions for each ROI. Further comparisons of the parameters are to be implemented in the Fig.2 (a *.wrl file).
[Conclusion]
Our analysis of the 3D brain model during pain of cold/pain and heat/pain provide a succinct illustration of howthe computerized Talairach representation can be used in neuroimaging of human pain. The 3D Brain can be usedfor house keeping the brain activation in pain research. A large scale statistical analysis of other pain conditions(modality, modulation, clinical categories) is anticipated using this system. The markedly variability acrossreported as observed, as extended to other modalities, can raise serious concerns in methodology andinterpretation. Obviously, methodological standardization is needed including subjects, stimuli, stimulusparameters, recording instruments and data acquisition parameters, statistical procedures. Both within- and across-laboratory reproducibility should be conducted to establish the reliability and validity of pain-related matrix in thehuman brain.
Acknowledgement:
Supported by the Danish Technology Research Council
e1538
Abstracts presented at the 9th International Conference on Functional Mapping of the Human Brain, June 19Œ22, 2003, New York, NY
e1538
Order of appearance: 796
AbsTrak ID: 17454
e1539
Abstracts presented at the 9th International Conference on Functional Mapping of the Human Brain, June 19Œ22, 2003, New York, NY
e1539
Poster number: 804
ACCOUNTING FOR MULTIPLE COMPARISONS USINGCONCURRENCES OF THE PRESENCE OF ACTIVATION ANDABSENCE OF DEACTIVATION IN NEUROIMAGING STUDIES
Kewei Chen*†‡§§, Daniel Bandy*§§, Eric Reiman*‡§§, Gene Alexander†§§, Micheal Lawson*
*Good Samaritan Regional Medical Center†Arizona State Univ.
‡Univ. of Arizona§Arizona Alzheimer Research Center
¶Alzheimer Disease Core Center
Modeling & Analysis
Abstract
When statistical maps are generated from functional brain images, it is important to address the possibility ofType 1 errors related to the number of regional comparisons in the brain volume of interest. Several methods havebeen proposed to address the problem of multiple comparisons such as those based on random field theory(Friston et al, 1994; Worsley et al, 1996), the false discovery rates (Genovese et al, 2002), and the non-parametricstatistical mappings (Holmes et al, 1996). Whereas these and other methods typically examine statistical maps inone direction (e.g., state-dependent increases in regional cerebral blood flow (CBF) or brain oxygenation ordisease-dependent decreases in regional glucose metabolism), they do not simultaneously take into accountinformation in both directions (e.g., both state-dependent increases and decreases in these measurements). Wepropose a strategy that addresses Type 1 errors in the direction of interest (e.g., state-dependent increases inregional blood flow), capitalizing on the absence of significant differences in the opposite direction. A computerMonte-Carlo software package which is based on SPM99 and is recently developed in our laboratory is used inthis study. This package can calculate different kinds of set-level Type 1 errors, such as that associated with nstatistical clusters, survived a magnitude threshold, whose sizes are not smaller than a spatial extent (Friston, etal., NeuroImage, 1995). In the case proposed here, this software incorporates information in the opposite direction(e.g., the absence of state-dependent decreases in regional CBF) to calculate the likelihood that the set ofstatistical clusters in the direction of interest (e.g., state-dependent increases in regional CBF) is attributable to aType 1 error. To illustrate this strategy for cases that lack significant differences in the opposite direction, wecompared it to the SPM99 multiple comparison correction method based on random field theory (at both theset-level and the voxel-level), when PET measurements from 7 healthy volunteers were used to characterize thechanges in regional CBF associated with hand movement, which we have consistently found to be associated withCBF increases in the supplementary motor area, the left sensorimotor cortex and thalamus, and the rightcerebellum. Searching the entire brain volume, SPM99 detected significant CBF increases (P<0.05 at both thevoxel-level and the set-level) in left sensorimotor cortex, the supplementary area, and the right cerebellar vermis,but were unable to detect increases in the thalamus. When the Monte-Carlo simulation incorporated informationabout regional CBF decreases to correct for multiple comparisons in the map of CBF increases, we were able todetect significant CBF increases in all of expected regions, including the thalamus (p<0.05). Capitalizing on theempirically determined absence of significant differences in the opposite direction, the strategy proposed heremay improve the power to detect changes in the direction of interest, while addressing the statistical problem ofmultiple comparisons in brain mapping studies.
e1540
Abstracts presented at the 9th International Conference on Functional Mapping of the Human Brain, June 19Œ22, 2003, New York, NY
e1540

Order of appearance: 797
AbsTrak ID: 18845
e1541
Abstracts presented at the 9th International Conference on Functional Mapping of the Human Brain, June 19Œ22, 2003, New York, NY
e1541

Poster number: 805
A qualitative review of two cortical surface modeling packages:FreeSurfer and SureFit
Peggy Christidis, Shruti Japee, Ziad S. Saad, Robert W. Cox
National Institute of Mental Health, National Institutes of Health, Department of Health and Human Services
Modeling & Analysis
Abstract
Traditionally, functional brain imaging data is analyzed by projecting activation data from a sequence of slicesonto a standardized 3-dimensional anatomical space. However, the cerebral cortex is better modeled by a2-dimensional sheet that is highly folded and curved. As such a 3D space may underestimate the “neural” distancebetween two points, particularly if the points lie on opposite sides of a sulcus. This anomaly has lead to the use ofcomputer-based tools that create 2D cortical surfaces, which can be inflated, flattened, and overlaid withfunctional activation data.
This review provides a discussion of two freely available cortical surface modeling packages that have gainedwide use in the field of neuroimaging: FreeSurfer [1, 2] and SureFit [3]. Although in-depth descriptions of thesetools have been provided by their respective authors, there has been to date no systematic qualitative orquantitative comparison between these tools. We provide here a qualitative comparison of these two packages.
Methods
The evaluation of FreeSurfer (October 2001 release) and SureFit (version 4.38, 2002) was based on a number ofqualitative criteria, including ease of installation, difficulty of the manual editing procedure, quality of thedocumentation and tutorials that accompany each software package, graphical user interfaces, and overall ease of use.
Results
Installation of SureFit proceeded more smoothly than FreeSurfer, which required considerable alterations to theuser environment. In terms of the processing sequence, FreeSurfer had the added advantage of a command lineoption that made the processing of volumes to create surfaces fairly automated and streamlined, eliminatingconstant user intervention and supervision. SureFit was usable only through the graphical user interface (GUI).We found the volume and surface GUIs within FreeSurfer to be less flexible and user-friendly than those withinSureFit. However, the weakest element of SureFit was the cumbersome manual editing tools. Finally, whileFreeSurfer provided tools to cut and flatten an inflated surface, these operations could not be performed fromwithin SureFit and a sister program, known as Caret, had to be used.
Conclusions
Despite sharing similar underlying principles, the packages discussed here differ widely in their GUIs, editingtools, and general ease of use. Although SureFit received better marks for its GUIs and easy installation,FreeSurfer had far superior editing tools, a convenient command line option, and excellent documentation, givingit a higher rating overall. Nonetheless, it is up to the user to consider our comments to determine which packagewould be better suited to their particular application. Future work on this project will include a method to makequantitative comparisons between surfaces obtained from different surface modeling packages.
e1542
Abstracts presented at the 9th International Conference on Functional Mapping of the Human Brain, June 19Œ22, 2003, New York, NY
e1542

References
1. Dale, A. M., Fischl, B. et al. (1999). "Cortical surface-based analysis.I. Segmentation and surface reconstruction." Neuroimage 9(2): 179-94.2. Fischl, B., Sereno, M.I., et al. (1999). "Cortical surface-based analysis.II: Inflation, flattening, and a surface-based coordinate system." Neuroimage 9(2): 195-207.3. Van Essen, D. C., Drury, H.A., et al. (2001). "An integrated software suite for surface-based analyses of cerebral cortex." J Am Med Inform Assoc 8(5): 443-59.
Order of appearance: 798
AbsTrak ID: 18339
e1543
Abstracts presented at the 9th International Conference on Functional Mapping of the Human Brain, June 19Œ22, 2003, New York, NY
e1543
Poster number: 806
Dissociating Refractory and Stimulus Repetition (fMR-A) Effects in EventRelated fMRI
Soon Chun Siong, Vinod Venkatraman, Michael Chee
Cognitive Neuroscience Lab, Singapore General Hospital
Modeling & Analysis
Abstract
Event related fMRI experiments involving finger tapping and alternating checker-boards indicate thatinter-stimulus intervals (ISI) as short as 2-4 seconds result in approximately linear summation of BOLDresponses. However, with more complex stimuli (faces), nonlinearities in response summation have been foundeven at ISI of 6s. Huettel et. al. showed that the second face in a pair of identical faces presented 6s apart eliciteda BOLD signal that was only about 70% of the magnitude obtained from individual faces presented at ISI of 18s,and the extent of this "recovery" varied across cortical regions [1]. This additional variance in signal amplitudeintroduced by "response refractoriness" could theoretically compromise the discrimination of response magnitudebetween different experimental tasks. Moreover, the use of identical faces could result in repetition or adaptation(fMR-A) effects that could compound the intrinsic refractory effects. In this study, we presented similar anddifferent faces at 3s and 6s to dissociate the relative contributions of fMR-A and refractory effects to signalattenuation in different cortical regions.
Methods
Eight healthy right-handed participants viewed one of five randomly intermixed trial types: a single face, a pair ofsame faces presented at ISI of 3s and 6s, and a pair of different faces presented at ISI of 3s and 6s. After eachtrial, a fixation cross was shown for 18s to allow for complete recovery of the hemodynamic response. Obliqueaxial slices using T2* weighted gradient-echo EPI sequence (TR=3s; matrix=64×64; FOV=192×192mm; 3.0mmthickness) were acquired. Interleaved sampling was used to increase the temporal resolution. GLM was used toestimate different sets of finite impulse response predictors for the first and second faces. The estimated amplitudeof BOLD response to the second face was expressed as a fraction of the estimated amplitude of the response tothe first face for each ROI.
Results
All eight participants showed consistent activation in seven ROIs: (right and left) calcarine cortex, posteriorfusiform gyrus, anterior fusiform gyrus, and right prefrontal cortex. Incomplete signal recovery was more evidentat 3s than at 6s ISI (Fig. 1). A four-factor ANOVA examined the normalized signal recovery as a function of ISI(3 or 6s), fMR-A (Repeated or Different), cortical region and laterality. Less signal recovery was observed at 3srelative to 6s ISI [F(1, 7)=23.45, p<0.005]. Signal recovery was significantly higher with different faces [F(1, 7)=12.92, p<0.01]. There was no interaction between ISI and cortical region [F(2, 6)<1]. In contrast, fMR-Adiffered by cortical region [interaction: F(2, 6)=7.12, p<0.05]. fMR-A was only significant in bilateralmid-fusiform and right prefrontal areas at 3 and 6s ISI.
Conclusion
fMR-A was regionally specific to bilateral mid-fusiform and right prefrontal areas. After taking the fMR-A effectinto consideration, signal attenuation due to the refractory effect was still significant across all activated corticalregions, but the previously described regional variation was not evident. These findings suggest that with tasks
e1544
Abstracts presented at the 9th International Conference on Functional Mapping of the Human Brain, June 19Œ22, 2003, New York, NY
e1544
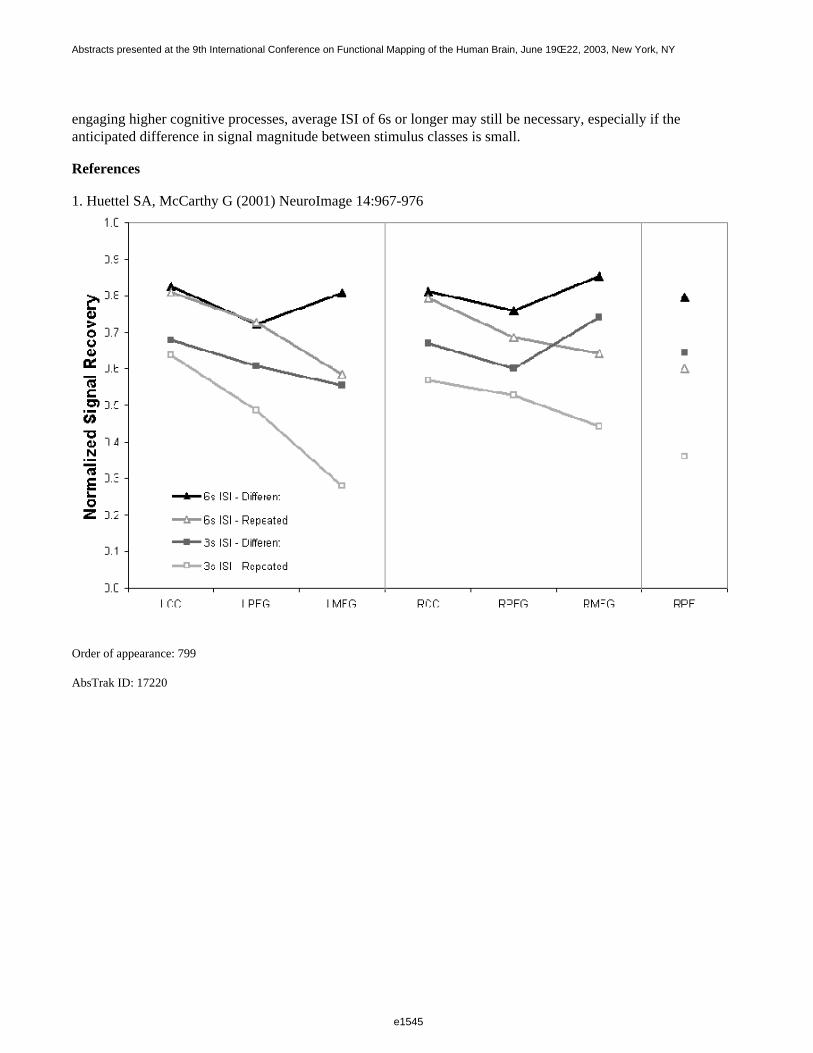
engaging higher cognitive processes, average ISI of 6s or longer may still be necessary, especially if theanticipated difference in signal magnitude between stimulus classes is small.
References
1. Huettel SA, McCarthy G (2001) NeuroImage 14:967-976
Order of appearance: 799
AbsTrak ID: 17220
e1545
Abstracts presented at the 9th International Conference on Functional Mapping of the Human Brain, June 19Œ22, 2003, New York, NY
e1545
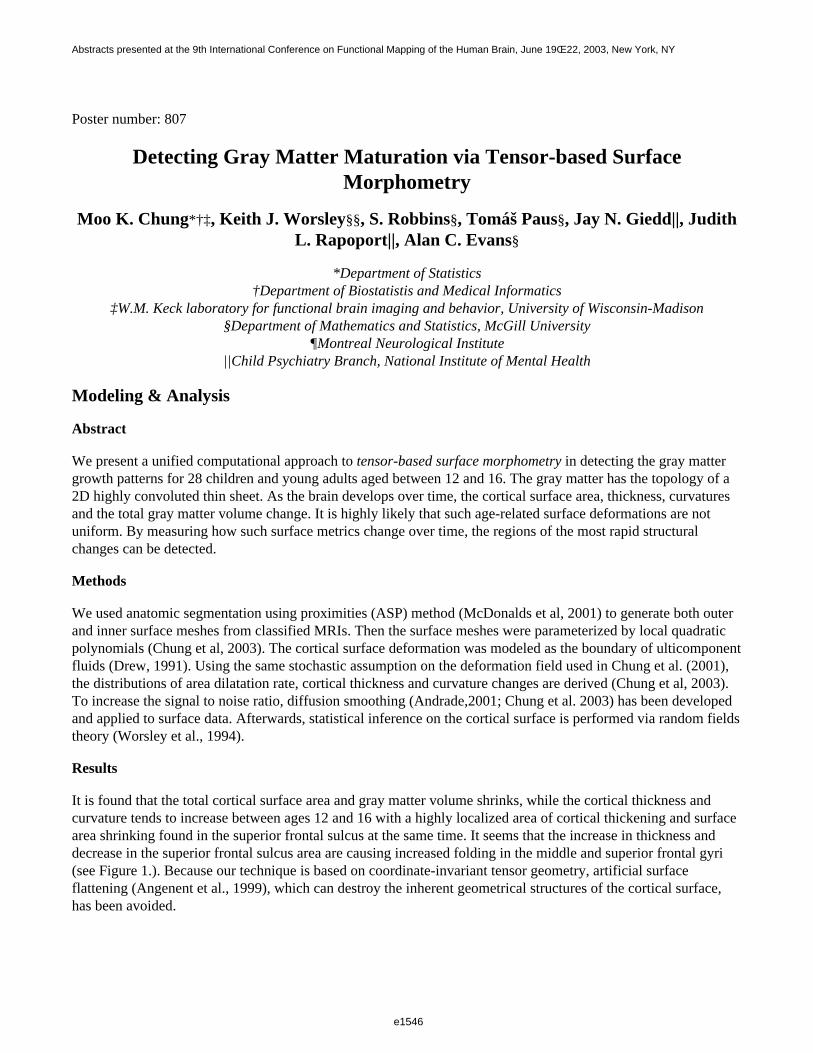
Poster number: 807
Detecting Gray Matter Maturation via Tensor-based Surface Morphometry
Moo K. Chung*†‡, Keith J. Worsley§§, S. Robbins§, Tomáš Paus§, Jay N. Giedd||, JudithL. Rapoport||, Alan C. Evans§
*Department of Statistics†Department of Biostatistis and Medical Informatics
‡W.M. Keck laboratory for functional brain imaging and behavior, University of Wisconsin-Madison§Department of Mathematics and Statistics, McGill University
¶Montreal Neurological Institute||Child Psychiatry Branch, National Institute of Mental Health
Modeling & Analysis
Abstract
We present a unified computational approach to tensor-based surface morphometry in detecting the gray mattergrowth patterns for 28 children and young adults aged between 12 and 16. The gray matter has the topology of a2D highly convoluted thin sheet. As the brain develops over time, the cortical surface area, thickness, curvaturesand the total gray matter volume change. It is highly likely that such age-related surface deformations are notuniform. By measuring how such surface metrics change over time, the regions of the most rapid structuralchanges can be detected.
Methods
We used anatomic segmentation using proximities (ASP) method (McDonalds et al, 2001) to generate both outerand inner surface meshes from classified MRIs. Then the surface meshes were parameterized by local quadraticpolynomials (Chung et al, 2003). The cortical surface deformation was modeled as the boundary of ulticomponentfluids (Drew, 1991). Using the same stochastic assumption on the deformation field used in Chung et al. (2001),the distributions of area dilatation rate, cortical thickness and curvature changes are derived (Chung et al, 2003).To increase the signal to noise ratio, diffusion smoothing (Andrade,2001; Chung et al. 2003) has been developedand applied to surface data. Afterwards, statistical inference on the cortical surface is performed via random fieldstheory (Worsley et al., 1994).
Results
It is found that the total cortical surface area and gray matter volume shrinks, while the cortical thickness andcurvature tends to increase between ages 12 and 16 with a highly localized area of cortical thickening and surfacearea shrinking found in the superior frontal sulcus at the same time. It seems that the increase in thickness anddecrease in the superior frontal sulcus area are causing increased folding in the middle and superior frontal gyri(see Figure 1.). Because our technique is based on coordinate-invariant tensor geometry, artificial surfaceflattening (Angenent et al., 1999), which can destroy the inherent geometrical structures of the cortical surface,has been avoided.
e1546
Abstracts presented at the 9th International Conference on Functional Mapping of the Human Brain, June 19Œ22, 2003, New York, NY
e1546
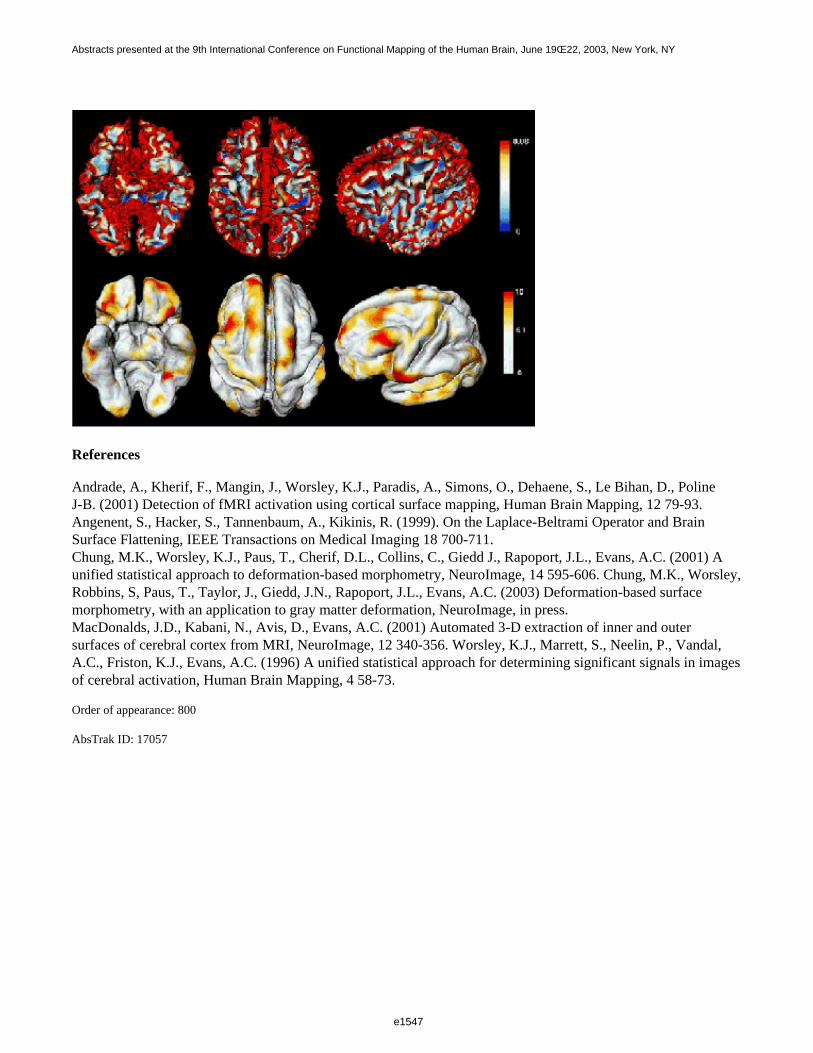
References
Andrade, A., Kherif, F., Mangin, J., Worsley, K.J., Paradis, A., Simons, O., Dehaene, S., Le Bihan, D., PolineJ-B. (2001) Detection of fMRI activation using cortical surface mapping, Human Brain Mapping, 12 79-93.Angenent, S., Hacker, S., Tannenbaum, A., Kikinis, R. (1999). On the Laplace-Beltrami Operator and BrainSurface Flattening, IEEE Transactions on Medical Imaging 18 700-711.Chung, M.K., Worsley, K.J., Paus, T., Cherif, D.L., Collins, C., Giedd J., Rapoport, J.L., Evans, A.C. (2001) Aunified statistical approach to deformation-based morphometry, NeuroImage, 14 595-606. Chung, M.K., Worsley,Robbins, S, Paus, T., Taylor, J., Giedd, J.N., Rapoport, J.L., Evans, A.C. (2003) Deformation-based surfacemorphometry, with an application to gray matter deformation, NeuroImage, in press. MacDonalds, J.D., Kabani, N., Avis, D., Evans, A.C. (2001) Automated 3-D extraction of inner and outersurfaces of cerebral cortex from MRI, NeuroImage, 12 340-356. Worsley, K.J., Marrett, S., Neelin, P., Vandal,A.C., Friston, K.J., Evans, A.C. (1996) A unified statistical approach for determining significant signals in imagesof cerebral activation, Human Brain Mapping, 4 58-73.
Order of appearance: 800
AbsTrak ID: 17057
e1547
Abstracts presented at the 9th International Conference on Functional Mapping of the Human Brain, June 19Œ22, 2003, New York, NY
e1547
Poster number: 808
SURFACE LAPLACIAN METRIC OF DATA SPACE IN THESOLUTION OF THE EEG LINEAR INVERSE PROBLEM
Febo Cincotti*†, Claudio Babiloni*, Filippo Carducci*, Donatella Mattia†, Luigi Carotenuto*, Paolo M. Rossini‡§, Fabio Babiloni*
*Dpt. Human Physiology and Pharmacology, Univ. "La Sapienza", Rome, Italy.†Fondazione Santa Lucia - IRCCS, Rome, Italy.
‡AFaR, Ospedale "S. Giovanni Calibita" - FBF, Rome, Italy.§IRCCS "San Giovanni di Dio" - FBF, Brescia, Italy.
Modeling & Analysis
Abstract
In the present study we evaluate the improvement in accuracy obtained by using a non-euclidean metric for thedata space in the estimation of the cortical sources of EEG. The particular metric lightens the weight of lowspatial frequency errors in the minimization of the residuals, since it is based on the transformation matrix of thesurface Laplacian Transformation (LT). This procedure, the model is fitted to EEG potentials that do not containcomponents due to brain electrical activity generated by subcortical sources (i.e. not represented into the usualsource cortical models). The source estimates obtained with LT-EEG potentials were compared to those obtainedwith raw EEG in the framework of a simulation study. Furthermore, the simulation tested the dependence of themodel on: i) the presence of a subcortically generated disturbance ii) the signal to noise ratio (SNR) of the scalpsimulated data; iii) the criterion for cortical sources weighting in the inverse operator used for source estimation;and iv) the number of virtual scalp electrodes. Accuracy is assessed by using as the dependent variable theRelative Error between the imposed and the estimated source strength at the level of cortical regions of interests.Realistic head and cortical surface models were used. Analysis of Variance (ANOVA) unveiled that all theconsidered factors significantly affect the accuracy of source estimation. As a main result, it was observed that,for most combinations of the other variables, the use of LT-EEG potentials yields the best estimation of corticalsource currents.
e1548
Abstracts presented at the 9th International Conference on Functional Mapping of the Human Brain, June 19Œ22, 2003, New York, NY
e1548
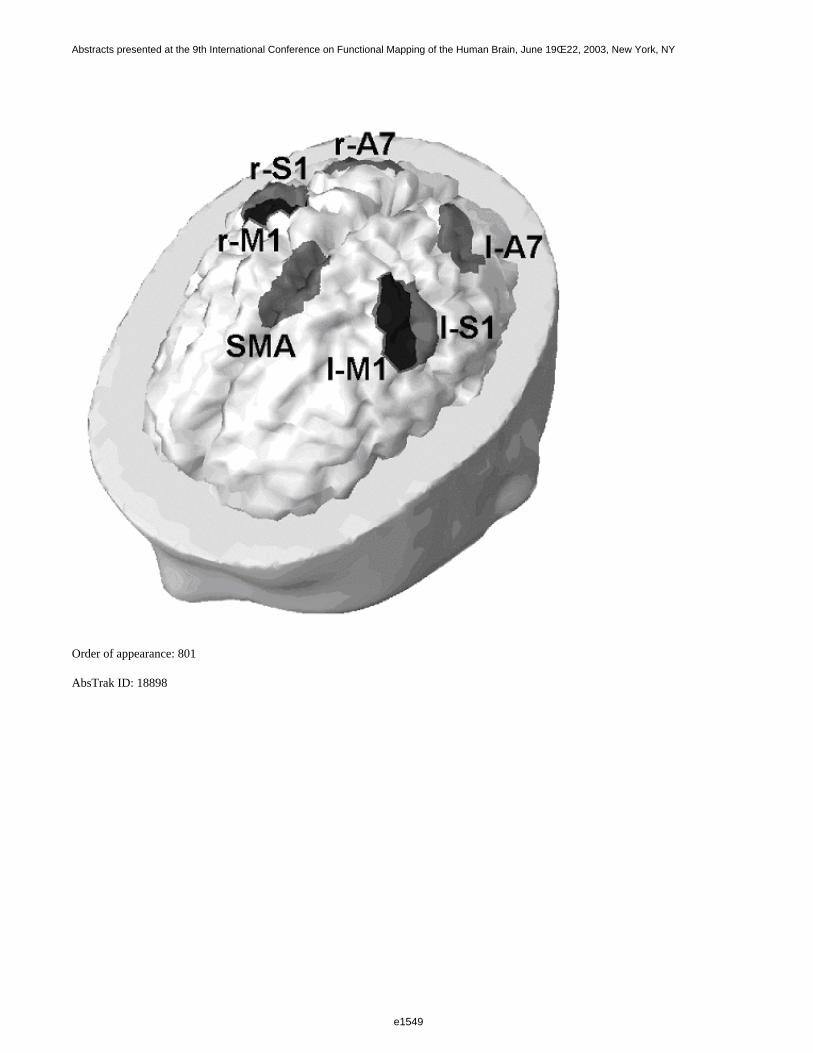
Order of appearance: 801
AbsTrak ID: 18898
e1549
Abstracts presented at the 9th International Conference on Functional Mapping of the Human Brain, June 19Œ22, 2003, New York, NY
e1549
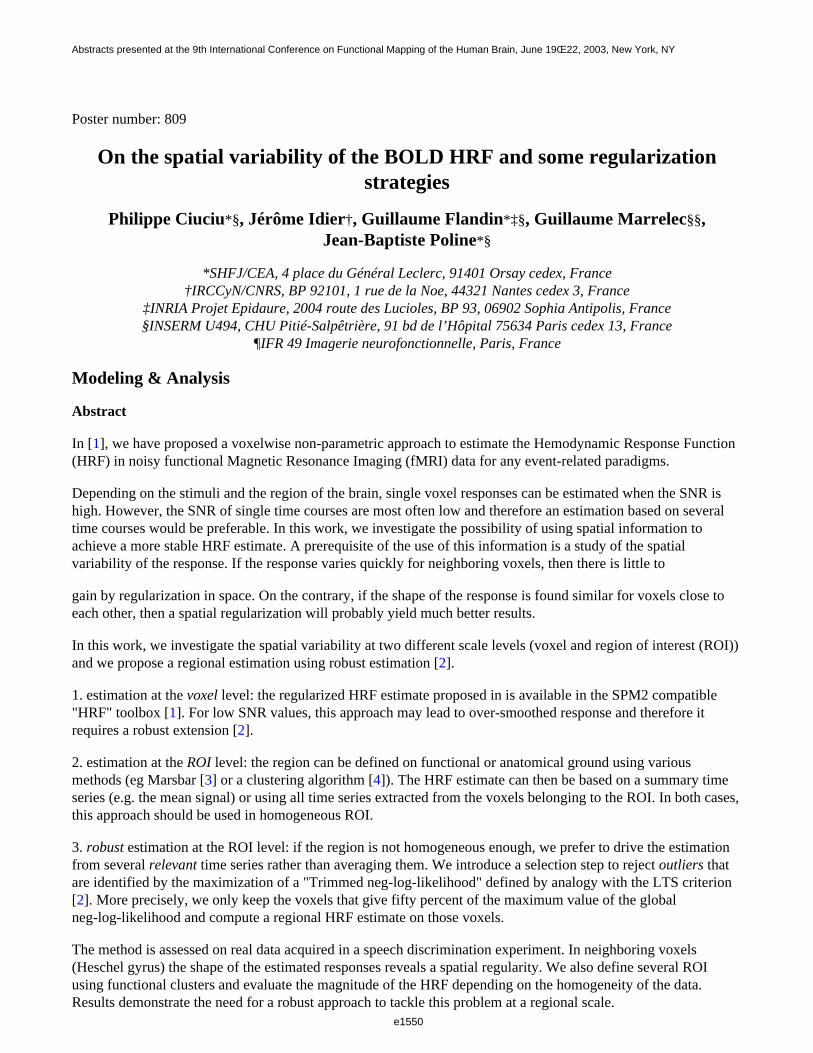
Poster number: 809
On the spatial variability of the BOLD HRF and some regularization strategies
Philippe Ciuciu*§, Jérôme Idier†, Guillaume Flandin*‡§, Guillaume Marrelec§§,Jean-Baptiste Poline*§
*SHFJ/CEA, 4 place du Général Leclerc, 91401 Orsay cedex, France†IRCCyN/CNRS, BP 92101, 1 rue de la Noe, 44321 Nantes cedex 3, France
‡INRIA Projet Epidaure, 2004 route des Lucioles, BP 93, 06902 Sophia Antipolis, France§INSERM U494, CHU Pitié-Salpêtrière, 91 bd de l’Hôpital 75634 Paris cedex 13, France
¶IFR 49 Imagerie neurofonctionnelle, Paris, France
Modeling & Analysis
Abstract
In [1], we have proposed a voxelwise non-parametric approach to estimate the Hemodynamic Response Function(HRF) in noisy functional Magnetic Resonance Imaging (fMRI) data for any event-related paradigms.
Depending on the stimuli and the region of the brain, single voxel responses can be estimated when the SNR ishigh. However, the SNR of single time courses are most often low and therefore an estimation based on severaltime courses would be preferable. In this work, we investigate the possibility of using spatial information toachieve a more stable HRF estimate. A prerequisite of the use of this information is a study of the spatialvariability of the response. If the response varies quickly for neighboring voxels, then there is little to
gain by regularization in space. On the contrary, if the shape of the response is found similar for voxels close toeach other, then a spatial regularization will probably yield much better results.
In this work, we investigate the spatial variability at two different scale levels (voxel and region of interest (ROI))and we propose a regional estimation using robust estimation [2].
1. estimation at the voxel level: the regularized HRF estimate proposed in is available in the SPM2 compatible"HRF" toolbox [1]. For low SNR values, this approach may lead to over-smoothed response and therefore itrequires a robust extension [2].
2. estimation at the ROI level: the region can be defined on functional or anatomical ground using variousmethods (eg Marsbar [3] or a clustering algorithm [4]). The HRF estimate can then be based on a summary timeseries (e.g. the mean signal) or using all time series extracted from the voxels belonging to the ROI. In both cases,this approach should be used in homogeneous ROI.
3. robust estimation at the ROI level: if the region is not homogeneous enough, we prefer to drive the estimationfrom several relevant time series rather than averaging them. We introduce a selection step to reject outliers thatare identified by the maximization of a "Trimmed neg-log-likelihood" defined by analogy with the LTS criterion [2]. More precisely, we only keep the voxels that give fifty percent of the maximum value of the globalneg-log-likelihood and compute a regional HRF estimate on those voxels.
The method is assessed on real data acquired in a speech discrimination experiment. In neighboring voxels(Heschel gyrus) the shape of the estimated responses reveals a spatial regularity. We also define several ROIusing functional clusters and evaluate the magnitude of the HRF depending on the homogeneity of the data.Results demonstrate the need for a robust approach to tackle this problem at a regional scale.
e1550
Abstracts presented at the 9th International Conference on Functional Mapping of the Human Brain, June 19Œ22, 2003, New York, NY
e1550

References:
[1]:Ciuciu P. et al: Proceedings 1st ISBI, July 7-10, 2002, pp 847-850, Washington DC, USA. http://www.madic.org/download/HRFTBx/index.html[2]: Rousseeuw P.J. and Leroy A.M., "Robust regression and outlier detection", 1987, Wiley.[3]: Brett M. et al: Proceedings 8th HBM, June 2-6, 2002, Sendai, Japan (CDRom: Vol 16, No 2, abstract 497). http://www.mrc-cbu.cam.ac.uk/Imaging/marsbar.html.[4]: Flandin G. et al: Proceedings 1st ISBI, July 7-10, 2002, pp 907-910, Washington DC, USA.
Order of appearance: 802
AbsTrak ID: 17626
e1551
Abstracts presented at the 9th International Conference on Functional Mapping of the Human Brain, June 19Œ22, 2003, New York, NY
e1551

Poster number: 810
A Freely available Anatomist/BrainVISA Package for Analysis ofdiffusion MR data
Yann Cointepas*†, C. Poupon*†, R. Maroy*†, D. Rivière*†, D. Papadopoulos-Orfanos*†,D. Le Bihan*†, J.-F. Mangin*†
*SHFJ, CEA, Orsay†IFR 49, Paris
Modeling & Analysis
Abstract
Analysis of MR diffusion data in a research or clinical framework requires the use of various processing tools andthe possibility to merge the diffusion related data with other kinds of data. A diffusion dedicated package has beendeveloped for this purpose in the context of the Anatomist/BrainVISA platform [1,2]. The package can accept asinput series of diffusion weighted data including any number of gradient directions and B values.
The processing tools are the following:
1) Correction of the Eddy current related spatial distortions induced by the diffudion gradients. The method warpseach 2D slice on the corresponding T2-weighted slice using the optimal affine transformation according to mutualinformation [3].
2) Estimation of the diffusion tensor using least square based or robust estimators [3].
3) Computation of various diffusion related maps including fractional anisotropy, volume ratio, maximumeigenvector (direction or RGB coded), etc...
4) A module for the 3D drawing of Volumes of Interest (VOI) made up of sets of voxels.
5) The computation of various statistics for each VOI.
6) Dedicated visualization tools for the various diffusion weighted maps, including the high angular resolutiondata leading to visualize for
each voxel a "diffusoid", namely a spherical mesh deformed and colored according to the diffusion directionalproperties (see Fig.up).
7) The tracking of the putative bundles of fascicles connecting the VOIs using a method including regularizationof the bundle directions in the voxels of low anisotropy [4,5]. This method is updated regularly in order to providea better management of the fiber crossing [6]. The different tracking approaches provided in the package belongto the same inverse problem framework, which leads to reconstruct the geometry of white matter as the lowestenergy configuration of a spin glass [7]. The spins represent pieces of fascicle that orient themselves according todiffusion data and interact in order to create low curvature fascicles.
The integration of the diffusion package into the Anatomist/BrainVISA platform results in a user friendlyinterface which allows the combination of multimodal data (aMRI, fMRI, dMRI, EEG/MEG, etc.). For instance,the trajectory of the tracked bundles can be localized relatively to the main cortical sulci automatically recognizedby an other package of the same platform (see Fig.down). The volumes of interest can be inferred from Statistical
e1552
Abstracts presented at the 9th International Conference on Functional Mapping of the Human Brain, June 19Œ22, 2003, New York, NY
e1552
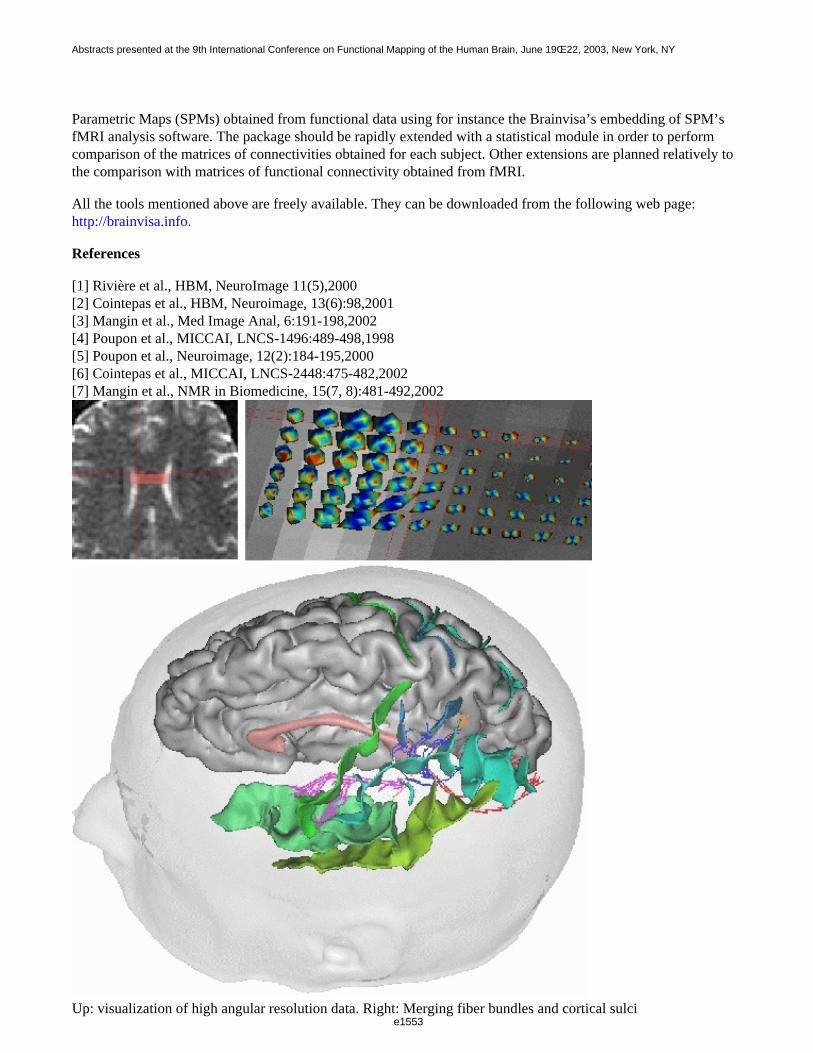
Parametric Maps (SPMs) obtained from functional data using for instance the Brainvisa’s embedding of SPM’sfMRI analysis software. The package should be rapidly extended with a statistical module in order to performcomparison of the matrices of connectivities obtained for each subject. Other extensions are planned relatively tothe comparison with matrices of functional connectivity obtained from fMRI.
All the tools mentioned above are freely available. They can be downloaded from the following web page: http://brainvisa.info.
References
[1] Rivière et al., HBM, NeuroImage 11(5),2000[2] Cointepas et al., HBM, Neuroimage, 13(6):98,2001[3] Mangin et al., Med Image Anal, 6:191-198,2002[4] Poupon et al., MICCAI, LNCS-1496:489-498,1998[5] Poupon et al., Neuroimage, 12(2):184-195,2000[6] Cointepas et al., MICCAI, LNCS-2448:475-482,2002[7] Mangin et al., NMR in Biomedicine, 15(7, 8):481-492,2002
Up: visualization of high angular resolution data. Right: Merging fiber bundles and cortical sulci
e1553
Abstracts presented at the 9th International Conference on Functional Mapping of the Human Brain, June 19Œ22, 2003, New York, NY
e1553

Order of appearance: 803
AbsTrak ID: 18368
e1554
Abstracts presented at the 9th International Conference on Functional Mapping of the Human Brain, June 19Œ22, 2003, New York, NY
e1554
Poster number: 811
Investigating the Frequency Dependence of Spatial Gradient Artifacts forthe Analysis of Resting-State fMRI Data
Dietmar Cordes, Rajesh Nandy
University of Washington, Seattle
Modeling & Analysis
Abstract
Artifacts in functional connectivity imaging resembling spatial gradient-like appearances are investigated bycomputation of the power spectral density function at each voxel. Results show a strong dependence on the valueof the lower limit of the frequency used in functional connectivity imaging.
Introduction
In functional connectivity MR imaging, functionally related regions of the brain are identified by computing thetemporal correlation of spontaneous low frequency MR signal fluctuations while the subject is in a “resting state” [1, 2]. Functional connectivity is still incompletely characterized and prone to artifacts [3, 4]. Whether the userselects “seed voxels” to probe for specific connections or uses more sophisticated model-independent methods(for example clustering), the method to establish connectivity maps is usually based on low-pass filtering of timecourses such that frequencies between 0 Hz (or close to 0 Hz) and 0.1 Hz are considered only. The value of thelower frequency threshold (0 Hz or close to 0 Hz), is extremely sensitive in providing good quality connectivitymaps. Whether a lower threshold of 0 Hz, 0.01 Hz, or 0.02Hz is chosen, the results can be very different andprone to artifacts resembling spatial gradients.
Methods
Four experienced normal male volunteers (aged 24 to 44) participated in this study. Each subject was instructed torelax, keep eyes closed, refrain from any cognitive exercise, and be as motionless as possible during dataacquisition. MR scanning was performed in a commercial 1.5T GE scanner with EPI parameters: FOV 240, TE40, TR 400, FA 50, BW ±62.5 kHz, slice thickness 7mm, gap 2mm, 776 time frames, 4 axial slices coveringmotor/somatosensory cortex. All EPI scans were repeated to assess accuracy. Motion analysis was carried out inAFNI using 3D registration (Robert Cox, NIH). Maximum motion displacement was less than 0.4 mm. The powerspectral density for each voxel was estimated using the multitaper method with a time-bandwidth product=4 andfurther smoothed using a moving window approach covering three discrete frequency points (Äf=0.00386Hz).Using histogram estimation (over all voxels), frequency-specific images I(x,y,z,f) were produced showing voxelswith significant (upper 25th percentile) spectral power and compared to the spatial gradient.
Results and Discussion
It is quite obvious that the power spectral density image at 0.01 Hz is very similar to the gradient image for thedata sets obtained. However, at 0.075 Hz, the features are quite different and more like functional connectivitymaps . The average minimal distance between gradient image and power spectral density images as a function ofthe frequency show a pronounced step-like increase at 0.02 Hz suggesting that the frequency range from 0 Hz to0.02+/- 0.01 Hz is strongly correlated to the spatial gradient. Therefore, the appropriate choice of the lowerfrequency limit (which varies in different data sets) is important in obtaining more meaningful functionalconnectivity maps.
e1555
Abstracts presented at the 9th International Conference on Functional Mapping of the Human Brain, June 19Œ22, 2003, New York, NY
e1555

References
[1] Biswal, et al. MRM 1995;34:537-541.[2] Lowe, et al. Neuroimage 1998;7:119-132.[3]. Smith et al. Neuroimage 1999;9:526-533.[4] Cordes D, et al. Magn Reson Imag 2002; 20:305-317.
Order of appearance: 804
AbsTrak ID: 18053
e1556
Abstracts presented at the 9th International Conference on Functional Mapping of the Human Brain, June 19Œ22, 2003, New York, NY
e1556
Poster number: 812
Wavelet Analysis of Clusters to Characterize the Time-FrequencyDependence of the Correlation Coefficient
Dietmar Cordes, Rajesh Nandy
University of Washington, Seattle
Modeling & Analysis
Abstract
Brain activity in fMRI during rest or active motor-task periods has been analyzed using a hierarchical clusteringmethod. Time-frequency specific correlations in the motor cortex are computed using the complex Morletwavelet. Results show that periodic maxima occur with frequencies above 0.05 Hz whereas (more or less)continuous maxima are present for very low frequencies less than 0.05 Hz.
Introduction
The wavelet transform is a powerful tool to visualize time-frequency dependence of signal time courses, inparticular for non-stationary time series [1,2]. Especially for visualizing the low-frequency content of a signal, thecomplex Morlet wavelet can provide detailed information of frequencies that contribute to functionalconnectivity. We have used the complex Morlet wavelet to decompose the correlation coefficient of two timeseries into time-frequency-specific terms to investigate the structure of voxels obtained after hierarchical clustering.
Theory
The correlation coefficient between two zero-mean time series f(t),g(t) is expanded in time and frequency usingthe complex Morlet wavelet transform. Thus, a time-frequency-specific correlation coefficient can be definedsuch that the integration over frequency and time will give the (total) correlation coefficient.
Methods
FMRI data sets were collected using a commercial 1.5T GE scanner with EPI parameters: FOV 240, TE 40, TR400, FA 50, BW ±62.5 kHz, slice thickness 7mm, gap 2mm, 2275 time frames, 4 axial slices coveringmotor/somatosensory cortex. The paradigm consisted of an initial resting period of 5 minutes 25 sec, which wasfollowed by a paced motor activation (5 seconds on, 5 seconds off, bilateral finger tapping) for five minutes, andin turn was followed by another 5 minutes of resting. The data sets were analyzed by a Hierarchical Clusteringalgorithm including only frequency components between 0.08 and 0.12 Hz. Then, after the clusters were obtained,the correlation coefficient of the corresponding voxel-time-courses were decomposed into time-frequency termsand an average time-frequency-specific correlation coefficient was computed for each cluster.
Results and Discussion
The dominant cluster corresponds well to activation in the motor/somatosensory cortex when compared to aconventional map using a hypothesized box-car reference function with 0.1 Hz period. This strong 0.1 Hzactivation is apparent by wavelet analysis. The initial and final resting segments show spikes with frequenciesabove 0.05 Hz which are possibly related to motion artifacts since they occurred at time intervals of 70 to 120time frames (28s to 48s). These artifacts are not eliminated by 3D realignment. Furthermore, all segments showsome regions with continuous contributions attributed to frequencies less than 0.05 Hz.
e1557
Abstracts presented at the 9th International Conference on Functional Mapping of the Human Brain, June 19Œ22, 2003, New York, NY
e1557

References
[1] Liszka L, Holmström M. Astron. Astrophys. Suppl. Ser. 1999;125-134.[2] Tscharner V, Thulborn KR. IEEE Trans Med Imag 2001;20:704-714.[3] Daubechies I. in ‘Ten Lectures on Wavelets’, Capital City Press, 1992.
Order of appearance: 805
AbsTrak ID: 18821
e1558
Abstracts presented at the 9th International Conference on Functional Mapping of the Human Brain, June 19Œ22, 2003, New York, NY
e1558
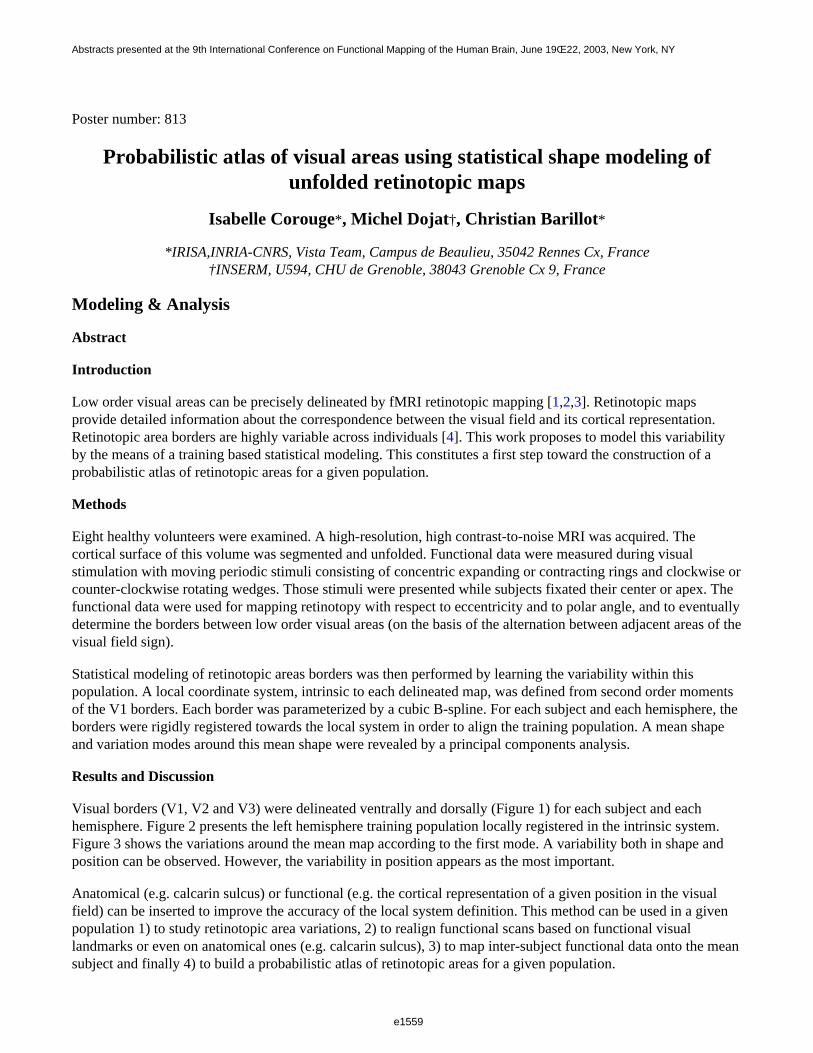
Poster number: 813
Probabilistic atlas of visual areas using statistical shape modeling ofunfolded retinotopic maps
Isabelle Corouge*, Michel Dojat†, Christian Barillot*
*IRISA,INRIA-CNRS, Vista Team, Campus de Beaulieu, 35042 Rennes Cx, France†INSERM, U594, CHU de Grenoble, 38043 Grenoble Cx 9, France
Modeling & Analysis
Abstract
Introduction
Low order visual areas can be precisely delineated by fMRI retinotopic mapping [1,2,3]. Retinotopic mapsprovide detailed information about the correspondence between the visual field and its cortical representation.Retinotopic area borders are highly variable across individuals [4]. This work proposes to model this variabilityby the means of a training based statistical modeling. This constitutes a first step toward the construction of aprobabilistic atlas of retinotopic areas for a given population.
Methods
Eight healthy volunteers were examined. A high-resolution, high contrast-to-noise MRI was acquired. Thecortical surface of this volume was segmented and unfolded. Functional data were measured during visualstimulation with moving periodic stimuli consisting of concentric expanding or contracting rings and clockwise orcounter-clockwise rotating wedges. Those stimuli were presented while subjects fixated their center or apex. Thefunctional data were used for mapping retinotopy with respect to eccentricity and to polar angle, and to eventuallydetermine the borders between low order visual areas (on the basis of the alternation between adjacent areas of thevisual field sign).
Statistical modeling of retinotopic areas borders was then performed by learning the variability within thispopulation. A local coordinate system, intrinsic to each delineated map, was defined from second order momentsof the V1 borders. Each border was parameterized by a cubic B-spline. For each subject and each hemisphere, theborders were rigidly registered towards the local system in order to align the training population. A mean shapeand variation modes around this mean shape were revealed by a principal components analysis.
Results and Discussion
Visual borders (V1, V2 and V3) were delineated ventrally and dorsally (Figure 1) for each subject and eachhemisphere. Figure 2 presents the left hemisphere training population locally registered in the intrinsic system.Figure 3 shows the variations around the mean map according to the first mode. A variability both in shape andposition can be observed. However, the variability in position appears as the most important.
Anatomical (e.g. calcarin sulcus) or functional (e.g. the cortical representation of a given position in the visualfield) can be inserted to improve the accuracy of the local system definition. This method can be used in a givenpopulation 1) to study retinotopic area variations, 2) to realign functional scans based on functional visuallandmarks or even on anatomical ones (e.g. calcarin sulcus), 3) to map inter-subject functional data onto the meansubject and finally 4) to build a probabilistic atlas of retinotopic areas for a given population.
e1559
Abstracts presented at the 9th International Conference on Functional Mapping of the Human Brain, June 19Œ22, 2003, New York, NY
e1559
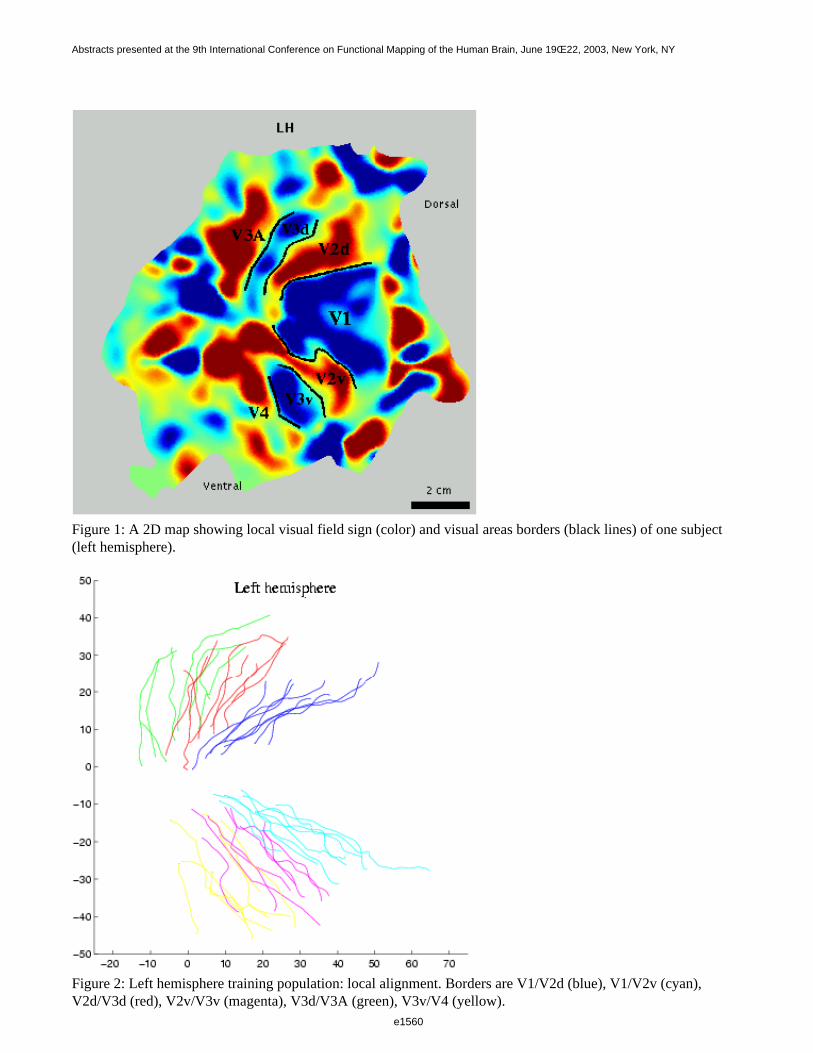
Figure 1: A 2D map showing local visual field sign (color) and visual areas borders (black lines) of one subject(left hemisphere).
Figure 2: Left hemisphere training population: local alignment. Borders are V1/V2d (blue), V1/V2v (cyan),V2d/V3d (red), V2v/V3v (magenta), V3d/V3A (green), V3v/V4 (yellow).
e1560
Abstracts presented at the 9th International Conference on Functional Mapping of the Human Brain, June 19Œ22, 2003, New York, NY
e1560
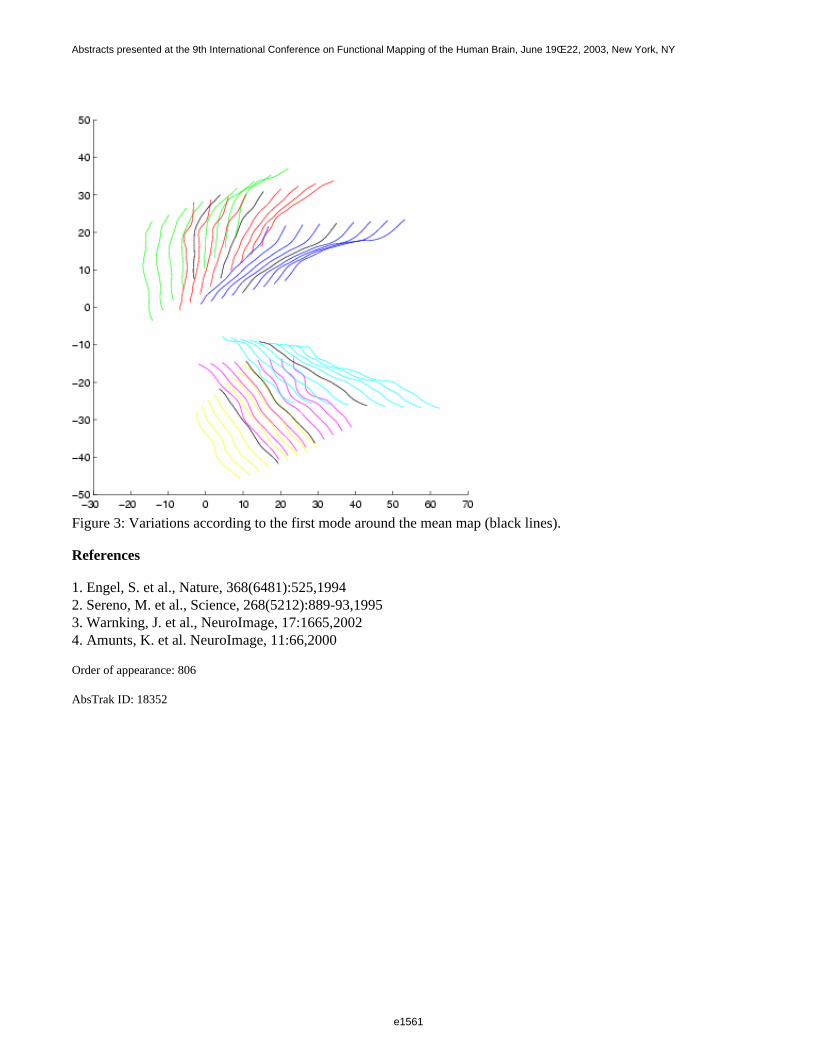
Figure 3: Variations according to the first mode around the mean map (black lines).
References
1. Engel, S. et al., Nature, 368(6481):525,19942. Sereno, M. et al., Science, 268(5212):889-93,19953. Warnking, J. et al., NeuroImage, 17:1665,20024. Amunts, K. et al. NeuroImage, 11:66,2000
Order of appearance: 806
AbsTrak ID: 18352
e1561
Abstracts presented at the 9th International Conference on Functional Mapping of the Human Brain, June 19Œ22, 2003, New York, NY
e1561
Poster number: 814
A quantitative meta-analysis of fMRI studies of verbal fluency in healthyindividuals and people with schizophrenia: segregation of activation
within inferior frontal gyrus
Sergi Costafreda*, Cynthia Fu†, Lucy Lee‡, Brian Everitt§, Michael Brammer§, Anthony David†
*Department of Psychiatry, Hospital de Terrassa, Barcelona, Catalonia, Spain†Division of Psychological Medicine, Institute of Psychiatry, King’s College London, London, United Kingdom
‡Functional Imaging Laboratory, Wellcome Department of Imaging Neuroscience, Queen Square, London,United Kingdom
§Department of Biostatistics and Computing, Institute of Psychiatry, King’s College London, London, United Kingdom
Modeling & Analysis
Abstract
Introduction
There has been increasing interest in developing methods for quantitative meta-analysis of neuroimaging data.The methods presented to date are usually qualitative in nature or assume a normal distribution of the data.Typically, meta-analytic methods have been used to obtain a set of coordinates within a standard 3-D brain space,consistently activated with similar tasks in different studies.
Aim: We examined whether published functional neuroimaging studies using different versions of a verbalfluency task produced consistent activations within the region of the left inferior frontal gyrus (LIFG).
Method
A systematic literature search (1990, 1991, 1992, 1993, 1994, 1995, 1996, 1997, 1998, 1999, 2000, 2001, 2002)with pre-established selection criteria was performed. This yielded 14 fMRI papers (n=127) of healthy individualswith a phonological letter fluency task (e.g. F.A.S) or a semantic category fluency task (e.g. animals), reporting20 peak activations in LIFG according to the Talairach and Tournoux atlas. Only 1 study testing 5 schizophrenicpatients with a phonological task met our criteria. Bootstrap analysis with 1000 samples was used to generateempirical distributions for each coordinate in the LIFG with respect to each factor (phonological letter fluency vs.semantic category task, visually vs. verbally presented stimulus, overt vs. covert responses) and for differences inthe corresponding coordinate values. Confidence intervals can be extracted from these bootstrap generated distributions.
Results
see Table 1. CI is 95% Confidence Interval for the x, y and z-coordinates. The units are in mm along the 3orthogonal spatial planes according to the Talairach atlas.
These results suggest that semantic fluency may show a more inferior activation in the z-axis relative tophonological fluency (Table 1, in bold). The CIs associated with other factors all included the value zeroindicating that there was no evidence of any differences in the corresponding coordinate values. The activation forthe schizophrenic patients (-52,6,31) lay outside the 3 axis confidence intervals for in healthy subjects.
e1562
Abstracts presented at the 9th International Conference on Functional Mapping of the Human Brain, June 19Œ22, 2003, New York, NY
e1562
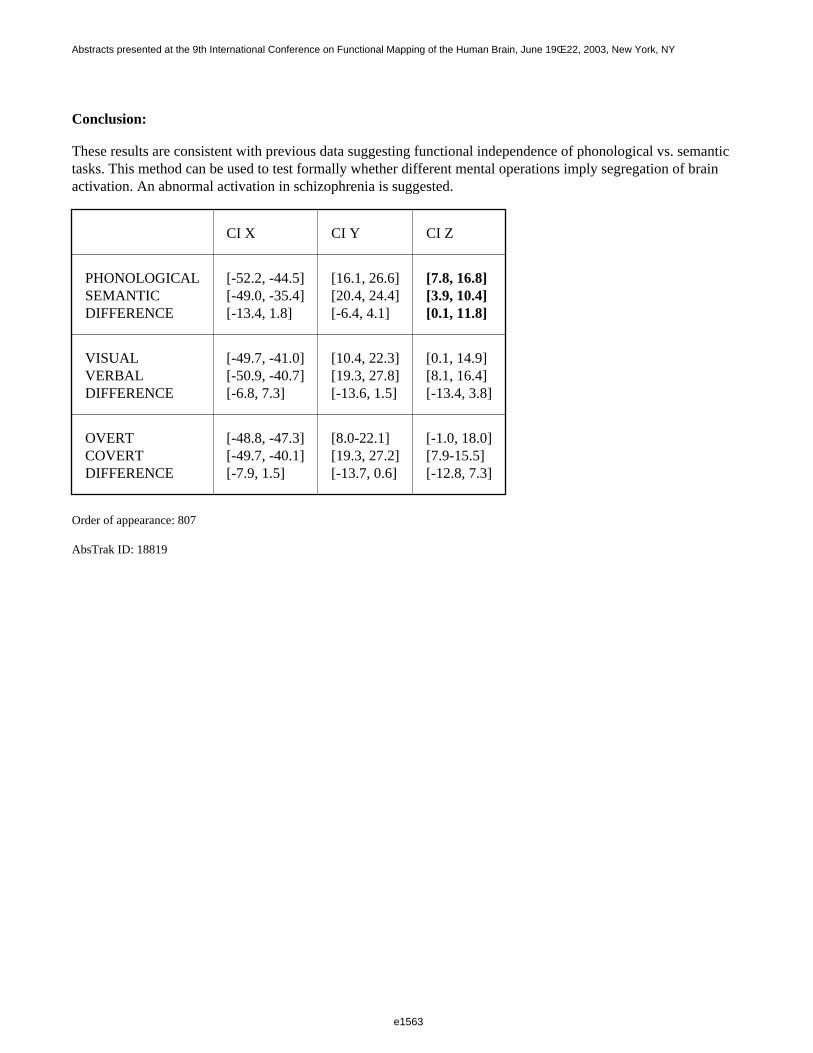
Conclusion:
These results are consistent with previous data suggesting functional independence of phonological vs. semantictasks. This method can be used to test formally whether different mental operations imply segregation of brainactivation. An abnormal activation in schizophrenia is suggested.
CI X CI Y CI Z
PHONOLOGICALSEMANTICDIFFERENCE
[-52.2, -44.5] [-49.0, -35.4][-13.4, 1.8]
[16.1, 26.6][20.4, 24.4][-6.4, 4.1]
[7.8, 16.8][3.9, 10.4][0.1, 11.8]
VISUALVERBALDIFFERENCE
[-49.7, -41.0][-50.9, -40.7][-6.8, 7.3]
[10.4, 22.3] [19.3, 27.8][-13.6, 1.5]
[0.1, 14.9][8.1, 16.4][-13.4, 3.8]
OVERTCOVERTDIFFERENCE
[-48.8, -47.3][-49.7, -40.1][-7.9, 1.5]
[8.0-22.1][19.3, 27.2][-13.7, 0.6]
[-1.0, 18.0][7.9-15.5][-12.8, 7.3]
Order of appearance: 807
AbsTrak ID: 18819
e1563
Abstracts presented at the 9th International Conference on Functional Mapping of the Human Brain, June 19Œ22, 2003, New York, NY
e1563
Poster number: 815
Quick computation of BP values for activation PET studies with [18F]MPPF
Nicolas COSTES*, Isabelle MERLET*, Isabelle FAILLENOT*, Franck LAVENNE*,Didier LE BARS*
*CERMEP, 59 bd Pinel, 69003 Lyon, FRANCE†EA1880,Federative Institute of Neurosciences, 69003 Lyon, FRANCE
Modeling & Analysis
Abstract
Introduction:
5-HT1A receptors are largely involved in psychiatric and neurological disorders such as depression,
schizophrenia, dementia, or epilepsy. PET can evidence exploration modification in serotoninergicneurotransmission system with several tracers1 . A fluorine 18 labelled tracer competitor to endogenous serotonin2 binding on 5-HT1A receptors has been recently characterized , quantified , and validated for clinical
investigations. A simplified model with tissue reference has been validated for parametric imaging of bindingpotential (BP)3,4 .
Objective:
The aim of this study was to verify that 10 minutes were sufficient to compute a reliable parametric image with aLogan model in order to assess immediate physiological variations of the serotonin system induced bypharmacological or external stimulations.
Methods:
Five healthy subjects underwent a complete modelisation study of [18 F]-MPPF with a multi-injection protocol(74 dynamic frames, 140 min scan), and 12 healthy subjects had a simplified protocol consisting in one injection(37 dynamic frames, 60 min scan). The PET scans obtained with a CTI Exact HR+ camera were normalized,corrected for attenuation (68 Ge transmission scan) and reconstructed with FBP (Hanning filter, cut-off 0.5 cyclesper voxel) leading to dynamic volumes of 128x128x63 with a voxel size 2.04x2.04x2.42 mm3. For themulti-injection study, a non-equilibrium, non-linear three compartmental model was used to determine the fiveunknown parameters, i.e. Fv (vascular fraction), k1 , k2 (plasma/free compartment exchange rate), kon , koff /Vr
(association and dissociation rate), and Bmax (receptor concentration), in 37 anatomical ROIs manually drawn on
the subject’s MRI. For the simplified protocol, two methods with a tissue region as reference were used. Onebased on the Gunn model, used a non-linear resolution to determined BP (BPGunn) from the whole scanningperiod; the second based on the Logan model used a graphical resolution to compute BP from data between 20 to30 min (BPL20-30), and data between 30 and 40 min. (BPL30-40). Parametric images were spatially normalizedto the ICBM brain template. Both ROI and SPM approaches were used to compare results from the different methods.
Results:
e1564
Abstracts presented at the 9th International Conference on Functional Mapping of the Human Brain, June 19Œ22, 2003, New York, NY
e1564
Correlation of BP found with the quantitative procedure validated the use of the simplified Gunn and Loganmethod. Analysis of variance over the 37 regions and with SPM did not show any significant difference in BPcomputed with BPGunn, BPL20-30 or BPL30-40 methods
Conclusion:
The use of a 10 minutes period after equilibrium for BP computation with the Logan graphical method is reliableto study the binding potential of MPPF on 5-HT1A receptor, which opens the field of MPPF activation study in
one injection protocol. The method will soon be confirmed by a displacement study with endogenous serotonin,and improved with functions based analysis of dynamic series.
References
1 Costes N, Merlet I, Zimmer L, et al. JCBF 2002; 22: 753-763.2 Zimmer L, Mauger G, Le Bars D, et al., J Neurochem 2002; 80: 278-86.3 Passchier J, van Waarde A, Vaalburg W, et al. J Nucl Med 2001; 42: 1025-31.4 Pike VW, Halldin C, Wikstrom H, et al. Nucl Med Biol 2000; 27: 449-55.
Order of appearance: 808
AbsTrak ID: 17717
e1565
Abstracts presented at the 9th International Conference on Functional Mapping of the Human Brain, June 19Œ22, 2003, New York, NY
e1565

Poster number: 816
AFNI, SUMA, and NIML: Interprocess Communication in FMRI Data Analysis
Robert Cox, Ziad Saad
National Institute of Mental Health, National Institutes of Health, Department of Health and Human Services
Modeling & Analysis
Abstract
Introduction
AFNI[1] is a software package for analysis and visualization of 3D and 4D FMRI datasets defined on rectangulargrids. Its features include
Display of 2D slices, 3D volume rendering, time series graphs
Voxel-wise linear and nonlinear time series modeling
Voxel-wise inter-dataset statistics in many flavors
SUMA is a new program in the AFNI suite; its function is display and analysis of datasets defined over 2D surfacedomains. SUMA can be used as a standalone surface+functional overlay viewer, and can "talk" to AFNI using thenewly developed NIML protocol. Below, we outline the capabilities of this software combination and of theNIML protocol that makes it possible.
Linked Programs: Volume and Surface Viewers
The screen snapshot below shows an AFNI controller window, a 5x3 axial slice viewer, a 3x3 time series viewer,and the SUMA surface overlay of the same functional map as shown in the slice viewer.
e1566
Abstracts presented at the 9th International Conference on Functional Mapping of the Human Brain, June 19Œ22, 2003, New York, NY
e1566
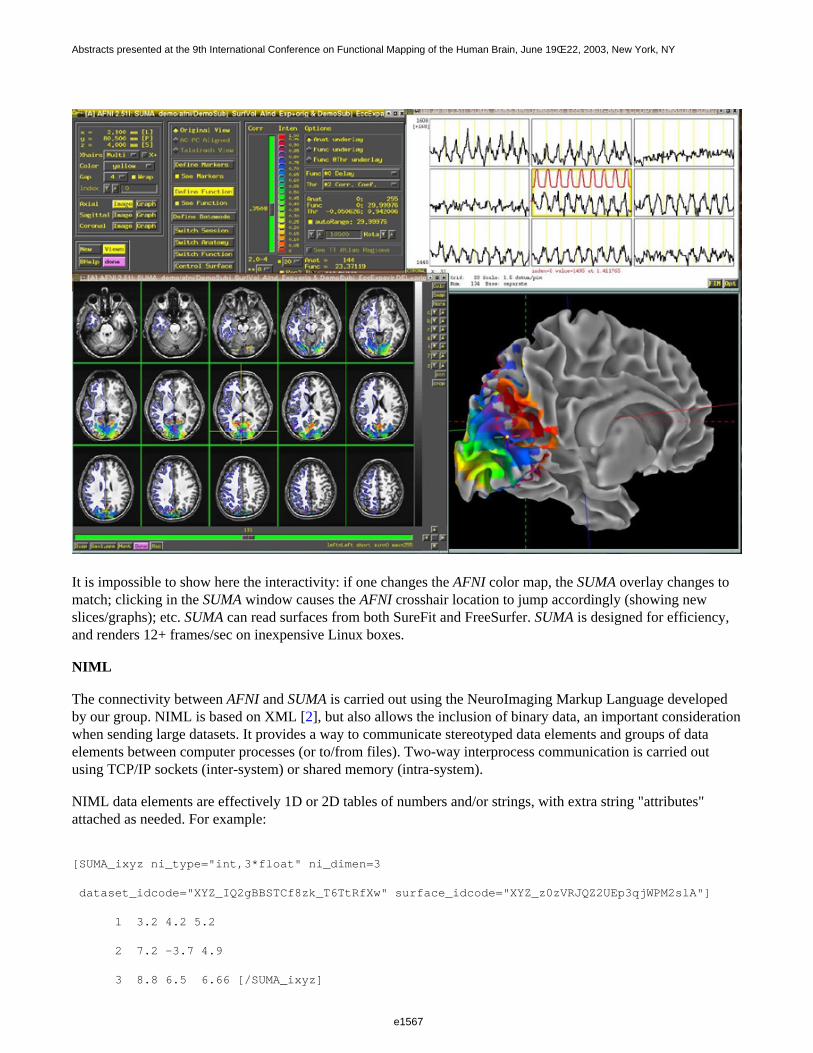
It is impossible to show here the interactivity: if one changes the AFNI color map, the SUMA overlay changes tomatch; clicking in the SUMA window causes the AFNI crosshair location to jump accordingly (showing newslices/graphs); etc. SUMA can read surfaces from both SureFit and FreeSurfer. SUMA is designed for efficiency,and renders 12+ frames/sec on inexpensive Linux boxes.
NIML
The connectivity between AFNI and SUMA is carried out using the NeuroImaging Markup Language developedby our group. NIML is based on XML [2], but also allows the inclusion of binary data, an important considerationwhen sending large datasets. It provides a way to communicate stereotyped data elements and groups of dataelements between computer processes (or to/from files). Two-way interprocess communication is carried outusing TCP/IP sockets (inter-system) or shared memory (intra-system).
NIML data elements are effectively 1D or 2D tables of numbers and/or strings, with extra string "attributes"attached as needed. For example:
[SUMA_ixyz ni_type="int,3*float" ni_dimen=3
dataset_idcode="XYZ_IQ2gBBSTCf8zk_T6TtRfXw" surface_idcode="XYZ_z0zVRJQZ2UEp3qjWPM2slA"]
1 3.2 4.2 5.2
2 7.2 -3.7 4.9
3 8.8 6.5 6.66 [/SUMA_ixyz]
e1567
Abstracts presented at the 9th International Conference on Functional Mapping of the Human Brain, June 19Œ22, 2003, New York, NY
e1567

is a tiny example of how the nodes of a surface are transmitted from SUMA to AFNI ("<",">" replaced above by"[","]" due to stupid abstract submission system limitations.) Each row is specified to comprise 1 int and 3 floats (ni_type), and 3 rows (ni_dimen) are specified. The 3D AFNI dataset to which the surface is attached isidentified by a globally unique ID code string, as is the surface itself. In this way, multiple surfaces can beattached to multiple volumes.
A C API has been developed, so that the application reading the NIML data element does not need to know if thedata was transmitted in text, binary, or Base64 format.
Summary
NIML provides an easy way for applications to store and exchange small and large tables of data. Future AFNIdevelopments will be built around this mechanism.
References
[1] RW Cox. AFNI: Software for analysis and visualization of functional magnetic resonance neuroimages.Computers and Biomedical Research, 29: 162-173, 1996.[2] XML Specification: http://www.xml.com/axml/testaxml.htm
Order of appearance: 809
AbsTrak ID: 17245
e1568
Abstracts presented at the 9th International Conference on Functional Mapping of the Human Brain, June 19Œ22, 2003, New York, NY
e1568
Poster number: 817
A guide to several popular fMRI analysis packages
Adrian Crawley, Timothy Roberts
Dept of Medical Imaging, University Hospital Network & University of Toronto, Toronto, Canada
Modeling & Analysis
Abstract
Several research groups have developed analysis packages that are available to the rest of the fMRI community.As a guide for new researchers, we summarize the main steps involved in fMRI data analysis, and include someinformation concerning relative ease of use (data and parameter input, visualization and interrogation tools suchas ROI analysis, overall layout and efficiency of computations) of five commonly used packages (Stimulate,AFNI, SPM, BrainVoyager and FSL). We also evaluate the main differences in their approaches to the following issues:
a) modeling of temporal response
Modeling methods represent a spectrum in terms of the amount of prior information introduced. Since the BOLDresponse is quite variable, SPM and FSL allow additional fitting terms to a standard hrf shape. AFNI encouragesthe use of separate regression coefficients over a range of time lags to estimate the actual hrf from the data. FSLalso provides an approach that makes no assumptions concerning the shape of the hrf but relies instead on ameasurement of variance within the interstimulus intervals. When even the stimulus timing information isexcluded from the analysis, the approach becomes completely data rather than hypothesis driven, represented inthese packages by the independent components analysis (ICA) tools available in BrainVoyager and FSL.
b) spatial and temporal noise correlation model
SPM and FSL correct for multiple comparisons to give a mapwise p-value based on random field theory.BrainVoyager relies on a simpler Bonferroni correction, while AFNI provides a tool for simulating mapwisefalse-positive rates. Correction for temporally autocorrelated noise is only an issue for first-level analyses(single-subjects or SPM’s fixed-effect multiple-subject analysis option). SPM99 relies on temporal filtering toequalize the autocorrelation throughout the data, and uses a global adjusted degrees of freedom. Just-releasedSPM2, BrainVoyager and FSL use rewhitening strategies.
c) multiple-subject analysis
Traditionally, SPM has provided a fixed-effect analysis of multiple-subject data, whereby the average response isstatistically compared to the within – rather than the between – subject errors. Most of the packages enableconjunction analyses to be performed between trial types and also between subjects, which forces all subjects toshow some minimum effect. The standard multiple-subject approach nowadays is probably the second levelrandom effects approach. The most sophisticated methods are offered by FSL and SPM2, where both levels ofanalysis are included in a hierarchical model, enabling the posterior probability distributions of the noise(nonsphericity) within the first level to be estimated at the second level, adding robustness and encouraging thedata to be viewed from a Bayesian perspective.
The basic approach used by Stimulate is likely to be the most suitable one for users who require a rapid analysisof blocked trial fMRI scans. Researchers who are primarily investigating alternative methodological approachesto fMRI analysis will probably favour AFNI. BrainVoyager is a relatively easy-to-use Windows-based applicationthat features sophisticated options such as flat-mapping. SPM and FSL are the most advanced packages in terms
e1569
Abstracts presented at the 9th International Conference on Functional Mapping of the Human Brain, June 19Œ22, 2003, New York, NY
e1569

of the statistical models used.
Order of appearance: 810
AbsTrak ID: 19085
e1570
Abstracts presented at the 9th International Conference on Functional Mapping of the Human Brain, June 19Œ22, 2003, New York, NY
e1570
Poster number: 818
Generic Head Models for Atlas-Based EEG-Source Analysis
Felix Darvas*, John C. Mosher†, Richard M. Leahy*
*University of Southern California, Signal & Image Processing Institute, Los Angeles, CA90089-2564†Los Alamos National Laboratory, Los Alamos, NM 87545
Modeling & Analysis
Abstract
Introduction
Realistic models of the electrical properties of the human head have been shown to decrease the localization errorof sources reconstructed from anatomical images of the subjects head, which are often not available. In this study,we describe a method for using a generic head model instead of the individual anatomy to produce EEG sourcelocalizations. The generic head model is fitted to the subjects head by a non-rigid warp, based on a set of surfacelandmarks [1]. The localized sources are then mapped back to the anatomical atlas on which the generic headmodel is based. This approach provides a mechanism for comparing source localizations across subjects in acommon atlas-based coordinate system, which can be used in the large fraction of EEG studies in which MRimages are not available. We evaluate this method by investigating the distribution of localization errors in bothsubject and atlas coordinate spaces.
Method
The montreal brain phantom was used as a generic model and anatomical atlas of reference [2]. The phantom wasfitted to the individual subject’s head by a landmark based thin-plate-spline (TSP) warp. A generic 155-electrodeconfiguration, generated from nasion and right and left ear anatomical landmarks, served as a basis for this fit. Forthe purposes of evaluating the approach, single dipolar sources were placed in the phantom geometry andtransferred to the individual geometry by an anatomical feature based polynomial warp [3], thus ensuring that thesource was placed at the same anatomical location in the phantom and in the subjects head. Data were simulatedin the subject geometry using the finite element method (FEM). A dipole fit, using RAP-MUSIC, was performedon these data, using an FEM of the TSP warped phantom. The source positions found in the TSP-warped phantomwere then transferred back to the original phantom geometry and compared to the original position, thus givingthe anatomical localization error in atlas space.
Results
Sources were simulated at 972 source locations, which were evenly distributed over the white-matter surface ofthe phantom. The anatomical localization error was estimated for 10 subjects. The spatial distribution of thelocalization error, averaged over the 10 subjects, is shown in Fig. 1 and the mean error for each subject in Fig. 2.The mean localization error over all 10 subjects was 15.2 mm (s.d. 5.8 mm) in the atlas space and 8.0 mm (s.d.4.4 mm) in the individual subject space. For comparison, when using a standard three-shell spherical model, thelocalization errors were 27.2 mm (s.d. 5.0 mm) in the subject space and 34.7 mm (s.d. 6.5 mm) when mapped toatlas space.
e1571
Abstracts presented at the 9th International Conference on Functional Mapping of the Human Brain, June 19Œ22, 2003, New York, NY
e1571
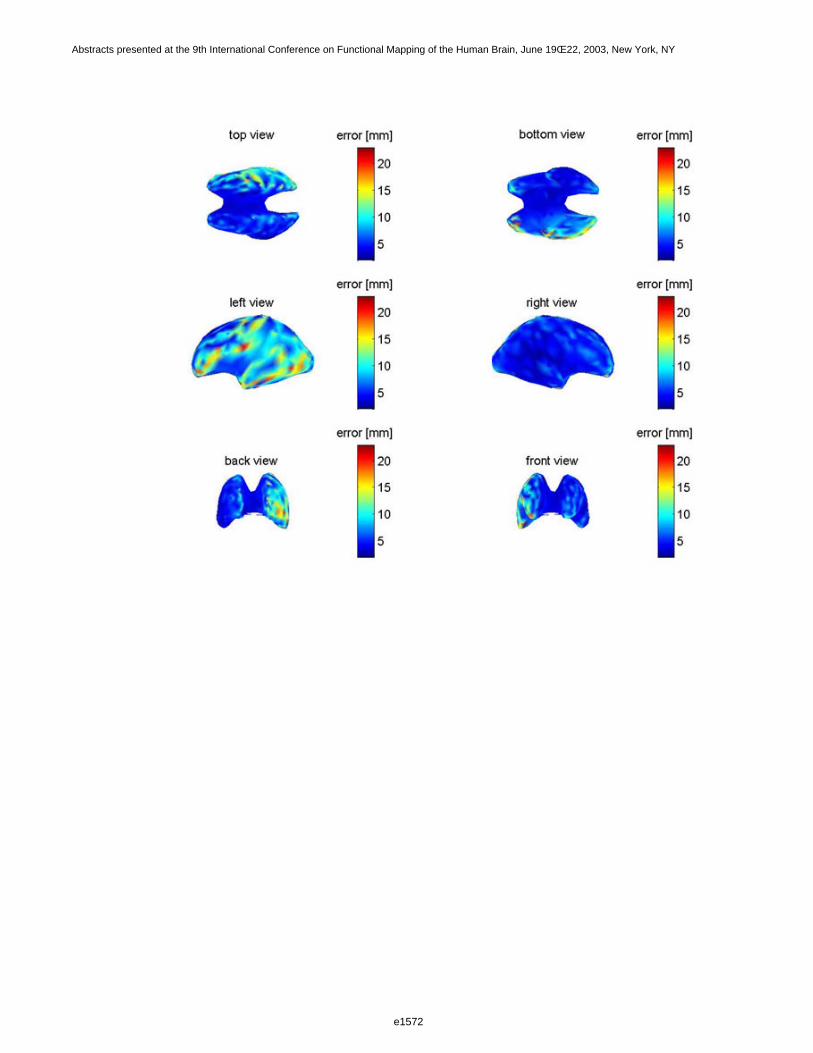
e1572
Abstracts presented at the 9th International Conference on Functional Mapping of the Human Brain, June 19Œ22, 2003, New York, NY
e1572
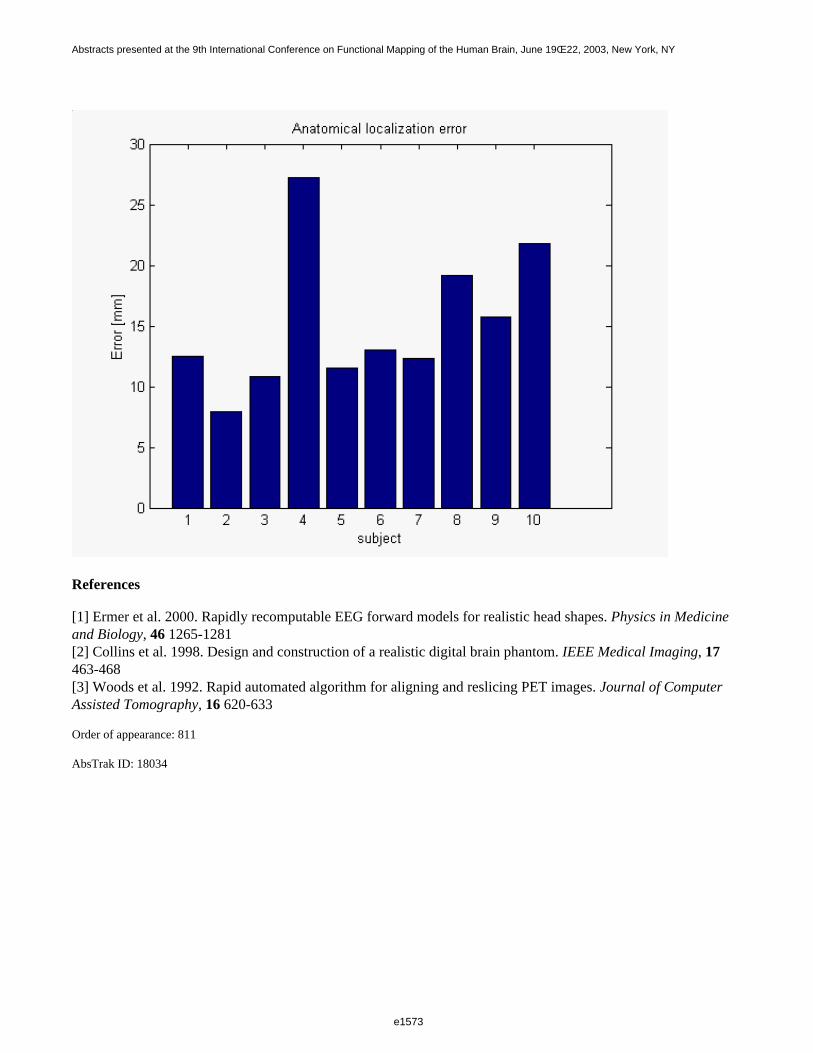
References
[1] Ermer et al. 2000. Rapidly recomputable EEG forward models for realistic head shapes. Physics in Medicineand Biology, 46 1265-1281[2] Collins et al. 1998. Design and construction of a realistic digital brain phantom. IEEE Medical Imaging, 17 463-468[3] Woods et al. 1992. Rapid automated algorithm for aligning and reslicing PET images. Journal of ComputerAssisted Tomography, 16 620-633
Order of appearance: 811
AbsTrak ID: 18034
e1573
Abstracts presented at the 9th International Conference on Functional Mapping of the Human Brain, June 19Œ22, 2003, New York, NY
e1573
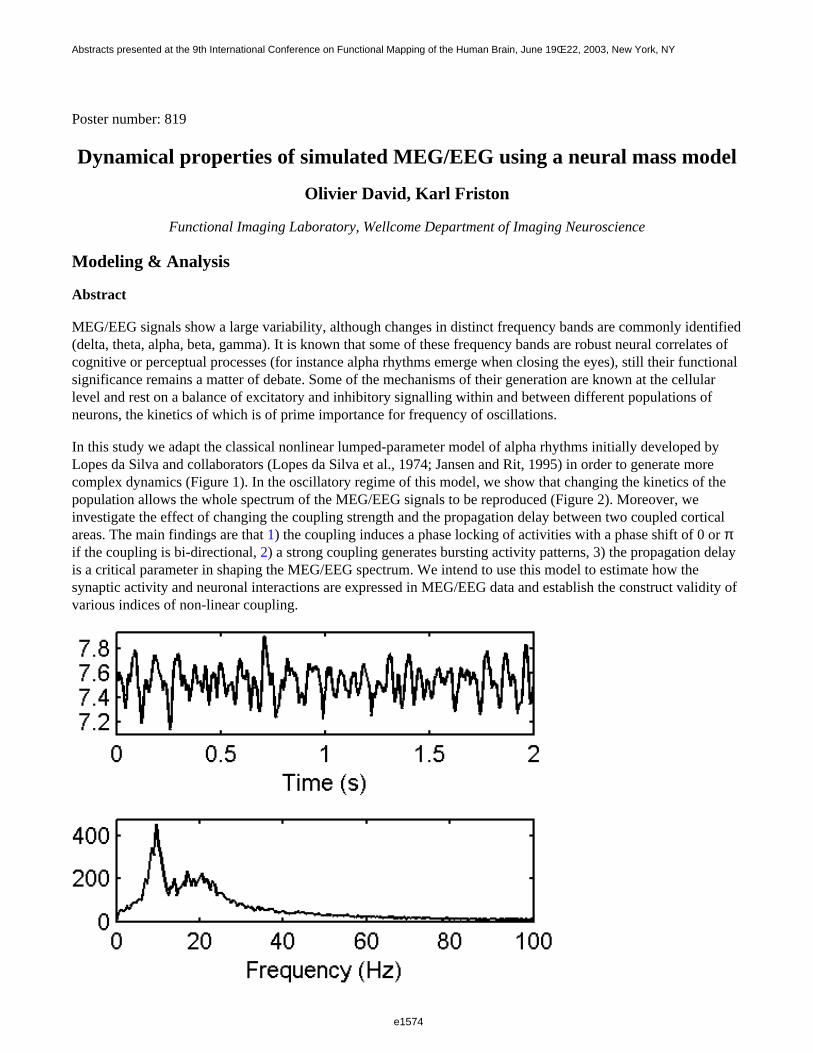
Poster number: 819
Dynamical properties of simulated MEG/EEG using a neural mass model
Olivier David, Karl Friston
Functional Imaging Laboratory, Wellcome Department of Imaging Neuroscience
Modeling & Analysis
Abstract
MEG/EEG signals show a large variability, although changes in distinct frequency bands are commonly identified(delta, theta, alpha, beta, gamma). It is known that some of these frequency bands are robust neural correlates ofcognitive or perceptual processes (for instance alpha rhythms emerge when closing the eyes), still their functionalsignificance remains a matter of debate. Some of the mechanisms of their generation are known at the cellularlevel and rest on a balance of excitatory and inhibitory signalling within and between different populations ofneurons, the kinetics of which is of prime importance for frequency of oscillations.
In this study we adapt the classical nonlinear lumped-parameter model of alpha rhythms initially developed byLopes da Silva and collaborators (Lopes da Silva et al., 1974; Jansen and Rit, 1995) in order to generate morecomplex dynamics (Figure 1). In the oscillatory regime of this model, we show that changing the kinetics of thepopulation allows the whole spectrum of the MEG/EEG signals to be reproduced (Figure 2). Moreover, weinvestigate the effect of changing the coupling strength and the propagation delay between two coupled corticalareas. The main findings are that 1) the coupling induces a phase locking of activities with a phase shift of 0 or πif the coupling is bi-directional, 2) a strong coupling generates bursting activity patterns, 3) the propagation delayis a critical parameter in shaping the MEG/EEG spectrum. We intend to use this model to estimate how thesynaptic activity and neuronal interactions are expressed in MEG/EEG data and establish the construct validity ofvarious indices of non-linear coupling.
e1574
Abstracts presented at the 9th International Conference on Functional Mapping of the Human Brain, June 19Œ22, 2003, New York, NY
e1574
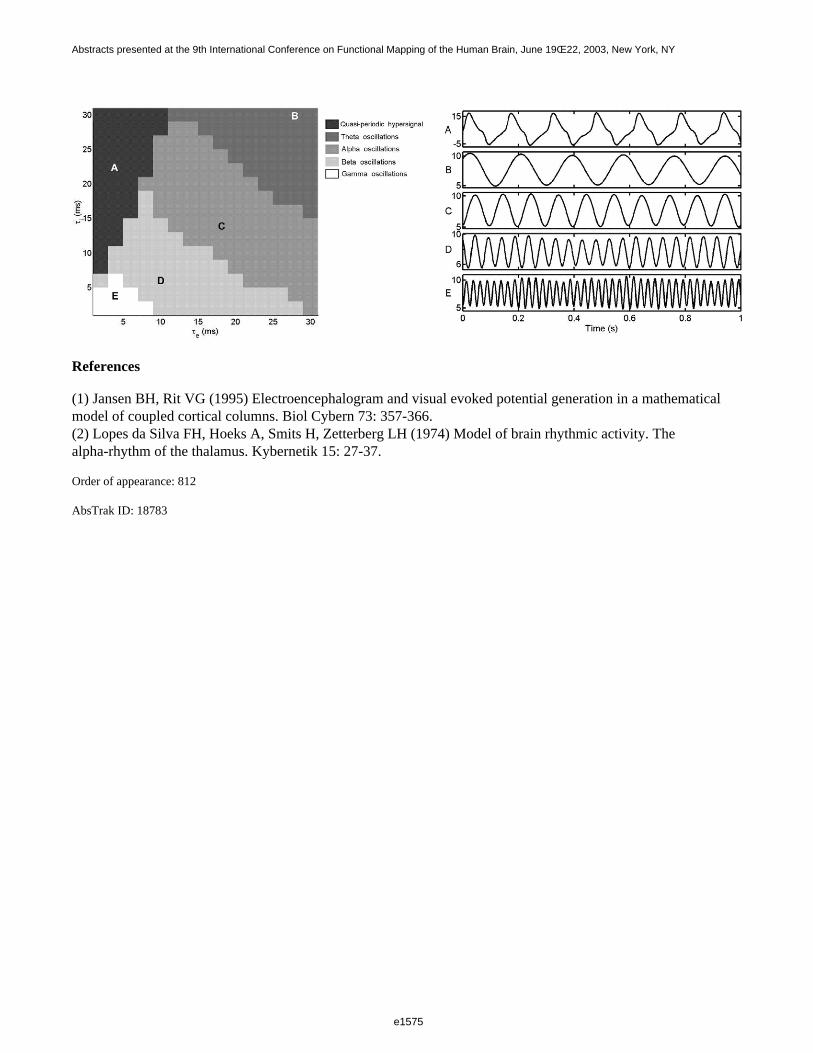
References
(1) Jansen BH, Rit VG (1995) Electroencephalogram and visual evoked potential generation in a mathematicalmodel of coupled cortical columns. Biol Cybern 73: 357-366.(2) Lopes da Silva FH, Hoeks A, Smits H, Zetterberg LH (1974) Model of brain rhythmic activity. Thealpha-rhythm of the thalamus. Kybernetik 15: 27-37.
Order of appearance: 812
AbsTrak ID: 18783
e1575
Abstracts presented at the 9th International Conference on Functional Mapping of the Human Brain, June 19Œ22, 2003, New York, NY
e1575
Poster number: 820
A Non-parametric Statistics Approach for fMRI Data Analysis
Patrick A. De Mazière, Marc M. Van Hulle
Laboratorium voor Neuro- & Psychofysiologie, Medical School, Campus Gasthuisberg, K.U.Leuven, B-3000Leuven, Belgium
Modeling & Analysis
Abstract
Introduction
The nature of the signal distribution of functional Magnetic Resonance Imaging (fMRI) data is subject todiscussion: many state it is Gaussian, some claim it is only slightly non-Gaussian [6, 1], while others state that thedistribution is Gamma-like [5]. In combination with studies exploring the nonlinearity of fMRI time series [4], thenon-parametric approach becomes favourable over the Gaussian one for performing fMRI analyses. Moreover,using the non-parametric approach, some filtering operations performed to obtain a Gaussian distribution, can beomitted leaving the signal space as original as possible while maintaining the validity of the analysis.
Implementation
Previously, there were reservations concerning non-parametric statistics, since these do not take into account, e.g.,multiple comparisons as revealed in [1], or serial correlations (autocorrelations). We propose a non-parametricstatistical analysis which resolves these issues by adopting the Cramér-von Mises test which is slightly morerobust than the Kolmogorov-Smirnov (KS) one. First, we show that autocorrelations within time series, whichshould be corrected for when using a General Linear Model (GLM) [7], do not influence KS-like statistics: theirresulting statistical values are based on the empirical signal distribution function (EDF), which is in fact apermuted (shuffled) version of the original time series. It can be proven mathematically that shuffling destroystemporal correlations within the data. The test yields statistical p-values that are not biased by autocorrelations.Second, multiple comparisons are dealt with by applying the False Discovery Rate [3], which corrects for thedependencies between p-values.
Using non-parametric statistics, one no longer makes assumptions regarding linearity. However, the absence of aGeneral Linear Model complicates the necessary correction for the hemodynamic response. This issue is resolvedby discarding the transitional scans or by using a technique based on Markov chains [2].
Finally, after application of the proposed statistical procedures, a simple clustering algorithm is applied whichguarantees that the detected active voxels are spatially grouped in a consistent manner. Given the simple layout ofthe algorithm and its implementation in C, we obtained a method which preforms a full one-run analysis in lessthan 2.5 minutes on a 1.2 GHz PC.
References
[1] G.K. Aguirre, E. Zarahn, and M. D’Esposito. Magnetic Resonance Medicine, 39(3):500-505, 1998.[2] B. Thirion and O. Faugeras. In IEEE Workshop on Mathematical Methods in Biomedical Image Analysis,pages 121-130, 2001.[3] Y. Benjamini and D. Yekutieli. The American Statistician, 29(4), 2001.[4] T. Gautama, D.P. Mandic, and M.M. Van Hulle. IEEE Transaction on Medical Imaging, in press, 2002.[5] S.J. Hanson and B.M. Bly. Neuroreport, 12(9):1971-1977, 2001.[6] A.P. Holmes, R.C. Blair, J.D.G. Watson, and I. Ford. Journal of Cerebral Blood Flow and Metabolism,
e1576
Abstracts presented at the 9th International Conference on Functional Mapping of the Human Brain, June 19Œ22, 2003, New York, NY
e1576

16(1):7-22, 1996.[7] J.L. Marchini and S.M. Smith. Neuroimage, 18:83-90, 2003.
Order of appearance: 813
AbsTrak ID: 17519
e1577
Abstracts presented at the 9th International Conference on Functional Mapping of the Human Brain, June 19Œ22, 2003, New York, NY
e1577

Poster number: 821
A mathematical description of habituation effects in multi channelMEG/EEG data
Jan C De Munck*†, Fetsje Bijma*, Rob M Heethaar*
*MEG Center of the Vrije Universiteit Medical Center, Dept. PMT†
Modeling & Analysis
Abstract
When a stimulus is presented to a subject, the brain produces a magnetic (MEG) and an electric (EEG) response,which may vary from trial to trial and which is embedded in spatially and temporally correlated noise. In order toestimate the brain response from the recorded MEG or EEG data, a mathematical model has to be formulateddescribing the trial to trial variability and the statistics of the noise.
Here it is assumed that the brain response is α (k) Qij , where k is the trial, i is the channel, and j is the time sample.
The background noise ε (k)ij is assumed to have a Gaussian distribution with a spatio-temporal covariance
that is independent of trial, and that is a Kronecker product of a spatial covariance matrix X and a temporalcovariance matrix T. Then the recorded data is modeled as
The ML estimates of Qij and α (k) can be found by setting the derivatives of the ML-function to zero. The basic
brain response is found to be a weighted average over the single trial data:
and the weights are the elements of the eigenvector with the largest eigenvalue of the following system:
The covariances X and T can be estimated from [1]
By applying equation (3) and the solution of (4) in iteration, ML estimates of the model presented in (1) can be computed.
e1578
Abstracts presented at the 9th International Conference on Functional Mapping of the Human Brain, June 19Œ22, 2003, New York, NY
e1578
The presented model was applied on the magnetic responses of the median nerve stimulation (MNS) and on a dataset containing epileptic spikes of similar spatio-temporal patterns, but of varying polarities. In the MNS data, nosystematic trial to trial variations were found (10 data sets) and it appeared that the temporal covariance is verystationary, indicating that no other trial to trial variations in the single trial data are to be expected. In the spikedata set the different polarities and strength were nicely extracted, and the temporal covariance was also found tobe stationary, when the trial to trial variations were accounted for.
The model presented here is useful to treat multi-spike MEG/EEG data in an integrated way, without the problemof a reduced SNR caused be cancelling spikes in a simple averaging procedure. Furthermore, this analysisdemonstrates that systematic trial to trial variations cannot be demonstrated in simple MNS data sets. The samemethod will be applied on data sets containing higher order cognitive data processes, because in those data setsthe simple constant response model is claimed to be incorrect [2].
References
[1] J.C. de Munck et al. (2002), Estimating stationary dipoles from MEG/EEG data contaminated with spatiallyand temporally correlated background noise, IEEE Trans Sign. Proc. Vol 50(7):1565-1572.[2] S. Makeig et al. (2002) Dynamic brain sources of visual evoked responses. Science 295:690-694.
Order of appearance: 814
AbsTrak ID: 18351
e1579
Abstracts presented at the 9th International Conference on Functional Mapping of the Human Brain, June 19Œ22, 2003, New York, NY
e1579
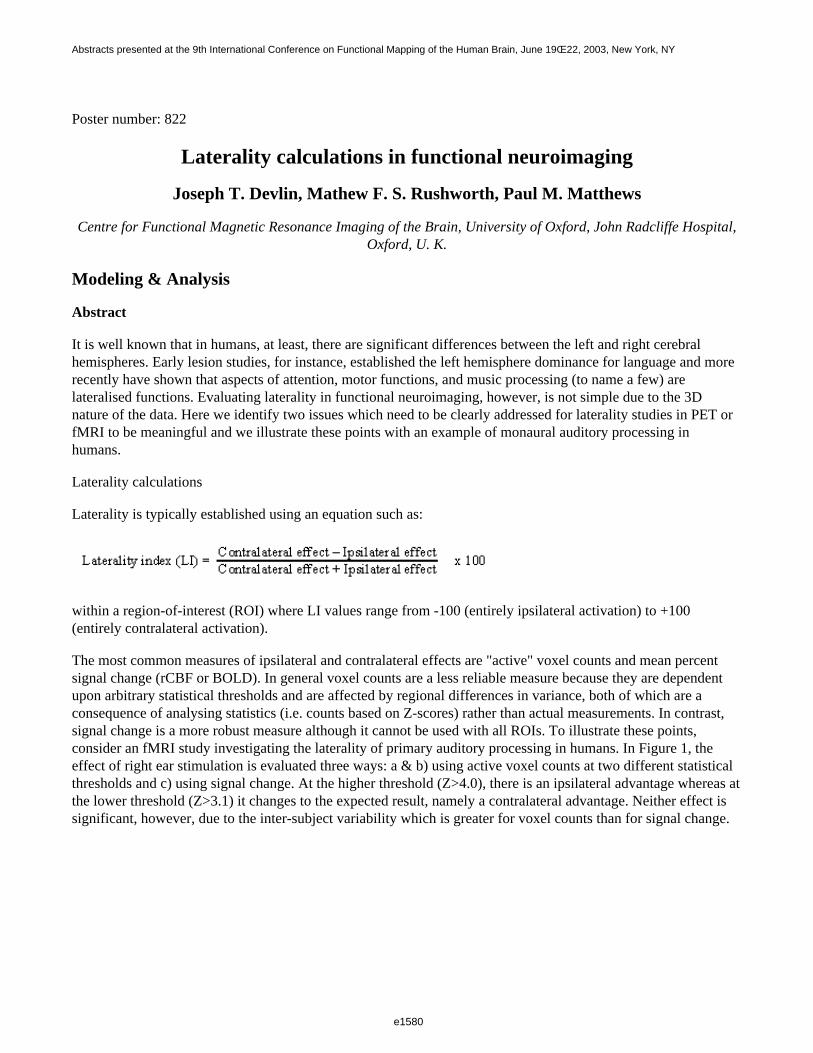
Poster number: 822
Laterality calculations in functional neuroimaging
Joseph T. Devlin, Mathew F. S. Rushworth, Paul M. Matthews
Centre for Functional Magnetic Resonance Imaging of the Brain, University of Oxford, John Radcliffe Hospital,Oxford, U. K.
Modeling & Analysis
Abstract
It is well known that in humans, at least, there are significant differences between the left and right cerebralhemispheres. Early lesion studies, for instance, established the left hemisphere dominance for language and morerecently have shown that aspects of attention, motor functions, and music processing (to name a few) arelateralised functions. Evaluating laterality in functional neuroimaging, however, is not simple due to the 3Dnature of the data. Here we identify two issues which need to be clearly addressed for laterality studies in PET orfMRI to be meaningful and we illustrate these points with an example of monaural auditory processing in humans.
Laterality calculations
Laterality is typically established using an equation such as:
within a region-of-interest (ROI) where LI values range from -100 (entirely ipsilateral activation) to +100(entirely contralateral activation).
The most common measures of ipsilateral and contralateral effects are "active" voxel counts and mean percentsignal change (rCBF or BOLD). In general voxel counts are a less reliable measure because they are dependentupon arbitrary statistical thresholds and are affected by regional differences in variance, both of which are aconsequence of analysing statistics (i.e. counts based on Z-scores) rather than actual measurements. In contrast,signal change is a more robust measure although it cannot be used with all ROIs. To illustrate these points,consider an fMRI study investigating the laterality of primary auditory processing in humans. In Figure 1, theeffect of right ear stimulation is evaluated three ways: a & b) using active voxel counts at two different statisticalthresholds and c) using signal change. At the higher threshold (Z>4.0), there is an ipsilateral advantage whereas atthe lower threshold (Z>3.1) it changes to the expected result, namely a contralateral advantage. Neither effect issignificant, however, due to the inter-subject variability which is greater for voxel counts than for signal change.
e1580
Abstracts presented at the 9th International Conference on Functional Mapping of the Human Brain, June 19Œ22, 2003, New York, NY
e1580
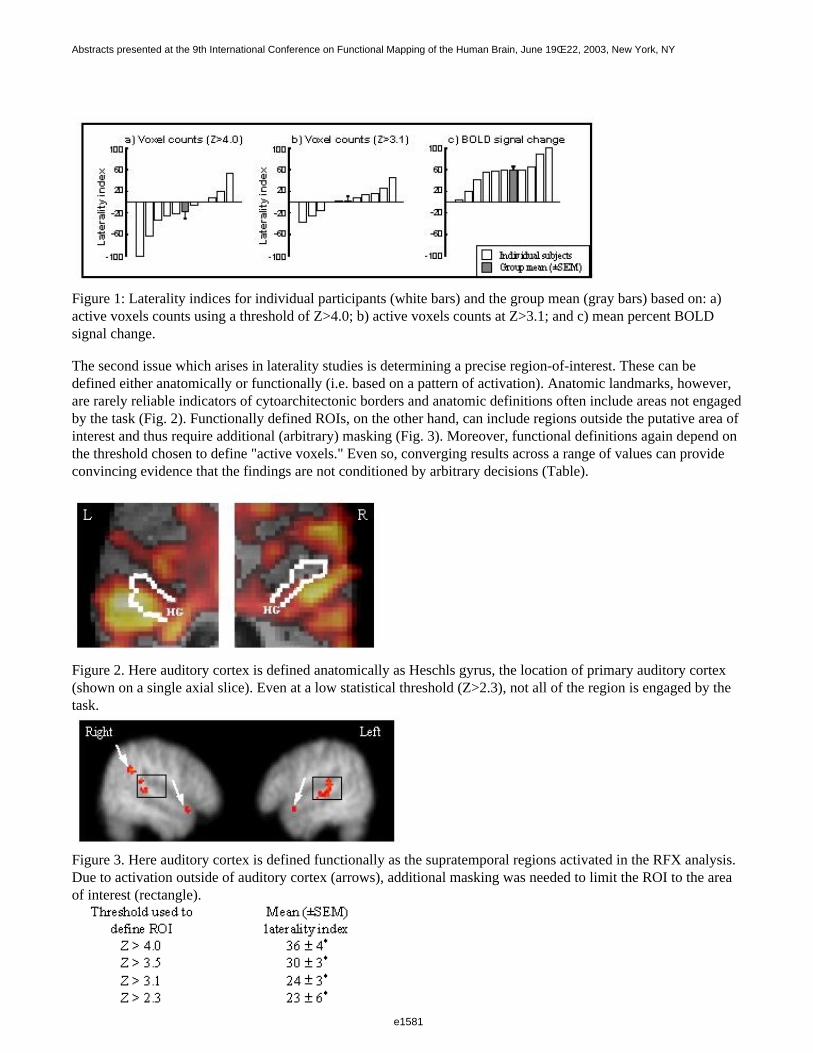
Figure 1: Laterality indices for individual participants (white bars) and the group mean (gray bars) based on: a)active voxels counts using a threshold of Z>4.0; b) active voxels counts at Z>3.1; and c) mean percent BOLDsignal change.
The second issue which arises in laterality studies is determining a precise region-of-interest. These can bedefined either anatomically or functionally (i.e. based on a pattern of activation). Anatomic landmarks, however,are rarely reliable indicators of cytoarchitectonic borders and anatomic definitions often include areas not engagedby the task (Fig. 2). Functionally defined ROIs, on the other hand, can include regions outside the putative area ofinterest and thus require additional (arbitrary) masking (Fig. 3). Moreover, functional definitions again depend onthe threshold chosen to define "active voxels." Even so, converging results across a range of values can provideconvincing evidence that the findings are not conditioned by arbitrary decisions (Table).
Figure 2. Here auditory cortex is defined anatomically as Heschls gyrus, the location of primary auditory cortex(shown on a single axial slice). Even at a low statistical threshold (Z>2.3), not all of the region is engaged by the task.
Figure 3. Here auditory cortex is defined functionally as the supratemporal regions activated in the RFX analysis.Due to activation outside of auditory cortex (arrows), additional masking was needed to limit the ROI to the areaof interest (rectangle).
e1581
Abstracts presented at the 9th International Conference on Functional Mapping of the Human Brain, June 19Œ22, 2003, New York, NY
e1581

Table: Laterality indices for right ear stimulation for functionally defined auditory cortices. Note that there is asignificant contralateral dominance across a range of functionally defined ROIs. * indicates p< 0.001.
In summary, laterality calculations in functional neuroimaging depend on decisions concerning the effect sizemeasure and the region-of-interest which can strongly bias the results. In some cases, the question beingaddressed partially constrains these choices but additional arbitrary decisions may remain. It is only when thesechoices are made clear and the effects of the decisions can be shown not to influence the overall findings thatfunctional neuroimaging can provide meaningful laterality results.
Order of appearance: 815
AbsTrak ID: 17632
e1582
Abstracts presented at the 9th International Conference on Functional Mapping of the Human Brain, June 19Œ22, 2003, New York, NY
e1582
Poster number: 823
Network Structures of Functional Connectivity from fMRI
Silke Dodel*†, Michael Herrmann†, Theo Geisel†, Jean-Baptiste Poline*
*SHFJ/CEA, 4 Pl General Leclerc, 91406 Orsay, France†MPI fuer Stroemungsforschung, Bunsenstrasse 10, 37073 Goettingen, Germany
Modeling & Analysis
Abstract
Functional connectivity between brain regions affects cross-correlations of fMRI time series. In this contributionwe derive a graph theoretical approach to functional connectivity which is based on correlation matrices. Ourapproach allows to analyze functional connectivity structures in detail without referring to a predefined region ofinterest or the use of a seed voxel. It involves the analysis of the global correlational structure among voxels, aswell as the specification of functional units, i.e. functionally connected areas, using criteria based on localproperties of the correlational structure. Further, an extended graph theoretical concept is used to analyze thestructure of temporal relations between functional units.
The basic idea of our approach is to consider the voxels of an image as the vertices of a graph and the temporalcorrelation matrix of their time courses as the weight matrix of the edges between the vertices. For zero temporaldelay the correlation matrix is symmetric and the corresponding graph is undirected. An unweighted graph can beextracted from the weighted graph by deleting all edges that have weights below a certain threshold. Globalproperties of the so extracted graph cast light on the correlational structure of the data and the thresholddependencies thereof can be used to define an optimal threshold for graph extraction. We analyze various globalgraph properties as criteria for optimal threshold definition.
Subgraphs reflect local properties of the extracted graph and can be identified with functionally connected units.There are two subgraph definitions which represent the two extremes of edge connectivity: cliques (maximalall-to-all connected subgraphs) and connectivity components (maximal connected subgraphs). Both definitionslead to meaningful functional units in the sense that they can be identified with known structures in real data.Their different properties, however, result in a tradeoff between homogeneity and separability of the functionalunits. We use the concept of edge-connectivity to interpolate between the two definitions to find an optimumfunctional unit definition maximizing structure resolution and separability simultaneously.
Delayed correlation matrices can be used to identify delayed, i.e. possibly causal, functional connectivity. Sincedelayed correlation matrices in general are not symmetric, the corresponding weighted graphs are directed. Toanalyze delayed functional connectivity while preserving the previously defined functional units we use theconcept of hypergraphs where the functional units form the hypervertices and the hyperedges are the multipledirected edges between the voxels of each pair of functional units. The weights of the hyperedges are taken fromthe delayed correlation matrices. Thresholding results in a network structure which can be used as a basis for largescale modeling of brain function.
Applying the method described above to fMRI data we detected functional units reflecting identifyable influencesonto the data. Furthermore, applying the hypergraph approach we found central functional units the activity ofwhich consistently preceded the activity of the functional units they were connected to (cf. Figure (e)). Thepresented method is not constrained to fMRI data but can be used in other imaging modalities such as EEG orMEG as well.
e1583
Abstracts presented at the 9th International Conference on Functional Mapping of the Human Brain, June 19Œ22, 2003, New York, NY
e1583
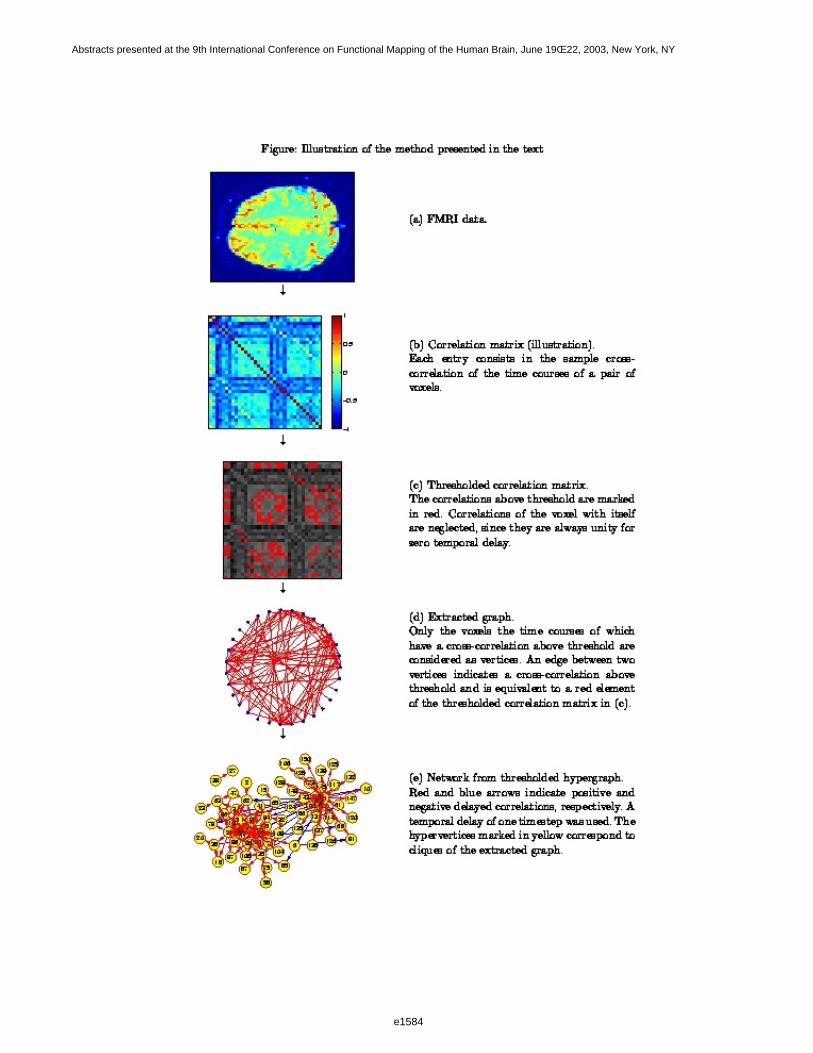
e1584
Abstracts presented at the 9th International Conference on Functional Mapping of the Human Brain, June 19Œ22, 2003, New York, NY
e1584

Order of appearance: 816
AbsTrak ID: 18327
e1585
Abstracts presented at the 9th International Conference on Functional Mapping of the Human Brain, June 19Œ22, 2003, New York, NY
e1585
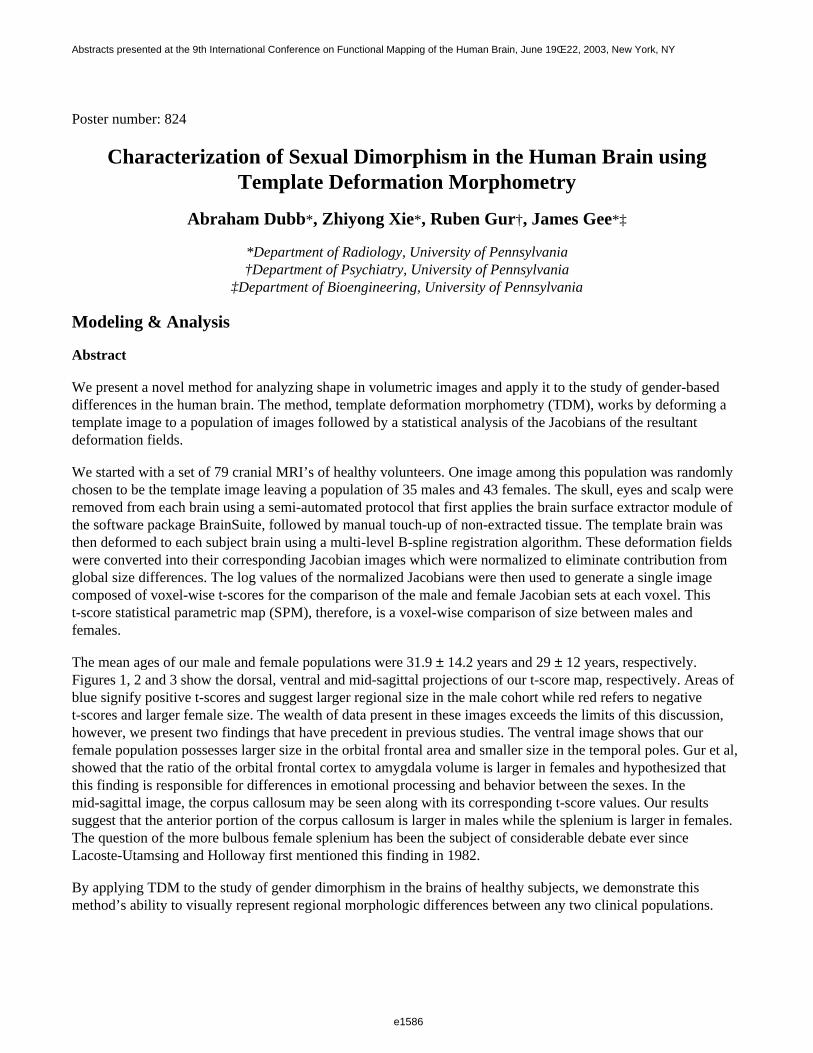
Poster number: 824
Characterization of Sexual Dimorphism in the Human Brain usingTemplate Deformation Morphometry
Abraham Dubb*, Zhiyong Xie*, Ruben Gur†, James Gee*‡
*Department of Radiology, University of Pennsylvania†Department of Psychiatry, University of Pennsylvania
‡Department of Bioengineering, University of Pennsylvania
Modeling & Analysis
Abstract
We present a novel method for analyzing shape in volumetric images and apply it to the study of gender-baseddifferences in the human brain. The method, template deformation morphometry (TDM), works by deforming atemplate image to a population of images followed by a statistical analysis of the Jacobians of the resultantdeformation fields.
We started with a set of 79 cranial MRI’s of healthy volunteers. One image among this population was randomlychosen to be the template image leaving a population of 35 males and 43 females. The skull, eyes and scalp wereremoved from each brain using a semi-automated protocol that first applies the brain surface extractor module ofthe software package BrainSuite, followed by manual touch-up of non-extracted tissue. The template brain wasthen deformed to each subject brain using a multi-level B-spline registration algorithm. These deformation fieldswere converted into their corresponding Jacobian images which were normalized to eliminate contribution fromglobal size differences. The log values of the normalized Jacobians were then used to generate a single imagecomposed of voxel-wise t-scores for the comparison of the male and female Jacobian sets at each voxel. Thist-score statistical parametric map (SPM), therefore, is a voxel-wise comparison of size between males and females.
The mean ages of our male and female populations were 31.9 ± 14.2 years and 29 ± 12 years, respectively.Figures 1, 2 and 3 show the dorsal, ventral and mid-sagittal projections of our t-score map, respectively. Areas ofblue signify positive t-scores and suggest larger regional size in the male cohort while red refers to negativet-scores and larger female size. The wealth of data present in these images exceeds the limits of this discussion,however, we present two findings that have precedent in previous studies. The ventral image shows that ourfemale population possesses larger size in the orbital frontal area and smaller size in the temporal poles. Gur et al,showed that the ratio of the orbital frontal cortex to amygdala volume is larger in females and hypothesized thatthis finding is responsible for differences in emotional processing and behavior between the sexes. In themid-sagittal image, the corpus callosum may be seen along with its corresponding t-score values. Our resultssuggest that the anterior portion of the corpus callosum is larger in males while the splenium is larger in females.The question of the more bulbous female splenium has been the subject of considerable debate ever sinceLacoste-Utamsing and Holloway first mentioned this finding in 1982.
By applying TDM to the study of gender dimorphism in the brains of healthy subjects, we demonstrate thismethod’s ability to visually represent regional morphologic differences between any two clinical populations.
e1586
Abstracts presented at the 9th International Conference on Functional Mapping of the Human Brain, June 19Œ22, 2003, New York, NY
e1586
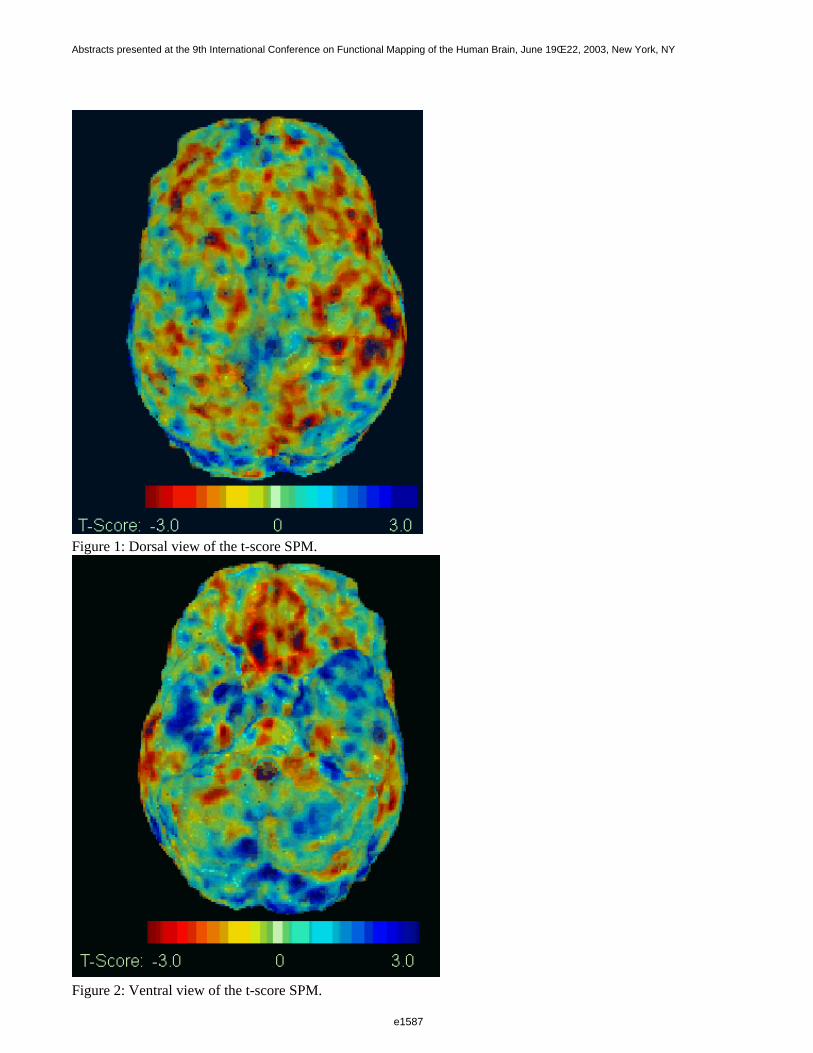
Figure 1: Dorsal view of the t-score SPM.
Figure 2: Ventral view of the t-score SPM.
e1587
Abstracts presented at the 9th International Conference on Functional Mapping of the Human Brain, June 19Œ22, 2003, New York, NY
e1587
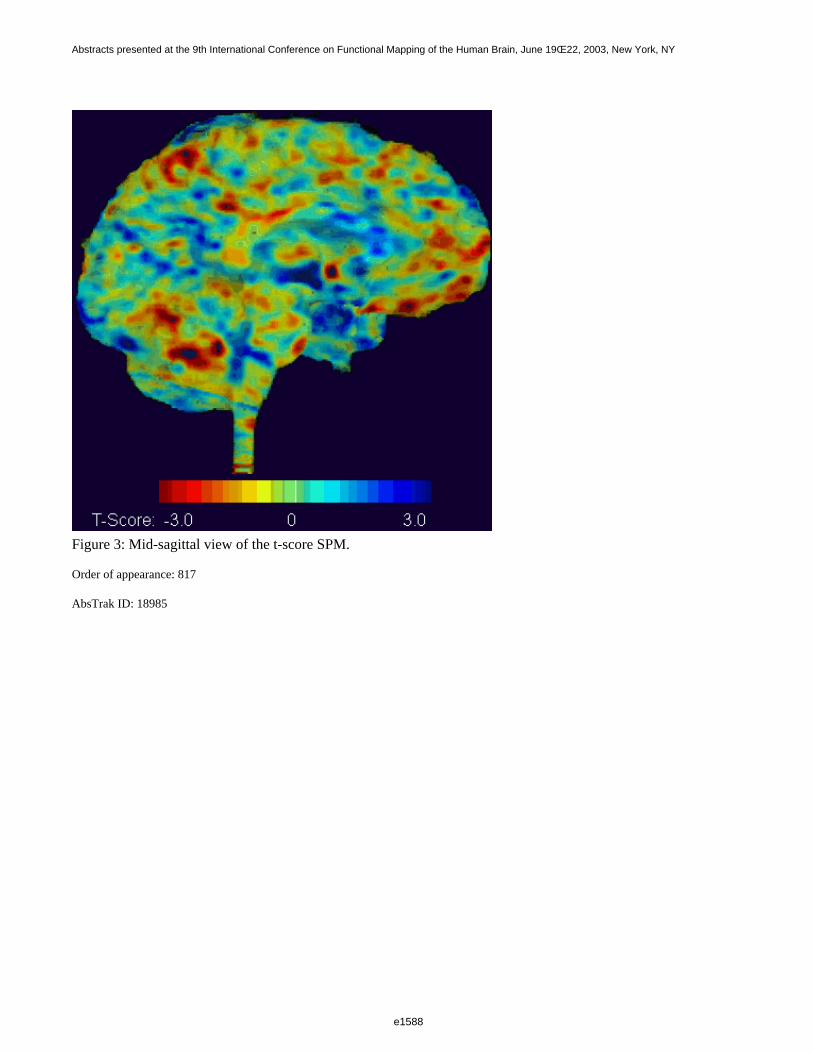
Figure 3: Mid-sagittal view of the t-score SPM.
Order of appearance: 817
AbsTrak ID: 18985
e1588
Abstracts presented at the 9th International Conference on Functional Mapping of the Human Brain, June 19Œ22, 2003, New York, NY
e1588
Poster number: 825
MRI-based FEM analysis for NIRS and EEG/MEG
Hideo Eda*, Norio Fujimaki†, Toshio Yanagida*‡
*Yanagida Brain Dynamism Research Group, KARC, CRL†Brain Function Group, KARC, CRL
‡Osaka University Graduate School of Medicine
Modeling & Analysis
Abstract
Several non-invasive measurement methods have been used for brain research. They are electroencephalography(EEG), magnetoencephalography (MEG), functional magnetic resonance imaging (fMRI), and near infraredspectroscopic imaging (NIRS). EEG and MEG measure the electrical activity of the brain, while fMRI and NIRSmeasure the hemodynamic response. Since each system has advantages and disadvantages, it is desirable to use acombination of these methods and is desirable to integrate the analysis of these data for investigatingspatiotemporal activities of the higher brain functions. For use of the integrative analysis, we developed anMRI-based Finite Element Method (FEM) system. It can simulate NIRS, EEG, and MEG signals for givenparameters of brain activation. The signal of NIRS is simulated by solving the diffusion equation for the analysisof light propagation in the brain. The signal of EEG is simulated by solving Maxwell• fs equations for the analysisof electrical potentials produced in the brain. And the signal of MEG is simulated by solving Maxwell• fsequations for the analysis of magnetic fields produced in the brain. Our 3D FEM system consists of apre-processor, three solvers, and a post-processor. The pre-processor imports MRI structural images. Then itsegments the regions of different materials such as scalp, skull, CSF, gray matter, and white matter. After thesegmentation, each region is divided into sections for each of which we input parameters of brain activation.Finally it generates cubic meshes in them. In the pre-processor we used cubic meshes instead of adaptive meshes,which simplify computational efforts of the solvers. The first solver calculates the scalar optical intensities forNIRS using Neumann boundary condition for both steady and non steady states. The input parameters required bythe first solver are two optical properties, absorption and reduced scattering, and reflective index normally set asthe same as water. The positions of illuminating and detecting optical fibers attached on the scalp are alsorequired. The second solver calculates scalar electric potentials for EEG, and the third solver calculates vectormagnetic fields for MEG, respectively. The input parameters of both solvers are electrical conductivities for eachsection, locations and moments of the current dipoles in the gray matter of the brain, and the positions of sensors.For the second solver the positions of EEG electrodes are on the scalp. For the third solver the positions of MEGsensors are outside the scalp. The electric potentials are produced only by the current dipoles. But the magneticfields are produced both by the current dipoles and by the accompanying volume currents around the dipoles. Thepost-processor displays the calculation results of these solvers. We can also display fMRI activation if we inputT2 star data into the post-processor. All the system works on the WindowsXP. We checked correct calculation bycomparing the results based on a four layers sphere model. It was demonstrated that the system enabled alarge-scale (over 500,000 voxels) analysis and enabled automatic mesh generation of complicated object, such ashuman heads.
Order of appearance: 818
AbsTrak ID: 18958
e1589
Abstracts presented at the 9th International Conference on Functional Mapping of the Human Brain, June 19Œ22, 2003, New York, NY
e1589
Poster number: 826
Analysis of brain activity as a massively interconnected dynamical network
Victor M Eguiluz†, Marwan Baliki‡, Guillermo Cechi*, Dante R Chialvo‡, A Vania Apkarian‡
*IBM, Yorktown Heights, NY 10589, USA†Instituto Mediterraneo de Estudios Avanzados IMEDEA (CSIC-UIB), E07071 Palma de Mallorca, Spain
‡Northwestern University, Chicago, Illinois, 60611, USA
Modeling & Analysis
Abstract
Standard analysis of network properties of fMRI tends to be a two step process: First brain regions involved in atask are determined using a general linear model analysis relating brain activity to the timings of taskpresentation. The inter-relationship between the identified regions are then analyzed based on theircross-covariance matrix, with or without considering underlying anatomy – resulting in ‘effective’ or ‘functional’network properties, where behavioral measures can also be taken into consideration. Biswal et al. (’95)demonstrated that fMRI is able to show correlated activity across remote areas of the brain in a ‘rest state’, i.e. inthe absence of an obvious task. This observation has been confirmed by others and further extended by showingthat such correlated networks are T2* dependent, similar to BOLD fMRI signal implying that it is based onneuronal activity. Recently it was shown that rest-state correlated networks can be detected in standard EPI longTR scans (Arfanakis et al. 2000). Here we extend functional connectivity analysis of fMRI by studyingconnectivity across all brain voxels. We contend that the evolution of this fully connected network in time and inrelation to behavioral states should provide a new spatial-temporal window regarding information processing bythe brain. In a typical fMRI data set, a single brain volume is comprised of 30,000 – 60,000 voxels. The fullcovariance matrix of this system has 25x108 connection pairs. We analyze information flow and topology of thismassively connected network as it evolves in time and with behavior.
Preliminary analysis of the full covariance matrix of the brain was done on fMRI data collected in rest-state and ina continuous finger moving task, on a 3 T Siemens Trio (TR = 2500, data acquired for 500 TRs). The connectionstrengths showed an approximate Gaussian distribution, but with a larger tail. Obtained networks were binarized(0/1 connected or not) by applying various cut-off thresholds. Histograms of connectivity for varioustime-windows, thresholds, and rest or active states, all were consistent with 1/f distributions, implying scaleinvariance. The hubs were identified as the nodes with the largest number of connections. Their locations in thebrain were determined as a function of threshold and state, and showed clear differences between behavioralstates. Changes in topology a. Changes in topology and in information flow remain to be determined in these data.
With this novel approach in analyzing fMRI, we explore the brain as a massively connected network, and test itsability to identify central nodes (hubs) and characterize global brain-states directly, in a manner that does notrequire a stimulus-driven paradigm.
Funded by NIH NINDS 35115
Order of appearance: 819
e1590
Abstracts presented at the 9th International Conference on Functional Mapping of the Human Brain, June 19Œ22, 2003, New York, NY
e1590

AbsTrak ID: 18833
e1591
Abstracts presented at the 9th International Conference on Functional Mapping of the Human Brain, June 19Œ22, 2003, New York, NY
e1591
Poster number: 827
-Dipole Source localisation in a realistically shaped tank withcommercially available head-nets
Louise Enfield, David S. Holder
*
Modeling & Analysis
Abstract
Introduction
For inverse source modelling of the EEG, it is preferable to have 64 or more electrodes; it is not practicable tomanually place this many conventional EEG electrodes. Several commercial headnet designs are available, butcould theoretically introduce measurement errors. The purpose of this experiment was to compare the accuracy offour different headnets/electrode arrangements using a saline filled realistic head model and an inverse sourcemodelling program.
Method and Materials.
A model of a human head was constructed using a human skull, with the scalp simulated from sodium alginate4mm thick, and skin from the skin of the vegetable Cucurbita pepo conv. Giromontina (Giant zucchini ormarrow). The skull was filled with 0.2% saline to simulate the brain. Up to 3 electrical sources, in edge or deeppositions, were produced using two balls made with Teflon coated silver wire, with independent current sourcesadjusted to give EEG amplitudes of about 50 uV with edge sources. EEG was recorded from 21 electrodes in thestandard 10:20 positions with current injected at 10 or 70 Hz. Inverse source modelling was performed usingAdvanced Source analysis (ASA, ANT software) and a BEM derived from a CT of the model. Localisationaccuracy was compared with 4 headnets -EEG cup electrodes, Geodesic net (EGI, Eugene, Oregon) with spongeor gel contacts, and the hydrogel based Physiometrix Hydrodot headnet, without skin abrasion.
Results-
A single dipole was located with an accuracy of 13±4 mm at the edge and 28±7 mm near the centre. Similarresults for 3 dipoles were 39±11 or 29±11 at the edge or centre, and 41±12 for 2 mm edge and 1 centre. There wasno significant difference in the localisation accuracy between headnets, using three way analysis of variance (p=0.073, Table 1), nor between frequencies (p=0.373).
e1592
Abstracts presented at the 9th International Conference on Functional Mapping of the Human Brain, June 19Œ22, 2003, New York, NY
e1592
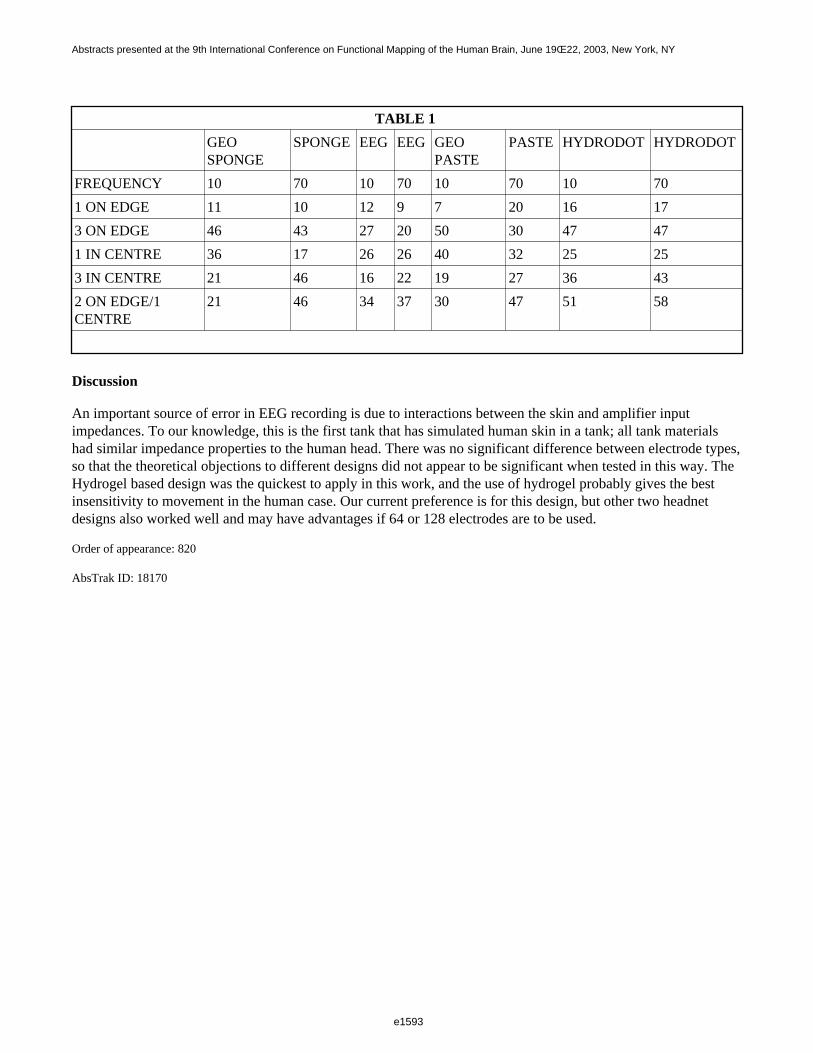
TABLE 1
GEO SPONGE
SPONGE EEG EEG GEO PASTE
PASTE HYDRODOT HYDRODOT
FREQUENCY 10 70 10 70 10 70 10 70
1 ON EDGE 11 10 12 9 7 20 16 17
3 ON EDGE 46 43 27 20 50 30 47 47
1 IN CENTRE 36 17 26 26 40 32 25 25
3 IN CENTRE 21 46 16 22 19 27 36 43
2 ON EDGE/1 CENTRE
21 46 34 37 30 47 51 58
Discussion
An important source of error in EEG recording is due to interactions between the skin and amplifier inputimpedances. To our knowledge, this is the first tank that has simulated human skin in a tank; all tank materialshad similar impedance properties to the human head. There was no significant difference between electrode types,so that the theoretical objections to different designs did not appear to be significant when tested in this way. TheHydrogel based design was the quickest to apply in this work, and the use of hydrogel probably gives the bestinsensitivity to movement in the human case. Our current preference is for this design, but other two headnetdesigns also worked well and may have advantages if 64 or 128 electrodes are to be used.
Order of appearance: 820
AbsTrak ID: 18170
e1593
Abstracts presented at the 9th International Conference on Functional Mapping of the Human Brain, June 19Œ22, 2003, New York, NY
e1593
Poster number: 828
MEG-fMRI Source Localization in One Single Software Environment
Sergio N Erné*, Hans-Peter Müller*†, Massimo Demelis*, Alberto Pasquarelli*, Eduard Kraft‡, Albert Ludolph‡, Jan Kassubek‡
*Division for Biosignals and Imaging Technologies, ZIBMT, University of Ulm, Germany†Department of Neurology, University of Ulm, Germany
Modeling & Analysis
Abstract
Introduction
The neuroimaging techniques magnetoencephalography (MEG) and functional Magnetic Resonance Imaging(fMRI) non-invasively map functional regions of the human brain. MEG localizes the sources of intracellularelectric currents, providing direct information of neural activity with high temporal resolution in the range ofmilliseconds. FMRI measures the changes in blood oxygenation with high spatial accuracy in localizing activatedregions but restricted temporal resolution. To pursue synergetic interactions between these two recordingmodalities, it is essential to analyze the data sets in one single software environment.
Method
The integrated bimodal imaging analysis was performed using the OMEGA (Open Magnetic and Electric GraphicAnalysis) software [1]. The subjects performed the identical stimulation paradigm both during MEG (55-channelmagnetometer system, AtB, Italy) and fMRI (1.5 T, Siemens, Germany) measurements. As the activationparadigm, a simple motor task (self-paced flexion of right index finger) was chosen. In the first step, thelocalization sources of MEG and fMRI experiments were processed within the OMEGA software. Then fMRI andMEG results were superimposed on the same individual 3-dimensional MRI (MP-RAGE), acquired during thefMRI session. Thus, the integration of the morphological data for fMRI and MEG analysis was performed byOMEGA: MRI data used as morphological background for fMRI results are also processed to build volumeconductor models needed in MEG source reconstruction. The fMRI analysis provides the information as possiblesites of sources, whereas MEG data complement the corresponding time course of the activation.
Results
In all subjects investigated so far, the center of activation both in MEG and in fMRI was localized in theprecentral M1 area. Localization results between the two modalities differed only slightly. MEG results wereobtained in two steps (single dipole localization and stability test with multiple dipoles as a control analysis) andproved to be highly reproducible.
Conclusion:
With OMEGA, the clinical researcher is able to gain comprehensive information about the localization offunctional activation from different neuroimaging modalities. Data processing and presentation of the results areperformed in one single software frame, thus facilitating comparison and combination of aspects of multimodal investigations.
e1594
Abstracts presented at the 9th International Conference on Functional Mapping of the Human Brain, June 19Œ22, 2003, New York, NY
e1594

References
[1] S.N. Erné, M. Demelis, A. Pasquarelli, A. Ludolph, H.-P. Müller, J. Kassubek. 2002, MEG-fMRI MultimodalImaging in One Single Software Environment. Proc. Biomag 2002, Jena, Germany, 872-874.
Order of appearance: 821
AbsTrak ID: 17731
e1595
Abstracts presented at the 9th International Conference on Functional Mapping of the Human Brain, June 19Œ22, 2003, New York, NY
e1595
Poster number: 829
Information theoretic modeling and removal of artifacts from EEGrecordings during fMR imaging
Luca A. Finelli*†, Tzyy-Ping Jung*†, Jeng-Ren Duann*†, Frank Haist‡, Scott Makeig*†,Terrence J. Sejnowski*†§
*Computational Neurobiology Laboratory, The Salk Institute, La Jolla, California†Swartz Center for Computational Neuroscience, Institute for Neural Computation, University of California San
Diego, San Diego, California‡Department of Neurosciences, University of California San Diego, San Diego, California
§The Howard Hughes Medical Institute
Modeling & Analysis
Abstract
Introduction
Simultaneous recording of EEG and fMRI combines the exquisite time resolution of the former with fMRI, thecurrent gold standard for studying the functional neuroanatomy of brain function. Yet the acquisition of weakelectric signals in an environment distinguished by strong magnetic fields is problematical and entails thetechnical challenge to remove EEG artifacts that may completely obscure signals of physiological relevance. Asnew scanners with higher static fields (3T, 4T, non-human primates 7T) are becoming available, the ability toidentify and remove such artifacts is becoming increasingly important. Based on principles of information theory,a method is demonstrated for modeling and removing artifacts arising from the main static magnetic field,including pulse artifacts, the gradient system and possibly other interacting sources.
Method
High-density EEG and electrooculogram (70+2 leads) data of six healthy subjects were recorded continuouslyprior to and during EPI scanning by a MR compatible polygraphic amplifier with timeout circuits synchronized toshut down signal acquisition briefly during scanner pulses (SA Instruments, San Diego). In 3 subjects theelectrodes were referenced to the right mastoid, whereas in the other 3 data were acquired from bipolarderivations, using either twisted or untwisted pairs. Ten axial slices were acquired using an EPI protocol (matrix =64 x 64 x 10; FOV = 256 x 256 mm; slice thickness = 7 mm) in a 1.5-T Siemens Vision MRI scanner. Theexperiment design consisted of 4-5 successive 6-min bouts with different cognitive tasks. 120-130 volumes perbout were acquired for each volunteer. Data from each bout were analyzed separately. The EEG was decomposedinto spatially fixed, temporally independent components with distinct but not orthogonal topographies. The EEGdata and the resulting independent components were analyzed with statistical and signal processing methodsincluding spectral, time-frequency analyses, and event-related ’ERP images’.
Results
Compared to other references, twisted bipolar pairs attenuated the effects of MR-induced currents. Severalindependent components from each individual data decomposition identified signal sources of distinct artifactualnature. These differed between subjects and could be classified according to their origin. The identified pulseartifact components were analyzed in more detail. Data were divided into 1-s epochs centered around the pulsatilepeak of the component with highest amplitude and were then averaged as heartbeat-related responses. Thespatiotemporal dynamics of their averaged, back-projected sum, when visualized using short scalp-map movies,revealed a pattern moving rapidly across the scalp sensors.
e1596
Abstracts presented at the 9th International Conference on Functional Mapping of the Human Brain, June 19Œ22, 2003, New York, NY
e1596

Discussion
Independent component analysis was able to separate the EEG acquired in the magnet into components withcharacteristic time courses accounting for distinct sources of signal and noise. In particular, identification andback-projection of the pulse-related components allowed detailed modeling of their summed spatio-temporaldynamics. The method is not affected by complex beat-to-beat variations, and can model those as well. Inaddition, it does not require acquisition of electrocardiographic reference signals, and uses principles ofinformation theory to obtain detailed spatio-temporal characteristics of the different artifacts, an approach thatmay help to understand their complex nature.
Order of appearance: 822
AbsTrak ID: 18617
e1597
Abstracts presented at the 9th International Conference on Functional Mapping of the Human Brain, June 19Œ22, 2003, New York, NY
e1597
Poster number: 830
Sequence-independent segmentation of MRI images
Bruce Fischl*†, André van der Kouwe*, Evelina Busa*, Brian T. Quinn*, Anders M. Dale*†
*ATHINOULA A.MARTINOS CENTER, Mass. General Hospital, Harvard Medical School, Charlestown, MA†MIT AI Lab, Cambridge, MA
Modeling & Analysis
Abstract
Introduction.
Techniques for automated quantification of morphometric properties of the brain using Magnetic ResonanceImaging (MRI) data frequently produce results whose accuracy degrades when the MRI acquisition parametersdiffer from those for which the algorithm was optimized. This is obviously undesirable, particularly in a clinicalsetting in which scan parameters may not be easily modified. In order to reduce the dependence of our existingwhole-brain segmentation [1] on the details of the MR acquisition, we present a technique for embedding theBloch equations [2] into the segmentation, resulting in procedure that is largely insensitive to changes in the MRIpulse parameters.
Methods
Our segmentation procedure computes the maximum a posteriori (MAP) estimate of the segmentation W and anatlas function f, given a set of MR images I:
(1) p(W,f|I)≈p(I|W,f)p(W|f)p(f)
In order to reduce the dependence on pulse parameters α=[TR,TE,&thetas;]T , we embed information about therelationship between the image intensities I, the MR pulse parameters α and the intrinsic tissue properties β (T1and proton density P) into p(I|W,f) factoring it as follows:
(2) p(I|W,f)=p(I(α)|β)p(β|W,f)
The intrinsic tissue parameters β
can be estimated using MR relaxometry techniques from standard FLASH images [3]. The probability ofobserving the image given the tissue parameters (p(I(α)|β) in Equation (2)) is estimated using a forward model forimage formation based on the Bloch equations [2]. The term p(β|W,f) is computed from manually labeled FLASHimages for which the tissue parameters have been estimated via:
(3) β=argmax p(I|β)=argmin(I-S(α,β))T (I-S(α,β))
where we have assumed identically distributed unit-variance Gaussian noise in the image intensities, and S is thesolution to the steady state Bloch equations given by:
(4) S(α,β)=P sin&thetas;exp(-TE/T2)(1-exp(-TR/T1))(1-cos&thetas;exp(-TR/T1)) -1
e1598
Abstracts presented at the 9th International Conference on Functional Mapping of the Human Brain, June 19Œ22, 2003, New York, NY
e1598
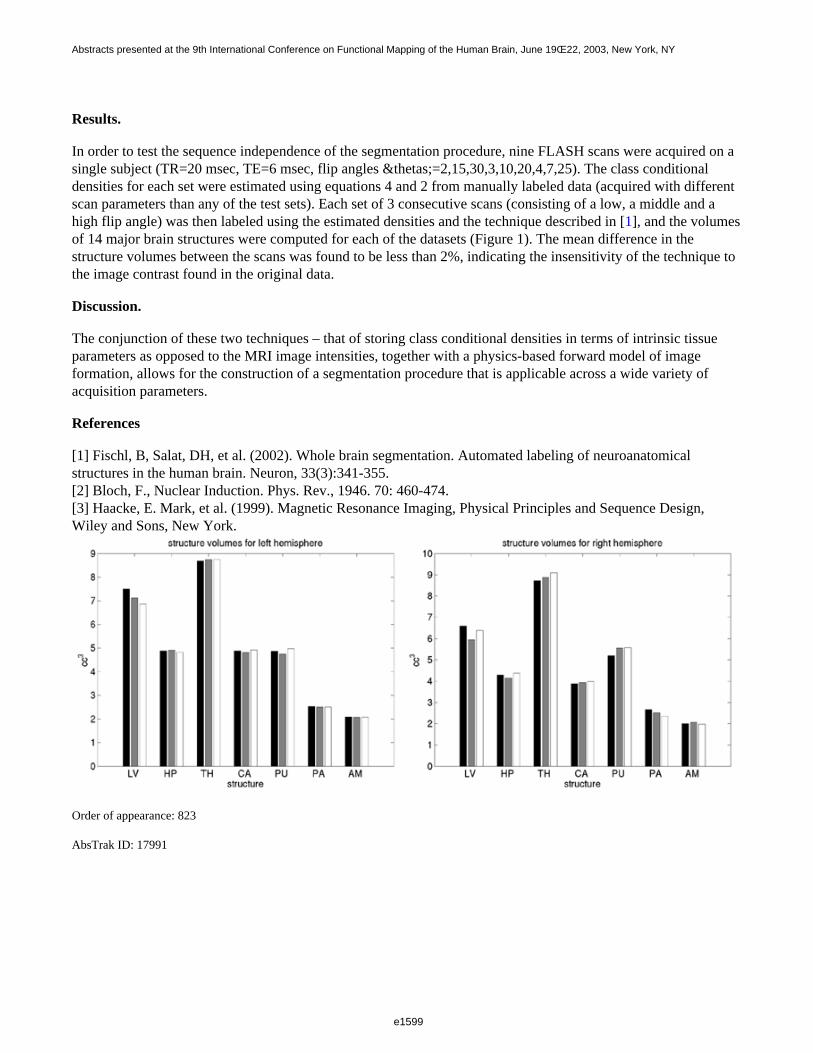
Results.
In order to test the sequence independence of the segmentation procedure, nine FLASH scans were acquired on asingle subject (TR=20 msec, TE=6 msec, flip angles &thetas;=2,15,30,3,10,20,4,7,25). The class conditionaldensities for each set were estimated using equations 4 and 2 from manually labeled data (acquired with differentscan parameters than any of the test sets). Each set of 3 consecutive scans (consisting of a low, a middle and ahigh flip angle) was then labeled using the estimated densities and the technique described in [1], and the volumesof 14 major brain structures were computed for each of the datasets (Figure 1). The mean difference in thestructure volumes between the scans was found to be less than 2%, indicating the insensitivity of the technique tothe image contrast found in the original data.
Discussion.
The conjunction of these two techniques – that of storing class conditional densities in terms of intrinsic tissueparameters as opposed to the MRI image intensities, together with a physics-based forward model of imageformation, allows for the construction of a segmentation procedure that is applicable across a wide variety ofacquisition parameters.
References
[1] Fischl, B, Salat, DH, et al. (2002). Whole brain segmentation. Automated labeling of neuroanatomicalstructures in the human brain. Neuron, 33(3):341-355.[2] Bloch, F., Nuclear Induction. Phys. Rev., 1946. 70: 460-474.[3] Haacke, E. Mark, et al. (1999). Magnetic Resonance Imaging, Physical Principles and Sequence Design,Wiley and Sons, New York.
Order of appearance: 823
AbsTrak ID: 17991
e1599
Abstracts presented at the 9th International Conference on Functional Mapping of the Human Brain, June 19Œ22, 2003, New York, NY
e1599
Poster number: 831
A multisubject anatomo-functional parcellation of the brain
Guillaume Flandin*‡§, Will Penny†, Xavier Pennec*, Nicholas Ayache *, Jean-Baptiste Poline‡§
*Projet Epidaure, INRIA Sophia Antipolis, France†Wellcome Department of Imaging NeuroScience, University College London, UK
‡Service Hospitalier Frédéric Joliot, CEA, Orsay, France§IFR 49, Institut d’Imagerie Neurofonctionnelle, Paris, France
Modeling & Analysis
Abstract
Most fMRI experiments involve data from several subjects that are analysed to yield inference about a population(random or fixed-effect analyses). Results then reflect averaged patterns of activation (temporally and spatially)across subjects. Such analyses are performed on coregistered images in a standard space and spatial smoothing isused to increase the signal overlap between subjects in the averaged images. This procedure, however, mayinduce losses in sensitivity and in spatial localisation. In this work, we seek a method that could partiallyovercome these limitations. We use a spatial and temporal clustering of resembling voxels where the positions ofclusters may vary across subjects.
Clustering algorithms [1] are exploratory techniques that have been generally applied to fMRI data on singlesubjects to look for clusters of voxels with similar time series but without spatial constraints. In the following, ouraim is to represent fMRI data as a group of clusters, where two functional voxels belong to the same cluster ifthey have 1/ a similar functional value and 2/ a similar position, among the subjects of an fMRI experiment. Thiscan be seen as a multisubject spatio-temporal extension of our previous work on brain anatomical parcellation [2].
Clustering algorithms can be formulated in a probabilistic framework via the use of mixture models. For example,K-means and fuzzy C-means are special cases of Gaussian mixture models (GMM). An important aspect of ourwork is that we reduce the feature space in clustering the voxel-wise estimated regression coefficients (the beta’s,denoted b) obtained from a Generalized Linear Model [4]. To add spatial priors we model the joint density overthe regression coefficients b and voxel positions v (in Talairach space) as a GMM:
p(b i , v i ) = Σk G(b i , v i | k) p(k)
where G denotes a multivariate normal distribution. Furthermore, to lower the number of parameters, we considerequal diagonal covariance matrices which act as a regularisation. The model parameters are estimated using anExpectation-Maximisation (EM) algorithm. If we consider the problem as space-time separable then we connectearlier work on spatio-temporal clustering [3]. After a Maximum a Posteriori step where each voxel is assigned tothe cluster with highest posterior probability, we obtain a partition of the brain for each subject with homologousclusters among subjects. Here the number of clusters k is generally high (several hundreds). Thus the exactnumber is not critical but its order of magnitude gives the scale of the parcellation sought. We illustrate withresults from both simulated and real fMRI data.
As it stands, this multisubject parcellation of the brain may be used for many applications, including activationdetection. For this last purpose, it would be embedded in a two-stage algorithm, where the second step wouldconsist in the merging of neighbouring clusters which share similar archetypal functional values.
e1600
Abstracts presented at the 9th International Conference on Functional Mapping of the Human Brain, June 19Œ22, 2003, New York, NY
e1600

References
[1] C. Goutte et al, Neuroimage 1999.[2] G. Flandin et al, MICCAI 2002.[3] W. Penny et al, IEEE TMI 2003.[4] K. Friston et al, HBM 1996.
Order of appearance: 824
AbsTrak ID: 17693
e1601
Abstracts presented at the 9th International Conference on Functional Mapping of the Human Brain, June 19Œ22, 2003, New York, NY
e1601
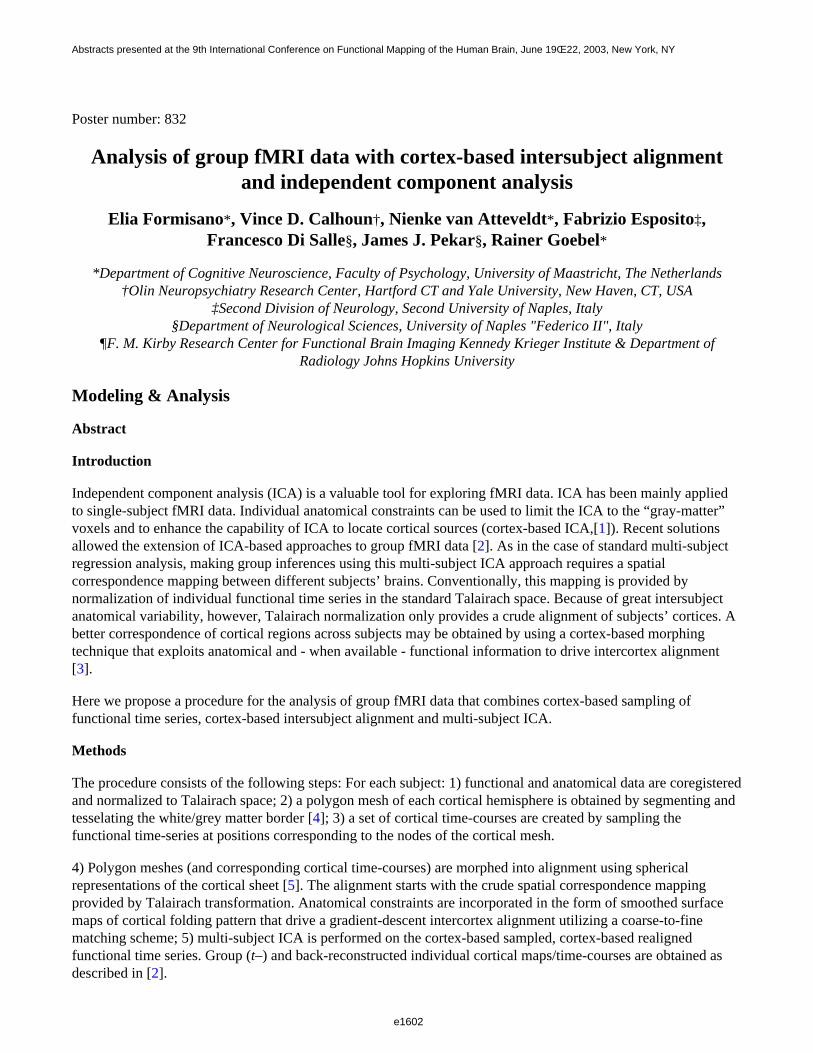
Poster number: 832
Analysis of group fMRI data with cortex-based intersubject alignmentand independent component analysis
Elia Formisano*, Vince D. Calhoun†, Nienke van Atteveldt*, Fabrizio Esposito‡,Francesco Di Salle§, James J. Pekar§, Rainer Goebel*
*Department of Cognitive Neuroscience, Faculty of Psychology, University of Maastricht, The Netherlands†Olin Neuropsychiatry Research Center, Hartford CT and Yale University, New Haven, CT, USA
‡Second Division of Neurology, Second University of Naples, Italy§Department of Neurological Sciences, University of Naples "Federico II", Italy
¶F. M. Kirby Research Center for Functional Brain Imaging Kennedy Krieger Institute & Department ofRadiology Johns Hopkins University
Modeling & Analysis
Abstract
Introduction
Independent component analysis (ICA) is a valuable tool for exploring fMRI data. ICA has been mainly appliedto single-subject fMRI data. Individual anatomical constraints can be used to limit the ICA to the “gray-matter”voxels and to enhance the capability of ICA to locate cortical sources (cortex-based ICA,[1]). Recent solutionsallowed the extension of ICA-based approaches to group fMRI data [2]. As in the case of standard multi-subjectregression analysis, making group inferences using this multi-subject ICA approach requires a spatialcorrespondence mapping between different subjects’ brains. Conventionally, this mapping is provided bynormalization of individual functional time series in the standard Talairach space. Because of great intersubjectanatomical variability, however, Talairach normalization only provides a crude alignment of subjects’ cortices. Abetter correspondence of cortical regions across subjects may be obtained by using a cortex-based morphingtechnique that exploits anatomical and - when available - functional information to drive intercortex alignment [3].
Here we propose a procedure for the analysis of group fMRI data that combines cortex-based sampling offunctional time series, cortex-based intersubject alignment and multi-subject ICA.
Methods
The procedure consists of the following steps: For each subject: 1) functional and anatomical data are coregisteredand normalized to Talairach space; 2) a polygon mesh of each cortical hemisphere is obtained by segmenting andtesselating the white/grey matter border [4]; 3) a set of cortical time-courses are created by sampling thefunctional time-series at positions corresponding to the nodes of the cortical mesh.
4) Polygon meshes (and corresponding cortical time-courses) are morphed into alignment using sphericalrepresentations of the cortical sheet [5]. The alignment starts with the crude spatial correspondence mappingprovided by Talairach transformation. Anatomical constraints are incorporated in the form of smoothed surfacemaps of cortical folding pattern that drive a gradient-descent intercortex alignment utilizing a coarse-to-finematching scheme; 5) multi-subject ICA is performed on the cortex-based sampled, cortex-based realignedfunctional time series. Group (t–) and back-reconstructed individual cortical maps/time-courses are obtained asdescribed in [2].
e1602
Abstracts presented at the 9th International Conference on Functional Mapping of the Human Brain, June 19Œ22, 2003, New York, NY
e1602
Results and conclusions
We computed cortical group-ICA maps and back-reconstructed individual maps in a multi-subject(N=6) datasetfrom an fMRI study on cross-modal integration [6]. The stimulation protocol included blocks of unimodalauditory (phonemes), visual (graphemes) and bimodal audio-visual (phonemes-graphemes) stimulation. Groupcortical maps and averaged IC-individual time-courses (see Figure) reflected correctly the multi-subject responsein the auditory cortex to phonemes (red), in the visual cortex to graphemes (purple) and to both phonemes andgraphemes in STS/STG regions (blue). Back-reconstructed individual maps obtained with our approach presentedsmaller inter-subject spatial variability than corresponding maps obtained using conventionally-realignedtime-series. The proposed method allows a reliable detection of fMRI cortical sources that are present consistentlyin a group of subjects and generalizes the use of anatomical constraints previously employed in single-subjectICA to multi-subject ICA.
References
1) Formisano et al. (2002), Neurocomputing.2) Calhoun et al. (2001), Human Brain Mapping3) Goebel R (2002). Neuroimage (Abstract)4) Kriegeskorte N and Goebel R (2001). Neuroimage5) Fischl et al. (1999) Human Brain Mapping.6) van Atteveldt et al. (this conference)Supported by Maastricht Universiteit and NIH P41 RR15241
e1603
Abstracts presented at the 9th International Conference on Functional Mapping of the Human Brain, June 19Œ22, 2003, New York, NY
e1603
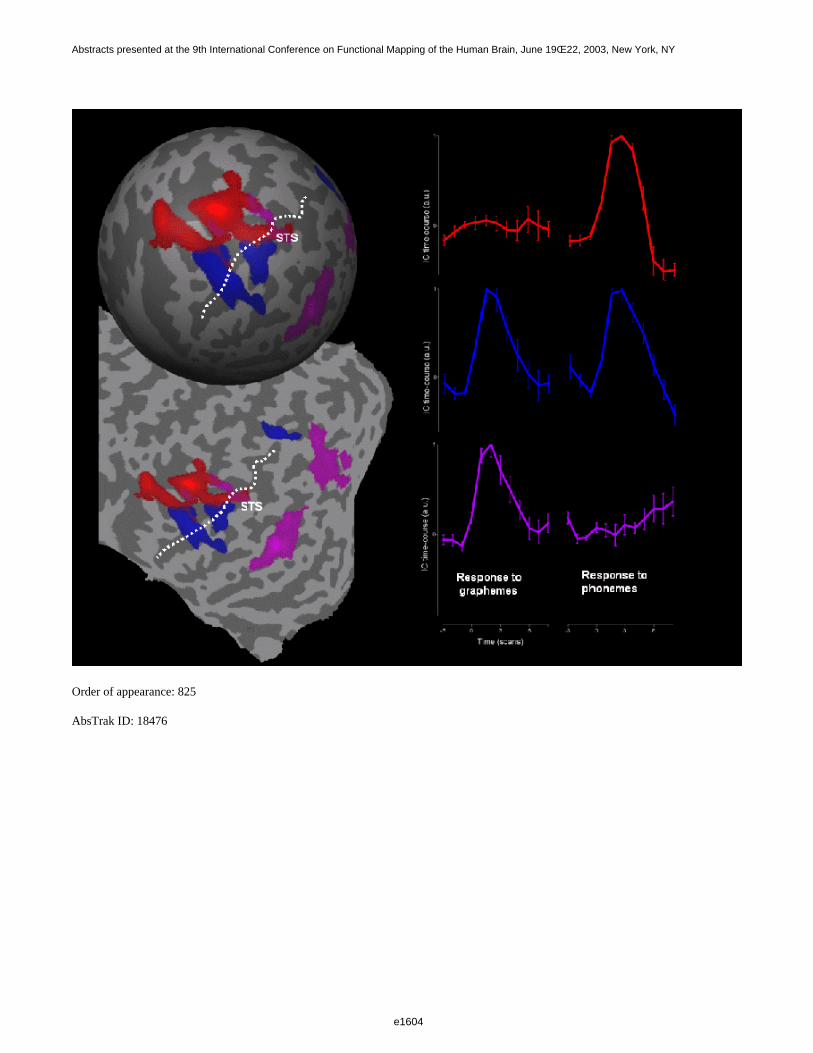
Order of appearance: 825
AbsTrak ID: 18476
e1604
Abstracts presented at the 9th International Conference on Functional Mapping of the Human Brain, June 19Œ22, 2003, New York, NY
e1604

Poster number: 833
NeuroViz - A Visualizer for the NeuroGenerator Database
Lars Forsberg
Royal Institute of Technology, Sweden
Modeling & Analysis
Abstract
Introduction
The aim in the NeuroGenerator [1] project is to generate statistical databases from PET and fMRI studies byprocessing submitted raw data in a uniform way. From these statistical databases it will be possible to compareand do meta research across experiments.
NeuroViz is a visualization tool developed by the NeuroGenerator project to be used with the database. It iswritten in C++ on a Unix system and uses GTK+ and OpenGL for GUI and graphics.
Visualize many overlays
The main feature of NeuroViz is the ability to visualize many statistical images from several experiments at thesame time and to show the overlap between these images. A conclusion may be drawn about which functionalfields these studies have in common from these overlaps. Such a conclusion requires that the clusters p-value andthe filter size are the same for all the statistical images [2]. It may also be necessary to compare with other similarexperiments from the database. The images are superimposed on a template image and a colormap is chosen foreach image and for the overlap. The number of overlays is only limited by the memory of the computer.
Volume of interest (VOI)
Defining volumes of interest is essential when quering the database for studies. The user can use cytoarchitecturalareas [2] from the database as volumes of interest. Figure 1 shows an image of area 4a overlapping an activationof a somatosensory study [3]. The 3D view gives an extra help in localizing both activations and anatomicalstructures such as sulci and gyri.
e1605
Abstracts presented at the 9th International Conference on Functional Mapping of the Human Brain, June 19Œ22, 2003, New York, NY
e1605

The user can define own volumes of interest (VOI) by either free drawing on each slice or by using some of the3D primitives provided by the tool such as box or sphere. It is also possible to create volumes from existingimages by binning them. This procedure allows the user to do simple segmentations of an anatomical image, forinstance segment the gray materia in the image. By using a boolean operator, the overlap between the VOI and thegray matter is created as a new VOI which can be used as a query to the database (figure 2).
References
[1] Roland, P., Svensson, G., Lindeberg, T., Risch, T., Baumann, P., Dehmel, A., Fredriksson, J., Halldorsson, H.,Forsberg, L., Young, J.,Zilles, K. A database generator for human brain imaging. TRENDS in Neurosciences 24(10), 562-564, 2001.[2] Roland, P. and Zilles, K. Structural divisions and functional fields in the human cerebral cortex. BrainResearch Reviews 26, 87-105, 1998.[3] Naito, E., Ehrsson, H., Geyer, S., Zilles, K., Roland, P. Illusory arm movements activate cortical motor areas:a positron emission tomography study, Journal of Neuroscience 19 (14), 6134-6144, 1999.
Order of appearance: 826
AbsTrak ID: 17495
e1606
Abstracts presented at the 9th International Conference on Functional Mapping of the Human Brain, June 19Œ22, 2003, New York, NY
e1606
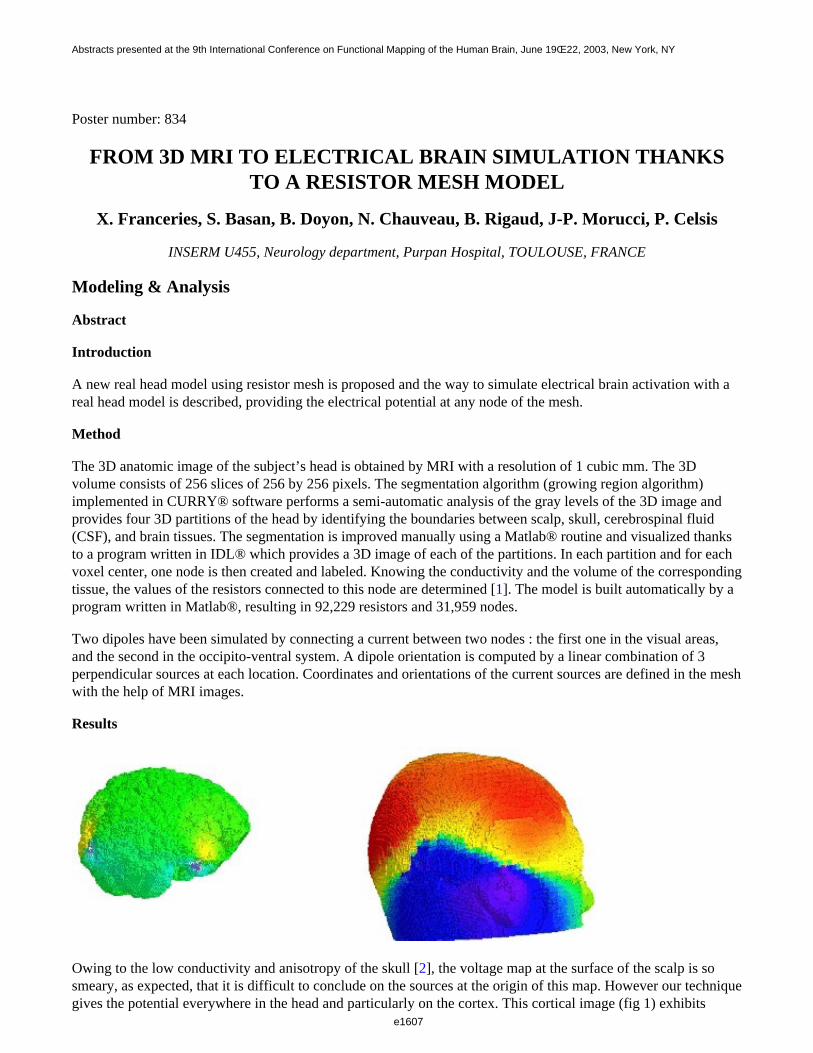
Poster number: 834
FROM 3D MRI TO ELECTRICAL BRAIN SIMULATION THANKSTO A RESISTOR MESH MODEL
X. Franceries, S. Basan, B. Doyon, N. Chauveau, B. Rigaud, J-P. Morucci, P. Celsis
INSERM U455, Neurology department, Purpan Hospital, TOULOUSE, FRANCE
Modeling & Analysis
Abstract
Introduction
A new real head model using resistor mesh is proposed and the way to simulate electrical brain activation with areal head model is described, providing the electrical potential at any node of the mesh.
Method
The 3D anatomic image of the subject’s head is obtained by MRI with a resolution of 1 cubic mm. The 3Dvolume consists of 256 slices of 256 by 256 pixels. The segmentation algorithm (growing region algorithm)implemented in CURRY® software performs a semi-automatic analysis of the gray levels of the 3D image andprovides four 3D partitions of the head by identifying the boundaries between scalp, skull, cerebrospinal fluid(CSF), and brain tissues. The segmentation is improved manually using a Matlab® routine and visualized thanksto a program written in IDL® which provides a 3D image of each of the partitions. In each partition and for eachvoxel center, one node is then created and labeled. Knowing the conductivity and the volume of the correspondingtissue, the values of the resistors connected to this node are determined [1]. The model is built automatically by aprogram written in Matlab®, resulting in 92,229 resistors and 31,959 nodes.
Two dipoles have been simulated by connecting a current between two nodes : the first one in the visual areas,and the second in the occipito-ventral system. A dipole orientation is computed by a linear combination of 3perpendicular sources at each location. Coordinates and orientations of the current sources are defined in the meshwith the help of MRI images.
Results
Owing to the low conductivity and anisotropy of the skull [2], the voltage map at the surface of the scalp is sosmeary, as expected, that it is difficult to conclude on the sources at the origin of this map. However our techniquegives the potential everywhere in the head and particularly on the cortex. This cortical image (fig 1) exhibits
e1607
Abstracts presented at the 9th International Conference on Functional Mapping of the Human Brain, June 19Œ22, 2003, New York, NY
e1607

clearly two spots that correspond to the simulated activations. The potentials resulting of the simulation are closedto those provided by BEM method using CURRY®. Moreover, our method provides potential values everywherein the mesh, and allows an original approach to the inverse problem.
Discussion
Our approach to the inverse problem starts with the potential distribution on the nodes of the scalp surface. Then,applying the Kirchhoff’s current law at each of these nodes makes it possible to obtain the potentials of the nodesin the resistor layer beneath the "scalp surface" one. Repeating this process from the scalp to deeper structures, itis possible to asses the potential distribution in the whole mesh, without constraint. Promising preliminary resultshave been obtained on simulated data, and our current works concern the application of this approach toneuropsychological studies.
References
[1] X. Franceries et al., Solution of Poisson’s equation in a volume conductor using resistor mesh models:application to event related potential imaging, Journal of Applied Physics, in press.[2] X. Franceries et al., NeuroImage Human Brain Mapping 2002 Meeting, June 2002, Sendai, Japan.
Order of appearance: 827
AbsTrak ID: 17728
e1608
Abstracts presented at the 9th International Conference on Functional Mapping of the Human Brain, June 19Œ22, 2003, New York, NY
e1608
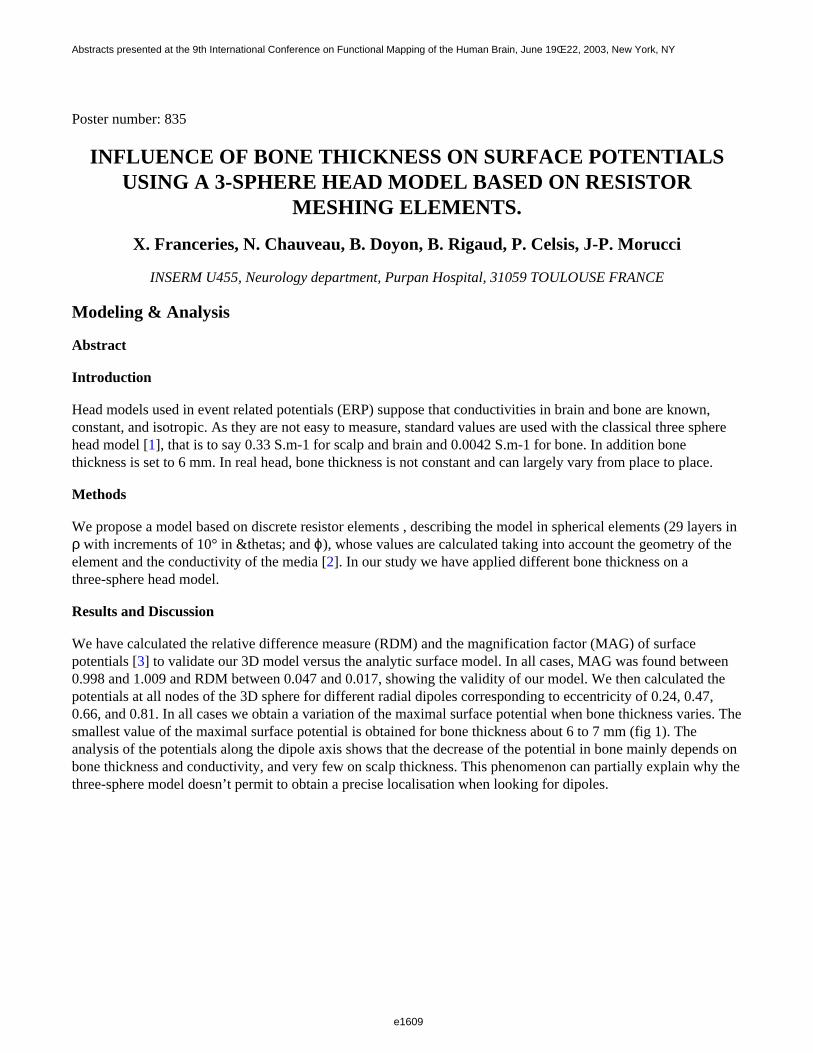
Poster number: 835
INFLUENCE OF BONE THICKNESS ON SURFACE POTENTIALSUSING A 3-SPHERE HEAD MODEL BASED ON RESISTOR
MESHING ELEMENTS.
X. Franceries, N. Chauveau, B. Doyon, B. Rigaud, P. Celsis, J-P. Morucci
INSERM U455, Neurology department, Purpan Hospital, 31059 TOULOUSE FRANCE
Modeling & Analysis
Abstract
Introduction
Head models used in event related potentials (ERP) suppose that conductivities in brain and bone are known,constant, and isotropic. As they are not easy to measure, standard values are used with the classical three spherehead model [1], that is to say 0.33 S.m-1 for scalp and brain and 0.0042 S.m-1 for bone. In addition bonethickness is set to 6 mm. In real head, bone thickness is not constant and can largely vary from place to place.
Methods
We propose a model based on discrete resistor elements , describing the model in spherical elements (29 layers in ρ with increments of 10° in &thetas; and ϕ), whose values are calculated taking into account the geometry of theelement and the conductivity of the media [2]. In our study we have applied different bone thickness on athree-sphere head model.
Results and Discussion
We have calculated the relative difference measure (RDM) and the magnification factor (MAG) of surfacepotentials [3] to validate our 3D model versus the analytic surface model. In all cases, MAG was found between0.998 and 1.009 and RDM between 0.047 and 0.017, showing the validity of our model. We then calculated thepotentials at all nodes of the 3D sphere for different radial dipoles corresponding to eccentricity of 0.24, 0.47,0.66, and 0.81. In all cases we obtain a variation of the maximal surface potential when bone thickness varies. Thesmallest value of the maximal surface potential is obtained for bone thickness about 6 to 7 mm (fig 1). Theanalysis of the potentials along the dipole axis shows that the decrease of the potential in bone mainly depends onbone thickness and conductivity, and very few on scalp thickness. This phenomenon can partially explain why thethree-sphere model doesn’t permit to obtain a precise localisation when looking for dipoles.
e1609
Abstracts presented at the 9th International Conference on Functional Mapping of the Human Brain, June 19Œ22, 2003, New York, NY
e1609
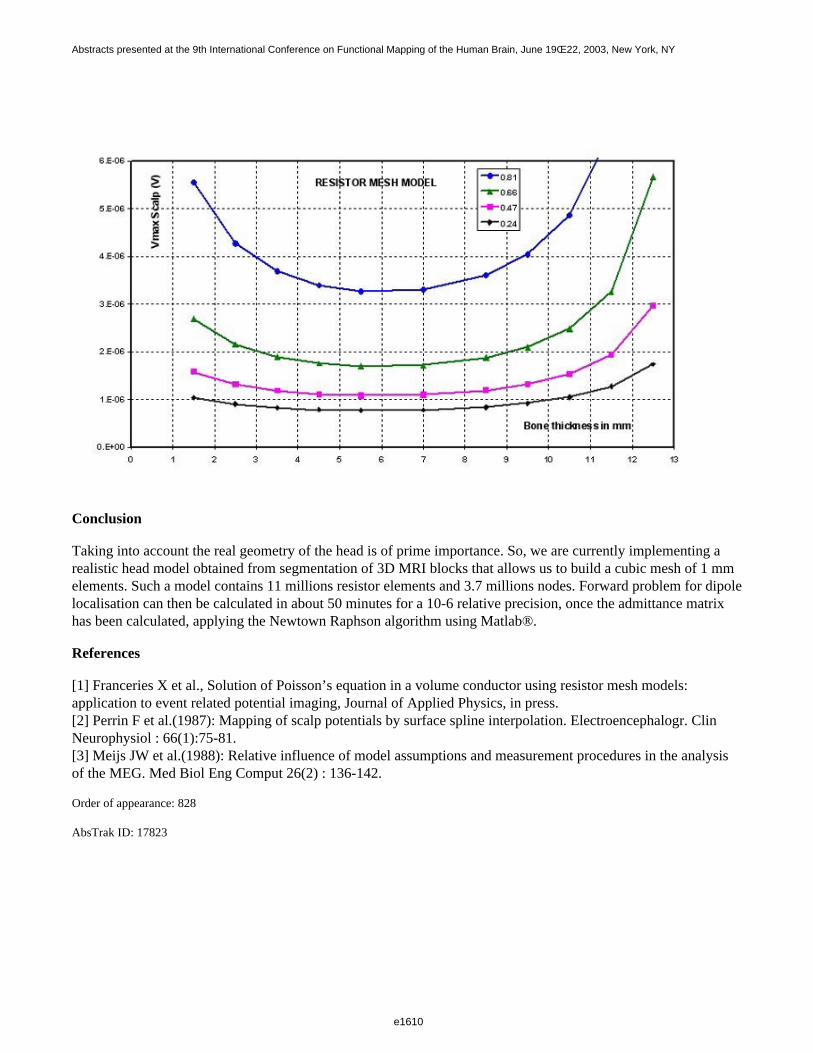
Conclusion
Taking into account the real geometry of the head is of prime importance. So, we are currently implementing arealistic head model obtained from segmentation of 3D MRI blocks that allows us to build a cubic mesh of 1 mmelements. Such a model contains 11 millions resistor elements and 3.7 millions nodes. Forward problem for dipolelocalisation can then be calculated in about 50 minutes for a 10-6 relative precision, once the admittance matrixhas been calculated, applying the Newtown Raphson algorithm using Matlab®.
References
[1] Franceries X et al., Solution of Poisson’s equation in a volume conductor using resistor mesh models:application to event related potential imaging, Journal of Applied Physics, in press.[2] Perrin F et al.(1987): Mapping of scalp potentials by surface spline interpolation. Electroencephalogr. ClinNeurophysiol : 66(1):75-81.[3] Meijs JW et al.(1988): Relative influence of model assumptions and measurement procedures in the analysisof the MEG. Med Biol Eng Comput 26(2) : 136-142.
Order of appearance: 828
AbsTrak ID: 17823
e1610
Abstracts presented at the 9th International Conference on Functional Mapping of the Human Brain, June 19Œ22, 2003, New York, NY
e1610
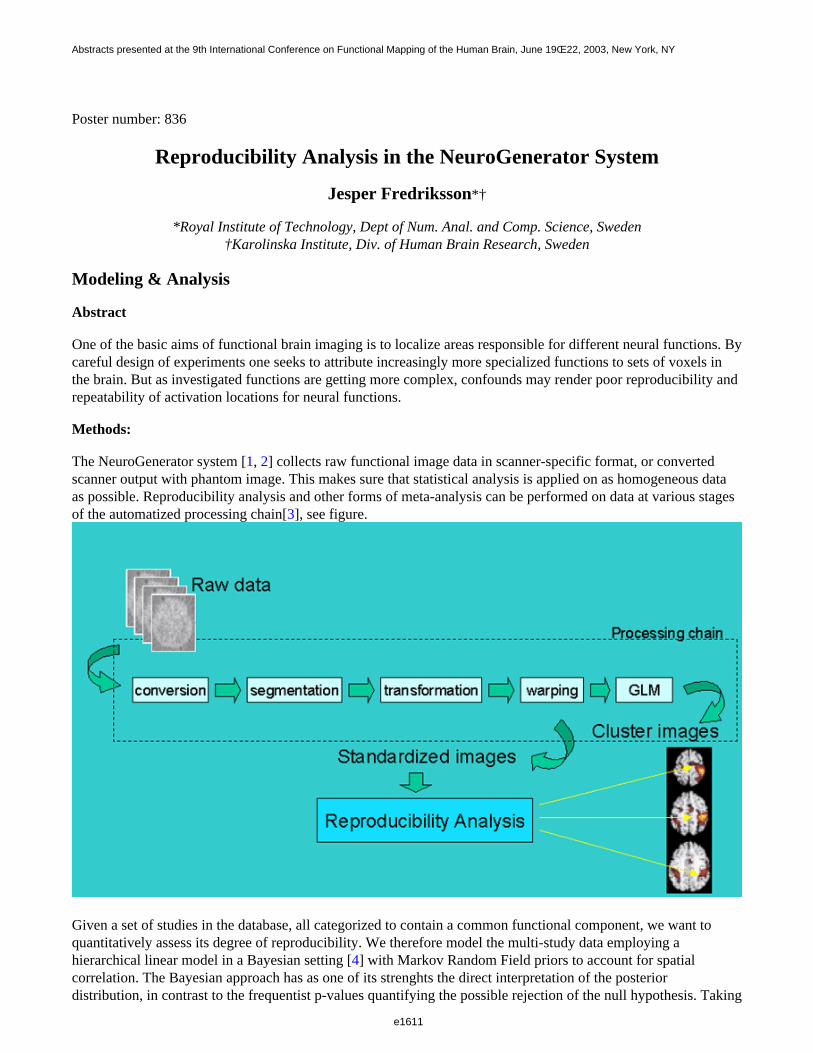
Poster number: 836
Reproducibility Analysis in the NeuroGenerator System
Jesper Fredriksson*†
*Royal Institute of Technology, Dept of Num. Anal. and Comp. Science, Sweden†Karolinska Institute, Div. of Human Brain Research, Sweden
Modeling & Analysis
Abstract
One of the basic aims of functional brain imaging is to localize areas responsible for different neural functions. Bycareful design of experiments one seeks to attribute increasingly more specialized functions to sets of voxels inthe brain. But as investigated functions are getting more complex, confounds may render poor reproducibility andrepeatability of activation locations for neural functions.
Methods:
The NeuroGenerator system [1, 2] collects raw functional image data in scanner-specific format, or convertedscanner output with phantom image. This makes sure that statistical analysis is applied on as homogeneous dataas possible. Reproducibility analysis and other forms of meta-analysis can be performed on data at various stagesof the automatized processing chain[3], see figure.
Given a set of studies in the database, all categorized to contain a common functional component, we want toquantitatively assess its degree of reproducibility. We therefore model the multi-study data employing ahierarchical linear model in a Bayesian setting [4] with Markov Random Field priors to account for spatialcorrelation. The Bayesian approach has as one of its strenghts the direct interpretation of the posteriordistribution, in contrast to the frequentist p-values quantifying the possible rejection of the null hypothesis. Taking
e1611
Abstracts presented at the 9th International Conference on Functional Mapping of the Human Brain, June 19Œ22, 2003, New York, NY
e1611

the opposite approach, the reproducibility analysis can also be used for exploratory analysis in finding studiescontaining possibly functionally related components.
Conclusion:
We show how, as of yet on a high level, meta-analysis and specifically reproducibility analysis may be performedin the NeuroGenerator system as a suitable application for a database system of raw data.
References
1. Roland, P; Svensson, G; Lindeberg, T; Risch, T; Baumann, P; Dehmel, A; Fredriksson, J; Halldorsson, H;Forsberg, L; Young, J; Zilles, K. A database generator for human brain imaging. TRENDS in Neurosciences24(10), 562-564, 2001.2. http://www.neurogenerator.org3. Fredriksson, J; Svensson, P; Risch, T. Mediator-based Evolutionary Design and Development of ImageMeta-Analysis Environments. Journal of Intelligent Information Systems 17(2, 3), 301-322, 2001.4. Friston, K. J; Penny, W; Philips, C; Kiebel, S; Hinton G; Ashburner, J. Classical and Bayesian Inference inNeuroimaging: Theory. NeuroImage 16, 465-483, 2002
Order of appearance: 829
AbsTrak ID: 18962
e1612
Abstracts presented at the 9th International Conference on Functional Mapping of the Human Brain, June 19Œ22, 2003, New York, NY
e1612
Poster number: 837
A dynamical solution to the inverse problem of EEG generation usingspatiotemporal Kalman filtering
Andreas Galka*†, Tohru Ozaki*, Okito Yamashita*, Rolando Biscay‡, Pedro Valdes-Sosa§
*Institute of Statistical Mathematics (ISM), Minami-Azabu 4-6-7, Tokyo 106-8569, Japan†Institute of Experimental and Applied Physics, University of Kiel, 24098 Kiel, Germany
‡University of Havana, Ciudad Habana, Calle 34 No. 304-2, Cuba§Cuban Neuroscience Center, Ave 25 No. 5202 esquina 158 Cubanacan, POB 6880, 6990, Ciudad Habana, Cuba
Modeling & Analysis
Abstract
We present a new approach for estimating approximative solutions of the inverse problem of EEG generation.Unlike with previous approaches, we develop our solution in a dynamical framework, i.e. we employ explicitlyspatiotemporal dynamical models for the evolution of the primary source density. The solution of the inverseproblem for time series of EEG recordings is reformulated as a very high-dimensional filtering problem. Byimposing suitable restrictions on the dynamical models and introducing an additional spatial pre-whitening step itbecomes possible to decompose this intractable high-dimensional filtering problem into a set of coupled tractablelow-dimensional filtering problems, each of which is confined to one gray-matter voxel and its close neighbours.
We develop a new variant of Kalman filtering which is appropriate for application to such spatiotemporalsituations. Whereas previous instantaneous solutions of the inverse problem could employ only a very limitedamount of information, given by the set of instantaneous measurements at the EEG electrodes, the inclusion of thedynamical aspect of the problem introduces the possibility to estimate inverse solutions on the basis of much moreinformation, given by both current measurements and all previous measurements. This opens up new perspectivesfor improved accuracy of the inverse solutions and for data-driven design of dynamical models. Thespatiotemporal Kalman filter implements a whitening filter for both space and time, thereby identifying theinnovation process which is driving the dynamics; we expect this additional information contained in the timeseries of innovation maps to be particularly relevant for future clinical applications.
For the purpose of estimating the parameters of the spatiotemporal dynamical models from given time series ofEEG recordings we develop a likelihood maximisation approach. The concept of likelihood provides us with awell-defined criterion to compare and optimise dynamical models in a purely data-driven way. These modelsthemselves represent a convenient new approach to characterising brain dynamics using only actual EEG data.
The performance of the algorithm is compared to an instantaneous solution (regularised LORETA) by applicationto EEG times series data obtained from a simulation of oscillating brain dynamics. The results show that thesimplest non-trivial dynamical models yield inverse solutions which are very similar to the instantaneoussolutions, whereas refinements of the models lead to considerably improved inverse solutions. Therefore weconclude that the development of appropriate spatiotemporal models for brain dynamics in voxel space will be thecrucial precondition for achieving further improvements of the accuracy of inverse solutions.
Finally we also present some results obtained from real EEG data; an example is shown in the following figure(the figure shows maximum-intensity projections of the absolute values of the estimated local current vectors).
e1613
Abstracts presented at the 9th International Conference on Functional Mapping of the Human Brain, June 19Œ22, 2003, New York, NY
e1613
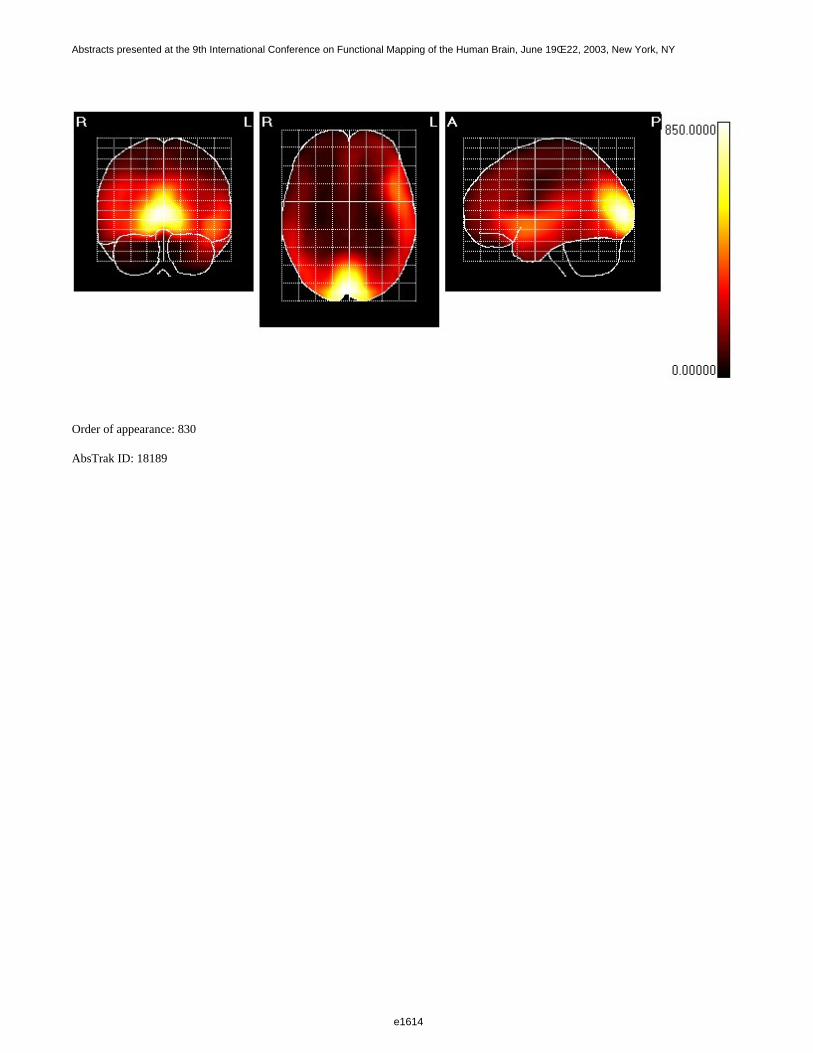
Order of appearance: 830
AbsTrak ID: 18189
e1614
Abstracts presented at the 9th International Conference on Functional Mapping of the Human Brain, June 19Œ22, 2003, New York, NY
e1614
Poster number: 838
TurboFIRE: Real-Time fMRI with Automated Spatial Normalization andTalairach Daemon Database
Kunxiu Gao*†, Stefan Posse
Dept. of Psychiatry & Behavioral Neurosciences, Wayne State University School of Medicine, Detroit, MI, USA
Modeling & Analysis
Abstract
Real-time fMRI enables continuous assessment of changes in brain activation during an ongoing scan andfeedback of brain activation to the subject (1, 2). However, quantification of brain activation and development ofan efficient graphical user interface are major challenges of real-time fMRI. We have created an integratedreal-time fMRI software package (TurboFIRE) that incorporates automated spatial normalization based onSPM99 (3) and the Talairach Daemon database (4) for automated assignment of activated areas.
Client/Server based TurboFIRE features preprocessing of multi-echo EPI data, 3D motion correction, spatialfiltering, time slice correction, global or region-based intensity scaling, and ROI analysis. “Sliding-window”correlation analysis with up to 4 reference vectors (e.g. for simultaneous single trial and cumulative analysis) isperformed in parallel to take advantage of multi-processor architecture.
Affine and non-linear spatial normalization was implemented based on SPM99 (3) with the aim to determineTalairach coordinates on the original non-normalized images. In a preparatory step a reference (object) image isnormalized to a template image and a lookup table is generated to relate coordinates in object space to MNI space(45-65 s for a 64x64x16 image). During real-time scanning, the user can choose points in displayednon-normalized images to lookup their normalized positions in MNI space using the table previously stored inmemory, which takes milliseconds to perform. Since several voxels in normalized space may be projected to thesame voxel in object space, corresponding source locations in normalized space are spatially averaged.Coordinates are transformed into Talairach space using Matthew Brett’s formula (5) and automatically assignedusing the Talairach Daemon database, which is also loaded in memory.
Five healthy subjects performed interleaved visual, motor, auditory and cognitive tasks in a Siemens Sonata 1.5 Tscanner (6). Real-time data processing of whole brain EPI data (TR/TE: 2 s, 60 ms, 64x64 matrix, 16 slices,3x3x7.5mm) was performed on a Linux workstation (two 2.4GHz Xeon processors with 400MHz Front Side Bus,and 2GB PC800 Rambus memory). Processing time with all interactive processing features activated was 206 msper image volume. Normalization of the same datasets was performed offline with SPM99 (3) and twelveanatomical landmarks distributed across the entire brain were selected. The mean distance between landmarkcoordinates measured with SPM99 and TurboFIRE was 3.8 mm (Table 1), consistent with the voxel resolution.Figure 1 shows the user interface of TurboFIRE with motor activation and automatic assignment of VOI (arrow).
e1615
Abstracts presented at the 9th International Conference on Functional Mapping of the Human Brain, June 19Œ22, 2003, New York, NY
e1615
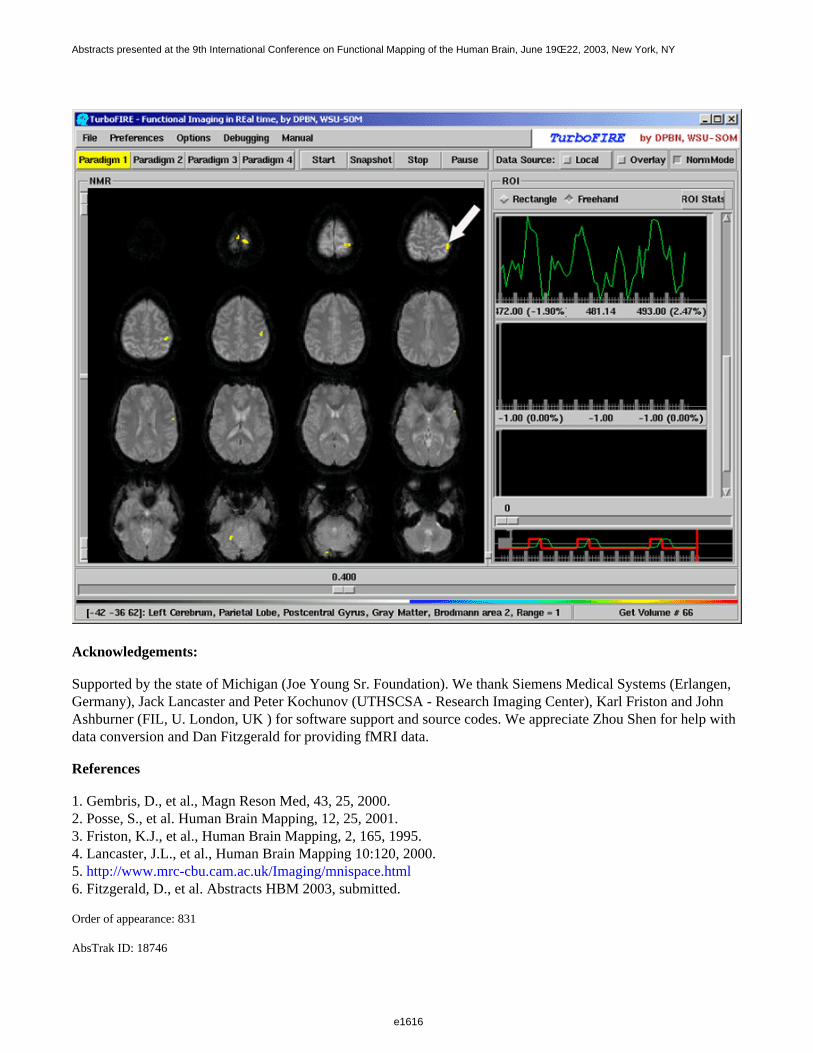
Acknowledgements:
Supported by the state of Michigan (Joe Young Sr. Foundation). We thank Siemens Medical Systems (Erlangen,Germany), Jack Lancaster and Peter Kochunov (UTHSCSA - Research Imaging Center), Karl Friston and JohnAshburner (FIL, U. London, UK ) for software support and source codes. We appreciate Zhou Shen for help withdata conversion and Dan Fitzgerald for providing fMRI data.
References
1. Gembris, D., et al., Magn Reson Med, 43, 25, 2000.2. Posse, S., et al. Human Brain Mapping, 12, 25, 2001.3. Friston, K.J., et al., Human Brain Mapping, 2, 165, 1995.4. Lancaster, J.L., et al., Human Brain Mapping 10:120, 2000.5. http://www.mrc-cbu.cam.ac.uk/Imaging/mnispace.html6. Fitzgerald, D., et al. Abstracts HBM 2003, submitted.
Order of appearance: 831
AbsTrak ID: 18746
e1616
Abstracts presented at the 9th International Conference on Functional Mapping of the Human Brain, June 19Œ22, 2003, New York, NY
e1616
Poster number: 839
Influence of data analysis on presurgical localization validity withparticular consideration of data smoothing effects
Alexander Geissler*, Rupert Lanzenberger*, Markus Barth†, Amir R. Tahamtan*,Denny Milakara*, Andreas Gartus*, Roland Beisteiner*
*Department of Neurology, General Hospital and University of Vienna, Austria†Department of Radiology, General Hospital and University of Vienne, Austria
Modeling & Analysis
Abstract
A comparison between analysis results of smoothed and non-smootehd data using SPM99 was performed toinvestigate the influence of smoothing procedures on localization of motor cortex areas. Seven healthy subjectsand one patient suffering a left postcentral tumor participated on a fMRI study using a motor paradigm. Wecompared the localization of cortical representations investigating hand and jaw movements performed in isolatedor simultaneous manner.
FMRI data were aquired from 7 healthy subjects (mean age: 25.4 years, 5 male and one patient (male, age 37)).With the exception of two subjects, all participants were right handed. A 3T BRUKER Medspec scanner was usedwith a phase corrected blipped GE, single shot EPI-sequence (TE/TR = 55.5/4000ms, 128x128matrix, 230x230FOV, 25 axial slices, slice thickness 3mm, sinc-pulse-excitation). Individual plaster helmets1 were applied foroptimised head fixation. Subjects performed 3 paradigms: opening and closing of (1) the dominant hand, (2)mouth (lower jaw movements) and (3) both hand and jaw movements simultaneously.
The movements were self-initiated and self-paced at a subjective convenient frequency. One run consisted of 4rest and 3 movement phases with 20s duration each. Depending on subject cooperation 5-7 runs wereaccomplished per condition. Start, stop, and type of movements were indicated to the subjects by acousticcommands, transmitted via earphones.
Localization of brain activity corresponding to 4 movement conditions was evaluated: jaw-isolated, hand-isolated,jaw-simultaneous and hand-simultaneous. Prior to further analysis, all volumes of every subject were realigned tothe first volume of the first run using AIR2. We performed two SPM993 analyses – a “standard” smoothed and anon-smoothed. The standard smoothed analysis represented most widely used SPM analysis settings and thereforeused a fixed response half-sine function convolved with a hemodynamic response function (HRF) as reference.The non-smoothed analysis represented often used non-smoothing analysis settings and was therefore calculatedwith a fixed response Box-car function with a time course shift of 4 seconds and not convolved with HRF.Smoothed data included spatial smoothing with a 4 mm FWHM Gaussian kernel and temporal low-pass filteringusing the HRF kernel. All t-value maps (p < 0.001, corrected p < 0.05 for multiple comparisons) were generatedwithout any cluster criterion. Based on SPM T-maps, the voxel with the highest t-value within the primarysensorymotor cortex was determined as the most active one and its location was compared for isolated andsimultaneous movements. Individual differences along the 3 spatial axes were calculated between both handisolated versus simultaneous, and jaw isolated versus simultaneous, respectively. Differences within hemisphereswere checked systematically by a paired t-test (double sided, hand isolated versus simultaneous, jaw isolatedversus simultaneous) using the same voxels (table 1). We found that the localization differences between isolatedand simultaneous movements were more variable with smoothed standard data analysis compared tonon-smoothed data analysis. We conclude that the uncritical use of standard SPM procedures may compromisepresurgical evaluation of eloquent cortex and a critical multimethodological data analysis as well as specialized
e1617
Abstracts presented at the 9th International Conference on Functional Mapping of the Human Brain, June 19Œ22, 2003, New York, NY
e1617
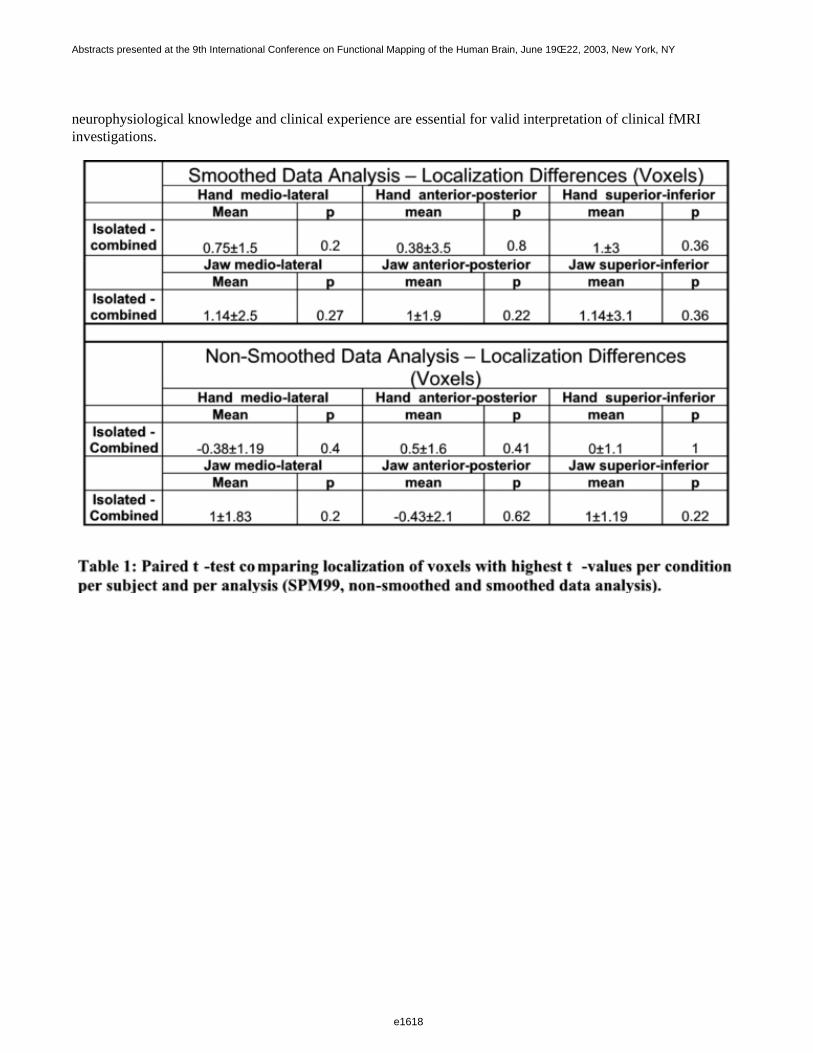
neurophysiological knowledge and clinical experience are essential for valid interpretation of clinical fMRI investigations.
e1618
Abstracts presented at the 9th International Conference on Functional Mapping of the Human Brain, June 19Œ22, 2003, New York, NY
e1618
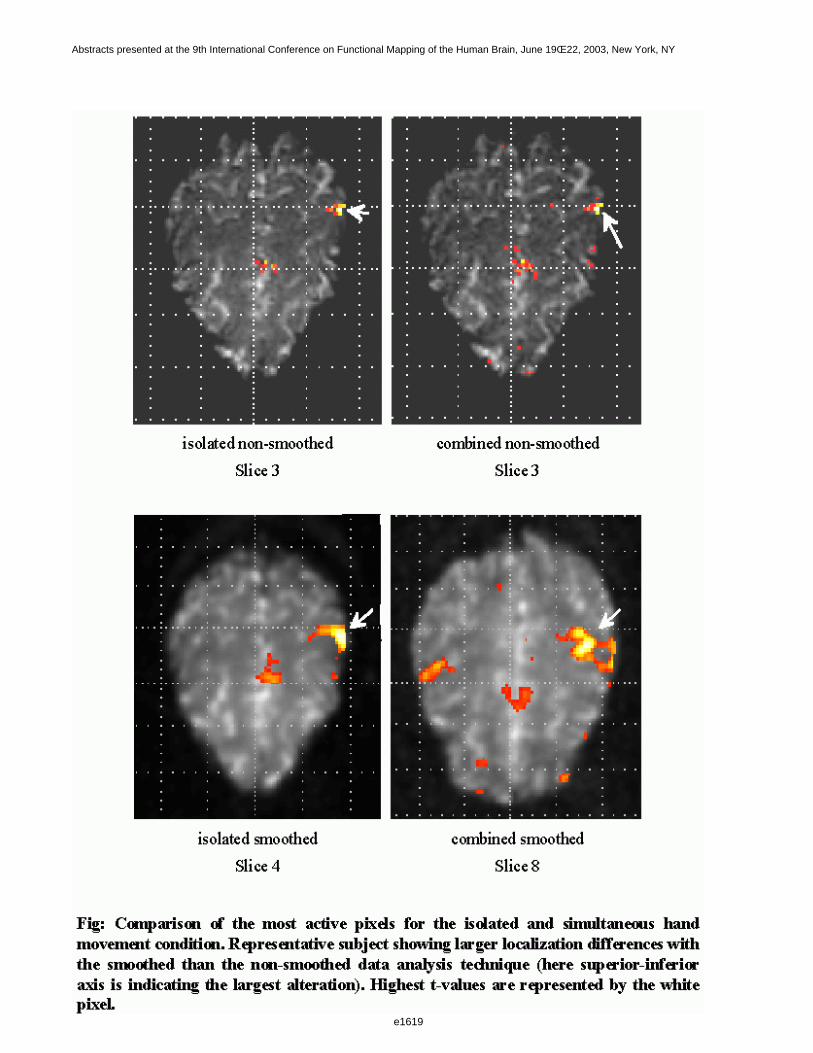
e1619
Abstracts presented at the 9th International Conference on Functional Mapping of the Human Brain, June 19Œ22, 2003, New York, NY
e1619

References
1) Edward V, Windischberger C, Cunnington R, et al. Human Brain Mapping 2000; 11(3);207-213.2) Woods R.P., Grafton S. T., Holmes, C. J., et al. Comput. Assist. Tomogr., 22:141-154 (1998).3) Members & collaborators of the Wellcome Department of Cognitive Neurology. Statistic Parameteric MappingAvailable at http://www.fil.ion.ucl.ac.uk/spm/. Accessed September 3. 2002.
Order of appearance: 832
AbsTrak ID: 18709
e1620
Abstracts presented at the 9th International Conference on Functional Mapping of the Human Brain, June 19Œ22, 2003, New York, NY
e1620
Poster number: 840
Single-trial Event Detection of Visual Object Recognition in EEG
Adam Gerson*, Lucas Parra†, Paul Sajda*
*Department of Biomedical Engineering, Columbia University, NY, USA†Adaptive Image and Signal Processing, Sarnoff Corporation, Princeton, NJ, USA
Modeling & Analysis
Abstract
We describe a method, using linear discrimination, for detecting single-trial EEG signatures of object recognitionevents in a rapid serial visual presentation (RSVP) task during which a rapid sequence of images is presented in astatic location. The neurophysiological response to target images during RSVP is well documented. Keysers’electrophysiological studies [1] of macaque monkey cortical cell response to RSVP stimuli indicate processingrequired for object recognition is completed within 150 milliseconds of stimulus onset. Face neurons in superiortemporal sulcus (STSa) were monitored while a sequence of random natural images was presented at a rapid rate(14-222 msec/image). Neurons consistently responded selectively to target face images approximately 108 msfollowing target onset, regardless of presentation rate. In an EEG study, Thorpe [2] compared trial-averagedresponse to target and distractor images during an RSVP task. A significant difference in frontal electrodeevent-related potential (ERP) became evident about 150-200ms following target/distractor onset. Lateral motorresponse related activity was observed approximately 375 ms after stimulus onset. We record EEG using a highspatial density array (87 electrodes) during the rapid presentation (50-200 msec per image) of natural images.Subjects were instructed to release a button when they recognized a target image (an image with a person/people).Trials consist of 100 images each, with a 50% chance of a single target being in a trial. Subject EEG was analyzedon a single-trial basis with an optimal spatial linear discriminator learned at multiple time windows after thepresentation of an image. By sliding the window used to train a linear discriminator, we are able to study thetemporal sequence of neuronal responses evoked by visual stimuli. Due to the high temporal resolution affordedby EEG this method provides an intuitive description of communication between visual and sensorimotor cortex.Linear discrimination enables the estimation of a forward model and thus allows for an approximate localizationof the discriminating activity. Results show multiple loci for discriminating activity (e.g. motor and visual). Usingthese detected EEG signatures, we show that in many cases we can detect targets more accurately than the overtresponse (button release) and that such signatures can be used to prioritize images for high-throughput search.
References
[1] C. Keysers, K.-K. Xiao, P. Földiák, and D. I. Perrett, "The speed of sight," Journal of Cognitive Neuroscience,vol. 13, no. 1, pp. 90-101, 2001.[2] S. Thorpe, D. Fize, and C. Marlot, "Speed of processing in the human visual system," Nature, vol. 381, pp.520-522, June 1996.
e1621
Abstracts presented at the 9th International Conference on Functional Mapping of the Human Brain, June 19Œ22, 2003, New York, NY
e1621
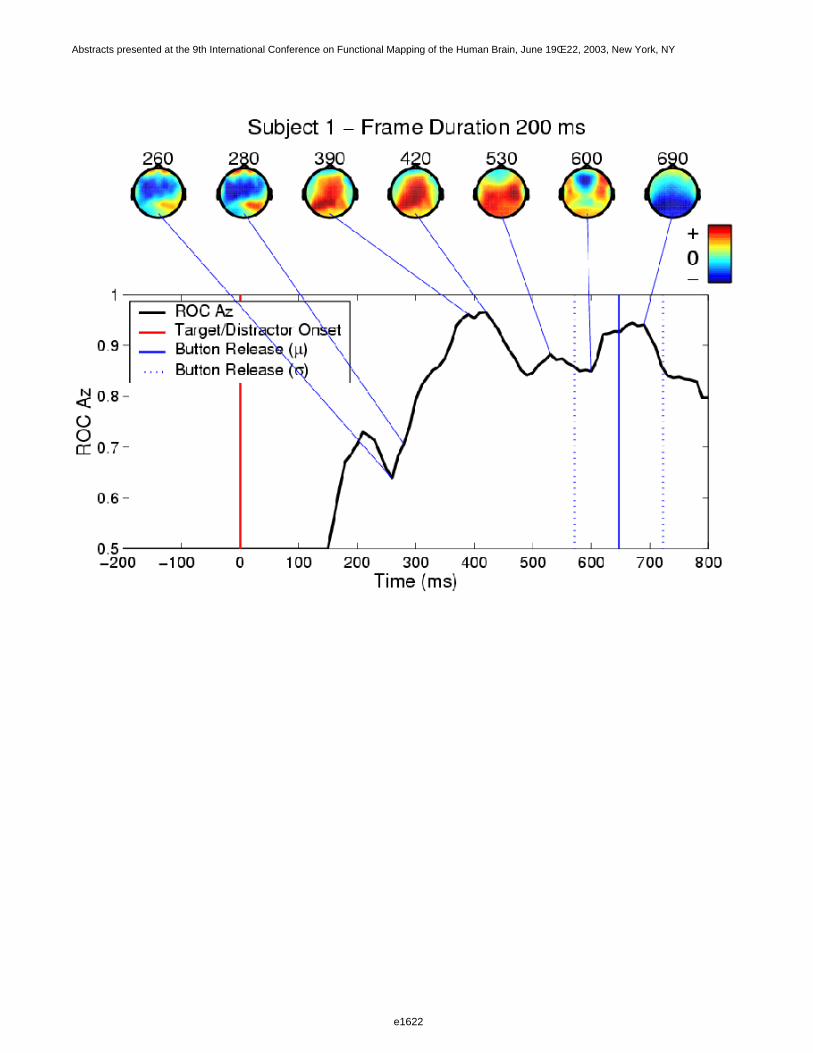
e1622
Abstracts presented at the 9th International Conference on Functional Mapping of the Human Brain, June 19Œ22, 2003, New York, NY
e1622
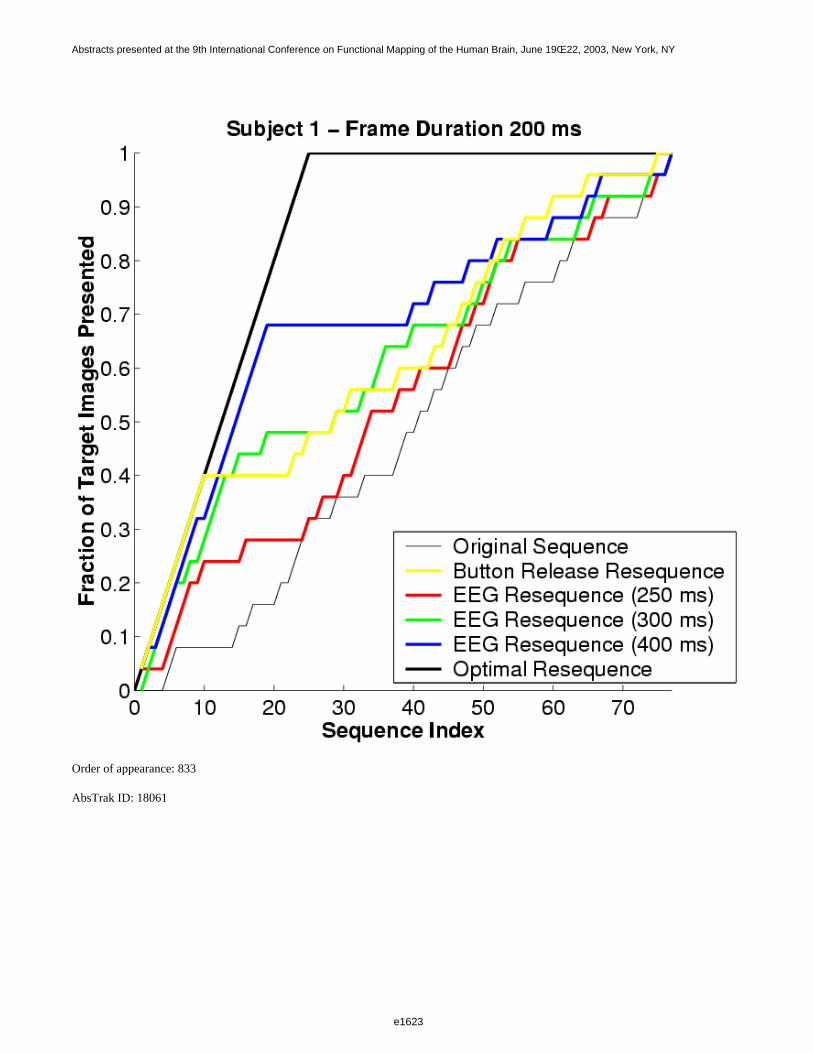
Order of appearance: 833
AbsTrak ID: 18061
e1623
Abstracts presented at the 9th International Conference on Functional Mapping of the Human Brain, June 19Œ22, 2003, New York, NY
e1623
Poster number: 841
Regional Inhomogeneity and Task-Dependence of Colored Noise in fMRI
Irene Giannoylis*, William J. Logan‡, David Mikulis†, Adrian P. Crawley†
*Toronto Western Research Institute†Department of Medical Imaging, Toronto Western Hospital
‡Department of Pediatrics, Hospital for Sick Children
Modeling & Analysis
Abstract
Introduction
Noise in fMRI data has been shown to be temporally autocorrelated and has been characterized as a 1/f-like process(1). It is well known that the width of the null distribution of correlation values (r-width) is broadened bythe temporal autocorrelation of the noise. Here we investigate the regional inhomogeneity and task-dependence ofr-width and assess whether the presence of task-correlated artifact introduces any additional increase in r-width.
Methods
Sixteen healthy subjects were imaged using a 1.5T GE echospeed MRI. Eight subjects performed a finger-tappingtask with their dominant hand for 15 seconds interleaved with a 15 second rest condition for 10 epochs over a 5minute period. The remaining eight subjects were imaged for the same amount of time but did not perform a task.Data were analyzed using AFNI version 2.45m. Anatomical images were talairached and segmented into grey andwhite matter regions. Erosion of the grey matter region was used to form a separate edge region. A referencewave form for the task condition was used to calculate correlation maps for each subject. R-width within eachregion was measured in a slice not expected to activate with a motor task.
Results
A two-factor ANOVA revealed a main effect for region (p<0.001) and task (p<0.0001). Separate t-tests(one-tailed) showed significantly greater r-width in edge of brain than in grey matter for task (p<0.05) and no-task(p<0.05). Greater r-width was also found in grey matter than in white matter for task (p<0.001) and no-task (p<0.01)
Discussion
Our study extends previous research showing brain tissue differences in noise and greater noise at the edge of thebrain than elsewhere (2). Most notable is our finding of greater noise in task than in no task demonstrating thatthere is a component of fMRI noise that is task-dependent. Further research is needed to investigate whethertask-dependent increase in r-width is due to higher noise autocorrelation or whether it is restricted to the paradigmfrequency. This has implications concerning the effectiveness of rewhitening strategies which only deal with the1/f-like component of noise.
References
(1) Zarahn E., Aguirre GK, and D’Esposito, M. Empirical analyses of BOLD fMRI statistics: I. Spatiallyunsmoothed data collected under null-hypothesis conditions. Neuroimage 5: 179-197, 1997.(2) Kruger G and Glover GH. Physiological noise in oxygenation-sensitive magnetic resonance imaging. MagnReson Med 46: 631-637, 2001.
e1624
Abstracts presented at the 9th International Conference on Functional Mapping of the Human Brain, June 19Œ22, 2003, New York, NY
e1624
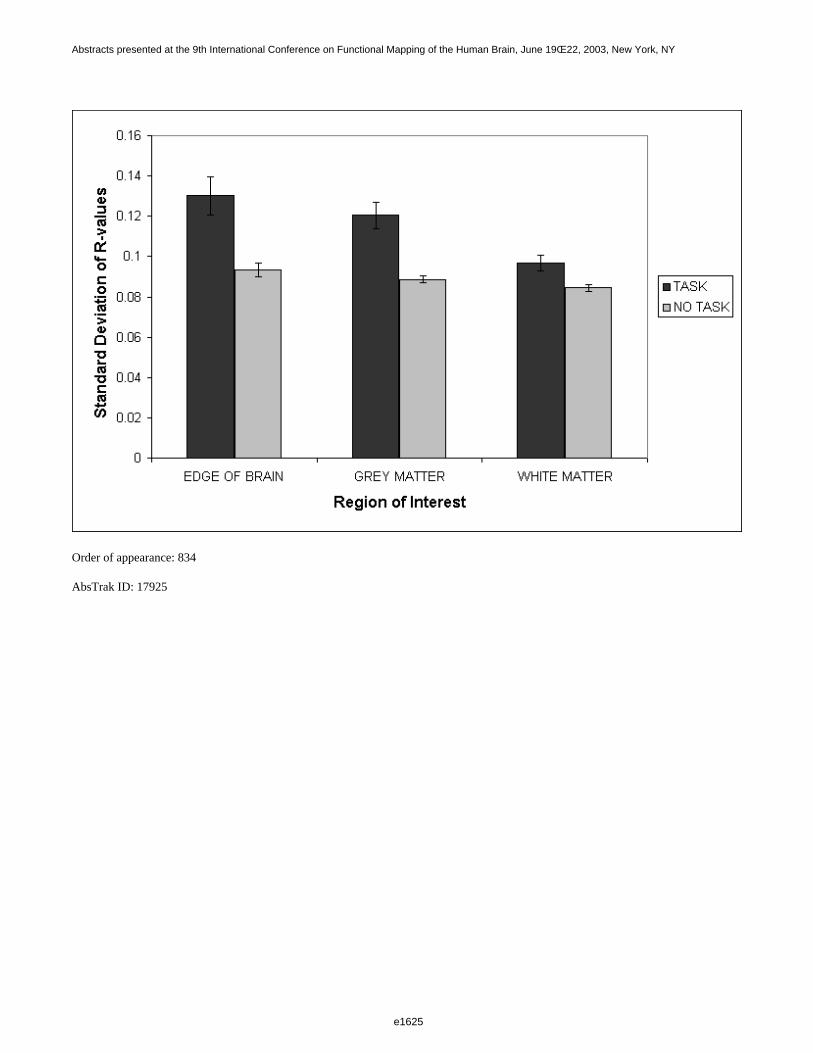
Order of appearance: 834
AbsTrak ID: 17925
e1625
Abstracts presented at the 9th International Conference on Functional Mapping of the Human Brain, June 19Œ22, 2003, New York, NY
e1625
Poster number: 842
Weighting of Multiple Gradient Echo Images to Improve Detection offMRI Activation
Douglas Greve, Caroline West, Andre van der Kouwe, Anders Dale
Martinos Center, Massachusetts General Hospital
Modeling & Analysis
Abstract
Introduction
A typical fMRI data acquisition will sample a single gradient echo image at an echo time that maximizes theexpected BOLD SNR. A shortcoming of this method is that the optimal echo time varies across the brain (e.g., ashort echo time is best for susceptibility regions). Multiple echos can be acquired from a single excitation. Thistechnique has mainly been used to map T2* and I0 ([1],[2]). Unfortunately, parameter mapping requires 6-8echos, which constrains the acquisition to have small brain coverage or long TR.
We introduce a technique to linearly combine multiple echoes in order to improving the detection of fMRIactivation. The weighting vector is derived such that the BOLD SNR is maximized. The weights are computedempirically on a voxel-by-voxel basis. The technique can be applied to as few as two echoes and so does notcompromise brain coverage or TR. If a short echo time is acquired, this technique can be used to recover signalfrom susceptibility regions. Results show that the SNR can increase by 50% with this method.
Methods
The SNR is given by wt Aw/wt Bw, where A and B are, respectively, the signal and noise cross-echo covariancematrices, and w is the vector of weights used to average the echos together. The weight vector that maximizes theSNR will be the maximum eigenvector of B-1 A To obtain A and B independent of w, we divide the data into Nsubsets and analyze N-1 with a GLM to get an estimate of the signal and noise at each voxel for each echo. Wethen use these estimates to compute A and B (and so w) at each voxel, and then apply the weights to the subsetleft out of the analysis. Weights for all subsets are computed in this way. When complete, we have one data setwhose different echoes have been combined into a single space-time volume, which can then be processed in theusual way.
Results
Echoes at 10, 23, 36, and 48ms were collected on a Siemens Allegra 3T scanner(TR=3,32x32x29,6.25x6.25x6mm,Ntp=100,Nruns=3). The task was a visual language blocked design with aperiod of 60s. For this method to work, it is necessary that the weights be repeatable across subsets of data. Figure1 shows the weight for the second echo for run 1 plotted against that for run 2 for each activated voxel. Ideally, alldata points would fall on a line of slope 1. The vast majority are clustered around this ideal (75% are within+/-15%), indicating that the weights are quite repeatable.
The power spectrum (averaged across activated voxels) and resulting SNR for each echo and the weightedaverage is shown in Figure 2. The peak at .0167Hz is due to the task. As can be seen the Weighted spectrum has amuch lower noise floor than any individual echo; the SNR is also 1.5 to 3 times higher. Weighting was also ableto substantially reduce low-frequency noise.
e1626
Abstracts presented at the 9th International Conference on Functional Mapping of the Human Brain, June 19Œ22, 2003, New York, NY
e1626
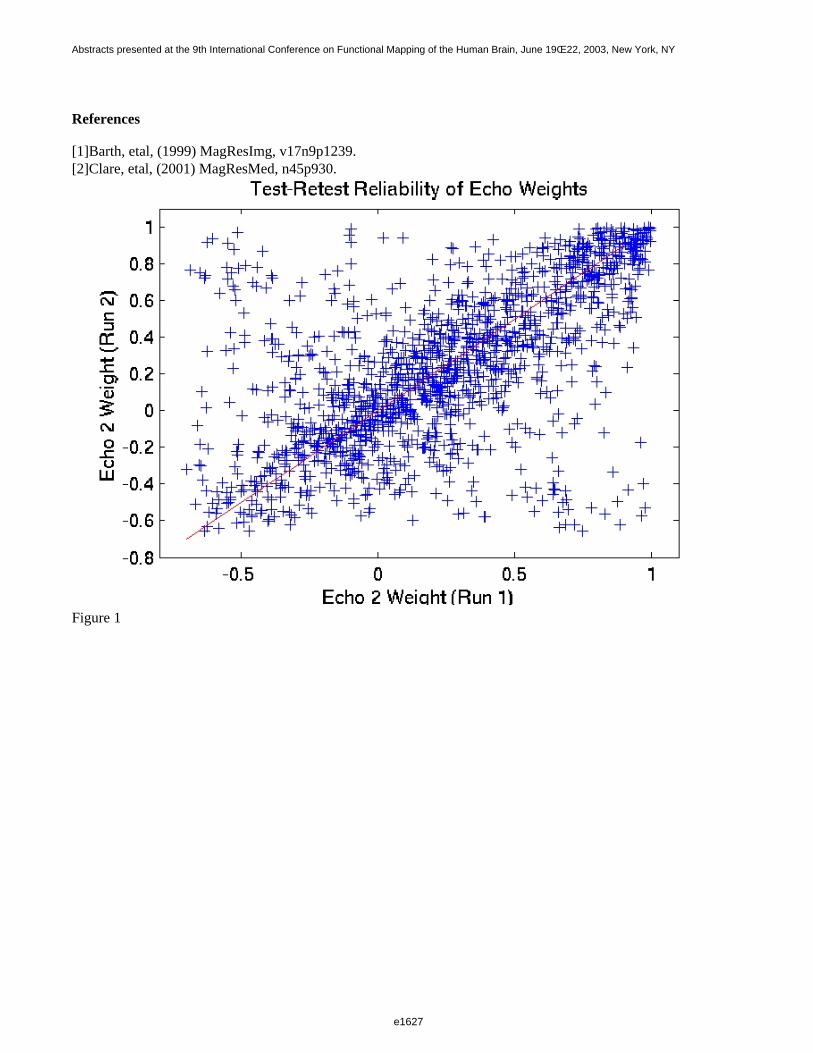
References
[1]Barth, etal, (1999) MagResImg, v17n9p1239.[2]Clare, etal, (2001) MagResMed, n45p930.
Figure 1
e1627
Abstracts presented at the 9th International Conference on Functional Mapping of the Human Brain, June 19Œ22, 2003, New York, NY
e1627
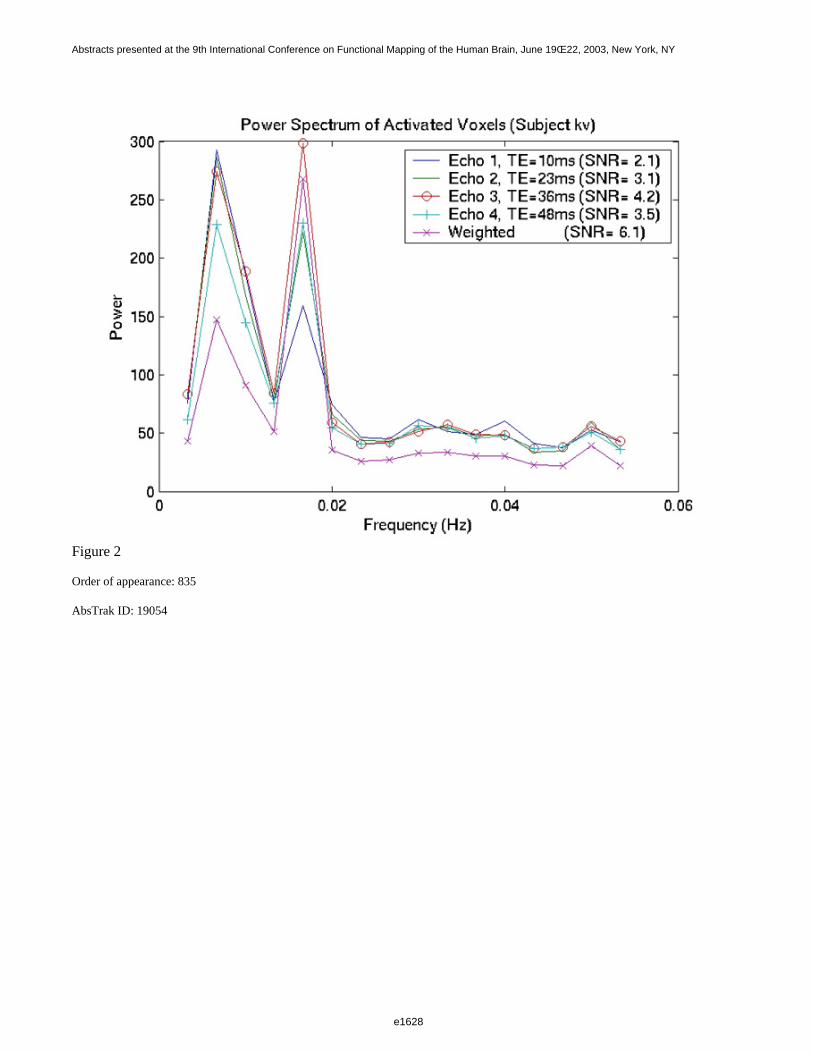
Figure 2
Order of appearance: 835
AbsTrak ID: 19054
e1628
Abstracts presented at the 9th International Conference on Functional Mapping of the Human Brain, June 19Œ22, 2003, New York, NY
e1628
Poster number: 843
Filtering of physiological noise as detected by ICA for improved reliabilityof fMRI data
Rao Gullapalli*†, Rakesh Arya*‡, Steve Roys*†, Tulay Adali‡, Joel Greenspan†§
*Department of Radiology,†University of Maryland at Baltimore
‡University of Maryland Baltimore County§Department of Oral & Cranial Biol Sciences
Modeling & Analysis
Abstract
Introduction
Cardiac and respiratory motion during fMRI acquisitions can limit the reliability of the detected neuronalactivation. Although there is some literature on the removal of the physiological noise, the effect of thephysiological noise on the reliability of fMRI data has not been studied.1,2 In this study we used independentcomponent analysis (ICA) to identify cardiac and respiratory components to assess the improvements in reliabilityachievable in the fMRI data by filtering these components.
Method
Three slices of the motor cortex were scanned using Philips Eclipse 1.5 T system at a TE/TR of 35/320ms and aresolution of 100x80 over 24cm FOV. A single volunteer was scanned seven times over a period of two weeks.The paradigm used was eight cycles of right hand finger thumb opposition task (20s on - 20s off) resulting in 960time points. Cardiac and respiratory data was acquired simultaneously during using an Invivo 3150 monitorconnected to a Data Translation DT9801 acquisition board. The functional scans were aligned, normalized, andsubject to ICA using the Infomax algorithm.3 The components from ICA were ranked and physiological signalswere identified using the distance measure that takes the variance, skewness, kurtosis, and entropy of each of thecomponents into account. These components were further verified through correlational analysis with thecaptured physiological signals. Fourth order Butterworth filters were used to filter the identified respiratoryfrequency at 0.3±0.04 Hz and the cardiac frequency at 1.3±0.3 Hz. The original time series and the three resultingfiltered time series (cardiac, respiratory, combination filters) were subject to correlation analysis with the taskparadigm to determine maximum threshold and the spatial extent of activation.
Results
The cardiac and respiratory components as identified by ICA had high kurtosis and skewness and were separablefrom the task related components which had high skewness but low kurtosis. Filtering provided both highercorrelation values and larger clusters of activation at the same location. Table 1 summarizes the results fromapplying each of the filters. Respiratory filtering had more of an effect than cardiac filtering (average 10.8%increase compared to 4.1%). Filtering to exclude both cardiac and respiratory components produced the highestincrease in correlation values (average 17.7%) and produced the largest clusters of activation. In addition toincreasing the correlation values, filtering also reduced the variation in the maximum correlation coefficientsuggesting improved reliability in the data.
e1629
Abstracts presented at the 9th International Conference on Functional Mapping of the Human Brain, June 19Œ22, 2003, New York, NY
e1629
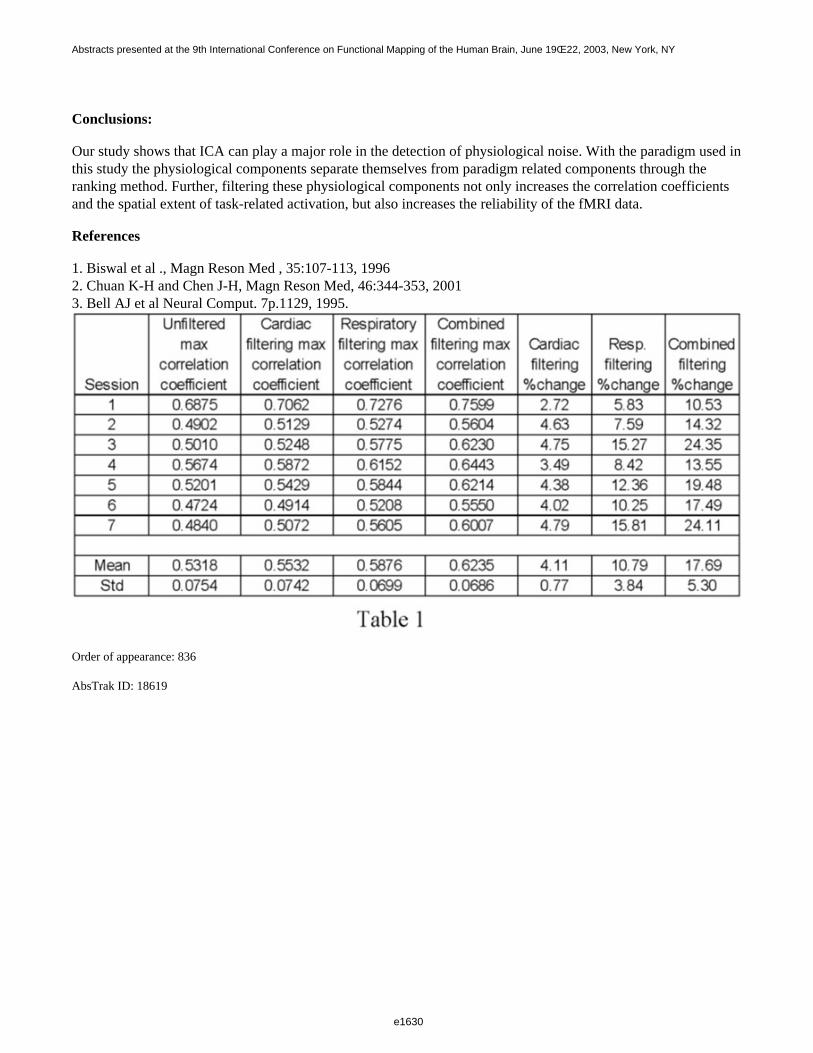
Conclusions:
Our study shows that ICA can play a major role in the detection of physiological noise. With the paradigm used inthis study the physiological components separate themselves from paradigm related components through theranking method. Further, filtering these physiological components not only increases the correlation coefficientsand the spatial extent of task-related activation, but also increases the reliability of the fMRI data.
References
1. Biswal et al ., Magn Reson Med , 35:107-113, 19962. Chuan K-H and Chen J-H, Magn Reson Med, 46:344-353, 20013. Bell AJ et al Neural Comput. 7p.1129, 1995.
Order of appearance: 836
AbsTrak ID: 18619
e1630
Abstracts presented at the 9th International Conference on Functional Mapping of the Human Brain, June 19Œ22, 2003, New York, NY
e1630
Poster number: 844
Advances in the Use of Canonical Variates Analysis in Neuroimaging:Ordinal Trend Analysis
Christian Habeck*, Yaakov Stern*, Eric Zarahn*, John Krakauer†‡, Claude Ghez†‡,David Eidelberg§||, James R. Moeller§
*Taub Institute, Department of Neurology, Columbia College of Physicians and Surgeons, New York, NY†Center for Neurobiology and Behavior, Motor Control Laboratory, Columbia College of Physicians and
Surgeons, New York, NY‡Department of Neurology, Columbia College of Physicians and Surgeons, New York, NY§Department of Psychiatry, Columbia College of Physicians and Surgeons, New York, NY
¶Center for Neurosciences, North Shore-Long Island Jewish Research Institute, Manhasset, NY||Departments of Neurology and Neurosurgery, New York University School of Medicine, New York, NY
**††
Modeling & Analysis
Abstract
We present innovations in neurobehavioral modeling that can yet be achieved with Canonical Variates Analysis(CVA), where our work builds on the original contributions of McIntosh (1996) and Worsley (1997). Our work isbased on Monte Carlo simulations of a plausible covariance model of the regional brain activations that aremanifest in experimental studies of ordinary human abilities. Although the model is necessarily a simplification ofactual human information processing, it has led us to a better understanding how close to the mark, and how wideoff the mark, one can be in interpreting the results of CVAs in terms of the relationship between regional brainactivations and the information processing components. We have added improvements to CVA so that, in itsapplication to elaborate functional brain architectures -like those operating during object recognition andidentification, remembering, visualization and reading- CVA produces more accurate estimates of the activationpatterns associated with the individual processing components (Kosslyn, 1999).
The new CVA technique, Ordinal Trend analysis (OrT), is used to pare down the regionally distributed activationpattern of a large functional architecture into its component parts. Of the component processes whose intensitylevels have been experimentally manipulated in a parametric manner, OrT focuses on those in which theassociated activation patterns express ordinal trends. That is, each pattern -as expressed in task x subject scans-displays a task activity curve that is monotonically increasing with the task parameter for every (or almost every)subject. In circumscribing the activated voxels of a particular component process (the targeted process), theHelmert design matrix is first applied to the neuroimaging data to wholly eliminate activation patterns from thetask x subject scans that express task-independent, subject effects. With the removal of these activation patterns, asecond design matrix is applied to the neuroimaging data, which is based on the second-order stochastic featuresof ordinal trends. This OrT design matrix adds new target identifying information that supplements theinformation provided by outcome variables and mean trend predictions. The OrT matrix enhances the salience ofthe activation patterns that exhibit ordinal trends while diminishing the salience of patterns that do not. The majorsingular images of this OrT/CVA, i.e., the most salient topographic patterns, are tested for statistically significantordinal trend effects. Subsequently, the results of this latter OrT/CVA are combined with outcome variables torecover the best estimate of the activation pattern of the targeted component process. The procedure is the OrTanalog of the behaviorally seeded PLS method (McIntosh et al., 1996).
e1631
Abstracts presented at the 9th International Conference on Functional Mapping of the Human Brain, June 19Œ22, 2003, New York, NY
e1631

Type I errors are tabulated for the new OrT test statistics. In addition the results of Monte Carlo simulations -ofsmall subject samples (10, 11, 12, 13, 14, 15, 16, 17, 18, 19, 20)- quantify the improved accuracy of activationpattern estimation achieved with OrT’s augmented target identifying information. Applications to PET and fMRIdata obtained from studies of visuomotor adaptation and visual object recognition, respectively, demonstrate thestatistical power of OrT in real data sets that involve complex regional covariance structures, but modest numbersof subjects.
Order of appearance: 837
AbsTrak ID: 18425
e1632
Abstracts presented at the 9th International Conference on Functional Mapping of the Human Brain, June 19Œ22, 2003, New York, NY
e1632
Poster number: 845
Long-range, linear and nonlinear intercortical interactions duringcognitive tasks evaluated using MEG beamformers
A. Hadjipapas*, G.R. Barnes*, I.E. Holliday*, G.M.J. Rippon*
*The Wellcome Trust Laboratory for MEG Studies, Neurosciences Research Institute, Aston University,Birmingham B4 7ET
†
Modeling & Analysis
Abstract
Background:
We have previously demonstrated that frequency specific, focal, task- related changes in cortical power werespatially coincident with BOLD- fMRI responses for the same cognitive task. Furthermore these power changesduring cognitive tasks could be examined at a millisecond time scale by time-frequency spectrograms at selectedcortical locations (1). We now aim to look for frequency specific interactions between the active areas duringvarious cognitive tasks. One influential approach to intercortical interactions, the synchronization hypothesis (2),has been proposed as a universal coding mechanism. At the level of large-scale cortical networks this is termedphase synchronization or phase locking (2). A second, dynamical approach, considers the changes in dynamicemergence and disruption of synchrony as the substrates of the neural code (3, 4) as the brain evolves in itscoordination dynamics (3). From this perspective the brain is in a metastable regime between functionalintegration and functional segregation of inputs (3, 4), where phase transitions among brain areas seem to befunctionally significant (3, 4). We now aim to examine these hypotheses by analyzing intercortical coherence andphase relationships in human MEG-data acquired during a delayed face recognition task.
Methods:
We estimate the time series of electrical activity in areas of major task related activity using Synthetic ApertureMagnetometry (1), compute the magnitude squared coherence pairwise between them and estimate theinstantaneous phase differences as a function of time (5, 6). Their first derivative can then be utilized as a markerof phase transitions in the intercortical interactions.
Results:
Preliminary results suggest that the cortical topography, the time window and the frequency bands of theintercortical interactions are consistent with an invasive intracranial recording study conducted with an identicalbehavioural paradigm (7). Areas that become significantly more coherent than the baseline in our studyconsistently seem to involve the Lateral Occipital Complex and the Anterior Cingulate in both hemispheres asareas of major intercortical communication. Interactions seem to take place in the theta, beta and gamma bands.
References
1. Singh, K.D. et al. (2002) Task-related changes in cortical synchronisation are spatially coincident with thehaemodynamic response. NeuroImage 16, 103–114.2. Varela, F. et al. (2001) The brainweb: phase synchronization and large-scale integration. Nat. Rev. Neurosci. 2, 229–2393. Bressler, S. L. & Kelso, J. S. A. (2001) Cortical coordination dynamics and cognition. Trends Cogn. Sci. 5,
e1633
Abstracts presented at the 9th International Conference on Functional Mapping of the Human Brain, June 19Œ22, 2003, New York, NY
e1633

26–364. Friston, K. J. (2000) The labile brain. II. Transients, complexity and selection, Phil.Trans. R. Soc. Lond. B 355, 237-2525. Le Van Quyen, M. et al. (2001) Comparison of Hilbert transform and wavelet methods for the analysis ofneuronal synchrony, Journal of Neuroscience Methods 111, 83-986. Gross, J. et al. (2001) Dynamic Imaging of Coherent Sources: Studying neural interactions in the human brain,Proc.Natl. Acad.Sci.USA, Vol.98, Issue 2, 694-6997. Klopp, J. et al. (2000) Early widespread cortical distribution of coherent fusiform face selective activity, HumBrain Mapp Dec; 11(4): 286-93
Order of appearance: 838
AbsTrak ID: 18306
e1634
Abstracts presented at the 9th International Conference on Functional Mapping of the Human Brain, June 19Œ22, 2003, New York, NY
e1634
Poster number: 846
Effect of Temporal Variability of BOLD Hemodynamic Responses onStatistical Analysis
Daniel A. Handwerker*†, John M. Ollinger*, Mark D’Esposito*
*Henry H. Wheeler Brain Imaging Center, Helen Wills Neuroscience Institute, University of California at Berkeley
†Bioengineering Group, UC Berkeley & UC San Francisco
Modeling & Analysis
Abstract
Abstract:
The shape of the BOLD hemodynamic response function (HRF) varies across subjects and regions. [1, 2] Whenan analysis uses an estimate of an HRF to model expected BOLD responses, differences between the estimatedand actual HRF will affect the results. Current research often uses linear models containing an HRF estimate andits first derivative to estimate significance and small temporal shifts in neural activity. [3] This same method mayalso model variations in BOLD signal across subjects or brain regions. In this study, empirical data andsimulations are used to characterize observed temporal variations and how well the HRF plus derivative modelexplains them. The method successfully modeled small variations, but was less accurate with larger, observed variations.
Methods:
Seventeen subjects performed a quick saccade and button press when a flickering checkerboard appeared on thescreen. This generated similar hemodynamic responses in primary visual cortex, primary motor cortex, frontal eyefields, and supplementary eye fields. Data were collected on a 4 Tesla Varian INOVA MR scanner using a 2-shotgradient echo EPI sequence with a 1.1, 1, or 0.55 second single shot TR. Interpolation was used to yield a timeseries following the single-shot sampling rate. A Fourier basis set was used in the general linear model (GLM) tofind shape-independent activity. [4] Significant voxels were averaged to estimate an HRF for each subject and region.
The range of temporal variability was measured and used in simulations. The models contained either one of theestimated HRFs and its first derivative or the SPM canonical HRF [5] and its first derivative. The simulated datacontained the estimated HRFs with temporal shifts. GLM results were examined to characterize the accuracy ofestimated signal magnitudes and temporal shifts.
Results and Discussion:
Marked variability was found in the shape of the HRF between subjects. The time-to-peak of each subject’s HRFderived from the motor cortex was usually within 1 second of the time-to-peak of the subject’s HRFs from otherregions. The canonical HRF time-to-peak was usually within 1.5 seconds of the estimated time-to-peak of theempirically derived HRFs from all regions. For the motor cortex and the canonical HRF the largest differencesfrom the other HRFs was 2.5 seconds. When the latency difference between the model’s and the simulated data’sHRFs were less than 1 second, most simulations showed reasonable magnitude and temporal shift estimates.When the latency difference reached 2 seconds, the magnitude and shift estimates were often inaccurate. Thus, weconclude that statistical models using a single canonical HRF and its temporal derivative may not accuratelymodel regional and subject variability. If an estimate of the HRF is used in a statistical model, these results
e1635
Abstracts presented at the 9th International Conference on Functional Mapping of the Human Brain, June 19Œ22, 2003, New York, NY
e1635

suggest that the estimate must be as accurate as possible.
References
1. Aguirre, G.K., et al., Neuroimage, 1998, 8(4): p. 360-9.2. Miezin, F.M., et al., Neuroimage, 2000. 11(6 Pt 1): p. 735-59.3. Henson, R.N., et al., Neuroimage, 2002. 15(1): p. 83-97.4. Josephs, O., et al., Human Brain Mapping, 1997,5(4): p. 243-248.5. Friston, K., et al., Statistical Parametric Mapping, (1999).
Order of appearance: 839
AbsTrak ID: 18307
e1636
Abstracts presented at the 9th International Conference on Functional Mapping of the Human Brain, June 19Œ22, 2003, New York, NY
e1636
Poster number: 847
ICA of fMRI based on a convolutive mixture model
Lars Kai Hansen
Informatics and Mathematical Modelling, Technical University of Denmark, email: [email protected]
Modeling & Analysis
Abstract
The fMRI signal has many sources: Stimulus induced activation, other brain activations, confounds includingseveral physiological signal components, the most prominent being the cardiac pulsation at about 1 Hz, andbreathing induced motion (0.2-1 Hz). Most fMRI data sets are acquired at sampling frequencies 0.2-0.5 Hz, hencethe heart and breathing signals are aliased and not represented faithfully. Whether the heart signal is aliased ornot, the fMRI signal is of a complicated spatio-temporal nature and is consequently approached by many differentsignal processing strategies. Global linear dependencies can be probed by independent component analysis (ICA)based on higher order statistics or spatio-temporal properties. With ICA we separate the different sources of thefMRI signal. ICA can be performed assuming either spatial or temporal independency. A major challenge withprevious independent component analyses is the convolutive nature of the mixing process in fMRI. In temporalICA we assume that the measured fMRI response is an instantaneous, spatially varying, mixture of independenttime functions. However, the convolutive structure of the hemodynamic response implies that the fMRI responseat a given time is the weighted sum of previous activation in the same location for say 10 secs or more. Similarly,the spatial structure of the hemodynamic response implies that neighboring regions activity “spill over” and giverise to a spatially convolutive mixing relevant for spatial ICA. Convolutive ICA has many computationalproblems and no standard solution is available. In this study a new predictive estimation method is used forfinding the mixing coefficients and the source signals of a convolutive mixture and it is applied in temporal mode.The mixing is represented by “mixture coefficient images” quantifying the local response to a given source at acertain time lag.
This is the first communication to address this important issue in the context of fMRI ICA.
Data: A single slice holding 128x128 pixels and passing through primary visual cortex was acquired with a timeinterval between successive scans of TR=0.333 msec. This sampling frequency is high enough to allow faithfulrepresentation of the heart signal. Visual stimulation in the form of a flashing annular checkerboard pattern wasinterleaved with periods of fixation. A run consisting of 30 scans of fixation, 31 scans of stimulation, and 60 scansof post-stimulus fixation was repeated 10 times (data acquired by Dr. Egill Rostrup, Hvidovre Hospital, DK).
Results
We apply a model with time lags 0-39*TR (=13sec), requiring 40 mixing coefficient images. In the figure weshow the 40 images for the temporal component most related to the stimulus reference function. The lower midpart of the images shows the visual areas that are (anti)correlated in (blue)red superimposed on the grand averagefMRI image. The red colored regions show increased activation when stimulation sets in. The temporal structureof the response images (left to right, starting with zero lag in the upper left corner) shows the characteristic quickresponse build up, followed by a negative undershoot which is visible towards the end of the image sequence.
e1637
Abstracts presented at the 9th International Conference on Functional Mapping of the Human Brain, June 19Œ22, 2003, New York, NY
e1637
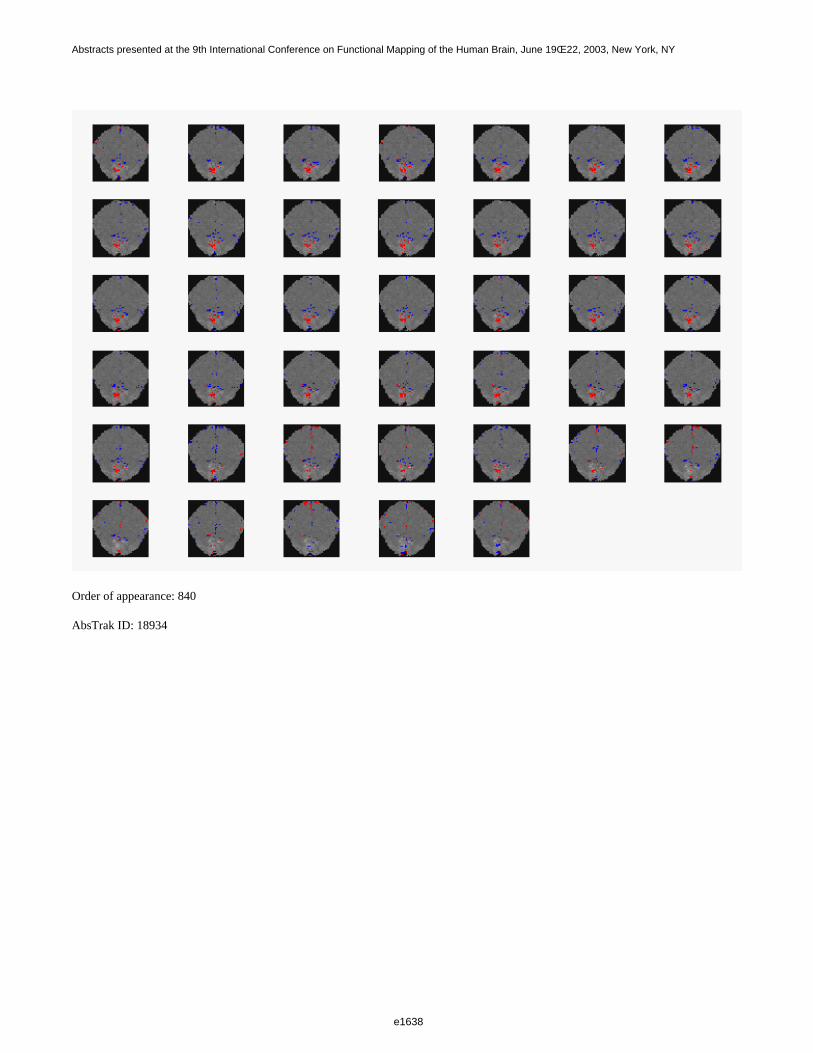
Order of appearance: 840
AbsTrak ID: 18934
e1638
Abstracts presented at the 9th International Conference on Functional Mapping of the Human Brain, June 19Œ22, 2003, New York, NY
e1638
Poster number: 848
Internet Brain Volume Database
Christian Haselgrove*, David Kennedy*†
*Center for Morphometric Analysis, Department of Neurology, MGH†Department of Radiology, MGH
Modeling & Analysis
Abstract
The neuroinformatics landscape in which human brain morphometry occurs has advanced dramatically over thepast few years. We are actively developing neuroinformatics tools which span a number of important areas in thislandscape. These include a website to facilitate the testing, validation and comparison of neuroanatomic imageanalysis tools, the Internet Brain Segmentation Repository (IBSR - http://neuro-www.mgh.harvard.edu/cma/ibsr/);an analysis tools database, the Internet Analysis Tools Registry (IATR - http://www.cma.mgh.harvard.edu/tools);and a database of brain volumetric results, the Internet Brain Volume Database (IBVD - http://www.cma.mgh.harvard.edu/ibvd/).
Initial prototype development has been performed for the creation of the IBVD. For feasibility testing, thedatabase has been initially created and tested using data obtained from the many studies already performed to datein our laboratory and a sampling of data derived from the published literature. The database supports results fromboth groups of individuals and individuals themselves. Specifically as of this writing, 80 publications,encompassing 209 subject groups, 1127 volumetric observations in these groups, spanning 25 clinical diagnosticcriteria are entered. In addition, 1660 individuals have been entered for which there are 7323 individual structuralvolume entries. These volume measurement cover a wide range of anatomic structures (37 discrete structures),from total brain volume, to subcortical nuclei. Extensions to include different species, as well as post mortem datahave been implemented.
The functionality of this database has been tested regarding its facilitation of a number of classes of query thatwould otherwise be quite difficult. For a given structure in the normal population and across the adult age range,what is the similarity of volumetric results obtained from different labs using different methods? What is theoverall group volume time course of volumetric development of various structures from childhood to old age?What is the relationship between the observed pathological effect sizes for various volumetric measures relative tothe variation of group volumes across age and measurement methodology? What is the nature of the relationshipbetween individual data and group data both within and between acquisition and analysis methods? These querieshave dramatic impact on the feasibility and power of within and between group analysis in multisite studies.
While much data has been entered manually to start, automated bulk data entry functions are now in place whichpermit rapid entry of vast sources of data. Efforts are on going to encourage outside users to reposit data into thissystem in a prospective fashion. Also, linkages of this database with other related databases of raw and processedimage and other morphometric results are also underway. Supported by Human Brain Project grant NS034189.
Order of appearance: 841
AbsTrak ID: 18979
e1639
Abstracts presented at the 9th International Conference on Functional Mapping of the Human Brain, June 19Œ22, 2003, New York, NY
e1639
Poster number: 849
Validating Cluster Size Inference: Random Field and Permutation Methods
Satoru Hayasaka, Thomas E Nichols
Department of Biostatistics, The University of Michigan, Ann Arbor, USA
Modeling & Analysis
Abstract
Introduction
The standard cluster size test based on random field (RF) theory [1,2] requires various assumptions, includingsmooth images and a high threshold. However, there only exists a vague guideline for image smoothness [3] andit is not well understood whether commonly used thresholds (0.01 or 0.001) are reasonably high. The permutationtest exists [4] as a less stringent alternative to the RF test, but it requires extensive computing resources and cananalyze only simple study designs. Thus, it is reasonable to ask under what conditions which of these tests areappropriate. To answer this, we carried out an extensive validation of both RF and permutation tests by simulatingGaussian and t images. A t image simulation is especially challenging because there is no algorithm to directlygenerate a smooth t image.
Methods
A Gaussian image was simulated by convolving a 104x104x104 Gaussian white noise image with a 3D isotropicGaussian kernel with known smoothness (1.5-12 voxels FWHM). Outer 36 voxels were then truncated in order toavoid non-stationarity, resulting in a 32x32x32 (32768 voxels) image. The RF tests implemented in the SPMpackage [2] and in the fmristat package [5] were applied to the resulting image at different thresholds (0.01,0.001, and 0.0001) with 0.05 significance level.
A t image was generated from two groups of Gaussian images (5, 10, and 15 in each group) as a two-sample tstatistics image. The RF tests in SPM and fmristat, as well as the permutation test implemented in the SnPMtoolbox [4] with 100 permutations were applied to the resulting t image at different thresholds (0.01, 0.001, and0.0001) with 0.05 significance level.
In both simulations, 3,000 realizations were generated and rejection rates were recorded.
Results
The RF tests were found conservative in both Gaussian (Figure 1) and t (Figure 2) simulations, which isconsistent with previous studies [6,7]. These tests were particularly conservative under low smoothness and lowthresholds. Furthermore, the tests became more conservative as df increased in the t simulation.
The permutation test performed well (Figure 2), with its rejection rates close to 0.05 significance level, as long asimages are smooth (FWHM>=3). For low smoothness, 0.05 rejection rate was not attainable due to discretenessamong cluster sizes, but the p-values were accurate; for example, with no smoothing, for cluster size 5 with df=28at 0.01 threshold, p-values were 0.045 for the truth, 0.048 for the permutation, and 0.756 for SPM.
e1640
Abstracts presented at the 9th International Conference on Functional Mapping of the Human Brain, June 19Œ22, 2003, New York, NY
e1640
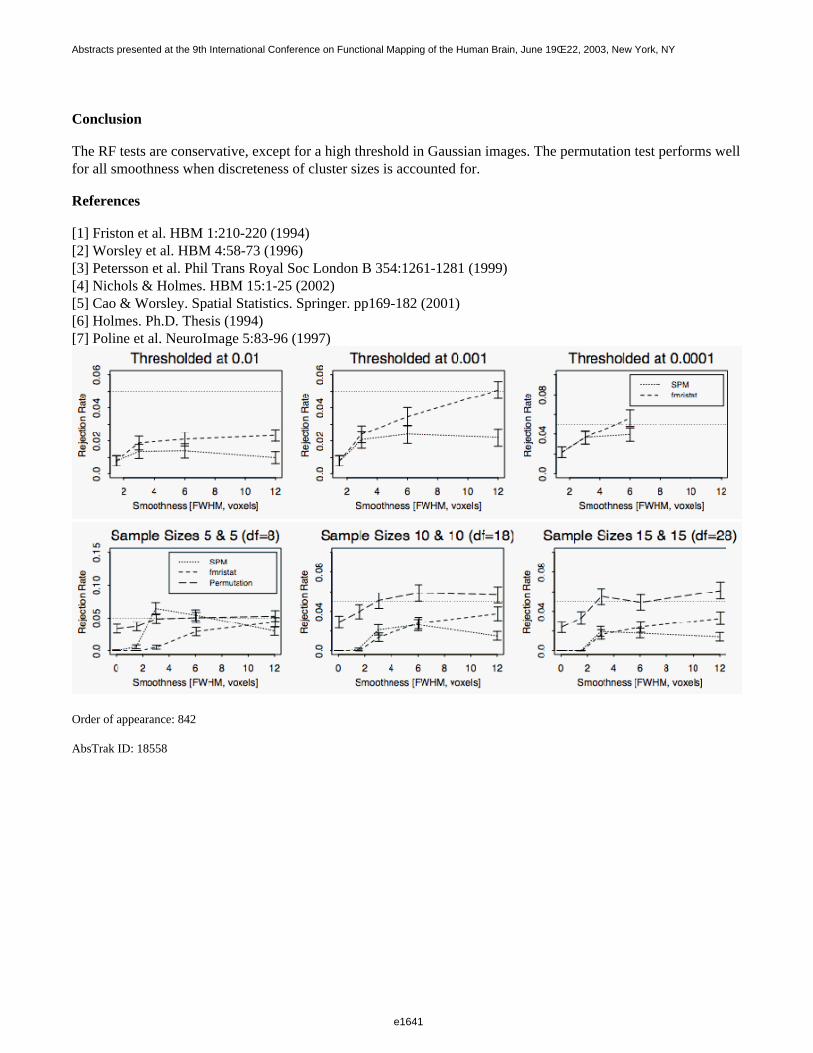
Conclusion
The RF tests are conservative, except for a high threshold in Gaussian images. The permutation test performs wellfor all smoothness when discreteness of cluster sizes is accounted for.
References
[1] Friston et al. HBM 1:210-220 (1994)[2] Worsley et al. HBM 4:58-73 (1996)[3] Petersson et al. Phil Trans Royal Soc London B 354:1261-1281 (1999)[4] Nichols & Holmes. HBM 15:1-25 (2002)[5] Cao & Worsley. Spatial Statistics. Springer. pp169-182 (2001)[6] Holmes. Ph.D. Thesis (1994)[7] Poline et al. NeuroImage 5:83-96 (1997)
Order of appearance: 842
AbsTrak ID: 18558
e1641
Abstracts presented at the 9th International Conference on Functional Mapping of the Human Brain, June 19Œ22, 2003, New York, NY
e1641
Poster number: 850
Anatomical constraints applied to MEG beamformers.
A. Hillebrand*, G.R. Barnes
The Wellcome Trust Laboratory for MEG Studies, Neurosciences Research Institute, Aston University,Birmingham, UK. *[email protected]
Modeling & Analysis
Abstract
Synthetic Aperture Magnetometry1 (SAM) is a beamformer approach for the localisation of neuronal activityfrom EEG/MEG data. SAM estimates the optimum orientation of each source in a pre-defined sourcespace by anon-linear search for the orientation that maximises the beamformer output. However, MEG is most sensitive tocortical sources2 and most of the dendrites of the pyramidal cells are oriented perpendicular to the cortical surface3 . The reconstructed neuronal activity can therefore reasonably be constrained to the cortical surface,orientated perpendicular to it, therefore removing the search for the optimum orientation for the computation ofthe beamformer weights. We will compare the performance of a constrained and unconstrained beamformer withrespect to the localisation accuracy of the source reconstructions and the spatial resolution.
Methods
Fifty sources were randomly placed on a cortical surface estimated from an MRI, and we simulated data with 13different signal-to-noise ratios (SNRs) for each source. Both an unconstrained beamformer (SAM) and aconstrained beamformer (with the sources orientated perpendicular to the cortical surface) were applied to thesedatasets in order to reconstruct the source activity onto the cortical surface, resulting in 13 separate images ofsource activity (SPMs). The localisation error was determined as the Euclidean distance between the targetsources and the peaks in the SPMs. Additionally, the FWHM of these peaks was determined. The influence oferrors in the estimation of the surface normals and surface location on the performance of the constrainedbeamformer, representing MEG/MRI co-registration and segmentation errors, were also examined.
Results and Conclusions
The spatial resolution of the beamformer improves by applying anatomical constraints, as the constraints force thelead fields of neighbouring voxels to be more dissimilar, resulting in a reduced correlation between the weightsand therefore an improved spatial resolution4 . However, the advantage in spatial resolution disappears whenerrors are introduced in the orientation and location constraints, and, moreover, the localisation accuracy of theinaccurately constrained beamformer degrades rapidly. We conclude that applying anatomical constraints to abeamformer is only advantageous if the MEG/MRI co-registration error is smaller than 2mm and the error in theestimation of the cortical surface orientation is smaller than 10°.
References
1. Robinson, S. E. and Vrba, J. 1999. Functional Neuroimaging by Synthetic Aperture Magnetometry (SAM) InRecent Advances in Biomagnetism (Yoshimoto, T., Kotani, M., Kuriki, S., Karibe, H. and Nakasato, N., Eds.),pp. 302-305. Tohoku University Press, Sendai.2. Hillebrand, A. and Barnes, G. R. 2002. A quantitative assessment of the sensitivity of whole-head meg toactivity in the adult human cortex. NeuroImage 16: 638-650.3. Okada, Y. 1982. Neurogenesis of evoked magnetic fields. In Biomagnetism: An Interdiciplinary Approach(Williamson, S., Romani, G. L., Kaufman, L. and Modena, I., Eds.), pp. 399-408. Pergamon Press, New York.
e1642
Abstracts presented at the 9th International Conference on Functional Mapping of the Human Brain, June 19Œ22, 2003, New York, NY
e1642

4. Barnes, G. R. and Hillebrand, A. 2003. Statistical flattening of MEG beamformer images. Hum. Brain Mapp.18 (1): 1-12.
Order of appearance: 843
AbsTrak ID: 18725
e1643
Abstracts presented at the 9th International Conference on Functional Mapping of the Human Brain, June 19Œ22, 2003, New York, NY
e1643
Poster number: 851
Modeling effective connectivity by state-space models in fMRI experiments
Moon-ho Ringo Ho*, Hernando Ombao†
*Department of Psychology, University of Illinois at Urbana-Champaign†Department of Statistics, University of Illinois at Urbana-Champaign
Modeling & Analysis
Abstract
(A)Background
Two common approaches, structural equation modeling (SEM) and time-varying parameter regression (TVPR),have been used in the fMRI literature for modeling effective connectivity (EC). Usually in SEM, a within-subjectcovariance matrix of the regions-of-interest (ROI) is derived and a path model is then fitted to this matrix. Alimitation of this approach is the temporal autocorrelation in the data is ignored and path coefficients (as ameasure for EC) are assumed to be time-invariant. On the other hand, TVPR relaxes such assumption and allowstime-varying EC but extension to handle multiple ROIs has not been discussed. Both SEM and TVPR usedobserved fMRI signals in EC analysis, which have the noise confounded in these signals. In this paper, wepropose a new class of time-series models which can (1) handle multiple ROIs, (2) use the BOLD signal withoutnoise confounded, (3) allow modeling autocorrelation, (4) allow EC to vary over different experimentalconditions, (5) integrate both the general linear model used in ‘activation studies? (which look for the ?hot spots?of the brain in performing a particular mental task) and effective connectivity analysis together into one single model.
(B)Method
The proposed model consists of two set of equations, namely, activation equation and connectivity equation.Activation equation is same as the general linear model used in activation studies except the stimulus-relatedregression coefficients are allowed to be time-varying. This time-varying regression coefficients are allowed tochange as a linear function of the BOLD history from the same or other brain regions in the connectivityequations. This new model has a state-space representation and can readily be estimated by maximum likelihoodthrough Prediction Error Decomposition.
(C)Analysis and Results
We illustrate our model by testing an attentional control network hypothesis based on Frith (2001) using a fMRIStroop task experiment. Frith (2001) argued there are two types of selection processes, bottom-up and top-downprocessing in our brain. Bottom-up selection is purely driven by the competing intrinsic features of the stimuluswhile top-down selection favors selection of the task-relevant stimulus features. Such top-down coordination ofneural activity is called attentional control. Attentional control is hypothesized to be implemented by biasing ofselection processes within working memory through (i) amplifying neural activity within system(s) processingtask-relevant feature(s) and/or (ii) dampening neural activity within system(s) processing task-irrelevantfeature(s). Three ROIs were selected representing (1) system processing task-relevant stimulus feature [shape];(2) system processing task-irrelevant stimulus feature [ink color]; (3) source of top-down selection process, to testthis hypothesis based on a block-designed fMRI experiment. Ten subjects first learned to name three unfamiliarshapes with three color labels. Then they were asked to name with the corresponding color labels in the learningphase sub-vocally. Eighteen neutral trials (shape printed in white color) followed by 18 interference trials (shape
e1644
Abstracts presented at the 9th International Conference on Functional Mapping of the Human Brain, June 19Œ22, 2003, New York, NY
e1644

printed in an ink color incongruent with the color used to name the shape) were presented alternatively for 6times. Mechanism (ii) (i.e., dampening in task-irrelevant processing system) is supported from the analysis but notfor mechanism (i).
Order of appearance: 844
AbsTrak ID: 18842
e1645
Abstracts presented at the 9th International Conference on Functional Mapping of the Human Brain, June 19Œ22, 2003, New York, NY
e1645
Poster number: 852
A Template Method for Combining Neural Networks Across Subjects
Raymond Hoffmann*, Robert Risinger*, Thomas Ross†, Natalia Lawrence‡, Thomas Hoffmann§, Elliot Stein†
*Medical College of Wisconsin†Neuroimaging Research Branch, NIDA-IRP
‡London Institute of Psychiatry§University of Wisconsin
Modeling & Analysis
Abstract
Introduction
Structural Equation Modeling (SEM) is often used to determine the connections between activated regions whenperforming a network analysis (1). Interaction terms can be used to identify modulating regions (2). Differencesin the neural pathways between groups of subjects are used to identify pathology. However, the model is usuallypresented as a single number with no indication of the variability of the model among subjects. Moreover, theSEM literature has no methods available for displaying the variability between subjects. This study presents anovel method for combining the results of fitting an SEM to a global template for each subject and presenting thevariability in the connections across subjects.
Methods:
24 nonsmokers were imaged with a 3T Bruker Medspec scanner with contiguous 4 mm sagittal slices was usedwith a blipped gradient-echo, echo-planar pulse sequence (TE=27.2 ms, TR=6000 ms). Subjects performed 8blocks composed of 90 seconds RVIP task (3) plus 90 seconds of visuomotor task plus 30 seconds of rest. Datawas processed with AFNI 2.2 after performing motion correction and edge detection. Functional ROI weredetermined in standard stereotaxic space (Talairach-Tourneaux) by regions differentially activated (3). A modelfor parietal cortico-cortical connectivity (5) and the connections expected from the RVIP attention task (6) wasused to determine the template for the SEM analysis. SAS proc Callis was used to obtain the SEM maps for eachsubject according to the template. A Bayes model with noninformative priors was used to estimate the posteriordistributions for the template(4) of the standardized path coefficients based on the individual subject data.
Results:
The figure shows some of the different posterior densities estimated across subjects. The Right Prefrontal to R.Posterior Parietal is strong and consistent across subjects (mode at 0.75 ) The R. Posterior Parietal to SMA showsa similar result with a mode at 0.64. On the other hand, the R. Posterior Parietal to the Posterior Cingulate, showssubstantial variability across subjects with a mode of 0.13; although a few subjects have a strong connection here,the global template shows no significant connectivity. The R. Posterior Parietal to R. Occipital shows two modesat 0.32 and 0.47, possibly indicating a mixture of two (slightly) different types of subjects.
Conclusions:
The posterior densities can be used to estimate and display the variability of the template among the subjects in astudy. Bimodal distributions can serve as means to identify different subpopulations of subjects or to indicatechanges in the strength of the connection during administration of a medication or an addictive drug. Using
e1646
Abstracts presented at the 9th International Conference on Functional Mapping of the Human Brain, June 19Œ22, 2003, New York, NY
e1646
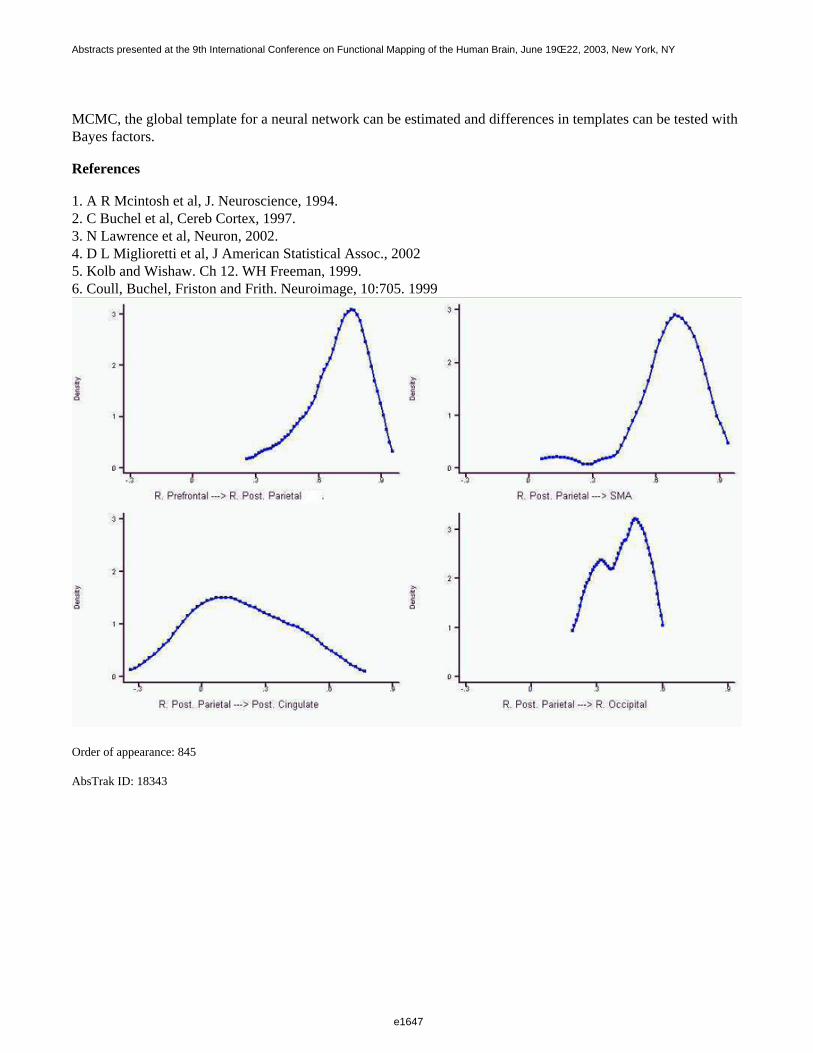
MCMC, the global template for a neural network can be estimated and differences in templates can be tested withBayes factors.
References
1. A R Mcintosh et al, J. Neuroscience, 1994.2. C Buchel et al, Cereb Cortex, 1997.3. N Lawrence et al, Neuron, 2002.4. D L Miglioretti et al, J American Statistical Assoc., 20025. Kolb and Wishaw. Ch 12. WH Freeman, 1999.6. Coull, Buchel, Friston and Frith. Neuroimage, 10:705. 1999
Order of appearance: 845
AbsTrak ID: 18343
e1647
Abstracts presented at the 9th International Conference on Functional Mapping of the Human Brain, June 19Œ22, 2003, New York, NY
e1647
Poster number: 853
Comparison of flow and BOLD responses during sensory stimulation,cognitive tasks, and hypercapnia
Richard Hoge*, Andrew Binks†, Shakeeb Moosavi†, Robert Banzett†, Carsten Warmuth*, Joseph Mandeville*
*Martinos Center for Biomedical Imaging, Charlestown USA†Harvard School of Public Health, Boston USA
Modeling & Analysis
Abstract
It has been observed that the magnitude of BOLD signal change produced by cognitive tasks is often smaller thanthat associated with primary sensory input such as visual stimulation. While it is likely that much of thisdifference is due to smaller focal increases in blood flow during cognitive loads, it may also reflect higher restinglevels of deoxygenated hemoglobin in primary sensory regions of the cortex. It is also possible that primarysensory areas exhibit an enhanced capacity for perfusion increase. Both of the latter scenarios are potentialsources of bias when comparing responses in different brain regions.
The goal of this study was to investigate the role of vascular reactivity and baseline deoxyhemoglobin levels indeterming the regional sensitivity of BOLD effects. This was achieved by using MRI to measure BOLD signalchanges during both cognitive and sensory tasks and also during hypercapnia. Hypercapnia (elevated blood CO2 )
provides a means of producing globally uniform increases in cortical blood flow with minimal collateralphysiological impact in most brain areas [1] (some regions are activated by respiratory sensation [2]). Byexamining CO2 -induced changes in BOLD signal in different brain regions, BOLD effects produced by a specific
flow change can be compared and potential bias revealed. In this study, CO2 -induced BOLD signals in a primary
sensory area (primary visual cortex) were compared with those in regions activated by a 2-back working memory task.
BOLD imaging (Siemens TRIO 2.9T TR/TE=3s/30ms) was performed on subjects during scans of six minutesduration in which they performed the memory task over three one minute blocks, and also during 11 minute scansin which their end-tidal CO2 was raised by 10mmHg in two blocks lasting three minutes each. For the memory
task, a sequence of random integers was presented and subjects asked to indicate whether a given numbermatched the one shown before the preceding one (i.e. two back). The baseline condition consisted of thezero-back version of the same task. Two subjects also underwent visual stimulation with a high contrast radialcheckerboard pattern modulated at 8Hz.
Activation images and estimated effect sizes were obtained by fitting a linear signal model to the data [3]. For then-back memory task the value of n as a function of time was used as the effect component of the model, while forthe hypercapnia scans the change in ETCO2 used as used. Estimated effect sizes for visual stimulation, the
memory task, and hypercapnia were converted to percent change and values in visual cortex compared with thoseseen in dorsolateral prefrontal regions activated by the memory task.
The BOLD effect size produced in dorsolateral prefrontal foci by the working memory task was significantlysmaller than that seen in activated visual cortex (1.5% for memory vs. 3.3% for visual). The CO2 -induced effects
did not differ significantly in the two regions (3.4% memory vs. 3.9% visual ), however. These observationssuggest that the smaller amplitude of the cognitive response is due primarily to a weaker neural response and not
e1648
Abstracts presented at the 9th International Conference on Functional Mapping of the Human Brain, June 19Œ22, 2003, New York, NY
e1648

differences in vascular reactivity or baseline levels of deoxygenated hemoglobin. We are currently working toincorporate arterial spin-labelling into these experiments in order to quantify the changes in perfusion producedby these and other stimuli.
References
1. Bandettini et al. NMR Biomed 1997 10(4, 5):197-2032. Banzett et al. Neuroreport 2000 11(10):2117-203. Worsley et al. NeuroImage. 1995 2(3):173-81
Order of appearance: 846
AbsTrak ID: 17954
e1649
Abstracts presented at the 9th International Conference on Functional Mapping of the Human Brain, June 19Œ22, 2003, New York, NY
e1649
Poster number: 854
Parametric design and correlation analysis to integrate fMRI and ERPdata in a high-level visual component paradigm
Silvina G. Horovitz*, Bruno Rossion†, Pawel Skudlarski§, John C. Gore‡
*Faculty of Engineering -Yale University†Unite de Neurosciences Cognitives - Universite Catholique de Louvain
‡Institute of Imaging Science and Department of Radiology and Radiological Sciences - Vanderbilt University§Diagnostic Radiology - Yale University
Modeling & Analysis
Abstract
Introduction
Different neuroimaging techniques have different advanatges and characteristics. EEG or MEG recordingspossess excellent time resolution (’when’), of the order of milliseconds, but the information obtained onlocalization is poor. Conversely, using metabolic or hemodynamic measurements, such as PET or fMRI, goodlocalization (’where’) is obtained but the time resolution is intrinsically limited. Therefore, integration of thesedifferent modalities may have value. Our approach to integration is to use parametric studies, wherein theamplitude of a particular ERP is modulated by the task design. These amplitudes are then applied as regressors tofind activations in the fMRI data set. We have previously showed that ERP and fMRI data could be integratedusing parametric designs and analyses in an oddball paradigm(1). The goal of this work was to test and extend themethod to high level visual responses. Face perception is typically associated with fusiform gyri activation infMRI and with a N170 peak in ERP studies, yet the exact sources of the N170 are debated. Jemel et al. (2) showedthe amplitude of the N170 monotonically decreases as gaussian noise is added to a picture of a face. We designeda parametric study where the amplitude of the N170 was gradually modulated by the level of noise in a picture,and identified regions where the percent signal change in fMRI correlated with the ERP data.
Method
Subjects viewed pictures of cars and faces with six levels of noise. To allow for a steady fMRI response to bereached at each condition, data were presented in blocks of six events of the same type. The 9.9 second blockswere intermixed pseudorandomly. Data were collected in a 1.5T Signa LX scanner, with single shot gradient EPIsequence (TR/TE: 1650/60 ms, flip angle = 60º, FOV=20 x 20 cm2 and matrix size = 64 x 64, leading to a voxelsize of 3.125 x 3.125 x 7 mm3). EEG recordings were collected with a 32 channels Neuroscan system. The samepresentation was used for EEG data collection in a separate session. Maps of fMRI signal changes wereconstructed for each subject and each condition and these maps were correlated with average N170 amplitude atelectrode P8 of the 10/20 System within subject and finally combined between subjects.
Results
N170 signals were observed for pictures of both cars and faces, but were stronger for faces. A linear decrease wasmainly observed for the N170 at P8 and PO8, but was much less clear on the left hemisphere side and at OZ.Correlation between MRI data and N170 amplitude for faces was significant (p<0.0001) in fusiform gyrus andsuperior temporal gyrus and for cars in fusiform gyrus (p<0.01).
e1650
Abstracts presented at the 9th International Conference on Functional Mapping of the Human Brain, June 19Œ22, 2003, New York, NY
e1650

Conclusions:
This is an example of how ERP information may be used synergistically in fMRI analyses. fMRI parametricdesigns of this type may provide some timing information on fMRI activity and help identify the generators ofERP signals.
References
(1) Horovitz et al. MRI 20 (2002) 319-325. (2) Jemel et al. submitted.
Order of appearance: 847
AbsTrak ID: 17957
e1651
Abstracts presented at the 9th International Conference on Functional Mapping of the Human Brain, June 19Œ22, 2003, New York, NY
e1651
Poster number: 855
An Evaluation of Statistical Parametric Mapping Analysis Based on ICAfor Processing fMRI data
Dewen Hu*, Lirong Yan*, Zongtan Zhou*, Yadong Liu*
*Department of Automatic Control, National University of Defence Technology, Changsha, Hunan 410073,P.R.China. [email protected]
†Supported by NSFC for Distinguished Young Scholars, National Important Basic R&D Preview Project
Modeling & Analysis
Abstract
Introduction:
Statistical parametric mapping(SPM) technique based on general linear model(GLM) has now become a powerfultool for analysis of functional mapping experiments. A particular form or some limited set of basis functions forthe hemodynamic response must be assumed in GLM. However, the assumption of canonical hemodynamicresponse function is not always valid in some situations. For example, the elusive ’initial dip’ is still in dispute.Incorrect or partial assumed shape on the hemodynamic response necessarily produces biased estimates of the trueresponse, resulting in inappropriate inference.
On the other hand, independent component analysis(ICA) has recently become a promising approach to examinethe activities of human brain. The principal advantage is its applicability to cognitive or motor control paradigmsfor which detailed models of brain activities are not available.
Methods and Analyses:
Here an unified approach using the temporal ICA(tICA) in setting the design matrix of GLM model is presentedand evaluated by applying to two sets of fMRI data acquired in motion-control paradigms. A healthy male wasasked to perform the right-hand and the left-hand finger-tapping tasks, respectively. The movement stimulationoccurred in a periodic design consisting of 5 blocks of 20 scans. Each block consisted of 10 baseline scansfollowed by 10 scans acquired during movement stimulation. The whole experiment lasted 312s.
At the first, image data is imported into SPM’99. Spatial transformation is performed to correct body motion. Thestandard SPM is used for the purpose of comparison. Using the reference function and high pass filters to set thedesign matrix, the activation results are shown in Fig.1. Then tICA is used to analyse the latter 80 scans, resultingin 10 independent time courses, which are put into the SPM design matrix. Finally statistical inference isperformed (t-test, p=0.05, corrected) and the results are shown in Fig.2. It is found that the contralateralsensorimotor and premotor areas, supplementary motor areas and ipsilateral premotor areas are activated (Table1), which is consistent with recognized results in cognitive neuroscience literature. The independent time coursesare shown in Fig.3.
Conclusions:
The experiments demonstrate that, combining ICA in model specification, only a little work needs to supervisethe process. Comparing with normal methods, our method doesn’t require averaging data over several task/controlblocks, which makes it more sensitive in detecting transient task-related changes and changes with a shift ofangle. At this point, ICA raises the spatial and temporal resolution of activation location. So it can be predicatedthat ICA would lay the basis of network analysis, which may greatly improve the analysis of dynamic process.
e1652
Abstracts presented at the 9th International Conference on Functional Mapping of the Human Brain, June 19Œ22, 2003, New York, NY
e1652
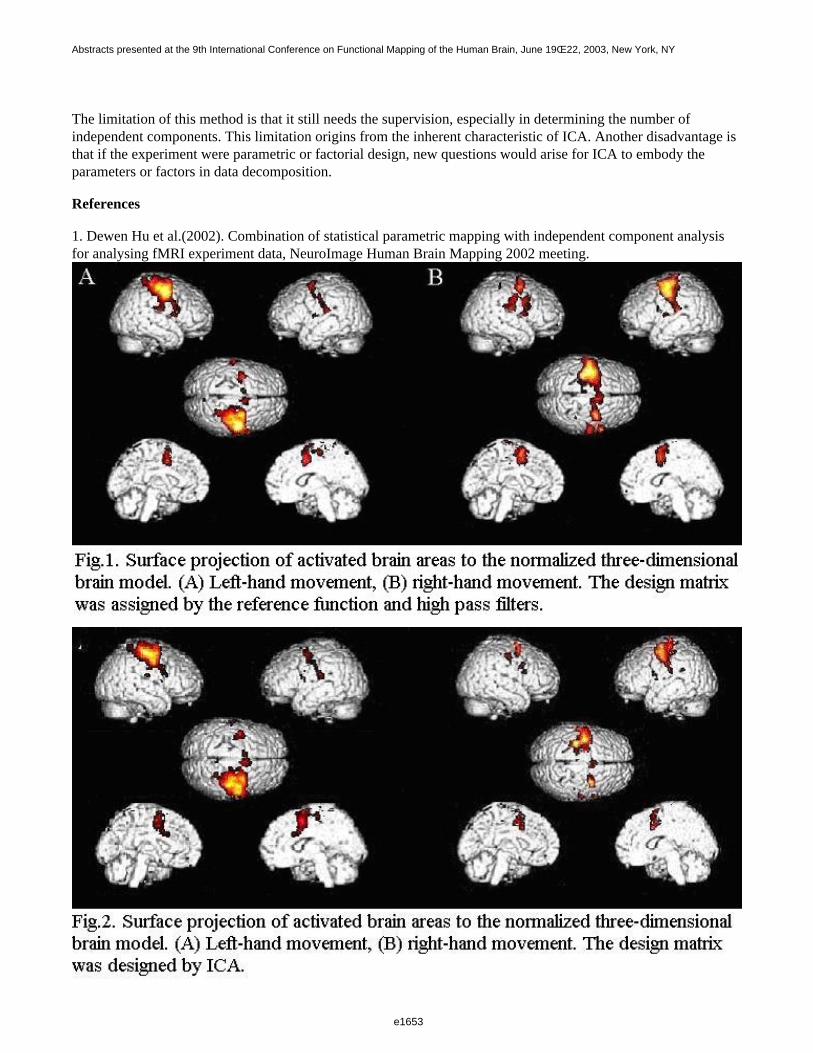
The limitation of this method is that it still needs the supervision, especially in determining the number ofindependent components. This limitation origins from the inherent characteristic of ICA. Another disadvantage isthat if the experiment were parametric or factorial design, new questions would arise for ICA to embody theparameters or factors in data decomposition.
References
1. Dewen Hu et al.(2002). Combination of statistical parametric mapping with independent component analysisfor analysing fMRI experiment data, NeuroImage Human Brain Mapping 2002 meeting.
e1653
Abstracts presented at the 9th International Conference on Functional Mapping of the Human Brain, June 19Œ22, 2003, New York, NY
e1653
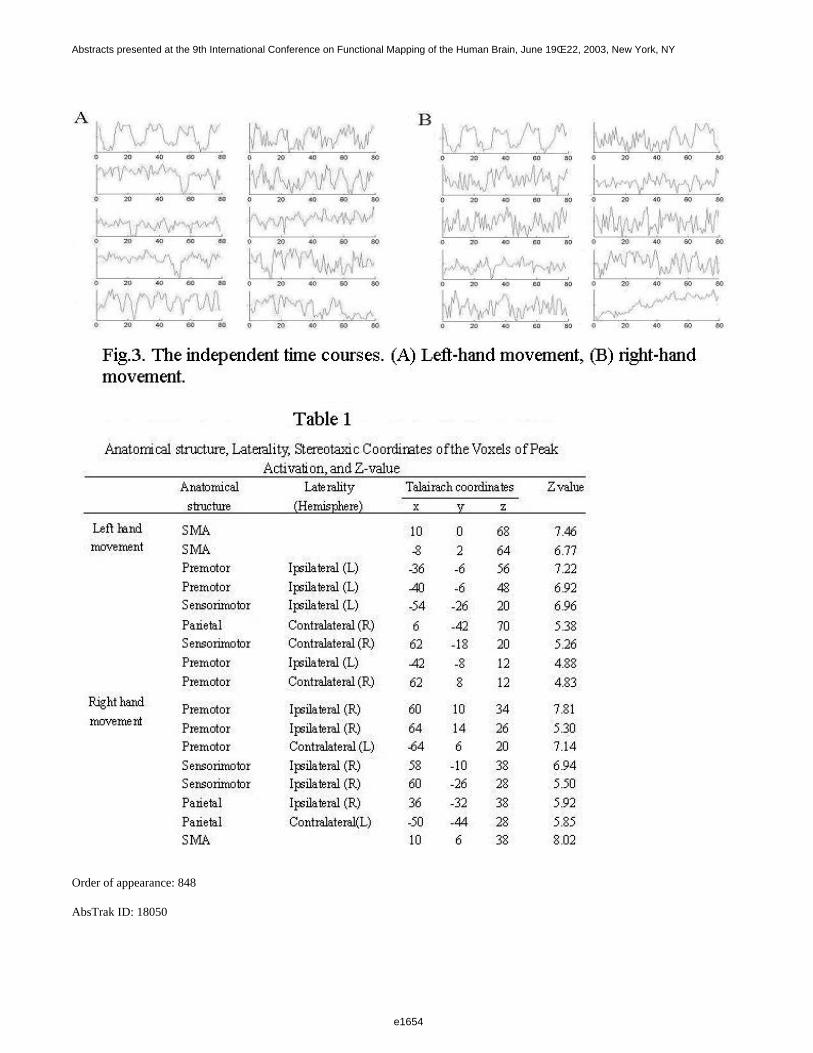
Order of appearance: 848
AbsTrak ID: 18050
e1654
Abstracts presented at the 9th International Conference on Functional Mapping of the Human Brain, June 19Œ22, 2003, New York, NY
e1654
Poster number: 856
Investigating the Medial Prefrontal Cortex with Cortical Flat Mappings
Monica K. Hurdal*, Agatha Lee†, J. Tilak Ratnanather†‡, Tomoyuki Nishino§, Michael I. Miller†‡, Kelly Botteron§§
*Department of Mathematics, Florida State University, Tallahassee, U.S.A.†Department of Biomedical Engineering, Johns Hopkins University, Baltimore, U.S.A.
‡Center for Imaging Science, Johns Hopkins University, Baltimore, U.S.A.§Department of Psychiatry, Washington University School of Medicine, St. Louis, U.S.A.¶Department of Radiology, Washington University School of Medicine, St. Louis, U.S.A.
Modeling & Analysis
Abstract
We are using a pipeline of tools, including cortical flat mapping, to process ventral medial prefrontal and orbitalfrontal cortical regions. There has been accumulating evidence of the role these cortical regions have indepression. Specific limbic circuits involving the medial and prefrontal cortex have been implicated in affectivedisorders such as major depressive disorder or bipolar affective disorder. Structural and functional changes inthese regions have been reported as grey matter volume reduction and differences in blood flow and glucosemetabolism. The highly curved geometry and complicated folding patterns of the MPFC make it an ideal regionto process using cortical flat mapping. Focusing cortical flat mapping efforts on smaller regions of cortex, such asthe medial prefrontal cortex (MPFC), will reduce the large distortions that result from flattening a cortical hemisphere.
Methods
Subjects were young adult female twins who are participants in a larger epidemiological twin imaging studyinvestigating major depression. We performed a number of automated processing steps that form the processingpipeline. Here we report the results of this processing pipeline as applied to the left and right MPFC for three twin pairs.
After data acquisition, a subvolume of the MPFC was extracted for each subject to which all subsequentprocessing methods were performed. We applied a Bayesian segmentation algorithm [1,2] to each of thesesubvolumes so that the grey matter/white matter cortical surfaces could be reconstructed and subsequentlyextracted. The surface topology for each surface was corrected as required and we then applied the Circle Packingquasi-conformal flat mapping algorithm [3,4]. The resulting cortical flat maps were then used to track sulci andgyri and identify anatomical boundaries on the MPFC.
Results and Conclusions
e1655
Abstracts presented at the 9th International Conference on Functional Mapping of the Human Brain, June 19Œ22, 2003, New York, NY
e1655
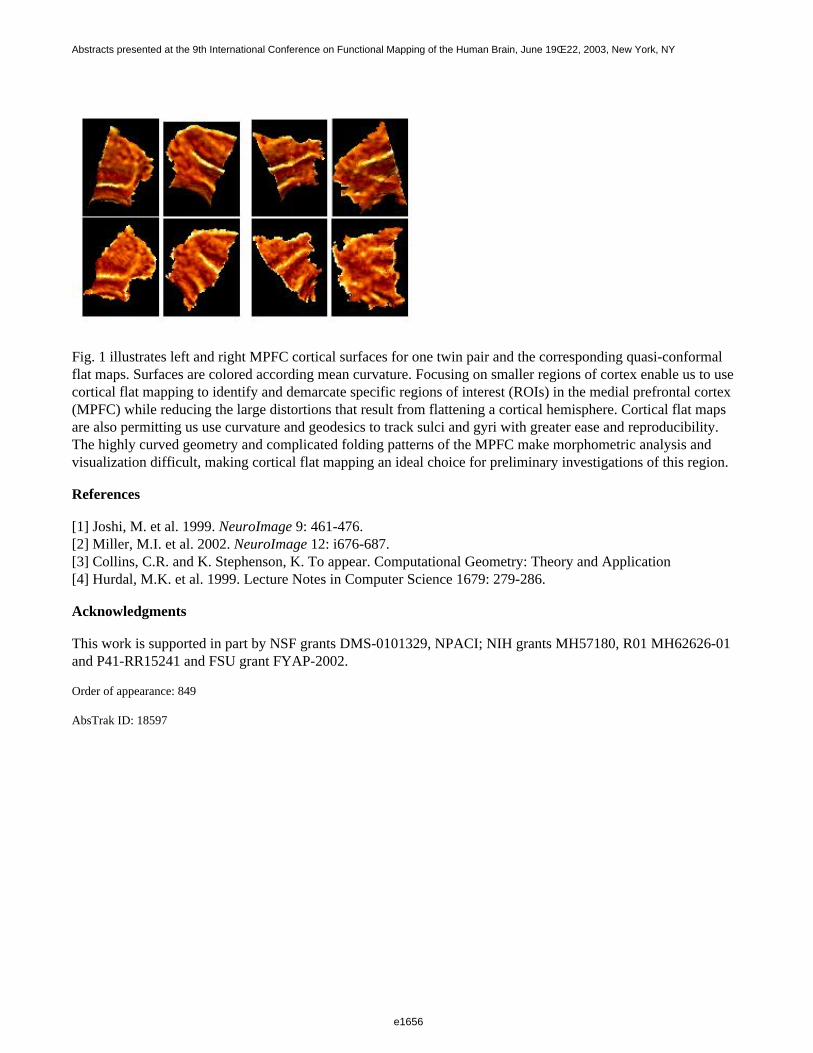
Fig. 1 illustrates left and right MPFC cortical surfaces for one twin pair and the corresponding quasi-conformalflat maps. Surfaces are colored according mean curvature. Focusing on smaller regions of cortex enable us to usecortical flat mapping to identify and demarcate specific regions of interest (ROIs) in the medial prefrontal cortex(MPFC) while reducing the large distortions that result from flattening a cortical hemisphere. Cortical flat mapsare also permitting us use curvature and geodesics to track sulci and gyri with greater ease and reproducibility.The highly curved geometry and complicated folding patterns of the MPFC make morphometric analysis andvisualization difficult, making cortical flat mapping an ideal choice for preliminary investigations of this region.
References
[1] Joshi, M. et al. 1999. NeuroImage 9: 461-476.[2] Miller, M.I. et al. 2002. NeuroImage 12: i676-687.[3] Collins, C.R. and K. Stephenson, K. To appear. Computational Geometry: Theory and Application[4] Hurdal, M.K. et al. 1999. Lecture Notes in Computer Science 1679: 279-286.
Acknowledgments
This work is supported in part by NSF grants DMS-0101329, NPACI; NIH grants MH57180, R01 MH62626-01and P41-RR15241 and FSU grant FYAP-2002.
Order of appearance: 849
AbsTrak ID: 18597
e1656
Abstracts presented at the 9th International Conference on Functional Mapping of the Human Brain, June 19Œ22, 2003, New York, NY
e1656

Poster number: 857
Spatial adaptive signal detection in fMRT
Axel Hutt, Joerg Polzehl
Weierstrass-Institute for Applied Analysis and Stochastics, Mohrenstr.39, 10117 Berlin, Germany
Modeling & Analysis
Abstract
In cognitive neuroscience, noninvasive measurements of brain activity help to understand cognitive mechanisms.While encephalography allows a very good temporal resolution and rather poor neuronal spatial resolution,functional Magnetic Resonance Tomography (fMRT) resolves spatial activity quite well in contrast to temporalresolution. Hence, the traditional primary interest of fMRT is the spatial localization of brain activity. Sincemeasured data are aquired in space and time, the temporal behaviour is assumed stationary, what allows aconvenient dimensionality reduction in time (e.g. [1]). The recently developed method Adaptive WeightsSmooting (AWS)[2] for nonparametric smoothing of spatial activity detects significant activation areas ofarbitrary geometry reducing the temporal dimensionality by a component analysis as Wavelet analysis or Fourieranalysis. First applications to simulated and real data [3] promise an elegant segmentation procedure for detectionand description of spatial activation areas. Applications to simulated and real data illustrate AWS with respect toits dependence on temporal frequency filtering and the optimal choice of the time window. The latter point isrealized by a detection method for temporal non-stationarities[4].
References
[1] K.J. Worsley and K.J. Friston, "Analysis of fMRI time series revisited - again", NeuroImage 2, 173-181 (1996)[2] J. Polzehl and V.G. Spokoiny, "", Functional and dynamic magnetic resonance imaging using vector adaptiveweights smooting, Applied Statistics 50 (4), 485-501 (2001)[3] J. Polzehl and V. Spokoiny, "Spatially Adaptive Smoothing Techniques for Signal Detection in Functional andDynamic Magnet Resonance Imaging", Neuroimage 11 (5), pp. 649 (2000)[4] A. Hutt, F.Kruggel and C.S. Herrmann, "Automatic detection of ERP-components and their modeling", J.Cogn. Neuroscience Supplement 85 (2001)
Order of appearance: 850
AbsTrak ID: 17244
e1657
Abstracts presented at the 9th International Conference on Functional Mapping of the Human Brain, June 19Œ22, 2003, New York, NY
e1657
Poster number: 858
Identifying Sulci for Cortical Thickness Measurements
Chloe Hutton, Enrico De Vita, Robert Turner
Wellcome Department of Imaging Neuroscience,University College London, UK
Modeling & Analysis
Abstract
Introduction
Cortical thickness measurements can provide valuable information in studies of normal and abnormalneuroanatomy [1,2]. To accurately measure the cortical thickness in brain MRI a precise segmentation of thecortical grey matter is necessary and it is important to identify deep cortical folds or brain sulci that may not befully resolvable in MRI. Methods have been proposed using deformable contour models (e.g. [3, 4]) which can betime-consuming. Here we propose an efficient method to delineate sulci based on Laplace’s equation.
Methods
Tissue segmentation is performed using SPM2 [5] and the results are used to identify the white matter (WM) andgrey matter (GM) borders. Initially a GM layer of thickness Ôhk is added to the WM. Using Laplace’s equation,vector normals at each point in the layer are calculated. The ‘effective’ thickness of the layer is estimated byintegrating along the path of the vector normals from one surface to the other. Voxels for which this estimated‘effective’ thickness is greater than Ôhk are labeled as sulcal points because these voxels are in contact with GMvoxels within the same layer but from an opposing sulcal bank. This process is repeated for successive GM layers,adding GM layers to existing ones until the outer GM border is reached, while progressively labelling the sulcalvoxels so that the GM is bound by two complete surfaces. Laplace’s equation is then solved between thesesurfaces and at each point the thickness is estimated by integrating between them [6].
Results
We applied our method to anatomical MR images of 1mm3 resolution acquired using an optimised MP-RAGEsequence [7]. The routines described above are fully 3-dimensional and implemented in Matlab with an averageprocessing time for each whole brain MR image of approximately 1 hour without human intervention on astandard desktop computer. Our results show an average cortical thickness over the whole brain of 2-3mm, whichis consistent with the literature. Our results also show regions of thinner cortex in the occipital lobe and theposterior bank of the central sulcus that correspond to regions of the brain where the cortex is known to be thinner [1]. Thicker regions of cortex are seen in the temporal lobe. Discussion We present a simple and efficientapproach to identify sulci for cortical thickness measurements. The routines can easily be adapted to usesub-voxel sampling yielding higher precision thickness estimates at the expense of processing time only.
References
[1] Meyer, J.R., et al. AJNR Am J Neuroradiol. 17 (1996) 1699-706.[2] Rusinek, H., et al. Radiology 178 (1991) 109-114.[3] MacDonald, D., et al. Neuroimage 12 (2000) 340-356.[4] Fischl, B., Dale, A..M. Proc Natl Acad Sci U S A. 97 (2000) 11050-5.[5] Ashburner, J., Friston, K. Neuroimage 6 (1997) 209-217.[6] Jones, S.E., Buchbinder, B.R., Aharon, I. Human Brain Mapping 11 (2000) 12-32.[7] Deichmann, R., et al NeuroImage 12 (2000) 112-127.
e1658
Abstracts presented at the 9th International Conference on Functional Mapping of the Human Brain, June 19Œ22, 2003, New York, NY
e1658

Order of appearance: 851
AbsTrak ID: 18292
e1659
Abstracts presented at the 9th International Conference on Functional Mapping of the Human Brain, June 19Œ22, 2003, New York, NY
e1659
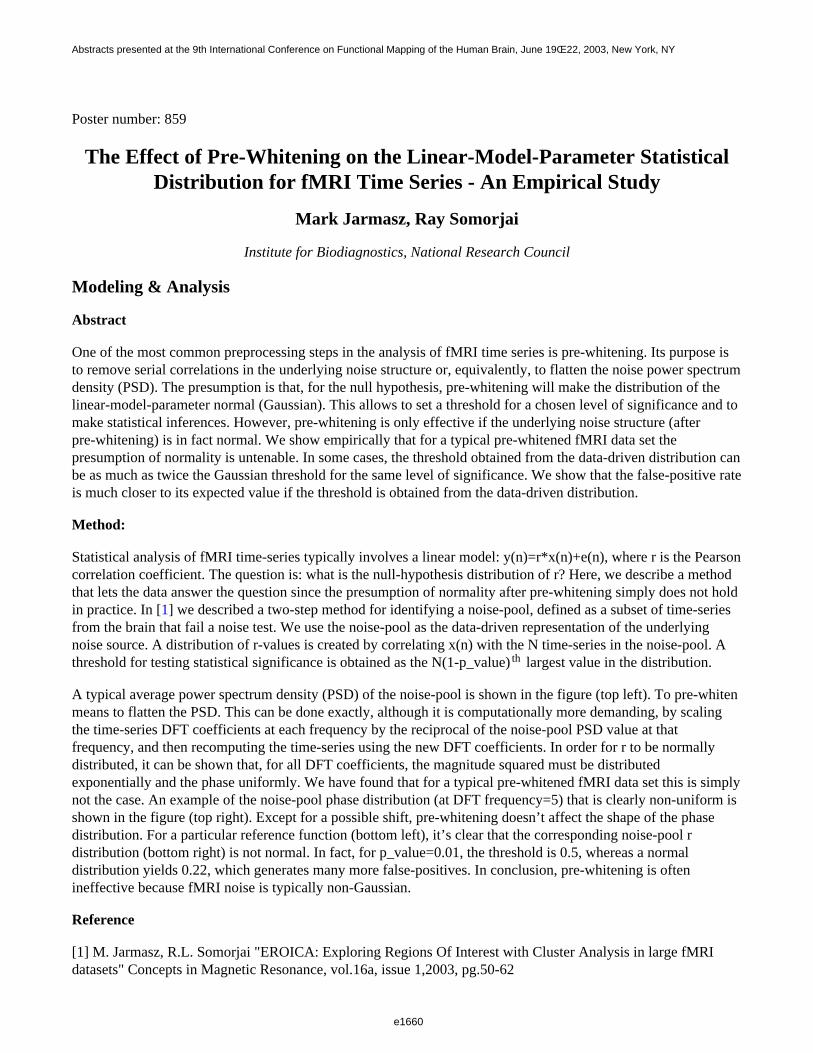
Poster number: 859
The Effect of Pre-Whitening on the Linear-Model-Parameter StatisticalDistribution for fMRI Time Series - An Empirical Study
Mark Jarmasz, Ray Somorjai
Institute for Biodiagnostics, National Research Council
Modeling & Analysis
Abstract
One of the most common preprocessing steps in the analysis of fMRI time series is pre-whitening. Its purpose isto remove serial correlations in the underlying noise structure or, equivalently, to flatten the noise power spectrumdensity (PSD). The presumption is that, for the null hypothesis, pre-whitening will make the distribution of thelinear-model-parameter normal (Gaussian). This allows to set a threshold for a chosen level of significance and tomake statistical inferences. However, pre-whitening is only effective if the underlying noise structure (afterpre-whitening) is in fact normal. We show empirically that for a typical pre-whitened fMRI data set thepresumption of normality is untenable. In some cases, the threshold obtained from the data-driven distribution canbe as much as twice the Gaussian threshold for the same level of significance. We show that the false-positive rateis much closer to its expected value if the threshold is obtained from the data-driven distribution.
Method:
Statistical analysis of fMRI time-series typically involves a linear model: y(n)=r*x(n)+e(n), where r is the Pearsoncorrelation coefficient. The question is: what is the null-hypothesis distribution of r? Here, we describe a methodthat lets the data answer the question since the presumption of normality after pre-whitening simply does not holdin practice. In [1] we described a two-step method for identifying a noise-pool, defined as a subset of time-seriesfrom the brain that fail a noise test. We use the noise-pool as the data-driven representation of the underlyingnoise source. A distribution of r-values is created by correlating x(n) with the N time-series in the noise-pool. Athreshold for testing statistical significance is obtained as the N(1-p_value) th largest value in the distribution.
A typical average power spectrum density (PSD) of the noise-pool is shown in the figure (top left). To pre-whitenmeans to flatten the PSD. This can be done exactly, although it is computationally more demanding, by scalingthe time-series DFT coefficients at each frequency by the reciprocal of the noise-pool PSD value at thatfrequency, and then recomputing the time-series using the new DFT coefficients. In order for r to be normallydistributed, it can be shown that, for all DFT coefficients, the magnitude squared must be distributedexponentially and the phase uniformly. We have found that for a typical pre-whitened fMRI data set this is simplynot the case. An example of the noise-pool phase distribution (at DFT frequency=5) that is clearly non-uniform isshown in the figure (top right). Except for a possible shift, pre-whitening doesn’t affect the shape of the phasedistribution. For a particular reference function (bottom left), it’s clear that the corresponding noise-pool rdistribution (bottom right) is not normal. In fact, for p_value=0.01, the threshold is 0.5, whereas a normaldistribution yields 0.22, which generates many more false-positives. In conclusion, pre-whitening is oftenineffective because fMRI noise is typically non-Gaussian.
Reference
[1] M. Jarmasz, R.L. Somorjai "EROICA: Exploring Regions Of Interest with Cluster Analysis in large fMRIdatasets" Concepts in Magnetic Resonance, vol.16a, issue 1,2003, pg.50-62
e1660
Abstracts presented at the 9th International Conference on Functional Mapping of the Human Brain, June 19Œ22, 2003, New York, NY
e1660
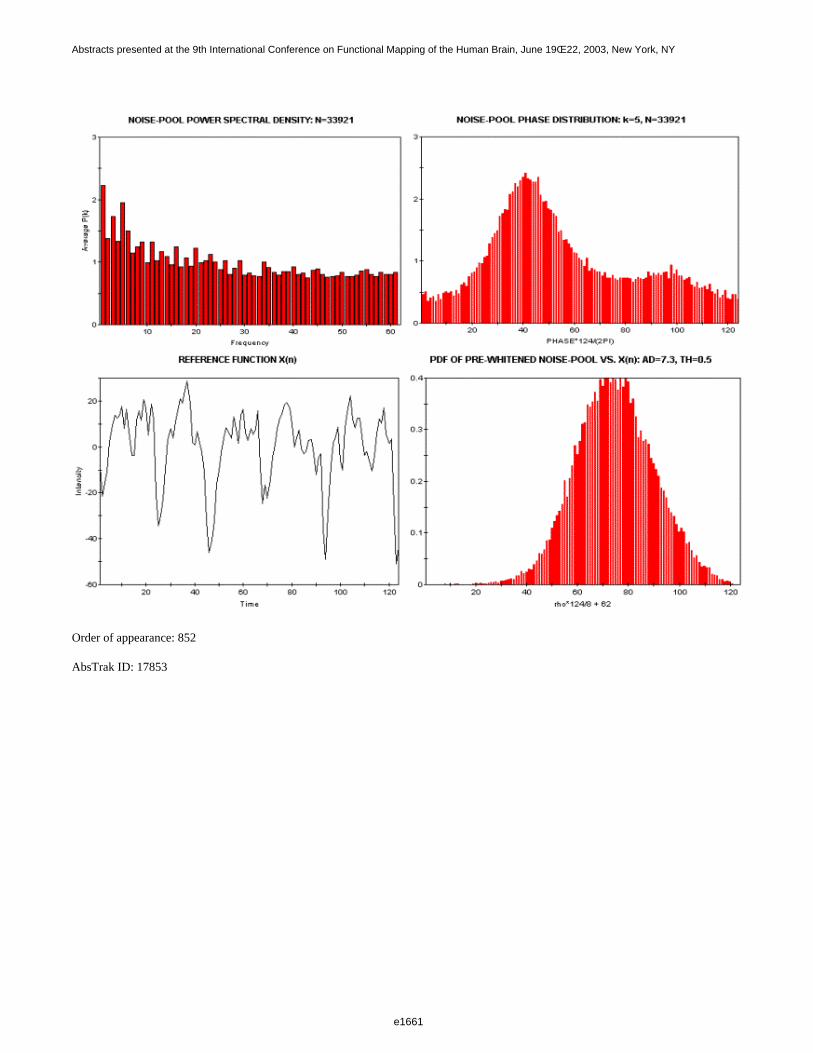
Order of appearance: 852
AbsTrak ID: 17853
e1661
Abstracts presented at the 9th International Conference on Functional Mapping of the Human Brain, June 19Œ22, 2003, New York, NY
e1661
Poster number: 860
More "mapping" in brain mapping: statistical comparison of effects
Terry Jernigan*†, Anthony Gamst†, Christine Fennema-Notestine†, Arne Ostergaard†
*Veterans Affairs San Diego Healthcare System†University of California, San Diego
Modeling & Analysis
Abstract
The term “mapping” in the context of brain imaging conveys to most the concept of localization; that is, a brainmap is meant to reveal a relationship between some condition or parameter and specific sites within the brain.However, in reality, conventional voxel-based maps of brain function, or for that matter of brain structure, aregenerally constructed using analyses that yield no basis for inferences regarding the spatial nonuniformity of theeffects. In the normal analysis path for functional images, for example, there is nowhere a statistical comparisonof the observed effect in any voxel relative to that in any other voxel. Under these circumstances, strictlyspeaking, the presence of significant activation serves as a legitimate basis only for inferences about the brain as aunit. Needless to say, in their discussion of results, investigators rarely are content to confirm the brain’s role, andinstead generally prefer to interpret the spatial patterns they have observed. Since “pattern” implies nonuniformeffects over the map, this is equivalent to interpreting results without bothering to test their significance, a practicemost of the experimentally-trained would eschew in other contexts. We will present examples of brain maps,illustrating the issues raised, and an appeal to investigators to adopt a new standard of data presentation thatfacilitates comparison of effects across the map. Evidence for sufficient effect size difference between the effectsin structures of interest should be a prerequisite to the interpretation of spatial patterns of activation.
Order of appearance: 853
AbsTrak ID: 18536
e1662
Abstracts presented at the 9th International Conference on Functional Mapping of the Human Brain, June 19Œ22, 2003, New York, NY
e1662
Poster number: 861
Inter-subject Coregistration Effects on Functional Imaging Voxelwise Statistics
Hans Johnson, Daniel O’Leary, Vincent Magnotta, Nancy Andreasen
Iowa Mental Health Clinical Research Center
Modeling & Analysis
Abstract
Function of interest (FOI) analysis is a method that uses voxelwise statistical tests on functional imaging data todetermine brain activation differences between groups. FOI based approaches may analyze the entire brainallowing for exploratory studies of brain circuitry. A disadvantage of many FOI approaches is that only lowdimensional spatial coregistration is done, and large spatial filters are required to remove structural and functionalvariability from the imaging data. In early positron emission tomography (PET) studies, a filter of size of 18-20mm was applied to the data. The large filter size was justifiable with the early PET scanners that had an inherentspatial resolution of 7-10 mm. With the development of three-dimensional PET cameras and functional magneticresonance (fMR) imaging, images can be acquired with a spatial resolution on the order of 1-3 mm in plane with a3-7 mm slice thickness; however, many recent FOI based studies use spatial filters similar in size to thoserequired by early PET scanners. The application of large smoothing filters to high resolution data reduces spatialspecificity that exists in the original data. This study compares two methods that account for structural variability:Talairach coregistration with 18mm spatial filtering, and inverse-consistent high-dimensional coregistration.
Thirteen normal controls were recruited to participate in a high-resolution structural MR and an eight injectionO15 PET imaging study designed to look at functional circuits responsible for verbal production. During threeinjections the subjects were asked to complete one of the following tasks: reading words (RW), reading a story(RS), or an eyes open resting baseline (RB). The structural MR images were preprocessed to produce tissueclassified images and an automated neural network application was used to define several brain regions including:the brain, eight cerebellar regions, and six subcortical regions. Intra-subject PET and MR images werecoregistered using the Automated Image Registration (AIR) software.
Inter-subject structural variability was accounted for using two different methods. The first method was aTalairach registration that placed the images into a standard space using piece-wise linear scaling and an 18mmhanning spatial filter to account for residual anatomical variability. The second method was an inverse consistenthigh dimensional non-linear warping algorithm used to coregister the thirteen MR scans. The high dimensionalwarping was guided by the image intensities and the anatomical structures defined with the automated neural network.
Functional difference images were generated corresponding to (RS)-(RW) and (RS)-(RB) tasks for each of thecoregistration methods. Voxelwise statistical T-tests accounted for the effective number of resolution elements inthe PET images. Analysis of the resulting T-test images showed that the significant activations present in theTalairach based method had corresponding significant activations present in the high-dimensional algorithm. Inaddition, the high-dimensional algorithm yielded additional focal areas of significant activation that were notpresent in the Talairach based method. This study shows that localized group activation analysis can be conductedwhen anatomical variability is minimized with high-dimensional warping, and the need for spatial filtering maybe reduced or eliminated.
e1663
Abstracts presented at the 9th International Conference on Functional Mapping of the Human Brain, June 19Œ22, 2003, New York, NY
e1663

Order of appearance: 854
AbsTrak ID: 18471
e1664
Abstracts presented at the 9th International Conference on Functional Mapping of the Human Brain, June 19Œ22, 2003, New York, NY
e1664
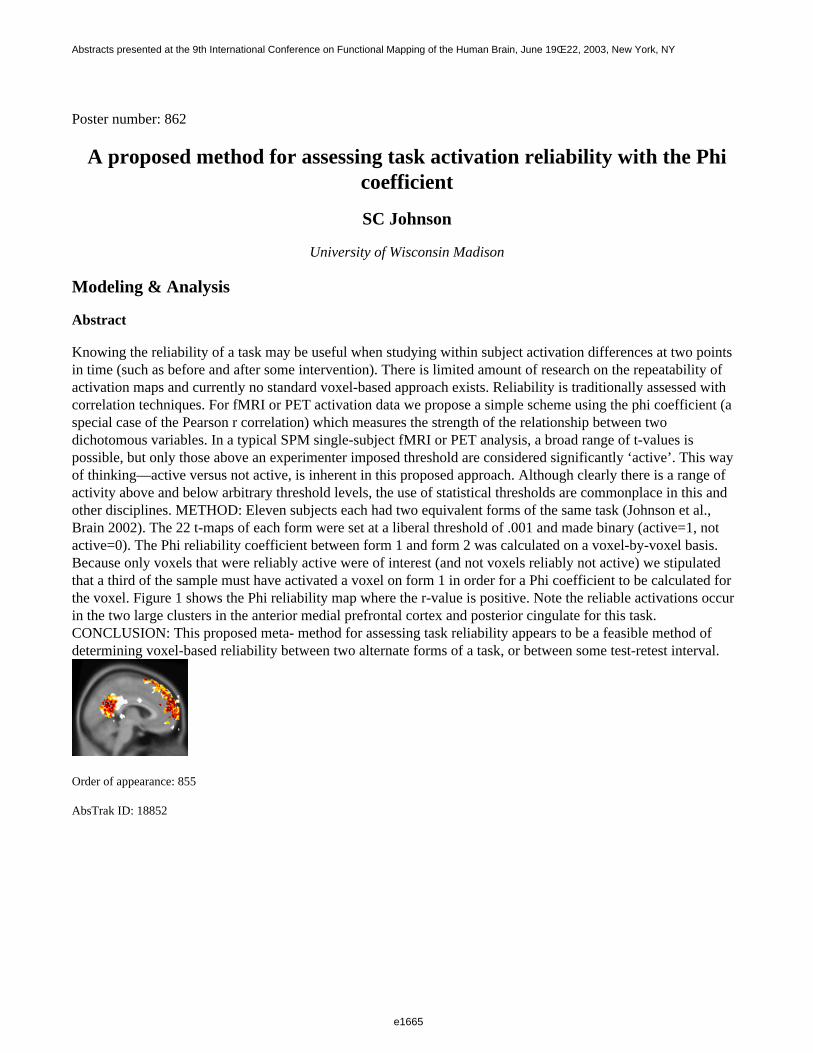
Poster number: 862
A proposed method for assessing task activation reliability with the Phi coefficient
SC Johnson
University of Wisconsin Madison
Modeling & Analysis
Abstract
Knowing the reliability of a task may be useful when studying within subject activation differences at two pointsin time (such as before and after some intervention). There is limited amount of research on the repeatability ofactivation maps and currently no standard voxel-based approach exists. Reliability is traditionally assessed withcorrelation techniques. For fMRI or PET activation data we propose a simple scheme using the phi coefficient (aspecial case of the Pearson r correlation) which measures the strength of the relationship between twodichotomous variables. In a typical SPM single-subject fMRI or PET analysis, a broad range of t-values ispossible, but only those above an experimenter imposed threshold are considered significantly ‘active’. This wayof thinking—active versus not active, is inherent in this proposed approach. Although clearly there is a range ofactivity above and below arbitrary threshold levels, the use of statistical thresholds are commonplace in this andother disciplines. METHOD: Eleven subjects each had two equivalent forms of the same task (Johnson et al.,Brain 2002). The 22 t-maps of each form were set at a liberal threshold of .001 and made binary (active=1, notactive=0). The Phi reliability coefficient between form 1 and form 2 was calculated on a voxel-by-voxel basis.Because only voxels that were reliably active were of interest (and not voxels reliably not active) we stipulatedthat a third of the sample must have activated a voxel on form 1 in order for a Phi coefficient to be calculated forthe voxel. Figure 1 shows the Phi reliability map where the r-value is positive. Note the reliable activations occurin the two large clusters in the anterior medial prefrontal cortex and posterior cingulate for this task.CONCLUSION: This proposed meta- method for assessing task reliability appears to be a feasible method ofdetermining voxel-based reliability between two alternate forms of a task, or between some test-retest interval.
Order of appearance: 855
AbsTrak ID: 18852
e1665
Abstracts presented at the 9th International Conference on Functional Mapping of the Human Brain, June 19Œ22, 2003, New York, NY
e1665

Poster number: 863
Biomedical Information Research Network : Characterization andCorrection of Image Distortions in Multi-Site Structural MRI
Jorge Jovicich, Douglas Greve, Elizabeth Haley, Bruce Fischl, Anders Dale, BrainMorphology BIRN
(www.nbirn.net/About/Institutions/PartnerInstitutions.htm#BrainMorphology))
Martinos Center, Massachusetts General Hospital
Modeling & Analysis
Abstract
Introduction
The Biomedical Information Research Network (BIRN) is an NIH consortium which is comprised of about 15institutions in the U.S., linked together with high speed internet to database, share and analyze images formulti-institutional research studies. One of the goals of this research is to gather and analyze morphological MRIdata of several patient populations pooled across sites. An important task in this effort is to accurately correct forgradient-induced distortions in order to allow cross-site comparisons of morphometry results, minimizingdependence on site-specific factors. This work extends previous work (Wald 2001) and shows preliminary resultsof how distortion correction can reduce site-specific variability effects
Method
Although distortions in MRI can arise from several factors, the most prominent one in structural MRI are gradientnon-linearities. While in principle the gradient distortion is addressable in manufacturer-supplied post-processingsoftware, the gradient unwarping option available on most MR systems tends to exacerbate the mis-registration of2D and 3D images, as conventional 2D images are usually corrected only in-plane, if at all.
To quantitatively characterize the extent of this warping, images of a cylindrical phantom were collected from 4commercial whole body scanners used for fMRI and structural studies amongst the BIRN sites: 1) GeneralElectric Signa CVi/NVi 1.5T (CRM gradients with max strength, slew rate = 40mT/m, 150T/m/s), from threedifferent sites, and 2) Siemens Medical System Magnetom Sonata 1.5T (Sonata gradients, 40mT/m, 200T/m/s)from one site. The phantom (250 mm diameter x 220mm) was constructed for this purpose from plastic plateswith 10mm diameter fluid filled spherical depressions spaced on an even 20 +/-0.05 mm grid.
The distortion correction consisted of two steps. First, a displacement vector map was calculated using thespherical harmonic coefficients from the vendor’s true gradients. Second, the displacement map was applied tothe original image.
Results and Conclusions:
The figures below show the phantom images before and after correction for gradient non-linearities. Theuncorrected distortions are relatively large and differ significantly between systems. Measurement of the phantomdiameter at the isocenter, from sagitall images (which show the strongest distortions), showed that the uncorrectedimages were about (12+-2)% smaller than the true diameter at the edges of the phantom. The error corresponds tothe variability of the estimages across sites. The same estimations on the corrected images showed that thedeviation from the true diameter was (0.5+-0.08)%. The drastic reduction of site-specific distortion effects due togradient non linearities has potentials for improving the accuracy of morphometric analysis in multi-site imaging
e1666
Abstracts presented at the 9th International Conference on Functional Mapping of the Human Brain, June 19Œ22, 2003, New York, NY
e1666
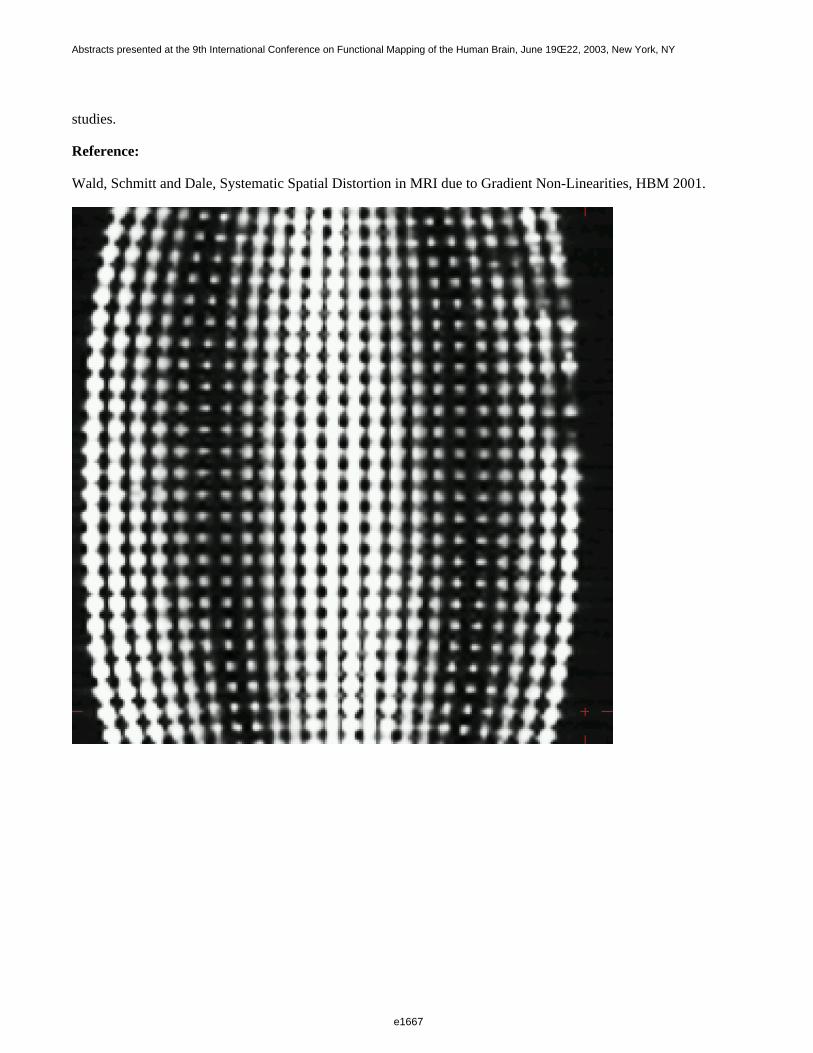
studies.
Reference:
Wald, Schmitt and Dale, Systematic Spatial Distortion in MRI due to Gradient Non-Linearities, HBM 2001.
e1667
Abstracts presented at the 9th International Conference on Functional Mapping of the Human Brain, June 19Œ22, 2003, New York, NY
e1667
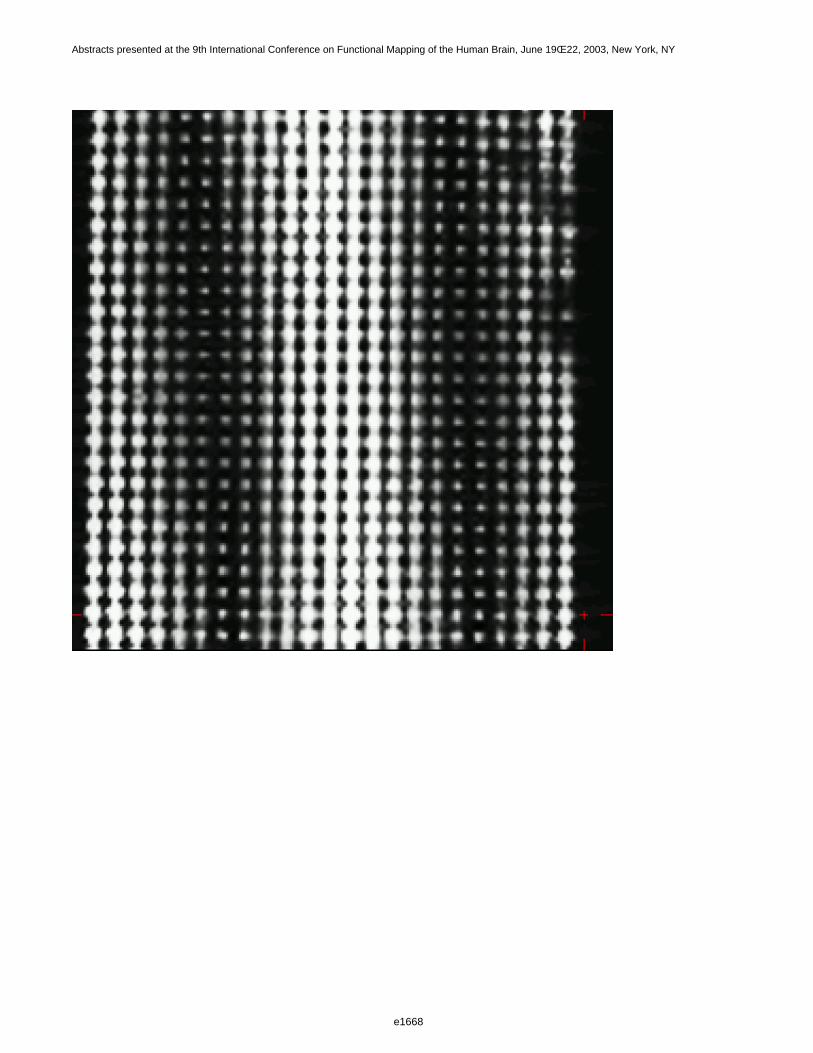
e1668
Abstracts presented at the 9th International Conference on Functional Mapping of the Human Brain, June 19Œ22, 2003, New York, NY
e1668
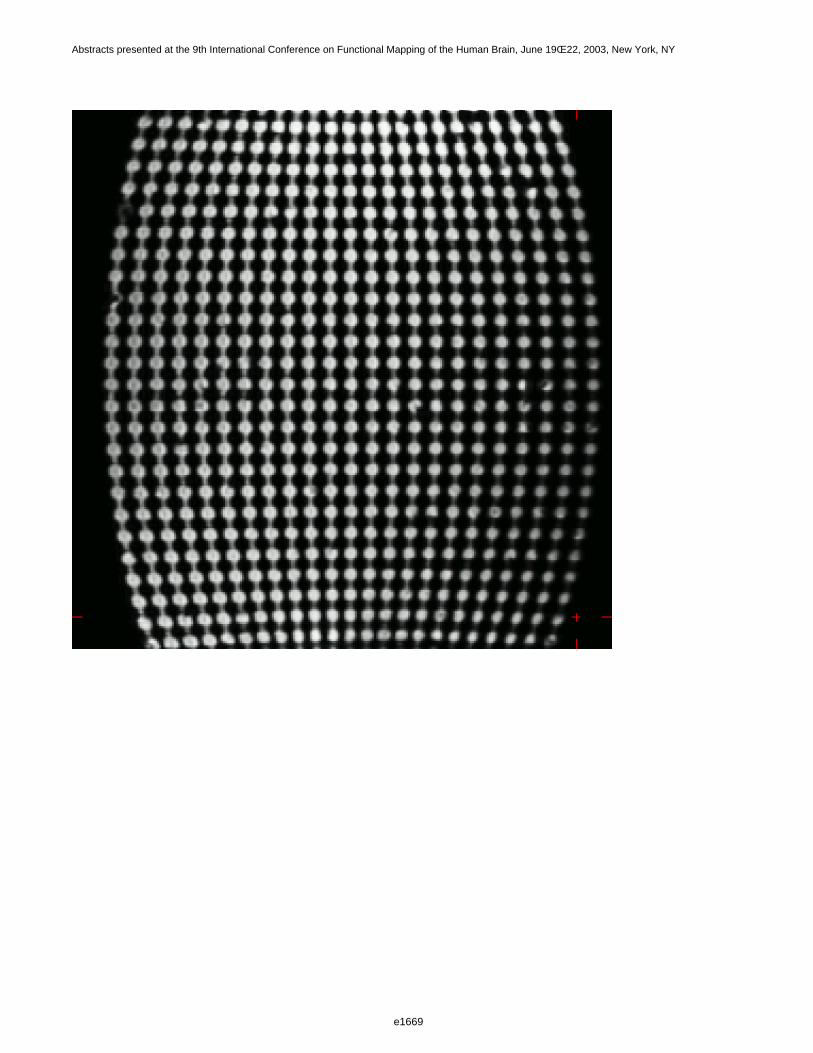
e1669
Abstracts presented at the 9th International Conference on Functional Mapping of the Human Brain, June 19Œ22, 2003, New York, NY
e1669
e1670
Abstracts presented at the 9th International Conference on Functional Mapping of the Human Brain, June 19Œ22, 2003, New York, NY
e1670
e1671
Abstracts presented at the 9th International Conference on Functional Mapping of the Human Brain, June 19Œ22, 2003, New York, NY
e1671
e1672
Abstracts presented at the 9th International Conference on Functional Mapping of the Human Brain, June 19Œ22, 2003, New York, NY
e1672
e1673
Abstracts presented at the 9th International Conference on Functional Mapping of the Human Brain, June 19Œ22, 2003, New York, NY
e1673
Order of appearance: 856
AbsTrak ID: 19102
e1674
Abstracts presented at the 9th International Conference on Functional Mapping of the Human Brain, June 19Œ22, 2003, New York, NY
e1674
Poster number: 865
Cortical Surface Flattening Using Discrete Conformal Mapping withMinimal Metric Distortion
Lili Ju*, Yongwu Shao†, Josh Stern‡, Kelly Rehm§, Kirt Schaper‡, Monica Hurdal§,David Rottenberg‡§
*Institute for Mathematics and its Applications, University of Minnesota, USA†Department of Statistics, University of Minnesota, USA
‡Department of Neurology, University of Minnesota, USA§Department of Radiology, University of Minnesota, USA
¶Department of Mathematics, Florida State University, USA
Modeling & Analysis
Abstract
Although flattening a cortical surface necessarily introduces metric distortion due to the non-constant Gaussiancurvature of the surface, the Riemann Mapping Theorem states that continuously differentiable surfaces can bemapped without angular distortion. Several techniques have been proposed for flattening polygonalrepresentations of surfaces while substantially minimizing metric distortion [1,2], and methods for conformalflattening of polygonal surfaces have also been proposed [3,4]. We describe an efficient method for generatingconformal flat maps of triangulated surfaces while minimizing metric distortion within the class of conformalmaps. Our method, which controls both angular and metric distortion, involves the solution of a linear system [5]and a small scale nonlinear minimization. It can be applied to user-defined "patches" or to an entire cortical surface.
Methods
Given any pair of surfaces, P and Q, that are both topological disks, and a fixed homeomorphism between theirboundaries, there exists a unique harmonic map from P to Q that minimizes the Dirichlet energy and isconformal. We utilize a discretization scheme and optimization-based algorithm for computing the harmonicmapping described in [5]. Since there is always a class of conformal mappings from P to Q related to each otherby an automorphism of Q, our algorithm then uses numerical methods to search for that conformal mappingwhich minimizes the metric distortion of the resulting mesh. Conformal mappings between topological spheresproceed via the mapping for disks using the same technique as [3]. A vertex v and all edges containing it areremoved from the input mesh, after that we generate a discrete conformal map from the pruned mesh to the unitdisk D; this map is then stereographically projected to the unit sphere S while v is mapped to the "north pole" of S, and the resulting map is again optimized by choosing the S automorphism that minimizes metric distortion.
Results and Conclusions
We created discrete conformal flat maps on the unit sphere from topologically-correct human cerebellar andcerebral cortices; we also flattened selected cortical patches from the cerebellum (Lobes IV and V) and cerebrum(occipital lobe). Mappings obtained for the cerebellar cortex are illustrated in Figure 1. Values for mean angularand normalized metric distortion are compared to those obtained using FreeSurfer [1] in Table 1. With our conformal method, metric distortion is no worse than that produced by FreeSurfer; moreover, angular informationis preserved, and computation time greatly reduced (20 minutes for the spherical flattening of cerebral cortex vs.10 hours using FreeSurfer).
e1675
Abstracts presented at the 9th International Conference on Functional Mapping of the Human Brain, June 19Œ22, 2003, New York, NY
e1675
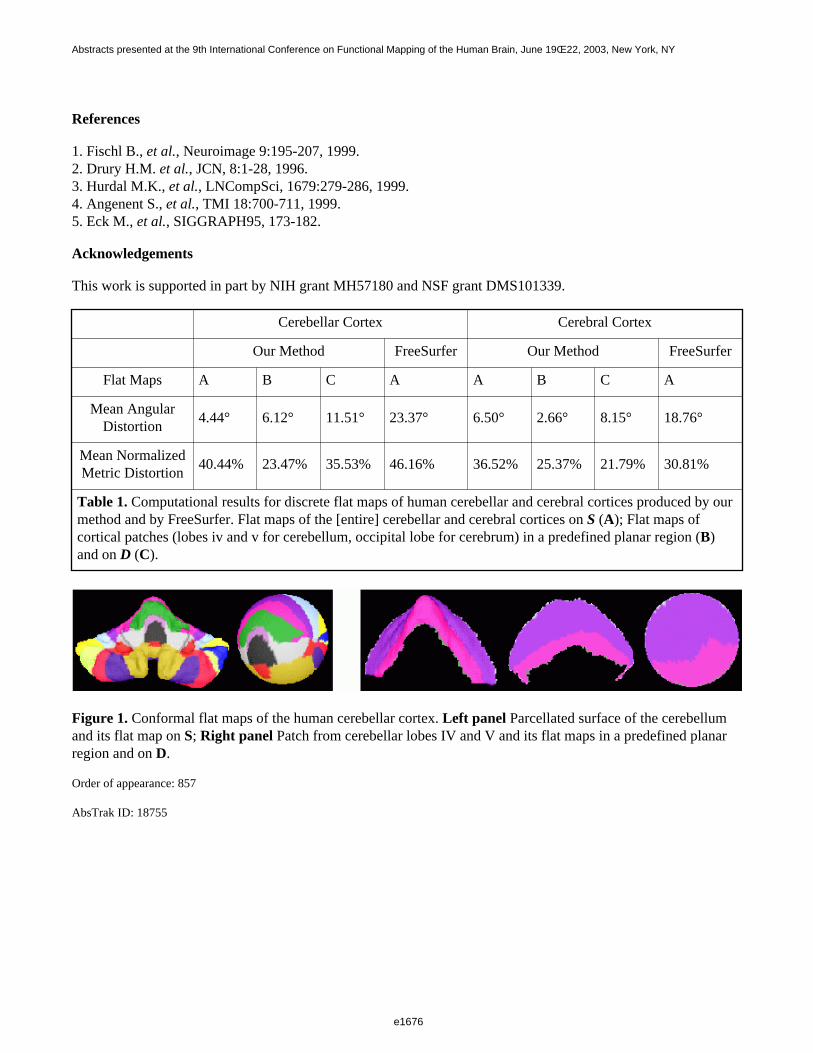
References
1. Fischl B., et al., Neuroimage 9:195-207, 1999.2. Drury H.M. et al., JCN, 8:1-28, 1996.3. Hurdal M.K., et al., LNCompSci, 1679:279-286, 1999.4. Angenent S., et al., TMI 18:700-711, 1999.5. Eck M., et al., SIGGRAPH95, 173-182.
Acknowledgements
This work is supported in part by NIH grant MH57180 and NSF grant DMS101339.
Cerebellar Cortex Cerebral Cortex
Our Method FreeSurfer Our Method FreeSurfer
Flat Maps A B C A A B C A
Mean Angular Distortion
4.44° 6.12° 11.51° 23.37° 6.50° 2.66° 8.15° 18.76°
Mean NormalizedMetric Distortion
40.44% 23.47% 35.53% 46.16% 36.52% 25.37% 21.79% 30.81%
Table 1. Computational results for discrete flat maps of human cerebellar and cerebral cortices produced by ourmethod and by FreeSurfer. Flat maps of the [entire] cerebellar and cerebral cortices on S (A); Flat maps ofcortical patches (lobes iv and v for cerebellum, occipital lobe for cerebrum) in a predefined planar region (B)and on D (C).
Figure 1. Conformal flat maps of the human cerebellar cortex. Left panel Parcellated surface of the cerebellumand its flat map on S; Right panel Patch from cerebellar lobes IV and V and its flat maps in a predefined planarregion and on D.
Order of appearance: 857
AbsTrak ID: 18755
e1676
Abstracts presented at the 9th International Conference on Functional Mapping of the Human Brain, June 19Œ22, 2003, New York, NY
e1676
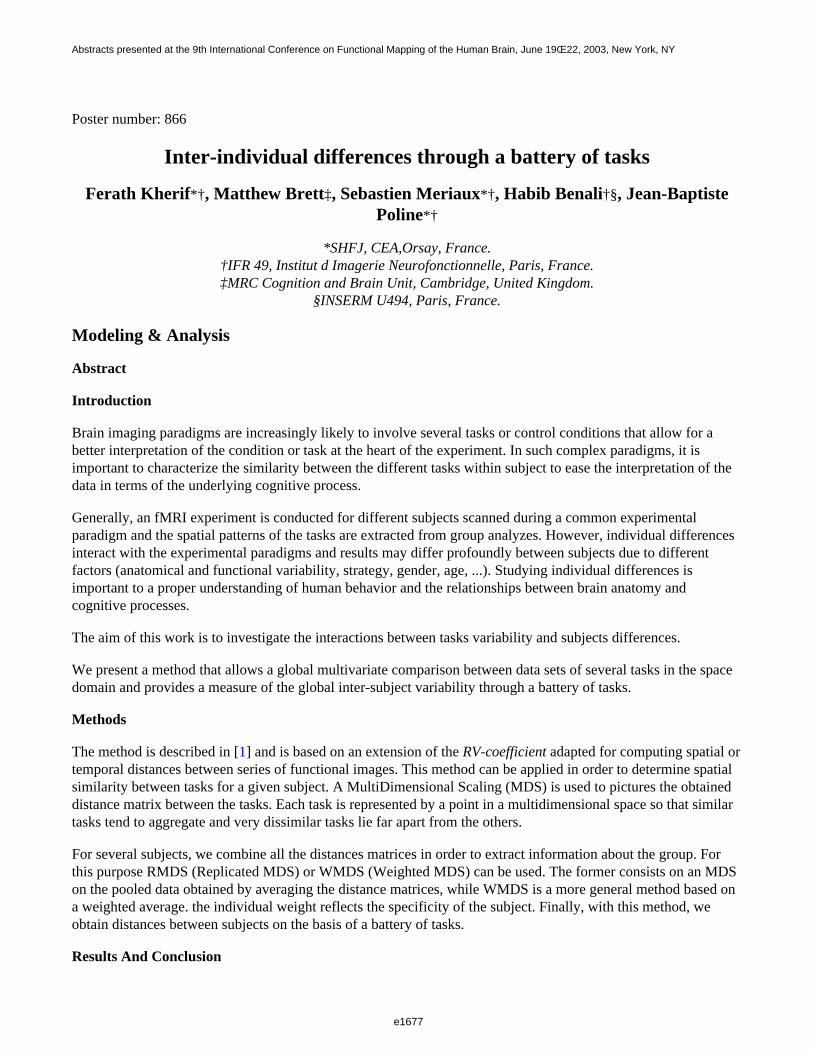
Poster number: 866
Inter-individual differences through a battery of tasks
Ferath Kherif*†, Matthew Brett‡, Sebastien Meriaux*†, Habib Benali†§, Jean-Baptiste Poline*†
*SHFJ, CEA,Orsay, France.†IFR 49, Institut d Imagerie Neurofonctionnelle, Paris, France.‡MRC Cognition and Brain Unit, Cambridge, United Kingdom.
§INSERM U494, Paris, France.
Modeling & Analysis
Abstract
Introduction
Brain imaging paradigms are increasingly likely to involve several tasks or control conditions that allow for abetter interpretation of the condition or task at the heart of the experiment. In such complex paradigms, it isimportant to characterize the similarity between the different tasks within subject to ease the interpretation of thedata in terms of the underlying cognitive process.
Generally, an fMRI experiment is conducted for different subjects scanned during a common experimentalparadigm and the spatial patterns of the tasks are extracted from group analyzes. However, individual differencesinteract with the experimental paradigms and results may differ profoundly between subjects due to differentfactors (anatomical and functional variability, strategy, gender, age, ...). Studying individual differences isimportant to a proper understanding of human behavior and the relationships between brain anatomy andcognitive processes.
The aim of this work is to investigate the interactions between tasks variability and subjects differences.
We present a method that allows a global multivariate comparison between data sets of several tasks in the spacedomain and provides a measure of the global inter-subject variability through a battery of tasks.
Methods
The method is described in [1] and is based on an extension of the RV-coefficient adapted for computing spatial ortemporal distances between series of functional images. This method can be applied in order to determine spatialsimilarity between tasks for a given subject. A MultiDimensional Scaling (MDS) is used to pictures the obtaineddistance matrix between the tasks. Each task is represented by a point in a multidimensional space so that similartasks tend to aggregate and very dissimilar tasks lie far apart from the others.
For several subjects, we combine all the distances matrices in order to extract information about the group. Forthis purpose RMDS (Replicated MDS) or WMDS (Weighted MDS) can be used. The former consists on an MDSon the pooled data obtained by averaging the distance matrices, while WMDS is a more general method based ona weighted average. the individual weight reflects the specificity of the subject. Finally, with this method, weobtain distances between subjects on the basis of a battery of tasks.
Results And Conclusion
e1677
Abstracts presented at the 9th International Conference on Functional Mapping of the Human Brain, June 19Œ22, 2003, New York, NY
e1677
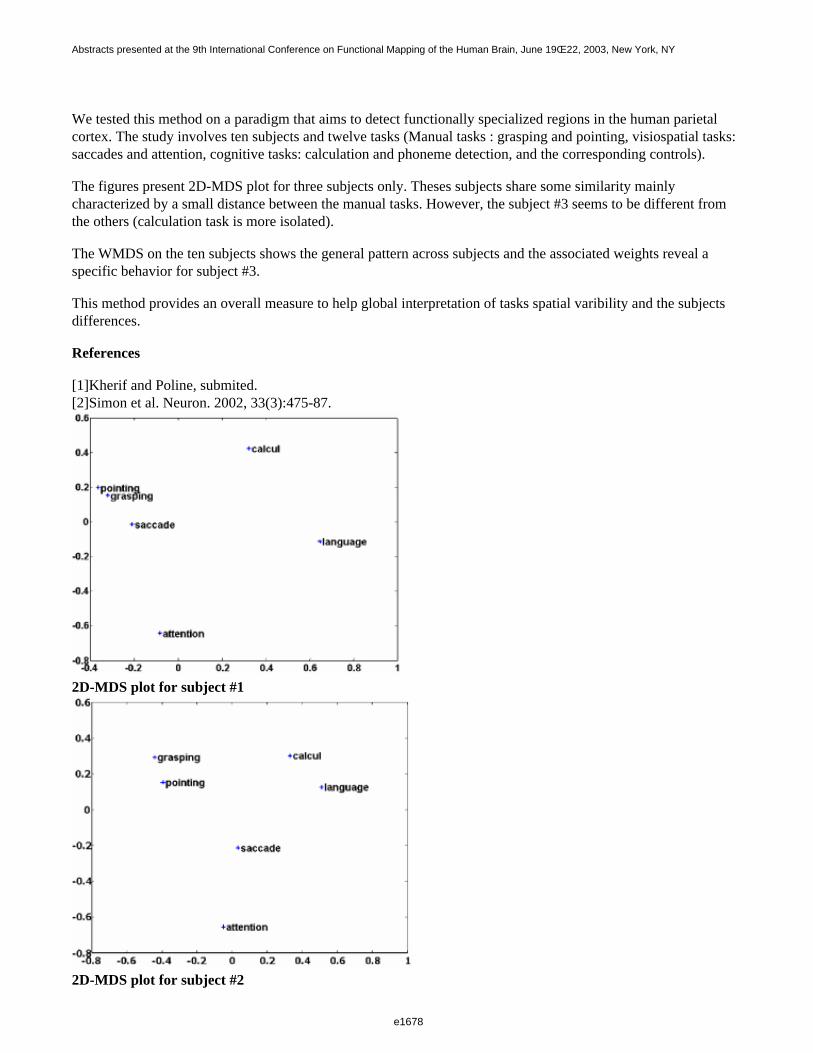
We tested this method on a paradigm that aims to detect functionally specialized regions in the human parietalcortex. The study involves ten subjects and twelve tasks (Manual tasks : grasping and pointing, visiospatial tasks:saccades and attention, cognitive tasks: calculation and phoneme detection, and the corresponding controls).
The figures present 2D-MDS plot for three subjects only. Theses subjects share some similarity mainlycharacterized by a small distance between the manual tasks. However, the subject #3 seems to be different fromthe others (calculation task is more isolated).
The WMDS on the ten subjects shows the general pattern across subjects and the associated weights reveal aspecific behavior for subject #3.
This method provides an overall measure to help global interpretation of tasks spatial varibility and the subjects differences.
References
[1]Kherif and Poline, submited.[2]Simon et al. Neuron. 2002, 33(3):475-87.
2D-MDS plot for subject #1
2D-MDS plot for subject #2
e1678
Abstracts presented at the 9th International Conference on Functional Mapping of the Human Brain, June 19Œ22, 2003, New York, NY
e1678
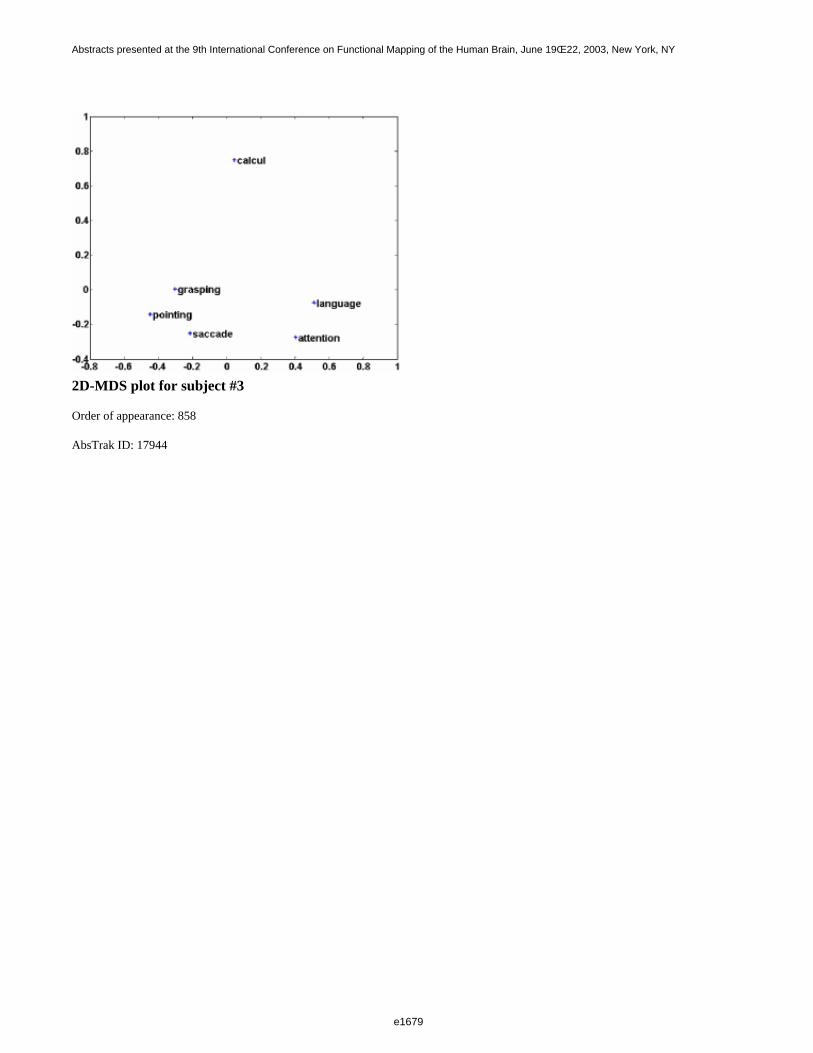
2D-MDS plot for subject #3
Order of appearance: 858
AbsTrak ID: 17944
e1679
Abstracts presented at the 9th International Conference on Functional Mapping of the Human Brain, June 19Œ22, 2003, New York, NY
e1679
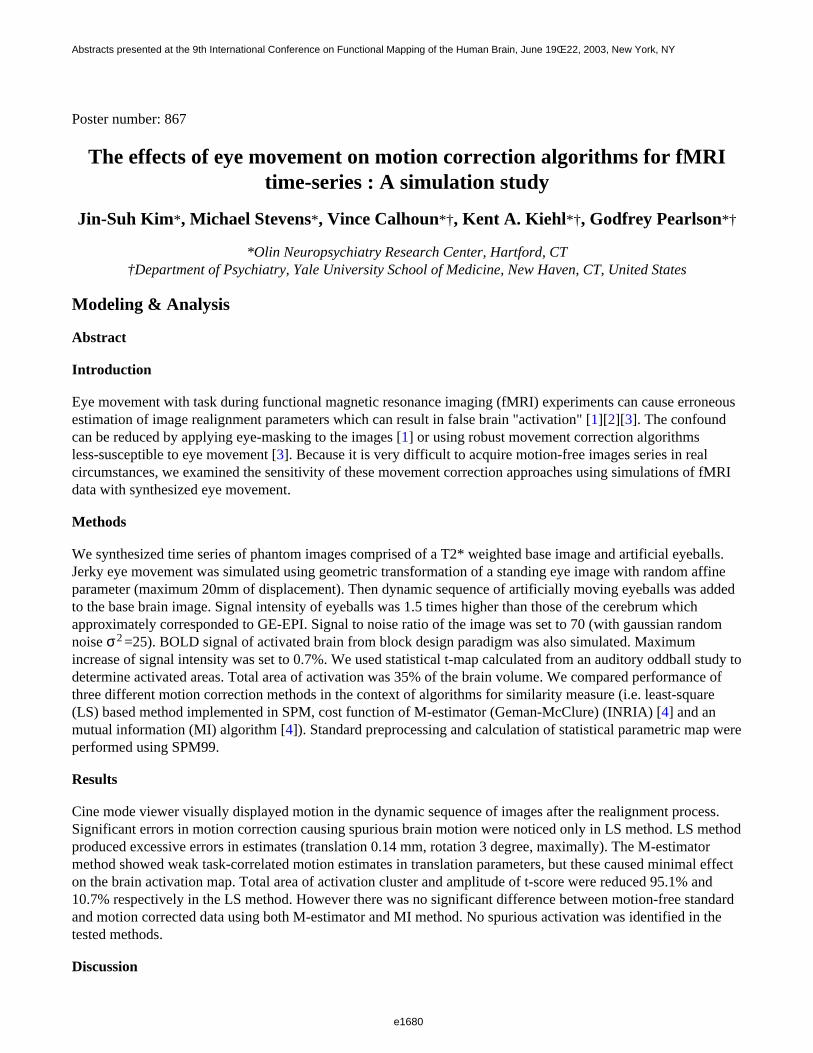
Poster number: 867
The effects of eye movement on motion correction algorithms for fMRItime-series : A simulation study
Jin-Suh Kim*, Michael Stevens*, Vince Calhoun*†, Kent A. Kiehl*†, Godfrey Pearlson*†
*Olin Neuropsychiatry Research Center, Hartford, CT†Department of Psychiatry, Yale University School of Medicine, New Haven, CT, United States
Modeling & Analysis
Abstract
Introduction
Eye movement with task during functional magnetic resonance imaging (fMRI) experiments can cause erroneousestimation of image realignment parameters which can result in false brain "activation" [1][2][3]. The confoundcan be reduced by applying eye-masking to the images [1] or using robust movement correction algorithmsless-susceptible to eye movement [3]. Because it is very difficult to acquire motion-free images series in realcircumstances, we examined the sensitivity of these movement correction approaches using simulations of fMRIdata with synthesized eye movement.
Methods
We synthesized time series of phantom images comprised of a T2* weighted base image and artificial eyeballs.Jerky eye movement was simulated using geometric transformation of a standing eye image with random affineparameter (maximum 20mm of displacement). Then dynamic sequence of artificially moving eyeballs was addedto the base brain image. Signal intensity of eyeballs was 1.5 times higher than those of the cerebrum whichapproximately corresponded to GE-EPI. Signal to noise ratio of the image was set to 70 (with gaussian randomnoise σ2 =25). BOLD signal of activated brain from block design paradigm was also simulated. Maximumincrease of signal intensity was set to 0.7%. We used statistical t-map calculated from an auditory oddball study todetermine activated areas. Total area of activation was 35% of the brain volume. We compared performance ofthree different motion correction methods in the context of algorithms for similarity measure (i.e. least-square(LS) based method implemented in SPM, cost function of M-estimator (Geman-McClure) (INRIA) [4] and anmutual information (MI) algorithm [4]). Standard preprocessing and calculation of statistical parametric map wereperformed using SPM99.
Results
Cine mode viewer visually displayed motion in the dynamic sequence of images after the realignment process.Significant errors in motion correction causing spurious brain motion were noticed only in LS method. LS methodproduced excessive errors in estimates (translation 0.14 mm, rotation 3 degree, maximally). The M-estimatormethod showed weak task-correlated motion estimates in translation parameters, but these caused minimal effecton the brain activation map. Total area of activation cluster and amplitude of t-score were reduced 95.1% and10.7% respectively in the LS method. However there was no significant difference between motion-free standardand motion corrected data using both M-estimator and MI method. No spurious activation was identified in thetested methods.
Discussion
e1680
Abstracts presented at the 9th International Conference on Functional Mapping of the Human Brain, June 19Œ22, 2003, New York, NY
e1680
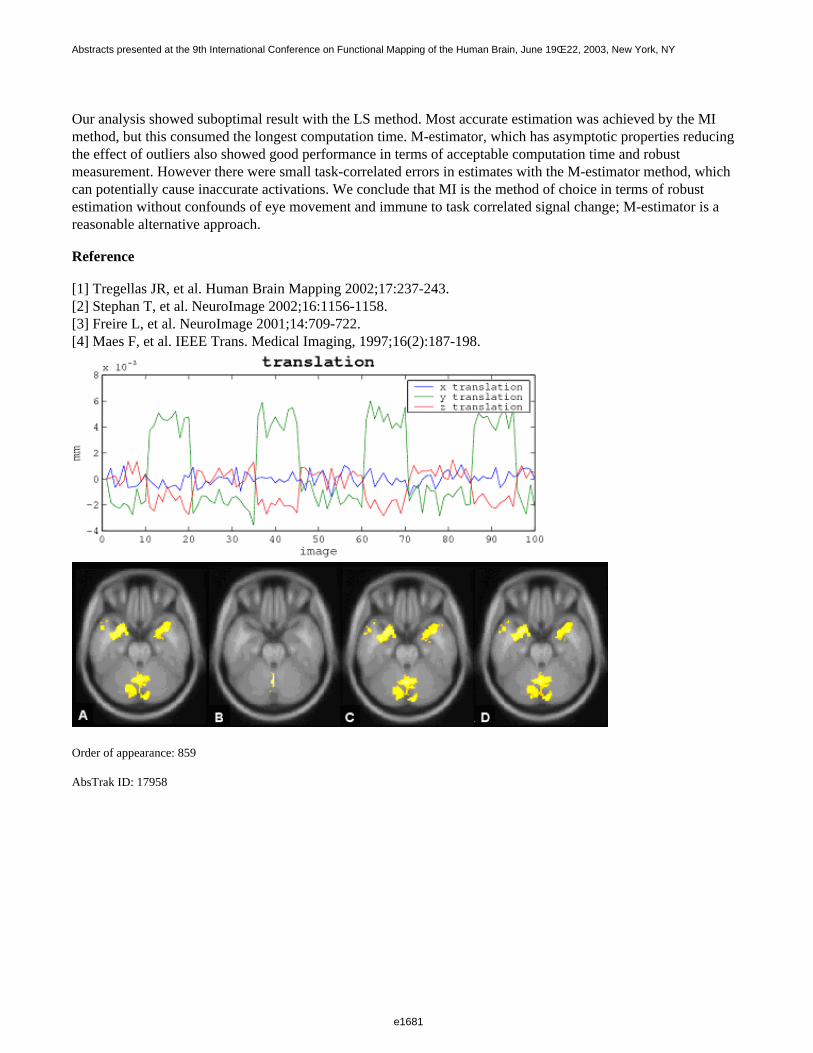
Our analysis showed suboptimal result with the LS method. Most accurate estimation was achieved by the MImethod, but this consumed the longest computation time. M-estimator, which has asymptotic properties reducingthe effect of outliers also showed good performance in terms of acceptable computation time and robustmeasurement. However there were small task-correlated errors in estimates with the M-estimator method, whichcan potentially cause inaccurate activations. We conclude that MI is the method of choice in terms of robustestimation without confounds of eye movement and immune to task correlated signal change; M-estimator is areasonable alternative approach.
Reference
[1] Tregellas JR, et al. Human Brain Mapping 2002;17:237-243.[2] Stephan T, et al. NeuroImage 2002;16:1156-1158.[3] Freire L, et al. NeuroImage 2001;14:709-722.[4] Maes F, et al. IEEE Trans. Medical Imaging, 1997;16(2):187-198.
Order of appearance: 859
AbsTrak ID: 17958
e1681
Abstracts presented at the 9th International Conference on Functional Mapping of the Human Brain, June 19Œ22, 2003, New York, NY
e1681
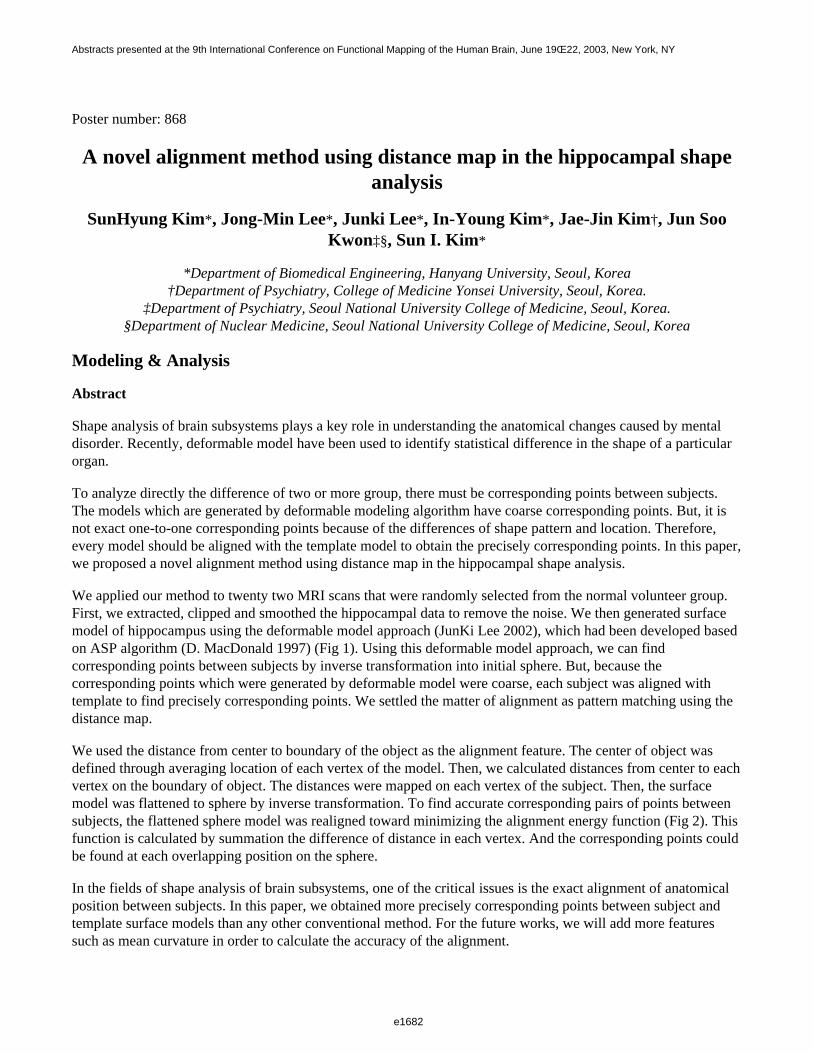
Poster number: 868
A novel alignment method using distance map in the hippocampal shape analysis
SunHyung Kim*, Jong-Min Lee*, Junki Lee*, In-Young Kim*, Jae-Jin Kim†, Jun Soo Kwon‡§, Sun I. Kim*
*Department of Biomedical Engineering, Hanyang University, Seoul, Korea†Department of Psychiatry, College of Medicine Yonsei University, Seoul, Korea.
‡Department of Psychiatry, Seoul National University College of Medicine, Seoul, Korea.§Department of Nuclear Medicine, Seoul National University College of Medicine, Seoul, Korea
Modeling & Analysis
Abstract
Shape analysis of brain subsystems plays a key role in understanding the anatomical changes caused by mentaldisorder. Recently, deformable model have been used to identify statistical difference in the shape of a particular organ.
To analyze directly the difference of two or more group, there must be corresponding points between subjects.The models which are generated by deformable modeling algorithm have coarse corresponding points. But, it isnot exact one-to-one corresponding points because of the differences of shape pattern and location. Therefore,every model should be aligned with the template model to obtain the precisely corresponding points. In this paper,we proposed a novel alignment method using distance map in the hippocampal shape analysis.
We applied our method to twenty two MRI scans that were randomly selected from the normal volunteer group.First, we extracted, clipped and smoothed the hippocampal data to remove the noise. We then generated surfacemodel of hippocampus using the deformable model approach (JunKi Lee 2002), which had been developed basedon ASP algorithm (D. MacDonald 1997) (Fig 1). Using this deformable model approach, we can findcorresponding points between subjects by inverse transformation into initial sphere. But, because thecorresponding points which were generated by deformable model were coarse, each subject was aligned withtemplate to find precisely corresponding points. We settled the matter of alignment as pattern matching using thedistance map.
We used the distance from center to boundary of the object as the alignment feature. The center of object wasdefined through averaging location of each vertex of the model. Then, we calculated distances from center to eachvertex on the boundary of object. The distances were mapped on each vertex of the subject. Then, the surfacemodel was flattened to sphere by inverse transformation. To find accurate corresponding pairs of points betweensubjects, the flattened sphere model was realigned toward minimizing the alignment energy function (Fig 2). Thisfunction is calculated by summation the difference of distance in each vertex. And the corresponding points couldbe found at each overlapping position on the sphere.
In the fields of shape analysis of brain subsystems, one of the critical issues is the exact alignment of anatomicalposition between subjects. In this paper, we obtained more precisely corresponding points between subject andtemplate surface models than any other conventional method. For the future works, we will add more featuressuch as mean curvature in order to calculate the accuracy of the alignment.
e1682
Abstracts presented at the 9th International Conference on Functional Mapping of the Human Brain, June 19Œ22, 2003, New York, NY
e1682
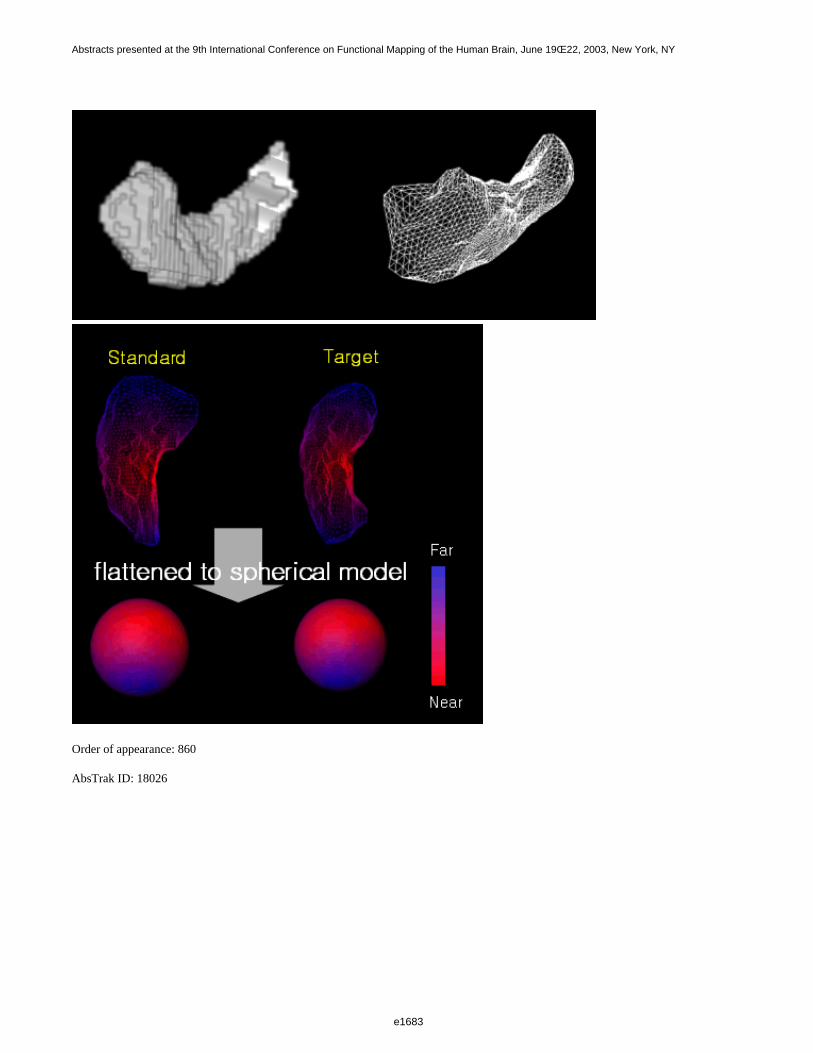
Order of appearance: 860
AbsTrak ID: 18026
e1683
Abstracts presented at the 9th International Conference on Functional Mapping of the Human Brain, June 19Œ22, 2003, New York, NY
e1683

Poster number: 869
Mindboggle: New developments in automated brain labeling
Arno Klein, Joy Hirsch
FMRI Research Center, Columbia University, New York
Modeling & Analysis
Abstract
Mindboggle [1,2] is a fully automated software package for anatomically labeling structural and functional MRI data.
To determine functional correspondences in fMRI data, we first establish structural correspondences. As brainmorphology varies considerably and manual labeling is extremely inconsistent, Mindboggle was designed to labelin a consistent and flexible manner, by the combinatoric matching of components using spatial constraints derivedfrom a labeled atlas [3].
Each subject MRI volume is skull-stripped [4], co-registered [5], and thresholded [6]. Mindboggle constructs askeleton from the thresholded volume, and breaks the skeleton into several hundred pieces by separating atbifurcations and regrouping with a modified k-means algorithm. Mindboggle then matches combinations of thesepieces with pieces of the atlas containing primary sulcus labels by minimizing a sum of weighted errors (distancebetween pieces, differences in volume and in number of voxels, and degree of non-overlap). Only the subjectvoxels closest to the primary sulci are labeled, resulting in the labeling of gyrus boundaries. Gyrii are labeled byinterpolating between labeled pieces.
To evaluate Mindboggle labels, we use a label agreement metric equal to the percentage of intersecting labeledvoxels that have the same label. Previous evaluations [1,2] demonstrated that Mindboggle was competitive withSPM nonlinear labeling of MRI data [7], and that its labeling of fMRI data acquired during the performance ofbasic tasks included expected labels. To evaluate our revised algorithm, we began by labeling a second atlas [8].The label agreement between the un-interpolated skeletons of the two atlases is over 90%, and between the labelsassigned to the second atlas and its original labels was 85%. We will evaluate interpolated results uponcompletion of the revised interpolation algorithm. As these preliminary results are higher than in previousversions, the interpolated results should be higher as well.
References
[1] Klein, A. and Hirsch, J. 2002. Fully-automated nonlinear labeling of human brain activity. 8th AnnualMeeting of the Organization for Human Brain Mapping. (Manuscript presently under review for publication in NeuroImage.)[2] Klein, A. and Hirsch, J. 2001. Automatic labeling of brain anatomy and fMRI brain activity. 7th AnnualMeeting of the Organization for Human Brain Mapping.[3] Tzourio-Mazoyer, et. al. 2002. Automated anatomical labeling of activations in SPM using a macroscopicanatomical parcellation of the MNI MRI single subject brain. NeuroImage, 16(2).[4] Smith, S. 2000. Robust automated brain extraction. In Sixth International Conference on Functional Mappingof the Human Brain, page 625.[5] Jenkinson, M. and Smith, S. 2001. A global optimisation method for robust affine registration of brain images.Medical Image Analysis 5: 143-156.[6] Zhang, Y., et. al. 2001. Segmentation of brain MR images through a hidden Markov random field model andthe expectation maximization algorithm. IEEE Transactions on Medical Imaging 20(1): 45-57.
e1684
Abstracts presented at the 9th International Conference on Functional Mapping of the Human Brain, June 19Œ22, 2003, New York, NY
e1684

[7] Friston, K.J., et. al. 1995. Spatial Registration and Normalization of Images. Human Brain Mapping 2: 165-189.[8] Kikinis, R., et. al. 1996. A digital brain atlas for surgical planning, model driven segmentation and teaching.IEEE Transactions on Visualization and computer graphics 2.
Order of appearance: 861
AbsTrak ID: 19128
e1685
Abstracts presented at the 9th International Conference on Functional Mapping of the Human Brain, June 19Œ22, 2003, New York, NY
e1685
Poster number: 870
Quantitative Evaluation of the Wavelet Based Analyzing method (HAW)in ER-fMRI study and comparison with SPM99
Syoji Kobashi*, Taro Inazumi*, Yuri T. Kitamura†, Katsuya Kondo*, Yutaka Hata*,Toshio Yanagida†
*Himeji Institute of Technology†Osaka University
Modeling & Analysis
Abstract
Purpose:
We have developed a novel method for analyzing ER-fMRI called HAW [1]. The method can detect activationarea and also estimate HR delay simultaneously. This study aims at investigating the performance of the HAWand at comparing with SPM99 proposed by Friston et. al.
Materials and Method:
We use artificially generated images imitating ER-fMRI images to investigate the performance. A data setconsists of 64×64×20 voxels (4mm×4mm×5mm/voxel). The signal intensity of backgrounds and brain are 80 and1000, respectively. The brain consists of voxels of an oval sphere with a radius of 120mm×120mm×40mm.Activation areas are defined as two oval spheres with radius of 20mm×20mm×7mm. Gaussian noise and HRfunction defined in SPM99 are convoluted in the time-course signal of every voxel. For the generated images,usual preprocessing of smoothing with FWHM of 8mm is done by SPM99. We then apply both of HAW andSPM99 whose parameter of HR delay is 4sec. The performance of detecting the activation area is investigated byusing the index of the area under the ROC curve between 0 and 1% of the false positive rate.
Results
Significant difference of the performance with changing Gaussian noise was not found. The sensitivity of bothmethods with changing HR delay to generate the artificial data is shown in Fig. 1. SPM99 shows the highestsensitivity in 4 sec HR delay, and the sensitivity decreases as HR delay becomes long. It is because that theSPM99 uses a parameter of HR delay of 4 sec. In contrast, the sensitivity of HAW was almost fixed among our experiments.
Conclusions
When two or more sites in the cerebral activate simultaneously, the detection performance differs according to thesite because HR delay differs by each activation site. Therefore, in the case of SPM99, we should analyze withsome parameters of HR delay. Because the sensitivity of HAW is almost fixed for HR delay, when two or moresites activate and/or HR delay of activation site is unknown, HAW is effective for analyzing ER-fMRI.
References
[1] S. Kobashi, T. Zui, Y. Hata, Y. T. Kitamura, and T. Yanagida, •gWavelet Based Analysis of theHemodynamic Response Delay in Event-related Functional MRI,•h NeuroImage, 8th Annual Meeting of theOrganization for Human Brain Mapping, Sendai, Jun. 2002.
e1686
Abstracts presented at the 9th International Conference on Functional Mapping of the Human Brain, June 19Œ22, 2003, New York, NY
e1686
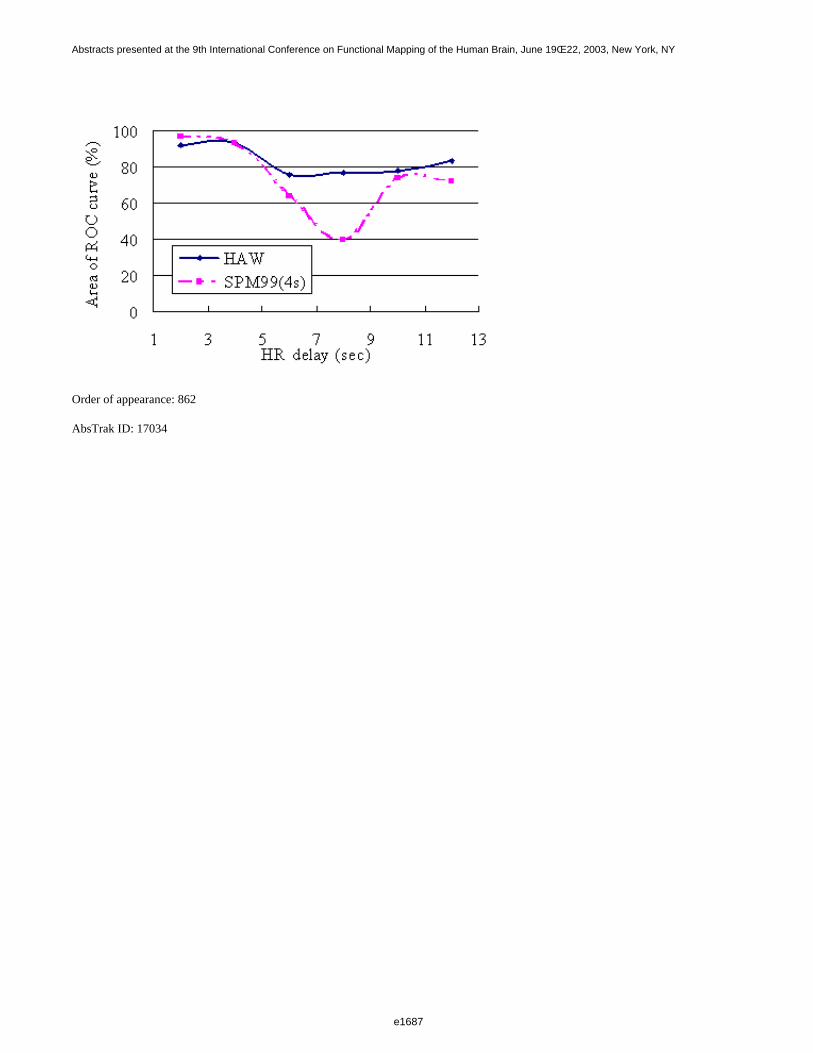
Order of appearance: 862
AbsTrak ID: 17034
e1687
Abstracts presented at the 9th International Conference on Functional Mapping of the Human Brain, June 19Œ22, 2003, New York, NY
e1687
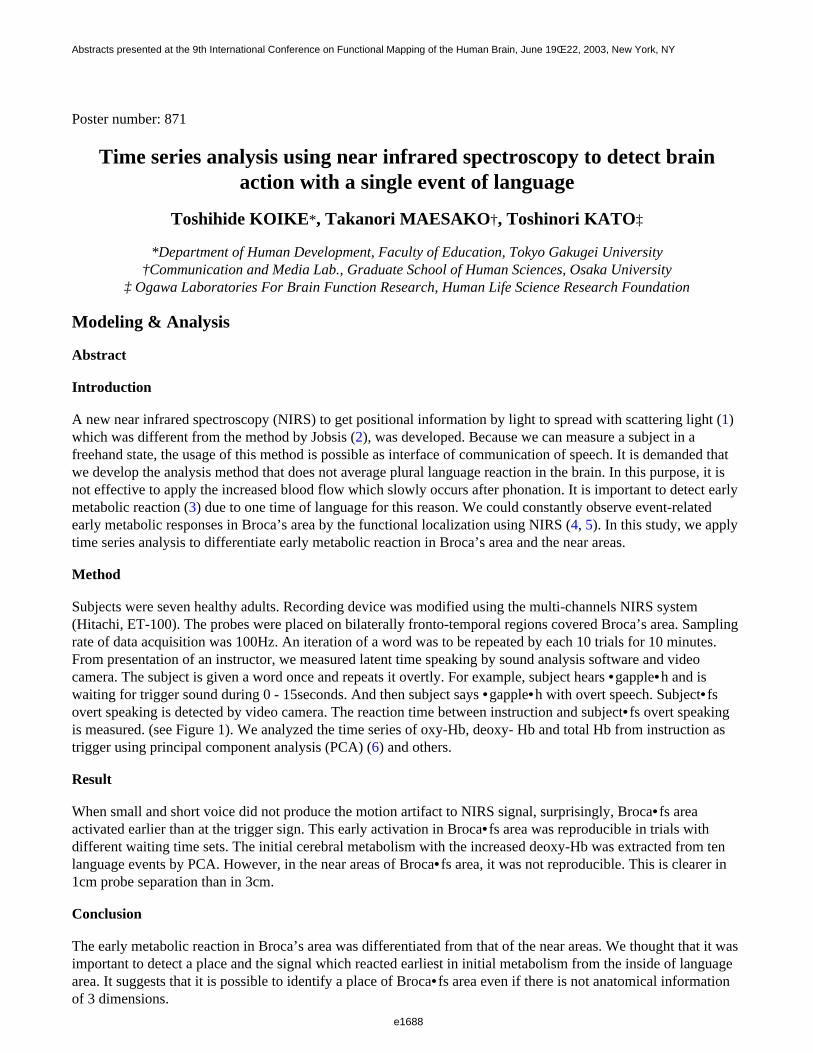
Poster number: 871
Time series analysis using near infrared spectroscopy to detect brainaction with a single event of language
Toshihide KOIKE*, Takanori MAESAKO†, Toshinori KATO‡
*Department of Human Development, Faculty of Education, Tokyo Gakugei University†Communication and Media Lab., Graduate School of Human Sciences, Osaka University
‡ Ogawa Laboratories For Brain Function Research, Human Life Science Research Foundation
Modeling & Analysis
Abstract
Introduction
A new near infrared spectroscopy (NIRS) to get positional information by light to spread with scattering light (1)which was different from the method by Jobsis (2), was developed. Because we can measure a subject in afreehand state, the usage of this method is possible as interface of communication of speech. It is demanded thatwe develop the analysis method that does not average plural language reaction in the brain. In this purpose, it isnot effective to apply the increased blood flow which slowly occurs after phonation. It is important to detect earlymetabolic reaction (3) due to one time of language for this reason. We could constantly observe event-relatedearly metabolic responses in Broca’s area by the functional localization using NIRS (4, 5). In this study, we applytime series analysis to differentiate early metabolic reaction in Broca’s area and the near areas.
Method
Subjects were seven healthy adults. Recording device was modified using the multi-channels NIRS system(Hitachi, ET-100). The probes were placed on bilaterally fronto-temporal regions covered Broca’s area. Samplingrate of data acquisition was 100Hz. An iteration of a word was to be repeated by each 10 trials for 10 minutes.From presentation of an instructor, we measured latent time speaking by sound analysis software and videocamera. The subject is given a word once and repeats it overtly. For example, subject hears •gapple•h and iswaiting for trigger sound during 0 - 15seconds. And then subject says •gapple•h with overt speech. Subject• fsovert speaking is detected by video camera. The reaction time between instruction and subject• fs overt speakingis measured. (see Figure 1). We analyzed the time series of oxy-Hb, deoxy- Hb and total Hb from instruction astrigger using principal component analysis (PCA) (6) and others.
Result
When small and short voice did not produce the motion artifact to NIRS signal, surprisingly, Broca• fs areaactivated earlier than at the trigger sign. This early activation in Broca• fs area was reproducible in trials withdifferent waiting time sets. The initial cerebral metabolism with the increased deoxy-Hb was extracted from tenlanguage events by PCA. However, in the near areas of Broca• fs area, it was not reproducible. This is clearer in1cm probe separation than in 3cm.
Conclusion
The early metabolic reaction in Broca’s area was differentiated from that of the near areas. We thought that it wasimportant to detect a place and the signal which reacted earliest in initial metabolism from the inside of languagearea. It suggests that it is possible to identify a place of Broca• fs area even if there is not anatomical informationof 3 dimensions.
e1688
Abstracts presented at the 9th International Conference on Functional Mapping of the Human Brain, June 19Œ22, 2003, New York, NY
e1688
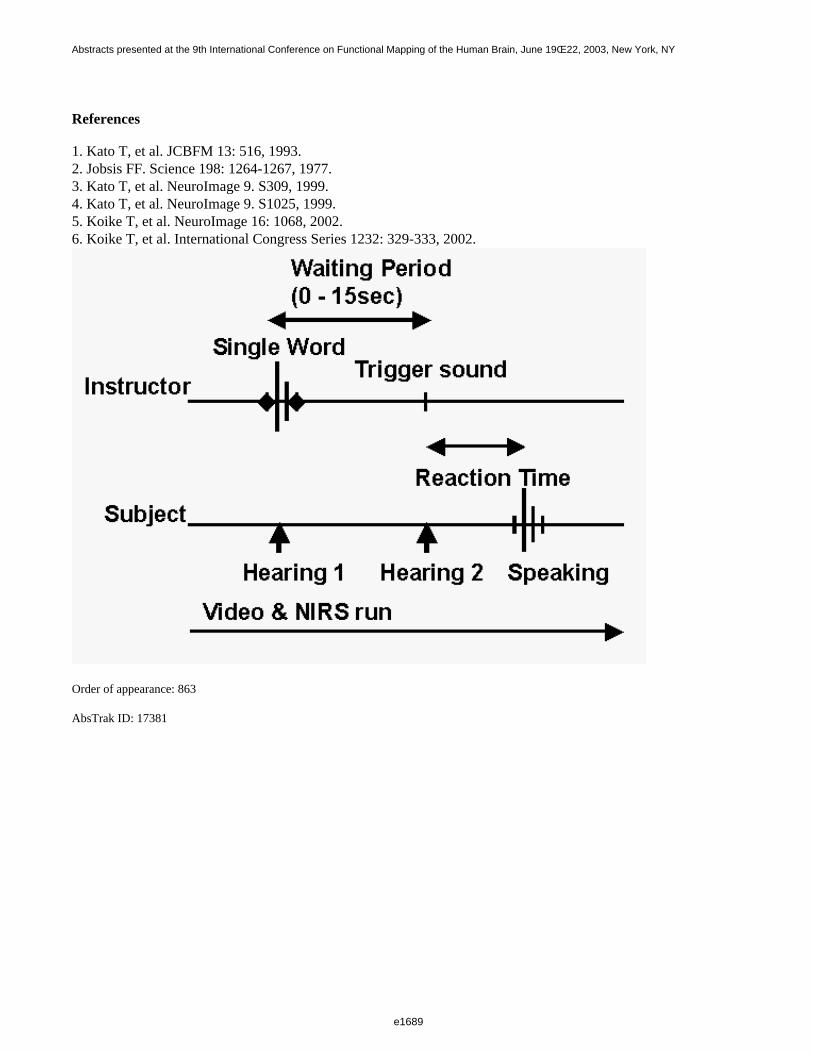
References
1. Kato T, et al. JCBFM 13: 516, 1993.2. Jobsis FF. Science 198: 1264-1267, 1977.3. Kato T, et al. NeuroImage 9. S309, 1999.4. Kato T, et al. NeuroImage 9. S1025, 1999.5. Koike T, et al. NeuroImage 16: 1068, 2002.6. Koike T, et al. International Congress Series 1232: 329-333, 2002.
Order of appearance: 863
AbsTrak ID: 17381
e1689
Abstracts presented at the 9th International Conference on Functional Mapping of the Human Brain, June 19Œ22, 2003, New York, NY
e1689
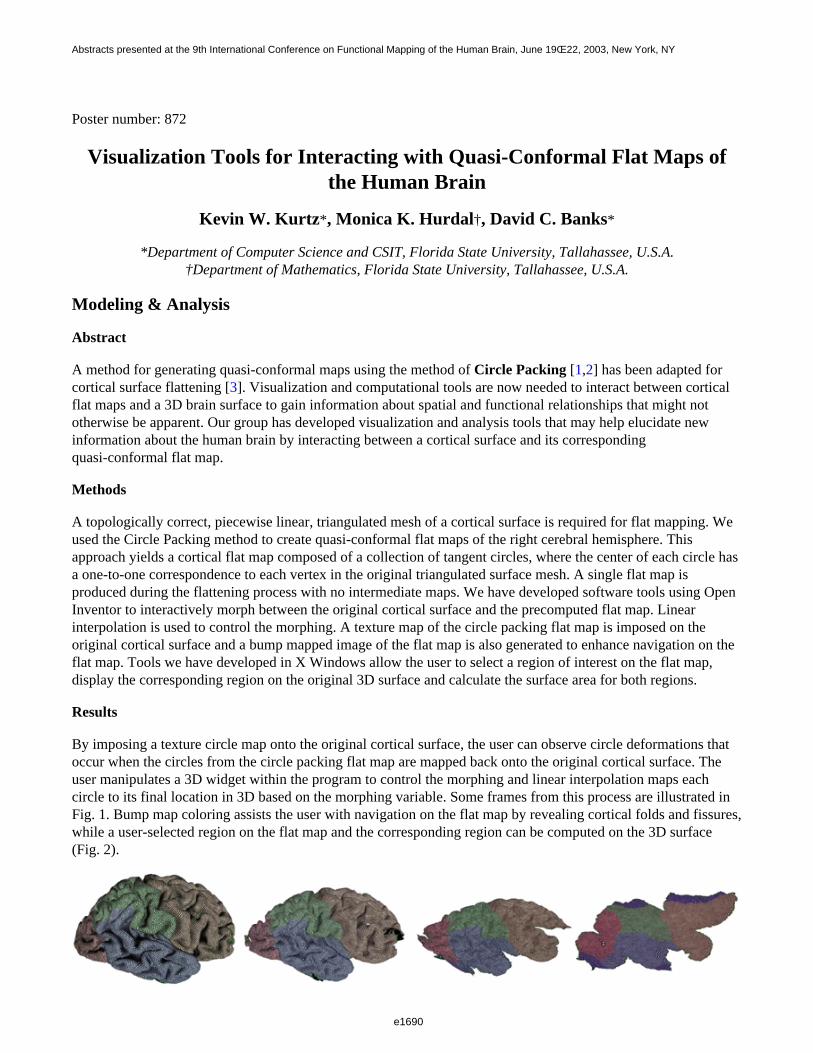
Poster number: 872
Visualization Tools for Interacting with Quasi-Conformal Flat Maps ofthe Human Brain
Kevin W. Kurtz*, Monica K. Hurdal†, David C. Banks*
*Department of Computer Science and CSIT, Florida State University, Tallahassee, U.S.A.†Department of Mathematics, Florida State University, Tallahassee, U.S.A.
Modeling & Analysis
Abstract
A method for generating quasi-conformal maps using the method of Circle Packing [1,2] has been adapted forcortical surface flattening [3]. Visualization and computational tools are now needed to interact between corticalflat maps and a 3D brain surface to gain information about spatial and functional relationships that might nototherwise be apparent. Our group has developed visualization and analysis tools that may help elucidate newinformation about the human brain by interacting between a cortical surface and its correspondingquasi-conformal flat map.
Methods
A topologically correct, piecewise linear, triangulated mesh of a cortical surface is required for flat mapping. Weused the Circle Packing method to create quasi-conformal flat maps of the right cerebral hemisphere. Thisapproach yields a cortical flat map composed of a collection of tangent circles, where the center of each circle hasa one-to-one correspondence to each vertex in the original triangulated surface mesh. A single flat map isproduced during the flattening process with no intermediate maps. We have developed software tools using OpenInventor to interactively morph between the original cortical surface and the precomputed flat map. Linearinterpolation is used to control the morphing. A texture map of the circle packing flat map is imposed on theoriginal cortical surface and a bump mapped image of the flat map is also generated to enhance navigation on theflat map. Tools we have developed in X Windows allow the user to select a region of interest on the flat map,display the corresponding region on the original 3D surface and calculate the surface area for both regions.
Results
By imposing a texture circle map onto the original cortical surface, the user can observe circle deformations thatoccur when the circles from the circle packing flat map are mapped back onto the original cortical surface. Theuser manipulates a 3D widget within the program to control the morphing and linear interpolation maps eachcircle to its final location in 3D based on the morphing variable. Some frames from this process are illustrated inFig. 1. Bump map coloring assists the user with navigation on the flat map by revealing cortical folds and fissures,while a user-selected region on the flat map and the corresponding region can be computed on the 3D surface(Fig. 2).
e1690
Abstracts presented at the 9th International Conference on Functional Mapping of the Human Brain, June 19Œ22, 2003, New York, NY
e1690
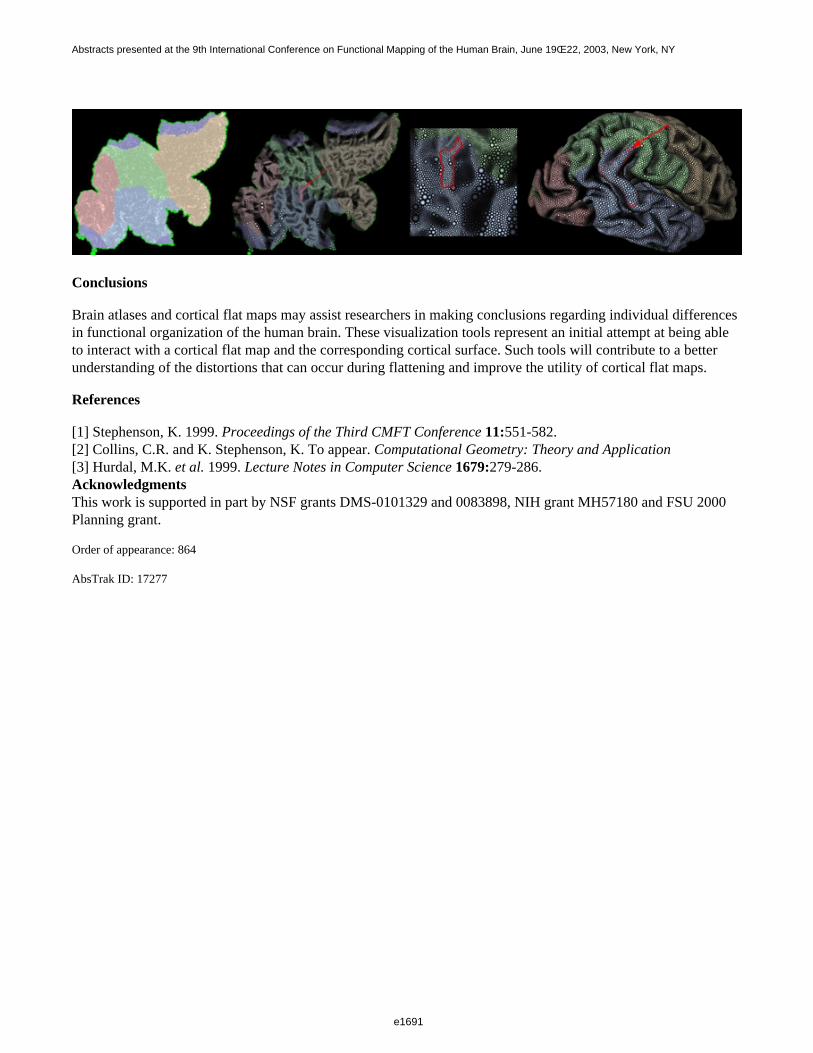
Conclusions
Brain atlases and cortical flat maps may assist researchers in making conclusions regarding individual differencesin functional organization of the human brain. These visualization tools represent an initial attempt at being ableto interact with a cortical flat map and the corresponding cortical surface. Such tools will contribute to a betterunderstanding of the distortions that can occur during flattening and improve the utility of cortical flat maps.
References
[1] Stephenson, K. 1999. Proceedings of the Third CMFT Conference 11:551-582.[2] Collins, C.R. and K. Stephenson, K. To appear. Computational Geometry: Theory and Application[3] Hurdal, M.K. et al. 1999. Lecture Notes in Computer Science 1679:279-286.AcknowledgmentsThis work is supported in part by NSF grants DMS-0101329 and 0083898, NIH grant MH57180 and FSU 2000Planning grant.
Order of appearance: 864
AbsTrak ID: 17277
e1691
Abstracts presented at the 9th International Conference on Functional Mapping of the Human Brain, June 19Œ22, 2003, New York, NY
e1691
Poster number: 873
Functional connectivity : Studying non-linear, asynchronous interactionsbetween BOLD signals
Pierre-Jean Lahaye*†, Jean-Baptiste Poline*†, Guillaume Flandin*†‡, Line Garnero†§
*CEA/DSV/DRM/SHFJ, France†IFR 49, Paris, France
‡INRIA Sophia-Antipolis§CNRS/LENA, Paris, France
Modeling & Analysis
Abstract
Correlation analysis has been widely used in the study of functional connectivity based on fMRI data. However,the assumption of linear, synchronous interactions has not been thoroughly investigated yet.
In this work, we study in depth the information shared by BOLD signals of pairs of brain regions. In particular,we assess the amount of non-linearity and/or historical influence included in the BOLD signal interactions. This isachieved through the test of models reflecting linear, synchronous interactions against more general models,encompassing non-linear, non-synchronous interactions. Systematic test of interactions spanning the whole cortexhas been made.
Data
Paradigms used include previously published data of parietal activations (1), as well as a rest paradigm. Somefactors, which influence measured BOLD signals, are critical for the study of connectivity, such assubject-specific regional haemodynamic, paradigm-induced BOLD responses, pre-treatments, motion artifacts (2)and the presence of artefacts in the low-frequency range (3). Interactions are also influenced by the proximity ofbrain regions. All those factors are reviewed by applying connectivity analysis on the datasets designed to test forthese factors, such that conclusions reached are robust to their variation. To cope with the dimensionnality of data,a parcellation of cortex is used (4).
Methods
A parametric model approach is used to represent interactions. After defining connectivity models includingnon-linearity and/or historical influence, they are compared to the null model of linear, instananeous interactionswhich is implicitly assumed when using correlation analysis. This comparison is done in the framework ofhypothesis testing.
In a second level of analysis, results of these tests, seen as distributions on the large number of interactionsconsidered, are compared to the distributions under the null hypothesis.
A new measure of connectivity acknowledging the role of signal history is proposed.
Results
We find that both non-linear and history terms are significant on the whole set of interactions, independently oftask and pre-treatments.
e1692
Abstracts presented at the 9th International Conference on Functional Mapping of the Human Brain, June 19Œ22, 2003, New York, NY
e1692
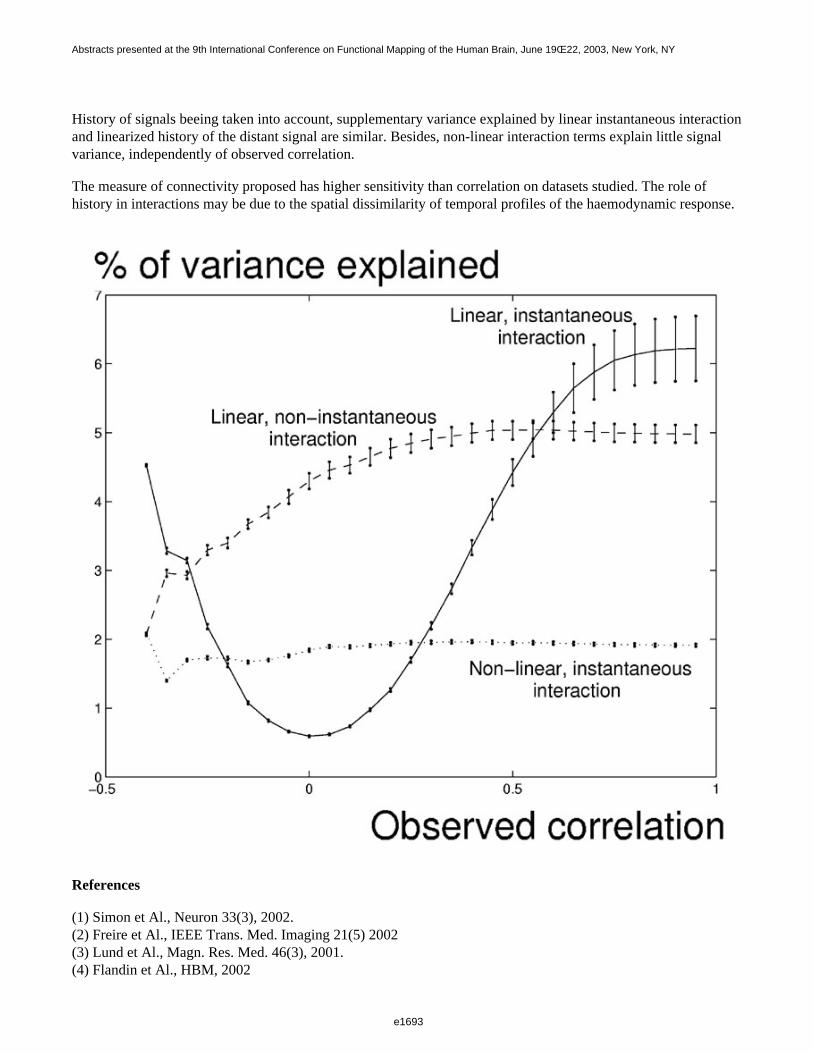
History of signals beeing taken into account, supplementary variance explained by linear instantaneous interactionand linearized history of the distant signal are similar. Besides, non-linear interaction terms explain little signalvariance, independently of observed correlation.
The measure of connectivity proposed has higher sensitivity than correlation on datasets studied. The role ofhistory in interactions may be due to the spatial dissimilarity of temporal profiles of the haemodynamic response.
References
(1) Simon et Al., Neuron 33(3), 2002.(2) Freire et Al., IEEE Trans. Med. Imaging 21(5) 2002(3) Lund et Al., Magn. Res. Med. 46(3), 2001.(4) Flandin et Al., HBM, 2002
e1693
Abstracts presented at the 9th International Conference on Functional Mapping of the Human Brain, June 19Œ22, 2003, New York, NY
e1693

Order of appearance: 865
AbsTrak ID: 18233
e1694
Abstracts presented at the 9th International Conference on Functional Mapping of the Human Brain, June 19Œ22, 2003, New York, NY
e1694
Poster number: 874
Teaching statistical analysis of fMRI data: an online resource
Ian S. Lai§, Richard Hoge†, Julie E. Greenberg‡||, Douglas Greve†, Mark Vangel†, Russ Poldrack§, Randy L. Gollub*†‡
*Department of Psychiatry, Massachusetts General Hospital†MGH/MIT/HMS Martinos Center for Biomedical Imaging‡Harvard-MIT Division of Health Sciences and Technology
§Department of Electrical Engineering and Computer Science, MIT¶Department of Psychology, UCLA
||Research Laboratory of Electronics, MIT
Modeling & Analysis
Abstract
Statistical analysis methods for interrogating functional magnetic resonance imaging (fMRI) data are complex andcontinually evolving. Investigators, novice and experienced, may lack the background education in signalprocessing and statistics required to independently analyze their imaging data. fMRI data is typically analyzedusing free or commercially-available software packages that may not facilitate learning about the underlyingassumptions and prinicples of the analysis methods. These shortcomings can lead to incorrect analyses withsubsequent misinterpretation of the fMRI data and reporting of spurious results. The availability of educationalmaterials that improve understanding of the fundamental principles of fMRI data analysis could have a positiveimpact by improving the quality of results reported by investigators and by stimulating the development of morepowerful analysis methods.
We are developing an instructional module for learning the fundamentals of statistical analysis of fMRI data. Thegoal is to provide a self-guided tool for teaching about the processing steps and assumptions underlying standardfMRI data analysis so that students and researchers can develop insights required to use existing analysis methodsin an informed fashion and adapt them to their own purposes. The module consists of a written tutorial that guidesa student in the use of a simulation of the processing steps of fMRI data. It provides students with opportunitiesfor hands-on exploration of the key concepts using phantom data as well as sample human fMRI data. Thesimulation allows students to control relevant parameters and observe intermediate results for each step in theanalysis stream (spatial smoothing, motion correction, statistical model parameter selection) [Figure 1].
The simulation utilizes a locally-developed software package, Dview, for navigating three- and four-dimensionalbrain image data. Dview displays a run of fMRI data, showing transverse, sagittal, and coronal views of the braincorresponding to the point in space occupied by the cursor. The user may click on any of the three views to movethe cursor and change the views. For four-dimensional data sets, another display frame shows the time-coursedata for the pixel corresponding to the cursor. Dview also contains the functionality to calculate and displaystatistical outputs.
The accompanying tutorial guides students through the individual processing steps, considering multiple cycles offMRI data analysis and prompting them to make direct comparisons, with emphasis on how processing choicesaffect the ultimate interpretation of the fMRI data.
To make the module widely accessible to students, educators and researchers, we are currently transforming thesimulation into an application that can be run over the World Wide Web. We intend to make the Web-accessibleversion of the module available to the general public via the Biomedical Informatics Research Network (BIRN).BIRN is a consortium of university and hospital research organizations concerned with neuroimaging data
e1695
Abstracts presented at the 9th International Conference on Functional Mapping of the Human Brain, June 19Œ22, 2003, New York, NY
e1695
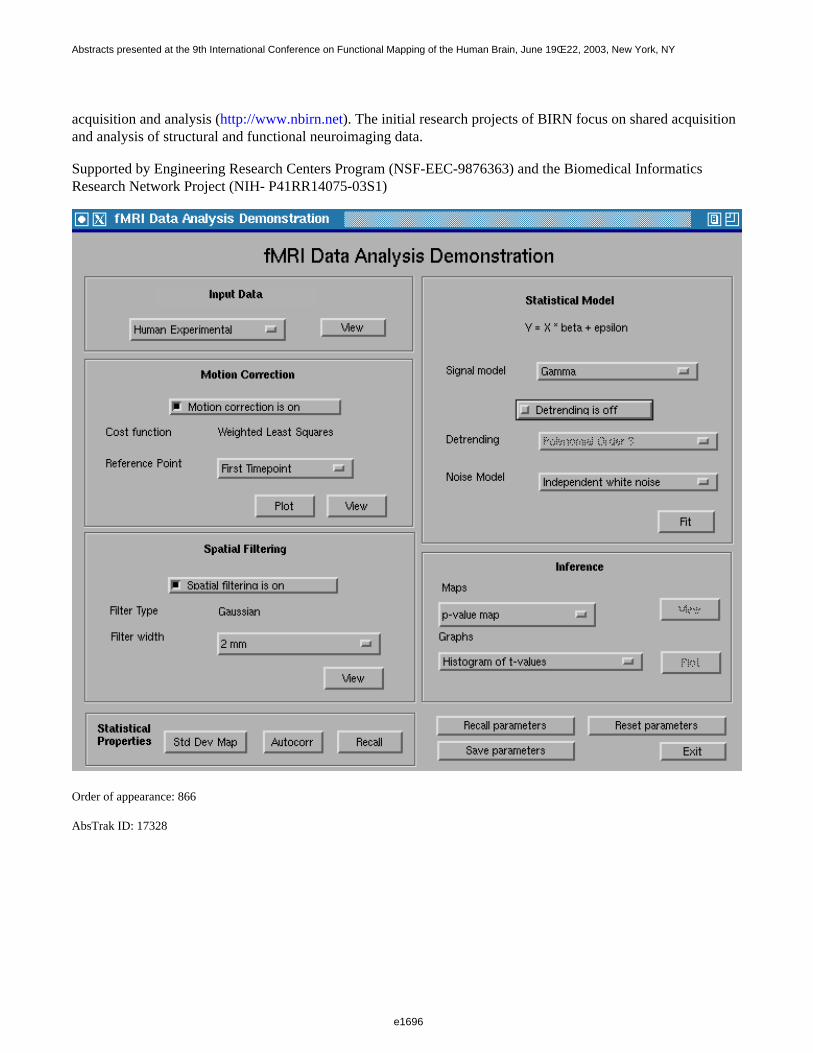
acquisition and analysis (http://www.nbirn.net). The initial research projects of BIRN focus on shared acquisitionand analysis of structural and functional neuroimaging data.
Supported by Engineering Research Centers Program (NSF-EEC-9876363) and the Biomedical InformaticsResearch Network Project (NIH- P41RR14075-03S1)
Order of appearance: 866
AbsTrak ID: 17328
e1696
Abstracts presented at the 9th International Conference on Functional Mapping of the Human Brain, June 19Œ22, 2003, New York, NY
e1696
Poster number: 875
Dynamic Programming Definition of Boundaries of the Planum Temporale
Nayoung Lee*, J. Tilak Ratnanather†, Patrick Barta‡, Monica Hurdal§, Michael Miller†
*Dept of Biomedical Engineering, Johns Hopkins University, Baltimore, MD 21218†Center for Imaging Science, Johns Hopkins University, MD 21218
‡Dept of Psychiatry, Johns Hopkins University School of Medicine, MD 21205§Dept of Mathematics, Florida State University, Tallahassee, FL 32306
Modeling & Analysis
Abstract
Dynamic programming was used to define boundaries of cortical submanifolds with focus on the planumtemporale (PT) of the superior temporal gyrus (STG), a region implicated in a variety of neuropsychiatricdisorders. To this end, automated methods were used to generate the cortical surface of PT from 10 highresolution MRI subvolume encompassing the STG. Bayesian segmentation was then used to segment thesubvolumes into cerebrospinal fluid, gray matter (GM) and white matter (WM). 3D
isocontouring using the intensity value at which there is equal probability of GM and WM is used to reconstructthe triangulated graph representing the STG cortical surface, enabling principal curvature at each point on thegraph to be computed. Dynamic programming was used to delineate the PT cortical surface by tracking principalcurves from the retro-insular end of the Heschl’s Gyrus (HG) to the STG, along the posterior STG up to the startof the ramus and back to the retro-insular end of the HG. A
coordinate system was then defined on the PT cortical surface. The origin was defined by the retro-insular end ofthe HG and the y-axis passes through the point on the posterior STG where the ramus begins.
Automated labelling of GM in the STG is robust with probability of misclassification of gray matter voxelsbetween Bayesian and manual segmentation in the range 0.001-0.12 (n=20). PT reconstruction is also robust with90% of the vertices of the reconstructed PT within 1 mm (n=20) from semi-automated contours. Finally, theinter-rater reliability for the surface area derived from repeated reconstructions was 0.96 for the left PT and 0.94for the right PT, thus demonstrating the
robustness of dynamic programming in defining a coordinate system on the PT. It provides a method withpotential significance in the study of neuropsychiatric disorders.
Joint work with N. Honeycutt and G. Pearlson. Research supported by NIH P41-RR15241, MH 43775, MH60504 and MH 52886 and NSF FRG DMS-0101329.
Order of appearance: 867
AbsTrak ID: 17931
e1697
Abstracts presented at the 9th International Conference on Functional Mapping of the Human Brain, June 19Œ22, 2003, New York, NY
e1697
Poster number: 876
A Population Simulation Validation Study of Cortical Thickness Analysis
Jason Lerch*†, Jens Pruessner, Alex Zijdenbos, Alan Evans Ph.D.
McConnell Brain Imaging Centre, Montreal Neurological Institute
Modeling & Analysis
Abstract
The use of fully automatic techniques to analyze structural in neurological populations is becoming increasinglywidespread. Among the newest of such analysis systems is cortical thickness analysis[1,2]. In order to understandthe precision with which cortical thickness analysis can capture structural changes, a population simulation wasundertaken. The goal was to find the sensitivity and specificity of multiple cortical thickness metrics, to evaluatethe effect of different sized blurring kernels on sensitivity and specificity, and to examine the relationship betweentrue positives, false positives, and false negatives according to different statistical thresholding techniques.
Methods
50 subjects were randomly selected from the ICBM database and arbitrarily divided into a patient and controlpopulation. Each MRI was corrected for non-uniformity artefacts[3], linearly registered into MNI-talairach space[4], and classified[5]. The patient population was automatically segmented using ANIMAL[6], and whitematter in the area of the right superior temporal gyrus was increased through one six neighbour dilation step,resulting in a locally thinned cortex. The inner and outer cortical surfaces of all subjects were then extracted usingthe ASP algorithm[2]. Cortical thickness was measured at every vertex using the following algorithms: linkedthickness (distance of corresponding point on grey matter surface, following the surface expansion)[2], distancealong the surface normal[2] and an iteratively computed surface normal, nearest point on opposite surface[2], andusing Laplace’s equation[7]. The results were smoothed using a series of differently sized surface based blurringkernels (5, 10, 20, 30 and 40 millimetres). A group comparison was then performed at every vertex. Truth, i.e.that part of the cortex that should be recaptured in the statistical analysis, was defined using the probability mapsof the right superior temporal gyrus. Correction of multiple comparisons was performed using both the FalseDiscovery Rate (FDR)[8] and Random Field Theory[9].
Results
e1698
Abstracts presented at the 9th International Conference on Functional Mapping of the Human Brain, June 19Œ22, 2003, New York, NY
e1698
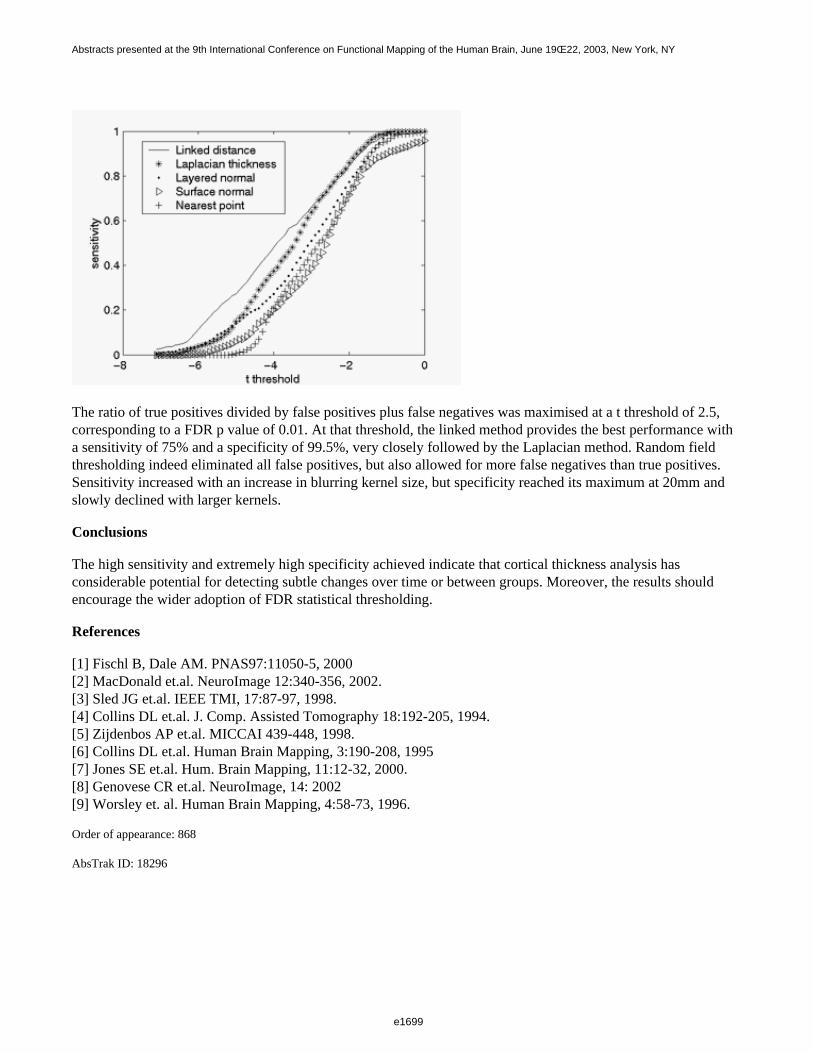
The ratio of true positives divided by false positives plus false negatives was maximised at a t threshold of 2.5,corresponding to a FDR p value of 0.01. At that threshold, the linked method provides the best performance witha sensitivity of 75% and a specificity of 99.5%, very closely followed by the Laplacian method. Random fieldthresholding indeed eliminated all false positives, but also allowed for more false negatives than true positives.Sensitivity increased with an increase in blurring kernel size, but specificity reached its maximum at 20mm andslowly declined with larger kernels.
Conclusions
The high sensitivity and extremely high specificity achieved indicate that cortical thickness analysis hasconsiderable potential for detecting subtle changes over time or between groups. Moreover, the results shouldencourage the wider adoption of FDR statistical thresholding.
References
[1] Fischl B, Dale AM. PNAS97:11050-5, 2000[2] MacDonald et.al. NeuroImage 12:340-356, 2002.[3] Sled JG et.al. IEEE TMI, 17:87-97, 1998.[4] Collins DL et.al. J. Comp. Assisted Tomography 18:192-205, 1994.[5] Zijdenbos AP et.al. MICCAI 439-448, 1998.[6] Collins DL et.al. Human Brain Mapping, 3:190-208, 1995[7] Jones SE et.al. Hum. Brain Mapping, 11:12-32, 2000.[8] Genovese CR et.al. NeuroImage, 14: 2002[9] Worsley et. al. Human Brain Mapping, 4:58-73, 1996.
Order of appearance: 868
AbsTrak ID: 18296
e1699
Abstracts presented at the 9th International Conference on Functional Mapping of the Human Brain, June 19Œ22, 2003, New York, NY
e1699
Poster number: 877
Minimum-Current Estimates with a Cortical Orientation Constraint
Fa-Hsuan Lin, John W. Belliveau, John W. Belliveau, Anders M. Dale, Matti S. Hamalainen
MGH-MIT-HMS Athinoula A. Martinos Center for Biomedical Imaging
Modeling & Analysis
Abstract
Introduction
A widely employed distributed source localization approach in MEG and EEG is based on the L2 norm approach,resulting in diffuse minimum-norm estimates (MNE), (1, 2). However, more focal estimates can be obtained byusing an L1 norm constraint instead (3). The implementation described in (3) requires information about theorientations of the sources, provided by MNE. Here, we propose to utilize information about local corticalanatomy taking into account the variation of the cortex orientation in the neighborhood of each source location.The results from an auditory MEG experiment demonstrate that MCE using anatomically informed sourceorientations gives more focal current source estimation compared to MNE.
Method
The geometry of the grey-white matter surface in the cortex was derived from high-resolution T1 MRI to yield atriangulated model with 340,000 vertices (4, 5). The original triangulation was decimated to a source space of3,889 dipoles with a 10-mm distance between the nearest two dipoles. The Dijsktra algorithm (6) along the edgesof the cortical mesh was employed to yield distances from all vertices to each of the decimated source points. Foreach vertex of the original brain mesh, the closest decimated dipole location was thus determined. Subsequently,local cortical patches were created as sets of vertices sharing the same closest decimated dipole location.
With information about the vertices constituting a patch, the averaged cortical orientation associated with eachpatch and the associated standard deviation of orientations within the patch were estimated. This information wasemployed in the initial MNE so that the average normal orientation is preferred and the amount of current allowedin the local tangential plane is determined by the standard deviation of orientations. Subsequent MCE estimationwas implemented by regularizing the lead fields using singular-value decomposition to reduce the rank to 200.Linear programming (7) was then used to estimate the optimal dipole strengths given the orientation from MNE.
The anatomically informed MCE was applied to an auditory MEG experiment in a healthy subject. The stimuliconsisted of 60 msec white noise (2K Hz central frequency with 4K Hz bandwidth, 70 msec duration). A306-channel MEG system (Neuromag, Helsinki, Finland) was used to record the neuromagnetic responses.
Results
Figure 1 shows the MNE and MCE estimates from the auditory MEG experiment at 118 msec after the onset ofthe acoustic stimuli.MEG dipole estimates were normalized between 0 and 1. The figure shows activated regionin the temporal lobe using a 30% cutoff. L-1 versus L-2 norm produces more focal estimates.
e1700
Abstracts presented at the 9th International Conference on Functional Mapping of the Human Brain, June 19Œ22, 2003, New York, NY
e1700
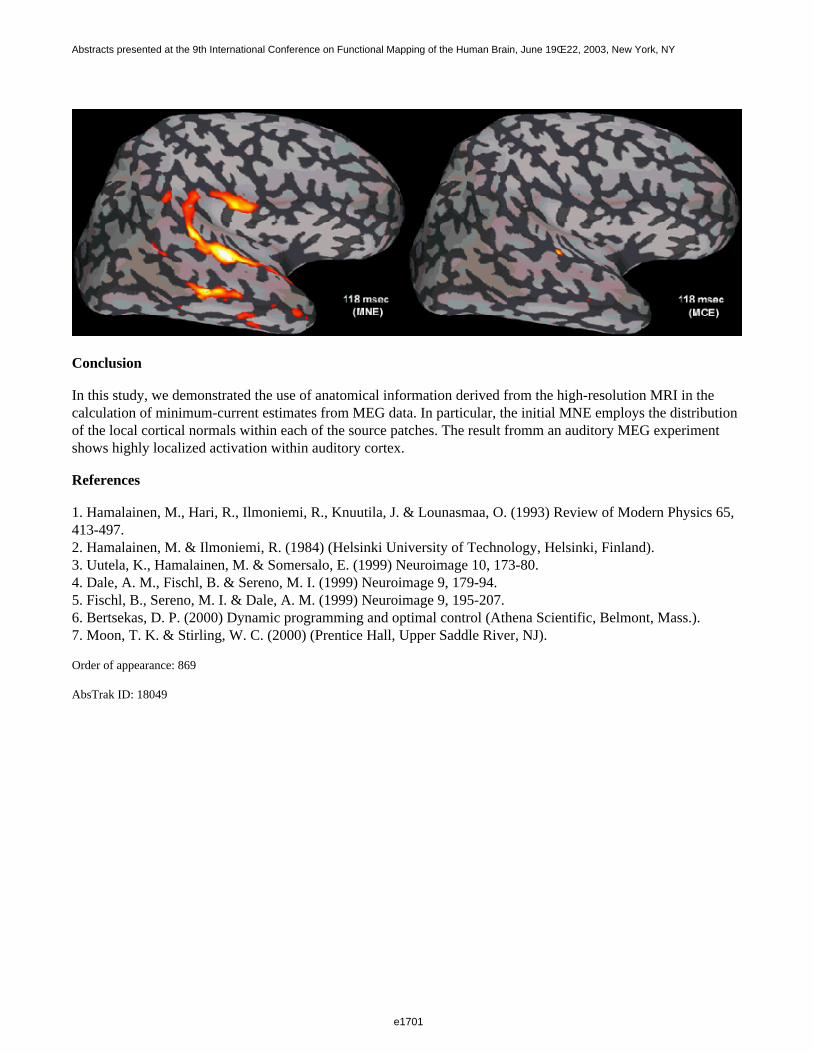
Conclusion
In this study, we demonstrated the use of anatomical information derived from the high-resolution MRI in thecalculation of minimum-current estimates from MEG data. In particular, the initial MNE employs the distributionof the local cortical normals within each of the source patches. The result fromm an auditory MEG experimentshows highly localized activation within auditory cortex.
References
1. Hamalainen, M., Hari, R., Ilmoniemi, R., Knuutila, J. & Lounasmaa, O. (1993) Review of Modern Physics 65, 413-497.2. Hamalainen, M. & Ilmoniemi, R. (1984) (Helsinki University of Technology, Helsinki, Finland).3. Uutela, K., Hamalainen, M. & Somersalo, E. (1999) Neuroimage 10, 173-80.4. Dale, A. M., Fischl, B. & Sereno, M. I. (1999) Neuroimage 9, 179-94.5. Fischl, B., Sereno, M. I. & Dale, A. M. (1999) Neuroimage 9, 195-207.6. Bertsekas, D. P. (2000) Dynamic programming and optimal control (Athena Scientific, Belmont, Mass.).7. Moon, T. K. & Stirling, W. C. (2000) (Prentice Hall, Upper Saddle River, NJ).
Order of appearance: 869
AbsTrak ID: 18049
e1701
Abstracts presented at the 9th International Conference on Functional Mapping of the Human Brain, June 19Œ22, 2003, New York, NY
e1701
Poster number: 878
Reliability of Human Subjects
Michelle Liou
Institute of Statistical Science, Academia Sinica
Modeling & Analysis
Abstract
Functional MRI experiments are normally conducted over a long period of time and subdivided into smallerexperimental runs to allow for short rest in between. Because having to repeatedly respond to experimentalstimuli, subjects may not give reliable functional images along the way due to fatigue, drowsiness and headmotion. It is important to assess the reliability of individual subjects as well as separate experimental runs beforecomputing the statistical maps. This study summarizes useful indices for examining reliability of subjects’performance and reliability of separate experimental runs. Statistical mapping of functional images often normlizeindividual images to a standard template and average the image intensity across subjects and assign equal weightto all experimental runs. It is desirable to calculate weighted average across subjects and experimental runs; thosesubjects who have added more noise to the experiment must be assigned smaller weights. This study will use thefunctional images supported by the National fMRI Data Center to illustrate the importance of reliability indicesfor statistical mapping of functional brain images.
Order of appearance: 870
AbsTrak ID: 18069
e1702
Abstracts presented at the 9th International Conference on Functional Mapping of the Human Brain, June 19Œ22, 2003, New York, NY
e1702
Poster number: 879
Spatial ICA Analysis for Motor Control Paradigm of fMRI
Yadong Liu*, Dewen Hu*, Zongtan Zhou*, Lirong Yan*
*Department of Automatic Control, National University of Defence Technology, Changsha, Hunan 410073,P.R.China. [email protected]
†Supported by NSFC for Distinguished Young Scholars, National Important Basic R&D Preview Project
Modeling & Analysis
Abstract
ICA can extract the intrinsic structure of the data without prior knowledge. It uses an iterative training process tofind the spatially independent components in the data set.
One right-handed volunteer with no history of neurological disease was recruited. The subject performed thetypical finger-tapping task used to map the sensorimotor cortex. The sensorimotor cortex is consistently identifiedwhen the reference function models a hemodynamic response sustained throughout the task. The result ofcross-correlation is showed in Fig(1), while the boxcar reference function is shown in the Fig(5)(the upper).
Firstly, for comparison, the cross-correlation coefficients of every pixel time sequence to box-car referencefunctions are calculated. The pixel is believed to be consistently related with the task if the cross-correlationcoefficient is greater than 0.6.
Then, the ICA method is used to process the data set. The number of fMRI scan time points determiningsmaximal number of output components. The FastICA is used to decompose fMRI data into the spatiallyindependent patterns of brain activities, their associated time courses can also be obtained. From the time courses,the consistently task-related(CTR) component is determined. Fig(2) shows CTR component and Fig(3) shows theassociated time course.
It is observed that the fMRI activations are identified regularly within the sensorimotor cortex,premotor cortexand supplementary motorarea(SMA). The result demonstrates more regions of activation than that of conventionalcorrelation analysis for the same tasks. In Fig(1), the farther the scan location from the brain active centre, the lessthe CTR has been found by cross-correlation method. This is because with the level farther from the activatedloci, the SNR is lower, which can be demonstrated by the time courses obtained by ICA. The cross-correlationmethod almost found no CTR in the first and second level. But ICA can still find the CTR when the SNR is low.
The current configuration of ICA demonstrates multiple components, only a few of which are specific to the taskperformed. Others may represent artifacts associated with motion. From the time course we can see that somecomponents are transiently related with the task, we call them the transiently task-related components(TTR).
Fig(4) and Fig(5)(the bottom)show the TTR component and its time course, we get it from the data set of whichthe right hand performing the task. From Fig(4) it can be known that this is the arm-reaching area. It is clear thatwe can’t get the TTR areas by the conventional cross-correlation method, we can’t either get it by commonhypothesis-driven methods.
Reference:
[1]Zhuqing Yang and Dewen Hu,"Functional MRI Data Analysis Using FastICA", NeuroImage Human BrainMapping 2002 Meeting.[2]A.Hyvarinen and E.Oja, "A Fast Fixed-Point Algorithm for Independent Component Analysis", Neural
e1703
Abstracts presented at the 9th International Conference on Functional Mapping of the Human Brain, June 19Œ22, 2003, New York, NY
e1703
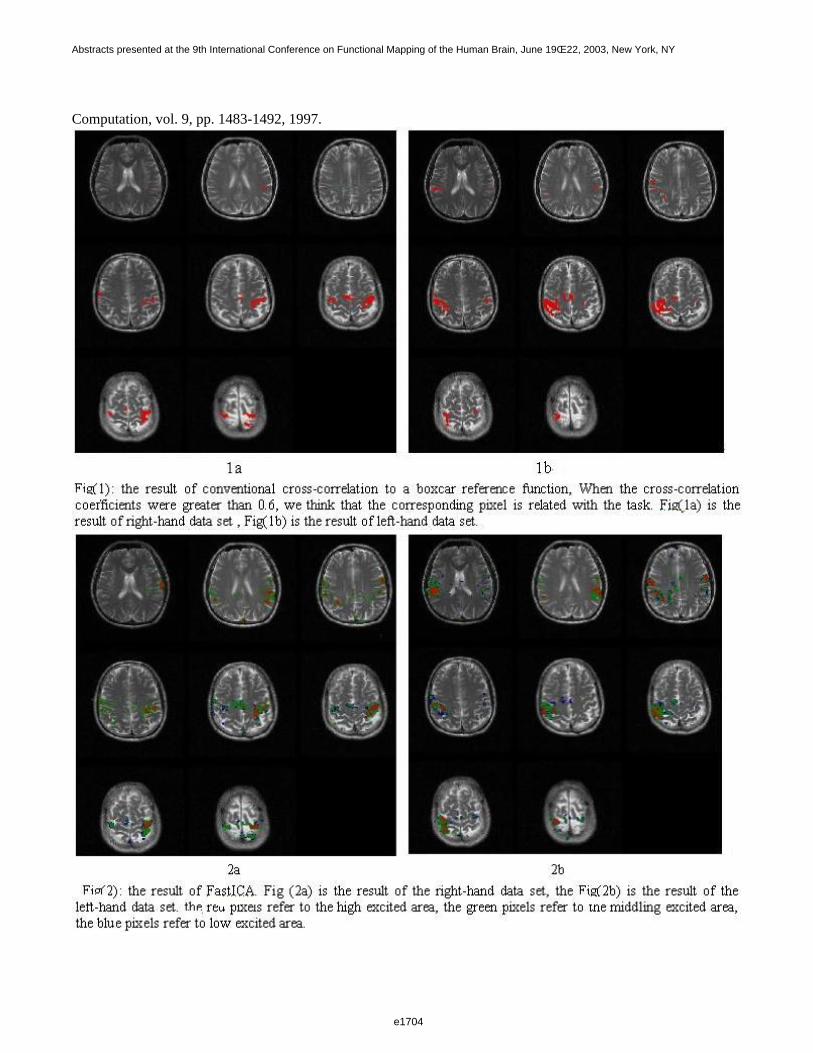
Computation, vol. 9, pp. 1483-1492, 1997.
e1704
Abstracts presented at the 9th International Conference on Functional Mapping of the Human Brain, June 19Œ22, 2003, New York, NY
e1704
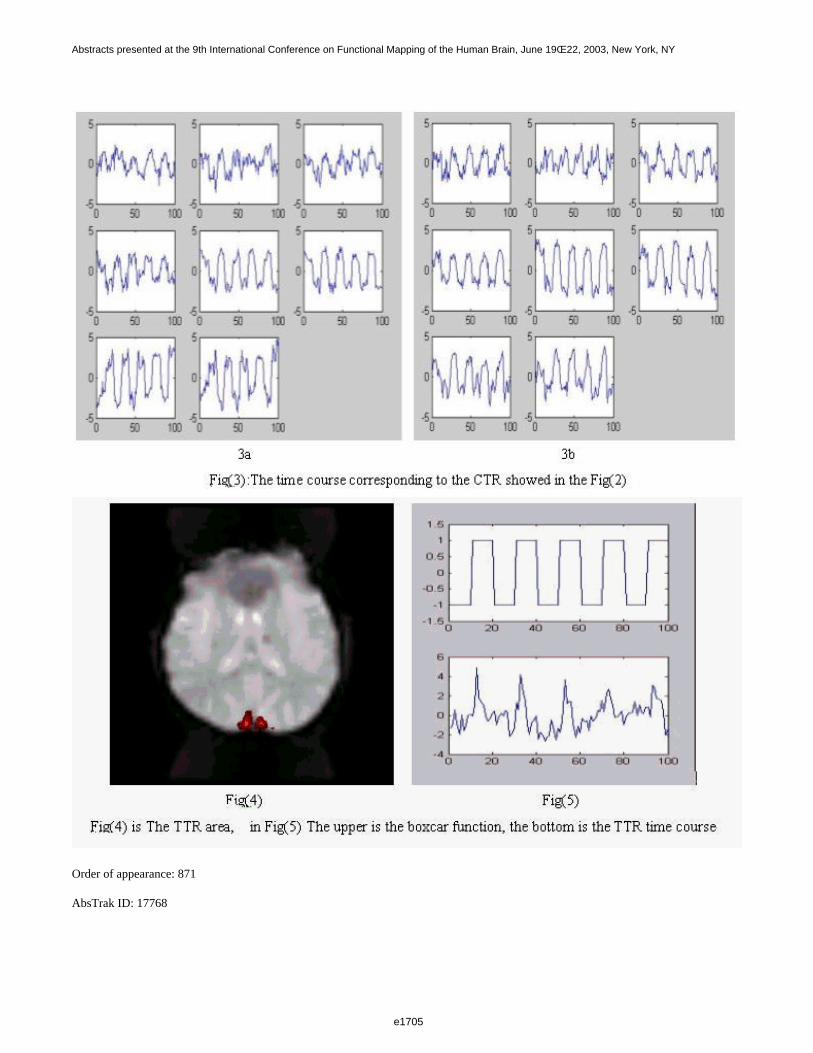
Order of appearance: 871
AbsTrak ID: 17768
e1705
Abstracts presented at the 9th International Conference on Functional Mapping of the Human Brain, June 19Œ22, 2003, New York, NY
e1705
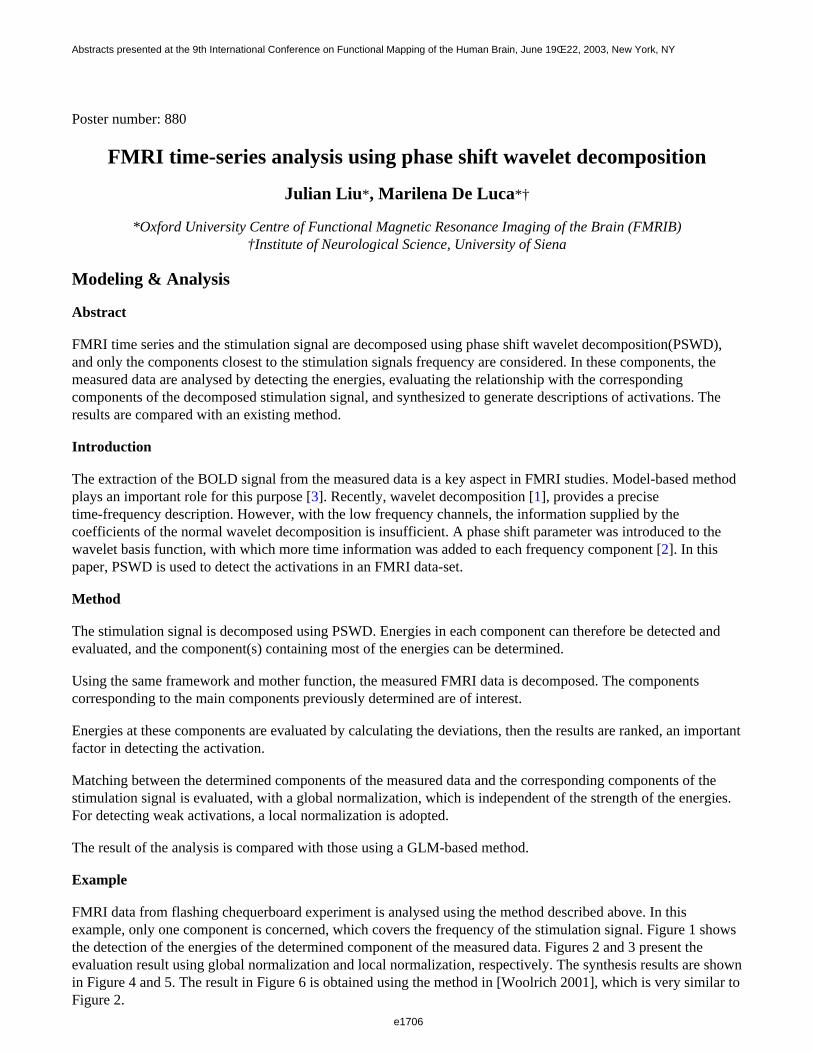
Poster number: 880
FMRI time-series analysis using phase shift wavelet decomposition
Julian Liu*, Marilena De Luca*†
*Oxford University Centre of Functional Magnetic Resonance Imaging of the Brain (FMRIB)†Institute of Neurological Science, University of Siena
Modeling & Analysis
Abstract
FMRI time series and the stimulation signal are decomposed using phase shift wavelet decomposition(PSWD),and only the components closest to the stimulation signals frequency are considered. In these components, themeasured data are analysed by detecting the energies, evaluating the relationship with the correspondingcomponents of the decomposed stimulation signal, and synthesized to generate descriptions of activations. Theresults are compared with an existing method.
Introduction
The extraction of the BOLD signal from the measured data is a key aspect in FMRI studies. Model-based methodplays an important role for this purpose [3]. Recently, wavelet decomposition [1], provides a precisetime-frequency description. However, with the low frequency channels, the information supplied by thecoefficients of the normal wavelet decomposition is insufficient. A phase shift parameter was introduced to thewavelet basis function, with which more time information was added to each frequency component [2]. In thispaper, PSWD is used to detect the activations in an FMRI data-set.
Method
The stimulation signal is decomposed using PSWD. Energies in each component can therefore be detected andevaluated, and the component(s) containing most of the energies can be determined.
Using the same framework and mother function, the measured FMRI data is decomposed. The componentscorresponding to the main components previously determined are of interest.
Energies at these components are evaluated by calculating the deviations, then the results are ranked, an importantfactor in detecting the activation.
Matching between the determined components of the measured data and the corresponding components of thestimulation signal is evaluated, with a global normalization, which is independent of the strength of the energies.For detecting weak activations, a local normalization is adopted.
The result of the analysis is compared with those using a GLM-based method.
Example
FMRI data from flashing chequerboard experiment is analysed using the method described above. In thisexample, only one component is concerned, which covers the frequency of the stimulation signal. Figure 1 showsthe detection of the energies of the determined component of the measured data. Figures 2 and 3 present theevaluation result using global normalization and local normalization, respectively. The synthesis results are shownin Figure 4 and 5. The result in Figure 6 is obtained using the method in [Woolrich 2001], which is very similar toFigure 2.
e1706
Abstracts presented at the 9th International Conference on Functional Mapping of the Human Brain, June 19Œ22, 2003, New York, NY
e1706
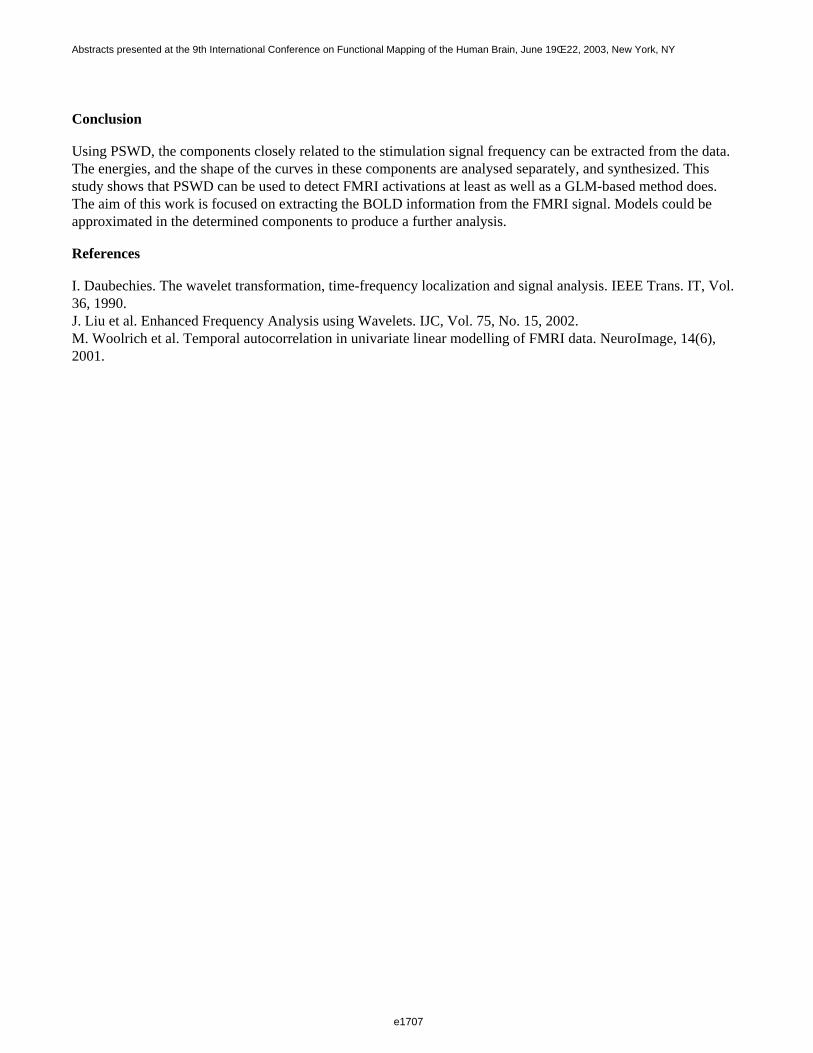
Conclusion
Using PSWD, the components closely related to the stimulation signal frequency can be extracted from the data.The energies, and the shape of the curves in these components are analysed separately, and synthesized. Thisstudy shows that PSWD can be used to detect FMRI activations at least as well as a GLM-based method does.The aim of this work is focused on extracting the BOLD information from the FMRI signal. Models could beapproximated in the determined components to produce a further analysis.
References
I. Daubechies. The wavelet transformation, time-frequency localization and signal analysis. IEEE Trans. IT, Vol.36, 1990.J. Liu et al. Enhanced Frequency Analysis using Wavelets. IJC, Vol. 75, No. 15, 2002.M. Woolrich et al. Temporal autocorrelation in univariate linear modelling of FMRI data. NeuroImage, 14(6), 2001.
e1707
Abstracts presented at the 9th International Conference on Functional Mapping of the Human Brain, June 19Œ22, 2003, New York, NY
e1707
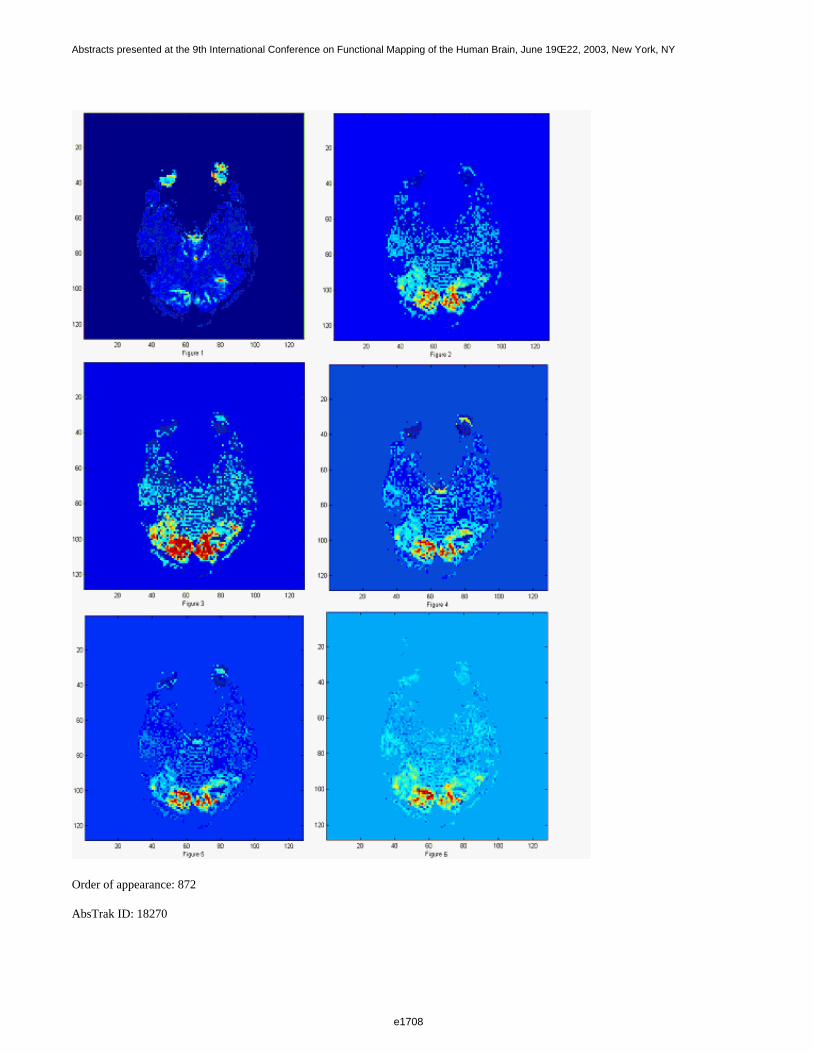
Order of appearance: 872
AbsTrak ID: 18270
e1708
Abstracts presented at the 9th International Conference on Functional Mapping of the Human Brain, June 19Œ22, 2003, New York, NY
e1708
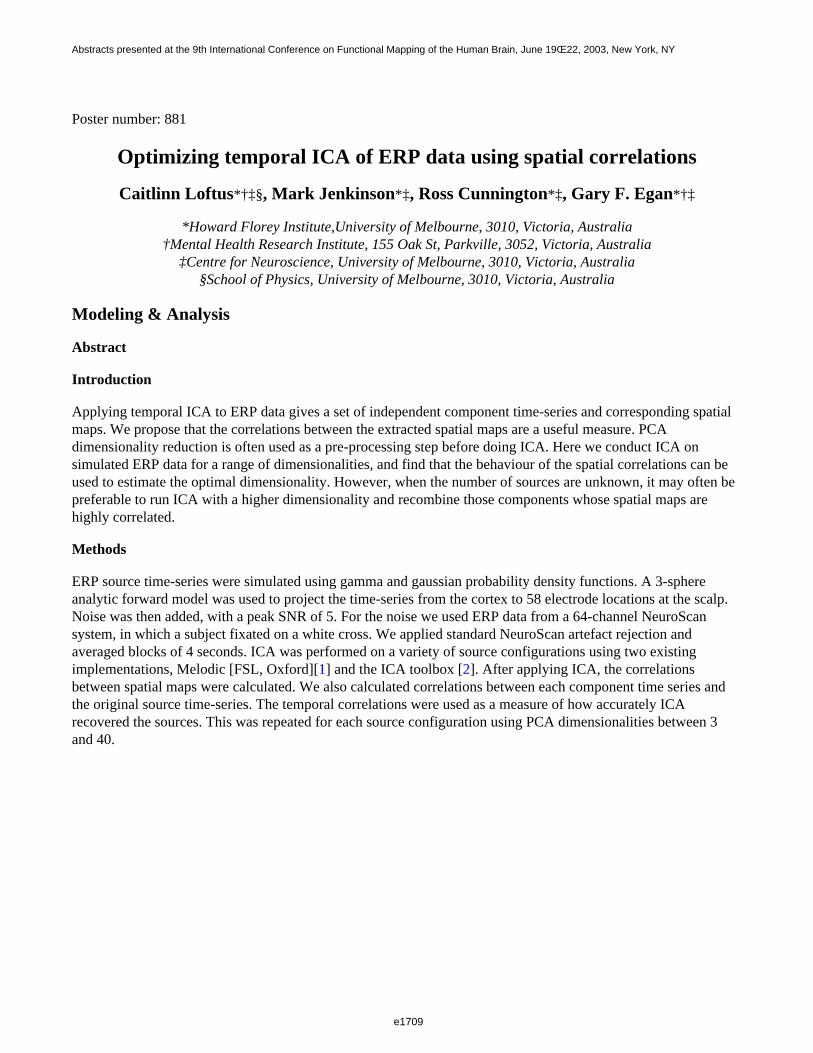
Poster number: 881
Optimizing temporal ICA of ERP data using spatial correlations
Caitlinn Loftus*†‡§, Mark Jenkinson*‡, Ross Cunnington*‡, Gary F. Egan*†‡
*Howard Florey Institute,University of Melbourne, 3010, Victoria, Australia†Mental Health Research Institute, 155 Oak St, Parkville, 3052, Victoria, Australia
‡Centre for Neuroscience, University of Melbourne, 3010, Victoria, Australia§School of Physics, University of Melbourne, 3010, Victoria, Australia
Modeling & Analysis
Abstract
Introduction
Applying temporal ICA to ERP data gives a set of independent component time-series and corresponding spatialmaps. We propose that the correlations between the extracted spatial maps are a useful measure. PCAdimensionality reduction is often used as a pre-processing step before doing ICA. Here we conduct ICA onsimulated ERP data for a range of dimensionalities, and find that the behaviour of the spatial correlations can beused to estimate the optimal dimensionality. However, when the number of sources are unknown, it may often bepreferable to run ICA with a higher dimensionality and recombine those components whose spatial maps arehighly correlated.
Methods
ERP source time-series were simulated using gamma and gaussian probability density functions. A 3-sphereanalytic forward model was used to project the time-series from the cortex to 58 electrode locations at the scalp.Noise was then added, with a peak SNR of 5. For the noise we used ERP data from a 64-channel NeuroScansystem, in which a subject fixated on a white cross. We applied standard NeuroScan artefact rejection andaveraged blocks of 4 seconds. ICA was performed on a variety of source configurations using two existingimplementations, Melodic [FSL, Oxford][1] and the ICA toolbox [2]. After applying ICA, the correlationsbetween spatial maps were calculated. We also calculated correlations between each component time series andthe original source time-series. The temporal correlations were used as a measure of how accurately ICArecovered the sources. This was repeated for each source configuration using PCA dimensionalities between 3and 40.
e1709
Abstracts presented at the 9th International Conference on Functional Mapping of the Human Brain, June 19Œ22, 2003, New York, NY
e1709
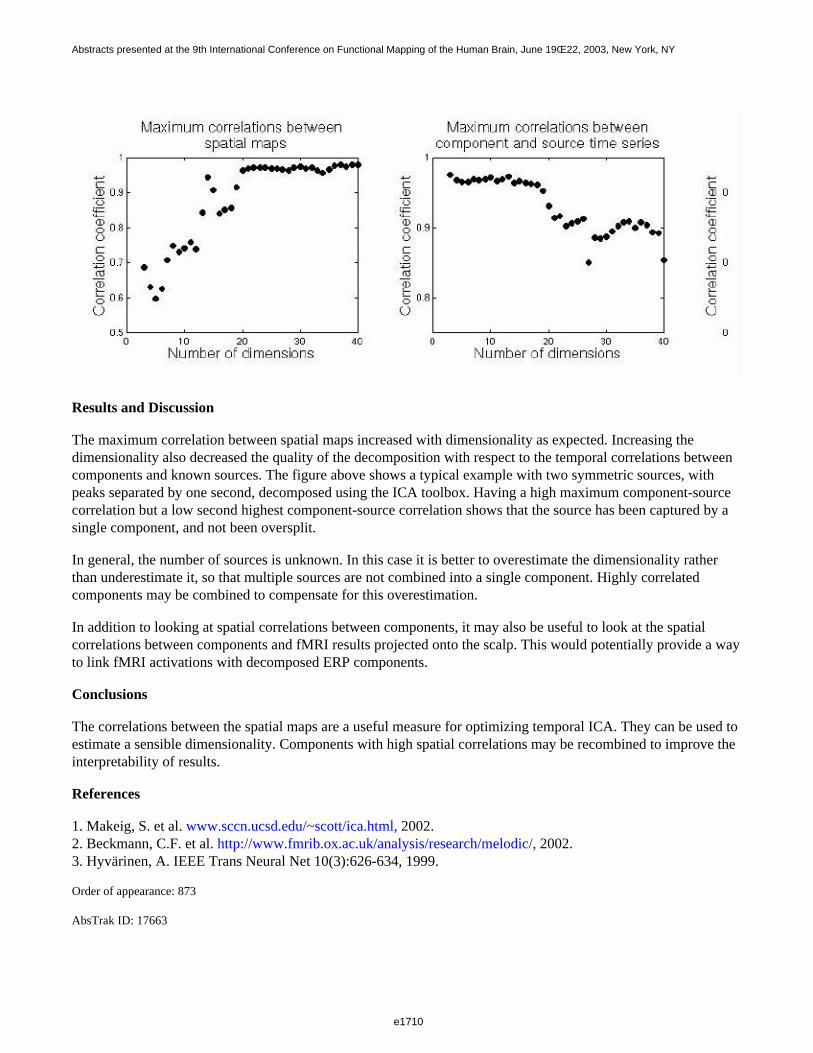
Results and Discussion
The maximum correlation between spatial maps increased with dimensionality as expected. Increasing thedimensionality also decreased the quality of the decomposition with respect to the temporal correlations betweencomponents and known sources. The figure above shows a typical example with two symmetric sources, withpeaks separated by one second, decomposed using the ICA toolbox. Having a high maximum component-sourcecorrelation but a low second highest component-source correlation shows that the source has been captured by asingle component, and not been oversplit.
In general, the number of sources is unknown. In this case it is better to overestimate the dimensionality ratherthan underestimate it, so that multiple sources are not combined into a single component. Highly correlatedcomponents may be combined to compensate for this overestimation.
In addition to looking at spatial correlations between components, it may also be useful to look at the spatialcorrelations between components and fMRI results projected onto the scalp. This would potentially provide a wayto link fMRI activations with decomposed ERP components.
Conclusions
The correlations between the spatial maps are a useful measure for optimizing temporal ICA. They can be used toestimate a sensible dimensionality. Components with high spatial correlations may be recombined to improve theinterpretability of results.
References
1. Makeig, S. et al. www.sccn.ucsd.edu/~scott/ica.html, 2002.2. Beckmann, C.F. et al. http://www.fmrib.ox.ac.uk/analysis/research/melodic/, 2002.3. Hyvärinen, A. IEEE Trans Neural Net 10(3):626-634, 1999.
Order of appearance: 873
AbsTrak ID: 17663
e1710
Abstracts presented at the 9th International Conference on Functional Mapping of the Human Brain, June 19Œ22, 2003, New York, NY
e1710
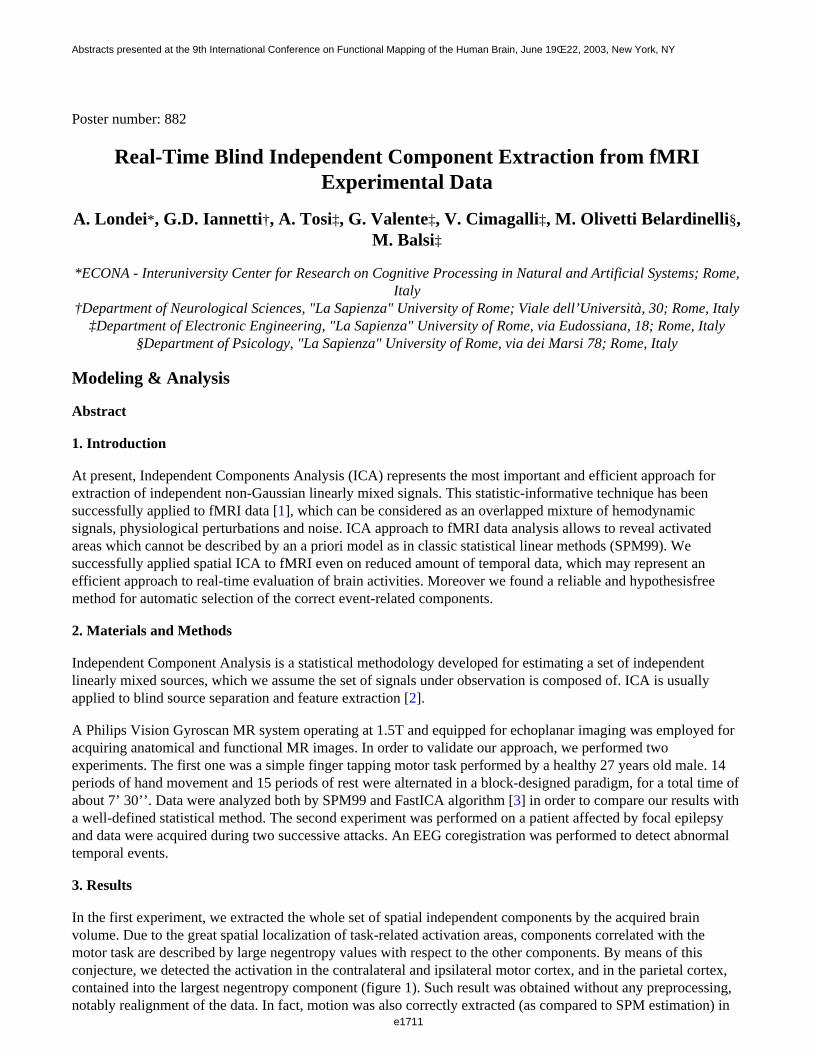
Poster number: 882
Real-Time Blind Independent Component Extraction from fMRIExperimental Data
A. Londei*, G.D. Iannetti†, A. Tosi‡, G. Valente‡, V. Cimagalli‡, M. Olivetti Belardinelli§,M. Balsi‡
*ECONA - Interuniversity Center for Research on Cognitive Processing in Natural and Artificial Systems; Rome, Italy
†Department of Neurological Sciences, "La Sapienza" University of Rome; Viale dell’Università, 30; Rome, Italy‡Department of Electronic Engineering, "La Sapienza" University of Rome, via Eudossiana, 18; Rome, Italy
§Department of Psicology, "La Sapienza" University of Rome, via dei Marsi 78; Rome, Italy
Modeling & Analysis
Abstract
1. Introduction
At present, Independent Components Analysis (ICA) represents the most important and efficient approach forextraction of independent non-Gaussian linearly mixed signals. This statistic-informative technique has beensuccessfully applied to fMRI data [1], which can be considered as an overlapped mixture of hemodynamicsignals, physiological perturbations and noise. ICA approach to fMRI data analysis allows to reveal activatedareas which cannot be described by an a priori model as in classic statistical linear methods (SPM99). Wesuccessfully applied spatial ICA to fMRI even on reduced amount of temporal data, which may represent anefficient approach to real-time evaluation of brain activities. Moreover we found a reliable and hypothesisfreemethod for automatic selection of the correct event-related components.
2. Materials and Methods
Independent Component Analysis is a statistical methodology developed for estimating a set of independentlinearly mixed sources, which we assume the set of signals under observation is composed of. ICA is usuallyapplied to blind source separation and feature extraction [2].
A Philips Vision Gyroscan MR system operating at 1.5T and equipped for echoplanar imaging was employed foracquiring anatomical and functional MR images. In order to validate our approach, we performed twoexperiments. The first one was a simple finger tapping motor task performed by a healthy 27 years old male. 14periods of hand movement and 15 periods of rest were alternated in a block-designed paradigm, for a total time ofabout 7’ 30’’. Data were analyzed both by SPM99 and FastICA algorithm [3] in order to compare our results witha well-defined statistical method. The second experiment was performed on a patient affected by focal epilepsyand data were acquired during two successive attacks. An EEG coregistration was performed to detect abnormaltemporal events.
3. Results
In the first experiment, we extracted the whole set of spatial independent components by the acquired brainvolume. Due to the great spatial localization of task-related activation areas, components correlated with themotor task are described by large negentropy values with respect to the other components. By means of thisconjecture, we detected the activation in the contralateral and ipsilateral motor cortex, and in the parietal cortex,contained into the largest negentropy component (figure 1). Such result was obtained without any preprocessing,notably realignment of the data. In fact, motion was also correctly extracted (as compared to SPM estimation) in
e1711
Abstracts presented at the 9th International Conference on Functional Mapping of the Human Brain, June 19Œ22, 2003, New York, NY
e1711
one of the first ICs. In the second experiment, by using the same approach, we were able to detect the centralthalamic activation (figure 2).
4. Discussion
Application of Independent Component Analysis to fMRI spatiotemporal data shows a great reliability inextracting hemodynamic components and identifying brain activity. We extended this approach even to ashort-term evolution which allowed to extract suitable results after a small amount of temporal samples (30 sec)(figure 3).
Bibliografy
[1] McKeown, M.J., Makeig, S., Brown, G.G., Jung, T.-P., Kindermann, S.S., Bell, A.J., Sejnowski, T.J.:Analysis of fMRI Data by Blind Separation into Independent Spatial Components. Human Brain Mapping 6(1998), 160-188[2] Hyvärinen, A.: Survey on Independent Component Analysis. Neural Computing Surveys 2:94-128 (1999)[3] Hyvärinen, A.: Fast and Robust Fixed-Point Algorithms for Independent Component Analysis. IEEE Trans.on Neural Networks, 10 (1999)
Figure 1 – Spatial and associated temporal Independent Component related to the activation of the motor areas
Figure 2 – ROI considered for ICA and associated activation in epileptic patient
e1712
Abstracts presented at the 9th International Conference on Functional Mapping of the Human Brain, June 19Œ22, 2003, New York, NY
e1712
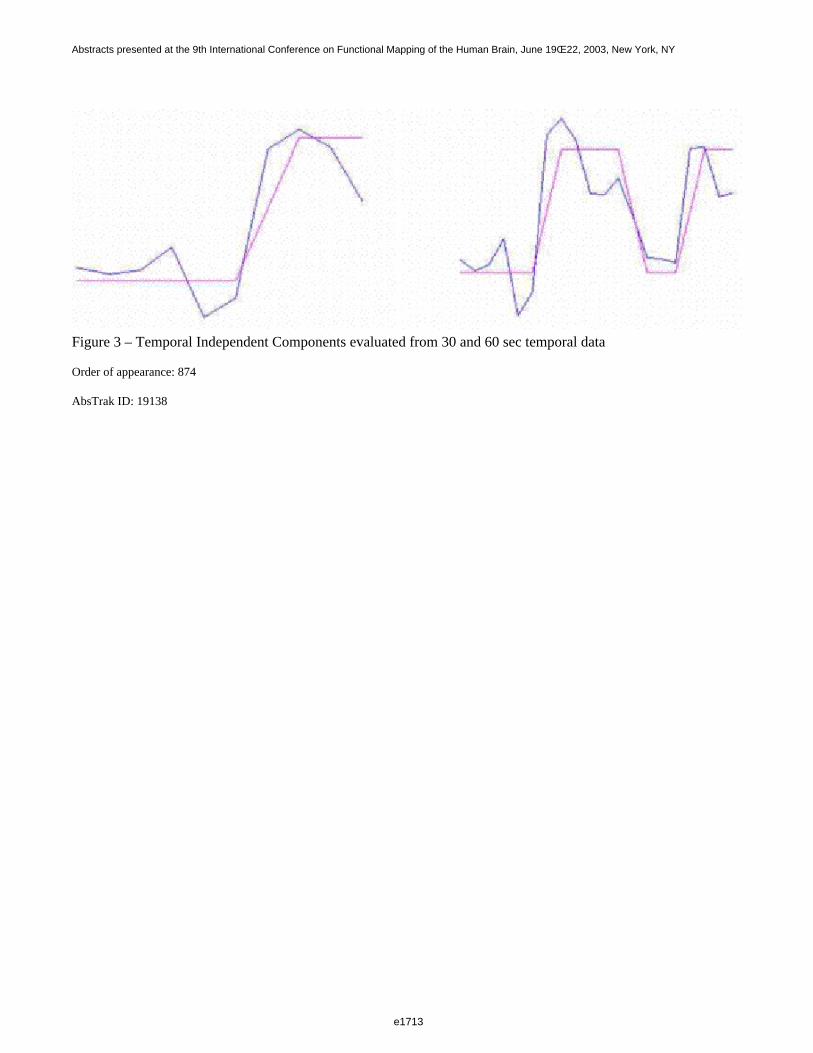
Figure 3 – Temporal Independent Components evaluated from 30 and 60 sec temporal data
Order of appearance: 874
AbsTrak ID: 19138
e1713
Abstracts presented at the 9th International Conference on Functional Mapping of the Human Brain, June 19Œ22, 2003, New York, NY
e1713
Poster number: 883
Lagrange Multipliers in fMRI Part(I): Signal Detection in Unidentified Models
Christopher J. Long*, Emery N. Brown†, Edward Bullmore‡, Victor Solo*§
*MGH/HMS/MIT Athinoula A. Martinos Center for Biomedical Imaging, Charlestown, MA, USA†Dept. of Anesthesia & Critical Care, Massachusetts General Hospital, Boston, MA, USA‡Dept. of Psychiatry, Addenbrookes Hospital, University of Cambridge, Cambridge, UK
§Dept. of Electrical Engineering, University of New South Wales, Sydney, Australia
Modeling & Analysis
Abstract
Many fields of science and engineering have independently discovered the need for constrained optimizationmethods in hypothesis testing. One such example is the use of Lagrange Multipliers(LMs) in econometrics. Wehave developed a new fMRI analysis tool based on LMs which has the following characteristics:
1)The optimization constraints imposed upon fMRI estimation within LM are equivalent to evaluating its solutionunder the null hypothesis. However, this hypothesis is tested at the estimation stage, rather than at the usualinferential step. Therefore, the method is released from having to identify, and pre-fit an explicit signal model.
2)The method performs intrinsic estimation of the spatial signal extent and is therefore independent of moreoblique inferential interpretation. This may be appealing, since the aims of p-value thresholding arefundamentally different from those of explicit signal detection - the latter might be considered a moreinterpretable aim of fMRI analysis.
3) Our formulation of the constrained LM test yields an interesting insight, namely quantification of theinteraction between deterministic noise (e.g. trends), stochastic noise (e.g. physiological+scanner noise) and truesignal. Typically, the estimation of these noises can be achieved respectively by a) regressing each timecourseonto a collection of (low-frequency) sinusoidal functions, and b) by specifying an explicit generating model,ARMA(1, 1) in our case, and using say an Expectation Maximization (EM) algorithm to estimate the latentparameters. Notably, there will be an ill-determined divide between the proportions of noise correctly attributed toeach of these types, but that is of less concern here. More important will be the overlap between higher-orderdrifts and the experimental design. Our proposed formulation of the LM test is able both to characterize andcompensate for the effect of this interaction on the activation.
4) The LM constraints have been formulated under the null hypothesis. As a result spatial signal extent is thenatural outcome. LM testing is therefore useful as a preprocessing step, acting essentially as a functional mask tofacilitate more complex signal estimation strategies. Discrimination of signal extent in this way may be importantin dealing with problems associated with identifiability in parts of the full-blown signal model, eg. spatiallyvarying hemodynamic dispersions or delays. However, the LM can be used in its own right as a self-containedanalysis tool possessing the combined benefits of simplicity, speed, and flexibility toward less traditional aspectsof functional testing (see Part(II)).
Method & Results
In the current approach, we have defined the fMRI parameter estimation problem within a spatially varying,system-identification procedure [Solo2001]. To calculate the LM statistic, we constructed a similar likelihood asfor the full model, except under the null constraint. A hybrid LM test was then derived in terms of the restricted
e1714
Abstracts presented at the 9th International Conference on Functional Mapping of the Human Brain, June 19Œ22, 2003, New York, NY
e1714
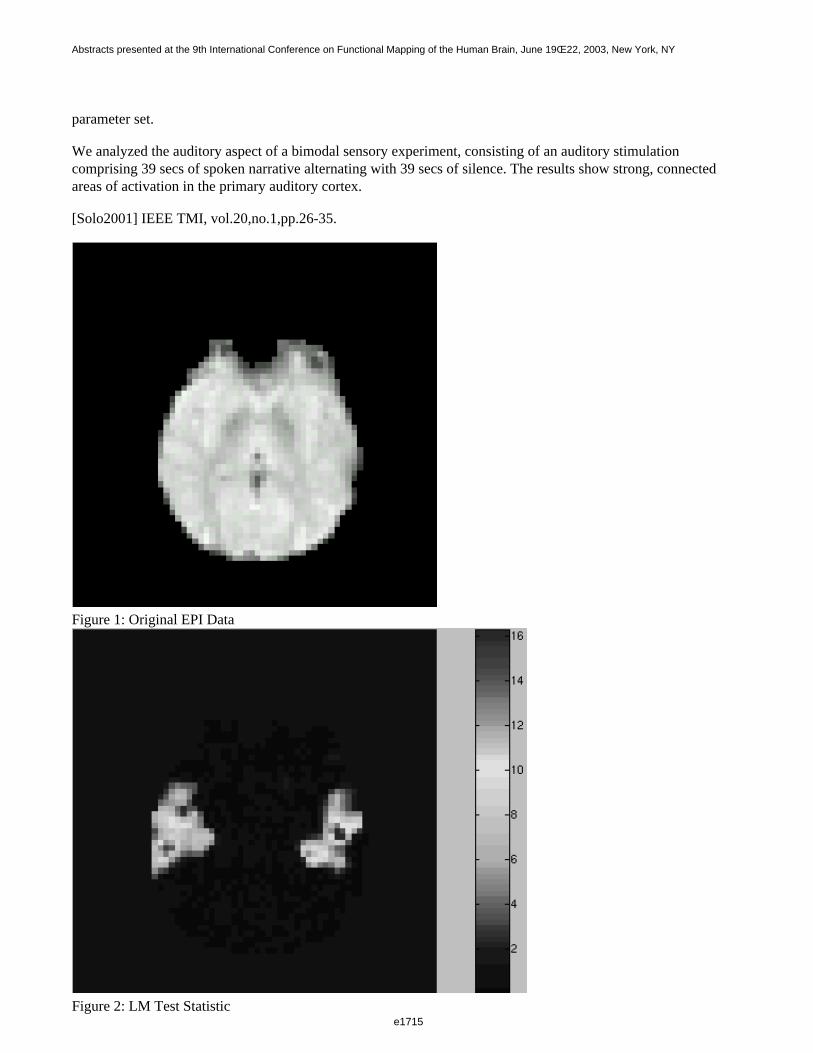
parameter set.
We analyzed the auditory aspect of a bimodal sensory experiment, consisting of an auditory stimulationcomprising 39 secs of spoken narrative alternating with 39 secs of silence. The results show strong, connectedareas of activation in the primary auditory cortex.
[Solo2001] IEEE TMI, vol.20,no.1,pp.26-35.
Figure 1: Original EPI Data
Figure 2: LM Test Statistic
e1715
Abstracts presented at the 9th International Conference on Functional Mapping of the Human Brain, June 19Œ22, 2003, New York, NY
e1715
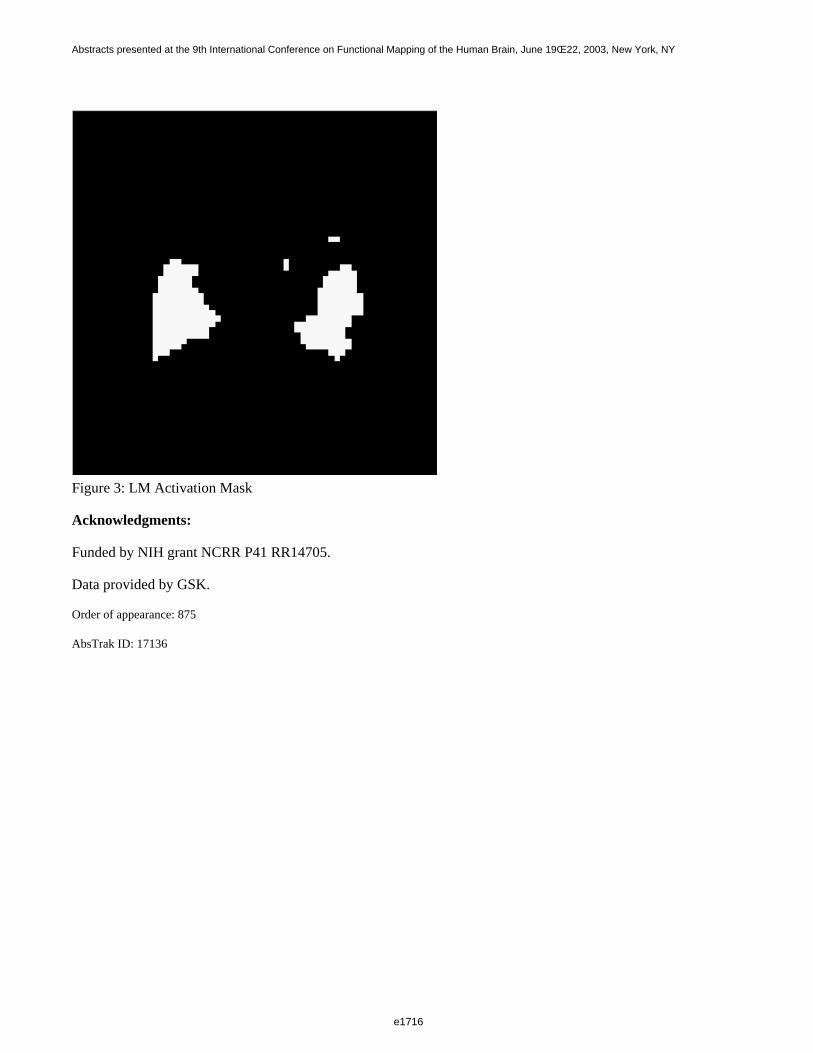
Figure 3: LM Activation Mask
Acknowledgments:
Funded by NIH grant NCRR P41 RR14705.
Data provided by GSK.
Order of appearance: 875
AbsTrak ID: 17136
e1716
Abstracts presented at the 9th International Conference on Functional Mapping of the Human Brain, June 19Œ22, 2003, New York, NY
e1716
Poster number: 884
Lagrange Multipliers in fMRI Part(II): Significance Testing ofHemodynamic Delay Maps within a Spatio-Temporal System
Identification Procedure
Christopher J. Long*, Emery N. Brown†, Edward Bullmore‡, Victor Solo*§
*MGH/HMS/MIT Athinoula A. Martinos Center for Biomedical Imaging, Charlestown, MA, USA†Dept. of Anesthesia & Critical Care, Massachusetts General Hospital, Boston, MA, USA
‡Dept. of Psychiatry,Addenbrookes Hospital,University of Cambridge, Cambridge, UK§Dept. of Electrical Engineering, University of New South Wales, Sydney, Australia
Modeling & Analysis
Abstract
We apply the Lagrange Multiplier (LM) method to significance testing of spatially-varying hemodynamic delaysin fMRI. These delays are computed using a physiologically-motivated model of the spatio-temporal fMRI signal.The LM test is developed using the null constraint that no delay is present. As a result, the full model collapsesand the LM test statistic can be derived. Creating a significance mask for the delay in this manner is equivalent tolocating the regions where this parameter is identifiable, i.e. where the information matrix for the delay parameteris properly bounded. Distinguishing regions in this way allows subsequent delay estimation computed as part of awider, spatio-temporal signal estimation problem.
Method
The statistical model itself possesses two main components. The first characterizes the activation itself and maybe considered as a realization of the spatio-temporal dynamics underlying BOLD signal generation. This BOLDmodel accounts for hemodynamic flow response and its associated volume effect. The presence of thespatially-varying latency term further influences these physiologic sub-components.
The second component of the model aims to capture the spatio-temporal noise processes implicit in the measuredfMRI data. In practice, this noise model consists of colored elements representing low frequency physiologicfluctuations within the brain, and white elements reflecting the additive scanner noise.This process isspatio-temporal since it undergoes iterative spatial regularization.
Delay significance is tested by constructing an LM statistic for the model under the null hypothesis. The LM testuses the null residuals along with a set of LM regressors derived under generalized inverse conditions. The finalLM test statistic is therefore generated by maximization of the appropriate likelihood function under the followingtwo constraints, (i)the subparameter constraint(delay here) and (ii)the singular case.
The next step involves estimating the overall model using an iteratively re-weighted, hybrid regression scheme.For computational efficiency these parameter estimations are carried out in the frequency domain. Frequencydomain estimation also has the intrinsic advantage of imposing ordinate-wise independence amongst the differentspectral components of the overall model. Projection into this domain effectually enhances discriminationbetween the signal and the serially correlated noise. In addition to this, arbitrary resolution can be captured incomputing the delay. During this iterative estimation, the algorithm cycles between computing the noiseparameters given the signal and its delay, and vice versa, with nested Expectation Maximization (EM)optimization to calculate the colored noise parameters and a linearized optimization step for computing the delay term.
e1717
Abstracts presented at the 9th International Conference on Functional Mapping of the Human Brain, June 19Œ22, 2003, New York, NY
e1717
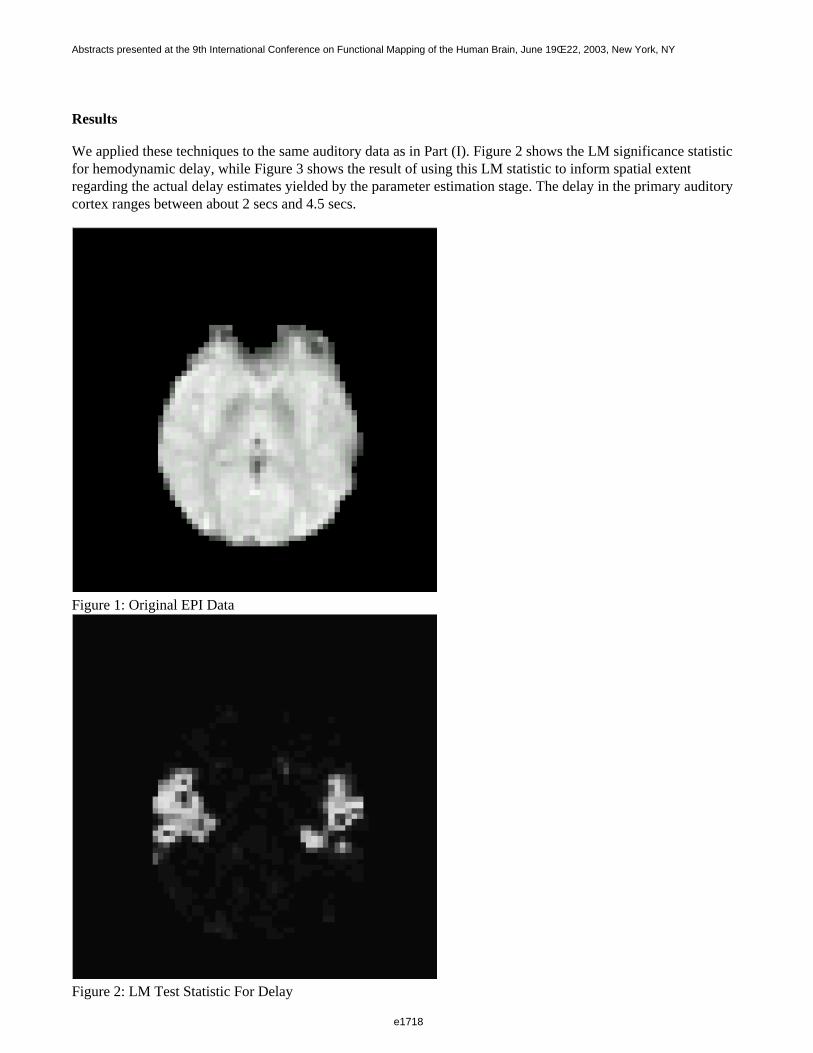
Results
We applied these techniques to the same auditory data as in Part (I). Figure 2 shows the LM significance statisticfor hemodynamic delay, while Figure 3 shows the result of using this LM statistic to inform spatial extentregarding the actual delay estimates yielded by the parameter estimation stage. The delay in the primary auditorycortex ranges between about 2 secs and 4.5 secs.
Figure 1: Original EPI Data
Figure 2: LM Test Statistic For Delay
e1718
Abstracts presented at the 9th International Conference on Functional Mapping of the Human Brain, June 19Œ22, 2003, New York, NY
e1718
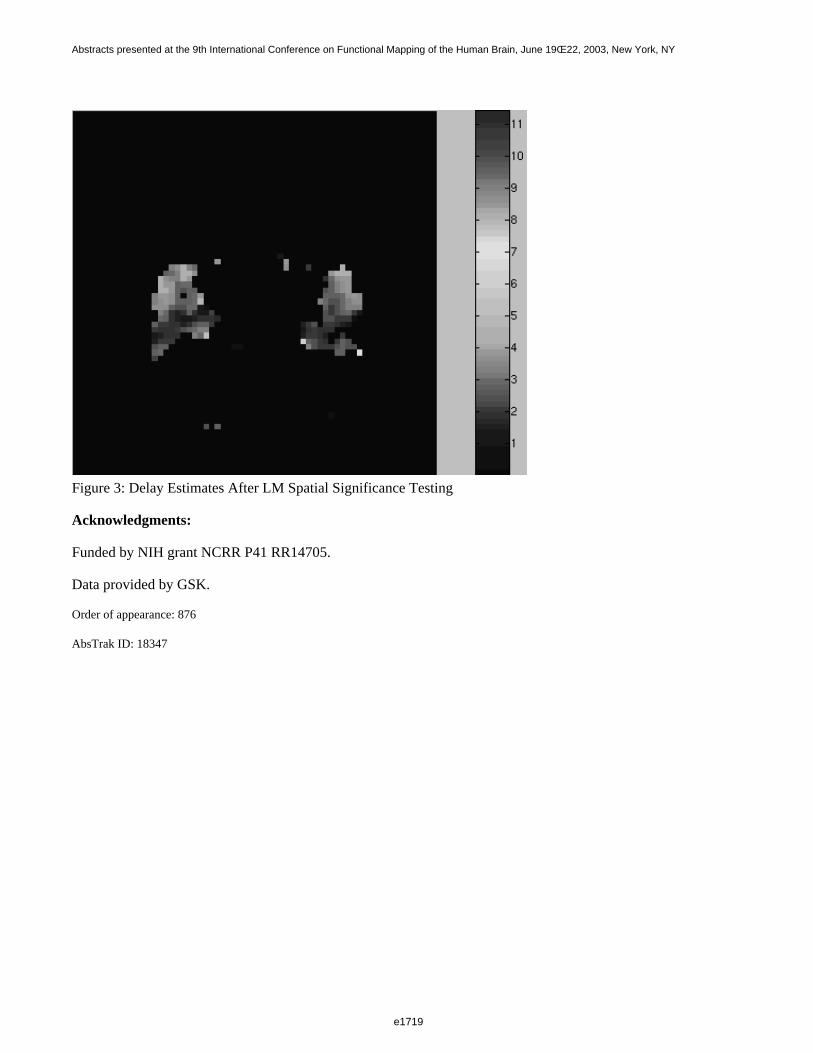
Figure 3: Delay Estimates After LM Spatial Significance Testing
Acknowledgments:
Funded by NIH grant NCRR P41 RR14705.
Data provided by GSK.
Order of appearance: 876
AbsTrak ID: 18347
e1719
Abstracts presented at the 9th International Conference on Functional Mapping of the Human Brain, June 19Œ22, 2003, New York, NY
e1719
Poster number: 885
A Novel Data Reduction Procedure for Estimating Low-Frequency BOLDFluctuation Signals
Mark J. Lowe*, Sea Chen†‡, Charles Bouman‡
*Cleveland Clinic Foundation†Indiana University School of Medicine
‡Department of Electrical Engineering, Purdue University
Modeling & Analysis
Abstract
It has been shown that BOLD weighted MRI timeseries data contain low-frequency fluctuations that are highlycorrelated between the functionally connected regions(1, 2). It has been shown that the correlation comes fromtemporal fluctuations in the frequency range 0-0.1Hz(3). Simple bandpass filtering has been used in analysis ofLFBF data as an ad-hoc way to restrict the correlation analysis to the frequency range of interest. We haveimplemented a data-driven technique to reduce the degrees of freedom in the low-frequency regime that retainsthe temporal features of the timeseries data in the frequency region of interest.
Method
Our signal subspace estimation procedure is based on harmonic decomposition followed by least-squares fit of theharmonic components to the observed data. The procedure determines the optimal dimensionality from the datathemselves. The approach for LFBF data was to choose the fundamental frequency of the harmonicdecomposition according to the spectral resolution of the acquired data. Least-squares fitting was done to estimatethe coefficients of each of the harmonic components. Finally, eigendecomposition of the final data estimator wasdone. The final components used were dictated by using the fact that the eigenvalues of the covariance matrix ofthe estimator must be positive. So, the final harmonic decomposition consists of all components with positiveeigenvalues in the covariance estimator
Data Acquisition
MR imaging was performed with a 1.5 tesla. A volume consisting of 2 axial slices of 7mm each through theprimary motor cortex was selected for this study. 1024 BOLD-weighted images were acquired with gradient-echoechoplanar imaging (GE-EPI). Head motion was controlled through the use of a bite bar mounted to a birdcageRF coil.
Results and Discussion:
The SSE procedure determined that the resting state fluctuations were well-represented by 36 out of the original51 harmonic functions. Figure 1a and b shows the resting state timeseries for a pixel in primary motor cortexbefore and after the SSE procedure. Since the harmonic functions are least-squares fit to the data, goodness-of-fitinformation is available to evaluate the quality of the signal estimation. It is also possible to use the resultingharmonic subset from given regions-of-interest to introduce a model for the LFBF.
Conclusion
e1720
Abstracts presented at the 9th International Conference on Functional Mapping of the Human Brain, June 19Œ22, 2003, New York, NY
e1720

We have introduced a data-driven method to reduce the dimensionality of rapid sampled data in order to estimatethe signal in the low-frequency regime that has been observed to reflect functional connectivity inBOLD-weighted MRI data. The method determines the degrees-of-freedom in an unsupervised manner andresults in an estimator and goodness-of-fit measures.
This work was supported by a grant from the Whitaker Foundation.
References
1. B. Biswal et al. Magn. Res. Med., 34, 537-41, (1995).2. M. J. Lowe et al. Neuroimage, 7, 119-32, (1998).3. D. Cordes et al. AJNR Am J Neuroradiol, 22, 1326-33, (2001).
Order of appearance: 877
AbsTrak ID: 17935
e1721
Abstracts presented at the 9th International Conference on Functional Mapping of the Human Brain, June 19Œ22, 2003, New York, NY
e1721
Poster number: 886
Canonical Correlation Analysis for Functional Connectivity MR Imaging
Yingli Lu, Yufeng Zang, Yong He, Tianzi Jiang
National Laboratory of Pattern Recognition, Institute of Automation, The Chinese Academy of Sciences,Beijing 100080,[email protected]
Modeling & Analysis
Abstract
Introduction
Pearson correlation has been used frequently as a measurement for functional connectivity due to its simplicityand effectiveness [1]. Correlation between ROI region A and B is measured by correlating the mean time series inROI A with the mean time series in ROI B. However, there is a shortcoming for this simple correlation method.As we have known that, hemodynamic response is different from different spatial location. Averaging of the timeseries in ROI will lose some useful information. In this paper, canonical correlation analysis method wasproposed as a measurement for functional connectivity between regions.
Method
Canonical correlation analysis (CCA) [2] is a method for measuring the linear relationship between twomultidimensional variables. Represent the ROI A as a matrix X=(x1,x2,...,xm), N is the number of voxels inregion A. xi is a column vector with T time instances. Similarly, ROI B can be denoted as a matrixY=(y1,y2,...,yn). CCA will find two sets of basis Wx and Wy vectors for X and Y such that the correlationbetween WxX and WyY is maximized.
The scheme of CCA method for functional connectivity is as follows:
Step1: Activation detection.
Step2: Select the ROI.
Step3: Calculate the CCA between ROI A and B.
Step4 For the got r non-zero canonical correlation coefficient C=(c1,c2,...,cr), five measurement can be recordedas correlation between A and B.
1.CA1=maxc1,c2,..,cr
2.CA2=(c1 x c2 x...x cr)1/r
3.CA3=(c1 + c2 +...+ cr)/r
4.CA4=minc1,c2,...,cr
5.CA5=1/((1/c1 +1/c2 +...+ 1/cr)/r)
e1722
Abstracts presented at the 9th International Conference on Functional Mapping of the Human Brain, June 19Œ22, 2003, New York, NY
e1722

Results and Discussion
In order to compare CCA with Pearson correlation method, an open dataset was used. This dataset is from theWelcome Department of Cognitive Neurology and with the kind permission of FIL (functional imaginglaboratory) methods group. The experiment is a study about auditory bi-syllabic stimulation. A modified 2Tscanner was used to acquire the EPI images with volume size 64 64 64. TR=7 seconds. ANOVA method [3] wasused for activation detection. ROI is from the 32-34 slices of the data (table.1). Mean time series Pearsoncorrelation between ROI is showed in table.2. CA1 and CA2 measurement is showed in table.3 and table.4 respectively.
Table.1
Symbol Region Voxel number
A Left BA 22 9
B Right BA 22,41,42 73
C Left BA 41,42 84
D Left BA 41,42 15
E Left BA 22 28
Regions of interest (ROI)
Table.2
A B C D E
A 1.00 0.88 0.84 0.75 0.84
B 1.00 0.93 0.85 0.92
C 1.00 0.89 0.88
D 1.00 0.85
E 1.00
Mean time series correlation
Table.3
A B C D E
A 1.00 0.99 1.00 0.85 0.91
B 1.00 1.00 1.00 1.00
C 1.00 1.00 1.00
D 1.00 0.95
E 1.00
Canonical correlation:CA1
e1723
Abstracts presented at the 9th International Conference on Functional Mapping of the Human Brain, June 19Œ22, 2003, New York, NY
e1723

Table.4
A B C D E
A 1.00 0.95 1.00 0.48 0.64
B 1.00 1.00 0.93 0.92
C 1.00 1.00 1.00
D 1.00 0.59
E 1.00
Canonical correlation:CA2
Future work is to give each CCA correlation measurement a physiological interpretation. Recently, functionalconnectivity has been researched in rest state brain [4]. Undoubtedly, CCA can be used as measurement forfunctional connectivity in resting state brain.
Acknowledgments
The authors would like to thank Professor Karl Friston for the kindly permission of using the datasets.
References
1. LIU Y, et al. Nature 400,1999,364-367.2. Kaitai Fang, et al. Applied multivariate statistics analysis,P339-353.3. Clare, S., et al. MRM, 1999;42:1117-1122.4. Biswal B, et al. MRM, 1995;34:537-541.
Order of appearance: 878
AbsTrak ID: 17733
e1724
Abstracts presented at the 9th International Conference on Functional Mapping of the Human Brain, June 19Œ22, 2003, New York, NY
e1724
Poster number: 887
Mutual Information based Generalized Correlation Analysis forFunctional Connectivity MR Imaging
Yingli Lu, Yong He, Yufeng Zang, Tianzi Jiang
National Laboratory of Pattern Recognition, Institute of Automation, The Chinese Academy of Sciences,Beijing100080, P. R. [email protected]
Modeling & Analysis
Abstract
Introduction
Pearson correlation based methods have been frequently used for functional connectivity [1]. Shortcoming ofthese methods is that only the linear correlation between ROI was considered. In this paper, a mutual informationbased generalized correlation analysis for functional connectivity was proposed. Compared with Pearsoncorrelation based method, the proposed method will consider the non-linear correlation between ROI.
Method
The mutual information based generalized correlation coefficient is defied as:
R=MI(x,y)/sqrt(H(x) x H(y))
Where, MI(x,y) is the mutual information between random variable x and y, H(x) is the entropy of x, H(y) is theentropy of y. sqrt(z) is the square root of z. R is value between 0 and 1. Represent the ROI A as a matrixX=(x1,x2,...,xm), N is the number of voxels in region A. xi is a column vector with T time instances. Similarly,ROI B can be denoted as a matrix Y=(y1,y2,...,yn). If we consider X and Y are the sample point of randomvariable x and y, then R can be calculated.
Results and Discussion
In order to demonstrate the proposed method, an open dataset was used. This dataset is from the WelcomeDepartment of Cognitive Neurology and with the kind permission of FIL (functional imaging laboratory) methodsgroup. The experiment is a study about auditory bi-syllabic stimulation. A modified 2T scanner was used toacquire the EPI images with volume size 64 64 64. TR=7 seconds. ANOVA method [2] was used for activationdetection. ROIs are from the 32-34 slices of the data (table.1). Mean time series Pearson correlation between ROIis showed in table.2. Generalized correlation coefficient (R) between ROI is showed in table.3.
e1725
Abstracts presented at the 9th International Conference on Functional Mapping of the Human Brain, June 19Œ22, 2003, New York, NY
e1725

Table.1
Symbol Region Voxel Number
A Left BA 22 9
B Right BA 22,41,42 73
C Left BA 41,42 84
D Left BA 41,42 15
E Left BA 22 28
Regions of interest (ROI)
Table.2
A B C D E
A 1.00 0.88 0.84 0.75 0.84
B 1.00 0.93 0.85 0.92
C 1.00 0.89 0.88
D 1.00 0.85
E 1.00
Mean time series correlation
Table.3
A B C D E
A 1.00 0.75 0.86 0.73 0.65
B 1.00 0.90 0.76 0.70
C 1.00 0.83 0.86
D 1.00 0.66
E 1.00
Generalized correlation
Future work is to give a physiological interpretation for the mutual information based generalized correlationcoefficient. Recently, functional connectivity has been researched in rest state brain [3]. Undoubtedly, measureproposed in this paper can be used as measure for functional connectivity in resting state brain.
Acknowledgments
The authors would like to thank Professor Karl Friston for the kindly permission of using the datasets.
References
1. LIU Y, et al. Nature 400,1999,364-367.2. Clare, S., et al. MRM, 1999;42:1117-1122.3. Biswal B, et al. MRM, 1995;34:537-541.
e1726
Abstracts presented at the 9th International Conference on Functional Mapping of the Human Brain, June 19Œ22, 2003, New York, NY
e1726

Order of appearance: 879
AbsTrak ID: 17746
e1727
Abstracts presented at the 9th International Conference on Functional Mapping of the Human Brain, June 19Œ22, 2003, New York, NY
e1727
Poster number: 888
Neighborhood principal component analysis for task-related componentremoval in functional connectivity
Yingli Lu, Yong He, Tianzi Jiang
National Laboratory of Pattern Recognition, Institute of Automation, The Chinese Academy of Sciences,Beijing100080, P. R. China. Mail:[email protected]
Modeling & Analysis
Abstract
Introduction
Recently, functional connectivity in resting state data has been proposed[1].Task-related component removal method[2] will give the opportunity for functional connectivity research in task-related datasets. This will reducethe conventional rest-data acquisition. In this paper, a neighborhood principal component analysis (PCA) methodwas introduced to remove task-related component. PCA has been a popular tool for activation detection in fMRI[3]. However, traditional PCA methods were applied on entire fMRI data. So, it becomes difficult to extracttask-related signal when variations of the fMRI data are very different in different regions. In the proposedmethod, PCA is applied on a tiny spatial domain. This will overcome the shortcoming of traditional PCA.
Methods
The scheme of neighborhood PCA method is as follows:
Step1: For voxel P at coordinate [x,y,z], apply PCA to the time series of voxel P and each of its 6 neighbors.
Step2: The got 7 principal components S=[S1,..S7] cross-correlated with a predefined reference waveform.Components with correlation coefficients higher than a threshold are considered task-related.
Step3: Set the task related components to zero.Then, compute X=AS, where, A is the mixing matrix in PCA.Mean time series of the got seven mixed components was recorded as time series of coordinate [x,y,z].
Step 4: Iterate to Setp1 until all voxels are calculated
Results and Discussion
This dataset is from the Welcome Department of Cognitive Neurology and with the kind permission of methodsgroup of Functional Imaging Laboratory. In the experiment, bi-syllabic auditory stimulation was conducted. TheEPI images size is 64x64x64. ANOVA method[4] was used to show the effectiveness of task-related componentremoval. Results of the proposed method are shown in Fig.1 and Fig.2. It is clear that the task-related componenthave been removed.
e1728
Abstracts presented at the 9th International Conference on Functional Mapping of the Human Brain, June 19Œ22, 2003, New York, NY
e1728
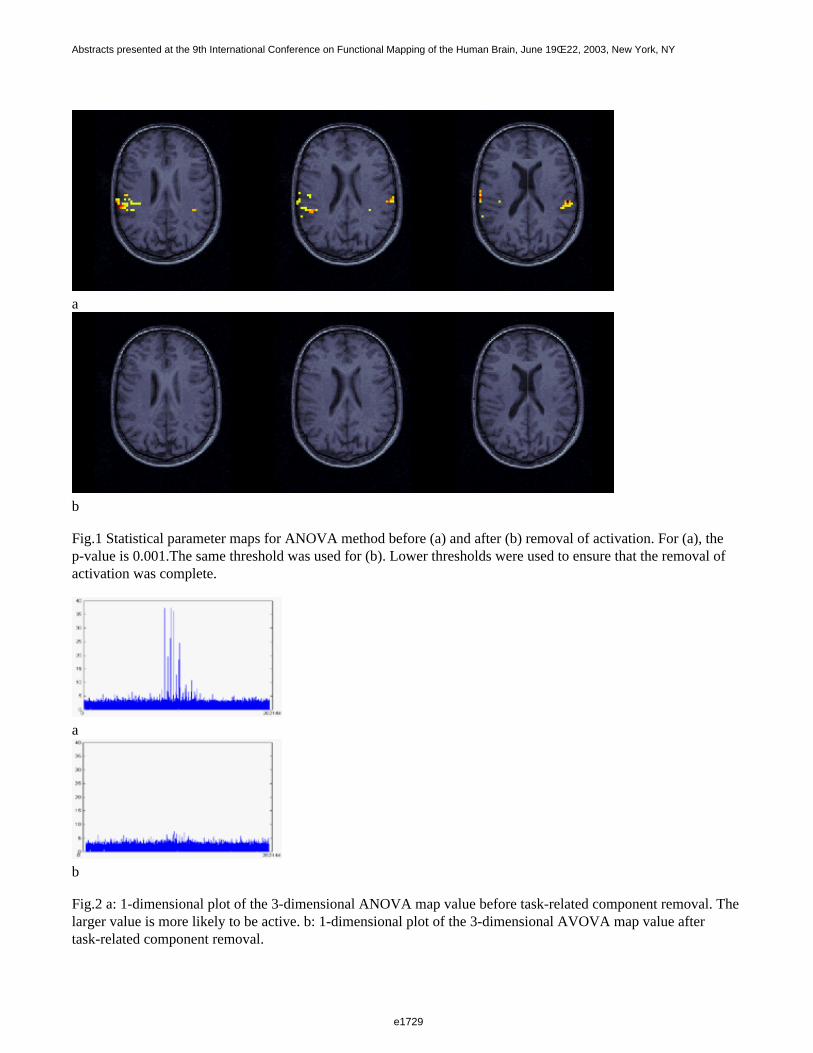
a
b
Fig.1 Statistical parameter maps for ANOVA method before (a) and after (b) removal of activation. For (a), thep-value is 0.001.The same threshold was used for (b). Lower thresholds were used to ensure that the removal ofactivation was complete.
a
b
Fig.2 a: 1-dimensional plot of the 3-dimensional ANOVA map value before task-related component removal. Thelarger value is more likely to be active. b: 1-dimensional plot of the 3-dimensional AVOVA map value aftertask-related component removal.
e1729
Abstracts presented at the 9th International Conference on Functional Mapping of the Human Brain, June 19Œ22, 2003, New York, NY
e1729

It’s naturally to think that PCA can be replaced by independent component analysis (ICA). Compared with PCA,ICA utilizes more strict criteria than PCA for determination of independence by taking advantage of higherstatistics. In this sense, ICA is a more sensitive method for fMRI data analysis. However, compared with PCA,there are two shortcomings for ICA: 1) ICA gives different output when repeatedly applied on the same inputdata; 2) the computation complexity of the neighborhood ICA method is very heavy.
Acknowledgments
The authors would like to thank Professor Karl Friston for the kindly permission of using the block trial datasets.
References
1. Biswal B, et al. MRM, 1995;34:537-541.2. Arfanakis K, et al. MRI, 2000;18:921-930.3. Moeller JR, et al. J. Cereb Blood Flow Metab,1991;11:A121-A135.4. Clare, S., et al. MRM, 1999;42:1117-1122.
Order of appearance: 880
AbsTrak ID: 17755
e1730
Abstracts presented at the 9th International Conference on Functional Mapping of the Human Brain, June 19Œ22, 2003, New York, NY
e1730
Poster number: 890
Structural asymmetries in the musician’s brain: a whole-brainvoxel-based approach
Eileen Luders*†, Christian Gaser‡, Lutz Jancke§, Gottfried Schlaug†
*Institute of Experimental and General Psychology, University of Magdeburg, Germany†Department of Neurology, Beth Israel Deaconess Medical Center and Harvard Medical School, USA
‡Department of Psychiatry, University of Jena, Germany§Department of Neuropsychology, University of Zuerich, Switzerland
Modeling & Analysis
Abstract
Introduction
The goal of this study was to examine gray matter (GM) differences in a large sample (n=60) of male and femaleprofessional musicians with and without absolute pitch (AP). We chose to study these particular groups becauseprevious studies using traditional morphometric techniques have shown hemispheric asymmetry differencesrelated to special musical abilities (e.g. AP) as well as to gender. The main contribution of this voxel-basedmorphometric (VBM) study is that we examined asymmetry differences automatically voxel by voxel through outthe entire brain, while previous approaches obtained laterality indices manually within pre-defined anatomical regions.
Methods
T1 weighted MRI images from 20 AP musicians (10 males, 10 females) and 40 non-AP musicians (20 males, 20females) were normalized, segmented, and smoothed using routines available in SPM99. Each preprocessed GMvolume was then flipped vertically in the midsagittal plane, and a new set of images was created by subtractingthe mirror images from the unflipped preprocessed GM volumes. We first determined hemispheric GMdifferences in the entire musician group using a one-sample t-test. Then we investigated whether GM asymmetrydiffers between groups defined by gender and AP using a one way analysis of variance in a two (males, females)by two (AP musicians, non-AP musicians) design. To evaluate whether VBM is sufficiently sensitive detectingGM asymmetry differences between groups, we computed the correlation between asymmetry scores obtainedmanually for the region of the planum temporale (PT) and asymmetry scores obtained automatically on avoxel-by-voxel basis across the entire brain within the same subjects.
Results
Across the entire sample of musicians we found a stronger rightward than leftward GM asymmetry. The mostsignificant leftward asymmetry was detected in the superior temporal gyrus including Heschl‘s gyrus and the PT,while the most significant rightward asymmetry was found in the mesial temporal lobe. Additional rightwardasymmetries were observed in the pre/post central gyrus, inferior/superior parietal lobe, temporal pole, and inposterior parts of the medial temporal gyrus. When comparing GM asymmetry between groups, we found thatmale AP musicians were more leftward lateralized in the anterior region of the PT than male non-AP musicians.Male non-AP musicians revealed an increased leftward GM asymmetry in the post central gyrus compared tofemale non-AP musicians. Correlating the manually and automatically acquired laterality indices revealed asignificant positive correlation within the anterior PT region.
e1731
Abstracts presented at the 9th International Conference on Functional Mapping of the Human Brain, June 19Œ22, 2003, New York, NY
e1731
Conclusion
Using a VBM technique to determine GM asymmetries, we found a good agreement with observations madeusing traditional morphometric techniques. In addition, we detected GM asymmetries in our sample ofprofessional musicians not observed previously in subjects unselected for musical background. Our results furthersuggest that GM asymmetry in musicians is influenced by gender, AP and the interaction between these twofactors. Our analysis confirms an association between PT asymmetry and the AP phenotype, which agrees withfindings in previous studies using different morphometric techniques. We demonstrated that VBM is a sufficientlysensitive method to detect hemispheric GM asymmetry differences between groups with different characteristics.
Order of appearance: 881
AbsTrak ID: 17331
e1732
Abstracts presented at the 9th International Conference on Functional Mapping of the Human Brain, June 19Œ22, 2003, New York, NY
e1732
Poster number: 891
Relationships between sulcal asymmetries and corpus callosummorphometry: gender and handedness effects
Eileen Luders*†, David E. Rex†, Katherine Narr†, Roger Woods†, Lutz Jancke‡, Paul M. Thompson†, John Mazziotta†, Arthur W. Toga†
*Institute of Experimental and General Psychology, University of Magdeburg, Germany†Laboratory of Neuro Imaging, Department of Neurology, Center of Brain Mapping, UCLA School of Medicine,
Los Angeles, USA‡Department of Neuropsychology, University of Zuerich, Switzerland
Modeling & Analysis
Abstract
Introduction
Given that there is a disagreement in the existing literature concerning whether increased callosal connectivity isassociated with more versus less lateralization, the present MRI study was designed to establish the presence andnature of relationships between sulcal asymmetry measures and midsagittal callosal areas in a sample ofneurologically intact subjects (n=59). In addition, we set out to examine whether these relationships are differentbetween males and females and between right and left handers, respectively. Against a background oflong-standing disputes, the influence of gender and handedness on corpus callosum (CC) size, shape, andvariability was additionally examined.
Methods
The CC was delineated in the cerebral midsagittal section followed by dividing it into five vertical partitions(splenium, isthmus, posterior midbody, anterior midbody, anterior third) and calculating midsagittal (sub)areameasures. For comparisons of callosal size between groups defined by gender and handedness, multivariateanalyses of variance were used. To obtain maps of average callosal shape and variability, surface points makingup callosal outlines were redigitized to make them spatially uniform. Surface points were then matched, and the(root) mean square distance between corresponding sets of points was calculated. Finally, cortical surface modelswere extracted and used to manually outline cortical surface sulci. After calculating asymmetry coefficients forsulcal extrema, Pearson’s correlation coefficients were calculated to establish linkages between callosal areas andsulcal asymmetry measures.
Results
Statistical tests assessing links between sulcal asymmetry measures and callosal areas in groups defined by genderand handedness, showed both positive and negative relationships depending on the nature (typical vs. untypical)and the chosen indicators (e.g. real vs. absolute measures) of sulcal asymmetry. When comparing males andfemales and left and right handers, we did not find any significant callosal size differences, both before and afterbrain size correction. Callosal shape differences between males and females appeared situated in anterior andposterior callosal regions, whereby callosal surfaces averaged within right and left handers were almost perfectlyaligned. Callosal surface variability appeared larger in males than in females contrasting to the similarvariabilities observed between right and left handers. In callosal subregions, higher variabilities were seen in allgroups in the anterior/posterior borders of the splenium and the anterior third. In females the smallest variabilitieswere present in the inferior/superior borders of the isthmus and the posterior midbody as well as in the inferiorsurface of the anterior third. In male, left handed and right handed groups the least variability was observed in the
e1733
Abstracts presented at the 9th International Conference on Functional Mapping of the Human Brain, June 19Œ22, 2003, New York, NY
e1733

inferior surface of the anterior third.
Conclusion
Our results suggest that the presence and direction of relationships between sulcal asymmetry measures andmidsagittal callosal areas are not only influenced by gender and handedness but also by the nature and chosenindicators of cerebral asymmetry. Furthermore this study revealed that the effect of individual variation in callosalsize is large enough to outrange any effect of CC size differences between males and females, or between left andright handers even when brain size corrections are employed. However, we clearly demonstrated that genderinfluences callosal shape and surface variability.
Order of appearance: 882
AbsTrak ID: 17333
e1734
Abstracts presented at the 9th International Conference on Functional Mapping of the Human Brain, June 19Œ22, 2003, New York, NY
e1734
Poster number: 892
Application of nonlinear time series analysis to single-trial ERPs
Arvid Lundervold*, Alexander Lundervold†, Helge Nordby‡, Astri J. Lundervold‡, Ivar Reinvang§
*Department of Physiology, University of Bergen, N-5009 Bergen, NORWAY†Faculty of Mathematics and Natural Sciences, University of Bergen, N-5020 Bergen, NORWAY
‡Department of Biological and Medical Psychology, University of Bergen, N-5009 Bergen, NORWAY§Department of Psychology, University of Oslo, N-0317 Oslo, NORWAY
Modeling & Analysis
Abstract
Since the early eighties, numerous attempts have been made to reveal the dynamics of the generating systems inthe working brain using EEG and nonlinear dynamical tools. The assumption is that EEG time series containinformation about chaotic attractors in state-space for various stages of brain activity (Basar, 1990). Byreconstructing state-space from EEG recordings using time delay τ and embedding dimension M, dimensionalcomplexity of the attractor set can be characterized by the correlation dimension, D2. However, not so manystudies have applied this kind of analysis to ERP data on a trial-by-trial basis. The aim of this investigation was todiscern possible relationship between D2 and stimulus type, early versus late trials, and topographic location instimulus-related EEG epochs from an auditory oddball P300 paradigm with composite tones. In all subjectsconventional P3 latencies and amplitudes in the trial averages were also calculated.
Subjects and ERP measures
Data from five healthy subjects (20-49 years) were used. A total of 360 tone stimuli were presented at 1000 msintervals. Duration and probability of target / standard / distractor (white noise) stimuli were 25ms (14%) / 75ms(72% ) / 100ms (14%). EEG was recorded in 22 channels including bilateral mastoid electrodes, with M1 asreference. Band pass frequency: 0.05 - 70 Hz; sampling rate: 500 Hz. Continuous EEG was segmented into [-100ms, 1000 ms] sweeps relative to stimulus onset, with baseline correction. Sweeps exceeding ±100 µV, or havingeye movement artifacts, were rejected. P3a (distractor) and P3b (target) were measured in Cz and Pz, respectively.
Estimation of dimensional complexity
We estimated the correlation dimension (D2) using the method proposed by Takens (1985). Initially theunivariate single-trial EEG epochs were vectorized by time-delay reconstruction to obtain state-space trajectoriesof the system generating the localized response. For each epoch, delay time τ was taken as the first minimum ofthe automutual information function. The minimal embedding dimension was calculated according to Cao (1997).All calculations were done with Matlab 6.5 and the OpenTSTOOL package (http://www.physik3.gwdg.de/tstool)
Experimental results
Mean (SD) of P300 latency and amplitude over all subjects were 257ms (19); 3.1µV (1.4) for P3a, and 440ms(70); 1.2µV (1.0) for P3b. The trial-by-trial distribution of D2 values showed no clear differences between thethree stimulus types. No systematic difference was seen between the first and last third of trials, or betweentopographic locations (Cz, Pz, Fz).
e1735
Abstracts presented at the 9th International Conference on Functional Mapping of the Human Brain, June 19Œ22, 2003, New York, NY
e1735

Discussion
With the present ERP design, dimensional complexity (D2) seemed not useful to characterize different brainactivations, as also shown by others (Couyoumdjian et al., 1997). However, the negative findings can be causedby the short ISI (allowing only 512 samples per trial for D2 calculations) and the stimulus characteristics in theparadigm. Since nonlinear dynamics has demonstrated success in other EEG applications, follow-up experimentsshould be designed and analyzed before firm conclusions are drawn about usefulness for ERPs.
References
Basar, E., ed. (1990) Chaos in Brain Function, Springer-Verlag.Couyoumdjian, A. et al. (1997) In: F. Angeleri et al. Analysis of the Electrical Activity of the Brain, Wiley, pp.93-102.
Order of appearance: 883
AbsTrak ID: 17409
e1736
Abstracts presented at the 9th International Conference on Functional Mapping of the Human Brain, June 19Œ22, 2003, New York, NY
e1736
Poster number: 893
Robust Autocorrelation Modeling for fMRI
Wen-Lin Luo, Thomas E. Nichols
Department of Biostatistics, University of Michigan
Modeling & Analysis
Abstract
Temporal autocorrelation is an important issue in the analysis of fMRI time series. Different methods have beenproposed to deal with autocorrelation, like prewhitening[1], coloring[2], or variance correction[3] which requiresan accurate estimate of the autocorrelation matrix. In this work, we apply the sandwich estimator[4] for inferenceon beta. The sandwich estimate uses two autocorrelation matrices, a working correlation matrix (W-1 ) and "true"correlation matrix (V) in the estimation procedures.
Use of these two correlation matrices has several advantages. The working correlation matrix needs to beinverted, but can use a simple model since a poor choice will only effect the efficiency of inferences for beta, nottheir validity. Thus W can use a simple and global autocorrelation structure, and it needs only be inverted once.On the other hand, a consistent but low-quality estimate of V can be used, which does not need to be inverted.
Methods
In the GLM, Y = Xβ+e, where Y is the observed response, X is the design matrix, and β is the parameters to beestimated. The error e is assumed to be N(0,σ2 V) distributed, where V is the true correlation matrix. The essentialidea of the sandwich estimator is to use generalized least-squares estimator of β, which is defined as: βg =
(X’WX)-1 X’WY in conjuction with the sandwich estimator of variance matrix: Var(βg )=σ2 (X’WX)-1 X’WVe (X’WX)-1 X’W, where Ve is consistent estimator for V whatever the true
correlation structure, and W-1 is the working correlation matrix.
We examine the performance of sandwich estimator via a simulation study. We use ARMA(1, 1) noise andrandom event related design. We use 4 different W-1 s, ARMA(1, 1), AR(1), AR(12), and identity, whereparameters are global estimates; we use V as either a globally or locally estimated ARMA(1, 1) and AR(12), andidentity. Performance is evaluated by bias, mean squared error (MSE) of Var(βg ) and QQ-plot of T-statistics vs.
expected quantiles.
Results
While true model for the noise was ARMA(1, 1), we found Ws of AR(1) and AR(12) performed equally well;however, they didn’t perform quite as good as W = I. The global V matrices performed as well as local, thoughboth were better than identity. The choice of V is much more important than the choice of W, suggesting thatvariance correction, where W = I, performs similar to using the sandwich estimator.
Conclusions
The sandwich estimator can simplify autocorrelation modeling by using separate covariance matrices forestimation of βs and their standard errors. However, in this preliminary work, we didn’t find much to offervariance correction.
e1737
Abstracts presented at the 9th International Conference on Functional Mapping of the Human Brain, June 19Œ22, 2003, New York, NY
e1737
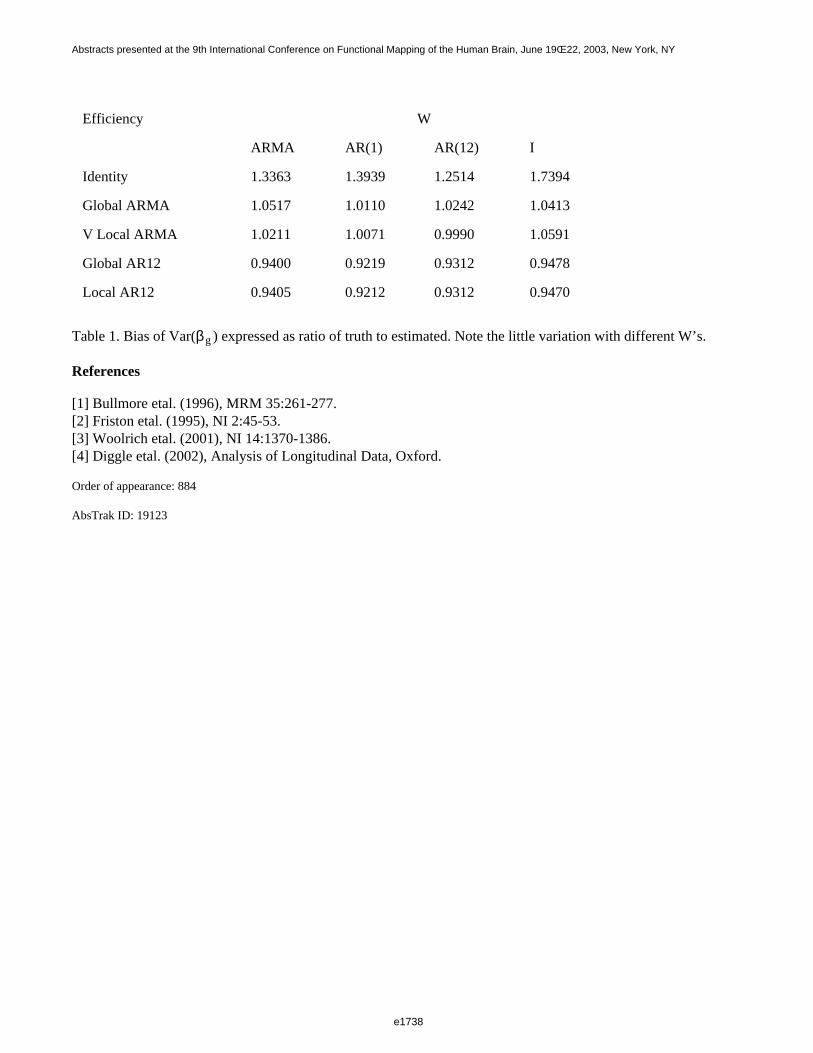
Efficiency W
ARMA AR(1) AR(12) I
Identity 1.3363 1.3939 1.2514 1.7394
Global ARMA 1.0517 1.0110 1.0242 1.0413
V Local ARMA 1.0211 1.0071 0.9990 1.0591
Global AR12 0.9400 0.9219 0.9312 0.9478
Local AR12 0.9405 0.9212 0.9312 0.9470
Table 1. Bias of Var(βg ) expressed as ratio of truth to estimated. Note the little variation with different W’s.
References
[1] Bullmore etal. (1996), MRM 35:261-277.[2] Friston etal. (1995), NI 2:45-53.[3] Woolrich etal. (2001), NI 14:1370-1386.[4] Diggle etal. (2002), Analysis of Longitudinal Data, Oxford.
Order of appearance: 884
AbsTrak ID: 19123
e1738
Abstracts presented at the 9th International Conference on Functional Mapping of the Human Brain, June 19Œ22, 2003, New York, NY
e1738
Poster number: 894
Investigating the Wavelet Coherence Phase of the BOLD Signal
Karsten Müller, Gabriele Lohmann, Toralf Mildner, D. Yves von Cramon
Max Planck Institute of Cognitive Neuroscience, P.O.Box 500 355, 04303 Leipzig, Germany
Modeling & Analysis
Abstract
Introduction
The aim of the study is to consider the wavelet coherence phase for investigating the stimulus-dependent temporaldynamics of the blood oxygenation-level dependent (BOLD) response in the human brain.
Although there are many studies that deal with the temporal dynamics of the BOLD signal, the reason for thedifferent behavior in different brain regions is still unknown. Our method is based on the computation of thewavelet coherence phase of time courses of functional magnetic resonance imaging (fMRI) data. The waveletcoherence phase yields a measure that shows the temporal relationship of time courses. In contrast to otherapproaches, the wavelet coherence phase gives a measure for the temporal displacement in time and frequencydomain. Our data showed a stable behavior of the wavelet coherence phase in the activated brain regions. Thus,the wavelet coherence phase is an appropriate measure to investigate the temporal behavior of the BOLD signalbetween brain regions.
Method
Wavelet analysis was applied to fMRI data using the Morlet wavelet function. The wavelet transform wascomputed convolving the discrete Fourier transforms (DFT) of the fMRI time course and the wavelet function. Tocompare the transforms between different frequency scales, the wavelet function was normalized to have unitenergy. Using the wavelet transforms of different processes, the cross-wavelet spectrum (Torrence and Compo, 1998) was obtained. Because the cross-wavelet spectrum is a complex measure, modulus and phase can becomputed separately. The modulus is the cross-wavelet power, and the phase is also called the wavelet coherencephase. Mean values and variances of the wavelet coherence phase were computed and overlaid onto associatedanatomical images.
Experiment
The wavelet coherence phase was computed for fMRI data acquired using 3 different sessions with differentdurations of visual stimulation of 2, 6, and 15 seconds, respectively (Table 1). In contrast to a preceeding study (Müller et al., 2003), these 3 different sessions were acquired for each subject. The correlations between thevariances of the wavelet coherence phase and the contrast images were above 0.8 for both subjects independent ofthe duration of visual stimulation. Activated voxels with high signal changes show small variances of the waveletcoherence phase (Figure 1). The higher the contrast value, the smaller the variance of the phase. This means thatactivated voxels with high BOLD signal changes show a nearly stationary behavior of the phase.
References
C.Torrence, G.P.Compo. 1998. A practical guide of wavelet analysis. Bulletin American Meterological Society 79:61-78.K.Müller, T.Mildner, G.Lohmann, D.Y.von Cramon. 2003. Investigating the stimulus-dependent temporaldynamics of the BOLD signal using spectral methods. Magnetic Resonance Imaging, in press.
e1739
Abstracts presented at the 9th International Conference on Functional Mapping of the Human Brain, June 19Œ22, 2003, New York, NY
e1739
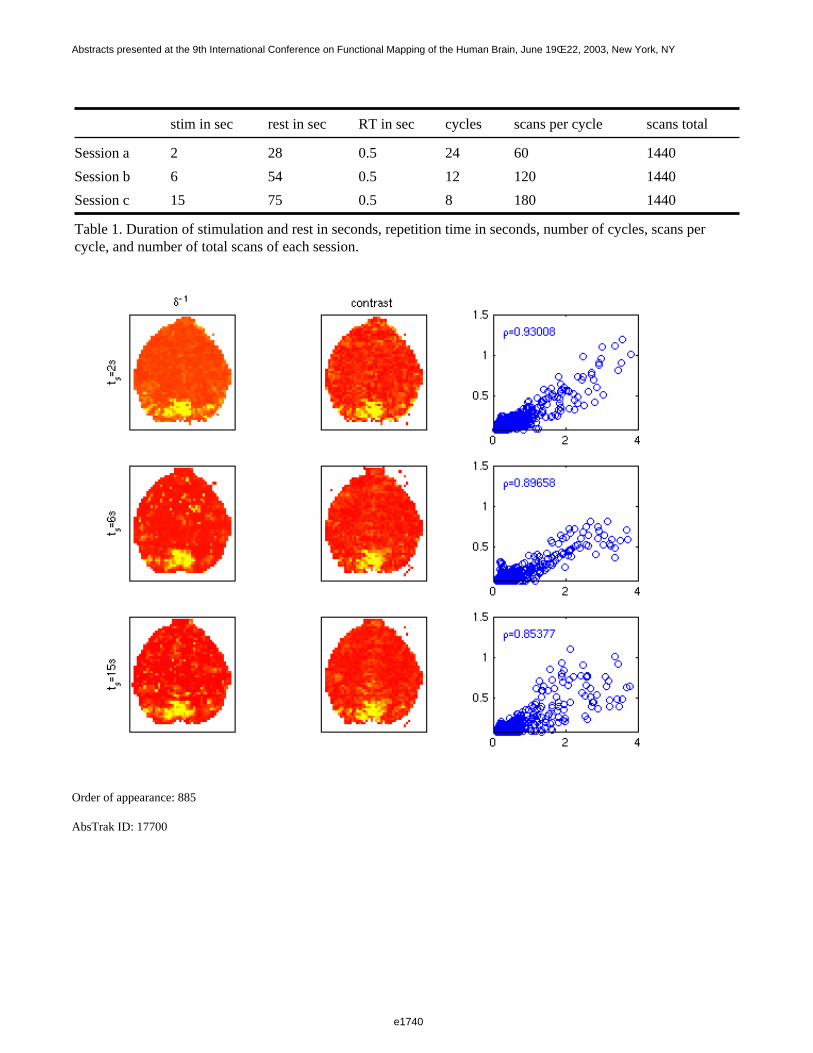
stim in sec rest in sec RT in sec cycles scans per cycle scans total
Session a 2 28 0.5 24 60 1440
Session b 6 54 0.5 12 120 1440
Session c 15 75 0.5 8 180 1440
Table 1. Duration of stimulation and rest in seconds, repetition time in seconds, number of cycles, scans percycle, and number of total scans of each session.
Order of appearance: 885
AbsTrak ID: 17700
e1740
Abstracts presented at the 9th International Conference on Functional Mapping of the Human Brain, June 19Œ22, 2003, New York, NY
e1740
Poster number: 895
The Effects of High Dimensional Warping on Anatomical Overlap ofCerebellar and Subcortical Structures
Vincent Magnotta*, Hans Johnson*, Gary Christensen†, Nancy Andreasen*
*Iowa Mental Health Clinical Research Center†Department of Electrical and Computer Engineering
Modeling & Analysis
Abstract
The human brain mapping community has extensively used the generation of an average space for voxel-wisestatistical tests to determine differences between groups. An average space is generated to minimize the effect ofstructural variability that exists within groups of data. This study compares four methods of image registration todetermine their effects on residual anatomic variability by looking at the resulting overlap of subcortical andcerebellar structures.
A new landmark-initialized segmentation and intensity-based (LI-SI) inverse-consistent linear elastic imageregistration algorithm is presented. This method uses manually identified landmarks, segmented volumetric(anatomical) structures, and normalized image signal intensity information to co-register datasets. The featuresused for image registration and evaluation include: 35 cortical, cerebellar, and commissure landmarks manuallyidentified by experts, sub-cortical and cerebellar regions defined semi-automatically by an artificial neuralnetwork and manually trimmed for validity by experts, and tissue classified images that were generated using adiscriminant analysis of three magnetic resonance image sets representing T1, T2, and PD modalities. Fourgroups of results were computed for co-registering 16 datasets with the following registration techniques: rigidregistration, extended Talairach registration, intensity-only inverse-consistent linear elastic registration, and thenew LI-SI registration. The results show that relative overlap measurements increased as the dimensionality of theregistration algorithm and amount of anatomical information increased. The average relative overlap improvedfrom 0.53 for the rigid registration to 0.55 for the Talairach registration to 0.74 for the intensity-only and to 0.85for the LI-SI algorithm. We found a statistically significant improvement for all but one structure using theintensity-only algorithm as compared to the Talairach registration. Furthermore, statistically significantimprovements for all structures were achieved using the LI-SI algorithm compared to the intensity-only algorithm.
The Talairach piecewise linear normalization provides little improvement over the rigid six parameterregistration. The thalamus had the highest overlap in these methods (~0.70) and this is due to the fact that thethalamus is pinned between the anterior and posterior commissure which are two of the defining piecewise linearscaling points. The inverse-consistent, intensity-only registration significantly improved the overlap of thestructures compared to the Talairach based overlaps. This is true for all of the cerebellar regions with overlapmeasurements of approximately 0.8. The new LI-SI registration method presented here was able to minimize thestructural variability for all of the regions in the common space with average overlaps of 0.85.
The results of this study suggest that significant improvements in structure overlap can be obtained by includingadditional anatomical information. This is due in part to some gray matter structures that abut one another like thenucleus accumbens, putamen, and caudate. A registration algorithm with a limited amount of anatomicalinformation, like signal intensity-only, may not correctly determine the border between these two structuresbecause of overall brain shape differences. Including additional anatomic information like landmarks and thedefinition of anatomical structures substantially improves the resulting overlap between structures in the average
e1741
Abstracts presented at the 9th International Conference on Functional Mapping of the Human Brain, June 19Œ22, 2003, New York, NY
e1741

space.
Order of appearance: 886
AbsTrak ID: 19091
e1742
Abstracts presented at the 9th International Conference on Functional Mapping of the Human Brain, June 19Œ22, 2003, New York, NY
e1742
Poster number: 896
Does BOLD latency correlate with latency modulatability?
Marta Maieron*‡, Ziad Saad*, Frank Ye*, Peter Bandettini*
*Laboratory of Brain and Cognition,NIMH,Bethesda, 20892-1148 Maryland, USA†
‡Dip. Scienze e Tecnologie Biomediche, Università di Udine, I-33100 Udine
Modeling & Analysis
Abstract
The latency of activation – induced blood oxygenation level dependent (BOLD) contrast has been studied for thepast decade [1,2,3], but only recently has it been used towards extracting neuronal timing information to betterunderstand the spatial relationship below that. In this study, the spatial variability of the hemodynamic latencyand latency modulation with task timing modulation is studied.
Method
Functional MRI was acquired from 4 subjects using the BOLD-EPI using a GE 3 Tesla scanner (TR = 400ms, TE= 30ms, slice thickness = 7mm, matrix = 64X64, FOV = 24mm, 4 axial slices covering the visual and auditorycortex). Subjects were presented two different stimuli: one auditory stimulus and one visual stimulus. The visualstimulus was used as a time reference for the hemodynamic response. The visual stimulus was repeated accordingto a constant temporal pattern (stimulus – 8 sec, rest – 8 sec) over a 240 sec interval, while the auditory stimuluswas delayed with respect to the start of the visual stimulus by 0msec, 400msec and 800msec.BOLD contrastlatency was measured and mapped using a Hilbert Transform based estimator, (a “plugin” in the AFNI softwaresuite) which allowed to determine the phase shift between the reference time series and the stimulated fMRIresponse time series [1].
Results And Conclusion:
Figure 1A shows the repeatability of the latency measures in the visual cortex in which the neuronal input timingwas not varied across runs. The x axis is the hemodynamic delay for run 1 and y axis is the delay for run 2. Figure1B shows the ability to discern systematic latency differences (as offset in the linear curve fit) with a systematicvariation in neuronal input.
Figure2 shows the voxel wise subtraction of the latency of each pixel (y axis) as function of baseline latency (xaxis). These results suggest a systematic over-estimation of the neuronal timing modulation at short intrinsiclatencies and a underestimation of the neuronal timing modulation at long intrinsic latencies. The best estimate ofthe neuronal timing modulation is obtainedat the mean delay.
The practical implication of these results is that better estimates of modulation of neuronal input should beobtained by pre-selection of only those voxels that are in the range of 2.3 sec onset latency. The physiologicalmechanism of these results remains unclear. Further study is underway to determine precisely how these latenciescorrelate with vascular architecture.
References
[1] Menon RS et al. PNAS 95(18):10902-7, 1998,[2] Calhoun VD et al. Proc. ISMRM Vol1. 983, 2000,[3] Saad Z et al. HBM 13:74-93, 2000
e1743
Abstracts presented at the 9th International Conference on Functional Mapping of the Human Brain, June 19Œ22, 2003, New York, NY
e1743

Order of appearance: 887
AbsTrak ID: 18658
e1744
Abstracts presented at the 9th International Conference on Functional Mapping of the Human Brain, June 19Œ22, 2003, New York, NY
e1744
Poster number: 897
Noninvasive imaging of cortical potential flow
Scott Makeig, Arnaud Delorme, Jorn Anemuller
Institute for Neural Computation, University of California San Diego
Modeling & Analysis
Abstract
Noninvasive imaging of cortical potential flow
Scott Makeig, Arnaud Delorme, Jorn Anemuller
Institute for Neural Computation
University of California San Diego
Introduction
In nearly all EEG analysis, signal sources are explicitly or implicitly modeled as spatially fixed domainscharacterized by activity synchronized across the spatial domain of each source. However, optical and electricalgrid recordings on cortex of animals often show activity occurring in waves that travel quickly across millimetersof cortex. In a convolutive mixing process, a single EEG component may elicit a sequence of potential maps withvarying spatial topography. We reasoned that it may be thereby possible to observe, in non-invasively recordedEEG data, temporally independent patterns of potential source flow on the cortex.
Method:
We developed and applied complex frequency-domain independent component analysis (ICA) (Anemuller et al.,2003) to separate characteristic patterns of cortical potential flow. Input data are transformed into the frequencydomain using the standard methods of short-time Fourier transformation or wavelet transformation. Complexsources are modeled by a circularly symmetric non-Gaussian probability density distribution over the complexplane. Maximum likelihood method is used to obtain the complex counterpart of the well-known infomaxalgorithm for real-valued EEG signals (Makeig et al., 1996) at each frequency of interest. The obtained complexindependent component activations and associated complex scalp maps were then visualized as flow patterns.
Results
Here we report preliminary results of first applications using 32-channel EEG data recorded duringattention-demanding tasks. These showed that many components with physiologically plausible maps (about half)exhibited a non-negligible imaginary part clearly deviating from the real/stationary case. Some of the complexcomponent maps, projected back to the real phase domain, resembled physiologically plausible spatiotemporalflows. The figure shows an example of such a dipole path and associated scalp maps at 12 equally-spaced phasesof a complex alpha component, with the trajectory of equivalent dipole positions determined using BESA(Scherg, 1986). Complex ICA components also exhibited a higher degree of temporal independence than standard(real) independent components of the same data. By clustering complex components across different frequencies,clusters of frequency bands emerged which were similar to those frequency bands that have long been associatedby EEG researchers with different physiological processes.
e1745
Abstracts presented at the 9th International Conference on Functional Mapping of the Human Brain, June 19Œ22, 2003, New York, NY
e1745
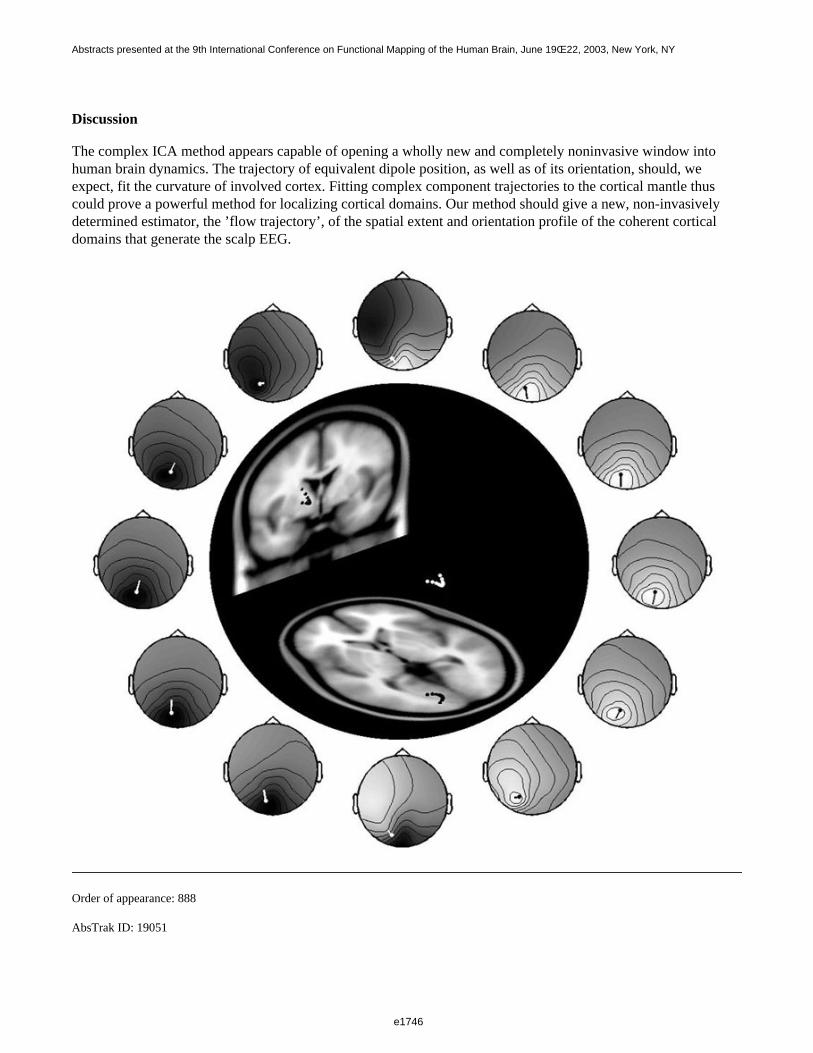
Discussion
The complex ICA method appears capable of opening a wholly new and completely noninvasive window intohuman brain dynamics. The trajectory of equivalent dipole position, as well as of its orientation, should, weexpect, fit the curvature of involved cortex. Fitting complex component trajectories to the cortical mantle thuscould prove a powerful method for localizing cortical domains. Our method should give a new, non-invasivelydetermined estimator, the ’flow trajectory’, of the spatial extent and orientation profile of the coherent corticaldomains that generate the scalp EEG.
Order of appearance: 888
AbsTrak ID: 19051
e1746
Abstracts presented at the 9th International Conference on Functional Mapping of the Human Brain, June 19Œ22, 2003, New York, NY
e1746
Poster number: 898
MRI-BASED TOPOGRAPHIC PARCELLATION OF HUMANBRAINSTEM WITH SYSTEMATICS OF CORTICOPONTINE
CONNECTIVITY
N. Makris*, S.M. Hodge*, H.C. Breiter†, S.C. McInerney*, C. Haselgrove*, D.N. Kennedy*, A. Dale†, B. Fischl†, A.L. Sonricker*, J.E. Schlerf*, M.E. Dieterich*, D.L.
Boriel*, K.K.S. Hui†, A.F.M. DaSilva†, D. Borsook†, L. Becerra†, V.S. Caviness*, J.D. Schmahmann*
*Department of Neurology, Massachusetts General Hospital†Department of Radiology, Massachusetts General Hospital
Modeling & Analysis
Abstract
Precise definitions of the anatomic subdivisions of the brainstem are required for structural and functionalimaging studies of the brainstem. Localization of functional activation is aided by this precise mapping offunction onto structure. Mapping corticopontine connectivity will allow further elucidation of thecorticocerebellar interactions. Moreover, brainstem abnormalities may be characterized in terms of their effects onbrainstem function and volume. We describe a self-referential parcellation system of the human brainstem as wellas a mapping system of corticopontine connections based upon neuroanatomy.
Method:
Based upon a set of topographical landmarks, we have defined a system for parcellation of the human brainsteminto well-defined, closed areas or parcellation units (PUs). To apply this method to T-1 weighted anatomic MRimages, brainstem exterior and peduncular borders were defined, 10 delimiting planes were identified using across-referential morphometric tool, and brainstem subdivision was performed. The resulting parcellation servedas the basis for morphometric and localization functions. The corticopontine map was formulated and adaptedfrom this MRI parcellation system based on the known neuroanatomical connections in the human.
Results
The entire brainstem was parcellated into 14 PUs per side of the brainstem (right and left). Specifically, themidbrain was divided into 6 PUs, the pons into 4 PUs, and the medulla into 4 PUs. We present the volumetricanalysis and the corticopontine maps for five individuals, as well as a measure of inter-rator reliability. We alsopresent the localization of brainstem activation in studies of acupuncture, stimulation of the trigeminal nerve, andcocaine exposure.
Supported by: NARSAD, ALSA
Order of appearance: 889
AbsTrak ID: 19035
e1747
Abstracts presented at the 9th International Conference on Functional Mapping of the Human Brain, June 19Œ22, 2003, New York, NY
e1747
Poster number: 899
Single Subject Multifactor Analysis of Widely Spaced Trials
Mark McAvoy, Gordon Shulman, Ayelet Sapir, Anthony Jack, Giovanni d’Avossa,Maurizio Corbetta
Washington University School of Medicine
Modeling & Analysis
Abstract
Introduction
Experiments that evaluate the effects of performance on the BOLD response or the pattern of BOLD response inpatients with highly idiosyncratic lesions are particularly suited to single subject analyses. In widely spaced fMRIdesigns, the evoked responses do not overlap in time. These designs have the advantage that the timecourses ofthe responses to specific stimuli can be extracted trial by trial. We present a method to generate statistical maps ofthe significance of BOLD responses in widely spaced designs for single subjects that allows direct comparisonbetween conditions without any assumption about the shape of the hemodynamic response function (HRF).
Methods
A subject took part in a motion discrimination task. A location cue provided information about which among a setof eccentric random dot kinematograms contained coherent motion. The subject reported on each trial thedirection of coherent motion. The interval between the last event in a trial and the beginning of the next trialvaried from 13 to 17.3 seconds, providing ample time for the HRF to fall to baseline. A general linear model [1]was fit to the BOLD responses that included delta functions to extract timecourses of the experimental conditionsand seperate regressors for each run to model a linear trend (slope and intercept) and low frequency drifts(cosinusiods). The linear trend and drift terms were subtracted from the BOLD responses. Statistical inferenceswere made on the BOLD responses using a multifactor analysis of variance (ANOVA) with a completelyrandomized design [2]. The "random" factor was trials and fixed factors included time frame and task.
Results
Figure 1 shows the statistical map corrected for multiple comparisons [3] of the main effect of time frame for asingle subject computed from the BOLD responses in 86 trials. Reliable effects on the evoked response werefound in regions that are expected to be active after an arrow cue including frontal eyefields bilaterally (FEF),supplementary motor area (SMA), along the intraparietal sulcas (IPS), ventral intraparietal regions (VIPS), andfusiform regions (FUS). Figure 2 shows the timecourse for left FEF.
e1748
Abstracts presented at the 9th International Conference on Functional Mapping of the Human Brain, June 19Œ22, 2003, New York, NY
e1748
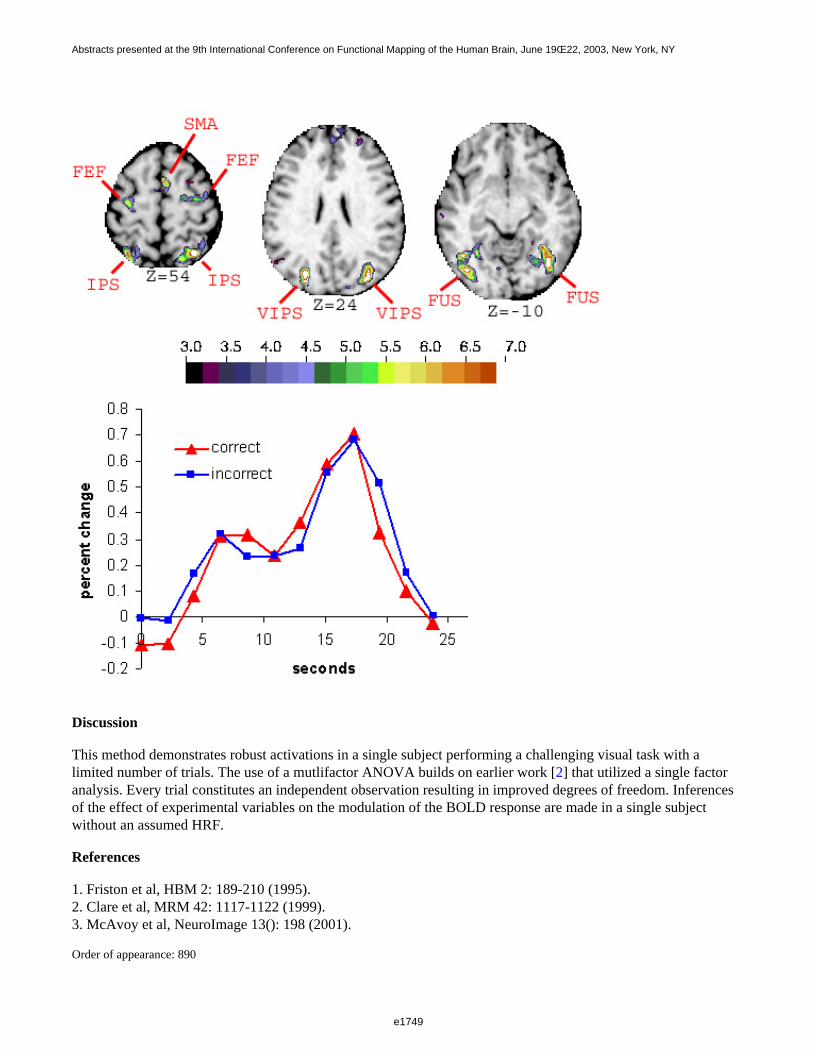
Discussion
This method demonstrates robust activations in a single subject performing a challenging visual task with alimited number of trials. The use of a mutlifactor ANOVA builds on earlier work [2] that utilized a single factoranalysis. Every trial constitutes an independent observation resulting in improved degrees of freedom. Inferencesof the effect of experimental variables on the modulation of the BOLD response are made in a single subjectwithout an assumed HRF.
References
1. Friston et al, HBM 2: 189-210 (1995).2. Clare et al, MRM 42: 1117-1122 (1999).3. McAvoy et al, NeuroImage 13(): 198 (2001).
Order of appearance: 890
e1749
Abstracts presented at the 9th International Conference on Functional Mapping of the Human Brain, June 19Œ22, 2003, New York, NY
e1749

AbsTrak ID: 19065
e1750
Abstracts presented at the 9th International Conference on Functional Mapping of the Human Brain, June 19Œ22, 2003, New York, NY
e1750
Poster number: 900
Software tools for anatomical localization of the clusters revealed by SPM
S.V. Medvedev, S.V. Pakhomov
Modeling & Analysis
Abstract
Viewing clusters on Talairach Atlas sections.
Images of sagittal, verticofrontal, and horizontal Sections from Talairach Atlas were scanned and edited to matchrectangular areas within limits [-68; 68], [-103; 70], and [-43; 75].
The cluster revealed by SPM may be described as the set of points in 3D space (coordinates of the points aregiven in space of MNI template) with the set of the corresponding values of the statistics. To prepare thevisualization of the cluster in coordinate system of Talairach Atlas we needed to described cluster as a volume inTalairach space. To get such a description the following steps were performed:
1. Calculating bounding box of the cluster in the MNI space and constructing MATLAB volume data in the MNIspace. Values for points on grid outside cluster were set to zero.
2. Applying non-linear transformations, as described at http://www.mrc-cbu.cam.ac.uk/Imaging/, to every point in3D grid in MMI space to get as a result non rectangular grid coordinates in Talairach space.
3. On the basis of the non rectangular grid in Talairach space calculating bounding box of the cluster in theTalairach space.
4. Calculating MATLAB volume data in the Talairach space. For calculating data values for points of rectangular3D grid in Talairach space MATLAB function interp3 with linear interpolation was used (data on rectangular gridare interpolated on the basis of data on non rectangular grid from step 3).
Given description of the cluster as a volume in Talairach space the sections from Talairach Atlas which intersectthe cluster were determined and intersection contours were calculated. After that with aid of friendly interface,user can visually inspect the intersection contours superimposed onto Talairach sections to get insight aboutanatomic localization of the cluster.
Besides the visualization of the cluster’s contours 3D visualization of the cluster is available. 3D view of thecluster with ability of manual rotation may be helpful for the inspection of large clusters of complicated shape.
Reporting Talairach Atlas labels for the clusters.
MNI coordinates (in mm) of each point on 2x2x2 mm grid inside the bounding box [-78;78]x[-112;76]x[-50;86]were transformed into Talairach coordinates using nonlinear transformations. Resulting coordinates were roundedto nearest integer and sent to stand alone version of Talairach Daemon to get up to five different Talairach AtlasLabels for each point according to different types of classification. All these data were stored in the local file thatwas used to determine Talairach Atlas Labels without querying Talairach Daemon.
Given the set of the clusters and using the above method utility prepare plain ASCII text report file withinformation about anatomic localization for each cluster in the set. This information for each cluster includes thelist of all Talairach Atlas Labels for the regions that intersect the cluster. For every such a region two quantitiesare calculated: the ratio of the intersection volume to cluster volume and the ratio of the intersection volume to the
e1751
Abstracts presented at the 9th International Conference on Functional Mapping of the Human Brain, June 19Œ22, 2003, New York, NY
e1751

whole region volume.
Both utilities can be downloaded from the site http://www.ihb.spb.ru/~pet_lab/. User manuals are also availableon-line from this site.
Order of appearance: 891
AbsTrak ID: 17695
e1752
Abstracts presented at the 9th International Conference on Functional Mapping of the Human Brain, June 19Œ22, 2003, New York, NY
e1752
Poster number: 901
A random variable approach to a voxel’s functional relevance in fMRI investigations
Gregor Meller, Alexander Geissler, Rupert Lanzenberger, Amir R. Tahamtan, DennyMilakara, Andreas Gartus, Roland Beisteiner
Department of Neurology, General Hospital and University of Vienna, Austria
Modeling & Analysis
Abstract
Introduction
A voxel’s lowest correlation value during repeated fMRI-measurements could represent a meaningful marker forit‘s functional relevance, since it specifically adds the factor of voxel reliability to conventional data analysisapproaches. For maps reflecting this functional relevance of brain voxels the term “fMRI risk map” was generatedand the validity of eloquent cortex localizations was demonstrated by comparisons with intraoperative corticalstimulations (2). Here we present an extension of this technique which allows generation of probability mapsdepicting a single voxels probability of becoming the most truly active voxel in a future measurement series.
Methods
FMRI risk-maps interpret a voxel‘s temporal BOLD-correlation as a continuously distributed random variable (1)defined by a continuous probability density function (pdf) on the 1-dimensional, real-valued domain [-1.0, +1.0].The connection between this pdf’s structure and the voxel‘s functional significance is established by calculating avoxels "greatest lower bound (glb)”-probability to exhibit the maximal correlation-minimum during repeatedmeasurements. The glb-probabilities depend on the pdf’s shape and "support", which designates the subset of allpoints in the domain [-1.0, +1.0] making the pdf non-vanishing. Thus, the support of a voxel‘s pdf may be viewedas the voxel‘s spectrum of accessible correlation-states. For each task and each voxel this spectrum posessesspecific upper and lower bounds, which will never be exceeded in finite time. Repeated measurements generaterandom samples of a voxel‘s correlations, mirrored in a phenomenological pdf, which determines the voxel‘sabsolute probability never to fall below under a given value during any measurement series. A voxel‘s lowerspectral bound describes the lowest correlation value this voxel can reach during an arbitrary, but finite number ofexperiments. Irrespective of this bound, in an experimenter’s eyes, a voxel’s correlation minimum duringmeasurement- sequences may also be viewed as a continuously distributed random variable, since another sessionmay lead to a noticeable different empirical lower bound. Hence, the detected lower spectral bounds may also bedescribed by a phenomenological or hypothetical pdf.
Results and Discussion
The number of voxels with realistic glb-probabilities during a fist-making-task of a healthy man was usuallyremarkably small, but strongly dependent on the pdf’s shape parameters. Fitting hardly deformed skew-normaldistributions to the voxel’s recorded data sharpened our pictures plausibly. Gaussians around the voxels empiricalminimum produced similar results (Fig.1). Skewed gaussians promoted "glb-activity" (Fig.2), but often in a lessplausibe way as shown here. Therefore, skew-normals should be used with great care (3). Our observationsencourage our conjectures, that the glb-property is quite delicate and that concepts like local departure fromnormality could play an interesting role at this level of functional brain-imaging under certain, well-defined conditions.
e1753
Abstracts presented at the 9th International Conference on Functional Mapping of the Human Brain, June 19Œ22, 2003, New York, NY
e1753
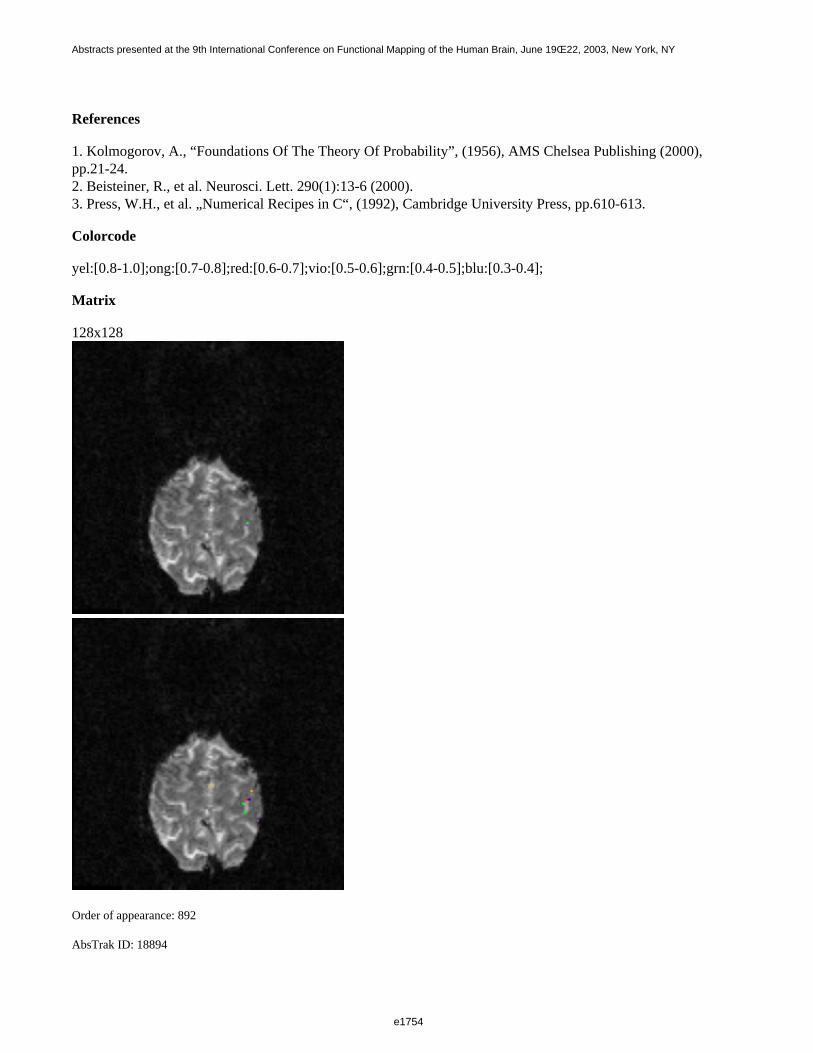
References
1. Kolmogorov, A., “Foundations Of The Theory Of Probability”, (1956), AMS Chelsea Publishing (2000), pp.21-24.2. Beisteiner, R., et al. Neurosci. Lett. 290(1):13-6 (2000).3. Press, W.H., et al. „Numerical Recipes in C“, (1992), Cambridge University Press, pp.610-613.
Colorcode
yel:[0.8-1.0];ong:[0.7-0.8];red:[0.6-0.7];vio:[0.5-0.6];grn:[0.4-0.5];blu:[0.3-0.4];
Matrix
128x128
Order of appearance: 892
AbsTrak ID: 18894
e1754
Abstracts presented at the 9th International Conference on Functional Mapping of the Human Brain, June 19Œ22, 2003, New York, NY
e1754
Poster number: 902
Assessing the homogeneity of subjects’ samples for random effect analysesin fMRI
Sebastien Meriaux*†, Ferath Kherif*†, Christophe Pallier*†‡, Veronique Izard*†‡,Matthew Brett§, Line Garnero†§, Jean-Baptiste Poline*†
*CEA/DSV/DRM, Service Hospitalier Frederic Joliot, Orsay, France.†IFR 49, Institut Imagerie Neurofonctionnelle, Paris, France.
‡INSERM U562, Service Hospitalier Frederic Joliot, Orsay, France.§MRC Cognition and Brain Unit, Cambridge, United Kingdom.
¶LENA, Neurosciences cognitives et Imagerie cerebrale, Hopital de la Salpetriere, Paris, France.
Modeling & Analysis
Abstract
Introduction
Standard group analyses of fMRI data rely on the spatial and temporal averaging of individuals, yet this operationis only sensible when the spatial or temporal mean is a good representation of the group. Therefore we developeda new method to assess group homogeneity and detect potential outliers (1).
The method computes temporal and spatial distances between subjects, using an extension of the RV-coefficient tofocus on a sub-space of interest. A MultiDimensional Scaling (MDS) procedure allows to display each subject’sposition with respect to the others. A Cook test has been chosen to detect atypical subjects.
In this study, we evaluate our method with two datasets in order to test its ability to detect outliers or sub-groupsof subjects. Our goal is also to provide a software allowing an easy checking of group homogeneity.
Experimental fMRI datasets
The method was tested on an experiment (dataset 1) investigating language acquisition and conducted on 16subjects : 8 French native speakers and 8 Korean adopted by French families in childhood (2). Using event-relatedfMRI, cortical activations were monitered while subjects listened to Korean, French, Japanese and Polish. Wecalculated temporal and spatial distances to investigate the possibility of distinguishing the two sub-groups of subjects.
We also tested our method on an experiment (dataset 2) investigating numbers representation in 11 subjects.Using event-related fMRI, cortical activations were monitered while subjects read short stories and answeredquestions about numbers present in the stories. Data analysis revealed that one subject showed atypicalbehaviorial responses, so we used our method to determine if it could detect this subject as an outlier.
Results
For dataset 1, the results are in agreement with those of Pallier et al. : French and Korean adoptees activate thesame regions to unknown languages stimuli and the Korean adoptees did not show specific activations to Koreanstimuli. The MDS plots of the temporal and spatial distances confirm that it is not possible to distinguish the twosub-groups of subjects.
e1755
Abstracts presented at the 9th International Conference on Functional Mapping of the Human Brain, June 19Œ22, 2003, New York, NY
e1755

For dataset 2, the results confirm that subject 3 should be considered as an outlier. Figure (left) shows a 2D MDSplot of the spatial distances between subjects. On this figure subject 3 clearly lies apart indicating a differentspatial behaviour. Figure (right) shows the Cook distances plot. Subject 3 appears as an outlier in the spatialdomain (Cook distance > 1). We excluded subject 3 to form an ’homogeneous’ sub-group. We then re-evaluatedthe random effect analysis with this ’homogeneous’ sub-group and found a better sensitivity compared to theanalysis with the original group.
This work shows that this method is a quick and easy tool to check group homogeneity. It has been implementedin SPM environment.
References
(1) Kherif et al., submitted to Neuroimage(2) Pallier et al., Cereb Cortex (2003), 13(2):155-61Figure : Dataset 2 - Left : 2D MDS plot of spatial distances - Right : Cook distances
Order of appearance: 893
AbsTrak ID: 18178
e1756
Abstracts presented at the 9th International Conference on Functional Mapping of the Human Brain, June 19Œ22, 2003, New York, NY
e1756
Poster number: 903
Model free non-linear regression analysis of fMRI data usingnon-parametric adaptive regression
Masaya Misaki, Satoru Miyauchi
Brain Information Group, Kansai Advanced Research Center, Communications Research Laboratory.
Modeling & Analysis
Abstract
In most imaging studies, searches are made looking for signal changes that correlate with certain events such astask, perception or cognition. In the general linear model approach, a signal change elicited by an event ishypothesized a priori and brain signals measured by PET, fMRI and so on are linearly regressed by thishypothesized change to find brain regions activated by such events. However, this approach cannot detect brainactivations whose signal changes are different from those in the hypothesized changes, even though they correlatewith tasks achieving by using some other style. In this study, we present a new method that is able to detect anycorrelation between signals and events. This method does not need any a priori hypothesis regarding signalchanges, even a parametric model of hemodynamic response function. Furthermore, the method is very flexible sothat any values can be used as a regressor.
In the method proposed, a correlation between a signal and an event is estimated directly using a three-layeredneural network and the adaptive regression method. A signal value at a time t is regressed by values of event timecourse at times t to t-k. A three-layered neural network with k+1 input units, an appropriate number of hiddenunits and one output unit conduct this regression by means of a back-propagation algorithm. Since the regressionfrom values of event time course to a signal is direct, this method is model free. Moreover, the most advantage ofthis method is that any values can be used as regressor values. For example, in an event-related analysis, we usebinary values representing those at the onset of an event. For parametric modulation, continuous values can beused as the value of an event occurring. Even continuous values that cannot be defined an event onset (ex.EEG-rhythms) can be used as a regressor.
We applied this method to an fMRI data of a simple visual stimulation experiment. The stimulus was acheckerboard pattern flickered at 9.4Hz. The stimulus duration was 1 second and SOA was 8, 10 or 12 seconds.Imaging parameters were TR = 2.0 sec, TE = 55.24 ms, voxel size = 3.5 x 3.5 x 4 mm, and 9 slices without gap.We used 16 binary values (0 to -30 seconds from scan onset time) of event time course as a regressor andconducted the adaptive regression analysis on the back-propagation neural network. We could regress fMRIsignals in many regions. We estimated the time courses of the hemodynamic response in the three regions (V1,LGN, SC) using the regressed mapping of event to signal, then the different time courses in the three differentregions were revealed. As shown in this result, the proposed method enabled us to detect simultaneously theactivated regions with different hemodynamic responses.
e1757
Abstracts presented at the 9th International Conference on Functional Mapping of the Human Brain, June 19Œ22, 2003, New York, NY
e1757
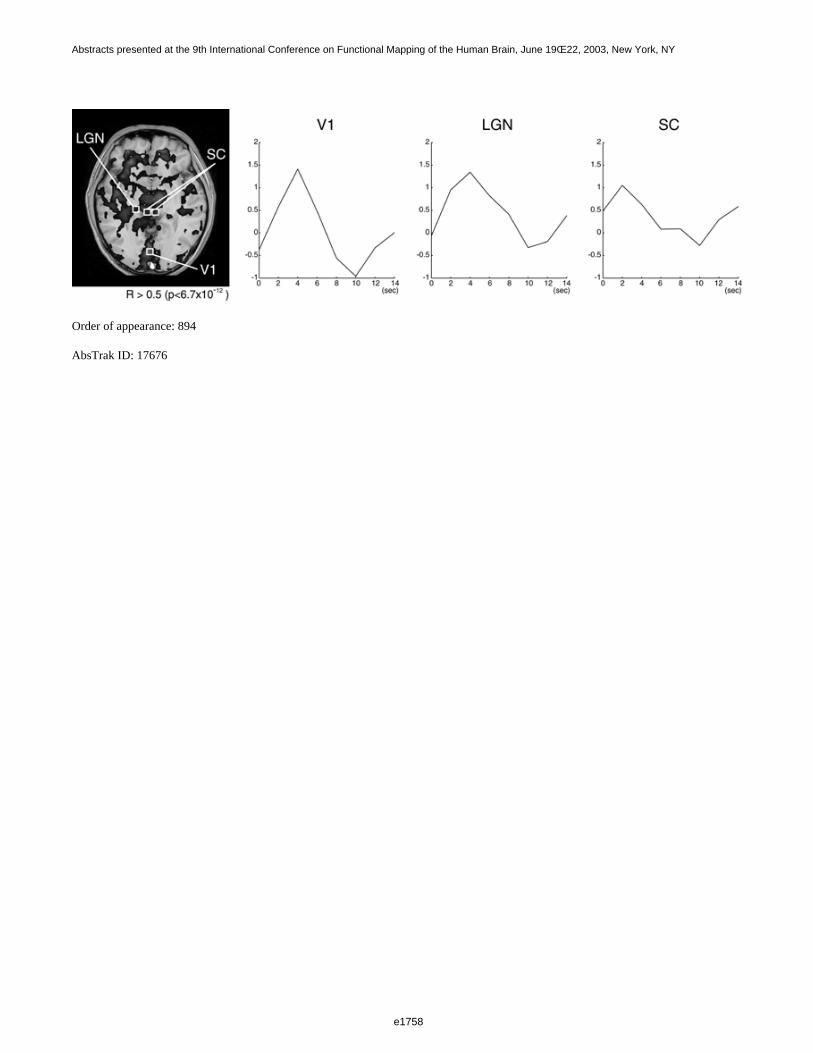
Order of appearance: 894
AbsTrak ID: 17676
e1758
Abstracts presented at the 9th International Conference on Functional Mapping of the Human Brain, June 19Œ22, 2003, New York, NY
e1758
Poster number: 904
Parallel Factor Analysis can extract significant activities in multi channel EEG
Fumikazu Miwakeichi*, Eduardo Martínez-Montes†, Pedro A. Valdes-Sosa†, Hiroaki Mizuhara*, Nobuaki Nishiyama*, Yoko Yamaguchi*
*RIKEN Brain Science Institute†Cuban Neuroscience Center
Modeling & Analysis
Abstract
Human EEG is usually characterized and discussed mainly in frequency band, e.g. theta activity (4-8Hz), alphaactivity (8-10Hz) and so on. Traditionally, band pass filter have been used for studying separated activities.However the peak and boundary of activities in frequency domain are different is subjects and trials. Accordinglynumerical definition of boundary of activities is artificial and not appropriate, rather arbitrary. In this study wepropose a new method for objectively extracting significant activities based on Parallel Factor Analysis (PARAFAC).
PARAFAC is a general well-described decomposition method for dealing with multidimensional data and it hasbeen used widely in food industry and chemometrics in general [1]. It is a generalization of Principal ComponentsAnalysis with the desirable advantage of having unique solution. In this work, PARAFAC was used for the firsttime in the analysis of EEG data in the space-time-frequency domain, in order to extract pure spectra andlocalization of separated brain activities.
Appropriate EEG data for evaluating the performance of extracting activities by PARAFAC are those that containmore than two activities differing in space and frequency localization. For this purpose, EEG which was recordedduring two different mental calculation tasks was analyzed. Task A is sequential subtraction 7 from 1000 withoutany trigger and task B is modified Uchida- Kreapelin test in which subject was required to sequentially add onedigit number with ignoring tens place. The numbers were presented by artificial voice.
EEG corresponding to task A, was wavelet transfromed and a three dimensional (channel-frequency-time) data setwas obtained. PARAFAC successfully extracted theta and alpha activities in frequency and time domain(Fig.1).Estimated sources of extracted theta activity using Low Resolution Electromagnetic Tomography (LORETA) [2]were around anterior cingulate gyrus and medial frontal-orbital gyrus (Fig.2). For extracted alpha activity, thelocalization of estimated sources was occipital lobe. The comparison of these results with those obtained byordinary band pass filter clearly shows the benefits of our new method as natural frequency separation.
Second data, corresponding to task B, was event related type and transformed four dimensional data set(time-frequency-channel-trial). PARAFAC was applied to this data extracting also theta and alpha activities.Event related theta activity were located in similar region as task A, and alpha activities are decomposed intoreasonable components whose time course characterized the event related appearance in each component. Thepure spectrums for each extracted activity, showing corresponding frequency’s peaks, were also found. Theapplication of PARAFAC to three dimensional data (time-frequency-channel) and projecting significant activitieson Talairach averaged brain by LORETA is also possible.
e1759
Abstracts presented at the 9th International Conference on Functional Mapping of the Human Brain, June 19Œ22, 2003, New York, NY
e1759
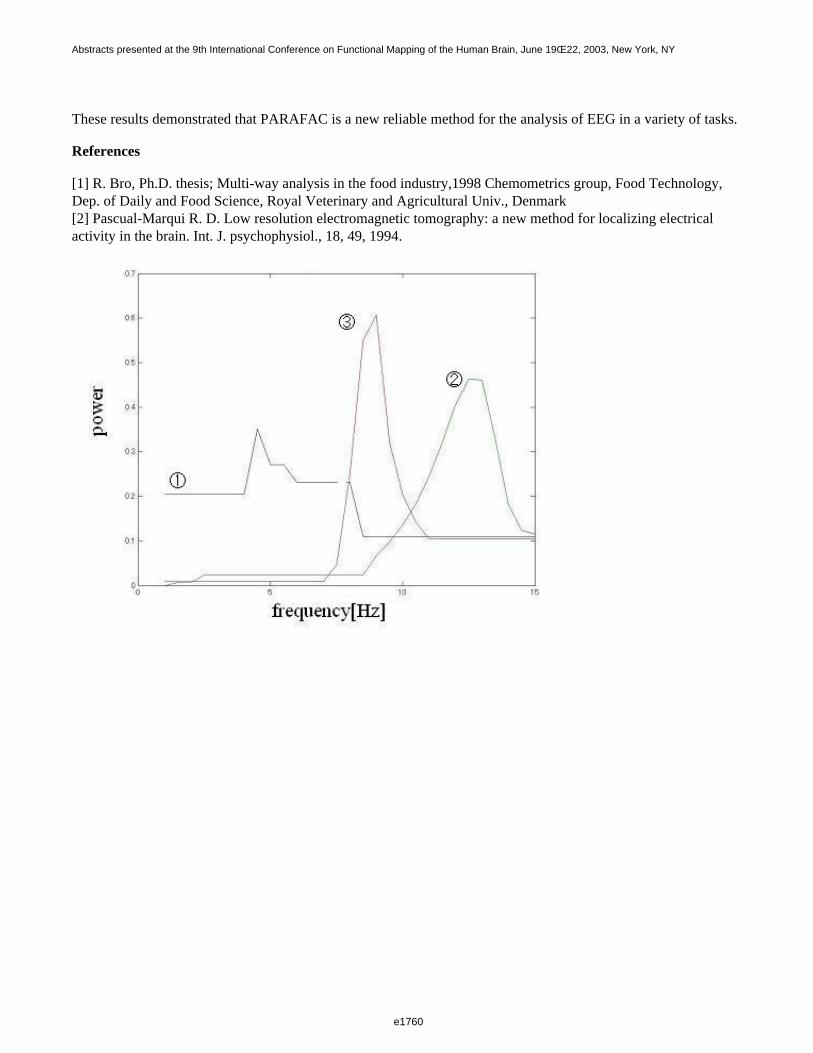
These results demonstrated that PARAFAC is a new reliable method for the analysis of EEG in a variety of tasks.
References
[1] R. Bro, Ph.D. thesis; Multi-way analysis in the food industry,1998 Chemometrics group, Food Technology,Dep. of Daily and Food Science, Royal Veterinary and Agricultural Univ., Denmark[2] Pascual-Marqui R. D. Low resolution electromagnetic tomography: a new method for localizing electricalactivity in the brain. Int. J. psychophysiol., 18, 49, 1994.
e1760
Abstracts presented at the 9th International Conference on Functional Mapping of the Human Brain, June 19Œ22, 2003, New York, NY
e1760
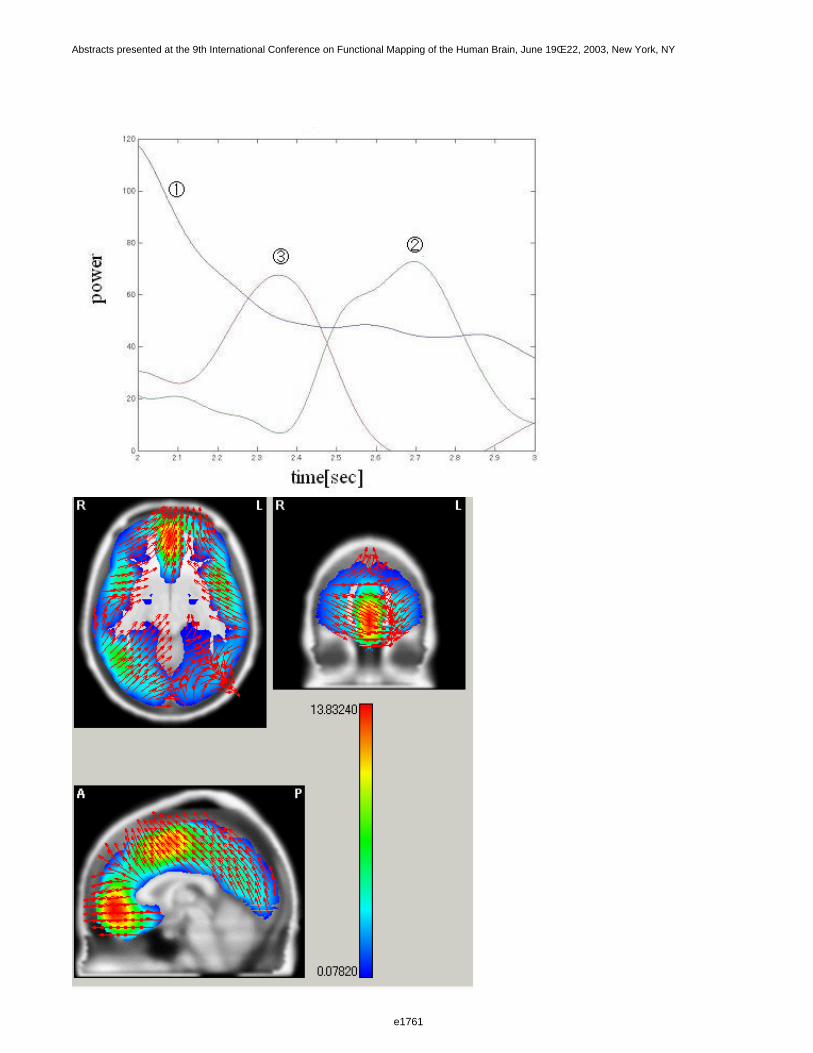
e1761
Abstracts presented at the 9th International Conference on Functional Mapping of the Human Brain, June 19Œ22, 2003, New York, NY
e1761

Order of appearance: 895
AbsTrak ID: 18244
e1762
Abstracts presented at the 9th International Conference on Functional Mapping of the Human Brain, June 19Œ22, 2003, New York, NY
e1762
Poster number: 905
Probabilistic cytoarchitectonic maps transformed into MNI space
Hartmut Mohlberg†, Jason Lerch*, Katrin Amunts†, Alan Evans Ph.D.*, Karl Zilles†‡
*MacConnell Brain Imaging Centre, Montreal Neurological Institute, Montreal, Canada†Institute of Medicine, Research Center Juelich GmbH, Juelich, Germany
‡Brain Research Institute, Heinrich-Heine University of Duesseldorf, Duesseldorf, Germany
Modeling & Analysis
Abstract
Introduction
For the localization of activated regions identified by functional imaging an overlay with an anatomical atlas, e.g.Talairach´s atlas, is required. However, there is considerable intersubject structural variability, caused by differentmacroscopical anatomy, as reflected by a different sulcus pattern, and by different location and extent ofarchtitectonic areas, which can only be defined microscopically. Therefore, only the spatial normalization of themacroscopical anatomy to a common reference system permits statements about the structural intersubjectvariability of architectonic areas and their correlation to functional activations. In Juelich and Duesseldorfcytoarchitectonic areas have already been analyzed and spatially normalized to ECHBD space [1]. Maps of themotor and somatosensory cortex, the auditory cortex, the visual cortex and Broca’s region, and fiber tracts havealready been published. However, within SPM, widely used for functional data analysis, brains are normalized toMNI space. Preceding studies showed the benefit of an overlay of cytoarchitectonic maps and SPM data [2].Therefore the transformation of the cytoarchitectonic maps into the MNI space is desirable for an easystructural-functional analysis.
Materials and Methods:
Sixteen adult human brains were fixed in formalin or Bodian’s fixative, scanned with a 3-D FLASH sequence,embedded in paraffin, sectioned coronally or sagittally at 20 µm, and stained for cell bodies or fiber tracts.Borders of the areas were defined by an observer independent statistical analysis on the basis of differences in thecortical architecture [3]. Histological volumes were 3-D reconstructed and automatically corrected for linear andnonlinear deformations due to histological processing. The reconstructed histological volume was warped to theindividual MNI reference brain (an average of 27 scans of the same subject (4)) using nonlinear warpingalgorithms (2, 6). The fixation of the postmortem brains occuring before MRI acquisition alters the signalsignificantly, e.g. resulting in a totally different intensity distribution. We used the MNI’s MRI simulator (5) tochange the gray value distribution by creating a T2 contrast version of the MNI reference brain in order to get acomparable image intensity distribution between a postmortem brain and the invivo MRI reference brain. Thedeformation fields were applied to each of the individual areas. The transformed areas were superimposed to thereference brain, and probability maps were calculated which quantified the intersubject variability in their locationand extent.
Results and Conclusions:
Due to different reference systems an overlay of our probabilistic cytoarchitectonic maps with functionalactivations was not yet possible. The transformation of the maps into the MNI space, hence on the referencesystem used by SPM changed this unsatisfactory situation. The maps are available at http://www.fz-juelich.de/ime/ime_brain_mapping and http://www.bic.mni.mcgill.ca/cytoarchitectonic.
e1763
Abstracts presented at the 9th International Conference on Functional Mapping of the Human Brain, June 19Œ22, 2003, New York, NY
e1763

This Human Brain Project/Neuroinformatics research was funded jointly by the National Institute of MentalHealth, of
Neurological Disorders and Stroke, of Drug Abuse, and the National Cancer Center.
References
1. Roland, P., Zilles, K., TINS, 1994, 17:458ff2. Mohlberg, H. et al., HBM 2002, Poster No.: 105013. Schleicher, A. et al., NeuroImage, 1999, 9:165ff4. Holmes, C.J. et. al., J. Comp. Assisted Tomography 1998, 22:324ff5. Kwan, R.K. et. al. IEEE TMI 1999, 18:1085-976. Collins et al., J. Comp. Assisted Tomography, 1994, 18:192ff
Order of appearance: 896
AbsTrak ID: 18398
e1764
Abstracts presented at the 9th International Conference on Functional Mapping of the Human Brain, June 19Œ22, 2003, New York, NY
e1764
Poster number: 906
ARX technique for real-time identification and feedback of event-relatedfMRI activation in a cognitive task
Kevin Murphy*, David Burke†‡, Hugh Garavan*§
*Department of Psychology and Trinity College Institute of Neuroscience, Trinity College, Dublin, Ireland.†Rehabilitation Engineering, National Rehabilitation Hospital, Dublin, Ireland.
‡Department of Electronic and Electrical Engineering, University College Dublin, Ireland.§Department of Psychiatry and Behavioral Medicine, Medical College of Wisconsin, Milwaukee, USA.
Modeling & Analysis
Abstract
Introduction
For at least 20 years, the ability to feedback EEG signals in real-time has revolutionised treatment of conditionssuch as epilepsy and also, of late, has lead to the development of brain-computer interfaces (BCIs). Given itssuperior spatial resolution, the ability to feedback fMRI signals may increase the scope of treatments of variousneurological impairments and could also dramatically boost the speed of BCIs. ARX is a feature extractiontechnique used with EEG data to detect evoked and event-related potentials. This study investigated the feasibilityof using the ARX technique with a linear discriminant analysis (LDA) classification scheme to locate activevoxels in real-time in an event-related experimental design.
Method
The data were taken from a subject in a previous inhibition study (Garavan, PNAS 1999). The task consisted of astream of letters presented serially every 500 msecs. Subjects were required to respond when the alternating targetletters (X and Y) were presented and to withhold responding when the alternation order was broken. Whole-brainfunctional data were acquired on a 1.5T scanner with TR = 2 seconds. Twelve voxels from a single subject werechosen, 6 displaying a strong haemodynamic response and 6 displaying no response (determined by the goodnessof fit to a best-fitting gamma-variate haemodynamic model). The subject’s haemodynamic shape, which formedthe exogenous signal to the ARX model, was obtained by ensemble averaging over the events from active voxels.The LDA classified each single event to be either from an active or inactive voxel. To obtain an estimation ofaccuracy, a cross-validation procedure was employed. The data were divided into N folds. Using each fold in turnas the test set, the LDA was trained on the remaining N-1 folds and accuracy for the test set was determined. Thiswas repeated for M shuffles of the data.
Results
The LDA classification accuracy, using M = 30 and N = 15, was determined using the ARX features and usingthe raw data as features over three different simulations. The first simulation, using na = 7 and nb = 4 as the ARX
orders, found the ARX accuracy to be 71% and the raw accuracy to be 69.3%. An accuracy of 74.2% for ARXand 69.3% for the raw data was found in the second simulation (na = 7, nb =3). The final simulation revealed
accuracies of 74.7% and 69.2% respectively (na = 7, nb =3). The mean ARX accuracy over the three sessions
was 73.3 ± 2.0% whilst the raw sample accuracy was 69.3 ± 0.1%.
e1765
Abstracts presented at the 9th International Conference on Functional Mapping of the Human Brain, June 19Œ22, 2003, New York, NY
e1765

Discussion
The results show that single trial detection is possible, even at relatively low temporal resolutions, and that theARX set of features yields higher classification accuracy than the raw samples. Increasing the temporal resolutioncan only help increase the accuracy of this technique. This method could be used to mark voxels as active orinactive allowing further more computationally intensive analysis to be performed on the active voxels only,including feedback of active brain areas to a subject.
Support
NIDA DA14100; GCRC M01 RR00058; IRCHSS.
Order of appearance: 897
AbsTrak ID: 18226
e1766
Abstracts presented at the 9th International Conference on Functional Mapping of the Human Brain, June 19Œ22, 2003, New York, NY
e1766
Poster number: 907
Quantification of the detrimental effects of adding error trials tofunctional brain maps.
Kevin Murphy*, Hugh Garavan*†
*Department of Psychology and Trinity College Institute of Neuroscience, Trinity College, Dublin, Ireland.†Department of Psychiatry and Behavioral Medicine, Medical College of Wisconsin, Milwaukee, USA.
Modeling & Analysis
Abstract
Introduction
Functional brain imaging investigations of certain populations of interest (e.g., clinical groups; sex or agedifferences) are often confounded by performance differences between the target group and controls. This veryoften occurs by design as the investigation focuses on a psychological process that a priori is expected to beaberrant in the population of interest. Previously (Murphy, HBM2002), we have shown that failing to excludeperformance errors can contaminate functional activation maps by either including post-error processes (cognitiveor emotional) or increasing noise (through averaging performance failures with successful performance). Thequestion then arises: how does the inaccuracy of the activation map vary with the number of errors included? Toinvestigate this, a response inhibition task was reanalysed using simulations.
Method
16 young participants (6 male, 10 female, range: 18-46) completed the experiment. The inhibitory task consistedof a stream of alternating letters (X and Y) presented serially for 600 ms followed by a 400ms blank screen ISI.Participants were required to press a button whenever a target letter (X or Y) was presented (GO). A responseinhibition (NOGO) was required if the alternation order was broken and the current target letter was the same asthe previous letter. The task had 448 GO stimuli and 52 NOGO stimuli with 24.2 commission errors made onaverage (range 12 - 41). The data were analysed using a deconvolution technique with NOGO correct andincorrect regressors resulting in a "true" correct NOGO activation map with 1838 significant voxels. Thesimulations consisted of redesignating 1 to 12 errors as correct and repeating all analyses. Each of the twelveresulting NOGO activation maps was compared with the "true" map and the percentage of false positive and truepositive voxels, with respect to the number of voxels in the "true" map, were calculated.
Results and Discussion
The numbers of voxels in the simulation maps increased linearly as errors were included in the "correct" NOGOactivation map. A regression analysis revealed an intercept of 2979 voxels and an increase of 158 voxels pererror. The number of false positives increased linearly with the number of redesignated errors (intercept: 62.13%,increase per error: 8.29%). That is, after the inclusion of just one error in the NOGO activation map, the numberof false positive voxels was 70% of the original true NOGO map. This rose to 162% after the inclusion of 12errors. Furthermore, the number of true positives decreased linearly (intercept: 39.54%, increase per error:-1.73%) which means that after relabelling just one error as correct, only 38% of the true NOGO map remainedstatistically significant. These results show that with the addition of errors, the false positive rate increases fasterthan the true positive rate decreases and demonstrate that the inclusion of errors, which is an inherent property ofblock designs, can substantially affect the outcome of an analysis.
e1767
Abstracts presented at the 9th International Conference on Functional Mapping of the Human Brain, June 19Œ22, 2003, New York, NY
e1767

Support
NIDA DA14100; GCRC M01 RR00058; IRCHSS
Order of appearance: 898
AbsTrak ID: 18303
e1768
Abstracts presented at the 9th International Conference on Functional Mapping of the Human Brain, June 19Œ22, 2003, New York, NY
e1768
Poster number: 908
Nonparametric distributions of test statistics in fMRI using resting state data
Rajesh Nandy, Larissa Stanberry, Dietmar Cordes
University of Washington
Modeling & Analysis
Abstract
Introduction
The fundamental problem in any hypothesis based fMRI method is to calculate the null distribution of the teststatistic. In many cases, it is difficult to obtain the parametric distribution. A more significant problem is posed bythe fact that due to the nature of the fMRI scans, the successive observations are not temporally independent. Herewe propose a nonparametric method to calculate the null distribution empirically from the resting state data.
Theory and Methods
A common approach to estimate the distribution of a random variable X without making any assumption is toobtain the distribution empirically from independent samples. To generate samples of the test statistic, we useresting state data since the assumption of non-activation is certainly a valid one for such a dataset. Strictlyspeaking, we are calculating the distribution of the test statistic under a slightly different null hypothesis of noparadigm induced activation which is a more realistic choice of null hypothesis. The dataset is used to calculatethe values of the relevant statistic at different voxels and generate the samples. Due to spatial dependence, all thesamples are not independent. To pick independent samples, we only select voxels (or groups of voxels in case ofmultivariate statistics) which are sufficiently separated so that the effect of spatial dependence is minimal.
We also need to investigate whether the samples really come from the same distribution. Due to theinhomogeneous nature of the brain, the voxel time courses themselves do not necessarily come from the samedistribution. However, here we are not looking at the distributions of the time courses themselves, but thedistributions of the test statistic (a function of the time courses) at different voxels. The test statistic only measuresthe dependence between a set of voxel time courses and a predetermined signal subspace. If we have a trulyrandom set of time courses with no explicit connection to the signal subspace, the distribution of the test statisticdoes not depend on the actual nature of the time courses. However, it is important to be careful about that andjustify the validity of the assumptions in every individual scenario.
Results
As an example we will calculate the distribution of the Wilks Lambda statistic
W=-[N-0.5(n1 +n2 +3)]∑log(1-r i2 ),
where r i -s are the sample canonical correlations. Here the statistic is a measure of dependence between the joint
timecourses in a set of n1 neighboring voxels and a set of n2 Fourier basis functions with periodicity consistent
with the paradigm. N is the number of time points. The parametric distribution is obtained asymptotically bymaking assumptions of normality and temporal independence. As expected, in Figure 1, we observe that theapproximate parametric distribution (C) is significantly different from the novel empirical distribution (A) with asharper peak and flatter tails. For comparison, we have also provided the distribution of the statistic when only the
e1769
Abstracts presented at the 9th International Conference on Functional Mapping of the Human Brain, June 19Œ22, 2003, New York, NY
e1769
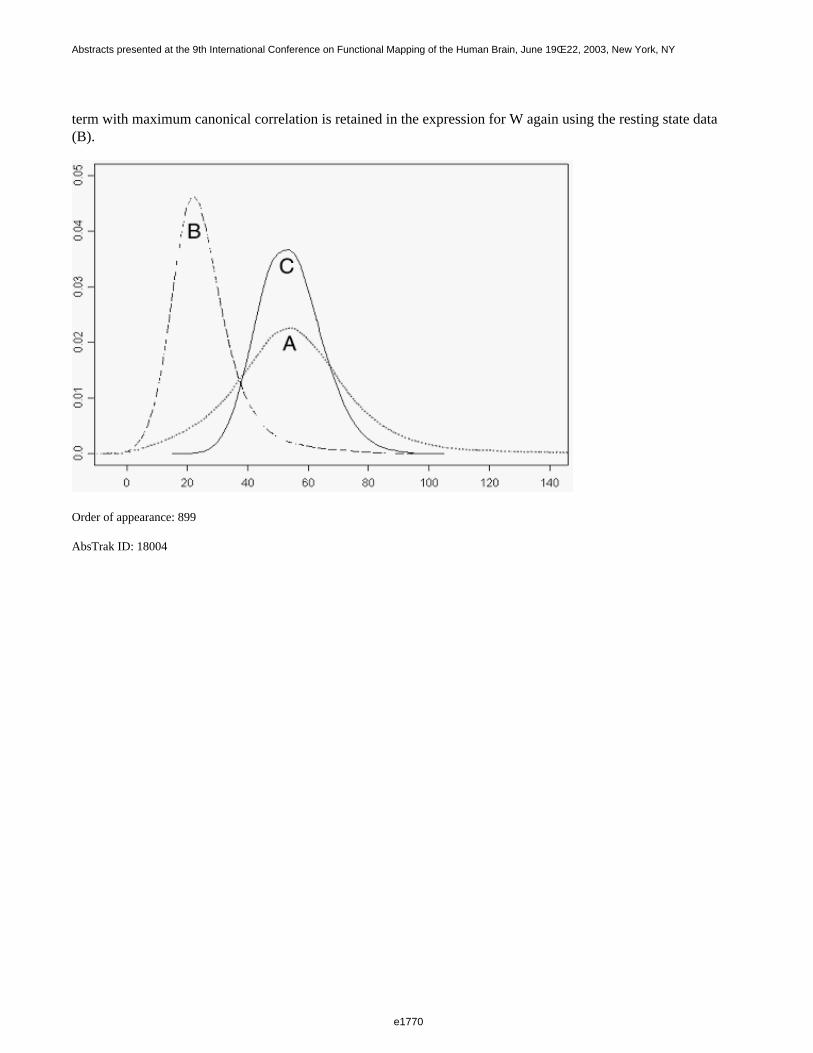
term with maximum canonical correlation is retained in the expression for W again using the resting state data (B).
Order of appearance: 899
AbsTrak ID: 18004
e1770
Abstracts presented at the 9th International Conference on Functional Mapping of the Human Brain, June 19Œ22, 2003, New York, NY
e1770
Poster number: 909
A novel assignment scheme for fMRI activity using canonical correlation analysis
Rajesh Nandy, Larissa Stanberry, Dietmar Cordes
University of Washington
Modeling & Analysis
Abstract
Introduction
The importance of multivariate statistical methods has been realized in fMRI in recent years. One such popularmethod is canonical correlation analysis (CCA), where we investigate the joint timecourses of a group ofneighboring voxels. The value of a suitable test statistic is used as a measure of activation which is assigned to thecenter voxel. However this method of assignment is prone to false activations. To rectify this deficiency amodified method is proposed.
Theory and methods
Suppose X1 and X2 are two random vectors with n1 and n2 components, respectively. In CCA, we look for the
linear combinations Y=α T X1 and Z=βT X2 so that their correlation coefficient (ρ) is maximum [1]. On fMRIsetup, the vector X1 stands for the observed signals at neighboring voxels and X2 stands for the Fourier basisfunctions related to the paradigm. Under the assumption of normality, the likelihood ratio test statistic Λ=[0.5(n1 +n2 +3)-N]Σ(1-r i
2 ) asymptotically follows a chi-square distribution with n1 n2 degrees of freedom.
One can now calculate parametrically the p-value of the dependence between these two sets of vectors. Thep-value is assigned to the voxel of interest (typically the center voxel). However in the event of a highly localizedactivation, this method will falsely detect its neighboring region as active as well. One alternative is to assign theactivation to the most dominant voxel among the set of voxels used for CCA. This is not perfect either, as a trulyactive voxel may be left out when all its neighbors are more active. We use a new assignment scheme whichrectifies the weaknesses mentioned above. In this new scheme, we assign p-values as measures of activationdynamically to the voxels so that the values get updated periodically. Initially, each voxel is assigned a p-valueusing a single voxel regression analysis as a preliminary value. For each voxel, we then perform CCA using thevoxel and its neighbors as in the conventional scheme. We calculate the p-value for the activation level using theasymptotic parametric distribution as mentioned above but do not assign it to the center voxel by default. Thep-value is assigned to the most dominant voxel provided the new p-value is an improvement. Unless the dominantvoxel is the center voxel, we drop the dominant voxel and repeat the CCA with the remaining voxels using thesame assignment scheme (see flowchart). The process is repeated until the dominant voxel is the voxel of interest(the initial center voxel). In this scheme, we get more accurate p-values for all the voxels. However, for each setof nine voxels, it may be necessary to perform CCA up to nine times as opposed to only once in the conventional scheme.
Results
In Figure 1, the two methods are compared at the same threshold using a periodic word-pairing memory task. Themodified CCA rectifies the bleeding effect the conventional method is prone to and also picks up activation at the hippocampus.
e1771
Abstracts presented at the 9th International Conference on Functional Mapping of the Human Brain, June 19Œ22, 2003, New York, NY
e1771
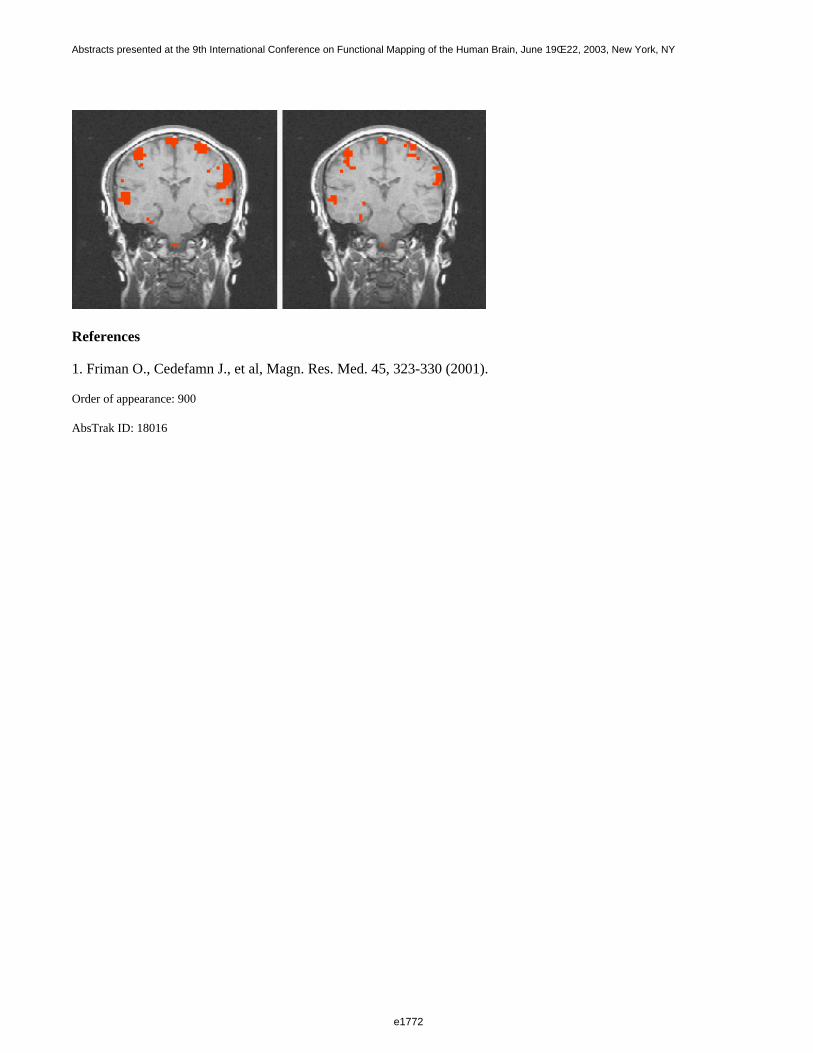
References
1. Friman O., Cedefamn J., et al, Magn. Res. Med. 45, 323-330 (2001).
Order of appearance: 900
AbsTrak ID: 18016
e1772
Abstracts presented at the 9th International Conference on Functional Mapping of the Human Brain, June 19Œ22, 2003, New York, NY
e1772
Poster number: 910
A nonparametric approach to multiple comparison problem using restingstate data
Rajesh Nandy, Larissa Stanberry, Dietmar Cordes
University of Washington
Modeling & Analysis
Abstract
Introduction
The multiple comparison problem is relevant when we have a family of hypotheses Hω:ω in Ω. In fMRI, Ω is
the collection of all intracerebral voxels. The omnibus null hypothesis HΩ is the hypothesis of no activation
anywhere in the brain which is rejected as soon as a single Hω is rejected. If we test every individual Hω at the
same level α, the probability of incorrectly rejecting at least one Hω is much larger than α. Two popular methods
to account for multiple comparison are the Bonferroni correction, which is too conservative and the Gaussianrandom field approach, which makes too many assumptions. Here we use bootstrap in autoregression for restingstate data to address this problem.
Theory and Methods
We denote the test statistic at voxel ω by Yω. At any threshold u for the test statistic, we want to calculate the
probability of incorrectly rejecting the omnibus hypothesis HΩ . Without loss of generality, we assume that the
hypothesis is rejected for values above the threshold. Then we can write
The p-values adjusted for multiple comparison may be obtained from the distribution of max Yω, which is rarely
tractable. Our solution to the problem is to use bootstrap to generate resamples of resting state data preserving theautoregressive structure. For each set of resampled data, we calculate the maximum value of the test statisticamong all voxels. This immediately gives us an empirical distribution of the maximum statistic. For theresampling, we use resting state data since the assumption of non-activation is certainly a reasonable one for sucha dataset. Even though there are certain activities in the resting state brain, they are unrelated to the paradigm forthe task during the active state. Resting state data has some strong autoregressive structures and the bootstrapmethod used by us preserves this structure. Simply speaking, the method is as follows. At each voxel, we fit anAR model (the order determined by AIC). We then estimate the residuals from the fit, and then bootstrap theresiduals to generate resamples of residuals. The resampled residuals are then added to the fitted curve to generatethe resampled data [1].
Results
As an example we will calculate the distribution of the maximum of the Wilks Lambda statistic
e1773
Abstracts presented at the 9th International Conference on Functional Mapping of the Human Brain, June 19Œ22, 2003, New York, NY
e1773
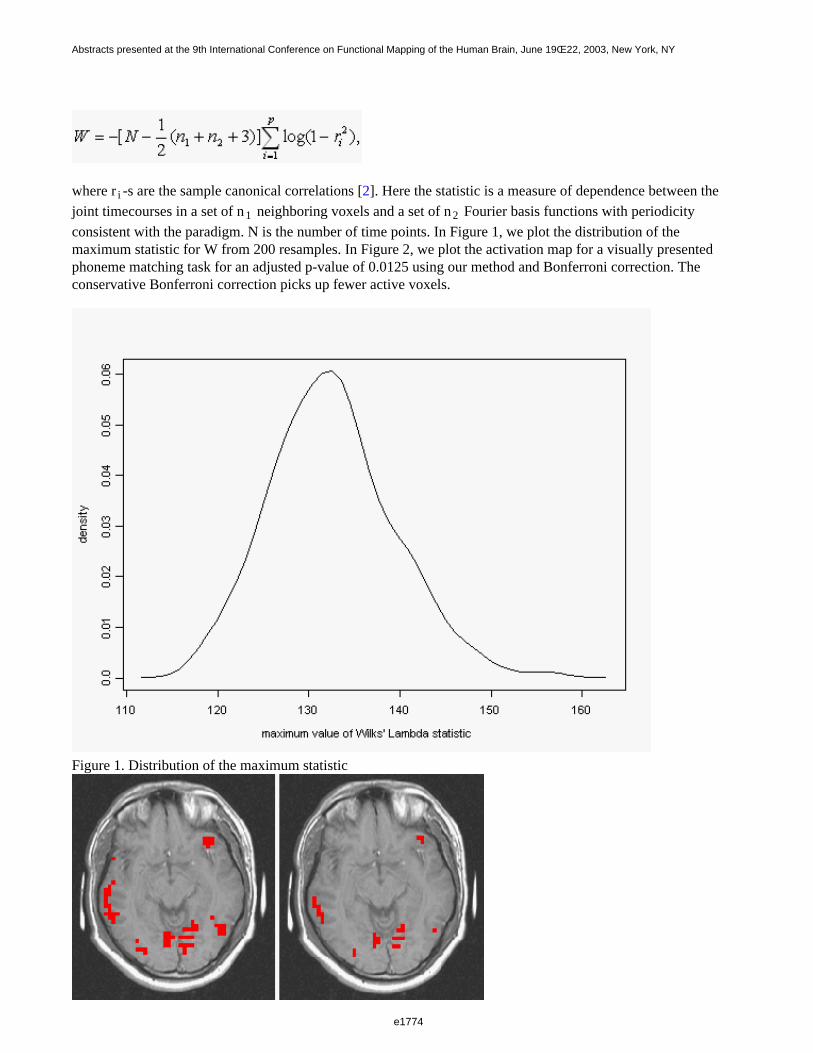
where r i -s are the sample canonical correlations [2]. Here the statistic is a measure of dependence between the
joint timecourses in a set of n1 neighboring voxels and a set of n2 Fourier basis functions with periodicity
consistent with the paradigm. N is the number of time points. In Figure 1, we plot the distribution of themaximum statistic for W from 200 resamples. In Figure 2, we plot the activation map for a visually presentedphoneme matching task for an adjusted p-value of 0.0125 using our method and Bonferroni correction. Theconservative Bonferroni correction picks up fewer active voxels.
Figure 1. Distribution of the maximum statistic
e1774
Abstracts presented at the 9th International Conference on Functional Mapping of the Human Brain, June 19Œ22, 2003, New York, NY
e1774

Figure 2. Adjusted activation maps using the maximum statistic (left) and Bonferroni correction (right)
References
1. Nandy et al. Proceedings ISMRM, 1438 (2002).2. Friman et al, Magn. Res. Med. 45, 323-330 (2001).
Order of appearance: 901
AbsTrak ID: 18037
e1775
Abstracts presented at the 9th International Conference on Functional Mapping of the Human Brain, June 19Œ22, 2003, New York, NY
e1775
Poster number: 911
A geostatistical approach to the modeling of the spatial structure of the brain
Rajesh Nandy, Larissa Stanberry, Dietmar Cordes, Yulia Gel
University of Washington
Modeling & Analysis
Abstract
Introduction
One of the key difficulties in the identification of the structure of the spatial dependence in the brain is theinhomogeneity arising from the presence of gray matter, white matter and CSF in the brain, which gives rise todiscontinuity at the boundaries of the surfaces of these three constituents. This calls for a segmentation basedapproach, which makes each individual segment more homogeneous. Here we introduce a geostatistical methodknown as kriging [1] for the spatial modeling. This method may be used to generate random images of the brainfrom the fitted model and can be very useful to resample fMRI data. Kriging is also an effective interpolationmethod to generate brain images at much higher resolution.
Theory and methods
Let X(q(u)) be the observation at voxel q with coordinates u. For simplicity we can write X(u)= X(q(u)). Then X(u) may be considered as a spatial random process described by X(u)= µ(u)+ e(u). Here µ(u) is a spatial trend,which may be modeled as a polynomial of u; e(u) is a spatial random process with a stationary covariancestructure Ω. Due to the segmentation, stationarity is a reasonable assumption for each individual segment. In asimplified model, µ can also be assumed to be constant. From the stationarity assumption, the covariance onlydepends on the distance between the two points.
We now describe how to construct new images using simple kriging. Let the random process X(u) have amathematical expectation E(X(u))=m for all u. As it was defined earlier, E((X(u) X(v))= Ω(||u-v||), for all u,v.Then with analogy to multiple regression the value of the process X at any location u0 may be defined as
where S is the number of voxels for which we have observed values, ωi -s are weights obtained by minimizing the
variance of the estimate under the constraint that the sum of the weights is one. This gives the linear system
This spatial interpolation method is very simple and may be applied to irregularly spaced data. The disadvantageis the assumption of stationarity. However, the area may be divided into small subspaces of local stationarity withthe subsequent application of the kriging methods. In general, to deal with nonstationarity, one can apply theBayesian methodology.
Results
e1776
Abstracts presented at the 9th International Conference on Functional Mapping of the Human Brain, June 19Œ22, 2003, New York, NY
e1776
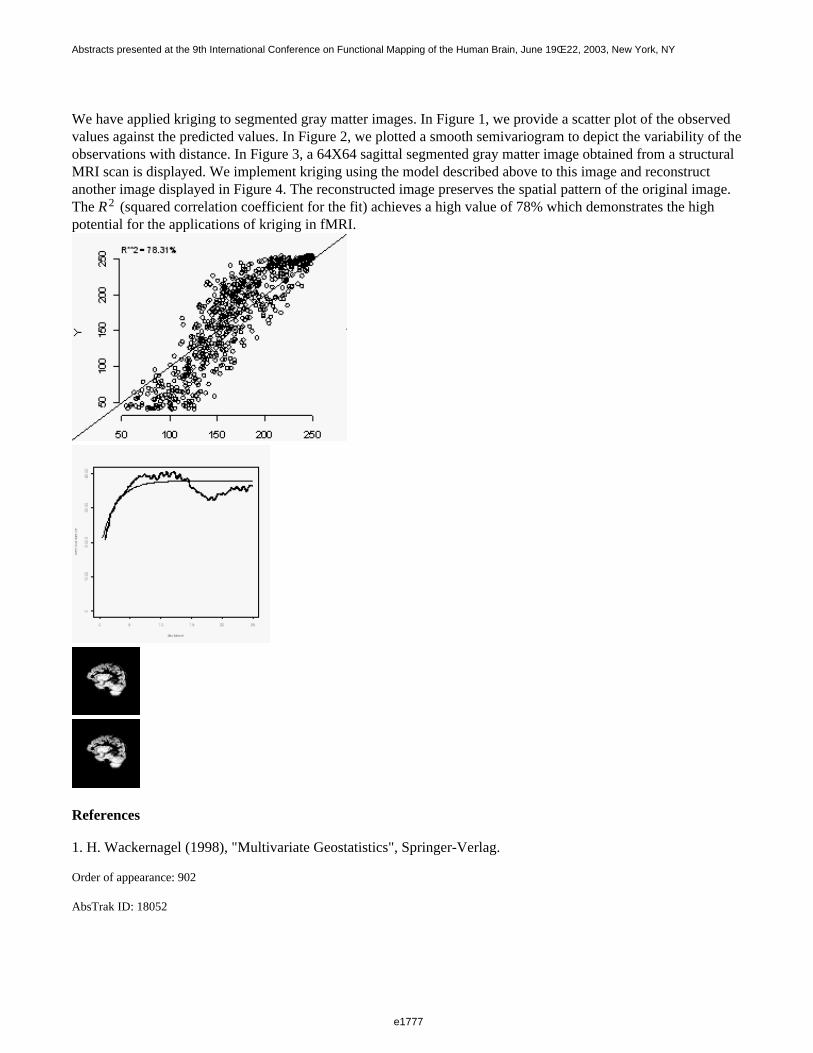
We have applied kriging to segmented gray matter images. In Figure 1, we provide a scatter plot of the observedvalues against the predicted values. In Figure 2, we plotted a smooth semivariogram to depict the variability of theobservations with distance. In Figure 3, a 64X64 sagittal segmented gray matter image obtained from a structuralMRI scan is displayed. We implement kriging using the model described above to this image and reconstructanother image displayed in Figure 4. The reconstructed image preserves the spatial pattern of the original image.The R2 (squared correlation coefficient for the fit) achieves a high value of 78% which demonstrates the highpotential for the applications of kriging in fMRI.
References
1. H. Wackernagel (1998), "Multivariate Geostatistics", Springer-Verlag.
Order of appearance: 902
AbsTrak ID: 18052
e1777
Abstracts presented at the 9th International Conference on Functional Mapping of the Human Brain, June 19Œ22, 2003, New York, NY
e1777
Poster number: 912
ROC methods with real fMRI data
Rajesh Nandy, Larissa Stanberry, Dietmar Cordes
University of Washington
Modeling & Analysis
Abstract
Introduction
The most popular and useful tools to assess the efficiency of different fMRI post-processing algorithms aremethods based on receiver operating characteristic (ROC), which depends on the distributions distributions of thetrue signal and noise (unknown in most cases). Here we propose a novel method to construct ROC curves fromreal data.
Theory and Methods
In fMRI, the problem to declare a voxel as active or inactive presents four possible events: voxel truly declared tobe active (AY), voxel falsely declared to be active (IY), voxel truly declared to be inactive (IN) and voxel falselydeclared to be inactive (AN). Here A and I respectively stand for active and inactive, whereas Y and Nrespectively stand for the voxel being declared active and inactive. This decision is based upon the value of asuitable test statistic X, which is a function of the response. The ROC curve is a plot of P(Y|A) against P(Y|I) fordifferent values of X and are also referred to as True Positive Fraction (TPF) and False Positive Fraction (FPF). Ifthe subject from whom the fMRI data is acquired refrains from any active task, it is reasonable to assume the datato be pure noise and FPF can be estimated. TPF cannot be directly estimated from real data. Instead we calculatethe fraction of all voxels detected to be active and define it as the fraction of Active Positives (FAP). A modifiedROC curve can be obtained by plotting FAP against FPF. It can be demonstrated mathematically thatP(Y|A)=[P(Y)-P(Y|I)P(F)]/P(T). Here P(Y) is the probability of a voxel detected to be active and P(T), P(F) arerespectively the probabilities that a voxel is truly active and truly inactive in the active state data. P(Y) and P(Y|I)are estimated by FAP and FPF. We estimate P(T) using a method based on p-values. For a fixed value of the teststatistic, the corresponding p-value is calculated. Suppose the total number of voxels is N and k is the number ofvoxels detected to be active for a corresponding p-value α. Then the lower bounds for the number of truly activevoxels and P(T) are respectively (k-αN) and (k-αN)/N The best estimate of P(T) is obtained at the peak when ittakes the maximum value.
Results
The post-processing methods we used for the analysis are CCA [1] and single voxel multiple regression, for aperiodic visually presented phoneme-matching task. In Figure 1, estimated modified ROC curves for CCA andregression are plotted using the methods described in the previous section. Figure 2 is a plot of estimated fractionsof active voxels against corresponding p-values. In Figure 3, a restricted portion of the graph near the peak isplotted. In Figure 4, the conventional ROC curve is constructed using the estimation process described above. InFigure 5, a portion of the graph (FRP≤0.015) is plotted and magnified. CCA appears to be a better performer forthis dataset.
e1778
Abstracts presented at the 9th International Conference on Functional Mapping of the Human Brain, June 19Œ22, 2003, New York, NY
e1778
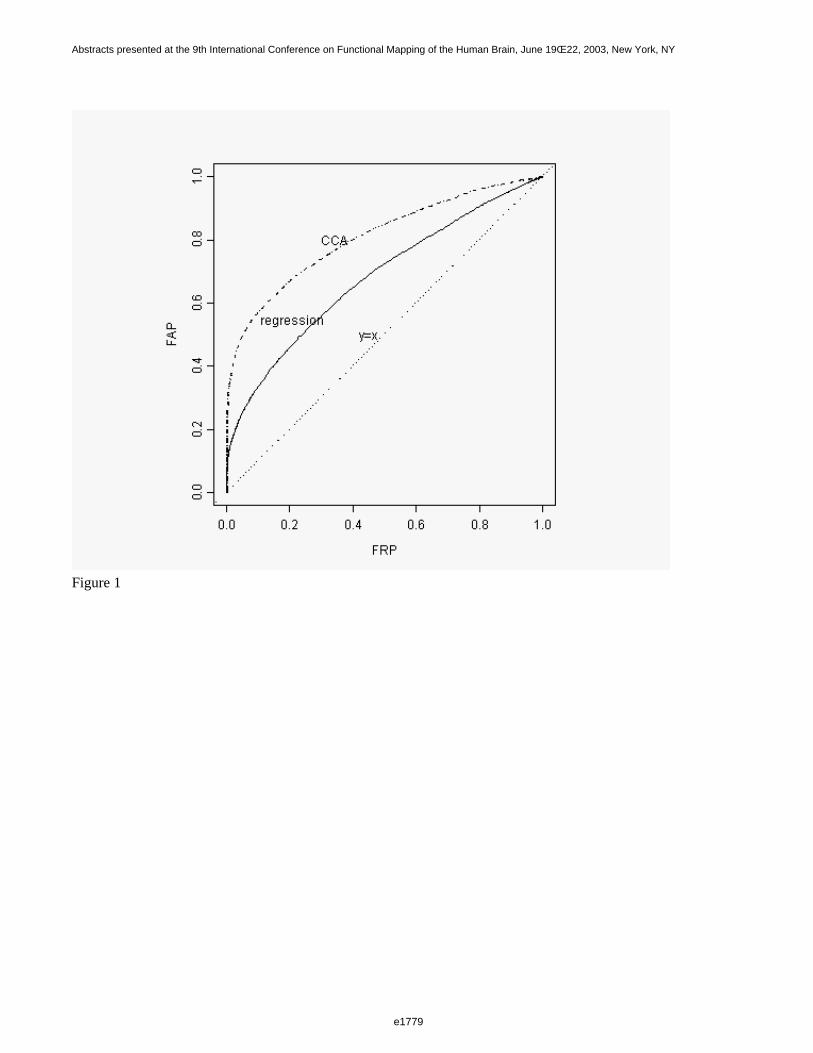
Figure 1
e1779
Abstracts presented at the 9th International Conference on Functional Mapping of the Human Brain, June 19Œ22, 2003, New York, NY
e1779
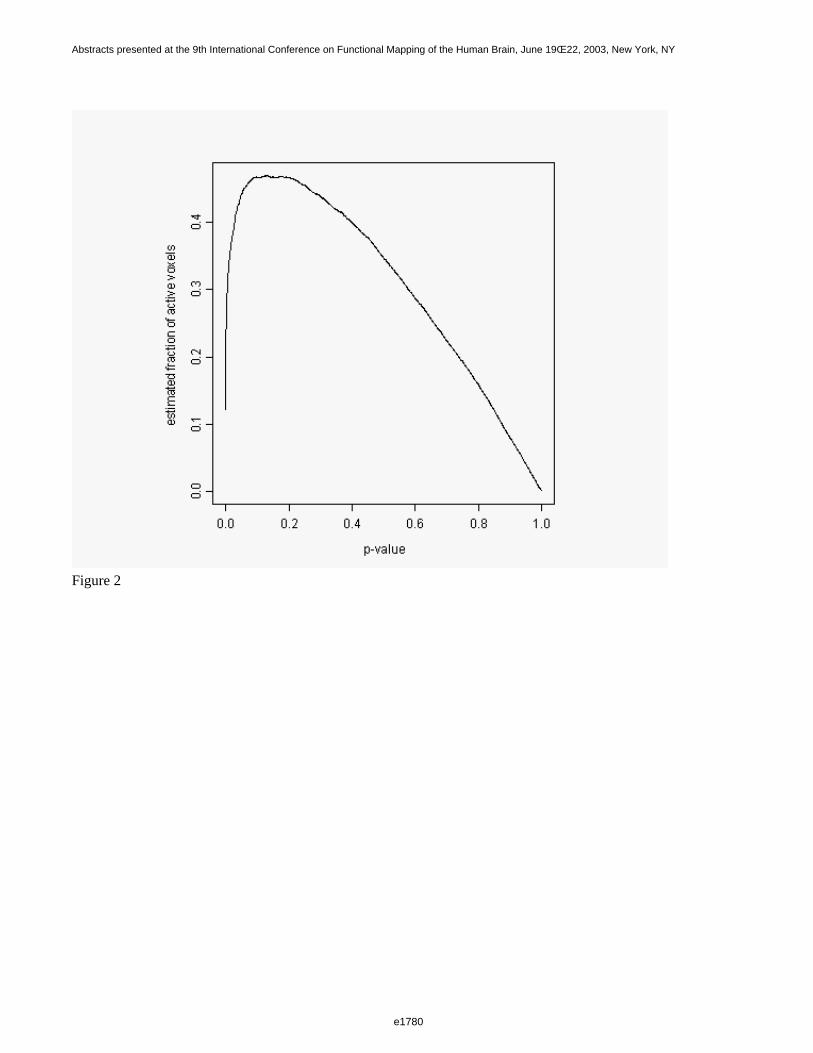
Figure 2
e1780
Abstracts presented at the 9th International Conference on Functional Mapping of the Human Brain, June 19Œ22, 2003, New York, NY
e1780
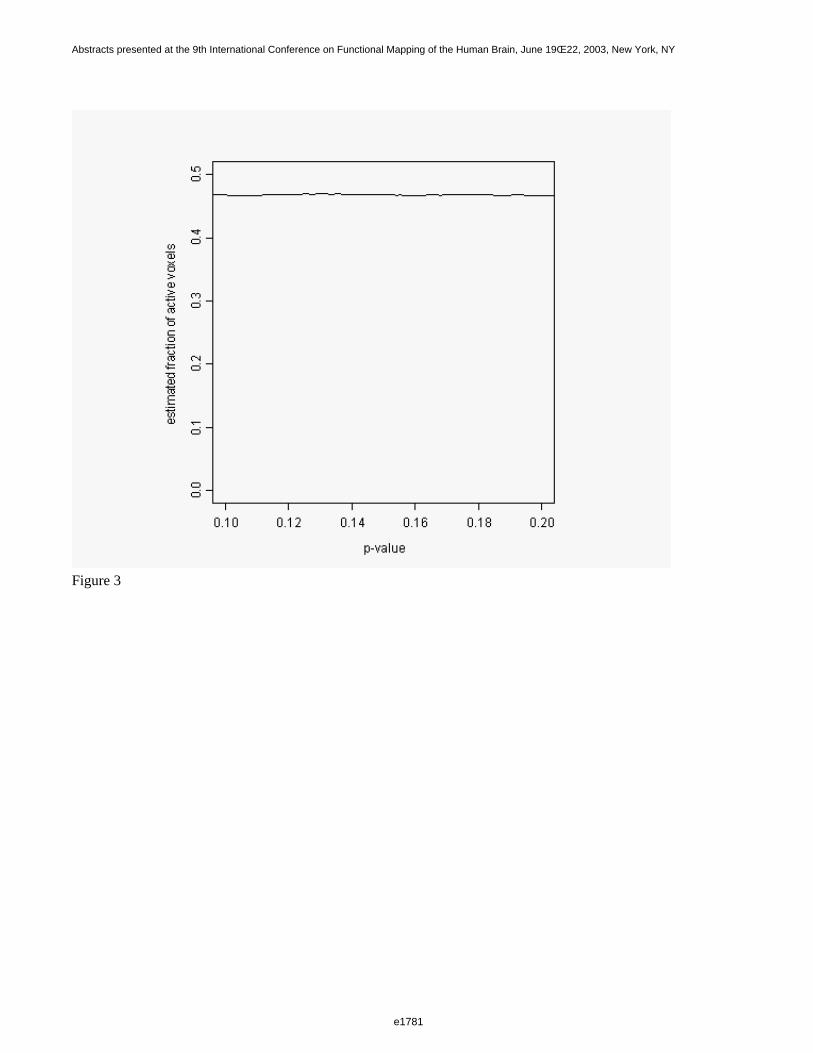
Figure 3
e1781
Abstracts presented at the 9th International Conference on Functional Mapping of the Human Brain, June 19Œ22, 2003, New York, NY
e1781
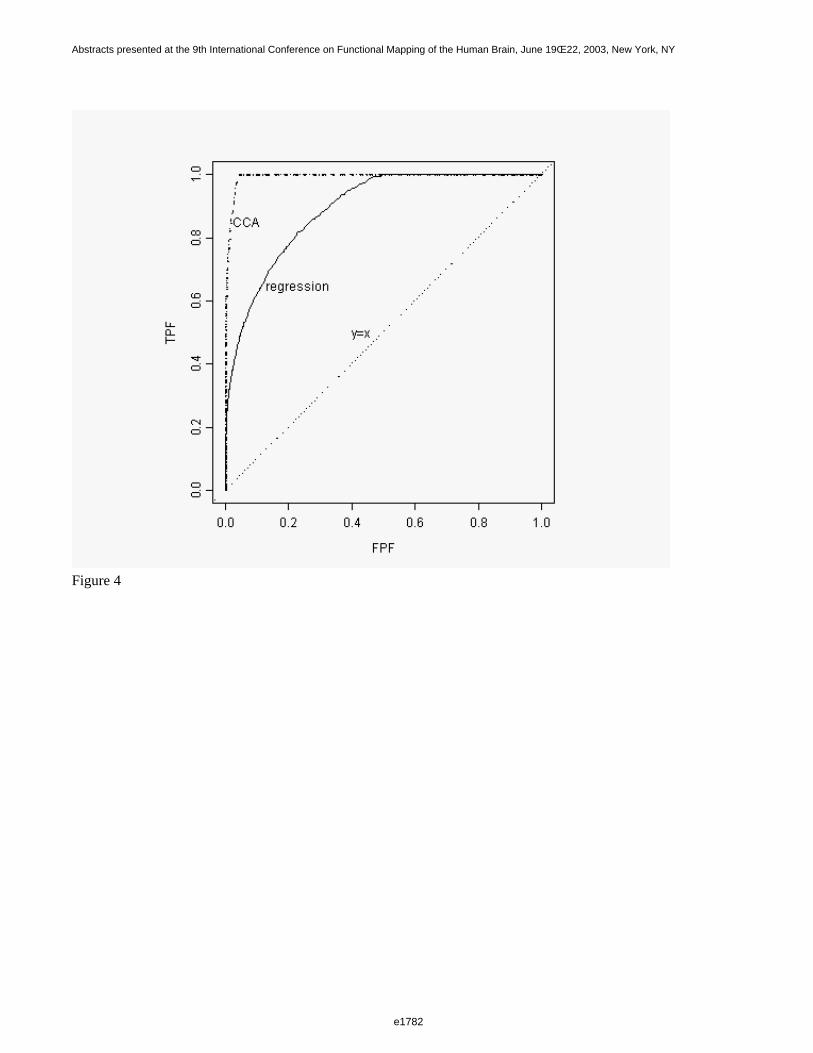
Figure 4
e1782
Abstracts presented at the 9th International Conference on Functional Mapping of the Human Brain, June 19Œ22, 2003, New York, NY
e1782
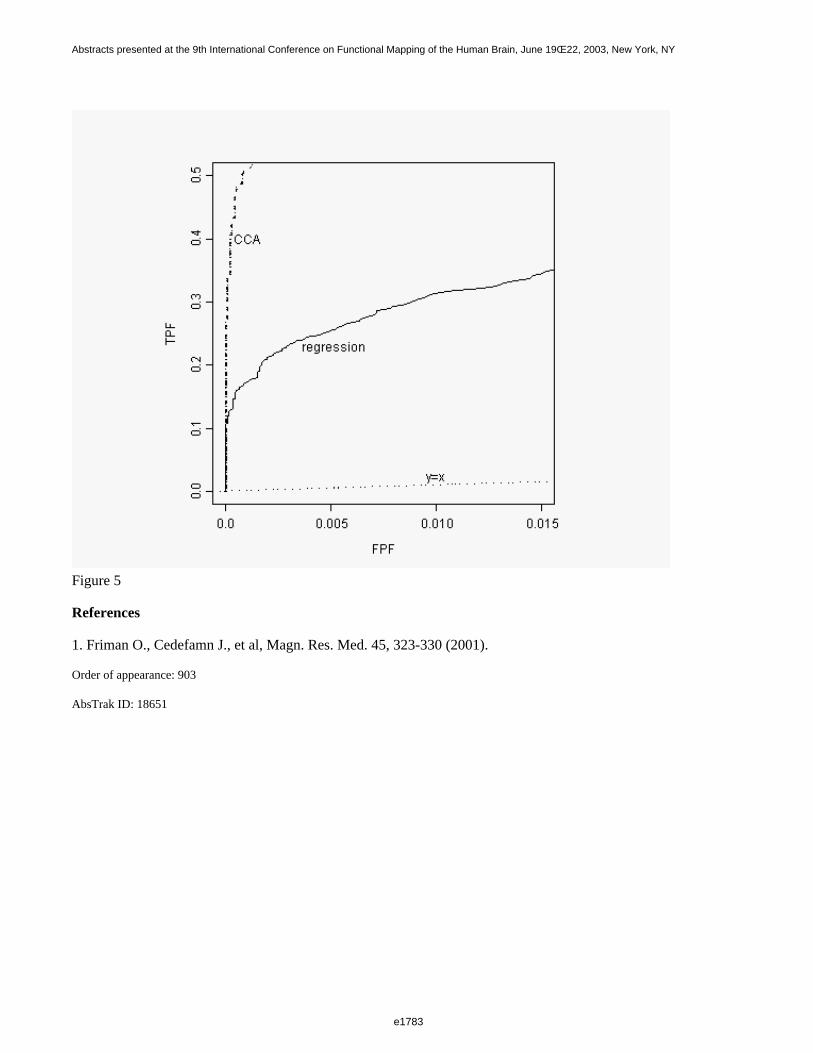
Figure 5
References
1. Friman O., Cedefamn J., et al, Magn. Res. Med. 45, 323-330 (2001).
Order of appearance: 903
AbsTrak ID: 18651
e1783
Abstracts presented at the 9th International Conference on Functional Mapping of the Human Brain, June 19Œ22, 2003, New York, NY
e1783
Poster number: 913
Effects of cortical alignment on EEG and its implication for EEG-fMRIfusion: a simulation study
Michiro Negishi*, R. Todd Constable*†
*Yale University, School of Medicine, Dept. of Diagnostic Radiology†Dept. of Neurosurgery
Modeling & Analysis
Abstract
There has been active research on simultaneous recording and fusion of electrophysiological and hemodynamicbrain data. However, EEG (or MEG) and fMRI capture different aspects of brain activity. One of such differencesis that EEG is most sensitive to cortical layers with aligned dipoles and insensitive to cortical layers withanti-aligned (opposing) dipoles and randomly oriented dipoles (Nunez 1995, Rugg 1998). In this simulation study,we investigate the effect of cortical alignment on EEG signals and its implication for an EEG-fMRI fusionalgorithm based on distributed dipole estimation.
Spatiotemporal EEG and fMRI data are generated using EEG and fMRI forward equations assuming three tissuesof different alignment types: aligned, anti-aligned, and random (Fig. a). Tissues are perpendicular to the figurefacing left and right. Activities are modulated on and off temporally, with anti-aligned and random tissuesmodulated in-sync and the aligned tissue anti-phase (Fig. a). Distributed dipole solutions (32x32x32) for EEG(spatial inverse) and fMRI (temporal inverse) are computed (Fig. b and c) using pseudoinverse with weightnormalization, and the geometric mean of activity of the two was used as the estimated activity (Fig. d).
Analysis of the estimate process showed that the EEG inverse solution corresponding to the anti-aligned andrandom tissues were weaker than that corresponding to the aligned tissue, but not non-zero. This was because thesize of the tissues were not negligible and granurality of the randomly oriented dipoles were not infinitely small.Thus, cortical alignment effect can be a problem but does not negate the use of the direct EEG-fMRI dusionapproach. However, if aligned tisses are close to anti-aligned or random tissues, the activity of the former maydecrease the temporal precision of the estimated activities of other tissue types.
References
Nunez PL. (1995) Neocortical Dynamics and Human EEG Rythms. Oxford Press, NY.Rugg MD. (1998) Convergent Approaches to Electrophysiological and Hemodynamic Investigations of Memory.Human Brain Mapping 6:394-398
e1784
Abstracts presented at the 9th International Conference on Functional Mapping of the Human Brain, June 19Œ22, 2003, New York, NY
e1784
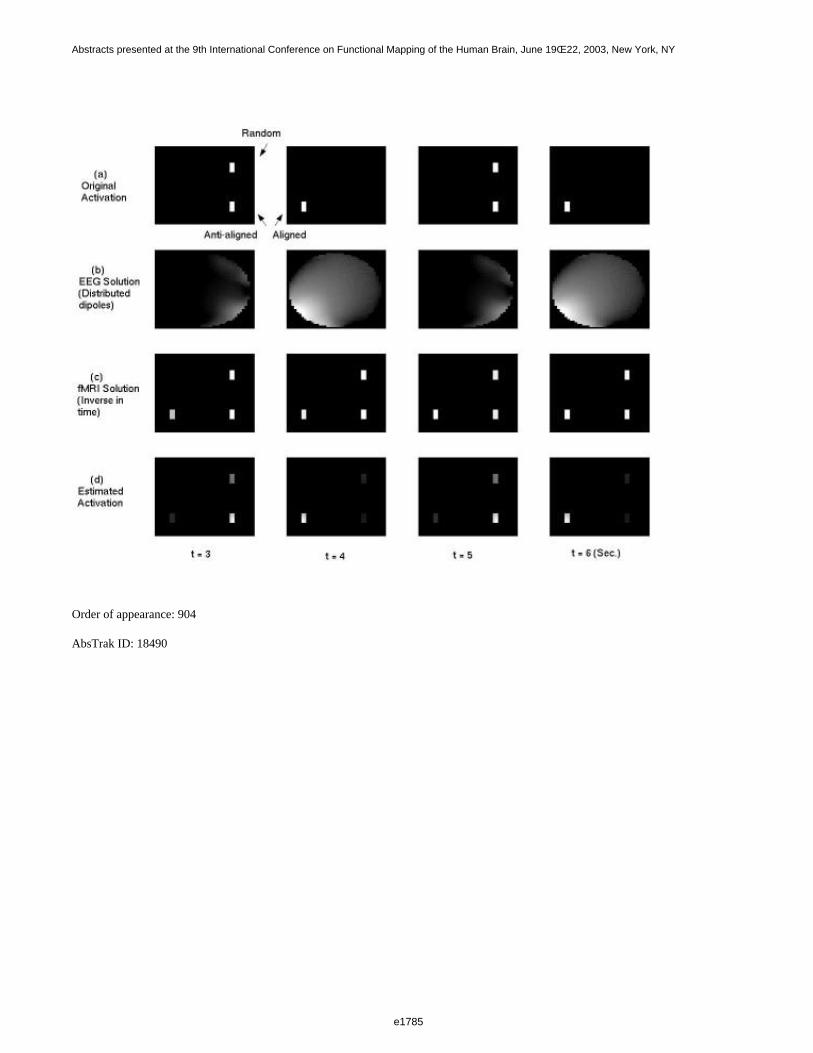
Order of appearance: 904
AbsTrak ID: 18490
e1785
Abstracts presented at the 9th International Conference on Functional Mapping of the Human Brain, June 19Œ22, 2003, New York, NY
e1785
Poster number: 914
Bayesian Inference in the Second-Level Analysis of fMRI Data
Jane Neumann, Gabriele Lohmann, Stefan Zysset, D. Yves von Cramon
Max-Planck-Institute of Cognitive Neuroscience, Stephanstrasse 1a, D-04103 Leipzig/Germany
Modeling & Analysis
Abstract
Introduction
The most widely used methods for the statistical analysis of fMRI data are based on a linear model with normallydistributed errors and null hypothesis tests using t and F statistics. However, null hypothesis testing has a numberof shortcomings. We propose a Bayesian method for the second-level analysis of fMRI data. The model does notrequire a computationally expensive fully Bayesian analysis on the first level. Rather, modeling is based on theGeneral Linear Model (GLM), and parameter estimates for single subjects are viewed as evidence for some effectof interest in a group of subjects. Probability maps for the effect are produced based on this evidence.
Methods
Given some parameter b of a model and some data y Bayes’ Theorem states that the posterior probabilitydistribution p(b|y) is proportional to the product of the prior distribution p(b) and the likelihood of the parametergiven the data l(b|y). Probability is regarded as a mathematical expression of our knowledge or belief about theparameter. This knowledge is modified by the information about the parameter present in the data.
Applying Bayes’ Theorem in an iterative manner, evidence about some effect in a single subject can be combinedwith a prior, which expresses our belief about the effect in the entire group of subjects. The resulting posteriorserves as prior in a subsequent step, where it is combined with data about the effect in the next subject. Thisprocess is particularly easy to implement, if both prior and data are normally distributed. Then, the posterior isagain a normal distribution (Box and Tiao, 1992).
An effect of interest in fMRI data (response strength, response delay, etc.) can be expressed as linear combinationof parameter estimates from the GLM, called contrasts. Contrasts have a normal sampling distribution. We use themethodology described above to combine contrasts estimated for single subjects to yield a probability distributionof the effect in the entire group. This probability distribution forms the basis for further inferences about the effectof interest. In the simplest case, a probability map contains for each voxel the probability of the effect to bepresent, i.e. p(contrast > 0). However, the probability distribution also facilitates inferences regarding morecomplex questions about the nature of the observed data that are hard or impossible to formulate in terms oftraditional hypothesis testing.
Results
Results are exemplified on a study of the functional neuroanatomy of evaluative judgment (Zysset et al., in press).The figure shows on the left the group z-map (z > 3.09) of the effect of interest calculated using a t statistic (from Zysset et al., in press). On the right, the corresponding Bayesian probability map for the group of subjects showsareas with p(contrast > 0) > 99.95 %.
e1786
Abstracts presented at the 9th International Conference on Functional Mapping of the Human Brain, June 19Œ22, 2003, New York, NY
e1786
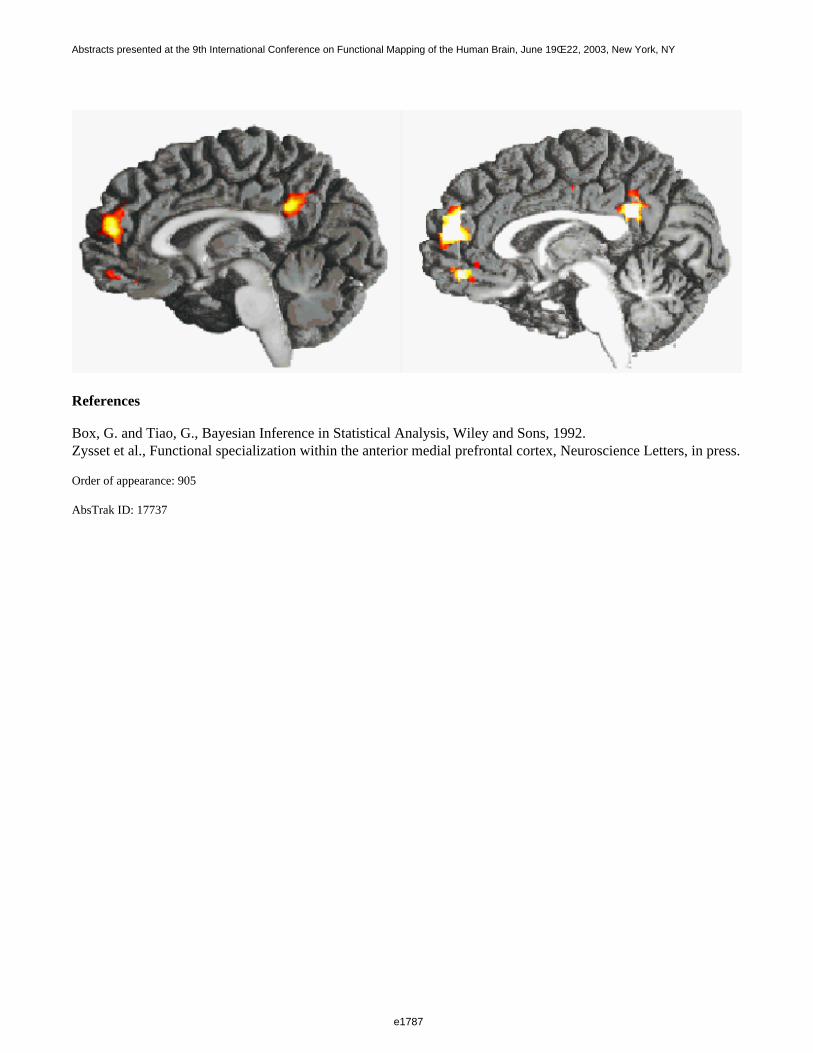
References
Box, G. and Tiao, G., Bayesian Inference in Statistical Analysis, Wiley and Sons, 1992.Zysset et al., Functional specialization within the anterior medial prefrontal cortex, Neuroscience Letters, in press.
Order of appearance: 905
AbsTrak ID: 17737
e1787
Abstracts presented at the 9th International Conference on Functional Mapping of the Human Brain, June 19Œ22, 2003, New York, NY
e1787
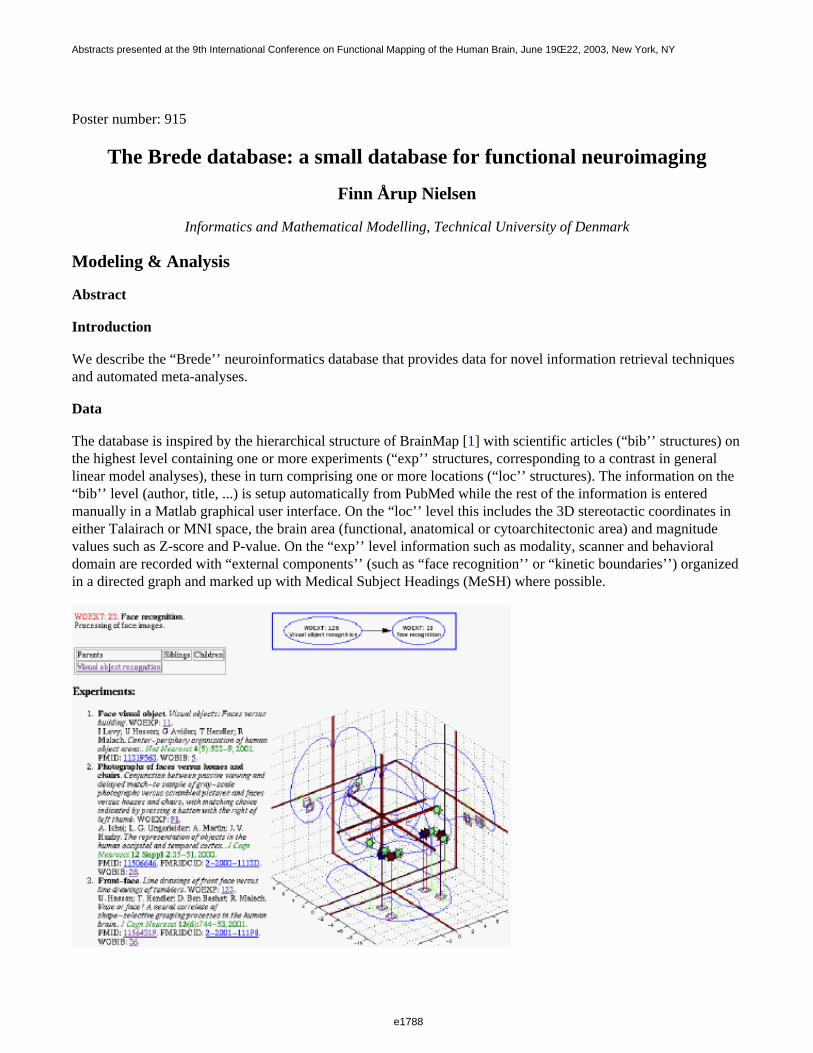
Poster number: 915
The Brede database: a small database for functional neuroimaging
Finn Årup Nielsen
Informatics and Mathematical Modelling, Technical University of Denmark
Modeling & Analysis
Abstract
Introduction
We describe the “Brede’’ neuroinformatics database that provides data for novel information retrieval techniquesand automated meta-analyses.
Data
The database is inspired by the hierarchical structure of BrainMap [1] with scientific articles (“bib’’ structures) onthe highest level containing one or more experiments (“exp’’ structures, corresponding to a contrast in generallinear model analyses), these in turn comprising one or more locations (“loc’’ structures). The information on the“bib’’ level (author, title, ...) is setup automatically from PubMed while the rest of the information is enteredmanually in a Matlab graphical user interface. On the “loc’’ level this includes the 3D stereotactic coordinates ineither Talairach or MNI space, the brain area (functional, anatomical or cytoarchitectonic area) and magnitudevalues such as Z-score and P-value. On the “exp’’ level information such as modality, scanner and behavioraldomain are recorded with “external components’’ (such as “face recognition’’ or “kinetic boundaries’’) organizedin a directed graph and marked up with Medical Subject Headings (MeSH) where possible.
e1788
Abstracts presented at the 9th International Conference on Functional Mapping of the Human Brain, June 19Œ22, 2003, New York, NY
e1788
Items in the database are identified with unique numbers and the type of identifier is given a unique string, e.g.,“WOBIB: 27’’ for an Epstein and Kanwisher paper. This will allow Internet search engine to identify the phrase.For storing the data we employ a simple XML format that we denote “poor-man’s’’ XML (pXML) with noattributes and no empty tags. The database presently consists of data constructed from 40 scientific articles,containing 134 experiments and 882 locations
Analyses and services
Static web-pages are generated from the “exp’’ and “bib’’ structures with Corner Cube visualization [2] as PNGand VRML files and hyperlinks to PubMed and fMRIDC [3]. The locations for each “exp’’ and “bib’’ structureare voxelized to a volume by convolving each location with a Gaussian kernel [4]. The combined set of volumesare converted to matrices and “automated’’ multivariate analyses are performed such as singular valuedecomposition (SVD) and independent component analysis (ICA). Sorted lists with related volumes are found foreach individual volume as well as with respect to the SVD eigenimages and the results of the ICA. Ad hoc searchcan obtain the closest locations to a user-specified coordinate or the closest experiments to a user-specified set of locations.
Availability
The database is distributed as part of the Brede neuroinformatics toolbox (hendrix.imm.dtu.dk/software/brede/, [5]) which also provides the functions to manipulate and analyze the data. It is also available directly on the web (hendrix.imm.dtu.dk/services/jerne/).
Acknowledgment
EU Project MAPAWAMO (QLG3-CT-2000-300161).
References
1. Fox, P. T., Lancaster, J. L., Science, 1994, 266:994-996.2. Rehm, K., et al., Medical Image Analysis, 1998, 2:215-226.3. Van Horn, J. D., et al., Phil. Trans. Royal Soc., B, 2001, 356:1323 - 1339.4. Nielsen, F. Å., Hansen, L. K., Human Brain Mapping, 2002, 15:146-156.5. Nielsen, F. Å., Hansen, L. K., Visualization Development Environments (VDE2000), April 27-28, 2000,Princeton Plasma Physics Laboratory, Princeton, New Jersey, 2000.
Order of appearance: 906
AbsTrak ID: 18680
e1789
Abstracts presented at the 9th International Conference on Functional Mapping of the Human Brain, June 19Œ22, 2003, New York, NY
e1789
Poster number: 916
Investigating Feedback Control in fMRI Studies by Autoregressive TimeSeries Models
Hernando Ombao*†, Moon-ho Ringo Ho*
*University of Illinois†
Modeling & Analysis
Abstract
Motivation: The goal in fMRI ‘activation studies’ is to identify brain regions that are activated in response to anexperimental task. These studies, however, revealed little or nothing about how the brain regions communicatewith each other. Many higher order psychological processes such as memory or attentional operations involve or‘emerge’ as the interaction of multiple brain areas. The influence of one neuronal system over another is usuallyreferred to in the fMRI literature as effective connectivity.
A commonly used method to study effective connectivity is structural equation modeling (SEM). A limitation ofSEM is that only instantaneous correlation between brain regions is considered. However, the fMRI signal usuallyshows non-negligible
autocorrelation.
Proposed Approach: The goal in this article is to investigate the feedback relation between brain regionsfollowing stimulus presentation. We propose to use vector autoregressive models which explicitly takes intoaccount the autocorrelation in the fMRI data. In addition, we include exogenous inputs in the model such ashemodynamic response which is derived from the impulse due to presentation of an experimental stimulus. Wealso define an impulse response function that can be viewed a dynamic change in the feedback relationshipfollowing stimulus presentation between brain regions. Our approach can easily handle multiple impulses andlends natural extension to nonlinear time series. Moreover, standard errors for the impulse response can beobtained by the bootstrap method. Our approach also allows easily for a large number of brain regions to beinvestigated. Finally, our approach can be used both as an exploratory tool as well as confirmatory tool ininvestigating feedback relationship.
Dataset: We will apply our proposed procedure to a single subject’s fMRI data from a Stroop task experiment.The following three regions were selected to investigate the attentional control in the Stroop task namely thelingual gyrus [LG] (task-irrelevant region); inferior occipital gyrus [OG](task-relevant region); and middle frontalgyrus [MFG] which has been suggested to be a source of attentional control to bias selection in favor oftask-relevant stimuli by increasing activity in regions handling task-relevant stimuli and damping activity inregions handling task-irrelevant stimuli. These areas were also found to be significantly activated in theinterference trials comparing to neutral trials in this experiment.
Conclusion:
Our analysis provides evidence that in response to stimulus presentation, both OG (task-relevant region) andMFG (higher order source of control) suppress the activity in LG (task-irrelvant region) but the the degree ofsuppression decreases over time. On the other hand, LG facilitates the activity in OG to a lesser degree but MFGhas negligible control on OG. Finally LG shows suppression on the activity on MFG. The results provideencouraging evidence to support the idea the higher order source of control influence the site of control in
e1790
Abstracts presented at the 9th International Conference on Functional Mapping of the Human Brain, June 19Œ22, 2003, New York, NY
e1790

particular the task-irrelevant areas by suppression but no obvious (substantial) influence on the task-relevant area.
Order of appearance: 907
AbsTrak ID: 19079
e1791
Abstracts presented at the 9th International Conference on Functional Mapping of the Human Brain, June 19Œ22, 2003, New York, NY
e1791
Poster number: 917
Multilevel Mixed-Effects Models for Nested Factors in fMRI
Hong Pan, Qiang Chen, Emily Stern, David A Silbersweig
Functional Neuroimaging Lab, Dept of Psychiatry, Weill Medical College of Cornell University, New York, NY 10021
Modeling & Analysis
Abstract
Introduction
It is well known that the temporal patterns of fMRI signal mayvary substantially across trials, sessions and brain regions for the sameexperimental stimuli and the same group of subjects[1, 2, 3, 4]. Most commonly usedmethods employ certain hemodynamic response templates to characterizecertain individual aspects of single-peaked event-related fMRI signals (suchas their magnitude, FWHM or time to the peak), while addressing the issue ofvariability at various levels through single-level mixed-effects models[5].In this work, it was shown that more flexible yet parsimonious parametricmodels such as multilevel extended linear or nonlinear mixed-effects modelsare needed to address the heteroscedasticity in variance-covariancestructure due to various nested factors in fMRI experiments.
Method
Brain activation experiments were performed on 11 right-handedsubjects with visual stimuli of standard flashing checkerboard pattern (8Hz, duration=1s, ISI=30s, 12 trials) and whole brain EPI images wereacquired in 180 time points (TR=2s). After SPM99[6] processing, the adjustedhemodynamic signal at voxels in primary visual cortex of the jth Sideon the ith Subject at the kth Trial and the Time tisdenoted as y ijkt , for i=1,…,M (M=11);
j=1,2 (e.g., the left and the right side of V1);k=1,…,N i (N i =12);
t=0,2,4,…S ik (seconds), and the time of the
tth Scan of the kth Trial on the ith Subject asd ikt . A multilevel mixed-effects model can be expressed as
y ijkt =β0 +β1 d
ikt +β2 f(d ikt )+b i0 +b i1 d ikt +b i2
f(d ikt )+b ij +b ik
+ε ijkt , where f(t) is a nonlinear function that characterizes the
shape of hemodynamic signal (e.g., a Gamma or Gaussian function, or assimple as a quadratic model). SAS PROC MIXED and S-PLUS NLME module[7,8]were used to create a series of data-driven mixed-effects models andevaluate them through diagnostic plots and ANOVA among alternative models.
e1792
Abstracts presented at the 9th International Conference on Functional Mapping of the Human Brain, June 19Œ22, 2003, New York, NY
e1792

Results
Nested random-effects terms are warranted to model: 1) interactionsbetween a fixed-effects factor and a random-effects factor(b i0 , b i1 , and b i2 ),
and 2) nested classification factors (b ij and
b ik ). The Trial factor is only significant as a random
effect nested within the Subject factor, as is the Side factor. There is nosystematic difference in signal in terms of the Trial and Side factorsmodeled as fixed-effects for this experiment and for the V1 area (same forthe Gender and the Age factors). There are highly significant random effectsin terms of the location of the peak and the shape of the peak inhemodymamic signal at the within-Subject level. These examples demonstratehow the data-driven characterization of the effects of the nested factorsupon the variance-covariance structure of fMRI data sets can lead tooptimized approaches for their analyses.
REFERENCES:
1) KJ Friston, et al. NeuroImage 7,30(1998).2) GK Aguirre, et al. NeuroImage 8,360(1998).3) F Kruggel, et al. Magn Reson Med 42,787(1999).4) JR Duann, et al. NeuroImage 15,823(2002).5) KJ Worsley, et al. NeuroImage 15,1(2002).6) RSJ Frackowiak, et al. Human Brain Function. Academic Press(1997).7) RC Littell, et al. SAS System for Mixed Models. SAS Institute Inc(1996).8) JC Pinheiro, DM Bates. Mixed-Effects Models in S and S-PLUS. Springer(2000).
Order of appearance: 908
AbsTrak ID: 19072
e1793
Abstracts presented at the 9th International Conference on Functional Mapping of the Human Brain, June 19Œ22, 2003, New York, NY
e1793
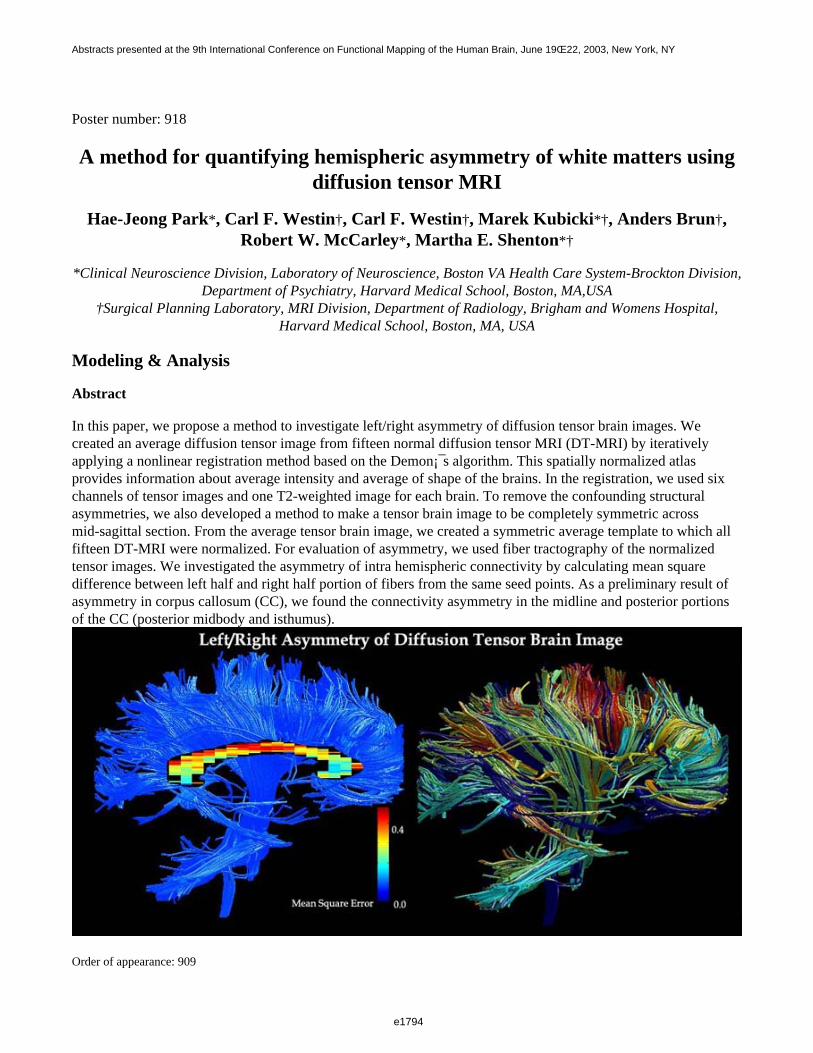
Poster number: 918
A method for quantifying hemispheric asymmetry of white matters usingdiffusion tensor MRI
Hae-Jeong Park*, Carl F. Westin†, Carl F. Westin†, Marek Kubicki*†, Anders Brun†,Robert W. McCarley*, Martha E. Shenton*†
*Clinical Neuroscience Division, Laboratory of Neuroscience, Boston VA Health Care System-Brockton Division,Department of Psychiatry, Harvard Medical School, Boston, MA,USA
†Surgical Planning Laboratory, MRI Division, Department of Radiology, Brigham and Womens Hospital,Harvard Medical School, Boston, MA, USA
Modeling & Analysis
Abstract
In this paper, we propose a method to investigate left/right asymmetry of diffusion tensor brain images. Wecreated an average diffusion tensor image from fifteen normal diffusion tensor MRI (DT-MRI) by iterativelyapplying a nonlinear registration method based on the Demon¡¯s algorithm. This spatially normalized atlasprovides information about average intensity and average of shape of the brains. In the registration, we used sixchannels of tensor images and one T2-weighted image for each brain. To remove the confounding structuralasymmetries, we also developed a method to make a tensor brain image to be completely symmetric acrossmid-sagittal section. From the average tensor brain image, we created a symmetric average template to which allfifteen DT-MRI were normalized. For evaluation of asymmetry, we used fiber tractography of the normalizedtensor images. We investigated the asymmetry of intra hemispheric connectivity by calculating mean squaredifference between left half and right half portion of fibers from the same seed points. As a preliminary result ofasymmetry in corpus callosum (CC), we found the connectivity asymmetry in the midline and posterior portionsof the CC (posterior midbody and isthumus).
Order of appearance: 909
e1794
Abstracts presented at the 9th International Conference on Functional Mapping of the Human Brain, June 19Œ22, 2003, New York, NY
e1794

AbsTrak ID: 18093
e1795
Abstracts presented at the 9th International Conference on Functional Mapping of the Human Brain, June 19Œ22, 2003, New York, NY
e1795
Poster number: 919
Using Enhanced FDR to Find Activation in FMRI Images
Martina Pavlicov‡*, Noel Cressie*, Thomas J. Santner*, Antonio Algaze†
*Department of Statistics, The Ohio State University, Columbus, OH 43210, USA†Biomedical Engineering Center, The Ohio State University, Columbus, OH 43210, USA
Modeling & Analysis
Abstract
Voxel-wise analysis is a common approach for processing FMRI data. Because of the large number of hypothesesinvolved, finding an activation threshold for the ensemble of voxels is a multiple-comparisons problem. Wepropose using a modification of the False Discovery Rate (FDR) procedure for thresholding. The method controlsthe expected proportion of false positives among the voxels declared to be activated. We transform a map ofdependent test statistics to the wavelet domain and test the activation hypotheses using a nonparametric statisticalprocedure called Enhanced FDR (EFDR) (Shen at al., 2002). Transforming the non-zero wavelet coefficients backvia the inverse discrete-wavelet transformation produces a final image that indicates the location and magnitudeof activation. We illustrate the method by applying it to t-test statistic maps for a block design experiment.Comparisons are made with other methods.
Theory
Many multiple hypothesis tests involve simultaneous thresholding of 2D spatial images. Such images are bothstrongly spatially correlated and contain a large number of hypotheses to be tested. EFDR enhances FDR byreducing the number of hypotheses being tested. EFDR represents spatial map of the test statistics sparsely in thewavelet domain, and selects an optimal set of hypotheses to be tested using a criterion based on generalizeddegrees of freedom (Ye, 1998). EFDR uses a wavelet representation of the spatial image (rather than the imageitself) due to the statistical properties of the wavelet representation. The ’distinctive’ wavelet coefficients of adeterministic signal are typically clustered, both within each scale and across different scales in the waveletdomain, while the corresponding wavelet coefficients of correlated noise are approximately uncorrelated.
Materials and Methods
Null data were taken from 3 subjects using 1.5-T GE Signa MRI scanner with a standard head coil. All imageswere obtained under a baseline condition (rest) with no time-locked experimental stimuli or tasks. To examine theeffectiveness of the EFDR procedure on FMRI data, we have created artificial-activation data sets, consisting ofnoise plus a signal component. To simplify computation, we limited our simulations to a single 2D slice of thebrain observed over 200 successive, equally spaced time points.
We compare the EFDR procedure with the FDR and Bonferroni procedures using Receiver OperatingCharacteristic (ROC) curves and power curves. Figure 1 illustrates the ROC comparisons.
e1796
Abstracts presented at the 9th International Conference on Functional Mapping of the Human Brain, June 19Œ22, 2003, New York, NY
e1796
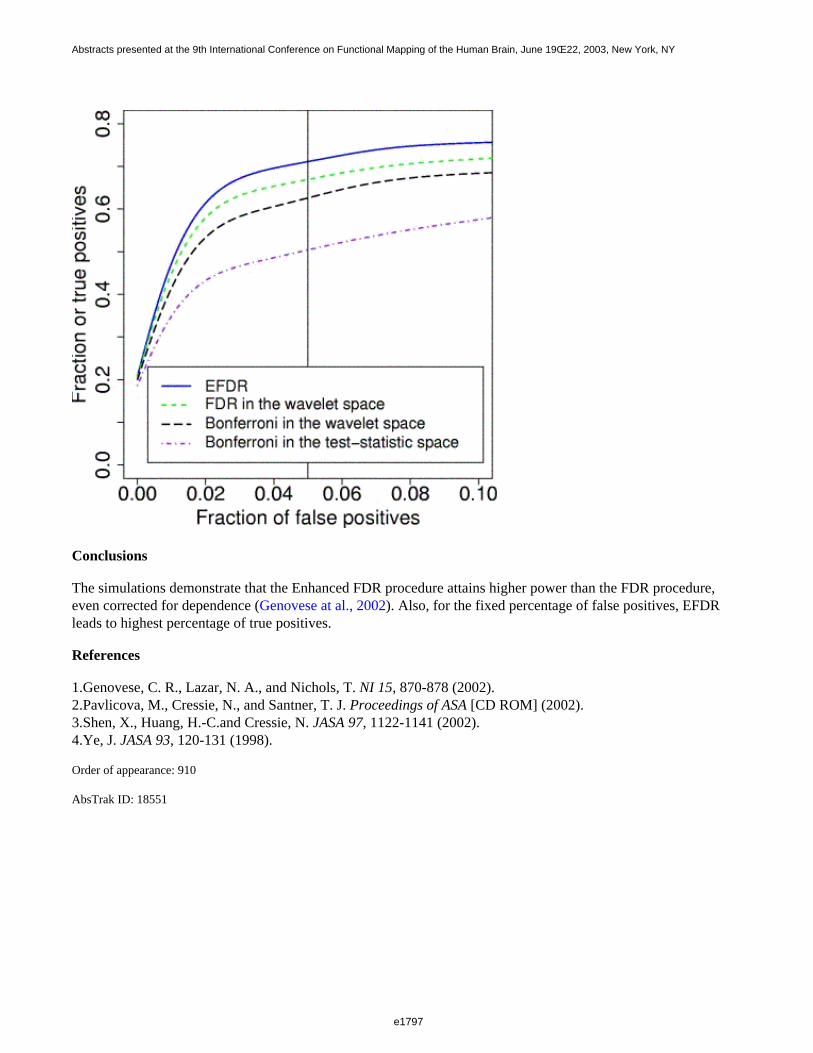
Conclusions
The simulations demonstrate that the Enhanced FDR procedure attains higher power than the FDR procedure,even corrected for dependence (Genovese at al., 2002). Also, for the fixed percentage of false positives, EFDRleads to highest percentage of true positives.
References
1.Genovese, C. R., Lazar, N. A., and Nichols, T. NI 15, 870-878 (2002).2.Pavlicova, M., Cressie, N., and Santner, T. J. Proceedings of ASA [CD ROM] (2002).3.Shen, X., Huang, H.-C.and Cressie, N. JASA 97, 1122-1141 (2002).4.Ye, J. JASA 93, 120-131 (1998).
Order of appearance: 910
AbsTrak ID: 18551
e1797
Abstracts presented at the 9th International Conference on Functional Mapping of the Human Brain, June 19Œ22, 2003, New York, NY
e1797
Poster number: 920
Bayesian model selection of temporal basis functions for fMRI
William Penny, Karl Friston
Wellcome Department of Imaging Neurosience
Modeling & Analysis
Abstract
To produce functional maps of the human brain using BOLD-contrast fMRI one needs to relate experimenentalmanipulations to observed changes in the BOLD signal. For event-related fMRI this can be achieved in atwo-stage process. Firstly, the events constituting
the experimental manipulations are deemed to cause instantaneous neuronal responses, the resulting neuronalactivity being represented as a time series of delta functions with peaks at times corresponding to the experimentalevents. Secondly, this event stream is convolved with a set of temporal basis functions that together constitute the so-called
Haemodynamic Response Function (HRF). The HRF specifies the BOLD response produced by a unit impulse ofneuronal activity. The resulting convolved time series are then used in the voxel-wise General Linear Model(GLM) framework [1].
In this paper we address the issue of how the temporal basis sets are chosen. Typical choices include sets ofgamma functions or the "Canonical HRF" [1] and its derivates with respect to onset and width. Other basis setsinclude sinusoids and the Finite Impulse Response (FIR) bases. In this work we provide a principled frameworkfor choosing between such basis sets and for fine-tuning individual bases.
Our approach builds on earlier work which models fMRI time series using GLMs with autoregressive errorprocesses [2]. This model is embodied in a Bayesian inference framework which we have now extended by usingLaplacian smoothness priors (see eg. [3]) and Gaussian priors which factorise over different groups of parameters.The Bayesian approach furnishes us with an approximation to the ’model evidence’ which can be used for modelselection. This can be used for example to select among optimal parameters for specific models, such as thenumber of bins used in an FIR model. We validate the methods on synthetic data sets and apply them to theanalysis of an event-related fMRI study of face processing.
References
[1] K. Friston et al. (1998) Event-related fMRI: Characterising Differential Responses. Neuroimage, 7, pp. 30-40.[2] W. Penny et al. (2003) Variational Bayesian Inference for fMRI time series. Neuroimage, Accepted for Publication.[3] P. Ciuciu et al. (2003) Unsupervised robust non-parametric estimation of the hemodynamic response functionfor any fMRI experiment. IEEE TMI, In Press.
Order of appearance: 911
AbsTrak ID: 18897
e1798
Abstracts presented at the 9th International Conference on Functional Mapping of the Human Brain, June 19Œ22, 2003, New York, NY
e1798
Poster number: 921
Restricted maximum likelihood solution of the source localisation problemin EEG.
Christophe L.M. Phillips*, Jeremie Mattout†‡, Michael D. Rugg†‡, Pierre Maquet*, KarlJ. Friston‡
*Cyclotron Research Centre, University of Liège, Belgium†Institute of Cognitive Neuroscience, UCL, London, UK
‡Wellcome Department of Imaging Neuroscience, Institute of Neurology, UCL, London, UK
Modeling & Analysis
Abstract
Distributed linear solutions of the EEG source localisation problem are used routinely. In contrast to discretedipole equivalent models, distributed linear solutions embody no assumptions about the number of active sourcesand lead to a discretisized fully 3D representation of the electrical activity of the brain. The problem isunderdetermined and, in order to ensure the uniqueness of the solution, constraints are applied on the solution. Ina Bayesian framework, the conditional expectation of the source distribution, given the data, is attained bycarefully balancing the minimisation of the residuals induced by noise and the improbability of the estimates asdetermined by their priors[1]. This balance is specified by hyperparameters that control the relative importance offitting and conforming to various constraints. Here we formulate the conventional “weighted minimim norm”(WMN) solution in terms of hierarchical linear models[2]. An “Expectation-Maximisation” (EM) algorithm isused to obtain a “Restricted Maximul Likelihood” (ReML) estimate[3] of the hyperparameters, before estimatingthe “Maximum a Posteriori” solution itself.
Classic WMN approach:
j=arg_min j ||C ε-1/2 (Lj-v)|| 2 +λ 1 ||H1 j || 2 +λ 2 ||H2 j || 2 +... where v=Lj+ε with ε˜N(O,C ε ), and j˜N(O,Cj ) with
Cj-1 =λ 1
2 H1t H1 +λ 2
2 H2t H2 +... Usually only one constraint matrix Hi is employed and the corresponding
hyperparameter λ 1 is simply used to take into account the noise component.
Hierarchical PEB problem:
v=Lj+ε1 and j=O+ε2 , with ε1 ˜N(O,C ε ) and ε2 ˜N(O,Cj ), where C ε =η 1 Ce1 +η 2 Ce2 +... and
Cj =µ1 Cj1 +µ2 Cj2 +... With the EM algorithm, the η i and µ i are estimated from the covariance matrix Cv of the
data, as Cv =C ε +LCj L t Projecting the source constraints Cj into the measurement space greatly reduces the size
of the problem and speeds up the iterative procedure.
The approach was tested on a simplified 2D source model: 408 oriented dipoles spread on an horizontal planewithin a sphere. The leadfield for each source was calculated for a set of 31 electrodes spread uniformely on theupper hemisphere of the sphere. Spatial basis functions are extracted to reduce the solution space a priori[4].Distributed source sets j o , comprising 3 to 5 adjacent dipoles, were generated at 200 random locations. With each
source j o , time-extended noise-free data sets vo were obtained, and scaled white noise was added to achieve 3
different signal-to-noise ratio data sets v For each data set v, the ReML solution was assessed with four types ofsimulations, depending on the choice of source location priors: 1. without any priors, 2. with accurate priors, 3.with inacurrate priors, and 4. with both accurate and inacurrate priors. In each case, depth weighting and spatialsmoothness were also used as source covariance constraints.
e1799
Abstracts presented at the 9th International Conference on Functional Mapping of the Human Brain, June 19Œ22, 2003, New York, NY
e1799

The ReML approach proved useful as: 1./In general the regularisation (or influence of the a priori sourcecovariance) increased as the noise level increased. 2./The localisation error (LE) was almost null when accuratelocation priors were used. 3./When accurate and inaccurate location priors were simultaneously used, the solutionwas not influenced by the inaccurate priors.
References
1. Phillips C., et al., 2002, NeuroImage, 17, 287-301.2. Friston K.J., et al., 2002, NeuroImage, 16, 465-483.3. Harville D.A., Journal of American Statistical Association, 1977, 72(358), 320-338.4. Phillips C., et al., 2002, NeuroImage, 16, 678-695.Supported by FNRS, Belgium.
Order of appearance: 912
AbsTrak ID: 17813
e1800
Abstracts presented at the 9th International Conference on Functional Mapping of the Human Brain, June 19Œ22, 2003, New York, NY
e1800
Poster number: 922
Quantitative measurement of cerebral blood flow with O-15-butanol-PETand simultaneous transcranial Doppler sonography
Thorsten D. Poeppel*, Hubertus Hautzel*, Christoph Terborg†, Hans Herzog‡,Hans-Wilhelm Müller*, Bernd J. Krause*
*Department of Nuclear Medicine (KME), University of Düsseldorf and Research Centre Jülich, Germany†Department of Neurology, University of Jena, Germany
‡Institute of Medicine (IME), Research Centre Jülich, Germany
Modeling & Analysis
Abstract
Easy and continuous assessment of cerebral hemodynamics is a major issue in neurological intensive care,especially in stroke patients. Transcranial Doppler sonography (TCD) allows noninvasive monitoring of cerebralblood flow velocity (CBFV). However, CBFV does not only depend on the cerebral blood flow (CBF), but alsoon the diameter of the insonated artery. Proportional changes in CBF and CBFV can only be expected if thevessel diameter remains constant. PET is the gold standard of non-invasive CBF determination. The aim of thisstudy was to evaluate whether CBFV assessed by TCD correlates with quantitative rCBF measurement usingO-15-butanol-PET during variations of endtidal CO2 (EtCO2).
Subjects and Methods
6 healthy young volunteers (2 females, 4 males) participated in this study after giving informed written consent.The study was approved by the local ethics committee and legal authorities. Each subject received 5 scans with aSiemens ECAT EXACT HR+ PET scanner at 5 different EtCO2 levels (s. Tab. 1). Variations of EtCO2 wereachieved by breathing room-air or carbogene (95% O2, 5% CO2). Per scan 550 MBq O-15-butanol wereadministered intravenously. Blood samples were taken from the radial artery. PET scans were coregistered withan individual anatomical MRI using the MPItool (ATV GmbH, Erftstadt). Volumes of interest (VOI) comprised abatch of 7 elliptic regions of interest (radius 25 x 7.5 mm) in the gray matter of the prefrontal cortex (PFC).Time-activity curves therein were calculated with the MPItool. A "flow and dispersion"-model (pmod) was fittedto the measured time activity curves using the arterial input curve. The CBFV was assessed with continuousbilateral TCD of the middle cerebral artery (MCA) using a 2-MHz Doppler system (Multi-Dop X4). Thestatistical comparison was carried out with a linear regression (SPSS).
Results
We found linear dependence of all tested parameters: rCBF vs. CBFV (R=0.74), CBFV vs. EtCO2 (R=0.74), andrCBF vs. EtCO2 (R=0.86). Increase of 10 mmHg leads to an increase of the rCBF of about 18 mL/100g/min andof the CBFV of about 19 cm/s. Further results are shown in table 1.
Discussion
Continuous TCD of the MCA represents a good approximation of the rCBF - as quantitatively assessed by PET-in the PFC during variations of EtCO2.
e1801
Abstracts presented at the 9th International Conference on Functional Mapping of the Human Brain, June 19Œ22, 2003, New York, NY
e1801

Table 1
EtCO2 [mmHg] 25 32 40 48 55
CBF +/- SEM [ml/100g/min] 38 +/- 9 43 + /- 8 56 +/- 9 63 +/- 6 98 +/- 11
CBVF +/- SEM [cm/s] 57 +/- 13 59 +/- 10 73 +/- 13 81 +/- 8 116 +/- 32
Order of appearance: 913
AbsTrak ID: 17759
e1802
Abstracts presented at the 9th International Conference on Functional Mapping of the Human Brain, June 19Œ22, 2003, New York, NY
e1802
Poster number: 923
Hypothesis testing and model selection : two frameworks for neuroimaging
Jean-Baptiste Poline*†, Marc Lavielle‡§
*UNAF-SHFJ-CEA Orsay†IFR 49
‡Universite Paris-Sud,§Equipe de Probabilités, Statistique et Modélisation
Modeling & Analysis
Abstract
Data analysis in neuroimaging can be seen as the means to integrate a priori information and data characteristicsto provide results interpretation. It is a growing field that takes many forms. The most salient recent developmentin this field is the wider use of the Bayesien framework (eg Friston et al, 2002 and others). Here, we discussanother aspect of data analysis, the pros and cons of two different statistical frameworks : model selection andhypothesis testing. Hypothesis testing has been the most widely used framework for data analysis in experimentalsciences, and among them neuroimaging. One starts with the so called null hypothesis that there is ?no effect? andassesses the probability that this hypothesis is true using the assessed distribution, yielding a p-value. An arbitrarythreshold is then applied to select the reported results (5%). There are (at least) two major problems with thisframework. First, the effect is assessed using a model of reality that is not known. Unfortunately, this frameworkrequires that the *true* model is known a priori. For instance, in an imaging experiment where one wants to knowwhether a condition had had an effect on the measured signal, the model will include this condition and itsmagnitude will be tested. But if the initial model is not correct (and strictly speaking it might never be), the test isinvalid. If the test is declared ?not significant at a given a risk of error?, then this should define a new model thatdoes not include this condition. Hypothesis testing is used here to select between two models. In practice, onealmost never redefines the model to test for other conditions, and if it was done, it would be problematic (testingorder and other problems). The second major difficulty is that the null hypothesis is almost certainly always false.As noted some years ago by K. Worsley, if one had enough data, the brain would be partitioned in two :?significantly positively activated? and ?significantly negatively activated? areas and all conditions included inthe model. P-values reported are therefore generally wrong and often uninformative (cf the importance ofpresenting effect sizes). On the other hand, model selection should provide better information on reality. It can beargued that a ?true model? does not exist, and that one is generally left to choose between several ?reasonable?models. Model selection criteria are numerous in the literature (AIC, AICc, BIC, TIC, ?) and can be divided intoKullback-Leibler estimates and K-consistent criteria. Problems here lie in the choice of the initial set ofreasonable models and the treatment of cases where several models are found almost equality appropriate.However, we agree with the rationales of Burnham (Biometrics,95) and others and suggest a wider use of modelselection in neuroimaging. This work is not limited to general considerations and a practical example will beprovided using the selection of conditions problem in an fMRI dataset.
Order of appearance: 914
AbsTrak ID: 18924
e1803
Abstracts presented at the 9th International Conference on Functional Mapping of the Human Brain, June 19Œ22, 2003, New York, NY
e1803
Poster number: 924
Independent Component Analysis for blind noise reduction inmultisensory signals with application to MEG analysis
Camillo Porcaro*, Giulia Barbati*, Patrizio Pasqualetti*, Franca Tecchio†, Paolo Maria Rossini‡§§
*Center of Biostatistics & Information Technology, AFaR-Ospedale Fatebenefratelli, Rome, Italy.†ISTC-CNR, Rome, Italy.
‡AFaR, Dipartimento di Neuroscienze, Ospedale Fatebenefratelli, Rome, Italy.§IRCCS "S. Giovanni di Dio-Fatebenefratelli", Brescia, Italy.
¶Neurologia Clinica, Università Campus Biomedico, Rome,Italy.
Modeling & Analysis
Abstract
In many applications of bioelectric signal analysis preprocessing is necessary to remove noise from data recordedby multiple sensors. Typically, each sensor measures the noisy mixture of original source signals: in this work wepresent a noise reduction technique using Independent Component Analysis (ICA).Spatial filters derived by ICAblindly separate the input data into a sum of temporally independent and spatially fixed components arising fromdistinct or overlapping brain or extra-brain sources.We perform ICA to the observed data, reject components thatidentify artifacts and obtain clean original signals by performing inverse projection of remaining componentsback onto the sensors level. Thus, corrected sensor signals could enable us to localize corresponding "interesting"brain sources. We use simulated data as well as a real recordings from a 28-channels MEG system.
Order of appearance: 915
AbsTrak ID: 17303
e1804
Abstracts presented at the 9th International Conference on Functional Mapping of the Human Brain, June 19Œ22, 2003, New York, NY
e1804
Poster number: 925
Comparing CCA and SPM99
Mattias Ragnehed*, Ola Friman†, Peter Lundberg§, Birgitta Söderfeldt‡, Hans Knutsson†
*Department of Radiology, Linköping University, Sweden†Department of Biomedical Engineering, Linköping University, Sweden
‡Department of Neurosciences and Locomotion, Linköping University, Sweden§Depts. of Radiation Physics and Diagnostic Radiology, Linköping University, Sweden
Modeling & Analysis
Abstract
Background:
Friman et al. [1,2] have developed a novel method for analysis of fMRI timeseries based on CanonicalCorrelation Analysis, CCA. One of the main benefits with the CCA approach is an adaptive spatial filteringstrategy. It was shown, on synthetic data, that the CCA method is more sensitive than traditional methods used instatistical analysis of fMRI data, e.g. the GLM approach. With this study we wish to confirm this assertion usingreal activation data.
Method:
Ten healthy male volunteers with the same native language (swedish) were scanned in a 1.5T GE scanner. Thesubjects performed a simple word generation task. All data were analyzed using SPM99 [3] and a novel CCAmethod. The analyses were specified to match each other as well as possible. The resulting statistical parametricmaps were thresholded at the same significance for all subjects, irrespective of analysis method. Voxels showingsignificant activation were indicated in yellow and the result from SPM99 and CCA were evaluated visually for differences.
Results:
As a specific example, consider Fig 1. The image shows three adjacent slices. The top row of images correspondsto the CCA analysis (p < 0.05 corrected). The middle row correspond to SPM99 analysis (p < 0.05 corrected, F =31.98). The bottom row shows the SPM analysis when the threshold (p < 0.001 uncorrected, F = 12.45) wasadjusted to detect approximately the same amount of active voxels as the CCA method. Except areas found by theCCA method, seemingly spurious activations also appear with this lower threshold. In general, the CCA methoddetects more supra-threshold voxels than the SPM99 analysis at same statistical significance, confirming thehypothesis that the CCA method is the more sensitive method. Even though CCA proves to be more sensitive,there are fewer spurious voxels surviving the selected threshold when thresholds are set to show approximatelysame amount of activation.
e1805
Abstracts presented at the 9th International Conference on Functional Mapping of the Human Brain, June 19Œ22, 2003, New York, NY
e1805
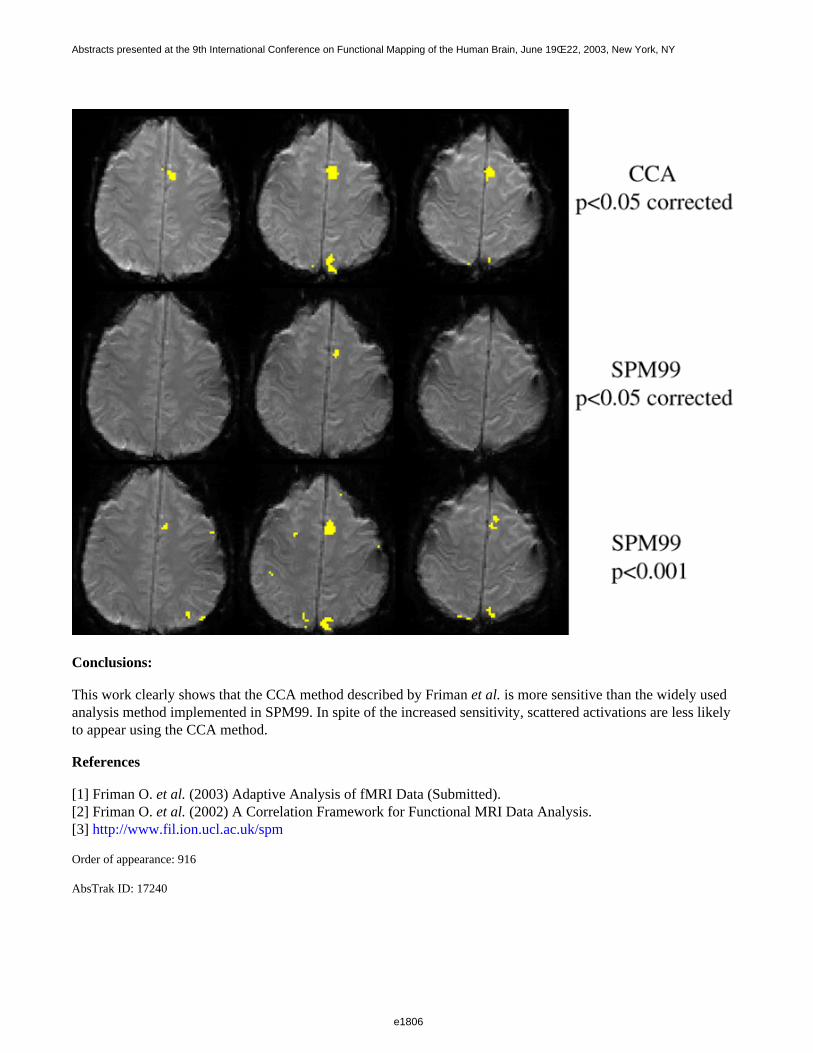
Conclusions:
This work clearly shows that the CCA method described by Friman et al. is more sensitive than the widely usedanalysis method implemented in SPM99. In spite of the increased sensitivity, scattered activations are less likelyto appear using the CCA method.
References
[1] Friman O. et al. (2003) Adaptive Analysis of fMRI Data (Submitted).[2] Friman O. et al. (2002) A Correlation Framework for Functional MRI Data Analysis.[3] http://www.fil.ion.ucl.ac.uk/spm
Order of appearance: 916
AbsTrak ID: 17240
e1806
Abstracts presented at the 9th International Conference on Functional Mapping of the Human Brain, June 19Œ22, 2003, New York, NY
e1806
Poster number: 926
Inter-subject spatial registration of the human cerebellum
Kelly Rehm*, Jon Anderson†, Roger Woods‡, David Rottenberg*†
*University of Minnesota Department of Radiology†University of Minnesota Department of Neurology
‡UCLA Department of Neurology
Modeling & Analysis
Abstract
We and others have discussed the benefits that may accrue from registering the cerebellum and the cerebrumindependently [1]. Thus, we compared linear transformation methods and nonlinear (warping) approaches forregistering high-resolution T1-weighted MR volumes with respect to landmark localization and intensity characteristics.
Methods
Sixteen T1-weighted MRI scans of normal subjects were acquired during an fMRI experiment using a static forceprotocol [2]. Voxel dimensions were 0.86 x 0.86 x 1mm. The Montreal Neurological Institute 27-scan-average T1MRI volume [3] served as our template and was manually stripped and divided into three spatialsubcompartments (left/right cerebrum, brainstem plus cerebellum). Seven cerebellar landmarks were selectedbased on the Schmahmann atlas [4] for comparing alignment methods: apex of V4, tips of the lingula andnodulus, and floors of the primary, preculminate, prepyramidal and secondary fissures in the midline. Acerebellum-brainstem subcompartment was generated for each subject by computing a warp transformation of thetemplate volume onto the subject volume, and the compartment boundary was automatically adjusted according tolocal intensity characteristics and used to compute a smooth "membrane" enclosing the cerebellum and brainstem.
Five registration methods were evaluated: (1) Rigid-body translation and rotation to a standard pose in which theposterior commissure, obex and apex of the fourth ventricle define three orthogonal planes [5], (2) Method 1 plus12-part linear scaling according to Grodd, et al. [1], (3) Grodd’s method, which differs from Method 1 in thedefinition of rotations, (4) A fourth-order warp transformation [6] of subject to template withoutcompartmentalization, (5) A fourth-order warp transformation computed from the cerebellar subcompartment.Alignment quality was assessed using the following metrics: (1) landmark cluster radius, (2) landmarkdisplacement vs. the template volume, (3) intersection volume, and (4) correlation of group average and templateintensities. Cluster radius was quantified by the standard deviation of the distances of subjects’ landmarks fromthe cluster centroid.
Results
For all methods, the average cluster radius was approximately one voxel (see Table 1). As expected, displacementwas reduced by warping, and warping increased the volume of intersection. The slight degradation in landmarkmetrics for Method 5 compared to Method 4 may reflect errors in landmark placement that are "corrected" byimproved alignment -- suggested by increased intensity correlation. Decreased blurring rom left to right in Figures1 and 2 indicates improved alignment. For intersubject registration of normal subjects, we conclude that thecerebellum should be treated as a separate compartment, and non-linear registration is preferable to piecewiselinear scaling for this application.
e1807
Abstracts presented at the 9th International Conference on Functional Mapping of the Human Brain, June 19Œ22, 2003, New York, NY
e1807
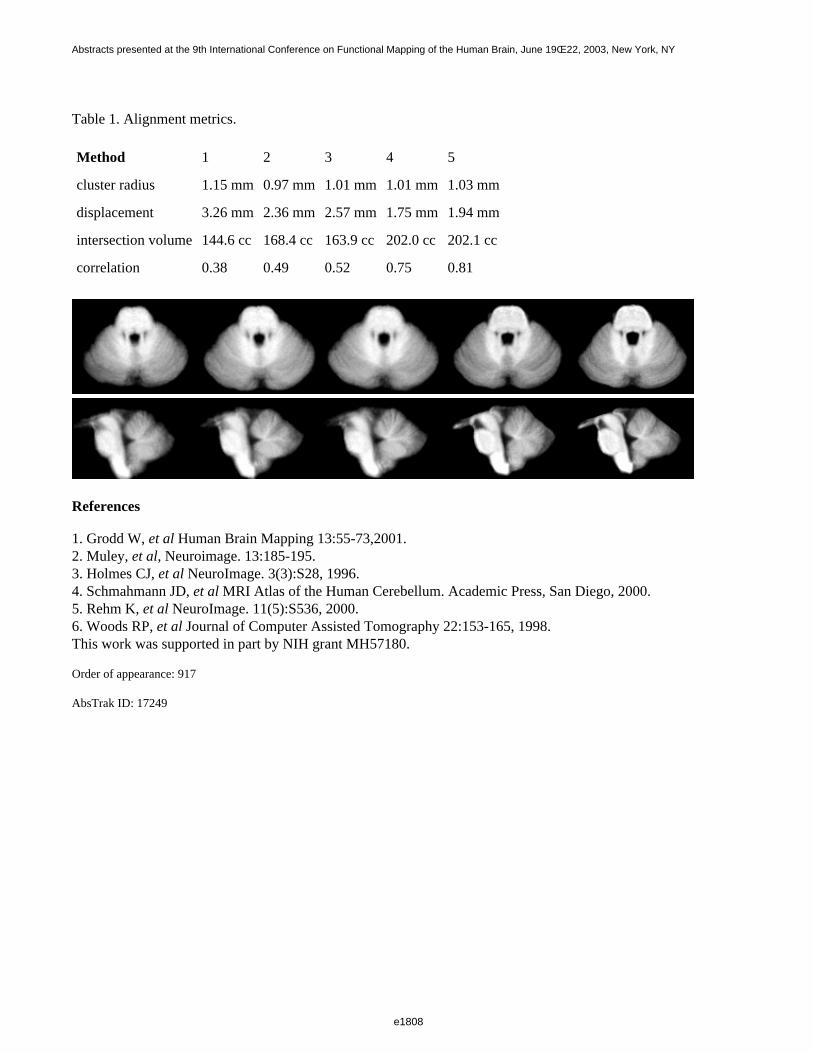
Table 1. Alignment metrics.
Method 1 2 3 4 5
cluster radius 1.15 mm 0.97 mm 1.01 mm 1.01 mm 1.03 mm
displacement 3.26 mm 2.36 mm 2.57 mm 1.75 mm 1.94 mm
intersection volume 144.6 cc 168.4 cc 163.9 cc 202.0 cc 202.1 cc
correlation 0.38 0.49 0.52 0.75 0.81
References
1. Grodd W, et al Human Brain Mapping 13:55-73,2001.2. Muley, et al, Neuroimage. 13:185-195.3. Holmes CJ, et al NeuroImage. 3(3):S28, 1996.4. Schmahmann JD, et al MRI Atlas of the Human Cerebellum. Academic Press, San Diego, 2000.5. Rehm K, et al NeuroImage. 11(5):S536, 2000.6. Woods RP, et al Journal of Computer Assisted Tomography 22:153-165, 1998.This work was supported in part by NIH grant MH57180.
Order of appearance: 917
AbsTrak ID: 17249
e1808
Abstracts presented at the 9th International Conference on Functional Mapping of the Human Brain, June 19Œ22, 2003, New York, NY
e1808
Poster number: 927
Motion correction for PET ligand imaging
Anthonin Reilhac, Sebastien Sechet, Isabelle Boileau, Roger Gunn, A. Evans, Alain Dagher
Montreal Neurological Institute, McGill University
Modeling & Analysis
Abstract
Background
Patient motion during dynamic PET ligand studies is a significant source of error. Frame to frame misalignmentwill alter the measured time activity curves from a selected region of interest or voxel. In addition, misalignmentbetween the emission and transmission scans introduces errors during attenuation correction. This problem has ledto the use of various registration algorithms for motion correction. However, because the spatial distribution oftracer usually varies with time, frame-to-frame realignment results in the introduction of "false" motion.Similarly, registration algorithms that compute a spatial transformation between each frame of the PET volumeand a template image (usually either an individual frame or a summed image) are also inadequate since thesestatic targets are not representative of the radiotracer spatial distribution at each time point. In addition, theseframe alignment programs do not account for emission - transmission mismatches.
Methods
Here, we investigate a coregistration method for dynamic PET studies that realigns each PET frame to aligand-specific MRI derived 4D-template. Such a target is itself free from subject motion and representative of thespatial distribution of tracer at each time frame. This template also allows correction of emission - transmissionmismatches since it can be used to generate attenuation factors for each frame using a 3D analytical PETsimulator [1]. We carried out realistic 4D Monte Carlo simulations of [11C]raclopride studies [2] to evaluate thecapacity of the algorithm to recover simulated head movement (up to 6 degree rotation and 12 mm translationsabout each axis) when employed on PET data with and without emission-transmission mismatches.
Results
In simulations without emission-transmission mismatches our realignment method effectively recovered thecorrect data (i.e. detects the simulated movement to within 0.5 mm and 0.5 degree). The effect of emission -transmission mismatch is significant. When it is not taken into account, the algorithm’s efficiency is severelyreduced (the recovery capability, as defined by recovered movement minus true movement, is 88.5% for thetranslations and 72.6% for the rotations). Using the anatomical template to first correct each emission sinogramwith suitable attenuation factors significantly enhances the recovery capability (96.7% for translations and 84.7%for rotations). The figure shows the recovery capability of the motion correction algorithm for each frame of thesimulated [11C]raclopride volumes. (Plain line: reconstruction with misaligned attenuation coefficients; Dashedline: reconstruction with analytically generated attenuation coefficients).
Conclusion
The proposed frame realignment method resulted in very good motion correction when there was noemission-transmission mismatch. However, in real-life situations, if head movement occurs during the dynamicPET scan there will be emission -transmission mismatches. Our investigations point out the importance of
e1809
Abstracts presented at the 9th International Conference on Functional Mapping of the Human Brain, June 19Œ22, 2003, New York, NY
e1809
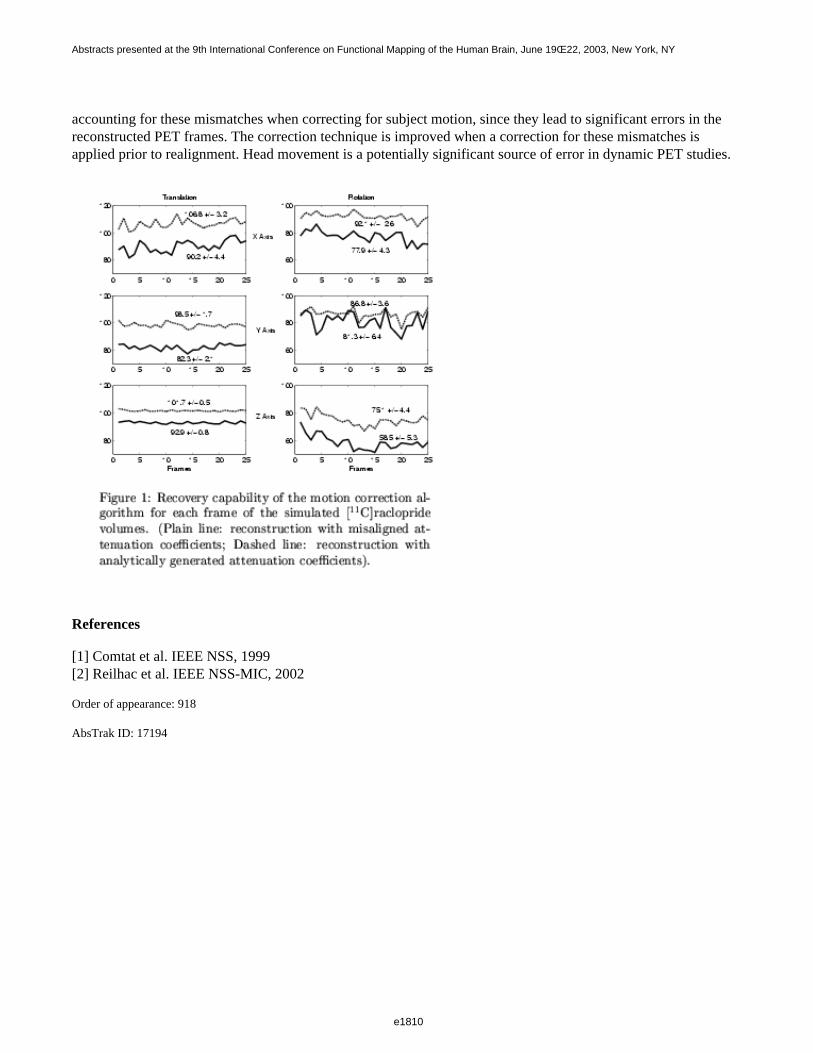
accounting for these mismatches when correcting for subject motion, since they lead to significant errors in thereconstructed PET frames. The correction technique is improved when a correction for these mismatches isapplied prior to realignment. Head movement is a potentially significant source of error in dynamic PET studies.
References
[1] Comtat et al. IEEE NSS, 1999[2] Reilhac et al. IEEE NSS-MIC, 2002
Order of appearance: 918
AbsTrak ID: 17194
e1810
Abstracts presented at the 9th International Conference on Functional Mapping of the Human Brain, June 19Œ22, 2003, New York, NY
e1810
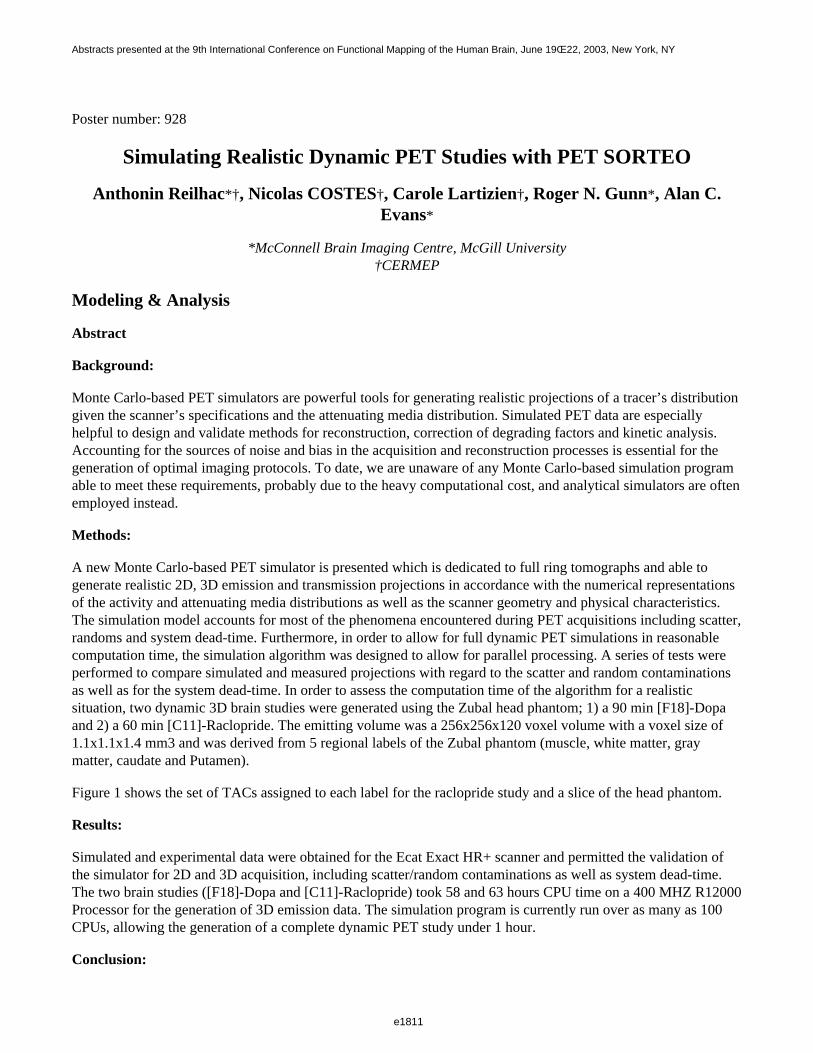
Poster number: 928
Simulating Realistic Dynamic PET Studies with PET SORTEO
Anthonin Reilhac*†, Nicolas COSTES†, Carole Lartizien†, Roger N. Gunn*, Alan C. Evans*
*McConnell Brain Imaging Centre, McGill University†CERMEP
Modeling & Analysis
Abstract
Background:
Monte Carlo-based PET simulators are powerful tools for generating realistic projections of a tracer’s distributiongiven the scanner’s specifications and the attenuating media distribution. Simulated PET data are especiallyhelpful to design and validate methods for reconstruction, correction of degrading factors and kinetic analysis.Accounting for the sources of noise and bias in the acquisition and reconstruction processes is essential for thegeneration of optimal imaging protocols. To date, we are unaware of any Monte Carlo-based simulation programable to meet these requirements, probably due to the heavy computational cost, and analytical simulators are oftenemployed instead.
Methods:
A new Monte Carlo-based PET simulator is presented which is dedicated to full ring tomographs and able togenerate realistic 2D, 3D emission and transmission projections in accordance with the numerical representationsof the activity and attenuating media distributions as well as the scanner geometry and physical characteristics.The simulation model accounts for most of the phenomena encountered during PET acquisitions including scatter,randoms and system dead-time. Furthermore, in order to allow for full dynamic PET simulations in reasonablecomputation time, the simulation algorithm was designed to allow for parallel processing. A series of tests wereperformed to compare simulated and measured projections with regard to the scatter and random contaminationsas well as for the system dead-time. In order to assess the computation time of the algorithm for a realisticsituation, two dynamic 3D brain studies were generated using the Zubal head phantom; 1) a 90 min [F18]-Dopaand 2) a 60 min [C11]-Raclopride. The emitting volume was a 256x256x120 voxel volume with a voxel size of1.1x1.1x1.4 mm3 and was derived from 5 regional labels of the Zubal phantom (muscle, white matter, graymatter, caudate and Putamen).
Figure 1 shows the set of TACs assigned to each label for the raclopride study and a slice of the head phantom.
Results:
Simulated and experimental data were obtained for the Ecat Exact HR+ scanner and permitted the validation ofthe simulator for 2D and 3D acquisition, including scatter/random contaminations as well as system dead-time.The two brain studies ([F18]-Dopa and [C11]-Raclopride) took 58 and 63 hours CPU time on a 400 MHZ R12000Processor for the generation of 3D emission data. The simulation program is currently run over as many as 100CPUs, allowing the generation of a complete dynamic PET study under 1 hour.
Conclusion:
e1811
Abstracts presented at the 9th International Conference on Functional Mapping of the Human Brain, June 19Œ22, 2003, New York, NY
e1811
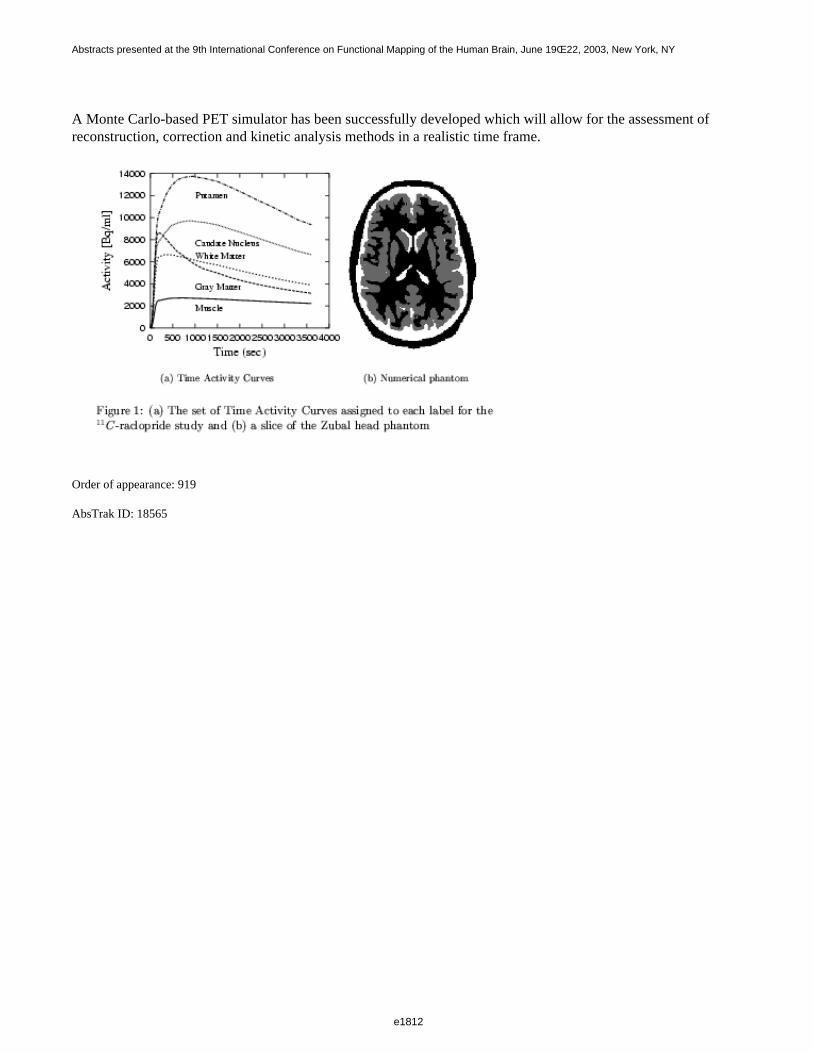
A Monte Carlo-based PET simulator has been successfully developed which will allow for the assessment ofreconstruction, correction and kinetic analysis methods in a realistic time frame.
Order of appearance: 919
AbsTrak ID: 18565
e1812
Abstracts presented at the 9th International Conference on Functional Mapping of the Human Brain, June 19Œ22, 2003, New York, NY
e1812
Poster number: 929
Analysis of Sulcal Shape Changes Associated with Aging
Maryam E. Rettmann*†, Jerry L. Prince*, Susan M. Resnick†
*The Johns Hopkins University, Baltimore, MD, USA†National Institute on Aging, Baltimore, MD, USA
Modeling & Analysis
Abstract
Introduction
Imaging studies of the human brain suggest that the sulcal folds undergo shape changes during aging. In thisstudy, we analyze the sulcal geometry of thirty-five individuals both cross-sectionally and longitudinally. Wecompute the geometry of “sulcal regions’’ defined as the buried cortex surrounding the sulcal spaces. Twogeometric quantities were used to access shape -- geodesic depth and mean curvature. Geodesic depth is definedas the shortest distance along the surface from a point in a sulcal region to the outer (visible) cortex.Measurements of mean curvature include both percentage of high positive and high negative mean curvaturepoints, respectively indicating convexity (outward bends) and concavity (inward bends) of the cortical surface.
Methods
Volumetric MRI data were from the Baltimore Longitudinal Study of Aging (BLSA) [1]. We analyzed thirty-fiveBLSA participants at three time points - years 1, 3 and 5. For each dataset, we computed a cortical surface modelusing the procedure described in [2] and subsequently segmented the sulcal regions as in [3]. Next, we manuallyassigned anatomic labels to four segmented sulcal regions on each cortical hemisphere -- the central, superiorfrontal, cingulate and parieto-occipital. For each sulcal region we computed the maximum and mean geodesicdepths, and the percentage of high positive and high negative curvature points. In the cross-sectional analysis thescans for years 1, 3 and 5 were analyzed separately. For each year, we computed the correlation coefficientsbetween the geometric measurements and age. For the longitudinal analysis we used a repeated measures analysisof variance.
Results and Conclusion
In the cross-sectional analyses we found significant negative correlations with age in the left and right cingulatesulcal regions for both the maximum and mean geodesic depths. We also found significant negative correlationswith age in the left and right cingulate sulcal regions for the percentage of high positive mean curvature pointsand in the left and right parieto-occipital sulcal regions for the percentage of high negative curvature points. In thelongitudinal analysis there were no statistically significant changes in maximum geodesic depth and for the meangeodesic depth measures, only the right parieto-occipital had a significant decrease in depth with time. Thepercentage of high positive curvature points decreased significantly for the left central, right central, rightcingulate and the right parieto-occipital sulcal regions. There were no significant changes for the percentage ofhigh negative curvature points. In conclusion, we observed several significant age related effects in the geometricmeasures of specific sulcal regions for both cross-sectional and longitudinal analyses.
References
[1] Resnick et. al., Cerebral Cortex, 10(5):464-72, May 2000.[2] Han et. al., MMBIA, 213-220, Dec. 2001.[3] Rettmann et. al., NeuroImage, 15:329-344, Feb. 2002.
e1813
Abstracts presented at the 9th International Conference on Functional Mapping of the Human Brain, June 19Œ22, 2003, New York, NY
e1813

Order of appearance: 920
AbsTrak ID: 17964
e1814
Abstracts presented at the 9th International Conference on Functional Mapping of the Human Brain, June 19Œ22, 2003, New York, NY
e1814

Poster number: 930
Age, Gender, and Handedness Influences on Relative Tissue Volumes inthe Human Brain
David E. Rex, Arthur W. Toga
Laboratory of Neuro Imaging, Department of Neurology, David Geffen School of Medicine at UCLA
Modeling & Analysis
Abstract
Cortical regions, nuclei and tracks differ in their size, composition, and relative positioning due to the influence ofmany factors. Some of these differences are easily characterized. Others require more statistical power toelucidate. The aim of this study is to utilize automated analyses with a large number of subjects to help define theinfluence of normal healthy variables on the structure of the human brain. We looked at the influence of gender,handedness, and age on the white matter (WM), gray matter (GM), and CSF concentrations in each of the cerebraland cerebellar hemispheres.
Four hundred forty-nine subjects from the ICBM database of normal adults were studied, 259 males (mean age =26.1 years, SD = 5.2; 232 right handed) and 190 females (mean age = 25.0 years, SD = 5.2; 168 right handed).Subjects were screened for possible neurological, psychological, or other pathological impairment by aneurologist when entered into the ICBM dataset. T1-weghted SPGR MRI brain scans were used for the analysis(Montreal Neurological Institute: 152 subjects, 1.5T Siemens, 176x256x256 1x1x1mm voxels; UCLA: 3TGeneral Electric, 124x256x256 1.2x1x1mm voxels; University of Texas Health Sciences Center at San Antonio:2T Elscint, 127x256x256 1.2x1x1mm voxels).
MRI volumes were stripped of non-brain tissues1, corrected for RF non-uniformity1, automatically aligned usinga full affine transformation to an average shape and intensity atlas2, and classified for GM, WM, and CSF1. A 5thorder polynomial registration2 was used to align a template from the atlas to each subject and label the cerebraland cerebellar hemispheres. Per hemisphere GM, WM, and CSF total volumes were calculated along withcross-hemisphere asymmetry measures for each tissue class. All processing and calculations were automated andcontrolled with the LONI Pipeline Environment3. A two-way ANOVA for gender and handedness, covaried forage was applied to all 18 measures. A post-hoc linear regression was used to analyze for suggested age related effects.
Females possessed more cerebellar GM than males (p<0.05). Aging correlated with GM decreases and WM andCSF increases in the left and right cerebral hemispheres as well as CSF increases in the left and right cereballarhemispheres (p<0.001). A leftward asymmetry for cerebellar GM and rightward asymmetry for cerebellar WMwas found to decrease with age (p<0.001). Right-handed subjects possessed more GM and less WM thanleft-handed subjects in the left cerebellar hemisphere and also less WM in the right cerebellar hemisphere(p<0.01). A rightward asymmetry for GM in the cerebral hemispheres was greater in left-handed subjects (p<0.05).
This work is supported, in part, by the Medical Scientist Training Program grant (GM08042), the ARCSFoundation, an NCRR Resource grant (P41 RR13642), and a Human Brain Project grant from NIMH and NIDA(P20 MH/DA52176).
e1815
Abstracts presented at the 9th International Conference on Functional Mapping of the Human Brain, June 19Œ22, 2003, New York, NY
e1815

References
1. Shattuck et al., 2001, Neuroimage, 13(5):856-76.2. Woods et al., 1992, JCAT, 16(4):620-33.3. Rex et al., (2002 submitted).
Order of appearance: 921
AbsTrak ID: 19113
e1816
Abstracts presented at the 9th International Conference on Functional Mapping of the Human Brain, June 19Œ22, 2003, New York, NY
e1816
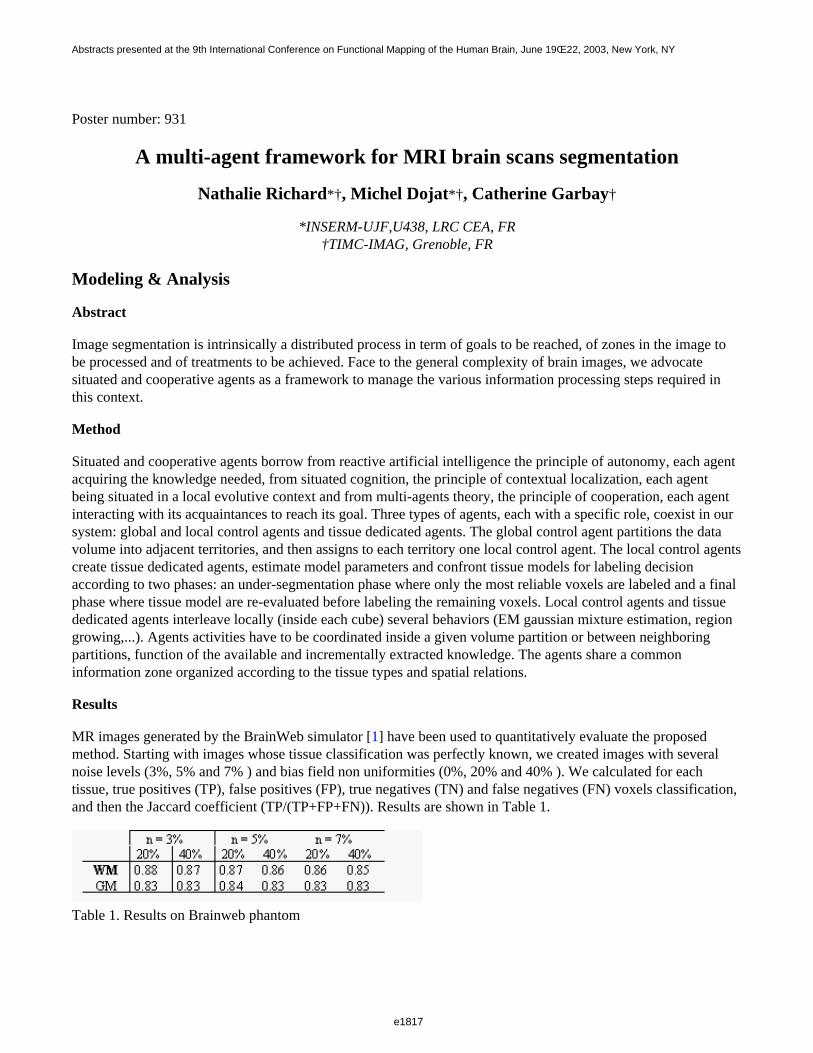
Poster number: 931
A multi-agent framework for MRI brain scans segmentation
Nathalie Richard*†, Michel Dojat*†, Catherine Garbay†
*INSERM-UJF,U438, LRC CEA, FR†TIMC-IMAG, Grenoble, FR
Modeling & Analysis
Abstract
Image segmentation is intrinsically a distributed process in term of goals to be reached, of zones in the image tobe processed and of treatments to be achieved. Face to the general complexity of brain images, we advocatesituated and cooperative agents as a framework to manage the various information processing steps required inthis context.
Method
Situated and cooperative agents borrow from reactive artificial intelligence the principle of autonomy, each agentacquiring the knowledge needed, from situated cognition, the principle of contextual localization, each agentbeing situated in a local evolutive context and from multi-agents theory, the principle of cooperation, each agentinteracting with its acquaintances to reach its goal. Three types of agents, each with a specific role, coexist in oursystem: global and local control agents and tissue dedicated agents. The global control agent partitions the datavolume into adjacent territories, and then assigns to each territory one local control agent. The local control agentscreate tissue dedicated agents, estimate model parameters and confront tissue models for labeling decisionaccording to two phases: an under-segmentation phase where only the most reliable voxels are labeled and a finalphase where tissue model are re-evaluated before labeling the remaining voxels. Local control agents and tissuededicated agents interleave locally (inside each cube) several behaviors (EM gaussian mixture estimation, regiongrowing,...). Agents activities have to be coordinated inside a given volume partition or between neighboringpartitions, function of the available and incrementally extracted knowledge. The agents share a commoninformation zone organized according to the tissue types and spatial relations.
Results
MR images generated by the BrainWeb simulator [1] have been used to quantitatively evaluate the proposedmethod. Starting with images whose tissue classification was perfectly known, we created images with severalnoise levels (3%, 5% and 7% ) and bias field non uniformities (0%, 20% and 40% ). We calculated for eachtissue, true positives (TP), false positives (FP), true negatives (TN) and false negatives (FN) voxels classification,and then the Jaccard coefficient (TP/(TP+FP+FN)). Results are shown in Table 1.
Table 1. Results on Brainweb phantom
e1817
Abstracts presented at the 9th International Conference on Functional Mapping of the Human Brain, June 19Œ22, 2003, New York, NY
e1817
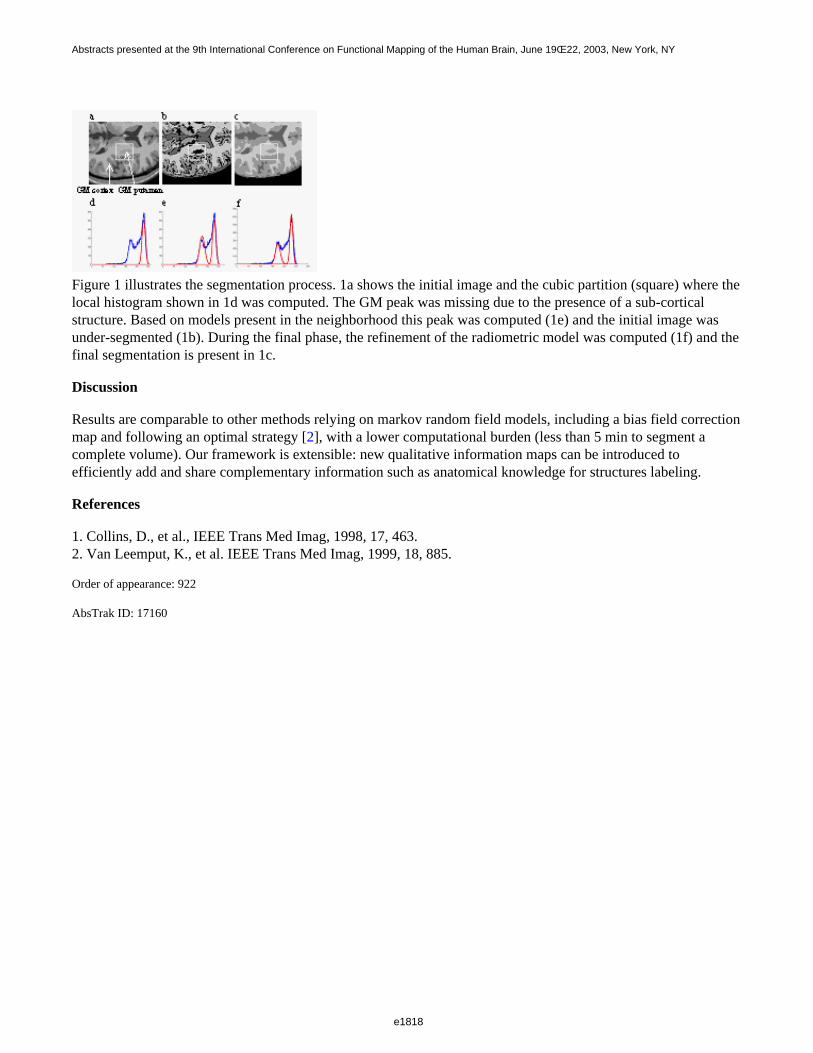
Figure 1 illustrates the segmentation process. 1a shows the initial image and the cubic partition (square) where thelocal histogram shown in 1d was computed. The GM peak was missing due to the presence of a sub-corticalstructure. Based on models present in the neighborhood this peak was computed (1e) and the initial image wasunder-segmented (1b). During the final phase, the refinement of the radiometric model was computed (1f) and thefinal segmentation is present in 1c.
Discussion
Results are comparable to other methods relying on markov random field models, including a bias field correctionmap and following an optimal strategy [2], with a lower computational burden (less than 5 min to segment acomplete volume). Our framework is extensible: new qualitative information maps can be introduced toefficiently add and share complementary information such as anatomical knowledge for structures labeling.
References
1. Collins, D., et al., IEEE Trans Med Imag, 1998, 17, 463.2. Van Leemput, K., et al. IEEE Trans Med Imag, 1999, 18, 885.
Order of appearance: 922
AbsTrak ID: 17160
e1818
Abstracts presented at the 9th International Conference on Functional Mapping of the Human Brain, June 19Œ22, 2003, New York, NY
e1818
Poster number: 932
A method to estimate neuronal dynamic from BOLD signals
Jorge Riera*, Jobu Watanabe*, Kazuki Iwata*, Naoki Miura*, Eduardo Aubert†, Ryuta Kawashima*
*Advanced Science and Technology of Materials, NICHe, Tohoku University, Japan†Neurophysics Department, Cuban Neuroscience Center, Havana, Cuba
Modeling & Analysis
Abstract
The elucidation of the temporal dynamics of neuronal activation in specific brain areas constitutes a currentproblem of great interest in neuroimaging. The major progresses have been possible due to the use of fMRImodality, which permit to explore hemodynamical changes with an excellent spatial resolution by the use ofBOLD signal. Unfortunately, the multiphasic nature of BOLD signal and the very limited sampling rate of fMRIsystems make almost impossible its usage to determine the time varying neuronal activity, which occurs in adifferent temporal scale. However, the physiological mechanisms underlying the relationship between synapticactivation and vascular/metabolic controlling systems have been widely reported in the literature [1]. The BOLDsignal is related to relative changes in the concentration of de-oxyhemoglobine [dHb] and Cerebral Blood Volume(CBV). The Balloon model presents a theoretical basic idea of a Stochastic Differential Equations (SDE) systemgoverning the dynamic of the inducing signal, cerebral blood flow, CBV, and [dHb] [2]. In this work, we proposea method to estimate the unknown neuronal activation function based in the following ideas: a)- a discretization ofBalloon continuous dynamical model, using the local linearization method; b)- the use of radial basis functions toconsider the arbitrary neuronal activation dynamic; and c)- the application of Kalman filter theory to estimatemodel parameters. This methodology was applied to a standard motor event related paradigm.
Methods:
The Balloon model is represented by a continuous, non-linear and non-autonomous SDE, with a Wiener processas an external force.
The local linearization method was used to discretize the continuous SDE, with the normal random process ξ t .
The neuronal activity u(t) was represented in terms of radial basis functions. The observation equation relatesBOLD signal to the global state variables.
The non-linear Kalman filter performs in the following steps: the equations for the evolution of the conditionalmean and covariance matrix; the zero-mean innovation process, from which a log likelihood functional can be defined;
and the difference equations defined from the Kalman filter gain.
The Talairach coordinate of the peak of activation was obtained from fMRI data during a block-design motor taskof right hand using SPM99 (Figure 1).
e1819
Abstracts presented at the 9th International Conference on Functional Mapping of the Human Brain, June 19Œ22, 2003, New York, NY
e1819
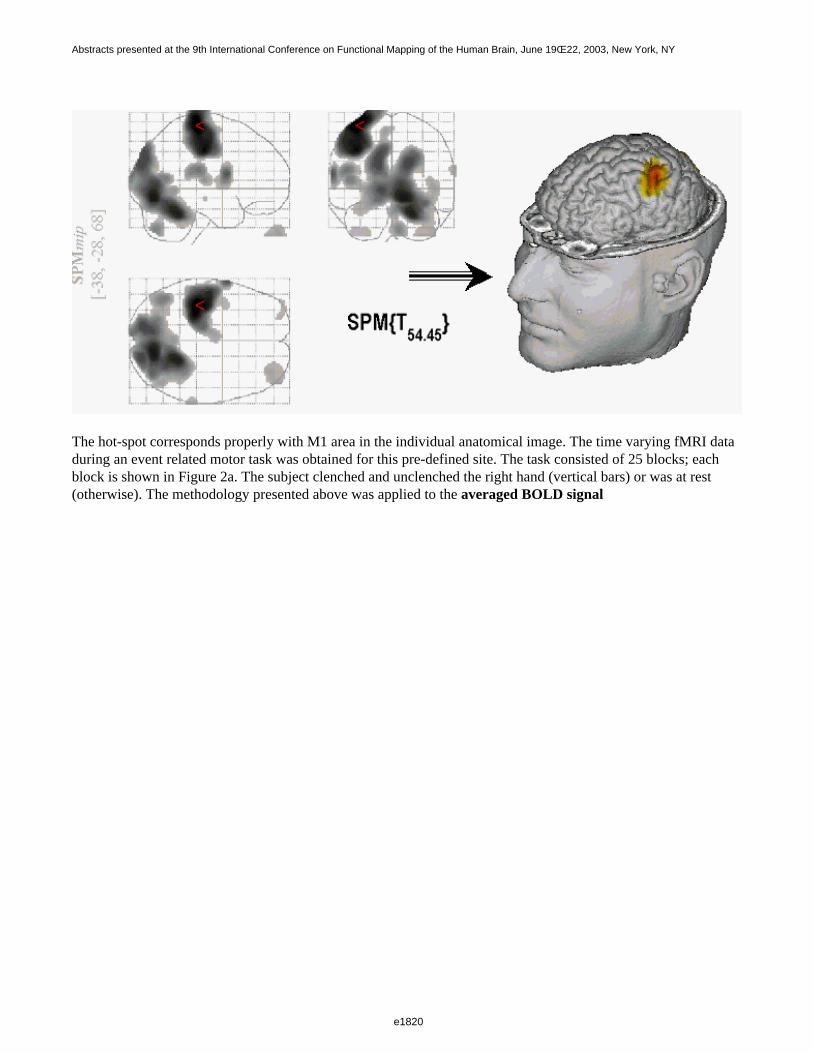
The hot-spot corresponds properly with M1 area in the individual anatomical image. The time varying fMRI dataduring an event related motor task was obtained for this pre-defined site. The task consisted of 25 blocks; eachblock is shown in Figure 2a. The subject clenched and unclenched the right hand (vertical bars) or was at rest(otherwise). The methodology presented above was applied to the averaged BOLD signal
e1820
Abstracts presented at the 9th International Conference on Functional Mapping of the Human Brain, June 19Œ22, 2003, New York, NY
e1820
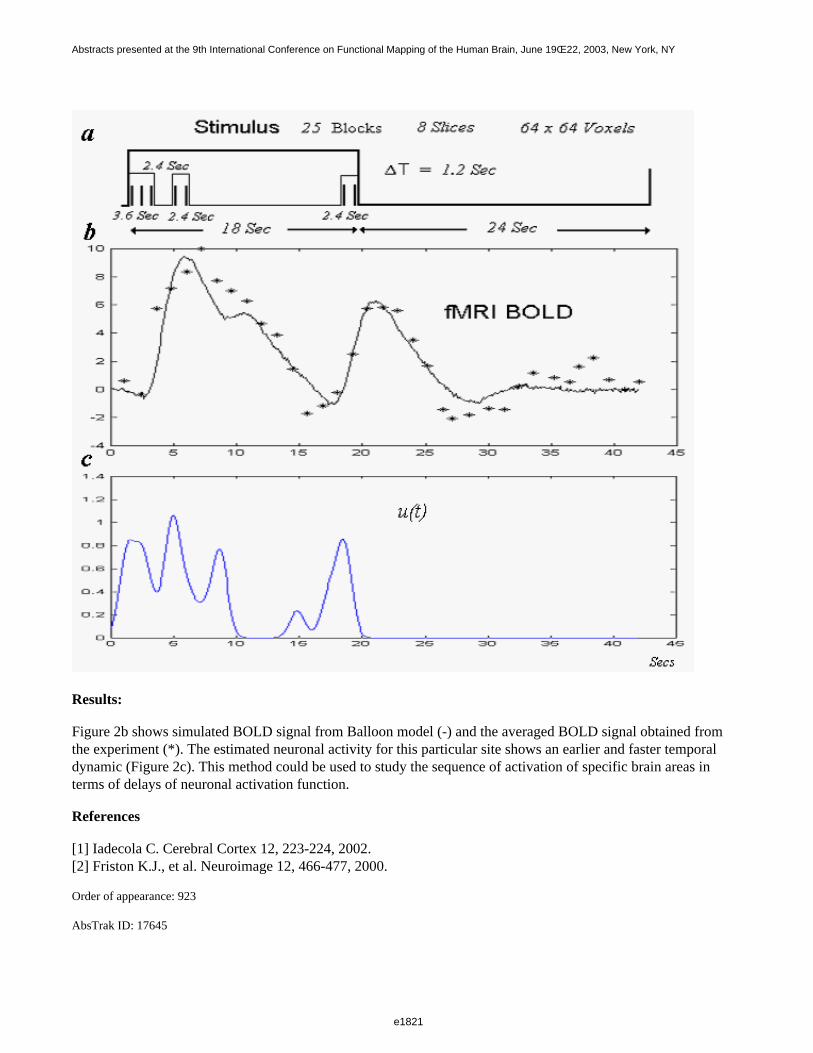
Results:
Figure 2b shows simulated BOLD signal from Balloon model (-) and the averaged BOLD signal obtained fromthe experiment (*). The estimated neuronal activity for this particular site shows an earlier and faster temporaldynamic (Figure 2c). This method could be used to study the sequence of activation of specific brain areas interms of delays of neuronal activation function.
References
[1] Iadecola C. Cerebral Cortex 12, 223-224, 2002.[2] Friston K.J., et al. Neuroimage 12, 466-477, 2000.
Order of appearance: 923
AbsTrak ID: 17645
e1821
Abstracts presented at the 9th International Conference on Functional Mapping of the Human Brain, June 19Œ22, 2003, New York, NY
e1821
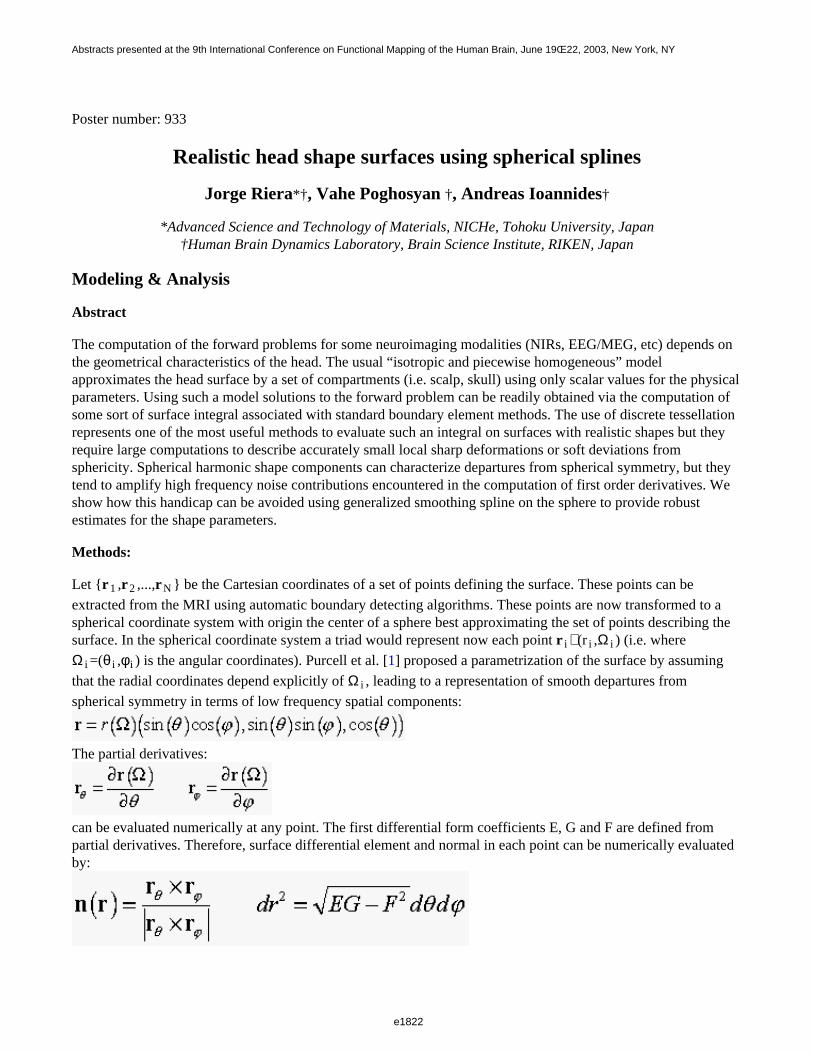
Poster number: 933
Realistic head shape surfaces using spherical splines
Jorge Riera*†, Vahe Poghosyan †, Andreas Ioannides†
*Advanced Science and Technology of Materials, NICHe, Tohoku University, Japan†Human Brain Dynamics Laboratory, Brain Science Institute, RIKEN, Japan
Modeling & Analysis
Abstract
The computation of the forward problems for some neuroimaging modalities (NIRs, EEG/MEG, etc) depends onthe geometrical characteristics of the head. The usual “isotropic and piecewise homogeneous” modelapproximates the head surface by a set of compartments (i.e. scalp, skull) using only scalar values for the physicalparameters. Using such a model solutions to the forward problem can be readily obtained via the computation ofsome sort of surface integral associated with standard boundary element methods. The use of discrete tessellationrepresents one of the most useful methods to evaluate such an integral on surfaces with realistic shapes but theyrequire large computations to describe accurately small local sharp deformations or soft deviations fromsphericity. Spherical harmonic shape components can characterize departures from spherical symmetry, but theytend to amplify high frequency noise contributions encountered in the computation of first order derivatives. Weshow how this handicap can be avoided using generalized smoothing spline on the sphere to provide robustestimates for the shape parameters.
Methods:
Let r1 ,r2 ,...,rN be the Cartesian coordinates of a set of points defining the surface. These points can be
extracted from the MRI using automatic boundary detecting algorithms. These points are now transformed to aspherical coordinate system with origin the center of a sphere best approximating the set of points describing thesurface. In the spherical coordinate system a triad would represent now each point r i ∼ (r i ,Ω i ) (i.e. where
Ω i =(θ i ,φi ) is the angular coordinates). Purcell et al. [1] proposed a parametrization of the surface by assuming
that the radial coordinates depend explicitly of Ω i , leading to a representation of smooth departures from
spherical symmetry in terms of low frequency spatial components:
The partial derivatives:
can be evaluated numerically at any point. The first differential form coefficients E, G and F are defined frompartial derivatives. Therefore, surface differential element and normal in each point can be numerically evaluated by:
e1822
Abstracts presented at the 9th International Conference on Functional Mapping of the Human Brain, June 19Œ22, 2003, New York, NY
e1822

Estimating partial derivatives using spherical splines
A scalar and real function evaluated on the surface of the sphere, which satisfies the condition
can be expressed in terms of the representers ξ i (φ) of the evaluation functional at point r i .
The representers are defined by the projection P1 of the reproducing kernels on the null space of the surface
laplace operator for the sphere.
In order to compute the N+1 coefficients a i the following discrete optimization problem must be solved:
In this formalism, the vectors y=(r1 ,...,rN )T are the radial coordinates of the N points. The smoothing/accuracy
conflict is resolved by the parameter λ, which can be estimated from the data using cross-validation.
The exact solution of the problem is:
Results: The figure shows the reconstruction of surface curvature and normal vectors of the inner skull surfaceobtained from MRI data. The reconstructed shape represented a smoothed version of the sampling points, whichwere additionally contaminated by noise. The normal to the surface were calculated with a proper accuracy inspite of using partial derivatives.
e1823
Abstracts presented at the 9th International Conference on Functional Mapping of the Human Brain, June 19Œ22, 2003, New York, NY
e1823
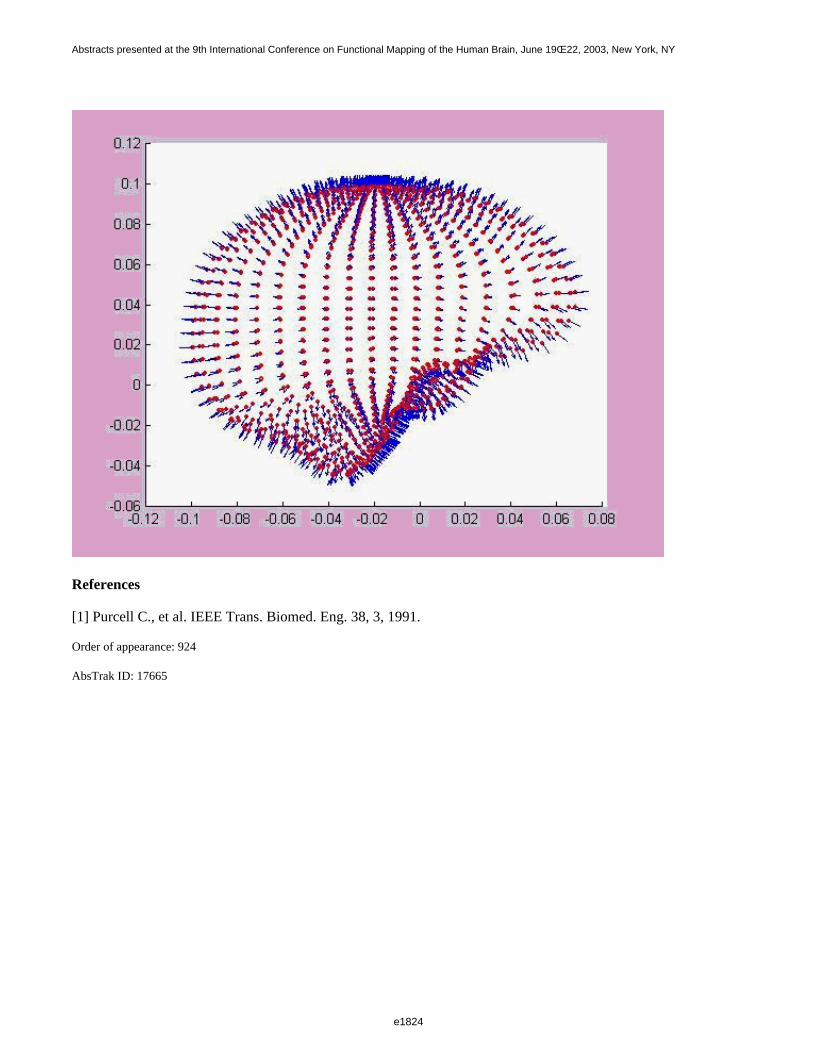
References
[1] Purcell C., et al. IEEE Trans. Biomed. Eng. 38, 3, 1991.
Order of appearance: 924
AbsTrak ID: 17665
e1824
Abstracts presented at the 9th International Conference on Functional Mapping of the Human Brain, June 19Œ22, 2003, New York, NY
e1824
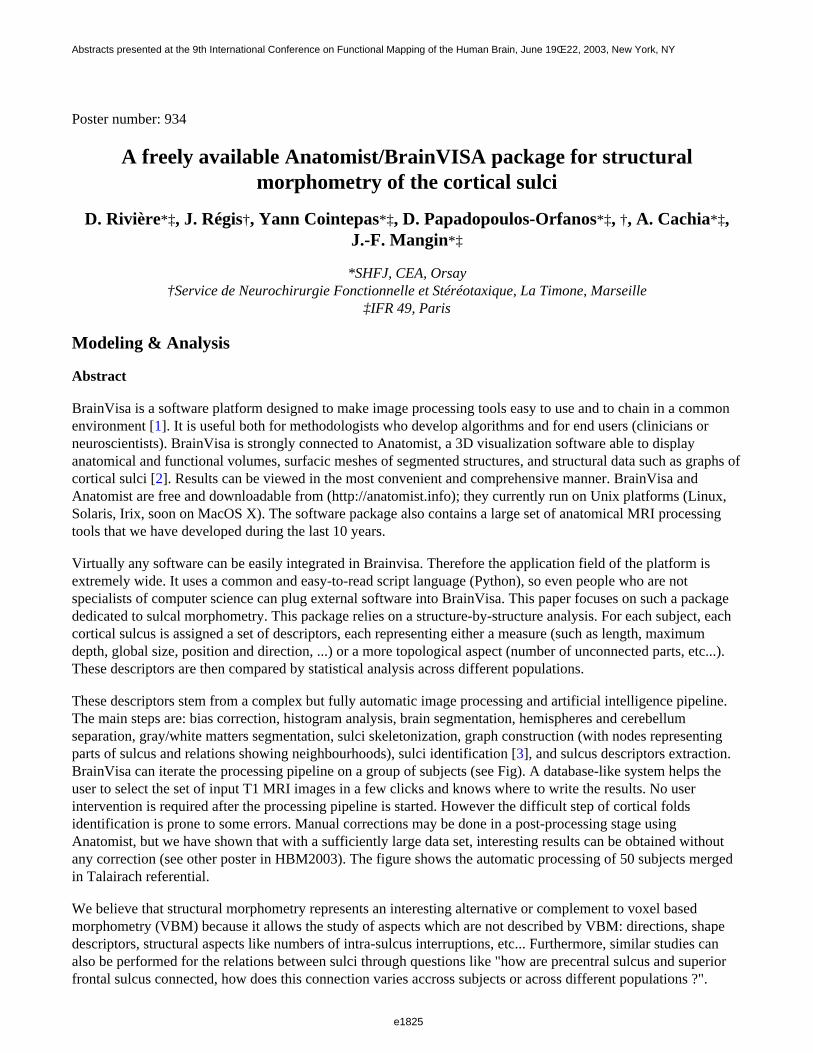
Poster number: 934
A freely available Anatomist/BrainVISA package for structuralmorphometry of the cortical sulci
D. Rivière*‡, J. Régis†, Yann Cointepas*‡, D. Papadopoulos-Orfanos*‡, †, A. Cachia*‡,J.-F. Mangin*‡
*SHFJ, CEA, Orsay†Service de Neurochirurgie Fonctionnelle et Stéréotaxique, La Timone, Marseille
‡IFR 49, Paris
Modeling & Analysis
Abstract
BrainVisa is a software platform designed to make image processing tools easy to use and to chain in a commonenvironment [1]. It is useful both for methodologists who develop algorithms and for end users (clinicians orneuroscientists). BrainVisa is strongly connected to Anatomist, a 3D visualization software able to displayanatomical and functional volumes, surfacic meshes of segmented structures, and structural data such as graphs ofcortical sulci [2]. Results can be viewed in the most convenient and comprehensive manner. BrainVisa andAnatomist are free and downloadable from (http://anatomist.info); they currently run on Unix platforms (Linux,Solaris, Irix, soon on MacOS X). The software package also contains a large set of anatomical MRI processingtools that we have developed during the last 10 years.
Virtually any software can be easily integrated in Brainvisa. Therefore the application field of the platform isextremely wide. It uses a common and easy-to-read script language (Python), so even people who are notspecialists of computer science can plug external software into BrainVisa. This paper focuses on such a packagededicated to sulcal morphometry. This package relies on a structure-by-structure analysis. For each subject, eachcortical sulcus is assigned a set of descriptors, each representing either a measure (such as length, maximumdepth, global size, position and direction, ...) or a more topological aspect (number of unconnected parts, etc...).These descriptors are then compared by statistical analysis across different populations.
These descriptors stem from a complex but fully automatic image processing and artificial intelligence pipeline.The main steps are: bias correction, histogram analysis, brain segmentation, hemispheres and cerebellumseparation, gray/white matters segmentation, sulci skeletonization, graph construction (with nodes representingparts of sulcus and relations showing neighbourhoods), sulci identification [3], and sulcus descriptors extraction.BrainVisa can iterate the processing pipeline on a group of subjects (see Fig). A database-like system helps theuser to select the set of input T1 MRI images in a few clicks and knows where to write the results. No userintervention is required after the processing pipeline is started. However the difficult step of cortical foldsidentification is prone to some errors. Manual corrections may be done in a post-processing stage usingAnatomist, but we have shown that with a sufficiently large data set, interesting results can be obtained withoutany correction (see other poster in HBM2003). The figure shows the automatic processing of 50 subjects mergedin Talairach referential.
We believe that structural morphometry represents an interesting alternative or complement to voxel basedmorphometry (VBM) because it allows the study of aspects which are not described by VBM: directions, shapedescriptors, structural aspects like numbers of intra-sulcus interruptions, etc... Furthermore, similar studies canalso be performed for the relations between sulci through questions like "how are precentral sulcus and superiorfrontal sulcus connected, how does this connection varies accross subjects or across different populations ?".
e1825
Abstracts presented at the 9th International Conference on Functional Mapping of the Human Brain, June 19Œ22, 2003, New York, NY
e1825
References
[1] Cointepas et al., HBM 2001, NeuroImage 13(6).[2] Rivière et al., HBM 2000, NeuroImage 11(5).[3] Rivière et al., Medical Image Analysis, 6(2):77-92,2002
Order of appearance: 925
AbsTrak ID: 18403
e1826
Abstracts presented at the 9th International Conference on Functional Mapping of the Human Brain, June 19Œ22, 2003, New York, NY
e1826
Poster number: 935
Multiscale brain modeling
Peter A. Robinson*†, Chris J. Rennie*†, Donald L. Rowe*†, Suzie C. O’Connor*, Michael Breakspear*†, Evian Gordon†
*School of Physics, University of Sydney†Brain Dynamics Centre, University of Sydney
Modeling & Analysis
Abstract
Introduction
A central difficulty of brain modeling is that of spanning the huge range of scales from synapses to the wholebrain. A powerful approach is to follow analogies from physics, where microscopic properties are oftenincorporated in tractable theories of large scale phenomena. In this vein, we have recently developed a model ofthe generation of brain electrical activity that incorporates both basic microscopic neurophysiology and largescale brain anatomy to predict the properties of brain electrical activity at scales from a few tenths of a millimeterup to the whole brain.
Method:
Our model incorporates such features as synaptic and dendritic dynamics, nonlinearity of the firing response,axonal conduction, and corticocortical and corticothalamic pathways. Its relatively few parameters measurequantities such as synaptic strengths, corticothalamic delays, dendritic time constants, and axonal ranges, and areall constrained by independent physiological measurements. Application of standard mathematical techniques tothe resulting equations allows predictions to be made of EEG spectra, ERPs, and other phenomena. Fitting ofthese predictions to experimental data then enables the underlying physiological parameters to be inferred.
Results
It is shown that the model reproduces the detailed, quantitative forms of EEGs seen in various states of arousal,including such features as sleep spindles and enhanced delta waves in deep sleep, and alpha waves and alphablocking in waking states. It also reproduces evoked response potentials, correlation and coherence functions,spatial spectra, and seizure dynamics. Fitting of model predictions to experimental EEG spectra to inferphysiological parameters gives a new noninvasive window into brain function at much shorter timescales,complementing the slower, finer spatial resolution techniques such as fMRI. Self-referencing of individuals’ EEGspectra already enables the parameters corresponding to alert and relaxed states to be readily distinguished.
Conclusion:
The ability to obtain physiologically relevant parameters from EEG and similar data opens the way to monitor andmap these parameters in various states of arousal, during cognitive tasks, in mental disorders, and in contexts suchas drug trials. Because the parameters measure physiological quantities (as opposed to the phenomenological onesof traditional quantitative EEG) relating to scales ranging from synaptic to whole-brain, and probe deep structuressuch as the thalamus, this will permit the testing of a range of hypotheses about vigilance, cognition, drug action,and multiscale brain function.
e1827
Abstracts presented at the 9th International Conference on Functional Mapping of the Human Brain, June 19Œ22, 2003, New York, NY
e1827

Order of appearance: 926
AbsTrak ID: 18021
e1828
Abstracts presented at the 9th International Conference on Functional Mapping of the Human Brain, June 19Œ22, 2003, New York, NY
e1828
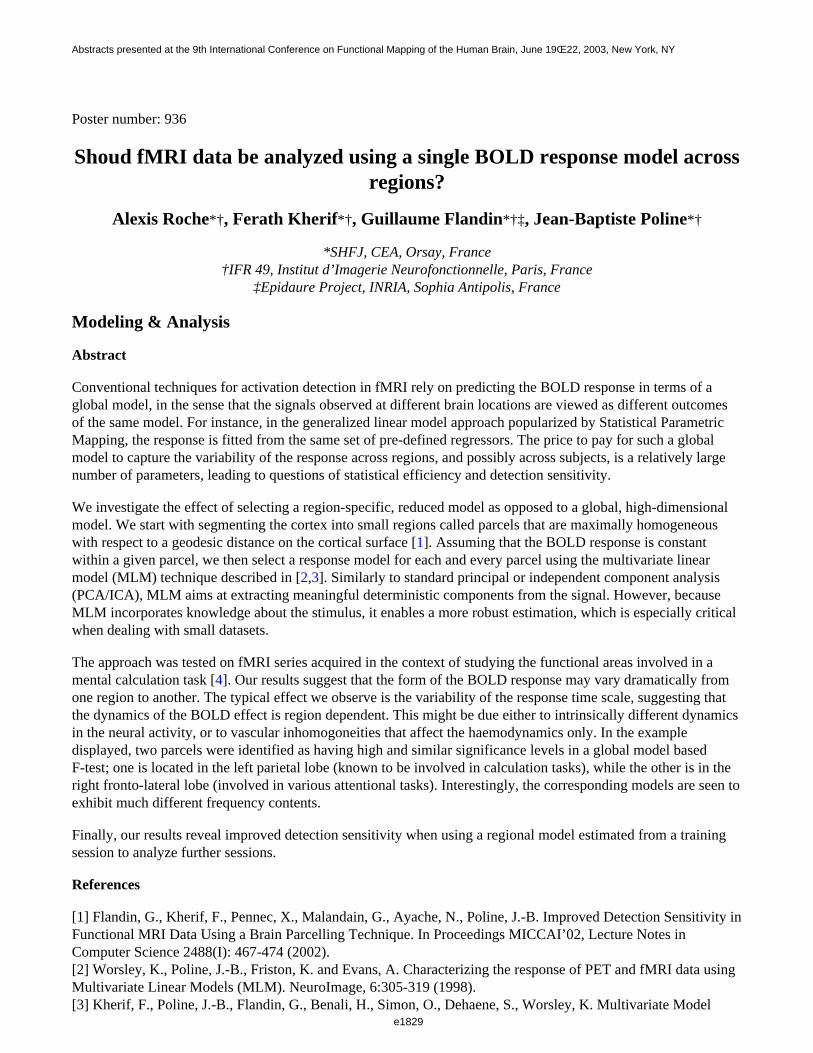
Poster number: 936
Shoud fMRI data be analyzed using a single BOLD response model across regions?
Alexis Roche*†, Ferath Kherif*†, Guillaume Flandin*†‡, Jean-Baptiste Poline*†
*SHFJ, CEA, Orsay, France†IFR 49, Institut d’Imagerie Neurofonctionnelle, Paris, France
‡Epidaure Project, INRIA, Sophia Antipolis, France
Modeling & Analysis
Abstract
Conventional techniques for activation detection in fMRI rely on predicting the BOLD response in terms of aglobal model, in the sense that the signals observed at different brain locations are viewed as different outcomesof the same model. For instance, in the generalized linear model approach popularized by Statistical ParametricMapping, the response is fitted from the same set of pre-defined regressors. The price to pay for such a globalmodel to capture the variability of the response across regions, and possibly across subjects, is a relatively largenumber of parameters, leading to questions of statistical efficiency and detection sensitivity.
We investigate the effect of selecting a region-specific, reduced model as opposed to a global, high-dimensionalmodel. We start with segmenting the cortex into small regions called parcels that are maximally homogeneouswith respect to a geodesic distance on the cortical surface [1]. Assuming that the BOLD response is constantwithin a given parcel, we then select a response model for each and every parcel using the multivariate linearmodel (MLM) technique described in [2,3]. Similarly to standard principal or independent component analysis(PCA/ICA), MLM aims at extracting meaningful deterministic components from the signal. However, becauseMLM incorporates knowledge about the stimulus, it enables a more robust estimation, which is especially criticalwhen dealing with small datasets.
The approach was tested on fMRI series acquired in the context of studying the functional areas involved in amental calculation task [4]. Our results suggest that the form of the BOLD response may vary dramatically fromone region to another. The typical effect we observe is the variability of the response time scale, suggesting thatthe dynamics of the BOLD effect is region dependent. This might be due either to intrinsically different dynamicsin the neural activity, or to vascular inhomogoneities that affect the haemodynamics only. In the exampledisplayed, two parcels were identified as having high and similar significance levels in a global model basedF-test; one is located in the left parietal lobe (known to be involved in calculation tasks), while the other is in theright fronto-lateral lobe (involved in various attentional tasks). Interestingly, the corresponding models are seen toexhibit much different frequency contents.
Finally, our results reveal improved detection sensitivity when using a regional model estimated from a trainingsession to analyze further sessions.
References
[1] Flandin, G., Kherif, F., Pennec, X., Malandain, G., Ayache, N., Poline, J.-B. Improved Detection Sensitivity inFunctional MRI Data Using a Brain Parcelling Technique. In Proceedings MICCAI’02, Lecture Notes inComputer Science 2488(I): 467-474 (2002).[2] Worsley, K., Poline, J.-B., Friston, K. and Evans, A. Characterizing the response of PET and fMRI data usingMultivariate Linear Models (MLM). NeuroImage, 6:305-319 (1998).[3] Kherif, F., Poline, J.-B., Flandin, G., Benali, H., Simon, O., Dehaene, S., Worsley, K. Multivariate Model
e1829
Abstracts presented at the 9th International Conference on Functional Mapping of the Human Brain, June 19Œ22, 2003, New York, NY
e1829
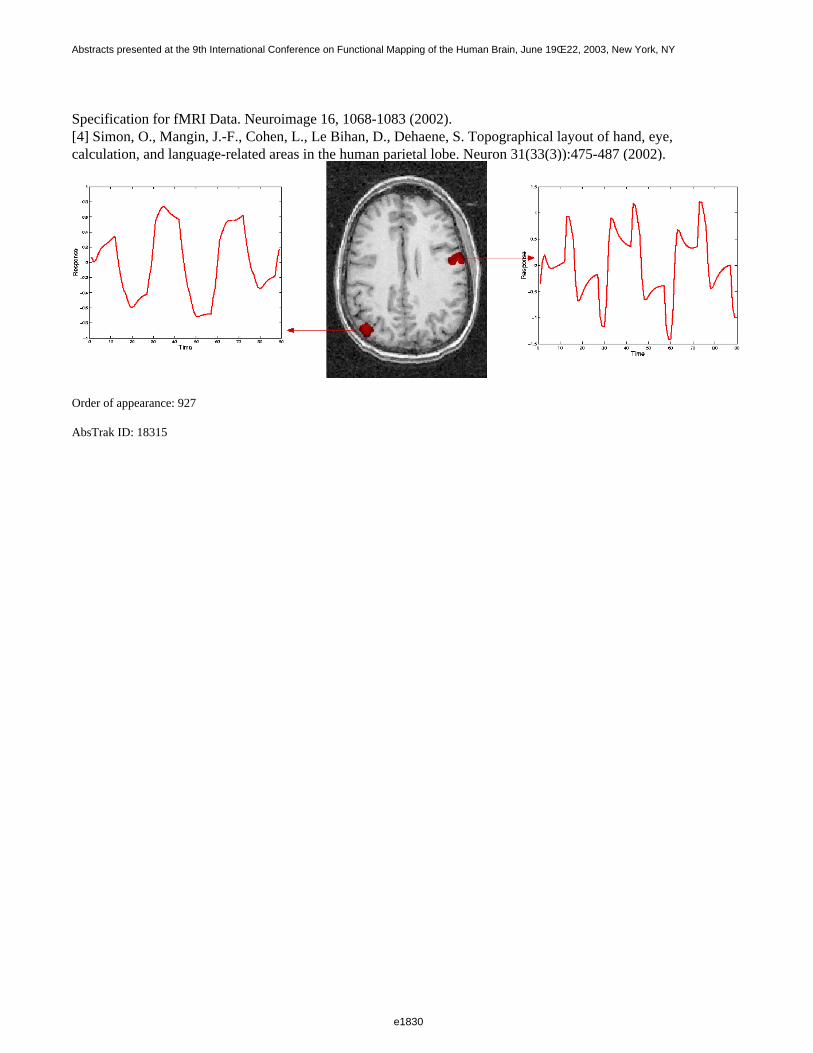
Specification for fMRI Data. Neuroimage 16, 1068-1083 (2002).[4] Simon, O., Mangin, J.-F., Cohen, L., Le Bihan, D., Dehaene, S. Topographical layout of hand, eye,calculation, and language-related areas in the human parietal lobe. Neuron 31(33(3)):475-487 (2002).
Order of appearance: 927
AbsTrak ID: 18315
e1830
Abstracts presented at the 9th International Conference on Functional Mapping of the Human Brain, June 19Œ22, 2003, New York, NY
e1830
Poster number: 937
Two-Stage Least Squares for Structural Equation Modeling of fMRI Data
Baxter P. Rogers, M. Elizabeth Meyerand
Department of Medical Physics, University of Wisconsin-Madison
Modeling & Analysis
Abstract
Introduction
Methods to estimate structural equation models of fMRI data includetwo-stage least squares (TSLS) and maximum likelihood (ML) [1,2,3].ML is more commonly used, for its availability and convenience.However, TSLS offers two theoretical advantages [1]: it does notassume that the data are multivariate normal, and parameter estimatesfor one model equation are guaranteed not to be affected by errors inother parts of the model. FMRI data is often not multivariate normal; also, it is very difficult to be sure that structural models used withfMRI data are correctly specified [3,4].
Using simulated data where true parameter values were known, we soughtsome indication whether the theoretical advantages of TSLS would playout in practice.
Methods
Two-stage least squares estimates the path coefficients of a model oneequation at a time. Each equation of a SEM is of the form
V1 = A2 V2 + A3 V3 + ... + E
where the Vn are variables in the model, the An are the respectivepath coefficients, and E is an error term. Ordinary least squares(OLS) is a biased method of fitting the equation when the model isnonrecursive and reciprocal paths are present, because E may becorrelated with some of the other variables. Two-stage least squaresavoids that bias by the use of instrumental variables (variables thatcan be assumed uncorrelated with E). Variables that cannot be assumeduncorrelated with the error term are replaced with their regression onthe instrumental variables.
Using simulation in R [5], we verified with some simple correctlyspecified, identified models that TSLS and ML both gave correct andconsistent parameter estimates (Figure 1, models A and B). Since oneof the hypothetical advantages of TSLS should appear when the modelthat is assumed for the data is not the model that generated it, wesimulated data using model C and then analyzed the same data with theincorrect model D using both TSLS and ML.
e1831
Abstracts presented at the 9th International Conference on Functional Mapping of the Human Brain, June 19Œ22, 2003, New York, NY
e1831
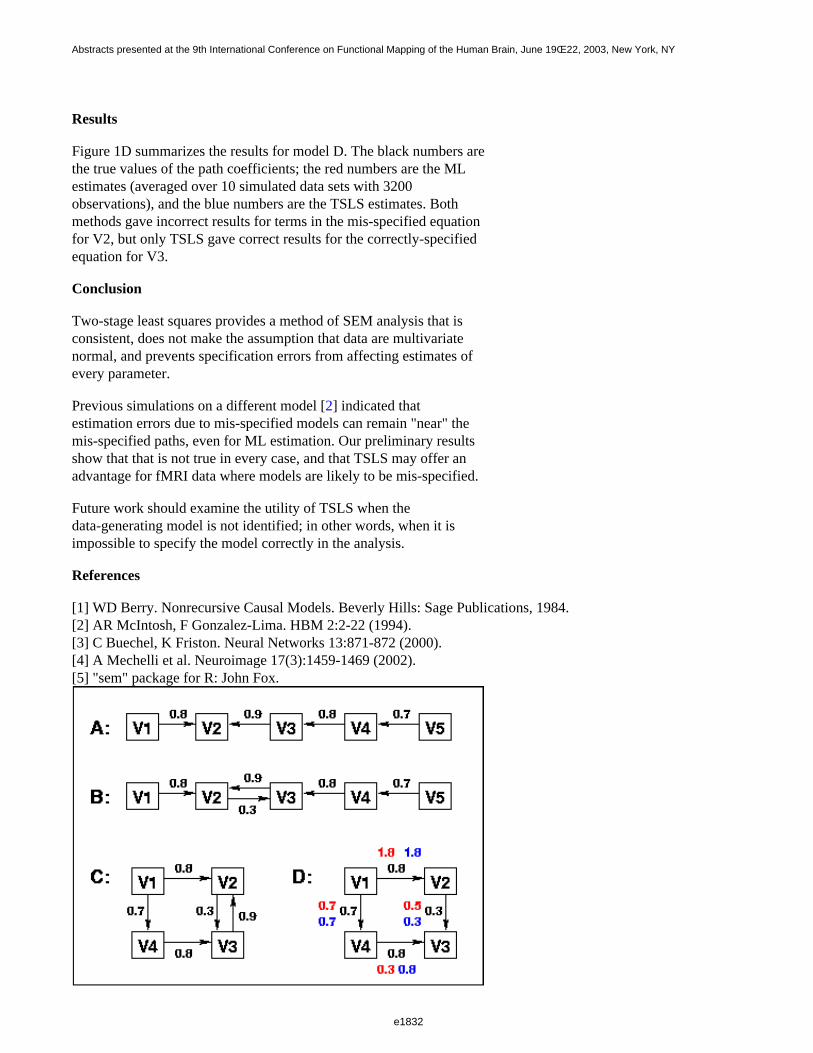
Results
Figure 1D summarizes the results for model D. The black numbers arethe true values of the path coefficients; the red numbers are the MLestimates (averaged over 10 simulated data sets with 3200observations), and the blue numbers are the TSLS estimates. Bothmethods gave incorrect results for terms in the mis-specified equationfor V2, but only TSLS gave correct results for the correctly-specifiedequation for V3.
Conclusion
Two-stage least squares provides a method of SEM analysis that isconsistent, does not make the assumption that data are multivariatenormal, and prevents specification errors from affecting estimates ofevery parameter.
Previous simulations on a different model [2] indicated thatestimation errors due to mis-specified models can remain "near" themis-specified paths, even for ML estimation. Our preliminary resultsshow that that is not true in every case, and that TSLS may offer anadvantage for fMRI data where models are likely to be mis-specified.
Future work should examine the utility of TSLS when thedata-generating model is not identified; in other words, when it isimpossible to specify the model correctly in the analysis.
References
[1] WD Berry. Nonrecursive Causal Models. Beverly Hills: Sage Publications, 1984.[2] AR McIntosh, F Gonzalez-Lima. HBM 2:2-22 (1994).[3] C Buechel, K Friston. Neural Networks 13:871-872 (2000).[4] A Mechelli et al. Neuroimage 17(3):1459-1469 (2002).[5] "sem" package for R: John Fox.
e1832
Abstracts presented at the 9th International Conference on Functional Mapping of the Human Brain, June 19Œ22, 2003, New York, NY
e1832

Order of appearance: 928
AbsTrak ID: 17961
e1833
Abstracts presented at the 9th International Conference on Functional Mapping of the Human Brain, June 19Œ22, 2003, New York, NY
e1833

Poster number: 938
Independent Component Analysis: an effective means for the extraction offetal biomagnetic signals from background noise.
Carlo Salustri*, Giulia Barbati†, Camillo Porcaro†
*Institute of Cognitive Science and Technology (ISTC-CNR), Roma (Italy)†AFaR-Dept. of Neuroscience, St. John Calibita - Fatebenefratelli Hospital, Roma (Italy)
Modeling & Analysis
Abstract
In the present work we propose the application of Independent Component Analysis (ICA) tomagnetocardiographic data recoded from the abdomen of pregnant women. We show that ICA is a powerfulmeans for the extraction of the magneto-cardiographic signals from the background noise and for a sharpseparation of the the baby’s hearts from the mother’s.
ICA works on the principle that if N sensors record the topographical distribution of a total signal, up to Nstatistically independent sources contributing to that signal can be identified and delivers the full time course oftheir projections on the total data.
In our measurements we used 28 magneto-cardiographic sensors: they delivered the distribution of the totalmagnetic field over the mother’s abdomen in the form of 28 recorded traces x1(t) …… x28(t), each one of whichrepresents a weighted mixture of the contributions of 28 statistically independent sources s1(t) …… s28(t). Inother words, our recordings can be written as
x1(t) = a1,1 s1(t) + a1,2 s2(t) + ………. + a1,28 s28(t)
x2(t) = a2,1 s1(t) + a2,2 s2(t) + ………. + a2,28 s28(t)
.
.
x28(t) = a28,1 s1(t) + a28,2 s2(t) + ………. + a28,28 s28(t)
or in matrix notation
X = A S
The matrix A is unknown and is called the ‘mixing’ matrix since it mixes up the independent sources S. ICAestimates the matrix A that best delivers statistical independence of the sources S.
ICA works well with biomagnetic data since the technique assumes the mixing process to be linear and stationary:contrary to electric potentials, magnetic fields generated by biological sources are in most situations virtually notdistorted by the presence of human tissues so that in the low frequency range of interest for us linearity andstationarity simply follow from the quasi-static approximation of the Maxwell equation.
As we submit the present abstract we are also investigating the possibility that some of the high-rank IndependentComponents extracted with the above described procedure may provide a description of the cerebral activity ofthe fetus. We intend to report on this issue at the conference.
e1834
Abstracts presented at the 9th International Conference on Functional Mapping of the Human Brain, June 19Œ22, 2003, New York, NY
e1834

Order of appearance: 929
AbsTrak ID: 18990
e1835
Abstracts presented at the 9th International Conference on Functional Mapping of the Human Brain, June 19Œ22, 2003, New York, NY
e1835
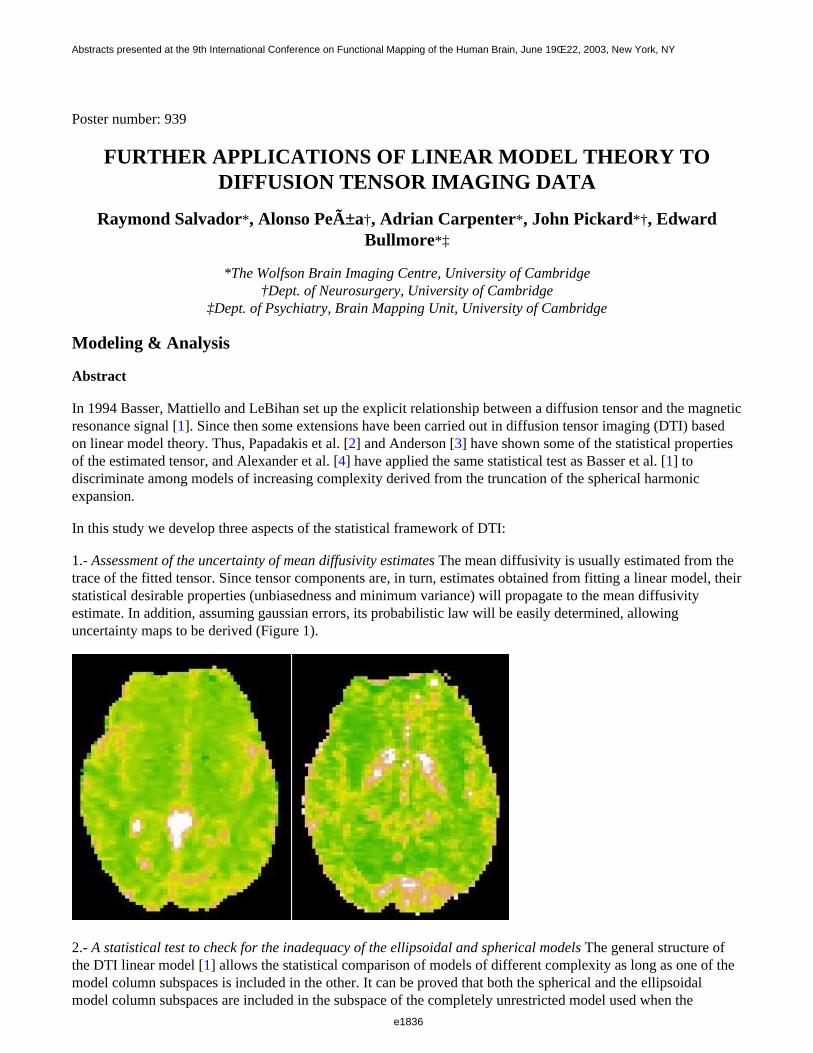
Poster number: 939
FURTHER APPLICATIONS OF LINEAR MODEL THEORY TODIFFUSION TENSOR IMAGING DATA
Raymond Salvador*, Alonso Peña†, Adrian Carpenter*, John Pickard*†, Edward Bullmore*‡
*The Wolfson Brain Imaging Centre, University of Cambridge†Dept. of Neurosurgery, University of Cambridge
‡Dept. of Psychiatry, Brain Mapping Unit, University of Cambridge
Modeling & Analysis
Abstract
In 1994 Basser, Mattiello and LeBihan set up the explicit relationship between a diffusion tensor and the magneticresonance signal [1]. Since then some extensions have been carried out in diffusion tensor imaging (DTI) basedon linear model theory. Thus, Papadakis et al. [2] and Anderson [3] have shown some of the statistical propertiesof the estimated tensor, and Alexander et al. [4] have applied the same statistical test as Basser et al. [1] todiscriminate among models of increasing complexity derived from the truncation of the spherical harmonic expansion.
In this study we develop three aspects of the statistical framework of DTI:
1.- Assessment of the uncertainty of mean diffusivity estimates The mean diffusivity is usually estimated from thetrace of the fitted tensor. Since tensor components are, in turn, estimates obtained from fitting a linear model, theirstatistical desirable properties (unbiasedness and minimum variance) will propagate to the mean diffusivityestimate. In addition, assuming gaussian errors, its probabilistic law will be easily determined, allowinguncertainty maps to be derived (Figure 1).
2.- A statistical test to check for the inadequacy of the ellipsoidal and spherical models The general structure ofthe DTI linear model [1] allows the statistical comparison of models of different complexity as long as one of themodel column subspaces is included in the other. It can be proved that both the spherical and the ellipsoidalmodel column subspaces are included in the subspace of the completely unrestricted model used when the
e1836
Abstracts presented at the 9th International Conference on Functional Mapping of the Human Brain, June 19Œ22, 2003, New York, NY
e1836
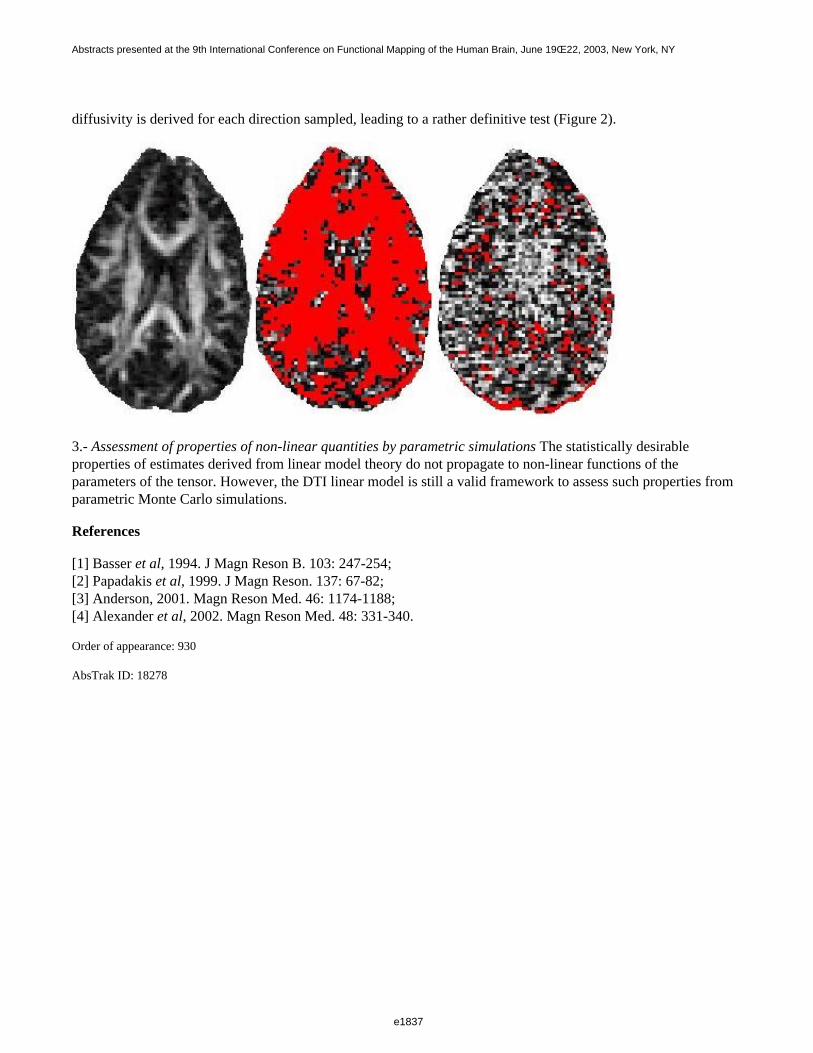
diffusivity is derived for each direction sampled, leading to a rather definitive test (Figure 2).
3.- Assessment of properties of non-linear quantities by parametric simulations The statistically desirableproperties of estimates derived from linear model theory do not propagate to non-linear functions of theparameters of the tensor. However, the DTI linear model is still a valid framework to assess such properties fromparametric Monte Carlo simulations.
References
[1] Basser et al, 1994. J Magn Reson B. 103: 247-254;[2] Papadakis et al, 1999. J Magn Reson. 137: 67-82;[3] Anderson, 2001. Magn Reson Med. 46: 1174-1188;[4] Alexander et al, 2002. Magn Reson Med. 48: 331-340.
Order of appearance: 930
AbsTrak ID: 18278
e1837
Abstracts presented at the 9th International Conference on Functional Mapping of the Human Brain, June 19Œ22, 2003, New York, NY
e1837
Poster number: 940
Recent Trends in MRI Brain-Tissue Segmentation
Kirt Schaper*, Kelly Rehm†, Joshua Stern*, David A. Rottenberg*†
*Department of Neurology, University of Minnesota, USA†Department of Radiology, University of Minnesota, USA
Modeling & Analysis
Abstract
MRI image segmentation plays a key role in a variety of image processing applications including cortical surfaceextraction, the determination of cortical thickness and substructure volumes, intersubject and cross-modalityregistration, partial volume correction for radioisotope studies, and longitudinal studies of cerebral atrophy.
Numerous techniques with different data requirements and algorithmic assumptions have been employed for thispurpose. In order to characterize the tissue segmentation algorithms used by the neuroimaging researchcommunity, we reviewed the recent biomedical literature and classified these algorithms along four dimensions of interest.
Methods
Peer-reviewed papers describing brain-tissue segmentation listed in Ovid Full Text for the period 1999.01.01 -2002.12.31 were selected, and the segmentation algorithms classified according to: the number of input MRIvolumes, e.g., T1, T2, proton-density (PD), diffusion-weighted (DW); degree of automaticity; output type ("hard"or "fuzzy" segmentation); and the amount of external information required (e.g., seed locations, templatevolumes, probabilistic atlases). Algorithms with mixed-tissue classes were treated as intermediate on the fuzzinessscale, as were algorithms which produced bimodal tissue-fraction histograms.
Results/Discussion
There was no clear trend regarding the number of input volumes (typically T1, T1+T2, or T1+T2+PD). Althoughone might expect that the use of multiple input volumes would result in an increased ability to determine thefractional tissue content per voxel, there was no obvious correlation between the number of input volumesemployed and the type of output produced, i.e., hard or fuzzy, and those methods which utilized more than threeinput volumes produced hard segmentations. We were surprised to discover that the majority of algorithmsproduced hard segmentations - in spite of the fact that, given the highly convoluted cerebral cortex with athickness of 3-5 mm, significant volume averaging occurs even within isotropic 1 mm voxels. Although mostalgorithms employed unsupervised clustering or histogram thresholding techniques and did not require externalinputs, the use of such inputs, e.g., the ICBM probabilistic atlas, to guide the segmentation appears to be increasing.
This work was supported in part by NIH grant MH57180.
e1838
Abstracts presented at the 9th International Conference on Functional Mapping of the Human Brain, June 19Œ22, 2003, New York, NY
e1838
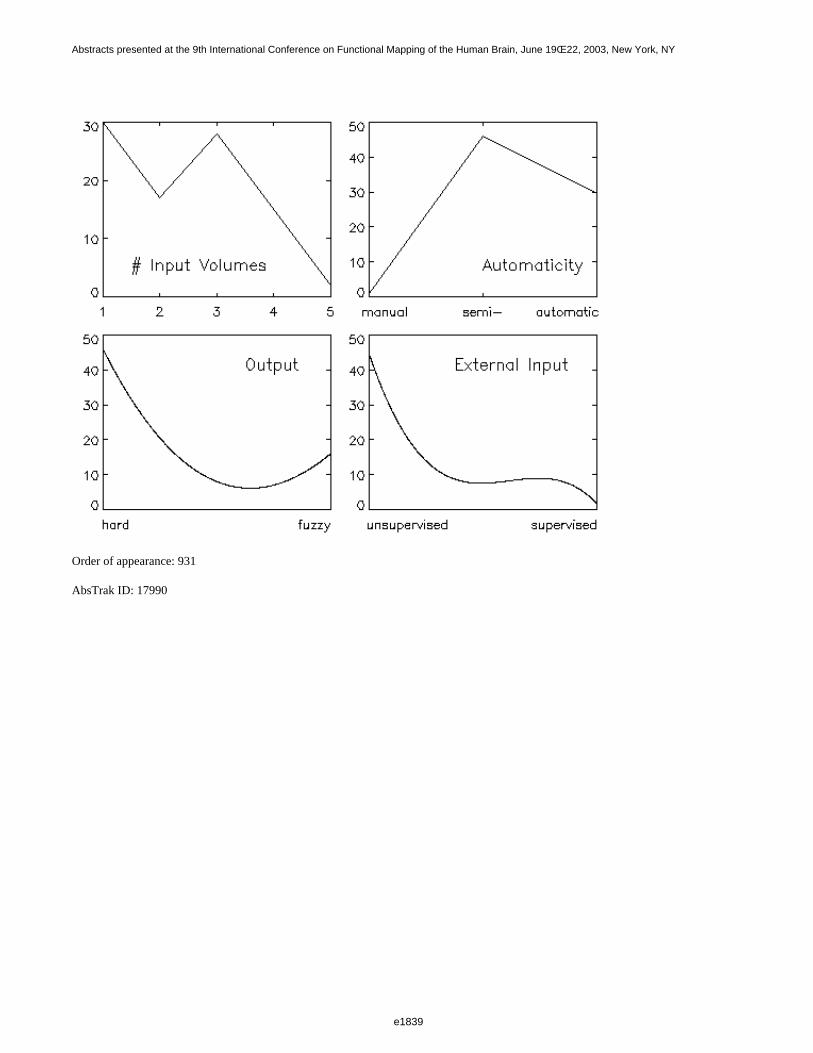
Order of appearance: 931
AbsTrak ID: 17990
e1839
Abstracts presented at the 9th International Conference on Functional Mapping of the Human Brain, June 19Œ22, 2003, New York, NY
e1839
Poster number: 941
When motion matters: An intra-individual comparison of event-relatedand block fmri-designs for mapping of eloquent brain areas
Lukas Scheef, Thomas Profitlich, Christiane Kuhl, Hans Schild
Dep. of Radiology, Univ. of Bonn, Germany
Modeling & Analysis
Abstract
Introduction:
Even though fMRI has been shown to be a reliable tool for mapping brain function, the application of fMRI in aclinical setting remains a challenge, the major issue being the impaired compliance of patients compared tovolunteers. Training might reduce this problem but can not entirely solve it. Especially if motor function isinvolved the situation becomes more difficult, because paradigm correlated gross head motion decreases both,sensitivity and specificity of fMRI. Other paradigms have to be modified in order to avoid artefacts and maybecome difficult to train or to control during the scanning session (overt vs. silent word generation tasks).
Aim of our study was to investigate whether event related designs can help alleviate the loss of statistical powerthat goes along with paradigm related noise in block design fMRI.
Material and Methods:
For 20 right handed volunteers we mapped motor and language functions using two different paradigms that arewell known to go along with gross motion (paradigm 1) or with relevant phase shift artifacts (paradigm 2):Paradigm 1 was a fist-clenching paradigm for mapping motor function; paradigm 2 was an overt speech paradigmto assess the main language areas and (additionally) the primary motor function. In the volunteers either the motor(10/20) or the language paradigm (10/20) were performed, using a block design (self-paced, 30sec on, 30sec off, 6blocks) and event-related designs. The latter were performed four times with different SOAS’s (7.5 / 10.5 / 13.5 /17.5sec) in four separate scanning sessions. In all four event-related runs, the stimulus duration was kept constant(3 sec). A T1-weigthed, 3D-FFE-data set was acquired as anatomical reference. All data were preprocessed andanalyzed using SPM99. For all data a fixed threshold of p<0.05 (corrected) was used. All experiments whereperformed on a 1.5 Tesla MR (Philips-Gyroscan Intera, 23mT/m, rise-time 0.2 sec). Scan parameters: GE,TR/TE/Flip= 3000/ 50/ 90° (fMRI); 3D-FFE; TR/TE/Flip= 25/1.71/ 30 (structural).
Results:
All event-related designs proved superior to the block design. For all SOA’s the ER-design achieved higherT-values compared to the block design, even though the total stimulus duration was constant for all paradigms.The advantage of the event related compared to block design became especially apparent for assessing languagefunction: The success rates were 3/10 for block design, compared to 9/10 of the event related.
Discussion:
Even though under optimal conditions a block design has the highest power for detection of main-effects, ifparadigm correlated noise sources are present, event related designs proved superior to ’conventional’ blockdesigns. Because paradigm correlated noise is one of the biggest problems when fMRI is applied in a clinicalsituation, event related designs appear to be mandatory for reliable mapping of eloquent brain regions in
e1840
Abstracts presented at the 9th International Conference on Functional Mapping of the Human Brain, June 19Œ22, 2003, New York, NY
e1840

(presurgical) patients.
Order of appearance: 932
AbsTrak ID: 18735
e1841
Abstracts presented at the 9th International Conference on Functional Mapping of the Human Brain, June 19Œ22, 2003, New York, NY
e1841
Poster number: 942
JohnDoe: Anonymizing MRI Data for the Protection of Research Subject Confidentiality
David Shattuck*, David E. Rex*, Felix Darvas†, Richard Leahy†, Arthur W. Toga*
*UCLA Laboratory of Neuro Imaging†USC Signal and Image Processing Institute
Modeling & Analysis
Abstract
Recent changes in the guidelines for research on human subjects have increased the requirements for protectingthe anonymity of those individuals. In certain instances, surfaces produced from high-quality MRI may bearenough resemblance to the actual physiognomy to compromise the anonymity of some subjects. We present anovel approach that alters the data near the scalp to obscure subject identity in T1-weighted MRI. The methodpreserves the brain data, allowing the anonymized volumes to be used in various neuroimaging studies.
Our method builds upon our previous segmentation work for brain[1] and skull and scalp[2]. We first extract thebrain using the Brain Surface Extractor (BSE), and identify a scalp mask using the method we described in [2].Using a sequence of morphological operators, we next generate a target binary scalp mask from the original mask.These operators expand the mask in regions of concavity, distorting the nose and cheekbones, as well as theorbits. We also generate a protection mask by eroding the original scalp mask, then taking the union of the erodedmask with the original brain mask. The voxels in the protected mask are not altered by our anonymization procedure.
We define the set difference between the protected mask and the target scalp to be our deformation region. Usinga deformable mesh, we generate a field that maps the voxels in the deformation region to points in the originalscalp volume. Each node in the mesh represents a voxel in the deformation region and is connected to the nodesrepresenting its face-adjacent voxels. We next apply two forces to the mesh. The first drives each point toward theoriginal scalp surface; the second pushes each mesh toward the centroid of it neighbors, keeping the mesh fromundergoing sharp deformations. The MRI data at the final positions of the nodes are mapped back to thecorresponding voxels using tri-linear interpolation. This result is then filtered at the edges to produce a smoothertransition at the new edge of the scalp.
We implemented the anonymization procedure as a C++ program called JohnDoe. We integrated it with BSE andthe scalp identification procedure as a module in the LONI Pipeline Processing Environment [3]. We processed59 volumes using JohnDoe and compared the similarity of skull stripping applied before and after the procedure.In each case, the same parameters were used for the original and anonymized MRI. The average of the Dicesimilarity coefficients for each pair was 0.9991±0.0027, showing very close agreement. We are currentlyconducting a human recognition study as well as analyzing the effects of our method on MEG/EEG sourcelocalization results using BrainStorm[4].
References
[1] Shattuck et al. (2001) MRI tissue classification using a partial volume model NeuroImage 13 (5):856-876.[2] Dogdas et al., (2002) Segmentation of skull in 3D human MRI using mathematical morphology Proc. SPIE 4684:1553-1562[3] Toga et al. (2001) A graphical interoperable processing pipeline NeuroImage 13(6):S266.[4] Baillet et. al. (1999) Brainstorm: A Matlab toolbox for the processing of MEG and EEG signals NeuroImage
e1842
Abstracts presented at the 9th International Conference on Functional Mapping of the Human Brain, June 19Œ22, 2003, New York, NY
e1842
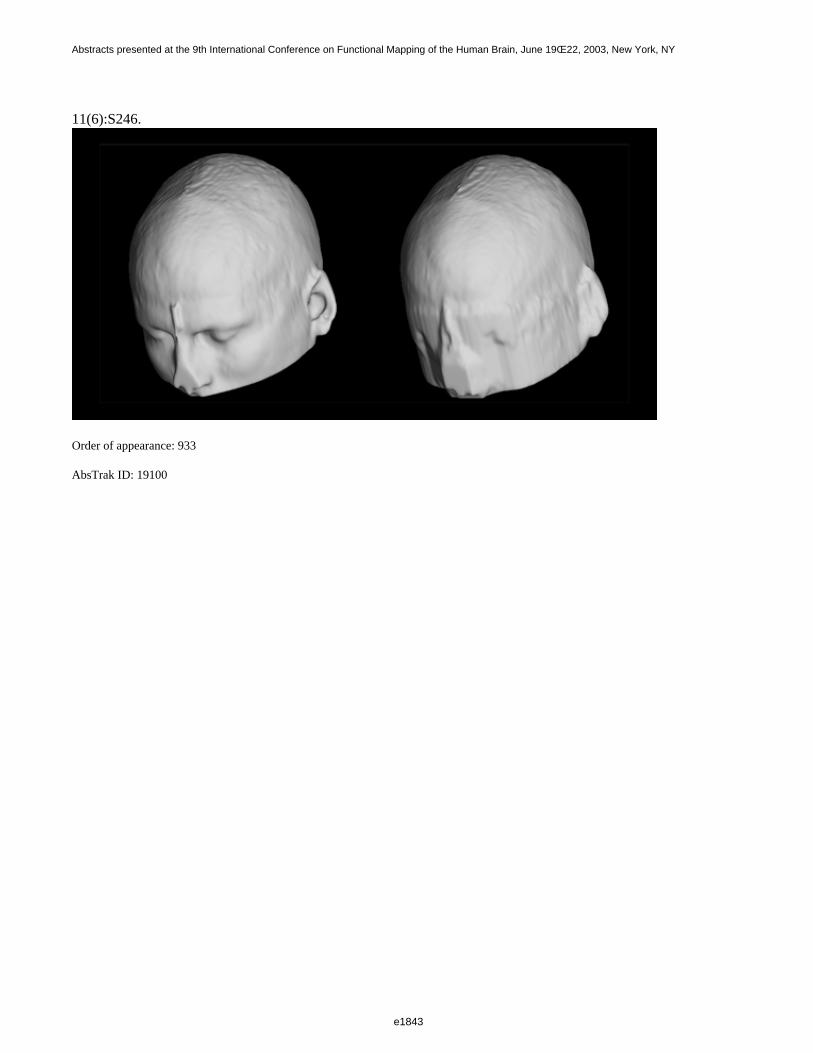
11(6):S246.
Order of appearance: 933
AbsTrak ID: 19100
e1843
Abstracts presented at the 9th International Conference on Functional Mapping of the Human Brain, June 19Œ22, 2003, New York, NY
e1843
Poster number: 943
Evaluating functional neuroimaging results: A comparison of ROCmethods and data-driven performance metrics
M.E. Shaw*†, A.B. Waites†, S.C. Strother‡
*Brain Sciences Institute, Melbourne, Australia†Brain Research Institute, Melbourne, Australia
‡VA Medical Center and University of Minnesota, Minneapolis, USA
Modeling & Analysis
Abstract
This study was motivated by a need to objectively evaluate the quality and validity of functional neuroimagingresults. Such evaluation is important to ensure that neuroimaging results are suitable for neuroscientificinterpretation. To evaluate results, receiver-operating characteristic (ROC) curves (i.e. summaries of true/falsepositive rates) are often used but they can generally only be applied to simulated data (where the ground truth isknown). Performance metrics, introduced recently by Strother et al., are an alternative to ROC methods [1,2]. Themetrics are generated using cross-validation resampling and are thought to reflect the validity and quality ofresults. This study compares, for the first time, the use of the performance metrics in comparison to standard ROC methods.
Methods
We investigated the relative evaluation of functional neuroimaging results with (a) ROC methods and (b)data-driven performance metrics. The evaluation methods were compared on the basis of their application to asimulated data set, smoothed with four different spatial filters (3D Gaussian, 4/8/12/20 FWHM). Multivariateanalyses were carried out using NPAIRS, an analysis framework developed recently by Strother et al [1]. For eachanalysis, NPAIRS was used to generate spatial pattern reproducibility (SPR) and prediction probability (PP)metrics. The ’optimal’ analysis was defined as that with the two metrics closest to (SPR,PP=1,1) i.e. the locationwith perfect prediction ability and infinite signal-to-noise. False/true positive rates were also measured for eachanalysis and ROC curves were plotted. For the ROC curves, the ’optimal’ analysis was defined as that with thegreatest area under the ROC curve.
e1844
Abstracts presented at the 9th International Conference on Functional Mapping of the Human Brain, June 19Œ22, 2003, New York, NY
e1844
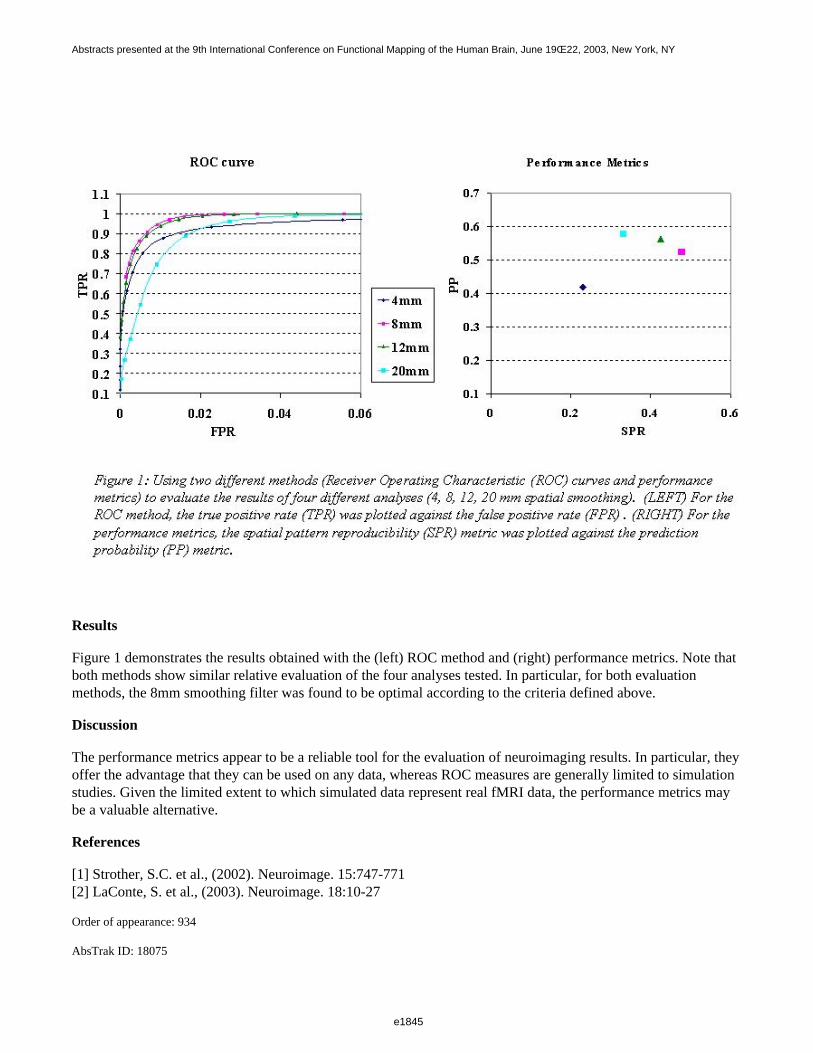
Results
Figure 1 demonstrates the results obtained with the (left) ROC method and (right) performance metrics. Note thatboth methods show similar relative evaluation of the four analyses tested. In particular, for both evaluationmethods, the 8mm smoothing filter was found to be optimal according to the criteria defined above.
Discussion
The performance metrics appear to be a reliable tool for the evaluation of neuroimaging results. In particular, theyoffer the advantage that they can be used on any data, whereas ROC measures are generally limited to simulationstudies. Given the limited extent to which simulated data represent real fMRI data, the performance metrics maybe a valuable alternative.
References
[1] Strother, S.C. et al., (2002). Neuroimage. 15:747-771[2] LaConte, S. et al., (2003). Neuroimage. 18:10-27
Order of appearance: 934
AbsTrak ID: 18075
e1845
Abstracts presented at the 9th International Conference on Functional Mapping of the Human Brain, June 19Œ22, 2003, New York, NY
e1845
Poster number: 944
Investigation of time-varying activation using State-Space Models
Ipsita Sinha*†, Dr. Richard Wise*, Professor Mike Brady†, Dr. Mark Woolrich*
*Centre for Functional Magnetic Resonance Imaging of the Brain, Oxford University†Medical Vision Laboratory, Robotics Research Group, Department of Engineering Science, Oxford University
Modeling & Analysis
Abstract
Introduction
Most statistical methods for assessing activated voxels in fMRI assume that activation remains constant betweensuccessive stimuli. In contrast, in (1), a dynamic approach is taken that makes few assumptions about theactivation level allowing assessment of the time-varying effects of stimulation. In our work, a subset of the modelproposed by (1) is implemented. The activation level is inferred under a fully Bayesian framework using MCMCsampling. Here, we test the method by examining the time-varying effect of the pain-killer drug Remifentanil onthe magnitude of the haemodynamic response arising from application of painful stimuli.
Methods
We use a temporal dynamic linear model with the activation level modelled as a Gaussian random walk of first order.
where y it is the intensity at voxel i at scan t of fMRI series where there are t=1,..,n scans, x kt is the kthexplanatory variable convolved with the assumed haemodynamic response at the t-th timepoint. Using a fullyBayesian approach, we can infer on the parameter of interest a it by incorporating all the uncertainity in unknown
parameters, W and V. Thus, temporal smoothing of the time series is data-driven and determined adaptively usingGibbs sampling.
The example dataset was drawn from a study by (2), in which a noxious thermal stimulation was combined with asingle infusion and washout of Remifentanil, a short acting opioid analgesic agent. The temporal profile of theconcentration of Remifentanil, estimated from the pharmokinetic model, is shown in figure 1a. Using our model,we estimate the variation in activation level without knowledge of the temporal profile of the drug concentration,and compare the results with the drug’s temporal concentration over time.
Results and Discussion
A cluster of pain-active voxels from the insular cortex was chosen and examined to see whether it correlated withdrug concentration levels (figure 1). The two vertical lines from left to right on the graphs in figure 1 indicate thebeginning and end of drug infusion.
e1846
Abstracts presented at the 9th International Conference on Functional Mapping of the Human Brain, June 19Œ22, 2003, New York, NY
e1846
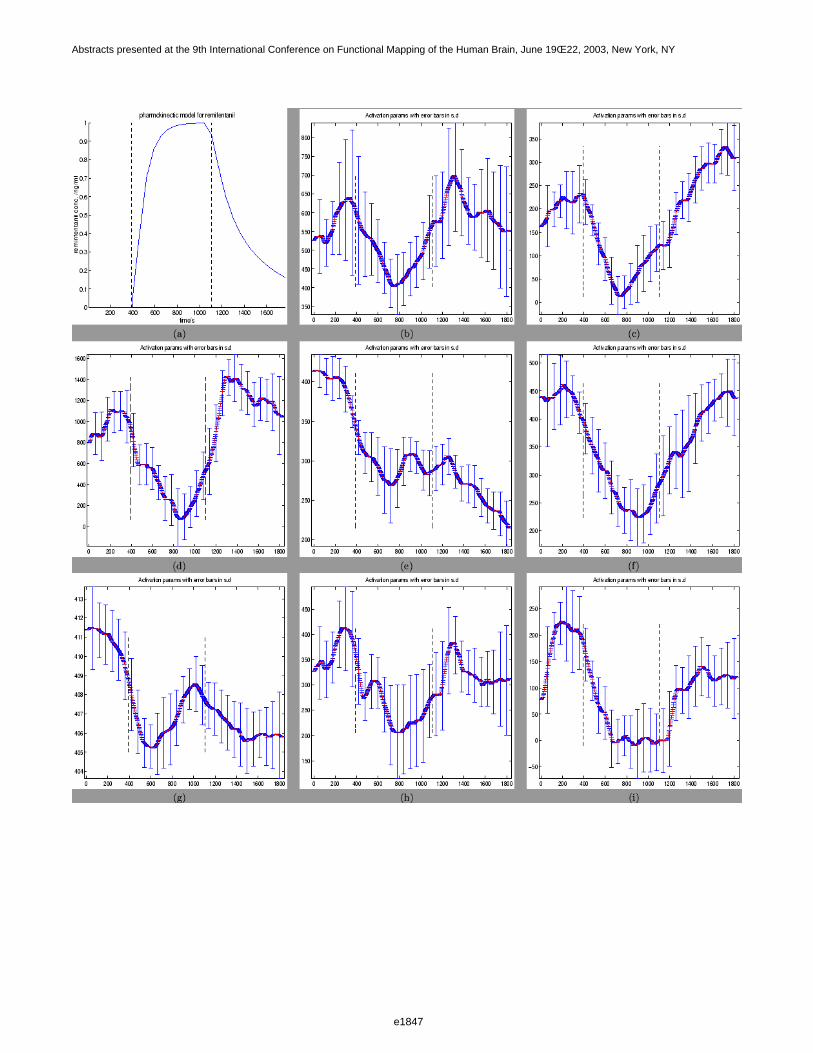
e1847
Abstracts presented at the 9th International Conference on Functional Mapping of the Human Brain, June 19Œ22, 2003, New York, NY
e1847
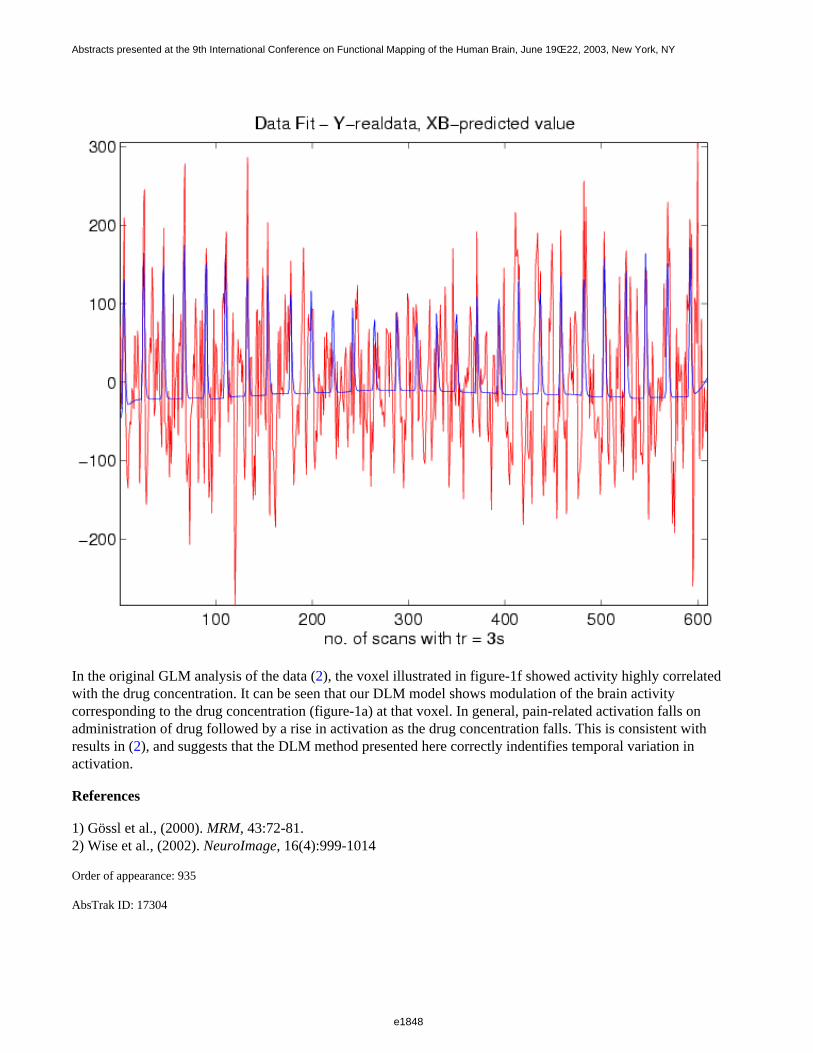
In the original GLM analysis of the data (2), the voxel illustrated in figure-1f showed activity highly correlatedwith the drug concentration. It can be seen that our DLM model shows modulation of the brain activitycorresponding to the drug concentration (figure-1a) at that voxel. In general, pain-related activation falls onadministration of drug followed by a rise in activation as the drug concentration falls. This is consistent withresults in (2), and suggests that the DLM method presented here correctly indentifies temporal variation in activation.
References
1) Gössl et al., (2000). MRM, 43:72-81.2) Wise et al., (2002). NeuroImage, 16(4):999-1014
Order of appearance: 935
AbsTrak ID: 17304
e1848
Abstracts presented at the 9th International Conference on Functional Mapping of the Human Brain, June 19Œ22, 2003, New York, NY
e1848
Poster number: 945
The Reproducibility of Functional Connectivity Maps Calculated UsingLow Frequency Correlations in the Steady State MRI Time Series.
Pawel Skudlarski*, Naomi Driesen*, Bruce Wexler†, R. Todd Constable*§, John Gore§
*Yale University, Department of Diagnostic Radiology†Yale University, Department of Psychiatry
‡Yale University, Department of Neurosurgery§Vanderbilt University
Modeling & Analysis
Abstract
Introduction
Temporal correlations in the low frequency oscillations of the BOLD signal in the MRI time series are ofconsiderable interest as they may provide new insights into the functional connectivity of the human brain.Correlations are observed in steady states series of MRI images between distant but functionally connectedregions of the brain. They have been shown to be modified by various activation conditions. The origin of thosecorrelations is not well understood and their neuronal origin has not yet been definitively proven. The authorsbelieve that they are caused by vasomotion (low frequency oscillations in the blood flow) that are modified byneuronal activity.
In this work the between-session reproducibility of those correlations is studied to improve our understanding ofsuch correlations and optimize the analytic conditions to study them.
Method
Study design
3 normal control subjects were scanned in two separate sessions run with the same imaging protocol. Each studysession contained 2 runs that interleaved blocks of working memory (3 back) task with control (0 back) task.These block-designed runs were used to localize regions involved in working memory processing. Then 10"steady" state runs were collected while the subject was resting (5 runs) and while each subject was continuouslyperforming a working memory (3 back) task.
Imaging
Imaging parameters were: single shot echo planar imaging TR = 1500 ms, TE = 45ms, flip angle = 60¢ª, FOV =20x20 cm, resolution 64x64 pixels, 16 axial slices, slice thickness 8 mm.
Data analysis
For each subject 4 regions of interest were defined in BA9, BA46, supramarginal gyrus and motor cortex in bothhemispheres. The ROIs were defined using activation maps from block design runs overlaid on the anatomical image.
e1849
Abstracts presented at the 9th International Conference on Functional Mapping of the Human Brain, June 19Œ22, 2003, New York, NY
e1849

The steady state runs were filtered using low pass filters at various cutoff frequencies between 0.3 and 0.05 Hz.For each of the predefined regions the average intensity time course was calculated. These time courses were usedto create maps of correlation using direct correlation or partial correlation to remove global effects. Motioncorrection was applied with or without decorrelation of the motion parameters.
The ¡°similarity¡± of two correlation maps was measured by calculating the correlation coefficient of those maps(this time correlation was calculated in spatial domain).
The reproducibility of the correlation maps was calculated for maps obtained from the same subject in twodifferent scanning sessions taken on different days. The measure of similarity of these maps was used to establishits significance and to compare various processing strategies.
Results
The similarities between correlation maps from different sessions of the same subjects were significant (p<0.001)and maps created in the same condition were significantly (p<0.001) more similar than maps created in differentconditions. More importantly, the maps of differences in correlation strength in two brain states was reproducible(p<0.001), indicating that correlation maps have a significant component that is affected by performing theworking memory task. This implies a direct relationship between the correlation maps and some level of cognitive activity.
Order of appearance: 936
AbsTrak ID: 18387
e1850
Abstracts presented at the 9th International Conference on Functional Mapping of the Human Brain, June 19Œ22, 2003, New York, NY
e1850
Poster number: 946
An Infrastructure For Securely Sharing Neuroimagery
Ken Smith, Monica Carley, Todd Cornett, Jeff Hoyt
The MITRE Corporation
Modeling & Analysis
Abstract
We describe an information infrastructure designed around a coherent "policy space" to enable neuroimagerysharing in a controlled yet straightforward manner. Data sharing options are frequently binary, that is: one eithershares nothing, or shares their data with a wide audience with little restriction (e.g. via a public database). Whileemail and file sharing systems (e.g. Napster, KaZaA, Gnutella) are more selective, there is no guarantee a dataowner’s specific sharing policy will be recognized and enforced. In addition, since the scope of sharing typicallygrows with time, such disparate strategies do not enable a graceful evolution of sharing to wider and wider circlesas appropriate. Finally, many data management systems for neuroimagery are being developed, both public andprivate, but they do not share a common "language" in which data owners can express their data sharing intent forany such system which may host their data.
We believe a single "space" of incremental data sharing options will a) free users from a binary "all-or-nothing"sharing situation, b) enable graceful evolution of data sharing approaches over time and events, and c) overcome asource of heterogeneity in emerging neuroimagery management environments and tools. We present five gradedsharing options (or "labels") ranging from fully private to fully public, including common options such aspeer-to-peer. We also describe a set of open-source tools in which this space is embedded, including a GUI for"drag and drop" assignment of sharing labels to datasets, a simple "sharing-aware" database tailored forneuroimagery, a "marketplace" application for posting dataset synopses to a limited community, and a query andadministration tool which recognizes the sharing status of data items and limits access accordingly.
Order of appearance: 937
AbsTrak ID: 18774
e1851
Abstracts presented at the 9th International Conference on Functional Mapping of the Human Brain, June 19Œ22, 2003, New York, NY
e1851
Poster number: 947
Interindividual Variability in the Cortex-to-Scalp Distance
J Sommer*, O Steinsträter*, C Breitenstein*, A Jansen*, C Konrad*, M Deppe*, A Foerster†, S Knecht*, E B Ringelstein*
*Department of Neurology, University of Münster, Germany†Department of Radiology, University of Bochum, Germany
Modeling & Analysis
Abstract
Introduction:
Studies using transcranial magnetic stimulation (TMS) to inhibit or facilitate motor, visual, or cognitive functionsare faced with the problem of determining optimal stimulation intensity. The generally accepted procedure is toapply a fraction of the subject’s individual motor threshold (MT), even when the motor cortex is not the area ofexperimental stimulation. The relationship of MT to thresholds of other cortical areas has not yet been thoroughlyinvestigated. The issue is of high priority because of the frequently observed inconsistent results obtained withidentical TMS parameters (cf., Cappa et al., 2002; Rossi et al., 2001). McDonnell et al. (2001) examined therelationship between MTs and distance from the coil to motor and prefrontal cortices and found that thevariability of MTs could be explained with differences in the scalp-cortex distance. In the present investigation,we aimed to extend the findings by McDonnell et al. (2001) by determining the scalp-to-cortex distance for avariety of cortex locations using an automated software developed in our laboratory. This will help to adjust TMSintensities more accurately at varying locations in future studies.
Methods:
Structural MRIs were assessed for 5 healthy adults (4 female, age 20-26). Nasion, inion, left and rightpre-auricular positions were determined manually. The 10-20-coordinates of the international 10-20 EEG system(cf., Figure 1) were computed with software written in our department.
MRIs were segmented using the segmentation procedure of SPM99. The distance between scalp and underlyingcortex surface was calculated with our software.
Results/Discussion:
Figures 2 and 3 display the individual scalp-to-cortex distances of the subjects for different locations of the 10-20 system.
There were no consistent correlations of distances for different locations for any of the subjects. This is mostobvious in Figure 4, where the changes in distance are displayed relative to C3, which is the approximate locationof the left hand motor cortex. For subjects ks_103 and ks_108, the distance increases at F3, whereas a decrease isseen for subject ks_107.
Conclusion:
The distance between cortex and scalp varies widely within and between subjects. Motor thresholds determinedover the motor cortex is thus not a reliable indicator for TMS intensities at other scalp locations. This may explainwhy TMS results vary in size and effect for – seemingly- identical stimulation parameters. Our results show thatassessing Motor thresholds alone is not sufficient when stimulating areas other than the motor cortex. Our
e1852
Abstracts presented at the 9th International Conference on Functional Mapping of the Human Brain, June 19Œ22, 2003, New York, NY
e1852
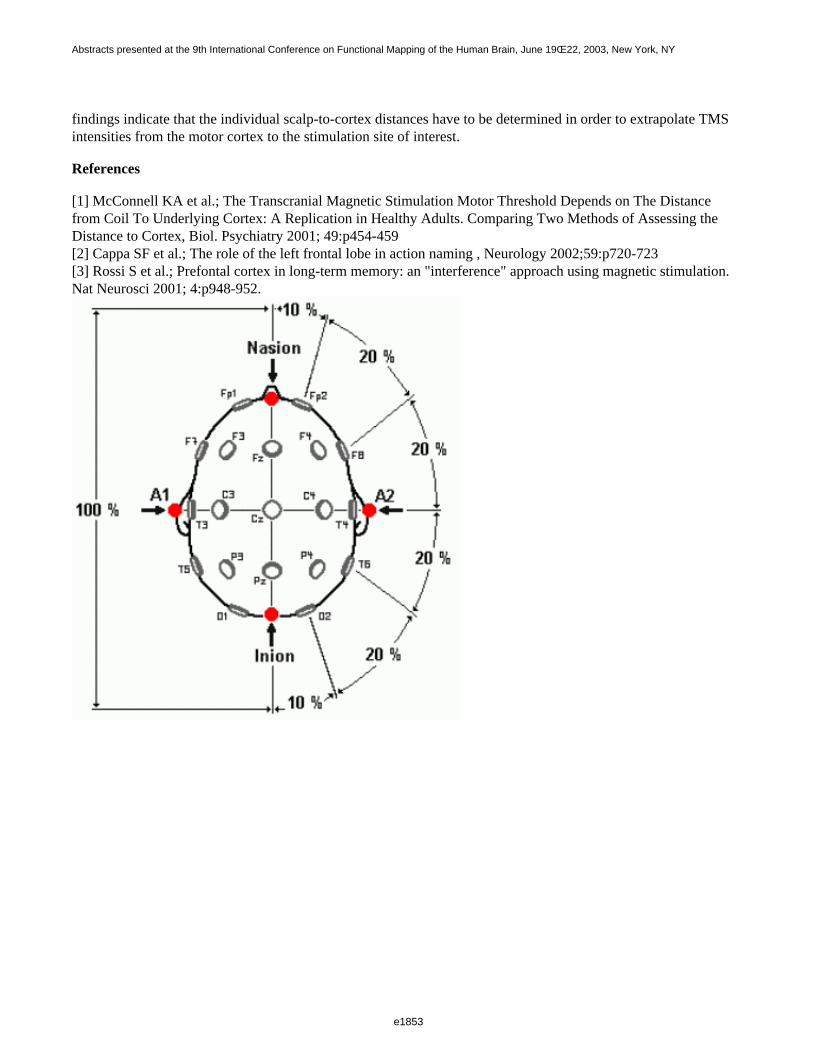
findings indicate that the individual scalp-to-cortex distances have to be determined in order to extrapolate TMSintensities from the motor cortex to the stimulation site of interest.
References
[1] McConnell KA et al.; The Transcranial Magnetic Stimulation Motor Threshold Depends on The Distancefrom Coil To Underlying Cortex: A Replication in Healthy Adults. Comparing Two Methods of Assessing theDistance to Cortex, Biol. Psychiatry 2001; 49:p454-459[2] Cappa SF et al.; The role of the left frontal lobe in action naming , Neurology 2002;59:p720-723[3] Rossi S et al.; Prefontal cortex in long-term memory: an "interference" approach using magnetic stimulation.Nat Neurosci 2001; 4:p948-952.
e1853
Abstracts presented at the 9th International Conference on Functional Mapping of the Human Brain, June 19Œ22, 2003, New York, NY
e1853
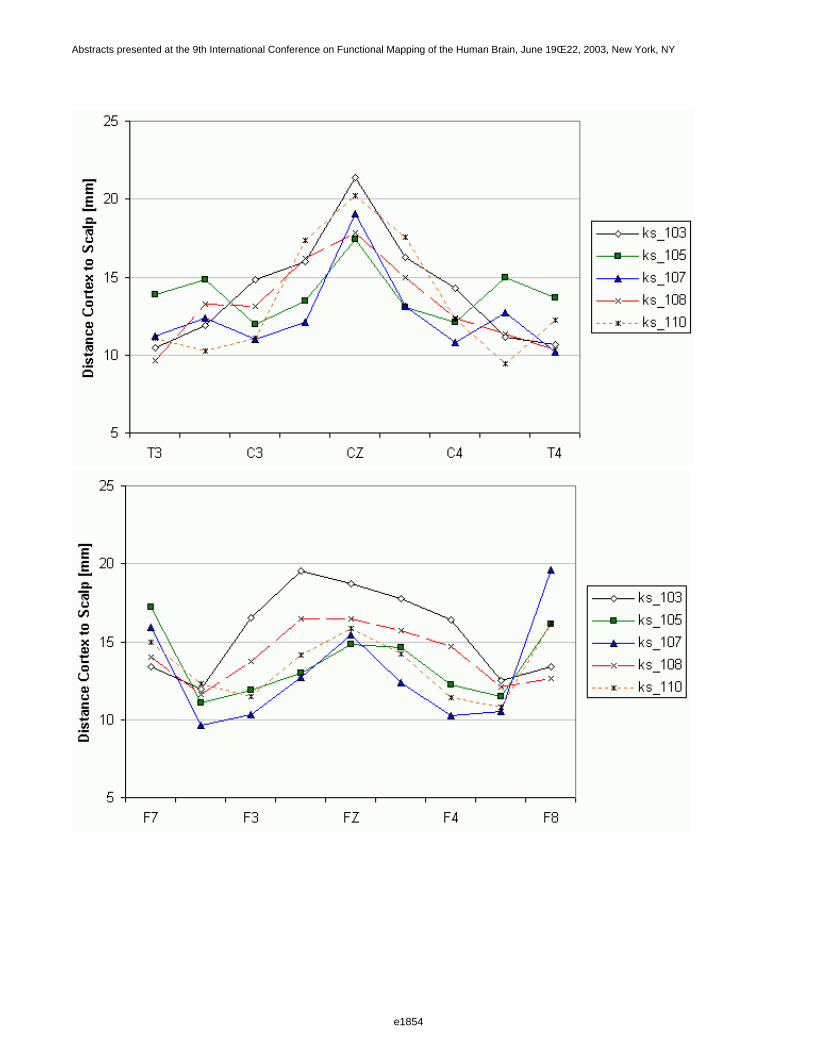
e1854
Abstracts presented at the 9th International Conference on Functional Mapping of the Human Brain, June 19Œ22, 2003, New York, NY
e1854
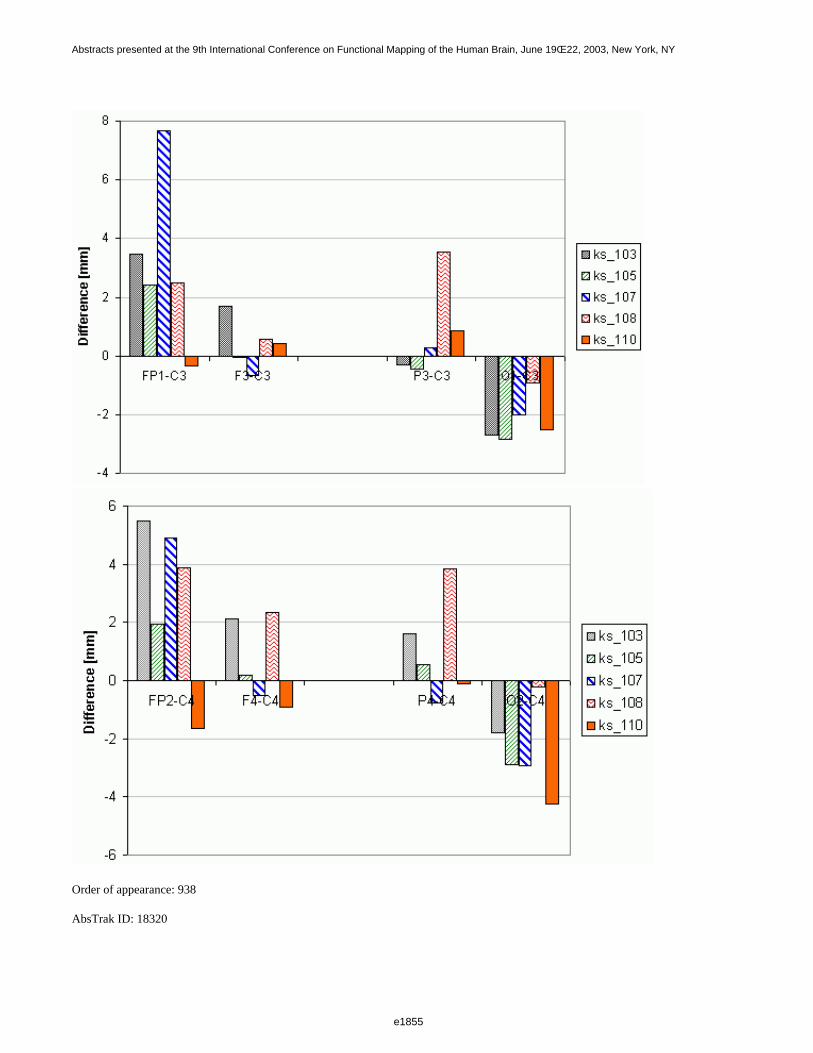
Order of appearance: 938
AbsTrak ID: 18320
e1855
Abstracts presented at the 9th International Conference on Functional Mapping of the Human Brain, June 19Œ22, 2003, New York, NY
e1855
Poster number: 948
Mapping functional connectivity using dendrogram sharpening
Larissa Stanberry, Rajesh Nandy, Dietmar Cordes, Dietmar Cordes
University of Washington
Modeling & Analysis
Abstract
Functionally related regions of the brain exhibit synchronous slow fluctuations of the regional cerebral bloodflow. The synchrony was observed in a resting state data when subject refrains from any specific task, and itbecomes even more evident when brain activity is induced by certain exercise. These observations led to thespeculation of the existence of the neuronal connectivity, which orchestrates the activity between the brainregions. While functional connectivity was studied by number of ways it still remains a challenging task to depictthe areas of “real” activation.
The proposed dendrogram sharpening method[1] removes observations from low density regions to obtain a clearrepresentation of the modality regions, which are, in essence, areas of activation in the human brain whileanalyzing fMRI data. The DSh algorithm is controlled by two parameters, (fluff-value, core-value), wherefluff-value is the maximum size of a child cluster that will be discarded if it has a parent node of a size not smallerthan a core-value.
Data was collected on a 1.5 T MR scanner (GE, Waukesha) equipped with echo-speed gradients and a standardbirdcage head coil with parameters TR/TE 400ms/40ms, FA 50, FOV 24x24, BW ±62.5 kHz, 64x64, slicethickness 7mm, gap 2mm, 2275 time points, 4 axial slices covering motor/somatosensory cortex. First paradigmconsisted of 5 minutes continuous finger-tapping exercise with 5 minutes of rest before and after the motor taskactivity. Second paradigm consisted of 5 minutes equally paced finger-tapping exercise with 5 minutes of restbefore and after the motor activity.
A hierarchical clustering method based on a single linkage algorithm was used to group the data. Distancemeasure is based on the correlation coefficient between the voxels. The DSh was performed twice withparameters (2,40) and (10,40). Cluster cores were identified using the method of inconsistent edges. The value ofmedian edge length of the left (right) subtree plus twice the interhindge spread is the proposed threshold, beyondwhich edge is considered inconsistent with respect to its left (right) child. The final classification was run onvoxels, set aside during DSh, attempting to assign them to the found clusters.
The sharpened dendrogram better reveals the structure of the data. All clusters were obtained using frequencycontributions between 0.02Hz and 0.1Hz. Most of the major clusters gave clearly identifiable patterns. Activationwas found in the motor sensorimotor cortex area during motor task activities as well as during the resting state.The dendrogram sharpening technique proved to be a very helpful tool for analysis of activation patterns in fMRI data
References
1.McKinney Autopaint: A Toolkit for visualizing data. Ph.D. thesis, UW,1995.2.Cordes, Nandy Investigating the frequency dependence of spatial gradient artifacts. ISMRM 20033.Cordes et al. Mapping functionally related regions of brain. AJNR 21, 20014.Cordes et al. Frequencies contributing to functional connectivity. AJNR 22, 2001
e1856
Abstracts presented at the 9th International Conference on Functional Mapping of the Human Brain, June 19Œ22, 2003, New York, NY
e1856
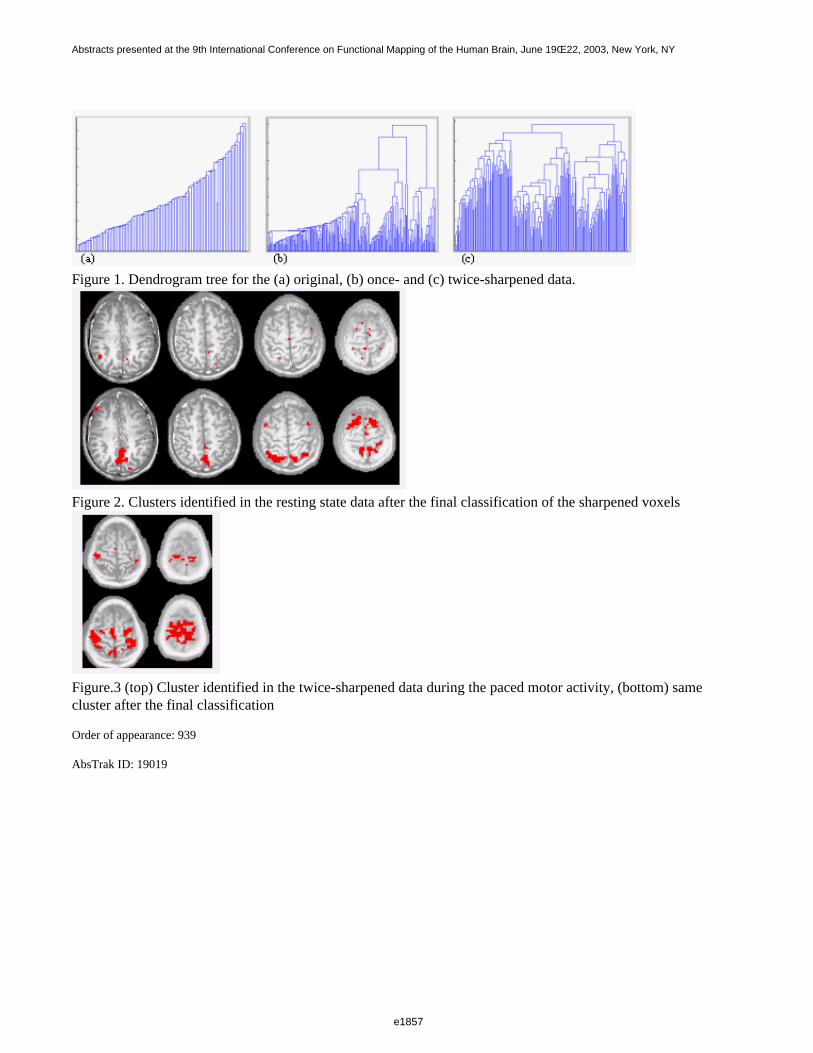
Figure 1. Dendrogram tree for the (a) original, (b) once- and (c) twice-sharpened data.
Figure 2. Clusters identified in the resting state data after the final classification of the sharpened voxels
Figure.3 (top) Cluster identified in the twice-sharpened data during the paced motor activity, (bottom) samecluster after the final classification
Order of appearance: 939
AbsTrak ID: 19019
e1857
Abstracts presented at the 9th International Conference on Functional Mapping of the Human Brain, June 19Œ22, 2003, New York, NY
e1857
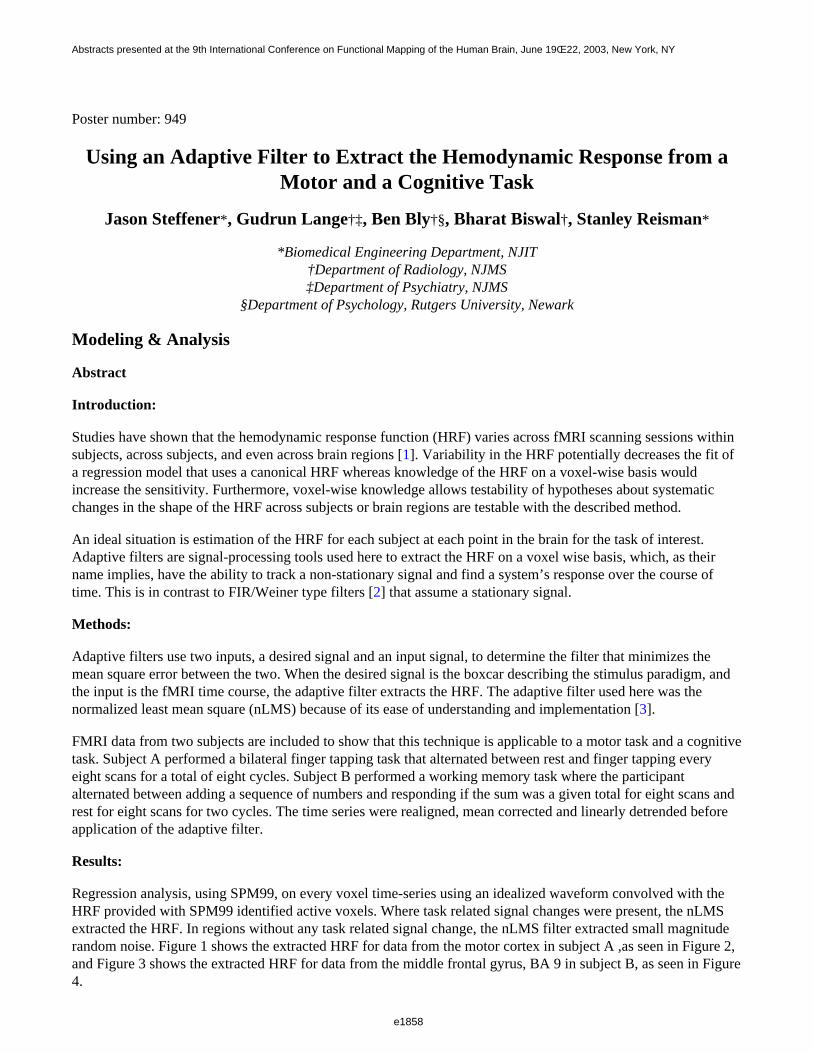
Poster number: 949
Using an Adaptive Filter to Extract the Hemodynamic Response from aMotor and a Cognitive Task
Jason Steffener*, Gudrun Lange†‡, Ben Bly†§, Bharat Biswal†, Stanley Reisman*
*Biomedical Engineering Department, NJIT†Department of Radiology, NJMS‡Department of Psychiatry, NJMS
§Department of Psychology, Rutgers University, Newark
Modeling & Analysis
Abstract
Introduction:
Studies have shown that the hemodynamic response function (HRF) varies across fMRI scanning sessions withinsubjects, across subjects, and even across brain regions [1]. Variability in the HRF potentially decreases the fit ofa regression model that uses a canonical HRF whereas knowledge of the HRF on a voxel-wise basis wouldincrease the sensitivity. Furthermore, voxel-wise knowledge allows testability of hypotheses about systematicchanges in the shape of the HRF across subjects or brain regions are testable with the described method.
An ideal situation is estimation of the HRF for each subject at each point in the brain for the task of interest.Adaptive filters are signal-processing tools used here to extract the HRF on a voxel wise basis, which, as theirname implies, have the ability to track a non-stationary signal and find a system’s response over the course oftime. This is in contrast to FIR/Weiner type filters [2] that assume a stationary signal.
Methods:
Adaptive filters use two inputs, a desired signal and an input signal, to determine the filter that minimizes themean square error between the two. When the desired signal is the boxcar describing the stimulus paradigm, andthe input is the fMRI time course, the adaptive filter extracts the HRF. The adaptive filter used here was thenormalized least mean square (nLMS) because of its ease of understanding and implementation [3].
FMRI data from two subjects are included to show that this technique is applicable to a motor task and a cognitivetask. Subject A performed a bilateral finger tapping task that alternated between rest and finger tapping everyeight scans for a total of eight cycles. Subject B performed a working memory task where the participantalternated between adding a sequence of numbers and responding if the sum was a given total for eight scans andrest for eight scans for two cycles. The time series were realigned, mean corrected and linearly detrended beforeapplication of the adaptive filter.
Results:
Regression analysis, using SPM99, on every voxel time-series using an idealized waveform convolved with theHRF provided with SPM99 identified active voxels. Where task related signal changes were present, the nLMSextracted the HRF. In regions without any task related signal change, the nLMS filter extracted small magnituderandom noise. Figure 1 shows the extracted HRF for data from the motor cortex in subject A ,as seen in Figure 2,and Figure 3 shows the extracted HRF for data from the middle frontal gyrus, BA 9 in subject B, as seen in Figure 4.
e1858
Abstracts presented at the 9th International Conference on Functional Mapping of the Human Brain, June 19Œ22, 2003, New York, NY
e1858
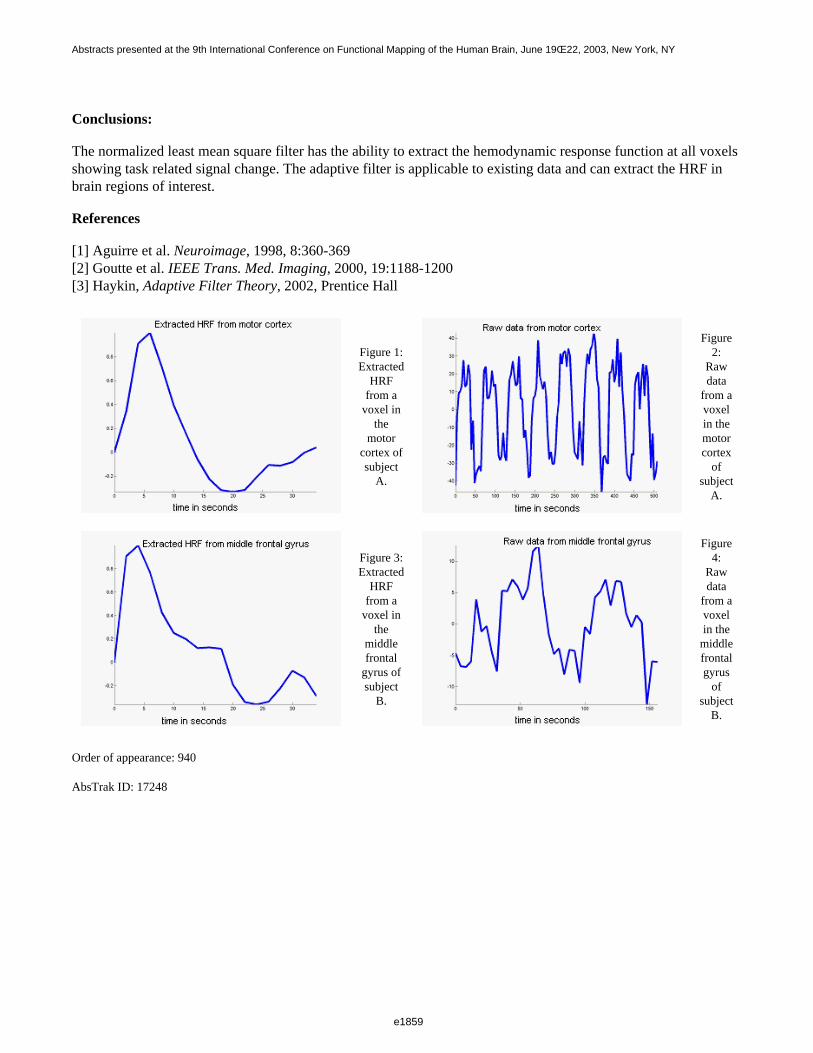
Conclusions:
The normalized least mean square filter has the ability to extract the hemodynamic response function at all voxelsshowing task related signal change. The adaptive filter is applicable to existing data and can extract the HRF inbrain regions of interest.
References
[1] Aguirre et al. Neuroimage, 1998, 8:360-369[2] Goutte et al. IEEE Trans. Med. Imaging, 2000, 19:1188-1200[3] Haykin, Adaptive Filter Theory, 2002, Prentice Hall
Figure 1:Extracted
HRFfrom a
voxel inthe
motorcortex ofsubject
A.
Figure2:
Rawdata
from avoxelin themotorcortex
ofsubject
A.
Figure 3:Extracted
HRFfrom a
voxel inthe
middlefrontal
gyrus ofsubject
B.
Figure4:
Rawdata
from avoxelin the
middlefrontalgyrus
ofsubject
B.
Order of appearance: 940
AbsTrak ID: 17248
e1859
Abstracts presented at the 9th International Conference on Functional Mapping of the Human Brain, June 19Œ22, 2003, New York, NY
e1859
Poster number: 950
Internet-based tool for calculating optimal TMS stimulation sites
O Steinsträter, M Deppe, S Knecht
University of Münster, Department of Neurology, Germany
Modeling & Analysis
Abstract
Introduction:
Transcranial Magnetic Stimulation (TMS) is a widely used technique for the stimulation of circumscribed brainareas. The efficacy of the stimulation of a given brain area depends on the correctness of the coil position. Wedeveloped an internet-based tool that identifies the optimal coil positions for given brain areas.
Methods:
For a given brain point, we define the scalp point perpendicular above this point as the optimal coil position forTMS stimulation. Such scalp positions are often specified with respect to the electrode positions of theInternational 10/20 system. To uniquely identify each position on the scalp of a subject, we refined the 10/20system to the system of 2D scalp coordinates shown in the figure. Here, the 10/20 points are expressed by integralcoordinates and the coordinates of intermediate points can be interpreted as the distances of this points to thesurrounding 10/20 points. To convert brain points to optimal stimulation sites expressed as 2D scalp coordinates,we developed an algorithm which maps our 2D coordinate system to the scalp reconstructed from the T1 templateprovided by SPM99. This algorithm is the core of a java applet which converts brain positions given as MNIcoordinates (Montreal Neurological Institute; the coordinate system of SPM99) to optimal scalp points (in thesense of TMS stimulation) expressed as 2D scalp coordinates. Because Talairach coordinates can be converted toMNI coordinates by the formula provided by Matthew Brett (http://www.mrc-cbu.cam.ac.uk/Imaging/mnispace.html), brain points can also specified as Talairach coordinates.By using the Talairach Daemon (http://ric.uthscsa.edu/projects/talairachdaemon.html) the applet is also capable toproject complete anatomical structures (e.~g. Brodmann areas) to the scalp. In addition, the Talairach brain alsoenables the inverse operation: For a given scalp point the cortex point perpendicular below this point (as a modelfor the focus of the TMS stimulation) can be calculated.
Results:
The java applet is accessible under http://neurologie.uni-muenster.de/t2t/ and should run under any operatingsystem and with any web browser capable to execute java 1.1 applets.
Besides the basic operations described in the methods section, the applet also provides sophisticated techniques tovisualise results in 2D and 3D. In addition a Talairach Atlas (derived from the Talairach Daemon) is providedwhich enables the interactive selection (mouse controlled) of brain points and anatomical structures as well asscalp positions.
e1860
Abstracts presented at the 9th International Conference on Functional Mapping of the Human Brain, June 19Œ22, 2003, New York, NY
e1860

Conclusions:
An applet was developed which provides the user with operations related to the calculation of optimal coilpositions for TMS stimulations. The applet should be useful not only in planing TMS studies but also in readingTMS related articles.
Order of appearance: 941
AbsTrak ID: 18333
e1861
Abstracts presented at the 9th International Conference on Functional Mapping of the Human Brain, June 19Œ22, 2003, New York, NY
e1861
Poster number: 951
fMRI Acquisition Informatics Tool
V. Andrew Stenger*, Haiwen Shi†, Deepa Shroff‡, William Eddy§, Douglas C. Noll§
*Universtity of Pittsburgh Dept.s of Radiology and Bioengineering†University of Pittsburgh Dept. of Computer Science
‡University of Pittsburgh Dept. of Radiology§University of Michigan Dept.s of Biomedical Engineering and Radiology
¶Carnegie Mellon University Dept. of Statistics
Modeling & Analysis
Abstract
Introduction
A limitation in validating or comparing fMRI analysis tools is that the true data without activation, noise, andartifact are unknown. A more quantitative approach would utilize a "gold standard" where the effect of interestcould be switched on and off. "Digital brain phantoms" have proven to be useful for simulating MRI acquisitions (1). This work extends on these phantoms by presenting a model for synthesizing simulated fMRI data thatcontains major sources of artifact and variation found in fMRI such as susceptibility artifacts, ghosting,acquisition type (EPI or spiral), physiological noise, random noise, trends, motion, and activation.This "fMRIacquisition informatics tool" is part of an ongoing effort by the Neuroimaging Informatics Technology Initiative(NIfTI) sponsored by the National Institute of Mental Health. Below we present the basic model and examples of results.
Method
The fMRI model consists of a 3D 1mm isotropic resolution whole brain image representing the spin magnitudeM(r) and a corresponding map of the time rate of change of phase due to off-resonance ∆ω(r) acquired at 3T. Thesignal s jp (t) for slice j at timepoint p as a function of time is:
Wj(z), α, Apcard (r), Ap
resp (r), and Φpresp (r,t) represent the slice profile, flip angle, focal cardiac variations, global respiratory variations, and
respiratory phase and frequency terms, respectively (2). Random noise is given by np (t) and ∆T2*(r) represents transverse relaxation changes due to
BOLD hemodynamics. The k-space kx (t) and ky (t) for spiral or EPI trajectories is explicitly included. The values for the physiological noise terms as
well as activation can be measured or modeled. The images at each timepoint p can be generated using standard EPI or spiral reconstructions once thesignal is numerically calculated. Reduction of image dimension, summation along the slice-select direction, and evolution of the phase terms as afunction of time will all contribute to a realistic simulation of image artifacts. All programming for this work was done in Matlab and thephysiological parameters were estimated.
e1862
Abstracts presented at the 9th International Conference on Functional Mapping of the Human Brain, June 19Œ22, 2003, New York, NY
e1862
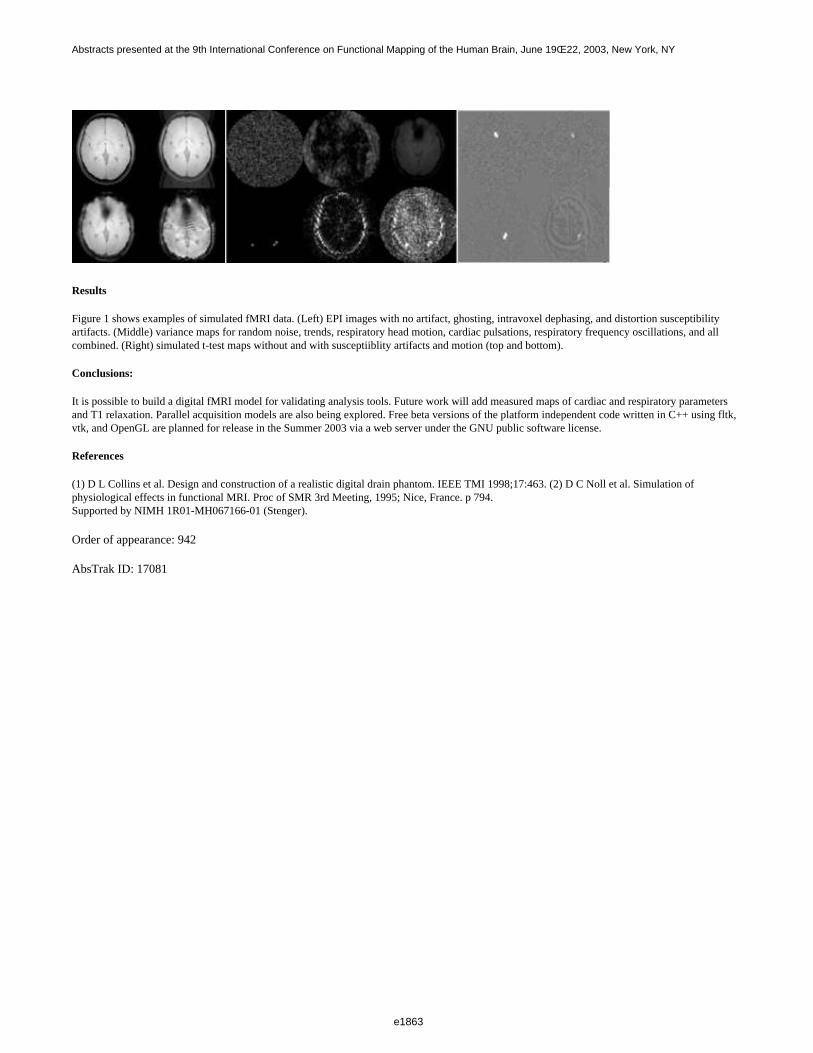
Results
Figure 1 shows examples of simulated fMRI data. (Left) EPI images with no artifact, ghosting, intravoxel dephasing, and distortion susceptibilityartifacts. (Middle) variance maps for random noise, trends, respiratory head motion, cardiac pulsations, respiratory frequency oscillations, and allcombined. (Right) simulated t-test maps without and with susceptiiblity artifacts and motion (top and bottom).
Conclusions:
It is possible to build a digital fMRI model for validating analysis tools. Future work will add measured maps of cardiac and respiratory parametersand T1 relaxation. Parallel acquisition models are also being explored. Free beta versions of the platform independent code written in C++ using fltk,vtk, and OpenGL are planned for release in the Summer 2003 via a web server under the GNU public software license.
References
(1) D L Collins et al. Design and construction of a realistic digital drain phantom. IEEE TMI 1998;17:463. (2) D C Noll et al. Simulation ofphysiological effects in functional MRI. Proc of SMR 3rd Meeting, 1995; Nice, France. p 794.Supported by NIMH 1R01-MH067166-01 (Stenger).
Order of appearance: 942
AbsTrak ID: 17081
e1863
Abstracts presented at the 9th International Conference on Functional Mapping of the Human Brain, June 19Œ22, 2003, New York, NY
e1863
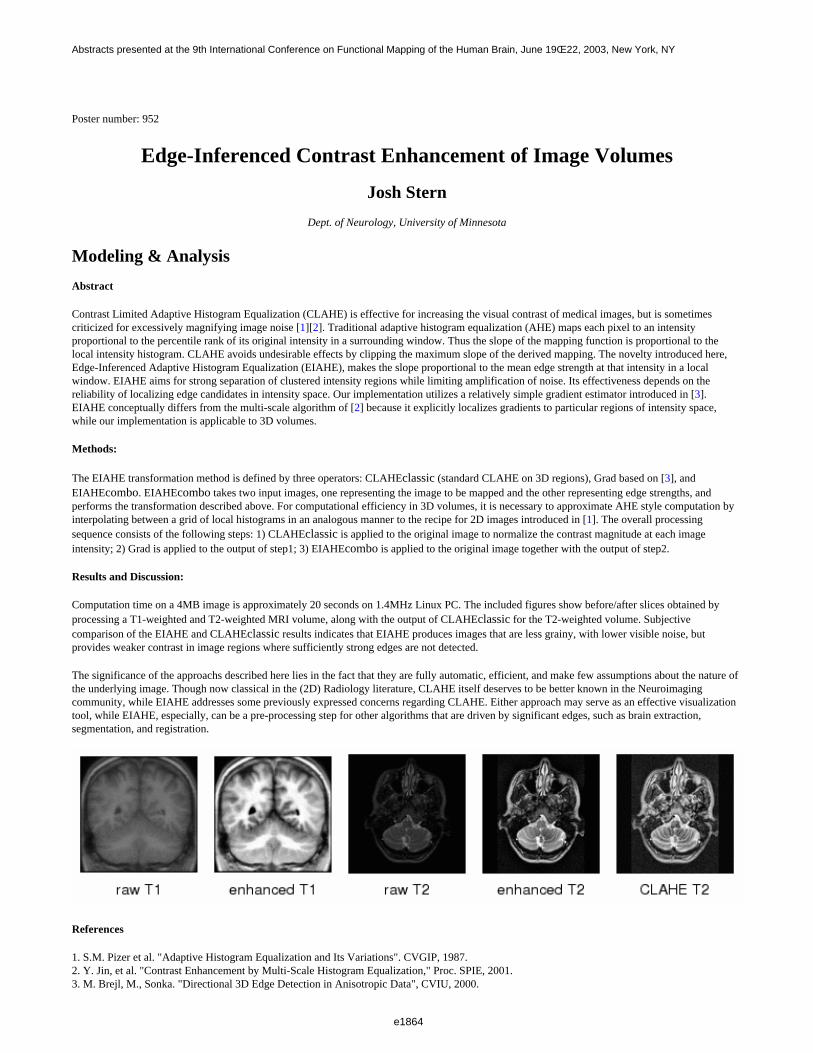
Poster number: 952
Edge-Inferenced Contrast Enhancement of Image Volumes
Josh Stern
Dept. of Neurology, University of Minnesota
Modeling & Analysis
Abstract
Contrast Limited Adaptive Histogram Equalization (CLAHE) is effective for increasing the visual contrast of medical images, but is sometimescriticized for excessively magnifying image noise [1][2]. Traditional adaptive histogram equalization (AHE) maps each pixel to an intensityproportional to the percentile rank of its original intensity in a surrounding window. Thus the slope of the mapping function is proportional to thelocal intensity histogram. CLAHE avoids undesirable effects by clipping the maximum slope of the derived mapping. The novelty introduced here,Edge-Inferenced Adaptive Histogram Equalization (EIAHE), makes the slope proportional to the mean edge strength at that intensity in a localwindow. EIAHE aims for strong separation of clustered intensity regions while limiting amplification of noise. Its effectiveness depends on thereliability of localizing edge candidates in intensity space. Our implementation utilizes a relatively simple gradient estimator introduced in [3].EIAHE conceptually differs from the multi-scale algorithm of [2] because it explicitly localizes gradients to particular regions of intensity space,while our implementation is applicable to 3D volumes.
Methods:
The EIAHE transformation method is defined by three operators: CLAHEclassic (standard CLAHE on 3D regions), Grad based on [3], and EIAHEcombo. EIAHEcombo takes two input images, one representing the image to be mapped and the other representing edge strengths, andperforms the transformation described above. For computational efficiency in 3D volumes, it is necessary to approximate AHE style computation byinterpolating between a grid of local histograms in an analogous manner to the recipe for 2D images introduced in [1]. The overall processingsequence consists of the following steps: 1) CLAHEclassic is applied to the original image to normalize the contrast magnitude at each imageintensity; 2) Grad is applied to the output of step1; 3) EIAHEcombo is applied to the original image together with the output of step2.
Results and Discussion:
Computation time on a 4MB image is approximately 20 seconds on 1.4MHz Linux PC. The included figures show before/after slices obtained byprocessing a T1-weighted and T2-weighted MRI volume, along with the output of CLAHEclassic for the T2-weighted volume. Subjectivecomparison of the EIAHE and CLAHEclassic results indicates that EIAHE produces images that are less grainy, with lower visible noise, butprovides weaker contrast in image regions where sufficiently strong edges are not detected.
The significance of the approachs described here lies in the fact that they are fully automatic, efficient, and make few assumptions about the nature ofthe underlying image. Though now classical in the (2D) Radiology literature, CLAHE itself deserves to be better known in the Neuroimagingcommunity, while EIAHE addresses some previously expressed concerns regarding CLAHE. Either approach may serve as an effective visualizationtool, while EIAHE, especially, can be a pre-processing step for other algorithms that are driven by significant edges, such as brain extraction,segmentation, and registration.
References
1. S.M. Pizer et al. "Adaptive Histogram Equalization and Its Variations". CVGIP, 1987.2. Y. Jin, et al. "Contrast Enhancement by Multi-Scale Histogram Equalization," Proc. SPIE, 2001.3. M. Brejl, M., Sonka. "Directional 3D Edge Detection in Anisotropic Data", CVIU, 2000.
e1864
Abstracts presented at the 9th International Conference on Functional Mapping of the Human Brain, June 19Œ22, 2003, New York, NY
e1864

Order of appearance: 943
AbsTrak ID: 19002
e1865
Abstracts presented at the 9th International Conference on Functional Mapping of the Human Brain, June 19Œ22, 2003, New York, NY
e1865
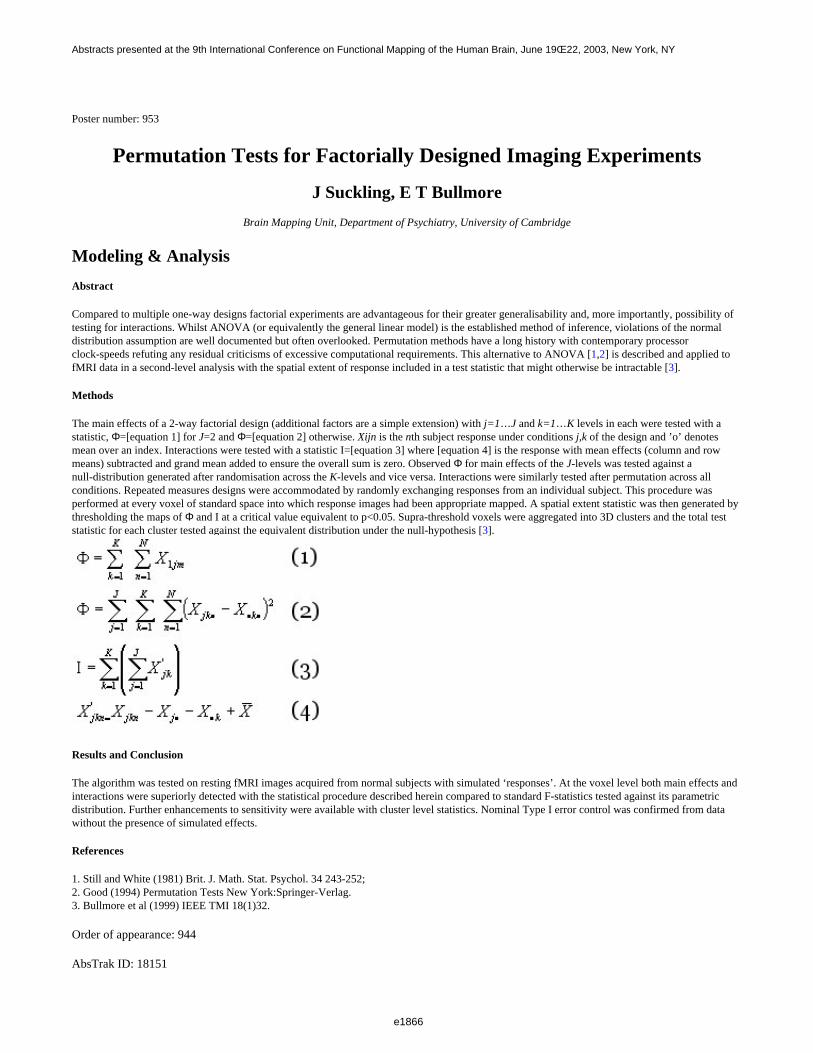
Poster number: 953
Permutation Tests for Factorially Designed Imaging Experiments
J Suckling, E T Bullmore
Brain Mapping Unit, Department of Psychiatry, University of Cambridge
Modeling & Analysis
Abstract
Compared to multiple one-way designs factorial experiments are advantageous for their greater generalisability and, more importantly, possibility oftesting for interactions. Whilst ANOVA (or equivalently the general linear model) is the established method of inference, violations of the normaldistribution assumption are well documented but often overlooked. Permutation methods have a long history with contemporary processorclock-speeds refuting any residual criticisms of excessive computational requirements. This alternative to ANOVA [1,2] is described and applied tofMRI data in a second-level analysis with the spatial extent of response included in a test statistic that might otherwise be intractable [3].
Methods
The main effects of a 2-way factorial design (additional factors are a simple extension) with j=1…J and k=1…K levels in each were tested with astatistic, Φ=[equation 1] for J=2 and Φ=[equation 2] otherwise. Xijn is the nth subject response under conditions j,k of the design and ’o’ denotesmean over an index. Interactions were tested with a statistic I=[equation 3] where [equation 4] is the response with mean effects (column and rowmeans) subtracted and grand mean added to ensure the overall sum is zero. Observed Φ for main effects of the J-levels was tested against anull-distribution generated after randomisation across the K-levels and vice versa. Interactions were similarly tested after permutation across allconditions. Repeated measures designs were accommodated by randomly exchanging responses from an individual subject. This procedure wasperformed at every voxel of standard space into which response images had been appropriate mapped. A spatial extent statistic was then generated bythresholding the maps of Φ and I at a critical value equivalent to p<0.05. Supra-threshold voxels were aggregated into 3D clusters and the total teststatistic for each cluster tested against the equivalent distribution under the null-hypothesis [3].
Results and Conclusion
The algorithm was tested on resting fMRI images acquired from normal subjects with simulated ‘responses’. At the voxel level both main effects andinteractions were superiorly detected with the statistical procedure described herein compared to standard F-statistics tested against its parametricdistribution. Further enhancements to sensitivity were available with cluster level statistics. Nominal Type I error control was confirmed from datawithout the presence of simulated effects.
References
1. Still and White (1981) Brit. J. Math. Stat. Psychol. 34 243-252;2. Good (1994) Permutation Tests New York:Springer-Verlag.3. Bullmore et al (1999) IEEE TMI 18(1)32.
Order of appearance: 944
AbsTrak ID: 18151
e1866
Abstracts presented at the 9th International Conference on Functional Mapping of the Human Brain, June 19Œ22, 2003, New York, NY
e1866
Poster number: 954
The Neurogenerator Database - Current Status
Gert Svensson*, Per Roland‡, Tony Lindeberg*, Tore Risch†, Christian Engström*, Lars Forsberg*, Jesper Fredriksson*, Mikael Naeslund*, Johan Sandström†, Anders Selander*,
Calle Underman‡
*Royal Institute of Technology, Sweden†Uppsala University, Sweden‡Karolinska Institute, Sweden
Modeling & Analysis
Abstract
Introduction
The Neurogenerator project [1, 2] is developing a database for functional 3D+ images of the human brain. Unprocessed PET and fMRI images aresubmitted to the database where automatic homogeneous statistical processing [3] forms new databases of statistical images. The Neurogeneratordatabase differs from other database in the field [4, 5] by storing both raw data, a detailed description of the experimental conditions as well asautomatically derived statistical data. The resulting statistical data is processed with the same set of analyses software in a common anatomical space,which facilitates conclusions drawn from several experiments. The approach also poses a number of challenges, some mentioned below.
Submission Procedure
To make automatic statistical processing of experiments possible, a detailed description of the experimental conditions is required. Conditions aredescribed in terms of time relations of atomic events, for example stimuli, think, and response events, where each atomic event is defined by a set ofpredefined keywords. The description of the experimental conditions and the description of one or several statistical experimental models (indirectlyor directly defining the design matrix) of the experiment is clearly separated. Submission of experiments is currently in full operation and a number oflaboratories have signed up to contribute with data.
Statistical Processing
Currently two complete processing chains are implemented in the data base system: one for standard PET processing and one for standard fMRIprocessing. The processing are either based on components developed in the project or on parts from standard tools like SPM. At the moments theautomatic processing can cope with normal experimental cases but will be improved to cover more advanced set-ups in the future. The processing ishighly modularised which makes it easy to include newly developed tools. The database is also ideal to test new algorithms on a large data set.
Using the Database
The database can be used either via a web browser over the Internet or locally from CD ROMs or DVDs with a selection of meta data and statisticaldata together with query and visualizations tools. The tools are currently planned to be released Q2, 2003.
References
1. Roland, P; Svensson, G; Lindeberg, T; Risch, T; Baumann, P; Dehmel, A; Fredriksson, J; Halldorsson, H; Forsberg, L; Young, J; Zilles, K. Adatabase generator for human brain imaging. TRENDS in Neurosciences 24(10), 562-564, 2001.2. http://www.neurogenerator.org3. Fredriksson, J; Svensson, P; Risch, T. Mediator-based Evolutionary Design and Development of Image Meta-Analysis Environments. Journal ofIntelligent Information System 17(2, 3), 301-322, 2001.4. Fox, P; Lancaster, J. Mapping context and content: the BrainMap model. Nature Reviews Neuroscience 3, 319-321, 2002.5. Van Horn, J; Gazzaniga, M. Databasing fMRI studies – towards a ‘discovery science’ of brain function. Nature Reviews Neuroscience 3, 314-318, 2002.
Order of appearance: 945
AbsTrak ID: 17390
e1867
Abstracts presented at the 9th International Conference on Functional Mapping of the Human Brain, June 19Œ22, 2003, New York, NY
e1867
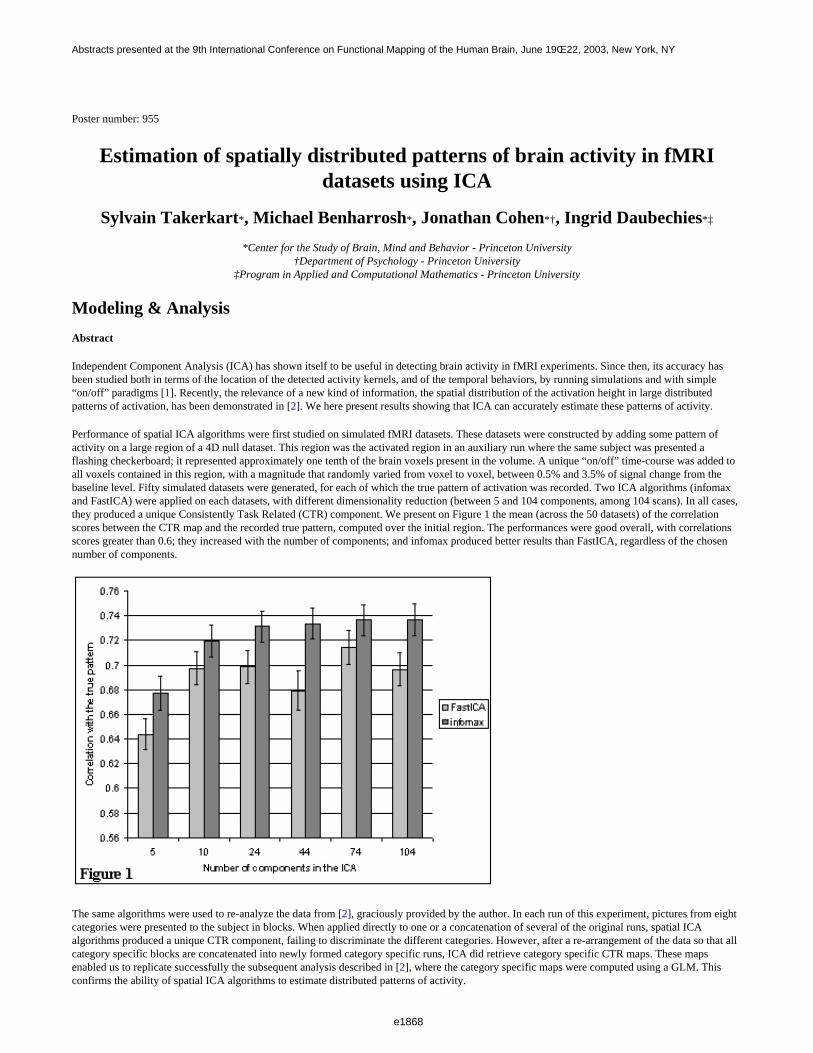
Poster number: 955
Estimation of spatially distributed patterns of brain activity in fMRIdatasets using ICA
Sylvain Takerkart*, Michael Benharrosh*, Jonathan Cohen*†, Ingrid Daubechies*‡
*Center for the Study of Brain, Mind and Behavior - Princeton University†Department of Psychology - Princeton University
‡Program in Applied and Computational Mathematics - Princeton University
Modeling & Analysis
Abstract
Independent Component Analysis (ICA) has shown itself to be useful in detecting brain activity in fMRI experiments. Since then, its accuracy hasbeen studied both in terms of the location of the detected activity kernels, and of the temporal behaviors, by running simulations and with simple“on/off” paradigms [1]. Recently, the relevance of a new kind of information, the spatial distribution of the activation height in large distributedpatterns of activation, has been demonstrated in [2]. We here present results showing that ICA can accurately estimate these patterns of activity.
Performance of spatial ICA algorithms were first studied on simulated fMRI datasets. These datasets were constructed by adding some pattern ofactivity on a large region of a 4D null dataset. This region was the activated region in an auxiliary run where the same subject was presented aflashing checkerboard; it represented approximately one tenth of the brain voxels present in the volume. A unique “on/off” time-course was added toall voxels contained in this region, with a magnitude that randomly varied from voxel to voxel, between 0.5% and 3.5% of signal change from thebaseline level. Fifty simulated datasets were generated, for each of which the true pattern of activation was recorded. Two ICA algorithms (infomaxand FastICA) were applied on each datasets, with different dimensionality reduction (between 5 and 104 components, among 104 scans). In all cases,they produced a unique Consistently Task Related (CTR) component. We present on Figure 1 the mean (across the 50 datasets) of the correlationscores between the CTR map and the recorded true pattern, computed over the initial region. The performances were good overall, with correlationsscores greater than 0.6; they increased with the number of components; and infomax produced better results than FastICA, regardless of the chosennumber of components.
The same algorithms were used to re-analyze the data from [2], graciously provided by the author. In each run of this experiment, pictures from eightcategories were presented to the subject in blocks. When applied directly to one or a concatenation of several of the original runs, spatial ICAalgorithms produced a unique CTR component, failing to discriminate the different categories. However, after a re-arrangement of the data so that allcategory specific blocks are concatenated into newly formed category specific runs, ICA did retrieve category specific CTR maps. These mapsenabled us to replicate successfully the subsequent analysis described in [2], where the category specific maps were computed using a GLM. Thisconfirms the ability of spatial ICA algorithms to estimate distributed patterns of activity.
e1868
Abstracts presented at the 9th International Conference on Functional Mapping of the Human Brain, June 19Œ22, 2003, New York, NY
e1868

References
[1] Esposito et al, 2002. Human Brain Mapping 16:146-157[2] Haxby et al, 2001. Science 293:2425-2430
Order of appearance: 946
AbsTrak ID: 18578
e1869
Abstracts presented at the 9th International Conference on Functional Mapping of the Human Brain, June 19Œ22, 2003, New York, NY
e1869
Poster number: 956
Incorporating spatial information into FDR thresholding of SPMs
Jonathan Taylor*, Brian Knutson†, Keith Worsley‡§
*Department of Statistics, Stanford University, Stanford, CA, USA†Department of Psychology, Stanford University, Stanford, CA, USA
‡Department of Mathematics and Statistics, McGill University, Montreal, PQ, Canada§McConnell Brain Imaging Center, Montreal Neurological Institute, Montreal, PQ, Canada
Modeling & Analysis
Abstract
The False Discovery Rate (FDR) has received attention recently [1] as an alternative to using Gaussian random field theory (GRF) [2] to thresholdSPMs arising from functional or anatomical data analyses. The GRF approach depends heavily on the spatial properties of the underlying noise,whereas the FDR approach is strictly based on the marginal distribution of the noise. While this simplifies a typical FDR analysis, in practice, usingthe FDR can result in "noisy" thresholded SPMs with many small "activations." We propose two procedures similar to FDR that use spatialinformation to denoise thresholded SPMs and choose the threshold in a data-driven way, as in FDR. The procedures are applied to a group SPMarising from a reward anticipation event-related fMRI study [3].
Methods
Gaussian random fields have been used to set thresholds for SPMs based on controlling the probability of observing any activation when there is notrue activation in the image. The FDR procedures seek to control the proportion of false "activations", relative to the total amount of activation.
Both procedures can be thought of fixing a feature, F , of a binary image, that is, a map from binary images to real numbers, and choosing a thresholdu by choosing the smallest threshold such that Fobs (I(u)) is bigger than C x Fexp (I(u)), for some predetermined constant C. Here, Fobs (I(u)) is the
observed feature of the thresholded SPM I(u) and Fexp (I(u)) is the expected value of the feature when there is no signal present in the image. In the
GRF setting, the feature F is 1 if the image is non-empty and 0 otherwise, whereas in the FDR setting, the feature F is the volume of the active regions.
We investigate the performance of two different features:
1. Ferode : this feature returns the volume of the "active" region after erosion with a ball of a fixed radius r typically small compared to the FWHM
of the underlying noise. 2. Fextent : this feature depends on the threshold u used, and returns the volume of the active region all clusters smaller than the 5% threshold for
spatial extent [4] at threshold u
The simplest way to compute the comparison curve Fexp (I(u)) is to use simulations after estimating the FWHM of the SPM.
Results
In Fig. 1, we show some preliminary results, obtained by applying these two procedures to a group map from a monetary reward anticipation study [3]. In the bottom row of Fig. 1, the group map is thresholded using the Benjamini-Hochberg procedure [1] with q=0.05, (C=1/0.05=20). In the toprow, the procedure Ferode was used with a radius of 3.5mm and (C=20). In both cases, at most 5% of the highlighted region is active, but the
procedure Ferode produces is less noisy than the region obtained by using standard FDR.
References
Genovese, et al (2002). NeuroImage, 15:870-878.Worsley, et al (1996). Human Brain Mapping, 4:58-73.Knutson, et al (2001). J Neuroscience, 21, 1-5.Friston et al (1994). Human Brain Mapping, 1:214-220.
e1870
Abstracts presented at the 9th International Conference on Functional Mapping of the Human Brain, June 19Œ22, 2003, New York, NY
e1870
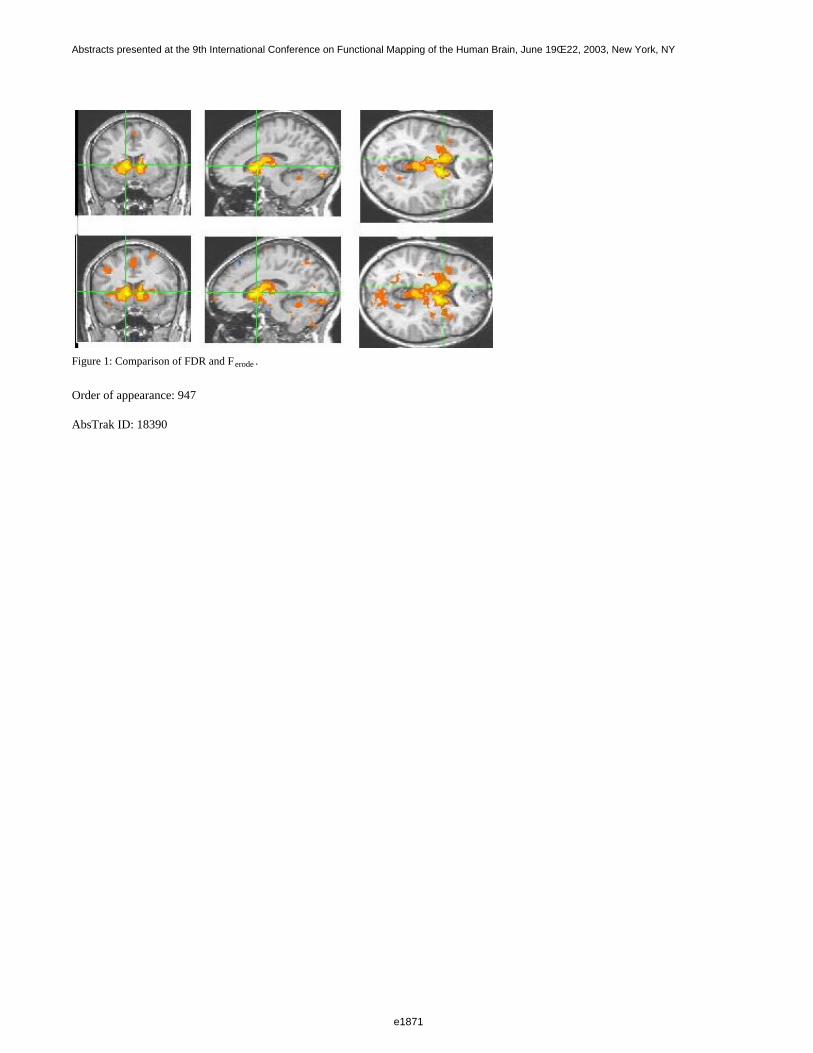
Figure 1: Comparison of FDR and Ferode .
Order of appearance: 947
AbsTrak ID: 18390
e1871
Abstracts presented at the 9th International Conference on Functional Mapping of the Human Brain, June 19Œ22, 2003, New York, NY
e1871
Poster number: 957
Thresholding Correlated Conjunctions
Jonathan Taylor*, Keith Worsley†‡
*Dept. of Statistics, Stanford University, Stanford, CA, USA†Dept. of Mathematics and Statistics, McGill University, Montreal, PQ, Canada
‡McConnell Brain Imaging Center, Montreal Neurological Institute, Montreal, PQ, Canada
Modeling & Analysis
Abstract
The original work on testing for a conjunction [1] assumed that the SPMs were independent. This assumption is justified if, for instance, theregressors in the GLM are orthogonal and the voxel-based standard deviation is known or the degrees of freedom is large. When the regressors are notorthogonal, as in an experiment comparing differences between task and baseline conditions, and / or the degrees of freedom in the voxel-basedstandard deviation is small these assumptions are violated and the results of [1] must be modified. In this work, we use the so-called Gaussian KFF[2] to adjust the p-values in these situations. We validate the results in a simulation study.
Methods
Suppose Z1,t and Z2,t are two Z-maps arising from a GLM where the voxel-wise correlation between Z1,t and Z2,t is equal to c != 0. The Gaussian
KFF [2] states that the approximate p-value for the conjunction of these tests over a search region T will be a function of c and can be derived usingthe intrinsic volumes of the search region T as well as the "Gaussian" intrinsic volumes of a cone K (dependent on c) in the plane. In the2-dimensional case there is a closed form expression for the "Gaussian" intrinsic volumes, but for higher dimensions, some numerical integration isneeded to compute the terms in the approximation.
A slightly more realistic situation is one in which the maps T1,t and T2,t are the above Z-maps divided by an independent X2 field, then they are
correlated t-maps. The Gaussian KFF can then be used to approximate the p-value of the conjunction of these two maps. As in the case of Z-maps, forhigher than 2 dimensions, some numerical integration is needed.
Results
To validate the approximations, we simulated correlated Z-maps and t-maps using Gaussian kernels with 20mm FWHM and compared the predicted5% threshold with the empirical 5% threshold for a range of values of correlation c and various shapes of search regions. Figure 1 shows somepreliminary results for correlated Z-maps searching over box-shaped regions of various sizes. As the figure indicates, the approximation does quitewell over the range of values of c and box sizes.
Order of appearance: 948
AbsTrak ID: 19097
e1872
Abstracts presented at the 9th International Conference on Functional Mapping of the Human Brain, June 19Œ22, 2003, New York, NY
e1872
Poster number: 958
New Approach to fMRI Analysis: Mutual Information Tests
Walfred Tedeschi*†, Hans-Peter Müller*, Eduard Kraft‡, Albert Ludolph‡, Ubiraci PC Neves†, Draulio B de Araujo†, Oswaldo Baffa†, Sergio N Erné*
*Division for Biosignals and Imaging Technologies, Central Institute for Biomedical Engineering, University of Ulm, Ulm, Germany†Department of Physics and Mathematics - FFCLRP, University of Sao Paulo, Ribeirao Preto, Brasil
‡Department of Neurology, University of Ulm, Ulm, Germany
Modeling & Analysis
Abstract
Introduction
An entropy-based method as an alternative in the analysis of fMRI time series is presented. The method is based on the calculation of entropy-basedalgorithm and was compared with results from standard analysis procedures. The methods were tested on simulated data and were applied on real datasets, identifying cortical and sub-cortical areas activated during motor activity, giving a clear picture of activated brain regions.
Method
Four different analysis methods are compared on fMRI data sets of volunteers performing power grips and on simulated data sets: Cross-correlation,Student t-test, Shannon entropy method and Tsallis entropy method.
Results
Out of the four different analysis methods, Tsallis entropy calculation shows the most strict activation map for simulated data sets as well as for motor activity.
Conclusion:
Shannon and Tsallis entropy are proposed as new analysis tools for fMRI analysis. Comparison to standard analysis techniques has been performed.The Tsallis entropy reveals most restrictive results. All the analysis tools are components of the OMEGA (Open Magnetic and Electric GraphicAnalysis) software [1] which also includes a variety of established functional analysis algorithms. With this platform, a direct comparison betweenvarious analysis techniques can be performed on identically pre-processed data sets.
References
[1] H.-P. Müller, S. Scharpf, W. Loichinger, A. Ludolph, E. Kraft, S.N. Erné. 2002, The OMEGA Software - Application in fMRI Studies ofBimanual Coordination. Proc. Biomag 2002, Jena, Germany, 884-886.
Order of appearance: 949
AbsTrak ID: 17734
e1873
Abstracts presented at the 9th International Conference on Functional Mapping of the Human Brain, June 19Œ22, 2003, New York, NY
e1873
Poster number: 959
Multivariate Analysis of fMRI data: Is it worth using nonlinear methods ?
Bertrand Thirion†, Ferath Kherif*, Jean-Baptiste Poline*, Olivier Faugeras†
*SHFJ/CEA, Orsay, France†Odyssée Laboratory (ENPC-Cermics/ENS-Ulm/INRIA), Sophia-Antipolis, France.
Modeling & Analysis
Abstract
Multivariate analyses (MA) have been useful for the interpretation of fMRI datasets in a number of situations. Generally, they are used in a moreexploratory than hypothesis testing framework. For instance, complex experiments including many different conditions are difficult to summarise /interpret without the use of such tools. Recently, [2] suggested to perform a singular value decomposition (SVD) on the data after projection on asubspace and variance normalization; it has been shown this method could yield a reduced and reliable interpretation of the data, but also outlineinter-subject differences.
However, most multivariate analyses proposed so far are based on SVD, rely on linear procedures, and are optimal only for Gaussian data (see e.g. [1] [3] for exceptions). This can be viewed as a strength since computation are therefore extremely efficient but the gaussian assumption is questionablesince activation patterns are often considered as the non-gaussian part of the data; this justifies a priori the use of different statistical descriptors of thedataset (clusters, independent components etc.). Here we propose the use of kernel PCA for the investigation of deviation from normality of the dataonce projected in a subspace of interest (which we call feature space).
Kernel PCA consists in computing a generalized covariance matrix κ of the data, which is not bilinear with respect to the the input data as covariancematrices. The diagonalization of κ yields orthogonal spatial components, but the corresponding time courses are no longer restricted to be orthogonal; moreover, a feature space of dimension d can be represented by an over-complete (greater than d) family of vectors. Intuitively, these two propertiesindicate some gain in the flexibility of data analysis, at the expense of more complex parameter tuning and additional computational load.
We concentrate on the empirical results obtained with Kernel PCA on an experiment which had been previously analyzed through MLM techniques [2]. Both methods give close results for the estimation of the most prominent contrast of interest on subjects which had unambiguous task-relatedresponses, with the small distinction that Kernel PCA can make a difference between activation foci and spread activation areas ; both methods alsoclearly indicate the outlying characteristics of some datasets; but they give different interpretations of the observed deviations with respect to theexpected activation patterns.
Based on these experimental results, we discuss the interpretation of non-linearity in the decomposition, which mainly amounts to the choice of thekernel in the kernel PCA method. As a conclusion, we suggest that the usefulness of the MLM for model specification is not really challenged, butthat nonlinear methods have additional descriptive power, which is useful for a better understanding of unexplained features present in the data.
References
[1]C.F. Beckmann and S.M. Smith. Probabilistic extensions to independent component analysis in fmri. In HBM 2002.[2] Ferath Kherif, Jean-Baptiste Poline, et al. Multivariate model specification for fmri data. NeuroImage, 16(4):1068--1083, August 2002.[3]Bertrand Thirion and Olivier Faugeras. Dynamical components analysis of fmri data. Proceedings of the 2002 IEEE International Symposium onBiomedical Imaging
Order of appearance: 950
AbsTrak ID: 17821
e1874
Abstracts presented at the 9th International Conference on Functional Mapping of the Human Brain, June 19Œ22, 2003, New York, NY
e1874

Poster number: 960
Bayesian Inference and Model Averaging in EEG/MEG imaging
N.J. Trujillo-Barreto, L. Melie-Garcia, E. Cuspineda, E. Martinez, P.A. Valdes-Sosa
Cuban Neuroscience Center
Modeling & Analysis
Abstract
In this paper, the full Bayesian inference framework is used to address the problem of dealing with different kinds of solutions (or models) of theEEG/MEG Inverse Problem (IP) for a given data. The models typically differ in the assumptions made by each inverse method about themathematical and physiological properties of the Primary Current Density (PCD) (j) inside the brain. The key point is that Bayesian theory, more thanproviding for posterior estimates of the PCD for a given model Hk (E[j|v,Hk ]), it also allows to obtain posterior expected utilities unconditional on
the model assumed (E[j|v]). This is achieved by considering a model averaging level of inference (Kass and Raftery 1994) that has beensystematically omitted by previous Bayesian approaches in this field. As a result, the PCD is calculated through a linear combination of the PCDestimated for each model, weighted by the posterior probability of the corresponding model given the data p(Hk |v):
The methodology was used in the case of considering different anatomical constraints taken from a segmentation of the brain in 69 compartments.The new approach seems not to be affected by the tendency of traditional linear inverse methods, like LORETA (Pascual-Marqui et al. 1994), tounderestimate deep sources against more superficial ones (Figure 1A); as well as showed significantly less blurring and ghost sources in the estimatedPCD. These advantages allowed us to find deep activations in real data, which otherwise it would be impossible to obtain (Figure 1B).
e1875
Abstracts presented at the 9th International Conference on Functional Mapping of the Human Brain, June 19Œ22, 2003, New York, NY
e1875
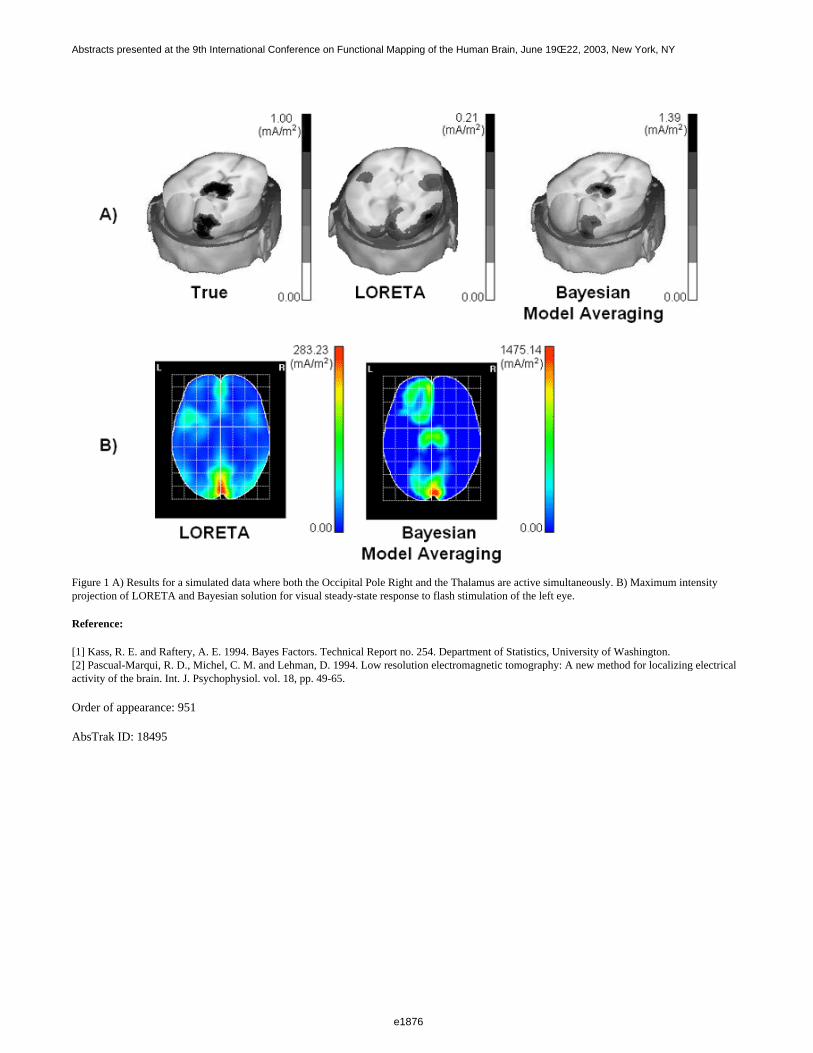
Figure 1 A) Results for a simulated data where both the Occipital Pole Right and the Thalamus are active simultaneously. B) Maximum intensityprojection of LORETA and Bayesian solution for visual steady-state response to flash stimulation of the left eye.
Reference:
[1] Kass, R. E. and Raftery, A. E. 1994. Bayes Factors. Technical Report no. 254. Department of Statistics, University of Washington.[2] Pascual-Marqui, R. D., Michel, C. M. and Lehman, D. 1994. Low resolution electromagnetic tomography: A new method for localizing electricalactivity of the brain. Int. J. Psychophysiol. vol. 18, pp. 49-65.
Order of appearance: 951
AbsTrak ID: 18495
e1876
Abstracts presented at the 9th International Conference on Functional Mapping of the Human Brain, June 19Œ22, 2003, New York, NY
e1876
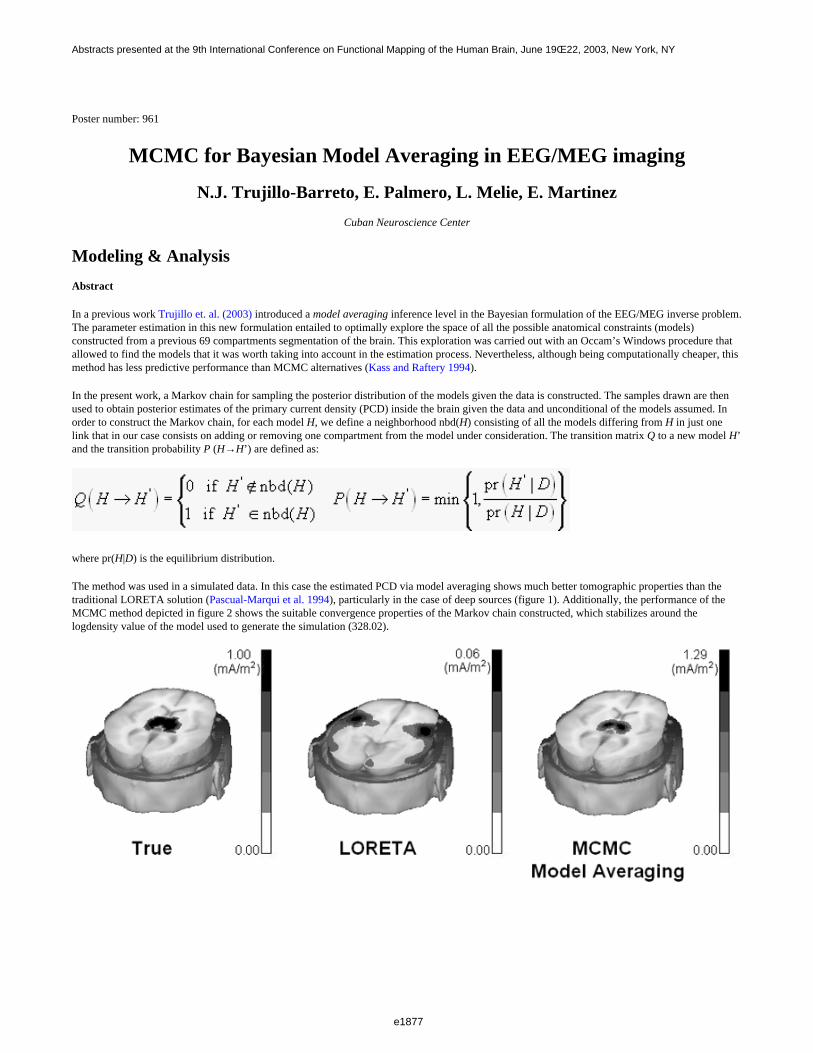
Poster number: 961
MCMC for Bayesian Model Averaging in EEG/MEG imaging
N.J. Trujillo-Barreto, E. Palmero, L. Melie, E. Martinez
Cuban Neuroscience Center
Modeling & Analysis
Abstract
In a previous work Trujillo et. al. (2003) introduced a model averaging inference level in the Bayesian formulation of the EEG/MEG inverse problem.The parameter estimation in this new formulation entailed to optimally explore the space of all the possible anatomical constraints (models)constructed from a previous 69 compartments segmentation of the brain. This exploration was carried out with an Occam’s Windows procedure thatallowed to find the models that it was worth taking into account in the estimation process. Nevertheless, although being computationally cheaper, thismethod has less predictive performance than MCMC alternatives (Kass and Raftery 1994).
In the present work, a Markov chain for sampling the posterior distribution of the models given the data is constructed. The samples drawn are thenused to obtain posterior estimates of the primary current density (PCD) inside the brain given the data and unconditional of the models assumed. Inorder to construct the Markov chain, for each model H, we define a neighborhood nbd(H) consisting of all the models differing from H in just onelink that in our case consists on adding or removing one compartment from the model under consideration. The transition matrix Q to a new model H’and the transition probability P (H→H’) are defined as:
where pr(H|D) is the equilibrium distribution.
The method was used in a simulated data. In this case the estimated PCD via model averaging shows much better tomographic properties than thetraditional LORETA solution (Pascual-Marqui et al. 1994), particularly in the case of deep sources (figure 1). Additionally, the performance of theMCMC method depicted in figure 2 shows the suitable convergence properties of the Markov chain constructed, which stabilizes around thelogdensity value of the model used to generate the simulation (328.02).
e1877
Abstracts presented at the 9th International Conference on Functional Mapping of the Human Brain, June 19Œ22, 2003, New York, NY
e1877
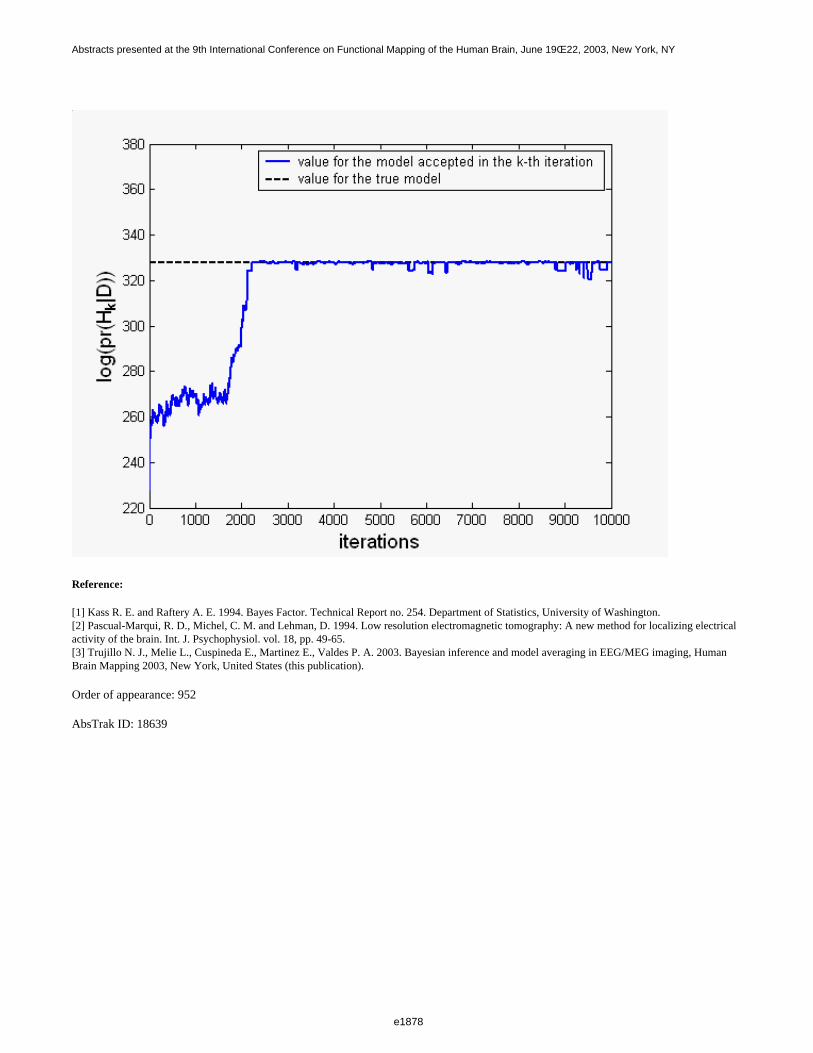
Reference:
[1] Kass R. E. and Raftery A. E. 1994. Bayes Factor. Technical Report no. 254. Department of Statistics, University of Washington.[2] Pascual-Marqui, R. D., Michel, C. M. and Lehman, D. 1994. Low resolution electromagnetic tomography: A new method for localizing electricalactivity of the brain. Int. J. Psychophysiol. vol. 18, pp. 49-65.[3] Trujillo N. J., Melie L., Cuspineda E., Martinez E., Valdes P. A. 2003. Bayesian inference and model averaging in EEG/MEG imaging, HumanBrain Mapping 2003, New York, United States (this publication).
Order of appearance: 952
AbsTrak ID: 18639
e1878
Abstracts presented at the 9th International Conference on Functional Mapping of the Human Brain, June 19Œ22, 2003, New York, NY
e1878
Poster number: 962
Surrogate Based Evidence for Static Nonlinearity inMagnetoencephalographic Recordings
Pradyumna S. Upadrashta*‡, Stephen C. Strother†‡
*Grad Program Scientific Computation, U of Minnesota, Minneapolis, MN, USA†Brain Sciences Center, VAMC, Minneapolis, MN, USA
‡Radiology, U of Minnesota, Minneapolis, MN, USA
Modeling & Analysis
Abstract
Static nonlinearities due to the MEG measurement processes can obscure the temporal dynamics of interest in surrogate tests for nonlinearity. Ingeneral, static nonlinearities are time-symmetric nonlinear transformations of data, generated by some temporally consistent measurement process.Separating static phenomena from brain-related dynamic nonlinearity is useful in MEG applications in which the structure of the underlying data isimportant. The method of surrogates is a data-driven resampling procedure for identifying nonlinear structure in a time-series. We present empiricalevidence, using the surrogates framework, that static nonlinearities may be identified in MEG data by estimating the distribution of two test-statistics:the time-reversal asymmetry (TRA) and nonlinear prediction error (NPE).
Methods
Data were collected on a whole-head, 248-channel magnetoencephalography (MEG) system (Magnes 3600, 4D-Neuroimaging), using twoexperimental conditions: (i) subject in the scanner, (ii) no subject in the scanner. Data were collected in 45s epochs, with 2 replicates per condition; 5ssegments were chosen within each epoch to adjust for endpoint mismatch. Time-series from each MEG channel were examined independently usingthe method of surrogates1,2 and the TISEAN3 software library. The null hypothesis of the two test-statistics considered jointly represents a linearprocess that is time-symmetric with respect to third-order moments. Rejection of one or both test-statistics is evidence for nonlinearity; rejection ofthe NPE alone is evidence for a static nonlinearity (time-symmetric nonlinearity).
Results
Analysis was carried out over all 248 channels independently, using linearly constrained surrogates. The threshold for significance was 95% with noadjustment for multiple comparisons. In condition (i), NPE rejected the null hypothesis of a linear process less often than in condition (ii), while TRAremains largely unaffected across conditions. In condition (ii), only the NPE consistently rejects the null. These results show evidence for atemporally-symmetric nonlinearity in condition (ii).
Discussion
The temporally symmetric nonlinearity measured in condition (ii) must originate from the MEG measurement process as there are no other sourcesfor dynamical contribution in an empty shielded room. No dynamical nonlinear component was discovered in condition (i), corresponding with braindynamics; however, there was a notable attenuation of the original static nonlinearity across a number of channels. These results would suggest thatthe original static nonlinearity is weak in comparison to any linear dynamics related to brain processes present in condition (i). The mechanism forsuch attenuation of the static component remains unclear. Considering these results, we propose the surrogate technique as a means of detectingspatially localized evidence for dynamic nonlinearities that can’t be completely understood by standard linear analyses.
References
1. T. Schreiber and A. Schmitz, Physica D 142, 346-382 (2000).2. T. Schreiber, in Is nonlinearity evident in time-series of brain electrical activity?, Singapore, 2000 (World Scientific).3. R. Hegger, H. Kantz, and T. Schreiber, 2.1 ed.(Dresden, DE, 2000).
Order of appearance: 953
AbsTrak ID: 19078
e1879
Abstracts presented at the 9th International Conference on Functional Mapping of the Human Brain, June 19Œ22, 2003, New York, NY
e1879
Poster number: 963
FMRI BOLD Signal Quantification and Relation to Neural Activity in aStudy of Precision Grip Force.
Romain Valabregue, Marc A Maier, Yves Burnod
INSERM U 483, Universite Paris 6.
Modeling & Analysis
Abstract
Although the fMRI technique is today commonly used to measure brain activation, there is still no consensus about the physiological interpretation ofthe BOLD signal. This measure needs more qualitative specifications, i.e. what kind of activation does the BOLD signal measure? as well as morequantitative specifications : i.e. what is the parametric relation of the BOLD signal ?
Several attempts of modeling the BOLD signal have been undertaken [1,2]. They show that different physiological parameters influence the timecourse of the BOLD signal. Among them are: the cerebral blood flow, the oxygen metabolism, the cerebral blood volume, the tissue oxygenconcentration and others. The variations of those parameters induce characteristic differences in the temporal form of the BOLD signal. However,whether the underlying variations can be directly observed in the BOLD signal will probably depend on the paradigm used.
The present work takes an experimental approach to this problem in order to evaluate the temporal BOLD signal. A visuo-motor ramp-and-holdparadigm has been chosen: the subjects control and vary the grip force between the thumb and index finger. This paradigm has been extensively usedin electrophysiological recordings of single cell activity in various cortical areas of non-human primates in order to characterize the relation betweengrip force and neural activity [e.g. 3,4]. Those studies have shown large populations of cells modulated in a phasic-tonic manner. The phasiccomponent often varies in relation to grip force velocity (dF/dt), whereas the tonic component is related to the amplitude of the hold-force. Thisparadigm offers then the opportunity to modulate the time varying neural activity and to compare it with the measured BOLD signal.
We performed experiments in five subjects with three different grip force levels, grouped in blocks of five ramp-and-hold events and analyzed thedata with the Radionet client server application [5] and the MarsBAR facilities. The number of activated pixels in the whole brain and in predefinedROI (M1 and SMA), as well as the associated percentage of signal change, increased as a function of force. A further difference was found byevaluating the time course of the BOLD signal : Although a tonic BOLD response was found at all three force levels, we saw a positive relationbetween the slope of the BOLD increase and the corresponding force. Such relations are consistent with the variation of neural activity with changinglevels of force as observed in non-human primates. We are currently investigating the influence of processing parameters on the quantification of thethe extent of activity.
References
1 Valabregue et al (2003). J Cereb Blood Flow & Metab. (In press)2 Zheng Y et al (2002) 16:617-6373 Smith AM et al (1975) (Exp Brain Res) 23:315-3324 Wannier TM et al (1991) (J Neurophysiol) 65:572-5895 Valabregue et al (2003) Sharing Data and Anlysis ... (HBM 2003)
Order of appearance: 954
AbsTrak ID: 17710
e1880
Abstracts presented at the 9th International Conference on Functional Mapping of the Human Brain, June 19Œ22, 2003, New York, NY
e1880

Poster number: 964
Sharing Data and Anlysis : Integration of SPM in a Client Server Application.
Romain Valabregue*†, Ivo Klaassen†, Roberto Toro*†, Arno Klaassen†
*INSERM U 483†Scito SA
Modeling & Analysis
Abstract
Neuroimaging is today one of the main experimental techniques used for the understanding of human brain structure and function. The interpretationof the data obtained from an experiment requires the use of the appropriate methods to correctly analyze the information. By ’methods’ we understandtheoretical framework and related software.
Various methods have been proposed and implemented, which leads to the need for comparison : one would like to compare different methods onidentical data as well as to validate a given method on known data. This is made difficult by the use of independent data formats and incompatiblesoftwares. Several groups have integrated different methods into coherent informatic platforms [1,2,3]. Further integration will be achieved by thedevelopment of shared databases [2,4,5]. Together, this will facilitate the use of research development in the clinical environment and will lower theeducational threshold for employing advanced neuro-imaging techniques. It also provides the opportunity to process large amounts of data.
We are developing a client-server application in order to create a novel database with integrated processing facilities. Our java client can be run fromany system and connects to either a web or Intranet server and allows secure access to the database. The following functionalities have been included :
_ Uploading of new data (formats: dicom, analyze and some manufacture-based formats)
_ Standard processing and analysis based on the SPM99 software [1]. The java interface allows the user to change the parameters to perform differenttypes of analysis. We directly call the original SPM99-code from within the server software.
_ Visualisation is made by a java viewer (3 simultaneous orthogonal planes of view, whole cortex view [6], fusion of volumes, graphical setting ofstatistical thresholds).
_ Downloading data and results.
Connection to a free database will be available from http://www.scito.com with data on Precision Grip Force [7]
References
1 http://www.fil.ion.ucl.ac.uk/spm/2 http://www.loni.ucla.edu/3 http://brainvisa.free.fr/4 Chicurel M (2000) Databasing the brain. Nature. 24;406:822-55 Toga AW (2002) Neuroimage databases: the good, the bad and the ugly. Nat Rev Neurosci. 3(4):302-96 Toro R et al, Surface visualisation of the vole cortex without mesh reconstruction HBM 20037 Valabregue et al, FMRI BOLD Signal Quantification and Relation to Neural Activity in a Study of Precision Grip Force. HBM 2003
Order of appearance: 955
AbsTrak ID: 18117
e1881
Abstracts presented at the 9th International Conference on Functional Mapping of the Human Brain, June 19Œ22, 2003, New York, NY
e1881
Poster number: 965
Dynamic Time-Frequency Coherence Mapping of EEGActivities:Rationale and Method
Johan van Doornik, Andrew CN Chen
Center for Sensory-Motor Control, Aalborg University, Denmark
Modeling & Analysis
Abstract
[Background]
Over the past decade, the importance of synchrony as a key feature of neuronal communication and neuronal information processing has becomeevident. EEG coherence has been emerged as one important tool. The calculation of coherence is usually based on the estimated auto-spectra andcross-spectrum. These estimations are obtained by a repeated experiment or by breaking up a single trial in a number of disjoint segments as if theywere separated measurements. The requirement for a large number of segments and a sufficiently large segment size, make coherence a staticmeasure. This study presents however a method in which coherence for single-trial experiments is extended into a fully dynamic measure. Wepropose to apply the principles of wavelet decomposition to both optimize the segment size and optimize the separation in disjoint segments. Thedynamic time-frequency coherence (DTFC) mapping becomes essential to examine functional integration and segregation in the brain.
[Methods]
We propose to part the signal in segments not in the time domain, but after the wavelet auto-spectra and cross-spectra for the complete signal havebeen calculated. When this is done separately for each frequency (or scale), an optimal time resolution is maintained. As a wavelet base the complexMorlet wavelet was used with wave number six. The estimated coherence was calculated using a sub-sampling from the wavelet coefficients and fromthe time series x(n) and y(n):
where w is the frequency of interest, Bw is the frequency dependent segment size, R is the number of segments, and k is the index (from 0 on) to theconsecutive coherence estimates used to built the DTFC mapping. Each coherence estimate takes BwR samples to compute; the time resolution of thecoherence is therefore a factor BwR lower than the original sample frequency. The segment size Bw was related to the size of the wavelet. Thecomplex Morlet wavelet is a plain wave modulated by a gaussian with s=1. Bw = 2s was sufficient to make subsequent segments ’disjoint’. Thenumber of segments R represents a trade-off between statistical confidence and time resolution. Confidence levels were numerically derived. Toillustrate the DTFC mapping, results from a 32-ch EEG recording during a cold pressor test (immerse the hand into ice water (2°C) for 3 min) were analyzed.
[Results]
To illustrate, TFCM was performed between electrode O1 and O2, with R = 40 and Bw = 2s, and is shown in a time-frequency plane coded in color.The 99.9% confidence limit was calculated to be 0.17. The time resolution with these parameters was 1.6s for 50 Hz, 4s for 20 Hz, 15.5s for 5 Hz.
[Conclusion]
It was shown that it was possible to obtain a dynamic measurement of coherence from a single-trial experiment. We propose that the method may beuseful in the study of the dynamics of cerebral coherence. Further studies are being conducted to optimize the method further.
Acknowledgement:
supported by Danish Technology Research Counsil and the Danish National Research Foundation.
e1882
Abstracts presented at the 9th International Conference on Functional Mapping of the Human Brain, June 19Œ22, 2003, New York, NY
e1882
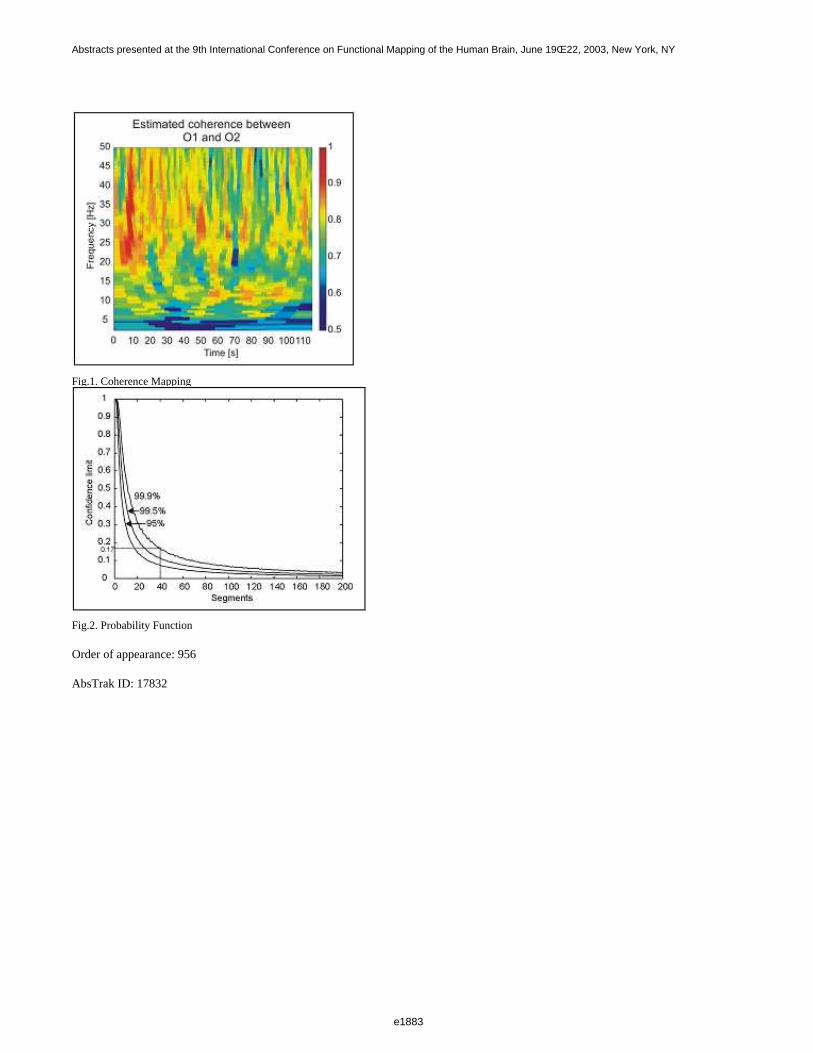
Fig.1. Coherence Mapping
Fig.2. Probability Function
Order of appearance: 956
AbsTrak ID: 17832
e1883
Abstracts presented at the 9th International Conference on Functional Mapping of the Human Brain, June 19Œ22, 2003, New York, NY
e1883
Poster number: 966
The fMRI Data Center: A Progress Report
John Van Horn*, Jeffrey Woodward†, Javed Aslam‡, Daniel Rockmore‡, Joseph Edelman†, Bennet Vance†, Sarene Schumacher†, Michael Gazzaniga*
*Center for Cognitive Neuroscienc, Dartmouth College, 6162 Moore Hall, Hanover, New Hampshire 03755 USA†The fMRI Data Center, Dartmouth College, 6162 Moore Hall, Hanover, New Hampshire 03755 USA
‡Department of Computer Science, Dartmouth College, Sudikoff Laboratory, Hanover, New Hampshire 03755 USA
Modeling & Analysis
Abstract
The fMRI Data Center (fMRIDC) has been successfully distributing raw functional imaging data to laboratories for the purposes of research andeducation since January 2000. The objective of the fMRIDC is the creation of an Internet-enabled mechanism by which the neuroscientificcommunity may more easily explore the functional neuroimaging data from published studies of cognitive function. Progress within other sciencesoffers proof of the utility and benefits that open data sharing provide. By maintaining a publicly accessible repository of raw data from thepeer-reviewed literature, the fMRIDC seeks to create a similarly successful environment for the cognitive and behavioral neurosciences.
At present, the fMRIDC is nearing 50 complete fMRI studies from the peer-reviewed literature representing ~2TB of data. This number is expected torapidly increase as new studies are contributed. An overwhelming response from the community has prompted the fMRIDC to develop of a set ofJava-based software tools aimed at the issues of data management, visualization and exploration, and data sharing called The fMRI DMT. These toolsare backed by a fMRI data ontological framework for describing neuroimaging experiments that facilitates the growth of an fMRI dataknowledge-base. We invite the neuroimaging community to participate in the development and extension of this ontology to encapsulate morecompletely the essential aspects involved in characterizing these often complex studies.
By making readily available raw and pre-processed neuroimaging data, statistical results maps, as well as tools for screening the details of theexperimental and scanner protocols, researchers using the fMRIDC may have access to a much more diverse pool of data than found in any singlefMRI study. Thus, dynamic analyses across datasets and experiments may be performed, new statistical techniques developed, improved techniquesfor image processing can be investigated, and unique neuroscientific questions may be explored. We describe some intial work in which data fromseveral archived studies are combined and examined using various "mega-analytic" techniques. Additionally, we describe attempts to abstract fMRItimecourse information into "feature-vectors" that allow large data sets to be more rapidly compared.
Additional information regarding the fMRI Data Center can be found at http://www.fmridc.org
The fMRIDC is supported by the National Science Foundation, The William M. Keck Foundation, and the National Institute of Mental Health. ThefMRIDC is a Sun Microsystems Center of Excellence for Neuroscience.
Order of appearance: 957
AbsTrak ID: 19069
e1884
Abstracts presented at the 9th International Conference on Functional Mapping of the Human Brain, June 19Œ22, 2003, New York, NY
e1884
Poster number: 967
Does overt responding during fMRI influence the activation pattern ofanother task?
Pieter Vandemaele, Eric Achten, Karel Deblaere, John Van Borsel
fMRI Workgroup Ghent, Ghent University Hospital, Belgium
Modeling & Analysis
Abstract
Introduction
When conducting speech-related fMRI studies, it is important to control the performance of subjects. The ideal way to achieve this is by means ofovert verbal responses. However, overt speech can introduce artifacts in the fMRI data [5]. Some studies use event-related paradigms and imagepreprocessing techniques [3,4] or describe general techniques [1] to suppress motion artifacts. In this study, we examined how overt speech influencesthe activation pattern of another task in a block design paradigm.
Materials and Methods
EPI data (25 5mm axial slices, in plane resolution = 3x3 mm, TR=3 s, TE= 58 ms, flip angle=90 °) were acquired in 11 right handed male subjects.Subjects performed a block design paradigm where two tasks, being overt (O) or covert (C) counting and right hand finger tapping (H) or rest (R),were fully crossed. The counting and finger tapping were visually cued at 1Hz. Eight cycles of OH-OR-CH-CR were performed where one epochtook 10 volumes, yielding 8’ of scanning time. Subjects were instructed to lie as still as possible. Statistical analysis was performed using SPM99.The hand activation during overt counting was compared with the hand activation during covert counting using a paired t-test (random effectsanalysis, RFX). For this, the contrast (OH>OR)>(CH>CR) was calculated.
Results
Hand activation shows no large differences during overt and covert counting when visually inspected for all subjects. The figure shows theSPMT-map (p<0.001, RFX analysis, not corrected) of the (OH>OR)>(CH>CR) contrast. Activation is observed in the right anterior cingulate andthe basal part of the head of the caudate nucleus. The anterior cingulate is known to play a role in self-monitoring [2] and suggests a higher difficultyin simultaneously performing a finger tapping task with an overt task compared to a covert task. The activation in the basal part of the head of thecaudate nucleus (important during verbal fluency and rhythm [6]), might reflect the overt component present in the calculated contrast.
There seems to be no effect of overt verbal responding on the activation pattern in M1 of the hand above a widely used threshold value in bothindividual and group analysis.
Conclusions
This study indicated the feasibility of overt verbal responding during fMRI, under the conditions that the control task is well balanced against theexperimental task concerning the use of overt speech and that subjects are well instructed. However, further analysis of the realignment parameters isnecessary to construct maps of regions sensitive to motion artifacts induced by overt speech.
References
1. Barch et al. Neuroimage (1999) 10:642-6572. Cameron et al. Science (1998) 280:747-7493. Huang et al. Human Brain Mapping (2002) 15:39-534. Palmer et al. Neuroimage (2001) 14:182-1935. Vandemaele et al. Human Brain Mapping 2002 Meeting, poster 104096. Wu et al. Neuroreport (1995) 6:501-505
e1885
Abstracts presented at the 9th International Conference on Functional Mapping of the Human Brain, June 19Œ22, 2003, New York, NY
e1885
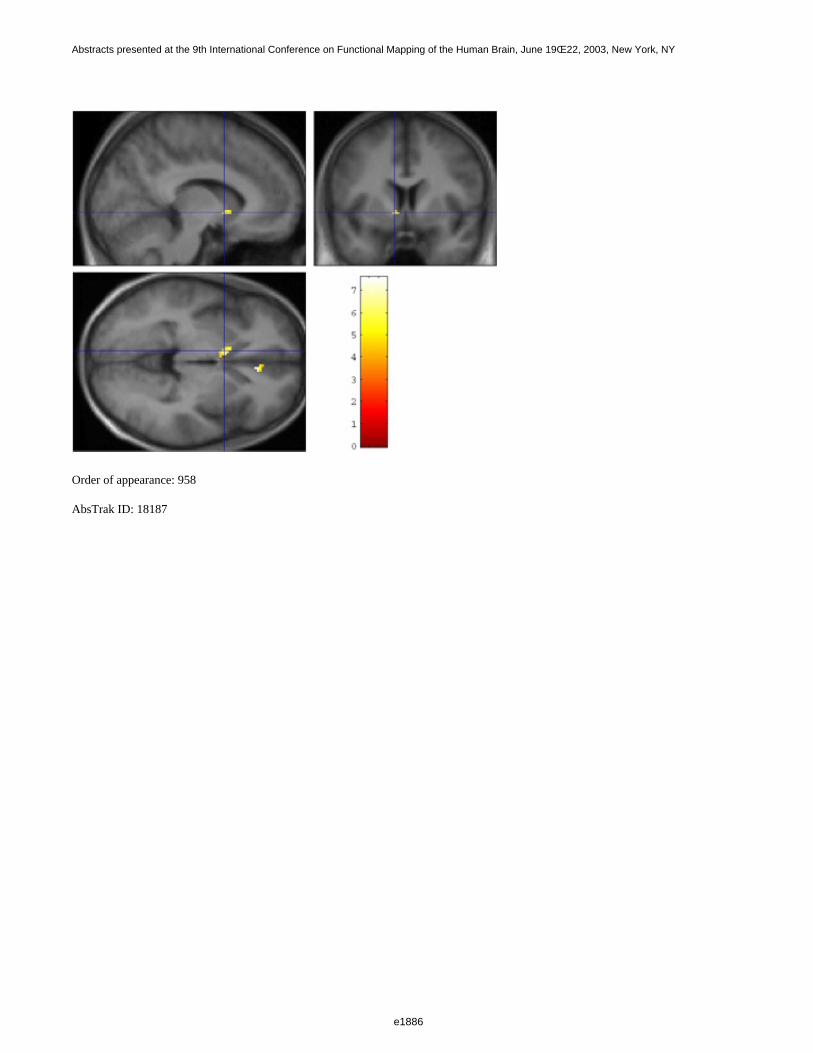
Order of appearance: 958
AbsTrak ID: 18187
e1886
Abstracts presented at the 9th International Conference on Functional Mapping of the Human Brain, June 19Œ22, 2003, New York, NY
e1886
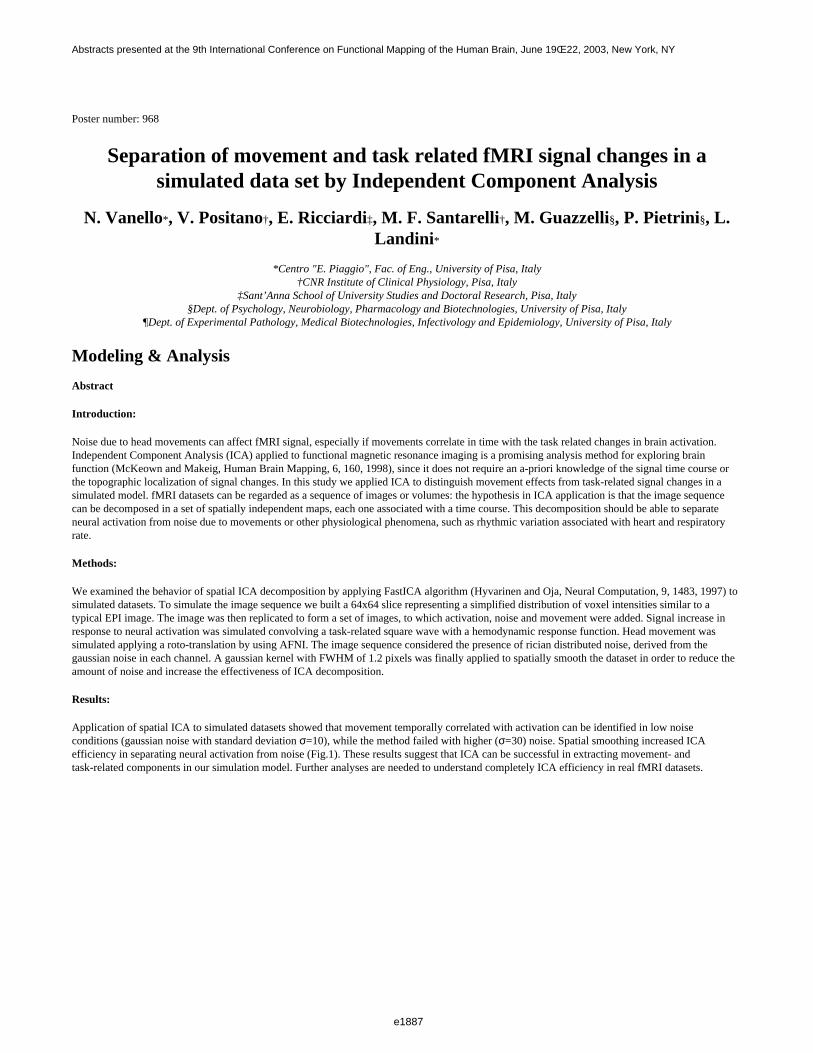
Poster number: 968
Separation of movement and task related fMRI signal changes in asimulated data set by Independent Component Analysis
N. Vanello*, V. Positano†, E. Ricciardi‡, M. F. Santarelli†, M. Guazzelli§, P. Pietrini§, L. Landini*
*Centro "E. Piaggio", Fac. of Eng., University of Pisa, Italy†CNR Institute of Clinical Physiology, Pisa, Italy
‡Sant’Anna School of University Studies and Doctoral Research, Pisa, Italy§Dept. of Psychology, Neurobiology, Pharmacology and Biotechnologies, University of Pisa, Italy
¶Dept. of Experimental Pathology, Medical Biotechnologies, Infectivology and Epidemiology, University of Pisa, Italy
Modeling & Analysis
Abstract
Introduction:
Noise due to head movements can affect fMRI signal, especially if movements correlate in time with the task related changes in brain activation.Independent Component Analysis (ICA) applied to functional magnetic resonance imaging is a promising analysis method for exploring brainfunction (McKeown and Makeig, Human Brain Mapping, 6, 160, 1998), since it does not require an a-priori knowledge of the signal time course orthe topographic localization of signal changes. In this study we applied ICA to distinguish movement effects from task-related signal changes in asimulated model. fMRI datasets can be regarded as a sequence of images or volumes: the hypothesis in ICA application is that the image sequencecan be decomposed in a set of spatially independent maps, each one associated with a time course. This decomposition should be able to separateneural activation from noise due to movements or other physiological phenomena, such as rhythmic variation associated with heart and respiratory rate.
Methods:
We examined the behavior of spatial ICA decomposition by applying FastICA algorithm (Hyvarinen and Oja, Neural Computation, 9, 1483, 1997) tosimulated datasets. To simulate the image sequence we built a 64x64 slice representing a simplified distribution of voxel intensities similar to atypical EPI image. The image was then replicated to form a set of images, to which activation, noise and movement were added. Signal increase inresponse to neural activation was simulated convolving a task-related square wave with a hemodynamic response function. Head movement wassimulated applying a roto-translation by using AFNI. The image sequence considered the presence of rician distributed noise, derived from thegaussian noise in each channel. A gaussian kernel with FWHM of 1.2 pixels was finally applied to spatially smooth the dataset in order to reduce theamount of noise and increase the effectiveness of ICA decomposition.
Results:
Application of spatial ICA to simulated datasets showed that movement temporally correlated with activation can be identified in low noiseconditions (gaussian noise with standard deviation σ=10), while the method failed with higher (σ=30) noise. Spatial smoothing increased ICAefficiency in separating neural activation from noise (Fig.1). These results suggest that ICA can be successful in extracting movement- andtask-related components in our simulation model. Further analyses are needed to understand completely ICA efficiency in real fMRI datasets.
e1887
Abstracts presented at the 9th International Conference on Functional Mapping of the Human Brain, June 19Œ22, 2003, New York, NY
e1887
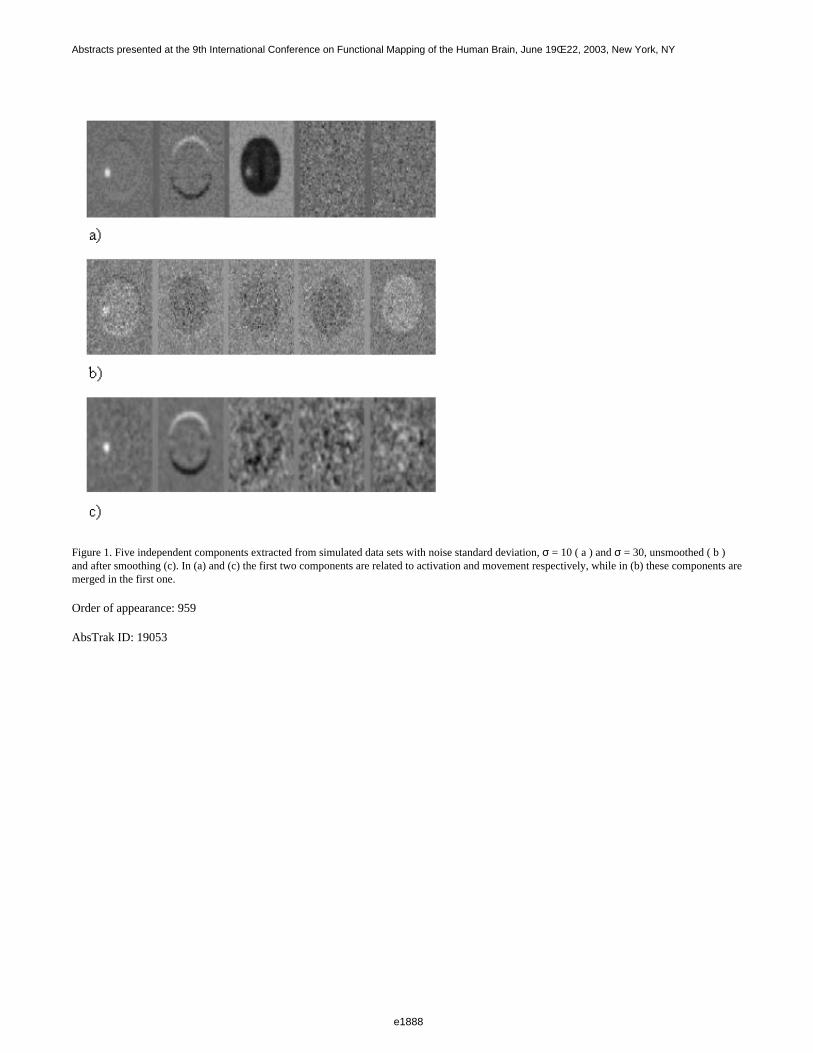
Figure 1. Five independent components extracted from simulated data sets with noise standard deviation, σ = 10 ( a ) and σ = 30, unsmoothed ( b )and after smoothing (c). In (a) and (c) the first two components are related to activation and movement respectively, while in (b) these components aremerged in the first one.
Order of appearance: 959
AbsTrak ID: 19053
e1888
Abstracts presented at the 9th International Conference on Functional Mapping of the Human Brain, June 19Œ22, 2003, New York, NY
e1888
Poster number: 969
A Dynamic Model of the Blood Oxygenation Response: Normocapnia,Hypocapnia and Hypercapnia Results
Alberto Vazquez*, Eric Cohen†, Seong-Gi Kim‡, Douglas Noll*
*University of Michigan†University of Minnesota‡University of Pittsburgh
Modeling & Analysis
Abstract
Introduction
Cerebral hemodynamics play a central role in the generation of the functional response observed during changes in neuronal activity using BOLDfMRI. An accurate understanding of the cerebral hemodynamics would render BOLD not only as a quantitative tool for functional brain imaging butmight also allow for measurements of aspects of vascular hemodynamics and oxygen extraction.
This work presents a model based on the fluid mechanical properties of a regional vascular tree that mimics the dynamic nature of the cerebralhemodynamics under different baseline states and compares it with BOLD hypocapnia/hypercapnia data.
Methods
The details of our model have been presented previously (10th ISMRM,pp1383,2002), but as a short summary, the vascular network is modeled as aresistive network (pressure-drops drive the flow). A Windkessel approach was used to account for the compliant nature of blood vessels. To drive thevascular system, a variable diameter tube (resistance) at the input of the arterial segment mimicked the stimulus-to-CBF response (assumed first-orderdynamics). The oxygen extraction and average amount of deoxyhemoglobin were computed to obtain an estimate of the MR signal change. The bloodflow response amplitude was set to a maximum 55% change and a time constant of 2.5s, and the baseline oxygen-extraction-fraction was set to 0.4.
Results
The model captures various features of the BOLD response (Figure 1), including initial dip and post-stimulus undershoot. It roughly predicts a bloodvolume response that follows Grubb’s relationship (23% vs. 20%), and oxygen extraction changes that agree with Hoge’s findings (~25% ∆CMRO2vs. ~55% ∆CBF) (MRM 42:849,1999). The largest changes in blood volume (Figure 2) occur in the arterial compartment (52%), due to the change incaliber and compliance of the supplying vessels. The capillary and venous blood volume changes were not as large (15% and 10%, respectively) andare in agreement with prior literature. Longer than expected mean transit-times were obtained (MTT art/cap/ven=0.9s/0.4s/1.9s), particularly in thearterial compartment. To fit the hypocapnia/hypercapnia BOLD data (Figure 1), a decrease/increase in the basal arterial compliance accounted formost changes. A closer fit of the response is obtained if the capillary and venous compliances are modified, and if the amplitude of the blood flowchange can vary between additive and proportional. All other parameters remained constant, including the BOLD gain factor.
Discussion
The results of the model suggest that the blood flow response is mostly proportional to the baseline, though small adjustments to the amplitude of theflow response indicate a deviation from this property. Because of the nature of the model, the effect of changing the arterial compliance is equivalentto changing the basal pressure-drop across the compartment. This work illustrates that the resistive-network model with proper adjustment of thebasal pressure-drop of the arterial compartment can explain most of the changes observed in hypocapnia/hypercapnia responses, though at theexpense of the arterial transit-time. Further refinement of the model will include changes to the baseline pressure-drop across all compartments(arterial/capillary/venous) to more accurately represent physiology and correct for the non-physiologic behavior of the arterial transit-time.
This work was supported by the Raynor Foundation.
e1889
Abstracts presented at the 9th International Conference on Functional Mapping of the Human Brain, June 19Œ22, 2003, New York, NY
e1889
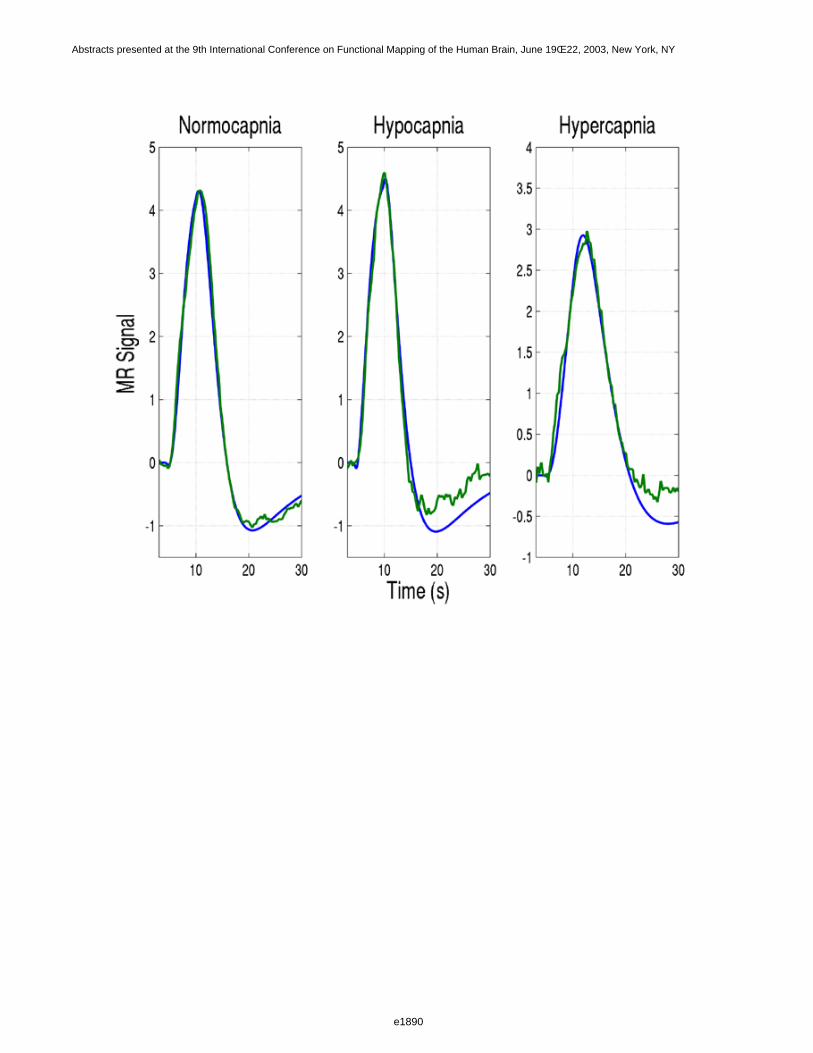
e1890
Abstracts presented at the 9th International Conference on Functional Mapping of the Human Brain, June 19Œ22, 2003, New York, NY
e1890
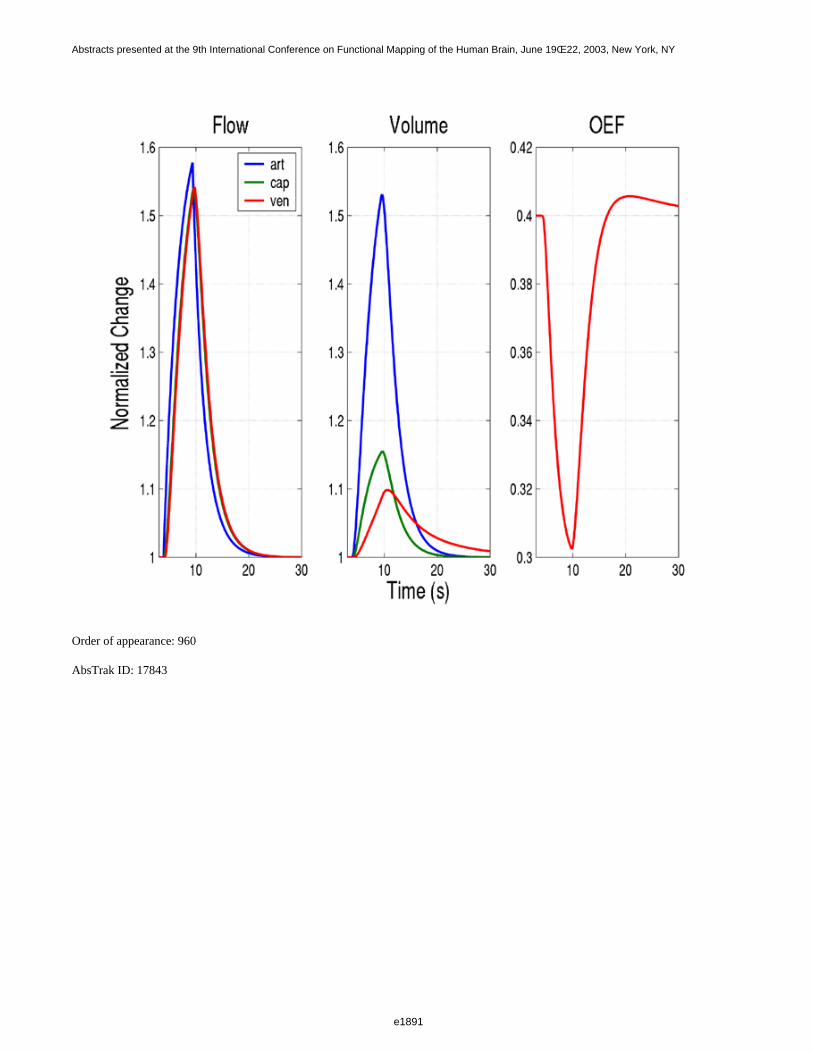
Order of appearance: 960
AbsTrak ID: 17843
e1891
Abstracts presented at the 9th International Conference on Functional Mapping of the Human Brain, June 19Œ22, 2003, New York, NY
e1891
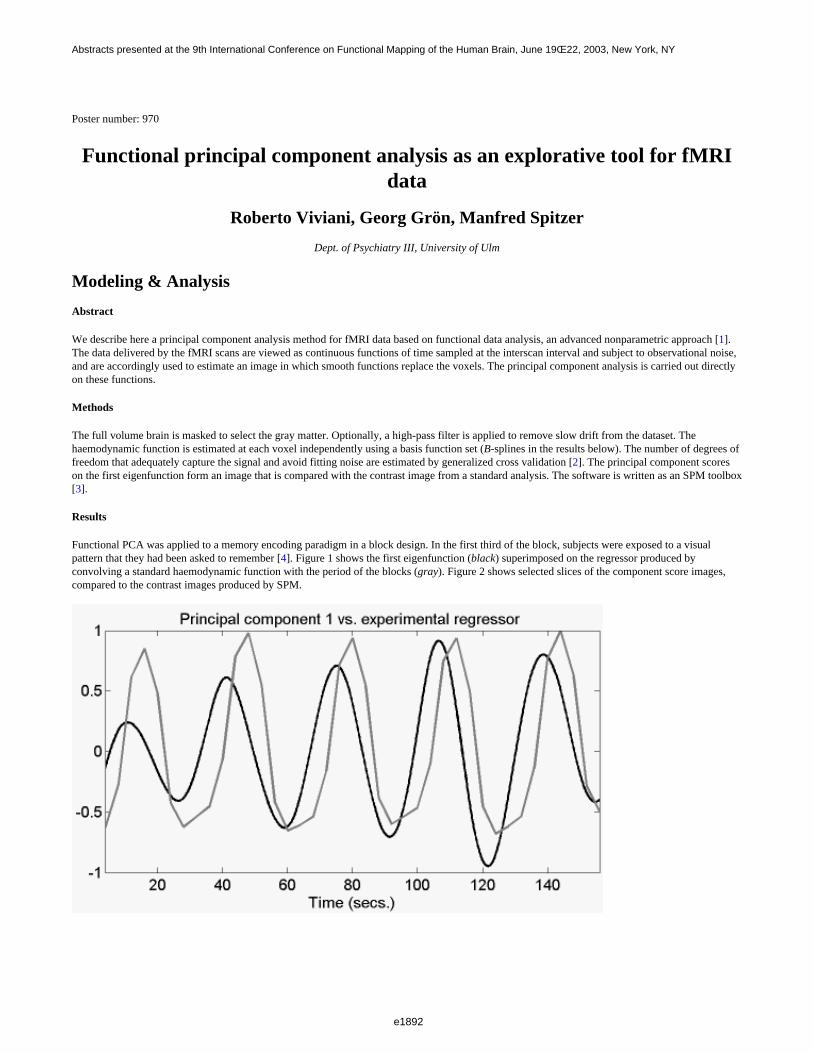
Poster number: 970
Functional principal component analysis as an explorative tool for fMRI data
Roberto Viviani, Georg Grön, Manfred Spitzer
Dept. of Psychiatry III, University of Ulm
Modeling & Analysis
Abstract
We describe here a principal component analysis method for fMRI data based on functional data analysis, an advanced nonparametric approach [1].The data delivered by the fMRI scans are viewed as continuous functions of time sampled at the interscan interval and subject to observational noise,and are accordingly used to estimate an image in which smooth functions replace the voxels. The principal component analysis is carried out directlyon these functions.
Methods
The full volume brain is masked to select the gray matter. Optionally, a high-pass filter is applied to remove slow drift from the dataset. Thehaemodynamic function is estimated at each voxel independently using a basis function set (B-splines in the results below). The number of degrees offreedom that adequately capture the signal and avoid fitting noise are estimated by generalized cross validation [2]. The principal component scoreson the first eigenfunction form an image that is compared with the contrast image from a standard analysis. The software is written as an SPM toolbox [3].
Results
Functional PCA was applied to a memory encoding paradigm in a block design. In the first third of the block, subjects were exposed to a visualpattern that they had been asked to remember [4]. Figure 1 shows the first eigenfunction (black) superimposed on the regressor produced byconvolving a standard haemodynamic function with the period of the blocks (gray). Figure 2 shows selected slices of the component score images,compared to the contrast images produced by SPM.
e1892
Abstracts presented at the 9th International Conference on Functional Mapping of the Human Brain, June 19Œ22, 2003, New York, NY
e1892
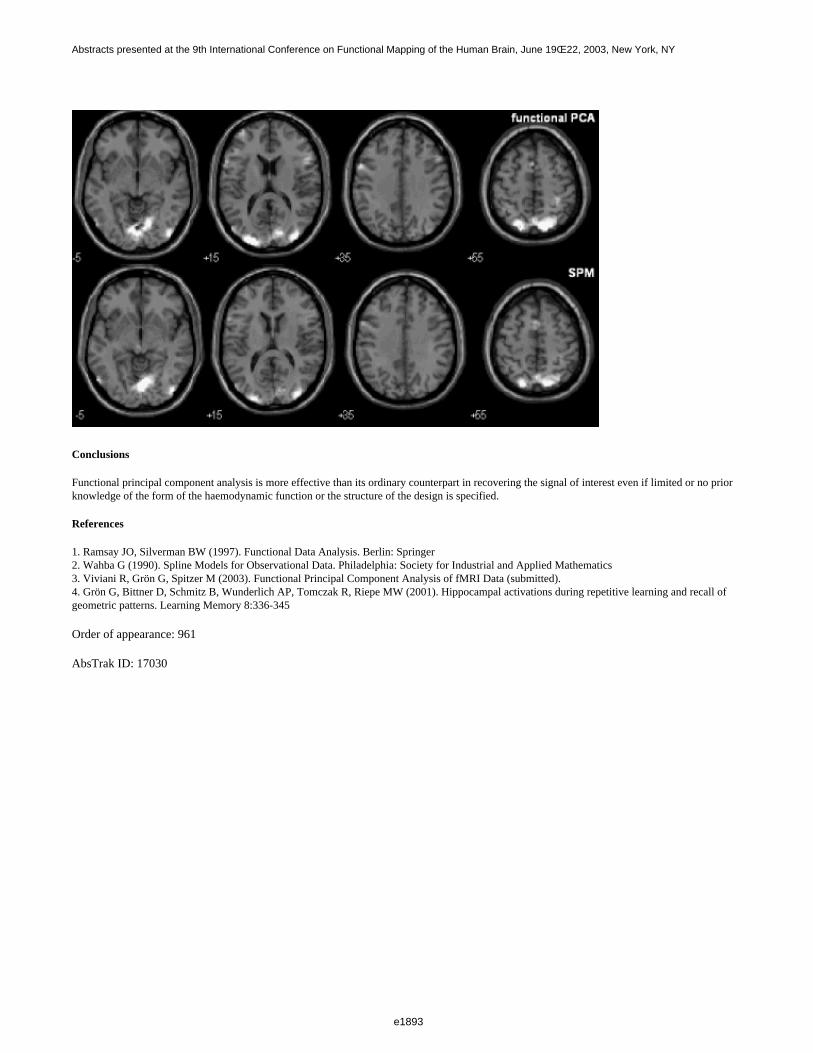
Conclusions
Functional principal component analysis is more effective than its ordinary counterpart in recovering the signal of interest even if limited or no priorknowledge of the form of the haemodynamic function or the structure of the design is specified.
References
1. Ramsay JO, Silverman BW (1997). Functional Data Analysis. Berlin: Springer2. Wahba G (1990). Spline Models for Observational Data. Philadelphia: Society for Industrial and Applied Mathematics3. Viviani R, Grön G, Spitzer M (2003). Functional Principal Component Analysis of fMRI Data (submitted).4. Grön G, Bittner D, Schmitz B, Wunderlich AP, Tomczak R, Riepe MW (2001). Hippocampal activations during repetitive learning and recall ofgeometric patterns. Learning Memory 8:336-345
Order of appearance: 961
AbsTrak ID: 17030
e1893
Abstracts presented at the 9th International Conference on Functional Mapping of the Human Brain, June 19Œ22, 2003, New York, NY
e1893
Poster number: 971
Evaluation of sLORETA in the Presence of Noise and Multiple Sources
Michael Wagner, Manfred Fuchs, Jörn Kastner
Neuroscan Labs, Hamburg, Germany
Modeling & Analysis
Abstract
Introduction
The standardized Low Resolution Brain Electromagnetic Tomography (sLORETA) method [1] can be used to compute statistical maps from EEGand MEG data that indicate the locations of the underlying source processes with low error. These maps are derived by performing a location-wiseinverse weighting of the results of a Minimum Norm Least Squares (MNLS) analysis with their estimated variances. In contrast to an earlier paper byDale et al. [2], the estimated source variances used are computed not only from the measurement noise, but also from the prior source variances.These prior source variances are assumed to be equal.
In this contribution, we evaluate the performance of the method under the presence of noise and with multiple, simultaneously active sources.
Methods
Simulated data containing one and two sources at different locations and with different strengths have been computed for an 81 electrode EEG setup.Three spherical shells were used as the volume conductor model. Data were disturbed using Gaussian noise of different levels. sLORETA analyseshave been performed using the CURRY software (Neuroscan, El Paso, TX, USA) and their results have been compared with other dipole and currentdensity results.
Results
While the method is capable of localizing single sources even in the presence of noise, multiple simultaneous sources can only be separated if they arenot too close and their strengths are not too different.
Discussion
The sLORETA method is fast and localizes well, as compared to other linear approaches such as MNLS and LORETA.
References
1. Pascual-Marqui AD, 2002: Standardized low resolution brain electromagnetic tomography (sLORETA): technical details. Methods & Findings inExperimental & Clinical Pharmacology 24D, 5-122. Dale AM, Liu AK, Fischl B, Buckner RL, Belliveau JW, Lewine JD, Halgren E, 2000: Dynamical Statistical Parametric Mapping: CombiningfMRI and MEG for High-Resolution Imaging of Cortical Activity. Neuron 26, 55-67
e1894
Abstracts presented at the 9th International Conference on Functional Mapping of the Human Brain, June 19Œ22, 2003, New York, NY
e1894
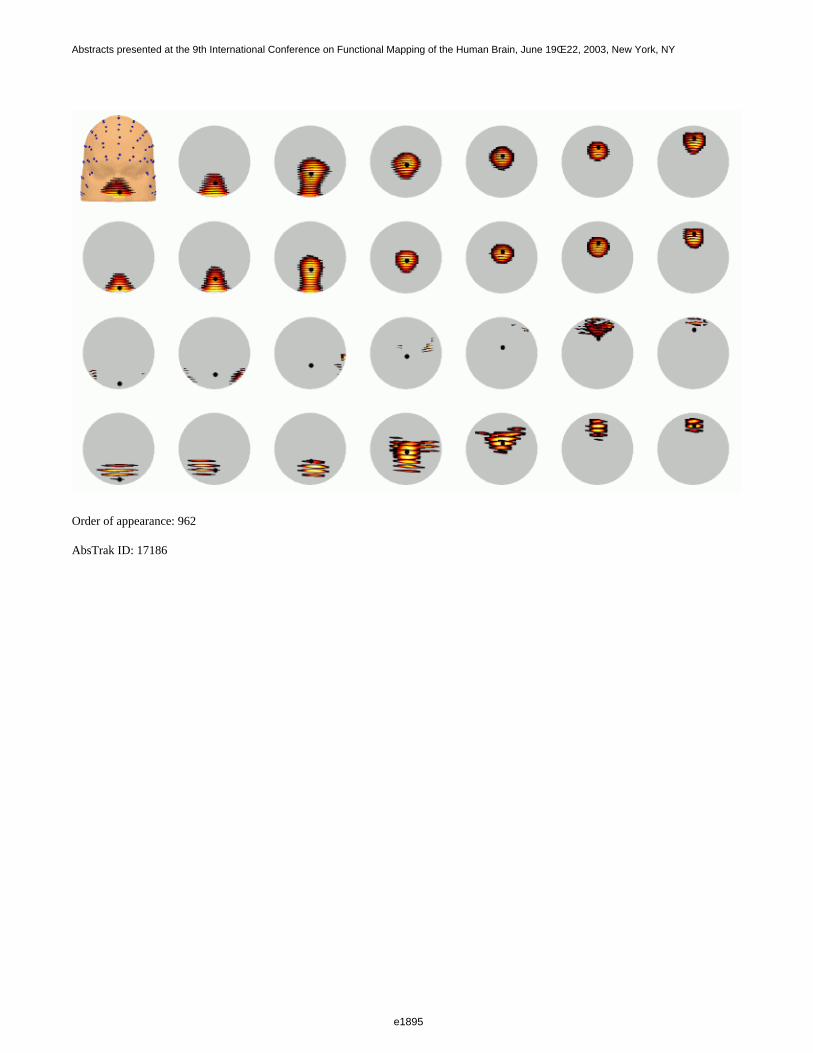
Order of appearance: 962
AbsTrak ID: 17186
e1895
Abstracts presented at the 9th International Conference on Functional Mapping of the Human Brain, June 19Œ22, 2003, New York, NY
e1895
Poster number: 972
Resting State Networks are influenced by prior cognitive activity
Anthony B Waites, Alexandra Stanislavsky, David F Abbott, Graeme D Jackson
Brain Research Institute, Melbourne, Australia
Modeling & Analysis
Abstract
Introduction
Resting state networks (RSNs) have been demonstrated in the motor and language systems, but their function remains unclear. The purpose of thepresent study is to consider whether this correlated inter-regional variation reflects a basic property of the resting brain state, or an increase in brainsynchrony invoked by specific cognitive processing. Specifically, can we influence the strength and extent of the resting state correlations betweenlanguage related areas by performing a language production task immediately prior to acquiring the resting state data?
Methods
fMRI studies of 8 healthy volunteers were performed with a 3 tesla GE Signa LX whole body scanner. 22 slice functional images were acquired(GR-EPI, TR/TE/alpha=3600/40ms/40deg, 24cm FOV, 22 slices, voxel size =1.87x1.87x5mm3). Each subject was first scanned for five minutes in aresting state. They then performed an orthographic lexical retrieval (OLR) task, generating a list of words beginning with a presented letter. A secondresting state followed. The OLR task was performed in a block design, allowing the determination of the location of language activity. The task wasperformed in 4 blocks of 36 seconds task & 36 seconds rest.
Analysis was performed using SPM99 (www.fil.ion.ucl.ac.uk/spm). Regions associated with performance of the language task for each individualwere first identified by standard block-design analysis. The most significant voxel in the anterior cingulate cortex (ACC) was identified, and voxelswithin a sphere of 1cm diameter and significantly activated (p<0.0001, uncorrected) were included in a region of interest (ROI). The time-course ofeach voxel was then low-pass filtered (<0.08Hz) to reduce the effect of cardiac and respiratory variance on the correlation. RSNs were identified bycorrelating the ROI time-course during each of the REST periods with all brain voxel time-courses. Correlation results for each subject wereconsidered separately, as well as grouped in a conjunction analysis (p<0.05 corrected). In each case contrasts compared the RSN before versus afterOLR performance.
Results
The performance of a language task affected the subsequent RSN. In all subjects, correlation with ACC was found in language regions, includingbilateral middle frontal gyrus (MFG), inferior frontal gyrus (IFG), Wernicke’s area and ACC (table 1). Conjunction analysis revealed a system oflanguage regions correlated with ACC signal (Fig.1). The observed change in the ACC RSN after OLR performance varied across subjects (table 1).This is illustrated in Fig.2, where the contrast between before and after RSN is shown for two subjects. Subject 1 shows increased left MFG/IFGactivity after OLR, suggesting increased functional connections between ACC and other elements of the language network, whereas subject 2 showsmore widespread ACC connectivity before language performance. Most subjects reported drowsiness which may, for subject 2, have modulated attention.
Discussion
The ACC and other language regions comprise a RSN, which is dynamic, varying after an explicit language task in a subject-specific manner.Variation in RSN may be due to continued language processing, fluctuations in attention, or other cognitive processes. Regardless of the cause, thevariability of RSNs is an important consideration when interpreting their meaning.
e1896
Abstracts presented at the 9th International Conference on Functional Mapping of the Human Brain, June 19Œ22, 2003, New York, NY
e1896
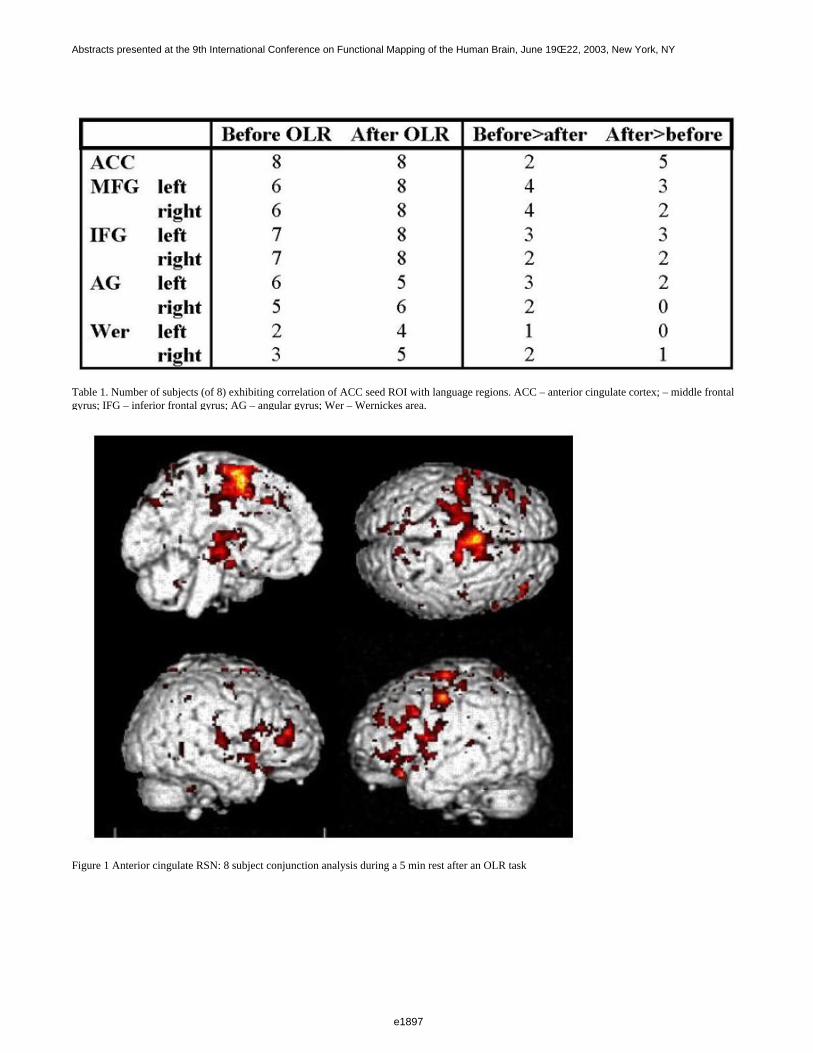
Table 1. Number of subjects (of 8) exhibiting correlation of ACC seed ROI with language regions. ACC – anterior cingulate cortex; – middle frontalgyrus; IFG – inferior frontal gyrus; AG – angular gyrus; Wer – Wernickes area.
Figure 1 Anterior cingulate RSN: 8 subject conjunction analysis during a 5 min rest after an OLR task
e1897
Abstracts presented at the 9th International Conference on Functional Mapping of the Human Brain, June 19Œ22, 2003, New York, NY
e1897
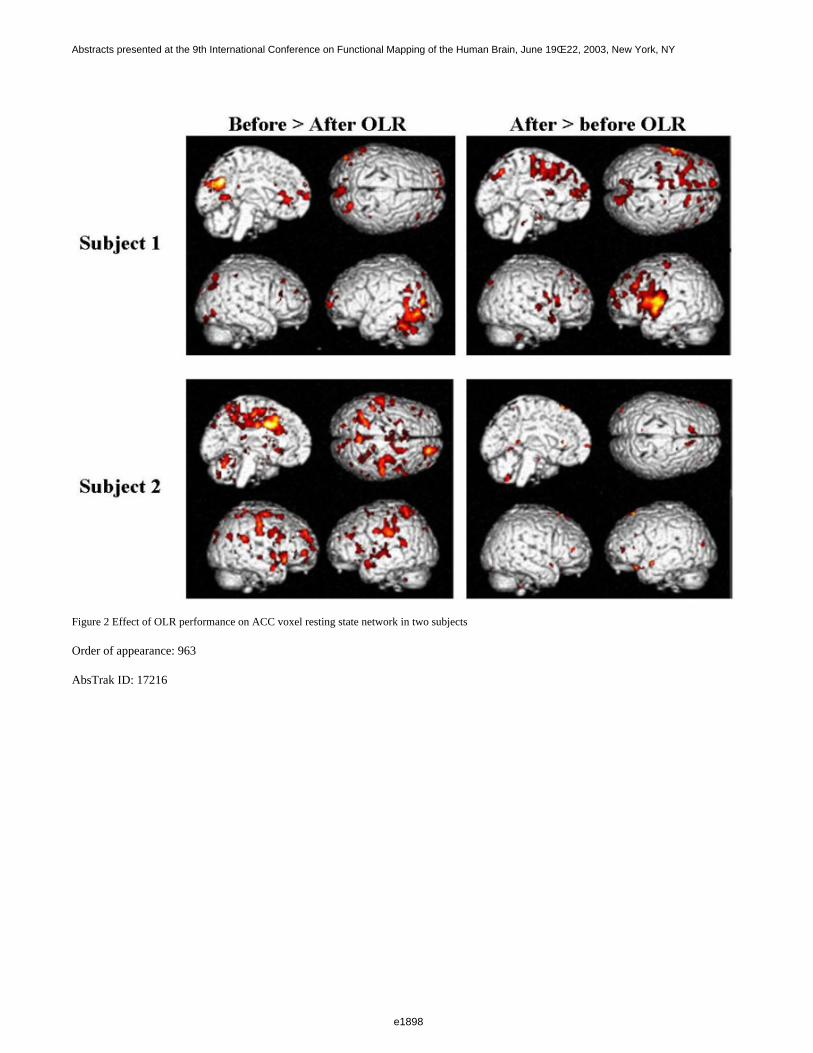
Figure 2 Effect of OLR performance on ACC voxel resting state network in two subjects
Order of appearance: 963
AbsTrak ID: 17216
e1898
Abstracts presented at the 9th International Conference on Functional Mapping of the Human Brain, June 19Œ22, 2003, New York, NY
e1898

Poster number: 973
MARINA: An easy to use tool for the creation of MAsks for Region ofINterest Analyes
Bertram Walter, Carlo Blecker, Peter Kirsch, Gebhard Sammer, Anne Schienle, RudolfStark, Dieter Vaitl
Bender Institute of Neuroimaging, University of Giessen
Modeling & Analysis
Abstract
The analysis of fMRI data is usually performed by voxelwise tests of the effects under question. The large number of tests (often > 50,000) requires arigid control of type I error, which is obtained by procedures using Bonferroni corrections, the random field theory, or the false discovery rate.However, even the least conservative procedure leads to a substantial loss in statistical power compared to a single test.
Statistical power can be greatly enhanced when the number of voxels to be tested is reduced by restricting the analysis to a region of interest (ROI)instead of testing the entire brain. This is appropriate for explorative analyses with specific search regions as well as for confirmatory testing ofhypotheses concerning selected brain regions.
ROI analyses require the definition of a ROI by means of a mask image in the space used for the functional images, which is usually the MNI space.MARINA allows creating, smoothing, thresholding, editing, and saving such masks in an SPM-ANALYZE format. The creation of masks issupported by the anatomical parcellation of the brain described by Tzourio-Mazoyer et al. (2002). Voxel coordinates of brain structures were takenfrom their SPM toolbox AAL (automated anatomical labeling). AAL also provides the coordinates of cerebellar regions, which were described bySchmahmann et al. (1999). Additionally, masks from other sources like these generated by Nielsen and Hansen (2002,http://hendrix.imm.dtu.dk/services/jerne/ninf/voi.html) using the BrainMap database (Fox & Lancaster, 1994) can be downloaded and edited byMARINA. The created masks can be used for region of interest analyses of functional neuroimaging data in the small volume correction feature ofSPM (http://www.fil.ion.ucl.ac.uk/spm/) or elsewhere.
MARINA is available at http://www.bion.de, runs under Windows, is free software and published under the terms of the GNU General Public License.
Order of appearance: 964
AbsTrak ID: 17756
e1899
Abstracts presented at the 9th International Conference on Functional Mapping of the Human Brain, June 19Œ22, 2003, New York, NY
e1899
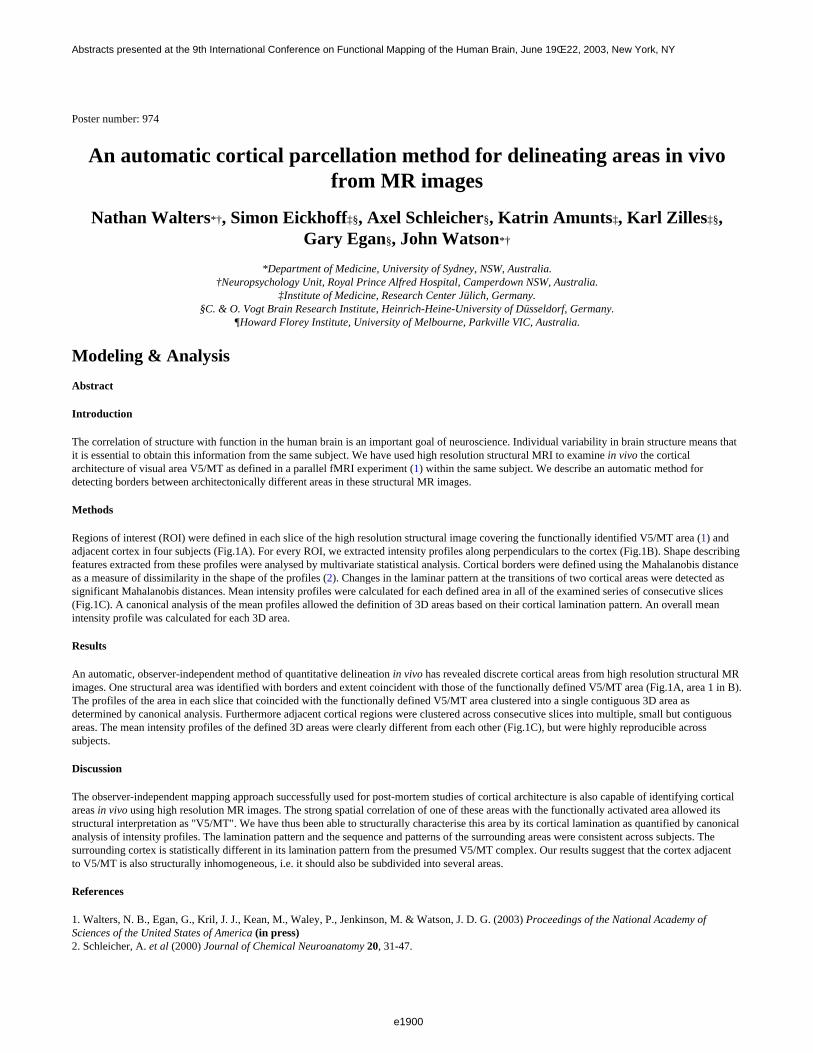
Poster number: 974
An automatic cortical parcellation method for delineating areas in vivofrom MR images
Nathan Walters*†, Simon Eickhoff‡§, Axel Schleicher§, Katrin Amunts‡, Karl Zilles‡§,Gary Egan§, John Watson*†
*Department of Medicine, University of Sydney, NSW, Australia.†Neuropsychology Unit, Royal Prince Alfred Hospital, Camperdown NSW, Australia.
‡Institute of Medicine, Research Center Jülich, Germany.§C. & O. Vogt Brain Research Institute, Heinrich-Heine-University of Düsseldorf, Germany.
¶Howard Florey Institute, University of Melbourne, Parkville VIC, Australia.
Modeling & Analysis
Abstract
Introduction
The correlation of structure with function in the human brain is an important goal of neuroscience. Individual variability in brain structure means thatit is essential to obtain this information from the same subject. We have used high resolution structural MRI to examine in vivo the corticalarchitecture of visual area V5/MT as defined in a parallel fMRI experiment (1) within the same subject. We describe an automatic method fordetecting borders between architectonically different areas in these structural MR images.
Methods
Regions of interest (ROI) were defined in each slice of the high resolution structural image covering the functionally identified V5/MT area (1) andadjacent cortex in four subjects (Fig.1A). For every ROI, we extracted intensity profiles along perpendiculars to the cortex (Fig.1B). Shape describingfeatures extracted from these profiles were analysed by multivariate statistical analysis. Cortical borders were defined using the Mahalanobis distanceas a measure of dissimilarity in the shape of the profiles (2). Changes in the laminar pattern at the transitions of two cortical areas were detected assignificant Mahalanobis distances. Mean intensity profiles were calculated for each defined area in all of the examined series of consecutive slices(Fig.1C). A canonical analysis of the mean profiles allowed the definition of 3D areas based on their cortical lamination pattern. An overall meanintensity profile was calculated for each 3D area.
Results
An automatic, observer-independent method of quantitative delineation in vivo has revealed discrete cortical areas from high resolution structural MRimages. One structural area was identified with borders and extent coincident with those of the functionally defined V5/MT area (Fig.1A, area 1 in B).The profiles of the area in each slice that coincided with the functionally defined V5/MT area clustered into a single contiguous 3D area asdetermined by canonical analysis. Furthermore adjacent cortical regions were clustered across consecutive slices into multiple, small but contiguousareas. The mean intensity profiles of the defined 3D areas were clearly different from each other (Fig.1C), but were highly reproducible across subjects.
Discussion
The observer-independent mapping approach successfully used for post-mortem studies of cortical architecture is also capable of identifying corticalareas in vivo using high resolution MR images. The strong spatial correlation of one of these areas with the functionally activated area allowed itsstructural interpretation as "V5/MT". We have thus been able to structurally characterise this area by its cortical lamination as quantified by canonicalanalysis of intensity profiles. The lamination pattern and the sequence and patterns of the surrounding areas were consistent across subjects. Thesurrounding cortex is statistically different in its lamination pattern from the presumed V5/MT complex. Our results suggest that the cortex adjacentto V5/MT is also structurally inhomogeneous, i.e. it should also be subdivided into several areas.
References
1. Walters, N. B., Egan, G., Kril, J. J., Kean, M., Waley, P., Jenkinson, M. & Watson, J. D. G. (2003) Proceedings of the National Academy ofSciences of the United States of America (in press)2. Schleicher, A. et al (2000) Journal of Chemical Neuroanatomy 20, 31-47.
e1900
Abstracts presented at the 9th International Conference on Functional Mapping of the Human Brain, June 19Œ22, 2003, New York, NY
e1900
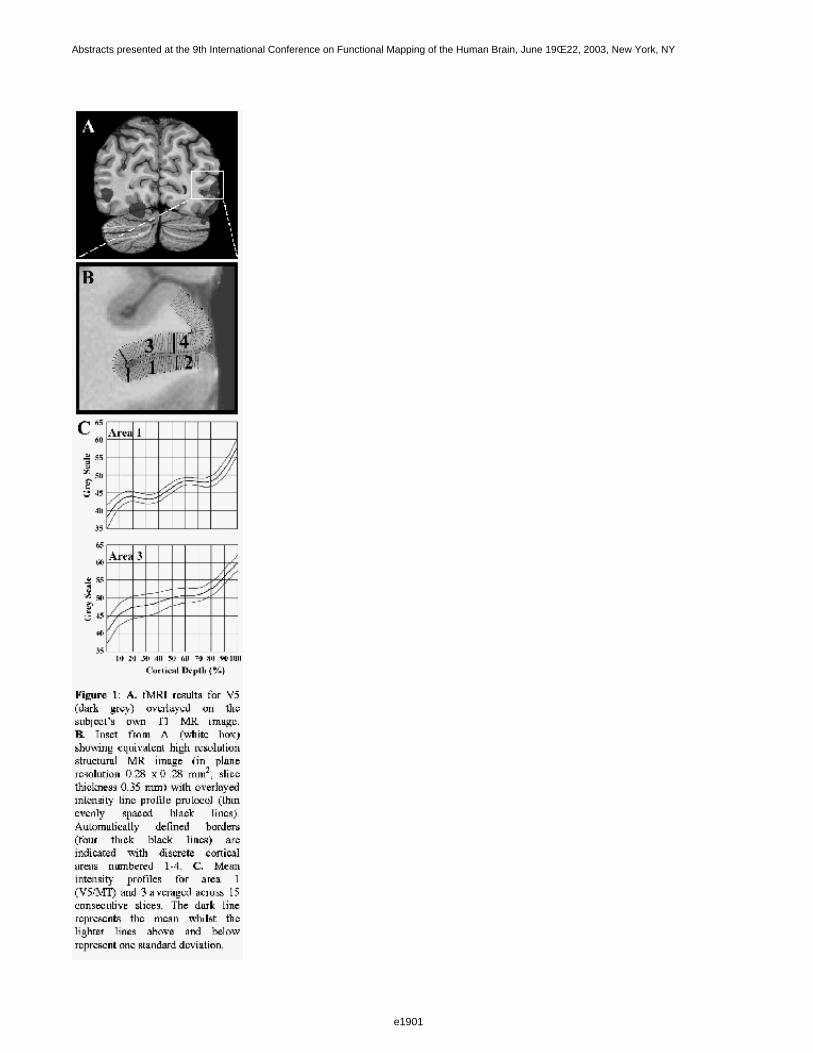
e1901
Abstracts presented at the 9th International Conference on Functional Mapping of the Human Brain, June 19Œ22, 2003, New York, NY
e1901

Order of appearance: 965
AbsTrak ID: 18045
e1902
Abstracts presented at the 9th International Conference on Functional Mapping of the Human Brain, June 19Œ22, 2003, New York, NY
e1902
Poster number: 975
Empirical Analyses of Null-Hypothesis Perfusion FMRI Data at 1.5 and 4T
Jiongjiong Wang, Geoffrey Aguirre, Daniel Kimberg, John A. Detre
Department of Neurology, University of Pennsylvania
Modeling & Analysis
Abstract
Introduction
Arterial spin labeling (ASL) perfusion fMRI is an emergent methodology for visualizing brain function. Because of the typical pair-wise subtractionapproach in generating perfusion images, ASL contrast manifests different noise properties and potential advantages in statistical analysis comparedwith BOLD contrast [1]. The present study explored the noise properties and statistical power of ASL contrast by examining null-hypothesisperfusion data acquired at both 1.5 and 4.0T.
Methods
Null-hypothesis data (resting quietly, eyes open) were obtained from 10 subjects using GE scanners at both 1.5 and 4T. Each subject was scanned for8 minutes (TR=3 sec, 8 slices x 10mm) using pulsed ASL technique [2]. After motion correction and spatial smoothing, the series of label imageswere shifted in time by one TR using sinc interpolation [1]. Perfusion and BOLD images were generated by pair-wise subtraction and summationbetween the time-matched label and control images, respectively. The image series were analyzed using VoxBo software package.
False-Positive Rate: General linear model (GLM) analysis assuming temporal independence was used to produce T statistic for both perfusion andBOLD data with two assumed experimental conditions (30s off/on and 4min off/on). False-positive rates were measured as the percentage of voxelswith t values greater than the nominal 0.05 threshold (FP1). False-positive rates were also measured by the proportion of data sets that contained atleast one voxel with t value greater than the 0.05 threshold that has been corrected for multiple comparison (FP2).
Spatial Coherence: The spatial coherence as a function of temporal frequency was determined as described previously [3]. The spatial characteristicof the global signal was also measured by correlating each voxel time series with the global signal to create correlation coefficient maps.
Temporal Fluctuation was characterized by normalized temporal standard deviation (SD), determined by the SD divided by the mean of the timecourse in each voxel.
Results
Perfusion image series were found to be independent in time. Both measures of FP1 and FP2 were compatible with theoretical values at 1.5 and 4T,while the BOLD data demonstrated substantial autocorrelation with more than 50% voxels displaying pseudo activation for the 4min off/on paradigm.Perfusion data were not found to have spatial coherence that varied across temporal frequency. In contrast, the spatial coherence of the BOLD datawas increased at lower temporal frequency. This finding has implications for the application of spatial smoothing to fMRI data, as spatial smoothingmay well preserve the white noise property of the perfusion data while deleteriously increase the slow drift effect in BOLD contrast. It was also foundthat the spatial coherence of the ASL data is greater at high magnetic field than low field as indicated in the correlation analysis (p<0.05). Includingthe global signal as a covariate in the GLM improves the central tendency of test statistic as well as reduces the temporal fluctuation in perfusionfMRI especially at high magnetic field.
References
1. Aguirre et. al., NeuroImage, 2002, 488-5002. Wang et al., MRM, 2003, in press3. Zarahn et al, NeuroImage, 1997, 179-197
e1903
Abstracts presented at the 9th International Conference on Functional Mapping of the Human Brain, June 19Œ22, 2003, New York, NY
e1903
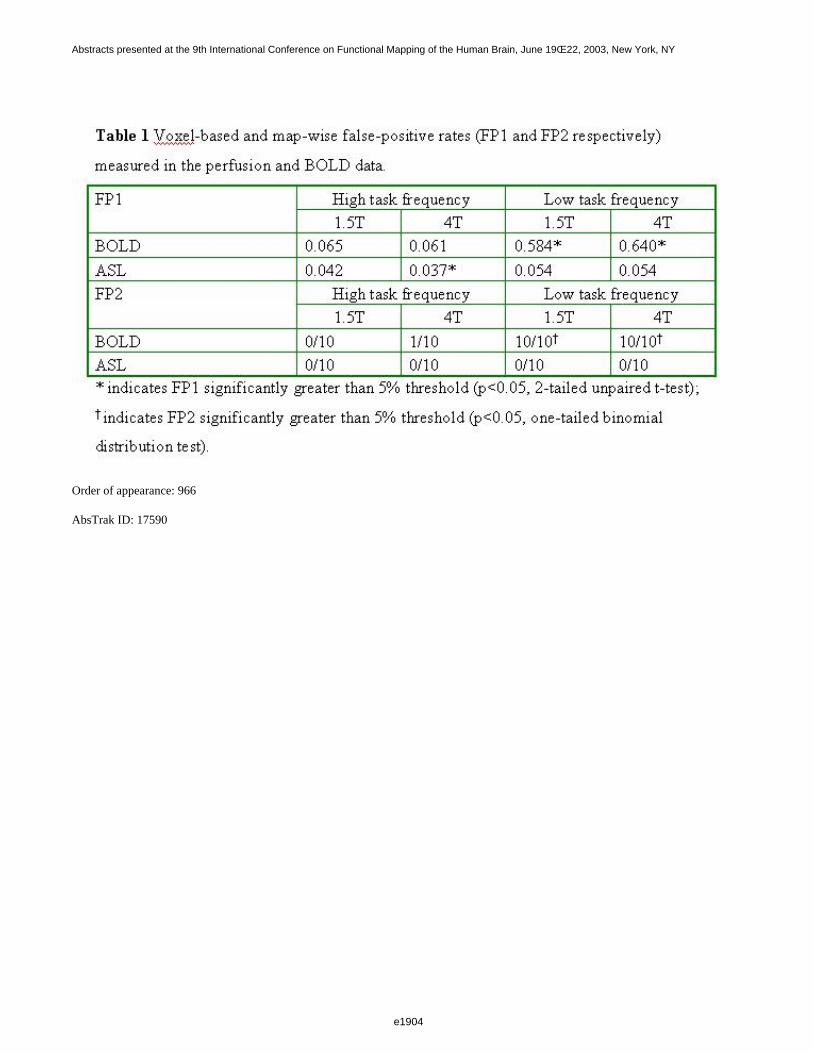
Order of appearance: 966
AbsTrak ID: 17590
e1904
Abstracts presented at the 9th International Conference on Functional Mapping of the Human Brain, June 19Œ22, 2003, New York, NY
e1904
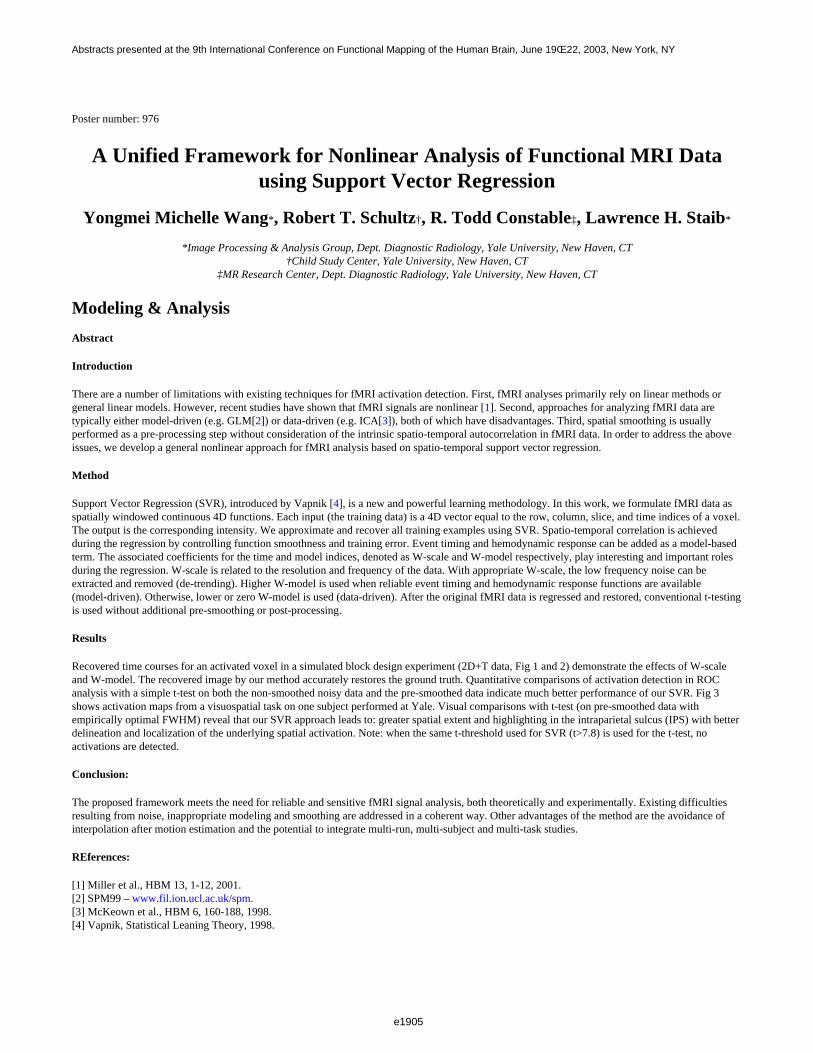
Poster number: 976
A Unified Framework for Nonlinear Analysis of Functional MRI Datausing Support Vector Regression
Yongmei Michelle Wang*, Robert T. Schultz†, R. Todd Constable‡, Lawrence H. Staib*
*Image Processing & Analysis Group, Dept. Diagnostic Radiology, Yale University, New Haven, CT†Child Study Center, Yale University, New Haven, CT
‡MR Research Center, Dept. Diagnostic Radiology, Yale University, New Haven, CT
Modeling & Analysis
Abstract
Introduction
There are a number of limitations with existing techniques for fMRI activation detection. First, fMRI analyses primarily rely on linear methods orgeneral linear models. However, recent studies have shown that fMRI signals are nonlinear [1]. Second, approaches for analyzing fMRI data aretypically either model-driven (e.g. GLM[2]) or data-driven (e.g. ICA[3]), both of which have disadvantages. Third, spatial smoothing is usuallyperformed as a pre-processing step without consideration of the intrinsic spatio-temporal autocorrelation in fMRI data. In order to address the aboveissues, we develop a general nonlinear approach for fMRI analysis based on spatio-temporal support vector regression.
Method
Support Vector Regression (SVR), introduced by Vapnik [4], is a new and powerful learning methodology. In this work, we formulate fMRI data asspatially windowed continuous 4D functions. Each input (the training data) is a 4D vector equal to the row, column, slice, and time indices of a voxel.The output is the corresponding intensity. We approximate and recover all training examples using SVR. Spatio-temporal correlation is achievedduring the regression by controlling function smoothness and training error. Event timing and hemodynamic response can be added as a model-basedterm. The associated coefficients for the time and model indices, denoted as W-scale and W-model respectively, play interesting and important rolesduring the regression. W-scale is related to the resolution and frequency of the data. With appropriate W-scale, the low frequency noise can beextracted and removed (de-trending). Higher W-model is used when reliable event timing and hemodynamic response functions are available(model-driven). Otherwise, lower or zero W-model is used (data-driven). After the original fMRI data is regressed and restored, conventional t-testingis used without additional pre-smoothing or post-processing.
Results
Recovered time courses for an activated voxel in a simulated block design experiment (2D+T data, Fig 1 and 2) demonstrate the effects of W-scaleand W-model. The recovered image by our method accurately restores the ground truth. Quantitative comparisons of activation detection in ROCanalysis with a simple t-test on both the non-smoothed noisy data and the pre-smoothed data indicate much better performance of our SVR. Fig 3shows activation maps from a visuospatial task on one subject performed at Yale. Visual comparisons with t-test (on pre-smoothed data withempirically optimal FWHM) reveal that our SVR approach leads to: greater spatial extent and highlighting in the intraparietal sulcus (IPS) with betterdelineation and localization of the underlying spatial activation. Note: when the same t-threshold used for SVR (t>7.8) is used for the t-test, noactivations are detected.
Conclusion:
The proposed framework meets the need for reliable and sensitive fMRI signal analysis, both theoretically and experimentally. Existing difficultiesresulting from noise, inappropriate modeling and smoothing are addressed in a coherent way. Other advantages of the method are the avoidance ofinterpolation after motion estimation and the potential to integrate multi-run, multi-subject and multi-task studies.
REferences:
[1] Miller et al., HBM 13, 1-12, 2001.[2] SPM99 – www.fil.ion.ucl.ac.uk/spm.[3] McKeown et al., HBM 6, 160-188, 1998.[4] Vapnik, Statistical Leaning Theory, 1998.
e1905
Abstracts presented at the 9th International Conference on Functional Mapping of the Human Brain, June 19Œ22, 2003, New York, NY
e1905
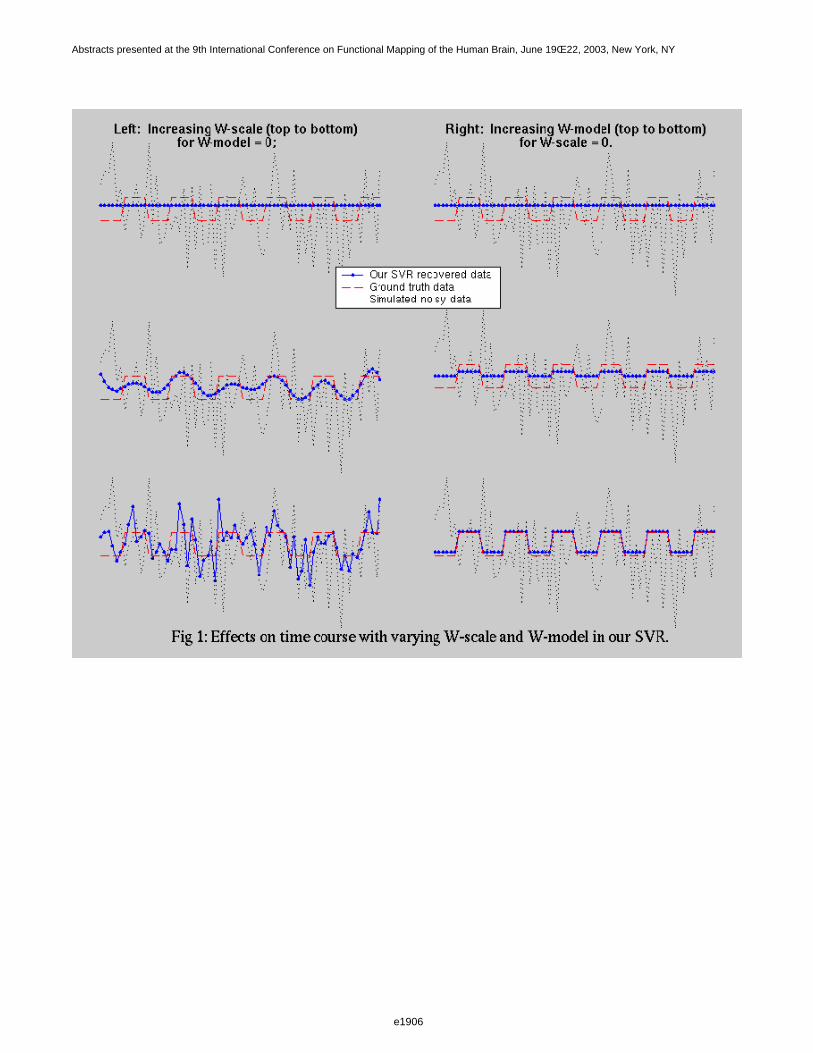
e1906
Abstracts presented at the 9th International Conference on Functional Mapping of the Human Brain, June 19Œ22, 2003, New York, NY
e1906
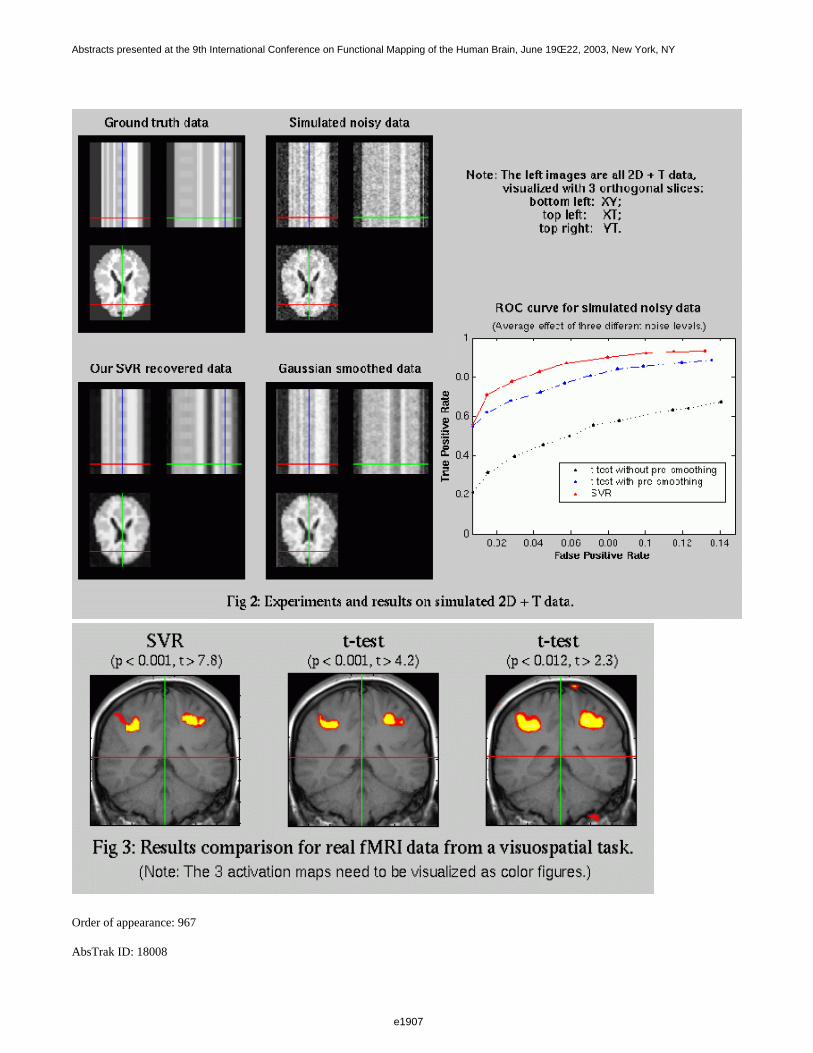
Order of appearance: 967
AbsTrak ID: 18008
e1907
Abstracts presented at the 9th International Conference on Functional Mapping of the Human Brain, June 19Œ22, 2003, New York, NY
e1907

Poster number: 977
Approach to identify regions of interest in SPM99 automatically
Wolfgang Weber-Fahr*, Matthias Ruf*, Gabriele Ende*, Fritz A. Henn*, Dieter F. Braus*†
*NMR-Research in Psychiatry, Central Institute of Mental Health, Mannheim, Germany†NeuroImage Nord, Department of Psychiatry, University of Hamburg Germany
Modeling & Analysis
Abstract
Introduction
When postprocessing fMRI data, it is of major interest to attribute the distribution of the calculated activation maps to the different anatomical areasin the human brain. Usually this is done either by rating the individual anatomy or by looking up the coordinates of local maxima in an anatomy atlas.The individual brains have to be transformed to a standard space. A commonly used atlas is the one defined by Talairach and Tournoux.
Purpose of this work is to evaluate an add-on to SPM99 which provides a direct access to the Talairach atlas and automatically analyses activatedareas for their local distribution over given anatomical regions of interest (ROI). To verify feasibility, the new tool was used to analyse a wellhypothesised activation of a moving visual stimulus intervals.
Method
The demarcated areas are based on the "Talairach daemon", which is a digitised version of the Talairach atlas and which has been transferred intoSPM by creating ROIs with 1 mm3 resolution for each anatomical area.
SPM uses a standard brain defined by the Montreal Neurological Institute (MNI) through averaging a large series of whole-brain MR-scans. TheROIs were converted from Talairach to MNI space using the inverse function from "mni2tal" and smoothed with a 2 mm Gaussian kernel to eliminategaps resulting from the non-linear transformation. A database of 147 different anatomical areas was created this way which can be directly accessedin SPM99.
The region analysis is performed by calculating the intersect of each cluster of a statistical activation map with the Talairach regions of interest Toconsider individual anatomical differences additionally the local maxima close to corresponding Talairach regions are identified.
The method was used to evaluate fMRI data obtained from a healthy subject using a robust visual paradigm consisting of moving vs. staticcheckerboard stimulation.
Results
The program offers a graphical user interface to select different Talairach regions for analysis.
The information displayed includes the spatial extent of the activation map with respect to the predefined ROIs and is categorised for the differentactivated clusters and laterality.
Additionally the T value as well as the corrected and uncorrected p value of the hot spot inside the ROI is displayed and the distance of local maximaof each cluster to the nearest selected ROI is calculated.
The visual stimulation yielded robust activation in extrastriate visual cortices (V2-V5, BA18-19,37,39) and higher areas of the dorsal pathwayincluding the posterior parietal cortex (BA7) which were correctly identified by the program (Tab. 1). For visual presentation the regions wereoverlaid on to orthogonal anatomical sections together with the statistical activation map and 3D-rendered on a standard template (Fig. 1)
e1908
Abstracts presented at the 9th International Conference on Functional Mapping of the Human Brain, June 19Œ22, 2003, New York, NY
e1908
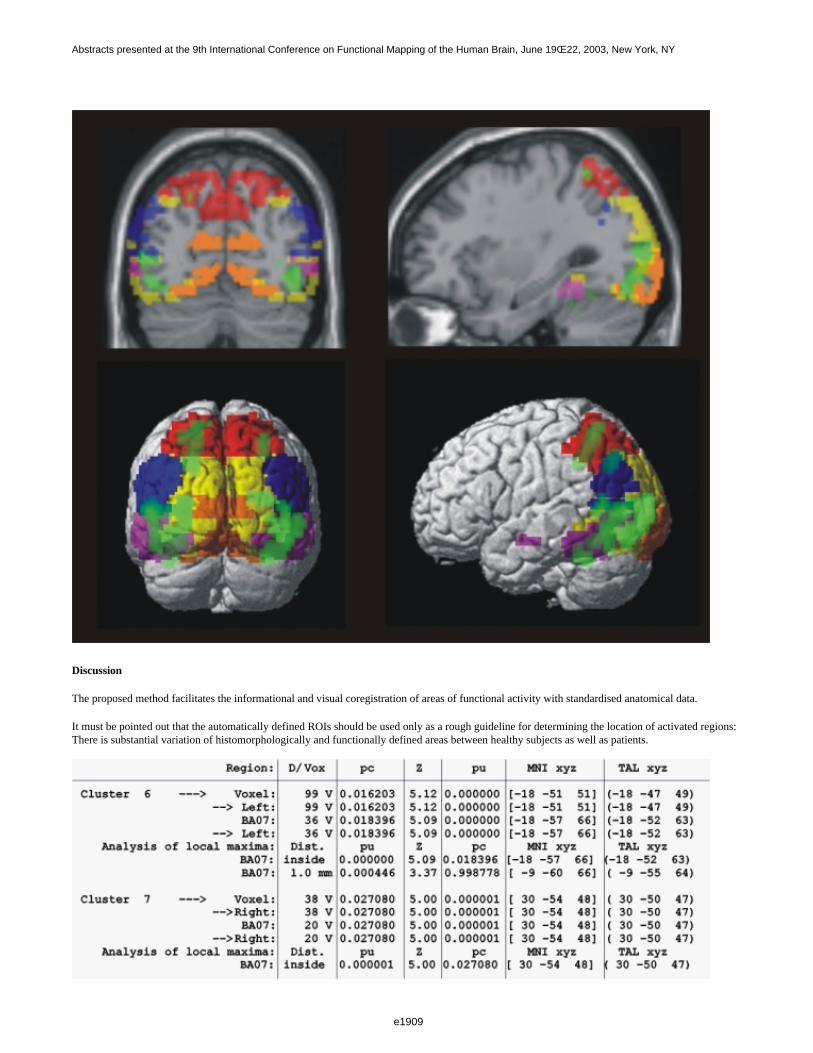
Discussion
The proposed method facilitates the informational and visual coregistration of areas of functional activity with standardised anatomical data.
It must be pointed out that the automatically defined ROIs should be used only as a rough guideline for determining the location of activated regions:There is substantial variation of histomorphologically and functionally defined areas between healthy subjects as well as patients.
e1909
Abstracts presented at the 9th International Conference on Functional Mapping of the Human Brain, June 19Œ22, 2003, New York, NY
e1909

Order of appearance: 968
AbsTrak ID: 18433
e1910
Abstracts presented at the 9th International Conference on Functional Mapping of the Human Brain, June 19Œ22, 2003, New York, NY
e1910

Poster number: 978
Effects of neuronal magnetic fields on MRI signals
Jinhu Xiong, Jia-Hong Gao, Peter Fox
Research Imaging Center, University of Texas Health Science Center, San Antonio, Texas, USA
Modeling & Analysis
Abstract
Introduction
Mapping neuronal activity with MRI by detecting magnetic fields induced by neural firing is theoretically straightforward. The MRI signal is basedon inducing and detecting phase coherent signals of nuclear spins. Neuronal activity creates ionic currents which induce weak magnetic fields.Nuclear spins exposed to neuronally induced magnetic fields will lose phase coherence, which will slightly decrease MRI signal strength. Neuronalmagnetic transients can be mapped, therefore, by detecting event-related decrements in the MRI signal. MRI detection of weak, transient magneticfields has been demonstrated in water phantoms and in the human body using externally applied current, but has not been successfully applied todirectly map neuronal activity in the human brain. We provide here a theoretical assessment of MRI signal change induced by neuronal magnetic fields.
Method:
Magnetic fields generated by neural firing have been estimated using a current dipole model, which is the model most commonly used for computingthe magnetic fields generated by neural firing. Each dendrite or axon has been modeled as a current dipole. The dipole model considers effects ofintracellular current ii and extracellular current ie and ignores the effect of through membrane current. Effects of neuron configurations and densityhave been investigated. Basic assumptions are that 1H spins and neuronal elements (dendrites or axons) are uniformly distributed in an image voxel.
Results
Magnetic field distribution strongly depends on configurations of neurons (Figure 1). Magnetic fields generated by neural firing are shown for parallelconfiguration (the left panel, intracellular currents in the adjacent dendrites are parallel and in the same direction) and anti-parallel configuration (theright panel, intracellular currents in the adjacent dendrites are parallel but in the opposite direction). Three different distances (color-coded) betweenneurons are shown. Figure 2 shows magnitude changes of MRI signal. Magnitude changes are sensitive to neuron configuration (parallel oranti-parallel) and number of dendrites firing simultaneously. For a typical fMRI study with a 3 X 3 mm2 in-plane resolution, there are about 0.1 to 1million dendrites firing simultaneously. Signal changes induced by neuronal magnetic fields were estimated to be about 1% to 10%. More complexneuron orientations have been considered. Parallel and anti-parallel configurations provide the lower and upper limits for MRI signal changes. On theother hand, phases of MRI signals tend to be destructively added. Phase detection is not a good choice for mapping neuronal magnetic fields.Magnetic fields detected on the scalp 2 – 4 cm away from the source were estimated ranging from 0 to 4 X 10–12 T, depending on neuronconfigurations, as compared with ~10-13 T reported by MEG experiments.
Conclusions:
Our results demonstrated, theoretically, that MRI signal changes induced by neuronal magnetic fields are in detectable levels. A MRI magnitude mapshould provide a better result than a phase map. Experimental validation of these theoretical predications is in progress in our laboratory.
References
1. D. Cohen, Science 161(843), 784 (1968). 2. J. Bodurka, P. A. Bandettini, Magn Reson Med 47(6), 1052 (2002).
e1911
Abstracts presented at the 9th International Conference on Functional Mapping of the Human Brain, June 19Œ22, 2003, New York, NY
e1911
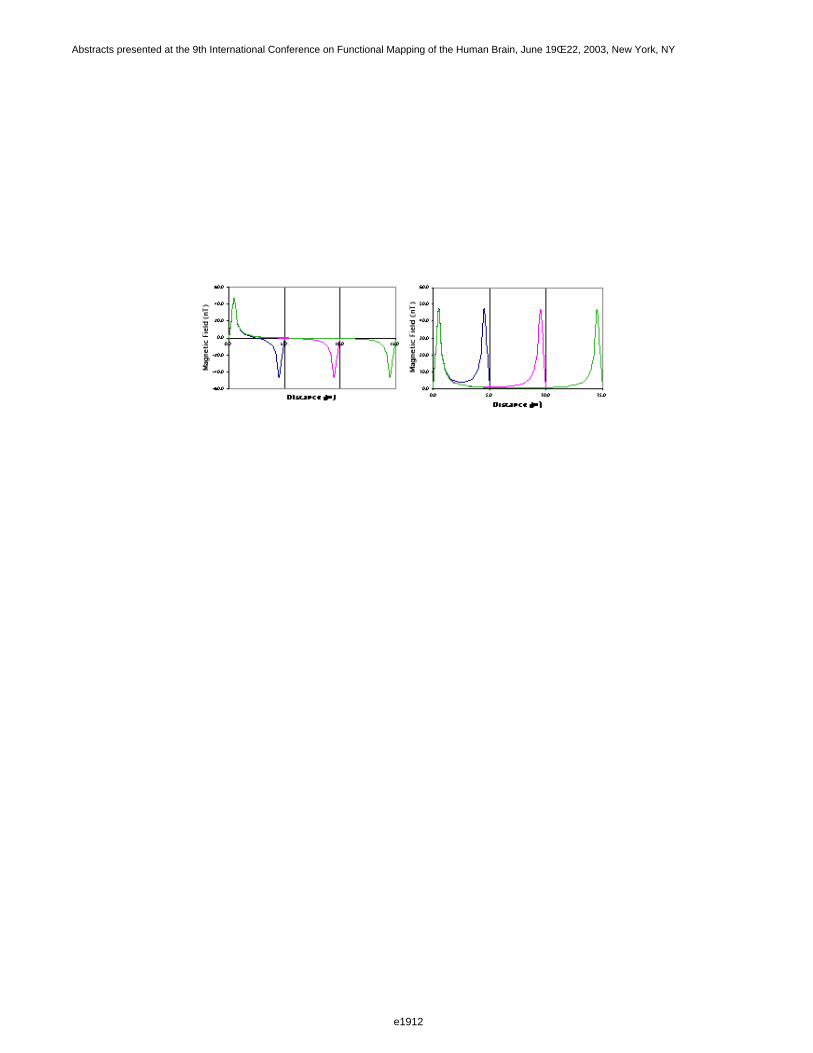
e1912
Abstracts presented at the 9th International Conference on Functional Mapping of the Human Brain, June 19Œ22, 2003, New York, NY
e1912
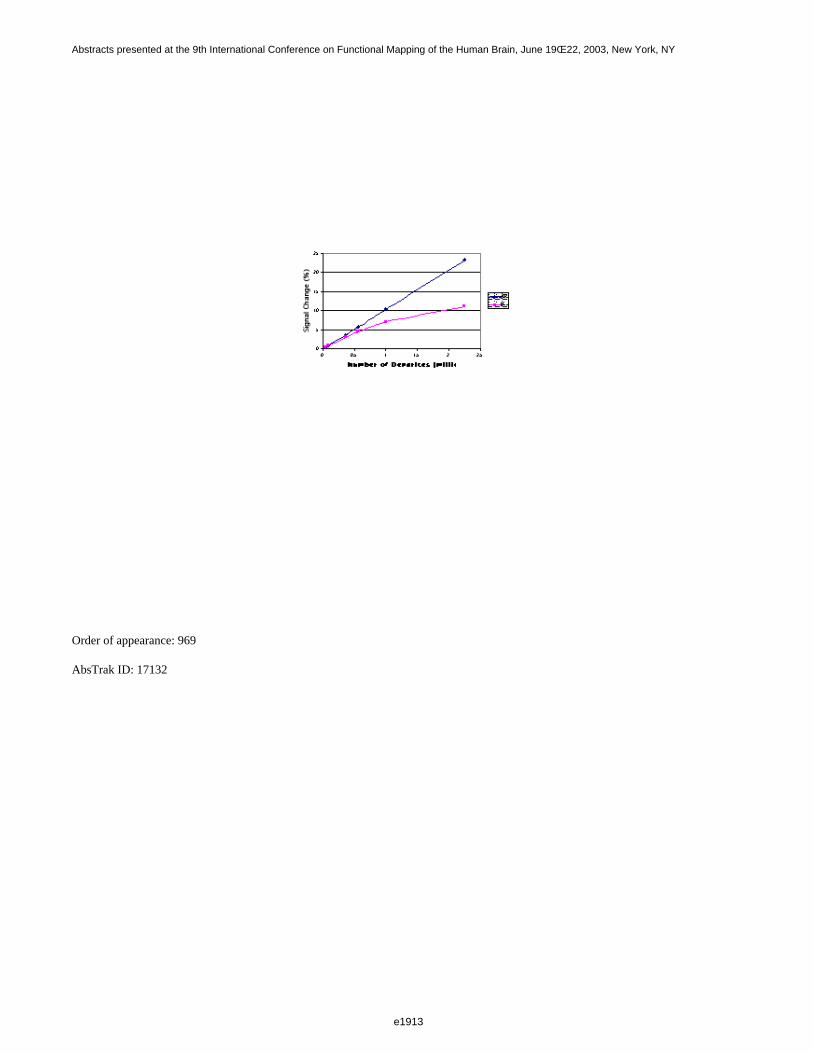
Order of appearance: 969
AbsTrak ID: 17132
e1913
Abstracts presented at the 9th International Conference on Functional Mapping of the Human Brain, June 19Œ22, 2003, New York, NY
e1913
Poster number: 979
Dynamic inverse problem of EEG and the practical computationprocedure for the solution
Okito Yamashita*, Tohru Ozaki†, Andreas Galka‡, Roland Biscay§, Pedro Valdes-Sosa§
*Department of Statistical Science, The Graduate University for Advanced Studies†Institute of Statistical Mathematics
‡Institute of Experimental and Applied Physics, University of Kiel§University of Havana
¶Cunban Neuroscience Center
Modeling & Analysis
Abstract
Introduction
The EEG measurement reflects electrical current of charged ions resulting from chemical neuronal activities in abrain. One of the primary concerns in EEG studies is to estimate such electrical generators in the brain from themeasurement. A method to attain this purpose is called inverse problem. As a new framework in EEG study wepropose ’dynamic’ inverse problem where dynamical constraints for a solution is considered. This is an extensionof instantaneous inverse problem which many researchers have been studying to obtain a solution with goodlocalization ability.
Methods
Our key idea is that dynamic inverse problem can be formulated in the form of state space representation. Tosolve dynamic inverse problem, we extend LORETA([1]) to the dynamical one. We call it "Dynamic LORETA".Time-dependency is considered according to the system equation of state space representation in obtaining thesolution of Dynamic LORETA. The estimation can be done by means of the well-known algorithm, Kalman filterin principle. However the computation cost is very heavy. So we introduce the practical computation procedurebased on the penalized least square method or Bayesian inference. The regularization parameter is determined bythe statistical criteria such as GCV and ABIC. Some parameters in dynamics are determined by 1-step prediction errors.
Result
We confirm that the lack of temporal information gives a spurious solution in the simulation study. The analysisof real data shows the possibility of getting the dynamical information from the estimated model that is a keypoint to our success.
e1914
Abstracts presented at the 9th International Conference on Functional Mapping of the Human Brain, June 19Œ22, 2003, New York, NY
e1914
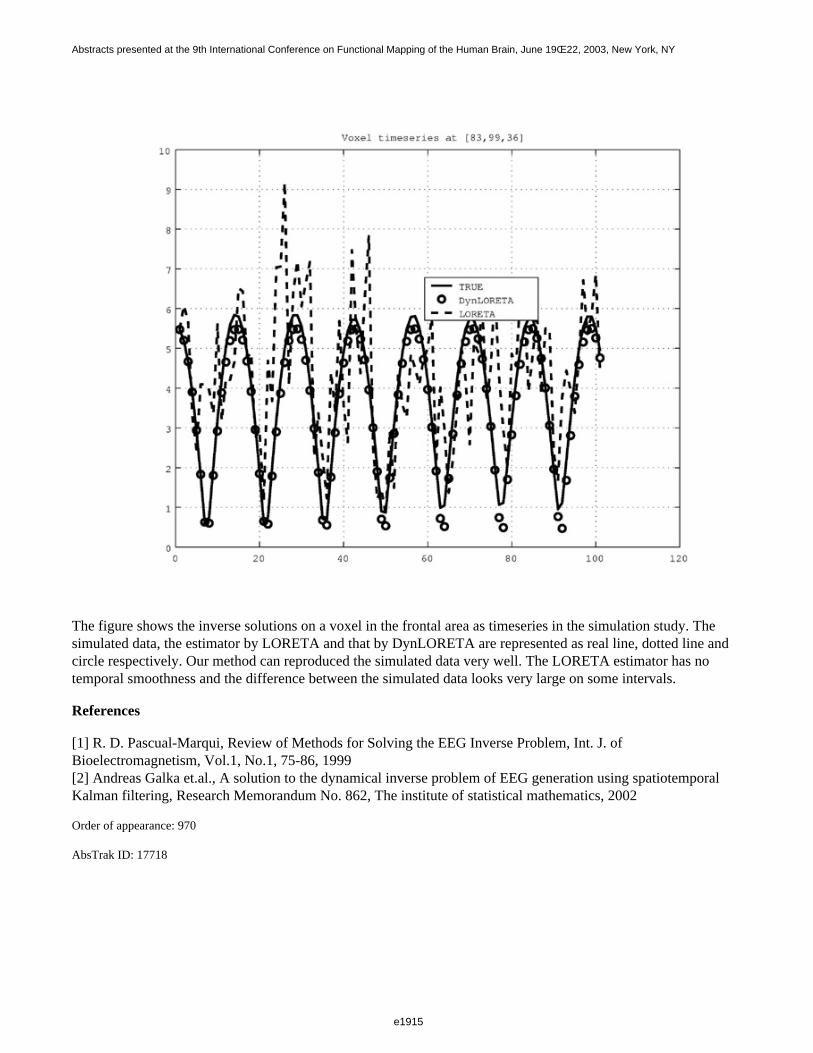
The figure shows the inverse solutions on a voxel in the frontal area as timeseries in the simulation study. Thesimulated data, the estimator by LORETA and that by DynLORETA are represented as real line, dotted line andcircle respectively. Our method can reproduced the simulated data very well. The LORETA estimator has notemporal smoothness and the difference between the simulated data looks very large on some intervals.
References
[1] R. D. Pascual-Marqui, Review of Methods for Solving the EEG Inverse Problem, Int. J. ofBioelectromagnetism, Vol.1, No.1, 75-86, 1999[2] Andreas Galka et.al., A solution to the dynamical inverse problem of EEG generation using spatiotemporalKalman filtering, Research Memorandum No. 862, The institute of statistical mathematics, 2002
Order of appearance: 970
AbsTrak ID: 17718
e1915
Abstracts presented at the 9th International Conference on Functional Mapping of the Human Brain, June 19Œ22, 2003, New York, NY
e1915
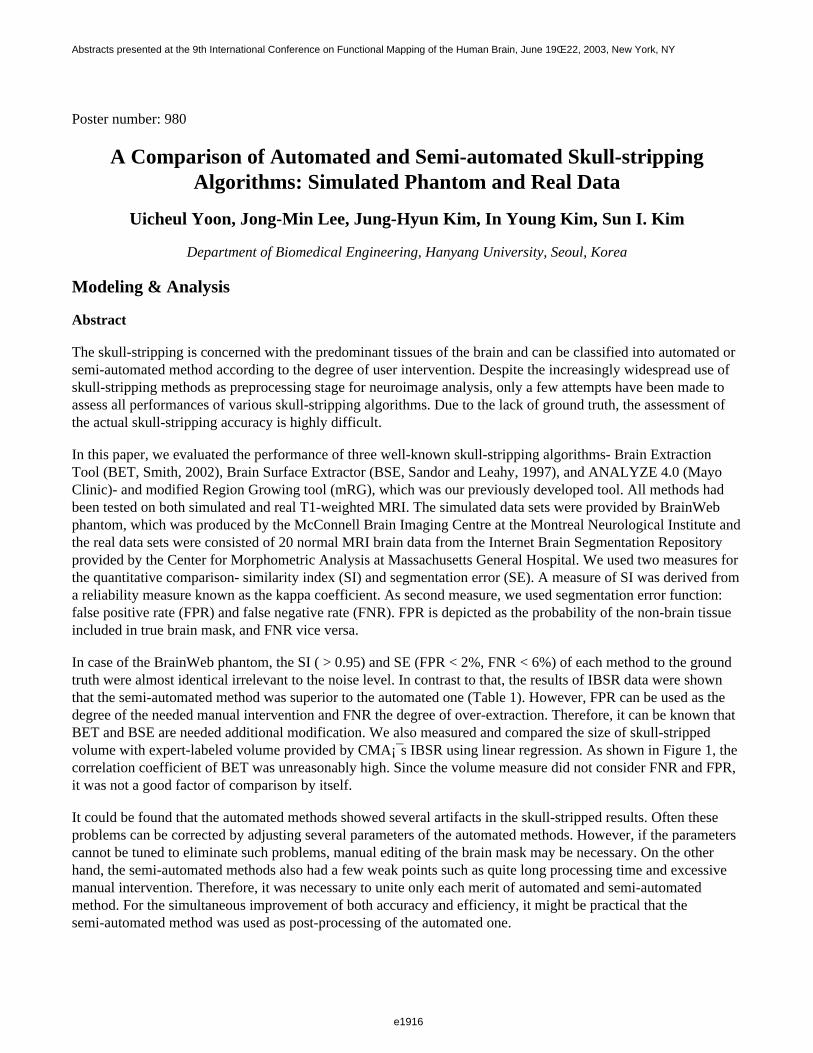
Poster number: 980
A Comparison of Automated and Semi-automated Skull-strippingAlgorithms: Simulated Phantom and Real Data
Uicheul Yoon, Jong-Min Lee, Jung-Hyun Kim, In Young Kim, Sun I. Kim
Department of Biomedical Engineering, Hanyang University, Seoul, Korea
Modeling & Analysis
Abstract
The skull-stripping is concerned with the predominant tissues of the brain and can be classified into automated orsemi-automated method according to the degree of user intervention. Despite the increasingly widespread use ofskull-stripping methods as preprocessing stage for neuroimage analysis, only a few attempts have been made toassess all performances of various skull-stripping algorithms. Due to the lack of ground truth, the assessment ofthe actual skull-stripping accuracy is highly difficult.
In this paper, we evaluated the performance of three well-known skull-stripping algorithms- Brain ExtractionTool (BET, Smith, 2002), Brain Surface Extractor (BSE, Sandor and Leahy, 1997), and ANALYZE 4.0 (MayoClinic)- and modified Region Growing tool (mRG), which was our previously developed tool. All methods hadbeen tested on both simulated and real T1-weighted MRI. The simulated data sets were provided by BrainWebphantom, which was produced by the McConnell Brain Imaging Centre at the Montreal Neurological Institute andthe real data sets were consisted of 20 normal MRI brain data from the Internet Brain Segmentation Repositoryprovided by the Center for Morphometric Analysis at Massachusetts General Hospital. We used two measures forthe quantitative comparison- similarity index (SI) and segmentation error (SE). A measure of SI was derived froma reliability measure known as the kappa coefficient. As second measure, we used segmentation error function:false positive rate (FPR) and false negative rate (FNR). FPR is depicted as the probability of the non-brain tissueincluded in true brain mask, and FNR vice versa.
In case of the BrainWeb phantom, the SI ( > 0.95) and SE (FPR < 2%, FNR < 6%) of each method to the groundtruth were almost identical irrelevant to the noise level. In contrast to that, the results of IBSR data were shownthat the semi-automated method was superior to the automated one (Table 1). However, FPR can be used as thedegree of the needed manual intervention and FNR the degree of over-extraction. Therefore, it can be known thatBET and BSE are needed additional modification. We also measured and compared the size of skull-strippedvolume with expert-labeled volume provided by CMA¡¯s IBSR using linear regression. As shown in Figure 1, thecorrelation coefficient of BET was unreasonably high. Since the volume measure did not consider FNR and FPR,it was not a good factor of comparison by itself.
It could be found that the automated methods showed several artifacts in the skull-stripped results. Often theseproblems can be corrected by adjusting several parameters of the automated methods. However, if the parameterscannot be tuned to eliminate such problems, manual editing of the brain mask may be necessary. On the otherhand, the semi-automated methods also had a few weak points such as quite long processing time and excessivemanual intervention. Therefore, it was necessary to unite only each merit of automated and semi-automatedmethod. For the simultaneous improvement of both accuracy and efficiency, it might be practical that thesemi-automated method was used as post-processing of the automated one.
e1916
Abstracts presented at the 9th International Conference on Functional Mapping of the Human Brain, June 19Œ22, 2003, New York, NY
e1916
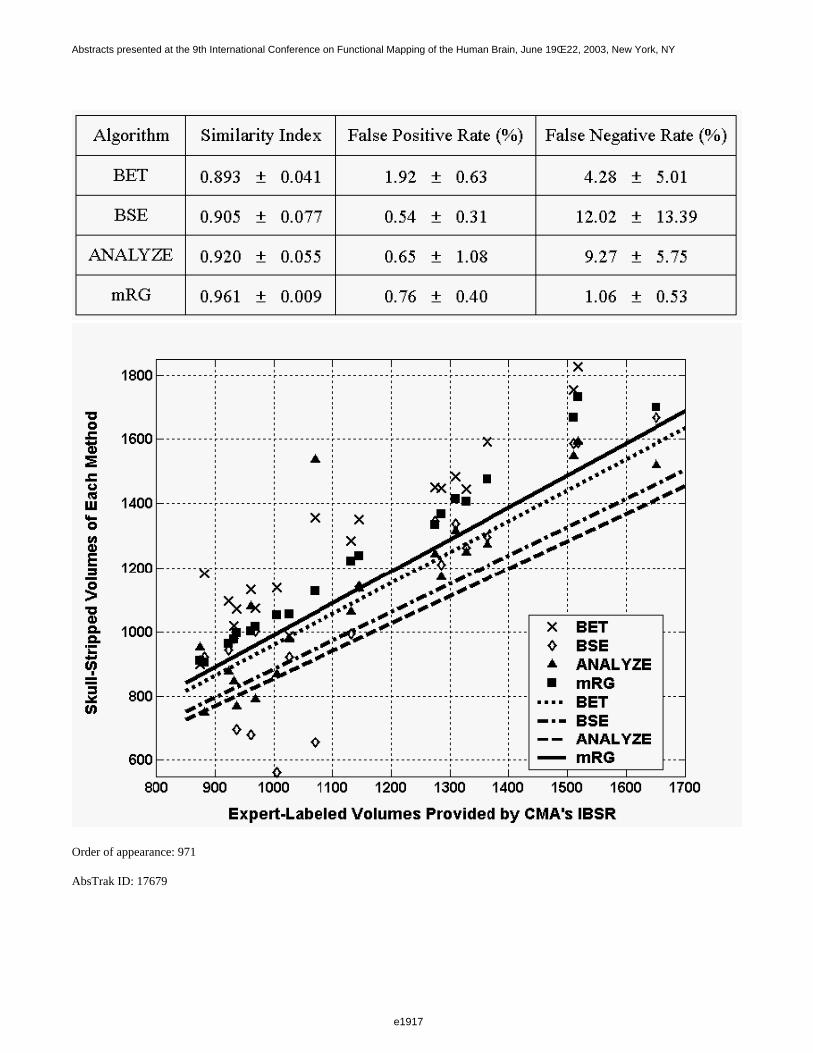
Order of appearance: 971
AbsTrak ID: 17679
e1917
Abstracts presented at the 9th International Conference on Functional Mapping of the Human Brain, June 19Œ22, 2003, New York, NY
e1917
Poster number: 981
Hippocampal Flat Maps of Cortical Thickness and Power
Michael Zeineh, John Mazziotta, Paul Thompson, Stephen Engel, Susan Bookheimer
UCLA Brain Mapping Division, Los Angeles, CA USA
Modeling & Analysis
Abstract
Introduction
The combination of high resolution structural and functional MRI with hippocampal unfolding allows one tovisualize activity within the substructures of the medial temporal lobe (MTL) and identify patterns of signalchange unique to its compartments (1, 2, 3). Signal change can only be detected when power is adequate. Powerin flat space may vary for several reasons including variance in the neurophysiology, susceptibility artifact, andcortical thickness. In this study, we produced maps of power across subregions in individual and group analysesand examined the contribution of cortical thickness to power to detect functional activation.
Methods
Ten subjects from prior unfolding studies were scanned on a 3.0-T GE scanner with ANMR upgrade for EPI. Weacquired structural images (spin echo, TR = 3000 ms, TE = 41 ms, 0.4 x 0.4 x 3 mm voxels, ETL=8, NEX = 2, 16slices) perpendicular to the long axis of the hippocampus and coplanar functional images (gradient echo, TR =3500 ms, TE = 30 ms, FOV = 20, 1.6 x 1.6 x 3 mm voxels, 11 slices, 116 time points) during memoryexperiments (1, 3). Hippocampal unfolding methods were identical to (1, 2, 3).
For the single subject analyses, variance in signal intensity was computed in each voxel across all time points. Wederived the power for a t-test (df = number of time points - 1) from the variance by referring the non-central tdistribution. Quantifying the number of voxels in 3-D space that contribute to a given voxel in flat space producedimages of cortical thickness.
Warping time series flat data from individual subjects to a template facilitated random effects group analyses viaregressions with stimulus paradigms (2, 3). Power for random effects analyses (df = # of subjects -1) wascomputed using variance in the regression slopes across subjects and the non-central t distribution. We warpedthickness maps from individual subjects to the flat template and averaged them across subjects.
Results
In single subjects, activations in all subregions with a magnitude of 2% or greater were detectable with 95%power. Power was reduced in the anterolateral MTL because of susceptibility artifact. Thickness exhibited acorrelation of approximately 0.15 with power. In the group analysis, ROC curves show approximately 85% powerfor signal changes of about 0.2% in all regions except the entorhinal and perirhinal cortices. Again, thickness wascorrelated with power at approximately 0.08.
e1918
Abstracts presented at the 9th International Conference on Functional Mapping of the Human Brain, June 19Œ22, 2003, New York, NY
e1918
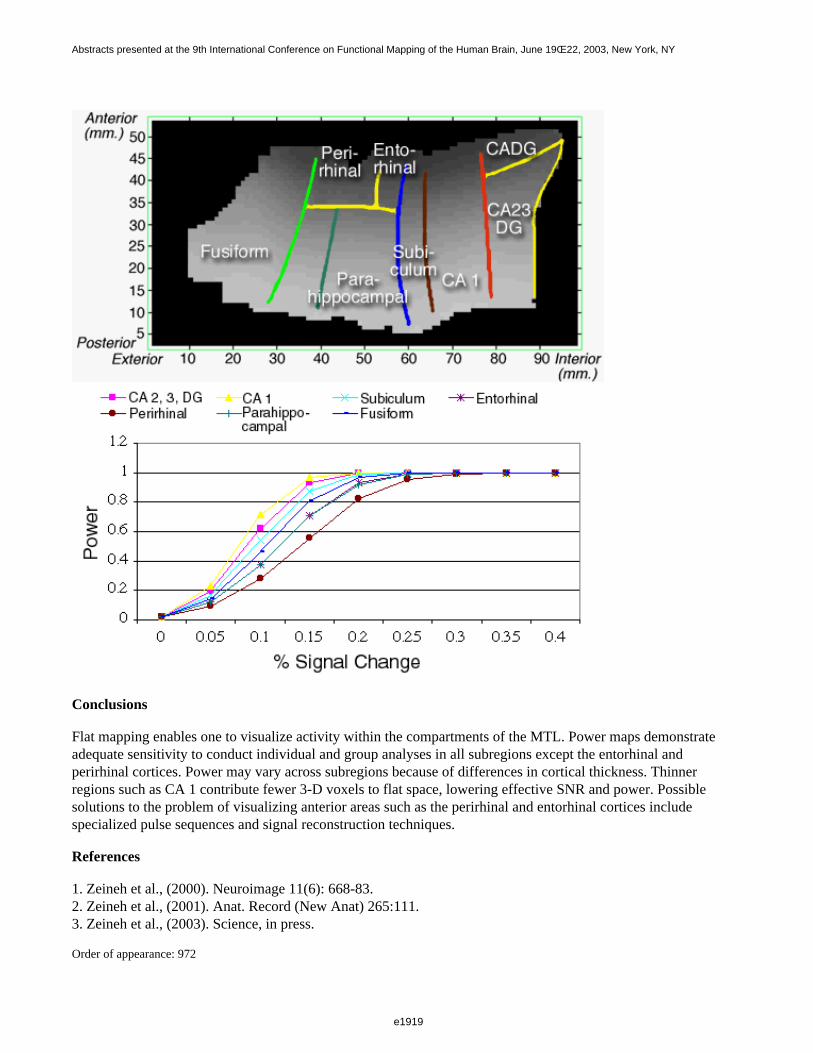
Conclusions
Flat mapping enables one to visualize activity within the compartments of the MTL. Power maps demonstrateadequate sensitivity to conduct individual and group analyses in all subregions except the entorhinal andperirhinal cortices. Power may vary across subregions because of differences in cortical thickness. Thinnerregions such as CA 1 contribute fewer 3-D voxels to flat space, lowering effective SNR and power. Possiblesolutions to the problem of visualizing anterior areas such as the perirhinal and entorhinal cortices includespecialized pulse sequences and signal reconstruction techniques.
References
1. Zeineh et al., (2000). Neuroimage 11(6): 668-83.2. Zeineh et al., (2001). Anat. Record (New Anat) 265:111.3. Zeineh et al., (2003). Science, in press.
Order of appearance: 972
e1919
Abstracts presented at the 9th International Conference on Functional Mapping of the Human Brain, June 19Œ22, 2003, New York, NY
e1919

AbsTrak ID: 18110
e1920
Abstracts presented at the 9th International Conference on Functional Mapping of the Human Brain, June 19Œ22, 2003, New York, NY
e1920

Poster number: 982
A Robust Spatial Information-Based Skull Strip in MR Head Images
Dequn Zhao*, Wei Sun*, ZhenSu Lv†, Tianzi Jiang*
*National Laboratory of Pattern Recognition, Institute of Automation, The Chinese Academy of Sciences,Beijing100080, P. R. China
†Institute of Information Science and Engineering LanZhou University, GanSu 730000, P. R. China‡[email protected]
Modeling & Analysis
Abstract
Introduction
There are abundant spatial and intensity information in MR images. Making full use of spatial and intensityinformation in MR images can make automated skull strip robust and accurate.
Method
The method consists of four steps: (1) selective edge detection based on gradient map, ISODATA classifier andspatial information; In this step, removing some edges of sulcus by size of edge and spatial relation betweencentroid of edge and intra-cranial boundary can improve skull strip accurateness; (2) isolated blocks generationand large blocks pickup using Euclidean distance transform; (3) removing non-brain blocks such as eyeballs orscalp using spatial information and getting initial Mask; (4) mask refinement using spatial relation between braintissue and intra-cranial boundary.
Results and Discussion:
In this method, edge detection is critical. Some edges of sulcus can heavily affect the method¡¯s accurateness.Some slices from the automated skull strip are shown in the second column of Figure 1. Clearly the method hasworked well, both in removing non-brain parts such as eyeballs or scalp, and also in eliminating the affection ofsulcus edges.
e1921
Abstracts presented at the 9th International Conference on Functional Mapping of the Human Brain, June 19Œ22, 2003, New York, NY
e1921
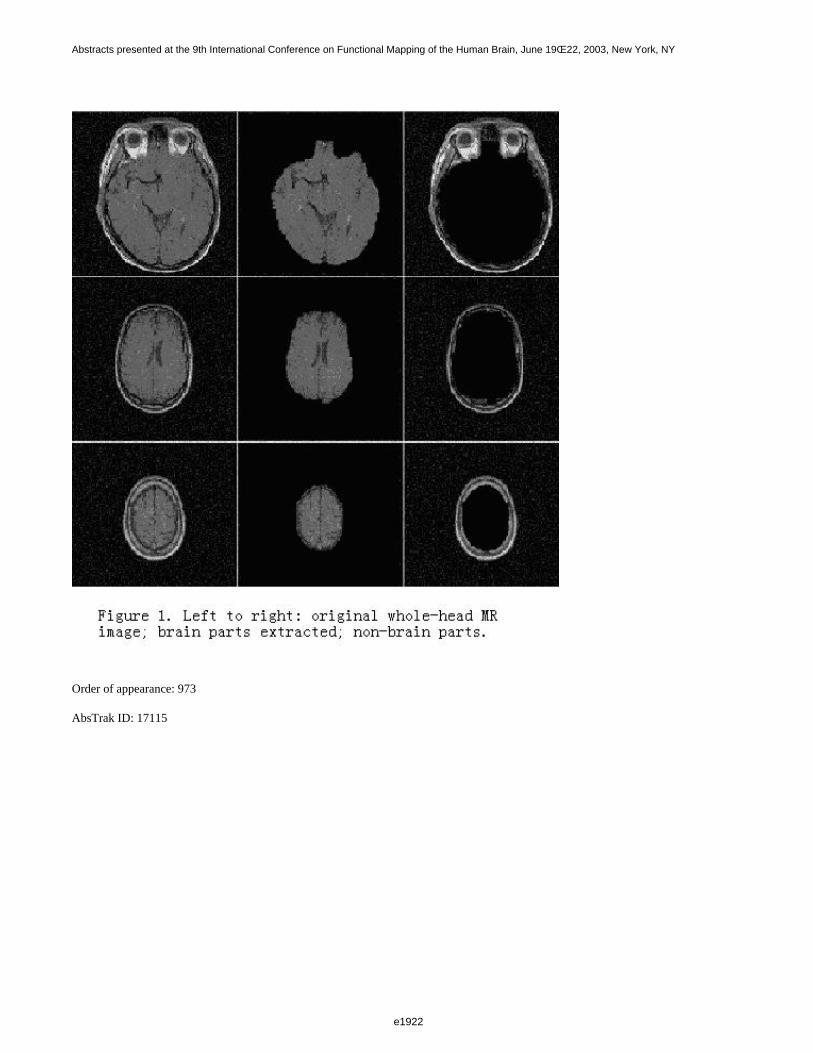
Order of appearance: 973
AbsTrak ID: 17115
e1922
Abstracts presented at the 9th International Conference on Functional Mapping of the Human Brain, June 19Œ22, 2003, New York, NY
e1922
Poster number: 983
Use of Spherical Harmonic Deconvolution Methods to Compensate forNon-linear Gradients Effects on MRI Images
Hawei Zhao, Gary Cowin, Graham Galloway, David Doddrell
Centre for Magnetic Resonance, University of Queensland, Brisbane, Australia
Modeling & Analysis
Abstract
When using high-speed gradients, which are the norms on the current generation of commercial MRI scanners,speed is often sacrificed for gradient linearity. Such non-linearity results in distorted images (1,2,3). The problemis analyzed from first principles and two methods are suggested to correct the resultant distorted images. Onemethod involves a regrinding of the k-space data prior to the accepted linear Fourier transformation while thesecond method uses the gradient field spherical harmonic expansion to correct the distorted images. Thedemonstrated method was developed using a commercial scanner, Siemens Magnetom Sonata, but the method hasgeneral applicability.
Methods
To accurately describe the gradient field distribution is not a simple task. Even for the same design of gradientcoil winding errors may induce variation from the predicted field. The optimum method is to measure the actualfield strength produced by the particular gradient coil set at a finite number of points in the image space. Afunction can be then constructed to describe accurately the field distribution. The obvious choice is to expand thefield using spherical harmonics as the bases function. The field generated by the gradients can be written inspherical coordinates as follow
Bz(r,θ,φ)=∑∑r^n[Anm cos(mφ)+Bnm sin(mφ)]Pnm(cos(θ)).
Once knowledge of the gradient field is established, the field can be represented by its linear gradient as
Bz(r)=(v+η(r))Gl, where η(r)=Bzn(r)/Gl.
Consequently, the relationships between linear and non-linear sampling of k-space and the image space are given as
(Kx2,Ky2,Kz2)=[Kx1(1+ηx(r))/x],[Ky1(1+ηy(r))/y],[Kz1(1+ηz(r))/z],
(X2,Y2,Z2)=[X1+ηx(r)],[Y1+ηy(r)],[Z1+ηz(r)].
A geometrically distorted image can thus be corrected in the both image space and k-space in the above equations.
Results
The gradient set analyzed in this paper is the high-speed Sonata gradients manufactured by SiemensAktiengesellschaft in Germany. The experimental gradient distributions for the X, Y, and Z gradients are shownin Figure 1.
e1923
Abstracts presented at the 9th International Conference on Functional Mapping of the Human Brain, June 19Œ22, 2003, New York, NY
e1923
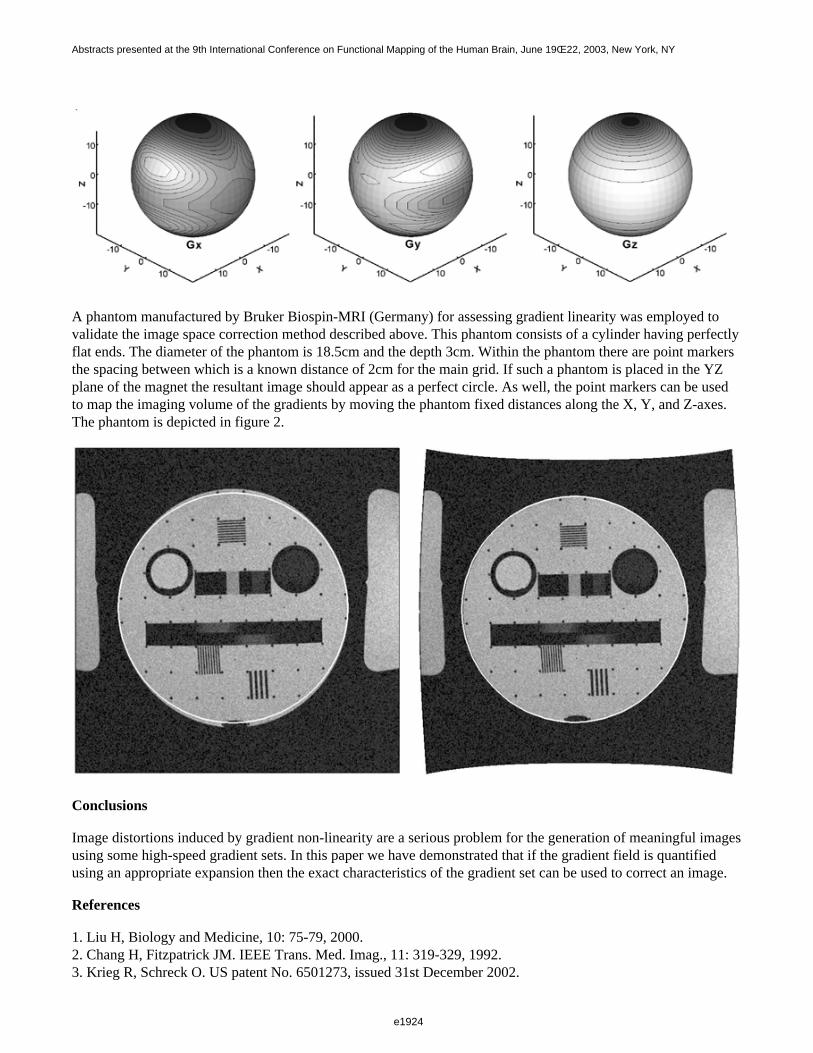
A phantom manufactured by Bruker Biospin-MRI (Germany) for assessing gradient linearity was employed tovalidate the image space correction method described above. This phantom consists of a cylinder having perfectlyflat ends. The diameter of the phantom is 18.5cm and the depth 3cm. Within the phantom there are point markersthe spacing between which is a known distance of 2cm for the main grid. If such a phantom is placed in the YZplane of the magnet the resultant image should appear as a perfect circle. As well, the point markers can be usedto map the imaging volume of the gradients by moving the phantom fixed distances along the X, Y, and Z-axes.The phantom is depicted in figure 2.
Conclusions
Image distortions induced by gradient non-linearity are a serious problem for the generation of meaningful imagesusing some high-speed gradient sets. In this paper we have demonstrated that if the gradient field is quantifiedusing an appropriate expansion then the exact characteristics of the gradient set can be used to correct an image.
References
1. Liu H, Biology and Medicine, 10: 75-79, 2000.2. Chang H, Fitzpatrick JM. IEEE Trans. Med. Imag., 11: 319-329, 1992.3. Krieg R, Schreck O. US patent No. 6501273, issued 31st December 2002.
e1924
Abstracts presented at the 9th International Conference on Functional Mapping of the Human Brain, June 19Œ22, 2003, New York, NY
e1924

Order of appearance: 974
AbsTrak ID: 17422
e1925
Abstracts presented at the 9th International Conference on Functional Mapping of the Human Brain, June 19Œ22, 2003, New York, NY
e1925
Poster number: 984
Comparison of TCA and ICA in fMRI Data Processing
Xia Zhao, David Glahn, Jin-Hu Xiong, Jia-Hong Gao
Research Imaging Center, University of Texas Health Science Center at San Antonio, San Antonio, TX, USA
Modeling & Analysis
Abstract
Introduction
Temporal cluster analysis (TCA) and independent component analysis (ICA) have been used to analyzefunctional MR data when temporal information regarding brain activation is unknown. Here we directly comparethese two methods, to suggest if the potential superiority of one method is over the other.
In 1998, McKeown et al (1) utilized ICA in fMRI studies that no prior knowledge of event timing is available.ICA technique is based on the assumption that all source signals are statistically independent and linearly mixedto form the observed signal. In 2000, Liu et al. (2) proposed TCA method that can be used in the same situation.TCA is based on the assumption that more pixels will reach extreme values during the “activation period” thanduring the control period. While TCA and ICA can generate functional MR images, the similarity and differenceof the brain activation maps generated by these two methods have not been investigated.
Method
As a basis for generating simulated fMRI image data, a single-shot T2*-weighted gradient-echo EPI image (72 x72 matrix) for one subject was selected. Images in a time series were generated by replicating this EPI image 150times. For this series of images, several brain activation patterns were constructed in the pre-selected region ofinterests (ROIs, N = 56, 88, and 108 pixels). The simulated response of the brain was based on the gammafunction (3, 4). 150 noise images following a Gaussian distribution were generated and were adjusted to produce anoise level of 2% when combined with the noise-free fMRI images so that the maximum CNR of the fMRI signalchange ranged from 1.25 to 2.0. The combined images, generated for each type of activation pattern and for eachimaginary subject, were analyzed using both TCA and ICA methods. In addition to the simulated data, in-vivovisual stimulation experiments also were performed to be tested for both TCA and ICA analysis. The procedurefor TCA data processing is described in our previous publication (2, 3, 4). The FastICA package (5, 6) was usedin our ICA data analysis.
Results
Results from both experiments and the computer simulation suggest that activation maps generated by TCA andICA are comparable (see Figure 1 for an example of Experiment 1). Formal statistical analyzes suggest that theactivation patterns obtained from TCA and ICA are not significantly different.
Conclusion:
Our results demonstrated that both TCA and ICA are equivalent and powerful ways of generating brain activationmaps when temporal information concerning brain activation is unknown. Given that TCA is conceptuallysimpler and computationally more efficient than ICA, we advocate the use of TCA.
e1926
Abstracts presented at the 9th International Conference on Functional Mapping of the Human Brain, June 19Œ22, 2003, New York, NY
e1926
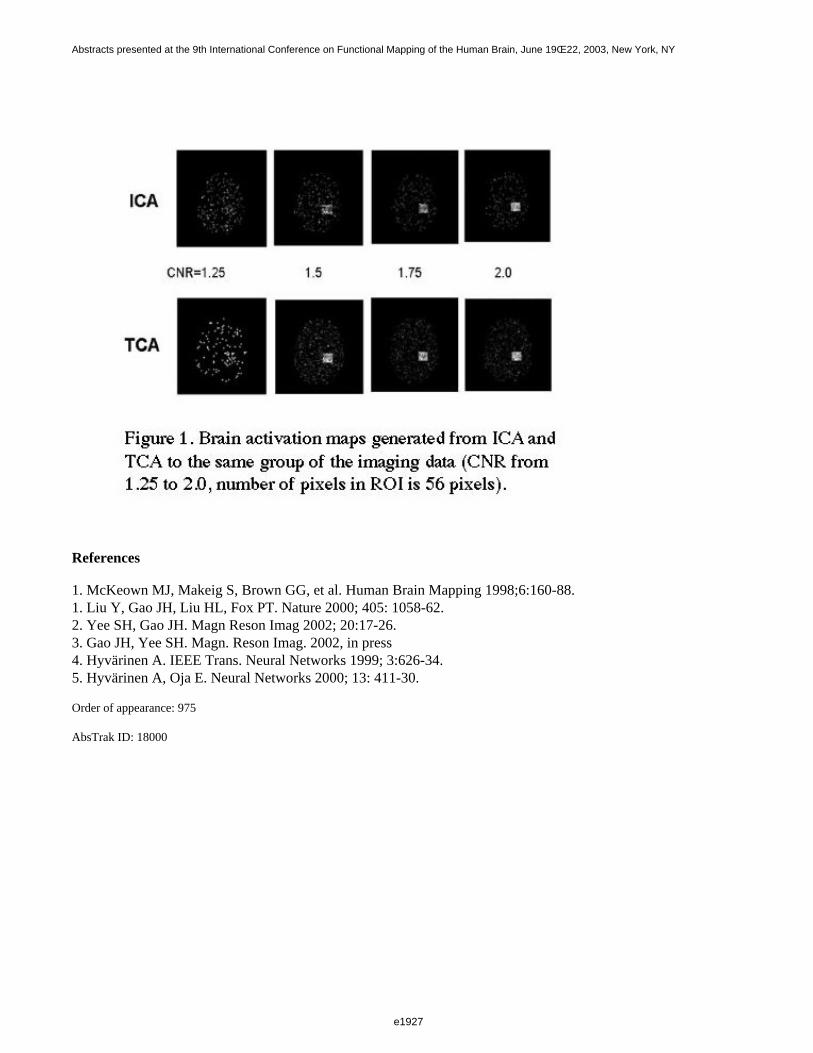
References
1. McKeown MJ, Makeig S, Brown GG, et al. Human Brain Mapping 1998;6:160-88.1. Liu Y, Gao JH, Liu HL, Fox PT. Nature 2000; 405: 1058-62.2. Yee SH, Gao JH. Magn Reson Imag 2002; 20:17-26.3. Gao JH, Yee SH. Magn. Reson Imag. 2002, in press4. Hyvärinen A. IEEE Trans. Neural Networks 1999; 3:626-34.5. Hyvärinen A, Oja E. Neural Networks 2000; 13: 411-30.
Order of appearance: 975
AbsTrak ID: 18000
e1927
Abstracts presented at the 9th International Conference on Functional Mapping of the Human Brain, June 19Œ22, 2003, New York, NY
e1927

Poster number: 985
Gaussian / Gamma mixture modelling of ICA/GLM spatial maps
Christian F. Beckmann*†, Mark W. Woolrich*, Stephen M. Smith*
*Oxford Centre for Functional Magnetic Resonance Imaging of the Brain (FMRIB), Oxford, UK†Medical Vision Laboratory, Department of Engineering, University of Oxford, Oxford, UK
Modeling & Analysis
Abstract
In [2] we proposed a Gaussian mixture model (GMM) for thresholding statistical maps generated from aprobabilistic ICA decomposition of functional imaging data. Under isotropic noise assumptions, the density of theestimated sources is given by a Gaussian
(projection of the noise) plus an unknown density (projection of ’true’ source processes) and was modelled usinga mixture of Gaussians. The mixture model order was
determined by estimating the Bayesian model evidence after fitting using EM. Identifying ’active’ voxels thenproceeds in essentially one of two ways: either by evaluating the probability of ’activation’ as the ratio of theprobability of intensity value under the ’noise’ Gaussian relative to the sum of probabilities of the value under the’activation’ Gaussians or by performing a null-hypothesis test relative to the fitted background Gaussian.
While this approach is attractive for its computational and conceptual simplicity there are also various problemsrelated to the restricted ’shapes’ that can be modelled by only few (or a single) Gaussian distributions (specifically’skewed’ distributions).
In order to address these issues we derived a novel EM algorithm for fitting a Gaussian/Gamma mixture model(GGM) with one Gaussian and a variable number of Gamma densities, where the Gamma density functions arefitted to the left and right tails of the estimated Gaussian density. This approach offers the advantage of i) beingable to better model the typically ’skewed’ shapes of activation clusters (extending far into the tails) and
ii) allowing to model ’activation’ differently from ’de-activation’.
Example Histogram-Fitting
Figure 1 shows different fits to an example intensity histogram. Both for GMM and GGM the model evidencesuggests three mixtures. For GMM (a), the third Gaussian fits to a high voxel count close to the mode resulting ina wrong estimate of the mode. In the case of GGM, the 2- and 3- mixture variants resulted in almost identicalestimates (the third Gamma in (c) was automatically reduced to a proportion of 10e-6).
e1928
Abstracts presented at the 9th International Conference on Functional Mapping of the Human Brain, June 19Œ22, 2003, New York, NY
e1928
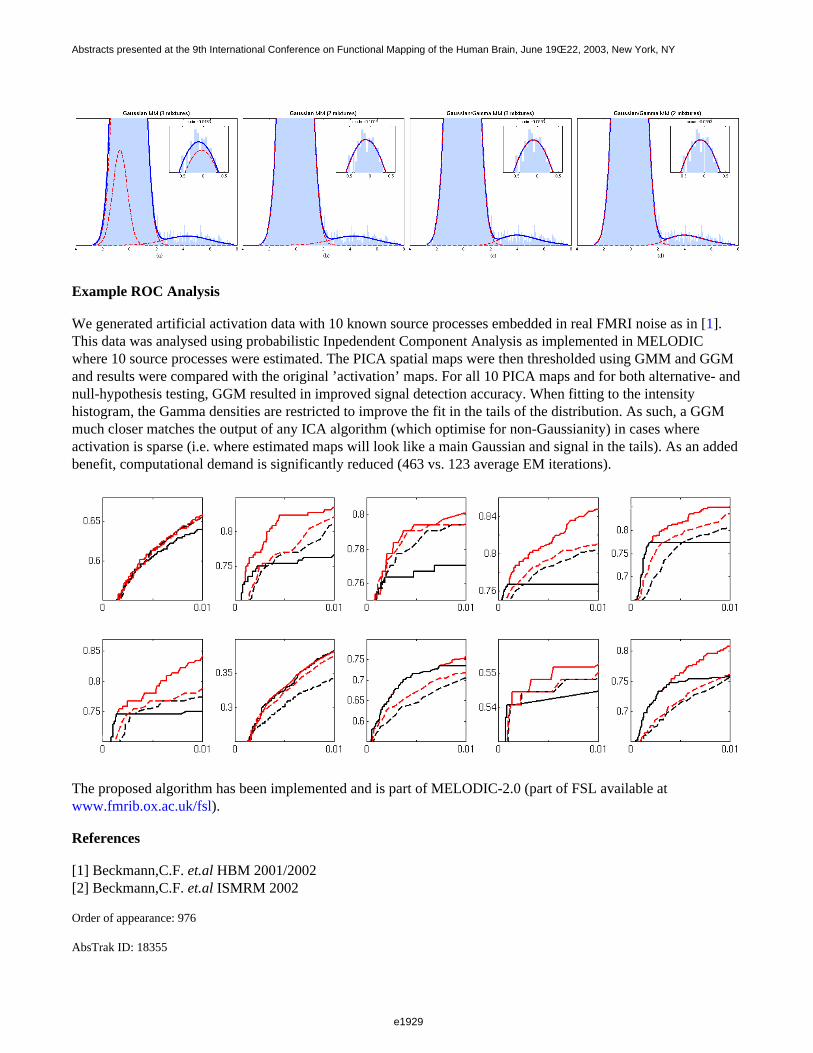
Example ROC Analysis
We generated artificial activation data with 10 known source processes embedded in real FMRI noise as in [1].This data was analysed using probabilistic Inpedendent Component Analysis as implemented in MELODICwhere 10 source processes were estimated. The PICA spatial maps were then thresholded using GMM and GGMand results were compared with the original ’activation’ maps. For all 10 PICA maps and for both alternative- andnull-hypothesis testing, GGM resulted in improved signal detection accuracy. When fitting to the intensityhistogram, the Gamma densities are restricted to improve the fit in the tails of the distribution. As such, a GGMmuch closer matches the output of any ICA algorithm (which optimise for non-Gaussianity) in cases whereactivation is sparse (i.e. where estimated maps will look like a main Gaussian and signal in the tails). As an addedbenefit, computational demand is significantly reduced (463 vs. 123 average EM iterations).
The proposed algorithm has been implemented and is part of MELODIC-2.0 (part of FSL available at www.fmrib.ox.ac.uk/fsl).
References
[1] Beckmann,C.F. et.al HBM 2001/2002[2] Beckmann,C.F. et.al ISMRM 2002
Order of appearance: 976
AbsTrak ID: 18355
e1929
Abstracts presented at the 9th International Conference on Functional Mapping of the Human Brain, June 19Œ22, 2003, New York, NY
e1929
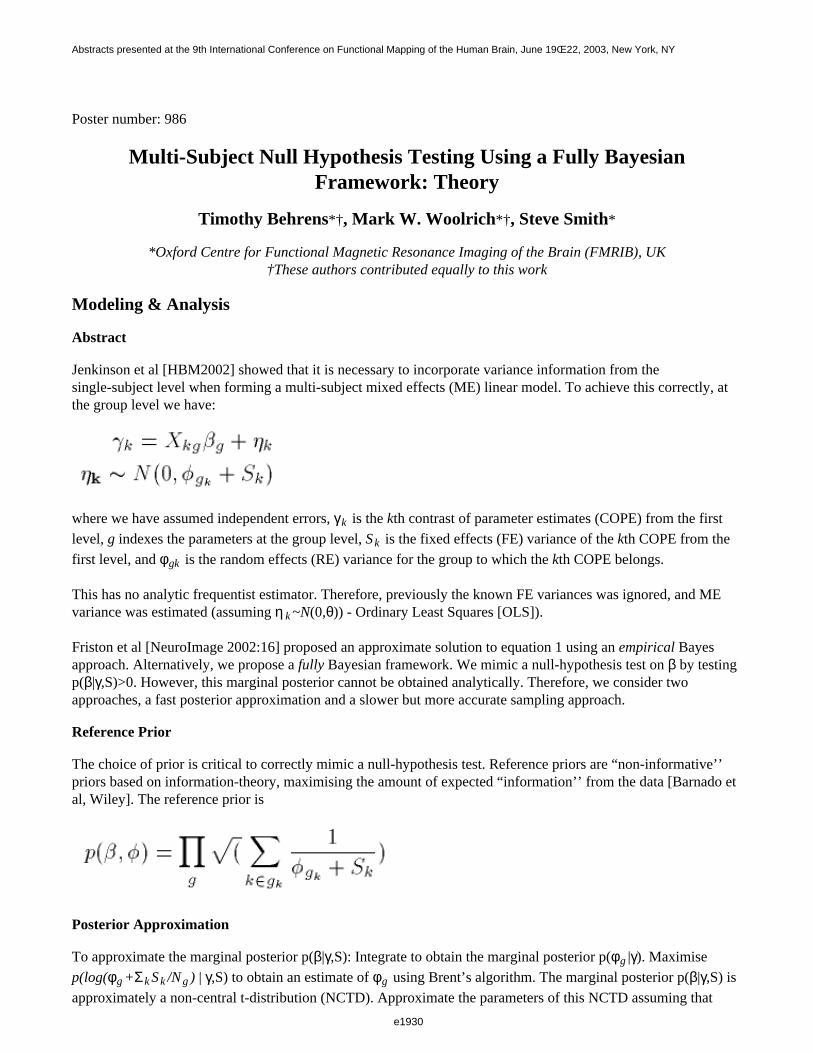
Poster number: 986
Multi-Subject Null Hypothesis Testing Using a Fully BayesianFramework: Theory
Timothy Behrens*†, Mark W. Woolrich*†, Steve Smith*
*Oxford Centre for Functional Magnetic Resonance Imaging of the Brain (FMRIB), UK†These authors contributed equally to this work
Modeling & Analysis
Abstract
Jenkinson et al [HBM2002] showed that it is necessary to incorporate variance information from thesingle-subject level when forming a multi-subject mixed effects (ME) linear model. To achieve this correctly, atthe group level we have:
where we have assumed independent errors, γk is the kth contrast of parameter estimates (COPE) from the first
level, g indexes the parameters at the group level, Sk is the fixed effects (FE) variance of the kth COPE from the
first level, and φgk is the random effects (RE) variance for the group to which the kth COPE belongs.
This has no analytic frequentist estimator. Therefore, previously the known FE variances was ignored, and MEvariance was estimated (assuming η k ~N(0,θ)) - Ordinary Least Squares [OLS]).
Friston et al [NeuroImage 2002:16] proposed an approximate solution to equation 1 using an empirical Bayesapproach. Alternatively, we propose a fully Bayesian framework. We mimic a null-hypothesis test on β by testing p(β|γ,S)>0. However, this marginal posterior cannot be obtained analytically. Therefore, we consider twoapproaches, a fast posterior approximation and a slower but more accurate sampling approach.
Reference Prior
The choice of prior is critical to correctly mimic a null-hypothesis test. Reference priors are “non-informative’’priors based on information-theory, maximising the amount of expected “information’’ from the data [Barnado etal, Wiley]. The reference prior is
Posterior Approximation
To approximate the marginal posterior p(β|γ,S): Integrate to obtain the marginal posterior p(φg |γ). Maximise
p(log(φg +Σk Sk /Ng ) | γ,S) to obtain an estimate of φg using Brent’s algorithm. The marginal posterior p(β|γ,S) is
approximately a non-central t-distribution (NCTD). Approximate the parameters of this NCTD assuming that
e1930
Abstracts presented at the 9th International Conference on Functional Mapping of the Human Brain, June 19Œ22, 2003, New York, NY
e1930
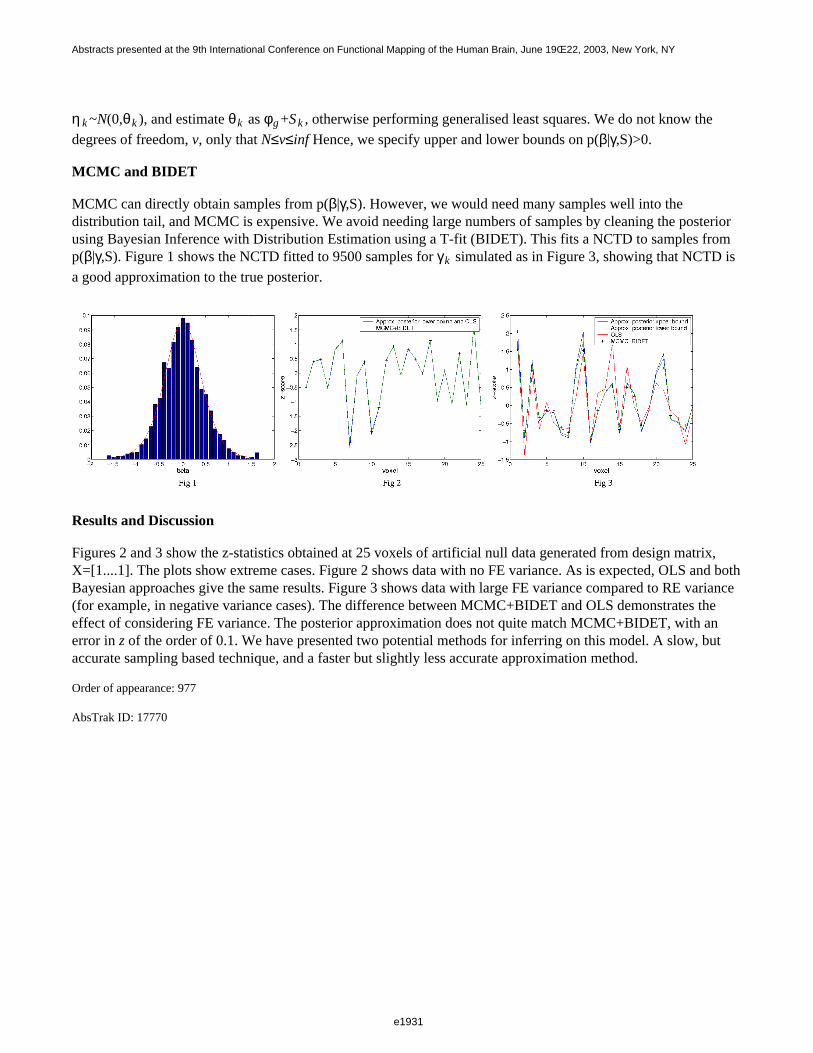
η k ~N(0,θk ), and estimate θk as φg +Sk , otherwise performing generalised least squares. We do not know the
degrees of freedom, v, only that N≤v≤inf Hence, we specify upper and lower bounds on p(β|γ,S)>0.
MCMC and BIDET
MCMC can directly obtain samples from p(β|γ,S). However, we would need many samples well into thedistribution tail, and MCMC is expensive. We avoid needing large numbers of samples by cleaning the posteriorusing Bayesian Inference with Distribution Estimation using a T-fit (BIDET). This fits a NCTD to samples from p(β|γ,S). Figure 1 shows the NCTD fitted to 9500 samples for γk simulated as in Figure 3, showing that NCTD is
a good approximation to the true posterior.
Results and Discussion
Figures 2 and 3 show the z-statistics obtained at 25 voxels of artificial null data generated from design matrix,X=[1....1]. The plots show extreme cases. Figure 2 shows data with no FE variance. As is expected, OLS and bothBayesian approaches give the same results. Figure 3 shows data with large FE variance compared to RE variance(for example, in negative variance cases). The difference between MCMC+BIDET and OLS demonstrates theeffect of considering FE variance. The posterior approximation does not quite match MCMC+BIDET, with anerror in z of the order of 0.1. We have presented two potential methods for inferring on this model. A slow, butaccurate sampling based technique, and a faster but slightly less accurate approximation method.
Order of appearance: 977
AbsTrak ID: 17770
e1931
Abstracts presented at the 9th International Conference on Functional Mapping of the Human Brain, June 19Œ22, 2003, New York, NY
e1931
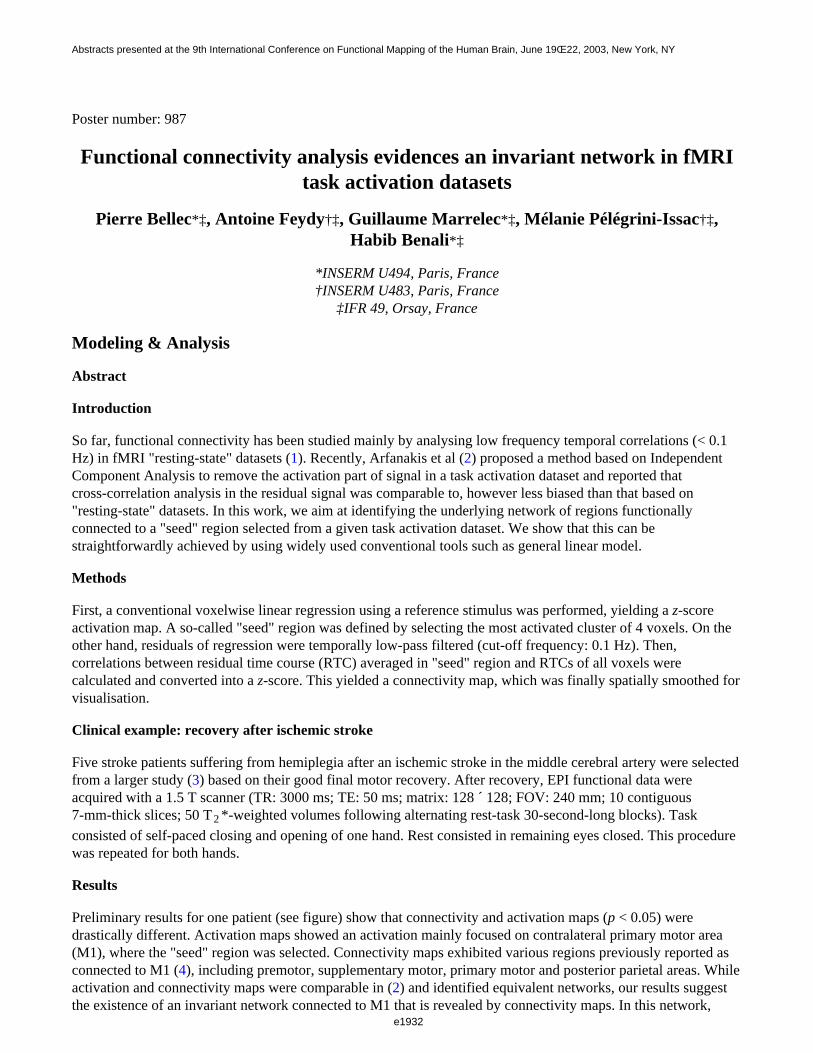
Poster number: 987
Functional connectivity analysis evidences an invariant network in fMRItask activation datasets
Pierre Bellec*‡, Antoine Feydy†‡, Guillaume Marrelec*‡, Mélanie Pélégrini-Issac†‡,Habib Benali*‡
*INSERM U494, Paris, France†INSERM U483, Paris, France
‡IFR 49, Orsay, France
Modeling & Analysis
Abstract
Introduction
So far, functional connectivity has been studied mainly by analysing low frequency temporal correlations (< 0.1Hz) in fMRI "resting-state" datasets (1). Recently, Arfanakis et al (2) proposed a method based on IndependentComponent Analysis to remove the activation part of signal in a task activation dataset and reported thatcross-correlation analysis in the residual signal was comparable to, however less biased than that based on"resting-state" datasets. In this work, we aim at identifying the underlying network of regions functionallyconnected to a "seed" region selected from a given task activation dataset. We show that this can bestraightforwardly achieved by using widely used conventional tools such as general linear model.
Methods
First, a conventional voxelwise linear regression using a reference stimulus was performed, yielding a z-scoreactivation map. A so-called "seed" region was defined by selecting the most activated cluster of 4 voxels. On theother hand, residuals of regression were temporally low-pass filtered (cut-off frequency: 0.1 Hz). Then,correlations between residual time course (RTC) averaged in "seed" region and RTCs of all voxels werecalculated and converted into a z-score. This yielded a connectivity map, which was finally spatially smoothed for visualisation.
Clinical example: recovery after ischemic stroke
Five stroke patients suffering from hemiplegia after an ischemic stroke in the middle cerebral artery were selectedfrom a larger study (3) based on their good final motor recovery. After recovery, EPI functional data wereacquired with a 1.5 T scanner (TR: 3000 ms; TE: 50 ms; matrix: 128 ´ 128; FOV: 240 mm; 10 contiguous7-mm-thick slices; 50 T2 *-weighted volumes following alternating rest-task 30-second-long blocks). Task
consisted of self-paced closing and opening of one hand. Rest consisted in remaining eyes closed. This procedurewas repeated for both hands.
Results
Preliminary results for one patient (see figure) show that connectivity and activation maps (p < 0.05) weredrastically different. Activation maps showed an activation mainly focused on contralateral primary motor area(M1), where the "seed" region was selected. Connectivity maps exhibited various regions previously reported asconnected to M1 (4), including premotor, supplementary motor, primary motor and posterior parietal areas. Whileactivation and connectivity maps were comparable in (2) and identified equivalent networks, our results suggestthe existence of an invariant network connected to M1 that is revealed by connectivity maps. In this network,
e1932
Abstracts presented at the 9th International Conference on Functional Mapping of the Human Brain, June 19Œ22, 2003, New York, NY
e1932
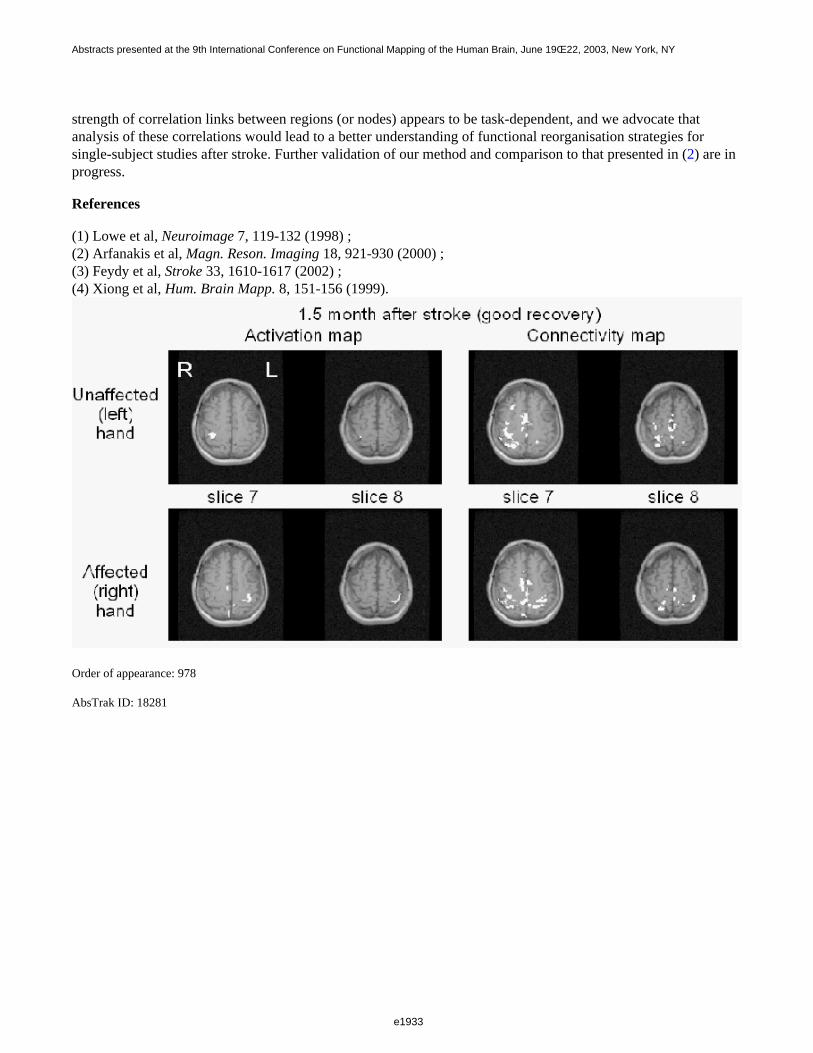
strength of correlation links between regions (or nodes) appears to be task-dependent, and we advocate thatanalysis of these correlations would lead to a better understanding of functional reorganisation strategies forsingle-subject studies after stroke. Further validation of our method and comparison to that presented in (2) are in progress.
References
(1) Lowe et al, Neuroimage 7, 119-132 (1998) ;(2) Arfanakis et al, Magn. Reson. Imaging 18, 921-930 (2000) ;(3) Feydy et al, Stroke 33, 1610-1617 (2002) ;(4) Xiong et al, Hum. Brain Mapp. 8, 151-156 (1999).
Order of appearance: 978
AbsTrak ID: 18281
e1933
Abstracts presented at the 9th International Conference on Functional Mapping of the Human Brain, June 19Œ22, 2003, New York, NY
e1933
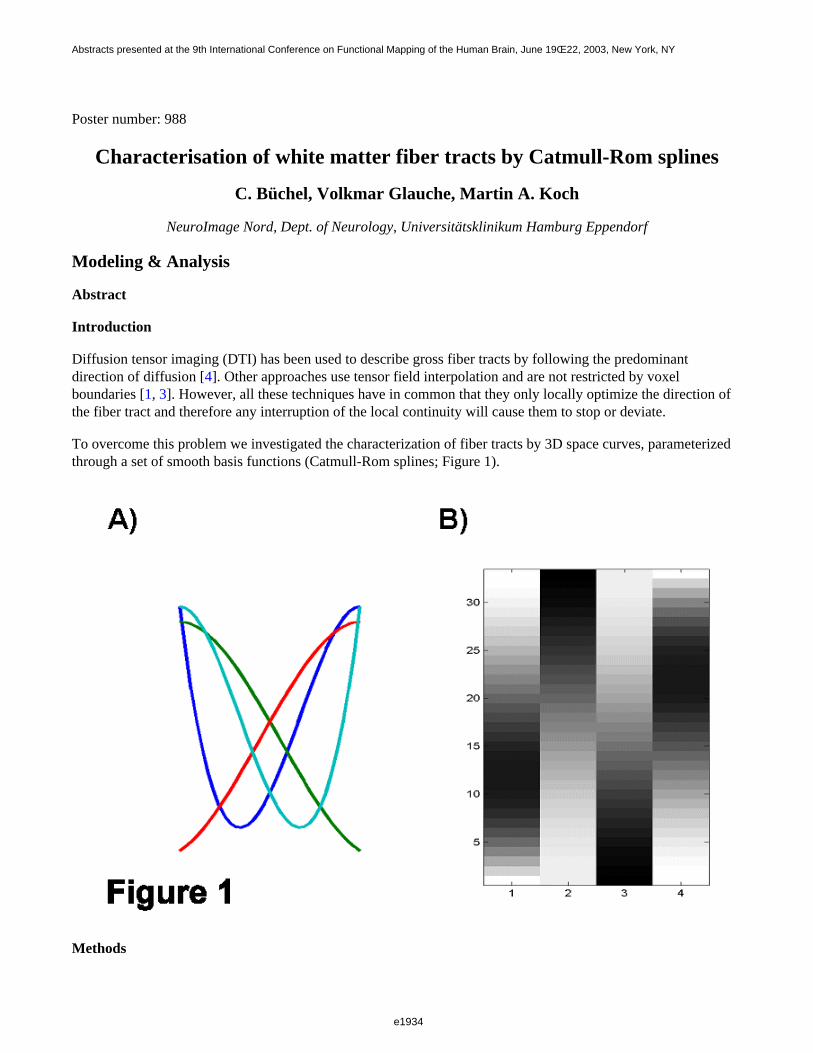
Poster number: 988
Characterisation of white matter fiber tracts by Catmull-Rom splines
C. Büchel, Volkmar Glauche, Martin A. Koch
NeuroImage Nord, Dept. of Neurology, Universitätsklinikum Hamburg Eppendorf
Modeling & Analysis
Abstract
Introduction
Diffusion tensor imaging (DTI) has been used to describe gross fiber tracts by following the predominantdirection of diffusion [4]. Other approaches use tensor field interpolation and are not restricted by voxelboundaries [1, 3]. However, all these techniques have in common that they only locally optimize the direction ofthe fiber tract and therefore any interruption of the local continuity will cause them to stop or deviate.
To overcome this problem we investigated the characterization of fiber tracts by 3D space curves, parameterizedthrough a set of smooth basis functions (Catmull-Rom splines; Figure 1).
Methods
e1934
Abstracts presented at the 9th International Conference on Functional Mapping of the Human Brain, June 19Œ22, 2003, New York, NY
e1934

Catmull-Rom splines are interpolating splines, i.e. all points lie on the space curve, which gives them an intuitiveinterpretation as waypoints on the 3D space curve [2]. Fitting Catmull-Rom splines to DTI data is less sensitive tolocal discontinuities because one can find the best solution on a more global level, defined by the length of thespline, which also represents a smoothness constraint that can be controlled by the Euclidean distance betweenpoints defining the spline.
Fitting Catmull-Rom curves to DTI data, one has to define an objective function that can be maximized. We havechosen a function that estimates the diffusion coefficients in the direction of the first partial derivative of thespline at some waypoints. This objective function is a non-linear function of the DT data and thus numericalalgorithms (e.g. Gauss-Newton) were used.
Data
We investigated our method with a single-shot diffusion weighted STEAM sequence [5]. (matrix size: 80 „e 128,FOV 160 mm „e 256 mm, effective TE = 76 ms, inter-echo spacing = 6.6 ms, TR = 12 s, flip angle = 11¢X,voxelsize 2 x 2 x 3 mm, b = 750 s/mm2) covering the whole brain. Data was preprocessed using SPM99.
e1935
Abstracts presented at the 9th International Conference on Functional Mapping of the Human Brain, June 19Œ22, 2003, New York, NY
e1935
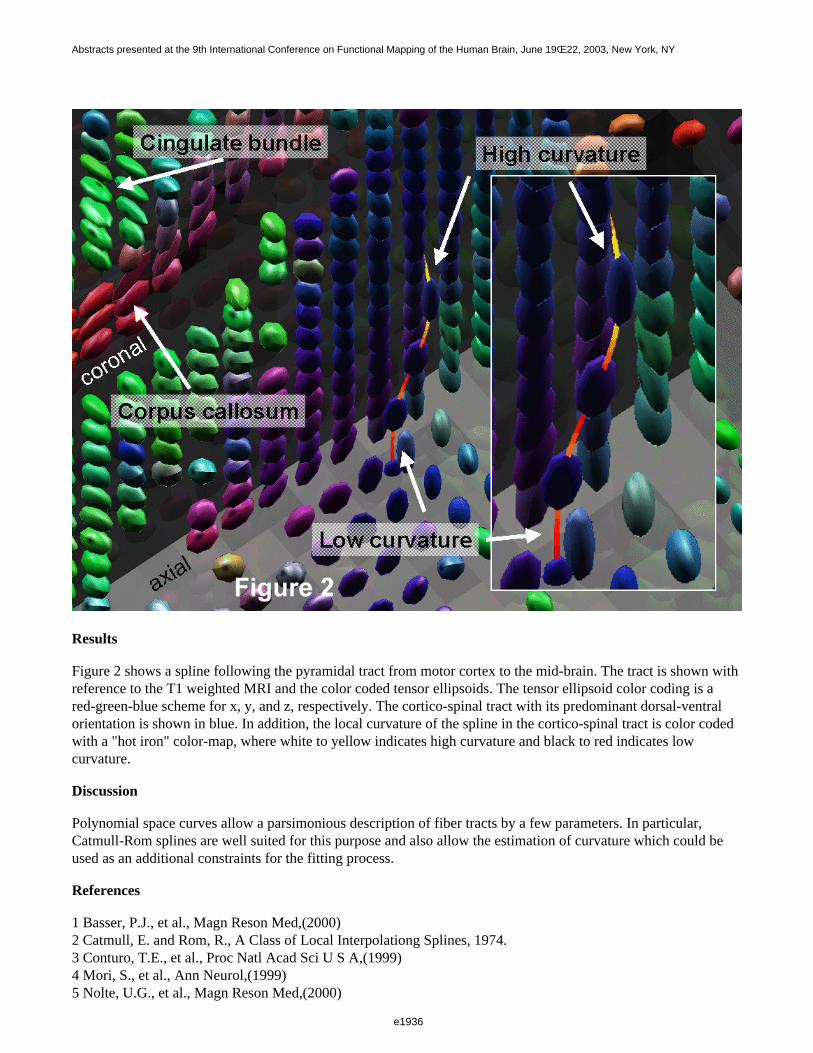
Results
Figure 2 shows a spline following the pyramidal tract from motor cortex to the mid-brain. The tract is shown withreference to the T1 weighted MRI and the color coded tensor ellipsoids. The tensor ellipsoid color coding is ared-green-blue scheme for x, y, and z, respectively. The cortico-spinal tract with its predominant dorsal-ventralorientation is shown in blue. In addition, the local curvature of the spline in the cortico-spinal tract is color codedwith a "hot iron" color-map, where white to yellow indicates high curvature and black to red indicates low curvature.
Discussion
Polynomial space curves allow a parsimonious description of fiber tracts by a few parameters. In particular,Catmull-Rom splines are well suited for this purpose and also allow the estimation of curvature which could beused as an additional constraints for the fitting process.
References
1 Basser, P.J., et al., Magn Reson Med,(2000)2 Catmull, E. and Rom, R., A Class of Local Interpolationg Splines, 1974.3 Conturo, T.E., et al., Proc Natl Acad Sci U S A,(1999)4 Mori, S., et al., Ann Neurol,(1999)5 Nolte, U.G., et al., Magn Reson Med,(2000)
e1936
Abstracts presented at the 9th International Conference on Functional Mapping of the Human Brain, June 19Œ22, 2003, New York, NY
e1936

Order of appearance: 979
AbsTrak ID: 17468
e1937
Abstracts presented at the 9th International Conference on Functional Mapping of the Human Brain, June 19Œ22, 2003, New York, NY
e1937
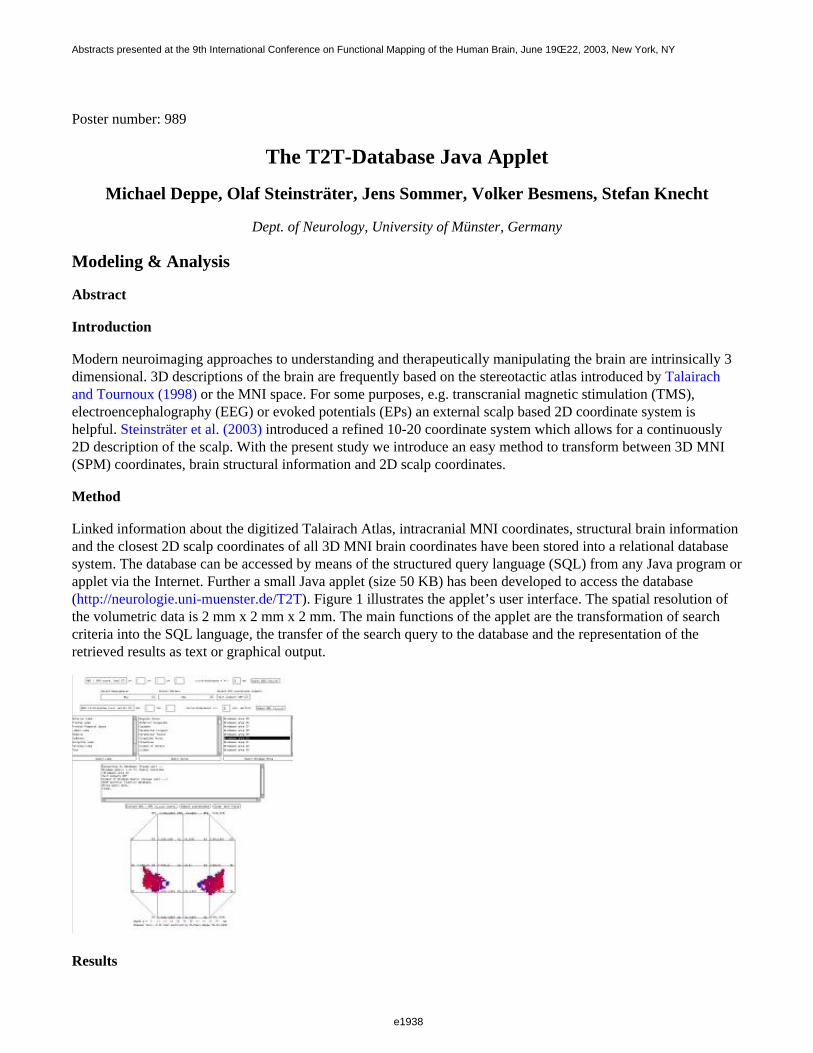
Poster number: 989
The T2T-Database Java Applet
Michael Deppe, Olaf Steinsträter, Jens Sommer, Volker Besmens, Stefan Knecht
Dept. of Neurology, University of Münster, Germany
Modeling & Analysis
Abstract
Introduction
Modern neuroimaging approaches to understanding and therapeutically manipulating the brain are intrinsically 3dimensional. 3D descriptions of the brain are frequently based on the stereotactic atlas introduced by Talairachand Tournoux (1998) or the MNI space. For some purposes, e.g. transcranial magnetic stimulation (TMS),electroencephalography (EEG) or evoked potentials (EPs) an external scalp based 2D coordinate system ishelpful. Steinsträter et al. (2003) introduced a refined 10-20 coordinate system which allows for a continuously2D description of the scalp. With the present study we introduce an easy method to transform between 3D MNI(SPM) coordinates, brain structural information and 2D scalp coordinates.
Method
Linked information about the digitized Talairach Atlas, intracranial MNI coordinates, structural brain informationand the closest 2D scalp coordinates of all 3D MNI brain coordinates have been stored into a relational databasesystem. The database can be accessed by means of the structured query language (SQL) from any Java program orapplet via the Internet. Further a small Java applet (size 50 KB) has been developed to access the database (http://neurologie.uni-muenster.de/T2T). Figure 1 illustrates the applet’s user interface. The spatial resolution ofthe volumetric data is 2 mm x 2 mm x 2 mm. The main functions of the applet are the transformation of searchcriteria into the SQL language, the transfer of the search query to the database and the representation of theretrieved results as text or graphical output.
Results
e1938
Abstracts presented at the 9th International Conference on Functional Mapping of the Human Brain, June 19Œ22, 2003, New York, NY
e1938
Queries against the database can be formulated by cortical structures, e.g. Brodmann areas and lobes, refined10-20 scalp coordinates (Xs, Ys) and intracranial coordinates (X, Y, Z). A special property of the database is toallow for queries by means of tolerance intervals for 2D and 3D coordinates as well as combinations of searchcriteria, e.g. "gray matter" AND "left cerebrum" AND "Brodmann area 44". In this case the output would be aseries of 265 database entries, representing information about the optimal TMS stimulation site of Broca’s area interms of refined 10-20 coordinates, graphical illustration and all corresponding MNI coordinates includingdistance to the scalp. Vice versa the output of a query for the SPM coordinate (-46, 38, 30), for example, wouldlead to the result, that this coordinate lies within Brodmann area 46, has a distance of 16 mm to the scalp and canbe optimal stimulated by TMS at the EEG position F3. A further advantage is that SPM results (volume summary)can be directly submitted to the database by pasting them into the applet’s text area. Further information isavailable at the above web site.
References
Talairach J, Tournoux P. Co-Planar Stereotaxic Atlas of the Human Brain. Thieme Medical Publishers, Inc. NewYork: 1988.Steinsträter O, Deppe M, Knecht S. Internet-based tool for calculating optimal TMS stimulation sites. (HBM 2003)This work was supported by the "Stiftung Neuromedizin - Neuromedical Foundation", Münster, Germany
Order of appearance: 980
AbsTrak ID: 18765
e1939
Abstracts presented at the 9th International Conference on Functional Mapping of the Human Brain, June 19Œ22, 2003, New York, NY
e1939
Poster number: 990
A Wavelet-Based Statistical Analysis of fMRI data: Motivation, DataDistribution Modeling and Analysis
Ivo D. Dinov*†, John W. Boscardin‡, Michael S. Mega§, Elizabeth Sowell*, Arthur W. Toga*
*LONI, Department of Neurology, UCLA Geffen School of Medicine, Los Angeles, CA 90095†Department of Statistics, UCLA, Los Angeles, CA 90095
‡Department of Biostatistics, UCLA School of Public Health, Los Angeles, CA 90095§Pacific Health Research Institute, Honolulu, HI 96813
Modeling & Analysis
Abstract
We propose a new method for atlas-based statistical analysis of functional magnetic resonance imaging (fMRI)data. The wavelet transformation is used for efficient and robust signal representation. The distributions of thewavelet coefficients of 3D and 4D MRI and fMRI data, across individuals and across spatial locations, areempirically estimated. Heavy-tail distributions are then proposed to model these data because these signals exhibitslower tail decay than the standard Gaussian distribution. The Cauchy, Pareto, T, double-Exponential and BesselK Forms heavy-tail distributions are studied as specific models for the real MRI and fMRI timeseries data. Ourfindings indicate that Cauchy, Bessel K-Forms and Pareto distributions provide the most accurate asymptoticmodels for the distribution of the wavelet coefficients of the data. We plan to apply these techniques to analyzelarge fMRI datasets involving repeated presentation of sensory-motor response stimuli in young, elderly anddemented subjects within the framework of a functional and anatomical sub-volume probabilistic brain atlas.
Order of appearance: 981
AbsTrak ID: 17075
e1940
Abstracts presented at the 9th International Conference on Functional Mapping of the Human Brain, June 19Œ22, 2003, New York, NY
e1940
Poster number: 991
New Developments in Source Imaging: Applications to Simulated andReal Data.
Rolando Grave de Peralta , Sara L. Gonzalez Andino, Gorant Lanz, Cristoph M. Michel
Human Brain Mapping Lab. Geneva University Hospital. Geneva. Switzerland
Modeling & Analysis
Abstract
Solutions to the neuroelectromagnetic inverse problem have been hitherto based on the straight application ofmathematical restrictions (e.g., minimal roughness, improved resolution kernels, probabilistic models, etc) oftencombined with anatomical constraints. Simulation results on the configuration proposed by Lütkenhöner andMosher, (i.e., 148 electrodes and 817 x 3= 2451 single sources) show that such mathematical constraints allow tolocalize at most a 21% of single sources with zero localization error and a maximum error of 3.16 grid units. Herewe introduce two linear alternatives to solve the electromagnetic inverse problem that incorporate physiological,physical and anatomical constraints into the source model. The selection of one or the other alternative dependsupon the type of data to be analyzed, that is:
1) Multiple active sources. In this case we use a Local Auto-Regressive Average (LAURA) solution obtained byconstraining the neuronal activity on the sole basis of biophysical a priori information, i.e., information about thenature of the measurements and the propagation of electrostatic potentials in biological media. For simulated data,this parametric solution double up the results obtained so far, attaining more than 49% of sources with zerolocalization error while keeping the maximum error bounded to 3.16 grid units. In this study we present detailedexamples of the tomographic images obtained with LAURA for the case of Event Related Potentials datacollected in our lab during the last 5 five years, providing new findings with respect to previously employedmethods. In particular, we illustrate the results on cognitive evoked potentials and sensorial evoked potential.While a definitive validation can never be claimed, these encouraging results from such diverse data, support theuse of LAURA as a powerful tool to study neuronal activity.
2) Single dominating source. Considering this a priori information we have developed a linear inverse solutioncalled EPIFOCUS. EPIFOCUSS is capable of localizing all single sources with a zero dipole localization error fora relatively small number of sensors (100). Extensive applications to epileptic data, where a single dominatingsource was identified or isolated by preprocessing techniques are presented to confirm the performance of themethod. A clear example of sub-lobar accuracy where other methods (minimum laplacian and dipolar model)failed illustrate that this technique may be particularly useful as an adjunct means of identifying cases whereamygdalo-hippocamectomy or other limited temporal lobe resections may be performed in lieu of the standard enbloc resections.
Order of appearance: 982
AbsTrak ID: 18884
e1941
Abstracts presented at the 9th International Conference on Functional Mapping of the Human Brain, June 19Œ22, 2003, New York, NY
e1941
Poster number: 992
Template Based Volume Measurements in Different Brain Lobes - A MRIStudy on Families Affected by Schizophrenia
Thomas Kamer*, Michaela Heimann†, Nadja Maric‡, Thomas Schneider-Axmann*, Ralf Tepest†, Peter Falkai*
*Institute of Psychiatry, Saarland University Hospital, Homburg/Saar, Germany†Institute of Psychiatry, University Clinical Center, Bonn, Germany
‡Institute of Psychiatry, University Clinical Center, Belgrade, Yugoslavia
Modeling & Analysis
Abstract
Introduction:
Brain structure changes observed with schizophrenia are possibly caused by genetic predisposition. Aim of thisstudy was the detection of volume deviations of major brain substructures both in patients and their relativescompared to controls. By analyzing the volumes as ratios of total brain volume, local effects could bedistinguished from global reduction.
Methods:
Magnetic resonance images (MRI) of 51 schizophrenic or schizo-affective patients, 29 relatives with otherpsychiatric diagnoses, 63 relatives without psychiatric diagnosis and 54 controls were analyzed.
A representative subsample of ten MRI was drawn. Within this subsample six different structures (prefrontal,frontal, parietal, occipital and temporal lobes, cerebellum) were manually extracted and separated into left andright part. The extraction was done by slice-bound free-hand editing with multiple rechecking and change of sliceorientation. After binarization the obtained masks were normalized along with the original MRI using SPM99standard procedure with 1mm target resolution. Mean masks were calculated and smoothed deriving quasiprobabilistic templates.
The SPM99 standard T1 brain template was coregistered with each MRI of the complete sample using a schemesimilar to the normalization routine of SPM99. The resulting coregistration parameters were used to coregistratethe structure templates.
For sufficient brain-CSF-boundary detection the MRI of the complete sample were segmented using SPM99standard procedure. By means of the resulting substance probability images all voxels were classified leading tomasks of gray matter (GM), white matter (WM) and brain matter (BM=GM&WM).
For each brain the coregistered structure templates and the substance masks were multiplied voxel-wise.Summation resulted in volumes of GM, WM and BM within the considered structures. The volumes of posteriorfrontal lobes were computed from prefrontal and frontal lobes. Structure volume ratios of total brain volume were calculated.
After testing for outliers and normal distribution predictor variables were selected by stepwise linear regression.Based upon these variables MANCOVA with appropriate intervening variables and covariates were performed.
e1942
Abstracts presented at the 9th International Conference on Functional Mapping of the Human Brain, June 19Œ22, 2003, New York, NY
e1942
Results:
In multivariate analyses of the GM ratios schizophrenic patients differed significantly from controls (p<0.0001)and from their relatives with (p=0.010) and without (p=0.021) other psychiatric diagnosis. Univariate analysesshowed differences primarily in prefrontal lobes (p<=0.0006 for all comparisons) with sporadic and lesssignificant findings in the occipital, parietal, temporal and posterior frontal lobes. Additionally, there wereinconclusive trends analyzing mean differences between controls and non schizophrenic relatives.
In multivariate analyses of the WM ratios schizophrenic patients differed significantly from controls (p=0.027).Univariate analyses showed differences to exist primarily in the temporal lobes.
In multivariate analyses of the BM ratios all subgroups differed from each other (0.0001<=p<=0.039). Univariateanalyses showed for subgroup comparisons including the group of schizophrenic patients the differences to lieprimarily in prefrontal (p<=0.0005 for all comparisons), but also in temporal lobes (0.0002<=p<=0.042) withhighest significance for controls versus schizophrenic patients. No conclusive results were found comparingcontrols with non schizophrenic relatives.
Conclusions:
Prefrontal GM reduction was confirmed for schizophrenic patients while their relatives seem to have only smallor no reductions compared to controls. WM reductions may be maximal in temporal lobe. Considering BMvolume reductions in prefrontal and temporal lobe were confirmed for schizophrenic patients.
Order of appearance: 983
AbsTrak ID: 18007
e1943
Abstracts presented at the 9th International Conference on Functional Mapping of the Human Brain, June 19Œ22, 2003, New York, NY
e1943
Poster number: 993
A multivariate FDG-PET voxel-based study comparing VascularDementia (VaD) to Alzheimer’s Disease (AD) and Normal Controls (NC).
Nacer Kerrouche*, Karl Herholz†, Vjera Holthoff‡, Francis Eustache*, Jean-Claude Baron§
*INSERM EMI218, Caen, France†Max-Planck Institute for Neurological Research and Neurology Department, University, Cologne, Germany
‡Department of Psychiatry and Psychotherapy, Dresden University of Technology, Germany§Neurology Department, Cambridge University, UK
Modeling & Analysis
Abstract
Introduction
The brain metabolic pattern of VaD remains poorly characterized. Univariate voxel-based studies do not considerthe functional correlations among the different brain structures so provide an incomplete understanding and maylack sensitivity and specificity. In this study we have applied a novel multivariate technique [1] to large FDG-PETdata sets from a multicentre consortium.
Materials and Methods
The sample consists of 55 probable VaD subjects (NINCDS-AIREN criteria) with subcortical lesions only, 55 ADpatients (NINDS-ADRDA criteria) and 40 NC. Neither MMSE nor age differed between the VaD and ADsubgroups (23.7 ± 3.5 and 23.6 ±3.4; and 67.2± 9.5 and 68.7± 8.5 yrs, respectively). The age of NC was 63.1 ±5.8 yrs (not significantly different from VaD and AD as compared by ANOVAs).
The data was transformed by Principal Components Analysis (PCA) to obtain new coordinates (PC-scores) of theobservations in an orthogonal new coordinates system (PC-space). Those PC-scores were then used as featuresvector in a multivariate analysis of variance (MANOVA) to get the canonical variables which maximize the ratioof the within-group variance (W) over the between-groups variance (B).
Results
The first two canonical variables C1 and C2 which are a linear combination of the initial variables (PC-scores)efficiently separated the 3 groups. C1 axis separated NC from demented subjects (sensitivity 92%, specificity100%), while C2 separated AD from VaD subjects (sensitivity 94%, specificity 94%). The C1 subject scores weresignificantly correlated with the MMSE (p<0.00001). By combining the PCs according to eigenvectors of thematrix W-1/B, the images corresponding to C1 and C2 were obtained.
C1 image: the hypometabolic pattern common to VaD and AD was bilaterally symmetrical and included theposterior parietal and precuneus, posterior cingulate, association temporal cortex, dorsolateral prefrontal cortex,caudate head, and medial thalamus.
C2 image : lower metabolism in VaD than in AD was seen mainly in the caudate and lenticular nuclei, thalamus,some sub-regions of the cerebellum, the motor and auditory cortices, the striate and extra-striate visual cortex, andanterior cingulate. Conversely, in AD compared to VaD the hypometabolic pattern concerned mainly thehippocampal/amygdala/temporal pole region, orbito-frontal cortex, precuneus/superior posterior cingulate, and
e1944
Abstracts presented at the 9th International Conference on Functional Mapping of the Human Brain, June 19Œ22, 2003, New York, NY
e1944

posterior parietal cortex.
Conclusion
This study illustrates the power of multivariate voxel-based analysis to extract common features related todementia severity and distinct differences between AD and VaD.
Acknowledgement
This study was conducted by the authors on behalf of the NEST-DD consortium with support from the EuropeanCommission (Framework V).
References
[1] Zuendorf G, Kerrouche N, Herholz K, , Baron J-C.. Human Brain Mapping, 2003, 18:13-21.
Order of appearance: 984
AbsTrak ID: 18892
e1945
Abstracts presented at the 9th International Conference on Functional Mapping of the Human Brain, June 19Œ22, 2003, New York, NY
e1945
Poster number: 994
Statistical Parametric Mapping for event-related potentials
Stefan J. Kiebel, Karl J. Friston
Wellcome Dept. of Imaging Neuroscience, UCL, 12 Queen Square, London, UK
Modeling & Analysis
Abstract
Introduction
We describe the strategy and motivations behind developments in statistical parametric mapping (SPM) for theanalysis of electroencephalography (EEG) data. We deal specifically with SPM procedures for the analysis ofevent-related potentials (ERPs). These developments are placed in the larger context of integratingelectrophysiological and haemodynamic measurements of evoked brain responses through the fusion of EEG andfMRI data.
Methods
ERP data present a major challenge to estimation and inference ambitions. These data show profoundspatiotemporal correlations or non-sphericity and embrace not only four dimensions (space and time) but also awhole variety of experimental design factors. We consider a number of fundamental choices that have to be madewhen selecting an appropriate statistical model that enables the right questions to be asked of the data and, at thesame time, retains maximum sensitivity. The two key choices addressed are: (i) Should multivariate or massunivariate analyses be adopted and, (ii) should time be treated as an experimental factor or as a dimension of themeasured response variable?
We review the relative merits of the different options and explain the rationale for our choices. In the temporaldomain, we specify a two level hierarchical linear model with multiple error covariance constraints (1) to accountfor the non-sphericity of the data. We use a wavelet basis function set (e.g. Daubechies 4, (2)) to generate thedesign matrix for the observation level. This basis set substantially finesses the hyperparameterization ofnon-spherical and non-stationary error covariance components. Linear error covariance constraints are used tomodel the first and second level error process. Model parameters are estimated using Maximum Likelihood andRestricted Maximum Likelihood. For making inferences in fixed or random effects analyses, we use classical t- orF-statistics to compute p-values for temporally localized effects in peri-stimulus time or in the time-frequencydomain. With this temporal model, we analyze source reconstructed ERP image time series, over voxels, in amass univariate fashion. P-values, corrected for multiple comparisons, are estimated using results from GaussianRandom Field (GRF) theory (3). GRF corrections allow one to adjust for spatial non-sphericity using spatial[smoothness] hyperparameters, whose number scales linearly with the number of voxels.
We describe the analysis procedures that are being incorporated into the SPM software and compare the results ofthe new analysis procedures with established techniques.
References
(1) K.J. Friston et al., Neuroimage, 16: 465-483, 2002.(2) I. Daubechies, Ten Lectures on Wavelets, 1992.(3) K.J. Worsley et al., Human Brain Mapping, 8:98-101, 1999.
e1946
Abstracts presented at the 9th International Conference on Functional Mapping of the Human Brain, June 19Œ22, 2003, New York, NY
e1946

Order of appearance: 985
AbsTrak ID: 17812
e1947
Abstracts presented at the 9th International Conference on Functional Mapping of the Human Brain, June 19Œ22, 2003, New York, NY
e1947
Poster number: 995
Spherical Registration of Cortical Folding Patterns in WilliamsSyndrome: A Cautionary Note
J. Shane Kippenhan*, Rosanna K. Olsen*, Andreas Meyer-Lindenberg M.D., Ph.D.*,Shruti Japee†, Carolyn B. Mervis‡, Colleen A. Mervis§, Karen Faith Berman*
*Unit on Integrative Neuroimaging, Clinical Brain Disorders Branch, NIMH, NIH†Laboratory of Brain and Cognition, NIMH, NIH
‡Dept. of Psychological and Brain Sciences, University of Louisville§University of Nevada School of Medicine
Modeling & Analysis
Abstract
Williams syndrome is a rare developmental disorder that is genetically and cognitively well-characterized,offering a powerful opportunity to study relationships between genotype, neurobiology and complex cognitivebehaviors. As part of an ongoing effort to characterize Williams syndrome in terms of observableneurophysiological and/or neurostructural features, cortical surface representations derived from high-resolutionMRI were created for a group of participants with Williams Syndrome and a group of normal controls of similarage, gender and IQ. These cortical surface representations were then used to perform group-wise comparisons ofcortical thickness and curvature.
Composition of Groups
Group M/F Age (s.d.) WASI (s.d.)
Williams 4/3 28.4 (11.1) 91.9 (11.7)
Controls 3/4 29.9 (5.1) 99.1 (5.1)
For each participant, six high-resolution SPGR sequences (256x256x124, 0.9375x0.9375x1.2mm resolution) wereacquired, intensity normalized [1], volume registered to a common reference image [2], and averaged together toreduce image noise. The Freesurfer software package [3, 4, 5] was then used to segment the images, create whitematter surface representations from the segmented images, “manually” edit the surface representations fortopological defects, and generate pial surface representations, along with cortical thickness and curvature at eachvertex in the surface mesh. Spherical surface representations were then generated, and gyral and sulcal patterns onsurfaces were subjected to Freesurfer’s registration process which attempts to map them to a spherical atlas. Theseregistered representations were then used to generate statistical maps, comparing cortical thickness and curvatureat presumably corresponding surface points across the two groups.
Initial findings indicated a region of cortical thickness difference near the posterior aspect of the inferior temporalgyrus on the left hemispherical surface. Projection of normalized points in this region back to surfaces ofindividual participants, however, revealed that this difference could be attributed to the fact that the registeredlocation of this difference mapped to gyral locations on the surfaces of 6 of 7 individuals with Williams syndromeand to sulcal locations for 6 of 7 controls, since cortical thickness is known to be greater at gyral locations [5].These results 1) suggest that there may be gross alterations in gyral/sulcal patterns in Williams syndrome, and 2)that caution is advised when performing such group comparisons and in interpreting their results, particularly ifabnormal gyrification or structural changes are known or suspected clinically. Further investigation will focus on
e1948
Abstracts presented at the 9th International Conference on Functional Mapping of the Human Brain, June 19Œ22, 2003, New York, NY
e1948

the curvature differences that were found in normalized space.
References
1. Sled, J.G., Zijdenbos, A.P. and A.C. Evans. A non-parametric method for automatic correction of intensitynon-uniformity in MRI data. IEEE Transactions on Medical Imaging, 17(2), 87-97, 1998.2. Cox, R.W. AFNI: Software for analysis and visualization of functional magnetic resonance neuroimages.Computers and Biomedical Research, 29: 162-173, 1996.3. Dale, A.M., Fischl, B. and M.I. Sereno. Cortical Surface-Based Analysis I: Segmentation and SurfaceReconstruction. NeuroImage 9(2), 179-194, 1999.4. Fischl, Bruce, Sereno, M.I. and A.M. Dale. Cortical Surface-Based Analysis II: Inflation, Flattening, and aSurface-Based Coordinate System. NeuroImage 9(2), 195-207, 1999.5. Fischl, Bruce, and A.M. Dale. Measuring the Thickness of the Human Cerebral Cortex from MagneticResonance Images. Proceedings of the National Academy of Sciences, 97, 11044-11049, 2000.
Order of appearance: 986
AbsTrak ID: 18853
e1949
Abstracts presented at the 9th International Conference on Functional Mapping of the Human Brain, June 19Œ22, 2003, New York, NY
e1949
Poster number: 996
Morphological classification of brains via high-dimensional shapetransformations and machine learning methods
Zhiqiang Lao*, Dinggang Shen*, Susan M. Resnick†, Christos Davatzikos*
*Section of Biomedical Image Analysis, Department of Radiology, University of Pennsylvania, Philadelphia, PA†Laboratory of Personality and Cognition, National Institute on Aging, Baltimore, MD
Modeling & Analysis
Abstract
Introduction
Developing image analysis methods for quantification of subtle anatomical and physiological group differences isbecoming increasingly important. In particular, early detection of subtle morphological and physiological brainchanges could ultimately lead to early diagnosis and classification of patients bound to develop disease. Wepresent an approach that uses the entire set of morphological measurements obtained from all voxels in a brainimage, to build a brain classifier. Our classification scheme operates in a very high-dimensional space, andtherefore can determine subtle population differences with complex spatial patterns, which often cannot beidentified via voxel-wise statistical analysis.
Method
Our approach is based on a mass-preserving framework called the Regional Analysis of Volumes Examined inNormalized Space (RAVENS) [1, 2] and a high-dimensional elastic registration [3]. A RAVENS map is createdby warping individual images into conformation with a template, while preserving the total amount of tissue inany brain region. Volume compression results in an increase of tissue density, so that the total amount of tissue ispreserved, and vice versa. Therefore, regional volumetric analysis is performed by applying statistical analysismethods on the RAVENS tissue density maps. Analysis of the RAVENS maps involves three major steps. First,we apply a wavelet decomposition to hierarchically decompose a RAVENS map in a scale-space way. Second,we use a feature selection method [4] to focus on the most discriminating aspects of the wavelet transformedRAVENS maps. Third, we use the selected features and apply a Support Vector Machine (SVM) patternrecognition method to achieve morphological classification.
Results and Discussion:
Three experiments are used to demonstrate the performance of our approach. All testing images are obtained fromthe Baltimore Longitudinal Study of Aging study [5], where MR brain images of over 150 older adults have beencollected yearly over 9 years. The first experiment is on age classification. We divided 150 subjects into 4 agegroups: 50~59, 60~68, 69~79, 80+, and test our classification performance, using the leave one out method. Theresult in Fig 1 shows that the more separated two groups were, the better the classification was. The secondexperiment was on normal and pathology classification. We used 10 normal subjects and 10 subjects withsimulated atrophy of different levels. For 5% atrophy, the leave-one-out classification rate was 95%, whereas itwas 100% for higher atrophy levels. In our final experiment we tested the morphological classification intomale/female, and found a 98.9% classification accuracy, using the leave one out method. We intend to use ourmorphological classification scheme in order to determine early brain changes that predict dementia.
e1950
Abstracts presented at the 9th International Conference on Functional Mapping of the Human Brain, June 19Œ22, 2003, New York, NY
e1950
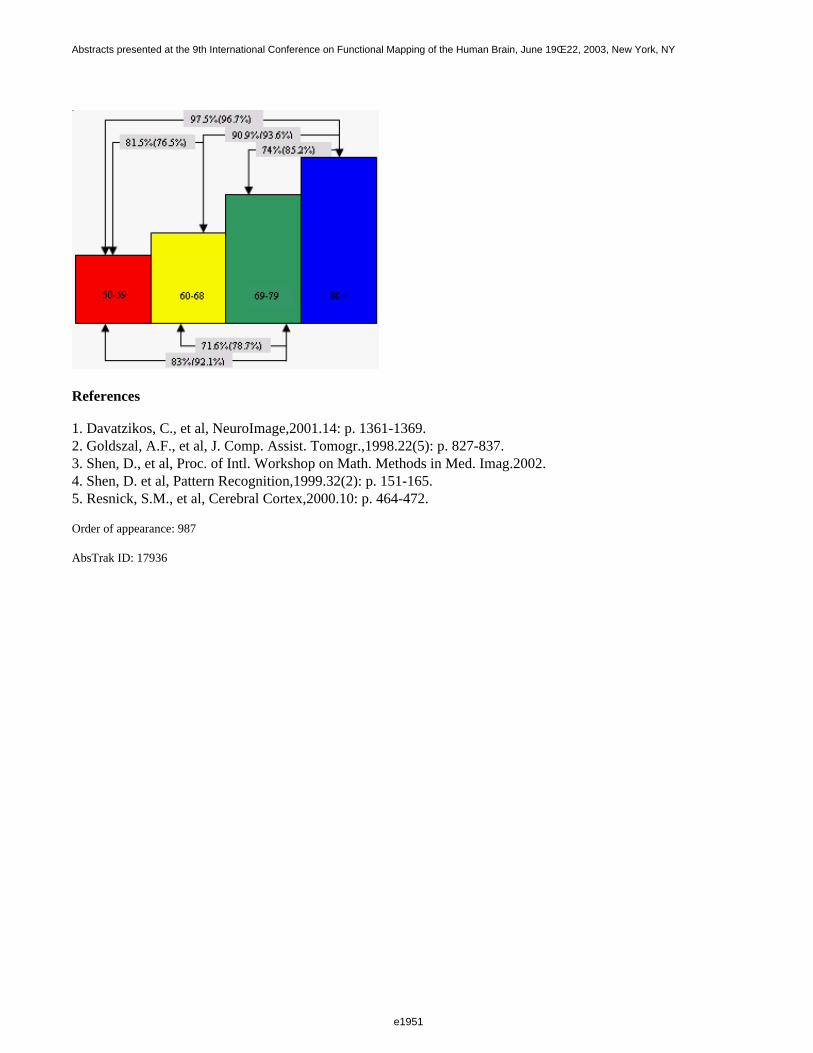
References
1. Davatzikos, C., et al, NeuroImage,2001.14: p. 1361-1369.2. Goldszal, A.F., et al, J. Comp. Assist. Tomogr.,1998.22(5): p. 827-837.3. Shen, D., et al, Proc. of Intl. Workshop on Math. Methods in Med. Imag.2002.4. Shen, D. et al, Pattern Recognition,1999.32(2): p. 151-165.5. Resnick, S.M., et al, Cerebral Cortex,2000.10: p. 464-472.
Order of appearance: 987
AbsTrak ID: 17936
e1951
Abstracts presented at the 9th International Conference on Functional Mapping of the Human Brain, June 19Œ22, 2003, New York, NY
e1951
Poster number: 997
Hippocampal Shape Difference in Schizophrenia Using DeformableSurface Model
Junki Lee*, Jong-Min Lee*, SunHyung Kim*, In-Young Kim*, Jae-Jin Kim§, Jun Soo Kwon†‡, Sun I. Kim*
*Department of Biomedical Engineering, Hanyang University, Seoul, Korea†Department of Nuclear Medicine, Seoul National University College of Medicine, Seoul, Korea
‡Department of Psychiatry, Seoul National University College of Medicine, Seoul, Korea§Department of Psychiatry, Yonsei University College of Medicine, Seoul, Korea
Modeling & Analysis
Abstract
Statistical studies of anatomical shape of brain subsystems are important in understanding anatomical changescoursed by mental disorders. Volume and area measurements were originally used for such studies, but recentlymore sophisticated shape based techniques have been used to identify statistical difference in the shape of aparticular organ in different groups. To represent the shape, a lot of shape descriptor used in medical images: suchas fourier descriptor, distance transform, medial axes, and landmark based descriptor. We used distance transformas a shape descriptor which had distance values on each vertex on the surface model. In this paper, we interpretedthe shape difference between schizophrenia and control groups using deformable surface model and distancetransform. To find accurate corresponding points between objects, the surface model aligned using patternmatching which is generated from distance transform. Then, we briefly calculated the difference of distancevalues between groups as subtraction control group to schizophrenia group. The data sample consisted of 22schizophrenia and 20 healthy control subjects. By first, we segmented original images into structure of interest,using the analyze 4.0. To reduce the process time, we clipped the segmented image into region of interest. We,then, removed the noise using smoothing, and converted the smoothed volume into binary volume. We extractedthe surface model of hippocampus using deformable surface model method which is based on the ASP(AnatomicSegmentation using Proximity, D. Macdonald 2000) algorithm. The number of points constituting each subjectwas about 2550. To find exact 1-to-1 corresponding points between each subjects, we aligned the surface modelsusing pattern matching. The alignment of the shape patterns on each subject was carried out by minimizing themean square difference between the distances from object center to boundary. After the distance of each positionof model converted to spherical coordinate, angle of representation vertex was transformed toward minimizing thealignment energy function. And we obtained the corresponding points of pairs of the surface. Finally, we calculatethe distance map of the object as subtraction each subject from a single standard subject. And we can obtain thesignificant value (p<0.05) on vertex using the t-test in the matlab. We report the result of method applied to a dataset that contains schizophrenia group and control group. We can find that schizophrenia group shrinks at lateralanterior and medial posterior in left and right hippocampus. In this paper, we compared two groups using thedeformable surface model and distance transform as a shape descriptor. And the problem of alignment is solvedby pattern matching using distance feature. We will calculate the asymmetry of hippocampus as furtherapplication through these procedures. And we will analyze any other mental disorder groups.
e1952
Abstracts presented at the 9th International Conference on Functional Mapping of the Human Brain, June 19Œ22, 2003, New York, NY
e1952
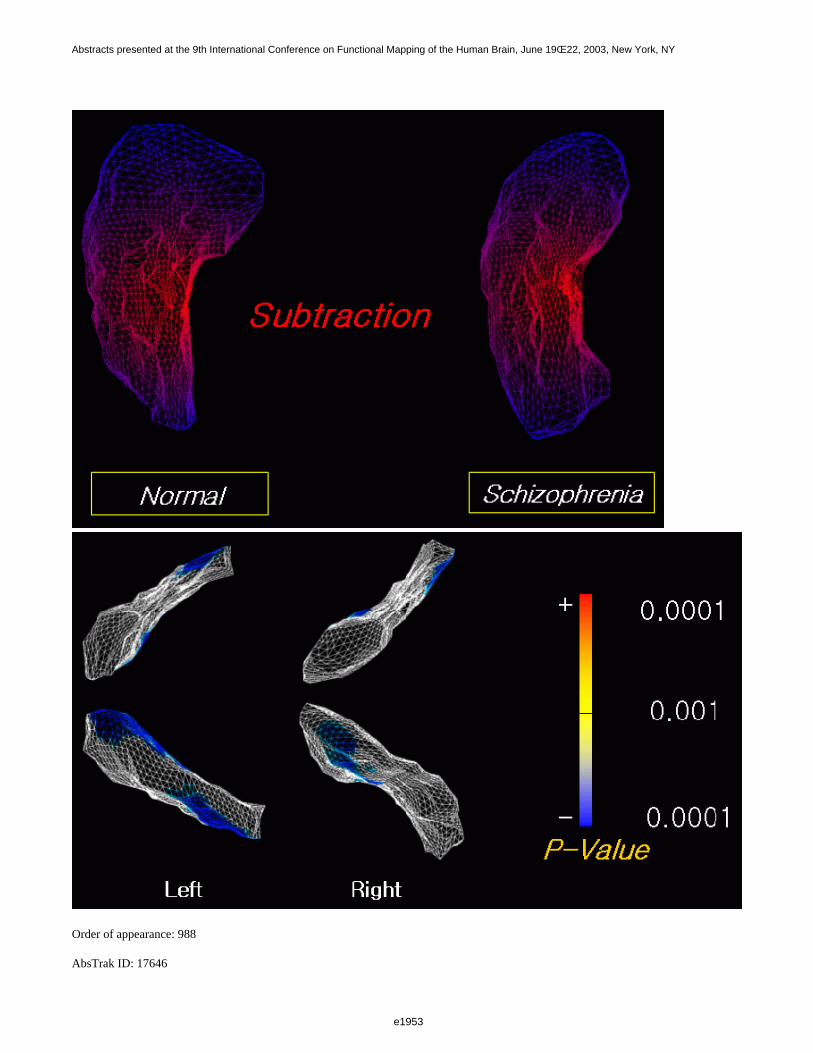
Order of appearance: 988
AbsTrak ID: 17646
e1953
Abstracts presented at the 9th International Conference on Functional Mapping of the Human Brain, June 19Œ22, 2003, New York, NY
e1953
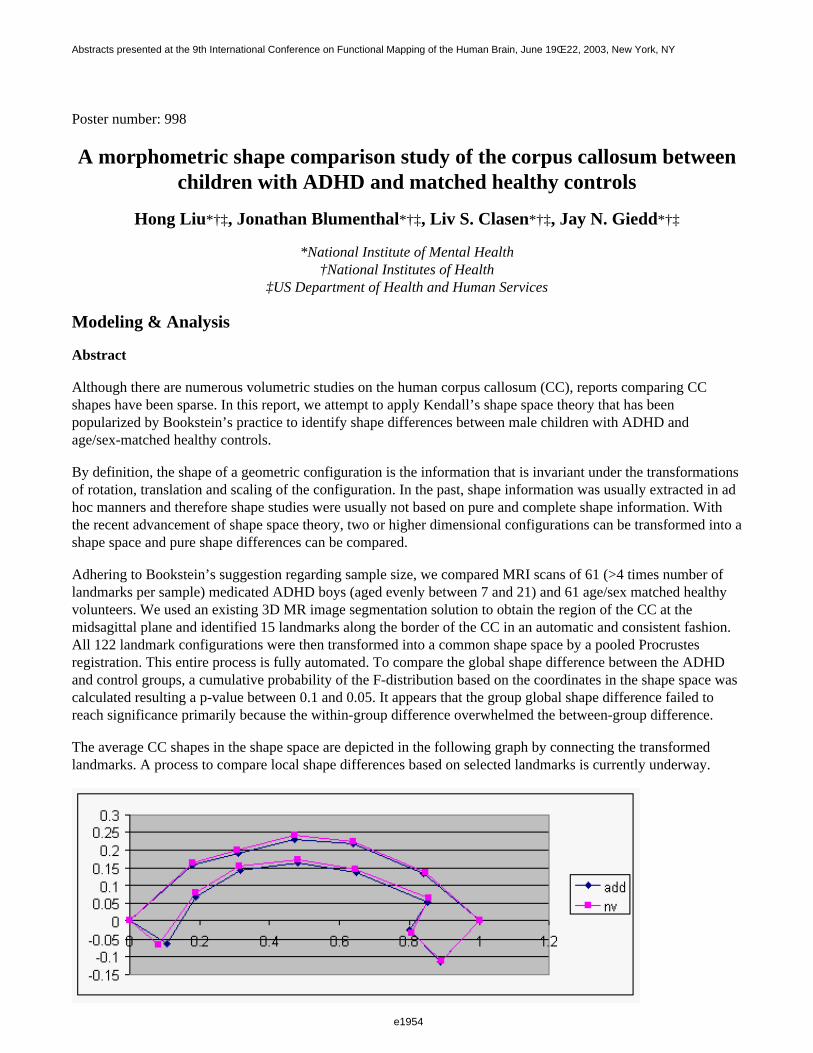
Poster number: 998
A morphometric shape comparison study of the corpus callosum betweenchildren with ADHD and matched healthy controls
Hong Liu*†‡, Jonathan Blumenthal*†‡, Liv S. Clasen*†‡, Jay N. Giedd*†‡
*National Institute of Mental Health†National Institutes of Health
‡US Department of Health and Human Services
Modeling & Analysis
Abstract
Although there are numerous volumetric studies on the human corpus callosum (CC), reports comparing CCshapes have been sparse. In this report, we attempt to apply Kendall’s shape space theory that has beenpopularized by Bookstein’s practice to identify shape differences between male children with ADHD andage/sex-matched healthy controls.
By definition, the shape of a geometric configuration is the information that is invariant under the transformationsof rotation, translation and scaling of the configuration. In the past, shape information was usually extracted in adhoc manners and therefore shape studies were usually not based on pure and complete shape information. Withthe recent advancement of shape space theory, two or higher dimensional configurations can be transformed into ashape space and pure shape differences can be compared.
Adhering to Bookstein’s suggestion regarding sample size, we compared MRI scans of 61 (>4 times number oflandmarks per sample) medicated ADHD boys (aged evenly between 7 and 21) and 61 age/sex matched healthyvolunteers. We used an existing 3D MR image segmentation solution to obtain the region of the CC at themidsagittal plane and identified 15 landmarks along the border of the CC in an automatic and consistent fashion.All 122 landmark configurations were then transformed into a common shape space by a pooled Procrustesregistration. This entire process is fully automated. To compare the global shape difference between the ADHDand control groups, a cumulative probability of the F-distribution based on the coordinates in the shape space wascalculated resulting a p-value between 0.1 and 0.05. It appears that the group global shape difference failed toreach significance primarily because the within-group difference overwhelmed the between-group difference.
The average CC shapes in the shape space are depicted in the following graph by connecting the transformedlandmarks. A process to compare local shape differences based on selected landmarks is currently underway.
e1954
Abstracts presented at the 9th International Conference on Functional Mapping of the Human Brain, June 19Œ22, 2003, New York, NY
e1954

Order of appearance: 989
AbsTrak ID: 19076
e1955
Abstracts presented at the 9th International Conference on Functional Mapping of the Human Brain, June 19Œ22, 2003, New York, NY
e1955

Poster number: 999
Localization Estimation Algorithm (LEA) : a supervised prior-basedsolution to the EEG/MEG inverse problem
J. Mattout*†‡, A. Bellio*‡, M. Pélégrini-Issac‡§, H. Benali*‡
*INSERM U494, Hôpital de la Pitié-Salpêtrière, Paris, FRANCE†Institute of Cognitive Neuroscience, University College London, UNITED KINGDOM
‡Institut Fédératif de Recherche en neuroimagerie fonctionnelle, IFR 49, Paris, FRANCE§INSERM U483, Université Paris 6, FRANCE
Modeling & Analysis
Abstract
Introduction
Solving the EEG/MEG inverse problem requires a spatial regularization involving anatomical and functionalpriors [1]. The distributed source model enables the introduction of a wide range of constraints [2]. However, itssolution is unstable due to the bad conditioned and under-determined equation system one has to solve [1]. Wepropose a new Localization Estimation Algorithm (LEA) that enables to deal with a better-determined system andto temper the influence of external priors according to their coherency with the EEG/MEG data.
Theory
LEA relies on a prior distribution p of activation probability associated with the set of dipole locations. Thisdistribution may be derived from the EEG/MEG data itself as performed by the Multivariate Source Preselection(MSP) approach [3].
LEA involves two consecutive steps:
Localization
(i) Pre-estimation: clusters of dipoles are successively introduced in an iterative inverse process. Each clustergathers neighbouring dipoles, provided that their respective activation probability is relatively closed.
At iteration k, estimation J k corresponds to the minimum of Uk (J k ) = Rk + λ k ¦¦W k J k ¦¦ 2 + µk ¦¦J k−1 −
S k J k ¦¦ 2 .
* First term Rk = ¦¦M −G k J k ¦¦ 2 , corresponds to the quality of the data M fit using the forward model G k
restricted to the considered clusters.
* Second term is a classical Weighted Minimum Norm (WMN) constraint [2], whose diagonal matrix W k is
related to prior distribution p
* Using mask S k , third term enforces the solution J k to be close to the previous solution J k-1 which has been
estimated from a smaller amount of clusters which are moreover most likely to be activated. ∆k = Rk-1 - Rk is
also calculated along this process.
e1956
Abstracts presented at the 9th International Conference on Functional Mapping of the Human Brain, June 19Œ22, 2003, New York, NY
e1956
(ii) Focalization: selection of the clusters that explain significant part of the data, i.e. whose corresponding ∆k is
positive and significantly large. This process also aims at correcting the effect of unaccurate priors.
Estimation
This final step is an iterative process similar to the pre-estimation but involving only the clusters selected in thefocalization step.
Application
We compared LEA and a WMN estimation on five hundred simulated noisy MEG data sets (SNR = 20dB)corresponding to the activation of a randomly chosen extended source. Both methods exploited the priorprobability of activation provided by MSP. According to this prior distribution, the solution space was restrictedto the 800 most probable activated dipoles. Regularization parameters were set to a common value as estimatedby the L-curve approach [4].
Solutions were compared in terms of localization and amplitude estimation, by calculating the Localization Error(LE) and the Root Mean Square Error (RMSE) [2]. The following table presents the mean values of RMSE andthe maximum LE bound allowing recovering at least 80% of the sources.
Conclusion
The proposed approach intermingles a focalization procedure (step 2) with an iterative estimation process (steps 1& 3). In terms of localization and amplitude estimation, preliminary simulations have shown much better resultsobtained with LEA than with WMN involving the same functional priors.
References
[1] Baillet et al. IEEE Sign. Proc. Mag. 18 :14-30 (2001)[2] Phillips et al. NeuroImage 17 :287-301 (2002)[3] Mattout et al. NeuroImage 13:S196 (2001).[4] Gorodnitsky et al. Electroenceph. Clin. Neurophysiol. 95:231-251 (1995)
Order of appearance: 990
AbsTrak ID: 18316
e1957
Abstracts presented at the 9th International Conference on Functional Mapping of the Human Brain, June 19Œ22, 2003, New York, NY
e1957
Poster number: 1000
Classification and Mining of Brain Image Data Using Adaptive RecursivePartitioning Methods: Application to Alzheimer Disease and Brain
Activation Patterns
Vasileios Megalooikonomou*†, Despina Kontos*†, Dragoljub Pokrajac‡, Aleksandar Lazarevic§, Zoran Obradovic*†, Orest Boyko§, Andrew Saykin||**, James Ford††, Fillia
Makedon††
*Department of Computer and Information Sciences, Temple University, Philadelphia, PA, USA†Center for Information Science and Technology, Temple University, Philadelphia, PA, USA
‡Department of Computer Science, Delaware State University, Dover, DE, USA§Department of Computer Science, University of Minnesota, Minneapolis, MN, USA
¶Department of Diagnostic Imaging, Temple University School of Medicine, PA, USA||Brain Imaging Laboratory, Departments of Psychiatry & Radiology, Dartmouth Medical School, Lebanon, NH,
USA**New Hampshire Hospital, Concord, NH, USA
††Department of Computer Science, Dartmouth College, Hanover, NH, USA
Modeling & Analysis
Abstract
Purpose:
To effectively identify discriminative spatial areas in MRI and fMRI and make image classification, similaritysearches and mining of associations between spatial distributions and other clinical assessment feasible we havedeveloped brain informatics tools that are based on adaptive recursive partitioning and use of statistical tests.
Method
We developed a methodology for classification and association mining that is based on adaptive recursivepartitioning of a 3D volume into a number of hyper-rectangles. The goal is to efficiently identify spatial regionsthat are associated with non-spatial variables thus reducing the computational complexity of the voxel-basedapproach and resolving the multiple comparisons problem due to reduction on the number of tests performed. Themain idea is that a particular hyper-rectangle is further partitioned if it does not have high discriminative powerdetermined by a statistical test (chi-square/Fisher’s exact, t-test, Wilcoxon rank sum test), but it is sufficientlylarge for further splitting. The statistical test is applied so many times as the number of partitions rather than asthe number of voxels in a voxel-based analysis. In preliminary analysis, we consider, as a potential attribute foreach hyper-rectangle, the sum of mean value of voxels that belong to regions of interest. The attributes of the finaldiscriminative hyper-rectangles form new attributes that are used with classification models such as neuralnetworks and decision trees.
Using the proposed adaptive recursive partitioning method we performed initial analysis of an fMRI Alzheimer’scontrast data set. The particular study [1] was designed to systematically explore neuroanatomical correlates ofsemantic processing in Alzheimer disease by contrasting patterns of neural activation in patients with those ofcontrols during a series of semantic decision tasks. These tasks were selected to differentially probe semanticknowledge of categorical, functional, and phonological congruence between word pairs. Each class of this datasetconsisted of 9 subjects and the experimental results were evaluated using 9-fold cross validation.
e1958
Abstracts presented at the 9th International Conference on Functional Mapping of the Human Brain, June 19Œ22, 2003, New York, NY
e1958

Results
The adaptive recursive partitioning technique found certain activation areas within the medial temporal lobe thatdiscriminate best Alzheimer patients from controls. Although the classification accuracy of statistical distancebased and maximum likelihood methods was almost 50% (same as random guess) the proposed adaptive recursivepartitioning technique achieved classification accuracy of 90%. This result is really impressive given the smalldata set of 9 controls and 9 subjects, its heterogeneity, and difficulty in generalizing the patterns observed.
Conclusions
The proposed method has been shown capable of identifying discriminative spatial areas of brain activation mapsbetween Alzheimer and normal subjects providing also accurate classification. The proposed approach beinggeneral enough can be potential applied to elucidate structure-function relationships and be valuable to humanbrain mapping.
Acknowledgements:
This work was supported, in part, by the NSF (IIS0083423), Pennsylvania Department of Health, Alzheimer’sAssociation and NIA AG19771.
References
[1] A.J. Saykin, L.A. Flashman, S.A. Frutiger, S.C.Johnson, A.C.Mamourian, C.H.Moritz, J.R.O’Jile, H.J.Riordan, R.B. Santulli, C.A. Smith, and J.B. Weaver, "Neuroanatomic substrates of semantic memory impairmentin Alzheimer’s disease: Patterns of functional MRI activation", Journal of the International NeuropsychologicalSociety, 5,377-392, 1999.
Order of appearance: 991
AbsTrak ID: 18815
e1959
Abstracts presented at the 9th International Conference on Functional Mapping of the Human Brain, June 19Œ22, 2003, New York, NY
e1959
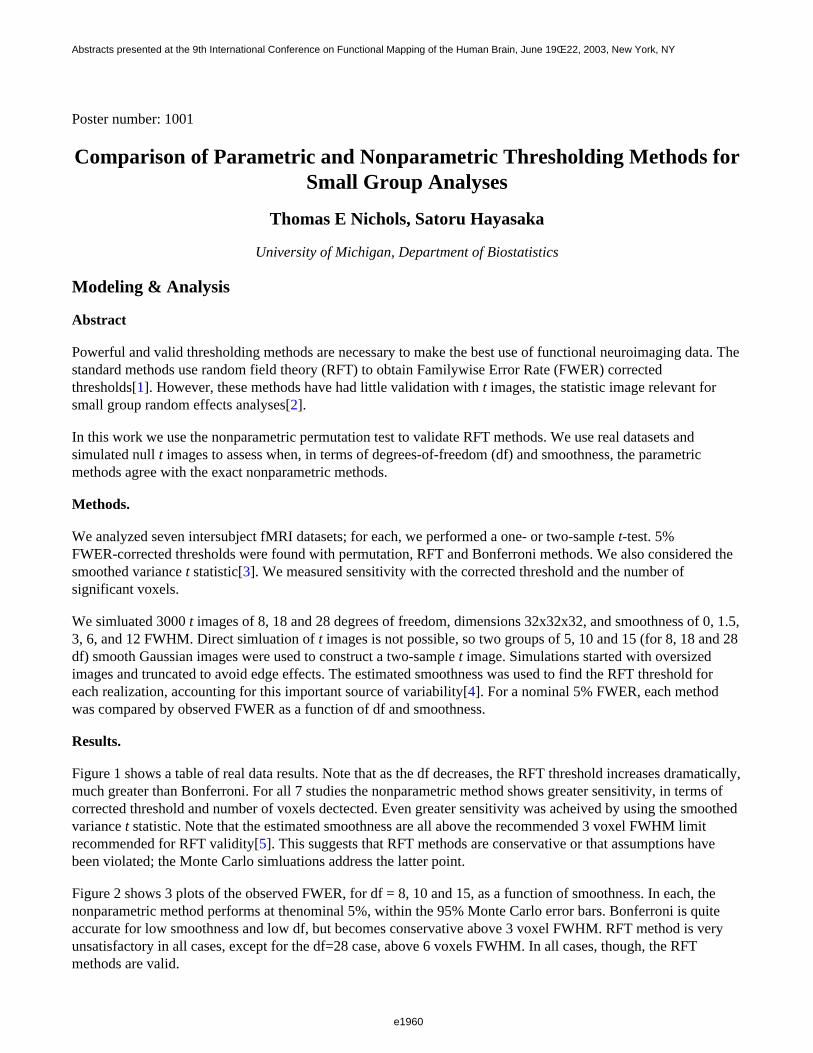
Poster number: 1001
Comparison of Parametric and Nonparametric Thresholding Methods forSmall Group Analyses
Thomas E Nichols, Satoru Hayasaka
University of Michigan, Department of Biostatistics
Modeling & Analysis
Abstract
Powerful and valid thresholding methods are necessary to make the best use of functional neuroimaging data. Thestandard methods use random field theory (RFT) to obtain Familywise Error Rate (FWER) corrected thresholds[1]. However, these methods have had little validation with t images, the statistic image relevant forsmall group random effects analyses[2].
In this work we use the nonparametric permutation test to validate RFT methods. We use real datasets andsimulated null t images to assess when, in terms of degrees-of-freedom (df) and smoothness, the parametricmethods agree with the exact nonparametric methods.
Methods.
We analyzed seven intersubject fMRI datasets; for each, we performed a one- or two-sample t-test. 5%FWER-corrected thresholds were found with permutation, RFT and Bonferroni methods. We also considered thesmoothed variance t statistic[3]. We measured sensitivity with the corrected threshold and the number ofsignificant voxels.
We simluated 3000 t images of 8, 18 and 28 degrees of freedom, dimensions 32x32x32, and smoothness of 0, 1.5,3, 6, and 12 FWHM. Direct simluation of t images is not possible, so two groups of 5, 10 and 15 (for 8, 18 and 28df) smooth Gaussian images were used to construct a two-sample t image. Simulations started with oversizedimages and truncated to avoid edge effects. The estimated smoothness was used to find the RFT threshold foreach realization, accounting for this important source of variability[4]. For a nominal 5% FWER, each methodwas compared by observed FWER as a function of df and smoothness.
Results.
Figure 1 shows a table of real data results. Note that as the df decreases, the RFT threshold increases dramatically,much greater than Bonferroni. For all 7 studies the nonparametric method shows greater sensitivity, in terms ofcorrected threshold and number of voxels dectected. Even greater sensitivity was acheived by using the smoothedvariance t statistic. Note that the estimated smoothness are all above the recommended 3 voxel FWHM limitrecommended for RFT validity[5]. This suggests that RFT methods are conservative or that assumptions havebeen violated; the Monte Carlo simluations address the latter point.
Figure 2 shows 3 plots of the observed FWER, for df = 8, 10 and 15, as a function of smoothness. In each, thenonparametric method performs at thenominal 5%, within the 95% Monte Carlo error bars. Bonferroni is quiteaccurate for low smoothness and low df, but becomes conservative above 3 voxel FWHM. RFT method is veryunsatisfactory in all cases, except for the df=28 case, above 6 voxels FWHM. In all cases, though, the RFTmethods are valid.
e1960
Abstracts presented at the 9th International Conference on Functional Mapping of the Human Brain, June 19Œ22, 2003, New York, NY
e1960
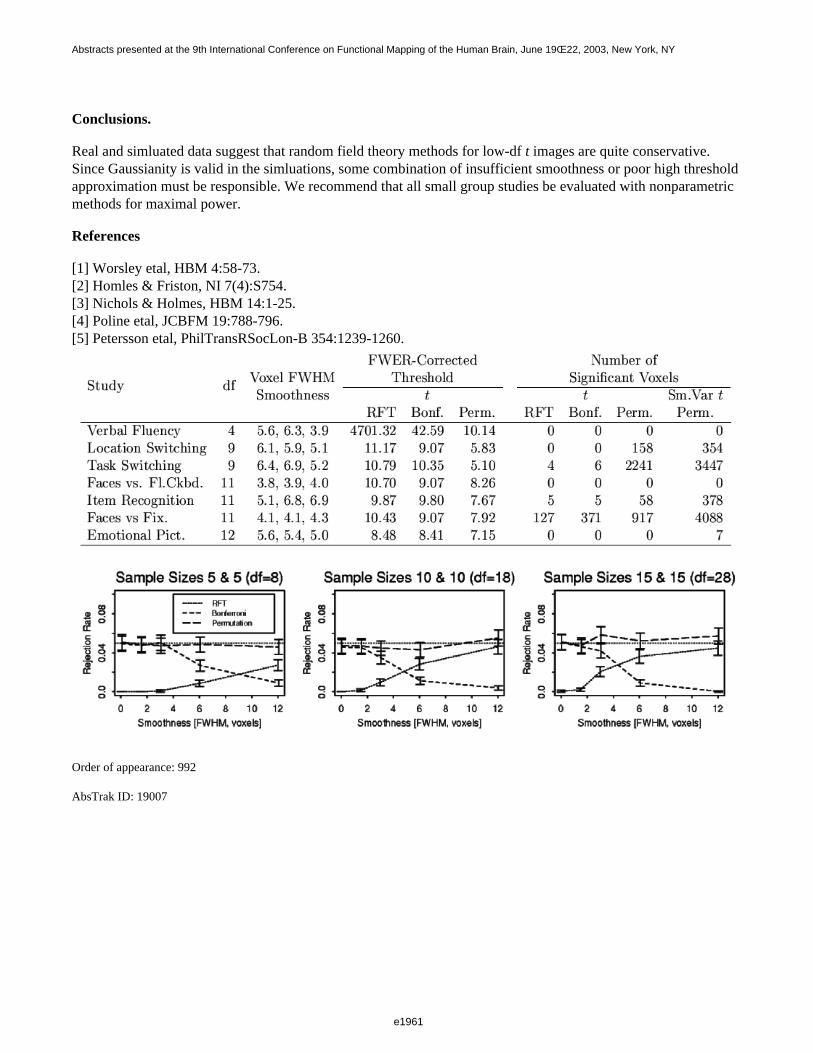
Conclusions.
Real and simluated data suggest that random field theory methods for low-df t images are quite conservative.Since Gaussianity is valid in the simluations, some combination of insufficient smoothness or poor high thresholdapproximation must be responsible. We recommend that all small group studies be evaluated with nonparametricmethods for maximal power.
References
[1] Worsley etal, HBM 4:58-73.[2] Homles & Friston, NI 7(4):S754.[3] Nichols & Holmes, HBM 14:1-25.[4] Poline etal, JCBFM 19:788-796.[5] Petersson etal, PhilTransRSocLon-B 354:1239-1260.
Order of appearance: 992
AbsTrak ID: 19007
e1961
Abstracts presented at the 9th International Conference on Functional Mapping of the Human Brain, June 19Œ22, 2003, New York, NY
e1961
Poster number: 1002
Time-lagged causal information: a new metric for effective connectivity analysis
Mark E. Pflieger
Source Signal Imaging, Inc.
Modeling & Analysis
Abstract
Brain organization at the systems level may be conceived as a collection of semi-autonomous modules withmodulated functional interconnections (constrained by anatomical pathways) that dynamically self-organize tocoordinate cognition, emotion, and behavior [1]. Neuroimaging with cognitive paradigms typically identifiesmultiple active brain areas, which presumably cooperate somehow, via a network of functional connections, toaccomplish a given task [2]. Effective connectivity analysis aims to detect and characterize causal relationships insuch networks [3].
The general problem is to assess causal relationships between processes based on the observation of multiple timeseries. Granger [4] formalized a causality concept essentially as follows: Process A does not cause process B if(and only if) the ability to predict B’s observables based on the histories of all observables is unaffected by theomission of A’s history. Metrics for Granger causality typically have been realized in the framework ofmultivariate Gaussian statistics via vector autoregressive (VAR) models [5]. Using information theory, Diks andDeGoede [6] have realized a more general Granger causality measure that accommodates in principle arbitrarystatistical processes (whether linear or nonlinear, Gaussian or non-Gaussian).
This work introduces a variant causality concept that emphasizes timing Process A has no causal influence onprocess B at lag d if (and only if) the ability to predict B’s state for all times t using three states, namely, B’searlier state at time t-d, A’s concurrent state at time t, and A’s earlier state at time t-d, is unaffected by ignoring thethird state. Here, the state of a process at time t is a vector that encapsulates observables at t and the history up to tinsofar as it conditions ensuing dynamics. This causality concept may be realized as an information theoreticmeasure that has two beneficial features: (a) causal information at lag zero is identically zero, and (b) the lagparameter that maximizes causal information characterizes (in part) the time required to transmit effects from A to B Thus, the measure suppresses electrical volume conduction and physiological zero-lag synchronization effects,and emphasizes neural conduction mechanisms (e.g., those that may participate to produce synchronization).
Computation of time-lagged causal information requires certain multivariate joint entropies that can be estimated,without estimating multivariate probability densities, via the correlation integral [7, 8]. Initially, dynamic statesubspaces must have been identified for each process, e.g., using singular spectrum analysis [9].
Results are illustrated using simulations of both linearly and nonlinearly interacting processes. Envisionedapplications include analyses of intracranial EEG, extracranial EMEG after deriving source time series, fMRItime series, and combined fMRI-EEG data.
References
[1] Bressler SL (1995) Brain Research Reviews 20:288-304.[2] Mesulam MM (1990) Annals of Neurology 28:597-613.[3] Friston K (1994) Human Brain Mapping 2:56-78.[4] Granger CWJ (1969) Econometrica 37:424-38.
e1962
Abstracts presented at the 9th International Conference on Functional Mapping of the Human Brain, June 19Œ22, 2003, New York, NY
e1962

[5] Kaminski M et al. (2001) Biological Cybernetics 85:145-57.[6] Diks C, DeGoede J (2001) In Broer et al. (eds.) Global Analysis of Dynamical Systems 391-403.[7] Grassberger P, Procaccia I (1983) Physical Review Letters 50:346-9.[8] Liebert W, Schuster HG (1988) Physics Letters A 142:107-11.[9] Broomhead DS, King GP (1986) Physica D 20:217-36.Supported by NIBIB EB000614.
Order of appearance: 993
AbsTrak ID: 17596
e1963
Abstracts presented at the 9th International Conference on Functional Mapping of the Human Brain, June 19Œ22, 2003, New York, NY
e1963
Poster number: 1003
Standard meshes for inter- and intra-subject surface-based analysis withminimal interpolation
Ziad S. Saad, Brenna D. Argall, Michael S. Beauchamp, Shruti A. Japee, Robert W. Cox
National Institute of Mental Health, National Institutes of Health, Department of Health and Human Services, USA
Modeling & Analysis
Abstract
Data from Functional Magnetic Resonance Imaging (FMRI) are increasingly being mapped to 3D models of thecortical surface. Such maps reveal the topology of activation that is often obscured in volumetric data and offerenhanced visualization of cortical function. Currently, surface mapping of functional activity involvesinterpolation of the functional data beyond what is necessary for classic volumetric analysis. Unnecessaryinterpolations, especially in the volumetric space, can strongly affect the topology of activation at points closetogether in space but far apart along the cortical surface. On surface maps, function is defined on connected nodesthat form a triangulated mesh. Since node number and connectivity differ between surface models, inter-subjectsurface-based analysis involves interpolation between meshes; a process that is time consuming and furtherobscures details of functional maps. Here, we present a method for creating surfaces using a standard mesh thatallows inter- and intra-subject analysis without interpolating functional data, thereby preserving as much aspossible the surface topological detail present in the volumetric data. For software implementation inAFNI/SUMA, see HBM2003 abstract by R.W. Cox.
3D models of the cortical surface (S) are generated from high-resolution anatomical MRI using FreeSurfer orSureFit software and consequently inflated and warped (Sw) to a standard spherical template [1,2]. The standardmesh is a tessellated icosahedron inflated to a sphere (Sico) of a radius equal to that of Sw. Next, each node n inSico is mapped to the triangle T:(n1, n2, n3) in Sw that contains the radial projection of n onto Sw. This mappingallows the representation of any node property, P(n), as a function of the properties of n1, n2, n3:
P(n) = a1 P (n1) + a2 P(n2) + a3 P(n3)
where a. represent the interpolation weights based on the area coordinates of n in T. To create a model of S withthe standard mesh, we substitute for P(.) the anatomically correct X,Y and Z coordinates of the nodes in S. Theresult (Fig.1) is Sstd, a surface virtually identical in shape to S, but with a mesh that is identical across subjects.With standard meshes, cross-subject analysis is reduced to node based analysis since the same node refers toanatomically similar (within the variance of the warping process) locations. Finally, Sstd is brought intoalignment with the experimental data via an affine transform obtained by registering the anatomical volume usedto create the surface model with the one acquired with the experimental data. A spatial transformation can beapplied to the geometry of Sstd at no interpolation cost, unlike interpolation of the experimental data proper.
In summary, mapping functional data onto standard cortical surfaces for both inter- and intra-subject analysis canbe done without interpolating the functional data, thereby preserving topological detail present in volumetric data.Standardized surface models are virtually identical to original surface models and allow for rapid cross-subjectsurface based analysis.
e1964
Abstracts presented at the 9th International Conference on Functional Mapping of the Human Brain, June 19Œ22, 2003, New York, NY
e1964
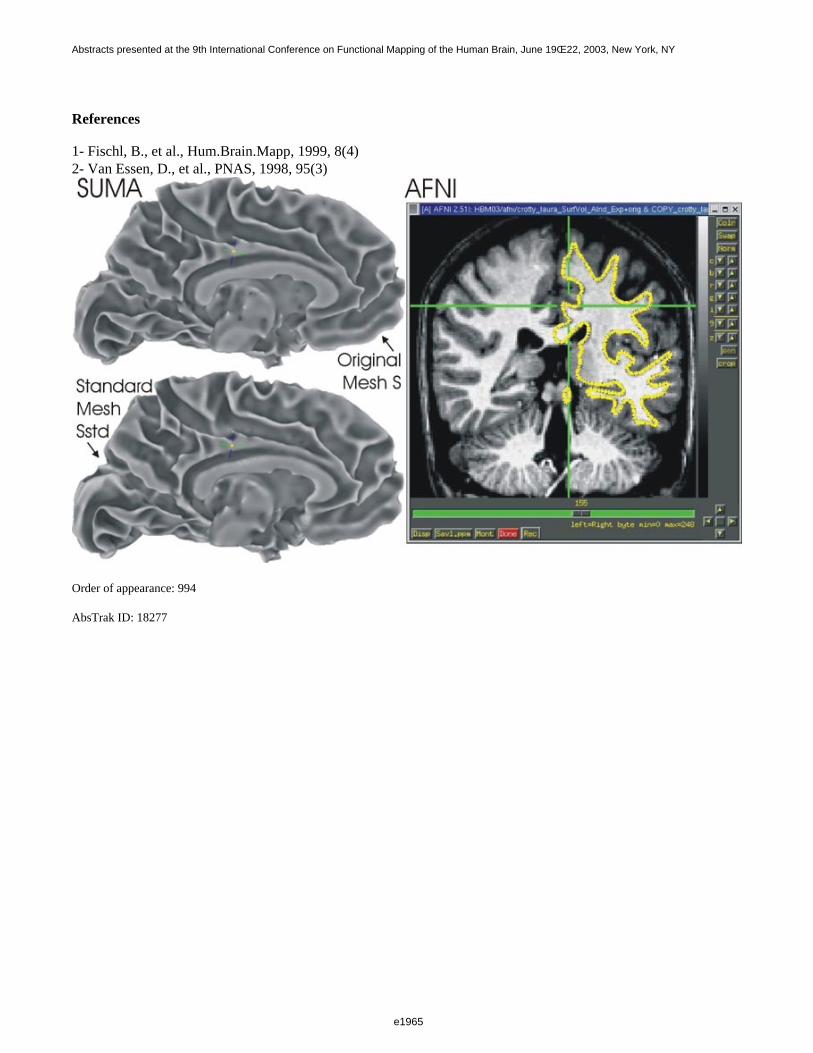
References
1- Fischl, B., et al., Hum.Brain.Mapp, 1999, 8(4)2- Van Essen, D., et al., PNAS, 1998, 95(3)
Order of appearance: 994
AbsTrak ID: 18277
e1965
Abstracts presented at the 9th International Conference on Functional Mapping of the Human Brain, June 19Œ22, 2003, New York, NY
e1965
Poster number: 1004
Surface-based Morphometric Analysis for Hippocampal Shape in Schizophrenia
Li Shen*, James Ford*, Fillia Makedon*, Laura Flashman†, Andrew Saykin†
*Dartmouth Experimental Visualization Laboratory, Computer Science, Dartmouth College, Hanover, NH 03755†Brain Imaging Lab, Psychiatry and Radiology, Dartmouth Medical School, Lebanon, NH 03756
Modeling & Analysis
Abstract
We investigate hippocampal shape analysis in schizophrenia using a surface-based approach. Participants are 34patients meeting DSM-IV criteria for schizophrenia or schizoaffective disorder and 21 healthy controls. Left andright hippocampi are manually segmented from their magnetic resonance scans.
We parameterize hippocampus surfaces using spherical harmonic (SPHARM) expansions [1]. Using moreSPHARM coefficients leads to a more detailed surface reconstruction (Figure 1). The coefficients are normalizedto extract shape information (i.e., excluding translation, rotation, and scaling). A uniform sampling of surfacelandmarks on each normalized reconstruction forms a shape descriptor. A two-sample t-test is performed for eachlandmark coordinate (x, y, or z) to obtain a p-value, and an s-value is defined as the absolute value of thelogarithm of a p-value. Each landmark corresponds to a vector of 3 s-values, the magnitude of which measureshow likely the group difference is to exist. The statistical group difference is visualized using this measurementon the mean surface (Figure 2): the shape abnormality appears in the head/anterior and tail/posterior regions forboth left and right hippocampi.
Surfaced-based classification is also studied. Principal component analysis is applied to reduce each shapedescriptor to a low dimensional feature vector, which contains the first 55 Principal Components (PCs) to keep allthe data variance. Fisher’s linear discriminant is applied to feature vectors for classification. Figure 3 and Figure 4show the jackknife classification results for left and right hippocampi respectively, using 3 approaches denoted as"PC", "SF" and "SF-J". In "PC" case, classification is performed using the first few PCs, which accounts forsignificant amount of data variance; the best accuracies achieved are 66% for left and 71% for right. To improvethe classification rate, we use a p-value derived from a t-test on feature values to order features, and the first fewfeatures (with the smallest p-values) are the most significant. In "SF" case, the t-test is applied using all 56subjects, and 100% accuracy is achieved. In "SF-J" case, we run t-test in a jackknife fashion to remove bias, andachieve the best accuracies of 88% for left and 86% for right.
Previous hippocampal shape studies often use volumetric representations [2,3]. We feel that surface-basedtechniques are more appropriate, since the surface of an object actually defines its shape. Some studies [4] alsoemploy SPHARM surfaces, but look at a summarized measurement of asymmetry. We perform more detailedsurface analysis on hippocampi themselves. Besides localizing statistical group difference, we achieve goodclassification rates. Our study suggests that shape abnormality in schizophrenia exists in both left and right hippocampi.
We thank NSF IDM, NARSAD, NH Hospital and Ira DeCamp Foundation for support.
References
e1966
Abstracts presented at the 9th International Conference on Functional Mapping of the Human Brain, June 19Œ22, 2003, New York, NY
e1966
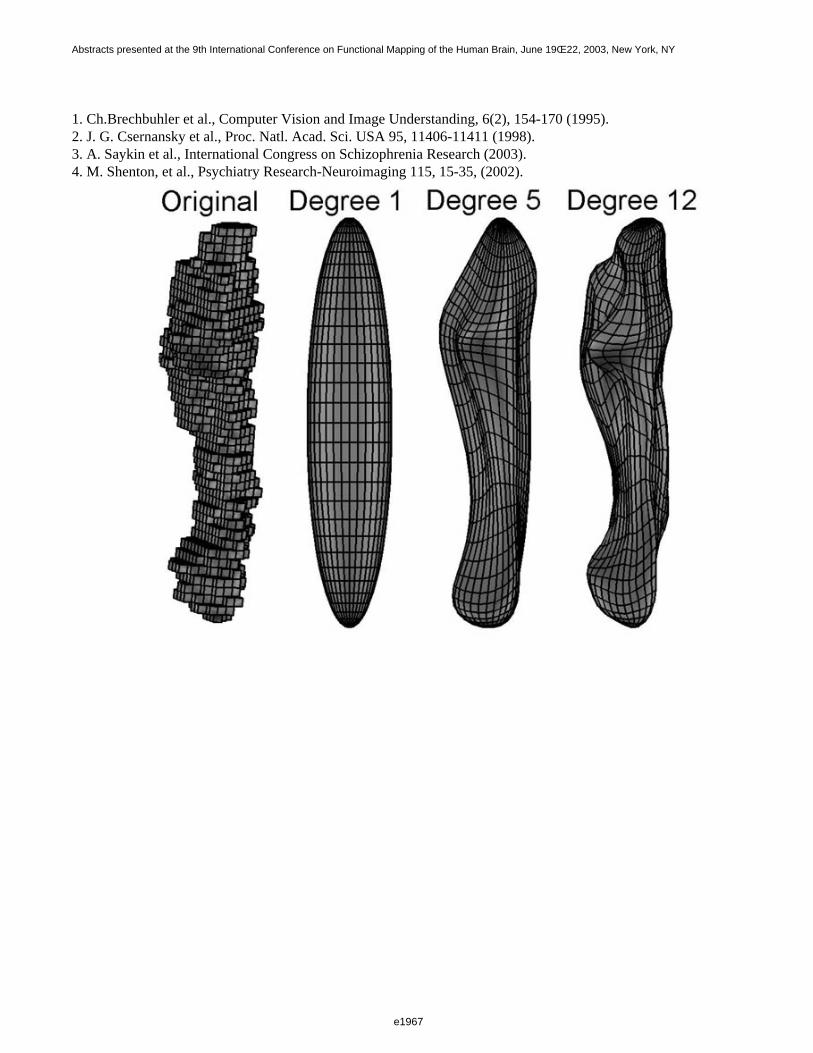
1. Ch.Brechbuhler et al., Computer Vision and Image Understanding, 6(2), 154-170 (1995).2. J. G. Csernansky et al., Proc. Natl. Acad. Sci. USA 95, 11406-11411 (1998).3. A. Saykin et al., International Congress on Schizophrenia Research (2003).4. M. Shenton, et al., Psychiatry Research-Neuroimaging 115, 15-35, (2002).
e1967
Abstracts presented at the 9th International Conference on Functional Mapping of the Human Brain, June 19Œ22, 2003, New York, NY
e1967
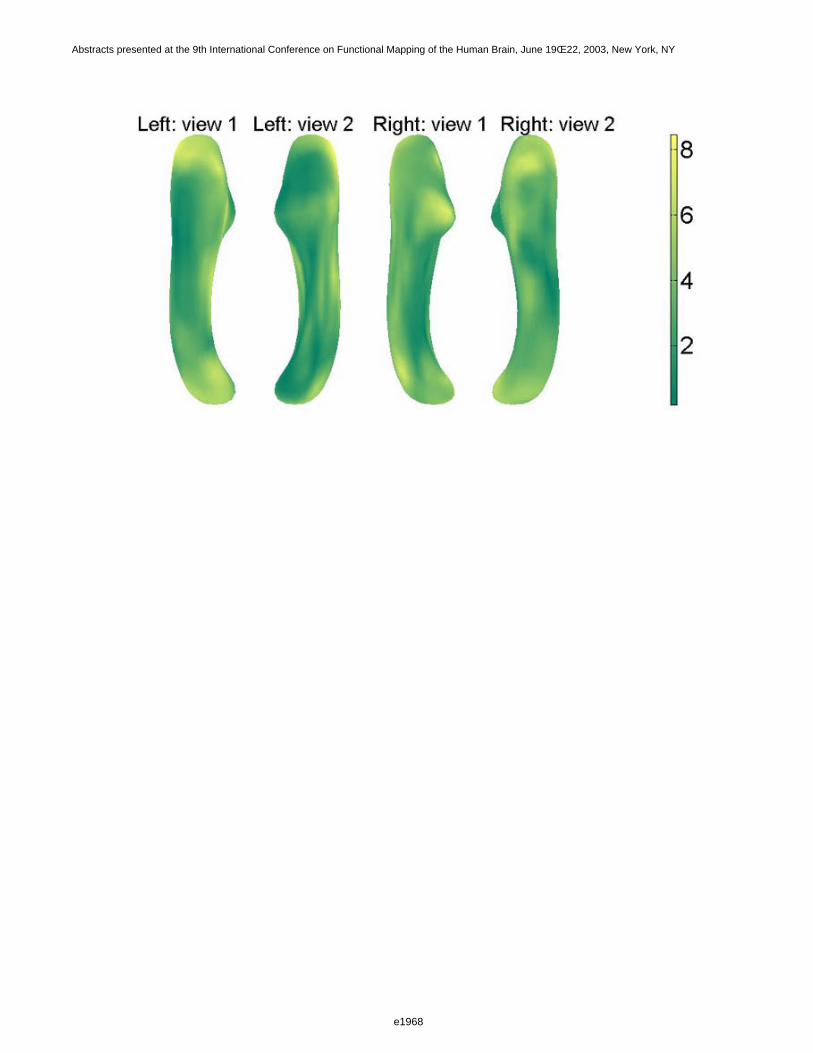
e1968
Abstracts presented at the 9th International Conference on Functional Mapping of the Human Brain, June 19Œ22, 2003, New York, NY
e1968
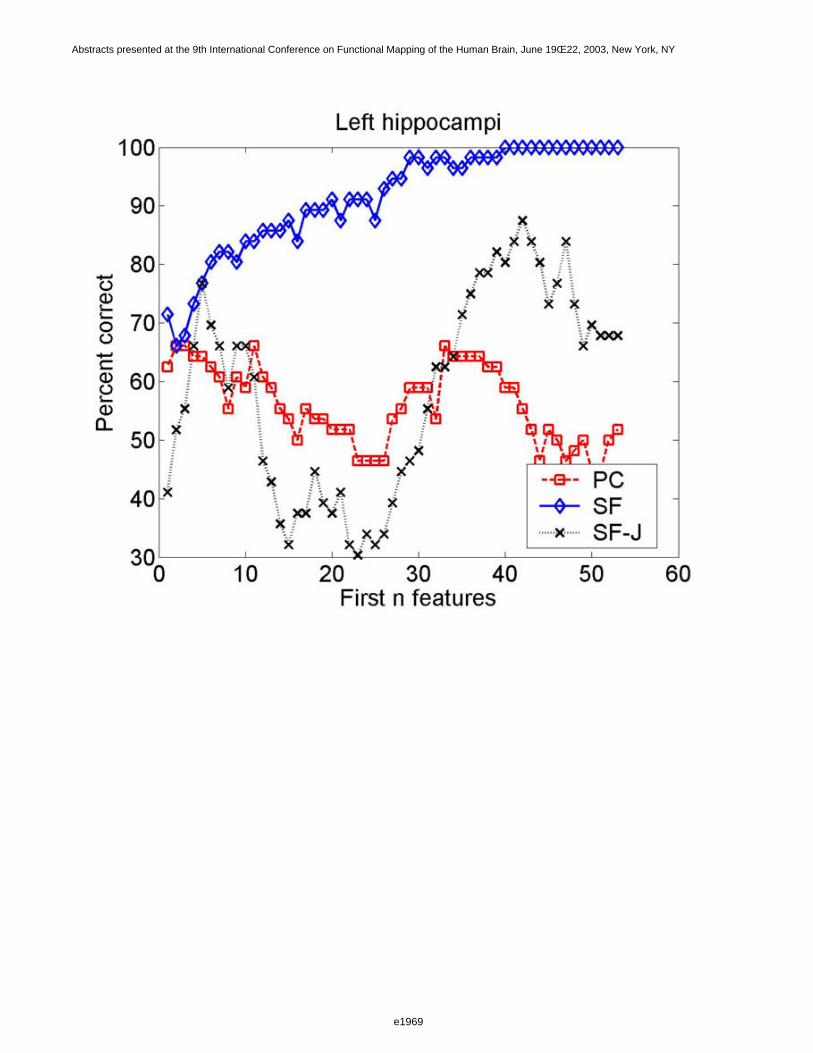
e1969
Abstracts presented at the 9th International Conference on Functional Mapping of the Human Brain, June 19Œ22, 2003, New York, NY
e1969
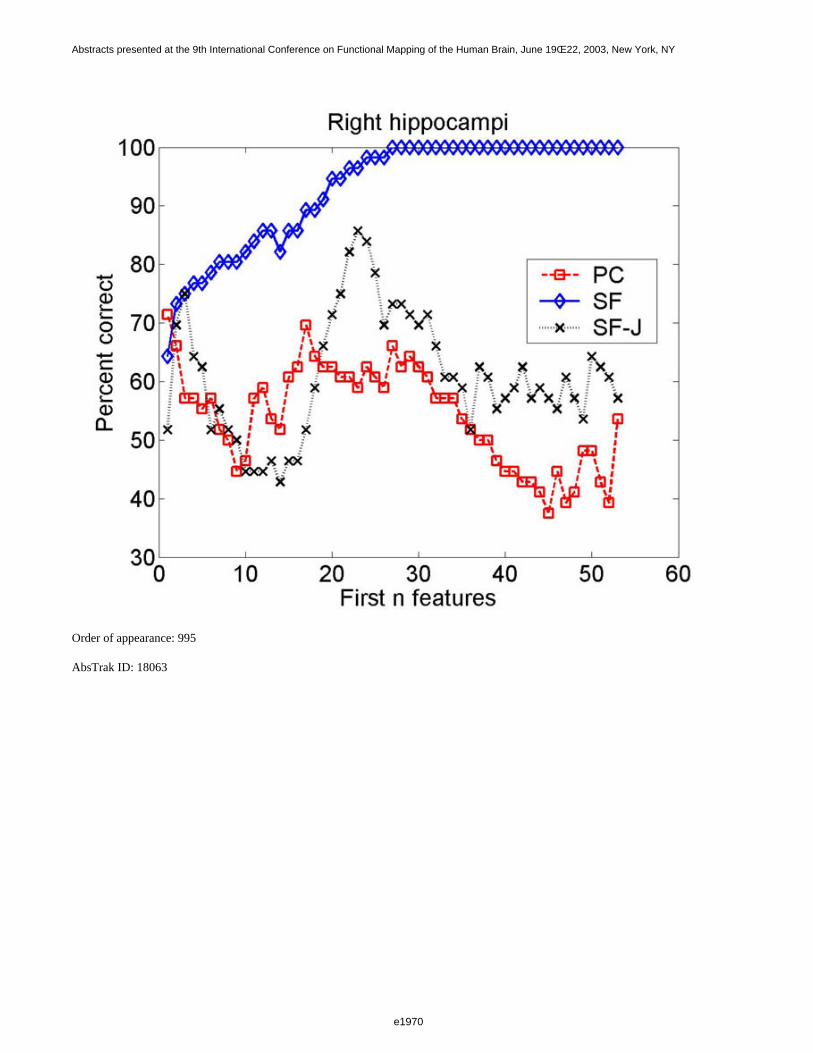
Order of appearance: 995
AbsTrak ID: 18063
e1970
Abstracts presented at the 9th International Conference on Functional Mapping of the Human Brain, June 19Œ22, 2003, New York, NY
e1970
Poster number: 1005
Multi-Subject Analysis: Specifying Models
Steve Smith, Tim Behrens, Mark Jenkinson, Christian Beckmann, Mark Woolrich
Oxford Centre for Functional Magnetic Resonance Imaging of the Brain (FMRIB), UK
Modeling & Analysis
Abstract
It is common to implement hierarchical (e.g. multi-subject)mixed-effects models using a two-stage (or three-stage, etc) GLM, e.g.using FSL or SPM. It is necessary to define a model at the second(etc.) level, and pass into this model, from the first-leveltime-series analyses, parameter/contrast estimates and their variances[Jenkinson et al, HBM2002]. Unfortunately, there exists confusion inthe field about how to setup such models for various common scenariossuch as paired t-tests and ANOVA analyses. We summarise mixed-effectsmodelling as implemented in FEAT (the GLM-based tool in FSL), andpresent some examples of group-level designs. For detail seewww.fmrib.ox.ac.uk/fsl/feat5/detail.html#higher
Variance Estimation
Mixed-effects (ME) variance is the sum of
fixed-effects (FE) variance (within-session across-time variance,estimated at first-level) and random-effects (RE) variance ("true"cross-session/subject variance of first-level parameterestimates). Ideally, one should allow for the modelling/estimation ofseparate group variances for different groups (e.g. controls andpatients); this is implemented in FSL and gives a potential increasein estimation efficiency and accuracy over single varianceestimation. Furthermore, estimation of ME-variance should take intoaccount lower-level FE-variance, allowing, for example, the preventionof negative RE-variance. There is also the advantage that it is notthen necessary for first-level design matrices to be identical (i.e."balanced designs" - for example having the same number of timepointsor event timings). FEAT estimates higher-level parameter estimates andME-variance in a fully Bayesian framework; for detail see [Behrens etal, HBM2003].
Design Examples
The main part of the design matrix contains arow for each first-level analysis (e.g. each subject) and a column foreach group-level explanatory variable (EV). The text column to theleft specifies which variance group a subject belongs in. The numbersunder the EVs show group-level contrast specification, with F-testsspecified to the right. Unpaired Two-Group Difference Two
e1971
Abstracts presented at the 9th International Conference on Functional Mapping of the Human Brain, June 19Œ22, 2003, New York, NY
e1971
groups of different kinds of subjects (e.g. patients and controls),different variances. Want mean group difference; test both directions,hence two contrasts. Paired Two-Group Difference (PairedT-Test) 8 subjects, two conditions. Enter condition A as the first8 inputs, and condition B as the second 8. One EV for A-B differences,and one extra for each subject. EVs 2-9 model each subject’s meaneffect. Multi-Session & Multi-Subject (Repeated Measures - ThreeLevel Analysis) 5 subjects times three sessions. Because fewsessions, assume single group variance. Then want the mean groupeffect across subjects using third-level analysis. Single-GroupAverage with Additional Covariate One group, additionalmeasurements such as age or mean reaction times. The additional effectof the extra measures can be found using an extra EV orthogonalisedwrt the group mean - in this case just demeaned. 1-factor 4-levelANOVA 8 subjects; where is there any treatment effect? The firsttwo inputs are level 1, the next two are level 2 etc. EV1 takes outglobal mean. EV2 fits cell 1 relative to this mean etc. Contrast 1gives cell 1 (level 1) relative to the global mean etc. The F-testthen tests for any deviation from the mean - any difference betweenthe levels. 2-factors 2-levels ANOVA 8subjects. Fixed-effects; the three F-tests give the standard ANOVAresults for factor-A, factor-B and interaction. Random-effects; for Aand B use Fa=fstat1/fstat3 and Fb=fstat2/fstat3. Mixed-effects (Afixed, B random); fstat2 gives effect of B and fstat1/fstat3 giveseffect of A.
e1972
Abstracts presented at the 9th International Conference on Functional Mapping of the Human Brain, June 19Œ22, 2003, New York, NY
e1972
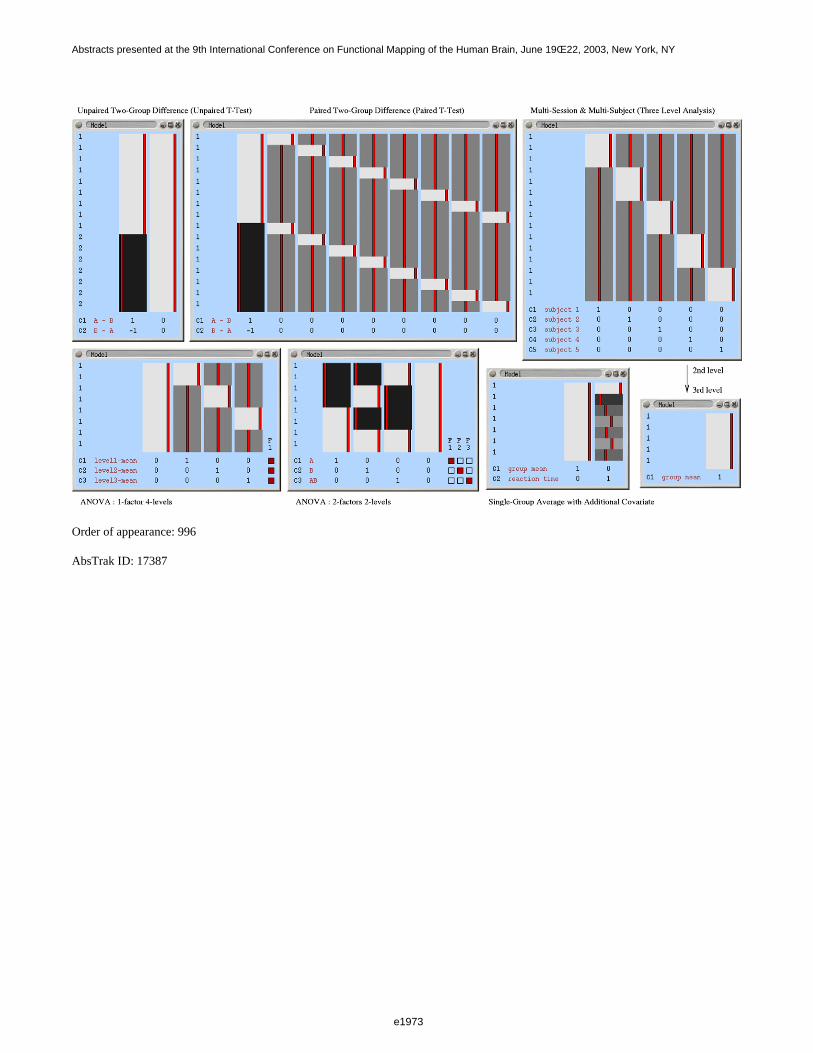
Order of appearance: 996
AbsTrak ID: 17387
e1973
Abstracts presented at the 9th International Conference on Functional Mapping of the Human Brain, June 19Œ22, 2003, New York, NY
e1973
Poster number: 1006
Intersession Variability in FMRI and the Effect of Different Analysis Methods
SM Smith*, CF Beckmann*, N Ramnani*, MW Woolrich*, PR Bannister*, M Jenkinson*,PM Matthews*, DJ McGonigle†
*Oxford Centre for Functional Magnetic Resonance Imaging of the Brain (FMRIB), UK†Biomagnetic Imaging Lab, UCSF, USA
Modeling & Analysis
Abstract
An important issue for FMRI studies is that of the inter-sessionvariability of FMRI activations, because this has implications forexperimental designs that test for experimentally-induced activationsacross sessions. McGonigle [NeuroImage 2000:11] examined this issue byassessing the variability of FMRI data acquired over 33 daily sessionsusing visual, motor and cognitive paradigms. A conclusion which many havetaken from [McGonigle00] is that there was a large amount of sessionvariability. Here we revisit the analysis of this data and considersession variability in the light of the effects that differentprocessing methods can have.
Analysis
Various pre-processing, registration and statisticalestimation components from FEAT (FMRI Expert Analysis Tool v4, part ofFSL) and SPM99 were compared. A: standard FEAT analysis; E: standardSPM analysis (with parameters matched to A as much as possible); F:standard SPM analysis (parameters matching [McGonigle00]); C: FEATpreprocessing/registration with SPM statistics; D: SPMpreprocessing/registration with FEAT statistics.
Comparisons
For all paradigms and all analysis methods, simple(OLS) fixed-effects (FE) and mixed-effects (ME) Z-statistics wereformed. We compared ME-Z, which is inversely proportional tointersession variability, between methods. Because of the centrallimit theorem, if an analysis method gives increased ME-Z, then, allother things being equal, this implies reduced overall method-relatederror (increased efficiency) in the method (i.e., a single-sessionanalysis cannot eliminiate session-related error/signal instrinsic tothe data, but does seek to minimise added method-related error;therefore the best methods should give ME-variance which approachesthe true inter-session ME-variance.) ME-Z images were adjusted fortranslational Z-shifts to account for biases in different “intensitynormalisation’’ procedures (ie to zero the mode and therefore make the
e1974
Abstracts presented at the 9th International Conference on Functional Mapping of the Human Brain, June 19Œ22, 2003, New York, NY
e1974

following null-hypothesis testing more valid across methods). For eachparadigm a mask of voxels which FE considered potentially activated(Z>2.3) was created, ie the voxels in which a ME analysis isinterested. This mask was averaged over A,C,D,E to balance across thevarious methods. The mean ME-Z from each method within the mask wasevaluated.
Results
Whilst there are statistically significant differencesbetween the methods (see below), the overall patterns are sufficientlysimilar for the results to be seen as positively cross-validating thevarious methods. FEAT produces the highest ME-Z, i.e. is leastsensitive to session effects. A-vs-C and D-vs-E compare statistics,whilst A-vs-D and C-vs-E compare preprocessing/registration. F>E,i.e. the slightly greater spatial smoothing and use of intensitynormalisation in F improves session-stability.
Inter-Session Variability and Conclusions
We compared theRE-variance (ME-var minus FE-var) with FE-variance using the sameFE-derived masks. On average RE-variance is less than FE-variance,i.e. session-session variability is less than within-sessionvariability in this data. Furthermore, one difference between ourthresholded single-session results and those in [McGonigle00] is thatwe found considerably smaller variability in the visual task. This ismainly due to the slightly different timing used in the originalmodel, i.e., the re-analyses were more efficient at estimating activation asbetter-matched models were used, indicating less apparentinter-session variability. We conclude that:
(i) inter-session variability should not be judged by apparentvariability in thresholded activation maps.
(ii) intersession variability in this data is not large relative tothe main effects.
(iii) different methods can give different apparent sessionvariability, due to different error rates.
Acknowledgements
We acknowledge support from the UK MRC andEPSRC. We are very grateful to Chris Freemantle for the retrieval andtransfer of the data from the Functional Imaging Lab, London.
e1975
Abstracts presented at the 9th International Conference on Functional Mapping of the Human Brain, June 19Œ22, 2003, New York, NY
e1975
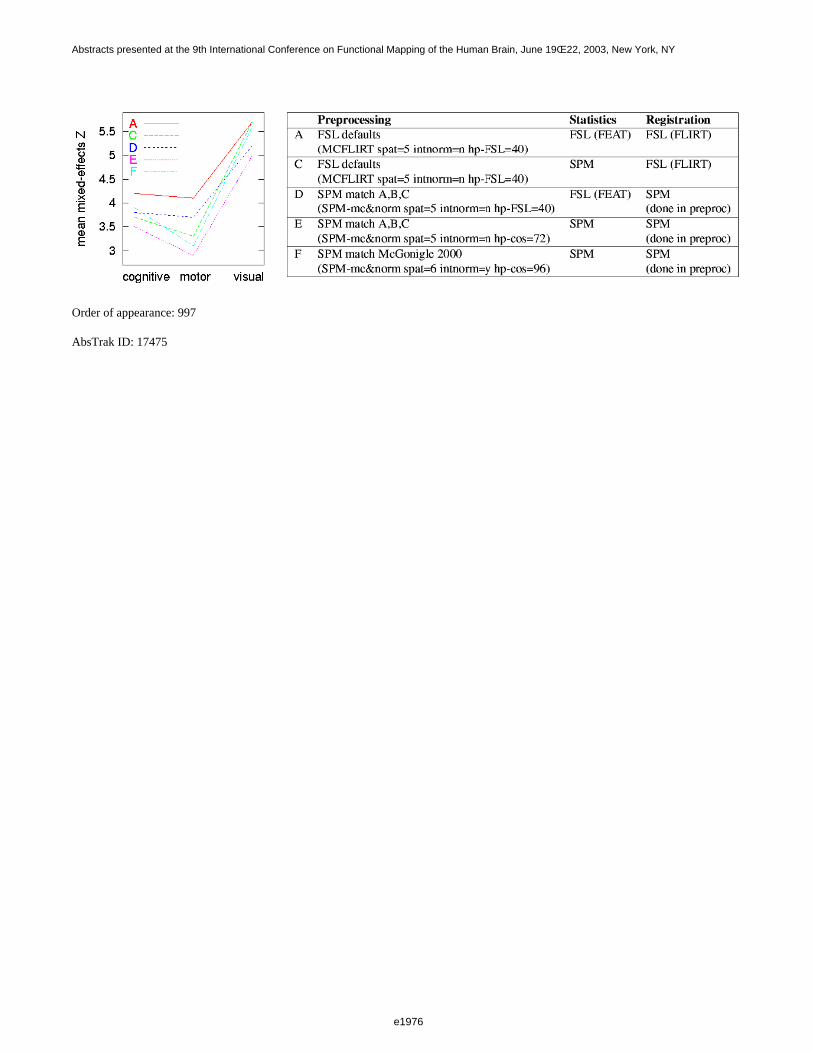
Order of appearance: 997
AbsTrak ID: 17475
e1976
Abstracts presented at the 9th International Conference on Functional Mapping of the Human Brain, June 19Œ22, 2003, New York, NY
e1976
Poster number: 1007
Comparing a single subject to a group, on choosing the distribution
Jonathan Stoeckel*, Gregoire Malandain*, Nicholas Ayache *, Jacques Darcourt†
*EPIDAURE project, INRIA, 2004 route des lucioles - BP 93, 06902 Sophia Antipolis, France†Service de Medecine Nucleaire, Centre Antoine Lacassagne, 33 avenue Valombrose, 06189 Nice Cedex 2,
France
Modeling & Analysis
Abstract
Different applications arise where the image of a single subject has to be compared to a group of other images.This usually occurs in SPECT/PET or in second level analysis of fMRI data. It is especially the case when onewants to use functional imaging in a diagnostical context; then one wants to obtain information about the singlesubject compared to a group of e.g. normal images.
The statistical test we will be using is a two-sample t-test. The first sample is the single image, and the secondsample is the group of images we want to compare to. In this abstract we are interested in doing the analysis at thevoxel level. This means that we need an estimate of the voxel value distribution of the t-map to be able todeterminate above which value a voxel can be considered to be significant. The most widely used method in ourfield is the use of the approximation of this distribution as given by the random field theory (RFT)[1](implemented in SPM). However in the case of a low number of degrees of freedom, which is almost always thecase when comparing one image to a group of images that is most often relatively small, the RFT can be ratherconservative. To maximize sensitivity one might also study other ways to obtain this distribution. First of allBonferroni correction could be considered which is also included in newer versions of SPM.
Permutations have been proposed as a solution for cases of a low number of degrees of freedom [2]. Howeverwhen comparing one image to a group of other images, the alternative number of permutations equals the numberof images in the group. So only an extremely small number of permutations is possible. This makes this methodnearly useless to obtain a reliable estimate of the critical value. Moreover if e.g. only ten images are available onecan not analyze at a significance level lower than 10%.
Ledberg [3] proposed a method based on Monte-Carlo simulations. Based on the residuals of the linear modelnew random realizations of the t-maps are generated. The advantage of this approach is that contrarily to thepermutation approach the number of realizations is not limited. So every significance level can be obtained withthe desired reliability. Of course this might lead to large computation times. This method also needs fewerhypotheses on the data to be valid.
The example figure shows the probability distribution of t-values, using the RFT, Bonferroni and the simulationapproach (10000 realizations). We compared one image to a group of 14 other HMPAO-SPECT images of normalsubjects in rest condition. In this case the simulations give the least conservative results. For almost all otherdata-sets we worked on, Bonferroni or the simulations outperformed the RFT for analyses at a 0.01 significancelevel. For smoother images the simulations outperform Bonferroni.
References
1. Worsley, AdvAppProbability, 26(1), 19942. Nichols et. al., HBM, 15(1), 20023. Ledberg, HBM, 9(3), 2000
e1977
Abstracts presented at the 9th International Conference on Functional Mapping of the Human Brain, June 19Œ22, 2003, New York, NY
e1977
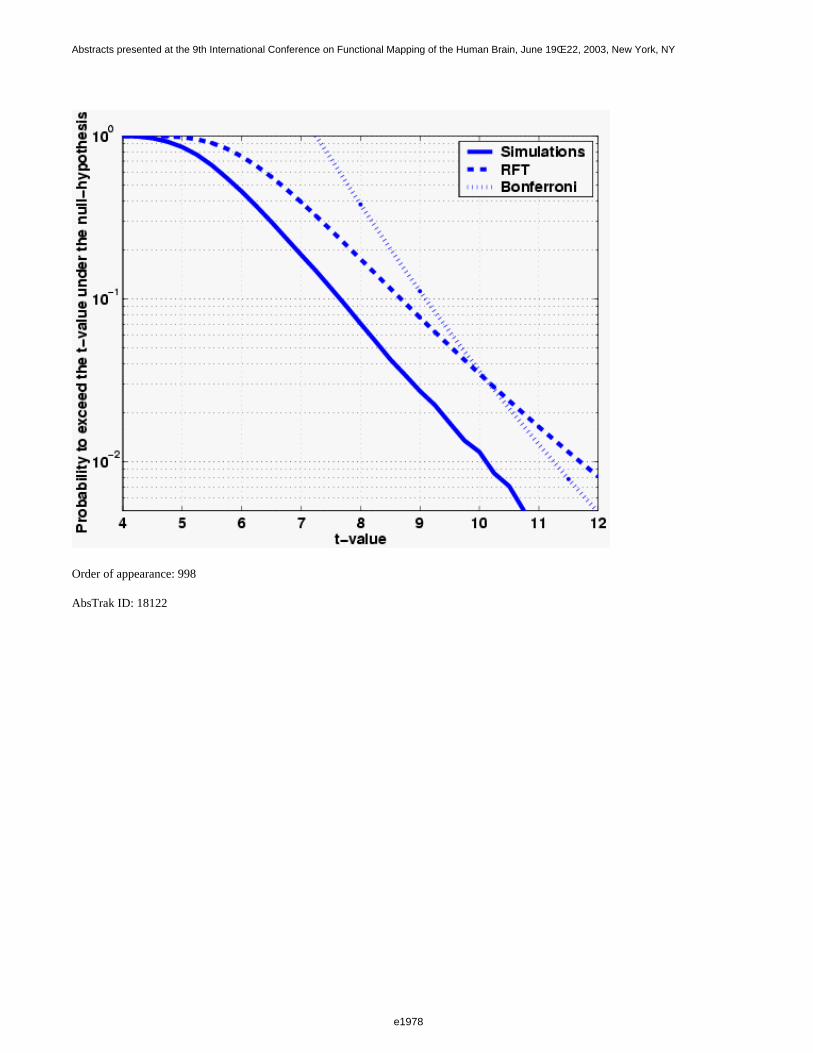
Order of appearance: 998
AbsTrak ID: 18122
e1978
Abstracts presented at the 9th International Conference on Functional Mapping of the Human Brain, June 19Œ22, 2003, New York, NY
e1978
Poster number: 1008
Surface visualisation of the whole cortex without mesh reconstruction
Roberto Toro, Romain Valabregue, Yves Burnod
Inserm Unité 483, Université Paris 6, France
Modeling & Analysis
Abstract
In the fifth month of gestation, the initially smooth cerebral hemispheres begin a period of important growth andfolding of its surface. In the adult brain, up to 70% of the cortical surface is buried in sulci. The complexity andvariability of the cortical geometry make the analysis and visualisation of its surface difficult. Furthermore, as forthe retinotopic, tonotopic and somatotopically organised cortices, it is the surface, and not the usual 3D volume,which is the appropriate space for the comprehension of the cortical organisation.
Many surface analysis systems have been developed over these last years. An essential step in these systems is theconstruction of a polygonal mesh that makes the cortical topology explicit. The detection of functional activity isimproved by restricting the analysis to these cortical meshes, and new representations of the cerebral cortex canthus be obtained which greatly simplifies the understanding of the cortical anatomy. Particularly important are thenew flat representations which permit the visualisation of the whole cortical surface, and the smoothed andinflated representations that allow for an intuitive grasp of its anatomy.
However, the methods involved in surface analysis are long, implying stages of data pre-processing, meshreconstruction and topology correction, and big specialised software systems are needed to obtain these newrepresentations of data. While this is acceptable when we are interested in surface based analysis, the extracomplexity may discourage users that are only interested in the intuitive grasp provided by the whole cortex andsmooth representations. Here we propose some simple methods intended to provide these representations of braindata just from the voxel, without need for mesh reconstruction.
Three-dimensional Polar Stereographic Projection.
To obtain representations of the whole cortical surface we use an algorithm based on the Universal PolarStereographic Projection (UPSP). This is a classic transformation widely used in cartography. For a sphere, theUPSP provides a flat conformal image of its surface where angles, but not areas, are conserved. Whole cortexrepresentations are obtained by scanning the data volume with spheres and stacking the successive flat images. Nocuts are needed, and the UPSP respects the connectivity for every point of the surface but one. This is the poleopposite to the viewpoint, which can be arbitrarily displaced.
Three-dimensional Dynamic Shape Filtering.
To obtain smooth representations of the cortical anatomy, we use a classic Dynamic Shape Algorithm (DSA) tofilter progressively the more shallow convolutions. The DSA is roughly the voxel equivalent of the curvature flowalgorithms used to smooth the meshes associated to the cortical reconstructions.
Visualising functional data over a smooth whole cortex representation.
Storing the successive steps of the DSA, we create a potential field whose gradient lines give a rough mappingbetween the original and the smooth volumes. Mapping allows us to project functional activity data over thesmooth representations. The whole cortex representation is then obtained by simply applying the UPSP.
e1979
Abstracts presented at the 9th International Conference on Functional Mapping of the Human Brain, June 19Œ22, 2003, New York, NY
e1979
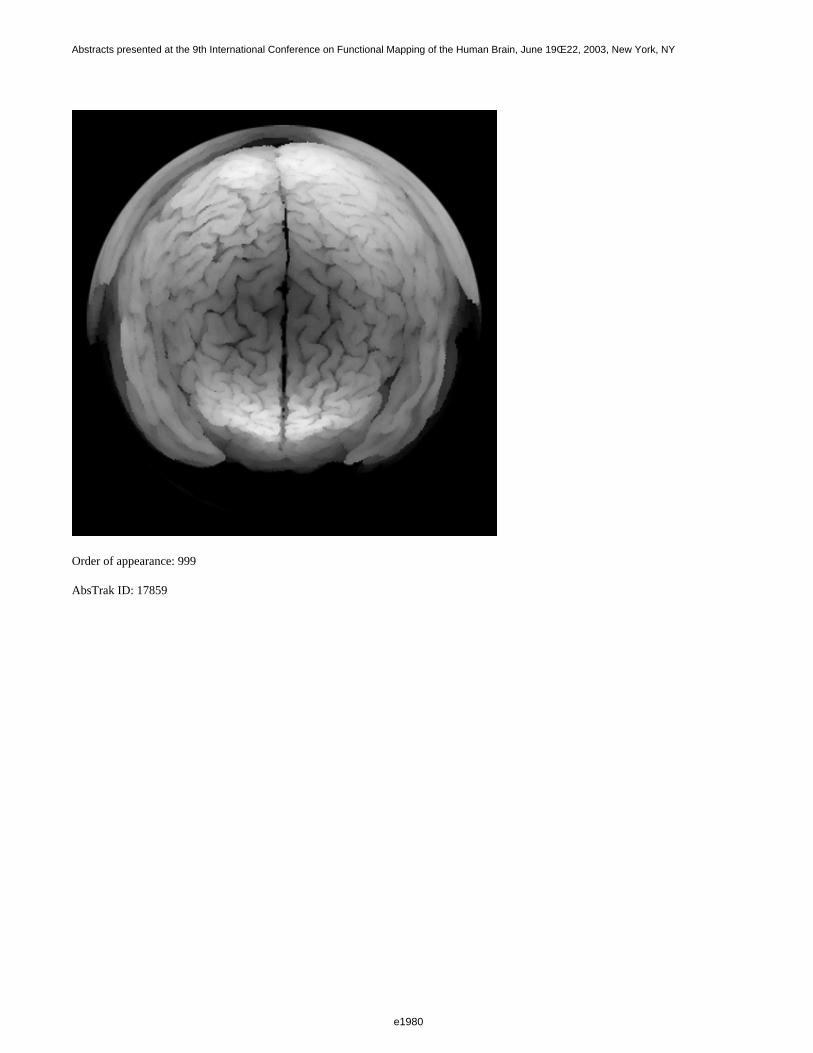
Order of appearance: 999
AbsTrak ID: 17859
e1980
Abstracts presented at the 9th International Conference on Functional Mapping of the Human Brain, June 19Œ22, 2003, New York, NY
e1980
Poster number: 1009
Delineation of the basal ganglia in MR images of patients by automaticregistration of a multimodal atlas based on histological and MR data
Jerome Yelnik*, Eric Bardinet†‡, Didier Dormont†§§, Chantal Francois*, Dominique Tande*, Carine Parain*, Gregoire Malandain‡, Nicholas Ayache ‡, Etienne Hirsch*, Yves
Agid*§
*INSERM U289, Paris, France†CNRS, UPR640, Paris, France
‡INRIA, Epidaure group, Sophia-Antipolis, France§Neuroradiology Dept, Salpetriere, Paris, France
¶CIC, Salpetriere, Paris, France
Modeling & Analysis
Abstract
Acquisition of atlas material
A human brain obtained at autopsy from body donation was submitted to T1- and T2-weighted MRI sequencesbefore extraction. The left hemisphere was fixed in formalin solution for 24 hours, cut into 1.5-cm-thick frontalblocks that were fixed for 8 days and cut into 70-µm-thick frontal sections on a freezing microtome. Photographsof the frozen blocks were taken every ten sections. The 800 sections obtained were collected serially. One seriesof sections (every tenth section) was Nissl-stained. Another adjacent series was immunostained for calbindin.
Tracing of histological cerebral contours
Contours of cerebral regions of the basal ganglia (striatum, globus pallidus, substantia nigra, subthalamic nucleus)and of their functional subterritories (sensorimotor, associative, limbic) and some related structures (thalamus,bed nucleus, pedunculopontine nucleus) were delimited on the basis of histological (cytoarchitectonic and myelinstaining) and immunohistochemical (calbindin and parvalbumin) staining.
Co-registration of atlas data
Photographs of the frozen sections were aligned by using fiducial markers to obtain a geometrically consistent 3D“cryo-block” which was registered with the T1-MR and T2-MR sequences. Each histological section wasregistered onto the corresponding cryo-section, compensating for histological processing distortions, thusproviding 3D “histo-blocks”. All registrations were performed by applying the same automatic intensity-basedmethod to a region of interest centered on the basal ganglia.
Multimodal and 3D optimization of atlas structures
Tracing of the contours was optimized by confronting all co-registered atlas data. 3D consistency of atlasstructures was also optimized at this stage. Such contours were considered as the best estimate of the actual 3Dgeometry of the atlas brain. Surfaces were generated from these serial contours, yielding a true 3D atlas of thebasal ganglia which could be sliced in any orientation (e.g. an AC-PC based plane or an oblique surgical trajectory).
e1981
Abstracts presented at the 9th International Conference on Functional Mapping of the Human Brain, June 19Œ22, 2003, New York, NY
e1981

Atlas-to-patient MR 3D registration
Automatic registration between atlas and patient T1-weighted MR images was performed on the basis of regionsof interest automatically defined around the basal ganglia, using local affine transformations. Surfaces of atlasstructures were deformed into the geometry of different patients following these transformations. Reliability ofatlas contours and of atlas-to-patient registration was assessed by the observation that structures visible inT1-weighted MR sequences (caudate nucleus, putamen, cerebral peduncle, mamillo-thalamic tract, anteriorcolumn of the fornix) were reliably delineated by atlas histology-based contours.
Results
Based on MR and histological data from the same brain specimen, we can propose an atlas in which fine leveldetails of histology are propagated into the true 3D geometry of the same brain provided by multimodal fusion.Moreover, registration of the 3D MR image of the atlas with the MR image of a patient is used to deform atlasstructures toward the particular geometry of this patient. Using this tool, localization of a neurosurgical functionaltarget such as a site for deep brain stimulation in Parkinson’s disease, could be performed with a far higheranatomic precision. Evaluation of the quality of atlas-to-patient registration will ask for comparison with othermodalities as diffusion tensor imaging or electrophysiology.
Order of appearance: 1000
AbsTrak ID: 18208
e1982
Abstracts presented at the 9th International Conference on Functional Mapping of the Human Brain, June 19Œ22, 2003, New York, NY
e1982
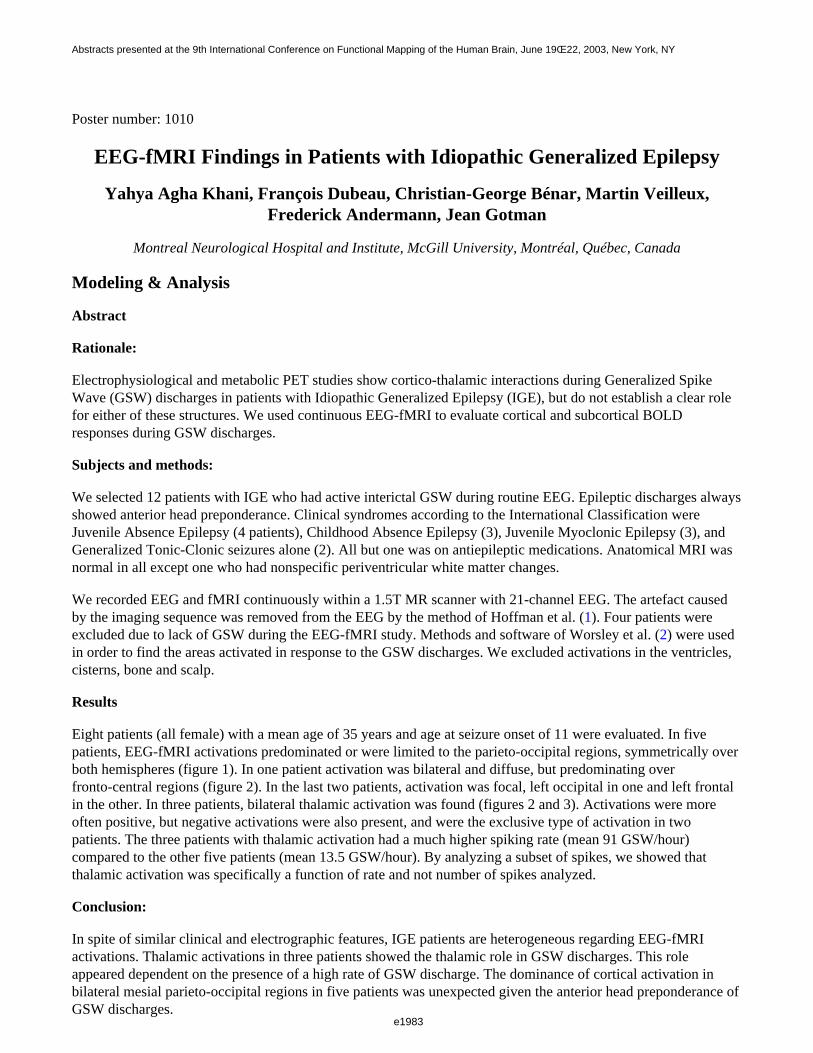
Poster number: 1010
EEG-fMRI Findings in Patients with Idiopathic Generalized Epilepsy
Yahya Agha Khani, François Dubeau, Christian-George Bénar, Martin Veilleux,Frederick Andermann, Jean Gotman
Montreal Neurological Hospital and Institute, McGill University, Montréal, Québec, Canada
Modeling & Analysis
Abstract
Rationale:
Electrophysiological and metabolic PET studies show cortico-thalamic interactions during Generalized SpikeWave (GSW) discharges in patients with Idiopathic Generalized Epilepsy (IGE), but do not establish a clear rolefor either of these structures. We used continuous EEG-fMRI to evaluate cortical and subcortical BOLDresponses during GSW discharges.
Subjects and methods:
We selected 12 patients with IGE who had active interictal GSW during routine EEG. Epileptic discharges alwaysshowed anterior head preponderance. Clinical syndromes according to the International Classification wereJuvenile Absence Epilepsy (4 patients), Childhood Absence Epilepsy (3), Juvenile Myoclonic Epilepsy (3), andGeneralized Tonic-Clonic seizures alone (2). All but one was on antiepileptic medications. Anatomical MRI wasnormal in all except one who had nonspecific periventricular white matter changes.
We recorded EEG and fMRI continuously within a 1.5T MR scanner with 21-channel EEG. The artefact causedby the imaging sequence was removed from the EEG by the method of Hoffman et al. (1). Four patients wereexcluded due to lack of GSW during the EEG-fMRI study. Methods and software of Worsley et al. (2) were usedin order to find the areas activated in response to the GSW discharges. We excluded activations in the ventricles,cisterns, bone and scalp.
Results
Eight patients (all female) with a mean age of 35 years and age at seizure onset of 11 were evaluated. In fivepatients, EEG-fMRI activations predominated or were limited to the parieto-occipital regions, symmetrically overboth hemispheres (figure 1). In one patient activation was bilateral and diffuse, but predominating overfronto-central regions (figure 2). In the last two patients, activation was focal, left occipital in one and left frontalin the other. In three patients, bilateral thalamic activation was found (figures 2 and 3). Activations were moreoften positive, but negative activations were also present, and were the exclusive type of activation in twopatients. The three patients with thalamic activation had a much higher spiking rate (mean 91 GSW/hour)compared to the other five patients (mean 13.5 GSW/hour). By analyzing a subset of spikes, we showed thatthalamic activation was specifically a function of rate and not number of spikes analyzed.
Conclusion:
In spite of similar clinical and electrographic features, IGE patients are heterogeneous regarding EEG-fMRIactivations. Thalamic activations in three patients showed the thalamic role in GSW discharges. This roleappeared dependent on the presence of a high rate of GSW discharge. The dominance of cortical activation inbilateral mesial parieto-occipital regions in five patients was unexpected given the anterior head preponderance ofGSW discharges.
e1983
Abstracts presented at the 9th International Conference on Functional Mapping of the Human Brain, June 19Œ22, 2003, New York, NY
e1983
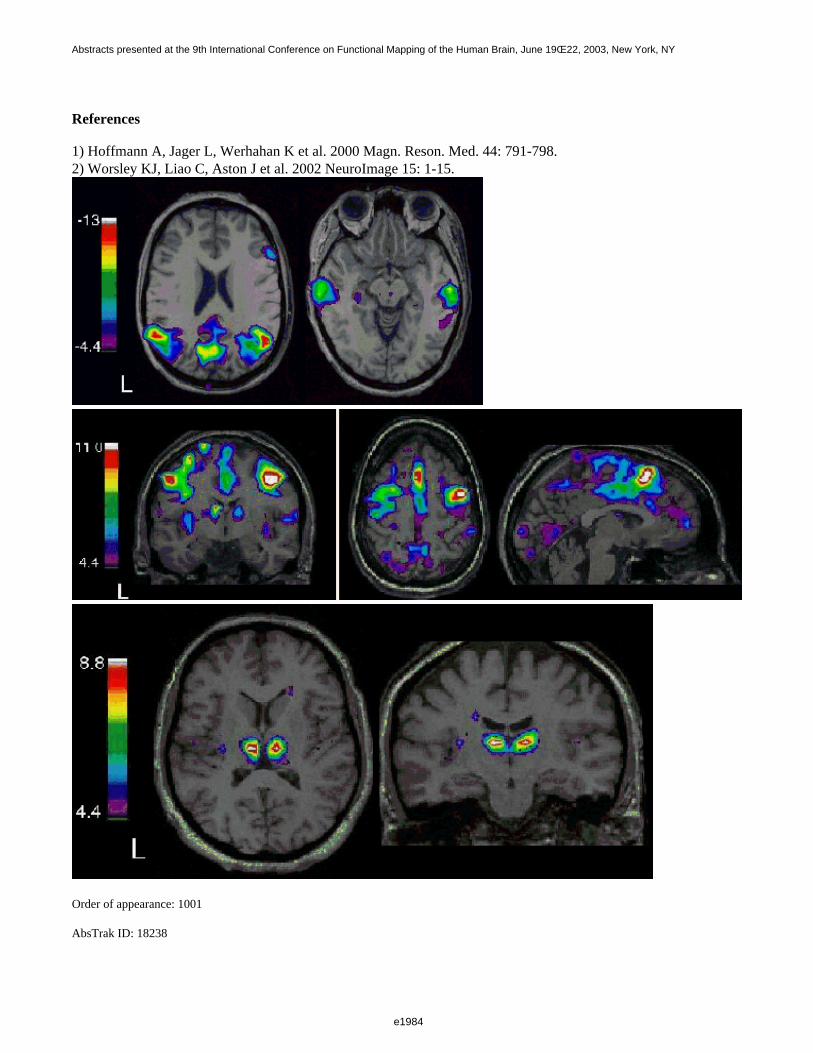
References
1) Hoffmann A, Jager L, Werhahan K et al. 2000 Magn. Reson. Med. 44: 791-798.2) Worsley KJ, Liao C, Aston J et al. 2002 NeuroImage 15: 1-15.
Order of appearance: 1001
AbsTrak ID: 18238
e1984
Abstracts presented at the 9th International Conference on Functional Mapping of the Human Brain, June 19Œ22, 2003, New York, NY
e1984
Poster number: 1011
Texture analysis of mesial temporal lobe structures lateralizes seizurefocus in TLE patients with volumetrically normal MRI
Samson Antel, Neda Bernasconi, Andrea Bernasconi
Montreal Neurological Institute
Modeling & Analysis
Abstract
Background:
Atrophy of the hippocampus and the amygdala as determined by MR volumetric analysis has become awidespread method for lateralizing the seizure focus in patients with temporal lobe epilepsy (TLE). However,10-20% of TLE patients have normal volumetric MRI. In these cases the seizure focus cannot be lateralized basedon volumetric data.
Texture analysis based on gray-level co-occurrence matrices (GLCMs) quantifies the spatial pattern of gray levelintensity pairs. This image analysis technique has been used to characterize MRI brain pathology in multiplesclerosis and tumors. We recently used this method to detect focal cortical dysplasia associated with epilepsy.Changes in texture values within brain tissue may be indicative of structural and organizational changes therein.
Purpose:
To lateralize the seizure focus in TLE patients with normal volumetric MRI using texture analysis of thehippocampus and amygdala.
Methods:
Preoperative 3D MR volumes were acquired on a 1.5T scanner using a fast field echo sequence (slicethickness=1mm; approximately 170 slices with an isotropic voxel size of 1 mm3 ).
1. Volumetric MRI:
Absolute volumes and left-right asymmetry scores were computed based on manual segmentation of the left- andright hippocampi and amygdalae, and transformed into z-scores via comparison to an age- and sex-matchedcontrol group of 30 control subjects. In our database of 230 consecutive TLE patients, 26 had bilaterallysymmetrically normal hippocampal and amygdalar volumes using a cut-off of 2 standard deviations below themean of the control group.
2. Texture analysis:
For each of the 26 TLE patients with normal MRI, four GLCMs were constructed, one each for the left and righthippocampus and amygdala. GLCMs were calculated by tallying the number of occurrences of each gray levelintensity pair separated by a distance of 3 voxels collapsed across direction. From each matrix, a set of six texturefeatures was calculated. A left-right asymmetry index was then calculated for each structure/feature combination.Left, right, and asymmetry values were converted to z-scores via comparison to a similarly analyzed, aged- andsex-matched group of 30 control subjects.
e1985
Abstracts presented at the 9th International Conference on Functional Mapping of the Human Brain, June 19Œ22, 2003, New York, NY
e1985

3. Data analysis:
We performed leave-one-out linear discriminant analysis (with stepwise feature selection) trained on the MRItexture data to lateralize the seizure focus. The gold standard was lateralization based on EEG data, and thepossible outputs of the classifier were left-lateralized or right-lateralized.
Results:
The classifier correctly lateralized 26/26 patients (100%).
Conclusions:
Texture analysis provides evidence of structural damage within the mesial temporal lobe structures that is notdetectable through volumetric MRI analysis. Texture analysis of MRI is a powerful tool for lateralizing theseizure focus in TLE patients with normal volumetric MRI.
Order of appearance: 1002
AbsTrak ID: 17128
e1986
Abstracts presented at the 9th International Conference on Functional Mapping of the Human Brain, June 19Œ22, 2003, New York, NY
e1986
Poster number: 1012
Multimodal brain neuroimaging and mathematical modeling of metabolic,electrophysiological and hemodynamic mechanisms: application to the
investigation of brain tumors
Agnès Aubert*†, Robert Costalat†‡, Hughes Duffau*†§, Laurent Capelle*†§, Rémy Guillevin†§, Habib Benali*†
*INSERM U 494, 91 boulevard de l’Hôpital, 75634 Paris Cedex 13, France†IFR 49, SHFJ-CEA, Orsay, France
‡INSERM U 483, Paris, France§Department of Neurosurgery, Hôpital de la Salpêtrière, Paris, France
¶Department of Neuroradiology, Hôpital de la Salpêtrière, Paris, France
Modeling & Analysis
Abstract
Introduction
In human the most frequent intracerebral primary tumors are gliomas. High-grade gliomas can displaypronounced energy metabolism impairment, e.g. increased lactate (in vivo), decreased total creatine andphosphocreatine (ex vivo), increased pH (review in Kaibara et al., Biochem. Cell Biol. 76: 477-486, 1998).Although intracerebral low-grade gliomas (LGGs) are clinically benign-appearing for a long time, they undergomalignant transformation at five years in about 50% of cases after the first clinical symptoms (Keles et al., Journalof Neurosurgery 95: 735-745, 2001). Thus, one can wonder whether there exists a continuum of energymetabolism impairment between low and high-grade gliomas.
Moreover, the surgical removal of gliomas remains difficult to achieve, since they often grow and diffuse in oradjacent to functionally eloquent areas. In order to avoid postoperative neurological sequelae, eloquent brain areasare mapped preoperatively using functional Magnetic Resonance Imaging (fMRI) (Lehericy et al., Journal ofNeurosurgery 92: 589-598, 2000) and intraoperatively using somatosensory evoked potentials or directcortico-subcortical stimulation (Duffau et al., Brain 125: 1-16, 2002).
However, BOLD contrast enhancement in fMRI can be significantly reduced, or even missing, within or nearmalignant gliomas, so that the location of eloquent areas may be erroneous (Schreiber et al., American Journal ofNeuroradiology 21: 1055-1063, 2000). The causes of this reduction of BOLD contrast enhancement are stillpoorly understood: it does not seem to result from reduced neuronal activity, but rather from an alteration ofneurovascular and metabolic coupling.
Method
We attempt to explain the links between (i) metabolic changes, as measured using Magnetic ResonanceSpectroscopy (MRS), and (ii) electrophysiological and BOLD fMRI data, by modeling pathophysiologicalprocesses in cerebral tissue (glioma or adjacent tissue). In a preceding study, we elaborated a mathematical modelof the coupling between brain electrical activity, energy metabolism and hemodynamics (Aubert and Costalat,NeuroImage 17: 1162-1181, 2002). We adapt this model, on the basis of a preceding study (Aubert et al., ActaBiotheoretica, 50: 281-295, 2002), in order to interpret BOLD, electrophysiological and MRS data in terms ofsome important parameters, especially: cerebral blood flow (CBF), phosphocreatine/creatine buffer, basal valuesand regulation of glycolysis and aerobic metabolism.
e1987
Abstracts presented at the 9th International Conference on Functional Mapping of the Human Brain, June 19Œ22, 2003, New York, NY
e1987

Results
We show that decreasing the cerebral blood flow (CBF) baseline value, or the CBF increase fraction, results in adecrease of the BOLD signal and an increase of the lactate peak during a sustained activation. Baseline lactate andPCr levels are not significantly affected by CBF baseline reduction, but are altered even by a moderate decreaseof mitochondrial respiration. Decreasing the total Cr and PCr concentration reduces the BOLD signal after theinitial overshoot.
Conclusion
We suggest that the coupled use of BOLD fMRI, electrophysiological recordings and MRS could contribute to abetter understanding of brain tissue pathophysiology within or in the vicinity of gliomas.
Order of appearance: 1003
AbsTrak ID: 18701
e1988
Abstracts presented at the 9th International Conference on Functional Mapping of the Human Brain, June 19Œ22, 2003, New York, NY
e1988
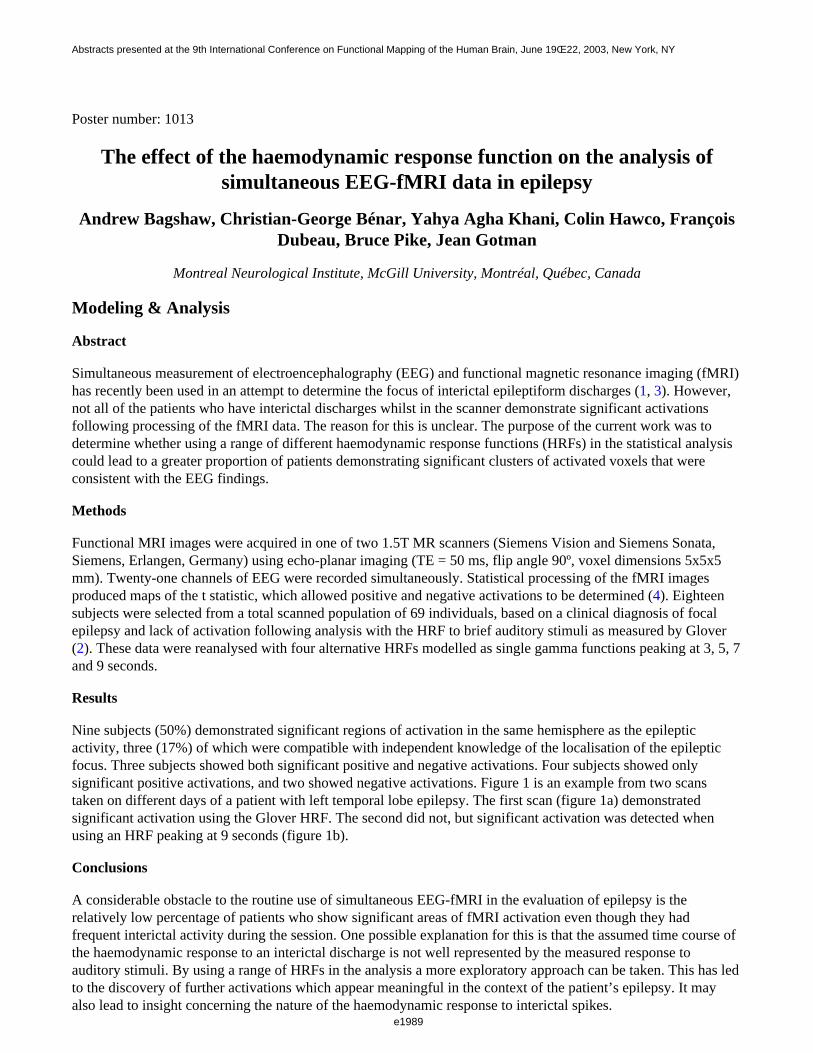
Poster number: 1013
The effect of the haemodynamic response function on the analysis ofsimultaneous EEG-fMRI data in epilepsy
Andrew Bagshaw, Christian-George Bénar, Yahya Agha Khani, Colin Hawco, FrançoisDubeau, Bruce Pike, Jean Gotman
Montreal Neurological Institute, McGill University, Montréal, Québec, Canada
Modeling & Analysis
Abstract
Simultaneous measurement of electroencephalography (EEG) and functional magnetic resonance imaging (fMRI)has recently been used in an attempt to determine the focus of interictal epileptiform discharges (1, 3). However,not all of the patients who have interictal discharges whilst in the scanner demonstrate significant activationsfollowing processing of the fMRI data. The reason for this is unclear. The purpose of the current work was todetermine whether using a range of different haemodynamic response functions (HRFs) in the statistical analysiscould lead to a greater proportion of patients demonstrating significant clusters of activated voxels that wereconsistent with the EEG findings.
Methods
Functional MRI images were acquired in one of two 1.5T MR scanners (Siemens Vision and Siemens Sonata,Siemens, Erlangen, Germany) using echo-planar imaging (TE = 50 ms, flip angle 90º, voxel dimensions 5x5x5mm). Twenty-one channels of EEG were recorded simultaneously. Statistical processing of the fMRI imagesproduced maps of the t statistic, which allowed positive and negative activations to be determined (4). Eighteensubjects were selected from a total scanned population of 69 individuals, based on a clinical diagnosis of focalepilepsy and lack of activation following analysis with the HRF to brief auditory stimuli as measured by Glover (2). These data were reanalysed with four alternative HRFs modelled as single gamma functions peaking at 3, 5, 7and 9 seconds.
Results
Nine subjects (50%) demonstrated significant regions of activation in the same hemisphere as the epilepticactivity, three (17%) of which were compatible with independent knowledge of the localisation of the epilepticfocus. Three subjects showed both significant positive and negative activations. Four subjects showed onlysignificant positive activations, and two showed negative activations. Figure 1 is an example from two scanstaken on different days of a patient with left temporal lobe epilepsy. The first scan (figure 1a) demonstratedsignificant activation using the Glover HRF. The second did not, but significant activation was detected whenusing an HRF peaking at 9 seconds (figure 1b).
Conclusions
A considerable obstacle to the routine use of simultaneous EEG-fMRI in the evaluation of epilepsy is therelatively low percentage of patients who show significant areas of fMRI activation even though they hadfrequent interictal activity during the session. One possible explanation for this is that the assumed time course ofthe haemodynamic response to an interictal discharge is not well represented by the measured response toauditory stimuli. By using a range of HRFs in the analysis a more exploratory approach can be taken. This has ledto the discovery of further activations which appear meaningful in the context of the patient’s epilepsy. It mayalso lead to insight concerning the nature of the haemodynamic response to interictal spikes.
e1989
Abstracts presented at the 9th International Conference on Functional Mapping of the Human Brain, June 19Œ22, 2003, New York, NY
e1989
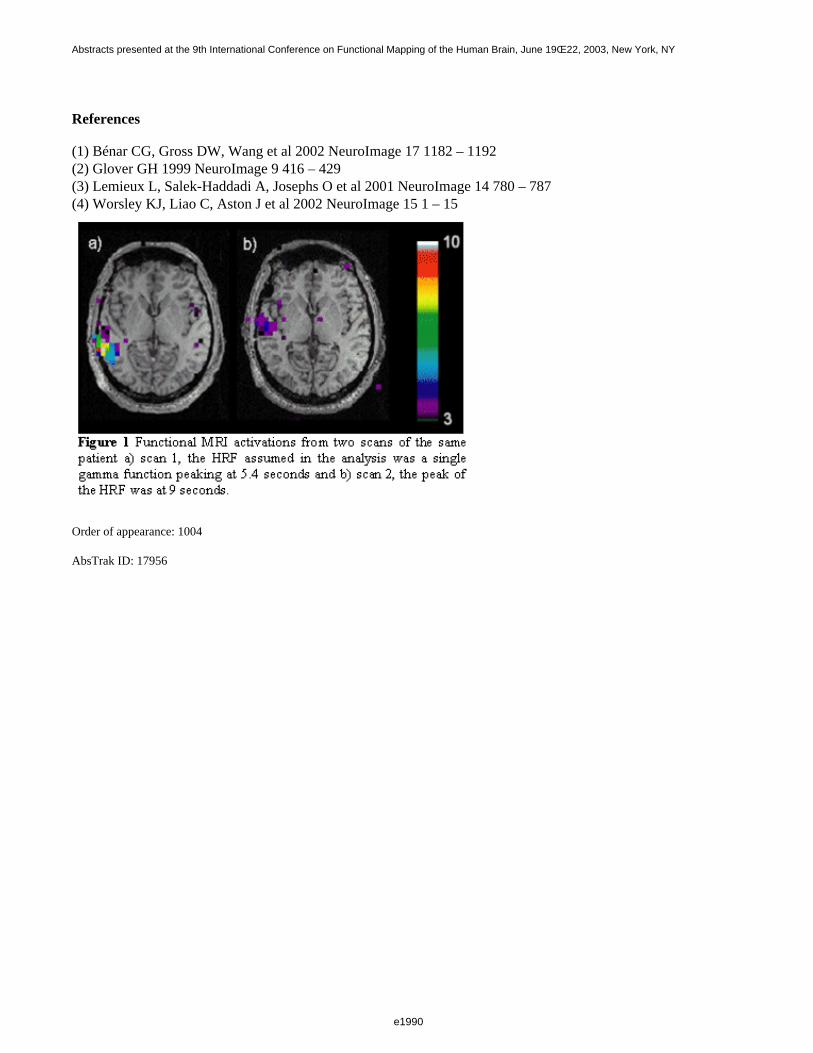
References
(1) Bénar CG, Gross DW, Wang et al 2002 NeuroImage 17 1182 – 1192(2) Glover GH 1999 NeuroImage 9 416 – 429(3) Lemieux L, Salek-Haddadi A, Josephs O et al 2001 NeuroImage 14 780 – 787(4) Worsley KJ, Liao C, Aston J et al 2002 NeuroImage 15 1 – 15
Order of appearance: 1004
AbsTrak ID: 17956
e1990
Abstracts presented at the 9th International Conference on Functional Mapping of the Human Brain, June 19Œ22, 2003, New York, NY
e1990
Poster number: 1014
Anatomical localization of human intracranial recordings (SEEG): 3Dvisualization of ERPs and co-registration on normalized flat maps of
auditory cortex
Françoise Bauchet*, Aurélie Bidet-Caulet*, Catherine Fischer†, Olivier Bertrand*
*Mental Processes and Brain Activation Lab, INSERM U280, Lyon, France†Neurological Hospital, Lyon, France
Modeling & Analysis
Abstract
Spatial normalization allows the co-registration of anatomical and functional data recorded across individuals andthe fusion of different imaging techniques in a common coordinate system. For instance, the Talairach coordinatesystem is widely used for co-registering PET/fMRI data, EEG/MEG sources, and intracranial depth electrodes(SEEG) to a standard anatomy. As an alternative to this global normalization method, local landmark-basedapproaches, using flattened cortical surfaces, appear to be more accurate for a refined exploration of specific brainareas like the auditory cortex. This has already been developed and applied to fMRI studies [1, 2].
When analyzing SEEG data in a group of patients, the classical approach consists in using the Talairach atlas toproject depth electrode locations onto a standard brain. This allows a clustering of electrodes according to theirgross anatomical location and their electrophysiological response similarities.
The methods presented here are dedicated to the study of the human auditory cortex explored by SEEG with two goals:
- to propose a new visualization method of intracranial ERPs on precise 3D representation of individual corticalsurface (fig.)
- to develop a landmark-based normalization scheme for elaborating a standardized auditory cortex anatomy onwhich depth electrodes used in a group of patients can be projected together.
3D visualization procedure
First, using FreeSurfer, the cortical surface is reconstructed from MRIs and inflated for cutting the region ofinterest (the temporal lobe). Second, this ROI is rendered as a 3D folded mesh, on which electrode locations aresuperimposed. Finally, the electrophysiological activity is drawn at each site as a sphere with radius and colordependent on the signal amplitude. An interactive time-varying representation of this data facilitates thedissociation between local sources and volume conduction effects.
Flat anatomical normalization
To precisely map the data obtained in a group of patients with electrodes covering the auditory cortex, weconsider a local spatial normalization based on anatomical landmarks. Using FreeSurfer, the inflated temporallobe is flattened. We then select fiducial points in the auditory cortex vicinity (tips of Heschl’s gyrus,anterior/posterior ends of superior temporal sulcus, midway point on medial temporal gyrus, lower tip ofsupramarginal gyrus) and apply a linear transform on each individual flat surface to build up an average auditorycortex. The delineation of the main structures (gyri and sulci) is based on the across-subject averaged corticalcurvature. The anatomical dispersion resulting from this procedure has been evaluated in 10 subjects and was
e1991
Abstracts presented at the 9th International Conference on Functional Mapping of the Human Brain, June 19Œ22, 2003, New York, NY
e1991
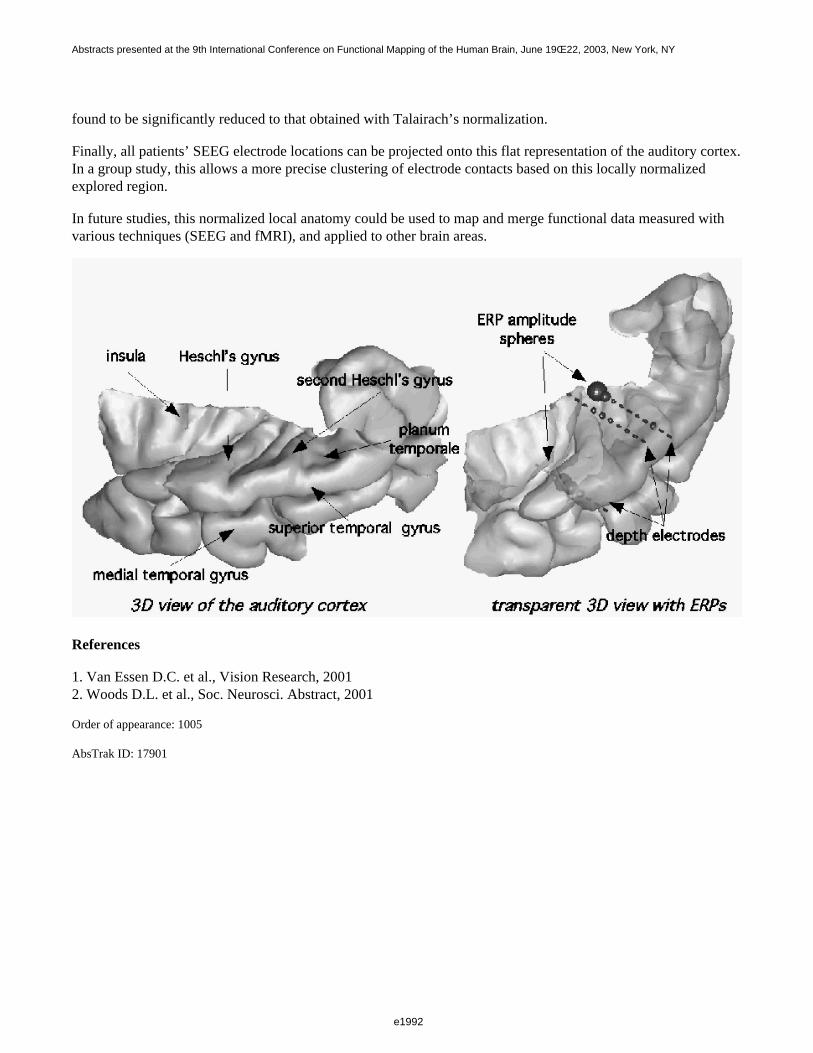
found to be significantly reduced to that obtained with Talairach’s normalization.
Finally, all patients’ SEEG electrode locations can be projected onto this flat representation of the auditory cortex.In a group study, this allows a more precise clustering of electrode contacts based on this locally normalizedexplored region.
In future studies, this normalized local anatomy could be used to map and merge functional data measured withvarious techniques (SEEG and fMRI), and applied to other brain areas.
References
1. Van Essen D.C. et al., Vision Research, 20012. Woods D.L. et al., Soc. Neurosci. Abstract, 2001
Order of appearance: 1005
AbsTrak ID: 17901
e1992
Abstracts presented at the 9th International Conference on Functional Mapping of the Human Brain, June 19Œ22, 2003, New York, NY
e1992
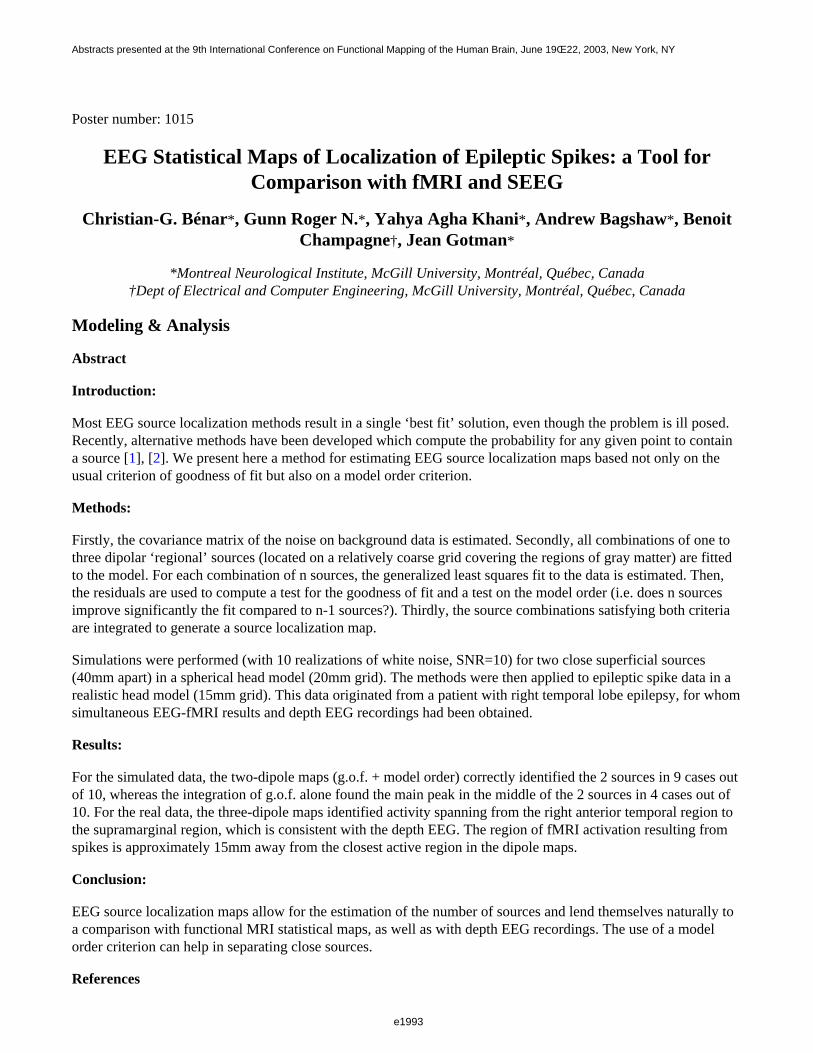
Poster number: 1015
EEG Statistical Maps of Localization of Epileptic Spikes: a Tool forComparison with fMRI and SEEG
Christian-G. Bénar*, Gunn Roger N.*, Yahya Agha Khani*, Andrew Bagshaw*, Benoit Champagne†, Jean Gotman*
*Montreal Neurological Institute, McGill University, Montréal, Québec, Canada†Dept of Electrical and Computer Engineering, McGill University, Montréal, Québec, Canada
Modeling & Analysis
Abstract
Introduction:
Most EEG source localization methods result in a single ‘best fit’ solution, even though the problem is ill posed.Recently, alternative methods have been developed which compute the probability for any given point to containa source [1], [2]. We present here a method for estimating EEG source localization maps based not only on theusual criterion of goodness of fit but also on a model order criterion.
Methods:
Firstly, the covariance matrix of the noise on background data is estimated. Secondly, all combinations of one tothree dipolar ‘regional’ sources (located on a relatively coarse grid covering the regions of gray matter) are fittedto the model. For each combination of n sources, the generalized least squares fit to the data is estimated. Then,the residuals are used to compute a test for the goodness of fit and a test on the model order (i.e. does n sourcesimprove significantly the fit compared to n-1 sources?). Thirdly, the source combinations satisfying both criteriaare integrated to generate a source localization map.
Simulations were performed (with 10 realizations of white noise, SNR=10) for two close superficial sources(40mm apart) in a spherical head model (20mm grid). The methods were then applied to epileptic spike data in arealistic head model (15mm grid). This data originated from a patient with right temporal lobe epilepsy, for whomsimultaneous EEG-fMRI results and depth EEG recordings had been obtained.
Results:
For the simulated data, the two-dipole maps (g.o.f. + model order) correctly identified the 2 sources in 9 cases outof 10, whereas the integration of g.o.f. alone found the main peak in the middle of the 2 sources in 4 cases out of10. For the real data, the three-dipole maps identified activity spanning from the right anterior temporal region tothe supramarginal region, which is consistent with the depth EEG. The region of fMRI activation resulting fromspikes is approximately 15mm away from the closest active region in the dipole maps.
Conclusion:
EEG source localization maps allow for the estimation of the number of sources and lend themselves naturally toa comparison with functional MRI statistical maps, as well as with depth EEG recordings. The use of a modelorder criterion can help in separating close sources.
References
e1993
Abstracts presented at the 9th International Conference on Functional Mapping of the Human Brain, June 19Œ22, 2003, New York, NY
e1993
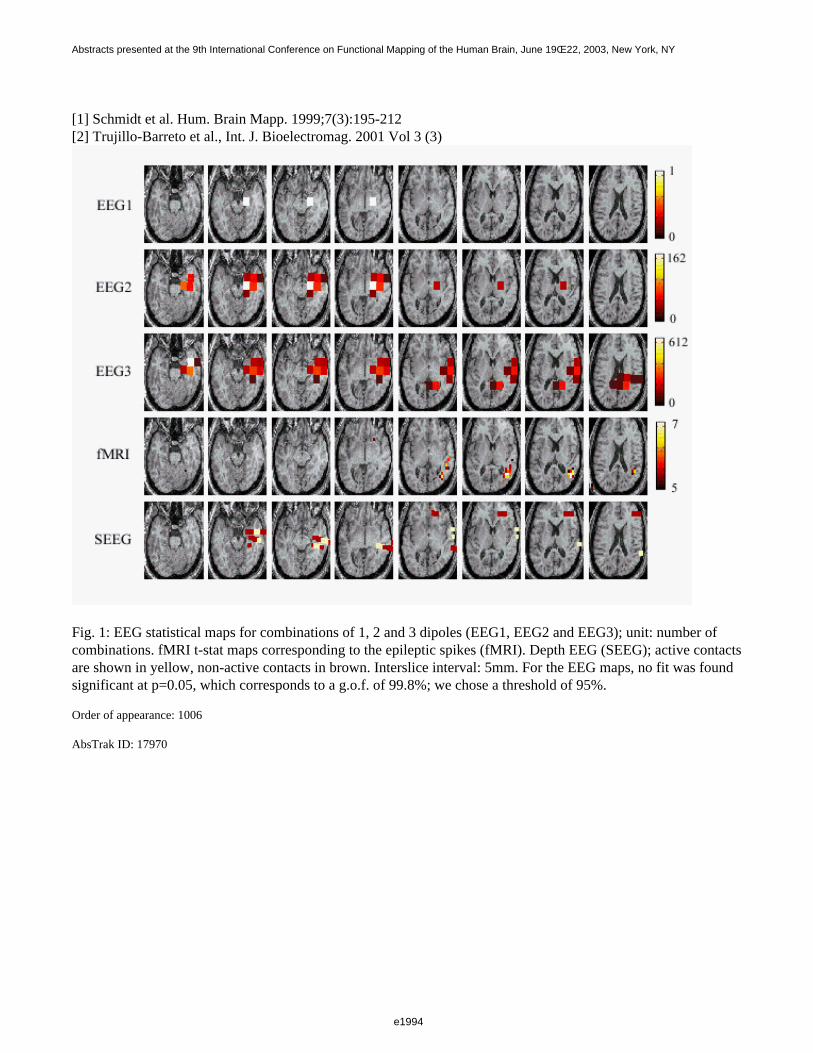
[1] Schmidt et al. Hum. Brain Mapp. 1999;7(3):195-212[2] Trujillo-Barreto et al., Int. J. Bioelectromag. 2001 Vol 3 (3)
Fig. 1: EEG statistical maps for combinations of 1, 2 and 3 dipoles (EEG1, EEG2 and EEG3); unit: number ofcombinations. fMRI t-stat maps corresponding to the epileptic spikes (fMRI). Depth EEG (SEEG); active contactsare shown in yellow, non-active contacts in brown. Interslice interval: 5mm. For the EEG maps, no fit was foundsignificant at p=0.05, which corresponds to a g.o.f. of 99.8%; we chose a threshold of 95%.
Order of appearance: 1006
AbsTrak ID: 17970
e1994
Abstracts presented at the 9th International Conference on Functional Mapping of the Human Brain, June 19Œ22, 2003, New York, NY
e1994
Poster number: 1016
An experimental test bed in Matlab for analyzing diffusion tensor MR images
Ørjan Bergmann*†, Renate Grüner*, Jochen G Hirsch‡, Kerstin von Plessen§, Erling Andersen§, Arvid Lundervold*
*Neuroinformatics and Image Analysis Group, Department of Physiology, University of Bergen, N-5009 Bergen, NORWAY
†The Bergen Center for Computational Science, University of Bergen, N-5020 Bergen, NORWAY‡Department of Neurology, University Hospital Mannheim, D - 68167 Mannheim, GERMANY
§Department of Clinical Engineering, Haukeland University Hospital, N-5021 Bergen, NORWAY¶Competence Centre for Child and Adolescent Psychiatry, University of Bergen, N-5020 Bergen, NORWAY
Modeling & Analysis
Abstract
Knowing that diffusion tensor imaging (DTI) is an inherently time-consuming, low-resolution and artifact-proneMR technique, it is important to explore robust and efficient algorithms for analyzing the data, and to providetools for visual inspection at each processing step. For use by physicians a taylor-made graphical user interface isalso desirable. Matlab™ is a a flexible programming environment which integrates mathematical computing,visualization, and a powerful language for technical computing. In this work we have utilized several of Matlab’sadvanced features to explore DTI-data, including a simple GUI, aimed for research application in child psychiatry.
DTI data
We have used data from both a Siemens Vision 1.5 T scanner equipped with a home made DTI pulse sequence(Hirsch), and a Symphony 1.5 T scanner with vendor-installed DTI capabilities. For the application reported here,we acquired 19 tilted axial slices (bhigh =1000 s/mm2 , b low =0, slice thickness 4mm, 8 acquisitions in each of 6
non-colinear diffusion-sensitive directions) during 4½ min measurement time. A high resolution T1-weightedMPR volume was also included in the protocol.
Processing steps
Since Matlab 6.5 has built-in support for reading DICOM images directly, geometrical information and imagedata from both the DTI sequence and the high-resolution anatomical sequence could be merged. Using a simplefiltering algorithm, brain parenchyma was segmented from background for further processing. In the presentimplementation, no movement correction or eddy-current correction was applied. However, a well-performingelastic registration algorithm was ready for use in case of geometric distortions between corresponding sliceimages. To calculate the symmetric 3x3 diffusion tensors D we used the derivations in Westin et al. (2002). Here,each diffusion tensor can be described by a linear combination of constant tensor elements, i.e. D =\sum_k=1^6 βk Gk , where βk = 1/b[ln(S0 ) - ln(Sb
k )], and the dual tensor basis, G 1 ,...,G 6 is calculated from
the outer product of gradient directions g1 ,...,g6 . We also calculate and visualize a number of diffusion
anisotropy measures derived from the tensors and their eigenvalues. Among these are the components of thetensor shapes - linear, planar, spherical - in the tensor basis D l ,Dp ,D s . Running our Matlab code on a 19 slices
DTI dataset using a P4 laptop computer, a complete analysis comprising all the above steps, took about 6 min(two of the resulting images are shown in Fig.1).
e1995
Abstracts presented at the 9th International Conference on Functional Mapping of the Human Brain, June 19Œ22, 2003, New York, NY
e1995
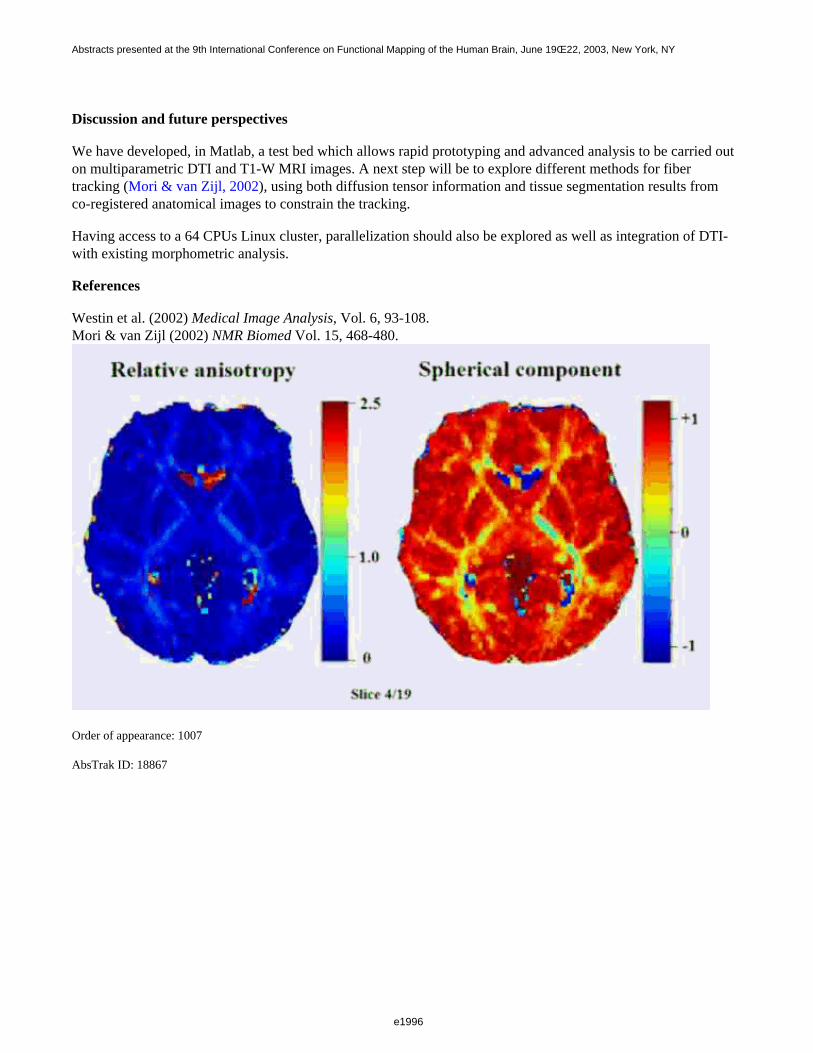
Discussion and future perspectives
We have developed, in Matlab, a test bed which allows rapid prototyping and advanced analysis to be carried outon multiparametric DTI and T1-W MRI images. A next step will be to explore different methods for fibertracking (Mori & van Zijl, 2002), using both diffusion tensor information and tissue segmentation results fromco-registered anatomical images to constrain the tracking.
Having access to a 64 CPUs Linux cluster, parallelization should also be explored as well as integration of DTI-with existing morphometric analysis.
References
Westin et al. (2002) Medical Image Analysis, Vol. 6, 93-108.Mori & van Zijl (2002) NMR Biomed Vol. 15, 468-480.
Order of appearance: 1007
AbsTrak ID: 18867
e1996
Abstracts presented at the 9th International Conference on Functional Mapping of the Human Brain, June 19Œ22, 2003, New York, NY
e1996
Poster number: 1017
Correction of FDG-PET data for Partial Volume Effect: Application toAlzheimer’s Disease (AD).
Karim Berkouk*, Mario Quarantelli†, Nacer Kerrouche*, BEATRICE DESGRANGES*,Anna Prinster†, Brigitte Landeau*, Bruno Alfano†, Jean Claude Baron‡
*INSERM EMI0218, Cyceron, Caen, France†Biostructure and Bioimaging Institute, National Council for Research, Naples, Italy
‡Dept of Neurology, Uni. of Cambridge, UK
Modeling & Analysis
Abstract
Introduction
Current methods for partial volume effect (PVE) correction [1] can provide PVE-corrected images [2] or ROIdata [3]. In a preliminary study, we corrected PVE from both CSF and WM in a small sample and using a fewlarge ROIs [4]. In the present work, we have included a larger sample of AD patients, and assessed smaller andmore relevant brain structures.
Material and Methods
Image processing: FDG-PET (ECAT HR+) and T1-weighted volume MRI sets were obtained in 23 mild ADpatients (NINDS-ADRDA criteria; MMSE=22.3 ±2.5; mean age: 73.3 ±5.4) and 13 normal volunteers (NV, meanage: 63.1 ±9.9). GM, WM and CSF maps were obtained by probabilistic MRI segmentation [5], and thenco-registered to PET [6].
ROI definition:
Using the Talairach Daemon, each voxel was labelled univoquely as belonging to one ROI only in the templatespace. Gray matter (GM) ROIs relevant to AD included association parietal, occipital and temporal cortices, thecaudate, pallidum, putamen and thalamus, the dorso-lateral prefontal cortex (DPLF, BA 8, 9 and 49), the posteriorcingulated gyrus, hippocampus and cerebellum. For each subject, normalization parameters for the PET imageswere determined using SPM99 (linear affine transformation). The ROIs template was accordingly brought to theoriginal PET space and applied to the normalised PET data set.
PVE:
using inhouse software, PVE was corrected according to four methods: Meltzer [1], Mueller Gartner [2], Rousset [3] and “modified Muller-Gartner” (WM value is first corrected from PVE and then used in the Mueller-Gartner’s method).
Statistics: Data were normalized by mean cerebellum counts, and comparison between AD and NV wasperformed using Wilcoxon (p< 0.05), controlling for age.
Results
e1997
Abstracts presented at the 9th International Conference on Functional Mapping of the Human Brain, June 19Œ22, 2003, New York, NY
e1997

Mean increase in GM PET values was 22% and 26% in NV and AD, respectively, when correcting for CSF only,and always >35% when correcting for both WM and CSF.
Without correction, most ROIs were significantly lower in AD relative to NV. With PVE correction for CSF only,the left parietal, caudate and pallidum as well as right putamen and posterior cingulate remained significant.When correcting also for WM, only the left parietal , left caudate (e.g. p= 0.034 with Rousset) and right posteriorcingulate (e.g p=0.017 with Muller-Gartner) remained significant, regardless of the of method used.
Comment
Using a novel ROI method, we show that PVE correction can be applied to small and specific brain structures.Importantly, we find that even after PVE correction for both CSF and WM, several regions remained significantlyhypometabolic in AD, including the parietal and posterior cingulate cortices. The finding regarding the caudatenucleus is less expected but intriguing. Further studies using different segmentation methods are in process.
Acknowledgments
This work is supported by PVEOut, a project co-financed by the EC (contract # QLG3-CT2000-594).
References
[1] Meltzer CC. J Cereb Blood Flow Metab 1996;16:650-8[2] Muller-Gartner HW, et al. J Cereb Blood Flow Metab 1992;12:571-83[3] Rousset OG, et al. J Nucl Med 1998;39:904-11[4] Prinster A, et al, HBM2002,S20183[5] Ashburner J. NeuroImage 2000; 11:805-21[6] Friston KJ. Human Brain Mapping 1995; 2:165-189
Order of appearance: 1008
AbsTrak ID: 18269
e1998
Abstracts presented at the 9th International Conference on Functional Mapping of the Human Brain, June 19Œ22, 2003, New York, NY
e1998
Poster number: 1018
The ICE software package: direct and accurate co-registration ofanatomical and functional datasets using DICOM image geometry
information.
Atle Bjørnerud
Dept. of Radiology, National Hospital, Oslo, Norway
Modeling & Analysis
Abstract
Introduction:
Accurate co-registration of anatomical and functional datasets is a critical requirement in fMRI; especially inpre-surgical planning. Most existing fMRI software tools perform ’brute force’ co-registration in the sense that noinformation about the actual real-world position of the acquired image volumes is used in the co-registrationalgorithms. Given that all current MR systems are DICOM compatible, accurate geometrical information isalways provided with every exported dataset and this information may therefore be used to perform accuraterealignment of any sets of data acquired in the same session without the need for any additional co-registrationprocedures.
Purpose:
The purpose of the current work was to develop a software package (ICE – Image Control and Evaluation) foraccurate co-registration of multiple datasets acquired in the same session based on the DICOM geometryinformation accompanying each dataset. A second objective was to ensure full compatibility between ICE andSPM (Statistical Parametric Mapping,Wellcome Department of Cognitive Neurology, London, UK).
Methods:
The Image Position and Image Orientation DICOM tags uniquely specify the exact position of any images slice ina DICOM dataset. The Image Position tag defines the x, y, and z coordinates of the upper left hand corner of theimage slice whereas the Image Orientation tag defines the direction cosines of the first row and the first column ofthe image slice with respect to the patient. A complete set of affine transformation matrices were constructed fromthe Image Orientation / Position data combined with the DICOM-provided voxel size for the respective imagesets. The resulting affine matrices were generated for each dataset and saved as Matlab compatible data files(mat-files). The DICOM dataset were converted to Analyze/SPM format and the resulting image/header files andtransformation mat-files could then be read directly into SPM and the resulting functional maps generated in SPMcould be imported back into ICE for overlay on anatomical datasets. The dataflow between ICE and SPM inshown in Figure 1.
Results:
The ICE software enables fast and accurate co-registration of functional and anatomical datasets. The accuracy ofthe co-registration could readily be validated by overlaying raw functional data sets onto anatomical datasets in amulti-planar reformat mode. The accuracy of the co-registration is mainly limited by the presence of geometricdistortion in the functional datasets.
e1999
Abstracts presented at the 9th International Conference on Functional Mapping of the Human Brain, June 19Œ22, 2003, New York, NY
e1999

Conclusions:
We have developed a software tool, which enables fast and accurate co-registration of anatomical and functionaldatasets based on the DICOM image geometry information. The approach requires no additional co-registrationsteps in most cases and the accuracy of the registration is only limited by the presence of geometric distortion inthe functional images.
Order of appearance: 1009
AbsTrak ID: 18370
e2000
Abstracts presented at the 9th International Conference on Functional Mapping of the Human Brain, June 19Œ22, 2003, New York, NY
e2000
Poster number: 1019
Segmentation of Perfusion-Weighted MR Images using IndependentComponent Analysis and Region Growing technique : Application to
acute ischemic stroke.
Kader Boulanouar*, Jean-Francois Albucher†, Christophe Cognard‡, Abdelkrim Lameche*, Isabelle Berry‡, Francois Chollet*†, Pierre Celsis*
*INSERM Unit455†Neurology Dept
‡Neuradiology Dept
Modeling & Analysis
Abstract
Introduction
Many issues in medical imaging could be handled with image segmentation methods. The perfusion-weightedimages in acute ischemic stroke is one among them. In this case, the problem is setting an optimal threshold toseparate hypoperfused cerebral areas from the tissue normally perfused. Delineation of ischemia andidentification of at-risk tissue is an important stage in the treatment plan for the emergency management of acuteischemic stroke. In ref. 1, segmentation of perfusion images is performed with a similarity-based method. Thismethod is a supervised segmentation and requires the determination of reference curves supplied by the userthrough the selection of typical pixels. The result is then dependent on the pixel selection . We have proposed (2)an ICA method which does not rely on any predefined with useful application to acute ischemic stroke. In thework presented here, we evaluated the quality of the segmentation offered by this method to differentiatehypoperfused areas from normal areas.
Design/Methods :
The perfusion images were obtained through bolus tracking of Gd-Pta with an echo-planar gradient-echo (TR=1.5s TE=66ms, voxel size 1x1x7 mm3, 12 slices). We applied the ICA analysis to the Dynamic SusceptibilityContrast data, the raw data. We used the fixed-point algorithm(3), a fast algorithm for ICA calculation. Thenumber of components was set to 14 and ICA was conducted in 24 patients with ischemic stroke. All patientsunderwent diffusion and perfusion MRI within 4H of symptom onset, and were examined again 4 days later. Twopatients underwent a PET examination following the first MRI exam.
Results
Two main components were systematically obtained in all subjects:
Component separating CSF from parenchyma.
Component separating normal tissue from hypoperfused tissue
Differentiation between White Matter and Grey Matter was not clearly evidenced by one component suggestingthat the susceptibility-curves are not very homogenous but are region dependent in White and Grey Matters.
e2001
Abstracts presented at the 9th International Conference on Functional Mapping of the Human Brain, June 19Œ22, 2003, New York, NY
e2001
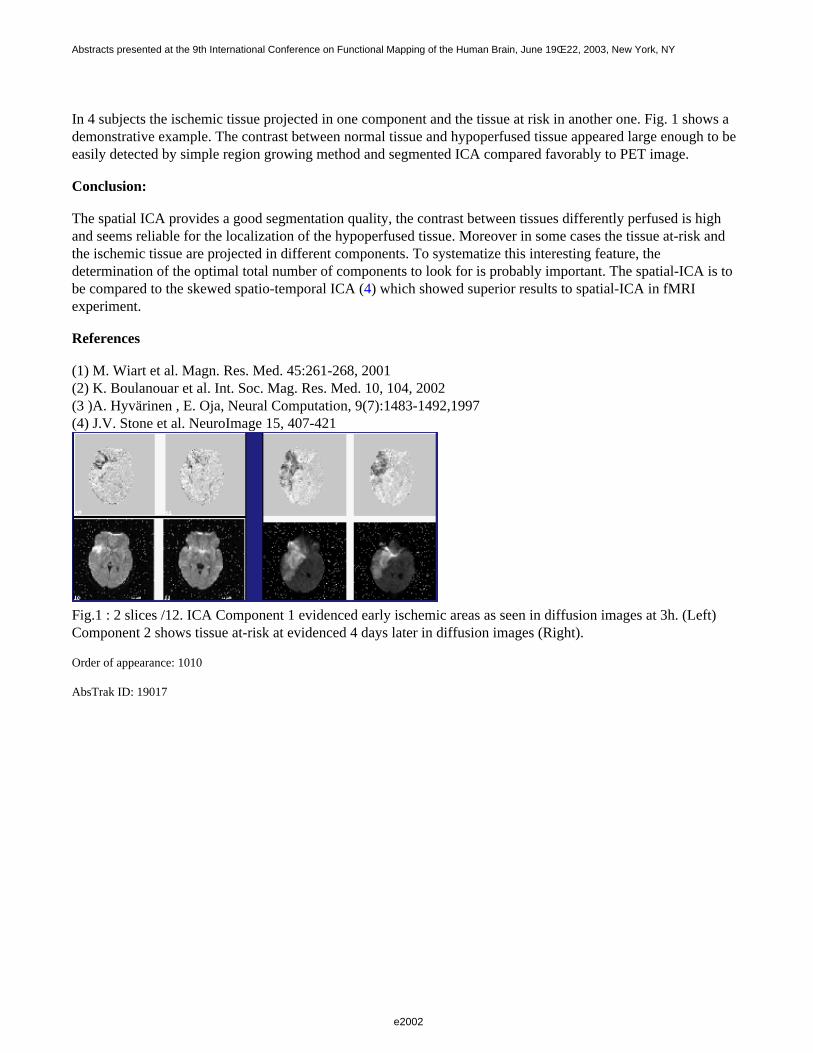
In 4 subjects the ischemic tissue projected in one component and the tissue at risk in another one. Fig. 1 shows ademonstrative example. The contrast between normal tissue and hypoperfused tissue appeared large enough to beeasily detected by simple region growing method and segmented ICA compared favorably to PET image.
Conclusion:
The spatial ICA provides a good segmentation quality, the contrast between tissues differently perfused is highand seems reliable for the localization of the hypoperfused tissue. Moreover in some cases the tissue at-risk andthe ischemic tissue are projected in different components. To systematize this interesting feature, thedetermination of the optimal total number of components to look for is probably important. The spatial-ICA is tobe compared to the skewed spatio-temporal ICA (4) which showed superior results to spatial-ICA in fMRI experiment.
References
(1) M. Wiart et al. Magn. Res. Med. 45:261-268, 2001(2) K. Boulanouar et al. Int. Soc. Mag. Res. Med. 10, 104, 2002(3 )A. Hyvärinen , E. Oja, Neural Computation, 9(7):1483-1492,1997(4) J.V. Stone et al. NeuroImage 15, 407-421
Fig.1 : 2 slices /12. ICA Component 1 evidenced early ischemic areas as seen in diffusion images at 3h. (Left)Component 2 shows tissue at-risk at evidenced 4 days later in diffusion images (Right).
Order of appearance: 1010
AbsTrak ID: 19017
e2002
Abstracts presented at the 9th International Conference on Functional Mapping of the Human Brain, June 19Œ22, 2003, New York, NY
e2002
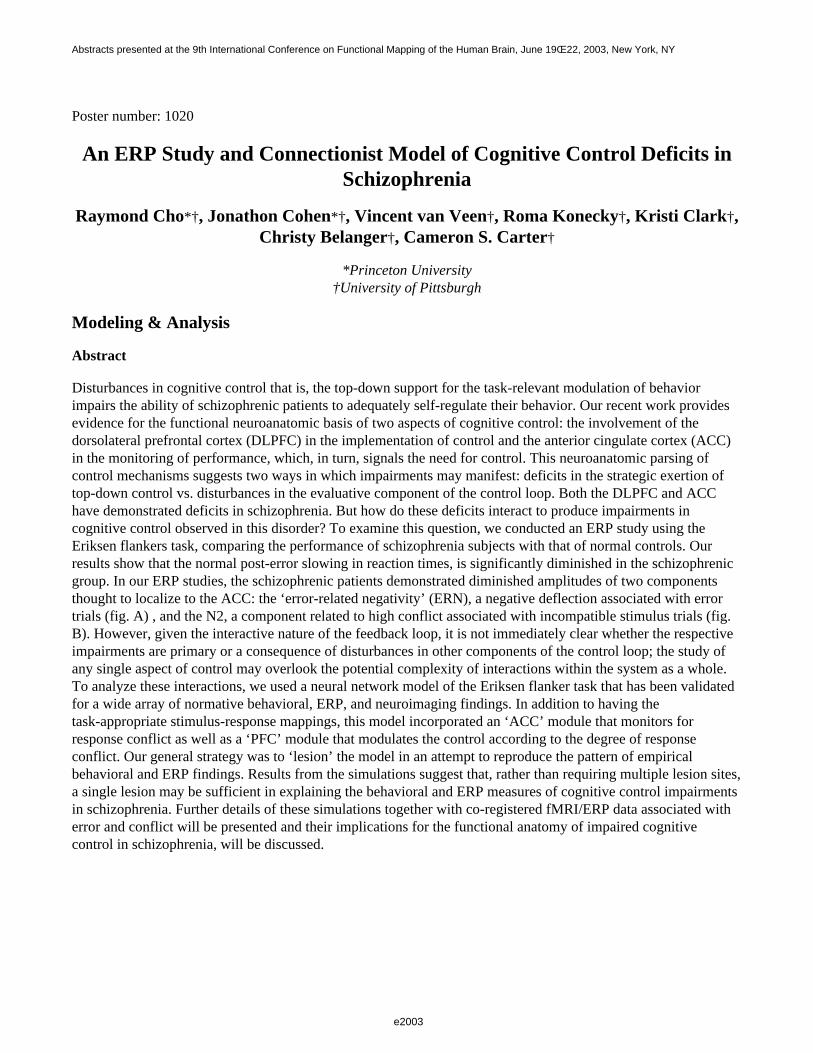
Poster number: 1020
An ERP Study and Connectionist Model of Cognitive Control Deficits in Schizophrenia
Raymond Cho*†, Jonathon Cohen*†, Vincent van Veen†, Roma Konecky†, Kristi Clark†,Christy Belanger†, Cameron S. Carter†
*Princeton University†University of Pittsburgh
Modeling & Analysis
Abstract
Disturbances in cognitive control that is, the top-down support for the task-relevant modulation of behaviorimpairs the ability of schizophrenic patients to adequately self-regulate their behavior. Our recent work providesevidence for the functional neuroanatomic basis of two aspects of cognitive control: the involvement of thedorsolateral prefrontal cortex (DLPFC) in the implementation of control and the anterior cingulate cortex (ACC)in the monitoring of performance, which, in turn, signals the need for control. This neuroanatomic parsing ofcontrol mechanisms suggests two ways in which impairments may manifest: deficits in the strategic exertion oftop-down control vs. disturbances in the evaluative component of the control loop. Both the DLPFC and ACChave demonstrated deficits in schizophrenia. But how do these deficits interact to produce impairments incognitive control observed in this disorder? To examine this question, we conducted an ERP study using theEriksen flankers task, comparing the performance of schizophrenia subjects with that of normal controls. Ourresults show that the normal post-error slowing in reaction times, is significantly diminished in the schizophrenicgroup. In our ERP studies, the schizophrenic patients demonstrated diminished amplitudes of two componentsthought to localize to the ACC: the ‘error-related negativity’ (ERN), a negative deflection associated with errortrials (fig. A) , and the N2, a component related to high conflict associated with incompatible stimulus trials (fig.B). However, given the interactive nature of the feedback loop, it is not immediately clear whether the respectiveimpairments are primary or a consequence of disturbances in other components of the control loop; the study ofany single aspect of control may overlook the potential complexity of interactions within the system as a whole.To analyze these interactions, we used a neural network model of the Eriksen flanker task that has been validatedfor a wide array of normative behavioral, ERP, and neuroimaging findings. In addition to having thetask-appropriate stimulus-response mappings, this model incorporated an ‘ACC’ module that monitors forresponse conflict as well as a ‘PFC’ module that modulates the control according to the degree of responseconflict. Our general strategy was to ‘lesion’ the model in an attempt to reproduce the pattern of empiricalbehavioral and ERP findings. Results from the simulations suggest that, rather than requiring multiple lesion sites,a single lesion may be sufficient in explaining the behavioral and ERP measures of cognitive control impairmentsin schizophrenia. Further details of these simulations together with co-registered fMRI/ERP data associated witherror and conflict will be presented and their implications for the functional anatomy of impaired cognitivecontrol in schizophrenia, will be discussed.
e2003
Abstracts presented at the 9th International Conference on Functional Mapping of the Human Brain, June 19Œ22, 2003, New York, NY
e2003
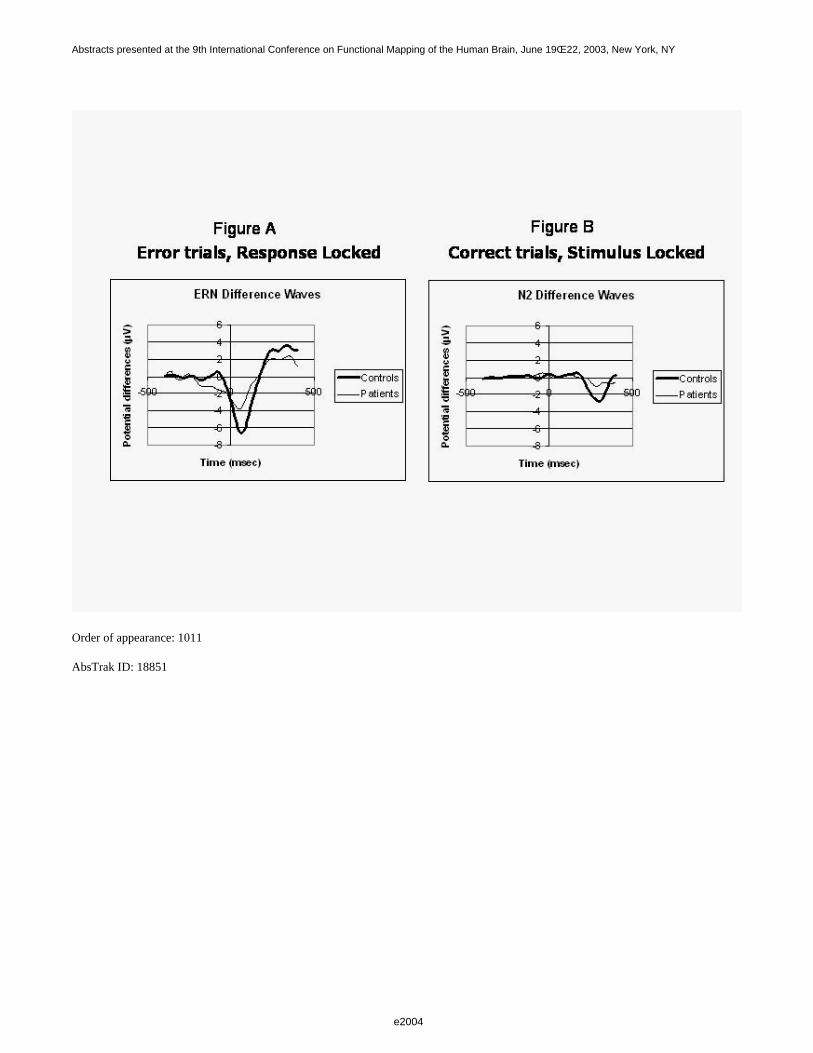
Order of appearance: 1011
AbsTrak ID: 18851
e2004
Abstracts presented at the 9th International Conference on Functional Mapping of the Human Brain, June 19Œ22, 2003, New York, NY
e2004
Poster number: 1021
A New Approach in fMRI Data Analysis for Detecting Activated Regionsin Stroke Patients
Andrea De Nicola*†‡, Cosimo Del Gratta*†‡, Antonio Ferretti*†‡, Massimo Caulo*‡,Armando Tartaro*‡, Gian Luca Romani*†‡
*Institute for Advanced Biomedical Technologies,University of Chieti, Italy†INFM, Chieti Group, Italy
‡Department of Clinical Sciences and Biomedical Imaging, University of Chieti, Italy§
Modeling & Analysis
Abstract
Introduction
In fMRI data analysis a standard hemodynamic response function (hrf) is commonly used, such as a delayedbox-car function, representing the expected hrf in healthy subjects. In stroke patients the BOLD fMRI responsemay considerably differ from a standard hrf, and, as a consequence, the BOLD signal may fail to be detected. Inthis work a new processing method for the detection of cerebral activated areas in stroke patients is presented.This method is based on the determination of the specific hrf for the activated area, resulting from anexperimental estimate of the average BOLD signal time-courses in this area. This way of analyzing fMRI data,allows the detection of activation in the cortical sensorimotor areas not detected by a statistical analysis that uses astandard hrf.
Methods
Preliminary results on five stroke patients are presented in this paper. We focus here on the relationship betweenneurophysiological and hemodinamic local properties, and for this reason we selected patients with preservedidentifiable neuronal response to somatosensory stimulation (Somatosensory Evoked Magnetic Fields). TheBOLD fMRI responses at 1.5 T to median nerve electric stimulation were investigated. For each study 60functional volumes were acquired with the following features: TR=3.5 s, TE=54 ms, 64x64 matrix, in-plane voxelsize 4mmx4mm, flip angle 90°, slice thickness 3mm and no gap. The paradigm was a block design with a total of6 rest and stimulation cycles, each lasting 35 s. Functional data were preprocessed before statistical analysis:motion correction, global normalization, temporal filtering were applied to the raw data. The statistical analysiswas performed in two steps. In the first step, a statistical analysis of the signal variance and a statistical correlationanalysis by means of a delayed box-car (standard statistical analysis) were performed jointly. Maps expressingrelative activation were calculated as a Z-score and cluster detection was performed on all voxels above Z=2.3 todetermine those significantly activated in both statistical tests (p<0.01). In the second step, the average BOLDsignal time-course measured in the voxels selected by the joint statistical analysis was used as the referencefunction in a subsequent statistical correlation analysis (specific statistical analysis).
Results
Results of the specific statistical analysis showed in all functional studies the presence of activation in the corticalsensorimotor areas, not revealed by the standard statistical analysis (Fig. 1a-b). In particular, the specificstatistical analysis, unlike the standard statistical analysis, always detected the activation of the primary sensoryarea (S1), which is the cortical area usually activated in healthy subjects for this kind of stimulation.
e2005
Abstracts presented at the 9th International Conference on Functional Mapping of the Human Brain, June 19Œ22, 2003, New York, NY
e2005
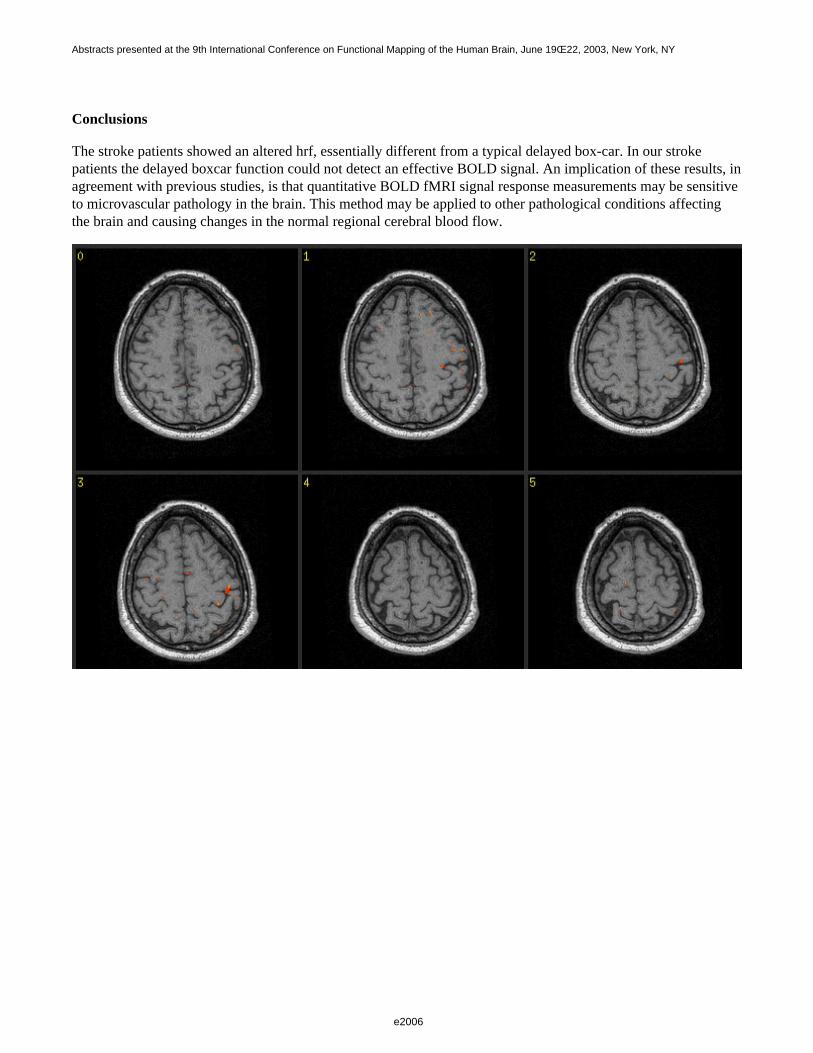
Conclusions
The stroke patients showed an altered hrf, essentially different from a typical delayed box-car. In our strokepatients the delayed boxcar function could not detect an effective BOLD signal. An implication of these results, inagreement with previous studies, is that quantitative BOLD fMRI signal response measurements may be sensitiveto microvascular pathology in the brain. This method may be applied to other pathological conditions affectingthe brain and causing changes in the normal regional cerebral blood flow.
e2006
Abstracts presented at the 9th International Conference on Functional Mapping of the Human Brain, June 19Œ22, 2003, New York, NY
e2006
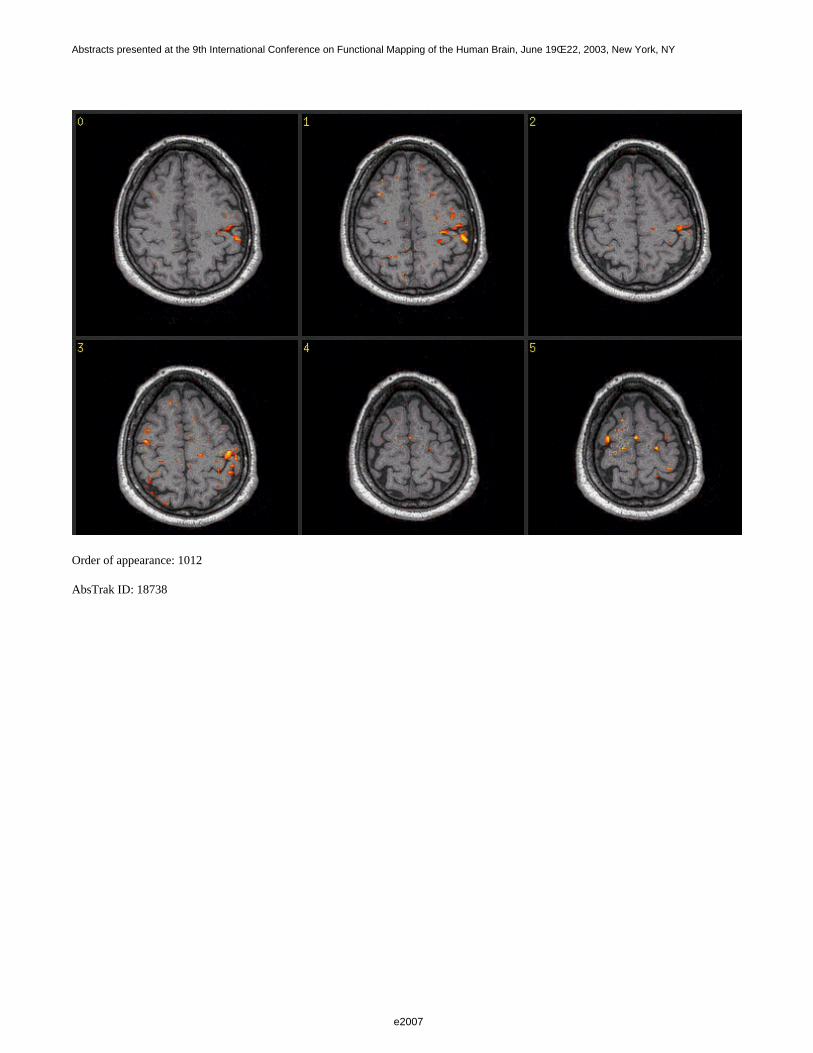
Order of appearance: 1012
AbsTrak ID: 18738
e2007
Abstracts presented at the 9th International Conference on Functional Mapping of the Human Brain, June 19Œ22, 2003, New York, NY
e2007
Poster number: 1022
Identifying Brain Areas with Significant rCBF Differences betweenParkinson’s Disease and Normal Control Subjects
Jeng-Ren Duann*†, Jung-Lung Hsu‡, Han-Cheng Wang‡, Tzyy-Ping Jung*†
*Computational Neurobiology Lab, the Salk Institute, La Jolla, CA 92037-5800, USA†Institute for Neural Computation, University of California, San Diego, CA 92093
‡Department of Neurology, Shin Kong WHS Memorial Hospital, Taipei, Taiwan, ROC
Modeling & Analysis
Abstract
Introduction
Despite extensive studies in Parkinson¡¦s disease (PD) in recent decades, the neural mechanisms of this commonneurodegenerative disease remain incompletely understood. Functional brain imaging technique such as singlephoton emission computerized tomography (SPECT) has emerged as a tool to help us understand the diseasepathophysiology by assessing regional cerebral blood flow (rCBF) changes. This study applies IndependentComponent Analysis (ICA) to assess the difference in rCBF between PD patients and healthy controls to identifybrain regions involving in PD.
Method:
Twenty PD patients (7 with Hoehn-Yahr stage I and 13 with stage III PD) and forty eight normal-controlvolunteers participated in this study. Patients were imaged after at least 1 month of stable anti-parkinsoniantherapy with optimal clinical benefit. Prior to scanning, subjects were injected with 740MBq (20 mCi) of [99mTc]HMPAO 30 minutes using the Dual-head Gamma Camera VariCam (GE, USA) with high resolution collimator.For each subject, the brain images were re-oriented and spatially normalized to the standard MNI (MontrealNational Institute) template in SPM99. The normalized images were then analyzed by Independent ComponentAnalysis to extract spatial independent brain areas that either account for the differences of rCBF between(normal vs PD) groups or subject variability in anatomy or rCBF. After the ICA training converged, we applied asimple statistic analysis (t-test) to the columns of unmixing matrix to identify components that account for grouprCBF differences.
Result:
The brain areas, identified by ICA accounting for group rCBF differences, including many regions in the basalganglia, the brainstem, the cerebellum and the cerebral cortex, are consistent with pathophysiological reports inPD. Most prominently, ICA finds many significant rCBF changes in the cerebral cortex that has been largelyoverlooked by the previous studies using region-of-interest approaches, yet the results are consistent withpathophysiological reports. We also found decreased rCBF in the substantia nigra in PD patients. According tobasal ganglia circuitry model, the neuronal loss in this region is the cause of clinical motor features of PD.However, until now, only the neuropathological study has demonstrated the involvement (i.e. neuronal loss) ofthis region in PD. Our result may be the first direct evidence to the well-anticipated decreased rCBF in thispathogenic region in PD.
Conclusion:
e2008
Abstracts presented at the 9th International Conference on Functional Mapping of the Human Brain, June 19Œ22, 2003, New York, NY
e2008
The use of ICA can complement hypothesis-driven methods for analyzing SPECT data because: (1) ICA does notrely on a priori knowledge of the involvement of brain regions in PD. (2) ICA can be used to separate thecomponent processes accounting for disease-related metabolic responses, non-disease related physiologicalphenomena and subject anatomical variability. ICA thus might be able to reveal additional connections,interactions or associations between different brain areas in PD, which might have been overlooked by somehypothesis-driven methods. Furthermore, this ICA-based data-driven approach may help or suggest neurologiststo consider alternative disease and brain circuitry model in PD or other neurodegenerative diseases with a broaderand more comprehensive aspect.
Order of appearance: 1013
AbsTrak ID: 18028
e2009
Abstracts presented at the 9th International Conference on Functional Mapping of the Human Brain, June 19Œ22, 2003, New York, NY
e2009
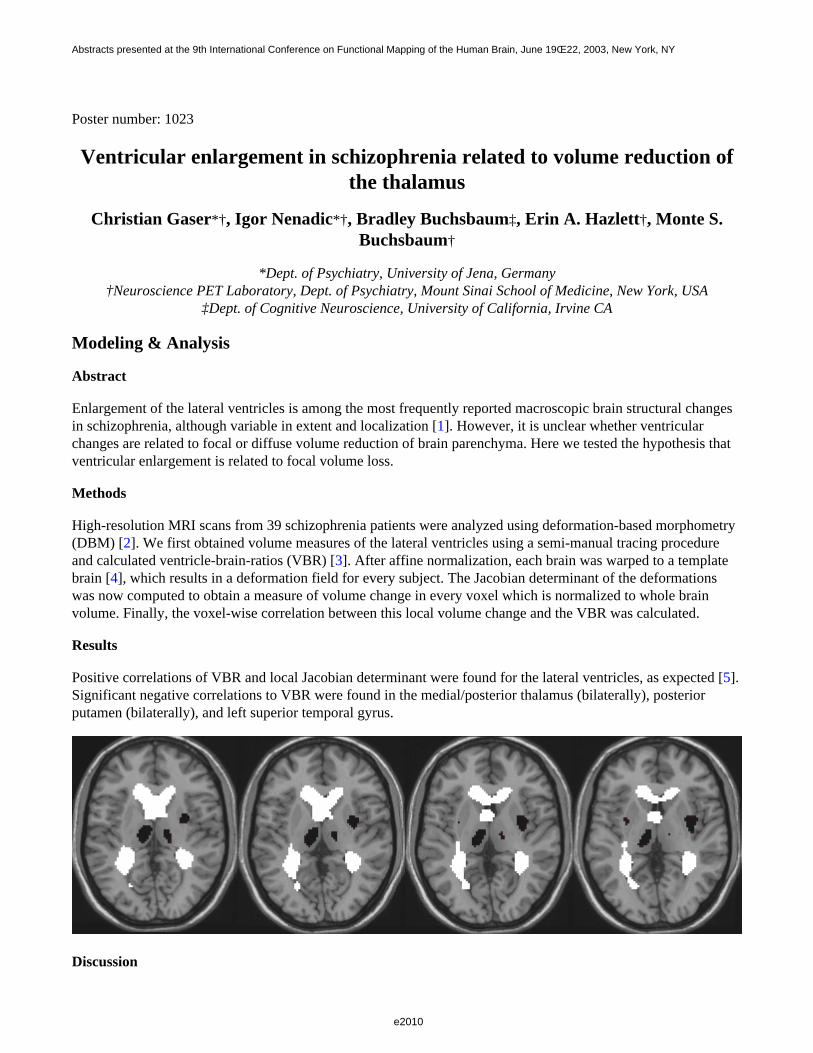
Poster number: 1023
Ventricular enlargement in schizophrenia related to volume reduction ofthe thalamus
Christian Gaser*†, Igor Nenadic*†, Bradley Buchsbaum‡, Erin A. Hazlett†, Monte S. Buchsbaum†
*Dept. of Psychiatry, University of Jena, Germany†Neuroscience PET Laboratory, Dept. of Psychiatry, Mount Sinai School of Medicine, New York, USA
‡Dept. of Cognitive Neuroscience, University of California, Irvine CA
Modeling & Analysis
Abstract
Enlargement of the lateral ventricles is among the most frequently reported macroscopic brain structural changesin schizophrenia, although variable in extent and localization [1]. However, it is unclear whether ventricularchanges are related to focal or diffuse volume reduction of brain parenchyma. Here we tested the hypothesis thatventricular enlargement is related to focal volume loss.
Methods
High-resolution MRI scans from 39 schizophrenia patients were analyzed using deformation-based morphometry(DBM) [2]. We first obtained volume measures of the lateral ventricles using a semi-manual tracing procedureand calculated ventricle-brain-ratios (VBR) [3]. After affine normalization, each brain was warped to a templatebrain [4], which results in a deformation field for every subject. The Jacobian determinant of the deformationswas now computed to obtain a measure of volume change in every voxel which is normalized to whole brainvolume. Finally, the voxel-wise correlation between this local volume change and the VBR was calculated.
Results
Positive correlations of VBR and local Jacobian determinant were found for the lateral ventricles, as expected [5].Significant negative correlations to VBR were found in the medial/posterior thalamus (bilaterally), posteriorputamen (bilaterally), and left superior temporal gyrus.
Discussion
e2010
Abstracts presented at the 9th International Conference on Functional Mapping of the Human Brain, June 19Œ22, 2003, New York, NY
e2010
This study demonstrates that larger ventricles within a population of schizophrenia patients are associated withregionally specific reductions of brain parenchyma, in both paraventricular and remote areas. Strongest effectswere found in the thalamus, which is adjacent to the body of the lateral ventricles, and might have a principal rolein schizophrenia. These results contradict the notion that large ventricles in schizophrenia simply reflect diffusebrain atrophy [6]. Rather, focal shrinkage in distinct gray matter regions involved in the pathophysiology of thedisorder might be a main contributor to this effect. This could also explain the variability in localization andextent of ventricular changes in schizophrenia.
References
[1] Wright, I.C. et al. (2000) Am J Psychiatry 157:16-25[2] Gaser, C. et al. (1999) Neuroimage 10:107-113[3] Buchsbaum, M.S. et al. (1997) Schizophr Res 27:45-53[4] Kjems, U. et al. (1999) IEEE Trans Med Imaging 18:306-319[5] Gaser, C. et al. (2001) Neuroimage 13:1140-1145[6] Symmonds, L.L. et al. (1999) J Neuroimaging 9:201-209
Order of appearance: 1014
AbsTrak ID: 17239
e2011
Abstracts presented at the 9th International Conference on Functional Mapping of the Human Brain, June 19Œ22, 2003, New York, NY
e2011
Poster number: 1024
Longitudinal changes of disease-specific gray matter deficits in twinsdiscordant for schizophrenia
Christian Gaser*, Heinrich Sauer*, Alexander Mohr†, Matthias Weisbrod‡
*Dep. of Psychiatry, University of Jena, Germany†Dept. of Neurology, University of Heidelberg, Germany
‡Dept. of Psychiatry, University of Heidelberg
Modeling & Analysis
Abstract
Genetic factors play a major role in the etiology of schizophrenia, but environmental effects may be necessary forits clinical expression [1]. Although structural MRI studies have provided much evidence for brain abnormalitiesin schizophrenia [2], there is still a controversial discussion on how genetic and environmental factors affect brainstructure and whether these brain abnormalities are neurodevelopmental and/or progressive [1]. Twin studies maybe able to give some answers on these questions because genetic and non-genetic effects could be separated. Arecent twin study of Cannon et al. revealed distributed gray matter deficits on the cortical surface and isolated itsgenetic and disease-specific components [3]. However, no study has yet explored whether these components arevariable over time. The goal of our study was to analyze whether disease-specific brain alterations are variableover time and point to a progressive component of disease-specific brain abnormalities.
Methods
We obtained high-resolution MRI-scans of 5 monozygotic (MZ) twin-pairs discordant for schizophrenia (3females, 2 males, age 31.8±15.9 years) and 5 MZ healthy twins (3 females, 2 males, age 31.8±14.2 years). Imageswere normalized and segmented into gray and white matter and CSF [4]. To obtain disease-specific effects wesubtracted gray matter images of the affected twin and its healthy co-twin and compared these intra-pairdifferences with healthy control twins.
We acquired a second MRI scan (discordant twins 10.8±3.3 months later, control twins 26.4±9.9 months) andcompared intra-pair differences between the two timepoints and two groups to obtain a map of disease-specificchanges over time.
Results
The first analysis of disease-specific effects revealed gray matter deficits in affected twins more pronounced inthe right hemisphere distributed over frontal, temporal, and parietal regions and in the cerebellum. Most of theregions were included in the result of the longitudinal analysis and showed that affected twins are loosingsignificantly more gray matter over time than their healthy co-twins in comparison to healthy twin-pairs.
e2012
Abstracts presented at the 9th International Conference on Functional Mapping of the Human Brain, June 19Œ22, 2003, New York, NY
e2012
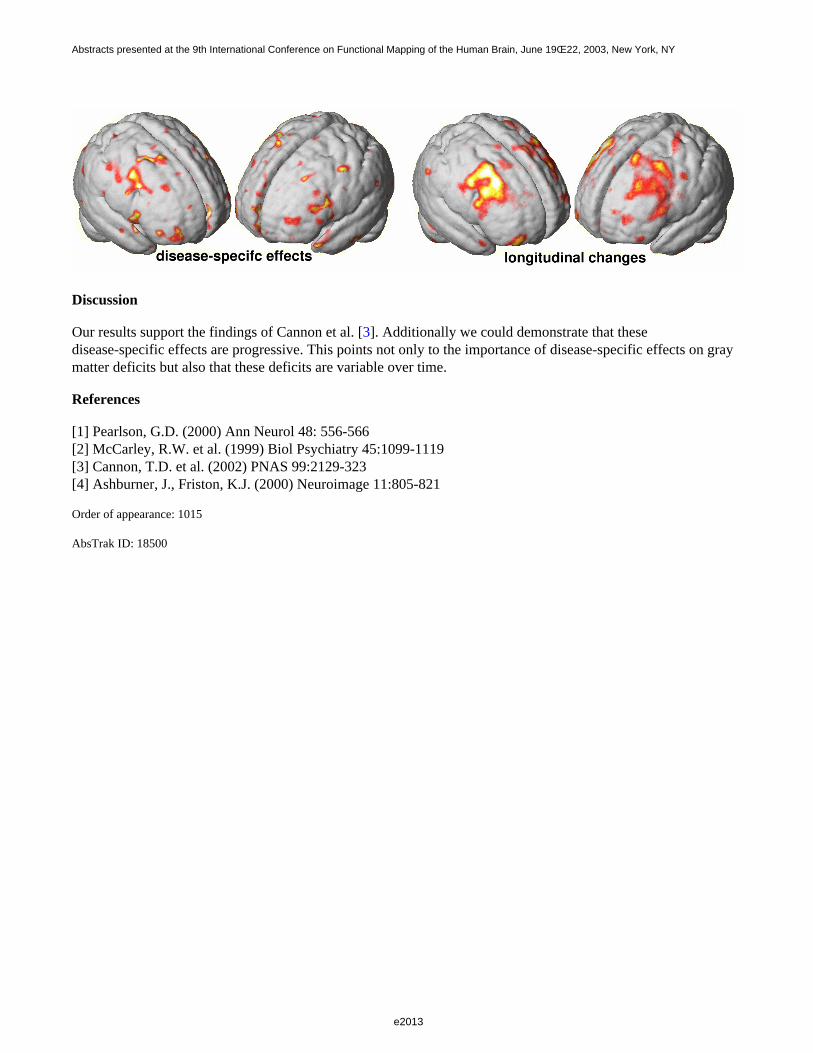
Discussion
Our results support the findings of Cannon et al. [3]. Additionally we could demonstrate that thesedisease-specific effects are progressive. This points not only to the importance of disease-specific effects on graymatter deficits but also that these deficits are variable over time.
References
[1] Pearlson, G.D. (2000) Ann Neurol 48: 556-566[2] McCarley, R.W. et al. (1999) Biol Psychiatry 45:1099-1119[3] Cannon, T.D. et al. (2002) PNAS 99:2129-323[4] Ashburner, J., Friston, K.J. (2000) Neuroimage 11:805-821
Order of appearance: 1015
AbsTrak ID: 18500
e2013
Abstracts presented at the 9th International Conference on Functional Mapping of the Human Brain, June 19Œ22, 2003, New York, NY
e2013
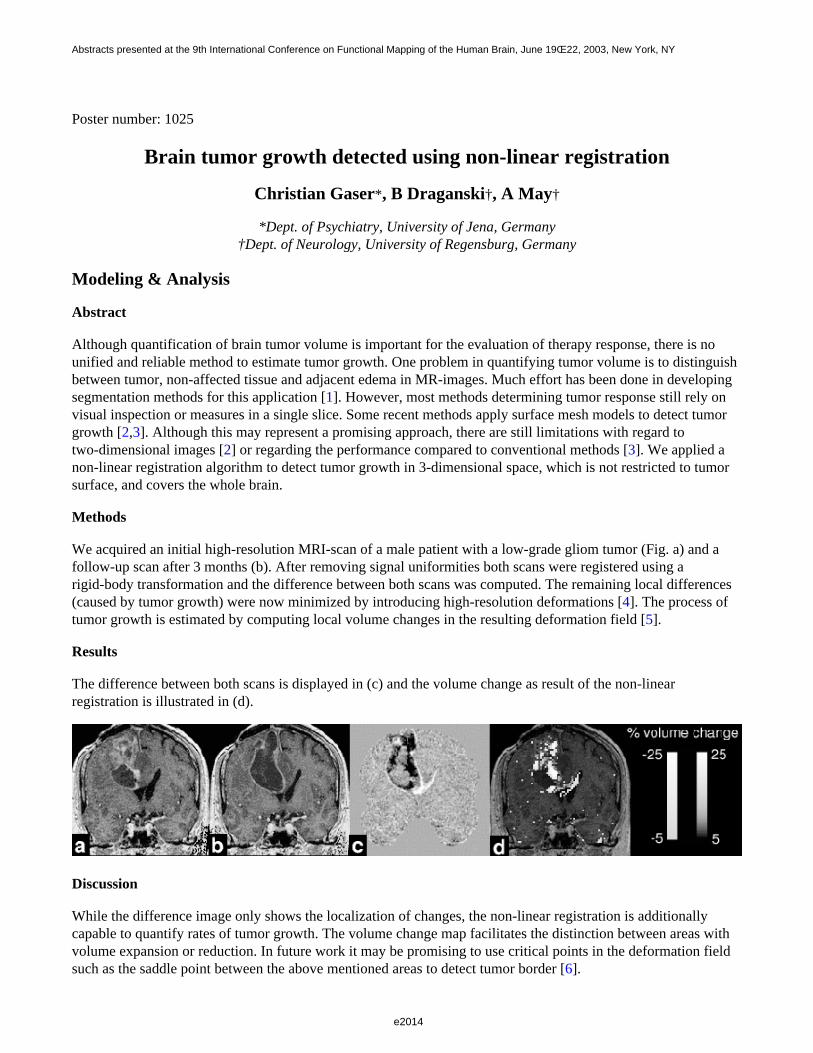
Poster number: 1025
Brain tumor growth detected using non-linear registration
Christian Gaser*, B Draganski†, A May†
*Dept. of Psychiatry, University of Jena, Germany†Dept. of Neurology, University of Regensburg, Germany
Modeling & Analysis
Abstract
Although quantification of brain tumor volume is important for the evaluation of therapy response, there is nounified and reliable method to estimate tumor growth. One problem in quantifying tumor volume is to distinguishbetween tumor, non-affected tissue and adjacent edema in MR-images. Much effort has been done in developingsegmentation methods for this application [1]. However, most methods determining tumor response still rely onvisual inspection or measures in a single slice. Some recent methods apply surface mesh models to detect tumorgrowth [2,3]. Although this may represent a promising approach, there are still limitations with regard totwo-dimensional images [2] or regarding the performance compared to conventional methods [3]. We applied anon-linear registration algorithm to detect tumor growth in 3-dimensional space, which is not restricted to tumorsurface, and covers the whole brain.
Methods
We acquired an initial high-resolution MRI-scan of a male patient with a low-grade gliom tumor (Fig. a) and afollow-up scan after 3 months (b). After removing signal uniformities both scans were registered using arigid-body transformation and the difference between both scans was computed. The remaining local differences(caused by tumor growth) were now minimized by introducing high-resolution deformations [4]. The process oftumor growth is estimated by computing local volume changes in the resulting deformation field [5].
Results
The difference between both scans is displayed in (c) and the volume change as result of the non-linearregistration is illustrated in (d).
Discussion
While the difference image only shows the localization of changes, the non-linear registration is additionallycapable to quantify rates of tumor growth. The volume change map facilitates the distinction between areas withvolume expansion or reduction. In future work it may be promising to use critical points in the deformation fieldsuch as the saddle point between the above mentioned areas to detect tumor border [6].
e2014
Abstracts presented at the 9th International Conference on Functional Mapping of the Human Brain, June 19Œ22, 2003, New York, NY
e2014

References
[1] Clark, L.P. et al. (1998) Magn Reson Imaging 16:271-279[2] Kyriacou, S.K. et al. (1999) IEEE Trans Med Imaging 18:580-592[3] Haney, S.M. (2001) Am J Neuroradiol 22:73-82[4] Ashburner, J. et al. (2000) Hum Brain Mapp 9:212-25[5] Gurtin, M.E. (1981) An Introduction to Continuum Mechanics, Academic Press[6] Abraham, R.H. and Shaw, C.D. (1992) Dynamics-The Theory of Behavior, Addison-Wesley
Order of appearance: 1016
AbsTrak ID: 18519
e2015
Abstracts presented at the 9th International Conference on Functional Mapping of the Human Brain, June 19Œ22, 2003, New York, NY
e2015
Poster number: 1026
Real-time fMRI processing and neurofeedback on a conventionalWindows PC
Vincent P. Giampietro*, Michael J. Brammer*, Steve Williams†, Virginia Ng†
*Brain Image Analysis Unit, Department of Biostatistics and Computing, Institute of Psychiatry, London†Neuroimaging Research Group, Department of Neurology, Institute of Psychiatry, London
Modeling & Analysis
Abstract
Introduction
A complete software solution is being developed to harness the advantages of fMRI so that information regardingdynamic brain changes can be assessed in real-time. Real-time fMRI (rtfMRI) is not a new idea: the first resultsusing this method were published in the mid-nineties and now around a dozen groups worldwide have unveiledtheir attempts at rtfMRI. Our method allows rtfMRI processing on a conventional Windows PC. It interactsautomatically with the MR scanner and other computers to access all the required data, processes it in thebackground, without operator intervention, allowing large-scale analysis of rtfMRI data. The functionalinformation is generated “on the fly” and the maps and associated data can be used for presentation to the subjectin neurofeedback paradigms. This technique is being tested in pre-surgical mapping and will also be applied to thesensory-motor rehabilitation of patients with acute stroke and to other cognitive disorders such as phobias.
Method
Our rtfMRI application automatically detects when an fMRI experiment is starting and intercepts the EPI images(GE Signa 1.5T) after reconstruction. The processing starts in the background and the activation maps and motionplots are updated as they are computed. Continuous communication with the stimulus presentation hardwareallows the software to get the experimental design in real time. The critical factor of rtfMRI is the TR, as all thereal-time work has to be performed within this time interval (1-2s). A biofeedback module, using 3D graphics,allows the subject to visually check and correct his head motion and will soon make it possible to modulate thebrain activity of a selected ROI. At the end of a run, the program resets itself and waits for the next experiment.
A flexible choice of analysis methods is offered and the images are saved in different formats, allowing the datato be re-analysed immediately and/or to be exported to other analysis packages.
Conclusions
With rtfMRI, data quality monitoring is possible in real-time. The experiment can be restarted if the subject ismoving too much, or if there is a clear indication that he is either not doing the experiment or has not understood it.
With rtfMRI, investigators are able to try new psychological tasks, new protocols or new hardware and can obtainan immediate feedback of their viability.
The analysis results can also be re-employed immediately to modify either the scanner parameters or theexperimental paradigm itself. This opens the door to a whole range of new and exciting techniques forneurological and clinical exploration.
e2016
Abstracts presented at the 9th International Conference on Functional Mapping of the Human Brain, June 19Œ22, 2003, New York, NY
e2016

RtfMRI seems to be ideally suited to the presurgical mapping of the sensory-motor strip and the language regions,and for the study of recovery after a brain insult. Carefully designed rtfMRI experiments could make a real impactin functional neurosurgery by providing immediate results to the surgeon.
Order of appearance: 1017
AbsTrak ID: 18228
e2017
Abstracts presented at the 9th International Conference on Functional Mapping of the Human Brain, June 19Œ22, 2003, New York, NY
e2017
Poster number: 1027
DIRECT NON INVASIVE BRAIN COMPUTER INTERFACE (BCIS).
Rolando Grave de Peralta *, Sara L. Gonzalez Andino*, Jose Millan†, Thierry Pun§,Cristoph M. Michel*
*Brain Mapping Lab. Neurology Dept. Geneva University Hospital, Switzerland†
‡IDIAP, Martigny. Switzerland§Informatics Dept. Geneva University. Switzerland
Modeling & Analysis
Abstract
A BCI allows a person to communicate with the external world using artificial electronic or mechanical devicescontrolled by means of brain signals. Present-day BCIs can be divided into invasive and noninvasive. Prospectiveapplication of invasive BCIs to humans is debatable, since they require direct recording of electrical activity fromthe cortex with the inherent medical risks. Furthermore, the quality of the signals directly recorded on the braindeteriorates over time requiring new surgical interventions and implants in order to keep the functionality of thedevice. Non-invasive BCI basically rely on specific scalp EEG features. The main disadvantage of latter methodsis that scalp EEG signals represent the noisy spatiotemporal overlapping of activity arising from very diversebrain regions, i.e., a single scalp electrode picks up and mixes the temporal activity of myriads of neurons at verydifferent brain areas. Consequently, temporal and spectral features, specific to different processes arising atdifferent areas, are intermixed on the same recording. Here we describe our approach to develop a directnoninvasive BCI system aimed to reproduce the excellent speed and prediction properties of the invasive systemswhile suppressing their risks. For doing that, we propose the non-invasive estimation of local field potentials inthe whole human brain from the scalp measured EEG data using recently developed inverse solutions (LAURA(2)and ELECTRA(1)) to the neuroelectromagtic inverse problem. Recent studies have shown that the temporal andspectral features of the electric activity within the brain can be estimated from the surface signals with highprecision. The goal of a linear inverse procedure is to de-convolve or un-mix the scalp signals attributing to eachbrain area it’s own temporal activity. By targeting on the particular temporal/spectral features at specific brainareas we expect to select a low number of features that capture information related to the state of the individual ina way that is relatively invariant to time. This avoids long training periods and increases the reliability andefficiency of the classifiers. For instances, in paralyzed patients the classification stage can be improved byfocusing on the specific brain areas known to participate and code the different steps of voluntary or imaginedmotor action trough temporal and spectral features. For these reasons, a direct non invasive BCI system based onlinear inverse solutions should combine the advantages of invasive and non invasive devices providing a safer andfaster alternative to translate brain thoughts into actions.
References
1.- Grave de Peralta, R, Gonzalez, S.L. Morand, S. Michel, C.M. and Landis, T. Imaging the electrical activity ofthe brain: ELECTRA. Human Brain Mapping,. 9, 1-12, (2000).2.- Grave de Peralta R, Gonzalez S, Lantz G, Michel CM, Landis T. Noninvasive localization of electromagneticepileptic activity. I. Method descriptions and simulations. Brain Topography, 2001; 14:131-138.
Acknowledgments:
e2018
Abstracts presented at the 9th International Conference on Functional Mapping of the Human Brain, June 19Œ22, 2003, New York, NY
e2018

Supported by IM2 Project (IDIAP) and Swiss National Science Foundation Grant 3165096.01.
Order of appearance: 1018
AbsTrak ID: 18878
e2019
Abstracts presented at the 9th International Conference on Functional Mapping of the Human Brain, June 19Œ22, 2003, New York, NY
e2019
Poster number: 1028
Brain Surface Conformal Mapping
Xianfeng Gu†, Yalin Wang*, Tony F. Chan*, Paul M. Thompson‡, Shing-Tung Yau§
*Division of Engineering and Applied Science, Harvard University†Department of Mathematics, UCLA
‡Laboratory of Neuro Imaging and Brain Research Institute, UCLA Medical Center§Department of Mathematics, Harvard University
Modeling & Analysis
Abstract
Recent developments in brain imaging have accelerated the collection and databasing of brain maps. However,computational problems arise when integrating and comparing brain data. One way to analyze and compare thebrain data is to map them into a canonical space while optimally retaining information on the original geometry.Many researchers have reported on surface parameterization, flattening, and warping methods to compare brain data[1, 2, 3, 4, 5, 6], some using conformal mappings.
Any genus zero surface can be mapped conformally onto the sphere and any local portion thereof onto a disc.This mapping, a conformal equivalence, is bijective and angle preserving, and the first fundamental form is onlyscaled. For this reason, conformal mappings are often described as being similarities in the small. Since thecortical surface of the brain is genus zero, conformal mapping is an ideal way to preserve its local geometricinformation. Indeed, several brain mapping groups have used conformal mappings to flatten surface data ortransform them to a canonical space[2, 3, 6]. However, these approaches are either not strictly angle preserving,or there are areas near the poles with large geometric distortion. In this paper, we propose a new genus zerosurface conformal mapping algorithm, which minimizes these problems, and demonstrate its application to themapping of brain surfaces.
A mapping between any two genus zero surfaces is conformal if and only if the mapping is harmonic. Ouralgorithm minimizes the harmonic energy of a degree one mapping by moving image points in the tangent spacesuntil the tangential Laplacian is zero. All conformal mappings form a so-called Mobius transformation group,which is six dimensional and can be formulated explicitly. By utilizing Mobius transformations, different regionsof the brain can be zoomed and examined. We add further constraints so that the algorithm converges to a uniqueconformal map.
Our algorithm computes conformal mappings accurately and stably. It depends only on the surface geometry andis invariant to differences in resolution and the specific triangulation used. More importantly, our algorithm canstraughtforwardly incorporate other constraints such as gyral/sulcal landmark information. It can be generalized tocompute the conformal mapping between any two genus zero surfaces, so it can register two brain surfacesdirectly, without using any intermediate canonical space. Our experimental results, applied to cortical surfacesextracted from MRI data, show that our algorithm is accurate and stable, and offers advantages for analyzingbrain surface data.
References
[1] Fischl et.al. Human Brain Mapping 8, 1999 [2] Hurdal et.al. NeuroImage 467(2000)[3] Haker et.al. IEEE Transactions on Visualization and Computer Graphics, 6(2), 2000[4–5] Thompson et.al. IPMI 2001, Computing and Visualization in Science 5, 2002
e2020
Abstracts presented at the 9th International Conference on Functional Mapping of the Human Brain, June 19Œ22, 2003, New York, NY
e2020

[6] Joshi et.al. Image Analysis and Understanding Data from Scientific Experiments, 2002
Order of appearance: 1019
AbsTrak ID: 17916
e2021
Abstracts presented at the 9th International Conference on Functional Mapping of the Human Brain, June 19Œ22, 2003, New York, NY
e2021
Poster number: 1029
Bayesian Morphological Analysis of Minimal Cognitive Impairment
Edward H Herskovits*, Hanchuan Peng†, Christos Davatzikos*, Susan M. Resnick‡
*University of Pennsylvania†Lawrence Berkeley National Laboratory
‡Laboratory of Personality and Cognition, National Institute on Aging, National Institutes of Health
Modeling & Analysis
Abstract
Introduction
We describe a morphology-function analysis method, based on data-mining techniques, for recoveringmorphology-function associations. We demonstrate our approach on magnetic-resonance (MR) brain images froma cross-sectional set of subjects, some of whom have mild cognitive impairment (MCI). This method detectsmorphological changes associated with MCI consistent with findings of other researchers.
Methods
Data Collection
We analyzed MR and clinical data from a cross-sectional subset of subjects from the Baltimore LongitudinalStudy of Aging (BLSA). Some of these individuals had developed signs of MCI, as defined by the ClinicalDementia Rating Scale [Morris 1993].
Image Preprocessing
Image segmentation [Pham 1999] yielded gray-matter (GM) and white-matter (WM) maps. Registration [Shen2001] yielded GM and WM volumetric histograms [Goldszal 1998]. Smoothed with a Gaussian kernel reducedthe effects of registration error. Down-sampling by a factor of 2 yielded 128x128x62 voxel GM and WMmorphological maps. Discretization identified GM and WM voxels that were decreased or increased in volumerelative to the mean across subjects.
Data Mining
Our Bayesian Morphological Analysis (BMA) algorithm is based on a Bayesian-network model of associationsamong morphological and clinical variables (Figure 1). We first find all voxels associated with MCI, based on aBayesian score [Cooper 1992]; we call the voxel most strongly associated with MCI the representative voxel(RV). We then find all voxels of which MCI is rendered conditionally independent, given the RV; MCI may havesimilar conditional-probability distributions given these candidate voxels (CVs), to that given the RV. We thenapply a Bayesian clustering method [Chickering 1997] to determine the subset of CVs for which MCI has aconditional distribution similar to that given the RV; these voxels constitute a cluster. We repeat this process untilno further RVs are found.
Results
We examined images from 40 BLSA subjects with varying degrees of cerebral atrophy, of which 7 had MCI. Inboth GM and WM maps, BMA produced two major MCI-association clusters. Approximately 5% of GM andWM voxels were found to be associated with MCI. There were no associations among clusters. The primary GM
e2022
Abstracts presented at the 9th International Conference on Functional Mapping of the Human Brain, June 19Œ22, 2003, New York, NY
e2022
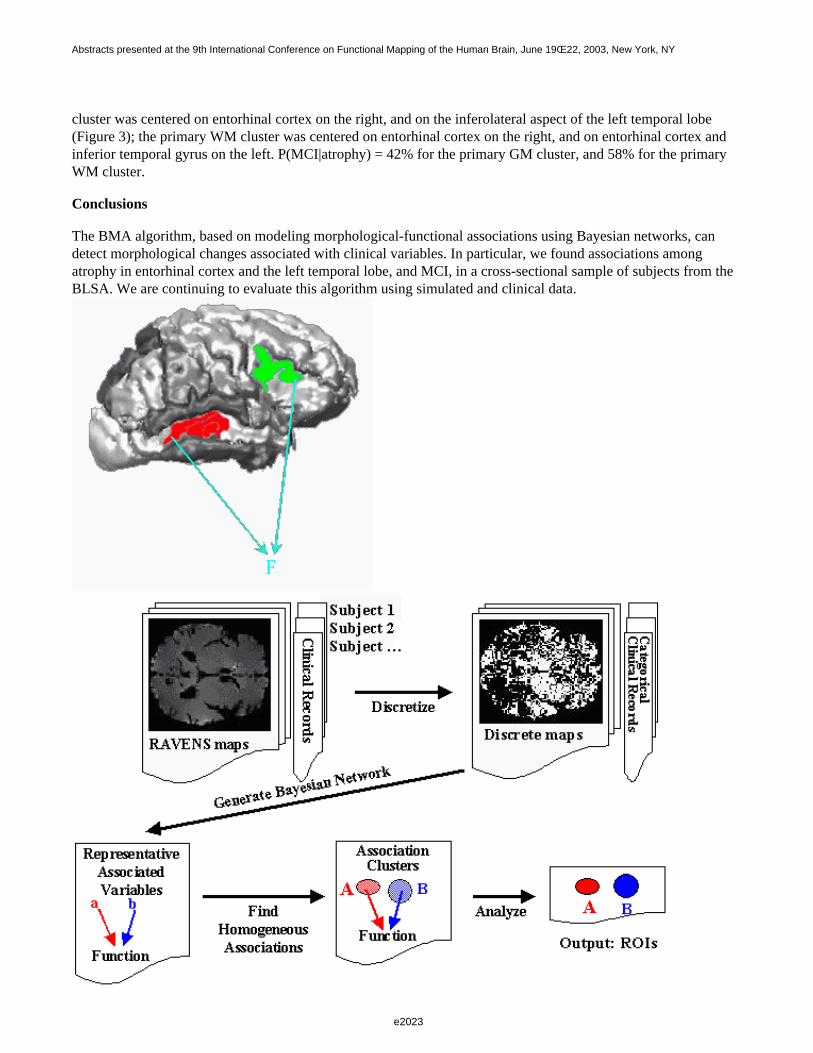
cluster was centered on entorhinal cortex on the right, and on the inferolateral aspect of the left temporal lobe(Figure 3); the primary WM cluster was centered on entorhinal cortex on the right, and on entorhinal cortex andinferior temporal gyrus on the left. P(MCI|atrophy) = 42% for the primary GM cluster, and 58% for the primaryWM cluster.
Conclusions
The BMA algorithm, based on modeling morphological-functional associations using Bayesian networks, candetect morphological changes associated with clinical variables. In particular, we found associations amongatrophy in entorhinal cortex and the left temporal lobe, and MCI, in a cross-sectional sample of subjects from theBLSA. We are continuing to evaluate this algorithm using simulated and clinical data.
e2023
Abstracts presented at the 9th International Conference on Functional Mapping of the Human Brain, June 19Œ22, 2003, New York, NY
e2023
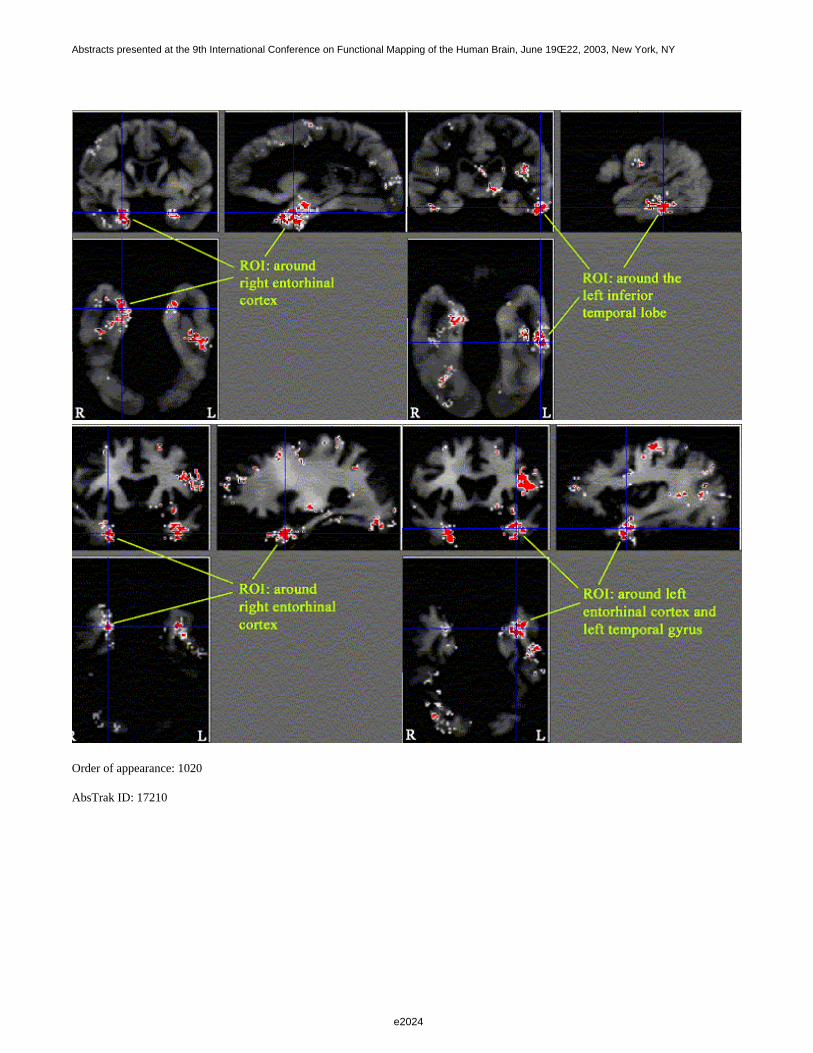
Order of appearance: 1020
AbsTrak ID: 17210
e2024
Abstracts presented at the 9th International Conference on Functional Mapping of the Human Brain, June 19Œ22, 2003, New York, NY
e2024
Poster number: 1030
The relationship of the BOLD response to the temporal distribution ofepileptiform discharges in EEG-fMRI
Lynn Ho*†, Louis Lemieux*, Afraim Salek-Haddadi*, Beate Diehl*‡
*Institute of Neurology, University College London†National Neuroscience Institute, Singapore
‡Cleveland Clinic Foundation
Modeling & Analysis
Abstract
Introduction
The relationship of the BOLD response to epileptiform discharges has yet to be systematically characterised [1, 2, 3, 4]. Stimuli timing in conventional fMRI is a crucial experimental factor [5, 6]. We investigated the relationshipof the temporal distribution of IEDs to the BOLD response using the concepts of detection (DE) and estimationefficiency (EE). Efficiency is inversely related to the variance of the parameter estimates [6]. We hypothesisedthat the efficiency scores and measures of BOLD response would correlate.
Methods
Data from five IGE patients with 3 Hz spike-and-wave IEDs were acquired. EEG-fMRI Acquisition: 1.5T GEHorizon Echospeed MRI scanner (continuous T2*-weighted gradient-echo EPI sequence; TR/TE=3000/40ms;700 vol., 21 slices). 11 channels of referential scalp EEG simultaneously recorded (online pulse and imagingartefact subtraction). Two datasets were acquired from Patient 5 and taken as independent. Pre-processing:slice-timing correction, spatial realignment, smoothing (FWHM 8mm); two expert observers encoded EEG eventonsets/durations. Data Analysis: DE and EE were calculated for each patient following [6]. For DE, the responseswere modeled using a canonical HRF and its time derivative. For EE, responses were modeled using a windowedFourier set of basis functions. Event onsets and onsets with variable event duration were considered separately.High-pass filtering (1/200s cut-off) was done. The computed SPMF’s were thresholded at α = 0.05, correctedfor multiple comparisons. Maximum F-ratios were correlated (Spearman) with the corresponding efficiency values.
Results & Discussion
The number of events ranged from 6 to 138; event interval range: 0.4 - 627.9s (range of means across patients:11.3 - 235.5s); event duration range: 0.3 - 15.1s (range of means across patients: 0.3 - 4.0s). Significant BOLDactivations (p<0.05) were revealed in 22 of the 24 analyses. When event duration was included, F-ratios werereduced in 7 out of 12 analyses and efficiencies were increased in all 12 analyses [Figure 1 & 2]. With eventonsets alone, the correlation between efficiency and the F-ratios were rs = 0.657 (p = 0.156) and rs = 0.60 (p =0.208) for DE and EE, respectively. For models incorporating event duration the correlation between efficiencyand the F-ratios were rs = 0.086 (p = 0.872) and rs = 0.086 (p = 0.872) for DE and EE, respectively.
In this small group of patients the temporal distribution of EEG events did not appear to be the main determinantof significant BOLD responses. An inherent assumption here is that all events and durations entered as parametersare equally meaningful, although we know that later events within a cluster could reflect propagation effects.Including event durations in the model yielded smaller correlation coefficients, possibly reflecting the inferiorityof the models as expressed by the generally lower F-ratios.
e2025
Abstracts presented at the 9th International Conference on Functional Mapping of the Human Brain, June 19Œ22, 2003, New York, NY
e2025
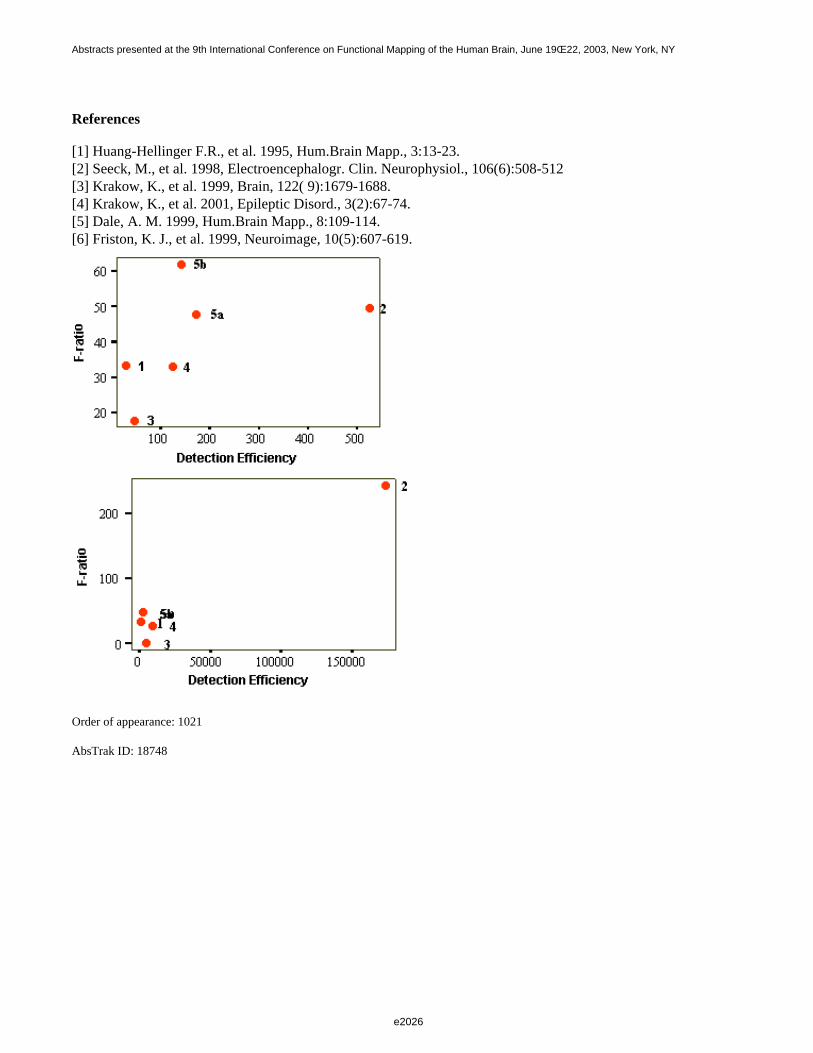
References
[1] Huang-Hellinger F.R., et al. 1995, Hum.Brain Mapp., 3:13-23.[2] Seeck, M., et al. 1998, Electroencephalogr. Clin. Neurophysiol., 106(6):508-512[3] Krakow, K., et al. 1999, Brain, 122( 9):1679-1688.[4] Krakow, K., et al. 2001, Epileptic Disord., 3(2):67-74.[5] Dale, A. M. 1999, Hum.Brain Mapp., 8:109-114.[6] Friston, K. J., et al. 1999, Neuroimage, 10(5):607-619.
Order of appearance: 1021
AbsTrak ID: 18748
e2026
Abstracts presented at the 9th International Conference on Functional Mapping of the Human Brain, June 19Œ22, 2003, New York, NY
e2026
Poster number: 1031
Quantification of secondary brain atrophy after capsular infarctiondetermined by Voxel-Guided Morphometry („VGM”)
Matthias Kraemer*, Thorsten Schormann†, Ruediger J. Seitz*
*Department of Neurology, Heinrich-Heine University, Düsseldorf, Germany†Department of Neuroanatomy, Heinrich-Heine University, Düsseldorf, Germany
Modeling & Analysis
Abstract
Introduction
Cerebral infarction undergoes excitotoxicity, inflammation, programmed neuronal death, and probably axonaldegeneration in the first weeks after acute ischemia. While structural changes in the infarcted core and periinfarctregions have been demonstrated in several studies, knowledge about delayed volume alterations in brain areasremote from the lesion is virtually lacking. Here we present the clinical and morphological long-terminvestigation in a lacunar infarction of the left internal capsule.
Method
The 34-year old woman suffered from a right hemiplegia at the time of admission to our hospital and had onlyone brain lesion in the internal capsule as demonstrated by T2-weighted MR images. The neurological deficit wasgraded using the European Stroke Scale (“ESS”) by the same experienced neurologists in the acute and chronicstage. The method we used for the assessment of brain volume changes is called Voxel-Guided Morphometry(“VGM”; 1). Briefly, patients were examined by means of a 3D fast, low angle shot (3D-FLASH) MRI scan. Thesegmented brains at two different times were matched to each other using a 4-step procedure resulting in an exactalignment of the two MRI data sets thus allowing to calculate and visualise morphological differences throughoutthe entire brain volume voxel-by-voxel without need for pre-selection of regions of interest.
Results
The volume of the left internal capsule infarction was 5 ml as determined planimetrically on T2-weighted MRimages. The initial ESS was 47/100 points and normalised to 100/100 points at 21 months after infarction.VGM-analysis showed that the brain volume affected by secondary atrophy was 89.5 mm3. This volume declineoccurred in the cerebral cortex of the affected hemisphere, the pons, and the contralateral cerebellum. Thus thesesecondary changes affected brain areas that were not affected by the infarct.
Conclusion
Secondary morphological changes after stroke can be quantified and demonstrated topographically using VGM.Notably, the patient showed a diverging development of an improving clinical status and a declining brainvolume. We hypothesise that this brain volume reduction was due to Wallerian degeneration of the afferent andefferent fibre tracts passing through the internal capsule which was induced by the lacunar infarct. The resultssuggest that the neurological recovery of the patient was due to plastic changes beyond the initially andsecondarily affected brain structures.
e2027
Abstracts presented at the 9th International Conference on Functional Mapping of the Human Brain, June 19Œ22, 2003, New York, NY
e2027

References
1. Thorsten Schormann, Matthias Kraemer, IEEE TMI, 2002 (in press).
Order of appearance: 1022
AbsTrak ID: 18207
e2028
Abstracts presented at the 9th International Conference on Functional Mapping of the Human Brain, June 19Œ22, 2003, New York, NY
e2028
Poster number: 1032
Cortical Atrophy in Left Temporal Lobe Epilepsy
Jason Lerch, Neda Bernasconi, Andrea Bernasconi, Alan Evans
McConnell Brain Imaging Centre, Montreal Neurological Institute
Modeling & Analysis
Abstract
Hippocampal atrophy is the most commonly reported MRI finding in patients with temporal lobe epilepsy (TLE).Structural damage outside of the hippocampus has been little investigated and the majority of studies have limitedtheir analysis to specific regions of interest. We previously demonstrated parahippocampal atrophy in TLEinvolving mostly the entorhinal cortex [1,2]. The present study aims to investigate changes in cortical thicknessacross the entire brain in TLE.
Methods
32 left-TLE patients and 51 normal controls were investigated. Lateralization of seizure focus in TLE wasdetermined by a comprehensive evaluation including video-EEG telemetry. A T1-weighted MRI with 1mmsampling was acquired for each subject. The MRIs were linearly registered into stereotaxic space [3], correctedfor non-uniformity artefacts [4], and classified into white matter, grey matter, and cerebro-spinal fluid [5]. Theinner and outer cortical surfaces were then extracted using deformable models [6]. The distance between thecorresponding vertices on the white and grey matter surfaces was measured at 40962 points across the cortex [6],and the resulting thickness map blurred using a 20 millimetre surface based blurring kernel [7]. Regressionagainst group was performed at every vertex, multiple comparisons corrected for using the False Discovery Ratealpha of 0.01, corresponding to a t-value of -2.47. Volumetric MRI showed left hippocampal atrophy in all patients.
Results
Statistically significant cortical thinning occurred ipsilaterally in the entorhinal cortex (t=-3), anteriorhippocampus (t=-3.1), dorsolateral prefrontal cortex (t=-3.1), and dorsal post-central gyrus (t=-3.7). Bilateralthinning was found in the middle post-central gyrus (t=-4 in the right hemisphere, t=-3 in the left). Contralateralthinning occurred in the frontal operculum (t=-4.1), the inferior temporal gyrus (t=-2.7) and superior temporalgyrus (t=-2.6), and the central sulcus(t=-2.7).
e2029
Abstracts presented at the 9th International Conference on Functional Mapping of the Human Brain, June 19Œ22, 2003, New York, NY
e2029
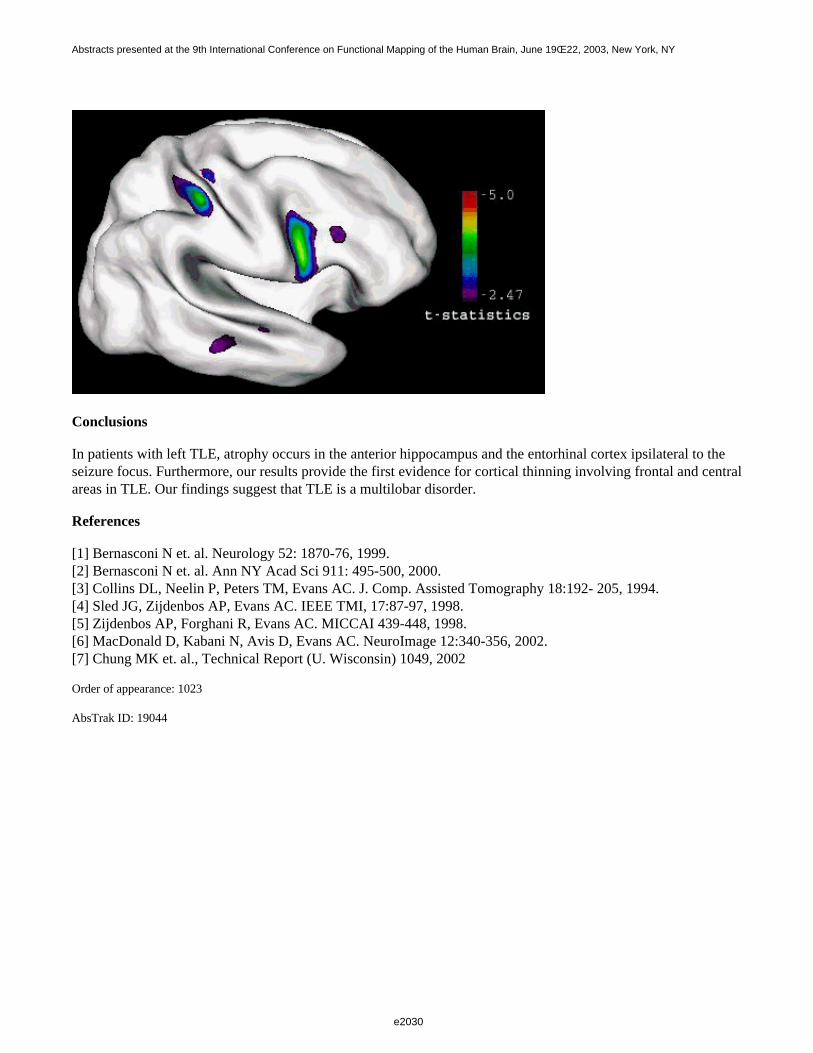
Conclusions
In patients with left TLE, atrophy occurs in the anterior hippocampus and the entorhinal cortex ipsilateral to theseizure focus. Furthermore, our results provide the first evidence for cortical thinning involving frontal and centralareas in TLE. Our findings suggest that TLE is a multilobar disorder.
References
[1] Bernasconi N et. al. Neurology 52: 1870-76, 1999.[2] Bernasconi N et. al. Ann NY Acad Sci 911: 495-500, 2000.[3] Collins DL, Neelin P, Peters TM, Evans AC. J. Comp. Assisted Tomography 18:192- 205, 1994.[4] Sled JG, Zijdenbos AP, Evans AC. IEEE TMI, 17:87-97, 1998.[5] Zijdenbos AP, Forghani R, Evans AC. MICCAI 439-448, 1998.[6] MacDonald D, Kabani N, Avis D, Evans AC. NeuroImage 12:340-356, 2002.[7] Chung MK et. al., Technical Report (U. Wisconsin) 1049, 2002
Order of appearance: 1023
AbsTrak ID: 19044
e2030
Abstracts presented at the 9th International Conference on Functional Mapping of the Human Brain, June 19Œ22, 2003, New York, NY
e2030
Poster number: 1033
Geometry-preserving white matter segmentation of MRI data
Gabriele Lohmann, Christoph Preul, Margret Hund-Georgiadis
Max-Planck-Institute of Cognitive Neuroscience, Stephanstr. 1a, D-04103 Leipzig, Germany
Modeling & Analysis
Abstract
An automatic white matter segmentation is a difficult task that poses a number of methodological problems. Weare mainly concerned with three aspects that arise in this context: grey level inhomogeneities, topologicalcorrectness and anatomical plausibility.
The problem of anatomical plausibility arises in particularly in cases where the MRI data show pathologicalabnormalities such as cortical atrophies. In such data, the boundary between grey and white matter may beobscured by partial volume effects so that the white matter stalks may become completely invisible in the data.
We present an new algorithm whose main characteristic is that it yields topologically correct results and observesgeometric constraints that allows it to segment images with extremely thin gyral stalks. Its prime advantage is thatit produces reliable results even in the presence of severe cortical atrophies.
Many existing algorithms fail in the presence of such conditions. In particular, algorithms that use deformablemodels impose smoothness constraints on the white matter surface that are unrealistic, because the white mattersurface is not smooth in many brain areas, especially not in the presence of pathologies.
Our present approach is an extension of our earlier algorithm that is included in the Lipsia software system. Itnow additionally includes a mechanism for geometry preservation that is essential for analyzing atrophied brains.
Our algorithm is a variation of the methodology of three-dimensional topological thinning. The main idea intopological thinning is to successively delete voxels until the “skeleton’’ remains where “deleting’’ amounts tosetting the voxel’s value to zero. The skeleton is topologically identical to the original image and it retains allbasic geometric features but it is reduced to a stick-figure representation.
In our context, we employ the same basic idea of voxel removal that leaves the topology and geometry intact.However, in our case, the process of voxel removal is stopped as soon as the grey/white matter boundary isreached. The criterion for detecting this boundary is adapted locally so that the problem of grey levelinhomogeneities is circumvented.
We use the fact that the brain’s white matter is covered by layers of grey matter which are iteratively eroded untilthe white matter surface appears. During the erosion process,topology preservation is enforced at each step. At thesame time, geometrical constraints are also enforced in much the same way as in topological thinning algorithms.This mechanism allows us to enforce the anatomical constraint that each gyrus must contain a white matter stalk.
Figure 1 shows a segmentation result. The brain shown in this image is severely atrophied so that the white matterstalks are invisible in some gyri. The arrows indicate problem areas. Note that even very thin gyral stalks arecorrectly segmented.
e2031
Abstracts presented at the 9th International Conference on Functional Mapping of the Human Brain, June 19Œ22, 2003, New York, NY
e2031
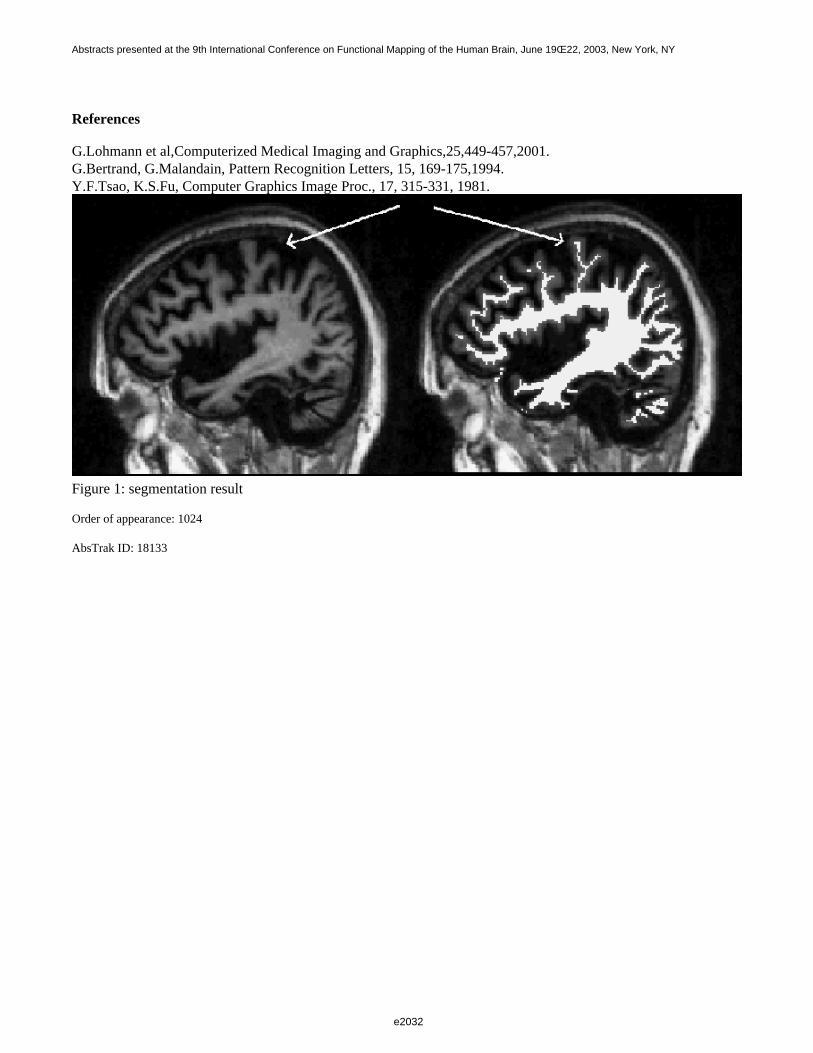
References
G.Lohmann et al,Computerized Medical Imaging and Graphics,25,449-457,2001.G.Bertrand, G.Malandain, Pattern Recognition Letters, 15, 169-175,1994.Y.F.Tsao, K.S.Fu, Computer Graphics Image Proc., 17, 315-331, 1981.
Figure 1: segmentation result
Order of appearance: 1024
AbsTrak ID: 18133
e2032
Abstracts presented at the 9th International Conference on Functional Mapping of the Human Brain, June 19Œ22, 2003, New York, NY
e2032
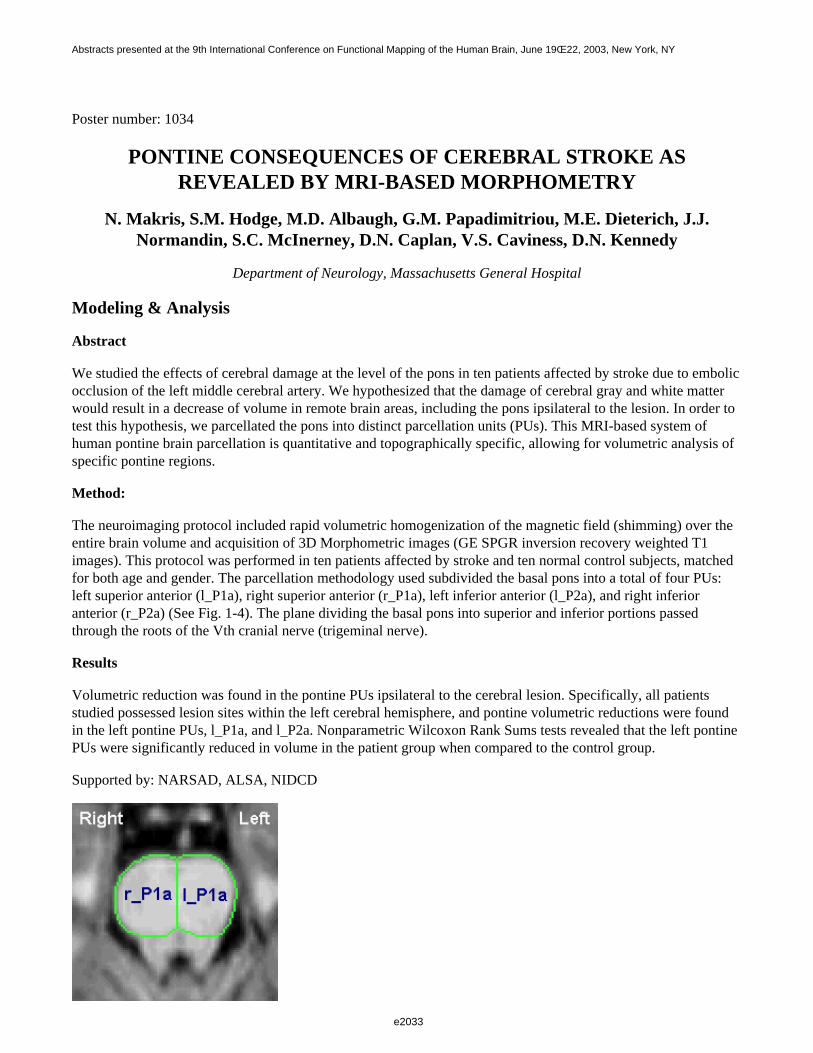
Poster number: 1034
PONTINE CONSEQUENCES OF CEREBRAL STROKE ASREVEALED BY MRI-BASED MORPHOMETRY
N. Makris, S.M. Hodge, M.D. Albaugh, G.M. Papadimitriou, M.E. Dieterich, J.J.Normandin, S.C. McInerney, D.N. Caplan, V.S. Caviness, D.N. Kennedy
Department of Neurology, Massachusetts General Hospital
Modeling & Analysis
Abstract
We studied the effects of cerebral damage at the level of the pons in ten patients affected by stroke due to embolicocclusion of the left middle cerebral artery. We hypothesized that the damage of cerebral gray and white matterwould result in a decrease of volume in remote brain areas, including the pons ipsilateral to the lesion. In order totest this hypothesis, we parcellated the pons into distinct parcellation units (PUs). This MRI-based system ofhuman pontine brain parcellation is quantitative and topographically specific, allowing for volumetric analysis ofspecific pontine regions.
Method:
The neuroimaging protocol included rapid volumetric homogenization of the magnetic field (shimming) over theentire brain volume and acquisition of 3D Morphometric images (GE SPGR inversion recovery weighted T1images). This protocol was performed in ten patients affected by stroke and ten normal control subjects, matchedfor both age and gender. The parcellation methodology used subdivided the basal pons into a total of four PUs:left superior anterior (l_P1a), right superior anterior (r_P1a), left inferior anterior (l_P2a), and right inferioranterior (r_P2a) (See Fig. 1-4). The plane dividing the basal pons into superior and inferior portions passedthrough the roots of the Vth cranial nerve (trigeminal nerve).
Results
Volumetric reduction was found in the pontine PUs ipsilateral to the cerebral lesion. Specifically, all patientsstudied possessed lesion sites within the left cerebral hemisphere, and pontine volumetric reductions were foundin the left pontine PUs, l_P1a, and l_P2a. Nonparametric Wilcoxon Rank Sums tests revealed that the left pontinePUs were significantly reduced in volume in the patient group when compared to the control group.
Supported by: NARSAD, ALSA, NIDCD
e2033
Abstracts presented at the 9th International Conference on Functional Mapping of the Human Brain, June 19Œ22, 2003, New York, NY
e2033
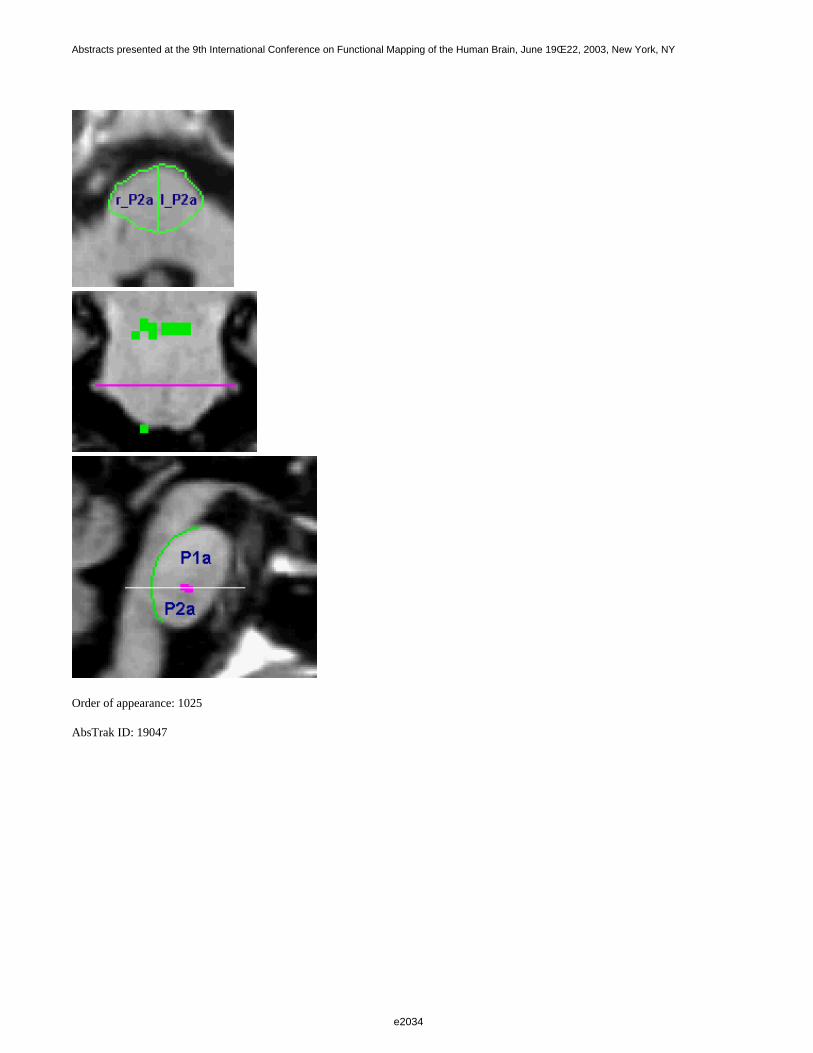
Order of appearance: 1025
AbsTrak ID: 19047
e2034
Abstracts presented at the 9th International Conference on Functional Mapping of the Human Brain, June 19Œ22, 2003, New York, NY
e2034
Poster number: 1035
"VIRTUAL" LESION ANALYSIS CREATES MAPS RELATINGBRAIN DAMAGE TO HIGHER COGNITIVE DYSFUNCTION
Coleman Martin, Daniel Tranel
Department of Neurology; University of Iowa
Modeling & Analysis
Abstract
Objective
Create lesion analysis maps of the human brain associating focal brain damage with neuropsychological deficitsby probing neural networks with virtual lesions.
Background
Until the advent of functional imaging, nearly all relationships between brain structure and function werediscovered through the lesion analysis method. Traditionally, this method selects patients with known structurallesions to test hypotheses about localization of function. In practice this method is hampered by barriers of fewsubjects with suitable lesions, and logistical difficulties in studying brain damaged individuals. Presented here arelesion analysis maps created with neural networks which generalize the relationships between focal brain damageand neuropsychological impairments.
Design/Methods:
Subjects:
415 right handed adults with focal brain damage due to stroke, trauma or surgical resection. All subjects wereassessed in the chronic epic with neuropsychological testing and structural magnetic resonance imaging to definethe location and extent of brain damage. Ten neural networks were trained to predict neuropsychologicalimpairments on each of 3 tests (Token test, Controlled Oral Word Association test, and Boston Naming test) fromthe lesion data. Each trained network was presented with 13,948,704 virtual lesions encompassing all possiblelesion patterns with properties similar to those in the training set. The networks were used to generateneuropsychological scores corresponding to each pattern. The 10,000 lesion patterns which yielded the lowestscores were retained. These worst-case lesions were overlapped to create 3-dimensional brain maps reflecting therelative importance of different brain areas for the execution of higher cognitive functioning.
Results
Overlapping the worst-case virtual lesions from each network resulted in maps with wide numeric separationbetween the least and most contributing brain areas. For example, with the Token test, 5 of the 37 left hemisphericareas probed accounted for over 50% of the 60,000 lesions included in the final overlap. These influential areasincluded inferior temporal gyrus, supramarginal gyrus, anterior and posterior limbs of the internal capsule,anterior insula. In contrast, basal ganglia and temporal pole were not represented in any of the worst case lesions.Three dimensional lesion overlap maps are presented for the above neuropsychological tests.
e2035
Abstracts presented at the 9th International Conference on Functional Mapping of the Human Brain, June 19Œ22, 2003, New York, NY
e2035

Conclusions:
With a robust database of lesion and neuropsychological data, machine learning algorithms can be used todetermine the relative importance of different brain areas for execution of higher cognitive functions. This newlesion analysis method maximally uses archival data and has the ability to infer important lesions not specificallyrepresented in the archival set.
Supported by Program Project Grant 5 PO1 NS19632-19
Order of appearance: 1026
AbsTrak ID: 18389
e2036
Abstracts presented at the 9th International Conference on Functional Mapping of the Human Brain, June 19Œ22, 2003, New York, NY
e2036
Poster number: 1036
Assessment of the vascular responses of drug abusers and its implicationsfor brain imaging investigations.
Kevin Murphy*, Jacqueline Kaufman†, Robert Risinger†, Elliot Stein†, Hugh Garavan*†
*Department of Psychology and Trinity College Institute of Neuroscience, Trinity College, Dublin, Ireland.†Department of Psychiatry and Behavioral Medicine, Medical College of Wisconsin, Milwaukee, USA.
Modeling & Analysis
Abstract
Introduction
The investigation of clinical populations to find inherent differences in brain activity is one of the applications ofnon-invasive brain imaging with great potential benefit. Research on the effects of drugs of abuse is one suchapplication. However, given that many drugs may have direct vascular effects, it is important that researchersshould determine the extent to which these non-neuronal effects might affect fMRI activation levels. This may beof particular concern in event-related fMRI designs in which haemodynamic responses may overlap, therebyrequiring deconvolution analyses which assume linearly additive haemodynamic responses. To investigatepossible alteration in task-related activation, four groups performed a simple event-related fingertapping task:controls, cocaine, nicotine and THC (marijuana) users.
Method
Twenty-eight subjects, 7 per group and all drug abstinent for at least 24 hours, performed the task. A flashingcheckerboard lasting 1 second was presented 30 times over 6 minutes every 8 to 16 seconds at a frequency of4Hz. When the checkerboard appeared, the subjects were required to finger-tap bilaterally. This was analysedusing a standard deconvolution technique yielding an impulse response function (IRF) for each voxel. Agamma-variate haemodynamic model, y = k t r e -t/b , was fitted to each IRF. A percentage area under the curvemeasure (%AUC) was calculated for each voxel by expressing the area under the hemodynamic curve as apercentage of the area under the baseline (i.e., tonic activation levels). A voxelwise t-test was performed using the28 %AUC activation maps, thresholded (t = 5.41, p = 0.00001) and a cluster criterion of 100 voxels imposed togive regions-of-interest (ROIs). The mean %AUC in each ROI for each subject was calculated. Each drug groupwas t-tested against controls.
Results
Of the eight ROIs that were found, only one, the largest ROI positioned in the left primary motor area (2444mm3 ,x = -39.3, y = 17.2, z = 49.1), showed significant group effects. Significant differences between cocaine users andcontrols (t(12) = -2.782, p = 0.017) and between THC users and controls (t(12) = -3.612, p = 0.004) were foundwhile nicotine users and controls did not differ (t(12) = -1.092, p = 0.296).
Discussion
The results suggest that cocaine and THC users may differ in fMRI activation measures when performing asimple motor task. Given that these drugs might not be expected to affect the neuronal basis of this simple fingertapping task, it is possible that the vascular response to increased neuronal firing (or the neuronal-vascularcoupling) may be compromised. Consequently, when investigating psychological processes of interest, cautionshould be exercised when comparing fMRI activation measures between controls and users of vasoactive drugs.
e2037
Abstracts presented at the 9th International Conference on Functional Mapping of the Human Brain, June 19Œ22, 2003, New York, NY
e2037

Ongoing analyses are investigating the specific alteration in the haemodynamic responses of the drug users andpresent the possibility that a simple task such as this may have clinical utility in detecting possible vascular compromise.
Support
NIDA DA14100; GCRC M01 RR00058; IRCHSS.
Order of appearance: 1027
AbsTrak ID: 18274
e2038
Abstracts presented at the 9th International Conference on Functional Mapping of the Human Brain, June 19Œ22, 2003, New York, NY
e2038
Poster number: 1037
Spatial Distribution of Temporal Lobe Subregions in First EpisodeSchizophrenia: Statistical Probability Atlas Approach
Hae-Jeong Park*†, Martha E. Shenton*†, Marek Kubicki*†, Robert W. McCarley*
*Clinical Neuroscience Division, Laboratory of Neuroscience, Boston VA Health Care System-Brockton Division,Department of Psychiatry, Harvard Medical School, Boston, MA, USA
†Surgical Planning Laboratory, MRI Division, Department of Radiology, Brigham and Womens Hospital,Harvard Medical School, Boston, MA, USA
Modeling & Analysis
Abstract
A statistical probability atlas map of schizophrenia can be a useful tool for better understanding developmentaland subsequent abnormalities, since it provides information on the neuroanatomic complexity and variability ofthis disease. In order to characterize this population’s distribution of specific ROIs in the spatial space, we createdstatistical probabilistic atlas maps of first episode schizophrenia and age-, sex-, and handedness-matched normalcontrols. Nine manually parcellated ROIs of the temporal cortex (Heschl gyrus, planum temporale, superiortemporal gyrus, medial temporal gyrus, inferior temporal gyrus, amygdala hippocampal complex,parahippocampus and fusiform gyrus) were spatially normalized to a Talairach space with affine transformations.Spatial distributions and anatomical variability of first episode schizophrenic subjects were explored withvoxel-by-voxel probability maps and probability difference maps. A significant difference of ROI locationbetween schizophrenia and controls was found in the (bilateral) fusiform gyri and the left hippocampus. In thefusiform gyrus and hippocampus, first episode schizophrenia patients showed lower probability at the lateral,dorsal and posterior regions than the normal control group. The different distribution of ROIs betweenschizophrenia patients and normal control subjects supports the necessity of pathology-specific probability atlasmaps, especially in the neuroimaging field.
e2039
Abstracts presented at the 9th International Conference on Functional Mapping of the Human Brain, June 19Œ22, 2003, New York, NY
e2039
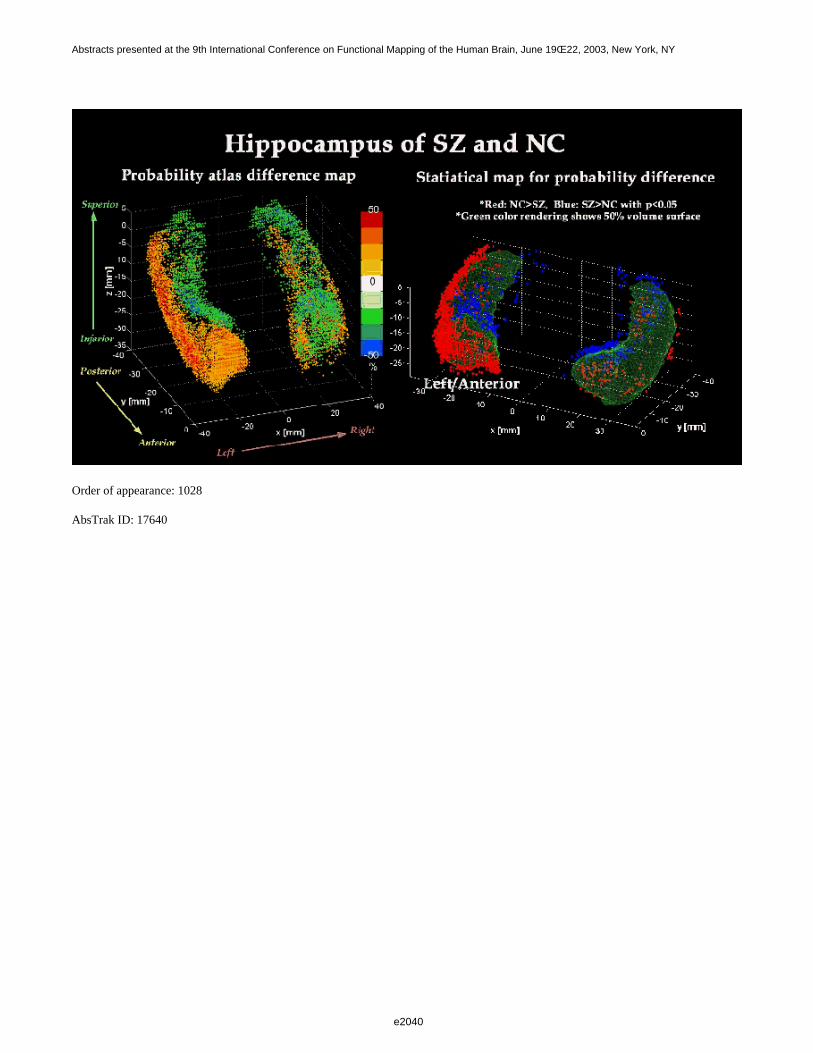
Order of appearance: 1028
AbsTrak ID: 17640
e2040
Abstracts presented at the 9th International Conference on Functional Mapping of the Human Brain, June 19Œ22, 2003, New York, NY
e2040
Poster number: 1038
Local differences in brain size between schizophrenia patients and healthy controls
P. Pieperhoff*, K. Amunts†, H. Mohlberg†, U. Habel*, M. Klein*, H.J. Choi‡, F. Schneider*, K. Zilles†‡
*Department of Psychiatry and Psychotherapy, Heinrich-Heine-University, Bergische-Landstrasse 2, D-40629Duesseldorf, Germany
†Institute of Medicine, Forschungszentrum Juelich, D-52425 Juelich, Germany‡C.&.O. Vogt Institute for Brain Research, Heinrich-Heine-University, P.O. Box 101007, D-40001 Duesseldorf,
Germany
Modeling & Analysis
Abstract
Gray-matter deficits, which occupy large parts of the parietal, prefrontal and temporal cortices, have beenreported in schizophrenia patients as compared to healthy controls and twins discordant for schizophrenia [1].Such deficits, however, cannot unambiguously be associated with cytoarchitectonically defined cortical areas, theborders of which can only be identified at the microscopical level. Therefore, the aim of this anatomical MR studywas to analyze differences in the shape of brains between a group of well documented schizophrenia patients andhealthy controls by analyzing the deformation fields, which determine the mapping of the individual brains onto areference brain, and to compare the results with probabilistic cytoarchitectonic maps represented in the samespatial reference system [2].
Materials and Methods
Anatomical MR scans of the brains of 12 male schizophrenia patients and 12 matched healthy controls have beenanalyzed. The brains were mapped to the stereotaxic reference space by applying linear and non-linear warpingtools [3]. The computation of the non-linear warping procedure produces a deformation field for each individualbrain (‘template’), which assigns to each voxel of the reference brain the displacement vector to the correspondingposition in the template. Deformation fields allow to compare the shapes and sizes of corresponding regions indifferent brains. Local changes in volume between the reference and each template were calculated, using therespective deformation field, and individual maps of local volume changes were created. Maps were averagedwithin the groups, and differences in volume between patients and controls were calculated. We considereddifferences between the averaged maps as being significant, when they were larger than the sum of the standard deviations.
Results and Discussion
Differences in the local volume between patients and controls were found in the left frontal, left temporal andright parietal lobes. Maximal volume differences reached 10 to 20 %. In these regions, patients showed shrinkageas compared to controls, which fits well with recent data on gray matter deficits in schizophrenia patients [1]. Nosignificant differences were found when the volume maps were compared with cytoarchitectonic probabilisticmaps of the hippocampus and entorhinal cortex. Differences were also found in the region of the right parietallobe. Parts of this region overlapped with the probabilistic maps of areas of the anterior part of the intraparietalsulcus (putative VIP, AIP [2]). We conclude that deformation fields are capable for detecting local differences inbrain anatomy between schizophrenia patients and controls, and that the identification of such differences can beconsiderably improved by combining deformation fields and cytoarchitectonic probabilistic maps.
e2041
Abstracts presented at the 9th International Conference on Functional Mapping of the Human Brain, June 19Œ22, 2003, New York, NY
e2041
Supported by DFG (Schn362/13-1,-2). This Human Brain Project/Neuroinformatics research was funded jointlyby the National Institute of Mental Health, of Neurological Disorders and Stroke of Drug Abuse, and the NationalCancer Center.
References
[1] Thompson et al; PNAS, USA, 98: 11650, 2002; Cannon et al, PNAS, USA, 99: 3228, 2002[2] Choi et al.; NeuroImage 16: 591, 2002; Amunts et al. (Conference proceedings)[3] Henn et al.; Informatik Aktuell, in: Musterkerkennung, Berlin: Springer: 392, 1997; Mohlberg et al.(Conference proceedings)
Order of appearance: 1029
AbsTrak ID: 18679
e2042
Abstracts presented at the 9th International Conference on Functional Mapping of the Human Brain, June 19Œ22, 2003, New York, NY
e2042
Poster number: 1039
Brain volume alterations in multiple sclerosis (MS) detected byVoxel-Guided-Morphometry (
Thorsten Schormann*, Matthias Kraemer†, Hans-Peter Hartung†, Ruediger J. Seitz†
*Institute of Anatomy I, Heinrich-Heine-University, Duesseldorf, Germany†Department of Neurology, University Hospital Duesseldorf, Germany
Modeling & Analysis
Abstract
Introduction
The purpose of this study is an exact determination of 3-D morphological alterations in human brains affected bymultiple sclerosis using T1 weighted MR datasets of the same brain at different time points. The local reductionof the brain volume caused by MS-lesions was analyzed in-vivo using a 4-step procedure, calledVoxel-Guided-Morphometry (VGM, Schormann & Kraemer, 2002). Subtle volume changes caused by MS werehypothesised to occur even in structures which were not primarily affected by the disease. For detection ofvolume changes within the whole brain volume without preselection of regions of interest, it was mandatory (i) toinclude the total gray-value information resulting from all voxels and (ii) to account for complex structuraldifferences by high-dimensional deformation fields with a pre-defined numerical accuracy. This longitudinal,intraindividual volumetry additionally fullfilled the assumption of small spatial differences such that anunambiguous determination of volume alterations was possible.
Methods
Two T1 weighted MR-datasets of the same patient were acquired at two different time points, thus enabling thedetermination of morphological changes over time. Volume processing was accomplished by VGM in order tocompensate for different spatial acquisition parameters and the determination of morphological alterationsbetween both volumes. It consisted of 4 image processing steps: (i) In order to avoid global rotation, scaling ortranslation, the classical principle axes theory was extended to affine movements (ePAT, Schormann et al, 1997, 1998), used for coarse alignment. (ii) Fine alignment was achieved by a cross-correlation based procedure using amatrix-norm (Schormann et al, 1993). After this global linear alignment, the datasets had optimal position andorientation in a least-square sense. (iii) In order to analyze spatial differences, high-dimensional transformationswere determined by an elastic model which was extended to a movement model thereby accounting for spatiallycomplex deformations. The gray-value forces which drove the movement of each voxel in the source object weredetermined by minimizing the gray-value difference between the first and second volume. Thus, the movement ofeach voxel was controlled by the data itself whereby no interactive support was required. The enormousnumerical effort was overcome by a combined multiresolution, full-multigrid method in order to calculate thenon-linear spatial differences (deformation filed). (iv) Volume alterations were then determined from thedeformation field.
Conclusion
VGM enables investigation of brain structures that had undergone reactive changes over time. MS-induced spatialdistortions were detected whereby the changes of the volume were exactly determined by the deformation fields.The technique applied to patients with MS revealed the extent of morphological alterations (volume reduction) ofaffected brain structures.
e2043
Abstracts presented at the 9th International Conference on Functional Mapping of the Human Brain, June 19Œ22, 2003, New York, NY
e2043

References
Schormann T, Kraemer M: IEEE Transactions on Medical Imaging 21 (2002), in pressSchormann T, Zilles K: IEEE Transactions on Medical Imaging 16 (1997), 942-947Schormann T, Zilles K: Human Brain Mapping 6 (1998), 339-347Schormann T, et al: Bioimaging 1 (1993), 119-128
Order of appearance: 1030
AbsTrak ID: 18107
e2044
Abstracts presented at the 9th International Conference on Functional Mapping of the Human Brain, June 19Œ22, 2003, New York, NY
e2044
Poster number: 1040
4D HAMMER Image Registration Method for Longitudinal Study ofBrain Changes
Dinggang Shen*, Susan M. Resnick†, Christos Davatzikos*
*Section of Biomedical Image Analysis, Department of Radiology, University of Pennsylvania, Philadelphia, PA†Laboratory of Personality and Cognition, National Institute on Aging
Modeling & Analysis
Abstract
Introduction:
Longitudinal studies of brain changes require highly accurate segmentation and volumetric measurement of brainstructures. Current automatic image segmentation, registration and atlas matching methods are designed for 3Dimages. The application of these 3D methods independently for each time-point in a longitudinal study typicallyleads to noisy longitudinal measurements, particularly for small structures such as the hippocampus. In this paper,we propose a fully automatic 4-dimensional atlas warping method that overcomes this limitation by constrainingthe smoothness in both spatial and temporal domains during the atlas warping procedure, thereby producing thedesired smooth and accurate estimations of longitudinal changes. Our approach results in significant improvementover our previously published 3D version of this method, referred to as HAMMER [1, 2].
Method:
There are two major steps in our approach. The first step is to rigidly align images of the same subject acquired atdifferent times. The second step is to hierarchically deform the 4D atlas to the 4D subject, by attribute-basedmatching. An attribute vector of a voxel is determined from image attributes and constitutes the morphologicalsignature of that voxel. It is designed to be as distinctive as possible, thereby reducing ambiguity in detectinganatomical correspondence. The initial deformation of the model to the subject is driven only by the points withdistinctive attribute vectors, which minimizes the chance of poor matching. Importantly, the deformation fieldsare assured to be smooth in both spatial and temporal domains, via appropriate constraints defined in both domains.
Results:
4D HAMMER is used to estimate the longitudinal changes of hippocampal volumes using the MR images of 9elderly subjects aged 59-78, selected from our ongoing studies in the Baltimore Longitudinal Study of Aging(BLSA). Annual MR images are available for each subject, and the images from the first 5 years are used in thispaper. We have labeled hippocampal regions in the model by manual definition of a single template brain. Bywarping the model to the subject, we can warp the mask of the model hippocampi to each subject, therebysegmenting each subject’s hippocampi. The following figure shows the average hippocampal volumes of 9subjects, estimated by 3D and 4D HAMMER, respectively. Obviously, 3D HAMMER results in noisylongitudinal estimations, while 4D HAMMER produces smooth longitudinal estimations. Importantly, thepercentage of hippocampal shrinkage detected during the 5 years is only 2.1% by 3D HAMMER, compared with5.5% by 4D HAMMER, and 5.7% by manual definition of an experienced rater. This experiment shows that 4DHAMMER is more robust and accurate in estimating longitudinal changes.
e2045
Abstracts presented at the 9th International Conference on Functional Mapping of the Human Brain, June 19Œ22, 2003, New York, NY
e2045
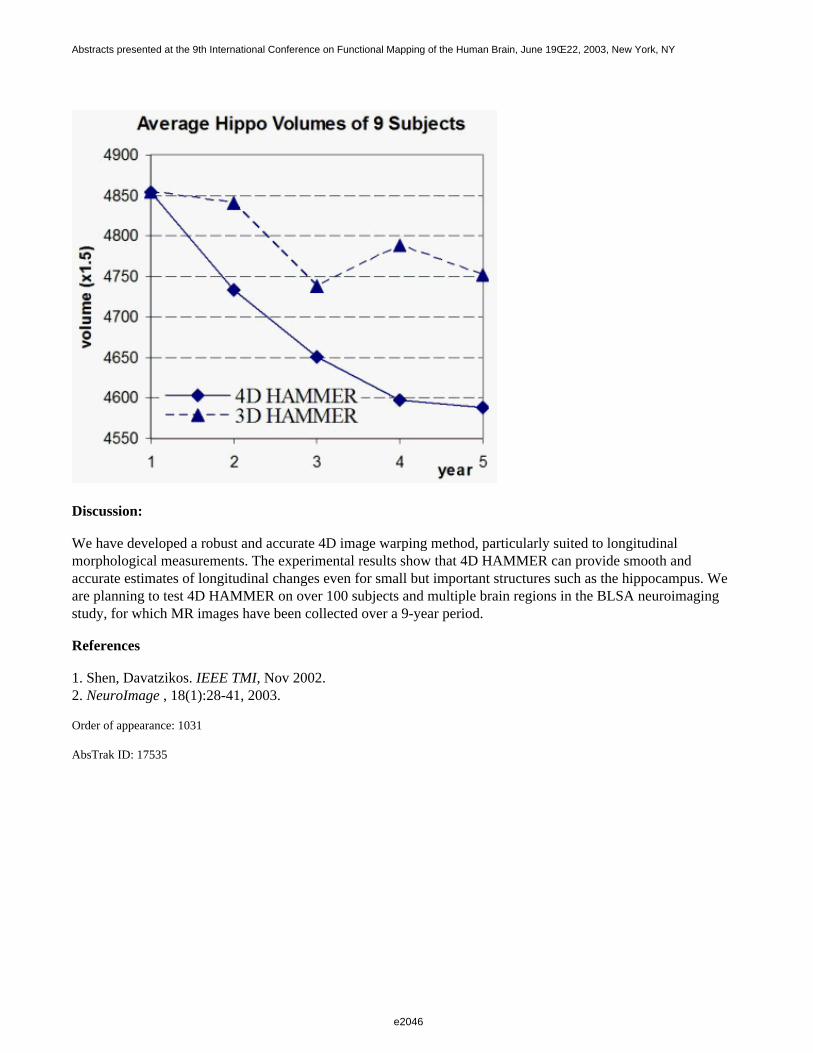
Discussion:
We have developed a robust and accurate 4D image warping method, particularly suited to longitudinalmorphological measurements. The experimental results show that 4D HAMMER can provide smooth andaccurate estimates of longitudinal changes even for small but important structures such as the hippocampus. Weare planning to test 4D HAMMER on over 100 subjects and multiple brain regions in the BLSA neuroimagingstudy, for which MR images have been collected over a 9-year period.
References
1. Shen, Davatzikos. IEEE TMI, Nov 2002.2. NeuroImage , 18(1):28-41, 2003.
Order of appearance: 1031
AbsTrak ID: 17535
e2046
Abstracts presented at the 9th International Conference on Functional Mapping of the Human Brain, June 19Œ22, 2003, New York, NY
e2046
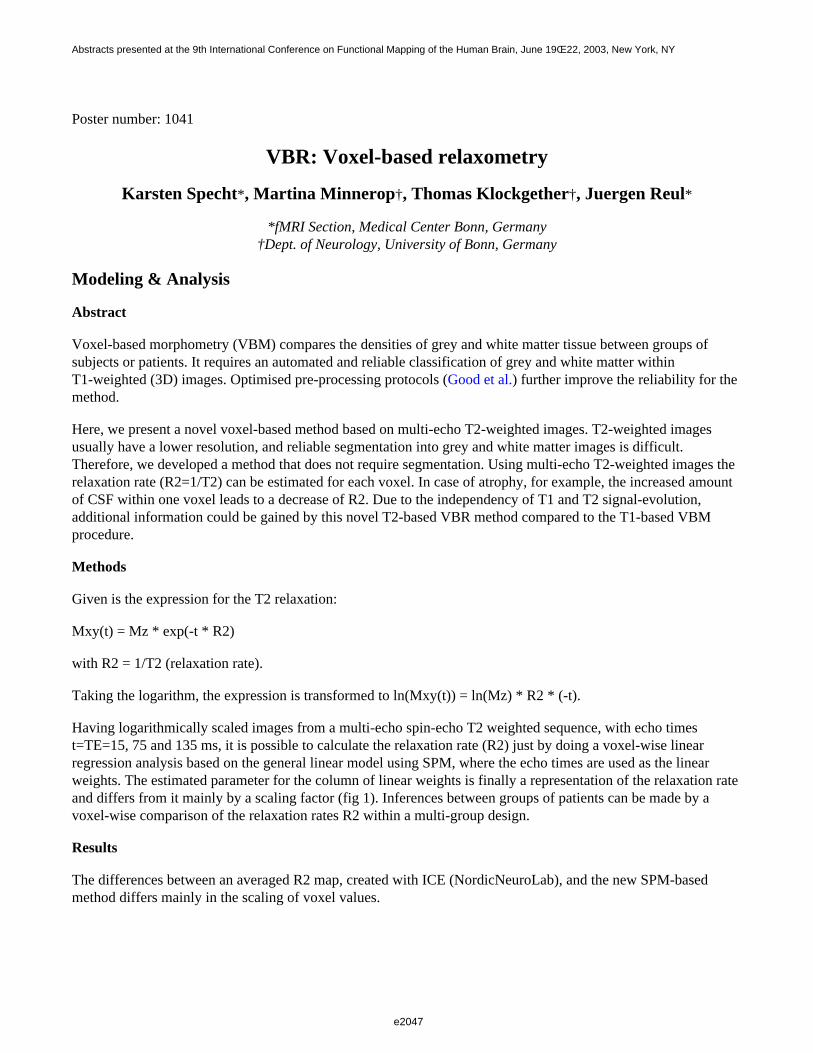
Poster number: 1041
VBR: Voxel-based relaxometry
Karsten Specht*, Martina Minnerop†, Thomas Klockgether†, Juergen Reul*
*fMRI Section, Medical Center Bonn, Germany†Dept. of Neurology, University of Bonn, Germany
Modeling & Analysis
Abstract
Voxel-based morphometry (VBM) compares the densities of grey and white matter tissue between groups ofsubjects or patients. It requires an automated and reliable classification of grey and white matter withinT1-weighted (3D) images. Optimised pre-processing protocols (Good et al.) further improve the reliability for the method.
Here, we present a novel voxel-based method based on multi-echo T2-weighted images. T2-weighted imagesusually have a lower resolution, and reliable segmentation into grey and white matter images is difficult.Therefore, we developed a method that does not require segmentation. Using multi-echo T2-weighted images therelaxation rate (R2=1/T2) can be estimated for each voxel. In case of atrophy, for example, the increased amountof CSF within one voxel leads to a decrease of R2. Due to the independency of T1 and T2 signal-evolution,additional information could be gained by this novel T2-based VBR method compared to the T1-based VBM procedure.
Methods
Given is the expression for the T2 relaxation:
Mxy(t) = Mz * exp(-t * R2)
with R2 = 1/T2 (relaxation rate).
Taking the logarithm, the expression is transformed to ln(Mxy(t)) = ln(Mz) * R2 * (-t).
Having logarithmically scaled images from a multi-echo spin-echo T2 weighted sequence, with echo timest=TE=15, 75 and 135 ms, it is possible to calculate the relaxation rate (R2) just by doing a voxel-wise linearregression analysis based on the general linear model using SPM, where the echo times are used as the linearweights. The estimated parameter for the column of linear weights is finally a representation of the relaxation rateand differs from it mainly by a scaling factor (fig 1). Inferences between groups of patients can be made by avoxel-wise comparison of the relaxation rates R2 within a multi-group design.
Results
The differences between an averaged R2 map, created with ICE (NordicNeuroLab), and the new SPM-basedmethod differs mainly in the scaling of voxel values.
e2047
Abstracts presented at the 9th International Conference on Functional Mapping of the Human Brain, June 19Œ22, 2003, New York, NY
e2047
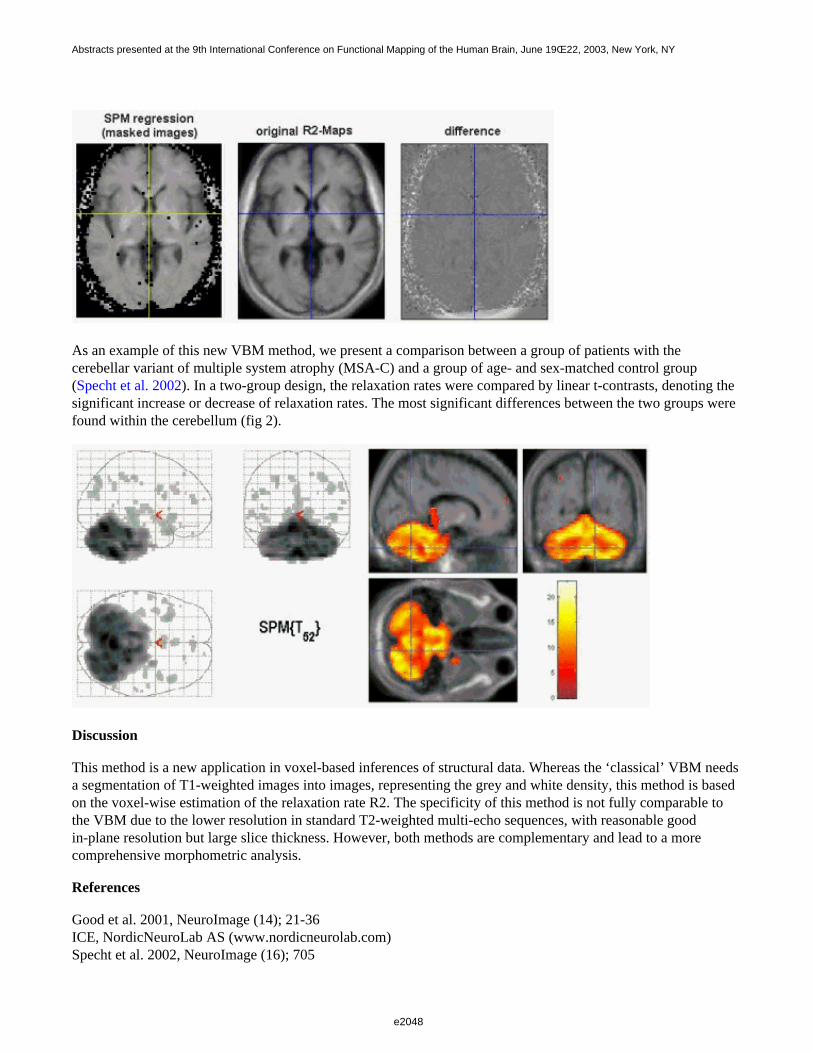
As an example of this new VBM method, we present a comparison between a group of patients with thecerebellar variant of multiple system atrophy (MSA-C) and a group of age- and sex-matched control group (Specht et al. 2002). In a two-group design, the relaxation rates were compared by linear t-contrasts, denoting thesignificant increase or decrease of relaxation rates. The most significant differences between the two groups werefound within the cerebellum (fig 2).
Discussion
This method is a new application in voxel-based inferences of structural data. Whereas the ‘classical’ VBM needsa segmentation of T1-weighted images into images, representing the grey and white density, this method is basedon the voxel-wise estimation of the relaxation rate R2. The specificity of this method is not fully comparable tothe VBM due to the lower resolution in standard T2-weighted multi-echo sequences, with reasonable goodin-plane resolution but large slice thickness. However, both methods are complementary and lead to a morecomprehensive morphometric analysis.
References
Good et al. 2001, NeuroImage (14); 21-36ICE, NordicNeuroLab AS (www.nordicneurolab.com)Specht et al. 2002, NeuroImage (16); 705
e2048
Abstracts presented at the 9th International Conference on Functional Mapping of the Human Brain, June 19Œ22, 2003, New York, NY
e2048

Order of appearance: 1032
AbsTrak ID: 17120
e2049
Abstracts presented at the 9th International Conference on Functional Mapping of the Human Brain, June 19Œ22, 2003, New York, NY
e2049
Poster number: 1042
Quantitative Analysis in Multimodal Imagery in Presurgical Explorationfor Epilepsy
Laurent Spinelli*, Goran Lantz†, Jon Lutz†, Christoph M. Michel†, Margitta Seeck*
*Presurgical Exploration for Epilepsy Unit, University Hospital of Geneva and Lausanne†Functional Brain Mapping Laboratory, Neurology Clinic, University Hospital of Geneva
Modeling & Analysis
Abstract
Neuroimaging technologies have improved neurology and neurosurgery by providing tools to look inside thebrain and investigate its functions and diseases. Pre-surgical evaluation for epilepsy is taking advantage of thedevelopment of all cerebral anatomical and functional imaging techniques. For this study, 3D electrical sourcesreconstruction based on 128 EEG channels, ictal and interictal SPECT and PET have been compared 21 patients.We have investigated the localisation precision of each in a quantitative way. For each modality, the distancebetween the abnormal area and the anatomic lesion was computed.
EEG source localisations were performed based on high spatial resolution EEG. The SMAC [1] head model wasapplied to each patient’s own MRI, resulting in ~3500 solution points. The EPIFOCUS [2] inverse algorithm wasused to reconstruct the source from spike averages. The PET and SPECT volumes held more than 40 axial sliceswith a thickness of 3.375 mm, a resolution of 128x128 pixel and a pixel size of 1.72x1.72 mm2. The nuclearmedicine images were aligned to the original MRI using the AIR software, and then transformed in the sphericalMRI coordinate system. In consequence, all modalities were in the same referential. For each modality wedetermined the most "abnormal" point (x,y,z) (i.e. the maximum of activity for the EEG source reconstruction andthe strongest deviance in metabolism for interical/ictal SPECT and PET). For each patient, the lesion area wasdetermined either by the postoperative MRI or by the contour of the lesion for the non-operated patients. Then theeuclidian distance from the most "abnormal" point to the anatomic lesion was calculated.
The results show that the EEG source reconstruction based on high electrode density and realistic head modelquantitatively performed as well as more established tools in a presurgical workup . Consequently this techniqueshould be used more intensively to localise epileptic foci in pharmaco-resistant patients.
References
[1] Spinelli L., et al. Electromagnetic inverse solutions in anatomically constrained spherical head models, Braintopography, Vol. 13, No. 2, 2000.[2] Grave de Peralta et al., Non-invasive localization of electromagnetic epileptic activity. I. Method descriptionsand simulations, Brain Topography, vol. 14, no2, winter 2001
Order of appearance: 1033
AbsTrak ID: 18176
e2050
Abstracts presented at the 9th International Conference on Functional Mapping of the Human Brain, June 19Œ22, 2003, New York, NY
e2050
Poster number: 1043
Detecting lesions on structural brain images with voxel based methodologies
Emmanuel A Stamatakis, Lorraine K Tyler
Experimental Psychology, University of Cambridge, UK
Modeling & Analysis
Abstract
Introduction
Qualitative interpretation of structural brain images suffers from low reproducibility and operator subjectivity.Automated approaches such as VBM [Ashburner & Friston 2000] compare local concentrations of gray/whitematter and consequently depend on successful brain segmentation, which fails with large lesions. Our aim was todevelop a robust methodology not affected by these problems. We used the GLM [Friston et al., 1995] to performlocal intensity comparisons between controls and artificially lesioned structural images in order to determine theaccuracy of the method in detecting these lesions.
Methods
Artificial lesions with known volumes and intensities were introduced to normal scans. The lesions were sphericalwith diameters of 5, 15, 25, 35 and 45 voxels and their mean intensity was reduced by 10%, 20%, 30% ... 90%from normal. Each lesioned image contained one lesion only. All images were spatially normalized with 12 linearaffine transformations and 7x8x7 nonlinear basis functions. To prevent image distortions the lesioned areas wereexcluded from the nonlinear calculations [Brett et al., 2001]. The spatially normalized images were skull strippedand smoothed with various Gaussian kernels (2mm, 4mm, 6mm ... 20mm) in order to determine the mostappropriate kernel size. We statistically compared each of the lesioned SPGR images to a group of 32 controls toestablish the best combination of variables for the accurate detection of the artificial lesions. Finally we used thefindings from the artificial lesion study to analyze patient images.
Results
Results were obtained at levels uncorrected (p<0.001) and corrected for multiple comparisons (p<0.05). Correctedresults produced more conservative estimates of lesion volumes (see figure 1) as previously stipulated in thecontext of structural image analysis [Ashburner & Friston 2000, Sowell et al., 1999]. Smoothing lesions that onlyvaried slightly (10%-30%) from normal resulted in underestimation of the lesion volume. When small smoothingkernels (up to 8mm) were used both corrected and uncorrected results contained false positives [FPs]. Smoothingkernels larger than 14mm also produced FPs. Smoothing kernels around 10mm and 12mm produced the mostreliable lesion detection.
Discussion
The use of SPM presupposes sufficient smoothing to make the data more normally distributed. FPs were thereforeexpected when small smoothing kernels were used. Optimal lesion detection was achieved for lesions that were40% - 60% below normal, at an uncorrected level of p<0.001, with 10mm smoothing. This is a satisfactory resultsince an examination of real stroke lesion morphology revealed that their intensity differed from thecorresponding intact area in the opposite hemisphere by 39% - 64%. We therefore conclude that the methodologypresented can produce robust, highly reproducible detection of lesions.
e2051
Abstracts presented at the 9th International Conference on Functional Mapping of the Human Brain, June 19Œ22, 2003, New York, NY
e2051
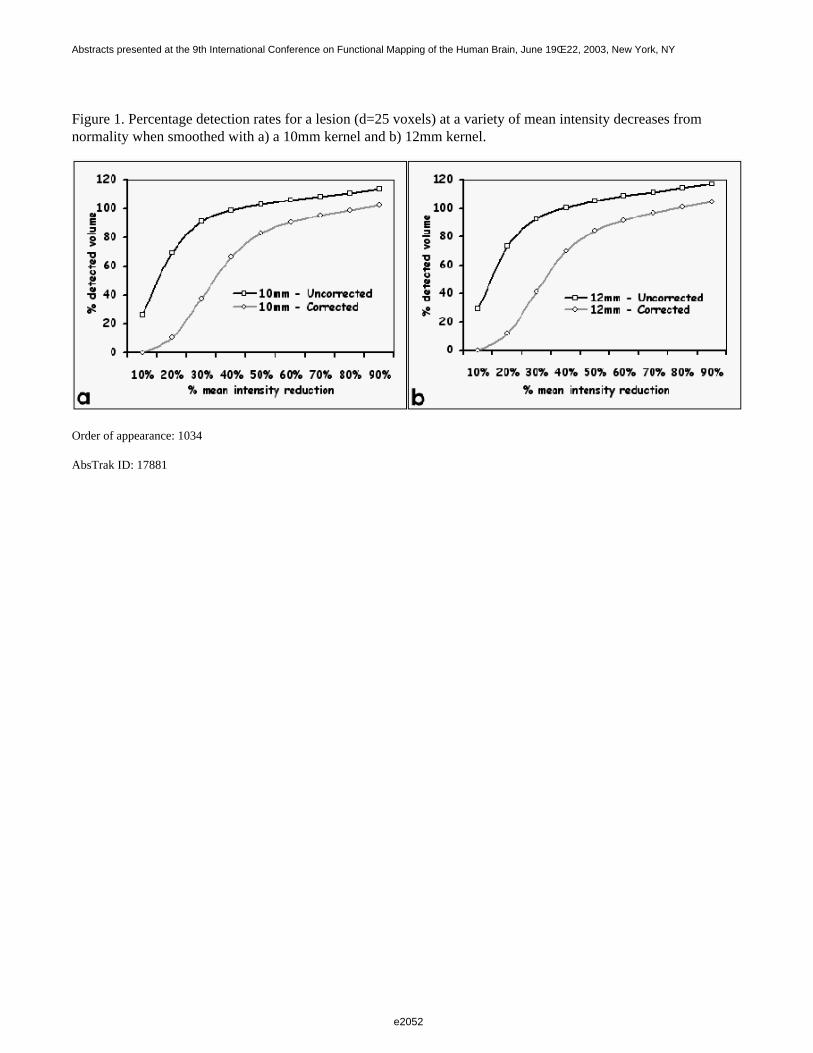
Figure 1. Percentage detection rates for a lesion (d=25 voxels) at a variety of mean intensity decreases fromnormality when smoothed with a) a 10mm kernel and b) 12mm kernel.
Order of appearance: 1034
AbsTrak ID: 17881
e2052
Abstracts presented at the 9th International Conference on Functional Mapping of the Human Brain, June 19Œ22, 2003, New York, NY
e2052
Poster number: 1044
Investigating the dynamics of brain responses during drug-inducedepileptic seizures in an animal (rat) model using clustering analysis
Larissa Stanberry, Bart Keogh, Ken Maravilla, Rajesh Nandy, Dietmar Cordes
University of Washington
Modeling & Analysis
Abstract
Epilepsy describes a constellation of disorders whose hallmark is the presence of recurrent, episodic seizures. Thefundamental questions underlying the study of epilepsy are the determination of the anatomic location of seizureorigination and how neural activation propagates through the brain. Functional MR studies involvingdrug-induced epileptic seizures have unknown and complicated hemodynamic response patterns. Accurateinvestigation of seizure dynamics requires the use of methods that are robust with respect to spatialnonstationarity. We used a hierarchical clustering method combined with a dendrogram sharpening algorithm(DSh) to segregate regions of the rat brain according to seizure response.
As applied to fMRI data, the aim of cluster analysis is to identify regions of similar activations. The DSh removesobservations from low-density regions producing a clear representation of the modal peaks. The hierarchicalclustering method does not require prior knowledge of the number of clusters or their locations. We hypothesizethat seizure activity has significant spatial and temporal structure and could be grouped into few types of responses.
The animals used in this study are adult male, 350-450 gm Sprague-Dawley rats. Rodents were fully anesthetizedand mechanically ventilated throughout the procedure. Well-known convulsants Pentylenetetrazol and KainicAcid were used to induce seizures. The choice of rats is due to their complicated nervous system and extremelywell characterized biology. Veterinary care was provided according to the UW animal care protocols.
Functional imaging was performed on a 1.5T GE (Milwaukee, WI) MRI scanner equipped with echo-speedgradients with parameters TR/TE 2s/40ms, 128x128, slice thickness 3mm, gap 0.1mm, 256 time points, 2 coronalslices. Images were checked for scanner drift and motion
We applied a mask to eliminate voxels outside the brain. Only voxels with cross-correlation coefficient, cc(a,b),of at least 0.3 were considered. The distance between voxels is defined as d=1-cc(a,b). The distance between twoclusters is given by the minimal distance of all pairs of voxels in two clusters. Remained voxels (about 1000pixels) were grouped into a binary tree. The DSh was performed twice with parameters: (fluff-value, core-value)set to (2,20) and (10,20), respectively, where fluff-value is the maximum size of a child cluster that is discarded ifit has a parent node of a size greater than a core-value. Cluster cores were identified using the method ofinconsistent edges. The value of median edge length of the left (right) subtree plus twice the interhindge spread isthe proposed threshold, beyond which edge is considered inconsistent with respect to its left (right) child. Thefinal classification was run on voxels, set-aside during DSh, attempting to assign them to the found clusters.
Our studies indicate a strong correlation between the cluster boundaries and the underlying anatomicalboundaries. From a neurobiological standpoint we would expect that the response of a particular region to aconvulsant should be a function of its anatomy. Although our preliminary results alone are not sufficient to provethis hypothesis, it certainly supports the physiologic relevance of the analysis.
e2053
Abstracts presented at the 9th International Conference on Functional Mapping of the Human Brain, June 19Œ22, 2003, New York, NY
e2053
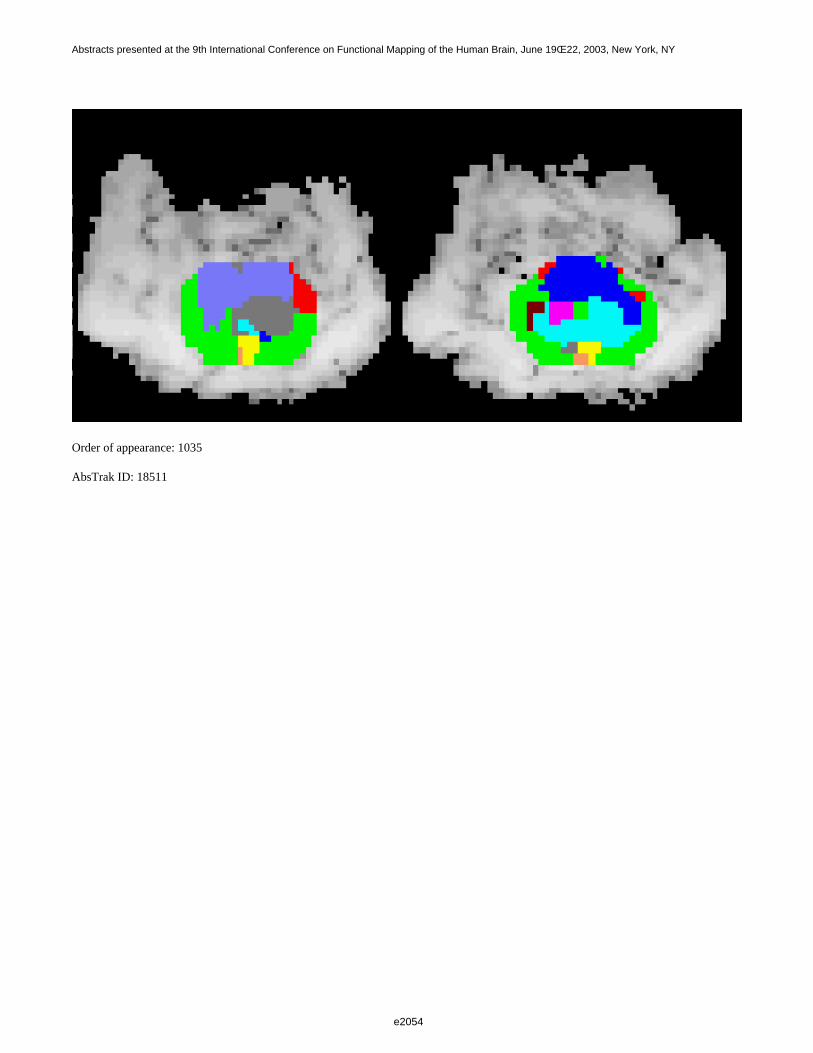
Order of appearance: 1035
AbsTrak ID: 18511
e2054
Abstracts presented at the 9th International Conference on Functional Mapping of the Human Brain, June 19Œ22, 2003, New York, NY
e2054
Poster number: 1045
fMRI Quality Assessment: Definition of an Efficient Measure by Means ofRealigned Data
T. Stöcker*†, U. Habel*, M. Klein*, T. Kellermann*, R. Schlösser‡, D. F. Braus§, N. J. Shah†, F. Schneider*
*Dept. Psychiatry, University of Düsseldorf, Düsseldorf, Germany†Institute of Medicine, Research Centre Jülich, Jülich, Germany
‡Dept. Psychiatry, University of Jena, Jena, Germany§Central Institute of Medical Health, Mannheim, Germany
Modeling & Analysis
Abstract
Introduction
We introduce a simple but efficient procedure to classify fMRI data for quality assessment. The work wasperformed within a German, multi-centre study on first episode schizophrenia patients. This study is particularlywell-suited for the detection of small BOLD changes by increasing the sample number. However, compared tohealthy controls, these patients often have more problems keeping still during the scanning so thatmovement-related artifacts occur. The inclusion of such data in the statistical group analysis is counterproductivefor the quality and inference of the results. To account for this, "rules of thumb" are widely used by researchers,e.g. the use of data with less than 3 mm correction during image registration. Such procedures are, however, ofteninsufficient to detect movement-related artifacts.
Method
An efficient and easy-to-calculate measure describing the matching of images after registration is the zerothmoment of the difference images. Here, the absolute difference between each realigned image R and the meanimage M are summed up along all voxels and this number is then normalized to the total intensity of the mean image:
Fig. 1 a) and b) show the time scale of this parameter during one fMRI experiment in comparison to the SPM99realignment parameters. Here, the realignment could not compensate for movement-related differences at scan 13.This image is most probably corrupted by artifacts caused by patient movement. Anyway, all spikes still presentin ∆ influence the fMRI post-processing, regardless of the cause of the artifacts. The standard deviation std[∆] iswell-suited to find the corrupted experimental runs: Fig. 1 c) shows std[∆] for 20 patients and 20 healthy controlvolunteers, respectively. The standard deviation is typically higher for patients than for normals in this study. Todemonstrate the effect on the group analysis, we divided the patients into two equally sized groups; those withlower std[∆] (i.e. less artifacts) and those with higher std[∆] (i.e. more artifacts). The results are shown in Fig 2.(The fMRI working memory task was a 0-back/2-back continuous performance test.) For the patient group withless movement artifacts, strong activations of the anterior cingular cortex and also bilateral frontal gyrusactivations are present (Tmax=6.7); the latter activation is hardly seen for the runs with more movement relatedartifacts (Tmax=4.5). Putting all data into one group reduces the statistical significance in comparison to Fig. 2a).
e2055
Abstracts presented at the 9th International Conference on Functional Mapping of the Human Brain, June 19Œ22, 2003, New York, NY
e2055
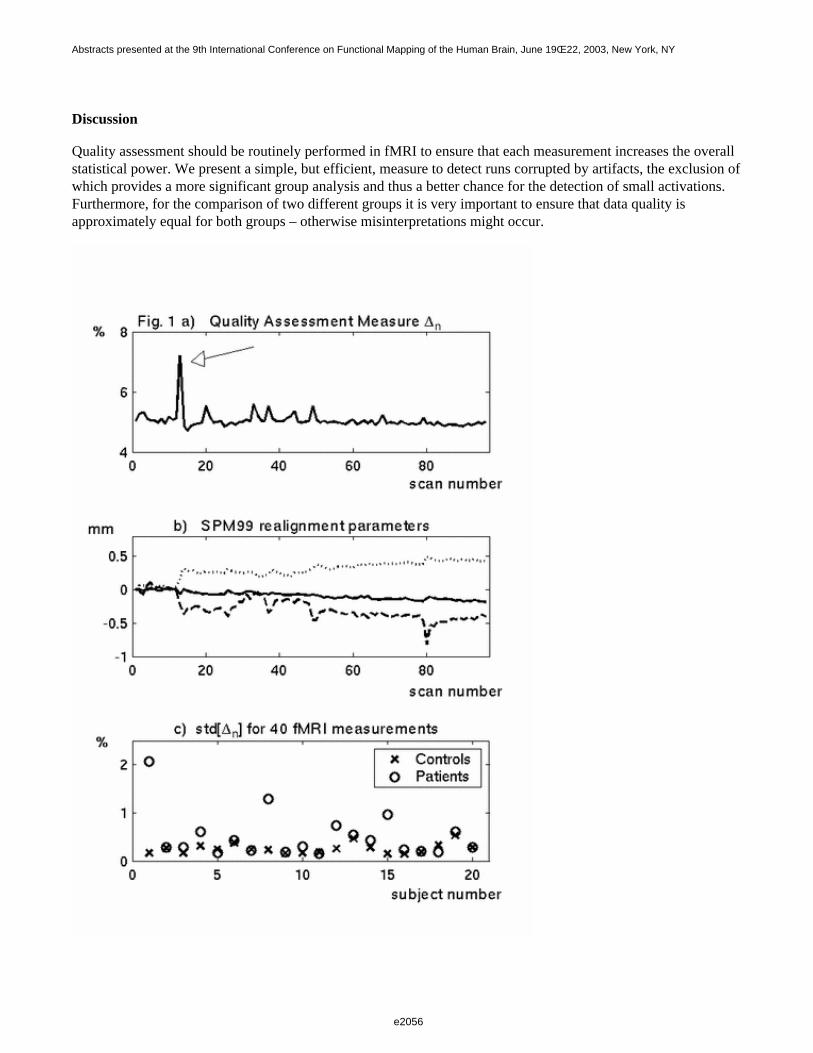
Discussion
Quality assessment should be routinely performed in fMRI to ensure that each measurement increases the overallstatistical power. We present a simple, but efficient, measure to detect runs corrupted by artifacts, the exclusion ofwhich provides a more significant group analysis and thus a better chance for the detection of small activations.Furthermore, for the comparison of two different groups it is very important to ensure that data quality isapproximately equal for both groups – otherwise misinterpretations might occur.
e2056
Abstracts presented at the 9th International Conference on Functional Mapping of the Human Brain, June 19Œ22, 2003, New York, NY
e2056
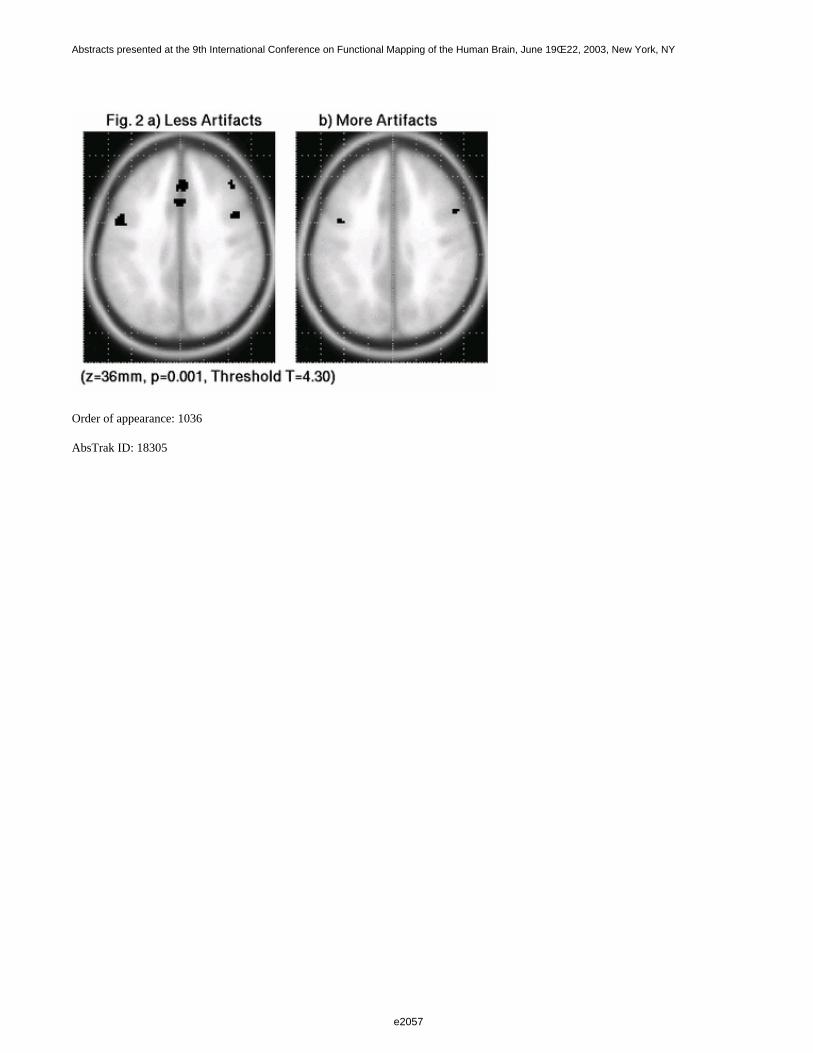
Order of appearance: 1036
AbsTrak ID: 18305
e2057
Abstracts presented at the 9th International Conference on Functional Mapping of the Human Brain, June 19Œ22, 2003, New York, NY
e2057
Poster number: 1046
Using intracranial depth electrode stimulation as a reference source forreconstruction from simultaneous scalp-EEG
Dinah Thyerlei*, Alexei Ossadtchi*†, Tatiana Maleeva‡, Felix Darvas†, Adam N. Mamelak‡, William W. Sutherling*‡
*Huntington Medical Research Institutes, MEG Unit, Pasadena, CA 91105†University of Southern California, Signal & Imaging Processing Institute, Los Angeles, CA 90089
‡Epilepsy and Brain Mapping, Pasadena, CA 91105
Modeling & Analysis
Abstract
Introduction
One of the routinely used methods in evaluating the focus of seizure onset in medically intractable patients withepilepsy is the comparison of after-discharge (AD) threshold in different brain regions. For this, intracranial depthelectrodes are stimulated and the currents needed to induce subclinical seizures (i. e. AD) are compared betweendifferent regions of the brain [1].
We recorded depth electrode stimulation and simultaneous scalp-EEG [2]. Stimulating an intracranial electrodecauses a local high current directly at the contact, which may cause AD and thereby provides a known currentsource location inside the patient’s head. We reconstructed the source from scalp-EEG and compared it to thelocation of the stimulated electrode contact. We performed a comparative analysis of different localizationtechniques (different head models, skull conductivities and source reconstruction algorithms) to find the best match.
Method
Two patients undergoing Phase II pre-surgical evaluation had 10 intracranial depth electrodes implantedbilaterally (hippocampus, amygdala, orbitofrontal, anterior cingulate, and supplementary motor cortex). Eachdepth electrode contained 8 iridium-platinum contacts. For this study contacts at two different sites (hippocampusand amygdala) were stimulated with symmetric biphasic pulses for 0.3 ms, with a 50 Hz frequency and 2-5 strains. The current intensity was increased every 20 s starting at 1 mA up to 5 mA in 1 mA steps [3] or until AD occurred.
Simultaneous 64-channel scalp-EEG was recorded with a 200 Hz sampling rate. Three landmarks and allelectrode positions were digitized. The pre-operative MRI was used to calculate a BEM model (skin, skull, CSF +brain). The intracranial electrode positions were taken from a post-operative MRI. The AD spikes seensimultaneously in depth and scalp electrodes were used to fit single moving and fixed dipoles (MUSIC) +/- 50 msaround the peak. Dipoles with less than 20% residual variance were accepted. Reconstruction accuracy wascompared for a three-shell sphere and a BEM model together with standard and measured skull conductivities [4](Curry 4.6).
Results
Preliminary results in a limited group of spikes show: The best fit was achieved using a single moving dipolefitted in a BEM model (skull conductivity 0.009 S/m, source space constrained to CSF + brain). The averagedistance of accepted dipoles to stimulated contact in one patient was 12.6 mm (+/-5.8 mm) (s. fig. 1). In contrast
e2058
Abstracts presented at the 9th International Conference on Functional Mapping of the Human Brain, June 19Œ22, 2003, New York, NY
e2058
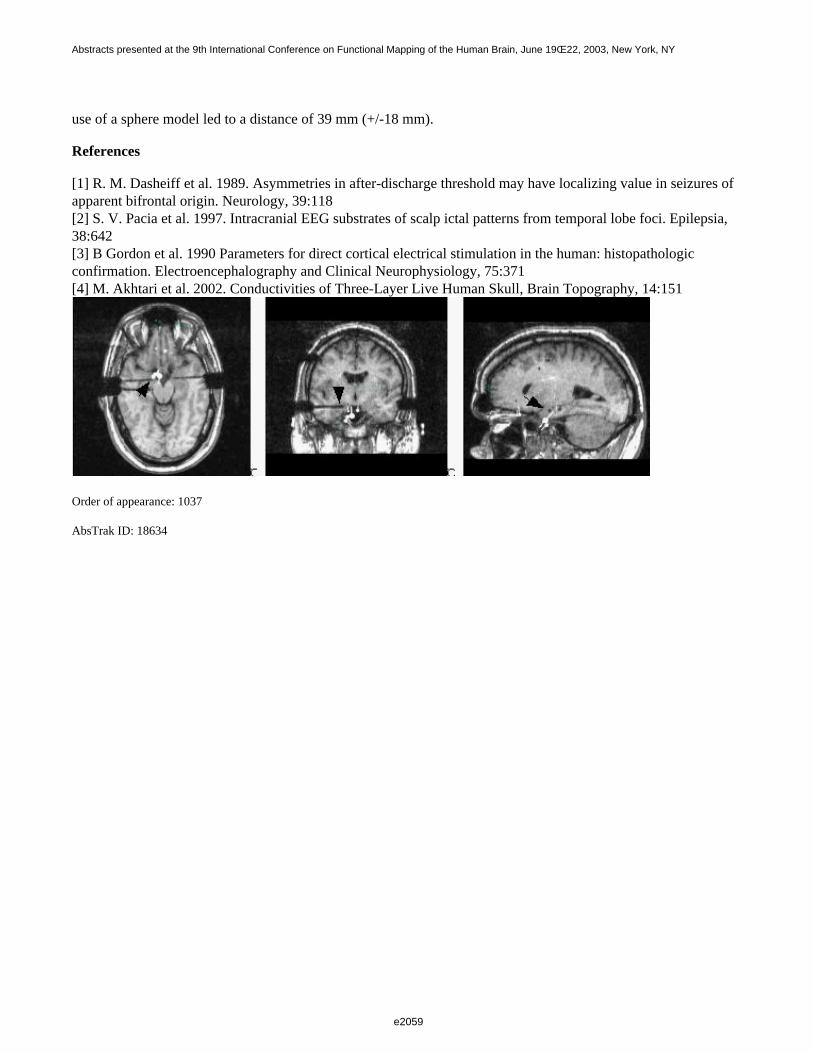
use of a sphere model led to a distance of 39 mm (+/-18 mm).
References
[1] R. M. Dasheiff et al. 1989. Asymmetries in after-discharge threshold may have localizing value in seizures ofapparent bifrontal origin. Neurology, 39:118[2] S. V. Pacia et al. 1997. Intracranial EEG substrates of scalp ictal patterns from temporal lobe foci. Epilepsia, 38:642[3] B Gordon et al. 1990 Parameters for direct cortical electrical stimulation in the human: histopathologicconfirmation. Electroencephalography and Clinical Neurophysiology, 75:371[4] M. Akhtari et al. 2002. Conductivities of Three-Layer Live Human Skull, Brain Topography, 14:151
Order of appearance: 1037
AbsTrak ID: 18634
e2059
Abstracts presented at the 9th International Conference on Functional Mapping of the Human Brain, June 19Œ22, 2003, New York, NY
e2059
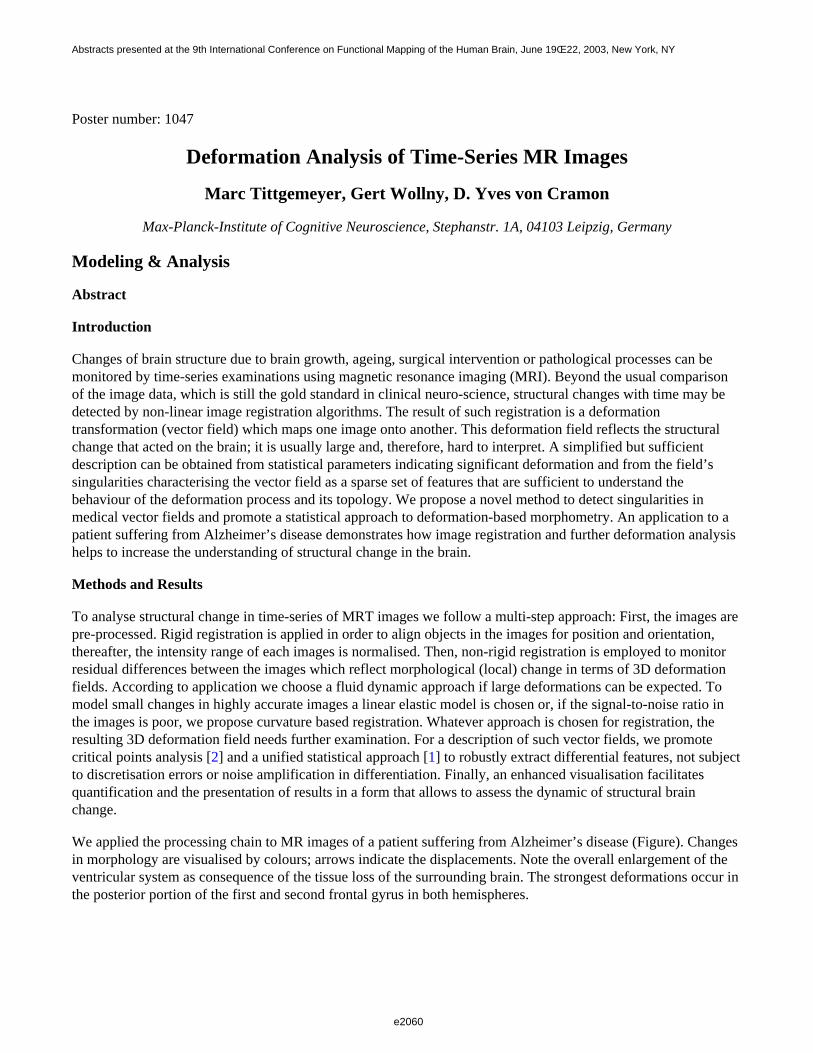
Poster number: 1047
Deformation Analysis of Time-Series MR Images
Marc Tittgemeyer, Gert Wollny, D. Yves von Cramon
Max-Planck-Institute of Cognitive Neuroscience, Stephanstr. 1A, 04103 Leipzig, Germany
Modeling & Analysis
Abstract
Introduction
Changes of brain structure due to brain growth, ageing, surgical intervention or pathological processes can bemonitored by time-series examinations using magnetic resonance imaging (MRI). Beyond the usual comparisonof the image data, which is still the gold standard in clinical neuro-science, structural changes with time may bedetected by non-linear image registration algorithms. The result of such registration is a deformationtransformation (vector field) which maps one image onto another. This deformation field reflects the structuralchange that acted on the brain; it is usually large and, therefore, hard to interpret. A simplified but sufficientdescription can be obtained from statistical parameters indicating significant deformation and from the field’ssingularities characterising the vector field as a sparse set of features that are sufficient to understand thebehaviour of the deformation process and its topology. We propose a novel method to detect singularities inmedical vector fields and promote a statistical approach to deformation-based morphometry. An application to apatient suffering from Alzheimer’s disease demonstrates how image registration and further deformation analysishelps to increase the understanding of structural change in the brain.
Methods and Results
To analyse structural change in time-series of MRT images we follow a multi-step approach: First, the images arepre-processed. Rigid registration is applied in order to align objects in the images for position and orientation,thereafter, the intensity range of each images is normalised. Then, non-rigid registration is employed to monitorresidual differences between the images which reflect morphological (local) change in terms of 3D deformationfields. According to application we choose a fluid dynamic approach if large deformations can be expected. Tomodel small changes in highly accurate images a linear elastic model is chosen or, if the signal-to-noise ratio inthe images is poor, we propose curvature based registration. Whatever approach is chosen for registration, theresulting 3D deformation field needs further examination. For a description of such vector fields, we promotecritical points analysis [2] and a unified statistical approach [1] to robustly extract differential features, not subjectto discretisation errors or noise amplification in differentiation. Finally, an enhanced visualisation facilitatesquantification and the presentation of results in a form that allows to assess the dynamic of structural brain change.
We applied the processing chain to MR images of a patient suffering from Alzheimer’s disease (Figure). Changesin morphology are visualised by colours; arrows indicate the displacements. Note the overall enlargement of theventricular system as consequence of the tissue loss of the surrounding brain. The strongest deformations occur inthe posterior portion of the first and second frontal gyrus in both hemispheres.
e2060
Abstracts presented at the 9th International Conference on Functional Mapping of the Human Brain, June 19Œ22, 2003, New York, NY
e2060
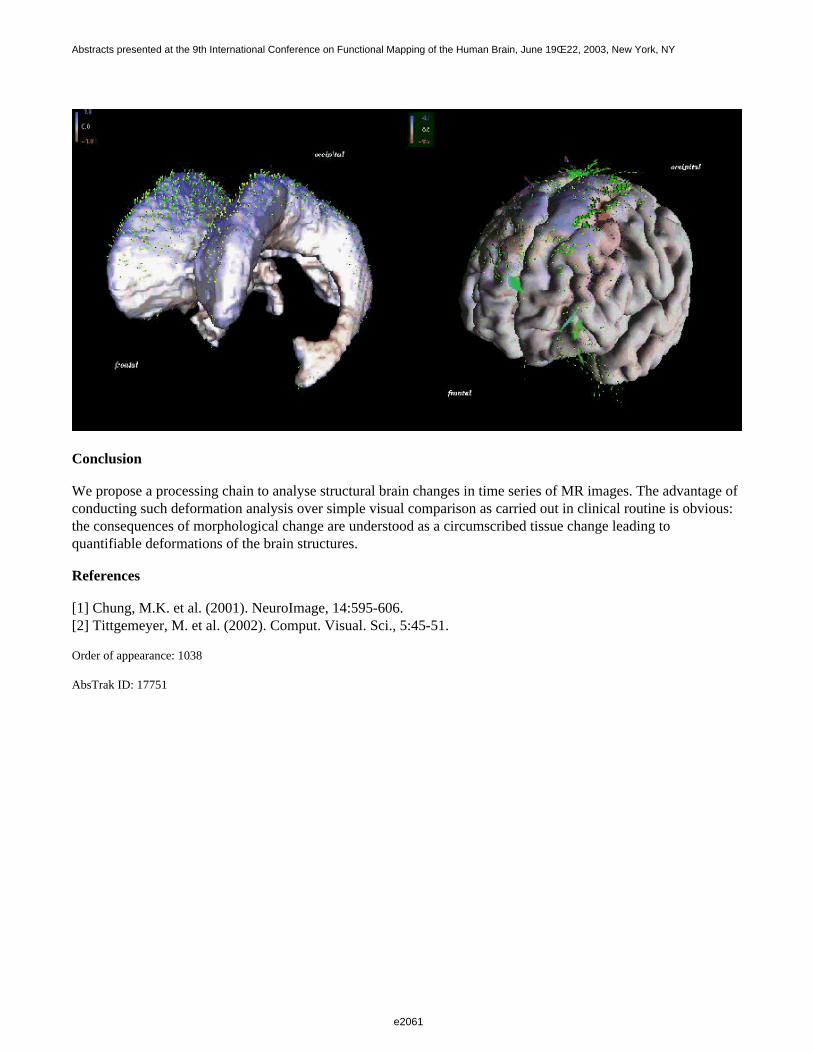
Conclusion
We propose a processing chain to analyse structural brain changes in time series of MR images. The advantage ofconducting such deformation analysis over simple visual comparison as carried out in clinical routine is obvious:the consequences of morphological change are understood as a circumscribed tissue change leading toquantifiable deformations of the brain structures.
References
[1] Chung, M.K. et al. (2001). NeuroImage, 14:595-606.[2] Tittgemeyer, M. et al. (2002). Comput. Visual. Sci., 5:45-51.
Order of appearance: 1038
AbsTrak ID: 17751
e2061
Abstracts presented at the 9th International Conference on Functional Mapping of the Human Brain, June 19Œ22, 2003, New York, NY
e2061
Poster number: 1048
Cortical responses of auditory hallucinations analysed using hypothesis-and data-driven methods: A first approach
VG van de Ven*, E Formisano†, D Prvulovic*, C Roeder‡, R Bittner*, MG Dietz§, D Hubl§, T Dierks§, A Federspiel§, R Goebel†, DEJ Linden*||
*Department of Psychiatry, University of Frankfurt, Germany†Department of Cognitive Neuroscience, Faculty of Psychology, Maastricht University, The Netherlands
‡Department of Psychosomatic Medicine, University of Frankfurt, Germany§Department of Psychiatry, Markus Hospital, Germany
¶Department of Psychiatric Neurophysiology, University Hospital for Clinical Psychiatry, Bern, Switzerland||Max-Planck-Institute fuer Hirnforschung, Frankfurt, Germany
Modeling & Analysis
Abstract
Introduction
The study of hallucinations has received a renewed interest with the use of functional neuroimaging techniques.Using such non-invasive techniques, brain responses occurring during hallucinations can be studied on-line byusing button presses as subject’s self-reports (1). However, using these self-reports is limited by the patients’ability to monitor the on- and offset of their hallucinations. Brain responses that are actually related to theoccurrence of hallucinations but show a timecourse that deviates from the button press model by onset, durationor frequency cannot be easily identified using hypothesis-driven methods. One approach to this problem would bethe complementary use of hypothesis- and data-driven techniques. A very promising technique is spatialindependent component analysis (sICA:(2)). sICA attempts to estimate statistically independent sources of brainresponse using the information between voxels. However, this technique typically yields a large amount of spatialcomponent maps, of which only a select few are of interest to the researcher. Therefore, a selection procedure“blind” to the shape of the component timecourses needs to be utilised (3).
Methods
In this study, we analysed cortical responses to auditory hallucinations of seven schizophrenic patients (1 female).Several different fMRI parameters were used, where the most important differences are TR = 4s (128 volumes)vs. TR = 2s (250 vols.). Preprocessing for hypothesis-driven analysis included slice-time and motion correction,spatial (FWHM = 4 mm) and temporal filtering (linear trend and high-pass = 0.008 Hz); for ICA only slice-timecorrection. We 1) analysed auditory hallucinations using correlation analysis, and 2) selected components ofinterest (COIs) using anatomical and functional volumes of interest (VOIs). Anatomical VOIs designatingbilateral primary auditory cortices and sensorimotor cortices were created from a probabilistic map (4) and astandardised map, respectively, while functional VOIs designating only the auditory cortices were created usingstatistical maps of acoustic stimulation (separate sessions). Of each component map the mean Z-values werecalculated for the VOI-covered voxels. The three components with the highest absolute mean value wereconsidered as COIs. The correspondence between the button presses and the COI timecourses were estimated intime and frequency domains. Data were analysed using BrainVoyager 4.8 (www.brainvoyager.com) andMATLAB (Mathworks, Inc.).
e2062
Abstracts presented at the 9th International Conference on Functional Mapping of the Human Brain, June 19Œ22, 2003, New York, NY
e2062

Results
Firstly, we were able to replicate earlier findings of primary auditory cortex activity during hallucinations (1).Secondly, COIs included auditory cortices for acoustic stimulation and sensorimotor cortex for hallucinations. Inaddition, for the hallucination sessions several COIs were identified that showed “activity” in Heschl’s gyrus, insome cases bilateral. However, the timecourses of these COIs did not obviously match the button press model.We conclude that 1) a COI selection method using VOIs generated from anatomical maps or from separatecontrol sessions is useful, 2) although several interesting components for Heschl’s gyrus activity duringhallucinations could be identified using ICA, further analysis is needed to evaluate the functional significance ofthese components.
References
1) T. Dierks et al. (1999). Neuron, 22, 615-621.2) M. McKeown et al. (1998). Human Brain Mapping, 6, 160-188.3) E. Formisano et al. (2002). Neurocomputing, in press.4) J. Rademacher et al. (2001). NeuroImage, 13, 669-683.
e2063
Abstracts presented at the 9th International Conference on Functional Mapping of the Human Brain, June 19Œ22, 2003, New York, NY
e2063
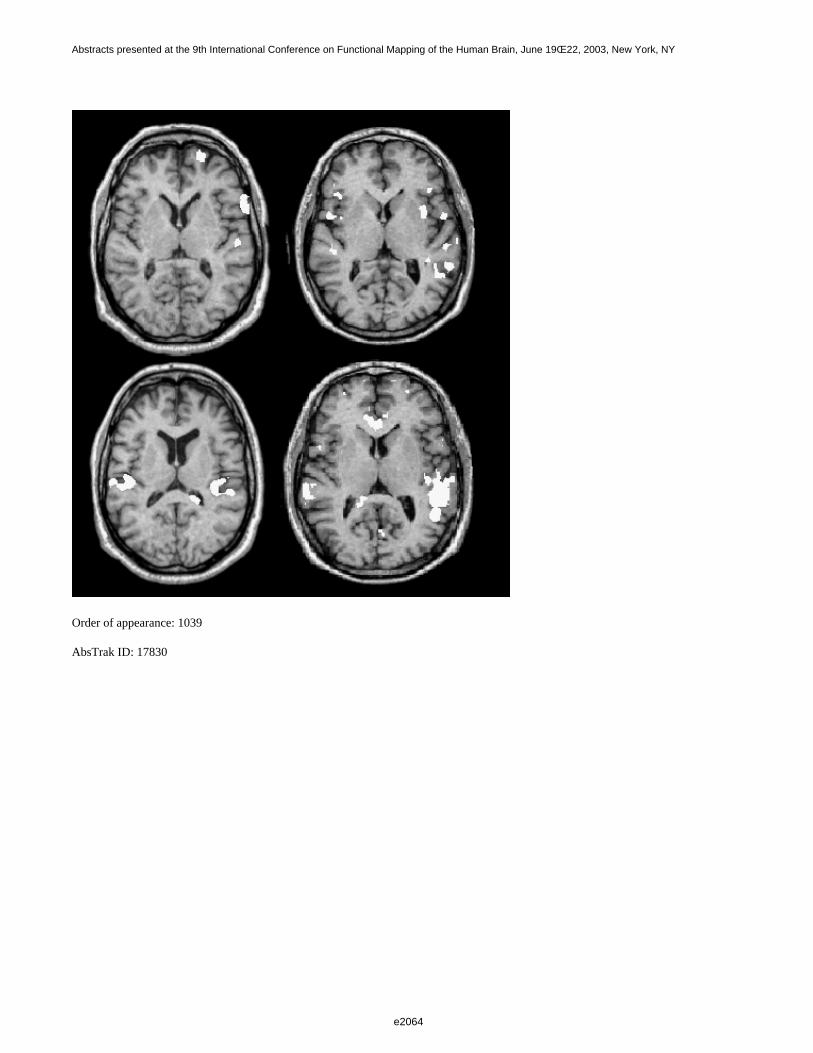
Order of appearance: 1039
AbsTrak ID: 17830
e2064
Abstracts presented at the 9th International Conference on Functional Mapping of the Human Brain, June 19Œ22, 2003, New York, NY
e2064
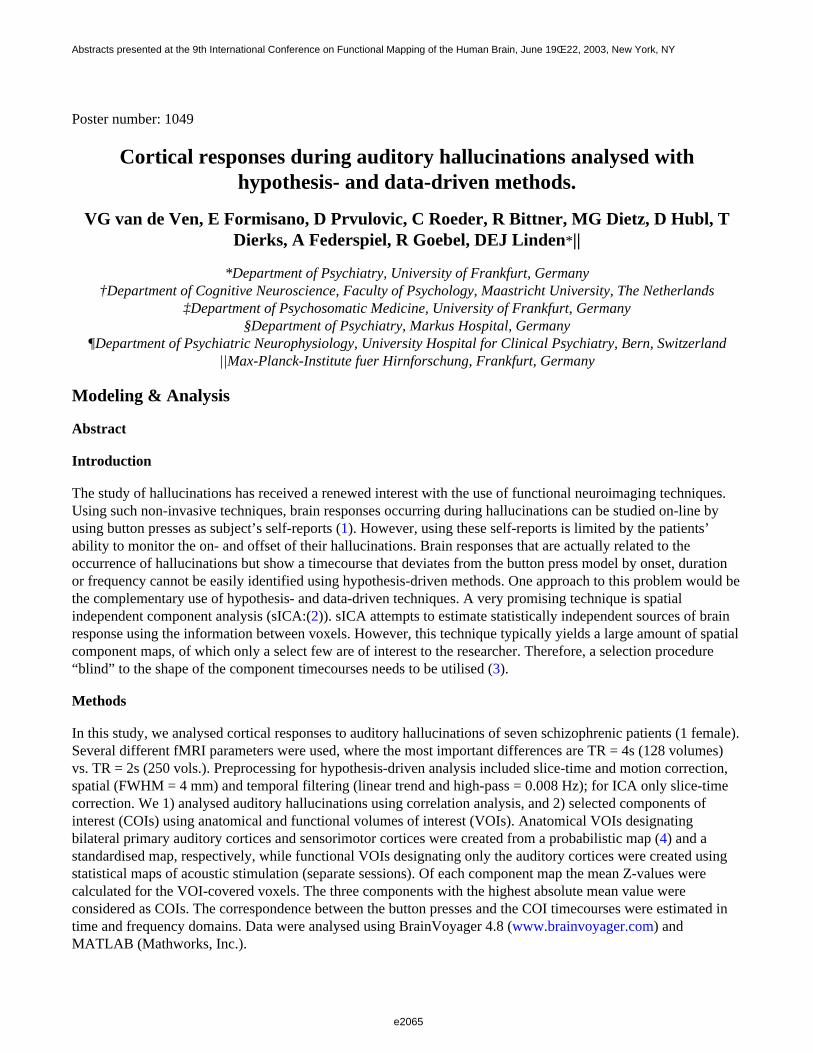
Poster number: 1049
Cortical responses during auditory hallucinations analysed withhypothesis- and data-driven methods.
VG van de Ven, E Formisano, D Prvulovic, C Roeder, R Bittner, MG Dietz, D Hubl, TDierks, A Federspiel, R Goebel, DEJ Linden*||
*Department of Psychiatry, University of Frankfurt, Germany†Department of Cognitive Neuroscience, Faculty of Psychology, Maastricht University, The Netherlands
‡Department of Psychosomatic Medicine, University of Frankfurt, Germany§Department of Psychiatry, Markus Hospital, Germany
¶Department of Psychiatric Neurophysiology, University Hospital for Clinical Psychiatry, Bern, Switzerland||Max-Planck-Institute fuer Hirnforschung, Frankfurt, Germany
Modeling & Analysis
Abstract
Introduction
The study of hallucinations has received a renewed interest with the use of functional neuroimaging techniques.Using such non-invasive techniques, brain responses occurring during hallucinations can be studied on-line byusing button presses as subject’s self-reports (1). However, using these self-reports is limited by the patients’ability to monitor the on- and offset of their hallucinations. Brain responses that are actually related to theoccurrence of hallucinations but show a timecourse that deviates from the button press model by onset, durationor frequency cannot be easily identified using hypothesis-driven methods. One approach to this problem would bethe complementary use of hypothesis- and data-driven techniques. A very promising technique is spatialindependent component analysis (sICA:(2)). sICA attempts to estimate statistically independent sources of brainresponse using the information between voxels. However, this technique typically yields a large amount of spatialcomponent maps, of which only a select few are of interest to the researcher. Therefore, a selection procedure“blind” to the shape of the component timecourses needs to be utilised (3).
Methods
In this study, we analysed cortical responses to auditory hallucinations of seven schizophrenic patients (1 female).Several different fMRI parameters were used, where the most important differences are TR = 4s (128 volumes)vs. TR = 2s (250 vols.). Preprocessing for hypothesis-driven analysis included slice-time and motion correction,spatial (FWHM = 4 mm) and temporal filtering (linear trend and high-pass = 0.008 Hz); for ICA only slice-timecorrection. We 1) analysed auditory hallucinations using correlation analysis, and 2) selected components ofinterest (COIs) using anatomical and functional volumes of interest (VOIs). Anatomical VOIs designatingbilateral primary auditory cortices and sensorimotor cortices were created from a probabilistic map (4) and astandardised map, respectively, while functional VOIs designating only the auditory cortices were created usingstatistical maps of acoustic stimulation (separate sessions). Of each component map the mean Z-values werecalculated for the VOI-covered voxels. The three components with the highest absolute mean value wereconsidered as COIs. The correspondence between the button presses and the COI timecourses were estimated intime and frequency domains. Data were analysed using BrainVoyager 4.8 (www.brainvoyager.com) andMATLAB (Mathworks, Inc.).
e2065
Abstracts presented at the 9th International Conference on Functional Mapping of the Human Brain, June 19Œ22, 2003, New York, NY
e2065
Results
Firstly, we were able to replicate earlier findings of primary auditory cortex activity during hallucinations (1).Secondly, COIs included auditory cortices for acoustic stimulation and sensorimotor cortex for hallucinations. Inaddition, for the hallucination sessions several COIs were identified that showed “activity” in Heschl’s gyrus, insome cases bilateral. However, the timecourses of these COIs did not obviously match the button press model.We conclude that 1) a COI selection method using VOIs generated from anatomical maps or from separatecontrol sessions is useful, 2) although several interesting components for Heschl’s gyrus activity duringhallucinations could be identified using ICA, further analysis is needed to evaluate the functional significance ofthese components.
References
1) T. Dierks et al. (1999). Neuron, 22, 615-621.2) M. McKeown et al. (1998). Human Brain Mapping, 6, 160-188.3) E. Formisano et al. (2002). Neurocomputing, in press.4) J. Rademacher et al. (2001). NeuroImage, 13, 669-683.
Order of appearance: 1040
AbsTrak ID: 18707
e2066
Abstracts presented at the 9th International Conference on Functional Mapping of the Human Brain, June 19Œ22, 2003, New York, NY
e2066
Poster number: 1050
Automated classification of interictal epileptiform spikes in MEG recordings
Dennis Van ’t Ent*, Ilonka Manshanden*, Pauly Ossenblok†, Dimitri N. Velis‡, Jan C. De Munck*, Jeroen P.A. Verbunt*, Fernando H. Lopes da Silva‡
*MEG Centre VUmc, Amsterdam†Epilepsy Centre Kempenhaeghe, Heeze
‡Dutch Epilepsy Clinics Foundation, Heemstede
Modeling & Analysis
Abstract
In Magneto-EncephaloGram (MEG) recordings of patients with epilepsy several epileptiform transients withdifferent spatial distributions are commonly present. Grouping of these spikes into distinct categories is generallyperformed on the basis of visual inspection. However the number of epileptiform spikes in the MEG of a patientmay be quite large and therefore this manual categorization can become highly complex. Our objective was todevelop a computer based method to identify and classify subpopulations of epileptiform spikes, as well as othersharp magnetic field deflections, in order to improve the identification of the region of the brain generating such discharges.
MEG data in time windows centered on detected spikes were stored in signal matrices consisting of c channels oflength T time samples. The matrices were normalised, through division by the Frobenius norm, and euclideandistances between spike representations on the unit sphere in vector space RcxT were input to a Ward’shierarchical clustering algorithm.
The method was applied to MEG recordings from four patients with localisation-related epilepsy that wereinvestigated as possible candidates for epilepsy surgery. For each patient, the clustering algorithm indicateddistinct subclasses in the population of spikes with clearly different topographical field maps. Inversecomputations applied on selected spike subaverages yielded source solutions in agreement with seizureclassification and location of structural lesions, if present, on Magnetic Resonance Images (MRI).
With the proposed method a reliable classification of interictal epileptiform spikes is obtained that can be appliedin an automatic way. Computation of subaverages of similar spikes enhances the signal-to-noise ratio of spikefield maps and allows for more accurate reconstruction of equivalent sources generating the epileptiformdischarges recorded.
Order of appearance: 1041
AbsTrak ID: 18123
e2067
Abstracts presented at the 9th International Conference on Functional Mapping of the Human Brain, June 19Œ22, 2003, New York, NY
e2067

Poster number: 1051
Statistical Mapping of Effects of Middle Cerebral Artery Occlusion(MCAO) on Blood Flow and Oxygen Consumption in Porcine Brain
Hideaki Watanabe*†, Masaharu Sakoh†, Flemming Andersen*, Anders Rodell*, Paul Comming*, Albert Gjedde*
*PET center, Aarhus University Hospital and Center of Functionally Integrative Neuroscience, AarhusUniversity, Aarhus, Denmark
†Neurosurgery, Ehime University School of Medicine, Ehime, Japan‡
Modeling & Analysis
Abstract
Background:
The domestic pig is increasingly used as an experimental model for brain imaging studies with positron emissiontomography (PET). We have created an MR-based statistical volumetric atlas of anatomical structures in the brainof pigs [1]. This approach can also be used to map changes in brain physiology in an experimental model ofstroke. In this study, we create statistically defined volumes for the decreases in cerebral blood flow (CBF) andthe rate of oxygen consumption (CMRO2 ) in porcine brain after middle cerebral artery occlusion (MCAO) [2].
Methods:
Eighteen anesthetized pigs (40 kg) underwent a series of PET studies to measure CBF and CMRO2 after MCAO
produced using the left transorbital approach. Summed emission recordings were registered to the pig brain atlasand the CBF and CMRO2 maps were calculated on a voxel-by-voxel basis. Magnitudes of CBF and CMRO2 on
the occluded side were calculated as a percentage of the magnitudes in the mirror-image voxels on theun-occluded side. These ratio images were used to create statistically defined volumes of decades of CBF and CMRO2 defects.
Results:
3D-rendering of the decades of reduced CBF and CMRO2 superimposed on the stereotaxic MR atlas of porcine
brain are illustrated in Figure 1. The corresponding volumes of perfusion and metabolism defects are listed inTable 1.
e2068
Abstracts presented at the 9th International Conference on Functional Mapping of the Human Brain, June 19Œ22, 2003, New York, NY
e2068
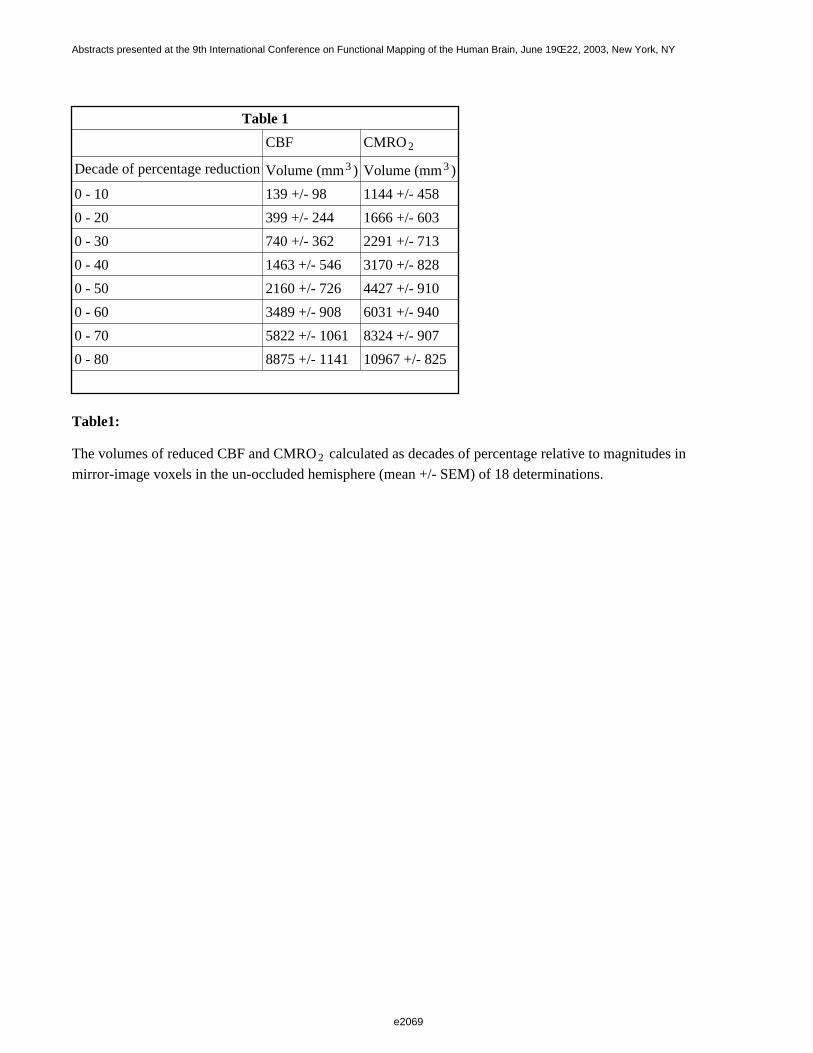
Table 1
CBF CMRO2
Decade of percentage reduction Volume (mm3 ) Volume (mm3 )
0 - 10 139 +/- 98 1144 +/- 458
0 - 20 399 +/- 244 1666 +/- 603
0 - 30 740 +/- 362 2291 +/- 713
0 - 40 1463 +/- 546 3170 +/- 828
0 - 50 2160 +/- 726 4427 +/- 910
0 - 60 3489 +/- 908 6031 +/- 940
0 - 70 5822 +/- 1061 8324 +/- 907
0 - 80 8875 +/- 1141 10967 +/- 825
Table1:
The volumes of reduced CBF and CMRO2 calculated as decades of percentage relative to magnitudes in
mirror-image voxels in the un-occluded hemisphere (mean +/- SEM) of 18 determinations.
e2069
Abstracts presented at the 9th International Conference on Functional Mapping of the Human Brain, June 19Œ22, 2003, New York, NY
e2069
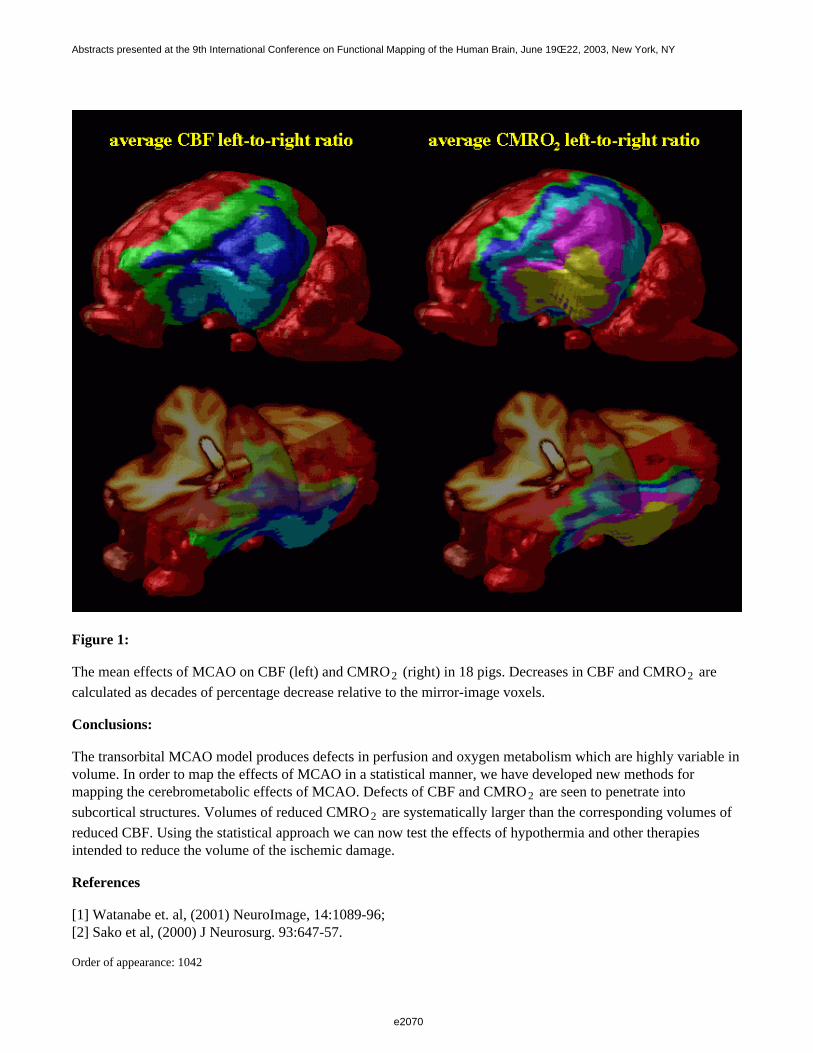
Figure 1:
The mean effects of MCAO on CBF (left) and CMRO2 (right) in 18 pigs. Decreases in CBF and CMRO2 are
calculated as decades of percentage decrease relative to the mirror-image voxels.
Conclusions:
The transorbital MCAO model produces defects in perfusion and oxygen metabolism which are highly variable involume. In order to map the effects of MCAO in a statistical manner, we have developed new methods formapping the cerebrometabolic effects of MCAO. Defects of CBF and CMRO2 are seen to penetrate into
subcortical structures. Volumes of reduced CMRO2 are systematically larger than the corresponding volumes of
reduced CBF. Using the statistical approach we can now test the effects of hypothermia and other therapiesintended to reduce the volume of the ischemic damage.
References
[1] Watanabe et. al, (2001) NeuroImage, 14:1089-96;[2] Sako et al, (2000) J Neurosurg. 93:647-57.
Order of appearance: 1042
e2070
Abstracts presented at the 9th International Conference on Functional Mapping of the Human Brain, June 19Œ22, 2003, New York, NY
e2070

AbsTrak ID: 17796
e2071
Abstracts presented at the 9th International Conference on Functional Mapping of the Human Brain, June 19Œ22, 2003, New York, NY
e2071
Poster number: 1052
Brain areas involved and interacting during mesial temporal lobe seizures
Bruno Weder*, John Missimer†, Kaspar Schindler‡, Thomas Loher‡, Peter Ritter§,Michael Wissmeyer§, Roland Wiest§, Johannes Mathis‡
*Neurology Department of Kantonsspital St. Gallen and Neurology Department of University Hospital Bern†Paul Scherrer Institut PSI Villigen
‡Neurology Department of University Hospital Bern§Institute of Nuclear Medicine of University Hospital Bern
¶Institute of Neuroradiology of University Hospital Bern, Switzerland
Modeling & Analysis
Abstract
Aim of the study was to delineate brain areas involved during temporal lobe seizures using covariance analysis (1)of interictal and ictal SPECT data.
Subjects and Methods
12 patients (7 males, 5 females; age range from 16 to 54 years) afflicted by drug resistant mesial temporal lobeepilepsy (MTLE) were evaluated. Examinations included 99m-Tc-ECD SPECT, EEG incl. foramen ovale methodand video monitoring in the interictal stage and during a seizure. A common clinical feature of the analyzedseizures was initial oro-alimentary behaviour.
Data analysis
A principal component analysis of the ictal and interictal SPECT data was performed 13 normal volunteersserving as controls. The findings were compared with categorical results of individual analysis (Subtraction IctalSPECT co-registered to MRI, SISCOM) and group analysis by SPM99.
Results
Ictal SPECT showed two principal components, PC 1 and PC 3, discriminating patients significantly from normalvolunteers. PC 1 included right temporal lobe (mesial part and frontal pole), right anterior insula, left frontaloperculum and neighbouring medial frontal areas, right parieto-occipital areas and the vermis and paramediancerebellum on both sides with a positive load. PC 3 showed positively loaded involvement of left temporal lobeand indicated a mirror–like pattern to PC 1. Plotting PC 1 versus PC 3 subject weights, right and left MTLEpatients and normal volunteers were differentiated into separated clusters. By comparison, interictal SPECT datashowed one pattern, PC 1, discriminating patients significantly from normal volunteers. The pattern correspondedto that of the PC 1 obtained from ictal SPECT data.
e2072
Abstracts presented at the 9th International Conference on Functional Mapping of the Human Brain, June 19Œ22, 2003, New York, NY
e2072
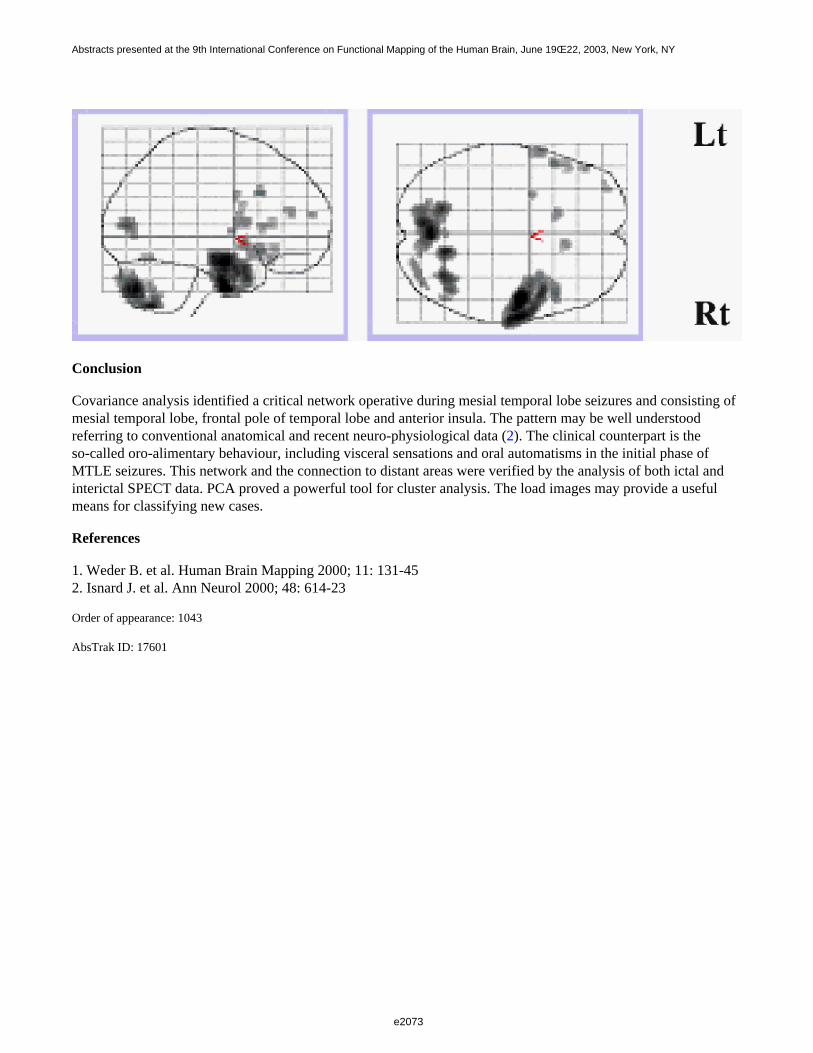
Conclusion
Covariance analysis identified a critical network operative during mesial temporal lobe seizures and consisting ofmesial temporal lobe, frontal pole of temporal lobe and anterior insula. The pattern may be well understoodreferring to conventional anatomical and recent neuro-physiological data (2). The clinical counterpart is theso-called oro-alimentary behaviour, including visceral sensations and oral automatisms in the initial phase ofMTLE seizures. This network and the connection to distant areas were verified by the analysis of both ictal andinterictal SPECT data. PCA proved a powerful tool for cluster analysis. The load images may provide a usefulmeans for classifying new cases.
References
1. Weder B. et al. Human Brain Mapping 2000; 11: 131-452. Isnard J. et al. Ann Neurol 2000; 48: 614-23
Order of appearance: 1043
AbsTrak ID: 17601
e2073
Abstracts presented at the 9th International Conference on Functional Mapping of the Human Brain, June 19Œ22, 2003, New York, NY
e2073
Related Documents