GEOTECHNICAL FRAMEWORK STUDY OF SHELI KOF STRAIT, ALASKA by Monty A. Hampton U.S. Geological Survey Final Report Outer Continental Shelf Environmental Assessment Program Research Unit 589 1983 637

Welcome message from author
This document is posted to help you gain knowledge. Please leave a comment to let me know what you think about it! Share it to your friends and learn new things together.
Transcript
GEOTECHNICAL FRAMEWORK STUDY OF SHELIKOF STRAIT, ALASKA
by
Monty A. Hampton
U.S. Geological Survey
Final ReportOuter Continental Shelf Environmental Assessment Program
Research Unit 589
1983
637
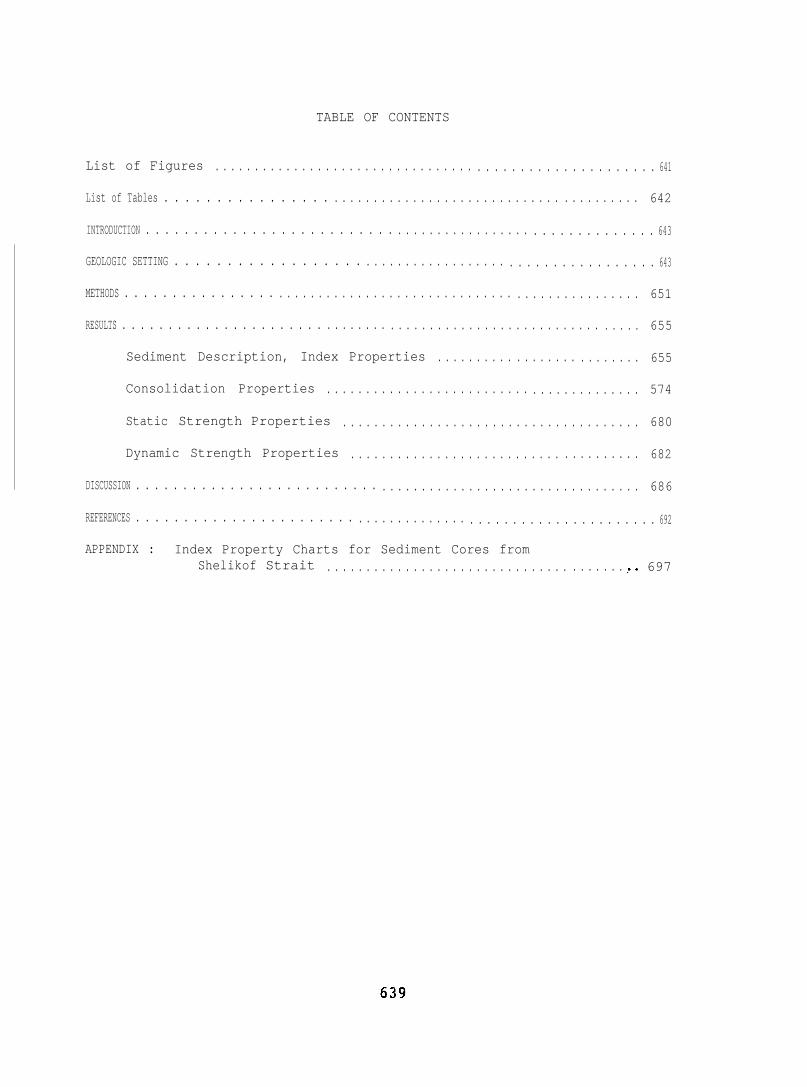
TABLE OF CONTENTS
List of Figures . . . . . . . . . . . . . . . . . . . . . . . . . . . . . . . . . . . . . . . . . . . . . . . . . . . . . . 641
List of Tables . . . . . . . . . . . . . . . . . . . . . . . . . . . . . . . . . . . . . . . . . . . . . . . . . . . . . . . 642
INTRODUCTION . . . . . . . . . . . . . . . . . . . . . . . . . . . . . . . . . . . . . . . . . . . . . . . . . . . . . . . . . 643
GEOLOGIC SETTING . . . . . . . . . . . . . . . . . . . . . . . . . . . . . . . . . . . . . . . . . . . . . . . . . . . . . 643
METHODS . . . . . . . . . . . . . . . . . . . . . . . . . . . . . . . . . . . . . . . . . . . . . . . . . . . . . . . . . . . . . . 651
RESULTS . . . . . . . . . . . . . . . . . . . . . . . . . . . . . . . . . . . . . . . . . . . . . . . . . . . . . . . . . . . . . . 655
Sediment Description, Index Properties . . . . . . . . . . . . . . . . . . . . . . . . . . 655
Consolidation Properties . . . . . . . . . . . . . . . . . . . . . . . . . . . . . . . . . . . . . . . . 574
Static Strength Properties . . . . . . . . . . . . . . . . . . . . . . . . . . . . . . . . . . . . . . 680
Dynamic Strength Properties . . . . . . . . . . . . . . . . . . . . . . . . . . . . . . . . . . . . . 682
DISCUSSION . . . . . . . . . . . . . . . . . . . . . . . . . . . . . . . . . . . . . . . . . . . . . . . . . . . . . . . . . . . 686
REFERENCES . . . . . . . . . . . . . . . . . . . . . . . . . . . . . . . . . . . . . . . . . . . . . . . . . . . . . . . . . . . 692
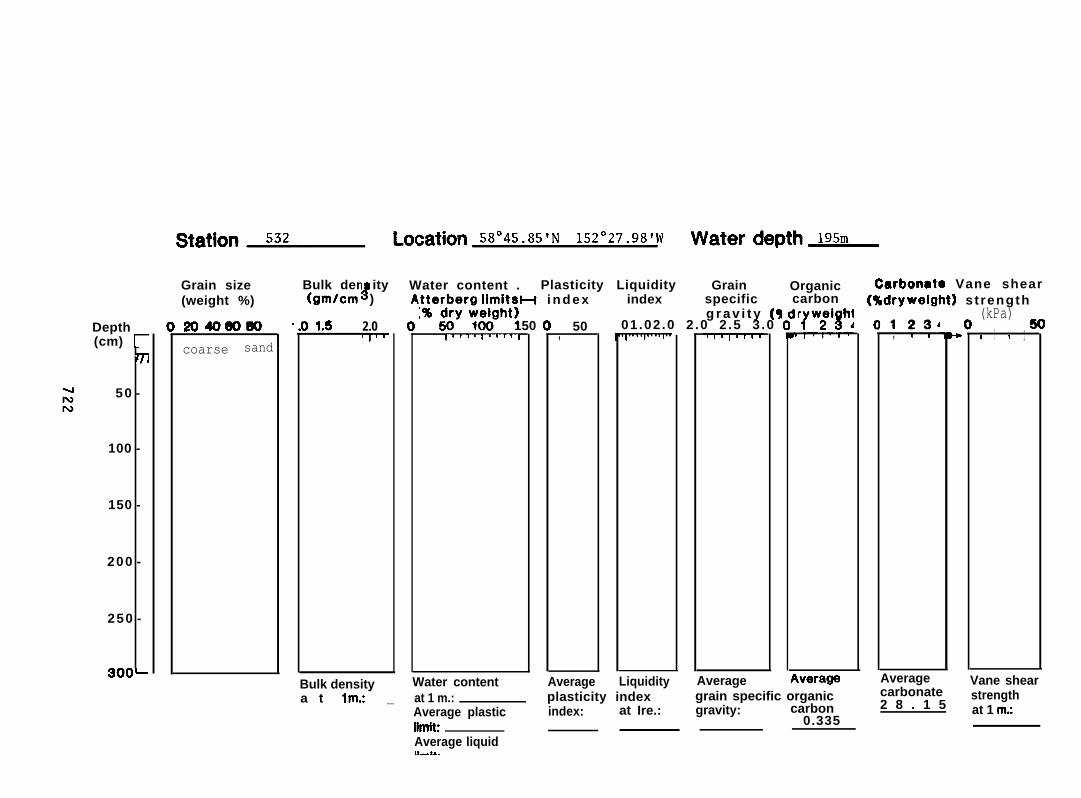
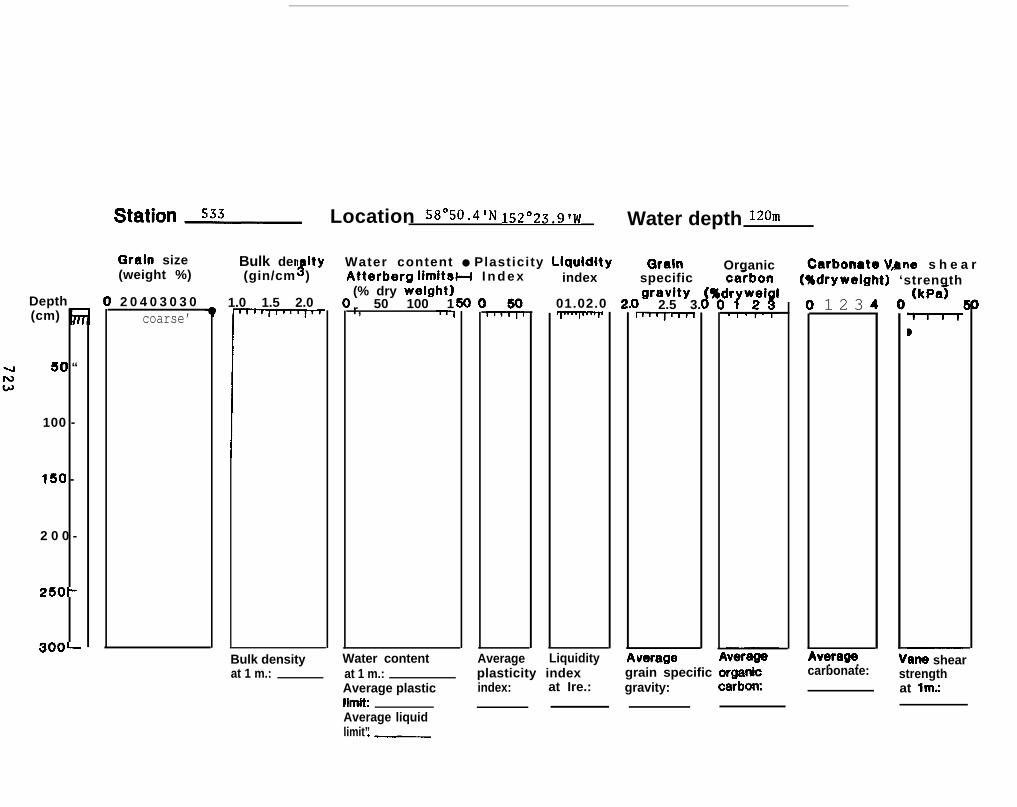
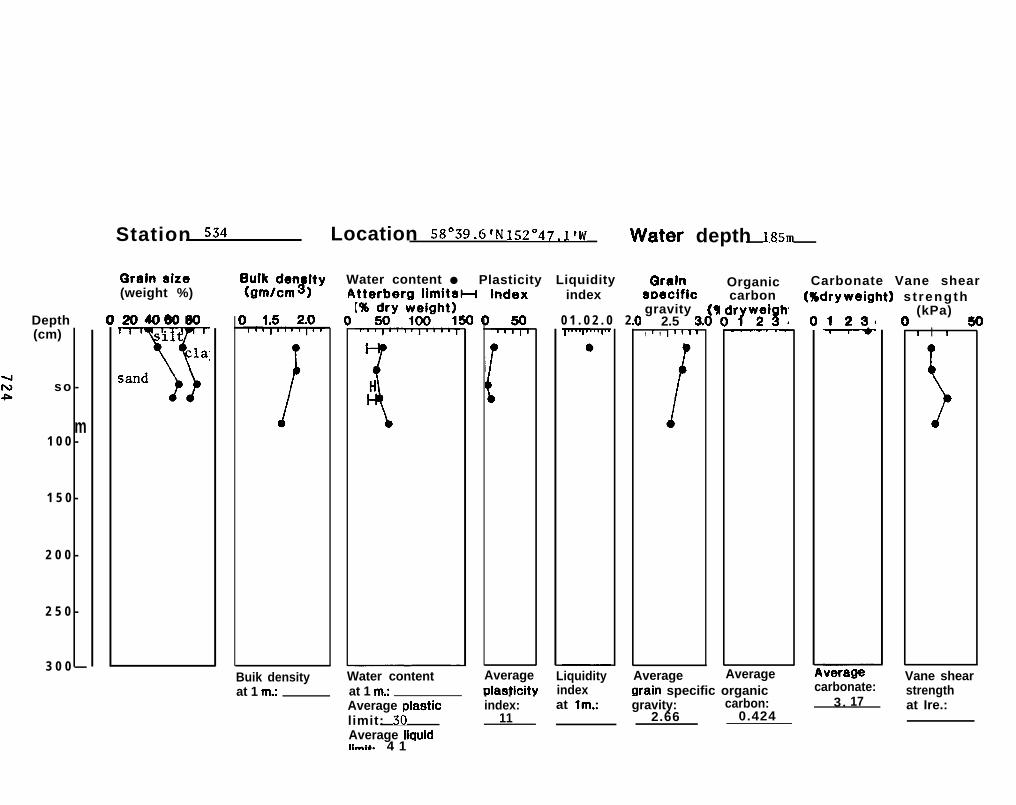
APPENDIX : Index Property Charts for Sediment Cores fromShelikof Strait . . . . . . . . . . . . . . . . . . . . . . . . . . . . . . . . . . . . . . ,. 697
LIST OF FIGURES
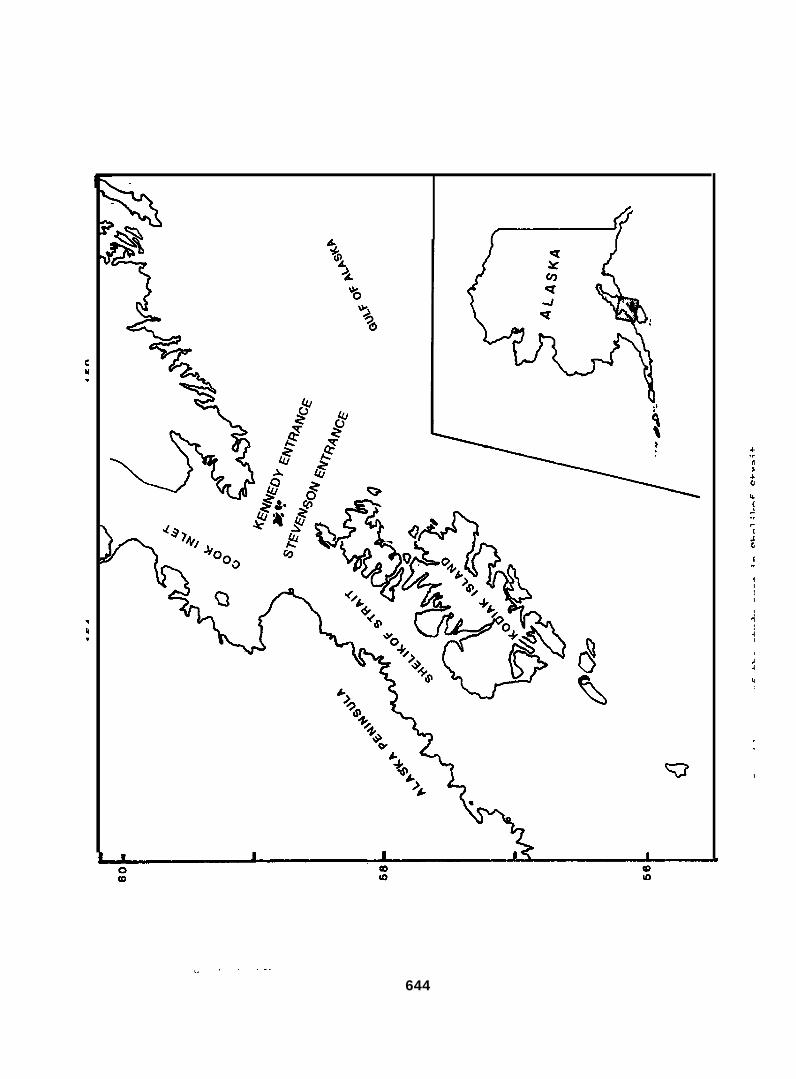
Figure 1. Location map of the study area in Shelikof Strait.
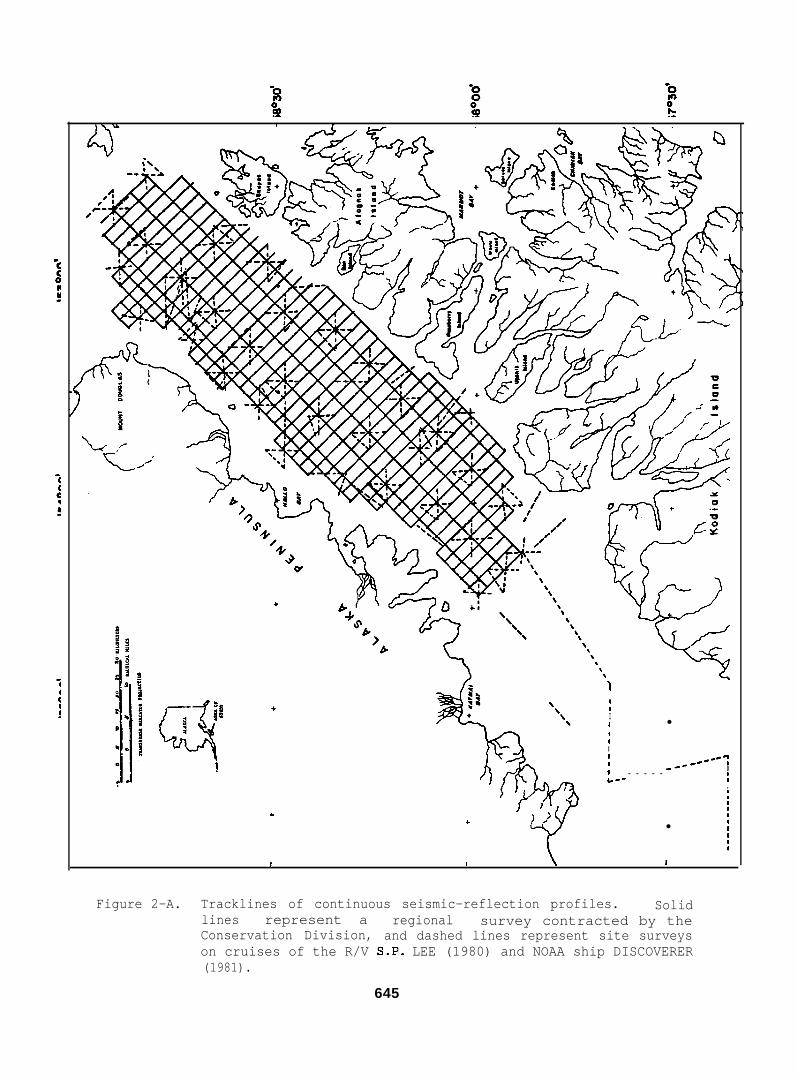
Figure 2. A. Tracklines of continuous seismic-reflection profiles.Solid lines represent a regional survey contracted by theConservation Division, and dashed lines represent site surveyson cruises of the R/V S.P. LEE (1980) and NOAA ship DISCOVERER(1981).
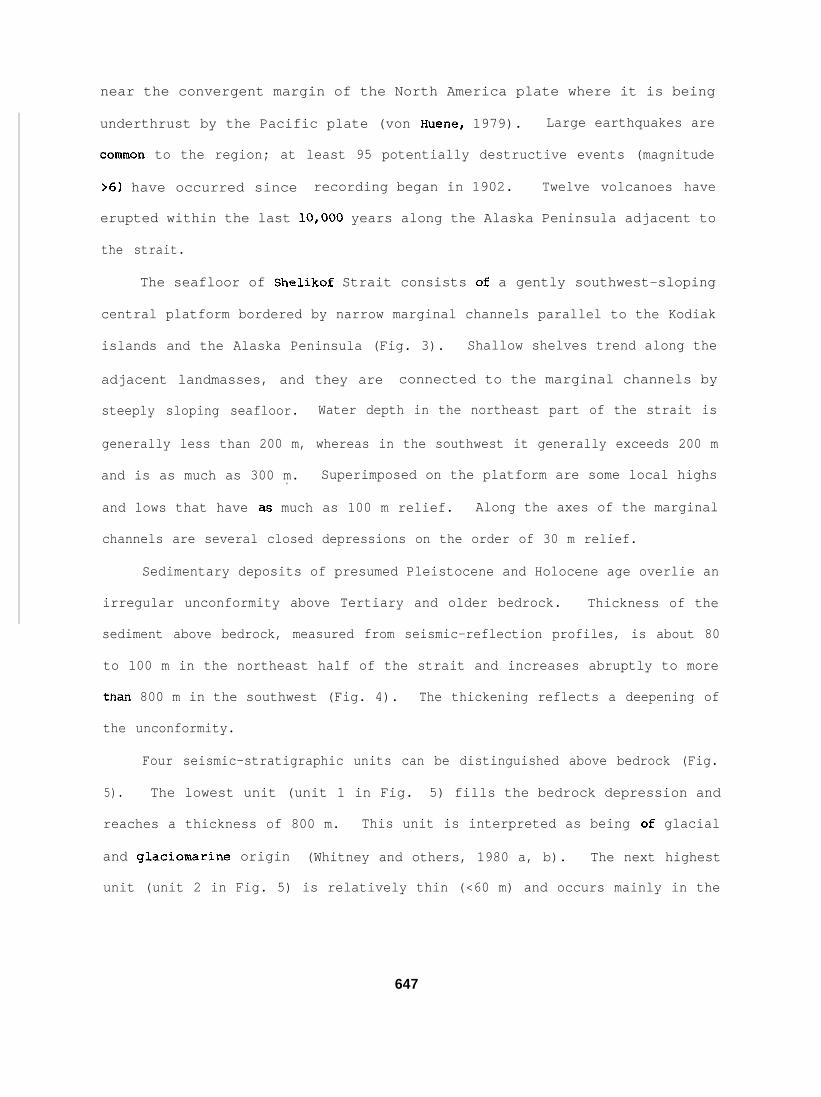
Figure 3. Bathymetry of Shelikof Strait, 20-m contour interval. Depthscorrected to mean lower low water.
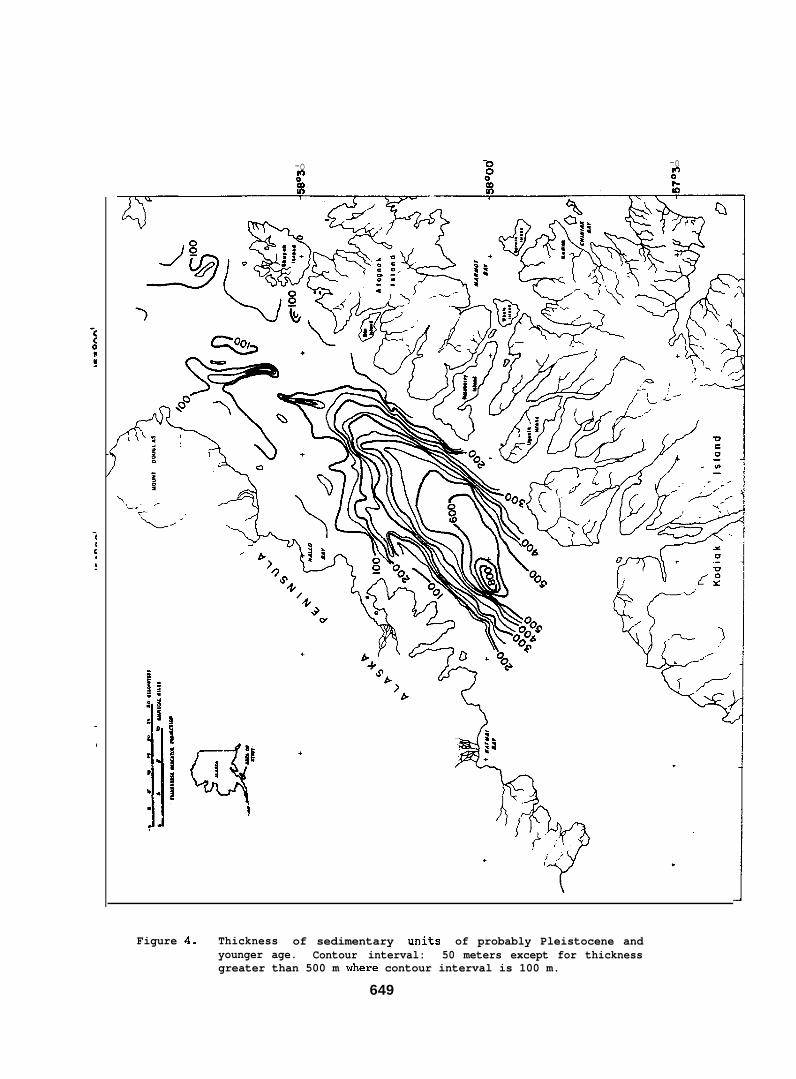
Figure 4. Thickness of sedimentary units of probably Pleistocene andyounger age. Contour interval: 50 meters except for thicknessgreater than 500 m where contour interval is 100 m.
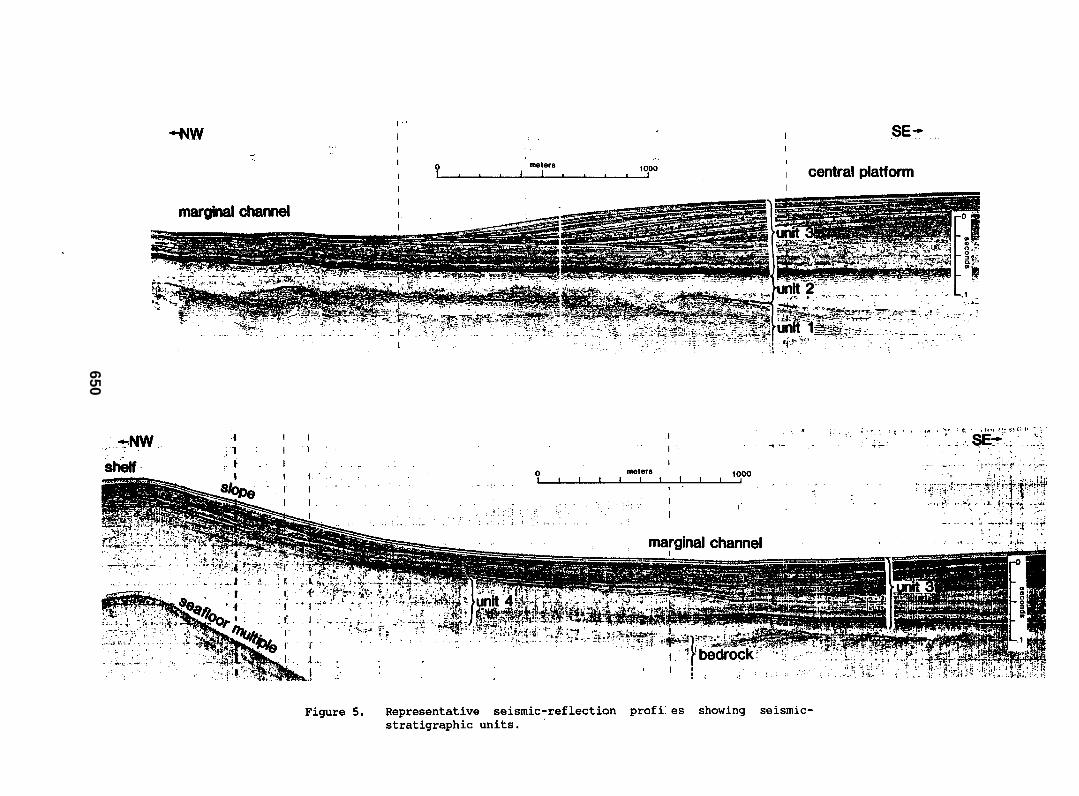
Figure 5. Representative seismic-reflection profiles showing seismic-stratigraphic units.
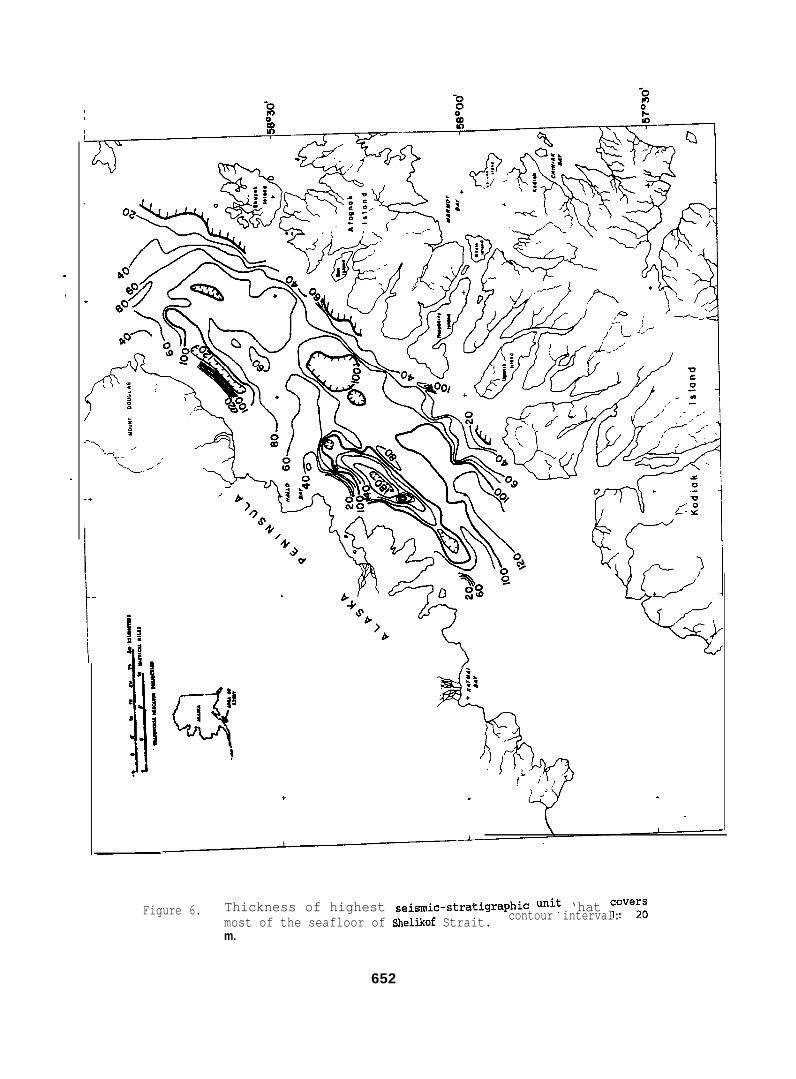
Figure 6. Thickness of highest seismic-stratigr-aphic unit that coversmost of the seafloor of Shelikof Strait. Contour interval: 20m.
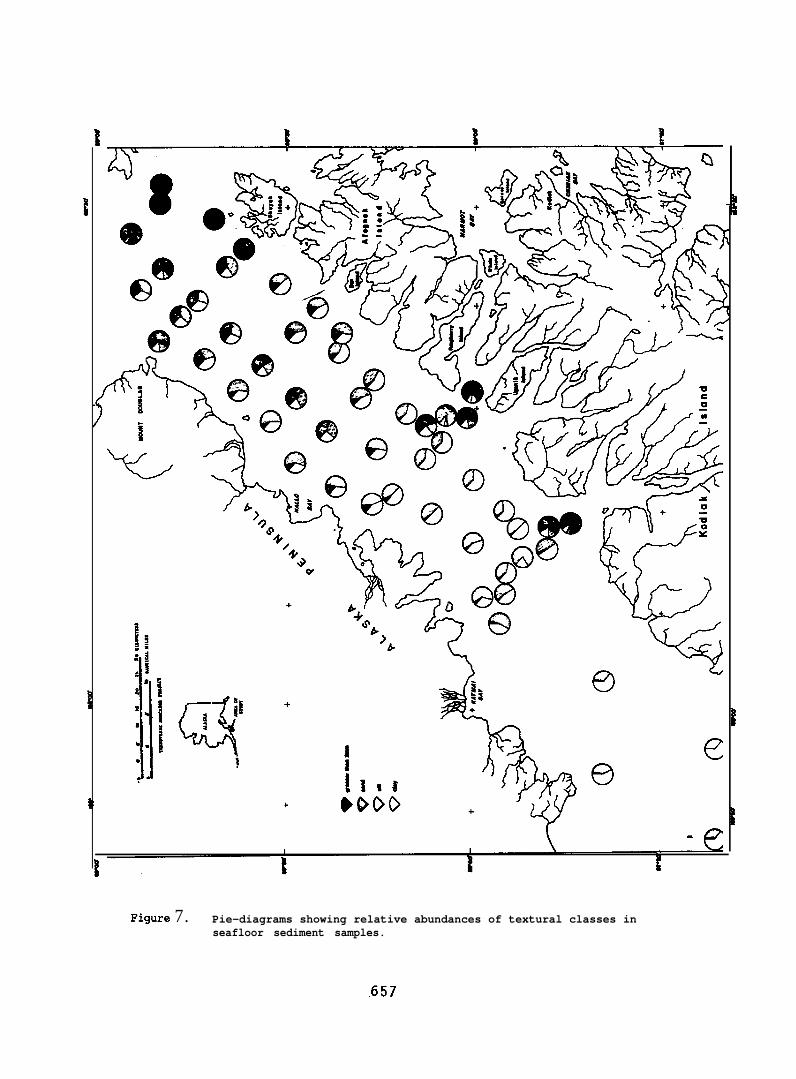
Figure 7. Pie-diagrams showing relative abundances of textural classes inseafloor sediment samples.
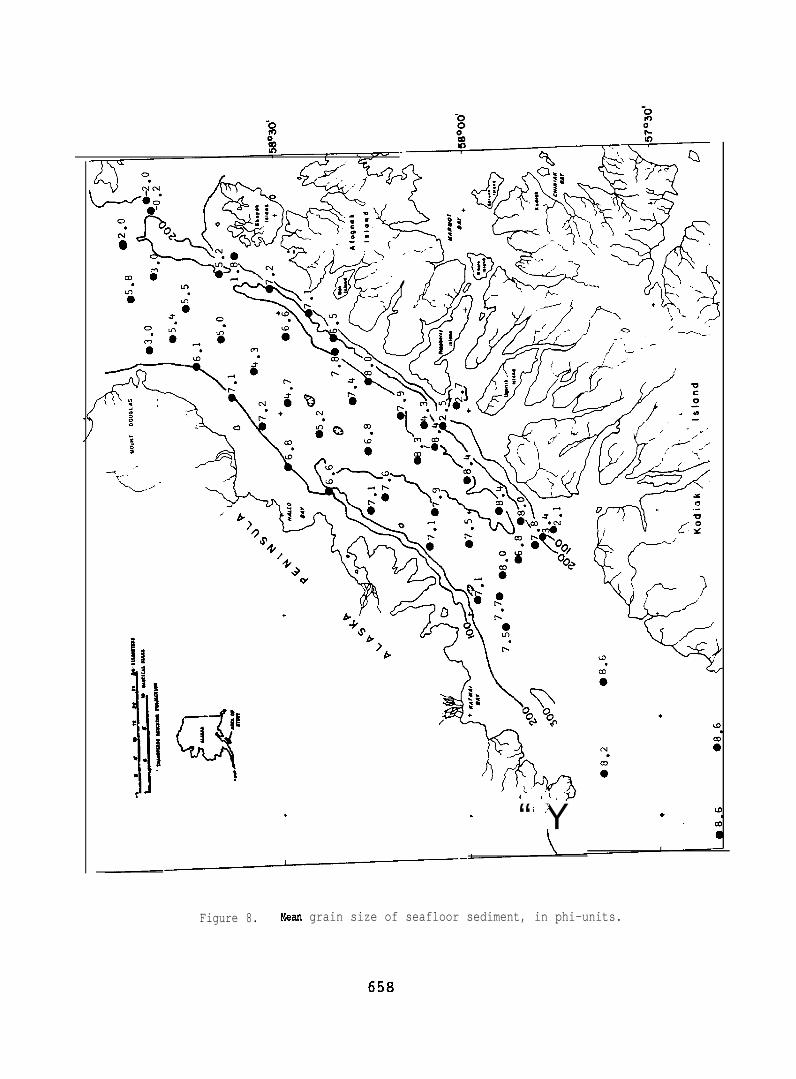
Figure 8. Mean grain size of seafloor sediment, in phi-units.
Figure 9. Sediment accumulation rates, in cm/100 yr.
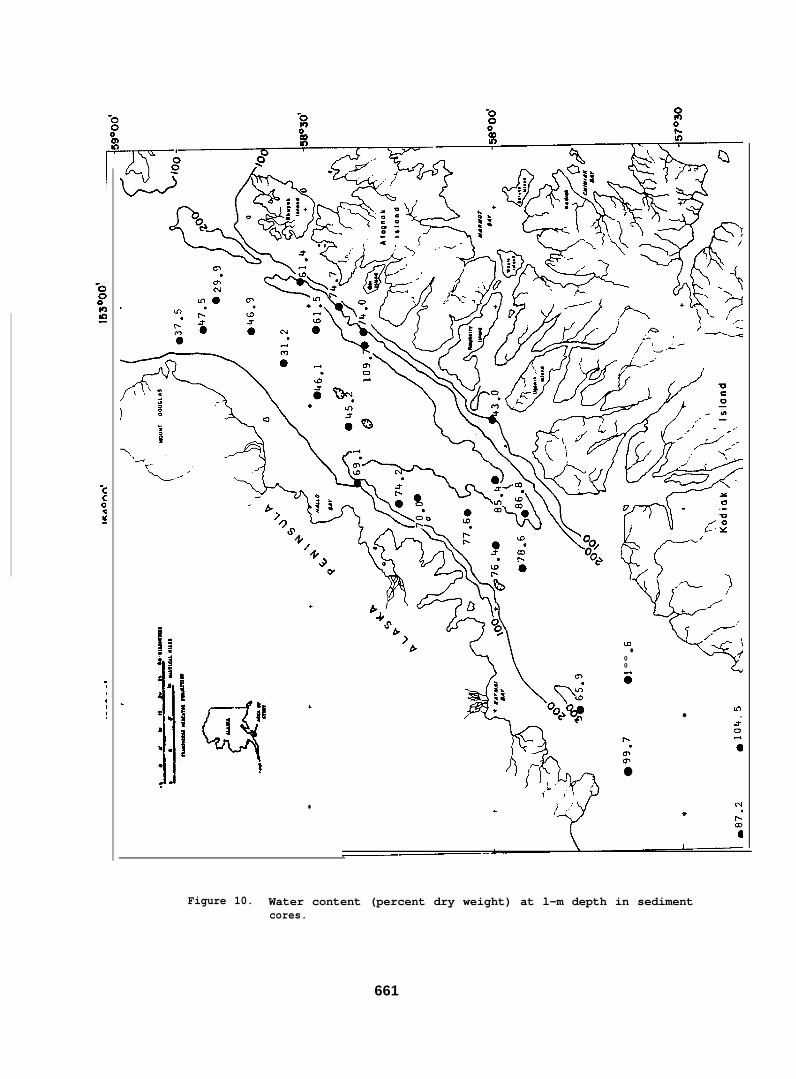
Figure 10. Water content (percent dry weight) at l-m depth in sedimentcores.
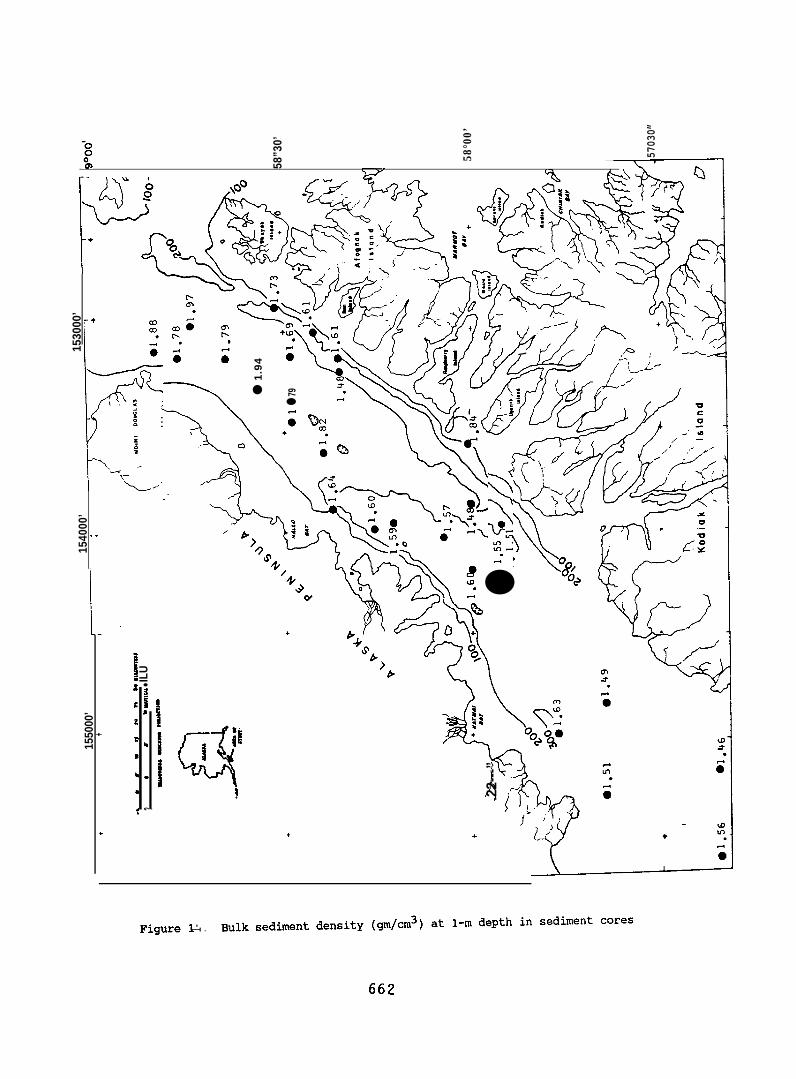
Figure 11. Bulk sediment density (gm/cm3) at l-m depth in sediment cores.
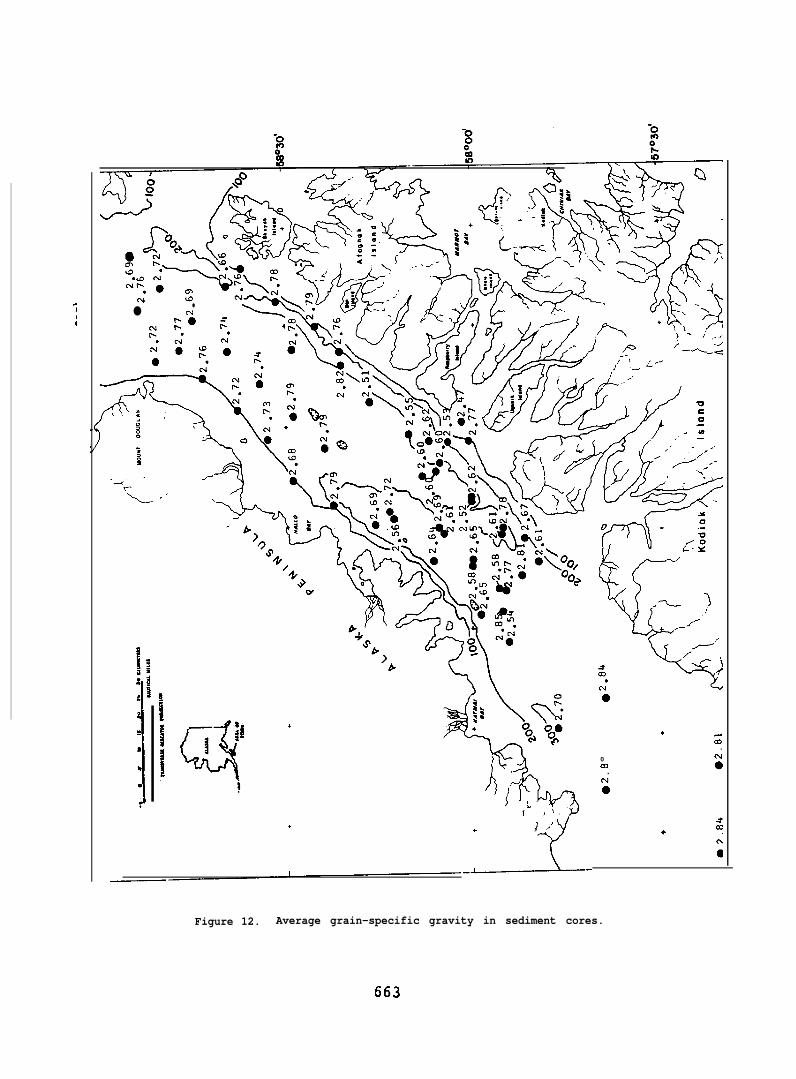
Figure 12. Average grain-specific gravity in sediment cores.
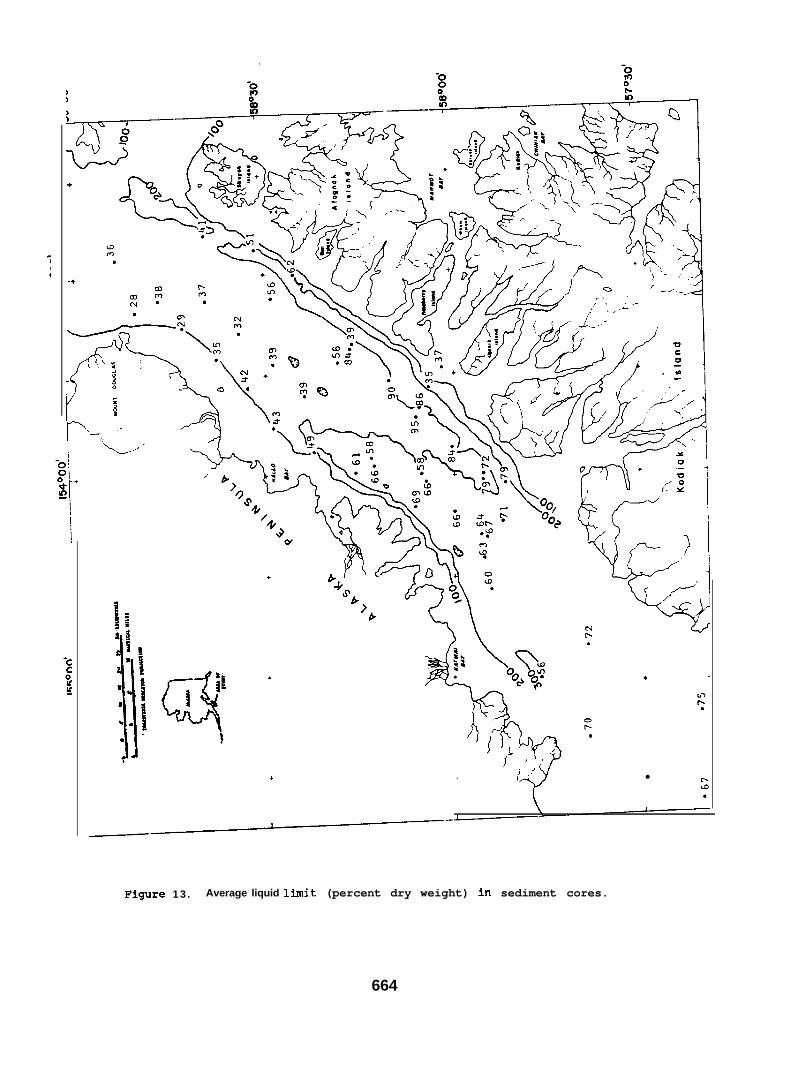
Figure 13. Average liquid limit (percent dry weight) in sediment cores.
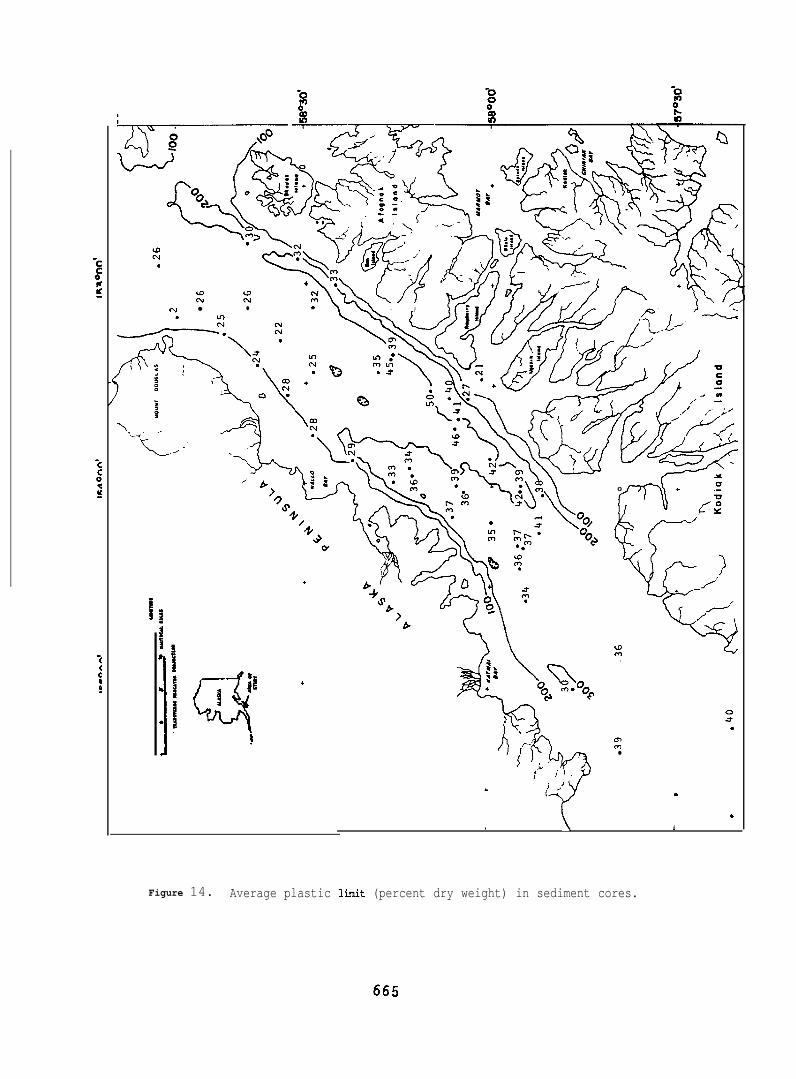
Figure 14. Average plastic limit (percent dry weight) in sediment cores.
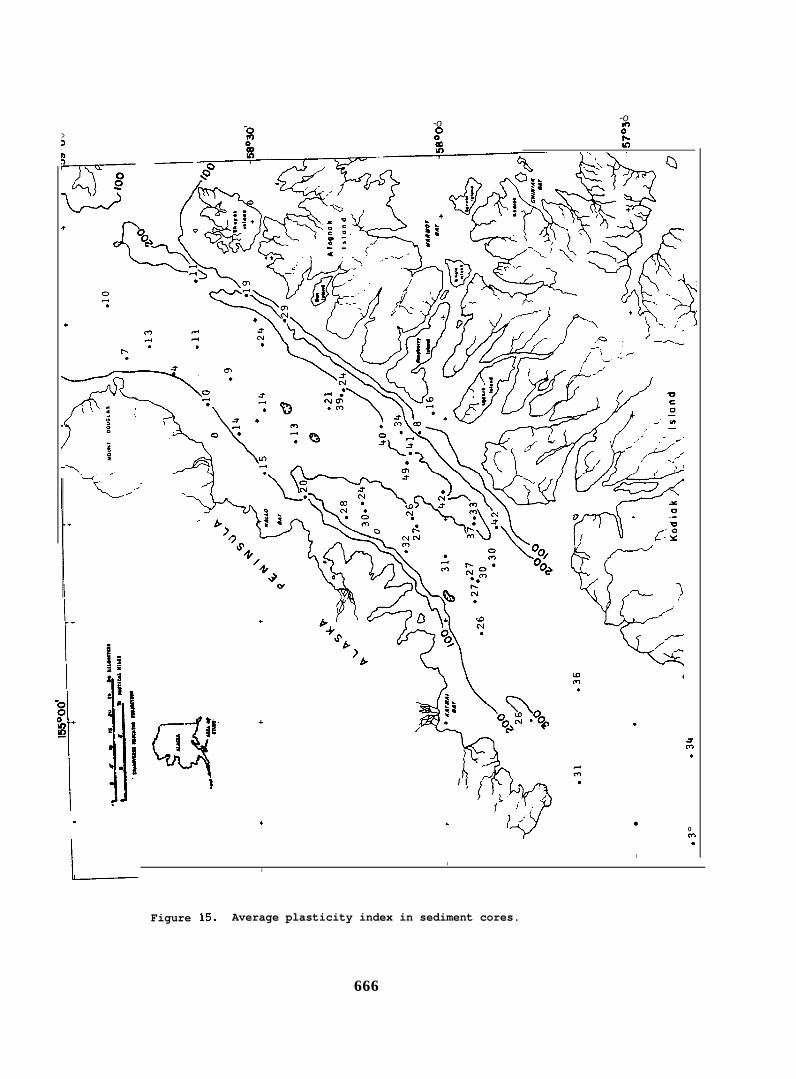
Figure 15. Average plasticity index in sediment cores.
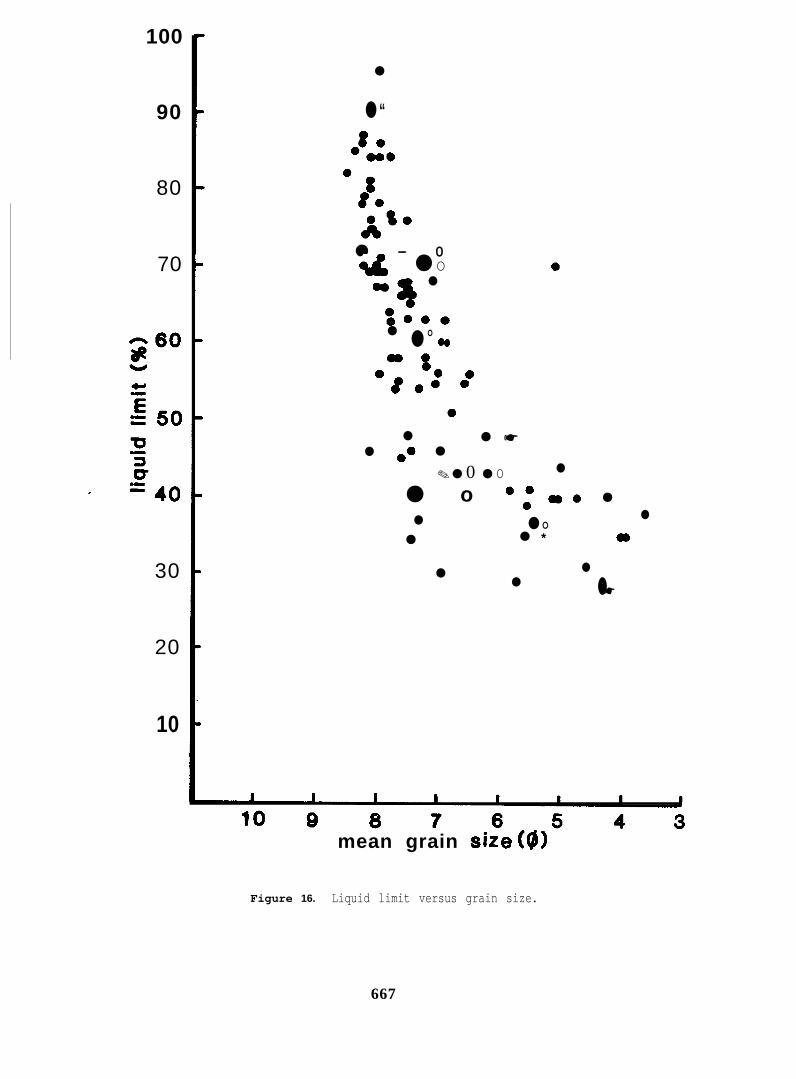
Iigure 16. Liquid limit versus grain size.
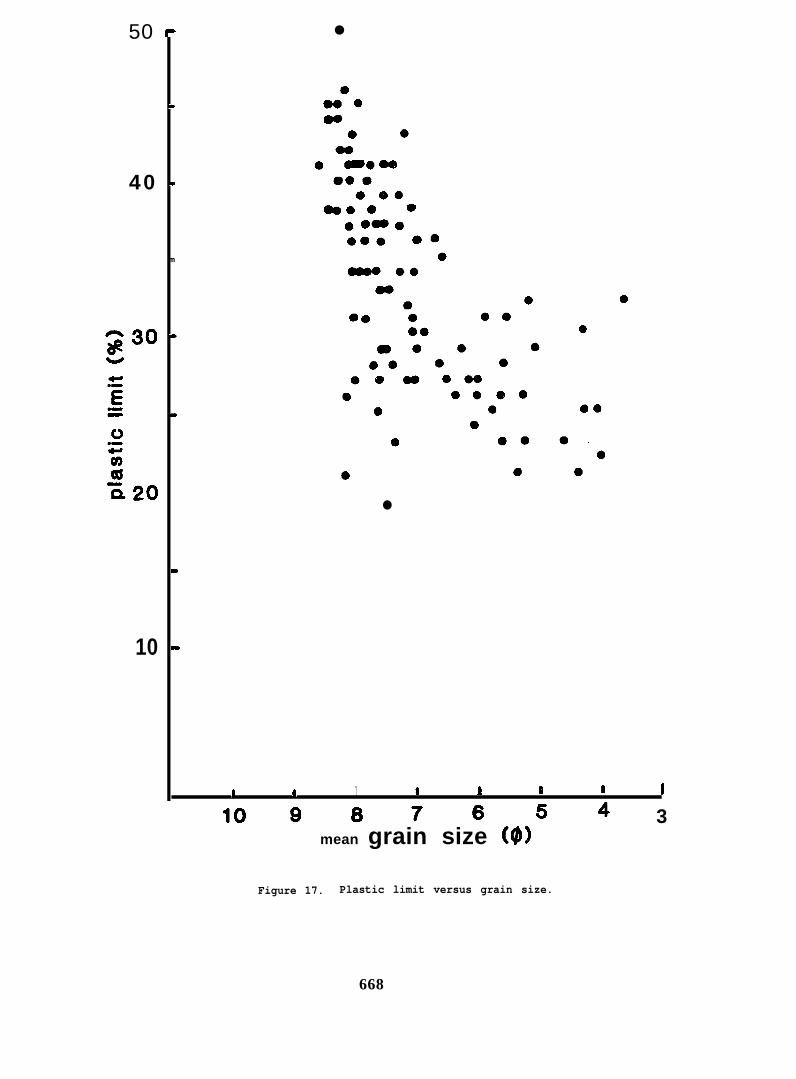
Figure 17. Plastic limit versus grain size.
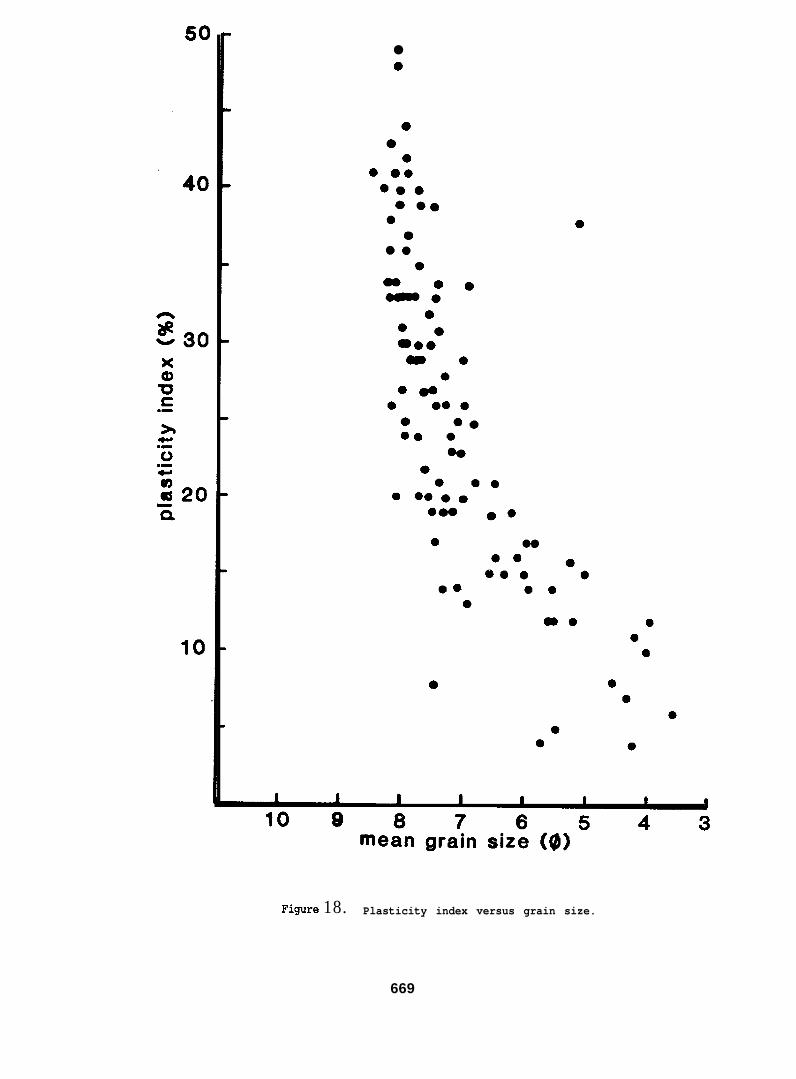
Figure 18. Plasticity index versus grain size.
641
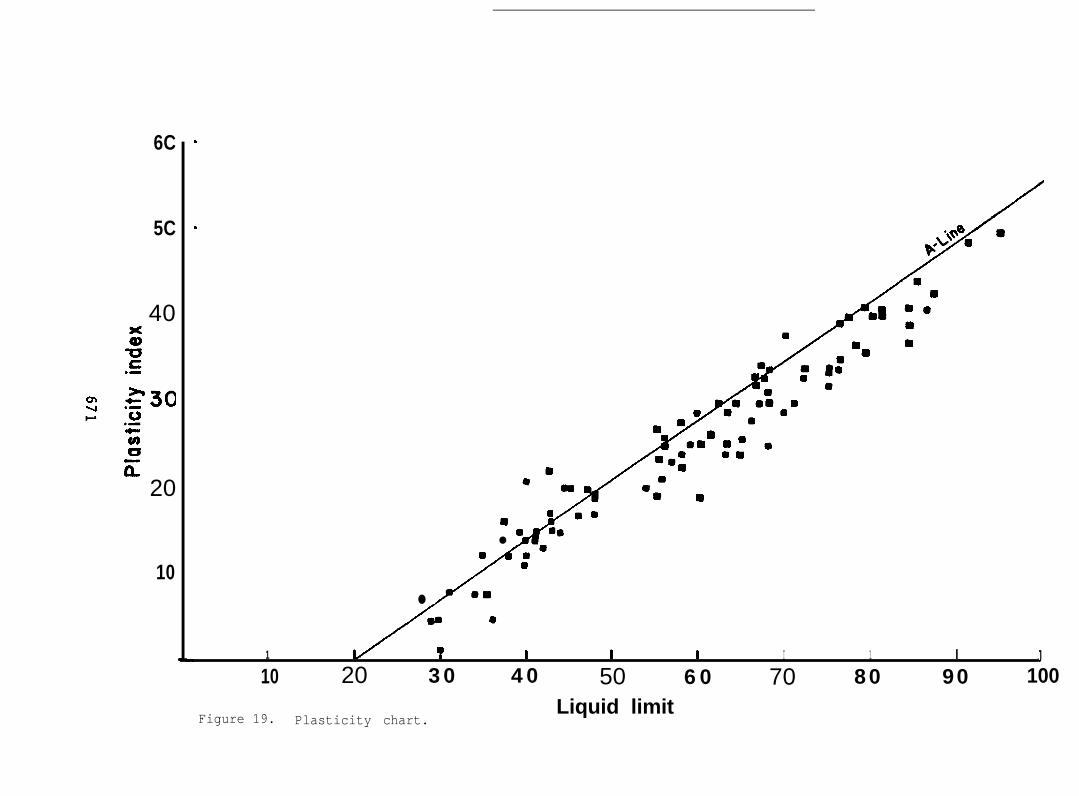
Figure 19. Plasticity chart.
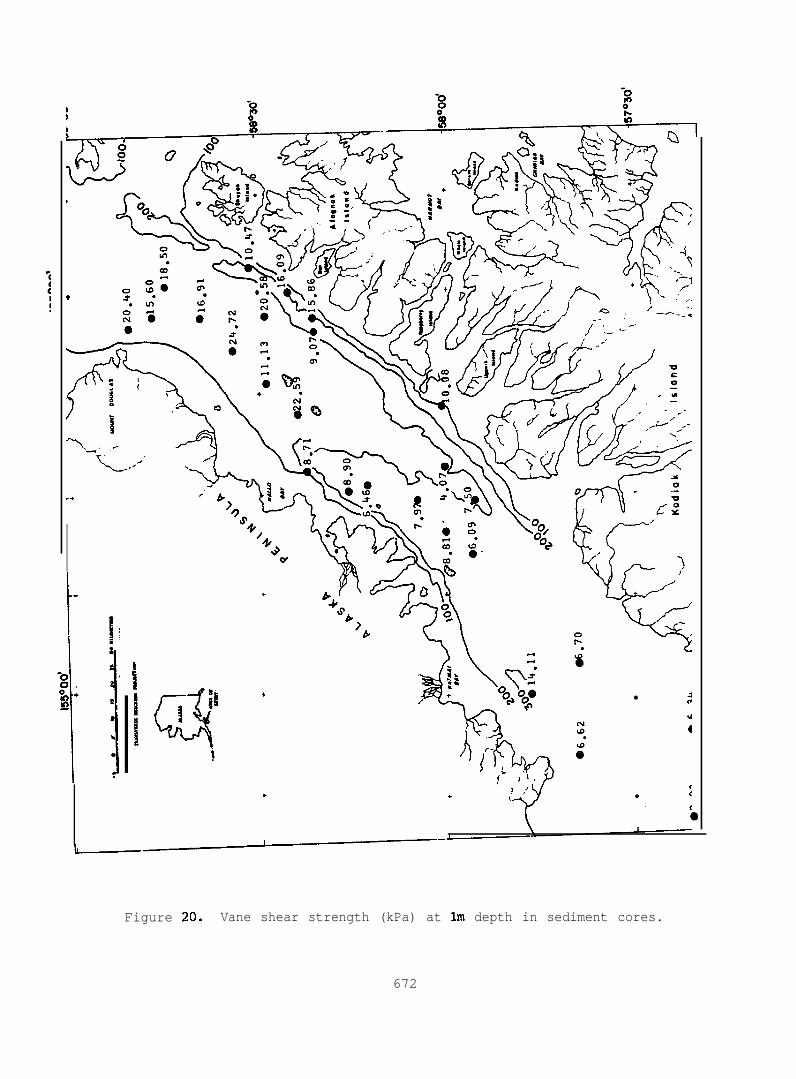
Figure 20. Vane shear strength (kPa) at lm depth in sediment cores.
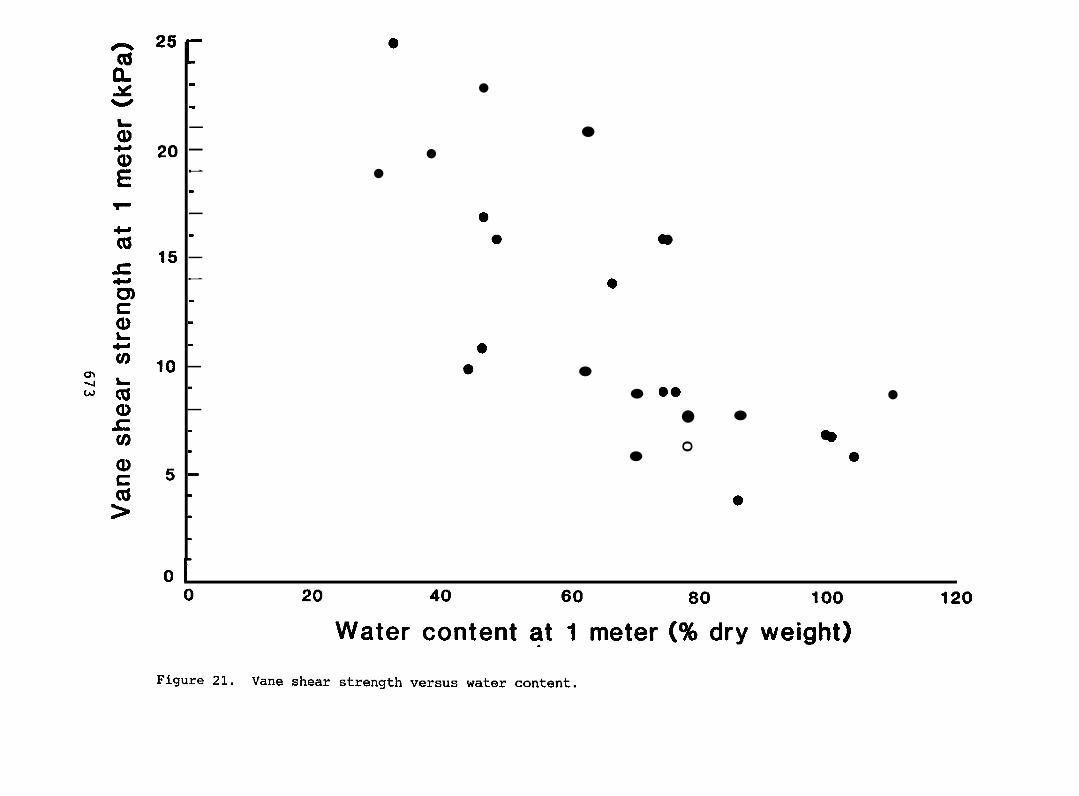
Figure 21. Vane shear strength versus water content.
Figure 22. Average organic carbon content in sediment cores.
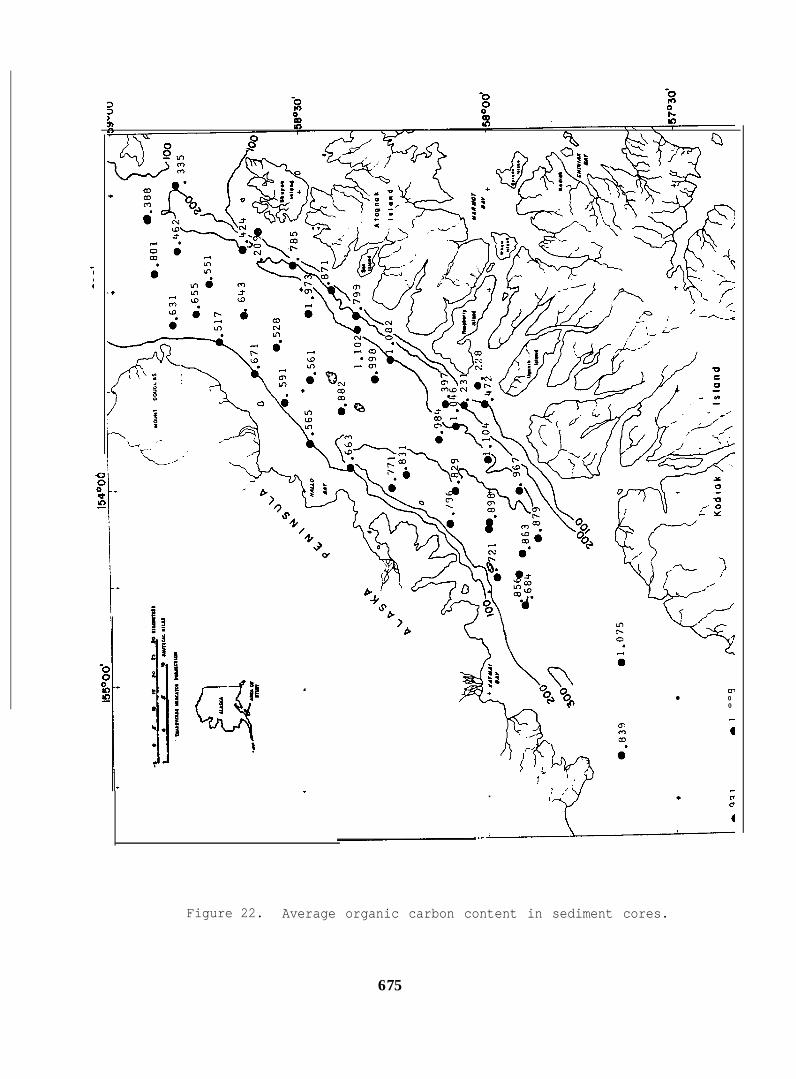
Figure 23. Average calcium carbonate content in sediment cores.
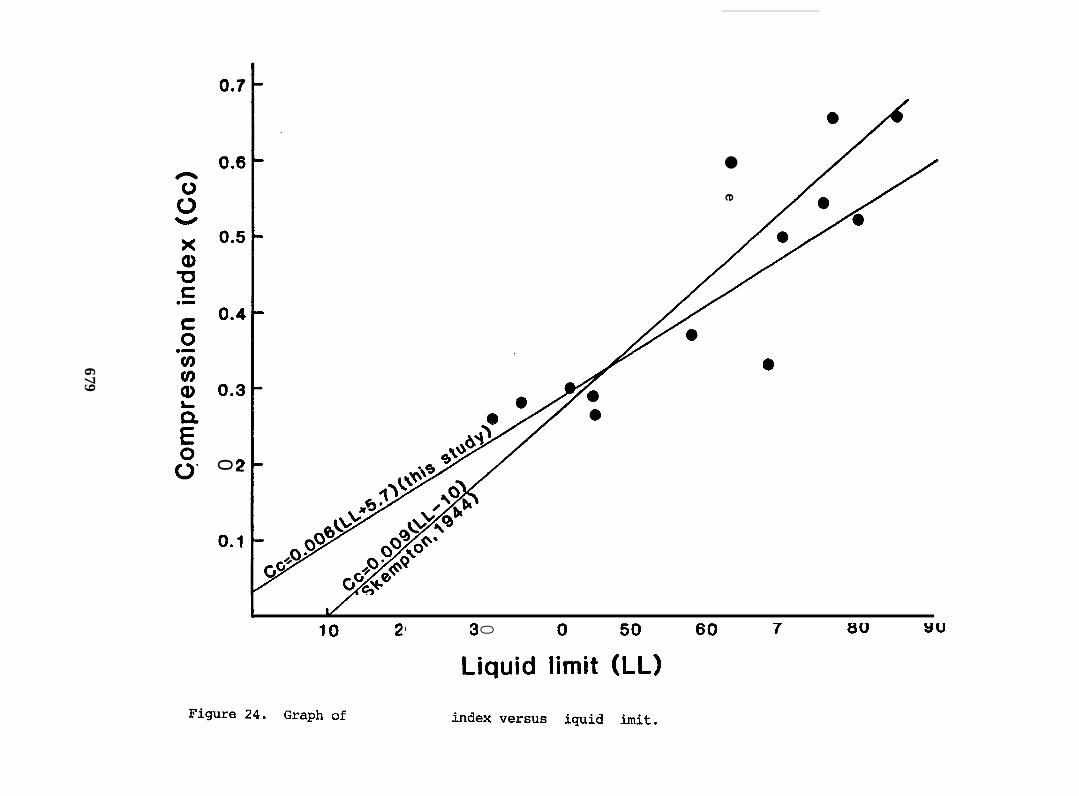
Figure 24. Graph of compression index versus liquid limit.
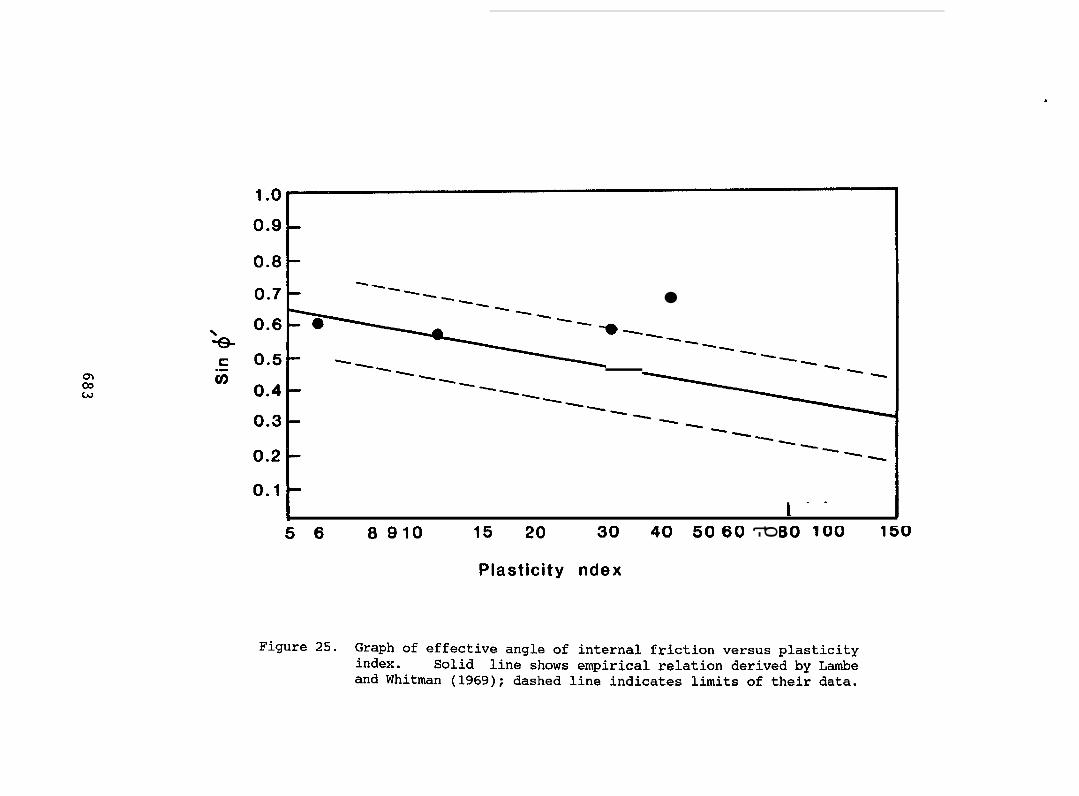
Figure 25. Graph of effective angle of internal friction versus plasticityindex. Solid line shows empirical relation derived by Lambeand Whitman (1969); dashed line indicates limits of their data.
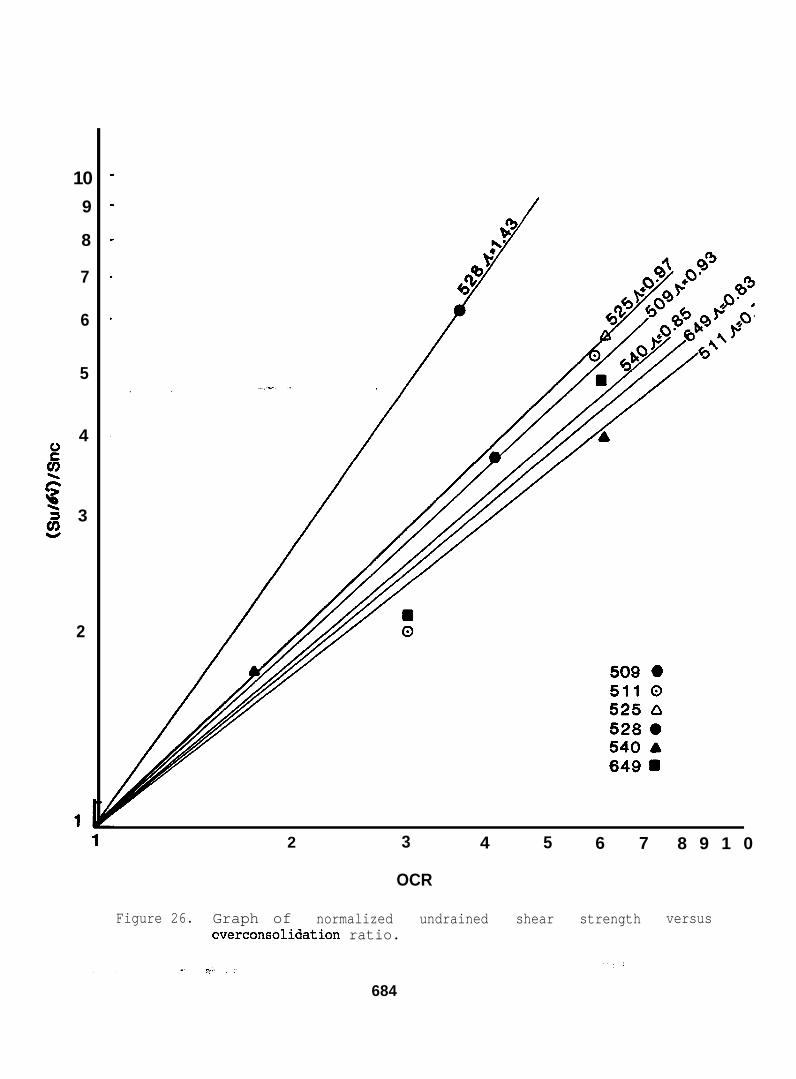
Figure 26. Graph of normalized undrained shear strength versusoverconsolidation ratio.
Figure 27. Graph of cyclic stress level versus number of cycles tofailure.
LIST OF TABLES
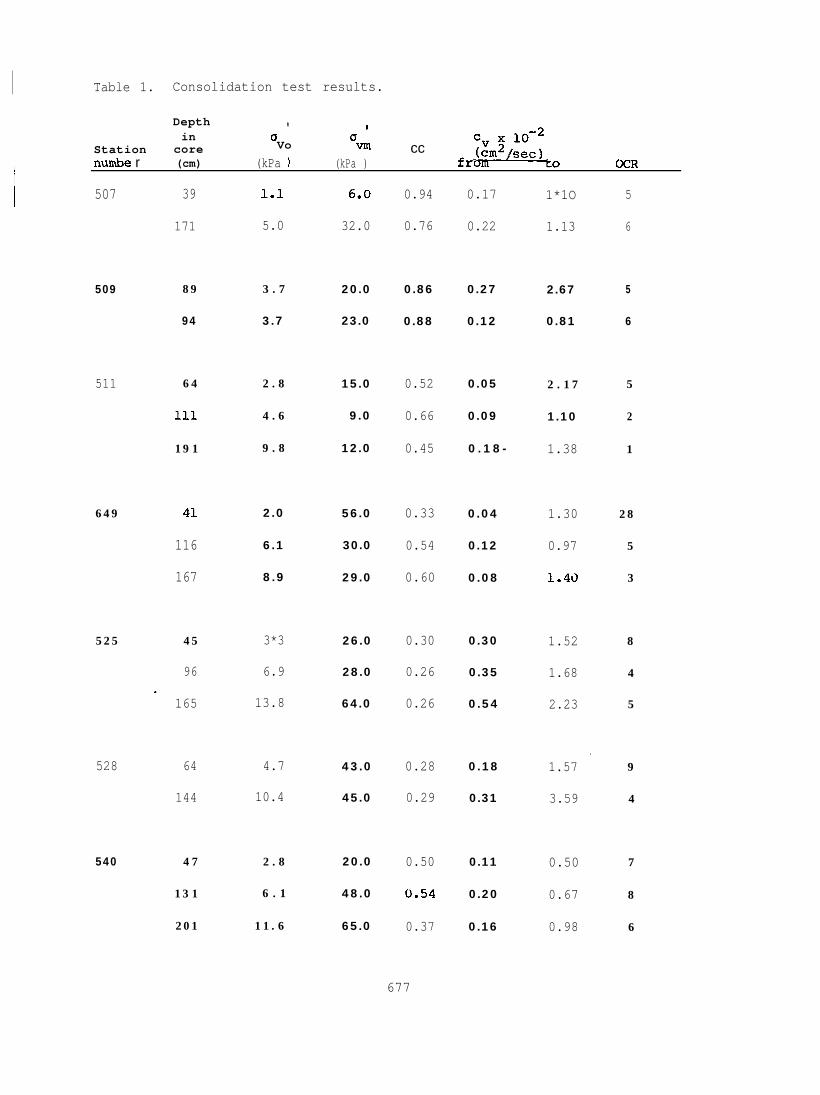
Table 1. Consolidation test results.
Table 2. Static triaxial strength test results.
Table 3. Dynamic triaxial strength test results.
642
INTRODUCTION
Studies have been conducted by the U.S. Geological Survey to ‘identify
geologic conditions that might impose constraints on offshore industrial
activities in Shelikof Strait, Alaska, an area designated for petroleum
leasing (Fig. 1; Hampton and others, 1981; Hampton and Winters, 1981). w
part of these studies sediment cores were collected throughout the strait
(Fig. 2), and physical properties of sediment samples were measured by
laboratory geotechnical testing methods. The geotechnical data are presented
in this report and are evaluated from a regional perspective to infer the
reformational reponse of the sedimentary deposits to static and dynamic loads.
Application of the test data to a regional analysis is restricted by the
degree to which core samples are representative of the sedimentary deposits.
Interpretive geologic studies indicate that the cores used for geologic
testing cover the range of surficial sediment types in the Shelikof Strait
lease area, but analysis of seismic-reflection profiles reveals the existence
of buried stratigraphic units that were not sampled because they lie beneath
the maximum core length of 3 m (Hampton and others, 1981; Hampton and Winters,
1981) . Therefore, the conclusions reached in this report apply directly to
the uppermost deposits in the stratigraphic section, only. Extrapolation
beyond the depths of sampling is limited by the vertical uniformity of
sediment type.
GEOLOGIC SETTING
Shelikof Strait is a nearly parallel-sided marine channel situated
between the Kodiak Island group and the Alaska Peninsula (Fig. 1). The strait
marks the location of a northeast-trending inner forearc basin that is located
643
‘war% W@?
... . ,-.644
7X2”” (5 Y“
1I
\ 1
\ II ●
II
III
~.--:----
$ 0- - - - - D
L-- 8,08I8a
+●
9
II10
1 I Y 1
Figure 2-A. Tracklines of continuous seismic-reflection profiles. Solidlines represent a regional survey contracted by theConservation Division, and dashed lines represent site surveyson cruises of the R/V S.P. LEE (1980) and NOAA ship DISCOVERER(1981).
645
.-
.
1 -L
●
.I
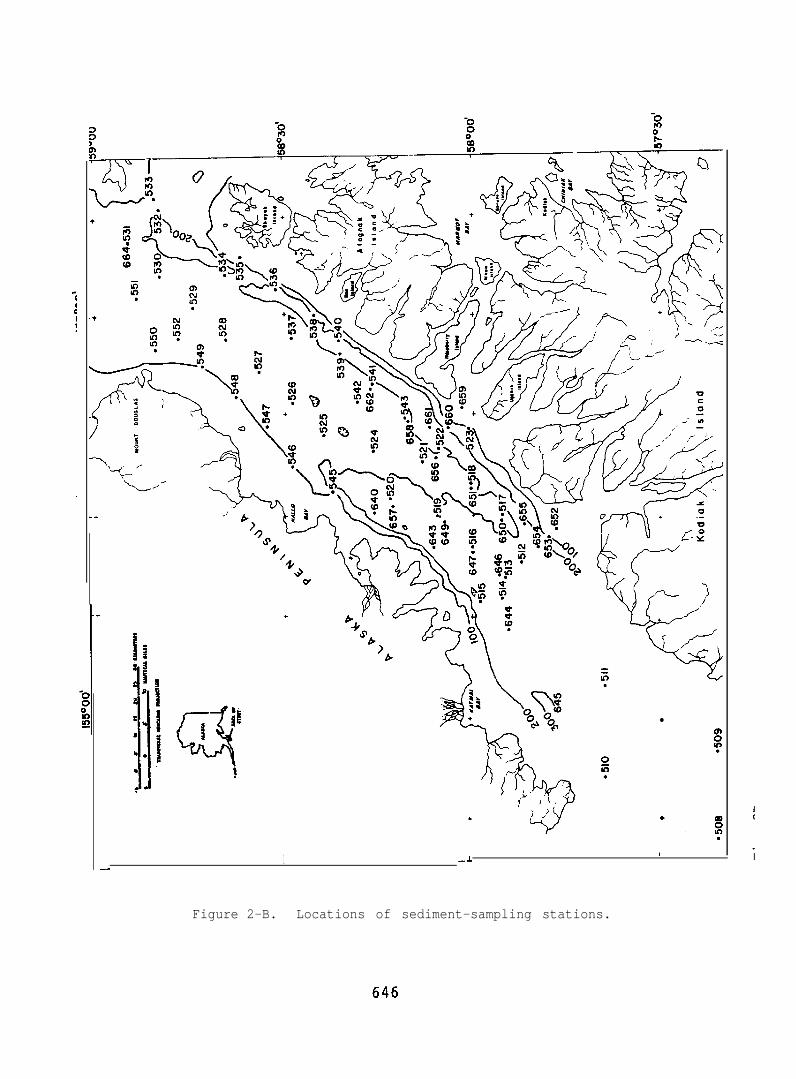
Figure 2-B. Locations of sediment-sampling stations.
near the convergent margin of the North America plate where it is being
underthrust by the Pacific plate (von Huene, 1979). Large earthquakes are
common to the region; at least 95 potentially destructive events (magnitude
>6) have occurred since recording began in 1902. Twelve volcanoes have
erupted within the last 10,000 years along the Alaska Peninsula adjacent to
the strait.
The seafloor of Shelikof Strait consists of a gently southwest-sloping
central platform bordered by narrow marginal channels parallel to the Kodiak
islands and the Alaska Peninsula (Fig. 3). Shallow shelves trend along the
adjacent landmasses, and they are connected to the marginal channels by
steeply sloping seafloor. Water depth in the northeast part of the strait is
generally less than 200 m, whereas in the southwest it generally exceeds 200 m
and is as much as 300 m. Superimposed on the platform are some local highs.
and lows that have as much as 100 m relief. Along the axes of the marginal
channels are several closed depressions on the order of 30 m relief.
Sedimentary deposits of presumed Pleistocene and Holocene age overlie an
irregular unconformity above Tertiary and older bedrock. Thickness of the
sediment above bedrock, measured from seismic-reflection profiles, is about 80
to 100 m in the northeast half of the strait and increases abruptly to more
tnan 800 m in the southwest (Fig. 4). The thickening reflects a deepening of
the unconformity.
Four seismic-stratigraphic units can be distinguished above bedrock (Fig.
5). The lowest unit (unit 1 in Fig. 5) fills the bedrock depression and
reaches a thickness of 800 m. This unit is interpreted as being of glacial
and glaciomarine origin (Whitney and others, 1980 a, b). The next highest
unit (unit 2 in Fig. 5) is relatively thin (<60 m) and occurs mainly in the
647
+
+
h\ ‘\\\,
+
●
Figure 3. Bathymetry of Shelikof Strait, 20-m contour interval. Depthscorrected to mean lower low water.
648
-oma-or
Figure 4. Thickness of sedimentary units of probably Pleistocene andyounger age. Contour interval: 50 meters except for thicknessgreater than 500 m where contour interval is 100 m.
649
——
—-
—
0-
-,---
——
—
:. ,.i.’
650
+. ..., -.$, ...!,-.
:::
;
:,. .“ “-’-.. . . .
,. .
;.?F
,..., -
;
,.. ,
. .
. . . .
,.
-——
.,..
,.,-
-—
“1
.. .
. .
, . .
, .. . . . ~,.: -,
mal
,
central part of the strait. Sediment of this unit was deposited within low
areas on the upper surface of bedrock and the glacial unit, and it apparently
was emplaced by marine processes during the Holocene sea-level rise. The
third unit (unit 3 in Fig. 5), which covers essentially all of the seafloor in
the central part of the strait (platform and marginal channels), is up to 180
m thick (Fig. 6) and was deposited by the modern-day oceanic current regime of
southwesterly baroclinic flow from Cook Inlet and the eastern Gulf of Alaska
(Muench and Schumacher, 1980). Unit 4 in Figure 5 underlies the shallow
shelves and interfingers seaward with unit 3. It is composed of sediment
eroded from the adjacent landmasses. The cores subjected to geotechnical
testing and discussed in this paper were taken from unit 3.
METHODS
Sediment cores were collected at 65 stations on two cruises in Shelikof
Strait, in June 1980 aboard the USGS R/V S.P. LEE and in July and August 1981
aboard the NOAA ship DISCOVERER (Fig. 2). A gravity coring system with 8.5-cm
diameter plastic liners in steel core barrels was used on the 1980 cruise,
whereas a vibracoring system with a 10-cm square cross-section plastic liner
in thin-wall stainless steel barrel was employed on the 1981 cruise. Some
grab samples were taken at locations of coarse sediment where the coring
devices were ineffective.
TWO cores were taken at most stations. One was designated mainly for
geological analysis. It was cut into l-m or 1.5-m-long sections, then split
lengthwise for geological description and vane-shear strength testing.
Subsamples were taken for index property determinations.
651
+
.
.
Figure 6. Thickness of highest seismic-strati9raPhic ‘nit ‘hat cove~~most of the seafloor of Shelikof Strait. contour interval:
m.
652
The second core was taken expressly for geotechnical testing. It was cut
into l-m-long sections, wrapped in cheesecloth, covered with microcrystalline
wax, and stored upright in a refrigerator. These cores were later subjected
to a suite of geotechnical tests in laboratories at the USGS and at a
commercial testing company. .
Several index properties were determined for subsamples of the sediment
cores. Grain size was measured by sieving and pipetting into four size
classes: gravel (>2 mm), sand (2-0.062 mm), silt (0.062-0.004 mm), and clay
(<0.004 mm). Water content, as a percentage of dry sediment weight, was
determined from the weight of sediment samples before and after even drying at
105”C. A correction for salt content of sea water (3.5%) was made to the
weighings. Atterberg limits were determined according to standard procedures
(American Society for Testing and Materials, 1976), except that samples were
not sieved prior to testing. Carbon content was measured with a LECO carbon
determinator with induction furnace and acid digestion. Vane shear
determinations of undrained shear strength were made on split core halves with
a motorized device at a vane rotation rate of 90°/min. The vane is l/2 inch
diameter by l/2 inch high and was inserted into the sediment to a depth twice
the height of the vane.
Consolidation tests were run on subsamples from geotechnical cores to
determine sub-failure reformational properties. Most tests were run on an
oedometer in a stress-controlled mode (Lambe, 1951). Others were run in a
triaxial loading cell under constant rate of strain conditions (Wissa and
others, 1971). The consolidation tests measure change in volume with change
in applied load. The results are normally plotted as void ratio (e = volume
of voids/volume of solids ) versus the logarithm of effective (buoyant)
653
.
vertical stress (p’). Two useful parameters are derived from these curves:
the compression index and the maximum past pressure. The compression index
(Cc) is the slope of the straight-line portion of the e-log p’ curve and
indicates the amount of compression produced by a particular load increment.
The maximum past pressure (u’ ) is the greatest effective overburden stress to
which the sediment has ever been exposed and is determined from the e-log p’
curve by a simple graphical construction (Casagrande, 1936). The ratio
of 0; to the effective overburden stress at the time of sampling (ov~) is the
overconsolidation ratio (OCR), which is a measure of unloading that the
sediment may have experienced, by erosion for example. A third parameter, the
coefficient of consolidation (Cv)I is determined for each load increment of
the one-dimensional consolidation test and is related to the rate of
consolidation.
Static traxial tests were run on cylindrical samples 3.6-cm diameter and
7.6-cm long in order to determine strength properties of the sediment. Tests
were run under undrained conditions with pore pressure measurements (Bishop
and Henkel, 1964) . Most samples were consolidated isotropically prior to
testing, but some were consolidated anisotropically.
Dynamically loaded triaxial tests were also run, with the axial stress on
samples varied sinusoidally at 0.1 Hz. Both compression and tension were
applied at a predetermined percentage of the static strength. These tests can
be used to evaluate the failure conditions of sediment under repeated loading,
such as by earthquakes.
A first set of triaxial tests was run on sediment samples that were
consolidated to somewhat arbitrary stress levels. However, the later testing
program followed the normalized stress parameter (NSP) approach (Ladd and
654
Foott, 1974), whereby consolidation
maxi mum past pressure (u;) , as
stresses are chosen on the basis of
determined from consolidation tests.
Typically, the triaxial test specimen was consolidated to four times o; ,
which eliminates some of the disturbance effects associated with coring.
Overconsolidation was artificially induced in some tests by rebounding the
specimen to lower stress levels before applying the triaxial load. Measured
values of undrained shear strength (Su) are normalized with respect to
effective overburden stress (aj) . A premise
ratio S /a’ is constant for a particular valueU v
of the NSP method is that the
of CCR. Moreover, a relation
exists between s/u’ and CXR that allowsU v
depths below the level of sampling (Mayne,
prediction of sediment strength at
1980) .
RESULTS
Sediment description, index properties: Sediment samples could only be
collected to shallow depths (<3 m) beneath the seafloor. Therefore, most are
from the highest stratigraphic unit (unit 3, Fig. 5). However, judging from
seismic-reflection profiles over sampling stations, a few outcrops of other
units were also sampled. Seismic-reflection profiles also show that unit 3
has a typical thickness of about 80 to 100 m
acoustic reflectors within this unit indicates
with depth, but there is no reason to suspect
type, except for possible thin beds of volcanic
for the
of the
this.
(Fig. 6). The appearance of
some lithologic variability
radical changes in sediment
ash. The physical properties
cores should therefore be representative of the terrigenous component
unit as a whole, but drill-hole samples would be necessary to confirm
655
The texture of surficial
adjacent marginal channels grades
northeast part of the strait
,
sediment on the central platform and in the
from gravelly and sandy material in the
to mud in the southwest (Figs. 7 and 8;
Appendix). A general fining trend from northwest to southeast across the
platform also exists.
The two grab samples of coarse sediment recovered from Stevenson Entrance
appear to have been taken from outcrops of unit 1. Most of the coarse clasts,
which range to boulder size, are angular to subangular, and some are faceted.
This supports the hypothesis that unit 1 was deposited by glacial processes.
A few grab samples of coarse material were also recovered from the
shallow shelves and from the adjacent slopes. They probably are from unit
4. Coarse clasts have similar morphology to those from unit 1, perhaps
reflecting glacial transport at some point in their history.
Sediment cores from the platform and marginal channels in the central
portion of the strait have a fairly uniform stratigraphy with depth. Sandy
sediment in the northeast end of the strait is predominantly greenish-gray,
with variations from black to yellowish brown. Sand-filled burrows, pebble
clasts, and whole or broken shells are common. In progressively finer-grained
cores to the southwest, color remains greenish-gray but is less varied, and
shells and clasts are rare.
A layer of
layer is nearly
few millimeters
The refractive
volcanic ash occurs in many cores. Maximum thickness of the
20 cm. It is size-graded, with the coarsest basal fragments a
diameter. The color is from tan to white with a pink cast.
index of the ash is 1.485 + 0.002, which in this region is
unique to the outfall from the 1912 Katmai eruption (Nayudu, 1964; Pratt and
others, 1973). Depth of the ash beneath the seafloor was used to calculate
656
@‘&
e
I?igure 7. Pie-diagrams showing relative abundances of textural classes inseafloor sediment samples.
+ . “ Y1 ,?
.
Figure 8. Mean grain size of seafloor sediment, in phi-units.
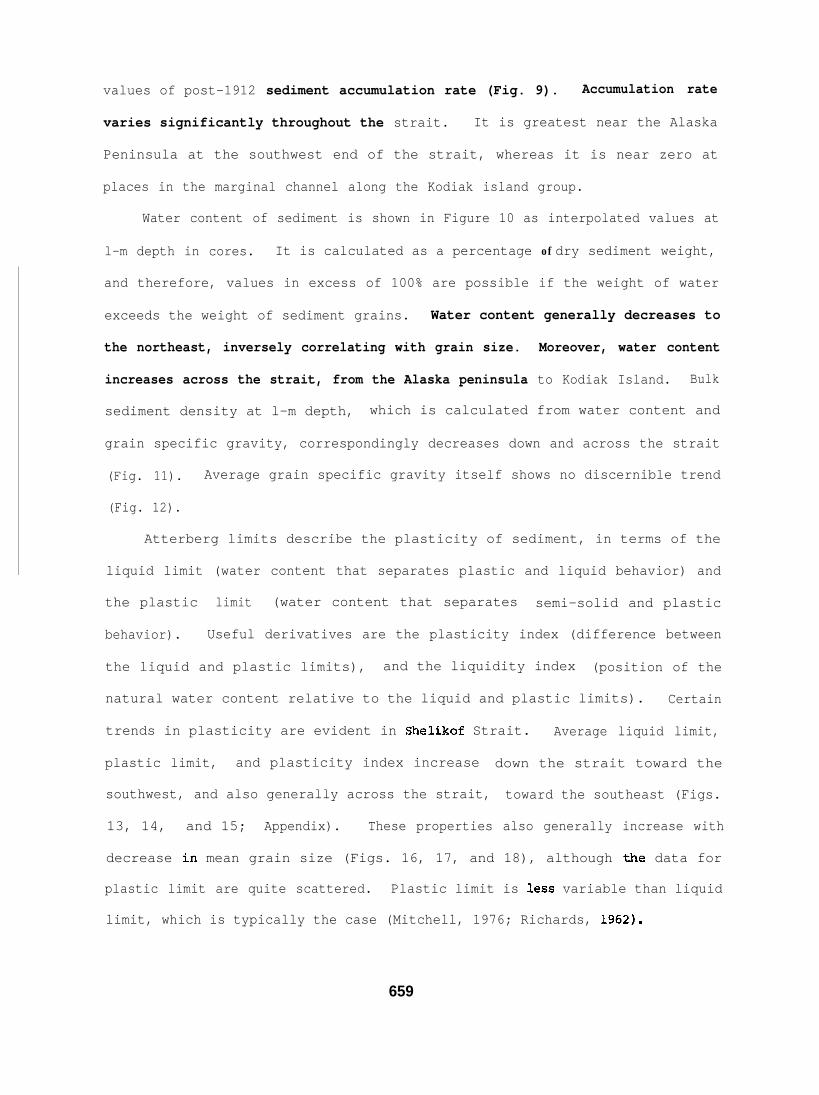
values of post-1912 sediment accumulation rate (Fig. 9). Accumulation rate
varies significantly throughout the strait. It is greatest near the Alaska
Peninsula at the southwest end of the strait, whereas it is near zero at
places in the marginal channel along the Kodiak island group.
Water content of sediment is shown in Figure 10 as interpolated values at
l-m depth in cores. It is calculated as a percentage of dry sediment weight,
and therefore, values in excess of 100% are possible if the weight of water
exceeds the weight of sediment grains. Water content generally decreases to
the northeast, inversely correlating with grain size. Moreover, water content
increases across the strait, from the Alaska peninsula to Kodiak Island. Bulk
sediment density at l-m depth, which is calculated from water content and
grain specific gravity, correspondingly decreases down and across the strait
(Fig. 11). Average grain specific gravity itself shows no discernible trend
(Fig. 12).
Atterberg limits describe the plasticity of sediment, in terms of the
liquid limit (water content that separates plastic and liquid behavior) and
the plastic limit (water content that separates semi-solid and plastic
behavior). Useful derivatives are the plasticity index (difference between
the liquid and plastic limits), and the liquidity index (position of the
natural water content relative to the liquid and plastic limits). Certain
trends in plasticity are evident in Shelikof Strait. Average liquid limit,
plastic limit, and plasticity index increase down the strait toward the
southwest, and also generally across the strait, toward the southeast (Figs.
13, 14, and 15; Appendix). These properties also generally increase with
decrease in mean grain size (Figs. 16, 17, and 18), although the data for
plastic limit are quite scattered. Plastic limit is less variable than liquid
limit, which is typically the case (Mitchell, 1976; Richards, 1962).
659
Figure 9. Sediment accumulation rates, in cm/100 yr.
660
.
● .‘+’
j ,,,
0
la●
00
0
m● .
●
Figure 10. Water content (percent dry weight) at l-m depth in sedimentcores.
661
al m Iv
P 1- .
1550
00’
1540
00’
1530
00’
T+
..#9
mW
mn
U-1
?*
su M
W,UL ●
ILU
WU
n M
4um
-m
‘-;
(U
T:
;(2
. . .
+?+
. Ual
/-\
)-I/
.*7
.1“
I
-A.22-
--”
-,●
l”%
!xz’!
!-
● 1
.94
● 79
\
9000
’
58”3
0’
58°0
0’
5703
0”
●●
N
“’o‘t“v+
w
‘l\
+ .
-?
)’, .,
.
0a.
co.
Figure 12. Average grain-specific gravity in sediment cores.
l“ E
i’:
‘+ “-!-
+
+,,
‘J) ..’.
●
● r.0
Figure 1 3 . Average liquid limit (percent dry weight) in sediment cores.
664
-g*
N&‘o-l
+.UY N3 c-l m
&, ● ● . - }. .
~,. .-J-% 0
+
+/
}
A ‘.l--
+ ‘+j ,’(
o
am
.
CT●
.
\.
t 1
Figure 14. Average plastic limit (percent dry weight) in sediment cores.
-o -o
> -CJ p 0:
. ,
Ib
IG
●0m
/ l <r-L).-*
1-.
1
II
Figure Is. Average plasticity index in sediment cores.
666
100
●
90
80
70
u
30
20
10
● “
● - 0& ● O-+
●
:000●
● ° 00
-$‘#@: 4’
● ● ☛
● ☛☛ ●
✎ ● 0 ● 0 ●
● o “:-. ●
● ●● O
● ● * m
●●
● ●☛
mean grain size (())
Figure 16. Liquid limit versus grain size.
667
50
40
10
T
m
m
m
m
m
m
D
1 9 1 1 1 I I \
10987654 3mean grain size (W
●
●
Figure 17. Plastic limit versus grain size.
668
●
9
Figure 18. Plasticity index versus grain size.
669
Correlations have been made between liquid limit and compressibility
(Herrmann and others, 1972; Skempton, 1944). The majority of Shelikof Strait
samples fall within the medium (30 < liquid limit < 50) and high (liquid limit
> 5 0 ) c o m p r e s s i b i l i t y r a n g e s .
Nearly all measured liquidity indices in Shelikof Strait are greater
1 (Appendix), which is usual for near-seafloor marine sediment. Sediment
than
with
a liquidity index greater
A plot of liquidity
chart (Casagrande, 1948)
than one behaves as a liquid when remolded.
index versus plasticity index - termed a plasticity
shows a trend parallel to the A-line that divides
basic soil types (Fig. 19). Most sediment samples from Shelikof Strait plot
below the A-1ine, which is typical of inorganic silt and silty clay of high
compressibility. The
taken throughout the
1962) .
linear trend of data points is expected for samples
same sedimentary deposit (Terzaghi, 1955; Richards,
Undrained shear strength of sediment samples (Su), as measured with a
laboratory miniature vane shear device, generally decreases toward the
southwest end of the strait, and thus correlates with the water content trend,
although there is much scatter (Figs. 20 and 21; Appendix). The consistency
of most of the near-seafloor sediment can be classified as very soft (Su < 12
kilopascals), but some is soft (12 kpa < Su < 24 kpa) to medium (24 kpa < SU <
48 kPa) (Terzaghi and Peck, 1948). Hampton and others (1981) showed that
shear strength is anisotropic in Shelikof Strait sediment cores. Values of
shear strength measured with the axis of vane rotation perpendicular to the
axis of core samples exceed the values of strength measured with the axis of
vane rotation parallel to the core axis. The magnitude of sediment strength
thereby depends on the orientation of the applied stress.
670
6C
5C
40x~.-
+m0
E20
10
10
.
s88
●
8
●
1 I I I 1 I J20 3 0 4 0 50
Liquid limit6 0 70 8 0 90 100
Figure 19. Plasticity chart.
-.
I .
●
Figure 20. Vane shear strength (kPa) at lm depth in sediment cores.
672
●:●
●●
O
●
●
●
●
●
●
Lg
II
II
1t
I1
I1
11
1I
II
1#
I9
1I
&
1-
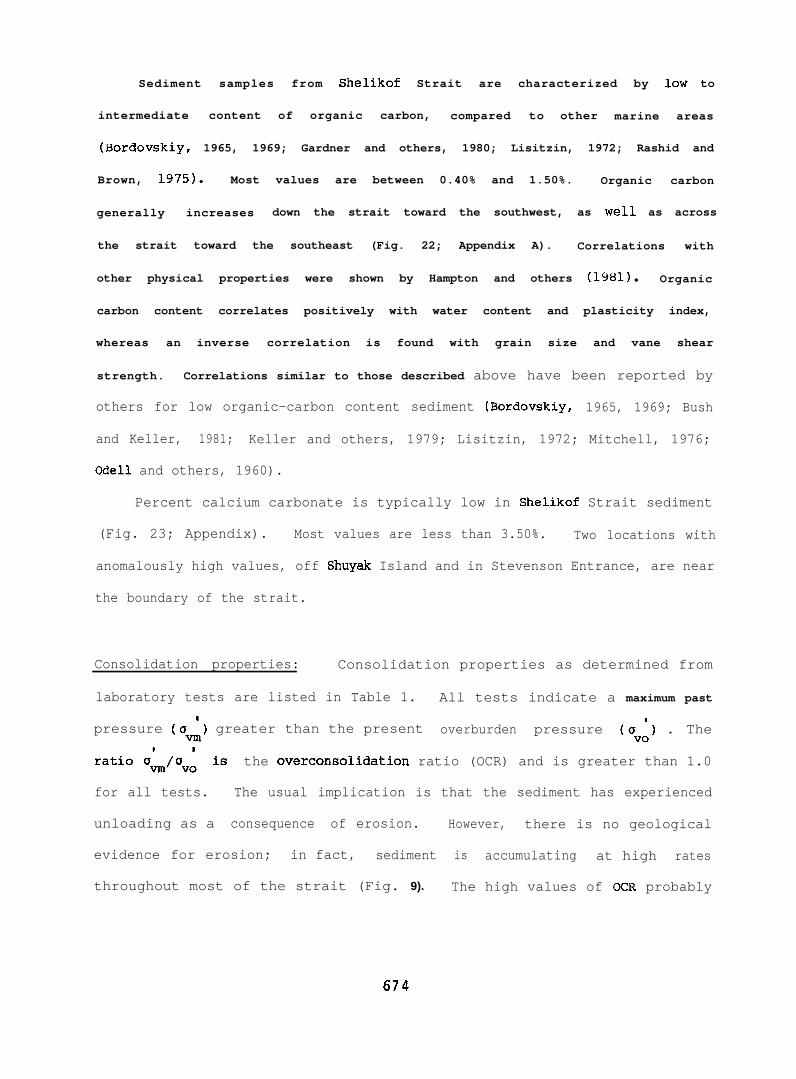
Sediment samples from Shelikof Strait are characterized by low to
intermediate content of organic carbon, compared to other marine areas
(Bordovskiy, 1965, 1969; Gardner and others, 1980; Lisitzin, 1972; Rashid and
Brown, 1975). Most values are between 0.40% and 1.50%. Organic carbon
generally increases down the strait toward the southwest, as well as across
the strait toward the southeast (Fig. 22; Appendix A). Correlations with
other physical properties were shown by Hampton and others (lW1). Organic
carbon content correlates positively with water content and plasticity index,
whereas an inverse correlation is found with grain size and vane shear
strength. Correlations similar to those described above have been reported by
others for low organic-carbon content sediment (Bordovskiy, 1965, 1969; Bush
and Keller, 1981; Keller and others, 1979; Lisitzin, 1972; Mitchell, 1976;
Odell and others, 1960).
Percent calcium carbonate is typically low in Shelikof Strait sediment
(Fig. 23; Appendix). Most values are less than 3.50%. Two locations with
anomalously high values, off Shuyak Island and in Stevenson Entrance, are near
the boundary of the strait.
Consolidation properties: Consolidation properties as determined from
laboratory tests are listed in Table 1. All tests indicate a maximum past
pressure (a~) greater than the present overburden pressure (cv~) . The
for all tests.
the overconsolidation ratio (OCR) and is greater than 1.0
The usual implication is that the sediment has experienced
unloading as a consequence of erosion.
evidence for erosion; in fact, sediment
throughout most of the strait (Fig. 9).
However, there is no geological
is accumulating at high rates
The high values of OCR probably
k-“-o ‘al
,
)
. ) /’[
\
CT● 0
0
Figure 22. Average organic carbon content in sediment cores.
675
-o -~o0m %In
I \ u {
IJ--J Om~.‘1 –“
I ‘2.
+
hj ,’. (+
t
Figure 23. Average calcium carbonate content in sediment cores.
676
I Table 1. Consolidation test results.
Depth * tin a u
Station core Vo Vxlocc
rmmbe r (cm) (kPa ) (kPa ) frGo OCR
1 507 39 1.1 6.o 0.94 0.17 1*1O 5
171 5.0 32.0 0.76 0.22 1.13 6
509
511
6 4 9
5 2 5
528
540
8 9 3 . 7 20.0 0.86 0.27 2.67 5
94 3.7 23.0 0.88 0.12 0.81 6
6 4
111
1 9 1
41
116
167
4 5
96.
165
64
144
4 7
1 3 1
2 0 1
2 . 8
4 . 6
9 . 8
2.0
6.1
8.9
3*3
6.9
13.8
4.7
10.4
2 . 8
6 . 1
1 1 . 6
15.0
9.0
12.0
56.0
30.0
29.0
26.0
28.0
64.0
43.0
45.0
20.0
48.0
65.0
0.52
0.66
0.45
0.33
0.54
0.60
0.30
0.26
0.26
0.28
0.29
0.50
0.54
0.37
677
0.05
0.09
0.18-
0.04
0.12
0.08
0.30
0.35
0.54
0.18
0.31
0.11
0.20
0.16
2 . 1 7
1.10
1.38
1.30
0.97
1.49
1.52
1.68
2.23
.1.57
3.59
0.50
0.67
0.98
5
2
1
2 8
5
3
8
4
5
9
4
7
8
6
represent initial cementation of sediment
are not indicative of overconsolidation in
particles or grain interlocking and
the strict sense of the term.
Compression index (Cc) is a measure of the amount of consolidation that
occurs for a given increment in load. The coarse sediment at the northeast
end of the strait is less compressible than the progressively finer sediment
to the southwest, as indicated by a southwest trend of increasing Cc ((rable
1). Richards (1962) reported a range of 0.20 to 0.87 for Cc measured on
samples of marine sediment from many areas, and most values fror.~ Shelikof
Strait fall within this range.
Compression index commonly shows a linear relation
(LL). The data from Shelikof Strait, when
general trend, but with much scatter (Fig.
plotted in this
24). Skempton
t o l i q u i d limit
manner, exhibit a
(1$344) found that
the relation can be expressed as
cc = 0.009
and the regression equation for Shelikof
cc = 0.006
( LL - lo),
is similar:Strait sediment
(LL + 5.7).
The rate at which consolidation occurs in response to loading determines
the coefficient of consolidation (cv). It is directly related to permeability
of a sediment and inversely related to the compressibility. The coefficient
is calculated for each load increment during a laboratory consolidation test
from plots of deformation versus tine. & shown in Table 1, Cv commonly
varies through one to two orders of magnitude for a single test. No general
trend in the data is evident, although the high expected permeability and low
compressibility of coarse-grained sediment would suggest a decrease of Cv to
the southwest. Measurements of Cv for clay sediment from various marine
locations by Richards and Hamilton (1967) are in the range 3.2 - 6.0 x
10-4 cm2/see, which are lower than typical values in Shelikof Strait.
●
e
t-.N0
0m
*.-E9-
679
Static strength properties: Sediment properties derived from static triaxial
strength tests are listed in l’able 2. The primary measured property is the
undrained shear strength (Su). It is the maximum sustainable shear stresst
within a sample subjected to a particular consolidation stress (oc) . Su acts
along a plane inclined at 45° to the axial load. The arisen of Su divided by
the effective normal stress across this plane is the effective angle of
internal friction
behavior of the
(+’), whose magnitude is an indication of the strength
sediment uncle r slow (drained) loading conditions. In
comparison, the ratio S [a’ gives an indication of the strength behaviorUc
during rapid (undrained) loading conditions. The difference in drained and
undrained strength behavior depends on the pore water pressure generated in
response to the tendency for volume change when the sediment is axially
loaded. If a sediment has a high tendency for volume change, the difference
in strength between rapid
The effective angle
sediment samples (OCR =
Compare with values given
and slow loading can be substantial.
of internal friction for the normally consolidated
1) in this study is relatively high (35° - 460).
by Lambe and Whitman (1969, p. 149 and 306). The
higher values (> 40°) are in the finer sediment cores from the southwest half
of the strait (Table 2). Therefore, sediment from Shelikof Strait appears to
be atypically strong under conditions of drained loading, with the finer
~ediment exhibiting higher strength. Samples tested at OCR > 1 tend to have
$’ comparable to that of normallY consolidated samples, except for station 649
where some overconsolidated samples have significantly higher values. The
data indicate similar drained behavior of normally consolidated and
overconsolidated sediment in the strait.
.,
680
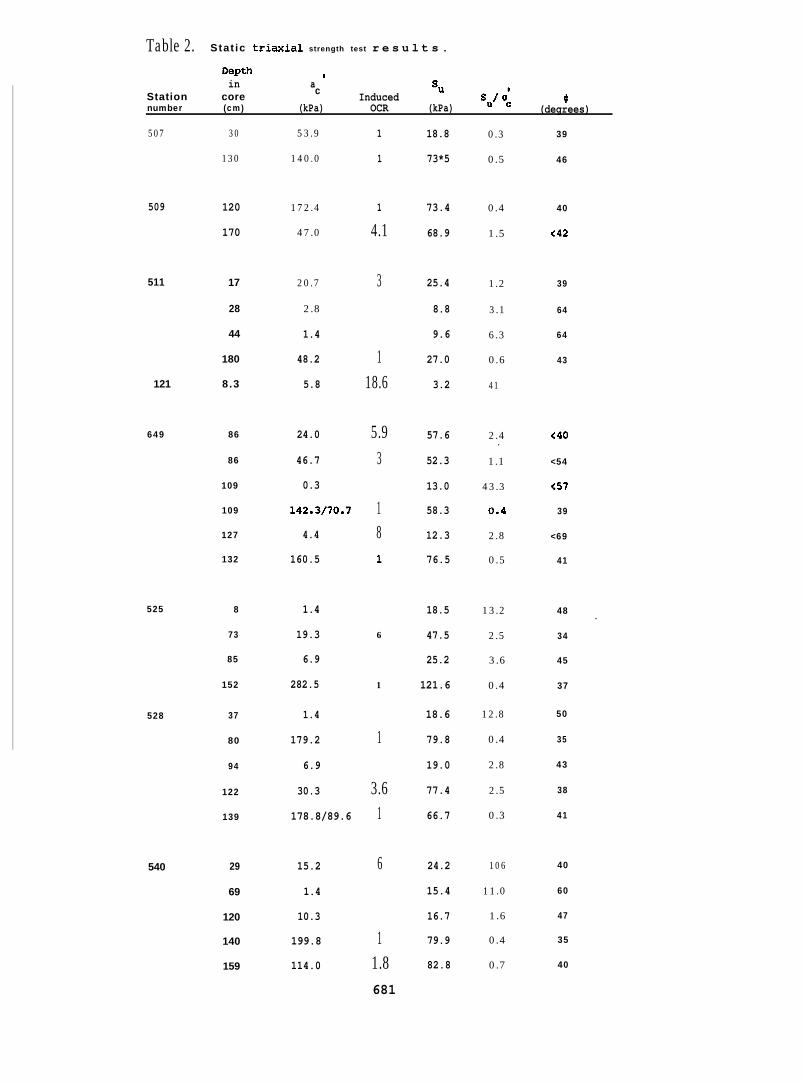
Table 2. Stat ic triaxial strength test r e s u l t s .
Depth 1in a Su
Station ccore Induced su/ 0: $number (cm) (kPa) OCR (kPa) (degrees)
509 120
170
511 17
28
44
180
121 8.3
649 86
86
109
109
127
132
525 8
73
85
152
528 37
80
94
122
139
540 29
69
120
140
159
507 30 53.9
130 140.0
172.4
47.0
20.7
2.8
1.4
48.2
5.8
24.0
46.7
0.3
142.3/70.7
4.4
160.5
1.4
19.3
6.9
282.5
1.4
179.2
6.9
30.3
178.8/89.6
15.2
1.4
10.3
199.8
114.0
1
1
1
4.1
3
118.6
5.93
181
6
1
1
3.61
6
11.8681
18.8
73*5
73.4
68.9
25.4
8.8
9.6
27.0
3.2
57.6
52.3
13.0
58.3
12.3
76.5
18.5
47.5
25.2
121.6
18.6
79.8
19.0
77.4
66.7
24.2
15.4
16.7
79.9
82.8
0.3
0.5
0.4
1.5
1.2
3.1
6.3
0.6
41
2.4.
1.1
43.3
0.4
2.8
0.5
13.2
2.5
3.6
0.4
12.8
0.4
2.8
2.5
0.3
106
11.0
1.6
0.4
0.7
39
46
40
<42
39
64
64
43
<40
<54
<57
39
<69
41
48 .
34
45
37
50
35
43
38
41
40
60
47
35
40
Lambe and Whitman (1969, p. 307, Figs. 21-24) detected
+’ anti plasticity index for normally consolidated soil.
wnich there are plasticity index values in Shelikof Strai
a relation between
Triaxial data for
t plot within the
range of Lambe and Whitman’s data, except for the core at station 511, which
is abnormally strong for sediment with such high plasticity (Fig. 25).
Evaluation of undrained strength,
judgment in order to detect trends. In
consolidation stress (act) seem to give
1in terms of su/o , requires some
c
particular, the tests run at low
erratic values of Su/U ‘. This wasc
also shown to be the case for triaxial data from nearby Kodiak Shelf (Hampton,
in press). Tests run at high values of consolidation stress (which corrects
some of the effects of disturbance) and OCR = 1 have values of Su/acqbetween
0.3 and 0.6, with no areal trend (Table 2). The value of Su/ac increases with
OCR for each core tested.
The static triaxial test data are plotted according to the NSP approach
in Figure
change in
and 0.97.
26. The slope (A) of the line for each core is a measure of the
undrained strength with OCR. Most cores have A values between 0.79
Mayne (1980) compiled the results of many triaxial tests and found
a mean value of A = 0.64 with a standard deviation of 0.18. The sediment in
Shelikof Strait, with its relatively high values of h would tend to retain
more of its strength after unloading compared to most sediment examined by
Mayne (1980). The A = 1.43 calculated for the sediment of station 52~ is
greater than the theoretical limit of A = 1.0, and further testing is required
to resolve this conflict.
Dynamic strength properties: The data from triaxial strength tests are given
in Table 3. The quantity =Cyc /su is the cyclic stress level, the average
.
●
ot-0@0100:
.-CM
.-
m
.u)
N
109
8
7
6
5
4
3
2
1
.
.
.
.
.
2 3 4 5 6 7 8 9 1 0
OCR
Figure 26. Graph of normalized undrained shear strength versusoverconsolidation ratio.
684
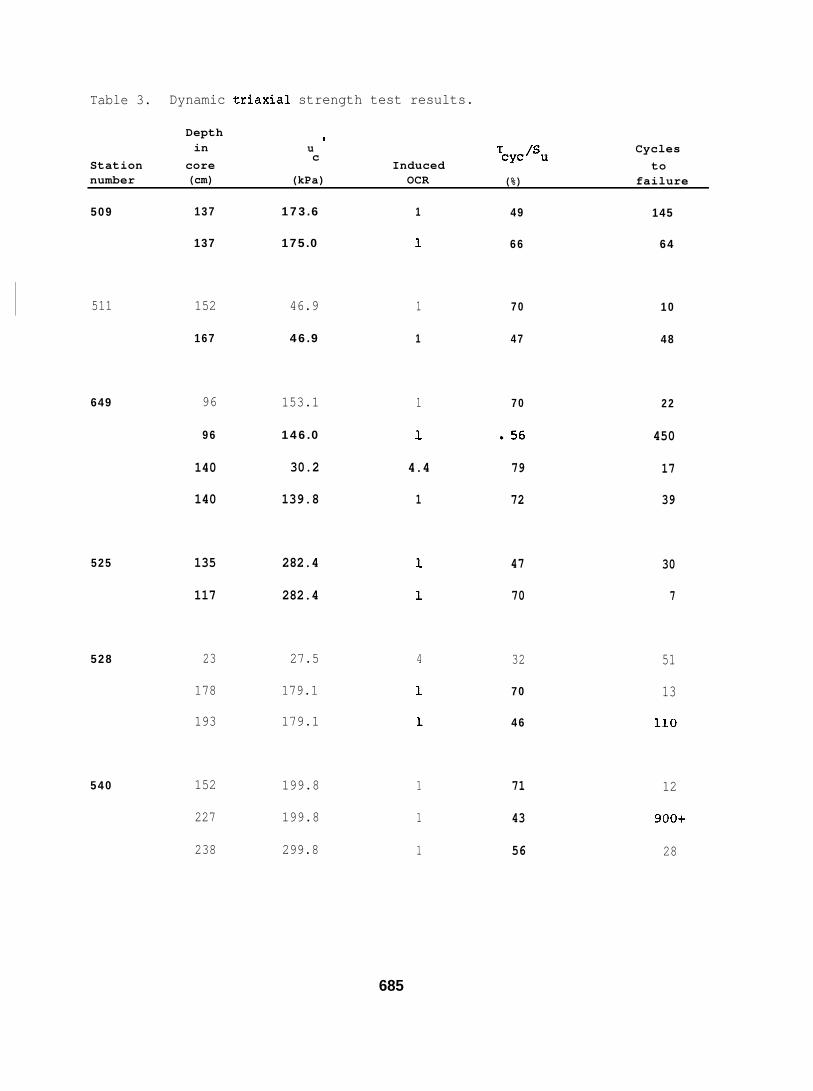
Table 3. Dynamic triaxial strength test results.
Depth vin u
c cycisuT Cycles
Station core Induced tonumber (cm) (kPa) OCR (%) failure
509 137 173.6 1 49 145
137 175.0 1 66 64
511
649
525
528
540
152 46.9 1 70 10
167 46.9 1 47 48
96 153.1 1 70 22
96 146.0 1 .56 450
140 30.2 4.4 79 17
140 139.8 1 72 39
135 282.4 1 47 30
117 282.4 1 70 7
23 27.5
178 179.1
193 179.1
152 199.8
227 199.8
238 299.8
4
1
1
1
1
1
32
70
46
71
43
56
51
13
110
12
900+
28
685
~yc) applied sinusoidally with full stress reversal atvalue of shear stress (T
0.1 Hz, expressed as a percentage of the static undrained shear strength
(Su).
Tcyc “
strain
chosen
Pore water pressure and strain accumulate with repeated application of
At some point, the pore water pressure approaches the confining stress,
increases abruptly, and the sediment fails. In our tests, failure was
when 20% strain was reached.
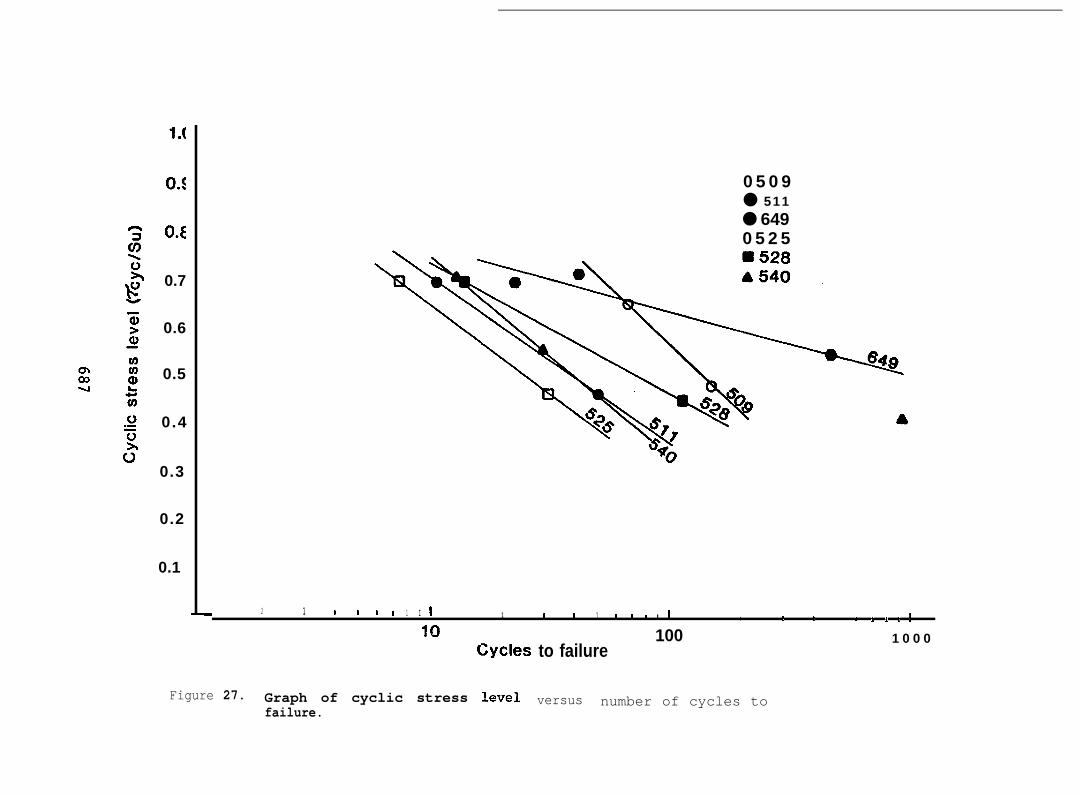
Samples typically fail
levels. Figure 27 shows the
for Shelikof Strait samples.
within the range of test results
and others, 1981; Anderson and
cyclic strength degradation is i
in fewer cycles at
number of cycles to
Although there is
progressively higher stress
failure versus stress level
some scatter, the data fall
on terrigenous
others, 1980;
ndicated;
(as might be imparted by an earthquake,
stress levels between 60% and 80% of their
DISCUSSION
The primary geotechnical concerns in
that
for
sediment from other areas (Lee
Hampton, in press). Moderate
is, after 10 cycles of loading
example), the samples fail at
static strength.
Shelikof Strait include settlement
of structures, bearing capacity under static and cyclic loading lateral load
capacity, and anchor breakout resistance. Natural slope failures are not a
serious problem because only one small sediment slide has been documented
(Hampton and others, 1981). There is some evidence for gas-charged sediment,
but the problem of low strength that might exist in sediment of this type was
not addressed in the present study.
Quarternary sediment in Shelikof Strait covers bedrock to a thickness of
from 20 m to more than 800 m (Fig. 4). The sequence consists of Pleistocene
glacial and glaciomarine sediment at the base, overlain by Holocene marine
686
1.(
()$
O.c
0.7
0.6
0.5
0.4
0.3
0.2
0.1
0 5 0 9● 511● 6490 5 2 5
1 1 I t I 1 1 I I 1 1 I 1 1 1 1 I I I t 1 n 1 t I I10
Cycles
Figure 27. Graph of cyclic stress levelfailure.
100 1 0 0 0to failure
versus number of cycles to
deposits. The highest stratigraphic unit, deposited by oceanic currents as
exist today, has accumulated to a thickness of 80-100 m over most of the
strait; the total range is about 20 m to 180 m. Geotechnical testing was
performed only on samples from this uppermost unit. A geotechnical analysis
based on these data probably addresses most situations of engineering
concern. Deeper stratigraphic units appear from interpretive geologic studies
to be relatively coarse-grained (Hampton and Winters, 1981; Whitney, Holden,
and Lybeck, 1980; Whitney, Hoose, Smith, and Lybeck, 1980), and they probably
are stable, but deep drill-core samples would have
confirm this by geotechnical testing.
The pattern of grain-size variation (Figs. 7
to be obtained in order to
and 8) evidently reflects
progressive sorting by the southwesterly flowing barotropic current tnat
dominates circulation in the strait. The present study and the previous
report by Hampton and others (1981) show that some index properties vary in
relation to grain
therefore increase
across the strait
size. Properties that show a direct correlation and
to the southwest down the strait and to the southeast
include water content, liquid limit, plastic limijz,
plasticity index, and organic carbon content (Figs. 10, 13, 14, 15, and 22).
Properties that correlate inversely with grain size include bulk sediment
density and undrained (vane) shear strength (Figs. 11 and 20).
Consolidation
but this probably
than a result of
tests indicate that sediment samples are overconsolidated,
is a near-seafloor diagenetic or fabric phenomenon rather
erosion, because net sediment accumulation is presently
occurring throughout the strait (Table 1, Fig. 9). The fine-grained sediment
to the southwest has high values of compression index (Cc), which indicates
that it is more compressible than the coarser material to the northeast. The
rate of consolidation, as shown by the coefficient of consolidation (cv)* is
688
highly variable for each consolidation test and does not show an areal trend
(Table 1). Intuitively, a higher value of Cv would be expected for the
coarser-grained sediment because of its normally higher permeability and lower
compressibility, but apparently this is not the case.
Another unexpected result is that the static drained strength, in terms
of the effective angle of internal friction ($), is higher for the fine-
grained sediment than it is for to the coarser-grained samp--es (Table 2).
Drained strength does not vary appreciably with OCR. Undrained static
strength behavior does not exhibit significant areal variation. Values
of S#Jc’ for tests run at OCR = 1 are between 0.3 and 0.6. This parameter
increases with OCR for each core that was tested. The NSF pore-pressure.
parameter (A) varies from 0.79 to 0.97, which indicates significant static
strength increase with OCR (Fig. 26). Again, no areal trend is apparent.
But, because few data points were used to plot the lines in Figure 26 and
because large scatter of data exists for some individual cores, additional
strength testing at more levels of OCR would add precision to the plots and
perhaps reveal some systematic variation.
Test data for most cores define similar response to cyclic loading over a
broad range of number of cycles required to cause failure (e.g., cores 511,
525, 528, and 540 in Fig. 27). Dynamic strength degradation varies over a
limited range at low number of cycles; for instance, it is between about 60%
and 80% for 10 cycles.
Geotechnical properties of Shelikof Strait sediment can be compared with
data from other studies to determine if the sediment has normal reformational
behavior. However, few data exist for some properties, which makes the
evaluations tentative.
689
Most values of compression index fall within the range of 0.20 to 0.87
reported by Richards and Hamilton (1967) for silty clay to highly colloidal
clay; one test on the core from station 507 has a high value of 0.94 (Table
1). Skempton’s (1944) classification of compressibility based on liquid limit
indicates that Shelikof Strait samples are moderately to highly compressible
(Appendix). Substitution of the class-boundary values of liquid limit
(moderate compressibility: 30 < LL < 50; high compressibility: LL > 50) into
the regression equation for Shelikof Strait data (Fig. 24),
cc = 0.006 (LL + 5.7),
indicates that the range of moderate compressibility is 0.21 < Cc < 0.33 and
the high range is Cc < 0.33, which is consistent with classifying the sediment
as moderately to highly compressible (Table 1).
Effective friction
(35” - 46°) compared to
(1969, p. 149 and 306)
angle ($’) for sediment in Shelikof Strait is high
the range (20° - 40°) reported by Lambe and Whitman
for normally consolidated sediment. Apparently, no
compilations of $’
made. Hampton (in
terrigenous samples
exclusively for terrigenous marine sediment have been
press) reports $’ mostly in the 30° - 40° range for
from the Kodiak Shelf. Shelikof Strait terrigenous
sediment is relatively strong under drained loading conditions.
Lambe and Whitman (1969, p. 452, Fig. 29.19) present
undrained strength of normally consolidated marine clay,
1
data on the
and values
of su/a “are between about 0.2 and 0.4. The range for normally consolidatedc
Shelikof Strait samples is 0.3 to 0.6, so they are relatively strong under
conditions of undrained loading. S /a ‘for normally consolidated terrigenousUc
690
sediment from the Kodiak Shelf are also high, from 0.4 to 1.0 (Hampton, in
press ) .
Values of the NSP factor A are high (0.79 - 0.97) compared to the average
value of 0.64 (standard deviation = 0.18) in the extensive compilation by
Mayne (1980). The implication is that the increase of strength with
overconsolidation is higher than normal.
The low to moderate cyclic strength degradation of Shelikof Strait
samples is similar to the behavior of clay sediment reported in other studies
(Lee and others, 1981; Anderson and others, 1980; Hampton, in press).
Sediment failure in response to large earthquakes certainly is a possibility,
but the potential is not as great as has been predicted for some deposits of
silt in the northeast Gulf of Alaska (cyclic strength at 10 cycles as low as
40% of the static strength; Lee and Schwab, in press) and volcanic ash on the
Kodiak Shelf (cyclic strength at 10 cycles is 12% of the static strength;
Hampton, in press). The deposit of Katmai ash in Shelikof Strait was not
subjected to geotechnical testing. However, its in situ density is so great
that normal gravity coring devices could not penetrate the layer. The
relative density appears to be high and therefore the liquefaction potential
is low. The possibility that more deeply buried ash layers are present and
might be highly susceptible to liquefaction cannot be evaluated with the
information presently available.
691
REFERENCES
American Society for Testing and Materials, 1976, Annual Book of ASTM
Standards. Philadelphia, ASTM, 485 p.
Anderson, K.H., Pool, J.H., Brown, S.F., and Rosenbrandr W.F., 1980, Cyclic
and static laboratory tests on Drammen clay. Journal of the Geotechnical
Engineering Division, ASCE, v. 106, p. 499-529.
Bishop, A.W., and Henkel, D.J., 1964, The Measurement of Soil Properties in
the Triaxial Test. London, Edward Arnold Ltd., 228 p.
Bordovskiy, O.K., 1965, Accumulation of organic matter in bottom sediments.
Marine Geology,. v. 3, p. 33-82.
Bordovskiy, O.K., 1969, Organic matter of recent
Sea. Oceanology, v. 9, p. 799-807.
Busch, W.H., and Keller, G.H., 1981, The physical
continental margin sediments - the influence
sediment physical properties. Jour. Sedimentary
719.
sediments of the Caspian
properties of Peru-Chile
of coastal upwelling on
Petrology, v. 51, p. 705-
Cassagrande, A., 1948, Classification and identification of soils.
Transactions, American Sot. Civil Engineerst v. 113, p. 901-991.
692
Gardner, J.V.,
geochemistry
Bering Sea.
Dean, W.E., and Vallier, T.L., 1980, Sedimentology and
of surface sediments, outer continental shelf, southern
Marine Geology, v. 35, p. 299-329.
Hampton, M.A., in press, Geotechnical framework study of the Kodiak Shelf,
Alaska. U.S. Geological Survey Open-File Report.
Hampton, M.A., and Winters, w.J., 1981, Environmental geology of Shelikof
Strait, OCS sale area 60, Alaska. Proceedings 13th Offshore Technology
Conference, p. 19-34.
Hampton, M.A., Johnson, K.H., Torresan, M.E., and Winters, W.J., 1981,
Description of seafloor sediment and preliminary geo-environmental
report, Shelikof Strait, Alaska. U.S. Geological Survey Open-File Report
81-1133, 86 p.
Herrmann, H. G., Rocker, K,, and Babineau, P.H., 1972, LOBSTER and FMS:
Devices for monitoring long-term seafloor foundation behavior. NaVal
Civil Engineering Laboratory,
Keller, G.I-I., Lambert, D.N., and
Technical Report R-775, 63 p.
Bennett, R.H., 1979, Geotechnical properties
of continental slope deposits - Cape Hatteras to Hydrographer Canyon.
Sot. Economic Paleontologists and Mineralogists Special Publication 27, p.
131-151.
693
Ladd, C. C., and Foott, R., 1974, New design procedure for stability of soft
clays. Journal of the Geotechnical Engineering Division, ASCE, v. 100, p.
763-786.
Lambe, T.W., 1951, Soil Testing for Engineers. New York, John Wiley and sons,
165 p.
Lambe, T.W., and Whitman, R.V., 1969, Soil Mechanics. New York, John Wiley
and sons, 553 p.
Lee, H.J., Edwards, B.D., and Field, M.E., 1981, Geotechnical analysis of a
submarine slump, Eureka, California. Proceedings 13th Offshore Technology
Conference, p. 53-65.
Lee, H.J., and Schwab, W.C., in press, Geotechnical framework, northeast Gulf
of Alaska. U.S. Geological Survey Open-File Report.
Lisitzin, A.P., 1972, Sedimentation in the World Ocean. SOc . Economic
Paleontologists and Mineralogists Special Publication 17, 218 p.
Mayne, P.W., 1980, Cam-clay predictions of undrained strength. Journal of the
Geotechnical Engineering Division, ASCE, v. 106, p. 1219-1242.
Mitchell, J.K., 1976, Fundamentals of Soil Behavior. New York, John Wiley and
Sons, Inc., 422 p.
694
Muench, R. D., and Schumacher, J.D., 1980, Physical oceanographic and
meteorological conditions in the northwest Gulf of Alaska. NOAA Technical
Memorandum ERL PMEL-22, 147 p.
.
Nayudu, Y.R., 1964, Volcanic ash deposits in the Gulf of Alaska and problems
of correlation of deep-sea ash deposits. Marine Geology, v.1, p. 194-212.
Odell, R.T., Thornburn, T.H., and McKenzie, L.T., 1960, Relationships of
Atterberg limits to some other properties of Illinois soils. Proceedings
of the Soils Society of America, v. 24, p. 297-300.
Pratt, R.M., Scheidegger, K.F.,
site 178, Gulf of Alaska.
V. XVIII, p. 833-834.
and Kulm, L.D., 1973, Volcanic ash from DSDP
Initial Reports of Deep Sea Drilling Project,
Rashid, M.A., and Brown, J.P., 1975, Influence of
engineering properties of remolded sediment.
p. 141-154.
marine organic compounds on
Engineering Geology, v. 9 ,
Richards, A.F’., 1962, Investigation of deep-sea sediment cores, II. Mass
physical properties. U.S. Navy Hydrographic Office Tech. Rept. 106,
146 p.
Richards, A.F., and Hamilton, E.L., 1967, Investigations of deep-sea sediment
cores, III. Consolidation. In: Richards, A.F. (cd.), Marine—
Geotechnique, Urbana, University of Illinois Presst p. 93-117.
695
Skempton, A.W., 1944, Notes on the compressibility of clays. Geological
Society of London, Quarterly Journal, v. 100, p. 119- 35.
Terzaghi, K., 1955, Influence of geological factors on the engineering
properties of sediments. Economic Geology, 50th Anniversary Volume 1905-
1955, p. 557-618.
Terzaghi, K., and Peck, R.B., 1948, Soil Mechanics in Engineering Practice.
New York, John Wiley and Sons.
von Huene, R., 1 9 7 9 , Structure of the outer convergent margin off Kodiak
Island, Alaska, from multichannel seismic records. In: Watkins, J.S.,—
Montadert, L., and Dickerson, P.W., (eds.), Geological and Geophysical
Investigations of Continental Margins, AAPG Memoir 29, Tulsa, American
Association of Petroleum Geologists, p. 261-272.
Whitney, J., Holden, K.D., and Lybeck, L., 1980,
glacial-marine sediments, outer continental
Alaska. U.S. Geological Survey Open-File Report
Whitney, J., Hoose, P.J., Smith, L.M.,
sections of the outer continental
Geological Survey Open-File Report
Isopach map of Quaternary
shelf, Shelikof Strait,
80-2036, 1 p.
and Lybeck, L., 1980, Geologic cross
shelf, Shelikof Strait, Alaska. Us.
80-2036, 1 p.
Wissar A.E., Christian, J.T., Davis, E.H., and Heiberg, s . , 1971,
Consolidation at constant rate of strain. Journal of the Soil Mechanics
and Foundation Division, ASCE, v. 97, p. 1393-1410.
696
APPENDIX:
INDEX PROPERTY CHARTS FOR SEDIMENT CORES
FROM SHELIKOF STRAIT
●
697
p);h
5 0 -
100 -
150 -
2 0 0 -
m
2 5 0 -
3 0 0 –
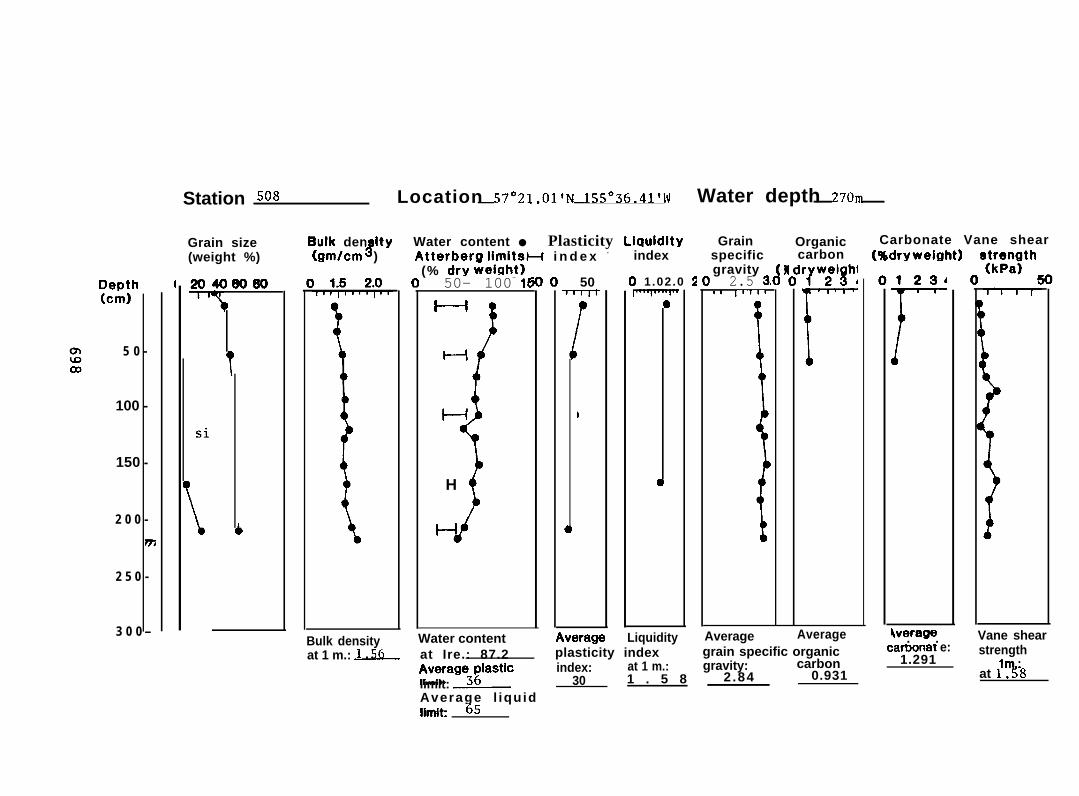
Station S08 Location 57”ZI.011N 155”36.41’IY Water depth zTOrn
Grain size(weight %)
Bulk den Ity8(gmtcm ) Atterberg limitSH i n d e x -
(% dry weight)
Bulk densityat 1 m.: JJIL
Water content ● Plasticity Llauldity
50- 100- 1?
H
50
index
) 1 .02.0 2
Grainspecificgravity2.5 3.
I I l“”
/
Organiccarbon
‘?w:’!lh:
IT
Water content kverage Liquidity Average Average
at Ire.: 87.2 plasticity index grain specific organicAverage3~lastic index: at 1 m.: gravity: carbon
limit: _ 30 1 . 5 8 2.84 0.931
Carbonate Vane shear(%drywehht) strenath
r
!verage. . Vane shearcar~onat e:
1.291strength
at ??8
Average l iquidlimit 65
Depth(cm) :
5 0 “
100 -
1 5 0 -
2 0 0 -
7d
250-
3oo—
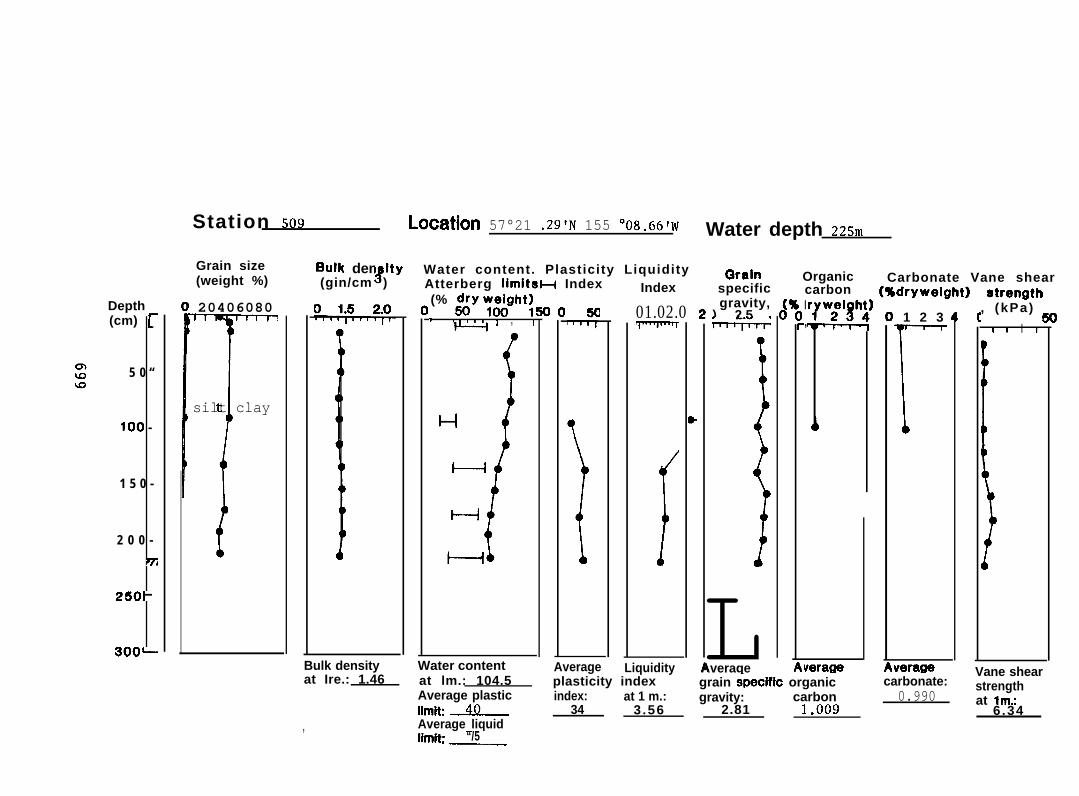
Station 509 Location 57°21 .29’N 155 °08.66’W Water depth zzsrn
Grain size(weight %)
20406080
T
Isilt clay
Bulk den ItyJ(gin/cm )
Water content. Plasticity LiquidityAtterberg limitsH Index(% ;;Y :$ght~* 1 , I
Bulk densityat Ire.: 1.46
Water contentat lm.: 104.5
Index
01.02.0
Average Liquidityplasticity index
Average plastic index: at 1 m.:limit: ~ 34 3.56
F
Qralnspecificgravity,
) 2.5d
/
LAverage
carbon (%drywelght)I,
Organic Carbonate Vane shearutrength
, (kPa) ~
I I I I
weragegrain 9peclflc organicgravity: carbon
2.81 1.009Average liquid, -.
1 2 3
r
verage Vane shearcarbonate:0.990
strengthat lm.:
6 .34
limit. “/5.—
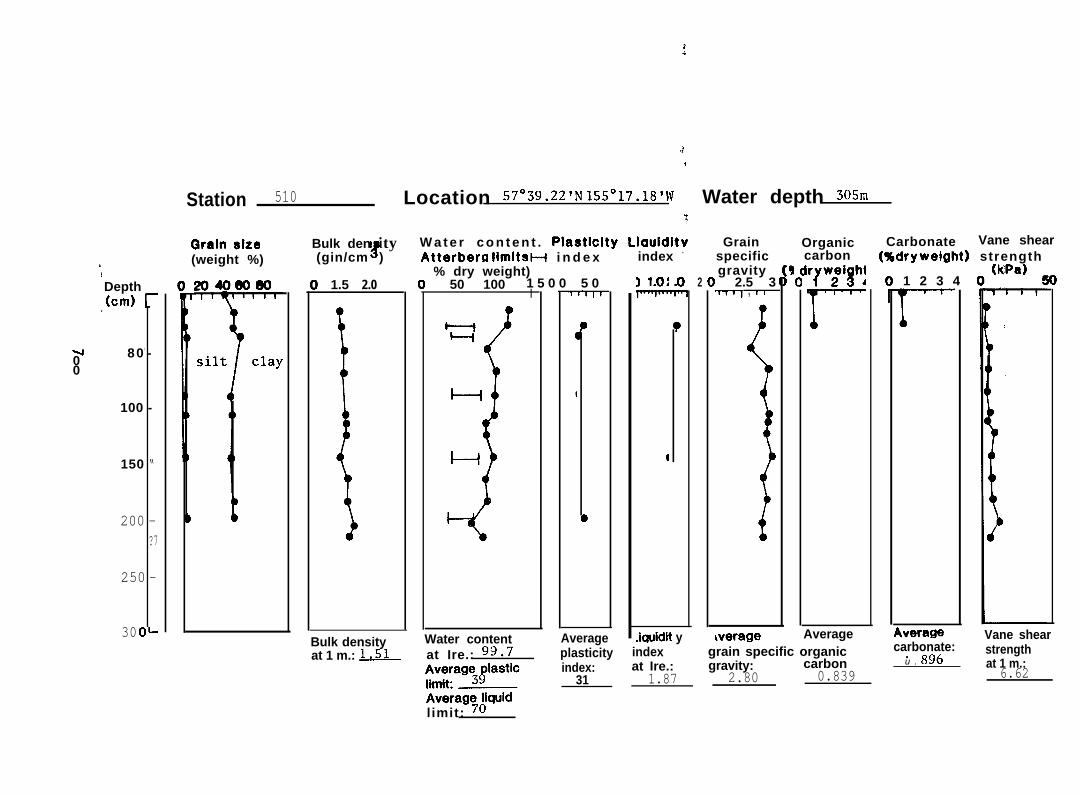
510 Location s7”w”z2’N M5”17”1B’w Water depth 30SCIStation
Llauiditv Grain Organiccarbon
Carbonate Vane shearBulk den ity8(gin/cm )
W a t e r c o n t e n t . PiaaticityGrain sizeindex - specific (%dryweight) strength
1 2 3 4 o(kpa)50
(weight %) Atterberg llIIIitSH i n d e x$IDepth,(cm) :
80 < -
100 -
150 “
200 -?7
250 -
300-
‘/’w;i!lh:r% dry weight)
50 100 1 5 0 0 5 0I
gravity2.5 3
, 1 r2I 1.5 2.0
i
r
\verage
-100
Vane shear.iquidit y ~verageindex grain specific organic carbonate:. .n/
AverageBulk densityat 1 m.: W
limit: ‘U
Water contentat Ire.: ‘9.7
Averageplasticity strength
at Ire.: gravity: carbon u . BYO at 1 m.:1.87 2.80 0.839 6.62::~g%’iastic index:
31Averag~~quid
Depth(cm)
I
50
100
150
2 0 0
2 s 0
300[
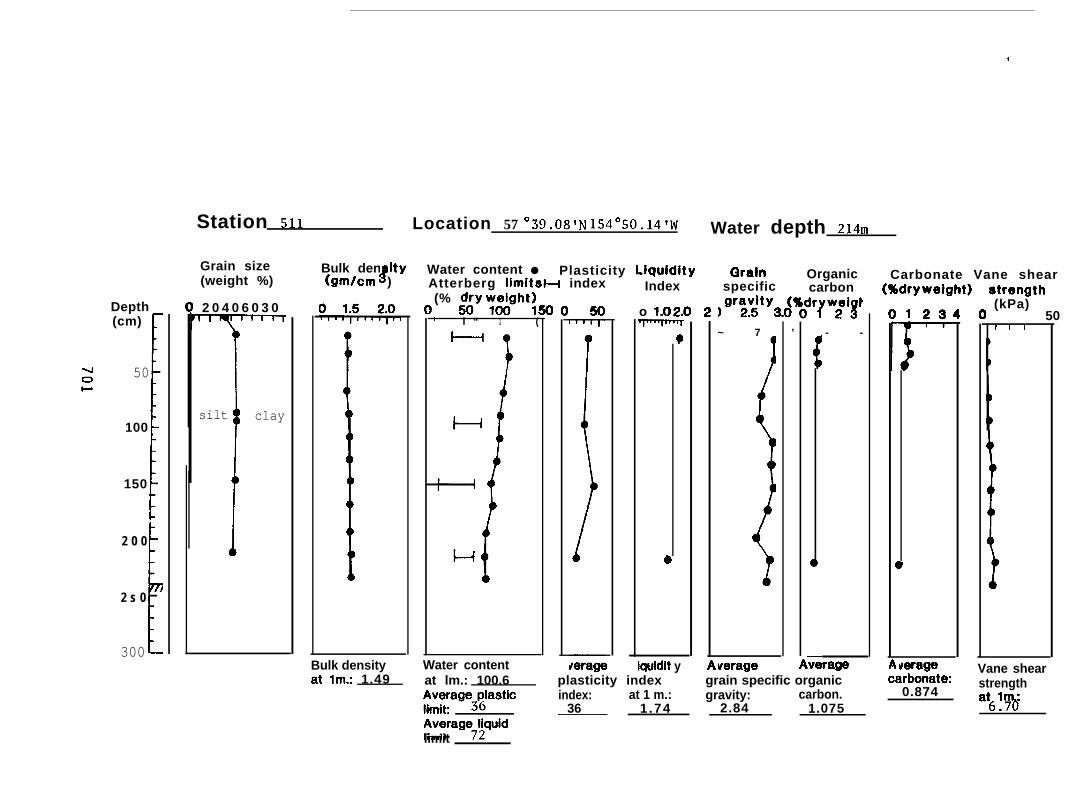
Station 511 Location 57 °39.08’N 154”50.14’w Water depth Zldm
Grain size(weight %)
2 0 4 0 6 0 3 0
T
silt
1
clay
Bulk densityatlm.: 1.49
Water contentat lm.: 100.6Average3~lasticlimitAverage7~quidlimit
o 1.02J
Qraln Organicspecific carbon
Bulk den MyJ
Water content ● Plasticity Llquldlty(gmicm ) Atterberg limitsH index Index
(% ;iy ;vght;1gr~;ty3.J%~r~w;i#~
1 l “ 1 (~ 7 ’ - -
—,verage
Carbonate Vane shear(%dryweight)
verage
!Wrongth(kPa)
50I I I
$erage lquidit y verageplasticity index grain specific organicindex: at 1 m.: gravity: carbon. 0.874
36 1.74 2.84 1.075 at Y’i
Vane shearstrength
Depth(cm)
1
/
50
100
150
2 0 0
2 5 0
3 0 01
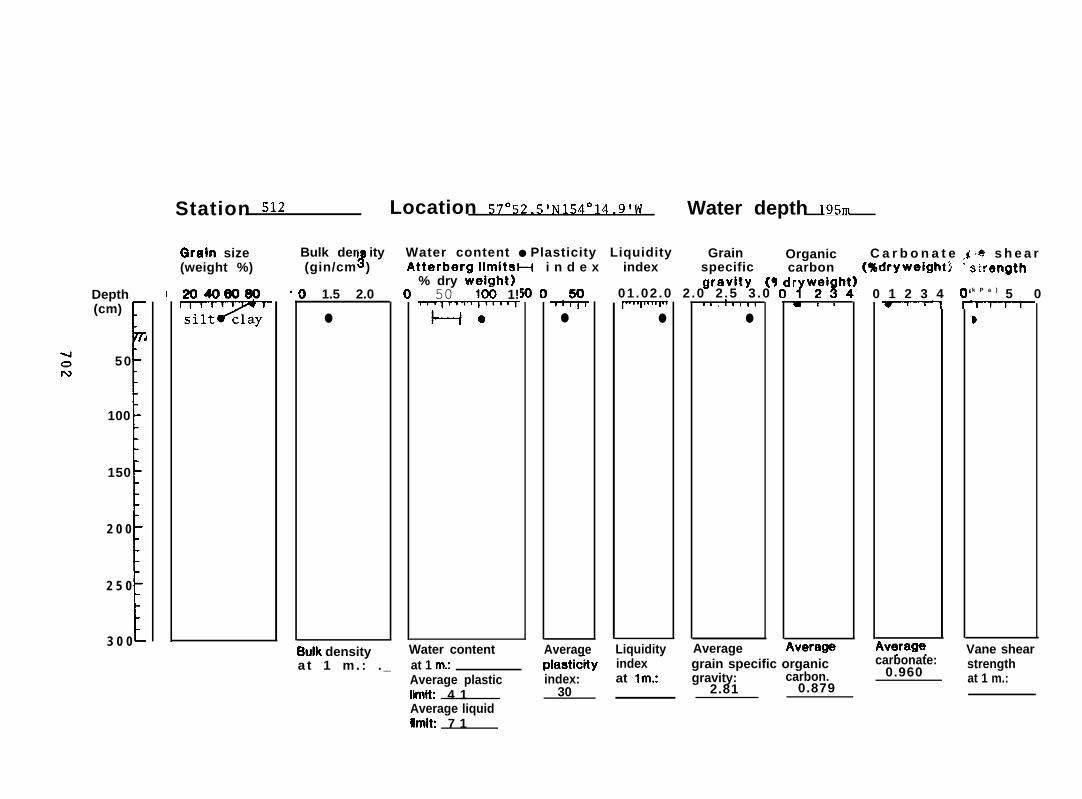
Station 512 Location ST”SZ.S’N 154”14.9’W Water depth lgsrn
Grain size(weight %)
m
Bulk den ityt(gin/cm )
I 1.5 2.0
●
Buik density
Water content ● Plasticity Liquidity Grain Organic C a r b o n a t e < J* s h e a r
% dry ;eight)50 100 1!
~
Water content
--i%●
g-ravity (q01 .02 .0 2 .0 2 .5 3 .0
Atterbera iimitsH i n d e x index specific carbon (%dryweightj “s!rength
‘?w;i~hi) 0 1 2 3 4 ‘k P a ) 5 0~11—f—11
●
piastitity index
1 i , 1 “1’●
k I 1
hverage iverage. . Vane shearAverage Liquidity Averagea t 1 m . : . _ at 1 m; grain specific organic
Average plastic index: at lm.: gravity: carbon.ilmit: 4 1 30 2.81 0.879
carbonate:0.960
strengthat 1 m.:
Average liquidiimit: 7 1
Depth(cm) y
n5 0 -
100 -
150 -
200 -
250-
3oo—
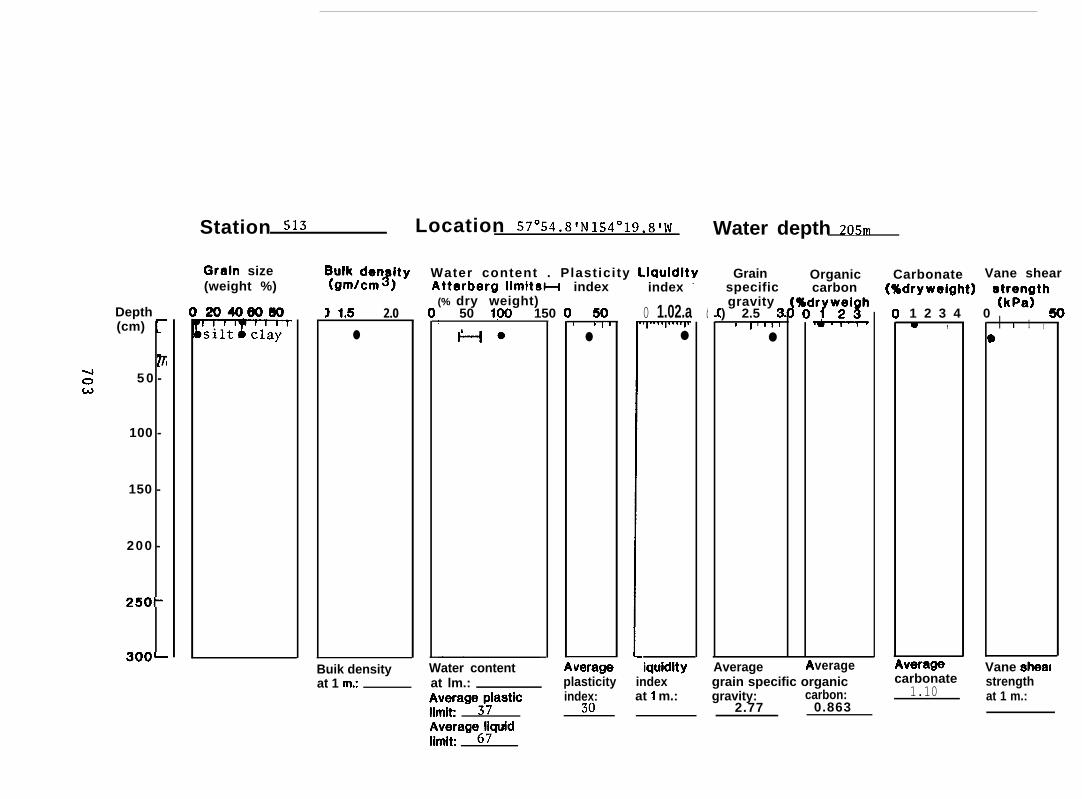
Station 513 Location 57”54.8’N lS4°19.8’W Water depth zosrn
Grain size(weight %)
204060m
W
Mkd-1’’;ty Water content . Plasticity LlquldityAtterberg llt?dtSH(% dry weight)
50 I@l 150I1 1.5 2.0
●
Buik densityat 1 m;
Water contentat lm.:
index
!501 I If
●
index -
0 1.02.a●
iquidity
d
Grainspecificgravity
) 2.5 {I 1“1~
●
Organiccarbon
Average
Carbonate Vane shear(%dryweight) aj~~a~th
1 2 3 4 0 50- ,
verage
I I 1 I
)
verage Average Vane shealplasticity index grain specific organic carbonate
Average3~iasticstrength
index: at 1 m.: gravity: carbon: 1.10
iimi~ 30 2.77 0.863at 1 m.:
Average6~idiimit:
*o.P
Depth(cm)
1
50 I
100
150
2 0 0
2 5 0
3 0 0I
I
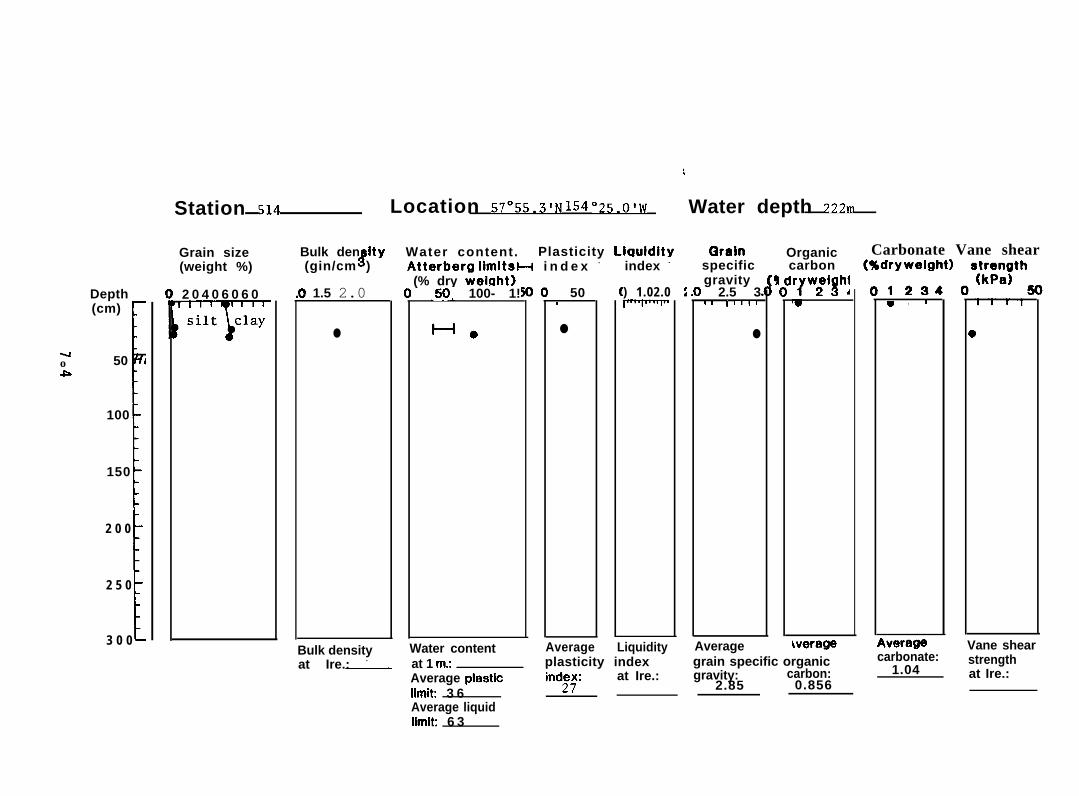
Station 514 Location 57”55.3’N 154 °25.0’W
Grain size(weight %)
2 0 4 0 6 0 6 0
v
) 1.5 2.0
●
Water content. Plasticity LiauldltyBulk den Ity#(gin/cm ) Atterberg lhIIitSH i n d e x -
(% dry weight).50: 100- 1!
H.
Bulk density Water content
50m
●
index -
) 1.02.0
— at 1 m; plasticity index
:
Water depth ppprn
Grainspecificgravity
I 2.5 3I I 1 “1’
●
Organiccarbon
‘/’w;i!h!
iverageAverage Liquidity Averageat Ire.: - grain specific organic
Average pkiStiC ind;;: at Ire.: gravity: carbon:
limit: 3 62.85 0.856
Carbonate Vane shear
9 , 1
~verage Vane shearcarbonate:
1.04strengthat Ire.:
Average liquidlimit 6 3
-doU-I
Depth(cm)
5 0
100
150
[
2 0 0
2 5 0
3 0 0I
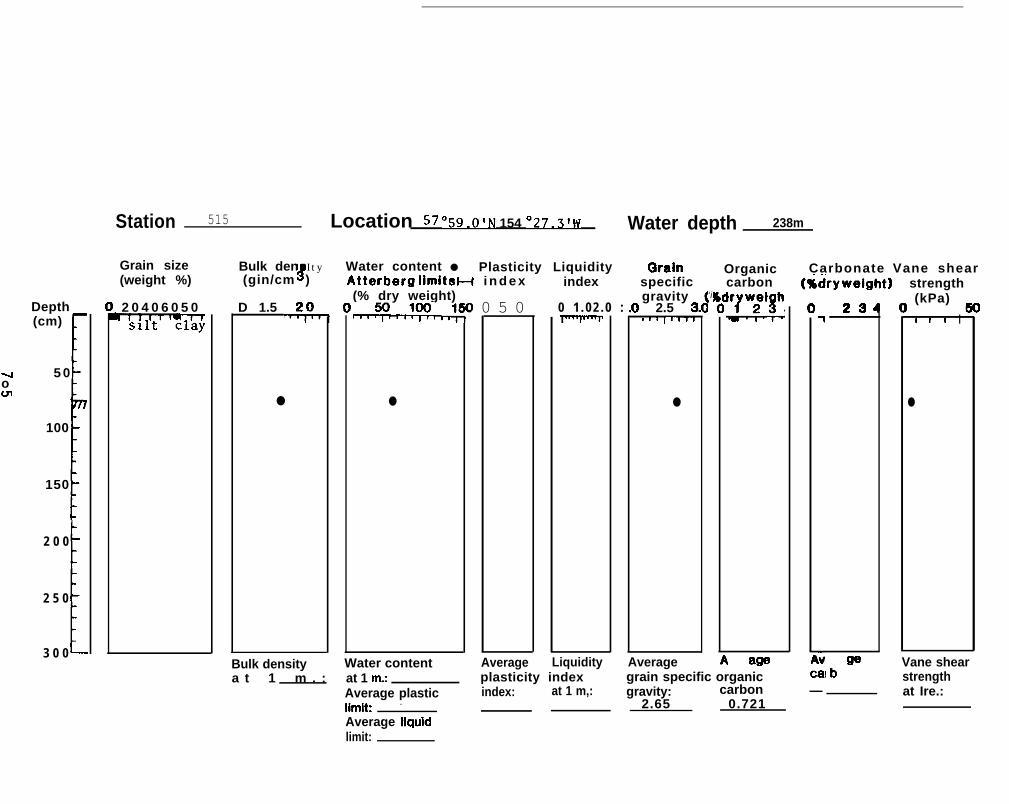
Station 515 Location 57 °59.0’N 154 °27.3’W Water depth 238m
Grain size(weight %)
2 0 4 0 6 0 5 0
Bulk den Ity#
Water content ● Plasticity Liquidity(gin/cm ) Atterberg hIHSH i n d e x index
D 1.5
●
(% dry weight),,,5p, ,,!w, ,,1150
●
Bulk density Water content
0 5 0 0 1 . 0 2 . 0 :
a t 1 m . : at 1 m: plasticity indexAverage plastic index: at 1 m,:
Qralnspecificgravity
1 2.5 <1 1 1 I’lwf
●
‘i,’
Organiccarbon
Average Liquidity Averagegrain specific organicgravity: carbon
limit: - 2.65 0.721
Carbonate Vane shear(%tiryweight)
cal—
strength(kPa) ,I I I I
●
Vane shearstrengthat Ire.:
Average liquidlimit:
Depth(cm)
50
100
150
I
2 0 0
2 5 0
3 0 0[
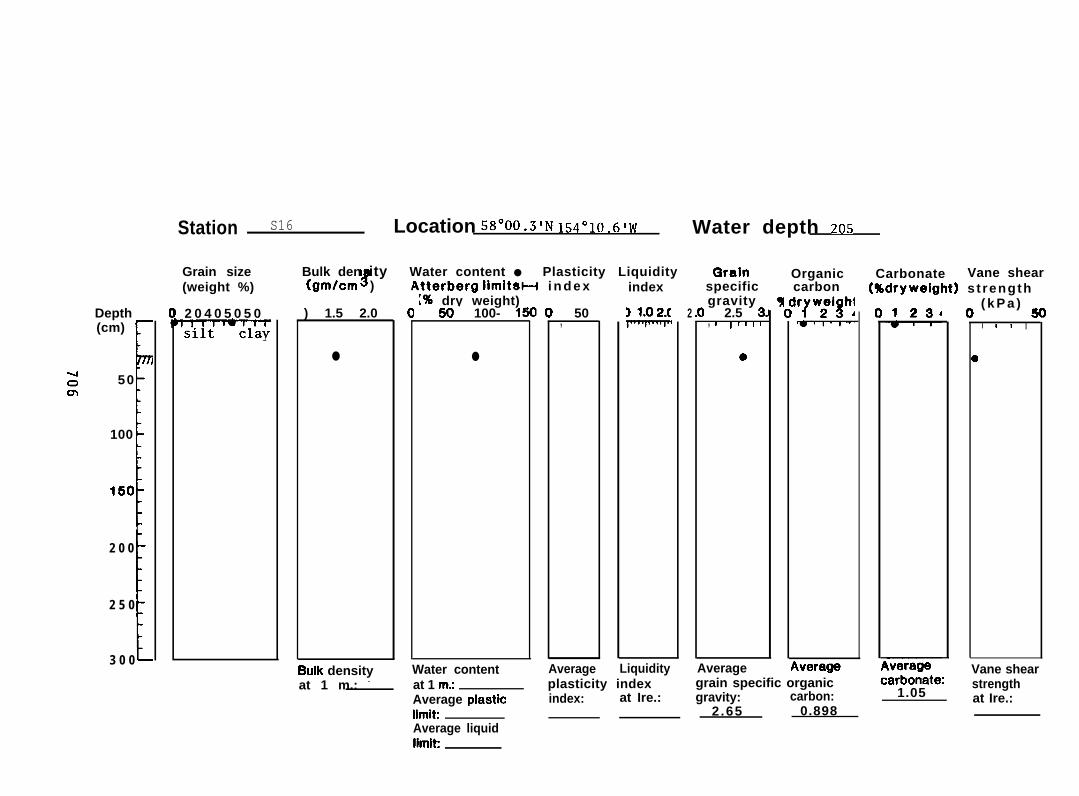
Station S16 Location SS”OO.S’N lSdOIO.G’~~ Water depth Z05
Grain size(weight %)
2 0 4 0 5 0 5 0~
clay
Bulk den ity#
Water content ● Plasticity Liquidity(gmtcm ) Atterberg iimitsH i n d e x
[% dry weight)) 1.5 2.0
●
Buik density
5C- 100- 1!
●
Water contentat 1 m.: - at 1 m;
I 50,
index
31.0 2.(
plasticity indexAverage piastic index: at Ire.:
2
Grainspecificgravity
2.5 3J, 1 l’rl~
Average
Organiccarbon
Carbonate Vane shear(%dryweight) s t rength
( k P a ) ~
I 1 I I
Average Liquidity Vane sheargrain specific organic carbo;ate:
1.05strength
gravity: carbon: at Ire.:limit 2 .65 0.898
iveraga
Average liquidiimik

Station 517 Location 57 °55.31N 154 °00.91hI Water depth lsorn
Grain size(weight %)
Bulk den ityJ(gin/cm )
Water content ● Plasticity LiquidityAtterberg iimitsH i n d e x(% $ ~sJght)
~
Grain Organic Carbonate Vane shearspecificindex
D 1.0 2.(
a
carbon (%dryweight) strength(kPa)
+
dg r a v i t y !) 2.5 3.
, I I“lf;~$h
m50 -
1 (JO -
150 -
2 0 0 -
2 5 0 -
3oo—
m 1.0 1.5 2.0
●
t 1 2 3 4
+-IO ●
-+0-1
AverageL
,verageBuik density Vane shearat 1 m.: at 1 m.: - - - - grain specific organic carbonate:
0.846strengthat Ire.:
Water content Average LiquidityDiasticitv index
Average piastic index: at lm.:iimik 3 9 33
gravity: carbon:2 .78 0.967
Average iiquidiimit: 7 2
Depth(cm)
5 0
100
150
1
200
250
300I
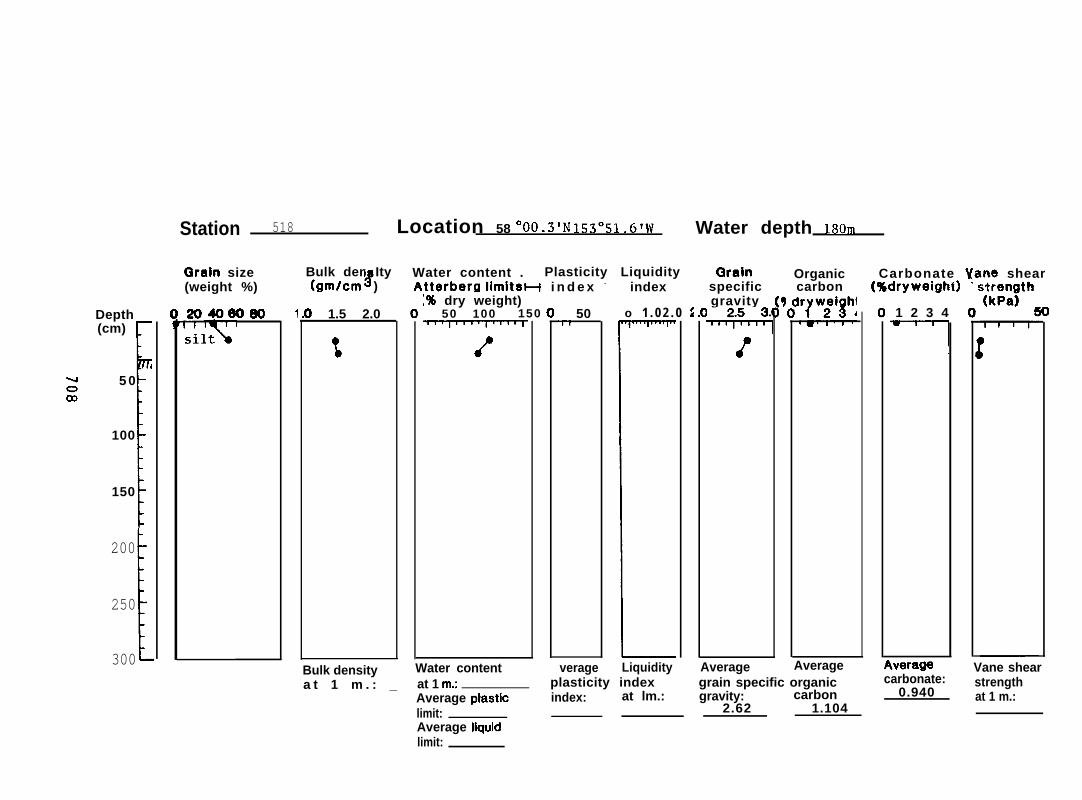
Station 518 Location 58 °00.3’N 153”51.6’W Water depth lsorn
20406x ) 1.5 2.0
t
tterberg llmitsH i n d e x -Grain size Bulk den Ity
8Water content . Plasticity Liquidity
(weight %) (gmicm ) index;% dry weight)
1 t 50 100 150 I o 1 . 0 2 . 0 i
Bulk density Water content
50?1
limit:
Qralnspecificgravity
w
Organiccarbon
Average
Carbonate !larie shear
1 2 3 4
7
\verageverage Liquidity Averagea t 1 m . : _ at 1 m; plasticity index grain specific organic carbonate:
Average plaStiC index: at lm.: gravity: carbon 0.9402.62 1.104
Vane shearstrengthat 1 m.:
Average liquidlimit:
Depth(cm) :
r
5 0 -
100 -
150 -
200 -
250 -
300 —
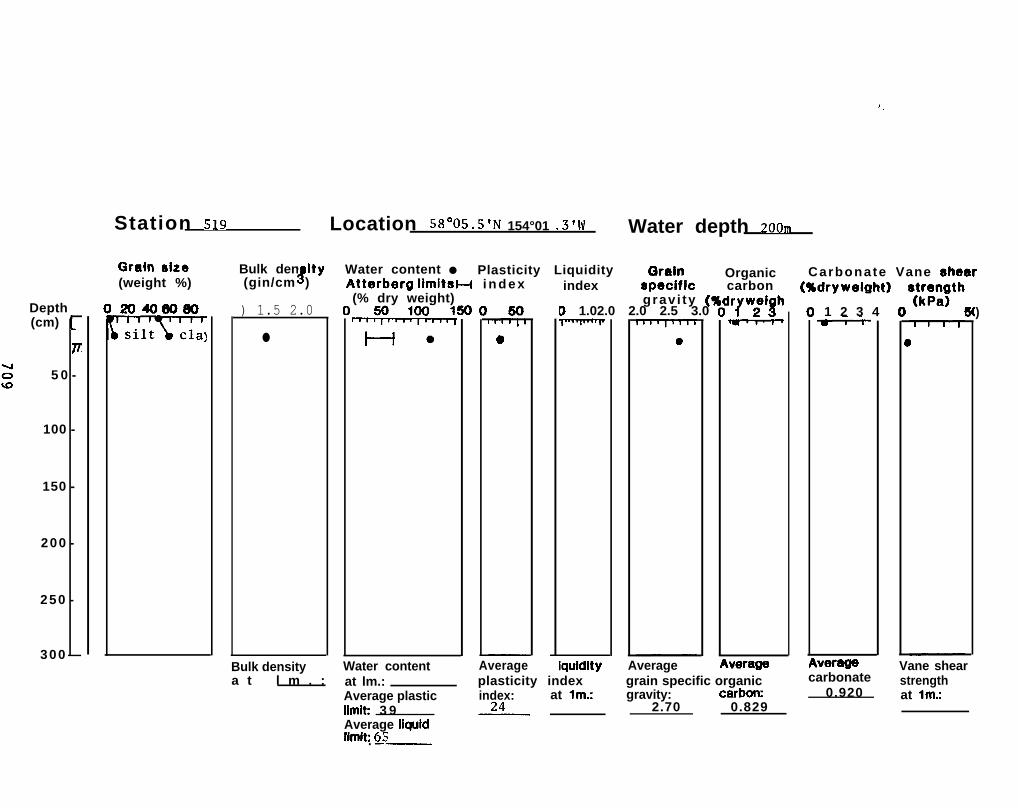
Station 519 Location 58”05.5’N 154°01 .3’Iv Water depth zoom
C3raln size(weight %)
204060B0
Wxz) 1.5 2.0
●
Bulk densitya t l m . :
Water content Averageat lm.:Average plasticlimit 3 9Average liquidlimi~ 65. .—
lquidityplasticity indexindex: at lm.:-
Average ,veragegrain specific organicgravity: carbom
2.70 0.829
Carbonate Vane shearBulk den ItyJ
Water content ● Plasticity Liquidity Qrain Organic(gin/cm ) Atterberg iimitsH i n d e x index llpecific carbon
(% dry weight)(%dryweight) af~~a~th
grav i ty (qD 1.02.0 2.0 2.5 3.0 1 2 3 4 (
-
verage Vane shearcarbonate strength
0.920 at lm.:
)
Depth(cm)
5 0
100
1
150
200
250
300“ I
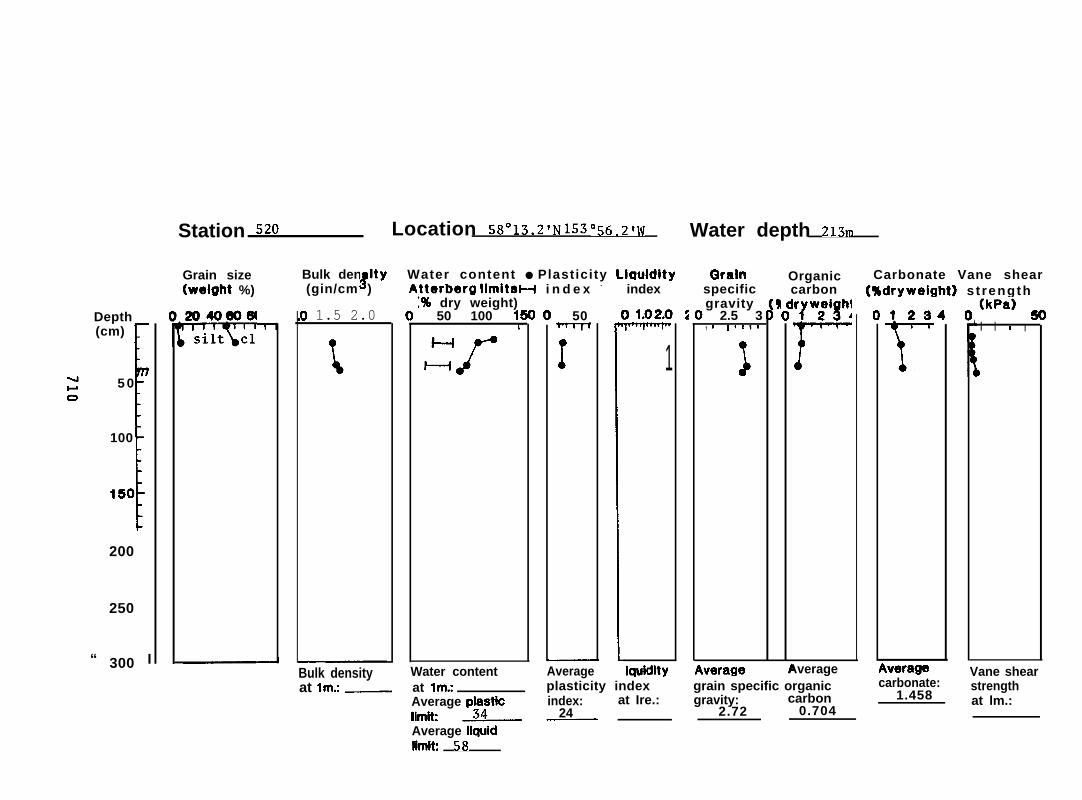
Station SZO Location 58”13.2’N 153 °56.2tlV Water depth Zlsm
Grain size(Welgtlt %)
Bulk den Ity#(gin/cm )
) 1.5 2.0
Bulk densityat lm.:_
Water content ● Plasticity LlauldltVtterberg liI’dtSH i n d e x - index ‘“t% dry weight)
50 100 1{r
50
I
Water content Average
1
iquidityat Im: plasticity indexAverage PiaStiC index: at Ire.:
24iimit ~ —
Qralnspecificgravity
1 2.5 3, 1 I’ll’
)
,verage
Organiccarbon
‘?w;i!lh!r
Average
gravity: carbon2.72 0.704
Carbonate Vane shear(%dryweight) s t rength
‘,verage
(kPaj5
I I I I
Vane sheargrain specific organic carbonate:
1.458strengthat lm.:
Average iiquidiimit 58
Depth(cm) ~
77
50 -
100 -
150 -
200 -
2 5 0-
300 —
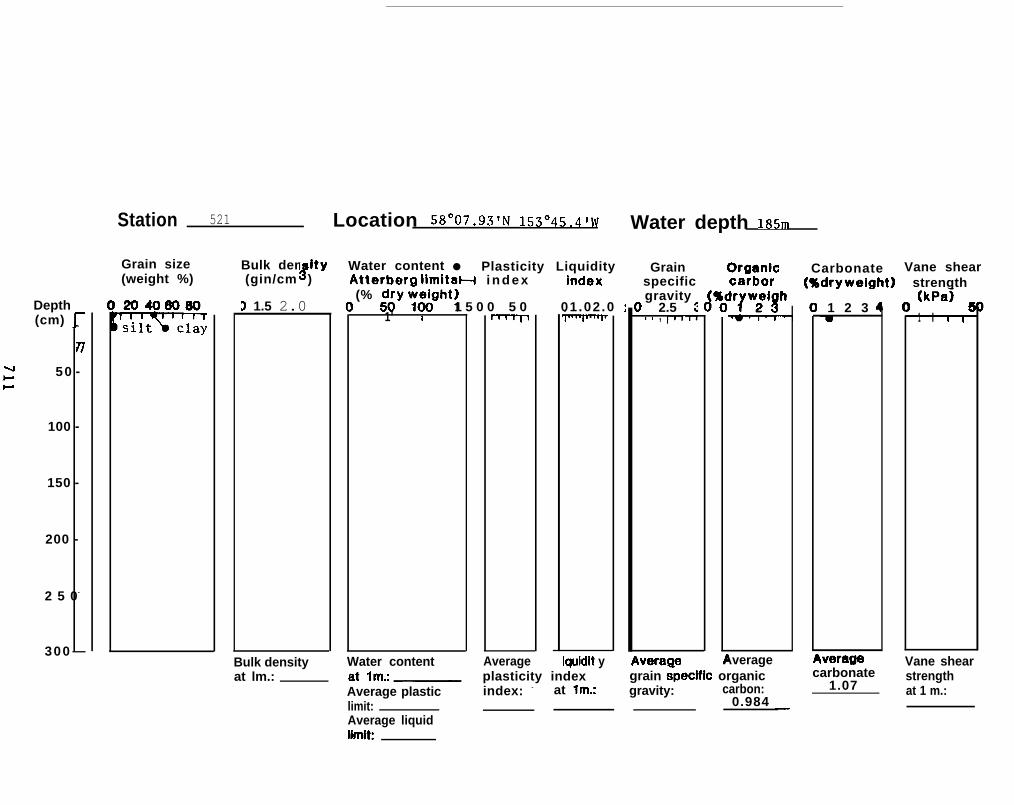
Station 521 Location 58”07.931N 1s3”45.4’w Water depth lssrn
Grain size(weight %)
m
Bulk den ItyJ
Water content ● Plasticity Liquidity(gin/cm ) Atterberg liITtit8H i n d e x
(% ~;y ~~ght)1 5 0 0 5 01 1’ I
o 1.5 2.0
Bulk densityat lm.:
--m
Index
01.02 .0 :
Iquidit y
Average plastic index: - at lm.:
Grainspecificgravity
I 2.5 fr I , l’J1f
verage
Oraanlc Carbonate Vane shear
Average
(%cfryweidtt)
1 2 3
verage
strength(kPaj ~
1 I I I
Water content Average Vane shearplasticity index grain ;pecific organic carbonate
1.07strength
gravity: carbon:limit: 0.984
at 1 m.:—
Average liquidlimit:
;:;;h
** 60 -w
100 -
150 -
200 -
250 -
300 —
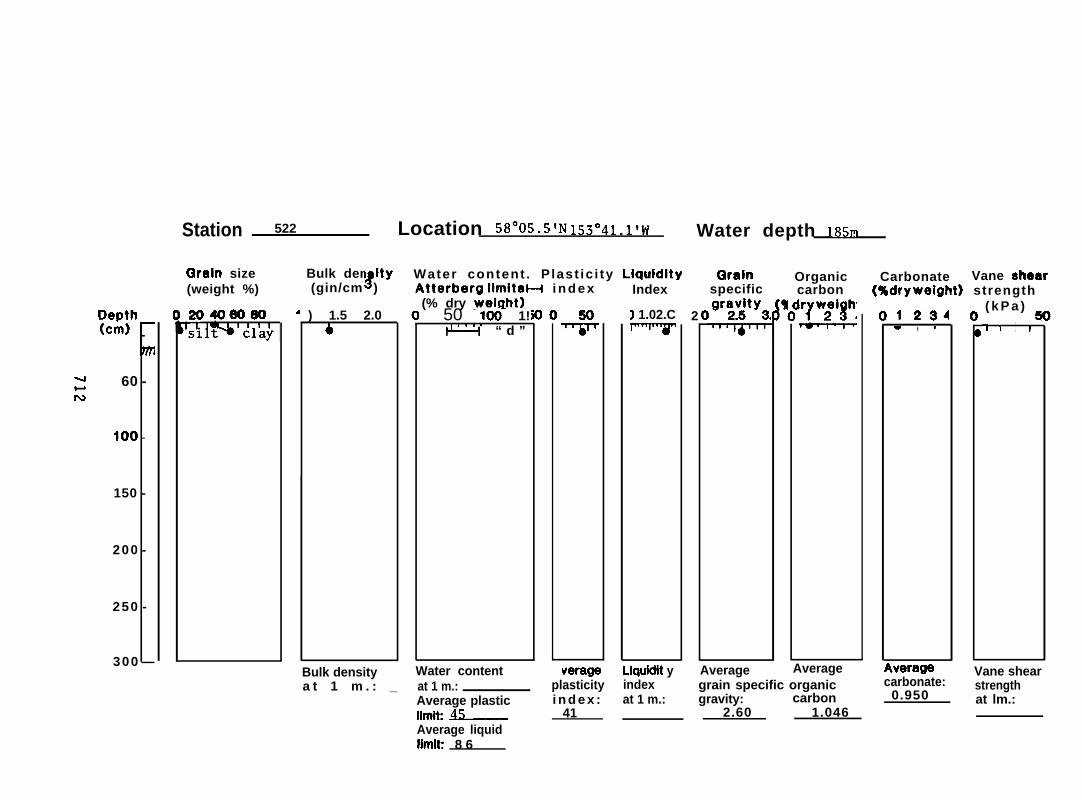
Station 522 Location S8”OS.S’N 153”41.1’W Water depth M5~
Qraln size(weight %)
204060B0
~
4
Bulk den Ity#
Water content . P last ic i ty Llquldlty(gin/cm ) Atterberg limitsH i n d e x Index
(% dry welaht)) 1.5 2.0
Bulk density
50 - 100- 1!
“ d ”
Water contenta t 1 m . : _ at 1 m.:
Average plasticlimit ~Average liquidlimit 8 6
3 1.02.C
verage Liquidlt yplasticity indexi n d e x : at 1 m.:
41
Grainspecific
2
Average
Organiccarbon
Averagegrain specific organicgravity: carbon
2.60 1.046
Carbonate Vane shear(%dryweight) strength
1234w , I
‘tverage
( k P a ) ~
-1 1 I 1
carbonate:0.950 at lm.:
Vane shearstrength
Depth(cm)
I
5 0
100
150
200
250
300[
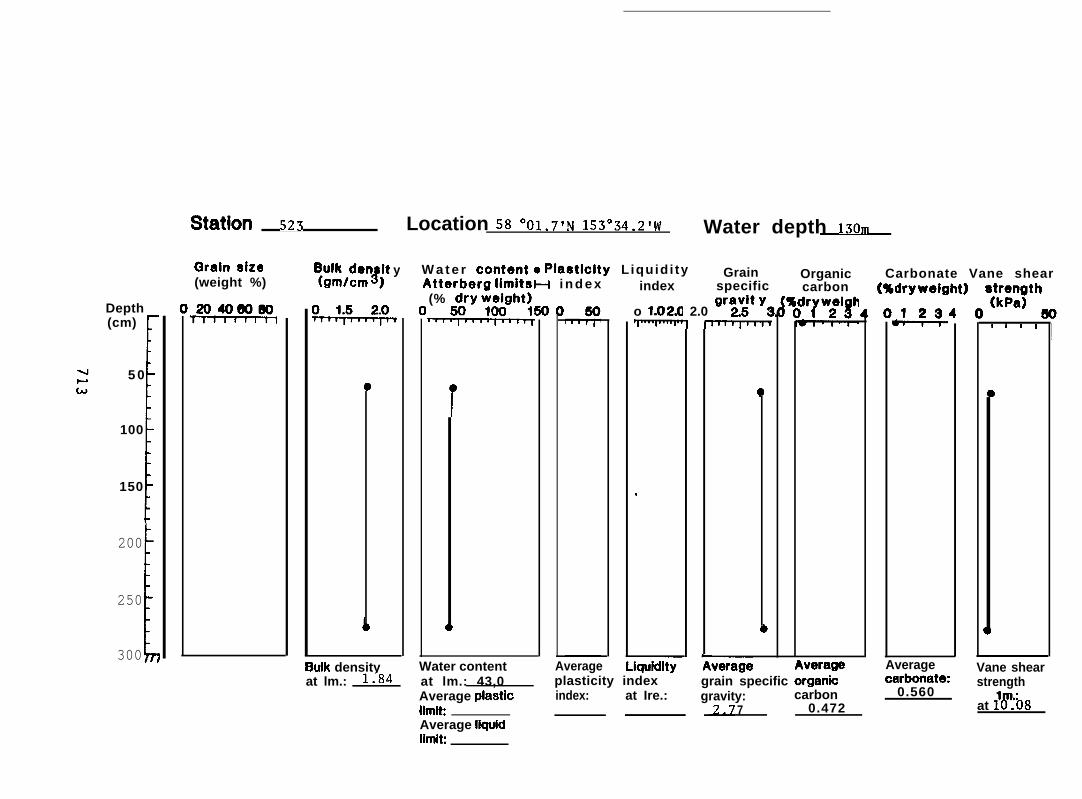
Stahn 523 Location 58 °01.7’N 153”34.2’W Water depth lsom
(3raln size(weight %)
,~,y,y,y( I
13:l;l:nl;t y W a t e r contento Plaatlclty L iquid i ty GrainAtterberg iimit8H i n d e x index specific(% $ry wvvght)
o 1.02.a 2.0 ‘rYJt ‘s~ ~~
T
,
.—
Organiccarbon
Carbonate Vane shear(%dwweight) strenath
I I 1 I
Buik density Water content Average Liquidity- A~rage Average Vane shearat lm.: 1.84 at lm.: 43,0 grain specific organio carbonato
gravity: carbon 0.560iimit 7 0.472 at 1~:i8
plasticity index strengthAverage piastic index: at Ire.:
Average iiquidiimit
Depth(cm)
5 0
100
150
I
200
260
3001
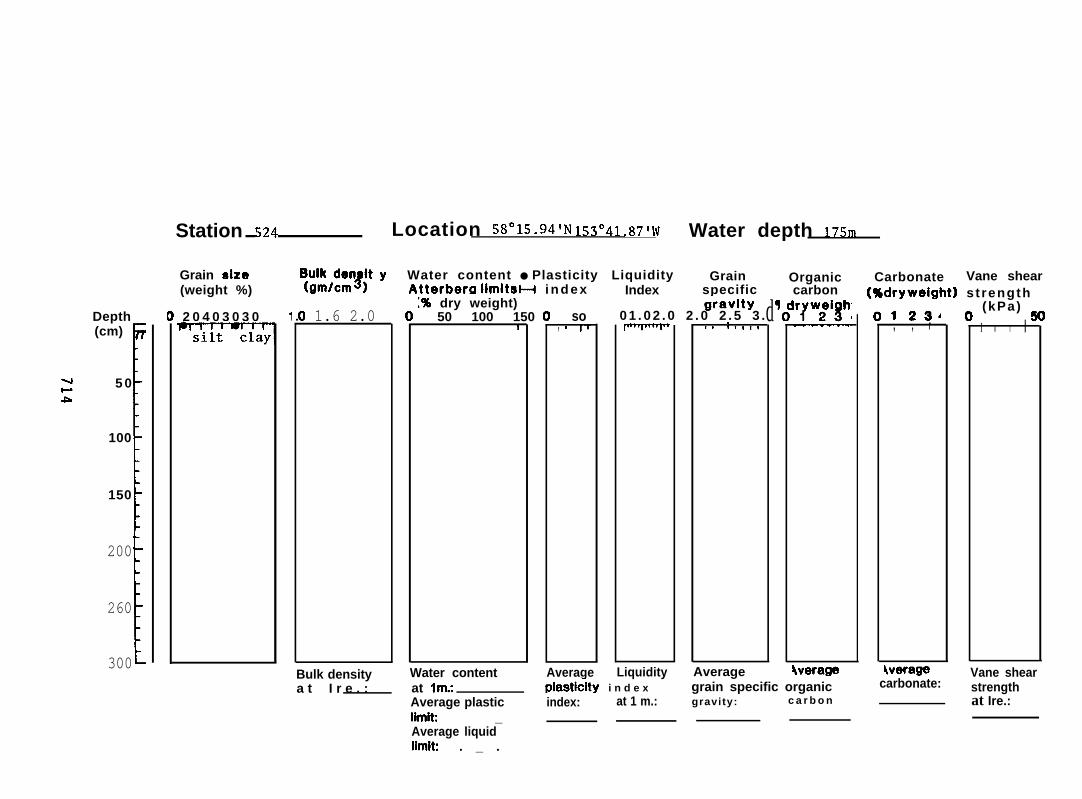
Station 524 Location SS”lS.94’N 153°41 .87’~V Water depth lTsrn
Grain 8ize(weight %)
2 0 4 0 3 0 3 0
~
1 1.6 2.0
Bulk densitya t I r e . :
Atterbera limitSH i n d e x13#l(&T4J;t y Water content ● Plasticity Liquidity Grain Organic Carbonate Vane shear
Index specific (%dryweight) s t rengtho (kPa) ~
11% dry weight)
50 100 150I
so, I Ifdg-ravlty I
0 1 . 0 2 . 0 2 . 0 2 . 5 3 .
Water contentat lm;
Average Liquidityplasti~ty i n d e x
Average plastic index: at 1 m.:
t 1 1 “1’
Average
carbon
“7W;’8:
4verage
1234, , r
$verage
I I I I
Vane sheargrain specific organic carbonate: strengthgravity: c a r b o n
limit _at Ire.:
Average liquidlimit . _ .
‘r
Depth(cm)
5 0 -
100 -
150 -
m2oo -
250-
3oo-
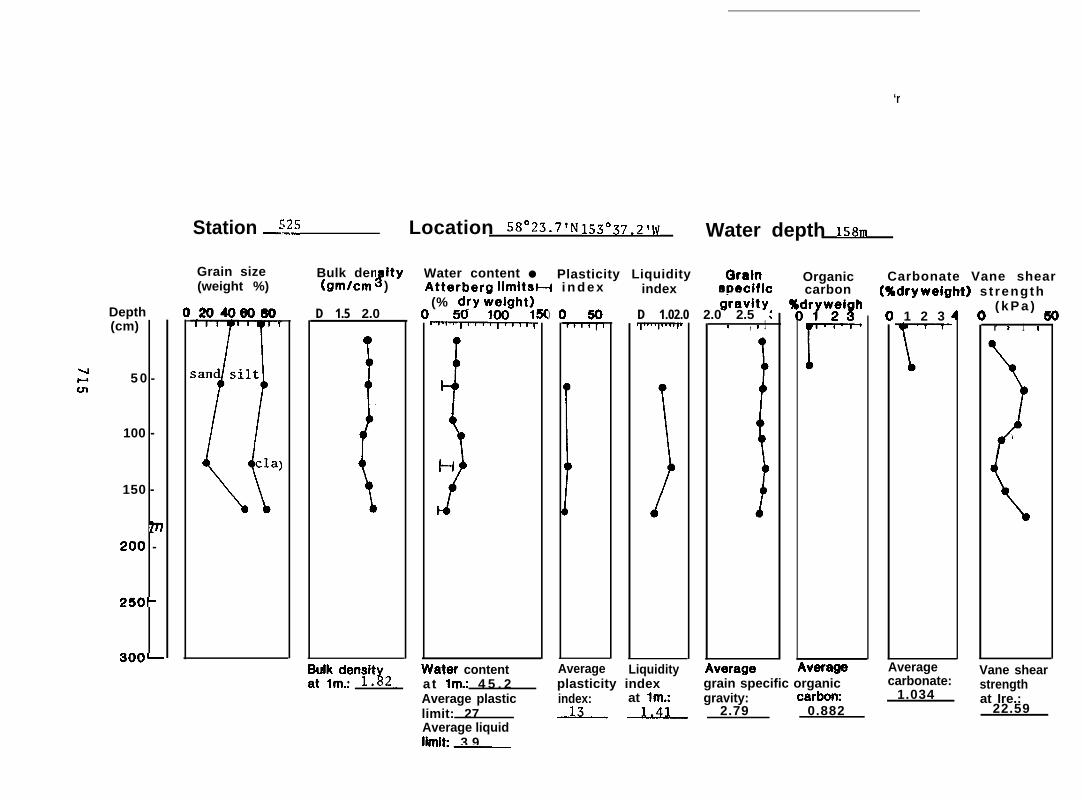
Station —!2S Location 58°Z3.7’N 153”37.2’W Water depth lssrn
Grain size(weight %)
2040e030
Bulk den ItyJ
Water content ● Plasticity Liquidity Grain(gmlcm ) Atterberg iimitsH i n d e x
(% :Jy ;#ght) g-ravityD 1.02.0 2.0 2.5 <
~ I , 1 1D 1.5 2.0
I
Water content
)
index St)ecific
,verage
Organiccarbon
Carbonate Vane shear
1 2 3
r
(%dryweight) s t rength~ ( k P a ) ~
r t 1 I
)
Average Liquidity Average Vane sheara t Ifn.: 4 5 . 2 plasticity index grain specific organic carbonate:Average plastic index:
strengthat lm.: gravity: carborc 1.034
limit: 27 ~-Uli.l_ 2.79 0.882at Ire.:
22.59Average liquidiimiti 3 9.—
Depth(cm) -
so -
100 -
150 -
m
200 -
250 -
3oo–
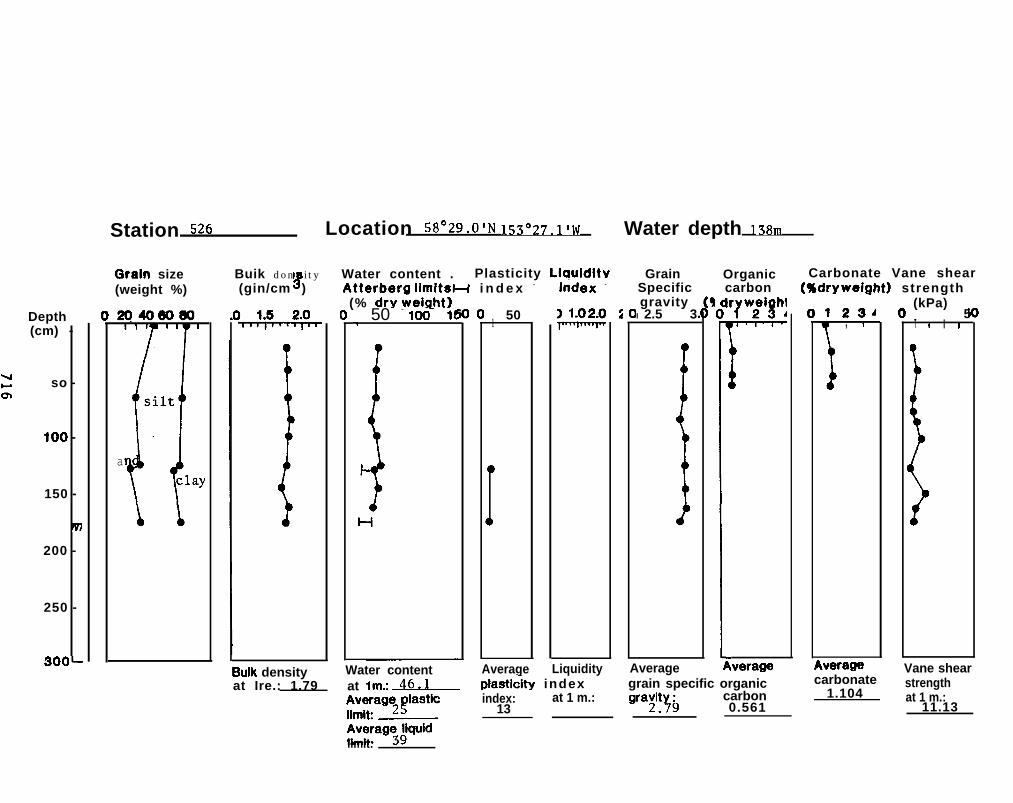
Station 526 Location SS”Z9.O’N lSsOzT.l’w Water depth lssrn
(3raln size Water content . Plasticity LiauidityBuik don ity
(weight %) #(gin/cm ) Atterberg lhIltSH i n d e x -
(% dry weight)2Q4060W
a
50 - 100- 1!-!
Water contentat lm: ~
501
Index -
Average Liquidityplasti~ty index
GrainSpecificgravity
I 2.5 3
I
Average
Organiccarbon
verage
carbon‘ra3i!;9 0.561
Carbonate Vane shear(%dryweight) strength
123A, I
~verage
(kPa)5
T I I I
!
Buik density Vane shearat Ire.: 1.79 grain specific organic carbonate
1.104strength
::t:agt’?iasticindex: at 1 m.:
13at 1 m.:
11.13
Avera~3;quidlimit:
~~;;h
so -
100 -
m
150 -
200 -
250 -
3oo—
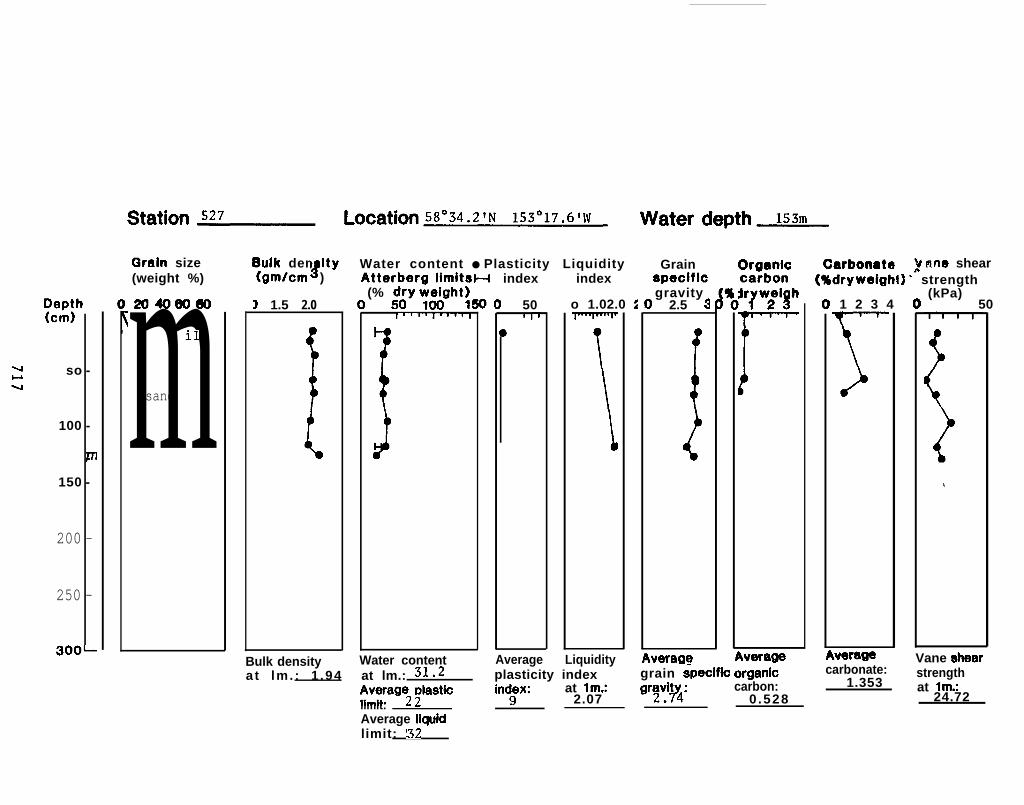
Grain size(weight %)
204050Wmil
sand
Bulk den ItyJ
Water content ● Plasticity Liquidity(gmtcm ) Atterberg limitSH
(% :Jy vvvght)1{
1 1“1’1”””1) 1.5 2.0
Bulk densityat lm. : 1 .94
1Water contentat lm.: 31.2
index
50I IT
)
index
o 1.02.0 i-
\
plasticity index
Grainapeclficgravity
) 2.5 4
/
~vera9e
Oraanlc Carbonat@ ~ ane shear(%dryweight} ‘ strengthca;bon
‘rYwY8h’
r
verage
1 2 3 4(kPa)
50
Average Liquidity Vane sheargrain ;peoiflc 0r9anic carbonate:
1.353strength
Averag~ ;Iastic ind;x: at lm.: carbon:limit: 2.07 ‘r3:iP4: 0 .528
at lm;24.72
Average liquidlimit: !32
~&h
50 -
100 -
150 -
2 0 0 -
2 5 0 m
3 0 0 -
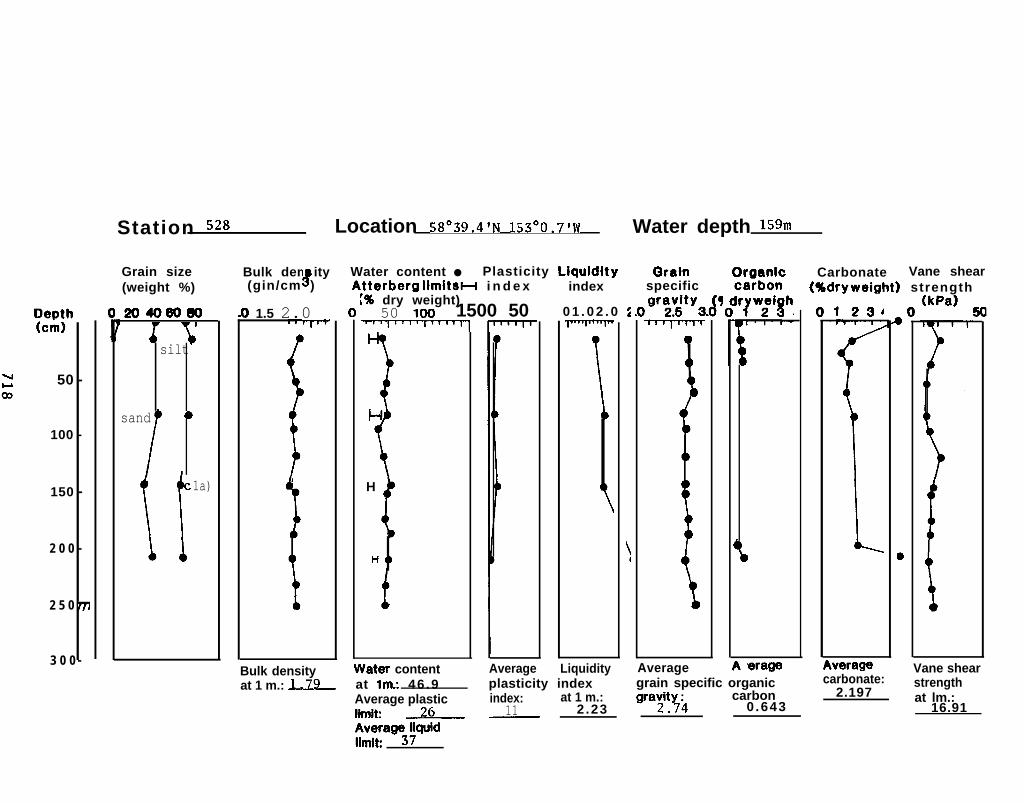
Station 528 Location S8”S9.4’N 153”0.7’w Water depth lsgrn
Grain size(weight %)
204060W
silt
sand tb
1a)
Bulk den ity#
Water content ● Plasticity Llquldlty Grain 0r9anlc(gin/cm ) Atterberg limitSH i n d e x specific
1% dry weight)50 100 1500 50~v
) 1.5 2.0
Bulk densityat 1 m.: J.J$L
H
H{ )
tater content
index
0 1 . 0 2 . 0 z
\
Average Liquidityplasticity index
\
Average
‘ra;!l’4
Ierage
carbon0.643
Carbonate Vane shear(%dryweight) strength
\verage Vane shearat lm: 46 .9 grain specific organic carbonate:
Average plastic 2.197strength
index: at 1 m.:11
at lm.:limit: ~ — 2.23 16.91
I
Avera@3;quldlimit
Depth(cm) ~
5 0 -
100 -
150 -
200 -m
250 -
300 —
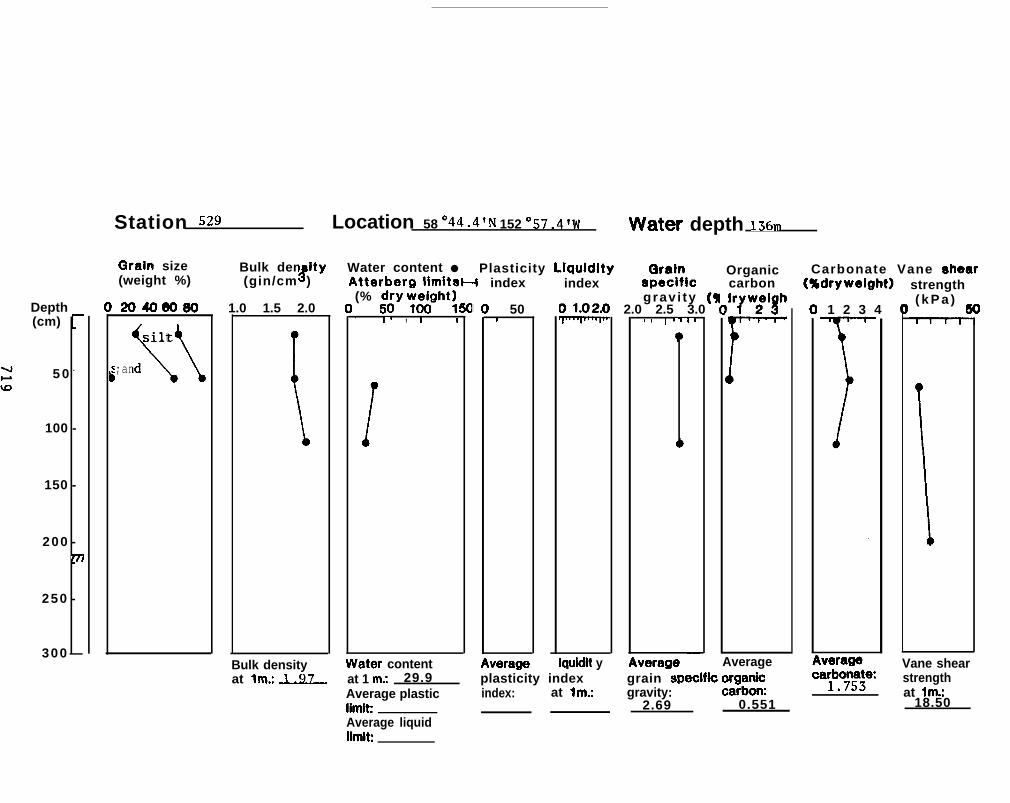
Station 529
Grain size(weight %)
2040e030
\\
silt
;and
Bulk densityat Im: JJIZ_
Bulk den Ity#(gin/cm )
1.0 1.5 2.0
\
Location 58 °44.4’N 152 °57.4’W water depth 136m
Water content ● Plasticity Llquldity (iraln OrganicAtterberg limitsH index apecfflc carbon(% $y vvvght)
1! grav i ty (q=0 2.0 2.5 3.0 (1 II , I I
!ater content
I
index
50#
Iquidit y
, 1 1 “1’
—verage
“1’W:’3’
F
Average
Carbonate Vane 8hear
1 2 3 4
strength( k P a ) ~
verage Vane shearat 1 m; 29.9 plasticity index grain specifk organk ca;b~i~
index: at lm.: gravity: carbom . at lm.:2.69 0.551 18.50
Average plasticlimitAverage liquidlimit
strength
-1wo
;:;;h
60
100 “
150 -
200 “
250 -
3oo—
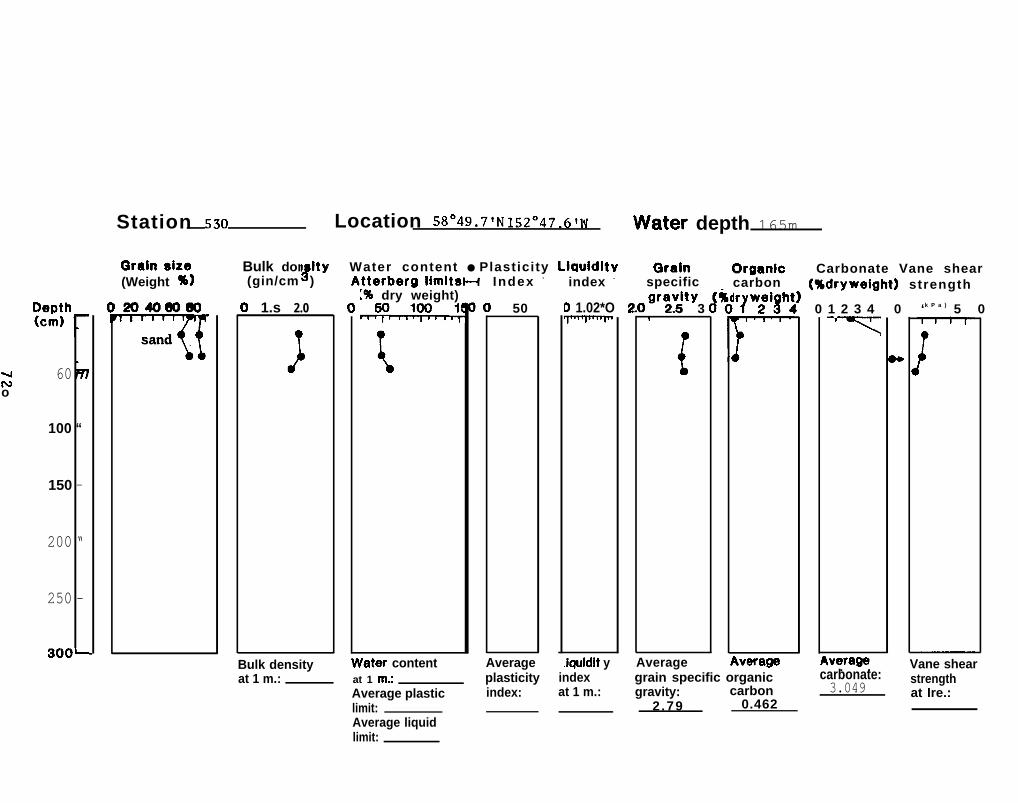
Station 530 Location 58”49.7’N 152”47.6’W water depth 165m
Grain size(Weight %1
2040eow
Tsand
Bulk don Ity#(gin/cm ) Atterberg limltsH
[% dry weight),,y, ,,ly, ,,l;) 1.s 2.0
Bulk densityat 1 m.:
Water content ● Plasticity Llauldltv
later contentat 1 m;
I
Index -
50
index -
D 1.02*O :
Qralnspecific,gravity
2.5 31
{
Averageplasticity index
,iquidlt y Average
Average plastic index: at 1 m.:limit:
Orgardc Carbonate Vane shear- carbon (%dryweight) strength
~ ‘r?w:igh;) 0 1 2 3 4 0 ‘k P a ) 5 0
I
iveragegrain specific organicgravity: carbon
2.79 0.462
,
,verage. . Vane shearcarbonate:3.049
strengthat Ire.:
Average liquidlimit:
Depth
1
(cm) ,
50
100
150
2 0 0
2 5 0
3 0 0[
“
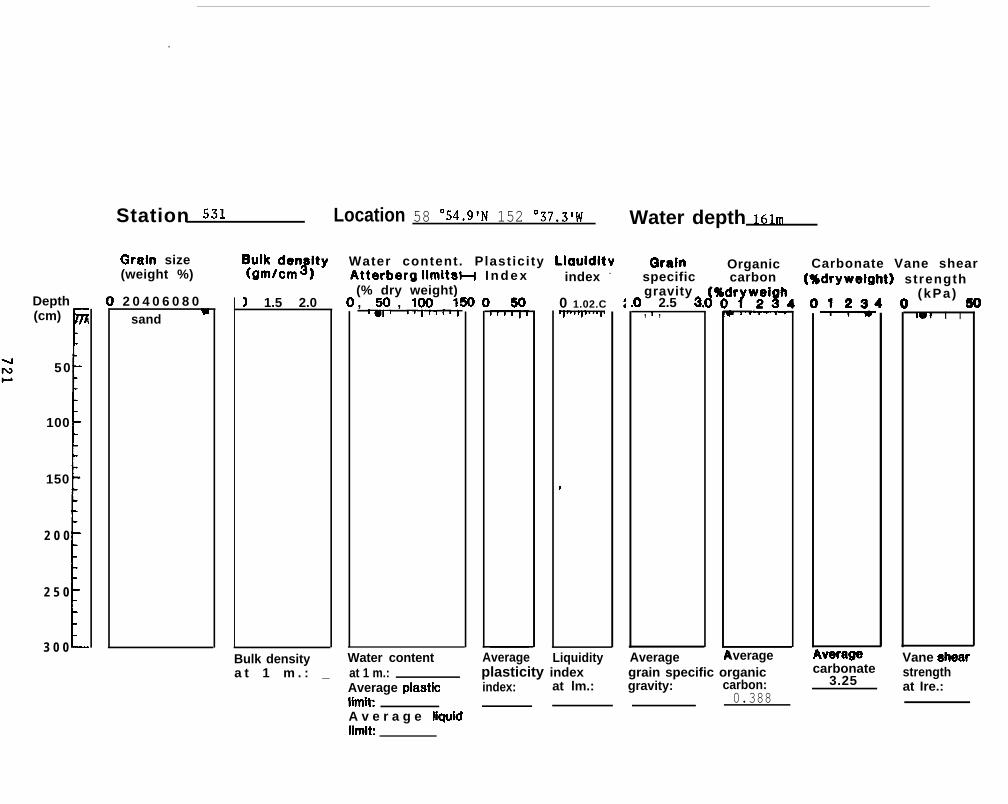
Station 531 Location 58 °54.91N 152 °37.3’W Water depth lGlrn
C3raln size(weight %)
2 0 4 0 6 0 8 0sand
~glkd:g;ty Water content. Plasticity LlauldityAtterberg limitsH I n d e x(% dry weight), ,=$ , ,!W, ,,1,!) 1.5 2.0
Bulk density Water contenta t 1 m . : _ at 1 m.:
index -
0 1.02.C
P
plasticity index
Grainspecificgravity
) 2.5 3, 1 ,
Organiccarbon
‘rYw#i3:
Average
Carbonate Vane shear(%drywoight) strength
~ (kPa) ~
191 I I
Average Liquidity Average Vane shealgrain specific organic carbonate
3.25strength
gravity: carbon: at Ire.:Average piastic index: at lm.:limit
.
0.388A v e r a g e iiquidlimit
Depth(cm) :
m
50 -
100 -
150 -
200 -
250 -
3oo–
Grain size(weight %)
204050W
coarse sand
I 1.5 2.0
Bulk density
Atterberg limitsH i n d e xBulk den ity
JWater content . Plasticity Liquidity Grain
(gmlcm )Organic
index specific carbon;% ~y &&ght)
150 (1“’’1’’”1
Water contentat 1 m.:
50,
g r a v i t y (901 .02 .0 2 .0 2 .5 3 .0
plasticity index\verage
Carbonato Vane shear(%dryweight) s t rength
01234, r I
(kPa)5
1 I I I
Average Liquidity Average Average Vane sheara t lm.: _ grain specific organic carbonate
2 8 . 1 5strength
Average plastic index: at Ire.: gravity: carbon0.335
at 1 m;limitAverage liquid11—9..
Depth(cm) ~
!50 “
100 -
150 -
2 0 0 -
250-
3oo—
Grain size(weight %)
2 0 4 0 3 0 3 0coarse’
Location S8”S0.A’N Isz”zs.g’w Water depth lzorn
(% dry ~eight)50 100 1r,
Water content
01.02.0 /!g“ravity !) 2.5 3.
Bulk den ityJ
Water content ● Plasticity Llquldity(gin/cm )
Qraln OrganicAtterbera limit9H I n d e x index specific
1.0 1.5 2.0
r
Bulk density Average Liquidityat 1 m.: at 1 m.: grain specific organk
Average plasticlimitAverage liquidlimit”.—
plasticity indexindex: at Ire.: gravity: carbom
Carbonate V~ne s h e a r(%dryweight) ‘strength
1 2 3
verage. . me shearcarbonate: strength
at Im;
Station 534 Location S8”S9.G’N 152”47.1’W water depth 185m
Depth(cm)
so -
m1 0 0 -
1 5 0 -
2 0 0 -
2 5 0 -
3 0 0 —
Grain alze(weight %)
2040W50
T
ygl:,:n$ty Water content ● Plasticity LiquidityAtterbera iimit8H
Buik densityat 1 m;
Water contentat 1 m:
index
dasticitv indexAverage piastic index: at lm.:limit: 30 11
GrainsDecificgravity
2.5 3J, v , 1“11
Organiccarbon
‘r?w:i3h\ 0 1 . 0 2 . 0 2 { I
~
Average Liquidity Average Average Vane shear. . . carbonate: strength
gravity: carbon: 3. 172.66 0.424
at Ire.:9rain specific organic
Carbonate Vane shear(%dryweight) s t rength
(kPa)5
I I I
\
Average iiquidlimit. 4 1
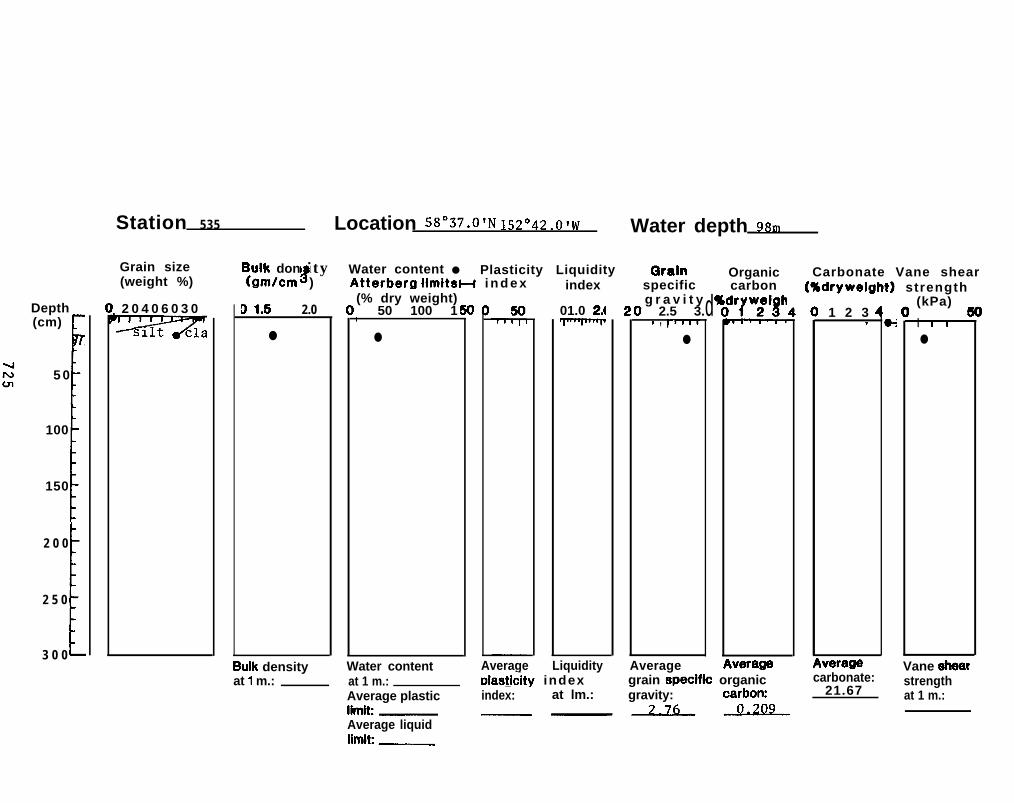
Depth(cm)
[
5 0
100
150
2 0 0
2 5 0
3 0 0[
Station 535 Location SS”ST.O’N Isz”dz.o’w Water depth gsrn
Grain size(weight %)
2 0 4 0 6 0 3 0
=
Bulk don i ty8
Water content ● Plasticity Liquidity(gmlcm ) Atterberg iimitsb-1 i n d e x
D 1.5 2.0
●
(% dry weight)50 100 1t
●
index
01.0 2.(
Grain Organicspecific carbon
dg r a v i t y qI 2.5 3.
1 , I“lf●
Buik densityat 1 m.: at 1 m.: .–. —._– _._z
Water content Average Liquidity AverageDiasti&tv index
Average plastic index: at lm.:
yw:i3h
veragegrain specifk organicgravity: carbom
Carbonate Vane shear(%dryweight) strength
1 2 31
verage
H
(kPa)t
I 1 I●
Vane eheafcarbonate:
21.67strengthat 1 m.:
Average liquidiimit-.—
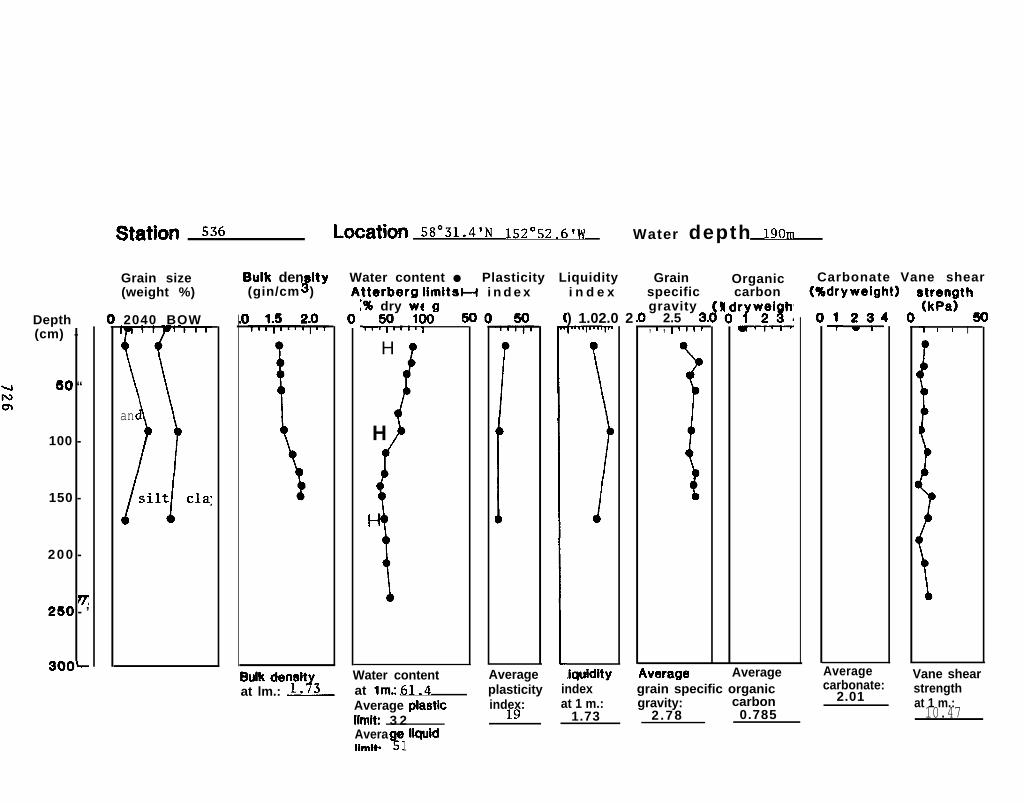
Depth(cm) -
so “
100 -
150 -
200 -
T2!50 - ’
3oo-
Statlon 536 Location 58”31.41N 152”52.6’W Water depth lgorn
Grain size(weight %)
2040 BOW
an
Water content ● Plasticity LiquidityBuik den ityJ(gin/cm ) Atterberg iimitsH i n d e x
;% dry wt,,y, ,l:
H
H
i n d e x
) 1.02.0 2
Grainspecificgravity
I 2.5 3, 1 , 1 “1’
/
Organiccarbon
Carbonate Vane shear
-
iverage Average Average
‘1 I I I
Buik densit Water content Average Jquidity Vane shearat lm.: J& at lm; 61.4 plasticity index grain specific organic carbonate:
Average piastic2.01
strengthindex: at 1 m.: gravity: carbon at 1 m.:
iimit: 3 2 19 1.73 2.78 0.785 10.47Avera
Yiiquid
Ilml+. 1
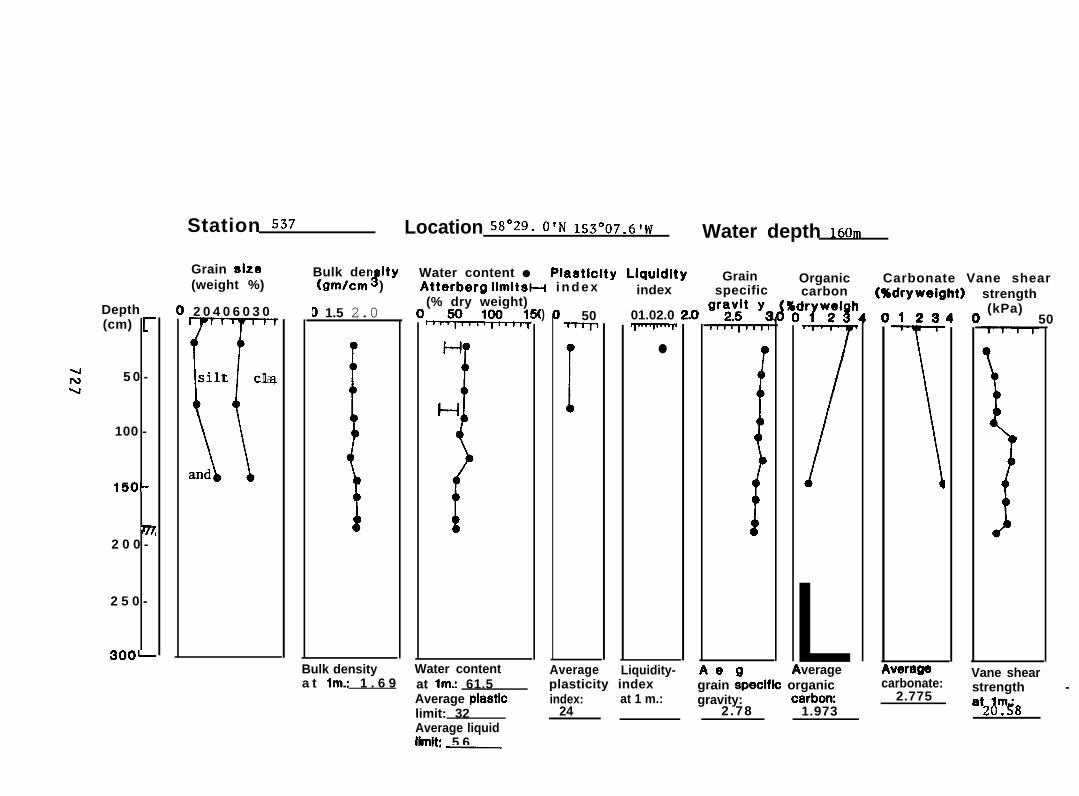
Depth(cm) ~
5 0 -
100 -
150-
m2 0 0 - ‘
2 5 0 -
3oo—
Station SST Location 58”29. O’N 153”07.6’W Water depth lGOrn
Grain size(weight %)
2 0 4 0 6 0 3 0
Ksilt cla,
and
Bulk den ity8
Water content ● Plastlclty Llquldlty(9m/cm )
Grain Organic Carbonate Vane shearAtterberg limitsH i n d e x index(% dry weight)
specific carbon (%drywelght)
~,y,,,!~,,,y 01.02.0 2.0 ‘rydt ‘:D 1.5 2.0
Bulk densitya t lm.: 1 . 6 9
Water content
Average plastlclimit: 32
) 50
I●
plasticity indexindex: at 1 m.:
24
‘r?w?’3h
7LAverageAverage Liquidity-
at lm.: 61.5Vane shear
grain ipeclfic organic carbonate:gravity: carbom 2.775
2.78 1.973 at2drn~8
123
1
veraga
strength(kPa)
50
strength -
Average liquidiimit~ 5 6.—
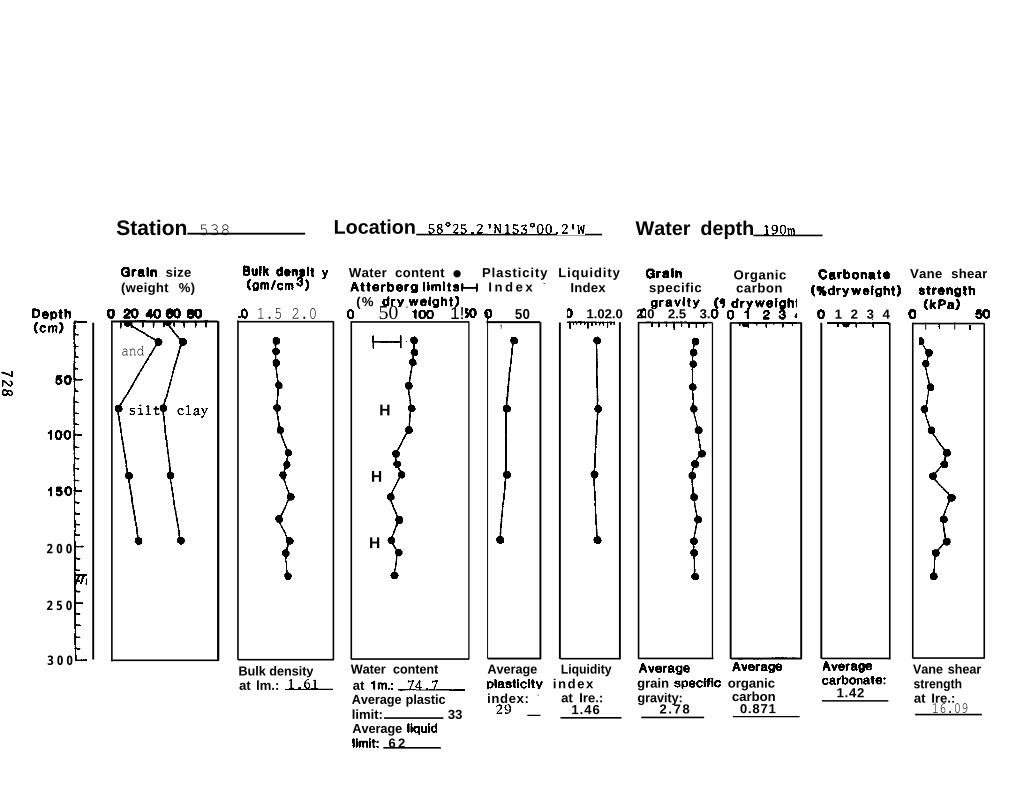
-JNm
2 0 0
I
/
2 5 0
3 0 0
Station 538 Location ss”zs.2 ‘N 153°00 .2’w Water depth lgorn
Qraln size(weight %)
2040tmm
and
) 1.5 2.0
\
Bulk density
Atterberg limitSH I n d e x - IndexB#kdrl$t y Water content ● Plasticity Liquidity Qraln Organic
specific carbon(% dry weight)
(%dryweight) at~p~~th
{50 - 100- 1!
H
H
H
H
Water content
50,
i
4g“ravity 9D 1.02.0 2.0 2.5 3.
dasticity index~verage
Carbonat. Vane shear
1 2 3 4-
werageAverage Liquidityat lm.: W at lm~~ grain specific organic carbo~ate:
Average plastic index: - at Ire.: gravity: carbon 1.42
limit: 33 —29 1.46 2.78 0.871
I I I I
Vane shearstrengthat Ire.:
16.09Average liquidtimit 6 2
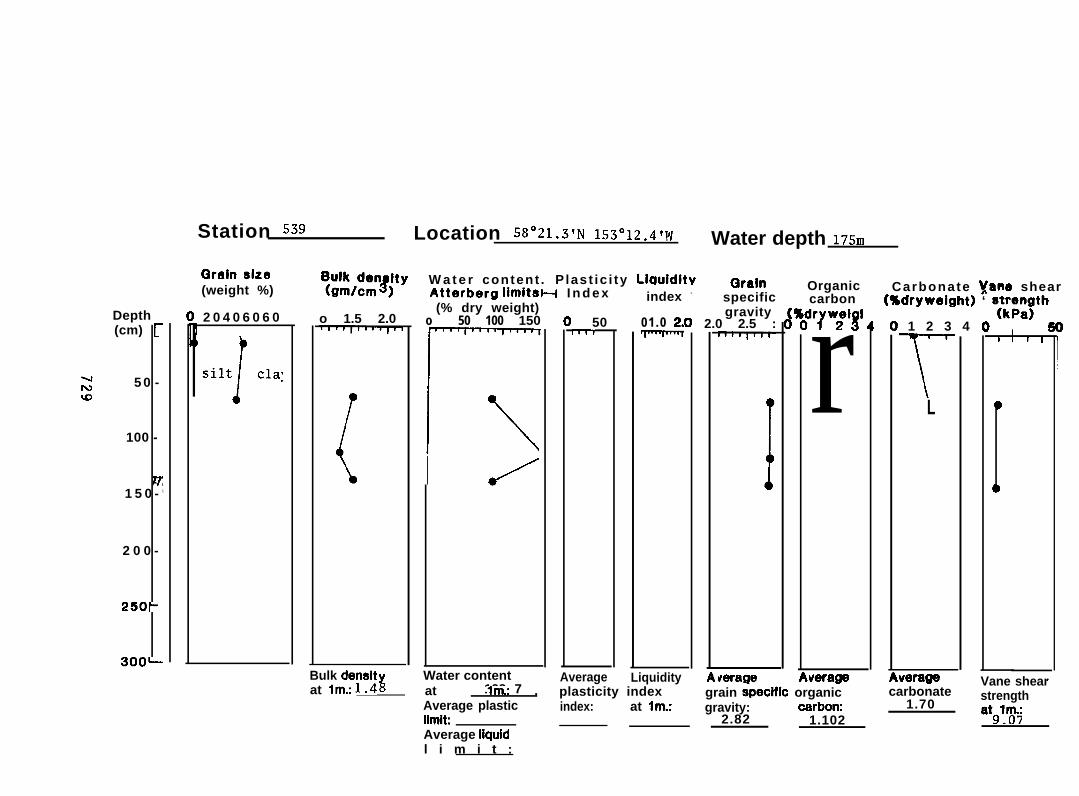
wNJu)
Depth(cm) :
5 0 -
100 -
w1 5 0 - ‘
2 0 0 -
250-
3oo—
Station 539 Location SS”Z1.S’N 153”12.4’w Water depth lTSrn
Grain SIZO(weight %)
2 0 4 0 6 0 6 0
silt‘1
claj
o 1.5 2.0
Bulk densitat lm.: 1.4~
l\I /’
50nwl
index -
01.0 2.(
Mkdn$ty W a t e r content . P last ic i ty Llauldity Qraln Organic Carbonate ~ane shearAtterberg limit8H I n d e x(% dry weight)
specific carbon (%dryweight) ‘ sj;~a~th
o 50 100 150
r
1 2 3 4 1 {
T
plasticity indexindex: at lm.:
gravity2.0 2.5 :
verage
‘r?wm’r
verage
L
i I 1 I
Water content Average Liquidity109 7 Vane shear
at lm.: . grain specific organic carbonateAverage plastic
strengthgravity: carbom 1.70
2.82 1.102at91~:
limitAverage liquidl i m i t :
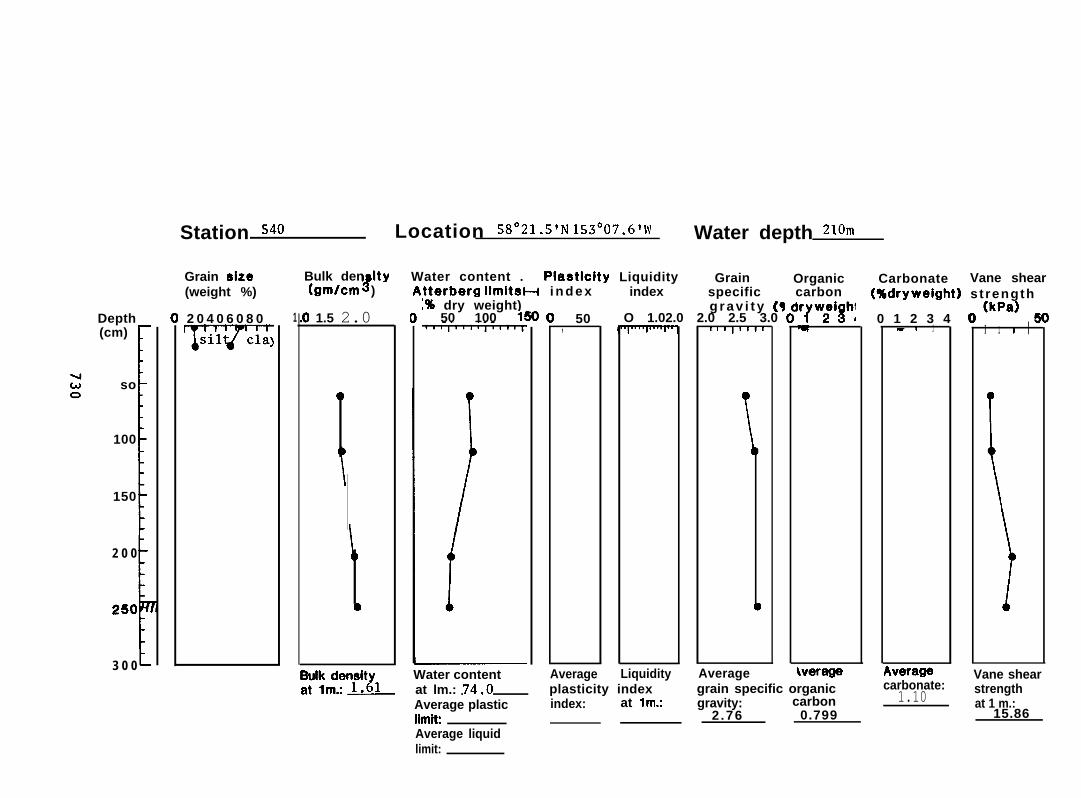
Depth(cm)
so
100
150
1
Station S40 Location S8”21”5’N 15s”07.6’w Water depth Z1O”
(weight %)
2 0 4 0 6 0 8 0
-
Grain size Bulk den Ity#
Water content . Plastlclty Liquidity Grain(grn/cm )
Organictterberg llmltSH i n d e x~% dry weight)
1 50 100 150 () 1.5 2.0
2 0 0
250
3 0 0[Water contentat lm.: 74.0
50,
index specific carbong r a v i t y (q
O 1.02.0 2.0 2.5 3.0
plasticity indexAverage plastic index: at lm.:limit
1 I 8 l’lv~‘r/’w#i3h!
Carbonate Vane shear(%dryweight) s t rength
0 1 2 3 4 O(kpa)50. 1 1
iverage
I I 1 I
\
Average Liquidity Average Vane sheargrain specific organic carbonate:
1.10 strengthgravity: carbon
2.76 0.799at 1 m.:
15.86
Average liquidlimit:
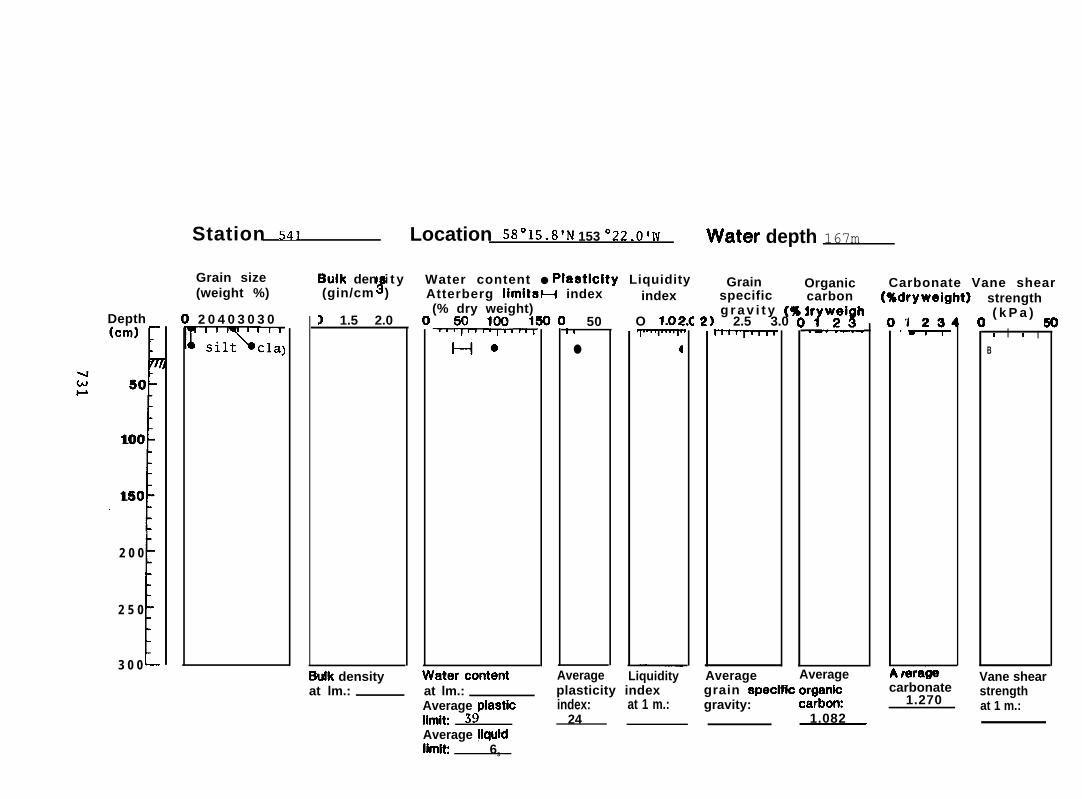
Depth(cm)
.1
5 0
100
150
2 0 0
2 5 0
3 0 0[
Station 541 Location 58 °15.8’N 153 °22.0’UI water depth 167m
Grain size(weight %)
2 0 4 0 3 0 3 0
m
3 1.5 2.0
Buik densityat lm.:
50) 1
●
at lm.: plasticity indexAverage piasticiimit 39Average iiquidiimiti 63
specificBulk den i t y
#Water content ● Pia8ticlty Liquidity
(gin/cm )Grain Organic
Atterberg lltWSH index index(% dry weight),,, y,, ,!~, ,,l;
g r a v i t y (1O 1.02.Q ‘ 1 2.5 3.0~ 1~
index: at 1 m.:24
carbon
‘r7w;i3:
Average
Carbonate Vane shear(%dryweight) strength
( k P a ) ~
I I 1 IB
Average Liquidity Average Vane sheargrain specifk organk carbonate
1.270strength
gravity: carbom1.082
at 1 m.:.
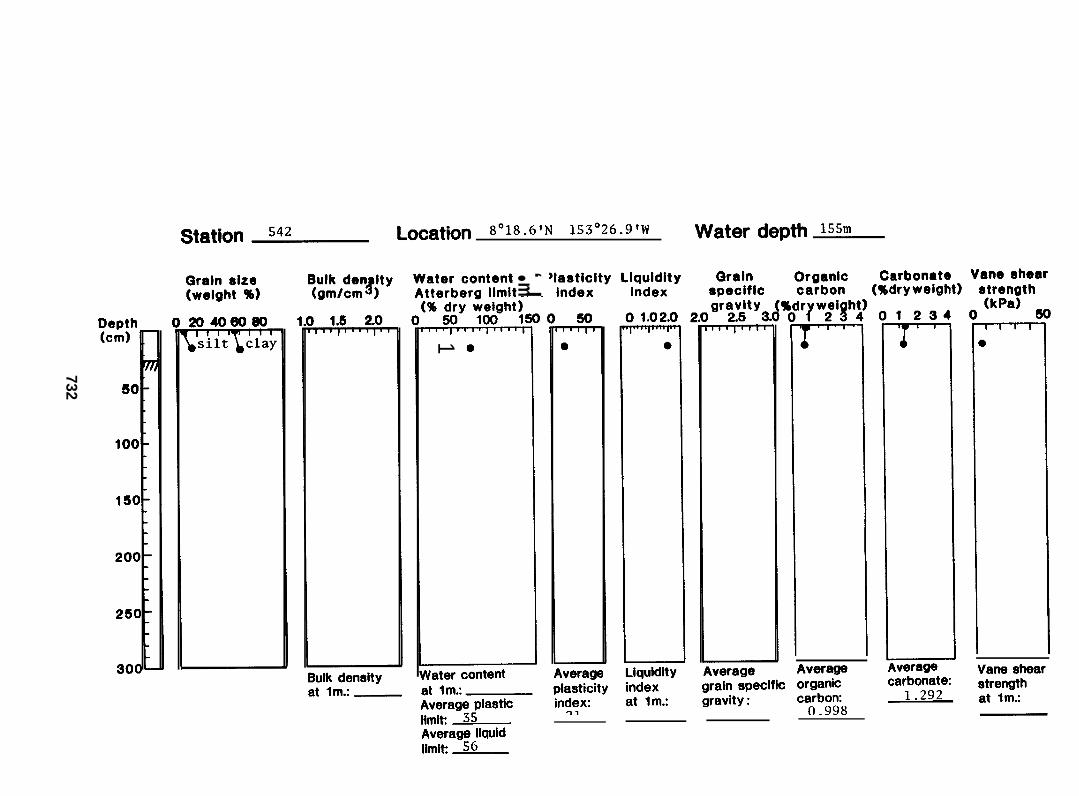
1+
‘I
● m
I
1
732
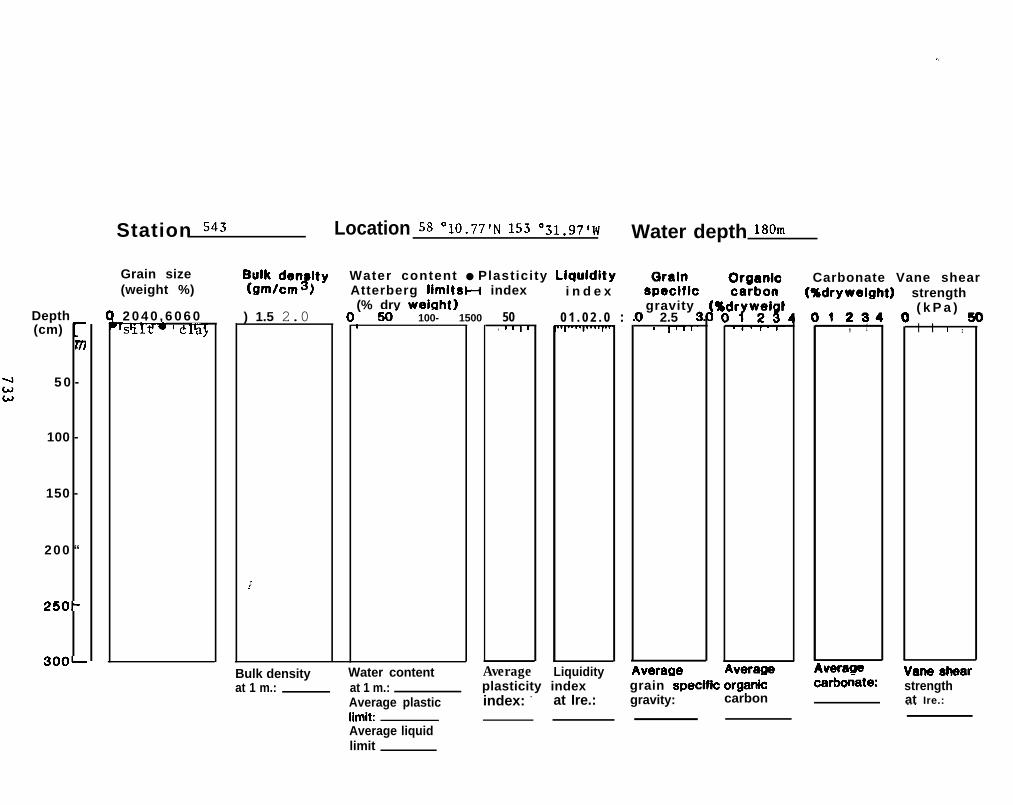
Depth(cm) :
m
5 0 -
100 -
150 -
200 “
250-
3oo—
Station 543 Location 58 °10.77’N 153 °31.97’lv Water depth 180”
Grain size(weight %)
2 0 4 0 , 6 0 6 0~shlf- ‘e l’a~
Mlmdn ;ty8
Water content ● Plasticity LlquldltyAtterberg limitSH index(% dry weight)
) 1.5 2.0
,:
Bulk densityat 1 m.:
50- 100- 1500 50b
Water contentat 1 m.:Average plasticIlmit:
1 , 1 1 If
i n d e x
0 1 . 0 2 . 0 :gravity
1 2.5 {v l’vl~
verage
1
,verage
Carbonate Vane shear(%dvmlght)
1231, 1
verageAverage Liquidityplasticity index grain speclfk organk cati-ate:index: - at Ire.: gravity: carbon
strength( k P a ) ~
I I I I
.
strengthat Ire.:—.
Average liquidlimit
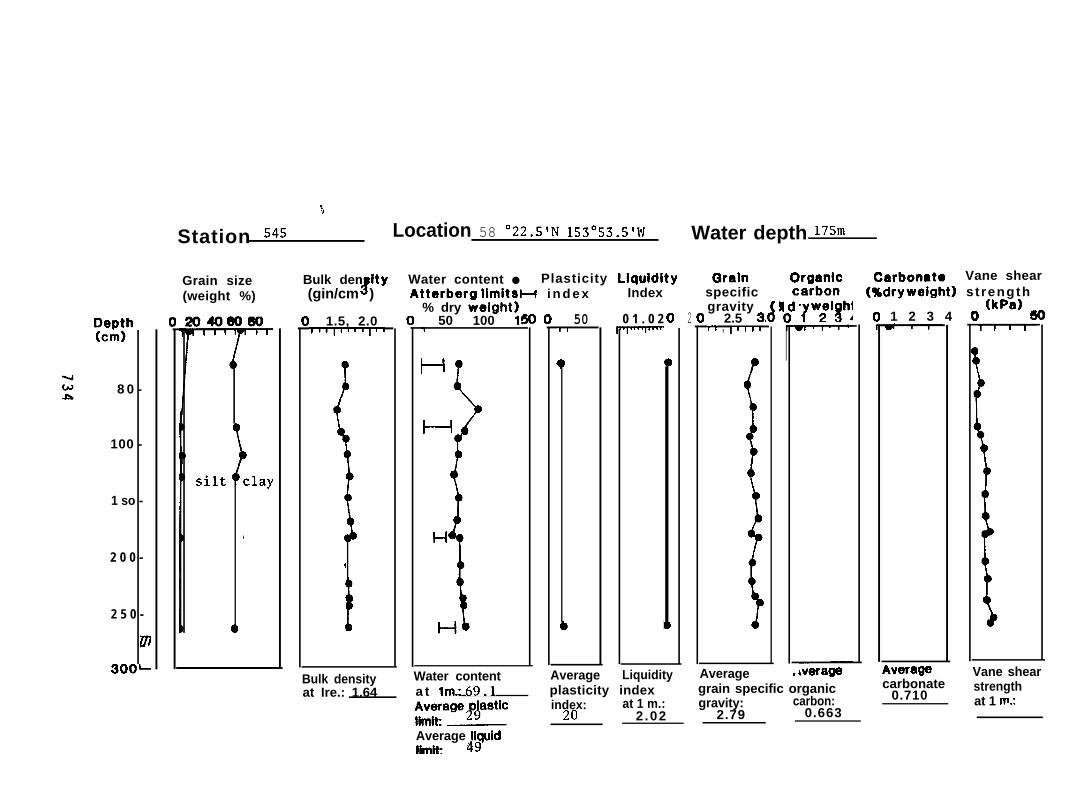
l));;h
8 0 -
100 -
1 so -
2 0 0 -
2 5 0 -
m
3oo-
%
Station 545 Location 58 °22.5’N 153”53.5’W
Grain size(weight %)
Bulk den Ity8(gin/cm )
1.5, 2.0-1,111,1,1,~
I
Bulk densityat Ire.: 1.64
Water content ● Plasticity LlquldityAtterbera limitsH i n d e x
% dry ~elght)50 100 1!>
Water content
50-t I
Index
0 1 . 0 2
(
Water depth 175”
2
Qralnspecificgravity
2.5 3.t, , I’ll’
Cwl:; Carbonato Vane shear(%dryweight) s t rength
1 2 3 4 O(kpa) 50
Average Liquidity Averagea t Imi 69.1 plasticity index grain specific organic
index:&~fJe?P’ic 2,
at 1 m.: gravity: carbon:2 .02 2.79 0.663
.—
iverage Vane shearcarbonate
0.710strengthat 1 m.:
Average Ii.guidIimi* 49
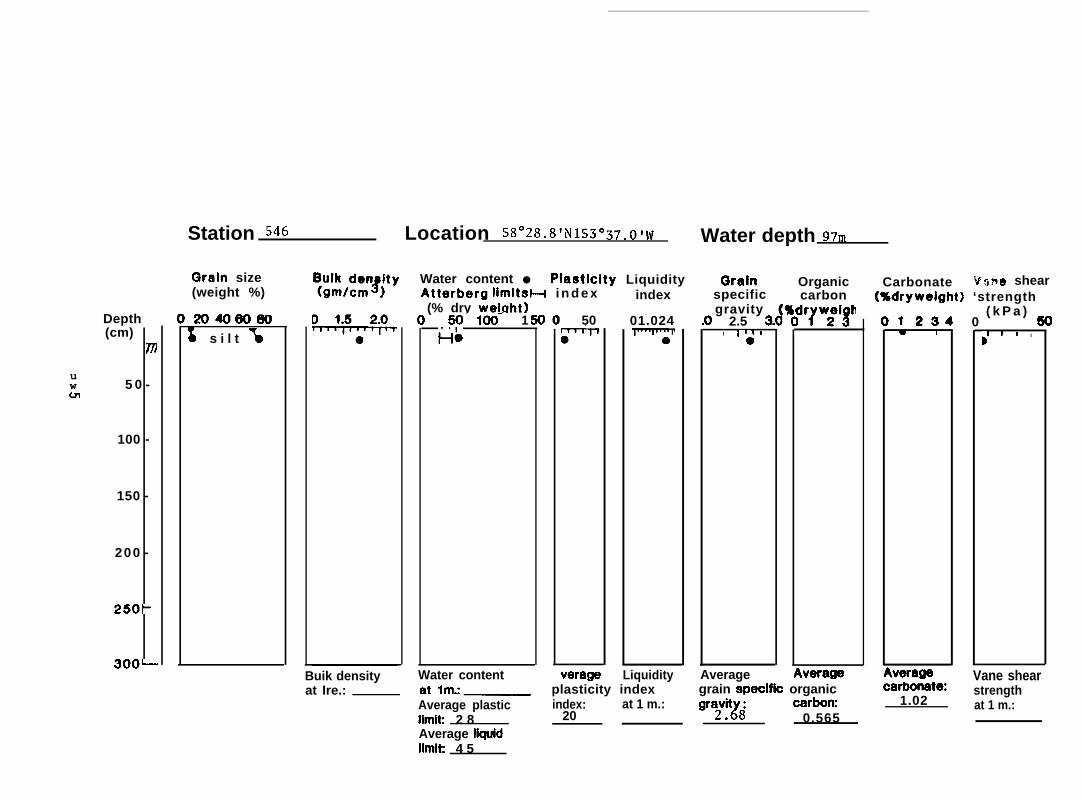
uwm
Depth(cm)
m
5 0 -
100 -
150 -
200 -
250-
3oo—
Station 546 Location s~OzB.B’N 153 °37.011v Water depth 9Trn
Grain size(weight %)
2040eo Bos i l t
lmdl ;tyJ
Water content ● Piaaticity LiquidityAtterberg limit~H i n d e x(% dry weight)
Buik densityat Ire.:
50- 100- 1
Hb
)0 50
index
01.024T’yr
Qralnspecificgravity
1 2.5 $,
‘oI I
‘4,,I
Organiccarbon
‘r?w;igh
Carbonate ‘?? ?me shear(%dryweight) ‘strength
( k P a ) ~1234 0w I
Average plasticiimit 2 8Average iiquidIimik 4 5
wrage
D’ I I I
Vane shearstrength
Water content verage Liquidity Averageplasticity index grain specifk organicindex: at 1 m.: carbom 1.02
20 ‘YY8at 1 m.:
0.565
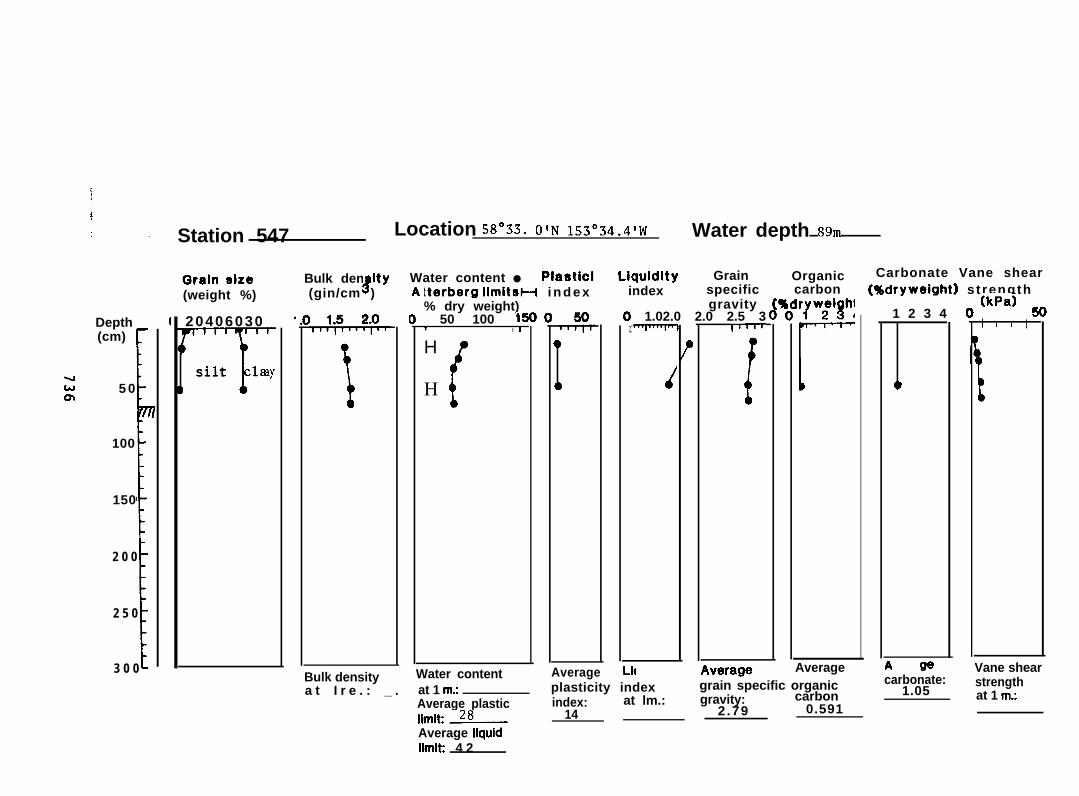
-Jham
Depth(cm)
5 0
100
1
150
2 0 0
2 5 0
13 0 0
Station 547 Location 58”33. O’N 153”34.4’W Water depth ggrn
Grain size(weight %)
20406030
T
)
silt 1 ay
Bulk den ItyJ(gin/cm )
i
\
Water content ● Plasticitterberg limitsH i n d e x% dry weight)
50 100 It? , I
H
H/
Bulk density Water content
r
Llquldity Grainindex specific
gravity~ 1.02.0 2.0 2.5 3
l’Jlr
~verage
Organiccarbon
‘rw?’!ih:r
Average
Carbonate Vane shear(%dryweight) s t rength
)1 2 3 4(kpa)
9I I I I
1
Average Lif Vane shear
a t I r e . : _ . at 1 m; plasticity index grain specific organic carbonate:1.05
strength
Average plastic index: at lm.: gravity: carbon at 1 m:
limit: ~ 14 2.79 0.591
Average liquidlimit 4 2
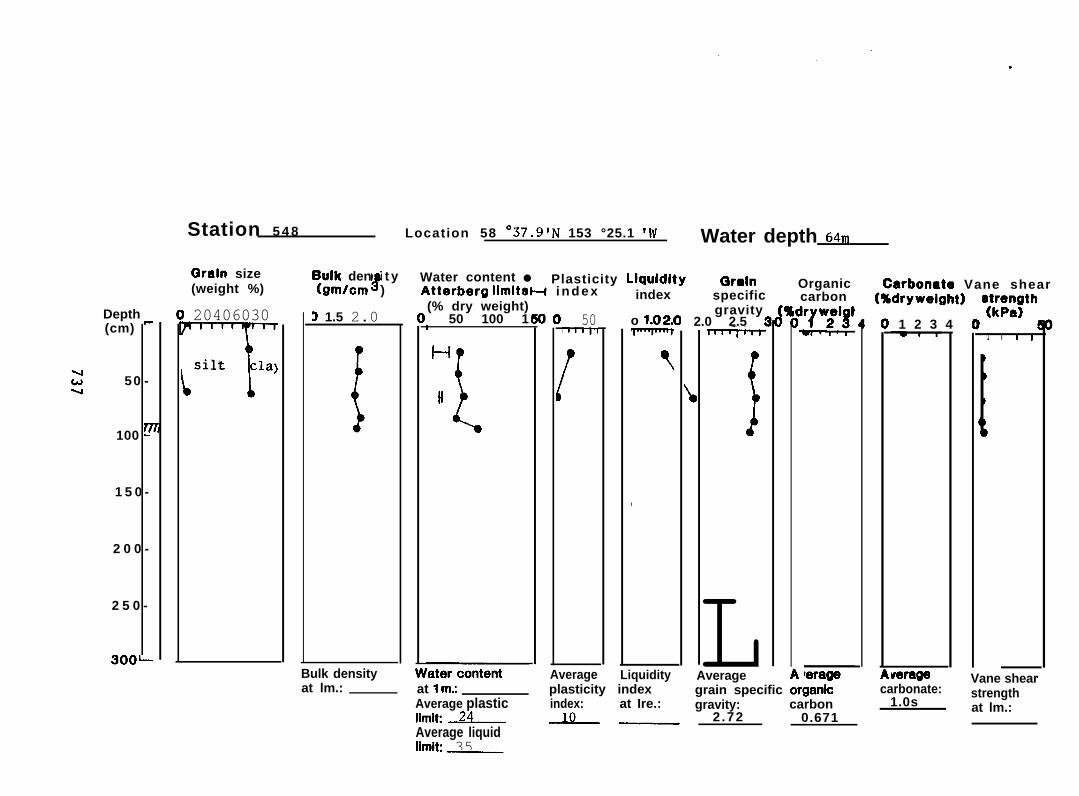
Depth(cm) -
50 -
100 ~
1 5 0 -
2 0 0 -
2 5 0 -
3oo-
Station 5 4 8 Location 58 °37.9’N 153 °25.1 ‘If Water depth Garn
C3raln size(weight %)
20406030
T
silt claj
r
D 1.5 2.0
Bulk densityat lm.:
5011 ,1,1
rindex
o 1.02J
7
,
Bulk den i t y8
Water content ● Plasticity Llquldity(gmlcm )
Grain Organic Carbonato Vane shearAtterberg iimit8H i n d e x(% dry weight) (%dryweight) $;~a~th
50 100 1I 1 2 3 4 !
Average Liquidityat 1 m; plasticity indexAverage plasticiimit: ~Average liquidIimir 35.—
index: at Ire.:~ —,
specificgravity
2.0 2.5 i
LAverage
carbon
werage
I I I !
Vane sheargrain specific organk carbonate: strengthgravity: carbon 1.0s
2.72 0.671at lm.:

2 0 0
2 5 0
3 0 0I
Station sag Location s8043.3’N 1s3015. oIw Water depth ~.
Qraln 8120(weight %)
w
Bulk den Ity#
Water content ● Plasticity Liquidity Grain(gmlcm ) Atterberg limitsH i n d e x
(% dry weight)o 50 100 150(
g“ravity31.02.0 2.0 2.5 3) 1.5 2.0
{
Bulk densityat 1 m.:
IIH
Water contentat lm;
index specific
Average Liquidityplastidty index
I I , l“”
L
Average
Organiccarbon
Averagegrain specifk organic
Carbonate Vane shear(%drywelght) strength
1 2 3 4 O(kpa) 50
Vana shearcarbonate:
Average plastic index: 1.01 strengthat lm.: gravity: carbon: at lm.:
limit: 25 4 2 .76 0.517
w t #
iverage
Average Uquidlimit ~,
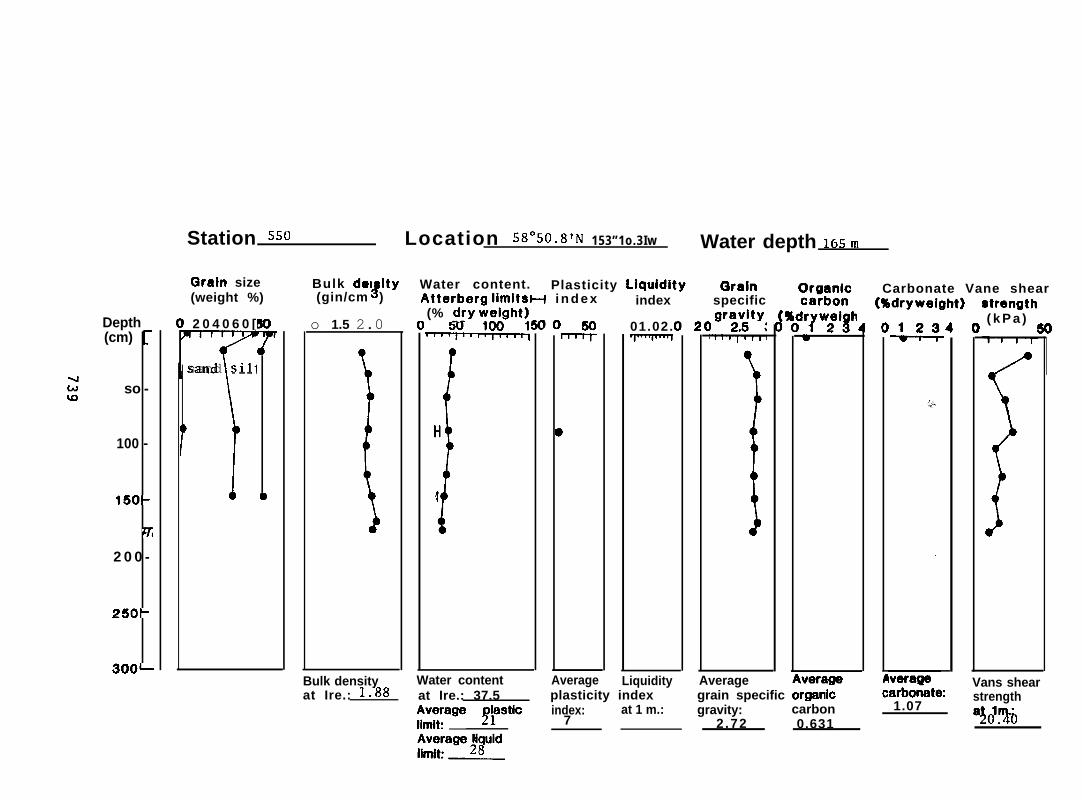
Depth(cm) :
so -
100 -
150-
?Z
2 0 0 -
250-
3oo—
Station SSO Location SS”SO.S’N 153”1o.3Iw Water depth 165 m
Grain size(weight %)
2 0 4 0 6 0 [
Jsand sillfr
Bulk don ItyJ
Water content. Plasticity Llquldlty(gin/cm )
Qraln 0r9anlcAtterberg limit8H i n d e x(% &y w&ght)
~o 1.5 2.0
\
Bulk densityat Ire.: 1.88
)0 !50
index
01.02.
specific caibon
‘r?w:i3h
Iverage
Carbonate Vane shear(%dryweight) $trength
( k P a ) ~
Water content Average Liquidity Averageat Ire.: 37.5
Vans shearplasticity index grain specific organk carbm-ate: strength
;~ge YPs’k 7index: at 1 m.: gravity: carbon 1.07
2.72 0.631 a!ll%io
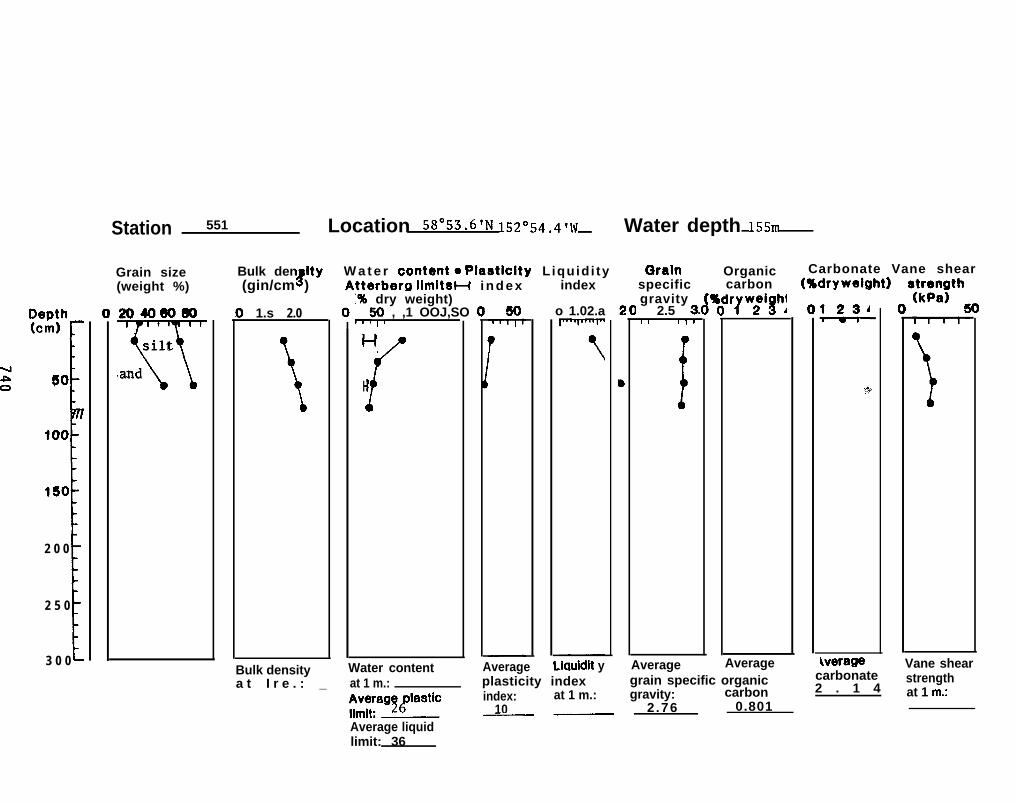
2 0 0
2 5 0
3 0 01
Station 551 Location SS”SS.G’N lszOsA.A’~$’ Water depth lssrn
Grain size(weight %)
204060Wvsilt
and
Bulk den ItyJ(gin/cm )
I 1.s 2.0
\
W a t e r contento Plastlclty L iquid i tyAtterberg limit8H i n d e x
% dry weight),,p, , ,1 OOJ,SO
l-l
(H
Water content
index
o 1.02.a
at 1 m.: plasticity index
Qralnspecificgravity
2.5 3,I 1 I I I
/
Organiccarbon
‘l’w;i!ilh:
Average Average
Carbonate Vane shear
::34
;*
Werags Vane shearBulk density Average Liquldlt ya t I r e . : _ grain specific organic carbonate
2 . 1 4strength
;:rag~glastic index: at 1 m.: gravity: carbon at 1 m;10 2 .76 0.801. ——
Average liquidlimit: 36
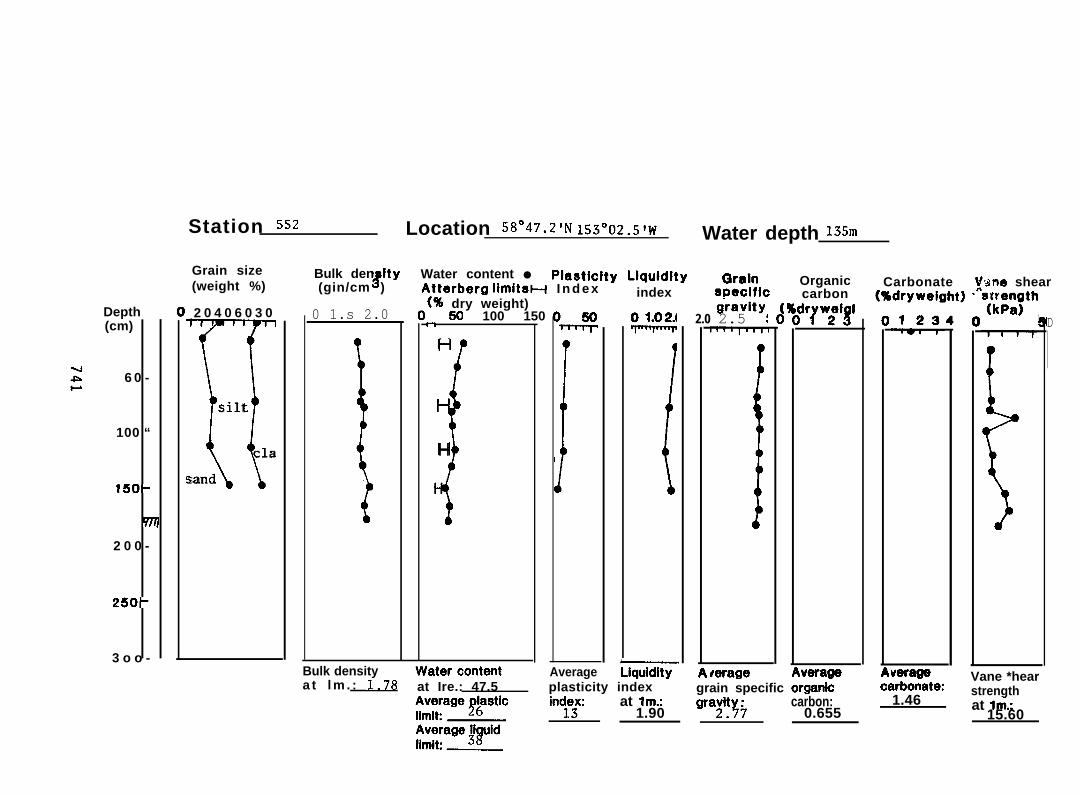
Station 552 Location S8”4Y.Z’N Iss”oz.s’w Water depth lssrn
Grain size(weight %)
2 0 4 0 6 0 3 0
E
silt
cla
sand
Bulk den Ity8
Water content ● Plastlclty Llquldlty(gin/cm )
Qraln Organic Carbonate ~~ne shearAtterberg limit8H I n d e x(% dry weight)
index (%dryvvelght) ‘ a~;~a~th
50 100 150r, 1234 1
speclflc carbon
“?W;’3’g-ravity
2.0 2.5 {Depth(cm)
6 0 -
100 “
150-
7/
2 0 0 -
250-
3 o o -
0 1.s 2.0
\
D
.
H
{
H
Average Liquidity ferageat Ire.: 47.5 grain specific organk
Bulk densitya t l m . : 1.78
verage Vane *hearplasticity index strengthindf;: at lm.: carbon: 1.46
1.90 ‘a;i!% 0.655 at lrn.:15.60
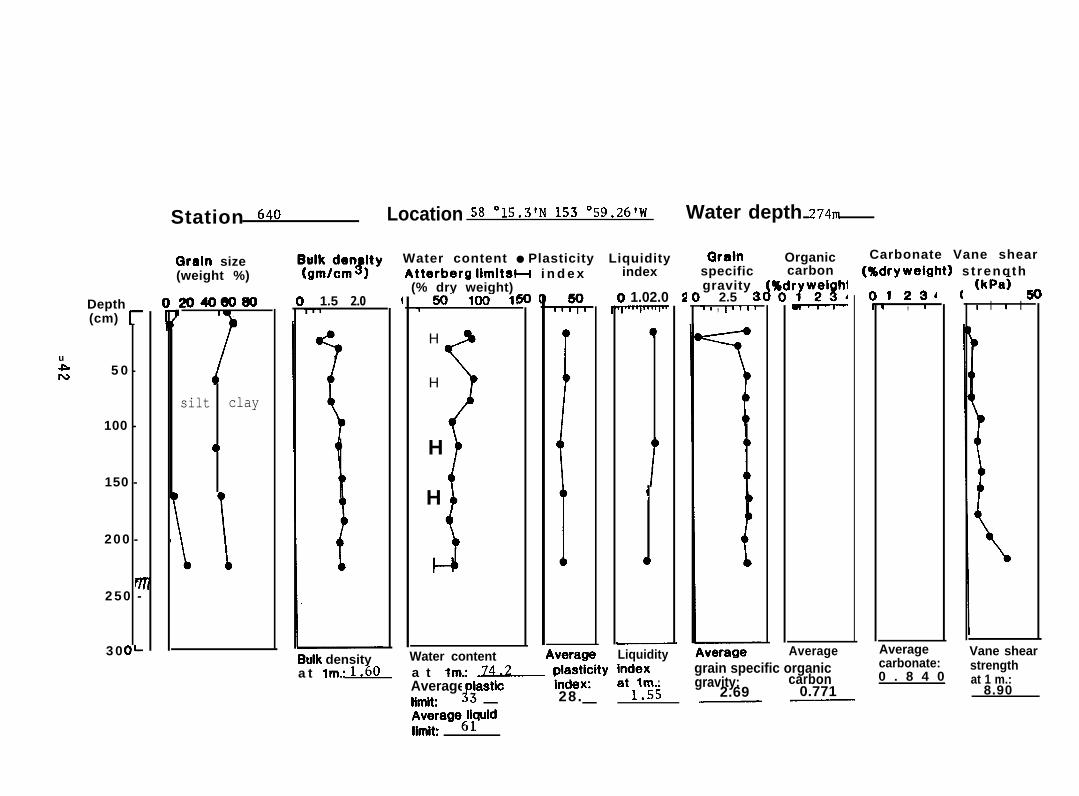
u.SN
Depth(cm) ~
5 0 -
100 -
150 -
200 -
v2 50 -
3 00-
Station GQO Location 58 °1S.3’N 153 °59.26’w Water depth z7dm
Qraln size(weight %)
204060W
silt clay
()
\\
Buik densitya t lm.: 1.60
1.5 2.0>Ie
Water content ● Plasticity LiquidityAtterberg iimit~H i n d e x(% dry weight)
5(- Im- 1!-1
H
H
H
H
Water content
index
) 1.02.0
1
iverage Liquidity
Grainspecificgravity
2.5 3<-1 I , 1 “1’
Organic Carbonate Vane shearcarbon (%dryweight) s t rength
Average
a t lm~ ~ ~e$itY ~~~ grain specific organicAverage ~tic
?. gravity: carbon
28.iimit — — 1.55 2.69 0.771——
1234, 1
Average
(kPa~ ~
1 I I I
Vane shearcarbonate:0 . 8 4 0
strengthat 1 m.:
8.90
AverageJ~luidiimit
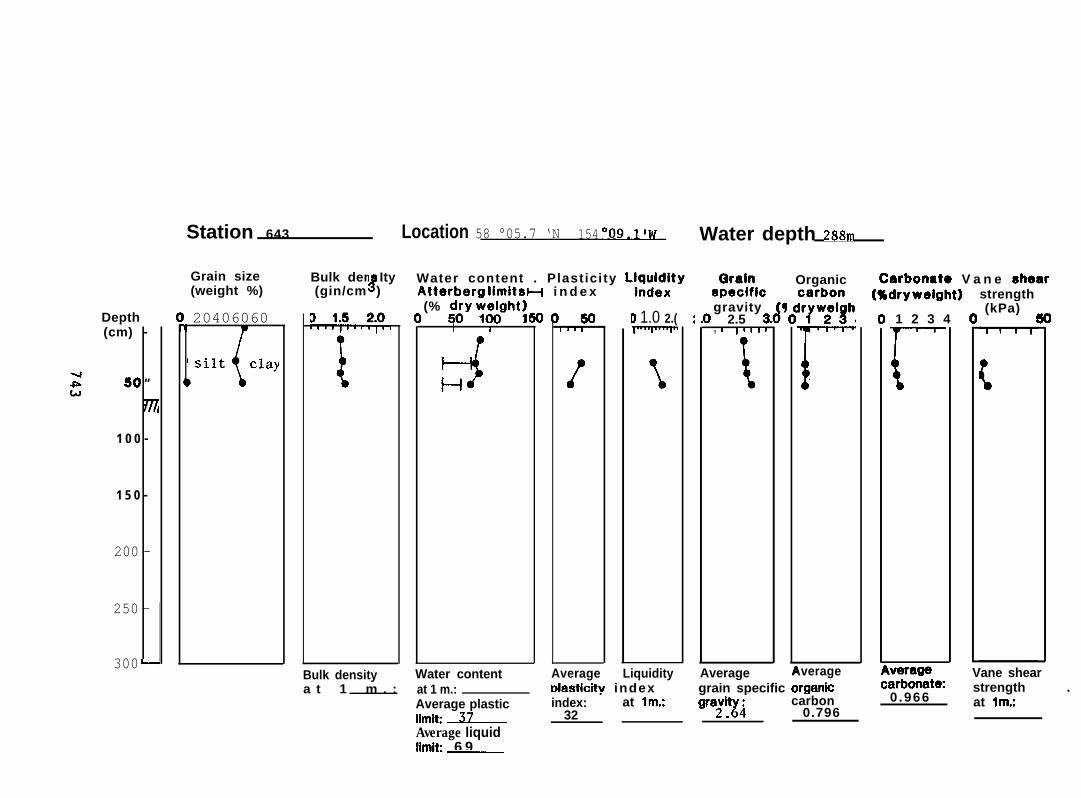
Station 643 Location 58 °05.7 ‘N 154 “09.1’W Water depth zggrn
Grain size(weight %)
Bulk den ItyJ
Water content . Plasticity Llquldlty(gin/cm ) Atterberg lirnitSH i n d e x
(% ~y vvvght)1
I 1
Qralnepeciflc
Organic Carbonato V a n e shear(%dryweight)index
D 1.0 2.(
1
strength(kPa)
50gravity
I 2.5 3., I 11111
Depth(cm) -
50 “
ml
1 0 0 -
1 5 0 -
200 -
250 -
300“
20406060 301 #11
[
1 2 3 4
Average Liquidity Vane shear. grain specific organk
0.966 at lm.:
Average AverageWater contentat 1 m.:
Bulk densitya t 1 m . : rdasticitv index strength .
Average plastic index: at lmo:limit ~ 32
carbon‘raY84 0.796
Average liquidIimir 6 9.—
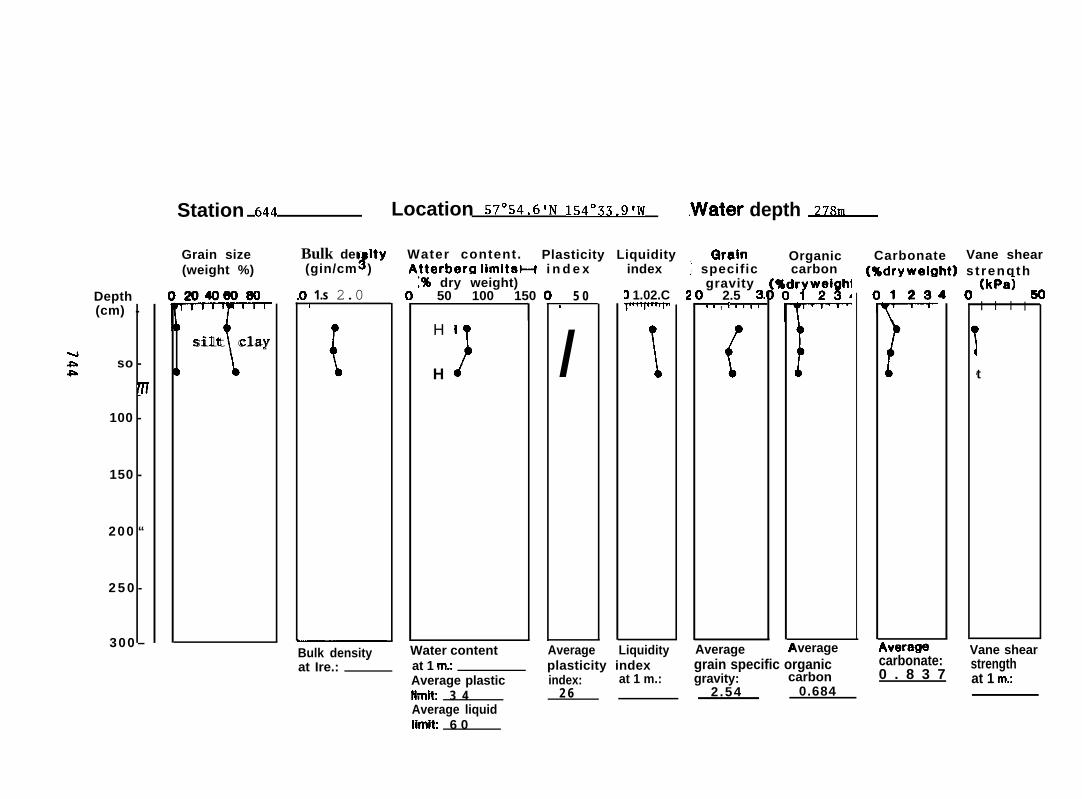
Depth(cm) -
so -
m
100 -
150 -
200 “
2 5 0 -
300 –
Station 644 Location 57”54.6’N lS4033.9’W
Grain size(weight %)
2040eo Bo
T
silt clay
) 1.s 2.01
Bulk densityat Ire.:
Water content. Plasticity LiquidityAtterber!a limitsH i n d e x
Bulk den ity#(gin/cm )
[% dry weight)50 100 150
H
H )
Water content
5 0v
I
index
3 1.02.C
\
Average Liquidityat 1 m; plasticity indexAverage plastic index: at 1 m.:Ilmik 3 4 2 6
.Water depth ~
Qralnj specific
gravity2.5 3,
I 1 , 1 “1’
{
Average
Organiccarbon
)
Vane sheargrain specific organic carbonate:
0 . 8 3 7strengthat 1 m:
Average
gravity: carbon2.54 0.684
Carbonate Vane shear(%dryweight) s t rength
\verage
(kPa) ~
I I I I
)
t
Average liquidlimit 6 0
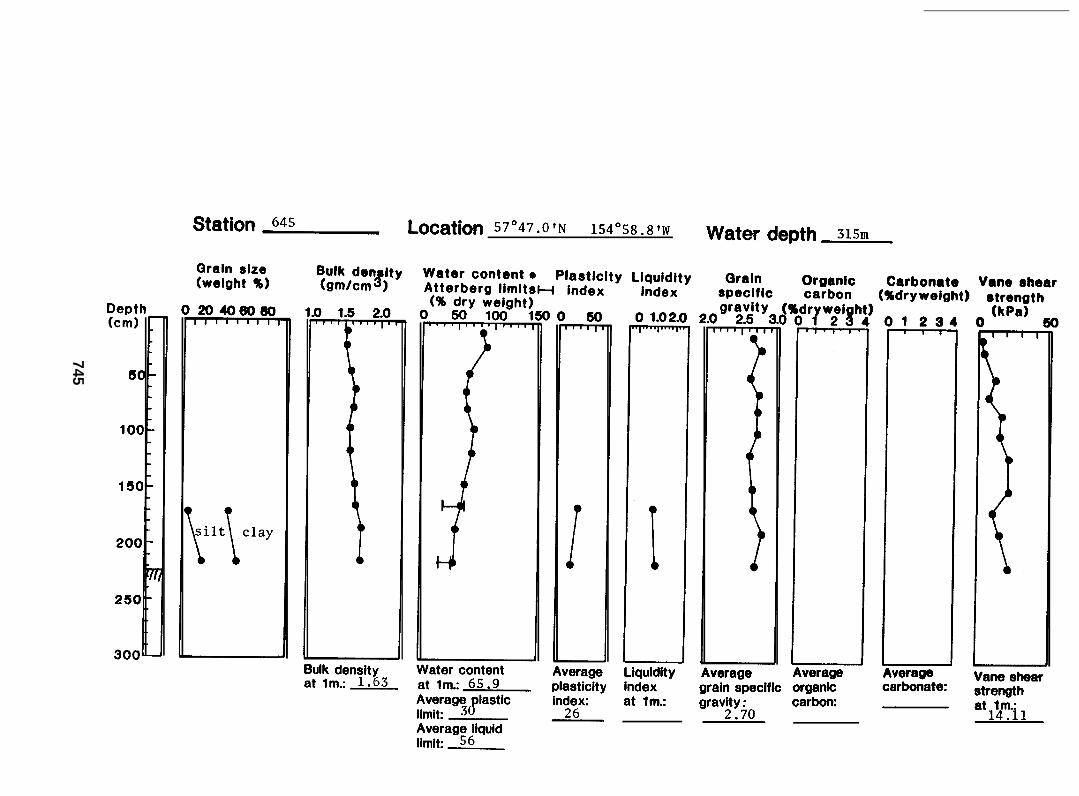
L1
745
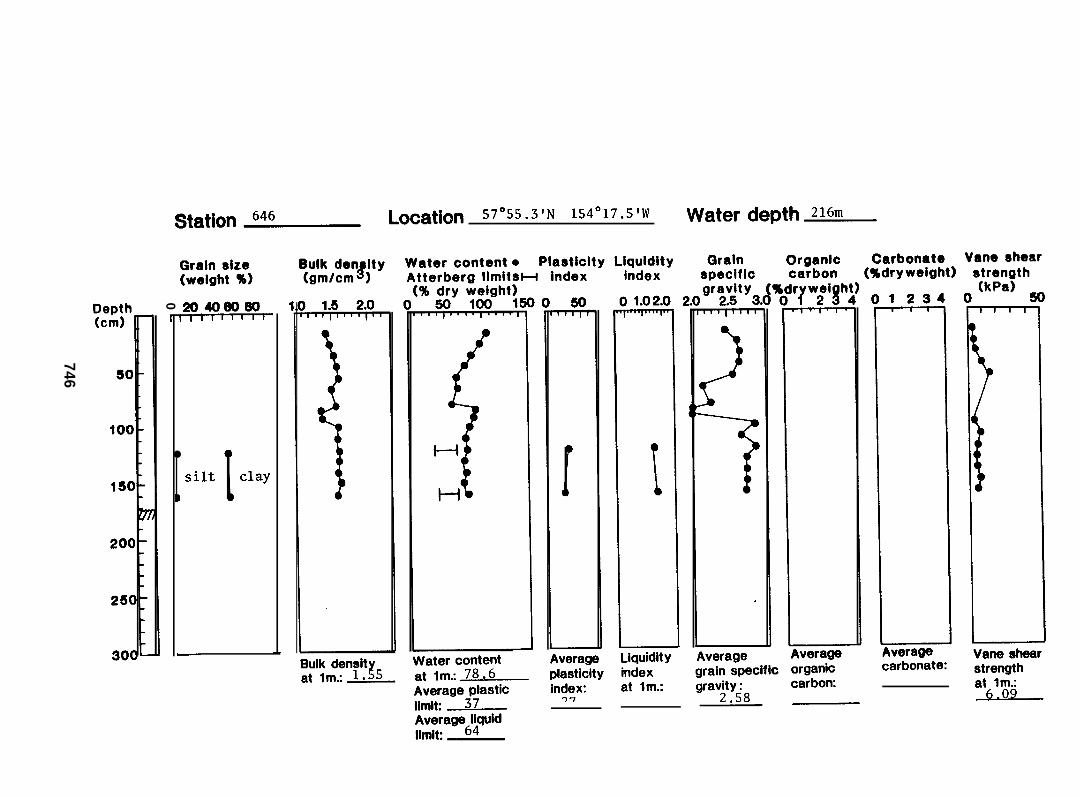
I
R.+v
)I
0●
a
746
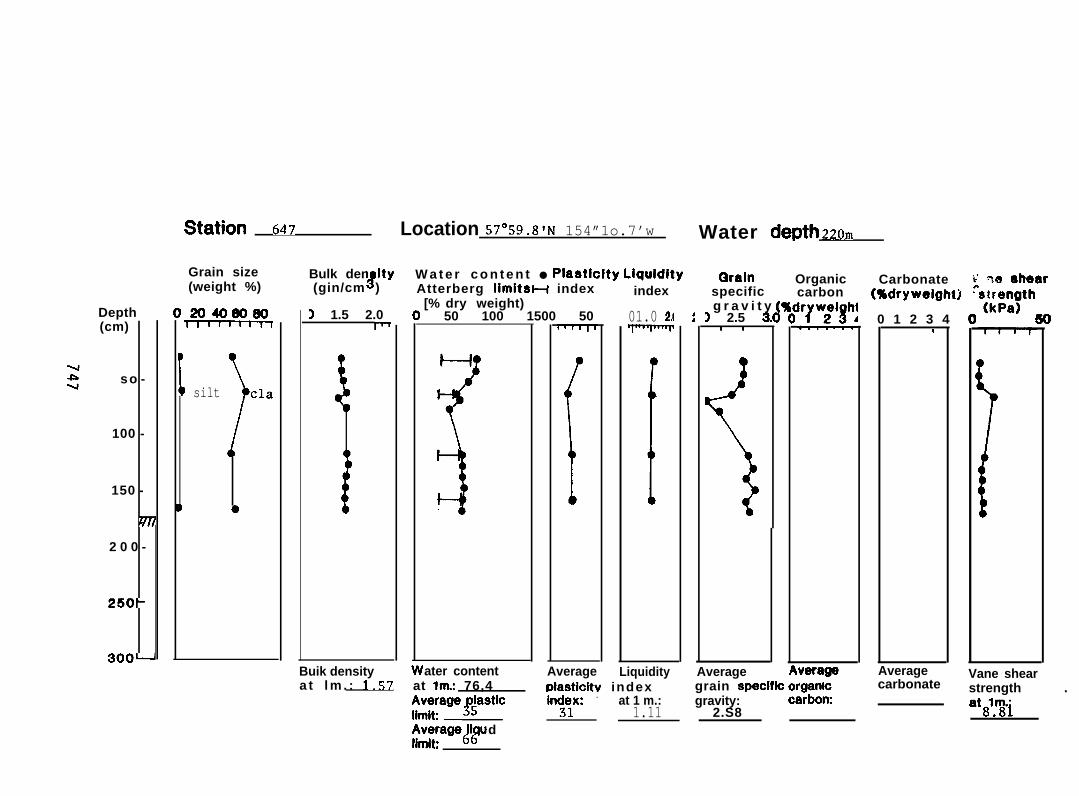
Depth(cm)
so -
100 -
150 -
U77
2 0 0 -
250-
3oo—
Shthn 647 Location 57”59.8’N 154”1o.7’w Water depth zzom
Grain size(weight %)
Bulk den Ity#
W a t e r c o n t e n t ● Plastlclty Llquldity(gin/cm )
Qrain Organic Carbonate $ ma shearAtterberg iimitSH index index
[% dry weight)(%dryweight~ ‘s~;~a~th
50 100 1500 50 t3 1.5 2.0
~ silt
)
cla
Buik densitya t l m . : 1.57
01.0 2.(
ater content Liquidity
specific
4g r a v i t y ~
3 2.5 aI I
(
carbon
‘m!
Average Averageat lmi 76,4 Diasticity index
f#yw-ticAve~age i id
(!Piimit
incjelx: - at 1 m.:1.11
,veragegrain specifk organlogravity: carbom
2.S8
0 1 2 3 4I
Averagecarbonate
I
Vane shearstrength .
at8’.”&i
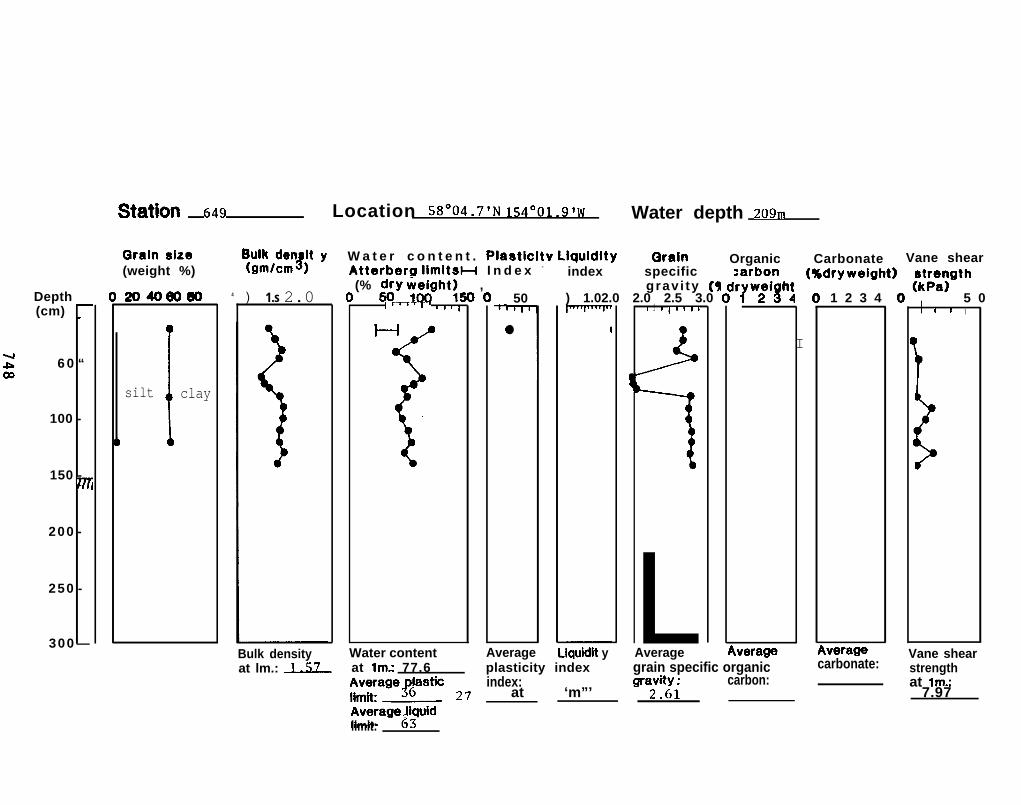
Depth(cm) ~
6 0 “
100 -
150 -m
200 -
250 -
300 —
StatiOn 649 Location SS”04.7’N 1s4”01.91w Water depth zogrn
C3raln 8129(weight %)
2040mw
silt
1
clay
1
4
Bl#dty;t y W a t e r c o n t e n t . Plastlcitv Llquldity Qraln Organic Carbonate Vane shearindex specific (%dryweight) 8trength
(% ~y ~~ght~a ,( 1 2 3 4 O(kpa) 5 0
l“1”l’’ *’I) 1.s 2.0
Atterberg IimitsH I n d e x -
50
1●
grav i ty (q) 1.02.0 2.0 2.5 3.0
1 1 I I’fl’
%
1
LAverage
:arbon
‘?w;i3h:
I
iverage iverage
I I I I
I
strengthBulk density Water content Average Llquidit y Vane shearat lm.: L&Z_ at Im: 77.6 plasticity index grain specific organic carbonate:
;;~ge?~tic ,, at ‘m”’ ‘?:;;index: carbon: at lm.:
7.97Ave;age..lluidlimit:
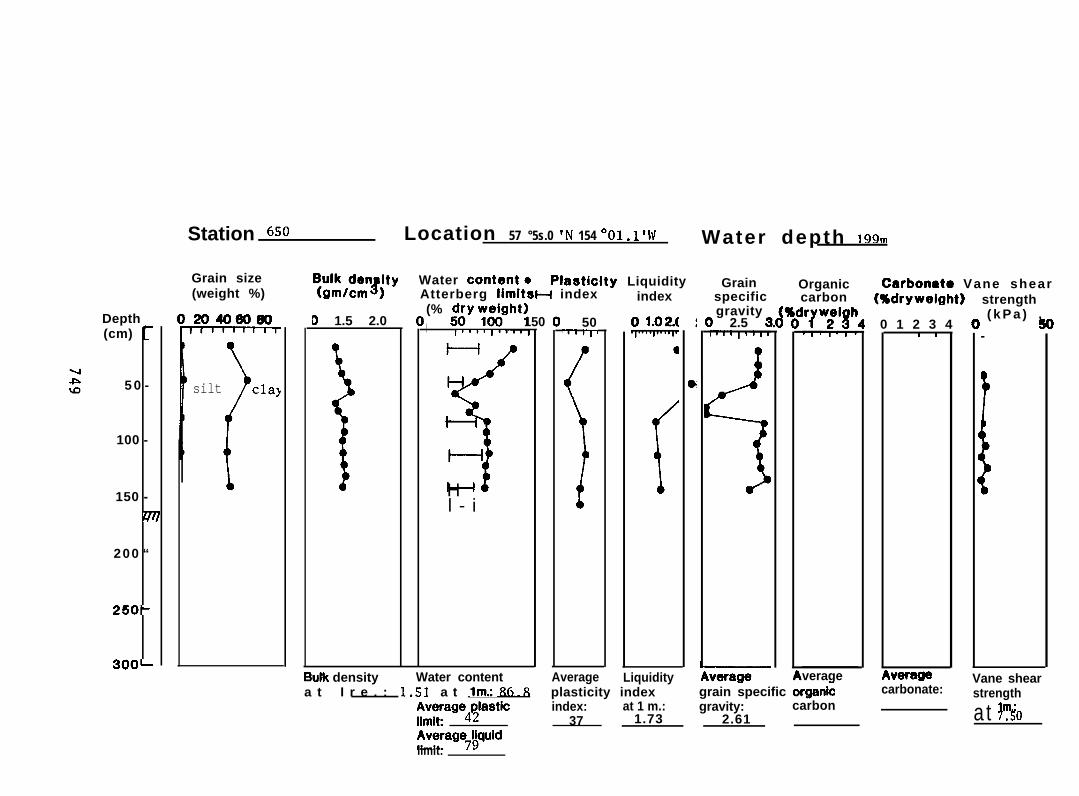
Depth(cm) :
5 0 -
100 -
150 -
v
200 “
250-
3oo—
Station GSO Location 57 °5s.0 ‘N 154 °01.1 ‘iv Water depth 199~
Grain size(weight %)
silt)
clay
i3uJkdlJJ;ty Water contente Plaatlclty LiquidityAtterberg iimitsH index index(% ~;y tvvht)
150I l“s”l’gr~l0 1.5 2.0
THl - i
Water contentBuik densitya t I r e . : 1.51 a t lm.:.&6.8
Average4~iasticIimlkAverage7~quidlimit:
5011, ,,1
!Average Liquidityplasticity indexindex: at 1 m.:
37 1.73
Grainspecificgravity
J 2.5 3
)
<
Organiccarbon
Average
Carbonato Vane shear(%drywelght)
0 1 2 3 4, i
strength( k P a ) ,
-
1
Vane sheargrain specific organk carbonate: strengthgravity: carbon
2.61 at %o
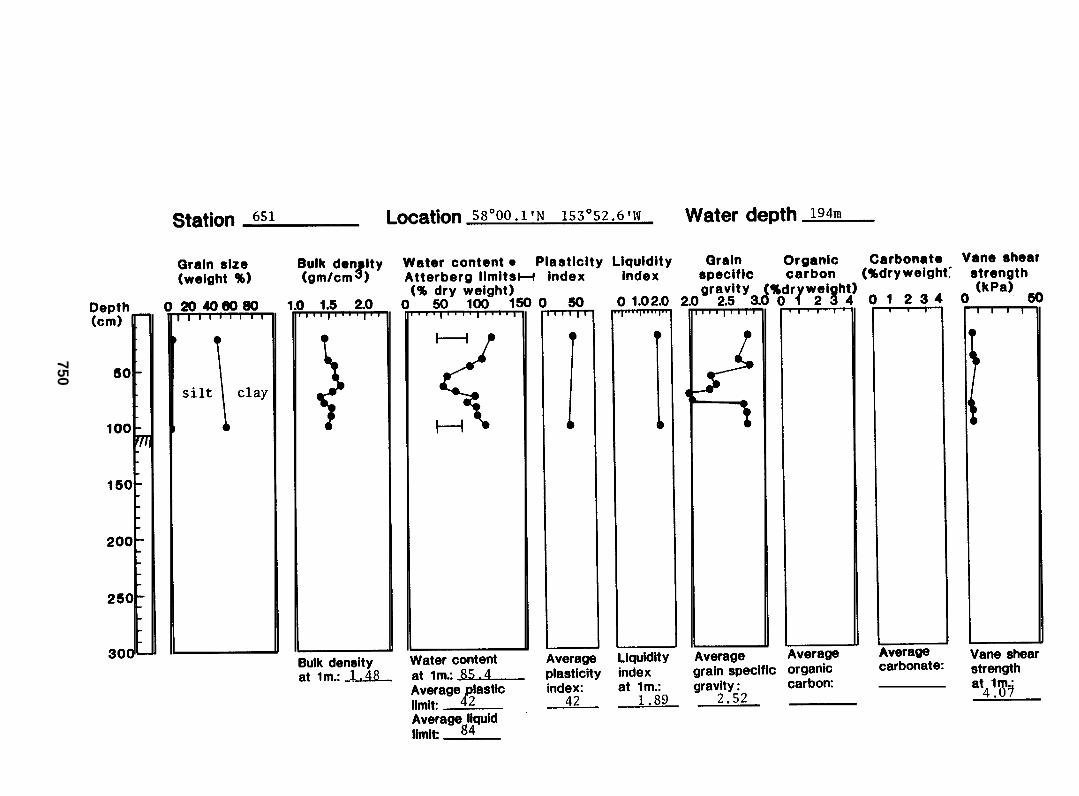
750
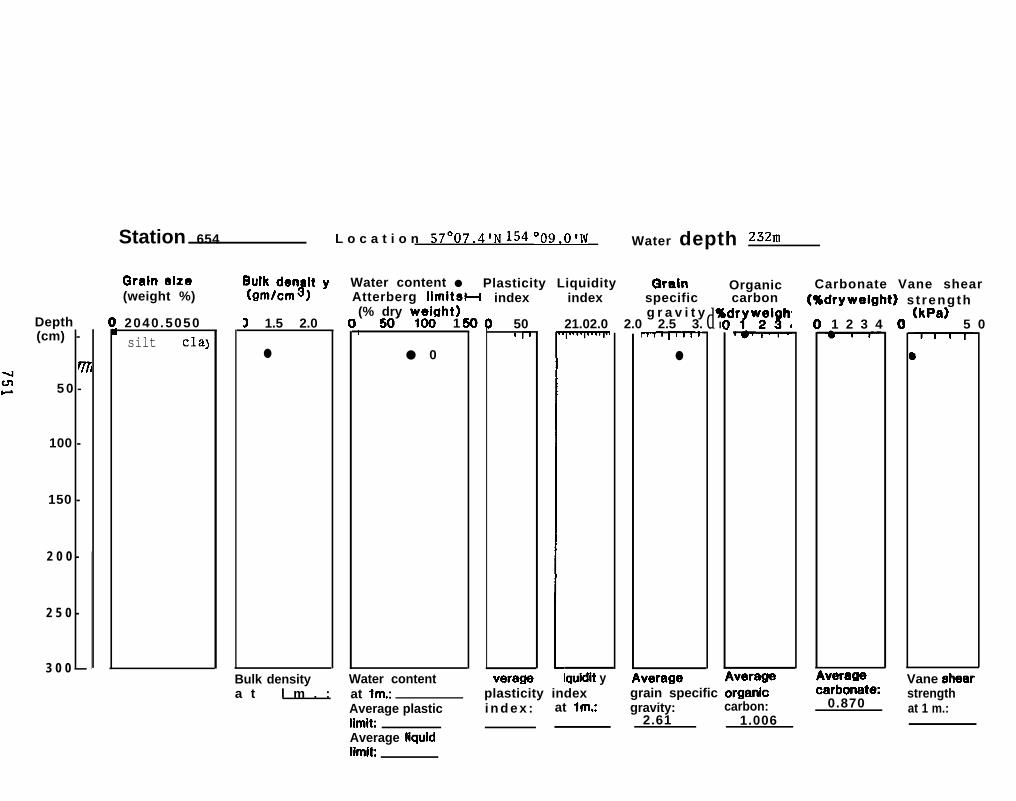
Depth(cm) -
n
5 0 -
100 -
150 -
2 0 0 -
2 5 0 -
3 0 0 —
Station 654 L o c a t i o n 57*07.4’N 154 °09.0’~f Water depth zszrn
Grain 9120(weight %)
2040 .5050
silt clajD 1.5 2.0
●
Bulk densitya t l m . :
50- 100- 1I
● 0
Water contentat lm;
index
50I If
verage Imidit y
Average plastic i n d e x : at lm.:limit
11-r, [lllr
●
verage ,verage
Carbonate Vane sheari3uul:,kd:$t y Water content ● Plasticity Liquidity Qraln OrganicAtterberg lkIltSH index specific carbon (%dryweight) s t rength(% dry weiaht) dg r a v i t y q
21.02.0 2.0 2.5 3. I
gravity: carbon:2.61 1.006
1 2 3 4 O(kpa) 5 0
Vane slmarplasticity index grain specific organk carbw-ate:
0.870 at 1 m.:strength
Average liquidlimit
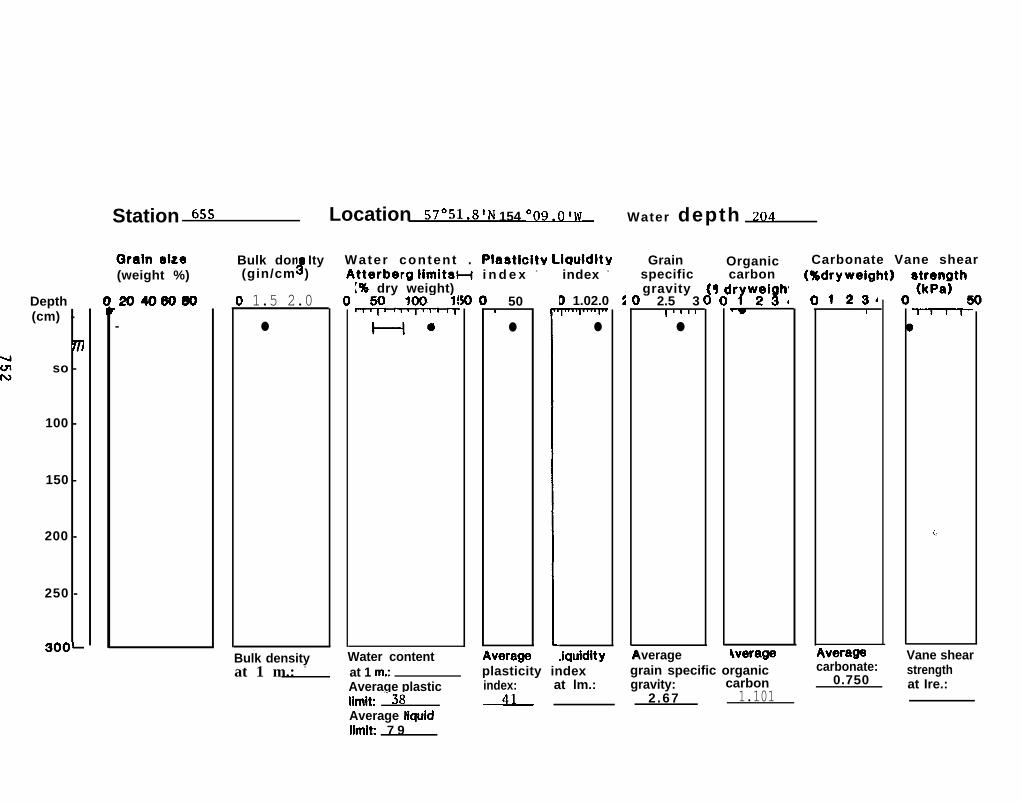
Station 655 Location 57”51.8’N 154 °09.0’w Water depth Z04
Depth(cm) -
m
so -
100 -
150 -
200 -
250 -
3oo—
Grain 0120(weight %)
204060B0
-
Bulk don ItyJ(gin/cm )
) 1.5 2.0
●
Bulk densityat 1 m.: -
Water content . Plaatlcity Llauldltvtterberg limitsH i n d e x -
[% dry weight),,y, ,,i~j, ,l)
Ho
Water content
501●
,verage
index -
D 1.02.0
●
.iquidityat 1 m; plasticity indexAverage plastic index: at lm.:
Grainspecificgravity
I 2.5 31 “1’
●
Average
Organiccarbon
‘rl’wr!lh:
tverage
Carbonate Vane shear(%dryweight) 8trength
12341
werags Vane sheargrain specific organic carbonate:
0.750strength
gravity:limit ’38
carbon~ 2.67 1.101
at Ire.:
Average Ilquidlimit 7 9
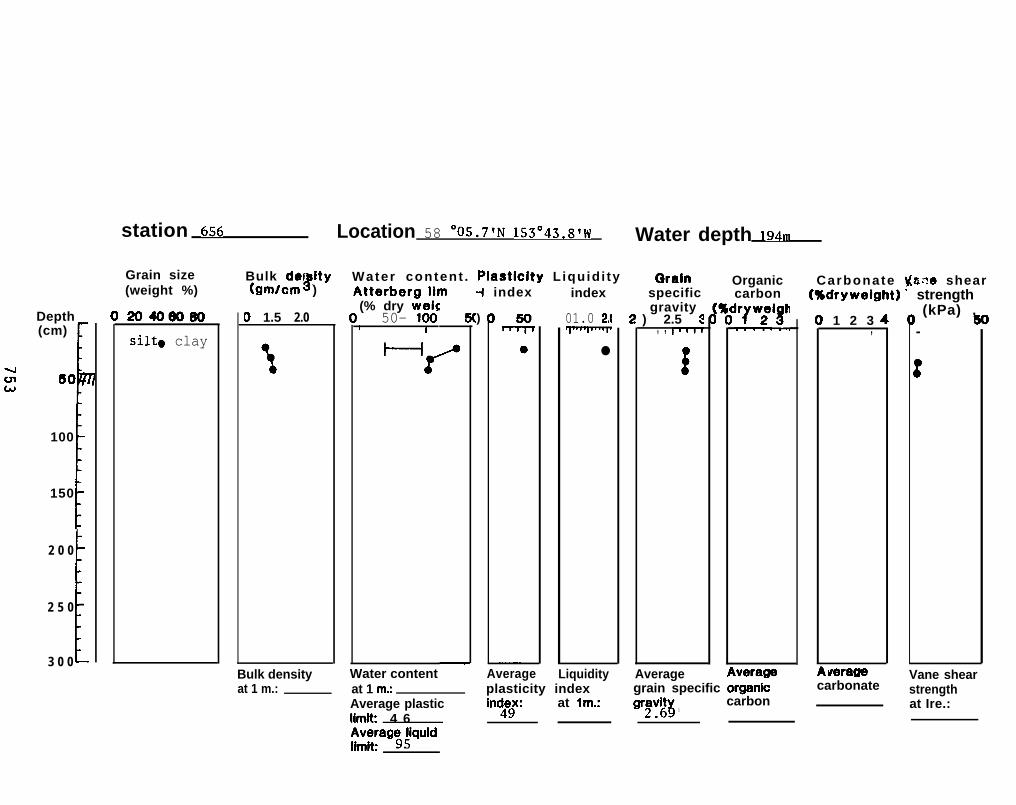
Depth(cm)
I
so )
100
150
station 1556 Location 58 °0S.7’N 153”43.8’W Water depth lgxm
Grain size(weight %)
204030W
silt. clay
Bulk den Ity8
Water content . Plastlclty L iquid i ty(gmlcm ) Atterberg Iir + index index
(% dry weico 1.5 2.0
2 0 0
2 5 0
3 0 0IBulk densityat 1 m.:
50- loo-) I
‘r
) 01.0 2.(i-r-r
●
Water content Average Liquidityat 1 m; plasticity indexAverage plastic in~~: at lm.:limit 4 6
Qralnspecificgravity
) 2.5 t, , I’lfl
f
Average
Organiccarbon
:IW?Y3:
iveragegrain specific organk
carbon‘r?:!~ :
Carbonate tiane shear(%dryweight) : strength
1 2 3,
uerage
(kPa) ,
-
;
Vane shearcarbonate strength
at Ire.:
)
Averag~~quldlimit

-Ja.P
Depth(cm) ;
so -
100 -
150 -
200 -
250 -
300 -
Station 657 Location 58”12.9’N 153”57-4’W Water depth zszrn
Grain size(weight %)
02040 Boal
Bulk don ity8(gin/cm )
I 1.5 2.0
Bulk densityat lm.: ._U&.
Water content ● Plasticity LiquidityAtterbera iimit8H i n d e x
~% dry ~eight)50 100 1!
index
11.02.0 2-
I.iquldit y
Grain Organic Carbonato Vane shearspecific carbon (%dryweight) strength
dg-ravity q2.5 3. I ‘rw$i3h! 0 1 2 3 4
Water content iverage Average Average
at lm.: 70.0Vane shear
plasticity index grain specifk organic carbonate: strengthAverage f$astic index: at 1 m.:
30 1.28carbon
limit ‘ra??6——a%?l-b
Avera@jlccidiimi~
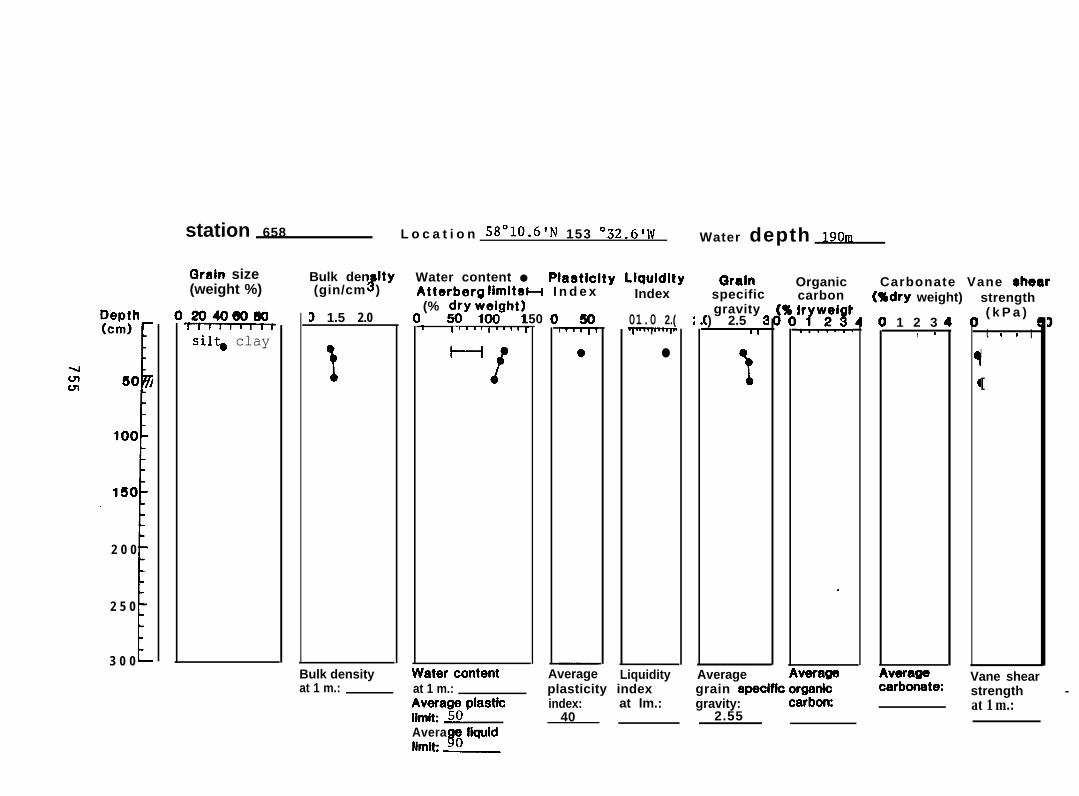
2 0 0
2 5 0
3 0 0[
station 658 L o c a t i o n 58”1O.6’N 153 °32.6’lV Water depth 190M
(3raln size(weight %)
sil~ clay
Bulk den Ity#
Water content ● Plastlclty Llquldlty(gin/cm ) Atterberg limit8H I n d e x
(% ~y ~sJght)150t l’”1’lqlt?r
D 1.5 2.0
1
Bulk densityat 1 m.:
Index
01.0 2.(
●
Average Liquidityat 1 m.:;&rs~o plastk
.
plasticity indexindex: at lm.:
40
t,
Qralnspecificgravity
) 2.5 3I I
1
Average
IOrganiccarbon
‘rlw$i$
.
,veragegrain specifk orgsnkgravity: carborc
2.55
Carbonate Vane shear(%dry weight)
1 2 3, #
verage
strength( k P a ) ~
t I I I
I
[
Vane shearcarbm-atw strength -
at 1 m.:
AveraE
IlquidIlmiv.—
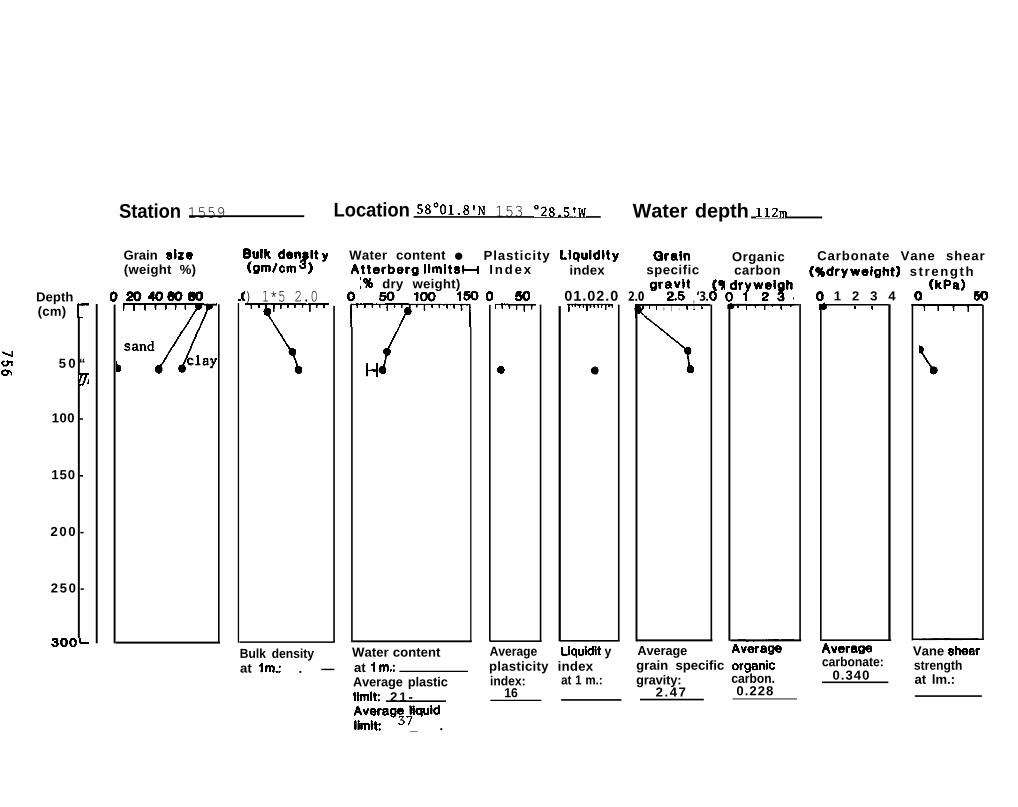
Depth(cm) -
u5 0 “
zYJ
100 -
150 -
200 -
250 -
3oo-
Station 1559 Location 58”01.8’N 153 °28.S’W Water depth llzm
Grain 81ze(weight %)
2040wm
7
sandclay
) 1*5 2.0
T
Bulk density Water content
(!01.02.0 2.0 ‘rYJt ‘3.91
ygl:,:r$t y Water content ● Plasticity Llquidlty Grain Organic Carbonate Vane sheartterberg limitsH I n d e x index specific carbon (%dryweight) s t rength~% dry weight)
1 2 3 4 O(kpa) 50
‘+”’, I , I , I 1 I
‘“t
Average
, I
Lverage Vane shesrAverage Llquidit yat Im”. . — at 1 m: plasticity index grain specific 0r9anic carbonate:
Average plastic 0.340strength
index: at 1 m.: gravity: carbon. at lm.:limit 2 1 - 16 2 .47 0.228
Avera@3#kluidlimit _ .
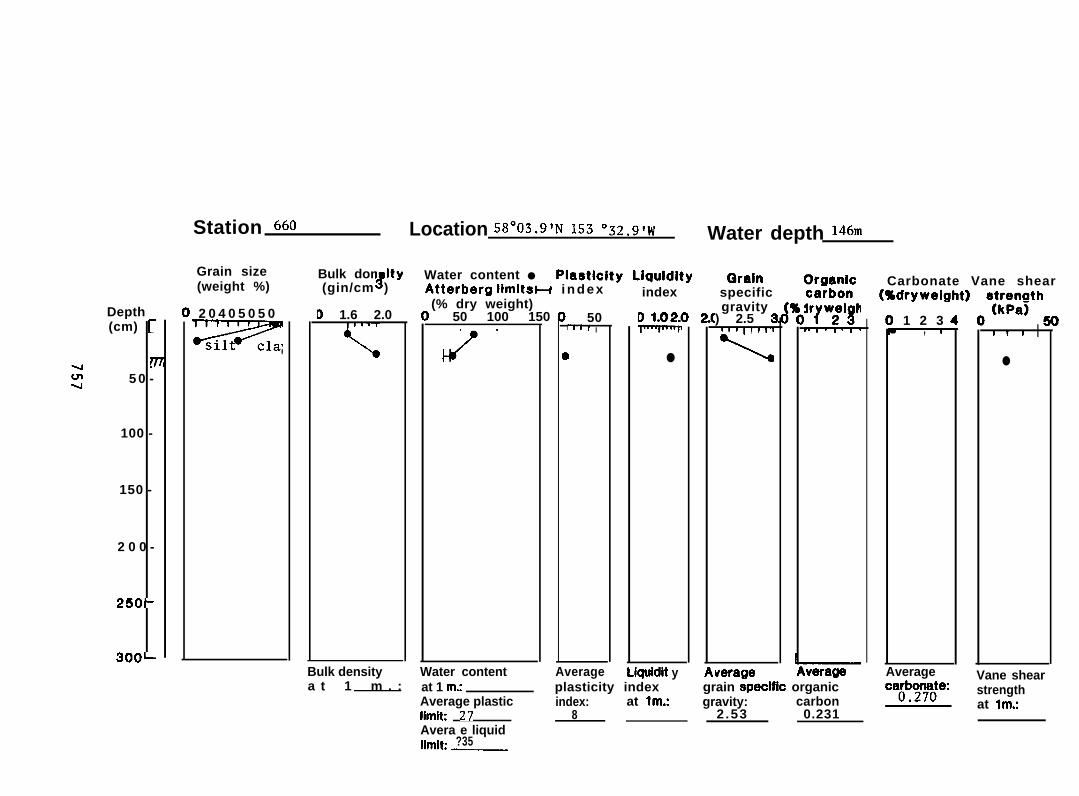
Depth(cm) ;
n5 0 -
100 -
150 -
2 0 0 -
250-
3oo–
Station GGO Location SS”OS.9’N 153 °32.91W Water depth 146”
Grain size(weight %)
2 0 4 0 5 0 5 0
Z.
Bulk don Ity8
Water content ● Plaetlcity Llquldlty(gin/cm ) Atterberg Iimltsw i n d e x
(% dry weight)50 100 150I
Q 1.6 2.0
Bulk densitya t 1 m . :
J’
Water content
50rl. , I
I
index
D 1.024
●
plasticity indexindex: at lm.:
8
C3ralnspecificgravity
) 2.5 4,
\
, I I
verage
I
Or9anlc Carbonate Vane shear(%dryweight) atrenath
1 2 3, 1 I f I I
●
Average plasticIimik 27Avera e liquidIlmit” ?35.—
Average Vane shearAverage Llquidit yat 1 m: grain specifk organic
gravity: carbon2.53 0.231
at lm.:caoti~7aJe
. strength
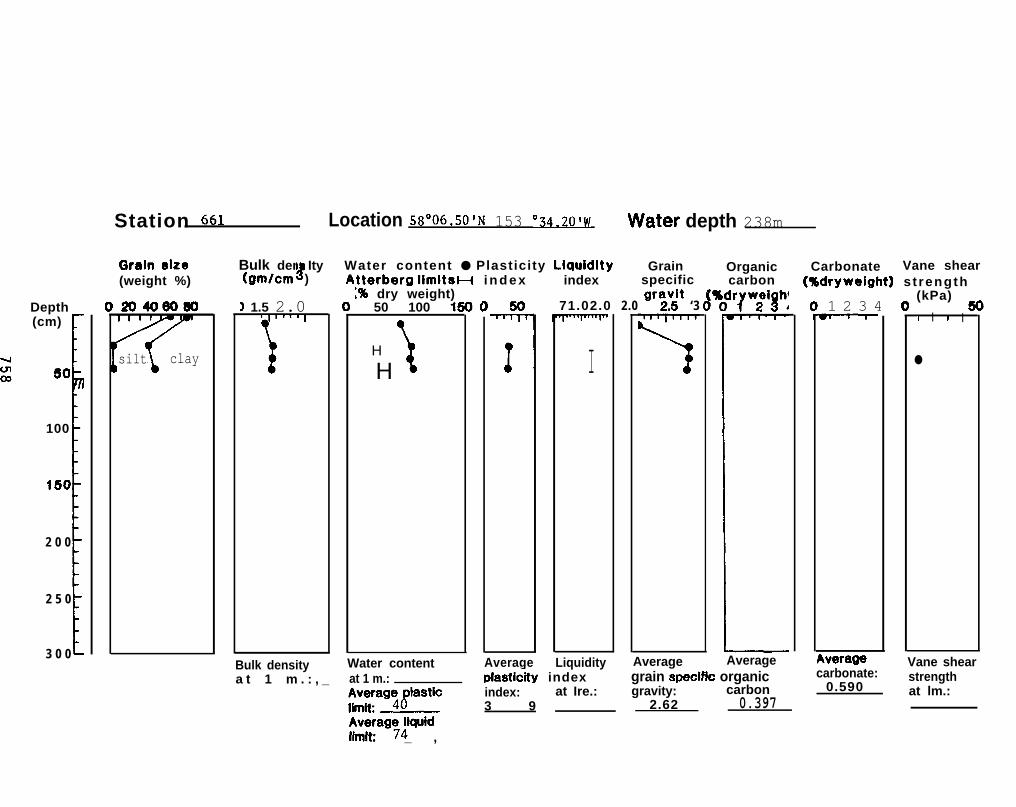
Depth(cm)
60
100
150
I
2 0 0
2 5 0
3 0 01
Station 661 Location 58”06.50’N 153 °34.20’W water depth 238m
Qraln alze(weight %)
204060B0
isilt clay
Bulk den Ity#(gmlcm )
) 1.5 2.0
\’
Bulk densitya t 1 m . : , _
Water content ● Plasticity Liquldlty Graintterberg limitsH i n d e x[% dry weight)
50 100 1!501 71.02.0 2.0 ‘rYlt ‘3
~
H
H \
-%
I’
index specific
I
Water contentat 1 m.:
Average Liquidityplasti&y index
Average
Organiccarbon
‘sr?w:i8h!
Averagegrain spedfk organic
Carbonate Vane shear(%dryweight) s t rength
1 2 3 4
Vane shearcarbonate:
0.590strength
index: at Ire.:;Fg:t’astic
gravity: carbon3 9 2.62
at lm.:0.397
-
kverage
(kPa)!5
I I I I
●
AverageJiquidlimit _ ,
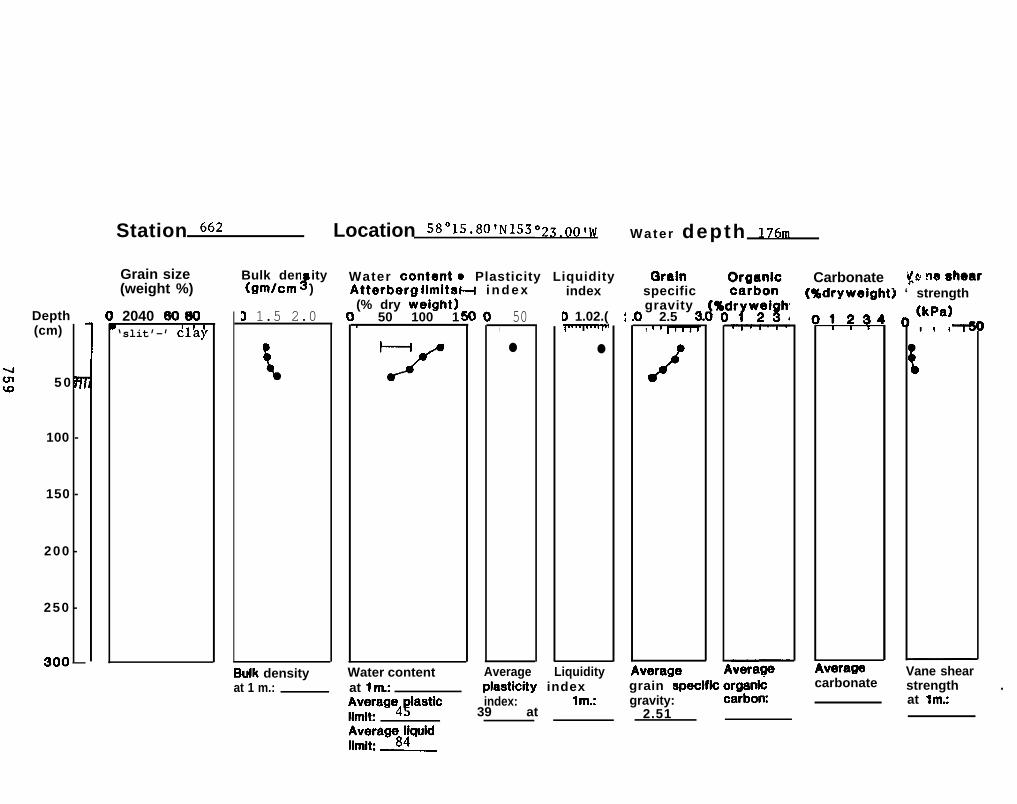
Depth(cm)
5 0 ~
100 -
150 -
200 -
250 -
300 —
Station 662 Location 58 °15.80’N 153 °23.00’W Water depth lTbrn
Grain size(weight %)
2040 G050‘slit’-’ ‘Cl!l$
Bulk den ity#
Water content. Plasticity Liquidity(gmlcm ) Atterbera llftIitSH i n d e x
t) 1.5 2.0
Buik densityat 1 m.:
(% dry ~eight)50 100 1t
“J
Water contentat 1 m:
50,●
index
D 1.02.(
●
piastic-ity index
Grainspecificgravity
1 2.5 3, I v l’llr
/
verage Averaae
Carbonate ye ne shear(%dryweight) ‘ strength
01234 O(kf’a) ~, , r
verageAverage Liquidity Vane sheargrain speoifk organk carbonate
index:::t:age4?iastic 39 at ‘m.:
gravity: carbom at lm.:2.51
strength .
Averaw8]quidiimifi.—
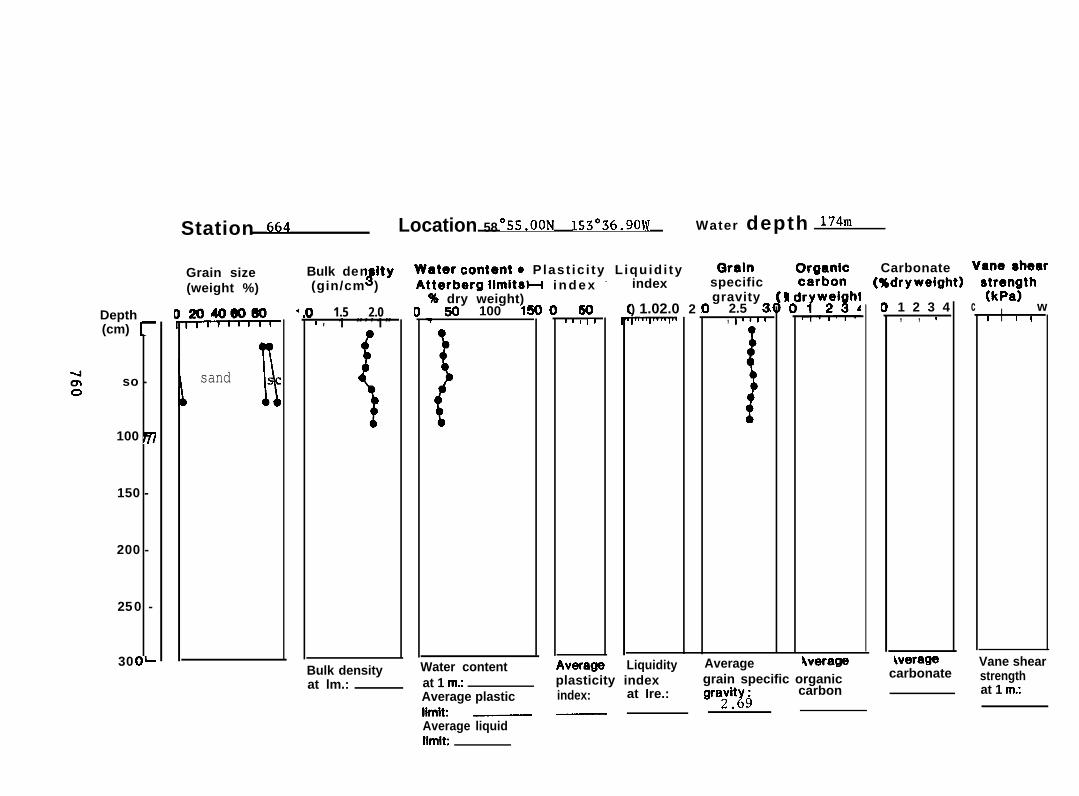
Depth(cm) -
so -
100 ~
150 -
200 -
250 -
300-
Station 664 Location 58 “55.00N 153”36.90W Water depth lTdrn
Grain size(weight %)
sand
!
Bulk den Ity8(gin/cm )
) 1.5 2.0I , 1 “ ’ ’ 1 ”
{
Bulk densityat lm.:
Water contento Plast ic i ty L iquid i tytterberg limitsH i n d e x -
% dry weight)50 100 1!
-I
}
Water content
soI I I l!
index
) 1.02.0 2
Qrainspecificgravity
2.5 34, 1 “1’
I
:::;:: Carbonate Vane shear(%dryweight) s~~p;~th
w
4veragsiverage Liquidity Average
at 1 m: plasticity index grain specific organicAverage plastic index: at Ire.: carbon
limit _ —
gra~~~g
1 2 3 4, , I
\verage
c I I I I
Vane shearcarbonate strength
at 1 m;
Average liquidlimit
Related Documents