SCANNED 289 Great Road D Suite 105 Geosyntec c consultants PH 978-263-9588 FAX 978-263-9594 www.geosyntec.com JU 2 4 22 June 2009 I/f File No. TR0076 Ms. Rodene Lamkin Commonwealth of Massachusetts OFF/cc Department of Environmental Protection Northeast Regional Office 205B Lowell Street Wilmington, MA 01887 Subject: General Electric Company West Lynn Facility, 40 Federal Street, Lynn, MA Release Tracking Number: RTN 3-0361 Initial Response to Notice of Audit Findings (NOAF) Dated May 22, 2009 Dear Ms. Lamkin: On behalf of the General Electric Company (GE), Geosyntec Consultants, Inc. (Geosyntec) has prepared this initial response to a Notice of Audit Findings (NOAF) dated May 22, 2009 for the GE West Lynn Site located at 40 Federal Street in Lynn, Massachusetts (RTN 3-0361) (the "Site"). This initial response provides data on conditions at the Site that are contained in documents submitted previously to the Massachusetts Department of Environmental Protection (MassDEP) that were not referenced as documents reviewed and considered in the Audit that was recently conducted. Documents submitted to the MassDEP between 1995 and 2003 not referenced in the NOAF include over 40 documents listed in Table 1, including the Phase II Comprehensive Site Assessment Report for the GE West Lynn Facility (the "Phase II Report"; Beak, 1998b) which presents a compilation of the results of comprehensive soil, groundwater, soil gas and indoor air investigations at the Site and addresses the issues raised in the NOAF. We think it is very important to discuss this information and the actions specified in the NOAF with you before we prepare and submit a formal Audit Follow-Up Plan. This letter presents the specific items that the NOAF requests be addressed in the Audit Follow-Up Plan and describes existing data that addresses each of the items. The specific data referenced in the NOAF for items 1 and 2 as discussed below were identified by GE and GE's consultants at the time of their collection and additional data were collected to evaluate more fully potential exposure pathways. An extensive soil gas and groundwater investigation program was implemented between 1992 and 1997 to address potential exposure pathways and the results of these investigations are presented in the Phase II Report. In addition, an indoor air, soil gas and groundwater monitoring program was developed to confirm that no changes were occurring in conditions at the Site which could impact the potential exposure pathways. This monitoring program was established in the TR0076 NOAF Response Letter 2009-06-22.doc engineers I scientists I innovators

Welcome message from author
This document is posted to help you gain knowledge. Please leave a comment to let me know what you think about it! Share it to your friends and learn new things together.
Transcript
SCANNED289 Great RoadD Suite 105Geosyntec c
consultants PH 978-263-9588FAX 978-263-9594
www.geosyntec.com
JU 2 4 22 June 2009
I/f File No. TR0076Ms. Rodene LamkinCommonwealth of Massachusetts OFF/ccDepartment of Environmental ProtectionNortheast Regional Office205B Lowell StreetWilmington, MA 01887
Subject: General Electric Company West Lynn Facility, 40 Federal Street, Lynn, MA ReleaseTracking Number: RTN 3-0361Initial Response to Notice of Audit Findings (NOAF) Dated May 22, 2009
Dear Ms. Lamkin:
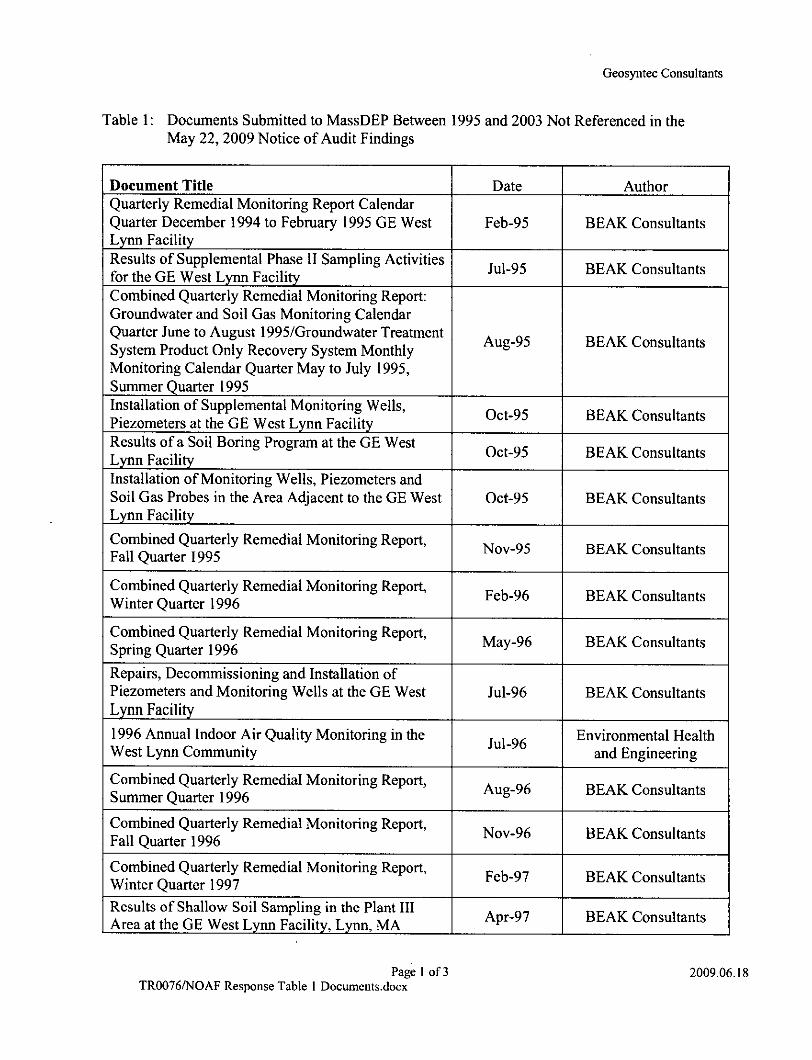
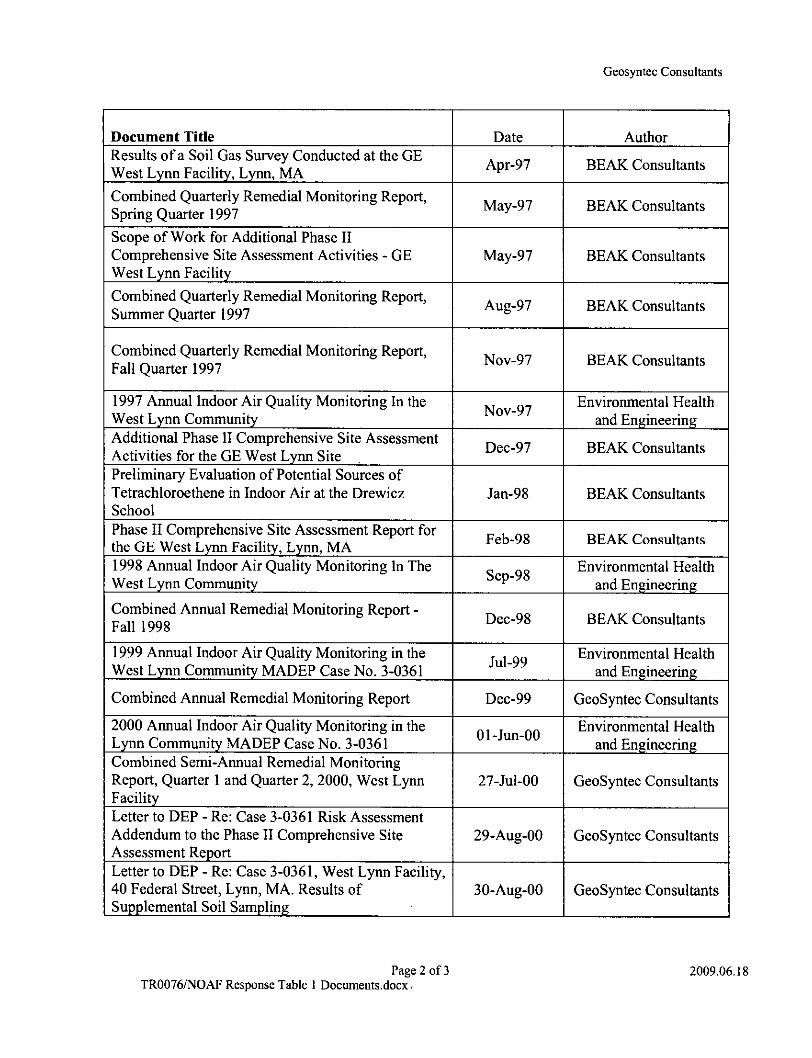
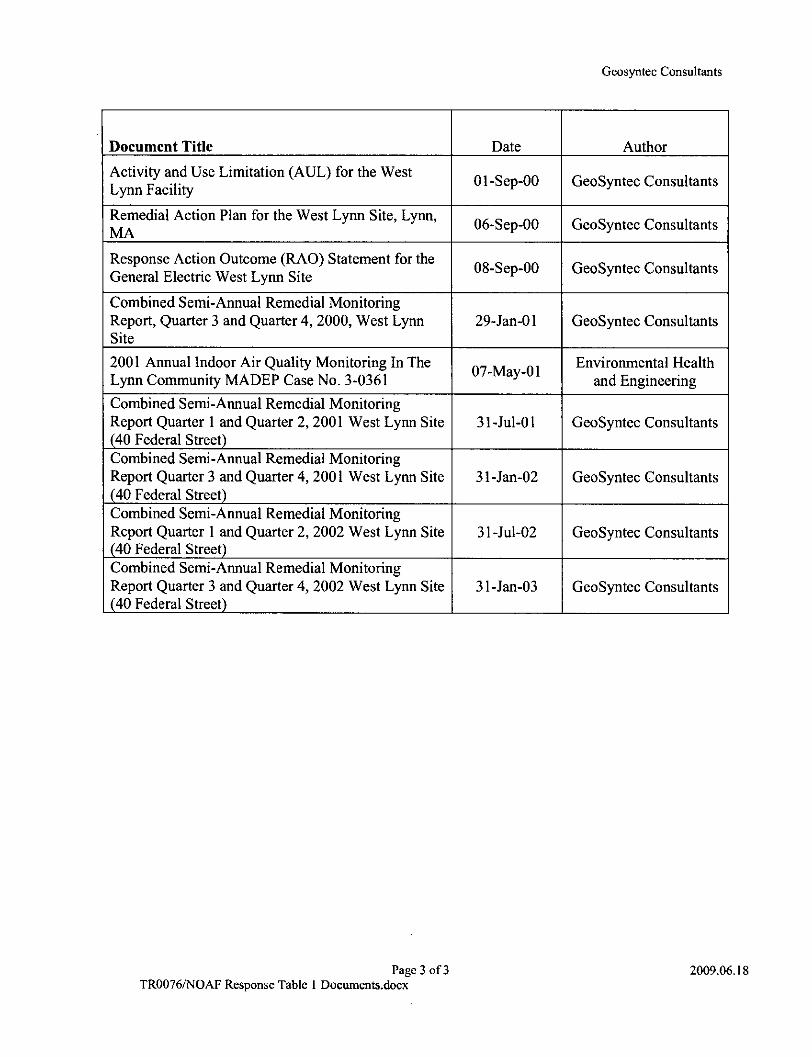
On behalf of the General Electric Company (GE), Geosyntec Consultants, Inc. (Geosyntec) has preparedthis initial response to a Notice of Audit Findings (NOAF) dated May 22, 2009 for the GE West LynnSite located at 40 Federal Street in Lynn, Massachusetts (RTN 3-0361) (the "Site"). This initialresponse provides data on conditions at the Site that are contained in documents submitted previously tothe Massachusetts Department of Environmental Protection (MassDEP) that were not referenced asdocuments reviewed and considered in the Audit that was recently conducted. Documents submitted tothe MassDEP between 1995 and 2003 not referenced in the NOAF include over 40 documents listed inTable 1, including the Phase II Comprehensive Site Assessment Report for the GE West Lynn Facility(the "Phase II Report"; Beak, 1998b) which presents a compilation of the results of comprehensive soil,groundwater, soil gas and indoor air investigations at the Site and addresses the issues raised in theNOAF. We think it is very important to discuss this information and the actions specified in the NOAFwith you before we prepare and submit a formal Audit Follow-Up Plan.
This letter presents the specific items that the NOAF requests be addressed in the Audit Follow-Up Planand describes existing data that addresses each of the items.
The specific data referenced in the NOAF for items 1 and 2 as discussed below were identified by GEand GE's consultants at the time of their collection and additional data were collected to evaluate morefully potential exposure pathways. An extensive soil gas and groundwater investigation program wasimplemented between 1992 and 1997 to address potential exposure pathways and the results of theseinvestigations are presented in the Phase II Report. In addition, an indoor air, soil gas and groundwatermonitoring program was developed to confirm that no changes were occurring in conditions at the Sitewhich could impact the potential exposure pathways. This monitoring program was established in the
TR0076 NOAF Response Letter 2009-06-22.doc
engineers I scientists I innovators
Ms. Rodene Lamkin22 June 2009Page 2
mid-1990s and continues to this day. The results of this monitoring program are presented in semi-annual monitoring reports provided to the MassDEP. We believe that the overall Site data presented inthe Phase II Report provides an assessment of all probable exposure pathways and that the on-goingmonitoring of groundwater, soil gas and indoor air conducted on an annual or semi-annual basisprovides assurance that there are no changes in conditions at the Site that would impact possibleexposure pathways and that there is no direct evidence to indicate that there are likely to be CriticalExposure Pathways (CEPs) related to the Site.
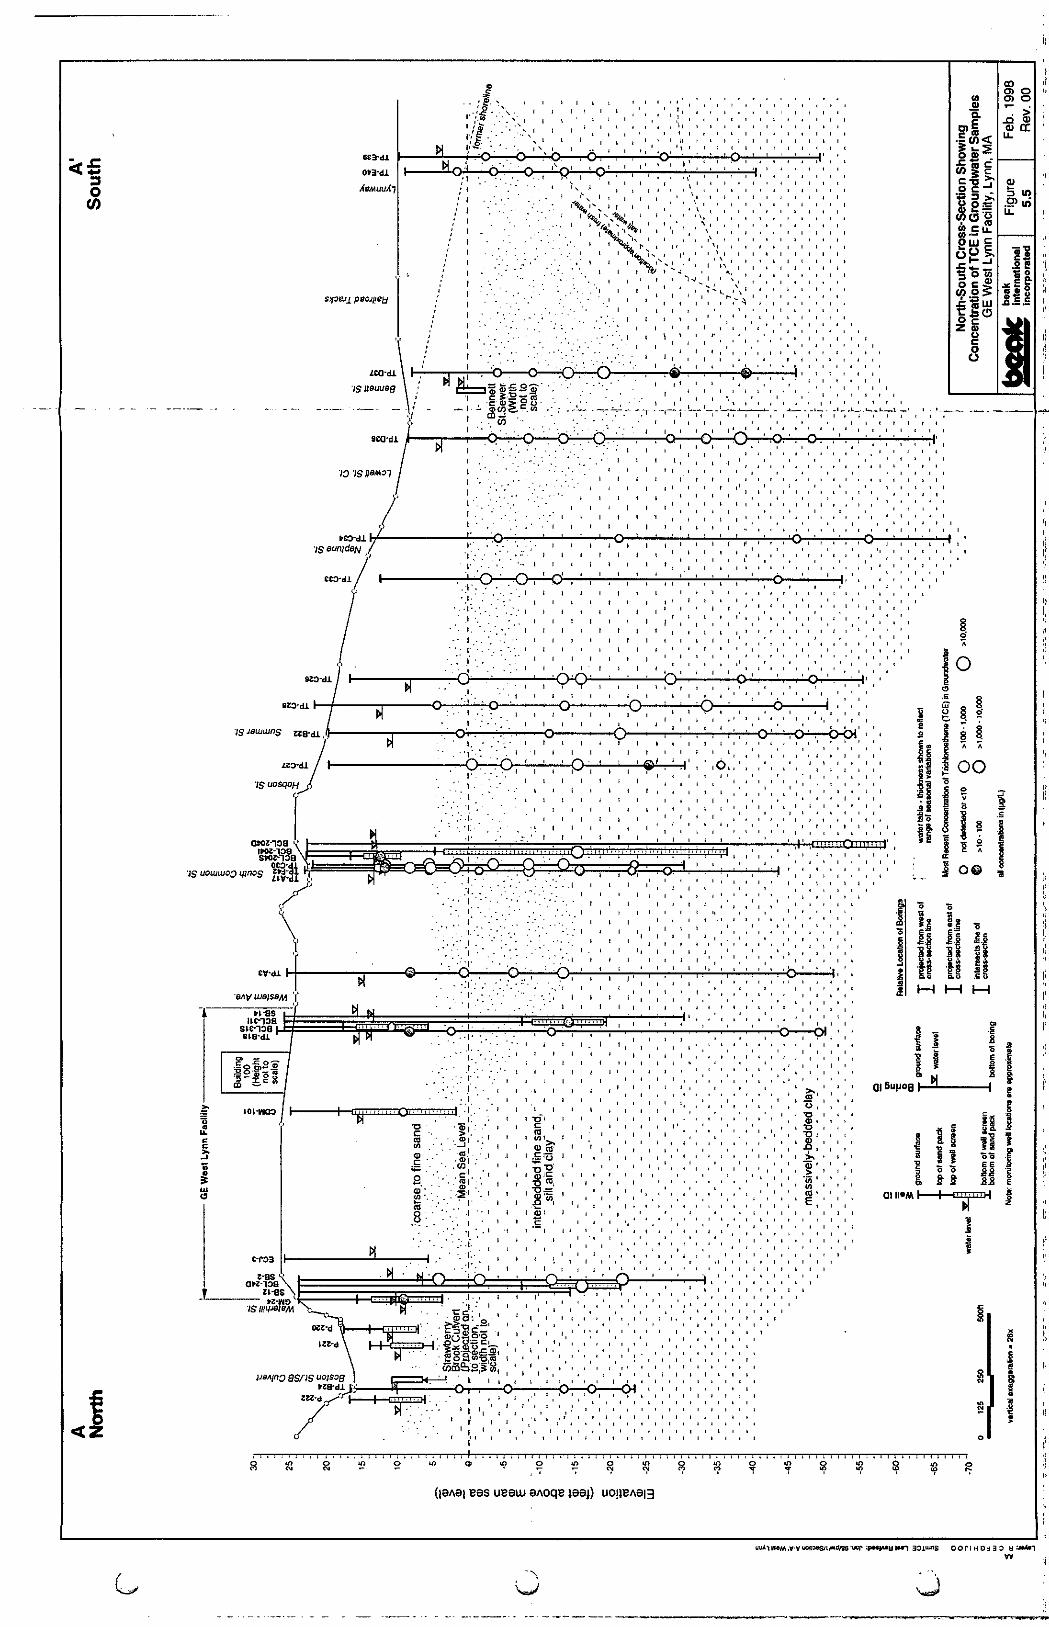
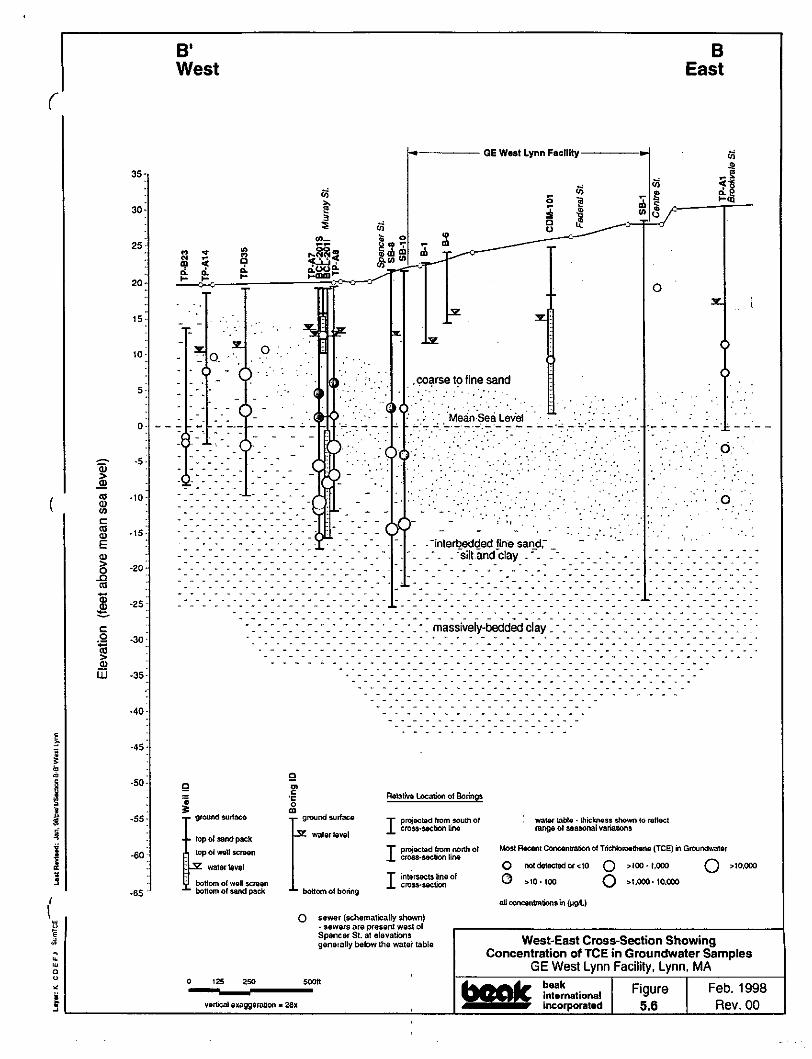
As described in the Phase II Report, a site conceptual model was developed based on an evaluation ofall available site data. This model includes the following key components: 1) TCE was released to thesubsurface on the GE Facility (the portion of the Site owned by GE) and this TCE migrated down to andbelow the water table; 2) as groundwater moved off the Facility property, precipitation that infiltratedinto the soil and reached the water table overlaid groundwater containing TCE and a layer of cleangroundwater formed above the impacted groundwater; 3) the thickness of this "clean water lens"increased as the groundwater moved further from the Facility; 4) the clean water lens prevents migrationof TCE from the deeper groundwater into the soil gas; and 5) the exposure pathway from groundwater tosoil gas to indoor air is not complete in areas where the clean water lens is present. Data to support theexistence of the clean water lens at the Site is presented in the Phase II report. Figure 5.5 and 5.6 of thePhase II Report shows cross-sections and TCE concentration data from different depth intervalsconsistent with the clean water lens. A copy of Figure 5.5 from the Phase II Report along with otherrelevant figures from the Phase II Report previously submitted to MassDEP are included inAttachment A.
The concept of a clean water lens is supported by several sources including a paper written by NancyFitzpatrick and John Fitzgerald of the MassDEP in 2002 (Fitzpatrick, 2002) and the New JerseyDepartment of Environmental Protection Vapor Intrusion Guidance (NJDEP, 2005). A copy of theFitzpatrick paper and excerpts from the NJDEP Guidance are presented in Attachment B.
Specific issues that were identified in the NOAF for follow-up in an Audit Follow-up Plan are listed initalics below, and our discussion of existing data that addresses each of these issues is set forth belowfor your consideration.
NOAF Item ]a - TP-C30 located south of the GE West Lynn facility at the corner of South Street andSouth Common Street contained 630 u2/L TCE at a depth of 20' bcs in 1995.
NOAF Item lb - TP-C27 located south of the GE facility on Summer Street near the corner of SouthStreet contained 670 uZ/L TCE at 20' bzs in 1995.
NOAF Item Ic - TP-C26 located south of the GE facilitv on South Street contained 690 uZ/L TCE at 16'bzs in 1995
TROO76 NOAF Response Letter 2009-06-22.doc
engineers I scientists I innovators
Ms. Rodene Lamkin22 June 2009Page 3
NOAF Item Id - TP-C33 located on Neptune Street Ct. near the corner of South Street, south of the GEfacility contained 680 uz/L TCE at a depth of 15' bzs in 1995.
Response: The temporary groundwater probes referred to in the four items above are all located to thesouth of the Facility and the information regarding the significance of the data from these locations arediscussed below.
The objective of the temporary probe investigation program conducted in 1995 that included TP-C30,TP-C27, TP-C26 and TP-C33 was to characterize fully the lateral extent and ultimate fate of volatileorganic compounds (VOCs) in groundwater associated with the Site. With this objective in mind, theseprobes were installed below the water table and, therefore, do not reflect VOC concentrations that havethe potential to off gas into soil gas. The objective of the temporary probe investigation was not toevaluate the potential for vapor intrusion because an extensive soil gas survey had been conducted in1992 to evaluate the potential exposure pathways associated with VOCs off-gassing from shallowgroundwater to soil gas in this area.
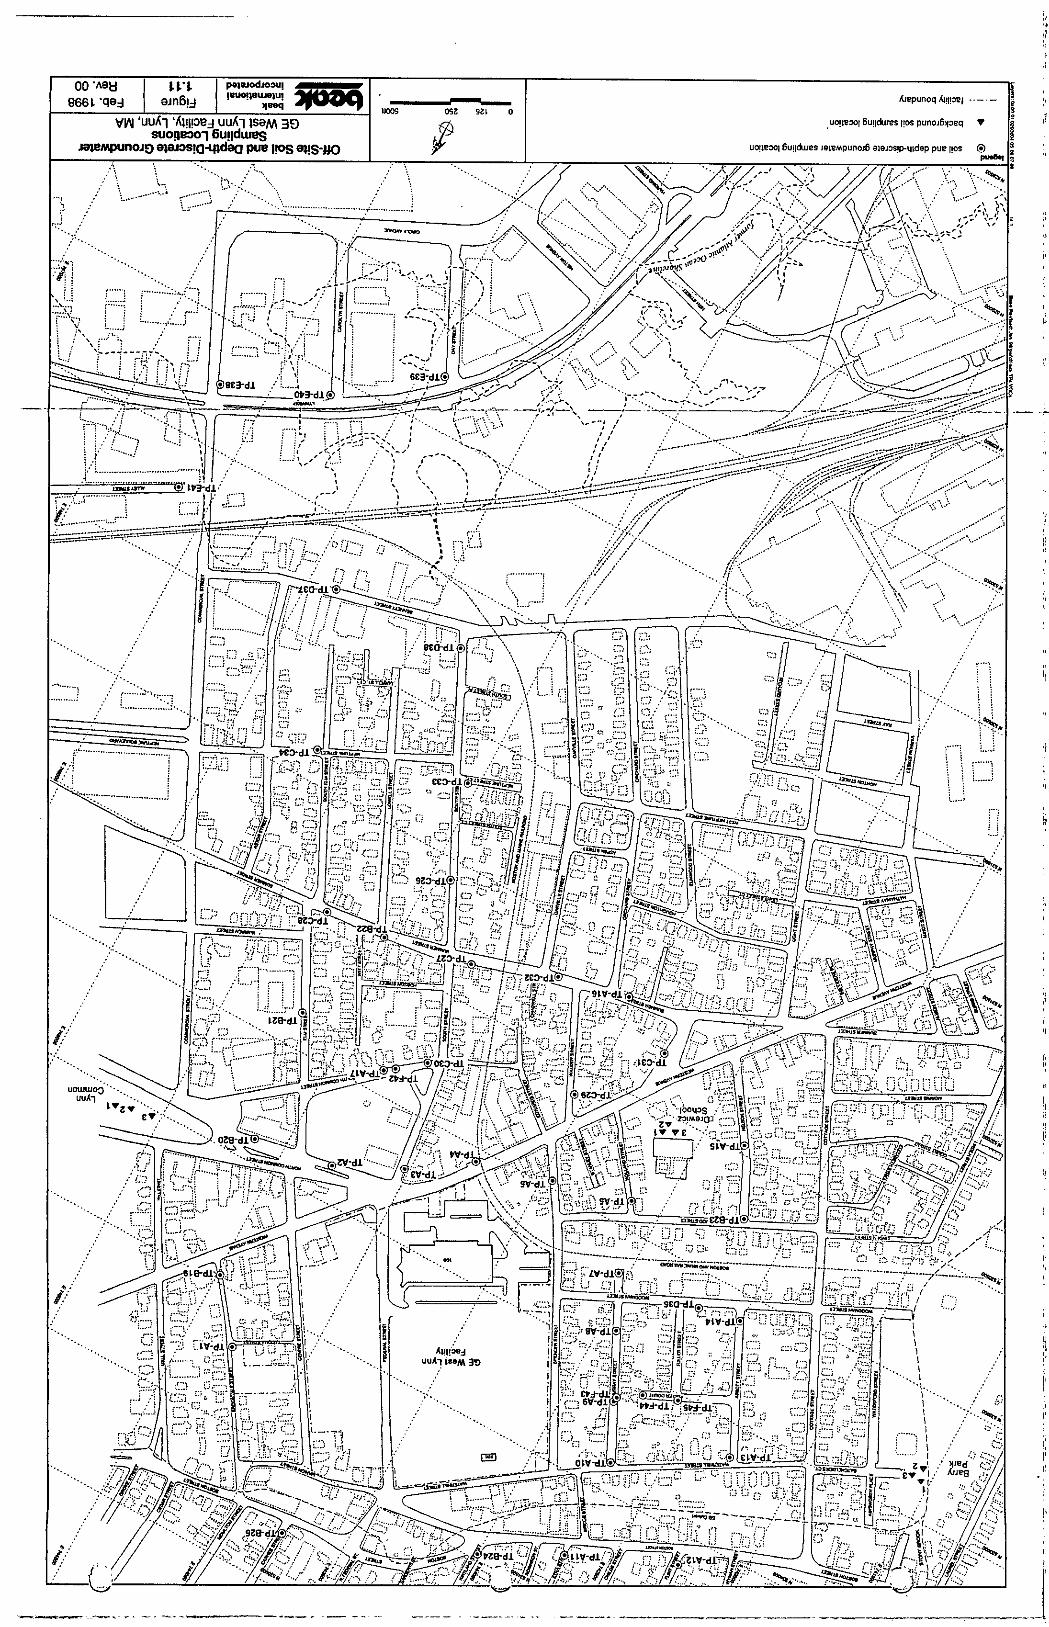
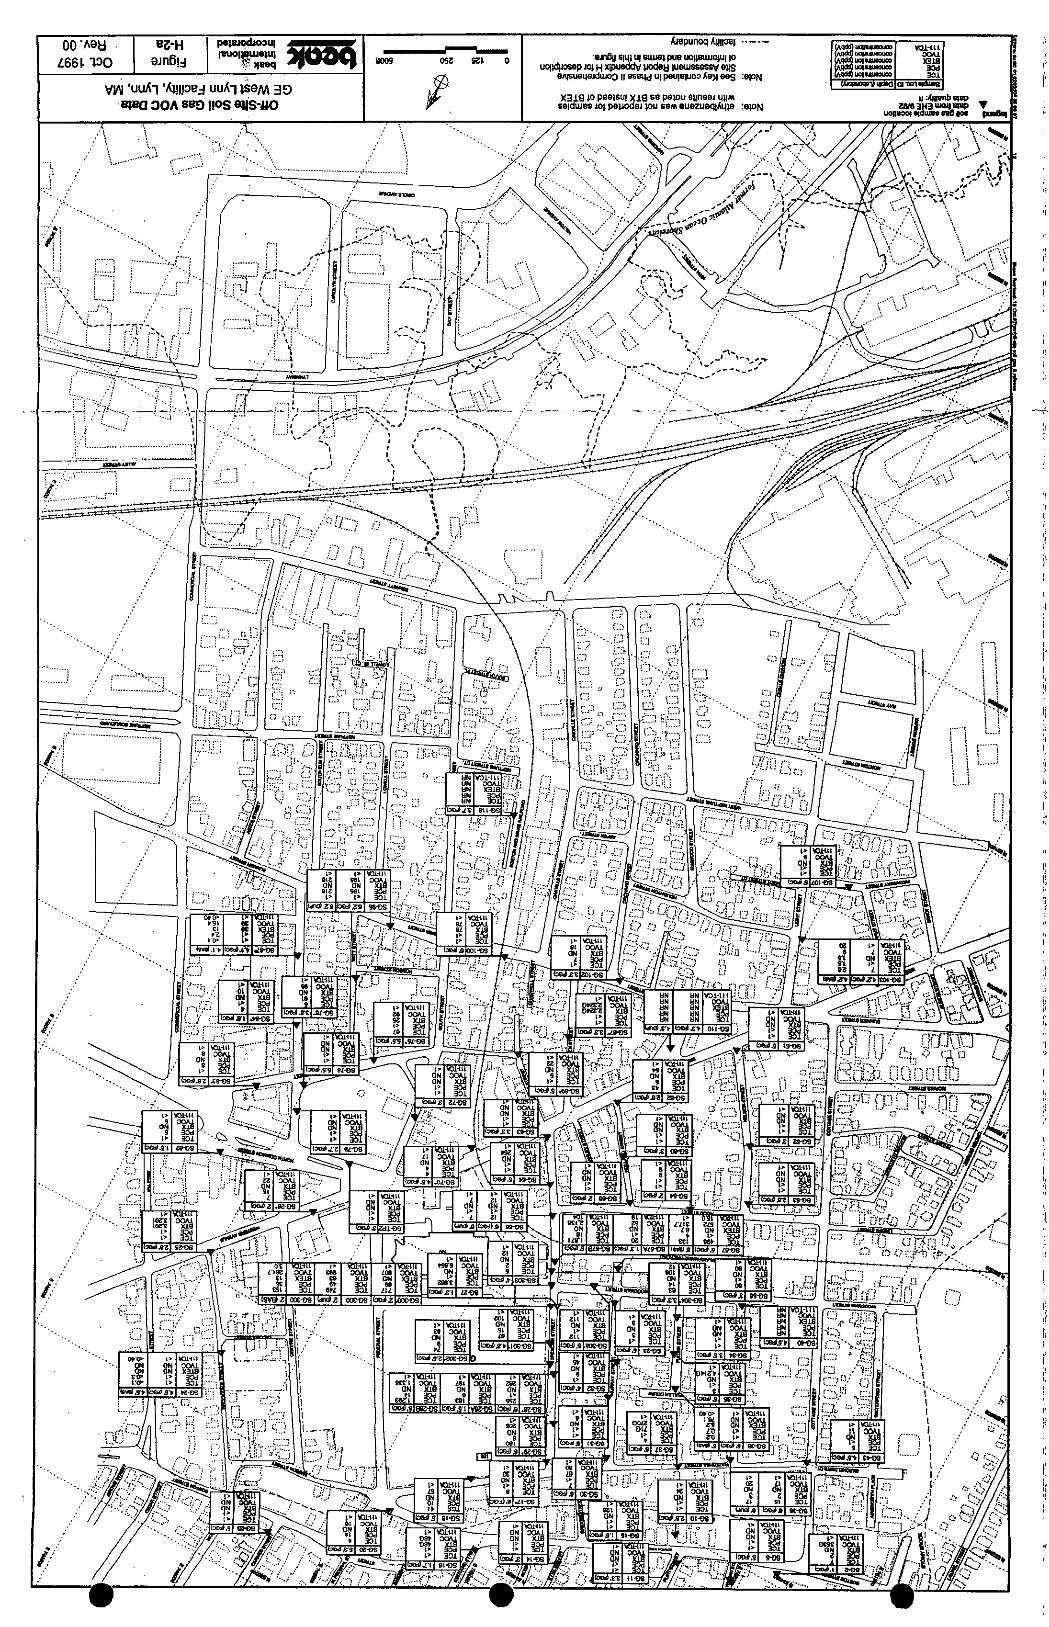
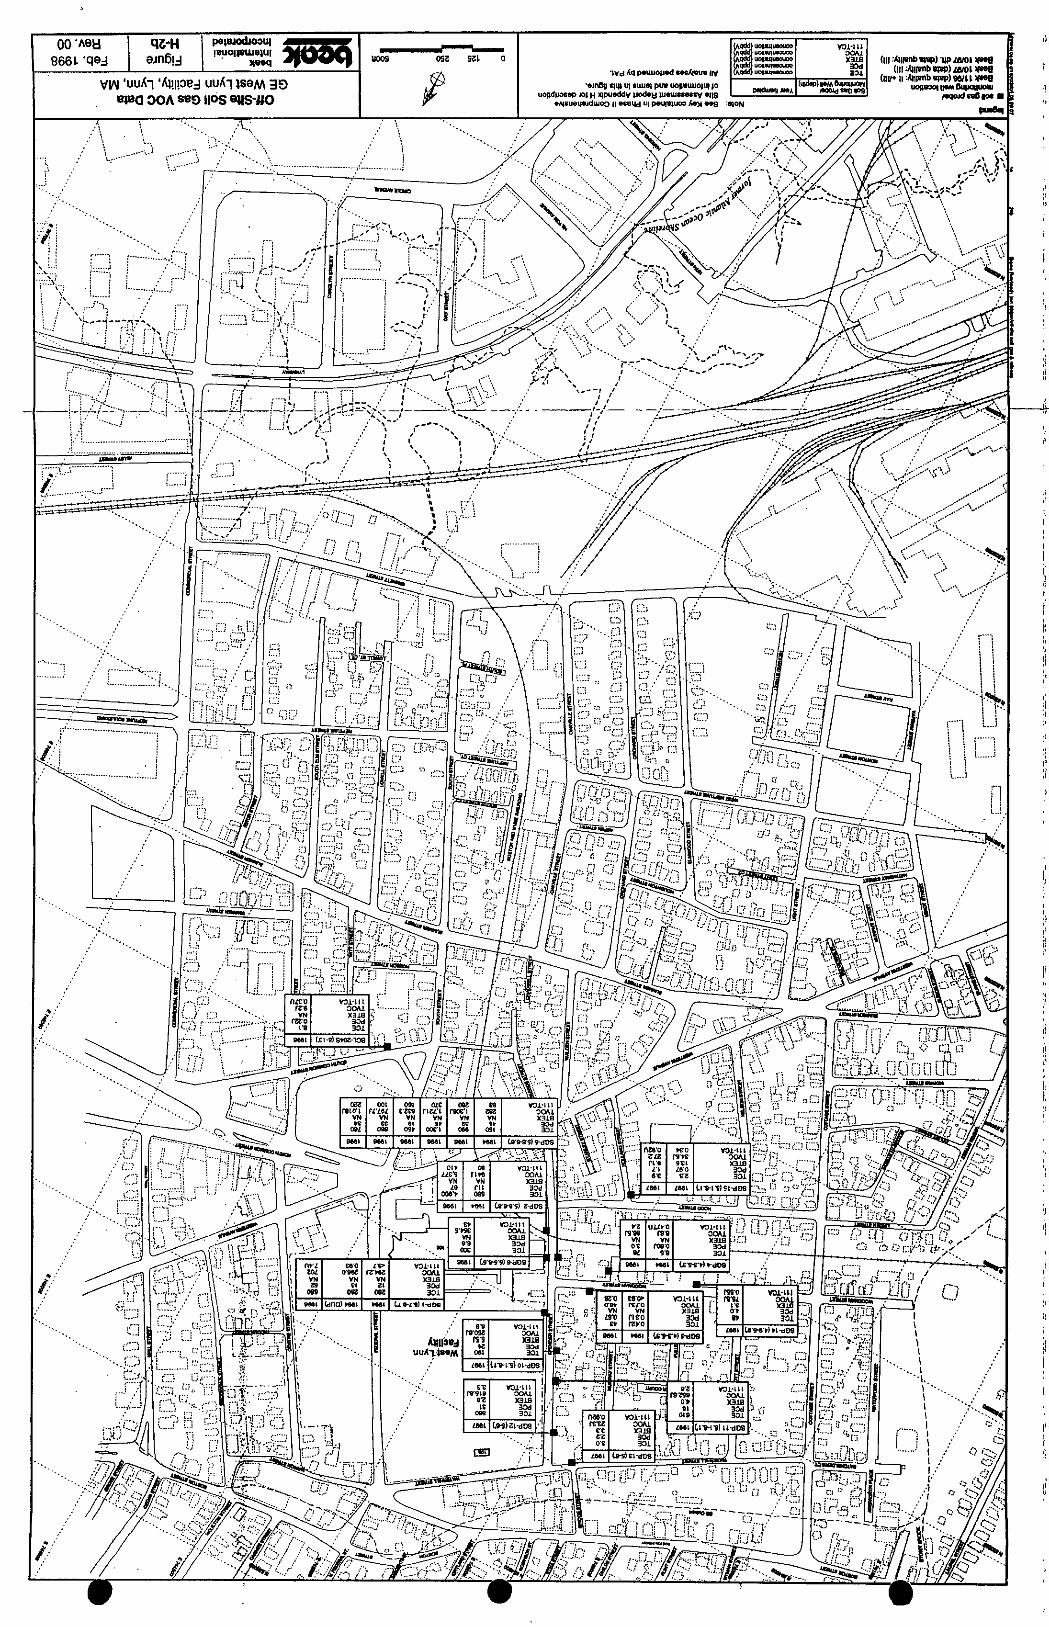
The soil gas survey conducted in 1992 included the collection of soil gas samples in the vicinity oftemporary probes TP-C30, TP-C27, TP-C26 and TP-C33. The locations of the temporary probes areshown on Figure 1.11 from the Phase I Report. Samples from soil gas probes SG-72, SG-75, SG-95and SG-100 had low and/or non-detectable concentrations of TCE of <1 ppbv, 67 ppbv, <1 ppbv, and <1ppbv, respectively. These data are shown on Figure H-2a from the Phase II Report.
In addition to this soil gas data, groundwater data are available from a set of nested monitoring wells(BCL-204S, I and D) located in close proximity to the location of TP-C30. The location of this well isshown on Figure 6 from the most recent Semi-Annual Remedial Monitoring Report Quarters 3 and 4,2008 (the "Monitoring Report Q3 and Q4, 2008"; Geosyntec, 2009). Data from the different depthwells in this well nest are shown in Figure 11 and Table E-2 from Appendix E of the Monitoring ReportQ3 and Q4, 2008. A copy of Figure 6, 11 and Table E-2 from the Monitoring Report Q3 and Q4, 2008along with other relevant tables and figures from this report are included in Attachment C. The shallowwell at BCL-204S is screened between 8 and 13 feet below ground surface (ft bgs), which is shallowerthan the sampling depths of elevated concentrations at temporary probes TP-C30, TP-C27, TP-C26 andTP-C33 as shown in Figure 5.5 from the Phase II Report. The temporal data for BCL-204S shown inFigure 6 from the Monitoring Report Q3 and Q4, 2008 show that the concentrations of TCE declinedsignificantly in 1996 and 1997, presumably as a result of the operation of additional groundwaterextraction wells along the southern boundary of the West Lynn Facility which was initiated severalyears earlier. The concentration of TCE in the shallow groundwater at BCL-204S has remained belowthe current GW-2 standard of 30 pg/L since the fall of 1997.
TR0076 NOAF Response Letter 2009-06-22.doc
engineers I scientists I innovators
Ms. Rodene Lamkin22 June 2009Page 4
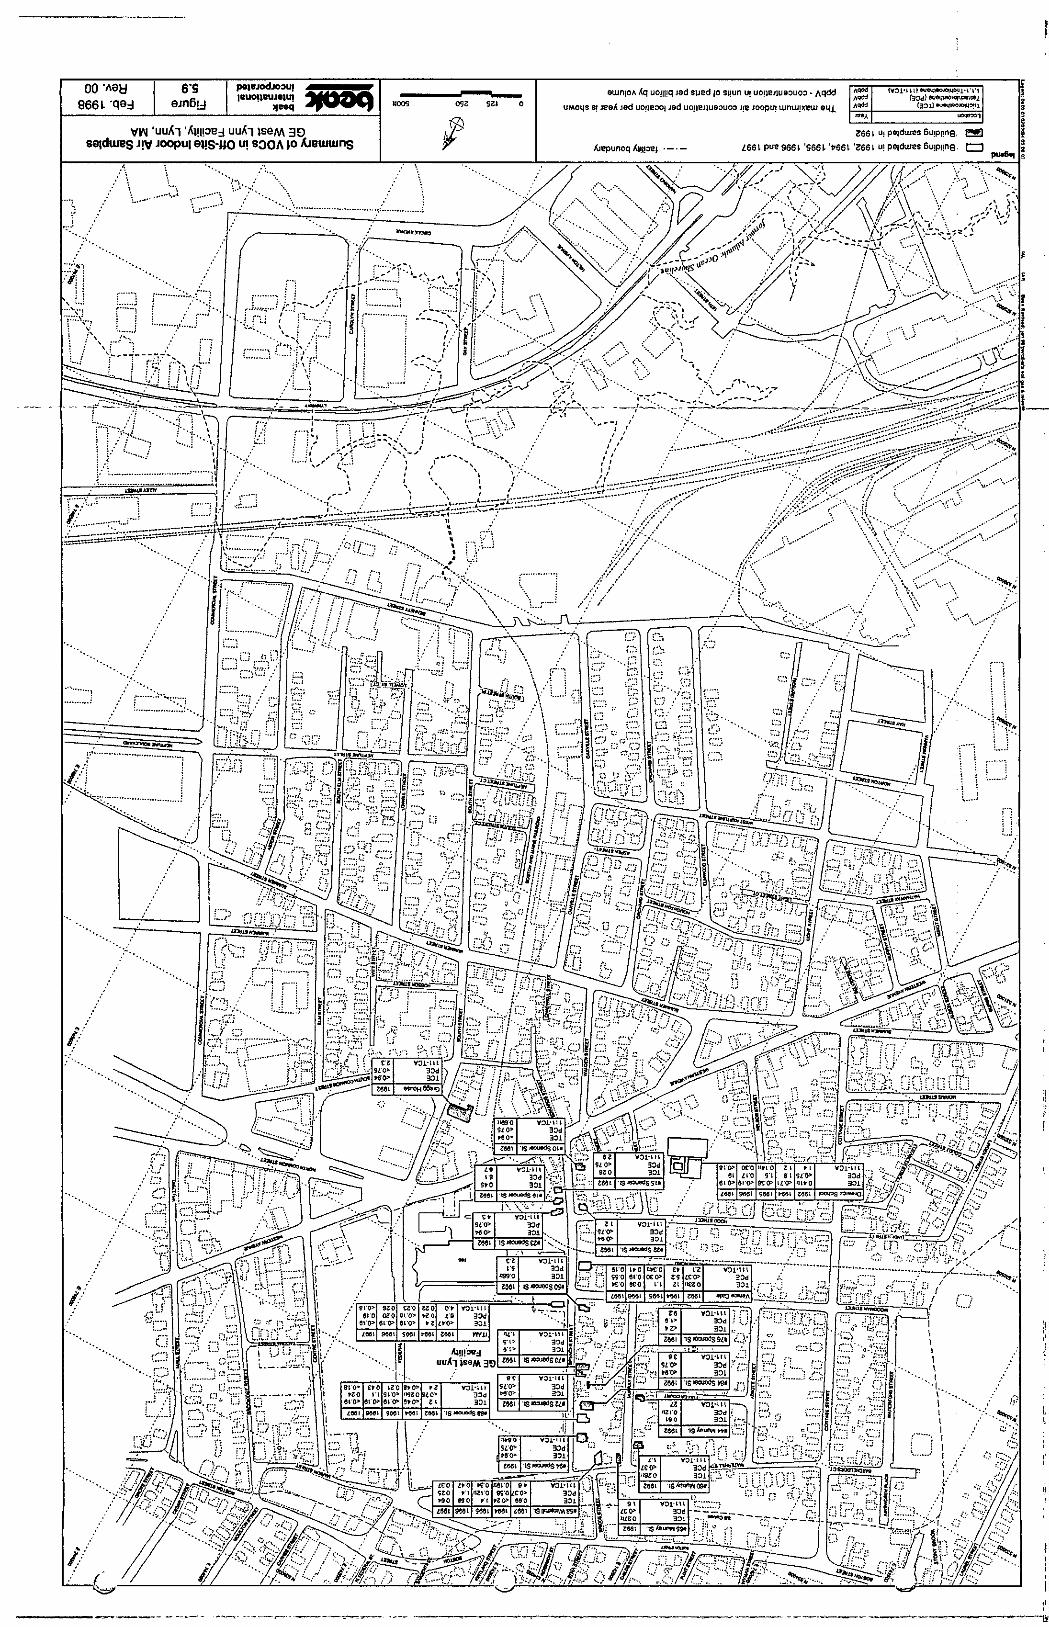
Indoor air monitoring was also conducted in 1992 in a daycare (Gregg House) located between TP-30and the Facility. The location of the Gregg House and the results of indoor air monitoring at thislocation are shown on Figure 5.9 of the Phase II Report. TCE was not detected in the indoor air samplecollected from Gregg House in 1992.
The soil gas data from 1992 showed a maximum concentration of TCE in soil gas in the vicinity of thelocation of TP-C30, TP-C27, TP-C26 and TP-C33 of 67 ppbv. Groundwater monitoring data fromBCL-204S show that the concentrations of TCE in shallow groundwater have decreased significantlysince the early 1990s and are below the current GW-2 standard. Based on these soil gas andgroundwater data, we believe that the existing data demonstrate that the vapor intrusion pathway is notcomplete in the vicinity of TP-C30, TP-C27, TP-C26 and TP-C33.
NOAF Item le - TP-D35 located on Woodman Street west of the GE facility contained the elevatedconcentration of 4400 ueIL TCE at 12' bzs in 1995.
Response: The 1995 groundwater sample from TP-D35 was collected from below the water table, andresults from this sample do not reflect VOC concentrations that have the potential to off gas into soil gasat this location. Additionally, an extensive soil gas survey was conducted in 1992 that included thecollection of soil gas samples in the vicinity of temporary probe TP-D35. The location of TP-D35 isshown on Figure 1.11 from the Phase II Report. Data from analysis of samples collected in 1992 fromsoil gas probes SG-35 located slightly north of TP-D35 and SG-33 located to the east of TP-D35 (closerto the Site) both showed concentrations of TCE in soil gas <1 ppbv. These data are shown on Figure H-2a from the Phase II Report. Additional soil gas data was collected in 1997 at a location (SGP-14)slightly to the south west of TP-D35 as shown on Figure H-2b from the Phase II Report and showed 48ppbv of TCE.
In addition to these soil gas data, groundwater data are available from shallow monitoring wells (BCL-201S and BCL202) located to the east and to the west of the location of TP-D35. The locations of thesewells are shown on Figure 6 from the most recent Monitoring Report Q3 and Q4, 2008. Unlike the TP-D35 sample that was collected below the water table, these wells (BCL-201S and BCL202) are screenedacross the water table between 4 and 9 ft bgs and 6 and 21 ft bgs respectively. These wells have beensampled on a regular basis since 1994 and data from analysis of these samples are shown in Figure 11and in Table E-2 from the Monitoring Report Q3 and Q4, 2008. The maximum concentration of TCEdetected in groundwater samples from BCL-201 S was 11 pg/L in 1994 and only trace concentrations(i.e., <5 pg/L) have been detected since that time. Only trace concentrations (i.e., <5 pg/L) have beendetected in samples from BCL-202.
The soil gas data from 1992 and 1997 showed a maximum concentration of TCE in soil gas in thevicinity of the location of TP-D35 of 48 ppbv. Groundwater monitoring data from BCL-201S and BCL-
TR0076 NOAF Response Letter 2009-06-22.doc
engineers I scientists I innovators
Ms. Rodene Lamkin22 June 2009Page 5
202, which has been collected on a regular basis since 1994, show that the concentrations of TCE inshallow groundwater are well below the current GW-2 standard of 30 gg/L. We believe that the existingdata demonstrate that the vapor intrusion pathway is not complete in the vicinity of TP-D35.
NOAF Item If - SG-2 7 located at the corner of Spencer and Woodman Streets revealed a hijzh level ofTCE at 3882 ppbv in soil vapor in 1992.
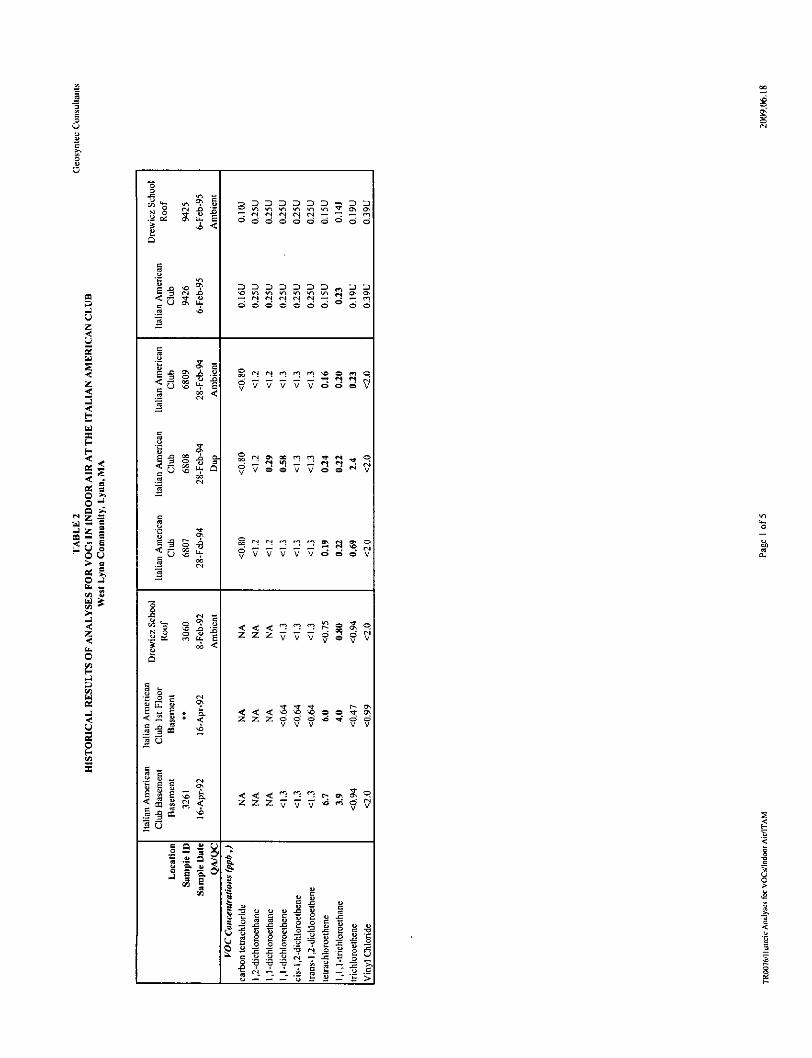
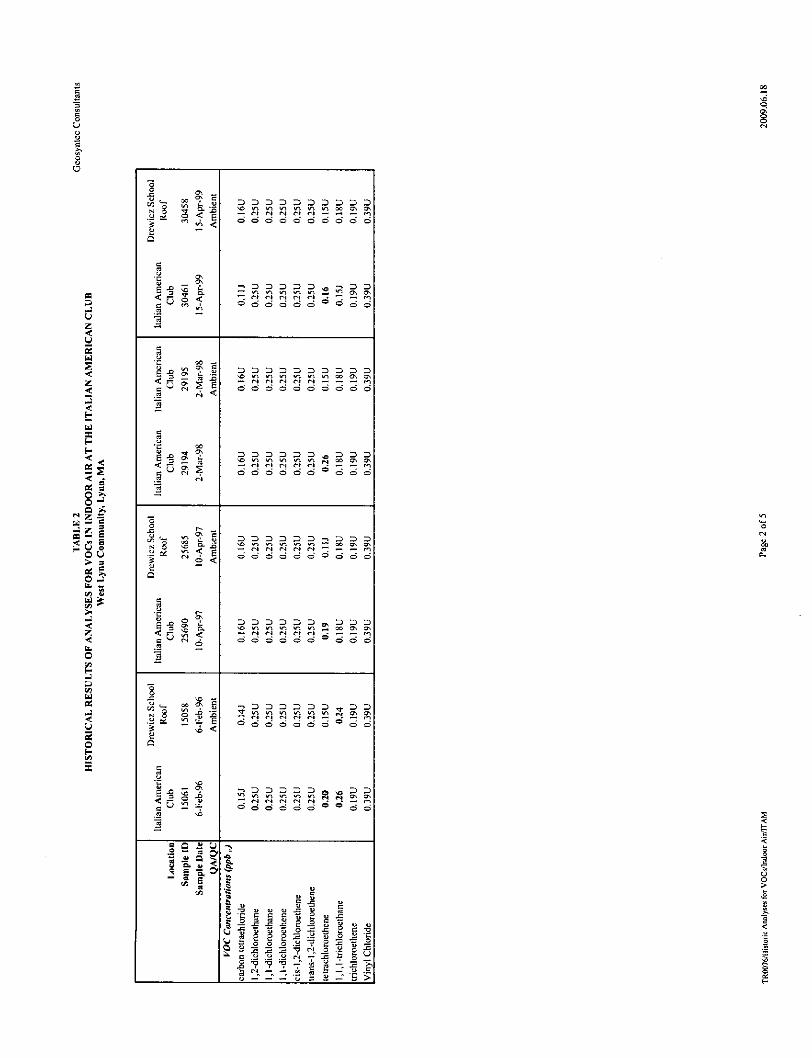
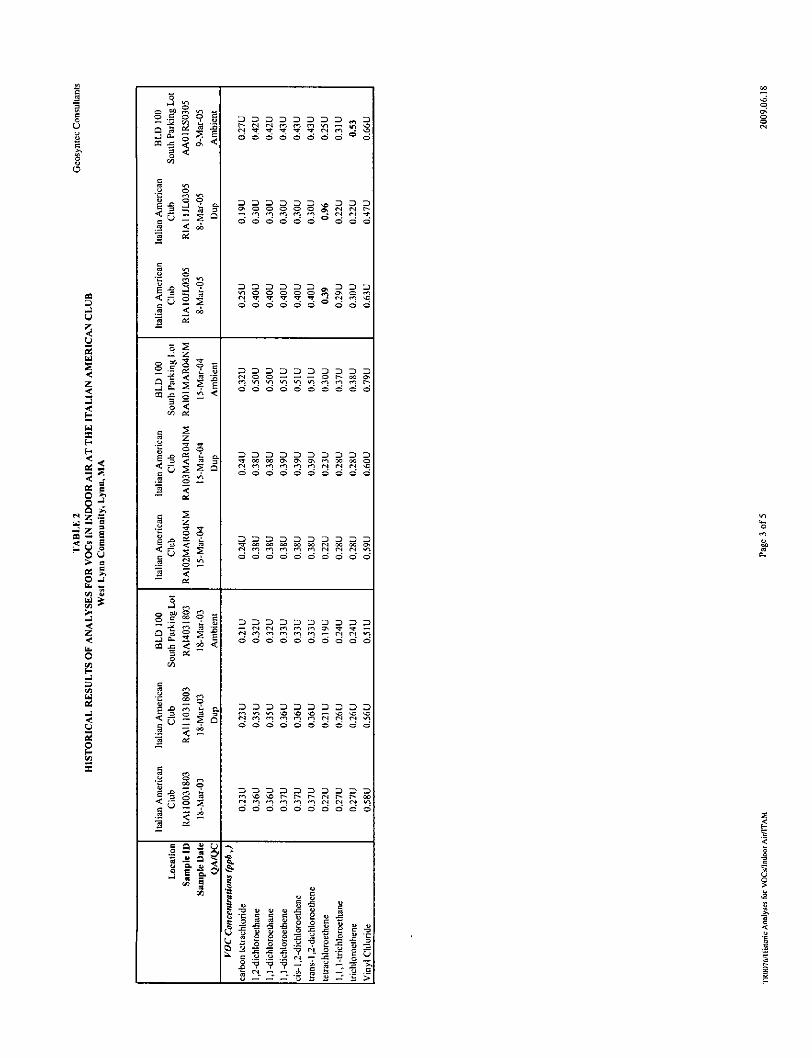
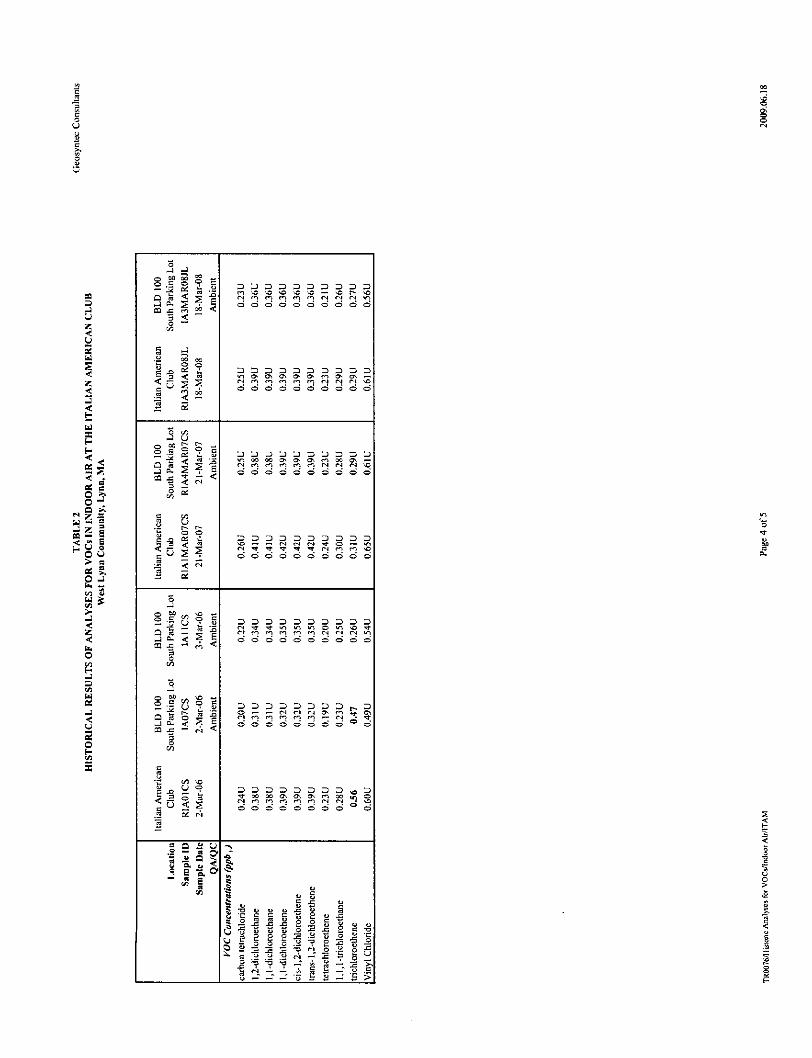
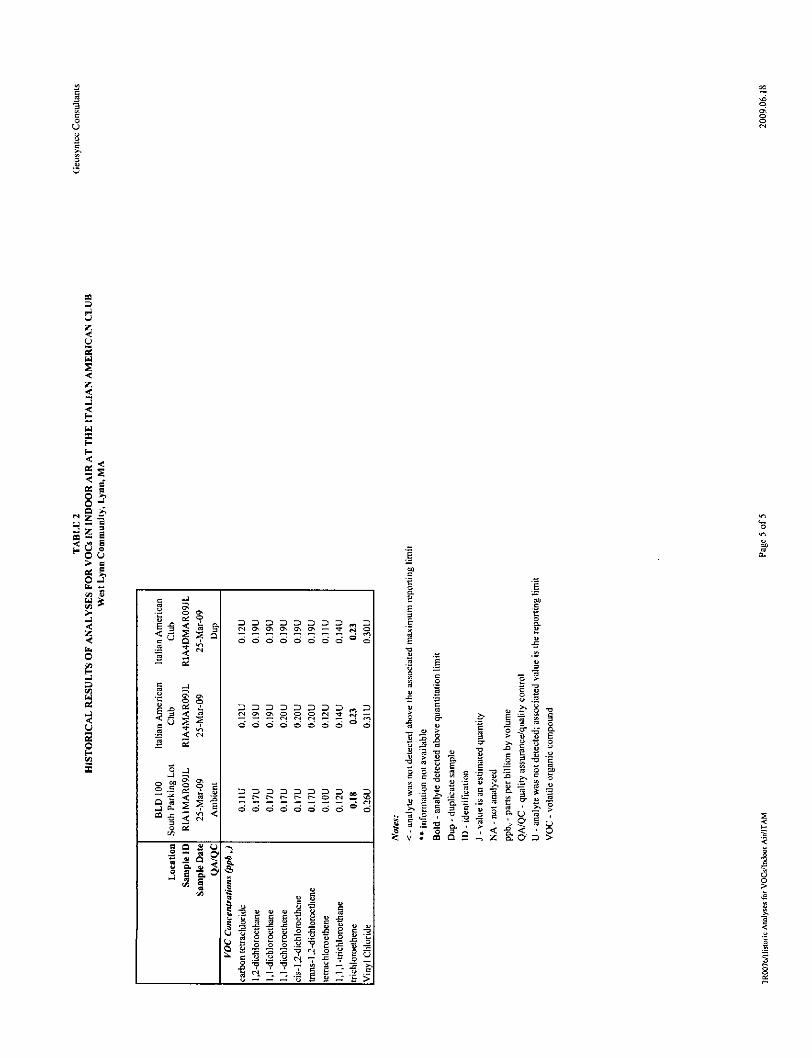
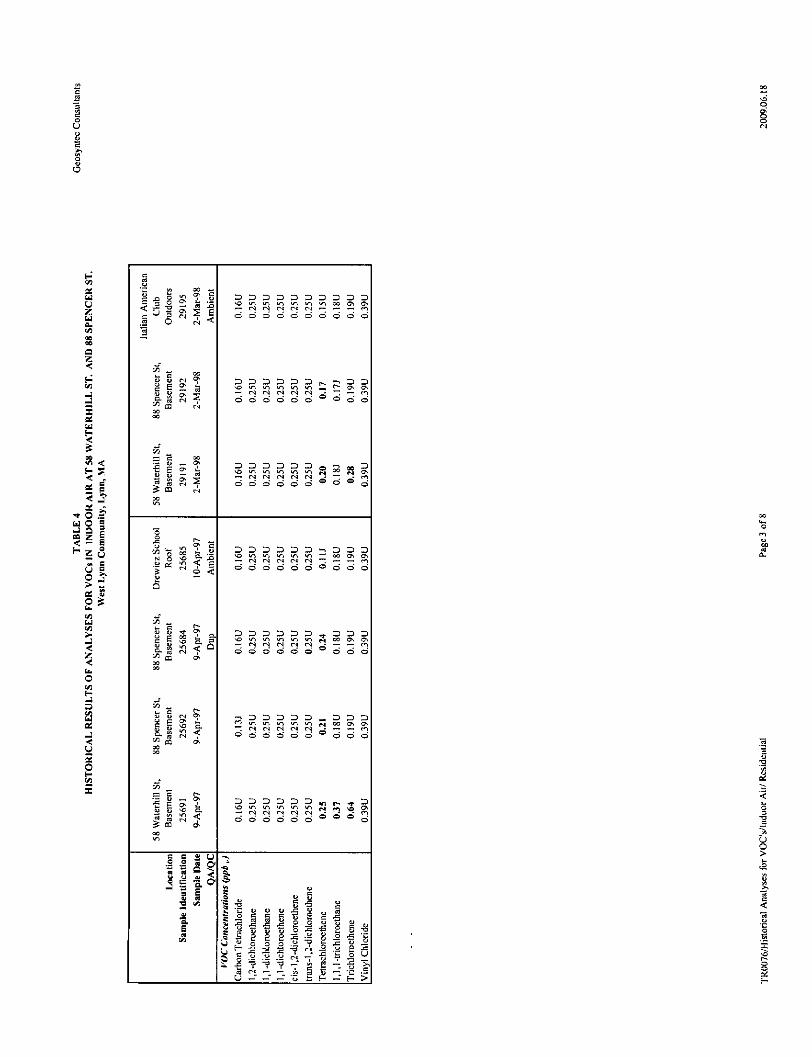
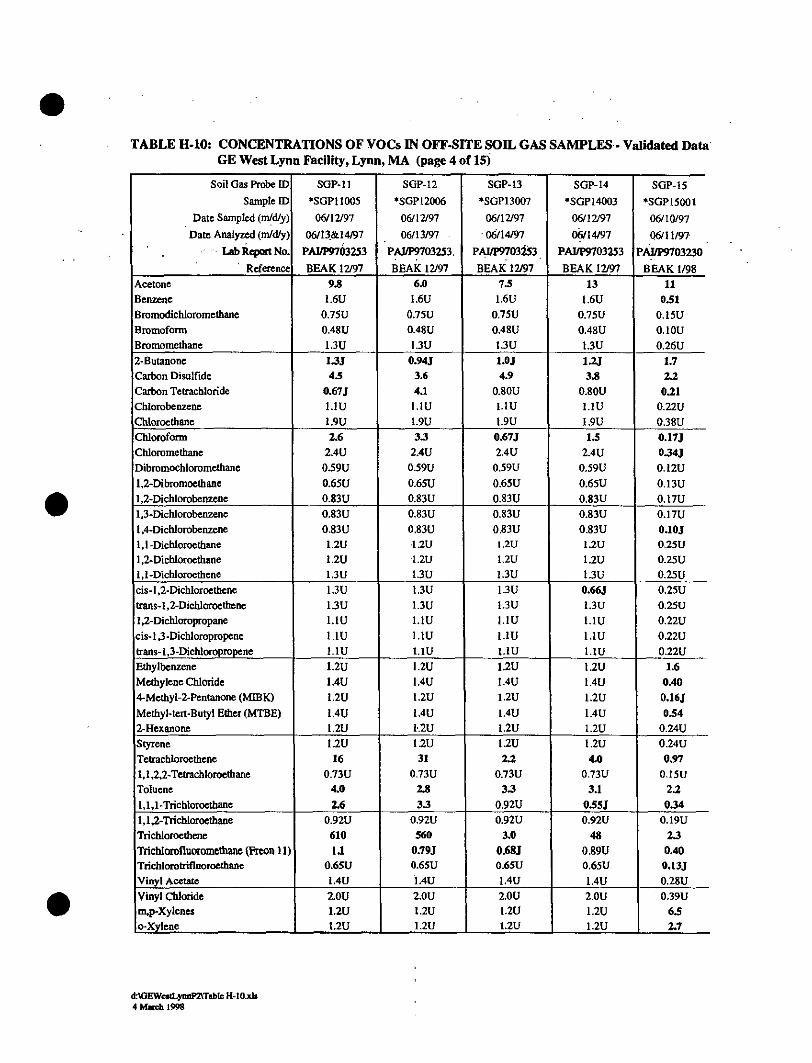
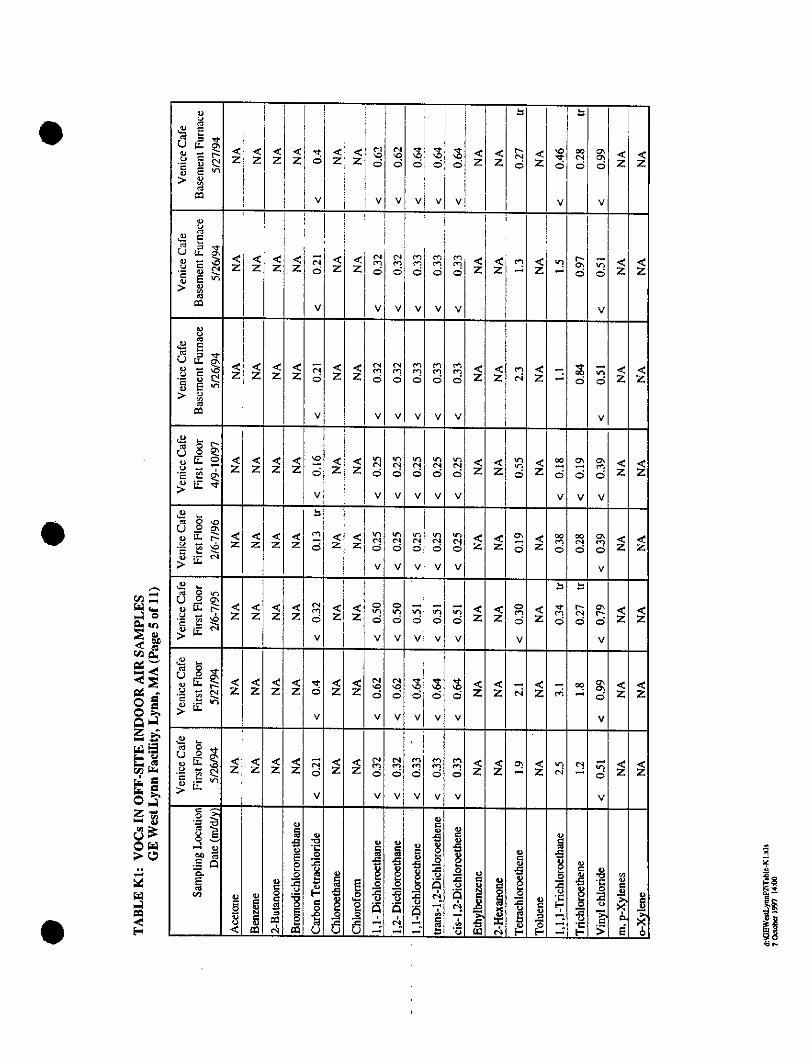
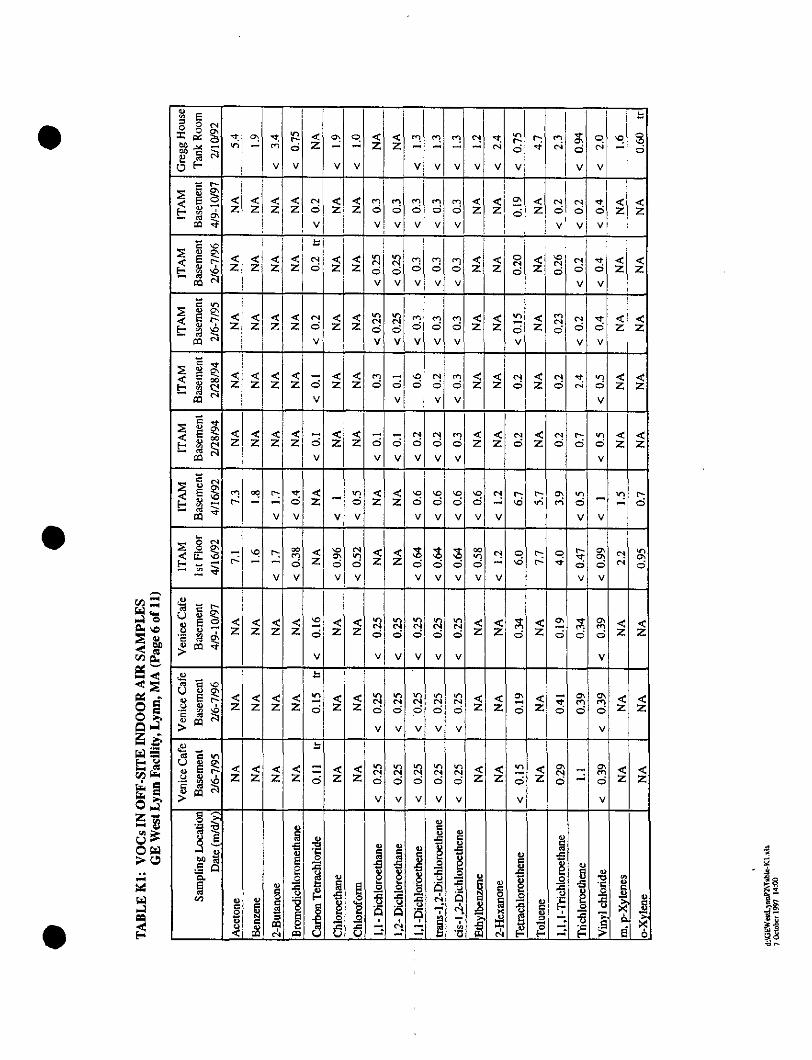
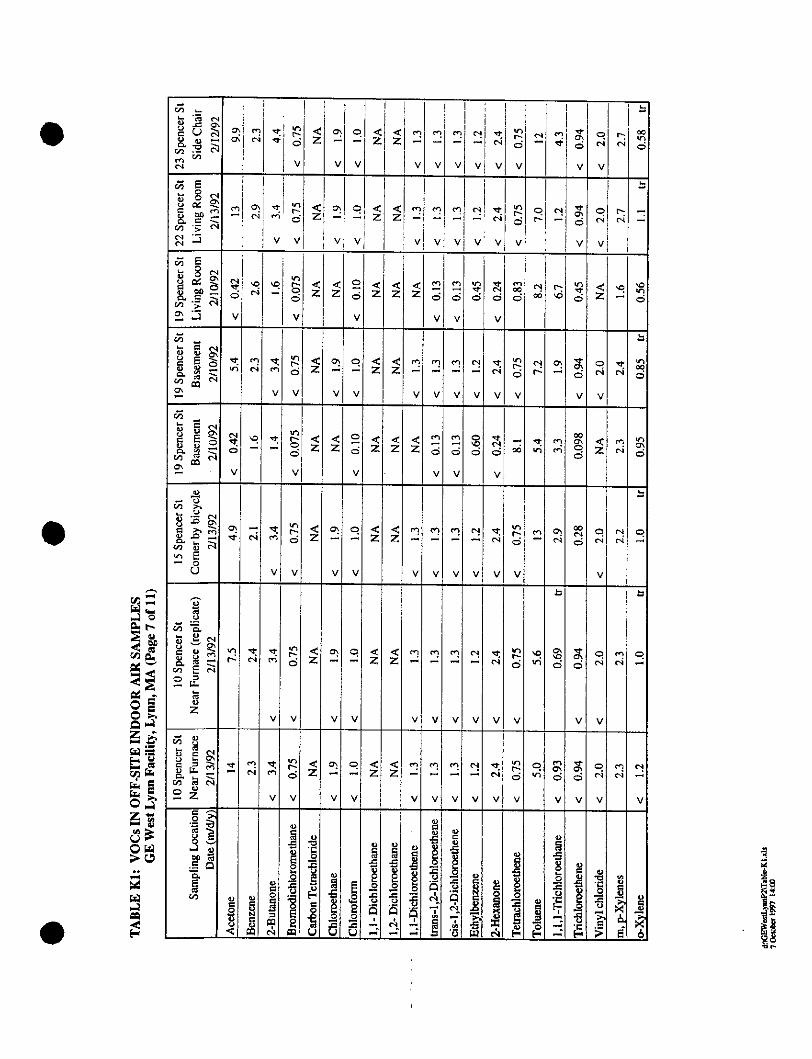
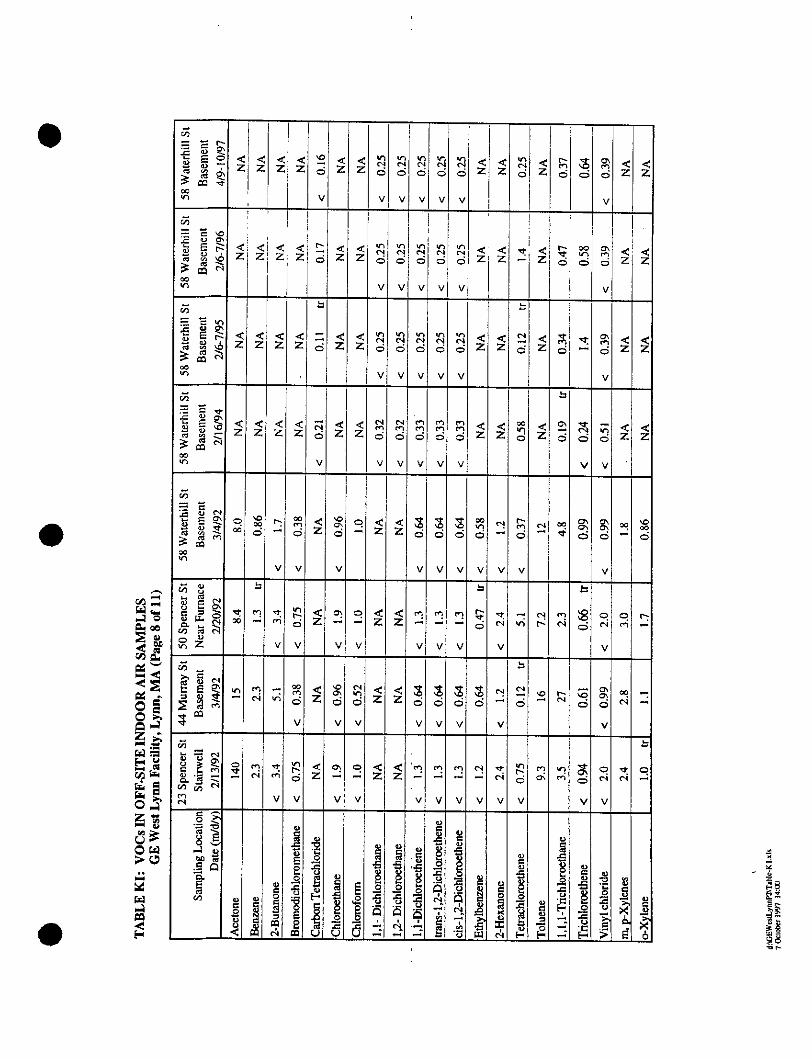
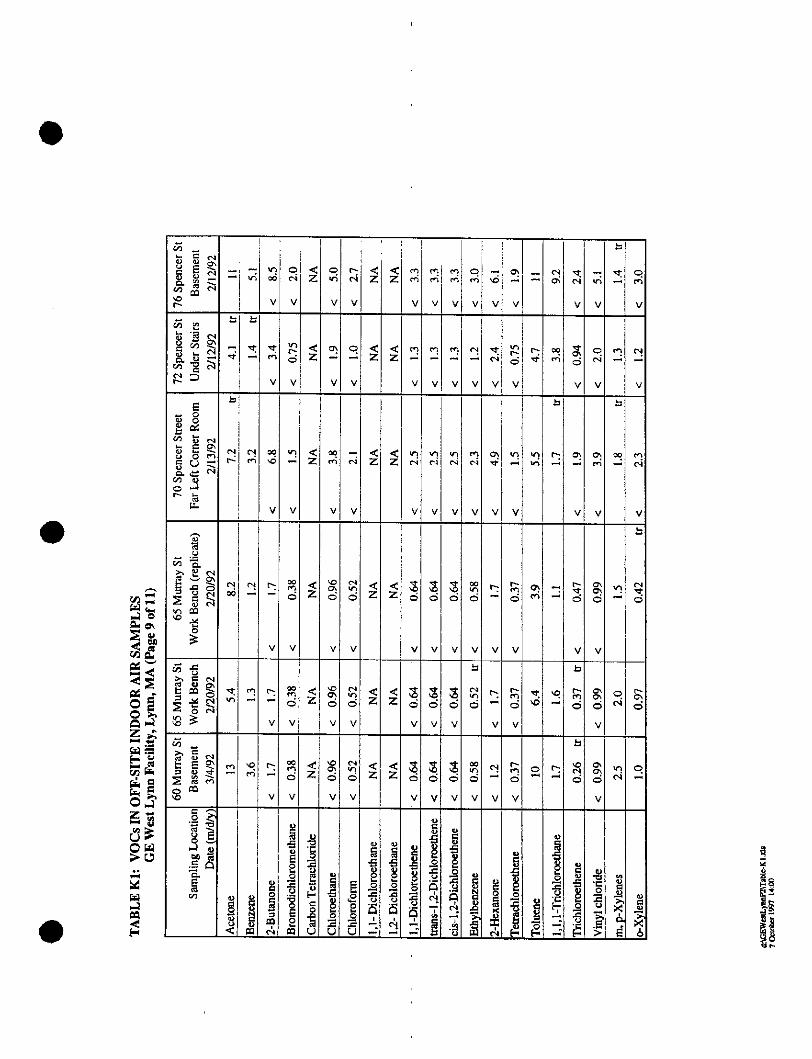
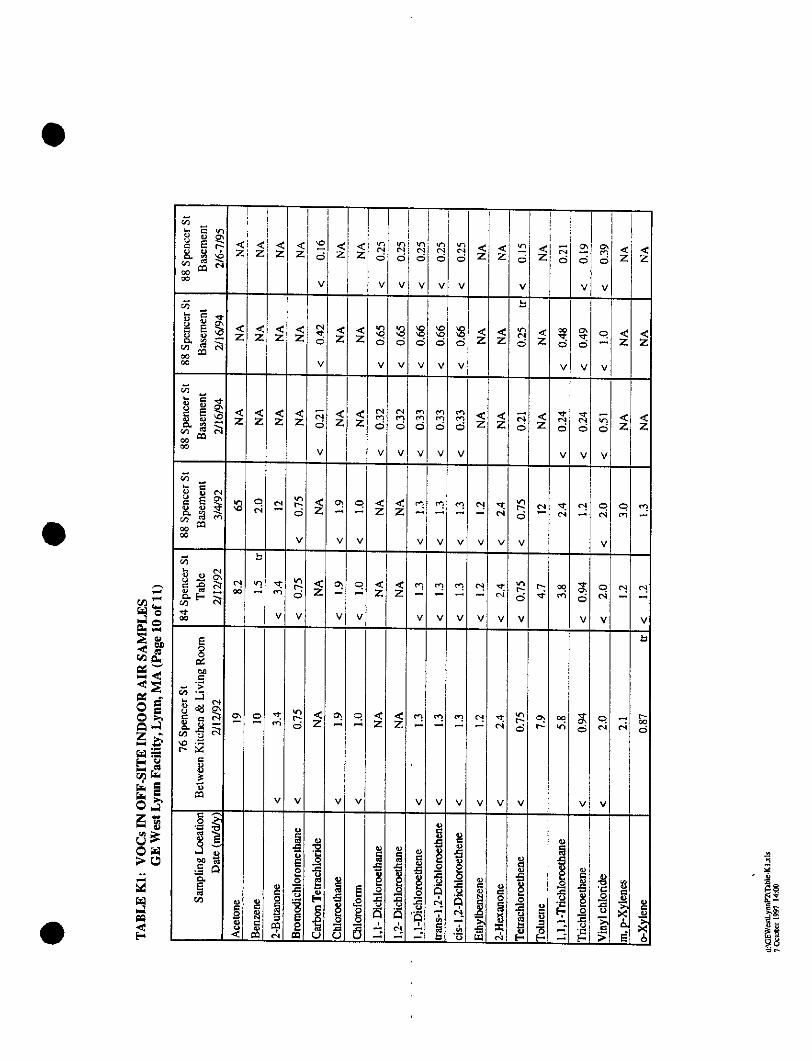
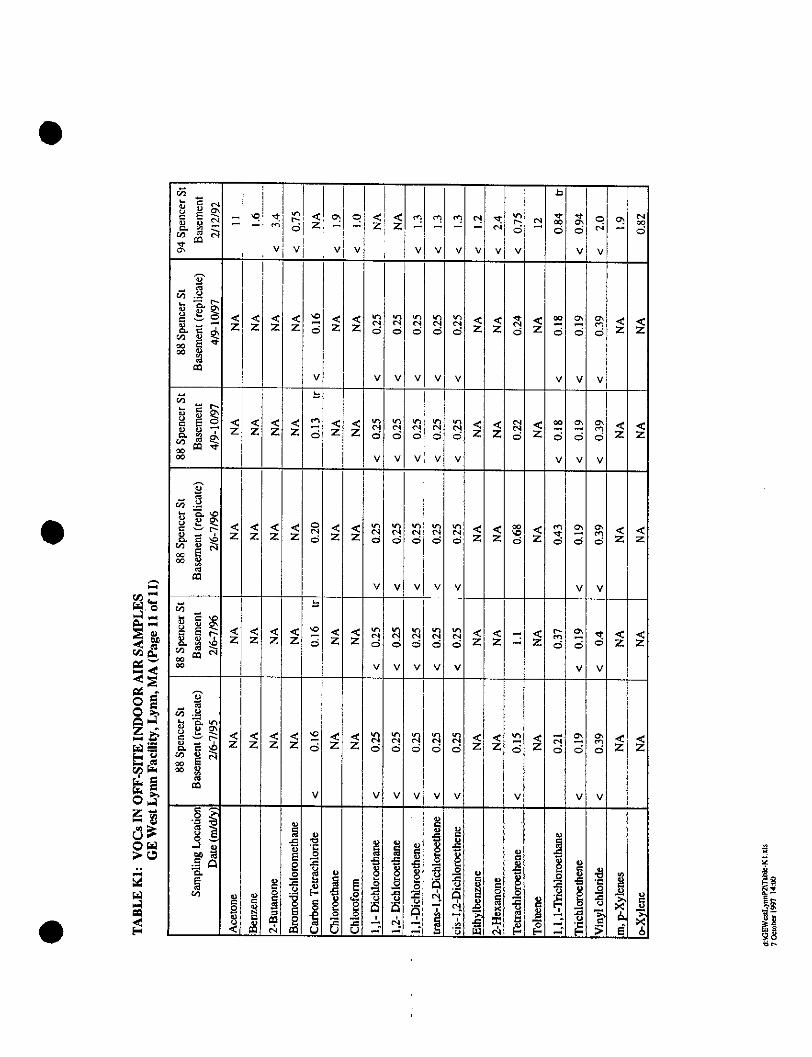
Response: Soil gas probe SG-27 was part of the extensive soil gas survey conducted in 1992. Thelocation of SG-27 and data from analysis of soil gas from this location can be seen on Figure H-2a andin Table H-10 in Appendix H from the Phase II Report. Indoor air monitoring was also conducted in1992 in the residence closest to SG-27 at #50 Spencer Street. The location of the residence at #50Spencer Street and the results of indoor air monitoring at this location can be seen on Figure 5.9 of thePhase II Report. The indoor air sample collected in 1992 from #50 Spencer Street showed a traceconcentration (0.66 ppbv) of TCE. This was reported as a trace or estimated concentration as it wasbelow the reporting limit for the analytical method used to conduct the analysis. Indoor air monitoringwas also conducted in the Italian American (ITAM) building located on the east side of Spencer Streetdirectly across from #50 Spencer Street on the same side of Spencer Street as the Facility. The locationof the ITAM building and data from indoor air monitoring in the ITAM building up to 1997 are shownon Figure 5.9 of the Phase 2 Report. The results of all indoor air monitoring in the ITAM building areshown in the attached Table 2. TCE was detected in the indoor air samples from the ITAM building in1994 at a concentration of 0.69 ppbv and 2.4 ppbv in the duplicate sample. TCE was also detected inthe ambient air sample in 1994 at a concentration of 0.23 ppbv. The concentrations of TCE were non-detect (i.e., <0.19 ppbv) in 1995, 1996, 1997, 1998 and 1999 and non-detect (<0.31 ppbv) in 2003,2004, 2005, 2007, and 2008. In 2006, TCE was detected in the indoor air at concentrations of 0.56 ppbvbut was also detected in the ambient air sample at a concentration of 0.47 ppbv. In 2009, TCE wasdetected in the indoor air at concentrations of 0.23 ppbv but was also detected in the ambient air sampleat a concentration of 0.18 ppbv.
Using the 1992 indoor air results from #50 Spencer Street and the ITAM building and the 1992 soil gasresults at SG-27, it is possible to calculate an empirical, site-specific attenuation factor for TCE vaporintrusion into these buildings by dividing the observed indoor air concentration by the detected soil gasconcentration. At #50 Spencer Street, the empirical attenuation factor would be the estimatedconcentration in the residence of 0.66 ppb divided by the measured concentration in the soil gas probeadjacent to the residence of 3,882 ppbv or 1.7 x 10-t Note that this empirical attenuation factor assumesthat 100% of the TCE detected in indoor air resulted from subsurface vapor intrusion; however, theindoor air results for PCE and 1,1,1-TCA indicate that interior or "background" sources of VOCs alsowere present in this building because these constituents were not detected in soil gas near the building.Accordingly, the actual soil gas to indoor air attenuation factor could be even lower. At the ITAMbuilding, TCE was not detected in indoor air in 1992, which is the time when soil gas data is also
TR0076 NOAF Response Letter 2009-06-22.doc
engineers I scientists I innovators
Ms. Rodene Lamkin22 June 2009Page 6
available near this building; however, we can estimate a conservative attenuation factor for the ITAM bydividing the TCE reporting limit for the indoor air sample (0.47 ppbv) by the soil gas concentration atSG-27. The resulting empirical attenuation factor for the ITAM building would be 1.2 x 10⁴; becausethis empirical attenuation factor is based on a reporting limit and not a detected concentration itrepresents a conservative, upper-bound range of soil gas to indoor air attenuation at the ITAM building.
Following the soil gas survey conducted in 1992, additional soil gas points were installed in the vicinityof SG-27 including: SGP-1, SGP-3, SGP-5 and SGP-6 installed in between February and May 1994.The locations of these soil gas probes and data from analysis of soil gas samples from these locationsobtained between 1994 and 1997 can be seen on Figure H-2b and Table H-10 in Appendix H of thePhase II Report. Soil gas samples have been collected from SGP-1 and SGP-5 on a regular basis (atleast twice per year) since 1997. Data from the analysis of samples from these locations are shown inFigure 7 and Table F-2 from the Monitoring Report Q3 and Q4, 2008. Since 2002, concentrations ofTCE in soil gas samples from soil gas probes SGP-1 and SGP-5 have had a maximum concentration of620 ppbv and 660 ppbv, significantly less than the concentration measured in SG-27 in 1992 of 3,882ppbv.
In response to the presence of TCE in soil gas at the site, a soil vapor extraction (SVE) system wasinstalled at a location approximately 80 feet south of the corner of Spencer Street and Woodman Streetand operated in 1994, 1997 and in 2001. Figure 12 from the Monitoring Report Q3 and Q4, 2008 showsthe periods of time when the SVE system was operated and the impact of the operation of the SVEsystem on the concentration of volatile organic compounds (VOCs) in soil gas probes in the immediatevicinity of the SVE system. The data show significant reductions in VOC concentrations followingoperation of the SVE system in 1997 and 2001.
Ongoing monitoring of soil gas from soil gas probes in the vicinity of SG-27, including SGP-1 andSGP-5, shows significantly lower concentrations than were reported in 1992 at SG-27. Using the site-specific, empirical attenuation factors discussed above that were calculated based on 1992 soil gas andindoor air results, we can calculate potential vapor intrusion-related indoor air concentrations associatedwith recent TCE concentrations detected in soil gas at SGP-i and SGP-5 by multiplying the soil gasconcentrations by the empirical attenuation factors. Using the maximum TCE concentrations that havebeen detected at SGP-1 and SGP-5 since 2002 and the empirical attenuation factors, resulting vaporintrusion-related indoor air concentrations for TCE would range from 0.07 to 0.11 ppbv. To provide aneven more conservative estimate of potential indoor air concentrations, we considered the TCEattenuation factor that MassDEP used to calculate the MCP Method 1 GW-2 standard for TCE of 7.53 x10⁴ (MassDEP, 2008). Using this "GW-2 attenuation factor", potential vapor intrusion-related indoorair concentrations associated with TCE detected at SGP-1 and SGP-5 would range from 0.47 to 0.50ppbv. Regardless of which attenuation factor is used (i.e., site-specific empirical or MassDEP GW-2),
TR0076 NOAF Response Letter 2009-06-22.doc
engineers I scientists I innovators
Ms. Rodene Lamkin22 June 2009Page 7
potential indoor air concentrations associated with recent soil gas concentrations in the vicinity of SG-27 are well below the risk-based concentration of 2.6 ppbv for TCE presented in MassDEP's Draft 2008Indoor Air Threshold Values document. Based on the available data discussed above, recentconcentrations of TCE detected in soil gas samples in the vicinity of SG-27 are not believed to result insignificant vapor intrusion into buildings in the area. Accordingly, additional assessment ofgroundwater, soil vapor, and potentially indoor air in this area is not warranted.
NOAF Item 2 - Room B-101 of the Drewicz School was found to contain .41 ovbv TCE in indoor air in1992. This value now exceeds the MassDEP draft threshold value of.15 vpbv which is indicative of aCEP that must be evaluated. A determination of whether recent indoor air data exists for the DrewiczSchool; and if not, indoor air monitoring is recommended to determine whether a CEP exists.
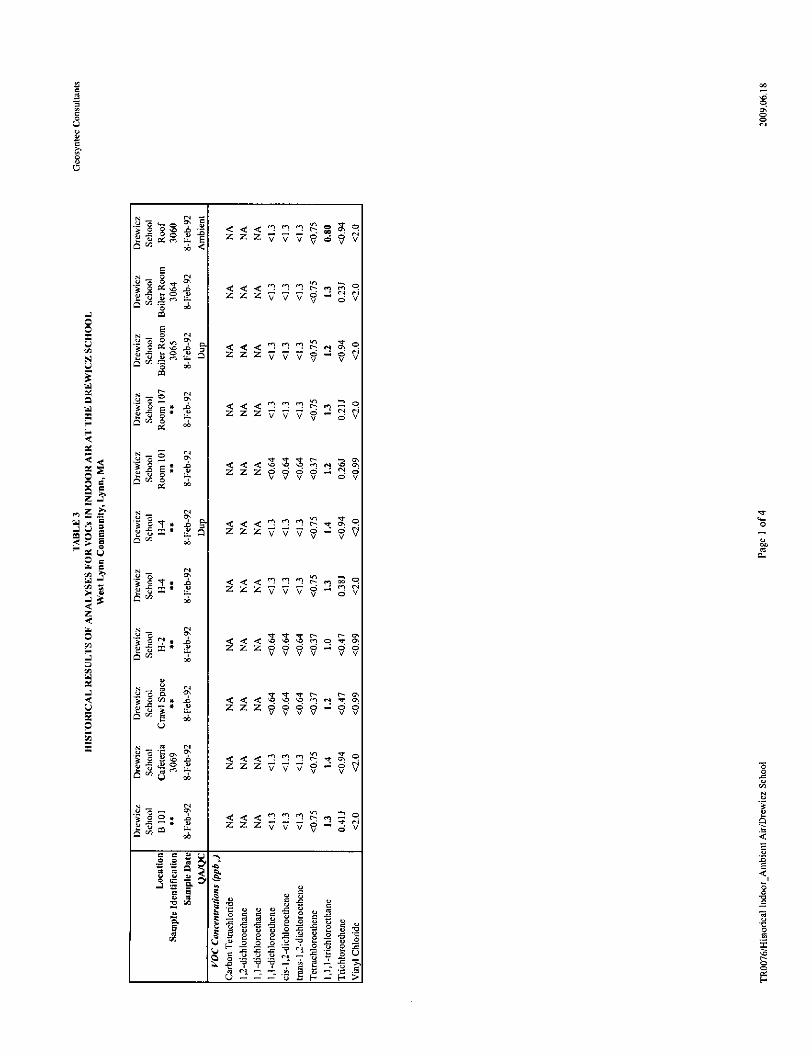
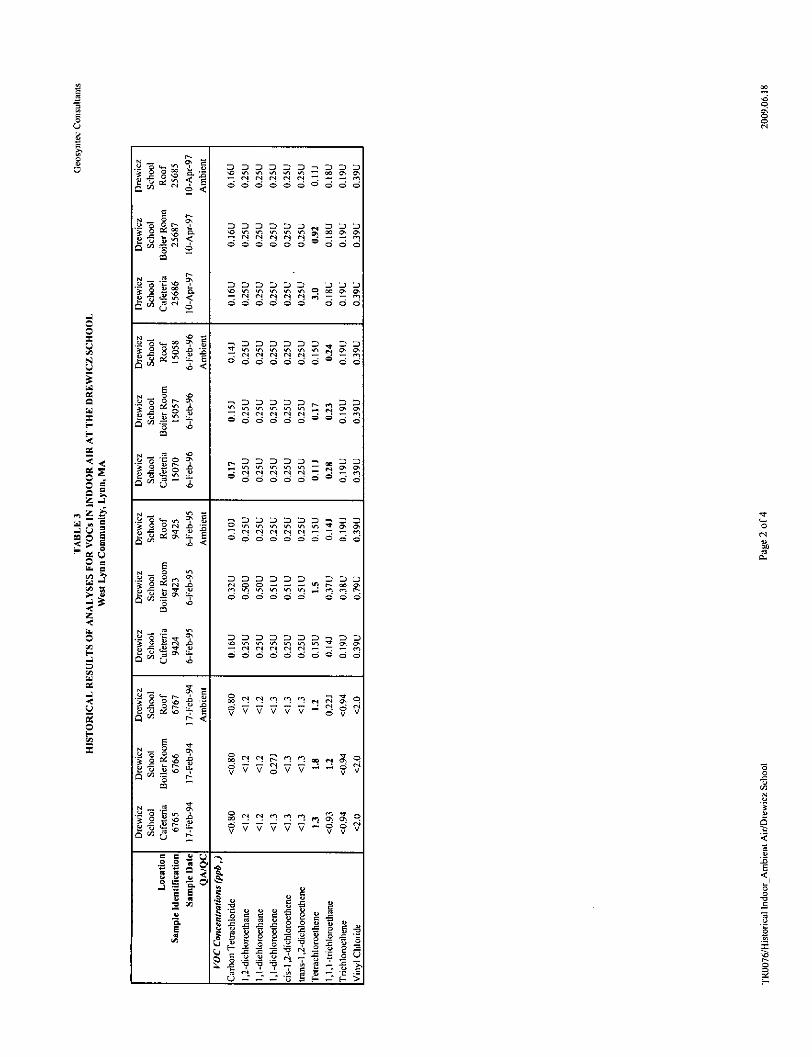
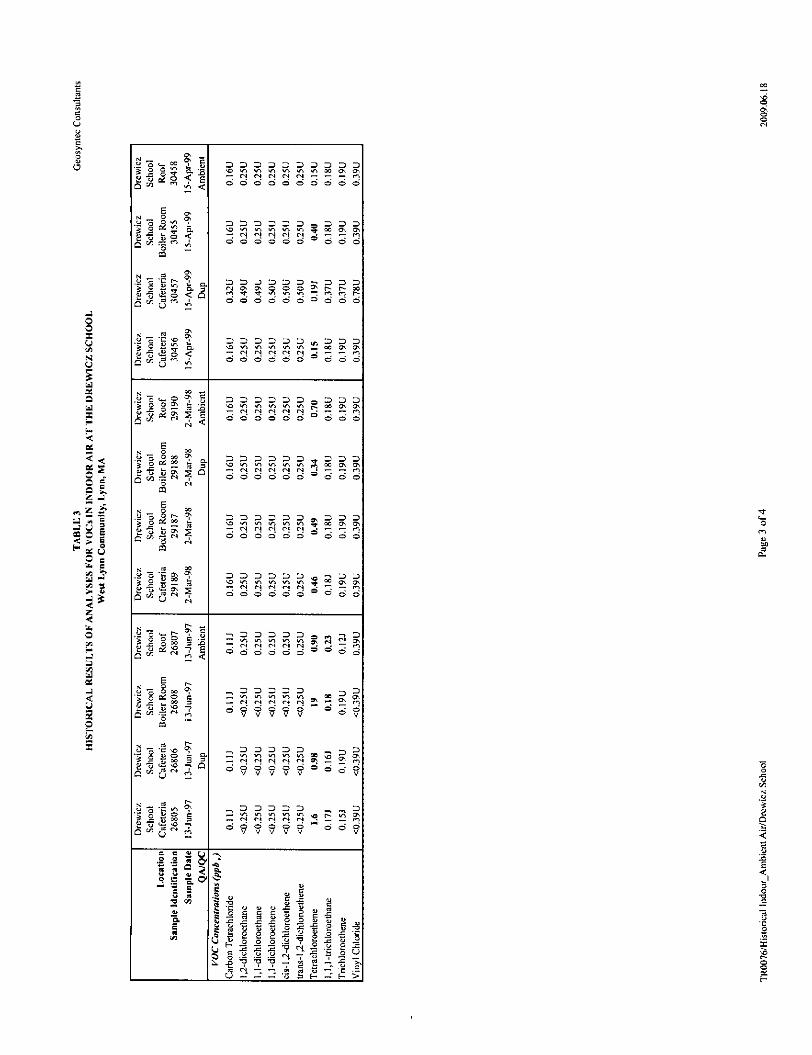
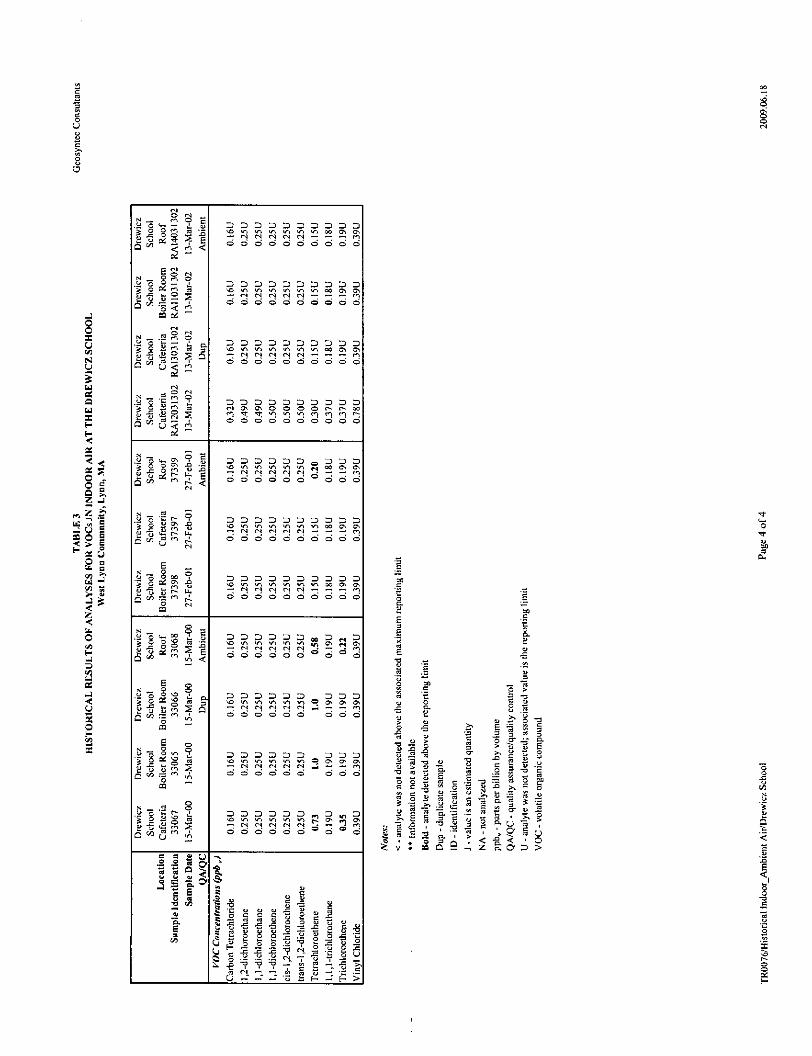
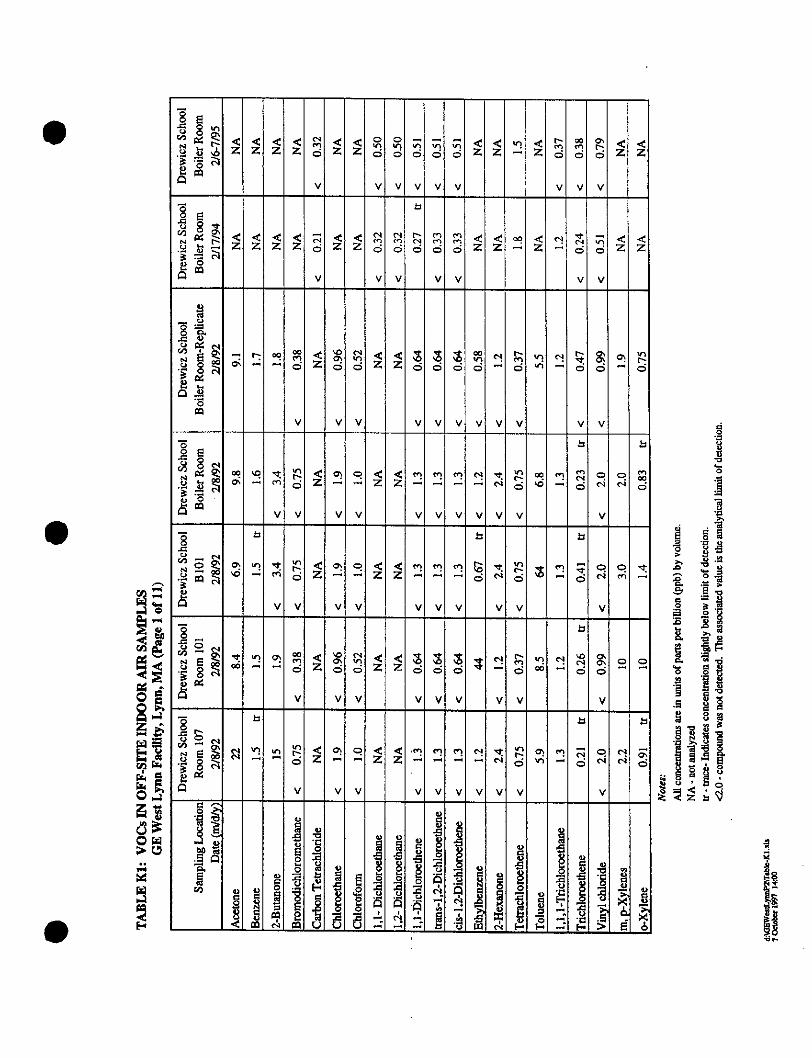
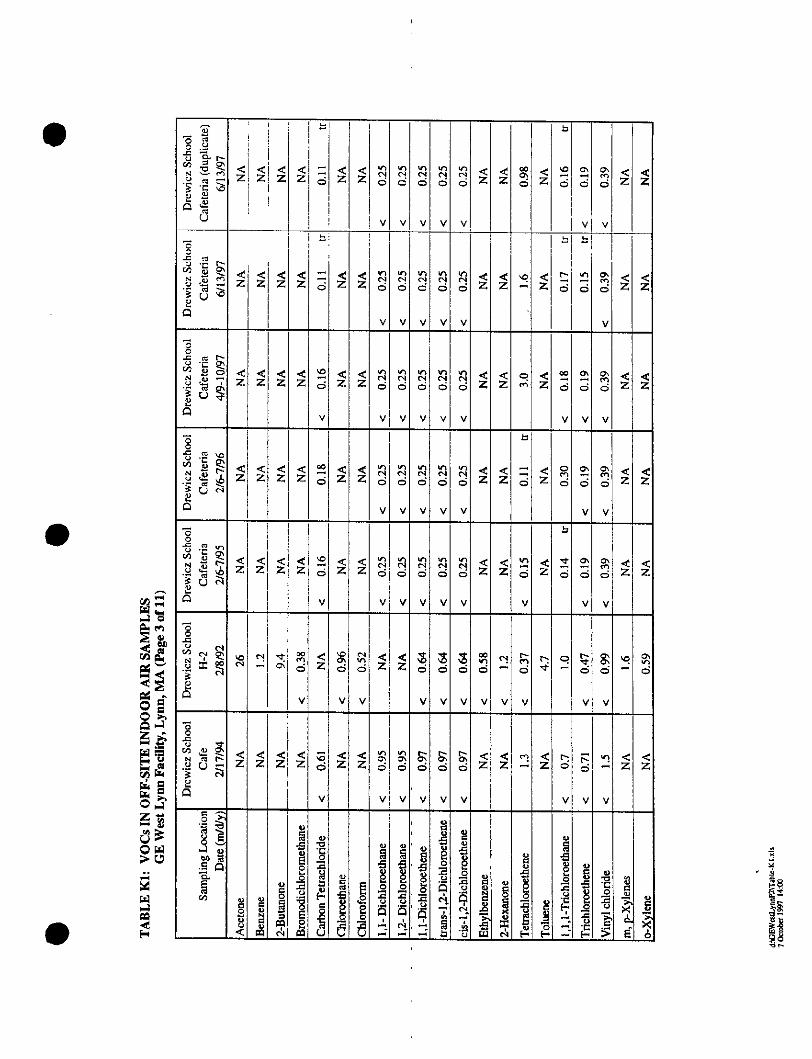
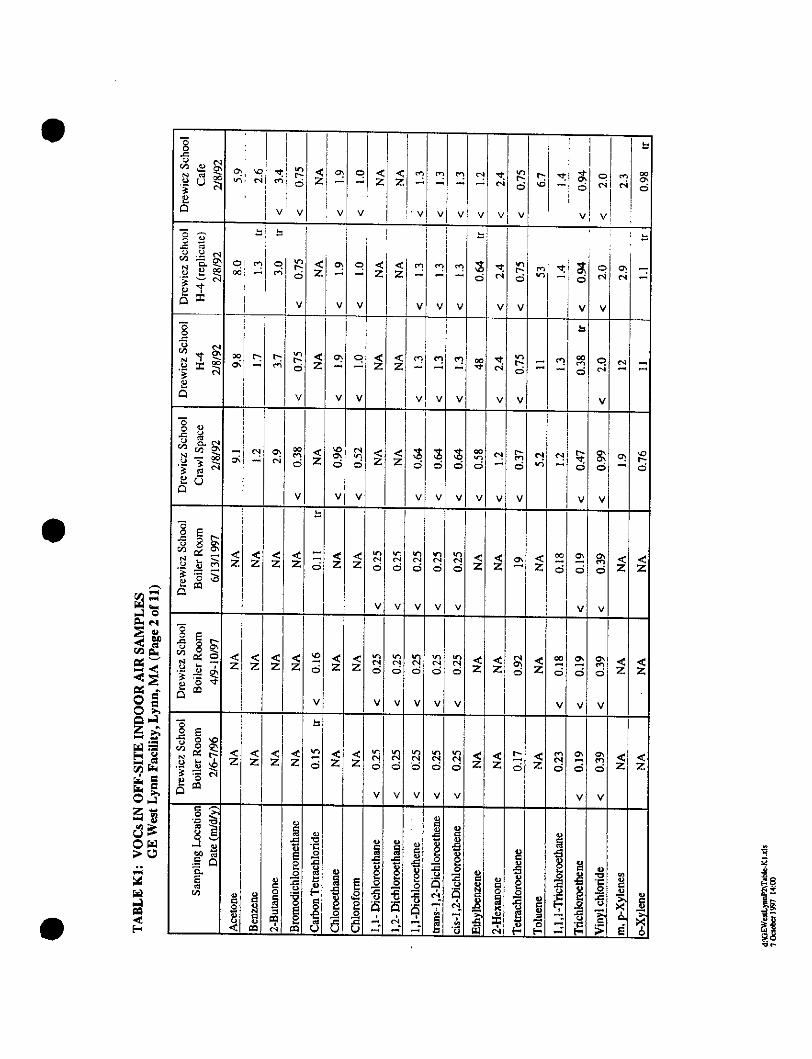
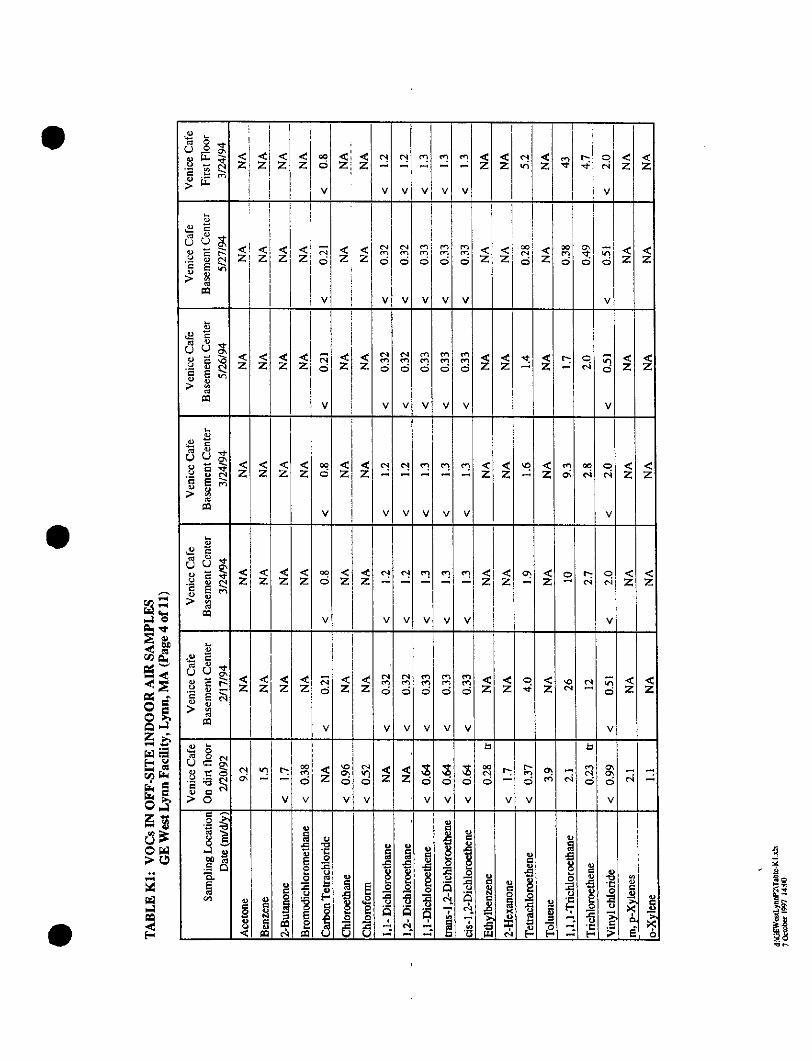
Response: Figure 5.9 from the Phase II Report presents the highest concentrations of TCE,tetrachloroethene (PCE) and 1,1,1 -trichloroethane (1,1,1 -TCA) from analysis of indoor air samples fromany of the rooms of Drewicz School where indoor air samples were collected in 1992, 1994, 1995, 1996and 1997. Table K-I and K-2 of Appendix K from the Phase II Report present the results from analysisof ambient air and indoor air samples from the eight locations sampled within the Drewicz School in1992 (rooms 107, 101, B101, H-2, H-4, the boiler room, the cafeteria, and crawl space) and the resultsof monitoring in the boiler room and cafeteria in 1994, 1995, 1996 and 1997. Additional data frommonitoring in the Drewicz School in 1998, 1999, 2000, 2001 and 2002 are presented in the 1998, 1999,2000, and 2001 Annual Indoor Air Quality Monitoring in the West Lynn Community prepared byEnvironmental Health & Engineering, Inc. and in the Monitoring Report QI and Q2, 2002 prepared byGeosyntec. The results of analysis of all the indoor air sampling conducted in the Drewicz School areshown in the attached Table 3. TCE was detected at trace concentrations in the samples collected fromrooms 107 and 101 on the first floor and H-4, B-101 and the boiler room in the basement in 1992 butwas not detected in any of the subsequent samples from the Drewicz School in 1994, 1995, and 1996 atdetection limits of 0.71, 0.38, and 0.19 ppbv respectively. Three samples were collected in the cafeteriain 1997, two were non-detect at less than 0.19 ppbv and one reported a trace concentration of 0.15 ppbv.Two samples were collected in the boiler room in 1997 and both were non-detect for TCE at less than0.19 ppbv. TCE was not detected in indoor air samples from the school in 1998, 1999, 2001 ahd 2002.In 2000, TCE was detected in the school cafeteria at a concentration of 0.35 ppbv but it was alsodetected in the ambient air sample at a concentration of 0.22 ppbv, therefore the detection of TCE in theschool is attributable to background sources.
Soil gas data from the vicinity of the Drewicz School has been collected during several phases of theinvestigation program. Soil gas samples were obtained from seven locations on the public streetsaround the Drewicz School in 1992. The soil gas sampling locations (SG-51, SG-52, SG-53, SG-54,SG-66, SG-60, and SG-62) and the results of analysis are presented in Figure H-2a of the Phase IIReport. The concentrations of TCE reported in samples from all of these locations were <1 ppbv with
TR0076 NOAF Response Letter 2009-06-22.doc
engineers I scientists I innovators
Ms. Rodene Lamkin22 June 2009Page 8
the exception of SG-62, located at the intersection of Western Avenue and Holland Street, whichreported a concentration of 43 ppbv. Soil gas samples were also collected in 1997 from SGP-15 locatedat the corner of Hood and Holland Streets. The location of SGP-15 and the results of analysis arepresented in Figure H-2b of the Phase II Report. The concentrations of TCE in two soil gas samplescollected from SGP-15 in 1997 were 2.3 and 3.9 ppbv.
Page 6 of the NOAF states that "indoor air monitoring conducted in 1995 reported 1.5 ppbv in the boilerroom". The 1.5 ppbv detected in the boiler room in 1995 was PCE and not TCE and the presence ofPCE in the boiler room is attributable to sources other than migration from soil vapor as discussed in areport submitted to MassDEP in January 1998 titled Preliminary Evaluation of Potential Sources ofTetrachloroethene in Indoor Air at the Drewicz School (BEAK, 1998a)
TCE was detected at a trace level (0.41 ppbv) in the Drewicz School in 1992 but TCE has not beendetected at concentrations above the reporting limit for the analytical method used to conduct theanalysis in samples of indoor air from the School other than in 2000 when it was also detected inambient air. The soil gas data from 1992 and 1997 showed a maximum concentration between theFacility and the Drewicz School (SG-66 sampled in 1992 and SGP-15 sampled in 1997) of 3.9 ppbv ofTCE. We believe that the existing data demonstrate that the vapor intrusion pathway is not complete inthe vicinity of the Drewicz School and a Critical Exposure Pathway does not exist at the School.
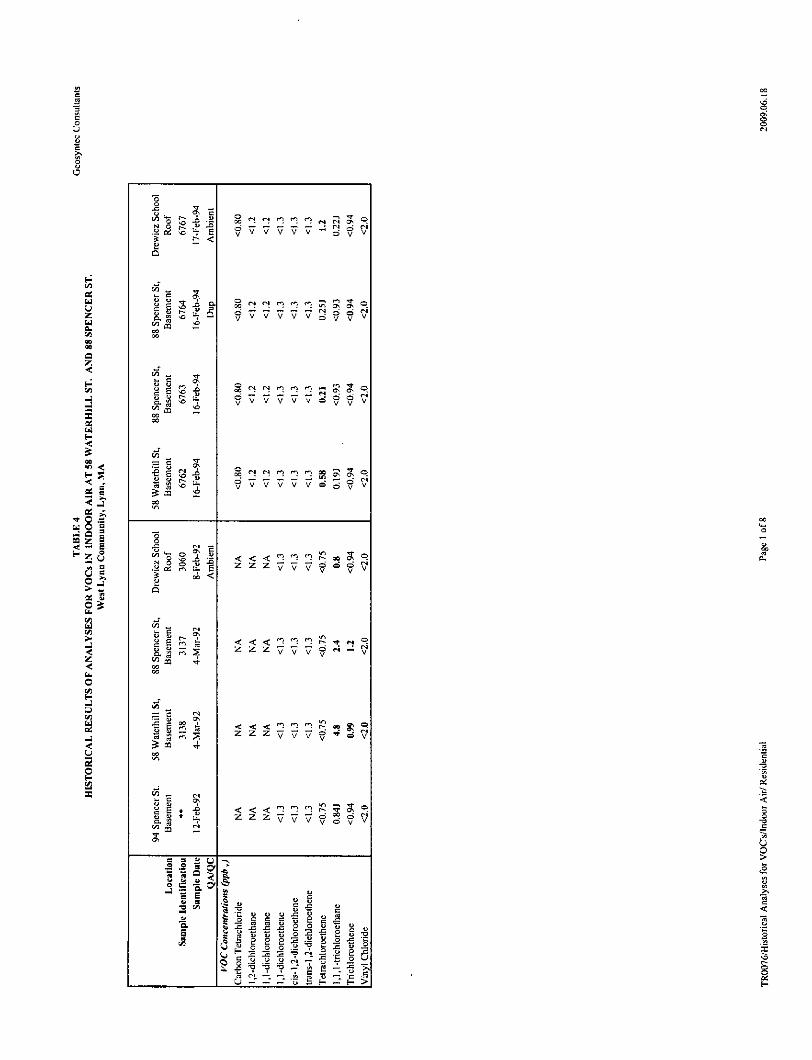
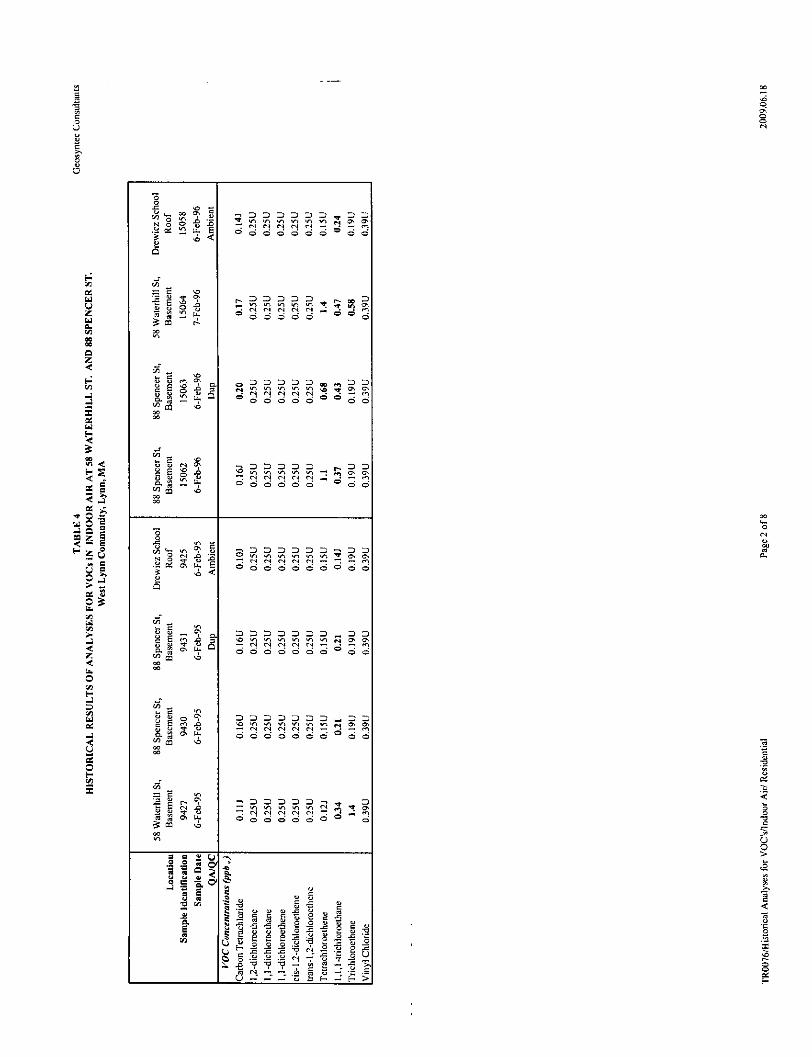
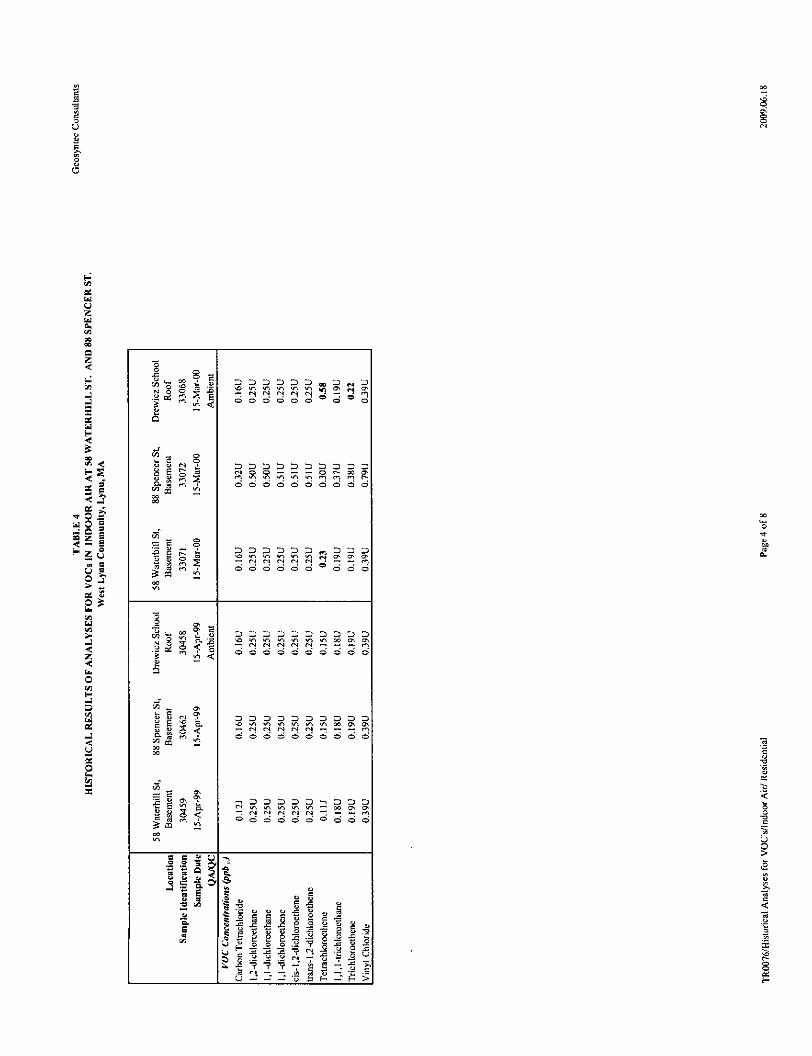
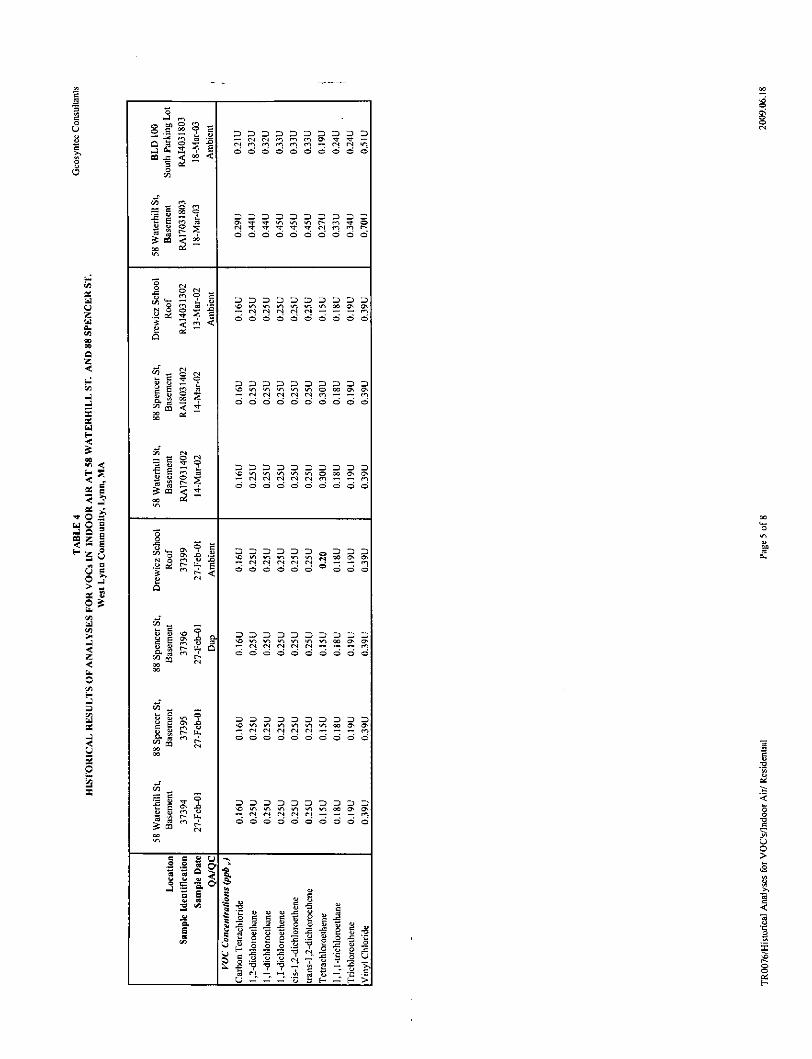
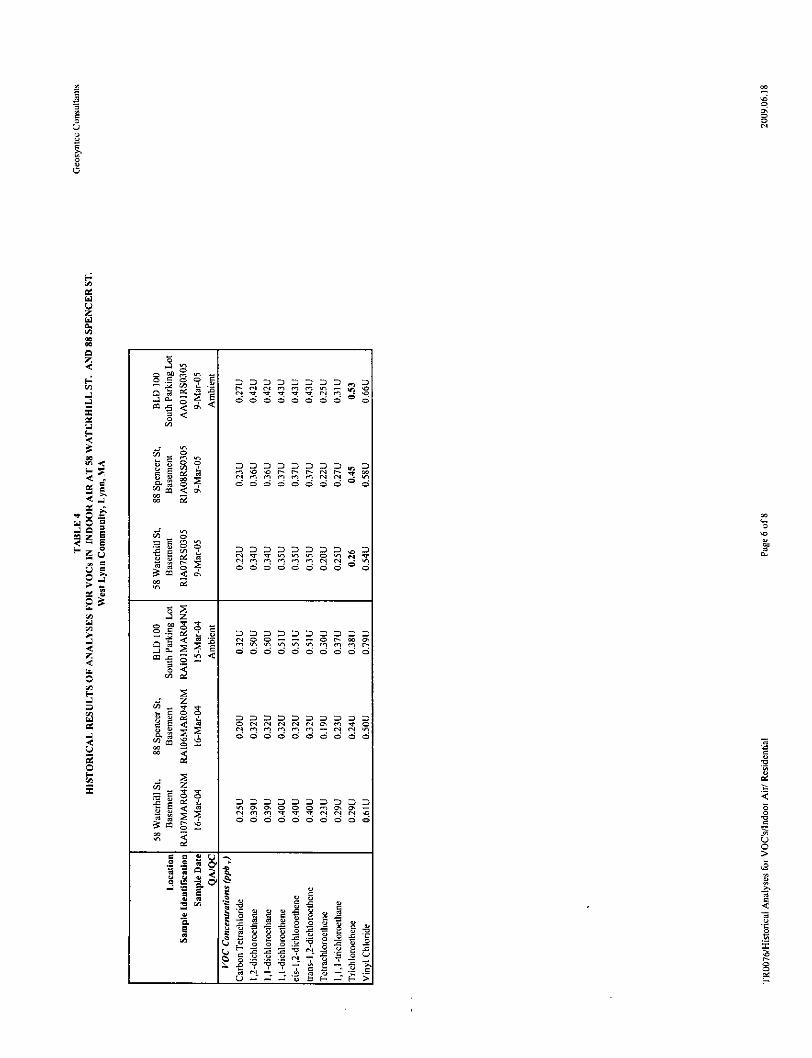
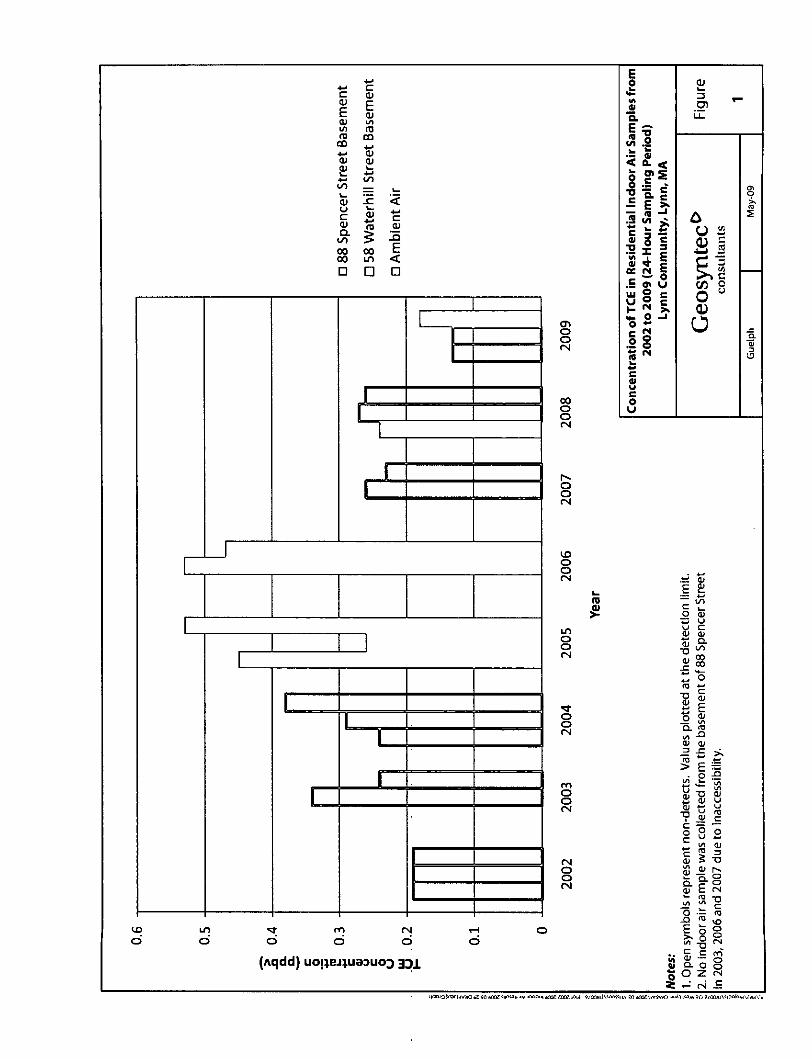
NOAF Item 3 - The 1992 indoor air data for two residences indicates that a CEP may be present. In1992, 1.2 ppbv TCE was detected in #88 Spencer Street and .99 ppbv TCE was found at #58 WaterhillStreet. Since 2003, lower levels of TCE (between .24 and .53 ppbv) have been detected in the tworesidences. A comparison to the ambient air monitoring results indicates that the data is sometimesconsistent with ambient levels and can be attributed to ambient conditions. TCE levels are consistentyabove the MassDEP draft threshold value of. 15 pybv TCE and it is not clear whether a CEP now existsin the two residences. If a CEP is present, the feasibility of installinz a mitigation system must beevaluated.
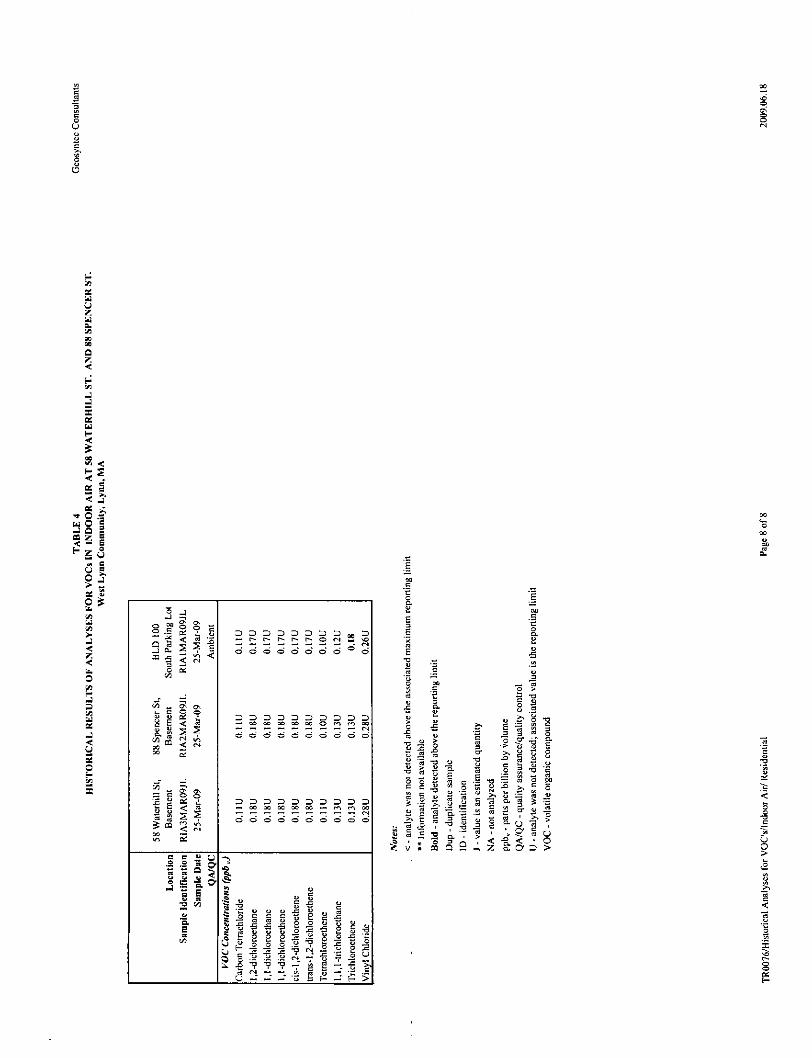
Response: Results of indoor air monitoring at #88 Spencer Street and #58 Waterhill Street obtainedbetween 2002 and 2008 are presented in previous Semi-Annual Monitoring Reports and are compiled inthe attached Table 4 and Figure 1. Recent sampling conducted in March 2009 not previously submittedto the MassDEP are also presented in Table 4 and shown in Figure 1. TCE was not detected in indoorair from either residence or the ambient air sample in 2002, 2003, 2004 or 2007. Figure 1 shows thedetection limits for analysis of TCE in the air samples as open symbols on the chart. As shown inFigure 1, TCE was detected in both residences in 2005 but at concentrations below that reported in theambient air sample collected at the same time. In 2006, TCE was detected in a sample of indoor airfrom #58 Waterhill Street at 0.53 ppbv but a similar concentration (0.47 ppbv) was detected in theambient air sample collected at the same time. It is reasonable to conclude that the TCE detected in
TR0076 NOAF Response Letter 2009-06-22.doc
engineers I scientists I innovators
Ms. Rodene Lamkin22 June 2009Page 9
samples from the residences in 2005 and 2006 are due to an outside source. In 2008, TCE was detectedin a sample of indoor air from #88 Spencer Street at a concentration of 0.24 ppbv. In 2009, TCE wasdetected in the ambient air sample (0.18 ppbv) but was not detected in either residence. Theconcentration of TCE detected at #88 Spencer Street in 2008 is consistent with concentrations detectedin ambient air in 2005, 2006 and 2009 and not considered attributable to chemicals at the Site. Webelieve that the existing data indicate that a Critical Exposure Pathway does not exists in either of theresidential buildings where monitoring has been conducted in the vicinity of the Site. Indoor airmonitoring has been and continues to be conducted to evaluate if there is a CEP for these residences. Itshould also be noted that the residences at #58 Waterhill Street and #88 Spencer Street were selected forongoing monitoring after 1992 because they were the locations with the highest detected concentrationsof TCE detected in indoor air in the survey conducted in 1992; however, as discussed above, other linesof evidence available for these buildings indicate that the presence of TCE in indoor air samples fromthese residences is not associated with subsurface vapor intrusion.
We think it is very important to discuss this information and the actions specified in the NOAF with youbefore we prepare and submit a formal Audit Follow-Up Plan. We would appreciate the opportunity tomeet with you to discuss information regarding the Site and appropriate follow-up actions. If you haveany questions or would like additional information, please do not hesitate to call Doug Larson at978-206-5774.
Sincerely,
GEOSYNTEC CONSULTANTS, INC
Dou . rson, Ph.D., P.E., LSPPrincipal
Thomas A. Krug, M.Sc. P. Eng.Associate
Copies to: Mr. John Uruskyj, General Electric CompanyLynn Board of Health, moconnoribci.lynn.ma.us
TR0076 NOAF Response Letter 2009-06-22.doc
engineers I scientists I innovators
Ms. Rodene Lamkin22 June 2009Page 10
REFERENCES
Beak Consultants Limited (BEAK). 1998a. Preliminary Evaluation of Potential Sources ofTetrachloroethene in Indoor Air at the Drewicz School. January 1998.
Beak Consultants Limited (BEAK). 1998b. Phase II Comprehensive Site Assessment Report for theGE West Lynn Facility. Lynn, MA. February 1998.
Commonwealth of Massachusetts Executive Office of Energy & Environmental Affairs Department ofEnvironmental Protection (MassDEP). 2009. Notice of Audit Findings. Letter to Mr. John Uruskyj ofGeneral Electric Company. 22 May 2009.
Commonwealth of Massachusetts Department of Environmental Protection (MassDEP). 2008b.Massachusetts Contingency Plan (MCP) Numerical Standards Development Spreadsheets -Development of MCP Risk-Based Levels for Soil and Groundwater; MCP GW2 alpha.xls. February2008. http://www.mass.gov/dep/service/compliance/riskasmt.htm
Fitzpatrick, N.A. and Fitzgerald J.J.. 2002. An Evaluation of Vapor Intrusion Into Building through aStudy of Field Data. Soil and Sediment Contamination. 11(4): 603-623.
Geosyntec Consultants (Geosyntec). 2009. Semi-Annual Remedial Monitoring Report - Quarter 3 and4, 2008, West Lynn Site. January 2009
New Jersey Department of Environmental Protection (NJDEP). 2005. Vapor Intrusion Guidance.October 2005.
TR0076 NOAF Response Letter 2009-06-22.doc
engineers I scientists I innovators
TABLES
Geosyntec Consultants
Table 1: Documents Submitted to MassDEP Between 1995 and 2003 Not Referenced in theMay 22, 2009 Notice of Audit Findings
Document Title Date AuthorQuarterly Remedial Monitoring Report CalendarQuarter December 1994 to February 1995 GE West Feb-95 BEAK ConsultantsLynn FacilityResults of Supplemental Phase II Sampling Activities Jul-95 BEAK Consultantsfor the GE West Lynn FacilityCombined Quarterly Remedial Monitoring Report:Groundwater and Soil Gas Monitoring CalendarQuarter June to August 1995/Groundwater Treatment Aug-95 BEAK ConsultantsSystem Product Only Recovery System MonthlyMonitoring Calendar Quarter May to July 1995,Summer Quarter 1995Installation of Supplemental Monitoring Wells, Oct-95 BEAK ConsultantsPiezometers at the GE West Lynn FacilityResults of a Soil Boring Program at the GE West Oct-95 BEAK ConsultantsLynn FacilityInstallation of Monitoring Wells, Piezometers andSoil Gas Probes in the Area Adjacent to the GE West Oct-95 BEAK ConsultantsLynn Facility
Combined Quarterly Remedial Monitoring Report, Nov-95 BEAK ConsultantsFall Quarter 1995
Combined Quarterly Remedial Monitoring Report, Feb-96 BEAK ConsultantsWinter Quarter 1996
Combined Quarterly Remedial Monitoring Report, May-96 BEAK ConsultantsSpring Quarter 1996
Repairs, Decommissioning and Installation ofPiezometers and Monitoring Wells at the GE West Jul-96 BEAK ConsultantsLynn Facility
1996 Annual Indoor Air Quality Monitoring in the Jul-96 Environmental HealthWest Lynn Community and Engineering
Combined Quarterly Remedial Monitoring Report, Aug-96 BEAK ConsultantsSummer Quarter 1996
Combined Quarterly Remedial Monitoring Report, Nov-96 BEAK ConsultantsFall Quarter 1996
Combined Quarterly Remedial Monitoring Report, Feb-97 BEAK ConsultantsWinter Quarter 1997Results of Shallow Soil Sampling in the Plant IIIArea at the GE West Lynn Facility, Lynn, MA Apr-97 BEAK Consultants
Page 1 of 3TR0076/NOAF Response Table I Documents.docx
2009.06.18
Geosyntec Consultants
Document Title Date AuthorResults of a Soil Gas Survey Conducted at the GE Apr-97 BEAK ConsultantsWest Lynn Facility, Lynn, MA
Combined Quarterly Remedial Monitoring Report, May-97 BEAK ConsultantsSpring Quarter 1997
Scope of Work for Additional Phase IIComprehensive Site Assessment Activities - GE May-97 BEAK ConsultantsWest Lynn Facility
Combined Quarterly Remedial Monitoring Report, Aug-97 BEAK ConsultantsSummer Quarter 1997
Combined Quarterly Remedial Monitoring Report, Nov-97 BEAK ConsultantsFall Quarter 1997
1997 Annual Indoor Air Quality Monitoring In the Nov-97 Environmental HealthWest Lynn Community and EngineeringAdditional Phase II Comprehensive Site Assessment Dec-97 BEAK ConsultantsActivities for the GE West Lynn SitePreliminary Evaluation of Potential Sources ofTetrachloroethene in Indoor Air at the Drewicz Jan-98 BEAK ConsultantsSchoolPhase II Comprehensive Site Assessment Report for Feb-98 BEAK Consultantsthe GE West Lynn Facility, Lynn, MA1998 Annual Indoor Air Quality Monitoring In The Sep-98 Environmental HealthWest Lynn Community and Engineering
Combined Annual Remedial Monitoring Report - Dec-98 BEAK ConsultantsFall 1998
1999 Annual Indoor Air Quality Monitoring in the Jul 99 Environmental HealthWest Lynn Community MADEP Case No. 3-0361 and Engineering
Combined Annual Remedial Monitoring Report Dec-99 GeoSyntec Consultants
2000 Annual Indoor Air Quality Monitoring in the rn-00 Environmental HealthLynn Community MADEP Case No. 3-0361 01-Jun-00 and EngineeringCombined Semi-Annual Remedial MonitoringReport, Quarter 1 and Quarter 2, 2000, West Lynn 27-Jul-00 GeoSyntec ConsultantsFacilityLetter to DEP - Re: Case 3-0361 Risk AssessmentAddendum to the Phase II Comprehensive Site 29-Aug-00 GeoSyntec ConsultantsAssessment ReportLetter to DEP - Re: Case 3-0361, West Lynn Facility,40 Federal Street, Lynn, MA. Results of 30-Aug-00 GeoSyntec ConsultantsSupplemental Soil Sampling I
Page 2 of 3TR0076/NOAF Response Table I Documents.doex.
2009.06.18
Geosyntec Consultants
Page 3 of 3TR0076/NOAF Response Table I Documents.docx
Document Title Date Author
Activity and Use Limitation (AUL) for the West 01-Sep-00 GeoSyntec ConsultantsLynn Facility
Remedial Action Plan for the West Lynn Site, Lynn, 06-Sep-00 GeoSyntec ConsultantsMA
Response Action Outcome (RAO) Statement for the 08-Sep-00 GeoSyntec ConsultantsGeneral Electric West Lynn Site
Combined Semi-Annual Remedial MonitoringReport, Quarter 3 and Quarter 4, 2000, West Lynn 29-Jan-01 GeoSyntec ConsultantsSite
2001 Annual Indoor Air Quality Monitoring In The 07-May-01 Environmental HealthLynn Community MADEP Case No. 3-0361 and Engineering
Combined Semi-Annual Remedial MonitoringReport Quarter 1 and Quarter 2, 2001 West Lynn Site 31-Jul-01 GeoSyntec Consultants(40 Federal Street)Combined Semi-Annual Remedial MonitoringReport Quarter 3 and Quarter 4, 2001 West Lynn Site 31-Jan-02 GeoSyntec Consultants(40 Federal Street)Combined Semi-Annual Remedial MonitoringReport Quarter 1 and Quarter 2, 2002 West Lynn Site 31-Jul-02 GeoSyntec Consultants(40 Federal Street)Combined Semi-Annual Remedial MonitoringReport Quarter 3 and Quarter 4, 2002 West Lynn Site 31-Jan-03 GeoSyntec Consultants(40 Federal Street)
2009.06.18
4
a
0
G ~ ~ ~ ~ ~ ~ l N.-- O N nn aoNO O *o ""N N N N N -
+-e o aEa66666660o662
E 0 v v ,
e Q e 2 vv v v v v eev0 r vausz v ve v v2 ivN
c =
.u~
E m ddr- oo - - -
ae ce
o VVVVV<< VO=OVGE gi
0
.0 ( -Q' 0
20
20
E. E. K
<at.< z zooc d 6* V V . V V V
.2"- c .C ,
<aU(N< zzzvvvdcgio
'0C
0
Coa0,
N
0
0 -
.d d
e in 6 66 0 64 *4 DDDD
<e N , 01 r O O 1 o o in.9 Ni 6 6 6 5
-0 -". 0 %DDDDE a DDDDDD 0 %D00N o
< Q 0. -- V! %UG G ae N ,O OO.O . O0O o
= 40 0 0 0
8
N d O OOo
Q
NO NoOO.O O o
0
-c
- 066666**06
'-'
5 iii. < tt .2 di
in -c 0 e .
- 0.=o -
U - o o ? 2 . 3 -di3-4 --- 2-
. . .2 . v N - . d o
ou$) U r1 d- k:
80
N0
el
=
F-
001
oil'40-
0
00
C
C-
.000
Ca
o o 0- 0 0 6 a6 6
o a ao o 0 o 6o 6c 6
DDDD0~~DZD~0404IsIsrn ON ~ -
0 a a a C 0 6 6 6 6
DDD~ZDZDDDC-'0'C'0
o a a o 0 0 6 6 6 6
Is 0 '0 N N N 00 N N
o66666666 GG GCCI
Oi
--
..2 E tII . 0)
~.) ~. 0e
u 5 g 33 3 5z E 3!c - - s .9
00
C
CC
C)
C
0
C
.09
ON
C
C
E5C
C
C
0 w 04 04Is ss - a04 6 t t o ds 6
F-
0 2
oo-
C o
z0
-0
.0
00
0
.
00
0
0o
0
0
0.
.0
C-
on
= C
0 C
C0
.6
E
eoa
LO16
C0
U
C
0
0
to0.
C.
2C
C
-
C
ECQC
zC
e
C
o >
.3C.*3 *
C e
. =
a2
aCc.
a-C
0
3CC
-
.: .C
~ C
.-za
.o
..
C-a
.
O T
0
a
-
to
I .2-2 C
.o
CC>0
C
0.
.0 .0O 0
*n 0
C.
. o. .
0o
* .0* 0
0.
00
* 0
0o
04
'0 .0o 0en 0.
00
04
0.00
ZZ<yggo gy
z zzv~ : 04ZZZvOOv v.
v v v v v
V V V V C
v ne
Et oo0 -
to
o
- 009
0 0 O ,
.2 .2 o o' o'5
.J 0 00.0 0 .:' 'S- oi.0 .. et , 0.c -0 0 0.0 0 - - -
a; J J e g .. 8 .a t . -.- -^ 'S .2 & ^
0
o0
'B-. 0 o.8880 a of 0.
C
E0
'000%00
v v v v o
v v v v v0-e 0-0%o
<<<'c'o rlo'.O
Z Z Z C C C C - 0 oV v V v v v
ZZZ0
ZZZ 0
en
='C
to0
e
w)
0
C,0
0C
.0
0,
00
.00O
i0
0
0~O C *
.0 - *
C
-0
2
0C
'0
0
'00-CC
z
0
-2C
[4
C
O a
za
0O.
'a
U
cc,6
aN
-E
00
'0C
gC
0
'0CC'CC0
-3
0
U
0
C
""I
0s
'.
50.
.
0.
0
o |>
o .30Ei tO
o a -a
N t-
0 di
oa -
t ,>.z aoo
Co0
-t
.0
.0E/
T02
C. '.' .' ' '
-v5;777M7"2C60
2
if, -a' =
No ~ .~ ~o if) .0~'o~ E
O a'a
0) 0
C a'0) ifsS 'o-~if) N'if '0
'0
C
if) ON
E0) N
z z z V7V6 -
.0
-E
if)
.0
~0
C
.0U'N0
0
u
8
'0CONCC
v v v v v v av v
ON0 'a 0)
.0E
0o
ONN
4
ON00
if,
E*
if,,
C.00
ON
ON
.0
2CC00
U0'
0'CC
0
C
S
=ifCa0
0.2
'if
if.
ifif
if
ifif.'Sifif
UU
0
C0
o0
U C"e
E0 ' 0-a ai sa
0666666 o66
a e aZ Q o0 0 .' -0n n. n eo
(a .(ae e n n . a e o(-aO O o ozog '.*
UC f' ,
2E6 6 *6
-~ j~~2 ~r~tr~jr4 s<8
00 00 0
"=Cg- e '0
U e19' Df r 0
.0 . 4 0
0 2 o- 02-
-D2E~~ 0.0- ' 2 5oe 666666,506-z. ' ' '0-"C. (ae o .- c -
0
(a1
(a1
'0C
0'CCCM
C0U0)
0
C
ao
80
CU
C
=
'a
C
.0E
-nE-C
N flenC,. mt '0
a a a a a a 6 6 ~ 6
'0 N N N (N N 0Neno, en en en N N C,a6666666 = a
D2DD22~~~ 0 fl01 t 0CCCCC,~ 0NrNenenenr, N N C,6666666606
N C C~~CN 00 ONenCCCCCrfl en en Na a a a a a 6 6 6 6
a N N N N N ON en ~ aN 0~ It) IN en 00 - N 01 C,a a a a a a 6 6 6 6
C, ON ON C C C en ON ON -N en en 0 0 0 N 04 04 '0a66666aaaa
2 U aU
. ,..2 P20 0aE -
0, E~ .2 o- - -. - -
_______u -__- -__ .. H- Z>
'0CONaCN
a
C
a
3a
0.2toC
'4
0-
000,
C
0'
0, - C
0,~ <
'a
-C0,
-z0E
Ct)CC0,
C-C
0as
C,
S2
az
C <
3-
2
0o
72

00
'0
C
04
e0
8C
C
0
0
C-
0
0
0
EEC
000
tCa
.0
a a
o >
- 8C
E -C
a ,.~ C
(S
E
a -
o-
0)
>0
0
C
z
.o
a
.0
a
o *C
t o
t .2-o C
00)
..0
.o
0
*0
0
=
CCCC
00
CC'CC(N
C00
00
C.

FIGURES
E
o I -
E Ea)mm m E -
(U,
0 c 4m
I. - .00 -
LI = o 0--
w eCLC
00~ 00 0'N 1E
a. .E rat u 0o E
o a0
cnc e4
00 0
0
Lo
00
-Z-
LAL
4.0
0 0 ,
>
E
0 n
C)a
r.4.
Eo"oCD~ 0 C 09
(Aqdd)~~~U U0lNU3O: i'0 Z
ATTACHMENT A
Pages from the Phase II Report
00 AOU TI polwodi966L *qeyj eiflB!Y ivuiwqu ........... _ Anpno nro~ --
1O "09 OSZ 9ZI 0VVy 'uuAl 'Iq!Iped uuki 198M 9EO uoim~3O Rui dims p05 punoJ6,lSq vsuoqso, fldumSimeapunoi sj iJ0!O-tadir pus lios evOSO-BMnsi#SPfoi lf$!~~~ m o
ns
.3
..........
- -d . ..
-0
d
...... P.
........ -- -- -
.C ... .. ..... / - -. ..
C3 -d-.
* ~ ~~~~ ........ // /' -
.-.---..............
.. .. ....
.... ....... BD-d *
.... L ................1
...
Z3 -di 7
/ Io..... ~
.......................
3..D
.... . .....- -- -. . ...... ...LV-d-dl.
6L9-dl. r - ,'
.
....... ..
W' d
'SV dl
it -dl,.
.................................
7- t3I
...'& .. .,W dl. '
/~d V.' .3 tZ-lnOtd
. ..... --- /---- A t ~ t & .~- ~ f -/ '~r'j IP' d
I.
00
O~o0 ~O
0P31ii I 0$0 0 Q 1
K ID1 ' i it ii 1i i t- , ii i i Ii i'
I L
WWI I $ I 1 ted A w
-i - -Ia
- *I. I 1 1 O -I-
It d p I I I '
~soun~deNI I I p~ l lislpe' ipdO- - . I(f)I I j t s is l a 'SZSCG-d
-4 - - - - 7
I I I ' i I' I I II
I ~ ~~~~~ I i i s ' l '-Ill il a i I a s s-i 5 I q I I L
I~ ~ I. - - a
* - t - I . I li i i I I
0 0 iiip..t '''li0la.
,
I
rla
' alit
rails
-S ww
is
I t l- d . . . .... .
*as I -IeI -di I | - 'i *a a LR -RC
I I I'1i
gla di|O GC
'p ---
- J- II-~ k IS$eI FI.monosus lli -il> iia
I I . -. - . .2.- - I 5
I s -im aI -I-- * I I 5 15 'i I
" C i' s
&U'd.
J2JOA/flQ flS/J U0JS09 . I5~i i
I* ..... 4...' r i I
-1 7- - '-'N - ) I-I C
(IBAGI eas ueew e~oqe ieej) UOIIAGIH
IfMVm IdAm V &S , UIS 301USS OOti H DA4 0 U "Q - *s a
U-.
B' BWest East
GE West Lynn Facility --
35-
30-
25-
20:- ~ 00
15.IIS--
-0 0OW
coarse to fine sand5.-
- - -Mean Sea Level0 ----- -- ----- -- ---- - - - - - ----. -- --- - ---
5 - ~
(U -10 -- - - - - - -- -----0 - - -0
- - - - - - - - - -
E----------------------- mieybeddfied cad --. -0 - - - - - - - - - *(00
W -35- - -- - - - - - - - - - -c~~ .3:- ----------------- - - - - - - masvlybde cla - - - - - - - - - - - - - - - - - - - - - - - - -
-40--
E-45.
-50- a-- - -eladv- location of Bo rings
-5 5 9rudsm ..g#n suaepoE k:d ro sut'o wa;be -thnss hnto refect rjoagnrlylw(owater leers-tab lie rae fs EasCo ss-Secdtion S ownpConcentration of TC in Groundwater amples
-6GE0estronnsFciliy.onyinMbo0tomo-welscre-n-s-'' - -- to O -10 -10--5 o -ott m---- -o b Frnconc nternsion aiUFb 19-rge- sewes ar r n ws oo - R -Concntrtio ofato TCE in rondatramleo55 p125t forsuto wate soole beak t rfelos-ecionUn internsaionala i gur F b. 993 ~ 6 verasacal exgealn-ixicoprtd 5.ee .0
00 6A6 1 9 Poegid"Ouj S OtflIA Aq uoiliq ied sued ;o spun u! utinu 300 1 Aqdd $tItlO#.1I
866 L -qe~j IUUO!IVUJSIWossij9 edu,
VAJ'UUA&1 A!f3OE UUA1 ISOM 30 A26 tL uq peq.jd Iitie
ofiwes~!VJOOUI ~i.U0 ! BOA O AUWUn~fi epunoq Ai'pe L-~661 Pue96619S661 V6OL'Z66L u!pe~dWsBu!pI!ng.t Pl
:"N2 -'uqN SO
--- ----- -- ---- -- - -- - -- - -- - -- - -- -. . .. . . . .
S. I .:4 Il
. .....
...............
-- - - ----.
.-.... ...... - -- - -
I .... ......
........ . h
.........
...... .. ...
............
.. ...... ...... . ...
.........
q';'
-:2L
.... ... ... aNS
i Ij... 7,
unee, ... odsi S1>80 5'$0 lP 3J
le.. i o"'
..........
"t-..
lit
301.
30
0i 1t:i\ 1/ l=0 :I 30
465 M /0 4 OO . -
Vol
NY
00'A6U IC-O-H MsWJodOUI Anmo . dpunq /11lJJII
166 I 130 q~u img oSZ SUl 0 11olxpMdvIIEH1 iaP ew onW(u It10as3d
vY 'uu Ajjjqpeez uuAi isOM 3E)i'W3 OOA0 8P8 IoloS oajs-ua ru :eto WAp toit
30/O 1SeS9 pR~l1o"lfi UZ~tJ1 O
.....
..
------------------......
-
-..
.S ........ ..........-/ i * Ut f~t9 O
4-~ - )7
jive ..........
it --- ---
£ ~ ~ ~ ~ ' *Lt rNXS -w~ O
00 'ABU q-H piodmiC966L 'qeA eJn6u Is osc sna II"- I (iii Aenibe)p V"pme
~ ~ .M.J ', ~(III1 :Aamnb uqw) OWoL W%yr uia 'Ampe uuA sem 3-na u H i wun p3Ei 9An5V 4L. 111 .
spaG DOA seD 11os eMS-4O ""o *"~~w. "1*' ou ",t"i p0,II-IpqusBum,
Dow"
--- ~~ ------
1......-
--
... .. ........
.... .... ... r
.........
.. re r.... r r.
ses ns ea ss se wes te-as)-do
5 -
-* * ... ...
ILno 1!eI
...............
rur
. ....... "I
s~~2 f-- - o.
... IOI -11 1 M L ... 1
6
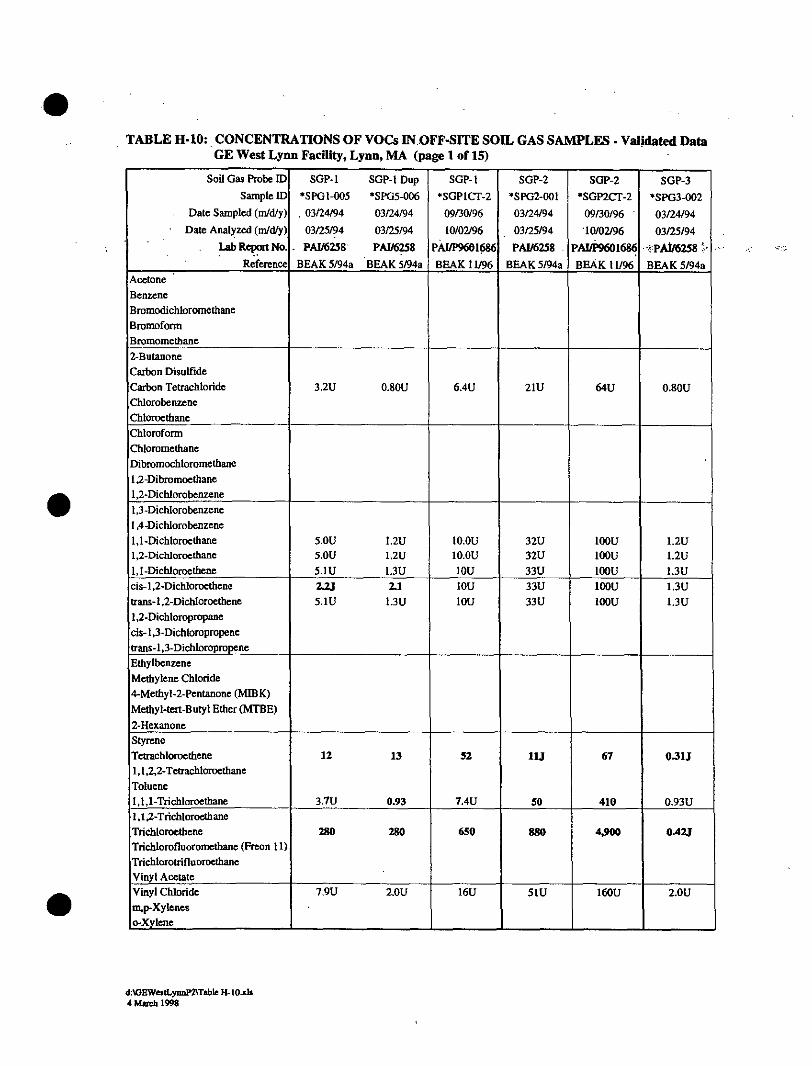
TABLE H-10: CONCENTRATIONS OF VOCs IN.OFF-SITE SOIL GAS SAMPLES - Validated DataGE West Lynn Facility, Lynn, MA (page 1 of 15)
Soil Gas Probe ID SOP-1 SGP-I Dup SGP-I SGP-2 SGP-2 SGP-3Sample ID *SPGI-005 *SPG5-006 *SGPICT-2 *SPG2-001 *SGP2CT-2 *SPG3-002
Date Sampled (m/d/y) . 03/24/94 03/24/94 09/30/96 03/24/94 09/30/96 03/24/94Date Analyzed (m/d/y) 03/25/94 03/25/94 10/02/96 03/25/94 10/02/96 03/25/94
Lab ReportNo. . PAI/6258 PAI/6258 PAI/P9601686 PAI/6258 PAI/P9601686 @PA1/6258Reference BEAK 5/94a BEAK 5/94a BEAK 11/96 BEAK 5/94a BEAK 11/96 BEAK 5/94a
AcetoneBenzeneBromodichloromethaneBromoformBromomethane2-ButanoneCarbon DisulfideCarbon Tetrachloride 3.2U 0.80U 6.4U 21U 64U 0.80UChlorobenzeneChloroethaneChloroformChloromethaneDibromochloromethane1,2-Dibromoethane1,2-Dichlorobenzene1,3-Dichlorobenzene1,4-Dichlorobenzene1,1-Dichloroethane 5.0U 1.2U 10.0U 32U 10OU 1.2U1,2-Dichloroethane 5.OU 1.2U 10.0U 32U 100U 1.2U1,1-Dichloroethene 5.IU I.3U IOU 33U 100U 1.3Ucis-1,2-Dichloroethene 2.2J 2.1 IOU 33U 100U 1.3Utrans-1,2-Dichloroethene 5.1U I.3U IOU 33U 100U 1.3U1,2-Dichloropropanecis- 1,3-Dichloropropenetrans-1,3-DichloropropeneEthylbenzeneMethylene Chloride4-Methyl-2-Pentanone (MIBK)Methyl-tert-Butyl Ether (MTBE)2-HexanoneStyreneTetrachloroethene 12 13 52 11J 67 0.31J1,1,2,2-TetrachloroethaneToluene1,1,1-Trichloroethane 3.7U 0.93 7.4U 50 410 0.93U1,1,2-TrichloroethaneTrichloroethene 280 280 650 880 4,900 0A2JTrichlorofluoromethane (Freon 11)TrichlorotrifluoroethaneVinyl AcetateVinyl Chloride 7.90 2.0U 16U 51U 160U 2.0Um,p-Xyleneso-Xylene
d:%EWlestLynnflTable H-lo.xls4 March 1998
0
0
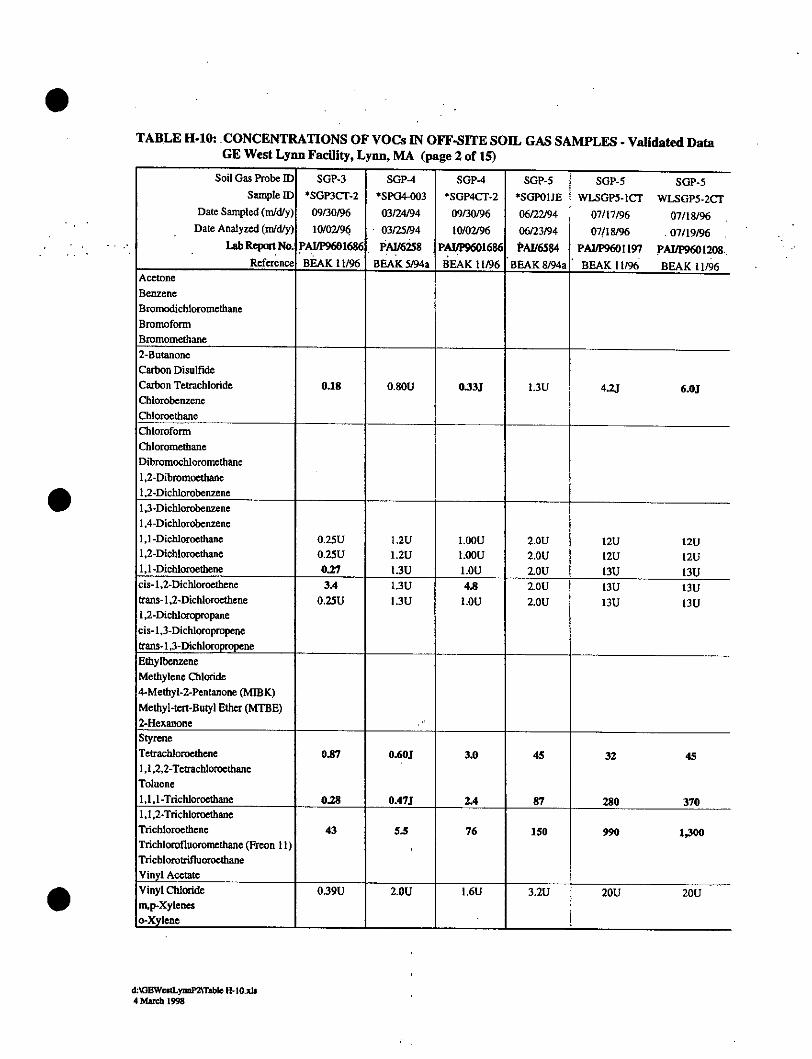
TABLE H-10: CONCENTRATIONS OF VOCs IN OFF-SITE SOIL GAS SAMPLES -Validated DataGE West Lynn Facility, Lynn, MA (page 2 of 15)
Soil Gas Probe ID SGP-3 SGP4 SGP-4 SGP-5 SGP-5 SGP-5Sample ID *SGP3CT-2 SPC4-003 *SGP4CT-2 *SGPOIJE WLSGPS-lCT WLSGP5-2CT
Date Sampled (m/d/y) 09/30/96 03/24/94 09/30/96 06/22/94 07/17/96 07/18/96Date Analyzed (ni/dy) 10/02/96 03/25/94 10/02/96 06/23/94 07/18/96 .07/19/96
Lab Report No. PAM/P9601686 PAII258. PAIP9601686 PA/6584 PAI/P9601197 PAI/P9601208.Reference BEAK 11/96 BEA 5/94a BEAK 11/96 BEAK 8/94a BEAK 11/96 BEAK 11/96
AcetoneBenzeneBromodichloromethaneBromoformBromomethane2-ButanoneCarbon DisulfideCarbon Tetrachloride 0.18 0.1 U 0.331 1.3U 4.2J 6.0JChlorobenzeneChloroethaneChloroformChloromethaneDibromochloromethane1,2-Dibromoethane1.2-Dichlorobenzene1,3-Dichlorobenzene1,4-Dichlorobenzene1.1-Dichloroethane 0.25U 1. U 1.00U 2.OU 12U 12U1,2-Dichloroethane 0.25U 1.-U 1.00U 2.0U 12U 12U1,1-Dichloroethene 0.27 1.:U LOU 2.0U 13U 13Ucis-1,2-Dichloroethene 3.4 1.U 4.8 2.0U 13U 13U(rans-1,2-Dichloroethene 0.25U 1.:U LOU 2.0U 13U 13U1,2-Dichloropropanecis-1,3-Dichloropropenetrans-1,3-DichloropropeneEthylbenzeneMethylene Chloride4-Methyl-2-Pentanone (MIBK)Methyl-tert-Butyl Ether (MTBE)2-HexanoneStyreneTetrachloroethene 0.87 0. 0J 3.0 45 32 451,1,2,2-TetrachloroethaneToluene1,1,1-Trichloroethane 0.28 047J 24 87 280 3701.1,2-TrichloroethaneTrichloroethene 43 55 76 150 990 1,300Trichlorofluoromethane (Freon 11)TrichlorotrifluoroethaneVinyl AcetateVinyl Chloride 0.39U 2IU 1.6U 3.2U 20U 20Uinp-Xylenes
o-Xylene
d.EWcstLynnP2Table H. l.xis4 March 1998
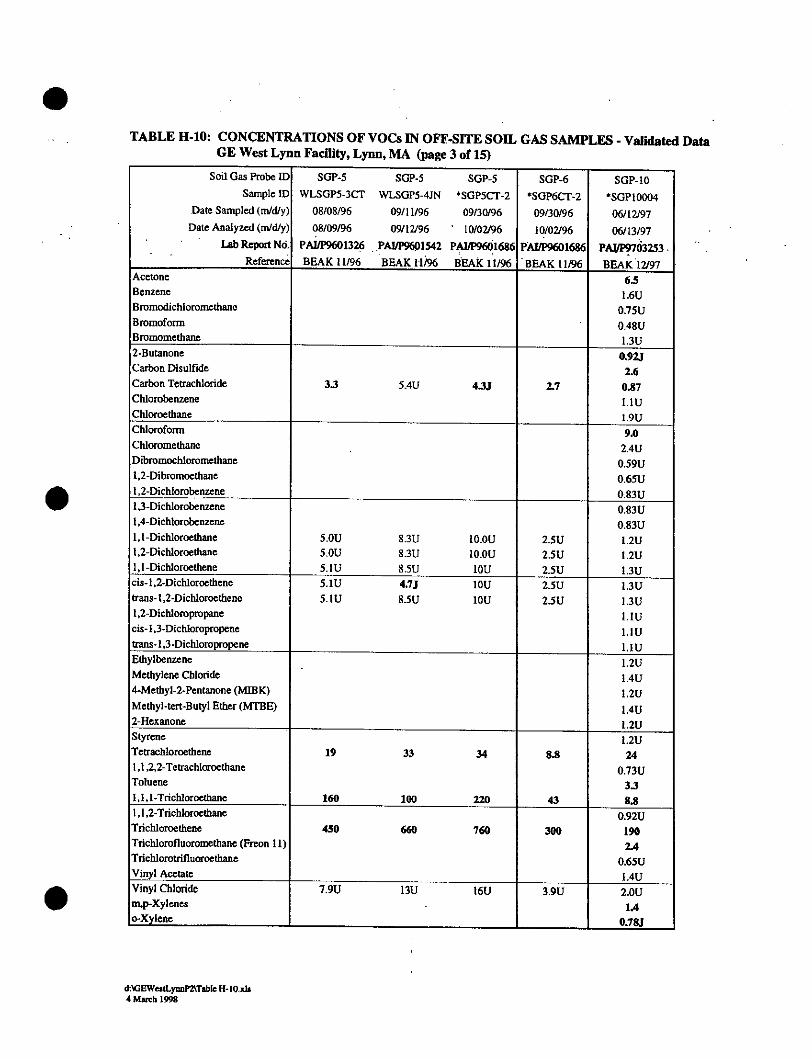
TABLE H-10: CONCENTRATIONS OF VOCs IN OFF-SITE SOIL GAS SAMPLES - Validated DataGE West Lynn Facility, Lynn, MA (page 3 of 15)
Soil Gas Probe ID SGP-5 SGP-5 SGP-5 SGP-6 SGP-10Sample ID WLSGP5-3CT WLSGP5-4JN *SGP5CT-2 *SGP6CT-2 *SGP10004
Date Sampled (m/d/y) 08108/96 09/11/96 09/30/96 09/30/96 06/12/97Date Analyzed (m/d/y) 08/09/96 09/12196 10/02/96 10/02/96 06/13/97
Lab Report No. PAI/P9601326 .PAJ/P9@1542 PAI/P96 1686 PAT/P9601686 PA/P9703253 .Reference BEAK 11/96 BEAK 11196 BEAKi 11/96 BEAK 11196 BEAK 12/97
Acetone 6.5Benzene 1.6UBromodichloromethane 0.75UBromoform- 0.48UBromomethane 1.3U2-Butanone 0.92JCarbon Disulfide 2.6Carbon Tetrachloride 3.3 5.4U 4.3.1 2.7 0.87Chlorobenzene 1.1UChloroethane 1.90Chloroform 9.0Chloromethane 2.4UDibromochloromethane 0.59U1,2-Dibromoethane 0.65U1,2-Dichlorobenzene 0.83U1,3-Dichlorobenzene 0.83UI,4-Dichlorobenzene 0.83U1.1-Dichloroethane 5.0U 8.3U 10OU 2.5U 1.2U1,2-Dichloroethane 5.0U 8.3U 10.OU 2.5U 1.2U1,1-Dichloroethene 5.1U 8.5U 10U 2.5U 1.3Ucis-1,2-Dichloroethenc 5.1U 4.7J 10U 2.5U 1.3Utrans-1,2-Dichloroethene 5.1U 8.5U 10U 2.5U 1.3U1,2-Dichloropropane 1.1cis-1,3-Dichloropropene 1.1Utrans- 1,3-Dichloropropene 1.UEthylbenzene 1.2UMethylene Chloride 1.4U4-Methyl-2-Pentanone (MIBK) 1.2UMethyl-tert-Butyl Ether (MTBE) 1.4U2-Hexanone 1.2UStyrene 1.2UTetrachloroethene 19 33 34 8.8 241,1,2,2-Tetrachloroethane 0.73UToluene 3.31,1,1-Trichloroethane 160 100 220 43 8.81,1,2-Trichloroethane 0.92UTrichloroethene 450 660 760 300 190Trichlorofluoromethane (Preen 11) 2.4Trichlorotrifluoroethane 0.65UVinyl Acetate 1.40Vinyl Chloride 7.9U 13U 16U 3.9U 2.0Ump-Xylenes 1,4o-Xylene 0.783
d: OEWetLynMTable H-1o.xls4 Mach 1999
0*TABLE H-10: CONCENTRATIONS OF VOCs IN OFF-SITE SOIL GAS SAMPLES - Validated Data
GE West Lynn Facility, Lynn, MA (page 4 of 15)
Soil Gas Probe D SGP-I1 SGP-12 SGP-13 SGP-14 SGP-15Sample ID *SGP11005 *SGP12006 *SGP13007 *SGP14003 *SGP15001
Date Sampled (r/Wdy) 06/12/97 06/12/97 06/12/97 06/12/97 06/10/97Date Analyzed (m/dy) 06/13.&14/97 06/13/97 06/14/97 06/14/97 06/11/97
Lab ReportNo. PA1/P9703253 PAIP9703253. PAJ/P9703233 PAD/9703253 PAI/P9703230
Reference BEAK 12/97 BEAK 12/97 BEAK 12/97 BEAK 12/97 BEAK 1/98Acetone 9.8 6.0 7.5 13 11Benzenc 1.6U 1.6U 1.6U 1.6U 0.51Bromodichloromethane 0.75U 0.75U 0.75U 0.75U 0.15UBromoform 0.48U 0.48U 0.48U 0.48U 0.10UBromomethane 1.3U l.3U 1.3U 1.3U 0.26U2-Butanone 1.3J 0.94J 1.0J 1.2J 1.7Carbon Disulfide 4.5 3.6 4.9 3.8 2.2Carbon Tetrachloride 0.67J 4.1 0.80U 0.80U 0.21Chlorobenzene 1.1U 1.1U 1.1U 1.1U 0.22UChloroethane 1.9U 1.9U 1.9U 1.9U 0.38UChloroform 2.6 3.3 0.67J 1.5 0.17JChloromethane 2.4U 2.4U 2.4U 2.40 0.34JDibromochloromethane 0.59U 0.59U 0.59U 0.59U 0.12U1,2-Dibromoethane 0.65U 0.65U 0.65U 0.65U 0.13U1,2-Dichlorobenzene 0.83U 0.83U 0.83U 0.83U 0.17U1,3-Dichlorobenzene 0.83U 0.83U 0.83U 0.83U 0.17U1,4-Dichlorobenzene 0.83U 0.83U 0.83U 0.83U 0.10J1,1-Dichloroethane 1.20 1.2U 1.2U 1.2U 0.25U1,2-Dichloroethane 1.2U 1.2U 1.2U 1.2U 0.25U1,I-Dichloroethenc 1.3U 1.30 1.3U 1.3U 0.25Ucis-1,2-Dichloroethene 1.3U 1.3U 1.3U 0.66J 0.25Utrans-1.2-Dichloroethene 1.3U '1.3U 1.3U 1.3U 0.25U1,2-Dichloropropane 1.1U 1.1U 1.1U 1.1U 0.22Ucis-1,3-Dichloropropene 1.1U 1.1U 1.1U 1.1U 0.22Utrans-1.3-Dichloropropene 1.1U 1.1U 1.1U 1.1U 0.22UEthylbenzene 1.2U 1.2U 1.2U 1.2U 1.6Methylene Chloride 1.4U 1.4U 1.4U 1.4U 0.404-Methyl-2-Pentanone (MIBK) 1.20 1.2U 1.2U 1.2U 0.16JMethyl-tert-Butyl Ether (MTBE) 1.4U 1.4U 1.4U 1.4U 0.542-Hexanone 1.2U 1..2U 1.2U 1.2U 0.24UStyrene 1.2U 1.2U 1.2U 1.2U 0.24UTetrachloroethene 16 31 2.2 4.0 0.971,1,2,2-Tetrachloroethane 0.73U 0.73U 0.73U 0.73U 0.15UToluene 4.0 2.8 3.3 3.1 2.21,1,1-Trichloroetbane 2.6 3.3 0.92U 0.551 0.341,1,2-Trichloroethane 0.92U 0.92U 0.92U 0.92U 0.19UTrichloroethene 610 560 3.0 48 2.3TrichiorofluoromethEM (Freon 11) 1.1 0.79J 0.681 0.89U 040Trichlorotrifluoroethane 0.6511 0.65U 0.65U 0.65U 0.13JVinyl Acetate 1.4U 1.4U 1.4U 1.4U 0.28UVinyl Chloride 2.0U 2.0U 2.0U 2.00 0.39Unp-Xylenes 1.20 1.20 1.20 1.2U 6.5o-Xylene 1.2U 1.2U 1.2U.1 1.2U 2.7
d:10EWestLynP2Table H-IO.xIs4 March 1998
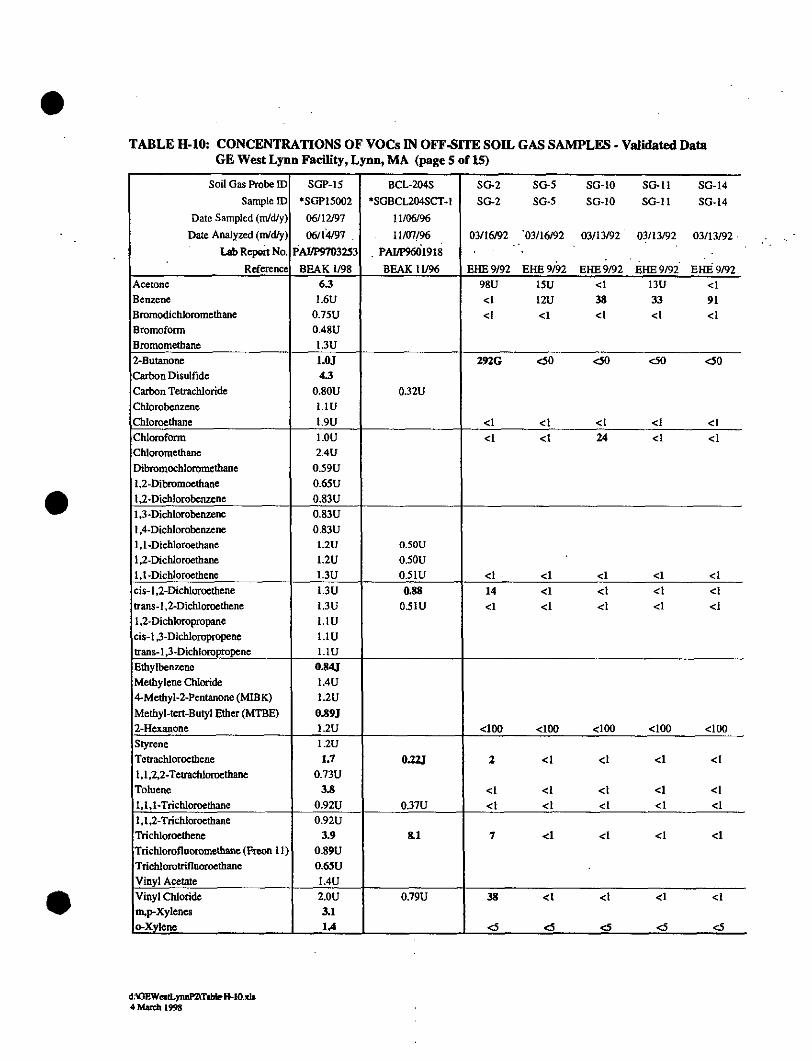
TABLE H-10: CONCENTRATIONS OF VOCs IN OFF-SITE SOIL GAS SAMPLES - Validated DataGE West Lynn Facility, Lynn, MA (page 5 of 15)
Soil Gas Probe ID SGP-15 BCL-204S SG-2 SG-5 SG-10 SG-11 SG-14Sample ID *SGP15002 *SGBCL204SCT-I SG-2 SG-5 SG-10 SG-ll SG-14
Date Sampled (m/d/y) 06/12/97 11/06/96Date Analyzed (n/dy) 06/14/97 11/07/96 03/16/92 '03/16/92 03/13/92 03/13/92 03/13/92
Lab Repot No. PAV/P9703253 PAI/P9601918Reference BEAK 1/98 BEAK 11/96 EHE 9/92 EHE 9/92 EHE 9192 EHE 9/92 EHE 9/92
Acetone 6.3 98U 15U <1 13U <1Benzene 1.U <1 12U 38 33 91Bromodichloromethane 0.75U <1 <1 <1 <1 <1Bromoform 0.48UBromomethane 13U2-Butanone 1.0J 292G <50 <50 <50 <50Carbon Disulfide 4.3Carbon Tetrachloride 0.80U 0.32UChlorobenzene 1.1UChloroethane 1.9U <1 <1 <I <1 <IChloroform LOU <1 <1 24 <1 <1Chloromethane 2.4UDibromochloromethane 0.59U1,2-Dibromoethane 0.65U1,2-Dichlorobenzene 0.83U1,3-Dichlorobenzene 0.83U1,4-Dichlorobenzene 0.83U1,1-Dichloroethane 1.2U 0.50U1,2-Dichloroethane 1.2U 0.50U1,1-Dichloroethene .3U 0.51U <1 <1 <1 <1 <1cis-1,2-Dichloroethene 1.3U 0.88 14 <1 <1 <1 <1trans-1,2-Dichloroethene 1.3U 0.51U <1 <1 <1 <1 <11,2-Dichloropropane 1.1Ucis-1,3-Dichloropropene 1.1Utrans-1,3-Dichloropropene 1.U
Ethylbenzene 0.84JMethylene Chloride 1.AU4-Methyl-2-Pentanone (MIBK) 1.2UMethyl-tert-Butyl Ether (MTBE) 0.89J2-Hexanone 1.2U <100 <100 <100 <100 <100Styrene 1.2UTetrachloroethene 1.7 0.223 2 <1 <1 <1 <11,1,2,2-Tetrachlomethane 073UToluene 3.8 <1 <1 <1 <1 <11,1,1-Trichloroethane 0.92U 0.37U <1 <1 <1 <1 <11,1,2-Trichloroethane 0.92UTrichloroethene 3.9 .1 7 <1 <1 <1 <1Trichlorofluoromethane (Freon 11) 0.89UTrichlorotrifluoroethane 0.65UVinyl Acetate 1.4UVinyl Chloride 2.0U 0.79U 38 <1 <1 <1 <1
m,p-Xylenes 3.1o-Xylene IA <5 <5 <5 <5 <5
d:OEWeuLynnlTableH-t0.is4 March 1998
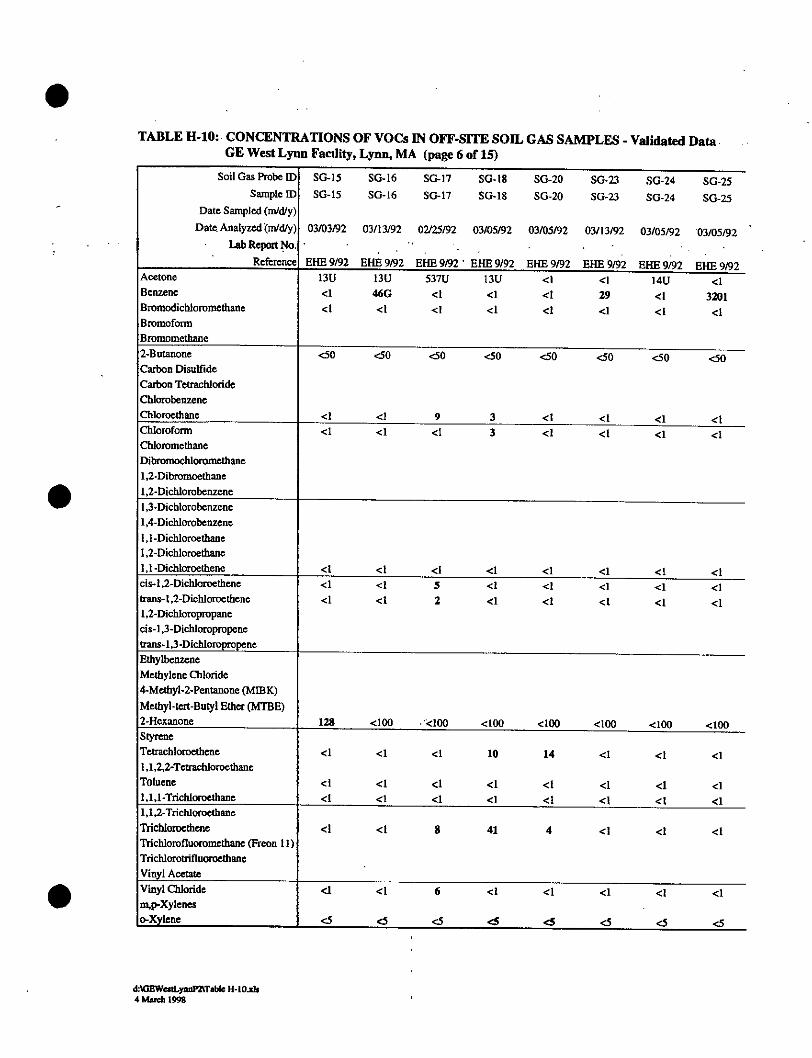
TABLE H-10: CONCENTRATIONS OF VOCs IN OFF-SITE SOIL GAS SAMPLES - Validated DataGE West Lynn Facility, Lynn, MA (page 6 of 15)
SoilGasProbelD SO-15 SG-16 SG-17 SG-18 SG-20 SG-23 SG-24 SG-25Sample ID SG-15 SG-16 SG-17 SG-18 SG-20 SG-23 SG-24 SG-25
Date Sampled (m/d/y)
Date. Analyzed(n/d/y) 03/03/92 03/13/92 02/25/92 03/05/92 03/05/92 03/13/92 03/05/92 03/05/92Lab Report No.
Reference EHE 9/92 EHE 9/92 EHE 9/92 - EE 9/92 EHE 9/92 EHE 9/92 EHE 9/92 EHE 9/92Acetone 13U 13U 537U 13U <I <1 14U <1Benzene <1 46G <1 <1 <1 29 <1 3201Bromodichloromethane <1 <1 <I <1 <I <1 <1 <1BromoformBromomethane2-Butanone <50 <50 <50 <50 <50 <50 <50 <50Carbon DisulfideCarbon TetrachlorideChlorobenzeneChloroethane <1 <1 9 3 <1 <1 <1 <1Chloroform <1 <1 <1 3 <1 < <1 1ChloromethaneDibromochloromethane1,2-Dibromoethane1,2-Dichlorobenzene1,3-Dichlorobenzene1,4-Dichlorobenzene1,1-Dichloroethane1,2-Dichloroethanei,1-Dichloroethene <1 <1 <1 <1 <1 <1 <1 <1cis-1,2-Dichloroethene <1 <I 5 <i 1 <1 <1 <1trans-1,2-Dichloroethene <1 <1 2 <1 <1 <1 1 <i1,2-Dichloropropanecis-1,3-Dichloropropenetrans-1,3-Dichlropropene
EthylbenzeneMethylene Chloride4-Methyl-2-Pentanone (MIBK)Methyl-tert-Butyl Ether (MTBE)2-Hexanone 128 <100 '<100 <100 <100 <100 <100 <100StyreneTetrachloroethene <1 <1 <1 10 14 <1 <1 c11,1,2,2-TetrachloroethaneToluene <1 <1 <1 <1 <1 <1 1 <11,1,1-Trichloroethane <1 <1 <1 41 <i 1 4<1 <11,1,2-TrichloroethaneTrichloroethene <l <1 8 41 4 <1 <1 <1Trichlorofluoromethane (Freon 11)TrichlorotrifluoroethaneVinyl Acetate
Vinyl Chloride <1 <1 6 <1 41 <1 <1 <1mn.p-Xyleneso-Xylene <5 <5 <5 <5 <5 <5 <5 <5
d%GBWestLynP24Tab H-lO.x4 March 1998
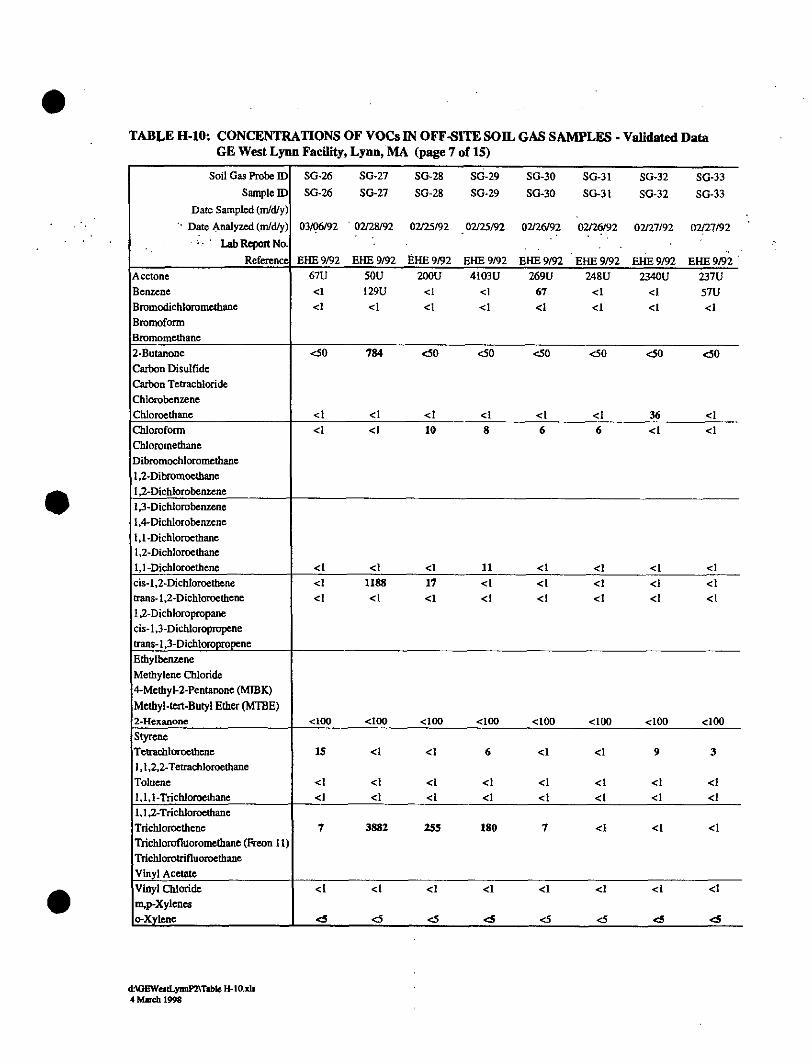
TABLE H-10: CONCENTRATIONS OF VOCs IN OFF-SITE SOIL GAS SAMPLES - Validated DataGE West Lynn Facility, Lynn, MA (page 7 of 15)
Soil Gas Probe ID SG-26 SG-27 SG-28 SG-29 SG-30 SG-31 SG-32 SG-33Sample ID SG-26 SG-27 SG-28 SG-29 SG-30 SG-31 SG-32 SG-33
Date Sampled (m/d/y)Date Analyzed (m/d/y) 03/06192 02/28/92 02/25/92 02/25/92 02/26/92 02/26/92 02/27/92 02/27/92
LabReportNo.
Reference EHE 9/92 EHE 9/92 EHEE 9/92 EHE 9/92 EHE 9/92 EHE 9/92 EHE 9/92 EHE 9/92Acetone 67U 50U 200U 4103U 269U 248U 2340U 237UBenzene <1 129U <1 <1 67 <1 <1 57UBromodichloromethane <1 <1 <1 <1 <1 <1 <1 <iBromoformBromomethane2-Butanone <50 784 <50 <50 <50 <50 <50 <50Carbon DisulfideCarbon TetrachlorideChlorobenzeneChloroethane <1 <1 <1 <1 <1 <1 36 <1Chloroform <1 <1 10 8 6 6 <1 <1ChloromethaneDibromochloromethane1.2-Dibromoethane1,2-Dichlorobenzene1,3-Dichlorobenzene1,4-Dichlorobenzene1,1-Dichloroethane1,2-Dichloroethane1,1-Dichloroethene <1 <l <1 11 <1 <1 <1 <1cis-1,2-Dichloroethene <1 1188 17 <1 <1 <1 <1 <1trans-1,2-Dichloroe:thene <1 <1 <1 <1 <1 <1 <1 <11,2-Dichloropropanecis-1,3-Dichloropropenetrans-1,3-DichloropropeneEthylbenzeneMethylene Chloride4-Methyl-2-Pentanone (MIBK)Methyl-tert-Butyl Ether (MTBE)2-Hexanone <100 <100 <100 <100 <100 <100 <100 <100StyreneTetrachloroethene 15 <1 <1 6 <1 <1 9 31, 1,2.2-TetrachloroethaneToluene <1 <I <I <1 <1 <I <1 <11,1-Trichloroethane <1 <I <I <1 <1 <1 <1 <1
1,1,2-TrichloroethaneTrichloroethene 7 3882 255 180 7 <I <1 <1Trichlorofluoromethane (Freon 11)TrichlorotrifluoroethaneVinyl Acetate
Vinyl Chloride <1 <1 <1 <1 <1 <1 <1 <1mp-Xyleneso-Xylene <5 <5 <5 <5 <5 <5 <5 <5
d0EWsatLynnP\Table H-10l.s4 March 1998

TABLE H-10: CONCENTRATIONS OF VOCs IN OFF-SITE SOIL GAS SAMPLES - Validated DataGE West Lynn Facility, Lynn, MA (page 8 of 15)
Soil Gas Probe ID SG-35 SG-34 SG-36 SG-37 SG-38 SG-38 SG43Sample ID SG-35 SG-34 SG-36 SG-37 SG-38 SG-38 Dup SG-43
Date Sampled (m/d/y)Date Analyzed (n/dy) 03/03/92 03/03192 03/03/92 03/03/92 03/03/92 03/03/92 03/16/92
Lab ReportNo.
Reference EHE 9/92 BHE 9/92 EHE9/92 EHE9/92 EHE9/92 EHE 9/92 .EHE 9/92Acetone 308U 411U 88U 22U 149U <1 IOUBenzene <1 <I <1 71 <1 <1 6UBromodichloromethane 3385G <1 <1 <1 <1 <1 <1BromoformBromomethane2-Butanone 847G <50 <50 96G <50 <50 <50Carbon DisulfideCarbon TetrachlorideChlorobenzeneChloroethane <1 <1 <i <1 <1 < <1Chloroform <1 <1 <i <i <1 <1 1ChioromethaneDibromochloromethane1,2-Dibromoethane1,2-Dichlorobenzene1,3-Dichlorobenzene1,4-Dichlorobenzene1,1-Dichloroethane1,2-Dichloroethane1,i-Dichloroethene <I <1 <i <I <1 <1 <1cis-1,2-Dichloroethene 6G <1 <1 <1 <1 <1 <1trans-1,2-Dichloroethene <1 <1 <1 <1 <1 <i <11,2-Dichloropropanecis- 1,3-Dichloropropenetrans-1,3-Dichloropropene
EthylbenzeneMethylene Chloride4-Methyl-2-Pentanone (MIBK)Methyl-tert-Butyl Ether (MTBE)2-Hexanone <100 <100 <100 99G <100 <100 <100StyreneTetrachloroethene <1 <1 <1 <1 2 3 <I1,1,2,2-TetrachloroethaneToluene <1 <1 <1 <i <1 <1 11,1,1-Trichoroethane <1 <1 <1 <I <1 <1 <11.1.2-TrichloroethaneTrichloroethene 3 <1 <1 4 15 17 5Trichlorofluoromethane (Freon 11)TrichlorotrifluoroethaneVinyl AcetateVinyl Chloride <1 <1 <1 <I <1 <1 6m,p-Xyleneso-Xylene <5 <5 <5 <5 <5 <5 <5
d:M0BWestLynalMTable H-1o.xis4 Mach 1998
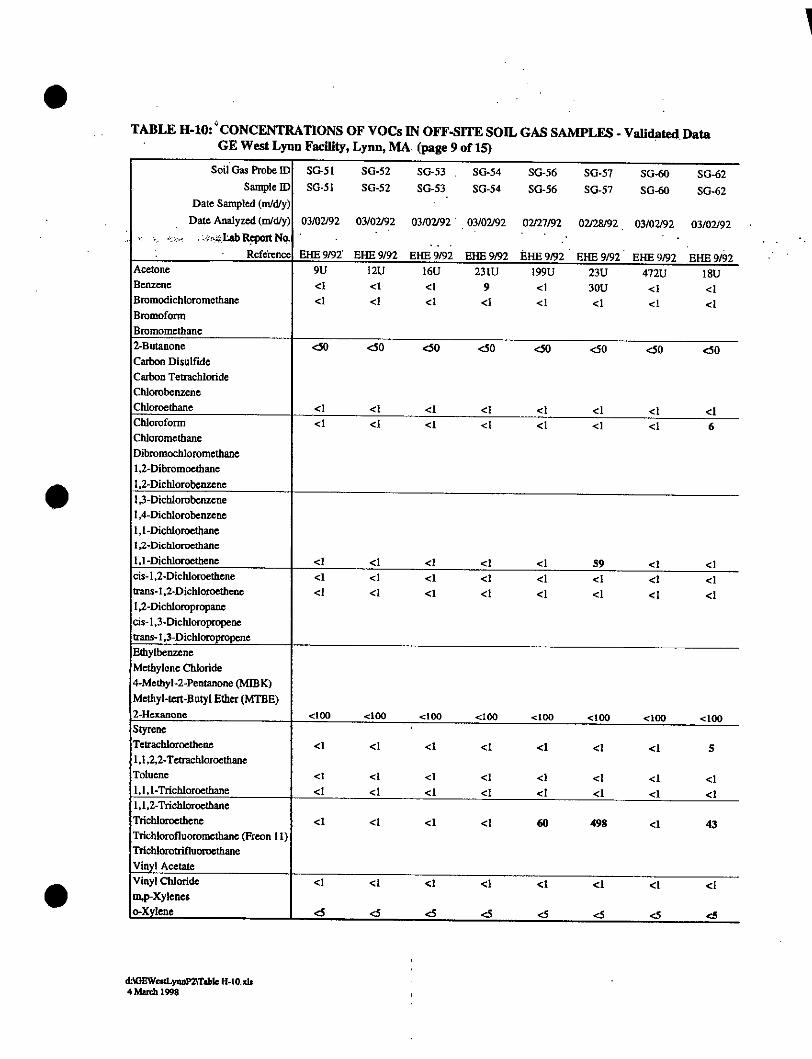
TABLE H-10:'CONCENTRATIONS OF VOCs IN OFF-SITE SOIL GAS SAMPLES -Validated DataGE West Lynn Facility, Lynn, MA (page 9 of 15)
Soil Gas Probe ID SG-51 SG-52 SG-53 SG-54 SG-56 SG-57 SG-60 SG-62Sample ID SG-51 SG-52 SG-53 SG-54 SG-56 SG-57 SG-60 SG-62
Date Sampled (m/d/y)Date Analyzed (m/d/y) 03/02/92 03/02/92 03/02/92 03/02/92 02/27/92 02/28/92 03/02/92 03/02/92
Lab Report No.Reference EHE 9/92 EHE 9/92 EHE 9/92 EHE 9/92 EHE 9192 EHE 9/92 EHE 9/92 EHE 9/92
Acetone 9U 12U 16U 231U 199U 23U 472U 18UBenzene <1 <1 <i 9 <1 30U <1 <1Bromodichloromethane <1 <1 <1 <1 c1 c1 <1 <1BromoformBromomethane2-Butanone <50 <50 <50 <50 <50 <50 <50 <50Carbon DisulfideCarbon TetrachlorideChlorobenzeneChloroethane <1 <i <1 <1 <1 1 c1 <iChloroform <1 <1 <1 <1 <1 1 <1 6ChloromethaneDibromochloromethane1,2-Dibromoethanc1,2-Dichlorobenzene1,3-Dichlorobenzene1,4-Dichlorobcnzene1,1-Dichloroethane1,2-Dichloroethane1.1-Dichloroethene <1 <1 <1 <1 <1 59 <1 <1cis-1,2-Dichloroethene ci <I c<1 <1 <1 < c <1trans-1,2-Dichloroethene <1 <1 <1 <l <1 ci <1 <11,2-Dichloropropanecis-1,3-Dichloropropenetrans-1,3-DichloropropeneEthylbenzeneMethylene Chloride4-Methyl-2-Pentanone (MIBK)Methyl-tet-Butyl Ether (MTBE)2-Hexanone <100 <100 <100 <100 <lOO <100 <100 <100StyreneTetrachloroethene <1 <1 <i <1 <1 <1 <1 51,l,2,2-TetrachloroethaneToluene <1 <1 <1 i <1 <1 c1 c11,1,1-Trichloroethane <1 <1 <1 <1 ci c1 c1 <11,1,2-TrichloroethaneTrichloroethene <1 <1 <1 <1 60 498 <1 43Trichlorofluoromethane (Freon 11)TrichlorotrifluoroethmeVinyl AcetateVinyl Chloride <1 <1 <I <i ci 1 <1 c1m,p-Xyleneso-Xylene <5 <5 <5 <5 <5 <5 <5 <5
dAGWesLynnP2Table H-lo.xs4 March 1998
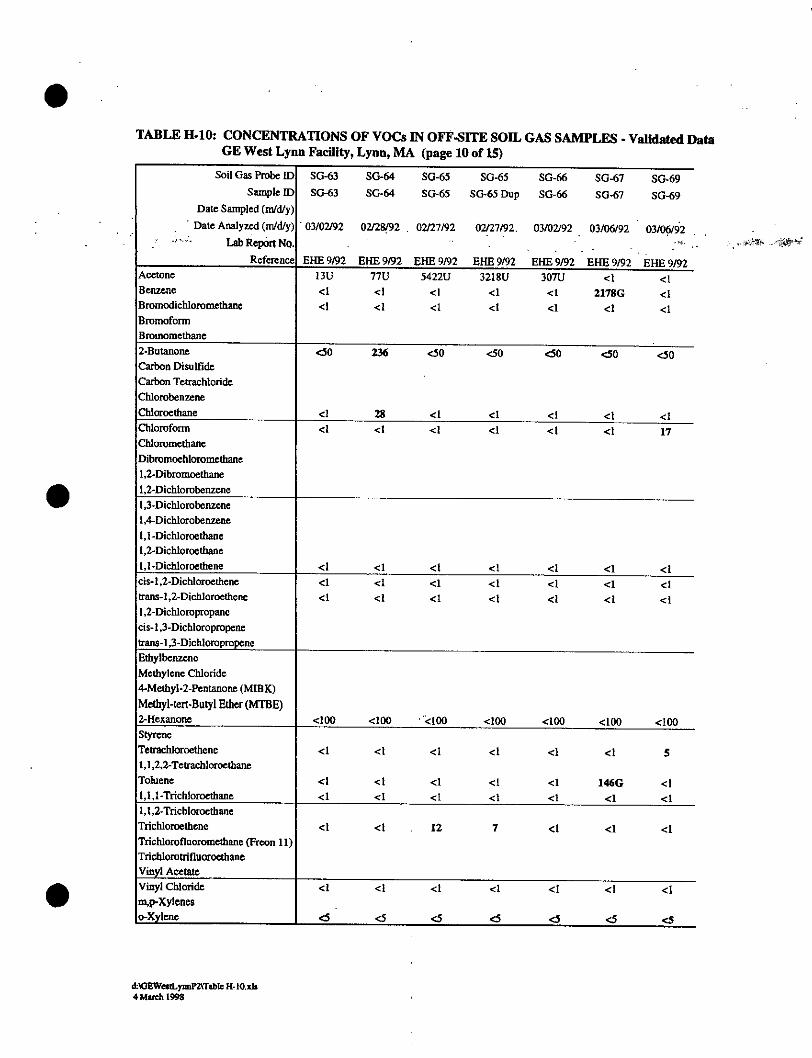
TABLE H-10: CONCENTRATIONS OF VOCs IN OFF-SITE SOIL GAS SAMPLES - Validated DataGE West Lynn Facility, Lynn, MA (page 10 of 15)
Soil Gas Probe ID SG-63 SG-64 SG-65 SG-65 SG-66 SG-67 8G-69Sample ID SG-63 SG-64 SG-65 SG-65 Dup SG-66 SG-67 SG-69
Date Sampled (m/d/y)Date Analyzed (m/d/y) 03/02/92 02/28/92 02/27/92 02/27/92. 03/02/92 03/06/92 03/06/92
Lab Report No.
Reference E 9/92 EHE 9/92 EHE 9/92 EHE 9/92 EHE 9/92 EHE 9/92 RHE 9/92Acetone 13U 77U 5422U 3218U 307U <1 <1Benzene <1 <1 <1 <1 <1 2178G <1Bromodichloromethane <1 <1 <1 <I <1 <1 <1BromoformBromomethane2-Butanone <50 236 <50 <50 <50 <50 <50Carbon DisulfideCarbon TetrachlorideChlorobenzeneChloroethane <1 28 <1 <1 <1 ci <iChloroform <1 <i <1 <i 41 <1 17ChlorornethaneDibromochloromethane1,2-Dibromoethane1,2-Dichlorobenzene
1.3-Dichlorobenzene1,4-Dichlorobenzene1,1-Dichloroethane1,2-Dichloroethane1.I-Dichloroethene <1 <1 <i <1 i <i 1cis-1,2-Dichloroethene <1 <1 <1 <1 1 <i <1trans-1,2-Dichloroethene <1 <1 <1 <1 <1 <1 <11,2-Dichloropropanecis-1,3-Dichloropropenetrans-1,3-DichloropropeneEthylbenzeneMethylene Chloride4-Methyl-2-Pentanone (MIBK)Methyl-tert-Butyl Ether (MTBE)2-Hexanone <100 <100 <100 <100 <100 <100 <100StyreneTetrachloroethene <1 <1 <1 <1 <1 <1 51,1,2,2-TetrachloroethaneToluene < <1 <1 <1 <1 146G <11,1,1-Trichloroethane <1 <1 <1 41 <1 <1 <11,1,2-TrichloroethaneTrichloroethene <1 <1 12 7 <1 <1 <1Trichlorofluoromethane (Freon 11)TrichlorotrifluoroethaneVinyl Acetate
Vinyl Chloride <1 <1 c1 <1 <1 <1 <1mnp-Xyleneso-Xylene <5 <5 <5 <5 <5 <5 <5
d:GEWestLyun2Table H.-10.xl4 MarIh to"
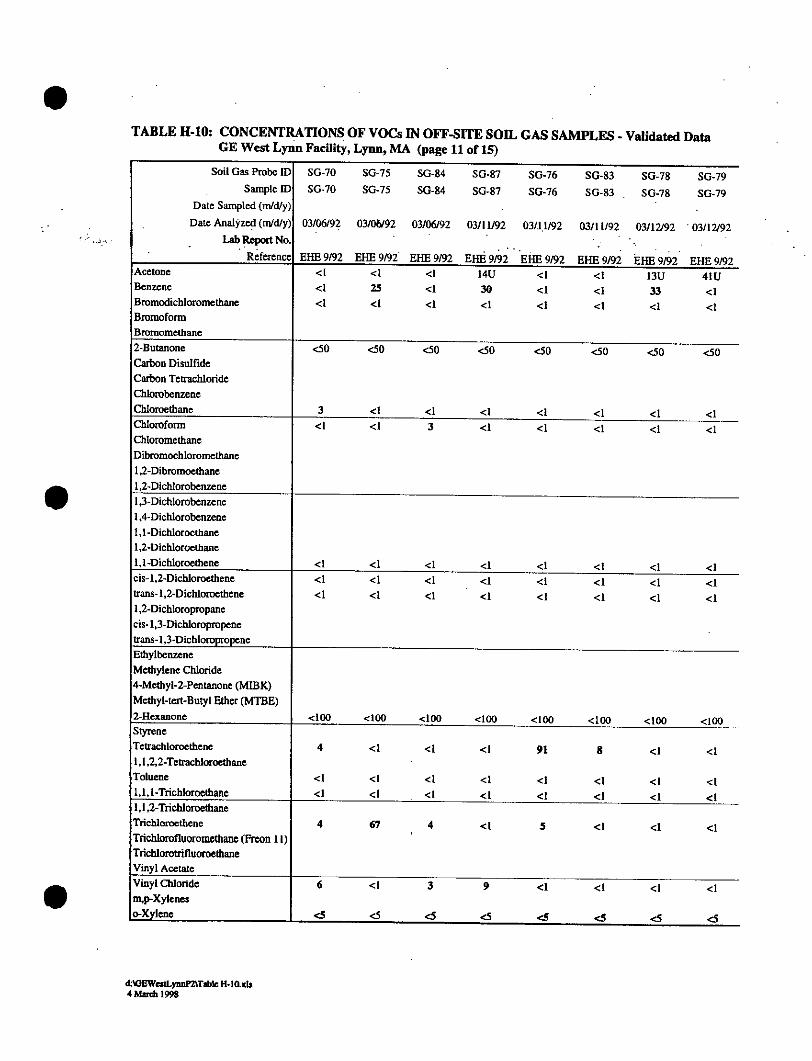
TABLE H-10: CONCENTRATIONS OF VOCs IN OFF-SITE SOIL GAS SAMPLES - Validated DataGE West Lynn Facility, Lynn, MA (page 11 of 15)
Soil Gas Probe ID SG-70 SG-75 SG-84 SG-87 SG-76 SG-83 SG-78 SG-79Sample ID SG-70 SG-75 SG-84 SG-87 SG-76 SG-83 SG-78 SG-79
Date Sampled (rn/d/y)Date Analyzed (rmd/y) 03/06/92 03/06/92 03/06/92 03/11/92 031.1/92 03/11/92 03/12/92 03/12/92
Lab Report No.Reference EHE 9/92 EHE 9/92 EHE 9/92 EHE 9/92 EHE 9/92 EHE 9/92 EHE 9/92 EHE 9/92
Acetone <1 <1 <1 14U <1 <1 13U 415Benzene <1 25 <1 30 <1 <1 33 <1Bromodichloromethane <1 <1 <i <1 <1 c1 <1 <1BromoformBromomethane2-Butanone <50 <50 <50 <50 <50 <50 <50 <50Carbon DisuffideCarbon TetrachlorideChlombenzeneChloroethane 3 <1 <1 <1 <1 <1 <1 <1Chloroform <1 <1 3 <1 <i <1 <1 <1ChloromethaneDibromochloromethane1,2-Dibromoethane1,2-Dichlorobenzene1,3-Dichlorobenzene1,4-Dichlorobenzene1,1-Dichloroethane1,2-Dichloroethane1,I-Dichloroethene <1 <1 <i <1 <1 <1 <1 <1cis-1,2-Dichloroethene <1 <1 <i <1 <1 <1 <1 <1trans-1,2-Dichloroethene <1 <1 <1 <1 <1 <1 <1 <11,2-Dichloropropanecis-1,3-Dichloropropenetrans-1,3-DichloropropeneEthylbenzeneMethylene Chloride4-Methyl-2-Pentanone (MIBK)Methyl-tert-Butyl Ether (MTBE)2-Hexanone <100 <100 <100 <100 <100 <100 <100 <100StyreneTetrachloroethene 4 <i <1 <1 91 8 <1 <11,1,2,2-TetrachloroethaneToluene <1 <1 <1 <1 c1 <1 <1 <11,1,I-Trichloroethane <1 <1 <I <1 <l <1 <1 <11,1,2-TrichloroethaneTrichloroethene 4 67 4 <1 5 <1 <1 <1Trichlorofluoromethane (Frcon 11)TrichlomtrifluoroethaneVinyl AcetateVinylChloride 6 <1 3 9 <1 <1 ci <Imnp-Xyleneso-Xyiene <5 <5 <5 <5 <5 <S <5 <5
d%0BWeLynnPA2Tabe H-1o.xhs4March 1998
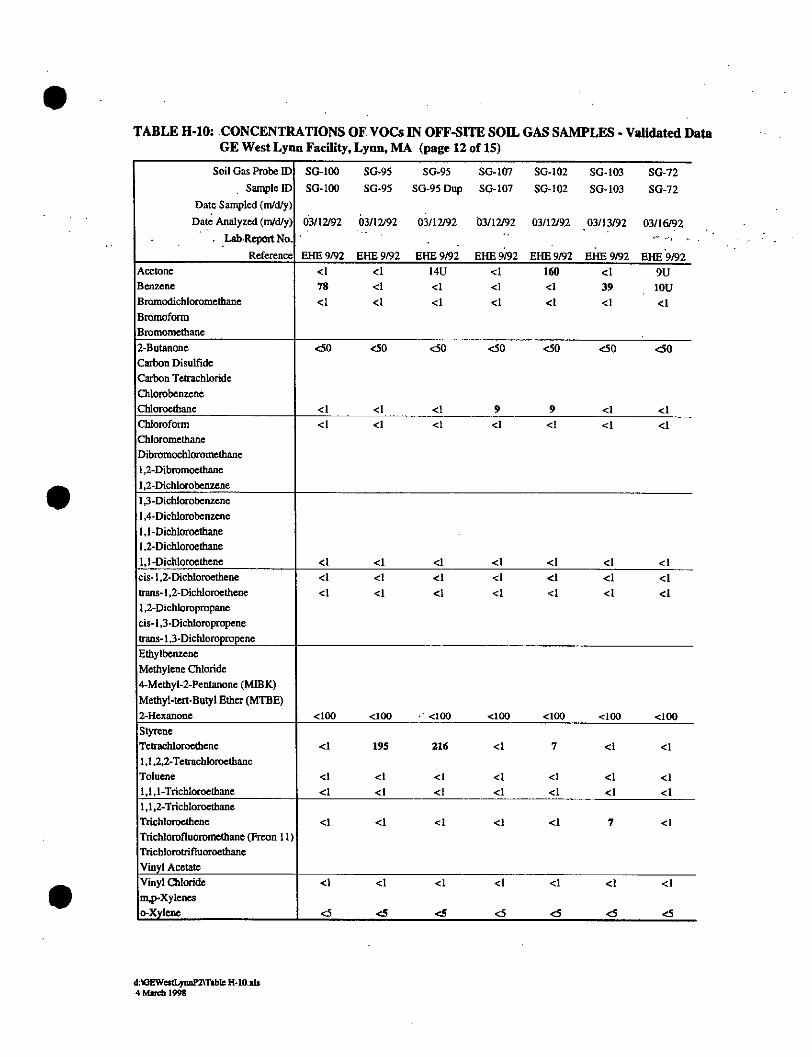
TABLE H-10: .CONCENTRATIONS OF VOCs IN OFF-SITE SOIL GAS SAMPLES - Validated DataGE West Lynn Facility, Lynn, MA (page 12 of 15)
Soil Gas Probe ID SG-100 SG-95 SG-95 SG-107 SG-102 SG- 103 SG-72Sample ID SG-100 SG-95 SG-95 Dup SG-107 SG-102 SG-103 SG-72
Date Sampled (rm/dy)
Date Analyzed (m/d/y) 03/12/92 03/12/92 03/12/92 03/12/92 03/12/92 03/13/92 03/16/92LabReportNo.
Reference EHE 9/92 EHE 9/92 EHE 9/92 EHE 9/92 EHE 9/92 EHE 9/92 EHE 9/92Acetone <1 <1 14U <1 160 <1 9UBenzene 78 <1 <1 <1 <1 39 IOUBromodichloromethane <1 <1 <1 <1 <1 <1 <1BromoformBromomethane2-Butanone <50 <50 <50 <50 <50 <50 <50Carbon DisulfideCarbon TetrachlorideChlorobenzeneChloroethane <1 <1 <1 9 9 <1 <1Chloroform <1 <1 <1 <1 <1 <1 <1ChloromethaneDibromocbloromethane1,2-Dibromoethane1,2-Dichlorobenzene1,3-Dichlorobenzene1,4-Dichlorobenzene1,1-Dichloroethane1,2-Dichloroethanei,i-Dichloroethene <1 <1 <1 <1 <1 <1 <1cis-1,2-Dichloroethene <1 <1 <1 <1 <1 <1 <1trans-1,2-Dichloroethene <1 <1 <1 <1 <1 <1 <11,2-Dichloropropanecis-1,3-Dichloropropenetrans-1,3-DichloropropeneEthylbenzeneMethylene Chloride4-Methyl-2-Pentanone (MIBK)Methyl-tert-Butyl Ether (MTBE)2-Hexanone <100 <100 <100 <100 <100 <100 <100StyreneTetrachloroethene <1 195 216 <1 7 <1 <11,1,2,2-TetrachloroethaneToluene <1 <1 <1 <1 <1 <1 <11,1,1-Trichloroethane <1 <1 <1 <1 <1 <1 <11,1,2-TrichloroethaneTrichloroethenc <1 <1 <1 <1 <1 7 <1Trichlorofluaromethane (Freon 11)TrichlorotrifluoroethaneVinyl AcetateVinyl Chloride <1 <1 <1 <1 <1 <1 <1m,p-Xyleneso-Xylene <5 <5 <5 <5 <5 <5 <5
d:ViEWestLynnfTable H-IO.xis4 March 1998
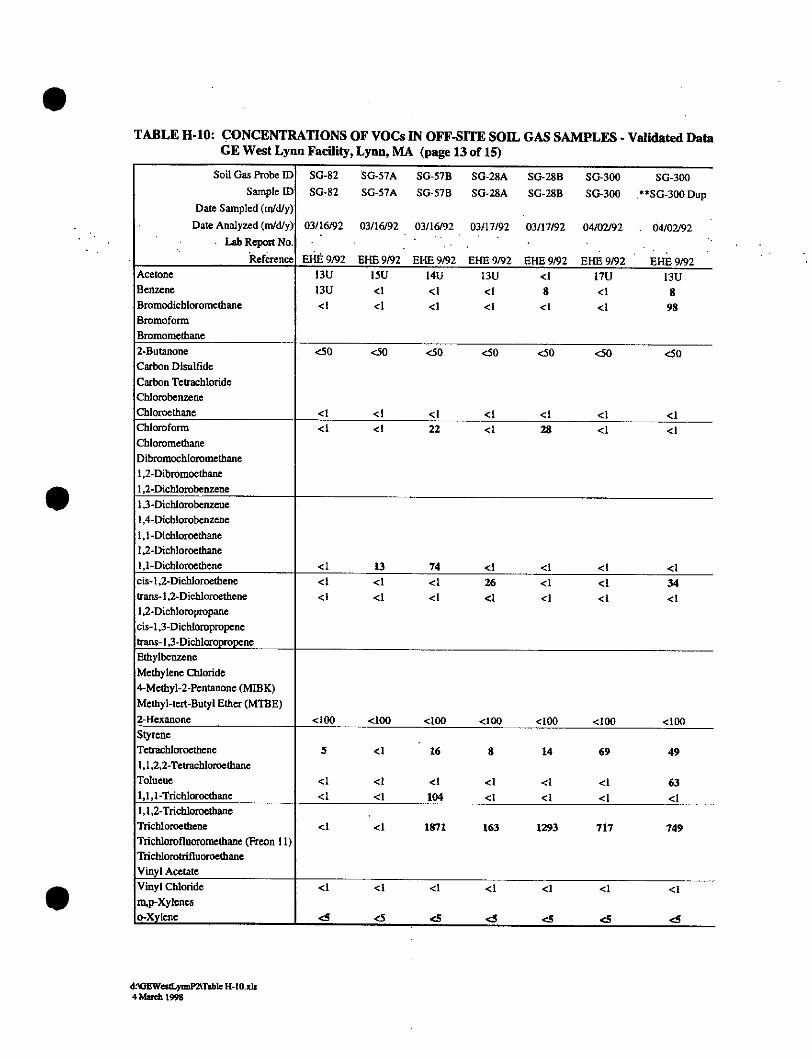
TABLE H-10: CONCENTRATIONS OF VOCs IN OFF-SITE SOIL GAS SAMPLES - Validated DataGE West Lynn Facility, Lynn, MA (page 13 of 15)
Soil Gas Probe ID SG-82 SG-57A SG-57B SG-28A SG-28B SG-300 SG-300Sample ID SG-82 SG-57A SG-57B SG-28A SG-28B SG-300 .**SG-300 Dup
Date Sampled (m/dly)Date Analyzed (n/d/y) 03/16/92 03/16/92 03/16/92 03/17/92 03/17/92 04/02/92 . 04/02/92
Lab ReportNo. -
Reference EHE 9/92 EHE 9/92 EHE 9/92 EHE 9/92 EHE 9/92 EHE 9/92 EHE 9/92Acetone 13U ISU 14U 13U <1 17U 13UBenzene 13U <1 <1 <1 8 <1 8Bromodichloromethane <1 <1 <1 <1 <1 <1 98BromoformBromomethane2-Butanone <50 <50 <50 <50 <50 <50 <50Carbon DisulfideCarbon TetrachlorideChlorobenzeneChloroethane <1 <1 <1 <1 <1 <1 <1Chloroform <1 <1 22 <1 28 <1 <1ChloromethaneDibromochloromethane1,2-Dibromoethane1,2-Dichlorobenzene1,3-Dichlorobenzene1,4-DichlorobenzeneI,i-Dichloroethane1,2-Dichloroethane1,i-Dichloroethene <1 13 74 <1 <1 <1 <1cis-1,2-Dichloroethene <1 <1 <1 26 <1 <1 34trans-1,2-Dichloroethene <1 <1 <1 <1 <i <I <11,2-Dichloropropanecis-1,3-Dichloropropenetrans-1,3-DichloropropeneEthylbenzeneMethylene Chloride4-Methyl-2-Pentanone (MIEBK)Methyl-tert-Butyi Ether (MTBE)2-Hexanone <100 <100 <100 <100 <100 <100 <100StyreneTetrachloroethene 5 <1 16 8 14 69 491,1,2,2-TetrachloroethaneToluene <1 <1 <1 <1 <1 <1 631,1,1-Trichloroethane <1 <1 104 <1 <1 <1 <I1.1,2-TrichloroethaneTrichloroethene <1 <1 1871 163 1293 717 749Trichlorofluoromethane (Freon 11)TrichlorotrifluoroethaneVinyl AcetateVinyl Chloride <1 <1 <1 <1 ci <i 41m,p-Xylencso-Xylene <5 <5 <5 <5 <5 <5 <5
d'OEWeusLynnP2Table H-10.is4Marcb 1998
ATTACHMENT B
Additional References
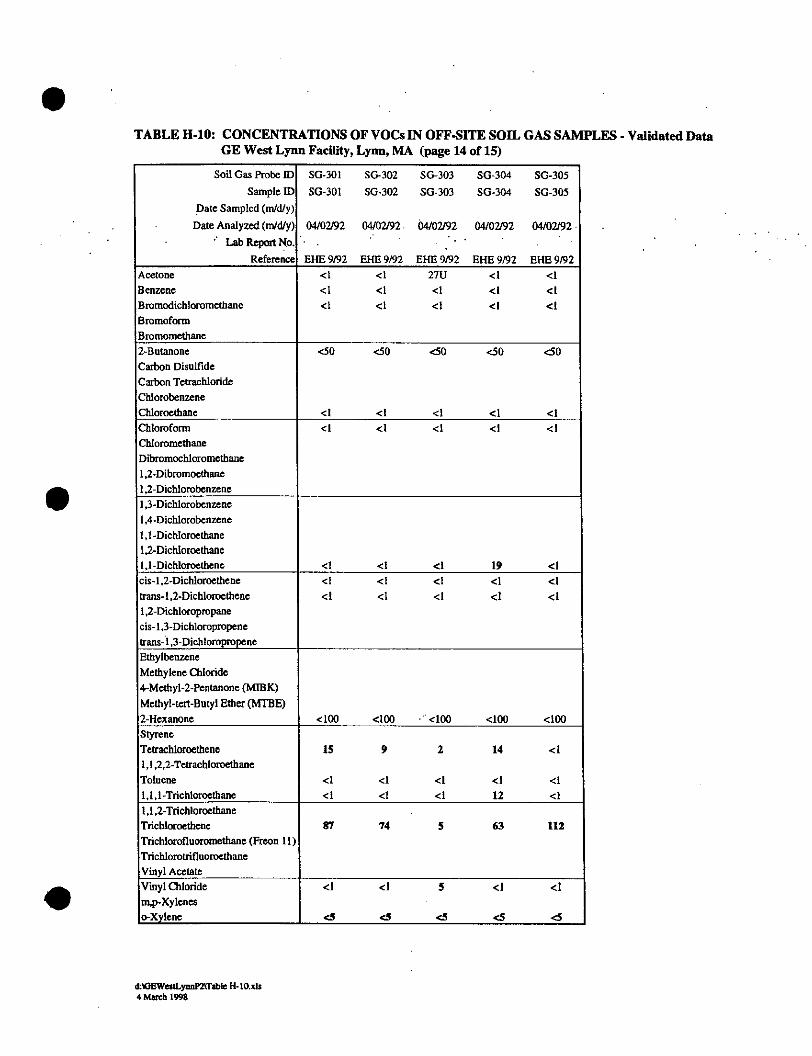
TABLE H-10: CONCENTRATIONS OF VOCs IN OFF-SITE SOIL GAS SAMPLES - Validated DataGE West Lynn Facility, Lynn, MA (page 14 of 15)
Soil Gas Probe ID SG-301 SG-302 SG-303 SG-304 SG-305Sample ID SG-301 SG-302 SG-303 SG-304 SG-305
Date Sampled (m/d/y)
Date Analyzed (m/d/y) 04/02/92 04/02/92. 04/02/92 04/02/92 04/02/92-Lab Report No. - -
Reference EHE 4/92 EHE 9/92 EHE 9/92 EHE 9/92 EHE 9/92Acetone <1 <1 27U <1 <1Benzene <1 <1 <1 <1 <1Bromodichloromethane <1 <1 <1 <1 <1BromoformBronomethane2-Butanone <50 <50 <50 <50 <50Carbon DisulfideCarbon TetrachlorideChlorobenzeneChloroethane <1 <1 <1 <1 <1Chloroform <1 <1 <1 <1 <1ChloromethaneDibromochloromethane1,2-Dibromoethane1,2-Dichlorobenzene
1,3-Dichlorobenzene1,4-Dichlorobenzene1,1-Dichloroethane1,2-Dichloroethane1,1-Dichloroethene <1 <1 <1 19 <1cis-1.2-Dichloroethene <1 <1 <1 <1 <1trans-1,2-Dichloroethene <1 <1 <1 <1 <11,2-Dichloropropanecis-1,3-Dichloropropenetrans- 13-DichloropropeneEthylbenzeneMethylene Chloride4-Methyl-2-Pentanone (MIBK)Methyl-tert-Butyl Ether (MTBE)2-Hexanone <100 <100 <100 <100 <100StyreneTetrachloroethene 15 9 2 14 <11,1,2,2-TetrachloroethaneToluene <1 <1 <1 <1 <11,1,1-Trichloroethanc <1 <1 <1 12 <11,1,2-TrichloroethaneTrichloroethene 87 74 5 63 112Trichlorofluoromethane (Freon 11)TrichlorotrifluoroethaneVinyl AcetateVinyl Chloride <1 <1 5 <1 <1m,p-Xyleneso-Xylene <5 <5 <5 <5 <5
dAEWestLynnP2Table H-lo.xis4 March 1998
S
01
40
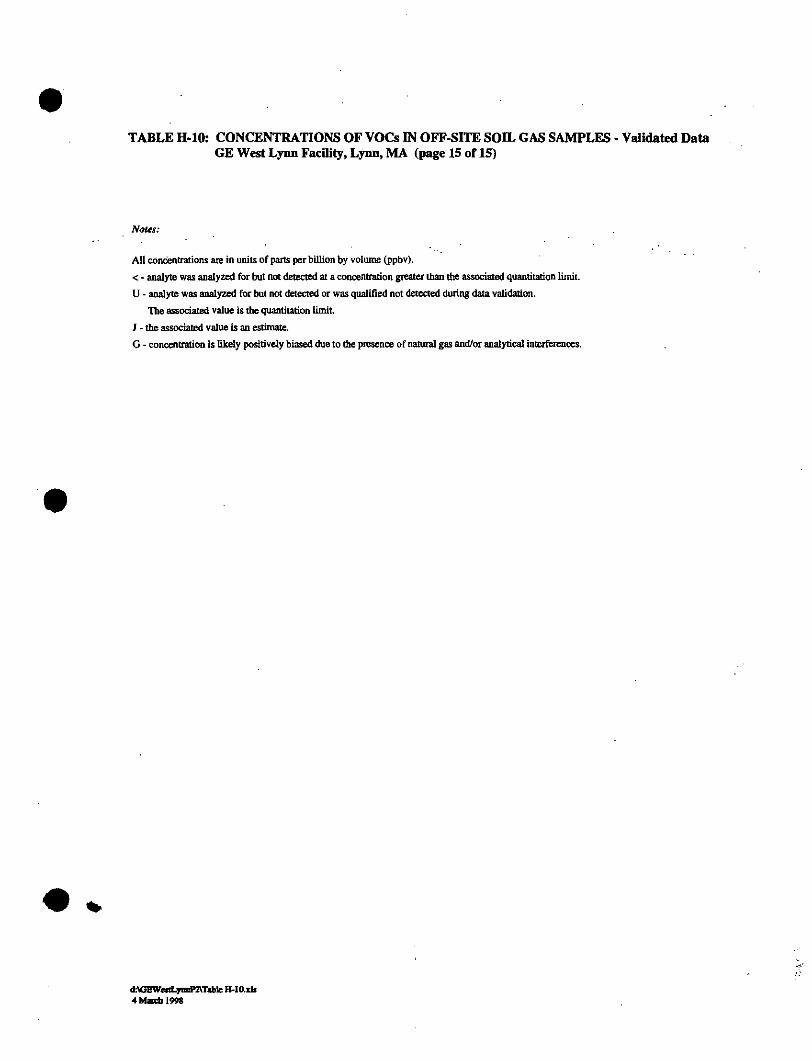
TABLE H-10: CONCENTRATIONS OF VOCs IN OFF-SITE SOIL GAS SAMPLES - Validated DataGE West Lynn Facility, Lynn, MA (page 15 of 15)
Notes:
All concentrations are in units of parts per billion by volune (ppbv).
< - analyte was analyzed for but not detected at a concentration greater than the associated quantitation limit.
U - analyte was analyzed for but not detected or was qualified not detected during data validation.
The associated value is the quantitation lint
J - the associated value is an estimate.
G - concentration is likely positively biased due to the presence of natural gas and/or analytical interferenc.
d:GEWesttyaP2Table H-10.z4Mah 1998
z~~ z z z z
v v v v v v v v v
Zz
zv v v v v v v
Os
V v v v v v v v v V
0 b
z - - Zz - - - - r, c' 02-
V I ivv v v v v v val) vi ,... o00 q ~ f ~ S t ~ tI V VI Vi V V V V i V i VVV
q 0 3 r e A a o o
8 - - - -oiv v v v v v--
4 b bb b
I 1 " 4 a, 81 1 1 el 81 612.
S
I11
0
.~ .p,,%
.0 0
0.0.0
aoa~
fo~
4-0
I 'I'S
~ 00
lB ~*
I81-
4)-aCto .Y-c -o ~ N
0~ ~'0 -
N -~~C,4-4)
4.4U
0-t -C)C-, 5N - -C) ~
< z zZi Z; Z
I2z z
<zI z z a
v4
6
v
to04
v
to046
v
v
a
v .
0C
v
U,
v
0
v
6V
< <I t <z zaz dl 6
VI
SIns6
0
vC"6
V
z
z
z
z
7
Z Z Z Z 6 Z Z 66666z z z z z
v v v v v v v v v
z zz z z 6 z 6 6 ci z z
v v v v V v vS < < < <<
S z zzz zz z z z zzU 04
0v v v v v v v v v00-
v v v v v v v v v v v
.2 .- z z z z z z Z< Z Z 0 5 z z- o -zz
vv v v v v v v v
, E o o - 1 -, >, I 6]< a g i . 8.<22226 z 200006.- 226266622 a& >e
0
mI-
r-
z <1 z z z z -P z|,
P! I I .N
N -
v v v v v v v v v vIT 04 Ci q <~ ~ c ~ ~ ~ e
-nz z - -: - -v v v v v v v v vooo o o - o-4
2 u
v v v v v
00 r N 2 C 0 < e e n -'.g6
o o ov v V V V V V V
I v V V Vv V. V
-0 E
u 8 1 e l
- h-.-i4 - a . a -
8 $ Iai i ~ 2-~3i< <<Cl tl! Z o oo 6
3e I 0V V V
9:1
u z04 ' t Z
46 2
p
o <: < a o o o O < < 04 < a 0- o < <z z z V z z z
v v v v v vv
2 ea zz za za aa az z z z zI
I
v v v v v v
v v v v v vv
u u N z z z Z 6 z Z - - - - - Z z - Z za) E
0
v |v v v v v vv < < < < 00<< 040 0 0C < < C< O000< <
u- -z z z z - - - Z Z N Z ->
v v v v v v vvV4)
OZ Z g Z Z Z
v v vi VI v a | jv-m g8'I < O < 3 6 6 6 - l ! # 6 Z .. - 2 2 7 -;
Cl
e-
or
~J C < 't < < I < < < < O O0= z z z z z z - o o o - - (MOz
v v vi v vi v vCo
z zl z z d :51a a z zl '0 z a a z ZZE z
v v v v v v0 2
z Z Z Z C Z z Z Z Z Z z
v v v v v v
u z z Z 5 z z 6 6 6 6 z z z 6 6 Q z z00
> v v V v v v v v v <
2 z zz z z oC5 aaaa zo- < < < <P4"
= 26 2 2 2 z
> v v v v v vu
z z z z z z z z -
> v IvI v vI v VI I I V I v I
-,0. 0U0- < <CC- C
> I 222262 600062 62666z
-. QV § < V V V < V
.2 Z Z Z 2 6 2 6 6 6 2 2 6 N 6 6 z
v v v v vi v v
1O I
oo 00 - -2
o-
sn
o J
S
I~s
V
o
-o z - - 22 - e a e o
Svv v v v v v v v v v vI I <
zO Z Z Z Z Z z z a z Z a ZzVv v v v v v
z zsa z z Z zl a i z zz zz zv v v v v v v
Q z zz zo z z 5 6 o o5 o; z Z z col o Zzv v v v v v v v v
o laaaz z z 0 a z zI v v v v<V <<20E 1< <<< < Cl! .t n f
z< z z z o z z o5 o Z 6 6 Z 6 Z Z zv v v Iv v v v< < < <
2 z - 6 6 z 0 0 2 a -v v v v v v v v v v v
- - 0 z z C5 C5 8 0v v v v v v v v v v v
z z z z 6 z z 66 c C 6 Z z 6 z 5 6 6 Z z
> v ~vi v v v v< < < << *<(2 ; z z z z ; 6 a o 6 z z2 z 6 6 z z< (12 <(' < < < I0 - 0(
IV V v v v v v v04 V> I V I VI.CCo-- 4 o I88. .-
<i H04v v v V V
z - - z z< .-- 6-<--v v v v v v v v v v v
ez - - Z
4 v Vv v v
z z z z, z z04Z ZC-0
v v v v v v v v v v v vz i 202 Z -Z ZV v v v v v v
z v v v v V v- Vv viv v v v---- --- -- --
C8o -
m I ' I >1 el 6-U aaa I #9a oE
(C-
omit-
Cc~C
~i.02
-u
iiEl
Z4 zzo z sz z zz
v v v v v v
- z z z z 6 6 6 6 6 Z z z
v v v v v
y v 7 v v v
vvv v v v v v 'E i < < ioZ Z Z a ~ Z z a a a 6 Z Z - Z Z 6 6 2
v v vv v v v v ven0
Vi< V V6.
Z
o oo
vv v v v v v vv004 E < < < t eo
vv v v v v vvvv vv
oI somi
o~~~~ Z - - - - .~~Z ZZ 6 Z 6 66z z 6en VI v V V V V V V
:a
z
u - - - bl - I -. 6
- .___<_o ___< <. ' -. -- . --. -
06 z z 0< MN~<
vvv v v
v v v v v v v v y v y67,
v v v v v v v v v v v v v
v v v v v v v V v v V V V
8, 5Nv V V V V v V V V V V V V VI VI , I V i
o- z C C V C' !
z U 6 Z5 N -
- - - - - - - - - - - - - - - -I > b
-U
- -
-
0
I-
S
Ii
z z - i z z zzZ! cu rz z- <n 'i <a<~
I V v V v v v v V V4)z C
V v v v v v V v
<o <
y v v v v v VC - V V&~- 2:2 2: :62 2- z z - - - <C -< - m <
V v v v v v v v v v
v V V v V v V y y V V V VE ,
8<
w o < < - tc In q - -n12 o -z - z z - - - - r O Q a qa
v v v v v v 1 v v V v v .V v
0
'
u
~M10U
0-ppV u V 8 VIV V V V V
a I- e 2 a E s.. e . a a a y o o . .. e e
0
rtm
C-,
I-Ot
6.- - H z1 - nC
V v ,V v v v v v v v! v
z ~ z z z Z Z z z "o z C5 6 Q z z
v v v v v v v v
vv vi v v v v v
8. ez z z z z z Ci Ci ci a z z -z z zcv v v V VI VII v v
z zz zz aa az z z zvvv v v v v v vg 5
) z .g Z ,z zzo<zz
I IVi V V V Vi I I I VI V i V i V
C',i
a0 z 00 0 6Z 6 Z
m4 fl6
S
C
'dcc
rt~
-'C41~
Oral>0
'ScF-
SI-'
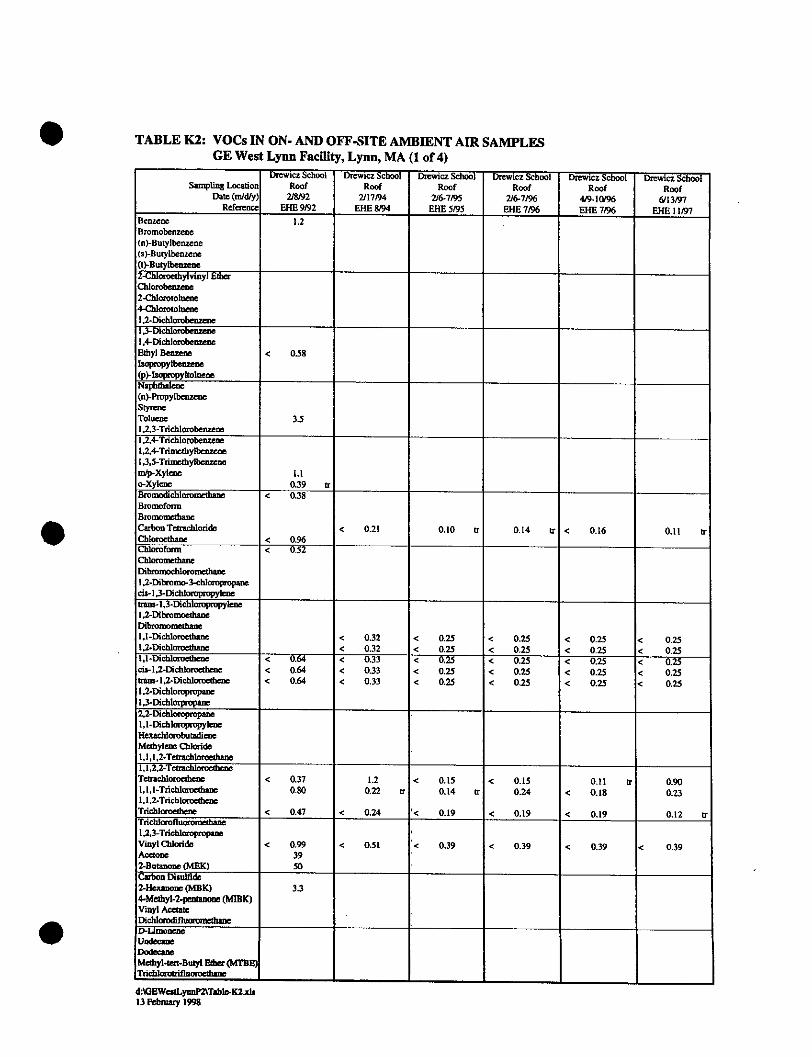
TABLE K2: VOCs IN ON- AND OFF-SITE AMBIENT AIR SAMPLESGE West Lynn Facility, Lynn, MA (1 of 4)
Drewici School Drcho DSchool Drwict School Dmcewicz SchoolSamiplin Loation Roof Roof Roof Roof Roof Roof
Datm(m/d/y) 2/J92 2117194 2/6-7195 2/6-7/% 4/9-10/96 6/13197Reference EHE 9/92 EHE 894 EHE 5/95 EHE 7196 EHE 7/96 EHE 1197
Bezene 1.2Bromobenzene(n)-Butylbenzene(s)-Butyibenze()-Butylbenzene2-Chloroethylvinyl EtherChloroeter2-Chlorotohe4-Chlovrtlee1.2-DichlorobenzeneI 3-Dichlorobenzene - -1,4-DichlorobenzeneEthyl Benwzene < 0.58Isoproplbenen(p)-4opropyloolueneNaphthalene --(n)-PropylbenzeneStyreneToluene 3.51,2,3-Trichtlorobenzene1,2,4-Trichlorobenzene1,2,4-Trimethylbenzene1.3.5-Timnethylbenaenemn/p-Xylene 1.1o-Xylene 0.39 trBromodichloromethane < 0.38BromoforniBromomethaneCarbonTetrachloride < 0.21 0.10 t 0.14 tr < 0.16 0.11 trChloroethane < 0.96Chloroform < 0.52ChlromethaenDibromochloromethane1,2-Dibromo-3-chloropropanecis-I,3-Dichloropropylenetrms-1.3-Dichloroprpylene1,2-DibromoethansDibromomethane1.1-Dichloroethune < 0.32 < 0.25 < 0.25 < 0.25 < 0.251,2-Dichloroethane < 0.32 < 0.25 < 0.25 < 0.25 < 0.251,I-Dichloroethene < 0.64 < 0.33 < 0.25 < 0.25 < 0.25 < 0.25cis-l.,2-Dichloroethene < 0.64 < 0.33 < 0.25 < 0.25 < 0.25 < 0.25tra-.2-Dichloroethene < 0.64 < 0.33 < 0.25 < 0.25 < 0.25 < 0.251.2-DichlooppaneI,3-Dichlorpropane2.2-Dichletopmpane1.l-DichloropolyeneHexachlorobutadieneMethylene Chloide1,1,I,2-Tetrachloroethane1,1,2,2-TctrachloroethaneTetrachloroethen: < 0.37 1.2 < 0.15 < 0.15 0.11 tr 0.901,1.-Trichlomethane 0.80 0.22 t 0.14 tr 0.24 < 0.18 0.231,1.2-TrichloroethaneTrichloroethlene < 0.47 < 0.24 '< 0.19 < 0.19 < 0.19 0.12 trTrichlorofluoromedhane1,2,3-TrichloropoaeViaylaloride < 0.99 < 051 < 0.39 < 0.39 < 0.39 < 0.39Acetone 392-Butanone (MBK) 50Carbon Diulfide2-Hexanone (MBK) 3.34-Methyl.-2pentanone (MIBK)Vinyl AcetateDichlorodfluorontamneD-Iamonee__ __
UndecameDodecameMethyI-tt-ButylEtherMTQBB'Tuidclorifluorefmhan
d:GEWcstLyoniMTable-K2sh13 February 1998
S
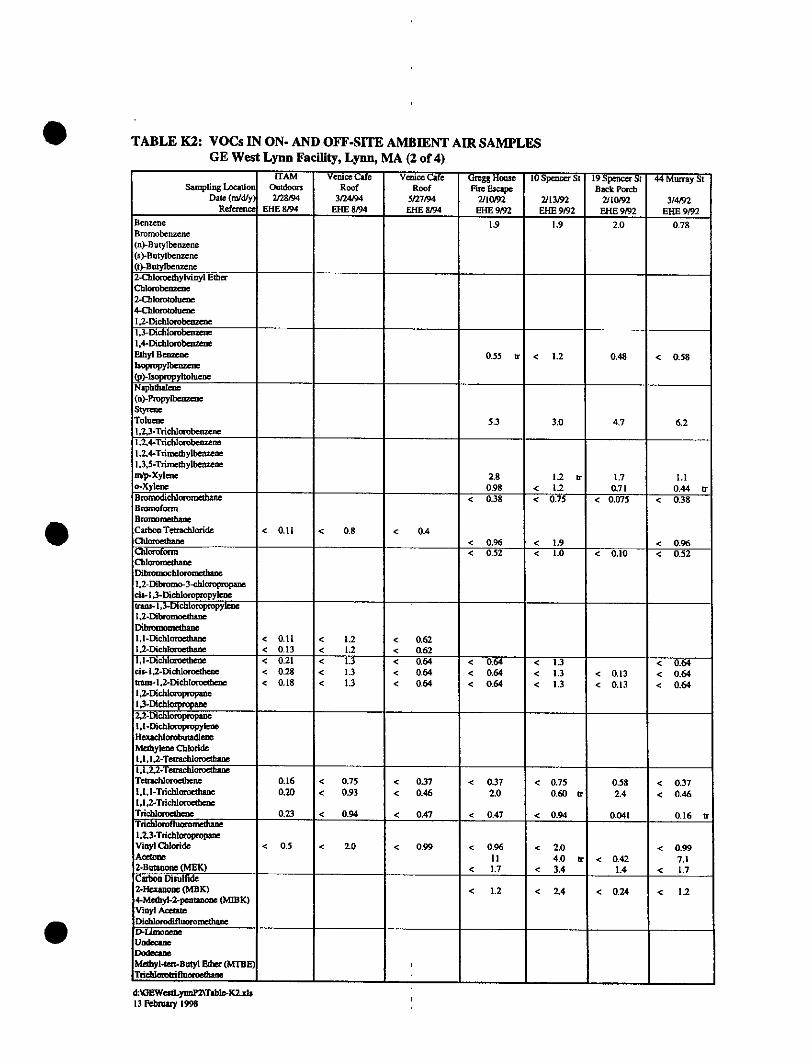
TABLE K2: VOCs IN ON- AND OFF-SITE AMBIENT AIR SAMPLESGE West Lynn Facility, Lynn, MA (2 of 4)
rAM Venice Cafe Vemice Cafe Gregg House 10Spe St 19 Spe St 44 Murray StSampling Location Outdoors Roof Roof FreEscape Back Porch
Date (rn/d/y) 2/28/94 324/94 5/27/94 2/10/92 2/13/92 2/10/92 3/4/92Refeence EHE 8,94 EHE 8/94 EHE 894 EHE 9/92 EHE 9192 EHE 9192 EHE 9/92
Benzene 1.9 1.9 2.0 0.78Bromobene(n)-Butylbenzene(s)-Butylbenzene(t)-Butylbenzene2-Cloroethylvinyl EtherChIrobenzcne2-Chlortoene4-Chlntouen1.2-Dichlorobenze1,3-Dichlorobenzene -----1,4-Dichlorobearne
Ethyl Be."*"" 0.55 tr 1.2 0.48 < 0.58Isopropylbenzene(p)-sopropyltolueneNaphthalene(n)-PmpylbenzenestyrenieToluene 5.3 3.0 4.7 6.2I2,3-Trichlorobenzene1,2,4-Trchlorobenzene -
1.2.4-TrinethylbenzeneI.3,5-Trinethylbenenem/p.Xylene 2.8 1.2 tr 1.7 1.1o-Xyleac 0.98 < 1.2 0.71 0,44 trBronodichloromnethae < 0.38 < 0.75 < 0.075 < 0.38BromformBromonrhaneCarbooTetrachloride < 0.11 < 0.8 < 0.4Chloroethane < 0.96 < 1.9 < 0.96Chloroform < 0.52 < 1.0 < 0.10 < 0.52ChloromethaneDibroonchloromethane1,2-Dibromo3-chloopropanecia-I,3-Didloropropylenetrans-l.3-Dichlorropylene1.2-DibromoethaneDiromomethane1.1-Dichlomethane < 0.11 < 1.2 < 0.621.2-Dichloroethne < 0.13 < 1.2 < 0.621,I-Dichlooethene < 0.21 < 1.3 < 0.64 < 0.64 < 13 < 0.64cis-.,2-Dichloroethene < 0.28 < 1.3 < 0.64 < 0.64 < 1.3 < 0.13 < 0.64uans-I.2-Dichlorcethene < 0.18 < 1.3 < 0.64 < 0.64 < 1.3 < 0.13 < 0.641,2-Dichloropropane1,3-Dichloipropane2,2-Dichloropropanelt-DichlormpropyleneHexahlorobutadienMethylene Chloie1,1,1,2-TetrachloroethaneI,1,2.2-TetrachlorethaneTetrachloroethene 0.16 < 0.75 < 0.37 < 0.37 < 0.75 0.58 < 0.371,1,1-Trichloroethane 0.20 < 0.93 < 0.46 2.0 0.60 r 2.4 < 0.461.I.2-TrichforoethaneTriclOroethene 0.23 < 0.94 < 0.47 < 0.47 < 0.94 0.041 0.16 trTriehlorofluromethane1.2.3-TrichloroppaneVinyl Chloride < 0.5 < 2.0 < 0.99 < 0.96 < 2.0 < 0.99Actone 11 4.0 tr < 0.42 7.12-Butanone (MEK) < 1.7 < 3.4 1.4 < 1.7Carbon Disulfide -------2-Hexnone (MK) < 1.2 < 2.4 < 0.24 < 1.24-Methyl-2-pentanone (MIBK)Vinyl A~,Dichlorodifluoromethane
Undcme
Methyl-tt-Butyl Eter (MTBE)Trielootifluoroethane ___________
dAGEWWLynm Table-K2.xls13 Fbruay 1998
S
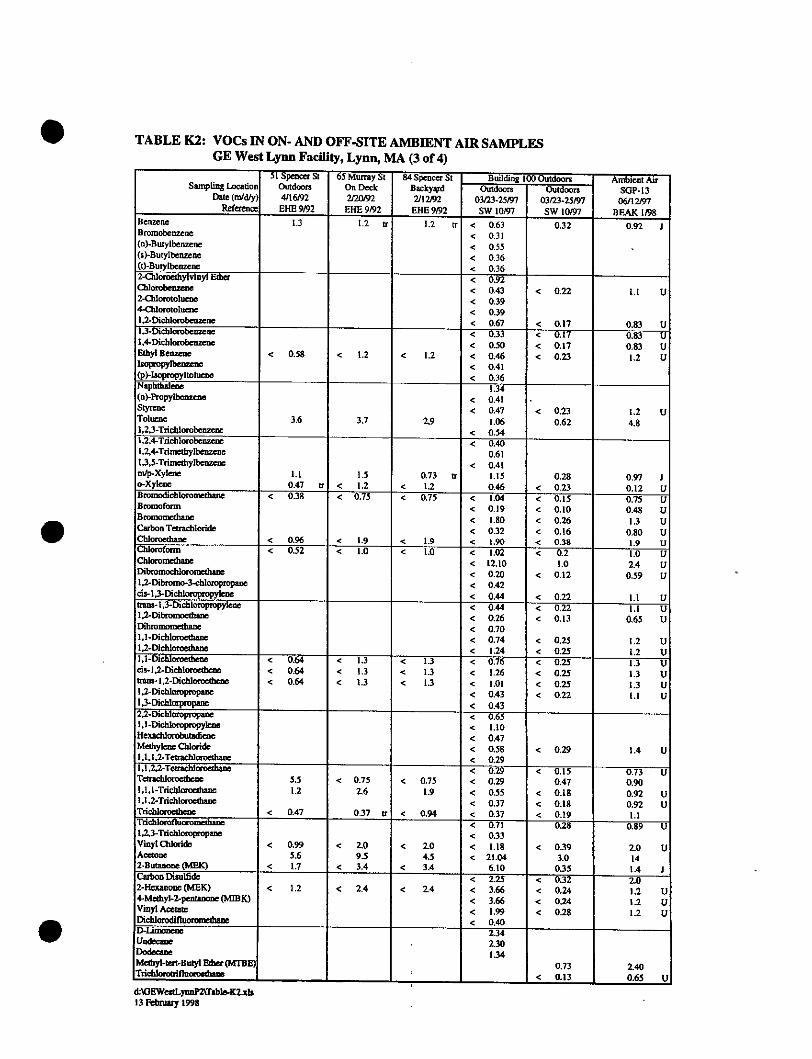
TABLE K2: VOCs IN ON- AND OFF-SITE AMBIENT AIR SAMPLESGE West Lynn Facility, Lynn, MA (3 of 4)
51 Spencer St 65 Muray St 84Spence St Building 120 Outdoors Amiet AirSampling Location Outdoors On Deck Backyyd Outdoors SGP-13
Date (mid/) 4/16/92 2/2092 2/12/92 03,23-25/97 03/23-25/97 06/12/97Reference EHE 9/92 EHE9/92 EHE 9/92 SW10/97 SW10/97 BEAK 1/98
Benzene 1.3 1.2 tr 1.2 tr < 0.63 0.32 0.92 JBromobenzene < 0.31(n)-Butylbenzene < 0.55(s)-Butylbenzene < 0.36(0-Butylbenrzene < 0.362-Chloroethylvinyl Edw < 0.92Chlorobenene < 0.43 < 0.22 1.1 U2-Chlorotoluene < 0.394-Chlorolotne < 0.39I.2-Dichlorobenzene < 0.67 < 0.17 0.83 UI-Dichlorobenec < 0.33 <T. 0.83 UI.4-Dichlorobenzene < 0.50 < 0.17 0.83 UEthyl Benzene < 0.58 < 1.2 < 1.2 < 0.46 < 0.23 1.2 UIsopropyklbe ae < 0.41(p)-hopropyltolurne < 0.36Naphthhlene 1.34(n)-Popylbenzene < 0.41Styrene < 0.47 < 0.23 1.2 UToluene 3.6 3.7 2.9 1.06 0.62 4.8I.2.3-Trichlorobenzene < 0.541,2,4-Trichlorobenzene < 0.401,2,4-Trhnethylbenzene 0.611,3,5-Trimethylbenzene < 0.41m/p-Xylene 1.1 1.5 0.73 tr 1.15 0.28 0.97 1o-Xylene 0.47 r < 1.2 < 1.2 0.46 < 0.23 0.12 UBromodichlommethne < 038 < 0.75 < 0.75 < 1.04 < 0.15 0.75 UBromoforn < 0.19 < 0.10 0.48 UBrotorthane < 1.80 < 0.26 1.3 UCarbon Temchloride < 0.32 < 0.16 0.80 UChloroethane < 0.96 < 1.9 < 1.9 < 1.90 < 0.38 1.9 UChloroform < 0.52 < 1.0 < I.0 < 1.02 0.2 1.0 UChloroonithmune < 12.10 1.0 2.4 UDibronochloronethane c 0.20 < 0.12 0.59 U1.2-Dibromo-3-chflotolopane < 0.42cis.--Dichloropmopylene < 0.44 < 0.22 1.1 Utanos-1.3-Dichlompropylene < 0.44 < 0.22 1.1 U1,2-Dibromoethane < 0.26 < 0.13 0.65 UDibrommnethane < 0.701.-Dichloroethane < 0.74 < 0.25 1.2 U1,2.Dichloroethane < 1.24 < 0.25 1.2 U1,1-Dichloroethene < 0.64 < 3.3 < 13 < 0.76 0.25 1.3 Ucis-,2-Dichloroethene < 0.64 < 1.3 < 1.3 < 1.26 < 0.25 1.3 Utrms-I.2-Dichloroethene < 0.64 < 1.3 < 1.3 < 1.01 < 0.25 1.3 Ul,2-Dichloropropane < 0.43 < 0.22 1.1 UI.3-Dichlorpmpane < 0.4322Dichloropropane < 0.65 - -.I-Dichloopropylene 1.10
Henchlorobutadiwee < 047Methylene Chloride < 0.58 < 0.29 1.4 U1.1.1,2-Tetchlomethane < 0.29I'l2,2-Teachkroethane < 029 < 0.15 0.73 UTetrachloroethene 5.5 < 0.75 < 0.75 < 0.29 0.47 0.901.1.l-Trichloroedane 1.2 2.6 1.9 < 0.55 < 0.18 0.92 U1.1.2-Trichloroethane < 0.37 < 0.18 0.92 UTrichloroethene < 0.47 0.37 tr < 0.94 < 0.37 < 0.19 1.1Trichooroinntne < 0.71 0.28 0.89 U1.2.3-Tricbloropropane < 0.33VinylChloride < 0.99 < 2.0 < 2.0 < 1.18 < 0.39 2.0 UAcetone 5.6 9.5 4.5 < 21.04 3.0 142-Butmnonc (MEK) < 1.7 < 3.4 < 3.4 6.10 0.35 1.4 1Carbon Disufide 2.25 < 0.32 2.02-Hexanone (MBK) < 1.2 < 2.4 < 2.4 < 3.66 < 0.24 1.2 U4-Methyl-2-pentmnone(MIBK) < 3.66 < 0.24 1.2 UVinyl Acetate < 1.99 < 0.28 1.2 UDichloodifluornethan < 0.40D-1Unonene 2.34Undecane. 130Dodeene 1.34Melbyl-trt-Butyl Ether (MBE) 0.73 2.40Tr ifluorehane < 0.13 0.65 Ud:EWestLynnP2Table-K2.zis13 Febray 1998
0
TABLE K2: VOCs IN ON- AND OFF-SITE AMBIENT AIR SAMPLESGE West Lynn Facility, Lynn, MA (4 of 4)
Notes:
All concentrations are in units of parts per billion (ppb) by volume.<2.0 - compound was not detected. The associated value is the detection or quantitation limitUt - trace- Indicates concentration slightly below limit of detectionJ - estimated valueU - analyte was not detected; the associated value is the detection limitBlank spaces indicate that the associated compounds were not analyzed for.
d:WEWestLynnP2\Tablc-K2.xls13 February 1998
!"#$%&' ()%*+'$(
I*' _t ( 0 /
(/0 /%+/2& /#"%)3 / ()$4S/ ( ! '%$ (3 / () "5%$) /.) '$
$.) $ 6/%&7889
-&' ()*L ./01'23415, 035517.38%"SM;c%1"_dd\"
-HWHa" BO !?'EO!, 451%".37'610537'D .4%Y'C%8$.1F%
#$"'1.4%l"O= ">. /01"17!==5, 0 3 "! , ".;054 "[4$d'&4"E/9%-;=5, 103 "O="7 ! , , O ?>%7 "80 34 . 9 3 .
41DSF$": . 41H'#$5,G"$ ! F$",0 ! ?'9 0! ,451%"?';'.I0, %'M O3%T"L9!4!8.?"1%758%"I%"
%=%8 ! >%'2l.. 4%'C=%">. /01"9 !F1l. 4103 3'4 $1%F!,"?'!9?Ml'@$W!$",0 !?5 0 !,451%",$05?7"
;%'803, 17%1%7"!3'4$%"7%>%?0/9%34'0=,'4!$%4423?'3MalK/?.3H'E 01%",/%8 =!8"!3=019 .4!03"0
$0:"4$%,%"8$.3F%,"805?39%,4-.%L&%'"//10.8$%,"!,"7!,85,,%7"'!3"I1$./4%1, "W".37"cH""l
2"923"9.3".1%., 0=&%:'%1,%G.Z5!=%!p'&f!Eti%/'?.h".,!F3!=!8.34"3O%"!3">./01"
9!F1.4!03H1"%I.,4.'*?."*$, [0F1./$L8"*10>L38%G".%3>7"'!$L *u",51=!81.?",.451.4%7"
?.<%1"08851,"3"53803,0?!7.4%7",%7!9 34/,B"FC$"."F10537": .4%1"=?0:"1%F!9%"4$.4"!,"
1%?.4>%-4'$09 0F%3%05, ".37"!,040/ !8G'!3=-?L 4!3F"/1%8 !/ 4.403 ".37"!1! .4!03'8.3'O=3"!3-3Z%38%"
4%'5%14!8.?9 F1.4103'0=".'F10537": .41'8034.9 !3 .34"/B9 %HP , ",58$G"14!, "!9 /014.34".,,%,,
.845.?"01"/04%341 .?UP.'F1%%,/%8!=!1.%BM3I-['.8401,",a$$"157,.4t>%6".90534"0="
/1%8!/!.4!03"!3".'F!>%3"/%107"='4!9 %G4:/%'=', 51=. 8%"80>%1G"%U4%34'="?. :3": . 4%1 ! 3FG". 37",
/%19 %.;!?1<" ,$05?7" ;%" %>..47H"
11
P ,'F10537": .tl'9 0>%,".: .<'LI9 '%",0538%".1%.G' 1 3= ?41.4 13F": .4%1'4$ .4 "1%. 8$%, '4$% ": .4%1'4
: !??'?%"03"c/"0='4%"8034.9 !3.47"F10537": .41 ". 37G"F1. 75.? ?<G". "?%3, "0= "8?% . 3 '$10537 ": . 4%3
9 .<"=019 ".;0>%".'"034.9 13.34'/39 %'['F51%"_X'7 #$%"/10; . ; ! ? 4-t' 'ThO 511%38%G". 37 "4$%"
,I 8K3%, ,"'0= "V%"*%3, G : 05?L%3,% ". ,"4$% "/39 % "9 0>%, "=514$%1". : . <"=9 ", 0518%G'
%,/%8 ?k"!3 ".1%.," :$%1%"/1%8 1/ 4 .4!D3Y8731:" !3=1?41.4%".37^01". "70:3: .17"$<71.5?
F1.7!%34"%U,4,"75%"40"04$%1"=.8401,H" "
P3'&' () *'B! 4%'C%9 %7 1 . 4 ! 03"A1F<."9d[3%: ,%4-1".148TG%34!i%7'( !> !3F"*59 %, '$. 4"
E ! F1 .4% " 40 " (%/4$ , " J%?0 : "D14$41" # .;41 A'(61061!,%9 %61" _dd[X. 1,"' .>. ?.;1%" .4"
:::H,4.4%H3eH5,^7%/A, 1/A3%: ,A dd rid#a6dWI$&1%"7%, 81! ;%,"4$ ,"/$%309%303". 3
>.1! 05, "8.5, %, "=01" . "g7!>!3F"/?59 %h" "
i
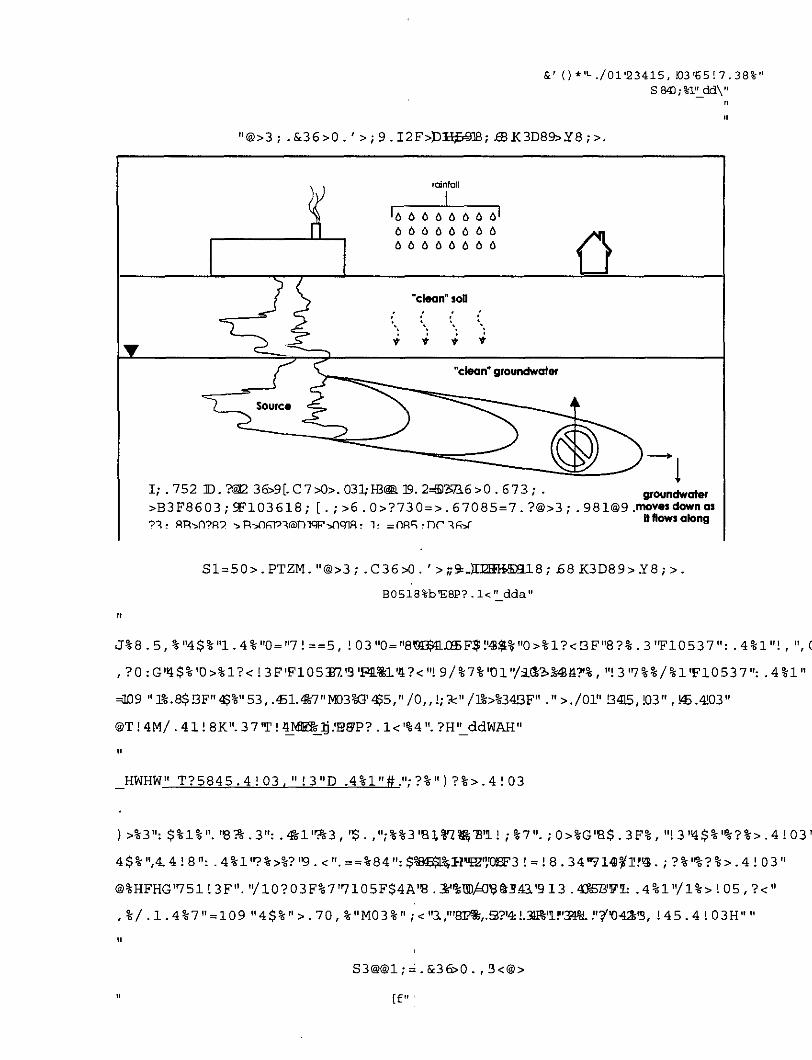
&'I() *"-./01'23415, !03165!7. 38%"1S 84;%1" dd\"
"@>3;.&36>0.'>;9.I2F>)DEjG3B; BK3D89>Y8;>.
reinfoI
66666666
"clean" soU
"clean" groundwater
Source
I; . 75 @2 36>9[. C 7>0>. 031; I-B@. 19. 2=9'373.6 >0 . 673;- groundwater>B3F8603 ; 9F103618; [ . ; >6 . 0>?730=>. 67085=7 . ?@>3; .981@9 .movesdownas
S1=50>.PTZM."@>3;.C36>0.'>;;..)I3HH8H18;68K3D89>.Y8;>.
B0518%b'ESP?.1<" dda"
fI
J%8.5,%"4$%"1.4%0="7I==5, !03"0="8 %T4LGF$"4$"1"0>%1?<!3F"8?%.3"F10537": .4%1"!,",
, ?0: G'4$%'0>%1?<!3 F'F1053T/.'9'FIL%'4?< "19/ %7%'01"/ M a'%"3"17%%%1'F10537":.4%1"
=109 " 1%.8$ 3F" '$%" 53, .A1.i7NM3%G'45," /0,,!; 3:" /1%>%3413F" >. /01" !3415,103" , IE .4!03"
@T !4M/ . 41!8K". 37 "r 1 _ME0Lj.'28P? . 1<'%41". ?H"_ ddWAH"I
HWHW" T?5845.4!03, "!3"D .4%1"#.";?%")?%>.4!03
)A3":$%1%".'A.3":. 1"?s3,'$.;%7".;0>%G'B$.3F%,"!3'4$%'%?%>.4!03'
4$%"-,4.4 8": .4%1"?%>%?"9.<".==%684":$*BB-L, RIP2",3!=!8.34"14W1'?..; ?%!?%>.4 03"
@%HFHG'75113F". "/10?03F%77105F$4A '%3/=0'43.4'913 .EB"'V: .4%1'V1%> L05,?<"
, %/. 1.4%7"'=109 "14$%"1>.70, %"M03%"; ",'I ,.? !31%U3 L"'4 "J !45.4 ! 03H""1
S3@@1.;=.&36>0. ,3<@>
11 [f",
ATTACHMENT CPages from the Semi-Annual Remedial Monitoring Report
Quarter 3 and 4, 2008, West Lynn Site
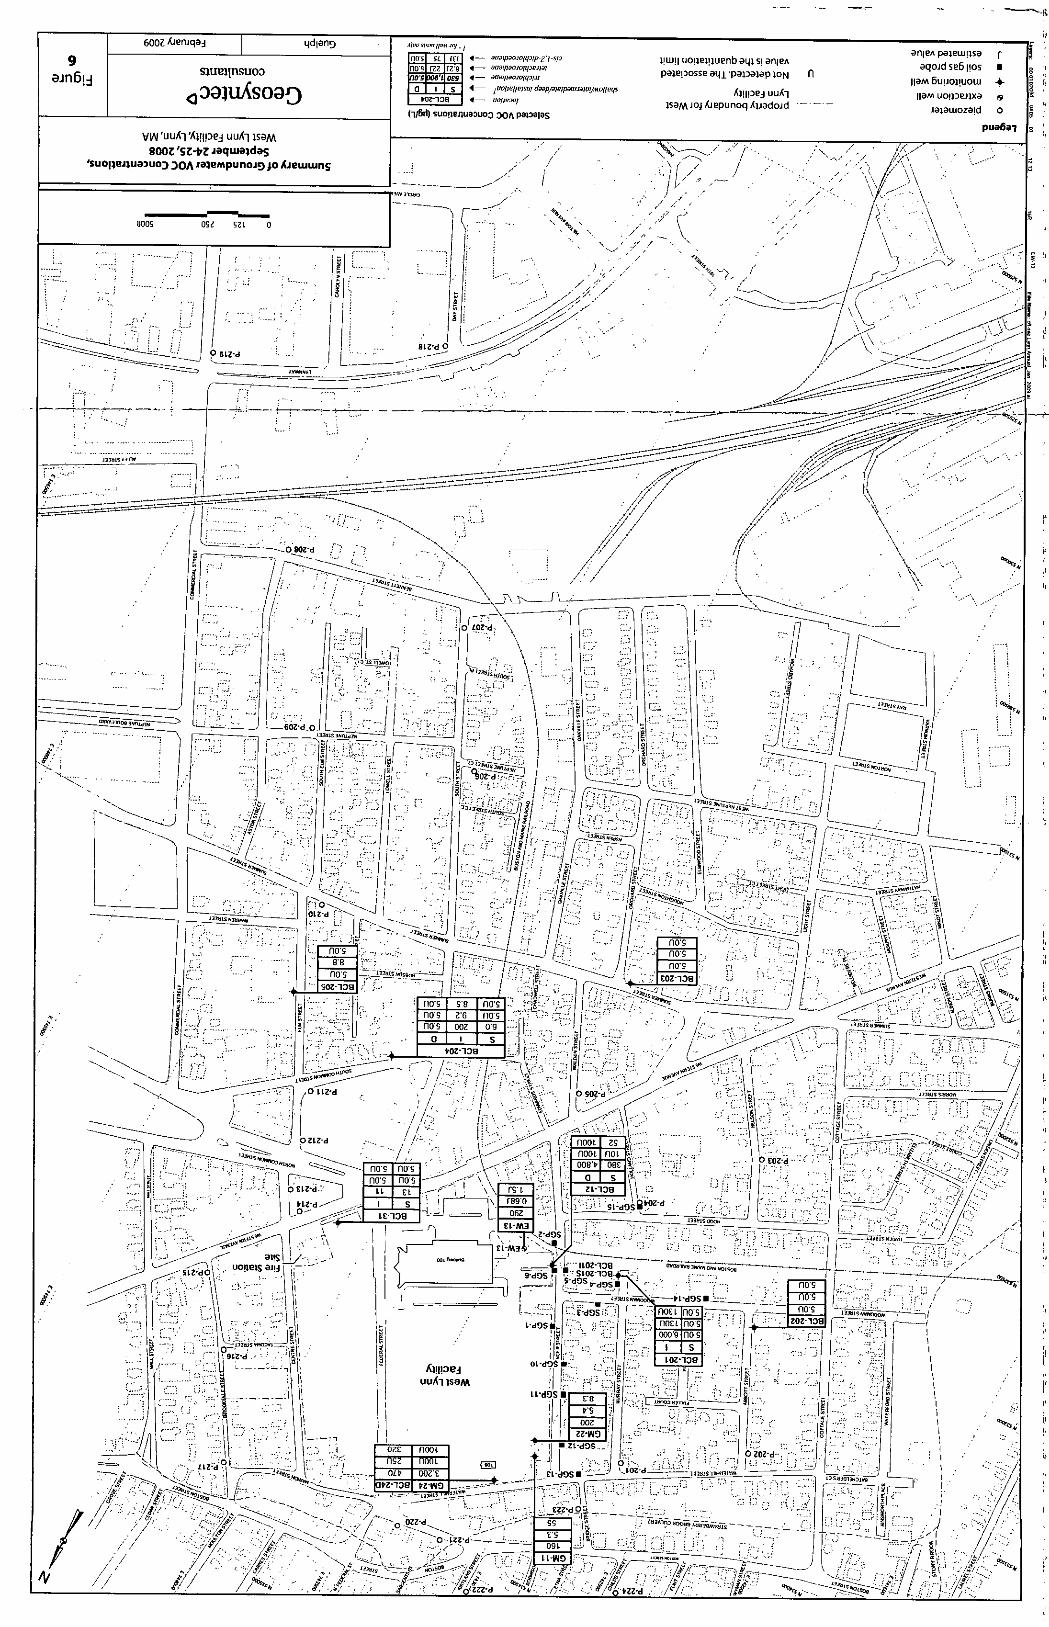
600ZlieflJqaj qdian9 4,,wpae~
SOl L Ii 4 aqaojpp(sn1!WI uo~lel!luenb aq s! alleA aqoi reiIO ne ee ts
n i d saum insuo a osrz 3g 4 aSqa~~~ Ja P oae IoSSe e1ppa lepwn aq i seM Euoo w m
VV J'UUA 'l!i PR)J uuA i 1M .P\
- 7sooc sz-tz jaqweld957 /-..
. ' /p.
'Su 01WJ1lU 03u:) DoAJa wMpunoj D)IoAjewwnS A -:~
/, -
Uioos 091 S L 0 . . . J 2 < i* ' >
JX,*
/ - >~-~~ ftjj22 .7... l~
kk --z'I-730+ So no
-0 AZ6 nnosd 0 o
OI t d .4
Lo o .
FlU1
EL -
.
0 I2dnno
.s
nn
E2 -d
LL EL 0 9 0d2. flO 00 0 6
,SOZ'38 .. fib 16 105 . '.L___
____
-- noSd S~~ nos9
fO no -s
n o s z 0 0 1 3 9
_____t ~0
Zozd - Z
I -~
O Z Z -d,
44.'V / 4)p24 11 4.
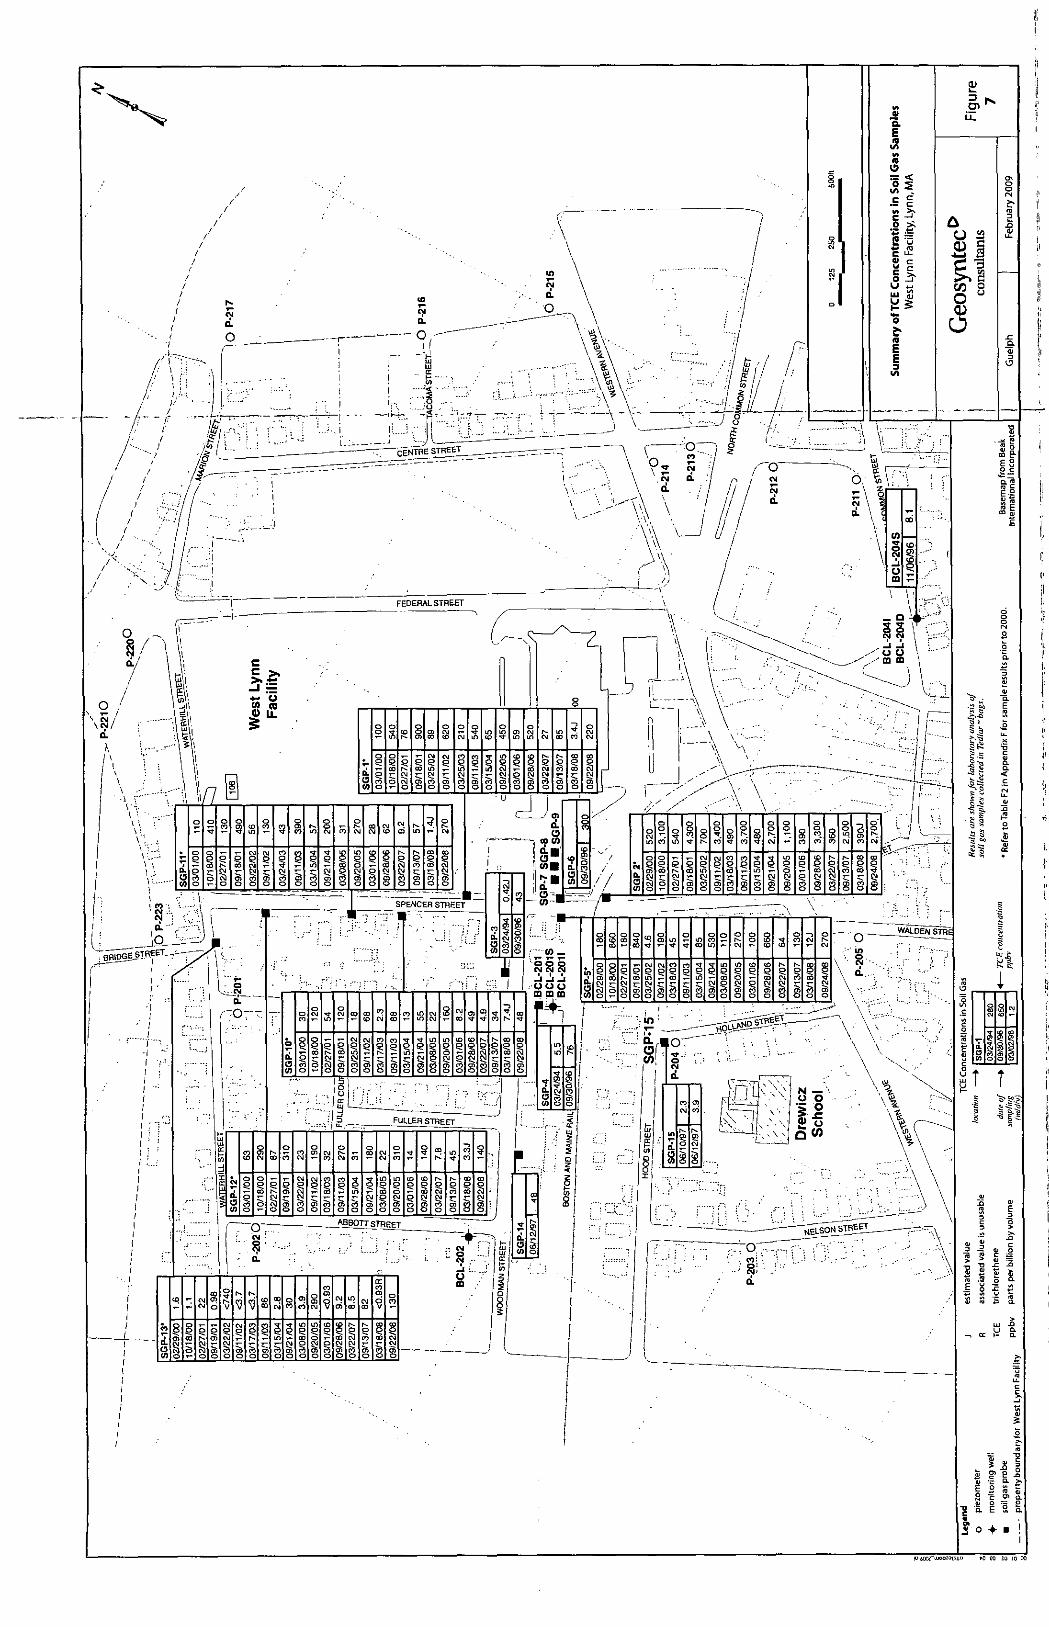
NN
00
o0 ----r~ c - -----
'9 .. CFEETRE STREET ~ ~
CLC
I-.Li'iI
-Jo ,' - U)
Q\; A
C
4,
a.(3(ii,
o
UC
o o o ]2 ~
0 0
SPENCER STREET
- _ _ _ _ _
_ FULLERSTREE
/, / " / 0
68 v
0o 00 0 0
ii2C00O 0.-
0 . 1.0
ISBB TTSREET
IM)00000 0000
0
0 o
811 'I NELSO[REET
v
E
0
E
+ 0
mooroorn0ol343OCtoI 0 00
Ii-
0
0\00
a0)
(/
K,/
/
0*
ESCC
al~
£0C
NU,
H
20
(n
2,40
Wr
'S.,.5cc
at-CCICC
3.3
-I"
CC
1.'
i~CC"
ItS
I
0JEa
C0. >
.0
0
). 4J 'C~ .C .0
~ rC- a
tij .0tj a
,-~- a
Go 0) -C
- c0!!!
o v oo j
2
I
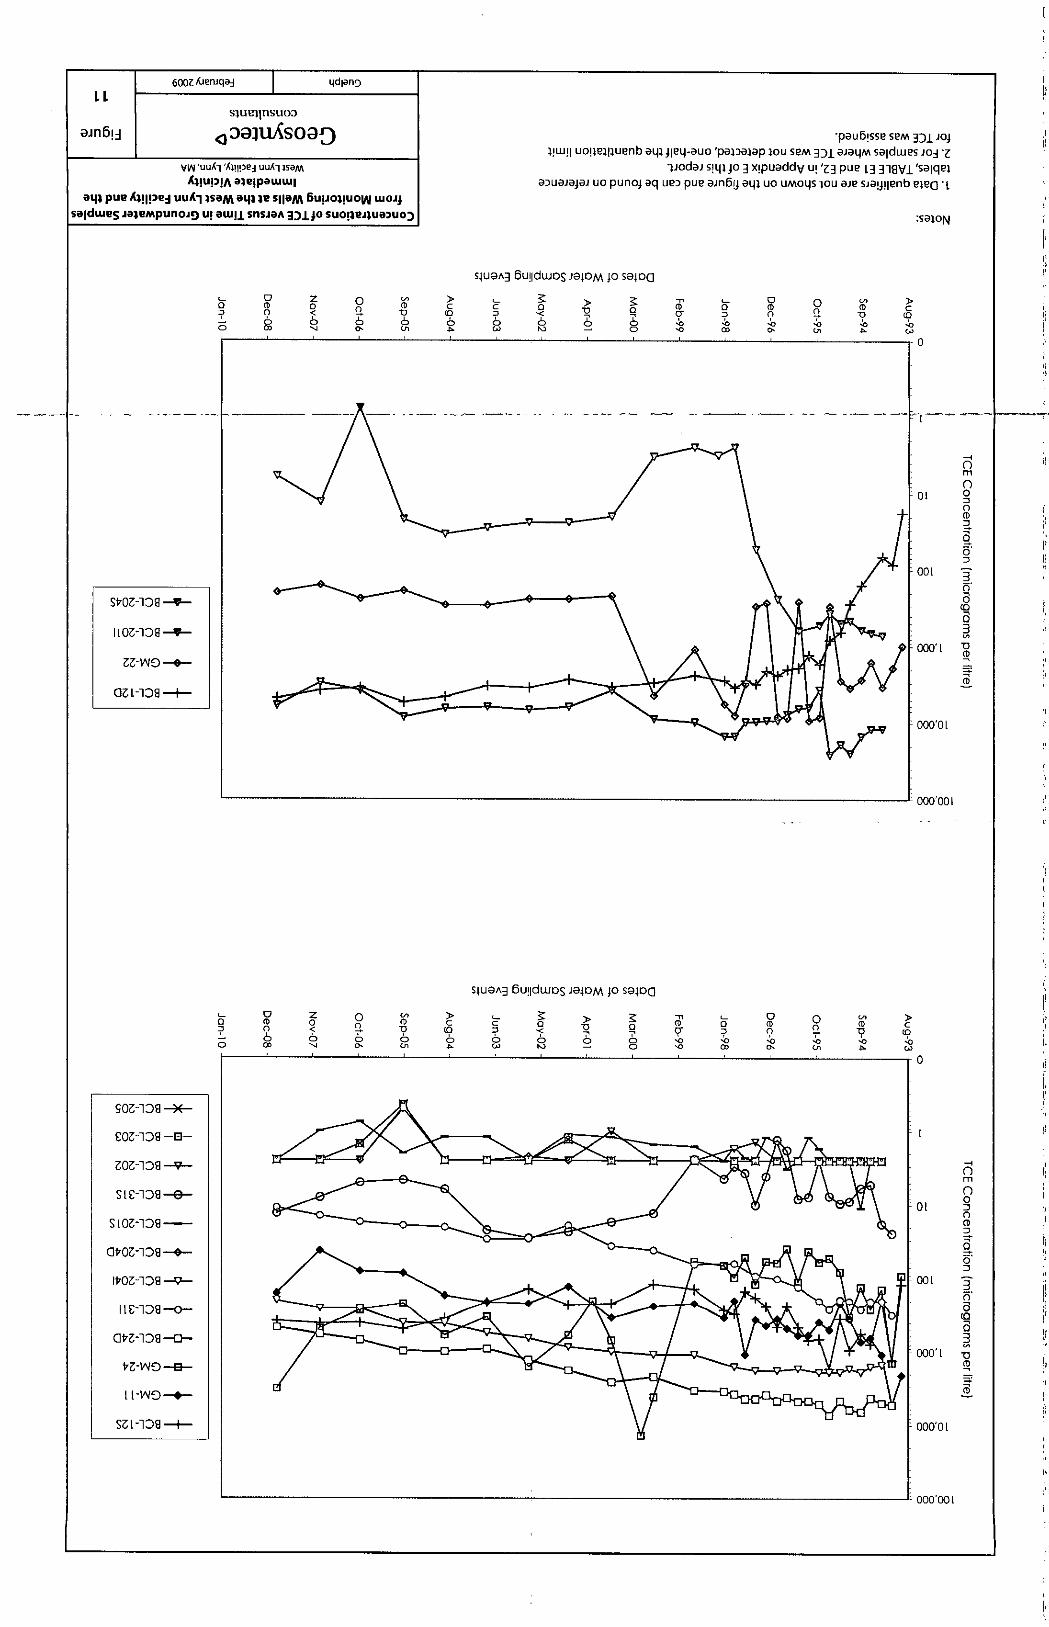
LL
Oi~Jfl!d
6001 ~enie~l d~eI
L~.
40 aiuAsoal)vvq 'uukj (1!!le1 uuAi ISaM
4!u!pIA OelePewwIueqs puu 43!Ip'j uuA1 zsaeq 84e siIOM 6uipoz~uoW waql
seidwe s BIMpUfloj9 u! BWI[L sSSJA 33j10 SUO!SjUoU2O:)
*peub1sse SPM Di JO)i!w!I uoimjiuenbeqa jjeq-auo 'pai)ap i0u SeM ]DJJ ajB4m saidwes Jj -E
'liodai s14l JO]3 xipUaddV U! 'Z3 Pup L3 31 Vi 'salqeia:ujjiuo punoj eq Ue:) P ein~j Eql~ uo umoqs iou me sJaIJ!Ienb ei( *t
:SaION
S4UG)A3 OuudwoS j@9i)M 10 sGjoU]
0:3
0
stlog-iog -y-
110-109 9
66-v40 -0-
061-108-4-
0 z(D 0 0 C.,
CDV6
c
6c 0
6N)
VS 0
500:3'C03
0
0 Cd,CD-D'04
C
mn
00 :3
000'l CD
000'0O
000,001
S4UGA9 5u!idwoS JeloM 40 s94DQ(
0:3
C
CIS-109 -03-
t,--w0 E3-
51 -Wo0--
6mD
z06
0O-;C
(A0*000'
19C:3C0)
0 _0 00 6
-'
0* 0:3'0
00C.
C-.,CDV'-04
c19
0
0)
-0
-4
0
CD
F000' 1
000'00 1
60OZ AieniqaA qdjanq
F
IF
II
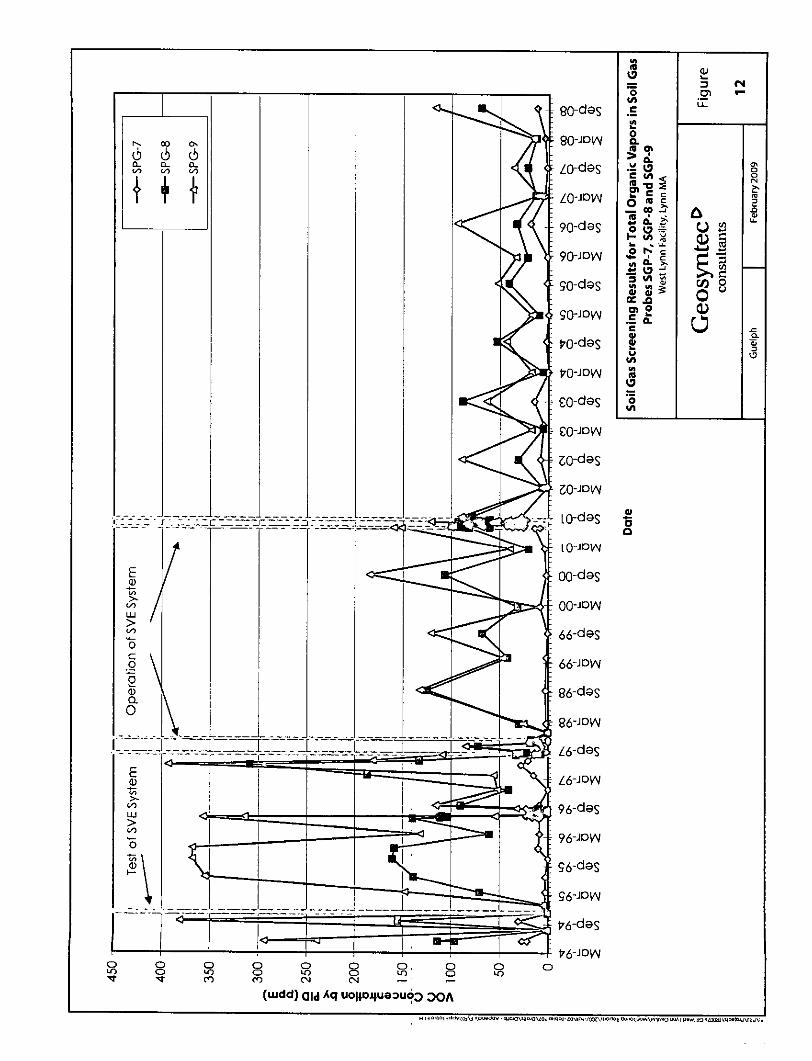
0 0n
90-des
90-JDW
L0-ds
LO-1Dvq
90-des
90-JOW
go-des
00-JDWyp-des
66-JoW
86-des
86-JDW4Co-des
6-JdW9o-JDv
ia-des
L0-JDVN
00-des
66-des
66-JDW4
86-JDVN
L6-das
L6-JDY4
96-daS
96-JDI.N
96-dGS
96 -ID V
V76-JDVN
CL
0C.
0.rC w
;A "
a'-C
C
CC-J
tV
CC-J
C)
a)
J C
0
-c0.C)
a,.5a
'I
0 0 0 3 0 0 0, 0) CD ~f 0 0mf (N N - -
(wudd) aild Aq UOjjj4UaoUO3 :)OA
0,CCN
C,U-
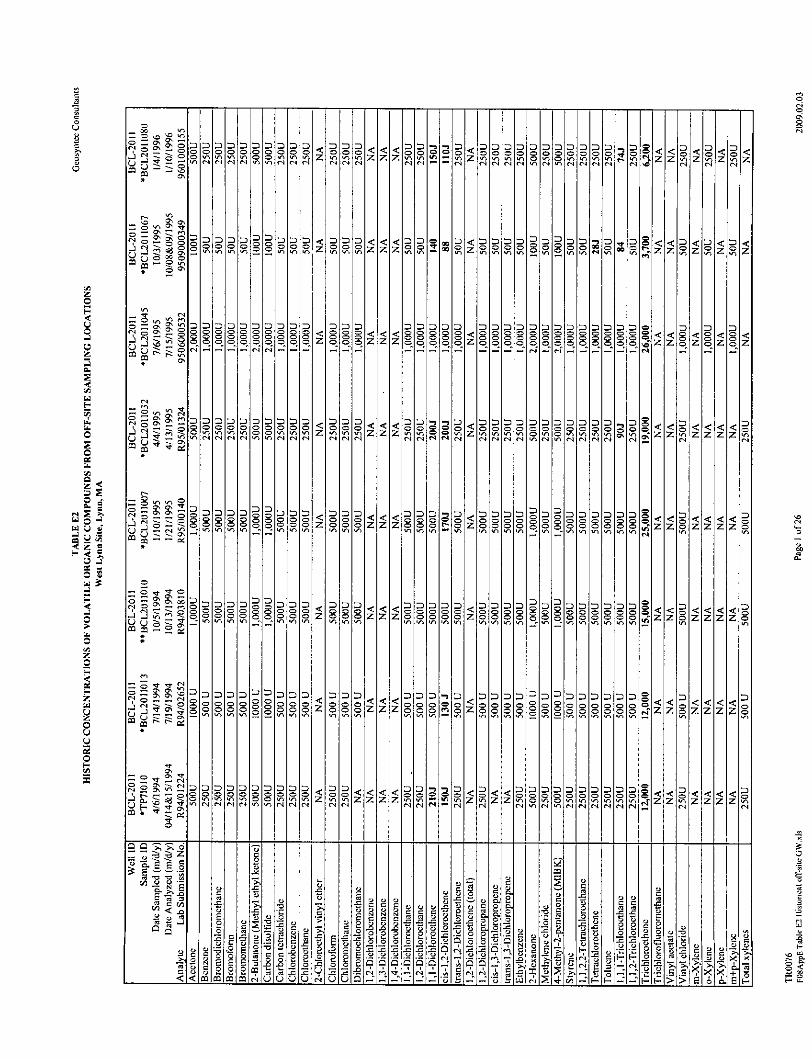
0
o
. 2 DIN000
.. .
0050-..Eiooi'DI ,NLN2[ NINU
2222222000 0 0 0 0000 00 000000000
------- 04 04
200
2000
2000
7
Z
<7
DI00
C
00C-)
C
0
222il
<OUNUNUNUN 0 0 UNUNUNZUNUNUN 7UN04 040404UNUN 040400 040404
o 0000 0000 000cooN U
~22 2~ 222DD ~ 200000 000 .0
0006008000 zooUNNNN - UNNN NNN
2000
222222222 2220000 000 -C 0 0 0 -Coooo 0 0 oooZoooz
22~ UN UN UN UN 00 UN UN UN 7 UN UNUN04040404UNUN040404 0404
-C-C7
zzzUllNUl
<-CZz
_*
222220000000 00000 000
20
Cl
Dle7,z .... 0404U
-C7
0 0 0 l
20
04
D.
04
1
22200 00 UN UNUN 0404
20
2,20~
~UN rtz04 (IC
ZNZ
zN -Z z1 1
-- - - - -- - - - -- - - - -------
'2
7000 0000
<l7 |00UNUNNUNU UNUNUNU
2<'(0ZZo
-C7.
Cl
2
- 2
z'J 7
ZJ-
-C7
M0:0
-C7
10 2 2 5 .<
9c98888s8 0
o .... 22 802
22.2 222222222222200 0 00 <00 0 ooo0o oooooS<00 t) oZooc o~o~o ooooorZUNUN~UNUN00UN UN - UN - UNUNUNUNUNON -
C
CI,UN UN 7 UN 7 7 UN 0 UN
04 CI ClUNCI
'2,00'UN
2222220000000UNUNUNUNUN UN04 040404040447
<70777708
707777$UN UN4
2 2$
z< z
rt~z C
0 022- -
222o 2 ~ 2 ~ a-
-u H NNN Z;OA 4u -- 94 > 0
00
C
- ONo ON04Z.2 ~
m
'CONON
0
000
ON
UNON
ZenON 000
000~UN0 ON
ClUN enON UNON 0~0
0' UNON
22
.2=-C
u
0
0Cl
C-)m
0
I
UNONON
0
0
ON
ON
04
004
C-)m
0
Cl
.2C-)
0 0(-4
0
ON
55I I
zzz<
zz
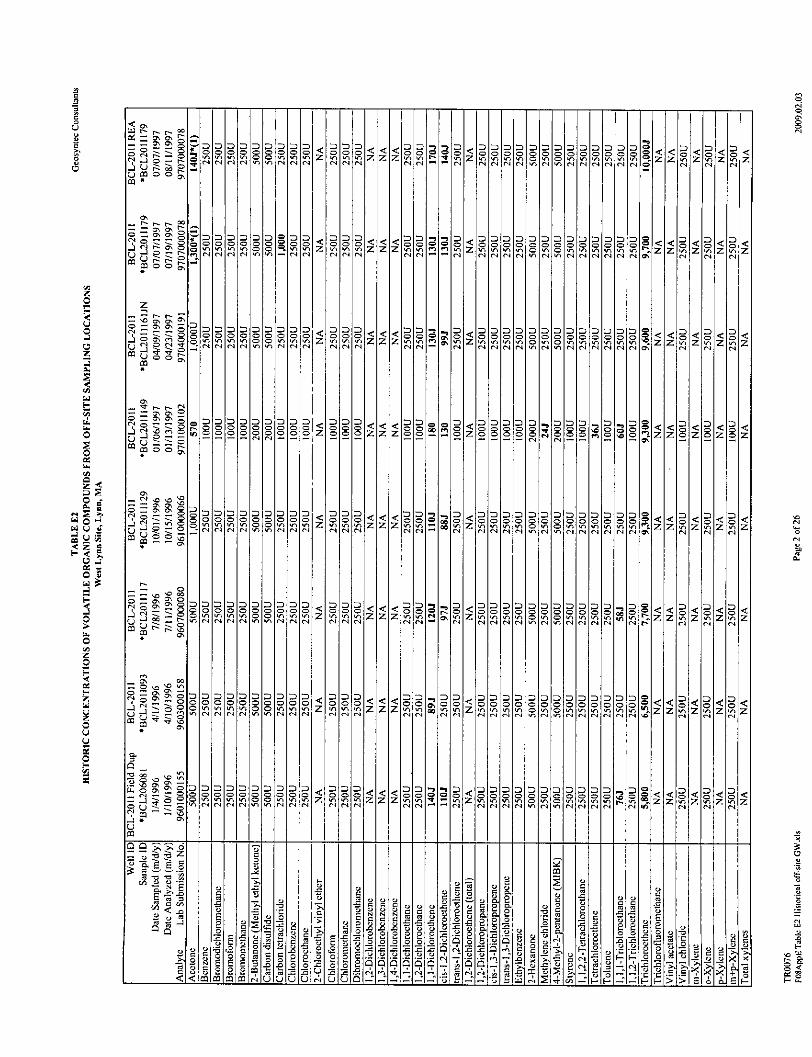
is,C-it
0=I,
0IDin'(N~E | | | | 00
00
(N
000000000<ZVVNin 7(N(N(N(Ninin(N(N (liNeN
00000000
CO0- 0UN 0
t00 S0 0000
000000000000000000oinininU~I 0 0 in in n- (N (N (N (Ninin(N0l(N
000000000000000000000 in in in in 00 *n in inin (N (N (N (N UN in (N (N (N
0:
00 =in in I-(N (N -
|
z
77UO VI MO~ i
000 00 0 000b
000000000000000000 00 0 00 0 0 0 0 -'Cul VI in 0 in 0 in in in in ~ ~ r(N (N 01 (lineN in e~ (N (N (N (N (N 0%
zle00(N
z'*0* 0 z'
ZilZlilz6
i |z i| | 7 7 V in in C i| | | |l% 7|(N:1e 1N~ (N : ( NNN Inin (N (OC C MM (NI (N : :: 1 "
900 OrqOOO e ll0 | $-(Nz E2% E 2 -
00i0n7 nUN-~i .ni~i.. nn 'o7 N U V(Ne zeN IN( IN zNNNN NNnNNNNNN ~ ( N
in .0Zn(N IN (NII
UN 00 0 7 1 7
z z 'C z' z
00in. 0000000 000 zo01-, 0440l0t 0r00 0D D<S I0
0000020000 tc =) 'C < 22~ 0i i n7 ni i 7 Zii'in iiin n O
in((NN(NN((N NCeN N(~(N (Nme=) i (
0!
ini
0000 000000 0in in in in C- in -(Nrq(N(N (NUN
-'C7 "C
i010(N
ZiZ
;00 -'C
7
z zin
6 -- 3
E5 t. 02g~ .g 00 . s
2 2. .0 -o u2 2u ulu z; 0
0
0U
05%0
'4
'a
I
'C0'0%
'00%ON
0
< <I<z z z
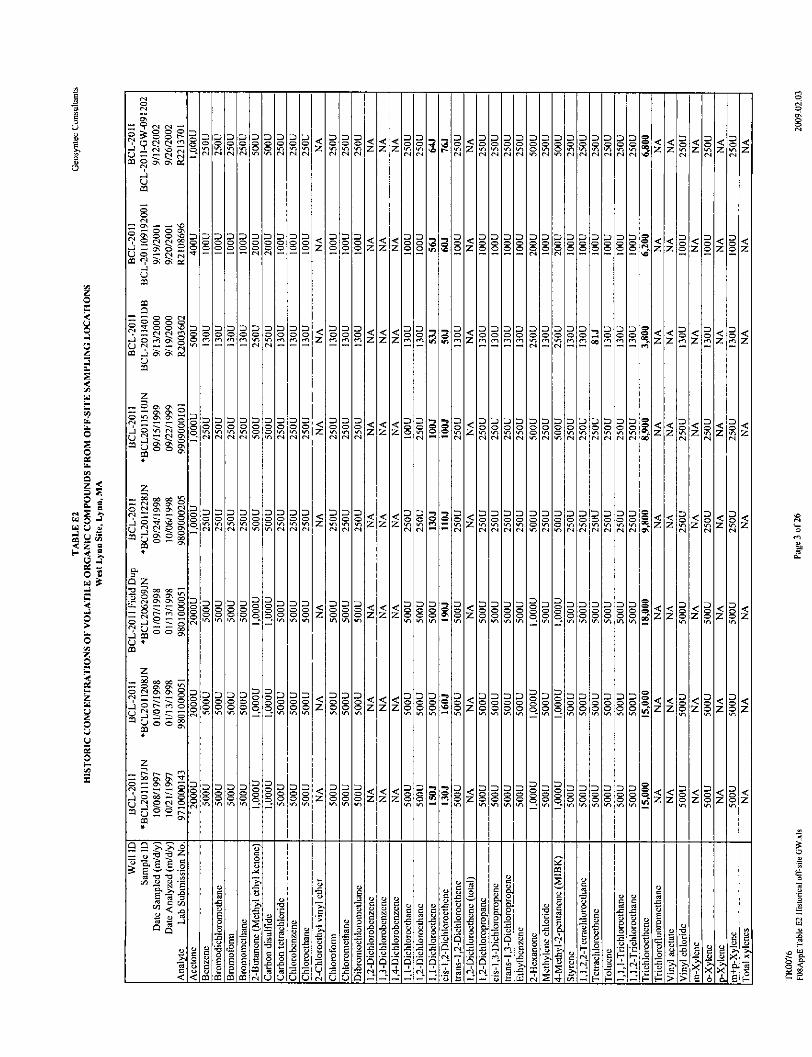
00 1. 11 0 0 0<< ~ <
z Z n Z nZ
so<222 .I 1 2 : 1:1R:I 01 O -IZOOO2 002ZZI<Roo2
000000 000R
0000000 in in in Un 0-01 01 ~ 0] in
00 00
in in in in -:
00
0104
~I
zlD
000000 Zin in in
~D~D22~nn00 0 000000000000000004 in in in in -t -:
a0
a220000000inin
a00
00'in
a00 Iz
P<iZ
.O o o o o. . Fz 0 0 000 0 0~ Z0Z 0 Z 0 ZI ,I 1,1 R 2 21 Il RIi R1i -r 0 - -RI21
222<<22~<22D D2D2
2,00
'in
Se22 1n en 0n Z1 Zl n Z1< 1 en2 J < 2< I <2<
000 .C]C]" M W r] C]]]CCC 9= C]= M<
22*<ininZC] C]
z~~ ~ ~~ D :D en-i nin in Dionniiii Z) ~zz C]0 ........... ~i C ]0 ] c]0]0' ] C]
inin"in- n ,,,,,,,~ 0 0 j z a Z 0 z 0Z
!<<2< 5
oZ zin in <1
DC0'
2<222~ ~ a ~aaa 0Co~cCOOOOCo2<2
2 s-~~ p 0
< U, U* - - - 0- - -
C00
'3
'ii
0±4f-i
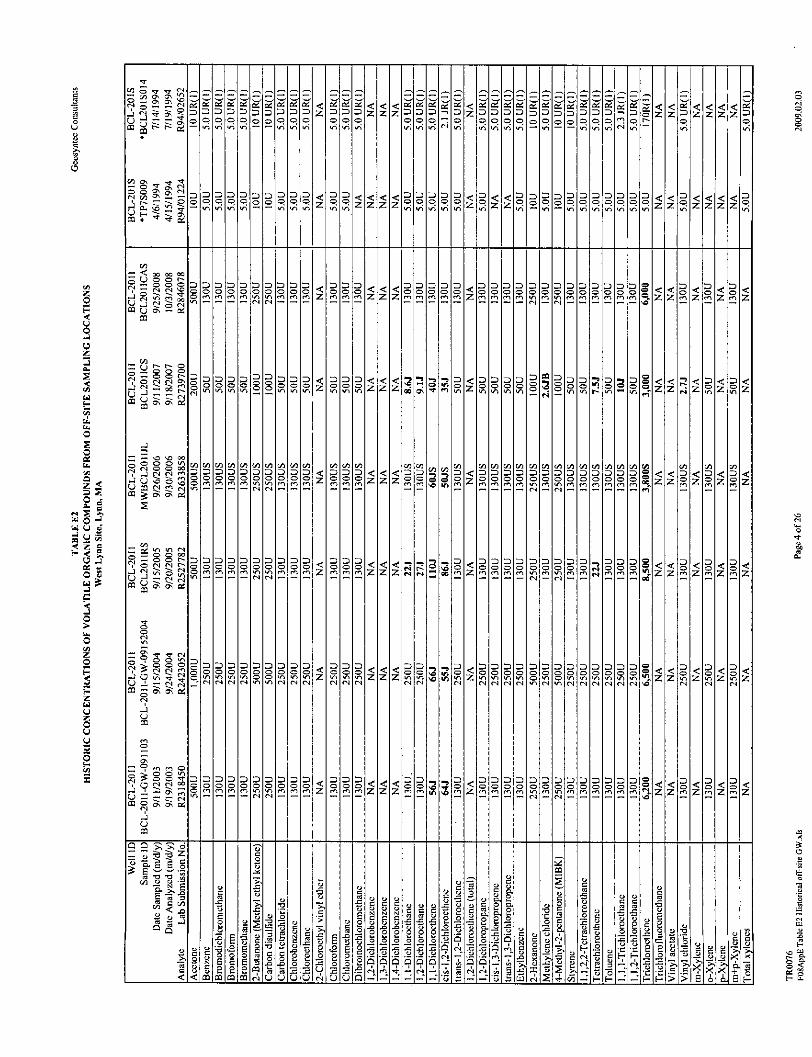
ZZDZZZZ
MI 1 I M 102 0 1 0 IM112 1M : S0
IC
U, 0
00 40 40 40 40 40 40 40 40 40404040000000 0000 222000 000 000000000 2 ICen en en en ~ en Qn enenenenenen 0~ Z--------------------------------------------------------------------------------------------------------------1~
<Z I n Ze 1 e 2, <1 zZo
<CCz "I l.)IC< <
D0 D0 Dz0z z z.,c z < Z< Z
$$zZZ,2oZ e ... ||||nZ Z------------------------------------------------------------0 - - -
0000220000~~C< OOC 0000 000 z
~O<C CCOC O~O n
r! en Z en en2 en1:212 en,1:,I:: !
*0
0
044
~0C).3 ~
2
000Cl0
C.
.0 C)-0£2 C)
'*40
0
C
0:en'
4 | | |
iZ z ezen zenz <
B).
V5 ~ 0.
C)
00 H
utI
C
C
'r ~rON ONON ON
't ON
C- t~-
£0x
ON00
C--3-
DID 00 IC IC IC 0
0:
D00 GD
en en a U, enIC
0004
ON
I-0004
ON
0004
ON
0004
ON
.3
40.2
E40
a
Z ZV)z
0
00 ~
0
0
0
0'I0-0
00
.0~C)
<M<z z z
,IRQI@IZ< IZ< IZ<
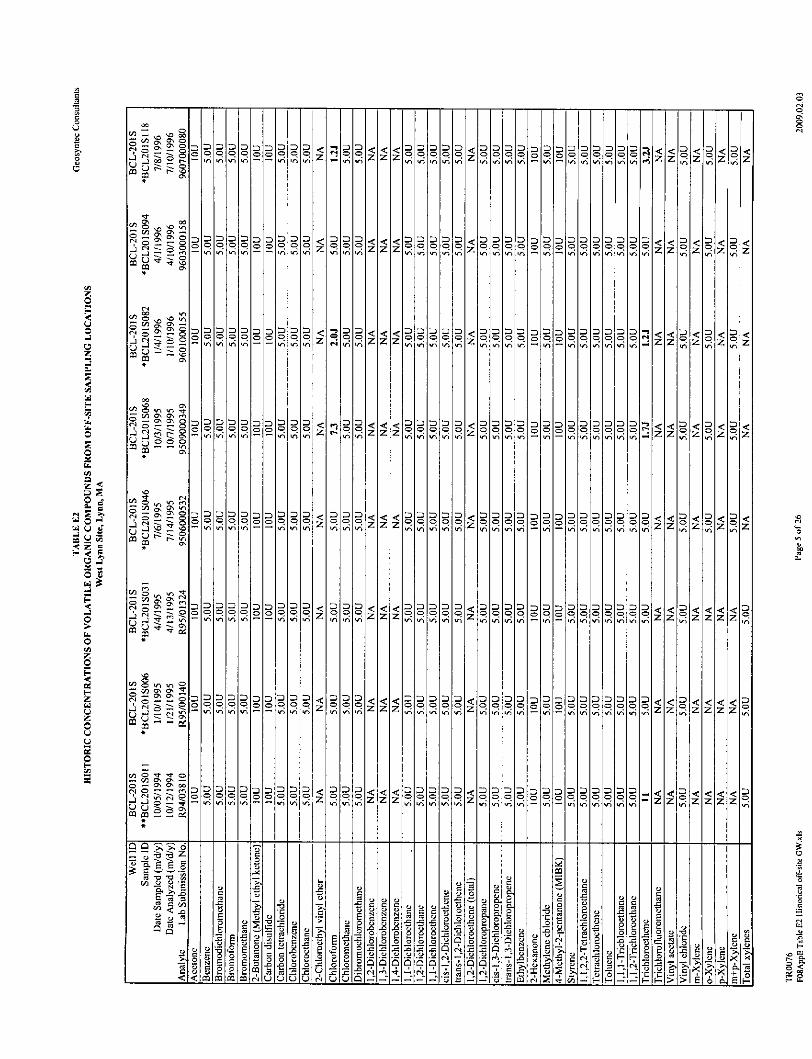
D1
e0l l. D
2l2l2l222 Z22l<<<|22|2l222
D22220 2222- 0Zj: I I<<D00.0.0.0.000.0.D91< - IDl~lz Z
01 0,20I -
20VI'
2
K0
20
0lis |.~90 | 0.I zl0II izlO|s zl
:* I C . .z 0 0 12 I lz zolI DIV 11 rIDl llVIV 1Dl"l<ZZ IDVI~I
I * 0 Z - s | $ 0 0 00 0 0 0 ql l-ull D.lZZ .90900nI00000<0 141 nIInI D11 DIDnln1D~l~
N
2 l22l2222 .l <l2 2 s< 2RZRRD00. l -0.0.0.c4o0 I .0.0 , DlOl I0 0 o o c o o o o 0 z c viz~l vzIDlIDM nIDInII : DDNDD
| | c o| o| |z|01 0| 00000 DOIDoDoOOOO20 ||1<<F2 l@|KI<I
I222222 2 1 2 2 <<21222 || fl n2 2I2fl 2< 2<I
20
2 DID121.
VIIDI I<1 DID
i2'0 z z
00 z z <kI11::
ro -f 7-t f0t
0 9 - 2 -Z "oo 00.m C) C) CCCC -uC i< <0 I0 I- I )
0
u0
0Q
0
0
C
*0
uf
0
000In0
0'
D1DID
Z Il I lzle
1'R91 $1
::, I :,:, fll :, I ,:, I z, I DII ::,CR IR Z . . . Z Z O,
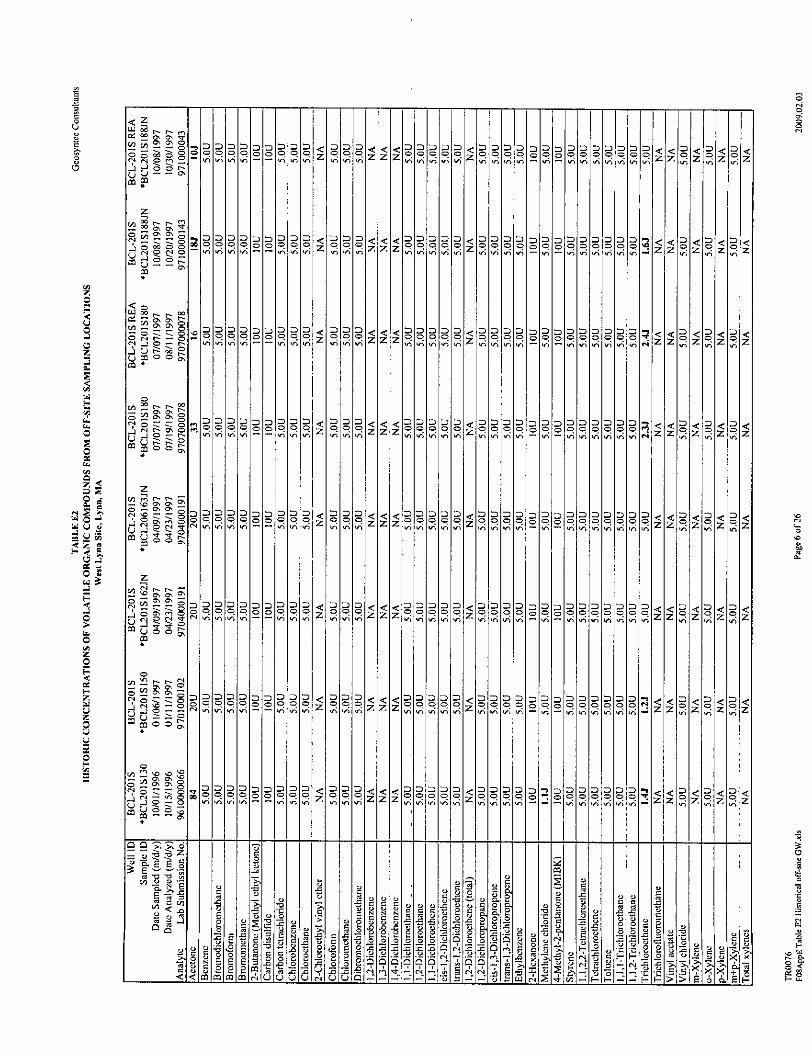
... DDIII~lillI III Z1 InwI
D0 0 0
-30
U
0
0
Zq~ Z Z Z....................Dq. C ZZq q&Z.AZ0 .
-ZZ ---- z .9 9 0 00 0 < 0,
Z Z Z lfl Z < lf 0 0 q q z z
Zi FZ p IZl
-------------------------- -- ----------------------z z -Rz z - z
< DID<0 OCoOOOz 000 -z~In
ZIIIIZI -I-I-11I 11z1-1 0 -I 0-- l
n0
Z Z Z Z C Z
IN *I<
DC C DI D<fzlDI~HI~l~f 0
102
019191919 I0I0~O~9Ez
nDInInIDInInIDIn0 01010 010 lolOlO
II~nbn
= n UI -FU-0199 OM I0~
D0*
n000ID0nn ..I.l:O I1111 0, z, , -I w I ;1.4
t0
t
- 2L0
E o5 0 0 .1
aa a1 :2 :a :m 0miii -u u >u touO~ 4o~ o
06
000N0\
C,-It
0000
C-C'.
zOCr-O00~
000
IN 0
U-
0CII
- 0 - .o0 0 z q - *z zz Zz o <J< o> 0 00Zq0C q.q00q
'0
NNo~ CI
~0*0
~0,- N,
NN
0' 0~0
0C~ 0
0~
a'0~
'C
0
0
'C0'
-l ,R Il , rlR:1R11<1 00000,Rqz< z< I lz< I lz<
D 0
Z z
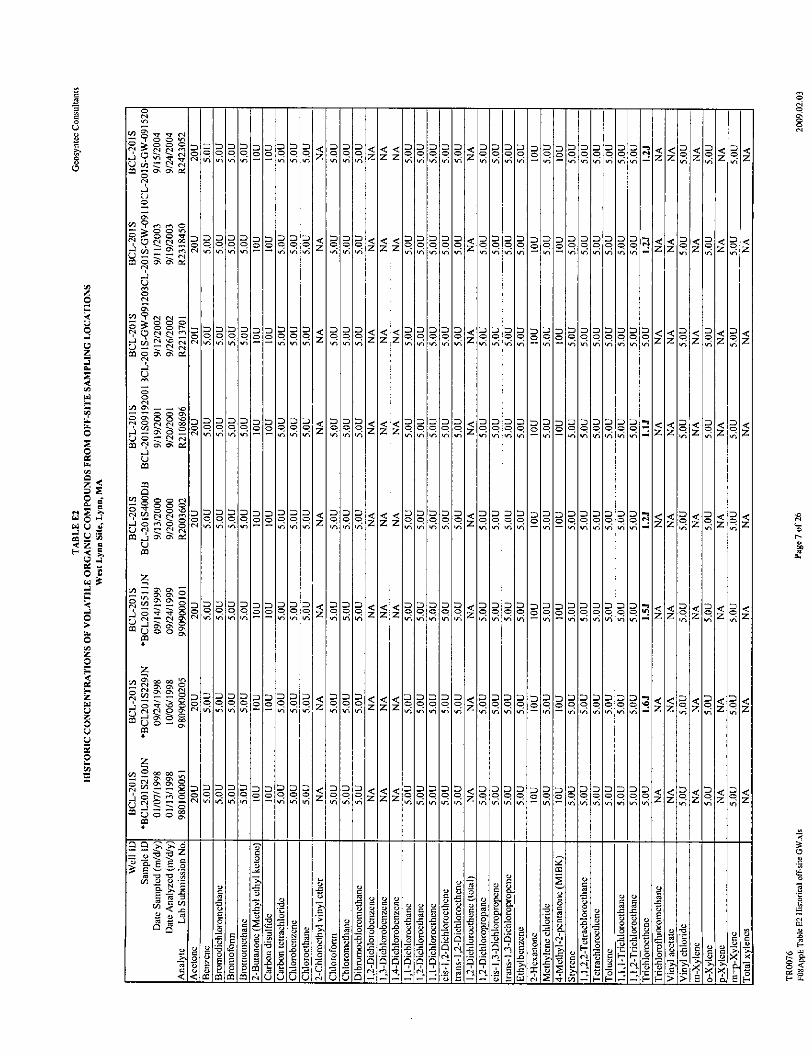
ll ||I-I-Vq IV I l&
o I o |o o l z lD0 l V, v IIIVIlVII I, 4 VI
00
CCCU
0
0
1<011
z|z z
1101~11 Dll -MDiDiDI < I 00[ 1 D1<<10
00000000o1v-;&IA 0 Ioo l l l I 0 l < <0
119DR I | Il91 | 1 97<1< 00
1Dl 21|oo - W I 0 00
00
D.0 |0
00 -o - 77.
<I DI .1c
D 0 l9l9 00000l rI D| D j 1[
0 0
DlD
0|
0 010101010 10101010 zIlI z IF l l
010 I 190 1 101 R1| <1<1 10d0DIIVIVIIIVI l fVI I I I I
<| | 00 0 0 0 l l | | l l l|
0000000000 D::)< D0D0D< 00 0 < 0 0 0 0 0 0I0-000-0- 00 09- 00000. .1 ZC 000 q00o0 00D~-' q- II M IIV VIV ID VW IVI I II I I V I'DIVD1 IIZ
OlolOlOlOlolo0 I OlOlOlOlolo0)JVilviIviI& I -
0~0
Th
0 4,I 010 0 I 0110
| | | V IVI I |Ik |V 1 :, VI
0.9.VI. zo00 z zII &H14<v.4i 1
1010VI
0000009900VI VI VI - VI
010101101z 919100'01VI
D00
o0110 101001010R,
10 I -"< <1<101 <
7
90-I
VII
Et
5
2 2~'7*
-~ -'
2) n? 14 C
M a-, u C) C)) Q) C
0'
0
I-.
'4-4=ICI-
0001
*
u
mI
uI
m
IA0
-2U
000.4U
IA0
-4U
CI,
004-4(-I
CA
0C~4-2C-)
'0
F-
z z lz
zl z
<1<1Dz z '- -, 1:1 z
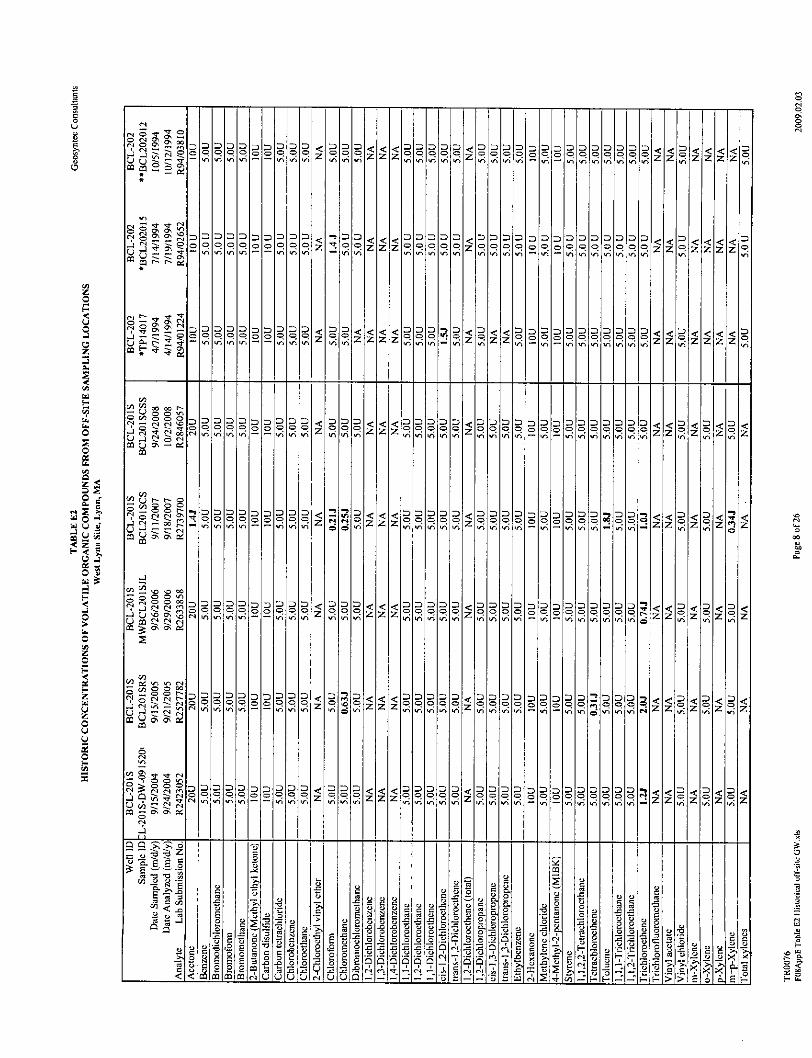
C
C
U
C
C-.0\0Ut'CCl
00C-0\
'4U,
'CC-.
00Cl
Cl
-t00Cl
0%
0 IIz i z z .| z
2222222222 9z " - <000990090.1:111Rl rOl ZzI
20
0
CC
0
C'
Cl
'C
0
0N
Cl
Cl
0
0%
22<2
20
212121212121201010 I 0101010U, I U, I U, I 11.nluj
20
19101000I 1 1z'z'
9 1
2 <2 m[ 222222R<z <<<<2OOAzOOCPoICrolOOOCOO<zzozzzz
20U,
zzzI 19
I z 9 1 z1
R 0< | |00 0 < 0 0 0 2 2 2 '2
22 2L 22 < < < 22222 < I 222 |C$l2222M I- -
9 ~~ 00 0 -z
Z 2 Z Z 222222 'R z-2
2001
0222299900
U, U, U, -
20
20-U,
:22I< I222<<<22222D1 DI' I : I<22I1:2ID 22D 222ID1=, 222 , R-ZZ C -I q"ZZ
-&I11Z zz
z;2 2
00 2
'C
0
H
Clm
0w5
z z z Z | 0 | | 1C|q1z
-UC'C'-2
I-
Cl0
0,
0Cl
-2U
00
0Cl
-2U
* C,,
0
-2U'C
CA0
a'fl 0%~0
20;'C-
0Cl
.4110
Z l l 1
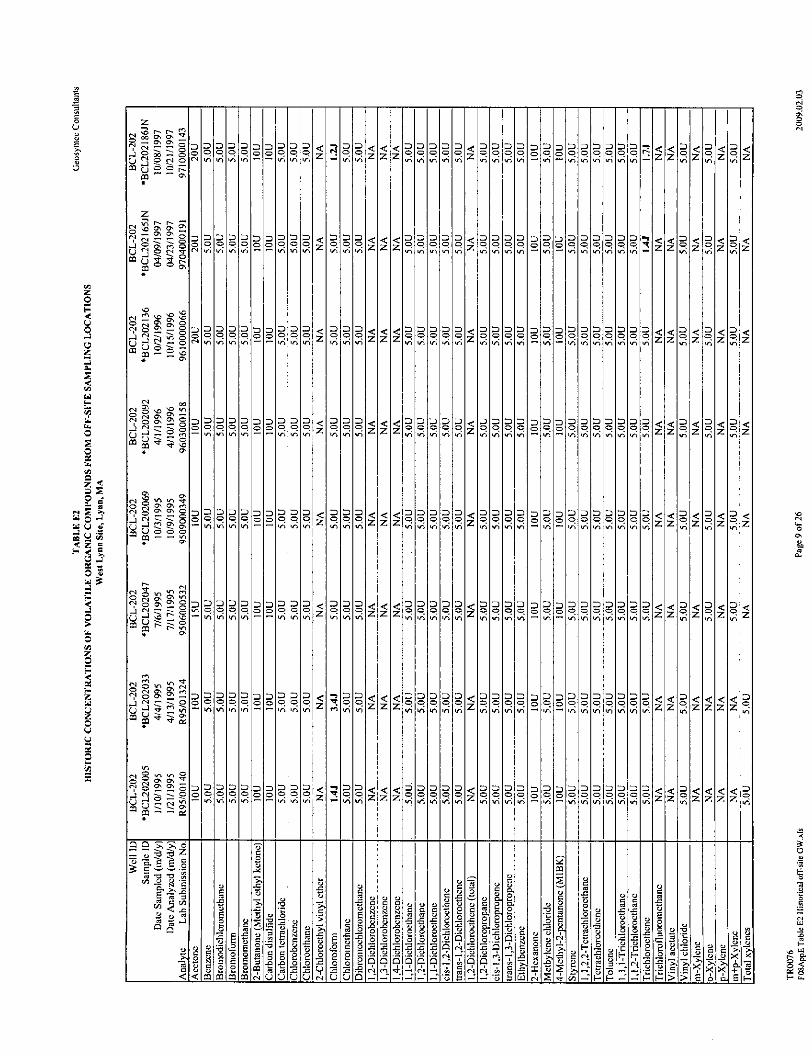
|N l |l llI K K K 0 |0 iliZlzii-lTh 1111111 wI 11 nlV
.0.O ..Q . .01 1zI [ I .10 .I 0 I ;I I I I < I I IZ ; I <I <11 IMMI
0 l l010.0.1
0
4 a 101. R0 tO1: ,llol~ 010
OlOlOlOlOloloololololo. 1010-I ~~tn I I I
D<000 q i0 0000000 ZI t II II II -I *zz t -z c I
<Is I -, I IS
ol l | zOzO zl<0 l00 z |||| |0RIR |I 1 I 1< 1 I1<0 11 1 i I1 N< I1 NI - 1- I IIDIDIDI 1N l
00
D0
oIOIDIOIOnItIOO
O <
I,
i - . IZi Z r IZI-I-I .1 10 - [ 1
|o .|7|-l--l--|||--------1:I I IN1 1 ,rlIIR IIJ LLLL 101-Q IL
DIII<<<111100<IIzoDo
| <||l< I < | | | ||<
0I0I0I0I loIo1IIqIoINo.M
00
00
.zszz z z -
010100.10.10
|101
ID.9VI
olol 1
00VI
z
01010101011101 I I I IcI cI o a 101<1<101< I<I<l4tI~III(~IZIZI~IZIZ*ZIZ I -VI IV~I~ Oflw'VI' I I I
z;~z 2
~2 2 2E) E E ?L ? ?C ?C
.z 2) 2 Y=C) =)C m UI I
0%0%
0000
0%0%
(N0
(N0(N
U
0
-4U
0- 0.0% 0%0% 0%
0% lflo (N
00
C0
U
C
A
m zi lzI zl l
Z<111 z 8
< , Z I lz< I lz<
z<I" 'z<lz<lz<
"i : ql I z l:11 I l<l< z -
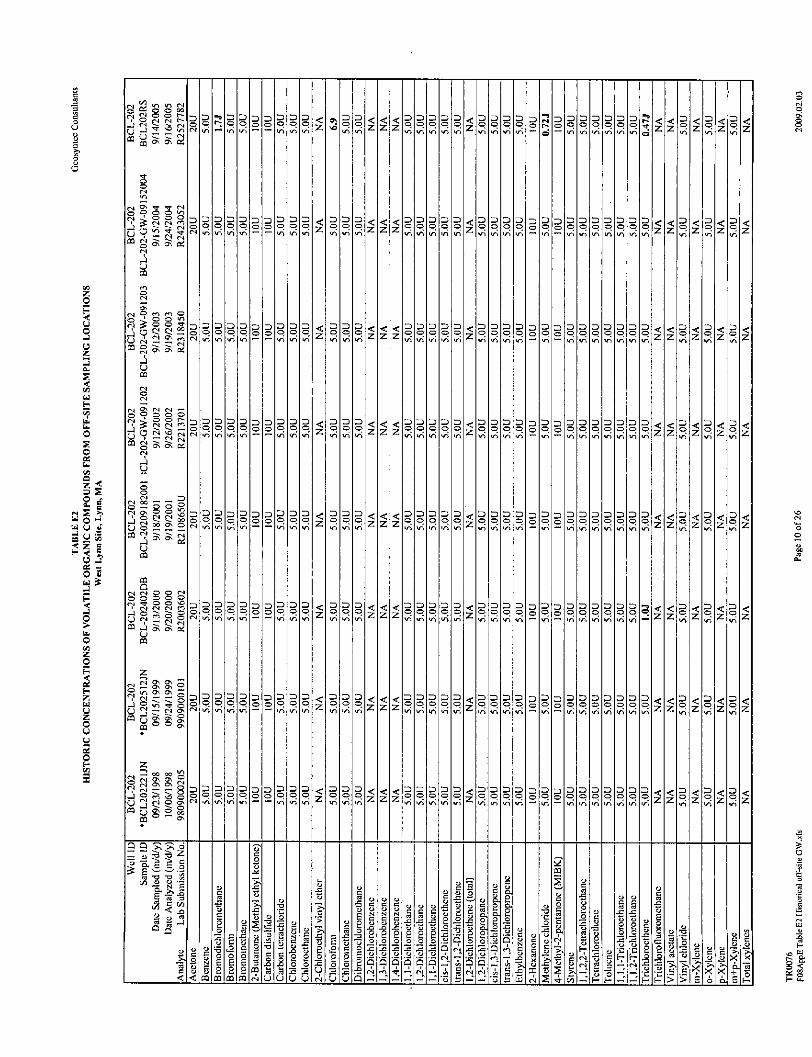
enlenle
00'01
z
0I0I00I~l000~0L ..009191991o~10. 1 1 , I 0 R0
S0 000191919
zOOo00.9001 en en
.00 MR:l R: l O
olololo
00en
00en
0
00
U
0
ZI* IZ
01010<1<0100 .ZIZen I en In I
7 7l 7. .0.o l9 0 00en znz0;7
<I
7:
7
I11 I 1 1:: 1 lrl-,I 0099 o 11oO 09OOIOI. <1<IO
2101010 0 <10101001010100 -. 101010en I en I en I& ~i Abnbnlen
| ||.. I. 10 l 1 10 1 10
0000020 00en
oIOflIOIOIzIolOlOIO010. 910.l0.1olo19191901lenenenen-I-IenlenIen
I lN l I 11e I eNlen
000qIq101010101 I
I 10:1I0III IZ< I
Z <Z 000<<<qlCZ<00Z 7 0
0
|,HZ lZ Ieleee d eeennneee&~v7
'
0 10'9'en
00
00'
enR Ien h1 AIA leni-leni-l I enlRn1en1nQuH7<Ioi <
0'0en 7
-S A - 15I
.2
-2
73 0
1i .2 02 .2 -2 1 ?C ?t lC l Z!< . Ma m o
5 4~~~ 0 00*0 0
'C
0
<<s2< 0000l0Z0Z leen
01001
.2U
en0001C
ON
010
01
-t01ON
01001
.2U
0001ON
01001.2U
0
0101
0
01
-2U
ONONON
01ONC
ON0'
0
0
e a
z z
l ll C Z
1 1 z
qllz< rollz<
Z: z z
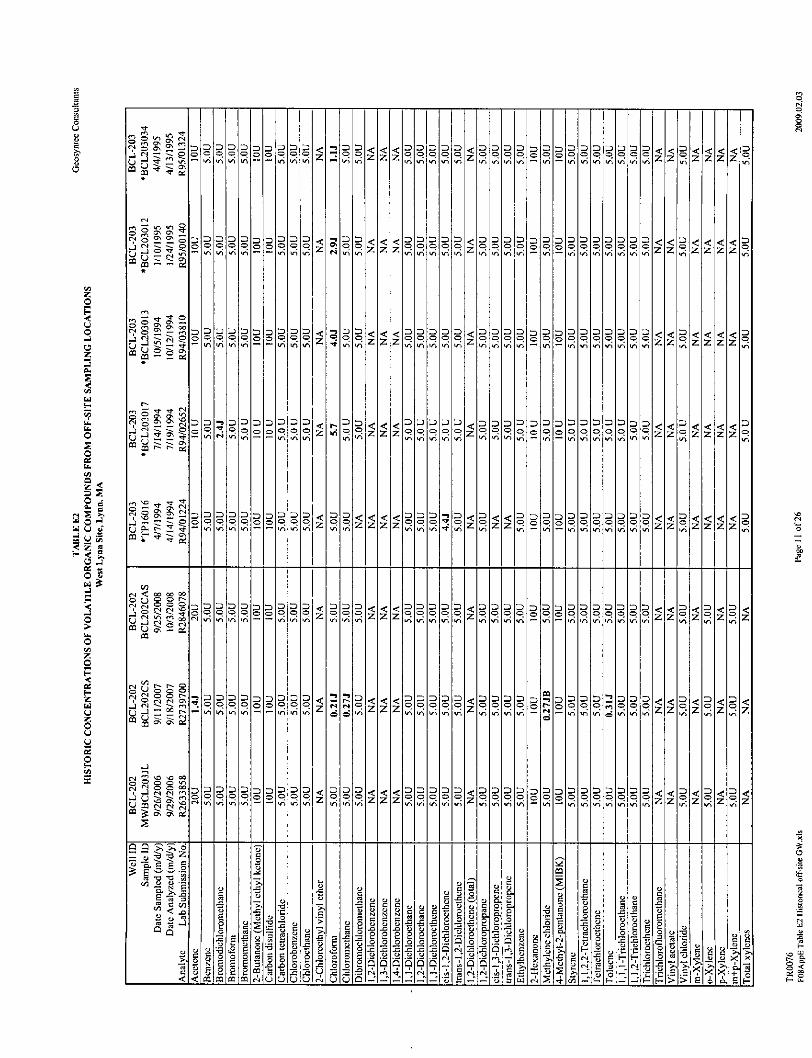
2 J2[22J212 12 122oI9L9 910.1010 IC. C.u-~ Pn -nI-n
2i
C z< z2< <2 2 z 2C
0 0Cn- Z vZ Zoo Z q C
a ,rl 919 - - 91011 11 I r. 9 lz20
:!222222220z zzqC 1 :, l I<1 I< <<<2 222< Z2
I9. 0 o 9 z I ll9- zzzIliIn99- 9z- 11
2 12 121010.1919Fr2'0'
:2C-n
212 U-129I9I~ICu~ Il-n
2[21212121212 21212 I0101010 I C 1010919191< ~
~lIl99ioC
2121212ri u-n Iu- un
0 000
0000
0
00
*~0*0 ~-00SE00
00
.0
.0 0
010
22<~00
* A.u, =
2121<120I0I&9u-ni u-n It-n
0
00.0U
C000.0C)
D0In
00
00
2I22I2 0I
20'
2121211212112121
2C-n
u-n i NrhnHbn Iv'lv~Ivl I-n bt
I12122111 12 Dl 112112I
222222
I I<<1211212121<2121 21221211211IZIZIZl IN iN N NQ- Iu-n 1:: u- -n, -::,ID1
C
N0
.000.000(N
0NC
.000
.00
0
00
0
-002
0000101<
00
.0000
.010
H
0 (N
0
0(4
0
0
C
120 ala-n I v
212212212210iC I 0.9III9I9
0eM-2C-)
en0
.4C)
C
(.2=
0(N-2(9
0
-2(4
(N0
-2(4
(NCeN-2C)
222222222090000009
(NC(N
(9
5-o ?V~ 6
a~ gS '00-..10 0 C
Cl0
Cfl.to
2 DIDCIau-n I-n
001010.0.0
0000
.0.0
0 0HF.
00
.0
0
00
00
.0
000000
.0.0
HF.
J0 I
CI
0
0 >~
£5
'00
I-.
Z Z Z
D :w)
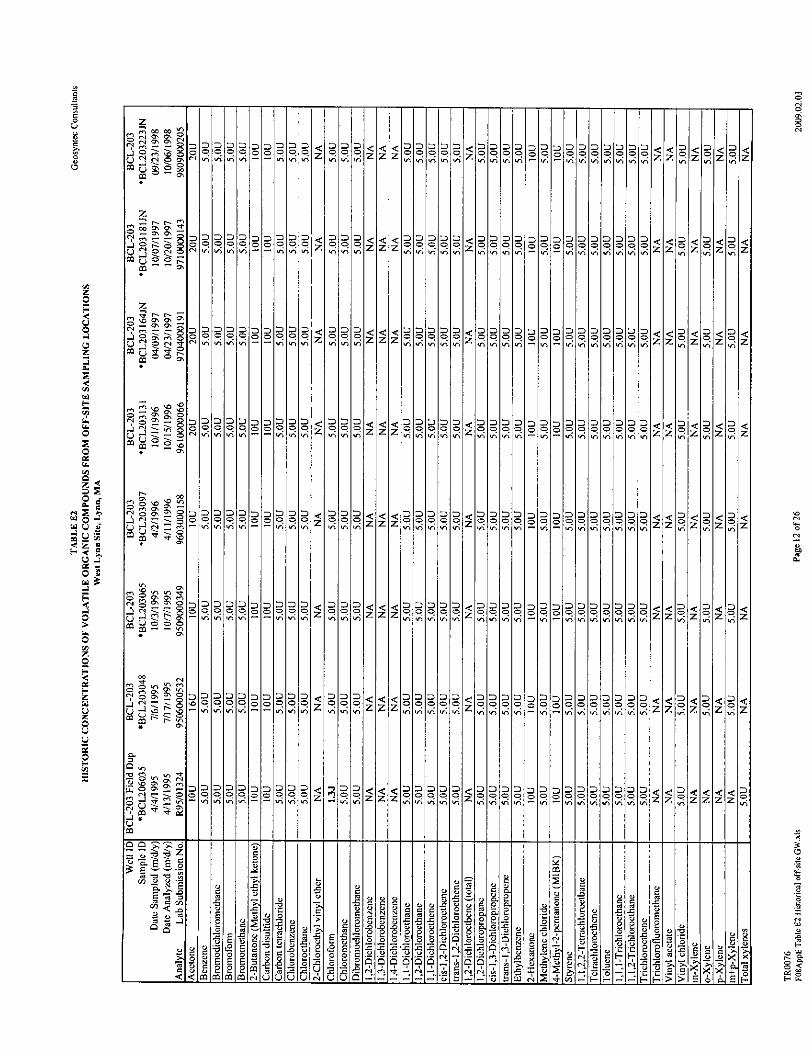
0;.OOO.
9O.z - C! zZ
VIVIVIVIVI VIVIVI VIz
0000000 0 0Z 0 0 0<000 000 90 000DI
I0
00
0
0
-2U
VI
0
0-
ON
0
'0
NO
0C0
0~0
O <
Vi Z
z.<JO
0zy
00
00VI
00
00VI
0~~0DD0 M000000VI
0000VI VI
00<0 0 0 0 0 0 0
0000000000VVi&ZZZ -.. . .0.00.09000000
0101001010VII VII VI z z
i< 0I 0z.
0000~0000 00000 000000000 00090000000009VIVIThIVI VI ~VIVI VI
I I JlV lIlVlI I IIH 1NIIII JIDO I:1CDI0I0
< < I VIVIVIVIV I VIVI =|,|I II VI I1V1
00000 000z <0D0, 0<flflooooo oooI:: 9O M O I:: 1 011 01 11 1< C< 0IK 1 =M ,I : =IDD
ohOIOIOIOo~o0~0I0 Zw 11C[.
0
1
0COr O 1- . 1 1l C.Iz<
C0
C)C.0
200
.0
C)0NE=0mm
00
EE-0m m
C0
>1.0C)
.0C) C)
0~0C'400 .0
040
C.0
00.0U
.2u
0l000<O ... IIOOOIlP
'4.0
'.0
0'
0
.0
0.0
5
0a0a0
.0
004
C
.0
.0in
C)0C'4N
2
C
'U
C),
C)0C)
0.0'C)in
'H
C00H
C)C
.0C) C)0CC)
2104.0
-z-I-
C)C
.0
20000~'
CC)0'4
C
I>
010101010 I 01010100 10 10 IC IC IC IC IC IC'NiVilVilVilVi I
olOlOlOPO I 01010100191910.I0.l0I0I0.I9I I I I ThThVIIVI
004
-3U
0
-5U
olO 1010 10 1010
en004-2U
C04-3U
001
-3U
C
04
-2U
0.00*0C)
0
-3C-)
0 0
0.
0,
6
r~N 2
"0
.0 CC) C)- IN
C
C)
a
CC)>1
0
C)
0.
'S
z 0 z
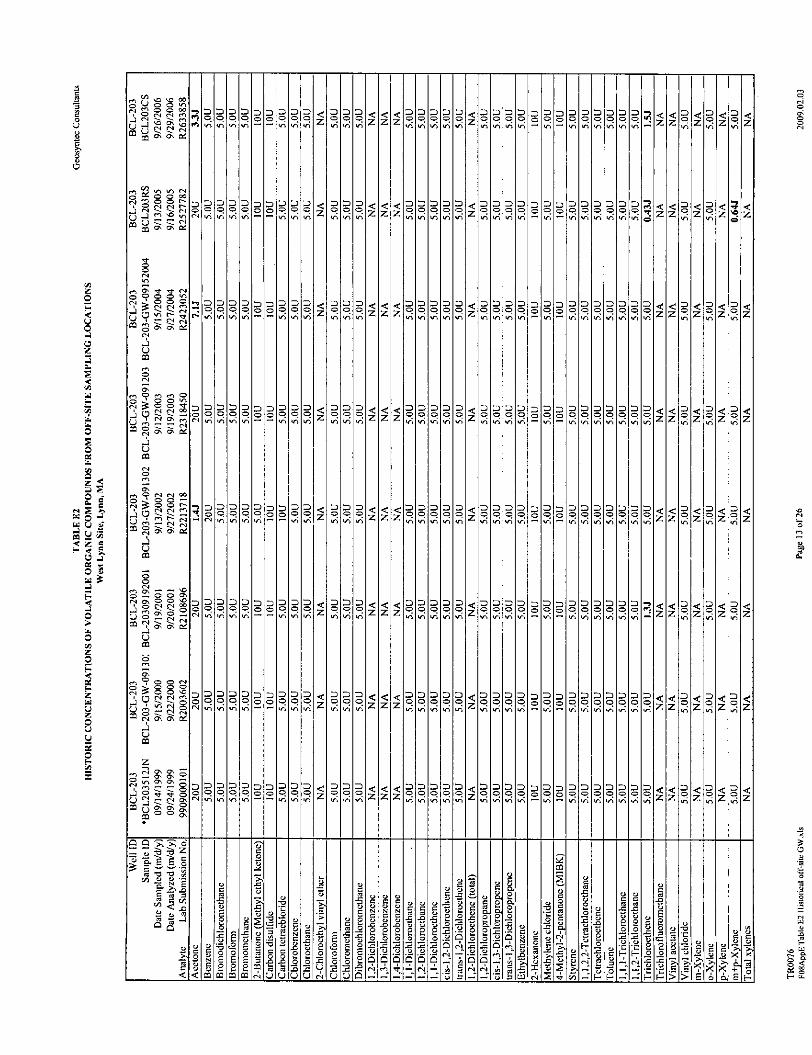
0101010 I 0101091919 I Olololo
I vs I I -i-mn
0000000009999009
D
0I<0II0I<<zI00I
0l<l0l01 IC <10 | 1
<0
z00
00
|Z| Z l 9 .C!f I || 00
OlOlOlOlOlo01919990Cl1 ul I In I 'n I Ifl
'OO19 191vs DI In~l N D&
00vs
000 0000000 0| |
OOOI 0 1 0 0000In l! In11~ vsvssvsv InU111DI
0000 000< 000 <<0 000000oo000 zOCRzzzOOOID z
oIOIOIOooooh 1010
0:
00
0<0
0.9'In I
0000000009090999902
| ~!000
Ojo910In
0100,0In -
010010In I-
0I
In -
<IC2:2:
IT z
| | | | l I i
|||| Ivslbenis 2
11||19 s as I2 I&2 [l :
00'R0 000. 0 01 q0 q0000r~ o1 o 01 0 00 0, 1 1
zz.Z...o 0o .0
'00
0, .0 .,0 R| '0
- - - . ~.l4. -i-4.--4.-l-l-4.-o
0M
Os ~ 0 ~- C) -tJ .Os V Cl0 - 0 V 0 ) 0 ~ .oC Os 0
.0 - .30 ~ V 00 .0*0 - CC 0)0.000000. 0~ C OslO
VVO ~ ~~~ee000Cl~0 t~ ~o~ ~ g~ CC ttV0V~~~ -oC OZ~~. W~See22.c- ~ I5 Os...~lO t otoSoOo0.s.~floo.~~ =V~Y ~2 ~ ~V
Os 0.0.00 S.C C ~SOQOOO nn ~V.0 VCJdE ~
0
U
'0500000Cl Cl50 0'Cl Cl0' 0'
-II, *2: -z
z| z zd z
00Cl
lfl
C2
~010
0<
vsI |IlssI&I Z -l 4
C! Z.R .<<<-
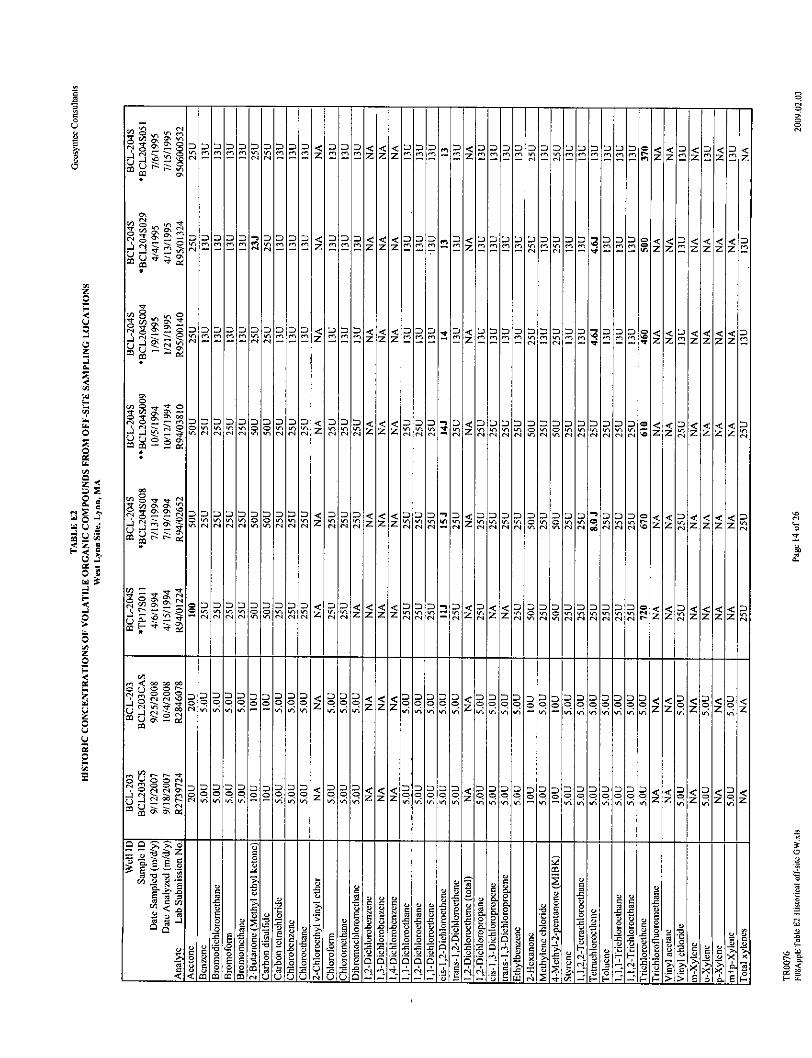
I 21 2 I I I 1nI2 :I2nI z I ! ' I z<I I Z I --
0iN
'In
I0
Q
C
C
01.4
0~0
0mnI0<IDI0I0~[0!0 010en -.0 00
eq
'0aIn
.4
04
a0%
a.4aaIn0%
a
a.4.C'
0110I <I<Il10,0 .. <100010 IIOOOOIIIl l <11<I<<II
00000< 000<<<000zzz,0<0... 0,0000.000 0<<0< <<<I 0
-11 l7 7777zz ll IZZ ZZ Z.... ZIZ Z~
< .. ;.-C;~ .. - - C
d -- -- - - .qoz zaoaza'<< z
D D D<<<
S22
CO im EC - C 0 0
5 0 CO 25too 2 ~~ g 2~ 2- 2
R 2 2 2.22r4$. 2A $ . CO .2
. .2. <CO~~~1 A00 . -0C
'0C-a
I-.
000 I=1 1 I I
2MIzS nz zz := m -z22m~nenM,2 ' '= nzz~zzzz
01000000Inlenlenlenlrn C In In
IC''- ~eq eq
CC.4a
.4C-)0
CC.4a
.4C-)
CC
-2C-)0
CC
.4m
a
CC
H
7 < z< 1: 2 1 z< I
mm:2M-,M=2z :!2mzzz2mmIPIPIPIRPIPIPI' l
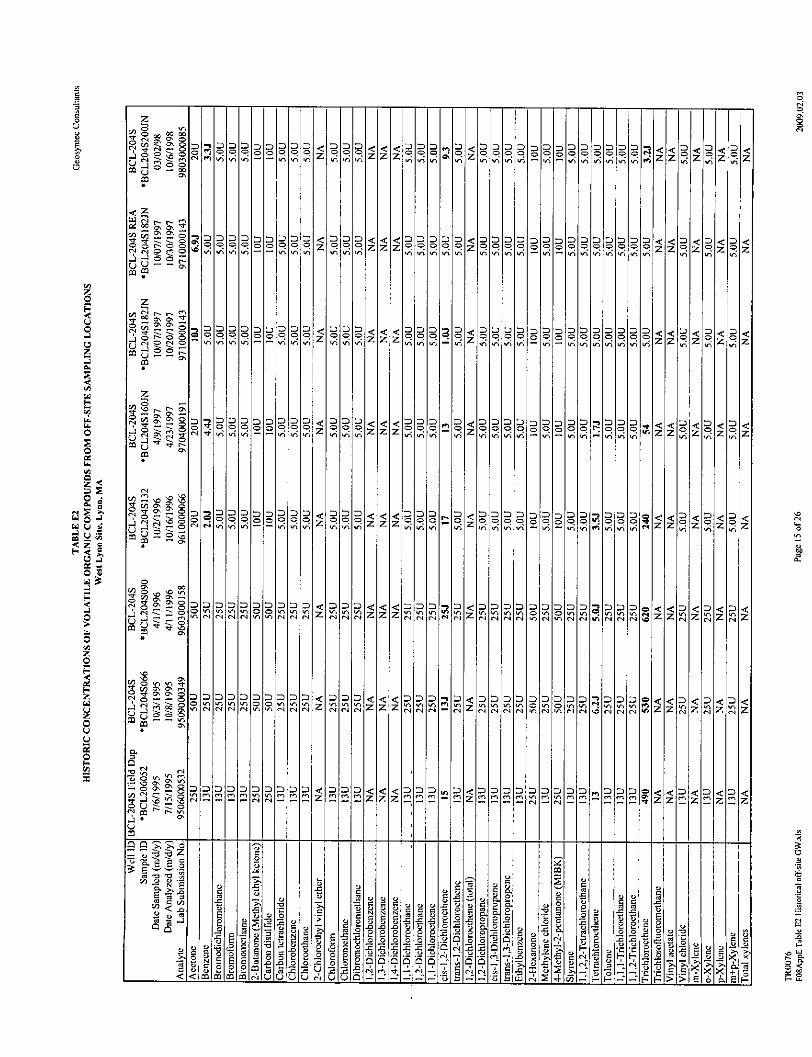
I I!IDI 0 I1z 0 z 000
0C
0000
r0h0 S 101<<' <00Z. z
9z 0 .0 0z z z R~ z 1 0 0IRO~C 0 R C RRRR Z Rz Rz0.z
00
0Q
C
0
C
000000
0000%
C000
ON
0000
0%
0%
000
0%
'0'000000
0ON
00
000
0
z -z -z -
00
1?U -) U- - % I I I
zzz 0I
0 II~I I I: 010 2M- I00IN
z Iz I z
00000000 0< 000<-<-<000.-o ..... 0 0' ..... <0' 1 1O :O N ZI< ~,<<< ) )Z )I: ,IZ <a Il
010101010101010U-) IC" IC" IC" IC" It) lU-N IC"
I I I I (NI(NH~ 1<0 0oI~0<0000000,,OO~cI
zI
OO ? 6 -'i----Lz~1 * 4 * -
N N2
A -c l- u 00 -Ul 1424 ;
0000000000<000~000oa909 z 0.02(Nw& --. nwU-0
00
N
01
t0
-,0001 Z0 Z Z Z Z Z Z Z Zooo0<0
01
-aIm-
01
0(N
-IC.)
01C
00
01
(N-aC.)m
ZllIZZZIII IZIl .... 0', ... zzz zlz
Di <1 =)IDID2 z m 2
<1<z z m I Z"' i: 2) 1 zl 1 2 12
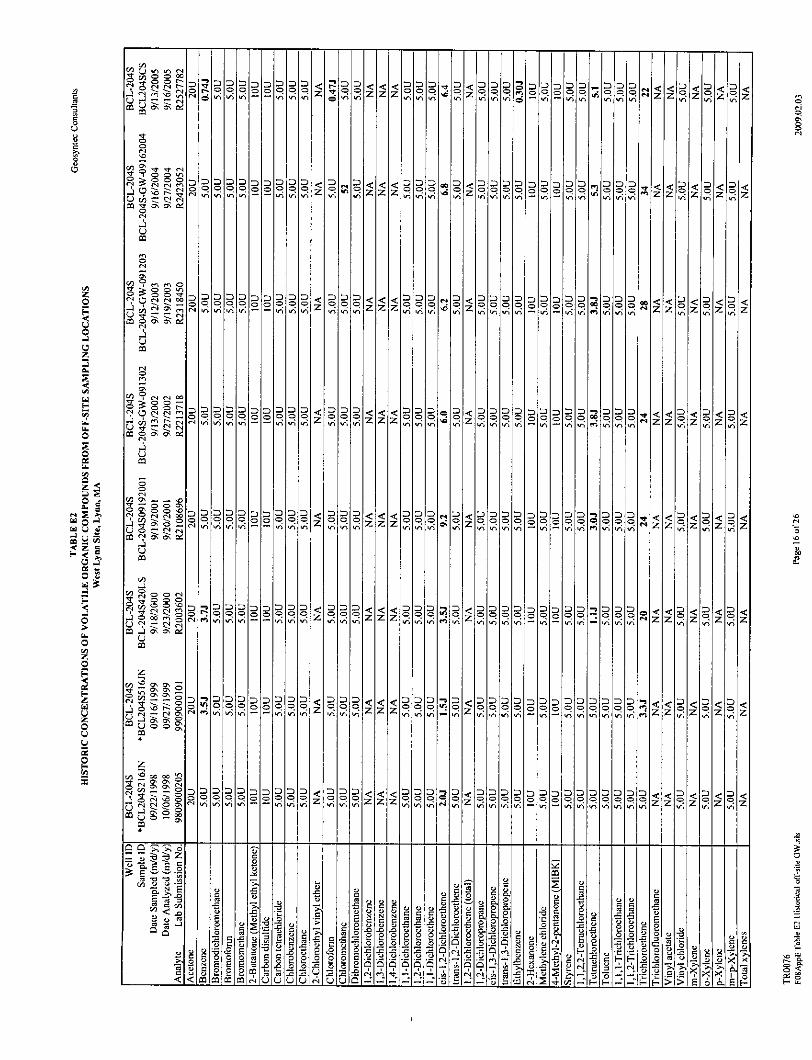
aOIDI0.I0ooII
az., 0 - 0 :ON ON
0
9DCION~~~ OCO NI]~flf' oN
0ON
.00 -zON ON ON ON ON
00000q2U, .-1 -1 lONONl~
z VIt qlzzz
0 oZZZec zl&O2 ICONQ11 ONI flIONI < < s
099900000 - Z 0 0 0 o 0 0 0
:)1 iI :;I ,,I -
0II> I I IoIo1I1I1I
A I I~ ON z IONLzf
0 ~I I< I z
2222222222 ~<<2< 2<2<-zzz - -co -z - - -- ~zz-z -z *zU~0ONON ONONON -ONON~flON ONON iN ON ON
222<< c222c z=.IDZZ -Ir &ZI 00.0 090 000 DCo-IDI
C O ON P q q & Z Z q | C| fNqO0ON
---- ---- z z<
z z z z z
CION
-Cz
- 02
0 2j>0S 0 0
0 U U Ug 0 .F
0,
m2
0'
Lim,
Cl00C-NCl
ClA20Li
0
iF"I
00-C
ClON0
0ON
00
Cl
Cl0aNClON
00o oCl ClCOO- ClON ON
000000
00 CN- ClON ON
ON ONON ONON ON
'C N- Cl
00
0,
0
.4Li00
0,0Cl
-ILi00
ONON
ClClON0
ONON
00
z z z z
' |~ z , z
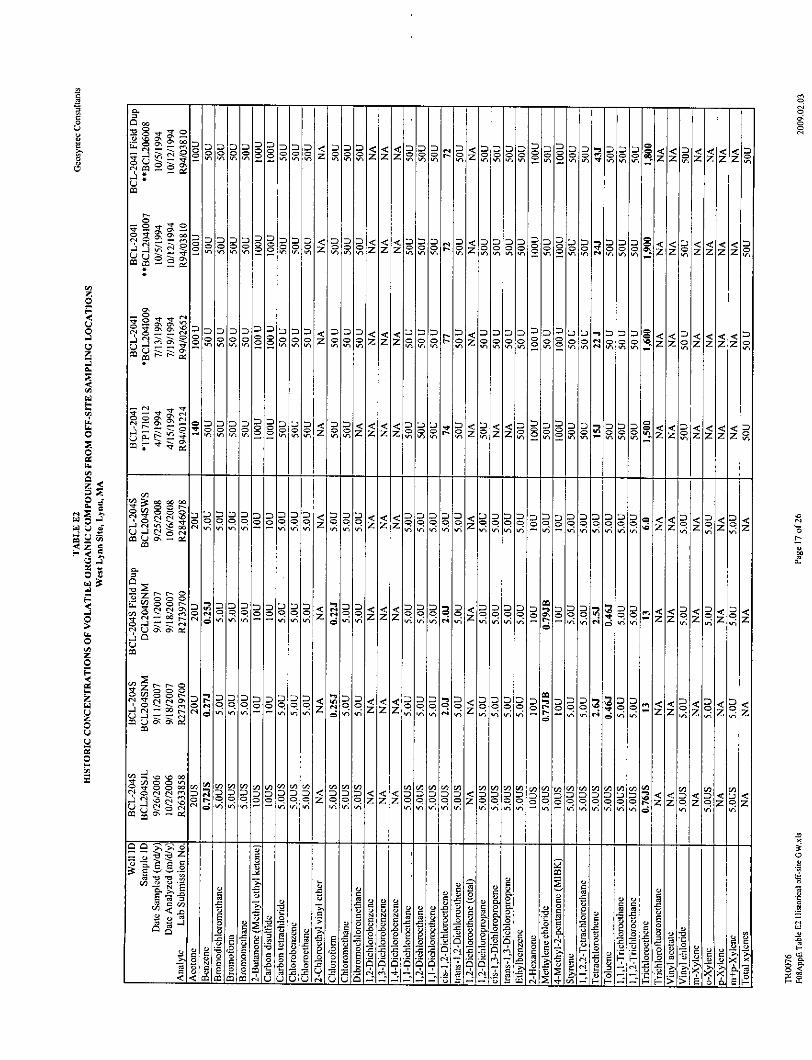
~0020~~002<0 000000000 2
C
U
C
00
C
00vi
I, 000 OOj z o zz -
0.0000*0 0-0o '0*CZO
(N~
.2,C-)
p.0
~0
(203
0%
.t 00~
00
- (N
(N -* P.2-(30.
00.0 000.2 000
O 000000 000000 ~~00vi vivivi~..~vivi
12 000'CO 00O0 00~,00 Z ZzI0z z 2zo
<o v
00<<'C'CDD0,'C0'C'C0O0O .. o o'C DI '''o,2 2 ,-n, _ Z Zozz l
(N z&~ z ZZzZ Z=
OeO..Ooo.0 2 rz 0 2 2
zzlooa z IR 0 00 %
0, 000, 0, 0, 0, 0, (fl 0,0~000oo000 N 00000 0 0(Nd&&&~~&v~
0,I
dvivivivii.Jii- .vivi~dvi
0,,0 0,,,0 0 000,0 0,,,000,,,0
0
IyR 2
Z 2 7-2
0ZID00R0O
<011P<
2 2
3% 00 E2~
-u C 0
u~' .-u -09 00 "A0~~>S - -*0 0
z ~ z z z %z zzz
0
0
S0%
0
0S0%
Ooooooooo0 000 0 0
- vi vi vi v-I - - vi vi
(N u
(N'0
0S0%
S(N
0
S0%
00N0'0S
00N0%
S0%0%
vi
S
00000000(N (Nvi"
0% -
0,S0(N
2(200
00
0%
N
00vi
'0(N
0,S0(N2U00
'000(N(N0
<1<z z
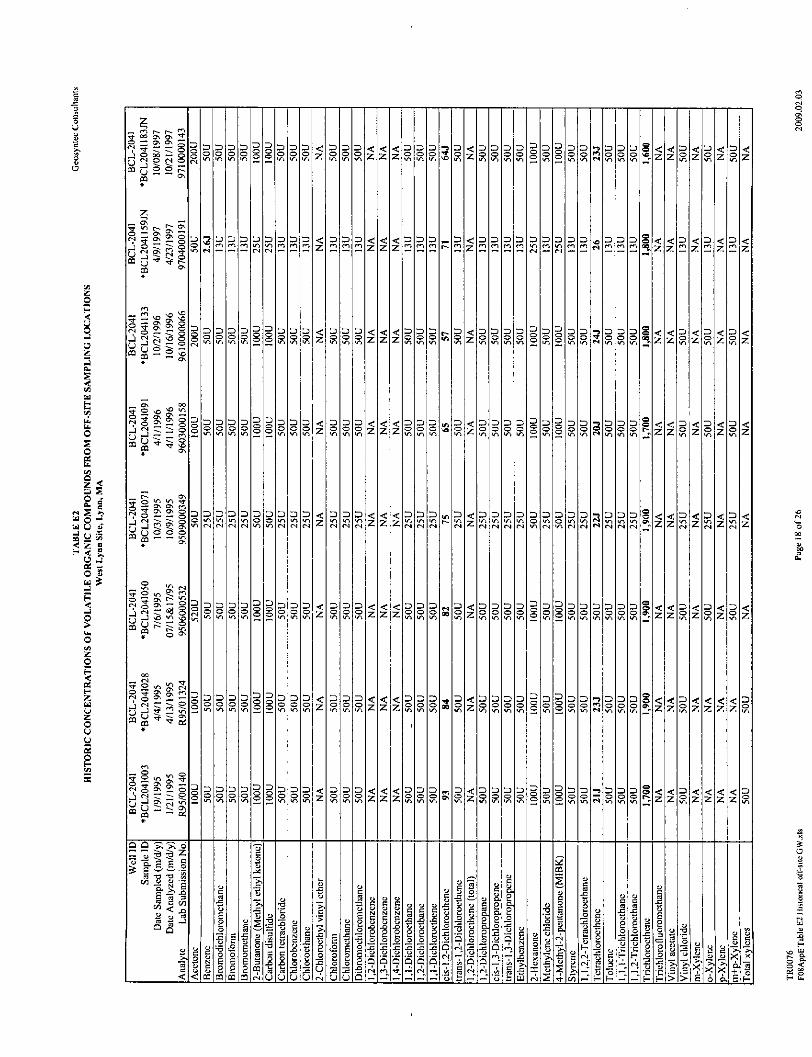
00000000000 000 000
0 1UN~NUNUN
0
0
(0
I01l1lIlIlMlr
00'C!
=00 -~ a a a c.UN ~NUNUN UN
z
001-J(-3
2ONUN
01.4(4
' ........l~ IM || IM || |
0 0 0 0 0 0 0 0 0 0 < 0 0 5 | 00 | |.|.|InInDaIA DIDo00 <1 00o 2 2 cooI I IMIa- D a< ooDI I oD ao 0 oo
0'UNCI
010010010 I0[DUNINI00UIUNUNIrINIUIUNo. . . .
00||.. |
==0000000 ID l<
'0aaa0C
'0ON
000
a'0ON
ON
a00ON0
UNa
aON
a
C
00
ON
01CIci- I
o[o~o~o 010ole CIO
Ct
UN U
< 0 < il< I 0Il<
0|||000n 1<0010oo00000000o<<0<0<
<< ||o 1 o1
0101001010UN I UN I UN
C 0 000. ,000S<0ICaa a. r-~ lUNIOUNUNCU NUNN nl 2
<<0zz~
O0~~6
00 2 -2
0. R ~
=21 .0uul - 0 w0 0 0 00 4* 4
(0
0<
.< n zz m 000<<<00... <000 00000 n000 <0 < <[<1DI zzI* I<z0DI 17InI 22I22C0=1DDDI K I = INrn n A., D IO ID
011
011.4=
0'.,
OooooooLUNUNUNUNCO
0
m4
,0Cl
1.4
01
U
0m1
am1
001
.4U
.4
|aml z I z111 1121 11
IC, I Z-:, I < I < I 1 1 I < Z,.-
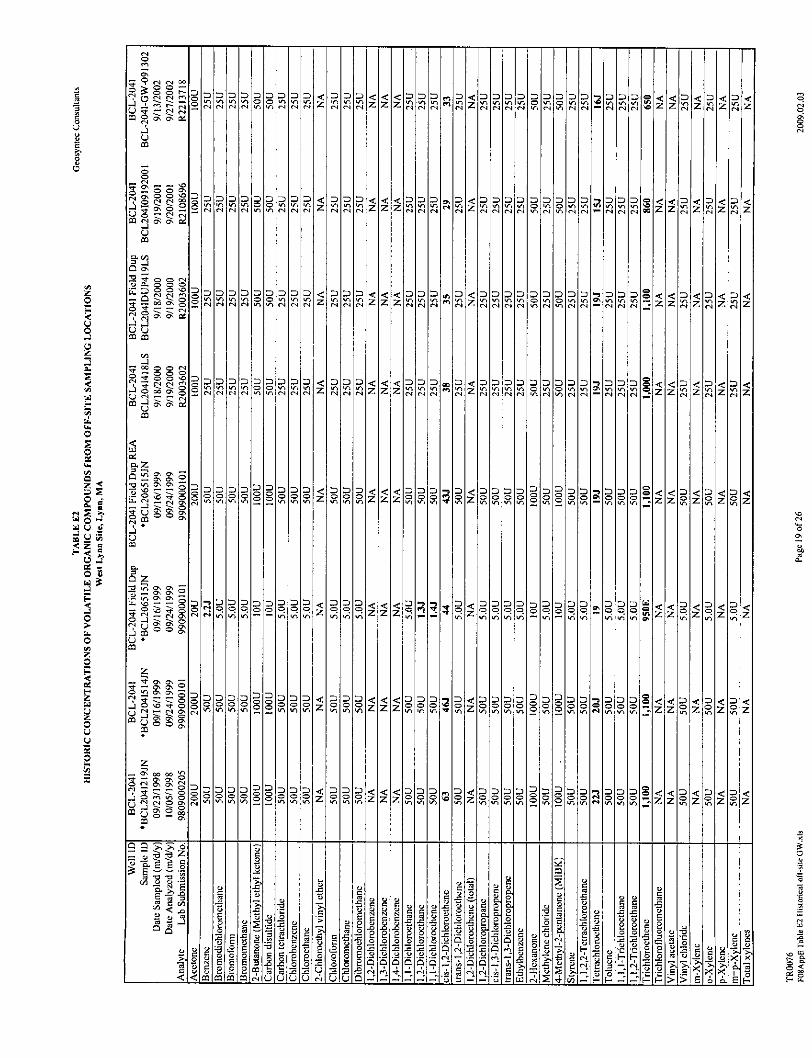
0 0 I I I z I Il I z04 1401 '-1Cl 111-V -
0In04
0In04
0In04
0'InCl z<
l000000000< |00<<l<|MM..la0<0000 Iland z<<l00
00000I00000nl ,, , ID, l< I000D' <I< I000.
| I In InlD I 0 Il DO In I 04 I < I In D, 0 N <
l l 0 l l0 l l0 | |al
|11001I0Io
0 z nn.. |000.00< 0 |
........ |. .. || l< z I <z<
<<ooo-~o<ozoo Ooooo..,08<<o<o<o<zz~z~~ 8o8000'oooIn InInIn ~ZZInZInZ~Z
.: zz n ,~ . . .0.0 0 0 0In~~~~ znn~ znn~~ In I z z~
0 .. 00 =n O cooDlf, 0<00In n 1 In - nInl n 0D lV D l7Dl nD 0
0In
o000fo~ooo<<o<o<o<O 808000000 ~:z Z In Z Z ~ Z
In~4
In In In - 0
IOnI0nI000 n00n 0 1nI I0<I<I<0rO .I -ID0<0D00DI:,InIO00 0ID0 DI-InoonI0DI8<Ik < I < I<<
ii 2 .2 c 0- 7 F7.2.
Lu u 0U L0 U.NE
0
0
H
MlolIn I In I In I I
CO
N 000
04
U
'C0%'0
0
0\0
0004
040'0
0
04
.2U
0
0%00%0%
0
00C0%00%0%
0
0000%0%0%
0010000%0000%
z
0\04
-2U
01 11 lll zz
1 111 ,
0131401_011 1
z
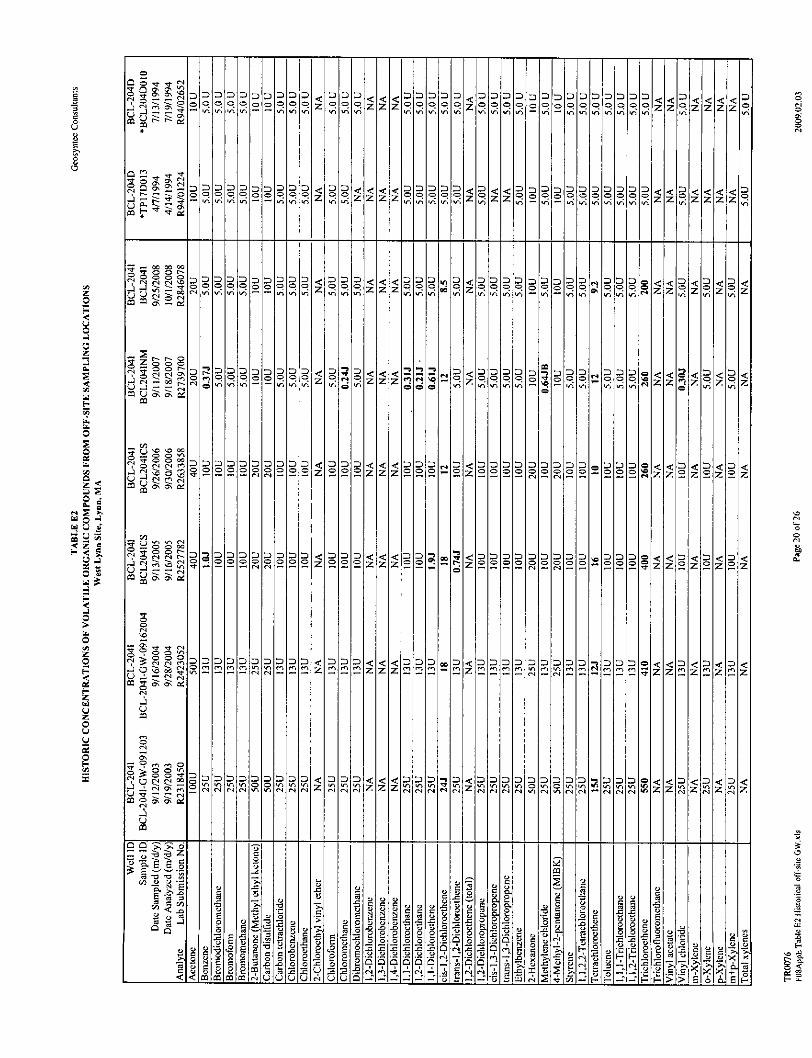
CCAS
<~ <9zz9 20 0z9 0 <~OO O <2 ~ zzz 0<
zz ~zzz-8,-I--- ------ ------
o [2 12 12a 19 19 19(N Lv~ In I
0P200rj99 I i D
*2Ia
20
22 Z22<2 29,
22 : 21 < 1:, D2:: Z
2 212 212121212 20
2H'12121212121212ci 01010 I 0101010
I I I I
21212121212 1212120Ir~IrCIrlIrn~JvlI(nIffl
I I I I ICAICAI.&.-
I I I (N I (N I IN
'2'CA
Z
z z I 'R I I fl IW
0IN
0
- 2- eq
o Z
D0 D1 D1 [ 2I :I I2[ :lII eiI2 rl o- I < I<Dl< I <1II<O zz1
22220 00 0
0 ~~-,n~qi -'~C
21212010.19-I
IN; 9029Azz~z,-Z,-z
2[l<221<<<221112<22222222111111I2 121212 I z I z 12I2 21 t! -12!IzI 212I 221:0 12ID i2 21 1 =)1A14 1W 0 Oz
z
20 < :1~l< 1:2 <
222zzz2~- z222 0 0 0 0 - 0 0 zzaz 2<2<
21212 2121211.,2 D2:l1 e< 1<< 1112 2 -Kk I L 2 ;!:1: IIzI:11Iz b2Ib2Iz<
D2 2 < <2 2 2 2 2 D2 2 2 =< D 2<0U~ll Z0lluI .. .. 0' Z . . Z nz zz11~~~~~~~~~~~~~~~~~~ CAIII I' CAI<<<I~ CACA CACA Z IZ I lZ)ID11"l ' I l
2-4
2~ 0
~~ 0 017~ o gE2 E
u00 u. u
0
C-)
C
'II
'C
cc00(N
0
000 0CA (N'0 cc- IN0' 0'
u 0mN
0
cc
CA
00(NCA
0'
00(N0'
0'
C:
'0
HL'-
n: 1 1 ::21 ?n I zl iz< iz< I DMI Dmpm E 1 Z<l n=
DID
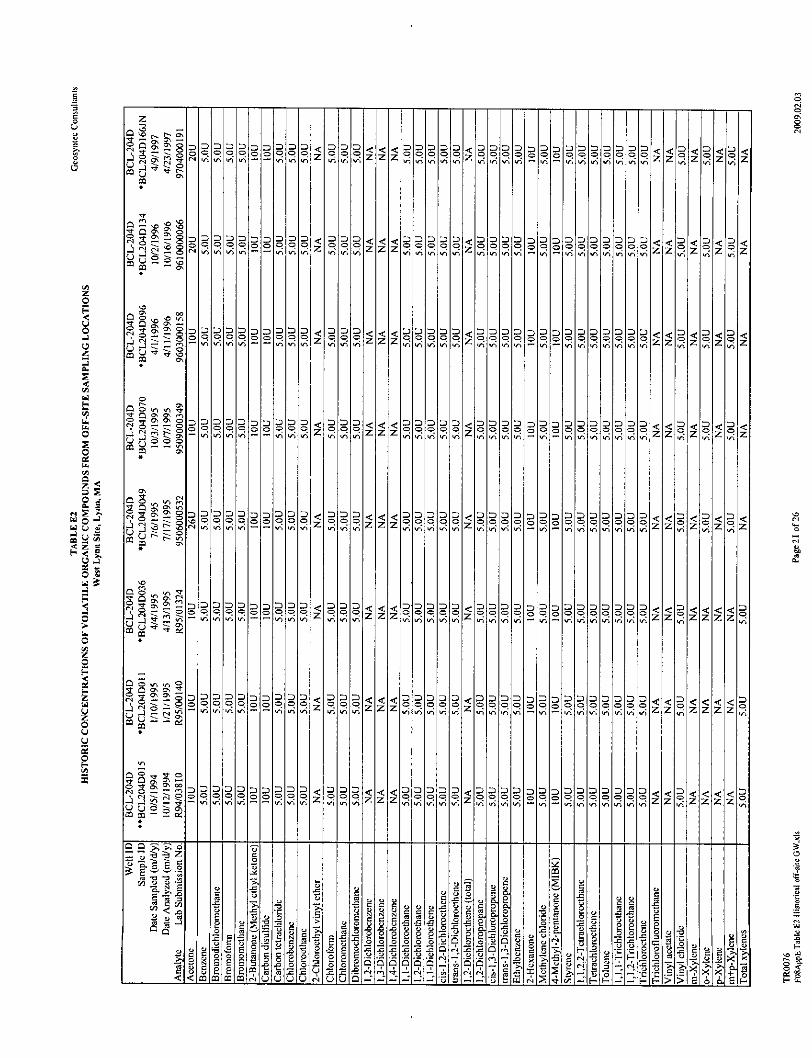
000<<<0000 ~<000 0000 0000 0000* 7
00
00 0 7 c! 7 0 7
0
0
z
0
<
zwu
0
0I-J(4
0
.40
0
.40
00
-40
0
04.4U
00
-a0
0
04
-aU
0004
(4
0 l zZ qq Z. .. 0 0 00 <c<z zql ~ ~ I .<1<O 1 1 IoI , , Do9 0ID
0000 1 kI< <I <1: 1I
00 o z1z O<l n zf ll Rz z Iq91.01.. 1<
000<.<q<R000<00 00 00 00 0.Z 0 0<0<Z< O C < ~ 9<9 9 9 9 9 <~0 00< <
oeeonL<ooe~ II .AqlA |RRZ lZZZ7
Z Z< < 0 00 0<& z < < 9 9 9 9 9 9
0 11 I I <11010:
0N0
.000
0
0' 0101 I<10 00 I110 I 01:: F , RIIIII<1I<1I
0.0
C
0.0
00
.0
Ca IO 04Ca -
Ct -
C.0
0
F-I-
0
.0
0
*0H
>a
<.
>lr
<
0CaON
0
es&M |Z
<,
01
7
Ca CaC C(4 C)?%
* 0E H
C|0 0 0 c | |o| 0
000000
7.
0
C.
C,,
0-ONON
04~1~
CONON
C
0
CONON
ONON
0.0
ON
ON
N
ONON
ONON
04
ONON
04
0
W~R 6C
-t -,
2CaCC .4
0'<1
ONON
ONON
0
ON
ON
C
CC
.0
S00
-- C000SE00
00Ca
0Ca0
*0~0
~0 -0.0
0000.0.0C C
00
E0C
Co
0000
.0.00(4
'I'.0
00
.0U04
000
.00
. .. ..
z
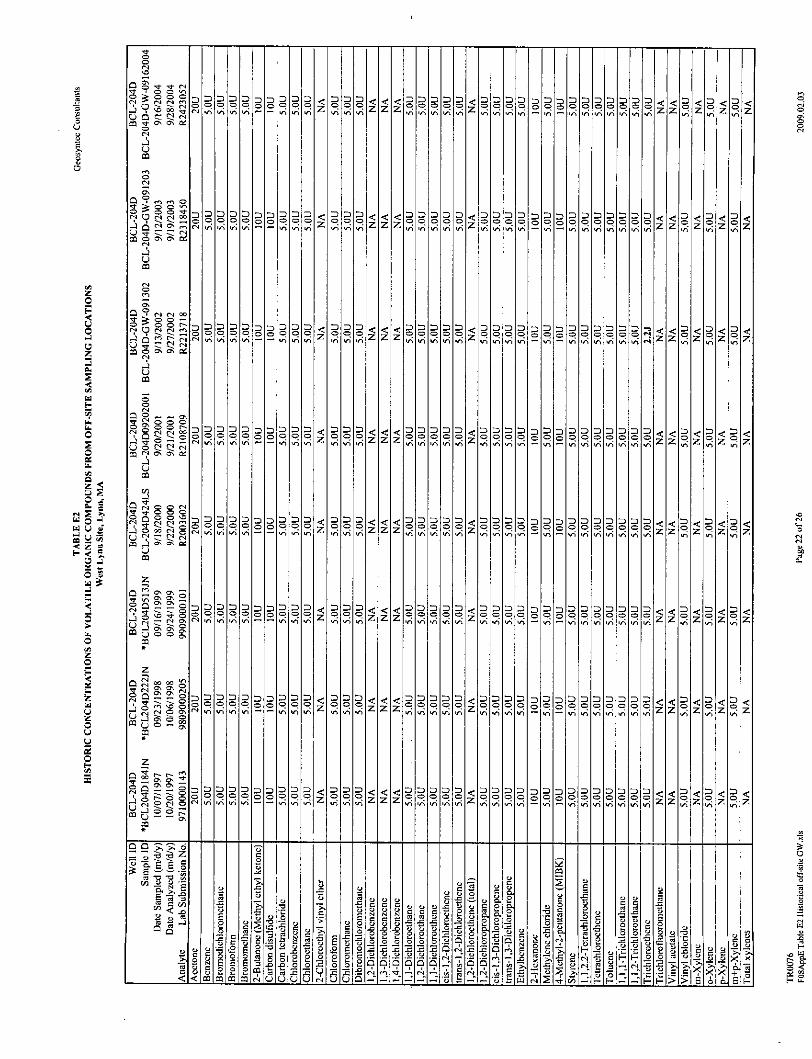
20as
2ojIn
22222000 0 0In In In -
2121212121212010010! 0 E 0 Ic~I~iI~iI&l& -F-
.Z -- Z
2! 2121<
<<22222<222222[200000 000
ZZ - In - Inl~20
< C!CO<<<OOOOC<ORCR Z 02Z<Z C2<2<
2i0'
20In
20In
D
I ZD 2
0In
2i0
2120210In
20
-~~ UIz VNiZ.ZI I<
2i222222 I qq222Z 00qq 0q0 C 02 D <<0 0DD~ 22 2 22 2 f<0 < z 2<2<0%10 ESM ADz Dzzz DI~ kI ZI InI ZZ DWIInZ "II fII D1Du DI="=
2121212121212q20
21<1212 21<1<1<129J.,j0~0 0bj ,40
222 22 22 < ,)IDID0 Z
20
20 0 2<222222222 0z2z<11. IMMM MM M MM l 1<M1 =11I
In fn I In 1 -20
oo ooa9
o| |z . l Z | |
| 1111 I M1OOIOIOOIOOL9 ,
2<
2222221 1 0ZZ RZ C000000rl ,,I:,I I0DI~M1::I
20In
l 2<| <1.<2 1121 111N 11 1 1 1
d- :9lzI-I 2Iz91Iz
20
I oZ20In
20In Z
p- I -, I I- I I
.0 - I 0 -O
E~ to 2 2N N C o2~R 2 2 E7
EtSQ E E~. I5C
0 o~~~a2~~3 E-. 2o 0. l O 4 2lA ~ ~ 1..2 4~a "i
Io0 0 H )IuIII UI* CCl,> u~ a-
C
.30
F)
C
0
C
N
I'
0
(N
C)
m
C0
.2C-)
NONON
N00
NONON
0
0
z z z z : z
z z z
< l
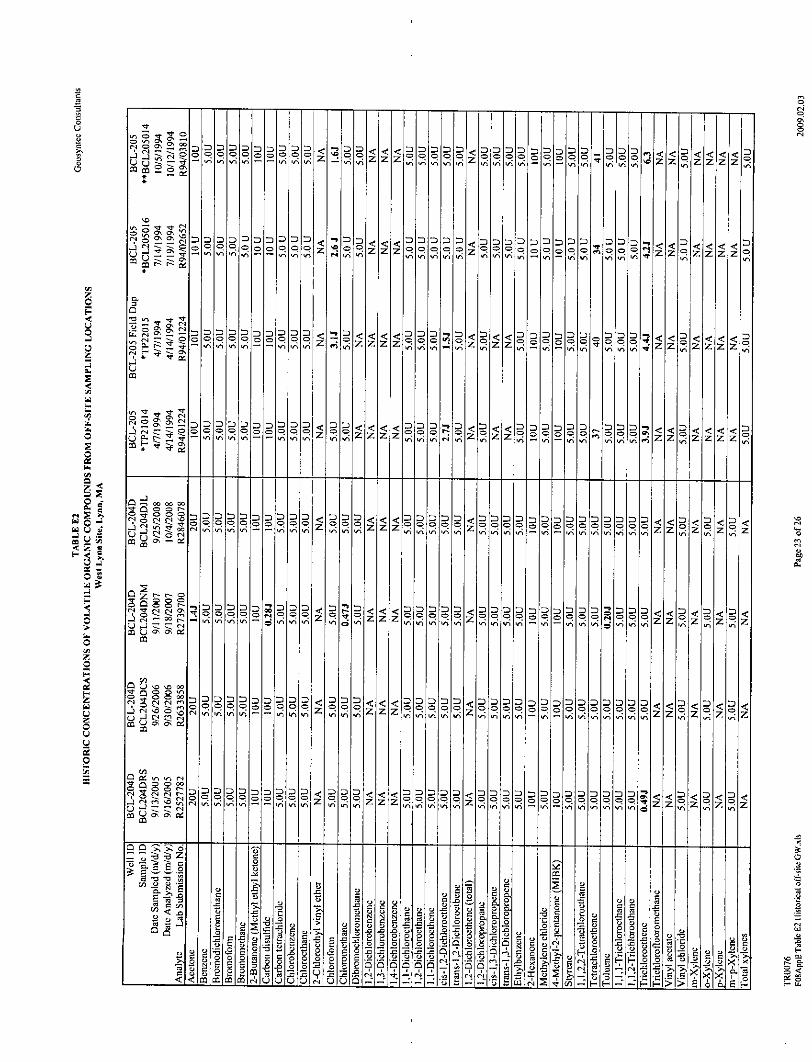
- l I I IVH -
00
< I
-Iz4& zz I000l~l00
0aIn
D0I s z 1 z10
0U
0
C
uu
In
0 Im1
-l O fl0190I 0.00
0 In In In In 10101001049 1040 10191010 z
I I Iz4 0 Z IR IR q IR *' z<<fl< I
Z .z zq 90.C 0 0 .. ! 0.R0-00Innn I'lln HA l 1- 1 Il z Z Z o o
CRo~o 0 0 - 0< <000 0<00 000D 00 zlc l 00 9 z 0 I 9 o 90~9 0 0 0<0<'
HZ In In.In0I= Z 0 C n : ztR zOMOOOM 0000 0....o.00 z04-4
$$ $ i ------ In--
0 0 o88:
-s r ; - CC -u002 2 o .
M l___ C_ -:0 -
u~ 00
U El --- -
20 0. .O CzdIRzzzz 0 -&zozz P.Co~o 9 9nIP 9 9
oozz
o99 0.a ooo -3ZZ 0.90 9A44 OzO. 0 .0.D00.0
zD
z
0
00
040\
01In'001040'
40101
040%
401
040%
00
0'04
0a
0%
N01
In
In
'0
ccN
01
0
IC
-4
U
C4001-2U
C4001-JU
C40
U
4
0
010.F-
000140
N N0000
~00
0% 0%
'0'00000Cl IN'00
IN (N
rH ~0
0% 0%
'0
0zH
1 1-7 1 1 . I i I , I I I I I I I . . . i . ;
1 1 1 t
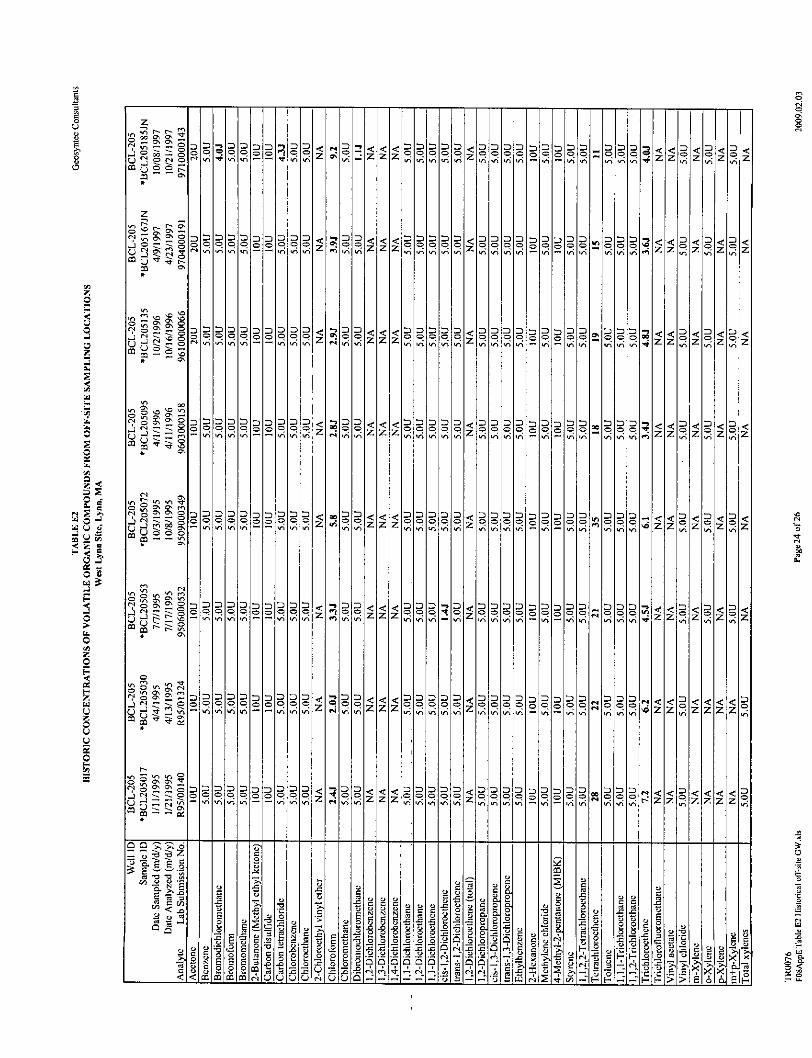
<|1C Z|l '0 :
< 1<2 00000<000IDII
|. 0 ll 0Ol 0 0IRM IN II:,I f4lIICl)I DIDIN IDI~l I<Cnn~~ I< IZJ :2:CrIZ1
n10 D. D D Z)I I0 'C) - q
.0 02 0 0 9 009 .0
2<<< 0' I< =, IDIlD-I I - I--< < D
~4I
0I I
0 0 oqzdIqqql loozllON 21MCI~I1113 rl IIIRnv R I , IV11b 1flhl
0
2: 0 2:
r, z<iz ' d<I zl<l2l
Q- z
C) j
E) U d ~oo 5 -
Im m)C M o-6 Qo - I -
0
00
U
0
C
-C
u ON
'0
~00
\00~0
- ON
D0 0
<1 <zl' z
1< 1< 1 1 1 I 1 1 l I - e 1 ,,zz ~ o
0..tqzz, Z Z.z'10. z z Z' , "Z,11111-1-11 ... I I I
z z Z,: 'R q C C Z'R ! q 0
p
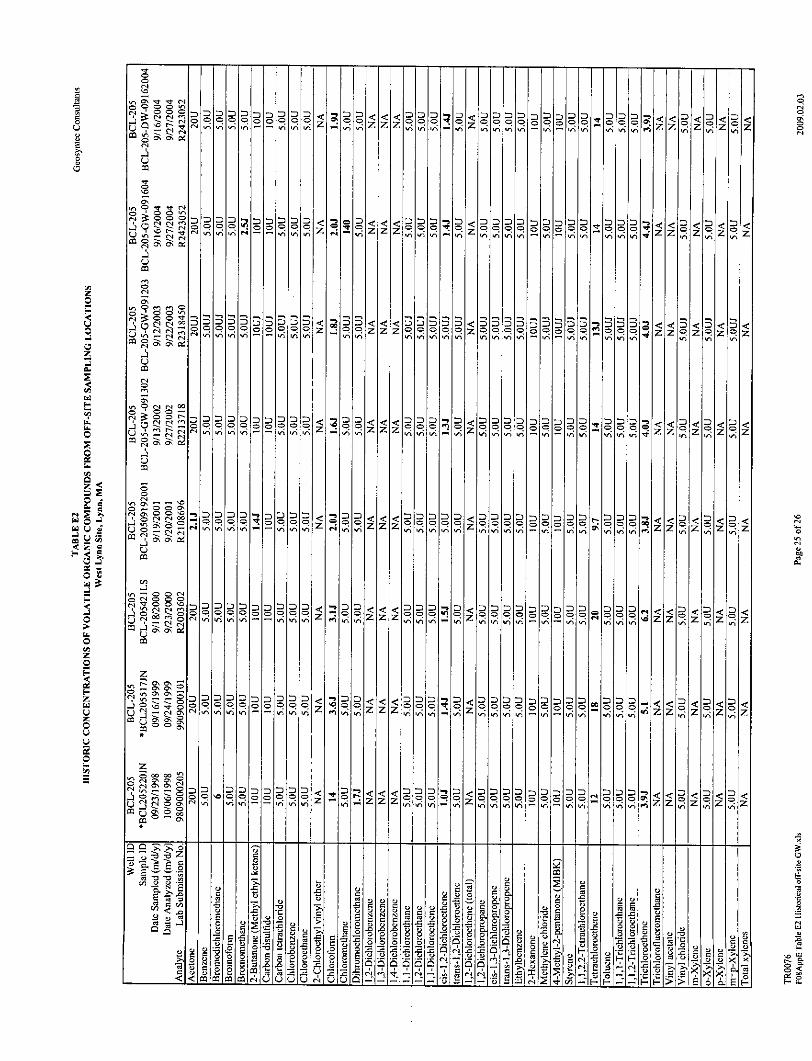
- - wlal *0a
00 Z 00 0 00 w
z
00
~500 1 < |0 1 DII=I
0000 1 0 <1 0Z*4.J> 4z Dn -='< 1IDID lD11D11l D D1ZI~ D
*.o O .C zZczz 00 0 O 1czocIooo
00 0 0 00 < 0 . |< 0 <0 0 0 00 0
010101010 10 10 [010
99010010 I aVtVt-I-V4MM
< < <0<0< < < <
0aVt,
z ,.":<<<o.ooonno00I-s~: z :,:, It z 1 l l FIZIZI
z10ez<101<
- = = ZZ&Z Z -
212
- :5
'0
Ci 5gu& c to<s Mto 1c R 5 s0sCCs s
0
-JU
04
a
0 C!10100
Cl
0 00Cl
'00Cs,
CCCQ
C
C
a
0
-w
"I
-4
I-
0
04
Zla
a
00
U
Cs,00]-4U
Cs,0(N-4U
004-4U
0
m4
CC
04
to0%'0a
0]
0]a'C
0
a000'00%
040000%0000%
a
-40R,
en
'0
0
0<
noo==MDO D DMD DDD3 p -A 3 3 R 3 R; E3; q < I < E3 < E3; < <
z z
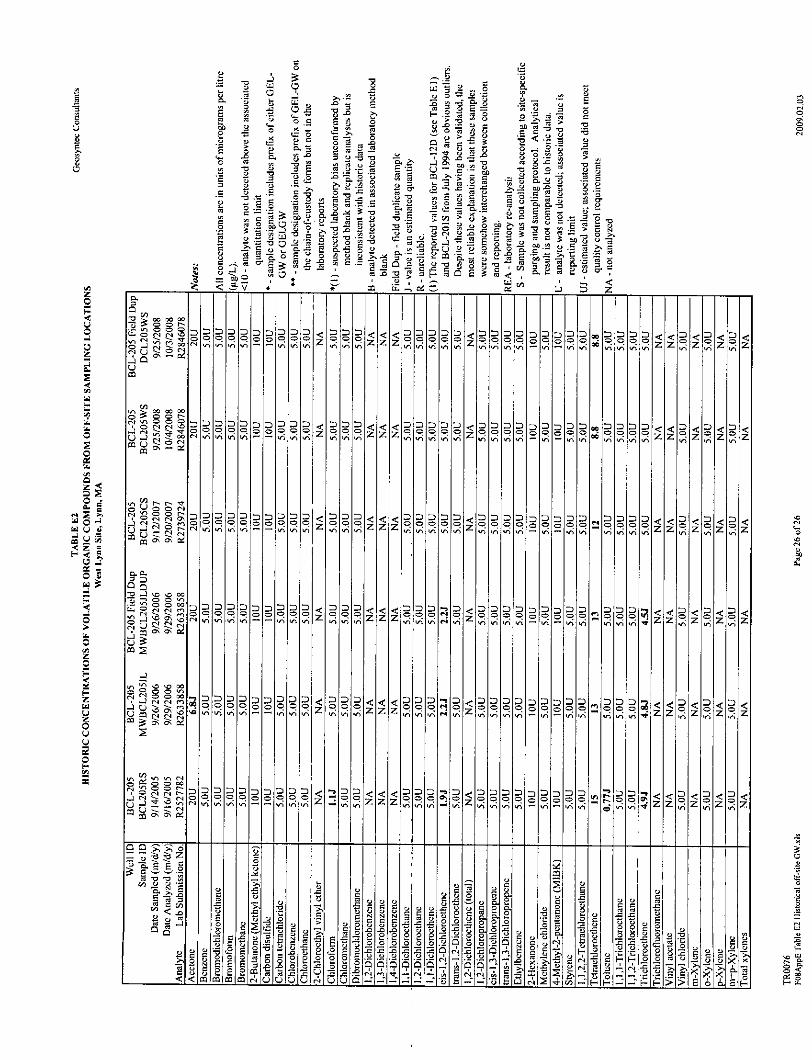
0
0
(20
0
(3
20
.2'2C
I-0
0
0.
0.
I00
0
1~0
000
0
000
00
00
00
0.2
0.000
e a00
0.5-n
0..
.0 -
0~~
005O C) 0
0
*0
0-~-V
000. 1 42,0'
21<120I.~I0
eo 20 0
Z
,-~C)
'2500
1- .20>0 .0
00'-
00\
.2(2-~ 2'
00-,-S00
0 00000 rI0'0 -J04*)
-' 0~~0
0.0 -
.sS 8o2500
~00
0~ ~
.n.50
i -~ ~.000
~
5.~ 2 ~0. - 0
~02~~
*1021ZIn In In tfl In I0
20
0
0.
0-~I 0
0o ~- ,-. 2'~n*~
*0 =o -~ 55O 0~08
- 0
S 0..2 2~ ,o*~ 0
= 0 ~ 00= 0. 0.000 E ~-'-0 0~0b~ 2
000'-S co~ ~.,o 0. 0 -- -
~ S Eo~ 2'
0.1.0
2
20In
20In
20
20
20
00
-aV
0
*00
0
C)-0
0--e 00
20
S
0
00S
0a-2
ON0 >'
>' 00
0~0
Z
"'ZZl Z z Z , 01z 7
000. 0o CC 9 ~ zz .z.co .o .
9 0 . 9.0. . 0..w ,! z o~~
I< ~ ~ ~ ~ ~ ~ ~ ue IyjZ DZ I.j DI ' DZIDI - D - Z l~ =, DI1~IIID<1II
2222222222000000 00299~~~InInIn
2 22 2 2 2 2 2 2 2099 ~~0o99~(N~nInIn~~InIn In
z22 z<<
Z
20 0000 0 0-. .0I 00C
Z422<<
222222222<Z Z Z< <Z 22, 2 0 Zl......................................................................9000.0I00
212P212121212J212010 I 0 I 0 I 0 I 0101919C-~ 1v [& I & I & I 11In In! z z ZZ R 1 1 0 R < :~~In~Qn , In VIzzZZRZI
r 2
~~~'- L5 E. S 0c
rs ci o-- -~ 2 r 1 4 00 >E E
0
E
00
S
000~
a -
- 0'-
0e 0
*0 _
0000o I'-00(N '0
S0 . 0,02n
00C-0'0
(N
0\
0000
0000(N
0
C-' N0000(N (N(N 0- (N0~
00
00
'0CC.
0' 0'
0
.2(2
00
00rI'0
0
.2(2
(N00NN(N
(N
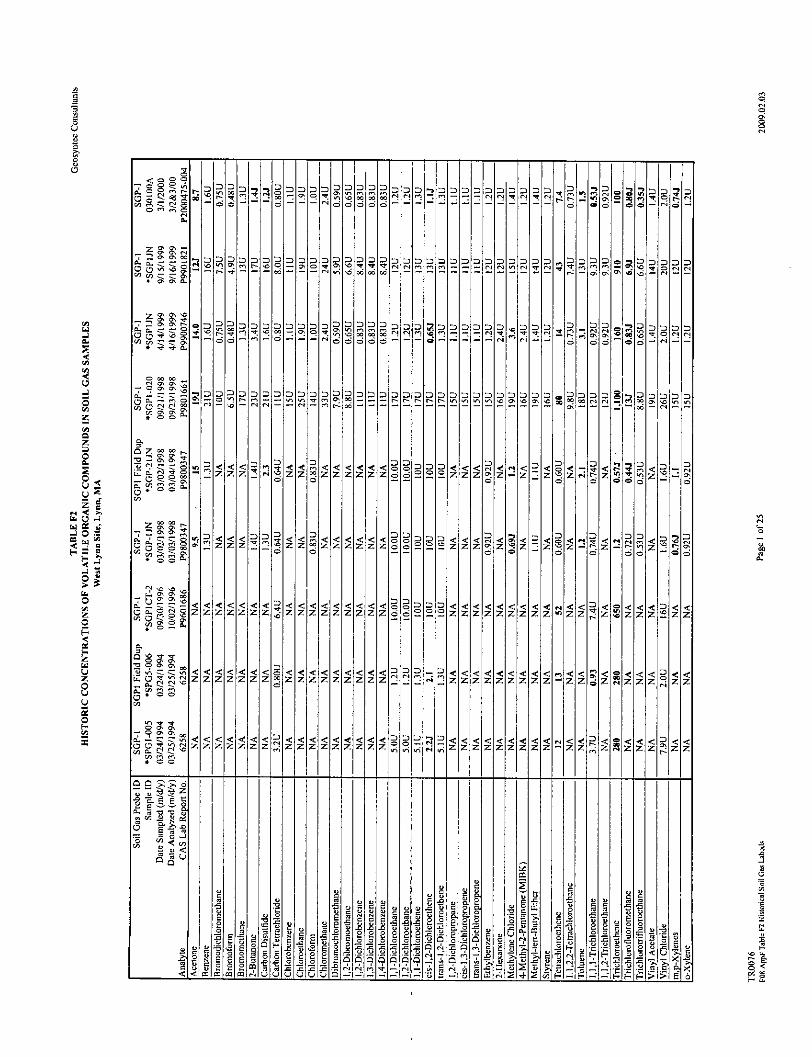
0
0
C
u
z
2
0'C
0
C
0
~00 00 00Cc tON~~2
- 66000~~ -o,-0-
.~0000ooo000IooI1401
0 00 00 00 0 00 00 0 066 666
0
6
01010 00110 ol
-1- - -1-1-'0
S
-C-C 0
0
0101010 OIOIIOIZIOIOIHCIOIOIoPOIZ01 ~ 01 ~ 'I r~Ifl r~
1 - ~[ C[ I ~J0 [01101
111- 11 I'- I 0~0 c%\4II~~
00 00 ~0 00000 '0 000 0
C
-0-- blOb ol[0 blo
* ***ZIc.ZZZZ * *zSSEEzZZ hZ.'Z
0 00 0ICNCO <<<01<
ZZZ _ 2. ~ 60
ZZZZZZZ, 6ZZZZZZZZZ6
-E.2
Z.
-2
[0
00 X0oo
*"-Ir
0
0
010 OjO 0~ I ON '31 I
umZ,
0
6' -
0ONC
0
0
< I <J.I<.I<0~0.~II I I I I <il I <I I <[zz ZI I - Z]ZZz zz Z121ZZZO 0.ZZZJI~
Z
-2
ZllIZIZ |Z
030300IC N N.0 = 00.3.3000
0--.0 0 0
0000101 It
110-
0
001
0
2 2.
<1<1Z Z
I.3
LI~
A
000*0 =*0 500
U,Or
0 ?-0
C-'Cr
0
I-* 001 ~01 ~
~.0
2N
< U
3
Co0.
C
C
H
C-C
0
g0
0
0~
~0
Cs~0
Z
3. 0.
ccCr cj~
00
ON
'0
ON
ONONON
ON
Z
CsCr
C
'3
3-
-C
~'0'0
C
ON0-
lotICCr
a.C
0.0C
'C-
0.CsCc
CsCt
0-CCr
'a
It
0.Az
0 !C:zzzzzzz 0
<<<<<<<0<
C Zz IZzzCI
cc0
o
IC - *
u-
2a20
00= C000000<0
Dlmmm<2!RLZZZZZZZZZ zz lz.zzz zz
z | |1<
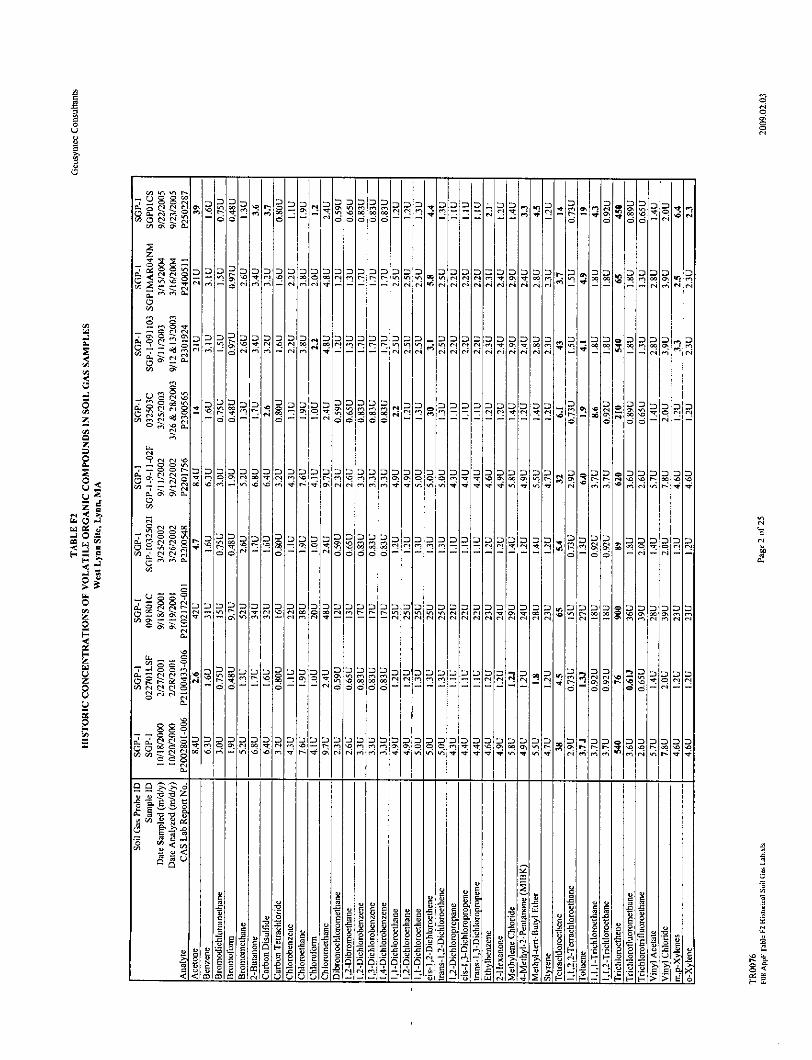
C
C
CC
|0|0|0l |0 0N ~
* - N- 6
0%00%C
0%
~00'oS96-(N
------- N - N N-2( N 4
OraOOOOOOOOO..001
0I0000000 OLOOOOOIOInO00 00NInr-r-NJf~n.tI.vNN,(NIn ~ *0000~00In00'0%*In(N ~ N!lb0 N
00-Q0- 000.000
00
z
0-C00
Cl'0-C00
oZOCoo00
0 0l0 0|0l0|........ .. . c 0.. 0 0l.
00 0 n '0 N n' I ~ ~ 0 % 0 0 n f t 0 % 0 % ~ ~ 0 * N * ' J O 0 ' '
oIoIoIoIoIoIololoIoIoIoIoIo001 (NIInINININHAWHWIUWnININI(N
I I I I I I I I I N IC-Il (N
0
6$ 6 66-
0 000000.
0; ~ N ~ 0% N (N.
0
66| :$ D1
0'I00Imm0ejjsg 1
'I2 1
0000000000000000InIn0%0%0CCInC0J00%000%~N
00
c
020
O ~asSi ~C.00o fl
-~ CfleA
2C
C0)00 00 500
U,N
00) >0
*;J 0
Do
IN0101
-100|$l@|$0
0'OPPoOOn
F7
D DID
27 P
z
(N
(N
0004
NCC
F-
0'00%
Il'
0
0 * ||I|
- 0 0| 0 0 - |-- -| l -
0
C
C~)
0
0
C
02.
C4
=
0|0| o|o- |-
0%
C
C
(N
C-
(N
C
0.
0%
C
(N
0-
0.
'0
C
(N0-
26 C- (N In -
00 % |$|lP
0.C00
0.CCt
N
C o c o - - |- |- -
0In.
0101010N [0 0] 100100
616
C
0
0%
0%
CC
CCC
C
U
0-Cl' 0%
C
'I-
- -J
00 N(N
0. 0.CC0000
fE
00
C
0
00*N'0
00.00 Or.'0 JO
1
000Or (N Cod'~i
>0 >0 0
.2iii00<00
202<
00'
E2
a i:
2
t)
Z
OFOil)
S'
1?
u
.0
E0
uu
au
1191215 ::n
1
=- -1- -
D
1
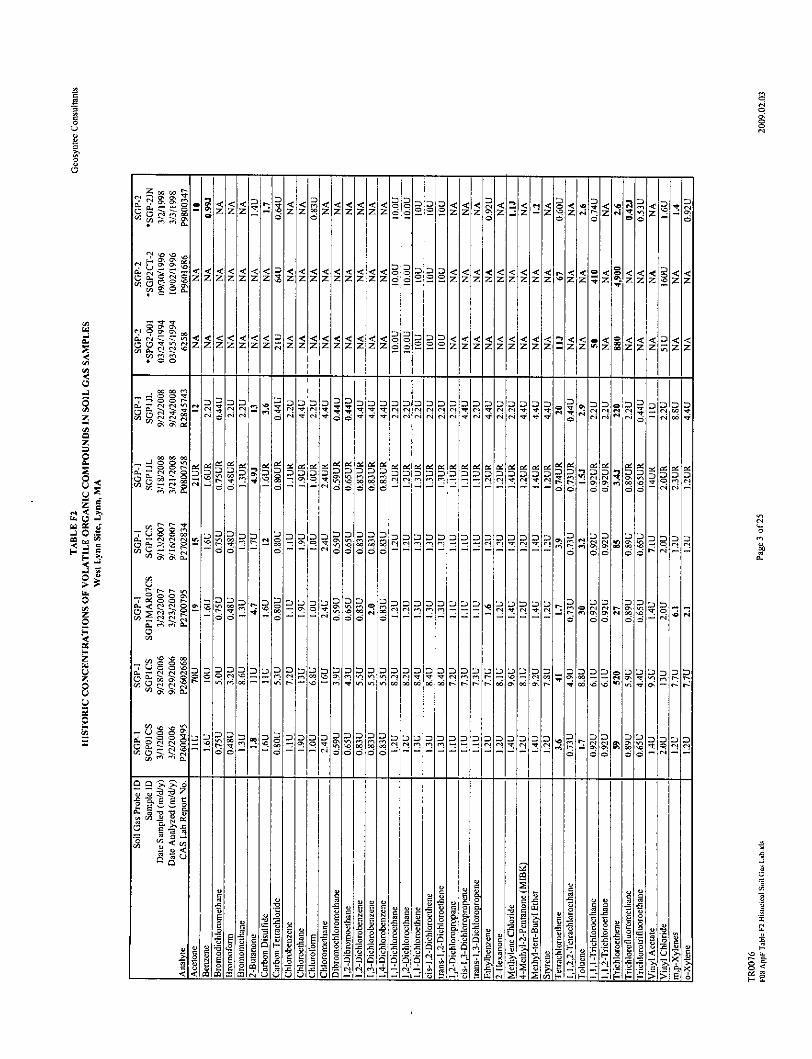
F.'s< z~z
zzzzzzlzjzzzzlz
z
t~o
7U
;,
0
2j~ 000
-t to
010
z
<I
Zz 6 6 sEzz
<<<ZZZc
<Z
-0-0
0006
0C0
-'
0~00
0
0
ZC.t0
-! W W< II <11 iIi Z< <h IZ
- - - - - 0 111
'C Z.
'0't0%0fl.e -o
z.
0~0D0fl00 ooO0'00
66 cc
't~2 ~ ------ IO ----- rqe'4 vt,
ZZr.0~000~ 00000~ e
cc 6 - - -i~ 666 6
0' 0
010 010101010101010101o1010101010!0101000cto'a~rnt 0%fl0fl too toitolN~roio6.. HtnINVI'cI Ie.~I4MIqI0,I00IodIo6
010
0 000000
0000202<00
00,'
6!
0
C:
0B000
to
00 'B.00 CO 00z =E ~
OoU
0C
C
0
IU
I..
0
-n
C-)
0,
00
00
.0000
U
00
00
U
000000o~ ~to~o 6 6 6 6 6 -2
E~
0
'ID0'0 ffi
gf0
N
0On <'a
6 - o | |
~~00000 00 *0* C on toO 6 to to -
0000003 to to
o6 N to - -
D 000
'0s-to
100 . MN0l I 4 IBl
BBB~oloBI [0 l
.5.52
o o.~110
004
-I-I 0
00
LI)
00
I
Cl
0Lz
IH.EL000
-& 00 .00>0
| M l 0
00
000to 00.44 ~H 'B
0
001010t ~0 I tolto-hto'-& -
-, t5 >~'I
0
0
0%
,
C
0%
0
to
6
0[0 001
;j -;
N
'C
.
00U
'C
a.C00
0.000
toa.
0%
0C
a.
a.
-rUe00-to
00~
00 'a-Uc
000Z00 "'
N
00 SV~ 6
.~ .a'~ ~
00 02 02
~3~ ~<00
- 0<
0
000000
a.
C
C
I-
8 -. zzz'T
,
ZZ Z Z Z|ZZZ|Z| ZZ ||~z
BBB1
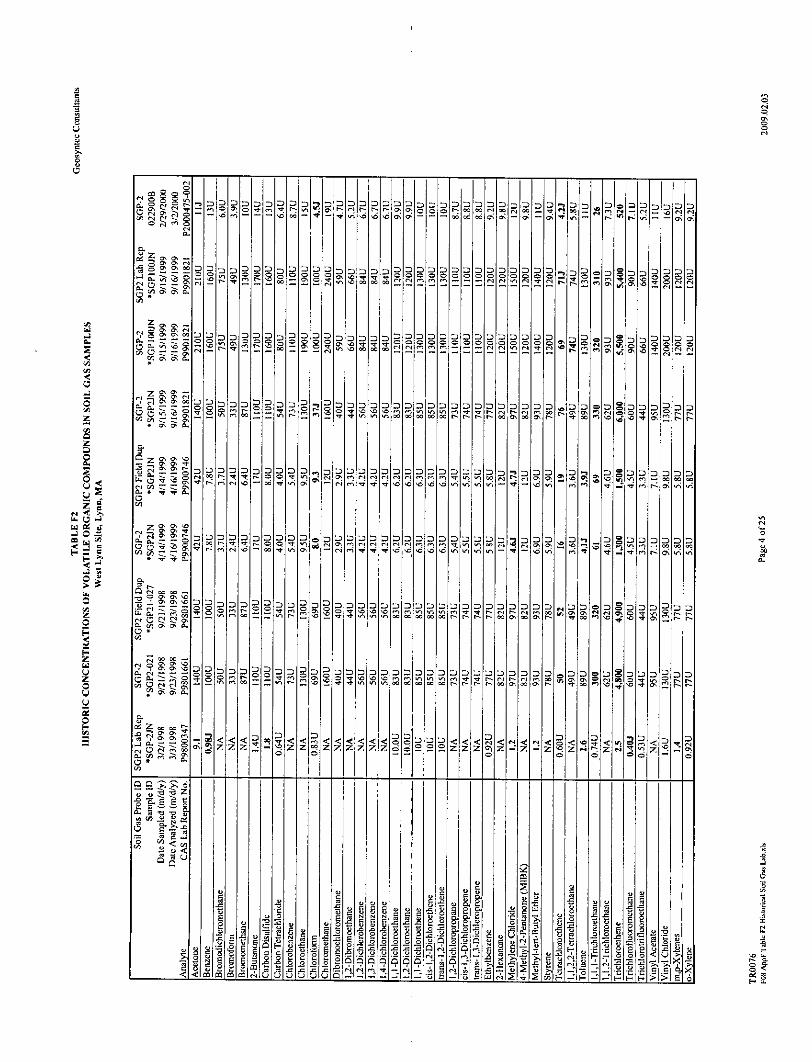
0~0I0I0I0i0[0I0I0I0~0I0lNIClIN
1P
11-0%0>(S
1 0 1 0,N,00
I" I 0%I(0'0 I '010% 0% 1 I -1001000
00!
0101 01010Cli
00i Cl 1091
&IoR I
00000000000000000
0001 Cl IIOflin---CleI IflClt Cl
ID
t
0
000CCCI
000~0 Cl Cl&oR
000CCC.0 Cl Cl
U~0 Cl 't Cl '0 in 1' 0% 0% ~ t C Cl Cl
0%
0%
000 ~ 0=02000 ~0 0Cl in 00 N 0% 0% inCl =0000%N ~00~'00.0%injNN
0101010101001010101o I -'IoIoIoI 0% IoI--~I0 joI~oI ololololoClClClrOinin ~~Vfl09ClII>ClI0%I0%b.4(0 *~'0~Yn flItI
0 00
0I~
'COn inin ~4~nitNI0%IOnIOn
00000000I00I0000000000000000I2o00'00~, 0C~recIiOnje~eoe]rlCelCCi.%.tonoooCl .Cl~in..'9t~'9
I OnunOn-~-(Cun in
=-v -tltnlpi0 %MK
00 0000 00 0 000 000000 00000 00 00 0000 r.OO 020 00 000~~CinNCCtinC0% ~C-t'0'0 ~Oinr0OnOnOnin fl~NClNClin 00 tt0%0%~
4ClC% C 'tOn
0NN
0nr000~~OnN'0 ~
'0 _ On00000000 00NNNN 000%000%N 0 0
in(0
4'Q ~0%Z~NN
000000000 0~o 0000000000000000000000=0=000000~~ 0 CinN in 00% Co'0'0 'CininOnOnOnin rtNClNClin00.r0%0%Clo0CCCC (0~t On00000000 00NNNN 000%000%N *t00in(o4(0 On CNNOnin
0 0-~in~
Zzzz Z Z 00
0)00Ig ~s ~ 8*OOto02o
2.00 .00
00000'Cl Cl in
2
.002
2.00.
fl-s
0
.0
z
*0 CC00
02r~
>0 -
N<0
0<z'9z
C
'a
I 02Cli C
t
N.Z
I -On.z
22
-00 02
>0>0
0
C
C
toCl C
Ceoto Cl
C
'0C'0
0~IobI0I0C I't It N
in 1111001000%
0%0%
0%
CC
C-
C0%0%0.
9ClC0%C
0.
-n
0.Cto
zC
0.Cto
A0
U
0
C
F-
00%
- I I inClI*-~ I I
OlOPololo
~ItI~I~ CCl
0001
1,01.OlolO I~ICIC I..400I~ I
zCl C
C(SC.
to
z0. o.to to
0.C
0 z
"-C0-Cto
0%0%0.
0%
0%
0%0%0%
-t
~J 0100101 HH 010 HI - lolojofoloHojo 0101 ~0 10100~'0'0 (cinInOn.nIJinI I I I I 01 !t.0I-tI~HvO[On 00100100001001 NI N I N I N
0%
0%
1o 10 010 01010101010K I ~ I ololo
0% 0% N
~ 0.
0% 0%'0
- 00
0% 0% 0.
N
0.Cto
C
0.(Sto
0
00
0.
L0pi
(0
'0
C
0%
0.
C
0%0.
T%
0.(S
1.
I
0% z
z
'.
0 z0
Z 0
a u*0 e
0) 02
-((0
z
.0
CFC
00
00
00
U
001.014 N(0*000
0.2
*0
0
0~ =
020h0200.~
(0 .000
0
to
0FC
to
gCC
c-i
0
.3U
C
c-i --------'U. -
l2lzl -
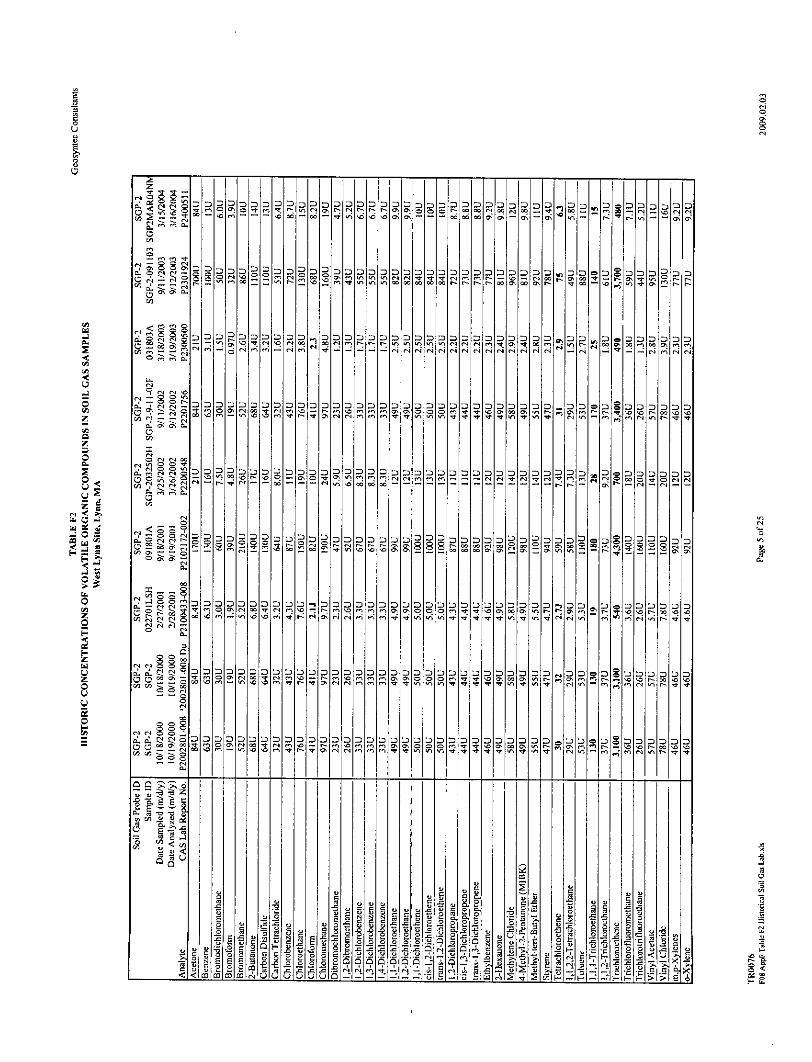
.0
S2000
0500
0.0C-)
.0(S
0
(S
E00
(S
0)1)
0)1)
1)1)
2200.0.0!
00
.0.0
~00) 0-20. C~
8] 2 .20. 0 .0
0 .Y 070
0
23
0
*0 C0 5
0-
-3
CI-
.0
-fit0 2
j-.0(N~=
-II-
N0 -
> 01
C
C
(N
010101010 0 01010] 010 00* ,n~C 0% IC 0* In I ~ I
1t I 0% I el 0'
"ci 001-100-0000 0 22 00
000%[0' ~ ~~ Ic 1o' Ivh1 i'l00- 'C
oio(Ni (N
0'
00.0. 00.0 0000.0.00.......0 0 0
001000000 00 000000001010I000 00000000..0*InICO%(N00 4(NIn'c- (NIn'OInInIn 0%00%lCICCIn0*0*'Cc%00c%~n(NIn001011n-InoC 'fin 0*(N0* 0\(N(NInInIn0* 1 0*,In1 qov%0*0*0*0*~n~0%~
010 i 000000 000 01000 I 0-, 'ci 0% 00 it (N I1oICI~I0'I 0 0*10% I
0%I In In
0
00%
( .,I ~ I -. iN fl (N I
=
0=
~0
001010001000] (N 1001 '110~n (NJ 0% (Nj 'tin
00000=000000000 ojo ~ 0 000000(NtOrOInI-,---(N(N0*(Nn(N ~Ifl>n ~ 00 C0*CCI(N
(N r-
OCC0%000 Z - -N % 00( 00( 0 C 0 C - i-"-2Y.. 0'oMnl A 2 0t00 0z1~0 ODID0 01C00.0
0DIIDMDD1D I0 DII- R MD:, I
0 0000000 00 ' 0 000 00 000 0000 000 00 00 ' 000* 0 0% (N 00 n(N1n10(NIn '0 In In In 0' 0% C C C In 0* 0* '0 0% 00 0% ~ t' - 0% In0000In.~.n0o 'cIn0*(NIN0%(N(NInnIn .o~o440%
OOOOOOiOO 000 00000000000000000000~..00=0S000000nInCc%(N0c,0*(NIn0C (NIn
00InInIn 0%0'0000*0*'c0'00 0%0%(NIn0%InI~I(N~ '0l0(N000C~I000OIn~no0LtIn0*(N 0%(Ne]InInon 0*0*0%0%u-00*0*0*0* 0*0%0*0%0* (Nv%.IngIn(N.n(N 0*0*
00"In
10)1)2' 00S N.
10)0
-C
I20
00
(N
C
00IO
0-
>0 CC
S0
00(S
>0
0
0&
-CI-
(N0-C00
0-C00
-C(N In
0-00
C
L0~
9 (N
0- (N(S -00 I'I -
* 0-0'C00
=C (N
(N In C(N C
0- (NCC~00 flJ (N
C00
(N-CC* - C
0- C (N000~000'
0- (N
00 (N (N(N~1C
CC0*
0~
0*
0'
0-
C
C
(N
(N
CO (N(N (N
Z0
0-
C
Co In
z~C(N -
0.
00
C C(N C
- C
O (N- C
C(N
o Co CC -z~00' 00-~ Co C
(N
0-C00
2 Q
C
0- 0-CC0000
00)0.200
00AMI0P o 00 0000 00000= oo o o
0%>,O
a00 0 ~00~002 0)-C
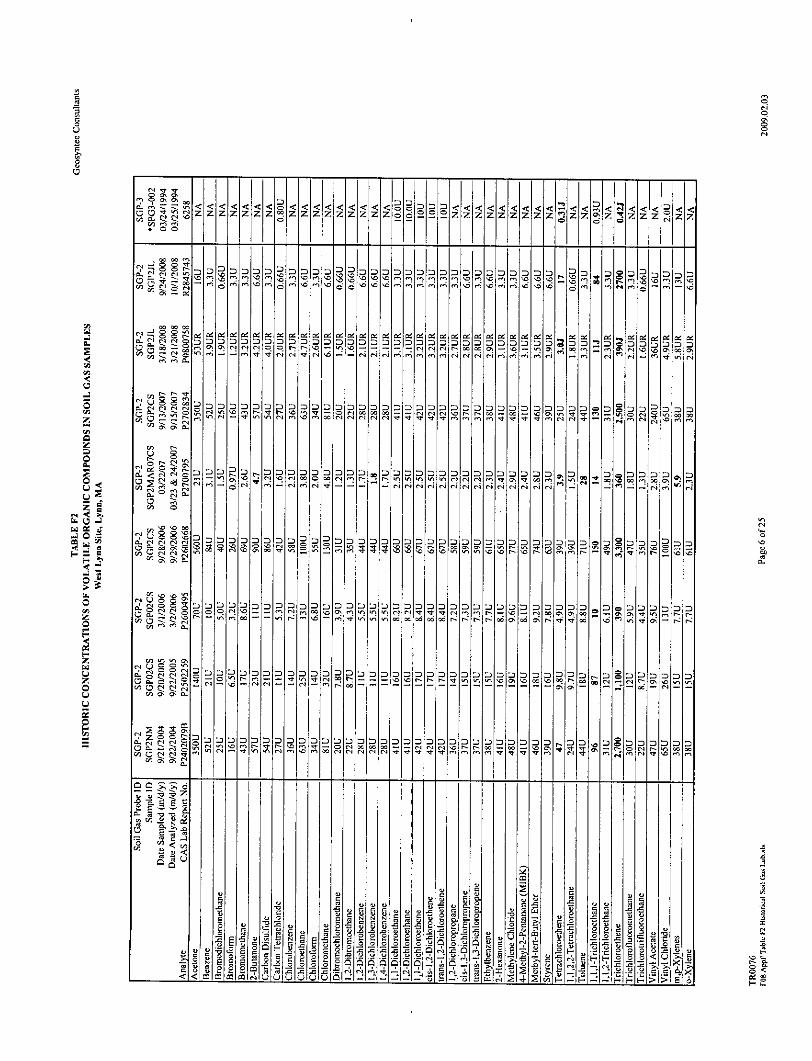
C
0~
00:--." 0 = a c ZZ 0o6 4 Z<Z0s0ss0s s si;e s s s s sis;s g
*
0DIN
0,C
000
0101 ~
00'3'0
&00'0-01 '0
0000000000000000~0 0 '00;0;0;,0;0;'00;'30;0;
6 6 '3'~ '3fl40;0;0;fl000;\00;cn
00000000000000000040 Ct ~'3
-~0 040;0;r~nfn 00 04 01 04 I, Or,
010101'p I'o. b~. It'~1 '31 'CI
0c0~0rnr-Ofl'
0 '3 00
00~0 0~0I~0 ~ 0
0
z
0
04
- - - - - -1-| 11 - - -DID
4 01lf0 0 0'04 0 0 0 0 0~f.. 0000 '0 t;14t
0;; 1 -1'3l11
D! o[oIoIoIoJo~oIoIo~oIo~oIooIol,NflflO~fl ~
D~ 101I
04
0'0
00
0.
q! 2 - - -- - - - -
00 00 00 00 00 00 00 00 00 000a O-c 000
DC 0'00 0
4'0 0t~l0 0r D0 00N C D400O D mD DD IDD DD nD DD N
oIOWAo~~
C
0
.0
*0
H
4)00.0 4)0000
.3.300 0
010101010101010100101010}01001o[OIoIo~C044000o40~01eo01'3NNoo...ocI...I'30'400101010404 ~ ~ ~ I ~ I ~ I ~
I30
C-,
NNN.3
4)44).,
2& 2&00.0
.3
4)4
to.3 4
4) p
. .- . . . .
-2 z
*00 'o 0 == 0 0 0
01't 0;40;04~
3
0
.3
F-.01 a000
-~ 0
4)4)4)29a
83 -: 3F- - 0
*~01 .0
4) *4)0, 4)8 .2 3.0.3 4)
4'iti ~
3C
C
I-
S.3
0C-)
0;
C
C
'V
to;.t0~00~o0;.
0 rnfl- 0; 50; 0;
0'P.'0
.01~~ a:- 01 00
0.
0'
01 044- 00000
0' 0' 0001010;- -0; ~
0001)
0.
00
0-aC
0'
0~
4'
C
0.
00C-)
0.000
o00~0,..00000000
tA0oc~
00 01 01 01
00~:-
0.C00
C0.000
C
4.
0'
0I
C
0.
SN'0'
C
0.
00040
C:-00Q
00
01~'23.04Co.000
00
Oloto~I01 Ion0; I ~
0
EQ
0
0<
4)
E
E E0.12
30
S
00S
uua
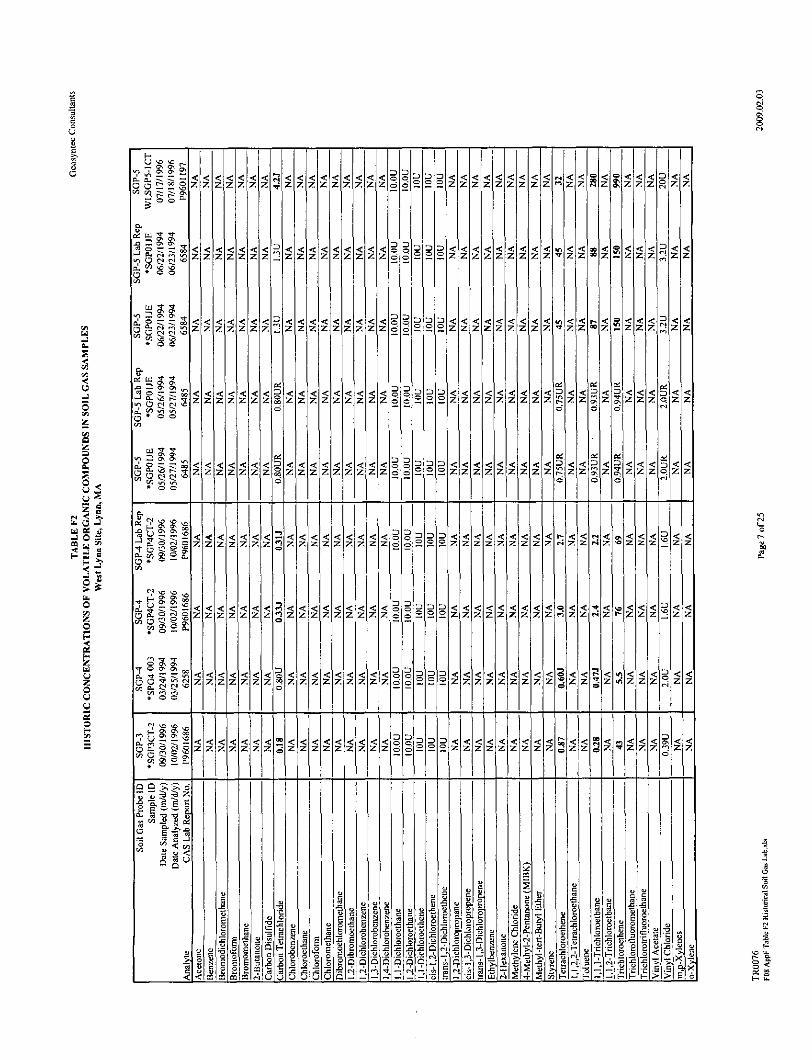
CU
0
r-
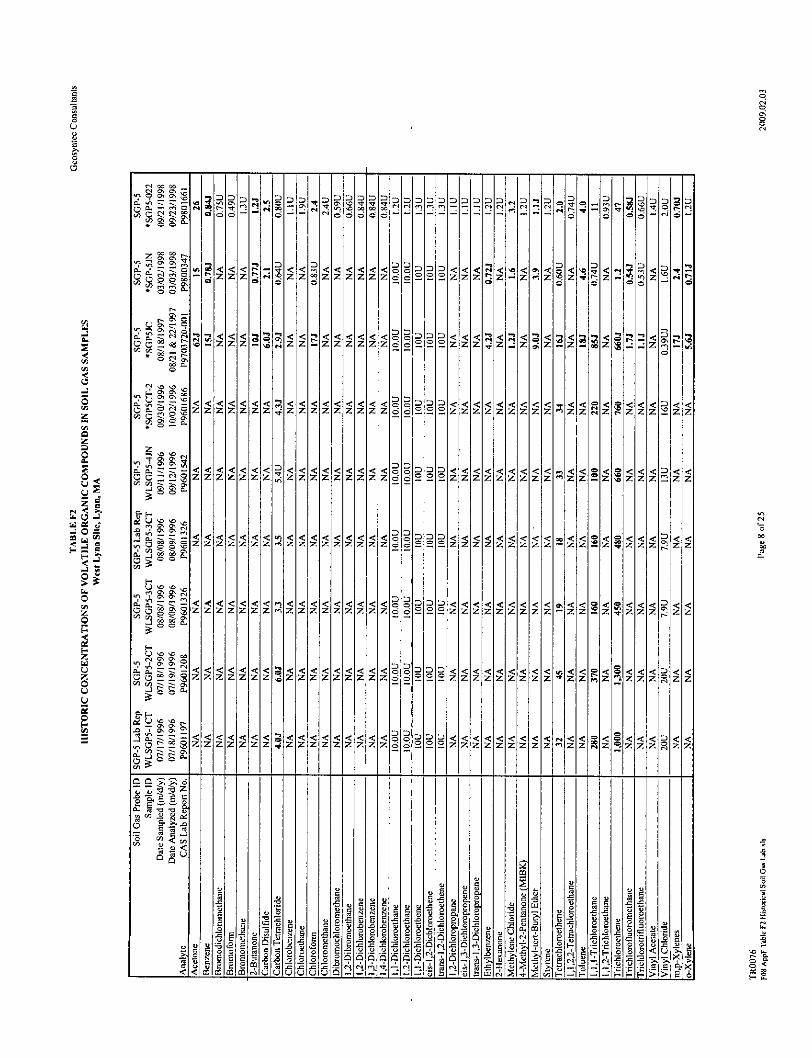
ufll0|CON ~0 ~ --- 04~lO0000
66666 01|0 ' '=
zl z ZZ 5 5| |6 l l lbZl iza -<-
5 15|1Z5, Z1ZZZZZ 161111ZZZ6Z
z- ZZZZ6 2W 00< < I Z I
zzz 6 ZZ z
< <101 0ZZZZZZZZZo
ZIZrZZZIZIZIZlZZZZlZ
zzzzzzz
u u
Zu u
Z ZZ6
0
Z 0)0)
000.0 C-
0a; 010I10< 1 < I <I <e22 Ozzlzz~z
-Co<aI- - z~Zz
0101001010
2 25
Z <I-<I<1<1<ZFZIZIZIZ
.0>0
0
2
< <
0t =
0
z
0
ONa
15|tIM -'
0lz-,,P1 I
C)~0 0
0- Nfl00)0fl0
En
z
U0- 0.00
En
1 <1= 1<II|
zzz z-z~zzg zz
ZA ON
-O R
* ON
auNf
EI.-
Z|Z< |IzI
0
F.-
00
2202.2 ~
0,o c 2
I- 04 0)>15
0U
0
0
0
'a'-4 IP
04
ON
a
z i .- z z z z
lzz ,l l 0
ON
S
'0ONON
C
ON
03=0- 04C -
2un
u0
<I <<1<1zzzz~z 1zIxzIz z
ZIZZZZZ i
Z
Z. Z<IZIZIZl~l~lnl<I<<1<<11<<110
2En
0)0Cu C0 500
0) >
T3
0<
C
Z z
R= _IZ ZEZIZ
E
NE
CuC0
aC
UC CO
<1<E0
m
AS a
'0
0
0
I-
.0
z|z1|1 z zzzz
zzzzzz <ILI<z z -ZZzz -
sl | zz
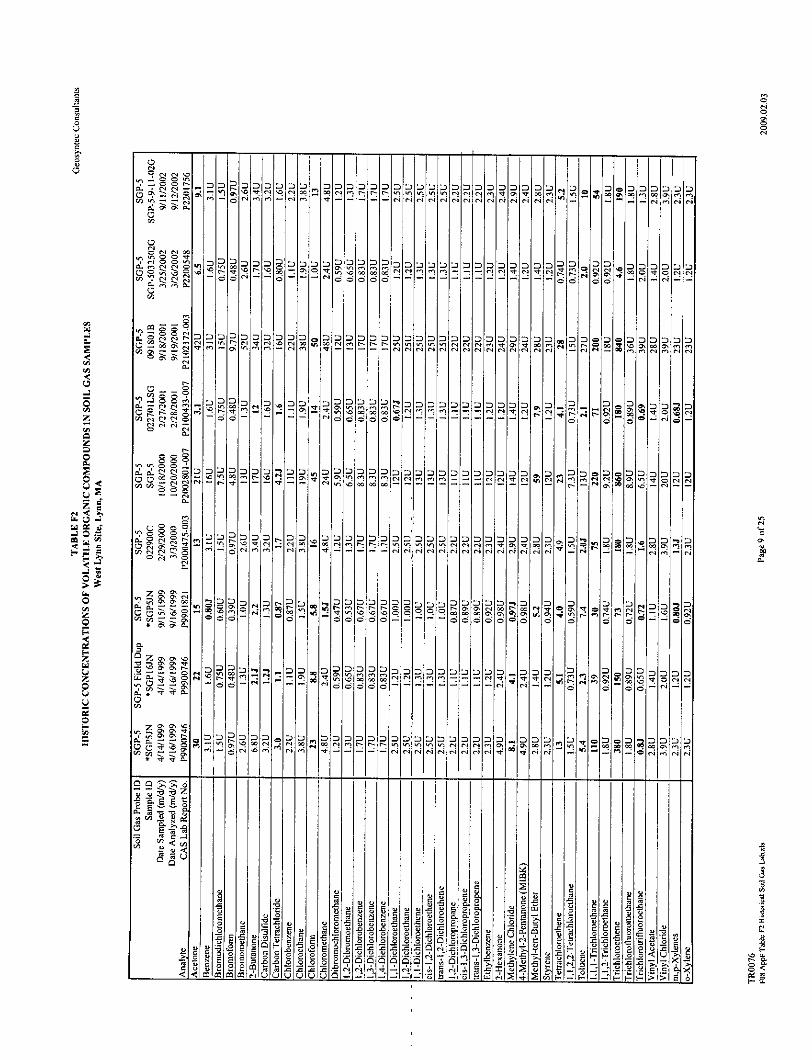
5
C0
C
O I00[0II|I I ~~ | | |01.0C
0!oloioioloio00I0O[001C0010010%ICn
Cl 100 'Cl
OOoOOoo'oo00000000000oooooooooo 0~~Uh0 00000
6 Cl o Cl 6 6 6 6 6 6o c
CC
0-cC~00 U']
C00
C
in in
C. C"]
0000
C'a
£0C-00 0%
0
C00
0-~
00 ClCl
0'Cl.
OIOi=iOIOiolo00~ ~ pa
IN - - - - - -- - - - - -!
ci 01001I 0 I
10] ~r0 %n nf Gl l & nn--ll-l8 ~ *nNC IOIt
d0
q .w~ *~inc 66
010 00 00 cO ot~~~002 Cl 01002in- 6 ClCCn ClOn
Z0u
0E
0
in
002
u
0
51;0 ooo00000I0I0
------- - - - -i
-c020
Pt.20
82Fe2 aa 4,.
fl
0000 = 000 ...Io ojoinininClClClC, 0% ',0%001,nV Clir
C
oila2Lo .0
0
>0.0U]
2
o
4
=02>0
.0=2
o o.~
Cl - 0
'0'en 100
'C
0
D in
0.CCl
~nioRID
0 gooooDoD-A. C C
8 .
I2.0 >0
~1010* - in
0% I 'I*I Cfl I-
0~0
6C
C-
C
C.
0
C
CCCl
OIIic1O1iIooi1i1ooooill
0In
'a
-J
I-
CC
in C
00C
C.C00
010000E
0000
100000C in 00
'Cl - r4
in00~0- 0% C
Cfl~ 6 Cl
~2~oconO
066
00~ Cl
00t~ C
00
N0
0020-CCCl00 Cl
C
z0-0.0 o0000
I.-
ic~,0
0
'A.
C.C00
zC.000
C
0%C.
z0.0-cc0000
01,
2
E0
n
.8
M
6
,u
8
2 E ~tu0'0
0 iu<1<
P-1-KI-ID
e
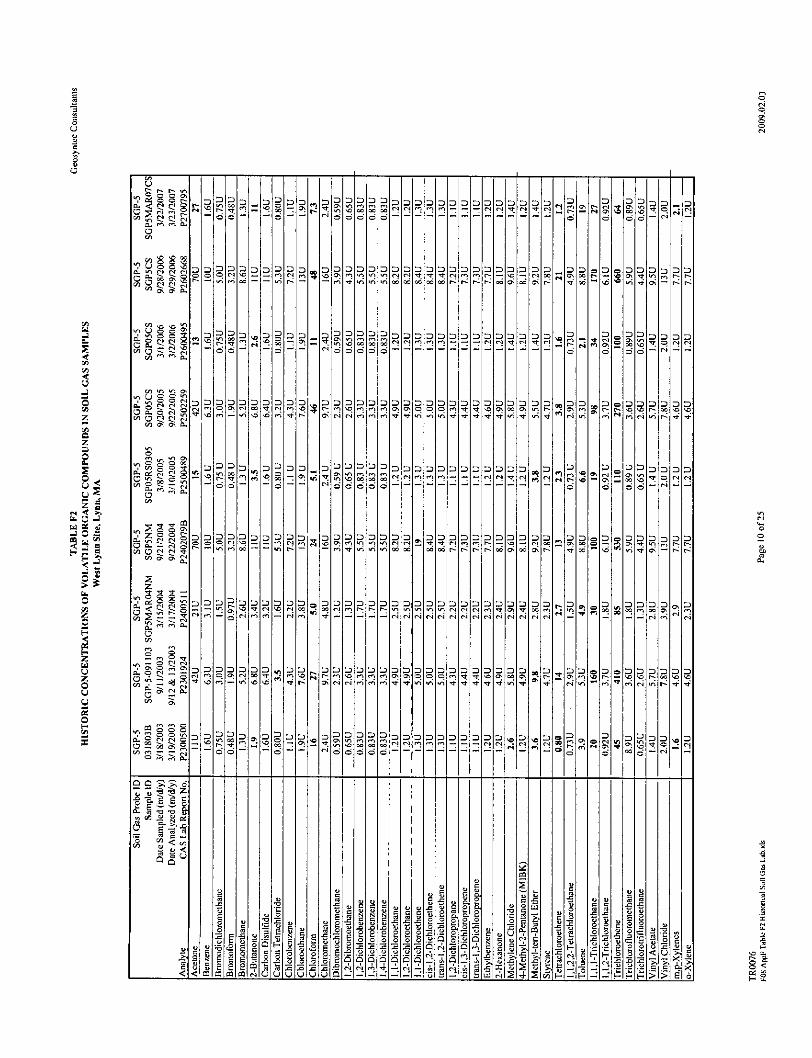
0]0
00
MID-6
~00
0
n
00]
16
'0
0
0001R M 000000 112 20 011 06 1 000110~0 * eq
...IZl0I&OIoIOIOIOIo 0100,VI~VI00 I 0] ~ C 'On ~00efl ~flr-.-~ I '0[~r00I00 ICI00It~[-I0al0%I0tiVIIen 0-HO.~~~~00cc0C00 I 000-I.-t.-0- I ccC%000%r- I '0<00 I I '01 IVII'tI0%W 0.10.
00.00 0000 0000 0 .0 0'00000 ~0000fleflefl6666
=en -
0 ||ID|D|D|
U0-0
00<
0.C&0
Co
C. VI
0,
0,
0.0CC.00(5
C',
"U
CC-00(5
Co
0
000
Cu,000
C-C
oO~o 0.0 0000-
0 00000000 0,, 00000000 '0...~ 000, eq '0 ~o 10.-u.jriod
000~0000 000000... ~VI
0 %IO't0]CO 0000 00000,
00.~-%r4
enen-0]en to~o-~
0
PO IDllL1 OItI01 10011100
V
.001. .~- 61 - ~666
*0toC
50
.0
U o u
0
U
RC2
U
0,
0
--immo lsle - 0
00010101010 I 0101010 I 010I '0.I~zi00.,cc.i~r0%I00
c~&[&e~r4o6ON 1 cc1 0 % 1 r. 1 l'Ojcc
O 0 000000~ 0%0% .to CO 0 00o
*0
010101010101 oololololo I 010 I 0o~..o I .~Iot4 ,IoIotoIoI0 % lo0-0uVIVIV1Ifl0000000, I 0t0 % ~
0C0,I *V0 I ~enIOqI=I09Ifll0qI0%.I0jJeno
41-00000000 eI000000000000000000 I - I Vt I~<00I0,I 00
00o0,.0 Ocen .0
't 00VI~
00000000 ~o0~o00c~
0
Coo
2.0'
Ow
0C
0000
200
0)0
00
U,o.S~
0)>- .0
T,'
C
0
H.0)00 C
2~
0*00
0
0=
0.0,
H
0|||0Ml0
0) U I00 H- 0)'
C1.1 .0 0)10)
>. .0-. .
0%
0-
OPo
0-00
CO
0%
S3
0U
C
0
C
=
IlM1 Il Melrt&le lel0Ia lC9
0
'0
C-
000000O 0 0 00 '0 -
- .0.t eq00
00000000 0, 0 0% 0000~ ~sI-~ 4 ~
*4~.- I
00
0
C-
'?zoCC--cnC~
00 0%
2z
C onco2-
CC',
0
-0* 0% 0
C. 000
00~
Co
0 00 00000
00VI 0,
00C-000,
0
0C
C
0
0.
6
i *t 0 a
00 o4
00<00
20.0<
00
E20
Co
000000
a02
ECS000
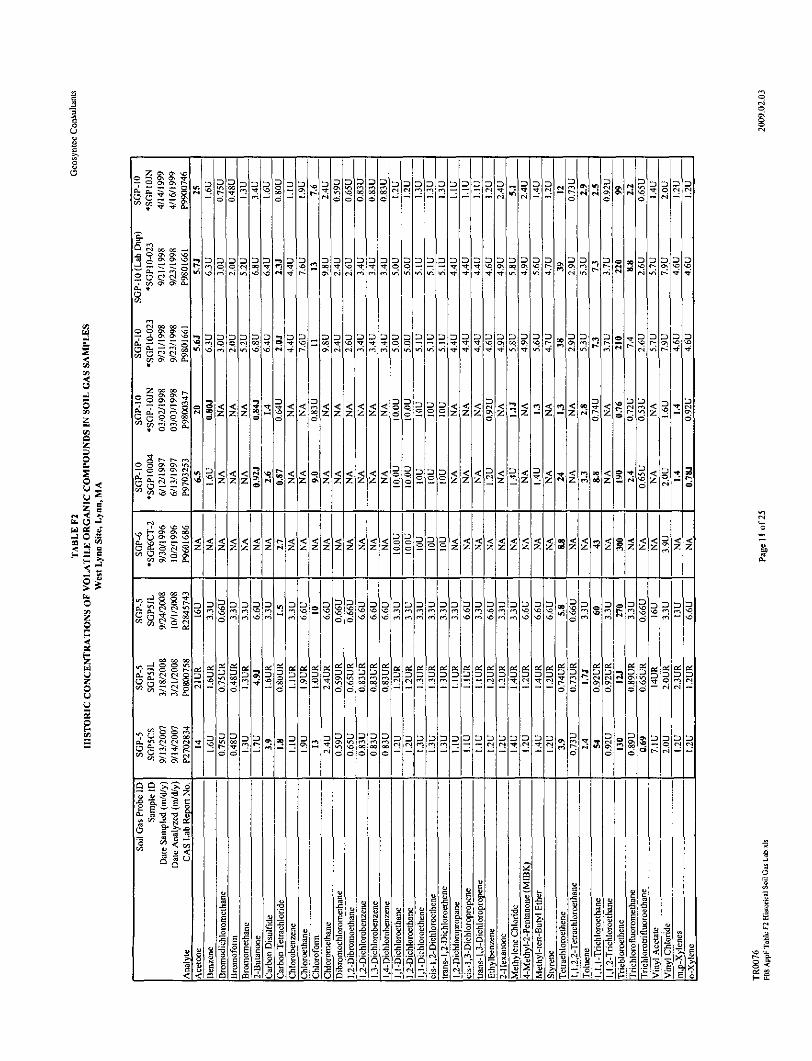
Ii
'0
0
0 I I I -I l I I 10
OHHoOHlirI I
* - dz <z.n"C'i
zo
S.3
C(~0
C
C0~0:
616
oIoIolIOIoIoloIOIOtt dim 00"Pt1 -tOI~I ldi% H~ I i '~ ~' I~Jt
SIi I 1- I19J1"J
z z
zlzIz z1z1z
0CiC
00o o66
010
012
0
010Cli ~t
Cl
01l1l1
z[~z< z I .21lz<z
0'0~'urn
01 0Cl ~
00%0
0'C0
01 I 0101 loIoI~I0Ior.IC'I0% Iini'fllr.irv i 'air.do,~ I rlvIt-ldNe4I~I
-LZI~iZ
z
z0
HP0
ii. '0C
00001
oI.,I~-l 6
<lI,
02 z z z z - zz z z z a ~ z z .z.zz
- 6- - - - - - - - - - - - - - - ----
- z lC ,
-ailn'~f.. .0 0 . . . .. ... O ' , ~E ~ 6~" " 6~li* *f~
2
6l
2 20. o -22
2
aa 0a j -
<
00z
-0
0. 0-
IiIn
0
0.CRi,
ciCl0
00
o C
"I
-c
C' 0% ~0- - 0
0% C'- - ii,
0 0 00
0.CGO
0
0-CCi,
'0
0
01'II'Cl
'C
0 0'0
z0
0.CGO
olo'CI 'C
I
a C- C-
C
C
Cl'
0.
'0
2
CI|
D 222zz b Z *M*-Z Z Zk
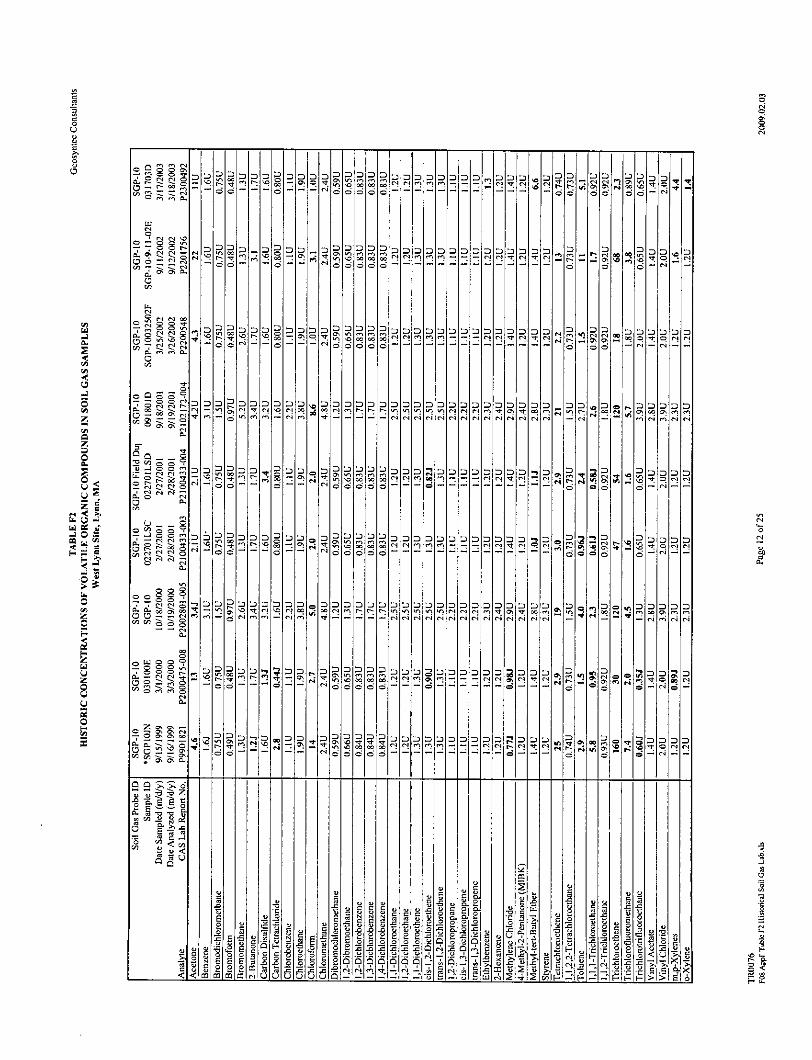
S.3
0U
0
0
000
66
000000% 0 Ca-'not-- to
6 6
0
6
0~0o..0 000
6~ to 6 6 6
o6
-
01010! OIOI2IOY 0 IOIOiO
Th:I:J:HrIZfl 'aO0
- - - - - - - -0 - - -0 0- -0 -
o6
0
0
6
I-
6
0to0%6
66------------66--------------------------6 6
2 00022 0 02 000
o 6
ol oooooloooo.
0202~00%I~~~N
1'
fl~00~oco't9
o6to
00'0
00
0'CC
OlOloalO
.00000000 o tO to to----
Ol oleosi 00100|
0to ~ow,'C
010|H $ I1r1
00l2|00 'Si
o00o0.,~o000020~000~in00'912 _ ~~-0% ~0I00
0 0 e in C%'cc 666166-----------------
0 ~ 0rn Mo~
00 -
E
CS0
S
42I'
U
S
*0
0
420-42
C .000
.5
0
C-,
t
0
0
00000000000000
to6 6 6 6 6 - - - - - -
00
.0.00000
.0.0
o n
01 0C'S
22
22
noto -
C
0. 0.
22o
20
0~:
a
'0
000000 to to
2------------------------------------
Ole ekool 15o315c~I10I1I01
-:|toloo@| 0 %
10Ito2
0
>0
U,
I.-C.
01010
0100 0-t 500.0U.42~C-
>0
Ca
2
rIo
* 0%C
0
C
0%00~Cfl20000ebAi0%~t4o0tCtoto
o
Nu
'SI420 I5~42 I42- 002.0 02142
<U:] ~>0 >0, >0
-r~r1to~
0
0
S0
0%
0
0.CCa
0-0'A
22
0
0%
0
0.CCa
Li.toC
0.0'A
0000210~flr-%0l~66~ -<6
1"
0%
to
,jo
-- Co
0 ~% 0%
not-4o
or-~- to -* to to
0-C0
U-o Ca- -~ C
0o o C-- C
CC-CaCa~
o L2 00- 0 CO
* C CC
000
to6
200-'012
6
~'00t.-Ca
0to
00
0.
zC --0
0. o.00
0%
C0%~
0.,
'0
0%
Q00
C0.
0
0
>o >, 0
n 0 0
"5'A<Ca
2 01<
4242
SN4204242<0
2
'C
CC
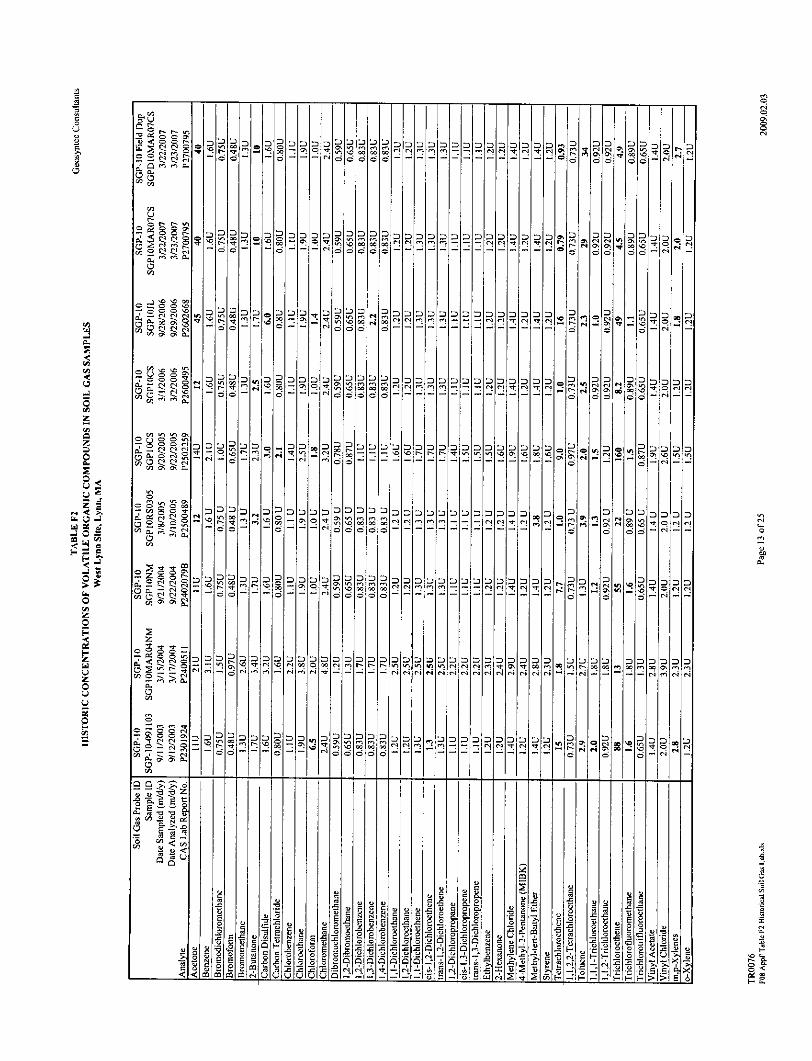
0
U
C
C
000m00 -CC
0-
00UC
0~COn
- l | -00
0000 0 OO 0 ~ ooooooooootO ~--- to
6 6 6 6 6 -
-- ~ -- -m66 -
00 -t 0 --- l--
-0-0-1- -d
0000%- C00000000 0
C
00 0 ~00r~0*t to to 0% 0%
C.CC c6~" -
0%
- - - - - - oe
-------
00 0tO to Mi
2 0%
CC c6~
0to 0%0% nC
0to CO
| *Wi
-C ------- - - - - - - - - - - - - - - - - - - - - - - - - - - - -
:0
.0
22 ~ dOo U 3
o*~~5 2 g0~CC0~~NE ES 0.0
522 2~~ = = to U
C
0I0I0l0l0I0I0I0l0I0I 010to 'CI to 10010 F00ItoIenItN n-I
I I IiI-I-B-fl-~ -Id
0
.0CC
U
.0
-0C-,
.0C-)
.0.0.0..0. .
2C
C
C)
di 0cdi
.0 0
S~ CI
02000
000C.0.0
m
000000000 zo
Wi IMi I Wi I to to I to i en, ~toe. tor ri I nilrild
di
0.WiQ0-
S ~0.~0OOrA
0.2 .0I
- - - Ne
di
C0
.0
I..to 0to 0
-C
0dic
00
U,
di>,
, 2, , , ,
= 0to0%
ol0
- t
C0
0 0
01010 01010~i:r ~> c-i
'0 0
2i d
.2,
1 5 E
2
'0
I-
I-.
.0
C
6
0%
C
0000
66
-r CC
000%
'0CC
0%
'cnn'-
00 Wi 0%o COWi- 5 acto
00 0% 0% 0-
a
00
C
0.C
CCtoa
0.C00
to
.. ~.... 3,000-z
* C'0- -'C 0-CCC
z
02
00000tori .2 6 ci
CC
0.
0%
CtoC
0-
atoC-
= V V 6t
2'--*0 ~0 d~i
00.2 ~>~ .0
00<'c
~A 0<
000000000
CC a
. . . . . . . . . .
ut
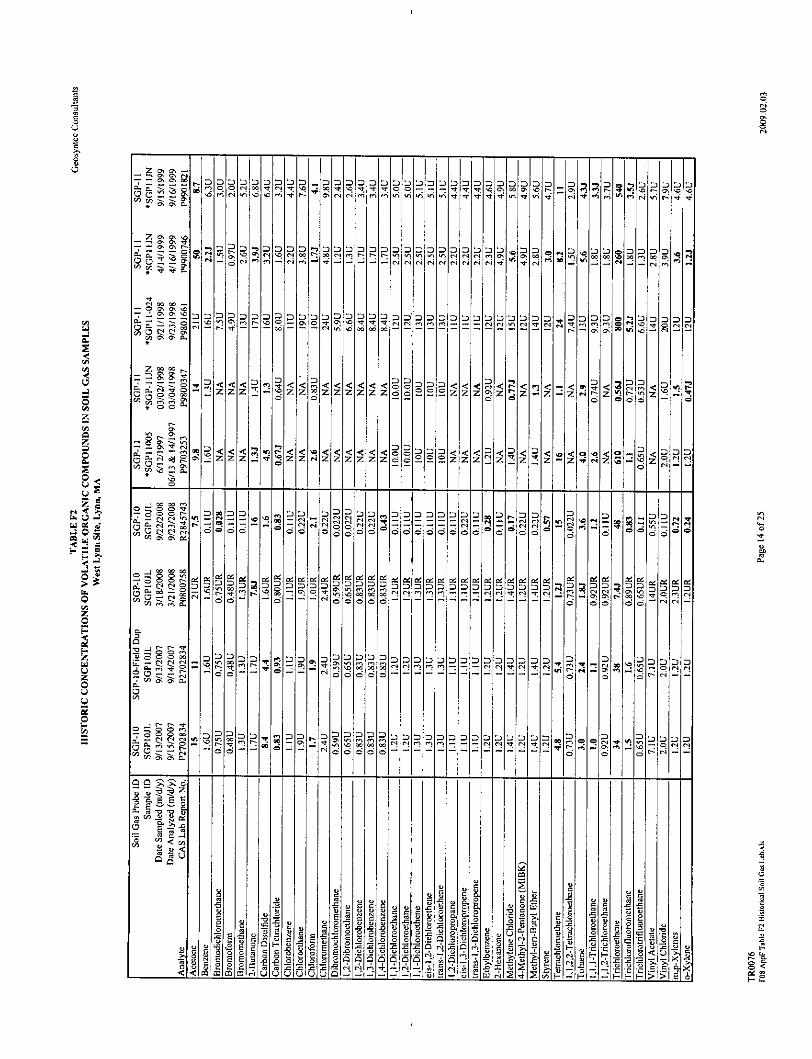
| olololo
0 0 0 0 00 0*4 ~ ~0
0 ~to'0to
- 6 ~ en - to
0U
0
>0
C
C
1 0 10 0 10 --
00000- to - -
z zlZ 6
'a
16
~~0000 - to
C C
|11 o lololol*0 D 00 = -a 010101010
'CI [CM '0I '0tolon I t- It
I l-|- - | ol-- irj- - - - 1 4| M -e
- -- - - - - - 0-1-0 00- - 0
z S l . 0<O11O
49.
z z
50
< < J n n .~
l%,
0 Z 121Z
000 oD ,0 00 0000 0 00 a- 0 0 t-.
to.CCtoto.d =~=.o06600 00000000 0 00
\0
co to6 6 6 6 6
-- - - - - - - - - -
0000 Oi.I000%O0000=0M01n
000 o0I
0
IOIO~IION0
iu d
.0
a-bn-to
2 uI
z ejr.z '00 0
Z Z,- '0 Z
0
CC
0
C
6O9
'0 -000 0 .00.0..-
-eo 6 -4 - - ---- -!
as0 0
00)01
di .0 .0COO
.0 02 02
- -i -
2
1) 05
. .0
2
0
* *0 C
CC- di
0O di >0'0 - .0
0) .Idi= t~
00
di~00
OH.0 , 0202 to ~
0)000H -[H
.0
0
6
0
ONC.
0ON6
c
00 en000
0
ON
6
a~ E
0
-ar.t
0 0ton-
-N - a-. to
6600
6 -toto-
~0000'0zci to todr-to--
0) di
0
02.042
>0>0 >0
70%
0'
0'
ad
C
C
D
0*
-200-CF-
0000%
o r-- C ON- - C'
7 0e nC
CC
4C
C00
CCto
ON
to
C.
Ct
00C.
C0*0
0
C.C00
0
C.
C
C00
It
0
C.a00
>. >0 0
Eat-n n a,-S ~'0 0
00<00
S
dimd
-C
'0
F-
ml:
zz zz

00000
66
0'Cl(N
"0IMMI000e. .000N
(0
5C
0Q
I0
Mlo~~n~koIz
P011012
0-
onL0~
-- (N
LI. C
- a00~00.
0
- C
0-en -
0-0en
0[olOIoIo[ololololoenI'3JInI-IenIICLIoIfl(,flN
010101 0'0 10 01010101010 010 01010I 0%IenIr[InIIn,(N((N(InIn(InI,..,...,(NI(N,.,
010101010 010~ 10% 'en, In I InI InI(N(N I ~l 6l~ I a I o61
I00 00InC INN
o Ca
010-4 (N
00 0t C (N- (N -
0
0 ooooooC. '1 C OlIN
0101u,101010101=1010101o1o10't ((Il~I I (N I (N I 00 C1t C' (N I (N
14 Ir'II0I~I~I J (NJ (N 11
01010 0IoIoIol0Iol0I0~oL~l0Io~0I0ld!oIoIolo oloInflIn--- I (NI(N It 't (N - I (ThInIN (N CU 00 C(01C (It((N- 11 iiiiriiti INITh0%I0%ItII(NI~v1~n
0000 --000 -----00- -
o~oo~~o~~oo~lo~loo~~o~~oorloI~ oHMiolno-lA 0n
0000000000000000000000000000000 0 ~000 00000tInC0%(Nen N(NIn%0-NIn'OInInen 0%0%000..nttlc0%000%enN0% *NN~IC00'3In~en4~N~entenN ~flfflt(nejen&4I,
0000
C C~C~(N 666
00N -?66
C
C00
10 1)
CO
(ic-i
r re
'0
C
00000000 .,000=0 ~~0-a00~0InrflIn---(N (Nc(NN(N.In~r4enIn.~
* ... e.N 0%CU.4Int.90%ri6 6 (NO
0101010
.3
.5
0C
4,z
Izi0 ~.0A
00V C0 5Co
a,>- .0
C
PROM~ %
(I) C
(N C-It
.0
C o
.0 a,
1-0
D0~
d) C
<U
JO
2 E0
00
C
a
(N
0
OIl3-
'0
I-
)0
~ooo~o ~ --------- ----oo
(NCC(N c0~
00
n%
Lz.
.4
0., vi. -
o ~LI. 00
0% -
0
- - C
0-enen~Z
0%
0(N
0
C
'0
(N N
- (N
0% -
- CCo (N(N N
- (NZ!C0% -
0-
C- Co In
It
(N0-
0I"
CC
en.4C
C
0-Cen CI I
0.
C*0
vi-
0-Cen
C.0en
C
CCC-
0.3
Co
C-C
Li.
0.0en
CCC
CC
0... QCC- C C C
C C C0.- (N (NCC0~
0o1
z *7 .
062C
2U. n 9
aI m m 1
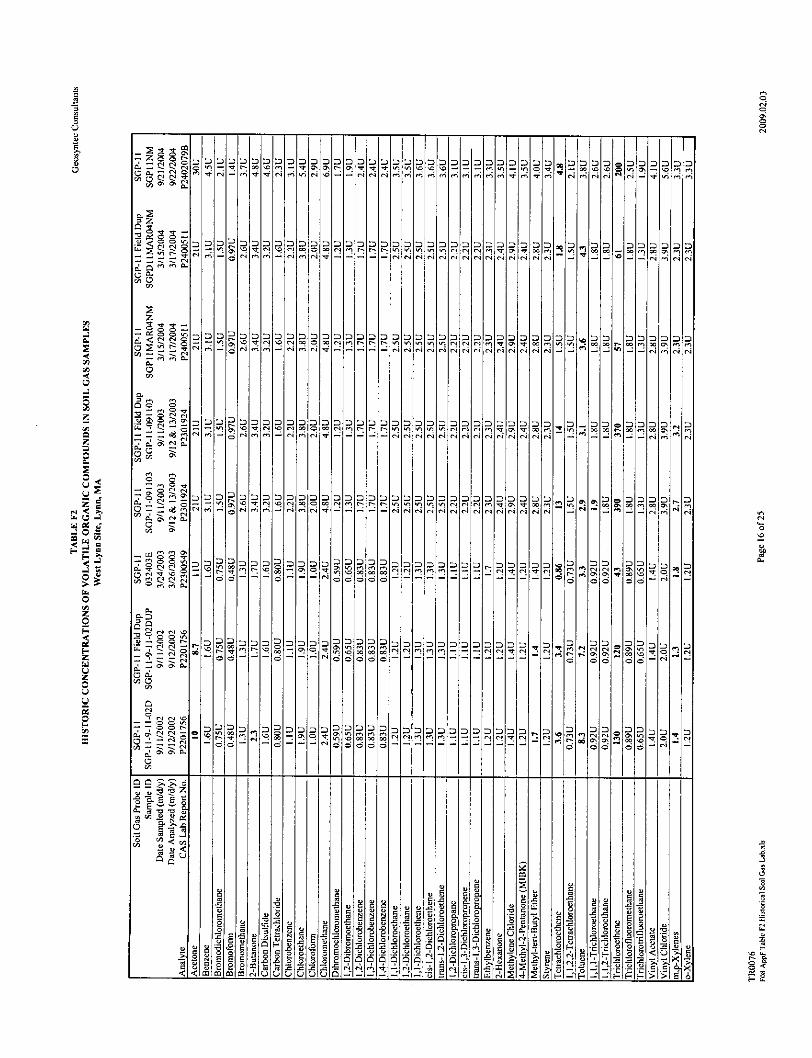
00010101010F010o n -'.t'~- I 00' 'OF ~I -'~ '4 oil .2 I C.l'rl 't Fool
000 00 00
olllooosl
ONOk-IN
tI
tIu
C00
0 00000000 00~00000- 0 ~ - 00 ~O ~fl =
~n~,~eoo~oioiNoi
-11- - - - -I-f IIes ooeoooloeishlh-1.
09 000 |0 0 00 |0000000000|00 0 | .
FO
010 101010WI '
0F I"'
-It F" on Ion
- -- - - -
011
o---- - --- -- - - - - - -o --- -
000~000000I00[0- - ~ ~00* ON ~t 0000000~ o0]r~%oion o.~ oi r~oi
0000000- ~ o~ 'C
CC -
I-
C
0
0000'96fDID
0
Ci
0I
C
0000 o~oooH0I0000o
66 I
2
~0
C
6
0
I-u
.16~u~
0,on*
000
10
010000000000000000 O=0000r.00-F unun.oon.nooooooon t ONtoc 000 *000%OOOnbOO%
~0100040000 0] ~ . UN -
0Cli
- - - - - -- - - - -0
fl~0 oo~n00 .~ =~ oo D.~C.00.g~o~~
" VSt
- - -- - - - - - - -
0o00ooooo~.~,I0 0
.2 2
LII
0
C
Cl
C
0 CC S0=
0)0
0)>.
00
C
C
0
F-.0)00 0000 =
2 0-Fl-.
0)00
.0
2
C10
DID
.0 0)
200)0
2 0
HOC
-[I--I--
00I~0t Cl 00-2 oil -
0) 0
<UI.
0
aCON
aC0N
S0
C0
U
>0
0
C
-z0.-00.coo
0),
0.0Co
CCl
0%CC
0%
C
Ct
0-
C
0.
004~0
4
I-.
C
C.
0.
0.0 onno~0 -to'
CCo.
C
- ON* C
0.00Co
a.0rs~
0000] 00
0.0.0
0) - Cto.
0% -
0%
CC.cooVt
Cl
- - C- - C
VI -
0Co
0666 6-
0-
CCl0.
n ~ 6;nz~
~n &J 0)
S
Si
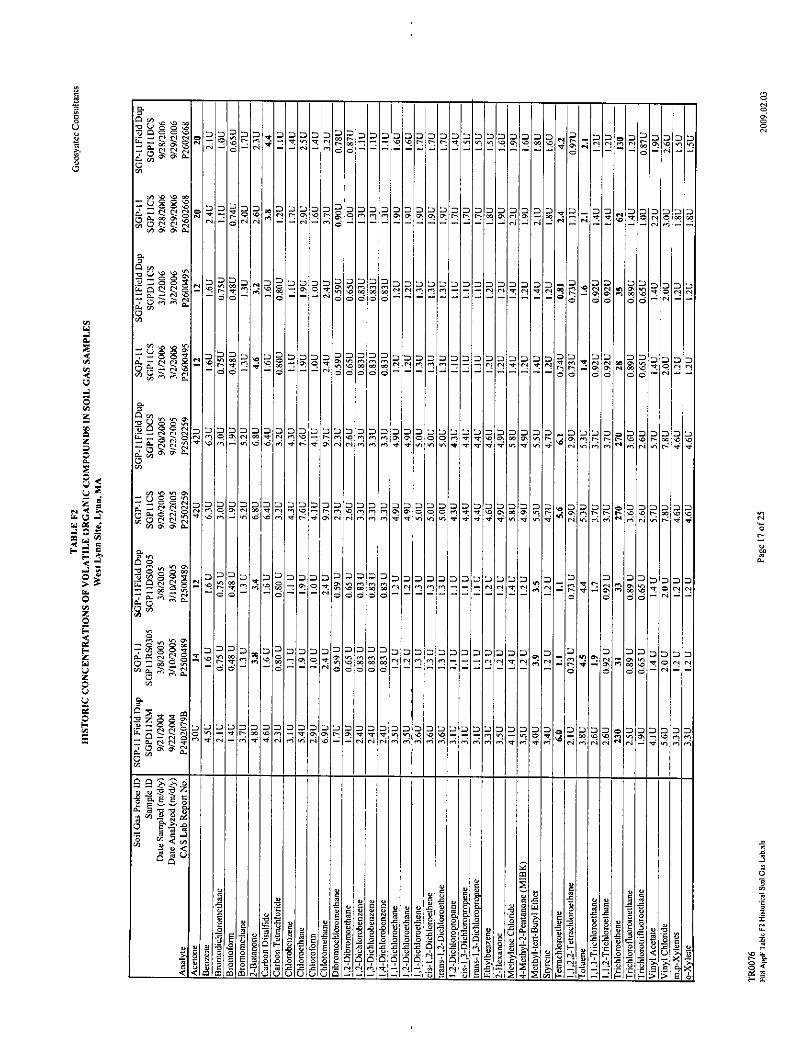
00
='0C
00 t
5
0
(~0
0
C
000000- -t to~c
:0I to
=
0
0.000
rA.~0(40*~0o
C00
00 '0
UO ON
0.00
-- 0-0
* Zen0-CCO
'A
~zz~ @40 ~ 0 0~0 000000ON~tInr;tn
.r- .~'90 0
-iON.C.-t 0 '000000066 66666
00 0~ 0 00 ...... O
0 I 0 i 01010 I 010 010to I en 101 ON I (N F 001 t 'tot en
0110I 010IM110 00
zZ~~ 0~00000
Co C
0
'0ON
0@4 I~- 010.1 00 01010
to I - I -
00,01 .. jOIOPIOIOIOlOIoio
i i-Il-I-Il- I I I
00 00 0 00m 00112 DIDi l Iooo I lD
--- 00------ 00
C
@4,
000000
OlololoFolo'01 NO I C.- '00 '0 I ~0
000000 00 00 000 00000 0 0 ..oO 0 00 C 0 000 0 0enNtrnenen ONONOCCen N000N0NN ~~ONenN'0N0r-0cN0N0ONtotoenu~44444q,~o.~ rIv~r2~4
0.
'0C
0000 1o 0 0 000 00'O~ r.~0C
0 ~ ~ON~
cc c ~65
00000000000000
00-10
2(4
U,
0.00O'A
Li. -0.
tO0.00CGO
(iO2(4
CA
0.
00-00t00
:0'A
C
- C- Ca
02000.
C00
0.
'0
20.(C
0.00CCA
0
Es
R 00MmEEmE m0 S2 E
u 0 0 Ci
0
--- -- -- -0010000 0
0
0
,0
C-,CI
0~
- 0'C
I,
g
000200
NO to C
000000ONfl-t
0 ~
Cd-to--
~0Z000000000~~
enenenenennene., [email protected]
0
0
0
0)~ -0-0 ')
00o -0
00 to
.0
0
0 0C 5000
0)'
- .0
t
C.0
0
0
0)
to Cto',
-ii t-(I-.
0)0)0)
-o -' 2k1- 0
'240 <(5d
~~~o0 oooofoooooooooor-~cenen0Nc.ONcNON QONt
C (N
C
=
- - - - - - - - - - --01 101
00~00~f-i
to 6 to (N
0.
NO0C
ONCo toto to
- toON 0.
OII 41 INONOOC I I 'I I I 0OIYt- I HOA INentr
CC'N
ON
000000000[olo 0000000C U, - 't C*~ 00 NOIn -' ~ION ON r- ON ~
0'(N
C
(N
0.
ON00
0.
Cl
C-CC.'
0.
00 ~
~
O0 ~
r~-Is
<I
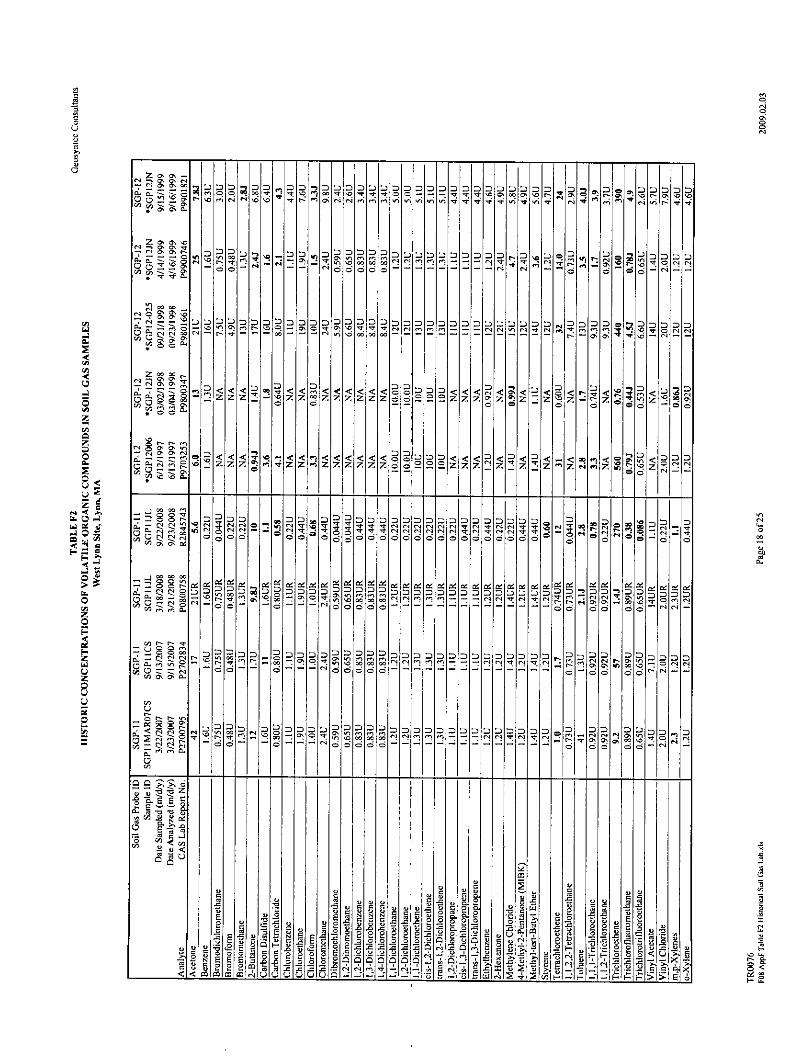
040
0
U0
0
C
0C0I0I0I0I0I0[olooI I I J~
0
- --m------
0l0101 01010 10~ tI'0 0% '000%' (0
o i i R10
a,0 0 ololo
0%' ~ '0
I i
nc - - - -
Psl-M 0l
l--$--0l -|-1-5-1---|- - l -
15 . 6 6 5151z1
"20~
0000~0Ye 00 '?Ooo'?*0400*' 0'?=
CCI C
ZZZZZZ
0-l .,6 -2n,&< 0< z 0 o'- 0
0CC - l : Ii Z I IIzI
6 0 0 66666.0. 6
0 4 --
d
0
S
z<= 0%
= z
0
C
=0=00~0~
= Na
R n: CR .P Q m 7 - --66
-----
66 0 0
0-- 0 ....0 -
C n,555 I
.0.-
I
u
-
u
.0.0 022E2000.0.0.0
000
oil 0200
.0.0
>0
.0(0]
0
=
02 0,
.~ II
~0204:
02 >0>0 -
65
*0'
0
.0
00
I-04 0
0204 Z
.0-'F-
00,1124 l
04Mr.ll00
0
00
0.
02~0 I~
.0 02.02
F-.
Z o,
a,
'0 | m N:
K ~lot ~Co
D0 0IRID
00Ye
0,041
I 0%
0:.
4
I-
04C
0.C00
0.C(0~
0'0\
0%C
0%0%
C
0%0%
00
z04~0-04
'0C
04 0t04
0-~
0%0%
C
C
0%0%
'C
m,
6 0C
Ozo
600
C
0DIq0
Q,00
.00
0 0C8Z2Q00 n% 0%
0C m
00000
C
C
04Q
00U
0.C00
002CoE00
0.C00
:0
00.
C
000
>0 >0
*0'3
00000<
00F:
C
.000
0.0
F-
U
n
z z z <1<ZZ lie*' l
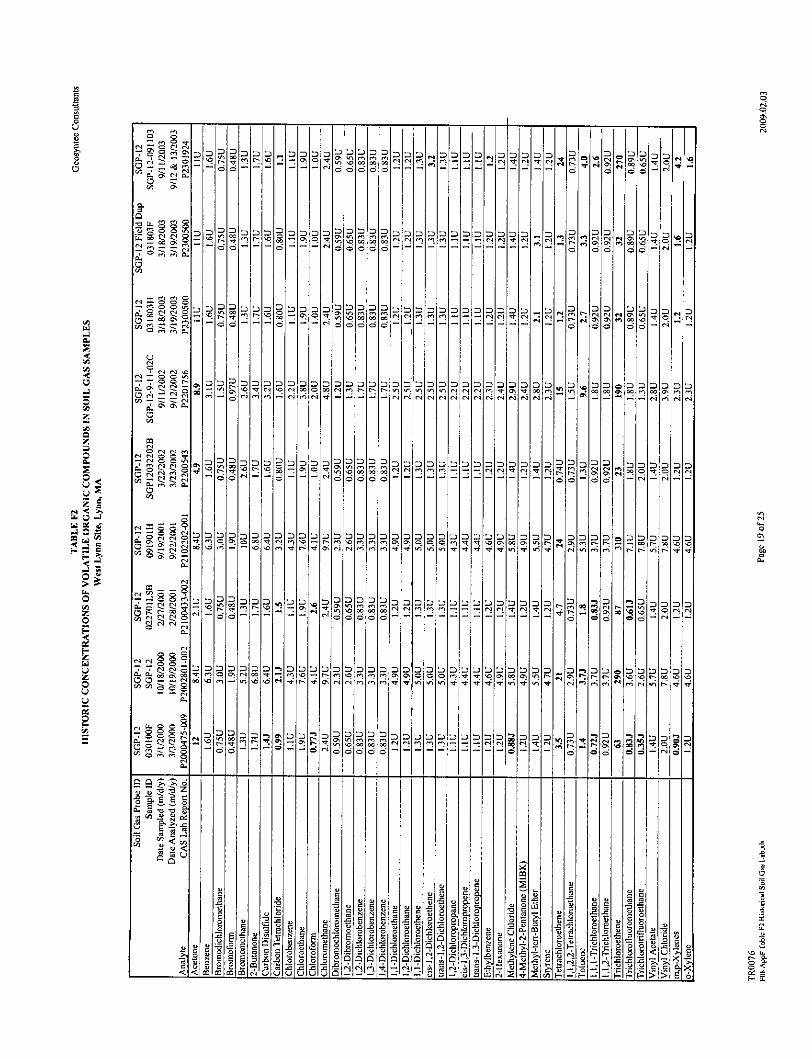
00000000000- 0' C Th~ 10
(100t (N t
Cl
0
C P-A~
00%C
C-
------- NNIIflfl -"- - - - - - - - - - - -
0000~00000000~0
- 66566
0-n - - - (N -N -r- -
00'6
I,
4 I I l 1 1 I
0o C - - 5|f-. .l
u0o$
Or.140C
~00Cl
,00.
0
001 01
eI IF I
0I 1I0I0Fo 0I0I0I0I II0 0 I I0Io o 1oto15 s a m l 1e z eII Dlolo l ol
0 ~00 000 .~ 0 0 ~0000
66666
0 000 00 0-, 00000 00000tInC0%(N00 tIn -C- CInnIn 0~00 ~O In - ~0 40 N ~ C- ~ 0' (N (N In In In ~
SC
'6
0.Z
00u Z'01
E
0E
ID
si ~ 0
. . . .. .1 ..
0101010
0l0
fl000 pleo
n 01010
0 ''oooo(N C- - ~9r](N0% 00 0S
000 0000o000000o o~ C O~ C: r- C- a' 40 40 C- 00 En En-tort (Nfle~C-~~
000~~ N (NI)1
C~ ;~00-'0
- - - 6 c 5 = = - (N = -
0 0*0 S00
(-'I
02 >
CA
0
(N 0(N~.
-II--
.0 K;
S
00C-,
00)
C
C
C~!zEn -~
0. 0'CEn
0-
-t Lz~ In
(N In -
0~CEn
CC
C
C.
0I En
,0I En
IN~
(N~2S~- I~~ C C ~o
C - 0'
(N
0-CEn
o ~oC
Z(N0' 0.
CC
(N
0.CEn
C
C
C.
(NC0
- C C
o ~ a'
CC
0.CEn
-4
C
C
C(N (N C
C
CC-EnEn~
CC(N LI-
- CC
0.-
En c cca
z ~ $1
& i ~0) 0) ~ I
(5~
2
.0
22
i 9,~EE000
C C CI
.1
20
CJI-
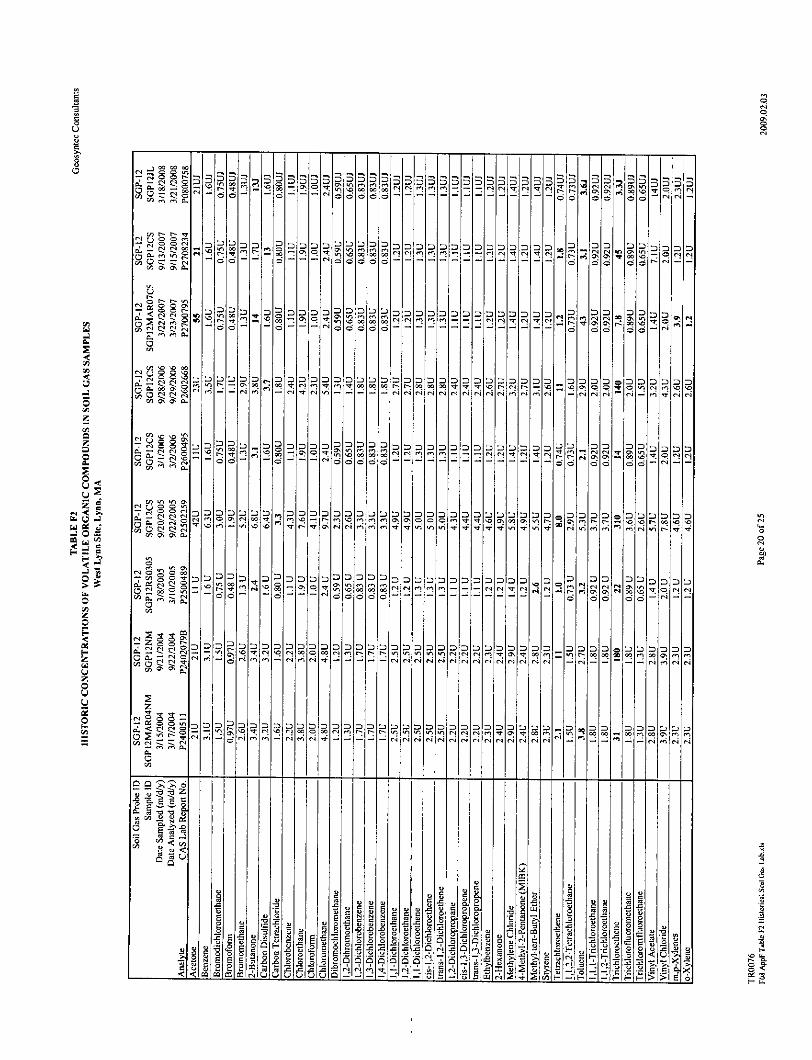
0S.300
C>0
0
C30 S
0- - l0 -0 -0 - 0 - - - - -00
0
C
0H M 0 D0 o-o 0-0 0-0 0-0 o-0 0 -0 0-On!'~ - -%J - - -~ - i~ - n -2 - _
oroioroioroi.-.ior 010INflOI00I.1 001t1 (N
E30
IC.
00D
-. 0On 0%'.00
C
v.~00c~0i
00 00
3(N
Oj
0 0 0 00 0 0 00 o ! 0 lo
0~0000000000
0-
0000000000 0000.(~On On (N (N 't(N~(N~~
~66
00 ~ - -- -00-00 0000=
o0000000ooooooooo
------------ -
D
6
C,
0
S I I mP'' 00'
00 OoooooN
----------$-------- $ $ $-l-I H 00~ 0O %ODIO
.0
0202
.0.022
.0.0
00(N On
n0000001( Nr 'T * 0O--------(N---
0)10
~. ~J20(0.~ii
o .2 0~0 0 A
5 ~.I
C
.0
0
r
ao =
U,0-
.4
102
I1-
-It
.002 02
*~ 2~0
--0 0
0) .0 02
>0 >0
0'
* C
(N~CO~- (N CC No~C~~0zzZt~0 0
OnOna.
N N ~C 0
C (N
0% 0% a.
0
00%CC
0-0On
0-C00
0.000
0'CIt D0
CC
(N
CC
0%
0%
0.
'C
%0
0.
00~00CC I,
(N 0 0
000 (N'00" '.~
00 00 0%
00 0% 0% 0-
C
C
00
0.000
0.000
oo0
C
(N~-zo
00.g000...00 0%
C
C
0.
00Q
C00
z
0-C
C
.3.
02~
7rl-. ~ .9 56' "~ -I
ta
00<00S .0:'a 0!
C-0:
C
00
a.
'C
C
H
.522.0
2~E8~2<03
~0
'00 0
0.3
~02 =OH 02
00.
o u U
.0
22.3
0
0 0
(-4
7c
4 Q u u 171
D 3
-o- --
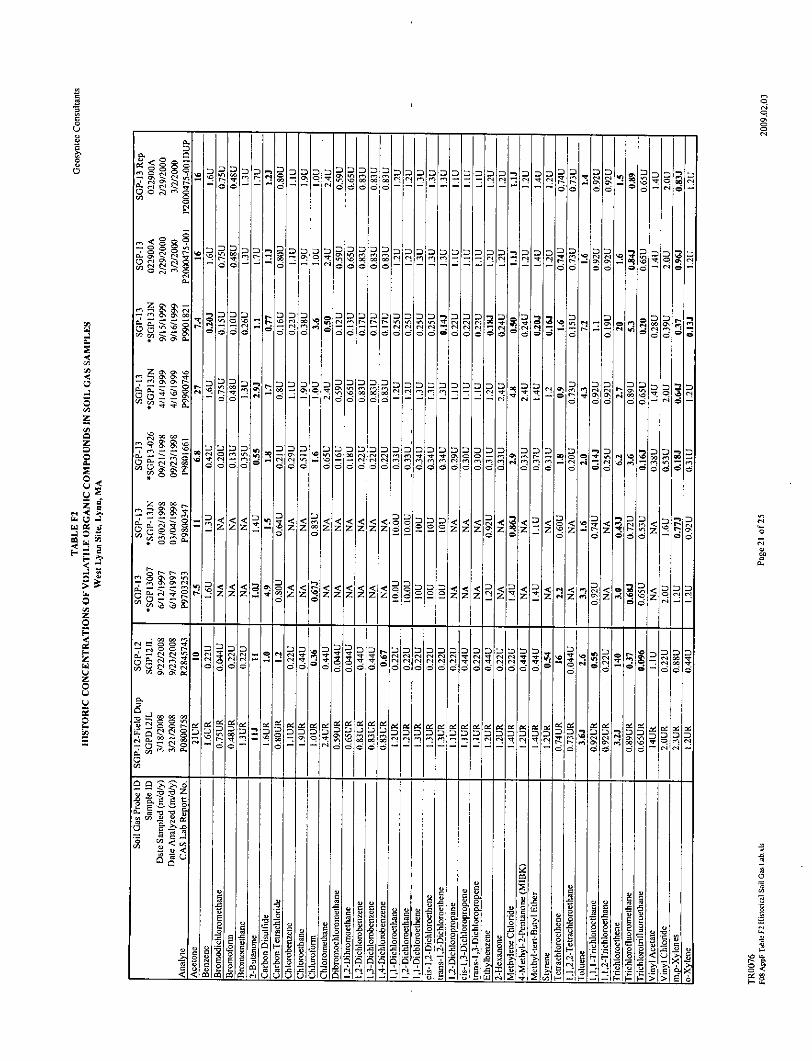
0:
,Oo oo0
0:
0
400 ,0M 4000000000-I
0En-
6
00 0001010000% -'001 'tEn rtN NN 01 -~cc 666161666
0
0
0 0MM 0 O%~ C
0000000 00 01 '0M 2 1
0
6
0 00N N U'
6 66
00'
6=
06
rO=0* e En
0
$$I0o
66~6
~v < <~ < 0 , 0z - zznZ~z~zz2zz z "Z 0zz0Irz .r- 62 6 - - 6 lo 0 6
Zr02Ezzz zlz~z zCNN
<0 I
N N N~ N~ t2 ~ ............ ~ ..
ZC ~ N 0 0 0 0 6 0 o o d 6 d o c 6 ~ 0 6
U~
M0.
En ER
'1-1.-.-1-1
00 In6Z.
001 |a 00
0%
aC.CEn
o-,Ooo
0o00000 $ooo
0. 0% .~ N
EnNZK~0 N
0000
66
0-000
0
0
0-
00
0
0
C-
000%
0-
z
20
~2
I.
------ 999--- 9
0%0%0%
%0
0%
0%
'0
0%0%0%
zoO ~ DI I1 000Dr
'001 EnI
0N
0
0
00%
0
N
0
CC0-
01
0-C
0.CEn
0-CEn
C-CEn
~EnC0
k3
0~0%En 0-
- On- 0
0%220.
0%
0%
'0
t 0
0%0-
&4fZZz Z.lzIRI~zzzzzz6
0
C
'0
0<
IR
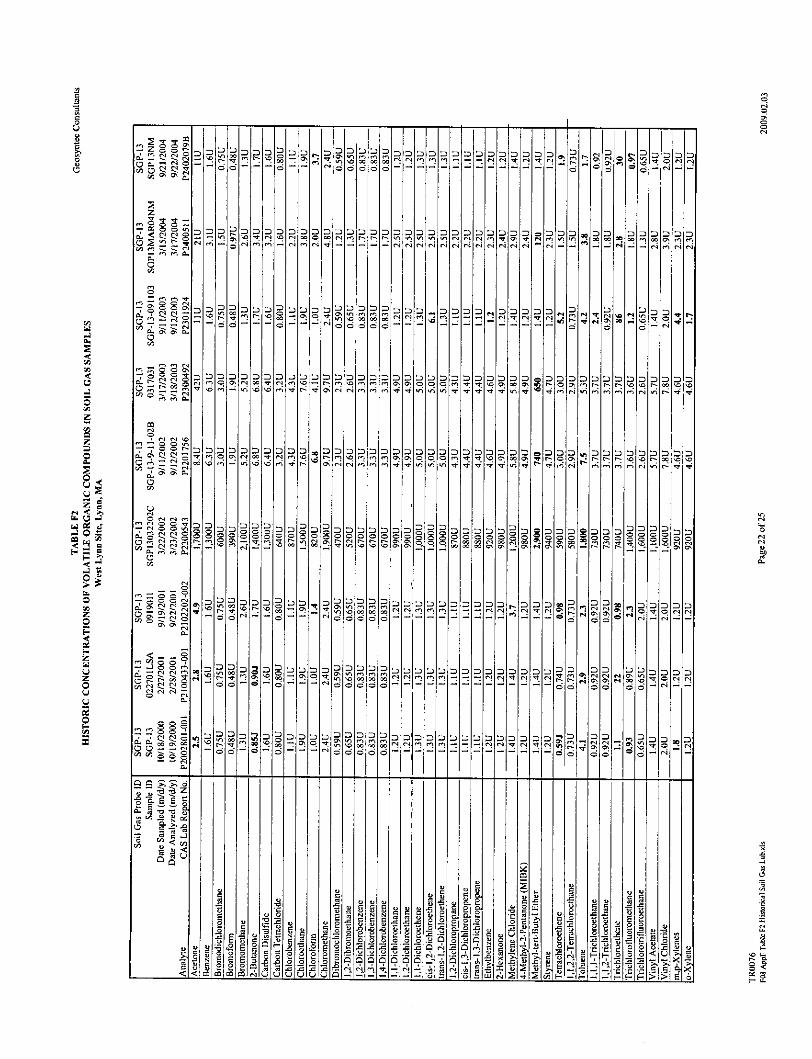
~Roo0oooooo~N.NrflCflrnCCC
00 onfo 0 00010.0N
1N tN~NR .0~6 6
-NrNN t---|IN|N|N!r | INK|'I |dHVI |I
0 oH l 00 00 00 0
I | s 00ON'N,.
00
00c.iO OOOOc.Or...0e.iOOO* .... itr~e0oMC.t~~
~ a 6 ~N
0001100000 00 04 10i | 0 0
00 00 0 0000000 ~ 00000a a C C a a a C C a 0 a 0 C C C C C C C C C a C C C C 0 0 00 0 00 0 00~raONr-.,r4 ~ (-0000N00 001 g ~ 000000000A ci -0000000N0N CNN r~r~r~ - - ~ONON
- - -- - lem-el-em--e Og
6666---------------
NN
CO
a a2200
a .o
0~0101101
m A0
0
a
'4)
I'~ 0~
* 0) >i
Ca
Cfl~-zSn 0~I0)0w
Ca
ooo0
aN0.
,0 0r. 0 $0i-Jo.2'C-Cl N
0
ON
* a
0'C6
000~001r2 6 cir
CI, 0000%
00
U
C
C
'K.
4il
=-C
00~
a
0 1010 0101010C 104 N 00 ~ CM! Cfl
CC~ 0-
a
a
N
ON
a
- a
0~~
CCa
UC ri
(~ N C- N a
(Jr NC), -
0. -~CC),
C ~C U,N a
(N 0.
CNNLOSZ02
ON ON
00 e0 0
-CCa2a
N
C
0.CCa
00
C
CON
a
N
0
00
0-
'0
a
1-.
'0 0-'Ca Ca
0
C
00' N4ON
a
ONe |00 00O$
0ONC N
C
zSii
00 11
a
0
0-
C
0C),
eez2
2C
Cd
Ca<Ca
~
00N NON ONC 0
000 t0
80-
NEE
i1~0 Lu
a0
0
0
0
a
20
U-u
.0
0
1-N 0
0
0.0<U
KIS
5 !s
191010|$ |160121 || | |
$
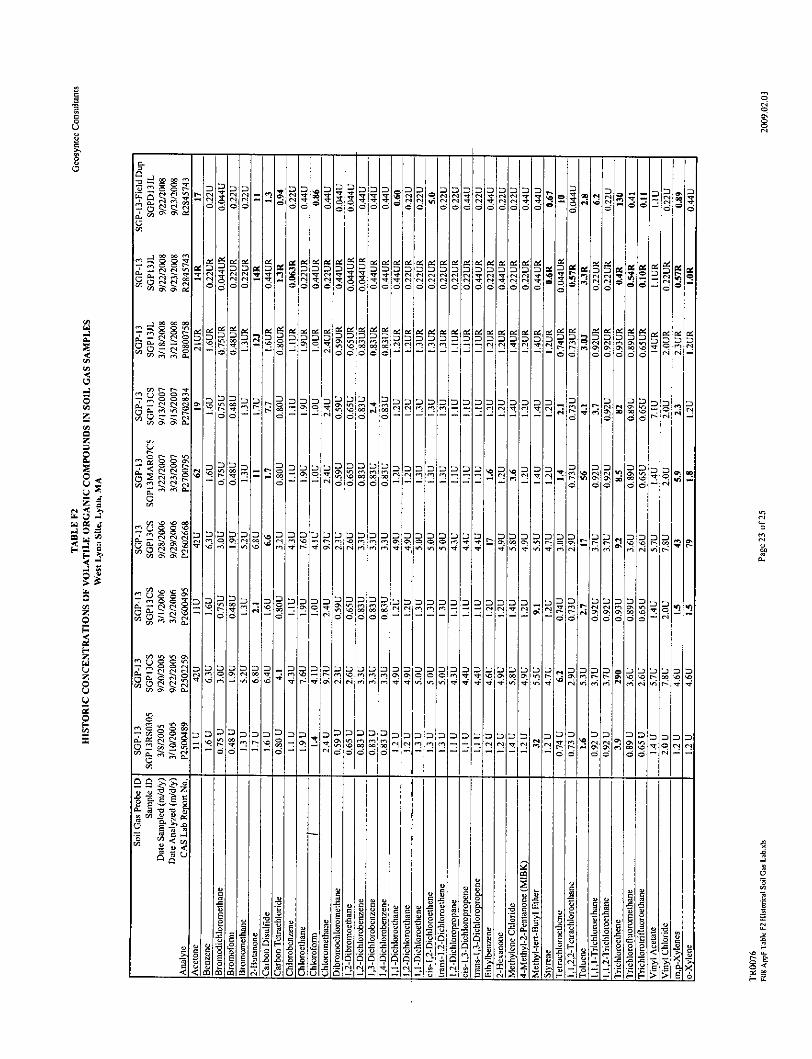
00
o c
0000 04
o a
00
0
>0
0
C
'1~000% (N ~
00
00C
0
C
OOoo00o
66006066
0In
0 0-
C
0004 ~
66
00000,fl (N 00 't
666560
271im A. .0.0.0.6.0coo0.6.6.60a
=
60
zC
0
C
00
0
n C
0.
04
0--o&00C00
4
4
0. -
4m~ 2 1NPD1111- A o
oO6o 00 00o~
m0 00 0 00
- - - - -
00000000 D D00~ In
0.
0%-.C.
0000 000% 0%o c
00~00oO'otQ66C-~
~oo00\0'~9
00 %to a(NO4 ~
~oo
0%0'6
00 0000
00000z
(N (N *
Z~'z000% 0% 0.
I-
0.
'00000
(N 0400
0% 0% 0.
-- -( t -u - - - - - - - - - -
00 0 0. OO O O Oo io o o o o M0 00=0 00 4
CC0-- --- ---- --- ----.NOCOCO % % 0 n~o0 00 v r. 0 n N N 0 \ 0noPPMtd nI~ 6 i i&o'0C11<
0
000
C-)
0-c 03
0~e3
0301-03
Co.
0 .0Ut)
0
00
C)
00
(4
- --I--
0
C-)
~03
03-5.0 03320 0,
0
It S'030
20o .2
*0 0
- - --01
-n
.0
in,
200
030*0 C-Os00
or?0-03 >0>0 -
lo 010'(N ~- I,,K:
'0
o
0
03F-.:00 0
S 3
00Cl (N0% 0%00
00l000
CC
C
0
0%
r.0
6
MORO --l-----------
6
60
6
C
0%
660t 00- 00
6
I -
I t.
C"-J=-C 0OOOO0 M 0000000000000 DOoI0 1 N0000"I0DII
04C00040m*0(nC. ( (N.n0000se00Q0T c+
00%0
C-01 =04 . 4
* CC
666000
0
cJ2
00U
0-000
U
6
0.C
00C.)
0.
000
0.C00
C.C00
0-000
'0
0.
66
0%
I.
00U 0
.
0
C
C006
0-C00
0
0.
D
0.000
0
0..
0
>0 >0 0
t
-t .v ~-S ~60.
00<00
03<
0
03103 03;
-~1S N0,03001<<00
0S0
=
03 *0
.0 03
>0.>0 6
E
aCC61-
Ulu . ------
1
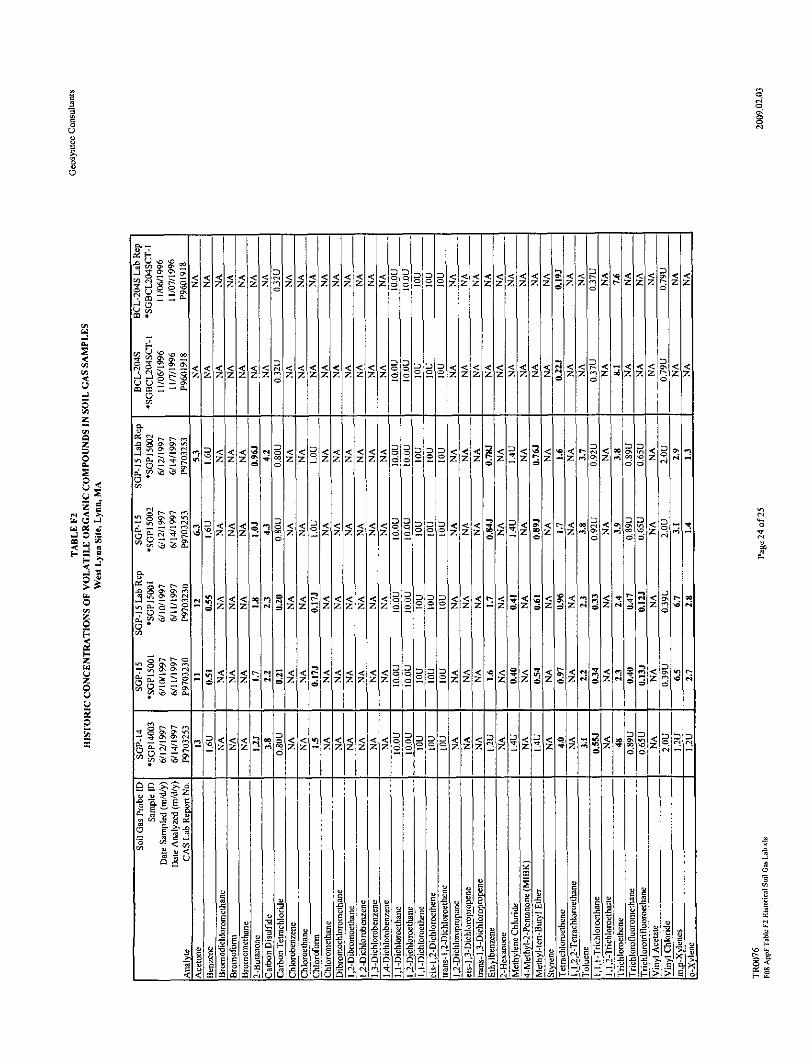
3-3
CU
C
0
C
el'
8
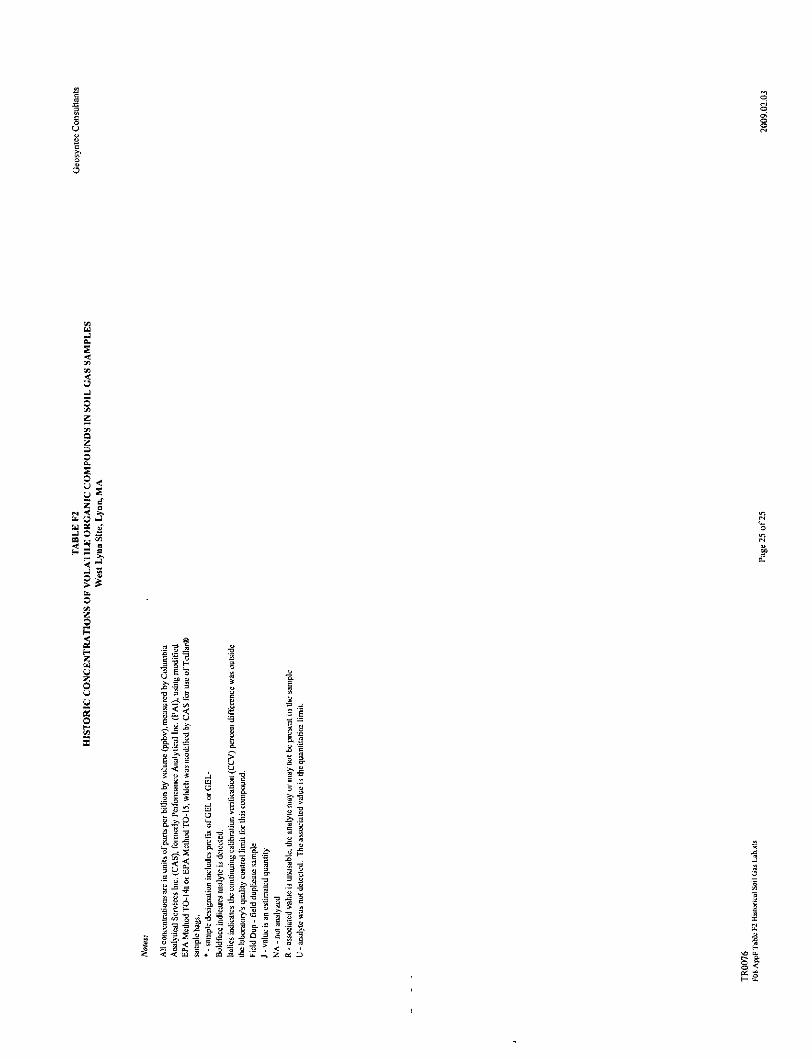
0
C.
0.
ftft
attC
2:8C ae0i.t< 6s
22:
U o o .-
o o >.22- ,- 'B .
o o 'U E =- -fa2 --- C
0 2-6.E a - > ' 2 2i
C s ~ -- . e .
Co a
Related Documents