GEOSPATIAL TOOLS FOR DATA-SHARING Case Studies of Select Transportation Agencies September 2014

Welcome message from author
This document is posted to help you gain knowledge. Please leave a comment to let me know what you think about it! Share it to your friends and learn new things together.
Transcript
GEOSPATIAL TOOLS FOR DATA-SHARING
Case Studies of Select Transportation Agencies
September 2014
i
ACKNOWLEDGMENTS The U.S. Department of Transportation John A. Volpe National Transportation Systems Center (Volpe Center) in Cambridge, Massachusetts, prepared this report for the Federal Highway Administration’s Office of Planning. The project team included Alisa Fine, Paige Colton, Ben Cotton, and Emily Futcher, all of the Volpe Center; and Scott Middleton and Clark Merrefield, of DIGITALiBiz, Inc. The Volpe Center project team wishes to thank the staff members from 22 organizations nationwide, which are listed in Appendix A, for providing their experiences, insights, and editorial review. The time they kindly provided was vital to preparing the case studies and reviewing this final report.

iii
TABLE OF CONTENTS ACKNOWLEDGMENTS ....................................................................................................................................... I SUMMARY ...................................................................................................................................................... IV BACKGROUND ................................................................................................................................................. 1
Background ............................................................................................................................................... 1 Methodology .............................................................................................................................................. 1 GIS for Data-Sharing Overview ................................................................................................................. 1
OBSERVATIONS ............................................................................................................................................... 3 Types of Geospatial Tools ......................................................................................................................... 3 Agreements ............................................................................................................................................... 4 Coordination Efforts ................................................................................................................................... 4 Benefits of Repositories and Gateways .................................................................................................... 4 Challenges of Repositories and Gateways ............................................................................................... 5 Opportunities ............................................................................................................................................. 6
APPENDIX A: LIST OF CASE STUDY PARTICIPANTS .......................................................................................... 7 APPENDIX B: PARTICIPATING AGENCIES’ REPORTED DATA-SHARING ACTIVITIES .............................................. 9 APPENDIX C: DISCUSSION GUIDE ................................................................................................................... 12 APPENDIX D: CASE STUDIES ......................................................................................................................... 13
iv
SUMMARY This report explores how State Departments of Transportation (DOTs) and other transportation agencies are developing and using geospatial tools, including Geographic Information Systems (GIS), to support increased collaboration and improved information-sharing. These objectives are associated with the Federal Highway Administration’s (FHWA) Geospatial Data Collaboration (GDC) initiative, which encourages State DOTs and others to use geospatial tools to streamline and improve transportation decision-making. Over the past several years, State DOTs and other transportation agencies have become increasingly interested in using geospatial tools to support more streamlined access to information. This interest has dovetailed with desires to promote information transparency and more open communications. This report provides examples of GIS and geospatial tools that support GDC objectives from 21 State DOTs and one non-profit organization. The examples comprise a spectrum of activities that include collecting geospatial data, integrating or consolidating geospatial data into a common framework, developing standards and common formats for these data, accessing these data, and using these data to better communicate with stakeholders. Case studies are included for:
• Arizona DOT (ADOT) • Colorado DOT (CDOT) • Connecticut DOT (CTDOT) • Delaware DOT (DelDOT) • Georgia DOT (GDOT) • Iowa DOT (IADOT) • Maryland State Highway Administration
(MDSHA) • Missouri DOT (MoDOT) • Montana DOT (MDT) • Nebraska Department of Roads (NDOR) • New Hampshire Audubon (NHA)
• New York State DOT (NYSDOT) • Nevada DOT (NDOT) • North Carolina DOT (NCDOT) • North Dakota DOT (NDDOT) • Ohio DOT (ODOT) • Pennsylvania DOT (PennDOT) • Rhode Island DOT (RIDOT) • South Carolina DOT (SCDOT) • Virginia DOT (VDOT) • Washington DOT (WSDOT) • West Virginia DOT (WVDOT)
FHWA also sponsored two peer exchanges in late May 2014 to provide opportunities for these agencies to discuss their experiences in more depth. Two companion reports present summaries and observations from these exchanges. The Denver, CO peer exchange report is available here, and the Raleigh, NC peer exchange report here. The peer exchanges and case studies demonstrated that agencies have developed a broad array of geospatial tools to address their needs to more effectively consolidate, communicate, or share information. Overall, agencies are focusing on dynamic, web-based tools that aggregate large amounts of geospatial information, allow users to create customized visualizations, and are easily accessible even to those without advanced GIS expertise. .
1
BACKGROUND Background The Federal Highway Administration’s (FHWA) Geospatial Data Collaboration (GDC) initiative encourages State Departments of Transportation (DOTs) and others to use geospatial tools to increase collaboration, improve information-sharing, and streamline transportation decision-making. FHWA established GDC as one element of its Every Day Counts (EDC) initiative. EDC aims to produce innovations, resources, and partnerships to shorten project delivery, enhance safety, and protect the environment. Both EDC and GDC leverage and support other ongoing FHWA efforts such as Planning and Environment Linkages (PEL) and Eco-Logical. All of these efforts are helping stakeholders work better together to achieve faster and more informed transportation decisions and projects. This report explores how State DOTs and other transportation agencies are developing and using Geographic Information Systems (GIS) applications and other geospatial tools to support GDC objectives. This report highlights examples that comprise a spectrum of activities, including collecting geospatial data, integrating or consolidating geospatial data into a common framework, developing standards and common formats for these data, accessing them, and using these data to communicate better with stakeholders.
Methodology The project team conducted an online literature scan to identify recurring themes and examples of State DOTs and transportation agencies using GIS and geospatial tools to support GDC objectives. The project team then reviewed the results of the 2014 American Association of State Highway and Transportation Officials’ (AASHTO) GIS for Transportation Symposium 2013 annual State survey. Finally, the team reviewed FHWA’s EDC Progress Report 2 (2013), which highlights examples of States participating in an EDC initiative to test or deploy GIS and geospatial tools for GDC goals. From these reviews, FHWA and the Volpe Center identified 22 agencies that appeared to be actively engaging in activities that supported GDC goals (see Appendix A for a list of these agencies and their staffs’ contact information. Appendix B lists the data-sharing activities that agencies reported to the project team). In winter and spring 2014, the Volpe Center conducted telephone discussions with these agencies to explore their activities in more detail (see Appendix C for the discussion guide used for these conversations). Case studies were developed from these discussions that documented agencies’ experiences in more detail (see Appendix D for all 22 case studies). Following the case studies, FHWA sponsored two peer exchanges in May 2014 hosted by the North Carolina DOT (May 20-21) and the Colorado DOT (May 28-29). These peer exchanges convened many of the case study participants to provide opportunities to discuss their experiences and activities with one another. The Denver, CO peer exchange report is available here, and the Raleigh, NC peer exchange report here.
GIS for Data-Sharing Overview GIS provides a framework for integrating layers of often complex information, allowing multiple users to access and manipulate data from a common entry point. As a result, GIS and other geospatial tools can help organizations share information with broader audiences, coordinate among multiple stakeholders, and support more informed decision-making. State DOTs and other transportation agencies are becoming more interested in using geospatial tools to support GDC goals of improved communication, coordination, and decision-making. This is especially true since many agencies have more limited budgets than they did in the past. For example, geospatial tools can help leverage resources by supporting agencies in “pooling” data into a common framework. AASHTO’s Technology Implementation Group (TIG) demonstrates State DOTs’ increased interests in these areas. The AASHTO TIG is actively promoting a data-sharing framework for State DOTs modeled
2
on the Utah DOT’s UPLAN application, which is a web-based, decision-support tool that aggregates and shares a wide variety of geospatial information. (Several agencies participating in the AASHTO TIG’s UPLAN initiative were also part of this report’s case study examples and peer exchanges.) The National States Geographic Information Council (NSGIC) noted that organizations creating geospatial data, including State DOTs, can derive significant benefits from sharing data more widely, including time- and cost-savings, increased data quality, and more informed planning.1 2 Interest in using geospatial tools for improved data-sharing has dovetailed with recent government initiatives to increase transparency and promote more effective communication. For example, the White House’s Open Government Initiative encourages all Federal agencies to implement activities that expand the public’s access to information, improve information quality, and institute a culture of openness. At the same time, there has been an increased emphasis on sharing information to support more effective transportation decision-making, as exemplified by FHWA’s EDC/GDC, PEL, and Eco-Logical initiatives.
1 See NSGIC Geospatial Data-Sharing: Guidelines for Best Practices (2011). See also the Government Accountability Office’s report on GIS: Challenges to Effective Data Sharing (2003), available at www.gao.gov/products/GAO-03-874T. 2 Other research demonstrates State DOTs’ interests in data-sharing more generally. For example, National Cooperative Highway Research Program (NCHRP) research demonstrated that State DOTs identified data integration as top research needs. See NCHRP Synthesis 446 (2013). AASHTO’s 2013 State survey showed that almost two-thirds of respondents identified enterprise data integration as a critical business area, while just under half thought that public information web portals were a critical business area. Almost two-thirds of respondents already had data-sharing agreements with other public agencies or private providers. For more information on the survey, see www.gis-t.org/files/CtXAV.pdf.
3
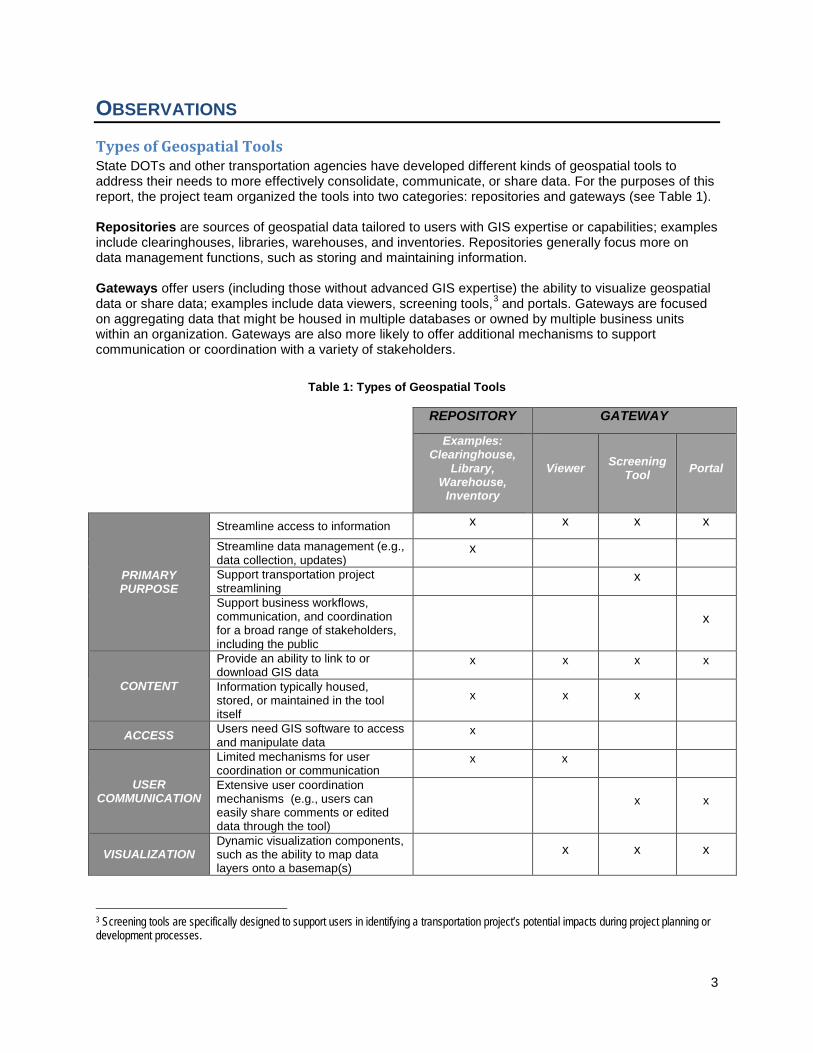
OBSERVATIONS Types of Geospatial Tools State DOTs and other transportation agencies have developed different kinds of geospatial tools to address their needs to more effectively consolidate, communicate, or share data. For the purposes of this report, the project team organized the tools into two categories: repositories and gateways (see Table 1).
Repositories are sources of geospatial data tailored to users with GIS expertise or capabilities; examples include clearinghouses, libraries, warehouses, and inventories. Repositories generally focus more on data management functions, such as storing and maintaining information.
Gateways offer users (including those without advanced GIS expertise) the ability to visualize geospatial data or share data; examples include data viewers, screening tools,3 and portals. Gateways are focused on aggregating data that might be housed in multiple databases or owned by multiple business units within an organization. Gateways are also more likely to offer additional mechanisms to support communication or coordination with a variety of stakeholders.
Table 1: Types of Geospatial Tools
REPOSITORY GATEWAY
Examples: Clearinghouse,
Library, Warehouse,
Inventory
Viewer Screening Tool Portal
PRIMARY PURPOSE
Streamline access to information x x x x
Streamline data management (e.g., data collection, updates)
x
Support transportation project streamlining
x
Support business workflows, communication, and coordination for a broad range of stakeholders, including the public
x
CONTENT
Provide an ability to link to or download GIS data
x x x x
Information typically housed, stored, or maintained in the tool itself
x x x
ACCESS Users need GIS software to access and manipulate data
x
USER COMMUNICATION
Limited mechanisms for user coordination or communication
x x
Extensive user coordination mechanisms (e.g., users can easily share comments or edited data through the tool)
x x
VISUALIZATION Dynamic visualization components, such as the ability to map data layers onto a basemap(s)
x x x
3 Screening tools are specifically designed to support users in identifying a transportation project’s potential impacts during project planning or development processes.
4
Practitioners are moving away from initiating or developing repositories, which tend to be more static, toward developing more dynamic gateways, particularly web-based portals. Many of these web-based portals tend to have similar features that include:
• Cloud-based data systems and storage4 that allow users to access and manipulate a large number of geospatial data layers, including data that partner agencies may own;
• Mapping components that make it easy for a user to visualize geospatial information, including users without advanced GIS expertise or capabilities; and
• A function for users (both within and outside the agency) to contribute and edit information in real-time. In some cases, a central data steward may vet data contributed to a portal or other tool.
Agreements In addition to repositories and gateways, practitioners have developed different kinds of data-sharing agreements, including memoranda of understanding (MOUs), programmatic agreements, or operating agreements (OAs) as mechanisms to formally outline and structure roles and responsibilities for administering, managing, and sharing data. MOUs or OAs typically specify coordination between a State DOT and its planning partners (e.g., State, city, or county government agencies). Few States reported having similar agreements focused on a specific data-sharing application or tool. Several States, including NCDOT, NYSDOT, RIDOT, and MDSHA, have not developed any formal data-sharing agreements to date. Instead, they rely on informal agreements with partner agencies about how and when to share geospatial information.
Coordination Efforts States are engaging in various processes to coordinate their data-sharing activities. Many States are defining data standards or templates to ensure a consistent data “look and feel” for information. Others participate in inter- and intra-agency groups (such as the AASHTO TIG or other groups) to discuss common goals or to share best practices for using specific geospatial tools/applications. For example, WSDOT coordinates with an intra-agency working group on data sharing standards. Most States noted they contribute to and access information available from statewide geospatial data repositories (which are usually data libraries or clearinghouses). Many or most of these statewide repositories are maintained by a State department of information technology and not by a State DOT. In some cases, State DOTs are actively engaging with the agencies that administer these statewide repositories to implement enhancements, such as adding new datasets or linking existing repositories with State DOT tools.
Benefits of Repositories and Gateways • Stronger communications. Users can consume data as soon as they are published. They can
also view the same data through a common framework. CDOT’s GIS Support Unit added height clearance information to its Online Transportation Information System (OTIS) portal in response to a request by the agency’s Permit Unit. This helped bridge a communication gap between the two units and strengthened their ability to collaborate (see also IADOT, PennDOT, and NDOT case studies).
• Increased efficiencies. Users can more easily assess data gaps to better target data collection and reduce the possibility that multiple data owners will collect the same information. Having a common data entry point also makes it easier and more efficient for users to find information and
4 Many of these web-based portals are using Esri’s ArcGIS Online (AGOL) cloud-based platform, which permits users to aggregate and share a wide array of geospatial information including mapping application and data layers.
5
respond to data requests. For example, PennDOT’s bridge engineering team used the agency’s web-based portal, PennShare, to develop a map showing the locations of all bridges across the State and their condition. PennDOT reported that this represented an approximate cost-savings of $100,000 since there was no need to procure consultant services to complete the assessment (see also NCDOT, WVDOT, MDSHA, and NYSDOT case studies).
• Improved data quality. Making information more transparent helps users see where there are
quality control issues and encourages data owners to quickly address errors. ADOT specifically noted that some of the agency’s smaller business units do not have enough staff resources to detect all potential data quality issues, so sharing data widely through multiple venues (including multiple ADOT web-based portals) has helped increase the likelihood that errors can be identified and addressed (see also CDOT and MDT case studies).
• Streamlined project screening and development. Agencies access and share information
more easily, allowing for earlier coordination during project development. Through visualizations, gateway users can identify relationships between transportation projects and the built and natural environments to identify potential impacts or issues (see also NHA and MoDOT case studies).
• More strategic decision-making. NDOT’s Planning and Needs System (PLANS), a web-based portal in development, has a mapping component that will help NDOT categorize “bundles” of transportation projects that have similar features. NDOT expects PLANS will support the agency to more strategically evaluate its project needs and priorities at a high level (see also NYSDOT, MDSHA, and PennDOT case studies).
Challenges of Repositories and Gateways • Standardizing data. Ensuring a consistent, common format for data can be difficult, particularly
for repositories and gateways that allow multiple data owners to submit information. Some States have developed data standards to address these issues. Others have specified metadata formats to help ensure data quality (metadata provides descriptions of data such as when information was collected and who is responsible for data maintenance). Enforcing standards; however, can take time and resources; having standards that are too strict may also deter contributors from wanting to share their information (see especially PennDOT, NYSDOT, MDT, and CDOT case studies).
• Sharing sensitive data. Many repositories and gateways include sensitive layers such as
locations of significant archaeological sites or endangered species nesting areas. Many States have found it difficult to determine how best to incorporate sensitive data into these tools and/or how to effectively manage access to these data (see especially MoDOT and ADOT case studies).
• Maintaining data. Keeping complex datasets up-to-date can be especially challenging when
multiple agencies are contributing data to a single clearinghouse, library, or portal. States often rely on data owners themselves to keep their own datasets up to date; this has worked well in situations where data owners are highly motivated. When data owners have limited resources; however, or do not see the benefits of a particular tool, they may be less motivated to contribute and monitor their information (see especially SCDOT case study).
• Adapting to change. Some agencies have found that fully implementing newer tools such as web-based portals requires new business practices or cultural changes within the organization. CTDOT noted that the process of developing its comprehensive road network has involved educating agency staff on new data collection protocols. NDOT reported that its organizational culture is currently focused on implementing projects rather than on identifying project needs. PLANS will likely help NDOT move to a needs-based environment, but this may take time.
6
Opportunities New geospatial platforms and technologies have recently emerged that are allowing data to be more efficiently stored, accessed, and shared with a broad array of stakeholders. Because many of these technologies are specifically designed to be intuitive and user-friendly, they are also reducing the amount of formal training required to work with or manipulate GIS data. Along with these developments, however, have come unique challenges, such as the need to develop improved data standards and governance, as well as the need to address concerns about properly managing access to sensitive data. Given these challenges there is an opportunity for FHWA to work more closely with State DOTs and others to provide support for developing, using, and maintaining data-sharing technologies in support of GDC goals. This support might include providing guidance for data collection efforts or coordination activities. It might also include implementing training that helps demonstrate the power of geospatial data for improving agency business practices, interagency relations, and public communications. Many States have not explicitly labeled their data-sharing tools or efforts as EDC or GDC activities. There is an opportunity for States to make stronger connections between their efforts and FHWA initiatives that include EDC/GDC, PEL, and Eco-Logical. Other opportunities are likely to emerge as a result of trends that may influence data-sharing activities in the future. For example, there may be a continued expectation for agencies to do more with less given decreasing budgets and increasing transportation needs; this might result in increased needs for cost-savings, collaboration, and streamlining supported by data-sharing activities. At the same time, it is likely there will be a continued emphasis on government transparency and information accessibility, including the need to demonstrate the need for and benefits of transportation expenditures to the public. Geospatial data-sharing tools will play important roles in these areas.
7
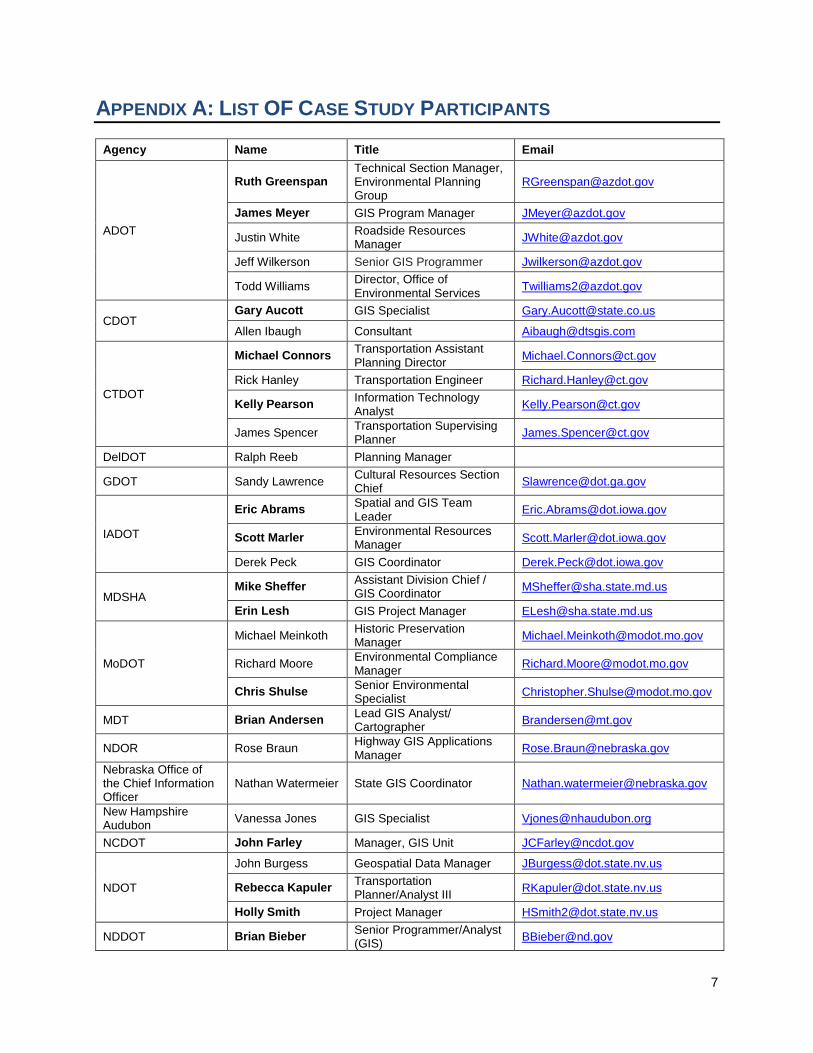
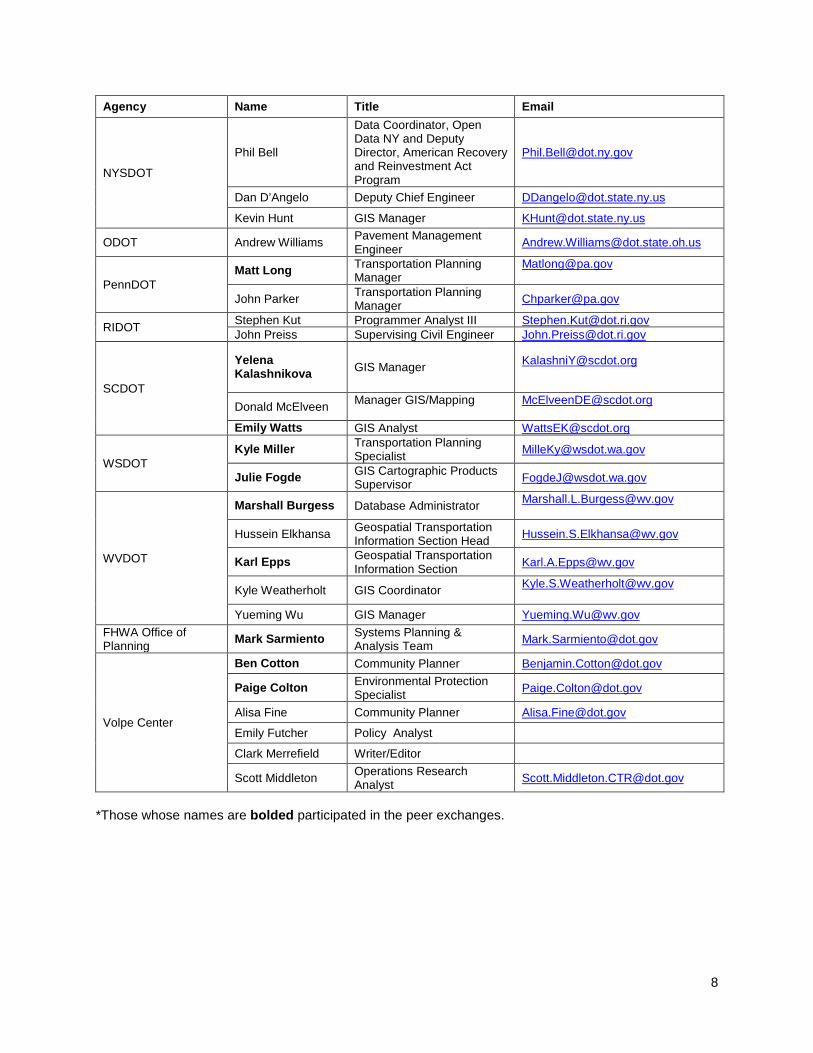
APPENDIX A: LIST OF CASE STUDY PARTICIPANTS
Agency Name Title Email
ADOT
Ruth Greenspan Technical Section Manager, Environmental Planning Group
James Meyer GIS Program Manager [email protected]
Justin White Roadside Resources Manager [email protected]
Jeff Wilkerson Senior GIS Programmer [email protected]
Todd Williams Director, Office of Environmental Services [email protected]
CDOT Gary Aucott GIS Specialist [email protected]
Allen Ibaugh Consultant [email protected]
CTDOT
Michael Connors Transportation Assistant Planning Director [email protected]
Rick Hanley Transportation Engineer [email protected]
Kelly Pearson Information Technology Analyst [email protected]
James Spencer Transportation Supervising Planner [email protected]
DelDOT Ralph Reeb Planning Manager
GDOT Sandy Lawrence Cultural Resources Section Chief [email protected]
IADOT
Eric Abrams Spatial and GIS Team Leader [email protected]
Scott Marler Environmental Resources Manager [email protected]
Derek Peck GIS Coordinator [email protected]
MDSHA Mike Sheffer Assistant Division Chief /
GIS Coordinator [email protected]
Erin Lesh GIS Project Manager [email protected]
MoDOT
Michael Meinkoth Historic Preservation Manager [email protected]
Richard Moore Environmental Compliance Manager [email protected]
Chris Shulse Senior Environmental Specialist [email protected]
MDT Brian Andersen Lead GIS Analyst/ Cartographer [email protected]
NDOR Rose Braun Highway GIS Applications Manager [email protected]
Nebraska Office of the Chief Information Officer
Nathan Watermeier State GIS Coordinator [email protected]
New Hampshire Audubon Vanessa Jones GIS Specialist [email protected]
NCDOT John Farley Manager, GIS Unit [email protected]
NDOT
John Burgess Geospatial Data Manager [email protected]
Rebecca Kapuler Transportation Planner/Analyst III [email protected]
Holly Smith Project Manager [email protected]
NDDOT Brian Bieber Senior Programmer/Analyst (GIS) [email protected]
8
Agency Name Title Email
NYSDOT
Phil Bell
Data Coordinator, Open Data NY and Deputy Director, American Recovery and Reinvestment Act Program
Dan D’Angelo Deputy Chief Engineer [email protected]
Kevin Hunt GIS Manager [email protected]
ODOT Andrew Williams Pavement Management Engineer [email protected]
PennDOT Matt Long Transportation Planning
Manager [email protected]
John Parker Transportation Planning Manager [email protected]
RIDOT Stephen Kut Programmer Analyst III [email protected] John Preiss Supervising Civil Engineer [email protected]
SCDOT
Yelena Kalashnikova GIS Manager [email protected]
Donald McElveen Manager GIS/Mapping
Emily Watts GIS Analyst [email protected]
WSDOT Kyle Miller Transportation Planning
Specialist [email protected]
Julie Fogde GIS Cartographic Products Supervisor [email protected]
WVDOT
Marshall Burgess Database Administrator [email protected]
Hussein Elkhansa Geospatial Transportation Information Section Head [email protected]
Karl Epps Geospatial Transportation Information Section [email protected]
Kyle Weatherholt GIS Coordinator [email protected]
Yueming Wu GIS Manager [email protected] FHWA Office of Planning Mark Sarmiento Systems Planning &
Analysis Team [email protected]
Volpe Center
Ben Cotton Community Planner [email protected]
Paige Colton Environmental Protection Specialist [email protected]
Alisa Fine Community Planner [email protected]
Emily Futcher Policy Analyst
Clark Merrefield Writer/Editor
Scott Middleton Operations Research Analyst [email protected]
*Those whose names are bolded participated in the peer exchanges.
9
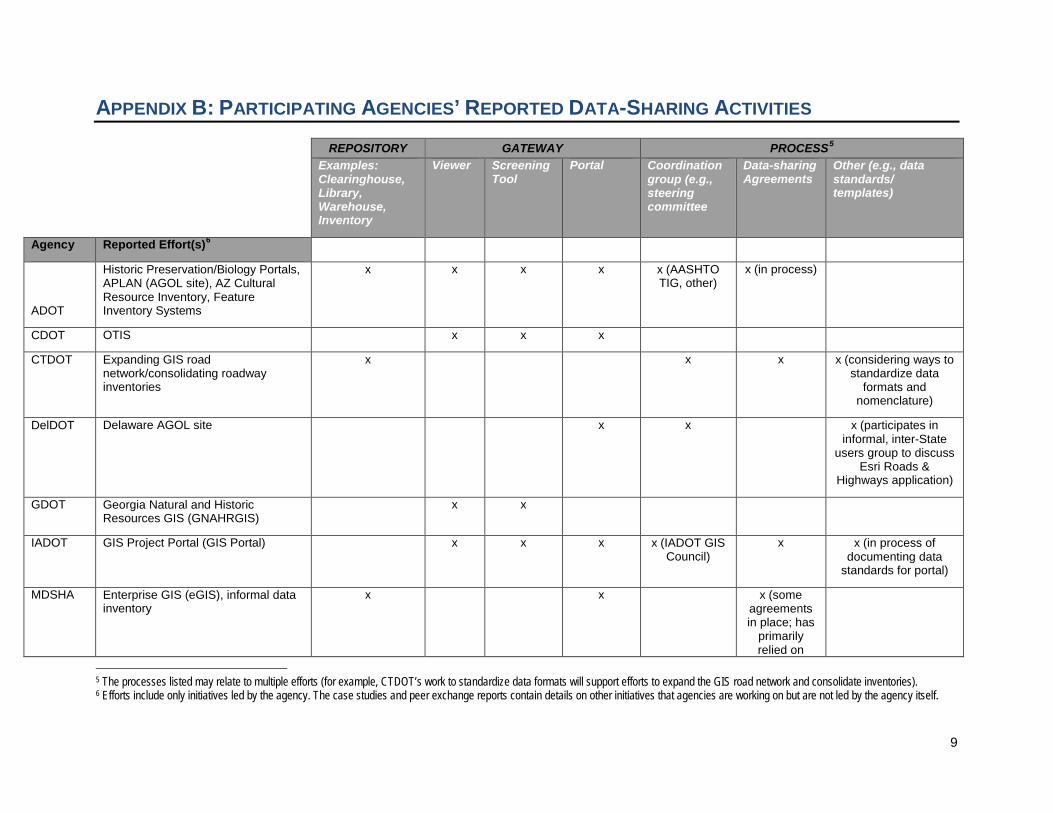
APPENDIX B: PARTICIPATING AGENCIES’ REPORTED DATA-SHARING ACTIVITIES
REPOSITORY GATEWAY PROCESS5 Examples: Clearinghouse, Library, Warehouse, Inventory
Viewer Screening Tool
Portal Coordination group (e.g., steering committee
Data-sharing Agreements
Other (e.g., data standards/ templates)
Agency Reported Effort(s)6
ADOT
Historic Preservation/Biology Portals, APLAN (AGOL site), AZ Cultural Resource Inventory, Feature Inventory Systems
x x x x x (AASHTO TIG, other)
x (in process)
CDOT OTIS x x x
CTDOT Expanding GIS road network/consolidating roadway inventories
x x x x (considering ways to standardize data
formats and nomenclature)
DelDOT Delaware AGOL site x x x (participates in informal, inter-State
users group to discuss Esri Roads &
Highways application)
GDOT Georgia Natural and Historic Resources GIS (GNAHRGIS)
x x
IADOT GIS Project Portal (GIS Portal) x x x x (IADOT GIS Council)
x x (in process of documenting data
standards for portal)
MDSHA Enterprise GIS (eGIS), informal data inventory
x x x (some agreements in place; has
primarily relied on
5 The processes listed may relate to multiple efforts (for example, CTDOT’s work to standardize data formats will support efforts to expand the GIS road network and consolidate inventories). 6 Efforts include only initiatives led by the agency. The case studies and peer exchange reports contain details on other initiatives that agencies are working on but are not led by the agency itself.
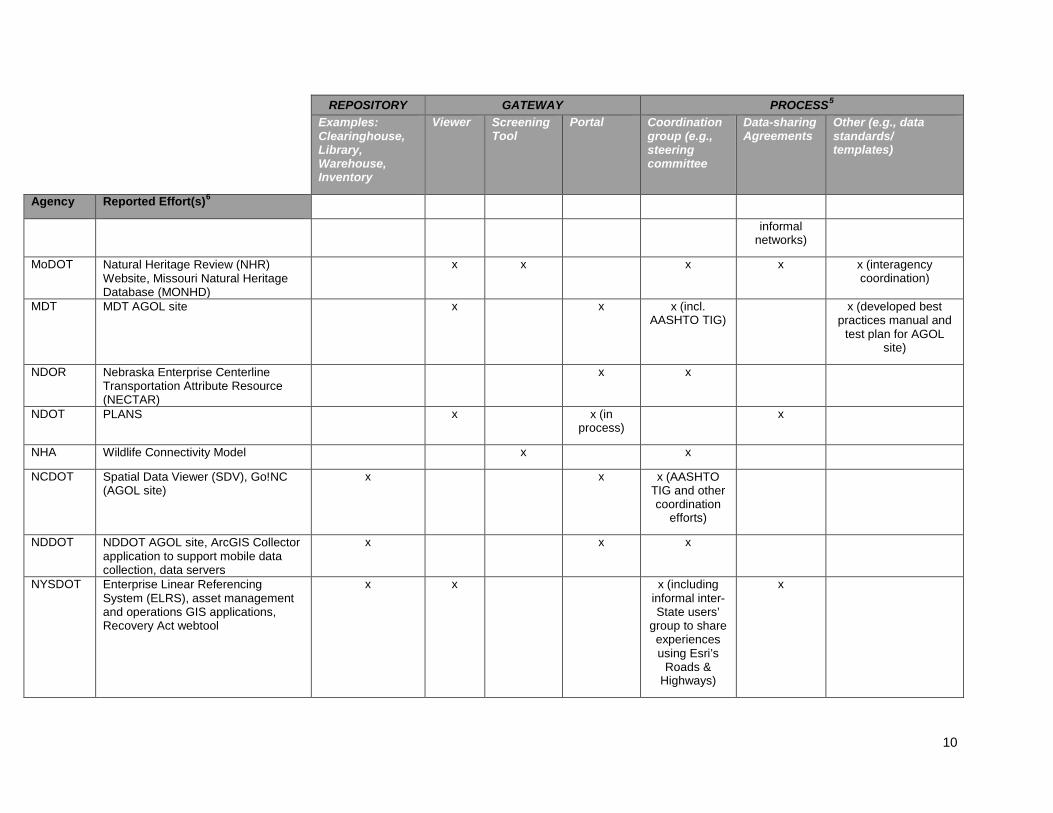
10
REPOSITORY GATEWAY PROCESS5 Examples: Clearinghouse, Library, Warehouse, Inventory
Viewer Screening Tool
Portal Coordination group (e.g., steering committee
Data-sharing Agreements
Other (e.g., data standards/ templates)
Agency Reported Effort(s)6
informal networks)
MoDOT Natural Heritage Review (NHR) Website, Missouri Natural Heritage Database (MONHD)
x x x x x (interagency coordination)
MDT MDT AGOL site x x x (incl. AASHTO TIG)
x (developed best practices manual and
test plan for AGOL site)
NDOR Nebraska Enterprise Centerline Transportation Attribute Resource (NECTAR)
x x
NDOT PLANS x x (in process)
x
NHA Wildlife Connectivity Model x x
NCDOT Spatial Data Viewer (SDV), Go!NC (AGOL site)
x x x (AASHTO TIG and other coordination
efforts)
NDDOT NDDOT AGOL site, ArcGIS Collector application to support mobile data collection, data servers
x x x
NYSDOT Enterprise Linear Referencing System (ELRS), asset management and operations GIS applications, Recovery Act webtool
x x x (including informal inter-State users’
group to share experiences using Esri’s
Roads & Highways)
x
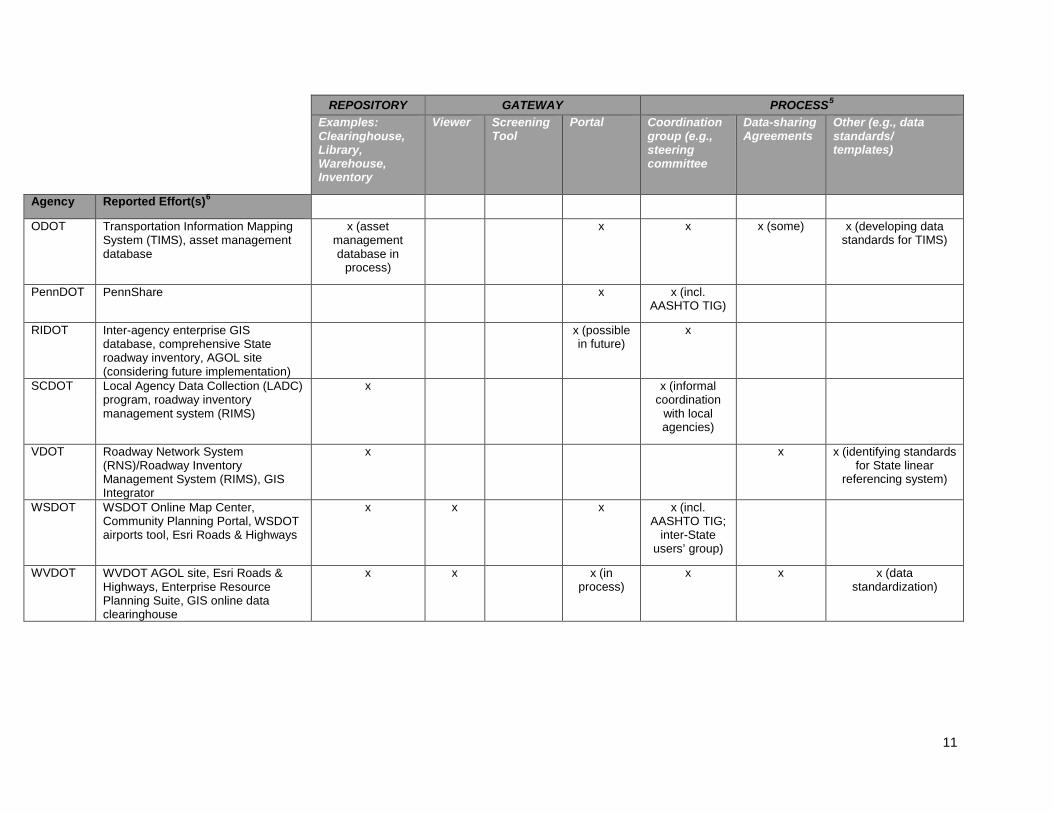
11
REPOSITORY GATEWAY PROCESS5 Examples: Clearinghouse, Library, Warehouse, Inventory
Viewer Screening Tool
Portal Coordination group (e.g., steering committee
Data-sharing Agreements
Other (e.g., data standards/ templates)
Agency Reported Effort(s)6
ODOT Transportation Information Mapping System (TIMS), asset management database
x (asset management database in
process)
x x x (some) x (developing data standards for TIMS)
PennDOT PennShare x x (incl. AASHTO TIG)
RIDOT Inter-agency enterprise GIS database, comprehensive State roadway inventory, AGOL site (considering future implementation)
x (possible in future)
x
SCDOT Local Agency Data Collection (LADC) program, roadway inventory management system (RIMS)
x x (informal coordination
with local agencies)
VDOT Roadway Network System (RNS)/Roadway Inventory Management System (RIMS), GIS Integrator
x x x (identifying standards for State linear
referencing system)
WSDOT WSDOT Online Map Center, Community Planning Portal, WSDOT airports tool, Esri Roads & Highways
x x x x (incl. AASHTO TIG;
inter-State users’ group)
WVDOT WVDOT AGOL site, Esri Roads & Highways, Enterprise Resource Planning Suite, GIS online data clearinghouse
x x x (in process)
x x x (data standardization)
12
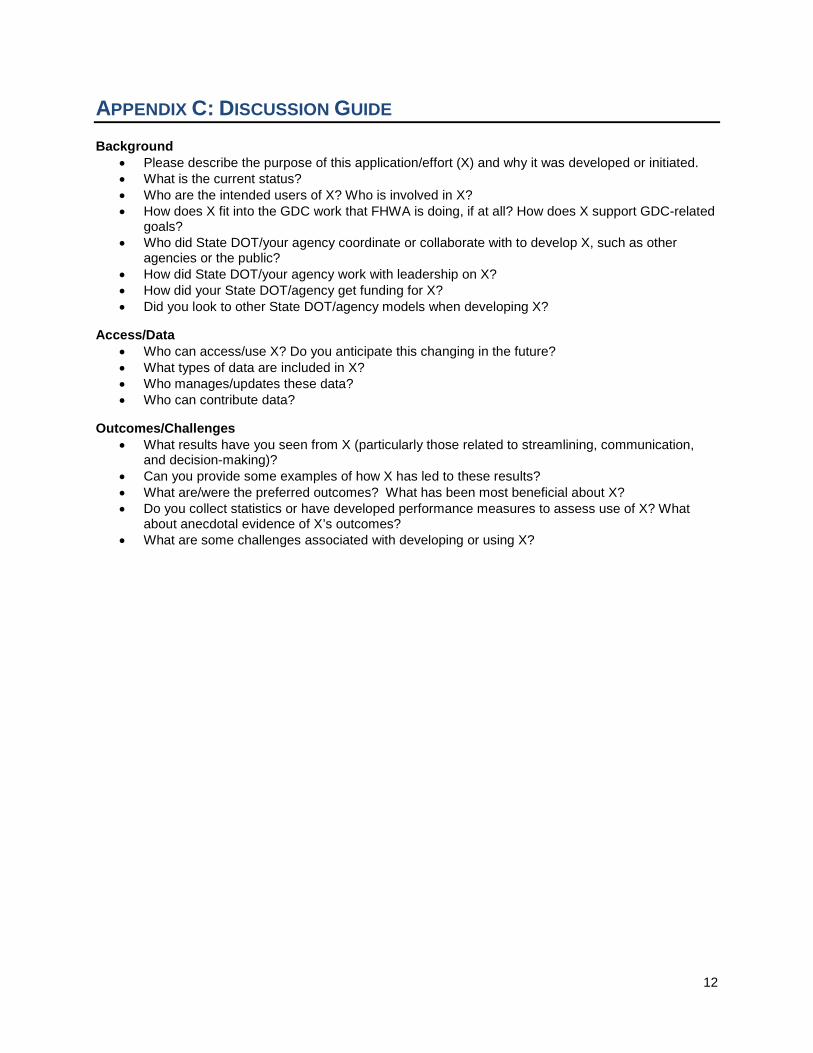
APPENDIX C: DISCUSSION GUIDE Background
• Please describe the purpose of this application/effort (X) and why it was developed or initiated. • What is the current status? • Who are the intended users of X? Who is involved in X? • How does X fit into the GDC work that FHWA is doing, if at all? How does X support GDC-related
goals? • Who did State DOT/your agency coordinate or collaborate with to develop X, such as other
agencies or the public? • How did State DOT/your agency work with leadership on X? • How did your State DOT/agency get funding for X? • Did you look to other State DOT/agency models when developing X?
Access/Data • Who can access/use X? Do you anticipate this changing in the future? • What types of data are included in X? • Who manages/updates these data? • Who can contribute data?
Outcomes/Challenges • What results have you seen from X (particularly those related to streamlining, communication,
and decision-making)? • Can you provide some examples of how X has led to these results? • What are/were the preferred outcomes? What has been most beneficial about X? • Do you collect statistics or have developed performance measures to assess use of X? What
about anecdotal evidence of X’s outcomes? • What are some challenges associated with developing or using X?
13
APPENDIX D: CASE STUDIES Arizona DOT Colorado DOT Connecticut DOT Delaware DOT Georgia DOT Iowa DOT Maryland State Highway Administration Missouri DOT Montana DOT Nebraska Department of Roads New Hampshire Audubon New York State DOT Nevada DOT North Carolina DOT North Dakota DOT Ohio DOT Pennsylvania DOT Rhode Island DOT South Carolina DOT Virginia DOT Washington DOT West Virginia DOT
ADOT: Portals and Other Data-Sharing Activities
14
ARIZONA DOT: PORTALS AND OTHER DATA-SHARING ACTIVITIES Summary Arizona DOT (ADOT) is involved in several data-sharing initiatives that include contributing to and developing data portals to support streamlined project planning and development, increased interagency collaboration, and improved transportation decision-making.
Background
Historic Preservation Team (HPT) and Biology Portals
ADOT developed the HPT Portal in 2003 as a vehicle for ADOT staff, consultants, and cultural resource professionals to access information on historic properties along State highways and ADOT-owned rights-of-way (ROW). The HPT Portal helps ADOT staff and consultants determine whether a proposed transportation project will affect historic properties and cultural resources. It houses information such as reports on cultural resources, consultation letters, and the location of historic properties, much of which ADOT collects during project construction. ADOT screens all users requesting access to the portal and “assigns” a level of access. Depending on the access level, information can be viewed, downloaded, edited, or displayed on an interactive GIS map showing specific locations of projects and historic properties. In 2010, ADOT used the HPT Portal as the template for developing a second GIS-based tool—the ADOT Biology Portal—that serves a similar purpose as the HPT Portal but includes ecological resource data. The Biology Portal is a document repository that allows users to enter biological reports, surveys, and consultation letters along with project-level documents such as plan sheets, project specifications, and technical documentation. Users can search documents based on criteria such as species, roadways, habitats, or mitigation measures. ADOT plans to update the information included in the HPT and Biology Portals. As part of this update, ADOT will develop a data-sharing agreement with ASM to ensure that data collection efforts are not duplicative (in the future, ADOT would like to enter into similar agreements with other agencies that maintain cultural resource databases for Arizona, such as the U.S. Forest Service).
APLAN
ADOT is a member of AASHTO’s UPLAN TIG initiative. As part of the TIG effort, ADOT has developed its own AGOL site, APLAN, to aggregate data and mapping applications. APLAN currently provides access to ADOT’s and other State agencies’ data (i.e., land ownership, jurisdictional districts, traffic count locations, travel surface type, and other information on State-owned highways). When fully implemented, APLAN will serve as ADOT’s central location for viewing and accessing geospatial data. Currently, APLAN is only accessible to invited users, such as project managers, who have a direct need to consume the data. Any data that is sensitive in nature requires an AGOL account. ADOT also makes a variety of maps available through its annual Map Book and on ADOT’s mapping homepage.
Feature Inventory System (FIS)
In response to State asset management requirements, ADOT mapped the location of transportation features such as guardrails (e.g., culvert locations), biological/environmental resources (e.g., bird nesting locations), wildlife features (e.g., wildlife crossing structures), and water quality features (e.g., dry wells) to create a GIS-based FIS. The intent of FIS was to document assets and assist maintenance staff in planning inspections and other activities. While FIS was initially viewed as an internal application, ADOT GIS staff may expand FIS in the future to incorporate functionality from the Biology Portal or include other information, like safety data, that might support broader agency decision-making. Ultimately, FIS might be integrated into APLAN as well.
ADOT: Portals and Other Data-Sharing Activities
15
Other Efforts
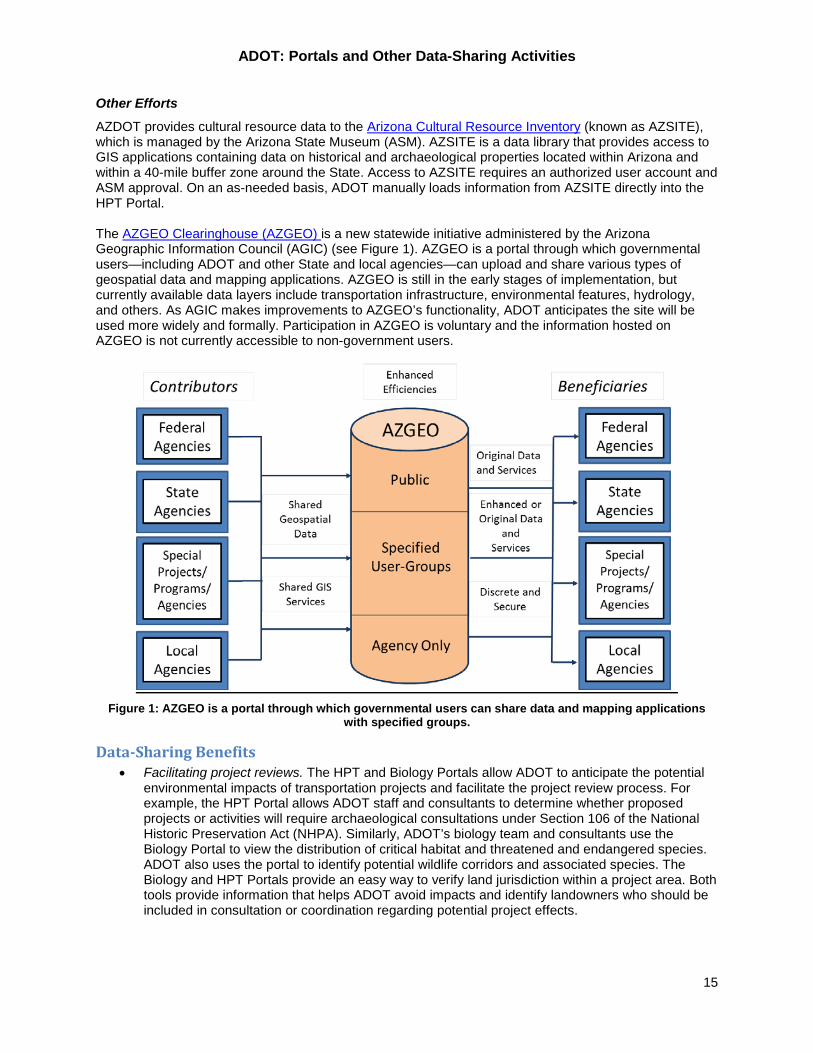
AZDOT provides cultural resource data to the Arizona Cultural Resource Inventory (known as AZSITE), which is managed by the Arizona State Museum (ASM). AZSITE is a data library that provides access to GIS applications containing data on historical and archaeological properties located within Arizona and within a 40-mile buffer zone around the State. Access to AZSITE requires an authorized user account and ASM approval. On an as-needed basis, ADOT manually loads information from AZSITE directly into the HPT Portal. The AZGEO Clearinghouse (AZGEO) is a new statewide initiative administered by the Arizona Geographic Information Council (AGIC) (see Figure 1). AZGEO is a portal through which governmental users—including ADOT and other State and local agencies—can upload and share various types of geospatial data and mapping applications. AZGEO is still in the early stages of implementation, but currently available data layers include transportation infrastructure, environmental features, hydrology, and others. As AGIC makes improvements to AZGEO’s functionality, ADOT anticipates the site will be used more widely and formally. Participation in AZGEO is voluntary and the information hosted on AZGEO is not currently accessible to non-government users.
Figure 1: AZGEO is a portal through which governmental users can share data and mapping applications
with specified groups.
Data-Sharing Benefits • Facilitating project reviews. The HPT and Biology Portals allow ADOT to anticipate the potential
environmental impacts of transportation projects and facilitate the project review process. For example, the HPT Portal allows ADOT staff and consultants to determine whether proposed projects or activities will require archaeological consultations under Section 106 of the National Historic Preservation Act (NHPA). Similarly, ADOT’s biology team and consultants use the Biology Portal to view the distribution of critical habitat and threatened and endangered species. ADOT also uses the portal to identify potential wildlife corridors and associated species. The Biology and HPT Portals provide an easy way to verify land jurisdiction within a project area. Both tools provide information that helps ADOT avoid impacts and identify landowners who should be included in consultation or coordination regarding potential project effects.
ADOT: Portals and Other Data-Sharing Activities
16
• Addressing data issues and duplications. Smaller business units within ADOT, such as the agency’s Historic Preservation Team, do not have enough staff to detect all potential data issues. Sharing data through portals such as HPT, AZSITE, AZGEO, and APLAN increases the likelihood that errors will be identified and addressed. Further, ADOT noted that these types of data-sharing efforts help multiple users view and access information at the same time, making it easier to identify where there are data duplications.
• Improving access to information. While the HPT and Biology Portals, AZGEO, and AZSITE all
improve information access, APLAN has been particularly helpful to ADOT in this respect. Prior to developing APLAN, it was difficult for some of ADOT’s departments and divisions without advanced GIS capabilities to visualize their own data. In other situations, individuals needing a map would submit a request to ADOT’s GIS staff, who would then manually develop a PDF or paper map and send it back. APLAN provides an intuitive interface through which users can easily access geospatial information and visualize that information on demand. Overall, this improves decision-making and collaboration within the agency. ADOT is still considering how to best serve the individual needs and requirements of business units.
Additional Resources ADOT can share the ADOT/ASM data-sharing agreement when it is complete. APLAN Fact Sheet Arizona Geographic Information Council FHWA Environmental Review Toolkit Case Study: ADOT Historic Preservation Team Portal
CDOT: OTIS
17
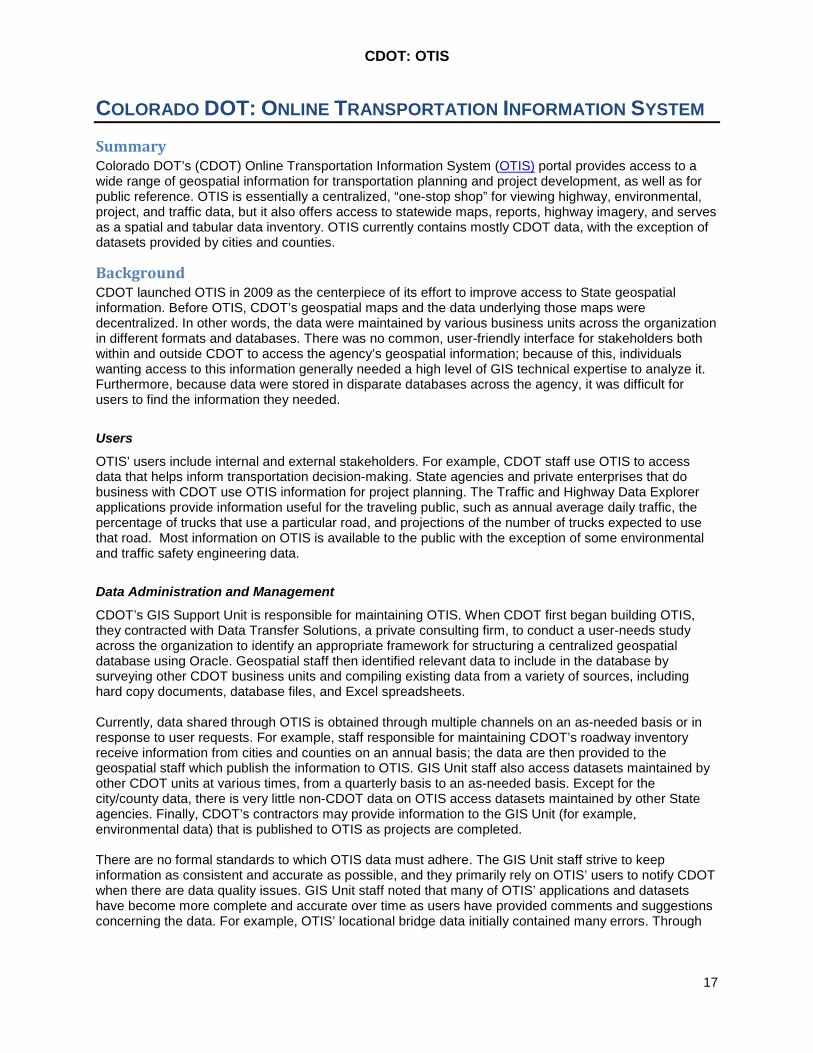
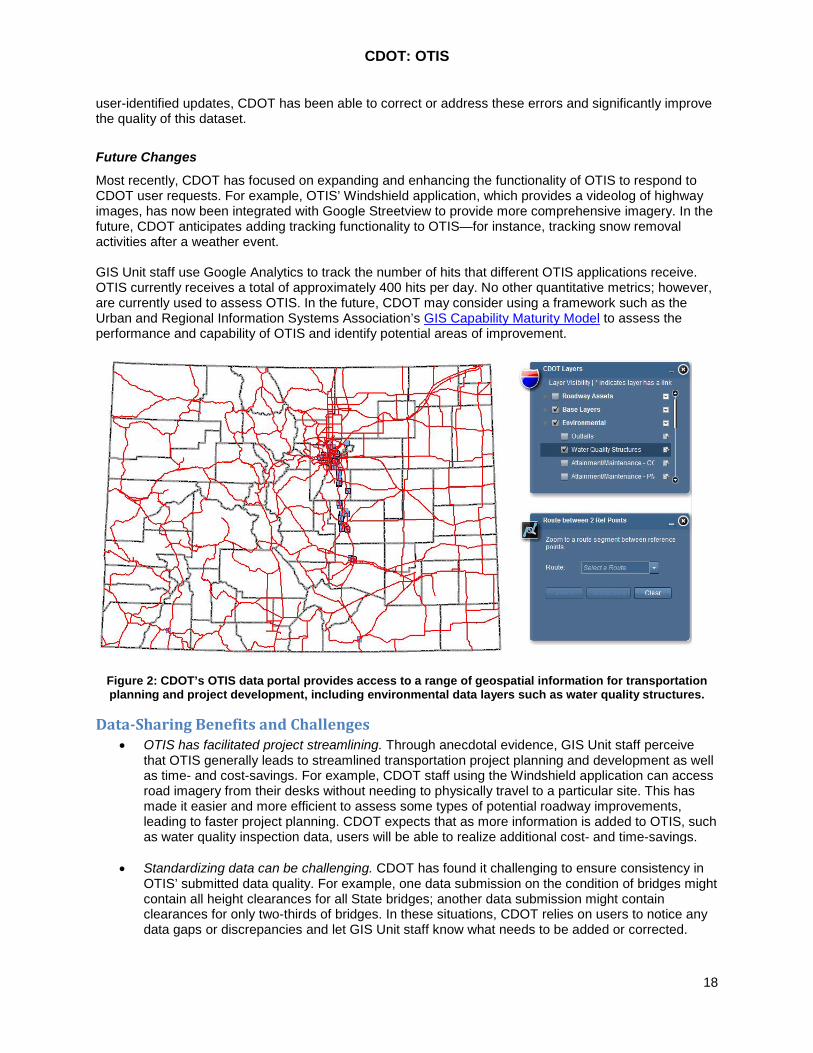
COLORADO DOT: ONLINE TRANSPORTATION INFORMATION SYSTEM Summary Colorado DOT’s (CDOT) Online Transportation Information System (OTIS) portal provides access to a wide range of geospatial information for transportation planning and project development, as well as for public reference. OTIS is essentially a centralized, “one-stop shop” for viewing highway, environmental, project, and traffic data, but it also offers access to statewide maps, reports, highway imagery, and serves as a spatial and tabular data inventory. OTIS currently contains mostly CDOT data, with the exception of datasets provided by cities and counties.
Background CDOT launched OTIS in 2009 as the centerpiece of its effort to improve access to State geospatial information. Before OTIS, CDOT’s geospatial maps and the data underlying those maps were decentralized. In other words, the data were maintained by various business units across the organization in different formats and databases. There was no common, user-friendly interface for stakeholders both within and outside CDOT to access the agency’s geospatial information; because of this, individuals wanting access to this information generally needed a high level of GIS technical expertise to analyze it. Furthermore, because data were stored in disparate databases across the agency, it was difficult for users to find the information they needed.
Users
OTIS’ users include internal and external stakeholders. For example, CDOT staff use OTIS to access data that helps inform transportation decision-making. State agencies and private enterprises that do business with CDOT use OTIS information for project planning. The Traffic and Highway Data Explorer applications provide information useful for the traveling public, such as annual average daily traffic, the percentage of trucks that use a particular road, and projections of the number of trucks expected to use that road. Most information on OTIS is available to the public with the exception of some environmental and traffic safety engineering data.
Data Administration and Management
CDOT’s GIS Support Unit is responsible for maintaining OTIS. When CDOT first began building OTIS, they contracted with Data Transfer Solutions, a private consulting firm, to conduct a user-needs study across the organization to identify an appropriate framework for structuring a centralized geospatial database using Oracle. Geospatial staff then identified relevant data to include in the database by surveying other CDOT business units and compiling existing data from a variety of sources, including hard copy documents, database files, and Excel spreadsheets. Currently, data shared through OTIS is obtained through multiple channels on an as-needed basis or in response to user requests. For example, staff responsible for maintaining CDOT’s roadway inventory receive information from cities and counties on an annual basis; the data are then provided to the geospatial staff which publish the information to OTIS. GIS Unit staff also access datasets maintained by other CDOT units at various times, from a quarterly basis to an as-needed basis. Except for the city/county data, there is very little non-CDOT data on OTIS access datasets maintained by other State agencies. Finally, CDOT’s contractors may provide information to the GIS Unit (for example, environmental data) that is published to OTIS as projects are completed. There are no formal standards to which OTIS data must adhere. The GIS Unit staff strive to keep information as consistent and accurate as possible, and they primarily rely on OTIS’ users to notify CDOT when there are data quality issues. GIS Unit staff noted that many of OTIS’ applications and datasets have become more complete and accurate over time as users have provided comments and suggestions concerning the data. For example, OTIS’ locational bridge data initially contained many errors. Through
CDOT: OTIS
18
user-identified updates, CDOT has been able to correct or address these errors and significantly improve the quality of this dataset.
Future Changes
Most recently, CDOT has focused on expanding and enhancing the functionality of OTIS to respond to CDOT user requests. For example, OTIS’ Windshield application, which provides a videolog of highway images, has now been integrated with Google Streetview to provide more comprehensive imagery. In the future, CDOT anticipates adding tracking functionality to OTIS—for instance, tracking snow removal activities after a weather event. GIS Unit staff use Google Analytics to track the number of hits that different OTIS applications receive. OTIS currently receives a total of approximately 400 hits per day. No other quantitative metrics; however, are currently used to assess OTIS. In the future, CDOT may consider using a framework such as the Urban and Regional Information Systems Association’s GIS Capability Maturity Model to assess the performance and capability of OTIS and identify potential areas of improvement.
Figure 2: CDOT’s OTIS data portal provides access to a range of geospatial information for transportation planning and project development, including environmental data layers such as water quality structures.
Data-Sharing Benefits and Challenges • OTIS has facilitated project streamlining. Through anecdotal evidence, GIS Unit staff perceive
that OTIS generally leads to streamlined transportation project planning and development as well as time- and cost-savings. For example, CDOT staff using the Windshield application can access road imagery from their desks without needing to physically travel to a particular site. This has made it easier and more efficient to assess some types of potential roadway improvements, leading to faster project planning. CDOT expects that as more information is added to OTIS, such as water quality inspection data, users will be able to realize additional cost- and time-savings.
• Standardizing data can be challenging. CDOT has found it challenging to ensure consistency in
OTIS’ submitted data quality. For example, one data submission on the condition of bridges might contain all height clearances for all State bridges; another data submission might contain clearances for only two-thirds of bridges. In these situations, CDOT relies on users to notice any data gaps or discrepancies and let GIS Unit staff know what needs to be added or corrected.
CDOT: OTIS
19
While user-identified improvements have helped improve OTIS’ data quality, data consistency issues are sometimes due to business process changes throughout the agency that affect how data are collected. For example, CDOT is currently implementing a new Drivability Life (DL) program that changes how road conditions are internally assessed and reported, and how improvements are prioritized. The DL program calls for enhanced road condition and pavement data. While having more robust information will help the agency maintain its assets and identify project priorities, it also increases the size of collected pavement datasets, making it more difficult to integrate the information into OTIS.
• OTIS encourages intra-agency collaboration. GIS Unit staff reported that OTIS has enhanced intra-agency collaboration. Data owners at CDOT often reach out to the GIS Unit and ask how they can add data to OTIS, or data owners will offer ideas for new data to be added or new OTIS functionalities. For example, CDOT bridge permit staff asked for height clearance data to be included in OTIS. GIS Unit staff worked with relevant staff to obtain the clearances and then added these into OTIS.
Additional Resources CDOT has an administrator’s manual for managing OTIS, but has not developed any operating agreements or data-sharing agreements related to OTIS. FHWA GIS in Transportation webcast on OTIS (2012) CDOT Online Transportation Information System
CTDOT: Roadway Inventory Expansion and Enhancement; Data Consolidation Activities
20
CONNECTICUT DOT: ROADWAY INVENTORY EXPANSION AND ENHANCEMENT; DATA CONSOLIDATION ACTIVITIES Summary The Connecticut DOT (CTDOT) is engaging in several efforts related to geospatial data-sharing and integration. CTDOT recently undertook a major revision of the State’s GIS road network to include data on all public roads throughout the State. The purpose of this effort is to produce a unified operational view of the State’s roads for CTDOT, other agencies, and potentially the public. CTDOT is also consolidating its roadway inventory data and considering ways to improve access to its data to support improved communications, decision-making, and more effective collaboration.
Background
Roadway Inventory Expansion
Historically, CTDOT’s roadway inventory data had been collected through the use of a GIS road network based on Topologically Integrated Geographic Encoding and Referencing Line Systems (TIGER/Lines). CTDOT had mapped the majority of the State-owned roadways in Connecticut (this work was done in-house), but not Connecticut’s 27,000 miles of locally owned roadways. CTDOT recently contracted with Bentley Exor, a third-party asset management software company. CTDOT is now primarily using Exor asset management software to expand the inventory, but has also made use of desktop Esri tools and orthophoto imagery acquired in 2012. When a particular orthophoto view does not support a clear view of a specific roadway segment due to forest growth or other obstructions, CTDOT relies on technologies such as Google Street View or Bing Maps to find a different view.
Data Consolidation and Access
CTDOT is exploring ways to enhance the roadway inventory to provide a stronger foundation for information-sharing between CTDOT and other agencies, as well as the public. For example, CTDOT is consolidating existing inventory datasets owned and managed by different business units into a single basemap. Further, the agency is considering ways to update the original TIGER data files to correct spatial inaccuracies and standardize nomenclature. Over time, CTDOT anticipates making this centralized inventory routable, which would allow all agencies throughout the State to reference one standard set of information (currently agencies such as the State Departments of Public Safety and Environmental Protection each have their own network). CTDOT is also considering implementing a web-based interface that would allow municipalities to electronically provide data updates to CTDOT to include in the inventory. Currently, the process by which CTDOT receives local roadway data from towns and cities is complex, time-consuming, and involves sharing paper maps (CTDOT now receives local data from multiple officials and jurisdictions since the State has 169 municipalities and no county governments). In the future, CTDOT envisions implementing a publically accessible interface, such as AGOL, to allow broader access to inventory data. If implemented, this type of platform could provide a foundation for aggregating all of CTDOT’s geospatial information to share it with a broader audience. CTDOT is looking to other State DOT initiatives focused on data-sharing (such as Utah DOT’s UPLAN) as models for how CTDOT might move forward.
Other Activities
The effort to consolidate the inventory dovetails with a recent State of Connecticut executive order that supports the creation of the Connecticut Open Data Portal, a web-based platform that will offer access to State-owned data, both geospatial and not, to increase government transparency and promote data-sharing. CTDOT has also participated in the State’s Geospatial Information Systems Council, which
CTDOT: Roadway Inventory Expansion and Enhancement; Data Consolidation Activities
21
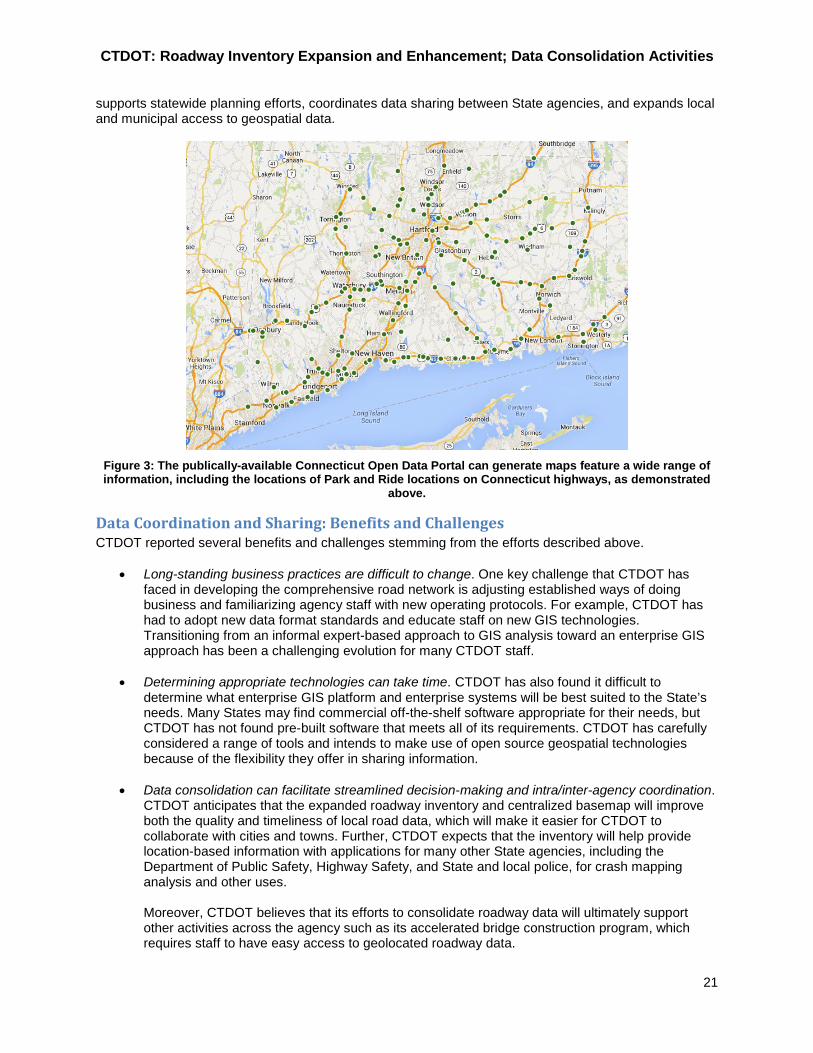
supports statewide planning efforts, coordinates data sharing between State agencies, and expands local and municipal access to geospatial data.
Figure 3: The publically-available Connecticut Open Data Portal can generate maps feature a wide range of information, including the locations of Park and Ride locations on Connecticut highways, as demonstrated
above.
Data Coordination and Sharing: Benefits and Challenges CTDOT reported several benefits and challenges stemming from the efforts described above.
• Long-standing business practices are difficult to change. One key challenge that CTDOT has faced in developing the comprehensive road network is adjusting established ways of doing business and familiarizing agency staff with new operating protocols. For example, CTDOT has had to adopt new data format standards and educate staff on new GIS technologies. Transitioning from an informal expert-based approach to GIS analysis toward an enterprise GIS approach has been a challenging evolution for many CTDOT staff.
• Determining appropriate technologies can take time. CTDOT has also found it difficult to
determine what enterprise GIS platform and enterprise systems will be best suited to the State’s needs. Many States may find commercial off-the-shelf software appropriate for their needs, but CTDOT has not found pre-built software that meets all of its requirements. CTDOT has carefully considered a range of tools and intends to make use of open source geospatial technologies because of the flexibility they offer in sharing information.
• Data consolidation can facilitate streamlined decision-making and intra/inter-agency coordination.
CTDOT anticipates that the expanded roadway inventory and centralized basemap will improve both the quality and timeliness of local road data, which will make it easier for CTDOT to collaborate with cities and towns. Further, CTDOT expects that the inventory will help provide location-based information with applications for many other State agencies, including the Department of Public Safety, Highway Safety, and State and local police, for crash mapping analysis and other uses.
Moreover, CTDOT believes that its efforts to consolidate roadway data will ultimately support other activities across the agency such as its accelerated bridge construction program, which requires staff to have easy access to geolocated roadway data.
CTDOT: Roadway Inventory Expansion and Enhancement; Data Consolidation Activities
22
In the past, CTDOT has not formally defined its data-sharing efforts as specifically tied to FHWA’s Every Day Counts or Geospatial Data Collaboration initiatives. However, CTDOT believes that its efforts support EDC/GDC-related goals, particularly in terms of facilitating interagency data-sharing through consolidating information and providing a more efficient means of doing business statewide. CTDOT also expects that the new comprehensive road network (and potential publically accessible interface) will ultimately allow the agency to better manage its resources, make more informed decisions, and identify cost-savings in many business areas, including asset management and project reviews.
Additional Resources CTDOT has an agreement with the State Department of Public Health to share information on wells and water supplies. Since this information is considered sensitive, its use is restricted to CTDOT. Connecticut Geospatial Information Systems Council State of Connecticut Executive Order No. 28 established the state’s Open Data Portal
DelDOT: State AGOL Site
23
DELAWARE DOT: STATE ARCGIS ONLINE SITE Summary Delaware DOT (DelDOT) is engaging in several geospatial data-sharing efforts. First, DelDOT is part of an inter-agency initiative to develop a Delaware ArcGIS Online (AGOL) site. The purpose of this site is to support users in more easily consolidating, sharing, and visualizing a range of data including transportation and environmental information. Additionally, DelDOT participates in several other activities with a common goal of improving geospatial data accessibility.
Background
Delaware AGOL Site
Over the past several months, several Delaware agencies have convened to discuss a mutual interest in consolidating the State’s data into an easily accessible, online enterprise system, and to develop a set of statewide geospatial data standards. The core agencies engaging in these conversations include the State’s Office of State Planning Coordination (OSPC), Department of Technology and Information (DTI), Department of Natural Resources and Environmental Control (DNREC), Department of Safety and Homeland Security (DSHS), Sussex County, and DelDOT. OSPC is taking a leading role in coordinating these agencies and has identified a four-phase process for developing and implementing the enterprise system. During the first two phases of the process, which are now complete, DTI worked with DelDOT and the other core agencies to identify an appropriate system architecture and platform (deemed to be AGOL); DTI then created a pilot AGOL site to test how statewide data could be published and displayed. During the last two ongoing phases, DTI and OSPC are working with State agencies to develop and implement an enterprise GIS structure and formalize data maintenance processes for Delaware’s AGOL site. A pilot version of the site, which is limited in scope, currently allows the agencies and the public to display a range of data relating to road centerlines, boundaries, parcels, schools, land uses, sea level rise, and trail networks. The full production enterprise GIS system will allow State agencies to display all of their public data through the AGOL site. DelDOT is currently testing the site and sharing its feedback with DTI and other core agencies. It is anticipated that the full production system will be implemented by December 2014. Delaware’s tightly knit GIS community has helped develop the enterprise GIS system and other GIS data-sharing efforts in the State. Delaware’s geospatial efforts have also benefitted from the Delaware Geographic Data Committee (DGDC), which provides loose geospatial governance to various State agencies. In the future, there will be a significant governance effort to ensure successful implementation of the enterprise GIS system.
DelDOT: State AGOL Site
24
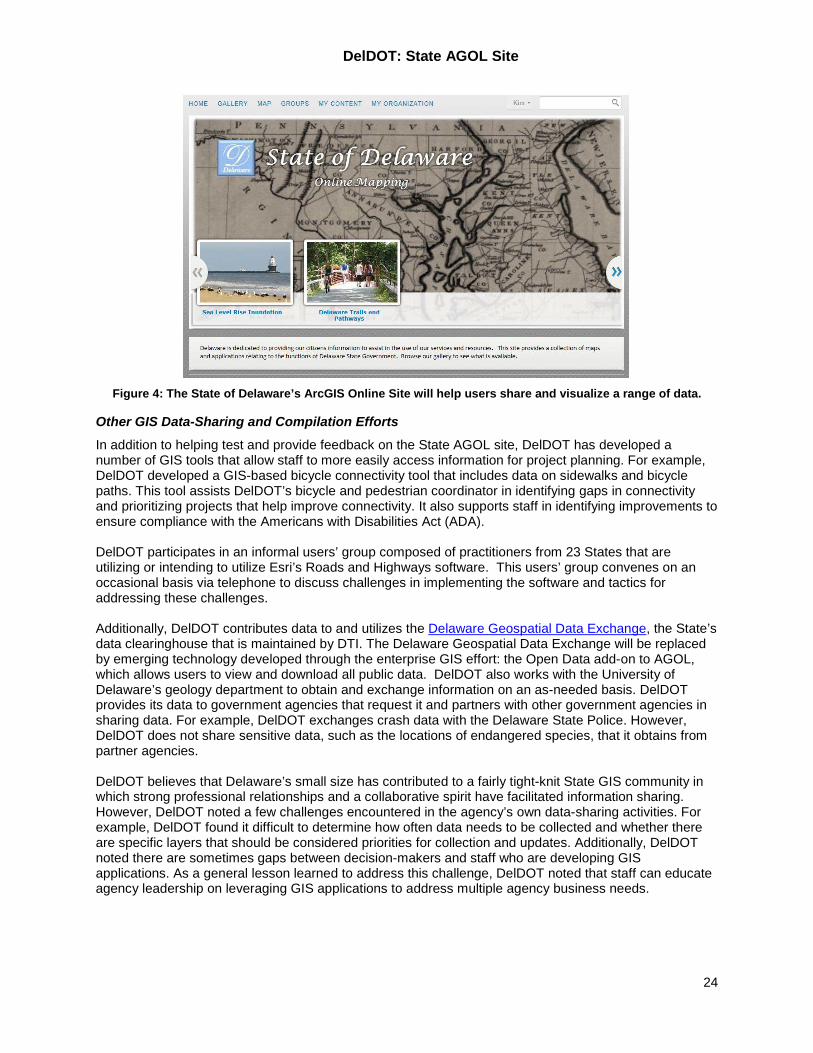
Figure 4: The State of Delaware’s ArcGIS Online Site will help users share and visualize a range of data.
Other GIS Data-Sharing and Compilation Efforts
In addition to helping test and provide feedback on the State AGOL site, DelDOT has developed a number of GIS tools that allow staff to more easily access information for project planning. For example, DelDOT developed a GIS-based bicycle connectivity tool that includes data on sidewalks and bicycle paths. This tool assists DelDOT’s bicycle and pedestrian coordinator in identifying gaps in connectivity and prioritizing projects that help improve connectivity. It also supports staff in identifying improvements to ensure compliance with the Americans with Disabilities Act (ADA). DelDOT participates in an informal users’ group composed of practitioners from 23 States that are utilizing or intending to utilize Esri’s Roads and Highways software. This users’ group convenes on an occasional basis via telephone to discuss challenges in implementing the software and tactics for addressing these challenges. Additionally, DelDOT contributes data to and utilizes the Delaware Geospatial Data Exchange, the State’s data clearinghouse that is maintained by DTI. The Delaware Geospatial Data Exchange will be replaced by emerging technology developed through the enterprise GIS effort: the Open Data add-on to AGOL, which allows users to view and download all public data. DelDOT also works with the University of Delaware’s geology department to obtain and exchange information on an as-needed basis. DelDOT provides its data to government agencies that request it and partners with other government agencies in sharing data. For example, DelDOT exchanges crash data with the Delaware State Police. However, DelDOT does not share sensitive data, such as the locations of endangered species, that it obtains from partner agencies. DelDOT believes that Delaware’s small size has contributed to a fairly tight-knit State GIS community in which strong professional relationships and a collaborative spirit have facilitated information sharing. However, DelDOT noted a few challenges encountered in the agency’s own data-sharing activities. For example, DelDOT found it difficult to determine how often data needs to be collected and whether there are specific layers that should be considered priorities for collection and updates. Additionally, DelDOT noted there are sometimes gaps between decision-makers and staff who are developing GIS applications. As a general lesson learned to address this challenge, DelDOT noted that staff can educate agency leadership on leveraging GIS applications to address multiple agency business needs.
DelDOT: State AGOL Site
25
Data-Sharing Benefits Historically, most of DelDOT’s geospatial data resided in multiple databases maintained by various business units across the agency. This has made it difficult for agency staff to find and access information and has led to redundancies in data collection. DelDOT anticipates that the forthcoming Delaware AGOL site will provide benefits that will help address these and other challenges. Some specific benefits from the AGOL site might include the following:
• Reduced areas of redundancy. In aggregating geospatial information and making it available in one location, the AGOL site will likely allow users to take a more strategic view of existing data and help DelDOT (and likely other agencies using the site) more easily address any data collection redundancies. Furthermore, the site will provide a similar “look and feel” to geospatial data and allow users to view the same information at the same time. DelDOT expects that this will facilitate general agency decision-making and improve overall efficiencies.
• Standardized information and improved data quality. The AGOL site will likely help provide a framework for standardizing datasets, which might lead to improved data quality. For example, the Delaware Transit Corporation (DTC) currently maintains data on Delaware’s complete road system, including a 10-mile buffer outside the State, from TomTom (formerly TeleAtlas), which provides quarterly updates. DelDOT and some local agencies currently collect and maintain their own roadway inventory data with linear referencing systems (LRS), which can result in duplicative datasets. The Delaware AGOL site might help DelDOT more widely share its LRS and support more coordinated and efficient collection of LRS information. Ultimately, having a more coordinated LRS dataset might lead to time- and cost-savings for DelDOT, as well as local agencies. The AGOL site might also help provide a standardized framework for keeping data up-to-date. Because the site would enable a broad audience to access information, DelDOT believes that users would have an increased interest in keeping their information as current as possible. As data quality improves, DelDOT suspects more users will want to access the AGOL site and would trust its data.
• More efficient analysis. Finally, DelDOT anticipates the AGOL site will help provide a mechanism for users to visualize information in new ways, or perhaps visualize information for the first time. For example, the agency’s Safe Routes to School program coordinator is using the pilot version of the Delaware AGOL site to map the relationships between schools and sidewalks in the State. The AGOL site will likely allow users to map information on demand, leading to more efficient and streamlined analyses.
Additional Resources July 2010 State of Delaware Geospatial Strategic Plan (this has not yet been implemented, but is a goal)
GDOT: GNAHRGIS
26
GEORGIA DOT: GEORGIA’S NATURAL, ARCHAEOLOGICAL, AND HISTORIC RESOURCES GEOGRAPHIC INFORMATION SYSTEM Summary Georgia’s Natural, Archaeological, and Historic Resources Geographic Information System (GNAHRGIS) is a web-based, interactive data catalog and GIS tool that provides access to geospatial information about Georgia’s natural, archaeological, and historic resources.
Background GNAHRGIS first developed in the 1990s, is a collaboration between GDOT, the Georgia Department of Natural Resources, the Georgia Department of Community Affairs, and The University of Georgia. The system was built to assist GDOT transportation planners and design staff in locating natural and cultural resources within a project area and evaluating the potential effects of the project on those resources. While GNAHRGIS was intended to serve transportation planners, it is now used mostly by subject matter experts, primarily archeologists and historians, to conduct background research on the state of resources in a particular area before going out into the field. In particular, archaeologists use the system to conduct historical research. Companies building cell phone towers also use GNAHRGIS to comply with Section 106 of the National Historic Preservation Act of 1966. GNAHRGIS has gone through two phases of updates over the past 20 years and is now in its third phase. The most recent update phase was launched in 2011. While most of the data available through GNAHRGIS is publically accessible, some resource data, including archaeological and endangered species data, is available to staff only.
Data Collection and Maintenance
Currently, GNAHRGIS does not allow easy entry of new or up-to-date information. The only new data in the system is provided by utility companies that hire students to conduct surveys of areas based on projected transmission line locations. GDOT and its partner organizations would like to change this system so that survey data can be more easily submitted and added into GNAHRGIS. Currently surveyors fill out draft reports that are saved online. Under the new process GDOT staff have proposed, surveyors would fill out a form online using radio buttons. When information about location, type of site, and other data is uploaded, the State Preservation Office would approve the data and the information would go public on GNAHRGIS. GDOT is also working with other agencies to access new datasets to add to GNAHRGIS. The department’s goal is to make the system a one-stop-shop for all GIS data for GDOT. For example, GDOT is currently working to add a “social” layer to the system. The social layer would let planners and NEPA specialists conduct demographic research within GNAHRGIS, and help them understand potential impacts of a transportation project.
Data-Sharing Challenges • Data sensitivity limits information sharing. Some agencies are reluctant to share information on a
public-facing site such as GNAHRGIS because of the sensitivity of certain information, such as archaeological or endangered species data. It is important that GNAHRGIS staff demonstrate to these agencies how their data will be protected. However even agencies that are willing to share data encounter logistical challenges to ensure that the information is both searchable and restricted. GNAHRGIS currently requires a password for users accessing archeological data.
• Difficulties coordinating among staff. Because GNAHRGIS was conceived by environmentalists and implemented by information technology specialists, it was sometimes difficult for the two
GDOT: GNAHRGIS
27
groups to understand each other’s constraints and visions. Lack of effective communication led to project delays and, ultimately, delays in giving planners, agencies, and the public an easy way to view and share historic and natural resource data. The project team also underestimated how long it would take to develop procedures for data-sharing between agencies. GDOT staff recommends that other States research and use best management practices to save valuable development time.
• Adding new data. While subject matter experts can currently use the system to conduct historic
research on natural, historic, and archeological data, GNAHRGIS does not include the most up-to-date data on these subjects because there is no easy way to add new information.
• Limited funding. FHWA Transportation Enhancement (TE) funds were not included in the most recent Federal transportation legislation, so GDOT and partner agencies must find new funding sources to make desired updates. GDOT staff found that finding funding for data innovation and upkeep is a commitment that all agencies in a State need to prepare for when developing geospatial data-sharing solutions.
IADOT: GIS Project Portal
28
IOWA DOT: GIS PROJECT PORTAL Summary Iowa DOT’s (IADOT) Highway Division GIS Project Portal is a centralized, web-based portal accessible to IADOT staff (in the future, IADOT may make the Portal or a different version of it available to users outside the agency network). The Portal provides a standard framework to query, analyze, and visualize geospatial information.
Background Several years ago, IADOT was planning upgrades along the 301 miles of Interstate 80 (I-80) that runs through Iowa. As part of this project, IADOT collected a large amount of spatial information related to baseline conditions such as infrastructure data and environmental features. To help aggregate and store this information, IADOT’s Office of Location and Environment (OLE) hired a consultant to build a geospatial framework and interface. Initially, this ArcGIS Server-based tool served as a repository for information obtained for the I-80 upgrades. Over time, OLE staff saw potential benefits in expanding the tool to include other spatial information stored in disparate databases. In 2010, OLE staff began adding statewide layers to the tool, including environmental, asset management and archaeological data, and completed the technological updates to the Portal that included upgrading ArcGIS server infrastructure. The renamed Highway Division GIS Portal enables users to query any of IADOT’s spatial information from one place and view it on a single basemap.7 The Portal does not function as a data warehouse, but as a database-centric, software-neutral environment. Data are still collected and managed by individual data owners in various business units or offices in their own databases across the agency; when a data owner updates a dataset, these updates are automatically pushed through to the GIS. The Portal’s interface provides a standard access point and visual framework through which users can call up data, view that data with a common look and feel, and map information on demand. OLE provides a system of governance to guide data formatting, but data custodians from other DOT offices, not OLE, are responsible for ensuring data is up-to-date and of good quality.
Access and Analysis
OLE decided not to provide public access to the Portal because it displays some sensitive information like proposed project costs and estimated letting dates. Additionally, other information (such as project schedule data) may fluctuate as projects progress. OLE GIS staff use an analysis tool called Geocortex Optimizer to identify the data layers that users access and the frequency with which they are accessed. The information is primarily used to identify and quickly address technical issues, such as layers that may be taking an unusually long time to load. OLE staff noted; however, that this tool helps assess a strategic direction for the Portal. For example, if staff notice that some layers are accessed more than others, they can decide whether to invest in improvements.
Documentation
OLE has developed a Geospatial Governance and Guidelines document which includes the responsibilities and structure of the IADOT GIS Council, metadata and projection standards, and where to
7 The Portal is an ArcGIS server-based product that uses Geocortex Essentials and ESRI’s Representational State Transfer (REST). ESRI’s REST architecture essentially allows data stored in one format to be shared with users in another format. In the Portal, REST is the underlying technology that allows data stored within agency databases to be displayed on top of a standard basemap.
IADOT: GIS Project Portal
29
find certain types of data, etc. In addition, IADOT has signed 28E agreements8 with other State and local agencies, including some for the purposes of sharing data with cities and counties. 28E agreements are one way in which IADOT obtains local geospatial data, except for imagery, which is obtained through informal sharing.
Lessons Learned and Challenges
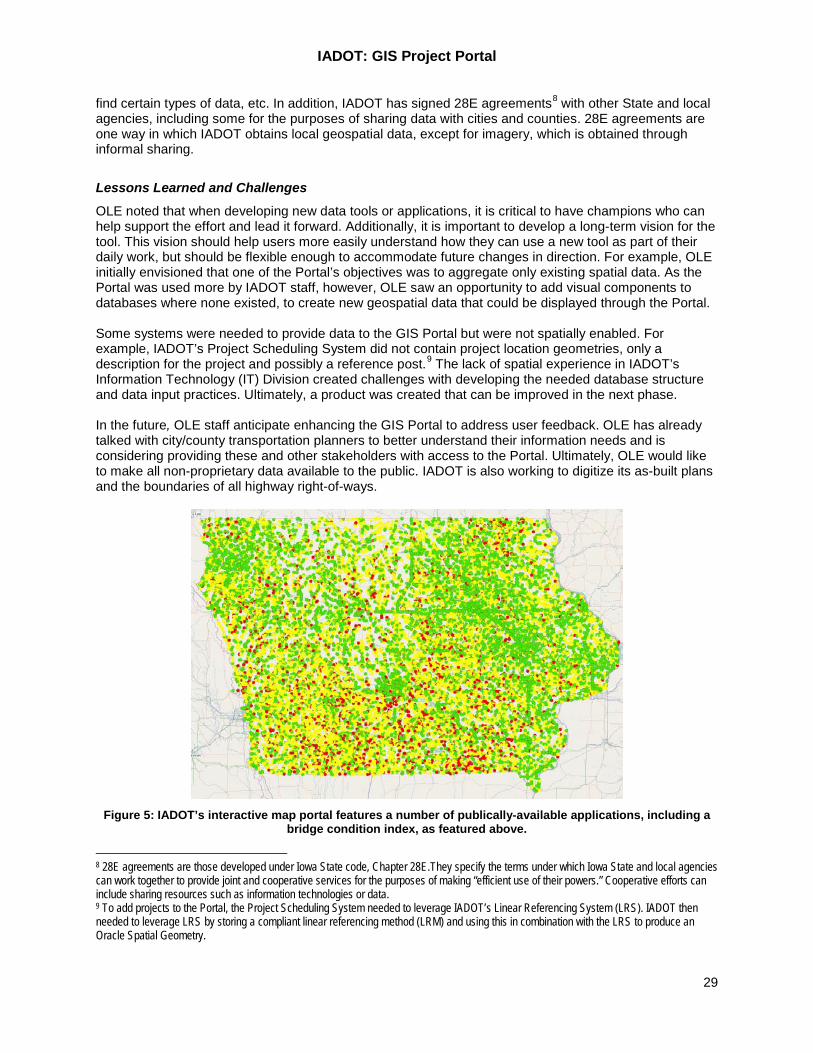
OLE noted that when developing new data tools or applications, it is critical to have champions who can help support the effort and lead it forward. Additionally, it is important to develop a long-term vision for the tool. This vision should help users more easily understand how they can use a new tool as part of their daily work, but should be flexible enough to accommodate future changes in direction. For example, OLE initially envisioned that one of the Portal’s objectives was to aggregate only existing spatial data. As the Portal was used more by IADOT staff, however, OLE saw an opportunity to add visual components to databases where none existed, to create new geospatial data that could be displayed through the Portal. Some systems were needed to provide data to the GIS Portal but were not spatially enabled. For example, IADOT’s Project Scheduling System did not contain project location geometries, only a description for the project and possibly a reference post.9 The lack of spatial experience in IADOT’s Information Technology (IT) Division created challenges with developing the needed database structure and data input practices. Ultimately, a product was created that can be improved in the next phase. In the future, OLE staff anticipate enhancing the GIS Portal to address user feedback. OLE has already talked with city/county transportation planners to better understand their information needs and is considering providing these and other stakeholders with access to the Portal. Ultimately, OLE would like to make all non-proprietary data available to the public. IADOT is also working to digitize its as-built plans and the boundaries of all highway right-of-ways.
Figure 5: IADOT’s interactive map portal features a number of publically-available applications, including a
bridge condition index, as featured above.
8 28E agreements are those developed under Iowa State code, Chapter 28E.They specify the terms under which Iowa State and local agencies can work together to provide joint and cooperative services for the purposes of making “efficient use of their powers.” Cooperative efforts can include sharing resources such as information technologies or data. 9 To add projects to the Portal, the Project Scheduling System needed to leverage IADOT’s Linear Referencing System (LRS). IADOT then needed to leverage LRS by storing a compliant linear referencing method (LRM) and using this in combination with the LRS to produce an Oracle Spatial Geometry.
IADOT: GIS Project Portal
30
Data-Sharing Benefits • Easier information gathering and analysis. The Portal facilitates the information gathering process
and makes geospatial analysis more efficient. For example, in the past, users seeking a map of crash data would need to manually fill out a form and submit it to the appropriate business unit. OLE would need to create a map and send it back to the user for review. Users needed to search multiple databases (each with its own access requirements) to find data. Now, using the Portal, users can check a box on the basemap indicating what information they would like to view and the portal will immediately display the data. This has led to time-savings and has given users without advanced GIS expertise a way to easily visualize information.
• Streamlined project development. The Portal helps IADOT identify environmental issues early on
that might otherwise slow project planning, development, or implementation. For example, a maintenance worker tasked with cleaning a culvert would be able to use the Portal to quickly identify any environmentally sensitive areas that might exist in or near the culvert. The worker would be able to bring any issues to management’s attention to assess mitigation steps that might need to be taken prior to starting work. This reduces sources of environmental conflict and supports more streamlined project implementation and operations.
• Opened data culture. IADOT has traditionally made data available to specific individuals through
custom-developed “front end” applications. Some information was tightly controlled by various business units or IT, which limited direct connections to IADOT’s underlying databases. IADOT’s new culture focuses on open data-sharing, unless information is deemed confidential. The Portal created doors to data previously not available and is helping to change data ownership culture throughout IADOT.
• Improved internal and external communications. IADOT noted that improved communication and
collaboration is one of the major benefits of the Portal. It has become easier for IADOT staff to “get on the same page” because the Portal lets staff look at the same data points using a standard visual framework. By opening up geospatial analysis opportunities to a broad audience—even to those without high-level GIS expertise—the Portal has established new communication channels where none or few existed. For example, the Portal allowed IADOT to more easily access FHWA bridge numbers, which led to better location information and standardization of field references to markers and posts along the highway network.
MDSHA: eGIS and MD iMap
31
MARYLAND STATE HIGHWAY ADMINISTRATION: ENTERPRISE GIS AND MARYLAND INTEGRATED MAP Summary The Maryland State Highway Administration (MDSHA) is engaging in several data-sharing efforts. First, it developed an Enterprise GIS (eGIS), a geospatial data portal accessible to MDSHA staff that supports internal collaboration, analysis, and decision-making. Since 2009, MDSHA has also contributed to Maryland Integrated Map (MD iMap), a statewide data portal accessible to agencies across Maryland and the public. MDSHA has been involved in recent efforts to improve the functionality and appearance of MD iMap.
Background
eGIS
MDSHA’s eGIS is an ArcGIS API for Flex web mapping application that allows internal agency staff to quickly and easily access an array of geospatial data and thematic content. It focuses primarily on an agency’s particular spatial data needs, including project-related information such as project location and status. These data are “housed” in multiple repositories across MDSHA. The portal functions as an aggregator, making it possible for users to query and visualize information from one source without needing to gain access to multiple databases. The portal is administered by MDSHA Office of Planning and Preliminary Engineering staff. Administrators release new versions of eGIS on a quarterly basis that include new datasets and functionalities. For example, staff recently updated eGIS to include a linkage to MDSHA’s Model of Sustainability and Integrated Corridors (MOSAIC), an Excel-based tool that estimates the sustainability impact of highway improvements based on user-derived inputs (this tool supports corridor-level transportation planning and environmental screening). While eGIS as a whole is accessible only to internal MDSHA staff, the agency has made some limited datasets available to the public through JavaScript-based applications. For example, MDSHA developed an application for pedestrians and cyclists that provides information on bike lane locations as well as recreational trails. The Maryland Transportation Authority (MDTA) is another transportation business unit within the Maryland Department of Transportation (MDOT). MDTA can access MDSHA’s eGIS system, but MDTA also maintains a separate eGIS system accessible to its own staff. The MDTA eGIS uses Google Earth and ArcGIS to compile information (e.g., stormwater data and bridge and tunnel locations) specific to MDTA’s business needs. While all data remain within MDTA’s firewall, a limited number of datasets are available to the public and other users. MDTA and MDSHA collaborate and share information freely. MDHSA noted that this data-sharing is infrequent; however, since the MDTA and MDSHA eGis portals serve different business needs and thus the information in the MDTA portal is not necessarily relevant to MDSHA, and vice versa. All MDOT business units have access to GIS data layers and mapping services. MDSHA also reported that the agency is currently conducting an informal data “inventory” to assess which business units are collecting and maintaining different geospatial datasets. The intent of this effort is to develop a more strategic approach for adding information to eGIS and ensure proper metadata.
MD iMap
Launched in 2009, MD iMap is Maryland’s publically accessible ArcGIS-based geospatial data and mapping portal. MD iMap was initially developed to improve data quality and accessibility, and to reduce costs of services through a collective investment in and strategic application of geographic data and
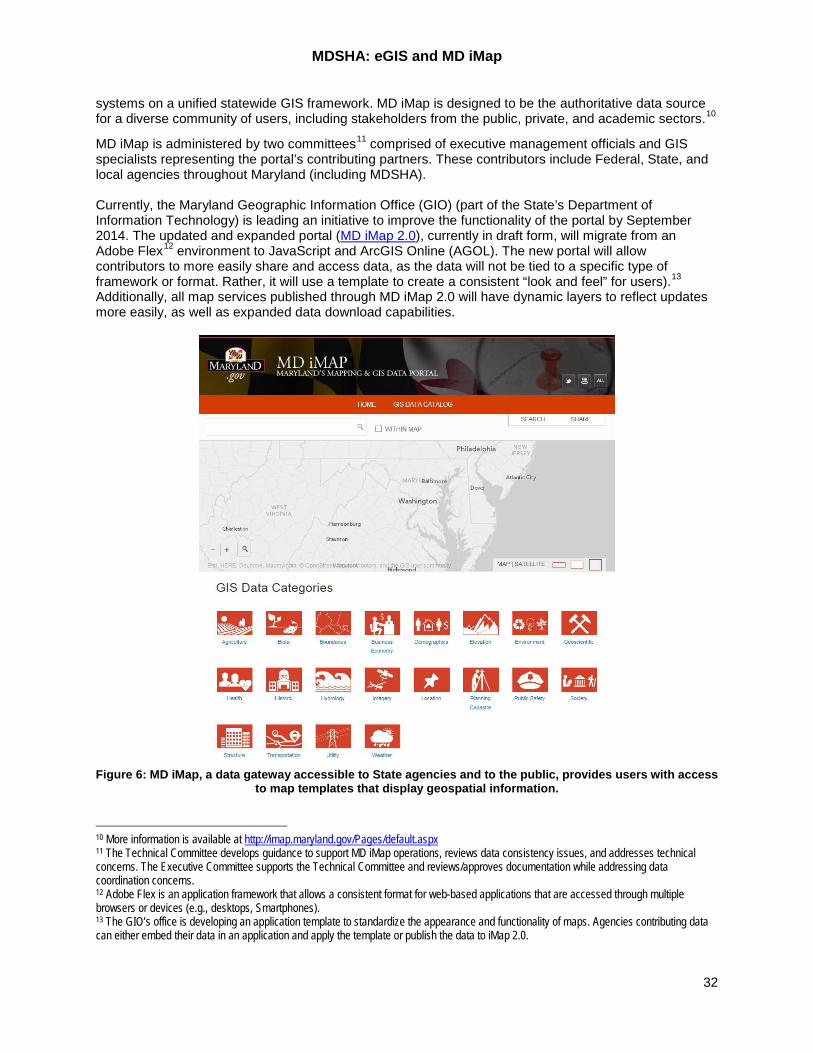
MDSHA: eGIS and MD iMap
32
systems on a unified statewide GIS framework. MD iMap is designed to be the authoritative data source for a diverse community of users, including stakeholders from the public, private, and academic sectors.10
MD iMap is administered by two committees11 comprised of executive management officials and GIS specialists representing the portal’s contributing partners. These contributors include Federal, State, and local agencies throughout Maryland (including MDSHA). Currently, the Maryland Geographic Information Office (GIO) (part of the State’s Department of Information Technology) is leading an initiative to improve the functionality of the portal by September 2014. The updated and expanded portal (MD iMap 2.0), currently in draft form, will migrate from an Adobe Flex12 environment to JavaScript and ArcGIS Online (AGOL). The new portal will allow contributors to more easily share and access data, as the data will not be tied to a specific type of framework or format. Rather, it will use a template to create a consistent “look and feel” for users).13 Additionally, all map services published through MD iMap 2.0 will have dynamic layers to reflect updates more easily, as well as expanded data download capabilities.
Figure 6: MD iMap, a data gateway accessible to State agencies and to the public, provides users with access
to map templates that display geospatial information.
10 More information is available at http://imap.maryland.gov/Pages/default.aspx 11 The Technical Committee develops guidance to support MD iMap operations, reviews data consistency issues, and addresses technical concerns. The Executive Committee supports the Technical Committee and reviews/approves documentation while addressing data coordination concerns. 12 Adobe Flex is an application framework that allows a consistent format for web-based applications that are accessed through multiple browsers or devices (e.g., desktops, Smartphones). 13 The GIO’s office is developing an application template to standardize the appearance and functionality of maps. Agencies contributing data can either embed their data in an application and apply the template or publish the data to iMap 2.0.
MDSHA: eGIS and MD iMap
33
Open Data Portal
While MD iMap is focused on spatial data, Maryland has also deployed an Open Data Portal for non-spatial datasets through the Governor’s StateStat Program, which aims to improve the State government’s accountability and efficiency. The Open Data Portal is administered by the StateStat Office and the Open Data Executive Committee, which includes executive management officials from multiple State agencies. While AGOL is one of the technical tools that support MD iMap, Socrata is the technical tool for the Open Data group. In April 2014, Maryland passed a new Open Data Bill (Senate Bill 644) into law, which will create an Open Data Council, essentially combining the MD iMap Executive Committee and Open Data Executive Committee into a single advisory group. The law will facilitate the refocusing of initiatives and goals for freely sharing data regardless of the data type.
Agreements
MDSHA has not developed any formal data-sharing agreements and noted that most data-sharing has historically occurred on an informal basis. However, the Maryland Department of Planning has developed some agreements with counties for parcel and vector data to help update an application called MdProperty View, an ArcGIS-based viewer that provides information on jurisdictions’ tax maps and parcel information. MDSHA does meet quarterly with other GIS staff within MDOT and from other State agencies to discuss projects and data collaboration needs. Overall, MDSHA believes that there has been a general trend in public sector agencies toward making information more accessible and open, and that any potential need for developing agreements would likely decrease over time.
Data-Sharing Benefits • Increased visualization abilities and improved project screening. Using the new MOSAIC add-in
to eGIS, MDSHA planners can now develop and run alternate project scenarios to more easily identify and visualize potential, corridor-level environmental constraints and sustainability effects. MDSHA also noted the new MD iMap 2.0 portal will make it easier to visualize information due the improved mapping templates currently being developed. MDSHA anticipates the expanded portal will support staff in more streamlined project needs identification and environmental screening.
• Improved efficiencies. Through eGIS, users can access a “one stop shop” to obtain information that was previously located in disparate databases or applications throughout MDSHA. The agency has not developed any formal quantitative measures to assess use of eGIS. However MDSHA noted that building an application to support interaction on users’ terms is key to ensuring buy-in and enthusiasm. The agency has collected anecdotal evidence suggesting that staff are able to work more efficiently as a result of being able to identify and visualize information on demand using eGIS.
Additional Resources 2009 FHWA GIS in Transportation webcast on iMap and other MDSHA initiatives
MoDOT: Improvements to NHR Website and MONHD
34
MISSOURI DEPARTMENT OF TRANSPORTATION: IMPROVEMENTS TO NATIONAL HERITAGE REVIEW WEBSITE AND MISSOURI NATURAL HERITAGE DATABASE Summary The Missouri Department of Transportation (MoDOT) is working with the Missouri Department of Conservation (MDC), U.S. Fish and Wildlife Service (FWS), the U.S. Army Corps of Engineers (USACE), and the Missouri Department of Natural Resources (DNR) to improve MDC’s National Heritage Review (NHR) website and the associated Missouri Natural Heritage Database (MONHD). This collaboration will support enhanced geospatial data quality and accuracy, integrated conservation and transportation planning, and improved project streamlining in Missouri.
Background MDC developed and maintains the NHR website and MONHD, which are part of MDC’s larger Missouri Natural Heritage Review Program. MONHD, which includes a range of biological and ecological data, is a GIS-based tool built using NatureServe’s Biotics platform.14 A “heritage coordinator” at MDC is responsible for updating information in the database as provided by partners such as MoDOT and USACE. The NHR website and MONHD are resources for counties, municipalities, developers, and private contractors to review upcoming projects for impacts to threatened and endangered species, as well as species of conservation concern. Stakeholders can request MDC’s assistance to conduct a “heritage review” to identify any potential impacts in the vicinity of their project areas. Using mapping tools and the MONHD, MDC can assess whether a project will potentially affect threatened or endangered species. In 2013, MDC contacted MoDOT to ask for assistance updating the Missouri Natural Heritage Review Program’s construction and transportation best management practices (BMPs), many of which were outdated or non-existent. MDC desired up-to-date, transportation-specific BMPs to provide to contractors working on projects that potentially impacted threatened and endangered species. MDC is also seeking assistance from MoDOT, FWS, USACE, and DNR to provide recommendations on improvements to the NHR website. These agencies meet periodically to coordinate and compile their recommendations. MoDOT is still in the early stages of identifying potential improvements, but these might include enhancing the website’s functionality to display real-time information or adding additional conservation data layers to MONHD. MoDOT was not involved in the initial development of the NHR website or MONHD, and does not currently use MONHD to access the natural heritage information that is shared by other partners. However, MoDOT expects that once the improvements to the NHR website are complete, the agency will use this website and MONHD more frequently as part of MoDOT’s project development, screening, and review processes. Since 2006, MoDOT has used a GIS-based natural heritage data layer that MDC provides on a quarterly basis (via CDs) to screen transportation projects for biological impacts. Before 2006, MDC delivered natural heritage information to MoDOT on paper maps. MoDOT already has a memorandum of understanding (MOU) with MDC stipulating the terms for how MoDOT will provide relevant data for the MONHD.
Implementing Eco-Logical
MoDOT’s partnership with MDC, FWS, USACE, DNR, and other agencies to explore enhancements to the NHR website and MONHD is part of a larger effort called Implementing Eco-Logical, an initiative
14 For more information on Biotics, see www.natureserve.org/conservation-tools/data-maps-tools/biotics-5
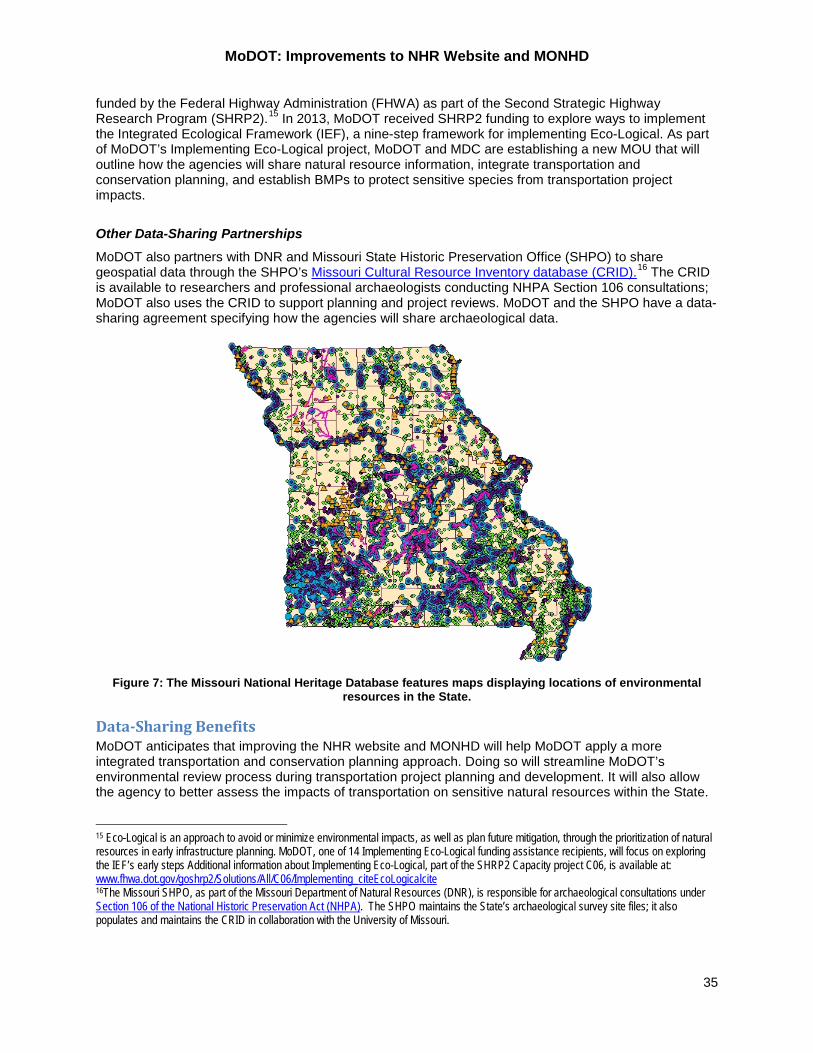
MoDOT: Improvements to NHR Website and MONHD
35
funded by the Federal Highway Administration (FHWA) as part of the Second Strategic Highway Research Program (SHRP2).15 In 2013, MoDOT received SHRP2 funding to explore ways to implement the Integrated Ecological Framework (IEF), a nine-step framework for implementing Eco-Logical. As part of MoDOT’s Implementing Eco-Logical project, MoDOT and MDC are establishing a new MOU that will outline how the agencies will share natural resource information, integrate transportation and conservation planning, and establish BMPs to protect sensitive species from transportation project impacts.
Other Data-Sharing Partnerships
MoDOT also partners with DNR and Missouri State Historic Preservation Office (SHPO) to share geospatial data through the SHPO’s Missouri Cultural Resource Inventory database (CRID).16 The CRID is available to researchers and professional archaeologists conducting NHPA Section 106 consultations; MoDOT also uses the CRID to support planning and project reviews. MoDOT and the SHPO have a data-sharing agreement specifying how the agencies will share archaeological data.
Figure 7: The Missouri National Heritage Database features maps displaying locations of environmental
resources in the State.
Data-Sharing Benefits MoDOT anticipates that improving the NHR website and MONHD will help MoDOT apply a more integrated transportation and conservation planning approach. Doing so will streamline MoDOT’s environmental review process during transportation project planning and development. It will also allow the agency to better assess the impacts of transportation on sensitive natural resources within the State.
15 Eco-Logical is an approach to avoid or minimize environmental impacts, as well as plan future mitigation, through the prioritization of natural resources in early infrastructure planning. MoDOT, one of 14 Implementing Eco-Logical funding assistance recipients, will focus on exploring the IEF’s early steps Additional information about Implementing Eco-Logical, part of the SHRP2 Capacity project C06, is available at: www.fhwa.dot.gov/goshrp2/Solutions/All/C06/Implementing_citeEcoLogicalcite 16The Missouri SHPO, as part of the Missouri Department of Natural Resources (DNR), is responsible for archaeological consultations under Section 106 of the National Historic Preservation Act (NHPA). The SHPO maintains the State’s archaeological survey site files; it also populates and maintains the CRID in collaboration with the University of Missouri.
MoDOT: Improvements to NHR Website and MONHD
36
Further, the improved website and database will allow counties, municipalities, and other stakeholders to access more robust biological and environmental data, improving their decision-making processes. MoDOT reported that its data-sharing agreement with the SHPO has also dramatically expedited the process of completing NHPA Section 106 consultations. While archaeological research for consultations once required a physical trip to the University of Missouri’s site files, cultural resource data can now be accessed instantly and remotely through the CRID.
Data-Sharing Challenges • It can be difficult to determine whether or how to share sensitive data. Although the NHR website
is available to the public, MONHD is not publically accessible due to concerns about sharing information that could encourage collectors and vandals. Also, many records in MONHD represent threatened and endangered species located on private land, which might lead to trespassing if publically shared. MoDOT is working with MDC to determine the public’s level of access to MONHD, but finds that it is difficult to balance the desire to increase information access with concerns about sharing sensitive data.
• Identifying funding sources for data management can be a challenge. MoDOT has found that,
while it may be easy to identify potential sources of funding to support new data efforts, it is more difficult to find funding support to improve data accuracy. MoDOT believes that maintaining and improving databases can be perceived as a less tangible effort than collecting new data sources or applications, but is no less crucial to data-driven decision-making.
• Intermittent database updates can lead to inconsistency and inaccuracy. Although location-based
information in MONHD is consistent and accurate, MoDOT has found that other fields are not always accurate or complete. Agencies that submit data to MDC’s heritage coordinator may do so on an intermittent basis. As a result, many records in MONHD are inaccurate or outdated.
Additional Resources Missouri State Historic Preservation Office website MOUs between MoDOT and MDC/DNR/SHPO can be shared upon request.
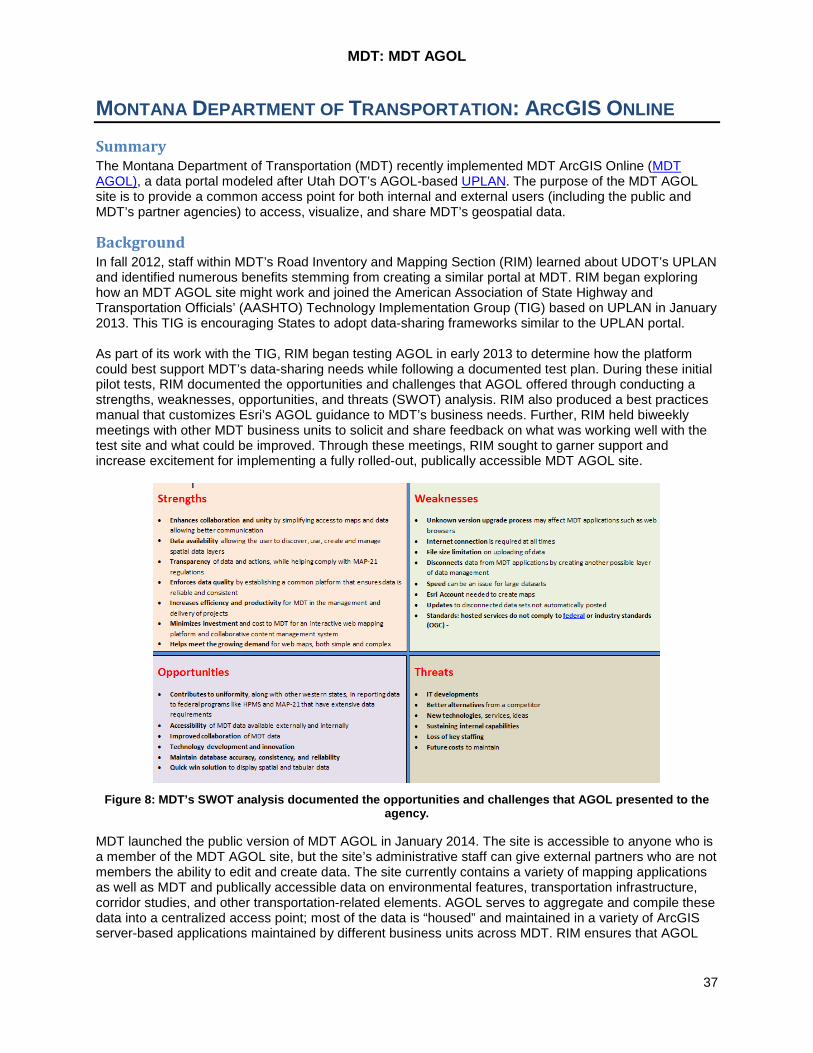
MDT: MDT AGOL
37
MONTANA DEPARTMENT OF TRANSPORTATION: ARCGIS ONLINE Summary The Montana Department of Transportation (MDT) recently implemented MDT ArcGIS Online (MDT AGOL), a data portal modeled after Utah DOT’s AGOL-based UPLAN. The purpose of the MDT AGOL site is to provide a common access point for both internal and external users (including the public and MDT’s partner agencies) to access, visualize, and share MDT’s geospatial data.
Background In fall 2012, staff within MDT’s Road Inventory and Mapping Section (RIM) learned about UDOT’s UPLAN and identified numerous benefits stemming from creating a similar portal at MDT. RIM began exploring how an MDT AGOL site might work and joined the American Association of State Highway and Transportation Officials’ (AASHTO) Technology Implementation Group (TIG) based on UPLAN in January 2013. This TIG is encouraging States to adopt data-sharing frameworks similar to the UPLAN portal. As part of its work with the TIG, RIM began testing AGOL in early 2013 to determine how the platform could best support MDT’s data-sharing needs while following a documented test plan. During these initial pilot tests, RIM documented the opportunities and challenges that AGOL offered through conducting a strengths, weaknesses, opportunities, and threats (SWOT) analysis. RIM also produced a best practices manual that customizes Esri’s AGOL guidance to MDT’s business needs. Further, RIM held biweekly meetings with other MDT business units to solicit and share feedback on what was working well with the test site and what could be improved. Through these meetings, RIM sought to garner support and increase excitement for implementing a fully rolled-out, publically accessible MDT AGOL site.
Figure 8: MDT’s SWOT analysis documented the opportunities and challenges that AGOL presented to the
agency.
MDT launched the public version of MDT AGOL in January 2014. The site is accessible to anyone who is a member of the MDT AGOL site, but the site’s administrative staff can give external partners who are not members the ability to edit and create data. The site currently contains a variety of mapping applications as well as MDT and publically accessible data on environmental features, transportation infrastructure, corridor studies, and other transportation-related elements. AGOL serves to aggregate and compile these data into a centralized access point; most of the data is “housed” and maintained in a variety of ArcGIS server-based applications maintained by different business units across MDT. RIM ensures that AGOL
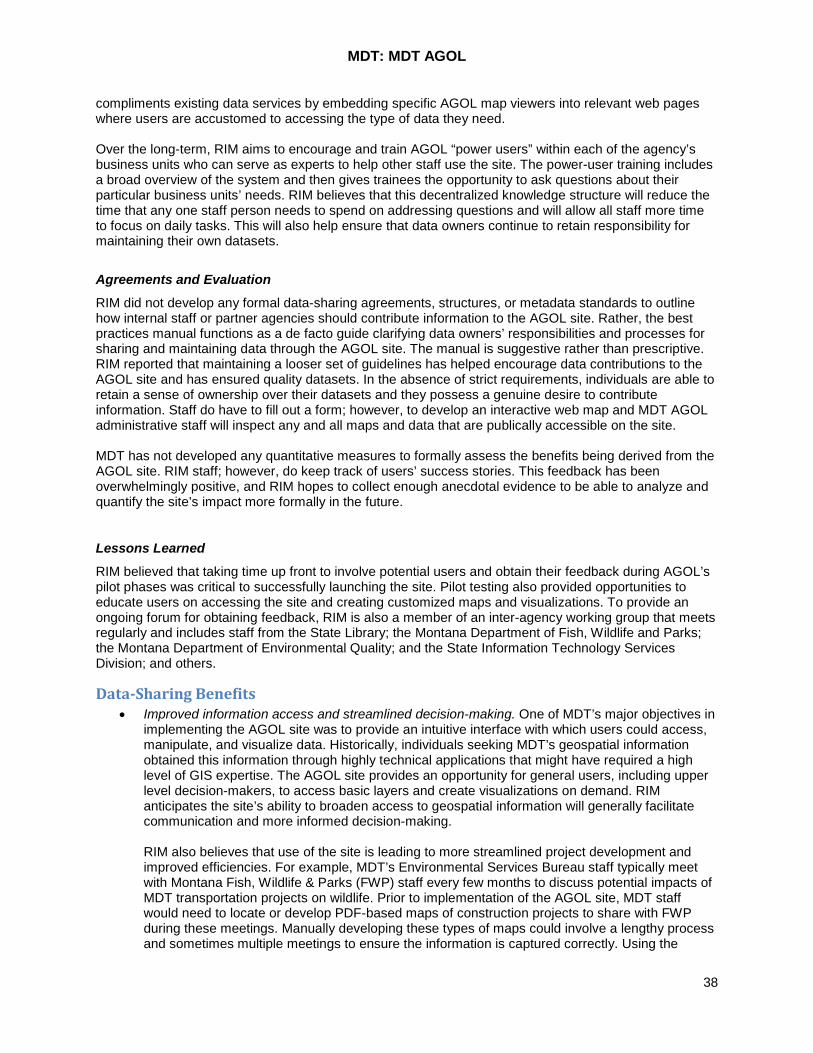
MDT: MDT AGOL
38
compliments existing data services by embedding specific AGOL map viewers into relevant web pages where users are accustomed to accessing the type of data they need. Over the long-term, RIM aims to encourage and train AGOL “power users” within each of the agency’s business units who can serve as experts to help other staff use the site. The power-user training includes a broad overview of the system and then gives trainees the opportunity to ask questions about their particular business units’ needs. RIM believes that this decentralized knowledge structure will reduce the time that any one staff person needs to spend on addressing questions and will allow all staff more time to focus on daily tasks. This will also help ensure that data owners continue to retain responsibility for maintaining their own datasets.
Agreements and Evaluation
RIM did not develop any formal data-sharing agreements, structures, or metadata standards to outline how internal staff or partner agencies should contribute information to the AGOL site. Rather, the best practices manual functions as a de facto guide clarifying data owners’ responsibilities and processes for sharing and maintaining data through the AGOL site. The manual is suggestive rather than prescriptive. RIM reported that maintaining a looser set of guidelines has helped encourage data contributions to the AGOL site and has ensured quality datasets. In the absence of strict requirements, individuals are able to retain a sense of ownership over their datasets and they possess a genuine desire to contribute information. Staff do have to fill out a form; however, to develop an interactive web map and MDT AGOL administrative staff will inspect any and all maps and data that are publically accessible on the site. MDT has not developed any quantitative measures to formally assess the benefits being derived from the AGOL site. RIM staff; however, do keep track of users’ success stories. This feedback has been overwhelmingly positive, and RIM hopes to collect enough anecdotal evidence to be able to analyze and quantify the site’s impact more formally in the future.
Lessons Learned
RIM believed that taking time up front to involve potential users and obtain their feedback during AGOL’s pilot phases was critical to successfully launching the site. Pilot testing also provided opportunities to educate users on accessing the site and creating customized maps and visualizations. To provide an ongoing forum for obtaining feedback, RIM is also a member of an inter-agency working group that meets regularly and includes staff from the State Library; the Montana Department of Fish, Wildlife and Parks; the Montana Department of Environmental Quality; and the State Information Technology Services Division; and others.
Data-Sharing Benefits • Improved information access and streamlined decision-making. One of MDT’s major objectives in
implementing the AGOL site was to provide an intuitive interface with which users could access, manipulate, and visualize data. Historically, individuals seeking MDT’s geospatial information obtained this information through highly technical applications that might have required a high level of GIS expertise. The AGOL site provides an opportunity for general users, including upper level decision-makers, to access basic layers and create visualizations on demand. RIM anticipates the site’s ability to broaden access to geospatial information will generally facilitate communication and more informed decision-making.
RIM also believes that use of the site is leading to more streamlined project development and improved efficiencies. For example, MDT’s Environmental Services Bureau staff typically meet with Montana Fish, Wildlife & Parks (FWP) staff every few months to discuss potential impacts of MDT transportation projects on wildlife. Prior to implementation of the AGOL site, MDT staff would need to locate or develop PDF-based maps of construction projects to share with FWP during these meetings. Manually developing these types of maps could involve a lengthy process and sometimes multiple meetings to ensure the information is captured correctly. Using the

MDT: MDT AGOL
39
AGOL site, environmental staff with limited GIS expertise can now develop accurate, customized maps within a few minutes. MDT and FWP can more quickly and easily coordinate their activities; decision-making can progress in hours rather than days.
• Leveraged resources. Because AGOL is a dynamic platform, MDT can leverage its resources
more effectively than before. For example, prior to implementing AGOL, a staff person needing to geolocate crashes in preparation for a meeting would have needed to work with RIM to build a map. As a first step, RIM would need to create an Oracle database to store data and provide a reference for the map. This process could require a significant amount of resource investment in a tool that might only need to be used occasionally. Through AGOL, an individual needing a map for a specific meeting can now create a web-based application that is stored in AGOL’s cloud. This limits the need to use MDT’s own infrastructure and staffing resources; overall, giving the agency more flexibility to focus on making strategic investments.
Further, since AGOL provides a common “window” to view MDT’s geospatial data, it has become easier to identify where there are information gaps or overlapping datasets. MDT as a whole can make more informed decisions about where and how to focus its resources on data collection and maintenance.
Additional Resources AGOL test plan and best practices manual available upon request from MDT TIG Fast Facts: MDT AGOL
NDOR: NECTAR and NebraskaMAP
40
NEBRASKA DEPARTMENT OF ROADS: NEBRASKA ENTERPRISE CENTERLINE TRANSPORTATION ATTRIBUTE RESOURCE AND NEBRASKA MAP Summary The Nebraska Department of Roads (NDOR) developed and now maintains a centralized GIS-based tool for all NDOR staff called the Nebraska Enterprise Centerline Transportation Attribute Resource (NECTAR), which is only accessible to internal users working from within NDOR’s firewall and provides users with a convenient way to access and visualize a range of transportation-related information. NDOR also plans to contribute to a statewide data portal called NebraskaMAP. The intent of NebraskaMAP is to provide a multi-use enterprise platform to allow multiple methods for State agencies and the public to access Nebraska geospatial data. NDOR is not leading the NebraskaMAP initiative but assists with this effort in coordination with several other State agencies.
Background
NECTAR
NDOR developed NECTAR in 2003 in response to an agency GIS strategic plan that identified the need to compile GIS-based data to enable more streamlined information access. NECTAR is a web portal that combines tabular data and displays it on maps for the entire department, including district offices, enabling them to make decisions more efficiently. The goal of NECTAR is to provide NDOR staff with convenient, “one-stop” access to a wide variety of data including maintenance activities, construction projects, fatal crash, guardrail, and bridge locations, and other information related to roads, bridges, railroads, and average daily traffic (ADT). While NECTAR does not store any data, it allows users to easily query information that resides in multiple databases across the agency and to easily visualize these data using NECTAR’s mapping templates and viewer.17 Most recently, NDOR considered and implemented ways to expand and enhance NECTAR. For example, the agency is creating an Internet version of the tool to allow expanded access to NECTAR’s data. NDOR noted that when implementing these modifications it will be important to ensure that the tool continues to be seen as an integral part of staff workflows. Furthermore, all NECTAR data is open source, meaning that it is available to be shared without acquiring permission from data owners. Any modifications made to NECTAR should not change this requirement for open source data. NDOR is currently drafting a project proposal to outline the need for modifications. The document will address the following key questions:
• What training will be needed for NDOR staff once the enhanced tool is available?
• How will the committee implement the modifications, such as the downloading feature into NECTAR’s current platform?
• How will NECTAR incorporate changes moving forward?
NDOR plans to complete this proposal by April 2014.
An NDOR GIS Committee comprised of members from various NDOR business units (e.g., Planning & Project Development, Business Technology Support, NDOR’s District One office) is also identifying new priority data layers and services to potentially add to NECTAR.
17 NECTAR uses GeoMedia’s WebMap as a platform.
NDOR: NECTAR and NebraskaMAP
41
Figure 9: NECTAR features a number of data layers, including right-of-way, as demonstrated above.
NebraskaMAP
The Nebraska Information Technology Commission (NITC) GIS Council, the Office of the Chief Information Officer (OCIO), and the NebraskaMAP Working Group are leading the NebraskaMAP effort. NDOR is part of this working group, which also includes representatives from other State agencies, city and county governments, and other organizations.
NebraskaMAP is considered the State’s clearinghouse and provides access to the Nebraska Spatial Data Infrastructure (NESDI) and other commonly used geospatial data in Nebraska. NESDI comprises geospatial data layers with multiple applications used by many stakeholders, including imagery, elevation, street centerlines, point addressing, land use/land cover, and transportation data. Currently, NebraskaMAP provides more than 242 geospatial metadata and some access to server web mapping services for use in State agency basemap applications. The metadata follow Federal and State standards and are referenced in the Random Access Metadata for Online Nationwide Assessments (RAMONA) database.18 Data stewards can upload data to NebraskaMAP on a voluntary basis. Once uploaded, data are peer-reviewed for completeness by an ad hoc team to make sure that NITC metadata standards are met; then data are released for full access through the clearinghouse. NebraskaMAP’s working group members are currently engaging in efforts to enhance NebraskaMAP and increase its functionality. For example, efforts are underway to implement direct downloading for NebraskaMAP’s data and the ability for users to access information through web and mobile services. These and other enhancements, as well as continued maintenance efforts, are likely to be jointly funded by several State agencies (including NDOR) and other Federal and local agency partners. 18 RAMONA is maintained by the National State Geographic Information Council (NSGIC). RAMONA provides the underlying structure for the NSGIC GIS Inventory, which provides information on the status of geospatial data and geospatial services/systems available from Federal, State, and local agencies across the United States. Participation in RAMONA/the GIS Inventory is voluntary but there is an expectation by the FGDC standards to submit ongoing updates by states to support the Federal Spatial Data Infrastructure (SDI) layers.
NDOR: NECTAR and NebraskaMAP
42
Data-Sharing Benefits • Centralized data portals or libraries can increase efficiencies and streamline information
access.NDOR noted that storing information in a centralized location can help prevent a situation where multiple individuals are creating the same data layer or service. For example, NECTAR allows NDOR staff to see what information is already available so they do not have to collect and maintain data that others in the agency are already collecting.
• NDOR also reported that having centralized information access points such as NECTAR
has made it much faster and easier to access data. Prior to NECTAR, NDOR staff would store data on external hard drives and share information by circulating these files. NECTAR has eliminated the need to manually circulate files, allowing many users access to the data at one time, therefore reducing the time and effort involved in sharing data.
• Recently, NDOR’s Program Management Office used NECTAR as a planning tool to more
efficiently schedule, visualize, and prioritize projects to maximize the use of funds and resources. For example, Program Management staff can graphically display proposed and approved construction projects in planning meetings with NDOR District Offices.
Additional Resources FHWA GIS in Transportation Winter 2010 Newsletter – includes article referencing NECTAR
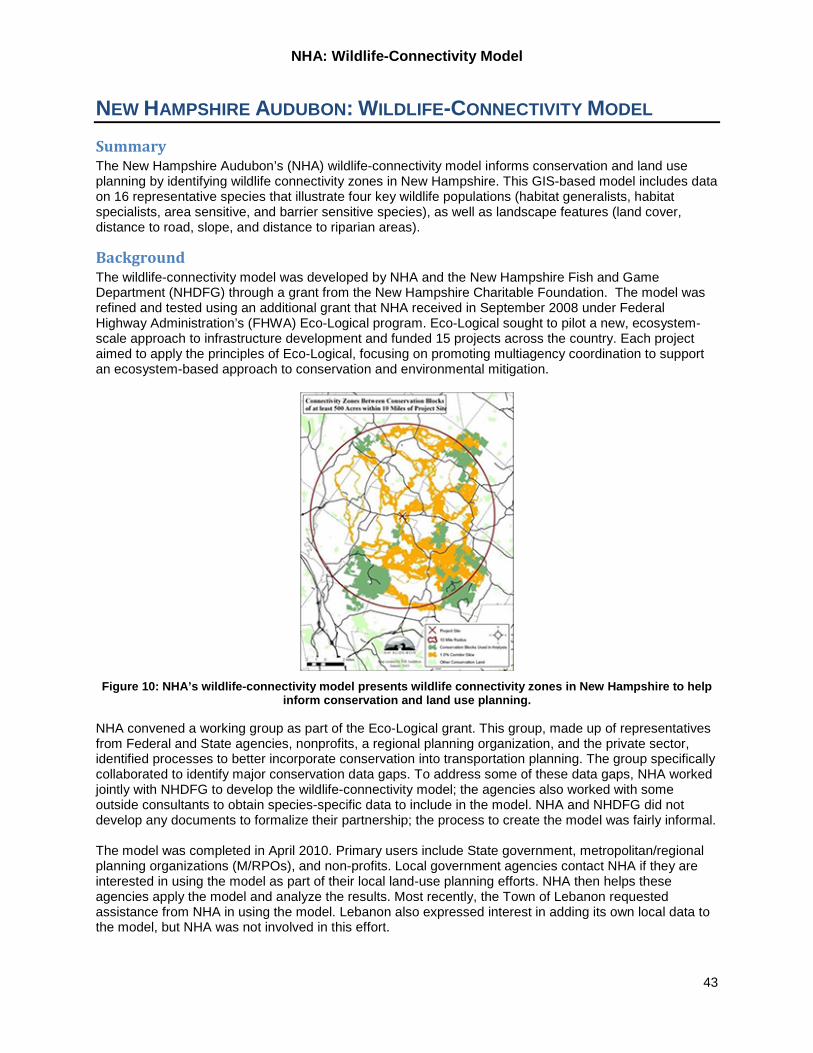
NHA: Wildlife-Connectivity Model
43
NEW HAMPSHIRE AUDUBON: WILDLIFE-CONNECTIVITY MODEL Summary The New Hampshire Audubon’s (NHA) wildlife-connectivity model informs conservation and land use planning by identifying wildlife connectivity zones in New Hampshire. This GIS-based model includes data on 16 representative species that illustrate four key wildlife populations (habitat generalists, habitat specialists, area sensitive, and barrier sensitive species), as well as landscape features (land cover, distance to road, slope, and distance to riparian areas).
Background The wildlife-connectivity model was developed by NHA and the New Hampshire Fish and Game Department (NHDFG) through a grant from the New Hampshire Charitable Foundation. The model was refined and tested using an additional grant that NHA received in September 2008 under Federal Highway Administration’s (FHWA) Eco-Logical program. Eco-Logical sought to pilot a new, ecosystem-scale approach to infrastructure development and funded 15 projects across the country. Each project aimed to apply the principles of Eco-Logical, focusing on promoting multiagency coordination to support an ecosystem-based approach to conservation and environmental mitigation.
Figure 10: NHA’s wildlife-connectivity model presents wildlife connectivity zones in New Hampshire to help
inform conservation and land use planning.
NHA convened a working group as part of the Eco-Logical grant. This group, made up of representatives from Federal and State agencies, nonprofits, a regional planning organization, and the private sector, identified processes to better incorporate conservation into transportation planning. The group specifically collaborated to identify major conservation data gaps. To address some of these data gaps, NHA worked jointly with NHDFG to develop the wildlife-connectivity model; the agencies also worked with some outside consultants to obtain species-specific data to include in the model. NHA and NHDFG did not develop any documents to formalize their partnership; the process to create the model was fairly informal. The model was completed in April 2010. Primary users include State government, metropolitan/regional planning organizations (M/RPOs), and non-profits. Local government agencies contact NHA if they are interested in using the model as part of their local land-use planning efforts. NHA then helps these agencies apply the model and analyze the results. Most recently, the Town of Lebanon requested assistance from NHA in using the model. Lebanon also expressed interest in adding its own local data to the model, but NHA was not involved in this effort.
NHA: Wildlife-Connectivity Model
44
Since the model’s completion in April 2010, NHDFG has updated the model to incorporate information in the State’s wildlife action plan. However, NHA does not anticipate making any major changes to the model and noted that developing and using GIS-based technologies are only a small portion of its current work.
Data-Sharing Benefits • Filling gaps in information accessibility. Many of New Hampshire’s municipalities have limited
access to natural resource data and limited access to GIS tools that visualize multiple data at one time. Few municipalities exist that have staff with GIS backgrounds who can develop and use GIS-based tools to assess the potential impacts of transportation projects on the natural environment. NHA believes that its wildlife-connectivity model fills these agencies’ data and resource gaps.
• Culture of collaboration. NHA noted that the process of developing the model encouraged
information-sharing and collaboration between the organization and its State and local partners, leading to more effective conservation planning. For example, in 2009 NHA worked with its colleagues at Maine Audubon to collaborate on an ecosystem-based approach to land-use planning, including a GIS-based framework similar to the NHA wildlife-connectivity model. NHA and Maine also sought to ensure that their two models were compatible to facilitate cross-state planning. NHA shared lessons learned from its experiences with Maine Audubon, which later adopted NHA’s overall strategy in developing its model. In turn, NHA made some revisions to its model, such as defining roads according to traffic levels rather than road classifications.
• NHA and NHDFG did not encounter any challenges in putting together the wildlife-connectivity
model, other than minor difficulties obtaining traffic data for some roads (NHA estimated these data from municipal population information).
Additional Resources Overview of the wildlife-connectivity model in 2009 FHWA report on GIS Applications in Eco-Logical Grant Projects Update on the model in 2011 FHWA review of Eco-Logical grant projects
NYSDOT: ELRS and Other Data-Sharing Efforts
45
NEW YORK STATE DOT: ENTERPRISE LINEAR REFERENCING SYSTEM AND OTHER DATA-SHARING EFFORTS Summary The New York State DOT (NYSDOT) is engaging in several efforts to integrate geospatial data and improve the accessibility of geospatial information for agency staff, partner agencies, and the general public. NYSDOT is establishing an Enterprise Linear Referencing System (ELRS) that will provide a single, authoritative representation of New York’s State-owned highway network, enabling business data integration among NYSDOT’s range of business systems. When completed, the ELRS will provide a framework to concisely locate all of the agency’s asset management- and roadway-related geospatial data. NYSDOT is also contributing to State initiatives to expand New York’s existing GIS Clearinghouse into a platform of geospatial web services that provides authoritative sources of GIS data and common geocoding and geoprocessing services.
Background
ELRS
NYSDOT maintains several web-based applications to store and share asset management- and operations-related data, including the Comprehensive Asset Management/Capital Improvement (CAMCI) Viewer (internal-only), Traffic Data Viewer, Prescreening Tool for Oversize/Overweight Vehicles, Road Status/Damage Assessment System (internal-only), and the Accident Location Information System (internal-only). While these systems have served the needs of their intended customers well, they are supported by distinct and somewhat divided internal systems. Business processes that require information from more than one NYSDOT system have typically required duplicated data and/or manual processes to combine business data in useful ways. Recently, NYSDOT decided to better enable business system integration among these systems and others by leveraging a comprehensive ELRS using Esri’s Roads and Highways platform. NYSDOT anticipates that the resulting ELRS will serve as the agency’s comprehensive roadway network to maintain consistent location references and asset information across all business units. The initiative to develop the ELRS began in July 2013, and NYSDOT expects it will be complete by spring 2015. Esri is assisting NYSDOT with the design and implementation of the Roads and Highways solution. NYSDOT is approximately halfway through the project and system design is nearly complete. While some business data will be managed inside the Roads and Highways solution, the ELRS will integrate directly with external systems, allowing those systems to reflect the most current highway network and the impact of changes to the business data maintained in the system. ELRS will be integrated with NYSDOT’s new AgileAssets enterprise asset management system, NYSDOT’s Roadway Inventory System, and the current safety analysis systems. The ELRS lays a foundation for NYSDOT’s overall vision to more reliably maintain information on the highway network and streamline access to the agency’s business data. NYSDOT is also collaborating with several other State DOTs and transportation agencies through a Roads and Highways User Group to establish best practices for implementation of the Roads and Highways solution.
American Recovery and Reinvestment Act (ARRA) Portal
Prior to building the ELRS, NYSDOT implemented a publically accessible Recovery Act website for reporting and sharing a variety of information on programs and projects funded through the American Recovery and Reinvestment Act (ARRA). Data on all programs is reported through the ARRA database using a specialized application developed specifically for ARRA. All Federal reports provided to USDOT are accessible and available via the website in order to ensure funding is transparent. One valuable and innovative development included data updates for all highway and bridge projects on a nightly basis to make that timely and accurate information is available for anyone. These projects are also all geospatially referenced and individual project data reports available. Performance data, including employment reporting, disadvantaged business enterprise participation, expenditures, and accomplishments, is also
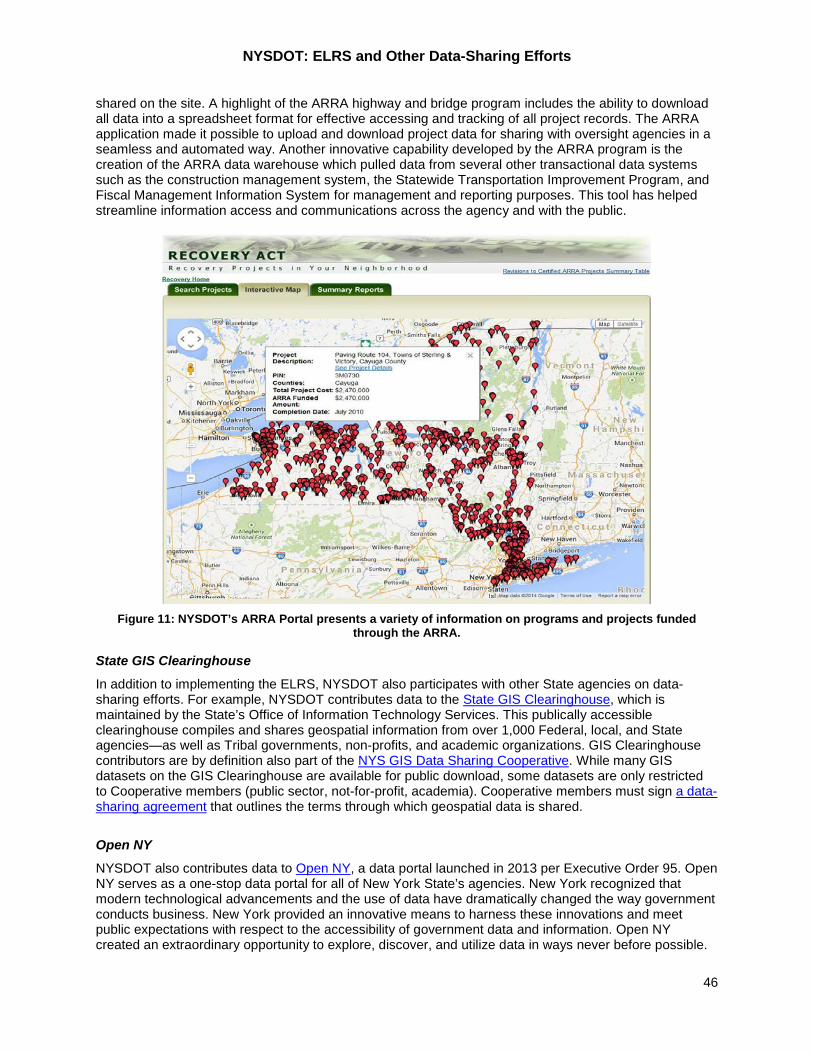
NYSDOT: ELRS and Other Data-Sharing Efforts
46
shared on the site. A highlight of the ARRA highway and bridge program includes the ability to download all data into a spreadsheet format for effective accessing and tracking of all project records. The ARRA application made it possible to upload and download project data for sharing with oversight agencies in a seamless and automated way. Another innovative capability developed by the ARRA program is the creation of the ARRA data warehouse which pulled data from several other transactional data systems such as the construction management system, the Statewide Transportation Improvement Program, and Fiscal Management Information System for management and reporting purposes. This tool has helped streamline information access and communications across the agency and with the public.
Figure 11: NYSDOT’s ARRA Portal presents a variety of information on programs and projects funded
through the ARRA.
State GIS Clearinghouse
In addition to implementing the ELRS, NYSDOT also participates with other State agencies on data-sharing efforts. For example, NYSDOT contributes data to the State GIS Clearinghouse, which is maintained by the State’s Office of Information Technology Services. This publically accessible clearinghouse compiles and shares geospatial information from over 1,000 Federal, local, and State agencies—as well as Tribal governments, non-profits, and academic organizations. GIS Clearinghouse contributors are by definition also part of the NYS GIS Data Sharing Cooperative. While many GIS datasets on the GIS Clearinghouse are available for public download, some datasets are only restricted to Cooperative members (public sector, not-for-profit, academia). Cooperative members must sign a data-sharing agreement that outlines the terms through which geospatial data is shared.
Open NY
NYSDOT also contributes data to Open NY, a data portal launched in 2013 per Executive Order 95. Open NY serves as a one-stop data portal for all of New York State’s agencies. New York recognized that modern technological advancements and the use of data have dramatically changed the way government conducts business. New York provided an innovative means to harness these innovations and meet public expectations with respect to the accessibility of government data and information. Open NY created an extraordinary opportunity to explore, discover, and utilize data in ways never before possible.
NYSDOT: ELRS and Other Data-Sharing Efforts
47
Through Open NY, New York State is promoting transparency, accountability, and efficiency; supporting a new level of collaboration between government and the public; and fostering innovation, business development, and scientific research. The portal includes downloadable datasets compiled from State agencies providing direct access to a significant amount of data. NYSDOT data sets include bridge and pavement conditions, 511 information, Annual Average Daily Traffic (AADT) and a host of other data sets.
ShareGIS
NYSDOT staff also contribute to the State’s ShareGIS initiative. In May 2013, the State’s Office of the Information Technology Services established New York’s first Geographic Information Officer (GIO). Since that time, the GIO has been working with an advisory group of agency GIS leads on a number of enterprise geospatial initiatives to standardize the State’s geospatial data, making this data more widely available to agencies as well as the general public. To implement this vision, the GIO and GIS Team are exploring options to expand the functionality of the GIS Clearinghouse. The resulting portal will be called ShareGIS. As conceptualized by the GIO and GIS Team, the main difference between the existing GIS Clearinghouse and ShareGIS is that the latter will host live GIS data via web services, which means users will be able to access current and authoritative information directly from GIS software or custom applications without first needing to download and store the data. ShareGIS will provide capabilities similar to UDOT’s UPLAN, but the scope is larger because it is envisioned to eventually serve all State and local agencies as well as the general public. While ShareGIS is likely to leverage the Esri ArcGIS Online platform, ShareGIS will be capable of providing geospatial data and geoprocessing services from any proprietary or open source technology. Ultimately, ShareGIS may replace the GIS Clearinghouse entirely, but ShareGIS is still in the early stages of development. NYSDOT expects that ShareGIS will rapidly expand over time as more users contribute information and take advantage of the current and authoritative data sources available through the portal.
Data-Sharing Benefits NYSDOT reported several benefits stemming from its data-sharing efforts, including:
• More strategic decision-making and improved efficiencies. NYSDOT noted that ELRS users will be able to geolocate anything along the highway system according to a common linear referencing method. This will make it easier to properly maintain transportation assets and other roadway information (e.g., crashes, pavement conditions, traffic counts) as changes to the highway system are made. In the broader sense, the ELRS will help provide a common “language” that will help users more effectively communicate with one another, prioritize projects, and make more informed and strategic investment decisions. Further, through the ELRS, NYSDOT will only need to complete updates to safety, asset management, and roadway attribute data once, rather than multiple times as is currently necessary (since currently many of the existing applications contain overlapping datasets). Overall, ELRS will streamline data collection and maintenance, which will likely lead to improved efficiencies for the agency.
• Increased transparency and data accessibility. Once completed, NYSDOT anticipates that
ShareGIS will improve data-sharing between Federal, State, and local agencies by making data more accessible to all parties. The ShareGIS portal will allow a broad range of stakeholders, including the public, to access data on demand and will minimize uncertainty about where to locate certain datasets that are now housed in disparate locations.
Additional Resources State of New York Executive Order on “Using Technology to Promote Transparency, Improve Government Performance and Enhance Citizen Engagement” – March 2013
NDOT: PLANS
48
NEVADA DOT: PLANNING AND NEEDS SYSTEM Summary Nevada DOT’s (NDOT) Planning and Needs System (PLANS) will be a centralized portal for collecting, maintaining, and tracking geospatial information and other data related to transportation projects at all stages of development. PLANS is still in the early stages of evolution and has not yet been implemented. NDOT anticipates that PLANS will help the agency take a more comprehensive view of transportation projects to streamline project development, improve communications and information-sharing with partner agencies and the public, and make transportation decision-making more transparent.
Background The need for PLANS emerged from a NDOT meeting on FHWA’s Every Day Counts (EDC) initiative. During that meeting, staff determined that NDOT was using several different systems for tracking transportation project needs and project development. Staff identified an opportunity to consolidate this information into a single GIS-based platform. This platform—now known as PLANS—will present a holistic view of transportation projects at all stages of development from needs identification to planning to implementation. PLANS will also allow users to visualize where projects are located and how they interact with environmental or other features. NDOT believes that shifting to a needs-based system (as represented by PLANS) will help staff make more strategic project decisions and support collaboration earlier in the planning phase.
Current Processes
NDOT envisions that PLANS will replace the current process for collecting project information from counties and districts, which involves conducting annual outreach to learn about project updates. Information is generally gathered from paper maps and there is no common framework that allows NDOT to take a strategic view of the State’s planned, ongoing, and constructed transportation projects. Currently, NDOT has some cooperative agreements (each covering a two- to four-year period) with counties to outline formal guidelines for geospatial data-sharing, such as for county road data and raster or vector GIS data. NDOT is also developing a separate agreement with utility companies to obtain utilities geospatial data. Engaging in data-sharing agreements; however, has not been a major priority for NDOT; furthermore, the process of obtaining geospatial data from partner agencies has generally occurred on an ad hoc basis. NDOT anticipates that, once fully implemented, PLANS will be a repository for storing and managing project information, as well as a mechanism for gathering information in a more strategic, organized way.
Implementation
Implementing PLANS will be a phased effort that will include participation from various NDOT business units, including the Location Division/GIS Section and Department of Public Involvement & Planning. In the first phase, NDOT put applications for project funding into a single format, shared these online, and developed a project initiation form. As a next step, NDOT will produce an electronic Statewide Transportation Improvement Plan (E-STIP) for fiscal year 2016. This E-STIP will provide a basis for conducting a workflow analysis to better understand how project data are currently collected, managed, and shared within the agency. NDOT will then create an online application form and interactive map through which users can select a GIS data point to identify a project location. In the second phase, NDOT will issue a request for proposals (RFP) to further develop a PLANS workflow, create a system architecture, and detail the process for integrating various data layers that are currently owned and managed by various stakeholders within and outside of NDOT. Users will be able to search for and view transportation needs in a given area and better evaluate potential projects as a result. NDOT expects that PLANS will ultimately be accessible to all external partner agencies across the State (such as metropolitan planning organizations) as well as the public; however, NDOT will likely retain the ability to approve and control what partner data are shared through PLANS.
NDOT: PLANS
49
Challenges
NDOT has encountered several challenges related to developing PLANS including staffing limitations and changes in leadership that have made it difficult to build forward momentum on the project. Additionally, project data are now “siloed” in different locations throughout the agency, making it difficult to identify where information is located and determine how to integrate it into one framework. Finally, it has been challenging for NDOT to encourage the organizational changes that will be necessary to fully implement PLANS, such as changing NDOT’s culture from a project-driven environment to a needs-driven one. NDOT has found several helpful resources to address these challenges. For example, NDOT has referenced other State data-sharing and integration models—particularly the Utah DOT’s UPLAN—to discern lessons learned that could be applicable to PLANS. NDOT has also worked with FHWA representatives to develop the list of project sites, E-STIP, and RFP submissions.
Data-Sharing Benefits • Consolidating project information can facilitate streamlined project development. NDOT expects
that PLANS will help the agency better assess potential project impacts before they arise. For example, PLANS might allow a user to identify potential right-of-way issues and project alternatives or mitigation options during a project’s early design phase. This will likely help avoid issues in projects’ later phases, leading to cost savings and more streamlined development.
• Visualizing projects can help set priorities. PLANS will provide an opportunity to visualize all
transportation projects and how they might interact. As a result, PLANS users will be able to identify how various projects might be “bundled” together to leverage resources, reduce redundancies, and achieve greater impacts than if they were implemented one at a time. Overall, NDOT believes that having the ability to visualize transportation projects will support the agency in strategically evaluating its project needs and priorities at a high level, as well as improved project analyses.
• Improved collaboration and accountability. NDOT noted that PLANS will likely support inter/intra-
agency collaboration in project development since users will be able to view the same information through a common framework. Further, NDOT hopes that PLANS will make it easier and faster to find information, which will generally support more effective communication among users. Finally, NDOT expects that PLANS will improve agency accountability by making project information more accessible and transparent to internal staff, external partners, and the public.
Additional Resources NDOT Location Division/GIS Section NDOT Department of Public Involvement & Planning

NCDOT: SDV, Go!NC, and NC OneMap
50
NORTH CAROLINA DOT: SPATIAL DATA VIEWER, GO!NC, AND NC ONE MAP Summary The North Carolina DOT (NCDOT) developed the Spatial Data Viewer (SDV), an ArcGIS Explorer-based data library, to consolidate and spatially enable over 40 of the agency’s transportation and environmental data layers, including highway infrastructure, county/municipal boundaries, topography, and hydrography. Most recently, NCDOT linked the SDV to a larger effort called Go!NC. Go!NC is an Esri ArcGIS Online (AGOL)-based data portal that consolidates, aggregates, and shares the agency’s geospatial information with users both within and outside NCDOT. NCDOT also makes its geospatial data available to NC OneMap, a statewide geospatial data portal administered by the NC Geographic Information Coordinating Council.
Background
SDV and Go!NC
NCDOT initially developed the SDV as an internal tool to consolidate the agency’s geospatial data and allow staff access to data in one location, create and comment on maps, and easily share data with others. The SDV was designed for a technical user. Due to its governance structure, users were unable to publish data to the library on their own (publishing data was a multi-step process involving a review by information technology staff). As NCDOT learned of new web-based data-sharing technologies, the agency began to explore ways to develop a “second generation” SDV that could serve a broader range of users—including those without advanced GIS expertise—and support more streamlined data publishing. NCDOT identified AGOL as a useful data-sharing platform that could potentially replace or complement the SDV based on several factors. First, AGOL allows refinement of user permission levels. An administrator can provide certain users or user groups with the ability to view, edit, or publish data, or do all three. Users can therefore publish data on their own. Second, AGOL has cloud-based data storage options, which NCDOT believed would help expand its ability to share more information with more users. To learn from others’ experiences in using AGOL, NCDOT joined the American Association of State Highway and Transportation Officials’ (AASHTO) Technology Implementation Group (TIG), which focused on sharing the Utah Department of Transportation’s UPLAN model. As a member of the TIG, NCDOT focused on developing an NCDOT AGOL site called Go!NC, which was launched in October 2013. Go!NC is publically accessible and aggregates a wide variety of data layers and mapping applications from across NCDOT. These data layers and mapping applications provide information on environmental features, boundaries, transportation infrastructure, and others. NCDOT anticipates that in the future, external stakeholders, including other State agencies, will be able to contribute to Go!NC as well. The now publically accessible SDV is no longer considered to be NCDOT’s primary data portal (although it contains information reflected in Go!NC). Rather, NCDOT considers SDV to be a companion tool to Go!NC. SDV supports more advanced business analysis that goes beyond the functionality of Go!NC and allows different users to access highly customized datasets or views. For example, the North Carolina State Ports Authority (NC Ports), which is part of NCDOT, uses the SDV to access its own customized viewer for published NCDOT data. Go!NC is administered by a steering committee comprised of six staff within NCDOT’s GIS unit. This administrative group sets some quality control standards, minimum metadata standards, and has outlined roles and responsibilities for various data owners within NCDOT. These standards reduce the likelihood of publishing duplicative or poor quality datasets, and makes clear which owners will be responsible for specific datasets. When a business unit within NCDOT wants to publish data to the site, it discusses the quality control standards with the Go!NC administrative group. The group will then designate specific
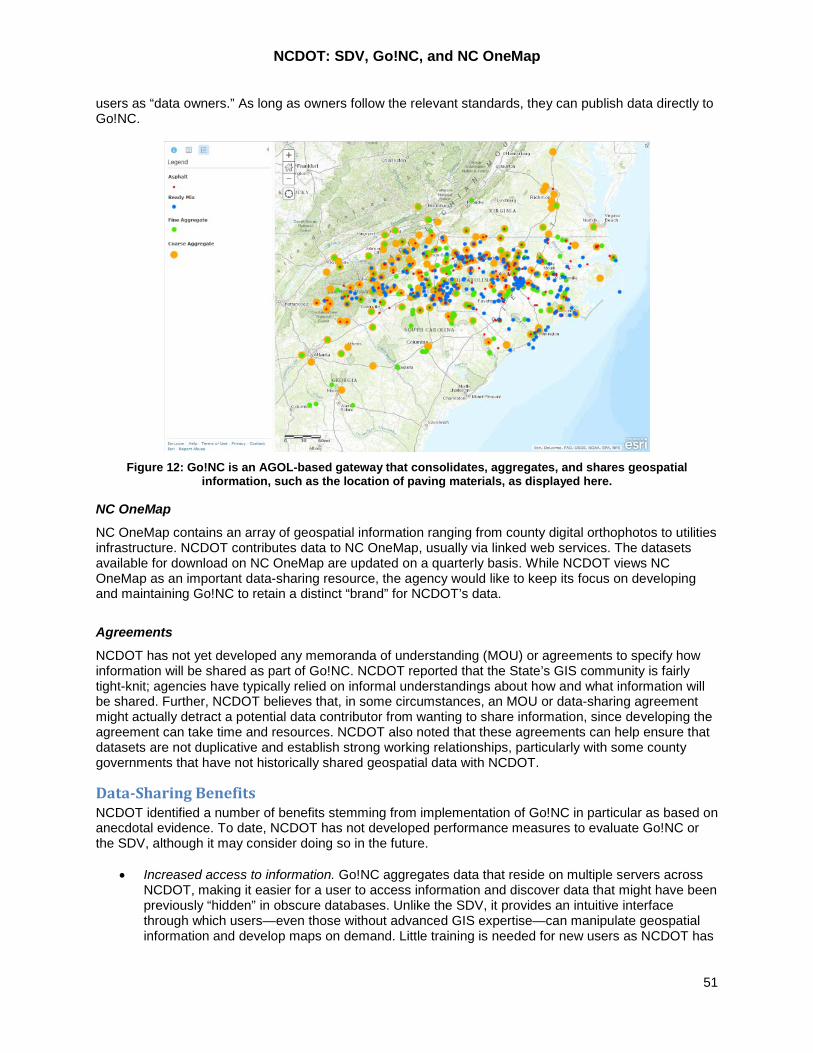
NCDOT: SDV, Go!NC, and NC OneMap
51
users as “data owners.” As long as owners follow the relevant standards, they can publish data directly to Go!NC.
Figure 12: Go!NC is an AGOL-based gateway that consolidates, aggregates, and shares geospatial
information, such as the location of paving materials, as displayed here.
NC OneMap
NC OneMap contains an array of geospatial information ranging from county digital orthophotos to utilities infrastructure. NCDOT contributes data to NC OneMap, usually via linked web services. The datasets available for download on NC OneMap are updated on a quarterly basis. While NCDOT views NC OneMap as an important data-sharing resource, the agency would like to keep its focus on developing and maintaining Go!NC to retain a distinct “brand” for NCDOT’s data.
Agreements
NCDOT has not yet developed any memoranda of understanding (MOU) or agreements to specify how information will be shared as part of Go!NC. NCDOT reported that the State’s GIS community is fairly tight-knit; agencies have typically relied on informal understandings about how and what information will be shared. Further, NCDOT believes that, in some circumstances, an MOU or data-sharing agreement might actually detract a potential data contributor from wanting to share information, since developing the agreement can take time and resources. NCDOT also noted that these agreements can help ensure that datasets are not duplicative and establish strong working relationships, particularly with some county governments that have not historically shared geospatial data with NCDOT.
Data-Sharing Benefits NCDOT identified a number of benefits stemming from implementation of Go!NC in particular as based on anecdotal evidence. To date, NCDOT has not developed performance measures to evaluate Go!NC or the SDV, although it may consider doing so in the future.
• Increased access to information. Go!NC aggregates data that reside on multiple servers across NCDOT, making it easier for a user to access information and discover data that might have been previously “hidden” in obscure databases. Unlike the SDV, it provides an intuitive interface through which users—even those without advanced GIS expertise—can manipulate geospatial information and develop maps on demand. Little training is needed for new users as NCDOT has
NCDOT: SDV, Go!NC, and NC OneMap
52
developed and made available simple training videos. For example, several staff from NCDOT’s Environmental Programs group recently used Go!NC to develop a map showing wetland mitigation locations. Prior to Go!NC, building this map would have required the environmental staff to submit a request to NCDOT’s GIS unit or make use of SDV’s long and complex publication process. Users can now pull and visualize data on their own in a shorter amount of time. Overall, Go!NC is expanding users’ access to information.
• Increased efficiencies. Before Go!NC, NCDOT’s GIS unit didn’t have the capacity to develop all of
the mapping applications business units requested. Go!NC empowers business units to develop and manage their own maps and data, allowing them to meet their own needs. For example, NCDOT’s Geotechnical Engineering Unit was able to develop a map of borehole locations in a relatively short amount of time using Go!NC. This will help the agency’s planners, engineers, and others make more strategic decisions about where transportation-related construction activities can take place. As another example, NCDOT’s Photogrammetry Unit is able to publish data on Go!NC within a short amount of time after new imagery is obtained (e.g., after a hurricane when storm paths are flown). Prior to Go!NC, publishing imagery to the SDV or making this imagery available through other databases would have taken a long time and been more complex.
• Better communication and leveraged resources. Go!NC is used by a wide range of NCDOT’s
partner agencies, including the State Wildlife Resources Commission and Department of Health and Human Services. NCDOT believes that Go!NC is helping establish a foundation for improved inter-agency coordination since multiple agencies can look to one location for geospatial data. Furthermore, Go!NC is allowing State agencies with limited geospatial resources an opportunity to access more information than they would be able to otherwise.
NDDOT: AGOL Site
53
NORTH DAKOTA DOT: ARCGIS ONLINE SITE Summary The North Dakota DOT (NDDOT) recently implemented an Esri ArcGIS Online (AGOL)-based data portal that serves as a publically accessible and centralized “aggregator” of NDDOT’s geospatial data and mapping applications.
Background NDDOT launched its AGOL site in fall 2013. NDDOT’s Information Technology Unit (ITU) is still in the early stages of rolling out this site and publicizing it to users both within and outside NDDOT. ITU anticipates that the data being shared through AGOL currently and in the future will support agency staff in more effective transportation planning, project development, and asset management. ITU also expects the site to assist the traveling public. For example, the site contains a travel information map through which the public can identify real-time traffic conditions and make better decisions about when and how to travel. Through developing the NDDOT AGOL site, ITU intends to provide agency staff and others with easier, more efficient access to the agency’s existing mapping applications, as well as a more standardized visual experience for consuming geospatial information. ITU identified AGOL as one of many ways to expose the agency’s spatial data to external users and to create a user-friendly interface for collecting and visualizing existing information. The site does not store any data but rather helps aggregate existing data that may be “housed” in disparate servers across the agency. The site currently offers links for easy access to seven non-AGOL mapping applications, including:
• Travel Information Map: Shows real-time traffic conditions for major roads across the State. This map is currently one of the most popular applications on NDDOT’s AGOL site, as assessed through Google Analytics (which shows the map receives on average approximately 200,000 hits per day during snow events).
• Transportation Information Map: Provides traffic counts for at least the most recent year. Users may add layers by specific highway, county, or city.
• ND Roads: A mobile version of the Travel Information Map (see Figure 13), compatible with most smartphones.
• Quick Maps: Provides the ability to develop highly customized maps using multiple datasets, imagery, and other types of datasets.
• NDDOT Imagery Swipe: Allows users to view two maps side-by-side and easily observe and compare information on both maps.
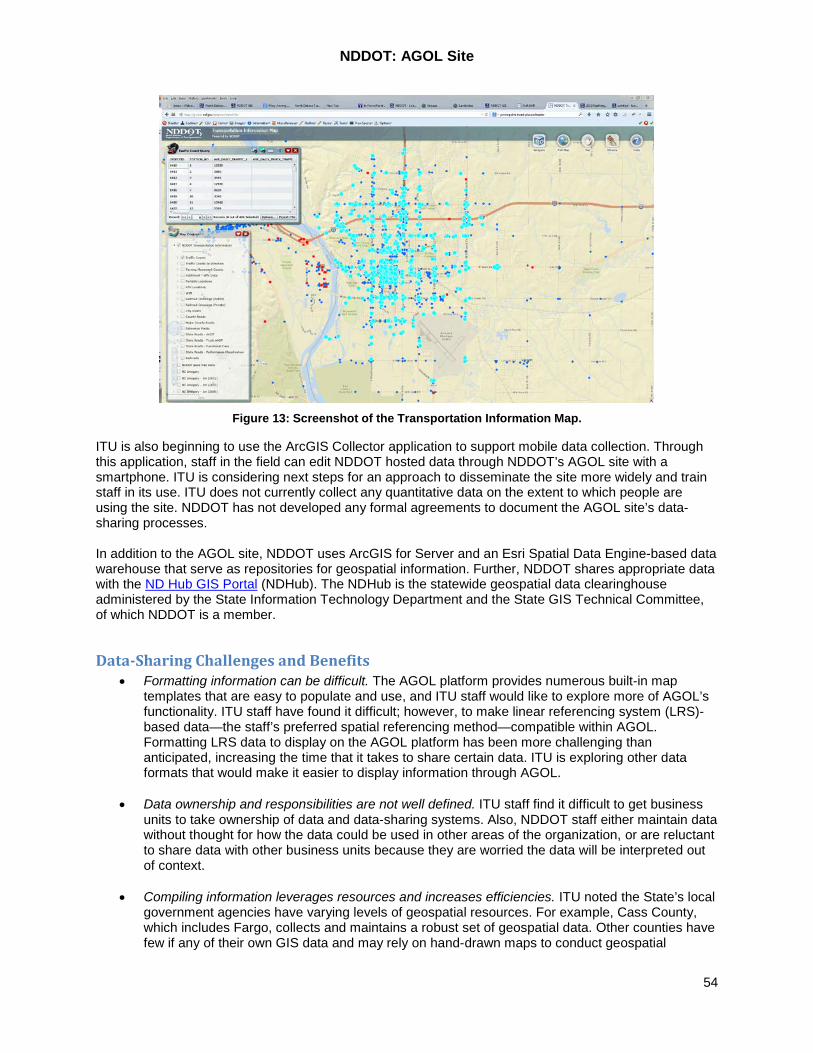
NDDOT: AGOL Site
54
Figure 13: Screenshot of the Transportation Information Map.
ITU is also beginning to use the ArcGIS Collector application to support mobile data collection. Through this application, staff in the field can edit NDDOT hosted data through NDDOT’s AGOL site with a smartphone. ITU is considering next steps for an approach to disseminate the site more widely and train staff in its use. ITU does not currently collect any quantitative data on the extent to which people are using the site. NDDOT has not developed any formal agreements to document the AGOL site’s data-sharing processes. In addition to the AGOL site, NDDOT uses ArcGIS for Server and an Esri Spatial Data Engine-based data warehouse that serve as repositories for geospatial information. Further, NDDOT shares appropriate data with the ND Hub GIS Portal (NDHub). The NDHub is the statewide geospatial data clearinghouse administered by the State Information Technology Department and the State GIS Technical Committee, of which NDDOT is a member.
Data-Sharing Challenges and Benefits • Formatting information can be difficult. The AGOL platform provides numerous built-in map
templates that are easy to populate and use, and ITU staff would like to explore more of AGOL’s functionality. ITU staff have found it difficult; however, to make linear referencing system (LRS)-based data—the staff’s preferred spatial referencing method—compatible within AGOL. Formatting LRS data to display on the AGOL platform has been more challenging than anticipated, increasing the time that it takes to share certain data. ITU is exploring other data formats that would make it easier to display information through AGOL.
• Data ownership and responsibilities are not well defined. ITU staff find it difficult to get business units to take ownership of data and data-sharing systems. Also, NDDOT staff either maintain data without thought for how the data could be used in other areas of the organization, or are reluctant to share data with other business units because they are worried the data will be interpreted out of context.
• Compiling information leverages resources and increases efficiencies. ITU noted the State’s local government agencies have varying levels of geospatial resources. For example, Cass County, which includes Fargo, collects and maintains a robust set of geospatial data. Other counties have few if any of their own GIS data and may rely on hand-drawn maps to conduct geospatial
NDDOT: AGOL Site
55
analyses. Furthermore, there are no statewide standards for geospatial metadata or data formats to which local government agencies must adhere. ITU anticipates the NDDOT AGOL site will help local government agencies access geospatial data that they might not otherwise have.
• Data-sharing can help spur more extensive coordination. Because the AGOL site provides a
standard “look and feel” for data, local government agencies (and others) will be able to access the same information, in the same format, at the same time. This will likely support better communication and coordination across agencies, reducing both the time and cost of transportation decision-making. Overall, ITU sees AGOL as a way to provide users with a familiar, intuitive interface for accessing information.
Additionally, as part of its overall effort to develop and publicize the AGOL site, ITU staff are coordinating with staff from the State’s Game and Fish Department, Information Technology Department, and the Department of Emergency Services through a statewide initiative called Visual ND. Through Visual ND, these agencies are sharing mapping applications and data from their own AGOL sites with a centralized AGOL site. Participating agencies will promote this centralized AGOL site through a coordinated effort. Through this coordination, ITU aims to develop a more strategic and consistent approach to sharing the State’s geospatial information. NDDOT believes that Visual ND will make it easier for users to access the information they need and will facilitate decision-making for State and local government agencies, and others.
Additional Resources North Dakota Geographic Information Systems
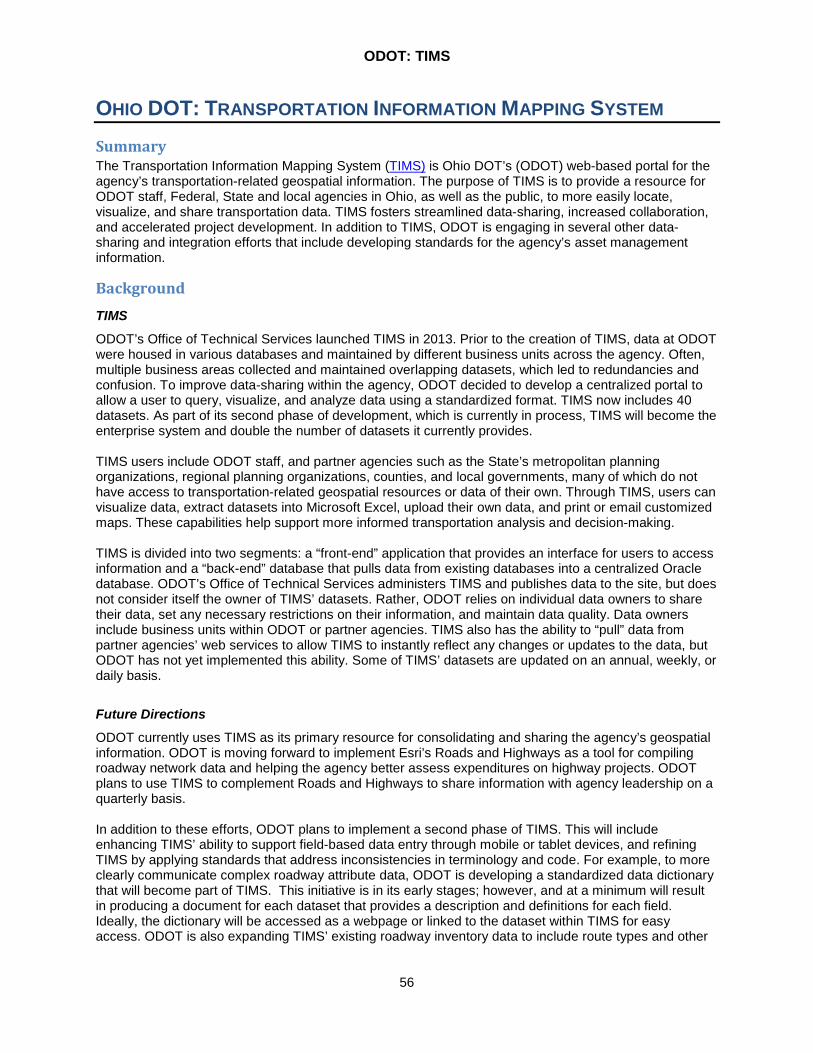
ODOT: TIMS
56
OHIO DOT: TRANSPORTATION INFORMATION MAPPING SYSTEM Summary The Transportation Information Mapping System (TIMS) is Ohio DOT’s (ODOT) web-based portal for the agency’s transportation-related geospatial information. The purpose of TIMS is to provide a resource for ODOT staff, Federal, State and local agencies in Ohio, as well as the public, to more easily locate, visualize, and share transportation data. TIMS fosters streamlined data-sharing, increased collaboration, and accelerated project development. In addition to TIMS, ODOT is engaging in several other data-sharing and integration efforts that include developing standards for the agency’s asset management information.
Background
TIMS
ODOT’s Office of Technical Services launched TIMS in 2013. Prior to the creation of TIMS, data at ODOT were housed in various databases and maintained by different business units across the agency. Often, multiple business areas collected and maintained overlapping datasets, which led to redundancies and confusion. To improve data-sharing within the agency, ODOT decided to develop a centralized portal to allow a user to query, visualize, and analyze data using a standardized format. TIMS now includes 40 datasets. As part of its second phase of development, which is currently in process, TIMS will become the enterprise system and double the number of datasets it currently provides. TIMS users include ODOT staff, and partner agencies such as the State’s metropolitan planning organizations, regional planning organizations, counties, and local governments, many of which do not have access to transportation-related geospatial resources or data of their own. Through TIMS, users can visualize data, extract datasets into Microsoft Excel, upload their own data, and print or email customized maps. These capabilities help support more informed transportation analysis and decision-making. TIMS is divided into two segments: a “front-end” application that provides an interface for users to access information and a “back-end” database that pulls data from existing databases into a centralized Oracle database. ODOT’s Office of Technical Services administers TIMS and publishes data to the site, but does not consider itself the owner of TIMS’ datasets. Rather, ODOT relies on individual data owners to share their data, set any necessary restrictions on their information, and maintain data quality. Data owners include business units within ODOT or partner agencies. TIMS also has the ability to “pull” data from partner agencies’ web services to allow TIMS to instantly reflect any changes or updates to the data, but ODOT has not yet implemented this ability. Some of TIMS’ datasets are updated on an annual, weekly, or daily basis.
Future Directions
ODOT currently uses TIMS as its primary resource for consolidating and sharing the agency’s geospatial information. ODOT is moving forward to implement Esri’s Roads and Highways as a tool for compiling roadway network data and helping the agency better assess expenditures on highway projects. ODOT plans to use TIMS to complement Roads and Highways to share information with agency leadership on a quarterly basis. In addition to these efforts, ODOT plans to implement a second phase of TIMS. This will include enhancing TIMS’ ability to support field-based data entry through mobile or tablet devices, and refining TIMS by applying standards that address inconsistencies in terminology and code. For example, to more clearly communicate complex roadway attribute data, ODOT is developing a standardized data dictionary that will become part of TIMS. This initiative is in its early stages; however, and at a minimum will result in producing a document for each dataset that provides a description and definitions for each field. Ideally, the dictionary will be accessed as a webpage or linked to the dataset within TIMS for easy access. ODOT is also expanding TIMS’ existing roadway inventory data to include route types and other
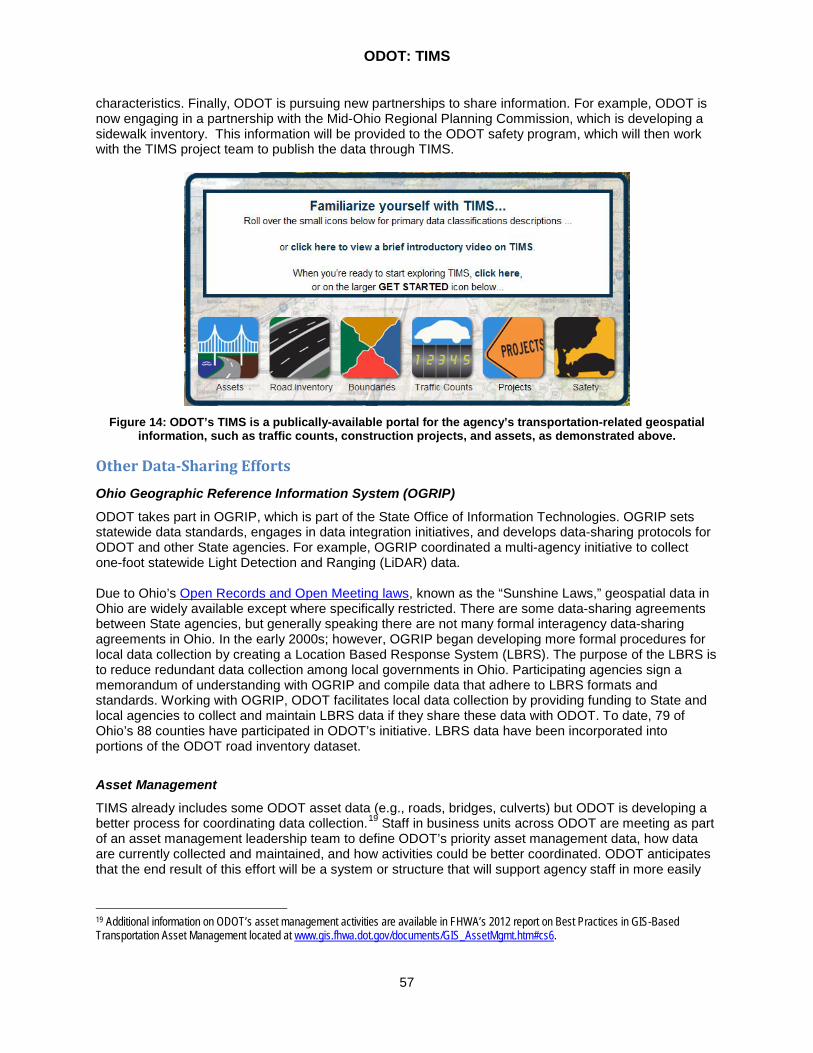
ODOT: TIMS
57
characteristics. Finally, ODOT is pursuing new partnerships to share information. For example, ODOT is now engaging in a partnership with the Mid-Ohio Regional Planning Commission, which is developing a sidewalk inventory. This information will be provided to the ODOT safety program, which will then work with the TIMS project team to publish the data through TIMS.
Figure 14: ODOT’s TIMS is a publically-available portal for the agency’s transportation-related geospatial
information, such as traffic counts, construction projects, and assets, as demonstrated above.
Other Data-Sharing Efforts
Ohio Geographic Reference Information System (OGRIP)
ODOT takes part in OGRIP, which is part of the State Office of Information Technologies. OGRIP sets statewide data standards, engages in data integration initiatives, and develops data-sharing protocols for ODOT and other State agencies. For example, OGRIP coordinated a multi-agency initiative to collect one-foot statewide Light Detection and Ranging (LiDAR) data. Due to Ohio’s Open Records and Open Meeting laws, known as the “Sunshine Laws,” geospatial data in Ohio are widely available except where specifically restricted. There are some data-sharing agreements between State agencies, but generally speaking there are not many formal interagency data-sharing agreements in Ohio. In the early 2000s; however, OGRIP began developing more formal procedures for local data collection by creating a Location Based Response System (LBRS). The purpose of the LBRS is to reduce redundant data collection among local governments in Ohio. Participating agencies sign a memorandum of understanding with OGRIP and compile data that adhere to LBRS formats and standards. Working with OGRIP, ODOT facilitates local data collection by providing funding to State and local agencies to collect and maintain LBRS data if they share these data with ODOT. To date, 79 of Ohio’s 88 counties have participated in ODOT’s initiative. LBRS data have been incorporated into portions of the ODOT road inventory dataset.
Asset Management
TIMS already includes some ODOT asset data (e.g., roads, bridges, culverts) but ODOT is developing a better process for coordinating data collection.19 Staff in business units across ODOT are meeting as part of an asset management leadership team to define ODOT’s priority asset management data, how data are currently collected and maintained, and how activities could be better coordinated. ODOT anticipates that the end result of this effort will be a system or structure that will support agency staff in more easily
19 Additional information on ODOT’s asset management activities are available in FHWA’s 2012 report on Best Practices in GIS-Based Transportation Asset Management located at www.gis.fhwa.dot.gov/documents/GIS_AssetMgmt.htm#cs6.
ODOT: TIMS
58
accessing and using asset management information. This system might be integrated as part of TIMS’ second phase.
Data-Sharing Benefits • Improved data quality. Sharing local roadway data through OGRIP has benefitted local agencies
across Ohio as well as ODOT itself. In setting a standard for roadway data, OGRIP and the LBRS have helped local agencies leverage data resources and reduce areas of redundancy. The LBRS has also helped local agencies take ownership over roadway datasets to keep them more accurate, complete, and current, which subsequently helps ensure the quality of any information passed on to ODOT and FHWA. The LBRS has also allowed Ohio as a whole to develop a relatively unified set of statewide roadway information.
• Better decision-making and increased efficiencies. ODOT is using software to monitor web traffic
on TIMS. Through this and other strategies, ODOT has found that TIMS is allowing users to access, share, and easily visualize data, as well as to manipulate information in new ways. As a result of TIMS, ODOT is identifying opportunities to leverage information, make data more usable across the agency, and streamline information access. These have led to increased efficiencies in many different activities across the agency. For example, ODOT maintenance crews are now using TIMS to identify how and where their activities (e.g., mowing) might intersect with areas of environmental concern to help protect sensitive environmental resources on ODOT-owned rights-of-way. Finally, because TIMS makes information more broadly accessible, users have an increased motivation to keep their data up-to-date, which has helped improve the overall quality of datasets and has generally informed decision-making statewide.
Additional Resources Transportation Information Mapping System (TIMS) Introductory Video FHWA 2013 case study report on Uses of Cloud Technologies for Geospatial Applications: Case Study on Mid-Ohio Regional Planning Commission (MORPC) ODOT’s Office of Environmental Services (OES) has data-sharing agreements with the Ohio Department of Natural Resources and the SHPO (to share information on culturally or historically sensitive information that impacts infrastructure projects) that can be shared upon request.
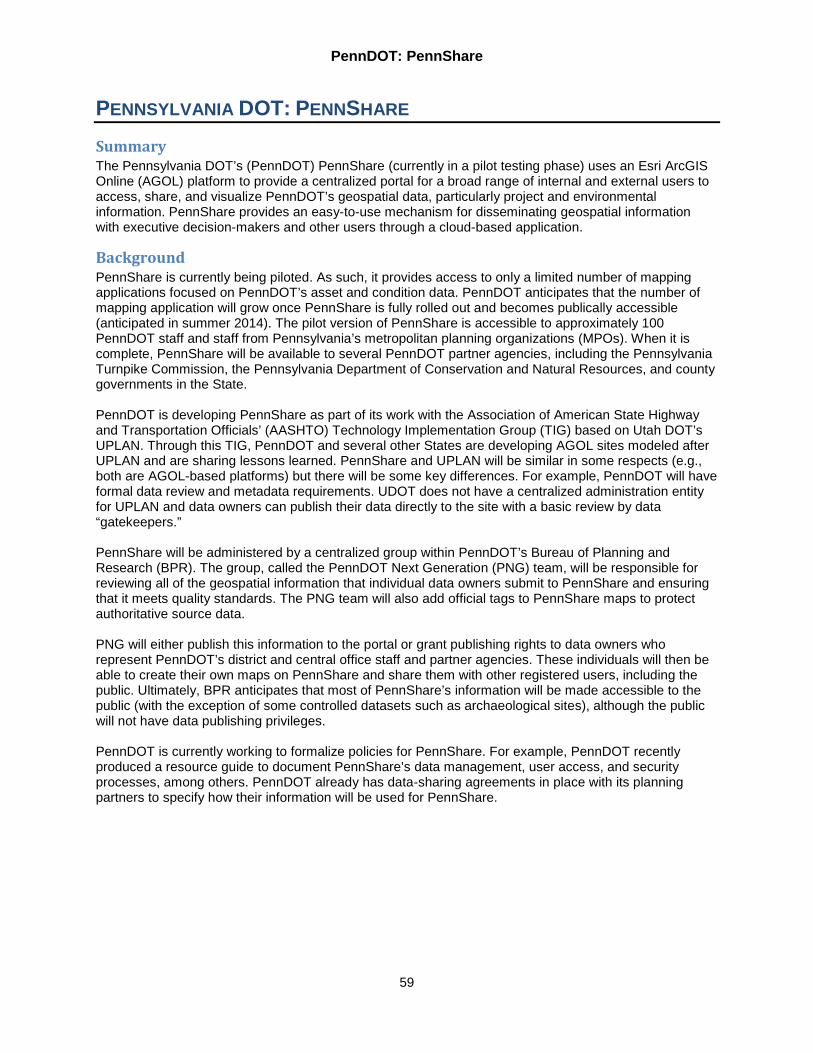
PennDOT: PennShare
59
PENNSYLVANIA DOT: PENNSHARE Summary The Pennsylvania DOT’s (PennDOT) PennShare (currently in a pilot testing phase) uses an Esri ArcGIS Online (AGOL) platform to provide a centralized portal for a broad range of internal and external users to access, share, and visualize PennDOT’s geospatial data, particularly project and environmental information. PennShare provides an easy-to-use mechanism for disseminating geospatial information with executive decision-makers and other users through a cloud-based application.
Background PennShare is currently being piloted. As such, it provides access to only a limited number of mapping applications focused on PennDOT’s asset and condition data. PennDOT anticipates that the number of mapping application will grow once PennShare is fully rolled out and becomes publically accessible (anticipated in summer 2014). The pilot version of PennShare is accessible to approximately 100 PennDOT staff and staff from Pennsylvania’s metropolitan planning organizations (MPOs). When it is complete, PennShare will be available to several PennDOT partner agencies, including the Pennsylvania Turnpike Commission, the Pennsylvania Department of Conservation and Natural Resources, and county governments in the State. PennDOT is developing PennShare as part of its work with the Association of American State Highway and Transportation Officials’ (AASHTO) Technology Implementation Group (TIG) based on Utah DOT’s UPLAN. Through this TIG, PennDOT and several other States are developing AGOL sites modeled after UPLAN and are sharing lessons learned. PennShare and UPLAN will be similar in some respects (e.g., both are AGOL-based platforms) but there will be some key differences. For example, PennDOT will have formal data review and metadata requirements. UDOT does not have a centralized administration entity for UPLAN and data owners can publish their data directly to the site with a basic review by data “gatekeepers.” PennShare will be administered by a centralized group within PennDOT’s Bureau of Planning and Research (BPR). The group, called the PennDOT Next Generation (PNG) team, will be responsible for reviewing all of the geospatial information that individual data owners submit to PennShare and ensuring that it meets quality standards. The PNG team will also add official tags to PennShare maps to protect authoritative source data. PNG will either publish this information to the portal or grant publishing rights to data owners who represent PennDOT’s district and central office staff and partner agencies. These individuals will then be able to create their own maps on PennShare and share them with other registered users, including the public. Ultimately, BPR anticipates that most of PennShare’s information will be made accessible to the public (with the exception of some controlled datasets such as archaeological sites), although the public will not have data publishing privileges. PennDOT is currently working to formalize policies for PennShare. For example, PennDOT recently produced a resource guide to document PennShare’s data management, user access, and security processes, among others. PennDOT already has data-sharing agreements in place with its planning partners to specify how their information will be used for PennShare.
PennDOT: PennShare
60
Figure 15: The PennDOT Next Generation effort comprises several distinct initiatives.
Data-Sharing Benefits PennDOT decided to work with the AASHTO TIG to develop PennShare after learning about the benefits that UPLAN brought to UDOT. PennDOT reported several benefits that have already emerged from PennShare’s pilot testing phase, but anticipates that others will emerge once PennShare is fully implemented. Some of these benefits may include:
• Visualization is powerful. Prior to PennShare, a PennDOT staff person who needed to create a map would have to work directly with the agency’s geographic information unit to do so. This process might take time and involve several steps. For example, a staff person would first submit a request for a map to the geographic information unit; the unit would create a map for review and make any revisions needed. Now, PennShare is allowing users to access geospatial information and visualize data on demand, and is enabling users to create their own customized maps without requiring support from the geographic information unit.
• Time- and cost-savings justify investments in data systems. Putting GIS data “in the hands of
users” is leading to more efficient and cost-effective transportation analysis. For example, PennDOT’s bridge engineering team used PennShare to develop a map showing the locations of all bridges across the State and their conditions. This represented approximately $100,000 in cost-savings as the agency did not need to procure consultant services to complete the assessment. As another example, PennDOT’s Office of Planning used PennShare to develop a map displaying programmed transportation projects. PennDOT believes this map will help legislators more easily visualize the locations of projects in their respective districts and will be an aid for PennDOT when requesting transportation funding.
• Sharing information supports communication. Prior to PennShare, PennDOT did not have an
effective way to share up-to-date information with the agency’s planning partners. Through PennShare, staff from local agencies will have a way to consume PennDOT’s data as soon as they are published online. This has allowed partners to access the most recent information possible while also improving overall communications between PennDOT and its partners. For example, planning partners now have the ability to access updated datasets on all of PennDOT’s assets.
Data-Sharing Challenges • Formalizing data-sharing processes can help maintain standards but can detract from
information-sharing. PennShare offers greater opportunities for PennDOT to easily share its information with a broader range of users. Some PennDOT staff; however, have expressed
PennDOT: PennShare
61
concerns about publishing and disseminating geospatial information that has not been vetted by the agency. To address these concerns, the PNG developed metadata standards and policies dictating that data must be reviewed by the PNG before being published online. The PNG also set up processes for how data publishing privileges will be assigned. These policies and processes will likely help maintain a common data standard. On the other hand, the PNG acknowledges that these policies may also make it more cumbersome for data owners to share their information and could detract potential owners from wanting to access and utilize the portal.
Additionally, the PNG requires data owners to submit 25 items of metadata for each dataset. This will allow users to have a comprehensive understanding of each dataset, but some data owners have expressed concern that providing the requested metadata will be very time-consuming. This concern has made it difficult to finalize some of the data-sharing agreements between PennDOT and local government agencies.
Additional Resources An example of a PennShare data-agreement between PennDOT and Dauphin County (draft version) is available from John Parker. An example of a 2009 geospatial data-sharing agreement between the Tri-County Regional Planning Commission, Cumberland County, Dauphin County, and Perry County is available from PennDOT. This agreement specifies how GIS information will be exchanged among the signing agencies. AASHTO TIG PennShare Fact Sheet PennShare pilot site
RIDOT: Enterprise Database and Roadway Inventory
62
RHODE ISLAND DOT: ENTERPRISE DATABASE AND ROADWAY INVENTORY Summary The Rhode Island DOT (RIDOT) is collaborating with several State agencies to develop an enterprise GIS database. The purpose of this database is to provide a centralized digital infrastructure for State organizations to share geospatial information. RIDOT is also integrating data stored in its linear referencing systems and developing several other GIS applications that will support data-sharing, increased collaboration, and streamlined project development.
Background
State Enterprise Database
The development of the State enterprise database, which is being funded and led by Rhode Island’s Emergency Management Agency (EMA), was prompted by a series of flooding and weather events in 2010 that led EMA to consider how to better coordinate its data-sharing activities with other State agencies. EMA reached out to RIDOT as a partner and EMA and RIDOT then identified several “core” agencies that represented the State’s primary GIS users—including RIDOT, the Rhode Island Department of Health, the State Department of Administration, the Rhode Island Department of Environmental Management, the Rhode Island Historical Preservation and Heritage Commission (RIHPHC), and EMA. These agencies are working to determine how best to combine datasets into one framework. Ultimately, RIDOT expects the enterprise database will include all State agencies and local municipalities. Currently, the core agencies are the only entities with access to the database. RIDOT noted that another impetus for developing the enterprise database was new reporting requirements for Highway Performance Monitoring System (HPMS) data specified under the Moving Ahead for Progress in the 21st Century Act (MAP-21). RIDOT expects that the database will help agency staff respond to these requirements since it will provide a single repository for data. Initially, the public will not have access to the database because it contains some sensitive data, but RIDOT is considering ways to enable public access in the future, possibly by using Esri’s ArcGIS Online platform. Data owners at the core agencies will be responsible for uploading their information to the database. These data owners will have the ability to implement their own restrictions on published datasets to control what information is being shared.
Linear Referencing System (LRS) Expansion
RIDOT is also implementing Esri Roads and Highways software20 to develop a more comprehensive State roadway inventory. Concurrently, RIDOT has hired a contractor to collect pavement data and other Model Inventory of Roadway Elements (MIRE) data elements on all public roads in Rhode Island; these data will ultimately be included in the LRS.
20 This software allows a user to integrate data from multiple LRSs.
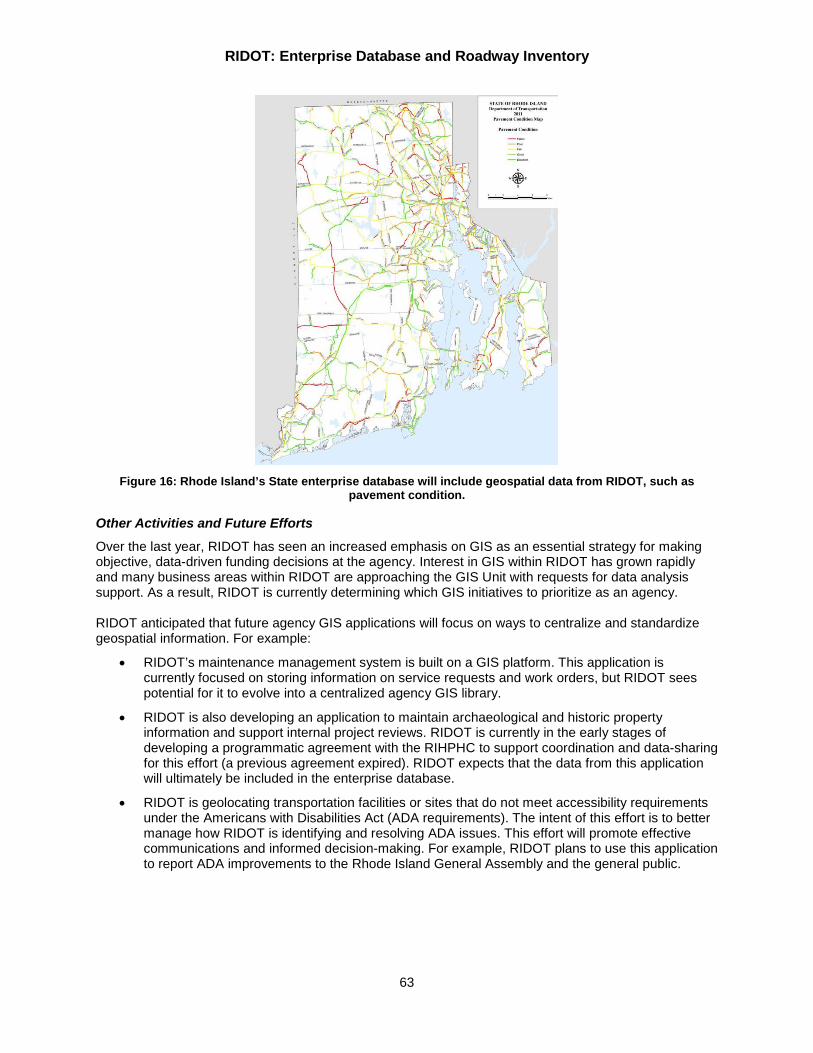
RIDOT: Enterprise Database and Roadway Inventory
63
Figure 16: Rhode Island’s State enterprise database will include geospatial data from RIDOT, such as
pavement condition.
Other Activities and Future Efforts
Over the last year, RIDOT has seen an increased emphasis on GIS as an essential strategy for making objective, data-driven funding decisions at the agency. Interest in GIS within RIDOT has grown rapidly and many business areas within RIDOT are approaching the GIS Unit with requests for data analysis support. As a result, RIDOT is currently determining which GIS initiatives to prioritize as an agency. RIDOT anticipated that future agency GIS applications will focus on ways to centralize and standardize geospatial information. For example:
• RIDOT’s maintenance management system is built on a GIS platform. This application is currently focused on storing information on service requests and work orders, but RIDOT sees potential for it to evolve into a centralized agency GIS library.
• RIDOT is also developing an application to maintain archaeological and historic property information and support internal project reviews. RIDOT is currently in the early stages of developing a programmatic agreement with the RIHPHC to support coordination and data-sharing for this effort (a previous agreement expired). RIDOT expects that the data from this application will ultimately be included in the enterprise database.
• RIDOT is geolocating transportation facilities or sites that do not meet accessibility requirements under the Americans with Disabilities Act (ADA requirements). The intent of this effort is to better manage how RIDOT is identifying and resolving ADA issues. This effort will promote effective communications and informed decision-making. For example, RIDOT plans to use this application to report ADA improvements to the Rhode Island General Assembly and the general public.
RIDOT: Enterprise Database and Roadway Inventory
64
RIDOT noted that there is already a strong foundation of inter-agency geospatial collaboration at the agency. For example, as a member of the Rhode Island’s Geographic Information System (RIGIS)21 Executive Committee, RIDOT coordinates activities and shares data with other RIGIS participants. The RIDOT GIS Unit also works closely with the State Division of Information Technology on many initiatives, including development of the enterprise GIS database and roadway inventory expansion. As RIDOT moves forward to enhance and prioritize its GIS activities, the agency hopes to enhance and expand these partnerships.
Data-Sharing Benefits • Formalized approach to data-sharing. Prior to the development of the enterprise GIS database,
the process of sharing geospatial data among State agencies was fairly informal; requests for data were made to individual agencies on an ad hoc basis. RIDOT also informally shared data with other RIGIS agencies. RIDOT maintained separate databases to store data files from partner agencies (such as cities and towns and other State organizations); because information was stored in disparate locations and were not always accessible to an external agency, it was difficult to share information or for RIDOT to respond to requests for information.
• Interagency collaboration. While the enterprise database is still evolving, RIDOT expects that this
tool will allow participating agencies to upload and share data more easily. Participating agencies will be able to more easily identify upcoming projects, monitor the status of projects, and better coordinate their activities with RIDOT.
• Common statewide reference system. The roadway inventory will be internal to RIDOT, but the
agency expects it will provide a foundation for adding other data from other organizations in Rhode Island, potentially including ecological and archaeological datasets. The expanded inventory will also allow RIDOT to more easily share data with other agencies (through the enterprise GIS database) by providing a common statewide reference system based on roadway milepoints. The new common reference system will allow RIDOT to reference all design projects, maintenance work, preservation work, and utility work in the State into one coordinated location. It will also allow all of RIDOT’s sections and units (e.g., ITS, Safety, Environmental, and Historical) to locate “wish list” projects into the same system, which will allow for these projects to be implemented easily into larger projects. Overall, RIDOT anticipates that this common reference system will facilitate increased collaboration among RIDOT staff and improved transportation decision-making.
Additional Resources Rhode Island Geographic Information System Executive Committee RIDOT Geographic Information Systems Unit
21 RIGIS is a consortium of government agencies and private organizations that manages and distributes the State’s publically available GIS data through the Rhode Island Digital Atlas. RIGIS coordinates with the University of Rhode Island to manage and distribute the Digital Atlas. The RIGIS Executive Committee provides guidance, oversight, and coordination of organizations in Rhode Island that use GIS technology; RIDOT is a member of this committee.
SCDOT: LADC
65
SOUTH CAROLINA DOT: LOCAL AGENCY DATA COLLECTION Summary The South Carolina DOT’s SCDOT Local Agency Data Collection (LADC) program is a GeoMedia and SharePoint-based application that promotes data sharing between local public agencies (LPAs) and SCDOT. The application allows the State’s 46 counties to upload and share local roadway GIS line work and roadway attribute data with SCDOT. The LADC Program features two components. First, LPAs upload data into the LADC Management Portal in SharePoint, which automatically notifies SCDOT that new data has been entered. SCDOT then uses the GeoMedia-based LADC Toolbox to process the data and run quality assurance and quality control (QA/QC). Once this step is complete, SCDOT integrates these data into its Roadway Inventory Management System (RIMS), an Oracle-based system that contains all of the State’s road network information. LADC provides a centralized mechanism through which SCDOT can collect road data across the State and integrate the information into a standardized format within RIMS. By allowing SCDOT to more easily identify local road mileage and attributes, LADC will help SCDOT more accurately allocate funding for local roadways and conduct effective transportation analyses, such as identifying transportation asset locations and analyzing accident locations. LADC takes data that was created by the counties and converts it to a format SCDOT can use, and then eventually sends it to the Federal Highway Administration (FHWA) as part of required Highway Performance Management System (HPMS) reporting. When all counties have shared their data through LADC, SCDOT will have a complete network.
Background Before the development of LADC, SCDOT collected county road information by manually recording road conditions and local assets across the State. Due to limited staffing, SCDOT was unable to consistently record these data and the available datasets were often low quality. SCDOT initially created LADC in order to more easily add locally owned roadway data attributes to RIMS. Later, SCDOT found LADC to be an effective way to address the requirements of the Moving Ahead for Progress in the 21st Century Act (MAP-21), which included new requirements for reporting the mileage of all public roads, including non-State roads. While South Carolina’s counties are not required to participate in LADC, SCDOT encourages them to participate by emphasizing that accurate local roadway data can increase the amount of funding available for local road improvements at the county level. To date, two counties have submitted their local roadway data to SCDOT through LADC. Through these initial submissions, SCDOT has worked to resolve data submission issues such as record duplication, missing data, inconsistent naming, and misaligned roads across municipality boundaries. After each county uploads its information to LADC, SCDOT staff standardize each county’s particular roadway data according to RIMS formats. While LADC primarily serves as a tool to collect information from counties, the application also supports data-sharing between SCDOT and other stakeholders. For example, SCDOT currently makes statewide roadway shapefiles available on its GIS/mapping website and will update the files shared on its website with county information pulled from LADC. SCDOT also anticipates that it will be able to share data collected through LADC with the Department of Public Safety, the business community, the general public, and other potential partners. Ultimately, SCDOT would like all of the State’s 46 counties to use LADC. Currently, SCDOT requests data from a county on an individual basis before that county is added into LADC. SCDOT created a SharePoint-based LADC entry point to allow counties to log in and easily upload their shape files and data dictionaries at their convenience in the future. SCDOT does not have any formal data-sharing agreements with counties for LADC and, when authorized by counties, metropolitan planning organizations and councils of government may submit local roadway data on the counties’ behalf.
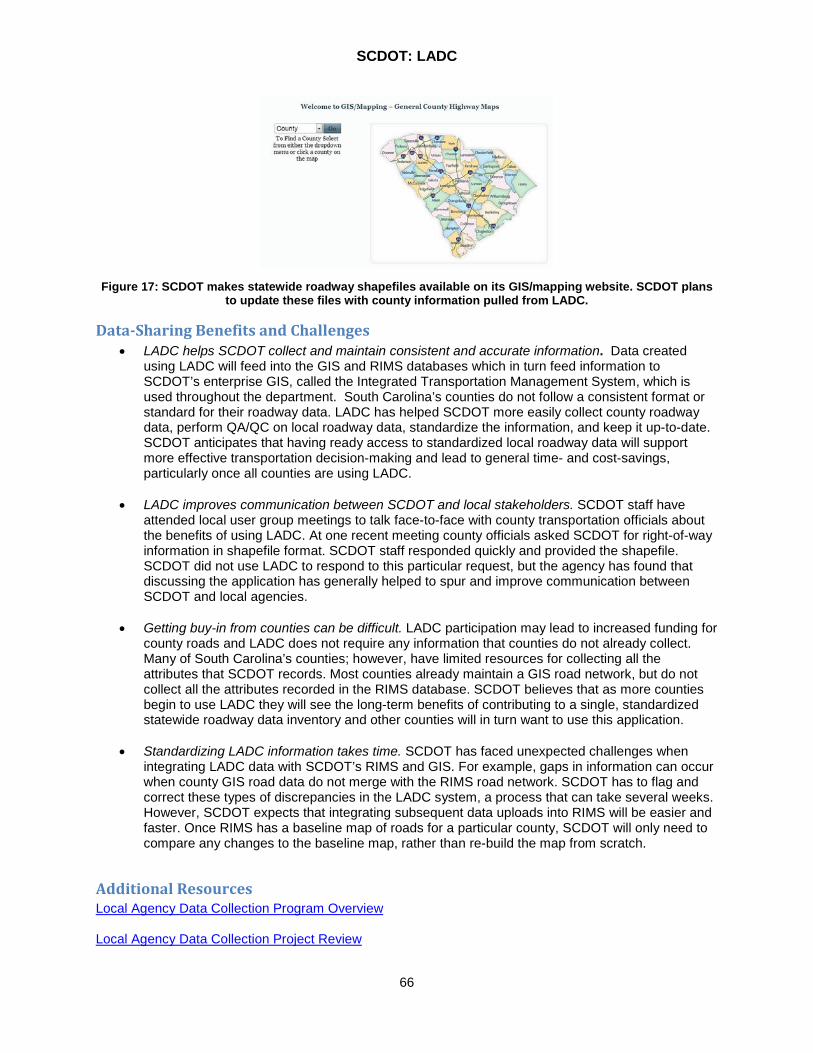
SCDOT: LADC
66
Figure 17: SCDOT makes statewide roadway shapefiles available on its GIS/mapping website. SCDOT plans
to update these files with county information pulled from LADC.
Data-Sharing Benefits and Challenges • LADC helps SCDOT collect and maintain consistent and accurate information. Data created
using LADC will feed into the GIS and RIMS databases which in turn feed information to SCDOT’s enterprise GIS, called the Integrated Transportation Management System, which is used throughout the department. South Carolina’s counties do not follow a consistent format or standard for their roadway data. LADC has helped SCDOT more easily collect county roadway data, perform QA/QC on local roadway data, standardize the information, and keep it up-to-date. SCDOT anticipates that having ready access to standardized local roadway data will support more effective transportation decision-making and lead to general time- and cost-savings, particularly once all counties are using LADC.
• LADC improves communication between SCDOT and local stakeholders. SCDOT staff have
attended local user group meetings to talk face-to-face with county transportation officials about the benefits of using LADC. At one recent meeting county officials asked SCDOT for right-of-way information in shapefile format. SCDOT staff responded quickly and provided the shapefile. SCDOT did not use LADC to respond to this particular request, but the agency has found that discussing the application has generally helped to spur and improve communication between SCDOT and local agencies.
• Getting buy-in from counties can be difficult. LADC participation may lead to increased funding for
county roads and LADC does not require any information that counties do not already collect. Many of South Carolina’s counties; however, have limited resources for collecting all the attributes that SCDOT records. Most counties already maintain a GIS road network, but do not collect all the attributes recorded in the RIMS database. SCDOT believes that as more counties begin to use LADC they will see the long-term benefits of contributing to a single, standardized statewide roadway data inventory and other counties will in turn want to use this application.
• Standardizing LADC information takes time. SCDOT has faced unexpected challenges when
integrating LADC data with SCDOT’s RIMS and GIS. For example, gaps in information can occur when county GIS road data do not merge with the RIMS road network. SCDOT has to flag and correct these types of discrepancies in the LADC system, a process that can take several weeks. However, SCDOT expects that integrating subsequent data uploads into RIMS will be easier and faster. Once RIMS has a baseline map of roads for a particular county, SCDOT will only need to compare any changes to the baseline map, rather than re-build the map from scratch.
Additional Resources Local Agency Data Collection Program Overview Local Agency Data Collection Project Review
VDOT: RNS/RIMS
67
VIRGINIA DOT: ROADWAY NETWORK SYSTEM/ROADWAY INVENTORY MANAGEMENT SYSTEM Summary Roadway Network System (RNS)/Roadway Inventory Management System (RIMS)is a repository and inventory of the Virginia’s roadway network, including all linear roadway assets and attributes such as bridge and railroad crossing locations, crash locations, and pavement conditions.
Background The Virginia DOT (VDOT) has the third-largest public road network in the country. The State has a dual-centerline system, which makes maintaining a geospatial inventory of roadway data more complex and challenging. No commercial products were available in the late-1980s to build a comprehensive roadway data inventory based on a dual-centerline network. In 1989, VDOT (with consultant support) created its own system, a mainframe database called the Highway Traffic Records Information/Inventory System (HTRIS), which merged manually collected pavement records and highway data. In 2003, VDOT began replacing HTRIS with an Esri-based geospatial solution: RIMS. The agency completed the basic infrastructure for RIMS in 2012. Over the last two years, VDOT’s Roadway Inventory Management (RIM) Unit, which administers RIMS, has focused on making strategic modifications to streamline how data are edited within a RIMS sub-structure called RNS. RNS tracks the geospatial location of all of Virginia’s roadway inventory and associated attributes over their lifecycles. It is essentially the editing gateway to RIMS. RNS keeps the coordinates for roadway attributes and assets up-to-date even if there are changes to the roadway—for instance, if a lane is widened or a curve in the roadway smoothed.
RNS/RIMS is an internal application available only to VDOT users. It centralizes and shares linear geospatial information within and outside the agency. For example:
• Pontis, VDOT’s bridge inventory tool, contains data that reside and are maintained within RNS/RIMS. A Pontis user requests bridge information and then view RNS/RIMS bridge data through the Pontis interface.
• RNS/RIMS incorporates local roadway data from the Virginia Geographic Information Network (VGIN), the State’s online geospatial data library maintained by the Virginia Information Technologies Agency (VITA). VITA collects the geospatial inventory for the local roadway network and maintains it as part of the VGIN dataset. VDOT developed a memorandum of understanding (MOU) with VITA that formalizes how roadway network data is shared between VGIN and RNS/RIMS.22 The MOU also specifies how data should be updated and lays out a common data format for VDOT and VITA to follow.
RIMS/RNS is now becoming an essential part of the agency’s business processes as well as the agency’s primary repository of linear geospatial information. VDOT maintains another GIS-based application, the GIS Integrator, which is the agency’s repository of non-linear geospatial information. (The Integrator includes over 150 data layers.) Data in the GIS Integrator are updated on a fixed schedule, while RNS/RIMS data are updated as needed. The RIM Unit is promoting RNS/RIMS throughout the agency to encourage various business units to use the application and integrate it into their workflows. The RIM Unit is also identifying standards for the
22 VDOT provides roadway attributes to VGIN that VITA does not otherwise have; these attributes are then made available through VGIN to local government agencies. These agencies benefit from having centralized access to these data through VGIN. The RIMS Unit has tried to automate some of the data-sharing that occurs between VGIN and RNS/RMS, but has not yet completed this effort.
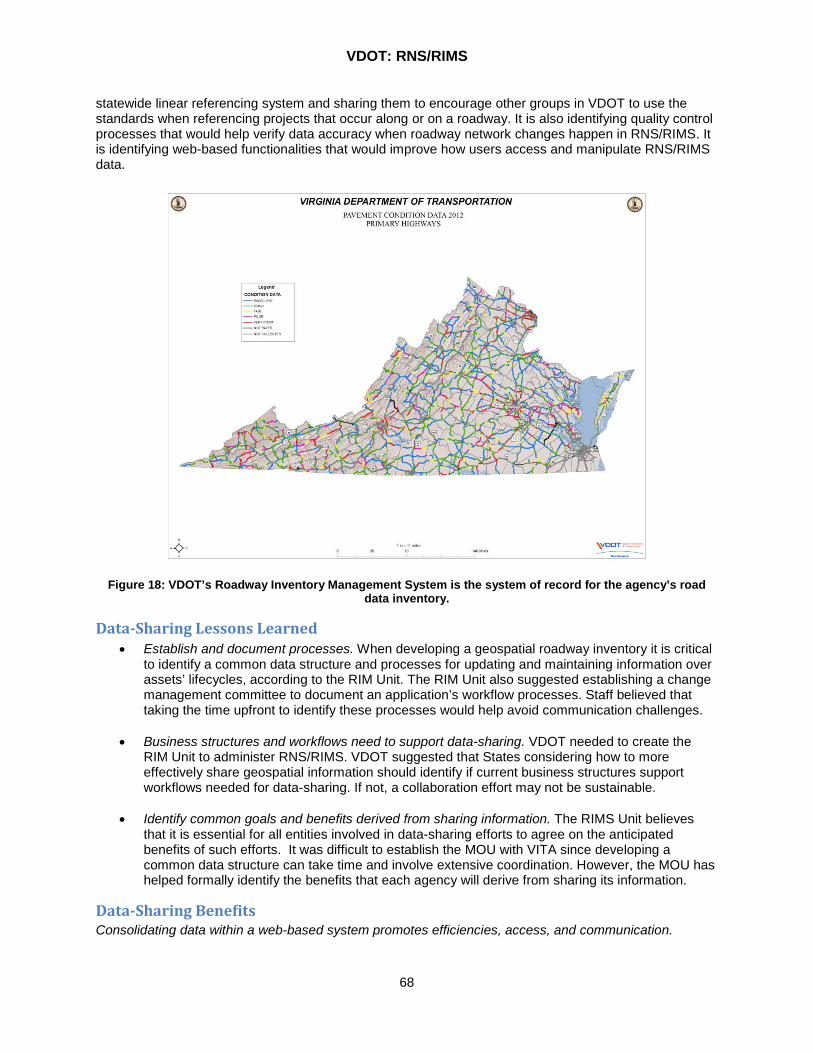
VDOT: RNS/RIMS
68
statewide linear referencing system and sharing them to encourage other groups in VDOT to use the standards when referencing projects that occur along or on a roadway. It is also identifying quality control processes that would help verify data accuracy when roadway network changes happen in RNS/RIMS. It is identifying web-based functionalities that would improve how users access and manipulate RNS/RIMS data.
Figure 18: VDOT’s Roadway Inventory Management System is the system of record for the agency’s road
data inventory.
Data-Sharing Lessons Learned • Establish and document processes. When developing a geospatial roadway inventory it is critical
to identify a common data structure and processes for updating and maintaining information over assets’ lifecycles, according to the RIM Unit. The RIM Unit also suggested establishing a change management committee to document an application’s workflow processes. Staff believed that taking the time upfront to identify these processes would help avoid communication challenges.
• Business structures and workflows need to support data-sharing. VDOT needed to create the
RIM Unit to administer RNS/RIMS. VDOT suggested that States considering how to more effectively share geospatial information should identify if current business structures support workflows needed for data-sharing. If not, a collaboration effort may not be sustainable.
• Identify common goals and benefits derived from sharing information. The RIMS Unit believes
that it is essential for all entities involved in data-sharing efforts to agree on the anticipated benefits of such efforts. It was difficult to establish the MOU with VITA since developing a common data structure can take time and involve extensive coordination. However, the MOU has helped formally identify the benefits that each agency will derive from sharing its information.
Data-Sharing Benefits Consolidating data within a web-based system promotes efficiencies, access, and communication.
VDOT: RNS/RIMS
69
• The RIM Unit’s long-term goal is to consolidate RNS/RIMS and the GIS Integrator to form a comprehensive library of all of VDOT’s geospatial information. Consolidation would support more efficient transportation planning and decision-making, according to RIM Unit staff. For example, to develop an environmental impact statement, VDOT’s planners currently must access data from RIMS/RNS, the GIS Integrator, and other systems such as VGIN, and then merge the information to conduct an analysis. The RIM Unit anticipates that making data available in one system would likely save time and streamline the planning process.
• Before the RIM Unit developed RNS/RIMS, adding roadway data to HTRIS was a difficult and
time-consuming process that could take several years. Multiple systems stored the information and staff found it challenging to access these systems and manually format data for HTRIS. Now, data can be brought into RNS/RIMS almost as soon as a project that affects the linear roadway system is completed, and the information is automatically formatted to fit within the RNS/RIMS data structure. RNS/RIMS can upload new data as frequently as needed.
• The standard network created by consolidating VDOT’s roadway information within RNS/RIMS leads to better communication across different parts of the agency. For example, a citizen might report an accident to VDOT’s customer service. Customer service staff will then locate the incident on the RNS/RIMS network and contribute that location information to the agency’s crash inventory. A frequently updated crash inventory supports safety-related analyses.
• The RIM Unit anticipates that adding web-based functionality to RNS/RIMS will streamline coordination between VDOT and other agencies. For example, through the web, VITA could download the RNS/RIMS network on an on-demand basis.
Additional Resources VDOT may be able to provide the MOU it has with VGIN. RNS overview (2012 GIS-T Symposium presentation) Pontis Element Data Collection Manual HTRIS overview (2008 GIS-T Symposium presentation)
WSDOT: AGOL and CPP
70
WASHINGTON STATE DOT: ONLINE MAP CENTER AND COMMUNITY PLANNING PORTAL Summary The Washington State Department of Transportation (WSDOT) has been working to develop tools and interactive mapping applications to increase public access to transportation related spatial data, maps, and mapping applications. Increased access to spatial data supports state and local agency coordination and enables all users to make decisions that are better informed.
Background
WSDOT Online Map Center
The WSDOT Online Map Center is an interactive web mapping site designed for users of every skill level. It is built upon the ArcGIS Online (AGOL) for Organizations platform. The Online Map Center offers an opportunity to view, create, share, and collaborate on map projects. State and local agencies as well as the general public also can view items from the Online Map Center that have been shared with the public. This platform allows users to make more informed decisions by providing a collaborative environment for the visual display of spatial and tabular data. The WSDOT Online Map Center combines WSDOT authored data layers and map applications into a single, easy to use, web-based map interface. Most of the map applications that are discoverable through the WSDOT Online Map Center, like the GeoPortal and the Functional Class Map Application, use map services that are hosted on WSDOT servers. Other mapping applications, like the New Zealand Mud Snail map application, are hosted entirely in the Cloud. As of July 2014, WSDOT’s public content included: 46 layers, 16 web maps, and 11 web map applications. WSDOT began development of the Online Map Center on August 31, 2012. Shortly thereafter, the project received a boost when WSDOT was invited to participate in an American Association of State Highway and Transportation Officials (AASHTO) Technology Implementation Group (TIG) UPLAN project. Participation in the project enabled WSDOT to benefit from the lessons learned by the UPLAN project team, which launched the Utah Department of Transportation’s online mapping efforts. WSDOT’s Transportation Data and GIS Office (TDGO) manages the Online Map Center. Its management activities include:
• Establishing criteria for what data can be shared to the public and ensuring that all publically discoverable content meets the Department’s established requirements for data sharing. Any WSDOT employee with a user account in the Online Map Center can publish data and share their data to groups within the Organization. However, data that is shared to the public must meet a more stringent set of data sharing requirements. This includes requirements that the data is WSDOT-authored content, and is fully documented and available for download on WSDOT’s GeoData Distribution Catalog. All publishers are required to create an item description page in AGOL that includes a comprehensive description of the dataset, data steward contact information, a statement of access and use constraints, and a custom thumbnail image. They also must have a data sharing agreement in place if they are not the original data steward of the item they are sharing to the public.
• Publicizing the tool to both internal and external users. Through the use of internal monthly newsletters, technical training sessions, and conference presentations, the TDGO actively promotes the Online Map Center as a spatial data presentation platform that is easy for technical and non-technical WSDOT staff use. The platform enables them to visualize and share spatial data. Once they meet the data sharing requirements, they can also share that information with the public.
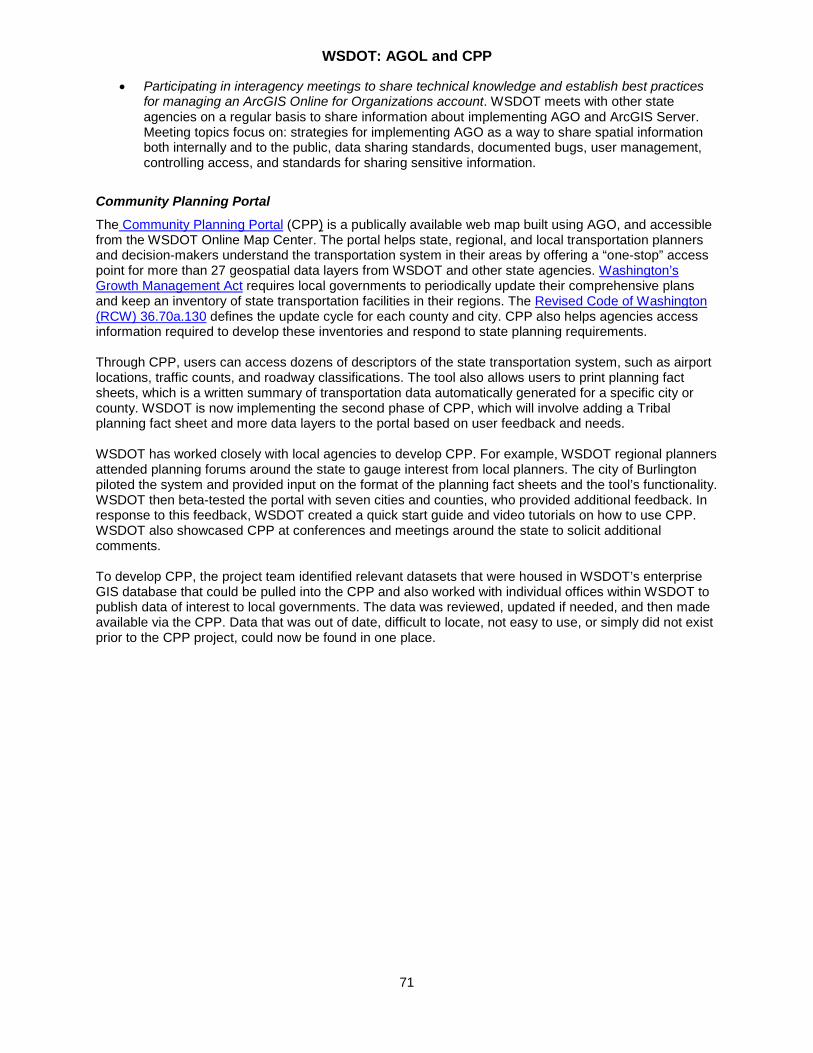
WSDOT: AGOL and CPP
71
• Participating in interagency meetings to share technical knowledge and establish best practices for managing an ArcGIS Online for Organizations account. WSDOT meets with other state agencies on a regular basis to share information about implementing AGO and ArcGIS Server. Meeting topics focus on: strategies for implementing AGO as a way to share spatial information both internally and to the public, data sharing standards, documented bugs, user management, controlling access, and standards for sharing sensitive information.
Community Planning Portal
The Community Planning Portal (CPP) is a publically available web map built using AGO, and accessible from the WSDOT Online Map Center. The portal helps state, regional, and local transportation planners and decision-makers understand the transportation system in their areas by offering a “one-stop” access point for more than 27 geospatial data layers from WSDOT and other state agencies. Washington’s Growth Management Act requires local governments to periodically update their comprehensive plans and keep an inventory of state transportation facilities in their regions. The Revised Code of Washington (RCW) 36.70a.130 defines the update cycle for each county and city. CPP also helps agencies access information required to develop these inventories and respond to state planning requirements. Through CPP, users can access dozens of descriptors of the state transportation system, such as airport locations, traffic counts, and roadway classifications. The tool also allows users to print planning fact sheets, which is a written summary of transportation data automatically generated for a specific city or county. WSDOT is now implementing the second phase of CPP, which will involve adding a Tribal planning fact sheet and more data layers to the portal based on user feedback and needs. WSDOT has worked closely with local agencies to develop CPP. For example, WSDOT regional planners attended planning forums around the state to gauge interest from local planners. The city of Burlington piloted the system and provided input on the format of the planning fact sheets and the tool’s functionality. WSDOT then beta-tested the portal with seven cities and counties, who provided additional feedback. In response to this feedback, WSDOT created a quick start guide and video tutorials on how to use CPP. WSDOT also showcased CPP at conferences and meetings around the state to solicit additional comments. To develop CPP, the project team identified relevant datasets that were housed in WSDOT’s enterprise GIS database that could be pulled into the CPP and also worked with individual offices within WSDOT to publish data of interest to local governments. The data was reviewed, updated if needed, and then made available via the CPP. Data that was out of date, difficult to locate, not easy to use, or simply did not exist prior to the CPP project, could now be found in one place.
WSDOT: AGOL and CPP
72
Figure 19: WSDOT’s CPP allows user to view a range of geospatial data, such as speed limits, traffic levels,
parking and ride lots, and functional class.
Data-Sharing Benefits • Enables easy data visualization. WSDOT’s Online Map Center supports data visualization and
more effective decision making. For example, as the result of a recent collision between a truck carrying an oversized load and a bridge, the WSDOT’s Transportation Data and GIS Branch is working with the agency’s bridge office to improve the current bridge dataset so that bridges and their clearance can be more easily located on a map. WSDOT plans to make a bridge map application available on the Online Map Center to help freight operators better plan their routes. Additionally, the CPP is helping smaller local agencies with more limited visualization software or GIS expertise to access and visualize data.
• Makes data more accessible and supports communication. Although most CPP data were
previously available for download on various agency websites in the form of shapefiles, only those with GIS software/training could access the information. Users can now access data without needing a high level of GIS expertise. WSDOT regional offices are also using CPP to communicate with local governments about state transportation planning requirements to facilitate local governments’ comprehensive plan updates.
• Improves data quality. Using AGO, Washington State agencies, local agency partners, project
consultants and the general public can turn to a definitive source to access data. In turn, the increased scrutiny that WSDOT’s datasets are receiving, coupled with easy to find data steward contact information, have resulted in improvements to the quality and documentation of WSDOT’s datasets.
Additional Resources Winter 2014 GIS in Transportation Newsletter article: “A Look at Washington Department of Transportation's Community Planning Portal”
WVDOT: AGOL and Other Initiatives
73
WEST VIRGINIA DOT: ARCGIS ONLINE AND OTHER INITIATIVES Summary WVDOT is engaging in several initiatives designed to better integrate, consolidate, and share the agency’s geospatial information with internal and external stakeholders through a one-stop, authoritative data source. These include developing a centralized linear referencing system (LRS) and building an agency-wide AGOL site that will function as a geospatial data portal.
Data-Sharing Initiatives In 2005, WVDOT created its GIS Section to build a more formalized GIS program and expand the agency’s use of GIS technologies. In 2007, the GIS Section merged with the Highway Data Services Unit to comprise the WVDOT Geospatial Transportation Information (GTI) Section, which is located within the Program Planning and Administration Division of the Division of Highways. Since its inception, the GTI Section developed a range of GIS-based applications that store and share a range of agency data; for instance, WVDOT Facilities is an Adobe Flex-based application and viewer that shows the location of State-owned transportation facilities. The GTI Section also maintains an online data clearinghouse that shares information on roadway networks, transportation infrastructure, traffic counts, imagery, and other transportation elements. Additionally, the GTI Section maintains several internal-only applications designed to share information that supports project planning, asset management, and general decision-making (e.g., a videolog that allows staff to see street-level road imagery and associated pavement data). The GTI Section is currently focused on identifying and implementing strategies to better consolidate the agency’s existing geospatial information such as standardizing data to ensure consistency and quality, and broadening access to information to improve intra- and inter-agency communication. As part of these initiatives, GTI Section staff are implementing Esri’s Roads and Highways to build a centralized LRS; this effort is ongoing and WVDOT anticipates the LRS will be in production by the end of 2014. WVDOT anticipates this will help provide a framework for making coordinated updates to WVDOT’s roadway network data, enabling users across the agency to access information on roadway assets or events (e.g., pavement conditions). This might be particularly helpful for planners, designers, or engineers who need access to current network data to make decisions about where or how a transportation facility should be built. WVDOT’s Roads and Highways initiative will also support the creation of the Straight Line Diagram (SLD), which will allow users to query a visualization of the State’s route to look up information such as functional class and attribute information. The SLD application, which is connected to Roads and Highways, will display any of 182 items, including videolog information. SLD users will also be able to highlight data points and print straight line diagrams. SLD is currently only available to internal users, but WVDOT is considering whether to create a log-in application to make a version of the tool available to the public. GTI Section staff are also developing an AGOL site to help users query and visualize information that currently resides in multiple databases. WVDOT anticipates this site will be especially useful for agency leadership to support transportation needs prioritization and monitoring of ongoing projects. The site will likely be implemented by the end of 2014 and will be available to all staff within WVDOT, including its 10 district offices. The site will also be made available to the agency’s planning partners such as other State and Federal agencies, as well as the public. There will be some restrictions on the site; however, to manage how sensitive information, such as the location of endangered species, will be accessible to different site users.
WVDOT: AGOL and Other Initiatives
74
It is likely that users will be able to add their own data to the site in the future. A mobile version of the AGOL site might also be developed to enable WVDOT staff to access information in the field. A governing body with representatives from across WVDOT will set data-sharing standards for the AGOL site. Currently, WVDOT is testing AGOL internally to identify effective processes and standards for collecting, compiling, and publishing data; data maintenance and quality assurance; site management/governance; and user access. GTI Section staff are exploring contract options with Esri for administering the AGOL site over time (although a contract has not yet been signed). Ultimately, GTI Section staff expect that some of the data displayed through the site will be stored using Esri’s cloud services, while other information will continue to be stored on WVDOT servers. GTI Section staff have also built several mapping applications for the AGOL site that are expected to serve as templates to help standardize the “look and feel” of queried information. In the long-term, WVDOT anticipates that data from all of the agency’s existing GIS-based applications, as well as ongoing efforts such as implementing Roads and Highways, will help feed a broader, enterprise framework informally called “Our Solution with Integrated Systems” (OASIS), or more formally the Enterprise Resource Planning (ERP) Suite. The ERP Suite will “pull” data from across the agency into one centralized location and will allow information to be exported to external systems maintained by other partners such as the Federal Highway Administration. Once fully implemented, the AGOL site would function as a portal and viewing interface through which ERP Suite data could be easily discovered, manipulated, and mapped.
Data-Sharing Benefits GTI Section staff believe one of the primary benefits of the AGOL site (and the future ERP Suite) will be an ability to make information more transparent and accessible to staff across the agency. Historically, GTI Section staff needed to reference multiple databases, each with its own data standards and formats, when responding to information requests from WVDOT leadership. The AGOL site will aggregate information and provide an intuitive interface; as such it will provide a mechanism for accessing information on demand. This will lead to both time- and cost-savings across the agency as well as more streamlined and strategic decision-making. GTI Section staff also predict that the AGOL site will improve data quality by allowing users to more easily view geospatial information and notice any existing errors. GTI Section staff also anticipate the AGOL site will help address potential conflicts earlier in transportation project development. For example, using the AGOL site, a planner or designer could identify how a transportation project might interact with sensitive ecological features such as endangered species. Any necessary mitigation strategies or alternative design options could be incorporated into a project before it is constructed, facilitating environmental reviews and project development. WVDOT reported it has already seen improved collaboration and efficiencies from its recent implementation of Roads and Highways. For example, compiling roadway network reports once took several weeks and multiple staff searching for data that were stored in disparate databases. Once fully implemented, WVDOT anticipates Roads and Highways will help one staff person produce a report in several hours. Empowering business units within WVDOT to conduct their own analysis is one key benefit of the AGOL site and other geospatial efforts underway at the agency.
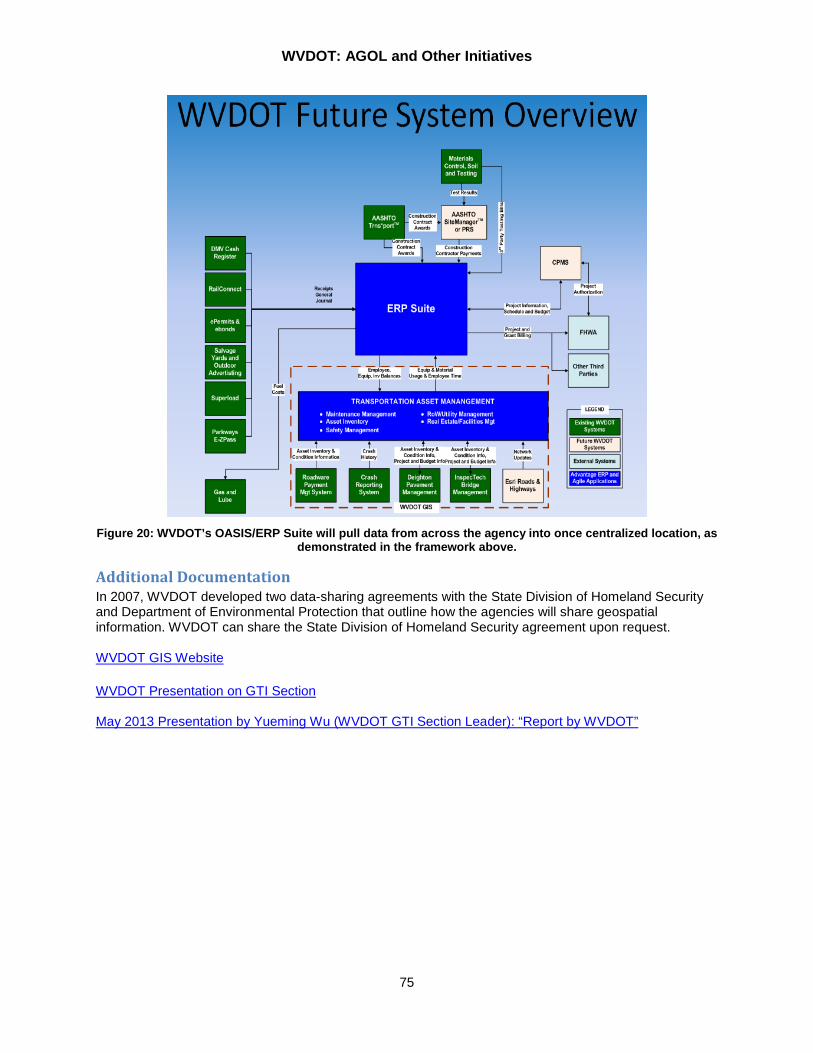
WVDOT: AGOL and Other Initiatives
75
Figure 20: WVDOT’s OASIS/ERP Suite will pull data from across the agency into once centralized location, as
demonstrated in the framework above.
Additional Documentation In 2007, WVDOT developed two data-sharing agreements with the State Division of Homeland Security and Department of Environmental Protection that outline how the agencies will share geospatial information. WVDOT can share the State Division of Homeland Security agreement upon request. WVDOT GIS Website WVDOT Presentation on GTI Section May 2013 Presentation by Yueming Wu (WVDOT GTI Section Leader): “Report by WVDOT”
Related Documents