Environ Monit Assess (2012) 184:2419–2431 DOI 10.1007/s10661-011-2127-2 Geospatial strategy for sustainable management of municipal solid waste for growing urban environment Prem Chandra Pandey · Laxmi Kant Sharma · Mahendra Singh Nathawat Received: 6 October 2010 / Accepted: 5 May 2011 / Published online: 10 June 2011 © Springer Science+Business Media B.V. 2011 Abstract This paper presents the implementa- tion of a Geospatial approach for improving the Municipal Solid Waste (MSW) disposal suitability site assessment in growing urban environment. The increasing trend of population growth and the absolute amounts of waste disposed of worldwide have increased substantially reflecting changes in consumption patterns, consequently worldwide. MSW is now a bigger problem than ever. De- spite an increase in alternative techniques for disposing of waste, land-filling remains the pri- mary means. In this context, the pressures and requirements placed on decision makers dealing with land-filling by government and society have increased, as they now have to make decisions taking into considerations environmental safety and economic practicality. The waste disposed by the municipal corporation in the Bhagalpur City (India) is thought to be different from the landfill waste where clearly scientific criterion for locat- ing suitable disposal sites does not seem to exist. The location of disposal sites of Bhagalpur City represents the unconsciousness about the envi- ronmental and public health hazards arising from disposing of waste in improper location. Concern- P. C. Pandey (B ) · L. K. Sharma · M. S. Nathawat Department of Remote Sensing, Birla Institute of Technology, Mesra 835215, Ranchi, India e-mail: [email protected] ing about urban environment and health aspects of people, a good method of waste management and appropriate technologies needed for urban area of Bhagalpur city to improve this trend using Multi Criteria Geographical Information System and Remote Sensing for selection of suitable dis- posal sites. The purpose of GIS was to perform process to part restricted to highly suitable land followed by using chosen criteria. GIS modeling with overlay operation has been used to find the suitability site for MSW. Keywords Municipal Solid Waste · Suitable site · Geospatial approach · Weighted overlay · Multi Criteria · Urban Environment Introduction A high population growth rate and increasing per capita income have resulted in the generation of enormous MSW, posing a serious threat to envi- ronmental quality and human health, even India is not untouched by this threat. Solid waste dis- posal is one of the most troublesome logistic prob- lems faced by society. Not only the quantity of solid waste has increased in past few years but also the available sites meeting stringent environ- mental requirements have been depleted. Landfill has become more difficult to implement because of its increasing cost, community opposition, and

Welcome message from author
This document is posted to help you gain knowledge. Please leave a comment to let me know what you think about it! Share it to your friends and learn new things together.
Transcript
Environ Monit Assess (2012) 184:2419–2431DOI 10.1007/s10661-011-2127-2
Geospatial strategy for sustainable managementof municipal solid waste for growing urban environment
Prem Chandra Pandey · Laxmi Kant Sharma ·Mahendra Singh Nathawat
Received: 6 October 2010 / Accepted: 5 May 2011 / Published online: 10 June 2011© Springer Science+Business Media B.V. 2011
Abstract This paper presents the implementa-tion of a Geospatial approach for improving theMunicipal Solid Waste (MSW) disposal suitabilitysite assessment in growing urban environment.The increasing trend of population growth and theabsolute amounts of waste disposed of worldwidehave increased substantially reflecting changes inconsumption patterns, consequently worldwide.MSW is now a bigger problem than ever. De-spite an increase in alternative techniques fordisposing of waste, land-filling remains the pri-mary means. In this context, the pressures andrequirements placed on decision makers dealingwith land-filling by government and society haveincreased, as they now have to make decisionstaking into considerations environmental safetyand economic practicality. The waste disposed bythe municipal corporation in the Bhagalpur City(India) is thought to be different from the landfillwaste where clearly scientific criterion for locat-ing suitable disposal sites does not seem to exist.The location of disposal sites of Bhagalpur Cityrepresents the unconsciousness about the envi-ronmental and public health hazards arising fromdisposing of waste in improper location. Concern-
P. C. Pandey (B) · L. K. Sharma · M. S. NathawatDepartment of Remote Sensing,Birla Institute of Technology,Mesra 835215, Ranchi, Indiae-mail: [email protected]
ing about urban environment and health aspectsof people, a good method of waste managementand appropriate technologies needed for urbanarea of Bhagalpur city to improve this trend usingMulti Criteria Geographical Information Systemand Remote Sensing for selection of suitable dis-posal sites. The purpose of GIS was to performprocess to part restricted to highly suitable landfollowed by using chosen criteria. GIS modelingwith overlay operation has been used to find thesuitability site for MSW.
Keywords Municipal Solid Waste · Suitable site ·Geospatial approach · Weighted overlay ·Multi Criteria · Urban Environment
Introduction
A high population growth rate and increasing percapita income have resulted in the generation ofenormous MSW, posing a serious threat to envi-ronmental quality and human health, even Indiais not untouched by this threat. Solid waste dis-posal is one of the most troublesome logistic prob-lems faced by society. Not only the quantity ofsolid waste has increased in past few years butalso the available sites meeting stringent environ-mental requirements have been depleted. Landfillhas become more difficult to implement becauseof its increasing cost, community opposition, and
2420 Environ Monit Assess (2012) 184:2419–2431
more restrictive regulations regarding the sitingand operation of landfills (Gholamalifard et al.2006). Growing urban regions face the problemof random landfill site due to shortage of land forwaste disposal. Land is a finite and scarce resourcethat needs to be used wisely due to increasingpressure from developmental growth of the popu-lation need for housing and commercial purposes.Most of the landfill sites in region are disposedoff randomly which has harmful impacts nature,human beings, and aquatic creatures. The ulti-mate destination of the solid waste is the landfillwhich needs to be at a suitable site, which is cost-effective, at transportable place and environmen-tal friendly. RS and GIS have been helpful in theallocation of the suitable site for solid waste. Themain parameters affecting the quantity and com-position of the MSW generated are populationgrowth and increased living standard of the peo-ple (Daskalopoulos et al. 1998). Because MSWarises as a direct consequence of human activities,population has been considered as the first majorparameter determining the amount of waste gen-erated. The increase in solid waste generation isattributed to changes in lifestyles of the people inthe last 50 years (McLain 1995).Municipal solidwaste management has thus become a major issueof concern for many nations, especially as popula-tions increase (Bartone 2000). In some countries(e.g., US and EU), there is legislation that restrictsthe disposal of organic matter in landfill sites inorder to decrease the greenhouse gas emission(European Commission Final Report 2009). TheDirective 99/31/EC defines a reduction to 35% ofthe total biodegradable waste going to landfillsuntil 2016 in order to reduce carbon dioxide andmethane emissions.
Vector GIS has been used to identify landfillsites (Basagaoglu et al. 1997), solid waste dispos-al sites in the Philippines (Cruz 1993), andanimal waste application sites in Australia(Basnet et al. 2000, 2001). Kallali et al. (2007)focused that GIS and expert knowledge areused as a decision support system to determineadequate potential soil aquifer treatment sites forgroundwater recharge of aquifer. These sites areidentified using a single-objective multi-criteriaanalysis (Chang et al. 2008). All criteria selectedare assumed to be constraints for site (Kallali
et al. 2007). Ratnapriya and De Silva (2009)determined the most suitable locations forputting up the treatment plants for non-pointsource pollutants using GIS thematic maps ofstream characteristics, land use and vegetationcover and socio-economic characteristics withDTM. In recent years, Geospatial technologyhave been widely used for the allocation ofsites for wastewater treatment plant suitability(Gemitzi et al. 2007; Finn et al. 2006; Gilliland andPotter 2007; Zhao et al. 2009; Kallali et al. 2007;Huffmeyer et al. 2009) and also efficiently usedfor assessment of land consumption rate withincreasing rate of population growth (Sharmaet al. 2011). Ribeiro et al. (2010) worked to findsuitable area for bio-solids storage. They defineda sludge application index using GIS to produceland-use suitability maps, which can be useful forsludge management.
Current research is focused to allocate the bestsuitable site for municipal solid waste disposalin Bhagalpur region with the use of advancedGeospatial techniques. While locating the mostsuitable site, there would be certain factor whichwould be taken into account (Chang et al. 2008).The overall criterion as per the current study formunicipal solid waste management in Bhagalpurregion is established for proper planning at rootlevel. Purpose of this research is to make peo-ple aware and be concerned about the plannedway rather than unplanned, haphazard disposal ofthe MSW in city. Improper disposal is an impor-tant aspect to taken in to consideration as it in-creases environmental degradation, pollution andfoul smell in the surrounding area. Suitable site forMSW disposal may be helpful for policy makersto give proper services to people at low-cost andin efficient timing. This will help them to meetthe future requirements and solve the problemsrelated to MSW disposal. Landscape protectionand conservation of the natural resources in thevicinity of city are also important points in thedecision MSW selection sites.
Current status of Municipal authorityin study area
Municipal solid waste management is one of themajor problems facing city planners all over the
Environ Monit Assess (2012) 184:2419–2431 2421
world. The problem is especially severe in mostdeveloping country cities where increased urban-ization, poor planning, and lack of adequate re-sources contribute to the poor state of municipalsolid waste management. In Bhagalpur city, thewaste management is also facing problem dueto lack of proper disposal of the municipal solidwaste. Thus, by having a suitable site for wastedisposal in this region, the problem of disposal ofMSW at suitable site can be solved. The problemis compounded as many region of the city continueto urbanize rapidly. For instance, 18% is the urbanpopulation ratio of total population in 1991, and in2001, this ratio increases to 19%.
Moreover, in Bhagalpur, the growth rate ofurban population is nearly 2% which causes atremendous contribution in solid waste genera-tion. Although government does spend a part ofmunicipal revenues on waste management, theyare often unable to keep pace with the scope ofthe problem. Bhagalpur municipality serves 51wards in its range. The municipality collects thewaste form 21 points regularly and weekly from10 points in its limit. The Bhagalpur Nagar Nigamdisposes the MSW at any place which it foundsuitable for disposal. MSW disposals by NagarNigam at Champanagar, nearby Andheri riverand Kalighat, nearby bank of River Ganga causingnuisance. Moreover, Jawaharlal Nehru MedicalCollege and hospital at Kalighat often dump theirbiomedical waste nearby bank of Ganga hamper-ing the conservation strategy of dolphins (knownas Sons) by government. It causes problems tothe dolphins as water carry away the MSW andbiomedical wastes as well as chemicals which aresoluble in water.
Current land filling sites are located atKalighat and Champanagar region which is notin the condition to accommodate such tremen-dous amount of waste. Many problems are arisingsuch as leachate percolation, foul smell, pollutionetc. in that area. Moreover, its location is nearbythe bank of pious Ganga River, and the aboveproblems also create havoc to river inhabitantslike dolphins (sons of the Ganga River, as calledthere). This is threatening the life and habitat ofdolphins and thus, the conservation strategies bythe government for protection of these mammalsare worthless.
Geographical description of the study area
The study area is Bhagalpur district, Biharstate having spatial extent between 2509′–2518′N and 8651′–8707′ E covering approximately434.40 km2. The study area is located in the plainsof Ganga river basin at a height of 42.97 m abovemean sea level (MSL). The population of thedistrict as per 2001 census was 2.43 million andthe density of population was 946/km2. Study areais flood prone particularly the South Eastern andMiddle Eastern part during rainy seasons. Themean maximum temperature and mean minimumtemperature of the region corresponds to 38.6Cand 11.8C, respectively. The average rainfall inthe region is 1,078 mm.
Materials and methodology
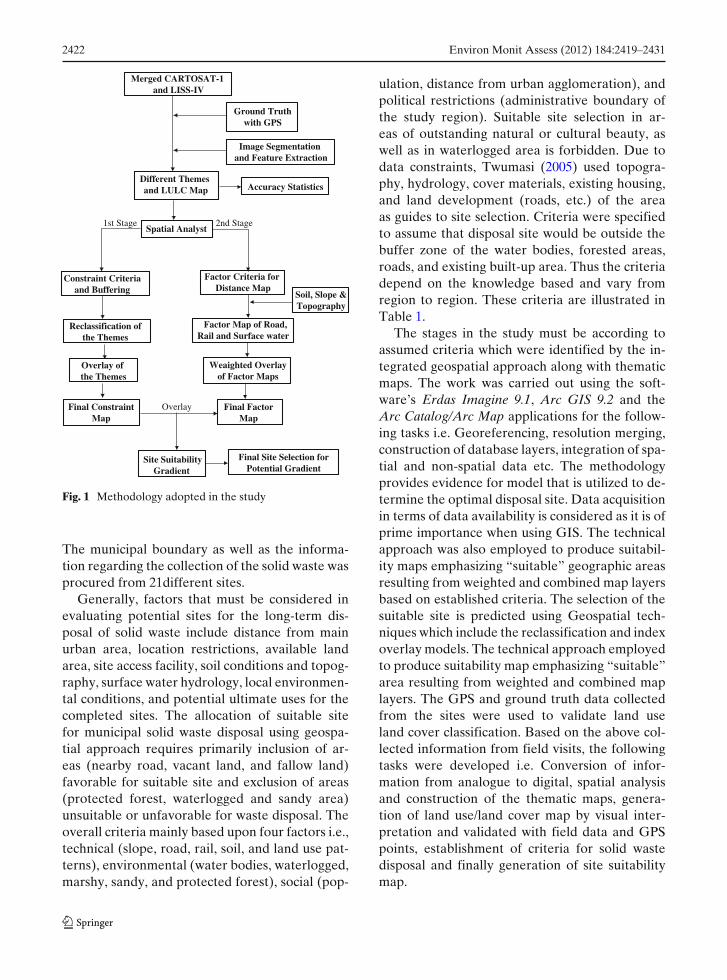
The satellite data used in the study includesmerged data of IRS-P6 LISS IV and Cartosat-1(IRS-P5) of year 2008. Ground truth data wascollected in the month of November 2008 andJanuary 2009 for visual interpretation and mapgeneration with the help of global positioningsystem in the form of latitude and longitude thatrepresent the accurate location. The overallmethodology adopted for this research is sum-marised in Fig. 1. The methodology adopted forstudy utilises spatial analyst tools in Arc GIS envi-ronment with distance, weithage overlay features.Spatial analyst is used for the overall study withweighted overlay analysis. The data used in thestudy includes the raster form (.img) which hasbeen resolution merged together (2.5 m spatialresolution of Cartosat-1and 5.8 m spatial resolu-tion of LISS IV). The resolution merged imageacquire the properties of both dataset like highspatial resolution of 2.5 m of Cartosat-1 and multi-spectral characteristics of LISS IV Imagery. Thereafter, the work is carried out in Arc GIS envi-ronment with vector format (.shp) for digitizationof the thematic maps as well as preparation ofLand use/land cover map at the scale of 1:10,000.The land use/land cover map was created which isshown in Fig. 2. The data collected at the site in-clude GPS points, field photographs and second-ary data sources provided by municipal authority.
2422 Environ Monit Assess (2012) 184:2419–2431
Soil, Slope & Topography
Merged CARTOSAT-1 and LISS-IV
Ground Truth with GPS
Image Segmentation and Feature Extraction
Different Themes and LULC Map
Factor Map of Road, Rail and Surface water
Reclassification of the Themes
Accuracy Statistics
Constraint Criteria and Buffering
Factor Criteria for Distance Map
Weaighted Overlay of Factor Maps
Spatial Analyst1st Stage 2nd Stage
Overlay of the Themes
Site Suitability Gradient
Final Constraint Map
Final Site Selection for Potential Gradient
Final Factor Map
Overlay
Fig. 1 Methodology adopted in the study
The municipal boundary as well as the informa-tion regarding the collection of the solid waste wasprocured from 21different sites.
Generally, factors that must be considered inevaluating potential sites for the long-term dis-posal of solid waste include distance from mainurban area, location restrictions, available landarea, site access facility, soil conditions and topog-raphy, surface water hydrology, local environmen-tal conditions, and potential ultimate uses for thecompleted sites. The allocation of suitable sitefor municipal solid waste disposal using geospa-tial approach requires primarily inclusion of ar-eas (nearby road, vacant land, and fallow land)favorable for suitable site and exclusion of areas(protected forest, waterlogged and sandy area)unsuitable or unfavorable for waste disposal. Theoverall criteria mainly based upon four factors i.e.,technical (slope, road, rail, soil, and land use pat-terns), environmental (water bodies, waterlogged,marshy, sandy, and protected forest), social (pop-
ulation, distance from urban agglomeration), andpolitical restrictions (administrative boundary ofthe study region). Suitable site selection in ar-eas of outstanding natural or cultural beauty, aswell as in waterlogged area is forbidden. Due todata constraints, Twumasi (2005) used topogra-phy, hydrology, cover materials, existing housing,and land development (roads, etc.) of the areaas guides to site selection. Criteria were specifiedto assume that disposal site would be outside thebuffer zone of the water bodies, forested areas,roads, and existing built-up area. Thus the criteriadepend on the knowledge based and vary fromregion to region. These criteria are illustrated inTable 1.
The stages in the study must be according toassumed criteria which were identified by the in-tegrated geospatial approach along with thematicmaps. The work was carried out using the soft-ware’s Erdas Imagine 9.1, Arc GIS 9.2 and theArc Catalog/Arc Map applications for the follow-ing tasks i.e. Georeferencing, resolution merging,construction of database layers, integration of spa-tial and non-spatial data etc. The methodologyprovides evidence for model that is utilized to de-termine the optimal disposal site. Data acquisitionin terms of data availability is considered as it is ofprime importance when using GIS. The technicalapproach was also employed to produce suitabil-ity maps emphasizing “suitable” geographic areasresulting from weighted and combined map layersbased on established criteria. The selection of thesuitable site is predicted using Geospatial tech-niques which include the reclassification and indexoverlay models. The technical approach employedto produce suitability map emphasizing “suitable”area resulting from weighted and combined maplayers. The GPS and ground truth data collectedfrom the sites were used to validate land useland cover classification. Based on the above col-lected information from field visits, the followingtasks were developed i.e. Conversion of infor-mation from analogue to digital, spatial analysisand construction of the thematic maps, genera-tion of land use/land cover map by visual inter-pretation and validated with field data and GPSpoints, establishment of criteria for solid wastedisposal and finally generation of site suitabilitymap.
Environ Monit Assess (2012) 184:2419–2431 2423
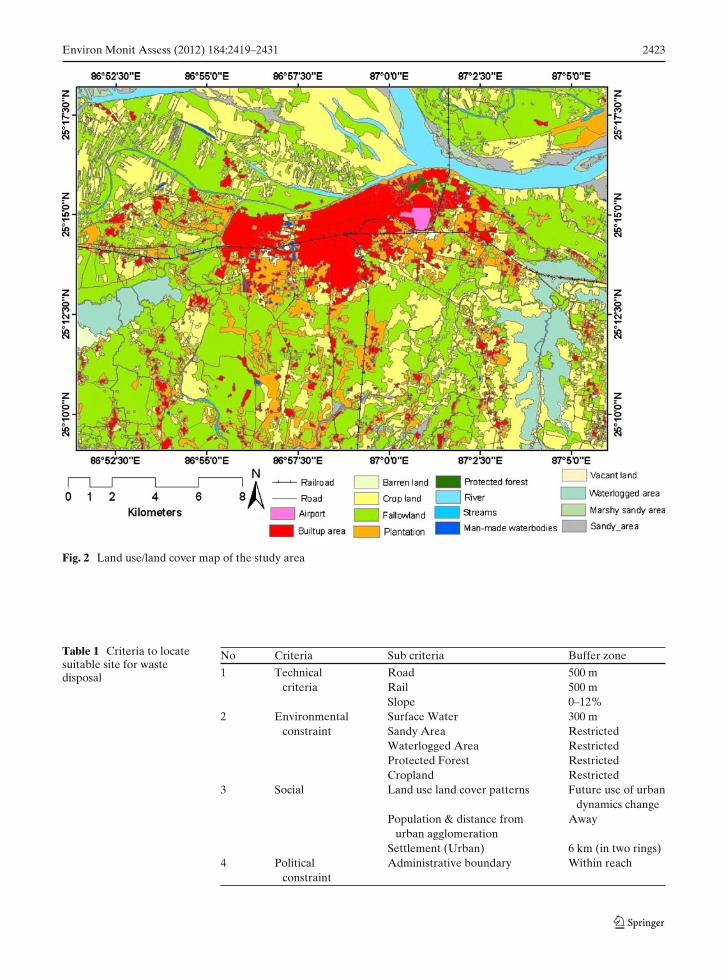
Fig. 2 Land use/land cover map of the study area
Table 1 Criteria to locatesuitable site for wastedisposal
No Criteria Sub criteria Buffer zone
1 Technical Road 500 mcriteria Rail 500 m
Slope 0–12%2 Environmental Surface Water 300 m
constraint Sandy Area RestrictedWaterlogged Area RestrictedProtected Forest RestrictedCropland Restricted
3 Social Land use land cover patterns Future use of urbandynamics change
Population & distance from Awayurban agglomeration
Settlement (Urban) 6 km (in two rings)4 Political Administrative boundary Within reach
constraint
2424 Environ Monit Assess (2012) 184:2419–2431
Results and discussions
Land use/land cover mapping
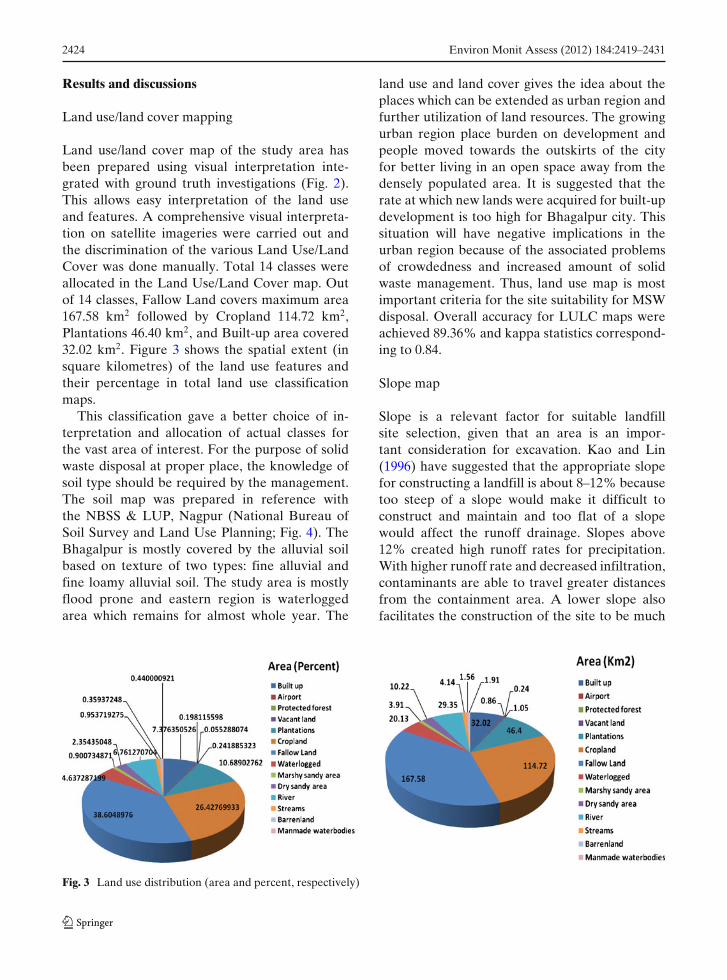
Land use/land cover map of the study area hasbeen prepared using visual interpretation inte-grated with ground truth investigations (Fig. 2).This allows easy interpretation of the land useand features. A comprehensive visual interpreta-tion on satellite imageries were carried out andthe discrimination of the various Land Use/LandCover was done manually. Total 14 classes wereallocated in the Land Use/Land Cover map. Outof 14 classes, Fallow Land covers maximum area167.58 km2 followed by Cropland 114.72 km2,Plantations 46.40 km2, and Built-up area covered32.02 km2. Figure 3 shows the spatial extent (insquare kilometres) of the land use features andtheir percentage in total land use classificationmaps.
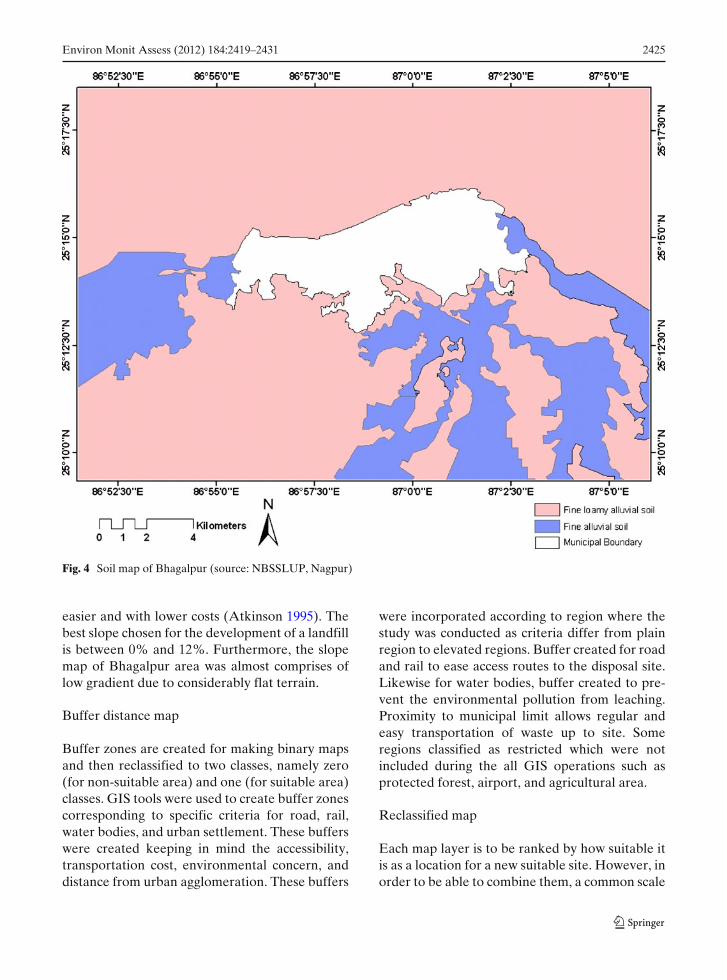
This classification gave a better choice of in-terpretation and allocation of actual classes forthe vast area of interest. For the purpose of solidwaste disposal at proper place, the knowledge ofsoil type should be required by the management.The soil map was prepared in reference withthe NBSS & LUP, Nagpur (National Bureau ofSoil Survey and Land Use Planning; Fig. 4). TheBhagalpur is mostly covered by the alluvial soilbased on texture of two types: fine alluvial andfine loamy alluvial soil. The study area is mostlyflood prone and eastern region is waterloggedarea which remains for almost whole year. The
land use and land cover gives the idea about theplaces which can be extended as urban region andfurther utilization of land resources. The growingurban region place burden on development andpeople moved towards the outskirts of the cityfor better living in an open space away from thedensely populated area. It is suggested that therate at which new lands were acquired for built-updevelopment is too high for Bhagalpur city. Thissituation will have negative implications in theurban region because of the associated problemsof crowdedness and increased amount of solidwaste management. Thus, land use map is mostimportant criteria for the site suitability for MSWdisposal. Overall accuracy for LULC maps wereachieved 89.36% and kappa statistics correspond-ing to 0.84.
Slope map
Slope is a relevant factor for suitable landfillsite selection, given that an area is an impor-tant consideration for excavation. Kao and Lin(1996) have suggested that the appropriate slopefor constructing a landfill is about 8–12% becausetoo steep of a slope would make it difficult toconstruct and maintain and too flat of a slopewould affect the runoff drainage. Slopes above12% created high runoff rates for precipitation.With higher runoff rate and decreased infiltration,contaminants are able to travel greater distancesfrom the containment area. A lower slope alsofacilitates the construction of the site to be much
Fig. 3 Land use distribution (area and percent, respectively)
Environ Monit Assess (2012) 184:2419–2431 2425
Fig. 4 Soil map of Bhagalpur (source: NBSSLUP, Nagpur)
easier and with lower costs (Atkinson 1995). Thebest slope chosen for the development of a landfillis between 0% and 12%. Furthermore, the slopemap of Bhagalpur area was almost comprises oflow gradient due to considerably flat terrain.
Buffer distance map
Buffer zones are created for making binary mapsand then reclassified to two classes, namely zero(for non-suitable area) and one (for suitable area)classes. GIS tools were used to create buffer zonescorresponding to specific criteria for road, rail,water bodies, and urban settlement. These bufferswere created keeping in mind the accessibility,transportation cost, environmental concern, anddistance from urban agglomeration. These buffers
were incorporated according to region where thestudy was conducted as criteria differ from plainregion to elevated regions. Buffer created for roadand rail to ease access routes to the disposal site.Likewise for water bodies, buffer created to pre-vent the environmental pollution from leaching.Proximity to municipal limit allows regular andeasy transportation of waste up to site. Someregions classified as restricted which were notincluded during the all GIS operations such asprotected forest, airport, and agricultural area.
Reclassified map
Each map layer is to be ranked by how suitable itis as a location for a new suitable site. However, inorder to be able to combine them, a common scale
2426 Environ Monit Assess (2012) 184:2419–2431
(for example, 0–1) giving higher values (scores)to more suitable attributes, is usually assigned toeach class, using “Reclassify” option in spatialanalyst. The layers generated in this step, was usedin Index overlay integration method.
Constraint maps
Constraint (binary) maps are used to distinguishbetween lands that are suitable or restricted fordisposal site. The constraint maps were producedby merging each individual theme containing onlytwo classes represented by 1s (for suitable land)and 0s (for unsuitable land). Selecting a suitablesite with respect to road, railway network or wa-ter bodies were based on the assumed criteria.
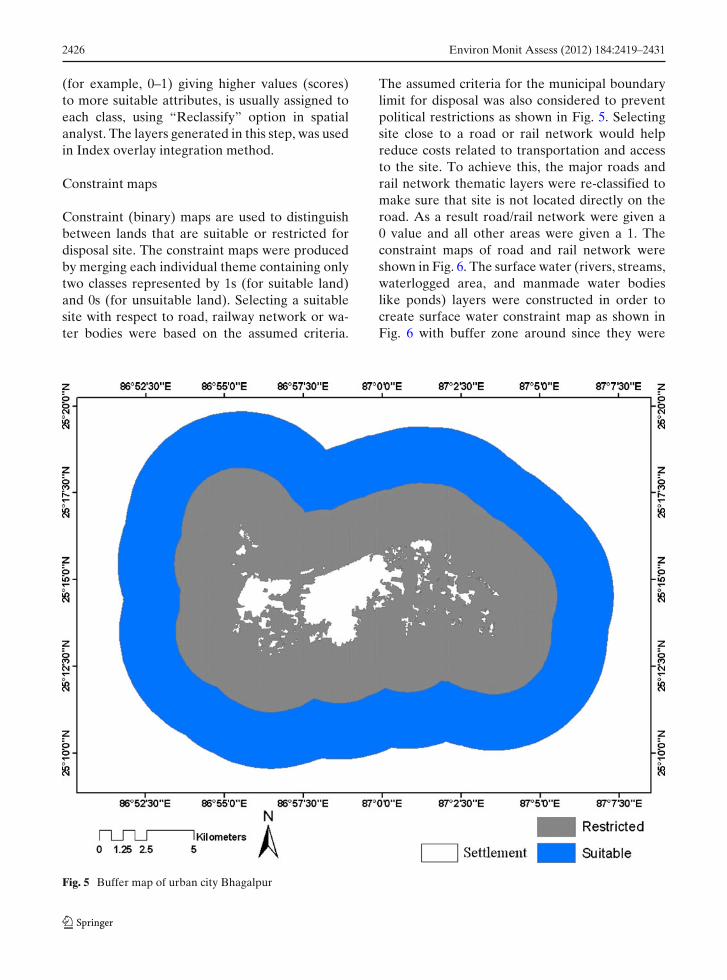
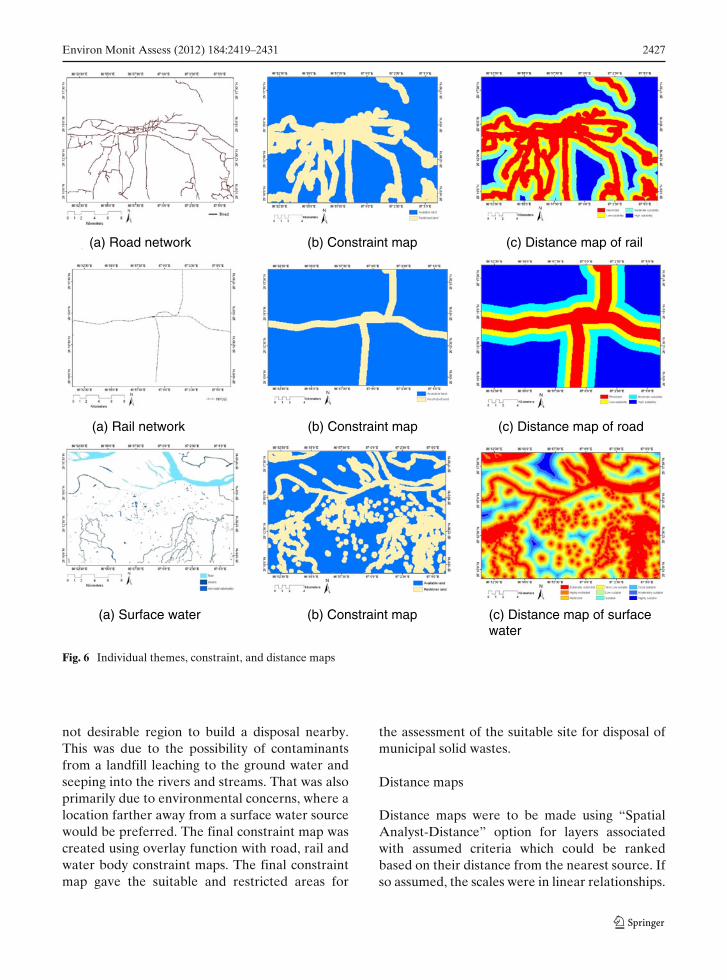
The assumed criteria for the municipal boundarylimit for disposal was also considered to preventpolitical restrictions as shown in Fig. 5. Selectingsite close to a road or rail network would helpreduce costs related to transportation and accessto the site. To achieve this, the major roads andrail network thematic layers were re-classified tomake sure that site is not located directly on theroad. As a result road/rail network were given a0 value and all other areas were given a 1. Theconstraint maps of road and rail network wereshown in Fig. 6. The surface water (rivers, streams,waterlogged area, and manmade water bodieslike ponds) layers were constructed in order tocreate surface water constraint map as shown inFig. 6 with buffer zone around since they were
Fig. 5 Buffer map of urban city Bhagalpur
Environ Monit Assess (2012) 184:2419–2431 2427
(a) Surface water (b) Constraint map (c) Distance map of surface water
(c) Distance map of rail (a) Road network (b) Constraint map
(a) Rail network (b) Constraint map (c) Distance map of road
Fig. 6 Individual themes, constraint, and distance maps
not desirable region to build a disposal nearby.This was due to the possibility of contaminantsfrom a landfill leaching to the ground water andseeping into the rivers and streams. That was alsoprimarily due to environmental concerns, where alocation farther away from a surface water sourcewould be preferred. The final constraint map wascreated using overlay function with road, rail andwater body constraint maps. The final constraintmap gave the suitable and restricted areas for
the assessment of the suitable site for disposal ofmunicipal solid wastes.
Distance maps
Distance maps were to be made using “SpatialAnalyst-Distance” option for layers associatedwith assumed criteria which could be rankedbased on their distance from the nearest source. Ifso assumed, the scales were in linear relationships.
2428 Environ Monit Assess (2012) 184:2419–2431
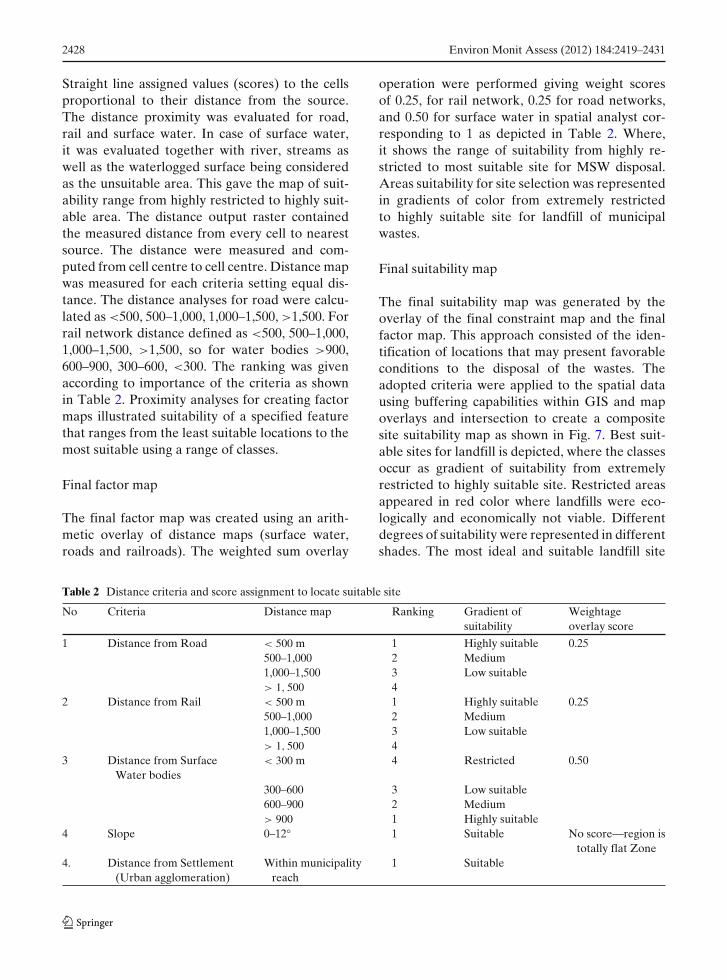
Straight line assigned values (scores) to the cellsproportional to their distance from the source.The distance proximity was evaluated for road,rail and surface water. In case of surface water,it was evaluated together with river, streams aswell as the waterlogged surface being consideredas the unsuitable area. This gave the map of suit-ability range from highly restricted to highly suit-able area. The distance output raster containedthe measured distance from every cell to nearestsource. The distance were measured and com-puted from cell centre to cell centre. Distance mapwas measured for each criteria setting equal dis-tance. The distance analyses for road were calcu-lated as <500, 500–1,000, 1,000–1,500, >1,500. Forrail network distance defined as <500, 500–1,000,1,000–1,500, >1,500, so for water bodies >900,600–900, 300–600, <300. The ranking was givenaccording to importance of the criteria as shownin Table 2. Proximity analyses for creating factormaps illustrated suitability of a specified featurethat ranges from the least suitable locations to themost suitable using a range of classes.
Final factor map
The final factor map was created using an arith-metic overlay of distance maps (surface water,roads and railroads). The weighted sum overlay
operation were performed giving weight scoresof 0.25, for rail network, 0.25 for road networks,and 0.50 for surface water in spatial analyst cor-responding to 1 as depicted in Table 2. Where,it shows the range of suitability from highly re-stricted to most suitable site for MSW disposal.Areas suitability for site selection was representedin gradients of color from extremely restrictedto highly suitable site for landfill of municipalwastes.
Final suitability map
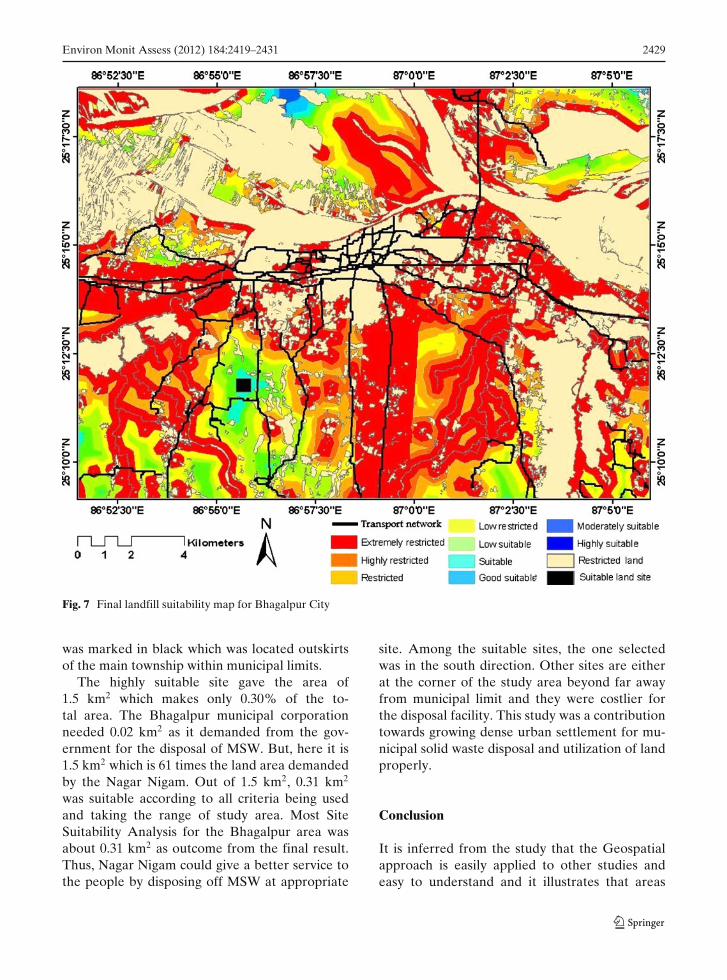
The final suitability map was generated by theoverlay of the final constraint map and the finalfactor map. This approach consisted of the iden-tification of locations that may present favorableconditions to the disposal of the wastes. Theadopted criteria were applied to the spatial datausing buffering capabilities within GIS and mapoverlays and intersection to create a compositesite suitability map as shown in Fig. 7. Best suit-able sites for landfill is depicted, where the classesoccur as gradient of suitability from extremelyrestricted to highly suitable site. Restricted areasappeared in red color where landfills were eco-logically and economically not viable. Differentdegrees of suitability were represented in differentshades. The most ideal and suitable landfill site
Table 2 Distance criteria and score assignment to locate suitable site
No Criteria Distance map Ranking Gradient of Weightagesuitability overlay score
1 Distance from Road < 500 m 1 Highly suitable 0.25500–1,000 2 Medium1,000–1,500 3 Low suitable> 1, 500 4
2 Distance from Rail < 500 m 1 Highly suitable 0.25500–1,000 2 Medium1,000–1,500 3 Low suitable> 1, 500 4
3 Distance from Surface < 300 m 4 Restricted 0.50Water bodies
300–600 3 Low suitable600–900 2 Medium> 900 1 Highly suitable
4 Slope 0–12 1 Suitable No score—region istotally flat Zone
4. Distance from Settlement Within municipality 1 Suitable(Urban agglomeration) reach
Environ Monit Assess (2012) 184:2419–2431 2429
Fig. 7 Final landfill suitability map for Bhagalpur City
was marked in black which was located outskirtsof the main township within municipal limits.
The highly suitable site gave the area of1.5 km2 which makes only 0.30% of the to-tal area. The Bhagalpur municipal corporationneeded 0.02 km2 as it demanded from the gov-ernment for the disposal of MSW. But, here it is1.5 km2 which is 61 times the land area demandedby the Nagar Nigam. Out of 1.5 km2, 0.31 km2
was suitable according to all criteria being usedand taking the range of study area. Most SiteSuitability Analysis for the Bhagalpur area wasabout 0.31 km2 as outcome from the final result.Thus, Nagar Nigam could give a better service tothe people by disposing off MSW at appropriate
site. Among the suitable sites, the one selectedwas in the south direction. Other sites are eitherat the corner of the study area beyond far awayfrom municipal limit and they were costlier forthe disposal facility. This study was a contributiontowards growing dense urban settlement for mu-nicipal solid waste disposal and utilization of landproperly.
Conclusion
It is inferred from the study that the Geospatialapproach is easily applied to other studies andeasy to understand and it illustrates that areas
2430 Environ Monit Assess (2012) 184:2419–2431
are better or less suitable for disposal site se-lection. The criteria used in this study are notfixed since it can vary from place to place andthese criteria can be changed accordingly. Apartfrom that, the present methodology can explainclearly and results in an easily understandableway. GIS indexing with constraint criteria usinghigh resolution imagery, which helps in accurateland use land cover classification, was successfullyadopted in the current study. The approach andresults of the suitability map can assist in manage-ment of the solid waste by the municipal author-ity. The Geospatial approach definitely improvesthe decision making capability and understand-ing of solid waste management by planners ingrowing urban environment. Therefore, the ap-plication of Geospatial approach for disposal siteselection is a cost-effective and time-saving toolcompared to conventional methods in times tocome.
Acknowledgements Authors express deep sense of grati-tude to Vice chancellor, BIT, Mesra for providing technicalfacilities and support. Authors are thankful to NUIS (Na-tional Urban Information System) project, Department ofRemote Sensing, BIT, Mesra, Ranchi for providing thesatellite data to carry out the research work successfully.We are also thankful to the municipal authorities and staffof Bhagalpur division for their kind co-operation. Depart-ment of Science and Technology, Govt. of India, is heartilyacknowledged for providing financial support to Mr. PremChandra Pandey as INSPIRE Fellow.
References
Atkinson, S. F. (1995). A geographic information systemsapproach to sanitary landfill siting procedures: A casestudy. Environmental Professional, 17(1), 20–26.
Bartone, C. (2000). Strategies for Improving MunicipalSolid Waste Management: Lessons from World BankLending and CWG Activities. Workshop on Planningfor Sustainable and Integrated Solid Waste Manage-ment, Manila.
Basagaoglu, H., Celenk, E., Mariulo, M. A., & Usul, N.(1997). Selection of waste disposal sites using GIS.Journal of American Water Resources Association,33(2), 455–464.
Basnet, B., Apan, A., & Raine, S. (2000). Selecting sitesuitable for animal waste application using a vectorGIS. In Proceedings for Engineering in AgricultureConference. Adelaide, Australia.
Basnet, B., Apan, A., & Raine, S. (2001). Selecting suitablesites for animal waste application using a raster GIS.Environmental Management, 28(4), 519–531.
Chang, N. B., Parvathinathan, G., & Breeden, J. B. (2008).Combining GIS with fuzzy multicriteria decision-making for landfill siting in a fast-growing urbanregion. Journal of Environmental Management, 87,139–153. doi:10.1016/j.jenvman.2007.01.011.
Cruz, G. I. (1993). Determining site for solid waste usingGIS. In Proceedings of the thirteenth annual Environ-mental System Research Institute (ESRI) user confer-ence. Redlands, California.
Daskalopoulos, E. O., Badr, O., & Probert, S. D. (1998).Municipal solid waste: A prediction methodology forthe generation rate and composition in the EuropeanUnion countries and the United States of America.Resources, Conservation and Recycling, 24, 155–166.
European Commission Final Report (2009). AssessingLegal Compliance With and Implementation of theWaste Acceptance Criteria and Procedures by theEU-15, 23 December Brussels pp. 1–65. http://ec.europa.eu/environment/waste/pdf/report_wac.pdf.
Finn, M.P., Usery, E. L., Scheidt, D.J., Jaromack, G. M.,& Krupinski, T. D. (2006). An Interface between theAgricultural Non-Point Source (AGNPS) PollutionModel and the ERDAS Imagine Geographic Informa-tion System (GIS). Geographic Information Sciences,12, 9–20.
Gemitzi, A., Tsihrintzisb, V. A., Christouc, O., & Petalasb,C. (2007). Use of GIS in sitting stabilization pond fa-cilities for domestic wastewater treatment. Journal ofEnvironmental Management, 82, 155–166.
Gholamalifard, M., & Mahini, & Salman, A. (2006). Sit-ing MSW landfills with a weighted linear combina-tion methodology in a GIS environment. InternationalJournal of Environmental Science and Technology,3(4), 435–445.
Gilliland, M. W., & Potter, W. B. (2007). A GeographicInformation System to predict non-pollutant sourcepollutant potential. JAWRA, 23, 281–291.
Huffmeyer, N., Klasmeier, J., & Matthies, M. (2009).Geo-referenced modeling of zinc concentrations inthe Ruhr river basin (Germany) using the modelGREAT-ER. Science of the Total Environment, 407,2296–2305.
Kallali, H., Anane, M., Jellali, S., & Tarhouni, J. (2007).GIS-based multi-criteria analysis for potential waste-water aquifer recharge sites. Desalination, 215, 111–119.
Kao, J. J., & Lin, H. Y. (1996). Multifactor spatial analysisfor landfill siting. Journal of Environmental Engineer-ing, 122(10), 902–908.
McLain, K. T. (1995). Recycling programmes. In BromleyD. W. (ed.), The handbook of Environ Economics.London: Blackwell.
Ratnapriya, E. A. S. K., & De Silva, R. P. (2009). Loca-tion optimization of wastewater treatment plants usingGis: a case study in Upper Mahaweli Catchment, SriLanka. Applied Geoinformatics for Society and Envi-ronment. Stuttgart University of Applied Sciences, pp.20–25.
Environ Monit Assess (2012) 184:2419–2431 2431
Ribeiro, P., Albuquerque, A., Quinta-Nova, L., &Cavaleiro, V. (2010). Recycling of pulp mill sludgeto improve soil fertility using GIS tools. Resources,Conservation & Recycling, 54(12), 1303–1311.
Sharma, L. K., Pandey, P. C., & Nathawat, M. S. (2011).Assessment of land consumption rate with urbandynamics change using geospatial techniques. Journalof Land Use Science, Taylor & Francis. iFirst: 24th
February. doi:10.1080/1747423x.2010.537790.
Twumasi, Y. A. (2005). Use of geo-spatial data for sus-tainable management of solid waste in Niamey, Niger.Journal of Sustainable Development in Africa, 8(1).
Zhao, Y., Qin, Y., Chen, B., Zhao, X., Li, Y., Yin, X., &Chen, G. (2009). GIS-Based Optimization for the lo-cations of sewage treatment plants and sewage outfalls- a case study of nansha district in Guangzhou City,China. Communications in Nonlinear Science andNumerical Simulation, 14, 1746–1757.
Related Documents