96 Ginjo Gitima et al. / Geosfera Indonesia 6 (1), 2021, 96-126 RESEARCH ARTICLE Assessing The Impacts of Climate Variability on Rural Households in Agricultural Land Through The Application of Livelihood Vulnerability Index Ginjo Gitima 1 * , Abiyot Legesse 2 , Dereje Biru 3 1 Department of Geography and Environmental Studies, University of Gondar, P. O. Box 196, Gondar, Ethiopia 2 Department of Geography and Environmental Studies, Dilla University, P.O. Box 419, Dilla, Ethiopia 3 Department of Geography and Environmental Studies, Bonga University, P. O. Box 334, Bonga, Ethiopia Received 18 November 2020/Revised 15 April 2021/Accepted 23 April 2021/Published 30 April 2021 Abstract Climate variability adversely affects rural households in Ethiopia as they depend on rain-fed agriculture, which is highly vulnerable to climate fluctuations and severe events such as drought and pests. In view of this, we have assessed the impacts of climate variability on rural household’s livelihoods in agricultural land in Tarchazuria district of Dawuro Zone. A total of 270 samples of household heads were selected using a multistage sampling technique with sample size allocation procedures of the simple random sampling method. Simple linear regression, the standard precipitation index, the coefficient of variance, and descriptive statistics were used to analyze climatic data such as rainfall and temperature. Two livelihood vulnerability analysis approaches, such as composite index and Livelihood Vulnerability Index- Intergovernmental Panel on Climate Change (LVI-IPCC) approaches, were used to analyze indices for socioeconomic and biophysical indicators. The study revealed that the variability patterns of rainfall and increasing temperatures had been detrimental effects on rural households' livelihoods. The result showed households of overall standardized, average scores of Wara Gesa (0.60) had high livelihood vulnerability with dominant major components of natural, physical, social capital, and livelihood strategies to climate-induced natural hazards than Mela Gelda (0.56). The LVI-IPCC analysis results also revealed that the rural households in Mela Gelda were more exposed to climate variability than Wara Gesa and slightly sensitive to climate variability, considering the health and knowledge and skills, natural capitals, and financial capitals of the households. Therefore, interventions including road infrastructure construction, integrated with watershed management, early warning information system, providing training, livelihood diversification, and SWC measures' practices should be a better response to climate variability-induced natural hazards. Keywords: Households; Livelihood Vulnerability Index; climate variability; Tarchazuria District qq Geosfera Indonesia Vol. 6 No. 1, April 2021, 96-126 p-ISSN 2598-9723, e-ISSN 2614-8528 https://jurnal.unej.ac.id/index.php/GEOSI DOI : 10.19184/geosi.v6i1.20718 *Corresponding author. Email address : [email protected] (Ginjo Gitima)

Welcome message from author
This document is posted to help you gain knowledge. Please leave a comment to let me know what you think about it! Share it to your friends and learn new things together.
Transcript
96
Ginjo Gitima et al. / Geosfera Indonesia 6 (1), 2021, 96-126
RESEARCH ARTICLE
Assessing The Impacts of Climate Variability on Rural Households
in Agricultural Land Through The Application of Livelihood
Vulnerability Index Ginjo Gitima 1 * , Abiyot Legesse 2, Dereje Biru 3
1Department of Geography and Environmental Studies, University of Gondar, P. O. Box 196,
Gondar, Ethiopia 2Department of Geography and Environmental Studies, Dilla University, P.O. Box 419, Dilla,
Ethiopia 3Department of Geography and Environmental Studies, Bonga University, P. O. Box 334,
Bonga, Ethiopia
Received 18 November 2020/Revised 15 April 2021/Accepted 23 April 2021/Published 30 April 2021
Abstract
Climate variability adversely affects rural households in Ethiopia as they depend on rain-fed
agriculture, which is highly vulnerable to climate fluctuations and severe events such as drought
and pests. In view of this, we have assessed the impacts of climate variability on rural
household’s livelihoods in agricultural land in Tarchazuria district of Dawuro Zone. A total of
270 samples of household heads were selected using a multistage sampling technique with
sample size allocation procedures of the simple random sampling method. Simple linear
regression, the standard precipitation index, the coefficient of variance, and descriptive statistics
were used to analyze climatic data such as rainfall and temperature. Two livelihood vulnerability
analysis approaches, such as composite index and Livelihood Vulnerability Index-
Intergovernmental Panel on Climate Change (LVI-IPCC) approaches, were used to analyze
indices for socioeconomic and biophysical indicators. The study revealed that the variability
patterns of rainfall and increasing temperatures had been detrimental effects on rural households'
livelihoods. The result showed households of overall standardized, average scores of Wara Gesa
(0.60) had high livelihood vulnerability with dominant major components of natural, physical,
social capital, and livelihood strategies to climate-induced natural hazards than Mela Gelda
(0.56). The LVI-IPCC analysis results also revealed that the rural households in Mela Gelda
were more exposed to climate variability than Wara Gesa and slightly sensitive to climate
variability, considering the health and knowledge and skills, natural capitals, and financial
capitals of the households. Therefore, interventions including road infrastructure construction,
integrated with watershed management, early warning information system, providing training,
livelihood diversification, and SWC measures' practices should be a better response to climate
variability-induced natural hazards.
Keywords: Households; Livelihood Vulnerability Index; climate variability; Tarchazuria
District
Geosfera Indonesia Vol. 6 No. 1, April 2021, 96-126
p-ISSN 2598-9723, e-ISSN 2614-8528
https://jurnal.unej.ac.id/index.php/GEOSI
DOI : 10.19184/geosi.v6i1.20718
*Corresponding author.
Email address : [email protected] (Ginjo Gitima)
97
Ginjo Gitima et al. / Geosfera Indonesia 6 (1), 2021, 96-126
1. Introduction
The detrimental effects of climate change and variability have become an environmental
and socioeconomic problem that is rapidly causing climate-driven hazards for people around the
world (Adu et al., 2018). Globally, climate-related hazards are seen to have a huge impact on
young, elderly, poor and marginalized populations such as households headed by women and
people with limited access to resources (IPCC, 2014; Tanner et al., 2015; Paul et al., 2019).
Climate-related hazards have many indirect impacts on the livelihoods, health, water, agricultural
production and socioeconomic welfare of systems (Gezie, 2019; Masuda et al., 2019; Endalew &
Sen, 2020). Climate variability is predicted to increase the frequency and severity of certain
severe weather events (IPCC, 2018), and disasters such as floods of agricultural lands, droughts,
storms, and cyclones (Ullah et al., 2018). Also, Africa is the utmost vulnerable continent to
climate variabilitywith 350–600 million Africans facing increased water stress by the 2050s
(Hahn et al., 2009).
Climate change and variability are adversely affecting smallholder farming households in
Africa because their activity depends on climate-regulated water resources with low adaptive
capacity (Adu et al., 2019). Similarly, dependence on agriculture, pastoralism and lack of
irrigation means that African farmers are especially vulnerable to climate hazards (Hahn et al.,
2009; Araro et al., 2019). Indeed, rural households' livelihood is considered to be highly
vulnerable to climate change and variability (Turpie & Visser, 2013). This livelihood
vulnerability of rural farmers in Africa is triggered by exposure to climate change and variability
and by combining social, economic, and environmental factors that interact with it, including
Sub-Saharan Africa (Ofoegbu et al., 2017). The agricultural sector in Sub-Saharan Africa is
extremely susceptible to potential climate changes and variability (Turpie & Visser, 2013).
Food insecurity is one of the major drivers that determine development dynamics in East
Africa, especially in Ethiopia; due to these the country faces drought and poverty in different
periods due to climate changes and variability that was directly affecting the agricultural output
(Few et al., 2015; Ademe et al., 2020; Ketema & Negeso, 2020). Ethiopia is an agro-based
economy where agriculture contributes 45% to the gross domestic product (GDP). The
agriculture sector is a source of livelihood for more than 80% of the population (Dendir &
Simane, 2019). In fact, rain-fed agriculture in the country is more vulnerable to the adverse
effects of climate variability (Gezie, 2019) and extreme events like drought and pests (Endalew
98
Ginjo Gitima et al. / Geosfera Indonesia 6 (1), 2021, 96-126
& Sen, 2020). Even if productivity grew, climate variability would still dramatically impact in-
country (Teshome & Baye, 2018).
In addition, climate change projected in Ethiopia is expected to result in decreased
precipitation variability and an increase in temperature (1.1 to 3.1°C by 2060 and 1.5 to 5.1°C by
2090) with a rise in the frequency and intensity of extreme events such as flood and drought
(National Meteorological Agency, 2007). Other studies indicate an increase of temperature in all
seasons of 1.4°C to 2.9°C by the 2050s (Conway & Schipper, 2011). Besides, rainfall and
temperature patterns show large regional differences (Gezie, 2019). Such trends of increasing
temperature, the high variability of precipitation, and the rising frequency of extreme events are
expected to continue in the country (Dendir & Simane, 2019).
Vulnerability assessment approaches tend to be inextricably related to the vulnerability
concept and interpretation. In line with, the outcome of vulnerability and its conceptual
meanings, Dessai & Hulme (2004) highlight the different approaches that the two concepts take
(without explicitly referring to them) to inform climate adaptation policy. Physical vulnerability
concepts prefer to adopt a top-down approach to assessing the strategy of climate adaptation,
while vulnerability of contextual concepts focus on socio-economic vulnerability that follow a
bottom-up approach (Young et al., 2009). A top-down approach usually starts with international
climate forecasts, which can then be rationalized and used to determine climate change's regional
effects.An essential feature of bottom-up approaches is primarily the participation of the
stakeholders and population of the scheme in classifying climate-change stresses, influences and
adaptive strategies (Fellmann, 2012). According to Neupane et al. (2013) socioeconomic
parameters such as access to essential resources like forest, land, and water should also be
reflected in the vulnerability analysis. Moreover, the importance of incorporating socioeconomic
systems with biophysical systems (integrated approach) at varied spatial and social scales in the
vulnerability assessment. An integrated approach is effective and may adequately capture all
possible dimensions of vulnerability when one integrates both the biophysical (sensitivity and
exposure) and the socioeconomic (adaptive capacity) aspects of vulnerability (Endalew & Sen,
2020).
Studies suggest that poor households' livelihood in rural areas of Ethiopia are the most
vulnerable to climate change and variability (Deressa et al., 2009). Similarly, current climate
shocks and stresses already have an overwhelming impact on the vulnerability of farmers,
99
Ginjo Gitima et al. / Geosfera Indonesia 6 (1), 2021, 96-126
particularly in rural communities (Sujakhu et al., 2019). Likewise, climate variability
vulnerability is understood to be the result of the interaction between the biophysical drivers
(include climatic exposure) and the function of the system’s sensitivity and adaptive capacity.
The exposure constituents entail individuals, biological systems, ecological capacities, services,
assets, infrastructure, financial, or social resources in places and settings that could be
unfavorably influenced by climate change and variability (Ademe et al., 2020). Sensitivity is the
degree to which the rural household is adversely affected by exposure to climatic variables'
variations (Teshome, 2017). The adaptive capacity constituent the capacity of systems or people
ability, establishments, people, and different ecosystems to conform to potential harm, exploit
openings, or react to varied consequences (Amuzu et al., 2018).
Different scholars have been conducted to study the vulnerability of Ethiopian
households to climate-related extreme events. For instance, a study conducted by Dercon et al.
(2005) using panel data set. However, most of these studies are very general and the results are
aggregated at national or regional levels. These studies have also been limited concerned about
rural livelihoods vulnerability to climatic-hazards on district and context-specific nature at a
local level. In addition, aggregated national results do not capture the complex state of
vulnerability at the local level, while they are important to understand development priorities
(Simane et al., 2014; Narayanan & Sahu, 2016). Moreover, the context-specific essence of risk
and interventions did not examine the degree to which rural livelihoods in agricultural land are
vulnerable to climatic-related extreme events (Ford et al., 2010; Azene et al., 2018).
Hence, our study focuses on livelihood vulnerability to climate variability at context-
specific nature in Tarchazuria district of Dawuro zone. Also, Dendir & Simane (2019) suggested
that stakeholders plan context-specific intervention is important than the national level to reduce
rural farmers' vulnerability to climate variability and strengthen farm households' adaptive
capacity. Tarchazuria district faced climate-related natural hazards and no study has examined in
our study area in local detail. The rural farm households in the district are predominantly rain-fed
and hence are prone to risks of climate variability. Due to frequent climatic events like drought,
floods, and rainfall irregularities, there are the main problems on indirect costs, crop failure,
death of livestock, water shortage, and loss of biodiversity. Moreover, climate variability has
also direct and indirect impacts on the prevalence and spread of diseases and pests in the study
area. Therefore, this study aimed to assess the impacts of climate variability on rural households
100
Ginjo Gitima et al. / Geosfera Indonesia 6 (1), 2021, 96-126
in agricultural land through the application of the Livelihood Vulnerability Index in the
Tarchazuria district of Dawuro Zone.
2. Methods
2.1 Biophysical Setting of The Study Area
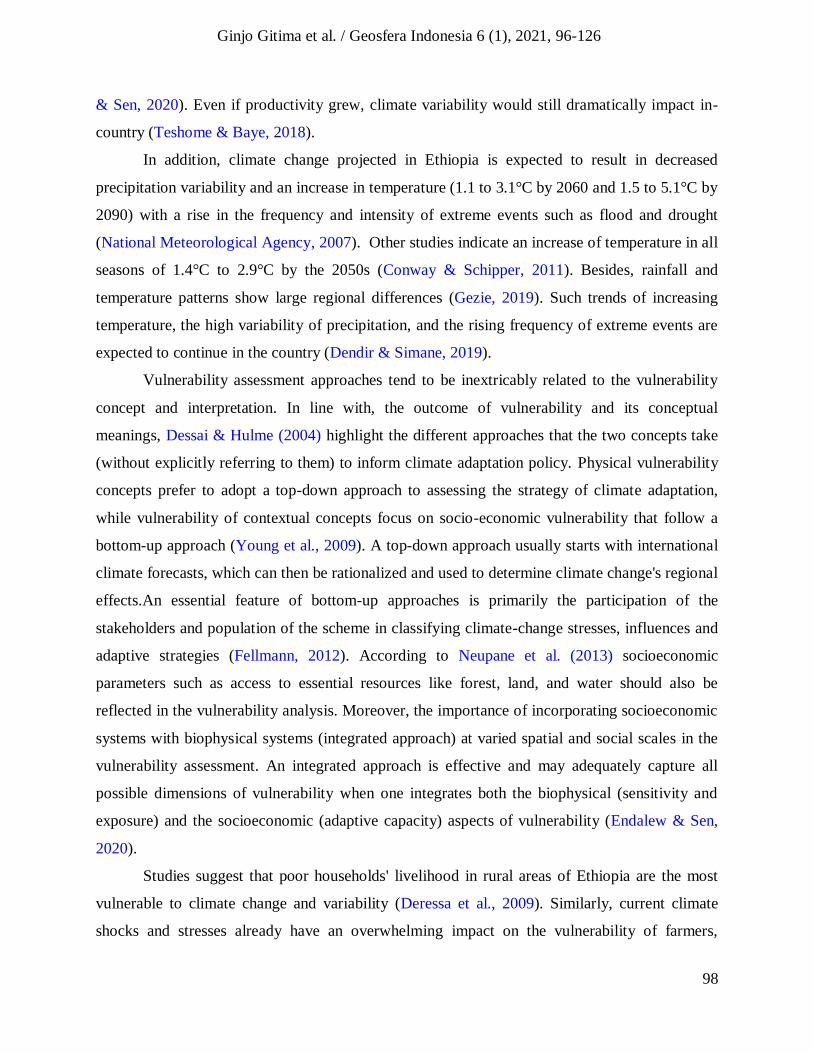
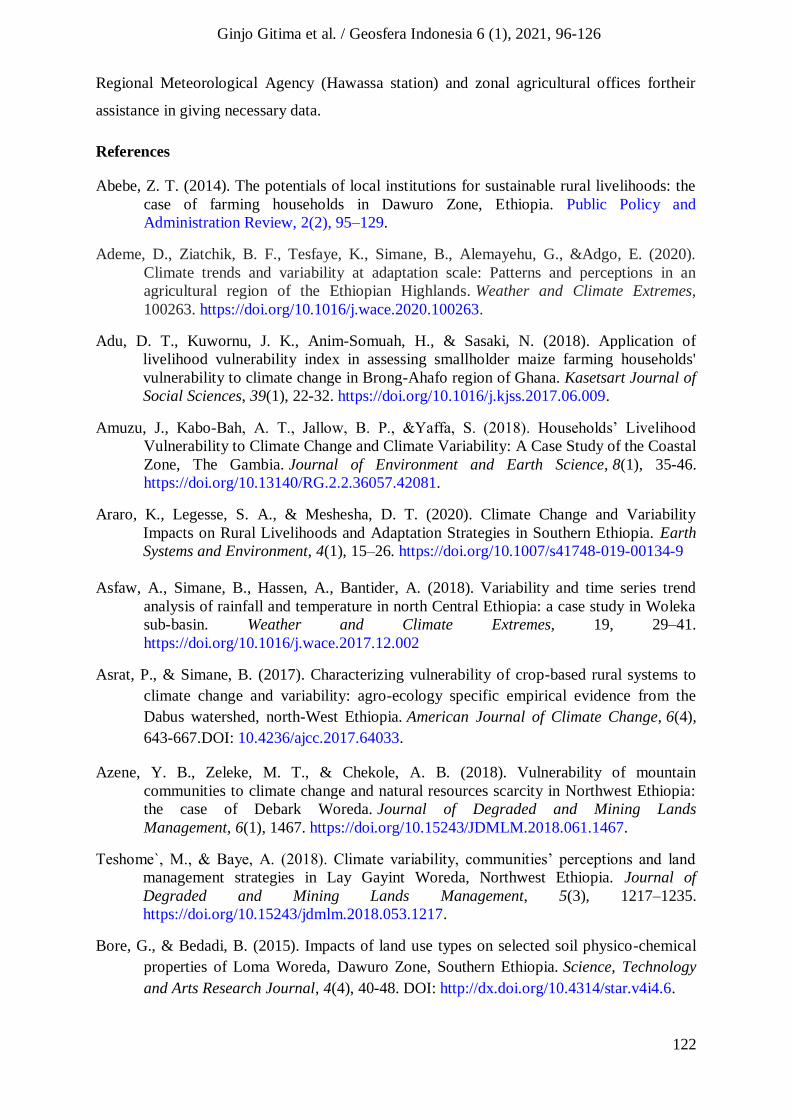
This study was conducted at Tercha Zuria district in the Dawuro zone of Southwest
Ethiopia. Geographically, the study area located between 7°05'00" to 7°15'00"N latitude and
36°45'00'' to 37°20'00''E longitude (Figure 1).The study area is located at 510 Km in Southwest
of Addis Ababa the capital city of Ethiopia. The district shares borders in the North with Maraka
and Tocha district, in the South and Southwest Gojeb river, in the East and Northeast Gena
district and in the West Konta special district. The district covers a total area of 588 square
kilometers.
Figure 1. Location of the study area
The physiographic setting of the study area is a dissected and rugged landscape, having
well-drained and moderately weathered brown soil (Nitisols) and Orthic Acrisols. Thus, soil
erosion and floods in the area is mainly attributed to the dissected and rugged topography. The
geology of the study area is abundant with rhyolites and trachy basalts mainly overlying in the
Precambrian basement and tertiary volcanism (Bore & Bedadi, 2015; Gitima & Legesse, 2019).
101
Ginjo Gitima et al. / Geosfera Indonesia 6 (1), 2021, 96-126
The elevation ranges lie between 918 m to 2170 m above sea level. The dominant agro-ecology
in the districtis tropical (kola) and sub-tropical (Woina-dega) agro-climate. The average annual
minimum and maximum temperatures of 13 years were 14.65℃ to 16.12℃ and 26.4℃ to 29.3℃,
respectively. The 13 years (2007-2019) of mean annual rainfall was 1398.8 mm, and the mean
monthly rainfall ranges between 18.6 mm and 323 mm (National Meteorological Agency, 2019).
The rainfall is a bimodal type in the study area: the short rainy season is between March and
May, and the long rainy season between June and September (Bore & Bedadi, 2015).
Agriculture is mainly composed of crop production and animal husbandry and it is the
main source of livelihood of the population in the district. The dominant activities under land use
pattern in the study area include the cultivation of perennial crops such as enset
(Enseteventricosum), banana, coffee, mango, avocado and etc. Whereas the annual food crops,
including cereals (maize, sorghum, teff), pulses (beans, peas), (maize and teff are largest
produced), and root crops like potatoes, yams, sweat potatoes and cassavas. Generally, mixed
agriculture is the major economic activity in the study area (Gitima & Legesse, 2019). However,
the watershed has ample potential for cultivations, its farm productivity is very low because
farmers use traditional means of production. Besides, crop production is mainly rain-fed coupled
with poor market access makes the livelihood of farming households extremely stagnant (Abebe,
2014).
2.2 Data Sources and Collection Tools
The data required for the current study is obtained from both primary and secondary
sources and also these necessary data were of both qualitative and quantitative in nature. The
primary data were collected through the questionnaire, key informant interviews, FGDs, and
field observations. Questionnaire was used to collect information from the sampled rural
households. Prior to the survey, the enumerators were trained how to interview and fill the
questions. Close-ended and open-ended format questions were prepared to the selected sample
rural household heads and administered through face-to-face interview to get information about
the impacts of climate variability on rural household livelihoods. Also, two focus group
discussions, the discussion among a small group of six to seven members of the farmers were
carried out in the district. In addition, key informant interviews were held with respondents from
different sections of the community such as three development agents, two from non-government
102
Ginjo Gitima et al. / Geosfera Indonesia 6 (1), 2021, 96-126
organizations, four model farmers, and three elderly farmers. Moreover, secondary data were
collected from published and unpublished documents. Furthermore, time series climatic data
such as temperature and rainfall were obtained from the regional meteorological agency
(Hawassa) to predict the trend and variability over time. The reference periods for the climatic
data were between 2007 and 2019. This range was chosen based on the concept of climate
variability and its resulting effects on the rural livelihoods in agricultural land.
2.3 Research Design and Sampling Procedure
This study employed a cross-sectional survey research design and longitudinal time series
meteorological data were used records over the period of 2007-2019. In selecting representative
sample households, multistage sampling techniques were carried out to select sample household
heads for the study from the district. The first stage, Tarchazuria district, was selected using
purposive sampling techniques among the ten districts of Dawuro zone because in the district
rural farmers' livelihoods affected by climate variability like drought and extreme events, and
climate data availability and meteorological station in the area. Secondly, two kebeles were
purposively selected using on the above district selection technique i.e., : Mela Gelda (372
household heads) and Wara Gesa (464 household heads).Finally, simple random sampling
procedure was applied to select 270 representative farm household heads for the study.
2.4 Methods of Data Analysis
The unit of analysis of this study focused on rural farm household heads. Qualitative data
were analyzed by using thematic analysis of categorization; the data were gathered through
observation, interview and focus group discussions. Quantitative data were analyzed by
descriptive statistics such as percentage, mean, ratio, maximum, and minimum by using
Microsoft Excel. Metrological data such as rainfall was analyzed by using standardized
precipitation index and coefficient of variation (CV), whereas, temperature was analyzed by
means of simple linear regression and standardized temperature anomalies. Household Exposure
(HE) and household Sensitivity (HS) indices complemented with basic household information of
farmers were analyzed using descriptive statistics.
103
Ginjo Gitima et al. / Geosfera Indonesia 6 (1), 2021, 96-126
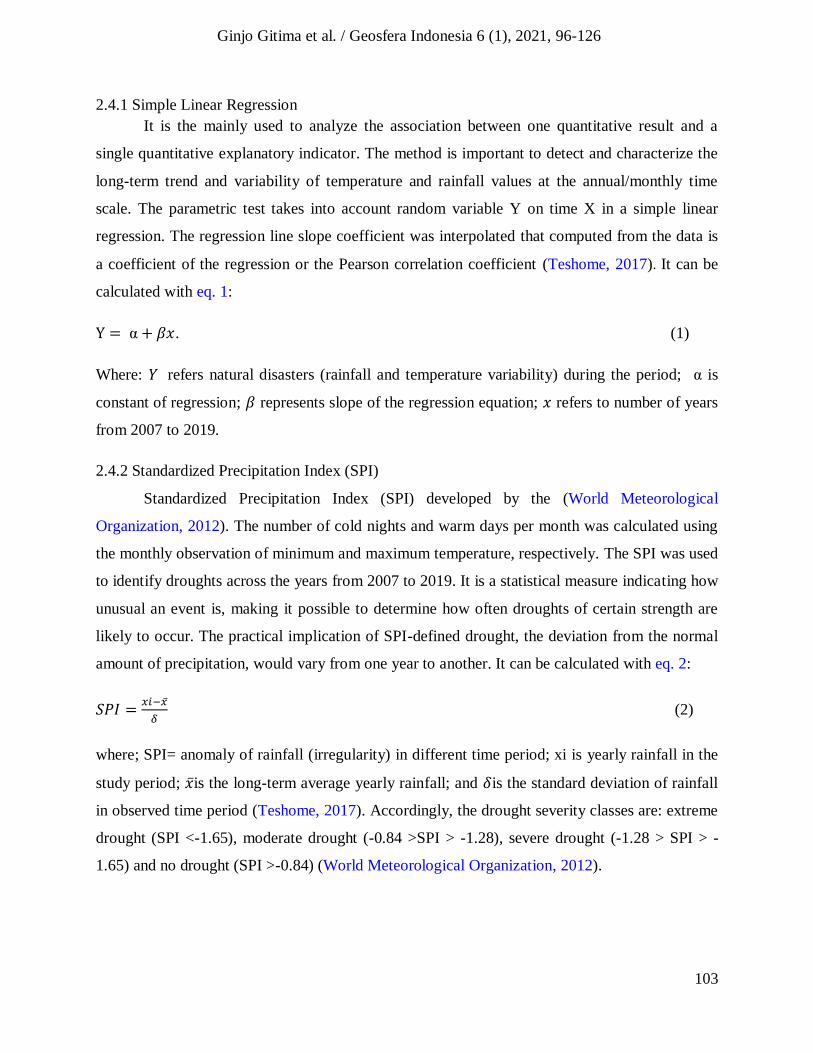
2.4.1 Simple Linear Regression
It is the mainly used to analyze the association between one quantitative result and a
single quantitative explanatory indicator. The method is important to detect and characterize the
long-term trend and variability of temperature and rainfall values at the annual/monthly time
scale. The parametric test takes into account random variable Y on time X in a simple linear
regression. The regression line slope coefficient was interpolated that computed from the data is
a coefficient of the regression or the Pearson correlation coefficient (Teshome, 2017). It can be
calculated with eq. 1:
Y = α + 𝛽𝑥. (1)
Where: 𝑌 refers natural disasters (rainfall and temperature variability) during the period; α is
constant of regression; 𝛽 represents slope of the regression equation; 𝑥 refers to number of years
from 2007 to 2019.
2.4.2 Standardized Precipitation Index (SPI)
Standardized Precipitation Index (SPI) developed by the (World Meteorological
Organization, 2012). The number of cold nights and warm days per month was calculated using
the monthly observation of minimum and maximum temperature, respectively. The SPI was used
to identify droughts across the years from 2007 to 2019. It is a statistical measure indicating how
unusual an event is, making it possible to determine how often droughts of certain strength are
likely to occur. The practical implication of SPI-defined drought, the deviation from the normal
amount of precipitation, would vary from one year to another. It can be calculated with eq. 2:
𝑆𝑃𝐼 =𝑥𝑖−�̅�
𝛿 (2)
where; SPI= anomaly of rainfall (irregularity) in different time period; xi is yearly rainfall in the
study period; �̅�is the long-term average yearly rainfall; and 𝛿is the standard deviation of rainfall
in observed time period (Teshome, 2017). Accordingly, the drought severity classes are: extreme
drought (SPI <-1.65), moderate drought (-0.84 >SPI > -1.28), severe drought (-1.28 > SPI > -
1.65) and no drought (SPI >-0.84) (World Meteorological Organization, 2012).
104
Ginjo Gitima et al. / Geosfera Indonesia 6 (1), 2021, 96-126
2.5 Constructing Livelihood Vulnerability Index
Vulnerability is one factor determining whether people have risks to their livelihoods in
agricultural land or not (Suryanto & Rahman, 2019). Thus, the index is used for comparison
among the communities. In addition, the Sustainable Livelihood Framework (SLF) where
vulnerability context is the major determinant of sustainability of livelihood assets as it directly
influences livelihood strategies, institutional process, and livelihood outcomes of the community.
The effects of climate change and variability on farmers' livelihoods have been considered under
the vulnerability context of the Sustainable Livelihood Framework or SLF (Can et al., 2013).
The Livelihood Vulnerability Index calculations developed by Hahn et al. (2009) is
applied in this study, which consists of the following six main components: These are livelihood
assets of Sustainable Livelihood Framework such as human, physical, social, natural and
financial capital. In addition to these, we added one main component i.e., livelihood strategies.
The sub-components have been developed as indicators under a single component.
Vulnerability to variability is determined by a complex interrelationship between multiple
factors where few factors are not often directly quantifiable. Vulnerability assessment requires a
detailed contextual understanding of the relevant systems and how structural changes impact
them. The vulnerability assessment involves estimation of the vulnerability level of a community
and its contributing factors through the development of indices following three steps. The first
step identifies the indicators. Next, using the actual, minimum, and maximum sub-component
indicators, the standardized index value for the sub-component indicators is calculated. Finally,
the standardized major component indices are calculated and aggregated to form an overall index
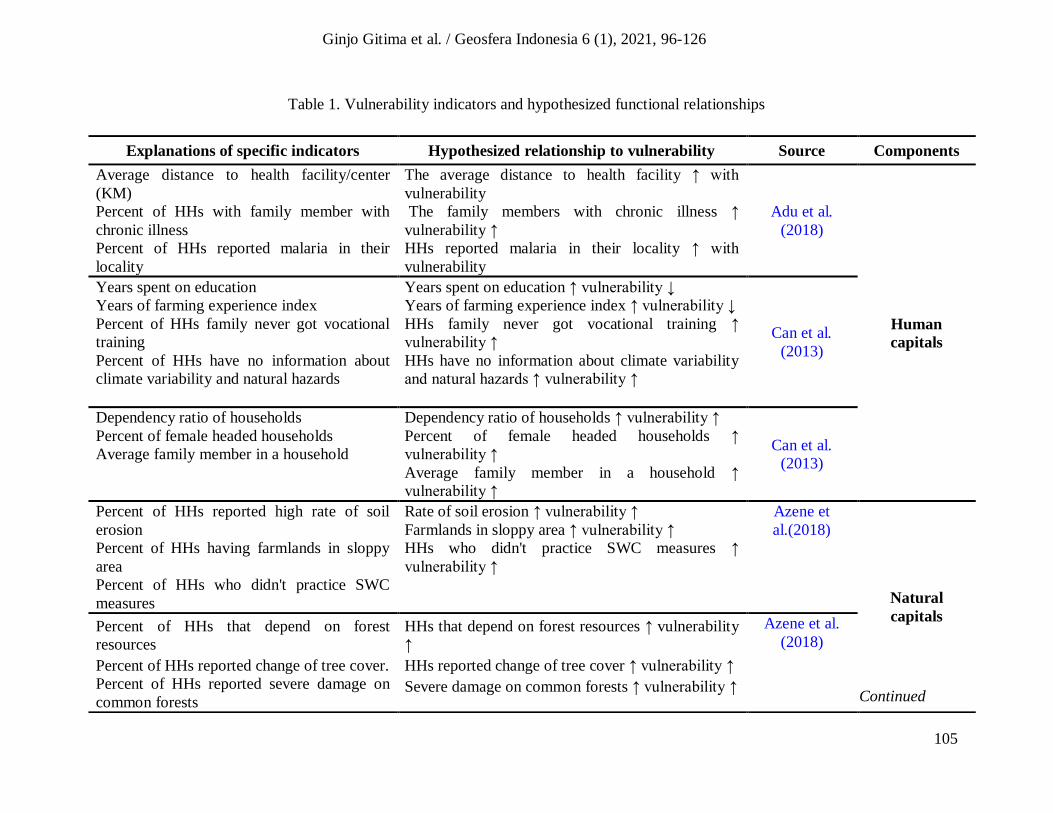
(Endalew& Sen, 2020). Therefore, the vulnerability indicators and measurements were
identified, operationalized, and hypothesized in table 1.
105
Ginjo Gitima et al. / Geosfera Indonesia 6 (1), 2021, 96-126
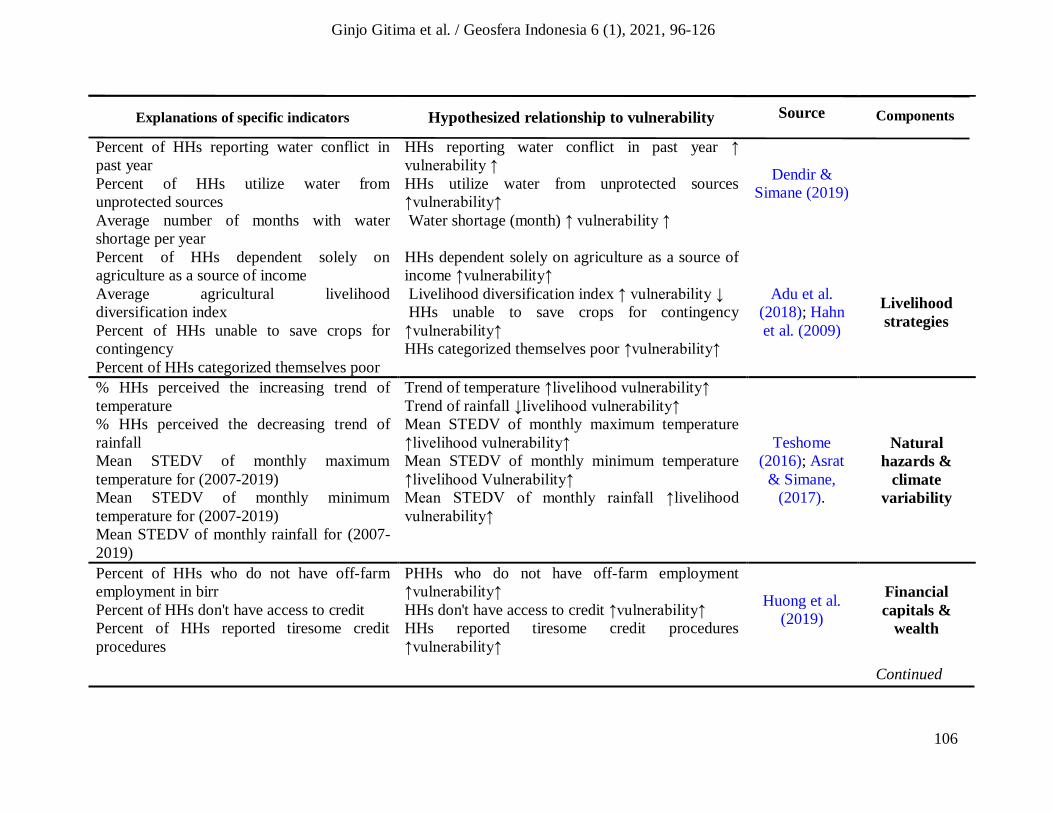
Table 1. Vulnerability indicators and hypothesized functional relationships
Explanations of specific indicators Hypothesized relationship to vulnerability Source Components
Average distance to health facility/center
(KM)
Percent of HHs with family member with
chronic illness
Percent of HHs reported malaria in their
locality
The average distance to health facility ↑ with
vulnerability
The family members with chronic illness ↑
vulnerability ↑
HHs reported malaria in their locality ↑ with
vulnerability
Adu et al.
(2018)
Human
capitals
Years spent on education
Years of farming experience index
Percent of HHs family never got vocational
training
Percent of HHs have no information about
climate variability and natural hazards
Years spent on education ↑ vulnerability ↓
Years of farming experience index ↑ vulnerability ↓
HHs family never got vocational training ↑
vulnerability ↑
HHs have no information about climate variability
and natural hazards ↑ vulnerability ↑
Can et al.
(2013)
Dependency ratio of households
Percent of female headed households
Average family member in a household
Dependency ratio of households ↑ vulnerability ↑
Percent of female headed households ↑
vulnerability ↑
Average family member in a household ↑
vulnerability ↑
Can et al.
(2013)
Percent of HHs reported high rate of soil
erosion
Percent of HHs having farmlands in sloppy
area
Percent of HHs who didn't practice SWC
measures
Rate of soil erosion ↑ vulnerability ↑
Farmlands in sloppy area ↑ vulnerability ↑
HHs who didn't practice SWC measures ↑
vulnerability ↑
Azene et
al.(2018)
Natural
capitals Percent of HHs that depend on forest
resources
Percent of HHs reported change of tree cover.
Percent of HHs reported severe damage on
common forests
HHs that depend on forest resources ↑ vulnerability
↑
HHs reported change of tree cover ↑ vulnerability ↑
Severe damage on common forests ↑ vulnerability ↑
Azene et al.
(2018)
Ginjo Gitima et al. / Geosfera Indonesia 6 (1), 2021, 96-126
Ginjo Gitima et al. / Geosfera Indonesia 6 (1), 2021, 96-126
Continued
106
Ginjo Gitima et al. / Geosfera Indonesia 6 (1), 2021, 96-126
Explanations of specific indicators Hypothesized relationship to vulnerability Source
Percent of HHs reporting water conflict in
past year
Percent of HHs utilize water from
unprotected sources
Average number of months with water
shortage per year
HHs reporting water conflict in past year ↑
vulnerability ↑
HHs utilize water from unprotected sources
↑vulnerability↑
Water shortage (month) ↑ vulnerability ↑
Dendir &
Simane (2019)
Percent of HHs dependent solely on
agriculture as a source of income
Average agricultural livelihood
diversification index
Percent of HHs unable to save crops for
contingency
Percent of HHs categorized themselves poor
HHs dependent solely on agriculture as a source of
income ↑vulnerability↑
Livelihood diversification index ↑ vulnerability ↓
HHs unable to save crops for contingency
↑vulnerability↑
HHs categorized themselves poor ↑vulnerability↑
Adu et al.
(2018); Hahn
et al. (2009)
Livelihood
strategies
% HHs perceived the increasing trend of
temperature
% HHs perceived the decreasing trend of
rainfall
Mean STEDV of monthly maximum
temperature for (2007-2019)
Mean STEDV of monthly minimum
temperature for (2007-2019)
Mean STEDV of monthly rainfall for (2007-
2019)
Trend of temperature ↑livelihood vulnerability↑
Trend of rainfall ↓livelihood vulnerability↑
Mean STEDV of monthly maximum temperature
↑livelihood vulnerability↑
Mean STEDV of monthly minimum temperature
↑livelihood Vulnerability↑
Mean STEDV of monthly rainfall ↑livelihood
vulnerability↑
Teshome
(2016); Asrat
& Simane,
(2017).
Natural
hazards &
climate
variability
Percent of HHs who do not have off-farm
employment in birr
Percent of HHs don't have access to credit
Percent of HHs reported tiresome credit
procedures
PHHs who do not have off-farm employment
↑vulnerability↑
HHs don't have access to credit ↑vulnerability↑
HHs reported tiresome credit procedures
↑vulnerability↑
Huong et al.
(2019)
Financial
capitals &
wealth
Components
s
Continued
Ginjo Gitima et al. / Geosfera Indonesia 6 (1), 2021, 96-126
107
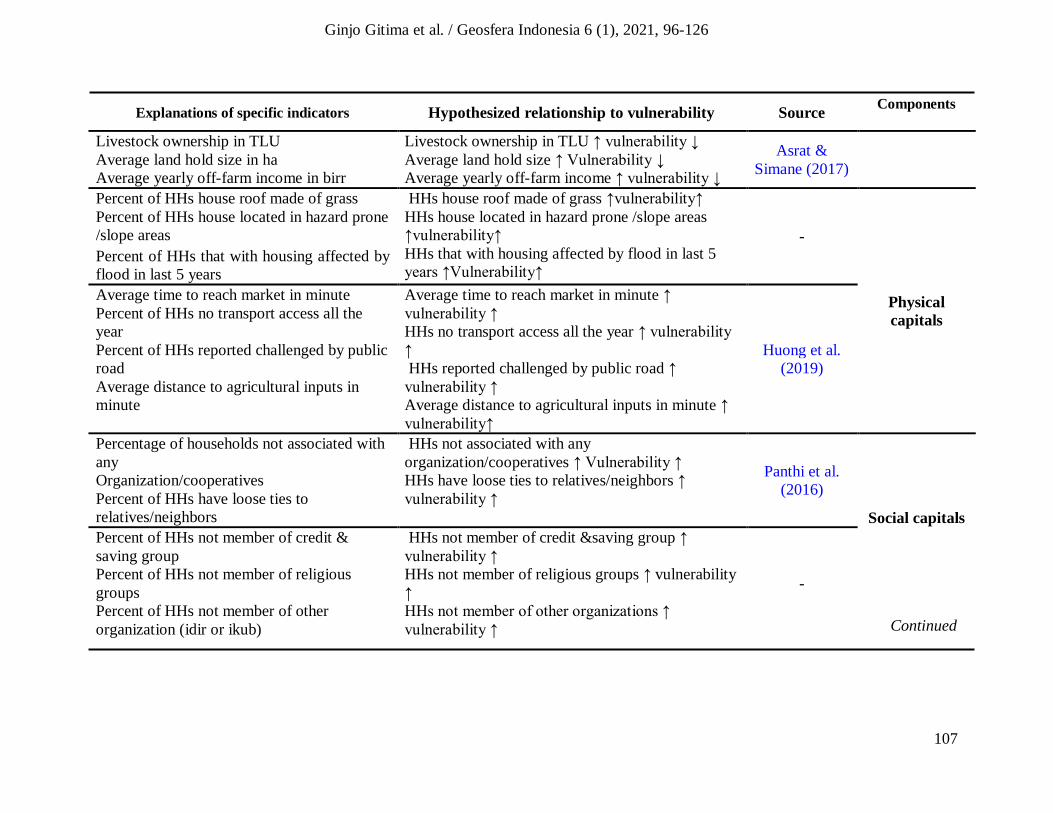
Ginjo Gitima et al. / Geosfera Indonesia 6 (1), 2021, 96-126
Explanations of specific indicators Hypothesized relationship to vulnerability Source Components
Livestock ownership in TLU
Average land hold size in ha
Average yearly off-farm income in birr
Livestock ownership in TLU ↑ vulnerability ↓
Average land hold size ↑ Vulnerability ↓
Average yearly off-farm income ↑ vulnerability ↓
Asrat &
Simane (2017)
Percent of HHs house roof made of grass
Percent of HHs house located in hazard prone
/slope areas
Percent of HHs that with housing affected by
flood in last 5 years
HHs house roof made of grass ↑vulnerability↑
HHs house located in hazard prone /slope areas
↑vulnerability↑
HHs that with housing affected by flood in last 5
years ↑Vulnerability↑
-
Physical
capitals
Average time to reach market in minute
Percent of HHs no transport access all the
year
Percent of HHs reported challenged by public
road
Average distance to agricultural inputs in
minute
Average time to reach market in minute ↑
vulnerability ↑
HHs no transport access all the year ↑ vulnerability
↑
HHs reported challenged by public road ↑
vulnerability ↑
Average distance to agricultural inputs in minute ↑
vulnerability↑
Huong et al.
(2019)
Percentage of households not associated with
any
Organization/cooperatives
Percent of HHs have loose ties to
relatives/neighbors
HHs not associated with any
organization/cooperatives ↑ Vulnerability ↑
HHs have loose ties to relatives/neighbors ↑
vulnerability ↑
Panthi et al.
(2016)
Social capitals
Percent of HHs not member of credit &
saving group
Percent of HHs not member of religious
groups
Percent of HHs not member of other
organization (idir or ikub)
HHs not member of credit &saving group ↑
vulnerability ↑
HHs not member of religious groups ↑ vulnerability
↑
HHs not member of other organizations ↑
vulnerability ↑
-
Ginjo Gitima et al. / Geosfera Indonesia 6 (1), 2021, 96-126
Continued
108
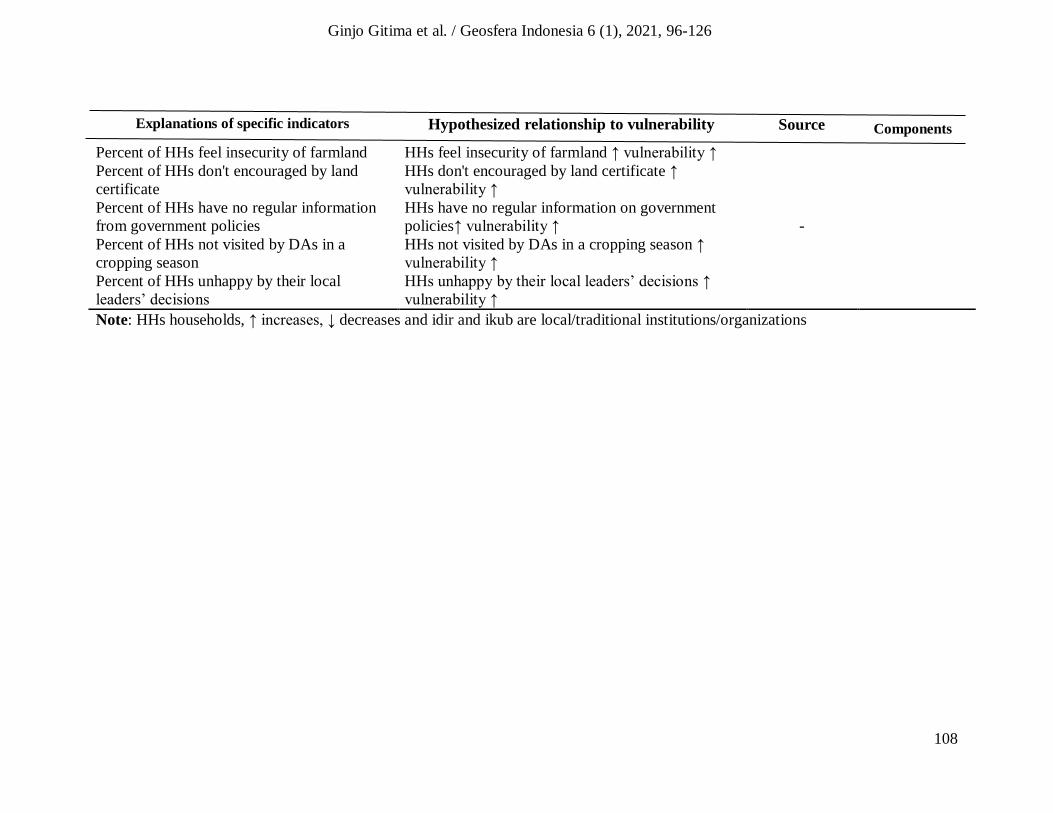
Ginjo Gitima et al. / Geosfera Indonesia 6 (1), 2021, 96-126
Note: HHs households, ↑ increases, ↓ decreases and idir and ikub are local/traditional institutions/organizations
Explanations of specific indicators Hypothesized relationship to vulnerability Source
Percent of HHs feel insecurity of farmland
Percent of HHs don't encouraged by land
certificate
Percent of HHs have no regular information
from government policies
Percent of HHs not visited by DAs in a
cropping season
Percent of HHs unhappy by their local
leaders’ decisions
HHs feel insecurity of farmland ↑ vulnerability ↑
HHs don't encouraged by land certificate ↑
vulnerability ↑
HHs have no regular information on government
policies↑ vulnerability ↑
HHs not visited by DAs in a cropping season ↑
vulnerability ↑
HHs unhappy by their local leaders’ decisions ↑
vulnerability ↑
-
Ginjo Gitima et al. / Geosfera Indonesia 6 (1), 2021, 96-126
Components
109
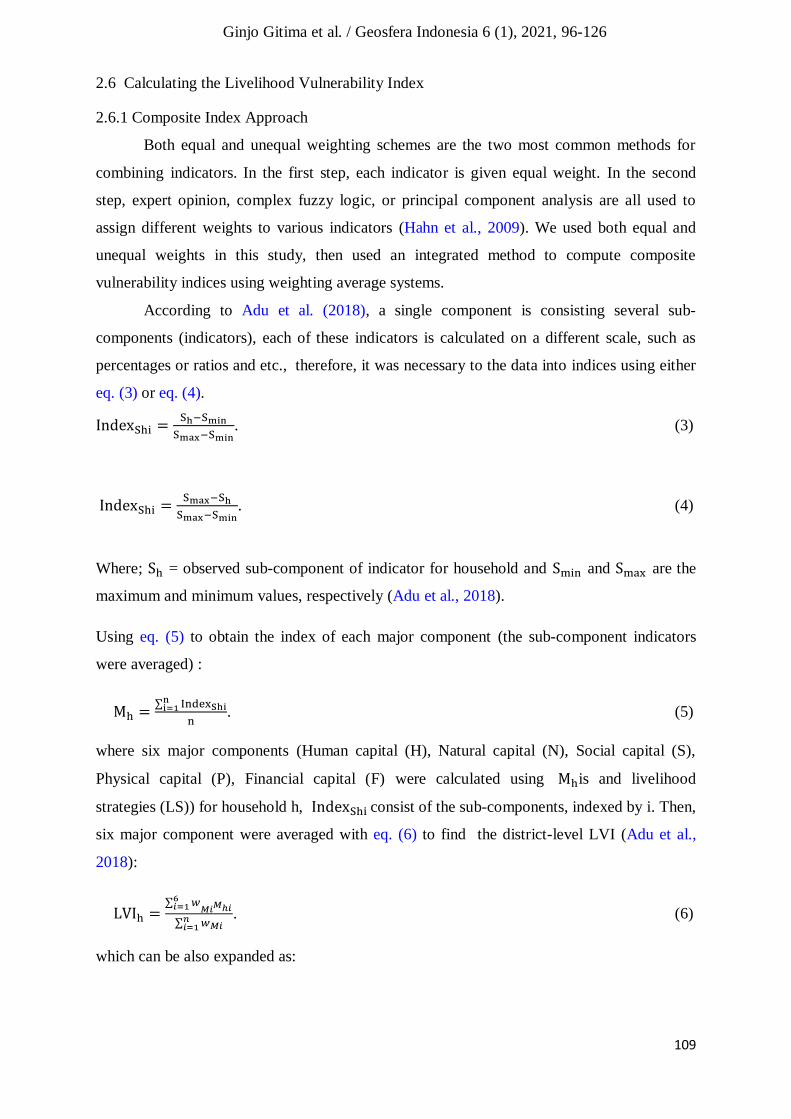
2.6 Calculating the Livelihood Vulnerability Index
2.6.1 Composite Index Approach
Both equal and unequal weighting schemes are the two most common methods for
combining indicators. In the first step, each indicator is given equal weight. In the second
step, expert opinion, complex fuzzy logic, or principal component analysis are all used to
assign different weights to various indicators (Hahn et al., 2009). We used both equal and
unequal weights in this study, then used an integrated method to compute composite
vulnerability indices using weighting average systems.
According to Adu et al. (2018), a single component is consisting several sub-
components (indicators), each of these indicators is calculated on a different scale, such as
percentages or ratios and etc., therefore, it was necessary to the data into indices using either
eq. (3) or eq. (4).
IndexShi =Sh−Smin
Smax−Smin. (3)
IndexShi =Smax−Sh
Smax−Smin. (4)
Where; Sh = observed sub-component of indicator for household and Smin and Smax are the
maximum and minimum values, respectively (Adu et al., 2018).
Using eq. (5) to obtain the index of each major component (the sub-component indicators
were averaged) :
Mh =∑ IndexShi
ni=1
n. (5)
where six major components (Human capital (H), Natural capital (N), Social capital (S),
Physical capital (P), Financial capital (F) were calculated using Mhis and livelihood
strategies (LS)) for household h, IndexShi consist of the sub-components, indexed by i. Then,
six major component were averaged with eq. (6) to find the district-level LVI (Adu et al.,
2018):
LVIh =∑ 𝑤
𝑀𝑖𝑀ℎ𝑖6𝑖=1
∑ 𝑤𝑀𝑖𝑛𝑖=1
. (6)
which can be also expanded as:
Ginjo Gitima et al. / Geosfera Indonesia 6 (1), 2021, 96-126
110
Ginjo Gitima et al. / Geosfera Indonesia 6 (1), 2021, 96-126
𝐿𝑉𝐼ℎ =𝑤𝐻𝐻ℎ+𝑤𝑁𝑁ℎ+𝑤𝑆𝑆ℎ+𝑤𝑃𝑃ℎ+𝑤𝐹𝐹ℎ+𝑤𝐿𝑆𝐿𝑆ℎ
𝑤𝐻+𝑤𝑁+𝑤𝑆+𝑤𝑃+𝑤𝐹. (7)
2.6.2 Calculating the LVI–IPCC: IPCC Framework Approach
According to Hahn et al. (2009), suggest an alternative approach to measuring the
LVI. Table 2 explain the major components’ organization. Table 1 (the same subcomponents
outlined) were used in Eq. (3), (4), and (5) to calculate the LVI–IPCC. When the major
components are combined, the LVI–IPCC diverges from the LVI (Hahn et al., 2009).
Table 2. Categorization of major components into contributing factors from the IPCC
IPCC contributing factors to vulnerability Major components
Exposure (e) Natural disasters and climate variability
Adaptive capacity (a) Socio-demographic profile
Livelihood strategies
Social networks
Sensitivity (s) Health, knowledge and skills
Natural capital
Financial capital
Source: Adopted from Can et al. (2013)
They are combined according to the categorization scheme in Table 2, using the following
equation:
𝐶𝐹ℎ =∑ 𝑤
𝑀𝑖𝑀ℎ𝑖𝑛𝑖=1
∑ 𝑤𝑀𝑖𝑛𝑖=1
.. (6)
Where; CFh is an IPCC defined contributing factor (exposure, sensitivity and adaptive
capacity) for rural households h, Mhi are main components for household h is indexed by i,
𝑤𝑀𝑖is the weight of every main component, and n is the number of main components in every
factor with contribution. When exposure, sensitivity, and adaptive capacity were combined in
calculation, the formula developed by Hahn et al. (2009) combining the three contributing
factors using:
𝐿𝑉𝐼 − 𝐼𝑃𝐶𝐶ℎ = (𝑒ℎ − 𝑎ℎ) ∗ 𝑆ℎ . (7)
where; LVI–IPCCh indicates the LVI for household h represented using the IPCC
vulnerability framework, e is the households’ exposure result, a is households’ the capacity
of adapative result, and s is the household’s sensitivity result (weighted mean score of the
health, knowledge, skills, natural capital and financial major components) which ranged from
111
Ginjo Gitima et al. / Geosfera Indonesia 6 (1), 2021, 96-126
(-1) the least vulnerable to (+1) the most vulnerable on the LVI–IPCC scale (Adu et al.,
2018).
3. Results and Discussion
3.1 Maximum And Minimum Temperatures Over The Last 13 Years
The average temperature hurts agricultural output and significantly reduces
agricultural output. A one percent increase in average temperature would reduce agricultural
output by 2.5% in the long run. The long-run elasticity of agricultural output concerning
average temperature is -2.5 indicating that agricultural output is most sensitive to an average
temperature increase in the long run. A decrease in agricultural productivity is likely as a
result of increased temperature variability. This may be due to the fact that high temperatures
deplete soil nutrients, making livestock and agricultural productivity difficult (Ketema &
Negeso, 2020). Climate variability causes the frequency and severity of weather events.
Accordingly, an analysis of the climate variability in the study area over the last 13
years (2007–2019) found that the maximum and minimum mean temperatures were increased
over time. In a way that simple linear regression shows about 0.66 and 0.36-degree
centigrade has been increased to the mean maximum and minimum temperatures of the study
area per decade, respectively. This shows that the district had been in a warming trend for the
last thirteen years (2007 to 2019). These results also confirm the survey results in terms of the
respondents' perceived increment trends of the temperature over the last 13 years. Moreover,
key informants’ interviewers indicated the increasing trends of temperature and shifting of
seasonal weather phenomenon causes the spreading of tropical diseases like malaria and
locust. Furthermore, FGDs discussants claimed that rise of temperature and its adverse effects
on crop production is increasingly being felt. These show the main evidence of the impacts of
climate variability on rural livelihoods in the district.
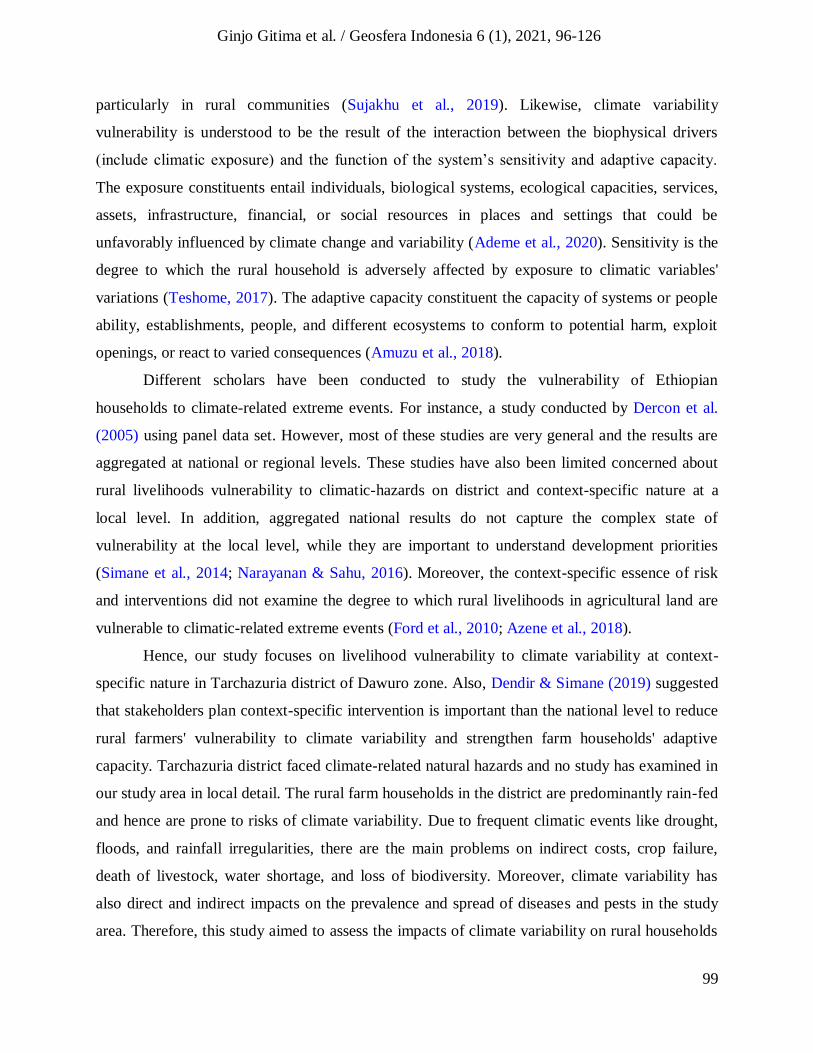
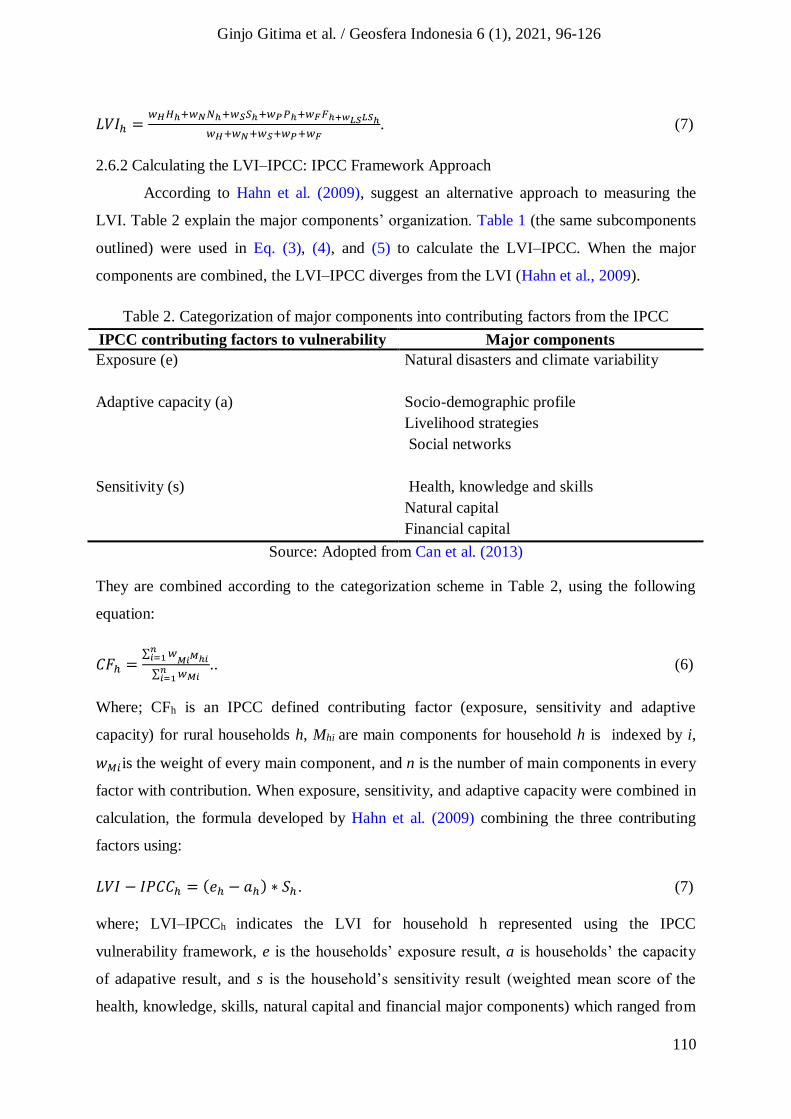
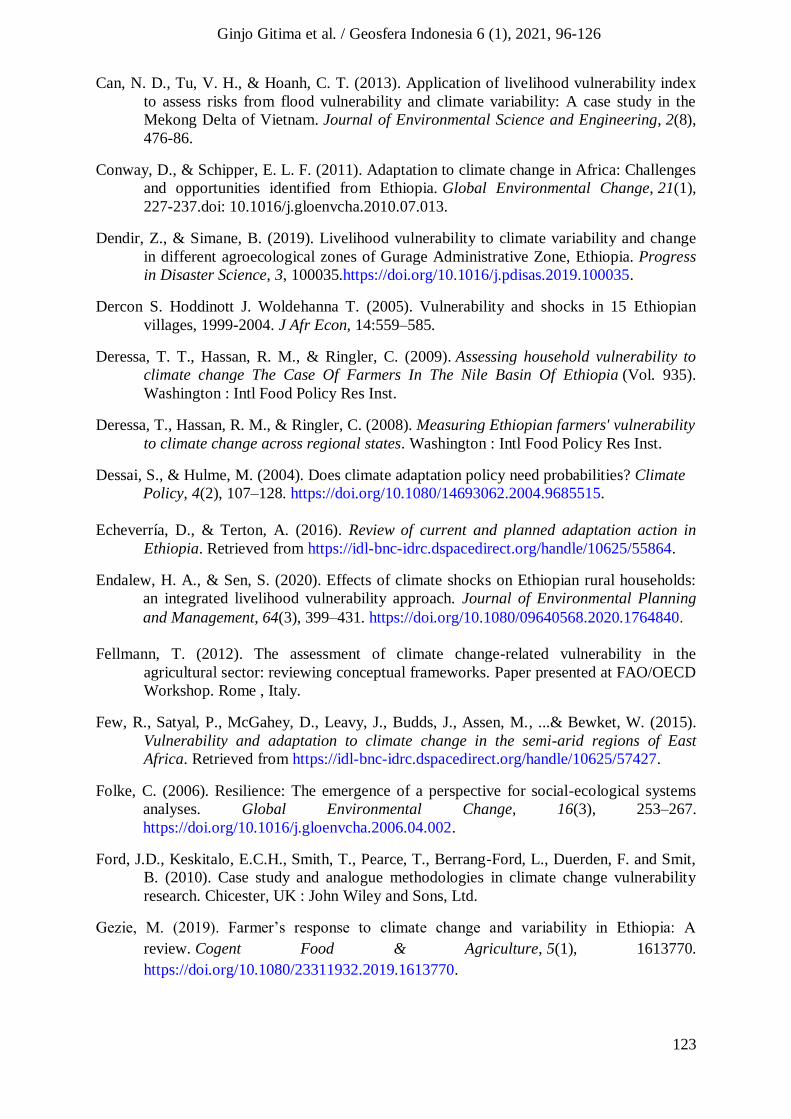
As shown in figure 2, the maximum and minimum deviations in temperature over the
last thirteen years (2007 to 2019) are clearly shown. Maximum temperature deviations
decreased in 2007, and in 2008 minimum temperature increases were observed from the long
average temperature. Whereas, both maximum and minimum temperature deviations were
shows to rise and fall in 2009 and 2010, respectively. From 2011 to 2012 temperature
deviations continued with fluctuation. But from 2013 to 2015 the deviations of minimum
temperatures rapidly decreased. From 2017 until 2019 the minimum temperature deviation
slightly went upwards from the study area's long-term average temperature.
112
Ginjo Gitima et al. / Geosfera Indonesia 6 (1), 2021, 96-126
Figure 2. Deviations of maximum and minimum temperatures in the study area
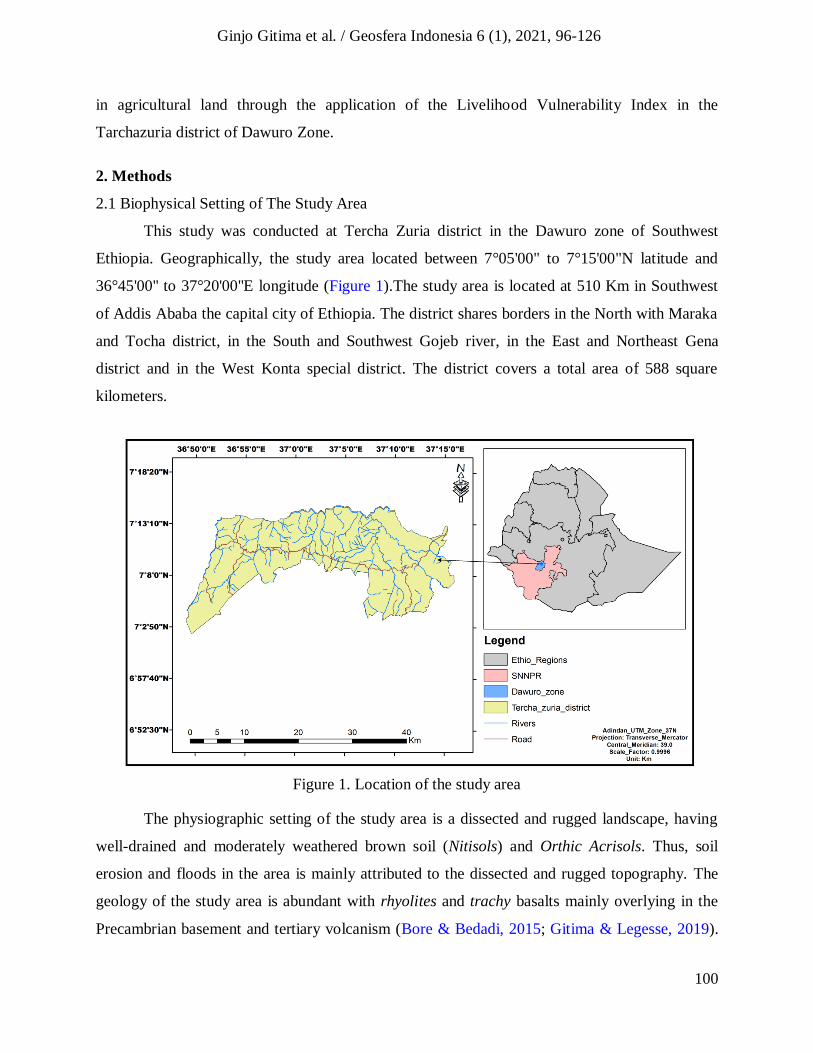
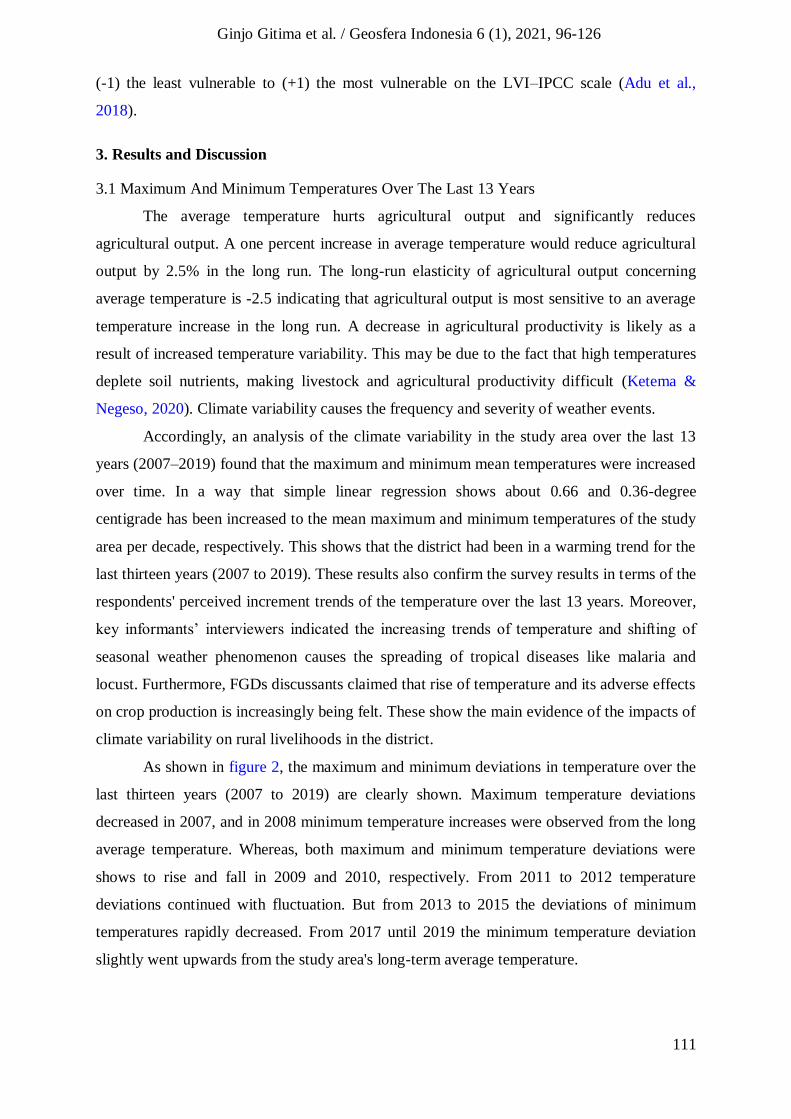
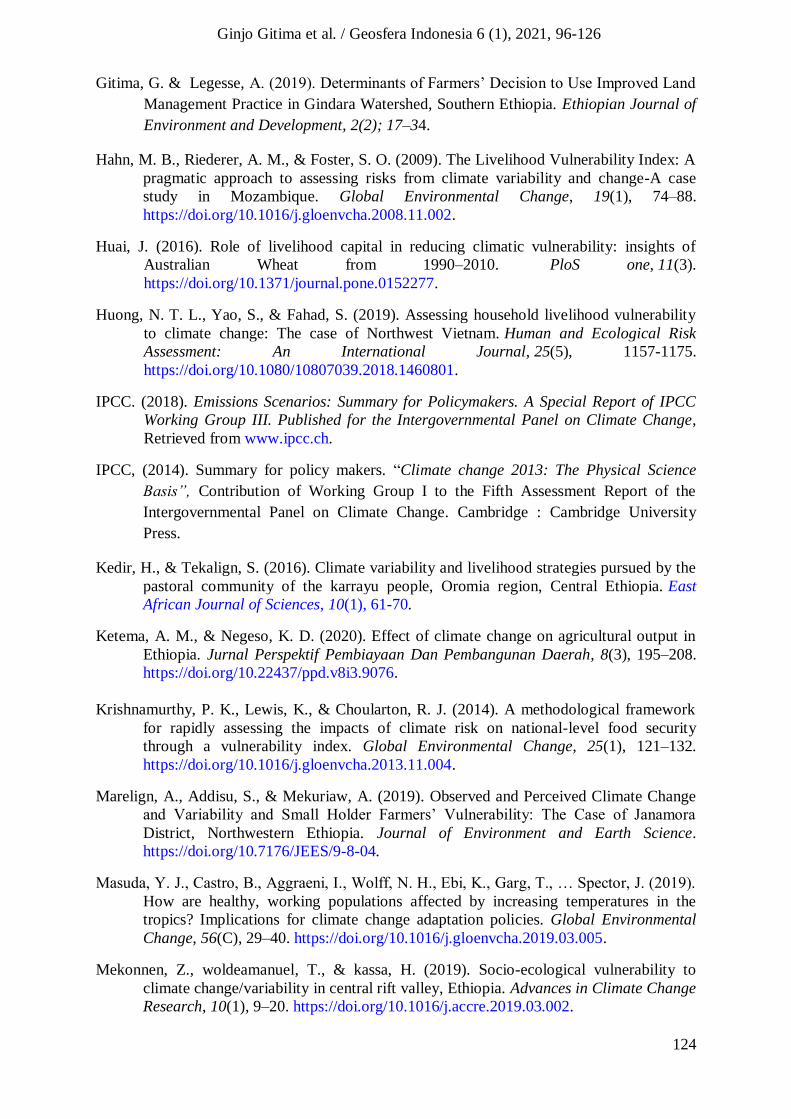
As shown in figure 3 the least mean monthly minimum temperature was recorded
from 2007 to 2019 in July (14.62 °C), August (14.7 °C), and September (14.68 °C). Whereas,
the highest minimum temperatures were recorded in the study area in January (16.3°C),
February (16.8°C), and March (16.5°C) from 2007 to 2019. The highest mean monthly
maximum temperature was recorded in January (29.75 °C), February 30.46 °C) and March
(30.5 °C) for the period of 2007 to 2019. While, the least mean monthly maximum
temperature was recorded in July (24.6 °C), August (25 °C), and September (25.6°C).
Similarly, the study made by Kedir & Tekalign (2016) in the pastoral community of the
Karrayu people in the Oromia region reported that the mean maximum monthly temperature
indicates an increasing trend except for July and August.
Figure 3. Mean monthly minimum and maximum temperatures
y = 0.095x - 0.671
R² = 0.139y = 0.023x - 0.161
R² = 0.008
-2.5
-2
-1.5
-1
-0.5
0
0.5
1
1.5
2
2.5
20
07
20
08
20
09
20
10
20
11
2012
2013
20
14
20
15
20
16
20
17
20
18
20
19
Tmax.
Tmin.
Linear (Tmax.)
Linear (Tmin.)
0
5
10
15
20
25
30
35
0 2 4 6 8 10 12 14
Tem
p. in
deg
ree c
en
tig
ra
de
Maximum temprature
Mean
Minimum temprature
113
Ginjo Gitima et al. / Geosfera Indonesia 6 (1), 2021, 96-126
3.2 Rainfall Anomaly Over The Last 13 Years: Standardized Precipitation Index (SPI)
Rainfall in Ethiopia is a major input in determining output due to this the country is
named as rain-fed agriculture, where rainfall play an important role (Ketema &Negeso,
2020). As shown in figure 4 the analysis of metrological data of rainfall indicates the annual
temporal variations. The annual rainfall variability from 2007 through 2019 can be detected
from the CV value. The result showed that the study area's annual temporal CV was 19.5
percent, indicating a low variability in rainfall. According to Asfaw et al. (2018), CV below
20% implies less variability and hence annual rainfall experienced less variability. However,
key informant interviewers indicated that climate variability has become unpredictable and
associated with erratic rainfall. They also claimed that rainfall's erratic nature brings
indescribable hardship to study communities as most of them expressed unhappiness to the
current irregular, and unstable nature of rainfall currently experienced. Similar findings have
been found by Araro et al. (2019) in Konso district of Southern Ethiopia, unexpected rain
followed by heavy flood and drought. These variations in rainfall pattern have a direct impact
on crop yields, livestock production and price fluctuation from the agricultural perspective.
Also, FGDs discussants reported there is a high variability of rainfall and rainy seasons could
either delay when farmers predict a fall of rains when they least expected them in the district.
Therefore, FGDs discussants suggested livelihood diversification strategies, and water
harvesting methods during the rainy seasons should be the best options to adapt to existing
rain variability and extreme weather events. Likewise, Kedir & Tekalign (2016) suggested
that proper use of water harvesting technology should be devised to use and manage the
intense rainfall of July and August in their study in central Ethiopia. Moreover, early warning
systems and integrated watershed and environmental management measures are required to
minimize/avoid disaster and design possible remedial actions.
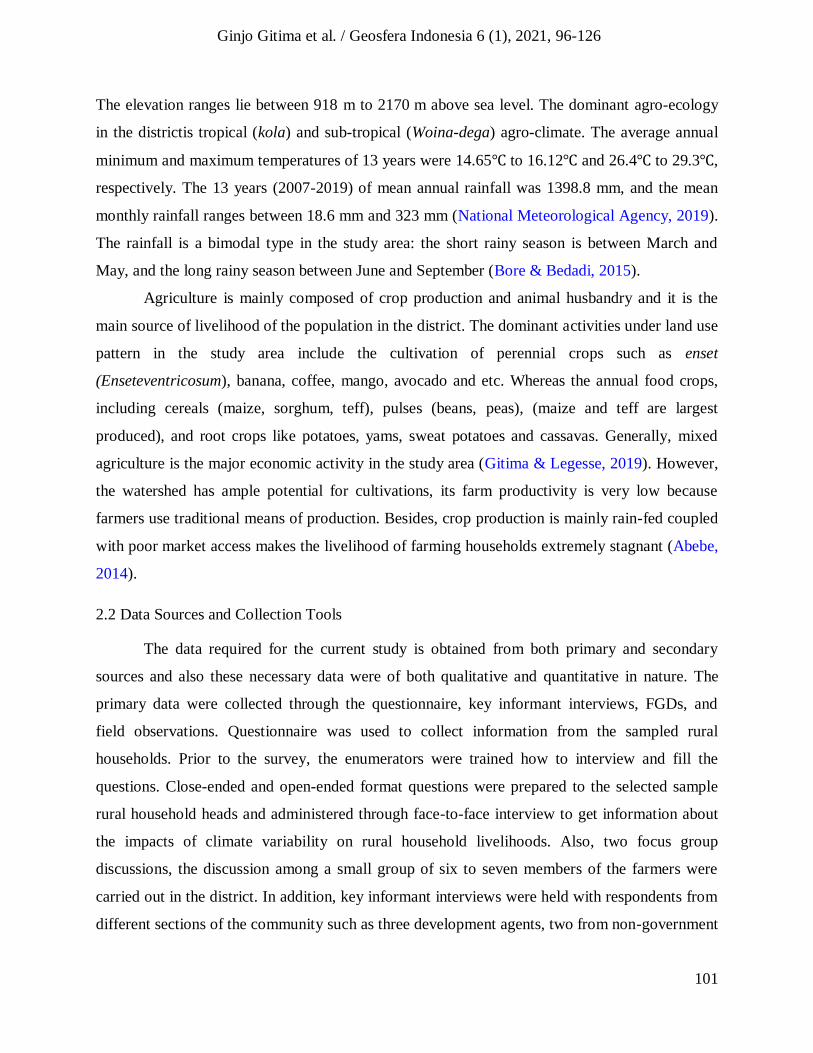
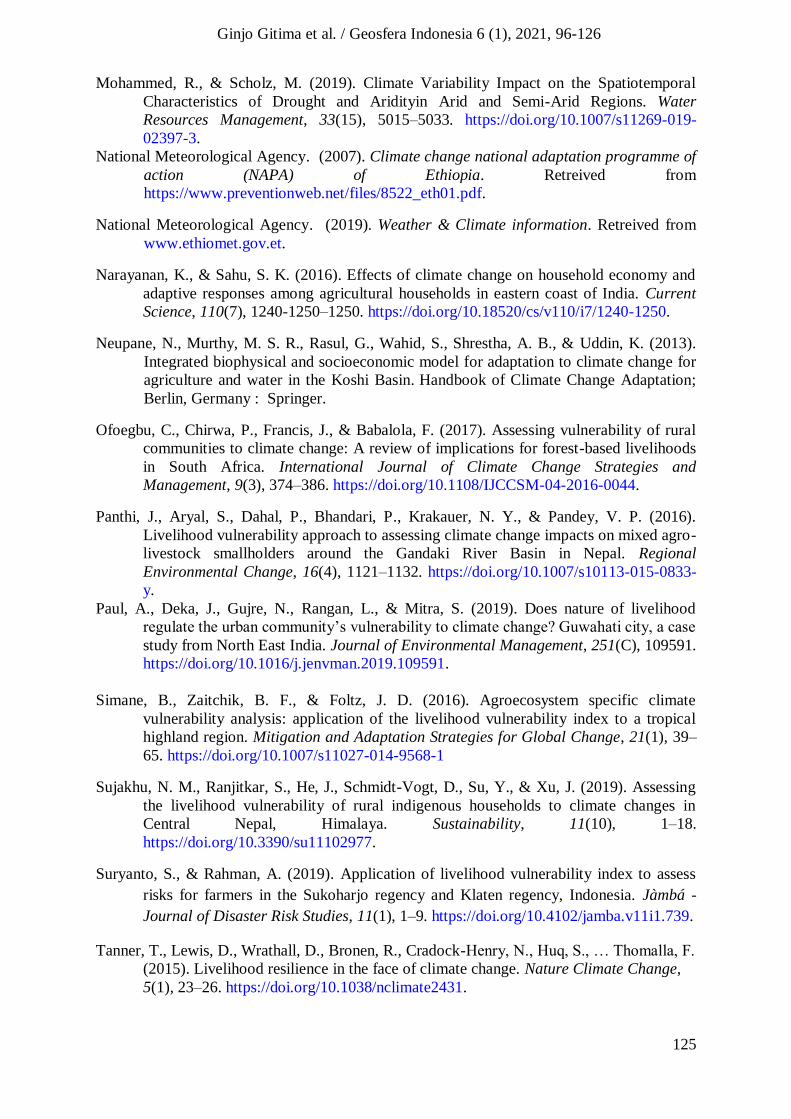
The rainfall anomaly also witnessed for the presence of annual variability and the
trends being below the long-term average. As shown in figure 4, the SPI (rainfall anomaly-
variability and irregularity) can identify and monitor droughts. The evaluation of SPI at a
certain location is based on a series of accumulated rainfall for a different monthly time scale
in a year. The rainfall series is fitted to probability distributions that are subsequently
transformed into normal distributions. It follows that the average SPI for the target location
and the chosen period is zero. Negative SPI numbers specify less than median or long-term
average rainfall, whereas positive SPI values indicate greater than median rainfall
(Mohammed & Scholz, 2019).
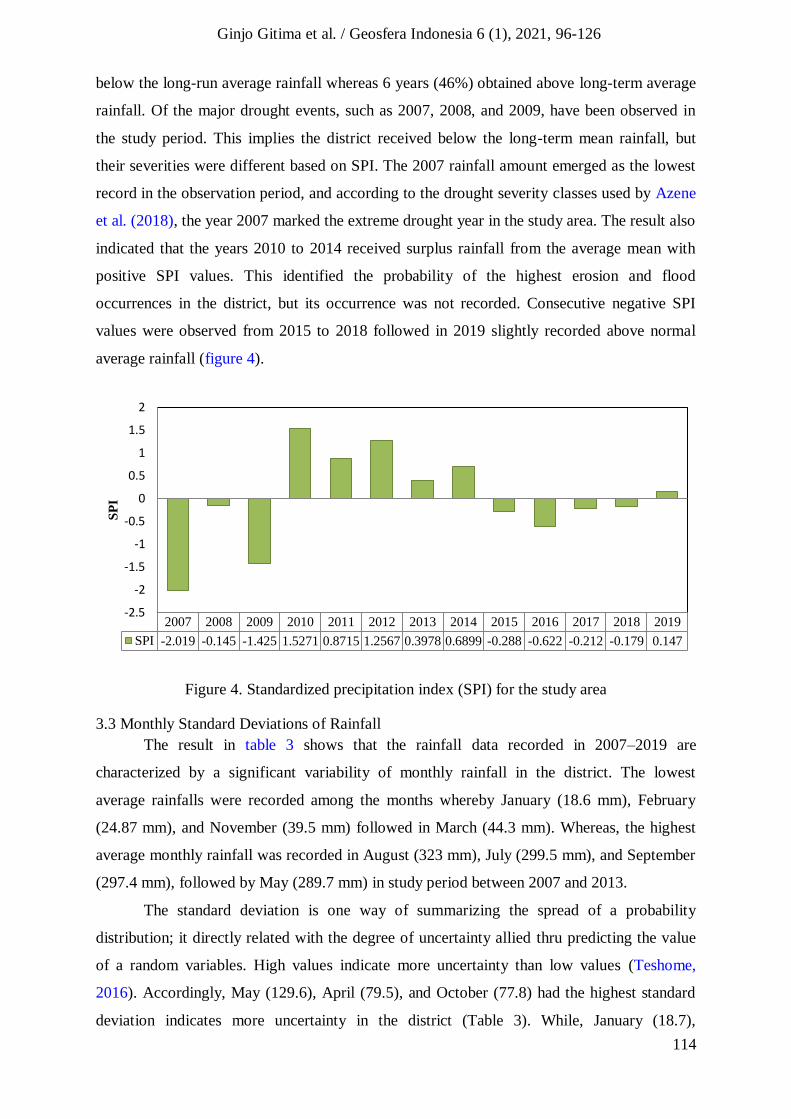
Figure 4 also clearly shows the variation of rainy years (wet) and years of drought
(dry) episodic pattern. The results of the last 13 years indicated; seven years (53.8%) received
114
Ginjo Gitima et al. / Geosfera Indonesia 6 (1), 2021, 96-126
below the long-run average rainfall whereas 6 years (46%) obtained above long-term average
rainfall. Of the major drought events, such as 2007, 2008, and 2009, have been observed in
the study period. This implies the district received below the long-term mean rainfall, but
their severities were different based on SPI. The 2007 rainfall amount emerged as the lowest
record in the observation period, and according to the drought severity classes used by Azene
et al. (2018), the year 2007 marked the extreme drought year in the study area. The result also
indicated that the years 2010 to 2014 received surplus rainfall from the average mean with
positive SPI values. This identified the probability of the highest erosion and flood
occurrences in the district, but its occurrence was not recorded. Consecutive negative SPI
values were observed from 2015 to 2018 followed in 2019 slightly recorded above normal
average rainfall (figure 4).
Figure 4. Standardized precipitation index (SPI) for the study area
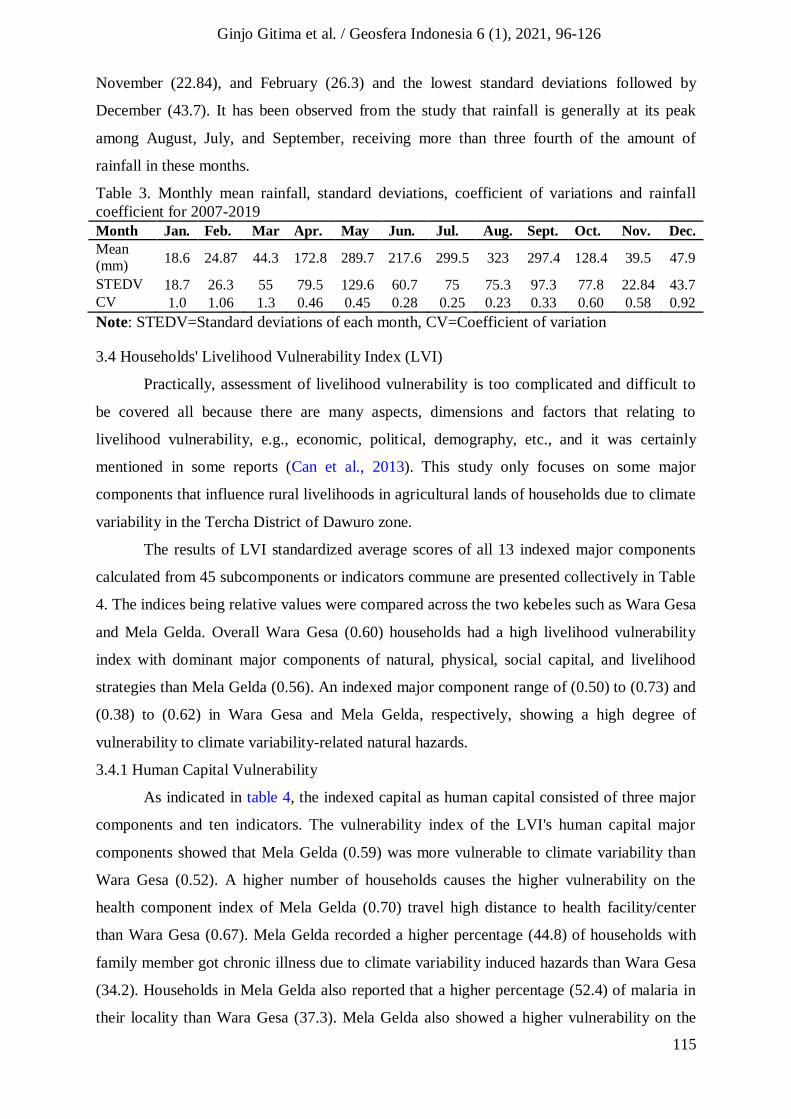
3.3 Monthly Standard Deviations of Rainfall
The result in table 3 shows that the rainfall data recorded in 2007–2019 are
characterized by a significant variability of monthly rainfall in the district. The lowest
average rainfalls were recorded among the months whereby January (18.6 mm), February
(24.87 mm), and November (39.5 mm) followed in March (44.3 mm). Whereas, the highest
average monthly rainfall was recorded in August (323 mm), July (299.5 mm), and September
(297.4 mm), followed by May (289.7 mm) in study period between 2007 and 2013.
The standard deviation is one way of summarizing the spread of a probability
distribution; it directly related with the degree of uncertainty allied thru predicting the value
of a random variables. High values indicate more uncertainty than low values (Teshome,
2016). Accordingly, May (129.6), April (79.5), and October (77.8) had the highest standard
deviation indicates more uncertainty in the district (Table 3). While, January (18.7),
2007 2008 2009 2010 2011 2012 2013 2014 2015 2016 2017 2018 2019
SPI -2.019 -0.145 -1.425 1.5271 0.8715 1.2567 0.3978 0.6899 -0.288 -0.622 -0.212 -0.179 0.147
-2.5
-2
-1.5
-1
-0.5
0
0.5
1
1.5
2
SP
I
115
Ginjo Gitima et al. / Geosfera Indonesia 6 (1), 2021, 96-126
November (22.84), and February (26.3) and the lowest standard deviations followed by
December (43.7). It has been observed from the study that rainfall is generally at its peak
among August, July, and September, receiving more than three fourth of the amount of
rainfall in these months.
Table 3. Monthly mean rainfall, standard deviations, coefficient of variations and rainfall
coefficient for 2007-2019
Month Jan. Feb. Mar Apr. May Jun. Jul. Aug. Sept. Oct. Nov. Dec.
Mean (mm)
18.6 24.87 44.3 172.8 289.7 217.6 299.5 323 297.4 128.4 39.5 47.9
STEDV 18.7 26.3 55 79.5 129.6 60.7 75 75.3 97.3 77.8 22.84 43.7
CV 1.0 1.06 1.3 0.46 0.45 0.28 0.25 0.23 0.33 0.60 0.58 0.92
Note: STEDV=Standard deviations of each month, CV=Coefficient of variation
3.4 Households' Livelihood Vulnerability Index (LVI)
Practically, assessment of livelihood vulnerability is too complicated and difficult to
be covered all because there are many aspects, dimensions and factors that relating to
livelihood vulnerability, e.g., economic, political, demography, etc., and it was certainly
mentioned in some reports (Can et al., 2013). This study only focuses on some major
components that influence rural livelihoods in agricultural lands of households due to climate
variability in the Tercha District of Dawuro zone.
The results of LVI standardized average scores of all 13 indexed major components
calculated from 45 subcomponents or indicators commune are presented collectively in Table
4. The indices being relative values were compared across the two kebeles such as Wara Gesa
and Mela Gelda. Overall Wara Gesa (0.60) households had a high livelihood vulnerability
index with dominant major components of natural, physical, social capital, and livelihood
strategies than Mela Gelda (0.56). An indexed major component range of (0.50) to (0.73) and
(0.38) to (0.62) in Wara Gesa and Mela Gelda, respectively, showing a high degree of
vulnerability to climate variability-related natural hazards.
3.4.1 Human Capital Vulnerability
As indicated in table 4, the indexed capital as human capital consisted of three major
components and ten indicators. The vulnerability index of the LVI's human capital major
components showed that Mela Gelda (0.59) was more vulnerable to climate variability than
Wara Gesa (0.52). A higher number of households causes the higher vulnerability on the
health component index of Mela Gelda (0.70) travel high distance to health facility/center
than Wara Gesa (0.67). Mela Gelda recorded a higher percentage (44.8) of households with
family member got chronic illness due to climate variability induced hazards than Wara Gesa
(34.2). Households in Mela Gelda also reported that a higher percentage (52.4) of malaria in
their locality than Wara Gesa (37.3). Mela Gelda also showed a higher vulnerability on the
116
Ginjo Gitima et al. / Geosfera Indonesia 6 (1), 2021, 96-126
knowledge and skills indexed major component (0.72) than Wara Gesa (0.63), these were
caused by lower years spent on the education of household heads for Mela Gelada (0.89) than
Wara Gesa (0.55), and a large percentage of household heads never got vocational training
about climate adaptation strategies for Mela Gelda (62.7) than Wara Gesa (58.3). Household
heads of Mela Gelda also reported a higher percentage (85.7) had no information about
climate variability and natural hazards than Wara Gesa (62.3).
The vulnerability index of the major components of the socio-demographic profile
showed that Mela Gelda (0.50) was more vulnerable than Wara Gesa (0.46); these were
because of a higher dependency ratio of households in Mela Gelda(0.72) than Wara Gesa
(0.56). This could be explained by the fact that the population proportions under 15 and over
65 years that were dependent were greater in Mela Gelda than in Wara Gesakebele. And,
high percentages of female-headed households were found in Mela Gelda (25.2) than Wara
Gesa (15.7), and a higher average family member in Mela Gelda (0.69) than Wara Gesa
(0.62). Similarly, FGDs discussants and key informant interviewers in Mela Gelda suggested
that large family size may contribute to households’ vulnerability to climate variability
induced risks in the case of limited rural livelihood options.
3.4.2 Natural Capital Vulnerability
Climate variability has a higher effect on agricultural land, forests, and water, which
are the essential source of rural livelihood sustainability. Climate variability's shortage of
natural resources enhances resource-dependent conflict (Thakur & Bajagain, 2019). The
indexed natural capital consisted of three major components as indicated in table 4. The
results of the natural capital of LVI standardized average scores in Wara Gesa (0.73) a higher
than Mela Gelda (0.62). Land is an important natural capital and indicator of wealth. In this
study, agricultural lands found in sloppy and erosion prone areas, farmers didn’t practice
structural SWC measures are considered as indicators to measure vulnerability. The major
components of land resources were found to be higher vulnerable to climate variability and
natural hazards in Wara Gesa (0.69) than Mela Gelda (0.49). When indicators reviewed the
major components land resources, Wara Gesa was the most vulnerable in terms of house
heads reported high percent rate of soil erosion in Wara Gesa (75) than Mela Gelda (53),
having a high percent of farmlands in a sloppy area in Wara Gesa (84) than Mela Gelda (52)
and a higher percentage of household heads who didn't practice physical soil and water
conservation measures in Wara Gesa (49) than Mela Gelda (42). Moreover, during FGDs the
participants reported the most of farmlands situated rugged topography and sloppy area these
causes a high rate of soil erosions.
117
Ginjo Gitima et al. / Geosfera Indonesia 6 (1), 2021, 96-126
In addition, when the total standardized weighted scores of the indicators of forest
resources showed that Mela Gelda (0.53) was less vulnerable than Wara Gesa (0.73). These
were because of the large percentage of households depending on forest resources recorded in
Wara Gesa (73) than Mela Gelda (54). In comparison, the highest percentage of households
reported that about a change of tree cover and severe damage to common forests in Mela
Gelda than Wara Gesa. The key informant interviewee realized the farmers located near the
main roads and close to the market place clear forests because charcoal is their income
source.Wara Gesa (0.74) showed a slightly higher vulnerability standardized score in terms of
water resources than Mela Gelda (0.70) on this aggregated major component. The indicators
of water resources were more vulnerable to climate-induced natural hazards due to a high
percentage of households reporting water conflict in past years and households to utilize
water from unprotected sources.
3.4.3 Financial Capital Vulnerability
As indicated in table 4, the indexed financial capital such as income and wealth
considered as major components to measure vulnerability. The aggregated indicators' overall
standardized average score was shown to be more vulnerable in Mela Gelda (0.60) than Wara
Gesa (0.55) to climate variability induced natural hazards. Mela Gelda (0.66) showed a
slightly higher vulnerability in terms of indicators of average yearly off-farm income than
Wara Gesa (0.60), a large percentage of households did not have off-farm employment in
Mela Gelda(34.5) than Wara Gesa (28.4). About (46.7) percent of Mela Gelda households
reported that they had no access to credit than Wara Gesa (36.2). Results from the survey
showed households' average livestock ownership in TLU of households for Mela Gelda
(1.66) was less vulnerable than Wara Gesa (1.23), and the average land hold size of
households for Mela Gelda (1.87) was less vulnerable than Wara Gesa (1.42).
3.4.4 Physical Capital Vulnerability
As shown in table 4, the indexed physical capital consisted of two major components
and seven indicators. WaraGesa showed a slightly higher vulnerability (0.72) on the physical
capital standardized score than Mela Gelda (0.69). Results from the survey showed the
percentage of households with a house roof made of grass of (35) percent for Wara Gesa and
(24.5) for Mela Gelda. Other indicators were the highest percentage of households’ crops and
houses affected by flood in the last 5 years for Wara Gesa (37.4) were more vulnerable to
climate variability than Mela Gelda (18.6). About (82.7) percentage of Wara Gesa
households reported their houses located in hazard-prone /slope areas and more vulnerable
118
Ginjo Gitima et al. / Geosfera Indonesia 6 (1), 2021, 96-126
than Mela Gelda (56.7). In addition, FGDs discussants suggested most households are
engaged in agricultural activities in sloppy areas, but the majority of the households have no
plans to protect floods along with rugged topography. By road infrastructure on households'
vulnerability to climate variability, the results suggest that levels of vulnerability in
WaraGesa (0.72) were slightly highest than WaraGesa (0.69). The cause of the road
vulnerability is that a large percentage of households had no transport access all year, and
public roads challenged them.
3.4.5 Social Capital Vulnerability
Social capitals such as social networks and relationships, organizational membership,
policy and leadership, and service delivery are affected by extreme weather events and
natural climatic hazards due to which they have to adjust their social partnership, delay the
delivery of services, often make the rural households dispute with the leader due to natural
disaster management. As revealed in table 4, the indexed social capital consisted of three
major components and nine specific indicators. The vulnerability standardized average score
of the social capital major components showed that Mela Gelda (0.64) was more vulnerable
to climatic-induced natural hazards than Wara Gesa (0.59).
When indicators reviewed the major components networks and relationships, Wara
Gesa was the most vulnerable in terms of households’ heads reported that a high percentage
of household heads not associated with any organization/cooperative in Wara Gesa (75.3)
than Mela Gelda (37.5), and a higher percentage of household heads had loose ties to
relatives/neighbors in Wara Gesa (23) than Mela Gelda (12). By organization affiliation on
households’ vulnerability to climate variability, the results show that levels of vulnerability in
WaraGesa (0.38) was highest vulnerable to climate-induced natural hazards than Mela Gelda
(0.20), this was because of a high percentage of households not a member of the organization
like idir and ikub, etc.
3.4.6 Livelihood Strategies Vulnerability
The indexed livelihood strategies component /profile consisted of four sub-
components/indicators. Considering the percentage of households dependent exclusively on
agriculture as a source of income as an indicator a higher vulnerable in Mela Gelda (83) than
Wara Gesa (62.4), and average inverse agricultural livelihood diversification index a higher
vulnerable in Wara Gesa (0.685) than Mela Gelda (0.50). Wara Gesa (54%) shows a slightly
greater vulnerability to climate variability based on the percentage of households unable to
save crops for contingency than Mela Gelda (52%). Wara Gesa also showed greater
119
Ginjo Gitima et al. / Geosfera Indonesia 6 (1), 2021, 96-126
vulnerability (77.4 %) on the percentage of households categorized themselves poor than
Mela Gelda (63%).
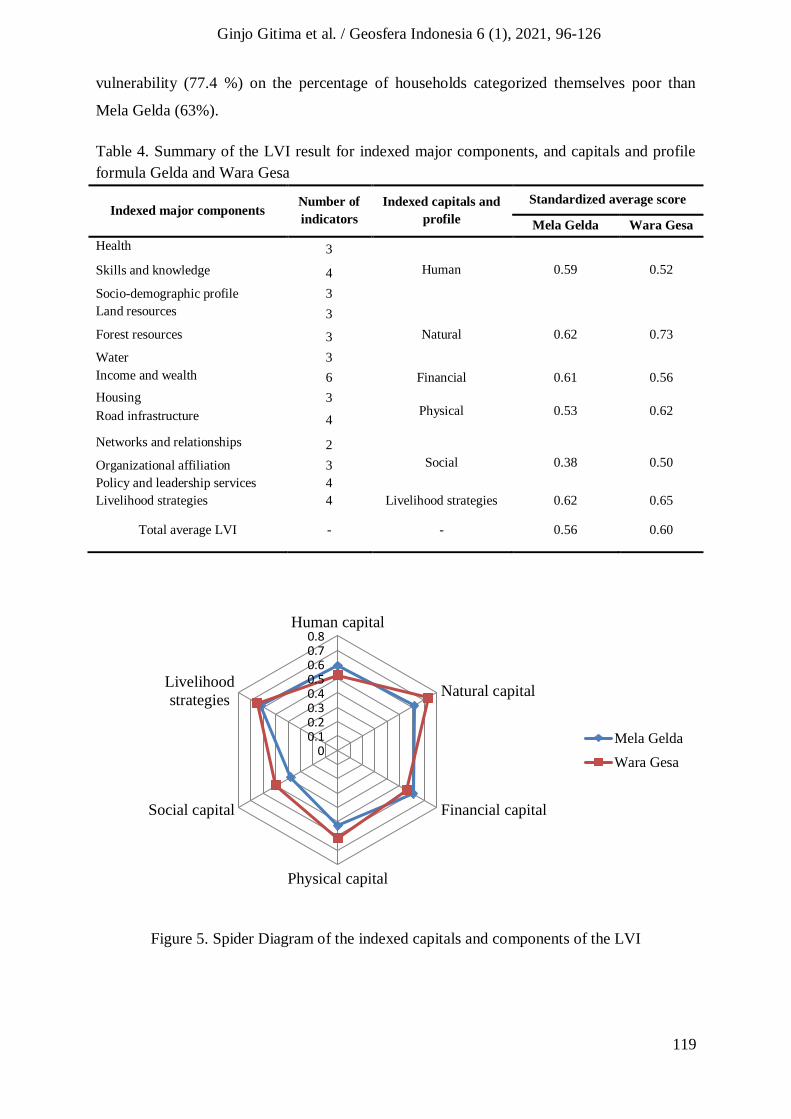
Table 4. Summary of the LVI result for indexed major components, and capitals and profile
formula Gelda and Wara Gesa
Indexed major components Number of
indicators
Indexed capitals and
profile
Standardized average score
Mela Gelda Wara Gesa
Health 3
Human 0.59 0.52 Skills and knowledge 4
Socio-demographic profile 3
Land resources 3
Natural 0.62 0.73 Forest resources 3
Water 3
Income and wealth 6 Financial 0.61 0.56
Housing 3 Physical 0.53 0.62 Road infrastructure 4
Networks and relationships 2
Social 0.38 0.50 Organizational affiliation 3
Policy and leadership services 4
Livelihood strategies 4 Livelihood strategies 0.62 0.65
Total average LVI - - 0.56 0.60
Figure 5. Spider Diagram of the indexed capitals and components of the LVI
00.10.20.30.40.50.60.70.8
Human capital
Natural capital
Financial capital
Physical capital
Social capital
Livelihood
strategies
Mela Gelda
Wara Gesa
120
Ginjo Gitima et al. / Geosfera Indonesia 6 (1), 2021, 96-126
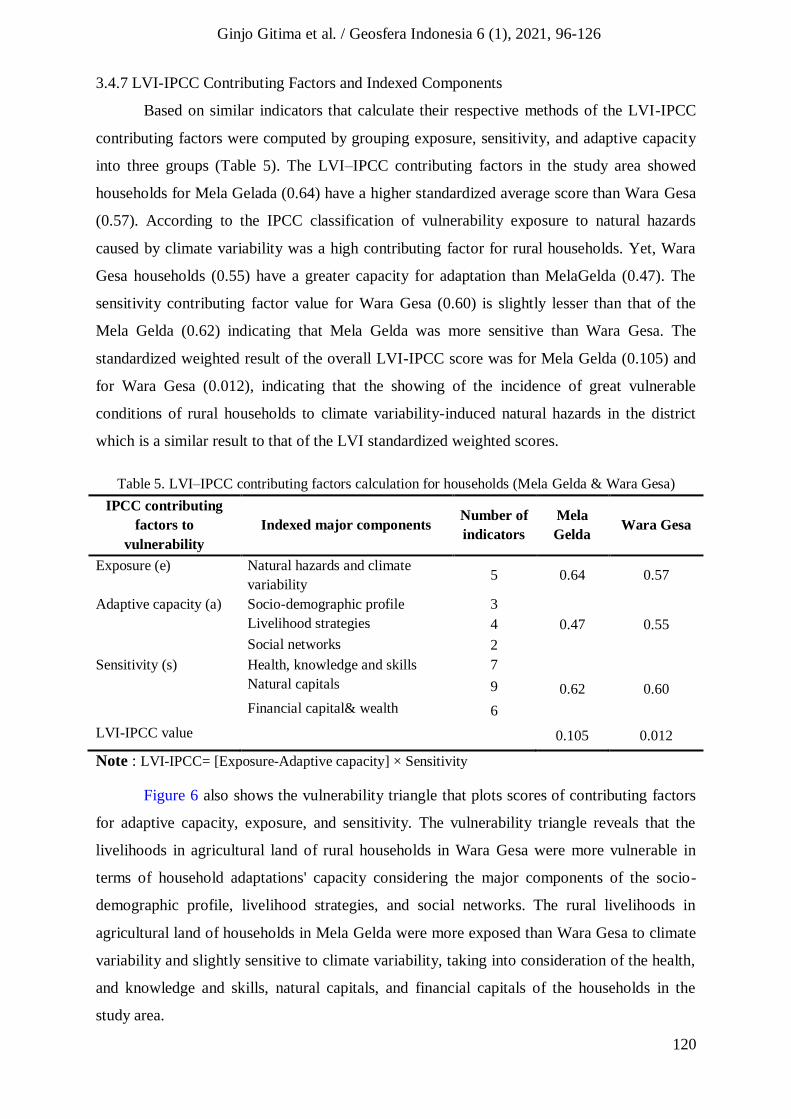
3.4.7 LVI-IPCC Contributing Factors and Indexed Components
Based on similar indicators that calculate their respective methods of the LVI-IPCC
contributing factors were computed by grouping exposure, sensitivity, and adaptive capacity
into three groups (Table 5). The LVI–IPCC contributing factors in the study area showed
households for Mela Gelada (0.64) have a higher standardized average score than Wara Gesa
(0.57). According to the IPCC classification of vulnerability exposure to natural hazards
caused by climate variability was a high contributing factor for rural households. Yet, Wara
Gesa households (0.55) have a greater capacity for adaptation than MelaGelda (0.47). The
sensitivity contributing factor value for Wara Gesa (0.60) is slightly lesser than that of the
Mela Gelda (0.62) indicating that Mela Gelda was more sensitive than Wara Gesa. The
standardized weighted result of the overall LVI-IPCC score was for Mela Gelda (0.105) and
for Wara Gesa (0.012), indicating that the showing of the incidence of great vulnerable
conditions of rural households to climate variability-induced natural hazards in the district
which is a similar result to that of the LVI standardized weighted scores.
Table 5. LVI–IPCC contributing factors calculation for households (Mela Gelda & Wara Gesa)
IPCC contributing
factors to
vulnerability
Indexed major components Number of
indicators
Mela
Gelda Wara Gesa
Exposure (e) Natural hazards and climate
variability 5 0.64 0.57
Adaptive capacity (a) Socio-demographic profile 3
0.47 0.55 Livelihood strategies 4
Social networks 2
Sensitivity (s) Health, knowledge and skills 7
0.62 0.60 Natural capitals 9
Financial capital& wealth 6
LVI-IPCC value 0.105 0.012
Note : LVI-IPCC= [Exposure-Adaptive capacity] × Sensitivity
Figure 6 also shows the vulnerability triangle that plots scores of contributing factors
for adaptive capacity, exposure, and sensitivity. The vulnerability triangle reveals that the
livelihoods in agricultural land of rural households in Wara Gesa were more vulnerable in
terms of household adaptations' capacity considering the major components of the socio-
demographic profile, livelihood strategies, and social networks. The rural livelihoods in
agricultural land of households in Mela Gelda were more exposed than Wara Gesa to climate
variability and slightly sensitive to climate variability, taking into consideration of the health,
and knowledge and skills, natural capitals, and financial capitals of the households in the
study area.
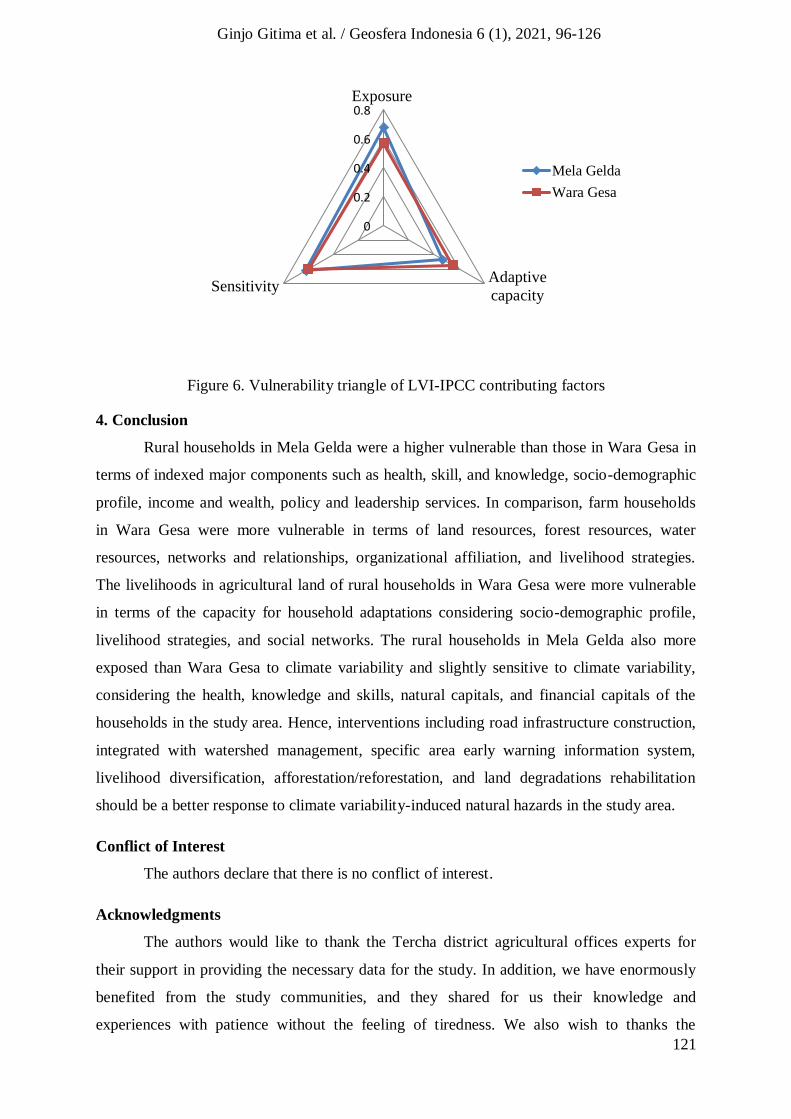
121
Ginjo Gitima et al. / Geosfera Indonesia 6 (1), 2021, 96-126
Figure 6. Vulnerability triangle of LVI-IPCC contributing factors
4. Conclusion
Rural households in Mela Gelda were a higher vulnerable than those in Wara Gesa in
terms of indexed major components such as health, skill, and knowledge, socio-demographic
profile, income and wealth, policy and leadership services. In comparison, farm households
in Wara Gesa were more vulnerable in terms of land resources, forest resources, water
resources, networks and relationships, organizational affiliation, and livelihood strategies.
The livelihoods in agricultural land of rural households in Wara Gesa were more vulnerable
in terms of the capacity for household adaptations considering socio-demographic profile,
livelihood strategies, and social networks. The rural households in Mela Gelda also more
exposed than Wara Gesa to climate variability and slightly sensitive to climate variability,
considering the health, knowledge and skills, natural capitals, and financial capitals of the
households in the study area. Hence, interventions including road infrastructure construction,
integrated with watershed management, specific area early warning information system,
livelihood diversification, afforestation/reforestation, and land degradations rehabilitation
should be a better response to climate variability-induced natural hazards in the study area.
Conflict of Interest
The authors declare that there is no conflict of interest.
Acknowledgments
The authors would like to thank the Tercha district agricultural offices experts for
their support in providing the necessary data for the study. In addition, we have enormously
benefited from the study communities, and they shared for us their knowledge and
experiences with patience without the feeling of tiredness. We also wish to thanks the
0
0.2
0.4
0.6
0.8Exposure
Adaptive
capacitySensitivity
Mela Gelda
Wara Gesa
122
Ginjo Gitima et al. / Geosfera Indonesia 6 (1), 2021, 96-126
Regional Meteorological Agency (Hawassa station) and zonal agricultural offices fortheir
assistance in giving necessary data.
References
Abebe, Z. T. (2014). The potentials of local institutions for sustainable rural livelihoods: the
case of farming households in Dawuro Zone, Ethiopia. Public Policy and
Administration Review, 2(2), 95–129.
Ademe, D., Ziatchik, B. F., Tesfaye, K., Simane, B., Alemayehu, G., &Adgo, E. (2020).
Climate trends and variability at adaptation scale: Patterns and perceptions in an
agricultural region of the Ethiopian Highlands. Weather and Climate Extremes,
100263. https://doi.org/10.1016/j.wace.2020.100263.
Adu, D. T., Kuwornu, J. K., Anim-Somuah, H., & Sasaki, N. (2018). Application of
livelihood vulnerability index in assessing smallholder maize farming households'
vulnerability to climate change in Brong-Ahafo region of Ghana. Kasetsart Journal of
Social Sciences, 39(1), 22-32. https://doi.org/10.1016/j.kjss.2017.06.009.
Amuzu, J., Kabo-Bah, A. T., Jallow, B. P., &Yaffa, S. (2018). Households’ Livelihood
Vulnerability to Climate Change and Climate Variability: A Case Study of the Coastal
Zone, The Gambia. Journal of Environment and Earth Science, 8(1), 35-46.
https://doi.org/10.13140/RG.2.2.36057.42081.
Araro, K., Legesse, S. A., & Meshesha, D. T. (2020). Climate Change and Variability
Impacts on Rural Livelihoods and Adaptation Strategies in Southern Ethiopia. Earth
Systems and Environment, 4(1), 15–26. https://doi.org/10.1007/s41748-019-00134-9
Asfaw, A., Simane, B., Hassen, A., Bantider, A. (2018). Variability and time series trend
analysis of rainfall and temperature in north Central Ethiopia: a case study in Woleka
sub-basin. Weather and Climate Extremes, 19, 29–41.
https://doi.org/10.1016/j.wace.2017.12.002
Asrat, P., & Simane, B. (2017). Characterizing vulnerability of crop-based rural systems to
climate change and variability: agro-ecology specific empirical evidence from the
Dabus watershed, north-West Ethiopia. American Journal of Climate Change, 6(4),
643-667.DOI: 10.4236/ajcc.2017.64033.
Azene, Y. B., Zeleke, M. T., & Chekole, A. B. (2018). Vulnerability of mountain
communities to climate change and natural resources scarcity in Northwest Ethiopia:
the case of Debark Woreda. Journal of Degraded and Mining Lands
Management, 6(1), 1467. https://doi.org/10.15243/JDMLM.2018.061.1467.
Teshome`, M., & Baye, A. (2018). Climate variability, communities’ perceptions and land
management strategies in Lay Gayint Woreda, Northwest Ethiopia. Journal of
Degraded and Mining Lands Management, 5(3), 1217–1235.
https://doi.org/10.15243/jdmlm.2018.053.1217.
Bore, G., & Bedadi, B. (2015). Impacts of land use types on selected soil physico-chemical
properties of Loma Woreda, Dawuro Zone, Southern Ethiopia. Science, Technology
and Arts Research Journal, 4(4), 40-48. DOI: http://dx.doi.org/10.4314/star.v4i4.6.
123
Ginjo Gitima et al. / Geosfera Indonesia 6 (1), 2021, 96-126
Can, N. D., Tu, V. H., & Hoanh, C. T. (2013). Application of livelihood vulnerability index
to assess risks from flood vulnerability and climate variability: A case study in the
Mekong Delta of Vietnam. Journal of Environmental Science and Engineering, 2(8),
476-86.
Conway, D., & Schipper, E. L. F. (2011). Adaptation to climate change in Africa: Challenges
and opportunities identified from Ethiopia. Global Environmental Change, 21(1),
227-237.doi: 10.1016/j.gloenvcha.2010.07.013.
Dendir, Z., & Simane, B. (2019). Livelihood vulnerability to climate variability and change
in different agroecological zones of Gurage Administrative Zone, Ethiopia. Progress
in Disaster Science, 3, 100035.https://doi.org/10.1016/j.pdisas.2019.100035.
Dercon S. Hoddinott J. Woldehanna T. (2005). Vulnerability and shocks in 15 Ethiopian
villages, 1999-2004. J Afr Econ, 14:559–585.
Deressa, T. T., Hassan, R. M., & Ringler, C. (2009). Assessing household vulnerability to
climate change The Case Of Farmers In The Nile Basin Of Ethiopia (Vol. 935).
Washington : Intl Food Policy Res Inst.
Deressa, T., Hassan, R. M., & Ringler, C. (2008). Measuring Ethiopian farmers' vulnerability
to climate change across regional states. Washington : Intl Food Policy Res Inst.
Dessai, S., & Hulme, M. (2004). Does climate adaptation policy need probabilities? Climate
Policy, 4(2), 107–128. https://doi.org/10.1080/14693062.2004.9685515.
Echeverría, D., & Terton, A. (2016). Review of current and planned adaptation action in
Ethiopia. Retrieved from https://idl-bnc-idrc.dspacedirect.org/handle/10625/55864.
Endalew, H. A., & Sen, S. (2020). Effects of climate shocks on Ethiopian rural households:
an integrated livelihood vulnerability approach. Journal of Environmental Planning
and Management, 64(3), 399–431. https://doi.org/10.1080/09640568.2020.1764840.
Fellmann, T. (2012). The assessment of climate change-related vulnerability in the
agricultural sector: reviewing conceptual frameworks. Paper presented at FAO/OECD
Workshop. Rome , Italy.
Few, R., Satyal, P., McGahey, D., Leavy, J., Budds, J., Assen, M., ...& Bewket, W. (2015).
Vulnerability and adaptation to climate change in the semi-arid regions of East
Africa. Retrieved from https://idl-bnc-idrc.dspacedirect.org/handle/10625/57427.
Folke, C. (2006). Resilience: The emergence of a perspective for social-ecological systems
analyses. Global Environmental Change, 16(3), 253–267.
https://doi.org/10.1016/j.gloenvcha.2006.04.002.
Ford, J.D., Keskitalo, E.C.H., Smith, T., Pearce, T., Berrang-Ford, L., Duerden, F. and Smit,
B. (2010). Case study and analogue methodologies in climate change vulnerability
research. Chicester, UK : John Wiley and Sons, Ltd.
Gezie, M. (2019). Farmer’s response to climate change and variability in Ethiopia: A
review. Cogent Food & Agriculture, 5(1), 1613770.
https://doi.org/10.1080/23311932.2019.1613770.
124
Ginjo Gitima et al. / Geosfera Indonesia 6 (1), 2021, 96-126
Gitima, G. & Legesse, A. (2019). Determinants of Farmers’ Decision to Use Improved Land
Management Practice in Gindara Watershed, Southern Ethiopia. Ethiopian Journal of
Environment and Development, 2(2); 17–34.
Hahn, M. B., Riederer, A. M., & Foster, S. O. (2009). The Livelihood Vulnerability Index: A
pragmatic approach to assessing risks from climate variability and change-A case
study in Mozambique. Global Environmental Change, 19(1), 74–88.
https://doi.org/10.1016/j.gloenvcha.2008.11.002.
Huai, J. (2016). Role of livelihood capital in reducing climatic vulnerability: insights of
Australian Wheat from 1990–2010. PloS one, 11(3).
https://doi.org/10.1371/journal.pone.0152277.
Huong, N. T. L., Yao, S., & Fahad, S. (2019). Assessing household livelihood vulnerability
to climate change: The case of Northwest Vietnam. Human and Ecological Risk
Assessment: An International Journal, 25(5), 1157-1175.
https://doi.org/10.1080/10807039.2018.1460801.
IPCC. (2018). Emissions Scenarios: Summary for Policymakers. A Special Report of IPCC
Working Group III. Published for the Intergovernmental Panel on Climate Change,
Retrieved from www.ipcc.ch.
IPCC, (2014). Summary for policy makers. “Climate change 2013: The Physical Science
Basis”, Contribution of Working Group I to the Fifth Assessment Report of the
Intergovernmental Panel on Climate Change. Cambridge : Cambridge University
Press.
Kedir, H., & Tekalign, S. (2016). Climate variability and livelihood strategies pursued by the
pastoral community of the karrayu people, Oromia region, Central Ethiopia. East
African Journal of Sciences, 10(1), 61-70.
Ketema, A. M., & Negeso, K. D. (2020). Effect of climate change on agricultural output in
Ethiopia. Jurnal Perspektif Pembiayaan Dan Pembangunan Daerah, 8(3), 195–208.
https://doi.org/10.22437/ppd.v8i3.9076.
Krishnamurthy, P. K., Lewis, K., & Choularton, R. J. (2014). A methodological framework
for rapidly assessing the impacts of climate risk on national-level food security
through a vulnerability index. Global Environmental Change, 25(1), 121–132.
https://doi.org/10.1016/j.gloenvcha.2013.11.004.
Marelign, A., Addisu, S., & Mekuriaw, A. (2019). Observed and Perceived Climate Change
and Variability and Small Holder Farmers’ Vulnerability: The Case of Janamora
District, Northwestern Ethiopia. Journal of Environment and Earth Science.
https://doi.org/10.7176/JEES/9-8-04.
Masuda, Y. J., Castro, B., Aggraeni, I., Wolff, N. H., Ebi, K., Garg, T., … Spector, J. (2019).
How are healthy, working populations affected by increasing temperatures in the
tropics? Implications for climate change adaptation policies. Global Environmental
Change, 56(C), 29–40. https://doi.org/10.1016/j.gloenvcha.2019.03.005.
Mekonnen, Z., woldeamanuel, T., & kassa, H. (2019). Socio-ecological vulnerability to
climate change/variability in central rift valley, Ethiopia. Advances in Climate Change
Research, 10(1), 9–20. https://doi.org/10.1016/j.accre.2019.03.002.
125
Ginjo Gitima et al. / Geosfera Indonesia 6 (1), 2021, 96-126
Mohammed, R., & Scholz, M. (2019). Climate Variability Impact on the Spatiotemporal
Characteristics of Drought and Aridityin Arid and Semi-Arid Regions. Water
Resources Management, 33(15), 5015–5033. https://doi.org/10.1007/s11269-019-
02397-3.
National Meteorological Agency. (2007). Climate change national adaptation programme of
action (NAPA) of Ethiopia. Retreived from
https://www.preventionweb.net/files/8522_eth01.pdf.
National Meteorological Agency. (2019). Weather & Climate information. Retreived from
www.ethiomet.gov.et.
Narayanan, K., & Sahu, S. K. (2016). Effects of climate change on household economy and
adaptive responses among agricultural households in eastern coast of India. Current
Science, 110(7), 1240-1250–1250. https://doi.org/10.18520/cs/v110/i7/1240-1250.
Neupane, N., Murthy, M. S. R., Rasul, G., Wahid, S., Shrestha, A. B., & Uddin, K. (2013).
Integrated biophysical and socioeconomic model for adaptation to climate change for
agriculture and water in the Koshi Basin. Handbook of Climate Change Adaptation;
Berlin, Germany : Springer.
Ofoegbu, C., Chirwa, P., Francis, J., & Babalola, F. (2017). Assessing vulnerability of rural
communities to climate change: A review of implications for forest-based livelihoods
in South Africa. International Journal of Climate Change Strategies and
Management, 9(3), 374–386. https://doi.org/10.1108/IJCCSM-04-2016-0044.
Panthi, J., Aryal, S., Dahal, P., Bhandari, P., Krakauer, N. Y., & Pandey, V. P. (2016).
Livelihood vulnerability approach to assessing climate change impacts on mixed agro-
livestock smallholders around the Gandaki River Basin in Nepal. Regional
Environmental Change, 16(4), 1121–1132. https://doi.org/10.1007/s10113-015-0833-
y.
Paul, A., Deka, J., Gujre, N., Rangan, L., & Mitra, S. (2019). Does nature of livelihood
regulate the urban community’s vulnerability to climate change? Guwahati city, a case
study from North East India. Journal of Environmental Management, 251(C), 109591.
https://doi.org/10.1016/j.jenvman.2019.109591.
Simane, B., Zaitchik, B. F., & Foltz, J. D. (2016). Agroecosystem specific climate
vulnerability analysis: application of the livelihood vulnerability index to a tropical
highland region. Mitigation and Adaptation Strategies for Global Change, 21(1), 39–
65. https://doi.org/10.1007/s11027-014-9568-1
Sujakhu, N. M., Ranjitkar, S., He, J., Schmidt-Vogt, D., Su, Y., & Xu, J. (2019). Assessing
the livelihood vulnerability of rural indigenous households to climate changes in
Central Nepal, Himalaya. Sustainability, 11(10), 1–18.
https://doi.org/10.3390/su11102977.
Suryanto, S., & Rahman, A. (2019). Application of livelihood vulnerability index to assess
risks for farmers in the Sukoharjo regency and Klaten regency, Indonesia. Jàmbá -
Journal of Disaster Risk Studies, 11(1), 1–9. https://doi.org/10.4102/jamba.v11i1.739.
Tanner, T., Lewis, D., Wrathall, D., Bronen, R., Cradock-Henry, N., Huq, S., … Thomalla, F.
(2015). Livelihood resilience in the face of climate change. Nature Climate Change,
5(1), 23–26. https://doi.org/10.1038/nclimate2431.
126
Ginjo Gitima et al. / Geosfera Indonesia 6 (1), 2021, 96-126
Teshome, M. (2016). Rural households’ agricultural land vulnerability to climate change in
Dembia woreda, Northwest Ethiopia. Environmental Systems Research, 5(1), 1–18.
https://doi.org/10.1186/s40068-016-0064-3.
Teshome, M. (2017). Perceived Human Health Vulnerability to Climate Change in
DembiaWoreda of Tana Basin, Northwest Ethiopia. Ethiopian Renaissance Journal of
Social Sciences and the Humanities, 4(2).
Thakur, S. B., & Bajagain, A. (2019). Impacts of Climate Change on Livelihood and its
Adaptation Needs. Journal of Agriculture and Environment, 20, 173–185.
https://doi.org/10.3126/aej.v20i0.25067.
Turpie, J., & Visser, M. (2013). The impact of climate change on South Africa’s rural
areas. Financial and Fiscal Commission, 14, 100-160.
Ullah, W., Nihei, T., Nafees, M., Zaman, R., & Ali, M. (2018). Understanding climate
change vulnerability, adaptation and risk perceptions at household level in Khyber
Pakhtunkhwa, Pakistan. International Journal of Climate Change Strategies and
Management, 10(3), 359–378. https://doi.org/10.1108/IJCCSM-02-2017-0038.
World Meteorological Organization (2012). Standardized precipitation index user
guide. Retreived from http://www.wamis.org/agm/pubs/SPI/WMO_1090_EN.pdf.
Young, G., Zavala, H., Wandel, J., Smit, B., Salas, S., Jimenez, E., … Cepeda, J. (2009).
Vulnerability and adaptation in a dryland community of the Elqui Valley, Chile.
Climatic Change, 98(1–2), 245–276. https://doi.org/10.1007/s10584-009-9665-4.
Related Documents