Georgia Tuberculosis Surveillance Report 2019

Welcome message from author
This document is posted to help you gain knowledge. Please leave a comment to let me know what you think about it! Share it to your friends and learn new things together.
Transcript

Georgia Tuberculosis Surveillance Report
2019

2019 GEORGIA TUBERCULOSIS SURVEILLANCE REPORT │1
2019 Georgia Tuberculosis Surveillance Report Georgia Department of Public Health………………..…………. Kathleen E. Toomey, MD, MPH
Commissioner
Division of Health Protection……………………..……………..….. Vikas Kapil, DO, MPH
Chief Medical Officer
Tuberculosis Program………….……………………………….………. Benjamin Yarn
TB Program Director
Epidemiology Section…..……………………………...……………..... Cherie Drenzek, DVM, MS
State Epidemiologist
Joy Wells, MPH
Lead Epidemiologist
Antoine Perrymon, MPH
Epidemiologist
Erin Anderson, MSPH
Epidemiologist
Acknowledgments:
We would like to thank the County Health Department staff, District Health Office TB Coordinators, and
State TB surveillance staff that collected and reported the data used in this annual report.
Additional information about the TB Program can be obtained by contacting:
Benjamin Yarn
Georgia Department of Public Health
Division of Health Protection, Tuberculosis Program
2 Peachtree St., NW, Atlanta, GA 30303
Phone: (404) 657-0791
E-mail: [email protected]
Additional information about this report can be obtained by contacting:
Erin Anderson, MSPH
Georgia Department of Public Health
Division of Epidemiology
2 Peachtree St., NW, Atlanta, GA 30303
Phone: (404) 548-7470
E-mail: [email protected]
Antoine Perrymon, MPH
Georgia Department of Public Health
Division of Epidemiology
2 Peachtree St., NW, Atlanta, GA 30303
Phone: (404) 463-0789
E-mail: [email protected]
Data Sources: 1) Surveillance data were obtained from the State Electronic Notifiable Disease Surveillance System
(SendSS) as of October 1st, 2020; 2) Census data were obtained from the U.S. Census Bureau via
https://oasis.state.ga.us/oasis/webquery/qryPopulation.aspx.
Suggested Citation: Georgia Department of Public Health, 2019 Georgia Tuberculosis Surveillance Report, Atlanta,
Georgia, October 2020.
2019 GEORGIA TUBERCULOSIS SURVEILLANCE REPORT │2
Table of Contents
Executive Summary………………………………………………….......................................... 3
Tuberculosis (TB) Surveillance in Georgia…………...…………….….…..................... 4
Current Epidemiology of Tuberculosis in Georgia…………………….................... 5
High-Risk Populations…………………………………………..………................................... 6
TB Diagnosis and Treatment Outcomes.…………………………………………………. 8
TB Contact Investigations and Latent TB Infection (LTBI)……….…………......... 9
Drug Resistance and Genotyping……………………………………………………………. 9
Tables and Figures: Descriptive Epidemiology,
Case Counts, and Program Performance Indicators………………………………… 11
Graphs: Tuberculosis Morbidity Trends by Health District, 2000-2019……. 31
2019 GEORGIA TUBERCULOSIS SURVEILLANCE REPORT │3
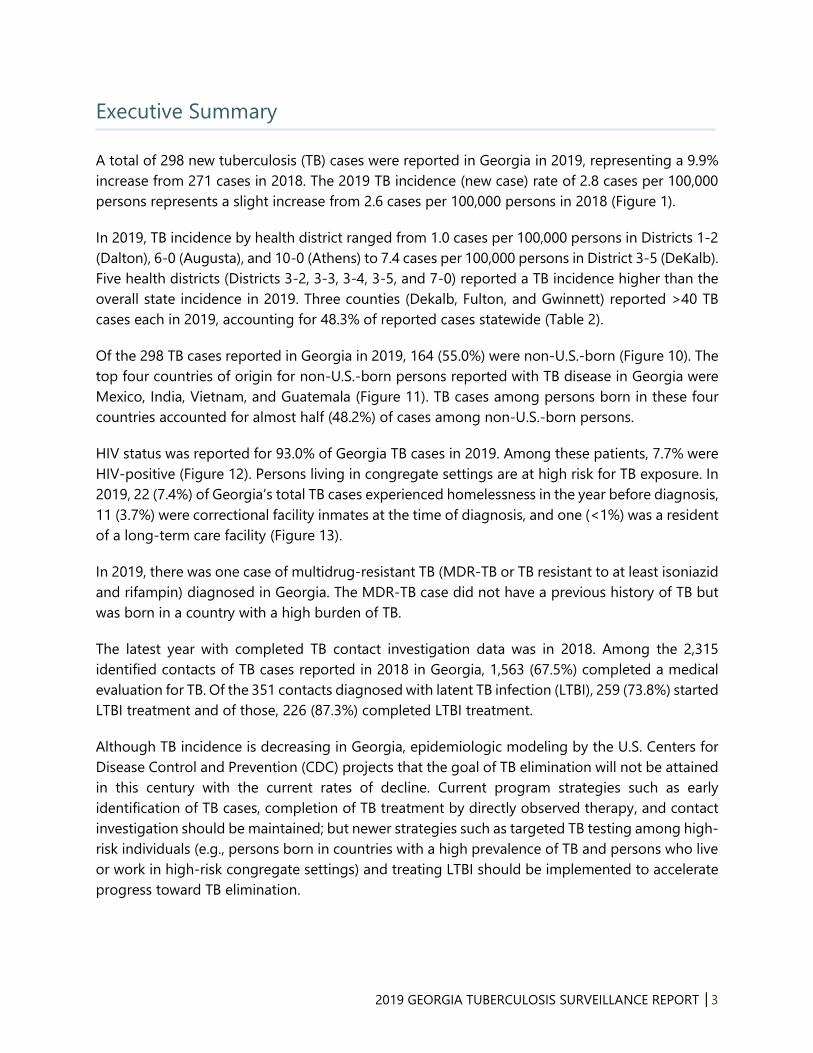
Executive Summary
A total of 298 new tuberculosis (TB) cases were reported in Georgia in 2019, representing a 9.9%
increase from 271 cases in 2018. The 2019 TB incidence (new case) rate of 2.8 cases per 100,000
persons represents a slight increase from 2.6 cases per 100,000 persons in 2018 (Figure 1).
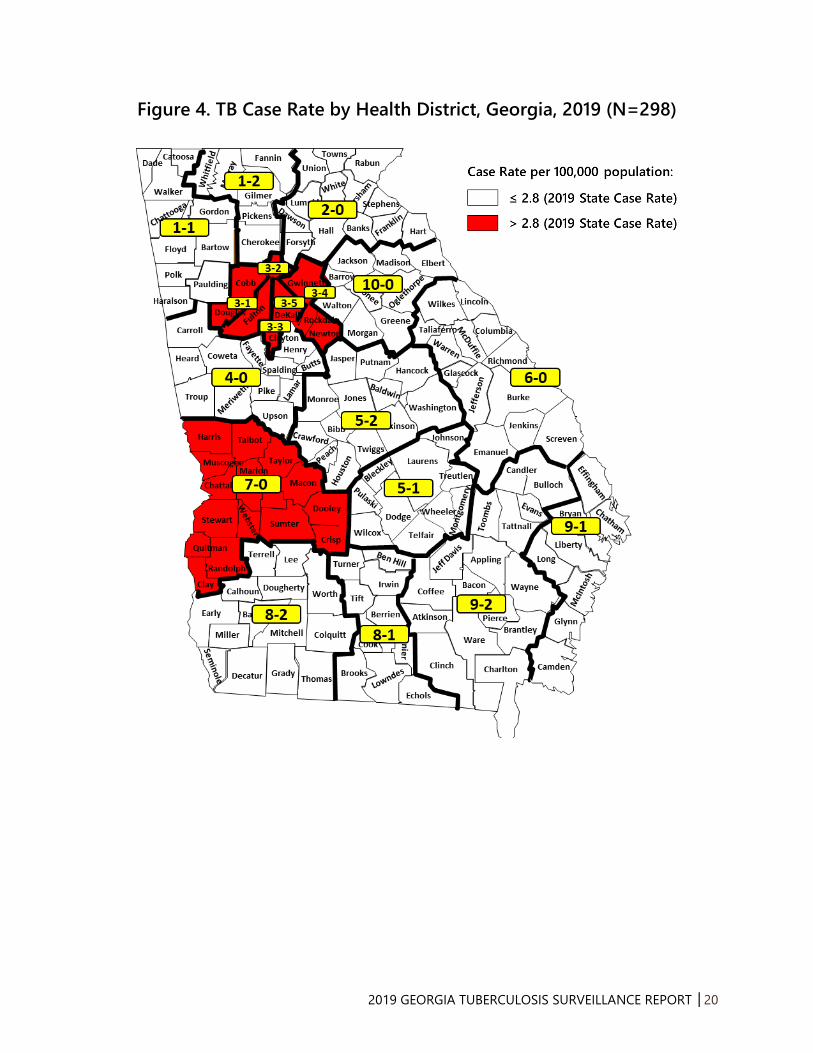
In 2019, TB incidence by health district ranged from 1.0 cases per 100,000 persons in Districts 1-2
(Dalton), 6-0 (Augusta), and 10-0 (Athens) to 7.4 cases per 100,000 persons in District 3-5 (DeKalb).
Five health districts (Districts 3-2, 3-3, 3-4, 3-5, and 7-0) reported a TB incidence higher than the
overall state incidence in 2019. Three counties (Dekalb, Fulton, and Gwinnett) reported >40 TB
cases each in 2019, accounting for 48.3% of reported cases statewide (Table 2).
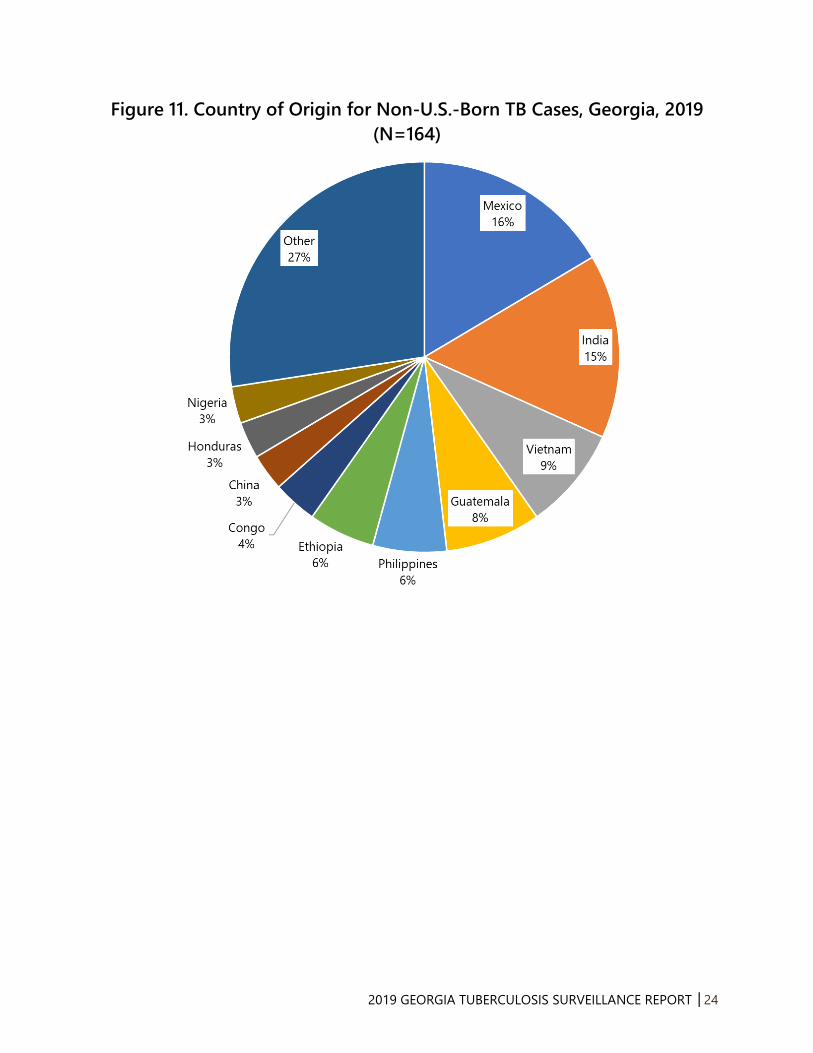
Of the 298 TB cases reported in Georgia in 2019, 164 (55.0%) were non-U.S.-born (Figure 10). The
top four countries of origin for non-U.S.-born persons reported with TB disease in Georgia were
Mexico, India, Vietnam, and Guatemala (Figure 11). TB cases among persons born in these four
countries accounted for almost half (48.2%) of cases among non-U.S.-born persons.
HIV status was reported for 93.0% of Georgia TB cases in 2019. Among these patients, 7.7% were
HIV-positive (Figure 12). Persons living in congregate settings are at high risk for TB exposure. In
2019, 22 (7.4%) of Georgia’s total TB cases experienced homelessness in the year before diagnosis,
11 (3.7%) were correctional facility inmates at the time of diagnosis, and one (<1%) was a resident
of a long-term care facility (Figure 13).
In 2019, there was one case of multidrug-resistant TB (MDR-TB or TB resistant to at least isoniazid
and rifampin) diagnosed in Georgia. The MDR-TB case did not have a previous history of TB but
was born in a country with a high burden of TB.
The latest year with completed TB contact investigation data was in 2018. Among the 2,315
identified contacts of TB cases reported in 2018 in Georgia, 1,563 (67.5%) completed a medical
evaluation for TB. Of the 351 contacts diagnosed with latent TB infection (LTBI), 259 (73.8%) started
LTBI treatment and of those, 226 (87.3%) completed LTBI treatment.
Although TB incidence is decreasing in Georgia, epidemiologic modeling by the U.S. Centers for
Disease Control and Prevention (CDC) projects that the goal of TB elimination will not be attained
in this century with the current rates of decline. Current program strategies such as early
identification of TB cases, completion of TB treatment by directly observed therapy, and contact
investigation should be maintained; but newer strategies such as targeted TB testing among high-
risk individuals (e.g., persons born in countries with a high prevalence of TB and persons who live
or work in high-risk congregate settings) and treating LTBI should be implemented to accelerate
progress toward TB elimination.

2019 GEORGIA TUBERCULOSIS SURVEILLANCE REPORT │4
Tuberculosis Surveillance in Georgia
TB is a reportable disease in Georgia. All Georgia physicians, laboratories, and other health care
providers are required by law to immediately report clinical and laboratory-confirmed TB cases
under their care to Georgia public health authorities. TB cases may be directly reported to a
County Health Department, a District Health Office, or to the State TB Program and TB
Epidemiology Section of the Georgia Department of Public Health (GDPH), which is responsible
for the systematic collection of all reported TB cases in the state. Immediate reporting of TB cases
enables public health staff to follow up with patients, administer directly observed therapy (DOT),
monitor TB treatment until completion, evaluate and screen individuals exposed to a TB case, and
control TB outbreaks.
TB cases in Georgia can be reported electronically through the State Electronic Notifiable Disease
Surveillance System (SendSS), a secure web-based surveillance software developed by GDPH, or
by calling, mailing, or faxing a report to public health authorities. Hospital infection control
personnel, as well as public health nurses, outreach staff, epidemiologists, and communicable
disease specialists involved in disease surveillance are encouraged to report TB through SendSS
and register to become a SendSS user by logging into the system’s website
(https://sendss.state.ga.us) and selecting TB from the list of reportable diseases.
Public health authorities collect demographic, clinical, and risk factor data about reported TB cases
and their contacts which are analyzed to describe the distribution of the disease among Georgia’s
population, identify high risk groups and TB clusters, describe trends in morbidity, mortality, drug
resistance patterns, treatment outcomes, and infection rates among contacts to TB cases. The data
are used at state and local levels to guide policy and decision making, set priorities for program
interventions, evaluate program performance for the prevention and control of TB in Georgia, and
educate key stakeholders and the general public on TB. Georgia’s TB surveillance data are
transmitted electronically to the U.S. Centers for Disease Control and Prevention (CDC) and
become part of the national TB surveillance database.
TB Case Definitions for Public Health Surveillance
GDPH utilizes the 2009 Council of State and Territorial Epidemiologists (CSTE) case definition for
tuberculosis (Position Statement 09-ID-65) that can be accessed at:
https://wwwn.cdc.gov/nndss/conditions/tuberculosis/case-definition/2009/.
Clinical case definition:
A case that meets all of the following criteria:
• A positive tuberculin skin test or positive interferon gamma release assay for M.
tuberculosis
• Signs and symptoms compatible with TB (abnormal chest imaging study or clinical
evidence of current disease)
• Treatment with two or more anti-TB medications
2019 GEORGIA TUBERCULOSIS SURVEILLANCE REPORT │5
• A completed diagnostic evaluation
Laboratory criteria for diagnosis:
• Isolation of M. tuberculosis complex on a culture from a clinical specimen, or
• Demonstration of M. tuberculosis complex from a clinical specimen by nucleic acid
amplification test
Confirmed case: A case that meets the clinical case definition or is laboratory confirmed.
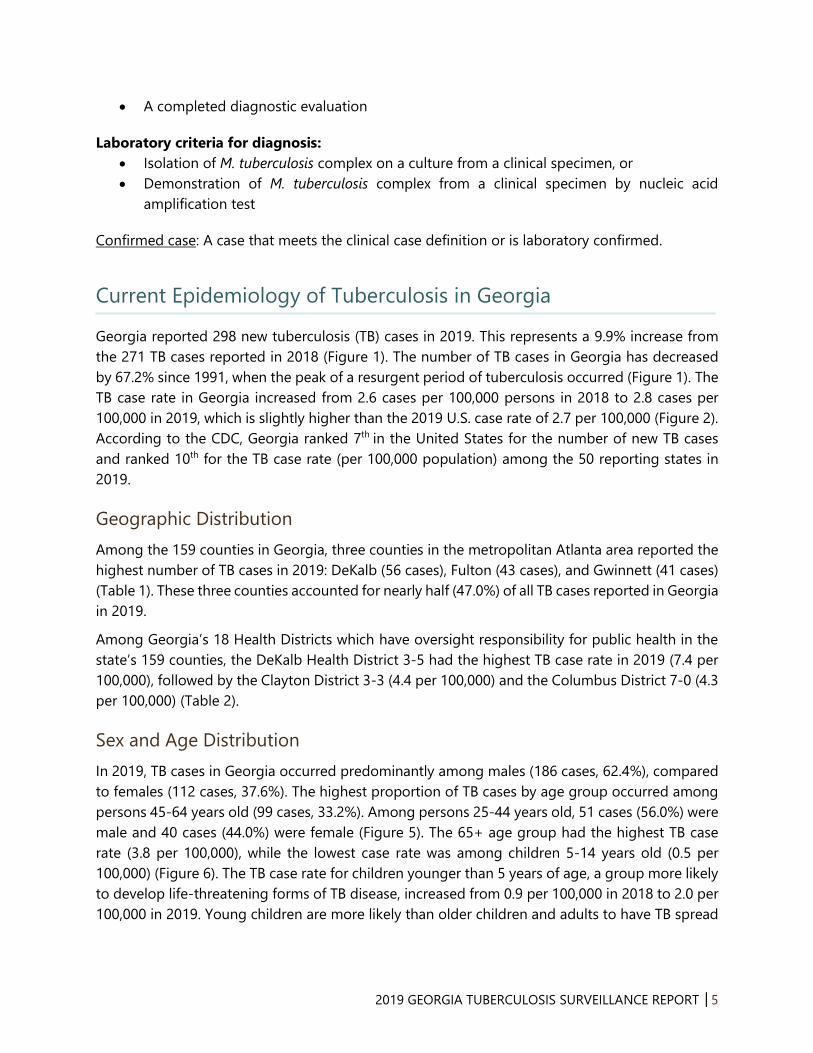
Current Epidemiology of Tuberculosis in Georgia
Georgia reported 298 new tuberculosis (TB) cases in 2019. This represents a 9.9% increase from
the 271 TB cases reported in 2018 (Figure 1). The number of TB cases in Georgia has decreased
by 67.2% since 1991, when the peak of a resurgent period of tuberculosis occurred (Figure 1). The
TB case rate in Georgia increased from 2.6 cases per 100,000 persons in 2018 to 2.8 cases per
100,000 in 2019, which is slightly higher than the 2019 U.S. case rate of 2.7 per 100,000 (Figure 2).
According to the CDC, Georgia ranked 7th in the United States for the number of new TB cases
and ranked 10th for the TB case rate (per 100,000 population) among the 50 reporting states in
2019.
Geographic Distribution
Among the 159 counties in Georgia, three counties in the metropolitan Atlanta area reported the
highest number of TB cases in 2019: DeKalb (56 cases), Fulton (43 cases), and Gwinnett (41 cases)
(Table 1). These three counties accounted for nearly half (47.0%) of all TB cases reported in Georgia
in 2019.
Among Georgia’s 18 Health Districts which have oversight responsibility for public health in the
state’s 159 counties, the DeKalb Health District 3-5 had the highest TB case rate in 2019 (7.4 per
100,000), followed by the Clayton District 3-3 (4.4 per 100,000) and the Columbus District 7-0 (4.3
per 100,000) (Table 2).
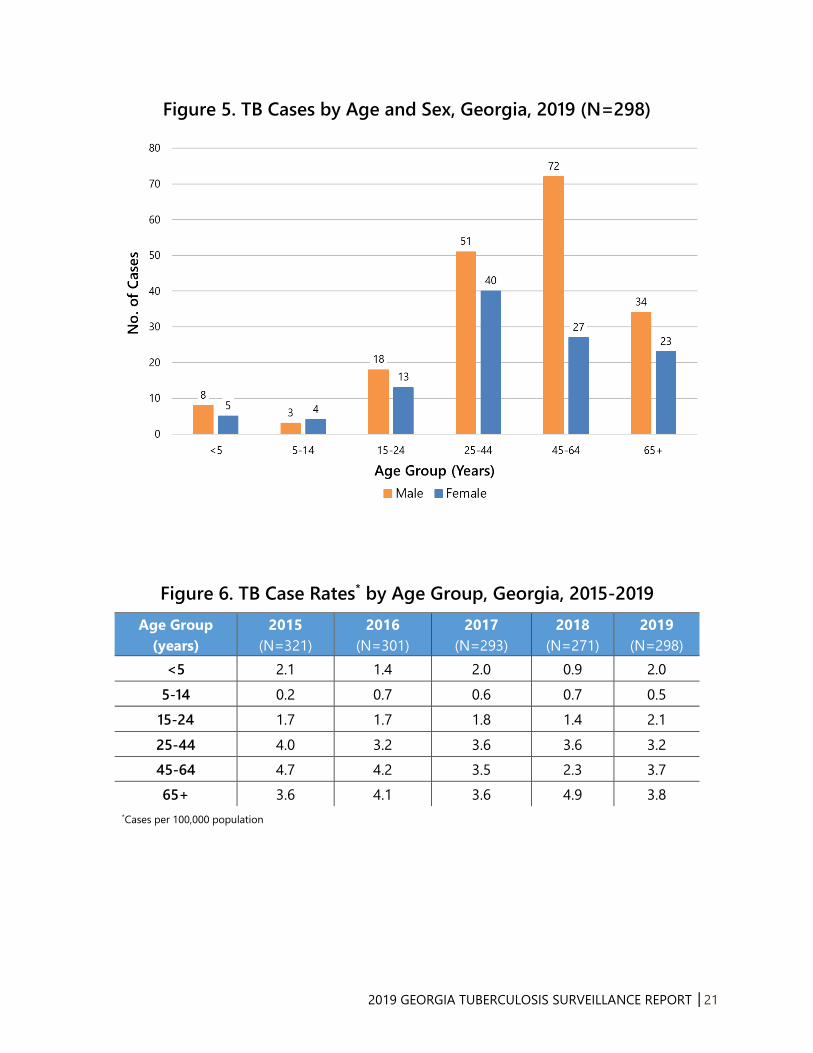
Sex and Age Distribution
In 2019, TB cases in Georgia occurred predominantly among males (186 cases, 62.4%), compared
to females (112 cases, 37.6%). The highest proportion of TB cases by age group occurred among
persons 45-64 years old (99 cases, 33.2%). Among persons 25-44 years old, 51 cases (56.0%) were
male and 40 cases (44.0%) were female (Figure 5). The 65+ age group had the highest TB case
rate (3.8 per 100,000), while the lowest case rate was among children 5-14 years old (0.5 per
100,000) (Figure 6). The TB case rate for children younger than 5 years of age, a group more likely
to develop life-threatening forms of TB disease, increased from 0.9 per 100,000 in 2018 to 2.0 per
100,000 in 2019. Young children are more likely than older children and adults to have TB spread
2019 GEORGIA TUBERCULOSIS SURVEILLANCE REPORT │6
through their bloodstream and cause complications and deadlier forms of TB, such as TB
meningitis or disseminated TB.
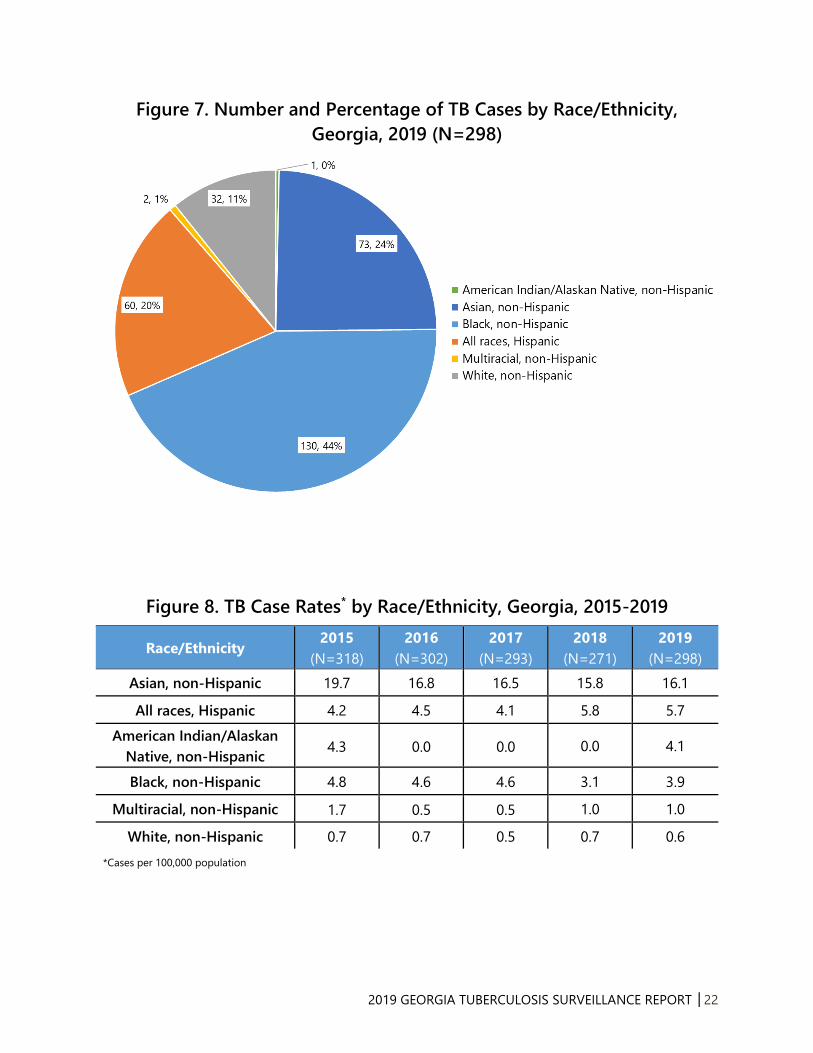
Race/Ethnicity Distribution and TB Disparities
TB disproportionately affects racial/ethnic minorities in Georgia. In 2019, non-Hispanic Blacks,
non-Hispanic Asians, and Hispanics accounted for 43.6%, 24.5%, and 20.1% of TB cases in Georgia
(Figure 7), respectively, but only represented 31.6%, 4.3%, and 9.9% of Georgia’s population,
respectively. Non-Hispanic whites constituted 10.7% of TB cases in 2019. Non-Hispanic Asians had
the highest TB case rate among race/ethnic groups (16.1 per 100,000), followed by Hispanics (5.7
per 100,000), non-Hispanic American Indian/Alaskan Natives (4.1 per 100,000), and non-Hispanic
Blacks (3.9 per 100,000) (Figure 8). The TB case rate among non-Hispanic Black persons represents
an 87.3% decrease from the non-Hispanic Black TB case rate in 1993 (30.6 per 100,000). However,
the TB case rate among non-Hispanic Blacks was still more than six times higher than the TB case
rate among non-Hispanic whites (0.6 per 100,000) in Georgia in 2019 (Figure 9).
High-Risk Populations
Non-U.S.-Born Persons
TB among persons born outside of the United States accounted for 55.0% of TB cases in Georgia
in 2019. Most non-U.S.-born cases reported in 2019 came from Mexico (16.5%), India (15.2%),
Vietnam (8.5%), and Guatemala (7.9%)—all countries where TB is an endemic disease (Figures 10-
11). Among the 158 non-U.S.-born cases in 2019 with a known year of arrival, 70 (44.3%) were
diagnosed in the first five years of their arrival in the United States. This represents a slight
decrease in proportion from the 66 (46.5%) non-U.S.-born cases diagnosed within the first five
years of their arrival in 2018.
In 2019, four health districts reported nearly two-thirds (65.2%) of the total number of non-U.S.-
born TB cases in Georgia: DeKalb 3-5 (42 cases), Gwinnett 3-4 (36 cases), Fulton 3-2 (18 cases)
and Cobb 3-1 (11 cases).
Persons with HIV Co-Infection
All TB patients need to be tested for HIV infection because TB treatment may change when
antiretroviral therapy for HIV is given, and active TB often accelerates the natural progression of
HIV infection. Of the 277 TB cases reported in 2019 with a known HIV status, 7.7% were HIV-
positive, compared to 5.9% in 2018 (Figure 12). Among the 23 TB cases with HIV co-infection in
2019, 60.9% were non-Hispanic Blacks, 82.6% were male, and 52.2% were between 45 and 64
years old.
HIV status was reported for 93.0% of TB cases in 2019. In the high-risk age group of adults 25-44
years of age, the percentage of TB cases for which HIV was reported was 96.7% in 2019, compared

2019 GEORGIA TUBERCULOSIS SURVEILLANCE REPORT │7
to 93.4% in 2018. Of the 21 TB cases whose HIV status was not reported, HIV testing was not
offered to 11 cases (52.3%). Among the cases for which HIV testing was not offered, four (36.4%)
were children less than 5 years old, four (36.4%) were in the 45-64 age group, and two (18.2%)
were greater than 65 years old. HIV test results were unknown for seven (33.3%) of the 21 TB cases
whose HIV status was not reported, including one patient who was dead at diagnosis, and three
of the 21 (14.3%) refused testing. The proportion of TB cases that were not offered HIV tests was
highest among children less than 5 years old (4 cases, 36.4%) and adults 45-64 years old (4 cases,
36.4%).
Persons in Congregate Settings and Persons with Substance Abuse
Persons residing in crowded congregate settings such as homeless shelters, prisons, and nursing
homes are at risk for acquiring TB. In 2019, 22 (7.4%) TB cases in Georgia experienced
homelessness in the year before TB diagnosis, 11 (3.7%) were residents of correctional facilities at
the time of their diagnosis, and 1 (<1%) was a resident of a long-term care facility. Of the 11 TB
cases incarcerated in correctional facilities, four (36.4%) were inmates of local jails and seven
(63.6%) were under custody of U.S. Immigration and Customs Enforcement (ICE).
Substance abuse is the most commonly reported behavioral risk factor among patients with TB in
the United States. TB patients who abuse substances often experience treatment failure and
remain infectious longer because treatment failure presumably extends periods of infectiousness.
In Georgia, 50 (16.8%) TB cases in 2019 had reported abuse of either illicit drugs or alcohol (Table
3, Figure 13).
TB in Children
TB in children is considered a sentinel public health event as it often indicates recent transmission
from an infectious adult case. Additionally, potentially lethal forms of TB, such as TB meningitis or
disseminated TB, can develop in very young children. In 2019, children younger than 15 years old
comprised 6.7% of TB cases in Georgia: 13 cases (2.0 per 100,000) were reported in children
younger than 5 years old and 7 cases (0.5 per 100,000) were reported in children 5-14 years old
(Figures 5 & 6). There were two cases of TB meningitis among children younger than 15 years old
in Georgia in 2019.
Persons with latent tuberculosis infection (LTBI) are infected with TB bacteria, but do not have
clinical signs and symptoms of TB disease. In Georgia, LTBI in children younger than five years old
is a reportable disease. When LTBI in a child less than five years of age is reported, the local health
department will initiate a contact investigation to identify the source of the infection, recommend
treatment, follow up with the child to ensure completion of treatment, and monitor for
development of active TB disease. Early identification and treatment of TB infection in children
can prevent progression to active disease and aid in identifying previously undiagnosed and
untreated cases of active TB.
2019 GEORGIA TUBERCULOSIS SURVEILLANCE REPORT │8
In 2019, 30 children younger than five years old were reported to have LTBI in Georgia; 12 (40.0%)
were identified by TB screening by a hospital or private health provider and 18 (60.0%) were
identified by contact investigations performed by county health department staff.
TB Diagnosis and Treatment Outcomes
TB Initial Diagnosis, Treatment, and Directly Observed Therapy
In Georgia, most TB cases are initially diagnosed in a hospital or clinic and are followed up by
county health departments after discharge to continue their TB treatment. In 2019, 184 (61.7%) of
the 298 TB cases in Georgia were diagnosed and initially reported by a hospital or clinic. Seven
hospitals in Georgia reported five or more TB cases in 2019.
Of the 198 TB cases with available data on type of outpatient healthcare provider, 164 (82.8%)
cases were managed and treated by county health departments, 25 (12.6%) were treated by both
the health department and a private physician, 6 (3.0%) were inpatient only and 3 (1.5%) were
cared for solely by a private physician.
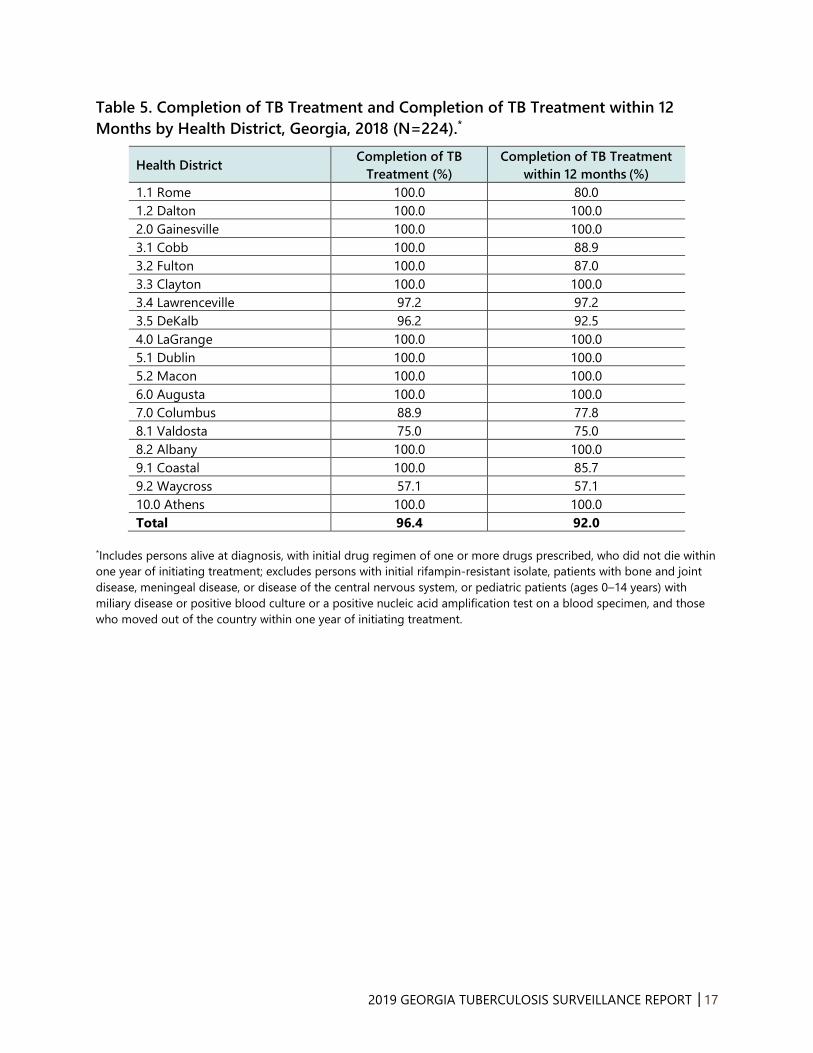
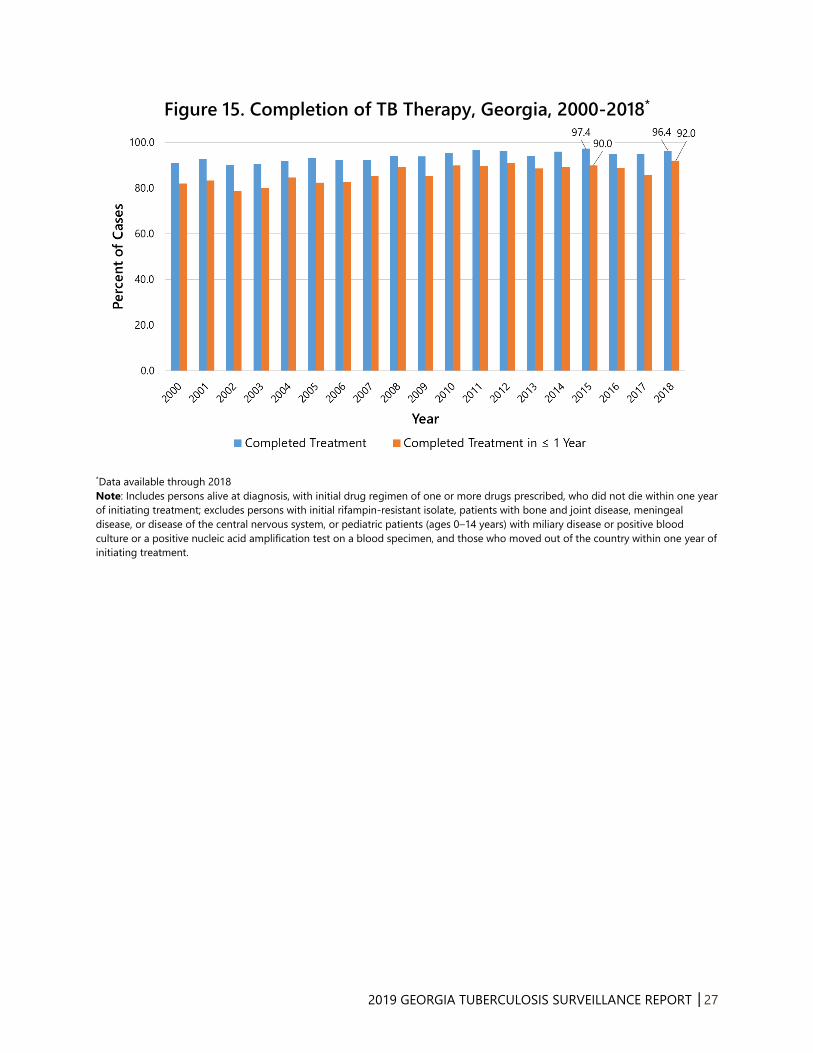
Treatment outcomes were analyzed for eligible 2018 cases as treatment completion data for cases
reported in 2019 are not yet available. Eligible cases included persons alive at diagnosis, with an
initial drug regimen of one or more drugs prescribed, who did not die within one year of initiating
treatment. Ineligible cases included persons with an initial rifampin-resistant isolate, patients with
bone and joint disease, meningeal disease, or disease of the central nervous system, or pediatric
patients (ages 0–14 years) with miliary disease or positive blood culture or a positive nucleic acid
amplification test on a blood specimen, and those who moved out of the country within one year
of initiating treatment.
Among the 224 eligible TB cases counted in 2018, a total of 216 (96.4%) completed treatment and
206 (92.0%) completed treatment within 12 months (Table 5).
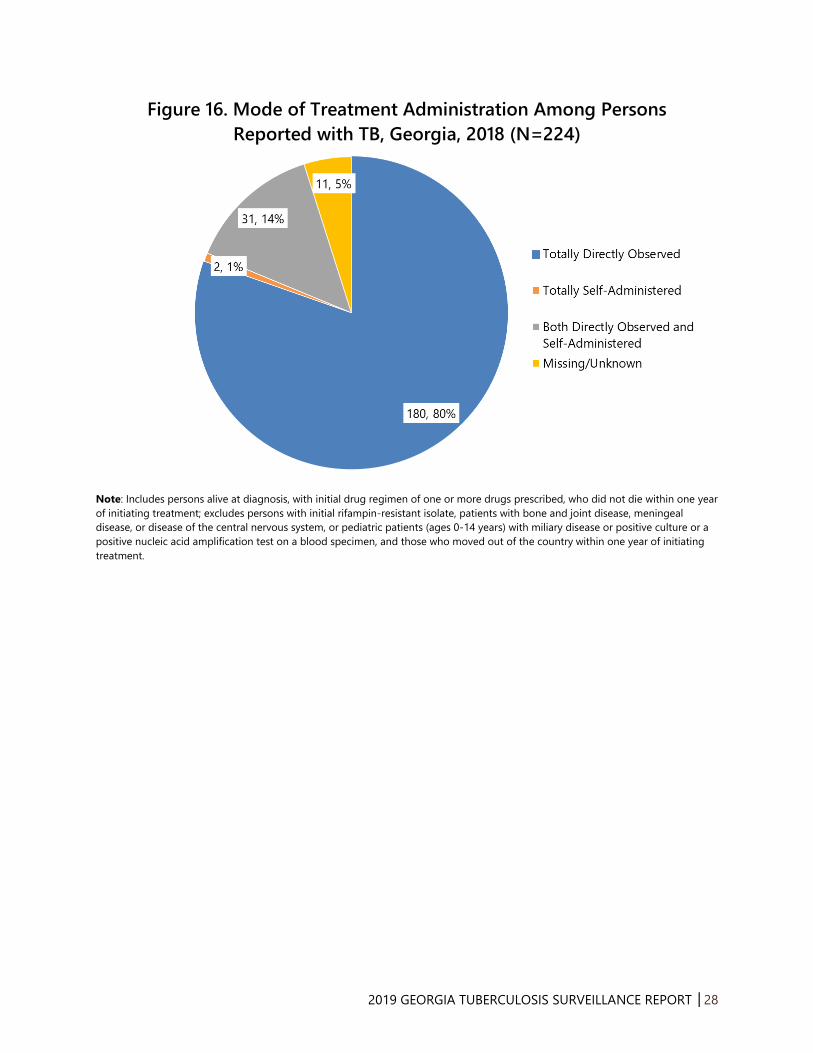
County health department staff provide directly observed therapy (DOT) to TB patients, which
entails watching a patient swallow every dose of their TB treatment medications for at least 6
months. Among the 224 eligible cases reported in 2018, 180 (80.4%) received TB treatment
entirely by DOT and 31 (13.8%) were treated by a combination of DOT and self-administered
therapy (Figure 16). Of the remaining 13 cases, 2 (<1%) were totally self-administered and 11
(4.9%) had missing/unknown modes of treatment administration (Figure 16).
TB Mortality
Sixteen persons died of TB in Georgia in 2019, where the age-adjusted TB mortality rate was 0.1
per 100,000. From 2015 to 2019, a mean of 13.2 TB deaths occurred in Georgia per year, with the
highest number of deaths from TB reported in 2016 (N=18).
2019 GEORGIA TUBERCULOSIS SURVEILLANCE REPORT │9
TB Contact Investigations and Latent TB Infection (LTBI)
Pulmonary TB
Persons with pulmonary or laryngeal TB have a greater potential to infect others with TB, and
infectiousness is higher if their sputum smears are positive for acid-fast bacilli (AFB), sputum
cultures are positive for Mycobacterium tuberculosis, or cavitary lesions are present on chest
radiography. In 2019, 81.5% of all Georgia TB cases had pulmonary TB. Of the pulmonary TB cases,
60.5% had sputum cultures that were positive for Mycobacterium tuberculosis, 40.3% were sputum
AFB smear-positive, and 21.0% showed cavitary lesions on chest radiography.
TB Contact Investigations and Latent TB Infection
Public health authorities routinely conduct contact investigations among persons exposed to a TB
case to identify any secondary TB cases and contacts with latent TB infection (LTBI). Index TB cases
(cases identified first in an investigation) with positive acid-fast bacillus (AFB) sputum-smear
results or pulmonary cavities have the highest priority for investigation. During a contact
investigation, public health staff conduct in-person interviews and ask recent contacts to a TB case
whether they have TB-like symptoms, administer a TB skin test (TST) or interferon gamma release
assay (IGRA), repeat the TST or IGRA 8-10 weeks after the last exposure to the index case if the
initial TST or IGRA is negative, and have a chest radiology exam performed if the TST or IGRA is
positive. Persons with LTBI have a positive TST or IGRA but are asymptomatic and have a normal
chest radiology exam. They are not contagious but have a 10% chance of developing TB disease
if they do not receive treatment for LTBI.
A total of 2,315 contacts were identified from the contact investigations of TB cases reported in
2018 (the latest year with complete contact investigation data). Among these, 1,563 (67.5%) were
completely evaluated for TB. Of the completely evaluated contacts, 351 (22.5%) had LTBI and 19
(1.2%) had TB disease. Among the 351 contacts with LTBI, 259 (73.7%) started LTBI treatment. Of
the contacts who started LTBI treatment, 226 (87.3%) completed LTBI treatment, 15 (5.8%) chose
to stop LTBI treatment, 7 (2.7%) were lost to follow-up, 1 (<1%) had adverse side effects, 1 (<1%)
moved elsewhere, 1 (<1%) developed active TB, and 8 (3.1%) discontinued treatment due to a
provider’s decision.
Drug Resistance and Genotyping
TB Drug Resistance
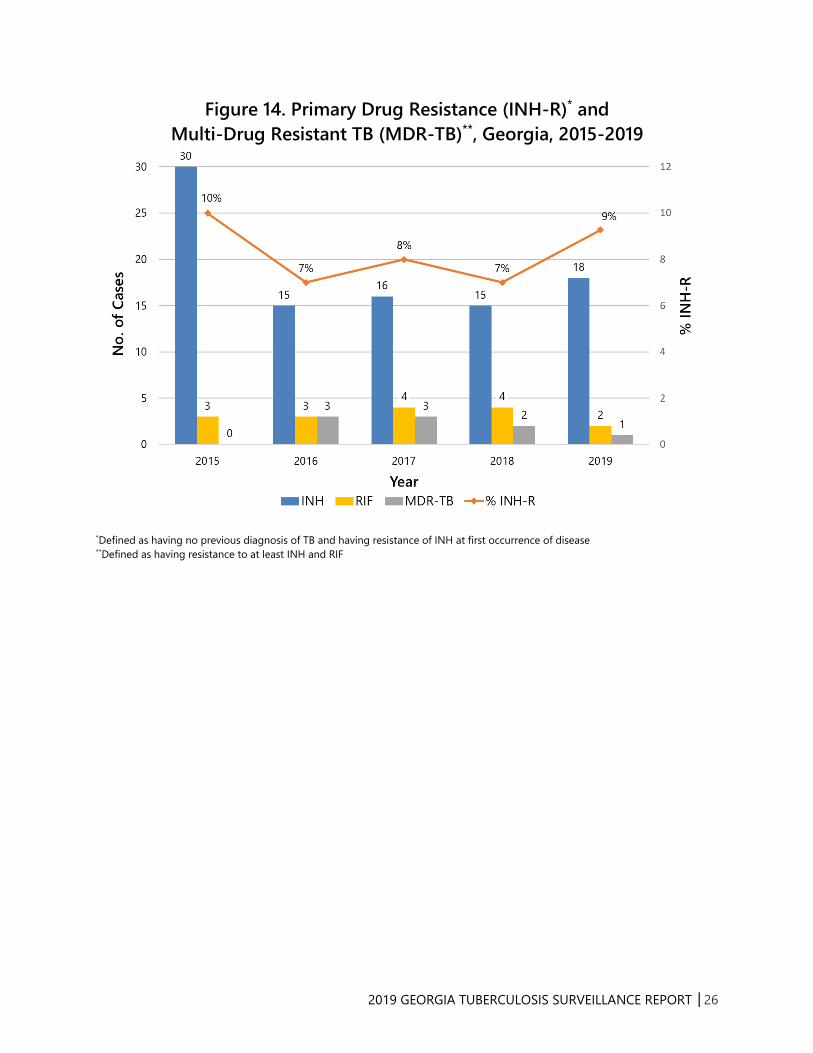
Among the 205 culture-positive TB cases in Georgia during 2019, 97.1% were tested for initial
drug susceptibility to the three first-line anti-TB medications: isoniazid (INH), rifampin (RIF), and
ethambutol (EMB). Of the 194 tested isolates from cases with no previous history of TB, 18 (9.3%)
2019 GEORGIA TUBERCULOSIS SURVEILLANCE REPORT │10
had primary resistance to INH and 2 (1.0%) had primary resistance to RIF. There was one reported
cases of multidrug-resistant TB (MDR-TB, i.e. TB resistant to at least INH and RIF) in 2019,
compared to two in 2018. From 2015-2019, the percentage of TB cases with primary INH
resistance (INH-R) in Georgia ranged from 7% to 10%, with an average of 1.8 MDR-TB cases per
year (Figure 14).
TB Genotyping
TB genotyping is a laboratory method that determines the genetic relatedness of TB strains
among different patients with culture-positive TB disease. Identical genotypes among persons
with TB disease suggest recent person-to-person transmission. The state TB program routinely
analyzes TB genotype clusters, which are comprised of two or more TB cases with identical
genotypes, to identify recent TB transmission, to describe risk factors for transmission, to identify
possible sources of transmission, and to determine ways to stop transmission.
From 2017-2019, there were 30 two-case clusters, 8 three-case clusters, 5 four-case clusters, 2
five-case clusters, and 2 six-case clusters in Georgia (Figure 17). Figure 18 displays the percentage
of genotype clusters by alert level. According to the CDC, alert level is determined by the log
likelihood ratio statistic (LLR) for a given cluster, identifying higher than expected geospatial
concentrations for a TB genotype cluster in a specific county, compared to the national
distribution of that genotype. The Tuberculosis Genotyping Information Management System (TB
GIMS) generates alert level notifications based on the LLR: “No alert” is indicated if the LLR is
between 0≤5, “medium” is for clusters with LLRs between 5≤10, and “high” alert is for clusters
with LLRs ≥10. Between 2017-2019, Georgia had 19 (40.0%) clusters with a medium alert and 28
(60.0%) clusters with no alert (Figure 18). There were no clusters with high alerts during this time
period.

2019 GEORGIA TUBERCULOSIS SURVEILLANCE REPORT │11
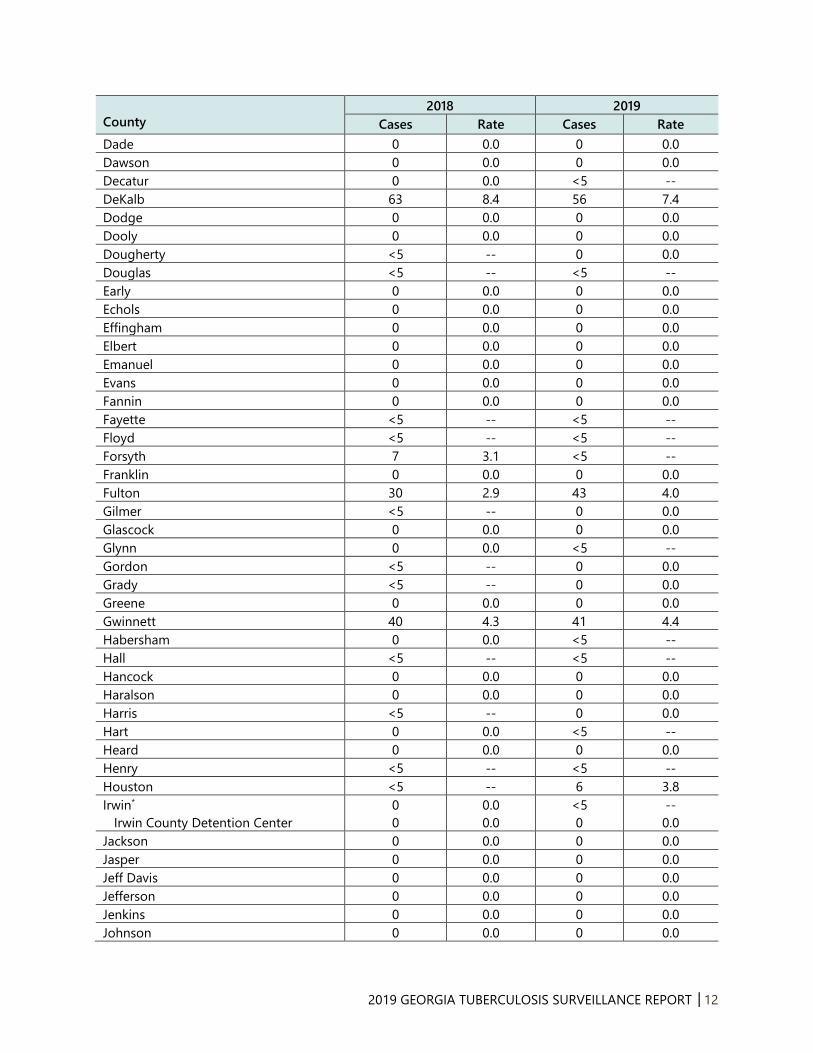
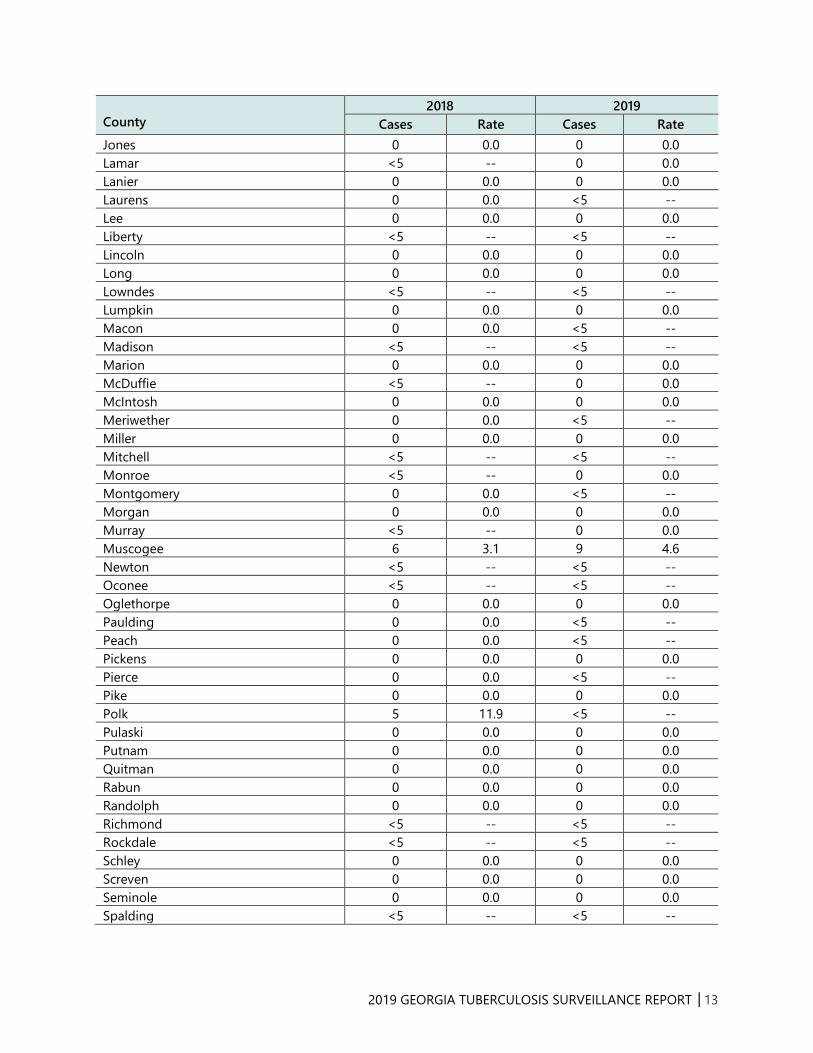
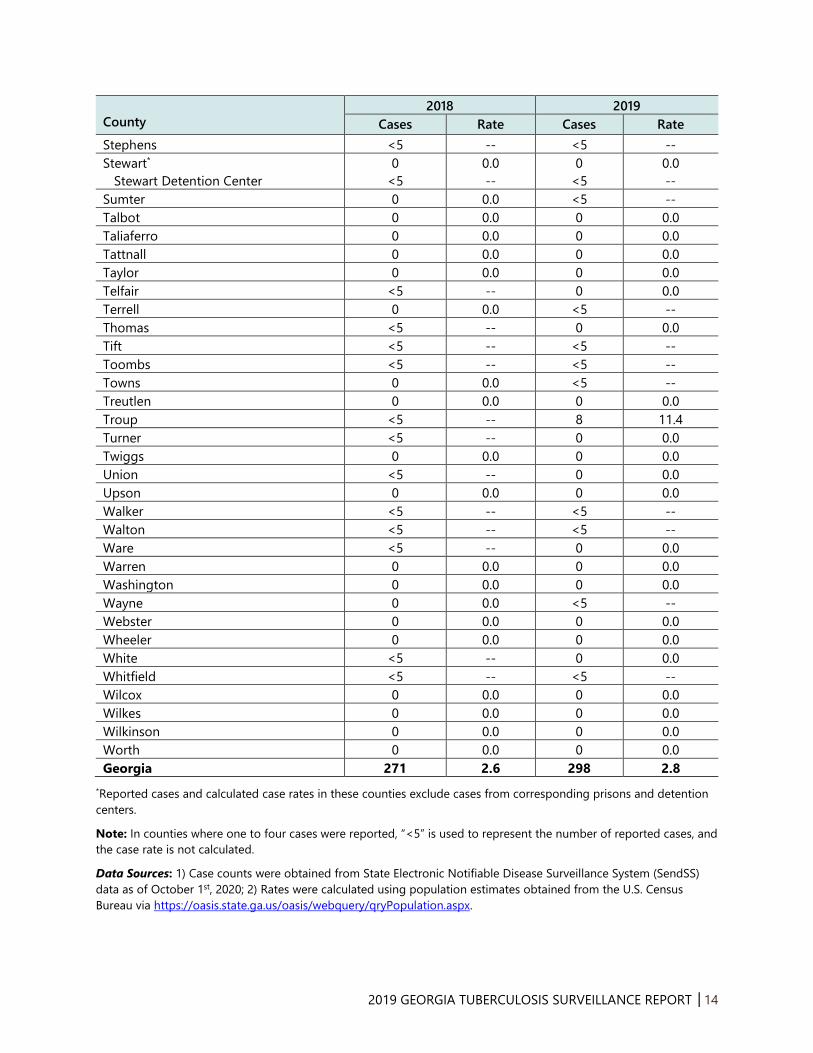
Table 1. Tuberculosis Cases and Case Rates per 100,000 Population by County,
Georgia, 2018-2019.
County 2018 2019
Cases Rate Cases Rate
Appling 0 0.0 0 0.0
Atkinson 0 0.0 0 0.0
Bacon 0 0.0 0 0.0
Baker 0 0.0 0 0.0
Baldwin <5 -- <5 --
Banks 0 0.0 0 0.0
Barrow <5 -- 0 0.0
Bartow <5 -- <5 --
Ben Hill 0 0.0 <5 --
Berrien 0 0.0 0 0.0
Bibb 5 3.3 5 3.3
Bleckley 0 0.0 0 0.0
Brantley 0 0.0 0 0.0
Brooks <5 -- 0 0.0
Bryan 0 0.0 0 0.0
Bulloch <5 -- <5 --
Burke 0 0.0 <5 --
Butts 0 0.0 0 0.0
Calhoun 0 0.0 0 0.0
Camden <5 -- 0 0.0
Candler 0 0.0 0 0.0
Carroll <5 -- <5 --
Catoosa 0 0.0 <5 --
Charlton*
Folkston ICE Processing Center
<5
0
--
0.0
0
5
0.0
--
Chatham 6 2.1 10 3.5
Chattahoochee 0 0.0 <5 --
Chattooga <5 -- <5 --
Cherokee 0 0.0 <5 --
Clarke 0 0.0 <5 --
Clay <5 -- 0 0.0
Clayton 9 3.2 13 4.4
Clinch 0 0.0 <5 --
Cobb 9 1.2 14 1.8
Coffee 0 0.0 0 0.0
Colquitt <5 -- <5 --
Columbia*
Augusta State Medical Prison
<5
0
--
0.0
0
0
0.0
0.0
Cook <5 -- 0 0.0
Coweta 0 0.0 <5 --
Crawford 0 0.0 0 0.0
Crisp 0 0.0 0 0.0
2019 GEORGIA TUBERCULOSIS SURVEILLANCE REPORT │12
County
2018 2019
Cases Rate Cases Rate
Dade 0 0.0 0 0.0
Dawson 0 0.0 0 0.0
Decatur 0 0.0 <5 --
DeKalb 63 8.4 56 7.4
Dodge 0 0.0 0 0.0
Dooly 0 0.0 0 0.0
Dougherty <5 -- 0 0.0
Douglas <5 -- <5 --
Early 0 0.0 0 0.0
Echols 0 0.0 0 0.0
Effingham 0 0.0 0 0.0
Elbert 0 0.0 0 0.0
Emanuel 0 0.0 0 0.0
Evans 0 0.0 0 0.0
Fannin 0 0.0 0 0.0
Fayette <5 -- <5 --
Floyd <5 -- <5 --
Forsyth 7 3.1 <5 --
Franklin 0 0.0 0 0.0
Fulton 30 2.9 43 4.0
Gilmer <5 -- 0 0.0
Glascock 0 0.0 0 0.0
Glynn 0 0.0 <5 --
Gordon <5 -- 0 0.0
Grady <5 -- 0 0.0
Greene 0 0.0 0 0.0
Gwinnett 40 4.3 41 4.4
Habersham 0 0.0 <5 --
Hall <5 -- <5 --
Hancock 0 0.0 0 0.0
Haralson 0 0.0 0 0.0
Harris <5 -- 0 0.0
Hart 0 0.0 <5 --
Heard 0 0.0 0 0.0
Henry <5 -- <5 --
Houston <5 -- 6 3.8
Irwin*
Irwin County Detention Center
0
0
0.0
0.0
<5
0
--
0.0
Jackson 0 0.0 0 0.0
Jasper 0 0.0 0 0.0
Jeff Davis 0 0.0 0 0.0
Jefferson 0 0.0 0 0.0
Jenkins 0 0.0 0 0.0
Johnson 0 0.0 0 0.0
2019 GEORGIA TUBERCULOSIS SURVEILLANCE REPORT │13
County
2018 2019
Cases Rate Cases Rate
Jones 0 0.0 0 0.0
Lamar <5 -- 0 0.0
Lanier 0 0.0 0 0.0
Laurens 0 0.0 <5 --
Lee 0 0.0 0 0.0
Liberty <5 -- <5 --
Lincoln 0 0.0 0 0.0
Long 0 0.0 0 0.0
Lowndes <5 -- <5 --
Lumpkin 0 0.0 0 0.0
Macon 0 0.0 <5 --
Madison <5 -- <5 --
Marion 0 0.0 0 0.0
McDuffie <5 -- 0 0.0
McIntosh 0 0.0 0 0.0
Meriwether 0 0.0 <5 --
Miller 0 0.0 0 0.0
Mitchell <5 -- <5 --
Monroe <5 -- 0 0.0
Montgomery 0 0.0 <5 --
Morgan 0 0.0 0 0.0
Murray <5 -- 0 0.0
Muscogee 6 3.1 9 4.6
Newton <5 -- <5 --
Oconee <5 -- <5 --
Oglethorpe 0 0.0 0 0.0
Paulding 0 0.0 <5 --
Peach 0 0.0 <5 --
Pickens 0 0.0 0 0.0
Pierce 0 0.0 <5 --
Pike 0 0.0 0 0.0
Polk 5 11.9 <5 --
Pulaski 0 0.0 0 0.0
Putnam 0 0.0 0 0.0
Quitman 0 0.0 0 0.0
Rabun 0 0.0 0 0.0
Randolph 0 0.0 0 0.0
Richmond <5 -- <5 --
Rockdale <5 -- <5 --
Schley 0 0.0 0 0.0
Screven 0 0.0 0 0.0
Seminole 0 0.0 0 0.0
Spalding <5 -- <5 --
2019 GEORGIA TUBERCULOSIS SURVEILLANCE REPORT │14
County
2018 2019
Cases Rate Cases Rate
Stephens <5 -- <5 --
Stewart*
Stewart Detention Center
0
<5
0.0
--
0
<5
0.0
--
Sumter 0 0.0 <5 --
Talbot 0 0.0 0 0.0
Taliaferro 0 0.0 0 0.0
Tattnall 0 0.0 0 0.0
Taylor 0 0.0 0 0.0
Telfair <5 -- 0 0.0
Terrell 0 0.0 <5 --
Thomas <5 -- 0 0.0
Tift <5 -- <5 --
Toombs <5 -- <5 --
Towns 0 0.0 <5 --
Treutlen 0 0.0 0 0.0
Troup <5 -- 8 11.4
Turner <5 -- 0 0.0
Twiggs 0 0.0 0 0.0
Union <5 -- 0 0.0
Upson 0 0.0 0 0.0
Walker <5 -- <5 --
Walton <5 -- <5 --
Ware <5 -- 0 0.0
Warren 0 0.0 0 0.0
Washington 0 0.0 0 0.0
Wayne 0 0.0 <5 --
Webster 0 0.0 0 0.0
Wheeler 0 0.0 0 0.0
White <5 -- 0 0.0
Whitfield <5 -- <5 --
Wilcox 0 0.0 0 0.0
Wilkes 0 0.0 0 0.0
Wilkinson 0 0.0 0 0.0
Worth 0 0.0 0 0.0
Georgia 271 2.6 298 2.8
*Reported cases and calculated case rates in these counties exclude cases from corresponding prisons and detention
centers.
Note: In counties where one to four cases were reported, “<5” is used to represent the number of reported cases, and
the case rate is not calculated.
Data Sources: 1) Case counts were obtained from State Electronic Notifiable Disease Surveillance System (SendSS)
data as of October 1st, 2020; 2) Rates were calculated using population estimates obtained from the U.S. Census
Bureau via https://oasis.state.ga.us/oasis/webquery/qryPopulation.aspx.

2019 GEORGIA TUBERCULOSIS SURVEILLANCE REPORT │15
Table 2. Number of TB Cases and TB Case Rates per 100,000 population by Health
District, Georgia, 2018-2019.
Health District
2018 2019
Cases Rate Cases Rate
1.1 Rome 14 2.1 10 1.5
1.2 Dalton 5 1.0 5 1.0
2.0 Gainesville 14 2.0 11 1.5
3.1 Cobb 12 1.3 16 1.8
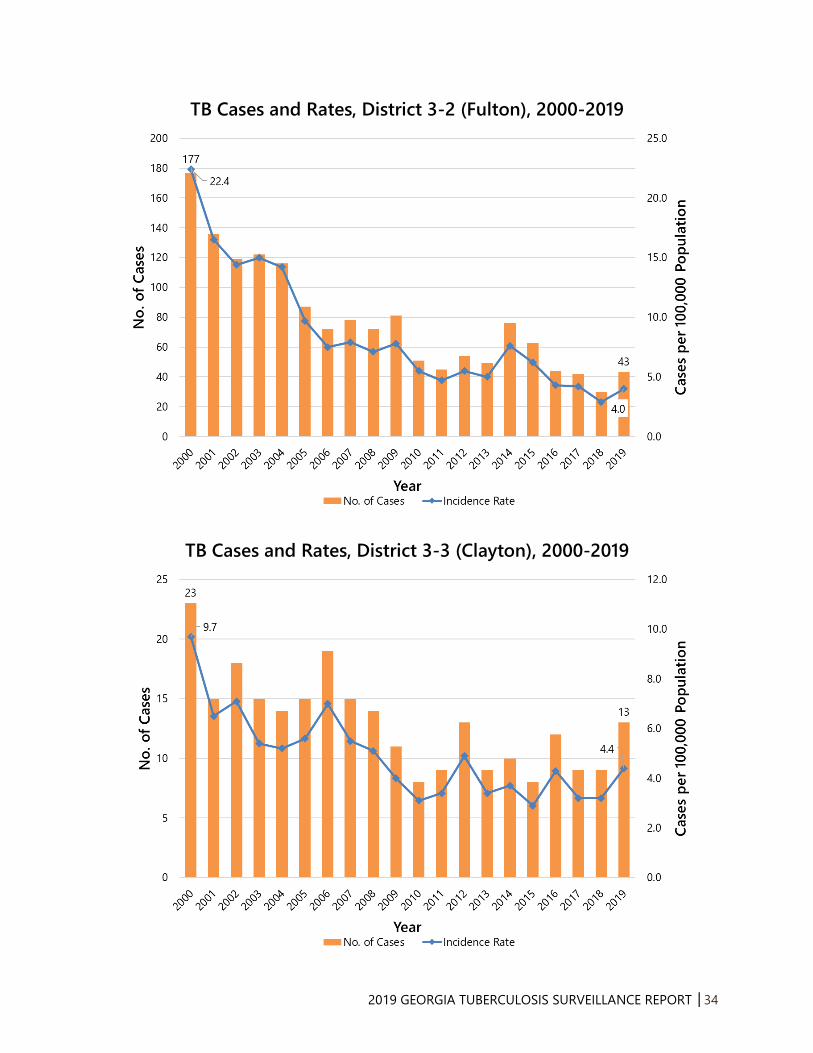
3.2 Fulton 30 2.9 43 4.0
3.3 Clayton 9 3.2 13 4.4
3.4 Lawrenceville 43 3.8 45 4.0
3.5 DeKalb 63 8.4 56 7.4
4.0 LaGrange 14 1.6 17 1.9
5.1 Dublin <5 -- <5 --
5.2 Macon 13 2.5 13 2.4
6.0 Augusta 8 1.6 5 1.0
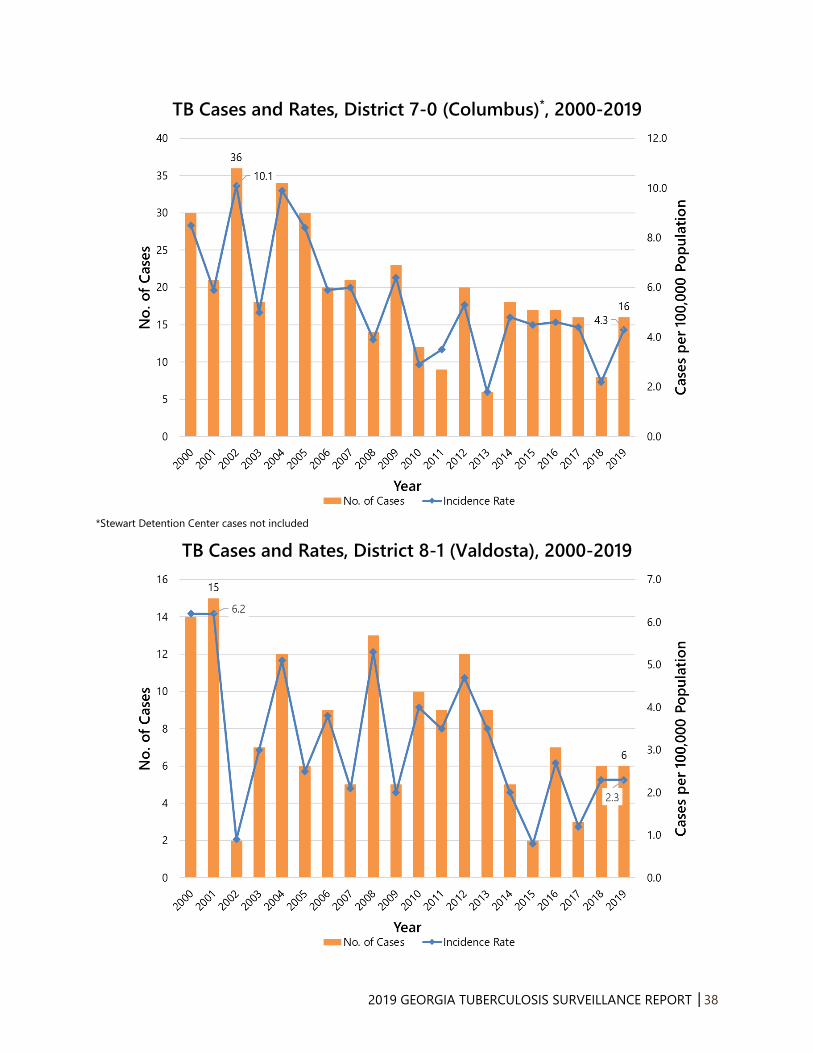
7.0 Columbus*
Stewart Detention Center
8
<5
2.2
--
16
<5
4.3
--
8.1 Valdosta 6 2.3 6 2.3
8.2 Albany 8 2.3 9 2.6
9.1 Coastal 10 1.6 14 2.2
9.2 Waycross*
Folkston ICE Processing Center
7
0
1.9
0.0
5
5
1.3
--
10.0 Athens 5 1.0 5 1.0
Total 271 2.6 298 2.8
*Reported cases and calculated case rates in these health districts exclude cases from corresponding prisons and
detention centers.
Note: In districts where one to four cases were reported, “<5” is used to represent the number of reported cases, and
the case rate is not calculated.
Data Sources: 1) Case counts were obtained from State Electronic Notifiable Disease Surveillance System (SendSS)
data as of October 1st, 2020; 2) Rates were calculated using population estimates obtained from the U.S. Census
Bureau via https://oasis.state.ga.us/oasis/webquery/qryPopulation.aspx.
2019 GEORGIA TUBERCULOSIS SURVEILLANCE REPORT │16
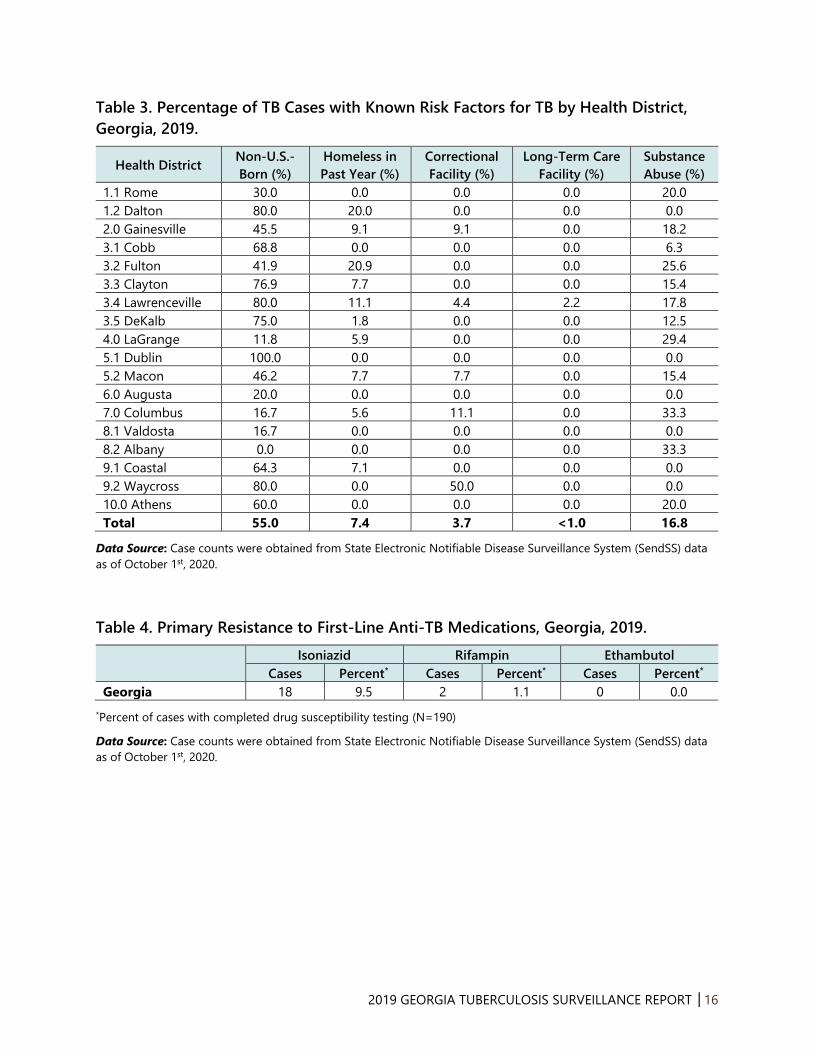
Table 3. Percentage of TB Cases with Known Risk Factors for TB by Health District,
Georgia, 2019.
Health District Non-U.S.-
Born (%)
Homeless in
Past Year (%)
Correctional
Facility (%)
Long-Term Care
Facility (%)
Substance
Abuse (%)
1.1 Rome 30.0 0.0 0.0 0.0 20.0
1.2 Dalton 80.0 20.0 0.0 0.0 0.0
2.0 Gainesville 45.5 9.1 9.1 0.0 18.2
3.1 Cobb 68.8 0.0 0.0 0.0 6.3
3.2 Fulton 41.9 20.9 0.0 0.0 25.6
3.3 Clayton 76.9 7.7 0.0 0.0 15.4
3.4 Lawrenceville 80.0 11.1 4.4 2.2 17.8
3.5 DeKalb 75.0 1.8 0.0 0.0 12.5
4.0 LaGrange 11.8 5.9 0.0 0.0 29.4
5.1 Dublin 100.0 0.0 0.0 0.0 0.0
5.2 Macon 46.2 7.7 7.7 0.0 15.4
6.0 Augusta 20.0 0.0 0.0 0.0 0.0
7.0 Columbus 16.7 5.6 11.1 0.0 33.3
8.1 Valdosta 16.7 0.0 0.0 0.0 0.0
8.2 Albany 0.0 0.0 0.0 0.0 33.3
9.1 Coastal 64.3 7.1 0.0 0.0 0.0
9.2 Waycross 80.0 0.0 50.0 0.0 0.0
10.0 Athens 60.0 0.0 0.0 0.0 20.0
Total 55.0 7.4 3.7 <1.0 16.8
Data Source: Case counts were obtained from State Electronic Notifiable Disease Surveillance System (SendSS) data
as of October 1st, 2020.
Table 4. Primary Resistance to First-Line Anti-TB Medications, Georgia, 2019.
Isoniazid Rifampin Ethambutol
Cases Percent* Cases Percent* Cases Percent*
Georgia 18 9.5 2 1.1 0 0.0
*Percent of cases with completed drug susceptibility testing (N=190)
Data Source: Case counts were obtained from State Electronic Notifiable Disease Surveillance System (SendSS) data
as of October 1st, 2020.
2019 GEORGIA TUBERCULOSIS SURVEILLANCE REPORT │17
Table 5. Completion of TB Treatment and Completion of TB Treatment within 12
Months by Health District, Georgia, 2018 (N=224).*
Health District Completion of TB
Treatment (%)
Completion of TB Treatment
within 12 months (%)
1.1 Rome 100.0 80.0
1.2 Dalton 100.0 100.0
2.0 Gainesville 100.0 100.0
3.1 Cobb 100.0 88.9
3.2 Fulton 100.0 87.0
3.3 Clayton 100.0 100.0
3.4 Lawrenceville 97.2 97.2
3.5 DeKalb 96.2 92.5
4.0 LaGrange 100.0 100.0
5.1 Dublin 100.0 100.0
5.2 Macon 100.0 100.0
6.0 Augusta 100.0 100.0
7.0 Columbus 88.9 77.8
8.1 Valdosta 75.0 75.0
8.2 Albany 100.0 100.0
9.1 Coastal 100.0 85.7
9.2 Waycross 57.1 57.1
10.0 Athens 100.0 100.0
Total 96.4 92.0
*Includes persons alive at diagnosis, with initial drug regimen of one or more drugs prescribed, who did not die within
one year of initiating treatment; excludes persons with initial rifampin-resistant isolate, patients with bone and joint
disease, meningeal disease, or disease of the central nervous system, or pediatric patients (ages 0–14 years) with
miliary disease or positive blood culture or a positive nucleic acid amplification test on a blood specimen, and those
who moved out of the country within one year of initiating treatment.

2019 GEORGIA TUBERCULOSIS SURVEILLANCE REPORT │18
Figure 1. TB Cases and Case Rates, Georgia, 1990-2019
Figure 2. TB Case Rates, United States and Georgia, 1990-2019

2019 GEORGIA TUBERCULOSIS SURVEILLANCE REPORT │19
Figure 3. Number of TB Cases by Health District, Georgia, 2019 (N=298)
2019 GEORGIA TUBERCULOSIS SURVEILLANCE REPORT │20
Figure 4. TB Case Rate by Health District, Georgia, 2019 (N=298)
2019 GEORGIA TUBERCULOSIS SURVEILLANCE REPORT │21
Figure 5. TB Cases by Age and Sex, Georgia, 2019 (N=298)
Figure 6. TB Case Rates* by Age Group, Georgia, 2015-2019
Age Group
(years)
2015
(N=321)
2016
(N=301)
2017
(N=293)
2018
(N=271)
2019
(N=298)
<5 2.1 1.4 2.0 0.9 2.0
5-14 0.2 0.7 0.6 0.7 0.5
15-24 1.7 1.7 1.8 1.4 2.1
25-44 4.0 3.2 3.6 3.6 3.2
45-64 4.7 4.2 3.5 2.3 3.7
65+ 3.6 4.1 3.6 4.9 3.8
*Cases per 100,000 population
2019 GEORGIA TUBERCULOSIS SURVEILLANCE REPORT │22
Figure 7. Number and Percentage of TB Cases by Race/Ethnicity,
Georgia, 2019 (N=298)
Figure 8. TB Case Rates* by Race/Ethnicity, Georgia, 2015-2019
Race/Ethnicity 2015
(N=318)
2016
(N=302)
2017
(N=293)
2018
(N=271)
2019
(N=298)
Asian, non-Hispanic 19.7 16.8 16.5 15.8 16.1
All races, Hispanic 4.2 4.5 4.1 5.8 5.7
American Indian/Alaskan
Native, non-Hispanic 4.3 0.0 0.0 0.0 4.1
Black, non-Hispanic 4.8 4.6 4.6 3.1 3.9
Multiracial, non-Hispanic 1.7 0.5 0.5 1.0 1.0
White, non-Hispanic 0.7 0.7 0.5 0.7 0.6
*Cases per 100,000 population

2019 GEORGIA TUBERCULOSIS SURVEILLANCE REPORT │23
Figure 9. TB Case Rates Among Non-Hispanic Black and Non-Hispanic
White Persons, Georgia, 2000-2019
Figure 10. U.S.-Born and Non-U.S.-Born TB Cases, Georgia, 2000-2019
2019 GEORGIA TUBERCULOSIS SURVEILLANCE REPORT │24
Figure 11. Country of Origin for Non-U.S.-Born TB Cases, Georgia, 2019
(N=164)

2019 GEORGIA TUBERCULOSIS SURVEILLANCE REPORT │25
Figure 12. HIV Status of TB Cases, Georgia, 2000-2019
Figure 13. Risk Factors Among TB Patients, Georgia, 2015-2019
2019 GEORGIA TUBERCULOSIS SURVEILLANCE REPORT │26
Figure 14. Primary Drug Resistance (INH-R)* and
Multi-Drug Resistant TB (MDR-TB)**, Georgia, 2015-2019
*Defined as having no previous diagnosis of TB and having resistance of INH at first occurrence of disease **Defined as having resistance to at least INH and RIF
2019 GEORGIA TUBERCULOSIS SURVEILLANCE REPORT │27
Figure 15. Completion of TB Therapy, Georgia, 2000-2018*
*Data available through 2018
Note: Includes persons alive at diagnosis, with initial drug regimen of one or more drugs prescribed, who did not die within one year
of initiating treatment; excludes persons with initial rifampin-resistant isolate, patients with bone and joint disease, meningeal
disease, or disease of the central nervous system, or pediatric patients (ages 0–14 years) with miliary disease or positive blood
culture or a positive nucleic acid amplification test on a blood specimen, and those who moved out of the country within one year of
initiating treatment.
2019 GEORGIA TUBERCULOSIS SURVEILLANCE REPORT │28
Figure 16. Mode of Treatment Administration Among Persons
Reported with TB, Georgia, 2018 (N=224)
Note: Includes persons alive at diagnosis, with initial drug regimen of one or more drugs prescribed, who did not die within one year
of initiating treatment; excludes persons with initial rifampin-resistant isolate, patients with bone and joint disease, meningeal
disease, or disease of the central nervous system, or pediatric patients (ages 0-14 years) with miliary disease or positive culture or a
positive nucleic acid amplification test on a blood specimen, and those who moved out of the country within one year of initiating
treatment.

2019 GEORGIA TUBERCULOSIS SURVEILLANCE REPORT │29
Figure 17. Number of County-Based TB Genotype Clusters*
by Cluster Size, Georgia, 2017-2019
*Genotype Clusters are defined as two or more cases with matching spoligotype and 24-locus MIRU-VNTR (GENType) within a
county during the specified 3-year time-period.

2019 GEORGIA TUBERCULOSIS SURVEILLANCE REPORT │30
Figure 18. Tuberculosis Genotype Clusters by TB GIMS* Alert Level^,
Georgia, 2017-2019
*Tuberculosis Genotyping Information Management System ^According to the CDC, alert level is determined by the log likelihood ratio statistic (LLR) for a given cluster, identifying higher than
expected geospatial concentrations for a TB genotype cluster in a specific county, compared to the national distribution of that
genotype. The Tuberculosis Genotyping Information Management System (TB GIMS) generates alert level notifications based on the
LLR: “No alert” is indicated if the LLR is between 0–<5, “medium” is for clusters with LLRs between 5–<10, and “high” alert is for
clusters with LLRs ≥10.

2019 GEORGIA TUBERCULOSIS SURVEILLANCE REPORT │31
Tuberculosis Morbidity Trends by Health District, Georgia, 2000-2019
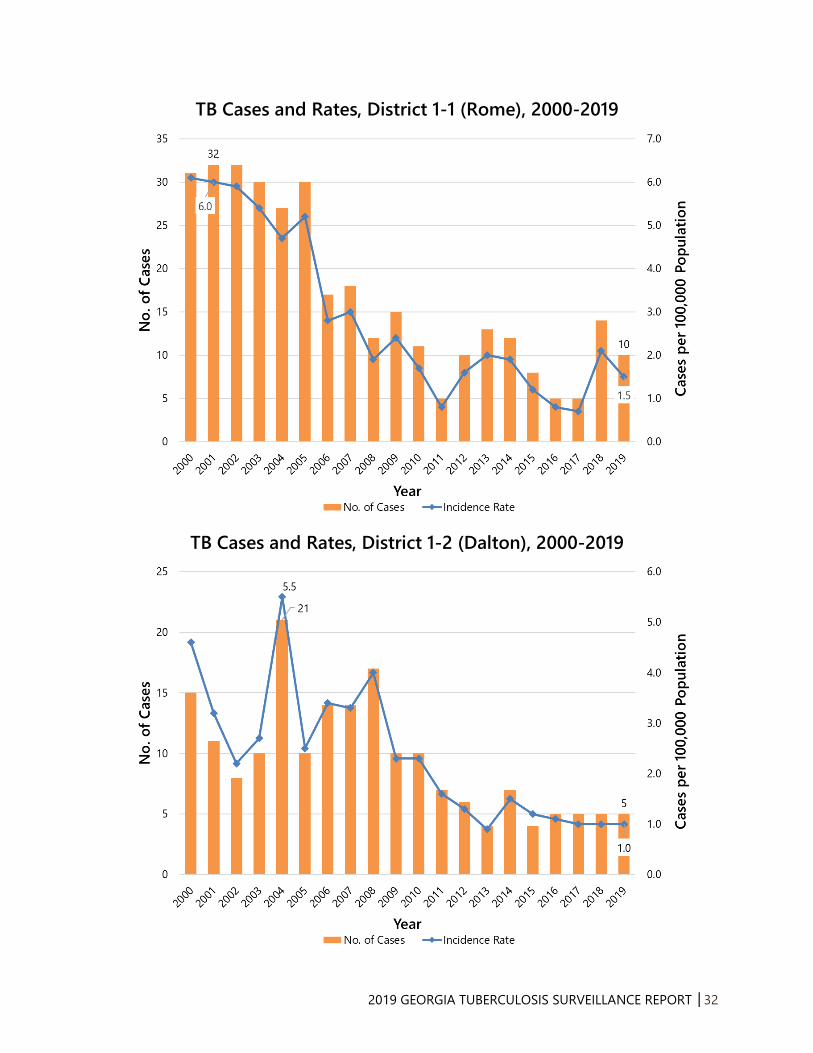
2019 GEORGIA TUBERCULOSIS SURVEILLANCE REPORT │32
TB Cases and Rates, District 1-1 (Rome), 2000-2019
TB Cases and Rates, District 1-2 (Dalton), 2000-2019

2019 GEORGIA TUBERCULOSIS SURVEILLANCE REPORT │33
TB Cases and Rates, District 2-0 (Gainesville), 2000-2019
TB Cases and Rates, District 3-1 (Cobb), 2000-2019
2019 GEORGIA TUBERCULOSIS SURVEILLANCE REPORT │34
TB Cases and Rates, District 3-2 (Fulton), 2000-2019
TB Cases and Rates, District 3-3 (Clayton), 2000-2019

2019 GEORGIA TUBERCULOSIS SURVEILLANCE REPORT │35
TB Cases and Rates, District 3-4 (Lawrenceville), 2000-2019
TB Cases and Rates, District 3-5 (DeKalb), 2000-2019

2019 GEORGIA TUBERCULOSIS SURVEILLANCE REPORT │36
TB Cases and Rates, District 4-0 (LaGrange), 2000-2019
TB Cases and Rates, District 5-1 (Dublin), 2000-2019

2019 GEORGIA TUBERCULOSIS SURVEILLANCE REPORT │37
TB Cases and Rates, District 5-2 (Macon), 2000-2019
TB Cases and Rates, District 6-0 (Augusta)*, 2000-2019
*Augusta State Medical Prison cases not included
2019 GEORGIA TUBERCULOSIS SURVEILLANCE REPORT │38
TB Cases and Rates, District 7-0 (Columbus)*, 2000-2019
*Stewart Detention Center cases not included
TB Cases and Rates, District 8-1 (Valdosta), 2000-2019

2019 GEORGIA TUBERCULOSIS SURVEILLANCE REPORT │39
TB Cases and Rates, District 8-2 (Albany), 2000-2019
TB Cases and Rates, District 9-1 (Coastal), 2000-2019

2019 GEORGIA TUBERCULOSIS SURVEILLANCE REPORT │40
TB Cases and Rates, District 9-2 (Waycross), 2000-2019
TB Cases and Rates, District 10-0 (Athens), 2000-2019
Related Documents