GEORGIA INTERSECTION SAFETY IMPROVEMENT PROGRAM A Thesis Presented to The Academic Faculty By Chester G. Thomas In Partial Fulfillment Of the Requirements for the Degree Master of Science in Civil Engineering Georgia Institute of Technology August, 2008

Welcome message from author
This document is posted to help you gain knowledge. Please leave a comment to let me know what you think about it! Share it to your friends and learn new things together.
Transcript

GEORGIA INTERSECTION SAFETY IMPROVEMENT PROGRAM
A Thesis Presented to
The Academic Faculty
By Chester G. Thomas
In Partial Fulfillment Of the Requirements for the Degree
Master of Science in Civil Engineering
Georgia Institute of Technology
August, 2008
GEORGIA INTERSECTION SAFETY IMPROVEMENT PROGRAM
Approved by: Dr. Michael Meyer, Advisor School of Civil Engineering Georgia Institute of Technology Dr. Laurie Garrow School of Civil Engineering Georgia Institute of Technology Dr. Adjo Amekudzi School of Civil Engineering Georgia Institute of Technology Date Approved: June 17, 2008

iii
ACKNOWLEDGEMENTS
I would like to thank my advisor Dr. Michael Meyer, Todd Long, and the Georgia
Department of Transportation (GDOT) for giving me this amazing opportunity.
iv
TABLE OF CONTENTS
ACKNOWLEDGEMENTS ............................................................................................ iii
LIST OF TABLES ............................................................................................................ v
LIST OF FIGURES ......................................................................................................... vi
LIST OF ABBREVIATIONS ........................................................................................ vii
SUMMARY .................................................................................................................... viii
CHAPTER I - INTRODUCTION ................................................................................... 1
Study Need .....................................................................................................................2
Study Objective ..............................................................................................................3
Analysis..........................................................................................................................4
CHAPTER II – GENERAL INTERSECTION CRASH TRENDS IN GEORGIA ... 6
National Statistics ..........................................................................................................8
Type of Intersection Collision in Georgia ...................................................................10
CHAPTER III – LITERATURE REVIEW ................................................................. 15
CHAPTER IV: PROPOSED INTERSECTION SAFETY PLAN ............................ 31
SHSP Comparison ........................................................................................................ 31
Standardized Hazardous Intersection Determination Method ...................................... 35
Public Involvement Taskforce ...................................................................................... 39
Automated Police Crash Reporting Through Improved Technologies ........................ 42
Intersection Crash Reduction Treatments ..................................................................... 46
CHAPTER V – CONCLUSION .................................................................................... 51
APPENDIX ...................................................................................................................... 53
WORKS CITED AND REFERENCES ........................................................................ 59

v
LIST OF TABLES
Table 2.1 Georgia Crashes & Intersection Crashes……………………….……… 9
Table 2.2 U.S. and Georgia Fatal Intersection Crashes…………….…………….. 9
Table 4.1 SHSP Eight State Comparison (State Goals and Intersection Safety)… 33
Table 4.2
SHSP Eight State Comparison (4 E’s Strategies and Crash Reporting)……………………………………………………………… 34
Table 4.3
Incandescent Ball and LED Ball Comparison…………………………. 47

vi
LIST OF FIGURES
Figure 2.1 Total Crashes and Intersection Crashes in Georgia…………..…...….. (2000-2005)
7
Figure 2.2 Total Crash Fatalities and Intersection Fatalities in Georgia…………. (2000-2004)
8
Figure 2.3 Intersection Crashes by Type of Collision by Percentage……………. (2000-2005)
10
Figure 2.4 Percentage of Fatal& Serious Injury Intersection Crashes by………... Type of Collision (2000-20005)
11
Figure 2.5 Urban Vs. Rural Split- All Crashes in Georgia (2000-2005)………….
12
Figure 2.6 Urban Vs. Rural Split – Fatal & Serious Injury Crashes……………... Intersection Crashes in Georgia (2000-2005)
12
Figure 3.1 Strategic Resource Allocation Process for Safety……………………..
30
Figure 4.1 Public Involvement Call Center Flow Chart………………………….. 41 Figure 4.2
U.S. Pedestrian Fatalities 1996-2006………………………………….
49
Figure A.1 2000-2005 Fulton County CARE Crash Data Sample Map…………..
55
Figure A.2 California DOT Traffic Congestion/Construction Problem Form……. 56 Figure A.3
California DOT Road Maintenance Request Form……………………
57
Figure A.4 Virginia DOT Road Problem Form…………………………………... 58

vii
LIST OF ABBREVIATIONS
AADT – Annual Average Daily Traffic CODES – Crash Outcome Data Evaluation System CRF – Crash Reduction Factors DMV – Department of Motor Vehicles DPS – Department of Public Safety EMS – Emergency Management Services FC – Fatal Crash GIS – Geographic Information System HCM – Highway Capacity Manual HSIP – Highway Safety Improvement Program HSM – Highway Safety Manual IC – Injury Crash ITE – Institute of Transportation Engineers MDT – Mobile Data Terminal MUTCD – Manual on Uniform Traffic Control Devices NCHRP – National Cooperative Highway Research Program NHTSA – National Highway Traffic Safety Administration NIBRS – National Incident Based Reporting System PDO – Property Damage Only ROW – Right of Way RSARS – Road Safety Audit Reviews SAFETEA-LU – Safe, Accountable, Flexible, Efficient, Transportation Equity Act TMC – Traffic Management Center TraCS – Traffic and Criminal Software TRB – Transportation Research Board U.S. – United States VMT – Vehicle Miles Traveled

viii
SUMMARY
Intersection crashes accounted for 47 percent of the total number of crashes in the
State of Georgia from 2000-2005, and as a location where crashes occur, represent the
largest number of crash locations in the state. (1) Federal legislation requires states to
implement statewide safety plans to reduce fatalities, crashes, and improve safety.
Intersection safety improvement is one of the emphasis areas in this plan. Intersections
vary in different ways and there are individual factors that can cause an intersection to be
safer or more dangerous than another. Acquiring better, uniform, and more updated
information with regard to intersection crashes will enable transportation officials to
prescribe policies for improving safety in an easier and more expedited manner.
The State of Georgia has published a federally-mandated Strategic Highway
Safety Plan (SHSP) in 2006. The SHSP for Georgia was written in accordance with the
American Association of State Highway Transportation Officials (AASHTO) initiative to
improve highway safety. (3) The main goal of the Georgia SHSP is to improve traffic
safety and reduce the amount of vehicle and pedestrian fatalities on Georgia roads. In
order to mitigate crashes at these locations, there is a need to detect systematically
dangerous intersection locations.
This thesis recommends a five-part program for intersection safety that will
enable Georgia transportation officials to better analyze, identify, and implement
countermeasures at intersections that are determined to be the most hazardous. The plan
consists of:

ix
1. Standardized Hazardous Intersection Identification Method:
The State of Georgia should implement a statewide standard method to determine
the degree of hazard at an intersection. Different counties use various analysis
methods to set one hazardous intersection apart from another. What one county
might consider safe, another may consider hazardous. An approach is necessary
that classifies intersection hazard severity and prescribes methods that can be used
to reduce hazards at these locations.
2. Statewide Public Involvement Taskforce:
It is difficult for traffic and highway engineers to analyze every intersection in the
state to ensure a safety treatment is warranted. Thus, other means are necessary to
identify hazardous locations. The program recommended in this thesis suggests
that the general public can play a role in reporting potentially hazardous
intersection conditions. The plan is to implement a county-level taskforce to allow
public reporting of unsafe roads, highways and intersections. Crash attenuation
devices are often damaged during a crash and timely repairs are not made because
local authorities are unaware that these devices are damaged. If counties have call
centers and a safety website, the public can be involved in their own safety. The
motto for this component of the plan is, “public awareness requires public
involvement.”
3. Automated Police Crash Reporting Through Improved Technologies:
Statewide crash data collection often takes years for hand written accident reports
to be incorporated into the state crash database. This plan recommends that patrol
vehicles statewide should be equipped with MDT (in-vehicle data input devices)

x
and Global Positioning Systems (GPS). With such technology, crash data could be
uploaded instantly into a uniform database. The benefit of this kind of system is
that it will allow traffic engineers to perform real time studies on safety treatments
at dangerous locations. Statewide compliance is essential for this to work so that
all reporting is submitted in the same data format. These technologies are
currently being used in parts of Georgia and in other states.
4. Strategic Highway Safety Plan (SHSP) Intersection Safety Strategies (8
State Comparison)
The intersection safety program focuses on current strategies being planned
through Georgia’s SHSP for intersection safety and will hopefully act as an
enhancement for the current plan. It also analyzes SHSPs submitted by seven
other states and compares what they are proposing to lessen crashes in their states.
The southern states analyzed, in addition to Georgia, include: Alabama, Florida,
Tennessee, and South Carolina, and three additional states analyzed included:
Texas, New York, and California. These latter three states were studied because of
their large road networks, which is similar to the challenge facing Georgia.
5. Statewide Minimal Intersection Safety Equipment
Due to financial constraints it is not feasible to rebuild or redesign every
intersection having a high crash frequency or a high severity index. However, if
the intersection is deemed extremely hazardous, geometric design improvements
can be made to reduce the number and severity of crashes. There are thousands of
intersections in Georgia that can be made safer by setting a standard of
implementing standard, reliable, and safety redundant equipment at every

xi
intersection statewide. Light Emitting Diode (LED) technology has been proven to
improve safety, is more reliable, and provides better visibility. (4) This technology,
which is already being implemented in parts of Georgia, has the possibility of
saving lives, and because of its low energy consumption, it will pay for itself in the
long run.(32) The statewide intersection equipment consists of:
• Retrofit existing signal heads to 12” LED traffic signal heads (signalized
intersections)
• LED pedestrian countdown timers and leading pedestrian interval in
highly dense pedestrian areas (signalized intersections)
The five parts of this plan lead to a statewide standard method of analyzing
intersections based on uniform collection methods and uniform equipment statewide.
Different funding sources for the recommended programs are also addressed in this
document. Among these is the program found in the 2005 “Safe, Accountable, Flexible,
Efficient, Transportation Equity Act: A Legacy for Users” (SAFETEA-LU), which
guarantees funding for transportation safety programs. (5)

1
CHAPTER I - INTRODUCTION From 2000 to 2005, more than 300,000 motor vehicle crashes occurred annually
on Georgia roadways, of which 47 percent occurred at intersections. (1) As Georgia’s
population continues to increase, so does the demand for its transportation facilities. The
safety of those who use the transportation system must be a top priority for state officials.
Georgia submitted its Strategic Highway Safety Plan (SHSP) in October, 2006. The
motto for Georgia’s SHSP is, “Every Life Counts – Strive for Zero Deaths and Injuries
on Georgia Roads.” The state plan adopts a goal of 1.0 fatality minimum per 100 million
vehicle miles traveled by 2010. (3)
In order to make significant progress in reducing the number and severity of
crashes, intersection safety must be a main focus of any statewide safety plan. This thesis
focuses on improved communication technologies and intersection improvement
strategies that can be used to implement a statewide intersection safety program.
Transportation officials have to be able to receive crash data in a timelier manner so that
they can identify improvements rapidly and ensure that any implemented improvements
are actually doing what they are supposed to. Providing police departments with
advanced reporting tools and giving the public the opportunity to identify what they
consider to be hazardous locations are essential tools for transportation officials to
identify hazardous intersection locations. Funding on a statewide basis needs to be
available to ensure that safety programs can be implemented not only in the highly dense
populated urban counties, but also the less populated rural counties, which have limited
resources.

2
Study Need
As noted in the introduction, intersection crashes account for 47 percent of all
crashes in Georgia. (1) This thesis analyzes feasible strategies and technologies to reduce
intersection crashes in a systematic way and improve intersection safety across Georgia.
The federal government has required all states to submit a State Strategic Highway Safety
Plan (SHSP) aimed at reducing vehicle fatalities and crashes. (2) Crashes, in general, are
a difficult measure to control because of the number of variables that have to be taken
into account when analyzing the causes of each crash. Some of the main causes or
reasons for motorist crashes include: driver errors, alcohol-related incidents, vehicle
failure, ambiguous road geometry, weather, speeding, lighting, etc. It is a challenge for a
state the size of Georgia for transportation engineers to analyze systematically available
crash data to figure out which intersections or roads are causing motorists to crash and
why. In addition to locations, it is also difficult to quantify which techniques and
methods might be used to improve the safety at these locations. Acquiring better crash
data is essential to understanding how to fix these problems.
Georgia should implement a statewide method to identify hazardous intersections
on both state and non-state designated routes. Different counties use various analysis
methods to determine the safety record of intersections in their jurisdiction; however,
from looking at the different methods currently in use, what one considers a safe
intersection may be considered hazardous by another. The Georgia Department of
Transportation (GDOT) collects and archives every crash report for the state. (6) GDOT
is also in charge of maintaining, improving and analyzing all of Georgia’s state
designated highways, also known as system routes. The “top 150 report” analyzes
3
intersection crashes on state routes by using a method known as a composite index. (6)
Georgia has recently been required to submit a “5 percent” report as per Section
148(c)(1)(D) and 148(g)(3)(A), of Title 23, United States Code. This requirement
mandates each state to submit a report describing at least five percent of the state’s
locations that have the most safety improvement needs. This “five percent report” is a
requirement of the Highway Safety Improvement Program (HSIP) of the SAFETEA-LU.
(7) The “standardized hazardous intersection determination method” section of this
thesis, located in Chapter 4, recommends a process that improves existing methods to
classify intersection hazard severity and reviews methods used by other states to
standardize this process.
Study Objective
The purpose of this thesis is to recommend a statewide program to improve the
safety of intersections in Georgia through improved data collection and analysis. The
purpose of this study was to serve as an additional intersection safety plan for the State of
Georgia to be used in conjunction with Georgia’s SHSP. This safety program
recommends a method by which intersections in Georgia can become safer through
implementing policies in which data can be more easily analyzed and safety changes can
be implemented in a more expedited manner. The safety program consists of five
components:
• A standardized hazardous intersection identification method
• Public involvement taskforce
• Automated police crash reporting through improved technologies

4
• State Strategic Highway Safety Plan (SHSP) intersection safety strategies (8
state comparison)
• Statewide minimal intersection safety equipment
Technology will play a huge role in the implementation of this plan. The
technology improvements recommended in this thesis will not only serve intersection
safety, but they will also provide advances that will aid all aspects of road safety analysis.
If Georgia decides to implement a statewide improved crash reporting system, many
crashes could be avoided given that more timely data will allow transportation officials to
respond more rapidly to hazardous locations. Safety studies can be expedited to make
sure that crash countermeasures or treatments are working the way they are supposed to.
Also, allowing the public to participate in the safety process with regard to hazardous
intersections and road conditions through a public safety taskforce would allow for public
reporting of hazardous locations.
Analysis
The data analysis for this thesis was conducted based upon an extensive literature
review of strategies that are being used to improve traffic safety in the United States and
in other countries. In particular, the SHSPs proposed by eight states were analyzed,
compared, and served to identify what other states are doing to improve safety at
intersections in their respective states. Crash data provided by the Critical Analysis
Reporting Environment (CARE) and the National Highway Traffic Safety
Administration’s (NHTSA) Fatality Analysis Reporting System (FARS) Encyclopedia
were used to quantify existing problems at Georgia’s intersections. CARE is a data
analysis software package designed for problem identification and countermeasure

5
development purposes. The FARS Encyclopedia contains data on a census of fatal traffic
crashes within the 50 States, the District of Columbia, and Puerto Rico. (8) Studies
conducted through the United States Department of Transportation (USDOT), the Federal
Highway Administration (FHWA), and numerous articles and journals related to
intersection safety were also analyzed to generate a plan with strategies that have been
proven to be successful.
The CARE data for this study captures only Georgia crashes that occurred on
public roadways from 2000 to 2005. The CARE datasets are developed from the Georgia
Department of Transportation’s crash database and have been transmitted to the database
via data entry from law enforcement crash reports. GDOT has data as accurate as 2007,
yet 2008 data is not yet available in its entirety. (6) The CARE system is a useful tool,
yet it takes a couple of years for data to be analyzed and updated into the database, which
does not allow for timely analysis.
To be included in FARS, a crash must involve a motor vehicle traveling on a
traffic way customarily open to the public and result in the death of a person (occupant of
a vehicle or a non-occupant) within 30 days of the crash. (8) A potential problem with
this is that if the proper authorities do not keep up with the status of the victim, the
fatality data may not represent the true fatality record of the state’s road network.

6
CHAPTER II – GENERAL INTERSECTION CRASH TRENDS IN GEORGIA
The following analysis describes the impact of intersection crashes in Georgia and
puts into perspective the need for a program to better analyze crash data. Between 2000
and 2005, intersection crashes in Georgia grew every year on average by 2400 crashes.
Crash trends increased throughout Georgia especially in highly dense metropolitan areas.
Fulton, Cobb, DeKalb, Clayton and Chatham Counties have the highest prevalence of
intersection crashes for the state. (1) This is not surprising as these counties have the
largest numbers of drivers and experience the largest amount of road travel. According
to the Office of Planning and Budget, the Georgia’s population will grow to 10.8 million
by 2015, an increase of 34% from 2000. (9) This will place an increasing demand on
Georgia’s transportation infrastructure and raises concerns about how the state will assure
a declining crash rate in light of such a large increase in travel demand.
In the United States as a whole, the total cost of intersection crashes to society is
estimated to be $40 billion dollars per year. (10) It is not feasible to redesign and rebuild
every intersection having a high crash rate or frequency; however, there are many
alternatives to reducing crashes at these intersections through the use of technologies that
modify a driver’s behavior. The key to implementing these technologies is understanding
why crashes are occurring at these locations.
Analyzing different methods that are currently implemented across the United
States to improve reporting of intersection crashes in both rural and urban areas will
improve an understanding of why crashes are occurring. Mandating redundant safety
equipment to be implemented in a standard way statewide such as LED traffic signals and
7
LED pedestrian countdown timers in dense pedestrian areas will improve safety and
reduce operational costs. Counties in Georgia have already begun incorporating some of
these safety techniques into their infrastructure. If safety officials can understand why
crashes are occurring, it will be possible to implement crash reduction technologies in
these areas.
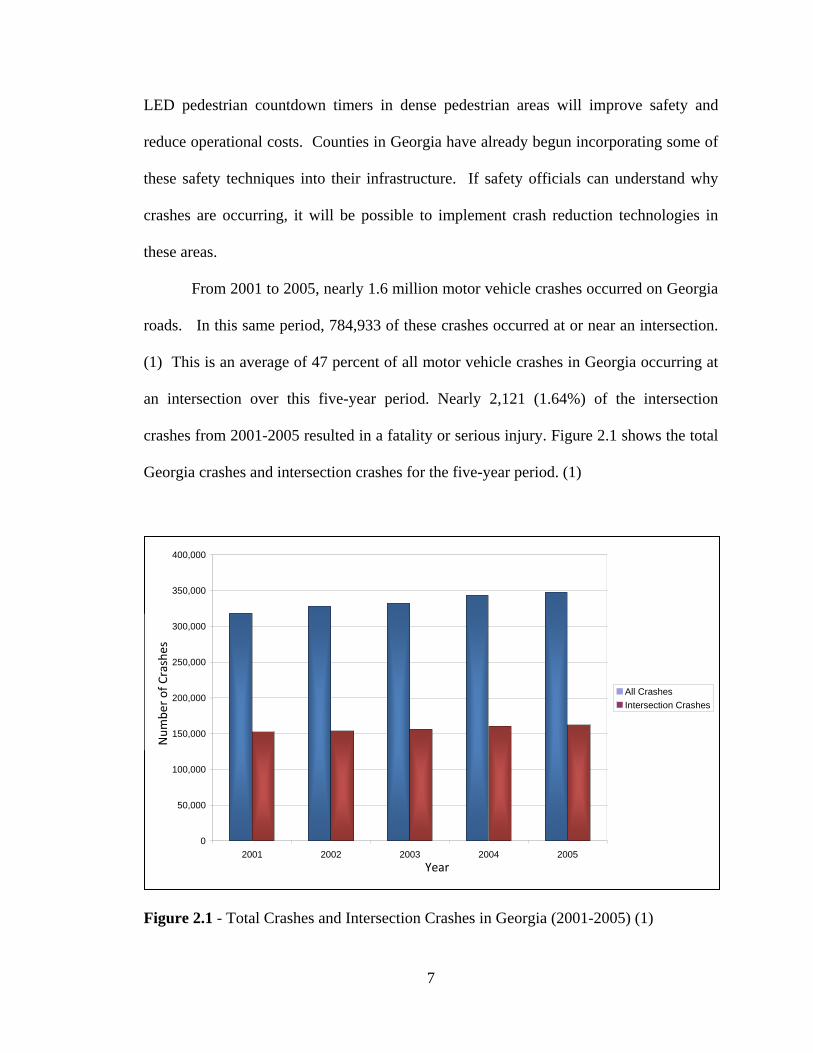
From 2001 to 2005, nearly 1.6 million motor vehicle crashes occurred on Georgia
roads. In this same period, 784,933 of these crashes occurred at or near an intersection.
(1) This is an average of 47 percent of all motor vehicle crashes in Georgia occurring at
an intersection over this five-year period. Nearly 2,121 (1.64%) of the intersection
crashes from 2001-2005 resulted in a fatality or serious injury. Figure 2.1 shows the total
Georgia crashes and intersection crashes for the five-year period. (1)
Figure 2.1 - Total Crashes and Intersection Crashes in Georgia (2001-2005) (1)
Num
ber o
f Crashes
Year
0
50,000
100,000
150,000
200,000
250,000
300,000
350,000
400,000
2001 2002 2003 2004 2005
All CrashesIntersection Crashes
8
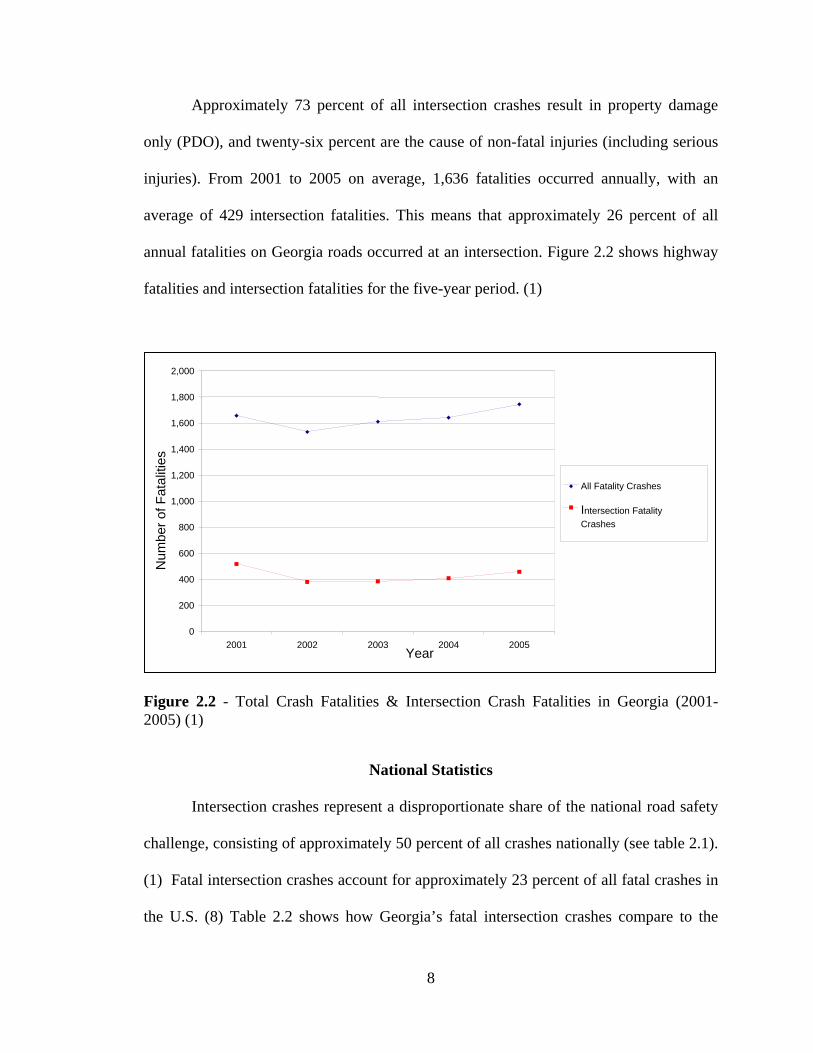
Approximately 73 percent of all intersection crashes result in property damage
only (PDO), and twenty-six percent are the cause of non-fatal injuries (including serious
injuries). From 2001 to 2005 on average, 1,636 fatalities occurred annually, with an
average of 429 intersection fatalities. This means that approximately 26 percent of all
annual fatalities on Georgia roads occurred at an intersection. Figure 2.2 shows highway
fatalities and intersection fatalities for the five-year period. (1)
Figure 2.2 - Total Crash Fatalities & Intersection Crash Fatalities in Georgia (2001-2005) (1)
National Statistics Intersection crashes represent a disproportionate share of the national road safety
challenge, consisting of approximately 50 percent of all crashes nationally (see table 2.1).
(1) Fatal intersection crashes account for approximately 23 percent of all fatal crashes in
the U.S. (8) Table 2.2 shows how Georgia’s fatal intersection crashes compare to the
Year
0
200
400
600
800
1,000
1,200
1,400
1,600
1,800
2,000
2001 2002 2003 2004 2005
Num
ber o
f Fat
aliti
es
All Fatality Crashes
Intersection Fatality Crashes

9
national statistics. As shown, Georgia experiences a higher percentage of fatal crashes at
intersections than the national average.
Table 2.1 - Georgia Crashes & Intersection Crashes (1)
Year Total
Crashes Intersection
Crashes
Percentage of
Intersection Crashes
2000 310,122 149,737 48.3%
2001 317,851 152,281 47.9%
2002 327,710 154,071 47.0%
2003 332,321 156,062 47.0%
2004 342,639 159,793 46.6%
2005 346,207 161,754 46.7%
Table 2.2 - U.S. and Georgia Fatal Intersection Crashes (8)
Year
United States Georgia
Fatal Intersection
Crashes Fatal
Crashes
Fatal Crash
Percentage
Fatal Intersection
Crashes Fatal
Crashes
Fatal Crash
Percentage 2000 8,524 37,526 22.7% 402 1,380 29.1%
2001 8,541 37,862 22.6% 462 1,471 31.4%
2002 8,876 38,491 23.1% 352 1,362 25.8%
2003 8,808 38,477 22.9% 355 1,463 24.3%
2004 8,619 38,444 22.4% 365 1,463 24.9%

10
Type of Intersection Collision in Georgia
Figure 2.3 shows the percentages of intersection crashes by the type of collision.
Forty-one percent of intersection-related crashes are rear-end crashes and 36 percent are
angle crashes. It is also important to note that 11 percent of intersection crashes are not a
collision with a motor vehicle, but include such things as a car leaving the road, hitting a
utility pole, tree or another fixed object.
Figure 2.3 - Intersection Crashes by Type of Collision by Percentage (1)
Angle 36%
Rear End41%
Head On 2%
Side Swipe-Same Direction 8%
Side Swipe - Opposite Direction 2%
Not a Collision with aMotor Vehicle 11%

11
Figure 2.4 - Percentage of Fatal & Serious Injury Intersection Crashes by of Collision (1)
Figure 2.4 shows that fatal and serious injury intersection crashes show a different
distribution of collision types. Forty-six percent of intersection crashes resulting in a
fatality or serious injury are caused by a collision with an object instead of a motor
vehicle. These crashes are usually considered run-off-the-road crashes. Angle and read-
end crashes make up 28 percent and 11 percent, respectively of fatal or serious injury
intersection crashes; 10 percent of these crashes are head-on collisions. (1)
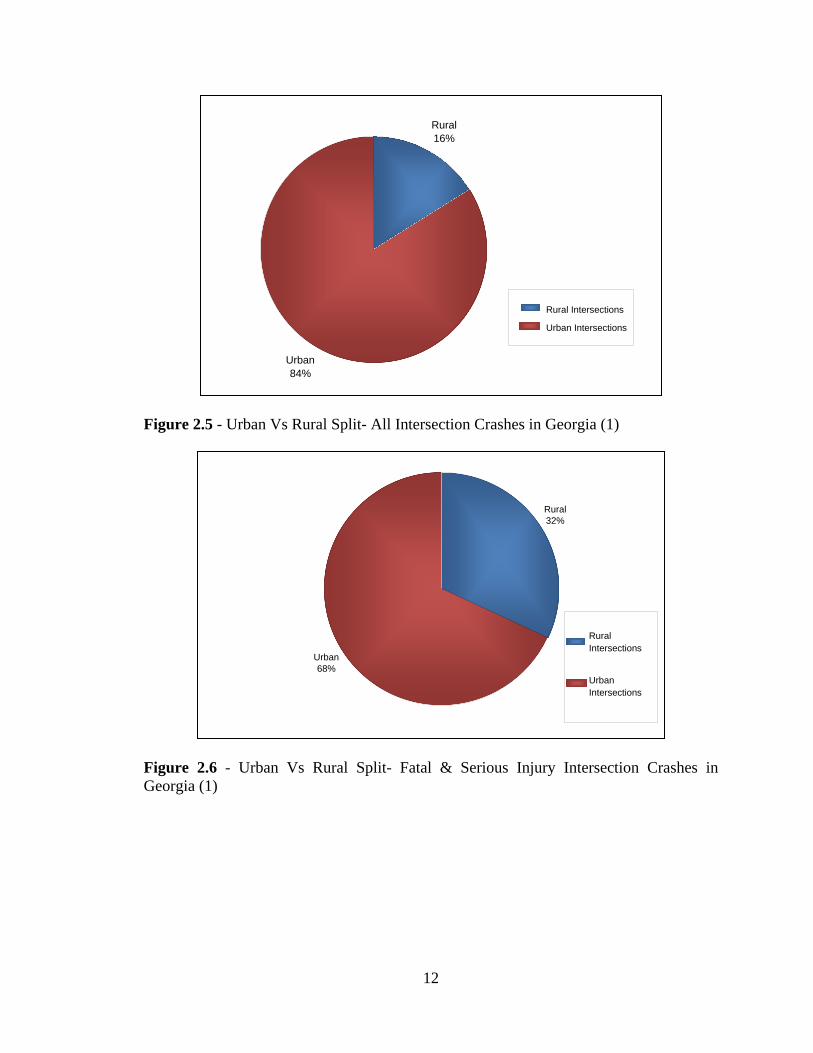
Eighty-four percent of intersection crashes occur on urban roads in Georgia (see
Figure 2.5). However, for intersection crashes that result in a fatality or serious injury, 68
percent occurred on urban roads and 32 percent occurred on rural roads (see Figure 2.6).
This suggests that in order to reduce fatalities and serious injuries, both urban and rural
intersection crashes must be reduced. This can be done if the locations of these
hazardous intersections are known and if the treatments implemented are actually
reducing overall crashes. Though fewer crashes are occurring on rural roads, a larger
Angle 28%
Rear End11%
Head On10%
Side Swipe-SameDirection 3%
Side Swipe - Opposite Direction 2%
Not a Collision with a
Motor Vehicle46%
12
Figure 2.5 - Urban Vs Rural Split- All Intersection Crashes in Georgia (1)
Figure 2.6 - Urban Vs Rural Split- Fatal & Serious Injury Intersection Crashes in Georgia (1)
Rural32%
Urban68%
Urban Intersections
Rural Intersections
Rural16%
Urban84%
Rural Intersections
Urban Intersections
13
percentage of those crashes are resulting in fatalities or serious injuries. Many rural routes
have un-signalized intersections and thus the objectives and strategies for improving un-
signalized intersection need to take this into account. (1) Based on the high frequency of
intersection crashes, however, this thesis will mostly focus on techniques to reduce
crashes and fatalities at signalized urban intersections.
Understanding the factors that most often contribute to intersection crashes allows
objectives and strategies to be identified that can reduce the occurrence of the crash
determining factors. Failure to yield was identified as a contributing factor in nearly 33
percent of all intersection crashes resulting in a fatality or serious injury. (1) Other factors
that contributed to these intersection crashes include the disregard of a signal, stop sign,
following too closely, and driving under the influence. Vehicle maneuvers most often
reported in intersection crashes have also been identified. Nearly 30 percent of fatal or
serious injury intersection crashes occur during a left turn maneuver. About 14 percent of
crashes occur when a vehicle is stopped. Other significant maneuvers with a lower crash
frequency include negotiating a curve and right hand turns. (1)
The intersection crash analysis for this thesis was conducted using the CARE
database with Georgia Department of Transportation (GDOT) crash data from 2000-
2005. The CARE program has important capabilities to filter almost any kind of crash
and export the crash data to a spreadsheet so that the data can be better analyzed. The
types of crash characteristics available from CARE include: high crash frequency
intersections, crashes by type, location, vehicle type, weather, road type, mile marker,
year, month, etc. In addition to providing data sets, the program has the ability to use X,
Y, and Z coordinates to pinpoint the exact location of the crash with detailed information

14
using Geographic Information System (GIS) programs such as ARCGIS. A sample map
is presented in figure A.1 in the appendix, which illustrates the mapping abilities. Also,
since the program has every crash record from previous years, it also has the capability of
plotting intersection crashes on an intersection crash diagram such as the one seen in the
appendix.
The CARE program is a very valuable tool, which is being used by Georgia
transportation agencies to help identify highly hazardous locations throughout the state.
The problem with these kinds of software, however, is that the crash data sets lag in time.
For example, the 2008 Georgia crash data set will not be available until mid-2009 to
2010. This is due to different crash reporting procedures and policies used by different
counties and jurisdictions. This thesis recommends a program by which crash data will
be able to be analyzed much faster through the means of technology improvements and
standardized data collection. Assuming a program such as the one being recommended is
put into effect, transportation officials will be able to analyze crash data in a timelier
manner and will be able to implement countermeasures that will hopefully reduce
crashes.

15
CHAPTER III – LITERATURE REVIEW
This chapter focuses on the strategies, plans, and legislation that have been
implemented across the United States and in other parts of the world to improve
intersection safety and crash reporting procedures.
National Agenda for Intersection Safety (10)
On November 14-16, 2001, the American Association of State Highway and
Transportation Officials (AASHTO), the Institute of Transportation Engineers (ITE), and
the Federal Highway Administration (FHWA) and other organizations sponsored a
National Safety Intersection Workshop. The goal of the workshop was to assemble a
group of experts ranging from engineers, emergency response organizations, and
academia to discuss best practices to improve intersection safety. The result from this
workshop was a National Agenda on Intersection Safety.
The workshop concluded with a national agenda that includes 11 categories of
possible strategies. These are: (10)
• Programmatic and legislative options
• Political support
• Safety management
• Research
• Traffic- and crash-record management systems
• Engineering
• Intersection safety audits
• Red light running
16
• Tools and best practices
• Outreach, Education and Training
• Marketing and Communications
The safety agenda describes the need to improve intersection safety. Among the 11
categories listed, the “Traffic and Crash-Record Systems” represented the fact that there
is currently a lack of accurate crash data, specifically in adequate coding, lack of
standardized formats and lack of information about the crash environment. The safety
agenda addressed the need for the implementation of a standardized crash reporting
system to better analyze hazardous crash locations. (10)
Safe, Accountable, Flexible, Efficient, Transportation Equity Act: A Legacy for Users (SAFETEA-LU) (5)
On August 10, 2005 President George W. Bush signed into law the SAFETEA-
LU. The purpose of this law was to guarantee funding for highways, highway safety, and
public transportation totaling $244.1 billion. (5) Traffic safety, reducing traffic
congestion, improving efficiency in freight movement, increasing intermodal
connectivity, and protecting the environment are some of the challenges this law is trying
to address.
The law is divided into seven sections, these: safety, equity, innovative finance,
congestion relief, mobility and productivity, efficiency, environmental stewardship, and
environmental streamlining. According to the Federal Highway Administration, the
safety section of the law is structured and funded to make significant progress in reducing
highway fatalities. (5) This plan will double the funds necessary for infrastructure safety
and strategic highway safety planning with a focus on “results”. In addition to focusing

17
on measurable results, the safety section also targets programs such as: work zone safety,
older drivers, pedestrians, and children walking to school. (5)
A Highway Safety Improvement Program (HSIP) is established as a core program
through the SAFETEA-LU. This program is separately funded and allows states to target
funds to their most critical safety needs, with $5.1 billion dollars being made available for
the 2006-2009 timeframe. The HSIP requires states to develop and implement a strategic
highway safety plan (SHSP) and submit annual reports to the Secretary of Transportation
that identify at least five percent of their most hazardous locations, and that describes
progress in implementing highway safety improvement projects, and their effectiveness
in reducing fatalities and injuries. (5)
AASHTO Strategic Highway Safety Plan (SHSP) Intersection Safety and Data Analysis Related Strategies (2)
In 1997, the AASHTO Board of Directors approved the creation of a Strategic
Highway Safety Plan (SHSP), and convened a meeting of national safety experts to create
the safety plan. The document was then updated seven years later in 2004. The purpose
of the plan is to “substantially reduce vehicle-related fatalities and injuries on the nation’s
highways.” This safety plan focused on 22 specific highway safety challenges or
emphasis areas, of which crash reporting and intersection safety will be focused. The
intersection safety section of the SHSP focuses on the following key items: (2)
• Improve safety using automated methods to monitor and enforce intersection
traffic control.
• Upgrade intersection controls that smooth traffic flow
• Utilize new technologies

18
• Include more effective access management policies with a safety perspective
ALABAMA SHSP - Intersection Safety and Data Analysis Related Strategies (11)
Alabama plans on using the CARE database for targeting specific counties and cities
to identify specific locations for the crash types of concern.
• According to the Alabama SHSP, evaluation, by its nature, must take place after
the countermeasure project is implemented. Two types of evaluations have to be
implemented in order to make sure a project such as a countermeasure is
successful. Administrative evaluations are conducted to assure project was
implemented at least to the specifications of the proposal. Effectiveness
evaluations can determine the impact that a countermeasure had on crash history
for the specific type of crash being treated. Preparation for evaluation is
important because typically one to three years of crash data must be accumulated
after project implementation. (11)
GEORGIA SHSP - Intersection Safety and Data Analysis Related Strategies (3) The following strategies are being considered, and in some cases already implemented, to
increase safety at intersections and improve crash reporting strategies: (3)
• Combined data system automation and linkages are addressed in the document
under the “Strategic Plan for Traffic Records Improvement.” Georgia has
identified a $7 million need for system improvements, and is scheduled to receive
$1,067,897 in NHTSA Section 408 grants.
• Georgia like Alabama is utilizing the CARE software to help identify hazardous
locations.

19
• The state will develop Georgia-specific Crash Reduction Factors (CRF), through
before and after crash benefit analysis.
• Crash Prioritization: Review and categorize crashes by crash types using four
dimensions: frequency of fatalities, comparison of total, percent change over
three years, current efforts in place to address the highway safety issue.
• Current Strategies: Top 150 report, local government /citizen inquiry, GDOT
Evaluations, LED Transition, 12” Signal Heads, Intersection Warning signals
• Future Opportunities: Choose appropriate intersection traffic control to minimize
crash frequency and severity; improve driver awareness of intersections as viewed
from intersection approach; improve driver compliance with traffic control
devices and traffic laws at intersections; reduce operating speeds on specific
intersection approaches; reduce frequency and severity of intersection conflicts
through traffic control and operational improvements, among others.
FLORIDA SHSP - Intersection Safety and Data Analysis Related Strategies (12)
Florida is planning to address intersection safety by focusing on three objectives:
1. Increase the safety of intersections for all users: (12)
• Strategies: Improve intersection infrastructure, signal equipment, signal
timing, and incorporate safety technologies such as pedestrian countdown
timers where needed.
2. Increase educational efforts concerning intersection behavior, design, and
engineering: (12)
• Strategies: Educating the public by reinforcing their driver education with
an emphasis on dangerous driving behaviors.

20
• Elder driver education
• Better educate engineering, design, and operations communities.
3. Strengthen traffic enforcement at intersections: (12)
• Strategies: Use of confirmation lights to improve signal enforcement;
enforce complete right turn on red, and increase speed enforcement at
intersections.
Florida is also trying to increase the number of law enforcement agencies using
TraCS, an electronic reporting tool that will be discussed in more detail in later sections
of this thesis.
Tennessee SHSP Intersection Safety and Data Analysis Related Strategies (13)
The Tennessee SHSP included the following intersection safety improvement strategies:
(13)
• Identify intersections that qualify for the Highway Safety Improvement Program
based on severity due to the number of fatal and serious injury crashes on the state
and local road systems.
• Implement cost effective intersection safety improvements that address project
specific fatal and serious crash data.
• Implement the latest designs and technology
• Increase enforcement at intersections
• Improve public awareness of compliance with traffic control devices.
Reporting Strategies: (13)
• Improve timeliness and accuracy of data collection, analysis processes, and
systems including the linkage of crash, roadway, driver, medical, Crash Outcome
21
Data Evaluation System (CODES), enforcement, conviction, homeland security
data, etc.
• Improve and expand the warehousing and accessibility of safety data. Expansion
will include additional data from local roads which is at this time limited.
• Continually update the data definitions in accordance with Model Minimum
Uniform Crash Criteria (MMUCC) and D-20.
• Maintain the Traffic Records Coordination Committee (TRCC) to include
representation from all stakeholders with a need for traffic safety information.
• Expand implementation of Traffic and Criminal Software (TraCS) and other
systems for the collection of data.
• Expand the local agencies’ role and resources to improve safety.
• Provide training on data analysis, updating, definitions, importance, and uses to
State and local personnel.
• Provide web access to the media and public on key data and analyses.
• Improve the exchange of information with the media.
• Independently verify the validity of the data.
• Continue to implement Road Safety Audit Reviews (RSARs) as a means of
identifying areas for safety improvements.
South Carolina SHSP Intersection Safety and Data Analysis Related Strategies (14)
South Carolina coined their SHSP “The Road Map to Safety.” Intersection
crashes account for 18 percent of South Carolina’s crashes. The following are the
objectives which the state is using to improve intersection safety: (14)

22
• Reduce the number of intersection traffic crashes, related traffic injuries and
fatalities reported on South Carolina’s roads and highways
• Improve the management and access near un-signalized intersections
• Reduce the frequency and severity of intersection conflicts through geometric
design improvements
• Improve sight distance at un-signalized intersections
• Improve the availability of gaps in traffic and assist drivers in judging gap sizes
at un-signalized intersections
• Improve driver awareness of intersections as viewed from the intersection
approach
• Choose appropriate intersection traffic control to minimize crash frequency and
severity
• Reduce operating speeds on specific intersection approaches
• Guide motorists more effectively through complex intersections
• Improve driver awareness of intersections and signal controls
• Improve driver compliance with traffic control devices
• Improve access management near signalized intersections
• Improve safety through other infrastructure treatments
Data Collection Strategies: South Carolina addresses the importance of accurately
capturing data; however, they also realize that much of their data does not interface
properly among agencies. The state lists these following objectives as part of their plan
to improve data collection: (14)

23
• Focus attention on partnering opportunities and sharing of available data among
agencies and jurisdictions
• Implement an automated traffic collision data system linked to road inventory
data that will reduce data collection time and improve the accuracy of collision
location reporting
• Implement new approaches, statistical methods, and tools as necessary to identify
locations of promise for safety improvements and to prioritize projects for safety
improvements.
Like Florida, South Carolina created “Emphasis Area Strategies” for its SHSP known
as the four “E’s”-- Education, Engineering, Enforcement, and Emergency Management
Services (EMS).
Texas SHSP Intersection Safety and Data Analysis Related Strategies (15)
According to this report, intersection crashes in Texas account for 22.5 percent of
fatalities and 45.5 percent of injuries annually. The state has a goal of reducing
intersection crashes 10 percent in 2010 compared to the amount of crashes that occurred
in 2005.
The Texas intersection safety improvement strategies consist of: (15)
• Implement engineering solutions to reduce red-light running, such as changes in
signal timing.
• More strictly regulate the number and placement of driveways.
• Eliminate more blind spots on high-speed rural roads.
• Add more turn bays and acceleration lanes on high-speed rural roads.
• Enhance advanced warning at intersections.
24
• Improve signal coordination and timing to control speeds through intersections.
• Expand the use of red-light cameras by municipalities.
• Educate consultants and developers on driveway regulation.
• Add information on gap acceptance and intersection crash frequency to a
standardized driver education curriculum.
• Encourage the use of EMS signal preemption.
Texas has also implemented a program known as “The four E’s of traffic safety.”
The plan is to improve: enforcement, public education, engineering, and emergency
medical services. Crash reporting strategies were not addressed in the report.
California SHSP Intersection Safety and Data Analysis Related Strategies (16)
The State of California recognizes intersections as one of the major areas of
concern that need to be addressed. According to the California SHSP, the following
intersection safety improvement strategies will be implemented: (16)
• Improve land use planning regarding impacts to intersections.
• Educate the public on intersection safety and the rules of the road.
• Increase enforcement at and near intersections.
• Improve the visibility of and at intersections (illumination, marking and advanced
warning).
• Improve the design of traffic control devices.
• Enhance the safety of rail-highway intersections.
• Improve roadway design at intersections.
• Reduce high risk rural road collisions.
• Apply advanced technology to reduce collisions.
25
• Improve design and operation of freeway interchanges.
This report states that quality incident and crash data has to be collected in a
uniform and consistent form statewide in order to have an effective traffic safety
program. The state recognizes that, in many cases, the data they collect with regard
to crashes is not easily understood due to compatibility issues between agencies. The
state lists the following strategies to improve crash data collection: (16)
• Improve the quality, completeness, and uniformity of data collection practices.
• Improve data sharing among State, federal, and local agencies and stakeholders.
• Improve accessibility to real-time information by California roadway users.
• Enhance accessibility of traffic safety data.
• Improve data collection and analysis regarding trip characteristics of all roadway
users, level of service, injuries, and fatalities on California road ways.
• Coordinate traffic safety information system improvements through the State
Traffic Records Coordinating Committee.
New York SHSP Intersection Safety and Data Analysis Related Strategies (17)
Intersection crashes account for over 25 percent of all highway fatalities in New
York State. The state has already created safety programs to target locations with high
crash frequencies. New York is trying to reach an objective of reducing the number of
fatal and injury crashes from 77, 161 in 2005 to 76,390 in 2007. In order to reach this
objective and reduce future intersection crashes, the state is planning on using the
following strategies: (17)
• Pursue installation of automated photo enforcement equipment – pilot with
enforcement

26
• Prohibit right turn on red
• Address specific localized intersection performance problems
• Install intersection advance warning signs
• Improve geometry of left turn lanes, protected left turn lanes, and signal phasing
• Reconstruct intersections to roundabouts
• Improve Access Management – reduce access conflicts
• Signal timing improvements – installation of improved Traffic Controllers
• Pursue targeted enforcement
• Install “No Turn on Red” signals at pedestrian crossings when pedestrian button is
activated
• Increase use of Leading Pedestrian Interval – increase “all red” times
• Incorporate National Cooperative Highway Research Program Report 500
Guidance into practice
New York State has used a NYSDOT Safety Information Management System to
analyze its 16,000 miles of state highway. However, the SAFETEA-LU requires data for
every type of road not only state-maintained roads in order to address safety
improvements. (5) The state plans to improve analysis tools, while ensuring that they
conduct a baseline analysis of available data and compatibility of data elements between
local and state systems.
ReportBeam Electronic Reporting (18)
ReportBeam is an electronic reporting tool that automates a traffic crash reporting
system. This system is currently being used by enforcement agencies in 25 states,
including agencies in Georgia. The benefit to this system is that it automates police forms

27
such as a crash reports, and allows all entries to be made by computer, therefore allowing
faster and more accurate reporting. (18) This system is not limited to crash reports; it can
automate any form requested. This system includes the SmartRoads diagramming and
live reporting data, which provides data to individual police departments about high crash
areas and Geographic Information System (GIS)-based crash locations. The Union City
Police Department in Union City, GA, adopted the system in July 2005. (18) This system
has greatly improved their reporting capabilities. According to the department, the
intuitive system allowed officers to use the system with less than 5 hours of training.
Union City assistant police chief, Chuck Odom, stated that it dramatically increased their
reporting numbers.
Mississippi, Wyoming, West Virginia, The Virgin Islands, and Virginia have
awarded contracts to the company Visual Statement to use the ReportBeam software
statewide. Every police enforcement agency in these states and territory will be able to
report crashes in a standard format throughout the state. ReportBeam reporting is one
example of how automated reporting will eventually become mainstream nationwide.
(18)
Traffic and Criminal Software (TRACS) (19)
The Federal Highway Administration (FHWA) chose Iowa in 1996 as a partner to
create the National Model for the Statewide Application of Data Collection and
Management Technology to Improve Highway Safety. The plan was to create an
information management system for the Iowa and share the results with other states. (19)
TraCS is a data collection and reporting tool for the public safety agencies to
simplify and automate the capture of incident data in the field and transfer the data from
28
the local agency to a statewide data collection system. Iowa’s TraCS package includes a
component for crash reporting, citation writing, warning ticket, driving while intoxicated
reporting, commercial motor vehicle inspections, field investigative reports, National
Incident Based Reporting System (NIBRS) compliant incident reporting, criminal
affidavit and complaint forms, and time and activity reports. (19)
The benefit to using TraCS is that it allows data to be captured at the site of the
crash or incident. This improves accuracy, completeness, and timeliness of incident data
and eliminates the need for duplicate entry into local and state databases. In addition to
better reporting capabilities it can achieve its objectives using less administrative staff
time than the more traditional manual approach. TraCS can provide law enforcement
administrators almost immediate information at a local and state level. (19)
This is another example of a program that is currently being used that will allow
improvements to crash and incident reporting. According to the TraCS website, the
program is licensed to one agency per state or province, which is usually the state DOT,
Department of Motor Vehicles (DMV) or the Department of Public Safety (DPS). This
agency then distributes the application to the other interested entities. Cobb County has
implemented this crash reporting technology. According to the GDOT Safety Program
Manager, the data furnished through the TraCS program is very reliable and accurate. (6)
FHWA White Paper: Safety and Asset Management (20)
This paper was published by the FHWA and is found in its website under asset
management. The paper starts with a quote from the US Secretary of Transportation,
Mary Peters, “If I had one additional dollar to spend on the transportation system how
would I spend it?” Asset management is a decision making structure for allocating funds

29
to different agencies in order to fund projects. (20) This white paper states that “Asset
management is concerned with the entire life cycle of transportation decisions, including
planning, programming, construction, maintenance, and operations.” In order to improve
transportation safety through asset management the FHWA recommends a goal which is
governed by AASHTO’s SHSP. The plan consists of the four “E’s”, engineering,
education, enforcement, and emergency response, which is illustrated in Figure 3.1.
Through these investments in safety, the FHWA, USDOT, and AASHTO plan to reduce
overall crashes, fatalities and injuries nationwide by forcing individual states to improve
their current safety policies with regard transportation safety. (20)
Conventional Vs LED Traffic Signals – Arkansas Department of Economic Development (21)
In 2002, the Arkansas Department of Economic Development awarded a $10,000
grant to the City of Little Rock to study the pros and cons of LED traffic signals. The
findings of this study concluded that LED signals are less expensive to operate than
conventional incandescent signals; approximately $35 dollars monthly can be saved
because of the low energy consumption used by these signals. The LED signals proved
to be brighter, they can be run on battery power, and the low power draw prolongs the
life of the intersection wiring. The City of Little Rock was so pleased with the results of
the study that they retrofitted every signal in the city. (21)
LED Signal Case Study: City of Philadelphia (22)
Philadelphia, similar to Little Rock, tried a LED signal pilot program to test the
feasibility of this technology. The Philadelphia Energy Office and Streets Department
began a two-year $3 million program in 1997 to replace 28,000 traffic signal lights with

30
LED lamps. It is estimated that the annual savings in energy and maintenance will be
more than one million dollars.
Figure 3.1 – Strategic Resource Allocation Process for Safety (20)

31
CHAPTER IV: PROPOSED INTERSECTION SAFETY PLAN This chapter focuses on the methods that Georgia transportation officials can use
to improve intersection safety throughout the state. This chapter is organized in five
sections:
• State Highway Safety Plan (SHSP) Intersection Analysis (8 State Comparison)
• Standardized Hazardous Intersection Determination Method
• Public Involvement Taskforce
• Police Mobile Data Terminals (MDT)
• Statewide Minimal Intersection Safety Equipment
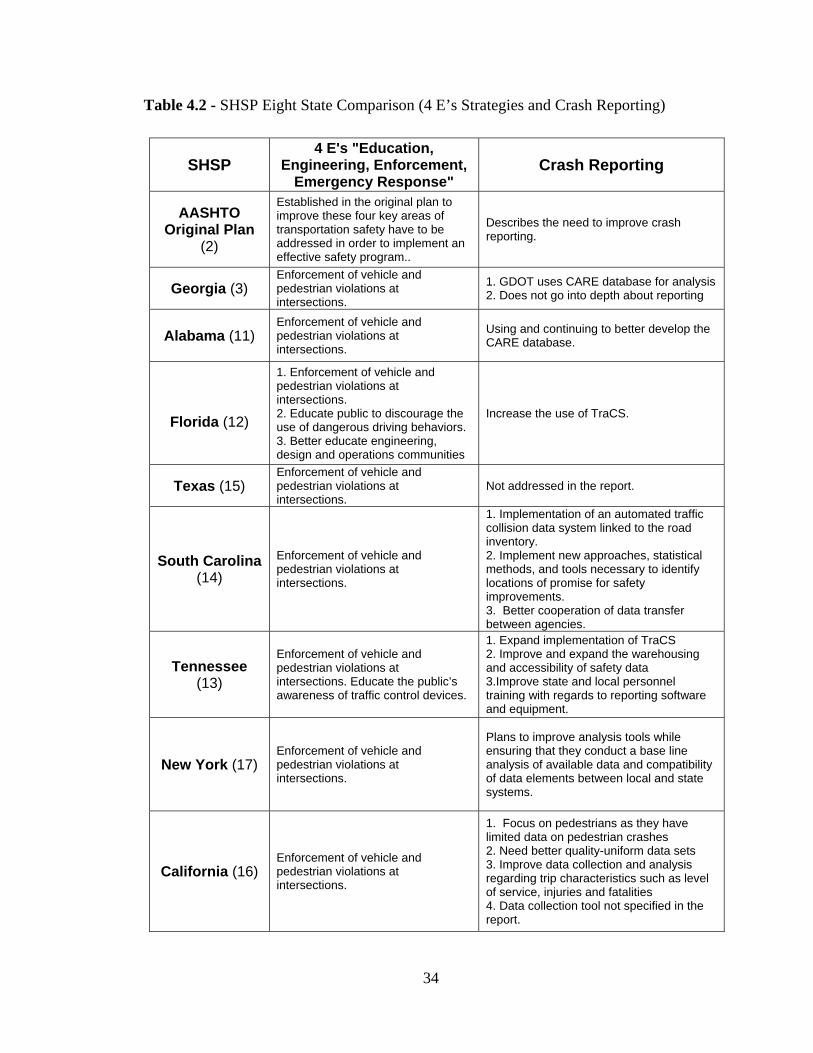
SHSP Comparison
In 1997, the AASHTO Board of Directors approved the creation of a Strategic
Highway Safety Plan, and convened a meeting of national safety experts to create the
safety plan. The document was then updated seven years later in 2004. The purpose of
the plan is to “substantially reduce vehicle-related fatalities and injuries on the nation’s
highways.” This safety plan focuses on 22 specific highway safety challenges or
emphasis areas. Intersection safety will be the focus of this thesis. (2)
This section outlines AASHTO’s plan and analyzes the intersection and reporting
plan implemented by eight individual states. The states in this analysis were chosen
based on proximity to Georgia, and the states with the largest transportation
infrastructure. The states included: Georgia, Florida, Alabama, Tennessee, South
Carolina, Texas, California, and New York. The best way to quantify the data for all
these states and the AASHTO plan was to create a matrix structure. Tables 4.1 and 4.2

32
describe what each state is planning to do to improve data reporting and intersection
safety. Some of the newest crash reduction and crash reporting technologies are being
implemented by different states. Georgia could benefit by conducting studies on the
performance measures that the individual states are using to quantify how well these new
technologies work.
Each of the eight states studied followed the guidelines of AASHTO’s master
Strategic Highway Safety Plan. Naturally each state was free to take different approaches
toward reducing fatalities and improving safety statewide. In each of the eight cases,
intersection crashes were addressed as one of the locations where most of the crashes for
the state occurred. The “4 E’s” solution, which came up in all of the reports, included
increased police enforcement at intersections in order to ensure that driving behavior is
modified. In addition, each state recommended the use of new technology to improve
traffic and vehicle operations.

33
Table 4.1 – SHSP Eight State Comparison (State Goals and Intersection Safety)
SHSP Crash Reduction
Goal Intersection Functional and Safety
Equipment Improvements
AASHTO Original Plan (2)
Reduce Nations highway fatalities to 1 fatality per 100 million vehicle miles traveled.
Specifies minimum requirements for improving intersection safety.
Georgia (3)
1 fatality per 100 million vehicle miles traveled by 2010.
1. LED transition 2. Better improve selection of traffic control devices 3. Reduce operating speeds on certain intersection approaches
Alabama (11)
Decrease fatal mileage rate from 1.8 to 1.5 per million vehicle miles traveled.
Improvement of administrative and effectiveness evaluations. This will allow for better countermeasure Implementation.
Florida (12)
5% annual reduction in the rate of fatalities and serious injuries beginning in 2007.
Improve intersection infrastructure, signal equipment, signal timing, and incorporation of safety technologies such as pedestrian countdown timers.
Texas (15)
10% crash reduction in 2010 compared to 2005
1. Implement engineering solution to stop reduce red light running, such as changes in signal timing. 2. Better regulation on the placement of driveways. 3. Eliminate more blind spots on high speed rural roads 4. Enhance advance warning at intersections 5. Expand use of red-light running cameras 6. Improve signal coordination and timing to better control speeds between intersections.
South Carolina (14)
25% reduction from the baseline year of 2004
1. Choose appropriate intersection traffic control to minimize crash frequency and severity 2. Reduce speeds on intersection approaches 3. Improve access management near signalized and non-signalized intersections
Tennessee (13)
Reduce fatality rate by 10 percent by the Fiscal Year 2008-2009
1. Identify hazardous intersection 2. Implement better safety technologies at intersections 3. Increase awareness of traffic control devices
New York (17)
Reduce motor vehicle fatalities from 1410 in 2005 to 1285 in 2011. And to reduce fatal crash rate per 100 million vehicle miles traveled (VMT) from 1.00 to .9 in 2011.
1. Pursue photo enforcement, such as red light running cameras 2. Advance warning signs 3. Signal timing improvements 4. Prohibit right on red 5. Implement Leading Pedestrian interval
California (16)
Less than 1 roadway fatality per 100 million vehicle miles traveled (VMT)
1. Improve illumination, marking and advanced warning. 2. Improve design of traffic control devices 3. Better technologies at intersection. 4. Increase # of pedestrian signals, median refuges, better pedestrian lighting
34
Table 4.2 - SHSP Eight State Comparison (4 E’s Strategies and Crash Reporting)
SHSP 4 E's "Education,
Engineering, Enforcement, Emergency Response"
Crash Reporting
AASHTO Original Plan
(2)
Established in the original plan to improve these four key areas of transportation safety have to be addressed in order to implement an effective safety program..
Describes the need to improve crash reporting.
Georgia (3) Enforcement of vehicle and pedestrian violations at intersections.
1. GDOT uses CARE database for analysis 2. Does not go into depth about reporting
Alabama (11) Enforcement of vehicle and pedestrian violations at intersections.
Using and continuing to better develop the CARE database.
Florida (12)
1. Enforcement of vehicle and pedestrian violations at intersections. 2. Educate public to discourage the use of dangerous driving behaviors. 3. Better educate engineering, design and operations communities
Increase the use of TraCS.
Texas (15) Enforcement of vehicle and pedestrian violations at intersections.
Not addressed in the report.
South Carolina (14)
Enforcement of vehicle and pedestrian violations at intersections.
1. Implementation of an automated traffic collision data system linked to the road inventory. 2. Implement new approaches, statistical methods, and tools necessary to identify locations of promise for safety improvements. 3. Better cooperation of data transfer between agencies.
Tennessee (13)
Enforcement of vehicle and pedestrian violations at intersections. Educate the public’s awareness of traffic control devices.
1. Expand implementation of TraCS 2. Improve and expand the warehousing and accessibility of safety data 3.Improve state and local personnel training with regards to reporting software and equipment.
New York (17) Enforcement of vehicle and pedestrian violations at intersections.
Plans to improve analysis tools while ensuring that they conduct a base line analysis of available data and compatibility of data elements between local and state systems.
California (16) Enforcement of vehicle and pedestrian violations at intersections.
1. Focus on pedestrians as they have limited data on pedestrian crashes 2. Need better quality-uniform data sets 3. Improve data collection and analysis regarding trip characteristics such as level of service, injuries and fatalities 4. Data collection tool not specified in the report.

35
With regard to reporting technologies, most of the states mentioned the need for
improvements in their crash reporting technologies. The general consensus was that
better, uniform, standardized, and electronic crash and incident reporting is essential to
understanding ways to improve safety. TraCS is being used by Florida and Tennessee
and both states are trying to incorporate this technology statewide to all enforcement
jurisdictions. (12,13) Georgia along with Alabama is using the CARE database for
analysis purposes, but no statewide reporting procedure was recommended in the SHSP
for the respective states.
An analysis of the intersection strategies presented by each one of the states
indicated that the descriptions of these strategies were somewhat vague. States
recommended strategies and assumed that, if implemented, would be effective.
However, the states did not specify in detail how each strategy could be implemented
statewide. Individual state SHSP’s submitted in the future should be required to analyze
their potential improvement strategies better and quantify how each one of these
improvements will be implemented throughout each state.
Standardized Hazardous Intersection Determination Method
Analyzing how safe or dangerous an intersection is can be a difficult task based
on the fact that there are many factors that have to be taken into account. Some states use
severity indexes as a safety or danger threshold. Other states focus on crash rates,
fatalities, severe injuries, frequency of crashes, types of accidents, direction of collision,
and AADT, among others. The problem is how to ensure that all intersections are
measured with the same baseline or threshold. The Manual on Uniform Traffic Control
Devices (MUTCD) is the standard for signs, signals, and pavement markings in the

36
United States. The Highway Capacity Manual (HCM) contains concepts, guidelines, and
computational procedures for calculating the capacity and level of service for highway
facilities. The Traffic Engineering Handbook contains a couple sections with regard to
safety and intersection severity or hazard classification, yet there is no standard
nationwide or statewide method. The Transportation Research Board (TRB), the
National Cooperative Highway Research Program (NCHRP), and other entities are
creating a Highway Safety Manual (HSM), which is scheduled to be available summer of
2009. (23) Some kind of intersection safety methodology will be proposed, but it will not
be published for another year, and the exact contents are not yet known.
Intersection crash severity index, crash rates, analysis of pedestrian fatalities and
injuries at intersections, manner of collision, and traffic volumes at the intersection being
studied will likely be the main data used to rank intersection safety and improvement
priority. A severity index takes into account three types of crashes: fatal crashes, injury
crashes, and property damage-only (PDO) crashes. Each of these crash types are
weighted differently, and based on the results the level of hazard for the intersection can
be established. The intersection safety plan proposed in this thesis is based on the
medical concept of triage. The intersections with the highest severity indexes and the
ones that pose the greatest safety threats will be prioritized so that safety will be
enhanced at these intersections first. SAFETEA-LU has really put traffic safety in the
forefront in that it requires individual states to focus on safety in order to receive funding
through the HSIP.
37
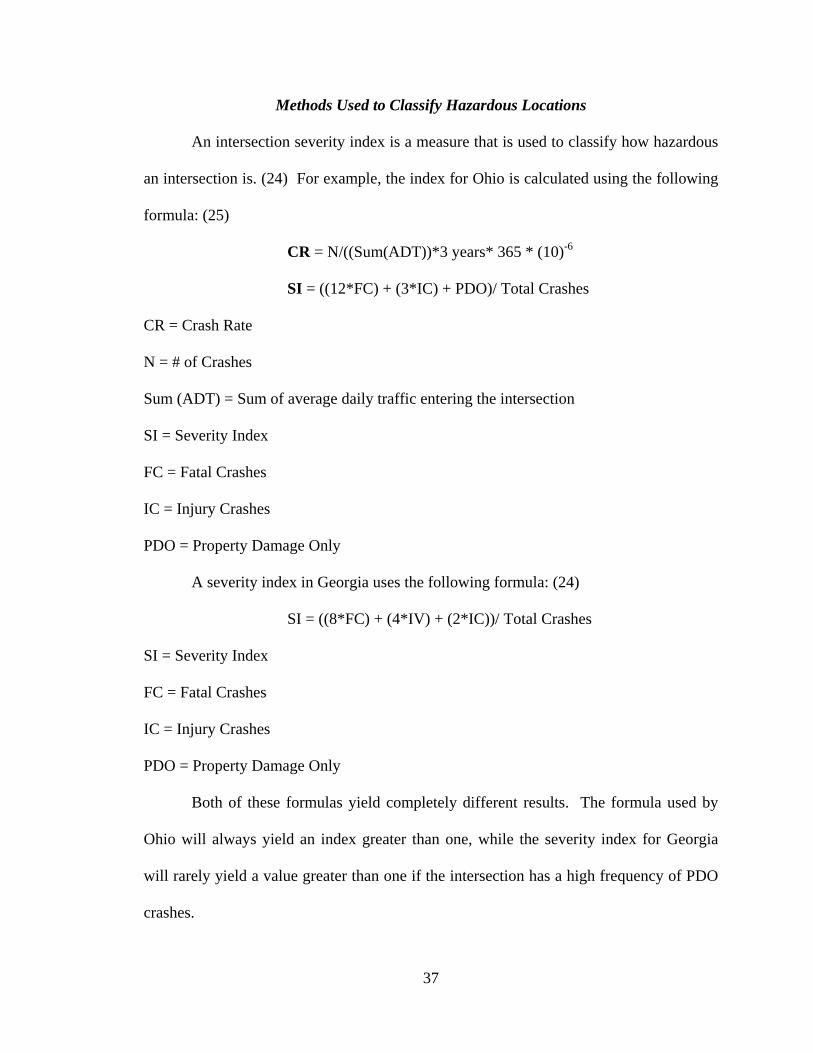
Methods Used to Classify Hazardous Locations
An intersection severity index is a measure that is used to classify how hazardous
an intersection is. (24) For example, the index for Ohio is calculated using the following
formula: (25)
CR = N/((Sum(ADT))*3 years* 365 * (10)-6
SI = ((12*FC) + (3*IC) + PDO)/ Total Crashes
CR = Crash Rate
N = # of Crashes
Sum (ADT) = Sum of average daily traffic entering the intersection
SI = Severity Index
FC = Fatal Crashes
IC = Injury Crashes
PDO = Property Damage Only
A severity index in Georgia uses the following formula: (24)
SI = ((8*FC) + (4*IV) + (2*IC))/ Total Crashes
SI = Severity Index
FC = Fatal Crashes
IC = Injury Crashes
PDO = Property Damage Only
Both of these formulas yield completely different results. The formula used by
Ohio will always yield an index greater than one, while the severity index for Georgia
will rarely yield a value greater than one if the intersection has a high frequency of PDO
crashes.
38
The severity index method weighs the different types of crashes differently. In
the case of the Ohio method, fatal crashes are multiplied by a factor of 12 which means
that they have the heaviest weight of the different crash types. Injury crashes are
multiplied by a factor of 3 and PDO crashes are not weighed any differently. Fatalities
and injuries are the determining factor for severity indexes. Basically an intersection
with a frequency of only PDO crashes will have a severity index of 1, which is the lowest
and safest index for an intersection in the Ohio method.
Since there are many different methods of calculating severity indexes, there
should be one method, at least at a state level, to ensure that the funds allotted to
intersection improvements on state routes are distributed equally among counties. It is
unknown what methods DOT district offices use in Georgia to classify severity indexes;
however if a statewide approach is implemented, it will make the process less ambiguous.
Severity indexes cannot be used alone as the “determining factor” for classifying
intersection safety. The amount of traffic on a given intersection has to be taken into
account also. Average annual daily traffic (AADT) is defined as the average 24-hour
volume at a given location over a full 365-day year; the number of vehicles passing a site
in a year divided by 365 days (366 in a leap year). (26) AADT has to be taken into
account because intersections with extremely high traffic volumes will usually have the
highest frequency of traffic crashes. Low volume intersections with high fatality or
accident rates will probably have higher severity indexes, so there has to be a balance to
ensure that intersection hazard is balanced properly. The HSIP requires States to
develop and implement a strategic highway safety plan (SHSP) and submit annual Five
Percent Reports to the federal government. Many steps are being undertaken to improve
39
the safety of the roadway system users. The Federal Government has established
programs which will push local governments to become better and safer. The Highway
Safety Manual (HSM) scheduled to be published and distributed in 2009 will hopefully
set new standards which will enable states to create standard safety analysis procedures.
(23)
Public Involvement Taskforce
Public involvement is the third component of this safety plan. The plan is to
empower the general public to voice their concerns regarding the safety of roadway
systems and provide information with regard to locations which they feel are potentially
dangerous. The Virginia Department of Transportation (VDOT) and the California
Department of Transportation have such a system in effect. For example, motorists in
Virginia can call the VDOT Highway Helpline or submit an electronic request to fix a
potentially hazardous condition on a state-maintained road. (27) A Virginia DOT web
based reporting page can be seen in appendix figure A.4, and similar web based reporting
through the California DOT can be seen in the appendix figures A.5 and A.6.
Georgia currently has the 511 call center maintained by GDOT, through the
Georgia Navigator in the Traffic Management Center (TMC) in Atlanta, Georgia. This is
a state of the art system that currently monitors traffic throughout the Atlanta and Macon
metropolitan areas. To better understand methods which Georgia is implementing to
report deficiencies at intersections a phone interview was conducted with a Georgia 511
media relations specialist at the TMC. (28) The specialist said that the TMC can receive
maintenance requests from anywhere in the state and that they will route maintenance to
that area if it is a state maintained route. If the request is not on a state route or not

40
maintained by GDOT, the caller will be transferred to or given information regarding
whom to contact in that respective county. The specialist also said that if it is an
intersection signal issue, such as a burned out signal light, 911 is usually notified before
511. 511 is a highly publicized traffic information system throughout the state of
Georgia; however, it is not widely publicized that maintenance or safety concerns can
also be reported through this service. The state could benefit by increasing 511’s
manpower and implementing a better safety reporting system which is widely publicized.
It has to be understood that not every request made will be addressed because the
state lacks the resources to do so. However, locations with a high frequency of requests
should be analyzed and evaluated accordingly. The plan is to create one main call center
that receives all calls. This main call center in turn can route calls to specialists that
manage county level call centers. Given the fact that the state of Georgia has 159
counties (29), it will be an extensive program. In essence this new reporting system will
handle two kinds of complaints: roadway repair and geometric design.
Roadway repair shall include, but not be limited to, pothole repair, damage to
crash attenuation devices, traffic signal malfunction, roadway illumination, road-side
abandoned vehicles, etc... This system will provide county maintenance crews better
information for repairing systems which they may or may not know need repair. Road
design will include but will not be limited to recommendations filed by the public with
regards to faulty design, dangerous intersections, or concerns they might have with
regards to the routes they travel.
This system would function through the existing 511 Americas Traveler
Information Telephone Number, also known as the Georgia DOT Navigator *DOT phone

41
number. There will be one statewide number which will route callers to their designated
county. In addition to a call center, internet-based reporting should also be implemented
so that roadway users are given more opportunities to report problems. This system will
require a structure such as the one seen in figure 4.1, which consists of four departments:
• Main Call Center
• County Call Center
• Roadway Maintenance
• Engineering Safety
This system will function based on call frequency and on the types of requests being
received. Phone calls which focus on damage to the roadway or roadway devices will be
analyzed and routed to the road maintenance department for the respective county or to
the designated DOT district if it is a state road.
Figure 4.1 – Public Involvement Call center Flow Chart
If a location receives numerous complaints with respect to safety, an engineering
team will study this location and determine whether there is a need to add a safety
treatment or possibly improve the design of the location. Historical crash trends at this
location will be analyzed, evaluated, and based on the findings appropriate actions will be

42
implemented. A caveat to this system is that the engineering safety division will only
function as a recommendation-based program to improve the road way system. Allowing
a recommendation-based program will lessen the GDOT liability as callers are being
allowed to voice their opinions knowing that their request may not necessarily be
implemented.
The general public should be allowed to voice their opinions about repairs or
locations that they deem unsafe or that need repair. Accidents in which property damage
such as guard rails and signage are damaged will be top priority fixes from maintenance
crews so that they can keep roadway users safe. This plan will facilitate not only
intersection improvements, but all the areas of the roadway system.
Automated Police Crash Reporting Through Improved Technologies In order for transportation safety improvements to be made, data has to be
collected efficiently and in a timely manner. Every county in Georgia is required to
submit every police crash report filed to the GDOT in order to be archived and input into
a statewide database. Due to the fact that some counties still file hand-written crash
reports, the statewide crash data collection process is often delayed in that these have to
be converted into proper data types. (6) The National Agenda for Intersection Safety
recommends improved crash reporting techniques and technologies in order to improve
the safety analysis process. (10) Crash countermeasures cannot be implemented without
properly knowing the causes of the crashes, and waiting up to a year to acquire crash data
for analysis is undesirable. The goal of this section is to identify the benefits associated
with automated crash reporting and recommend possible methods that can be used to
fund these kinds of technologies.
43
Some counties in Georgia have the latest crash data collection technologies in
their police, fire, and other emergency reponse departments, while other counties trail far
behind. These technologies include the latest police vehicles equipped with Wi-Fi
mobile data terminals (MDT), global positioning systems (GPS), and automated reporting
software such as TraCS and ReportBeam. These technologies allow for up-to-date
reporting with standard formats that can easily be uploaded into DOT databases.
Georgia’s safety plan is to mandate that every county equip its safety departments with
minimal reporting equipment or hardware, and to to use one standard type of reporting
system that can submit data electronically directly from a crash site. Funding for these
programs will be distributed through performance grants such as a program used by the
Illinois DOT. (30)
The most common technology application in police, fire, and emergency service
departments has been that implemented in patrol vehicles. These improvements include
better communication systems that enable them to access and transmit information
rapidly via internet Wi-Fi technology. (31) If police departments statewide are mandated
to implement a standard reporting system, this will allow every crash report to be
submitted in the same format. An MDT can be equated to a laptop computer that can be
docked into an emergency response vehicle. The purpose of MDT’s is to provide police
and emergency response agencies with the ability to transfer and receive information via
a secure internet connection while in their vehicle. (31) This allows police to be better
informed and to transmit data back to a central system. In the near future, all of
Georgia’s crash reports could be filed through these kinds of technologies assuming that
these MDT’s are equipped with GIS based software that allows the police officer or the
44
person filing the report to pinpoint the exact location of the crash through a GPS
receiver/transmitter or a map-based program.
One of the difficulties with GPS units is that they are usually mounted to the
police vehicle, which after the vehicles involved in the crash have been removed from the
flow of traffic, a police report will indicate the crash site as being a nearby area such as
the closest parking lot. If the GPS location for the crash is established in the nearby
parking lot, the crash location can be off by hundreds of feet. This approach has to be
improved, and this is why map-based identification might work better. The police officer
or person filing the report can identify the location via a map-based software program and
input the coordinates for the crash into the crash report. For this to work, the mobile data
terminal would have to have this capabilty. (6) Either method, if done properly, will
obtain very good data with regard to crash location. If the response vehicle submitting
the report is not equipped with an MDT, the hand-written crash report can be taken back
to the respective precinct where it can be input into an automated crash reporting
software program.
Now that the basic procedure for automated reporting has been established, a
software program has to be chosen to manage the system. Two of the most widely used
automated reporting software systems are:
• Traffic and Criminal Software (TraCS)
• ReportBeam
Currently, both systems are used in Georgia. Cobb County has started using the
TraCS (6) and the Union City Police Department has started using ReportBeam. (18)
TraCS was developed through a partnership between the State of Iowa and the FHWA.
45
The purpose of TraCS was to create a national model for automated law enforcement
reporting. (19) These technologies are widely available, and are oftentimes subsidized by
grants and federal safety programs. Local match funding, however, is a major barrier that
many counties and agencies are facing when trying to implement these kinds of
programs.
The Illinois Department of Transportation developed a plan to persuade agencies
to increase their use of electronic reporting through an Electronic Crash Reports Incentive
Grant (MCR-XML). (30) The grant reimburses agencies for implementing automated
crash reporting systems, based on performance. Basically, an agency has to show a
certain reporting improvement milestone in order to get reimbursed. This is an effective
method to fund projects because it actually forces individual agencies to improve
continually this technology and maximize its efficiency.
Rapid acquisition of crash data is the key to early identification of high crash
locations throughout Georgia. Several agencies in Georgia have begun to implement
better crash reporting systems into their programs, but this movement has not occurred
statewide. Of Georgia’s 159 counties there are many who may not see the benefit to
automated crash reporting since their county has very little vehicle traffic and relatively
few high crash locations. For such a situation, the Georgia Legislature and state
transportation officials have to develop incentives to persuade counties to implement
these data collection systems.

46
Intersection Crash Reduction Treatments
12” Light Emitting Diode (LED) Traffic Signals
There are many intersections in Georgia that use 8” incandescent bulb (balls)
traffic signals to display a three color vehicular traffic phase. Many counties and cities
throughout the United States have begun retrofitting existing traffic signals with bigger
12”, brighter, more reliable, and lower energy consuming LED light balls. The biggest
safety improvement that these balls provide is reliability. LED’s have been said to last as
long as 100,000 hours of operation, and some manufacturers guarantee up to 15 years of
operation. (4) Traditional incandescent balls fail repeatedly because they operate using a
single filament and fail constantly due repeated exposure to shock and vibration. (21)
When an incandescent bulb fails there is no backup for it; the safety hazard with these
types of bulbs is that there will be no signal when burnt out. This violates driver
expectancy because in the case of failure, the driver could potentially proceed through an
intersection during darkened conditions without knowing they had a red stop signal.
The advantage to using LED bulb is that each bulb uses dozens LEDs the size of a
pencil eraser. Most LED bulbs have service lives of 7-10 years. (32) The reliability rate
of these bulbs is warranted by most manufacturers. Another safety feature these bulbs
are capable of is that if there is a power outage they can operate on emergency mode
through the use of a back up battery due to their low power draw. (21)
Finally, this improvement will pay for itself long term. The initial cost of the bulb
is significant compared to a traditional incandescent bulb. LED bulbs vary in price
depending on what color phase (red, yellow, or green), from $57-$127. A traditional
incandescent bulb costs on average $2.75. The savings come into effect with energy

47
consumption. (32) ACT ONE Communications is a traffic signal bulb manufacturer that
sells these LED systems world-wide. Table 4.3 compares the difference between an ACT
ONE system and a traditional incandescent system based on 5-year duration. The LED
signal model T1-12R-4, energy cost $0.08/kWh, 55% on-time, emergency repair twice a
year for incandescent light bulbs. (32)
Table 4.3 - Incandescent Ball and LED Ball Comparison (32)
Power Consumption
Lifetime Expectancy
Cost of Ownership
ACT ONE LED Traffic Signal 7.9(w) 44,000 hours $335/UnitIncandescent Bulb Traffic Signal 150(w) 7000 hours $2,889/Unit
Cities such as Little Rock and Philadelphia have undergone massive LED retrofit
programs to improve safety and reduce operating costs. This technology is being used in
Georgia, but incandescent signals are still common all over Georgia. State, county, city,
and traffic officials have to make better “cost to benefit” analysis for this kind of systems.
Basically the project will pay for itself and will improve safety at the same time. This
technology would be most useful in rural areas where incandescent lights are being used.
If a signal is burnt out and an impaired driver does not notice it they have the potential to
be involved in a serious accident. LED signals are proven to be more reliable and can
help avoid this kind of situations.
LED Pedestrian Countdown Timers
Pedestrian countdown timers (PCT) are intersection safety devices that provide
pedestrians and vehicle operators real time information on pedestrian signal timing. PCT
have been around for years, and are slowly being integrated into intersections across the
United States, and in other countries around the world.

48
According to the Fatality Analysis Reporting System (FARS) encyclopedia, on
average in the United States, 4,962 pedestrians have died yearly during the past 10 years
as a result of vehicle collisions, of which 1,060 pedestrians on average died yearly at
intersections. (See Figure 4.2) (8) One answer to improve intersection safety and reduce
the number of pedestrian intersection injuries and fatalities is the implementation of PCT.
Many pedestrians are not familiar with the way traditional (non-PCT pedestrian signals)
pedestrian timing operates. A recent study surveyed 4,700 pedestrians to learn how
pedestrians interpret signals at intersections. From this survey it was concluded that the
flashing “DON’T WALK” signal was misunderstood by 50 percent of road users. The
study concluded that 50 percent of the pedestrians surveyed were not sure if this meant to
continue crossing or to return to the curb they had initially started from. (33) PCT
provide additional safety for pedestrians by removing the ambiguity associated with the
non-PCT equipped intersections.
The implementation of PCT has grown significantly throughout the last couple of
years. According to Frank Markowitz, Pedestrian Program Manager Department of
Parking and Traffic City and County of San Francisco, a survey was conducted in 2001 to
measure how pedestrians reacted to the implementation of PCT. Just over 82 percent of
the post-installation interviewed pedestrians felt that PCT were easier to understand than
conventional pedestrian intersection signals (26). The advantages of pedestrian
countdown timers are: (34)
• easily understood by all age groups
• they increase the feeling of safety
• reduce the number of pedestrians stranded at a crosswalk when the light changes
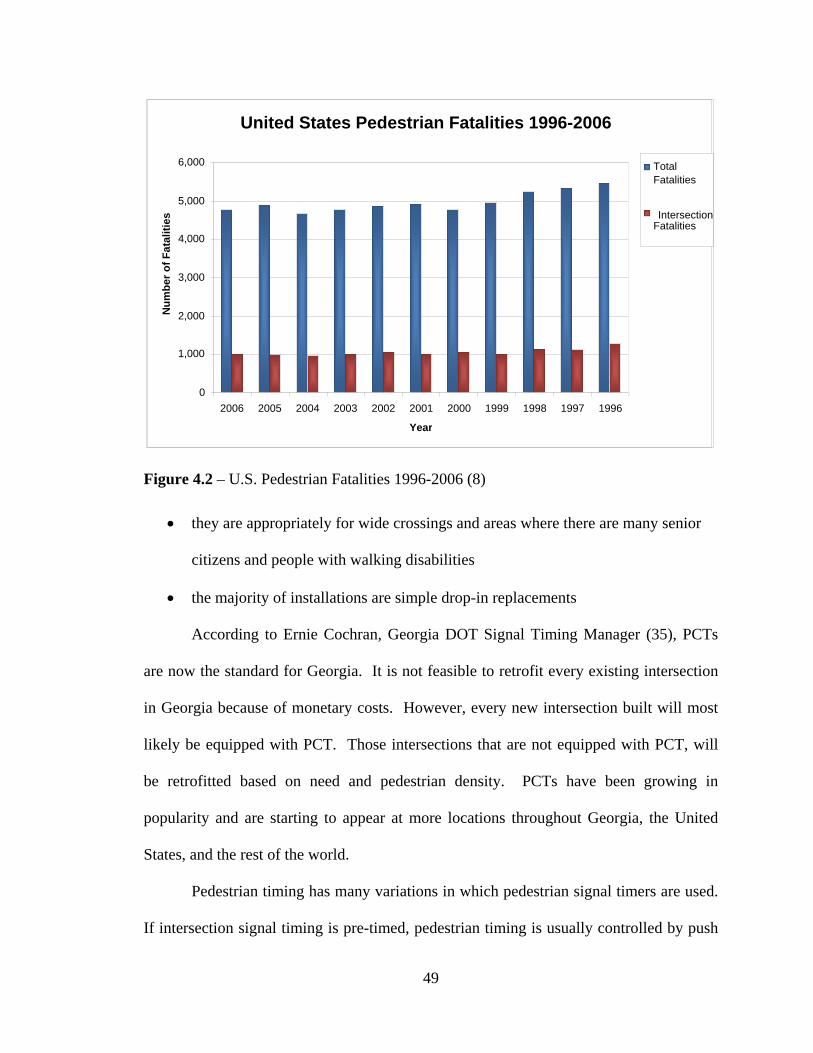
49
Figure 4.2 – U.S. Pedestrian Fatalities 1996-2006 (8)
• they are appropriately for wide crossings and areas where there are many senior
citizens and people with walking disabilities
• the majority of installations are simple drop-in replacements
According to Ernie Cochran, Georgia DOT Signal Timing Manager (35), PCTs
are now the standard for Georgia. It is not feasible to retrofit every existing intersection
in Georgia because of monetary costs. However, every new intersection built will most
likely be equipped with PCT. Those intersections that are not equipped with PCT, will
be retrofitted based on need and pedestrian density. PCTs have been growing in
popularity and are starting to appear at more locations throughout Georgia, the United
States, and the rest of the world.
Pedestrian timing has many variations in which pedestrian signal timers are used.
If intersection signal timing is pre-timed, pedestrian timing is usually controlled by push
United States Pedestrian Fatalities 1996-2006
0
1,000
2,000
3,000
4,000
5,000
6,000
2006 2005 2004 2003 2002 2001 2000 1999 1998 1997 1996
Year
Num
ber o
f Fat
aliti
es
TotalFatalities
IntersectionFatalities
50
button actuation. This allows for a longer pedestrian crossing time than the crossing time
given by the pre-timed interval. When the pedestrian signal is preempted by vehicle
actuation, the additional green time is subtracted from other phases (in pre-timed signal)
to maintain the cycle length. (26) Pedestrians sometimes can feel encroached upon by
vehicles as drivers many times make left and right turns that may potentially impose a
driver’s right of way.
One of the daily obstacles that pedestrians face is Pedestrian Right of Way
(ROW) violations. Pedestrians attempting to cross a crosswalk are many times cut off by
vehicles making right turns cutting through the crosswalk. There are different types or
methods of controlling pedestrian signal timing, which is usually established by the
traffic engineer who manages a given intersection. A method which is being tested in
San Francisco is known as “head start”, “leading pedestrian interval”, or “early release
timing”. This method holds all cars for a few seconds, while pedestrians are given a
“walk” signal. The purpose for doing this is to allow pedestrians to enter the intersection,
and drivers will be less likely to preempt the right of way when making turns. When
vehicles cut in front of a pedestrian crossing a crosswalk on a green light, it is known as a
pedestrian right of way (ROW) violation. In the case of San Francisco, this signal timing
method was requested from pedestrian and senior citizen groups from that area. (34)
Pedestrian countdown timers and leading interval timing are great methods that
can be used in highly dense pedestrian areas through Georgia. If LED pedestrian
countdown timers are used, operating energy costs will be reduced significantly and the
signals may prove to be more reliable.

51
CHAPTER V – CONCLUSION Intersection crashes accounted for 47 percent of all crashes in the State of Georgia
from 2000-2005, and as a physical location, accounted for the largest number of crash
locations throughout the state. (1) The federal government has passed substantial safety
legislation that requires states to implement statewide safety plans to reduce fatalities,
crashes, and improve safety. These requirements not only direct states to improve safety,
they are also providing funding for many of these programs through programs established
in SAFETEA-LU and the Highway Safety Improvement Plan (HSIP) program.
Improving intersection safety can be difficult given that intersections vary in one
way or another, and there are many individual factors that can cause an intersection to be
safer or more dangerous than another. Acquiring better, uniform, and more updated
information with regard to intersection crashes will enable transportation officials to
analyze crash data more rapidly and allow them to prescribe policies in which safety
changes can be implemented in an easier and more expedited manner.
Georgia published the federally-mandated Strategic Highway Safety Plan (SHSP)
in 2006 and the Georgia Five Percent Report in 2007. Both of these reports explain the
need for safety improvements and target locations that need to be improved. It is no
surprise due to the high crash frequencies at intersections that intersections are being
targeted for safety improvements.
The five part safety program recommended in thesis will improve safety at
intersections and enable Georgia transportation officials to better analyze, identify, and
implement countermeasures at intersections which are recognized to be the most

52
hazardous. This program does not target individual crash types, instead it recommends a
holistic approach to acquiring the proper tools that will allow for better analysis of any
location and in turn compares new methods that different states are using to achieve
better levels of safety.
A standard statewide hazardous identification method is important to ensure
locations are not overlooked. If different counties are given guidance to implement a
standard analysis method it will be easier for the counties to quantify their safety
improvement needs compared to other counties and justify why one county is receiving
funding versus another. In order for better analysis to be performed, better crash data
collection techniques are needed. Many states are adopting standard statewide reporting
procedures through federally established reporting programs such as TraCS. Georgia
would benefit from implementing a standard and consistent reporting system because
every county could be held accountable for submitting consistent data.
Intersections or roadway segments with a high prevalence of accidents that are not
reported to the proper authorities might be better identified through public involvement
programs. Roadway users should be included in the safety improvement process since
they are the ones using the system.
Another important key to improving safety is equipping locations with safe and
reliable equipment. Georgia would save money on electricity, maintenance operating
costs and improve safety at intersections if a statewide LED transition program was
implemented. There are thousands of intersections that are still equipped with
incandescent bulbs that have high energy consumption and poor reliability. (32)

53
The five programs this thesis recommends are basic programs that are proven to
improve safety at intersections. Georgia has been given the mandate by the federal
government to try to reduce crashes and improve safety statewide. The intersection
safety improvement program recommended in this thesis will accomplish some of the
goals outlined in the existing AASHTO SHSP and will not only enhance intersection
safety, but in the process will improve the performance of the entire roadway system.

54
APPENDIX Figure A.1 – 2000-2005 Fulton County crash data sample map – Locations of fatal intersection crashes in which the driver failed to yield or disregarded the signal.
Figure A.2 – California DOT Traffic Congestion/Construction Problem Form. Figure A.3 – California DOT Road Maintenance Request Form Figure A.4 – VA DOT Road Problem Form
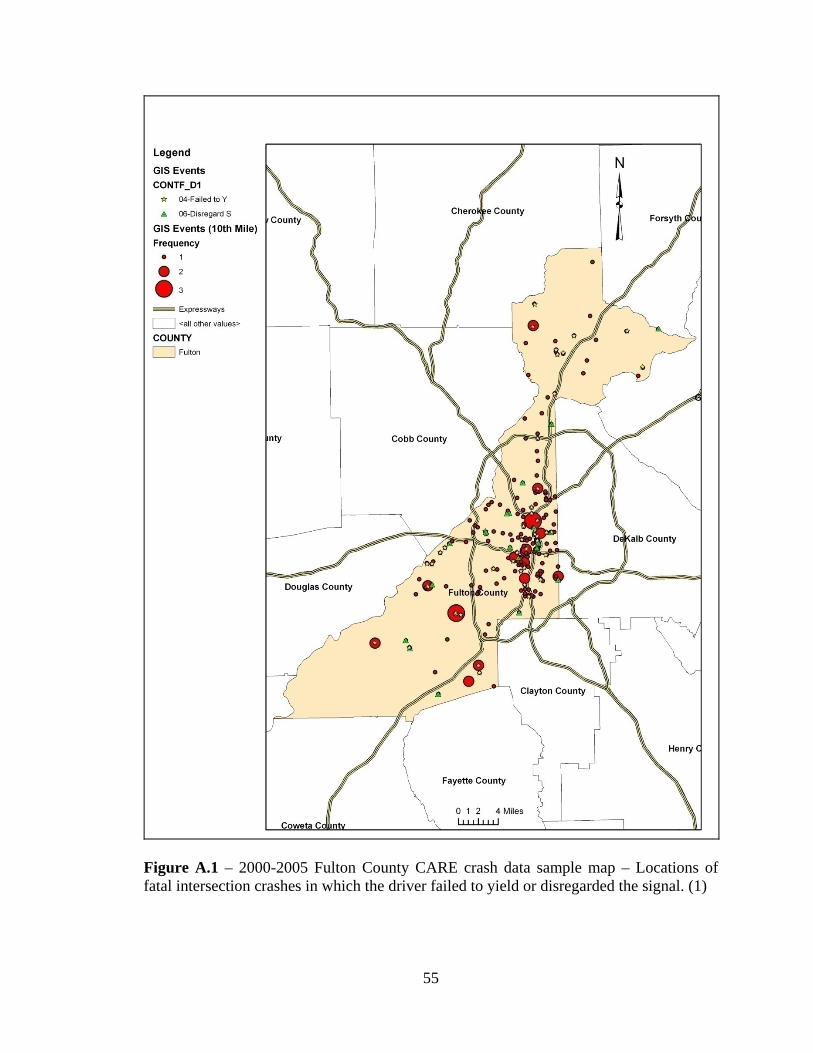
55
Figure A.1 – 2000-2005 Fulton County CARE crash data sample map – Locations of fatal intersection crashes in which the driver failed to yield or disregarded the signal. (1)

56
Figure A.2 – California DOT Traffic Congestion/Construction Problem Form. (36)

57
Figure A.3 – California DOT Road Maintenance Request Form (36)

58
Figure A.4 – VA DOT Road Problem Form (27)

59
WORKS CITED AND REFERENCES
1. Citical Analysis Reporting Environment (CARE) Database. 2000-2005 Crash Data. 2. AASHTO, American Association of State Highway Transportation Officials -. Strategic Highway Safety Plan. 2001. 3. Georgia-DOT. Georgia Strategic Highway Safety Plan. 2006. 4. Beasley, D. Ibrahim and M. The benefits of LED traffic lights in London and Pilot Test sites. s.l. : IEE, 1998. Road Transport Information and Control, 21-23 Conference Publication No. 454. 5. FHWA. SAFETEA-LU. [Online] 2005. [Cited: May 25, 2008.] http://www.fhwa.dot.gov/safetealu/summary.htm. 6. Cressman, Norm. Georgia DOt Safety Program Manager . Atlanta, GA, June 6, 2008. 7. Design, Georgia Department of Transportation - Office of Traffic Safety and. Georgia 2007 Highway Safety Improvement Report (HSIP) Five Percent Report. 2007. 8. Fatality Analysis Reporting System (FARS). [Online] [Cited: March 2008, 2008.] http://www-fars.nhtsa.dot.gov/Main/index.aspx. 9. Budget, GA Office of Planning and. Georgia 2015 Population Projections. 2005. 10. FHWA, USDOT. National Agenda for Intersection Safety. 2001. FHWA-SA-02-007. 11. Alabama-DOT. Strategic Highway Safety Plan For Alabama. 2006. UTCA Report 04608. 12. Florida-DOT. Florida Strategic Highway Safety Plan. 2006. 13. Comittee, Tennessee Strategic Highway Safety. State of Tennessee Strategic Highway Safety Plan. 2007. 14. South Carolina DOT, SC Dept. of Public Safety, SCFHWA. The Road Map to Safety - South Carolina SHSP. 2007.
60
15. Texas DOT, Texas Transportation Institute, Center for Transportation Safety. Texas Strategic Highway Safety Report. 2006. 16. California-DOT, California Highway Patrol, California Office of Traffic Safety. California Strategic Highway Safety Plan. 2006. 17. New York State DOT, NY Governor's Traffic Safety Comitee. New York State Strategic Highway Safety Plan. 2007. 18. ReportBeam. Report Beam. www.visualstatement.com/reportbeam. [Online] [Cited: June 07, 2008.] www.visualstatement.com/reportbeam/success-stories/unioncity.aspc. 19. TraCS. [Online] [Cited: June 07, 2008.] www.tracsinfo.us/Tracs_About_NationalModelHistory.asp. 20. FHWA. FHWA White Paper: Safety and Asset Management. [Online] [Cited: June 5, 2008.] http://www.fhwa.dot.gov/infrastructure/asstmgmt/amppsafe.htm. 21. Traffic Engineering Division, Department of Pubic of Public Works City of Little Rock Arkansas. Conventional Vs LED Traffic Signals; Operational Characteristics and Economic Feasibility . Arkansas : s.n., 2003. 22. [Online] [Cited: 05 12, 2008.] www.depweb.state.pa.us. 23. Highway Safety Manual. [Online] 06 12, 2008. www.highwaysafetymanual.org. 24. DOT, Georgia. Georgia 2007 Five Percent Report. Atlanta, Georgia : s.n., 2007. 25. Commission, Miami Valley Regional Planning. High Crash Loaction Selection Process. Miami, Ohio : s.n., 2006. 26. Roess, R. Traffic Engineering 3rd Edition. s.l. : Pearson Education, 2004. Ch. 18.3, pg 523. 27. Transportation, Virginia Department of. www.virginiadot.org. [Online] [Cited: 04 23, 2008.] www.virginiadot.org/travel/citizen.asp. 28. Gunter, Brian. GA DOT-511 Media Relations. Atlanta, GA, 06 10, 2008. 29. http://search1.georgia.gov/. [Online] 06 10, 2008.

61
30. Transportation, Illinois Departmenmt of. Electronic Crash Reports Incentive Grant MCR-XML). Springfield, Il. : s.n., 2008. 31. Philadelphia Police Department. [Online] [Cited: 06 12, 2008.] http://www.ppdonline.org/ops/ops_tech_mdt.php. 32. COMMUNICATIONS, ACT ONE. LED TRAFFIC SIGNALS - Ball and Arrow Signal Modules. http://www.actone1.com. [Online] [Cited: 01 21, 2008.] http://www.actone1.com/supports/FO-T1TA.pdf. 33. Tidwell, J.E. and Doyle, D. Driver and Pedestrian Comprehension of Pedestrian Laws and Traffic Control Devices. Washington, D.C. : AAA Foundation for Traffic Safety, 1993. 34. Markowitz, Frank Pedestrian Program Manager Dept. of Parking and Traffic, City and county of San Francisco. Pedestrian Countdown signal, case Study #63. www.walkinginfo.org. [Online] [Cited: 02 12, 2008.] www.walkinginfo.org/pedsafe/casestudy.cfm?CS_NUM=63. 35. Cochran, Ernie. Sate Signal Timing Manager. Atlanta, GA, 04 23, 2008. 36. Transportation, California Deparrtment of. www.dot.ca.gov. California Department of Transportation. [Online] May 23, 2008. www.dot.ca.gov/maintform.html. 37. Governors Office of Highway Safety, Georgia DOT. Georgia Strategic Highway Safety Plan. October 2006. 38. Commission, Metropolitan Transportation. Planning and Bicyclist Safety Tool box.
Related Documents