George Yannis, Alexandra Laiou, Katerina Folla, Dimosthenis Pavlou Robert Bauer, Klaus Machata, Christian Brandstaetter Pete Thomas, Alan Kirk National Technical University of Athens (NTUA) Kuratorium für Verkehrssicherheit

Welcome message from author
This document is posted to help you gain knowledge. Please leave a comment to let me know what you think about it! Share it to your friends and learn new things together.
Transcript

George Yannis, Alexandra Laiou, Katerina Folla, Dimosthenis Pavlou
Robert Bauer, Klaus Machata, Christian Brandstaetter
Pete Thomas, Alan Kirk
National Technical
University of Athens
(NTUA)
Kuratorium für
Verkehrssicherheit
Introduction
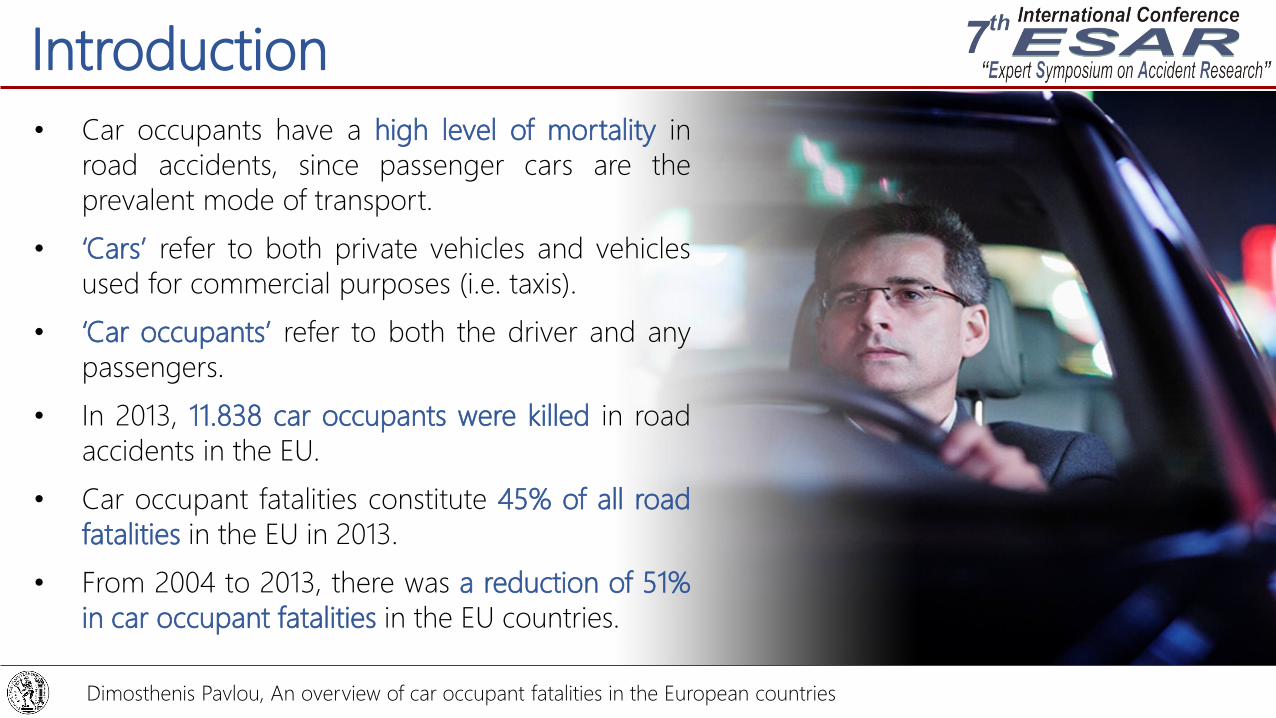
• Car occupants have a high level of mortality in
road accidents, since passenger cars are the
prevalent mode of transport.
• ‘Cars’ refer to both private vehicles and vehicles
used for commercial purposes (i.e. taxis).
• ‘Car occupants’ refer to both the driver and any
passengers.
• In 2013, 11.838 car occupants were killed in road
accidents in the EU.
• Car occupant fatalities constitute 45% of all road
fatalities in the EU in 2013.
• From 2004 to 2013, there was a reduction of 51%
in car occupant fatalities in the EU countries.
Dimosthenis Pavlou, An overview of car occupant fatalities in the European countries
Objectives
• Macroscopic analysis of basic road safety
parameters related to car occupants, using
data from the EU CARE database with
disaggregate data on road accidents.
• EU IDB data for the period 2005 - 2008 are
used to identify injury patterns and improve
the assessment of injury severity.
• Additional insight into accident causation
recorded for car occupants is offered
through analysis of a set of in-depth data,
collected for the period 2005 – 2008.
The paper is based on work done within the development of the Traffic Safety Basic Facts 2015 – Car Occupants (European Commission,
2015), as well as through SAFETYNET and DaCoTA EC co-funded research projects and the European Road Safety Observatory (ERSO -
http://ec.europa.eu/transport/wcm/road_safety/erso/index-2.html).
Dimosthenis Pavlou, An overview of car occupant fatalities in the European countries
Methodology• Macroscopic road accident data from the EU CARE
database, in-depth accident data from the SafetyNet Accident
Causation System (SNACS) and injury data from the EU Injury
Database (EU IDB).
• Macroscopic time series data from 27 EU countries for the
period 2004-2013.
• In-depth data from 6 EU countries for the period 2005-2008
using a common methodology.
• Injury data from hospitals in 9 EU countries for the period
2005-2008 using a common methodology.
• Road accident data involving car occupants correlated with
basic safety parameters: casualty age and gender, road type
and presence of junction, season of the year, day of week and
time of day
• Population data from Eurostat (used as exposure).
Dimosthenis Pavlou, An overview of car occupant fatalities in the European countries
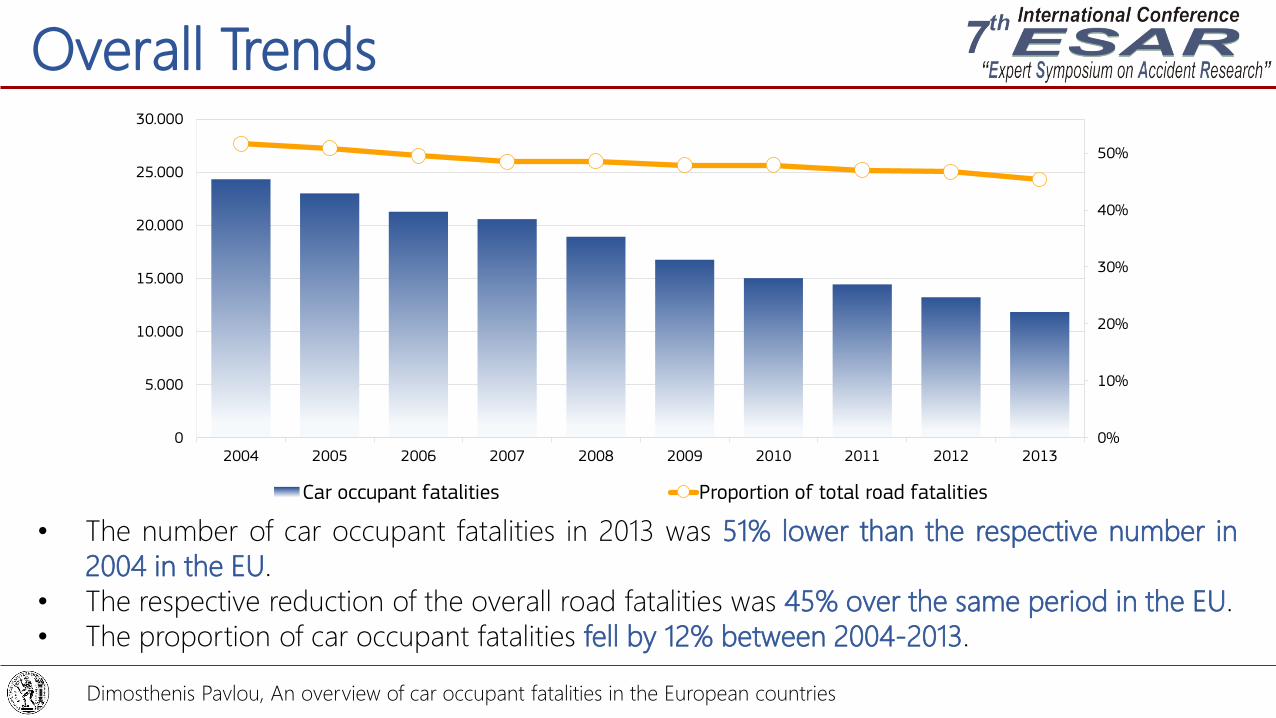
Overall Trends
• The number of car occupant fatalities in 2013 was 51% lower than the respective number in
2004 in the EU.
• The respective reduction of the overall road fatalities was 45% over the same period in the EU.
• The proportion of car occupant fatalities fell by 12% between 2004-2013.
0%
10%
20%
30%
40%
50%
0
5.000
10.000
15.000
20.000
25.000
30.000
2004 2005 2006 2007 2008 2009 2010 2011 2012 2013
Car occupant fatalities Proportion of total road fatalities
Dimosthenis Pavlou, An overview of car occupant fatalities in the European countries
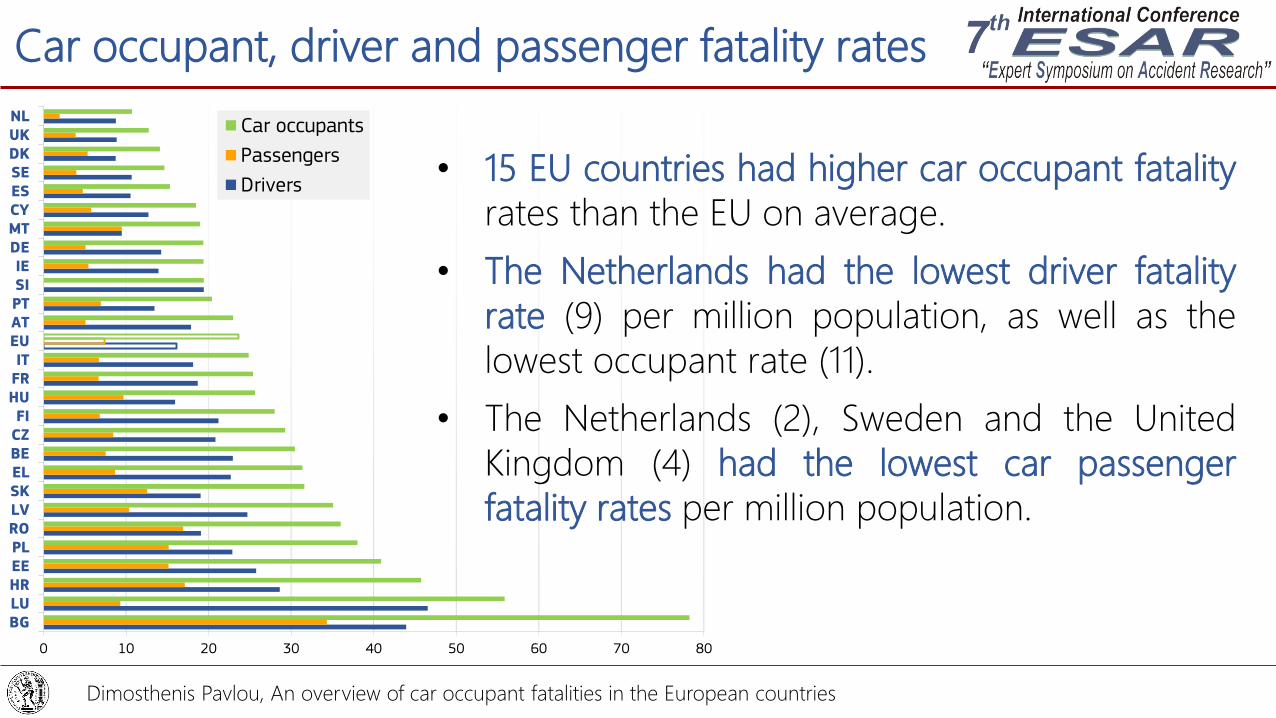
Car occupant, driver and passenger fatality rates
0 10 20 30 40 50 60 70 80
BGLUHREEPLROLVSKELBECZFI
HUFRIT
EUATPTSIIE
DEMTCYESSEDKUKNL
Car occupants
Passengers
Drivers• 15 EU countries had higher car occupant fatality
rates than the EU on average.
• The Netherlands had the lowest driver fatality
rate (9) per million population, as well as the
lowest occupant rate (11).
• The Netherlands (2), Sweden and the United
Kingdom (4) had the lowest car passenger
fatality rates per million population.
Dimosthenis Pavlou, An overview of car occupant fatalities in the European countries
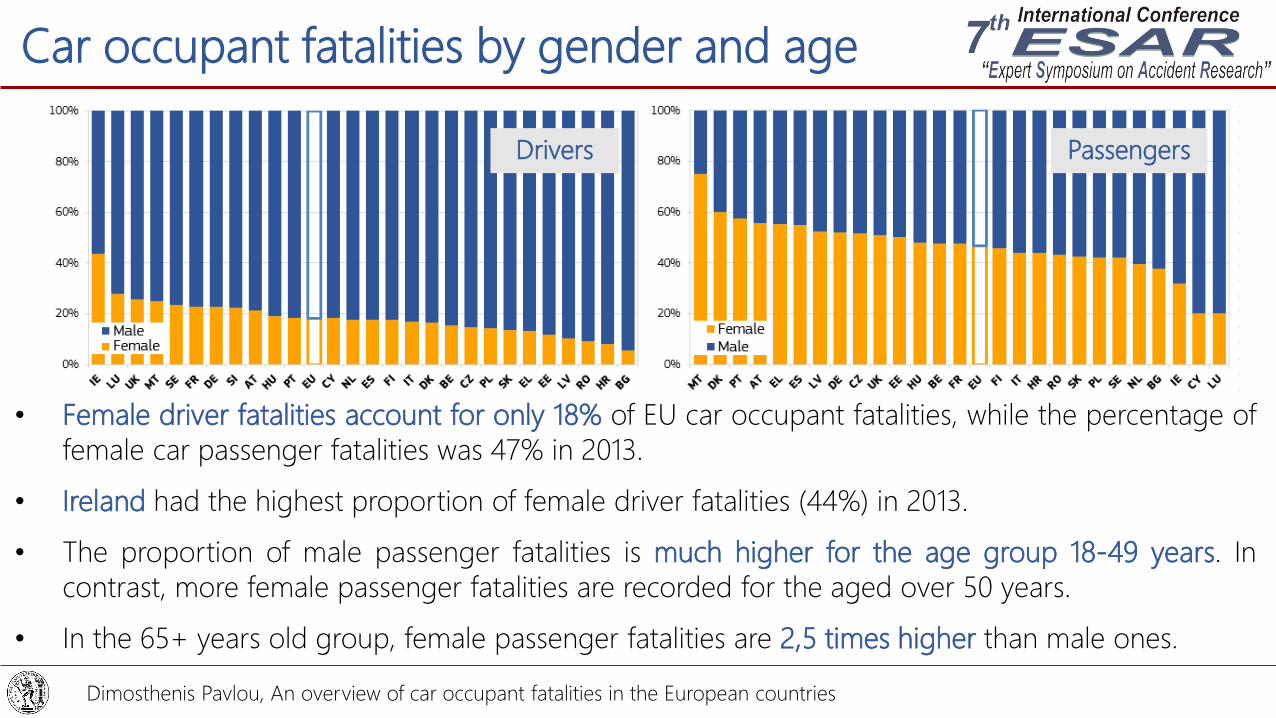
Car occupant fatalities by gender and age
• Female driver fatalities account for only 18% of EU car occupant fatalities, while the percentage of
female car passenger fatalities was 47% in 2013.
• Ireland had the highest proportion of female driver fatalities (44%) in 2013.
• The proportion of male passenger fatalities is much higher for the age group 18-49 years. In
contrast, more female passenger fatalities are recorded for the aged over 50 years.
• In the 65+ years old group, female passenger fatalities are 2,5 times higher than male ones.
Drivers Passengers
Dimosthenis Pavlou, An overview of car occupant fatalities in the European countries
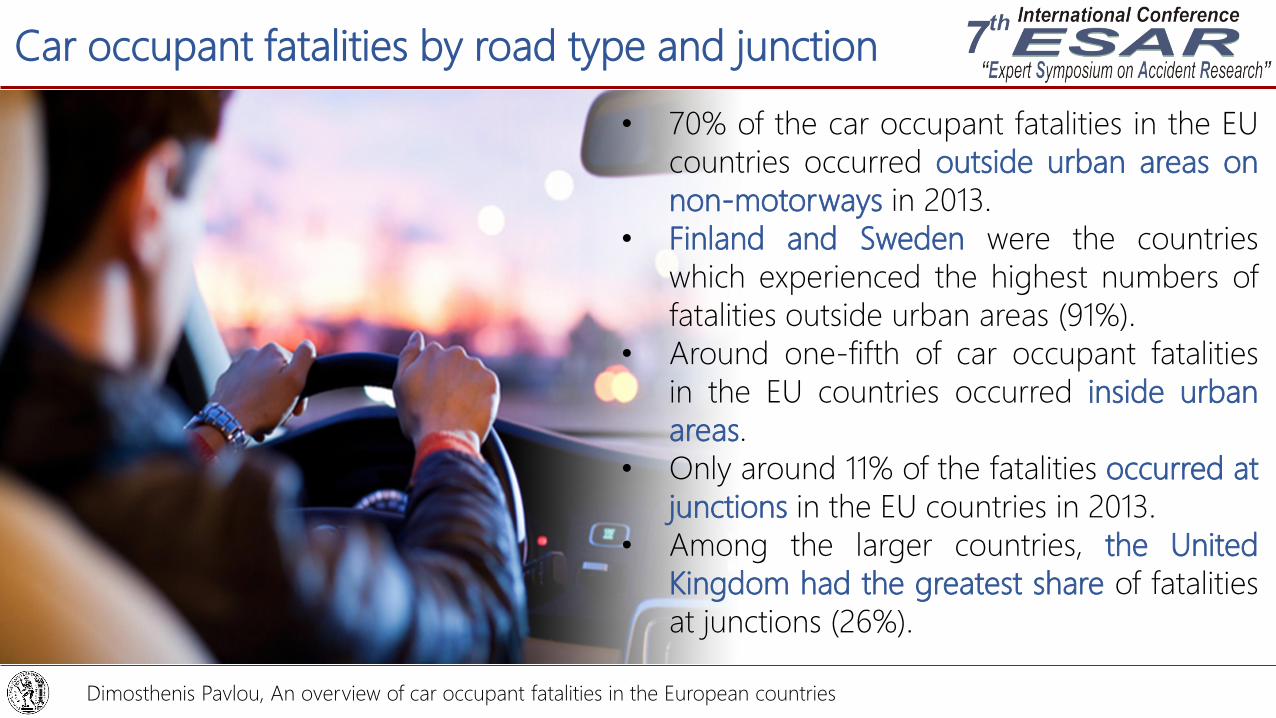
Car occupant fatalities by road type and junction
• 70% of the car occupant fatalities in the EU
countries occurred outside urban areas on
non-motorways in 2013.
• Finland and Sweden were the countries
which experienced the highest numbers of
fatalities outside urban areas (91%).
• Around one-fifth of car occupant fatalities
in the EU countries occurred inside urban
areas.
• Only around 11% of the fatalities occurred at
junctions in the EU countries in 2013.
• Among the larger countries, the United
Kingdom had the greatest share of fatalities
at junctions (26%).
Dimosthenis Pavlou, An overview of car occupant fatalities in the European countries
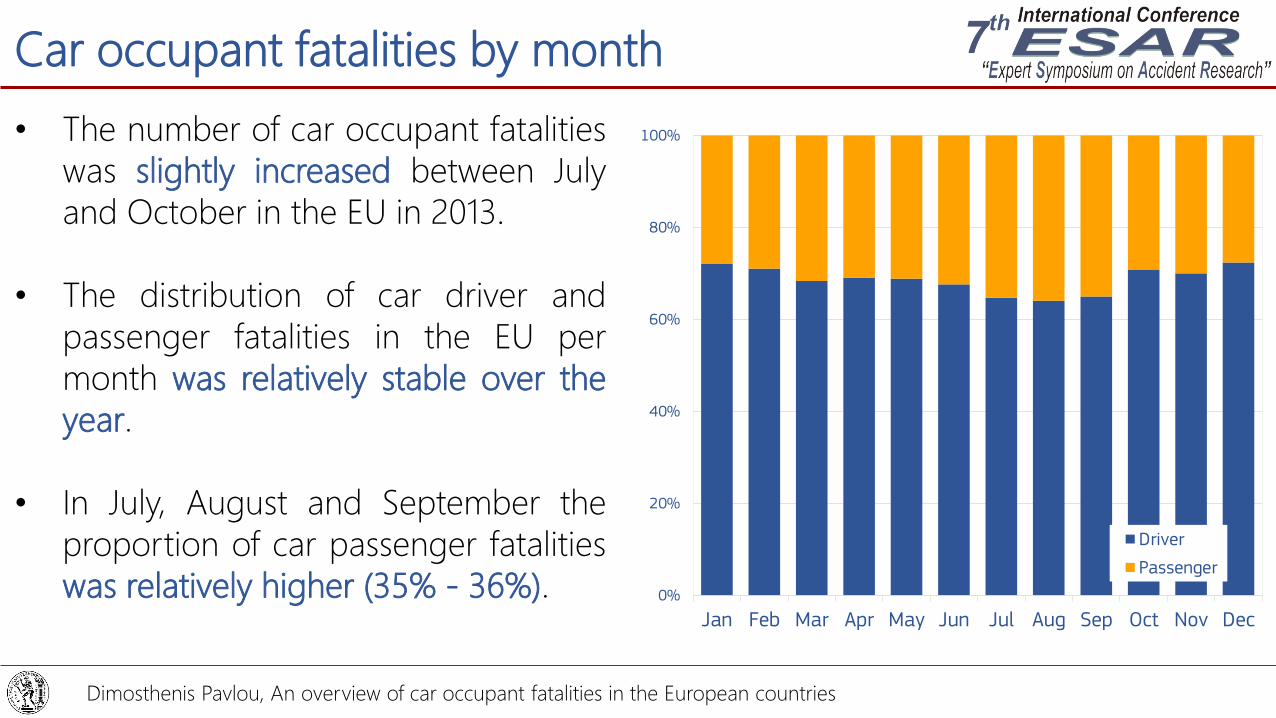
Car occupant fatalities by month
• The number of car occupant fatalities
was slightly increased between July
and October in the EU in 2013.
• The distribution of car driver and
passenger fatalities in the EU per
month was relatively stable over the
year.
• In July, August and September the
proportion of car passenger fatalities
was relatively higher (35% - 36%).
Dimosthenis Pavlou, An overview of car occupant fatalities in the European countries
0%
20%
40%
60%
80%
100%
Jan Feb Mar Apr May Jun Jul Aug Sep Oct Nov Dec
Driver
Passenger
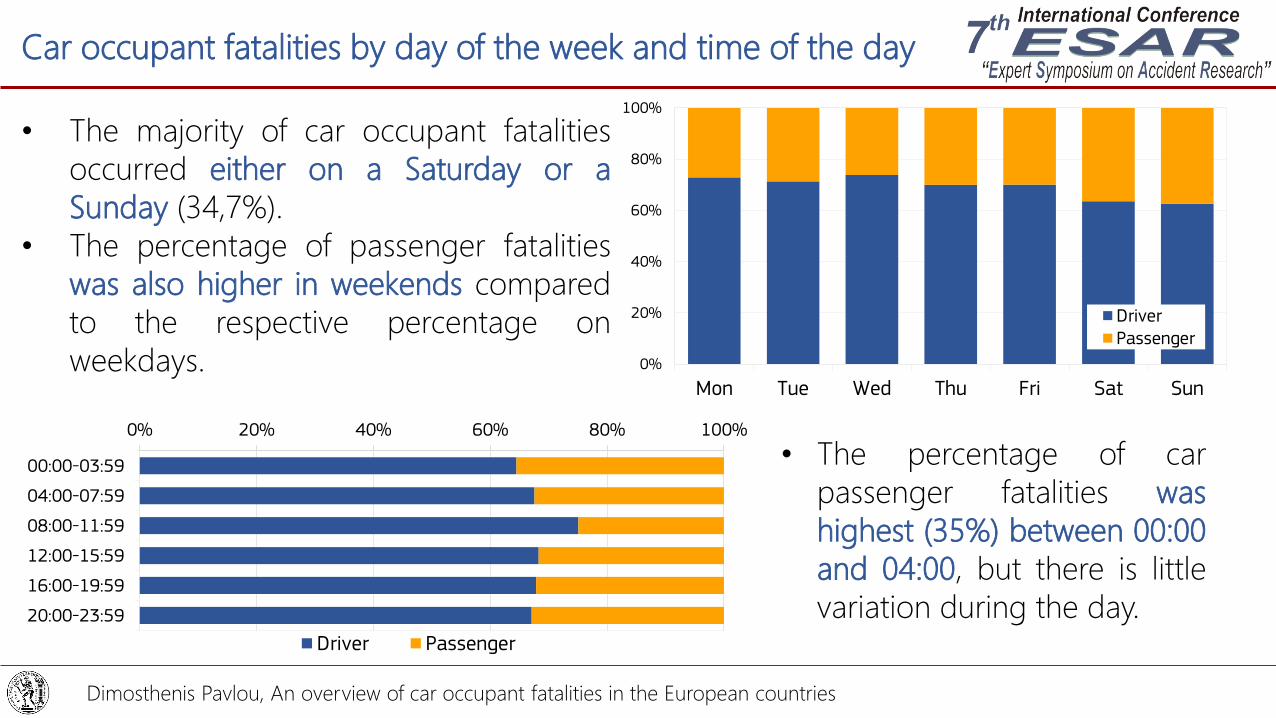
• The majority of car occupant fatalities
occurred either on a Saturday or a
Sunday (34,7%).
• The percentage of passenger fatalities
was also higher in weekends compared
to the respective percentage on
weekdays.
Car occupant fatalities by day of the week and time of the day
Dimosthenis Pavlou, An overview of car occupant fatalities in the European countries
0%
20%
40%
60%
80%
100%
Mon Tue Wed Thu Fri Sat Sun
DriverPassenger
0% 20% 40% 60% 80% 100%
00:00-03:59
04:00-07:59
08:00-11:59
12:00-15:59
16:00-19:59
20:00-23:59
Driver Passenger
• The percentage of car
passenger fatalities was
highest (35%) between 00:00
and 04:00, but there is little
variation during the day.
Accident causation
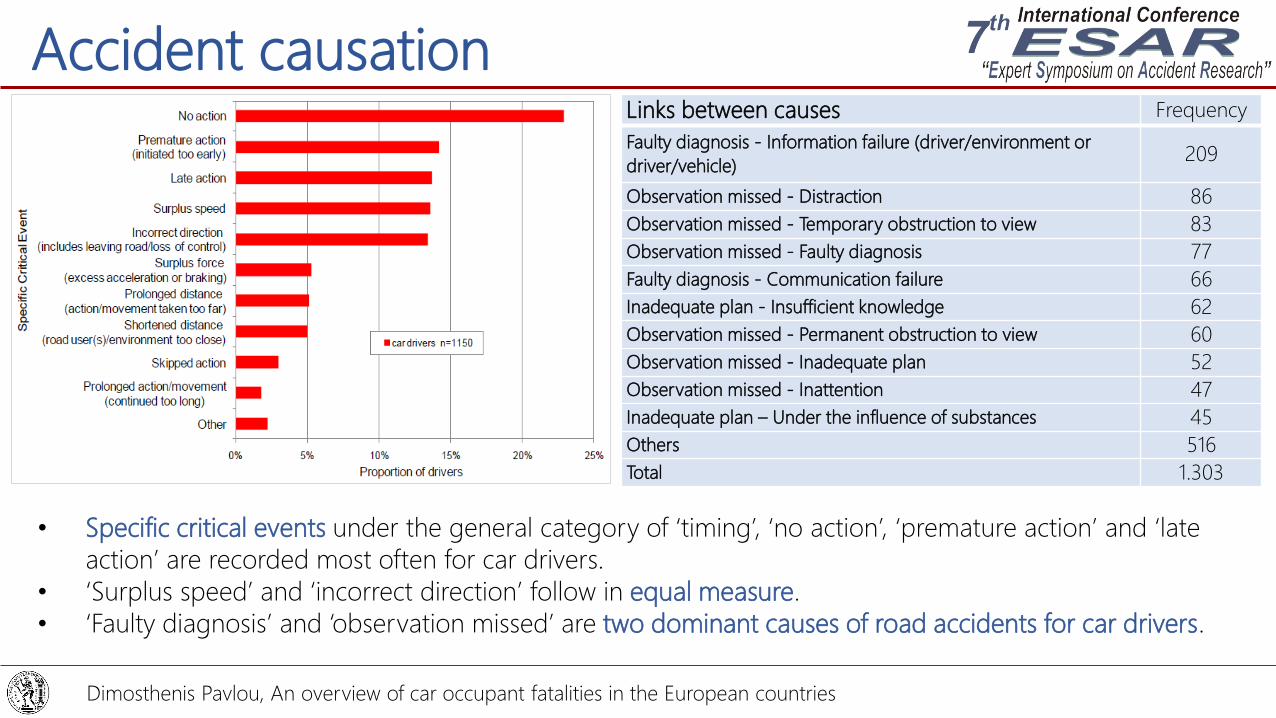
• Specific critical events under the general category of ‘timing’, ‘no action’, ‘premature action’ and ‘late
action’ are recorded most often for car drivers.
• ‘Surplus speed’ and ‘incorrect direction’ follow in equal measure.
• ‘Faulty diagnosis’ and ‘observation missed’ are two dominant causes of road accidents for car drivers.
Dimosthenis Pavlou, An overview of car occupant fatalities in the European countries
Links between causes Frequency
Faulty diagnosis - Information failure (driver/environment or
driver/vehicle)209
Observation missed - Distraction 86
Observation missed - Temporary obstruction to view 83
Observation missed - Faulty diagnosis 77
Faulty diagnosis - Communication failure 66
Inadequate plan - Insufficient knowledge 62
Observation missed - Permanent obstruction to view 60
Observation missed - Inadequate plan 52
Observation missed - Inattention 47
Inadequate plan – Under the influence of substances 45
Others 516
Total 1.303
Road accident health indicators
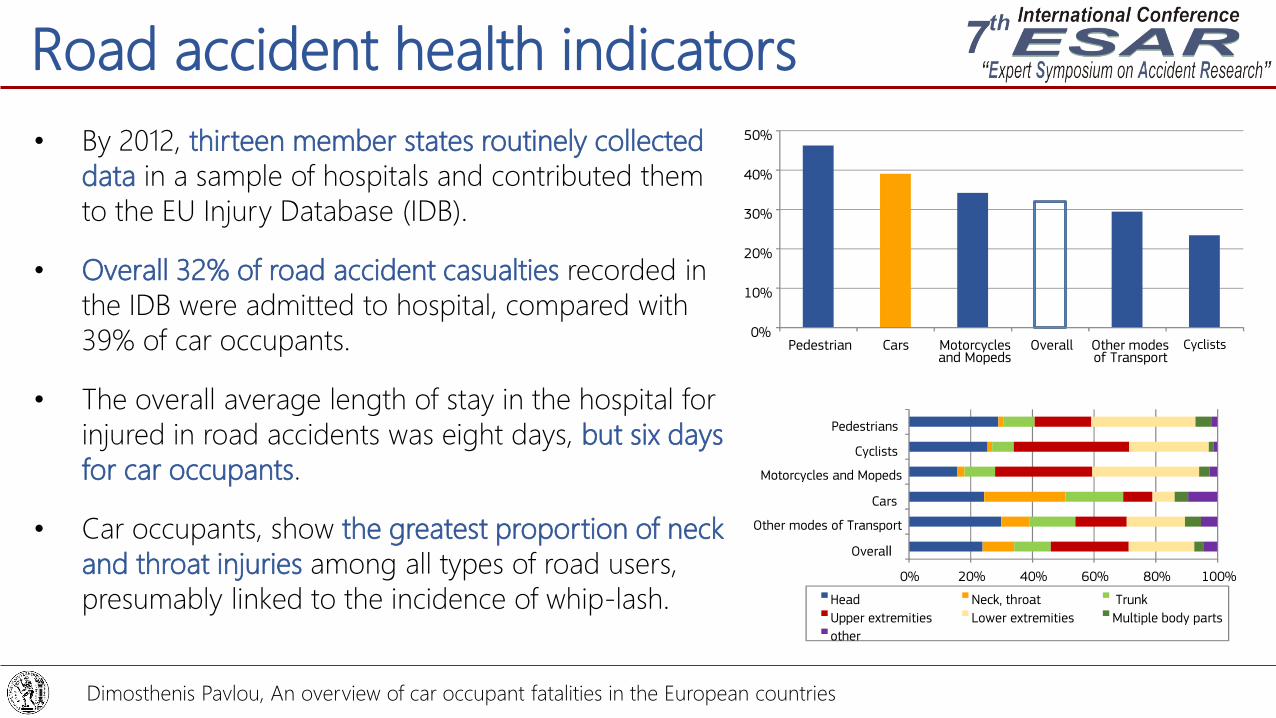
• By 2012, thirteen member states routinely collected
data in a sample of hospitals and contributed them
to the EU Injury Database (IDB).
• Overall 32% of road accident casualties recorded in
the IDB were admitted to hospital, compared with
39% of car occupants.
• The overall average length of stay in the hospital for
injured in road accidents was eight days, but six days
for car occupants.
• Car occupants, show the greatest proportion of neck
and throat injuries among all types of road users,
presumably linked to the incidence of whip-lash.
Dimosthenis Pavlou, An overview of car occupant fatalities in the European countries
0%
10%
20%
30%
40%
50%
Pedestrian Cars Motorcyclesand Mopeds
Overall Other modesof Transport
Cyclists
0% 20% 40% 60% 80% 100%
Pedestrians
Cyclists
Motorcycles and Mopeds
Cars
Other modes of Transport
Overall
Head Neck, throat Trunk
Upper extremities Lower extremities Multiple body parts
other
Conclusions
• A considerable decrease by 51% in the number of car
occupant fatalities was recorded within the decade
2004-2013.
• Most of the car occupant fatalities in the EU countries
occurred outside urban areas, on non-motorways.
• The results of the analysis allow for a better
understanding of the car occupant safety problem in
the European road network, providing thus useful
support to decision makers working for the
improvement of safety in the European road
network.
• Exposure data related to the mobility are needed for
a more complete picture.
Dimosthenis Pavlou, An overview of car occupant fatalities in the European countries

George Yannis, Alexandra Laiou, Katerina Folla, Dimosthenis Pavlou
Robert Bauer, Klaus Machata, Christian Brandstaetter
Pete Thomas, Alan Kirk
National Technical
University of Athens
(NTUA)
Kuratorium für
Verkehrssicherheit
Related Documents