Mediterranean Archaeology and Archaeometry, Vol. 11, No.1, pp. 51‐58 Copyright © 2011 MAA Printed in Greece. All rights reserved. GEOPHYSICAL INVESTIGATION AT TELL EL‐DABAA ʺAVARISʺ ARCHAEOLOGICAL SITE A.I. Taha, 1 , G. El‐Qady 1 , M.A. Metwaly 1,2 , U. Massoud 1 1 National Research Institute of Astronomy and Geophysics (NRIAG), 11722, Helwan, Cairo, Egypt 2 King Saud University, Saudi Arabia Received: 06/04/2010 Accepted: 24/04/2010 Corresponding author: [email protected] ABSTRACT Tell El –Dabaa is one of the important archaeological sites in the Eastern part of the Nile Delta. It is located at about 7 km north of Faqous city, Sharqiya governorate, Egypt. The ancient name of El‐ Dabaa area was Avaris, which had been considered as the main capital of Hyksos (Dynasty XV) from 1650 to 1542 B.C. The whole area was covered by the deltaic deposits during the successive flood events along Nile Delta. Geomagnetic and geoelectric surveys have been carried out in order to outline the subsurface archaeological remains in this area. The target area, which is about 10000 m 2 , was surveyed in grid pattern each of 20x 10 m for magnetic survey and 20 × 20 m for geoelectri‐ cal resistance survey. Integrated results of the magnetic and geoelectric data analysis have suc‐ ceeded in delineating a clear subsurface picture of archaeological remains. The results show many linear anomalies, which may represent buried walls, as well as some small archaeological remains detached from the main walls. Also, we could notice some rectangular features with different sizes, which might be described as remains of different archaeological buildings. Besides, some circular structures with small size obtained and could be interpreted as columns foundations. KEYWORDS: Tell El‐Dabaa (Avaris), magnetic, resistivity, geophysical, archaeology, Hyksos, Egypt

Welcome message from author
This document is posted to help you gain knowledge. Please leave a comment to let me know what you think about it! Share it to your friends and learn new things together.
Transcript
Mediterranean Archaeology and Archaeometry, Vol. 11, No.1, pp. 51‐58 Copyright © 2011 MAA
Printed in Greece. All rights reserved.
GEOPHYSICAL INVESTIGATION AT TELL EL‐DABAA ʺAVARISʺ ARCHAEOLOGICAL SITE A.I. Taha,1, G. El‐Qady1, M.A. Metwaly1,2, U. Massoud1
1National Research Institute of Astronomy and Geophysics (NRIAG), 11722, Helwan, Cairo, Egypt 2King Saud University, Saudi Arabia
Received: 06/04/2010 Accepted: 24/04/2010
Corresponding author: [email protected]
ABSTRACT
Tell El –Dabaa is one of the important archaeological sites in the Eastern part of the Nile Delta. It is located at about 7 km north of Faqous city, Sharqiya governorate, Egypt. The ancient name of El‐Dabaa area was Avaris, which had been considered as the main capital of Hyksos (Dynasty XV) from 1650 to 1542 B.C. The whole area was covered by the deltaic deposits during the successive flood events along Nile Delta. Geomagnetic and geoelectric surveys have been carried out in order to outline the subsurface archaeological remains in this area. The target area, which is about 10000 m2, was surveyed in grid pattern each of 20x 10 m for magnetic survey and 20 × 20 m for geoelectri‐cal resistance survey. Integrated results of the magnetic and geoelectric data analysis have suc‐ceeded in delineating a clear subsurface picture of archaeological remains. The results show many linear anomalies, which may represent buried walls, as well as some small archaeological remains detached from the main walls. Also, we could notice some rectangular features with different sizes, which might be described as remains of different archaeological buildings. Besides, some circular structures with small size obtained and could be interpreted as columns foundations.
KEYWORDS: Tell El‐Dabaa (Avaris), magnetic, resistivity, geophysical, archaeology, Hyksos, Egypt
A.I. TAHA A.I. 52
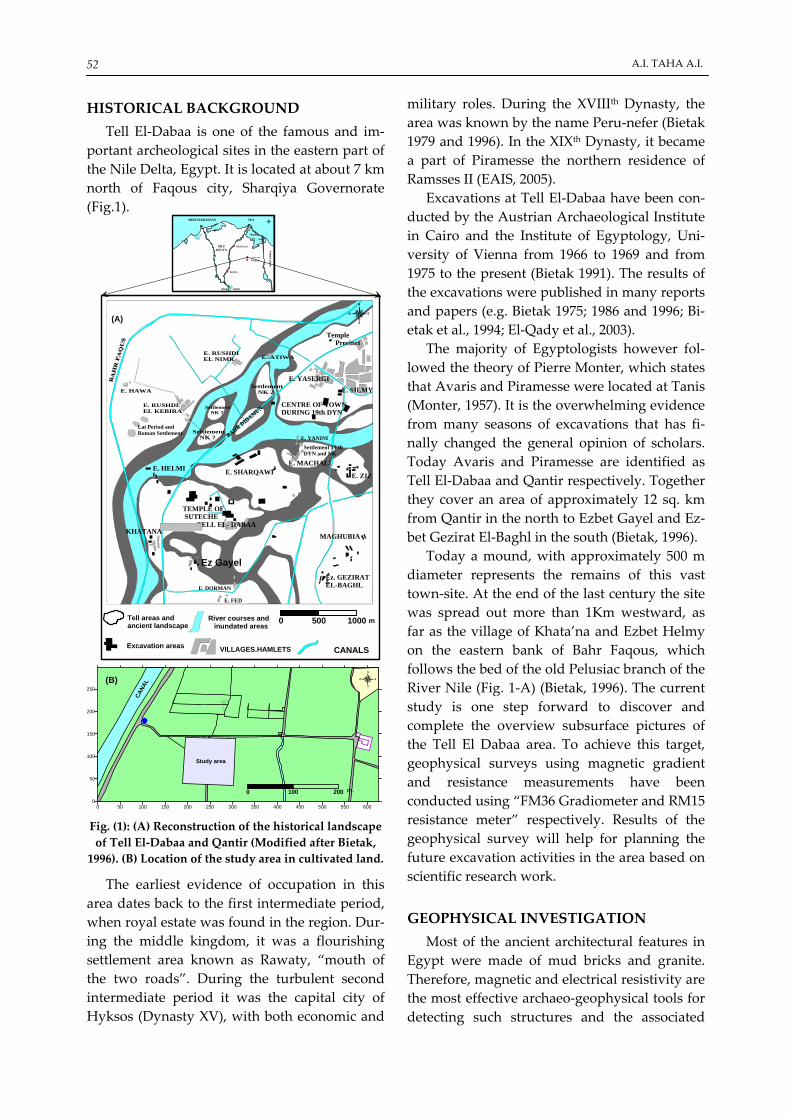
HISTORICAL BACKGROUND Tell El‐Dabaa is one of the famous and im‐
portant archeological sites in the eastern part of the Nile Delta, Egypt. It is located at about 7 km north of Faqous city, Sharqiya Governorate (Fig.1).
0 50 100 150 200 250 300 350 400 450 500 550 6000
50
100
150
200
250
Study area
CANA
L
0 100 200 m.
(B)
Faqous
Mansoura
Benha
CairoGiza
MEDITERRANEAN SEA
study area
SU
EZ
CA
NA
L
NILEDELTA
Manzala
lake
Temple Precinct
E. YASERGIE. SILMY
E. ZIZ
E. MACHALI
E. YANINISettlement 15 th DYN and NK
CENTRE OF TOWNDURING 19th DYN
Settlement NK 2
Settlement NK ?
Settlement NK ?
0 500 1000 m
E. ATIWAE. RUSHDIEL NIMR
E. RUSHDIEL KEBIRA
E. HAWA
Tell areas and ancient landscape
Excavation areas
River courses and inundated areas
VILLAGES.HAMLETS CANALS
MAGHUBIA
Ez. GEZIRATEL-BAGHL
E. FED
E. DORMAN
TELL EL- DABAA
TEMPLE OF SUTECHE
KHATANA
E. HELMI
Lat Period and Roman Settlement
E. SHARQAWI
(A)
Ez Gayel
Fig. (1): (A) Reconstruction of the historical landscape of Tell El‐Dabaa and Qantir (Modified after Bietak, 1996). (B) Location of the study area in cultivated land.
The earliest evidence of occupation in this area dates back to the first intermediate period, when royal estate was found in the region. Dur‐ing the middle kingdom, it was a flourishing settlement area known as Rawaty, “mouth of the two roads”. During the turbulent second intermediate period it was the capital city of Hyksos (Dynasty XV), with both economic and
military roles. During the XVIIIth Dynasty, the area was known by the name Peru‐nefer (Bietak 1979 and 1996). In the XIXth Dynasty, it became a part of Piramesse the northern residence of Ramsses II (EAIS, 2005).
Excavations at Tell El‐Dabaa have been con‐ducted by the Austrian Archaeological Institute in Cairo and the Institute of Egyptology, Uni‐versity of Vienna from 1966 to 1969 and from 1975 to the present (Bietak 1991). The results of the excavations were published in many reports and papers (e.g. Bietak 1975; 1986 and 1996; Bi‐etak et al., 1994; El‐Qady et al., 2003).
The majority of Egyptologists however fol‐lowed the theory of Pierre Monter, which states that Avaris and Piramesse were located at Tanis (Monter, 1957). It is the overwhelming evidence from many seasons of excavations that has fi‐nally changed the general opinion of scholars. Today Avaris and Piramesse are identified as Tell El‐Dabaa and Qantir respectively. Together they cover an area of approximately 12 sq. km from Qantir in the north to Ezbet Gayel and Ez‐bet Gezirat El‐Baghl in the south (Bietak, 1996).
Today a mound, with approximately 500 m diameter represents the remains of this vast town‐site. At the end of the last century the site was spread out more than 1Km westward, as far as the village of Khata’na and Ezbet Helmy on the eastern bank of Bahr Faqous, which follows the bed of the old Pelusiac branch of the River Nile (Fig. 1‐A) (Bietak, 1996). The current study is one step forward to discover and complete the overview subsurface pictures of the Tell El Dabaa area. To achieve this target, geophysical surveys using magnetic gradient and resistance measurements have been conducted using “FM36 Gradiometer and RM15 resistance meter” respectively. Results of the geophysical survey will help for planning the future excavation activities in the area based on scientific research work.
GEOPHYSICAL INVESTIGATION Most of the ancient architectural features in
Egypt were made of mud bricks and granite. Therefore, magnetic and electrical resistivity are the most effective archaeo‐geophysical tools for detecting such structures and the associated
GEOPHYSICAL INVESTIGATION AT TELL EL‐DABAA ʺAVARISʺ ARCHAEOLOGICAL SITE 53
fired remains, such as pottery, fire bricks and kilns, (Breiner, 1973; Abdallatif et al., 2003, Bates et al., 2007, ). In this work, the study area is surveyed using magnetic gradient and elec‐trical resistance scanning techniques to confirm the subsurface features.
1. Magnetic gradient survey
The magnetic gradient survey has been applied in this study as the gradient of the vertical components of the magnetic field or the difference between the readings of two sensors separated by specified short vertical distance was recorded. The survey was conducted using
FM36 fluxgate gradiometer with sensitivity of 0.1 nT (Geoscan Research, 1987). The gradiom‐eter emphasizes the near surface features and tends to cancel response of deeper of longer range features.
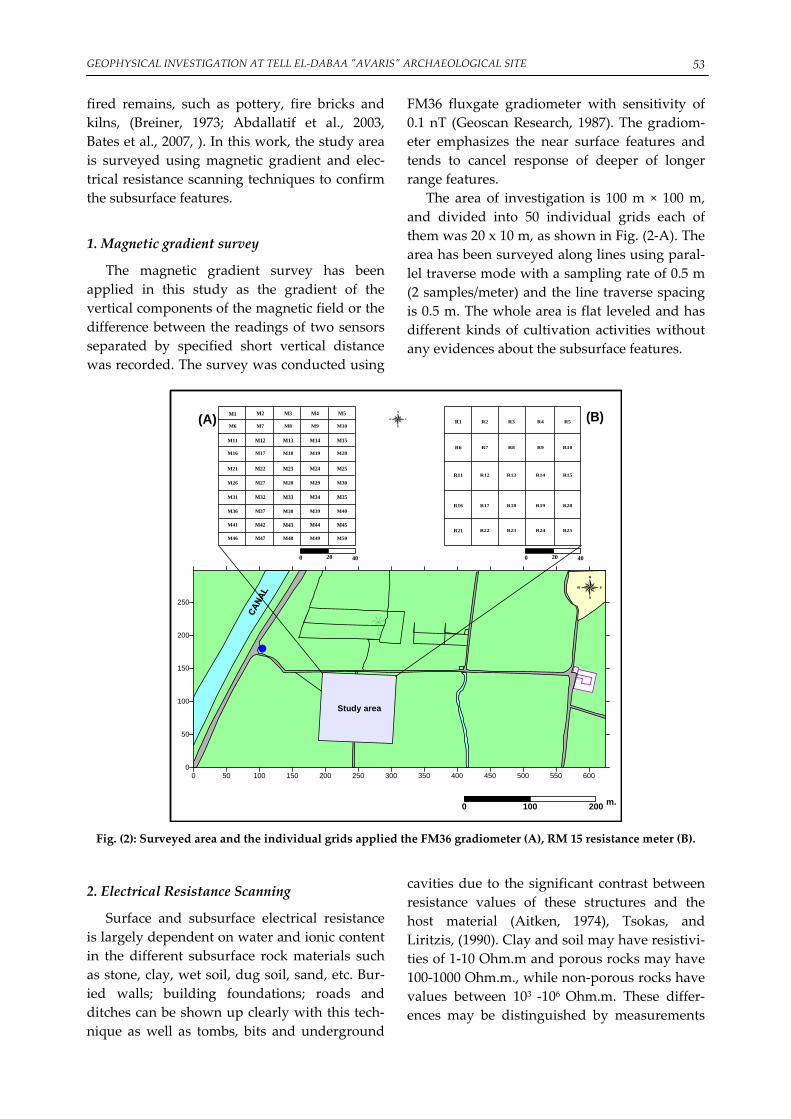
The area of investigation is 100 m × 100 m, and divided into 50 individual grids each of them was 20 x 10 m, as shown in Fig. (2‐A). The area has been surveyed along lines using paral‐lel traverse mode with a sampling rate of 0.5 m (2 samples/meter) and the line traverse spacing is 0.5 m. The whole area is flat leveled and has different kinds of cultivation activities without any evidences about the subsurface features.
0 50 100 150 200 250 300 350 400 450 500 550 6000
50
100
150
200
250
Study area
0 100 200 m.
M1
0 20 40
M6
M11
M16
M21
M2 M3 M4 M5
M7 M8 M9 M10
M12 M13 M14 M15
M17 M18 M19 M20
M22 M23 M24 M25
M31 M32 M33 M34 M35
M26 M27 M28 M29 M30
M36 M37 M38 M39 M40
M41 M42 M43 M44 M45
M46 M47 M48 M49 M50
R1 R2 R3 R4 R5
R6 R7 R8 R9 R10
R11 R12 R13 R14 R15
R16 R17 R18 R19 R20
R21 R22 R23 R24 R25
0 20 40
(A) (B)
Fig. (2): Surveyed area and the individual grids applied the FM36 gradiometer (A), RM 15 resistance meter (B).
2. Electrical Resistance Scanning
Surface and subsurface electrical resistance is largely dependent on water and ionic content in the different subsurface rock materials such as stone, clay, wet soil, dug soil, sand, etc. Bur‐ied walls; building foundations; roads and ditches can be shown up clearly with this tech‐nique as well as tombs, bits and underground
cavities due to the significant contrast between resistance values of these structures and the host material (Aitken, 1974), Tsokas, and Liritzis, (1990). Clay and soil may have resistivi‐ties of 1‐10 Ohm.m and porous rocks may have 100‐1000 Ohm.m., while non‐porous rocks have values between 103
‐106
Ohm.m. These differ‐
ences may be distinguished by measurements
A.I. TAHA A.I. 54
of resistivity of the ground, enabling archaeo‐logical remains to be discovered and planned.
The study area has been surveyed through‐out 25 grids each of them was 20 x 20 m, as shown in Fig. (2‐B). The distance between the measuring points is 1 m along a line, and the traverses spacing was 1 m, while the mobile electrodes spacing was 0.5 m. In the present study the Geoscan Resistance Meter (RM–15) has been used, with the twin‐array of electrodes configuration.
The twin electrode array was especially de‐signed for near surface investigations and par‐ticularly for the archaeological Prospection (Geoscan Research, 1993.). The system is quick, where up to 6000 readings can be acquired per day (Evan, 2003).
DATA PROCESSING
1. Geomagnetic data
The gradiometer survey is normally accom‐panied by some noise owing to the relatively high sensitivity of the instrument, weather con‐ditions at the survey time, and also the experi‐ence of the operator. Removal of these errors and noise are significant in order to enhance the presentation of the data obtained as well as fa‐cilitate the interpretation process in proper way.
The errors and noise in the current field data are mainly summarized as tilting of the FM36, discontinuities at grid edges, striping of trav‐erses and displacement of the obtained features. However, enhancement of the field data ob‐tained has also been extended to removing the effects of scattered iron objects at the surface and hidden high‐frequency clutters like cans, nails, iron sticks, and cables. Also using Geoplot program (Geoscan, 1994) was essential, which has many functions for remove noise and re‐duce errors effect, such as zero mean grid, zero mean traverse, despiking, destaggering, and multiply. The details of processing scheme were as follow:
1‐ The grid edge discontinuities are treated by the application of Zero Mean Grid (ZMG) with a threshold value of 2.5.
2‐ The stripes between traverses are re‐moved by the application of Zero Mean Trav‐erse (ZMT) with least mean square fit.
3‐ The data were clipped initially at ‐9/9nT to remove the high frequencies resulting from any expected surface iron spikes. Also, the despike function (K) is applied for more enhancement and good presentation.
Finally, the Gaussian Low‐Pass Filter (L) is applied to remove the high frequencies as well as to smooth and enhance the weak anomalies of deep archaeological features. The Low‐Pass Filter parameters are set to X and Y radii = 2.
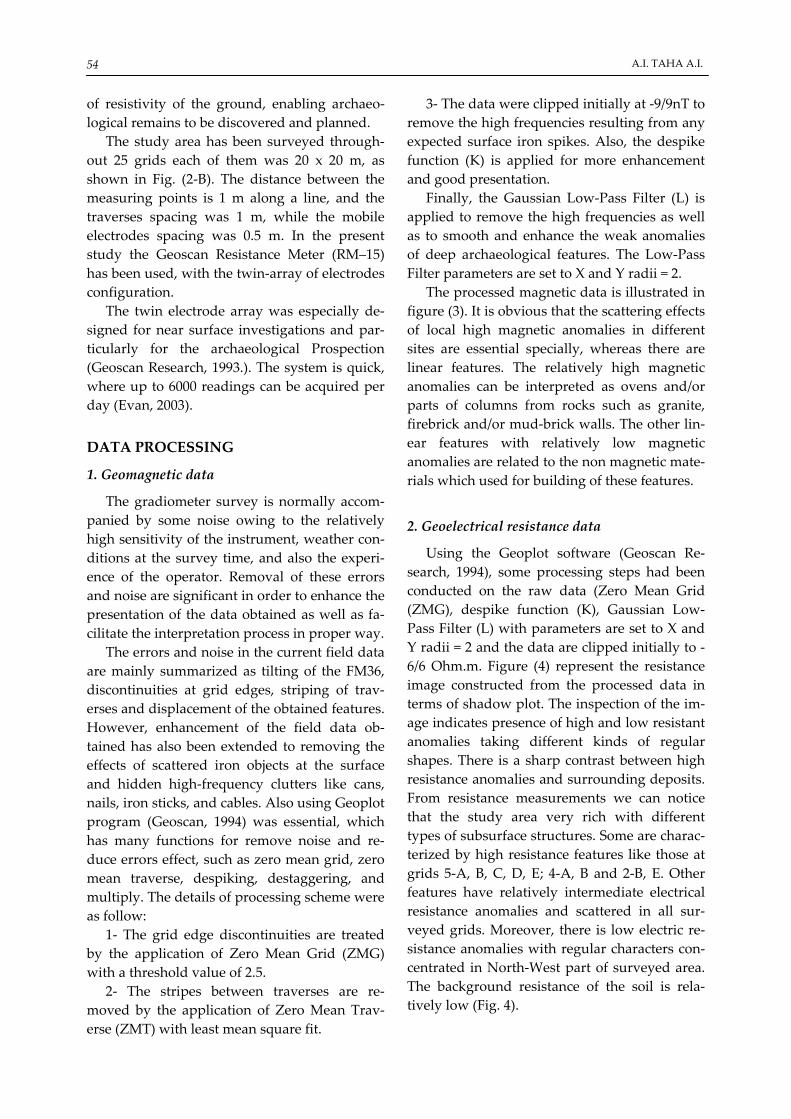
The processed magnetic data is illustrated in figure (3). It is obvious that the scattering effects of local high magnetic anomalies in different sites are essential specially, whereas there are linear features. The relatively high magnetic anomalies can be interpreted as ovens and/or parts of columns from rocks such as granite, firebrick and/or mud‐brick walls. The other lin‐ear features with relatively low magnetic anomalies are related to the non magnetic mate‐rials which used for building of these features.
2. Geoelectrical resistance data
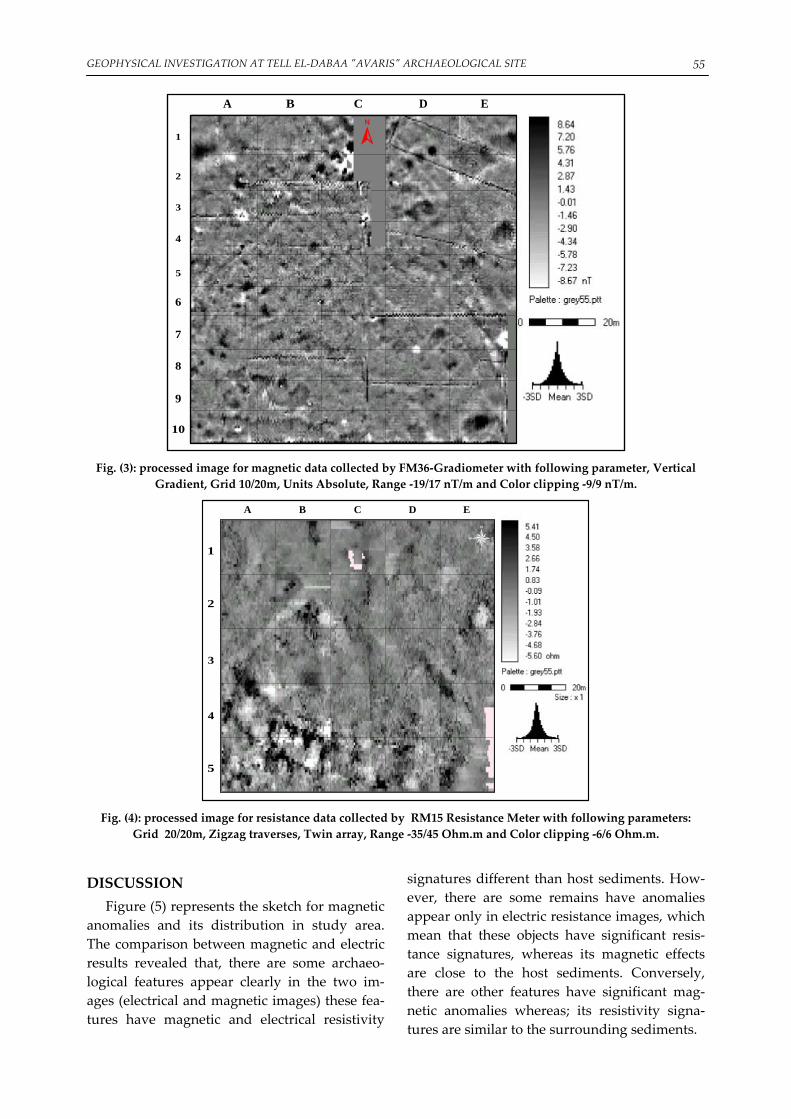
Using the Geoplot software (Geoscan Re‐search, 1994), some processing steps had been conducted on the raw data (Zero Mean Grid (ZMG), despike function (K), Gaussian Low‐Pass Filter (L) with parameters are set to X and Y radii = 2 and the data are clipped initially to ‐6/6 Ohm.m. Figure (4) represent the resistance image constructed from the processed data in terms of shadow plot. The inspection of the im‐age indicates presence of high and low resistant anomalies taking different kinds of regular shapes. There is a sharp contrast between high resistance anomalies and surrounding deposits. From resistance measurements we can notice that the study area very rich with different types of subsurface structures. Some are charac‐terized by high resistance features like those at grids 5‐A, B, C, D, E; 4‐A, B and 2‐B, E. Other features have relatively intermediate electrical resistance anomalies and scattered in all sur‐veyed grids. Moreover, there is low electric re‐sistance anomalies with regular characters con‐centrated in North‐West part of surveyed area. The background resistance of the soil is rela‐tively low (Fig. 4).
GEOPHYSICAL INVESTIGATION AT TELL EL‐DABAA ʺAVARISʺ ARCHAEOLOGICAL SITE 55
A B C D E
1
2
3
4
5
6
7
8
9
10
Fig. (3): processed image for magnetic data collected by FM36‐Gradiometer with following parameter, Vertical
Gradient, Grid 10/20m, Units Absolute, Range ‐19/17 nT/m and Color clipping ‐9/9 nT/m.
1
2
3
4
5
A B C D E
Fig. (4): processed image for resistance data collected by RM15 Resistance Meter with following parameters:
Grid 20/20m, Zigzag traverses, Twin array, Range ‐35/45 Ohm.m and Color clipping ‐6/6 Ohm.m.
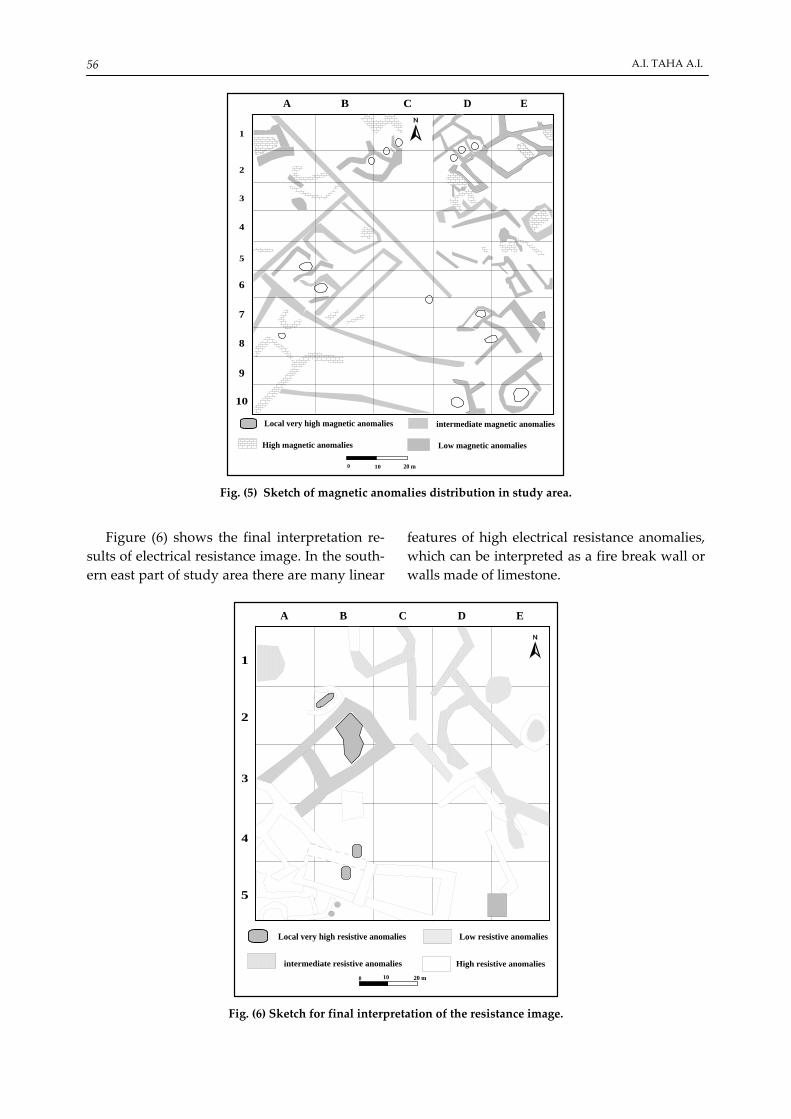
DISCUSSION Figure (5) represents the sketch for magnetic
anomalies and its distribution in study area. The comparison between magnetic and electric results revealed that, there are some archaeo‐logical features appear clearly in the two im‐ages (electrical and magnetic images) these fea‐tures have magnetic and electrical resistivity
signatures different than host sediments. How‐ever, there are some remains have anomalies appear only in electric resistance images, which mean that these objects have significant resis‐tance signatures, whereas its magnetic effects are close to the host sediments. Conversely, there are other features have significant mag‐netic anomalies whereas; its resistivity signa‐tures are similar to the surrounding sediments.
A.I. TAHA A.I. 56
0 10 20 m
A B C D E
1
2
3
4
5
6
7
8
9
10
High magnetic anomalies
Local very high magnetic anomalies intermediate magnetic anomalies
Low magnetic anomalies
Fig. (5) Sketch of magnetic anomalies distribution in study area.
Figure (6) shows the final interpretation re‐
sults of electrical resistance image. In the south‐ern east part of study area there are many linear
features of high electrical resistance anomalies, which can be interpreted as a fire break wall or walls made of limestone.
1
2
3
4
5
A B C D E
High resistive anomalies
Low resistive anomaliesLocal very high resistive anomalies
0 10 20 m
intermediate resistive anomalies
Fig. (6) Sketch for final interpretation of the resistance image.
GEOPHYSICAL INVESTIGATION AT TELL EL‐DABAA ʺAVARISʺ ARCHAEOLOGICAL SITE 57
The northern and western parts have many mud‐brick walls of regular shapes. This can be interpreted as part of big building; however, the increasing of the overburden clay content at‐tenuates its anomaly signature. In addition there are circular bodies that interpreted as some patches and pits distrusted along the surveyed site. At the junction of each two wall sides, there is a relatively high resistivity values. This high resistivity value could be interpreted as columns connecting the wall systems in the expected palace. However, we can notice that, the effective anomaly size of the interpreted structure (wall and columns) is affected by the type of the host sediments and almost its dimensions are larger than the real size that appears at some excavation sites near to the study area.
Correlating the archaeological features re‐sulted from geomagnetic gradient and resis‐tance measurements showed a good consistence between them at many sites. Contrarily, some features only appear in magnetic results and other only notice in electrical resistance results. So, it is generally essential to carry out the archaeological survey using more that one geophysical technique.
CONCLUSION The aim of the present study was to detect
the ancient remains located underneath the cul‐tivated land close to Tell El‐Dabaa archaeologi‐cal site using the magnetic and electrical resis‐tance surveys. The archaeological sites of tell El‐Dabaa and surrounding area has many differ‐ent types of archaeological remains such as tombs, palaces, houses and temples. These ar‐chaeological remains constructed from different types of materials such as fire‐brick, mud‐brick and/or stones.
Technically, the resistance and magnetic im‐aging surveys are powerful and sensitive tools for exploring the archaeological site at Tell El‐Dabaa area, which is believed to be the capital of the Hyksos, AVARIS. We could recommend a future planning to excavate this site. Addi‐tionally, further geophysical surveys are rec‐ommended in many parts of Tell El‐Dabaa like GPR and frequency domain electromagnetic. Applying many geophysical methods for Ar‐cheo‐geophysical Prospection help to detect all features in the area and reinforce the results of different tools.
ACKNOWLEDGEMENTS The authors are thankful to the Austrian Archaeological Institute, Cairo and Prof. Manfred
Bietak for their valuable information and guidance during the selecting and surveying the site. Also many thanks for team work of NRIAG. We appreciate the Egyptian supreme council of antiquities for permitting us to work at the site. We also appreciate the constructive comments by the editor and the two anonymous referees that help to improve the clarity of the manuscript.
REFERENCES Abdallatif, T.F; Mousa, S. E.; and Elbassiony, A. (2003) Geophysical Investigation for Mapping the
Archaeological Features at Qantir, Sharqyia, Egypt., Archaeological Prospection 10, 27–42. Aitken, M.J., (1974) Physics and archaeology, 2nd edn. London: Oxford University Press, Oxford. Bates R. Martin, C. Richard Bates, John E. Whittaker (2007) Mixed method approaches to the inves‐
tigation and mapping of buried Quaternary deposits: examples from southern England. Archaeological Prospection V. 14, Issue 2, 104‐129
Bietak M., (1986) Avaris and Piramesse: archaeological exploration in the eastern Nile Delta. Re‐vised reprint from the proceedings of the British Academy 65 (1979), 225‐296
Bietak M., (1991) Tell el‐Dab’a V: Ein Friedhofsbezirk der Mittleren Bronzezeitkultur mit Totentem‐pel und Siedlungsschichten. Untersuchungen der Zweigstelle Kairo des Österreichischen Ar‐chäologischen Institutes VIII. Vienna.
Bietak M., (1996) Avaris, the capital of the Hyksos, recent excavations at Tell El‐Dabaa. British Mu‐seum Press. 99 p.
A.I. TAHA A.I. 58
Bietak M., Dorner, J., Hein, I. and Jánosi, P., (1994) Neue Grabungesergebnisse aus Tell El‐Dabaa und Ezbet Helmi im Östlichen Nildelta (1981‐1991). Ägypten und Levante 4, 9‐58.
Bietak, M. (1979) Urban Archaeology and the ʺTown Problemʺ. In Weeks, K. (ed.) Egyptology and the Social Sciences. Cairo: American University in Cairo Press, 95‐144.
Bietak, M., (1975) Tell El‐Dabaa II. Der fundort im Rahmen einer archäeologischen‐geographischen Untersuchung über das ägyptische Ostdelta. Untersuchungen der Zweigstelle Kairo des Öster‐reichischen Archäologischen Institüt I. Vienna.
Breiner, S., (1973) Applications manual for portable magnetometer, Geometrics California, U.S.A. 58p. Egyptian Antiquities Information System Project (EAIS) (2005) Geographical Information System
cahiers of Sharqiya Governorate, In Antiquities, Egypt, 65p El‐Qady G., Soliman, N., Taha, A. and Dorner, J., (2003) Archaeological prospection in AVARIS, the
capital of Hyksos using geoelectrical resistance imaging. Journal of Geophysics of the National Research Institute of astronomy and geophysics (NRIAG), 2, 103‐113.
Evan G. Gurrison, (2003): Techniques in Archaeological Geology, Springer, 304p. Geoscan Research Resistance Meter RM‐15, (1993) Instruction Manual. Bradford: Geoscan Research. Geoscan Research. (1987) Instruction Manual Version 1.0 (Fluxgate Gradiometer FM9, FM18, FM36).
Geoscan Research: Bradford. Geoscan Research. (1994) Instruction Manual 1.01 (Geoplot 2.01). Geoscan Research: Bradford. Hesse, A., Jolivet, A., and Tabbagh, A., (1986) New prospects in shallow depth electrical surveying
for archaeological and pedological Applications. Geophysics, Vol. 51, 585‐594. Monter P, (1957) Géographie de lʹEgypte Ancienne, Première Partie. To‐Mehou, La Basse Egypte. Paris. Tsokas, G and Liritzis, I (1990) Resistivity prospecting in the centre of Athens for the detection of
buried antiquities. Prospezione Archeologishe, Quaderni 1, 133‐143.
Related Documents