Geomorphology/Archaeological Borings and GIS Model, 2014 New York/New Jersey Harbor Navigation Project Page 1 Contract No. DACW 51-01-D-0018-4 NEA Delivery Order 0065 Hunter Research, Inc. Project 06017 U.S. Army Corps of Engineers New York District Geomorphology/Archaeological Borings and GIS Model of the Submerged Paleoenvironment in the New York and New Jersey Harbor and Bight in Connection with the New York and New Jersey Harbor Navigation Project, Port of New York and New Jersey March 2014 Geoarcheology Research Associates 92 Main Street, Suite 207 Yonkers, New York 10701 Under subcontract and prepared in conjunction with: Hunter Research, Inc. 120 West State Street Trenton, New Jersey 08608-1185 Prepared for: Tetra Tech 451 Presumpscot Street Portland, Maine 04103 Under contract to: U.S. Army Corps of Engineers New York District CENAN-PL-EA, 26 Federal Plaza New York, New York 10278-0900

Welcome message from author
This document is posted to help you gain knowledge. Please leave a comment to let me know what you think about it! Share it to your friends and learn new things together.
Transcript

Geomorphology/Archaeological Borings and GIS Model, 2014 New York/New Jersey Harbor Navigation Project Page 1
Contract No. DACW 51-01-D-0018-4
NEA Delivery Order 0065
Hunter Research, Inc. Project 06017
U.S. Army Corps
of Engineers
New York District
Geomorphology/Archaeological Borings and GIS Model of
the Submerged Paleoenvironment in the New York and New
Jersey Harbor and Bight in Connection with the New York
and New Jersey Harbor Navigation Project, Port of New
York and New Jersey
March 2014
Geoarcheology Research Associates
92 Main Street, Suite 207
Yonkers, New York 10701
Under subcontract and prepared in conjunction with:
Hunter Research, Inc.
120 West State Street
Trenton, New Jersey 08608-1185
Prepared for:
Tetra Tech
451 Presumpscot Street
Portland, Maine 04103
Under contract to:
U.S. Army Corps of Engineers
New York District
CENAN-PL-EA, 26 Federal Plaza
New York, New York 10278-0900

Geomorphology/Archaeological Borings and GIS Model, 2014 New York/New Jersey Harbor Navigation Project Page 2
Geomorphology/Archaeological Borings and GIS Model of the Submerged
Paleoenvironment in the New York and New Jersey Harbor and Bight
In Connection with the New York and New Jersey Harbor Navigation Project
Port of New York and New Jersey
Prepared for:
Tetra Tech
451 Presumpscot Street
Portland, Maine 04103
Under Contract to:
U.S. ARMY CORPS OF ENGINEERS
NEW YORK DISTRICT
CENAN-PL-EA, 26 Federal Plaza
New York, New York 10278-0900
Prepared by:
Joseph Schuldenrein, Ph.D. (Principal Investigator)
Curtis E. Larsen, Ph.D. (Co-Principal Investigator)
Michael Aiuvaslasit, M.A.
Mark A. Smith, Ph.D.
Geoarcheology Research Associates
92 Main Street, Suite 207
Yonkers, NY 10701
Under subcontract to and prepared in conjunction with:
Hunter Research Inc.
120 West State St.
Trenton, N.J. 08608
Contract No. DACW 51-01-D-0018-4
NEA Delivery Order 0065
Hunter Research, Inc. Project 06017
Joseph Schuldenrein, Ph.D.
Principal Investigator
March 2014

Geomorphology/Archaeological Borings and GIS Model, 2014 New York/New Jersey Harbor Navigation Project Page 3
MANAGEMENT SUMMARY
Project Name. Geomorphology/Archaeological Borings and GIS Model of the Submerged
Paleoenvironment in the New York/New Jersey Harbor and Bight in Connection with the New
York and New Jersey Harbor Navigation Project, Port of New Jersey and New York, conducted
for the US Army Corps of Engineers, New York District (USACE-NYD).
Project Location and Environmental Setting. The project area designation is the New
York/New Jersey Harbor and includes a series of navigation channels of the Upper Bay
including Ambrose, Anchorage, Kill van Kull, Port Jersey, Newark Bay (South Elizabeth,
Elizabeth, Elizabeth Pierhead, Port Newark Pierhead, and Port Newark channels), and Bay Ridge
channels. Previous work has been done at these locations. New locations include Raritan Bay,
Lower Bay, and the area west of a line connecting Jones Inlet (Long Island) and Long Branch
(New Jersey).
Purpose and Goals. The primary objective of this investigation is to develop a model of the
submerged paleoenvironment. The model will function as a planning document to assist the
USACE-NYD and researchers in identifying areas that may have been suitable for prehistoric
and historic settlement and also to delimit areas in which stratigraphic sequences and intact Late
Quaternary landforms offer potential for preservation of prehistoric and historic surfaces and
sites.
This project will test and refine previous models of archaeological sensitivity thereby serving
as a blueprint to guide the USACE-NYD in the avoidance or mitigation of adverse impacts on
parcels designated for channel improvements.
Investigation Methods and Results. Examination and consolidation of previous research was
undertaken in advance of the present project. Prior to this study, a preliminary model of
archaeological sensitivity was assembled from baseline studies at select reaches in the Upper
Bay (Schuldenrein 2006). The present study extends the project area to the Lower Bay and began
with the systematic collection of cores aligned along three transects spanning the Lower Bay and
two to supplement earlier data collection in the Upper Bay. The transects were selected on the
basis of potential for yielding information in both closed and open marine and estuarine
environments that were considered to have strong potential for intact Late Quaternary
stratigraphy. The cores were identified for macrostratigraphy and were then dated and submitted
for specialized analysis by biostratigraphers (pollen, microfauna, and malacology) and geologists
(sediment stratigraphy and microstratigraphy). A key element in the study is the formulation of a
revised sea level curve for the New York Bight. The need for this baseline work was identified as
more detailed examination of the buried landform configurations and the stratigraphy
underscored trends that had not been recognized by earlier stratigraphers and geomorphologists.
The new data, and especially historic maps and Late Quaternary sequences, are being integrated

Geomorphology/Archaeological Borings and GIS Model, 2014 New York/New Jersey Harbor Navigation Project Page 4
into a Geographic Information Systems (GIS) platform to facilitate a multi-dimensional and
integrated landscape model that accommodates the changes registered by the specialists working
in each of the sub-disciplines. It also synthesizes the archaeological sensitivity model from a 3-
dimensional perspective. The model tracks spatio-temporal trends in landscape availability in
response to dynamically changing shore environments for the various periods in prehistory and
early history.
Regulatory Basis. The USACE-NYD is constructing navigation channels within the Port of
New York/New Jersey to a depth of 50 ft. The Corps as a federal agency is required to identify
the cultural resources within the project area and evaluate their eligibility for listing on the
National Register of Historic Places (NRHP).
The Federal statutes and regulations authorizing the Corps to undertake these responsibilities
include Section 106 of the National Historic Preservation Act, as amended through 1992 and the
Advisory Council on Historic Preservation Guidelines for the Protection of Cultural and Historic
Properties (36 CFR Part 800).

Geomorphology/Archaeological Borings and GIS Model, 2014 New York/New Jersey Harbor Navigation Project Page 5
Contents MANAGEMENT SUMMARY .................................................................................................. 3
Contents ....................................................................................................................................... 5
List of Figures ............................................................................................................................. 7
List of Tables ............................................................................................................................... 9
Chapter 1: Overview and Introduction ......................................................................................... 10
Chapter 2: Research Design .......................................................................................................... 19
Geoarchaeological Investigations to Date ................................................................................. 23
Baseline Model of Cultural Resource Sensitivity ..................................................................... 25
Structuring a Model: Holocene Environments, Site Geography, and Historic Impacts ........... 25
Toward a Working Model of Cultural Resource Sensitivity..................................................... 31
Testing the Model...................................................................................................................... 34
Chapter 3: Relative Sea level Rise along the Mid-Atlantic Coast ................................................ 35
Global Eustatic Sea Level ......................................................................................................... 35
Relative Sea Level Change along the Atlantic Coast ................................................................ 38
Comparative Holocene Sea Level Curves ................................................................................. 40
Development of an Accurate Local Relative Sea Level Curve ................................................. 43
Detailed Reconstruction of the past 3,000 Years ...................................................................... 46
Chapter 4: Geological and Environmental Setting ....................................................................... 53
Physiography and Bedrock Geology ......................................................................................... 53
Pleistocene Glaciation, Chronology, and Paleoecology............................................................ 54
Post-Pleistocene Geography ...................................................................................................... 65
Chapter 5: Sediment Cores ........................................................................................................... 67
Raritan Bay ................................................................................................................................ 69
Upper New York Harbor ........................................................................................................... 85
Jamaica Bay............................................................................................................................... 97
Chapter 6: Paleoecological Overview ......................................................................................... 100
Previous Studies ...................................................................................................................... 100

Geomorphology/Archaeological Borings and GIS Model, 2014 New York/New Jersey Harbor Navigation Project Page 6
Detailed Studies from Tappan Zee .......................................................................................... 102
Applications to New York Harbor .......................................................................................... 104
Chapter 7: Environmental Reconstruction and Prehistoric Landscape....................................... 107
Chapter 8: The Archaeological Geography of Human Settlement and Site Preservation .......... 126
Chapter 9: Assessing the Potential for Preserved Prehistoric Sites ............................................ 142
Previous Work ......................................................................................................................... 142
Raritan Bay and the Arthur Kill Channel ................................................................................ 142
Western Long Island, the Narrows, and Ambrose Channel .................................................... 146
Jamaica Bay............................................................................................................................. 148
The Inner New York Bight...................................................................................................... 149
Upper New York Harbor and Newark Bay ............................................................................. 150
Chapter 10: Conclusions and Recommendations ....................................................................... 159
Previous Results and Follow up Fieldwork............................................................................. 154
Integrating the matrix of buried landscapes and archaeological relationships:
The GIS model ................................................................................................................... 155
Recommendations: An archaeological probability model for planning.................................. 158
References ............................................................................................................................... 160
Appendix A Borings (cores and data) ..................................................................................... 170
Appendix B Radiocarbon Ages ............................................................................................... 190
Appendix C Mollusc Analysis ................................................................................................ 197
Appendix D-E Foraminiferal & Pollen Analysis .................................................................... 202
Appendix F Qualifications of Project Personnel ..................................................................... 210
Appendix G Scope of Work .................................................................................................... 229

Geomorphology/Archaeological Borings and GIS Model, 2014 New York/New Jersey Harbor Navigation Project Page 7
List of Figures Figure 1.1: Location map for New York Harbor. ......................................................................... 14
Figure 1.2: Upper New York Harbor and Newark Bay. ............................................................... 15
Figure 1.3: Lower New York Harbor and Raritan Bay. ............................................................... 16
Figure 2.1: Erroneous Subsurface Profile from Seguine Point, Staten Island, NY to Union
Beach, NJ. (MacClintock and Richards 1936, cited in Bokuniewicz and Fray 1979). ........... 20
Figure 2.2: Mammoth and mastodon finds on the Continental Shelf and known Paleoindian and
Early Archaic sites. .................................................................................................................. 27
Figure 2.3: Example of archaeological sensitivity denotation. ..................................................... 32
Figure 3.1: Eustatic sea level results (a) from the Last Glacial Maximum to the present day,
and (b) for the Holocene. The initial nominal eustatic curve Δζnesl (solid) and a modified
eustatic
curve Δζmesl (dotted) are also shown (from Fleming et al. 1998). ......................................... 37
Figure 3.2: Relative rates of sea level rise along the Atlantic Coast as recorded by tide gauges.
The rise in rates of subsidence (PGR) delineates the area of proglacial forebulge (figure
provided by C.E. Larsen and I. Clark). .................................................................................... 39
Figure 3.3: Comparison of tide gauges of long term bedrock founded sites. Each site shows a
Rate of rise of 2.9 to 3.0 mm/yr (0.12 in/yr). ........................................................................... 41
Figure 3.4: Comparative trends of Holocene sea level along the Mid-Atlantic Coast (adapted
from Larsen and Clark, 2006). ................................................................................................. 42
Figure 3.5: Relative sea level at New York determined from 14C-dated brackish marsh
deposits and peats. ................................................................................................................... 44
Figure 3.6: Comparison of Pre and Post 7000 cal yrsbp Sea Level Trends. The green line
represents dated oyster reefs in the Tappan Zee area (Carbotte et al., 2004) .......................... 46
Figure 3.7: Zonation of saltmarsh vegetation (provided by C.E. Larsen and I. Clark). ............... 48
Figure 3.8: Lateral marsh accretion under constant sediment supply and stable mean sea level
(provided by C.E. Larsen and I. Clark). ................................................................................... 49
Figure 3.9: Saltmarsh response to sea level rise (provided by C.E. Larsen and I. Clark). ........... 50
Figure 3.10: Detailed Reconstruction of Late Holocene Sea Level Variation. ............................ 52
Figure 4.1: Surficial geology of the New York area. .................................................................... 57
Figure 4.2: Glaciation of New York and New Jersey (from Stone et al. 2002). ........................... 59
Figure 4.3: Proglacial lakes in the New York Harbor area (from Stone et al. 2002). .................. 61
Figure 4.4: 1844 3D bathymetry of New York Harbor viewed from the south. ........................... 62
Figure 4.5: Seismic profile east of the Narrows (from Thieler et al. 2007). ................................. 64
Figure 5.1: Core recovery, Raritan Bay. ....................................................................................... 68
Figure 5.2: Processing core samples, Alpine Ocean Seismic Surveys, Inc. ................................. 71
Figure 5.3: Cores prepared for curation at the Caven Point facility. ............................................ 71
Figure 5.4: Raritan Bay transects along profiles I-I’, II-II’, and III-III’ as well as assembled
study core locations.................................................................................................................. 72
Figure 5.5: Seguine Point-Union Beach transect. ......................................................................... 73

Geomorphology/Archaeological Borings and GIS Model, 2014 New York/New Jersey Harbor Navigation Project Page 8
Figure 5.6: Stratigraphic profile I-I’, Seguine Point to Union Beach. .......................................... 77
Figure 5.7: 40-ft vibracore, Raritan Bay. ...................................................................................... 78
Figure 5.8: Keansburg transect. .................................................................................................... 79
Figure 5.9: Stratigraphic profile II-II’, Keansburg to Hugenot Beach. ........................................ 83
Figure 5.10: Great Kills- Sandy Hook profile III-III.’ .................................................................. 84
Figure 5.11: Coring along Liberty Island. .................................................................................... 96
Figure 5.12: Upper Harbor core locations showing new cores along profiles IV-IV’ and V-V.’ 87
Figure 5.13: Liberty Island transect. ............................................................................................. 92
Figure 5.14: Liberty Island stratigraphic profile IV-IV. ............................................................... 88
Figure 5.15: Bay Ridge Flats transect. .......................................................................................... 93
Figure 5.16(a): Port Jersey-Bay Ridge Flats stratigraphic profile V-V’, western section. ........... 95
Figure 5.16(b): Port Jersey-Bay Ridge Flats stratigraphic profile V-V’, eastern section. ............ 96
Figure 5.17: Jamaica Bay core locations. ..................................................................................... 97
Figure 6.1: Relative sea level compared with Tappan Zee oysters, salinity, and
unconformities. ...................................................................................................................... 105
Figure 7.1: 1844 Bathymetry of project area showing modern shoreline................................... 108
Figure 7.2: Sea level ca. 9,000 cal yrsbp (ca. 8,000 B.P.) at -22 m (-72 ft), Early Archaic. ...... 109
Figure 7.3: Sea level ca. 8,000 cal yrsbp (ca. 7,000 B.P.) at -16 m (-52 ft), Middle Archaic. ... 111
Figure 7.4: Sea level ca. 7,000 cal yrsbp (ca. 6,000 B.P.) at -10.7 m (-35 ft), Middle Archaic
to Late Archaic transition....................................................................................................... 112
Figure 7.5: Sea level ca. 6,000 cal yrsbp (5,200 B.P.) at -9 m (-30 ft), Late Archaic. ............... 113
Figure 7.6: Sea level ca. 5,000 cal yrsbp (ca. 4,500 B.P.) at -7.6 m (-25 ft), Late Archaic. ....... 116
Figure 7.7: Sea level ca. 4,000 cal yrsbp (ca. 3,700 B.P.) at -6 m (-20 ft), Late Archaic. .......... 117
Figure 7.8: Sea level ca. 3,000 cal yrsbp (ca. 3,000 B.P.) at -4.5 m (-15 ft), Late Archaic to
Early Woodland Transition. ................................................................................................... 118
Figure 7.9: Sea level ca. 2,000 cal yrsbp (ca. 2,000 B.P.) at -3 m (-10 ft), Early to Middle
Woodland Transition ............................................................................................................. 121
Figure 7.10: Sea level ca. 1,000 cal yrsbp (ca. 1,000 B.P.) at -1.5 m (-5 ft) .............................. 122
Figure 7.11: 1844 sea level and shoreline model. ....................................................................... 124
Figure 7.12: Historic bathymetric change 1844-1985. ............................................................... 125
Figure 8.1: Modern dredged navigation channels overlaid on 1844 map of New York Bay
and Harbor (US Coast Survey 1844). .................................................................................... 130
Figure 8.2: Dutch settlement on the Hudson in 1639 (Vingboons 1639). .................................. 133
Figure 8.3: Governors Island and the Buttermilk Channel (US Coastal Survey 1844). ............. 134
Figure 8.4: Historic dredging 1934 to 1980. ............................................................................... 139
Figure 8.5: Shoreline change in the Upper Harbor since 1844. .................................................. 140
Figure 9.1: Composite map of archeological potential superimposed on bathymetry of the
Lower Harbor and Inner Bight. .............................................................................................. 144
Figure 9.2: Composite map of archaeological potential superimposed on bathymetry of the
Upper Harbor and Newark. .................................................................................................... 152

Geomorphology/Archaeological Borings and GIS Model, 2014 New York/New Jersey Harbor Navigation Project Page 9
Figure 10.1: 3D view of sensitivity model and borings. ............................................................. 156
List of Tables Table 5.1: Average Penetration and Recovery by Transect .......................................................... 68
Table 10.1: Probability Model and Recommended Strategies for Planning ............................... 159
Geomorphology/Archaeological Borings and GIS Model, 2014 New York/New Jersey Harbor Navigation Project Page 10
Chapter 1
Overview and Introduction
OVERVIEW
This report presents data, results and recommendations from a multidisciplinary study of
the history and prehistory of New York and New Jersey Harbor, and part of the New York Bight
and Jamaica Bay. Primary outcomes of the research have been the development of a fuller, and
more thoroughly documented understanding of the human and physical geography of the
presently submerged landscapes surrounding the metropolitan New York City. The study is a
synthetic narrative linking the past 15,000 years of environmental change and human occupation.
The objective of the work is the creation of an archaeological sensitivity model for this complex
setting that enables planning agencies to mitigate the effects of development on irreplaceable
cultural resources.
The study supports the U.S. Army Corps of Engineers, New York District (USACE-
NYD) in its mission and responsibilities. As an agency of the Federal Government, the District
must include in its planning and programming the identification and appropriate treatment of
historic properties on or, eligible for, the National Register of Historic Places. This responsibility
is codified in Sections 110 and 106 of the National Historic Preservation Act of 1966 (as
amended) and in the associated regulations for Section 106 at 36 CFR Part 800.
The District’s responsibilities for New York Harbor navigation include the design,
implementation and oversight of undertakings that have the potential to adversely affect historic
properties (primarily archaeological sites). The challenge facing the District is how best to
identify, evaluate and appropriately treat such historic properties, given the effects of
contemporary human impacts on the estuarine and marine settings fronting the harbor.
This study is characterized as a ―blueprint for assisting…in isolating and delimiting areas
that might have been available for settlement during the prehistoric and historic past‖ (page 153).
In other words, while the scope of the project did not envisage the identification of specific
archaeological sites, locations where they are likely to remain can be mapped. Figure 9.1,
Figure 9.2 and Figure 10.1 therefore provide a three-part archaeological sensitivity assessment
of the study area which can be used in the District’s Planning process.

Geomorphology/Archaeological Borings and GIS Model, 2014 New York/New Jersey Harbor Navigation Project Page 11
Since the focus of the study is on the potential of this environment to retain significant
evidence of past human activity, the chronological range is from about 15,000 years ago (when
the area first became viable for human occupation) until the present.
The signal environmental mechanism accounting for landscape change during this period
has been the punctuated but ongoing rise in sea level and the consequent flooding and
submergence of formerly dry-land areas. While general trends in sea level rise have been
generally understood for decades, a major contribution of the current study has been to revise
and calibrate the rates and extents of this process (known as the late Quaternary marine
transgression) through time. A model charting the transgressive cycle has been developed in
detail through the integration of diverse but complementary data sets. The study has assimilated
information from sea-bed borings (including a program of vibracores specifically included in the
study), landform relations, sequence stratigraphy, radiocarbon dating, and from pollen,
foraminifera, and molluscan studies.
The comprehensive revision of the sea-level curve for the New York Bight represents a
stand-alone product that incorporates multi-disciplinary data sets generated both from this report
and records obtained from published and unpublished sources. It constitutes a significant
contribution to the understanding of post-glacial sea-level change on the Atlantic coast of the
United States. Moreover, it serves as a guideline for calibrating the former levels of terrestrial
surfaces that once marked the edges of the transgressive sea. In this sense they allow
archaeologists to determine positions of the migrating coastline to various periods in prehistory
and history.
Based on the newly calibrated curve, it is hypothesized that at the height of the last
glaciation (about 20,000 years ago) the oceans were almost 100 m (328 ft) below their present
level. As the rapidly melting ice sheets returned huge amounts of water to the oceans there was a
rapid rise in the first part of the study period (up to 9 mm/0.35 in per year), but in more recent
millennia rates of sea level rise slowed appreciably. Rates were on the order of 1.5 to 1.6 mm
(less than a tenth of an inch) per year. Within this general pattern there were fluctuations in the
rate of rise. Between 2000 and 3000 years ago, for example, there was a pause (or ―stillstand‖)
which was long enough for a shoreline terrace to develop about 4.5 meters (15 feet) below
present sea level.

Geomorphology/Archaeological Borings and GIS Model, 2014 New York/New Jersey Harbor Navigation Project Page 12
A model of this type has critical implicaions for assessing both the prehistoric location
and preservation of archaeological sites. Periods of faster sea-level rise may be conducive to the
preservation of sites because of the possibility of rapid burial by sediments, while slower rates of
marine transgression can leave sites more exposed to erosion. The inverse may also be true. Thus
sediment composition and vegetation records contained within the strata inform as to how these
deposits were laid down and whether or not erosion or deposition were favored. In some
instances rapid sedimentation by flooding resulted in accelerated erosion while slow accretion
served to bury sites in place. In general the present study suggests that sites from earlier
prehistoric periods (Paleoindian through Middle Archaic, down to about 7000 years ago) have a
better chance of survival in the study area than those from later prehistory. Later prehistoric sites
are also more vulnerable to the massive modifications (both filling and removal) that have taken
place in historic times since the 17th century, and particularly from the mid-19th century to the
present. Historic-period resources are likely to be quite numerous, especially in shoreline or
near-shoreline locations where they have been submerged and/or filled.
Taken together the refinement and restructuring of geo-archaeological relations have
resulted in a document that provides a utilitarian baseline for planning decisions for the U.S
Army Corps of Engineers as it continues to plan for long term maintenance of its navigation
channel network. The systematics of geomorphology, sea-level rise, prehistoric and historic
settlement geography and, most recently, the large scale impacts of accelerated human impacts
on the sea floor are all taken into account in fashioning this planning document for preservation
compliance. The geoarchaeological models advanced herein will be put to the test in coming
years as planners move ahead in their design and channel maintenance efforts.
Introduction
The US Army Corps of Engineers, New York District (USACE-NYD) is responsible for
maintenance of harbors and waterways and is actively involved in dredging existing channels
and deepening others to allow greater access to the Port of New York and New Jersey (the
Harbor Navigation Project) (Figure 1.1, Figure 1.2, and Figure 1.3). Ongoing and anticipated
changes involve widening and deepening channels to a depth of 50 ft in specific areas. As a
federal agency, the USACE is required to identify cultural resources within its project areas and
to evaluate their potential for eligibility for listing on the National Register of Historic Places
(NRHP). Federal statutes and regulations identifying these responsibilities include Section 106 of
the National Historic Preservation Act, as amended through 1992 and the Advisory Council on
Historic Preservation Guidelines for the Protection of Cultural and Historic Properties (36 CFR
Geomorphology/Archaeological Borings and GIS Model, 2014 New York/New Jersey Harbor Navigation Project Page 13
Part 800). These responsibilities extend to both land-based and submerged cultural resources. In
terms of the Harbor Navigation Project, the shore and near-shore areas of the New York and
New Jersey harbors have been subject to filling or removal of former coastal past terrain
segments that once sustained and preserved evidence of historic and prehistoric activities.
A critical aspect to understanding the systematics of archaeological preservation in the New
York Harbor complex has been the documented progressive encroachment of sea level on the
adjacent land areas. Sea level has risen as much as 100 m since the last glaciation of North
America ended approximately 20,000 years ago. Rising sea level has progressively inundated the
continental shelves and continues to raise, flood, and cover coastal lands. The post-glacial rise in
sea level has covered former land surfaces that were attractive as settlements for prehistoric
peoples throughout this time period. While the probability of affecting ―drowned‖ cultural
resources seems remote, the potential for their identification and protection need to be
considered. One of the most efficient methods for avoiding disturbance of submerged cultural
resources is to identify and evaluate the former areas of greatest site potential in their former
subaerial site settings. Just as land-based cultural resources studies address the potential for
archaeological sites on the basis of the geologic and geomorphic settings best suited for past
settlement, so too may these same tools be adapted to identifying potential underwater sites. One
of the more effective methods of addressing the latter approach is through modeling the rise of
post-glacial sea level and the interaction between the sea and its contemporaneous coastal zone
through time. Thus, the interface between land and sea, and related coastal, riverine, and marsh
environments, can be tracked over time and space to provide clues to which of these loci have
the greatest potential for in situ cultural resources. Similarly, the study of offshore stratigraphy
from cores aids both to document the position and timing of past sea level stands and to provide
fossil pollen and faunal samples for reconstruction of former vegetation and estuarine
environmental changes.
As part of USACE’s Section 106 compliance activities related to the Harbor Navigation
Project, extensive background research was conducted to examine past studies and especially the
logs of the numerous cores taken in the project area. In addition, a series of vibracores was
collected in key locations within the Upper and Lower Harbors and Jamaica Bay to aid in the
description and dating of sediments, and to provide new samples for micropaleontological
analyses. These cores, together with the records of cores from previous studies, helped to
determine locations within areas of proposed deepening and widening that may preserve
significant irreplaceable data on paleoenvironments as well as now submerged landforms.

Geomorphology/Archaeological Borings and GIS Model, 2014 New York/New Jersey Harbor Navigation Project Page 14
Fig
ure
1.1
: L
oca
tio
n m
ap
fo
r N
ew Y
ork
Ha
rbo
r

Geomorphology/Archaeological Borings and GIS Model, 2014 New York/New Jersey Harbor Navigation Project Page 15
Fig
ure
1.2
: U
pp
er N
ew Y
ork
Ha
rbo
r an
d N
ewa
rk B
ay

Geomorphology/Archaeological Borings and GIS Model, 2014 New York/New Jersey Harbor Navigation Project Page 16
Fig
ure
1.3
: L
ow
er N
ew Y
ork
Ha
rbo
r an
d R
ari
tan
Ba
y

Geomorphology/Archaeological Borings and GIS Model, 2014 New York/New Jersey Harbor Navigation Project Page 17
Prior studies conducted by Geoarcheology Research Associates (GRA) for the USACE-NYD
related to submerged cultural resources in the New York/New Jersey Harbor complex, along
with investigations performed by others that are on file with the USACE-NYD, provided data for
this larger synthetic model of the now submerged landforms and the probability of their
preservation. The model is important for determining areas of sensitivity for past Native
American occupation. Previous work by GRA demonstrated the feasibility of archaeological
sensitivity modeling and determined areas where additional data should be acquired. The present
report is the culmination of working model concepts attained through these earlier studies. Apart
from the acquisition and analysis of past reports and data, GRA designed and implemented a
strategic subsurface exploration program. A total of 20 new vibracores were extracted in
November 2006 and 2007 to investigate stratigraphic and temporal relationships not addressed in
previous geotechnical borings and cores, and to develop a more detailed relative sea level history
than was formerly available.
On the basis of the material provided in the present study, together with the vast core
database provided by the USACE, GRA has developed an inundation model of the Upper New
York Harbor and Raritan Bay together with portions of the New York Bight and Jamaica Bay.
The graphic model shows approximate prehistoric shoreline positions on a 1,000-year
incremental basis that delineates former coastal landforms and helps to pinpoint the
contemporaneous environmental settings now submerged beneath the harbor. The provided maps
will help to visualize the characteristics of the changing New York and New Jersey shorelines in
time and space while at the same time suggesting the habitats most conducive for past human
settlement over this period.
The project GIS was used to georeference an 1844 U.S. Coastal Survey map of the New
York Harbor region. Almost 12,000 bathymetric soundings were digitized from this map and a
digital elevation model (DEM) of the seabed created via a kriging algorithm. This DEM formed
the baseline for sea level regression images as it models the submerged landscape of the harbor
region before industrial-era dredging activities dramatically transformed it. The GIS was also
used to consolidate locational and stratigraphic information from geotechnical borings from a
large number of previous studies along with those carried out under the aegis of the current one.
Previous studies had recorded boring locations in a number of different coordinate systems (e.g.,
NJ or NY state plane, UTM, unprojected latitude/longitude). These loci were reprojected into a
single system and all available stratigraphic information was entered into a single database that
was used within the GIS to visualize and analyze the information in three dimensions.
The present study envisions the submerged landscape of the New York Bight as a series of
ancient land surfaces that sustained human populations since the arrival of people into the New
World. The detection of these surfaces and their systematic destruction or preservation and burial
is the purpose of the work in order to satisfy the obligations of the USACE-NYD under Section
106 of the National Historic Preservation Act (Chapter 1). A variety of previous studies have

Geomorphology/Archaeological Borings and GIS Model, 2014 New York/New Jersey Harbor Navigation Project Page 18
probed the subaqueous sediments underlying the Bight for paleoenvironmental and
paleogeographic purposes. This present study is synthetic and proposes to integrate and refine
previous models of the buried landscape into a comprehensive GIS-based construct for buried
site potential across the New York Bight (Chapter 2). The model is centered on a new paradigm
for sea level rise that is derived from regional models for the Atlantic Coast bolstered by a coring
program explicitly designed for this project (Chapter 3). The geological, bathymetric,
geomorphic, and hydrographic foundations for the new landscape reconstructions are developed
(Chapter 4) and the detailed paleoenvironmental results are presented on the basis of the new
corings for select portions of the Bight (Chapter 5). A systematic paleoenvironmental
reconstruction for the Late Quaternary is then presented, largely driven by the new sea level
curve, and by interpretations generated from biostratigraphic investigations of the sediment cores
(Chapter 6 and Chapter 7). This construct is the basis for a proposed settlement model that
plots the surfaces and landscapes that were sequentially available for settlement through time
(Chapter 8 and Chapter 9). A series of results and recommendations concludes the presentation
(Chapter 10). Supporting data sets are incorporated as Appendices. Details of the most recent
vibracores, including photographs and stratigraphies, appear in Appendix A. A compilation of
all available marine radiocarbon dates are featured in a table in Appendix B. Appendix C is a
contribution by Dr. Lynn Wingard on molluscan fauna from the most recent cores. Appendix D
is a contribution by Dr. Benjamin Horton, who reports on the foraminifers. Appendix E presents
a pollen analysis by Christopher Bernhard. The qualifications of all contributors appear in
Appendix F. Appendix G is the final ―Scope of Work‖ for this project.

Geomorphology/Archaeological Borings and GIS Model, 2014 New York/New Jersey Harbor Navigation Project Page 19
Chapter 2
Research Design
Previous investigations of the New York Harbor, focused on evaluating the potential for
submerged prehistoric and historic cultural resources for the Harbor Navigation Project, have
relied heavily on the post-glacial rise in sea level to identify, isolate, and explain relative site
potential. The history of sea level rise is important because it facilitates reconstruction of the
now-submerged former environmental zones, both riverine and marine, that were once most
conducive to human habitation. It became clear during the evaluation of these earlier studies that
the prevailing models for sea level change were dated and could not accommodate the
chronologies and sequences that emerged from the expanding database. Moreover, regional
(Atlantic Coast) sea level models have produced curves that were more in line with observations
from this study. Hence, the interpretations drawn from subsurface coring in the harbor for the
purpose of environmental reconstruction were flawed. To remedy this shortcoming, GRA
invested resources as part of the current study to develop a revised relative sea level model that is
up to date and accurate for both geological and archaeological researchers as well as engineers
and planners.
The fieldwork, conducted in November 2006 and 2007 sea level and utilizing the vibracoring
equipment of Alpine Ocean Seismic Survey, Inc., Norwood, NJ, investigated three specific areas,
Raritan Bay, Upper New York Harbor, and Jamaica Bay. Raritan Bay was chosen to address two
questions. Firstly, given that much of the present array of cultural resource investigations has
been aimed at the upper New York Harbor, GRA needed firsthand knowledge of Raritan Bay to
observe and assess the effect of rising sea level on coarse-grained sandy sediments in a relatively
sheltered environment. Secondly, previous investigations had cited a 1936 study (MacClintock
and Richards 1936, cited in Bokuniewicz and Fray 1979) that showed early borings for a
proposed bridge crossing from Staten Island (Figure 2.1). This model had been central to
previous reconstructions of New York Harbor stratigraphies. A profile across Raritan Bay
documented a deeply incised channel near the Staten Island shore filled with ―mud.‖ The channel
was recorded as extending 45.7 m (150 ft) below present sea level. Obtaining a deep core from
the ―mud‖ fill of this channel for use in pollen, foraminifer analysis, and radiocarbon dating of
organics would provide a record of continuous deposition of fine-grained sediment that
documented the post-glacial rise in sea level. Radiocarbon dating of this deep sequence promised
to aid in dating the marine transgression. Furthermore, data from this core was anticipated to
make an important contribution as the original work has been cited by many past researchers and
was apparently unstudied since 1936.

Geomorphology/Archaeological Borings and GIS Model, 2014 New York/New Jersey Harbor Navigation Project Page 20
Figure 2.1: Erroneous Subsurface Profile from Seguine Point, Staten Island, NY to Union Beach, NJ. (MacClintock
and Richards 1936, cited in Bokuniewicz and Fray 1976).
Staten Island, NY Union Beach, NJ
Geomorphology/Archaeological Borings and GIS Model, 2014 New York/New Jersey Harbor Navigation Project Page 21
Nine 12 m (40 ft) vibracores were extruded along two transects in Raritan Bay. These cores
are discussed in detail in Chapter 6. A series of five vibracores was placed to reconstruct the
MacClintock and Richards (1936) profile between Seguine Point on Staten Island and
Conaskonk Point at Union Beach, NJ. The transects provided compelling evidence that the 1936
study was erroneous in its findings. There was no deeply incised channel in any of the locations
shown in this early study.
Subsequent researchers are warned to avoid further use of that study. Four additional 12 m
(40 ft) vibracores were located along a transect normal to the shoreline at Keansburg, NJ. This
series of cores was drilled to record the effects of the marine transgression on a sandy shore
subjected to relatively low wave energy. As anticipated, reworked surficial sands were evident.
Although it was hoped that wave energy here had been subdued sufficiently to preserve possible
paleosols or other evidence of the prior subaerial land surface, these could not be distinguished.
Upper New York Harbor investigations also utilized 12 m (40 ft) vibracores. Two transects
were located to address questions raised by earlier GRA studies centered on the Port Jersey area
along the west bank of the Hudson River (Schuldenrein et al. 2001). A radiocarbon profile in that
study showed an apparent anomalous stratigraphic arrangement of time horizons in estuarine silts
and clays. Here cores taken at greater depths on the edge of the estuarine fill adjacent to the
Anchorage Channel had younger ages than those further inland. This juxtaposition of ages was
counter to the concept of how the marine transgression could be dated. An earlier report
suggested that the anomalous and apparently inverted stratigraphy might relate to a period of
lower sea level during the overall rise. Alternately, the inverted stratigraphy might reflect
slumping of the channel edge.
A series of 40 ft vibracores taken in a similar setting provided an independent view of the
stratigraphy and was geared to penetrate the estuarine fill to reach the pre-marine transgressive
land surface. This transect was located south of the Liberty Island access channel on relatively
undisturbed estuarine silt. Vibracores from shallow (1.8 m/6 ft) to greater (15.5 m/51 ft) depths
broadly paralleled the earlier Port Jersey transect. Only the innermost core (C-1) penetrated the
estuarine fill and furnished organics suitable for radiocarbon dating. The deeper core located
along this transect (C-4) and drilled in 16 m (51 ft) of water penetrated 12 m (40 ft) of estuarine
sediment. This core was expected to penetrate the estuarine fill and furnish basal organics to date
early flooding of the Hudson Channel when relative sea level was 27.4 m (90 ft) lower than
present. Ironically, core C-4 furnished a basal date of 2,520 ± 40 B.P. (2,606 cal yrsbp). The
preliminary conclusion is that either estuarine sediment is ―draped‖ over a preexisting irregular
land surface and filling deep depressions or incised channels, or slumping of younger estuarine
sediment has occurred to collect at the bases of the steep slopes on the edge of the Anchorage
Channel. Nonetheless, core C-1 with a basal date of 5,650 ± 40 B.P. (6,473 cal yrsbp) has
presented the greatest time depth for a continuous sedimentation record for microfossil analyses.
Pollen, foraminifer, and macro-molluscan studies were performed on this core.

Geomorphology/Archaeological Borings and GIS Model, 2014 New York/New Jersey Harbor Navigation Project Page 22
Two additional 12 m (40 ft) vibracores were taken in the Upper Harbor. These were drilled
on the surface of the Bay Ridge Shoal. The purpose of these cores was to furnish a stratigraphic
record of sedimentary deposition that could be correlated across the Anchorage Channel for
comparison with sediments of similar type and depth described in an earlier GRA study of Port
Jersey (Schuldenrein et al. 2001). Once again, radiocarbon dating produced unanticipated results.
Wood fragments found at 10.18 m (33.40 ft) below mean sea level yielded a date of 1,850 ± 40
B.P. (1,806 cal yrsbp).
The final area of investigation in the current study was Jamaica Bay. Coring in this location
was designed to provide the marine transgression history for the flooding of a sheltered
embayment upon which salt marsh had developed. It was hoped that stratified peat deposits
would help date the youngest portions of the marine transgression and anchor the young end of
the developing relative sea level reconstruction. Bridge access to Jamaica Bay limited the
investigation to 6.1 m (20 ft) vibracores. The objective was to obtain a series of five 6.1 m (20 ft)
cores leading from the surface of the Yellow Bar salt marsh southward into progressively deeper
water and stratigraphically lower sediment packages. This operation was conducted on
November 6, 2007. Falling tides prohibited reaching the surface of the Yellow Bar marsh;
however, a continuous record of fine-grained sediment underlying the marsh was obtained. One
radiocarbon date, 4,130 ± 40 B.P. (4,432 cal yrsbp), at a depth of 9.8 m (32.14 ft) below mean
sea level suggested the transgression history of this portion of the Long Island shore.
Unfortunately, none of the five recovered cores included stratified peat deposits.
The re-assessment of the range of available work, published and unpublished, underscored
major inconsistencies in the databases. In part, anomalies are attributable to methodological
variability as well as fallacious interpretations generated from older sea level models. In the
course of the present work, a primary goal was to upgrade previous and present observations and
interpretations. In addition, previous GRA reports provided significant data that enabled us to
reconstruct the trends of relative sea level change over the past 10,000 years. Consequently, a
highly detailed reconstruction for the past 3,000 years was possible (Chapter 3). Specialized
analyses were undertaken as appropriate and by segment. Radiocarbon determinations were
obtained for samples from the Liberty Island transect (4), the Bay Ridge Shoal (1), and Jamaica
Bay (1). The limited number of samples was an indicator that many specimens were either
contaminated or provided contexts unsuitable for dating (i.e., minimal organic materials).
Samples from the Liberty Island transect and the Bay Ridge Shoal transect were submitted for
specialized analyses of foraminifera, pollen, and plant macrofossils. Pollen and foraminifer
specimens were productive and documented changing biomes and shifting margins of the
estuaries during the Holocene. Forty-foot core C-1 from the Liberty Island transect was sampled
at 30 cm (ca. 1 ft) intervals for analyses. Core D-1 from Bay Ridge Shoal was also sampled in
this manner to furnish 40 samples. In all, 80 pollen and foraminifer samples were analyzed.
Macro-molluscan samples were taken from all cores to aid in the determination of
contemporaneous water depths and habitat. Intensive sedimentological examination and mapping

Geomorphology/Archaeological Borings and GIS Model, 2014 New York/New Jersey Harbor Navigation Project Page 23
led to the development of a baseline stratigraphy. Collective stratigraphic observations and
supplementary specialized analysis allowed for reconstruction of the subsurface environments
and landscapes by navigation channel (Chapter 9).
In addition to the vibracores collected as part of the present study, results from previous GRA
harbor studies for the USACE-NYD were integrated, including the pilot for the present
investigation (Schuldenrein et al. 2006), and the Port Jersey and Shooters Island: Newark Bay
and Kill Van Kull (Schuldenrein et al. 2000a, 2000b, 2001). Other prior studies directed towards
paleoenvironmental reconstruction for submerged sites included work by LaPorta et al. (1999)
for portions of Raritan Bay, Arthur Kill, the inner New York Bight, and portions of the Upper
Harbor, and by Wagner and Siegel (1997) in the Kill Van Kull. Boring logs with sediment
descriptions were also recorded from the collection at the USACE-NYD library along with
pertinent geotechnical reports. The following section summarizes the results of initial attempts to
formulate a model of archaeological sensitivity based on a series of limited subaqueous testing
efforts and the paleoenvironmental sequences and submerged landform histories outlined earlier.
The model also incorporates the evidence for subaqueous disturbance that resulted from the past
150 years of navigation channel and near-shore dredging that has occurred within the New York
Bight.
Geoarchaeological Investigations to Date
GRA performed four (4) sets of field investigations in the project area between 1999 and
2001 (Schuldenrein 2000a, 2000b, 2001). Supplementary investigations, in conjunction with
harbor dredging were also undertaken by La Porta et al. (1999), and by Wagner and Siegel
(1997). Their results were integrated into the GRA reports and are referenced again in this
presentation.
New York Harbor Study. An extensive set of subsurface borings for the New York Harbor
area were analyzed for a pilot study for the USACE-NYD, which established a baseline
stratigraphy indexed by radiocarbon analysis and foraminifer, pollen, and plant and macrofossil
studies (Schuldenrein 2000a). GRA had access to a total of 114 borings extracted for
geotechnical purposes. Additionally, curated samples were examined at the USACE-NYD
storage facility at Caven Point, New Jersey.
Geoarchaeological field work was undertaken in November 1998 and involved inspection
and sampling of borings from two available drilling platforms. Standard geotechnical procedure
was used to recover 0.6 m (2 ft) long split-spoon samples at every five feet in the uppermost
sediments. This procedure was later modified to furnish a continuous series of 0.6 m (2 ft)
spoons until the sediments appeared to be of Pleistocene age. Samples of bulk organic sediment
and plant macrofossils were collected. It was noted that some of the uppermost sediments
contained hydrocarbons and other hazardous materials. This was a function of the mixing of
dredged materials plus the accumulation of effluents and discharge over the past 150 years.

Geomorphology/Archaeological Borings and GIS Model, 2014 New York/New Jersey Harbor Navigation Project Page 24
Seven (7) borings were in the vicinity of the Newark Bay (NB) navigation channel work
area; five (5) borings were in the vicinity of the Port Newark (PN); one (1) boring in Port
Newark Point (PNP); and two (2) borings in the Elizabeth Channel (E) work area. Two (2)
borings were described and sampled during fieldwork in the Claremont channel (CC); three (3)
borings in Port Jersey (PJ); and five (5) borings in the Buttermilk Channel (BC). Borings in the
other navigation channel work areas had been completed prior to fieldwork.
Thirteen (13) borings in the Anchorage Channel (ANC) work area were described and
sampled at the Caven Point curation facility as were seven (7) from Stapleton (STA); and one (1)
from Ambrose (AMB). The total number of borings integrated into the GRA database was fifty
nine (59), or fifty-two percent of the 114 borings collected for the New York and New Jersey
Harbor navigation study.
Port Jersey Study. In addition to the four (4) vibracores taken near Liberty Island as part of
the present study, five (5) cores on the Jersey Flats/Port Jersey navigation channel were
reexamined for the USACE-NYD (Schuldrenrein 2001). The cores were located along a transect
lying in water depths of 3.7 to 9.1 m (12 to 30 ft), according to the bathymetric contours. Based
on the revised Holocene sea level rise model presented in Chapter 3, the ―Jersey Flats‖ should
have spanned habitable terrain along the Hudson River shore during periods as early as 6,000
B.P. (7,000 cal yrsbp). Thus, submerged cultural resources associated with the Late Archaic or
older might be expected if occupation and site preservation were favored by subsequent
environments of deposition within the estuary.
Shooters Island: Newark Bay and Kill Van Kull Channels. This study for the USACE-NYD
involved subaqueous coring at four (4) locations in connection with mitigation activities at the
site of the Arthur-Kill-Howland Hook Marine Terminal Channel project (Schuldenrein 2000b).
Borings were spaced approximately 50 m (164 ft) in each cardinal direction from a previous core
(AK-95-5) that was formerly identified as having potential for Holocene landscape
reconstruction (Wagner and Siegel 1997). Vibracore locations were recorded using a differential
global positioning system and ship-board computer linked to the vibrator head. Depths of these
four cores ranged from 3 to 5.5 m (7 to 18 ft), three of which provided Middle Holocene dates
(ca. 6,100-3,000 B.P.). The sequences were described lithostratigraphically and were examined
for plant macrofossils. The data from these observations shows a documentation of relatively
high-energy fluvial to near-shore facies directly overlying glacial till or outwash. Stratigraphies
are diagnostic of changing estuarine and terrestrial balances in the Middle to Late Holocene. The
macrofossil analyses suggested that brackish conditions emerged at approximately the beginning
of the Middle Holocene (ca. 6,000 B.P. [7,000 cal yrsbp]), and that by 4,000 B.P. (ca. 4,500 cal
yrsbp) an intertidal system was established at this location. The muds at Shooters Island
apparently accumulated at a rate of just over 1 m (3 ft) per millennium. Sedimentation rates
indicate a brackish intrusion at about 2 m (6.5 ft) between 1,000 and 2,500 B.P. The presence of
oyster beds at the same depth is a confirming source of evidence for the same conditions at this

Geomorphology/Archaeological Borings and GIS Model, 2014 New York/New Jersey Harbor Navigation Project Page 25
depth. These observations are consistent with a 0.3 to 0.6 m (1 to 2 ft) rise in sea level at the
same time. Such a period of calm would explain the increase in submerged aquatic beds
(preserved in the West Core at this depth). An increase in aquatic vegetation was documented at
about 2 m (7 ft) in the South Core as well. The ongoing submergence of Shooters Island is the
result of a sustained but subdued sea level rise over the course of the Holocene, beginning at
about 6,000 years B.P. (7,000 cal yrsbp). After that time, estuarine clay and silt began to cap
sequences. They signify landward marine transgression. Conditions became increasingly
brackish until the system was completely intertidal ca. 4,000 years B.P. Increased salinity up the
sequence is also registered.
Baseline Model of Cultural Resource Sensitivity
The earlier studies of dredging impacts to the New York Bight produced a baseline model of
archaeological sensitivity based on the relationships between cultural resource potential,
dynamic landscapes of the past 20,000 years, and the impacts of dredging on former human
landscapes. In general the geologic record offers a broad range of data because of several
disciplines—geography, marine science, palynology, and sedimentology— have contributed
variously to the database. In contrast, the archaeological information is considerably more
uneven, since most investigations prior to the implementation of the National Historic
Preservation Act (NHPA) were not systematic and the thirty years of subsequent research have
produced limited results because of the complex logistics of both subaqueous archaeological
exploration and access to cultural deposits in urban and ―made‖ landscapes.
Structuring a Model: Holocene Environments, Site Geography, and Historic
Impacts
The formulation of the model of cultural resource sensitivity presented in previous work rests
on synthesizing the following three sets of data.
Geomorphic and Paleoenvironmental Trends: Sea level rise is probably the most central
factor accounting for changes in Holocene landscape and environmental history. It accounts for
modifications to the shape, extent, and biotic potential of the former coastline during particular
periods. It is reflected in distinct sedimentation modes during phases of sea level rise. Finally, the
pattern of landscape transformation is indexed by dating the sediments associated with
depositional environments along the coast.
As discussed earlier, post-glacial sea level rise (after 12,000-10,000 B.P.) resulted in
drowning of Continental Shelf, including areas that may have been occupied prehistorically
(Figure 2.2). The sea level rise to the general area of the New York Bight allows paleoshorelines
to be plotted to suggest former areas of prehistoric occupation for the study area here. Between

Geomorphology/Archaeological Borings and GIS Model, 2014 New York/New Jersey Harbor Navigation Project Page 26
6,000-2,500 B.P. sea level had risen to within 4.0 m (13 ft) of its present level. Sea level
continued to rise at the same rate over the following millennia, although it is now known that
slight fluctuations above and below its mean trend took place. Since the 19th century, Industrial
Age erosion and contemporary ocean circulation systems have produced unique depositional
patterns in the ―made‖ landscapes of New York Harbor.
The habitable Coastal Plain land surface extended at least 97 km (60 mi) onto the present
continental shelf during the Paleoindian period (Bloom 1983a: 220-222; Emery and Edwards
1966; Stright 1986: 347-350). The Kraft et al. (1985) paleoshoreline reconstruction for the mid-
Atlantic region suggests that there was still an additional 16 km (10 mi) of Coastal Plain at 9,000
B.P. (10,000 cal yrsbp). The succession of Middle Holocene shorelines rapidly approximated the
present contours. All other factors considered, stratified shoreline occupations should have
existed within the ten mile belt of the Middle Atlantic shore.
The overall pattern of sea level encroachment resulted in distinct modes of sedimentation that
are reasonably well understood regionally, but poorly documented locally. The chronology of
late glacial to post glacial sedimentation was initially explored by Newman et al. (1969) who
identified the emergence, if not the particular morphologies, of the major pre-glacial lakes in the
Hudson Valley. Most critically, the depositional signature for alternating clay and silt beds
seasonally laid down in the individual lake basins was recognized. After 12,500 B.P. these beds
were overridden by glacial meltwater sands whose distributions remain incompletely mapped.
What is clear is that estuarine fines—finer sands, organic silts, and clays—typically cap sand
deposits in many differentiated shoreline settings after 6,000 B.P. (ca. 7,000 cal yrsbp). Thus the
sands, or dateable organics in them, may date to between 10,000 and 5000 B.P. depending on the
depth. The absence of complete chronologies is complicated in near channel settings by ongoing
dredging activities that have tended to redistribute the sands.

Geomorphology/Archaeological Borings and GIS Model, 2014 New York/New Jersey Harbor Navigation Project Page 27
Figure 2.2: Mammoth and mastodon finds on the Continental Shelf and known Paleoindian and Early Archaic sites.

Geomorphology/Archaeological Borings and GIS Model, 2014 New York/New Jersey Harbor Navigation Project Page 28
The chronology of Holocene sedimentation remains poorly understood for the New York
Harbor area, in part because of the extensive historic reworking of shore facies. Radiocarbon
determinations document near shore transformations for the late Pleistocene and peak glacial
environments. However, dated materials are rare for terminal deglaciation (especially on the
coast); there is a gap in the sequence of dates between 19,000 and 9,500 B.P. Early Holocene
dates (ca. 10,000-6,000 B.P.) are present but not abundant, while Middle and Late Holocene
determinations are common. These data suggest that after 6,000 B.P. (ca. 7,000 cal yrsbp)
regional and local landscape configurations begin to approximate those of the present.
Archaeological Site Geography. Archaeological models of site geography remain relatively
poorly known for New York City to the present day (Cantwell and diZerega Wall 2001). This is
because archaeological investigation within the city environs has been impeded by urban
constraints. The most relevant regional settlement models are those for the upstream segments of
the Hudson as well as from neighboring trunk drainages (i.e. Delaware and Susquehanna; see
Funk 1976, 1993; Ritchie 1980). These constructs suggest that settlement trends are best
reflected in the modifications to landscape caused by changing stream valley morphologies for
terrestrial habitats and by rapidly rising sea level for near shore locations. In both situations,
―available land‖ for occupation shifts in response to sedimentation patterns. That tendency was
most pronounced during the Early Holocene (i.e. 10,000-6,000 B.P. [11,500-7,000 cal yrsbp]).
After the rate of relative sea level rise leveled off during the Middle Holocene, the newly
exposed and lower gradient near shore surfaces opened up for colonization. A corollary to this
effect of near-shore stabilization is the increasing stasis of river systems which became confined
to preexisting channels by 6,000 B.P. (7,000 cal yrsbp) and whose floodplains subsequently
mirror near-present configurations.
Post-glacial landscape transformation and dynamic geomorphic environments are a primary
cause for the diffuse preservation records of early archaeological sites. Progressive stability of
later Holocene environments accounts for settlement patterns that increasingly follow
contemporary environmental zonations. Thus, the infrequent occurrences of Early Archaic sites
everywhere in the Northeast are largely explained by their potential containment in sediments
and river fills that are submerged or deeply buried, and not accessible by typical survey
strategies. In contrast, Late Archaic sites are considerably more abundant and accessible (Ritchie
1980), due to their alignment with contemporary floodplains; the geography of such floodplains
has not changed dramatically in the past 3,000 years. It has also been widely recognized that
population densities for later prehistoric periods are higher as well. While there is evidence for
both population reduction and dispersed settlement during various phases of the Woodland, such
trends are explained more in terms of subsistence and scheduling variability rather than by
environmental change (Funk 1993). The absence of an extensive record of prehistoric occupation
across the metropolitan New York City area is in no small measure a function of non-systematic
survey and the uneven record of preservation and compliance. Projecting the Hudson Valley data

Geomorphology/Archaeological Borings and GIS Model, 2014 New York/New Jersey Harbor Navigation Project Page 29
onto the lower estuary, it is noteworthy that for the Paleoindian period mammoth and mastodon
finds were found on the continental shelf and south of the Hudson River channel (Fisher 1955;
Whitmore et al. 1967). Indications are that both of these large mammals were plentiful in valley
flats that have since been drowned by sea level rise. However, the only known Paleoindian
archaeological contexts are in what were formerly upland locations at Port Mobil and Ward’s
Point on western Staten Island along the Arthur Kill.
Subsequently, the geography of site distributions may be characterized as one of progressive
―landward migration,‖ specifically to interior (north and west) locales in response to sea level
rise. The bathymetric band between 3 and 9 m (10 and 30 ft) below present mean sea level
should be particularly rich in inundated archaeological sites of Middle to Late Archaic age and
such sites could have extended across a broad band that would have attracted humans for periods
of up to a thousand years prior to their submergence. It has been suggested that humans were
frequenting northwestern Staten Island at least by the 9th millennium B.C. (Kraft 1977a, 1977b;
Ritchie and Funk 1971), when spruce was beginning to decline relative to pine in the boreal
forest. Early Archaic sites, currently bordering shoreline or salt marsh settings represent the
vestiges of campsites in the boreal forest alongside small freshwater rivers or ponds. Their
apparent low density and isolated distribution suggests that people were visiting them seasonally
as part of an annual round, which also included more substantial base camps at locations now
submerged within the harbor or on the continental shelf.
Until recently, the lack of diagnostic indicators for earlier Holocene paleoenvironments
accounted for inaccurate depictions of the Early Archaic. Reconstructions of salinity, water
depth, and other factors affecting shellfish habitat within the Early- to Middle-Holocene
estuarine waters would aid in environment and habitat reconstruction for rare Early Archaic sites.
This would assist in explaining the sudden appearance of oyster shell bearing sites such as
Dogan Point during the 6th millennium B.P. (Brennan 1974, 1977; Claassen 1995b). It is also
possible that environmental conditions changed at this point to permit the combined procurement
of faunal and floral resources whose previously discontinuous distribution in coastal and interior
settings required more ―scheduling‖ of the annual round (Flannery 1968). Continuation of
residential mobility at least through the Middle Archaic is supported by Claassen (1995b),
however, with an annual round which included both the shellfish, seeds, meat, and hides
available at Dogan Point and other unspecified resources available from interior locations such
as the Goldkrest site northeast of Albany. Travel by canoes and other watercraft was common
throughout the Northeast at least as early as 3,000 B.P. (3,100 cal yrsbp) as substantiated by
Woodland culture assemblages found on Ellis Island and Liberty Island (Boesch 1994; Pousson
1986). Similar trends are suggested for the original portion of Governors Island (Herbster et al.
1997) within New York Harbor. More systematic examination of Woodland period contexts is
precluded by the diffuse distribution of such sites and their limited documented presence within
the project area.

Geomorphology/Archaeological Borings and GIS Model, 2014 New York/New Jersey Harbor Navigation Project Page 30
Settlement models for later prehistoric sites are varied, as they must account for the complex
subsistence and settlement strategies characteristic of the later Holocene. Another factor
accounting for selective preservation of Archaic and even Woodland age sites is depositional
patterns in the near shore environment. As implicated earlier, drowning of terminal Pleistocene
valleys, realignments of landscapes, and the establishment of new drainage lines during the Early
Holocene would have buried or severely reworked the limited sites of the Paleoindian and Early
Archaic periods. Middle Archaic sites and settings within the Upper New York Bight of Middle
Archaic age may have been vulnerable to the same processes of submergence and destruction.
However, it is possible that during the Late Archaic (ca. post 6,000 B.P.) isolated sites at 10 m
(33 ft) below mean sea level might have survived intact, since they would have been shielded
from previous (alluvial or colluvial) disturbance processes. On Staten Island, many of the earlier
period artifacts may have been eroded and redeposited far from their original context. However,
later sites in unique settings may have remained intact. Typically, marine transgressions did not
preserve archaeological sites with undisturbed systemic context (Rapp and Hill 1998: 78-79;
Waters 1992: 270-275).
Most models of sea level rise, even those developed in the 1960s, account for short-term
fluctuations in the overall transgressive regime. The initial rapid rate of sea level rise prior to
6,000 B.P. (7,000 cal yrsbp) suggests minimal disturbance due to wave action until sea level
began to stabilize after 6,000 B.P.. Rapid submergence of sites followed by rapid burial by
sediment should actually preserve artifacts and their spatial patterning better than gradual
inundation (Stewart 1999: 571-574; Waters 1992: 275-280). This hypothesis would apply for all
sites from upper Late Archaic, Transitional and Woodland to Historic periods. An overriding
exception applies to subaerial and even currently subaqueous landscapes which have been
extensively modified by historic erosion, recontouring and development. The preservation
contexts of all sites are therefore subject to post-depositional modifications.
Historic Impacts on the Channel Settings. Both episodic and cumulative effects of terrain
modification during the Industrial period in the New York Bight cannot be underestimated.
Historic impacts include modifications to the morphology of the coastline (by additions and
removal of land) and impacts to the channel by depth and lateral extent. It is instructive to
compare the overall differences between contemporary shore morphology and that of the 19th
century in order to understand how historic modifications and land use patterns have affected the
geography of the harbor.
An earlier New York Harbor study (Schuldenrein et al. 2006) presented a pilot study of this
kind, superposing the present navigation channels onto the positions of both the 1874 and present
shoreline for most of the New York Bay navigation channels (Schuldenrein 2000a: Figures 12,
13, and 14). For Newark Bay, Port Newark, Port Newark Point, and Elizabeth Channels, the
plots illustrated that the eastern shore remains at approximately the same location as that of the
present, but the western shoreline is considerably modified. First, ―made land‖ and docking slips

Geomorphology/Archaeological Borings and GIS Model, 2014 New York/New Jersey Harbor Navigation Project Page 31
were cut into the old land surface in three separate locations. Next, the shoreline itself was
expanded harbor-ward (to the east) on the order of 610 m (2,000 ft). On a larger scale, the
segments encompassing Anchorage, Claremont, and Port Jersey Channels revealed similar
changes, with the eastern shorelines remaining essentially the same as in 1874, but the western
shorelines have been more intensively relandscaped; they were relocated nearly one mile to the
west. Finally, for the limited segment investigated along the Buttermilk Channel, the eastern
shore is largely the same, but Governors Island has been built out significantly, extending its area
by nearly one-half.
The plots and records also documented significant impacts to the channels by extent and
depth. Channel excavation typically extended flow lines to depths of 10 to 14 m (35 to 45 ft),
although depths up to 17 m (55 ft) have been projected for Ambrose and Anchorage Channels.
For cultural resource planning purposes, it should be noted that project impacts are critical not
only for surfaces immediately underlying the channels which preserve deposits younger than
7,000 years, but also for adjacent tracts that may preserve intact buried surfaces.
Toward a Working Model of Cultural Resource Sensitivity
The baseline model for cultural resources sensitivity was developed in conjunction with the
initial New York Harbor study (Schuldenrein 2000a: Figure 18). It was framed around a crude
synthesis of subaqueous stratigraphies from geotechnical cores and an equally limited
assessment of the integrity of the sediments recorded in those sequences. The follow up studies
for the Shooters Island (and attendant Kill van Kull and Port Newark channels) (Schuldenrein
2000b) and Port Jersey (Schuldenrein 2001) have provided additional subsurface data and a
refinement of sensitivity. Additional modifications derived from the GIS-based mapping of
bathymetry and reanalysis of the historic maps. Revised interpretations are incorporated into the
present discussion.
A baseline composite cultural resource sensitivity plot for the project impact area was
generated. The individual channels were identified, as were the locations of cores and borings
excavated and examined to date. Sensitivity rankings were presented in terms of Low,
Moderate, and High potential for sites, based on the conflation, by channel, of the data collected
for assembling the paleoenvironmental, archaeological, and channel impact histories. The key
paleoenvironmental relationships used for ranking the sensitivity were presented along with
more specific rankings of sensitivity by archaeological component, by depth (below mean sea
level) of expected occurrence per the shoreline histories discussed above. Impact areas referred
not only to the navigation channels sensu stricto but to channel margins as well, since these are
likely to be excavated and/or disturbed by channel widening activities and future ship traffic.

Geomorphology/Archaeological Borings and GIS Model, 2014 New York/New Jersey Harbor Navigation Project Page 32
A relative scale for site preservation invoking High and Moderate probability was derived
from the recognition of deposits below impact levels that correlate with shore, near-shore,
estuarine, or floodplain surfaces. These identify the range of buried surfaces that would have
sustained human occupation during prehistoric time. For the earlier time frames (i.e. Paleoindian
through Middle Archaic) rates of sea transgression were rapid and would have resulted in rapid
burial of archaeological deposits. Recognition of deposits likely to contain archaeological
evidence resulted in Moderate to High determinations. Low rankings were generally assigned to
channel segments in which investigations disclosed presence of a proglacial lake deposit or
glacial till, both of which are unlikely to contain archaeological materials because of their
subaqueous contexts or Pleistocene antiquity. Radiocarbon ages and the foraminifer data index
the chronology and patterns of environmental change respectively. Low rankings were also
assigned to segments in which bedrock was reached (i.e. Port Newark Point, Elizabeth Channel).
For the later time frames (Late Archaic through historic), clear recognition of estuarine or fluvial,
alluvial, and near shore deposits was critical. These sediments document presence of a stable
surface and/or potentially rich resource biome. The foraminifer data indicate shifts in resource
zones that might be tracked by assessing types and frequency changes in the foraminifer types.
Figure 2.3: Example of archaeological sensitivity denotation.

Geomorphology/Archaeological Borings and GIS Model, 2014 New York/New Jersey Harbor Navigation Project Page 33
Primary determinants for the probability rankings are sea level position and extent of
disturbance by dredging. Two additional concerns include site probability by period and post-
depositional modification. It is assumed that while site expectation might be considered highest
for late prehistoric components, integrity is compromised by their presumed location in those
near shore settings most susceptible to disturbance by dredging and by earlier reworking by near
shore geomorphic process during the long intervals of shore stabilization. Conversely, older
sites, traditionally thought to be less dense and less likely to be preserved are more likely to be
sealed at depths beneath dredging impact areas. Along similar lines, during the Early Holocene
relatively rapid burial of earlier prehistoric components would have resulted in their optimal
preservation contexts. In reviewing the geoarchaeological relationships, the following trends
were suggested by the baseline site probability model.
1. There is a relatively high potential for historic finds, even along channel reaches that are
acknowledged to have low overall cultural resource potential. This is because historic sites
include contexts that may have been partially modified, but retain some integrity. Accordingly,
even century old edifices constructed on ―made land‖ are considered potentially eligible for the
National Register of Historic Places (NHRP). Examples would include tanning yards that
functioned along older shorelines that remain partially preserved in now submerged or disturbed
settings.
2. With some exceptions—Newark Bay, Claremont, Port Jersey and Anchorage Channel—
most segments have Low expectations for later prehistoric remains. Reference is made to post
Late Archaic site potential and locations above the 6-12 m (20-40 ft) bathymetric contours. The
Low ranking reflects dredging disturbance to these channels and the probability of mixing of
assemblages (i.e. Late Archaic and Woodland) on near shore surfaces during the Late Holocene,
as sea level rise was stabilizing. Wave action and shifting beach margins of the estuaries would
have affected land expanses and shapes along the coastline. Smaller sites would have been swept
away well before historic times. Low and Moderate rankings were assigned to locations flanking
channels minimally dredged; here there remains a likelihood of Late Archaic and Woodland site
survival.
3. The Late Archaic marks a threshold for Moderate site potential. As noted, by 6,000 B.P.
(7,000 cal yrsbp) rates of sea level rise diminished and shorelines stabilized. Many sites could
have been rapidly buried, thus resulting in retention of site integrity. Moreover, sites of this
period are abundant, since in addition to the fact that landscapes began to approximate
contemporary configurations, the changing coastlines marked the transitions to estuarine and
highly differentiated microenvironments. These would have been excellent as well as prolific
settlement loci. Stratigraphically, this portion of the vertical sequence is the break beneath which
impacts by dredging were minimal. Thus, the potential for site preservation rises proportionately
with increasing depth.

Geomorphology/Archaeological Borings and GIS Model, 2014 New York/New Jersey Harbor Navigation Project Page 34
4. Paleoindian to Middle Archaic site expectations are Moderate or High in several channel
segments. Only Port Newark, Port Newark Point, and Buttermilk Channel have Low site
potential rankings. The Low ranking was determined because elevations below 9 m (30 ft) in
these channels either encounter Late Pleistocene lake beds or bedrock. Moderate to High
rankings are the product of stratigraphic exploration that either revealed a pristine glacio-fluvial
facies (possible stream side location at Newark Bay), or Early Holocene near shore facies
(Anchorage Channel; dated) or floodplain (Claremont, Port Jersey) contexts. Stapleton and
Ambrose Channels, while not examined in detail, provide limited records of analogous Early
Holocene sedimentation regimes. In all locations, with the possible exception of Ambrose, the
deposits with potential are below the limits of dredging.
Testing the Model
The above hypotheses are testable on several scales. Large scale refinements are generated
by more detailed mapping. In the past few years, since the baseline New York Harbor
investigations were undertaken, several agencies have completed the mapping and digitizing
(GIS) of data sets bearing on local and regional surface geology.
Both the New York and New Jersey Geological Surveys have updated plots of the surficial
geology of the coast and terrestrial landforms of the New York Harbor area. Present surfaces are
either underlain by bedrock or surficial deposits of Late Quaternary age. In general, the latter
reach thicknesses of 1-20 m (3-68 ft) in marine, estuarine, and terrestrial contexts. Because of the
complex record of glacial activity, the chrono-stratigraphy of the surface sediments is the key
variable in assessing buried site potential for prehistoric deposits. Accordingly, accurate mapping
is a key measure of the zonation of landform complexes likely to contain archaeological
sediments of a given age.
Substantial refinement has been achieved in mapping complex subsurface lithologies. It has
been provisionally possible to correlate between states by comparing descriptions of landform
and sediment complexes in the vicinity of state lines and by generalizing unit designations. GIS
databases available in both states facilitate such tasks. Surficial geology maps provide an index
for observations made over the course of the previous field testing. Ideally, the correspondences
between the stratigraphies with broad landform/sediment complexes established by the mapping
units would facilitate a stratigraphic sequence and chronology for the New York Harbor area.

Geomorphology/Archaeological Borings and GIS Model, 2014 New York/New Jersey Harbor Navigation Project Page 35
Chapter 3
Relative Sea level Rise along the Mid-Atlantic Coast
Global Eustatic Sea Level
Global sea level is ultimately controlled by climate change, which varies the volume of water
available in the ocean basins. Simplistically, sea levels can be thought of as being low during
periods of glaciation when great volumes of the available earth’s water were been removed from
the oceans and held in storage as ice on the continents. The converse is true when glaciers melt
on the continents and return water to the oceans once more. Geologic records from out
continental shelves show sea level to have been at least 100 m (328 ft) lower than present during
the last glaciation, ca. 20,000 years ago. The change in volume of sea water in the ocean basins is
termed the eustatic sea level.
Accurate determination of global sea level is more complex. Although studied over the past
century, sea level records could only be reconstructed in detail after the advent of radiocarbon
dating following World War II. Radiocarbon dated sea level records presented during the 1960’s
(Fairbridge 1961; Shepard 1965) generated subsequent decades of intense debate and research on
sea level. Importantly, it appeared unlikely that eustatic sea level could be determined with
accuracy because of the complexity of the changing size of the ocean basins due to sea floor
spreading or subsidence of the oceanic basins due to the mass of water returned from melting
glaciers. Similarly, the temperature of sea water influenced its volume as well, with warming
water giving rise to higher levels (steric effects). As a result, the study of sea level change was
complicated by the changing position of the earth’s crust with respect to the level of the sea and
the level of the sea with respect to temperature and the continental shorelines. Current concerns
with ongoing rise in sea level contend with the relative position of the sea relative to the land—
hence relative sea level. Yet the impact of relative sea level on the continent shores requires a
better understanding of eustatic sea level.
In recent years, the eustatic sea level has been reconstructed with greater reliability through
the study of ―far field‖ sites. These are records of sea level change determined from islands ―far
field‖ from the complex, crustal changes of the continents. In theory, radiometric dating of sea
level sensitive markers (specific coral species, etc.) provide the basis for determining the
―absolute‖ level of the sea with respect to its volume as varied by glacier melting and steric
effects. The leading models for eustatic sea level are presented by Peltier (2002) and Fleming et
al. (1998). Both models rely on estimates of the volumes of glacial meltwater returned to the
ocean basins since the last glaciation. Peltier maintains that virtually all of the glacier ice had
been returned to the ocean basins by 6,000 to 7,000 year ago suggesting that sea level has been
stable since that time. Fleming and his colleagues have maintained that eustatic sea level has

Geomorphology/Archaeological Borings and GIS Model, 2014 New York/New Jersey Harbor Navigation Project Page 36
risen from 3 to 5 m (ca. 10 to 15 ft) over the past 7,000 years. The arguments are not relative to
this study other than to help understand the record of relative sea level changes on the Atlantic
coast of the United States and Canada. It is important to recognize that during the melting of
continental glaciers, the eustatic level of sea rose rapidly until ca. 7,000 years ago when the rate
of rise decreased dramatically.
The pattern of eustatic sea level rise is shown graphically in Figure 3.1 which is the Fleming
et al. (1998) compilation of sea level recorded from ―far field‖ sites. This model illustrates a low
sea level of 120 m (394 ft) at the height of the last glaciation.
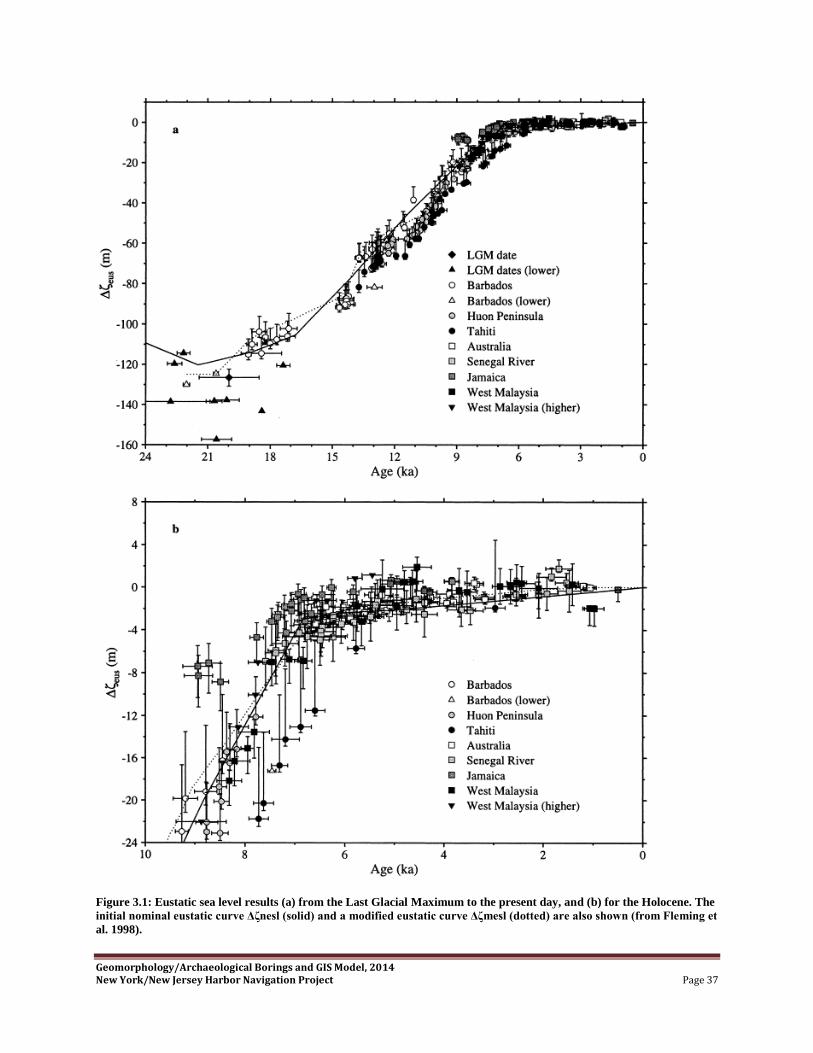
Geomorphology/Archaeological Borings and GIS Model, 2014 New York/New Jersey Harbor Navigation Project Page 37
Figure 3.1: Eustatic sea level results (a) from the Last Glacial Maximum to the present day, and (b) for the Holocene. The
initial nominal eustatic curve Δζnesl (solid) and a modified eustatic curve Δζmesl (dotted) are also shown (from Fleming et
al. 1998).

Geomorphology/Archaeological Borings and GIS Model, 2014 New York/New Jersey Harbor Navigation Project Page 38
Relative Sea Level Change along the Atlantic Coast
Tide gauges along the coasts of the U.S. and Canada provide historic records of relative sea
level changes. It is clear, however, that there is great variation in the rates of sea level rise from
one station to another. This is shown graphically in Figure 3.2 which shows the rates of relative
sea level rise along the U.S. Atlantic coast from Key West, Florida to the Canadian border. Note
that the rates of sea level rise recorded by the gauges are on the order of 1.5 to 2.0 mm/yr (0.06
to 0.08 in/yr) for the Florida peninsula and the New England coasts but rise to highs from 3.0 to
4.0 mm/yr (0.12 to 0.16 in/yr) for the Mid-Atlantic coast. These are shown in comparison to the
rate of global eustatic sea level rise proposed by Peltier (1995, 2000). Peltier (1995, 2000) and
Douglas (1991) relate these anomalously high rates of relative sea level rise to ongoing post-
glacial crustal adjustments. More specifically, these researchers point to subsidence along a zone
peripheral to the southern limit of glaciation termed a proglacial forebulge. The forebulge
represents an uplift of the earth’s crust caused by simultaneous depression of the crust in the
Hudson Bay region and Laurentian Highlands under great thicknesses of glacier ice. As the crust
in the former glacier ice center rises, the forebulge collapses and continues to do so. This
ongoing process is termed post-glacial rebound (PGR). Both Peltier and Douglas consider the
rate of subsidence of the forebulge (labeled PGR) to be on the order of 1.5 mm/yr (0.06 in/yr).
Subsidence increases in rate from a minimum in the Florida peninsula to a maximum between
Georgia and Long Island Sound while decreasing further north. In essence, since the crust is
subsiding, this rate must be added to the global eustatic rate of sea level rise. Hence, the relative
rates of ongoing sea level rise along the Mid-Atlantic coast are on the order of 3.0 mm/yr (0.12
in/yr).
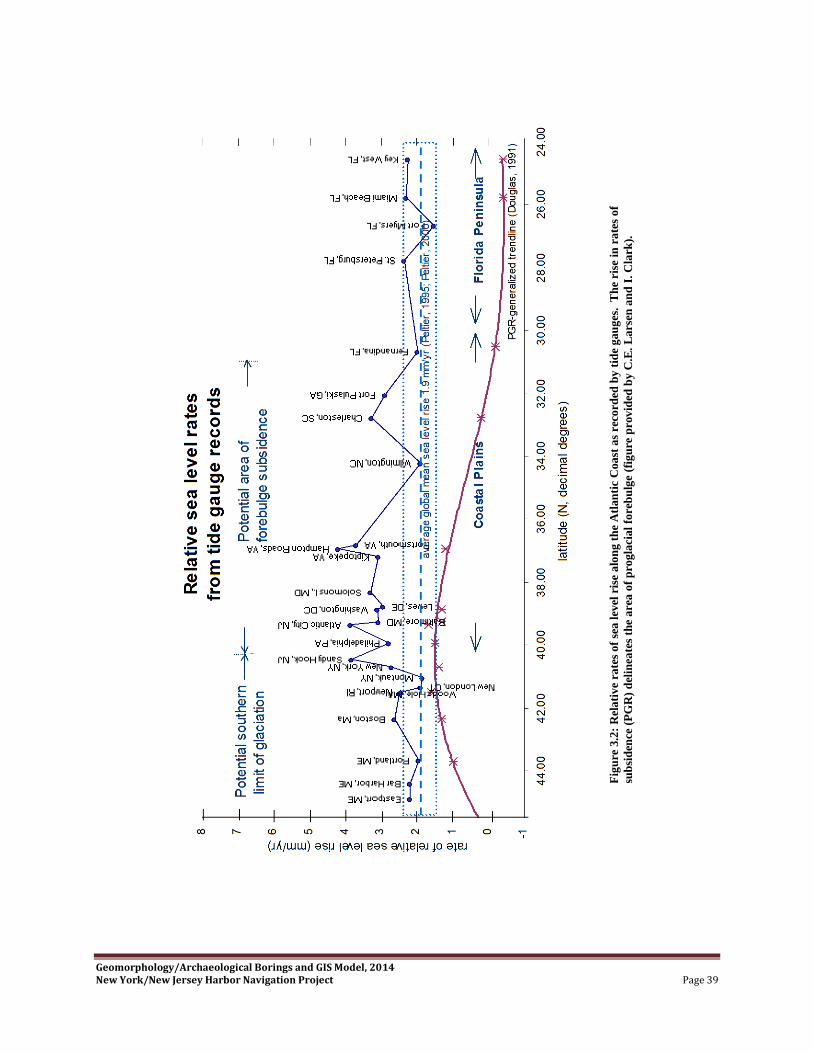
Geomorphology/Archaeological Borings and GIS Model, 2014 New York/New Jersey Harbor Navigation Project Page 39
Fig
ure
3.2
: R
ela
tiv
e ra
tes
of
sea l
evel
ris
e a
lon
g t
he
Atl
an
tic
Coa
st a
s re
cord
ed b
y t
ide
gau
ges
. T
he
rise
in
ra
tes
of
sub
sid
ence
(P
GR
) d
elin
eate
s th
e a
rea
of
pro
gla
cial
fore
bu
lge (
fig
ure
pro
vid
ed b
y C
.E.
La
rsen
an
d I
. C
lark
).

Geomorphology/Archaeological Borings and GIS Model, 2014 New York/New Jersey Harbor Navigation Project Page 40
Comparative Holocene Sea Level Curves
The combination of eustatic sea level and forebulge subsidence provide an entrée for an
understanding of post-glacial relative sea level rise along the Mid-Atlantic coast. But first, it is
necessary to show consistency between rates of relative sea level rise on historic and geologic
time scales. Figure 3.2 shows consistency in rates among New York, Philadelphia, and
Washington, D.C. but only the first two sites have long enough periods of record to allow close
comparison. Baltimore, MD, is another site with a suitably long record. Figure 3.3 below
shows a comparison of these three historic tide gauge records. All three of these are located on
areas underlain by crystalline rocks which cannot be expected to show the effects of sediment
compaction or anthropogenic subsidence due to groundwater withdrawal. These sites are in
contrast to sites at Hampton Roads, VA, Atlantic City, NJ, and Sandy Hook, NJ which show
anomalously high rates of relative sea level rise. The latter two lie on the outer edge of the
Atlantic Coastal Plain underlain by sedimentary rocks, while the former is located in a zone of
probable anthropogenic subsidence due to groundwater withdrawal (Davis 1987). The close
agreement in the rates, trends, and patterns among these three tide gauge sites is striking. They
form the comparative basis for building a Holocene relative sea level curve for the New York
Harbor study area.
Detailed reconstructions of Holocene relative sea level are available from four critical areas:
Chesapeake Bay, Delaware Bay, Long Island Sound, and Cape Cod Bay. Each of these sea level
records are derived from radiocarbon-dated basal peat lying on sediments resistant to
compaction. They represent the best sources for representing the trend of Holocene sea level rise
over the past several thousand years. The trends calculated from the radiocarbon-dated peat are
shown below in Figure 3.4.
Consistent with the historic tide gauge records for the ―bedrock-founded‖ sites shown in
Figure 3.3, the Clinton, Barnstable, and Chesapeake Bay sites show relative rates of sea level
rise at 1.4 mm/yr (0.06 in/yr) while the sites at the mouth of the Delaware Bay show a greater
rate: 2.0 mm/yr (0.08 in/yr). The latter is likely affected by the thick sequence of less
consolidated sediments and sedimentary rocks underlying this portion of the Atlantic Coastal
Plain. Hence the Delaware Bay sites seem to display regional compaction, while the Connecticut
and Massachusetts sites are underlain by more consolidated sedimentary rocks (or crystalline
rocks). Chesapeake Bay displays the 1.4 mm/yr (0.06 in/yr) rate, but lies at the inner edge of the
Atlantic Coastal Plain where sediments and sedimentary rocks form a thin wedge lying on
crystalline rocks of the Piedmont region, similar to Philadelphia and New York City.

Geomorphology/Archaeological Borings and GIS Model, 2014 New York/New Jersey Harbor Navigation Project Page 41
Ea
st C
oa
st b
ed
rock s
tati
on
s M
SL
tre
nd
y =
0.0
029x -
3.6
543
y =
0.0
03x -
4.2
824
y =
0.0
03x -
4.5
697
1
1.2
1.4
1.6
1.82
2.2
2.4
2.6 1
900
1920
1940
1960
1980
2000
year
annual MSL, meters
New
York
Phila
delp
hia
Balti
more
Fig
ure
3.3
: C
om
pa
riso
n o
f ti
de
ga
ug
es o
f lo
ng
ter
m b
edro
ck f
ou
nd
ed s
ites
. E
ach
sit
e sh
ow
s a
ra
te o
f ri
se o
f 2
.9 t
o 3
.0
mm
/yr
(0.1
2 i
n/y
r).

Geomorphology/Archaeological Borings and GIS Model, 2014 New York/New Jersey Harbor Navigation Project Page 42
Figure 3.4: Comparative trends of Holocene sea level along the Mid-Atlantic Coast (adapted from Larsen and Clark,
2006).
In terms of the eustatic sea level discussion above, these rates of are considered by Peltier
(1997, 2002) and Douglas (1991) to represent the rates of crustal subsidence along the eastern
seaboard (Figure 3.2). For the purposes of constructing a sea level rise model for the New York
Harbor area, the resulting curve of relative sea level should resemble the eustatic pattern shown
in Figure 3.1 lowered by consistent subsidence on the order of 1.4 mm/yr (0.06 in/yr) over at
least the past 7,000 years. In concept for New York Harbor then, a rising trend should be
expected on the order of 1.4 to 1.5 mm/yr (0.06 in/yr) for at least the past 7,000 years preceded
by a more rapid rate of rise following deglaciation. In addition, since the current record of
eustatic sea level has been presented in sidereal (calendar) years, radiocarbon ages determined as
part of the present study as well as data contributed by other workers to build the model must be
calibrated to maintain consistency.
Relative long-term sea level trends for Delaware, Connecticut, Massachussets and Chesapeake Bay
0
2
4
6
8
10
12
010002000300040005000600070008000
callibrated age, years BP
depth
, m
Delaw are Bay
Barnstable, MA
Clinton, CT
Chesapeake Bay
2 mm/yr
1.4 mm/yr
1.3 mm/yr
1.3 mm/yr

Geomorphology/Archaeological Borings and GIS Model, 2014 New York/New Jersey Harbor Navigation Project Page 43
Development of an Accurate Local Relative Sea Level Curve
The Past 10,000 Years. Although the New York area researchers have figured prominently in
discussing sea level histories (Fairbridge 1961; Newman et al. 1969), few studies have been
specific to New York Harbor or the New York Bight. Psuty (1986) and Psuty and Collins (1986)
presented a relative sea level reconstruction on the basis of dated stratigraphy from several New
Jersey sites, including two from Raritan Bay. More recently Stanley et al. (2004) have again
discussed New Jersey data, but largely focused on the Cape May area which in some ways
duplicates the longstanding work on Delaware Bay by Belknap and Kraft (1977) and synthesized
most recently by Nikitina et al. (2000). These two complementary studies argue for a rate of
relative sea level rise on the order of 2 mm/yr (0.08 in/yr) (as discussed above for the Lewes,
DL, and Cape May, NJ area). Other important studies were conducted by Bloom and Stuiver
(1963) on the salt marshes of the Clinton, CT area of Long Island Sound followed by Van de
Plassche et al. (1998) and most recently by Varekamp and Thomas (1992, 1998). Further to the
northeast, Redfield and Rubin (1962) provided a dated record of transgression at the Great Marsh
at Barnstable, MA. The majority of work in the 1960’s through the 1980’s relied on radiocarbon
ages. Refined calibration techniques for radiocarbon age dating have since impacted the
interpretation of the early studies by allowing the direct comparison of the prehistoric sea level
record to the historic data recorded by the tide gauges. Calibration of radiocarbon ages used in
past sea level studies in the region points to different interpretations of the data originally
presented. For example, earlier studies often showed sharp changes in the rate of sea level rise at
various times in the past several thousand years marked by a sharp break in slope of the curve
(Psuty 1986; Psuty and Collins 1986; Redfield and Rubin 1962). The break was generally
considered to have occurred about 5,000 years ago but can now be understood to be an artifact of
uncalibrated radiocarbon dates. Few dated relative sea level curves are available from the New
York area that extends beyond 6,000 cal yrsbp. The trend of the rate of rise since this time is
nearly linear with probable departures of ± 1 m about the mean trend (Larsen and Clark 2006).
This seems to be consistent for the Mid-Atlantic region where there are sufficient data to
establish a trend.
During the course of the present study 20 vibracores were taken in Raritan Bay, Jamaica Bay,
and the Upper Harbor. Only a few of these provided sufficient organic material for radiocarbon
dating of the marine transgression. Others, while datable, were from probable disturbed contexts
or were from very young sediments. The data collected in 2006 and 2007 are supplemented by
radiocarbon dates from pertinent cores taken by other researchers in the past as well as from
cores taken by GRA during previous studies. Radiocarbon ages, calibrated to calendar years
before the present, are shown in Appendix B. This table provides the elevations of the critical
dates and stratigraphy in both meters and feet below mean sea level (m bmsl, and ft bmsl).

Geomorphology/Archaeological Borings and GIS Model, 2014 New York/New Jersey Harbor Navigation Project Page 44
Calibration is provided by the Oxford University (OXCAL) system available online
(c14.arch.ox.ac.uk/oxcal.html). The mid-point of the calibration range forms the basis for
plotting age versus depth to establish a sea level transgression curve for New York harbor. As
basal peat ages furnish the only dependable measure for determining contemporaneous sea level
elevations, only those samples labeled as basal peat or brackish marsh are used in the calculation.
Figure 3.5 illustrates this curve. Unlike the eustatic sea level curve (Figure 3.1) the relative rise
of sea level in New York harbor is a smooth curve extending 9,000 years in the past. The data
suggest a rising trend over the past 5,000 years at a rate of between 1.4 and 1.5 mm/yr (0.05 and
0.06 in/yr). Prior to 5,000 cal yrsbp, the trend is more difficult to discern, largely due to the
scarcity of earlier radiocarbon-dated stratigraphy. Three dated peats from the south shore of
Long Island recorded by Field et al. (1979) and another from an incised stream channel along the
eastern shore of Staten Island near Ward Point (LaPorta et al. 1999) suggest the rapid rise in sea
level immediately following deglaciation at a rate on the order of 2.6 mm/yr (0.10 in/yr). The
differing rates of rise are not consistent with the eustatic sea level and clearly do not exhibit the
marked break in slope shown in Figure 3.1. Earlier dates on wood from the Anchorage Channel
(98ANC44) at 20.12 m bmsl (66 ft bmsl) and basal peat overlying sand at 18.6 m bmsl (61 ft
bmsl) from the Jersey City viaduct (R15-4) show earlier dates but their interpretation is
uncertain. In either case the pre-5,000 cal yrsbp trend is poorly defined.
Figure 3.5: Relative sea level at New York determined from 14C-dated brackish marsh deposits and peats.
Relative Sea Level Rise at New York
0
5
10
15
20
25
0200040006000800010000
Age in Calibrated Radiocarbon Years Before Present
De
pth
Be
low
Me
an
Se
a L
ev
el in
Me
ters

Geomorphology/Archaeological Borings and GIS Model, 2014 New York/New Jersey Harbor Navigation Project Page 45
Trends in the data are better understood when dates from before 7,000 cal yrsbp are
interpolated separately from those dating to after 7,000 cal yrsbp. Figure 3.6 below shows a
comparison of linear trends calculated on pre- and post-7,000 cal yrsbp samples shown above.
Although there are few post-7,000 samples, there is a clear dichotomy between the two groups.
The trend calculated for the post 7,000 cal yrsbp samples shows a rate of rise of 1.6 mm/yr (0.63
in/yr) over this period and is consistent with rates derived from dated stratigraphy from
Barnstable and Clinton marshes as well as Chesapeake Bay. The pre-7,000 cal yrsbp trend of 9
mm/yr (0.4 in/yr) suggests the rapid rise following deglaciation and is in agreement with the 10
mm/yr (0.4 in/yr) rate for this period suggested by Flemming et al. (1998). Clearly the
curvilinear format is an artifact of the curve fitting technique and does not fit the current
knowledge of eustatic sea level.
It is important to note that a recent study of submerged oyster reefs in Tappan Zee (Carbotte
et al. 2004) has provided corroborating evidence for the interpretation of relative sea level
change over the past 7,000 years. Shell dates, adjusted for dead carbon and subsequently
calibrated, have been plotted in green on Figure 3.6. The calculated rate of relative sea level rise
shown here is 1.6 mm/yr (0.63 in/yr) and the trend calculated for the dated oyster reefs is 1.8
mm/yr (0.7 in/yr) and comparable. This shows that living oyster communities adjusted to water
depth and salinity were able to keep pace with the rate of sea level rise for at least a 5,000-year
period for which there are data. Carbotte et al. (2004) also note that oyster growth was not
continuous through time but showed distinct breaks in colonization. The authors propose that
climate change and possible salinity changes related to sea level rise may have been contributing
factors to periods conducive to oyster growth. These findings also reflect on distinct periods of
oyster harvesting activity recorded in shell middens at Croton Point (Salwen 1964; Newman et
al. 1969) and Dogan Point (Claassen 1995) that also point to periods when shellfish were not an
important part of the diet at this particular site at these particular periods.
For the purpose of this study, the relative sea level shown in Figure 3.6 demonstrates the best
agreement with the eustatic models argued by both Fleming et al. (1998) and Peltier (1995,
2000) and will be the interpretation used to reconstruct the overall sea level rise history of the
New York Harbor area.

Geomorphology/Archaeological Borings and GIS Model, 2014 New York/New Jersey Harbor Navigation Project Page 46
Figure 3.6: Comparison of pre- and post-7,000 cal yrsbp sea level trends. The green line represents dated oyster reefs in
the Tappan Zee area (Carbotte et al., 2004)
Detailed Reconstruction of the past 3,000 Years
Techniques for detailed reconstruction of relative sea level positions and rates of rise are in
their infancy, however particularly cogent studies have been carried out in the New York area.
Salt marsh stratigraphy is a key to determining short term and low amplitude fluctuations of sea
level. Because many of the extant saltmarshes are relatively young—on the order of 2,000 years
or less—knowledge is limited. Further, the field and laboratory studies required are labor
intensive and therefore the results of the studies are not widely known. The concepts are
straightforward. Saltmarshes are zoned with specific vegetation types dominant in specific tidal
and salinity regimes. Figure 3.7 demonstrates this concept. The intertidal zone located between
mean high water (MHW) and mean low water (MLW) is most conducive to Spartina alterniflora
and, lithologically, the sediment present contains high amounts of organic material in a matrix of
clayey silt. Higher in elevation and away from the increasing reach of the tide, progressively less
salt-tolerant vegetation extends up imperceptibly gentle slopes. This progression often proceeds
from Spartina patens through Disticulus spicata to Scirpus americanus or olneyi and Juncus
Relative Sea Level Rise at New York
y = 0.0017x - 0.5399
y = 0.009x - 59.165
y = 0.0018x + 2.271
0
5
10
15
20
25
0200040006000800010000
Calibrated radiocarbon years before present (cal yrsbp)
de
pth
bm
sl, m

Geomorphology/Archaeological Borings and GIS Model, 2014 New York/New Jersey Harbor Navigation Project Page 47
roemerianus. In the more freshwater dominant areas upslope, the vegetation may give way to
Typha sp., the common cattail and the invasive Phagmites sp. common to the marshes of New
York area.
Because these plant types are salinity dependent, they respond to rising and falling water
levels. Together with the underlying sediment, the pollen and seeds for each vegetation zone, as
well as the microfauna living in the marsh, changes in past sea level can be tracked through time
and space provided there is sufficient material for isotopic age dating. Figure 3.7 demonstrates
the zonation of vegetation and sediment in a tidal setting governed by a stable mean sea level.In
this scenario, sediment accretion takes place along the edges of the marsh adjacent to tidal
channels carrying suspended sediment. As sediment is added to the marsh edge, the marsh grows
laterally and expands. The sedimentary zones or facies within the marsh also spread laterally
forming near-horizontal stratigraphic units while simultaneously preserving the pollen and
microfauna of the marsh surface. Abundant organic debris at the surface forms a saltmarsh peat
layer underlain by organic silts indicative of the intertidal zone. This example can be considered
the steady-state example of saltmarsh growth and expansion.
Sediment cores taken at sites A and B in Figure 3.8 show the attitude of the facies and
furnish the fossil record needed to reconstruct the contemporaneous environment. With the
steady-state example in mind, the complexity of the saltmarsh to sea level variation can be better
understood. Figure 3.9 illustrates the changing vegetation positions and sedimentary facies
during an episode of rising sea level. In this case both the vegetation and underlying sediment
rise and move inland with a rising sea level. The sedimentary facies are no longer horizontal but
rise and lap onto and cover previous deposits. For example, note the rise and movement of
saltmarsh peat inland, now overlying the previously deposited freshwater peat and land surface.
Sediment cores taken in this scenario record the transgression of sea level onto the marsh.
For a falling sea level, the pattern reverses allowing the vegetation and stratigraphy to shift
back to the lateral accretion model shown in Figure 3.8. Each transgression and regression of the
sea surface is recorded stratigraphically in an interfingered sequence of lithologic units
containing a fossil record of marsh history.
Fletcher et al. (1993) recognized transgressive and regressive facies in saltmarshes at the
mouth of Delaware Bay. These researchers identified 5 separate transgressive units over a 5,000-
year period, each separated by a period of regression during lowered sea level. Distinct periods
of lower sea level were noted at 2,200 and 800 B.P..

Geomorphology/Archaeological Borings and GIS Model, 2014 New York/New Jersey Harbor Navigation Project Page 48
Fig
ure
3.7
: Z
on
ati
on
of
salt
ma
rsh
veg
eta
tio
n (
pro
vid
ed b
y C
.E.
La
rsen
an
d I
. C
lark
).

Geomorphology/Archaeological Borings and GIS Model, 2014 New York/New Jersey Harbor Navigation Project Page 49
Fig
ure
3.8
: L
ate
ral
ma
rsh
acc
reti
on
un
der
co
nst
an
t se
dim
ent
sup
ply
an
d s
tab
le m
ean
sea
lev
el (
pro
vid
ed b
y
C.E
. L
ars
en a
nd
I.
Cla
rk).

Geomorphology/Archaeological Borings and GIS Model, 2014 New York/New Jersey Harbor Navigation Project Page 50
Fig
ure
3.9
: S
alt
ma
rsh
res
pon
se t
o s
ea l
evel
ris
e (p
rov
ided
by
C.E
. L
ars
en a
nd
I.
Cla
rk).

Geomorphology/Archaeological Borings and GIS Model, 2014 New York/New Jersey Harbor Navigation Project Page 51
Varekamp and Thomas (1992, 2001) analyzed foraminifers from the saltmarshes of the
Connecticut shore of Long Island Sound, and constructed highly detailed records of sea level
fluctuations over the past 1,500 years. Significantly, they identified differing rates of sea level
rise with acceleration beginning as early as 1,500 years ago. Perhaps more important, they
showed a relatively long period of lowered sea level on the order of 30 cm (1 ft) lower than
present from 1,200 cal yrsbp to 400 cal yrsbp.
Another extensive and detailed study of salt marsh stratigraphy was conducted along the
Raritan River upstream from Raritan Bay by Kenen (1999). Kenen reconstructed an interval of
fluctuating higher sea level on the order of 30 cm (1 ft) from ca. 2,500 to 1,000 cal yrsbp. He,
too, identified differing rates of relative sea level rise ranging from 2.0 mm/yr to 5.4 mm/yr (0.08
in/yr to 0.21 in/yr). A composite sea level record determined from the Kenen (1999) and
Varekamp and Thomas (1992, 2001) studies is presented in Figure 3.10. The composite record
points to the great scientific value of saltmarshes for unraveling the subtle changes in sea levels
of the past and discerning differing rates of sea level rise and fall on a century by century scale.
Such detailed records of sea level variation bridge the geologic and historic records to provide a
context for both past and modern change in environment.

Geomorphology/Archaeological Borings and GIS Model, 2014 New York/New Jersey Harbor Navigation Project Page 52
Figure 3.10: Detailed Reconstruction of Late Holocene Sea Level Variation.

Geomorphology/Archaeological Borings and GIS Model, 2014 New York/New Jersey Harbor Navigation Project Page 53
Chapter 4
Geological and Environmental Setting
The Late Quaternary landform history of New York Harbor area is function of bedrock
geology and events associated with glacial history. The end of the Pleistocene (after 18,000 B.P.)
is recorded extensively in the surface and subsurface deposits of the coast and near shore settings
of metropolitan New York City and adjacent New Jersey and New York. Variable accumulations
of sediment record the region’s history of glaciation and deglaciation as well as submergence and
emergence as ice sheets formed and global (eustatic) sea level changed during the past million
years.
Regional geological and paleoenvironmental studies are extensive. Relevant research has
focused on bedrock geology (Isachsen et al. 1991; Schuberth 1968); late Pleistocene and (to a
lesser degree) Holocene surficial deposits (Antevs 1925; Averill et al. 1980; Lovegreen 1974;
Merguerian & Sanders 1994; Rampino & Sanders 1981; Reeds 1925, 1926; Salisbury 1902;
Salisbury & Kummel, 1893; Sirkin 1986; Stanford 1997; Stanford & Harper 1991; Widmer
1964) as well as post-glacial vegetation change (Peteet et al. 1990; Rue & Traverse 1997;
Thieme et al. 1996) and sea level rise (Newman et al. 1969; Weiss 1974). More recently, there
have been detailed studies of archaeological preservation potential for the under-studied
Holocene surficial deposits (GRA 1996a, 1996b; Schuldenrein 1995a, 1995b, 2000; Thieme &
Schuldenrein 1996, 1998) and estuarine sediments (GRA 1999; LaPorta et al. 1999; Wagner &
Siegel 1997).
Physiography and Bedrock Geology
The New York and New Jersey Harbor is an estuary formed within valleys deepened and
widened by the advance and retreat of the great continental (Laurentide) ice sheet of the last Ice
Age. The valleys occupy rifts which first developed during the separation of the North American
and African continents beginning about 200 million years ago (Isachsen et al. 1991: 50-51). The
Atlantic Ocean formed within the largest of these rifts while lesser rifts sliced through Paleozoic
continental land masses and left isolated remnants such as the Manhattan Prong east of the
Hudson River Valley. The Newark Group rocks underlying most of the Harbor Region formed
from primarily alluvial sediments which filled the rifts as they were opening.
The Quaternary deposits of the Harbor Region (Figure 4.1) rest unconformably on the
Newark Group sedimentary rocks from upper Newark Bay east to the Hudson River. The
Stockton, Lockatong, and Brunswick formations of the Newark Group consist of redbed
sediments deposited in a Triassic basin which was subsequently faulted and intruded by igneous

Geomorphology/Archaeological Borings and GIS Model, 2014 New York/New Jersey Harbor Navigation Project Page 54
magma. The most significant intrusion occurred on the eastern edge of the basin at the Palisades
sill, adjacent to the Hudson River of today.
East of the Hudson River, the Manhattan Prong consists of outcropping Cambrian to
Ordovician igneous and metamorphic lithologies of the New York City Group. Rare outcrops of
gneiss or schist occur on Governors Island (Herbster et al. 1997; Schuberth 1968: 82), and in
Queens and Brooklyn, but these land masses consist primarily of Quaternary sediments or older
marine units of the Atlantic Coastal Plain. A northeast trending axial ridge of gneiss and
serpentinite comprises the core of Staten Island against which tens of meters of glacial till were
lodged by the Laurentide ice sheet.
Several contributing drainages to Newark Bay follow channels inherited from the great
southwest trending Pensauken River system of probable Pliocene age (Stanford 1997). Diversion
of the Pensauken River into the Hudson Canyon between the Pliocene and the Pleistocene
refocused continental shelf deposition from the Baltimore Canyon area (Poag and Sevon 1989;
Stanford 1997) but the Pensauken deposits have been long since scoured way from the Harbor
Region. Cretaceous and possible interglacial (oxygen isotope stage 5e) sediments occur at the
Narrows but sediments older than the Wisconsinan glaciation are otherwise missing from the
lower Hudson as a result of erosion following base-level fall (Weiss 1974: 1567).
Pleistocene Glaciation, Chronology, and Paleoecology
Glaciers advanced across the region at least twice during the Pleistocene (Stanford 1997;
Sirkin 1986). Both Illinoisan (ca. 128-300 ka) and pre-Illinoisan (> 300 ka) terminal moraines
are mapped in northern New Jersey, and these ice advances may be represented by lower tills on
Long Island such as the Montauk (Rampino and Sanders 1981; Merguerian and Sanders 1994).
An abundance of gneiss clasts gives the older tills a ―dirty‖ appearance and they can always be
distinguished from late Wisconsinan deposits by the presence of some unweathered mudstone,
sandstone, and igneous rock clasts in the late Wisconsinan deposits (Stanford 1997).
The Hudson-Mohawk Lobe of the latest, or Wisconsinan, ice sheet advanced to its Harbor
Hill terminal moraine by 20,000 years B.P. based on the evidence obtained from Port
Washington on Long Island by Les Sirkin (Sirkin 1986: 14; Sirkin and Stuckenrath 1980). Some
organic sediments from the preceding, warmer, interstadial period (oxygen isotope Stage 3)
appear to have survived beneath or within the till and outwash, and several such sequences were
identified in the earlier phases of the Harbor study (Schuldenrein 2000a).
In addition to the oxygen isotope geochronology (Richmond and Fullerton 1986), and the
data from Port Washington on Long Island (Sirkin 1986: 14; Sirkin and Stuckenrath 1980), the
age of the terminal Wisconsinan Harbor Hill moraine is constrained by basal post-glacial

Geomorphology/Archaeological Borings and GIS Model, 2014 New York/New Jersey Harbor Navigation Project Page 55
radiocarbon dates from northwestern New Jersey of 19,340 ± 695 B.P. (23,334 cal yrsbp) in a
bog on Jenny Jump Mountain (Witte 1997) and 18,570 ± 250 B.P. (21,941 cal yrsbp) in Francis
Lake (Cotter 1983). Thieme and Schuldenrein (1998) recently obtained a date of 19,400 ± 60
B.P. (23,061 cal yrsbp) from a loamy sediment overlying glacial till along Penhorn Creek in the
Hackensack Meadowlands. A pollen core from Budd Lake in northwestern New Jersey (Harmon
1968) also provides supporting evidence for Sirkin’s chronology of the Hudson-Mohawk Lobe.
A sample of clay from 11 m (37 ft) below surface was dated to 22,870 ± 720 B.P. (23,003 cal
yrsbp) and contained a pollen assemblage dominated by pine (50-60%) and spruce (10-20%)
with some oak (5-10%) and Ambrosiae dominant in the non-arboreal pollen. A boreal forest or
park-like vegetation community is further indicated by pollen assemblages dated to 22,310 ±
2070 B.P. (22,325 cal yrsbp) and 22,040 ± 550 B.P. (22,125 cal yrsbp) from varved silt and clay
in the Hackensack Meadowlands (Schuldenrein 1992; Rue and Traverse 1997) although
reworked Cretaceous spores and pollen were also present. Pollen sequences documenting post-
glacial vegetation change have been registered in the initial New York Harbor study
(Schuldenrein 2000a), as well as in the examinations of subsurface sequences at Jersey Flats
(Schuldenrein 2001).
The terminal Pleistocene pollen record has been most informative for environmental
reconstructions. Full glacial and late glacial pollen assemblages have been variously attributed to
―tundra,‖ ―taiga,‖ ―spruce park,‖ or ―boreal forest‖ vegetation (Davis 1965, 1969; Deevey 1958;
Martin 1958; Ogden 1959, 1965; Watts 1979). Several authors have also pointed out that the late
Pleistocene vegetation may not have clear analogs in present-day plant communities (Davis
1969; Overpeck et al. 1985, 1992). Herb-dominated assemblages corresponding to the tundra
Zone T of Deevey (1958) have been identified in basal samples of cores studied in the region
(Sirkin et al. 1970; Peteet et al. 1990). A radiocarbon date of 12,840 ± 110 B.P. (15,190 cal
yrsbp) from Alpine Swamp Core A indexes the succession to the spruce-hardwood Zone A
(Peteet et al. 1990: 224). Newman et al. (1969) obtained a comparable radiocarbon date of
12,500 ± 600 B.P. (14,830 cal yrsbp) for Zone A in their boring UH-1 from Salisbury Meadow
on western Iona Island; Sirkin et al. (1970) report a radiocarbon date of 12,330 ± 300 B.P.
(14,459 cal yrsbp) for Zone A in their boring SH-29 from a Coastal Plain bog west of Raritan
Bay.
Spruce-dominated assemblages were present in the basal samples of five cores from the
Lower Hudson River estuarine sediments analyzed by Weiss (1974), who obtained a radiocarbon
date of 10,280±270 B.P. (12,024 cal yrsbp) for the top of Zone A in a core beneath the Tappan
Zee Bridge. Abundant spruce pollen was also characteristic of basal samples from borings for the
Carlstadt Loop (Rue & Traverse 1997; 3DI 1992) and the North Arlington force main (Thieme &
Schuldenrein 1996; Thieme et al. 1996) in the Hackensack Meadowlands. The basal North
Arlington assemblage was interpreted to indicate scattered spruce trees on open, tundra-like
terrain. An increase in ―boreal‖ species such as spruce and paper birch between 11,000 and

Geomorphology/Archaeological Borings and GIS Model, 2014 New York/New Jersey Harbor Navigation Project Page 56
10,000 B.P. was attributed by Peteet et al. (1990) to the Younger Dryas abrupt cooling of global
climate.
A more direct cause of the migrations of plant species through the project area can be found
in the irregular northwesterly retreat of the Laurentide ice sheet, as previously inferred from
southern New England pollen records by Ogden (1959), Davis (1976), and others (Davis &
Jacobson 1985; Gaudreau 1988; Gaudreau & Webb 1985). Zone B of Deevey (1958) is thus
characterized by declining spruce and increasing pine pollen, with at least three species of pine
potentially represented by grains which can be classified into at most two pollen ―taxa.‖ Davis
(1976:19-21) maps the presence in the Harbor Region of Pinus banksiana (jack pine) and/or
Pinus resinosa (red pine) by 11,000 B.P. and Pinus strobus (white pine) by 10,000 B.P.
Hemlock, oak, birch, and alder pollen were also quite abundant in the Alpine Swamp Zone B
assemblage (Peteet et al. 1990:222). With the change to essentially modern climatic conditions,
there is a gradual shift toward an oak-dominated pollen assemblage (Deevey’s Zone C), with
basal dates of 9,000 ± 100 B.P. (10,088 cal yrsbp) in the Alpine Swamp core (Peteet et al. 1990)
and 7,100 ± 180 B.P. (7,962 cal yrsbp) in the Tappan Zee core (Weiss 1974).
During the critical later phases of the Pleistocene, the hydrography at the glacial margin was
dynamic and resulted in a glaciolacustrine landscape that involved cyclic retreats and
transgressions of linear lakes that approximated the morphologies of structural valleys. A
reconstruction of the terminal glacial geography is shown in Figure 4.3. Lakes Passaic,
Hackensack, Hudson, and Flushing variously crossed the terrain between Long Island and east-
central New Jersey. In Newark Bay and the lower reaches of the Hackensack and Passaic River
valleys subsurface stratigraphy has revealed uniform lake bed sequences beginning with deep,
―varved‖ proglacial rhythmites (or paired laminations) (Antevs 1925; Lovegreen 1974; Reeds
1925, 1926; Salisbury 1902; Salisbury and Kummel 1893; Stanford, 1997; Stanford and Harper,
1991; Widmer, 1964). Reddish-brown muds derived from Newark Group rocks typify the thicker
winter varves while the more heterolithic sandy varves were deposited as the ice melted during
the summer. The top of the glaciolacustrine facies is typically an unconformable contact from 4
to 9 m (12 to 30 ft) below the present land surface in the Hackensack Meadowlands (Lovegreen
1974). At the last glacial maximum, approximately the time of deposition of the Harbor Hill
moraine (Figure 4.2), nearly one percent of the Earth’s water was transformed into glacier ice
(Strahler 1971). Eustatic sea level consequently plummeted, and a terrestrial coastal plain
extended from 39 to 97 km (24 to 60 mi) onto the present continental shelf along the Atlantic
coast (Bloom 1983a: 220-222; Emery and Edwards 1966; Stright 1986: 347-350). Sea level rise
was extremely rapid in the period immediately following the retreat of the ice (Figure 3.1) as
meltwater was delivered to the oceans basins from runoff and from proglacial lakes that were
impounded by recessional glacial margins. Locally, the lower Hudson and Hackensack River
Valleys were sequentially scoured and flooded (Reeds 1925, 1926; Stanford 1997; Stanford and
Harper 1991), forming much of the present-day topography surrounding New York and New
Jersey Harbor. The basins left behind after the proglacial lakes drained were initially incised by

Geomorphology/Archaeological Borings and GIS Model, 2014 New York/New Jersey Harbor Navigation Project Page 57
meandering channels and then transformed into tidal marsh in the mid- to late-Holocene
(Widmer and Parillo 1959; Thieme and Schuldenrein 1996; Carmichael 1980; Heusser 1949,
1963).
Figure 4.1: Surficial geology of the New York area.

Geomorphology/Archaeological Borings and GIS Model, 2014 New York/New Jersey Harbor Navigation Project Page 58
Critical to interpretation of the submerged sediments underlying New York Harbor is the
glacial and sea level rise history of the Late Pleistocene and Holocene. New York lies at the
southern limit of the last glaciation when glacier ice reached its final position approximately
18,000 years B. P.. The Harbor Hill moraine, extending across Long Island, Staten Island, and
Middlesex County, New Jersey marks its terminus. Stone et al. (2002) show the lobate spread of
glacier ice across New Jersey and New York (Figure 4.3). Stone (personal communication)
notes that ice did not remain for an extended period at the terminal moraine, thus only small
amounts of outwash were deposited at the outer edge of the moraine. This is of importance in
interpreting the submerged deposits beneath the lower harbor and Raritan Bay.
Retreat of glacier ice from the terminal moraine supplied meltwater to proglacial lakes
retained behind the moraines. Proglacial lakes occupied preexisting depressions determined by
the bedrock geology as well as others created by deposition of glacial sediments. The levels of
the proglacial lakes were controlled by the contemporaneous altitudes of spillways through
adjacent lowlands or across channels cut into the terminal moraines. This was the case for the
New York area where a series of proglacial lakes were retained behind the Harbor Hill moraine.
The earliest of these lakes, Lake Bayonne, spread across the New York harbor area and East
River while its broader extent occupied the lowlands west of the Palisades sill, including Arthur
Kill, Kill Van Kull, and Newark Bay. Lake Bayonne drained southward across the terminal
moraine through a spillway at Perth Amboy. The level of Lake Bayonne was controlled by a
spillway altitude of 9 m (30 ft). A lower glacial Lake Hackensack of less area drained through
the moraine at Perth Amboy as its spillway was eroded more deeply into the Harbor Hill
moraine. Further ice retreat from western Long Island allowed additional lowering of lake level
to the glacial Lake Hudson level which drained eastward through the East River at Hell Gate.
This final lake was contained within the glacially scoured and deepened Hudson River channel
that progressively expanded northward with ice retreat until the Mohawk valley lowland was
deglaciated about 12,000 BP (13,875 cal yrsbp) (Stone et al. 2002). Figure 4.3 shows the
location and extent of proglacial lakes in the study area.

Geomorphology/Archaeological Borings and GIS Model, 2014 New York/New Jersey Harbor Navigation Project Page 59
Figure 4.2: Glaciation of New York and New Jersey (from Stone et al. 2002).
The time of deglaciation of the Mohawk River lowland between 13,000 and 12,000 B.P. is a
key time in the geologic history of the New York harbor area. About this time drainage of
proglacial Lake Iroquois, which occupied the Lake Ontario basin, was free to drain directly to
the Hudson River valley and add to the volume of proglacial Lake Hudson. Researchers disagree
on the mechanism, but an outlet through the Harbor Hill moraine at the Narrows was opened at
about this same time emptying Lake Hudson and gave rise to the present drainage pattern to the
Hudson River. Newman and his coauthors (Newman et al. 1969) note that marine and brackish
water filled the 27 m-deep (89 ft-deep) channel of the Hudson River at 12,500 ± 600 B.P.
(14,830 cal yrsbp) as evidenced by marine and brackish marine microfossils preserved at the
base of organic silts beneath peat bogs at Iona Island. It is problematic whether the erosion of
the outlet through the Harbor Hill moraine was gradual or catastrophic as recently proposed by
Uchupi et al. (2001) and Thieler et al. (2006). Nonetheless, it is clear that flow from the Hudson
River eroded a channel and valley across the exposed continental shelf to drain and deposit a
delta on the outer shelf at a lowered sea level stand. Most challenging for the understanding of

Geomorphology/Archaeological Borings and GIS Model, 2014 New York/New Jersey Harbor Navigation Project Page 60
the Hudson River history is the lack of a clear explanation for a direct marine connection
between contemporaneous sea level at the edge of the continental shelf and the upper Hudson
River valley. For all intents and purposes, the shelf is considered to have been subaerially
exposed at this time. Differential isostatic adjustment of the earth’s crust following deglaciation
is the most reasonable process to suggest with downwarping and depression of the crust beneath
glacier ice in the north, and possible compensating uplift of the continental shelf to bring sea
level in line with the upper Hudson River channel. Differential uplift of the crust along the upper
Hudson Valley relative to the New York Harbor area on the basis of historic tide gauge data has
been presented by Fairbridge and Newman (1968), but the complete relationship remains
unclear. Figure 4.4 is a three dimensional representation of the New York Harbor area viewed
from the south. The deeply incised channel of the Hudson River is well defined, as is the pre-
dredging channel of Arthur Kill, showing its incised outwash channel from Newark Bay to
Raritan Bay that marks the overflow from proglacial lakes Bayonne and Hackensack. A broad
wedge of sediment, ostensibly derived from outwash from the ice front and carried by the
Raritan River and Arthur Kill spillway, fills Raritan Bay and spreads eastward with a lobate front
into the New York Bight area. Splayed channels leading from the mouth of the main Hudson
channel at the Narrows spread across the mouth of the lower harbor between Sandy Hook and
Coney Island. The incised channels of the Raritan River and the Arthur Kill spillway appear to
join near Perth Amboy and terminate near Great Kills where they appear to have been filled by
littoral sediment derived from longshore drift from the northeast. The incised channels of these
drainages were studied by Gaswirth (1999) and are discussed in a later section of this report.
Earlier studies by Williams (1974) and Kondolf (1978) discuss the incised Raritan channel
passing beneath Sandy Hook and draining to the continental shelf. Kondolf (1978) has
suggested that the outer edge of the outwash sand body extending offshore Sandy Hook and
Coney Island derives from beach sands and longshore transport from both the south and east
along the New Jersey and Long Island shores, but Figure 4.4 shows no indication of barrier
island formation and points to its outwash related history. In fact, this figure suggests that the
discontinuous shoal area east of Sandy Hook, and noted as the False Hook on current navigation
charts, may be related to the outwash fan but truncated by the flow of tidal currents around the
tip of Sandy Hook.

Geomorphology/Archaeological Borings and GIS Model, 2014 New York/New Jersey Harbor Navigation Project Page 61
Figure 4.3: Proglacial lakes in the New York Harbor area (from Stone et al. 2002).
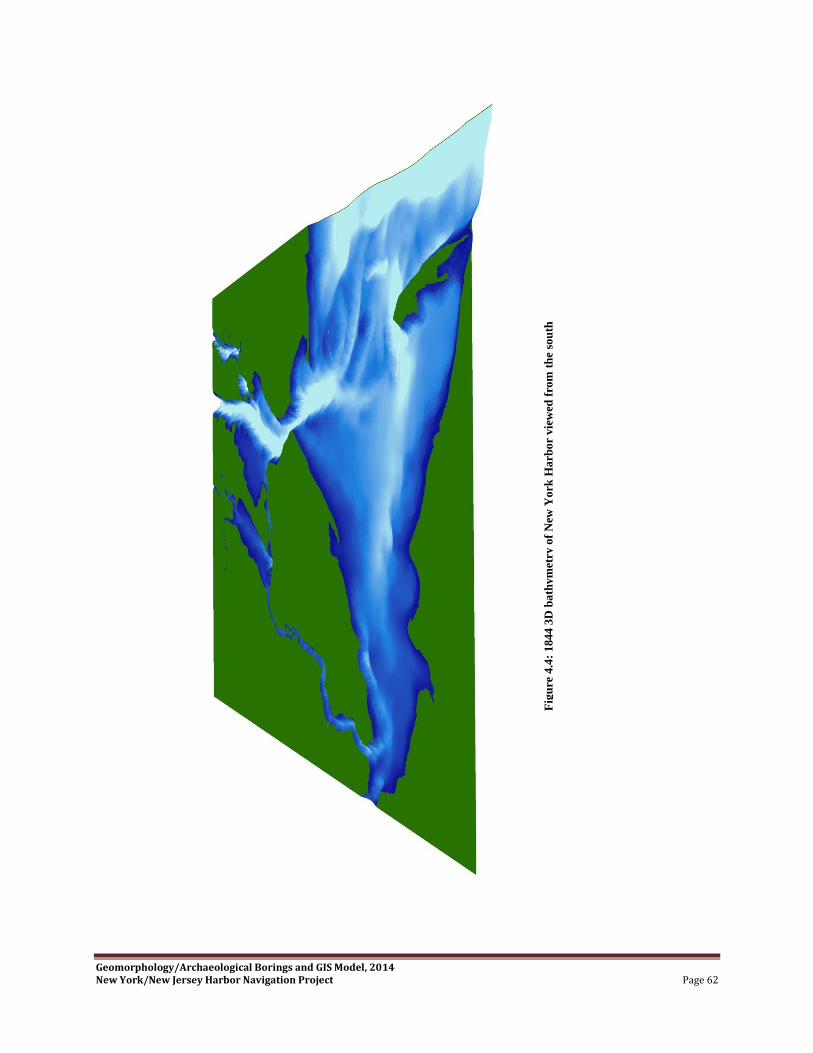
Geomorphology/Archaeological Borings and GIS Model, 2014 New York/New Jersey Harbor Navigation Project Page 62
Fig
ure
4.4
: 1
84
4 3
D b
ath
ym
etry
of
New
Yo
rk H
arb
or
vie
wed
fro
m t
he
sou
th

Geomorphology/Archaeological Borings and GIS Model, 2014 New York/New Jersey Harbor Navigation Project Page 63
Thieler et al. (2007) present a seismic reflection profile across the area east of the Narrows
showing a deeply incised, but filled channel attributed to discharge of the Hudson upon erosion
of the Harbor Hill moraine barrier (Figure 4.5). This channel was cut to 45 m (148 ft) below
present mean sea level in underlying Cretaceous sediments and is filled and overlain by 15 m (49
ft) of younger sediment. The depth of this incised channel relative to Thieler’s observation of a
subaqueous delta for the Hudson at the edge of the continental shelf (-110 to -120 m [-360 to -
394 ft]) underlines the need for a mechanism to reconcile this sea level position relative to the
reflooded Hudson river channel at Iona Island.
One of the goals of the present study has been to develop an accurate record of relative sea
level rise for the New York Harbor area for use in determining the submerged locations of
probable prehistoric human habitation areas. Derivation of the new sea level rise model is
addressed in detail in a later chapter and coupled with a detailed submergence reconstruction for
the study area. The present model is derived from existing and newly reported radiocarbon
analyses from nearby submerged environmental settings acquired during this study or as part of
previous GRA studies. This work presents a two-part relative sea level history consistent with
―far field‖ eustatic sea level studies (Fleming et al. 1998). The relative sea level rapidly rises at a
rate of approximately 9 mm/yr (3.5 in/yr) from at least 9,000 cal yrsbp until about 8,000 cal
yrsbp when the rate decreases to a consistent 1.5 – 1.6 mm/yr (0.6 in/yr) from 7,000 cal yrsbp
until the present. The more detailed record of the last 2,000 cal yrsbp shows low amplitude
century-scale fluctuations in sea level on the order ± 30 cm (12 in) until the period of historic
tide gauge records. The new sea level model utilized here is also consistent with studies by
Bloom and Stuiver (1963) for the Connecticut shore, Redfield and Rubin (1962) for Barnstable,
Massachusetts, Belknap and Kraft (1977), and Nikitina et al. (2000) for Delaware Bay, as
reexamined by Larsen and Clark (2006). This new model (Figure 3.6) differs markedly from
that used in earlier GRA studies of New York Harbor, as these relied directly on curves
presented by Newman et al. (1969).
In general terms, the new relative sea level model can be hindcast to account for reflooding
of the incised Hudson channel described by Thieler et al. (2007) for the Narrows at ca. 12,000
B.P. (13,875 cal yrsbp) as well as the marine incursion of the upper Hudson Valley. It cannot,
however, resolve the differential positions of the incised channel at the Narrows with the
proposed delta at the edge of the continental shelf. The same data indicate progressive flooding
of the main Hudson channel until its present configuration. The area currently known as the
New Jersey flats begins to be flooded about 7,000 cal yrsbp. Oyster reefs begin to form upriver
at Tappan Zee at this time as well and are found at successively shallower depths following the
rising sea level (Carbotte et al. 2004). Marine water enters and progressively floods Raritan Bay
and Newark Bay about 6,000 cal yrsbp. Significantly, we also recognize an erosional marine
terrace at 5 m (17 ft) below modern chart datum (MLLW). This terrace extends from Raritan
Bay to Coney Island and includes Flynn’s and Romer shoals as well as the East Bank and the
False Hook east of Sandy Hook. This terrace indicates a prolonged hesitation in sea level rise

Geomorphology/Archaeological Borings and GIS Model, 2014 New York/New Jersey Harbor Navigation Project Page 64
between 2,000 and 3,000 cal yrsbp. The terrace also limits the ages of the above shoals to
predate this time. Marshes upstream from the present mouth of the Raritan River as well as the
Hackensack marshes begin to become saline after 3,000 cal yrsbp and subsequently develop into
salt marshes. It is suspected that portions of Jamaica Bay underwent a similar history, but
sufficient data do not yet support this assertion.
Fig
ure
4.5
: S
eism
ic p
rofi
le e
ast
of
the
Na
rro
ws
(fro
m T
hie
ler
et a
l. 2
00
7)

Geomorphology/Archaeological Borings and GIS Model, 2014 New York/New Jersey Harbor Navigation Project Page 65
Post-Pleistocene Geography
Recent studies on Staten Island (Schuldenrein 1996a, 1996b), Ellis Island (Pousson 1986),
and Governors Island (Herbster et al. 1997; Thieme and Schuldenrein 1999) suggest some of the
complexity of Quaternary depositional environments in the lower Hudson River valley as well as
the variable preservation of archaeologically sensitive deposits. While the generic stratigraphy
can be said to consist of Wisconsinan ice-contact and meltwater deposits capped by quartzose
sheet sands, grain-size analyses of basal sands on Governors Island indicated a combination of
glaciofluvial, ice-contact, and fluviomarine deposition (Thieme and Schuldenrein 1999).
There is very little evidence of soil formation or stability of Holocene shorelines until after
7,000 cal yrsbp, although some submerged contexts may in fact be present within the harbor
itself. As proposed for the northeastern United States in general by Nicholas (1988), Mid-
Holocene terrestrial sediment packages have occasionally been identified in the project vicinity
at the margins of freshwater ponds or marshes (e.g., Thieme and Schuldenrein 1996). The most
recent example of this is at the Collect Pond in lower Manhattan (Schuldenrein 2000). However,
early- to mid-Holocene sediments are virtually absent in the estuarine valley fills.
In Newark Bay and the lower reaches of the Hackensack and Passaic River valleys there is a
different and more uniform sequence that was discovered at the interface of the terminal
Pleistocene glacio-lacustrine varves discussed earlier. Here, relatively late Holocene peat often
overlies the contact except for where sediment was stored by one of the pre-estuarine river
systems. In North Bergen, Thieme and Schuldenrein (1998) identified a stratigraphic column
wherein a fining upward alluvial sequence—sandy loam to fine silt—Indicates deposition on the
natural levee of a meandering stream (Brown 1997: 70-81; Waters 1992: 134-135). A buried soil
within this Holocene floodplain facies was dated to 3,650 ± 70 B.P (3,977 cal yrsbp) while plant
stem fragments from overlying tidal marsh were dated to 1,130 ± 60 B.P (1,075 cal yrsbp)
(Thieme and Schuldenrein, 1998).
A representative section for the submerged depositional contexts of landforms in the general
New York Harbor area is shown in Figure 5.6. This is also a general model for shoreline
evolution, chronology, and stratigraphy, and it is reinterpreted from an earlier GRA
reconstruction at Jersey Flats (Schuldenrein 2001). As shown, core locations JF-1 and JF-3 core
are separated by approximately 600 m (1969 ft) across which the harbor floor steps from
approximately -3 m to -9 m MSL (-10 ft to -20 ft MSL). Much of this change occurs at a step or
terrace "riser" immediately landward of the JF-3 location. The model postulates three time-
transgressive surfaces along an east to west transect between Port Jersey and Anchorage
Channel. At this location, an indicator of this development is a series of Aligena shell beds that
register still stands of the sea. They record a certain depth of water (for the sediment-water
interface) that has advanced landward as an indicator of sea level rise. The core sequence did not
definitively isolate the Pleistocene-Holocene contact but a date of 9,400±150 B.P. (10,690 cal

Geomorphology/Archaeological Borings and GIS Model, 2014 New York/New Jersey Harbor Navigation Project Page 66
yrsbp, Beta-127019) for Anchorage Channel boring 98ANC44 (Schuldenrein et al. 2000a:
Appendix 3) is a reasonable temporal benchmark.
Early-Middle Holocene sedimentary sequences are projected from regional chronologies and
the relative sea level model developed in the present study. Based on this relative sea level
curve, a transgressive shoreward coastline has some measure of support from dates at JF-1
(3,460 ± 70 B.P. [3,736 cal yrsbp], Beta-150701) and JF-6 (3,360 ± 70 B.P. [3,586 cal yrsbp
Beta-15074). The model assumes that the inverted sequence at JF-3 is completely disturbed,
perhaps by mixing of the recent subtidal sediments or, alternatively, by channeling and dredging
activities in the historic past. Thus, recent and localized scour and fill along the terrace riser
probably accounts for the thin intercalations of dark gray clay and grayish brown sand from 2 to
3 m (7 to 9 ft) below the sediment-water interface in core JF-3a.
The upper portion of the sequence identifies the Late Holocene shoreline, reworked by
historic tidal scour and fill. This portion of the sequence, extending to depths of at least 1 m (3
ft), is consistent for all the cores. At Jersey Flats, the pollen and other biostratigraphic evidence
suggests that uppermost core stratigraphy everywhere appears to be contemporaneous with Euro-
American settlement and the present shoreline position. In the study, it was determined that the
JF-4 core location has the best potential for preserving deposits which predate the post-glacial
marine transgression and estuary formation within the lower Hudson valley. Paleoecological
analysis indicated that JF-4 preserves the most intact vegetation succession. If intact early- to
mid-Holocene sediments are actually present, and particularly if these are from a terrestrial
fluvial depositional environment, the JF-4 core location would have moderate to high potential
for submerged cultural resources.
More generally, buried soils are the most sensitive indicators for stable surfaces and are, thus,
the most critical measures for subsurface prehistoric cultural resources (Holliday 1992: 101-104;
Rapp 1998: 34-36; Waters 1992: 74-77). Buried soils have been identified primarily within the
interval 4,000-2,000 B.P. (4,527-1,982 cal yrsbp) for terrestrial settings in the project vicinity
(Schuldenrein et al. 1996a, 1996b; Herbster et al. 1997; Schuldenrein 1995a, 1995b; Thieme and
Schuldenrein 1998, 1999). In some locations, such as on Governors Island and the north shore of
Staten Island, the buried soils are at, or even slightly below, mean sea level. Earlier, as yet
undocumented, soil forming intervals may be represented by stratigraphy which has been
submerged, although no buried soils were definitively identified from geotechnical borings
during the present study.

Geomorphology/Archaeological Borings and GIS Model, 2014 New York/New Jersey Harbor Navigation Project Page 67
Chapter 5
Sediment Cores
This chapter describes the sediment lithologies observed during the inspection of split cores.
Examination of the cores took place in the Alpine Ocean Seismic Survey, Inc. storage facility in
Norwood, NJ rather than in the field to ensure optimal recovery, under controlled conditions, of
samples for paleoecological (i.e. pollen, foraminifers, and shell) and radiometric (radiocarbon
dating) analyses. The recovery of these cores was critical for developing a paleoecological and
chronological framework (Chapter 7 and Appendices C, D, and E).
It is emphasized that the lithostratigraphic underpinnings of the present study were generated
on the strength of field observations and broader guidelines established by the best calibrated
successions assembled by earlier Quaternary researchers, most notably Newman et al. (1969).
The range and variability of geologically based stratigraphies used by the numerous teams
working in the New York Harbor and Bight are simply too uneven to distill into a universal and
overarching sequence. The GRA sediment-stratigraphy registers the major geomorphic
transitions, incorporates the latest batteries of radiometric dates and, to this point, serves as the
most comprehensive Late Quaternary sequence for the Bight.
In all, twenty (20) cores were collected. Five transects, located in Raritan Bay, the Upper
New York Harbor, and Jamaica Bay were selected for vibracoring. The core samples were
extracted into flexible, semi-opaque poly tubing and immediately sealed to prevent
contamination and to maintain stable conditions (Figure 5.1). Coring locations, water depth,
penetration depth, and actual recovery were recorded. The percentages of recovery relative to
penetration depth varied by transect relative to differences in lithology. The depth of penetration
versus recovery for each core are presented in core stratigraphic descriptions (Appendix A),
while averages by transect are presented below (Table 5.1). Transects A and B, which are
located in Raritan Bay, had generally poorer recovery than transects C, D, and E, which are
located in Upper New York Harbor and Jamaica Bay. This is probably due to lithology
differences between the coarser sands (which are prone to compaction in vibracore sampling)
found in the Raritan Bay transects as compared to the generally higher clay content encountered
in the Upper New York Harbor and Jamaica Bay transects. The core was described using the
recovered samples with no retrofitting of the stratigraphy to the penetration depths.

Geomorphology/Archaeological Borings and GIS Model, 2014 New York/New Jersey Harbor Navigation Project Page 68
Table 5.1: Average Penetration and Recovery by Transect
Transect Name Average
Penetration (m)
Average
Recovery (m)
Percentage
Recovered
A. Seguine Point–Union
Beach 9.88 6.00 61%
B. Keansburg 11.05 8.19 74%
C. Liberty Island 10.93 9.60 88%
D. Bay Ridge Flats 12.00 10.38 86%
E. Yellow Bar Marsh 5.85 5.02 86%
Figure 5.1: Core recovery, Raritan Bay.

Geomorphology/Archaeological Borings and GIS Model, 2014 New York/New Jersey Harbor Navigation Project Page 69
After recovery the cores were stored and examined at the Alpine Ocean Seismic Survey, Inc.
storage facility in Norwood, New Jersey (Figure 5.2). The cores were not refrigerated. They
were split, the lithostratigraphy was documented, and paleoecological and radiometric dating
samples were collected by GRA staff. Lithostratigraphy here refers to the description of
principal sediment characteristics of discrete layers and the identification of major stratigraphic
unconformities between deposits. Results of the radiocarbon dating are found in Chapter 3,
while special studies of shells, foraminifers, and pollen are found in Appendices C, D, and E. A
split of each core was resealed (Figure 5.3) and archived at the Army Corps of Engineers storage
facility at Caven Point, NJ. The core lithologies and interpreted stratigraphy are presented
below by project area and transect.
Raritan Bay
Seguine Point – Union Beach Profile (Cores A0-A5). A total of five (5) localities (A0 – A4)
were vibracored (Figure 5.4). Two localities required additional cores to maximize recovery
resulting in seven (7) total core recoveries. Core locality A-2 had the upper 5.14 m (16.86 ft)
recovered in one core (A-2/R1) while a second core was collected from approximately 5.10 m
(16.73 ft) to approximately 7.70 m (25.26 ft) below the water/sea bottom contact. Core locality
A-3 was also sampled by multiple cores due to poor recovery, largely due to complications
associated with attempting to core through lithologically dissimilar strata. Core A-3/R1
recovered a representative sequence; however though the sample penetrated 10.67 m (35.01 ft)
only 4.57 m (14.99 ft) was recovered. In order to better sample the deposits, a second series of
cores (A-3/R2-3) was recovered. This two-stepped coring consisted of taking one core from the
upper coarser sandy sediments, then taking a second core that began collection below the coarse
sandy sediments. This method provided a 12.5 m (41.01 ft) long core sample that was more
representative of the sediments.
The cores provide an approximately 6.2 km (3.9 mi) cross section of Raritan Bay from
Seguine Point, Staten Island, NY at the north to Union Beach, NJ at the south (Figure 5.5). As
mentioned in Chapter 2, this location was chosen to duplicate the results of an often cited
geologic cross section across Raritan Bay made in 1936 as part of a bridge construction study
(McClintock and Richards, 1936, cited in Bokuniewicz and Fray, 1976; Gaswirth, 1999, and
Thieler et al., 2007). Recovered cores ranged in length from 2.65 to 12.5 m (8.69 to 41.01 ft).
Descriptions can be found in Appendix A. No radiocarbon samples were collected from the
cores due to lack of potentially datable carbon, however, six (6) shell samples from the cores
were examined (Appendix C).

Geomorphology/Archaeological Borings and GIS Model, 2014 New York/New Jersey Harbor Navigation Project Page 70
The cores along the Seguine Point to Union Beach transect in Raritan Bay encountered four
(4) lithostratigraphic units:
Stratum IV: Very dark gray reworked sandy marine
sediments
Stratum III: Truncated, stacked, fining upwards glacio-fluvial
sequences with polygenetic phreatic weathering
at its lower contact
Stratum II: Poorly sorted glacial till
Stratum I: Highly weathered Cretaceous clays and sands

Geomorphology/Archaeological Borings and GIS Model, 2014 New York/New Jersey Harbor Navigation Project Page 71
Figure 5.2: Processing core samples, Alpine Ocean Seismic Surveys, Inc.
Figure 5.3: Cores prepared for curation at the Caven Point facility.

Geomorphology/Archaeological Borings and GIS Model, 2014 New York/New Jersey Harbor Navigation Project Page 72
Figure 5.4: Raritan Bay transects along profiles I-I’, II-II’, and III-III’ as well as assembled study core locations.

Geomorphology/Archaeological Borings and GIS Model, 2014 New York/New Jersey Harbor Navigation Project Page 73
Fig
ure
5.5
: S
egu
ine
Po
int-
Un
ion
Bea
ch t
ran
sect

Geomorphology/Archaeological Borings and GIS Model, 2014 New York/New Jersey Harbor Navigation Project Page 74
The uppermost sediments (Stratum IV) are reworked marine deposits to a depth of 1 m.
They consist of very dark gray (10YR3/1) silty, fine to medium sand with broken shell
fragments. These deposits were found in all the cores except for A-4 at the southern end of this
transect. The thickness of this uppermost deposit ranges from 0.69 to 0.98 m (2.26 to 3.2 ft). The
deposits are texturally similar to the underlying sandy fluvial deposits, however the presence of
marine shell and organics indicate that the extant fluvial sediments were likely reworked by sea
level transgression through the Holocene. Six marine mollusk samples were recovered from
Core A-0 and A-3 and characterized by depositional environment (Appendix C).
Below, the marine deposits are a truncated, but otherwise undisturbed, dark brown
(7.5YR3/2) clean, poorly-sorted, gravelly, fine to coarse sand of Stratum III. The gravel
fraction is sub- to well-rounded, and ranges in size from 10 to 40 mm (0.49 to 1.57 in).
Sequences of fining upward were found in these deposits, indicating a series of high-energy
fluvial events, which may have been associated with fluvio-glacial conditions. The deposits
ranged in thickness from approximately 2.26 to 4.95 m (7.41 to 16.24 ft). No paleosols or
textural unconformities which would suggest preserved stable surfaces during this depositional
period were observed. Core A-0 terminated at 6.5 m (21.33 ft) below the sediment/water
interface in these fluvial sediments without encountering a deeper stratigraphic break.
A thin, weathering horizon is found at the base of Stratum III, where the horizon comes into
contact with the lithologically dissimilar, heavily weathered Cretaceous clays of Stratum I.
This horizon exists in Cores A-2 and A-3. In A-2 it is expressed as a 0.13 m (0.43 ft) thick
horizon of dark reddish brown (5YR3/4) hard, fine to coarse sand with few well rounded and
cemented gravels up to 10 mm (0.39 in) in size. In Core A-3 the horizon is 0.10 m (0.33 ft), and
is manifested as a color change from brown (7.5YR4/2) to reddish brown (5YR3/4) in a gravelly,
medium to coarse sand that is otherwise similar to the overlying deposits. The reddening of
sediment color indicates pedogenic alteration due primarily to the weathering of iron (Fe). This
saturated condition is likely a function of water collecting atop the impervious Cretaceous clays,
weathering the base of Stratum III.
Underlying Core A-4 on the southern end of the ―A‖ transect near Conaskonk Point, NJ is
dark grayish brown (2.5Y4/2) clayey silty sandy gravel. This lithology was only observed in
core A-4, and is identified as Stratum II. This poorly sorted deposit is similar to a diamict or
glacial till.
A major stratigraphic unconformity was observed beneath the sandy fluvio-glacial deposits
of Stratum III in cores A-1, A-2, and A-3. Stratum I is identified as a deeply weathered
unconsolidated Upper Cretaceous clays, silts and sands. The Cretaceous deposits are southeast
dipping quart-rich clay and sand deposits which form aquifers and aquicludes (Gaswirth, 1999).
The locations of cores A-0, A-1, and A-2 are mapped as Raritan Formation, while cores A-3 and
A-4 fall within the Magothy Formation (Gaswirth, 1999; Minard, 1969). The upper portion of
this deposit is a 0.5 to 1.0 m (1.6 to 3.28 ft) thick deeply weathered gray (2.5Y6/1) clay with

Geomorphology/Archaeological Borings and GIS Model, 2014 New York/New Jersey Harbor Navigation Project Page 75
weak olive yellow (10YR6/6) weathering stains and black mineral lamellae. In core A-2 the
clayey sediments continued with an additional 1.5 m (4.9 ft) thick dark gray (10YR4/1) clay that
coarsened to very fine sandy silty clay at the base. Below these clays, a gray (2.5Y6/1) well-
sorted fine sand with distinct laminations was observed in A-3. The fine sands of this lower
portion of the Cretaceous deposit are interbedded with distorted (possibly by injection),
subhorizontal to broken vertical black (10YR2/1) and light yellowish brown (10YR6/4) organic
and mineral silty fine laminae.
Figure 5.6 shows an interpretation of the stratigraphy along the Seguine Point-Union Beach
transect I-I’. The five new vibracores obtained from the present study as well as an additional
core from an earlier Union Bay study (Alpine, unpublished), UB-3 are plotted on a bathymetric
profile across Raritan Bay in the same location as the 1936 stratigraphic profile by McClintock
and Richards (1936) cited by Bokuniewicz and Fray (1976) and discussed in Chapter 2 (Figure
2.1). Their figure was scaled and the boring locations were selected to resample the deep incised
valley shown. Figure 5.6 shows the actual subsurface conditions and negates the often used
information attributed to these authors. The cores along this transect show the surface covered
by a thin veneer of silty, fine to coarse grained sand. North of Conasconk Point this fine to
coarse sand overlies medium, dark brown to reddish brown coarse sandy gravel that fines
upslope to a clean fine to coarse sand. Downslope and near the center of the bay, the gravel
gives way to reddish brown medium grained sand that extends northward across the bay to the
edge of the Raritan Bay West Reach channel. The reddish brown color and coarse grain size of
the sediments are normally attributed to Pleistocene outwash sediments (Bokuniewicz and Fray,
1976; Gaswirth 1999). These coarse sediments overlie weathered, stiff clay to the north that
generally is considered to represent the Cretaceous Raritan Formation. To the south, stiff clay
overlies a thick sequence of gray silty very fine sand with black and light yellowish brown
subhorizontal laminae. The clay and underlying fine sand are considered to be the Cretaceous
Magothy Formation (Gaswirth, 1999). Core UB-3 in the central portion of the bay and
approximately above Gaswirth’s (1999) proposed buried paleochannel of the Pleistocene Raritan
River shows brown fine and medium sand overlying gray silty and gravelly sands. The gray
sands at the base of this boring likely represent reworked Cretaceous Magothy Formation which
displays similar characteristics. Thus, Figure 5.7 shows an unconformity outlining an incised
sand filled channel as well as a Cretaceous surface sloping from south to north beneath the bay.
Clearly there is no evidence of a deep ―mud-filled‖ channel extending ca. 45 m (150 ft) below
present sea level. Two shallow troughs are present on the floor of the bay at this location. Both
of these troughs may mark the position of former incised outwash channels. The northern trough
was labeled the Pleistocene Arthur Kill paleochannel, and the central trough the Pleistocene
Raritan paleochannel. The age of these channels is problematical as Gaswirth obtained only one
radiocarbon date for the sediments at the base of the Pleistocene valley fill. This date was
31,740 ± 1830 B.P., thus the paleochannel may predate the final glaciation of the area.

Geomorphology/Archaeological Borings and GIS Model, 2014 New York/New Jersey Harbor Navigation Project Page 76
Keansburg Profile (Cores B1-B4). Four (4) vibracores were collected along the Keansburg
profile (Figure 5.4) using a Vibracore as shown in Figure 5.7. The cores are located along a
transect beginning at Keansburg, NJ and continuing to the northwest for 3.1 km (1.9 mi) across
the southern half of Raritan Bay (Figure 5.8). Core recovery ranged in thickness from 2.65 to
12.5 m (8.69 to 41.0 ft). Depths to the Raritan Bay bottom ranged from 3.32 to 4.51 m (10.89 to
14.79 ft) below sea level in cores B-4 through B-2 on the southernmost portion of the profile,
while core B-1 was far deeper at 11.28 m (37.01 ft). No radiocarbon samples were analyzed from
the Keansburg Profile. Two (2) shell samples were collected; one shell from 0.15 m (0.49 ft)
below the top of core B-1, and one shell from 1.35 m (4.43 ft) below the top of core B-3.
Descriptions can be found in Appendix C.

Geomorphology/Archaeological Borings and GIS Model, 2014 New York/New Jersey Harbor Navigation Project Page 77
Fig
ure
5.6
: S
tra
tig
rap
hic
pro
file
I-I
’, S
egu
ine
Po
int
to U
nio
n B
each
.

Geomorphology/Archaeological Borings and GIS Model, 2014 New York/New Jersey Harbor Navigation Project Page 78
Figure 5.7: 40-ft vibracore, Raritan Bay.
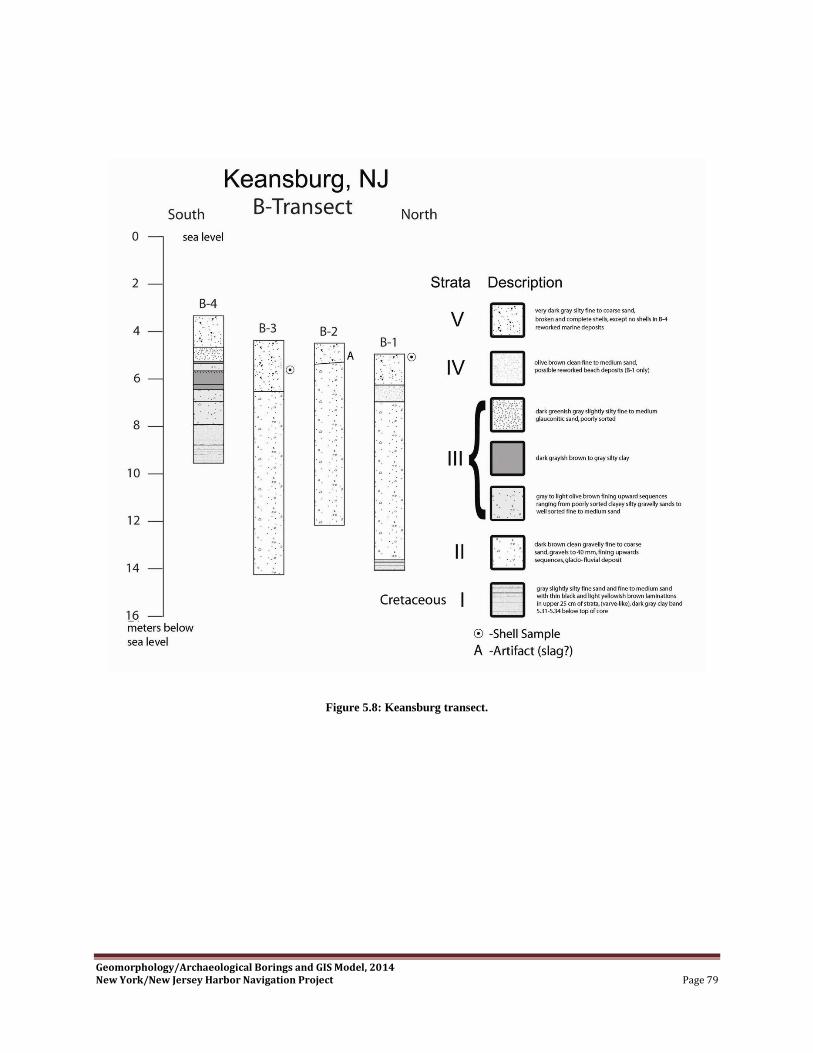
Geomorphology/Archaeological Borings and GIS Model, 2014 New York/New Jersey Harbor Navigation Project Page 79
Figure 5.8: Keansburg transect.

Geomorphology/Archaeological Borings and GIS Model, 2014 New York/New Jersey Harbor Navigation Project Page 80
The cores along the Keansburg transect in Raritan Bay encountered five (5) lithostratigraphic
units:
Stratum V: Very dark gray reworked clayey, silty, sandy
marine sediments
Stratum IV: Olive brown, clean, fine sand, possible reworked
beach (B-1 only)
Stratum III: Complex of glaconitic sands, weathered clays,
and well sorted brown sands associated with
colluvial and alluvial settings along submerged
portions of Waackaack Creek (B-4 only)
Stratum II: Truncated, stacked, and fining upwards fluvial
sequences with polygenetic, phreatic weathering
at its lower contact
Stratum I: Highly weathered Cretaceous sands
Stratum V consisted of a very dark gray (10YR3/1) clayey sandy silt to silty fine sand
ranging in thickness from 0.80 to 2.15 m. Occasional fine broken shell fragments are found
throughout this stratum in cores B-1 to B-3. Two slag-like fragments were found in core B-2
between 0.45 and 0.89 m, indicating historical deposition of these deposits. Core B-2 has a dark
yellowish brown (10YR3/4) fine to medium clean sand overlying Stratum V which, considering
the historic object recovered immediately below, suggests that this sand was deposited very
recently.
Stratum IV consisted of olive brown (2.5Y4/3) fine to medium clean sand, with a thickness
of 0.70 m, between 1.3 and 2.0 m below the water/sea floor interface. This Stratum was only
observed in B-1. These clean sands may represent a preserved and reworked beach surface,
which implies a period of stability during the Holocene transgression. The B-1 core is the only
setting with a potentially preserved beach deposit atop the truncated glacio-fluvial deposits.
Stratum III is a complex series of sediments and soils found only in Core B-4 that are more
likely associated with submerged portions of Waackaack Creek than buried paleochannels of the
ancestral Raritan River. The deposit ranges from between 1.35 m and 3.62 m below the top of
the core. The top of the deposit from 1.35 m to 1.93 m is a dark greenish gray (GLEY1 4/1)
slightly silty fine to medium glauconitic sand. Sand continues below this horizon from 1.93 to
2.11 m with an olive brown poorly sorted clayey silty gravelly sand. From 2.11 m to 2.31 m is a
dark gray (10YR4/1) silty clay with organics. Below the clay from 2.31 m to 2.38 m is a reddish
gray (2.5Y5/1) fairly well sorted fine to medium sand, with abrupt contacts above and below.
From 2.38 m to and irregular contact at 2.85 m to 3.05 m is a dark grayish brown (10YR4/2) silty

Geomorphology/Archaeological Borings and GIS Model, 2014 New York/New Jersey Harbor Navigation Project Page 81
clay with a weathered reddish yellow (7.5YR6/8) oxidized zone in the upper five (5) cm of the
horizon. The dark grayish brown (10YR4/2) silty clay continues from 2.85 m to 3.05 m contact
to 3.23 m. From 3.23 m to 3.62 m is a fining upward sequence of black (10YR2/1) very silty
fine to medium sand with gravels at the base that fines upwards to a sandy silt. This undated
sequence of deposits appears to represent a wedge of alluvium and colluvium at the southern
margin of Raritan Bay. Stratum III can be interpreted as a fining upward fluvial deposit capped
by alluvial overbank muds, which experienced limited pedogenic weathering. The deposits were
then capped by glauconitic sands, which may derive from colluvial wash or a high energy fluvial
deposit from weathering glauconitic bedrock, which can be found in the upland portions of the
Waackaack Creek drainage.
Stratum II is analogous to Stratum III as identified in the Seguine Point to Union Beach
transect. Sediments range from fining upward sequences of olive brown (2.5Y4/3) clean coarse
to fine sand in core B-1, to brown (10YR5/3) interbedded, clean, fine to medium sands to
gravelly sands with gravels up to 30-40 mm in core B-2. Stratum II is found in all of the cores,
including a 0.95 m thick package of these deposits between the underlying Cretaceous Stratum I
sands below and the Stratum III complex of deposits associated with the submerged Waackaack
Creek.
Stratum I was identified at the base of Cores B-1 and B-4. Unlike the expression of the
Cretaceous deposits along the Seguine Point – Union Beach transect, these deposits are not
capped by deeply weathered clays. Instead, these deposits are analogous to the gray sands
observed deep in Stratum I along the Seguine Point – Union Beach transect. The sediments are
gray (10YR5/1) well-sorted fine sand with common, horizontal to subhorizontal distinct black
(10YR2/1) 5 to 15 mm thick lamina.
The Keansburg transect extends further east and ―downstream‖ in the drowned valley of the
Raritan River. Figure 5.9 shows a continuation of the characteristic reddish brown fine to coarse
sand and gravel of the Pleistocene valley fill present in the Seguine Point – Union Beach
transect, II-II’. These deposits underlie the southern slope of the bay and are known as the
―Keansburg Sands‖ as reported by Bokuneiwicz and Fray (1976), although the line of vibracores
lies in an area mapped as West Raritan mud in their report. The Pleistocene sands and gravels
were penetrated in cores B-1 and B-4 where the same gray fine grained sand with black and
yellowish laminae was encountered as in cores A-1, A-2, and A-3, indicating the Cretaceous
Magothy Formation. Although Gaswirth (1999) maps the area of B-4 as being underlain by the
Cretaceous Merchantville Formation, the sediments are more similar to the Magothy sands. The
submerged floodplain of the ancestral Raritan River shows fluvial characteristics. For example,
prominent breaks in slope suggest the presence of a terrace at -6 m (-20 ft) below sea level.
This may signify a hesitation in sea level rise at this position. Evidence of the rising sea level is
also present as a thin wedge of clean, olive brown fine to medium sand that appears to have been
a transgressive beach deposit that appears to pinch out upslope. A similar unit of very dark gray
Geomorphology/Archaeological Borings and GIS Model, 2014 New York/New Jersey Harbor Navigation Project Page 82
silty fine to coarse sand appears to pinch out at -4.6m (-15 ft) between cores B-1 and B-2.
Another noticeable break in slope is present on the north side of the bay at -4.6m (-15 ft) at the
base of a sand apron associated with the Orchard Shoal. The probable position of southeastward
dipping Cretaceous formations is below the Pleistocene outwash and alluvium. The central
portion of the drowned Raritan River valley is generally underlain by estuarine clayey silt that
covers Pleistocene sand and gravel. Gaswirth’s (1999) core RB08 is projected on to the cross
section and marks the position of the radiocarbon sample with the 31,740 ± 1830 B.P. age at the
base of the Pleistocene gravel. This limits the age of the overlying deposits.
Submerged Terraces in Lower New York Harbor. Close examination of NOAA Chart 12327
of New York Harbor shows clear indications of continuous terrace surfaces at approximately -4.6
m (-15 ft) in depth that extend from the area east of Great Kills across the harbor to the East
Bank shoal offshore Coney Island. The terrace is also present on the surface of Romer Shoal and
Flynns Knoll. Figure 5.10 is a cross section of a portion of this area drawn southeastward from
Great Kills towards Sandy Hook and across Flynns Knoll, III-III’. The submerged topography
shows clear evidence of a -4.6 m (-15 ft) terrace between the base of the Orchard Shoal across
the surface of Flynns Knoll. This suggests an erosional terrace indicative of a temporary
―stillstand‖ in sea level rise, or a low fluctuation similar to that shown in the detailed sea level
curve shown in Figure 3.10. This depth also relates to the break in slope described above. Since
the surface is continuous and traceable across the lower harbor, it is considered evidence for the
relative stability of the deposits underlying this portion of the harbor. Other researchers (for
example Williams and Duane 1974, and Bokuniewicz and Fray 1976) have considered the lower
harbor to have been a ―sink‖ for sediments moving in longshore transport along the Long Island
and New Jersey shores. Also, Williams (personal communication) has pointed to sand waves at
the harbor entrance as indications of sediment movement into the harbor from offshore. The
presence of terraces, however, suggests that the sediments beneath the lower harbor have had a
relatively stable surface for at least 3,000 years, dated on the basis of the sea level curve (Figure
3.6). Relative stability of the surface of the lobate fan of sediment spreading out from Raritan
Bay and the Narrows supports the idea of this fan as a preexisting outwash feature reworked by
channels from the ancestral Hudson River and Raritan River and later sculpted by tidal current
action. This hypothesis, however, requires additional study.

Geomorphology/Archaeological Borings and GIS Model, 2014 New York/New Jersey Harbor Navigation Project Page 83
Fig
ure
5.9
: S
tra
tig
rap
hic
pro
file
II-
II’,
Kea
nsb
urg
to
Hu
gen
ot
Bea
ch.

Geomorphology/Archaeological Borings and GIS Model, 2014 New York/New Jersey Harbor Navigation Project Page 84
Fig
ure
5.1
0:
Gre
at
Kil
ls-
Sa
nd
y H
oo
k p
rofi
le I
II-I
II.’

Geomorphology/Archaeological Borings and GIS Model, 2014 New York/New Jersey Harbor Navigation Project Page 85
Upper New York Harbor
Liberty Island Profile (Cores C1-C4). Four (4) localities (C-1 to C-4) were sampled with a
total of four (4) cores extracted using a vibracore (Figure 5.11). The Liberty Island transect was
located south of Liberty Island (Figure 5.12) and was oriented along a northwest to southeast
azimuth. The cores provide an approximately 0.85 km cross section of the western half of Upper
New York Harbor, from the Jersey Flats to the west to the margins of the Anchorage Channel in
the center of the Harbor to the east (Figure 5.13). Cores C-1 and C-2 were located on the Jersey
Flats, at a shallow depth of 1.95 m and 2.90 m below sea level. Cores C-3 and C-4 are located
on the margin of the Jersey Flats and at the base of the slope to the Hudson Anchorage, with
depths of 8.84 m and 15.79 m below sea level. The recovered cores range in thickness from 8.4
m to 11.48 m. Detailed descriptions can be found in Appendix A. Samples for radiocarbon
dating, shell identification, and pollen analysis were collected from this transect. Pollen and
foraminifer samples were collected from core C-1 (Appendices D and E). A total of three (3)
radiocarbon samples were collected from cores C-1 and C-4. A total of sixteen (16) shell
samples from the across transect were examined (Appendix C).

Geomorphology/Archaeological Borings and GIS Model, 2014 New York/New Jersey Harbor Navigation Project Page 86
Figure 5.11: Coring along Liberty Island.

Geomorphology/Archaeological Borings and GIS Model, 2014 New York/New Jersey Harbor Navigation Project Page 87
Figure 5.12: Upper Harbor core locations showing new cores along profiles IV-IV’ and V-V.’

Geomorphology/Archaeological Borings and GIS Model, 2014 New York/New Jersey Harbor Navigation Project Page 88
Figure 5.13: Liberty Island transect.

Geomorphology/Archaeological Borings and GIS Model, 2014 New York/New Jersey Harbor Navigation Project Page 89
The cores along the Liberty Island transect in Upper New York Harbor encountered three (3)
lithostratigraphic units:
Stratum III: Black oily clay muck, recent historical
disturbances and limited biological activity
Stratum II: Very dark gray clayey silt, marsh deposits with
common marine shell fragments and shell hash
lenses. Historic ceramic recovered in upper
portions of the stratum. The extremely young
radiocarbon ages determined for the deposit
suggests it has slumped down from the upper
slopes to fill an incised depression along the
west side of the Anchorage Channel.
Stratum I: Very dark gray silty fine to medium sand, that
becomes cleaner with depth, common marine
shell fragments, and partially decayed organics
Stratum III was only identified in cores C-2 and C-3. It ranges in thickness from 2.25 m
thick in C-3 to 4.60 m in C-2. It is a black (10YR2/1) oily clay muck that has a scent of H2S,
diesel, and oil. In C-3 there are clay intrusions and shell fragments, however the shell fragments
are in far lower concentrations than the undisturbed deposits of Stratum II. One small slag
fragment was identified in this stratum of the obviously historically disturbed stratum.
Stratum II was identified in all four cores. The stratum consists of a very dark gray
(10YR3/1) clayey silt with common shell fragments of oyster and mussel. The deposits are
estuarine in nature. Cores C-2, C-3, and C-4 reached their terminal depths within Stratum II. It is
6.05 m thick in core C-1, and is present at the surface. This suggests that core C-1 is a relatively
undisturbed profile as opposed to the cores with the Stratum III overburden. The stratum has
seen only limited historical disturbance, however its orientation along the slope of the Hudson
Anchorage Channel in cores C-3 and C-4 indicates that Stratum II has slumped deep into the
Anchorage Channel due to colluvial processes. Core C-4 has two temporal controls from
Stratum II. An historic ceramic sherd was recovered 1.4 m below the top of the core. A
radiocarbon date from a sample 7.25 m below the channel bottom, which was already 15.79 m
below the water surface was dated at 1090 ± 40 BP (1000 cal yrsbp, Beta 225757). This young
date so deep below the floor of the Anchorage Channel indicates that Stratum II sediments have
been transported down slope to this depth and location or, alternatively, that young sediment has
filled a deep depression at the base of the adjacent slope
Stratum I was only identified in core C-1. A 2.35 m thick section of this Stratum was
observed from 6.05 to 8.40 m below the Harbor bottom at the base of core C-1. It consists of a
very dark gray (10YR3/1) silty fine to medium sand with common marine shells and decayed

Geomorphology/Archaeological Borings and GIS Model, 2014 New York/New Jersey Harbor Navigation Project Page 90
organics. The sands become cleaner with depth. The abundant organics in this horizon
facilitated the analysis of a radiocarbon samples. From a depth below the top of the core of 7.78
to 8.15 m (25.52 to 26.74 ft) a decayed log was recovered. A section of wood from the outer
rings of the log dated to 5650 ± 90 BP (6473 cal yrsbp, Beta-225755) These mid-Holocene dates
and the relationship between the overlying clayey marine sediments and the underlying coarser
sands of Stratum I represent the inundation of the land surface by sea level rise.
The Liberty Island transect is put into its broader stratigraphic context in Figure 5.14, which
shows cores C-1 through C-4 plotted along an east-west section (IV-IIV’) drawn on bathymetry
derived from NOAA Chart 12327. Additional borings (LSP 1-118, LSP 1-105, LSP 1-68, and
LSP 1-107) obtained from the New York District USACE core library are projected on to an
expanded profile along the Liberty Island channel. The profile shows the surface of what has
been collectively called the ―Jersey Flats‖, known historically for its oyster beds. The ―flats‖
extend westward from the edge of the Anchorage Channel to shallow water at the head of the
channel. The new vibracores are shown at the entrance of the channel south of Bedloe’s Island.
The figure outlines the surface of the ―flats‖ underlain by dark gray organic silt that pinches out
in a peat deposit at the edge of a former saltmarsh deposited on the surface of crystalline rocks
(LSP 1-105, LSP 1-68). The organic silt is underlain by dark gray gravelly sand lying on the
surface of the crystalline rocks. This sand represents the reworked surface of more extensive
fluvial sand underlying the Hudson River channel. The organic silt thickens to the east while
maintaining the shallow depths of the flats. The flats terminate between cores C-2 and C-3
where the landform drops off into the deeper water of the Anchorage Channel. With the
exception of core C-1, the Liberty Island core recovered dark gray clayey silt for their entire ca.
12.2 m (40 ft) lengths. Cores C-3 and C-4 both contain shell rich zones. Core C-4 shows wood
in mid depth dated at 1,090 ± 90 B.P. (1,000 cal yrsbp) and a basal date of 2520 ± 40 (2,606 cal
yrsbp). The historic ceramic sherd location is shown at the base of a black, oily clayey silt
deposit that has a maximum thickness at the edge of the flats in core C-2. Anomalously young
radiocarbon ages such as those in core C-4 may derive from slumping of younger deposits from
the edge of the adjacent steeper slopes. The location and depth of a radiocarbon-dated wood
sample obtained from the sand underlying the estuarine clayey silt in core C-1 is also shown.
The wood, dated at 5,650 ± B.P. (6473 cal yrsbp) is shown in its stratigraphic position. This date,
representing drowned river edge forest, provides a limit on the timing of the inundation of the
western edge of the Hudson River channel.

Geomorphology/Archaeological Borings and GIS Model, 2014 New York/New Jersey Harbor Navigation Project Page 91
Fig
ure
5.1
4:
Lib
erty
Isl
an
d s
trati
gra
ph
ic p
rofi
le I
V-I
V.

Geomorphology/Archaeological Borings and GIS Model, 2014 New York/New Jersey Harbor Navigation Project Page 92
Bay Ridge Flats Profile (New cores D1-D2). Two (2) cores (D-1 to D-2) were obtained
(Figure 5.15) from the Bay Ridge Flats. The transect was located on the east side of Upper New
York Harbor on the Bay Ridge Flats on an east to west azimuth located west of Brooklyn, and
south of Governors Island in Gowanus Bay. The two cores provide an approximately 0.50 km
cross section of the Bay Ridge Flats. The recovered cores ranged in length from 9.7 m to 11 m.
Detailed descriptions are found in Appendix A. Samples for radiocarbon dating, shell
identification, and pollen analysis were collected from this transect. Pollen and foraminifer
samples were collected from core D-1 (Appendices E and D). The radiocarbon sample
collected from the core D-1 yielded a date of 1850 ± 40 /B.P. (1806 cal yrsbp, Beta-228847).
One shell sample from core D-1 was collected for identification (Appendix C).
The cores of the Bay Ridge Flats transect in Upper New York Harbor encountered two (2)
litho-stratigraphic units:
Stratum II: Modern sand bar deposits of very dark grayish
brown slightly silty fine to medium sand
interbedded with horizons of black oily clays to
sands with inclusions of wood and shell
fragments
Stratum I: Estuarine deposits of very dark gray fine sandy
clayey silt and sand fining with depth to silty
clay, with common marine shell fragments and
shell hash lenses
The modern Stratum II sand bar deposits consisted of very dark grayish brown (10YR3/2)
slightly silty fine to medium sand. These sands were interbedded with historical disturbances of
black (10YR2/1) oily clays and sands that included shell and wood fragments. Stratum II ranged
in thickness from 2.20 m in core D-1 to only 1.25 m in core D-2.
Stratum I consists of estuarine deposits analogous to sediments identified as Stratum II in
the Jersey Flats transect on the west side of New York Harbor. These deposits consist of very
dark gray (10YR3/1) fine sandy clayey silt that fines to a silty clay with depth. Shell
concentrations range from occasional shell fragments throughout the recovery as seen in core D-
2 to multiple distinct shell hash concentrations in core D-1. A sandstone pebble was recovered
in core D-2 at a depth of 4.05 m. The lack of soils, coarse fragments, or cultural material
precludes the identification of this pebble as a cultural object. Stratum I was the basal deposit
encountered in both cores, which reached maximum depths below the Harbor bottom of 11 m
and 9.7 m below surface, respectively.

Geomorphology/Archaeological Borings and GIS Model, 2014 New York/New Jersey Harbor Navigation Project Page 93
Figure 5.15: Bay Ridge Flats transect.

Geomorphology/Archaeological Borings and GIS Model, 2014 New York/New Jersey Harbor Navigation Project Page 94
The Bay Ridge cores were taken to provide possible correlation of deposits of similar depth
and form across the main Anchorage Channel and to obtain a more complete record of the
depositional history of the harbor than was possible in the earlier study of the Port Jersey
(Schuldenrein et al., 2001). Figure 5.16 places these two cores in stratigraphic context with
more detailed subsurface information available from the Port Jersey area. A composite profile
(V-V’) across the Anchorage Channel includes cores obtained in the earlier study (Schuldenrein
et al., 2001) as well as several geotechnical boring logs obtained from the New York District
USACE core library. The Port Jersey cores are projected on to a common profile to better
understand the subsurface relationships. Like the Liberty Island channel, this portion of the
Jersey Flats is marked by shallow water extending westward to the now covered historic
shoreline of this embayment. For example, historic fill is shown above gray, clayey estuarine silt
in geotechnical borings B-172, B-62, B-59A and B-58. Here again, the western flank of the
Anchorage Channel is characterized by a steep slope dipping eastward to the floor of the
channel. The greater amount of sediment underlying the flats at this location is estuarine silt that
thins to the west. It overlies brown, fine to coarse grained fluvial sands representing Pleistocene
outwash deposits. These outwash sands, in turn overlie the irregular surface of crystalline rocks
at depth. An incised channel in the crystalline rocks filled by Pleistocene gravels is shown in
borings B-172, B-62, B-59A, and B-58. Radiocarbon ages were determined from three previous
GRA borings. JF-1 provided an age of 3,460 ± 40 B.P. (3,736 cal yrsbp). Estuarine silt from JF-
6 was dated to 3,360 ±40 B.P. (3,586 cal yrsbp). These two dated cores provide a reasonable
timing for the time of inundation for this portion of the flats. Two other dates obtained from core
JF-3, 1,970 ± 60 B.P. (1,927 cal yrsbp) and 2,360 ±70 B.P. (2,606 cal yrsbp), were considered
anomalous and came from the edge of the channel. These also suggested movement and
redeposition or young sediment along the flanks of the channel. The Anchorage Channel as
shown is asymmetrical with the deepest portion on the west at the base of the slope to the Jersey
Flats. The channel is underlain by thick gray, estuarine clayey silt that is underlain by fluvial
sand and gravel. The Bay Ridge Flats rise to the east and represent the final remnant of a more
extensive shoal area now isolated by dredged navigation channels. Cores D-1 and D-2 are
shown in relative position. One radiocarbon date obtained from wood in mid core D-1, 1,850 ±
40 (1,806 cal yrsbp) is anomalously young given its depth and location. The depositional history
of the Bay Ridge Flats, given that age determination is unclear, requires further investigation.

Geomorphology/Archaeological Borings and GIS Model, 2014 New York/New Jersey Harbor Navigation Project Page 95
Fig
ure
0.1
6(a
): P
ort
Jer
sey
-Ba
y R
idg
e F
lats
str
ati
gra
ph
ic p
rofi
le V
-V’,
wes
tern
sec
tio
n.

Geomorphology/Archaeological Borings and GIS Model, 2014 New York/New Jersey Harbor Navigation Project Page 96
Fig
ure
5.1
6(b
): P
ort
Jer
sey
-Bay R
idg
e F
lats
str
ati
gra
ph
ic p
rofi
le V
-V’,
ea
ster
n s
ecti
on
.

Geomorphology/Archaeological Borings and GIS Model, 2014 New York/New Jersey Harbor Navigation Project Page 97
Jamaica Bay
Yellow Bar Marsh Profile (Cores E1-E5). Five (5) cores (E-1 to E-5) were taken in Jamaica
Bay (Figure 5.17). The sampling strategy used differed from the other areas studied. Due to
the shallow water depth in Jamaica Bay a smaller barge was used which collected shorter cores.
Core recovery ranged from 3.90 m to 5.65 m. The transect was oriented on a northeast to
southwest azimuth from the southern end of Yellow Bar Hassock to south of Ruffle Bar between
Ruffle Bar and Little Egg Marsh (Figure 6.19). The bottom depths of Jamaica Bay varied
greatly between core locations. Cores E-1 and E-2 were located on the edge of the Yellow Bar
Hassock, and were very shallow. Water depths ranged between 0.76 m and 0.88 m. Cores E-3,
E-4, and E-5 were located in the channel between Ruffle Bar and Little Egg Marsh. Water
depths were 6.68 m, 6.10 m, and 6.89 m respectively.
Figure 5.17: Jamaica Bay core locations.

Geomorphology/Archaeological Borings and GIS Model, 2014 New York/New Jersey Harbor Navigation Project Page 98
The Yellow Bar Marsh cores from Jamaica Bay encountered six (6) lithostratigraphic units:
Stratum VI: black oily silty clay with disturbed organics
Stratum V: gray well sorted bar sands
Stratum IV: gray sand with bedded black mineral lamellae
found only in the channel
Stratum III: very dark gray sands above marsh deposits with
shell fragments
Stratum II: marsh deposits of very dark gray fine sandy silt
to clayey silt with shell fragments
Stratum I: gray silty fine sand below marsh deposits with
shell fragments
Stratum VI was only recovered in cores E-3, E-4, and E-5 in the channel. The black
(10YR2/1) oily organic silty clay ranges in thickness from 0.42 m to 0.80 m. The stratum was
only present at the top of the cores at the interface of the water and Bay floor bottom. The
stratum had a faint H2S smell and abrupt lower boundary. These observations coupled with the
stratigraphic position on the bay bottom, and the oily texture of the deposit suggests that the
deposit is a historically recent deposit. The upper 0.10 m of core E-2 is a disturbed dark gray
(10YR4/1) sand, but it lacks oily deposits.
Stratum V was recovered in cores E-3, E-4 and E-5.
Stratum IV was only recovered in cores E-3, E-4, and E-5 in the channel. The deposits were
a gray (10YR5/1) fining upward sequence of medium to fine sand with occasional 10 mm thick
very dark gray subhorizontally dipping silt lamina (10YR3/1). This deposit was identified as the
terminal deposit in core E-5, while cores E-3 and E-4 had a gray to very dark gray (10YR5/1,
3/1) fine to coarse sands lacking laminae. Wood fragments were recovered at a depth of 2.52 m
below the top of the core E-3 (9.2 m below sea level). A radiocarbon analysis dated this sample
to 4130 ± 40 B.P. (4432 cal yrsbp, Beta-228848). This sample recovered from a channel is not
considered in situ.
Stratum III was recovered in E-1 and E-2.
Stratum II was also identified in cores E-1 and E-2 on the southern end of the Yellow Bar
Hassock. Stratum II is a dark gray to very dark gray (10YR4/1, 3/1) clayey silt that coarsens
upwards to a clayey silty fine sand. Shell fragments are found throughout the stratum, with three
(3) shell hash lenses in the upper clayey silty fine sand portions of stratum II in core E-2. The
stratum was encountered 1.48 m and 1.65 m below the sea floor bottom. Core E-1 was the only

Geomorphology/Archaeological Borings and GIS Model, 2014 New York/New Jersey Harbor Navigation Project Page 99
core that exposed the full thickness of the deposit (2.12 m) while core E-2 terminated in stratum
II at 4.88 m below the Bay bottom. Stratum II is analogous to organic clayey marsh deposits of
stratum II in the Liberty Island transect and stratum I in the Bay Ridge Flats transect in the New
York Harbor.
Stratum I was only recovered in the base of core E-1. It consisted of a gray (10YR5/1) silty
fine sand with shell fragments that extended from a depth of 3.60 m below surface to the base of
the extracted core at 3.90 m. This stratum is analogous to Stratum I identified in the Liberty
Island transect in the New York Harbor. In both settings gray fine sand with shell is found
below marsh deposits of organic clayey silts. This facies relationship conforms to model of
marsh formation under rising sea level.

Geomorphology/Archaeological Borings and GIS Model, 2014 New York/New Jersey Harbor Navigation Project Page 100
Chapter 6
Paleoecological Overview
Tracing the history of past environmental change in the New York Harbor area is a key to
evaluating the potential for past human habitation. Sediment lithology is a clue to the
depositional environment in which deposits were laid down, but the biological evidence is more
informative in many ways. As an example, it was possible to reconstruct the past record of
temperature and salinity changes through detailed analyses of foraminifera. Similarly it was
possible to derive clues to past floral communities in the region through pollen records preserved
in cores. The latter especially give an idea of the ages of sediments in subsurface through
comparison with more complete regional pollen records. Both pollen and microfauna such as
foraminifers provide a general view of past environmental conditions. Pollen in New York
Harbor, for example, is not only derived from ongoing pollen rain throughout the area, but also
pollen transported downriver from areas of different vegetation far upstream in the Hudson.
Pollen analysis is a regional indicator at best. Benthic foraminifers, on the other hand, are
bottom dwellers and populate the bottom sediments of the marine environment in which they are
found. They too can be transported by tidal currents to give mixed assemblages. Most useful for
discerning the immediate environmental setting for sediments is the macromolluscan fauna
consisting of gastropods and of bivalves like oysters and pelecypods. These larger bottom
dwellers give an immediate record of the environmental setting of the sediment studied.
Previous Studies
Past paleoecological studies conducted by GRA as part of the Harbor Navigation Project
have utilized all of the above approaches. Past analyses have utilized the expertise of Dr. Ellen
Thomas (foraminifers) and Dr. Richard Orson (pollen and macro-mollusks). Their reports
appear in past studies of Shooters Island and the Jersey Flats. Their work is the foundation for
the present study. Different researchers have been utilized for the present report. This study also
utilized previous work on pollen and microfossils by LaPorta and his coworkers. Macro-
mollusks have been identified by Dr. Georgiana Lynn Wingard, pollen by Christopher Bernhardt
and foraminifers by Dr. Benjamin Horton. Dr. Wingard has studied mollusks along the entire
Atlantic coast. Christopher Bernhardt has similar experience. Dr. Horton is an internationally
known researcher specializing in sea level rise through the use of foraminifer studies. Since
previous work by GRA, several important studies have been completed by Lamont-Doherty
Earth Observatory on the Hudson estuary. The latter studies give more immediate information
on pollen, sedimentation, salinity changes, and shellfish (oyster) colonization further upstream in
the Tappan Zee area. Radiocarbon ages from salt marshes as well as submerged oyster reefs in
Tappan Zee have formed an independent check on the relative sea level history presented here.
Many of the recent Lamont-Doherty findings relate directly to past and present GRA studies.

Geomorphology/Archaeological Borings and GIS Model, 2014 New York/New Jersey Harbor Navigation Project Page 101
Past GRA paleoecological studies were site specific while the present study seeks to present
a broader view of past environmental changes in New York Harbor. Two Upper Harbor cores
were chosen for study. These cores, C-1, and D-1, were from opposite sides of the harbor (e.g.
Liberty Island and the Bay Ridge shoal). The former was chosen because it promised the
greatest time depth. Core C-1 yielded a basal date on wood of 6473 cal yrsbp. Provided this
12.2 m (40 ft) core was not disturbed, virtually the complete environmental history over this time
span was anticipated. Core D-1 was chosen as a check on core C-1 as it had a similar surface
elevation and promised to represent the same sedimentary sequence. Both cores were 12.2 m
(40.0 ft) in length. They were sampled at 30 cm (ca. 1 ft) intervals. Surprisingly, core D-1 was
age dated at 1806 cal yrsbp at a depth of 10 m (33 ft). It was clear that the two cores did not
correlate temporally across the harbor. A detailed analysis of these cores is presented in
Chapter 5 and Appendix A.
The Shooter’s Island cores were from shallow water at the entrance to Newark Bay. They
extended little more than 5.5 m (18 ft) below mean sea level. All cores bottomed in fluvial
gravelly sands and were overlain by estuarine clayey silt. First and foremost, the analysis
attested that there had been no upland or tidal marsh vegetation present in the core. Fluvial
gravelly sands graded to fine sands at a depth of 4.9 m (16 ft) were inundated at least since 3200
cal yrsbp on the basis of the relative sea level curve (Figure 3.6, Figure 3.10) and had remained
underwater since that time. At 3.4 m (11 ft) depth, oysters began to appear about 2200 cal yrsbp
and an oyster reef was in place at 2.0 m (6.5 ft) by 1320 cal yrsbp. Presence of oysters pointed to
an increase in brackish water (salinity) at the mouth of Newark Bay. While increased salinity
could result from decreased freshwater runoff from the Passaic and Hackensack rivers, this same
period corresponds with rise in sea level (Figure 3.10) at the same time period and in concert
with thriving oyster habitat further upstream in Tappan Zee (Carbotte et al., 2004). The oyster
reef was overlain by sediments with remnants of submerged aquatic vegetation pointing to a
shallower water column and a possible decrease in the marine submergence rate. Here again the
change in molluscan fauna and vegetation are contemporaneous with a fall in sea level
corresponding with the onset of the Little Ice Age. Thus this significant change may result from
both climate and sea level driving forces. In the upper 1 m (3 ft) of the core, surf clams appear
pointing to deeper water conditions in the last 500 years.
Another paleoecological analysis of cores from the Jersey Flats explored a different
environment on the steep slope on the western edge of the Anchorage Channel. Two cores were
studied but core JF-2 provided the most complete data set. Cores here did not extend to bottom
of the estuarine fill, but rather began with subtidal habitats. At a depth of 3.3 m (11 ft) the
presence of the pelecypod Eastern Aligena and the gastropod Sayella fusca suggests that the
water was brackish. By 2.65 m (8.8 ft) periwinkle (Littorina irrorata) fragments are found
suggesting low tide zones or marshes in the vicinity. From 2.65 m to 2.7 m (8 to 7.2 ft) the
development of a ―clam bar‖ indicated this site was near the head of tide or at least was in a low
tide zone. From 2.0 to 1.0 m (6.5 to 3.5 ft) there were few clams consistent with a deepening

Geomorphology/Archaeological Borings and GIS Model, 2014 New York/New Jersey Harbor Navigation Project Page 102
water column consistent with rising sea level. This core was topped by a final ―clam bar‖
populated by surf clams and pointed to deeper water conditions.
Detailed Studies from Tappan Zee
Earlier paleoecological studies of Tappen Zee Bay conducted by Lamont-Doherty Earth
Observatory were important to the interpretations drawn within this study. A study by Carbotte
et al. (2004) on submerged oyster reefs has also been critical to the understanding of potentially
submberged cultural resources. Work by Pekar et al. (2004) documents salinity changes in the
lower Hudson estuary over the past 7,000 years. Pollen work by Pederson et al. (2005) and
Peteet (personal communication) gives us long term records of vegetation and climate change in
the project area as well as the history of salt marsh development in response to relative sea level
changes.
Pekar et al. (2004) infer paleosalinity reconstructions on the basis of benthic foraminifera and
associated biofacies. The study shows an initial high summertime salinity of 20 to 25o/o
beginning at about 6,000 years ago decreasing to 10 to 15o/o by 2,000 years ago. The latter
salinities are generally consistent with the modern salinity range. A period of high frequency
salinity changes marked the transition to lower summer time salinity at about 3,600 years ago.
The sedimentation rates in Tappan Zee were relatively low and similar to the rate of relative sea
level rise although it’s noted that rates were lowest over the past 2,400 years in shallow water
with increased rates further downstream between 2,300 and 1,300 years ago. Variations in
sedimentation rates are attributed to the migrations of a salt water wedge migrating up and
downstream from the mouth of the estuary. The Lamont-Doherty researchers refer to this wedge
of saltwater intrusion as the ETM or Estuarine Turbidity Maximum, considered the zone where
fine grained sediment (largely clay minerals), carried downstream by the Hudson River,
flocculate and tend to drop out of the water column. Their conclusions suggest that estuarine
sedimentation was highly localized, signifying complex depositional patterns.
The development of oyster reefs in the Tappan Zee (as well as Shooters Island, see above)
has not been continuous. Carbotte et al., (2004) have noted that oysters thrived between 6,100
and 5,600 cal yrsbp and 2,400 to 500 cal yrsbp, but virtually disappeared between 5,000 and
4,000 cal yrsbp associated with the onset of a cooler climate. Additionally, they point to a more
recent demise of oysters in the estuary between 900 and 500 cal yrsbp which may have
accompanied the cooler climates of the Little Ice Age. Radiocarbon dated oysters from the
study’s core SD30 (the most continuous record in the study) have been incorporated into this
investigation’s relative sea level model (Figure 3.6) as they reflect the same rate of sea level rise.
The Carbotte et al. (2004) study data also show a clear low phase and decrease in the rate of sea
level rise between 5,000 and 3,500 cal yrsbp with a rate of 2 to 4 mm/yr (0.1 to 0.2 in/yr) toward

Geomorphology/Archaeological Borings and GIS Model, 2014 New York/New Jersey Harbor Navigation Project Page 103
the end. Overall, the long term rate of relative sea level rise shown by the Tappan Zee oysters is
on the order of 1.7 to 1.8 mm/yr (0.067 to 0.071 in/yr) as is this study’s calculated rate.
The Tappan Zee oyster studies also provide a background to archeological investigations at
Croton Point (Newman et al. 1969) and at Dogan Point (Brennan, 1974 and Claassen, 1995).
Shell middens at Dogan Point, for example, show that oyster harvesting by Late Archaic
populations began as early as 6,000 cal yrsbp. Distinctly large oysters characterize the base of
the shell midden at Dogan Point and date between 5,900 and 5,100 cal yrsbp (Brennan, 1974,
Little, 1995). Smaller oysters are dated in two distinct horizons at the site (5,100 to 4,000 and
1,800 to 1,500 cal yrsbp) separated by a 2,000-year hiatus. While the archeological
interpretation might suggest changes in dietary patterns or cultural groups (the hiatus is
contemporaneous with the end of the Late Archaic period and includes the more agriculturally
oriented Early Woodland period), the hiatus is present in the fossil record, as well, and points to
significant temperature and salinity changes in the estuary, making it less conducive to oyster
growth.
A detailed study of the Piermont Marsh (Pederson et al., 2005) not only provides us with a
regional view of vegetation and climate change over the past 2,000 years, but also the
contemporaneous changes within the marsh. These, in turn, reflect changes in the local
watershed as well as the ongoing changes in sea level as the marsh adjusted to the rising sea
level. One of the key findings of this study is the suggested correspondence between high
concentrations of charcoal and the timing of the Medieval Warm Phase (1,200 to 700 cal yrsbp).
Pederson et al (2005) attributes these concentrations of charcoal to drought conditions and
frequent fires related to warmer climate conditions in the region, as well as changes in
sedimentation rates over the past 2,000 years. Additionally, they show a decrease in
sedimentation rate from .3 mm/yr (0.01 in/yr) during the Medieval Warm Phase, increasing to
2.9 mm/yr (0.11 in/yr) and 5.9 mm/yr (0.23 in/yr) and then decreasing to background rates of 1.1
and 1.4 mm/yr (0.043 and 0.055 in/yr). The overall sedimentation rate for the Piermont Marsh
core was ca. 1.8 mm/yr consistent with the rate of relative sea level rise determined by Carbotte
et al.’s (2004) oyster reef trend and the sea level model presented. Also important for this study,
are the varying trends and rates of sedimentation documented by Pederson et al. (2005). Close
examination of their sedimentation results suggests an overall decrease in rates between 1,000
and 300 cal yrsbp. When viewed against the background sedimentation rate of 1.8 mm/yr (0.071
in/yr) between 1,600 and 1,000 cal yrsbp, the study suggests an overall period of lower
sedimentation rates which correspond with the period of lower relative sea level presented by
Thomas and Varekamp (2001) of Connecticut salt marshes, used here in Figure 3.10. These
pollen studies not only track changes in climate and local runoff, but also are an independent
marker of relative sea level change in the Hudson estuary.
An additional study by Slagle et al. (2006) discusses infilling of the estuary. It identifies
three distinct unconformities representing erosional surfaces or periods of non-deposition in the

Geomorphology/Archaeological Borings and GIS Model, 2014 New York/New Jersey Harbor Navigation Project Page 104
sedimentary record at Tappan Zee. Maximum ages for the unconformities are 3,655, 2,200, and
1520 cal yrsbp. It also identifies two sedimentary facies apparently overlapping the above
unconformities. A deeper sedimentary unit identified as a delta and dated to ca 1,700 years
accumulated at rates of 2 to 4 mm/yr (and lapped onto the 2,200 cal yrbp surface of erosion or
non-deposition. Identification of a delta suggests sediment contribution from a nearby fluvial
source. A shallower depositional facies accumulated at a slower rate of 1 to 2 mm/yr (0.1 to 0.2
in/yr) and tended to cover the above delta deposit. The data suggest that the shallow flats at
Tappan Zee were no longer depositional sites but rather the site of alternating periods of erosion
and deposition sensitive to small fluctuations in sea level and climate conditions.
Applications to New York Harbor
The detailed paleoecological studies conducted by Lamont-Doherty provide a useful context
for previous studies of mollusks, foraminifers, and pollen conducted by GRA and other
researchers. By necessity, the GRA studies are coarse-grained in comparison. It is useful,
however, to compare the findings of the earlier studies at Shooters Island and the Jersey Flats
with the Tappan Zee area. This is shown graphically using the new relative sea level
reconstruction as a background. Figure 6.1 shows the relative sea level trend contrasted with the
Carbotte et al. (2004) radiocarbon dated oyster sequence from their core SD30. Also shown are
the approximate dates of the inundation of the Jersey Flats (ca. 6,000 cal yrsbp), Raritan Bay (ca.
5,000 cal yrsbp) and Newark Bay (ca. 3.500 cal yrsbp). It is assumed, based on radiocarbon
dates (from the Hudson River at Iona Island and the outwash channel of Arthur Kill), that the
main incised channel of the Hudson River was inundated by brackish water as early as 12,000
radiocarbon years B.P. (ca. 14, 500 cal yrsbp). The figure also shows the intervals of active
oyster growth at Tappan Zee.

Geomorphology/Archaeological Borings and GIS Model, 2014 New York/New Jersey Harbor Navigation Project Page 105
Figure 6.1: Relative sea level compared with Tappan Zee oysters, salinity, and unconformities.
The inundation history of the Jersey Flats area appears to parallel that at Tappan Zee. The
earliest basal radiocarbon dates of 6,473 and 5,769 cal yrsbp gathered at Liberty Island
correspond with the earliest known appearance of oysters further upstream. That incursion
marks the intrusion of marine water into the shallower flanks of the Hudson, both in the Harbor
and upstream. The inundation is congruent with the observed increase in salinity to 25o/o, which
subsequently decreased to 15 o/o by 3,500 cal yrs bp. At Shooters Island oysters began to
populate the entrance to Newark Bay at about 2,200 cal yrsbp corresponding to the return of
oysters at Tappan Zee after at least a 1,000 year hiatus.
In summary, Figure 6.1 represents the convergence of the latest diagnostic indicators to
produce a comprehensive model of sea level rise for New York Harbor. The data incorporate the
most recently upgraded lithostratigraphic (geological), biostratigraphic (mollusk and shell), and
radiometric (carbon, wood, and shell-based dates) data sets. Taken together, these data sets
reliably calibrate rates of sea-level rise because they draw on multi-disciplinary sources. The
foundations of this model are traceable to the Newman et al. (1969) baseline model that was tied
to the major geomorphic and stratigraphic sequences developed for New York Harbor. That
model, however, was based on limited radiometric determinations and shell-stratigraphies that
were not well calibrated. Moreover, the regional (Atlantic Coast) models that were drawn on
were equally uneven. The GRA construct integrates the more refined regional and local
models—the latter (in part) generated from this study—to establish the most accurate sea-level
rise curve to date. As discussed subsequently, the model also guides spatio-temporal expectations
for buried archaeological site distributions. Finally it is hoped that the sea-level curve can serve

Geomorphology/Archaeological Borings and GIS Model, 2014 New York/New Jersey Harbor Navigation Project Page 106
as a baseline for understanding of the paleoecology of the New York Harbor as well as the
Hudson estuary. It should enable other researchers and cultural resources specialists to better
anticipate the geographic location of submerged prehistoric archaeological sites.

Geomorphology/Archaeological Borings and GIS Model, 2014 New York/New Jersey Harbor Navigation Project Page 107
Chapter 7
Environmental Reconstruction and Prehistoric Landscape
The following portion of this study is designed to present a graphic characterization of the
inundation of the New York Harbor study area for aid in understanding both its sedimentary
history and in the determination of the potential for submerged prehistoric archaeological sites.
A digital elevation model (DEM) showing topography merged with shorelines and bathymetry
from the earliest dependable charts (New York Bay and Harbor and Environs, U.S. Coast
Survey, 1844) has been constructed from U.S. Geological Survey topographic data and
digitization of the 1844 bathymetry and shoreline data. The resulting model (Figure 8.1) shows
the harbor study area in 1844 prior to dredging and significant land fill operations. Important for
future Federal interests are the original shoreline positions for both the Jersey Flats and Jamaica
Bay, which have undergone extensive modification over the past 150 years.
To conceptually set the stage, Figure 7.1 shows the deeply incised channel of the Hudson
River upstream from the Narrows as well as the incised channel of the East River through Hell
Gate to Long Island Sound. The original shorelines of the Jersey Flats and Jamaica Bay are
useful markers. The Hackensack and Passaic rivers entered Newark Bay from the north and the
incised channel of the precursor to the Hackensack River was visible and drained to the Hudson
through the Kill Van Kull. South of the Narrows, the Hudson channel gave way to a more
subdued topography characterized by an array of splayed channels separated by interfluves that
have historically been shoals limiting access to the harbor and directing maritime traffic into
Raritan Bay through a deeper channel at the tip of Sandy Hook. Though they were indistinct, the
channels at the mouth of the Narrows apparently drained eastward to the edge of the incised
Hudson Shelf Valley and ultimately to the Continental Shelf. Arthur Kill was inundated, though
there are indications that its incision began at Newark Bay, the position of the former glacier ice
front and subsequent proglacial lake that drained through its channel. The mouth of the Raritan
River lies to the west of Raritan Bay, though the bottom surface outlines the general course of
the ancestral channel of the Raritan River, which merged with the Hudson channel north of
Sandy Hook. The Navesink and Shrewbury rivers entered their conjoined estuaries behind the
barrier island at the base of Sandy Hook, which had not yet prograded to its current position.
Using the relative sea level model (Figure 3.6) it is possible to interpret and display sea level
at its 9,000 cal yrsbp position (-22m, -72 ft) and view the previously exposed landscape (Figure
7.2). This also allows for visually interpreting the flooding of the New York Bight and upper and
lower harbors on an incremental, 1,000 year basis. For example, Figure 7.2 shows the landscape
at 9,000 cal yrsbp, a period that postdates the draining of the proglacial lakes held behind the
Harbor Hill moraine. These draining lakes apparently incised the Hudson Shelf Channel across
the Continental Shelf at a lowered sea level stand. The Hudson, Raritan, Hackensack, and
possibly Arthur Kill rivers drained across reworked outwash from both the Raritan River and the
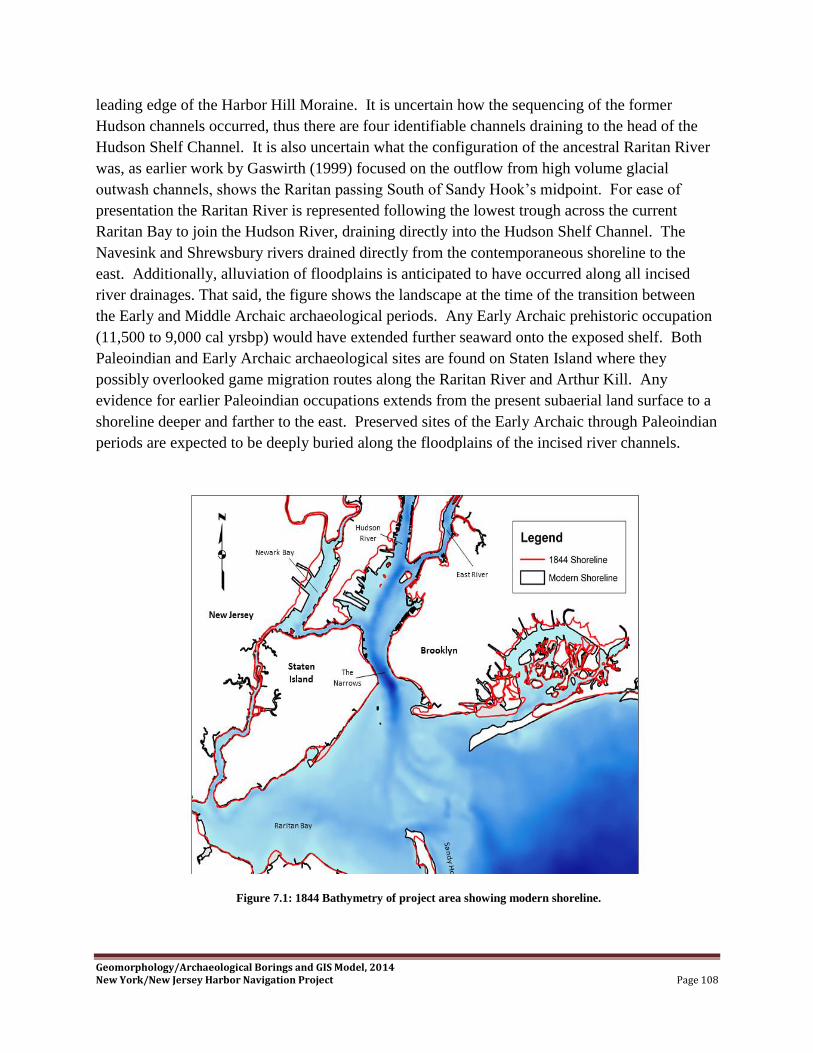
Geomorphology/Archaeological Borings and GIS Model, 2014 New York/New Jersey Harbor Navigation Project Page 108
leading edge of the Harbor Hill Moraine. It is uncertain how the sequencing of the former
Hudson channels occurred, thus there are four identifiable channels draining to the head of the
Hudson Shelf Channel. It is also uncertain what the configuration of the ancestral Raritan River
was, as earlier work by Gaswirth (1999) focused on the outflow from high volume glacial
outwash channels, shows the Raritan passing South of Sandy Hook’s midpoint. For ease of
presentation the Raritan River is represented following the lowest trough across the current
Raritan Bay to join the Hudson River, draining directly into the Hudson Shelf Channel. The
Navesink and Shrewsbury rivers drained directly from the contemporaneous shoreline to the
east. Additionally, alluviation of floodplains is anticipated to have occurred along all incised
river drainages. That said, the figure shows the landscape at the time of the transition between
the Early and Middle Archaic archaeological periods. Any Early Archaic prehistoric occupation
(11,500 to 9,000 cal yrsbp) would have extended further seaward onto the exposed shelf. Both
Paleoindian and Early Archaic archaeological sites are found on Staten Island where they
possibly overlooked game migration routes along the Raritan River and Arthur Kill. Any
evidence for earlier Paleoindian occupations extends from the present subaerial land surface to a
shoreline deeper and farther to the east. Preserved sites of the Early Archaic through Paleoindian
periods are expected to be deeply buried along the floodplains of the incised river channels.
Figure 7.1: 1844 Bathymetry of project area showing modern shoreline.

Geomorphology/Archaeological Borings and GIS Model, 2014 New York/New Jersey Harbor Navigation Project Page 109
Fig
ure
7.2
: S
ea l
evel
ca
. 9
,00
0 c
al
yrs
bp
(ca
. 8
,000
B.P
.) a
t -2
2 m
(-7
2 f
t), E
arl
y A
rch
aic
.

Geomorphology/Archaeological Borings and GIS Model, 2014 New York/New Jersey Harbor Navigation Project Page 110
By 8,000 cal yrsbp (Figure 7.3), with sea level at -16 m (-52 ft) the landscape was little
changed, reflecting upon the relative steepness of slopes draining to the Hudson Shelf Channel,
while river channels further inland followed their earlier courses. This was the height of the
Middle Archaic period, characterized by small groups of hunter-gatherers utilizing riverine
systems. Figure 7.4 shows the relative sea level position at 7,000 cal yrsbp at -11 m (-35 ft),
marking the transition between the Middle Archaic and Late Archaic periods. By this time, sea
level had risen to edge of an apparent outwash fan extending seaward from Raritan Bay and the
Narrows. There were clear connections between the main Hudson channel and Long Island
Sound through the East River and Hell Gate. Multiple channels draining the Hudson to the Bight
continued to be present, though for the first time, the remnants of former Hudson channels began
to emerge at the edge of the outwash fan. A deeper embayment extended inland to join with the
northernmost channel across the fan. A second channel to the south exited the fan at a similar
reentrant. The interfluve between these channels suggests that the outwash fan predated the
opening of the Hudson channel at the Narrows and that flow from the Hudson eroded channels at
the edge of the fan. This apparent incision suggests that these channels were the earliest in the
sequence as incision points for preceding lower sea levels. Thus it would seem that channels
across the fan migrated from north to south as time transgressed. In terms of archaeology, the
now submerged surface between the modern shoreline and that of 7,000 years ago was
potentially occupied by groups from the Late Archaic through Paleoindian periods.
At that time, the rate of relative sea level rise slowed to an average rate of about 1.5 mm/yr
(0.06 in/yr). By 6,000 cal yrsbp (Figure 7.5) coastal environment settings began to stabilize.
This marked the initiation of oyster growth as far upriver as Tappan Zee and possibly on the
Jersey Flats as marine water transgressed up the flanks of the main Hudson channel, reworking
fluvial sand and gravel by wave action. While it isn’t clearly understood what the connection
between the Hudson channel and the open water of the Bight was, runoff from the Hudson River
drainage basin was clearly sufficient enough to maintain an open channel that was subject to
tidal currents. This was the time of the onset of increased salinity at Tappan Zee. The Raritan
River, together with possible flow from Arthur Kill, crossed the open surface of the outwash fan
to reach the open marine water east of present day Sandy Hook. The Hackensack and Passaic
rivers drained directly into the main Hudson River channel through Kill Van Kull. There
continues to be a direct deep water connection between Long Island Sound and the Hudson via
the East River and Hells Gate. Virtually all of the present Raritan Bay, the seaward edge of the
outwash fan to present-day Coney Island, the Jersey Flats, and land surface between Brooklyn
and Manhattan were all exposed and open for Late Archaic prehistoric habitation.

Geomorphology/Archaeological Borings and GIS Model, 2014 New York/New Jersey Harbor Navigation Project Page 111
Fig
ure
7.3
: S
ea l
evel
ca
. 8
,00
0 c
al
yrs
bp
(ca
. 7
,000
B.P
.) a
t -1
6 m
(-5
2 f
t), M
idd
le A
rch
aic
.

Geomorphology/Archaeological Borings and GIS Model, 2014 New York/New Jersey Harbor Navigation Project Page 112
Fig
ure
7.4
: S
ea l
evel
ca
. 7
,00
0 c
al
yrs
bp
(ca
. 6
,000
B.P
.) a
t -1
0.7
m (
-35
ft)
, M
idd
le A
rch
aic
to L
ate
Arc
ha
ic t
ran
siti
on

Geomorphology/Archaeological Borings and GIS Model, 2014 New York/New Jersey Harbor Navigation Project Page 113
Fig
ure
7.5
: S
ea l
evel
ca
. 6
,00
0 c
al
yrs
bp
(5,2
00
B.P
.) a
t -9
m (
-30
ft)
, L
ate
Arc
ha
ic

Geomorphology/Archaeological Borings and GIS Model, 2014 New York/New Jersey Harbor Navigation Project Page 114
At 5,000 cal yrsbp (Figure 7.6), as sea level rose to within 7.6 m (25 ft) of the present mean
sea level, the active channels of the Hudson seem to have been better defined, emptying offshore
through two probable channels. The lower portion of the Raritan River began to flood and
define itself as a narrow estuary, although the Raritan River and Arthur Kill continued to
maintain separate channels, emptying into this narrow estuary. Farther north, the Hackensack
and Passaic rivers continued to remain active, emptying into the Hudson River via the Kill Van
Kull. That sea level stand marks the beginning of a thousand year period of oyster decline in
Tappan Zee for yet unknown reasons, but possibly related to salinity changes. Since 7,000 cal
yrsbp, when direct linkage between Long Island Sound and the Hudson appears to have begun,
dissimilar tidal regimes apparently began to interact and influence tidal currents in the upper and
lower harbor. Here again, the area was open to Late Archaic period use by bands of hunter-
gatherers utilizing riverine and coastal settings.
Over the succeeding 1000 years, the sea rose to -6 m (-20 ft) relative to present sea level
(Figure 7.7). A fully flooded Hudson estuary was recognizable as it spread out from the
confines of the main incised channel and into an expanding estuary in the central portion of
present Raritan Bay. Interfluves separating the previous splayed channels of the Hudson across
the outwash fan then began to appear as distinct islands, recognized as linear shoals on early,
pre-dredging maps of New York Harbor. One of these islands, east of modern Sandy Hook,
occupies the eastern edge of the outwash fan at the mouth of the outer harbor. This feature is
known on navigation charts as the ―False Hook‖. It is suspected that another similar island
underlies Sandy Hook and acted as a platform for the spit to develop as longshore sediment
moved northward along the New Jersey barrier island system. There is an indication that the
incised channel of the Kill Van Kull began to flood at that time, and reached the mouth of the
Hackensack River in the vicinity of present Shooters Island. That period, ca. 4,000 cal yrsbp,
marked the final years of the Late Archaic period and the probable transition to a form of
horticulture in addition to the hunting and gathering subsistence pattern. Perhaps concomitantly
this also marked a period of oyster demise at Tappan Zee, removing a significant shellfish
resource in the prehistoric diet.
By the end of the Late Archaic period at 3,000 cal yrsbp (Figure 7.8) during the transition to
a more agriculturally based Early Woodland period, sea level stood at -4.6 m (-15 ft). The outer
edges of the outwash fan were inundated at this time, leaving narrow linear islands that marked
the locations of present-day Flynn Knoll and Romer Shoal. The present East Bank shoal off of
Coney Island was exposed as well. Marine water extended further into Raritan Bay and began to
define the southern shoreline of Staten Island as the Raritan River drained to the bay through the
incised former outwash spillway channel of Arthur Kill. Marine water also flooded the deep
Arthur Kill channel. Continued flooding of the Kill Van Kull deepened marine water, which
extended further upstream to become the mouth of the Hackensack River. The Hudson estuary
continued to invade the sloping edges of the main channel in the area of the Upper Harbor and
widened the channel. Distinct islands occupied shoals off Brooklyn near Bay Ridge. Inundation

Geomorphology/Archaeological Borings and GIS Model, 2014 New York/New Jersey Harbor Navigation Project Page 115
of the Jersey Flats also continued, although it is not represented in Figure 7.8, as sedimentation
had largely filled in the area by 1844, when bathymetry was composed. Again, the area below
the present sea level was available for Paleoindian to Woodland occupation.

Geomorphology/Archaeological Borings and GIS Model, 2014 New York/New Jersey Harbor Navigation Project Page 116
Fig
ure
Sea
lev
el c
a. 5
,000
cal
yrs
bp
(ca
. 4
,500
B.P
.) a
t -7
.6 m
(-2
5 f
t),
La
te A
rch
aic

Geomorphology/Archaeological Borings and GIS Model, 2014 New York/New Jersey Harbor Navigation Project Page 117
Fig
ure
7.7
: S
ea l
evel
ca
. 4
,00
0 c
al
yrs
bp
(ca
. 3
,700
B.P
.) a
t -6
m (
-20
ft)
, L
ate
Arc
ha
ic

Geomorphology/Archaeological Borings and GIS Model, 2014 New York/New Jersey Harbor Navigation Project Page 118
Fig
ure
7.8
: S
ea l
evel
ca
. 3
,00
0 c
al
yrs
bp
(ca
. 3
,000
B.P
.) a
t -4
.5 m
(-1
5 f
t), L
ate
Arc
ha
ic t
o E
arl
y W
oo
dla
nd
Tra
nsi
tio
n

Geomorphology/Archaeological Borings and GIS Model, 2014 New York/New Jersey Harbor Navigation Project Page 119
New York harbor began to attain its near-modern configuration by 2,000 cal yrsbp (Figure
7.9), when sea level stood at -3 m (-10 ft). Islands were still present at the mouth of the harbor
and occupied the locations of the present East Bank and Romer Shoal. The former West Bank
shoal, (now largely removed by dredging) also appeared as a distinct island. GRA investigations
of Raritan Bay and the Lower Harbor have identified an apparent ―still stand‖ or low fluctuation
along the rising trend of sea level between 3,000 and 2,000 cal yrsbp marked by erosional
surfaces at -4.6 m (-15 ft) that defined the islands shown in this image. Temporally, this period
of ―still stand‖ seems to correspond with a long period of oyster ―demise‖ in Tappan Zee that
ended fairly abruptly before 2,000 cal yrsbp and near the close of the Early Woodland period
when oysters again became prevalent. This correspondence suggests that lower salinity
associated with a fall in sea level and retreat of the salt water wedge in the estuary may have
occurred. By 2,000 cal yrsbp sea level back-flooded Arthur Kill to its pre-dredged depth at its
headwaters near present Newark Bay. The Raritan River emptied directly into Raritan Bay,
which was still confined within the earlier, and then drowned, channel of the river. It’s
suspected that Sandy Hook may have begun its formation around this time (2,000 cal yrsbp). In
the Upper Harbor the Bay Ridge Shoal was present as a distinct island between Manhattan and
Brooklyn. The Kill Van Kull continued its expansion of marine water along the lower reach of
the Hackensack River and may have extended as far upstream as Newark along its incised
channel. Little is known at this timeabout Jamaica Bay beyond the 1844 configuration of the
Rockaway Beach barrier island. Figure 7.9 does, however, show back barrier channels leading
inland to the present Jamaica Bay marshes as well as shoals on either side of the inlet. The
shoreline pattern shown in Figure 7.9 marks the time of transition from Early Woodland to
Middle Woodland periods and an increased dependence on agriculture. Concomitantly, the
Tappan Zee studies (Carbotte et al. 2004) point to the return of oysters in the estuary, perhaps
suggesting more favorable temperature and salinity conditions at the end of the low phase or
―still stand‖ in sea level during the preceding 1,000 years. Coastal settlements were likely
prevalent during this period along small drainages entering the harbor areas. Late Archaic
through Middle Woodland use of shellfish (oysters) has been documented by Claassen (1995) for
Dogan Point north of Tappan Zee. The study summarizes similar shell-bearing sites along the
lower Hudson and also points to that subsistence pattern and timing. Thus, shell middens
associated with this and earlier shoreline positions may have been common along now
submerged tributary drainages.
Throughout the subsequent 1,000 years (Figure 7.10) continued rise in sea level presented a
more recognizable landscape, shoreline, and riverine drainage pattern. One thousand years ago,
sea level was about 1.5 m (5 ft) lower than the present level. Newark Bay was flooded to the
confluence of the Hackensack and Passaic rivers and connected to the Hudson River through Kill
Van Kull. The Jersey Flats were clearly inundated. The Arthur Kill channel had been flooded
and nearly connected with Kill Van Kull and Newark Bay. The mouth of the Raritan River was
inundated, indicating the spread of estuarine conditions upstream from Raritan Bay. The
southeastern shore of Staten Island remained exposed. Studies of Raritan Bay suggest that an

Geomorphology/Archaeological Borings and GIS Model, 2014 New York/New Jersey Harbor Navigation Project Page 120
earlier barrier island system and spit similar to the modern Great Kills spit may have existed at
that time. Most of the islands capping the shoals at the entrance to the harbor were largely gone
with remnants present on the Romer Shoal, the West Bank, and at the entrance to the Rockaway
inlet and entrance to Jamaica Bay. Inundation of preexisting lowlands at the present mouth of
Jamaica Bay apparently began at this point, marking the onset of conditions conducive to salt
marsh growth and development. Archaeologically, this shoreline configuration corresponds with
the transition between Middle Woodland and Late Woodland periods. It closely approximates
the conditions present in the few centuries prior to European entry into the area in the 17th
century.

Geomorphology/Archaeological Borings and GIS Model, 2014 New York/New Jersey Harbor Navigation Project Page 121
Fig
ure
7.9
: S
ea l
evel
ca
. 2
,00
0 c
al
yrs
bp
(ca
. 2
,000
B.P
.) a
t -3
m (
-10
ft)
, E
arl
y t
o M
idd
le W
oo
dla
nd
Tra
nsi
tion

Geomorphology/Archaeological Borings and GIS Model, 2014 New York/New Jersey Harbor Navigation Project Page 122
Fig
ure
0.1
0:
Sea
lev
el c
a. 1
,000
ca
l y
rsb
p (
ca. 1
,00
0 B
.P.)
at
-1.5
m (
-5 f
t)
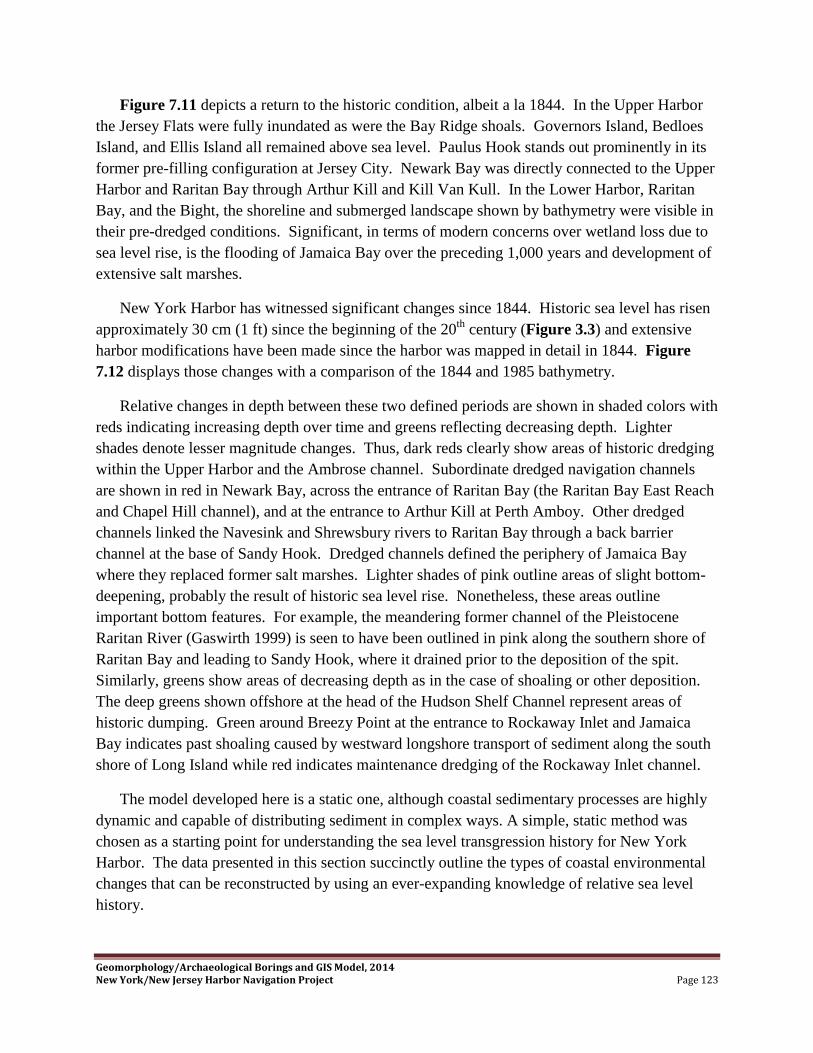
Geomorphology/Archaeological Borings and GIS Model, 2014 New York/New Jersey Harbor Navigation Project Page 123
Figure 7.11 depicts a return to the historic condition, albeit a la 1844. In the Upper Harbor
the Jersey Flats were fully inundated as were the Bay Ridge shoals. Governors Island, Bedloes
Island, and Ellis Island all remained above sea level. Paulus Hook stands out prominently in its
former pre-filling configuration at Jersey City. Newark Bay was directly connected to the Upper
Harbor and Raritan Bay through Arthur Kill and Kill Van Kull. In the Lower Harbor, Raritan
Bay, and the Bight, the shoreline and submerged landscape shown by bathymetry were visible in
their pre-dredged conditions. Significant, in terms of modern concerns over wetland loss due to
sea level rise, is the flooding of Jamaica Bay over the preceding 1,000 years and development of
extensive salt marshes.
New York Harbor has witnessed significant changes since 1844. Historic sea level has risen
approximately 30 cm (1 ft) since the beginning of the 20th
century (Figure 3.3) and extensive
harbor modifications have been made since the harbor was mapped in detail in 1844. Figure
7.12 displays those changes with a comparison of the 1844 and 1985 bathymetry.
Relative changes in depth between these two defined periods are shown in shaded colors with
reds indicating increasing depth over time and greens reflecting decreasing depth. Lighter
shades denote lesser magnitude changes. Thus, dark reds clearly show areas of historic dredging
within the Upper Harbor and the Ambrose channel. Subordinate dredged navigation channels
are shown in red in Newark Bay, across the entrance of Raritan Bay (the Raritan Bay East Reach
and Chapel Hill channel), and at the entrance to Arthur Kill at Perth Amboy. Other dredged
channels linked the Navesink and Shrewsbury rivers to Raritan Bay through a back barrier
channel at the base of Sandy Hook. Dredged channels defined the periphery of Jamaica Bay
where they replaced former salt marshes. Lighter shades of pink outline areas of slight bottom-
deepening, probably the result of historic sea level rise. Nonetheless, these areas outline
important bottom features. For example, the meandering former channel of the Pleistocene
Raritan River (Gaswirth 1999) is seen to have been outlined in pink along the southern shore of
Raritan Bay and leading to Sandy Hook, where it drained prior to the deposition of the spit.
Similarly, greens show areas of decreasing depth as in the case of shoaling or other deposition.
The deep greens shown offshore at the head of the Hudson Shelf Channel represent areas of
historic dumping. Green around Breezy Point at the entrance to Rockaway Inlet and Jamaica
Bay indicates past shoaling caused by westward longshore transport of sediment along the south
shore of Long Island while red indicates maintenance dredging of the Rockaway Inlet channel.
The model developed here is a static one, although coastal sedimentary processes are highly
dynamic and capable of distributing sediment in complex ways. A simple, static method was
chosen as a starting point for understanding the sea level transgression history for New York
Harbor. The data presented in this section succinctly outline the types of coastal environmental
changes that can be reconstructed by using an ever-expanding knowledge of relative sea level
history.

Geomorphology/Archaeological Borings and GIS Model, 2014 New York/New Jersey Harbor Navigation Project Page 124
Fig
ure
7.1
1:
18
44
sea
lev
el a
nd
sh
ore
lin
e

Geomorphology/Archaeological Borings and GIS Model, 2014 New York/New Jersey Harbor Navigation Project Page 125
Figure 7.12: Historic bathymetric change 1844-1985. Relative changes in depth between these two defined periods are
shown in shaded colors with reds indicating increasing depth over time and greens reflecting decreasing depth. Yellow
indicates no change in depth between 1844 and 1985.

Geomorphology/Archaeological Borings and GIS Model, 2014 New York/New Jersey Harbor Navigation Project Page 126
Chapter 8
The Archaeological Geography of Human Settlement and Site
Preservation
In general, prehistoric deposits are sparsely distributed within both naturally deposited
sediments and their weathered counterparts or soil, as large segments of the pristine landscape
have been removed and new landforms constructed. As this study shows, even submerged
surfaces have been either overridden or exhumed, with reworked materials often capping deeply-
scoured substrate. Next, because of the scale of historic activity in the area, surficial materials of
the 19th, 20th, and 21st centuries reflect human impacts on the landscape which, over the past
100 to 150 years have affected landform relations almost as greatly as the natural events in the
last ten millennia. Accordingly, much of the regional sediment cover, both terrestrial and
submerged, reflects the effects of industrial-age and subsequent human activity on the near shore
environment. In order to date, interpret, and assess the cultural resource potential of these
deposits, it is necessary to understand the chronologies and patterns of occupation in and along
the shifting margins of New York Harbor.
Prehistory. There is minimal evidence for prehistoric activity in areas that are currently
submerged, although there are limited efforts underway to reconstruct potential site
environments on the continental shelf (Merwin 2002). However, data to date are questionable
and testing programs are neither extensive nor systematic. There is no significant submerged site
database for prehistoric sites in the New York Harbor area.
The earliest accepted occupations of the present New York Harbor area would have begun
during the Paleoindian cultural period, ca. 11,500-8,000 years B.P. (13,390-8,890 cal yrsbp). As
discussed earlier, relative sea level was at least 15 to 37 m (50 to 120 ft) below present
throughout the period (Figure 2.2) and the habitable Coastal Plain land surface extended from
7.3 to 18 m (24 to 60 mi) to the edge of the continental shelf (Bloom 1983a: 220-222; Emery and
Edwards 1966; Stright 1986: 347-350).
Mammoth and mastodon finds on the continental shelf and within the Hudson River channel
(Fisher 1955; Whitmore et al. 1967) indicate that both of these large mammals were sufficiently
abundant to have permitted focal hunting adaptations. Nevertheless, recent Paleoindian site
excavations in the Northeast suggest a more varied subsistence (Adovasio et al. 1977, 1978;
Gardner 1977, 1983; Funk and Steadman 1994; McNett et al. 1985). Exploitation of marine fish
and shellfish in settings now submerged beneath the harbor would not be surprising given the
broad-spectrum diet of plants, birds, small mammals, and freshwater fish now suggested for
Paleoindians in the Northeast.
Early prehistoric occupation begins with a series of sites with diagnostic artifacts from either
the Late Paleoindian or Early Archaic (10,000-8,000 B.P. [11,600-8,890 cal yrsbp]) cultural

Geomorphology/Archaeological Borings and GIS Model, 2014 New York/New Jersey Harbor Navigation Project Page 127
periods. The most unique landscape that preserves (relatively) extensive evidence for these
earliest prehistoric periods is the western shore of Staten Island (Kraft 1977a, 1977b; Ritchie and
Funk 1971). Intact landforms survive because to date they have largely escaped development. At
Port Mobil, fluted points, end and side scrapers, and unifacial stone tools were among over 51
lithic artifacts recovered from a sandy slope between 6 and 12 m (20 and 40 ft) above sea level.
Fluted points were also found on Charlestown Beach south of Port Mobil. Projectile points
classified as Kirk, Kanawha, LeCroy, and Stanly have been recovered from the Hollowell and
Ward’s Point sites at the island’s southwestern tip of the Island. The Old Place site near the
crossing of the Goethals Bridge appears to be primarily a Middle Archaic (8,000 to 6,000
B.P.[8890 to 6900 cal yrsbp]) through Late Archaic (6,000 to 3,000 B.P.[6900-3150 cal yrsbp])
encampment, although a radiocarbon date of 7,260 ± 140 B.P., 8106 cal yrsbp (I-4070) was
obtained on hearth charcoal associated with Stanly, LeCroy, and Kirk points.
Early prehistoric sites represent only a very small portion of settlement networks, which
extended across Harbor Region surfaces, subsequently by sea level rise. The rate of transgression
slowed at approximately 7,000 cal yrsbp (Fairbanks 1989; Peltier 2001; Fleming et al. 1998).
This timing accounts for the abundance of Late Archaic sites in settings that are now at or
slightly below present shoreline positions. Of five inundated sites along shores or tidal stream
banks on Long Island reported by Stright (1990), all are Late Archaic or Woodland period
encampments.
The magnitude of landscape change diminished significantly after the Middle Holocene.
Between 5000 to 3000 B.P., as this study has confirmed, near-shore environments began to
stabilize. Late Archaic hunter-gatherers of coastal New York and New Jersey specialized in the
exploitation of shellfish and other marine resources (Brennan 1974; Kraft and Mounier 1982;
Ritchie 1980: 165-167). Although Brennan (1977) argued for antecedents extending back to the
Early Archaic, his only evidence was the date of 6,950 ± 100 B.P., 7786 cal yrsbp (L-1381) from
the deepest level of the Dogan Point shell midden (Little 1995). Dogan Point did have a small
Middle Archaic component, as evidenced by both the radiocarbon chronology and presence of
Neville, Stark, and other large side-notched projectile points (Claassen 1995a). The main
shellfish-gathering period, however, dates from 5,900 to 4,400 B.P. and 6730 to 5070 cal yrsbp
(Claassen 1995b: 131), correlating with other shell midden sites in the Lower Hudson such as the
Twombly Landing site below the Palisades near Edgewater, New Jersey (Brennan 1968).
Settlement geography and site structure increase in variability from the Late Archaic onward.
As noted by Funk (1991:51), shell matrix and shell bearing sites on Martha’s Vineyard (Ritchie
1969), Nantucket (Pretola and Little 1988), Fishers Island (Funk and Pfeiffer 1988), and Long
Island (Ritchie 1980: 164-178; Stright 1990: 442-443) are all younger than 4,500 years. Older
shell middens may once have existed along coastlines that are now beneath the sea. In addition to
the more ephemeral hunting camps of the earlier cultural periods, this type of prehistoric culture
resource is likely to be preserved in several contexts within the Harbor navigation channels.

Geomorphology/Archaeological Borings and GIS Model, 2014 New York/New Jersey Harbor Navigation Project Page 128
The transition between the Archaic and Woodland periods in the Northeast is marked by the
presence of ceramics and, in many areas, by the first remains of cultivated plants. The Woodland
period is generally divided into three stages, Early (3,000-2,000 B.P. [3145-1982 cal yrsbp]),
Middle (2,000-1,000 B.P. [1982-902 cal yrsbp]), and Late (1,000 B.P. to European contact). In
coastal New York, however, the Windsor and East River ―traditions‖ were defined by Smith
(1950, 1980) as distinct ethnic groups manifested in several contemporaneous phases.
The North Beach phase of the Windsor tradition is contemporaneous with shell-bearing
Terminal Archaic sites of the Orient phase. In several sites on Long Island, Windsor ceramics
have been found associated with steatite vessels and Orient fishtail points. After the Middle
Woodland the Clearview phase of the Windsor tradition is succeeded by the Sebonac phase of
the Late Woodland Period. Sebonac sites are most common in Connecticut, although the phase is
named for a site on eastern Long Island excavated by Harrington (1924).
Later Windsor tradition sites coincide with the earliest, Bowmans Brook phase of the East
River tradition on Staten Island (Smith 1950, 1980). Bowmans Brook begins ca. A.D. 1000 and
its geographic range eventually included western Long Island, Manhattan, and the lower Hudson
River Valley (Ritchie 1980: 268-270). The type site on the northwestern shore of Staten Island
was investigated by Skinner in 1906 (Skinner 1909: 5-9; Smith 1950: 176-177).
Larger features are characteristic of Woodland sites. Pits filled with shell and other refuse
ranged from four to six feet in diameter and from three to six feet in depth. The pottery is either
stamped or incised and tempered with grit or occasionally shell.
The Late Woodland to Euroamerican transition is registered locally by the Clasons Point
phase of the East River tradition (ca. A.D. 1300). The type site on the north side of the East
River in the Bronx was excavated by Skinner in 1918 (Skinner 1919: 75-124; Smith 1950: 168-
169). The few known village sites are approximately an acre in size and are located on higher
landforms well above any tidal submergence (Ritchie 1980: 270-272). The pottery is typically
shell-tempered but there is a wide range of both vessel forms and surface decoration. European
trade goods have been found in the upper levels of some Clasons Point phase sites.
History of the Harbor and the Navigation Channel Network. Historic maps shed light on the
nature of the Harbor transformation over the past four centuries since Euroamerican
colonization. Figure 8.1 illustrates the geography of New York Harbor during the mid-19th
century. That shoreline was somewhat, but not substantially different from that encountered by
Florentine navigator Giovanni da Verrazano who sailed between the straits that now bear his
name in 1524. Locally Verrazano’s voyage initiated European exploration that culminated in the
colonization of Upper New York Harbor. Trade goods from this period have been found in the
upper levels of some Clasons Point phase sites (Ritchie 1980: 270-272) and the native
inhabitants are known to have been Algonquin relatives of the Delaware (Homberger 1994: 16).
They sold the island they called Manhattan to the Dutch for trinkets in 1626 and moved west of

Geomorphology/Archaeological Borings and GIS Model, 2014 New York/New Jersey Harbor Navigation Project Page 129
the Bronx River. Dutch settlement was first localized near the tip of Manhattan Island,
commanding naval access to both the Hudson River and the East River (Homberger 1994: 20).
By 1639 (Figure 8.2), Dutch plantations thinly lined the East River and three small villages on
Long Island were combined to form Breukelen in 1642 (Homberger 1994: 30). Buildings on the
East River waterfront were constructed on an unstable and muddy shoreline until after Peter
Stuyvesant became Director-General in 1647 (Homberger 1994: 32); there is considerable
potential for early historic as well as prehistoric archaeological contexts beneath the present piers
and seawalls (Cantwell and deZerega Wall 2001).

Geomorphology/Archaeological Borings and GIS Model, 2014 New York/New Jersey Harbor Navigation Project Page 130
Figure 8.1: Modern dredged navigation channels overlaid on 1844 map of New York Bay and Harbor (US Coast Survey
1844).

Geomorphology/Archaeological Borings and GIS Model, 2014 New York/New Jersey Harbor Navigation Project Page 131
Dutch commercial activity and settlement of the Upper Bay expanded steadily because of the
virtually land-locked harborage, well protected from ocean gales, that was afforded by the
Narrows between Brooklyn and Staten Island. At its most constricted point, this passage is less
than three-quarters of a mile wide, where it is presently spanned by the Verrazano- Narrows
Bridge (Water Resources Support Center, 1988). Historically, this constriction does not appear to
have changed significantly (Figure 8.2). The natural geography of the New York and New
Jersey Harbor region nonetheless posed certain challenges for early maritime commerce. Unlike
the naturally deep harbors of Boston, Quebec and Norfolk, which could accommodate any vessel
afloat during the eighteenth and early nineteenth centuries, the lower portion of New York
Harbor had a controlling depth of 21 ft at low tide and the upper bay contained numerous areas
of shoals and treacherous currents. Prior to the first dredging of the harbor, larger vessels could
approach New York only through the Main Ship Channel, which required navigation of a narrow
passage between Sandy Hook and a series of shoals that blocked most of the Lower Bay (Albion,
1939; Newberry, 1978). Smaller vessels could utilize the Swash, ―Fourteen Feet,‖ or East (later
known as Ambrose, see below) channels. Only isolated channels in Upper Bay (Buttermilk
Channel) were considerably more hospitable for commerce. In 1837, Lieutenant R. T. Gedney
conducted a Coast Survey study that charted an outer alternative channel that still bears his
name.
Public funding for harbor improvement was initiated with a New York City municipal
appropriation of $13,861 in 1851. The effort was designed to remove rocks and reefs in the Hells
Gate entrance to the East River. This effort was supplemented two years later by a federal
appropriation of $20,000 (Albion 1939:28). However, most efforts at Harbor improvement
during this period were privately funded and poorly coordinated. The dredging of underwater
property was under the jurisdiction of the New York City Street Commissioner and the
unregulated construction of piers and wharfs was found to be a hindrance to the economic
potential of the harbor (Homans 1859; New York State Harbor Encroachment Commission
1864). In 1870, the city and state legislature established the New York City Department of
Docks, appointing General George McClellan of Civil War fame to serve as engineer-in-chief.
Since all of the new wharfs and piers would ultimately be owned by the municipality, the
Department of Docks represents the first sustained attempt at municipal ownership and
administration of port facilities in the United States. In1921 this agency was renamed the
Division of Surveys and Dredging. McClellan’s first task was to invite public proposals and
comment with a view of developing a Master Plan for piers, wharfs, and seawalls around the
island of Manhattan. The subsequent processes of seawall construction and landfill reconfigured
the geography of Manhattan Island to its present shape. It is now thirty percent larger than the
landform initially encountered by the first Dutch settlers.

Geomorphology/Archaeological Borings and GIS Model, 2014 New York/New Jersey Harbor Navigation Project Page 132
McClellan’s plan called for the excavation of some six hundred soil borings around the entire
perimeter of Manhattan. As described in the 1871 Annual Report, these borings were performed
by various techniques, including: hand rod, Woodcock, and artesian well boring machine (Betts
1997; New York City Department of Docks 1872). At least some of the logs from these borings
are apparently still held in the New York City Municipal Archives.
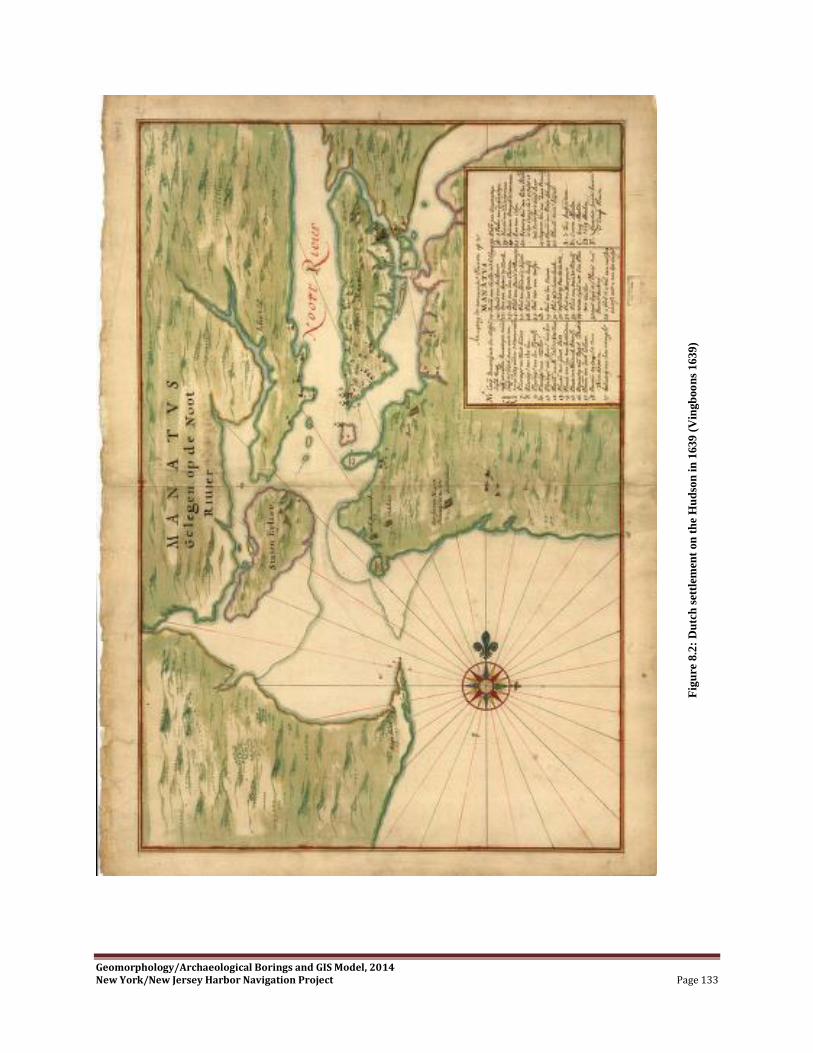
Geomorphology/Archaeological Borings and GIS Model, 2014 New York/New Jersey Harbor Navigation Project Page 133
Fig
ure
8.2
: D
utc
h s
ettl
emen
t on
th
e H
ud
son
in
163
9 (
Vin
gb
oo
ns
163
9)

Geomorphology/Archaeological Borings and GIS Model, 2014 New York/New Jersey Harbor Navigation Project Page 134
Ultimately Harbor maintenance and enhancement was bolstered by federal assistance.
Municipal and federal efforts worked in conjunction with each other. In 1872 Congress
commissioned a survey of Buttermilk Channel, the narrow passage between Governors Island
and the city of Brooklyn (Figure 8.3). The survey located a large shoal with a minimum depth of
9.5 ft at the junction with the East River. This shoal was in the track of navigation, making it
unsafe to maneuver large vessels in the vicinity of the Brooklyn wharves. The proposed dredging
was conducted from October1 through November 3, 1884 (U.S. Bureau of Engineers, 1885). The
shoal was removed to a depth of 24 to 26 ft below mean low water in a zone extending 850 ft
from the wharves. The estimated cost of this work was $210,000. By 1976 Buttermilk Channel
had been enlarged to a width of 1,000 ft and a depth of 34 to 40 ft below mean low water
(Hammon 1976).
Figure 8.3: Governors Island and the Buttermilk Channel (US Coastal Survey 1844).

Geomorphology/Archaeological Borings and GIS Model, 2014 New York/New Jersey Harbor Navigation Project Page 135
On July 5, 1884 a congressional appropriation of $200,000 facilitated a survey for deepening
Gedney’s Channel, marking the first attempt to improve a navigation channel in the Lower Bay
(Edwards 1893; U.S. Engineer Bureau 1886). That project was the first large-scale dredging
project in New York Harbor, and formed the basis for subsequent channel maintenance programs
in support of commercial boat traffic. Perhaps the key long term component of the appropriation
was funding of a detailed survey of the Lower New York Bay. Detailed investigations included
current and tide records, borings to a depth of three feet below bottom, and detailed bathymetric
maps showing the location of the 7.3 m (24 ft) contour in 1835, 1855, 1881, and 1884. Despite
dramatic changes in the configuration and location of several landforms, for example the Sandy
Hook peninsula, the bottom profile had changed very little between 1835 and1884. The survey
also found that in 1884 the minimum depth in Gedney’s Channel at mean low tide was 6.83 m
(22.3 ft). The mean high tide rose to 1.5 m (4.8 ft), giving a controlling depth at high tide of 8.26
m (27.1 ft). The report noted that the largest steamships running out of New York drew 8.5 m
(28 ft) when fully loaded, but few vessels were loaded to capacity. The 1886 Engineers Report
also discussed options for creating a safe navigable channel along or near Spuyten Duyvil Creek
between Manhattan and the Bronx. This project would not come to fruition until the completion
of the Harlem River Ship Canal in 1923.
The Gedney’s Channel dredging contract was awarded to Elijah Brainard at a cost of 54
cents per cubic yard. The program commenced on September 26th, 1885, and by the beginning
of November, 1886 303,869 cubic yards had been dredged from the channel (Edwards 1893). On
the basis of the Engineer’s Report (U.S. Engineer Bureau 1886: 737-739) it is possible to
reconstruct the stratigraphic sequence encountered during the dredging. The dredging first
encountered a bed of live mussels ranging from six to ten inches thick. Some of the mussels were
quite large and large quantities of dead shells and a very fine powder of pulverized mussel shells
was also encountered. The mussel layer was underlain by a stratum of ―pea gravel‖ to which the
mussels often adhered. Beneath the upper stratum of pea gravel the dredging encountered
interbedded layers of fine sand and water-worn quartz gravel. The gravel ranged in size from
―the size of a pea to the size of a goose egg.‖ About 70% of the gravel was classified as ―pea
gravel.‖ The dredging also encountered a few large pieces of water-worn sandstone, the largest
of which measured 330 mm by 200 mm by 127 mm (13 in by 8 in by 5 in). Finally, at the
western end of the channel the dredging encountered a stratum of very compact ―blue clay‖ at 10
to 11 m (33 to 35 ft) beneath mean low water. The report notes that this clay is ―evidently a very
old formation.‖ By 1889 the dredging program had resulted in an unobstructed navigable channel
with a 9-m (30- ft) controlling depth at mean low water and a depth of 10.6 m (34.8 ft) at high
tide.
Increased harbor traffic coupled with the large size of vessels that utilized the Harbor resulted
in additional harbor development. On June 3, 1896 Congress authorized a survey with a view to
providing a 11-m (35-ft) channel at mean low water from the Narrows to the sea. It was
recommended that the East Channel be dredged to maintain a channel of 12-m (40-ft) depth and

Geomorphology/Archaeological Borings and GIS Model, 2014 New York/New Jersey Harbor Navigation Project Page 136
600-m (2,000-ft) width. The funds were appropriated by the River and Harbor act of 1899. The
East Channel was renamed by an Act of Congress in 1900 to ―Ambrose Channel,‖ in honor of
Mr. John Wolf Ambrose, who had worked diligently for the improvement of New York Harbor.
The channel continues officially to be known by this name (U.S. Engineer Bureau, 1939). The
project was completed in 1914, providing a mean low water controlling depth of 12 m (40 ft) and
a width of 600 m (2,000 ft). A total of approximately 60,350,400 cubic meters (66,000,000 cubic
yards) of material was removed under the project.
The Federal Rivers and Harbors Act gave the U.S. Engineers Bureau (now the U.S. Army
Corps of Engineers) control over all navigable waters in the United States in 1888. The Bureau
was given the order to establish bulkhead and pierhead lines. With the 1898 consolidation of
Greater New York under a single municipal government, the Department of Docks also became
responsible for city-owned ferries and ferry terminals and was renamed the Department of Docks
and Ferries (Betts 1997; Hoag 1911). Meanwhile, the development of the New Jersey portion of
the harbor lagged, in part because of the lack of a comprehensive, cooperative approach to
waterfront use. A 1914 report by the New Jersey Harbor Commission, entitled ―New Jersey’s
Relation to the Port of New York‖ noted that New York City’s waterfront development had cost
more than one-hundred million dollars and that waterfront development produced annual
revenue in excess of four and one-half million dollars. The report recommended creation of a
permanent New Jersey Harbor Commission with statutory authority to regulate all waterfront
development in the state.
Following World War I, it was becoming increasingly apparent that the long-standing New
York-New Jersey animosity was hindering unified development of New York Harbor. In 1921
the Port of New York Authority was created as the first interstate agency permitting compacts
between states. It assumed responsibility for Harbor maintenance since the port included portions
of New Jersey and New York. In 1972 the name of the agency was changed to the Port Authority
of New York and New Jersey (Port of New York Authority 1946; Port Authority of New York
and New Jersey 1996).
As dredging of the recently renamed Ambrose Channel was nearing completion, the River
and Harbor Act of March 4, 1913, authorized a survey for a channel 12 m (40 ft) deep and 600 m
(2,000 ft) wide as an extension of Ambrose Channel through Upper Bay. The funds for the
dredging were appropriated by the Act of August 8, 1917. Commonly known as the Anchorage
Channel, this project was completed in 1929. A similar large-scale project was initiated in the
Stapleton vicinity, located above the Narrows on the northeast shore of Staten Island. This area
offered a substantially undeveloped stretch of waterfront approximately1,900 m (6,300 ft) in
length (U.S. Engineer Bureau 1939). Piers over 300 m (1,000 ft) long could be constructed in
this area, where the natural water depth at the pier head line exceeded 12 m (40 ft). By 1939,
most of the navigation channels had already been covered by maintenance programs. Only the
Port Elizabeth, Port Newark, and Port Jersey areas remained relatively undeveloped.

Geomorphology/Archaeological Borings and GIS Model, 2014 New York/New Jersey Harbor Navigation Project Page 137
The most recent maintenance efforts have included the removal of drift and debris from
shorelines of the entire New York Harbor (Hammon 1976; U.S. Army Corps of Engineers 1971).
The New York Harbor Collection and Removal of Drift Project ultimately timber and steel
vessels, 100 dilapidated piers, wharves, and miscellaneous shore structures, and 23.6 million
cubic feet of timber drift and debris (Hammon 1976: 32). One of the highest concentrations of
derelict vessels was located in the Port Jersey Channel. The drift removal project was initiated in
1976, in conjunction with development of Liberty State Park in Jersey City.
The sequence of historic modifications to New York Harbor’s shoreline and bathymetry is
shown in Figure 8.4. These projections were generated from historic maps that were assembled,
digitized, and analyzed using georeferenced GIS data sets. The 1844 shoreline (Figure 8.5) has
been superposed on the existing coastal contours of the Upper Bay. The projection shows that the
harbor and near shore margins effectively conformed to the boundaries of the natural landscape.
Following the mid-nineteenth century, as barge and boat traffic increased shipping facilities were
built up and filling activities resulted in coastal modifications extended the once natural
landforms bay ward, especially in Brooklyn and Manhattan. The most significant expansions to
the shipping facilities were engineered along the former isthmus between the Lower
Hackensack/Newark Bay and Hudson Rivers. This is the landform bounded by the Arthur Kill
Channel, Newark Bay, and Elizabeth channels to the west; the Kill Van Kull to the south; and
most dramatically by the Port Jersey and Claremont Channels to the east. The east-west reach of
the peninsula was nearly doubled by landfill attendant to commercial and port expansion.
Figure 8.5 shows the steep flanks of the incised Hudson River channel. The difference
between the early and contemporary bathymetry of the harbor is a function of accelerated rates
of infilling initiated by near shore sedimentation due to consistent dredging and channel
widening. Figure 7.12 underscores the changes to bathymetry for the Upper and Lower Bay
since 1844. This GIS-based plot establishes a framework for examining the depth of dredging
along the channels over the past 150 years. The contemporary plot verifies the long-term
maintenance of the Ambrose channel, the main transport artery into the metropolitan area.
Accordingly, the deepest portions of this channel extend from -7.3 to 9.8 m (–24 to –32 ft). Most
navigation channels are at least -3 to -4 m (–10 to –13 ft) in depth. Figure 7.12 shows that, on
average, over the past 150 years Ambrose channel has undergone a net deepening of 2 to 4 m (5
to 12 ft), largely in the southeastern approach to New York City and along the key traffic lines
north of the Narrows and into the approach to Manhattan. Deepening in the latter area is not
confined to present channels but to surrounding portions of the bay floor as well. In general, the
result of long term channel maintenance across the New York Harbor has resulted in lowering of
the bay floor by an average of 0.9 to 1.12 m (3 to 4 ft).
The bathymetry of the Lower Bay was not greatly modified during the mid-20th century.
Figure 8.4 shows that the Ambrose channel was substantially widened to the east and
significantly deepened in its north end. However, across the greater reach of Raritan Bay floor

Geomorphology/Archaeological Borings and GIS Model, 2014 New York/New Jersey Harbor Navigation Project Page 138
depths remained intact at 1.5 to 4 m (5 to 13 ft). It is critical to note, however, that sustained and
scheduled dredging activities, especially over the past 50 years were directed at maintenance
(and not necessarily deepening and widening) of channels for navigation purposes. Thus, the GIS
maps do not offer indications of the frequency of dredging but provide a time transgressive
picture of net changes to the morphology of the bay floor. Records suggest that stringent
monitoring of patterns and frequency of sedimentation dictate the schedule of dredging based on
volume and congestion of vessel traffic. Weights of vessels also impact dredging timetables and
procedures.

Geomorphology/Archaeological Borings and GIS Model, 2014 New York/New Jersey Harbor Navigation Project Page 139
1934
1980
Fig
ure
8.4
: H
isto
ric
dre
dg
ing
19
34 t
o 1
98
0.
1934
1980

Geomorphology/Archaeological Borings and GIS Model, 2014 New York/New Jersey Harbor Navigation Project Page 140
Figure 8.5: Shoreline change in the Upper Harbor since 1844.

Geomorphology/Archaeological Borings and GIS Model, 2014 New York/New Jersey Harbor Navigation Project Page 141
GRA’s initial studies (GRA 2000a, 2000b, 2001, 2006) proposed that most of the active
navigation channels have been dredged below the elevation of any terrestrial surfaces younger
than 7,000 B.P. Many were presumed to preserve no Holocene surfaces whatsoever. It is not
necessarily the case that all sediments beneath the channel floors are Pleistocene or older,
however, since thick estuarine packages of Holocene age have been reported throughout the
harbor (Carmichael, 1980; Heusser, 1949; LaPorta et al., 1999; Lovegreen, 1974; Newman et al.,
1969; Weiss, 1967, 1974; Wagner and Siegel, 1997). In some cases the contexts of Holocene
packages, even when dated, may represent secondary displacements of thick and possibly even
contaminated organic or hydrocarbon-enriched sediment packages (GRA 2001).
GRA’s long term research suggests that archaeological compliance and management
planning must be mindful of dredging schedules and strategies. The present research in particular
demonstrates that systemic mobilization of sediments in shoreline environments is an essential
component in the evaluation of their archaeological potential. These issues are as critical as
geomorphological and paleoenvironmental data. This research has demonstrated that ancient and
contemporary sedimentation processes allow for the refinement and expansion of the baseline
model for archaeological sensitivity. It is hoped that this model for archaeological sensitivity in
the historically dynamic submerged environments of New York Harbor will serve as a guide to
planners concerned with mitigating impacts on cultural resources discussed in the following
sections.

Geomorphology/Archaeological Borings and GIS Model, 2014 New York/New Jersey Harbor Navigation Project Page 142
Chapter 9
Assessing the Potential for Preserved Prehistoric Sites
Previous Work
The pilot study that preceded this report (Schuldenrein et al. 2006) focused on the
development of an archaeological sensitivity model for Upper New York Harbor. It developed a
methodology for defining zones of High, Moderate, and Low Potential on a channel-by-channel
basis. Site potential was determined from information provided from cores taken as a part of that
and previous GRA studies as well as other cultural resource investigations and study of samples
from geotechnical borings curated at the USACE-NYD storage facilities at Caven Point, NJ.
Potential was evaluated using the criteria presented in Chapter 2. Most significantly, however,
the initial model was based on a sampling of only those channel segments that were scheduled
for immediate mitigation. Accordingly, it was not possible to consider the entire New York Bight
as a macro-landscape from which the systematics of archaeological geography and site
preservation could be generated.
Those individual channel evaluations showing zones of site potential are presented again in
this chapter as part of a synthesis of potential for the entire Harbor Navigation Project study area.
With the exception of two channels -- the Ambrose Channel and Port Jersey -- the criteria for
assignment of potential as presented in that report were expanded. On the basis of more recent
investigations, the Ambrose Channel was downgraded to Low potential and the entire Port Jersey
area to Moderate potential. The present study looks in detail at the Lower Harbor. This area was
broken into zones: Raritan Bay including Arthur Kill; Long Island and the Narrows including the
Ambrose Channel; the inner Bight; and Jamaica Bay. Jamaica Bay was included as it is an area
significant to broader USACE-NYD concerns as well as pivotal to the development of a sea level
model which is prerequisite to understanding the structure of the submerged landscape and its
archaeological potential. The generalized impact of relative sea level rise on the study area is
evident from the graphics included in Chapter 8. Although reworking of the landscape has taken
place during inundation of the area and by wave and tidal current action, it is clear that major
portions of the former land surface has been preserved, albeit under a veneer of later sediment.
Raritan Bay and the Arthur Kill Channel
Figure 9.1 is a detailed digital bathymetric model of the Lower Harbor bounded by Great
Kills on the north, Sandy Hook and Long Island on the east, and the mouth of Arthur Kill on the
west. Apart from the obvious dredged navigation channels, traces of three prominent landscape
features are visible on the floor of the bay. First and foremost, prominent traces of meanders are

Geomorphology/Archaeological Borings and GIS Model, 2014 New York/New Jersey Harbor Navigation Project Page 143
visible offshore Union Beach and Keansburg, New Jersey in positions consistent with the pattern
shown by Gaswirth (1999) for the former Pleistocene Raritan River outwash channel.
A sinuous channel abuts the south shore of the bay and apparently exits the bay under Sandy
Hook through a channel identified offshore in seismic profiles by Williams and Duane (1974).
The approximate course of this former Raritan River channel is shown in Figure 9.1. Also
identified by Gaswirth (1999) and discernible here is the course of the former trench of the
Pleistocene Arthur Kill that carried overflow from proglacial lakes retained behind the Harbor
Hill moraine. While not the ―mud‖ filled channel proposed by McClintock and Richards in 1936
(Figure 2.1), the former Arthur Kill channel appears to be close to shore at Seguine Point and
beneath the dredged West Reach navigation channel. This channel is shown joining the former
Raritan River channel in a mid-bay position as suggested by Gaswirth (1999).
Both of these drainage trenches are filled by 10 to 15 ft (3 to 4.5 m (10 to 15 ft) of later
sediment which also appears to cover the red brown Pleistocene sands and gravels over much of
the bay. This study only penetrated the Raritan River channel in one location, B3, on the
Keansburg transect where the Cretaceous surface has been cut to a deeper level than the adjacent
core B4. The channel is filled by gray fine to medium sand at core B3. The sea level inundation
model indicates that the floor of Raritan Bay did not begin to become inundated until about
5,000 years ago and did not reach its near modern shoreline position until 2,000 years ago. This
has critical archaeological implications. The submerged landscape was exposed for Woodland
through Paleoindian occupations. Given the presence of PaleoindianPaleoindian and Early
Archaic archaeological sites on Staten Island along the Arthur Kill, it is highly likely that the
former Pleistocene-age drainage lines were cut across terrestrial terrain and carried water from
the uplands at this time. It is also possible that these early sites represented camps frequented by
hunters following game along the former Pleistocene drainage channels. That said, none of the
cores yielded evidence of clearly identifiable floodplain sediments or soils associated with these
channels. These channels were apparently not inundated until quite late. It is not known when or
how they were filled, whether by subsequent fluvial sediment or by reworked marine deposits
during the transgression. At some time drainage shifted to the central part of the present Raritan
Bay as shown in the sea level models in the preceding chapter. Whether this was forced by
progressive progradation of Sandy Hook to the north or some other mechanism is unclear
Despite the fact that this feature is so prominent and it cannot be overlooked, it was apparently
subject to considerable sedimentation and ongoing erosional and depositional cycles. It should be
assigned a Low potential for submerged Late Archaic through PaleoindianPaleoindian sites.
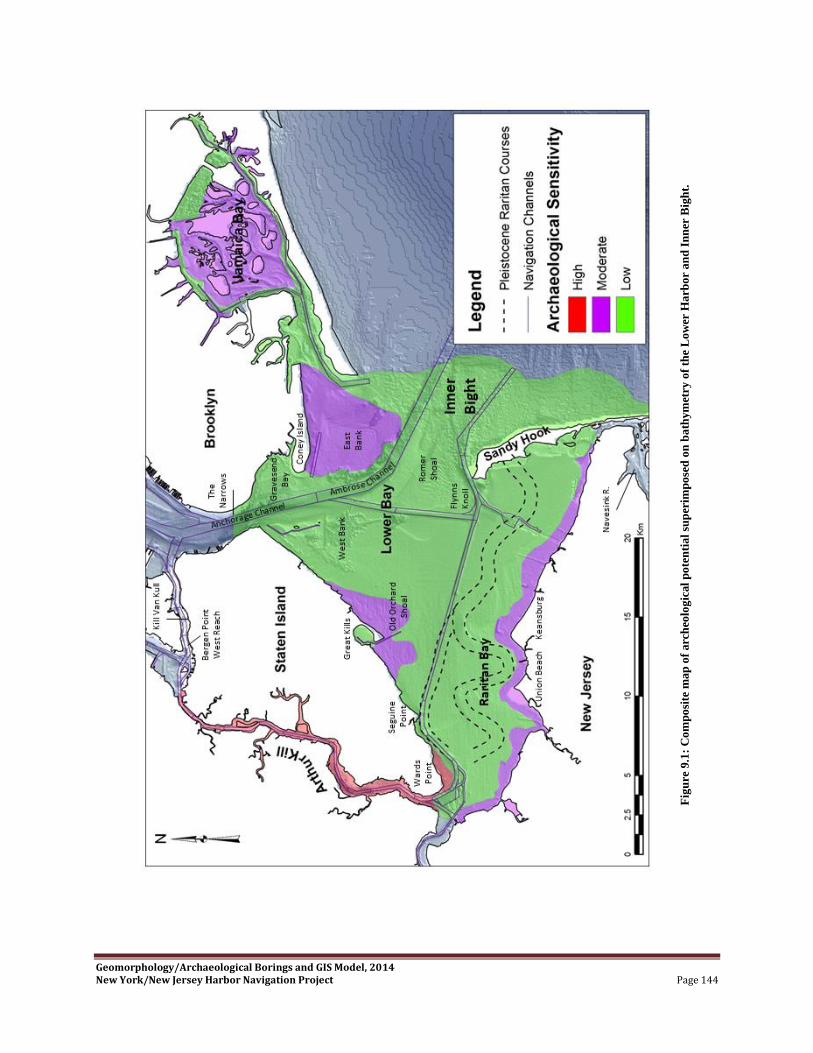
Geomorphology/Archaeological Borings and GIS Model, 2014 New York/New Jersey Harbor Navigation Project Page 144
Fig
ure
9.1
: C
om
po
site
ma
p o
f arc
heo
log
ical
po
ten
tia
l su
per
imp
ose
d o
n b
ath
ym
etry
of
the
Lo
wer
Ha
rbo
r a
nd
In
ner
Big
ht.

Geomorphology/Archaeological Borings and GIS Model, 2014 New York/New Jersey Harbor Navigation Project Page 145
Figure 5.9 shows a cross section of Raritan Bay at Keansburg, New Jersey. This section
shows that sediments bearing marine shells represent only a thin 1.5-m (5-ft ) veneer overlying
the Pleistocene fluvial sediments beneath the bay. Perhaps significantly there were no marine
shells identified in core B-3 from the suggested fill of the buried Raritan outwash channel. Of
note, however is the suggested presence of identifiable -6.0 and -4.5 m (-20 and -15 ft) terrace
features along the later talweg of the submerged Raritan River. These features are dated
relatively to 4,000 and 3,000 years ago respectively, and correspond with the final portion of the
Late Archaic period. Significantly, this period also corresponds with the documented demise of
oyster colonization (Carbotte et al., 2004) further upstream. The oyster demise may be related to
―stillstands‖ or lower sea level at periods up river that altered the salinities necessary for oyster
growth. It is not clear whether these same conditions would have applied to the mouth of the
estuary immediately adjacent marine water. Yet, this area, as well as that flanking the banks of
this former narrow estuary of the Raritan River, must be considered as having a Moderate
potential for submerged sites.
As a caveat, however, this zone lies at a depth greater than the currently dredged operational
depth of the West Reach Channel to be 11 m (35 ft) below mean lower low water (MLLW).
Therefore, it should pose no problems unless deeper navigation channels are required in the
future.
The north shore of Raritan Bay presents a somewhat different scenario. Identifiable offshore
Great Kills are shoals referred to as Old Orchard Shoal, on NOAA chart 12327. The south shore
of Staten Island is the high wave energy shore of the bay. This is indicated by groin fields
showing westward longshore sediment transport giving rise to a former spit across the mouth of
Great Kills, now marked by a structurally protected spit forming the entrance to Great Kills
harbor. Close examination of the navigation charts coupled with the landform expression on the
above chart suggests that the area offshore Staten Island to a depth of -4.6 m (-15 ft) may
represent a drowned barrier island analogous to those along the shore of Long Island that
terminated at the Old Orchard Shoal. As a result, this portion of the shore of the bay has been
deemed to have a Moderate potential for submerged sites. This area is also sensitive for shellfish
harvesting suggesting that it may have also been a popular prehistoric shellfish harvesting area
during the Woodland period. Similarly, the importance of shellfish harvesting may preclude the
sediments on this side of the bay being disturbed for other purposes. Also important vis a vis the
Staten Island shoreline is the known presence of Early Archaic and Paleoindian sites in the
vicinity of Wards Point at the mouth of Arthur Kill. This same location was noted in LaPorta et
al. (1999) as having a submerged peat bed beneath the dredged channel dated at 7950 ± 70 B.P.
(8,803 cal yrsbp) which places it in the Early to Middle Archaic range.
The early sites in this vicinity likely indicate use of freshwater marshes at the mouth of
Arthur Kill as a subsistence resource. As a result, this general area has been assigned a High
potential for submerged site presence and preservation. This is and has been an important area

Geomorphology/Archaeological Borings and GIS Model, 2014 New York/New Jersey Harbor Navigation Project Page 146
for maintenance of a navigation channel subject to further dredging. Given the richness of
wetlands and salt marshes as a habitat for waterfowl and as a spawning area for various marine
species, the Arthur Kill becomes an area of prime importance for deeply buried or submerged
cultural resources. The great expanses of marshes that once covered the northwestern shore of
Staten Island and nearby New Jersey in association with the number of early archaeological sites
in the area attest to the importance of wetlands as a human subsistence resource. Peteet et al.
(2007) report a basal peat date of 11,100 B.P. for a Staten Island freshwater marsh. This early
date places added importance on the Arthur Kill area. As result, Arthur Kill and its fringing
marshes is considered to have high archaeological potential along the full length of its channel.
Traditionally, stream mouths, or the confluence of streams, have been important loci for
Native American settlement in historic times and in evidence prehistorically. In Raritan Bay,
stream mouth areas are most prevalent along the south shore of the bay where they are often
associated with salt marshes. The south shore accordingly should be highlighted as an area of
interest for the preservation of submerged sites. This shore is a low wave energy area conducive
to site preservation. The nearshore portion of the south shore of the bay has been assigned to the
category of Moderate potential.
In overview, the site preservation potential for Raritan Bay is dictated by the extent of
sediment reworking in the core section of the Lower Bay. Much of the sediment displacement is
a function of dredge activity, per examination of the historic bathymetric data. Preliminary
indications are that even prior to historic dredging wave-action and resulting sediment
mobilization would have destroyed or buried intact near-shore and terrestrial features at the
margins of the transgressive sea (during the Early to Middle Holocene). Accordingly,
archaeological sensitivity in that portion of the project area is considered to be Low. A
Moderate potential ranking is assigned to the north shore flanking the Raritan outlet because it
may represent an aggrading near-shore landform or relict fluvio-deltaic feature. Sediment-
stratigraphy is inconclusive and such settings were preferred by Middle to Late Archaic peoples.
High preservation in this geographic unit is confined to the outer floodplain (submerged and
locally exposed) of the Arthur Kill, which was spared from extensive flooding and (onshore)
relandscaping to the present day.
Western Long Island, the Narrows, and Ambrose Channel
For ease of organization, these three areas have been grouped into a single category. The pre-
dredging topography described from the1844 navigation chart shows that the channel at the
Narrows was originally flanked by a western shoal termed the West Bank and another on the east
was described as the East Bank. The East Bank was shown as contiguous with Coney Island and
Gravesend Bay. Coney Island was clearly an active barrier island with a back barrier salt marsh

Geomorphology/Archaeological Borings and GIS Model, 2014 New York/New Jersey Harbor Navigation Project Page 147
much like those farther to the east today. The Ambrose Channel provided a direct deep-water
access to the harbor when it was dredged between the East Bank and the West Bank through the
former East Channel. To the south of the modern Ambrose Channel lie the Romer Shoal and
Flynns Knoll separated by the Swash Channel. In the assessment of the submerged landforms,
the various shoals and historic channels across the mouth of the Lower Harbor were considered
to be relicts of a previous Hudson River channel network now capped by a veneer of later
sediment. As mentioned earlier, the presence of submerged terraces and especially the -15 ft
terrace suggest that the surface of these landforms is unlikely to have been disturbed during the
last 3,000 years. This terrace can be identified on the surface of each of these shoals as well as
the West Bank and East Bank.
The channel at the Narrows lies below the planned depth for navigation and is not considered
to present difficulty with respect to cultural resources. It should be added, however, that Charles
Dill of Alpine Ocean Seismic Survey, Inc. describes peat deposits from a core approximately 30
ft (9 m) beneath the bottom in the vicinity of the Narrows. Large areas of the West Bank and
Gravesend Bay have been dredged for sand and gravel for use in construction projects. Both the
West Bank and East Bank were mapped as being underlain by fine to medium-grained sands by
(Bokuniewicz and Fray 1976); and this is corroborated by research into core records. In the sea
level rise model, the surfaces of shoal areas were not inundated until after 2,000 cal yrsbp and
have doubtless undergone sorting and redistribution of surface sediment since that time. The East
Bank shoal is contiguous with the mainland at Coney Island and would have been available to
prehistoric populations for occupation. The West Bank shoal is also contiguous with Staten
Island although it has been substantially destroyed by dredging operations.
On the basis of the sediment studies and sea level rise model, the East Bank is considered to
be the only area with archaeological potential, which is assessed to be of Moderate likelihood.
The Romer Shoal and Flynns Knoll doubtless extended above the water surface as islands in the
past. It remains unclear as to whether these were inhabited or not. This study finds that they are
of less importance than other sites in Raritan Bay; thus, they are assessed as Low potential areas.
The dredged Ambrose Channel was classified as Moderate to High potential in an earlier GRA
report, on the basis of limited core information. If consideration is limited to the existing dredged
channel, recent seismic profiles across the Lower Harbor by Thieler et al. (2007), show the
Pleistocene channel of the Hudson east of the Narrows to have incised to a depth of ca. 46 m
(150 ft) below present sea level; it was overlain by ca. 15 m (50 ft) of younger sediment.
Dredging has already removed the overlying sediment package over much of its length. Thus, the
Ambrose channel can be downgraded to Low potential. Figure 9.1 presents a composite map of
archaeological potential for the Lower Harbor including Raritan Bay and extends eastward to
include Jamaica Bay and the Inner New York Bight.
There is limited potential (Moderate) for buried site preservation at the margins of the
natural landforms northeast of the (disturbed) Ambrose channel where intact sediments may be

Geomorphology/Archaeological Borings and GIS Model, 2014 New York/New Jersey Harbor Navigation Project Page 148
preserved along the southwest margin of Brooklyn. Archaeological deposits would appear to
date to a period of stabilization during the end of the Middle Holocene, when wave action was
minimized and sediment reworking was laterally confined.
Jamaica Bay
Investigations were undertaken in Jamaica Bay to provide potential information on the
formation of salt marshes during the ongoing marine transgression. Jamaica Bay falls within
purview of the U.S. National Park Service as part of Gateway National Recreation Area. Work
was performed under Permit # GATE-2006- SCI-0019. As noted earlier, it was not possible to
obtain cores from the actual marsh surface at the Yellow Bar Marsh as anticipated due to water
depths. Personal communication with Dorothy Peteet of Lamont-Doherty Earth Observatory, as
well as Peteet et al. (2007), supports the sea level rise conclusion that the formation of salt
marshes in Jamaica Bay is a very young event. This study concurs with Peteet et al. that the
marshes here are less than 1,000 years old and that the current marsh has developed in a
preexisting depression on the surface of glacial outwash. The outline of this depression as well as
the centripetal drainage network entering it can be plainly seen on the digital elevation models in
the chapter on environmental reconstruction using the sea level model. Consequently, Jamaica
Bay does not appear to be a classic back barrier salt marsh like that at South Oyster Bay behind
the Jones Beach barrier island. Jamaica Bay is a clear anomaly. Other than relatively thin
estuarine silt layers covered by fine sand adjacent to the Yellow Bar marsh the five cores taken
in this location did not give any indication of submerged land surfaces within 12 m (40 ftft) of
present sea level. Marine shell fragments were not recovered lower than (9 m) 30 ft below
present sea level although the bedding on the well sorted fine-grained sands below the marsh
suggests a littoral history. However, the deepest core was obtained from an active channel
deposit.
Pending further investigation, it is hypothesized that the fine-grained sands decrease in
thickness towards the edges of the Jamaica Bay depression and its former shoreline now
circumscribed by a dredged channel. Archaeologically the pre-sea level rise surface beneath the
Jamaica Bay salt marshes would have been available for prehistoric occupation extending from
the Woodland back to the Paleoindian periods. On this basis, it is suggested that Jamaica Bay,
with the exception of the present dredged channels, that have obviously been reworked
historically, be considered to have Moderate potential for prehistory beneath the existing marsh.
It is recommended that future dredging activities for navigation or marsh restoration consider the
presence of deeply buried sites.
Jamaica Bay remains an offset cove, whose exposure to intensive sediment reworking in
historic times was variable. The sediment stratigraphy is not conclusive as to whether or not

Geomorphology/Archaeological Borings and GIS Model, 2014 New York/New Jersey Harbor Navigation Project Page 149
capping deposits represent veneers burying intact estuarine deposits or whether the upper meter
of sediment is completely retransported. Intact ecological features persist in the area bolstering
the evidence for at least relict Holocene features. Thus an archaeological site preservation
potential of Moderate can be assigned here.
The Inner New York Bight
The Inner New York Bight as currently referenced comprises the area seaward from Sandy
Hook and extending from Long Branch, New Jersey on the south to Jones Inlet on the Long
Island shore and east of Jamaica Bay. Various geotechnical borings have been taken along the
barrier islands, for the purpose of evaluating offshore sand and gravel resources for beach
nourishment and restoration. The locations of core logs examined for this study are shown
incompiled maps of boring and core locations (Figure 5.4, Figure 5.12, Figure 5.17). Extensive
work was done in the vicinity of Sea Bright, New Jersey as well as offshore Jones Beach. Earlier
discussion noted the presence of evidence of Pleistocene megafauna on the continental shelf
south of the Hudson Shelf channel suggesting the possible presence of Paleoindian hunters in the
same area during the low Pleistocene sea level low stand. More pertinent to this study are the
shallower waters nearer to the present shoreline. Figure 7.2 and Figure 7.3, for example, show
the approximate location of the shoreline at 9,000 and 8,000 cal yrsbp. The exposed landscape
offshore the barrier island systems mark the general areas available to both Early and Middle
Archaic as well as Paleoindian hunters in the Inner Bight area and at depths consistent with the
future navigation channel needs in New York Harbor. It is only after 7,000 cal yrsbp, when the
rate of sea level rise slowed, that environmental settings along the coasts began to stabilize so
that shellfish colonization and coastal fisheries pattern could become predictable as subsistence
resources. This type of resource establishment is exemplified by the dated colonization of oysters
in Tappan Zee at about this time.
In terms of the Inner Bight, Figure 7.5 gives and insight into the former landscape. The
shoreline outlines the outer edge of the outwash fan spreading out from the Raritan Bay and the
Hudson River valley. The major portion of this fan passes beneath Sandy Hook and extends
southward to the Navesink River. Like much of Raritan Bay, this area was progressively
inundated so that Late Archaic groups most likely utilized the coastal and marine resources of
this narrow portion of the shore. Like Late Archaic groups at Croton Point and Dogan Point as
far up the Hudson River at Tappan Zee similar types of subsistence strategies can be expected to
have been practiced along the coast. Where this stretch of the shore in a sheltered environment, it
would be assessed as having moderate to high potential for submerged sites.
In general these landscapes have been subject to extensive wave action. Accordingly, it is
suggested that in situ archaeological evidence has been disturbed or eroded over the past 6,000

Geomorphology/Archaeological Borings and GIS Model, 2014 New York/New Jersey Harbor Navigation Project Page 150
years. This portion of the shore is considered to have Low archaeological potential. The coastal
areas of the Long Island shoreline offshore the present barrier islands do not present areas as
extensive as those near Sea Bright, New Jersey. The narrow bands of areas exposed during lower
sea level along the Long Island shore are likewise exposed to high wave energy, thus the
assessment of Low potential is extended to this portion of the Inner Bight as well.
Upper New York Harbor and Newark Bay
Newark Bay. The Newark Bay navigation channel has been studied intensely to determine
the geotechnical problems associated with dredging to required future channel depths. These
have involved the depth and attitude of the bedrock surface that underlies the channel as well as
deeply incised Pleistocene sediment filled channels in the bedrock surface (Beda et al., 2003).
This study by necessity looks beyond the confines of the narrow channel and its feeder channels
to Port Newark, Port Newark Point, and the Elizabeth Channel. The pre-engineered topography
and bathymetry shown in the 1844 charts, stratigraphic study of cores from Kill Van Kull, and
the new relative sea level model show that Newark Bay was occupied by the meandering channel
of the prehistoric Hackensack River until about 4,000 years ago when it began to be inundated
by rising sea level. It can be anticipated that brackish marshes began forming along the edges of
the valley edges and spread laterally with rising sea level and expanding in area to fill the present
basin. Carmichael (1980) has described the later portion of the present Hackensack marshes and
notes changing vegetation and salinity.
Archaeologically, the Hackensack River valley, now covered by the marshes, might have
afforded rich subsistence base for Paleoindian through Late Archaic groups that were situated on
higher terrain along the valley margins. The expanding fringes of the marshes can be considered
to have offered the same resource base to Woodland period groups as well. The main dredged
channel has been assigned a Low potential while the marsh peripheries have been assigned a
Moderate potential. The Port Newark and Elizabeth Channels maintain their Low potentials as
previously dredged channels. Port Newark Point is included within the overall Moderate
potential category given to Newark Bay.
Upper New York Harbor. For the purposes of this discussion of archaeological potential, the
Upper Harbor includes contiguous channels and areas. These are the Anchorage Channel,
Claremont Channel, Port Jersey, Buttermilk Channel, and Stapelton Channel.
Thirteen cores were examined as part of GRA’s previous investigation to better understand
the Anchorage Channel. Critical to that study was a radiocarbon date on organic fragments from
weathered fluvial deposits at 20 m (66 ft) below sea level in core 98ANC64, overlain by thick
estuarine silt and clay that floors the Hudson in this area. A determination of 9,400 ± 150 (10,690

Geomorphology/Archaeological Borings and GIS Model, 2014 New York/New Jersey Harbor Navigation Project Page 151
cal yrsbp) suggested the dated deposits were of a potential Early Archaic affinity and appeared to
represent a riverine environment. Other cores from the Anchorage Channel also contained
organics from fluvial sands beneath the estuarine fill (98AC80 and 98ANC81) from between 21
and 27 m (70 and 90 ft) below sea level. This was an indication that there was a potential for
relatively old prehistoric sites at depth. The depth of the channel at these locations is on the order
of 18 m (60 ft) below sea level and below proposed future dredging requirements or plans. The
Anchorage Channel was assigned a Low priority on this basis although they should be noted as
potentially important future sites for further investigation. The present study adds a context to the
Anchorage Channel cores because of the revised sea level model. Figure 5.16 is a cross section
of the Hudson from Port Jersey to the Bay Ridge Flats and across the Anchorage Channel. It is
clear from this section that the organic zones at the base of the estuarine silt are continuous with
the underlying former land surface composed of crystalline bedrock covered in turn by
Pleistocene fluvial gravels. Radiocarbon ages from the silts point to a time of deposition between
3,500 and 3,700 years ago for the upper portions of the Jersey Flats. Anomalously young ages
were found on the slope of the Jersey Flats in core JF-6. Across the harbor another anomalously
young date on wood fragments, 1,850 ± 40 B.P. (1,806 cal yrsbp) was found in the new core D-1
from the Bay Ridge Flats at a depth of 10 m (33 ft) below sea level. An additional cross section,
Figure 5.13 along the Liberty Island channel, gives a better representation of the depositional
history in the harbor. Here a marine transgression on to a former land surface is more clearly
defined with estuarine silt overlapping fluvial outwash sands with in situ trees. These are dated at
5,650 ± 90 B.P. (6473 cal yrsbp) and 5,000 ± 40 B.P. (5,769 cal yrsbp) and give a reasonable
indication for the inundation of the western shore of the harbor. Examination of the bathymetry
in the harbor also identifies a black oily mud, in the core C-2, as the product of relatively recent
filling of an early dredged channel.
This disturbed edge of the Jersey flats was given a High potential in GRA’s earlier report,
but it is now downgraded it to Moderate, in keeping with the remainder of the Jersey Flats. The
Jersey Flats including the Claremont and Port Jersey channels are now classified as Moderate
potential. The depositional history of the Bay Ridge Flats is not yet understood, thus, it has been
given a Moderate potential. Across the harbor in the vicinity of the Bay Ridge Flats there is
evidence for recent dredging along the west side that has removed formerly intact sediment. That
area is now included in the expanded Low potential area of the Anchorage Channel. Along
similar grounds, the Buttermilk Channel retains a Low potential classification. The individual
study areas of the Upper Harbor are included on a map of composite archaeological potential in
Figure 9.2. In conjunction with Figure 9.1, these maps are designed for use in overall planning
for compliance requirements for future specific projects. Most importantly, these maps together
with the information furnished in this study provide a needed context to view the complex
environmental history of the New York Harbor area.
A synthetic overview of archaeological site potential for the entire study area is presented in
the next section. The objectives of that overview are to provide a baseline for developing

Geomorphology/Archaeological Borings and GIS Model, 2014 New York/New Jersey Harbor Navigation Project Page 152
systemic mitigation strategies for the U.S. Army Corps as their channel maintenance plan for the
New York and New Jersey Harbor and Bight.
Figure 9.2: Composite map of archaeological potential superimposed on bathymetry of the Upper Harbor and
Newark.

Geomorphology/Archaeological Borings and GIS Model, 2014 New York/New Jersey Harbor Navigation Project Page 153
Chapter 10
Conclusions and Recommendations
The objective of this project has been the development of a model of submerged
paleoenvironments within the Upper and Lower Harbor segments of the New York Bight that
bear on the systematics of cultural resource preservation potential. The model is built on
previous geoarchaeological research undertaken by the present project team and other
researchers. The present need is to synthesize previous work on the submerged landforms, to
develop clear associations between buried landscapes and buried prehistoric resources, and to
identify gaps in the matrix of landform and archaeological site associations. Identifying these
gaps would help to structure a limited field testing program that would produce a comprehensive
model of archaeological sensitivity. Such a sensitivity model allows the USACE-NYD to
develop specific protocols for cultural resource work in areas of the Bight subject to subsurface
impacts to the channel and bay floor.
The present document is ultimately a planning document, or blueprint, for assisting the
USACE-NYD and researchers in isolating and delimiting areas that might have been available
for settlement during the various periods of the prehistoric and historic past.
The methodology for achieving these goals involved performance of three basic tasks as
follows:
1. Reviewing previous geoarchaeological results and performing field work to refine
landform and stratigraphic relationships that inform on archaeological resource
location and preservation;
2. Integrating the matrix of buried landscape and archaeological relationships in a
comprehensive organizational framework using a Geographic Information System
(GIS) format;
3. Developing an archaeological probability model that allows for informed assessments
of segments of the Bight slated for potentially adverse impacts
The performance of each of these tasks is summarized in turn. It is noted that item 3 constitutes
the Recommendations of this study.
Geomorphology/Archaeological Borings and GIS Model, 2014 New York/New Jersey Harbor Navigation Project Page 154
Previous Results and Follow up Fieldwork
This report is the culmination of a near decade-long effort in assembling and assimilating
data sets from various individual projects which collectively provided clues on the systematics of
submerged landscapes and archaeological preservation. The formulation of an overarching
model, one that would allow planners and managers to develop archaeological site prediction
modules in advance of Harbor-wide improvement projects, was previously untenable. This is
because earlier efforts were confined to assessments of specific channels or locations within the
Bight. Accordingly, mitigation efforts were not afforded broader landform and site expectation
assessments based on a Bight-wide set of geoarchaeological associations. Discussions with the
USACE-NYD in 1998 led to a long term mitigation strategy that addressed both the near term
requirements of the Section 106 process (i.e. the need for immediate mitigation efforts at Harbor
Channels scheduled for adverse impacts) and longer term goals of providing planners with a
Bight-wide, model of archaeological sensitivity that could be utilized for future management
plans.
Practically, the implementation of that strategy involved the formulation of an inductive
model of archaeological sensitivity that was built on identifying the integrity of buried or
―drowned‖ landforms (i.e. terraces, meander belts) and identifying potentially sealed and intact
surfaces for the terrain delimited by the impact zone (i.e. Jersey Flats, Shooter’s Island). The key
to determining integrity was the development and dating of lithostratigraphies for the impact
zones. These sequences were assembled through systematic coring, designed and implemented
by GRA personnel, and supplemented by available geotechnical boring records. It is noted that
these lithostratigraphies, while streamlined for present purposes, remain provisional for the Bight
generally, given the variable and uneven stratigraphic frameworks applied by earlier researchers.
Bio-stratigraphic records provided an additional database and archaeological sensitivity maps
were prepared for each project zone based on databases and the dating of buried organic
horizons. While archaeological sites, sensu stricto, were never identified, laterally continuous
facies for Late Holocene estuarine deposits and occasional alluvial sequences provided a
guideline for recognizing ―available surfaces for occupation‖ for given slices of prehistoric time.
The application of a consistent investigative methodology geared towards assessing the integrity
of Holocene columns and dating stratigraphic breaks allowed expansion of the inductive model
and refinement of the stratigraphies across broader reaches of the Harbor.
Five separate studies were undertaken and in 2006, the USACE-NYD issued an SOW to
assimilate the results of project-specific investigations and to create archaeological sensitivity
modules for 14 reaches and channels of the New York Bight (Schuldenrein 2006: Figure 5.1).
These modules were examined synthetically and a series of recommendations were made that
facilitated expansion and projection of the sensitivity model across the Bight. That model
became the empirical core of the present report.

Geomorphology/Archaeological Borings and GIS Model, 2014 New York/New Jersey Harbor Navigation Project Page 155
The research design and methodology underlying this synthesis are straightforward. They
emerged from the need to develop a comprehensive model for landscape evolution in the
subaqueous terrain, which in turn, provides a reliable measure of prehistoric geography. The
individual modules structured in the earlier report were incomplete, driven by an uneven record
of subsurface geological data and, perhaps even more significantly, by a sea level model that was
both dated and partially obsolete. Accordingly, an unanticipated need for fine-tuning the
archaeological sensitivity paradigm involved a complete rebuilding of the sea level curve for the
Holocene marine cycles of the New York City area. While the recommended Research Design of
the earlier report rightly pointed out the need for collecting additional paleogeographic and
environmental data, it was originally thought that these data would ―fill in gaps‖ that would link
up the individual modules. In the course of collecting the data, however, the potential for
updating the then extant New York area sea level curve became a focus of the data collection
effort. Accordingly, the present report has emerged as a more reliable construct for both
paleogeographic and archaeological sensitivity.
The data collection effort was concentrated in the Lower Bay and its upstream periphery,
areas that were determined to have the greatest potential for preserving intact submerged
Quaternary sequences. The cores also sampled the most diverse micro-environments housed in
the subaqueous terrains. Limited coring upstream allowed refinement and rethinking of the initial
sequences, specifically successions developed in the earlier phases of the New York Bight
research. It was then possible to retrofit these observations into what is now emerging as the first
comprehensive model of Late Quaternary landscape evolution for this part of the world.
Ongoing sedimentological and bio-stratigraphic studies have allowed, and will continue to
allow, researchers to systematically reconstruct the submerged terrain with a degree of detail
previously unattainable. This is because 3-dimensional mapping, the use of historic maps and the
integration of observations into GIS formats facilitates construction of the buried landscape on a
segment by segment basis. While there are still gaps between segments, the framework of the
present study is sufficiently comprehensive to identify broad spatio-temporal trends in Late
Quaternary landscape evolution.
Integrating the matrix of buried landscapes and archaeological relationships:
The GIS model
The new model of archaeological sensitivity is illustrated in Figure 10.1. It represents the
most accurate depiction of archaeological site sensitivity, based on the comprehensive
geoarchaeological and stratigraphic work assembled and synthesized in the present research

Geomorphology/Archaeological Borings and GIS Model, 2014 New York/New Jersey Harbor Navigation Project Page 156
efforts. Figure 10.1 has also utilized GIS templates for historic mapping as well as data sets that
have been digitally manipulated to filter out shoreline and subaqueous disturbance patterns.
GIS-facilitated multi-layered mapping enables the depiction and interpretation of patterned
changes in geomorphology, paleogeographic groupings, and archaeological site distributions.
The GIS model was initially structured from terrain elevation models that charted near-shore and
subaqueous elevations and incorporated recently mapped surface geology data. Previously
assembled information sets were combined with those obtained from the new field work to
Fig
ure
10
.1:
3D
vie
w o
f se
nsi
tiv
ity
mo
del
an
d b
ori
ng
s.

Geomorphology/Archaeological Borings and GIS Model, 2014 New York/New Jersey Harbor Navigation Project Page 157
generate baseline sedimentological and stratigraphic associations. Digitized versions of the data
modules were then produced. A total of 25 image sets depict the composite interpretations of the
data in this platform.
More specifically, the original proposal for this study targeted the generation of seven (7)
specific GIS based products (see Schuldenrein et al., 2006).
(1) Historic terrain and bathymetric plots. 1844 bathymetric plots of the New York Bight
were presented as a baseline for documenting subaqueous contours. It was proposed that
additional time-based projections be developed. Such projections were successfully generated.
(2) Shoreline models for prehistoric and historic terrain. Sea level curves were constructed
that track shoreline contours and migrations by millennial intervals. These track changing
configurations of terrestrial (stream lines), estuarine, marsh, and marine margins for these time
frames. The original plan was to obtain resolution at 500 year intervals but the present model is
configured on the basis of the reworked sea level curve. It provides considerably more accurate
projections.
(3) Surficial geology of the shore and subaqueous terrain of the Bight. GRA’s initial study
illustrated the maps that were available for various sections of the Bight. These were so diverse
and based on such a broad variety of sedimentological and geomorphic criteria that
comprehensive integration would require a complete reworking of primary data sets. A GIS
model for surface and subsurface Quaternary landforms was built which accommodated
landforms that are a product of or were affected by marine transgressions and regressions. It is
possible that additional refinements can be incorporated.
(4) GIS plots of subsurface lithostratigraphy. The layer plotted the late Quaternary
lithostratigraphy based on an assimilation of the bore logs, first by the individual channel reaches
and subsequently for the entire project area. This proved to be the most complex task for the GIS
because comprehensive lithostrata have never been codified, nor can they be readily transformed
into a single data set. Accordingly, the prospect of grouping diverse accounts of
lithostratigraphies is minimal without a more fundamental sorting of landforms. The latter is not
yet possible.
(5) GIS plots of biostratigraphy. The layer integrates the foraminifera, macrofossil, and
pollen records to sort out habitats through time. This is an independent measure of the zonation
of nearshore environments established by the shoreline model, and the fit between the sequences
and the landform zonations is consistent.
(6) GIS plots and simulation of prehistoric and historic site geography. This construct
projects likely settings of sites based on known patterns of settlement in near shore environments
through time (i.e., for Paleoindian, Archaic, Woodland, Contact and historic periods) based on a
dynamic model of fluctuating nearshore margins and attendant environments. That model is then
―fitted‖ against the submerged landscape maps developed for this study. A first iteration of these
projections was successfully implemented.

Geomorphology/Archaeological Borings and GIS Model, 2014 New York/New Jersey Harbor Navigation Project Page 158
Projection of a refined model of archaeological sensitivity. The baseline models were refined on
the strength of the present investigations. The predictive model for the major navigation channels
and surrounding areas is advanced and illustrated in Figure 10.1.
Recommendations: An archaeological probability model for planning
Figure 9.1, Figure 9.2 and Figure 10.1 chart the archaeological sensitivity of the project
area. These sensitivity designations are intended to guide future cultural resource compliance
strategies related to dredging activities. The designations follow a tripartite probability ranking
(Low, Moderate, High) representing the union of two factors: the likelihood that given locations
were occupied or variously utilized in the past, and the probability that material evidence of such
use has been preserved. Both of these factors were taken into account in determining
designations. For example, an area with a high probability of prehistoric or historic use but with
a low probability of preservation was designated as Moderate. Only areas with both a high
probability of prehistoric or historic use and a high probability of preservation have been
designated as High.
Table 10.1 ranks archaeological sensitivity probability by geomorphic and stratigraphic
contexts. High and moderate probability rankings are determined by associations with landforms
with intact dated sequences of Holocene age. In general, mitigation strategies include detailed
programs of coring and landform evaluations that can determine integrity of channel margins or
bay floors. High probability areas that cannot be avoided will likely require mitigation in the
form of corings, sampling and analyses. Moderate probability areas will necessitate additional
exploration to determine the integrity of sequences, their antiquity, and the stability of attendant
landforms in the historic or prehistoric past. Low probability areas will require no additional
work.

Geomorphology/Archaeological Borings and GIS Model, 2014 New York/New Jersey Harbor Navigation Project Page 159
Archaeological
Sensitivity
Landscape and
Stratigraphy Recommendations
High
Contemporary near shore settings
and discrete marine, terrestrial or
sub-tidal features; landform
segments affixed to contemporary
land masses and unaffected by
historic sediment mobilization.
Should be avoided. If that is not
possible, further work would include
coring (subaqueous contexts) and deep
testing (near shore or terrestrial
contexts); mitigation includes
geomorphic , sedimentological and
biostratigraphic sampling supplemented
by absolute dating. Results should be
entered into the GIS model.
Moderate
Landform segments partially
affected by terrestrial historic re-
landscaping, or where stratigraphy
remains unknown; generally affixed
to contemporary shorelines or
isolated and shielded micro-
environments.
Detailed exploration of select and
representative reaches of the affected
segment or landform; studies need to
resolve antiquity of landform through
dating and assessments of landform
integrity. Results should be entered into
the GIS model.
Low
Interior portions of Bight that have
already been affected by historic
mobilizations of sediment and
subaqueous impacts due to
dredging and historic boat traffic;
modern sediment accumulated over
pre-occupation sediment
stratigraphies.
No response required.
Table 10.1: Probability Model and Recommended Strategies for Planning
Summarily, this study has produced a dynamic and integrated human ecological model. The
use of GIS produced a dynamic model for environmental change and human geography that will
continue to evolve as future studies are conducted and new data are entered into the model. The
sensitivity model will help structure decisions made by cultural resource managers working in
the Harbor and Bight.

Geomorphology/Archaeological Borings and GIS Model, 2014 New York/New Jersey Harbor Navigation Project Page 160
References
3DI. (1992). Paleoecological and geomorphological studies for Transcontinental Gas Pipe Line
Corporation’s 0.75 mile Carlstadt Loop project in Bergen County, New Jersey. Houston,
Texas.
Adovasio, J.M., Gunn, J.D., Donahue, J., and Stuckenrath, R. (1978). Meadowcroft Rockshelter,
1977: An Overview. American Antiquity, 43, 632-651.
Albion, R.G. (1939). The Rise of the New York Port, 1815-1860 (Vol. 1815-1860). New York:
Charles Scribner’s Sons.
Antevs, E.V. (1925). Conditions of Formation of the Varved Glacial Clay. Geological Society of
America Bulletin(36).
Averill, S.P., Pardi, R.R., Newman, W.S., and Dineen, R.J. (1980). Late Wisconsin-Holocene
History of the Lower Hudson Region: New Evidence from the Hackensack and Hudson
River Valleys. In W. Manspeizer (Ed.), Field Studies of New Jersey Geology and Guide
to Field Trips: 52nd
Annual Meeting of the New York Geological Survey.
Bache , A.D., and Hassler, F.R. (Cartographer). (1845). New York Bay, Harbor.
Beda, S., Ward, W.B., Murphy, W., Fleming, R., Fleming, G., and Boyd, B.B., B.A. (2003). The
Quaternary Geology of Newark Bay and Kill Van Kull Channel, New York and New
Jersey. Abstract: Conference Geology of Long Island and Metropolitan New York. Stony
Brook: University of New York.
Belknap, D.F., and J.C., K. (1977). Holocene Relative Sea-Level Changes and Coastal
Stratigraphic Units on the Northwest Flank of the Baltimore Canyon through
Geosyncline. Journal of Sedimentary Petrology, 47, 610-629.
Betts, M.B. (1997). Master Planning: Municipal Support of Maritime Transport and Commerce
1870-1930's. In K. Bone (Ed.), The New York Waterfront: Evolution and Building
Culture of the Port and Harbor (pp. 36-83). New York: Monacelli Press.
Bloom, A.L. (1983). Sea Level and Coastal Morphology of the United States through the Late
Wisconsin Glacial Maximum. In H.E. Wright (Ed.), Late Quaternary Environments of
the United States, The Late Pleistocene. Minneapolis: University of Minnesota Press.
Bloom, A.L., and Stuiver, M. (1963). Submergence of the Connecticut Coast. Science, 139, 332-
334.
Boesch, E. (1994). Archaeological Evaluation and Sensitivity Assessment of Staten Island, New
York. New York, NY: New York City Landmarks Preservation Commission.
Brennan, L.A. (1974). The Lower Hudson: A Decade of Shell Middens. Archaeology of Eastern
North America, 2, 8193.
Brennan, L.A. (1977). The Lower Hudson: The Archaic. In W.S. Newman and B. Salwen (Eds.),
Amerinds and their Paleoenvironments in Northeastern North America (Vol. 288, pp.
411-430). New York: Annals of the New York Academy of Sciences.
Brokuniewicz, H.J., and Fray, C.T. (1976). The Volume of Sand and Gravel Resources in the
Lower Bay of NewYork Harbor: New York Sea Grant Institute.
Brown, A.G. (1997). Alluvial Geoarchaeology: Floodplain Archaeology and Environmental
Change. Cambridge: Cambridge University Press.
Bureau, U.S.E. (1939). The Harbor of New York: Improvement of Entrance Channels and New
York and New Jersey Channels: United States Army Corps of Engineers, New York
District.
Geomorphology/Archaeological Borings and GIS Model, 2014 New York/New Jersey Harbor Navigation Project Page 161
Cantwell, A.-M., and diZerega, D. (2001). Unearthing Gotham: The Archaeology of New York
City. Wall: Yale University Press.
Carbotte, S., Bell, R., Ryan, W., McHugh, C., Slagle, A., Nitsche, F., et al. (2004).
Environmental Change and Oyster Colonization within the Hudson River Estuary Linked
to Holocene Climate. Geo-Mar Lett, 24, 212-224.
Carmicheal, D.P. (1980). A Record of Environmental Change During Recent Millennia in the
Hackensack Tidal Marsh, New Jersey. Bulletin of the Torrey Bontanical Club, 107(4),
513-524.
Claassen, C. (1995). Dogan Point in it Social Context. In C. Claassen (Ed.), Dogan Point: A
Shell Matrix on the Hudson River (Vol. 14, pp. 129-142). Bethlehem: Occasional
Publications in Northeastern Anthropology.
Claassen, C. (Ed.). (1995). A Shell Matrix Site in the Lower Hudson Valley (Vol. 14).
Bethlehem, CT: Franklin Pierce College.
Cotter, J.F.P. (1983). The Timing of the Deglaciation of Northeastern Pennsylvania and
Northwestern New Jersey, Unpublished Ph.D. Dissertation (pp. 159): Lehigh University.
Davis, M.B. (1969). Climate Change in Southern Connecticut: Recorded by Pollen Deposition at
Rodgers Lake. Ecology, 50(3), 409-422.
Davis, M.B. (1976). Pleistocene Biogeogaphy of the Termperate diciduous Forests. Geoscience
and Man 13 (Ecology and Pleistocene, 13-26.
Davis, R.B.J., G.L. (1985). Lateglacial and early Holocene landscapes in Northern New England
and Adjacent areas of Canada. Quartery Research, 23, 341-368.
Deevey, E.S. (1958). Bogs. Scientific American, 199, 114-122.
Deevey, E.S. (1958). Radiocarbon-dated pollen sequences in eastern North America. Geobot.
Inst. Rubel. Veroff, 34, 30-37.
Douglas, B.C. (1991). Global Sea Level Rise. Journal of Geophysical Research, 96(c4), 6981-
6992.
Edwards, J. (1893). Improvements of New York Harbor, 1885-1891. New York: Wynkoop and
Hallenback.
Edwards, R.L., and Emery, K.O. (1977). Man on the Continental Shelf. Annals of the New York
Academy of Sciences, 288, 245-256.
Emery, K.O., and Edwards, R.L. (1966). Archaeological Potential of the Atlantic Continental
Shelf. American Antiquity, 31(5), 733-737.
Emery, K.O., and Edwards, R.L. (1966). Archaeological Potential of the Atlantic Continental
Shelf. American Antiquity, 31(5), 733-737.
Emery, K.O., and Uchupi, E. (1972). Western North Atlantic Ocean: Topography, Rocks,
Structure, Water, Life and Sediments. American Association of Petroleum Geologists
Memoirs, 17.
Emery.K.O., and Edwards, R.L. (1966). Archaeological Potential of the Atlantic Continental
Shelf. American Antiquity, 31(5), 733-737.
Fairbridge, R.W. (1961). Eustatic Changes in Sea Level. In L.H. Ahrens and F. Press (Eds.),
Physics and Chemistry of the Earth (Vol. 4, pp. 99-185). London: Pergamon Press.
Field, M.E., Meisburger, E.P., Stanley, E.A., and Williams, S.J. (1979). Upper Quaternary Peat
Deposits on the Inner Shelf of the United States. Geological Society of America Bulletin,
90, 618-628.
Fischer, A. (1995). Man and Sea in the Mesolithic: Coastal Settlement Above and Below Present
Sea Level (Vol. 53). Oxford: Oxbow Books.

Geomorphology/Archaeological Borings and GIS Model, 2014 New York/New Jersey Harbor Navigation Project Page 162
Fisher, D.W. (1955). Prehistoric Mammals of New York. New York Conservationist, Febuary-
March, 18-22.
Flannery, K.V. (1968). The Olmec and the Valley of Oaxaca: A Model for Interregional
Interaction in Formative Times. In E. Benton (Ed.), Dumbarton Oaks Conference on the
Olmec (pp. 79-110). Washington, D.C.
Flecther, C.H., and Knebel, H.J.K., J.C. (1990). Holocene Evolution of an Estuarine Coast and
Tidal Wetlands. Geological Society of America Bulletin, 102, 283-297.
Flecther, C.H., and Van Pelt, G.S.S., J. (1993). Tidal Wetland Record of Holocene Sea-level
Movements and Climate History. Palaegeography, Paleoclimatology, Paleoeceology,
102, 177-213.
Fleming, K., Johnston, P., D., Z., Yokoyama, Y., Lambeck, K., and Chappell, J. (1998). Refining
the Eustatic Sea-Level Curve Since the Last Glacial Maximum Using Far- and
Intermediate-Field Sites. Earth and Planetary Science Letters, 163, 327-342.
Fletcher, C.H.P., J., and Van Pelt, J.E. (1993). Sea-level Rise Acceleration and the Drowning of
the Delaware Bay Coast at 1.8 ka. Geology, 21.
Fullerton, D.S., and Richmond, G.M. (1986). Comparison of the Marine Oxygen Isotope Record,
the Eustatic Sea Level Record and Chronology of glaciation in the United States of
America. In S. Vladimir, D.Q. Bowen and R. G.M. (Eds.), Quarternary Glaciations in the
Northern Hemiphere (Vol. 5, pp. 197-200): Quaternary Science Reviews.
Funk, R. (1991). The Middle Archaic in New York. Journal of Middle Atlantic Archaeology, 7,
7-18.
Funk, R.A. (1976). Recent Contributions to Hudson Valley Prehistory: New York State
Museum.
Funk, R.A., and Pfeiffer, J.E. (1988). Archaeological and Paleoenvironmental Investigations on
Fishers Island, New York: A Preliminary Report. Bulletin of the Archaeological Society
of Connecticut, 51, 69-110.
Funk, R.E. (1993). The Upper Susquehanna Sequence and Chronology. In Archaeological
Investigations in the Upper Susquehanna Valley, New York State. (Vol. 1). Buffalo:
Persimmon Press.
Funk, R.E., and Steadman, D.W. (1994). Archaeological and Paleontological Investigations of
the Dutchess Quarry Caves, Orange County, New York. Buffalo: Persimmon Press.
Gardner, W. (1977). The Flint Run Paleoindian Complex and its Implications for Eastern North
American Prehistory (Vol. 288): Annals of the New York Academy of Sciences.
Gaswirth, S.B. (1999). The Late Pleistocene to Holocene Glacial History of Raritan Bay, New
Jersey. New Brunswick: Rutgers, The State University of New Jersey.
Gaudreau, D.C. (1988). The Distribution of Late Quaternary Forest Regions in the Northeast. . In
G.P. Nicholas (Ed.), Holocene Human Ecology in Northeastern North America (pp. 215-
256). New York: Plenum.
Gaudreau, D.C., and Webb, T., III. (1985). Late-Quaternary Pollen Stratigraphy and Isochrone
Maps for the Northeastern United States. In V.M. Bryant and R.G. Holloway (Eds.),
Pollen Records of Late Quaternary North American Sediments (pp. 245-280): American
Association of Stratigraphic Palynologists Foundation.
Geoarcheology Research Associates (GRA). (1996). Enhancement Project, Phase 1B,
Geomorphological Analysis, Final Report of Field Investigations. New York: Parsons,
Brinckerhoff, Quade, and Douglas, Inc.

Geomorphology/Archaeological Borings and GIS Model, 2014 New York/New Jersey Harbor Navigation Project Page 163
Geoarcheology Research Associates (GRA). (1996). Staten Island Bridges Program
Modernization and Capacity Enhancement Project, Phase 1B Geomorphological
Analysis, Provisional Interpretations of Shoreline Stratigraphy. New York: Parsons,
Brinckerhoff, Quade, and Douglas, Inc.
Hammon, A. (1976). MESA New York Bight Atlas. Albany: Port Facilities and Commerce.
Marine Ecosystems Analysis (MESA) Program, New York Sea Grant Institute.
Harrington, M.R. (1924). An Ancient Village Site of the Shinnecock Indians. Anthropological
Papers of the American Museum of Natural History, 22(5), 1882-1971.
Herbster, H., Garman, J.C., Schuldenrein, J., and Thieme, D.M. (1997). Phase 1B Archaeological
Survey of the Governors Island National Historic Landmark District, Governors Island.
New York.
Heusser, C.J. (1949). History of an Estuarine Bog at Secaucus, New Jersey. Bulletin of the
Torrey Bontanical Club, 76, 385-406.
Heusser, C.J. (1963). Pollen Diagrams from Three Former Ceder Bogs in Hackensack Tidal
Marsh, Northeastern New Jersey. Bulletin of the Torrey Botanical Club, 90, 16-28.
Hoag, S.W. (1911). Report Accompanying General Description of the Harbor of New York.
New York: New York City Department of Docks and Ferries.
Holliday, V.T. (2004). Soil Formation, Time, and Archaeology. In V.T. Holliday (Ed.), Soils in
Archaeology: Landscape Evolution and Human Occupation. Washington, DC:
Smithsonian Institution Press.
Homans, J.S. (Cartographer). (1859). A Cyclopedia of Commerce and Commercial Navigation,
with Maps and Engravings, To Which is Added a Chart of the Bay and Harbor of New
York
Homberger, E. (1994). The Historical Atlas of New York City: A Visual Celebration of 400
Years of New York City's History. New York: Holt, Henry & Company, Inc.
Isachsen, Y.W., Landing, E., Lauber, J.M., Rickard, L.V., and Rogers, W.B. (1991). Geology of
New York: A Simplified Account. Albany: New York State Museum.
Kardas, S., and Larrabee, E. (1978). Cultural Resource Reconnaissance, Jersey City Reach, New
York Harbor Collection and Removal of Drift Project. Trenton, NJ: New Jersey State
Historic Preservation Office.
Kenen, O.K. (1999). Brackish Esttuarine Marsh Sediments in the Raritan River Estuary and
Thier Relationship to Sea Level during the Holocene. Rugers, The State University of
New Jersey, New Brunswick.
Kondolf, G.M. (1978). Genesis and Development of Sandy Hook, New Jersey. Princeton
University, Princeton, N. J.
Kraft, H., and Mounier, A. (1982). The Late Woodland Period in New Jersey. In O. Cheste (Ed.),
New Jersey’s Archaeological Resources from the Paleo Indian Period to the Present: A
Review of Research Problems and Survey Priorities (pp. 139-184). Trenton: Office of
Cultural and Environmental Services.
Kraft, H.C. (1977). The Paleo-Indian sites at Port Mobil, Staten Island. In Current Perspectives
in Northeastern Archaeology: Essays in Honor of William A. Ritchie. In R.A. Funk and
C.F. Hayes (Eds.), Current Perspectives in Northeastern Archaeology: Essays in Honor of
William A. Ritchie (Vol. 17, pp. 1-19): Researches and Transactions of the New York
State Archaeological Association.
Kraft, H.C. (1977). Paleoindians in New Jersey. In W.S. Newman and B. Salwen (Eds.),
Geomorphology/Archaeological Borings and GIS Model, 2014 New York/New Jersey Harbor Navigation Project Page 164
Amerinds and their Paleoenvironments in northeastern North America (Vol. 288, pp.
264-281): Annals of the New York Academy of Sciences.
Kraft, J., Kayan, I., and Ashenbrenner, S. (1985). Geological Studies of Coastal Change applies
to Archaeological Settings. In G. Rapp and J.A. Gillford (Eds.), Archaeological Geology
(pp. 57-84). New Haven: Yale University Press.
LaPorta, P.C., Sohl, L.E., M.C., B., Elder, K.L., Franks, C.E., Bryant Jr., V.M., et al. (1999).
Cultural Resource Assessment of Proposed Dredged Material Management Alternative
Sites in the New York Harbor-Apex Region: Report prepared for U. S. Army Corps of
Engineers, New York District.
Larsen, C., and Clark, I. (2006). A Search for Scale in Sea-Level Studies. Journal of Coastal
Resarch, 22(4), 788-800.
Little, E. (1995). Apples and Oranges: Radiocarbon Dates on Shell and Charcoal at Dogan Point.
In C. Classen (Ed.), Dogon Point: A Shell Matrix in the Lower Hudson Valley (Vol. 14,
pp. 121-128). Bethlehem: Occasional Papers in Northeastern Anthropology.
Little, E. (1995). Apples and Oranges: Radiocarbon Dates on Shell and Charcoal at Dogan Point.
Dogan Point: a shell matrix site in the lower Hudson Valley, 14, 121-128.
Lovegreen, J.R. (1974). Paleodrainage History of the Hudson Estuary. Columbia University,
New York.
Martin, P.S. (1958). Taiga-tundra and Full-glacial Period in Chester County, Pennsylvania.
American Journal of Science, 256(7), 470-502.
McClintock, P., and Richards, H.G. (1936). Correlation of the Late Pleistocene Marine and
Glacial Deposits of New Jersey and New York. Geological Society of America Bulletin,
47(3), 289-338.
McNett, C., Dent, J., Evans, J., Marshall, S.B., and Mac Millan, B. (1985). The Upper Delaware
Valley Early Man Project. In C.W. McNett (Ed.), Shawnee Minsunk: and Stratified Paleo
Indian-Archaic Site in the Upper Delaware Valley of Pennsylvania (pp. 3-14). Orlando:
Academic Press.
Merguerian, C., and Sanders, J.E. (1994). Field Trip 33 - Staten Island and Vicinity. New York:
New York Academy of Sciences.
Minard, J.P. (1969). Geology of the Sandy Hook Quadrangle in Monmouth County, New Jersey.
U.S. Geological Survey Bulletin, 1276, 43.
New Jersey Harbor Commission. (1914). New Jersey’s Relation to the Port of New York.
Newark: Essex Press.
New York City Department of Docks. (1872). Annual Report for the Year Ending December 31,
1871. New York: New York City Department of Docks.
New York State Harbor Encroachment Commission. (1864). Reports of the New York Harbor
Commission of 1856 and 1857. New York: C.S. Wescott.
Newberry, J.S. (1978). The Geological History of the New York Island and Harbor. New York.:
D. Appleton and Company.
Newman, W.S., Thurber, D.S., Zeiss, H.S., Rokach, A., and Musich, A.L. (1969). Late
Quaternary Geology of the Hudson River Estuary: A Preliminary Report. Transactions of
the New York Academy of Sciences, 31, 548-570.
Nicholas, G.P. (1988). Holocene Human Ecology in Northeastern North America. Current
Anthropology, 39(5), 720-733.
Nikitina, D.L., Pizzuto, J.E., Schwimmer, R.A., and Ranmsey, K.W. (2000). An Updated

Geomorphology/Archaeological Borings and GIS Model, 2014 New York/New Jersey Harbor Navigation Project Page 165
Holocene Sea-Level Curve for the Delaware Coast. Marine Geology, 171(7-20).
Ogden, J.G. (1959). A Late Glacial Pollen Sequence from Martha's Vineyard, Massachusetts.
American Journal of Science, 257, 366-381.
Ogden, J.G. (1965). Pleistocene Pollen Records from Eastern North America. Botanical Review,
31(3), 481-504.
Overpeck, J.T., R.S., W., and Webb, T. (1992). Mapping Eastern North American Vegetation
Changes of the Past 18 KA: No Analogs and The Future. Geology, 20(12), 1071-1074.
Overpeck, J.T., Webb, T., and Prentice, C. (1985). Quantitative Interpretation of the Fossil
Pollen Spectra: Disssimilarity Coefficients and the Method of Modern Analogs.
Quaternary Research, 23, 87-108.
Pederson, D.C., Peteet, D.M., Kurdyla, D., and Guilderson. (2005). Medieval Warming, Little
Ice Age and European Impact of the Environment During the Last Millennium in the
Lower Hudson Valley, New York, USA. Quaternary Research, 63, 238-249.
Pekar, S.F., McHugh, C.M., Christie-Blick, N., Jones, M., Carbotte, S.M., and Bell, R.E. (2004).
Estuarine Processes and their Stratigraphic Record: Paleosalinity and sedimentation
changes in the Hudson Estuary. Marine Geology, 209(1-4), 113-129.
Peltier, W.R. (1995). VLBI baseline variations for the ICE-4G model of postglacial rebound.
Geophysical Research Letters, 22(4).
Peltier, W.R. (2000). Global Glacial Isostatic Adjustment and Modern Instrumental Records of
Relative Sea Level History. In B.C. Douglas, M.S. Kearney and S.P. Leatherman (Eds.),
Sea Level Rise: History and Consequences (Vol. 75). New York: Academic Press.
Peltier, W.R. (2001). On Eustatic Sea Level History: Last Glacial Maximum to Holocene.
Quarternary Science Reviews, 21, 377-396.
Peltier, W.R. (2002). Global glacial isostatic adjustment: palaeogeodetic and space-geodetic tests
of the ICE-4G (VM2) model. Journal of Quaternary Science, 17(5 ).
Pertola, J., and E.A., L. (1988). Nantucket: An Archaeological Record from the Far Island.
Connecticut Archaeology Bulletin, 51, 47-68.
Peteet, D.M., Pederson, D.C., Kurdyla, D., and Guilderson, T. (2007). Hudson River
Paleoecology from Marshes: Environmental Change and its Implications for Fisheries. In
J.R. Waldman, K.E. Limburg and D. Strayer (Eds.), Hudson River Fishes and Their
Environment (pp. 112-128): American Fisheries Society.
Peteet, D.M., Vogel, J.S., Netson, D.E., Southon, J.R., Nickman, R.J., and Heusser, L.E. (1990).
Younger Dryas Climatic Reversal in Northeastern USA? AMS Ages for an Old Problem.
Quaternary Research, 33, 219-230.
Poag, C.W., and Sevon, W.D. (1989). A Record of Appalachian Denudation in Postrift Mesozoic
and Cenozoic Sedimentary Deposits of the U.S. Middle Atlantic Continental Margin.
Geomorphology(2), 155-169.
Port Authority of New York and New Jersey. (1996). The Port of New York and New Jersey.
New York: Port Authority of New York and New Jersey.
Pousson, J.F. (1986). An Overview and Assessment of Archeological Resources on Ellis Island,
Statue of Liberty National Monument, New York. Rockville, MD: United States
Department of the Interior.
Psuty, N.P., and Collins, M. (1986). Holocene Sea Level in New Jersey. Physical Geography, 7,
156-167.

Geomorphology/Archaeological Borings and GIS Model, 2014 New York/New Jersey Harbor Navigation Project Page 166
Rampino, M.R., and Sanders, J.E. (1981). Upper Quaternary Stratigraphy of Southern Long
Island, New York. Marine Geology, 171, 7-20.
Rapp, G., and C.L., H. (1998). Geoarchaeology. New Haven: Yale University Press.
Redfield, A.C., and Rubin, M. (1962). The Age of Salt Marsh Peat and its Relation to Recent
Changes in Sea Level in Barnstable, Massachusetts National Academy of Sciences
Reeds, C.A. (1925). Glacial Lake Hackensack and Adjacent Lakes. Geological Society of
America Bulletin, 36(155).
Reeds, C.A. (1926). The Varved Clays at Little Ferry, New Jersey. American Museum
Novitiates, 209, 1-19.
Ritchie, W.A. (1969). The Archaeology of New York State (2 ed.). Garden City: Natural History
Press.
Ritchie, W.A. (1980). The Archaeology of New York State. Harrison, N.Y.: Harbor Hill Books.
Ritchie, W.A., and Funk, R.A. (1971). Evidence for Early Archaic Occupations on Staten Island.
Pennsylvania Archaeologist, 41(3), 45-59.
Rue, D.J., and Traverse, A. (1997). Pollen Analyses of the Hackensack, New Jersey
Meadowlands Tidal Marsh. Northeastern Geology and Environmental Notes, 19(3), 211-
215.
Salisbury, R.D. (1902). The Glacial Geology of New Jersey.
Salisbury, R.D., and Kummel, H.B. (1893). Lake Passaic: An Extinct Glacial Lake.
Salwen, B. (1964). Current Resaerch, Northeast. American Antiquity, 29, 541.
Schuberth, C.J. (1968). The Geology of New York City and Environs. Garden City: Natural
History Museum.
Schuldenrein, J. (1992). The Padula Site (36Nm12) and Chert Resource Exploitation in the
Middle Delaware River Valley. Archaeology of Eastern North America, 20, 39-45.
Schuldenrein, J. (1995). Geoarcheological Observations for the Arthur Kill Factory Outlet Center
(AKFOC) Project, Staten Island. Riverdale, NY. Riverdale, NY.
Schuldenrein, J. (1995). Geoarcheological Overview of Bellman’s Creek, Hackensack
Meadowlands, New Jersey. In J. Geismar (Ed.), A Stage 1A Cultural Resources Survey
of the Impact Area of the New Jersey Turnpike Secaucus Interchange Project, Hudson
County, New Jersey. New York.
Schuldenrein, J. (1995). Prehistory and Changing Holocene Geography of Dogan Point. In C.
Claassen (Ed.), Dogan Point: a shell matrix site in the lower Hudson Valley (Vol. 14, pp.
39-65). Bethlehem: Occasional Publications in Northeastern Anthropology.
Schuldenrein, J. (2000). Geoarcheological Investigations of the Collect Pond Borings, Report
prepared for Joan Geismar, Inc. Riverdale, NY.
Schuldenrein, J., Epperson, T., Smith, M., Thomas, E., and McWeeney, L. (2000a). A
Geomorphological and Archaeological Study In Connection with the New York and New
Jersey Harbor Navigation Study, Upper and Lower Bay, Port of New York and New
Jersey. New York: United States Army Corps of Engineers, New York District.
Schuldenrein, J. (2000b). Geomorphological and Archaeological Study Northeast of Shooters
Island, Hudson and Union Counties, New Jersey, in Connection with the Arthur Kill -
Howland Hook Marine Terminal Channel Project. New York: U. S. Army Corps of
Engineers, New York District.
Schuldenrein, J., Thieme, D.M., and Malin-Boyce, S. (2001). Geomorphological and Remote

Geomorphology/Archaeological Borings and GIS Model, 2014 New York/New Jersey Harbor Navigation Project Page 167
Sensing Survey of Port Jersey, City of Bayonne and Jersey City, Hudson County, New
Jersey: United States Army Corps of Engineers, New York District.
Schuldenrein, J., Smith, M.A., Rowles, R.A., and DuBrroff, N. (2006). Developing a Framework
for a Geomorphological /Archaeological Model of the Submerged Paleoenvironment in
New York/New Jersey Harbor and Bight in Connection with the New York and New
Jersey Harbor Navigation Project, Port of New York and New Jersey: Barry A. Vittor and
Associates, Inc.
Shepard, F.P. (1965). Importance of Submarine Valleys in Funneling Sediments to the Deep Sea.
Progress in Oceanography, 3, 321-332.
Sirkin, L. (1986). Pleistocene Stratigraphy of Long Island, New York. In The Wisconsinan Stage
of the First Geological District, eastern New York. Albany: New York State Museum.
Sirkin, L.A., Owens, J.P., Minard, J.P., and Rubin, M. (1970). Palynology of Some Upper
Quaternary Peat Samples from the New Jersey Coastal Plain.
Skinner, A. (1909). The Indians of Manhattan Island and Vicinity. New York: American
Museum of Natural History.
Skinner, A. (1919). Exploration of Aboriginal Sites at Throgs Neck and Clasons Point, New
York City. New York: Museum of the American Indian.
Slagle, A.L., Ryan, W.B.F., Carbotte, S.M., Bell, R., Nitsche, F.O., and Kenna., T. (2006). Late-
Stage Estuary Infilling Controlled by Limited Accommodation Space in the Hudson
River. Marine Geology, 232(3-4), 181-202.
Smith, C.S. (1950). The Archaeology of Coastal New York. Anthropological Papers of the
American Museum of Natural History, 43, 107.
Stanford, S.D. (1997). Pliocene-Quaternary Geology of Northern New Jersey-An Overview. In
S.D. Stanford and R.W. Witte (Eds.), Pliocene-Quaternary Geology of Northern New
Jersey-Guidebook for the 60th
Annual Reunion of the Northeastern Friends of the
Pleistocene, New Jersey Geological Survey. New Jersey: New Jersey Geological Survey.
Stanford, S.D., and Harper, D.P. (1991). Glacial Lakes of the Lower Passaic Hackensack, And
Lower Hudson Valleys, New Jersey and New York. Northeastern Geology, 13(4), 277-
286.
Stanley, A., K.G., M., and Sugarman, P.J. (2004). Holocene Sea Level Rise in New Jersey: An
Interim Report.: New Jersey Department of Environmental Protection.
Stewart, D.J. (1999). Formation Processes Affecting Submerged Archaeological Sites:An
Overview. Geoarcaheology, 14, 565–587.
Stone, B.D., Stanford, S.D., and White, R.W. (Cartographer). (2002). Surficial Geological Map
of Northern New Jersey
Strahler, A.N. (1971). Earth Sciences. New York: Harper and Row.
Stright, M.J. (1986). Human Occupation of the Continential Shelf During the Late
Plestocene/Early Holocene, Methods for Site Location. Geoarchaeology, 1(4), 347-363.
Stright, M.J. (1990). Archaeological Sites on the North American Continental Shelf, in
Archaeological Geology of North America. In N.P. Lasca and J. Donahue (Eds.),
Centennial Special Volume 4 (pp. 439-465). Boulder: Geological Society of America.
Survey, U.S.C. (Cartographer). (1844). Map of New York Bay and Harbor and the Environs.
The Port Authority of New York and New Jersey. (1946). Development of Newark Airport and
Seaport. New York.

Geomorphology/Archaeological Borings and GIS Model, 2014 New York/New Jersey Harbor Navigation Project Page 168
Thieler, E.R., Butman, B., Schwab, W.C., Allison, M.A., Discoll, N.W., Donnelly, J.P., et al.
(2007). A Catastrophic Meltwater Flood Event and Formation of the Hudson Shelf
Valley. Palaeogeography, Palaeoclimatology, Palaeoecology, 246, 120-136.
Thieme, D.M., and Schuldenrein, J. (1996). Quaternary Paleoenvironments in the Hackensack
Meadowlands. A Geological and Palynological Study of Borings for the Proposed North
Arlington Force Main and Pumping Station. Lyndhurst: Neglia Engineering Associates.
Thieme, D.M., and Schuldenrein, J. (1998). Paleoenvironmental Analysis of the Combined
Sewer Overflow Planning Study Planning Area IA, North Bergen (West), Hudson
County, New Jersey. Cranbury, NJ: Richard Grubb and Associates, Inc.
Thieme, D.M., and Schuldenrein, J. (1999). Geomorphology and Sediment Stratigraphy. In
Phase II Archaeological Investigations of the Governors Island National Historic
Landmark District. Pawtucket: The Public Archaeology Laboratory, Inc.
Uchupi, E., Driscoll, N., Ballard, R.D., and Bolmer, S.T. (2001). Drainage of Late Wisconsin
Glacial Lakes and the Morphology and Late Quaternary Stratigraphy of the New Jersey-
Southern New England Continental Shelf and Slope. Marine Geology, 172, 117-145.
United States Army Corps of Engineers. (1971). New York Harbor Collection and Removal of
Drift, Survey Report on Review of Project. New York: U.S. Army Corps of Engineers,
New York District.
United States Engineer Bureau. (1885). Annual Report of the Chief of Engineers for 1885.
Washington, D.C.: U.S. Government Printing Office.
United States Engineer Bureau. (1886). Annual Report Upon the Improvement of Rivers and
Harbors in the Vicinity of New York City, and in Northern New Jersey, In Charge of
Walter McFarland...Being Appendix E of the Annual Report of the Chief of Engineers
for 1886. Washington, D.C.: U.S. Government Printing Office.
Van de Plassche, O., Van der Borg, K., and De Jong, A.F.M. (1998). Sea level - climate
correlation during the past 1400 years. Geology, 26, 319-322.
Varekamp, J.C., and Thomas, E. (1998). Climate change and the rise and fall of sea level over
the millenium. EOS, 79, 69-75.
Varekamp, J.C., and Thomas, E. (2001). Paleoenvironmental records from salt marshes in
Connecticut: sea level rise and human impacts. Earth and Planetary Science Letters.
Varekamp, J.C., Thomas, E., and Van de Plassche, O. (1992). Relative Sea Level Rise and
Climate Change Over the Last 1500 years. Terra Nova, 4, 293-304.
Vinckeboons, J. (Cartographer). (1639). Mantvs gelegen op de Noot [sic] Riuier
Wagner, D.P., and Siegel, P.E. (1997). A Geomorphological and Archeological Analysis of the
Arthur Kill-Howland Hook Marine Terminal Channel, Richmond County, New York,
and Union County, New Jersey, prepared for the New York District, U.S. Army Corps of
Engineers.
Water Resources Support Center. (1988). The Ports of New York, NY and NI and Ports on Long
Island, N.Y. New York: U.S. Army Corps of Engineers, New York District, Water
Resources Support Center.
Waters, M.R. (1992). Principles of Geoarchaeology. Tucson: University of Arizona Press.
Watts, W.A. (1979). Late Quarternary Vegitation of Central Appalachia and the New Jersey
Coastal Plain. Ecological Monographs, 49, 427-469.
Weiss, D. (1967). A Study of Four Cores from the Harverstraw Bay - Tappan Zee Bay Area of
the Hudson River, New York. New York University, New York.
Weiss, D. (1974). Late Pleistocene Stratigraphy and Paleoecology of the Lower Hudson River

Geomorphology/Archaeological Borings and GIS Model, 2014 New York/New Jersey Harbor Navigation Project Page 169
Estuary. Geological Society of America Bulletin, 85, 1561-1580.
Whitmore, F.C., Emery, K.O., Cooke, H.B.S., and Swift, D.J.P. (1967). Elephant Teeth from the
Atlantic Continental Shelf. Science, 156, 1477-1481.
Widmer, K. (1964). The Geology and Geography of New Jersey. Princeton: Van Nostrand
Company.
Widmer, K., and Parrillo, D.G. (1959). Pre-Pleistocene topography of the Hackensack Meadows,
New Jersey. Geological Society of America Bulletin, 70(12), 1698.
Widner, K. (1964). The Geology and Geopograhy of New Jersey. Princeton: Van Nostrand
Company.
Williams, S.J., and Duane, D.B. (1974). Geomorphology and Sediments of the Inner New York
Bight Continental Shelf. Fort Belvoir: U.S. Army Corps of Engineers, Coastal
Engineering Research Center.
Witte, R.W. (1997). Late Wisconsinan glacial history of the Upper part of Kittatinny Valley,
Sssex and Warren Counties, New Jersey. Northeastern Geology and Environmental
Sciences, 19(3), 155-169.

Geomorphology/Archaeological Borings and GIS Model, 2014 New York/New Jersey Harbor Navigation Project Page 170
Appendix A
Borings (cores and data)

Geomorphology/Archaeological Borings and GIS Model, 2014 New York/New Jersey Harbor Navigation Project Page 171

Geomorphology/Archaeological Borings and GIS Model, 2014 New York/New Jersey Harbor Navigation Project Page 172

Geomorphology/Archaeological Borings and GIS Model, 2014 New York/New Jersey Harbor Navigation Project Page 173
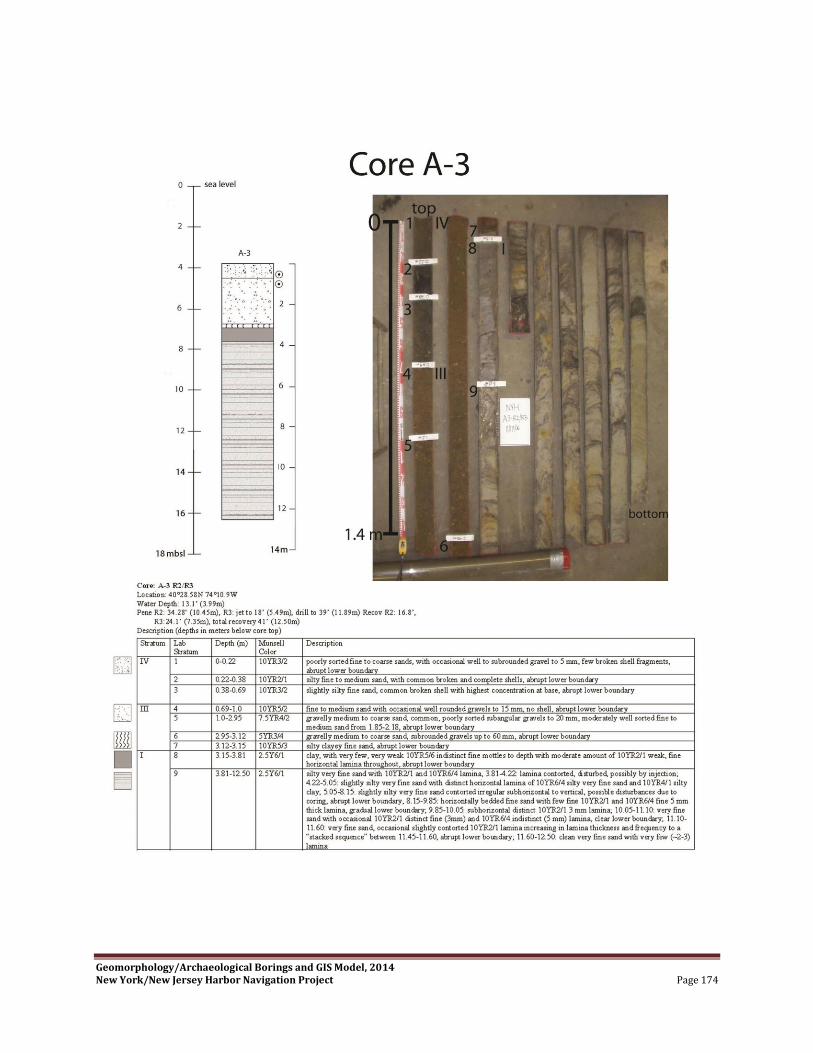
Geomorphology/Archaeological Borings and GIS Model, 2014 New York/New Jersey Harbor Navigation Project Page 174

Geomorphology/Archaeological Borings and GIS Model, 2014 New York/New Jersey Harbor Navigation Project Page 175

Geomorphology/Archaeological Borings and GIS Model, 2014 New York/New Jersey Harbor Navigation Project Page 176

Geomorphology/Archaeological Borings and GIS Model, 2014 New York/New Jersey Harbor Navigation Project Page 177

Geomorphology/Archaeological Borings and GIS Model, 2014 New York/New Jersey Harbor Navigation Project Page 178

Geomorphology/Archaeological Borings and GIS Model, 2014 New York/New Jersey Harbor Navigation Project Page 179

Geomorphology/Archaeological Borings and GIS Model, 2014 New York/New Jersey Harbor Navigation Project Page 180
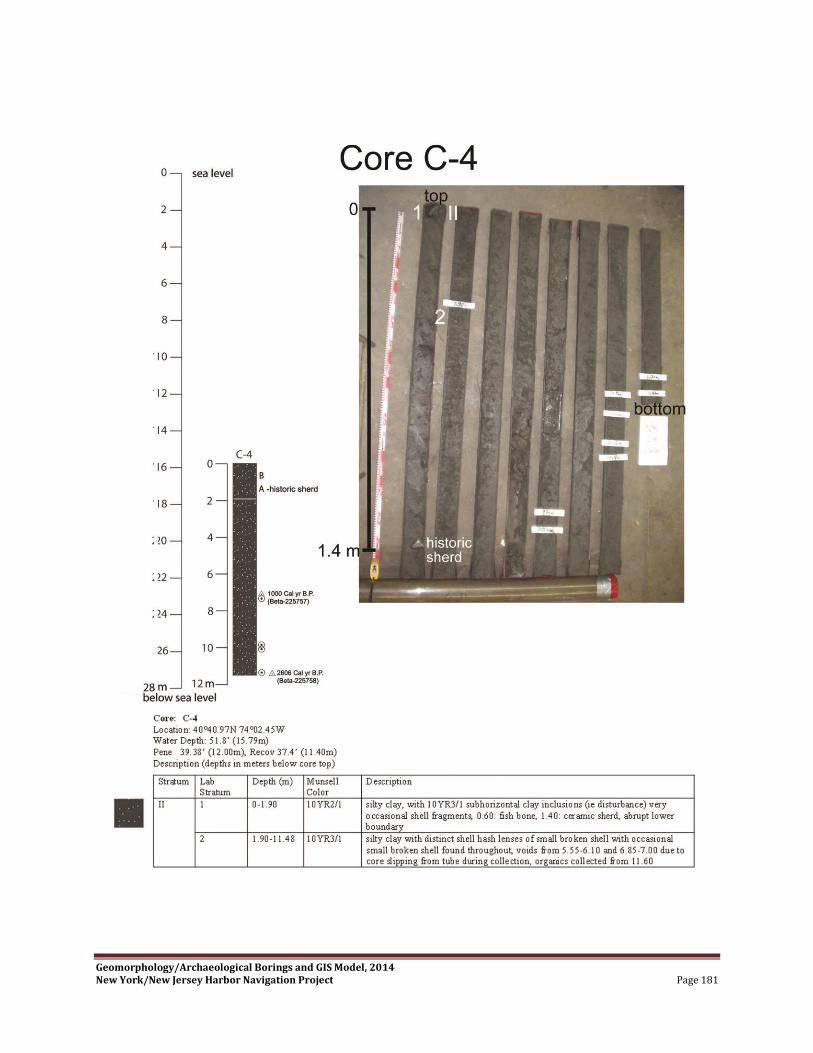
Geomorphology/Archaeological Borings and GIS Model, 2014 New York/New Jersey Harbor Navigation Project Page 181

Geomorphology/Archaeological Borings and GIS Model, 2014 New York/New Jersey Harbor Navigation Project Page 182

Geomorphology/Archaeological Borings and GIS Model, 2014 New York/New Jersey Harbor Navigation Project Page 183

Geomorphology/Archaeological Borings and GIS Model, 2014 New York/New Jersey Harbor Navigation Project Page 184

Geomorphology/Archaeological Borings and GIS Model, 2014 New York/New Jersey Harbor Navigation Project Page 185

Geomorphology/Archaeological Borings and GIS Model, 2014 New York/New Jersey Harbor Navigation Project Page 186

Geomorphology/Archaeological Borings and GIS Model, 2014 New York/New Jersey Harbor Navigation Project Page 187
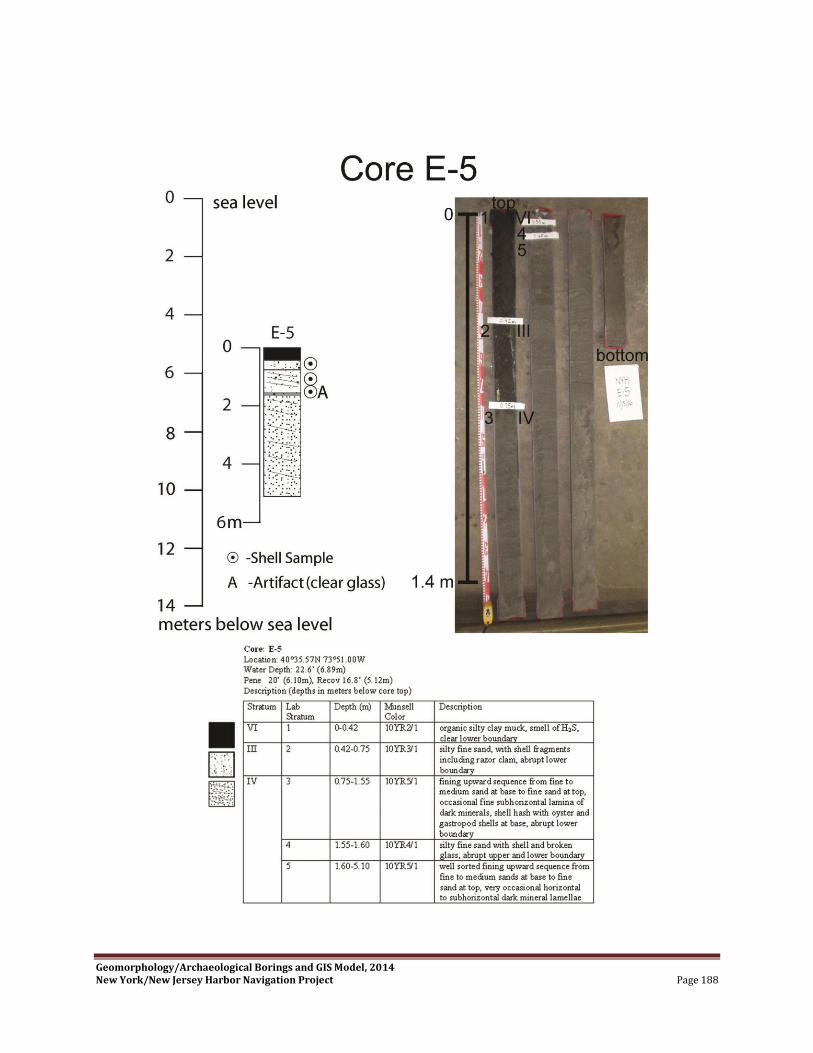
Geomorphology/Archaeological Borings and GIS Model, 2014 New York/New Jersey Harbor Navigation Project Page 188

Geomorphology/Archaeological Borings and GIS Model, 2014 New York/New Jersey Harbor Navigation Project Page 189

Geomorphology/Archaeological Borings and GIS Model, 2014 New York/New Jersey Harbor Navigation Project Page 190
Appendix B
Radiocarbon Ages
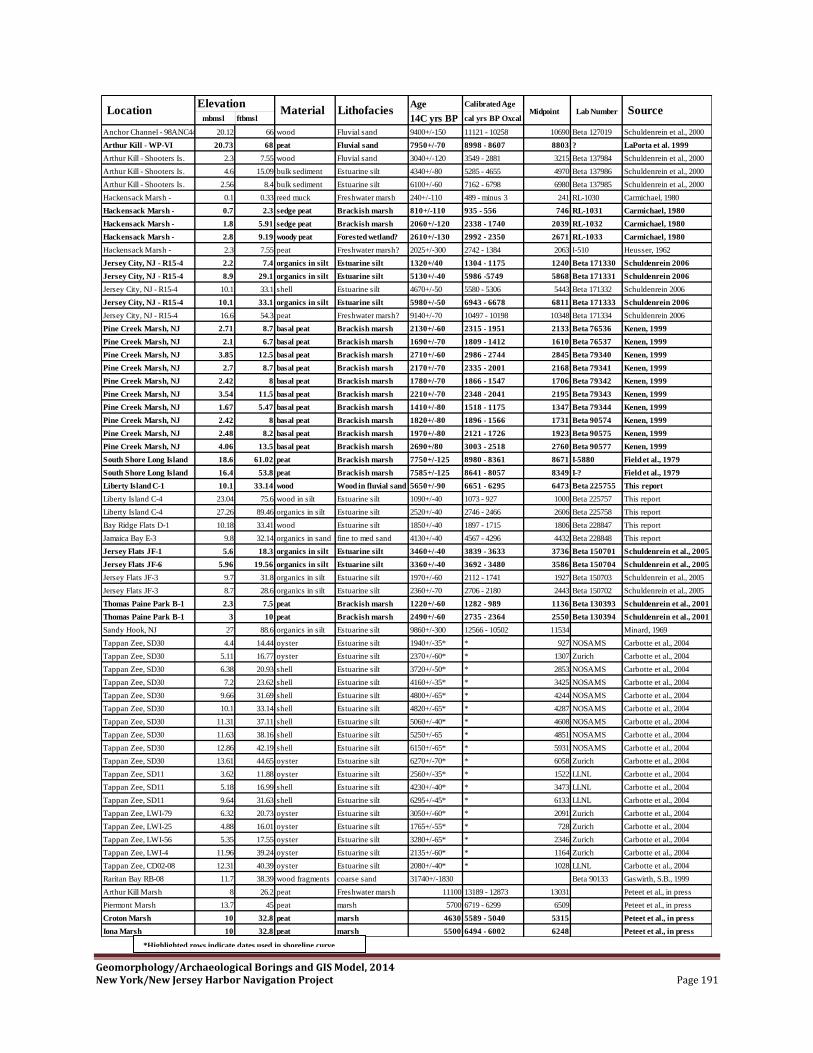
Geomorphology/Archaeological Borings and GIS Model, 2014 New York/New Jersey Harbor Navigation Project Page 191
Age Calibrated Age
mbmsl ftbmsl 14C yrs BP cal yrs BP Oxcal
Anchor Channel - 98ANC44 20.12 66 wood Fluvial sand 9400+/-150 11121 - 10258 10690 Beta 127019 Schuldenrein et al., 2000
Arthur Kill - WP-VI 20.73 68 peat Fluvial sand 7950+/-70 8998 - 8607 8803 ? LaPorta et al. 1999
Arthur Kill - Shooters Is. 2.3 7.55 wood Fluvial sand 3040+/-120 3549 - 2881 3215 Beta 137984 Schuldenrein et al., 2000
Arthur Kill - Shooters Is. 4.6 15.09 bulk sediment Estuarine silt 4340+/-80 5285 - 4655 4970 Beta 137986 Schuldenrein et al., 2000
Arthur Kill - Shooters Is. 2.56 8.4 bulk sediment Estuarine silt 6100+/-60 7162 - 6798 6980 Beta 137985 Schuldenrein et al., 2000
Hackensack Marsh - 0.1 0.33 reed muck Freshwater marsh 240+/-110 489 - minus 3 241 RL-1030 Carmichael, 1980
Hackensack Marsh - 0.7 2.3 sedge peat Brackish marsh 810+/-110 935 - 556 746 RL-1031 Carmichael, 1980
Hackensack Marsh - 1.8 5.91 sedge peat Brackish marsh 2060+/-120 2338 - 1740 2039 RL-1032 Carmichael, 1980
Hackensack Marsh - 2.8 9.19 woody peat Forested wetland? 2610+/-130 2992 - 2350 2671 RL-1033 Carmichael, 1980
Hackensack Marsh - 2.3 7.55 peat Freshwater marsh? 2025+/-300 2742 - 1384 2063 I-510 Heusser, 1962
Jersey City, NJ - R15-4 2.2 7.4 organics in silt Estuarine silt 1320+/40 1304 - 1175 1240 Beta 171330 Schuldenrein 2006
Jersey City, NJ - R15-4 8.9 29.1 organics in silt Estuarine silt 5130+/-40 5986 -5749 5868 Beta 171331 Schuldenrein 2006
Jersey City, NJ - R15-4 10.1 33.1 shell Estuarine silt 4670+/-50 5580 - 5306 5443 Beta 171332 Schuldenrein 2006
Jersey City, NJ - R15-4 10.1 33.1 organics in silt Estuarine silt 5980+/-50 6943 - 6678 6811 Beta 171333 Schuldenrein 2006
Jersey City, NJ - R15-4 16.6 54.3 peat Freshwater marsh? 9140+/-70 10497 - 10198 10348 Beta 171334 Schuldenrein 2006
Pine Creek Marsh, NJ 2.71 8.7 basal peat Brackish marsh 2130+/-60 2315 - 1951 2133 Beta 76536 Kenen, 1999
Pine Creek Marsh, NJ 2.1 6.7 basal peat Brackish marsh 1690+/-70 1809 - 1412 1610 Beta 76537 Kenen, 1999
Pine Creek Marsh, NJ 3.85 12.5 basal peat Brackish marsh 2710+/-60 2986 - 2744 2845 Beta 79340 Kenen, 1999
Pine Creek Marsh, NJ 2.7 8.7 basal peat Brackish marsh 2170+/-70 2335 - 2001 2168 Beta 79341 Kenen, 1999
Pine Creek Marsh, NJ 2.42 8 basal peat Brackish marsh 1780+/-70 1866 - 1547 1706 Beta 79342 Kenen, 1999
Pine Creek Marsh, NJ 3.54 11.5 basal peat Brackish marsh 2210+/-70 2348 - 2041 2195 Beta 79343 Kenen, 1999
Pine Creek Marsh, NJ 1.67 5.47 basal peat Brackish marsh 1410+/-80 1518 - 1175 1347 Beta 79344 Kenen, 1999
Pine Creek Marsh, NJ 2.42 8 basal peat Brackish marsh 1820+/-80 1896 - 1566 1731 Beta 90574 Kenen, 1999
Pine Creek Marsh, NJ 2.48 8.2 basal peat Brackish marsh 1970+/-80 2121 - 1726 1923 Beta 90575 Kenen, 1999
Pine Creek Marsh, NJ 4.06 13.5 basal peat Brackish marsh 2690+/80 3003 - 2518 2760 Beta 90577 Kenen, 1999
South Shore Long Island 18.6 61.02 peat Brackish marsh 7750+/-125 8980 - 8361 8671 I-5880 Field et al., 1979
South Shore Long Island 16.4 53.8 peat Brackish marsh 7585+/-125 8641 - 8057 8349 I-? Field et al., 1979
Liberty Island C-1 10.1 33.14 wood Wood in fluvial sand 5650+/-90 6651 - 6295 6473 Beta 225755 This report
Liberty Island C-4 23.04 75.6 wood in silt Estuarine silt 1090+/-40 1073 - 927 1000 Beta 225757 This report
Liberty Island C-4 27.26 89.46 organics in silt Estuarine silt 2520+/-40 2746 - 2466 2606 Beta 225758 This report
Bay Ridge Flats D-1 10.18 33.41 wood Estuarine silt 1850+/-40 1897 - 1715 1806 Beta 228847 This report
Jamaica Bay E-3 9.8 32.14 organics in sand fine to med sand 4130+/-40 4567 - 4296 4432 Beta 228848 This report
Jersey Flats JF-1 5.6 18.3 organics in silt Estuarine silt 3460+/-40 3839 - 3633 3736 Beta 150701 Schuldenrein et al., 2005
Jersey Flats JF-6 5.96 19.56 organics in silt Estuarine silt 3360+/-40 3692 - 3480 3586 Beta 150704 Schuldenrein et al., 2005
Jersey Flats JF-3 9.7 31.8 organics in silt Estuarine silt 1970+/-60 2112 - 1741 1927 Beta 150703 Schuldenrein et al., 2005
Jersey Flats JF-3 8.7 28.6 organics in silt Estuarine silt 2360+/-70 2706 - 2180 2443 Beta 150702 Schuldenrein et al., 2005
Thomas Paine Park B-1 2.3 7.5 peat Brackish marsh 1220+/-60 1282 - 989 1136 Beta 130393 Schuldenrein et al., 2001
Thomas Paine Park B-1 3 10 peat Brackish marsh 2490+/-60 2735 - 2364 2550 Beta 130394 Schuldenrein et al., 2001
Sandy Hook, NJ 27 88.6 organics in silt Estuarine silt 9860+/-300 12566 - 10502 11534 Minard, 1969
Tappan Zee, SD30 4.4 14.44 oyster Estuarine silt 1940+/-35* * 927 NOSAMS Carbotte et al., 2004
Tappan Zee, SD30 5.11 16.77 oyster Estuarine silt 2370+/-60* * 1307 Zurich Carbotte et al., 2004
Tappan Zee, SD30 6.38 20.93 shell Estuarine silt 3720+/-50* * 2853 NOSAMS Carbotte et al., 2004
Tappan Zee, SD30 7.2 23.62 shell Estuarine silt 4160+/-35* * 3425 NOSAMS Carbotte et al., 2004
Tappan Zee, SD30 9.66 31.69 shell Estuarine silt 4800+/-65* * 4244 NOSAMS Carbotte et al., 2004
Tappan Zee, SD30 10.1 33.14 shell Estuarine silt 4820+/-65* * 4287 NOSAMS Carbotte et al., 2004
Tappan Zee, SD30 11.31 37.11 shell Estuarine silt 5060+/-40* * 4608 NOSAMS Carbotte et al., 2004
Tappan Zee, SD30 11.63 38.16 shell Estuarine silt 5250+/-65 * 4851 NOSAMS Carbotte et al., 2004
Tappan Zee, SD30 12.86 42.19 shell Estuarine silt 6150+/-65* * 5931 NOSAMS Carbotte et al., 2004
Tappan Zee, SD30 13.61 44.65 oyster Estuarine silt 6270+/-70* * 6058 Zurich Carbotte et al., 2004
Tappan Zee, SD11 3.62 11.88 oyster Estuarine silt 2560+/-35* * 1522 LLNL Carbotte et al., 2004
Tappan Zee, SD11 5.18 16.99 shell Estuarine silt 4230+/-40* * 3473 LLNL Carbotte et al., 2004
Tappan Zee, SD11 9.64 31.63 shell Estuarine silt 6295+/-45* * 6133 LLNL Carbotte et al., 2004
Tappan Zee, LWI-79 6.32 20.73 oyster Estuarine silt 3050+/-60* * 2091 Zurich Carbotte et al., 2004
Tappan Zee, LWI-25 4.88 16.01 oyster Estuarine silt 1765+/-55* * 728 Zurich Carbotte et al., 2004
Tappan Zee, LWI-56 5.35 17.55 oyster Estuarine silt 3280+/-65* * 2346 Zurich Carbotte et al., 2004
Tappan Zee, LWI-4 11.96 39.24 oyster Estuarine silt 2135+/-60* * 1164 Zurich Carbotte et al., 2004
Tappan Zee, CD02-08 12.31 40.39 oyster Estuarine silt 2080+/-40* * 1028 LLNL Carbotte et al., 2004
Raritan Bay RB-08 11.7 38.39 wood fragments coarse sand 31740+/-1830 Beta 90133 Gaswirth, S.B., 1999
Arthur Kill Marsh 8 26.2 peat Freshwater marsh 11100 13189 - 12873 13031 Peteet et al., in press
Piermont Marsh 13.7 45 peat marsh 5700 6719 - 6299 6509 Peteet et al., in press
Croton Marsh 10 32.8 peat marsh 4630 5589 - 5040 5315 Peteet et al., in press
Iona Marsh 10 32.8 peat marsh 5500 6494 - 6002 6248 Peteet et al., in press
Source LocationElevation
Material Lithofacies Midpoint Lab Number
*Highlighted rows indicate dates used in shoreline curve *Highlighted rows indicate dates used in shoreline curve

Geomorphology/Archaeological Borings and GIS Model, 2014 New York/New Jersey Harbor Navigation Project Page 192

Geomorphology/Archaeological Borings and GIS Model, 2014 New York/New Jersey Harbor Navigation Project Page 193

Geomorphology/Archaeological Borings and GIS Model, 2014 New York/New Jersey Harbor Navigation Project Page 194

Geomorphology/Archaeological Borings and GIS Model, 2014 New York/New Jersey Harbor Navigation Project Page 195

Geomorphology/Archaeological Borings and GIS Model, 2014 New York/New Jersey Harbor Navigation Project Page 196

Geomorphology/Archaeological Borings and GIS Model, 2014 New York/New Jersey Harbor Navigation Project Page 197
Appendix C
Mollusc Analysis
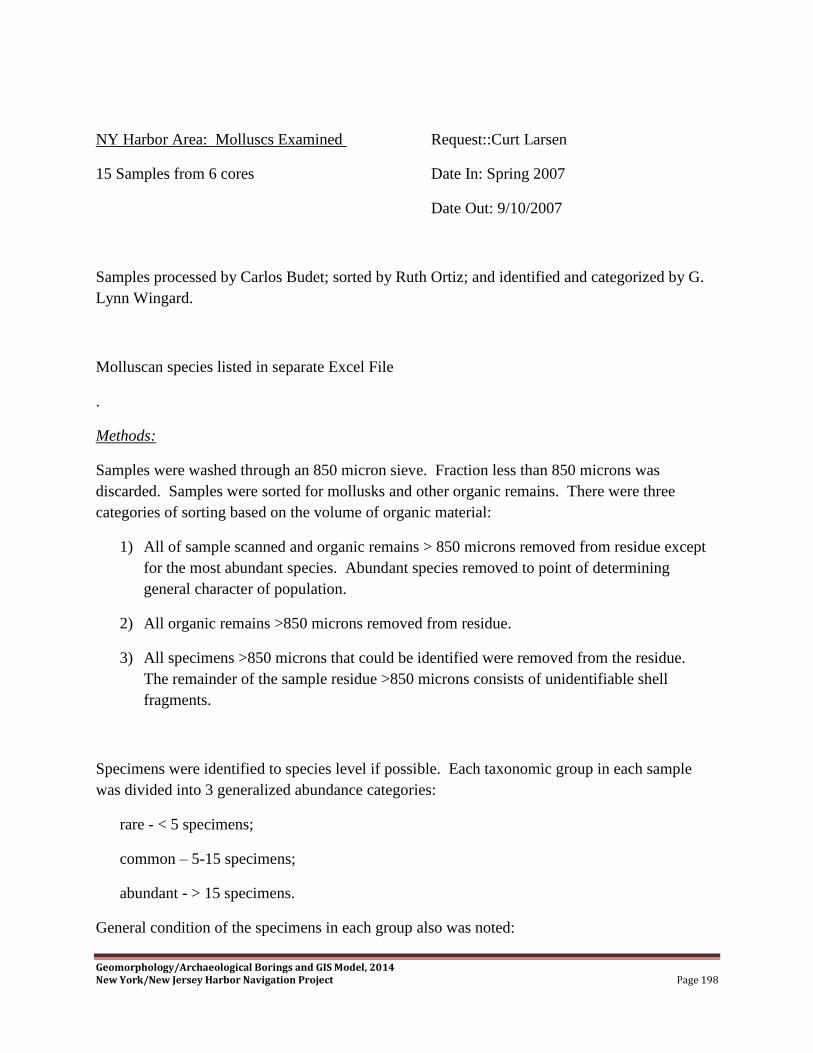
Geomorphology/Archaeological Borings and GIS Model, 2014 New York/New Jersey Harbor Navigation Project Page 198
NY Harbor Area: Molluscs Examined Request::Curt Larsen
15 Samples from 6 cores Date In: Spring 2007
Date Out: 9/10/2007
Samples processed by Carlos Budet; sorted by Ruth Ortiz; and identified and categorized by G.
Lynn Wingard.
Molluscan species listed in separate Excel File
.
Methods:
Samples were washed through an 850 micron sieve. Fraction less than 850 microns was
discarded. Samples were sorted for mollusks and other organic remains. There were three
categories of sorting based on the volume of organic material:
1) All of sample scanned and organic remains > 850 microns removed from residue except
for the most abundant species. Abundant species removed to point of determining
general character of population.
2) All organic remains >850 microns removed from residue.
3) All specimens >850 microns that could be identified were removed from the residue.
The remainder of the sample residue >850 microns consists of unidentifiable shell
fragments.
Specimens were identified to species level if possible. Each taxonomic group in each sample
was divided into 3 generalized abundance categories:
rare - < 5 specimens;
common – 5-15 specimens;
abundant - > 15 specimens.
General condition of the specimens in each group also was noted:

Geomorphology/Archaeological Borings and GIS Model, 2014 New York/New Jersey Harbor Navigation Project Page 199
pristine (shells intact and still have luster and/or color);
whole (shells intact but luster all or mostly gone);
worn (shells show obvious signs of wear; may or may not be intact);
broken (> 50% of shell present; has luster);
fragments (< 50% of shell present – any degree of surface condition).
Also, whether adults and juveniles were present was noted for each group.
Ecologic information on species was derived from a number of sources and from field data on
modern mollusks (http://sofia.usgs.gov/exchange/flaecohist/).
Results and Discussion:
Samples from Core A-3 R2/R3 (0.65-0.70 mbs [2.1-2.3 ftbs]) and Core B-3 (0.60-0.65 mbs
[2.0-2.1 ftbs]) in Raritan Bay contain only a few molluscan fragments. The taxa that are present
are consistent with either estuarine or marine deposition. In comparison to samples from other
cores, the lack of benthic remains in these samples could potentially be indicative of very rapid
deposition or a very unfavorable benthic habitat.
Nine of the ten samples from cores C-2, C-3, and C-4 in the Liberty Island transect contain
abundant mollusks. The single sample from C-2 (5.30-5.25 mbs [17.4-17.2 ftbs) contains
relatively few mollusks, but the same species are found in cores C-3 and C-4 farther out from the
island. The predominant molluscan species in samples from C-3 and C-4 is Mulinia lateralis,
with the exception of the sample from 8.65-8.70 mbs (28.4-28.5 ftbs) in C-3. The species is
present in large numbers, mostly whole or pristine preservation, and both adults and juveniles are
present, indicating the specimens are in situ. Mulinia comprise a significant component of many
Atlantic Coast estuaries (Abbott, 1974; Franz and Harris, 1982; Holland and others, 1977; Knox,
1986; Weiss, 1995), tolerating broad ranges of salinity (15 to >40 ppt (Andrews, 1971)), and
substrates (mud, clay and sand (Andrews, 1971; Holland and others, 1977)). Knox (1986, p.
184) identifies Mulinia lateralis as ―very fecund, grows rapidly, matures quickly, and as such is
adapted for opportunistic exploitation of resources‖.

Geomorphology/Archaeological Borings and GIS Model, 2014 New York/New Jersey Harbor Navigation Project Page 200
The prevalence of Mulinia in these samples from C-3 and C-4 many indicate an opportunistic
species moving into a changing environment and/or an environment with an available food
supply. Associated with Mulinia in relatively significant numbers in these samples are Acteocina
canaliculata, and Nucula proxima, also typical of estuarine assemblages with highly variable
salinities, shallow water, and fine sand or mud (Abbott, 1974; Weiss, 1995). The presence of
oyster fragments in C-3 from samples at 2.43-2.47, 3.25-3.30, and 3.75-3.80 mbs (7.97-8.10,
10.7-10.8, 12.3-12.7 ftbs) indicates an oyster bed may have been nearby during deposition of this
section of the core. The sample from 3.75 to 3.80 mbs (12.3-12.7 ftbs) in C-3 contains
hydrobiids and Petricolaria pholadiformis, which may indicate relatively shallow water
deposition. Hydrobiids are classified to species level primarily on soft tissue parts, therefore, it
is impossible to determine which species is present, but the shell form here is consistent with
Hydrobia totteni, common in salt-marsh ponds and on seaweeds (Weiss, 1995). Petricolaria
pholadiformis commonly bores in clay and peat-moss (Abbott, 1974), and is often associated
with shallow nearshore to marshy environments. In addition to the prominence of Mulinia
lateralis, Acteocina canaliculata, and Nucula proxima in C-4, a Pyramidellidae (probably
Turbonilla elegantula), Tellina sp. cf. T. agilis, and Yoldia limatula are common in many of the
samples. The Anadara in C-4 samples from 7.35 to 11.45 mbs (24.11 to 37.57 ftbs), indicate
deeper water deposition than C-3 samples, yet the hydrobiids are also present in C-4 at 11.30 to
11.45 mbs (37.07 to 37.57 ftbs). All other species in C-3 and C-4 (see species occurrence table)
are consistent with deposition in a shallow estuarine environment subject to highly variable
salinity conditions.
Samples from Jamaica Bay Core E-2 contain significantly fewer total mollusks than samples
from cores C3 and C4. No single species dominates all of the samples, but Gemma gemma, a
minute infaunal filter feeding clam that is considered a very common shallow water species and
is frequently found in Atlantic estuaries (Abbott, 1974; Franz and Harris, 1982; Weiss, 1994) is
present in all samples. Hydrobiids also are present in all 3 samples from E-2. All other
molluscan species (see species occurrence table) are consistent with deposition in a shallow
estuarine environment with variable salinity conditions.

Geomorphology/Archaeological Borings and GIS Model, 2014 New York/New Jersey Harbor Navigation Project Page 201
References Cited
Abbott, R. T. 1974. American Seashells, 2nd
edition. Van Nostrand Reinhold Co., New York,
663 pp.
Andrews, Jean. 1971. Shells and shores of Texas. University of Texas Press, Austin, Texas, 365
pp.
Franz, D.R. and Harris, W.H. 1982, Seasonal and Spatial Variability in Macrobenthos
Communities in Jamaica Bay, New York: An Urban Estuary: Estuaries, v. 11, n. 1, p.
15-28.
Holland, F.A., Mountford, N.K., and Mihursky, J.A., 1977, Temporal variation in upper bay
mesohaline benthic communities: I. The 9-m mud habitat: Chesapeake Science, v.18, n.
4, p. 370-378.
Knox, G.A., 1986; Estuarine Ecosystems: A Systems Approach. CRC Press, Boca Raton, FL,
289 pp.
Weiss, H.W., 1995, Marine Animals of Southern New England and New York: Bulletin 115,
Connecticut Dept. Environmental Protection.

Geomorphology/Archaeological Borings and GIS Model, 2014 New York/New Jersey Harbor Navigation Project Page 202
Appendix D-E
Foraminiferal & Pollen Analysis

Geomorphology/Archaeological Borings and GIS Model, 2014 New York/New Jersey Harbor Navigation Project Page 203
Pollen Analysis of Sediment Samples from New York Harbor Core C1
Analyst: Christopher Bernhardt
Interpretation: The top 600 cm of the core demonstrates a regional pollen signature. Pine
pollen (Pinus) is dominant with oak (Quercus), birch (Betula), hickory (Cayra), and hemlock
(Tsuga) pollen sub-dominant. There four trees distribute their pollen over a large area; thererfore,
it is assumed that changes in their abundance is regional in nature and does not reflect changes in
local marshes or other plant communities. Based on other pollen studies from the Atlantic coast
of the United States, fluctuations in pine are most likely regional in nature and related to changes
in temperature and/or precipitation (Willard et al, 2005). The abundance of ragweed (Ambrosia)
in the top meter of the core tends to indicate that this sediment is post-Colonial in age
(Carmichael, 1980; Pederson et al, 2005). Based on other sediment cores collected from the
Hudson River (Peteet et al, 2007; Pedeson et al, 2005; Carmichael, 1980) increased percentages
of grass (Poaceae), chenopod (Chenopodaceae), and ragweed pollen indicate that the top 250 cm
(98 in) could represent the last 400 years of deposition, however radiometric age control for the
upper 250 cm (98 in) would make the sedimentation rate more certain.
The bottom 200 cm (98 in) of the core is likely to represent a different vegetational
environment from the upper core section. Pine is no longer dominant and oak becomes more
abundant. Marsh pollen, Cyperaceae, Chenopodiaceae (chenopods), and Poaceae, increases in
the bottom intervals of core C1. The increase in marsh pollen reflects local changes (not
regional) in vegetation because marsh pollen is usually not transported long distances.
Identification to species level of chenopod pollen is not reliable using light microscopy (Personal
observation), however it must be noted that pollen of certain species of chenopod can be
indicative of saline conditions. Based on the below foram data, it could be assumed that the
pollen around 780 cm (307 in) indicates a saline marsh habitat. The increased abundance of fern
spores also indicates that the sediments in this interval were either marsh like or close to land.
The low abundance of pine pollen potentially serves as a biostratigraphic marker for the early
Holocene. Willard et al. 2005, consistently find pine pollen is below 30% in Early Holocene
sediments from the Chesapeake Bay, while percentages higher than 30% are usually indicative of
Late Holocene sediments (Willard et al, 2005). Once again, while further dating would confirm
the sedimentation history, the near absence in Betula pollen after 700 cm (276 in), could confirm
that these sediments are older than 4000 years before present. Sediment cores from the Hudson
Highlands indicate a general decline in Betula pollen after 4000 years (Maenza-Gmelch, 1997).
Methodology: Pollen was isolated from sediment samples using standard palynological
preparation techniques (Traverse 1988). Samples were processed with HCl and HF to remove
carbonates and silicates respectively, acetolyzed (1 part sulfuric acid: 9 parts acetic anhydride) in
a boiling water bath for 10 minutes, neutralized, and treated with 10% KOH for 10 minutes in a
water bath at 70 C. After neutralization, residues were sieved with 149 μm and 10 μm nylon
mesh to remove the coarse and clay fractions, respectively. When necessary, samples were
swirled in a watch glass to remove mineral matter. After staining with Bismarck Brown,
palynomorph residues were mounted on microscope slides in glycerin jelly.

Geomorphology/Archaeological Borings and GIS Model, 2014 New York/New Jersey Harbor Navigation Project Page 204
References:
Carmichael, D.P. A record of environmental change during recent millennia in the
Hackensack tidal marsh, New Jersey. 1980. Bulletin of the Torrey Botanical Club 107: 514-524.
Maenza-Gmelch, T.E. 1997. Holocene vegetation , climate, and fire history of the Hudson
Highlands, southeastern New York, USA. The Holocene 7:25-37.
Pederson, D.C., D.M. Peteet, D. Kurdyla, T. Guilderson. 2005. Medieval Warming, Little Ice
Age, and European impact of the environment during the last millennium in the lower Hudson
Valley, New York, USA. Quaternary Research 63: 238-249.
Peteet, D.M., D.C. Pederson, D. Kurdyla, and T. Guilderson. 2007. Hudson River
paleoecology from marshes: Environmental change and its implications for fisheries. In Hudson
River Fishes and Their Environment, A.F.S. Symposium 51. J.R. Waldman, K.E. Limburg, and
D. Strayer, Eds. American Fisheries Society:112-128.
Traverse, A. 1988. Paleopalynology. Boston: Unwin Hyman, 600pp.
Willard, D.A., C.E. Bernhardt, D.A. Korejwo, and S.R. Meyers. 2005. Impact of millennial-
scale Holocene climate variability on eastern North American terrestrial ecosystems: pollen-
based climatic reconstruction. Global and Planetary Change 47: 17-35.
Data: See Attached Excel File

Geomorphology/Archaeological Borings and GIS Model, 2014 New York/New Jersey Harbor Navigation Project Page 205
Figure 1. Percent Abundance of Major Pollen Taxa from New York Harbor Core C1

Geomorphology/Archaeological Borings and GIS Model, 2014 New York/New Jersey Harbor Navigation Project Page 206
Pe
rce
nt
Po
lle
n A
bu
nd
an
ce
Da
ta f
or
Co
re C
-1
Sp
ecie
s0-2
cm
28-3
0cm
60-6
2cm
88-9
0cm
120-1
22cm
148-1
50cm
180-1
82cm
208-2
10
240-2
42cm
268-2
69cm
300-3
02cm
328-3
30cm
360-3
62cm
388-3
90cm
420-4
22cm
448-4
50cm
480-4
82cm
508-5
10cm
540-5
42cm
568-5
70cm
600-6
02cm
628-6
30cm
660-6
62cm
688-6
90cm
720-7
22cm
748-7
50cm
778-7
80cm
810-8
12cm
Qu
erc
us
15.6
25.0
48.9
25.2
14.6
29.8
28.8
28.1
17.5
21.0
16.4
23.8
14.0
21.6
22.5
12.2
19.0
32.4
26.2
14.6
48.6
27.4
52.6
43.6
23.4
44.7
39.1
26.0
SA
00.9
2.9
0.0
0.0
3.4
2.1
3.8
3.5
5.0
6.5
3.3
7.9
0.0
5.9
3.4
4.1
3.4
7.0
5.6
2.1
10.8
1.6
3.5
7.3
9.0
6.8
7.8
4.0
Pin
us
39.4
47.1
11.1
40.5
44.9
42.6
25.0
52.6
53.8
45.2
60.7
49.2
66.7
45.1
44.9
56.1
50.0
26.8
34.6
58.3
13.5
41.9
17.5
20.9
18.9
12.6
6.3
18.0
UK
1.8
0.0
0.0
0.0
0.0
0.0
0.0
0.0
0.0
0.0
0.0
0.0
0.0
0.0
1.1
0.0
0.0
0.0
0.0
0.0
0.0
0.0
0.0
0.0
1.8
0.0
0.8
2.0
Be
tula
2.8
0.0
6.7
2.7
0.0
2.1
9.6
1.8
3.8
4.8
1.6
1.6
2.2
3.9
0.0
0.0
0.0
1.4
1.9
0.0
2.7
1.6
1.8
3.6
1.8
0.0
0.0
0.0
Ca
rya
12.8
2.9
6.7
11.7
3.4
12.8
7.7
1.8
0.0
14.5
1.6
6.3
3.2
5.9
7.9
12.2
10.3
4.2
6.5
12.5
8.1
8.1
3.5
0.9
10.8
2.9
2.3
0.0
Po
ace
ae
2.8
1.0
4.4
5.4
3.4
0.0
1.9
0.0
3.8
1.6
0.0
0.0
0.0
2.0
0.0
0.0
1.7
1.4
2.8
2.1
5.4
4.8
1.8
4.5
5.4
2.9
2.3
0.0
Am
bro
sia
0.9
2.9
4.4
1.8
1.1
0.0
1.9
1.8
0.0
0.0
0.0
0.0
0.0
0.0
0.0
0.0
1.7
0.0
0.9
0.0
0.0
1.6
1.8
0.0
0.0
1.0
0.0
0.0
P03
1.8
0.0
2.2
0.9
0.0
2.1
5.8
0.0
1.3
0.0
0.0
0.0
0.0
0.0
2.2
1.0
0.0
1.4
3.7
0.0
0.0
0.0
0.0
0.0
0.9
0.0
1.6
0.0
TC
T2.8
2.9
2.2
0.0
0.0
0.0
0.0
1.8
0.0
1.6
3.3
1.6
1.1
2.0
2.2
0.0
0.0
4.2
1.9
0.0
0.0
1.6
0.0
0.0
1.8
0.0
0.8
2.0
Ace
r0.9
0.0
2.2
0.0
0.0
0.0
1.9
1.8
0.0
0.0
0.0
1.6
0.0
0.0
0.0
0.0
1.7
0.0
0.0
0.0
0.0
0.0
0.0
0.0
0.0
0.0
0.0
0.0
Tsu
ga
3.7
8.7
0.0
2.7
11.2
4.3
7.7
1.8
7.5
4.8
4.9
0.0
5.4
9.8
5.6
7.1
8.6
1.4
3.7
8.3
5.4
9.7
8.8
1.8
7.2
7.8
3.9
2.0
Ast
era
ce
ae
0.9
0.0
2.2
0.0
1.1
0.0
1.9
0.0
1.3
0.0
0.0
1.6
0.0
0.0
1.1
0.0
0.0
2.8
0.0
0.0
0.0
0.0
0.0
0.0
0.9
0.0
1.6
0.0
SC
05.5
1.9
0.0
2.7
12.4
0.0
0.0
0.0
3.8
0.0
4.9
0.0
3.2
3.9
4.5
4.1
1.7
0.0
4.7
0.0
0.0
0.0
5.3
4.5
4.5
8.7
17.2
40.0
Cyp
era
ce
ae
1.8
1.0
0.0
0.0
0.0
0.0
0.0
1.8
0.0
0.0
0.0
0.0
0.0
0.0
0.0
1.0
0.0
2.8
1.9
0.0
2.7
0.0
0.0
7.3
2.7
2.9
9.4
2.0
PC
01.8
0.0
0.0
0.0
0.0
0.0
0.0
0.0
0.0
0.0
0.0
1.6
0.0
0.0
0.0
0.0
0.0
0.0
0.0
0.0
0.0
0.0
0.0
0.0
0.0
0.0
0.0
0.0
Ju
gla
ns
0.9
0.0
0.0
0.0
0.0
0.0
0.0
0.0
0.0
0.0
0.0
0.0
0.0
0.0
0.0
0.0
0.0
1.4
0.0
0.0
0.0
0.0
0.0
0.0
0.0
0.0
0.0
0.0
Eu
ph
orb
ia0.9
0.0
0.0
0.0
0.0
0.0
0.0
0.0
0.0
0.0
0.0
0.0
0.0
0.0
0.0
0.0
0.0
0.0
0.0
0.0
0.0
0.0
0.0
0.0
0.0
0.0
0.0
0.0
Ch
en
op
od
s0.9
1.0
0.0
0.0
1.1
0.0
0.0
0.0
0.0
0.0
0.0
0.0
0.0
0.0
0.0
0.0
0.0
0.0
0.0
0.0
0.0
0.0
0.0
0.9
0.0
0.0
5.5
4.0
Myri
ca
0.9
0.0
0.0
1.8
0.0
4.3
0.0
3.5
0.0
0.0
0.0
0.0
0.0
0.0
0.0
0.0
0.0
0.0
0.0
0.0
0.0
0.0
0.0
0.9
0.0
0.0
0.0
0.0
Typ
ha
0.0
1.0
2.2
0.0
0.0
0.0
0.0
0.0
0.0
0.0
0.0
0.0
0.0
0.0
0.0
0.0
0.0
0.0
0.0
0.0
0.0
0.0
0.0
0.0
0.0
0.0
0.0
0.0
Ulm
us
0.0
1.0
0.0
0.0
1.1
0.0
0.0
0.0
0.0
0.0
0.0
0.0
0.0
0.0
1.1
0.0
0.0
0.0
0.0
0.0
0.0
0.0
0.0
0.0
0.9
0.0
0.8
0.0
Co
rlyu
s0.0
1.0
0.0
0.0
1.1
0.0
0.0
0.0
0.0
0.0
0.0
0.0
0.0
0.0
0.0
0.0
0.0
2.8
0.9
0.0
0.0
0.0
0.0
0.0
0.0
0.0
0.0
0.0
PC
30.0
0.0
2.2
0.9
0.0
0.0
0.0
0.0
1.3
0.0
0.0
0.0
0.0
0.0
0.0
0.0
0.0
0.0
1.9
2.1
0.0
0.0
1.8
0.0
0.9
0.0
0.8
0.0
Nyss
a0.0
0.0
2.2
2.7
1.1
0.0
0.0
0.0
1.3
0.0
0.0
0.0
0.0
0.0
2.2
0.0
0.0
0.0
0.0
0.0
0.0
1.6
0.0
0.9
0.9
2.9
0.0
0.0
Ost
rya
0.0
0.0
2.2
0.0
0.0
0.0
0.0
0.0
0.0
0.0
0.0
0.0
0.0
0.0
0.0
0.0
0.0
0.0
0.0
0.0
0.0
0.0
0.0
0.0
0.0
0.0
0.0
0.0
Fa
gu
s0.0
0.0
0.0
0.9
0.0
0.0
1.9
0.0
0.0
0.0
0.0
1.6
1.1
0.0
0.0
0.0
0.0
0.0
1.9
0.0
0.0
0.0
1.8
0.0
0.9
1.9
0.0
0.0
Fra
xin
us
0.0
0.0
0.0
0.0
0.0
0.0
1.9
0.0
0.0
0.0
1.6
0.0
2.2
0.0
0.0
0.0
0.0
1.4
0.0
0.0
0.0
0.0
0.0
0.9
0.0
1.0
0.0
0.0
pic
ea
0.0
0.0
0.0
0.0
0.0
0.0
0.0
0.0
0.0
0.0
1.6
0.0
1.1
0.0
1.1
2.0
1.7
4.2
0.0
0.0
0.0
0.0
0.0
0.9
0.9
1.0
0.0
0.0
tili
a0.0
0.0
0.0
0.0
0.0
0.0
0.0
0.0
0.0
0.0
0.0
1.6
0.0
0.0
0.0
0.0
0.0
1.4
0.0
0.0
0.0
0.0
0.0
0.0
0.0
0.0
0.0
0.0
aln
us
0.0
0.0
0.0
0.0
0.0
0.0
0.0
0.0
0.0
0.0
0.0
1.6
0.0
0.0
0.0
0.0
0.0
1.4
0.9
0.0
0.0
0.0
0.0
0.9
0.9
0.0
0.0
0.0
on
ag
race
ae
0.0
0.0
0.0
0.0
0.0
0.0
0.0
0.0
0.0
0.0
0.0
0.0
0.0
0.0
0.0
0.0
0.0
1.4
0.0
0.0
0.0
0.0
0.0
0.0
0.0
0.0
0.0
0.0
liri
od
en
dro
n0.0
0.0
0.0
0.0
0.0
0.0
0.0
0.0
0.0
0.0
0.0
0.0
0.0
0.0
0.0
0.0
0.0
0.0
0.0
0.0
2.7
0.0
0.0
0.0
1.8
0.0
0.0
0.0
sali
x0.0
0.0
0.0
0.0
0.0
0.0
0.0
0.0
0.0
0.0
0.0
0.0
0.0
0.0
0.0
0.0
0.0
0.0
0.0
0.0
0.0
0.0
0.0
0.0
0.9
0.0
0.0
0.0
sass
afr
ass
0.0
0.0
0.0
0.0
0.0
0.0
0.0
0.0
0.0
0.0
0.0
0.0
0.0
0.0
0.0
0.0
0.0
0.0
0.0
0.0
0.0
0.0
0.0
0.0
2.7
0.0
0.0
0.0
pin
k0.0
0.0
0.0
0.0
0.0
0.0
0.0
0.0
0.0
0.0
0.0
0.0
0.0
0.0
0.0
0.0
0.0
0.0
0.0
0.0
0.0
0.0
0.0
0.0
0.0
2.9
0.0
0.0

Geomorphology/Archaeological Borings and GIS Model, 2014 New York/New Jersey Harbor Navigation Project Page 207
Foraminiferal Analysis of Sediment Samples from New York Harbor Core C1
Analyst: Simon Engelhart
Interpretation: The foraminiferal assemblages divide the C1 core into two distinct zones.
This distinction is based primarily on the presence/absence of the two dominant calcareous
species Elphidium excavatum and Ammonia parkinsoniana. The top 6 m (20 ft) of the core
contains both calcareous and agglutinated foraminifera. The environment is likely to be a
shallow water body based on the presence of Elphidium excavatum. The combination of this
species and Ammonia parkinsoniana is typical of a transition environment between marine and
marsh sediments especially when coupled with the low species diversity (only four identifiable
calcareous species). This section of the core also contains numerous agglutinated species, which
is consistent with these forminifer being washed in from nearby marsh sediments, reinforcing the
interpretations of a shallow transitional environment.
The bottom zone (6.30-8.12 m/20.67-26.64 ft) is characterized by a sudden absence of
calcareous foraminifera (with the exception of sample 6.30 and 7.22 m (20.67 and 26.64 ft),
which show reduced counts of calcareous species and reduced diversity). Counts per gram are
usually lower in this section of core, compared to the upper zone but there is an increase in
sample 7.80 m (25.6 ft). This sample is of interest because it has a monospecific assemblage of
Jadammina macresecens. This species is indicative of a saltmarsh environment, which correlates
with the increase in organic nature of the sediment at this depth. The bottom zone contains three
samples that contained no foraminifera, indicated by grey boxes on the figure. The sudden
increase in the abundance of Trochammina inflata in samples 6.62 and 7.22 m (21.72 and 23.69
ft) is also indicative of a move to a more marsh like environment, with a shallowing in water
depth from the upper zone.
It is also interesting to note that the mineralogy of the substrate changed between the two
zones. The upper zone contained many fine silts with few larger grains, whilst the lower zone
was dominated by large quartz grains. These results are also supported by the change in the
pollen assemblages at the same point in the core.
In conclusion, the foraminiferal assemblages demonstrate that the C1 core can be subdivided
into two differing paleoenvironments. The top section of the core is indicative of a shallow water
environment, whilst the bottom section of the core is indicative of a shallower more marsh like
environment. It is apparent that sample 7.80 m (25.59 ft) is indicative deposition within a
saltmarsh.
Methodology: Foraminifera were separated from the samples following the standard
methods of Scott and Medioli (1978). The sample was treated with sodium hexametaphosphate
to disperse the clays and silts before being washed through a 500 and 63-micron sieve. The 500
micron and above fraction was saved and analyzed for larger foraminifera, though none were
found in core C1. The 500 – 63 micron fraction was analyzed with all foraminifera present being
counted and contributing to the final total. Sample weights were noted to allow the calculation of
number of foraminifera per gram.

Geomorphology/Archaeological Borings and GIS Model, 2014 New York/New Jersey Harbor Navigation Project Page 208
Data: See attached excel file

Geomorphology/Archaeological Borings and GIS Model, 2014 New York/New Jersey Harbor Navigation Project Page 209
Pe
rce
nt
Fo
ram
inif
era
Ab
un
da
nc
e D
ata
fo
r C
ore
C-1
Sp
ecie
s0-2
cm
28-3
0cm
60-6
2cm
88-9
0cm
120-1
22cm
148-1
50cm
180-1
82cm
208-2
10
240-2
42cm
268-2
69cm
300-3
02cm
328-3
30cm
360-3
62cm
388-3
90cm
420-4
22cm
448-4
50cm
480-4
82cm
508-5
10cm
540-5
42cm
568-5
70cm
600-6
02cm
628-6
30cm
660-6
62cm
688-6
90cm
720-7
22cm
748-7
50cm
778-7
80cm
810-8
12cm
Am
monia
park
insonia
na
0.0
1.7
0.0
100.0
25.0
4.2
25.0
75.0
0.0
42.9
50.0
33.3
11.8
0.0
23.1
0.0
25.0
16.7
12.5
50.0
22.2
66.7
0.0
0.0
20.0
0.0
0.0
0.0
Elp
hid
ium
excava
tum
70.6
96.6
0.0
0.0
0.0
8.3
41.7
0.0
0.0
0.0
12.5
0.0
35.3
44.4
0.0
23.1
75.0
0.0
0.0
0.0
77.8
0.0
0.0
0.0
0.0
0.0
0.0
0.0
Elp
hid
ium
gunte
ri5.9
0.0
0.0
0.0
0.0
0.0
0.0
0.0
0.0
0.0
0.0
0.0
0.0
0.0
0.0
0.0
0.0
0.0
0.0
0.0
0.0
0.0
0.0
0.0
0.0
0.0
0.0
0.0
Elp
hid
ium
sp
5.9
0.0
0.0
0.0
0.0
0.0
0.0
0.0
0.0
0.0
0.0
0.0
5.9
0.0
0.0
0.0
0.0
0.0
12.5
0.0
0.0
0.0
0.0
0.0
0.0
0.0
0.0
0.0
Calc
are
ous (
Unid
entifia
ble
)0.0
0.0
0.0
0.0
0.0
4.2
0.0
0.0
0.0
0.0
0.0
0.0
5.9
0.0
0.0
46.2
0.0
0.0
0.0
0.0
0.0
0.0
0.0
0.0
0.0
0.0
0.0
0.0
Am
motium
sals
um
17.6
0.0
0.0
0.0
8.3
0.0
0.0
0.0
0.0
0.0
0.0
0.0
0.0
0.0
0.0
0.0
0.0
0.0
0.0
0.0
0.0
0.0
0.0
0.0
0.0
0.0
0.0
0.0
Are
nopare
lla m
exic
ana
0.0
0.0
0.0
0.0
0.0
4.2
8.3
0.0
0.0
0.0
0.0
0.0
0.0
0.0
0.0
0.0
0.0
0.0
0.0
0.0
0.0
0.0
0.0
0.0
0.0
0.0
0.0
0.0
Haplo
phra
gm
oid
es s
p0.0
0.0
0.0
0.0
0.0
0.0
0.0
0.0
0.0
14.3
0.0
0.0
0.0
0.0
0.0
0.0
0.0
0.0
0.0
0.0
0.0
0.0
0.0
0.0
0.0
0.0
0.0
0.0
Haplo
phra
gm
oid
es W
ilbert
i0.0
0.0
0.0
0.0
0.0
8.3
0.0
0.0
0.0
0.0
0.0
0.0
0.0
0.0
7.7
0.0
0.0
8.3
0.0
0.0
0.0
0.0
0.0
0.0
0.0
0.0
0.0
0.0
Jadam
min
a m
acre
scens
0.0
0.0
50.0
0.0
0.0
0.0
0.0
0.0
100.0
14.3
0.0
0.0
5.9
11.1
0.0
0.0
0.0
25.0
0.0
0.0
0.0
0.0
0.0
0.0
0.0
0.0
100.0
0.0
Tip
hotr
ocha c
om
prim
ata
0.0
0.0
16.7
0.0
0.0
0.0
0.0
0.0
0.0
0.0
0.0
16.7
5.9
11.1
0.0
0.0
0.0
0.0
0.0
0.0
0.0
0.0
0.0
0.0
0.0
0.0
0.0
0.0
Tip
hotr
ocha s
p0.0
0.0
0.0
0.0
0.0
0.0
0.0
0.0
0.0
14.3
0.0
0.0
0.0
0.0
0.0
0.0
0.0
0.0
0.0
0.0
0.0
0.0
0.0
0.0
0.0
0.0
0.0
0.0
Tro
cham
min
a infla
ta0.0
1.7
16.7
0.0
33.3
8.3
0.0
25.0
0.0
0.0
0.0
0.0
0.0
0.0
0.0
0.0
0.0
8.3
0.0
0.0
0.0
0.0
100.0
0.0
80.0
0.0
0.0
0.0
Tro
cham
min
a o
cra
cen
0.0
0.0
16.7
0.0
8.3
0.0
0.0
0.0
0.0
14.3
0.0
0.0
5.9
0.0
7.7
0.0
0.0
0.0
12.5
0.0
0.0
0.0
0.0
0.0
0.0
0.0
0.0
0.0
Tro
cham
min
a s
p0.0
0.0
0.0
0.0
0.0
4.2
0.0
0.0
0.0
0.0
0.0
0.0
0.0
0.0
0.0
0.0
0.0
0.0
0.0
0.0
0.0
0.0
0.0
0.0
0.0
0.0
0.0
0.0
Aggultin
ate
(U
nid
entifia
ble
)0.0
0.0
0.0
0.0
25.0
58.3
25.0
0.0
0.0
0.0
37.5
50.0
23.5
33.3
61.5
30.8
0.0
41.7
62.5
50.0
0.0
33.3
0.0
0.0
0.0
0.0
0.0
0.0
Co
un
ts/g
ram
34.7
116.0
12.0
6.0
21.4
24.0
29.3
7.0
6.1
11.1
12.7
11.8
27.0
13.0
22.8
30.2
14.8
27.3
18.6
7.7
40.0
5.7
1.5
0.0
8.3
0.0
37.0
0.0
% A
gglu
tinate
d17.6
1.7
100.0
0.0
75.0
83.3
33.3
25.0
100.0
57.1
37.5
66.7
41.2
55.6
76.9
30.8
0.0
83.3
75.0
50.0
0.0
33.3
100.0
0.0
80.0
0.0
100.0
0.0
% C
alc
are
ous
82.4
98.3
0.0
100.0
25.0
16.7
66.7
75.0
0.0
42.9
62.5
33.3
58.8
44.4
23.1
69.2
100.0
16.7
25.0
50.0
100.0
66.7
0.0
0.0
20.0
0.0
0.0
0.0

Geomorphology/Archaeological Borings and GIS Model, 2014 New York/New Jersey Harbor Navigation Project Page 210
Appendix F
Qualifications of Project Personnel

Geomorphology/Archaeological Borings and GIS Model, 2014 New York/New Jersey Harbor Navigation Project Page 211
Joseph Schuldenrein, Ph.D.
President and Principal Archeologist
Dr. Joseph Schuldenrein is Principal Archeologist and President of Geoarcheology Research Associates (GRA). A former
Fulbright Fellow in Geology and Archaeology (Hebrew University, Israel) and Fellow of the Field Museum of Chicago, Dr.
Schuldenrein received his Ph.D. in environmental archeology at the University of Chicago in 1983. His professional
experience includes work across the entire Eastern Woodlands as well in all geographic areas west of the Mississippi River.
Internationally he has consulted on projects in Central Europe, the entire Middle East, India and eastern and southern Africa.
He is involved in research on Human Origins, early civilizations (South Asia) and site formation process in the Middle
Atlantic region of North America and elsewhere. Dr. Schuldenrein has served as Principal Investigator on over 80
archeological and paleoenvironmental projects with a wide variety of clients in the federal, state, local and private sectors.
He is the liaison between the Register of Professional Archeologists (RPA) and the Society for Archaeological Sciences
(SAS), as well as past president of the Professional Archaeologists of New York City (PANYC). He has published widely in
key professional journals including American Antiquity, Journal of Field Archaeology, Geoarchaeology, Journal of
Archeological Sciences, and has contributed to numerous edited volumes.
In recent years, Dr. Schuldenrein has been extensively involved in large scale project management, attempting to integrate
the various disciplines within CRM. He is also active in the Society for American Archaeology's drive to restructure
educational priorities in higher education towards empirical and applied objectives. Dr. Schuldenrein has been a reviewer on
numerous funding and granting panels and has appeared on television and radio to advance the exposure of professional
archeology.
Education
Ph.D. 1983 University of Chicago Anthropology
M.A. 1976 University of Chicago Anthropology
B.A. 1971 State University of New York at Stony Brook Anthropology
Employment History
1989-present President/Principal Archeologist, Geoarcheology Research Associates, Riverdale, New York
1997-present Visiting Scholar, Department of Anthropology, New York University, New York, New York
1988-1989 Principal Archeologist and Geomorphologist, John Milner Associates, Inc., West Chester, Pennsylvania
1982-1988 Senior Cultural Resource Manager, Gilbert/Commonwealth, Reading, Pennsylvania
1980-82 Cultural Resource Manager, Gilbert/Commonwealth, Jackson, Michigan
Fellowships and Grants
1967-71 New York State Regents Scholarship
1974-75 University Fellowship, Department of Anthropology, University of Chicago
1975-76 Field Museum of Chicago Fellowship
1976-78 Fulbright-Hays Fellowship for Overseas Research Government of Israel Research Grant

Geomorphology/Archaeological Borings and GIS Model, 2014 New York/New Jersey Harbor Navigation Project Page 212
Honors and Committee Appointments
1999 Executive Board, Archeology Division, American Anthropological Association
1999 Chair, SAA Committee on Finance and Investments
1998 Invited Participant on SAA Sponsored Workshop on Methods for the Improvement of Undergraduate and Graduate Education in Public Archeology and Cultural Resources Management. Wakulla Springs, FL
1996 Program Committee and Reviewer, 61st Annual SAA Conference, New Orleans, LA
1996 President of the Professional Archaeologists of New York City (PANYC)
1996 Reviewer for Geo-Archeology: An International Journal, Journal of Field Archaeology, and American Antiquity
1993-1995 Board Member of the Professional Archaeologists of New York City (PANYC)
1994-present Society for American Archaeology (SAA) Task Force on Consulting Archaeology
1993-1995 Society for American Archaeology (SAA) Membership Committee
1992-94 Board Member SOPA; Society for Archaeological Sciences (SAS) Representative to SOPA
1991-94 SOPA Certification Committee for Archeometry and Archeological Sciences
1986-87 Grant and Proposal Reviewer, Anthropology Program, National Science Foundation.
1986 Listing in Who's Who in the Midwest, 1987 (21st) edition.
1986 Reviewer for Geo-Archeology: An International Journal.
1985 Invited panelist to workshop on Applications of High Technology to Archeological Cultural Resource Management Issues. Organized by Office of Technology Assistance, Washington, D.C.
Selected Publications
2007 Harappan Geoarchaeology Reconsidered: Holocene Landscapes and Environments of the Greater Indus Plain (with R.P. Wright and M. Afzal Khan). In Settlement and Society: Essays Dedicated to Robert McCormick Adams (E. Stone, ed.): 83-116. Cotsen Institute of Archaeology, Volume 3. UCLA.
2007 A Reassessment of the Holocene Stratigraphy of the Wadi Hasa Terrace and Hasa Formation, Jordan. Geoarchaeology 22 (6): 559-588.
2007 Landscape Archaeology in Lower Manhattan: The Collect Pond as an Evolving Cultural Landmark in Early New York City (with R. Yamin). In Envisioning Landscape: Situations and Standpoints in Archaeology and Heritage (D. Hicks, L. McAtackney, and G. Fairclough, eds): 75-100. Left Coast Press, Walnut Creek, CA.
2007 Emergence of Geoarchaeology in Research and Cultural Resource Management: Part II. The SAA Archaeological Record 7 (1): 16-24
2006 Emergence of Geoarchaeology in Research and Cultural Resource Management: Part I. The SAA Archaeological Record 6 (5): 11-14.
2005 The Beas River Landscape and Settlement Survey: Preliminary Results from the Site of Vaniwal (with R.P. Wright, M. Afzal Khan, and S. Malin-Boyce). In South Asian Archaeology 2003 (U. Franke-Vogt and H.-J. Weisshaar eds): 101-110. Proceedings of Seventeenth International Conference of the European Association of South Asian Archaeologists (7-11 July, 2003, Bonn). Aachen.
Geomorphology/Archaeological Borings and GIS Model, 2014 New York/New Jersey Harbor Navigation Project Page 213
2004 Landscapes, Soils, and Mound Histories of the Upper Indus Valley, Pakistan: New Insights on the Holocene Environments Near Ancient Harappa (with R.P. Wright, M.R. Mughal, and M. Afzal Khan). Journal of Archaeological Science 31 (6): 777-797.
2003 Landscapes, Activity, and the Acheulean to Middle Paleolithic Transition in the Kaladgi Basin, India (with M.D. Petraglia and R. Korisettar). Eurasian Prehistory 1(2): 3-24.
2003 Landscape Change, Human Occupation, and Archaeological Site Preservation at the Glacial Margin: Geoarchaeological Perspectives from the Sandts Eddy Site (36Nm12), Middle Delaware Valley, Pennsylvania. In Geoarchaeology of Landscapes in the Glaciated Northeast (D.L. Cremeens and J.P. Hart eds.): 181-210. New York State Museum Bulletin 497. Albany, New York.
2003 Prehistoric Landscapes and Settlement Geography along the Wadi Hasa, West-Central Jordan. Part II: Towards a Model of Palaeoecological Settlement for the Wadi Hasa (with G.A. Clark). Environmental Archaeology 8: 1-16.
2003 An Extensive Middle Paleolithic Quarry Landscape in the Kaladgi Basin, Southern India (with M. Petraglia, R. Korisettar, and M. Noll). Antiquity 77 (295).
2002 Geoarchaeological Perspectives on the Harappan Sites of South Asia. In Indian Archaeology in Retrospect, Volume II (Protohistory) (Settar, S. and Korisettar, R., eds.): 47-80. New Delhi, India. Manohar and Indian Council of Historical Research.
2001 Urbanism in the Indus Valley: Environment and Settlement on the Beas River (with R.P. Wright and M.A. Khan). In Dialogue Among Civilizations: The Indus Valley Civilization (M.A. Halim and A. Ghafoor, eds): 102-113. Special UNESCO Volume. Government of Pakistan, Islamabad
2001 Prehistoric Landscapes and Settlement Geography along the Wadi Hasa, West-Central Jordan. Part I: Geoarchaeology, Human Palaeoecology and Ethnographic Modelling (with G.A. Clark). Environmental Archaeology 6: 25-40.
2001 Stratigraphy, Sedimentology, and Site Formation at Konispol Cave, Southwest Albania. Geoarchaeology 16(5): 559-602.
2000 Pennsylvania Geoarcheology and Cultural Resource Management: An Assessment of Achievements and Shortcomings. Journal of Middle Atlantic Archaeology 16: 13-26.
2000 Archeological Education and Private Sector Employment (with J.H. Altschul). In Teaching Archaeology in the Twenty-First Century (S. J. Bender and G.S. Smith, eds.): 59-64. Society for American Archaeology. Washington, D.C.
2000 Refashioning Our Profession: Practical Skills, Preservation, and Cultural Resource Management. In Teaching Archaeology in the Twenty-First Century (S. J. Bender and G.S. Smith, eds.): 133-139. Society for American Archaeology. Washington, D.C.
1999 Reply to Comment by William R. Farrand on "Konispol Cave, Southern Albania, and Correlations with Other Aegean Caves Occupied in the Late Quaternary" Geoarchaeology 14(5): 473-478.
1999 Charting a Middle Ground in the NAGPRA Controversy: Secularism in Context. Bulletin of the Society for American Archaeology 17 (4): 22-23.
1999 The Palaeolithic of Southernmost Albania (with F.B. Harrold and others). In The Palaeolithic Archaeology of Greece and Adjacent Areas (G.N. Bailey, E. Adam, E. Panagopoulou, C. Perles and K. Zachos, eds.): 361-372. British School at Athens Studies 3. Nottingham.
1998 Wyoming Valley Landscape Evolution and the Emergence of the Wyoming Valley Culture (with D.M. Thieme). Pennsylvania Archaeologist 68(2): 1-17.
1998 Geomorphology and Stratigraphy of Prehistoric Sites along the Wadi al-Hasa. In The Archaeology of the Wadi al-Hasa, West Central Jordan, Volume I: Surveys, Settlement Patterns and Paleoenvironments (N. Coinman, ed.): 205-228. Anthropological Research Papers No. 50. Arizona State University
1998 Changing Career Paths and the Training of Professional Archaeologists: Observations from the Barnard College Forum: Part II. Bulletin of the Society for American Archaeology 16 (3): 26-29.
Geomorphology/Archaeological Borings and GIS Model, 2014 New York/New Jersey Harbor Navigation Project Page 214
1998 Konispol Cave, Southern Albania, and Correlations with Other Aegean Caves Occupied in the Late Quaternary. Geoarchaeology 13(5): 501-526.
1998 Changing Career Paths and the Training of Professional Archaeologists: Observations from the Barnard College Forum: Part I. Bulletin of the Society for American Archaeology 16 (1): 31-33.
1998 The Eastern Al-Hasa Late Pleistocene Project: A Preliminary Report on the 1997 Season. (with D. I. Olszewski and others). Annual of the Department of Antiquities of Jordan 42:53-74.
1997 Chronostratigraphic Contexts of Middle Paleolithic Horizons at the 'Ain Difla Rockshelter (WHS 634), West-Central Jordan (with G.A. Clark and others). In The Prehistory of Jordan II. Perspectives from 1997. Studies in Early Near Eastern Production, Subsistence, and Environment 4 (H.G.K. Gebel, Z. Kafafi, and G.O. Rollefson, eds.): 77-100. Berlin, ex oriente.
1997 WHS 1065 (Tor at-Tariq): An Epipaleolithic Site in its Regional Context (with M.P. Neeley and others). In Studies in the History and Archaeology of Jordan VI: 219-225.
1997 Prehistory and Holocene Floodplain Evolution Along the Inner Coastal Plain of Virginia: A Case Study From the Chickahominy Drainage (with D. Blanton). In Proceedings of the Second International Conference on Pedoarchaeology (A.C. Goodyear and J.E. Foss, eds.): 75-95. University of South Carolina Press.
1997 High Resolution Paleoclimatic Trends for the Holocene Identified Using Magnetic Susceptibility Data from Archaeological Excavation in Caves (with B. Ellwood and others). Journal of Archaeological Science 24: 569-573.
1996 Geoarchaeology and the Mid-Holocene Landscape History of the Greater Southeast. In Archaeology of the Mid-Holocene Southeast,(Kenneth E. Sassaman and David G. Anderson, eds.): 3-27. University Press of Florida.
1995 The Care and Feeding of of Archaeologists: A Plea for Pragmatic Training in the 21st Century. Bulletin of the Society for American Archaeology 13 (3): 22-24.
1995 Prehistory and the Changing Holocene Geography of Dogan Point. In Dogan Point: A Shell Matrix Site in the Lower Hudson Valley. Publications in Northeastern Anthropology No. 14 (C. Claassen, ed.): 39-64.
1995 Geochemistry, Phosphate Fractionation and the Detection of Activity Areas at Prehistoric North American Sites. In Pedological Perspectives in Archaeology Research Proceedings, (Mary Collins, ed.): Soil Science Society of America Special Publication No. 44: 107-132
1994 Wadi el Hasa: Geomorphology and Prehistory. American Journal of Archaeology 98(3):528-529.
1994 Alluvial Site Geoarcheology of the Middle Delaware Valley: A Fluvial Systems Paradigm. Journal of Middle Atlantic Archaeology 10:1-21.
1994 Landscape and Prehistoric Chronology of West-Central Jordan (with G.A. Clark). Geoarchaeology 9(1)31-55.
1992 Wadi Al-Hasa Paleolithic Project - 1992: Preliminary Report (with G.A. Clarke and others). Annual of the Department of Antiquities of Jordan 36:13-23.
1992 The Padula Site (36Nm12) and Chert Resource Exploitation in the Middle Delaware River Valley (with C. Bergman and others). Archaeology of Eastern North America 20:39-45.
1991 Archaeology of the Lower Black's Eddy Site, Bucks County, Pennsylvania: A Preliminary Report (with R. Kingsley and others). Pennsylvania Archaeologist 61(1):19-75.
1991 Coring and the Identity of Cultural-Resource Environments: A Comment on Stein. American Antiquity 56(1):131-137.
1990 Depositional History of an Archeologically Dated Floodplain, Haw River, North Carolina (with C.E. Larsen). In Geological Society of America, Centennial Special Volume 4 (N. Lasca and J. Donahue, eds.): 161-181. Geological Society of America, Boulder.
1988 Excavations at Middle, Upper and Epipaleolithic Sites in the Wadi Hasa, West Central Jordan (with G.

Geomorphology/Archaeological Borings and GIS Model, 2014 New York/New Jersey Harbor Navigation Project Page 215
A. Clark and others). In The Prehistory of Jordan (A. N. Garrard and H. G. Gebel, eds.), B.A.R. International Series 396:209-285.
1986 Paleoenvironment, Prehistory, and Accelerated Slope Erosion Along the Central Coastal Plain of Israel: A Geoarcheological Case Study. Geoarcheology 1(1):61-81.
1986 Geoarchaeology of the Kurkar Ridges on the Coastal Plain of Israel. Oxford Polytechnic Discussion Papers in Geography: No. 23. Oxford.
1984 Towards a Geo-archeological Context for Saginaw Valley Prehistory: A Perspective from CRM. Michigan Academician 16(3):353-369.
1983 Late Quaternary Paleo-environments and Prehistoric Site Distributions in the Lower Jordan Valley, Israel. Ph.D. Dissertation, University of Chicago.
1983 Early Archaic Settlement on the Southeastern Atlantic Slope: A View From the Rucker's Bottom Site, Elbert County, Georgia (with David G. Anderson). North American Archeologist 4(3):177-210.
1983 Mississippian Period Settlement in the Southern Piedmont: Evidence from the Rucker's Bottom Site, Elbert County, Georgia (with David G. Anderson). Southeastern Archeology 2(2):98-117.
1981 Late Quaternary Paleo-environments and Prehistoric Site Distributions in the Lower Jordan Valley: A Preliminary Report (with P. Goldberg). Paleorient 7:57-75.
1980 Gilgal, A Pre-Pottery Neolithic Site in the Lower Jordan Valley (with T. Noy and E. Tchernov). Israel Exploration Journal 30:63-82.
1978 Paleo-geographic Implications of Prehistoric Settlement Systems in the Central Illinois Valley. Anthropology 2:47-63.
1978 Late Quaternary Stratigraphy and Prehistory of the Lower Jordan Valley. Metequfat Ha'even 17.
1976 Bio-physical and Paleo-ecological Dimensions of Site Settlement Variability in the Central Riverine (Midwestern) Archaic. M.A. Thesis, University of Chicago.
1976 Occupational Terraces and Natural Stratigraphy in the Central Illinois Valley: The Beardstown Terrace Complex. Transactions of the Illinois Academy of Sciences 69:122-44.
Selected Presentations at Professional Meetings
2009 "The River Runs Through It": Can We Get Beyond Alluvial Geoarchaeology? Pennsylvania Statewide Conference on Heritage, Byways to the Past X, Harrisburg, Pennsylvania.
2009 Geoarchaeology at Leetsdale: Reconstructing Prehistoric Landscapes of the Upper Ohio Valley. Geological Society of America, Annual Meeting, Portland, Oregon.
2008 From Harappa to the Hudson: Archaeo-climatic Modeling in Global Context. Society for American Archaeology Annual Meetings in Vancouver, British Columbia.
2008 Geoarchaeology on the Edge: Submerged, near-Shore and off-Shore Landscapes of New York Harbor and Early Manhattan Island. Geological Society of America Meeting, Houston, Texas.
2008 Working with the military: Not evil, just necessary. World Archaeological Congress, Dublin, Ireland.
2008 Landscape archaeology of contemporary genocide:Exhumation of a mass grave in Muthanna Province, Iraq. Society for Historical Archaeology, Albuquerque, New Mexico.
2007 "Landscapes at the Edge": Geomorphology and Archaeology at the Margins of Raritan Bay. Middle Atlantic Archaeological Conference. Virginia Beach, Virginia.
2007 Innovative Uses of OSL Dating for Interpreting Suspected Prehistoric Quarries: A Case Study in the Glaciated Terrain of Northeast Pennsylvania, USA. New World Luminescence Dating and Dosimetry Workshop, Chicago, Illinois.

Geomorphology/Archaeological Borings and GIS Model, 2014 New York/New Jersey Harbor Navigation Project Page 216
2007 Archaeoclimatology: Applications of a Century-Resolution, Site-Specific, Climate Model to Indus Culture History. Annual Meeting of the Society for American Archaeology, Austin, Texas.
2007 The Changing Face of Geoarchaeological Investigations in CRM: Lessons Learned and Future Planning. New York Archaeological Council Meeting, Albany, New York.
2007 The Emergence of the Tanning Industry In Lower Manhattan--A Landscape Perspective. Professional Archaeologists of New York City (PANYC) 27th annual public program.
2006 Landscape History and Geoarchaeological Systematics of the Delaware Valley. Geological Society of America Meeting, Philadelphia, Pennsylvania.
2006 Geoarchaeological Systematics of Delaware Valley Landscapes: Regional and Extra-Regional Correlations. Eastern States Archological Federation 73rd Annual Meeting.
2006 Geoarchaeology and Site Formation in Complex Depositional Environments: Paradigms for Planning. Transportation Research Board of the National Academies 85th Annual Meeting.
2006 "Beneath These Mean Streets": Reconstructions of Lower Manhattan's Prehistoric and Historic Landscapes. Geoarcheology 6, Exeter, United Kingdom.
2004 Geoarchaeological Perspectives on Prehistoric Settlement of the Wadi el Hasa. Eastern Mediterranean/Near Eastern Geoarchaeology Meeting of Arbeitskreis Geoarchäologie, University of Tübingen, Germany.
2004 Regional Stratigraphy and Human Paleoecology of the Jordan Rift Valley. Geological Society of America Meeting, Denver, Colorado.
2003 "Yours for $24": The Richness of Manhattan's Buried Archeological Landscapes. Geological Society of America Meeting, Seattle, Washington.
2003 The Great American Disconnect: Traditional archaeology, cultural resources and the emerging global archeological paradigm. World Archaeological Congress, Washington, D.C.
2000 Geoarchaeology in New Jersey and Beyond. Archaeological Society of New Jersey, Spring Meeting, Newark, NJ.
1999 An Overview of Geoarcheological Applications for DOT Projects in the Northeast. Transportation Research Board Summer Workshop, Madison, Wisconsin.
2000 Modeling site formation and preservation in northeastern Pennsylvania: examples from the Susquehanna and Delaware Valley floodplains. The New York Natural History Conference VI, Albany, New York.
1999 Historic sedimentation and site formation process in the Middle Atlantic Province. Middle Atlantic Archaeological Conference, Harrisburg, Pennsylvania.
1996 Early Holocene Paleo-geography of the Middle Atlantic Region: Synthetic Perspectives. Presented at the Sixty-first Annual Meeting of the Society for American Archaeology, New Orleans, Louisiana.
1995 Prehistory and Geography of the Northern Aegean: Perspectives from Konispol Cave, Northern Albania. Presented at the Ninety-first Annual Meeting of the Association of American Geographers, Chicago, Illinois.
1994 Alluvial Site Geoarcheology of the Eastern Woodlands: Towards a Pan-Regional Paradigm. Presented at the Fifty-first Southeastern Archaeological Conference, Lexington, Kentucky.
1994 Prehistoric Geography of the Hudson Valley: Interdisciplinary Perspectives. Presented at the Reconstructing Past Landscapes: Methods and Case Studies Symposium, Barnard College, New York City. Sponsored by the Professional Archaeologists of New York City.
1994 "Small Site" Pedo-Archeology: Research Strategies for Limited Scopes of Work (Dennis Blanton). Presented at the Second International Conference on Pedo-Archaeology, Columbus, South Carolina.
1994 The Changing Holocene Geography of Dogan Point: Archaic Period Perspectives. Conference on the Archaeology of the Hudson Valley, New York State Museum, Albany, New York.

Geomorphology/Archaeological Borings and GIS Model, 2014 New York/New Jersey Harbor Navigation Project Page 217
1993 Patterned Variability in Soil Environments and Archeological Deposits Across North America. Presented at the 85th Annual Meeting of the American Society of Agronomy, Crop Science of America, and Soil Science Society of America, Cincinnati, Ohio.
1993 Earth Science Perspectives on Archeology. Presented at the Harrisburg Area Geological Society in collaboration with Pennsylvania Archeological Week.
1993 The Geomorphic Background to Prehistoric Occupation of the Middle Delaware Valley. Presented at the Fifty-eighth Annual Meeting of the Society for American Archaeology, St. Louis, Missouri.
1993 Landscape Archeology and the Formulation of Site Sensitivity Models in Pennsylvania. Presented at the 1993 Middle Atlantic Archaeology Conference, Ocean City, Maryland.
1992 The Geoarcheology of Pennsylvania Drainages: Guidelines for Research and CRM Planning. Presented at the Fifty seventh Annual Meeting of the Society for American Archaeology, Pittsburgh.
1992 Floodplain Dynamics, Site Formulation, and Interpretations of the Archeological Record: A Case Study from the Mayview Site, Upper Ohio Valley. Presented at the 1992 Middle Atlantic Archaeology Conference, Ocean City, Maryland.
1991 Geo-archeological Observations in West-Central Jordan. Presented at the Fifty fifth Annual Meeting of the Society for American Archeology, New Orleans.
1991 Guns in My Backyard: The Evolution of a Military Neighborhood in Staten Island. Presented at the Eleventh Annual Symposium of the Archaeology of New York City, New York.
1989 Soil Phosphate "Prints" and the Detection of Activity Loci at Prehistoric Sites. Presented at the Fifty fourth Annual Meeting of the Society for American Archeology, Atlanta.
1988 Implications of Subsoil Lamellae for Reconstructing Prehistoric Occupation Surfaces. Presented at the Fryxell Symposium on Inter-disciplinary Archeological Studies, Fifty-third Annual Meeting of the Society for American Archeology, Phoenix.
1986 Dynamic Paleo-geography and the Prehistoric Occupation of the Upper Savannah River Valley. Presented at the Symposium on Paleogeographic Research in the United States, Fifty-first Annual Meeting of the Society for American Archeology, New Orleans.
1985 Processes of Geological and Archeological Sedimentation at a Pawnee Hunting Site, 25LP8, Nebraska. Presented at the Forty-third Annual Plains Conference, Iowa City, Iowa.
1984 A Preliminary Report of Archeological and Environmental Investigations at 25LP8, Nebraska (with D. C. Roper). Presented at the Forty-second Annual Plains Conference, Lincoln, Nebraska.
1984 The Geomorphic Background to Prehistoric Settlement at Piñon Canyon, Colorado. Presented at the Forty-ninth Annual Meeting of the Society for American Archeology, Portland.
1984 Geoarcheological, Historic Archeological, and Historic Investigations at Blue Water Bridge, Port Huron, Michigan (with J. R. Kern). Presented at the Annual Meeting of the Society for Historic Archeology,Williamsburg, Virginia.
1983 Human Ecology and Prehistory Along the Savannah River: A Geo-archeological Perspective (with David G. Anderson). Presented at the Symposium on Science and Archeology in the Southeast, Forty-eighth Annual Meeting of the Society for American Archeology, Pittsburgh.
1983 The Prehistory and Environmental Background to Settlement in the Red Rock Reservoir, Central Des Moines River Valley, Iowa (with D. C. Roper). Presented at the Twenty-ninth Midwest Archeological Conference, Iowa City.
1982 Geo-archeological Investigations at Rucker's Bottom, a Multi-component Site at the Richard B. Russell Reservoir, Georgia. Presented at the Forty-seventh Annual Meeting of the Society for American Archeology, Minneapolis.
1982 Archeo-stratigraphy and Geomorphic Dynamism at the Palmahim sites, Israel. Presented at the Eleventh International Congress on Sedimentology, Hamilton, Ontario, Canada.
1982 The Early Archaic Component at the Rucker's Bottom Site, Georgia (with David G. Anderson).

Geomorphology/Archaeological Borings and GIS Model, 2014 New York/New Jersey Harbor Navigation Project Page 218
Presented at the Thirty-ninth Annual Meeting of the Southeastern Archeological Conference, Memphis.
1981 Holocene Alluviation Sequences and the Archaic Succession in the Southeastern Interior: Observations on Synchroneity in the Geoarcheological Record. Presented at the Forty-sixth Annual Meeting of the Society for American Archeology, San Diego.
1980 Late Quaternary Environments and Prehistoric Occupation of the Lower Jordan Valley. Presented at the Forty-fifth Annual Meeting of the Society for American Archeology, Philadelphia.
1980 The Application of Micromorphological Analysis to Archeological Soils: A Case Study from the lower Jordan Valley. Presented at the Annual Meeting of the Geological Society of America, Atlanta.
1978 Soil Catenary Relations and Prehistoric Site Distributions Along the Coastal Plain of Israel. Presented at the Israel Geological Society Congress on "The Quaternary of the Coastal Plain," Jerusalem, Israel.
1975 Early Prehistory and Geomorphology Along the Central Illinois Valley. Presented at the Twentieth Annual Midwestern Archeological Conference, Ann Arbor.
Symposia Chaired at Professional Meetings
1992 Geoarchaeology and Site Mitigation Concepts, Applications and Regulatory Requirements. Symposium sponsored by Z-Environmental Services, Harrisburg, PA.
1992 Management of Cultural Resources. Fifty seventh Annual Meeting of the Society for American Archeology, Pittsburgh.
1991 Geoarcheology from Forensics to Landscapes. Fifty fifth Annual Meeting of the Society for American Archeology, New Orleans.
1981 The Haw River Archeological Project: Methodological Advances in Southeastern Prehistory and Geoarcheology. Forty-sixth Annual Meeting of the Society for American Archeology, San Diego.
\Professional Affiliations
American Anthropological Association Archaeological Institute of America American Quaternary Association International Society of Sedimentologists Geological Society of America National Geographic Society New York State Archaeological Association Professional Archaeologists of New York City Register of Professional Archaeologists Smithsonian Association Society for American Archaeology Society for Archaeological Science Society for Pennsylvania Archeology Southeastern Archaeological Conference

Geomorphology/Archaeological Borings and GIS Model, 2014 New York/New Jersey Harbor Navigation Project Page 219
Curtis E. Larsen, Ph.D.
Geoarcheologist
Recently retiring after a twenty six year career with the United States Geological Survey, Curtis Larsen now works as a geomorphologist for GRA on a project-by-project basis. While working for the USGS Curtis was involved in project management and research projects across the United States. Much of his research focused on understanding the relationship between climate change and sea level rise, particularly in the Mid-Atlantic and the Chesapeake Bay. Other significant work while with the USGS included studies of climate, lake levels and geomorphology of the Great Lakes. Prior to working for the USGS Curtis worked as a project manager for a cultural resource firm and undertook projects in the Southeast and the Great Lakes. His dissertation research while attending the University of Chicago was conducted in the Persian Gulf and the Eastern Arabian Peninsula and focused on long term human/landscape interactions in the Bahrain Islands. His research is published in The Journal of Coastal Research, Shore and Beach, Geoarcheology, Quaternary Science Reviews, The Journal of Great Lakes Research, numerous special publications and open file reports with the USGS, as well as in edited volumes and his dissertation by the University of Chicago Press. With GRA he applies his expertise to projects in off- and near-shore settings.
Education
Ph.D. 1980 University of Chicago Anthropology/Archaeology
M.A. 1971 Western Washington University Anthropology/Archaeology
B.S. 1964 University of Illinois Geology/Math & Physics
Employment History
2006 – present Geoarcheology Research Associates, Riverdale, New York. — Geoarcheologist on a project-by-project basis.
1980 – 2006 – Career:
United States Geological Survey, Reston, Virginia.
2003 – 2006 Research geologist (GS-14), International Programs Office. Served as area specialist for USGS programs and activities in Europe, Russia, and the states of the former Soviet Union. Duties carried out in tandem with research shown below.
1997 – 2006 Research geologist (GS-14), Eastern Earth Surface Processes and Climate History Teams. Research on global sea level rise focused on Chesapeake Bay and the Mid Atlantic Coast.
1995 – 1997 Deputy Eastern Regional Geologist (GS-15). Management of Eastern Region Geologic Division policy and research funding with Regional Geologist.
1982 – 1995 Research Geologist (GS-13, GS-14), Eastern Mineral Resources Branch. Research on heavy mineral placer deposits as well as climate related lake level history of the Great Lakes.
1980 to 1982 Environmental Scientist (GS-13), Environmental Affairs Office. Served as Bureau Historic Preservation Officer and as the principal authority in areas of cultural and archeological resources. 1977 to 1980: Archeologist, Environmental Planning Division, Gilbert Commonwealth Assoc., Inc., Jackson, MI. Responsible for planning, implementation, and completion of various archeological resource and geological projects for Federal and private sector clients. Projects included archeological surveys and excavations as well as environmental planning studies.

Geomorphology/Archaeological Borings and GIS Model, 2014 New York/New Jersey Harbor Navigation Project Page 220
1976 to 1977 Doctoral Candidate, studied museum collections and other materials related to my dissertation topic in the Persian Gulf region at the University of Aarhus, Aarhus, Denmark. Funded by George C. Marshall Scholarship provided by the Denmark-America Fund and the American Scandinavian Foundation.
1975 to 1976 Doctoral Candidate, dissertation field research, Persian Gulf Region. Conducted archeological and geological fieldwork in Bahrain and eastern Saudi Arabia. This work included appraisals of geomorphology, hydrology, geologic structure, and Quaternary stratigraphy. Research was aimed at documenting long-term land use patterns on the Bahrain Islands, and determining paleoenvironmental changes in eastern Arabia and Bahrain.
1974 to 1975 Instructor at the University of North Carolina--Wilmington, Wilmington, North Carolina. Taught introductory courses in general anthropology, New World archeology, world prehistory, and environmental archeology. Held committee memberships and advised undergraduate students. Left position to complete dissertation research.
1973 to 1974 Geologist and Research Assistant with the Illinois State Geological Survey, Urbana, Illinois. Conducted coastal geomorphological research and fieldwork along Lake Michigan shorelines. Investigated evidence for Holocene fluctuations in Lake Michigan levels as exposed in outcrop and subsurface.
Books
Larsen, Curtis E., 1983, Life and Land Use on the Bahrain Islands, the Geoarcheology of an Ancient Society, The University of Chicago Press, Chicago and London, 339 p.
Articles and Published Reports
Larsen, C.E. and Inga Clark, 2006, A search for scale in sea level studies, Journal of Coastal Research, Vol. 22, pp. 788-800.
Clark, Inga, C.E. Larsen, and M. Herzog, 2004, Evolution of equilibrium slopes at Calvert Cliffs, Maryland, a method of
estimating the timescale of slope stabilization, Shore and Beach, Vol. 72, pp. 17-23. Herzog, Martha, C.E. Larsen, and Michele McRae, 2002, Slope Evolution at Calvert Cliffs, Maryland, Measuring the Change
from Eroding Bluffs to Stable Slopes, U.S. Geological Survey Open-File Report OF-02-332. On USGS website as:http://pubs.usgs.gov/of/2002/of02-332/
Clark, Inga, C.E. Larsen, and Michele McRae, 2002, Historic bluff retreat and stabilization at Flag Harbor, Chesapeake Bay,
Maryland, U.S. Geological Survey Open-File Report OF-02-331. On USGS website as:http://pubs.usgs.gov/of/2002/of02-331/
Larsen, C.E., 1999, A century of Great Lakes research: finished or just beginning, in Halsey, J.R., ed., Retrieving Michigan's
Buried Past, Cranbrook Inst. of Science Bulletin 64, p. 1-30 Larsen, C.E., 1999, Cultural resources and the U.S. Geological Survey, CRM (Special Issue, A Sesquicentennial Overview
of CRM at the Interior Department), Vol. 22, no. 4, p. 38-40. Larsen, C.E., 1998, The Geological Background to Sea Level Rise in Chesapeake Bay. U.S. Geological Survey Fact Sheet
FS-102-98, 4 p. On USGS website as: http://pubs.usgs.gov/fs/fs102-98/ Colman, S.M., Clark, J.A., Clayton, L., Hansel, A.K., and Larsen, C.E., 1994, Deglaciation, lake levels, and meltwater
discharge in the Lake Michigan basin, in Teller, J.T., and Kehew, A.E., eds, Late glacial history of large proglacial lakes and meltwater runoff along the Laurentide Ice Sheet, Quaternary Science Reviews, Vol. 13, p. 879-890.
Larsen, C.E., 1994, Beach ridges as monitors of isostatic uplift in the upper Great Lakes, Journal of Great Lakes Research,
vol. 20, p. 108-134. Larsen, C.E., 1993, Heavy minerals at the Fall Zone--a theoretical model of grain size, density, and gradient, in Berger, B.R.,
and Detra, P.S., eds., Advances for United States and international mineral resources, developing a framework and exploration technologies, U.S. Geological Survey Bulletin 2039, p. 167-180.
Larsen, C.E., 1991, Relative lake level changes in the upper Great Lakes--reconstructing the pattern of postglacial warping

Geomorphology/Archaeological Borings and GIS Model, 2014 New York/New Jersey Harbor Navigation Project Page 221
with accuracy: in Folger, D.W., Colman, S.M., and Barnes, P.W., eds, Southern Lake Michigan Coastal Erosion Study Workshop, February 5-6, 1991, U.S. Geological Survey Open-File Report 91-284, p. 33-40.
Larsen, C.E., and Schuldenrein, J., 1990, The depositional history of an archaeologically-dated floodplain, Haw River, North
Carolina, in Lasca, N.P., and Donahue, J.D., eds, Archaeological Geology of North America: Geological Society of America, Centennial Special Volume 4, p. 161-181.
Larsen, C.E., Hill, R.H., Kulik, D.M., Brown, M.K., and Scott, D.C., 1988, Mineral resources of the Cedar Mountain
Wilderness Study Area, Washakie and Hot Springs Counties, Wyoming: U.S. Geological Survey Bulletin 1756-B, 17 p. Larsen, C.E., 1988, Book Review: Quaternary Glaciations in the Northern Hemisphere, V. Sibrava, D.W. Bowen, and G.M.
Richard, eds, 1986, Quaternary Science Reviews, v. 5, 510 p., in Geoarchaeology, v. 4, p. 376-380. Larsen, C.E., 1987, Long term trends in Lake Michigan levels, a view from the geological record, in Proceedings of the First
Indiana Dunes Research Conference: Symposium on Shore Processes, National Park Service, Atlanta, Ga., p. 5-22. Larsen, Curtis E., 1987, Geologic History of Lake Algonquin and the Upper Great Lakes, U.S. Geological Survey Bulletin
1801, 36 p. Larsen, C.E., 1986, Book review: Masters, P.M. and Flemming, N.C., eds. 1983, Quaternary Coastlines and Marine
Archaeology: Academic Press, Geoarchaeology, v. 1, p. 313-315. Hansel, A.K., Mickelson, D.M., Schneider, A.F., and Larsen, C.E., 1985, Late Wisconsin and Holocene History of the Lake
Michigan Basin, in Karrow, P.F., and Calkin, P., eds. Quaternary Evolution of the Great Lakes: Geological Association of Canada, Special Paper 30. p. 39-53.
Larsen, C.E., 1986, Variation in Holocene land use patterns on the Bahrain Islands: Construction of a land-use model, in Al-
Khalifa, S.H.A., and Rice, M., eds., Bahrain through the Ages, The Archaeology: Routledge and Kegan Paul, London, p. 25-46.
Larsen, C.E., 1985, Lake level, uplift and outlet incision, the Nipissing and Algoma Great Lakes, in Karrow, P.F., and Calkin,
P., eds. Quaternary Evolution of the Great Lakes: Geological Association of Canada, Special Paper 30, p. 63-77. Larsen, C.E., 1985, Chapter 2, Water Resources of the Past, in Water Atlas of Saudi Arabia, Ministry of Agriculture and
Water, Kingdom of Saudi Arabia, p. 9-16. Larsen, C.E., 1985, A Stratigraphic Study of Beach Features on the Southern Shore of Lake Michigan: New Evidence of
Holocene Lake Lake Level Fluctuations: Illinois State Geological Survey Environmental Geology Notes 112, 31 p. Larsen, C.E., 1985, Geoarcheological interpretation of Great Lakes, Lakeshore Environments, in Stein, J.K., and Farrand,
W.R., eds., Archaeological Sediments in Context: Peopling of the Americas Edited Series, no. 1, Institute for Quaternary Studies, University of Maine, Orono, p. 99-110.
Larsen, C.E., l983, The early environment and hydrology of ancient Bahrain, in D.F. Potts, ed., Dilmun: New studies in the
Archaeology and History of Bahrain: Berliner Beiträge zum Vordern Orient, no. 2, D. Reimer Verlag, Berlin, p. 1-34. Larsen, C.E., l983, Life and Land Use on the Bahrain Islands: The Geoarcheology of an Ancient Society: The University of
Chicago Press, Chicago, Illinois, 339 p. Larsen, C.E., Beckely, B.S., and Bierschenk, W.H., 1982, Reconnaissance investigations of selected galleries in the
Western Province, Saudi Arabia: report prepared for the Ministry of Agriculture and Water, Riyadh, Saudia Arabia through the USGS, Office of International Hydrology, Reston.
Larsen, C.E., 1982, Geoarcheology of the Haw River, in Claggett, S.R. and Cable, J.S., assemblers, The Haw River sites:
Archeological investigations at two stratified sites in the North Carolina Piedmont, v. 1, p. 145-222. Larsen, Curtis E., 1980, Holocene Land Use Variations on the Bahrain Islands, unpublished doctoral dissertation, The
University of Chicago, 408 p. Claggett, S.R., and Cable, J.S. assemblers; Larsen, C.E., principal investigator, 1982, The Haw River sites: Archeological
investigations at two stratified sites in the North Carolina Piedmont, 3 vols, Commonwealth Associates, Inc., Jackson, Michigan.
Larsen, C.E., Weston, D.E., Newkirk, J.A., Weir, D.J., and Schaeffer, J.E., 1980, The Bazuin Site. Excavation of Lowes

Geomorphology/Archaeological Borings and GIS Model, 2014 New York/New Jersey Harbor Navigation Project Page 222
Island Site 44LD3, Loudoun County, Virginia: Commonwealth Associates, Inc., Jackson, Michigan, 190 p. Larsen, C.E., Anderson, D.G., Kimball, J.C., Newkirk, J.A., and Weir, D.J., 1979, A cultural resource overview of the Wayne
National Forest: Commonwealth Associates, Inc., Jackson, Michigan, 148 p. Larsen, C.E., Anderson, D.G., Claggett, S.R., Kimball, J.C., and Newkirk, J.A., 1979, A culturalresource overview of the
Hoosier National Forest: Commonwealth Associates, Inc., Jackson, Michigan, 156 p. Larsen, C.E., and Demeter, C.S., 1979, Archeological investigations of the proposed West River Drive, Bay City, Michigan:
Commonwealth Associates, Inc., Jackson, Michigan, 109 p. Fitting, J.E., Larsen, C.E., and Kern, J.R., 1979, Archeological and historical investigations of the floodplain area, Midland,
Michigan: Commonwealth Associates, Inc., Jackson, Michigan, 69 p. 15. Larsen, C.E., and Evans, G., 1978, The Holocene geological history of the Tigris-Euphrates-Karun Delta, in W. Brice, ed.,
The Environmental History of the Near and Middle East Since the Last Ice Age: Academic Press, London, p. 227-244. Larsen, C.E., Demeter, C.S., 1978, Archeological/historical reconnaissance survey of the Shiawassee National Wildlife
Refuge, Saginaw, Michigan: Commonwealth Associates, Inc., Jackson, Michigan, 75 p. Larsen, C.E., Claggett, S.R., and Kern, J.R., 1978, An archeological and historical survey of the Grass Rope Unit, Lower
Brule, South Dakota: Commonwealth Associates, Inc., Jackson, Michigan, 77 p. Fitting, J.E., Larsen, C.E., and Demeter, C.S., 1977, A cultural resources survey of the Shiawassee Flats flood control
project: Commonwealth Associates, Inc., Jackson, Michigan, 61 p. Fitting, J.E., Larsen, C.E., and Kimball, J.C., 1977, Archeological testing project, Tri-Creek Watershed, Monroe County,
Wisconsin: Commonwealth Associates, Inc., Jackson, Michigan, 50 p. Larsen, C.E., 1975, The Mesopotamian delta region: A reconsideration Lees and Falcon: Journal of the American Oriental
Society, v. 95, no. 1, p. 43-57. Fraser, G.S., Larsen, C.E., and Hester, N.C., 1975, Climatically controlled high lake levels in the Lake Michigan and Lake
Huron basins: An Acad. brasil, Cienc., v. 47. Grabert, G.F., and Larsen, C.E., 1975, Marine transgressions and cultural adaptation: Preliminary tests of an environmental
model, in W. Fitzhugh, ed., Prehistoric Maritime Adaptations of the Circumpolar Zone: Mouton, The Hague, p. 229-251. Larsen, C.E., 1974, Late Holocene lake levels in southern Lake Michigan, in C. Collinson, ed., Coastal Geology,
Sedimentology, and Management: Chicago and the Northshore: Illinois State Geological Survey Guidebook Series No. 12, p. 39- 49.
Larsen, C.E., 1973, Prehistoric levels of Lake Michigan-Huron: Their potential in shoreland planning: Proceedings of the
Lake Michigan Shoreland Planning Conference, Lake Michigan Federation, Chicago, p. 169-195. Larsen, C.E., 1973, Variation in bluff recession to lake level fluctuations along the high bluff Illinois shore: Document No. 73-
14, Illinois Institute for Environmental Quality, Chicago, 73 p. Fackler, R.C., Hoerauf, E.A., Larsen, C.E., Lingbloom, K.L., and Short, M.S., 1972, Nearshore currents--southeastern Strait
of Georgia: Proceedings of the 13th International Conference on Coastal Engineering, Vancouver. Schwartz, M.L., Fackler, R.C., Hoerauf, E.A., Larsen, C.E., Lingbloom, K.L., and Short, M.A.,1972, Nearshore currents--
southeastern Strait of Georgia: Syesis, Jour. of the B.C. Provincial Museum, v. 5, p. 17-130.

Geomorphology/Archaeological Borings and GIS Model, 2014 New York/New Jersey Harbor Navigation Project Page 223
Michael Aiuvalasit, M.A.
Staff Geoarcheologist
Mr. Aiuvalasit specializes in conducting investigations of the geological context, paleoenvironmental record, and site formation processes of archeological sites. Since 2001 Mr. Aiuvalasit has held a variety of positions for cultural resource firms, including lab director, staff archeologist, assistant lithic analyst, and field archeologist. He has authored both archeological and geoarcheological reports for cultural resource investigations in Texas, New Jersey, Pennsylvania, and New York, and coauthored or presented papers on research conducted in Mexico, Texas, New Mexico, and New York. Currently he is completing the reports on geoarcheological studies at seven prehistoric data recovery investigations in upstate New York. He is listed in the Register of Professional Archaeologists (RPA), and is a member of the Society for American Archaeology (SAA), Geological Society of America (GSA), and other local societies. He has current HAZWOPER and Confined Space Entry training. He received training at the University of Texas and Texas A&M University.
Education
M.A. 2006 Texas A&M University Anthropology/Archaeology
B.A. 2001 University of Texas Anthropology/Archaeology/History
Employment History
2006 – 2011 Project Geoarcheologist Geoarcheology Research Associates Riverdale, New York
2005 – 2006 Field Archaeologist Environment and Archaeology, Inc, Kittatiny Archaeological Research Inc., Gray and Pape Inc.
2002 – 2004 Staff Archaeologist and Lab Manager Hicks and Company Austin, Texas
1999 – 2002 Field Archaeologist, various CRM companies in Texas and New Mexico.
Fellowships and Grants
2005 Texas Archeological Society Donors Fund Research Grant
2005 Council of Texas Archeologists Student Research Grant
2005 Teaching Assistantship (Texas A&M University, Department of Anthropology)
Publications
Aiuvalasit, Michael, James A. Neely and Mark Bateman 2010. New Radiometric dating of water management features at the prehistoric Purrón Dam Complex, Tehuacán Valley, Puebla, México. Journal of Archeological Sciences doi:10.1016/j.jas.2009.12.019.
Aiuvalasit, Michael. 2007. The Geoarchaeology of the McNeill Ranch site: Implications for Paleoindian Studies of the Gulf Coastal Plain of Texas. Bulletin of the Texas Archeological Society 78.

Geomorphology/Archaeological Borings and GIS Model, 2014 New York/New Jersey Harbor Navigation Project Page 224
Cultural Resources Management Reports
Schuldenrein, Joseph, Michael Aiuvalasit, and Mark A. Smith. 2009. Geoarcheological Investigations at the Treehouse site (38LX531) along the Saluda River near Lake Murray Dam, Columbia, South Carolina. Report prepared by Geoarcheology Research Associates, Inc., Yonkers, NY. For S&ME, Inc.,Columbia, South Carolina.
Aiuvalasit, Michael and Mark A. Smith. 2009. Phase I and II Geoarchaeological Investigations at the proposed Outfall
Project for the Somerset-Raritan Sewerage Authority, Bridgewater Township, Somerset County, New Jersey. Prepared by Geoarcheology Research Associates, Yonkers, NY. For Somerset-Raritan Sewerage Authority, Bridgewater, N.J.
Aiuvalasit, Michael. 2009. Geoarchaeological observations of geotechnical borings for the T.H.E. Partnership at the Twelfth
Avenue Fan Plant/Construction Access Shaft Site, 29th Street and 12th Avenue, Manhattan, New York. Report prepared by Geoarcheology Research Associates, Inc., Yonkers, NY. For Richard Grubb and Associates, Cranbury, New Jersey.
Schuldenrein, Joseph, Michael Aiuvalasit, and Mark A. Smith. 2009. Results of Phase I Geoarcheological Investigations at
the North Columbia Quarry, Richland County, South Carolina. Report prepared by Geoarcheology Research Associates, Inc., Yonkers, NY. For Brockington and Associates, Mt. Pleasant, South Carolina.
Schuldenrein, Joseph and Michael Aiuvalasit. 2009. Geoarcheological Investigations, Project Independence, Washington
County, Georgia. Report prepared by Geoarcheology Research Associates, Inc., Yonkers, NY. For MACTEC Engineering and Consultants, Knoxville, TN.
Aiuvalasit, Michael J. and Joseph Schuldenrein. 2009. Draft Report of Geoarcheological Investigations at site BRO-
117(OPRHP A00716.000034), Town of Windsor, Broome, County, New York (OPRHP 04PR02986). Report prepared by Geoarcheology Research Associates, Inc., Yonkers, NY. For Gray and Pape, Cincinnati, OH.
Aiuvalasit, Michael J. and Joseph Schuldenrein. 2009. Draft Report of Geoarcheological Investigations at site BRO-212
(OPRHP A00716.000035), Town of Windsor, Broome, County, New York (OPRHP 04PR02986). Report prepared by Geoarcheology Research Associates, Inc., Yonkers, NY. For Gray and Pape, Cincinnati, OH.
Aiuvalasit, Michael J. and Joseph Schuldenrein. 2009. Draft Report of Geoarcheological Investigations at site ORA-0550
(OPRHP A007118.00281), Town of Minisink, Orange, County, New York.Report prepared by Geoarcheology Research Associates, Inc., Yonkers, NY. For Gray and Pape, Cincinnati, OH.
Aiuvalasit, Michael J. and Joseph Schuldenrein. 2008. Draft Report of Geoarcheological Investigations at site ORA-9931
(OPRHP A007118.00281), Town of Minisink, Orange, County, New York.Report prepared by Geoarchaeology Research Associates, Inc., Yonkers, NY. For Gray and Pape, Cincinnati, OH.
Aiuvalasit, Michael J. and Joseph Schuldenrein. 2008. Draft Report of Geoarcheological Investigations at site ORA-9936
(OPRHP A007118.00281), Town of Minisink, Orange, County, New York. Report prepared by Geoarchaeology Research Associates, Inc., Yonkers, NY. For Gray and Pape, Cincinnati, OH.
Aiuvalasit, Michael J. and Joseph Schuldenrein. 2008. Draft Report of Geoarcheological Investigations at site ORA-9942
(OPRHP A007118.00281), Town of Minisink, Orange, County, New York. Report prepared by Geoarchaeology Research Associates, Inc., Yonkers, NY. For Gray and Pape, Cincinnati, OH.
Aiuvalasit, Michael J., Donald M. Thieme, and Joseph Schuldenrein. 2008. Draft Report of Geoarcheological Investigations
at site BRO-0509 Town of Binghamton, Broome, County, New York (OPRHP 04PR02986). Report prepared by Geoarchaeology Research Associates, Inc., Yonkers, NY. For Gray and Pape, Cincinnati, OH.
Aiuvalasit, Michael J. and Joseph Schuldenrein. 2008. Observations of Lithic Weathering, Material Characterizations, and
Precontact Procurement Strategies at Site 36Bk239/36Bk746, S.R. 1010 Section 02B Bridge Replacement, Longswamp Township, Berks County, Pennsylvania. Report prepared by Geoarchaeology Research Associates, Inc., Yonkers, NY. For CHRS North Wales, P.A.
Aiuvalasit, Michael J. and Joseph Schuldenrein. 2008. Geoarcheological Assessment of Geotechnical Borings for the
Proposed Bridge and Access Road for the Paulsboro Marine Terminal Project, Borough of Paulsboro and Township of West Deptford, Gloucester County, New Jersey. Report prepared by Geoarcheology Research Associates, Inc., Riverdale, N.Y. for Richard Grubb and Associates, Cranbury, NJ.
Aiuvalasit, Michael J., Joseph Schuldenrein. 2008. Geoarcheological Assessment NJTA Interchange 18W NWC Widening,
Carlstadt, Bergen County New Jersey. Report prepared by Geoarcheology Research Associates, Inc., Yonkers, N.Y. for the RBA Group, Parsippany, N.J.

Geomorphology/Archaeological Borings and GIS Model, 2014 New York/New Jersey Harbor Navigation Project Page 225
Schuldenrein, Joseph, Michael Aiuvalasit, and Mark Smith. 2008 . Geoarchaeological Study of Buried Landscapes for the
Proposed 2nd Avenue Subway between E 92nd and E 99th Streets, New York, New York. Report prepared by Geoarcheology Research Associates, Inc., Riverdale, N.Y. for the Metropolitan Transportation Authority, DMJM+HARRIS-ARUP, JV, New York, New York.
Aiuvalasit, Michael and Charles Frederick. 2008. Goarchaeological Investigation of the McFaddin Ranch, Exelon Project,
Victoria County, Texas. Report prepared by Geoarcheology Research Associates, Inc, Riverdale, NY and C. Frederick Consulting Geoarcheologist, Dublin, TX for Geomarine, Inc, Plano, T.X.
Aiuvalasit, Michael. 2008. Results of a Geomorphological Assessment for T-336 Mill Hill Road Bridge Replacement Project,
Luzerne County, Sugarloaf Township, Pennsylvania. Report prepared by Geoarcheology Research Associates, Inc., Riverdale, NY. for Borton Lawson, Wilkes Barre, P.A.
Aiuvalasit, Michael and Joseph Schuldenrein. 2006. Geoarchaeological Assessment for the Croton Falls Pumping Station,
New York. Report prepared by Geoarcheology Research Associates, Inc., Riverdale, N.Y. for Historical Perspectives Inc., Westport, C.T.
Aiuvalasit, Michael. 2006. Summary Report of Geoarcheological Investigations at SR4024 Bridge at Equinunk Creek,
Wayne County, P.A. Report prepared by Geoarcheology Research Associates, Inc., Riverdale, N.Y. for Cultural Resource Heritage Services, Inc., North Wales, P.A.
Aiuvalasit, Michael. 2006. Summary Report of Geoarcheological Investigations at SR247 Bridge Replacement at the
Lackawaxen River, Wayne County, P.A. Report prepared by Geoarcheology Research Associates, Inc., Riverdale, N.Y. for Cultural Resource Heritage Services, Inc., North Wales, P.A.
Aiuvalasit, Michael. 2006. Summary Report of Geoarcheological Investigations at SR170 Bridge Replacement at the
Lackawaxen River, Wayne County, P.A., Report prepared by Geoarcheology Research Associates, Inc., Riverdale, N.Y. for Cultural Resource Heritage Services, Inc., North Wales, P.A.
Aiuvalasit, Michael. 2006. Summary Report of Geoarcheological Investigations at SR118 Bridge at Huntington Creek,
Luzerne County, P.A., Report prepared by Geoarcheology Research Associates, Inc., Riverdale, N.Y. for Cultural Resource Heritage Services, Inc., North Wales, P.A.
Brett A. Houk, Michael Aiuvalasit, and Thanet Skoglund. 2005. An Archaeological Survey of the McNutt Wastewater
Interceptor Project, Williamson County, Texas. SWCA Environmental, Inc. Aiuvalasit, Michael and Chris Caran. 2003. Results of Geoarcheological Investigations at a Playa Lake in McAlister Park,
Lubbock, TX. Hicks & Co. Archeology Series 117. Aiuvalasit, Michael and Rachel Feit. 2003. Upper Tannehill/Lower Fort Branch Sewer Line Upgrade Archeological Survey.
Hicks & Co. Archeology Series 122.
Selected Presentations at Professional Meetings
2010 Alluvial Geoarchaeology of the Susquehanna River sites. Society for American Archaeology.
2008 Geoarchaeology on the Edge: Submerged, near-Shore and off-Shore Landscapes of New York Harbor and Early Manhattan Island. Geological Society of America.
2007 The Purrón Dam Complex Revisited: Results of a Pilot Geoarchaeological Investigation at a Prehistoric Water Management System in the Tehuacán Valley of Southern México. Geological Society of America
2007 Geoarchaeology of Deweyville Terraces. Society for American Archaeology
2006 The Geoarchaeology of Deweyville Terraces in Texas: Implications for Paleoindian Studies. Texas Archaeological Society
2001 The Parallel Mischaracterizations of Golden Age Spain's and Pre-Hispanic Americas Landscape and Agriculture. World History Association of Texas

Geomorphology/Archaeological Borings and GIS Model, 2014 New York/New Jersey Harbor Navigation Project Page 226
Mark A. Smith, Ph.D.
Staff Archeologist
Dr. Mark Smith specializes in Geographic Information Systems (GIS) and mapping applications for cultural resource surveys and excavations. He is the primary cartographic specialist for GRA and is trained in the use and application of various surveying systems (e.g., Total Station, GPS, etc.). Dr. Smith is also experienced in nautical archeology having received his M.A. in the subject at Texas A&M University and participated in underwater excavations off the coast of Turkey and in the Caribbean. His dissertation research at New York University entailed an analysis of settlement geography in the Punjab, Pakistan, during the Early Historic and Medieval Periods. Dr. Smith has field experience in the Eastern United States, the Eastern Mediterranean, the Middle East, South Asia and the Caribbean. He has directed CRM projects in the Northeast and recently he held the position of Field Director for the Regime Crimes Liaison Office Iraq Mass Graves Team.
Education
Ph.D. 2007 New York University Anthropology
M. Phil 1999 New York University Anthropology
M.A. 1995 Texas A&M University Anthropology
B.A. 1989 University of Arizona Anthropology
Employment History
1998 –2011 Staff Archaeologist/GIS coordinator, Geoarcheology Research Associates Riverdale, NY
2006 Field Director, Regime Crime Liaison Office, U.S. Department of State Baghdad, Iraq
2005 – 2006 GIS Coordinator/Assistant Field Director, Regime Crime Liaison Office, U.S. Department of State Baghdad, Iraq
2004 Research Assistant, New York University New York, NY
2000 – 2004 Assistant Archaeologist/GIS Consultant, John Milner Associates, Inc. Croton-on-Hudson, NY
2002 GIS consultant, New York University New York, NY
Awards and Fellowships
1996 – 2004 Graduate Teaching Assistant, New York University
1999 George Franklin Dales Foundation Scholarship
1998 Salwen Fellowship for dissertation Research
1991 Institute of Nautical Archaeology Scholarship
1990 Institute of Nautical Archaeology Scholarship

Geomorphology/Archaeological Borings and GIS Model, 2014 New York/New Jersey Harbor Navigation Project Page 227
Publications
Smith, M. A. and Boyle, J. 2003. Using GIS to Analyze Farms and Farmstead Architecture in the Finger Lakes national Forest. In GIS in Historical Archaeology / Case Study from Central New York, James A. Delle and Patrick Heaton, editors. Northeastern Historical Archaeology, 32: 45-56.
Delle, J. A., P. J. Heaton, J. Boyle, T. Cuddy, K. Holmberg, J. Six, M. Smith, N. Thomas, and K. Wehner. 2003. The Hector
Backbone: A Quiescent Landscape of Conflict. Historical Archaeology 37 (3). Smith, M. A. 1994. The Bronze Age shipwreck at Uluburun, Turkey. In S. R. Rao (ed.) The Role of Universities and
Research Institutes in Marine Archaeology. Goa: Society for Marine Archaeology.
Cultural Resources and Management Reports
Schuldenrein, J., M. A. Smith, S. Malin-Boyce and C. Bergoffen. 2008. Phase 1A Archaeological Investigation for the Proposed Randall's Island Field Development Project. A report prepared by Geoarcheology Research Associates, Inc., Yonkers, N.Y. for Randall's Island Sports Foundation, Inc., New York and DMJM+Harris, Inc., NY.
Schuldenrein, J., M. Aiuvaslasit, M. A. Smith. 2008. Geoarchaeological Study of Buried Landscapes for the Proposed 2nd
Avenue Subway between E. 92nd and E99th Streets, New York, New York. A report prepared by Geoarcheology Research Associates, Inc., Riverdale, N. Y. for Metropolitan Transportation Authority (MTA), New York, New York.
Schuldenrein, J. C. E. Larsen, M. Aiuvalasit, M. A. Smith and S. Malin-Boyce. 2007. Geomorphological/Archaeological
Borings and GIS Model of the Submerged Paleoenvironment in the New York/New Jersey Harbor and Bight in connection with the New York and New Jersey Harbor Navigation, Project Port of New York and New Jersey. 2A report prepared for NEA, Portland, Maine.
Schuldenrein, J. R. A. Rowles, N. DuBroff and M. A. Smith. 2006. Developing a Framework for a
Geomorphological/Archaeological Model of the Submerged Paleoenvironment in the New York/New Jersey Harbor and Bight in connection with the New York and New Jersey Harbor Navigation Project Port of New York and New Jersey. A report prepared for Barry A. Vittor & Associates, Inc.
Malin-Boyce, S., M. A. Smith and S. Selby. 2004. Phase I/II Archaeological Investigations for the Proposed Valley View
Group Campsite, Delaware Water Gap Nation Recreation Area, Lehman Township, Pike County, Pennsylvania. A report prepared for U. S. Department of the Interior, National Park Service, Delaware Water Gap National Recreation Area.
Schuldenrein, J., Donald Thieme and M. A. Smith. 2004. The Development and Archaeological Applications of a
Geomorphological Survey and Map, Fort Bragg, North Carolina. A report prepared for Ft. Bragg Directorate of Contracting, Ft. Bragg, North Carolina.
Heaton, P. J., M. A. Smith and Joel I. Klein. 2003. GIS Archaeological Sensitivity Model and Results of Archeological Field
Survey, High Falls Public Water Installation, Ulster County, New York. A report prepared for John Milner Associates, Croton-on-Hudson, New York.
Malin-Boyce, S., M. A. Smith, and J. Schuldenrein. 2002. Phase 1A and Phase 1B Archaeological Survey Proposed Blue
Point Development Site Hamlet of Blue Point, Township of Brookhaven, Suffolk County, New York. Report prepared by Geoarcheology Research Associates, Inc., Riverdale, N. Y. for Two Guys, LLC., Centereach, N.Y.
Malin-Boyce, S., M. A. Smith, and J. Schuldenrein. 2001. Phase 1A and Phase 1B Archaeological Surveys Proposed Stony
Point Substation Site, Town of Stony Point, Rockland County, New York. Report prepared by Geoarcheology Research Associates, Inc., Riverdale, N.Y. for Orange and Rockland Utilities, Inc., Spring Valley, N.Y.
Malin-Boyce, S., M. S. Smith, and J. Schuldenrein. 2001. Supplement 5 to Phase IB Archaeological Investigation,
Stagecoach Storage Project, Town of Owego and Town of Nichols, Tioga County, New York. Report prepared by Geoarcheology Research Associates, Inc., Riverdale, N.Y. for Foster Wheeler Environmental Corp., Livingston, N.J.
Malin-Boyce, S., M. A. Smith, and J. Schuldenrein. 2001. Supplement 6 to Phase IB Archaeological Investigation,
Stagecoach Storage Project, Town of Owego and Town of Nichols, Tioga County, New York. Report prepared by Geoarcheology Research Associates, Inc., Riverdale, N.Y. for Foster Wheeler Environmental Corp., Livingston, N.J.
Heaton, P. J., M. A. Smith and J I. Klein. 2001. A GIS Based Archaeological Sensitivity Model for use in Conjunction with the

Geomorphology/Archaeological Borings and GIS Model, 2014 New York/New Jersey Harbor Navigation Project Page 228
Public Water Supply Installations Project Village of High Falls, Ulster County, New York. A report prepared for John Milner Associates, Croton-on-Hudson, New York.
Schuldenrein, J., D. M. Thieme, M. A. Smith and T. Epperson. 2000. A Geomorphological and Archeological Study in
Connection with the New York and New Jersey Harbor Navigation Study, Upper and Lower Bay, Port of New York. A report prepared for Barry A. Vittor & Associates, Inc.
Regime Crimes Liason Office Reports
Smith, M. A., D. Z. C. Hines, N. J. Brighton, M. K. Trimble, C. S. Steele (editors). 2007. Forensic Investigation of Mass Grave KAR0024, Karbala Province, Iraq. United States Army Corps of Engineers, St. Louis District, Mandatory Center of Expertise for Archaeological Curation and Collections Management. Submitted to Department of Justice, Regime Crimes Liaison Office, United States Embassy Baghdad, Iraq.
Trimble, M. K., N. J. Brighton, D. Z. C. Hines, M. A. Smith (editors). 2007. Forensic Survey Along the Tar-as-Saiyid, Karbala
Province, Iraq. United States Army Corps of Engineers, St. Louis District, Mandatory Center of Expertise for Archaeological Curation and Collections Management. Submitted to Department of Justice, Regime Crimes Liaison Office, United States Embassy Baghdad, Iraq.
Hines, D. Z. C., S. Malin-Boyce, M. A. Smith, C. S. Steele (editors). 2006 Archaeological and Forensic Reconnaissance of
Potential Mass Graves Sites: Iraq, 2005-2006. United States Army Corps of Engineers, St. Louis District, Mandatory Center of Expertise for Archaeological Curation and Collections Management. Submitted to Department of Justice, Regime Crimes Liaison Office, United States Embassy Baghdad, Iraq.
Hines, D. Z. C., M. A. Smith, N. J. Brighton (editors). 2006. Forensic Investigation of Mass Grave KAR0008, Karbala
Province, Iraq. United States Army Corps of Engineers, St. Louis District, Mandatory Center of Expertise for Archaeological Curation and Collections Management. Submitted to Department of Justice, Regime Crimes Liaison Office, United States Embassy Baghdad, Iraq.
Selected Papers/Posters Presented
2008 The Application of GIS in Forensic Archaeology, Karbala, Iraq. A paper presented at the 2008 Meeting of the International Association of Forensic Scientists, New Orleans, Louisiana.
2008 (with Stephen A. Chomko) GIS Applications in Mass Graves Documentation and Analyses. A paper presented at the 41st Annual Conference on Historical and Underwater Archaeology, Albuquerque, New Mexico.
2003 The geomorphic background to human settlement in the New Jersey Meadowlands: New Perspective. A poster presented at the Meadowlands Symposium, New Jersey Meadowlands Commission, Lyndhurst, NJ.
2000 The archaeology of abandoned farmsteads in Hector Township, New York. A poster presented at the 33rd Conference on Historical and Underwater Archaeology, Quebec City, Quebec.
1999 Analysis of 19th and 20th century farmsteads in Hector Township: Integrating CAD, CPS and GIS. A poster presented at the 64th Annual Meeting of the Society for American Archaeology, Chicago, Illinois.
1997 (with James Delle) Archaeology, the tourist industry, and the state. A paper presented (by James Delle) at the 97th Annual Meeting of the American Anthropological Association, Washington, D.C.
1994 The Bronze Age shipwreck at Uluburun, Turkey. A paper presented at the Third Indian Conference on Marine Archaeology of Indian Ocean Countries, Karnataka State University, Karnataka, India.

Geomorphology/Archaeological Borings and GIS Model, 2014 New York/New Jersey Harbor Navigation Project Page 229
Appendix G
Scope of Work

Geomorphology/Archaeological Borings and GIS Model, 2014 New York/New Jersey Harbor Navigation Project Page 230
Scope of Work
and
Request for Proposal
For
Geomorphology/Archaeological Borings
And
GIS Model of the Submerged Paleoenvironment
In the New York/New Jersey Harbor and Bight
In Connection with the
New York and New Jersey Harbor Navigation Project
2000 Port of New York and New Jersey
I. Introduction
The U.S. Army Corps of Engineers, New York District (Corps), is constructing
navigation channels within the Port of New York - New Jersey (the Harbor Navigation Project)
to 15 m (50 ft) depth. As a federal agency, the Corps, is required to identify cultural resources
within its project areas and evaluate their eligibility for listing on the National Register of
Historic Places (NRHP). The Federal statutes and regulations authorizing the Corps to undertake
these responsibilities include Section 106 of the National Historic Preservation Act, as amended
through 1992 and the Advisory Council on Historic Preservation Guidelines for the Protection of
Cultural and Historic Properties (36 CFR Part 800).
As part of the Corps’ Section 106 compliance work, background research was conducted
and a series of cores were excavated and examined to determine locations within the areas of
proposed deepening and, more importantly, associated widening, that might preserve
stratigraphy containing significant data on the paleoenvironment. This initial work was
conducted to determine the feasibility of developing a model of the now submerged landforms
and landform preservation and from that determine the sensitivity of areas for Native American
occupation. Geoarcheology Research Associates (GRA), consultants to the Corps, developed a
preliminary sensitivity model. The previous work also determined areas where additional data
should be acquired. They subsequently developed a working framework and direction for
honing the preliminary model. This scope of work contains the tasks to develop the model using
a Geographic Information System. Up to forty (40) brings will be excavated in locations
determined by the geomorphologist based on review of previous work. The data recovered from
these borings will be used to refine the model. The model will be provided to the Corps in a
format that can be used by the Corps and shared with interested organizations.
A Programmatic Agreement for the project was signed in 2000 and amended in 2003.
The stipulations addressing off shore Native American resources appear below.

Geomorphology/Archaeological Borings and GIS Model, 2014 New York/New Jersey Harbor Navigation Project Page 231
Stipulation II. TREATMENT OF HISTORIC PROPERTIES.
The New York District shall adhere to the following treatment strategies in order
to avoid adverse effect to historic properties.
A. The New York District shall excavate a limited number of borings in locations
determined by a qualified geomorphologist within or adjacent to the Ambrose,
Anchorage, Kill Van Kull, Arthur Kill, Newark Bay, South Elizabeth and Bay
Ridge Channels as well as in the Jersey Flats at Port Jersey. These sediments will
be subject to foraminifera, pollen and Carbon-14 analysis. The results of this
work will be incorporated into a sensitivity model of now inundated former
prehistoric occupation areas. This work will be entered into a Geographic
Information System (GIS) compatible with other GIS data developed for the
Study.
B. The New York District shall notify appropriate institutions and organizations
of the availability of the prehistoric sensitivity model on GIS. A list of
appropriate institutions and organizations will be developed by the New York
District and will be submitted to the SHPO(s) for review. If the New York
District does not receive a response from the SHPO(s) within 45 days of receipt
the New York District will notify availability to the institutions and organizations
on the list submitted for review.
II. Study Area
The Harbor Navigation Project as a whole is limited to selected navigation channels
including Ambrose, Anchorage, Kill Van Kull, Arthur Kill, Port Jersey, Newark Bay (includes
South Elizabeth Channel, Elizabeth Channel, Elizabeth Pierhead Channel, Port Newark Pierhead
Channel and Port Newark Channel) and Bay Ridge Channels (Figure 1). These channels are
being deepened to 15 m (50 ft).
Cultural resources studies to date have been limited to the harbor and the channels listed
above as well as Stapleton and Claremont Channels; two channels for which no further work is
proposed. For purposes of this scope the study area will include the harbor channels listed
above, Raritan Bay, Lower Bay and part of the New York Bight defined as the area west of a line
drawn between Jones Inlet on Long Island and Long Branch, New Jersey (Figure 2). As habitat
mitigation sites may be located outside the harbor itself and Ambrose Channel extends outside
the harbor, a more regional approach may be beneficial to the Corps in its project planning.
III. Purpose
The purpose of the investigations outlined in this scope is to develop a model of the now
submerged paleoenvironment. This model should assist the Corps and researchers in
determining areas that might have been suitable for habitation and also indicate those areas that
stratigraphy from periods of occupation might remain intact. Also under this scope is the
acquisition of additional data through the excavation of off-shore borings/vibra cores to refine

Geomorphology/Archaeological Borings and GIS Model, 2014 New York/New Jersey Harbor Navigation Project Page 232
the model. This study is not designed to specifically locate cultural material. The overall goal of
this cultural resource work will be to determine those locations within the study areas that are
potentially sensitive for prehistoric resources.
IV. Previous Research
The work outlined in this scope will build on previous work conducted for the Harbor
Navigation Project and for the Corps’ Dredged Material Management Plan (DMMP). Recently
Geoarcheology Research Associates prepared a preliminary model with directions for further
research and model development. They based this on a previous a harbor-wide study that
included research, the excavation of a limited number of borings and pollen, foraminifera and
Carbon-14 analyses. They also conducted more detailed work for discrete portions of the harbor
(Arthur Kill and Port Jersey). The Arthur Kill and Port Jersey work were guided by previous
studies by LaPorta, Sohl and Brewer and Wagner and Siegel (Wagner and Siegel 1997; LaPorta,
Sohl and Brewer 1999). GRA developed a preliminary archaeological sensitivity model for
prehistoric resources within the harbor.
A second regional study within the harbor was conducted in connection with the DMMP.
The results of this study indicate that even in existing navigation channels, deeply buried
deposits may preserve prehistoric sites. However, most of the pertinent deposits are within the
uppermost 9 m (30 ft) of sediments (LaPorta, Sohl, and Brewer 1998). This study looked at
several locations within the harbor, two large areas in Raritan Bay and an area in the bight.
Most reports cited in the text above have been provided to the consultant by the Corps.
Other reports can be obtained from the Corps as needed.
V. Contractor Services and Required Investigations
A. The general services to be provided under this contract are those required to conduct
research and prepare a report on the prehistoric environment of the study area described
above in Section II, and develop a working GIS model of now buried landforms and their
sensitivity to have had, and to retain, prehistoric resources, as described in Sections I and
III, above. Borings or corings will be excavated offshore to obtain data relevant for the
model.
B. The Contractor shall be responsible for conducting, in the manner prescribed, the
work detailed below. Failure to fully meet the requirements of this scope of work may be
cause for termination of work for default of the contract, or for an evaluation of
unsatisfactory upon completion of the project.

Geomorphology/Archaeological Borings and GIS Model, 2014 New York/New Jersey Harbor Navigation Project Page 233
C. This scope of work requires the completion of the following tasks:
Task 1 - Prepare Health & Safety Plan and Hazard Analysis Plan
a. The Health and Safety Plan (HASP) and a Hazard Analysis Plan shall be
prepared. The HASP will serve as a safety plan and research strategy for all work.
The HASP and all work will comply with Engineering Manual EM 385-1-1,
"Safety and Health Requirements Manual" dated 3 November 2003 and all other
applicable regulations and guidelines. Appendix A of this manual provides a
minimum basic outline for the plans. The Corps can provide samples of plans.
The manual is available on-line at
http://www.hq.usace.army.mil/soh/hqusace_soh.htm.
b. District acceptance of the Health and Safety Plan must be obtained before any fieldwork is undertaken.
c. The HASP will also indicate the location of proposed tests and provide an overall
strategy for conducting the work.
Task 2 – Excavation of Borings and Sample Preparation
No more than forty (40) vibracores shall be excavated, unless the time allotted for
fieldwork allows for more. The location of these cores will be determined by the
geomorphologist prior to initiating fieldwork, as appropriate, based on background
material. The locations can be refined based on field results.
A continuous profile, using a medium diameter bore (80 to 100 mm/3 to 4 in
diameter), or 2-foot split spoon sampling device, should be obtained through Holocene
deposits and into the terminal Pleistocene deposits, if present. A geomorphologist
familiar with local submerged Pleistocene/Holocene deposits will be on board the vessel
as borings are taken and will determine the depths to which continuous cores must be
collected. The cores will not exceed 9 m (30 ft) of sediment and may be terminated prior
to that depth, under the direction of the geomorphologist, if the Holocene/Pleistocene
deposits of archaeological interest are encountered and examined before 9 m (30 ft) is
reached. If bedrock is encountered the borings shall be terminated. If soils appear
disturbed through natural or human action the coring may be terminated. The work shall
not exceed twenty nine (29) days including operation, contingency and preparation.
Location of cores shall be recorded with a differential global positioning system (DGPS).
The retrieved cores shall be recorded in standard log format or as directed by the
geomorphologist. The cores themselves shall be labeled as appropriate and shall include
project name, date, core hole identification and top and bottom of the cored interval will
be clearly labeled on both ends of core boxes. The lid on the inside of the core box will
show boring or core hole identification, depth and location of the top of the core and
depth and location of bottom of core.

Geomorphology/Archaeological Borings and GIS Model, 2014 New York/New Jersey Harbor Navigation Project Page 234
Immediately following retrieval of the vibracoring device at each station, the core
liner will be removed from the vibracorer, carefully capped to prevent loss of sediment,
marked with a unique station identifier, and placed on ice in a container aboard the
survey vessel. Cores should be stored in a vertical position to retain stratigraphy and
facilitate testing. Cores shall be held on ice or under refrigeration, as needed, aboard the
vessel and while being held ashore at the Corps’ Caven Point facility where they may be
temporarily stored during the course of the field investigation. The samples may be
prepared at Caven Point for shipping to the appropriate laboratories. The duration of
temporary storage and use of the Caven Point facility may not exceed 2 weeks from the
final day of fieldwork. The contractor is responsible for assuring proper handling of
samples. If results are deemed unacceptable due to improper handling or transport, it will
be the contractor’s financial responsibility to resample.
Task 3 - Sediment Testing
Samples will be taken from the cores and examined for evidence of cultural
material and paleoenvironmental data. Modern sediments will not be tested. All samples
selected for further analysis will undergo palynological testing (not to exceed 400
samples). Foraminifera (or macrofossils) and Carbon-14 analyses will be undertaken for
only those sediments determined by the geomorphologist as likely to yield significant
information. The number of samples to be tested for foraminifera/macrofossils by the
geomorphologist will not exceed a total of 400 samples. Carbon-14 testing will not
exceed 60 samples. The facilities undertaking the analyses must, at a minimum, abide
by local, state and federal OSHA standards and other applicable safety regulations and
guidelines.
Task 4 - Data Analysis and GIS Model
The Contractor will assemble and interpret all data collected for this study with
the purpose of collating it in the preparation of the model. Recommendations for the
model and suggested data layers were developed under previous work (see Attachment
1). These recommendations should form the basis of the GIS work. A report detailing
the work undertaken under this scope will be prepared. The report will also describe the
model and how it works, how it was developed and use and appropriateness of the data.
The report requirements are outlined in Section VI, below, and shall be followed as
applicable to this work.
The Corps’ GIS staff will be available to provide information on existing Corps
project datasets and Corps GIS requirements. All GIS products shall be fully compatible
with ESRI GIS software, to work with the Corps’ existing harbor datasets. The term
―compatible‖ means that data can be accessed directly by the target system without
translation, preprocessing, or post-processing of the digital data files. It is the
responsibility of the contractor to ensure this level of compatibility.

Geomorphology/Archaeological Borings and GIS Model, 2014 New York/New Jersey Harbor Navigation Project Page 235
All GIS data (including geospatial data acquisition and map development for use
in a GIS) shall conform to the most current release of the Spatial Data Standard for
Facilities, Infrastructure and Environment (SDSFIE). The most current release of the
SDSFIE is available for download from the Corps’ CADD/GIS Technology Center’s
Internet Website (http://tsc.wes.army.mil). All delivered digital GIS data files shall also
be submitted in strict compliance with the SDSFIE for the target GIS software system.
This work must be in compliance with ER 1110-1-8156: Policies, Guidance and
Requirements for Geospatial Data and Systems, dated1 August 1996.
The contractor shall provide metadata files for all geospatial and GIS data and
products under this contract. The metadata file shall conform to the Spatial Data Transfer
Standards (SDTS)/Federal Information Processing Standard (FIPS) 173, and Federal
Geographic Data Committee and to the SDSFIE. ―Corpsmet‖ is the preferred metadata
generating software and can be obtained free from the USACE Geospatial Data
Clearinghouse Node (http://corpsgeo1.usace.army.mil).
A draft version of any GIS product shall be submitted to the Corps according to
the schedule below, Section VII. The draft files will be reviewed by the Corps’ GIS staff
to ensure compatibility. Comments by the GIS staff shall be addressed and incorporated
into the final product. Once finalized, Fifteen (15) copies of all data and files developed
under this contract shall be delivered to the Corps in digital format. All digital files shall
be provided on compact disk, read-only memory (CD-ROM) in ISO-9660 format, or
Digital Versatile Disk (DVD) compatible with the Corps’ target GIS hardware. A
―Readme.txt‖ file must be included in the delivered digital media that includes normal
transmittal information (see Attachment 2). Use of the Internet to transfer files between
the contractor and the Corps is an option, as approved by the Corps’ Contracting Officer.
The report generated through this project shall be included in .pdf format on the CD-
ROM or DVD with the model.
The external label for each digital media shall contain, as a minimum, the
following:
―US Army Corps of Engineers, New York District‖
Contract Number and Delivery Order
Contractor name
Format and version of the operating system
Name and version of the utility software used for preparation (eg.,
compression/decompression) and copying files to the media.
Sequence number of digital media
List of the names on the digital media (as space permits)
Task 5 - Report Preparation

Geomorphology/Archaeological Borings and GIS Model, 2014 New York/New Jersey Harbor Navigation Project Page 236
The Contractor shall prepare interim, draft and final reports. The final report will
incorporate all comments received from the Corps and other reviewing agencies.
The report produced by a cultural resource investigation is of potential value not
only for its specific recommendations but also as a reference document. To this end, the
report must be a scholarly statement that can be used as a basis for any future cultural
resources work. It must meet both the requirements for cultural resource protection and
scientific standards of current research as defined in 36 CFR Part 800 and the Councils
Handbook.
1. One copy of each interim report will be submitted to the Corps, according to the
time schedule established in Section VII "Project Schedule", below. The interim
report will provide a brief summary of the work conducted to date and the work
yet to be completed. It shall present any preliminary results of the research.
2. Four copies of the draft report will be prepared and submitted to the
ContractingOffice according to the schedule established in Section VII, "Project
Schedule", below. The draft report will be reviewed by the Corps, the NJHPO,
the NYSHPO and the New York City Landmarks Preservation Commission. All
comments of the reviewing agencies and will be transmitted to the Contractor
prior to the submission of the final report.
3. Fifteen (15) copies of the final report shall be submitted to the Contracting Office
according to the schedule established below in Section VII, "Project Schedule".
The final report shall address all comments made on the draft report.
Task 6 - Project Management
The Contractor will be responsible for ensuring that all deliverables are provided
on schedule and that all terms of this scope of work are satisfied.
VI. Report Format and Content
A. The draft and final reports shall have the following characteristics, as applicable, to
this study:
1. The draft and final copies of the cultural resources report shall reflect and
report on the work outlined in Section V (Required Investigations) above.
They shall be suitable for publication and be prepared in a format reflecting
contemporary organizational and illustrative standards of professional
archaeological journals. The draft report will be revised to address all review
comments.
2. The report produced by a cultural resources investigation is of potential value
not only for its specific recommendations, but also as a reference document.

Geomorphology/Archaeological Borings and GIS Model, 2014 New York/New Jersey Harbor Navigation Project Page 237
To this end, the report must be a scholarly statement that can be used as a
basis for any future cultural resources evaluation. It must meet both job
requirements for cultural resources protection and scientific standards as
defined in 36 CFR Part 800 and in the "The Treatment of Archeological
Properties: A Handbook" (1980) published by the Advisory Council on
Historic Preservation.
3. All interim, draft and final copies of the report shall reflect and report on the
work required by this scope.
B. PAGE SIZE AND FORMAT. Each report shall be produced on 8 1/2" x 11"
archivally stable paper, single spaced with double spacing between paragraphs. The
printing of the text should be letter quality. All text pages, including figures, tables,
plates and appendices must be consecutively numbered.
C. Final copies of the report, with original photographs, shall be submitted in a hard-
covered binder suitable for shelving.
D. The TITLE PAGE of the report shall include the municipalities and counties
incorporated by the project area, the author(s) including any contributor(s). The
Principal Investigator should be identified and is required to sign the original copies
of the report. If the report has been written by someone other than the contract
Principal Investigator, then the cover of the publishable report must bear the
inscription "Prepared Under the Supervision of (NAME), Principal Investigator".
The Principal Investigator in this case must also sign the original copies of the report.
E. A MANAGEMENT SUMMARY or ABSTRACT shall appear before the TABLE
OF CONTENTS and LIST OF FIGURES. It should include a brief project
description including the location and size of the project area, the methods of data
collection, the results of the study, evaluations and identification of impacts and
recommendations. It should also include the location of where copies of the report
are on file.
F. The TABLE OF CONTENTS will include a list of all figures, plates and tables
presented in the report.
G. The INTRODUCTION will state the project's purpose and goals as defined by the
Scope of Work and will include the applicable regulations for conducting this work
and will contain a general statement of the work conducted and the recommendations
proposed.
H. The BACKGROUND RESEARCH must be sufficient to provide a detailed
description and evaluation of the prehistoric research of the project area. This section
should include a summary of the existence of sites and a description of previous work
conducted in the area. The following information should be presented and discussed
as applicable to the study:

Geomorphology/Archaeological Borings and GIS Model, 2014 New York/New Jersey Harbor Navigation Project Page 238
1. The ENVIRONMENTAL SETTING, including bathymetry, soils, and
geology.
2. An ANALYSIS of paleoenvironment.
3. PAST AND PRESENT LAND USES and current conditions.
4. A DISCUSSION of prehistoric and historic cultural history of project locale.
This section should provide contexts for research questions, survey methods,
etc.
5. A REVIEW of known sites, previous investigations and research in the
project area and vicinity.
I. A RESEARCH DESIGN will outline the purpose of the investigation, basic
assumptions about the location and type of cultural resources within the project area.
The following shall also be included:
1. RESEARCH OBJECTIVES and THEORETICAL CONTEXT
2. Specific RESEARCH PROBLEMS or questions.
3. METHODS to be employed to address the research objectives and questions.
4. A DISCUSSION of the expected results, including hypotheses to be tested.
J. A METHODS section, if applicable, shall include:
1. A DESCRIPTION OF FIELD METHODS employed, including rationale,
discussion of biases and problems or obstacles encountered.
2. A DEFINITION of site used in the survey.
K. RESULTS, INTERPRETATIONS AND RECOMMENDATIONS: A discussion
of the results in terms of the background cultural context, research design, goals,
research problems, and potential research questions.
L. A REFERENCES CITED section will list all references and citations located within
the text, including all figures, plates or maps, and within any appendices. All sources
(persons consulted, maps, archival documentation, etc.) maybe listed together. This
list must be in a format used by professional archaeological journals, such as
American Antiquity.
M. APPENDICES shall include, but not be limited to:

Geomorphology/Archaeological Borings and GIS Model, 2014 New York/New Jersey Harbor Navigation Project Page 239
1. A copy of relevant boring/subsurface exploration data used in the report.
2. The QUALIFICATIONS of the Principal Investigator and any other key
personnel used.
3. The final SCOPE OF WORK.
O. PHOTOGRAPHS will be glossy black and white prints no smaller than 5" x 7".
Photographic illustrations should be securely mounted by use of an archivally stable
mounting medium. Photograph captions for site overviews must include direction or
orientation. At a minimum, captions should identify feature or location, direction,
photographer and date of exposure. All photographs should be fully captioned on
the reverse of the photograph in case they should be removed from the report.
Photographs should be counted as "Figures" in a single running series of illustrations,
plates, etc. High quality prints of digital images are acceptable and must be printed
on photo paper for the final report. A CD ROM containing images must be submitted
in a pocket bound to three (3) copies the final report.
P. GRAPHIC PRESENTATION OF THE RESULTS.
1. All pages, including graphic presentations, will be numbered sequentially.
2. All graphic presentations, including maps, charts and diagrams, shall be
referred to as "Figures". All figures must be sequentially numbered and cited
by number within the body of the text.
3. All figures, plates and tables should be incorporated into the text on the page
following their citation. They should not be appended.
4. All tables shall have a number, title, appropriate explanatory notes and a
source note.
5. All figures shall have a title block containing the name of the project, county
and state.
6. All maps, including reproductions of historic maps, must include a north
arrow, accurate bar scale, delineation of the project area, legend, map title and
year of publication.
7. The report must include the project area(s) accurately delineated on a U.S.G.S.
7.5' topographic map and a county soils survey map, if available for that area.
A NOAA chart may also be submitted on which the project area(s) is
delimited.
VII. Project Schedule

Geomorphology/Archaeological Borings and GIS Model, 2014 New York/New Jersey Harbor Navigation Project Page 240
A. All reports should be submitted in a timely manner as stipulated below:
1. An interim report will be submitted to the Corps upon completion of
fieldwork. The interim report shall discuss what work has been accomplished
and what work has yet to be completed. It shall also state any problems the
Contractor has encountered in conducting the work and can contain requests
for information.
2. The draft report will be submitted to the Corps not later than seven (7) months
after notice to proceed. The draft report will be reviewed by the Corps, the
NYSHPO, the NJHPO and New York City Landmarks Preservation
Commission. One copy of the draft report will be returned to the Contractor
with comments. The final report will address all comments provided with the
draft report.
3. The final report will be submitted to the Corps four (4) weeks after the
Contractor receives the draft report with comments.
B. The number of copies for the interim, draft, and final reports will be submitted,
according to the above schedule, as follows:
1. One copy of the interim report.
2. Four copies of the draft report and the draft GIS model on CD-ROM
3. Fifteen (15) copies of the final report; one of which will be unbound and will
contain original photographs and drawings, if applicable. Three bound copies,
suitable for shelving, which will also contain original photographs or digital
images on photo paper. Two bound copies will also be submitted but
photocopies of the photographs are acceptable.
4. Fifteen (15) copies of the CD-ROM containing the model will be submitted
with the final report.
C. Scheduled completion date for the work specified in this scope is nine months from
date of award.
VIII. Additional Contract Requirements
A. Agencies, institutions, corporations, associations or individuals will be considered
qualified when they meet the minimum criteria given below. As part of the
supplemental documentation, a contract proposal and appendices to the draft and final

Geomorphology/Archaeological Borings and GIS Model, 2014 New York/New Jersey Harbor Navigation Project Page 241
report must include vitae for the PRINCIPAL INVESTIGATOR and MAIN
SUPERVISORY PERSONNEL in support of their academic and experiential
qualifications for the research, if these individuals were not included in the original
contract proposal. The Principal Investigator must also be a qualified
geomorphologist. Additional personnel should consist of an archaeologist that meets
the qualifications presented below. Personnel must meet the minimum professional
standards stated below:
1. Archaeological Project Director or Principal Investigator (PI). Persons in
charge of an archaeological project or research investigation contract, in
addition to meeting the appropriate standards for archaeologist, must have a
doctorate or equivalent level of professional experience as evidenced by a
publication record that demonstrates experience in project formulation,
execution, and technical monograph reporting. Suitable professional
references may also be made available to obtain estimates regarding the
adequacy of prior work. If prior projects were of a sort not ordinarily
resulting in a publishable report, a narrative should be included detailing the
proposed project director's previous experience along with references suitable
for to obtain opinions regarding the adequacy of this earlier work.
2. Geomorphologist. Personnel hired for their special knowledge and expertise
in geomorphology should have a Master's degree or better and experience and
a publication record demonstrating a substantial contribution to the field
through research. For this project, the individual must have experience in the
interpretation of sediments on the Continental Shelf, particularly with regard
to the potential for archaeological resources. The individual should also
ideally be able to interpret seismic data.
3. Archaeologist. The minimum formal qualifications or individuals practicing
archaeology as a profession area a B.A. or B.S. degree from an accredited
college or university, followed by two years of graduate study with
concentration in anthropology and specialization in archaeology during one of
these programs, and at least two summer field schools or their equivalent
under the supervision of an archaeologist of recognized competence. A
Master's thesis or its equivalent in research and publications is highly
recommended, as is the PhD degree. Individuals lacking such formal
qualifications may present evidence of a publication record and references
from archaeologists who do meet these references. In addition, the
archaeologist should also have experience in the prehistoric archaeology of
the southern New York - northern New Jersey area.
4. Standards for Consultants. Personnel hired or subcontracted for their special
knowledge and expertise must carry academic and experiential qualifications
in their own fields of competence. Such qualifications are to be documented
by means of vitae attachments to the proposal or at a later time if the
consultant has not been retained at the time of proposal.

Geomorphology/Archaeological Borings and GIS Model, 2014 New York/New Jersey Harbor Navigation Project Page 242
B. Principal Investigators shall be responsible for the validity of the material presented in
their reports. In the event of a controversy or court challenge, Principal Investigators
shall be required to testify on behalf of the government in support of findings
presented in their reports.
C. Neither the Contractor nor his representatives shall release any sketch, photograph,
report or other data, or material of any nature obtained or prepared under this contract
without the specific written approval of the Contracting Officer prior to the time of
final acceptance by the government.
D. The Contractor shall furnish all labor, transportation, instruments, survey equipment,
boats and other associated materials to perform the work required by this Scope of
Work.
E. The Contractor shall return all copies of reports provided by the Corps when the final
report is submitted.
IX. Fiscal Arrangements
A. Partial payments of the total amount allocated will be dispersed upon the receipt of
invoices. Invoices will be submitted with the interim report, and every month there
after will reflect the amount expended. The total amount of all monthly invoices shall
not total more than 90% of the agreed work order amount. The remaining 10% of the
agreed work order amount shall be paid upon the receipt and acceptance of the final
report, all reports provided by the Corps, etc. and receipt of the final invoice. No
invoice payments will be made if it is does not include an accompanying interim
or draft report.
B. Invoice payments will be made pursuant to the "Prompt Payment" clause of the
contract.

Geomorphology/Archaeological Borings and GIS Model, 2014 New York/New Jersey Harbor Navigation Project Page 243
Attachment 1.
The primary GIS data bases include:
(7) Historic terrain and bathymetric plots. The present study establishes the 1844
bathymetric plots of the New York Bight as a baseline for documenting subaqueous
contours. Progressive terrain modifications are plotted for 1866 and then for several
time frames in the 20th
century. Future projections are also charted.
(8) Shoreline models for prehistoric and historic terrain. Sea level curves are used to
isolate shoreline contours by 100-500 year intervals in the Holocene. These track
changing configurations of terrestrial (stream lines), estuarine, marsh, and marine
margins for these time frames.
(9) Surficial geology of the shore and subaqueous terrain of the Bight. Maps recently been
produced for the eastern margins of the Bight (New Jersey side; Stone et al, 2002) that
track the glacial margins, lake basins and Holocene surface deposits. Independent work
has been done in New York as well (New York side; Sanders and Merguerian 1994).
The GIS model will attempt to link these independent studies and establish a
comprehensive map of the surface and subsurface Quaternary landforms, including
those that are a product of or were affected by marine transgressions and regressions.
(10) GIS plots of subsurface lithostratigraphy. The layer involves plots of the late
Quaternary lithostratigraphy based on an assimilation of the bore logs, first by the
individual channel reaches and subsequently for the entire project area.
(11) GIS plots of biostratigraphy. The layer integrates the foram, macrofossil, and pollen
records to sort out habitats through time. This is an independent measure of the
zonation of nearshore environments established by the shoreline model (item 2 above).
(12) GIS plots and simulation of prehistoric and historic site geography. This projects likely
settings of sites based on known patterns of settlement in near shore environments
through time (ie, for Paleoindian, Archaic, Woodland, Contact and historic periods)
based on the model of changing nearshore environments through time.
(13) Projection of a refined model of archaeological sensitivity. The former models are
assessed and reworked from the plots constructed in the GIS data set. A predictive
model for the major navigation channels and surrounding areas is advanced.
Summarily, this next phase of the study will develop a dynamic human ecological model
that begins with the systematic collection and analysis of the most recent field data. It processes
these data together with digitized spatial and temporal mapping layers (GIS template). Field and
mapping sets passed through the GIS filter will then produce a model for environmental change
and human geography that will help structure planning decisions for cultural resource planners.

Geomorphology/Archaeological Borings and GIS Model, 2014 New York/New Jersey Harbor Navigation Project Page 244
Attachment 2.
Transmittal Information
A transmittal letter containing, at a minimum, the following information shall accompany each
digital media submittal to the Corps. The transmittal letter shall be dated and signed by the
appropriate contractor’s representative. The transmittal letter shall be provided in hard copy and
a digital copy of the letter shall be included in .pdf on the digital media submitted to the Corps.
a. The information included on the external label of each media unit (e.g., disk, tape), along
with the total number being delivered, and a list of the names and descriptions of the files
on each one.
b. Brief instructions for transferring the files from the media to the Corps’ target GIS.
c. Certification that all delivery media are free of known computer viruses. A statement
including the name(s) and release date(s) of the virus-scanning software used to analyze
the delivery media, the date the virus scan was performed, and the operator’s name shall
be included in the certification. The release or version date of the virus-scanning
software shall be the current version which has detected the latest known viruses at the
time of the delivery of the digital media
d. A statement indicating that the contractor will retain a copy of all delivered digital media
(with all files included) for at least one year, during this period, will provide up to 5 (five)
additional copies of each to the Corps, if requested, at no additional cost.
In addition, the following documentation information shall be provided to the Corps as an
attachment to the hard copy of the transmittal letter. A digital copy of the documentation in a
.pdf format shall be provided on the digital media submitted to the Corps.
a. Description of how the data were acquired and input into the GIS
b. Brief development history for each graphic and non-graphic file on the submitted
digital media (e.g., content, when developed, modified, etc.)
c. Reference files and symbols library names. A list and file location of all new
symbols created for the project, which were not provided with the GFM
d. Level/layer assignments and lock settings, where applicable
e. Fonts, and line styles/types used
f. Metadata files in the Corps-approved format
g. Database schema and instruction for its use. A list of all database files associated with
was drawing, as well as a description of the database format and schema design.
h. Plotting instructions on tape/diskette and paper. The plotter configuration (e.g., name
and model of plotter), pen settings, and any specific plotting instructions.
i. A list of all deviations from the Corps’ specified or provided standards.
j. A list of any non-IGES crosshatch/patterns used.
Any recommended modifications necessary to make the data available for future use with
a different type of GIS or with other ―life-cycle‖ activities.

Geomorphology/Archaeological Borings and GIS Model, 2014 New York/New Jersey Harbor Navigation Project Page 245
REFERENCES
Geoarcheology Research Associates (GRA)
2000a Geomorphological and Archaeological Study of New York and New Jersey Harbor
Navigation Study, Upper and Lower Bay, Port of New York and New Jersey, Hudson,
Essex and Union Counties, New Jersey, Kings, Richmond and New York Counties, New
York.
2000b A Geomorphological and Archaeological Study, Northeast of Shooters Island, Hudson
and Union Counties, New Jersey, in Connection with the Arthur Kill-Howland Hook
Marine Terminal Channel Project.
2001 Geomorphological Study, Port Jersey, City of Bayonne and Jersey City, Hudson County,
in Connection with the New York and New Jersey Harbor Navigation Study.
LaPorta, Philip C., Linda Sohl and Margaret Brewer
1999 Preliminary Draft Cultural Resource Assessment of Proposed Dredged Material
Management Alternative Sites in the New York Harbor-Apex Region, Affecting the
Coastal Areas of New York, Queens, Kings, and Richmond Counties in New York and
Bergen, Hudson, Middlesex and Monmouth Counties, New Jersey. On file, U.S. Army
Corps of Engineers, New York District.
Wagner, Daniel P., Ph.D. and Peter E. Siegel, Ph.D.
1997 A Geomorphological and Archaeological Analysis of the Arthur Kill - Howland
Hook Marine Terminal Channel, Richmond County, New York and Union County, New
Jersey. On file, U.S. Army Corps of Engineers, New York District.
Related Documents