Geometrical characterization techniques for microlens made by thermal reflow of photoresist cylinder Mohammed Ashraf a, , Cherry Gupta b , Franck Chollet a , Stuart Victor Springham c , Rajdeep Singh Rawat c a MicroMachines Centre, School of MAE, Nanyang Technological University (NTU), 50 Nanyang Avenue, Singapore 639798, Singapore b Delhi College of Engineering, Delhi, India c National Institute of Education, Nanyang Technological University, Singapore 637616, Singapore article info Article history: Received 3 April 2008 Received in revised form 13 May 2008 Accepted 14 May 2008 Available online 7 July 2008 Keywords: Microlens Characterization Microscopy SEM Confocal Fluorescence Profilometry abstract Microlens characterization is a prerequisite for improving fabrication process, and for satisfying the end user needs. In this paper we explore techniques to characterize geometrical properties of microlens made by thermal reflow: viz. microlens profile; radius of curvature; microlens height; contact angle and focal length. The geometrical characterization is done using techniques such as contact profilometry, scanning electron microscopy (SEM), optical microscopy, white light confocal microscopy and fluorescence confocal microscopy. All the above techniques are studied and compared, keeping in mind the characterization requirements of polymer microlens made by thermal reflow technique. & 2008 Elsevier Ltd. All rights reserved. 1. Introduction Microlens characterization is needed to optimize the process parameters of the fabrication technique. It is also useful in satisfying the quality requirements for a specific application. The characterization of microlens (or even bigger lens) can be split into two groups: optical characterization and geometrical char- acterization [1]. Optical characterization accommodates the point of view of end user and the applications for which it is needed. It requires the accurate measurement of parameters like, focal length, depth of focus, aberrations, wavefront profile, efficiency, and point spread function [2]. On the other hand, geometrical characterization mostly entertains the need of manufacturer, where a quick and reliable technique is needed to measure the profile of microlens, which helps in optimizing the fabrication parameters [3]. Moreover, geometrical characterization can also provide good estimates of radius of curvature (a measure of focal length) and deviation from spherical profile present in the microlens. It can also provide data for the verification of model with the experimental profile [4–6]. In addition to these parameters, array of microlens would require the measurement of array parameters like fill factor and uniformity of focal length over the array. However, in this paper, we restrict our investiga- tion to individual microlens and do not deal with characterizing array geometry. In principle, the measurement of microlenses is no different from conventional large lenses. However, their small size and the range of measurements do create practical problems, such as alignment issues, handling issues, and lack of dedicated technique, which are inherent because of the smaller dimension (below 1mm) of these structures. In this paper, we explore techniques to characterize important geometrical parameters of microlens and use them for process development (to optimize and control the fabrication of microlens by thermal reflow technique), optical characteristics prediction (to predict important optical parameters like focal length and spherical aberration), and model verification (to compare profiles based on theoretical model and experimental data). 1.1. Thermal reflow Thermal reflow of polymer is an effective way to fabricate refractive microlenses. The technique is considered to be a simple technique for fabricating refractive microlens and is based on the mass transport of photoresist. It was first described by Popovic et al. in 1988 and uses standard photolithographic process to create photoresist cylinders of desired dimension [7]. These cylinders are then reflowed (melted) at an optimum temperature ARTICLE IN PRESS Contents lists available at ScienceDirect journal homepage: www.elsevier.com/locate/optlaseng Optics and Lasers in Engineering 0143-8166/$ -see front matter & 2008 Elsevier Ltd. All rights reserved. doi:10.1016/j.optlaseng.2008.05.008 Corresponding author. Tel./fax: +65 6790 6994. E-mail address: [email protected] (M. Ashraf). Optics and Lasers in Engineering 46 (2008) 711– 720

Welcome message from author
This document is posted to help you gain knowledge. Please leave a comment to let me know what you think about it! Share it to your friends and learn new things together.
Transcript
ARTICLE IN PRESS
Optics and Lasers in Engineering 46 (2008) 711– 720
Contents lists available at ScienceDirect
Optics and Lasers in Engineering
0143-81
doi:10.1
� Corr
E-m
journal homepage: www.elsevier.com/locate/optlaseng
Geometrical characterization techniques for microlens made by thermalreflow of photoresist cylinder
Mohammed Ashraf a,�, Cherry Gupta b, Franck Chollet a, Stuart Victor Springham c, Rajdeep Singh Rawat c
a MicroMachines Centre, School of MAE, Nanyang Technological University (NTU), 50 Nanyang Avenue, Singapore 639798, Singaporeb Delhi College of Engineering, Delhi, Indiac National Institute of Education, Nanyang Technological University, Singapore 637616, Singapore
a r t i c l e i n f o
Article history:
Received 3 April 2008
Received in revised form
13 May 2008
Accepted 14 May 2008Available online 7 July 2008
Keywords:
Microlens
Characterization
Microscopy
SEM
Confocal
Fluorescence
Profilometry
66/$ - see front matter & 2008 Elsevier Ltd. A
016/j.optlaseng.2008.05.008
esponding author. Tel./fax: +65 6790 6994.
ail address: [email protected] (M. Ashraf).
a b s t r a c t
Microlens characterization is a prerequisite for improving fabrication process, and for satisfying the end
user needs. In this paper we explore techniques to characterize geometrical properties of microlens
made by thermal reflow: viz. microlens profile; radius of curvature; microlens height; contact angle and
focal length. The geometrical characterization is done using techniques such as contact profilometry,
scanning electron microscopy (SEM), optical microscopy, white light confocal microscopy and
fluorescence confocal microscopy. All the above techniques are studied and compared, keeping in
mind the characterization requirements of polymer microlens made by thermal reflow technique.
& 2008 Elsevier Ltd. All rights reserved.
1. Introduction
Microlens characterization is needed to optimize the processparameters of the fabrication technique. It is also useful insatisfying the quality requirements for a specific application. Thecharacterization of microlens (or even bigger lens) can be splitinto two groups: optical characterization and geometrical char-acterization [1]. Optical characterization accommodates the pointof view of end user and the applications for which it is needed. Itrequires the accurate measurement of parameters like, focallength, depth of focus, aberrations, wavefront profile, efficiency,and point spread function [2]. On the other hand, geometricalcharacterization mostly entertains the need of manufacturer,where a quick and reliable technique is needed to measure theprofile of microlens, which helps in optimizing the fabricationparameters [3]. Moreover, geometrical characterization can alsoprovide good estimates of radius of curvature (a measure of focallength) and deviation from spherical profile present in themicrolens. It can also provide data for the verification of modelwith the experimental profile [4–6]. In addition to theseparameters, array of microlens would require the measurementof array parameters like fill factor and uniformity of focal lengthover the array. However, in this paper, we restrict our investiga-
ll rights reserved.
tion to individual microlens and do not deal with characterizingarray geometry.
In principle, the measurement of microlenses is no differentfrom conventional large lenses. However, their small size andthe range of measurements do create practical problems, suchas alignment issues, handling issues, and lack of dedicatedtechnique, which are inherent because of the smaller dimension(below 1 mm) of these structures. In this paper, we exploretechniques to characterize important geometrical parameters ofmicrolens and use them for process development (to optimize andcontrol the fabrication of microlens by thermal reflow technique),optical characteristics prediction (to predict important opticalparameters like focal length and spherical aberration), and modelverification (to compare profiles based on theoretical model andexperimental data).
1.1. Thermal reflow
Thermal reflow of polymer is an effective way to fabricaterefractive microlenses. The technique is considered to be a simpletechnique for fabricating refractive microlens and is based on themass transport of photoresist. It was first described by Popovicet al. in 1988 and uses standard photolithographic process tocreate photoresist cylinders of desired dimension [7]. Thesecylinders are then reflowed (melted) at an optimum temperature
ARTICLE IN PRESS
Fig. 2. Geometrical parameters.
M. Ashraf et al. / Optics and Lasers in Engineering 46 (2008) 711–720712
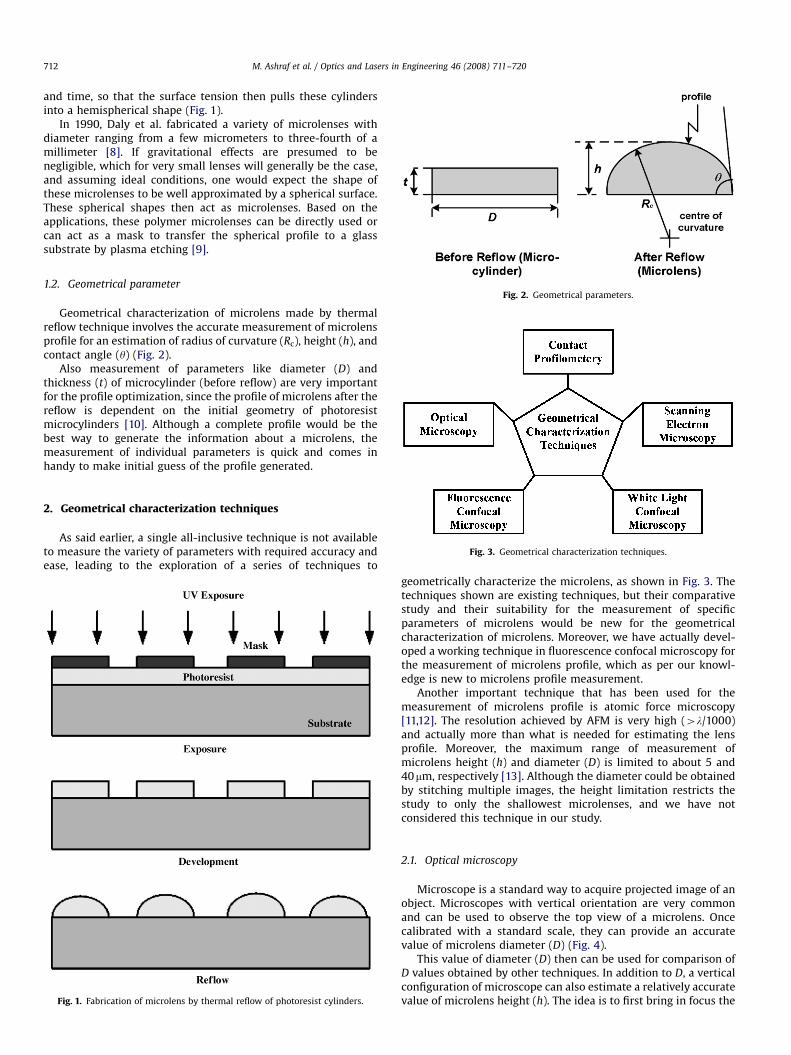
and time, so that the surface tension then pulls these cylindersinto a hemispherical shape (Fig. 1).
In 1990, Daly et al. fabricated a variety of microlenses withdiameter ranging from a few micrometers to three-fourth of amillimeter [8]. If gravitational effects are presumed to benegligible, which for very small lenses will generally be the case,and assuming ideal conditions, one would expect the shape ofthese microlenses to be well approximated by a spherical surface.These spherical shapes then act as microlenses. Based on theapplications, these polymer microlenses can be directly used orcan act as a mask to transfer the spherical profile to a glasssubstrate by plasma etching [9].
1.2. Geometrical parameter
Geometrical characterization of microlens made by thermalreflow technique involves the accurate measurement of microlensprofile for an estimation of radius of curvature (Rc), height (h), andcontact angle (y) (Fig. 2).
Also measurement of parameters like diameter (D) andthickness (t) of microcylinder (before reflow) are very importantfor the profile optimization, since the profile of microlens after thereflow is dependent on the initial geometry of photoresistmicrocylinders [10]. Although a complete profile would be thebest way to generate the information about a microlens, themeasurement of individual parameters is quick and comes inhandy to make initial guess of the profile generated.
Fig. 3. Geometrical characterization techniques.
2. Geometrical characterization techniques
As said earlier, a single all-inclusive technique is not availableto measure the variety of parameters with required accuracy andease, leading to the exploration of a series of techniques to
Fig. 1. Fabrication of microlens by thermal reflow of photoresist cylinders.
geometrically characterize the microlens, as shown in Fig. 3. Thetechniques shown are existing techniques, but their comparativestudy and their suitability for the measurement of specificparameters of microlens would be new for the geometricalcharacterization of microlens. Moreover, we have actually devel-oped a working technique in fluorescence confocal microscopy forthe measurement of microlens profile, which as per our knowl-edge is new to microlens profile measurement.
Another important technique that has been used for themeasurement of microlens profile is atomic force microscopy[11,12]. The resolution achieved by AFM is very high (4l/1000)and actually more than what is needed for estimating the lensprofile. Moreover, the maximum range of measurement ofmicrolens height (h) and diameter (D) is limited to about 5 and40mm, respectively [13]. Although the diameter could be obtainedby stitching multiple images, the height limitation restricts thestudy to only the shallowest microlenses, and we have notconsidered this technique in our study.
2.1. Optical microscopy
Microscope is a standard way to acquire projected image of anobject. Microscopes with vertical orientation are very commonand can be used to observe the top view of a microlens. Oncecalibrated with a standard scale, they can provide an accuratevalue of microlens diameter (D) (Fig. 4).
This value of diameter (D) then can be used for comparison ofD values obtained by other techniques. In addition to D, a verticalconfiguration of microscope can also estimate a relatively accuratevalue of microlens height (h). The idea is to first bring in focus the
ARTICLE IN PRESS
Fig. 4. Vertical configuration of microscope and top measurements (D, t, and h) of microlens.
Fig. 5. Horizontal configuration of microscope and side measurements (D, t, h, and Rc) of microlens.
Table 1Optical microscopy for microlens measurements: advantages and limitation
Advantages Limitation
Best way to measure lateral dimensions
(D)
Gives only projected profile
Can measure h, t, y, and Rc with
horizontal configuration of
microscope
Do not work well for shallow profiles
contact angle (y) measurement
Non-contact method Cannot measure 3D profile
M. Ashraf et al. / Optics and Lasers in Engineering 46 (2008) 711–720 713
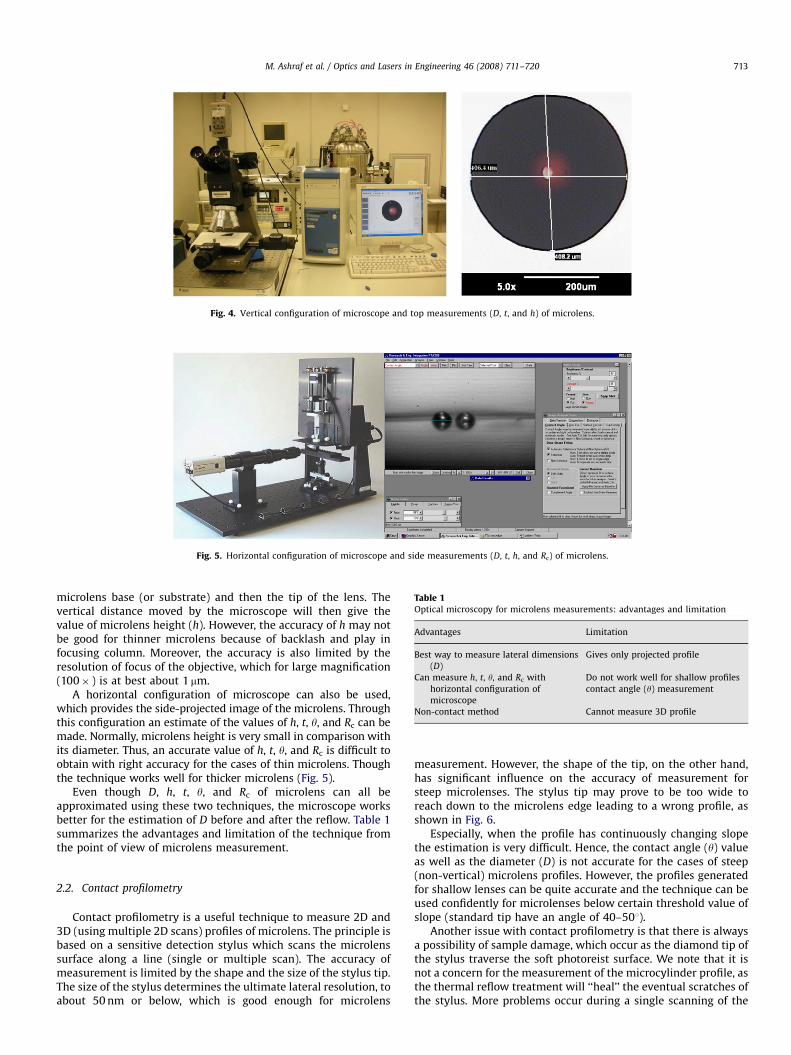
microlens base (or substrate) and then the tip of the lens. Thevertical distance moved by the microscope will then give thevalue of microlens height (h). However, the accuracy of h may notbe good for thinner microlens because of backlash and play infocusing column. Moreover, the accuracy is also limited by theresolution of focus of the objective, which for large magnification(100� ) is at best about 1 mm.
A horizontal configuration of microscope can also be used,which provides the side-projected image of the microlens. Throughthis configuration an estimate of the values of h, t, y, and Rc can bemade. Normally, microlens height is very small in comparison withits diameter. Thus, an accurate value of h, t, y, and Rc is difficult toobtain with right accuracy for the cases of thin microlens. Thoughthe technique works well for thicker microlens (Fig. 5).
Even though D, h, t, y, and Rc of microlens can all beapproximated using these two techniques, the microscope worksbetter for the estimation of D before and after the reflow. Table 1summarizes the advantages and limitation of the technique fromthe point of view of microlens measurement.
2.2. Contact profilometry
Contact profilometry is a useful technique to measure 2D and3D (using multiple 2D scans) profiles of microlens. The principle isbased on a sensitive detection stylus which scans the microlenssurface along a line (single or multiple scan). The accuracy ofmeasurement is limited by the shape and the size of the stylus tip.The size of the stylus determines the ultimate lateral resolution, toabout 50 nm or below, which is good enough for microlens
measurement. However, the shape of the tip, on the other hand,has significant influence on the accuracy of measurement forsteep microlenses. The stylus tip may prove to be too wide toreach down to the microlens edge leading to a wrong profile, asshown in Fig. 6.
Especially, when the profile has continuously changing slopethe estimation is very difficult. Hence, the contact angle (y) valueas well as the diameter (D) is not accurate for the cases of steep(non-vertical) microlens profiles. However, the profiles generatedfor shallow lenses can be quite accurate and the technique can beused confidently for microlenses below certain threshold value ofslope (standard tip have an angle of 40–501).
Another issue with contact profilometry is that there is alwaysa possibility of sample damage, which occur as the diamond tip ofthe stylus traverse the soft photoreist surface. We note that it isnot a concern for the measurement of the microcylinder profile, asthe thermal reflow treatment will ‘‘heal’’ the eventual scratches ofthe stylus. More problems occur during a single scanning of the
ARTICLE IN PRESS
Fig. 6. Cases for contact profilometry: (a) accurate profile for shallow lens and (b) deviation in profile for steep lens.
Table 2Contact profilometry microlens measurements: advantages and limitation
Advantages Limitation
Good way to estimate t and h Contact with specimen may
damage it
Generate accurate 2D and 3D profiles for
shallow lens
Inaccurate for steep profiles
D of photoresist cylinders can be estimated
accurately
Slow (multiple scanning)
Fig. 7. Data acquisition from SEM image.
M. Ashraf et al. / Optics and Lasers in Engineering 46 (2008) 711–720714
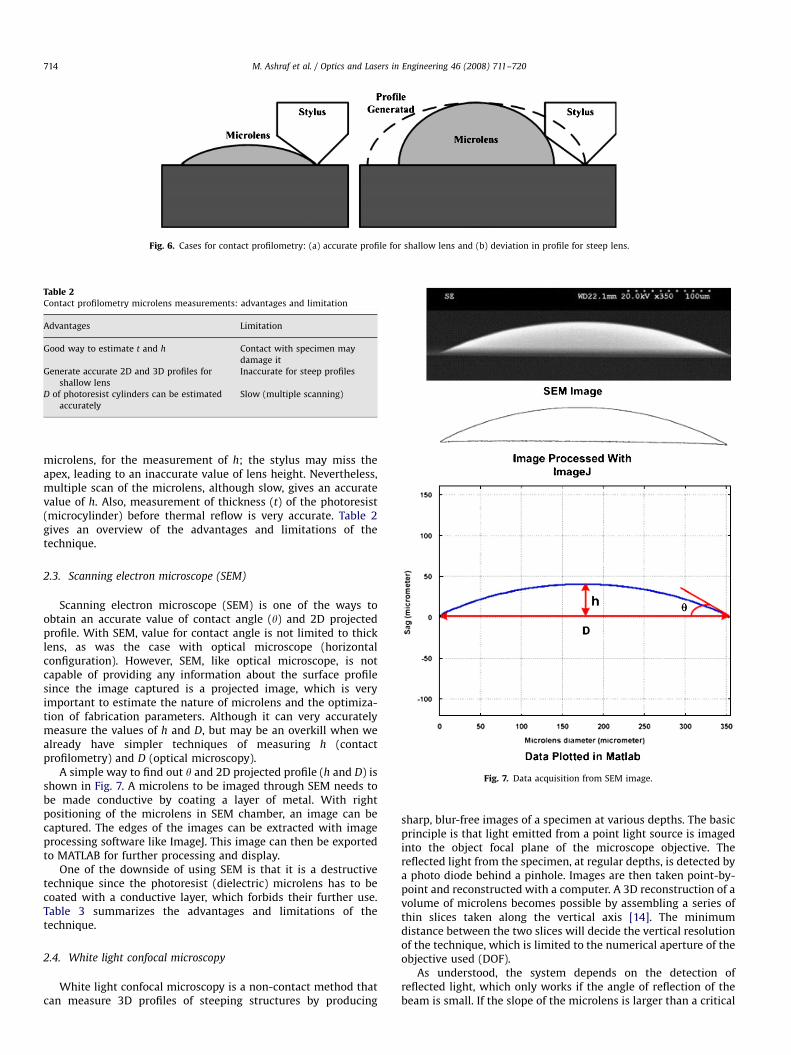
microlens, for the measurement of h; the stylus may miss theapex, leading to an inaccurate value of lens height. Nevertheless,multiple scan of the microlens, although slow, gives an accuratevalue of h. Also, measurement of thickness (t) of the photoresist(microcylinder) before thermal reflow is very accurate. Table 2gives an overview of the advantages and limitations of thetechnique.
2.3. Scanning electron microscope (SEM)
Scanning electron microscope (SEM) is one of the ways toobtain an accurate value of contact angle (y) and 2D projectedprofile. With SEM, value for contact angle is not limited to thicklens, as was the case with optical microscope (horizontalconfiguration). However, SEM, like optical microscope, is notcapable of providing any information about the surface profilesince the image captured is a projected image, which is veryimportant to estimate the nature of microlens and the optimiza-tion of fabrication parameters. Although it can very accuratelymeasure the values of h and D, but may be an overkill when wealready have simpler techniques of measuring h (contactprofilometry) and D (optical microscopy).
A simple way to find out y and 2D projected profile (h and D) isshown in Fig. 7. A microlens to be imaged through SEM needs tobe made conductive by coating a layer of metal. With rightpositioning of the microlens in SEM chamber, an image can becaptured. The edges of the images can be extracted with imageprocessing software like ImageJ. This image can then be exportedto MATLAB for further processing and display.
One of the downside of using SEM is that it is a destructivetechnique since the photoresist (dielectric) microlens has to becoated with a conductive layer, which forbids their further use.Table 3 summarizes the advantages and limitations of thetechnique.
2.4. White light confocal microscopy
White light confocal microscopy is a non-contact method thatcan measure 3D profiles of steeping structures by producing
sharp, blur-free images of a specimen at various depths. The basicprinciple is that light emitted from a point light source is imagedinto the object focal plane of the microscope objective. Thereflected light from the specimen, at regular depths, is detected bya photo diode behind a pinhole. Images are then taken point-by-point and reconstructed with a computer. A 3D reconstruction of avolume of microlens becomes possible by assembling a series ofthin slices taken along the vertical axis [14]. The minimumdistance between the two slices will decide the vertical resolutionof the technique, which is limited to the numerical aperture of theobjective used (DOF).
As understood, the system depends on the detection ofreflected light, which only works if the angle of reflection of thebeam is small. If the slope of the microlens is larger than a critical
ARTICLE IN PRESS
Table 3Scanning electron microscope (SEM) microlens measurements: advantages and
limitation
Advantages Limitation
Good way to estimate y Gives only projected profile
Can accurately estimate values
D and h
Maybe overkill in view of availability of simpler
and cheaper techniques
Works well for all profile
(shallow and steep)
Destructive technique
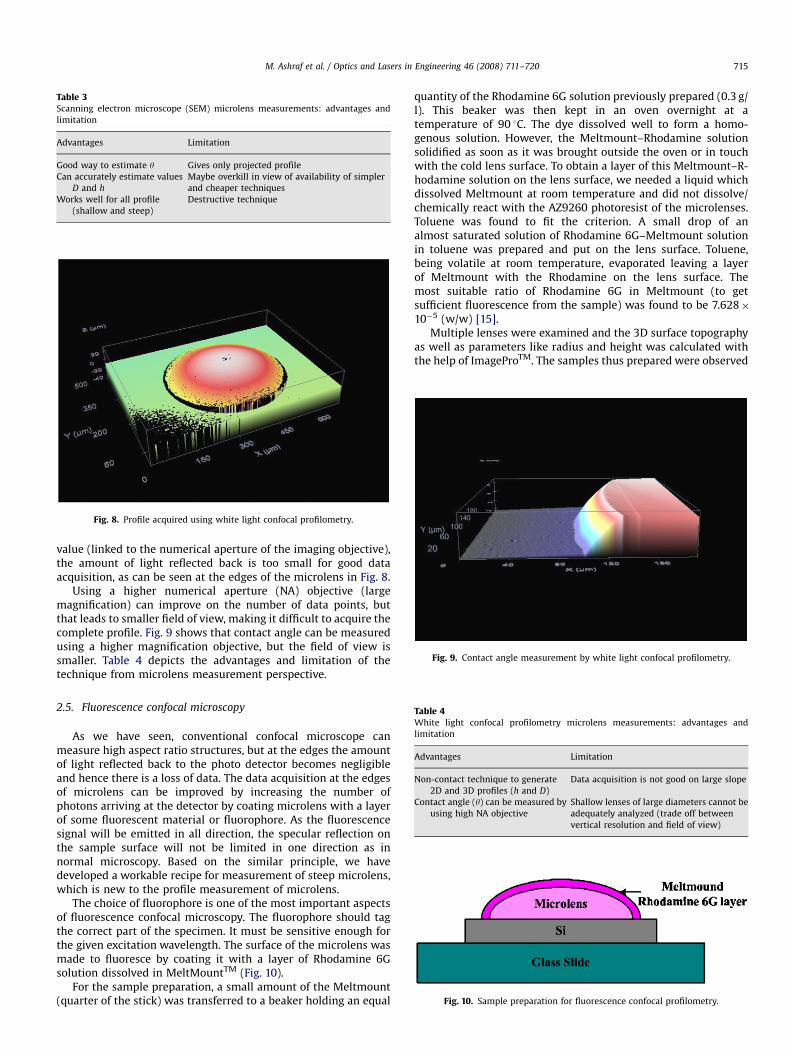
Fig. 8. Profile acquired using white light confocal profilometry.
Fig. 9. Contact angle measurement by white light confocal profilometry.
Table 4White light confocal profilometry microlens measurements: advantages and
limitation
Advantages Limitation
Non-contact technique to generate
2D and 3D profiles (h and D)
Data acquisition is not good on large slope
Contact angle (y) can be measured by
using high NA objective
Shallow lenses of large diameters cannot be
adequately analyzed (trade off between
vertical resolution and field of view)
Fig. 10. Sample preparation for fluorescence confocal profilometry.
M. Ashraf et al. / Optics and Lasers in Engineering 46 (2008) 711–720 715
value (linked to the numerical aperture of the imaging objective),the amount of light reflected back is too small for good dataacquisition, as can be seen at the edges of the microlens in Fig. 8.
Using a higher numerical aperture (NA) objective (largemagnification) can improve on the number of data points, butthat leads to smaller field of view, making it difficult to acquire thecomplete profile. Fig. 9 shows that contact angle can be measuredusing a higher magnification objective, but the field of view issmaller. Table 4 depicts the advantages and limitation of thetechnique from microlens measurement perspective.
2.5. Fluorescence confocal microscopy
As we have seen, conventional confocal microscope canmeasure high aspect ratio structures, but at the edges the amountof light reflected back to the photo detector becomes negligibleand hence there is a loss of data. The data acquisition at the edgesof microlens can be improved by increasing the number ofphotons arriving at the detector by coating microlens with a layerof some fluorescent material or fluorophore. As the fluorescencesignal will be emitted in all direction, the specular reflection onthe sample surface will not be limited in one direction as innormal microscopy. Based on the similar principle, we havedeveloped a workable recipe for measurement of steep microlens,which is new to the profile measurement of microlens.
The choice of fluorophore is one of the most important aspectsof fluorescence confocal microscopy. The fluorophore should tagthe correct part of the specimen. It must be sensitive enough forthe given excitation wavelength. The surface of the microlens wasmade to fluoresce by coating it with a layer of Rhodamine 6Gsolution dissolved in MeltMountTM (Fig. 10).
For the sample preparation, a small amount of the Meltmount(quarter of the stick) was transferred to a beaker holding an equal
quantity of the Rhodamine 6G solution previously prepared (0.3 g/l). This beaker was then kept in an oven overnight at atemperature of 90 1C. The dye dissolved well to form a homo-genous solution. However, the Meltmount–Rhodamine solutionsolidified as soon as it was brought outside the oven or in touchwith the cold lens surface. To obtain a layer of this Meltmount–R-hodamine solution on the lens surface, we needed a liquid whichdissolved Meltmount at room temperature and did not dissolve/chemically react with the AZ9260 photoresist of the microlenses.Toluene was found to fit the criterion. A small drop of analmost saturated solution of Rhodamine 6G–Meltmount solutionin toluene was prepared and put on the lens surface. Toluene,being volatile at room temperature, evaporated leaving a layerof Meltmount with the Rhodamine on the lens surface. Themost suitable ratio of Rhodamine 6G in Meltmount (to getsufficient fluorescence from the sample) was found to be 7.628�10�5 (w/w) [15].
Multiple lenses were examined and the 3D surface topographyas well as parameters like radius and height was calculated withthe help of ImageProTM. The samples thus prepared were observed
ARTICLE IN PRESS
20 40 60 80 100 120 140 160 180 2000
10
20
30
40
50
60
70
80
90
100
Diameter (D) of microlens in μm
Mic
role
ns h
eigh
t (h)
in μ
m
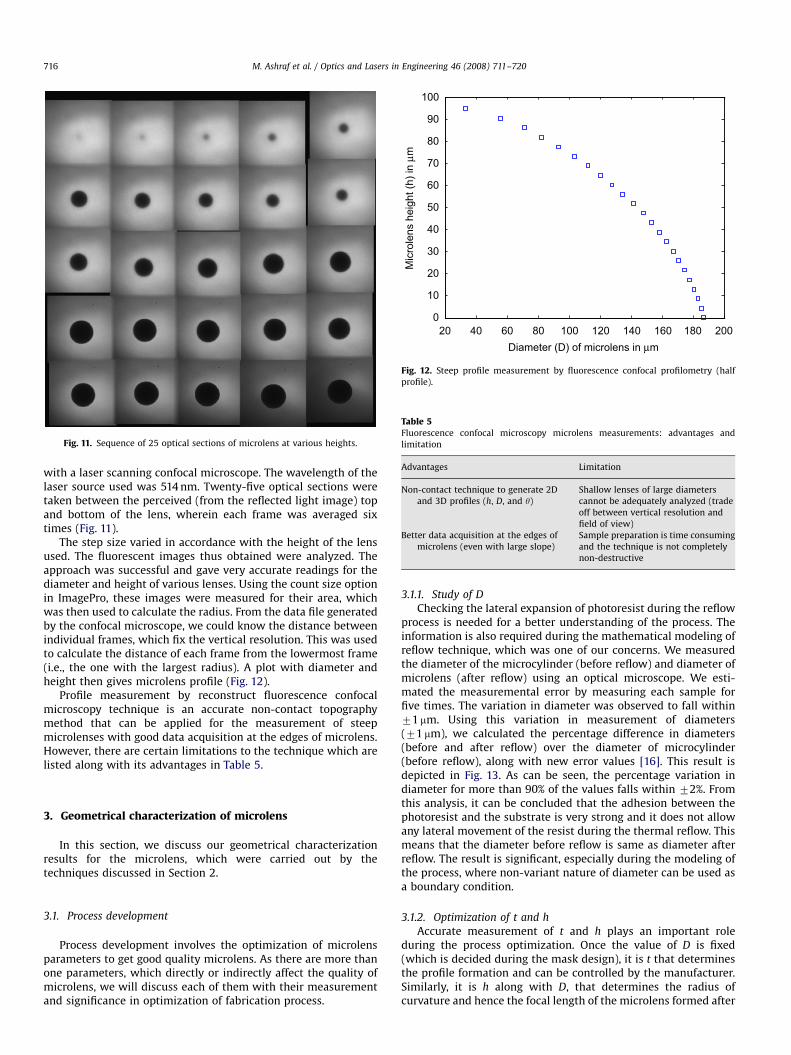
Fig. 12. Steep profile measurement by fluorescence confocal profilometry (half
profile).
Table 5Fluorescence confocal microscopy microlens measurements: advantages and
limitation
Advantages Limitation
Non-contact technique to generate 2D
and 3D profiles (h, D, and y)
Shallow lenses of large diameters
cannot be adequately analyzed (trade
off between vertical resolution and
field of view)
Better data acquisition at the edges of
microlens (even with large slope)
Sample preparation is time consuming
and the technique is not completely
non-destructive
Fig. 11. Sequence of 25 optical sections of microlens at various heights.
M. Ashraf et al. / Optics and Lasers in Engineering 46 (2008) 711–720716
with a laser scanning confocal microscope. The wavelength of thelaser source used was 514 nm. Twenty-five optical sections weretaken between the perceived (from the reflected light image) topand bottom of the lens, wherein each frame was averaged sixtimes (Fig. 11).
The step size varied in accordance with the height of the lensused. The fluorescent images thus obtained were analyzed. Theapproach was successful and gave very accurate readings for thediameter and height of various lenses. Using the count size optionin ImagePro, these images were measured for their area, whichwas then used to calculate the radius. From the data file generatedby the confocal microscope, we could know the distance betweenindividual frames, which fix the vertical resolution. This was usedto calculate the distance of each frame from the lowermost frame(i.e., the one with the largest radius). A plot with diameter andheight then gives microlens profile (Fig. 12).
Profile measurement by reconstruct fluorescence confocalmicroscopy technique is an accurate non-contact topographymethod that can be applied for the measurement of steepmicrolenses with good data acquisition at the edges of microlens.However, there are certain limitations to the technique which arelisted along with its advantages in Table 5.
3. Geometrical characterization of microlens
In this section, we discuss our geometrical characterizationresults for the microlens, which were carried out by thetechniques discussed in Section 2.
3.1. Process development
Process development involves the optimization of microlensparameters to get good quality microlens. As there are more thanone parameters, which directly or indirectly affect the quality ofmicrolens, we will discuss each of them with their measurementand significance in optimization of fabrication process.
3.1.1. Study of D
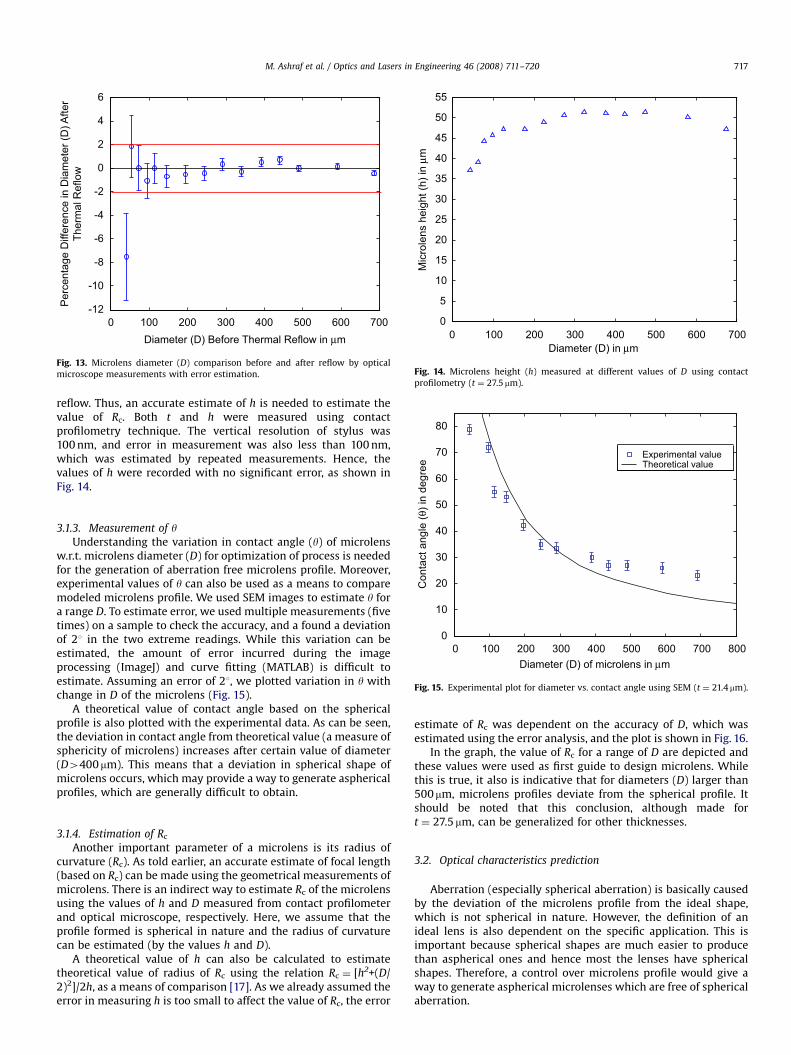
Checking the lateral expansion of photoresist during the reflowprocess is needed for a better understanding of the process. Theinformation is also required during the mathematical modeling ofreflow technique, which was one of our concerns. We measuredthe diameter of the microcylinder (before reflow) and diameter ofmicrolens (after reflow) using an optical microscope. We esti-mated the measuremental error by measuring each sample forfive times. The variation in diameter was observed to fall within71mm. Using this variation in measurement of diameters(71 mm), we calculated the percentage difference in diameters(before and after reflow) over the diameter of microcylinder(before reflow), along with new error values [16]. This result isdepicted in Fig. 13. As can be seen, the percentage variation indiameter for more than 90% of the values falls within 72%. Fromthis analysis, it can be concluded that the adhesion between thephotoresist and the substrate is very strong and it does not allowany lateral movement of the resist during the thermal reflow. Thismeans that the diameter before reflow is same as diameter afterreflow. The result is significant, especially during the modeling ofthe process, where non-variant nature of diameter can be used asa boundary condition.
3.1.2. Optimization of t and h
Accurate measurement of t and h plays an important roleduring the process optimization. Once the value of D is fixed(which is decided during the mask design), it is t that determinesthe profile formation and can be controlled by the manufacturer.Similarly, it is h along with D, that determines the radius ofcurvature and hence the focal length of the microlens formed after
ARTICLE IN PRESS
60
70
80 d
egre
e
Experimental valueTheoretical value
0 100 200 300 400 500 600 7000
5
10
15
20
25
30
35
40
45
50
55
Diameter (D) in μm
Mic
role
ns h
eigh
t (h)
in μ
m
Fig. 14. Microlens height (h) measured at different values of D using contact
profilometry (t ¼ 27.5 mm).
0 100 200 300 400 500 600 700-12
-10
-8
-6
-4
-2
0
2
4
6
Diameter (D) Before Thermal Reflow in μm
Per
cent
age
Diff
eren
ce in
Dia
met
er (D
) Afte
rTh
erm
al R
eflo
w
Fig. 13. Microlens diameter (D) comparison before and after reflow by optical
microscope measurements with error estimation.
M. Ashraf et al. / Optics and Lasers in Engineering 46 (2008) 711–720 717
reflow. Thus, an accurate estimate of h is needed to estimate thevalue of Rc. Both t and h were measured using contactprofilometry technique. The vertical resolution of stylus was100 nm, and error in measurement was also less than 100 nm,which was estimated by repeated measurements. Hence, thevalues of h were recorded with no significant error, as shown inFig. 14.
0 100 200 300 400 500 600 700 8000
10
20
30
40
50
Diameter (D) of microlens in μm
Con
tact
ang
le (θ
) in
Fig. 15. Experimental plot for diameter vs. contact angle using SEM (t ¼ 21.4 mm).
3.1.3. Measurement of yUnderstanding the variation in contact angle (y) of microlens
w.r.t. microlens diameter (D) for optimization of process is neededfor the generation of aberration free microlens profile. Moreover,experimental values of y can also be used as a means to comparemodeled microlens profile. We used SEM images to estimate y fora range D. To estimate error, we used multiple measurements (fivetimes) on a sample to check the accuracy, and a found a deviationof 21 in the two extreme readings. While this variation can beestimated, the amount of error incurred during the imageprocessing (ImageJ) and curve fitting (MATLAB) is difficult toestimate. Assuming an error of 21, we plotted variation in y withchange in D of the microlens (Fig. 15).
A theoretical value of contact angle based on the sphericalprofile is also plotted with the experimental data. As can be seen,the deviation in contact angle from theoretical value (a measure ofsphericity of microlens) increases after certain value of diameter(D4400 mm). This means that a deviation in spherical shape ofmicrolens occurs, which may provide a way to generate asphericalprofiles, which are generally difficult to obtain.
3.1.4. Estimation of Rc
Another important parameter of a microlens is its radius ofcurvature (Rc). As told earlier, an accurate estimate of focal length(based on Rc) can be made using the geometrical measurements ofmicrolens. There is an indirect way to estimate Rc of the microlensusing the values of h and D measured from contact profilometerand optical microscope, respectively. Here, we assume that theprofile formed is spherical in nature and the radius of curvaturecan be estimated (by the values h and D).
A theoretical value of h can also be calculated to estimatetheoretical value of radius of Rc using the relation Rc ¼ [h2+(D/2)2]/2h, as a means of comparison [17]. As we already assumed theerror in measuring h is too small to affect the value of Rc, the error
estimate of Rc was dependent on the accuracy of D, which wasestimated using the error analysis, and the plot is shown in Fig. 16.
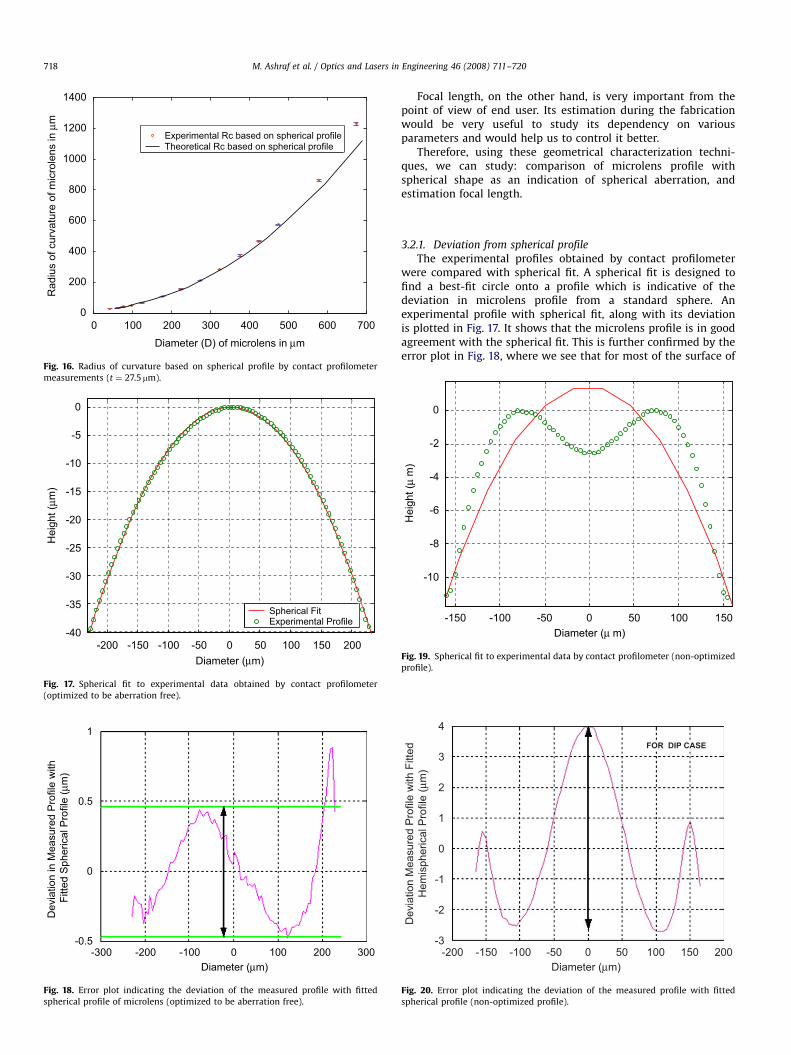
In the graph, the value of Rc for a range of D are depicted andthese values were used as first guide to design microlens. Whilethis is true, it also is indicative that for diameters (D) larger than500 mm, microlens profiles deviate from the spherical profile. Itshould be noted that this conclusion, although made fort ¼ 27.5mm, can be generalized for other thicknesses.
3.2. Optical characteristics prediction
Aberration (especially spherical aberration) is basically causedby the deviation of the microlens profile from the ideal shape,which is not spherical in nature. However, the definition of anideal lens is also dependent on the specific application. This isimportant because spherical shapes are much easier to producethan aspherical ones and hence most the lenses have sphericalshapes. Therefore, a control over microlens profile would give away to generate aspherical microlenses which are free of sphericalaberration.
ARTICLE IN PRESS
-200 -150 -100 -50 0 50 100Diameter (μm)
150 200-40
-35
-30
-25
-20
-15
-10
-5
Hei
ght (
μm)
0
Spherical FitExperimental Profile
Fig. 17. Spherical fit to experimental data obtained by contact profilometer
(optimized to be aberration free).
1
0.5
0
-0.5
Dev
iatio
n in
Mea
sure
d P
rofil
e w
ith
Fitte
d S
pher
ical
Pro
file
(μm
)
-300 -200 -100 0 100 200 300Diameter (μm)
Fig. 18. Error plot indicating the deviation of the measured profile with fitted
spherical profile of microlens (optimized to be aberration free).
0 100 200 300 400 500 600 7000
200
400
600
800
1000
1200
1400
Diameter (D) of microlens in μm
Rad
ius
of c
urva
ture
of m
icro
lens
in μ
m
Experimental Rc based on spherical profileTheoretical Rc based on spherical profile
Fig. 16. Radius of curvature based on spherical profile by contact profilometer
measurements (t ¼ 27.5 mm).
M. Ashraf et al. / Optics and Lasers in Engineering 46 (2008) 711–720718
Focal length, on the other hand, is very important from thepoint of view of end user. Its estimation during the fabricationwould be very useful to study its dependency on variousparameters and would help us to control it better.
Therefore, using these geometrical characterization techni-ques, we can study: comparison of microlens profile withspherical shape as an indication of spherical aberration, andestimation focal length.
3.2.1. Deviation from spherical profile
The experimental profiles obtained by contact profilometerwere compared with spherical fit. A spherical fit is designed tofind a best-fit circle onto a profile which is indicative of thedeviation in microlens profile from a standard sphere. Anexperimental profile with spherical fit, along with its deviationis plotted in Fig. 17. It shows that the microlens profile is in goodagreement with the spherical fit. This is further confirmed by theerror plot in Fig. 18, where we see that for most of the surface of
4
3
2
1
0
-1
-2
-3
Dev
iatio
n M
easu
red
Pro
file
with
Fitt
edH
emis
pher
ical
Pro
file
(μm
)
-200 -150 -100 -50 0 50 100 150 200Diameter (μm)
FOR DIP CASE
Fig. 20. Error plot indicating the deviation of the measured profile with fitted
spherical profile (non-optimized profile).
-150 -100 -50 0 50 100 150
-10
-8
-6
-4
-2
0
Diameter (μ m)
Hei
ght (
μ m
)
Fig. 19. Spherical fit to experimental data by contact profilometer (non-optimized
profile).
ARTICLE IN PRESS
M. Ashraf et al. / Optics and Lasers in Engineering 46 (2008) 711–720 719
the lens, the deviation, which probably also include measurementerror, is less than 500 nm.
However, similar conclusion is not true for the cases where dipoccurs, as can be seen in Figs. 19 and 20. Here, the amount ofdeviation has increased to more than 3 mm, clearly showing thatthe microlenses are not spherical. This means that a deviation inspherical shape of microlens occurs, which may provide a way togenerate aspherical profiles, which are generally difficult toobtain.
Table 7Suitability of techniques for microlens parameters
Technique/
parameter
Optical microscope (vertical
configuration)
Optical microscope (horizontal
configuration)
Profile 2D projected 2D projected
Lens type All Thick
D +++ + +
h + + +
t + + +
y � +++
Rc � + +
Table 6Focal length comparison [refractive index (n) ¼ 1.62]
Diameter of
microlens (D)
(mm)
Optical focal
length (Fopt)
(mm)
Focal length derived
from Rc (Frc ¼ Rc/n�1)
(mm)
Percentage difference
(Fopt�Frc)/Fopt�100
674 2121 1980 6.6
579 1409 1386 1.6
474 938 924 1.5
424 709 753 �6.2
377 557 600 �7.7
324 468 453 3.2
275 339 341 �0.6
225 250 247 1.2
178 182 173 4.9
125 122 104 14.7
98 89 79 11.2
78 65 63 3.0
43 37 39 �5.4
-300 -200 -100 0 100 200 300-40
-35
-30
-25
-20
-15
-10
-5
0
Diameter (μ m)
Hei
ght (
μ m
)
Model ProfileExperimental
Fig. 21. Profile comparison: model vs. experimental.
3.2.2. Focal length estimation
Focal length is the most important criterion from the point ofview of end user. Estimation of focal length based on Rc refractiveindex (n) of 1.62 was made using our measurement data [18].A comparison of these values is done with the actual (optical)focal length measured separately (Table 6).
As can be seen, the estimated focal length based on Rc is a goodmatch with optical focal length, and hence provide a simple wayto measure focal local during the fabrication stage.
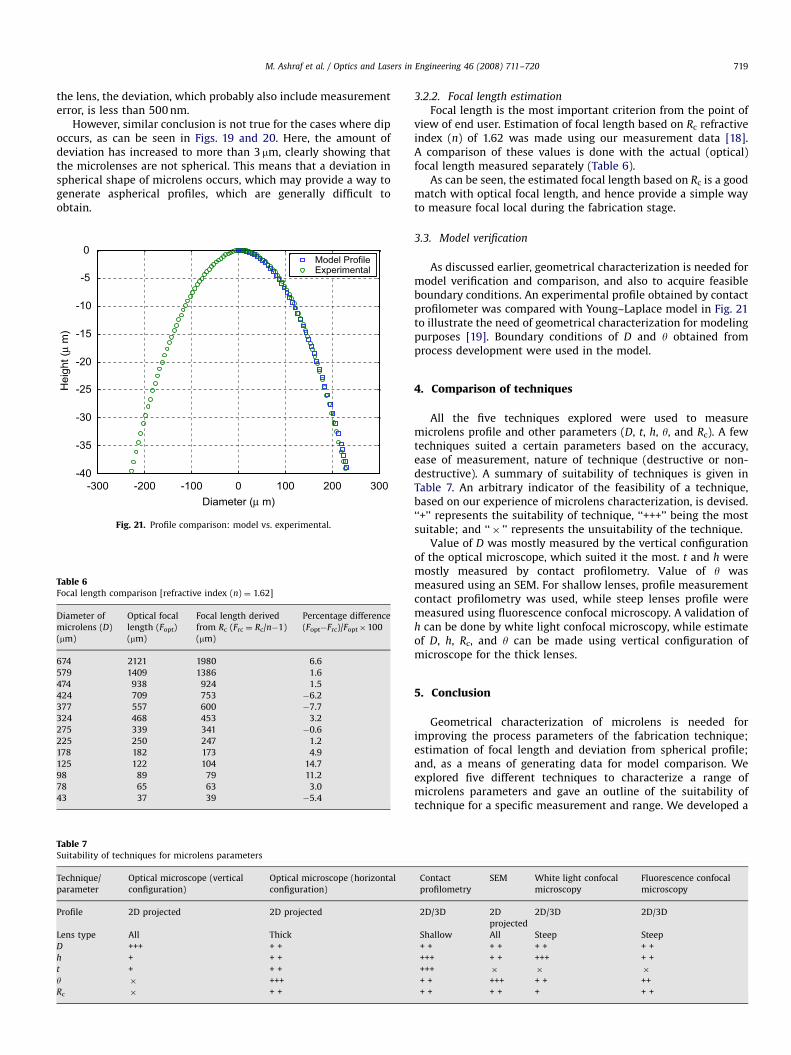
3.3. Model verification
As discussed earlier, geometrical characterization is needed formodel verification and comparison, and also to acquire feasibleboundary conditions. An experimental profile obtained by contactprofilometer was compared with Young–Laplace model in Fig. 21to illustrate the need of geometrical characterization for modelingpurposes [19]. Boundary conditions of D and y obtained fromprocess development were used in the model.
4. Comparison of techniques
All the five techniques explored were used to measuremicrolens profile and other parameters (D, t, h, y, and Rc). A fewtechniques suited a certain parameters based on the accuracy,ease of measurement, nature of technique (destructive or non-destructive). A summary of suitability of techniques is given inTable 7. An arbitrary indicator of the feasibility of a technique,based on our experience of microlens characterization, is devised.‘‘+’’ represents the suitability of technique, ‘‘+++’’ being the mostsuitable; and ‘‘� ’’ represents the unsuitability of the technique.
Value of D was mostly measured by the vertical configurationof the optical microscope, which suited it the most. t and h weremostly measured by contact profilometry. Value of y wasmeasured using an SEM. For shallow lenses, profile measurementcontact profilometry was used, while steep lenses profile weremeasured using fluorescence confocal microscopy. A validation ofh can be done by white light confocal microscopy, while estimateof D, h, Rc, and y can be made using vertical configuration ofmicroscope for the thick lenses.
5. Conclusion
Geometrical characterization of microlens is needed forimproving the process parameters of the fabrication technique;estimation of focal length and deviation from spherical profile;and, as a means of generating data for model comparison. Weexplored five different techniques to characterize a range ofmicrolens parameters and gave an outline of the suitability oftechnique for a specific measurement and range. We developed a
Contact
profilometry
SEM White light confocal
microscopy
Fluorescence confocal
microscopy
2D/3D 2D
projected
2D/3D 2D/3D
Shallow All Steep Steep
+ + + + + + + +
+++ + + +++ + +
+++ � � �
+ + +++ + + ++
+ + + + + + +
ARTICLE IN PRESS
M. Ashraf et al. / Optics and Lasers in Engineering 46 (2008) 711–720720
workable recipe for the measurement of steep microlens usingfluorescence confocal microscopy, which as per our knowledge isnew to the profile measurement of microlens. We also discussedthe advantages and limitations of techniques in terms ofmicrolens profile measurements, and used these techniques tostudy various microlens parameters. Additionally, the techniquesdiscussed here can be generalized for their use in other kind ofmicroprofile measurements.
References
[1] Ashraf M, Gupta C, Chollet F, Springham SV, Rawat. Geometrical character-ization of refractive microlens made by thermal reflow of photoresistcylinders. ICMAT (MEMS Technology and Devices), Singapore, 2007.
[2] Sinzinger S, Jahns J. Microoptics. 2nd ed. Weinheim: Wiley-VCH GmbH & Co.KGaA; 2003.
[3] Daly D. Microlens array. CRC; 2000.[4] Schilling A, Merz R, Ossmann C, Herzig H P. Surface profiles of reflow
microlenses under the influence of surface tension and gravity. Opt Eng2000;39(8):2171–6.
[5] Audran S, et al. Study of mechanisms involved in photoresist microlensformation. J Micro Eng 2006;86:1087–90.
[6] O’Neill FT, Sheridan JT. Photoresist reflow method of microlens production.Part II: Analytic models. Optik 2002;113(9):405–19.
[7] Popovic ZD, Sprague RA, Connell GAN. Technique for monolithic fabrication ofmicrolens arrays. Appl Opt 1988;27:1281–4.
[8] Daly D, Stevens RF, Hutley MC, Davies N. The manufacture of microlenses bymelting photoresist. Meas Sci Technol 1990;1:759–66.
[9] Strzelecka EM, Robinson GD, Coldren LA, Hu EL. Fabrication of refractivemicro-lenses in semiconductors by mask shape transfer in reactive ionetching. Microelectron Eng 1997;35:385–8.
[10] Ashraf M, Chollet F. Simultaneous fabrication of concave and convexmicrolenses using thermal reflow. ICMAT (MEMS Technology and Devices),Singapore, 2007.
[11] Gu E, et al. Reflection/transmission confocal microscopy characterization ofsingle-crystal diamond microlens arrays. Appl Phys Lett 2004;84:2754–6.
[12] Choi HW, et al. Fabrication of natural diamond microlenses by plasmaetching. J Vac Sci Technol B 2005;23(1):130–2.
[13] O’Neill FT, Sheridan JT. Photoresist reflow method of microlens production.Part I: Background and experiments. Optik 2002;113(9):391–404.
[14] Semwogerere D, Weeks ER. Confocal microscopy. Emory University, Atlanta,GA, USA.
[15] Data obtained from the website of Cargille Labs, /http://www.cargille.com/meltmount.shtmlS.
[16] Taylor JR. An introduction to error analysis: the study of uncertainties ofphysical measurements. University Science Books; 1982.
[17] Goh YN, Ashraf M, Chollet F. Design fabrication and characterization of coppermicro mould for microlens array using electroplating. In: Asia-Pacificconference of transducers and micro-nano technology (APCOT), Singapore,2006.
[18] Ashraf M, Chollet F, Matham M, Yang C. Polymer microlens with independentcontrol of radius and focal length for an imaging fiber. Proc SPIE 2006;6037:66–76.
[19] Miyashita T. Standardization for microlens and microlens arrays. JJAP2007;46(8B):5391–6.
Related Documents