Geology and Ground- Water Resources of the Ahtanum Valley, Yakima County, Washington By BRUCE L. FOXWORTHY GEOLOGICAL SURVEY WATER-SUPPLY PAPER 1598 UNITED STATES GOVERNMENT PRINTING OFFICE, WASHINGTON 1962

Welcome message from author
This document is posted to help you gain knowledge. Please leave a comment to let me know what you think about it! Share it to your friends and learn new things together.
Transcript

Geology and Ground- Water Resources of the Ahtanum Valley, Yakima County, WashingtonBy BRUCE L. FOXWORTHY
GEOLOGICAL SURVEY WATER-SUPPLY PAPER 1598
UNITED STATES GOVERNMENT PRINTING OFFICE, WASHINGTON 1962

UNITED STATES DEPARTMENT OF THE INTERIOR
STEWART L. UDALL, Secretary
GEOLOGICAL SURVEY
Thomas B. Nolan, Director
The U.S. Geological Survey Library has cataloged this publication as follows:
Foxworthy, Bruce La Verne, 1925-
Geology and ground-water resources of the Ahtanum Valley, Yakima County, Washington. Washington, U.S. Govt. Print. Off., 1962.
v, 100 p. maps (1 col.) diagrs., tables. 25 cm. (U.S. Geological Survey. Water-supply paper 1598)
Part of illustrative matter in pocket.
Bibliography: p. 66.
1. Water, Underground Washington (State) Ahtanum Valley. 2. Water-supply Washington (State) Ahtanum Valley. 3. Bor ings Washington (State) Ahtanum Valley. I. Title. II. Title: Ahtanum Valley, Yakima County, Washington. (Series)
For sale by the Superintendent of Documents, U.S. Government Printing Office Washington 25, D.C.

CONTENTS
Page
Abstract__. _____________________________________________________ 1Introduction._ ____________________________________________________ 2
Purpose and scope of the investigation_._______.___..__...._______ 2Location and extent of the area_ ______-______-_-.____-_-_-__._ _ 3Previous investigations._____-________-__--.__-_____-_--__-____-_ 4Acknowledgments _____________________________________________ 5Well-numbering system ____.___.__-_--_____.______________-__-- 5
Geography_. ___________________________ _________________________ 6Landforms_ _ _______-.._----______-__-_-_-_-___-_-_-___._____- 6Drainage_________________________________ ____________________ 7Climate ______________________________________________________ 8Vegetation._ __________________________________________________ 11Culture and industry__________________________________________ 12History of water use_-_-_-_--_-_________________-___-_________- 12
Geology._-____-._-_______-----________-___-___-_____-_-___.____-_ 14Description of the rock units____ ________________________________ 14
Yakima basalt. ___. __-_---___-_-__.________-.-____________ 14Ellensburg formation_______________________________________ 16Cemented basalt gravel. ___________________________________ 19Rock materials of Recent age_--___--_--_-___-_-_-.__________ 21
Structure.._-_____-_------_-_-_-___-_-___-_______-_________.__ 22Geologic history.._____________________________________________ 24
Water resources_-__-_-_---------_-_-_-_-___________.____________-- 25Surface water._______-_-_--___ _______________________________ 26
Surface-water inflow.______________________________________ 27Surface-water outflow._---____________-_-___________.___. . 28Utilization of surface water.________________________________ 30
Ground water._-___-----_-_-_-_______---_-_-_-_-.---_____._-_- 31Aquifer properties.________________________________________ 31Water table_..--_-----__--.-_------__-_-_-_---_-___-_-_-_- 32Confined ground water.____.-_____-_-_________-_____.___--_ 33Recharge to aquifers.______________________________________ 33Movement of ground water_________________________________ 34Ground-water discharge_____-__--___-_-____-._-___________. 34Hydraulics of a well. _____-_______-----__ .__---__________-_ 35Occurrence of water in the rock units. _______________________ 36
Yakima basalt._______________________________________ 36Ellensburg formation._______--_--_-_____-_----.________- 39Cemented basalt gravel. ____-__-__-_-_-__ ______________ 42Unconsolidated alluvium. _____---_________-_________--- 43
Water-level fluctuations.____.-._______-_____---_--___-_---_ 49m
IV CONTENTS
Water resources Continued Ground water Continued
Development---___-_-____-__-_-_-_--_-__-_-__---_--___-__ 53Upper valley____-____-___-__----__--___-_-___________- 53Upland benches_____--_-_____--_-_--_-_____________--- 54Lower valley__________________________________________ 55
Present development..______-_--___.-___-_-_____-__ 55Potential development_____________________________ 56
Summary of withdrawals.___-_____-_---_-___________-_- 58Chemical quality___________ ______________________________ 59
Range in chemical concentration. _______________________ 59General character______________________________________ 59Suitability for use_____________________________________ 62
Ground-water discharge to the Yakima River._____________--- 62Problems of future water supply_____________________________________ 64
Streamflow.__________________________________________________ 64Ground water.________________________________________________ 65Water use____________________________________________________ 65Precipitation. _________________________________________________ 65
References cited.-_________________________________________________ 66Basic data________________________________________________________ 67Index.___________________________________________________________ 99
ILLUSTRATIONS
[Plates in pocket]
PLATE 1. Geologic map and sections of Ahtanum Valley, showing location of representative wells, Yakima County, Wash.
2. Hydrographs of selected wells.3. Hydrograph of well 12/17-2R2, for the period June 1951-July 1953.
Page FIGURE 1. Map of the Ahtanum-Moxee subbasin showing study area---- 3
2. Diagram showing well-numbering system.__________________ 53. Mean monthly precipitation at three stations in and near
Ahtanum Valley_____________________________________ 94. Graph showing annual precipitation at Yakima_ _____^_____- 105. Diagrammatic cross section showing various occurrences of
ground water.________________________________________ 346. Diagrammatic section through a discharging water-table well. 357. Hydrograph of well 12/17-2R2, showing diurnal water-level
fluctuations and drawdown from pumping of a nearby well__ 518. Graph showing chemical character of water from wells______.. 61

CONTENTS
TABLES
Page TABLE 1. Monthly surface-water inflow and outflow, Ahtanum Valley. __ 29
2. Summary of pumping tests, lower Ahtanum Valley___________ 463. Estimated ground-water withdrawals in subareas of the Ahta
num Valley__________________________________________ 584. Records of representative wells in Ahtanum Valley.__________ 685. Materials penetrated by representative wells in the Ahtanum
Valley_-_________-_---__________________--------_----_ 866. Chemical analyses of ground water in the Ahtanum Valley.___ 967. Field analyses of water from wells in the Ahtanum Valley_____ 97


GEOLOGY AND GROUND-WATER RESOURCES OF THE AHTANUM VALLEY, YAKIMA COUNTY, WASHINGTON
By BRTJCE L. FOXWORTHY
ABSTRACT
The Ahtanum Valley covers an area of about 100 square miles in an important agricultural district in central Yakima County, Wash. Because the area is semiarid, virtually all crops require irrigation. Surface-water supplies are inade quate in most of the area, and ground water is being used increasingly for irriga tion. The purpose of this investigation was the collection and interpretation of data pertaining to ground water in the area as an aid in the proper development and management of the water resources.
The occurrence and movement of ground water in the Ahtanum Valley are directly related to the geology. The valley occupies part of a structural trough (Ahtanum-Moxee subbasin) that is underlain by strongly folded flow layers of a thick sequence of the Yakima basalt. The upper part of the basalt sequence interfingers with, and is conformably overlain by, sedimentary rocks of the Ellensburg formation which are as much as 1,000 feet thick. These rocks are in turn overlain unconformably by cemented basalt gravel as much as 400 feet thick. Unconsolidated alluvial sand and gravel, as much as 30 feet thick, form the valley floor.
Although ground water occurs in each of the rock units within the area, the Yakima basalt and the unconsolidated alluvium yield about three-fourths of the ground water currently used. Wells in the area range in depth from a few feet to more than 1,200 feet and yield from less than 1 to more than 1,000 gallons per minute.
Although water levels in water-table wells usually are shallow often less than 5 feet below the land surface levels in deeper wells tapping confined water range from somewhat above the land surface (in flowing wells) to about 200 feet below. Wells drilled into aquifers in the Yakima basalt, the Ellensburg formation, and the cemented gravel usually tap confined water, and at least 12 wells in the area flow or have flowed in the past. Ground-water levels fluctuate principally in response to changes in stream levels, variations in the flow of irrigation ditches and in rates of water application, variations in local precipita tion, and seasonal differences in withdrawals from wells. Annual fluctuations of levels generally are less than 10 feet except in localities of heavy pumping. Periodic measurements of water levels in two observation wells in the area indicate, locally at least, a persistent decline in artesian pressures in confined basalt aquifers, although the record is too short to show whether withdrawal by pumping has reached, or is nearing, an optimum balance with recharge.
The aquifers are recharged by precipitation, by infiltration from streams, and by ground-water underflow into the area. Ground water is discharged by seepage to streams, by evapotranspiration, by springs and seeps at the land surface, and, artificially, by withdrawal from wells. It is estimated that the seepage
1
2 GEOLOGY, GROUND WATER, AHTANUM VALLEY, WASH.
discharge to the Yakima River from the area studied may range from about 20,000 to 25,000 acre-feet per year. The consumptive waste of ground water by phreatophytes probably exceeds 4,000 acre-feet per year and may represent a large reclaimable source of water in the area. The annual withdrawal of ground water from wells in the area for domestic, industrial, irrigation, public, and stock supplies is estimated to be 6,300 acre-feet.
The chemical quality of the ground water generally is satisfactory for most purposes, although the water from many wells is harder than is desirable for domestic use.
INTRODUCTION
PURPOSE AND SCOPE OF THE INVESTIGATION
The surface-water supplies that usually are available for irrigation in the Ahtanum Valley during the growing season are inadequate for the full development of the agricultural potential of the area. About 60 percent of the irrigable land in the area is irrigated entirely with surface water, but only about 15 percent receives an amount consid ered adequate throughout the growing season. An additional 10 to 15 percent of the irrigable land is, or has been, irrigated partly or entirely with ground water. Hence, although ground water does not now constitute a major part of the total irrigation water used, the acreage that has been supplied by ground water is nearly as large as that for which adequate supplies of surface water are available. Because the surface-water resources of the area are completely appor tioned, future agricultural development of the area will depend largely upon the availability and proper utilization of ground water, even though the efficiency of surface-water utilization might be improved. Ground water also provides virtually all the water now used for domestic, industrial, and municipal purposes; hence, its availability could be a limiting factor in future population growth and industrial development within the area.
The purpose of this investigation was the collection and interpre tation of data pertaining to ground water in the Ahtanum Valley in order to aid in the proper development and management of the water resources. Special consideration has been given to the source and movement of the ground water, its availability throughout the valley, its hydraulic relation to the streams, and its suitability for domestic and irrigation use.
The occurrence of underground water in any area is controlled by the character, distribution, and structure of the rocks and is influenced by the climate and the drainage pattern of the area. Therefore, dis cussions of the geology, landforms, climate, and drainage in the Ahta num Valley, and their relation to the occurrence of ground water in the area, are included in this report.
The report is based largely upon fieldwork done by the writer between April 1951 and July 1952. During that time, wells were can-

INTRODUCTION
vassed and well logs and hydrologic data were gathered. A network of observation wells was established, in which water levels were meas ured periodically. Detailed geologic mapping was done on aerial photographs.
In 1953, during the course of this investigation, the writer prepared a brief report on ground water in the lower Ahtanum Velley (Fox- worthy, 1953), at the request of, and under cooperative financing with, the State of Washington's Department of Conservation, Division of Water Resources. Many of the data presented in that report are included herein, although the area covered and the scope of the present report are much broader than those of the earlier report.
This study is part of a continuing program of the U.S. Geological Survey for the collection and interpretation of information bearing on the Nation's ground-water resources. It was conducted under the supervision of M. J. Mundorff, former District Geologist of the Ground Water Branch of the Geological Survey for the State of Washington.
LOCATION AND EXTENT OP THE ABBA
The area of this investigation is the Ahtanum Creek valley, in central Yakima County (fig. 1). The area extends from the Yakima River westward for 21 miles and ranges in width from 6 miles at the west end to about 3 miles in the eastern part. It constitutes the southwestern part of the Ahtanum-Moxee subbasin. The total area mapped is about 100 square miles.
The center of the area is about 11 miles west-southwest of Yakima, which is the county seat of Yakima County and the largest commer cial center in south-central Washington. The southern side of the valley, south of Ahtanum Creek, is part of the Yakima Indian Reservation.
FIGURE l. Map of the Ahtanum-Moxee subbasin, Yakima County, Wash., showing location of study area.

4 GEOLOGY, GROUND WATER, AHTANUM VALLEY, WASH.
Because there is virtually no farming, and consequently little ground-water use in the mountain valleys drained by the upper reaches of the North and South Forks of Ahtanum Creek, these areas were not included in the investigation.
PREVIOUS INVESTIGATIONS
In 1893, I. C. Russell made a preliminary investigation of the geo logic features of central Washington to ascertain whether the region was favorable for a supply of artesian water for irrigation. In his description of what is called in this report the Ahtanum-Moxee sub- basin, Russell presented well logs and descriptions of some of the pioneer wells in Yakima County.
A more detailed study of part of Yakima County, including the Antanum-Moxee subbasin, was made by G. O. Smith (1901), who described the main geologic features, the general conditions affecting ground water, and the flowing artesian wells in the subbasin.
Smith (1903) also mapped the geology of the Ellensburg quadrangle, which covers an area of 820 square miles and includes the Ahtanum Valley. In his description of the quadrangle, Smith treated in detail the rock units and geologic structure of the Ahtanum Valley and in cluded a general evaluation of ground-water resources in the Yakima area.
In 1943 a short report on the ground water of the Ahtanum Valley was completed by S. N. Twiss of the Soil Conservation Service, U.S. Department of Agriculture. Twiss differentiated a rock unit that had not been recognized as a separate unit by earlier workers, and he described the water-yielding potentialities of the various rock mate rials in the valley.
In 1954, J. E. Sceva completed a report evaluating the streamflow records from the Yakima basin, including the Ahtanum Valley, with regard to possible subsurface flow of water past stream-gaging sta tions. The report contains descriptions of the rock units and the larger structural features in the Yakima basin, and of their influence on the hydrology of the region; discussions of the various subbasins, including the Ahtanum-Moxee subbasin, and the utilization of water within them; descriptions of the geologic conditions at each gaging station; a generalized geologic map and a section along the Yakima River; and detailed geologic sections at the sites of gaging stations.
The geology of the Yakima East quadrangle, which includes the eastern \% miles of the lower Ahtanum Valley, and of the adjacent Moxee Valley was mapped and described in detail by A. C. Waters (1955). Although Waters' report is concerned primarily with the area east and northeast of the Ahtanum Valley, it provides an excellent description of the rock units and geomorphology of the region.

INTRODUCTION
Because all these publications deal with the area herein considered, they have been consulted frequently during this investigation.
ACKNOWLEDGMENTS
The fieldwork and preparation of this report were greatly facilitated by the assistance of many persons. Well owners, operators, and drillers provided many of the well data included in this report. Spe cial acknowledgment is given to the owners who allowed their wells to be usad for water-level observations and for aquifer tests. The Ran- kin Equipment Co., of Yakima, contributed many records of pumping tests. Mr. J. L. Dobie furnished information and collaborated in the collection of fossils. Vertebrate fossils from the collection of the State College of Washington have proved extremely valuable in the assign ment of ages for the rock units; appreciation is expressed to Mr. Harold E. Culver for the use of his lucid field notes, and to Mr. W. Frank Scott for his help in making the fossils available for examination. The cooperation of personnel of the State Division of Water Resources in supplying well records and comments on this report also is grate fully acknowledged. Assistance given by members of the Geological Survey includes the identification of invertebrate fossils by Mr. T. C. Yen and identification of vertebrate fossils by Miss Jean Hough.
WELL-NUMBERING SYSTEM
Well numbers used in this report are based on and show locations of wells according to the rectangular system for subdivision of public land, indicating township, range, section, and 40-acre tract within the section. For example, in the well number 12/17-9J1, the part pre ceding the hyphen indicates successively the township and range
D
E
M
N
C
F
L
P
B
G
K
Q
A
H
o^J
R
FIGURE 2. Diagram showing well-number ing system.
(T. 12 N., R. 17 E.) north and east of the Willamette base line and meridian. The first number following the hyphen indicates the section (9), and the letter (J) gives the 40-acre subdivision of the section as shown in figure 2. The last number is the serial number of

6 GEOLOGY, GROUND WATER, AHTANUM VALLEY, WASH.
the well (1) in that particular 40-acre tract. Thus, the first well re corded in the NEjiSEJi sec. 9, T. 12 N., R. 17 E., would have the number 12/17-9J1, and the second well would have the number 12/17-9J2.
GEOGRAPHY
LANDFOBMS
The Ahtanum Valley descends eastward from the foothills of the Cascade Mountains to the Yakima River. It is one of several struc turally controlled eastward-trending valleys in the central Yakima basin. In general, the valley has steep sides, a relatively flat floor, and considerable downvalley slope. Altitudes within the area range from about 940 feet at the Yakima River to about 4,100 feet at the crest of Cowiche Mountain.
The major landforms of the area are directly related to the geo logic structure. The valley itself occupies the southwestern part of the Ahtanum-Moxee subbasin, which is a structural trough, or syncline (fig. 1). The ridges that border the area on the south, west, and northwest are formed by structural upfolds, or anticlines.
The valley is bordered on the south by Ahtanum Ridge, a narrow, even-crested anticlinal ridge that rises about 1,000 feet above the valley floor and locally exceeds 2 miles in width. It extends east ward from the irregular and deeply eroded Cascades some 40 miles to the Yakima River. Its eastward extension, beyond the Yakima River, is known as the Rattlesnake Hills. The Yakima River, flowing southward across the axis of the ridge, has eroded a narrow, steep- walled gorge called Union Gap, for which the nearby town is named.
Sedge Ridge and Cowiche Mountain are similar to Ahtanum Ridge, though somewhat higher. They are the topographic expression of the Sedge Ridge-Cowiche Mountain anticline and form the west and northwest boundaries of the Ahtanum-Moxee subbasin.
Discussions of ground water in the area may be related effectively to the valley's three main physiographic sections, herein termed the lower valley, the upper valley, and the upland benches.
The lower valley includes the broad valley floor along the lower, or eastern, reach of Ahtanum Creek and the adjacent lower slopes of Ahtanum Ridge. For a distance of approximately 6 miles west of the Yakima River, the lower valley floor has no marked natural boundary on the north. This part of the valley floor is a southern continuation of a broad alluvial plain that extends southwestward from Yakima. Farther west, however, the lower valley is bordered on the north by a moderately dissected terrace remnant that rises, at places, more than 100 feet above the valley floor. The lower valley floor is about 1 to 2% miles wide and has a relatively flat cross-valley

GEOGRAPHY 7
(north-south) profile. The down valley (easterly) gradient of the lower valley floor ranges from about 36 to 75 feet per mile and averages 52 feet per mile.
Fourteen miles west of the Yakima River, the valley floor is sharply constricted by resistant lava rock which forms low bluffs and vertical cliffs along both sides of Ahtanum Creek for a distance of 3 or 4 miles. In this constriction, locally called the Narrows, the valley floor is less than half a mile wide. Upstream from the Narrows, the valley floor widens somewhat, although it is less than a mile wide at its widest point, in the vicinity of Tampico. The upper valley, as described in this report, comprises the Narrows and the valley floors to the west, including those of the North and South Forks of Ahtanum Creek for distances of about 4 and 3 miles, respectively, upstream from their confluence.
The upper valley is sharply delimited by steep banks and bluffs that rise to well-defined upland benches on the north and south sides of the valley floor and on the west between the North and South Forks of Ahtanum Creek. In general, these upland benches are terrace remnants formed between bedrock valley Walls and overlying irregu larities in the upper surface of the underlying bedrock. The benches adjacent to the valley floor slope upward toward the margins of the basin, merging with the alluvial fans and pediment slopes along the flanks of the anticlinal ridges.
The upland bench on the north side of the valley locally is more than 200 feet above the valley floor. It extends eastward beyond the Narrows and merges with the terrace remnant that separates the lower Ahtanum Valley from Wide Hollow. This terrace gradually dimin ishes in height toward the east and dies away near the center of the lower valley.
The bluffs and slopes on both sides of the valley have been moder ately gullied by small, intermittent streams. From the mouths of the gullies and ravines, fan-shaped deposits of gravel have been built out onto the edges of the valley floor. On the south side of the lower valley, these alluvial fans coalesce to form a continuous, undulating slope along the base of Ahtanum Ridge.
DRAINAGE
The most important stream in the area is Ahtanum Creek, a peren nial stream which flows eastward through the entire length of the Ahtanum Valley and enters the Yakima River at Union Gap. Wide Hollow Creek, which flows southeastward across the east end of the lower valley and enters the Yakima River less than half a mile above the mouth of Ahtanum Creek, also is a perennial stream, although its

8 GEOLOGY, GROUND WATER, AHTANUM VALLEY, WASH.
flow is largely supported during the summer months by waste water from irrigation outside the area.
The Ahtanum Creek drainage area covers about 171 square miles, almost half of which lies to the west of the area studied, on the high, well-dissected east slope of the Cascades. This headwater region is drained by the North Fork and South Fork of Ahtanum Creek, which converge near Tampico to form the main stream. Gradients along Ahtanum Creek range from 36 feet per mile near Union Gap to more than 100 feet per mile along the North and South Forks above Tampico.
The drainage pattern in the area mapped is closely controlled by the structure of the underlying rocks. Ahtanum Creek and its South Fork follow the axis of the structural trough that forms the Ahtanum Valley, whereas the North Fork, after following a course paralleling the Sedge. Bidge-Cowiche Mountain anticline, turns directly across that upfold. Also, because the geologic structure closely controls the topography, most of the intermittent streams in the area flow generally in the direction of dip of the underlying rocks.
In the lower valley Ahtanum Creek splits into three main courses which converge again into one main stem before leaving the area. At some places these natural distributaries have been incorporated into a complex system of canals used to irrigate that part of the valley. During the summer the water of Ahtanum Creek is diverted for irriga tion and returned to the main channels of the creek several times in its course between Tampico and the Yakima River.
CLIMATE
The climate of the Ahtanum Valley is of the continental semiarid type characteristic of southeastern Washington. Summer days are clear, hot, and dry, and the nights usually are cool. Winters are comparatively wet and cloudy and have occasional periods of cold.
Precipitation and perhaps other weather conditions in the region vary substantially with elevation and with proximity to the Cascade Mountains. Because these factors differ considerably from place to place within the Ahtanum Valley, observations made at one place may not relate directly to weather conditions in other parts of the area. For this reason, and to provide supplemental information not available from the area itself, climatological data from four weather stations in the Yakima basin are included herein. Weather observations made at the U.S. Weather Bureau station at the Yakima Airport doubtless apply over much of the lower Ahtanum Valley. A weather station at Rimrock, about 15 miles northwest of Tampico, is about 1,700 feet higher and some 30 miles closer to the crest of the Cascades than the Yakima station. Data from the Rimrock station probably are indica tive of weather conditions over much of the headwaters area of

GEOGRAPHY 9
Ahtanum Creek, and the climate in the upper Ahtanum Valley prob ably is intermediate between climatic conditions at the Rimrock and Yakima stations. At a weather station at White Swan, 16 miles southwest of the Yakima Airport and at about the same elevation, only temperature and precipitation data are recorded. These data compare very closely with similar data for Yakima. Evaporation data, which are not available for the Yakima station, have been obtained from a station near Prosser. The Prosser station is about 45 miles southeast of Yakima, in an area climatologically similar to the lower Ahtanum Valle}7 .
Figure 3 shows the mean monthly precipitation at three stations, Rimrock, White Swan, and Yakima, all in or near the Ahtanum Valley. The records indicate that more than half the precipitation in the Yakima region occurs during the 4 months from November through February. December is the wettest month of the year and July is the driest. There is a tendency (at 2 of the 3 stations) for June to be wetter than either April or May, largely because of occasional thunderstorms.
Figure 3 also indicates a general relationship between precipitation and altitude. For example, at the Yakima station, 1,061 feet above sea level, the mean annual precipitation is 7.21 inches, whereas at Rimrock, 2,730 feet above sea level, the mean is 26.2 inches. Although no climatological data are available for the upper valley, this relation-
Rimrock Mean annua Altitude, 2
26 2 inches/ 730feet z-^.
V
White Swan Mean annual 7.60 in Altitude, I 061 feet
I
YakimaMeon annual 7.21 inchesAltitude, I 061 feet
May June July Aug. Sept. Oct Nav Dec.
FIGURE 3. Mean monthly precipitation at three stations in and near the Ahtanum Valley. (From U.S.Weather Bureau records.)

10 GEOLOGY, GROUND WATER, AHTANUM VALLEY, WASH.
ship suggests that at Tampico, at about 2,120 feet, a mean of about 15-18 inches might be expected.
The annual precipitation at the Yakima station from 1910, the first year of record, to 1956 is shown in figure 4. As the figure shows,
15
Ld -Io H z ~ 10
o -< ~~E ~~
UJ 5a: -JQ.
Average, 1910-56, 7.25 inches
FIGURE 4. Graph showing annual precipitation at Yakima during the period 1910-56. (Data from U.S.Weather Bureau records.)
there has been considerable variation in annual precipitation during the 47-year period. The least amount, 3.90 inches, fell in 1930; the greatest amount, 11.87 inches, in 1948. However, the annual precipitation was less than 6 inches in only 12 of the years of record (about 1 year in 4), and exceeded 9 inches in only 8 years (about 1 year in 6). The annual precipitation during 1917-36 averaged about 1 inch less than the long-term mean, a deficiency of about 14 percent per year. During 1937-56, the annual precipitation averaged about 1 inch more than the long-term mean.
Snowfall data from the Yakima station, not presented herein, indicate that about one-fifth of the annual precipitation at that station falls as snow.
Temperatures in the Ahtanum Valley are relatively mild, but the area occasionally has extremely high and low temperatures. Weather Bureau records show that, although the average temperature at Yakima during the period of record was 50.2° F, a high of 111° F (July 1928) and a low of 25° F (February 1950) have been observed. July is the warmest month and January is the coolest. The mean

GEOGRAPHY 11
temperatures at the Yakima station for those months are 71.4° F and 26.9° F.
The regional movement of air generally is from the west and southwest; however, because of the effect of the topography of the Ahtanum Valley, the wind comes from the west or northwest during most of the year. Winds are mostly light; wind speed at the Yakima station averages 5.6 miles per hour.
The average relative humidity is comparatively high in winter, moderate to low during most of the year, and very low in summer afternoons and evenings. At the Yakima station the monthly rela tive humidity is highest, 81 percent, in December. It is lowest, 41 percent, in July.
Evaporation in the Ahtanum Valley is great during the months of low humidity. No evaporation data are available for the Yakima station, but those for a class A Weather Bureau land pan at a weather station near Prosser, in the lower Yakima Valley about 45 miles southeast of Yakima, probably are representative of the Ahtanum Valley. Average monthly pan evaporation at the station near Prosser during the period 1948-56, in inches, is as follows: March, 2.61; April, 4.35; May, 5.64; June, 6.58; July, 7.56; August, 6.29; Septem ber, 4.29; October, 2.09; and November, 0.75.
The average growing season at the Yakima station is 193 days. The average dates of the last killing frost in spring and the first in fall are April 13 and October 23, respectively. This growing season and its limits probably apply over most of the lower Ahtanum Valley. The growing season in the upper valley is shorter, but its length probably is closer to the Yakima average than to the 111-day average recorded at Rimrock.
VEGETATION
Vegetation in the area reflects the area! range of climatic conditions. In the eastern part, the slopes and ridges are generally treeless, and in their native condition they are covered with sagebrush and asso ciated desert shrubs and grasses. Trees are more abundant closer to the high Cascades, and extensive thick groves of yellow pine, fir, cedar, and mountain hemlock grow in the headwaters area. How ever, except in the extreme western part of the area, conifers are rare. One of the most abundant trees in the upper valley is the scrub white oak, which grows in dense thickets along stream courses and in ravines west of the Narrows.
Cottonwood, willow, and associated water-loving plants (phreato- phytes or "well-plants") grow in belts and clumps along streams and in marshy parts of the valley floor. These phreatophytes grow only
603275 O £2 2

12 GEOLOGY, GROUND WATER, AHTANUM VALLEY, WASH.
in areas where their roots can be sent down to the water table or to some other secure, perennial supply of water. The consumptive use of ground water by the phreatophytes is an important factor in the study of water resources of the Ahtanum Valley and is discussed in a subsequent part of this report.
CULTURE AND INDUSTRY
Union Gap is the only incorporated city in the area; in 1950 it had a population of about 1,800. The remainder of the population is scattered throughout the valley or centered around the three small communities of Ahtanum, Tampico, and Wiley. Probably less than one-tenth of the valley's population lives south of Ahtanum Creek, on the Yakima Indian Reservation.
Although there is some manufacturing in and near Union Gap, the principal industries in the valley are agriculture, animal hus bandry, and the processing of agricultural products. Fruit of the finest quality is grown and processed within the area. Hops are an important crop, and much hay is grown throughout the valley. Sheep and beef cattle graze in the uplands during the open seasons of the year and are wintered in the valley.
Some grain has been grown on the upland by dry-farming methods, but most of the crops in the Ahtanum Valley require irrigation during at least part of the growing season. In the valley, most of the water supply developed as of 1958 is used for these irrigation needs.
HISTORY OF WATER USE
The first known irrigation in the Ahtanum Valley began about 1864 (Kinnison, 1952, p. 3). At that time, and for many years thereafter, the magnitude of irrigation was small and the surface- water supplies were more than adequate to irrigate the developed lands of both the settlers north of Ahtanum Creek and the Yakima Indians south of the creek. However, continued development of irrigable land, with the accompanying need for more water, subsequently led to a series of legal acts aimed at apportioning the water resources of the area and regulating their use for irrigation.
The first of these acts was an agreement in 1908 between the Yakima Indian Nation and the non-Indian water users, 1 wherein one-quarter of the total surface inflow of Ahtanum Creek was allotted to the lands of the Yakima Indian Reservation, south of Ahtanum Creek, and three-quarters to the lands north of the Creek.
i Agreement of May 9, 1908, between U.S. Indian Bureau and W. W. Clidden et al., representing users of water from Ahtanum Creek. Approved June 30, 1908, by Franklin Pierce, First Assistant Secretary of the Interior.

GEOGRAPHY 13
By an adjudication decree in 1925,2 the tracts of land north of Ahtanum Creek were assigned water rights according to preexisting irrigation usage. These water rights are ranked according to classes numbered from 1 to 32, the lower numbers representing the more generous allotments. According to Wallace Owen, stream patrolman for the Ahtanum Valley, the lands having water right numbers 1 to 4 are usually assured adequate surface water for irrigation, but lands having water rights numbered higher than about 8 receive little or no surface water for irrigation after the middle of July. No supervised apportionment of the surface water is m,ade until the summer flow of Ahtanum Creek no longer supplies all the irrigation demands. As the flow of the creek diminishes in early summer, surface irrigation water for the higher numbered water rights is decreased gradually, class by class, until toward the end of the irrigation season only the lower numbered classes receive surface water. Those landowners who in the past have planted crops requiring more water than they could obtain from their surface-water rights have been obliged to obtain the extra water by buying or leasing water rights or by developing ground- water supplies. Mr. Owen reported (oral communication, August 1951) that the water shortage has been considerably relieved by the greater development of ground-water supplies in recent years, even though more land has been put under irrigation during that time.
In 1945 the State of Washington established a ground-water code (Washington State legislature, 1945) requiring permits for the with drawal of ground water in excess of 5,000 gpd (gallons per day). The regulation of ground-water withdrawals is designed to prevent the indiscriminate and wasteful development of this valuable resource.
In 1957 the validity of the aforementioned 1908 agreement was challenged by the U.S. Bureau of Indian Affairs. In the resulting lawsuit 3 the Bureau of Indian Affairs petitioned for a higher pro portion of the surface-water inflow than the 25 percent provided for in the original agreement. The decision on this lawsuit was pending when this report was written. A judgment for the Bureau of Indian Affairs would necessitate the development of additional irrigation supplies to replace surface water diverted from the non-Indian lands, and probably would result in accelerated development of additional ground-water supplies in the area.
2 Stateof Washington v. Annie AchepohletaL, CauseNo. 18279, Superior Court of the State of Washington, Yakima County.
' United States v. Ahtanum Irrigation District et al., Civl. cause No. 31?, United States Dist. Court, Eastern Dist. of Washington, Southern Div.

14 GEOLOGY, GROUND WATER, AHTANUM VALLEY, WASH.
GEOLOGY
DESCRIPTION OF THE BOCK UNITS
YAKIMA BASALT
The oldest and most prominent rock unit exposed in the Ahtanum Valley is the Yakima basalt. This formation is composed of a sequence of basaltic lava flows several thousand feet thick, interbedded with a few minor sedimentary strata. It is the basal rock unit, or bedrock, of the Yakima region, and in the lower Ahtanum Valley and many other places the top of the formation is hundreds of feet below the land surface. The basalt is quite resistant to erosion and weathering and is a notable cliff-forming rock. Arched strata of basalt form the highest ridges of the region, including Ahtanum Ridge, Sedge Ridge, and Cowiche Mountain.
The basalt is a dense rock, having a texture so fine that most of the individual crystals cannot be seen by the unaided eye. Fresh, unweathered surfaces are black or dark gray; weathered surfaces range in color from gray to reddish brown. According to Warren (1941, p. 802) the basalt consists principally of small crystals of calcic labradorite, pyroxene, and olivine in a dense matrix of sodic labra- dorite, augite, and volcanic glass. Magnetite and apatite are common accessory minerals. Calcite, siderite, zeolites, opal, and chalcedony are common in veins and vesicles in the basalt.
Individual flow layers in the Yakima basalt range from less than 20 to more than 200 feet in thickness, and individual flows may differ considerably in thickness from place to place. The thicker flows, especially in their basal parts, exhibit a characteristic jointing that forms well-developed prismatic columns at right angles to the upper and lower surfaces of the flow layers. Subsequent jointing has divided many of the columns into closely spaced plates or irregular blocks. In the upper parts of the thicker flows, and in the thinner flows, the jointing may be predominantly irregular or platy. The abundance and configuration of jointing vary greatly from flow to flow and may even change abruptly in short distances within the same flow. Usu ally the joints are most abundant at the top of a flow and decrease in number toward the base. However, in areas of strong folding, such as along the north side of Ahtanum Ridge, there are zones of extreme shattering that apparently extend from base to top across the flow layers.
The upper parts of many of the lava flows are characterized by zones of abundant gas cavities (vesicles) which give the rock a spongy appearance. These vesicles were formed by bubbles of gases that issued from the molten lava as it solidified. At places the vesicles have been partly or completely filled with secondary minerals depos ited by water percolating through the rocks. Generally, however,

GEOLOGY 15
except where the vesicular zones have been fractured or deeply weathered, the vesicles are separated from each other by the encasing solid rock.
Enough time elapsed between extrusion of some lava flows to allow considerable weathering, and thin soil zones developed at places on top of the basalt and were buried by subsequent flows. One buried soil zone more than a foot thick can be seen in a small basalt quarry on the north slope of Ahtanum Ridge, due south of Wiley (SEtfNEtf sec. 23, T. 12 N., R. 17 E.). Generally, weathering did not affect the basalt deeper than a few feet below the upper surfaces of the flows. It is the upper parts of certain flows, rendered relatively permeable by weathering, jointing, and (in conjunction with these processes) vesicularity that constitute the principal water bearing zones in the basalt sequence.
The base of many flows is a layer of dense black volcanic glass, usually less than half an inch thick, which is the result of a quick chilling of the first part of the basalt flow as it came in contact with the cooler surface below.
The total thickness on the basalt in the Yakima area has not been determined, for no wells have penetrated to the rocks beneath. However, it is at least 2,000 feet at Union Gap. An oil test well (12/19-17C1) was drilled in that gorge to an approximate depth of 3,800 feet, almost entirely in basalt (table 5). The well was drilled through steeply dipping flow layers; consequently, for most of its depth the well penetrates the flow layers diagonally, and it may even follow the dip of the flows for a considerable distance at depth. How ever, the total penetration of the well is almost certainly equivalent to more than 1,000 feet stratigraphically that is, across the flow layers. As there is also about 1,000 feet of basalt exposed in and above the gorge, the basalt sequence must be at least 2,000 feet thick at Union Gap and probably is much thicker.
In the western part of the Ahtanum Valley, the upper 2 or 3 lava flows (total thickness about 250 feet) are separated from the main body of the basalt by a discontinuous member or tongue of the overlying Ellensburg formation. The upper, separated group of flows is similar in appearance, thickness, and stratigraphic position to the Wenas basalt member of the Yakima (previously the Wenas basalt of formation rank) which is exposed at Selah Gap. Although these 2 basalt units may be equivalent, no method of definite cor relation has been found because at other places in the region, 1 layer, and possibly 2, of sedimentary rocks similar in appearance and lithology to the Ellensburg formation are interbedded with lava flows in the upper part of the basalt sequence (Mackin, 1947; Waters, 1955, p. 670-672).

16 GEOLOGY, GROUND WATER, AHTANUM VALLEY, WASH.
The name Yakima basalt is applied locally to the thick sequence of basaltic lava flows underlying southeastern Washington and ex tending into Oregon and Idaho; elsewhere this sequence is known as the Columbia River basalt. The name was applied by Smith (1901) to that part of the Columbia River basalt that poured out in the Yakima region during the Miocene epoch. The age assign ment was made on the basis of fossil plants in the Manastash forma tion (Eocene), which underlies the Yakima basalt in the vicinity of Cle Elum, Wash., and fossil plants in the overlying Ellensburg forma tion, which were first assigned an age of late Miocene (Russell, 1893, p. 103). Subsequent workers have assigned an age of Miocene or early Pliocene, and Pliocene, to the Ellensburg formation.
In 1952 an assemblage of fossil fresh-water mollusks was collected from large blocks of loose debris high on the northwest flank of Sedge Ridge, in a locality some 4% miles west of Tampico (NE%SW# sec. 16, T. 12 N., R. 15 E.). The enclosing material, once an alluvial sand, has been altered to a tan or rusty-brown highly resistant richly fossiliferous quartzite. It can be traced for about half a mile in a band roughly parallel to the strike of the basalt flows of Sedge Ridge. Although the contact of the fossiliferous material with the basalt was not seen, apparently being covered by slope wash, the material almost certainly is a minor interflow deposit near the top of the sequence of basalt flows. Mr. T. C. Yen of the U.S. Geological Survey has identified the fossils (Sphaerium, sp. undet.; Viviparus cf. V. leiostracta Brusinia; Fluminicola cf. F. williamsi (Hannibal); Goniobasis cf. G. kettlemanensis), and he listed their age as probably Pliocene. This new evidence indicates that at least the latest flows of the Yakima basalt may have poured out during the Pliocene epoch.
ELLENSBURG FORMATION
The Yakima basalt is overlain by the Ellensburg formation, which consists of several hundred feet of semiconsolidated clay, silt, sand, and gravel. In the Ahtanum Valley, rocks of the Ellensburg for mation underlie the gravels of the upland benches in the vicinity of the Narrows and crop out in bands along the slopes of Ahtanum Ridge and Sedge Ridge. In general, the formation is easily eroded, and over much of the uplands it has been entirely stripped away from the underlying basalt.
A somewhat unusual topography has been developed on the south side of the lower valley by differential erosion of the sedimentary rocks. Headward erosion by northward-flowing intermittent streams has formed a number of steep, narrow canyons in the north flank of the anticlinal Ahtanum Ridge, creating well-defined spur ridges that extend northward from the main ridge. The bases of these

GEOLOGY 17
spur ridges are formed in the resistant basalt of Ahtanum Ridge, the central parts in steeply dipping beds of the Ellensburg formation, and the noses in moderately resistant cemented gravel. As a result of differential erosion, most of the spur ridges terminate in knobs consisting of this resistant cemented gravel. Saddles occur where the less resistant Ellensburg formation appears at the land surface for example, between the knobs and the basalt of Ahtanum Ridge.
In appearance and lithology, the Ellensburg formation in the Ahtanum Valley is identical to exposures of the formation in other parts of the Yakima region. It consists of 85 to 95 percent semi- consolidated clay, silt, and sand and only 5 to 15 percent gravel and conglomerate. The color is predominantly gray, tan, and buff, although there are a few relatively thin rusty-brown sand and gravel strata. The clay and silt parts are massive at most places, but excellent bedding and shaly parting also are found. Some sand and gravel strata are crossbedded. The thickness of the individual beds ranges from a few feet to more than 100 feet; strata of clay, silt, and fine sand usually are somewhat thicker than strata of the coarser materials.
The Ellensburg formation is mostly indurated and tough, but some sand and gravel strata are weakly cemented and appear moderately permeable. Cementing material is mostly argillaceous.
The silt and sand are composed chiefly of pumice, volcanic ash, quartz, and scattered feldspar and hornblende particles, Clay-size particles consist mostly of finely divided pumice and ash. The gravel of the Ellensburg formation contains large amounts of tuff and a dis tinctive purple or gray tuffaceous hornblende andesite. Minor amounts of diorite, quartzite, and various granitic and metamorphic rock types also are found locally in the gravel; basaltic fragments are rare.
In the area mapped, most of the gravel of the Ellensburg formation is found in the lower valley and is best exposed along the north side of Ahtanum Ridge 2 to 3 miles west of Union Gap. In that locality, the gravel includes a wide variety of rock types.
Beneath the upper valley and in the adjacent slopes, a discontinu ous layer of the Ellensburg is interbedded with lava flows 250 to 300 feet below the present upper surface of the basalt. This sedimentary bed crops out in a discontinuous band on the lower slopes of Sedge Ridge and along the north flank of Ahtanum Ridge. The same stra tum has been reported in the logs of four wells in the Narrows and the upper valley. It is 20 to 30 feet thick in surface exposures and is reported to be 77 feet thick at well 12/16-15F1, about. 2% miles east of Tampico. The bed could not be found on the north side of the valley,

18 GEOLOGY, GROUND WATER, AHTANUM VALLEY, WASH.
and apparently it has been hidden by an overlying body of cemented gravel (pi. 1).
The sedimentary bed apparently pinches out a short distance east of the Narrows, for it could not be traced farther east by surface mapping and has not been reported in the logs of wells east of the Narrows. However, probably only a few of the deeper wells in the lower valley have been drilled deep enough into the basalt to have reached the horizon of the bed.
To show the interbedded Ellensburg material on the geologic map (pi. 1), its thickness has been exaggerated somewhat. Its true thick ness is shown in the geologic sections.
A section of about 900 feet of the Ellensburg formation is exposed in sec. 11, T. 12 N., R. 18 E., and well logs indicate that this unit is almost certainly more than 1,000 feet thick beneath the east end of the lower valley floor. At least the lower part of the main body of the Ellensburg formation apparently is conformable with the underlying Yakima basalt. The contact between the Ellensburg formation and the overlying cemented gravel generally is sharp where it is exposed along the north flank of Ahtanum Ridge, where at several places an an gular unconformity exists between the two units. However, logs of wells in the lower valley indicate considerable gradation and inter- bedding of the upper part of the Ellensburg formation and the lower part of the overlying cemented gravel in the center of the subbasin.
Most of the material constituting the Ellensburg formation obvi ously was derived from a region of intense volcanic activity. Its com position shows that the volcanism that produced it was violently eruptive, as opposed to the slow, quieter extrusions of the Yakima basalt. The source area for the Ellensburg apparently was west of the Yakima region, in the area occupied by the present Cascade Mountains.
Most of the material making up the Ellensburg formation was de posited by streams or in lakes and ponds. However, scattered thin beds of volcanic ash or shards of volcanic glass indicate that at least small amounts fell directly from the sky.
The first determination of the age of the Ellensburg formation was made by F. H. Knowlton (Russell, 1893, p. 103) on the basis of fossil plants, which were classified as belonging to the upper part of the Miocene series. Smith (1903) cited an unpublished report by Knowl ton confirming this age determination. Subsequently the Ellensburg formation has been assigned ages of Miocene or early Pliocene (Mer- riam and Buwalda, 1917, p. 255-256; Beck, 1940).
In 1936, during construction of a tunnel through Yakima Ridge about 6K miles north of the city of Union Gap, fossil bones were found in sedimentary rocks mapped by Smith (1903) as the Ellensburg

GEOLOGY 19
formation (NEtfNWtf sec. 5, T. 13 N., R. 19 E.). Elephant remains were found 8 to 10 feet stratigraphically above the top of the Wenas basalt member, and camel bones were collected from a clay layer about 15 feet below the base of the Wenas member. These fossils subse quently were borrowed from the collection of the State College of Washington and were identified by Miss Jean Hough. In her report on the fossils, Miss Hough states her belief that the possible age of these vertebrate fossils (Mammut (Miomastodon) merriami Osborn, and a large camelid, Pliauchenia merriami Frick?) is not younger than late Pliocene and not older than middle Miocene; the balance of evi dence being in favor of an early Pliocene age. This age assignment, along with the age determination for the fossils from Sedge Ridge, strongly indicates that the main body of the Ellensburg formation probably was deposited entirely during the Pliocene epoch, and that the Wenas basalt member, and perhaps the uppermost flows of the main body of the Yakima basalt, probably are of early Pliocene age.
CEMENTED BASALT GRAVEL,
An extensive body of cemented basalt gravel overlies the older rocks along both sides and throughout the entire length of the Ah- tanum Valley. The cemented gravel is moderately resistant to ero sion, and it caps, or forms entirely, the upland-bench deposits in the west half of the Ahtanum-Moxee subbasin. It may be wholly or partly contemporaneous with similar gravel bodies in other parts of the Yakima basin. A typical exposure of the cemented gravel may be seen in a small gravel pit at the north base of Ahtanum Ridge, in the SWtfNWtf sec. 11, T. 12 N., R. 18 E. Smith (1903) mapped the gravel in the Ellensburg formation and did not describe it in detail. On the basis of lithology, structure, and hydrologic properties, how ever, the cemented gravel should be treated as a separate rock unit.
The gravel unit consists of 75 percent or more cemented basaltic gravel and 25 percent or less sand, silt, and clay in lenses and discon tinuous layers. The color ranges from buff and gray to reddish brown and black. The gravel strata usually are massive but may exhibit fair to indistinct bedding. Crossbedding is rare in the gravel but is not uncommon in layers of sand. Pebbles and larger particles gener ally constitute about 75 percent of the gravel strata, boulders make up only a few percent and the matrix of sand and finer material generally is less than 25 percent. Most of the cobbles and pebbles are moderately well or well rounded; the finer material commonly is more angular.
The cemented gravel differs greatly in lithology from gravel typical of the Ellensburg formation, which Smith (1903, p. 3) correctly described as containing very little basalt. Most of the pebbles and

20 GEOLOGY, GROUND WATER, AHTANUM VALLEY, WASH.
larger particles in the cemented gravel consist of basalt which is identical in texture and composition to the Yakima basalt. Tuff and hornblende andesite are predominant accessory rock types in some parts of the report area; diorite, quartzite, and many granitic and metamorphic varieties are less common. The relative amount of each rock type varies considerably. For example, at the gravel pit de scribed above, basalt constitutes only about half the pebbles and larger particles, whereas in the west half of the valley, and particularly on the pediment slopes, all or nearly all the large particles are basalt.
The matrix in the gravel is a heterogeneous mixture of sand, silt, and clay similar in composition to the gravel-free interbedded layers. Finely pulverized pumice, quartz, volcanic glass, augite, and clay minerals predominate. Cementing material commonly is argillaceous or ferruginous, or a combination of both. The gravel generally is well cemented and, at places, constitutes a true conglomerate. At most places the interbedded clay lenses are well indurated and tough, but the sandy layers are weakly cemented and friable. Some of these sandy layers appear to be moderately permeable and may typify the water-bearing zones in the cemented-gravel unit.
In some localities the basaltic cobbles and boulders have undergone considerable weathering in place. Weathering of a fragment of basalt rock typically forms concentric shells of decayed rock that separate from the core, giving an onionlike appearance. Evidently the weath ered material has been incorporated to some extent in the matrix, so that it is difficult to determine what the size and degree of angularity of the gravel fragments were at the time of their deposition.
Exposures of the cemented gravel, and records of wells that have penetrated it, indicate that this unit is almost certainly more than 400 feet thick at some places. Few sand and clay layers within the gravel are thicker than about 10 feet. Cemented gravel rests on each of the older rock units in, various parts of the area, and many exposures show some evidence of unconformity (either angular or erosional). Where bedding is evident, that in the upper part of the gravel unit appears to be horizontal, or nearly so. However, in the vicinity of the type locality described above, the basal part of the unit was some what tilted, apparently at the time of the deformation of the under lying Ellensburg formation. Also in the type area, minor thrust faults can be found in the cemented-gravel unit. Thus, at some places part of the basalt gravel apparently was deposited before or during the last deformation. Conversely, the obvious unconformity with Tertiary rocks in other parts of the valley, and the nearly horizontal attitude of the upper, younger layers of the gravel unit, indicate that the upper part of this rock body was deposited since the last period of deformation.
GEOLOGY 21
The cemented basalt gravel has the physical characteristics of fanglomerate, flood gravel, or glacial outwash, indicating that the agent of deposition was abundant fast-moving water. Much of this material obviously was deposited in the form of alluvial fans along the flanks of upfolds and was derived from the upfolds themselves. The terrace remnants along the upper valley and the north side of the lower valley indicate that the gravel unit formerly was much more extensive than it is at present. Because the gravel probably was deposited during the Pleistocene or glacial epoch, outwash from alpine glaciation may have contributed to it. The foreign rock types, such as quartzite and metamorphic and granitic rocks, that are present in the gravel may indicate deposition from melt water; how ever, they may have been derived by reworking of the Ellensburg formation in which these same rock types occur locally.
Smith (1903, p. 4) mapped a large deposit of cemented gravel in the small valley of Cowiche Creek, approximately 8 miles north of the Ahtanum Valley, and gave it the name Cowiche gravel. Smith did not describe the gravel in detail, but he attributed its deposition to the damming of Cowiche Creek by flows of the Tieton andesite in the Pleistocene epoch. Recent geologic reconnaissance and study of logs of wells in that area indicate that gravel apparently identical with some of that mapped as the Cowiche gravel is beneath, and interbedded with, the andesite flows. Therefore, the deposition of the Cowiche gravel was, at least in part, independent of any damming by the andesite flows.
In appearance, lithology, and stratigraphic relations with the older rocks, the Cowiche gravel of Smith is almost identical with some of the cemented gravel in the Ahtanum Valley. Also, the cemented- gravel unit in the Ahtanum Valley has been traced northward to within 3% miles of the Cowiche gravel in an area where the 2 units are sepa rated by the Cowiche Mountain anticline. For these reasons, it is concluded that the cemented basalt gravel in the area mapped was deposited during virtually the same time, and under the same general conditions, as was the Cowiche gravel of Smith and the other gravel bodies associated with the Tieton andesite. The interbedded relation ship of the gravel and the Tieton andesite (of Pleistocene age) indi cates that at least a large part of the deposition took place during the Pleistocene epoch.
ROCK MATERIALS OF RECENT AOE
The Ahtanum Valley is floored by a relatively thin mantle of uncon- solidated and semiconsolidated stream deposits of Recent age. In the upper valley and through the Narrows, this alluvial material consists of unsorted to sorted gravel, sand, and silt. Downstream, the allu-

22 GEOLOGY, GROUND WATER, AHTANUM VALLEY, WASH.
vium generally is slightly finer and better sorted, and in many places it includes discontinuous, semiconsolidated strata of silt and clay, which locally are called hardpan. However, even in the lower end of the valley near Union Gap, the alluvium contains a considerable propor tion of cobbles. The thickness of the alluvium, as determined from well logs, ranges from a few feet to about 30 feet.
The material in the alluvial fans on both sides of the valley is gener ally coarser and less well sorted than that of the flood-plain alluvium. Most unconsolidated gravel throughout the Ahtanum Valley is com posed of basalt particles; however, the gravel in the alluvial fans was derived from the Ellensburg formation or from the less basaltic parts of the cemented-gravel unit.
Over much of the upland benches, patches and mounds of wind blown silt, or loess, a few feet thick overlie the resistant cemented gra vel or the basalt. The patchy cover evidently is a remnant of a mantle of loess which covered the Yakima area at one time and which is simi lar to, and may be correlative with, the Palouse formation of eastern Washington. Some of the patches are large enough to be cultivated; the mounds generally are 10 to 30 feet long and a few feet high and are protected from erosion by grass and shrubs.
The unconsolidated alluvium in the valley floor and in alluvial fans is shown without pattern on plate 1. The loess is neither widespread nor thick enough to map separately from the underlying units.
STRUCTURE
The Tertiary rocks of the Yakima region have been deformed into a series of prominent east- and southeast-trending folds, which closely control the main topographic features. The upfolds, or anticlines, form the ridges; the downfolds, or synclines, make troughlike basins. The Ahtanum Valley occupies part of one such synclinal trough (the Ahtanum-Moxee subbasin) and is bordered on the south and west, re spectively, by the Ahtanum Ridge and Sedge Ridge-Cowiche Moun tain anticlines.
In the area of this investigation, the Ahtanum-Moxee syncline slopes, or plunges, east (pi. 1, section A-A'}. The axis of the syncline is located definitely only where the depth and configuration of the upper basalt flows can be determined from geologic mapping and reli able well logs. Information available at present indicates that smaller flexures are superimposed along and across the main folds, but the deep burial of the basalt and the scarcity of reliable deep-well logs precludes the early delineation of this structural detail.
Ahtanum Ridge, the anticlinal ridge south of the valley, is a tight asymmetrical fold the inclination, or dip, being steeper on the north side of the ridge. This asymmetry is readily seen at Union Gap, where

GEOLOGY 23
the arched basalt strata that form the ridge are well exposed. The flow layers at the north end of the gorge are vertical, but within half a mile to the south across the fold, the attitude changes to a moderate southerly dip.
From the east end of the Narrows to within 2 miles of Union Gap, the north side of Ahtanum Ridge is flanked by the upturned edges of Ellensburg strata. As a rule, the Yakima basalt and the Ellensburg formation on this flank of the ridge dip moderately or steeply north, toward the center of the valley. However, in the southern parts of sees. 9-12, T. 12 N., R. 18 E., sandstone and conglomerate strata of the Ellensburg formation have been overturned slightly past the vertical by strong thrusting from the south, and dip steeply south.
The intensity and complexity of the deformation in this part of the valley may be judged from the abrupt changes in the attitudes of the rocks. For example, in the SEtfSWtf sec. 11, T. 12 N., R. 18 E., El lensburg strata dip southward at a high angle; about 500 yards to the west,rocks of the same formation dip about 46° N.; half a mile farther west-northwest and north, in the SE#NE# sec. 10, the strata dip about 20° S.
The complexity of the structure at this locality probably is due to either a slumping or a wrinkling of a large block of the sedimentary rocks during the major diastrophism that produced the Ahtanum Ridge anticline, although minor faulting also may have occurred here.
No evidence of major displacement by faulting was found in the area, although some minor displacement, which may have been caused by several small thrust faults, is present in the cemented-gravel unit in the structurally complex locality just described. The tight folding exposed at Union Gap shows that the basalt was strongly deformed by folding alone.
The Narrows, in sees. 13-15, T. 12 N., R. 16 E., is the result of a gentle cross flexure in the Ahtanum-Moxee subbasin. The lava flows in the bottom of that syncline were warped upward and were later cut through by stream erosion to produce this narrow, steep-walled part of the Ahtanum Valley. The Narrows has an important influence on the movement of ground water in the area, as the cross flexure partially separates the upper Ahtanum Valley from the rest of the Ahtanum- Moxee subbasin to the east (pi. 1, section A-A], and retards ground- water flow from the upper valley. At the upstream end of the Nar rows the nearly horizontal basalt strata emerge from beneath the alluvial materials and gradually pass into steep bluffs and vertical cliffs, as the valley floor slopes more steeply to the east than does the basalt. The flow layers are quite distinct at numerous places, and examples of typical columnar jointing may be seen along the highwa}-. The attitude of the basalt throughout most of the Narrows is so nearly

24 GEOLOGY, GROUND WATER, AHTANUM VALLEY, WASH.
horizontal that no dip is discernible, but in sec. 13 a slight eastward plunge becomes apparent. Farther east the plunge gradually in creases to about 2.5°, or 225 feet per mile, between the downstream end of the Narrows and Wiley. The steepness of the plunge probably diminishes somewhat between Wiley and Union Gap, as shown in section A-A' (pi. 1), but the top of the basalt probably is at least 1,500 feet below the land surface, or some 500 feet below sea level, at the Yakima River. Well 13/18-29Q1, just north of the lower valley (pi. 1), was reported to have penetrated basalt at about 60 feet below sea level (table 4).
GEOLOGIC HISTORY
At the end of the Miocene epoch, the area that is now the Ahtanuin Valley was part of a vast, monotonous plain of basaltic lava that cov ered most of eastern Washington and extended eastward into Idaho and southward into Oregon. The basaltic lava flows were extruded from fissures which probably were centered somewhere southeast of the Yakima region. At the west side of the lava plain, approximately where the present Cascade Mountains now stand, there was a region of more intense volcanic activity at an elevation somewhat higher than the lava plain but probably lower than the present Cascades. Those ancestral Cascade Mountains were the source for the sedimentary materials, constituting the Ellensburg formation, that were trans ported by eastward-flowing streams and deposited along the west side of the lava plain.
The outpourings of basaltic lava probably continued intermittently into the Pliocene epoch, covering the discontinuous sedimentary depos its, changing stream courses, and forming new basins of deposition. Before the period of lava extrusion ended, there was increased uplift and volcanic activity in the ancestral Cascades, furnishing more vol canic debris and resulting in thicker deposits of sedimentary material which became interbedded with the upper basalt flows. After the flows ceased, and as the Cascades continued to rise, the main body of the Ellensburg formation was deposited. Most of the Ellensburg was deposited from streams or in lakes, but some ash and pumice fell directly from the sky.
The deformation that produced the sharp folds in the older rocks of the Yakima region probably began during Pliocene time, while the Ellensburg sedimentary material was still accumulating. This defor mation undoubtedly was related to the Cascade uplift, but in part it may have beon due also to subsidence of the center of the lava body, somewhere to the southeast. The folding proceeded slowly so that the Yakima River was able to maintain its course at Union Gap by eroding its channel as the Ahtanum Ridge anticline rose. The Yakima

WATER RESOURCES 25
River was never dammed to a very great depth by the uplift of Ahta- num Ridge; if it had been deeply ponded, the water would have spilled over and established a new course through Donald Pass (fig.l), a structural gap about 5 miles east of Union Gap and some 400 feet lower than the present crest of Ahtanum Ridge near Union Gap.
As the folding continued, the sedimentary material previously depos ited on the parts of the plain that became the anticlinal ridges was eroded off and carried down into the centers of the synclinal basins. This process accounts in part for the great thickness of the Ellensburg formation (1,000-1,500 feet) in the center of the Ahtanum-Moxee sub- basin. It is very unlikely that such a tremendous thickness of sedi mentary material was continuous throughout the Yakima basin.
After the easily eroded Ellensburg material had been removed from the ridges, the underlying lava rock was exposed to erosion, and basaltic debris was carried down the flanks of the ridges and out to the centers of the valleys, forming a part of the cemented-gravel unit. The lower part of the cemented gravel along the ridges has been con siderably tilted, indicating that deposition of the gravel began before the folding ended. However, probably most of the cemented gravel was deposited after the folding and uplift of the anticlinal ridges had ceased.
Deformation of the rocks in the Yakima area had ceased by the last of the Pliocene or the beginning of the Pleistocene, or glacial, epoch. Since then, the major topographic features in the Ahtanum Valley probably have not changed. Gravel continued to accumulate during Pleistocene time, and, as evidenced by the terrace remnants on either side, the valley probably was once filled with a nearly continuous sheet of gravel to a level as much as 200 feet above the present valley floor. Much of the gravel undoubtedly was deposited as fans, but melt water and outwash sediments fiom alpine glaciers in the Cascade Mountains may have contributed to the forming of the gravel sheet.
A change in physical conditions, probably related to the recession of Pleistocene glaciers, resulted in active erosion of the extensive gravel deposit into the form of the present valley floor. Sometime before or during this period of downcutting, the uplands in the Ahtanum-Moxee subbasin were covered by a nearly continuous mantle of windblown silt, or loess, of which there are only remnants today.
WATER RESOURCES
Of the precipitation that falls within the drainage basin of Ahtaiium Creek, part evaporates directly or is transpired by vegetation, part begins its return to the Pacific Ocean as direct runoff, and the remain der infiltrates into the soil and rocks to the zone of saturation, the surface of which is called the water table. This ground water moves
26 GEOLOGY, GROUND WATER, AHTANUM VALLEY, WASH.
slowly toward the streams and either is discharged into them, forming most of their dry weather (base) flow, or is evaporated and transpired as it approaches the land surface.
Ground water in the unconsolidated alluvium in the area is freely interconnected with the streams. Water may alternately rise to or sink below the land surface several times during its course eastward through the valley. During most of the year, the flows of the streams are maintained largely by ground-water discharge; conversely, much of the recharge to both the shallow and the deep ground-water bodies occurs by direct infiltration from stream channels and by infiltration of irrigation water derived from streams. Therefore, any quantita tive study of the ground-water resources of the area necessarily must include an appraisal of the surface-water supplies.
SURFACE WATER
The surface runoff in the Ahtanum Valley varies widely from year to year and from season to season. The amount of annual runoff is determined mainly by the total yearly precipitation in the drainage basin, but other influencing factors are the type and seasonal distri bution of precipitation, air temperature, soil conditions, and evapora tion. Seasonal distribution of the runoff is determined mostly by the amount and melting rate of snow in the headwaters area. About one-fifth of the total precipitation falls as snow; consequently, years of high total precipitation usually are years of above-normal snowfall.
The runoff is greatest during years in which the snowfall is excessive, especially if the melting of accumulated snow is rapid. Conversely, the runoff is least during years of scanty snowfall, especially if the melting is slow. During years of rapid melting and quick runoff, the loss of water through evaporation is considerably less than in years of slow melting of the snow and correspondingly slow runoff.
The Geological Survey maintains two stream-gaging stations in the area studied. One is on the North Fork and the other is on the South Fork of Ahtanum Creek above all major diversions. Three other Geological Survey gaging stations have been discontinued at the Narrows, at the mouth of Ahtanum Creek near Union Gap, and on the South Fork near Tampico. (See pi. 1 for location of gaging stations.) Complete streamflow records from these stations have been published by the U.S. Geological Survey.4
The U.S. Bureau of Reclamation formerly maintained a gaging station on Wide Hollow Creek near its mouth (pi. 1). The records from that station have not been published, but they are available for inspection at the office of the Bureau of Reclamation in Yakima.
« U.S. Geol. Survey Water-Supply Papers 252, 272, 292, 492, 812, 832, 862, 870, 882, 902, 932, 962, 982, 1012, 1042, 1062, 1092, 1122, 1152, 1182, 1216, 1246, 1286, 1346, 1396, 1446, 1516.

WATER RESOURCES 27
SURFACE-WATER INFLOW
More than half the water that supplies the area of the investigation enters as streamflow in the North and South Forks of Ahtanum Creek. The remainder consists of precipitation falling within the area, irrigation water supplied from outside the area, streamflow entering the lower valley in the channel of Wide Hollow Creek, and probably ground-water inflow from Wide Hollow.
The streamflow entering the valley in the North and South Forks of Ahtanum Creek may be at a maximum during any of the months from March through June. The runoff in both streams during those 4 months usually constitutes about two-thirds of the year's total. Flows are at a minimum in the fall and winter; yearly minimums have been recorded at least once in each of the months from August through February. The following table shows that the average annual inflow (North Fork plus South Fork Ahtanum Creek) to the upper Ahtanum Valley during the periods 1909-14 and 1931-55 was about 62,000 acre-feet. It shows also that May was the month of greatest average runoff, and September was the month of minimum average flow.
January_______ 2,920February._______ 2, 840March..._______ 4,930April_____._____ 9,520
May____________ 15,000June. ___________ 12,000July____________ 4,340August________ 2,010
September. ______ 1, 530October________. 1,630November_____ 2, 170December. ______ 3, 210
Avg annuaL62, 100
A considerable amount of surface water passes through the north east corner of the lower valley in the channel of Wide Hollow Creek, which discharges into the Yakima River about half a mile upstream from the mouth of Ahtanum Creek. Wide Hollow Creek is a perennial stream that is fed principally by runoff, unused canal water, and return flow from irrigation in the area north of the lower valley. The flow of Wide Hollow Creek undoubtedly is related to ground water in much the same manner as are the flows of other streams of the area, in that it supplies some recharge to the shallow ground-water bodies during flood stages and in turn is supplied by ground water during low stages. However, the role of the creek in the hydrologic regimen of the area is not clearly known because of a lack of concurrent stream- flow records and water-level data covering a period great enough for dependable analysis.
The only continuous record of the flow of Wide Hollow Creek was obtained from a gaging station near the mouth of the creek and, there fore, does not indicate the amount of surface water entering the lower Ahtanum Valley, but only the outflow from the stream.
Some additional surface water enters the area from the Tieton603275 O 62 3

28 GEOLOGY, GROUND WATER, AHTANUM VALLEY, WASH.
canal, which brings in almost the entire water supply for the terrace known as Wiley Heights, north of the lower Ahtanum Valley. Of this, perhaps as much as 1,000 acre-feet per year eventually reaches the Ahtanum Creek drainage system or recharges the water-bearing formations, within the Ahtanum Valley.
Near the east end of the Narrows, the flow of Ahtanum Creek splits into three principal channels which rejoin downstream before Ahta num Creek empties into the Yakima River. The surface water is further distributed throughout the valley by a complex system of irrigation distributaries. Thus, the surface runoff, and particularly the flood-stage runoff, of Ahtanum Creek is spread widely over the floor and on the lower slopes of the valley.
Of the total surface-water inflow, part is used beneficially by crops, part recharges the ground-water reservoir, part evaporates directly from streams and irrigation canals, and part is evaporated and tran spired by stream-bank vegetation and other water-loving plants; the remainder leaves the valley by surface runoff and underflow to the Yakima River.
SURFACE-WATER OUTFLOW
Records of surface-water outflow from the Ahtanum Valley include those for Ahtanum Creek near Union Gap and for Wide Hollow Creek near its mouth. The records on Ahtanum Creek were collected by the Geological Survey during three short periods March-October 1910, April 1911-September 1914, and June 1951-March 1953. Records of the flow of Wide Hollow Creek were collected by the Bureau of Reclamation during the periods April 1911-March 1915 and May 1922-February 1933.
Records of the outflow of Ahtanum Creek at its mouth (near Union Gap) and the inflow to the west end of the valley, in the North and South Forks of Ahtanum Creek, are shown together for corresponding months of record in table 1. A comparison of the figures in this table shows that, during the period of record, Ahtanum Creek lost about 22 percent of its annual inflow in its course through the area. However, downstream loss occurred mainly during the months April through November, and a slight to moderate downstream gain occurred during the months December through March.
The period of downstream loss coincides approximately with the growing season. During this period, large amounts of water are diverted from Ahtanum Creek. More water is lost by evapotran- spiration and by ground-water outflow from the east part of the valley than is gained by the Ahtanum Creek system from irrigation return flow, from ground-water discharge, or from other sources such as runoff. Seasonal differences in the inflow-outflow relationship are due to variations in the relative magnitudes of these losses and gains.

WATER RESOURCES 29
s e e 3
£ 3^ tt
I £
£ S S s
8P
o
o O
aCO
1
|
Hj
a2
s
1
Hj
1
OO OO OO OO OOcorn coco os os OSTH osm <M TH oco rnco -*t* coosTH 1 1 C^ TH TH TH C^l CO TH 1 t
S TH OO OCO OO OO O t*CO i-ttti (MO COt*
OS CD i-H O COOS OOS i-H *
Ot* OO p(M OCO OO QO
om m * com oos IM IM COIM01 i r i i o 01 01 i i TH
<M
OCO OCO OCO OCO OOS OO OO i-Ht* TH t* m CO CO CD OCO CO-* OSOo-* CD-* com osm t*m oco mco<N TH~ 1 1 TH TH O1 T-T TH 1 1
OS OS M3 CO OS t* OS CO OS ^^ t* t* CO CO
TH" r-T (M~ <M~ I-H" IM"TH" ofr-T
O CD OO OCO 2® Ot* ®Q OO
COCO TH CO t*OS -*TH OCO COO COCO
CO ^^ ^H CO CO C^ ^^ *O ?^ CO ^ H
OO OO OO OO OO OO OO
§ t^ IQ ^^ ^JH Oi t*^ ^H lO ^^ *^ t1^ C^ O O COOS COTH OSOS OOt* <M i-H THCO
osco m os coco oo-* i-Ht* t* CD ocorH TH i 1 i 1 i 1 i 1 TH i-H
OO OO PO OO OO *O OSOS COO -*CD COO *co (Mm coo -*co coco
(M <M TH (M TH 1-1 (M TH
OO OO OO OO OOt* o or* mm <MTH coo osco ost* coos t*co oscoCD"-*" co~co" <M~rn" co~co" CO"IM"1 t 1 t TH TH TH
OO (MO
(MCO
OO OO OOrH CO t*CD * O
i 1 rH
OO OO OOTH os m * ooo^sJH CO ^O C^l ^O CO
COCO (M CO (Mm
0808 mco oSCO ^2 t*^ CO ^^ t1^
(M(M (M(N CO^ON^~
S|
rH
OO
COCOTH"OS"
rH
BrH OScoco
coo
OO (MOcocorH
o m
CD CO
OO coco co"os~
g o o cot*
rH i-H
OO
§£.co"co"rH
OO OO OOt* t* os m GO oOCO (MO OTH
"* t* CO "* OS THTH
OO OO OO COOS OSCO * CO
<NCO THI> COlO
t^r-H OCO COiO
r-t CO CO O^ CO ^
i i
60
§>
«fl*
O i t C^ CO ^ i t C*l CO1-ii-ii-iTHT-immmOS OS OS OS OS OS OS OS

30 GEOLOGY, GROUND WATER, AHTANUM VALLEY, WASH.
Downstream gain occurs during the period of high precipitation and low evaporation, and it probably represents chiefly runoff from pre cipitation within the valley.
The data in table 1 indicate that, for a given inflow into the valley, the surface outflow during the months of August, September, October, and November in recent years has been appreciably higher than it was during the earlier years of record. For example, the inflow dur ng September 1951 was about the same as it had been during September 1910; however, the outflow during September 1951 was 1,640 acre-feet, or about 3% times the 476 acre-feet recorded for the same month in 1910. The same general relationship is shown for each of the autumn months during the two periods of measurement. The periods of record are too short to allow any definite conclusion regarding the validity of this indicated increase in autumn outflow. If the increase is truly representative, it could be due to one or more changes in con ditions affecting the seasonal gain or distribution of the water supplies in the valley, such as (1) increased utilization of Ahtanum Creek water for irrigation, resulting in a delay in the down-valley transit of some of the water and a correspondingly greater return flow to the stream during autumn; (2) an increase in unmeasured surface inflow to the area, such as water reaching the area via the Tieton canal; and (3) an increase in the amount of irrigation water, pumped from the deep ground-water bodies, that ultimately reaches the channel of Ahtanum Creek during and after the irrigation season.
The outflow in Wide Hollow Creek was measured by the U.S. Bureau of Reclamation during the periods 1911-15 and 1922-33 at a gaging station near the mouth of the creek. Unpublished records from that station show that the average annual runoff was about 20,000 acre-feet and that the seasonal variation in flow was much less than that in Ahtanum Creek.
Because Wide Hollow Creek was gaged only near its mouth, it is not possible to determine the amount of gain or loss in the flow of the stream as it passes through the area. However, the relatively small range between maximum and minimum flow suggests that the stream receives substantial amounts of ground-water effluent throughout most of the year.
UTILIZATION OF SURFACE WATER
The most important use of surface water in the Ahtanum Valley is for irrigation. Water from Ahtanum Creek is used and reused for irrigation a number of times between the creek's entrance into the valley above Tampico and its confluence with the Yakima River at Union Gap. The lower valley in particular is served by a maze of interlacing irrigation canals and stream channels, so complex that

WATER RESOURCES 31
tabulation of the flow in individual channels is impractical for this report.
Perhaps 17,000 acres of arable land in the area could be irrigated with water from Ahtanum Creek if the supply were sufficient through out the irrigation season. However, because the available surface- water supplies are not adequate during late summer, much of the land in the valley is not cultivated, is irrigated only during the first 2 or 3 months of the irrigation season (when the creeks are at high stage), or is irrigated partly or completely with ground water. Although no quantitative records of surface-water use are available, it is estimated that the water of Ahtanum Creek constitutes the entire irrigation supply for about 10,000 acres. Kinnison (1952, p. 31) reported, however, that only 2,600 acres is irrigated under water rights of a priority high enough to assure a supply of surface water throughout the irrigation season of an average year.
The above estimates do not include an unknown amount of land that is irrigated partly with surface water and partly with ground water, nor do they include an undetermined acreage that is irrigated with water brought into the area by the Tieton canal.
GROUND WATER
That portion of subsurface water that fills voids or interstices in the rocks under hydrostatic pressure is ground water. The water above the zone of saturation is under less than atmospheric pressure, whether or not it completely fills the interstices in which it occurs, and is not considered to be ground water. This water is called vadose, and the zone in which it occurs is called the zone of aeration.
AQUIFER PROPERTIES
Because ground water occurs in the interstices in the rock mate rials that is, in the spaces not occupied by solid material the ability of a soil or rock to transmit water is determined by the abun dance, character, and degree of interconnection of the interstices. A rock material that is capable of transmitting and yielding appreciable quantities of water to a well is called an aquifer.
The interstices in the rock materials of the Ahtanum Valley vary widely in size, shape, and arrangement. They range in size from the minute pore spaces in clay of the Ellensburg formation to the larger openings between coarse gravel particles and crevices in the basalt. Likewise, the shapes of the interstices range from the simple nearly round vesicles in basalt and thin, tabular joints in the consolidated and semiconsolidated rocks to the complex interstices in poorly sorted granular rocks. In most of the sedimentary rocks the interconnection between interstices is good. Conversely, interconnection of inter stices, particularly vesicles, in the basalt often is poor or lacking.

32 GEOLOGY, GROUND WATER, AHTANUM VALLEY, WASH.
The porosity of a rock or soil is the ratio of the volume of its inter stices to its total volume. Thus, it is a measure of the ability of the rock to contain water. Natural rock materials differ greatly in poros ity. The porosity of some consolidated rocks, such as tightly cemented sandstone or massive lava flows, is only a few percent or even a fraction of a percent, whereas the porosity of some clays may exceed 50 per cent. In unconsolidated rocks, the well-sorted materials, such as clay or clean even-textured sand or gravel, have very high porosity. Poorly sorted materials, in which the smaller particles fill the openings between the larger grains, have low porosity.
Soil or rock may have a high porosity and yet yield little water. For example, a clay having a porosity of 50 percent or more might yield virtually no water because of the smallness of the pore spaces. Also, water may be retained in isolated or poorly interconnected pore spaces, such as the vesicles in basalt flows. Saturated vesicular zones of most basalt flows will not yield appreciable amounts of water unless the walls between adjacent vesicles are broken down by weathering or shattering. The ratio of the volume of water a saturated rock will yield by gravity to the total volume of the rock is known as the specific yield and usually is stated as a percentage. If water moves freely through a rock material under ordinary conditions, the material is said to be permeable, or pervious. Material described as imperme able, or impervious, allows relatively little movement of water through it. Another convenient term, closely related to permeability, is transmissibility. It, also, refers to the ability of a rock material to transmit water, but of the whole thickness of an aquifer rather than a unit thickness such as 1 foot.
WATER TABLE
The upper surface of an unconfined saturated zone is known as the water table. The level at which water stands in a well penetrating an unconfined zone of saturation represents the water table at that place.
The water table in most places is a sloping surface. It is highest in areas of recharge, where water is added to the aquifer, and slopes downward to areas of discharge, where water leaves, or is removed from, the aquifer. The slope of the water table (hydraulic gradient) adjusts automatically to the velocity of the moving water and the permeability of the rock. Rocks of low permeability require a steeper gradient than more permeable rocks to transmit water at a given rate.
The water table has irregularities that are generally comparable with the configuration of the land surface, although more subdued. Additional irregularities are caused by local differences in the permea bility of the rock materials and by local differences in ground-water discharge and recharge. The water table fluctuates chiefly in response

WATER RESOURCES 33
to variations in recharge to, and discharge from, the ground-water body.
A saturated zone may be held above an unsaturated zone by a rela tively impermeable rock stratum. Such a saturated water zone is called perched, and its upper surface is a perched water table.
CONFINED GROUND WATER
Water moving in an unconfined aquifer may pass between relatively impermeable beds and become confined there under a pressure due to the weight of the water in the unconfined part of the aquifer. Such water will rise higher in a well than the bottom of the overlying con fining bed and is called confined, or artesian. The imaginary surface coinciding with the level to which confined water will rise in wells is called the piezometric surface. The piezometric surface is similar to the water table of an unconfined aquifer in that it usually is a sloping, irregular, fluctuating surface. It is highest in areas of ground-water recharge and lowest in areas of discharge. Fluctuations and irregu larities in the piezometric surface are caused by variations in recharge and discharge and by differences in permeability within the aquifer.
Water which flows naturally from the top of a well, particularly a deep well, is commonly called artesian water. However, in the Geo logical Survey the term is used to mean water that is under pressure sufficient to raise it above the top of the confined aquifer. If the top of the well is at a lower elevation than the piezometric surface, the well is called a flowing artesian well. Of the examples shown in figure 5, wells A, C, and D are artesian wells, although only wells A and C flow. There are many artesian wells in the Ahtanum Valley, but relatively few of them flow.
RECHARGE TO AQUIFERS
Aquifers receive natural replenishment (recharge) chiefly by down ward seepage from the surface, either from rain and melting snow or from streams and lakes which themselves are supplied by precipita tion. Irrigation may be considered a form of artificial recharge, inasmuch as part of the water that is spread over the land surface commonly seeps downward to a zone of saturation.
Streams that cross permeable zones above the water table contrib ute to the ground-water reservoirs. On the other hand, streams that flow at a level lower than the water table receive contributions from the ground-water body. At places within the report area, Ahtanum Creek and its principal distributaries recharge the aquifers during their flood stage, when stream levels are higher than the adjacent water table, but receive virtually their entire flow from ground-water discharge during the low-flow periods, when streams are below the water table.

34 GEOLOGY, GROUND WATER, AHTANUM VALLEY, WASH.
FIGURE 5. Diagrammatic cross section showing various occurrences of ground water. Water in the aquifers and wells is indicated by crosshatching. Arrows show the direction of ground-water movement. Wells A, C, and D arc artesian wells tapping a basalt aquifer confined by impermeable basalt and clay. At wells A and C the land surface is below the piezometric surface of the confined aquifer, and these wells flow. Well B taps an unconfined (water-table) gravel aquifer. Well E taps an unconfined aquifer perched above the regional water table by impermeable strata within the cemented gravel.
When a ! permeable zone is completely saturated, the rate of recharge cannot exceed the rate of discharge. Any water available for recharge in excess of the amount of discharge will be rejected and will flow off as direct runoff. Generally, the ground-water system tends toward a state of equilibrium wherein annual recharge equals annual discharge.
MOVEMENT OF GROUND WATER
Ground water moves in response primarily to the force of gravity. Therefore, areas of discharge from an aquifer are necessarily lower than areas of recharge, and ground water moves down the hydraulic gradient, even though it may locally move upward toward a point of discharge, such as in a confined aquifer or in an unconfined aquifer near a stream. The rate of movement varies directly with the hydrau lic gradient that is, if all other factors >remain the same, doubling the hydraulic gradient doubles the velocity.
GROUND-WATER DISCHARGE
Ground water is discharged naturally through springs and seeps (either at the land surface or into streams, lakes, or the sea), by evaporation or transpiration, and artificially by withdrawal from wells or drains.
Evaporation directly from the zone of saturation can take place where the water table is close to the land surface. Discharge by
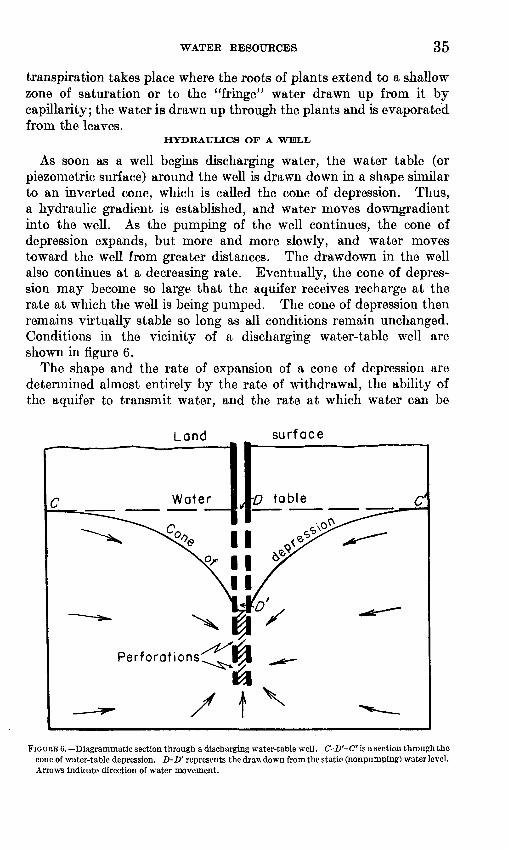
WATER RESOURCES 35
transpiration takes place where the roots of plants extend to a shallow zone of saturation or to the "fringe" water drawn up from it by capillarity; the water is drawn up through the plants and is evaporated from the leaves.
HYDRAULICS OF A WELL,
As soon as a well begins discharging water, the water table (or piezometric surface) around the well is drawn down in a shape similar to an inverted cone, which is called the cone of depression. Thus, a hydraulic gradient is established, and water moves downgradient into the well. As the pumping of the well continues, the cone of depression expands, but more and more slowly, and water moves toward the weU from greater distances. The drawdown in the well also continues at a decreasing rate. Eventually, the cone of depres sion may become so large that the aquifer receives recharge at the rate at which the weU is being pumped. The cone of depression then remains virtually stable so long as all conditions remain unchanged. Conditions in the vicinity of a discharging water-table well are shown in figure 6.
The shape and the rate of expansion of a cone of depression are determined almost entirely by the rate of withdrawal, the ability of the aquifer to transmit water, and the rate at which water can be
Land surface
FIGURE 6. Diagrammatic section through a discharging water-table well. C-D'-C' is a section through the cone of water-table depression. D-D' represents the drawdown from the static (nonpumpingl water level. Arrows indicate direction of water movement.

36 GEOLOGY, GROUND WATER, AHTANUM VALLEY, WASH.
removed from storage in the rock material during the withdrawal. A higher gradient (steeper cone of depression) is required to transmit water in material of low permeability at the same rate as in more permeable material. Similarly, a cone of depression expands more rapidly in material that has a low storage capacity than in material that has a high storage capacity. When the rate of pumping from a well is increased, the hydraulic gradient at every point on the cone of depression must become steeper so that water can move to the well at the increased rate.
The area of influence of a well is the land area beneath which the water table (or piezometric surface) is perceptibly lowered by with drawal of water from the well. In the area of influence of a well that is being pumped, water levels are lowered in all other wells tapping the same aquifers.
The rate at which a well will yield water can be called its capacity. The amount of water it will yield with a given drawdown is the spe cific capacity and usually is expressed in gallons per minute per foot of drawdown.
OCCURRENCE OF WATER IN THE ROCK UNITS
Locally within the Ahtanum Valley each of the major rock units (the Yakima basalt, the Ellensburg formation, the cemented basalt gravel, and the unconsolidated alluvium) yields ground water. At most places in the valley, however, only one or two of these units will yield supplies adequate for substantial uses.
YAKIMA BASALT
The basalt sequence contains the most productive aquifers in the Ahtanum Valley. It supplies ground water to at least 14 irrigation wells in the area, some of which yield more than 1,000 gpm (gallons per minute) by punming. Of the wells, 6 are in the upper valley or in the Narrows, 2 are on the upland bench north of the upper valley, and 6 are in the lower valley, between the Narrows and Wiley. Most of the ground water in the basalt is under artesian pressure, controlled by the troughlike structure of the subbasin and confined by the over lying Ellensburg formation or by adjacent, less permeable layers of basalt. About half the wells that penetrate basalt either flow or have water levels standing less than 10 feet below the surface.
At least locally near the east end of the Narrows, the uppermost basalt flows, the Wenas(?) member of the Yakima basalt, may con tain an important aquifer. In that area, well 12/16-13D1 was drilled to a depth of 146 feet, reportedly without penetrating the interbedded sedimentary layer that overlies the main body of the Yakima basalt. (For location of this well and others cited in text or tables, see pi. 1.) That well has a reported pumping yield of 850 gpm and is used regu-

WATER RESOURCES 37
larly for irrigation. Farther west, however, the Wenas(?) member apparently contains no significant aquifers. Without exception, wells in the upper valley that penetrate the Wenas(?) flows have failed to yield water from that unit in quantities sufficient for irrigation. Most of the wells have been drilled deeper, through the underlying sedimentary layer, into the main body of the Yakima basalt in order to produce enough water for irrigation.
The basalt aquifers of the Ahtanum Valley are recharged partly within the area mapped, partly north of the area along the south side of the Cowiche Mountain anticline, and partly just west of the area along the valley of the South Fork of Ahtanum Creek between Sedge Ridge and Ahtanum Ridge. Sources of recharge to the basalt are infiltration from precipitation, influent seepage from the intermittent streams on the slopes and upland benches, and influent seepage from Ahtanum Creek in 1 or 2 localities where the piezometric surface of the basalt aquifers is below stream level. The relative amounts of recharge received from each of these sources is not known. Some recharge from streamflow probably goes on throughout the year, but the infiltration from precipitation is limited to the wetter seasons of the year.
Most of the direct infiltration to the basalt from precipitation takes place on the slopes bordering the west half of the Ahtanum-Moxee subbasin, where the beveled flow layers are exposed at the surface or covered only by a thin mantle of slope wash; however, some infiltration from precipitation probably occurs at most places where the basalt is at or near the land surface. Some of the recharge from precipitation that occurs within the subbasin, but outside the area mapped for example, in the valley of the South Fork and on the slope of Cowiche Mountain reaches the basalt aquifers in the Ahtanum Valley as ground-water inflow. Most of the recharge to the basalt from stream- flow probably takes place in the Narrows, where Ahtanum Creek flows directly on basalt of the Wenas(?) member or through a shallow layer of permeable gravel overlying the basalt, and where the piezo metric surface of the basalt aquifers is about 30 to 40 feet lower than the stream. The streams probably contribute some recharge also in the vicinity of Tampico during the irrigation season, when the large- yield irrigation wells in that area draw the artesian levels down below the stream levels. The basalt undoubtedly recieve's additional re charge by infiltration from the intermittent streams around the margins of the subbasin.
In the lower valley, few wells tapping basalt aquifers have pene trated more than about 200 feet into the basalt. In the western part of the lower valley, this upper part of the basalt sequence probably corresponds to the Wenas(?) flows exposed in the Narrows. Ground

38 GEOLOGY, GROUND WATER, AHTANUM VALLEY, WASH.
water entering the Wenas(?) basalt member as influent seepage from Ahtanum Creek in the Narrows may migrate eastward and provide part of the supply for wells that penetrate the upper part of the basalt sequence.
Movement of ground water in the basalt consists of slow percolation across the beds, through joints in the massive parts of the flows, and lateral flow through the interflow zones, toward areas of discharge. In general, ground water in the basalt moves from the intake areas on higher slopes toward the axis of the subbasin and eastward toward the Yakima River. Locally, however, the movement may be to ward a discharging well, or away from a localized area of recharge such as the Narrows. Because of the extremely wide range in per meability of the basalt, the rate of ground-water movement through it also ranges widely. Percolation across the flow layers undoubtedly is very slow, but the amounts of water removed each year from wells indicate that lateral movement through some of the water-bearing zones may be comparatively rapid perhaps several feet per day under the hydraulic gradients occurring naturally within the area. Under conditions of pumping, the movement near wells is still more rapid.
Ground water is discharged from the Yakima basalt principally by seepage to streams, through seeps and minor springs at the surface, and from wells. The basalt loses water also by upward leakage to shallower aquifers.
Some ground water from the Yakima basalt undoubtedly discharges directly into the Yakima River (or into the unconsolidated alluvium) in Union Gap. Also, some ground water undoubtedly is discharged from the basalt to streams in the upper valley. As this effluent seep age cannot be seen or measured directly, the actual amount is un known, but it is believed to be only a few thousand acre-feet per year or less.
Small seeps and springs issuing from the basalt are common on the lower slopes in the area. Few of these seeps and springs flow perenni ally, however, and this form of discharge is believed to account for only a small percentage of the total ground-water discharge from the basalt.
Ground water is withdrawn from about 20 wells tapping basalt aquifers in the area mapped. At least 14 of those wells are used for irrigation. Possibly as much as 1,500 acres is irrigated partly or completely with ground water from the Yakima basalt. The maxi mum withdrawal from basalt aquifers may be as much as 4,000 acre-feet per year, but the average withdrawal probably is closer to 3,000 acre-feet per year. The rate of withdrawal is influenced by

WATER RESOURCES 39
variations in climate and streamflow and by the market demand for agricultural products. As much as one-quarter or one-fifth of the ground water withdrawn from the Yakima basalt (and also from the Ellensburg formation) eventually may reach the shallow aquifer or discharge into the small streams as return flow from irrigation.
Perhaps the largest discharge of ground water from the Yakima basalt in the Ahtanum-Moxee subbasin is that by interformational leakage to the overlying rock units and thence to the Yakima River and the smaller streams. Ground water in the basalt beneath the lower valley is under pressure sufficient to raise it 50 or more feet above the land surface in many places. For example, well 12/17- 16D3, which is 384 feet deep and penetrates 59 feet of basalt, had a shut-in pressure of 25 pounds per square inch in 1952. That pressure is sufficient to raise a column of water about 58 feet above the land surface. Thus, where the water table is 10 feet below the land surface, the differential upward pressure exerted upon the confining bed between the artesian and water-table aquifers is about 30 pounds per square inch. Even though the confining beds have a very low permeability and are several hundred feet thick, it is believed that thousands of acre-feet of ground water leaks upward each year from the Yakima basalt, through the small pores and joints in the confining strata, into the unconsolidated alluvium or into permeable zones in the Ellensburg formation or the cemented gravel unit. From these more permeable rock bodies, the ground water may then be discharged into the streams or through wells.
ELLENSBURG FORMATION
Within the Ahtanum Valley the Ellensburg formation is important as an aquifer only in the lower valley and northwest of Wiley on the terrace known as Wiley Heights. West of the Narrows that is, throughout the upper valley and on the adjacent upland benches the Ellensburg formation generally is too impervious, too thin, or too discontinuous to yield appreciable amounts of water to wells.
Of the wells tapping the Ellensburg formation, the most productive are in the center of the valley east of Wiley. Seven wells in that part of the valley are known to obtain water from the Ellensburg formation, and only 2 are reported to have yields smaller than 100 gpm. Well 12/18-1 Ml, at the Yakima Farm Labor Camp, is the most productive well tapping this aquifer. It is 620 feet deep and in 1939 was reported to flow at a rate of 560 gpm. In contrast, the wells on Wiley Heights that tap the Ellensbm-g formation usually yield less than 100 gpm, although larger yields might be obtained by deeper penetration into the aquifer. Seven wells on the floor of the lower valley between Wiley and the Narrows have failed to obtain water from the Ellens-

40 GEOLOGY, GROUND WATER, AHTANUM VALLEY, WASH.
burg formation in amounts sufficient for irrigation and were drilled deeper, into the underlying Yakima basalt, to obtain economic yields.
The principal aquifers in the Ellensburg formation consist of weakly cemented, permeable layers of gravel and well-sorted sand which are interbedded with less permeable layers of clay and shale. The aquifers are confined by the less permeable strata in the Ellens- burg formation and by the underlying basalt. The structure of the formation (the rock layers of the sides of the valley dip inward toward the center of the valley and eastward toward the Yakima River) and the alternation of permeable and impermeable strata produce artesian pressure in the confined aquifers, so that several of the wells tapping the Ellensburg formation in the center of the lower valley are flowing wells.
The water-bearing properties of the Ellensburg formation within the valley are not well known, for only a few wells in the area are known to obtain all their water from that rock unit, and the information derived from these wells is sufficient for only general conclusions. It is believed, however, that the water-bearing zones in the Ellensburg become generally deeper downvalley (eastward) from the vicinity of Wiley. Also, the records indicate that the permeability of the Ellens burg formation, at some places, changes rather abruptly within short distances. Records of several of the wells indicate that the basal layer of the formation, which is about 10 to 20 feet thick and lies directly above the uppermost basalt flow, may be one of the most productive of the water-bearing zones in the Ellensburg formation.
The Ellensburg formation is recharged by infiltration from precipi tation and irrigation, by influent seepage from streams, and by upward leakage from the Yakima basalt. The principal intake areas probably are those in which the Ellensburg formation is exposed at the surface, as on the upland bench northwest of the Narrows and along the north flank of Ahtanum Ridge in the lower valley. In these areas, infiltra tion from precipitation, from irrigation, and from streams undoubtedly contributes much of the recharge. Some recharge to the Ellensburg formation probably takes place by downward percolation from the allu vium in a small area of the valley floor near the east end of the Narrows (sees. 8, 17, and 18, T. 12 N., R. 17 E.) where the saturated alluvial gravels directly overlie the Ellensburg formation (pi. 1,A-A'). At least locally in that area, the lower part of the Ellensburg formation is somewhat permeable, and water levels in that part of the formation apparently are below stream levels. For example, in well 12/17-8K1 (tables 4 and 5), which reportedly derives its water entirely from a 20-foot-thick layer of permeable sand directly overlying the basalt, the water level is about 20 or 30 feet below local stream level. Here

WATER RESOURCES 41
the ground water in the alluvial gravel is able to percolate downward into the Ellensburg formation.
At other places where the Ellensburg formation contains significant aquifers, the pressure head in those aquifers generally is above the levels of the streams and the local water table; hence, no water moves downward to the aquifers. The Ellensburg formation receives addi tional recharge to the north of the area mapped, where the formation is exposed along the south flank of the Cowiche Mountain anticline. The amount of recharge that normally migrates from outside the area to aquifers beneath the Ahtanum Valley proper is not known, but it probably does not constitute a major source of ground water for the valley. One reason is that most of the water that is recharged to the Ellensburg formation from north of the area probably migrates toward Wide Hollow, where a large part of it is intercepted by wells. Also, the postulated small buried upfold (see p. 23) in the beds of the Ellensburg formation between Wide Hollow and the lower Ahtanum Valley (pi. 1, sections E-E' and F-F'} doubtless would retard the southward movement of ground water from Wide Hollow. However, unless additional information becomes available through future drilling of deep wells in the Wiley Heights area, this hypothetical structure cannot be affirmed.
Probably one of the most important sources of recharge to the Ellensburg formation is upward leakage from the Yakima basalt. In parts of the lower valley, ground water in the basalt is under pressure sufficient to cause appreciable upward leakage, and it doubt less contributes to the ground water available for withdrawal from aquifers of the Ellensburg formation.
Although the overall movement of ground water in the Ellensburg formation is toward the center of the subbasin and eastward toward the Yakima River, the hydraulic gradient may be modified by pumping so that locally the water may be diverted to a discharging well. No measurements or estimates have been made of the velocity of ground- water movement in the formation, but the water probably moves very slowly in the dense, clayey strata and moderately slowly even in the more permeable zones.
In the Ahtanum Valley, ground water from the Ellensburg formation probably is discharged mainly by withdrawal from wells and by up ward leakage to the cemented gravel and unconsolidated alluvium.
The Ellensburg formation may yield as much as 800 acre-feet of ground water each year to wells. More than 95 percent of that total comes from irrigation wells, and most is withdrawn between July 1 and October 1.
Perhaps the largest part of the natural discharge from the Ellensburg formation is the upward seepage to the overlying cemented-gravel

42 GEOLOGY, GROUND WATER, AHTANUM VALLEY, WASH.
unit and unconsolidated alluvium, from which the water then dis charges into the Yakima River. Of course, such upward leakage can occur only where the pressure is sufficient to raise the confined water in the Ellensburg formation above stream levels or the water table. Near the center of the subbasin in the eastern part of the lower valley, the relatively high transmissibility of the cemented-gravel unit and the high head in the underlying aquifers favor upward leakage.
Although the total amount of ground-water discharge from the Ellensburg formation has not been estimated, it is believed to be approximately balanced by recharge.
CEMENTED BASALT GRAVEL
The cemented basalt gravel is important as a source of ground water only in the eastern part of the lower valley and on the upland bench north of the lower valley. Elsewhere in the area, wells generally have failed to obtain water from the cemented-gravel unit in amounts sufficient for either domestic or irrigation use.
Although at most places part or all of the cemented gravel is sat urated, the interstices generally have been so nearly filled with cementing material that the unit has low permeability and will yield very little water to wells. Even on the upland bench north of the lower valley, where supplies of water adequate for domestic use are obtained from the cemented gravel, the yields of individual wells are small (commonly less than a gallon per minute) and apparently are derived from discontinuous sandy or poorly cemented lenses. How ever, beneath the eastern part of the lower valley, an abrupt change in the character of the materials constituting the cemented-gravel unit is indicated by the logs of wells. In that part of the area, the unit contains more and thicker layers of sand and gravel, some of which are only weakly cemented and constitute productive aquifers. Well 12/19-5N1, a municipal well of the city of Union Gap, is the most productive of several large-yield wells that tap the cemented gravel unit in that part of the area. The well is 370 feet deep and produces as much as 970 gpm from gravel and sand.
The cemented gravel on the slopes and upland benches is recharged entirely by infiltration of precipitation, irrigation water, and water from intermittent streams. The more permeable zones beneath the eastern part of the lower valley, however, may be recharged mostly by upward leakage from the underlying artesian aquifers.
In general, movement of water in the cemented gravel is very slow. Even the presence of permeable lenses within the gravel may increase its overall permeability only slightly, as most of these sandy or poorly cemented lenses are discontinuous or poorly connected hydraulically. On the upland benches, the direction of movement generally is toward

WATER RESOURCES 43
the edges of the benches. On the south side of the lower valley, where beds of cemented gravel have been tilted along with the underlying rock units, some water, recharged from local precipitation and irriga tion, probably moves northward toward the center of the valley. Beneath the eastern part of the valley floor, ground water in the unit moves generally toward the Yakima River.
Ground water is discharged from the cemented gravel on the upland benches mainly as seeps along the bluffs and terrace faces and by with drawal from wells. At the east end of the valley, a considerable amount of ground water undoubtedly seeps directly from the unit into the Yakima River, but in that area also the withdrawal from wells constitutes a major form of discharge. It is estimated that about 500 acre-feet of ground water is pumped from the unit each year for industrial uses in and around the city of Union Gap, and another 300 acre-feet per year supplies the water system of that city.
UNCONSOLIDATED ALLUVIUM
The unconsolidated alluvium is the second most productive aquifer in the Ahtanum Valley, being surpassed in total yield only by the Yakima basalt. Most of the wells in the area tap the alluvium, and even though many of these are small-yield, domestic wells, the alluvium produces about a third of the ground water used. The alluvium pro vides nearly all the domestic water for the entire valley, and in the lower valley it is an important source of irrigation water. Yields as great as 400 gpm have been reported from shallow dug wells and, at most places in the floor of the lower valley, yields of more than 100 gpm can reasonably be expected from a properly constructed dug well. The unconsolidated materials making up the alluvial slope on the south side of the lower valley also yield moderate supplies of ground water, but the depth to water there is somewhat greater than beneath the flood plain of Ahtanum Creek, and the yields of individual wells generally are less. The water table in the alluvium of the valley floor is generally less than 10 feet below the surface.
Ground water in the alluvium generally is unconfined, although at places lenses of silt and clay within the gravel body doubtless retard the movement of water and create small bodies of confined water.
The unconsolidated alluvium is recharged by infiltration from streams, irrigation canals, and irrigated fields; by precipitation; and by upward leakage from underlying artesian aquifers.
During the freshet stage, water from the swollen creeks percolates downward to the water table, filling the interstices of the alluvium and gradually replenishing the ground-water reservoir. During the rest of the year, the streams are at levels so low that ground water
603275 0 62 4

44 GEOLOGY, GROUND WATER, AHTANUM VALLEY, .WASH.
from the alluvium seeps into the stream channels and helps maintain the flow of the streams.
Throughout the irrigation season, the slow draining of the valley alluvium is partly offset by more or less continuous recharge from irrigation ditches and irrigated fields. It should be noted that a con siderable part of the ground water withdrawn from both the shallow and the deep aquifers eventually recharges the shallow alluvium, and some of this flows into the streams.
During the wetter seasons of the year, local precipitation is an important form of recharge to the unconsolidated alluvium. Precipi tation is greatest when evaporation is low, and much of the rainfall or melt water percolates downward to the shallow water table. During the summer months, however, the meager precipitation (usually less than 1 inch for the period July-August) is largely intercepted by vegetation or evaporates directly from the soil without reaching the water table.
On much of the gentle alluvial slope south of the lower valley, the elevation of the water table is higher than the highest possible stage of Ahtanum Creek. Therefore, the alluvium on those slopes cannot receive recharge from Ahtanum Creek; instead, ground water from the alluvial slopes discharges slowly but continuously into Ahtanum Creek. The water table beneath the lower alluvial slope is, in many places, maintained at fairly high levels by recharge from local irri gation, by seepage from irrigation canals and drainage courses from the higher slopes, and by precipitation that falls directly on the slope.
In the lower valley, and particularly in its eastern part, the alluvium that forms the valley floor doubtless is recharged to some extent by upward leakage from the underlying artesian aquifers. The difference in head between the water table and the piezometric surface of the artesian aquifers may be as much as 70 feet at places. Even though the rock materials that separate the alluvium from the artesian aquifers are relatively impermeable, they do not prevent entirely the upward movement of ground water, and it is possible that thousands of acre-feet of water per year leaks upward into the alluvium in this manner.
Ground water in the valley alluvium moves generally downstream, toward the Yakima River, but the movement at any given place may be toward or away from a stream or toward a discharging well, according to the local gradient of the water table.
It is obvious from the records of the shallow wells in the area that at most places the alluvium is at least moderately permeable, and that water readily moves through it. However, in order to esti mate the velocity of ground-water movement and to make other quantitative estimates, it was necessary to make some quantitative

WATER RESOURCES 45
determination of the ability of the alluvium to transmit water. To this end, pumping tests were made in September 1951 on four wells that tap the valley alluvium. In these tests, the wells were pumped at a constant rate, and water-level measurements were made in them during and after the periods of pumping. The data were then ana lyzed by the recovery method developed by Theis (1935, p. 522; see also Wenzel, 1942, p. 95). Under certain conditions, this method, when applied to data obtained from a pumping test of a well tapping an ideal aquifer, affords a satisfactory means of determining the coefficient of transmissibility of the aquifer. The coefficient of transmissibility may be defined as the number of gallons per day of water, at the prevailing water temperatures, that will pass through a vertical section of the aquifer 1 mile wide (measured normal to the direction of flow) under a hydraulic gradient of 1 foot per mile. The coefficient of transmissibility, when divided by the thickness of the aquifer in feet, gives the field coefficient of permeability, which is the rate of flow of water, in gallons per day, through a section of the aquifer 1 foot thick and 1 mile wide under a hydraulic gradient of 1 foot per mile, at the prevailing water temperature.
The characteristics of the alluvium and the conditions under which the aquifer tests in the area were made differ greatly from the ideal conditions assumed in the derivation of the recovery method. For example, the recovery method assumes a homogeneous artesian aquifer, of infinite areal extent, bounded above and below by per fectly impervious confining beds; the well is assumed to penetrate the aquifer completely. In contrast, the alluvium in the area is typically heterogeneous in character, and the ground water is uncon- fined. None of the wells completely penetrates the aquifer, and all undoubtedly have less than perfect efficiency. Furthermore, the wells were pumped for only short periods 2 hours or less in order to prevent recirculation of the discharge water; thus, the cone of pumping depression of the water table in the vicinity of the well could not spread far enough from the well to test a large area. All these differences between theoretical and field conditions tend to cause inaccuracies in the results of an aquifer test. Their overall effect on the tests in the Ahtanum Valley is not known, but the results of the tests are considered to represent only the general magnitude of transmissibility in the permeable gravels of the alluvium, and they are the best basis presently available for quantitative estimates of ground-water movement in the alluvium.
The four tests and the results derived therefrom are summarized in table 2. As the table shows, the indicated coefficients of trans missibility range from about 30,000 to 90,000 gpd (gallons per day) per foot, and the coefficients of permeability from about 5,000 to

46 GEOLOGY, GROUND WATER, AHTANUM VALLEY, WASH.
6,000 gpd per square foot. However, each of the wells tested derives all or most of its water from coarse gravel, and the values obtained from the tests do not apply to the lenses and discontinuous layers of the finer grained materials, such as sand and silt. It is concluded, therefore, that the average transmissibility and permeability are less, but how much less is not known.
TABLE 2. Summary of pumping tests on wells tapping sand and gravel aquifers of alluvium, in lower Ahtanum Valley
Well
12/17-2R2... 12/17-10C1
12/18-5J1-
Distance (miles) from
WILEY
In Wiley
AHTA-NUM
IV E
Depth (feet)
98
12 18
Thick ness of
pro ducing
zone (feet)
1 15 6
9
Duration of test
hr min
2 0 1 9
52 1 42
Depth to
water level
before pump
ing (feet)
3.66 1.18
6.45 7.54
Aver age
yield (gpm)
69 64
64 62
Maxi mum draw down (feet)
0.74 2.27
1.00 .85
Specific capa city
(gpm per ft)
9328
64 73
Coeffi cient of
trans missi bility (gpd
per ft)
90,000 30, 000
51,000
Coeffi cient of perme ability (gpd per
sqft)
6,000 5,000
5,700
1 Estimated.2 Data derived from test not suitable for calculation of coefficient of transmissibility.
It is assumed, however, that the average permeability of the least permeable body of alluvium of substantial size is 100 gpd per square foot. Doubtless there are pods of clay having extremely low permea bility, but any such pods are believed to be small and not of conse quence in affecting areal movement of ground water. The value of 100 is believed to be reasonable for bodies of mixed sand and silt.
With these data, the probable range of velocity of water moving in the shallow alluvium can be calculated by the use of the following formula based on Darcy's law and adapted from Tolman (1937, p. 215):
Ve= (2.632X10-P,)*
where Ve is the effective velocity of the water, in feet per day,Pf is the field coefficient of permeability, in gallons per day per
square foot,h is the hydraulic gradient, in feet per mile, p is the porosity.
As stated, the field coefficient of permeability (Pf) of the valley al luvium is estimated to range from about 6,000 to 100 gpd per square foot. The hydraulic gradient in the upper valley and through the Narrows averages about 85 feet per mile, and in the lower valley the gradient between Wiley and Union Gap averages about 40 feet per

WATER RESOURCES 47
mile. The average porosity of the valley alluvium probably is between 0.15 and 0.25.
Substituting the values above so as to obtain the widest numerical spread for the sections of the valley where alluvium is present, the results indicate the limits of the downvalley velocity at which ground water in the shallow alluvium might be expected to move.
Upper valley:
T7 , , 2.532X10⁻⁵ (6,000) (85) _. ,, , Fe (max) = ^ -=86 ft per day U.lo
T7 , . , 2.532X10⁻⁵ (100) (85) . _ ., , Fe(mm)= ^ ^^=o.9 ft per day
Lower valley, Wiley to Union Gap:
T7 , , 2.532X10⁻⁵ (6,000) (40) An .. , Fe (max)= j^ -=4:0 ft per dayU. lo
T7 , . v 2.532X10⁻⁵ (100) (40) . . ., , Fe (mm) = Q-^5 ^A ^=0.4 ft per day
Thus, in the upper valley, ground water in the inconsolidated allu vium might be expected to move downstream at a velocity approach ing 100 feet per day in the permeable coarse gravels, and less than a foot per day in the bodies of mixed sand and silt. The rates in the lower valley would be expected to be roughly half as great. Thus, in the floor of the lower valley, using the highest calculated velocity, several months would elapse while ground water in the very permeable gravel of the unconsolidated alluvium moved a mile downstream. In the least permeable material a considerable number of years would be required for water to move the same distance.
In the lower valley, the profile across the valley floor is much flatter than the downvalley gradient, and the gradient at which water moves laterally toward the small streams probably is lower also. Therefore, the average velocity of ground water moving laterally across the lower valley floor probably is considerably less than the downvalley movement, on the order of a few feet or less per day. In the upper valley, the gradient across the valley is much steeper, and in many places the velocity of ground water moving laterally through the alluvium may be equal to, or greater than, the downvalley velocity.
Ground water is discharged from the unconsolidated alluvium naturally by effluent seepage to the Yakima River and the smaller streams, by evapotranspiration, and probably, in the Narrows and the

48 GEOLOGY, GROUND WATER, AHTANUM VALLEY, WASH.
upper valley, by seepage to the deeper aquifers. It is also discharged artificially by means of wells and drainage systems. Of these modes of discharge, effluent seepage is one of the more important.
That part of the seepage discharge from the unconsolidated allu vium which reaches the small streams, including Ahtanum Creek, helps to maintain their low-level flow (p. 44). That part which discharges directly to the Yakima River results in a contribution of perhaps 5,000 acre-feet per year to the flow of the river in its course past the mouth of Ahtanum Valley. (See p. 63.)
It is not known how much ground water migrates downward from the alluvium to the lower aquifers. However, the water table in most parts of the area is lower than the piezometric surfaces of deeper aquifers, and there could be no downward leakage from the alluvium at these places. In a few rather small areas in the upper valley and the Narrows, the alluvium is underlain at shallow depth by basalt and the Ellensburg formation, in which the piezometric surfaces are lower than the water table. In these areas, water from the alluvium moves downward probably at rates depending on the transmission capabili ties of the underlying materials.
Evapotranspiration from the shallow alluvium includes (a) con sumptive waste of shallow ground water by phreatophytes of low economic value, (b) consumptive use by crops, and (c) direct evap oration of moisture from the capillary fringe where the water table is near the surface.
The group of phreatophytes, or "well plants," that grow within the Ahtanum Valley includes cottonwood, willows and associated shrubs, and marsh grasses. Alfalfa is an economic plant that acts as a phreatophyte in areas where it can send its roots down to the water table. Where phreatophytes grow near streams, their roots may withdraw water from both the surface- and ground-water bodies.
The amount of water used by a unit area of phreatophytes may be as much as, or more than, the evaporation from a free water surface covering the same area. In an extensive study made in the Safford Valley, Ariz. (Gatewood and others, 1950, p. 203), careful measure ments showed that dense stands of cottonwood use as much as 6 acre- feet of water per acre in the year ended September 30, 1944. It cannot be stated whether the year of the estimate was typical, but the estimate gives at least a good general idea of the magnitude of trans piration by cottonwood.
The amount of stream-bank vegetation growing in medium to dense stands in the Ahtanum Valley has been estimated from aerial photographs at about 1,200 acres. The average consumptive waste by that vegetation is assumed to be half that for cottonwood in the Safford Valley, or 3 acre-feet per acre, to allow for both the lower

WATER RESOURCES 49
temperature in the Ahtanum Valley and the fact that not all the vegetation grows at maximum density. On the basis of this estimate, about 3,600 acre-feet of water is lost each year. No attempt has been made to determine the evapotranspiration losses from marshy or waterlogged land between the streams. However, the annual non- beneficial discharge of ground water by evapotranspiration throughout the valley probably exceeds 4,000 acre-feet. This consumptive waste may represent a large reclaimable source of water in the Ah tanum Valley. Even though not all the wasted water could be sal vaged, the possibility of reclaiming a part of it to alleviate the water shortage certainly warrants a careful study of the problem.
Withdrawals from wells tapping the alluvium are estimated to average about 1,800 acre-feet per year. Of that total, about 1,300 acre-feet is used for irrigation, about 400 acre-feet for domestic sup plies, and less than 100 acre-feet for industrial purposes.
In addition to that withdrawn from wells, some ground water is discharged artificially from the unconsolidated alluvium in the lower valley by drainage systems. Several large drains were constructed beneath the Yakima Airport and at the east end of the lower valley, in the vicinity of Union Gap. In addition, experiments were started about 1950 on the effectiveness of drainage systems for use on farms in some of the waterlogged areas of the lower valley (A. L. Dickinson, U.S. Soil Conservation Service, oral communication, September 1952). The quantity of ground water that is discharged through these drains is not known. Apparently, however, the systems are effective in lowering the water table only in very localized areas near the drains.
WATEK-LEVEL FLUCTUATIONS
During the investigation, levels in 9 wells in the area were measured at intervals of 1 or 2 months for periods of a year or more, and levels in several other wells, in the lower valley and in Wide Hollow, were measured for shorter periods. In addition, during part of the time, recording gages were maintained on wells 12/17-2R2 and 12/17-9J3. Hydrographs from 11 wells in the Ahtanum Valley are shown on plates 2 and 3.
Of these wells, 2 tap the Yakima basalt, 1 the EUensburg formation, and 8 the unconsolidated alluvium. The location of the wells are shown on plate 1, and descriptions of the wells are given in table 4.
Water-level fluctuations in the alluvium are moderate. In the ob servation wells tapping the alluvium, the maximum observed change in water levels was 6.96 feet in well 12/16-18A1, from 14.02 feet (Oct. 18, 1951) to 7.06 feet below the land surface (May 19, 1952). The mini mum observed change was 1.24 feet in well 12/17-16Q1, from 6.02 feet (Aug. 10, 1951) to 4.78 feet below the land surface (Feb. 20, 1952).
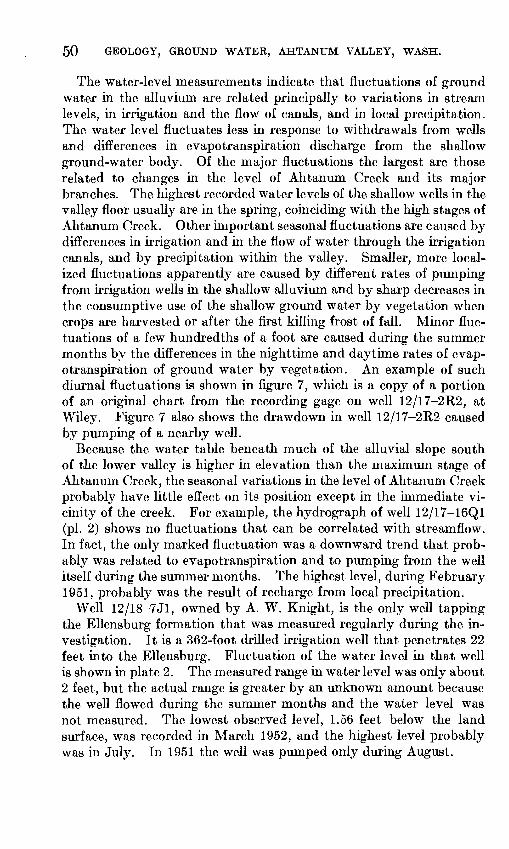
50 GEOLOGY, GROUND WATER, AHTANUM VALLEY, WASH.
The water-level measurements indicate that fluctuations of ground water in the alluvium are related principally to variations in stream levels, in irrigation and the flow of canals, and in local precipitation. The water level fluctuates less in response to withdrawals from wells and differences in evapotranspiration discharge from the shallow ground-water body. Of the major fluctuations the largest are those related to changes in the level of Ahtanum Creek and its major branches. The highest recorded water levels of the shallow wells in the valley floor usually are in the spring, coinciding with the high stages of Ahtanum Creek. Other important seasonal fluctuations are caused by differences in irrigation and in the flow of water through the irrigation canals, and by precipitation within the valley. Smaller, more local ized fluctuations apparently are caused by different rates of pumping from irrigation wells in the shallow alluvium and by sharp decreases in the consumptive use of the shallow ground water by vegetation when crops are harvested or after the first killing frost of fall. Minor fluc tuations of a few hundredths of a foot are caused during the summer months by the differences in the nighttime and daytime rates of evap otranspiration of ground water by vegetation. An example of such diurnal fluctuations is shown in figure 7, which is a copy of a portion of an original chart from the recording gage on well 12/17-2R2, at Wiley. Figure 7 also shows the drawdown in well 12/17-2R2 caused by pumping of a nearby well.
Because the water table beneath much of the alluvial slope south of the lower valley is higher in elevation than the maximum stage of Ahtanum Creek, the seasonal variations in the level of Ahtanum Creek probably have little effect on its position except in the immediate vi cinity of the creek. For example, the hydrograph of well 12/17-16Q1 (pi. 2) shows no fluctuations that can be correlated with streamflow. In fact, the only marked fluctuation was a downward trend that prob ably was related to evapotranspiration and to pumping from the well itself during the summer months. The highest level, during February 1951, probably was the result of recharge from local precipitation.
Well 12/18-7J1, owned by A. W. Knight, is the only well tapping the Ellensburg formation that was measured regularly during the in vestigation. It is a 362-foot drilled irrigation well that penetrates 22 feet into the Ellensburg. Fluctuation of the water level in that well is shown in plate 2. The measured range in water level was only about 2 feet, but the actual range is greater by an unknown amount because the well flowed during the summer months and the water level was not measured. The lowest observed level, 1.56 feet below the land surface, was recorded in March 1952, and the highest level probably was in July. In 1951 the well was pumped only during August.

WATER RESOURCES 51
from pumping ofnearby well
18 19 20 21 22 23 24 25 26 27 28 29 30 31JULY 1951
FIGURE 7. Hydrograph of well 12/17-2R2, showing diurnal water-level fluctuations and drawdown frompumping of a nearby well.
The water-level fluctuations in well 12/18-7J1 probably are con trolled chiefly by differences in the recharge to the formation. How ever, in other parts of the lower valley, the water-level fluctuations may be controlled mainly by withdrawals from wells tapping the El- lensburg formation.
The two observation wells that tap basalt aquifers are 12/16-13D2, at the east end of the Narrows, and 12/17-9J3, 2 miles west-southwest of Wiley.
Well 12/16-13D2, owned by Herke Bros., was drilled as a test well. It is about 8 feet from a very productive irrigation well that probably

52 GEOLOGY, GROUND WATER, AHTANUM VALLEY, WASH.
withdraws water entirely, or mostly, from the Yakima basalt. As its hydrograph shows, the water level in well 12/16-13D2 is controlled primarily by pumping from the irrigation well. The water levels in both wells respond immediately to pumping, which usually is begun in July, and continue to decline throughout the period of pumping which usually continues steadily for 60 or 70 days at the rate of about 850 gpm. The maximum drawdown during a season of pumping usually is less than 40 feet. After pumping is stopped, the water levels in the wells do not recover as rapidly as might be expected from the specific capacity of the pumped well. Instead, the aquifer requires about 10 months, or until the next irrigation season, to be replenished, and in some years the water levels do not fully recover before pumping is re sumed. It is therefore assumed that, although the transmissibility of that particular water-bearing zone in the basalt is rather high, the re charge is limited by adjacent materials of low permeability, so that a period of 10 months is required to replenish the ground water that is discharged during 2 months of heavy pumping.
Well 12/17-9J3, owned by Walter Mclnnis, is 575 feet deep and also taps aquifers in the Yakima basalt. The well originally supplied water for a school, but it has been used exclusively for observation since the U.S. Geological Survey installed a recording gage in January 1953.
On July 20, 1953, the water level in this well was 66.80 feet below the land-surface datum. This level represented the seasonal high for that year. On July 19, 1957, the approximate seasonal high was 80.98 feet below the datum. Hence, the overall decline was 14.18 feet, or about 3% feet per year, for the 4-year span. The year-to-year decline was not consistent however. In the years 1954, 1955, and 1956 the seasonal highs were as much as 10 feet below the 5-year average trend, but the reason for these inordinately low levels is not known. Major water-level fluctuations in the Mclnnis well probably are caused large ly by the pumping of four large-yield irrigation wells, which tap basalt aquifers and are located within 1.5 miles of the Mclnnis well. The water level doubtless is affected also by other factors, such as seasonal variations in recharge and natural discharge.
The hydrographs of wells 12/17-9J3 and 12/16-13D2 suggest that at least locally in the western part of the lower valley, there may be a declining trend in the artesian pressures in the basalt aquifers. How ever, the length of record is not adequate to determine whether pump ing has reached, or is approaching, an optimum balance with recharge.
In the Pullman area (Foxworthy and Washburn, 1957, p. 56-58), in creased pumping withdrawals and the attendant decline in ground- water levels have resulted in an increase hi natural recharge to basalt aquifers recharge that otherwise would have been rejected. In the Ahtanum Valley, therefore, moderate drawdown of water levels in the

WATER RESOURCES 53
basalt aquifers may not necessarily be detrimental to the hydrologic regimen of the area but could result, as in the Pullman area, in in creased recharge to the aquifers.
DEVELOPMENT
UPPER VALLEY
The ground-water resources of the upper valley are developed on a moderate scale. Virtually all domestic water is derived from wells, and the irrigation water from streams is supplemented to a consider able extent by ground water. The Yakima basalt and the uncon- solidated alluvium are the principal sources of ground water; the Ellensburg formation and the cemented gravel are not important aquifers. The estimated withdrawals of ground water from the upper valley, and also from other parts of the area, are presented in table 3.
All the large-yield wells in the upper valley derive water from basalt aquifers which yield as much as 1,700 acre-feet of water per year to 6 irrigation wells. The irrigation wells range in depth from 146 to 598 feet, and a pumping yield of 1,300 gpm has been reported for one of them (12/16-13D1). All 6 wells tap artesian aquifers, and 4 of the wells either flow or have flowed in the past.
The unconsolidated alluvium is an important aquifer in the upper valley, although not a highly productive one at present. It supplies nearly all the domestic wells, the total withdrawal from which is about 15 acre-feet per year. At some places, as in the Narrows, the alluvium may be generally thinner than in the lower valley, but its similarity in appearance to the unconsolidated gravel in the lower valley suggests that it may be capable of yielding much larger quantities of water than are presently withdrawn.
Any sizable increases in ground-water withdrawals from the upper valley probably would come mostly from wells in the main body of the Yakima basalt. Withdrawals from the basalt aquifers probably could be increased somewhat without exceeding the long-term yield. How ever, any additional irrigation wells that tap the basalt should be spaced as far as possible from other wells in the same aquifer, in order to minimize interference that is overlapping of the cones of depres sions of the discharging wells.
Although properly constructed wells tapping the unconsolidated alluvium of the upper valley might produce as much as several hun dred gallons per minute each, continued pumping of several such wells throughout an irrigation season might cause at least slight decreases in streamflow. The floor of the upper valley is so narrow that on most farms it would be difficult to locate a well more than a few hundred yards away from a branch of Ahtanum Creek, and after several months of pumping the cone of depression around the dis-

54 GEOLOGY, GROUND WATER, AHTANUM VALLEY, WASH.
charging well probably would spread far enough to affect the flow of the stream either by inducing direct infiltration from the stream channel or by intercepting appreciable amounts of ground water that normally would discharge into the stream. The possible effects of increased withdrawals from the alluvium are discussed more fully in a subsequent part of this report.
UPLAND BENCHES
Ground water on the upland bench north of the upper valley is developed by means of three irrigation wells and half a dozen domestic wells. All the irrigation wells derive water from the basalt, which is the only source available in that part of the area for the development of large supplies of ground water. The maximum withdrawal from the irrigation wells is estimated to be about 800 acre-feet per year. The domestic wells, of which some have barely adequate yields, derive water from cemented gravel or from the Ellensburg formation, over lying the basalt.
East of the Narrows the basalt dips below the surface, and the upland bench or terrace north of the lower valley is formed mostly by cemented gravel, underlain at depths of about 50 to more than 100 feet by the Ellensburg formation. During the investigation, wells were canvassed in the southern part of this terrace. (See pi. 1.) Most of the wells range in depth from 90 to 200 feet; they com pletely penetrate the cemented-gravel units and tap aquifers in the upper part of the Ellensburg formation. A few deeper wells penetrate farther into the Ellensburg formation, and a few shallower wells evidently derive small supplies of water from the cemented gravel. In general, the wells tapping the cemented gravel are the least pro ductive of those in the southern part of the terrace and have yields of not more than a few gallons per minute. Somewhat larger yields, up to perhaps 50 gpm, usually are obtained from the wells that pene trate a short distance into the Ellensburg formation, and yields of more than 50 gpm have been obtained from the deeper wells. Well 12/17-3M3, owned by F. T. Tissell, about 2 miles west of Wiley, is the most productive well in that part of the area. This drilled well, which is 262 feet deep, penetrates more than 100 feet into the Ellens burg formation and reportedly was pumped at a rate of 90 gpm for 4 hours, with a drawdown of 33 feet. In the southern part of the terrace, the estimated ground-water withdrawal is 65 acre-feet per year, most of which is derived from the Ellensburg formation (table 4).
No wells have been drilled on the bench south of the Narrows, although it probably is potentially as good an area for ground-water development as the bench on the north side. The structure of the basalt layers that underline the upland benches on both sides of the

WATER RESOURCES 55
upper valley is generally favorable for the occurrence of ground water under artesian pressure.
Well records indicate that any additional large-capacity wells that are drilled on the upland benches must penetrate a considerable dis tance into the older rock units that is, the Yakima basalt (adjacent to the upper valley) and the Ellensburg formation (on the terrace north of the lower valley). Yields of more than 100 gpm probably will require wells at least 200 feet deep. Recharge to those deeper aquifers probably is sufficiently great that a few additional large- capacity wells located on the upland benches would not withdraw ground water in excess of the long-term average intake.
LOWER VALLEY
PRESENT DEVELOPMENT
In the lower Ahtanum Valley, sizable amounts of ground water are withdrawn from all the rock units; however, the degree of develop ment of the various aquifers differs widely from place to place. Estimated withdrawals of ground water from the rock units in the lower valley are given in table 3.
In the lower valley between the Narrows and Wiley, the unconsoli- dated alluvium and the Yakima basalt are the only productive sources of ground water. Neither the cemented-gravel unit nor the Ellens- burg formation is known to yield more than small amounts of water to wells. Basalt aquifers yield as much as 1,050 acre-feet per year to 5 wells in the lower valley; individual well yields range from 210 gpm (well 12/17-8R3) to 640 gpm (well 12/17-16D3). The wells range in depth from 243 feet (well 12/17-17C1) to 1,078 feet (well 12/17-16R1).
Farther east the Yakima basalt plunges deeper beneath the valley floor; its upper surface may be as much as 1,500 feet below the land surface near the city of Union Gap. Its depth in the eastern part of the lower valley makes the cost of drilling to the basalt prohibitive, and no wells have been drilled deep enough to reach it. Well 13/18- 29Q1, in Wide Hollow, penetrated basalt at a depth of 1,250 feet, but it apparently was not drilled far enough into the basalt to tap a productive aquifer (table 4). Fortunately, the Ellensburg formation contains productive aquifers east of the Wiley-Ahtanum district, and the cemented-gravel unit is a productive source of ground water at the mouth of the lower valley. The Ellensburg formation yields about 730 acre-feet per year to 10 wells in the lower valley. The wells produce up to 1,100 gpm (well 12/18-2E1), and range from less than 100 to more than 600 feet in depth. The cemented-gravel unit yields about 800 acre-feet per year, mostly to wells in and near the town of Union Gap.
56 GEOLOGY, GROUND WATER, AHTANUM VALLEY, WASH.
The unconsolidated alluvium yields most of the domestic water used in the lower valley and is a productive source of irrigation water in most of that area. Most of the wells tapping the alluvium are dug or driven and are less than 30 feet deep. Yields as great as 400 gpm have been reported for some of the shallow dug wells, and the total withdrawal from the alluvium in the lower valley is estimated to be about 1,750 acre-feet per year.
POTENTIAL DEVELOPMENT
Recharge to the Ellensburg formation, the cemented-gravel unit, and the unconsolidated alluvium probably is sufficient that additional withdrawals could be made from those aquifers in the lower valley without lowering the water levels excessively. However, in any addi tional development of the ground-water resources, wells should be spaced to minimize interference, and observations of water levels should be made regularly to give early warning of any overdraft.
Because of the trend toward declining water levels in wells tapping basalt aquifers, any additional development of these aquifers should be planned carefully, and the plan should include a program for the collection of hydrologic data.
Each of the aquifers in the lower valley, in localities favorable for development, is capable of yielding several hundred gallons of water per minute to a properly constructed well. The unconsolidated allu vium is, of course, the most easily developed of the aquifers. In most parts of the lower valley, a properly constructed dug well can be expected to produce more than 100 gpm. However, the probable depth, yield, and construction cost of wells in the other aquifers differ widely in different parts of the lower valley. In general, the with drawal of additional ground water from aquifers other than the allu vium will require drilled wells ranging in depth from a few hundred feet to 1,000 feet, or even more.
Some of the probable results of increased withdrawal from the alluvium would be a lowering of the water table; a decrease, at least temporarily, in effluent seepage to streams, with a corresponding temporary increase in ground-water recharge; and possibly a slight increase in the consumptive use by vegetation if the water is used for irrigation. In order to estimate the overall effects of such increased withdrawal, it is necessary to consider not only the individual results but also the interrelation of all foreseeable results.
Any increase in the withdrawal of ground water from the uncon solidated alluvium of the lower valley would tend to lower the water table in the vicinity of the wells. This effect, by itself, would be desirable in some waterlogged areas, but along the banks of streams a lowering of the water table might be considered undesirable, as it
WATER RESOURCES 57
would decrease the gradient, and therefore the amount, of water moving to the streams or, if the water table locally were lowered below the stream levels, would induce local infiltration from the stream. In either event it would decrease the streamflow. Unless the wells were located close to the streams, however, the resulting decrease in streamflow would not occur until some time after pumping was increased. On the basis of the yields from existing wells and the probable rates of ground-water movement in the alluvium, it is believed that withdrawals from shallow irrigation wells located more than a mile or two west of the town of Union Gap would have no direct effect upon the seepage of ground water directly to the Yakima River during the same irrigation season, but the cones of depression of most irrigation wells in the valley alluvium probably would be extensive enough during the latter part of the irrigation season to cause at least slight decreases in the flow of the smaller streams (Foxworthy, 1953, p. 18).
These effects that is, the decrease in streamflow and the lowering of the water table would be partly offset by return flow from the addi tional irrigation. Under normal conditions, an estimated 25 percent of the water applied returns to the streams or to the shallow ground- water body.
Additional cultivation and irrigation in the lower Ahtanum Valley would of course increase the consumptive use of water by crops. Evaporation losses also would be increased during the period of application of irrigation water. On the other hand, the nonbeneficial evapotranspiration loss would be virtually eliminated on the tracts brought under cultivation. Also, if the water table were lowered generally by increased pumping, the consumptive waste by phreat- ophytes in surrounding areas probably would be decreased somewhat, because in general the deeper the water table the smaller the waste by phreatophytes. The net effect that increased irrigation would have upon the amount of annual evapotranspiration discharge depends upon the degree to which these factors would balance each other.
On much of the reclaimable land in the lower Ahtanum Valley, the annual nonbeneficial evapotranspiration loss doubtless is as much as 2 acre-feet per acre, and in localities having rather dense phreatophytic growth, it probably reaches or exceeds 3 acre-feet per acre. If reason ably efficient irrigation methods were used, any crop suitable to the lower Ahtanum Valley probably would not require the application of more than about 3.5 acre-feet of irrigation water per acre, and of this amount perhaps 1 acre-foot would return to streams or the ground- water body. If this irrigation water were applied to land that is now wasting 2 or 3 acre-feet per acre, little or no additional water would be lost by evapotranspiration. Hence, the proper reclamation of a

58 GEOLOGY, GROUND WATER, AHTANUM VALLEY, WASH.
considerable area in the lower Ahtanum Valley probably would require little, if any, additional water. Any decrease in streamflow resulting from the withdrawal of ground water to irrigate the reclaimed land would be only temporary, occurring partly during the latter part of the irrigation season but mostly later in the year when the demand on streams is no longer critical.
SUMMARY OF WITHDRAWALS
The estimated withdrawal of ground water in the subareas of the Ahtanum Valley, the amounts withdrawan from the various rock units, and the utilization of the ground water in the area are sum marized in table 3.
TABLE 3. Estimated ground-water withdrawals, in acre-feet per year, in subareas of the Ahtanum Valley, according to use and principal aquifer
(USE)
Stocki
Total..... ..........- ..............
(AQUIFER)
Total....... _ _.
Upper valley
150
1,1000
2<5
1,115
1,10000
15
1,115
Lower valley
400700
3,000220
10
4,330
1,050730800
1,750
4,330
Upland benches
4520
8000
2<5
865
80060
50
865
Total
460720
4,900220
10
6,310
2,950790805
1,765
6,310
1 Includes supplies for dairies.2 Not included in total.
Most of the estimates are based on data gathered during the canvass of wells in the area. Estimates of irrigation withdrawals, however, were based largely on ground-water certificates issued by the Washington State Department of Conservation. The average irrigation withdrawal undoubtedly is considerably less than the maxi mum allowable under the water-right certificates, as some of the irrigation wells are not operated during years of above-average stream- flow, and many others are not utilized to the extent of their water rights. Therefore, to estimate average withdrawals from wells for which certificates have been granted, the maximum allowable with drawals have been arbitrarily reduced by one-third. For irrigation wells for which water-right certificates have not been issued, such as those south of Ahtanum Creek on the Yakima Indian Reservation, the averages were based on reported or estimated irrigated acreages.
Irrigation demands of course vary greatly from year to year, depend ing on such factors as climate, the availability of surface water, and

WATER RESOURCES 59
market prices for crops. All the ground water used for irrigation is withdrawn during the period from May to October, and most of the large-scale pumping is done after July 1.
CHEMICAL QUALITY
Comprehensive chemical analyses of samples of water from 7 wells in the area were made by the U.S. Geological Survey in 1951 and 1952. Of these, 3 tap the unconsolidated alluvium, 2 the basalt, 1 the Ellensburg formation, and 1 the cemented basalt gravel. The results of the analyses are given in table 6. In addition, field deter minations of hardness and chloride content were made of samples from about a tenth of the wells visited. The results of determinations of hardness and chloride are given in table 7. These data indicate the general character of water from the various aquifers.
RANGE IN CHEMICAL CONCENTRATION
The overall range in chloride concentration was from 0.7 to 26 ppm (parts per million), and the range in hardness was from 49 to 265 ppm. The chloride content and hardness of samples from the various aquifers range as follows:
Source of samplesNumber of
samples
69
1019
Chloride (ppm)
1.2-86 -265 -26.7-14
Hardness as CaCO 3 (ppm)
54-9575-240
120-26549-148
The range in concentration of all dissolved constituents was not determined for the area as a whole because the scope of the investi gation did not warrant an extensive geochemical study. In the analyses shown in table 6, the dissolved solids ranged from 113 ppm (well 12/16-17J1, tapping unconsolidated alluvium) to 235 ppm (well 12/18-11E1, tapping the Ellensburg formation). Values for pH indi cated all samples to be slightly alkaline; the bicarbonate content ranged from 74 to 180 ppm.
GENERAL CHARACTER
The analyses show that the concentrations of chemical constituents in the ground water are related much more closely to the rock material in which the water occurs than to the depth of the aquifer or the geographic location of the well. Water from basalt aquifers generally has a lower concentration of chloride and lower hardness than water from the other aquifers. Water from both the basalt and the alluvium is lower in concentration of chloride and hardness than water from
603275 O 62 5

60 GEOLOGY, GROUND WATER, AHTANUM VALLEY, WASH.
either the Ellensburg formation or the cemented gravel. Hardness of water in the alluvium apparently increases slightly downvalley, and shallow ground water in the alluvial slope south of Ahtanum Creek generally is harder than water from the alluvium north of the creek.
Differences in the chemical character of the ground water from different aquifers can be seen more clearly in figure 8, which is a graph upon which the seven comprehensive analyses have been plotted. In general, the position of each point on the graph is dependent upon the chemical character of the water with respect to proportions of 2 groups of major cations (calcium and magnesium, and sodium and potassium) and 2 groups of major anions (bicarbonate and carbonate, and sulfate and chloride) (Piper, 1944). Analyses of water samples of nearly identical chemical character plot closely together, but analyses of samples of different chemical character plot in different parts of the graph. The analyses of water from the basalt and the alluvium, represented by points 1, 3, 5, 6, and 7, all plot in a fairly close group in a part of the graph that indicates they are all of the calcium magnesium bicarbonate type. In contrast, the analyses of water from the Ellensburg formation and the cemented gravel, points 2 and 4, are entirely separate from the other group, apparently owing largely to a higher proportion of sulfate and chloride in these two water samples.
An important chemical characteristic of water for irrigation is the proportion of sodium to the principal basic constituents (calcium, magnesium, sodium, and potassium) the "percent sodium." The U.S. Department of Agriculture (Wilcox, 1948, p. 25-27) commonly rates water as to its suitability for irrigation according to the percent sodium and the concentration of dissolved solids. By this classifi cation, all samples analyzed rated "excellent to good" for irrigation.
The temperature of water in shallow aquifers is controlled largely by the mean annual temperature of the area. Water from deeper aquifers usually is warmer, in response to the effect of the geothermal gradient. The type of material that yields the water usually has very little influence upon the temperature of ground water. In the Ahta num Valley, the water from the shallow wells, as much as about 40 feet deep, showed a considerable range of temperatures from 43° to 55° F. In wells deeper than 50 feet, the temperature increases about 1° F for every 45 feet of depth, with no apparent relation to the type of material from which the water is derived. For example, well 12/17- 3D1, which is 125 feet deep, yields water at 54° F, whereas well 12/18-lMl, which is 620 feet deep, yields water about 11° warmer, or at 65° F. Measurements of the ground-water temperatures in the area are given in table 4.

WATER RESOURCES 61
FIGURE 8. Graph showing chemical character of water from wells in Ahtanum Valley.
Plot Well
I........................................... 12/16-13D12--.__. _.-_..--___. -...- __. .-.__ 12/18-11E13-.. _.-- .. _._ 12/18-5G2^........................................... 13/19-31J15....._____._.____...__...._.... 12/18-5J16. .... ................................. 12/16-17J17.... .........._............_........ 12/17-16R1
Depth(feet)
146213
10841811
1,078
Principalaquifer
Basalt.Ellensburg formation. Alluvium. Cemented gravel. Alluvium. Alluvium. Basalt.

62 GEOLOGY, GROUND "WATER, AHTANUM VALLEY, WASH.
SUITABILITY FOR USE
The analyses, together with information supplied by residents during the canvass of wells in the area, show that the chemical quality of ground water in the Ahtanum Valley generally is satisfactory for most purposes, although water from many wells is harder than desirable for domestic use. The water generally is clear and cool and has no objectionable taste or odor. A few wells that tap basalt aquifers reportedly yield water that has a slight odor of hydrogen sulfide, but this odor usually disappears if the water is allowed to stand in an open vessel.
GROUND-WATER DISCHARGE TO THE YAKIMA RIVER
Analyses of available streamflow records indicate that the flow of the Yakima River increases substantially as it traverses the Ahtanum- Moxee subbasin. This increase is attributable partly to direct runoff from tributary streams and partly to ground-water discharge. It is possible to estimate the amount of ground-water discharge to the Yakima River within the subbasin provided that concurrent records of the flow of the river as it enters and leaves the subbasin and of streams tributary to the river within that reach are available for study.
Streamflow records have been collected concurrently at stations on the Yakima and Naches Rivers at Selah Gap, the Yakima River at Union Gap, and Ahtanum and Wide Hollow Creeks near their mouths during only two brief periods, July-October 1911 and July-September 1912. Additional measurements were made at all these stations except Wide Hollow Creek during the period May-November 1904. s These periods are too short to allow more than a tentative estimate of ground-water discharge.
The records show that the flow of the Yakima River nearly doubles between Selah Gap, where it enters the Ahtanum-Moxee subbasin, and Union Gap, where it leaves the subbasin. Most of the increase comes from the Naches River, which discharges into the Yakima just below Selah Gap, and from Ahtanum and Wide Hollow Creeks. The rest enters the river as ground-water seepage and intermittent surface runoff.
On the basis of records for the period cited above (but omitting those for May and June 1904, which reflect flood stages that apparently mask the effect of ground-water discharge), the average monthly ground-water increment to the Yakima River between Selah Gap and Union Gap is estimated at 9,000 acre-feet per month.
Kecords cited above, except those for Wide Hollow Creek, have been published in U.S. Geological Survey Water-Supply Paper 1316. The records for the station on Wide Hollow Creek have not been published but are available for examination at the office of the U.S. Bureau of Reclamation at Yakima.

WATER RESOURCES 63
Ground-water contributions from specific areas within the subbasin also may be estimated from the total discharge, provided that certain additional assumptions are made. It is assumed that more than half the ground-water increment to the Yakima River, perhaps 5,000 acre- feet per month, came from the west side of the Ahtanum-Moxee sub- basin, where precipitation and surface discharge are greater. If it is assumed further that the contribution from the west side of the sub- basin is evenly distributed throughout the 8-mile reach, the yearly total for each mile would amount to about 7,500 acre-feet. Because of lack of precise data on elevations of the land surface and on water levels in wells and streams, no ground-water drainage divide between wide Hollow Creek and the Ahtanum Creek system has been located. Hence, the ground-water contribution from the area drained by Ahtanum Creek cannot be determined directly. However, for the 3-mile reach of the Yakima River shown on figure 1 the effluent seep age directly into the Yakima River and to the short intermittent streams and drains which empty into the river may be on the order of 20,000 to 25,000 acre-feet per year. Doubtless a part of that ground- water discharge is from Wide Hollow, but the proportion cannot be determined on the basis of available data.
The preceding estimate of ground-water discharge to the Yakima River constitutes the total for all the aquifers. The discharge from the unconsolidated alluvium may be estimated separately, using the transmissibility data derived from aquifer tests and the gradient of the water table, according to the following modification of the gradient formula:
Q=Thl
where Q is the quantity of water discharged, in gallons per day,Tis the coefficient of transmissibility, in gallons per day per
foot,h is the hydraulic gradient, in feet per mile, I is the length of the discharging area, in miles.
The gradient of the water table (h) in the lower valley near the Yakima River is about 25 feet per mile, and the length of the discharg ing area (I) is 3 miles. If the average coefficient of transmissibility ( T) is assumed to be 60,000 gpd per foot on the basis of the results of the aquifer tests previously described (table 2), the discharge (Q) is on the order of 4.5 mgd (million gallons per day), or about 5,000 acre-feet per year. Thus it is estimated that the alluvium discharges as much as one-fourth of the total ground-water discharge from the area to the Yakima River.

64 GEOLOGY, GROUND WATER, AHTANUM VALLEY, WASH.
PROBLEMS OF FUTURE WATER SUPPLY
The foregoing discussion outlines the ground-water conditions in the Ahtanum Valley during 1951-58, insofar as avaliable data permit. This period has been marked by continuing construction of wells for irrigation and by a major lawsuit concerning apportionment of the inadequate summertime flow of the streams. If the productivity of the land and the economy of the population are to reach optimum levels, a comprehensive plan must be established for the systematic development and management not only of the ground water but also of the total water resources of the area.
Efficient management requires a comprehensive inventory of the water resources of the area. This report provides estimates for some of the factors pertinent to such an inventory; the available data allow only tentative conclusions about other critical factors. Also, some of the quantitative estimates presented in this report may require revision as new data become available or if the use of water changes materially. To complete a comprehensive water-resources inventory, insofar as possible, to refine and check the conclusions reached during the present investigation, and to evaluate the long-term effect of water use upon the hydrologic regimen, the investigative studies out lined in the following paragraphs are recommended, to begin as soon as possible.
STREAMFLOW
For a continuing evaluation of the inflow-outflow relationship of Ahtanum Creek, the records from the existing gaging stations on the North and South Forks of the creek need to be supplemented by addi tional streamflow data at its mouth. Therefore, permanent reestab- lishment of the former gaging station on Ahtanum Creek near Union Gap is recommended. In addition, a station at the Narrows would provide data for determining seasonal gains and losses in streamflow within the upper or lower parts of the valley.
Additional data are needed also on the flow of Wide Hollow Creek to determine gains or losses in the stream as it traverses the lower Ahtanum Valley and to establish its relation to the water table in that part of the area. A gaging station located near its mouth would be required to provide adequate data on the outflow from the creek; another gaging station near the Yakima Airport would be required to measure the surface inflow to the lower valley.
The present estimate of ground-water discharge from the Ahtanum Valley to the Yakima River probably could be refined if additional data were available on the gain in flow of the river in the reach adjacent

PROBLEMS OF FUTURE WATER SUPPLY 65
to the valley. This would necessitate at least one additional gaging station, on the river upstream from the project area and below the confluence with the Naches River, to provide records to supplement those from the existing station at Parker. However, much better results would be obtained if the downstream record were collected in Union Gap (below the mouth of Ahtanum Creek) rather than at Parker.
GROUND WATER
Periodic field canvasses should be made of newly constructed wells, particularly those of modera/te or large yield, to fill gaps in current information on the availability of ground water in various parts of the area, on the extent and yield of the aquifers, and on ground-water levels.
The network of observation wells used in this investigation should be expanded and maintained on a continuing basis to define more accurately the seasonal fluctuations of water levels and artesian pressures and to give early warning of any possible overdraft from the aquifers. The network should include at least a few wells tapping each aquifer and as many of the irrigation and other large-yield wells as possible. The elevations of the measuring point at each well on the network should be established precisely by leveling. In the eastern part of the lower valley, relatively close spacing of observation wells tapping the unconsolidated alluvium will be necessary to determine whether a clearly defined ground-water divide exists between the lower Ahtanum Valley and Wide Hollow.
WATER USE
Inasmuch as the amount of water used in the Ahtanum Valley varies from year to year, a continuing appraisal of water use for all purposes from both surface- and ground-water sources is needed for effective management of the water resources. Data on annual withdrawals from wells are especially important as a possible means of determining optimum yields of some of the aquifers where the withdrawal can be related to water-level changes.
PRECIPITATION
In order to determine the total amount of water entering the Ahtanum Valley, it will be necessary to refine the estimates, made in this report, of the distribution of precipitation throughout the valley. Operation of additional precipitation gages on the floor and slopes of the upper valley for at least a few years probably would yield the data required.

66 GEOLOGY, GROUND WATER, AHTANUM VALLEY, WASH.
REFERENCES CITED
Beck, G. F., 1940, Late Tertiary stratigraphy and paleontology of south-central Washington and adjacent Oregon [abs].: Geol. Soc. America Bull., v. 51, no. 12, pt. 2, p. 2018.
Foxworthy, B. L., 1953, Ground water in the lower Ahtanum Valley, Washington and' possible effects of increased withdrawal in that area: U.S. Geol. Survey open-file report, 26 p., 1 pi.
Foxworthy, B. L., and Washburn, R. L., 1957, Ground water in the Pullman area, Whitman County, Washington: U.S. Geol. Survey open-file report 122 p., 8 pis., 9 figs.
Gatewood, J. S., Robinson, T. W., Colby, B. R., Hem, J. D., and Halpenny, L. C., 1950, Use of water by bottom-land vegetation in lower Safford Valley, Arizona: U.S. Geol. Survey Water-Supply Paper 1103, 210 p., 5 pis., 45 figs.
Kinnison, Hallard B., 1952, Evaluation of streamflow records in Yakima River basin, Washington: U.S. Geol. Survey Circ. 180, 38 p., 1 pi., 2 figs.
Mackin, J. H., 1947, Diatomite deposits in eastern Washington [abs.]: North west Sci., v. 21, p. 33.
Merriam, J. C., and Buwalda, J. P., 1917, Age of strata referred to the Ellensburg formation in the White Bluff of the Columbia River: California Univ. Pub., Dept. Geology Bull., v. 10, p. 255-266.
Piper, A. M., 1944, A graphic procedure in the geochemical interpretation of water analyses: Am. Geophys. Union Trans., v. 25, pt. 6, p. 914-923.
Russell, I. C., 1893, A geological reconnaissance in southeastern Washington: U.S. Geol. Survey Bull. 108, 108 p., 12 pis.
Sceva, J. E., 1954, Geohydrologic evaluation of streamflow records in the Yakima River basin, Washington: U.S. Geol. Survey open-file report 129 p., 3 pis., 18 figs.
Smith, G. O., 1901, Geology and water resources of a portion of Yakima County, Washington: U.S. Geol. Survey Water-Supply Paper 55, 68 p., 7 pis.
1903, Description of the Ellensburg quadrangle [Washington]: U.S. Geol. Survey Geol. Atlas, Folio 86.
Theis, C. V., 1935, The relation between the lowering of the piezometric surface and the rate and duration of discharge of a well using ground-water storage: Am. Geophys. Union Trans., p. 519-524.
Tolman, C. F., 1937, Ground water: New York, McGraw-Hill, 593 p., illus.Twiss, S. N., 1943, Report on ground water in Ahtanum Valley, Yakima County,
Washington: U.S. Soil Conserv. Service duplicated rept., 10 p., illus.Warren, W. C., 1941, Relation of Yakima basalt to the Keechelus andesite series:
Jour. Geology, v. 49, no. 8, p. 795-814.Washington State Legislature, 1945, Ground water code relating to the regula
tion and control of certain ground waters within the State and rights to the use thereof, chap. 263 of Session laws, 1945: Washington Dept. Conserv. and Devel., Div. Water Resources, 18 p.
Waters, A. C., 1955, Geomorphology of south-central Washington, illustrated by the Yakima East quadrangle: Geol. Soc. America Bull., v. 66, p. 663-684.
Wenzel, L. K., 1942, Methods for determining permeability of water-bearing materials, with special reference to discharging-well methods, with a section on direct laboratory methods and bibliography on permeability and laminar flow, by V. C. Fishel: U.S. Geol. Survey Water-Supply Paper 887, 192 p., 6 pis.
Wilcox, L. V., 1948, The quality of water for irrigation use: U.S. Dept. Agri culture Tech. Bull. 962, 40 p.

BASIC DATA
67
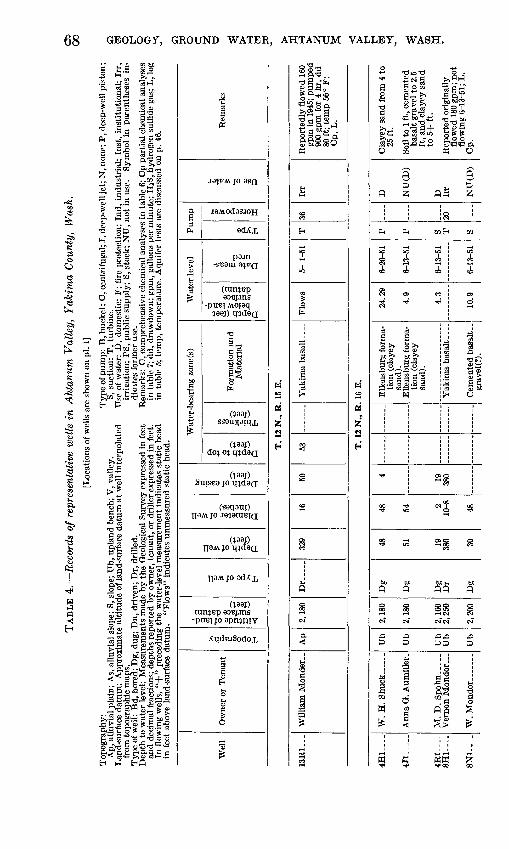
TAB
LE 4
. R
ecor
ds o
f re
pres
enta
tive
wel
ls i
n A
htan
um V
alle
y, Y
akim
a C
ount
y, W
ash.
[Loc
atio
ns o
f wel
ls a
re s
how
n on
pi.
1]
Top
ogra
phy:
Ap,
all
uvia
l pl
ain;
As,
allu
vial
slo
pe;
S, s
lope
; U
b, U
plan
d be
nch;
V, v
alle
y.
Lan
d-su
rfac
e da
tum
: A
ppro
xim
ate
alti
tude
of l
and-
surf
ace
datu
m a
t w
ell i
nter
pola
ted
from
top
ogra
phic
map
s.T
ype
of w
ell:
Bd,
bor
ed; D
g, d
ug;
Dn,
dri
ven;
Dr,
dri
lled.
D
epth
to
wat
er le
vel:
Mea
sure
men
ts m
ade
by t
he G
eolo
gica
l Su
rvey
exp
ress
ed in
fee
t
yp S, s
uctio
n; T
, tu
rbin
e.U
se o
f w
ater
: D
, do
mes
tic;
F; f
ire p
rote
ctio
n; I
nd,
indu
stri
al;
Inst
, in
stit
utio
nal;
Irr
, ir
riga
tion;
PS,
pub
lic
supp
ly;
S, s
tock
; N
U,
not
in u
se.
Sym
bol
in p
aren
thes
es i
n
dica
tes
form
er u
se.
Rem
arks
: C
, com
preh
ensi
ve c
hem
ical
ana
lyse
s in
tab
le 6
; Cp
part
ial c
hem
ical
ana
lyse
s
In f
low
ing
wel
ls, "+
" pr
eced
ing
the
wat
er-l
evel
mea
sure
men
t in
dica
tes
stat
ic h
ead
in t
able
5; t
emp,
tem
pera
ture
. A
quif
er t
ests
are
dis
cuss
ed o
n p.
46.
in
fee
t ab
ove
land
-sur
face
dat
um.
"Flo
ws"
ind
icat
es u
nmea
sure
d st
atic
hea
d.
Wel
lO
wne
r or
Ten
ant
Topography
Altitude
of
land- surfac
e datum (feet
)
Type
of
wellDept
h of
well
(feet)
Diameter
of
well (inche
s)
Depth
of
casing (fee
t)
Wat
er-b
eari
ng z
one(
s)
Depth
to
top (feet
)Thickne
ss (feet)
For
mat
ion
and
Mat
eria
l
Wat
er le
vel
Depth (feet below
land-
surface datum
)Date
meas
ured
Pum
p
a >> E-I
Horsepower
Use
of
waterR
emar
ks
T.
12 N
., R
. 15
E.
13R
1...
Will
iam
Mon
der.
.A
p2,
180
Dr.
....
329
1650
53Y
akim
a ba
salt
. _Fl
ows
5- 1
-51
T36
Irr
Rep
orte
dly
flow
ed 1
60
gpm
in 1
945;
pum
ped
900
gpm
for
4 h
r, d
d 80
ft;
tem
p 56
° F;
C
p, L
.
T.
12 N
., R
. 16
E.
4H1.
__.
4J1
. .
4R
1....
8H1-
8N1-
W.
H.
Shuc
k ...
...
Ann
a G
. Aum
iller
.
M.
D.
Spoh
n..
...
Ver
non
Mon
dor .
..
Ub
Ub
Ub
Ub
Ub
2,18
0
2,18
0
2,16
0 2,
250
2,20
0
Dg
Dg
Dg
Dr
Dg
48
51 19
380 30
48
54 2 10
-8 48
4 19
380
Elle
nsbu
rg fo
rma
tio
n (c
laye
y sa
nd).
E
llens
burg
form
a
tion
(cla
yey
sand
).
Cem
ente
d ba
salt
., gr
avel
(?).
24.2
9
4.9
4.3
10.9
6-20
-51
6-13
-51
6-13
-51
6-13
-51
P
P S T S
26"
D NU
(D)
D Irr
NU
(D)
Cla
yey
sand
fro
m 4
to
25ft
.
Soil
to 1
ft,
cem
ente
d ba
salt
grav
el t
o 2.
5 ft
, and
cla
yey
sand
to
5+
ft.
Rep
orte
d or
igin
ally
fl
owed
180
gpm
; no
t fl
owin
g 6-
13-5
1; L
. C
p.
O5
00

9H1
9M1
10
N1...
1 1 V
I
13D
1...
13H
1...
14F
1 .
15
D1
...
17
D1
...
17
J1.
1 *7V
1
18A
11
8B
4..
.
M
A
Les
h
__
do... _
.. _
_ .
..d
o......
...
TTb
TTb
R V Ap
Ap
Ap
Ap
Ap
Ap
Ap
Ap
Ap
An
Ap
Ap
Ap
An
An
2,08
0
2,15
0
1,99
01,
850
1,75
0
1,69
01,
700
1 83
0
1 96
0I'g
oo
i on
n
1,87
02
160
2,05
0
9 Of
tn
2,11
02,
120
2,20
0
2,11
0
Dg
Dg
Dr
Dr
Dr
Dg
Dg
Dr
Dn
Dr
Dr
Dr
Dg
Dg
Dg
Dr
Dr
Dr
Dr
Dr
16 18 i ift 9 13 160 Q
598
544 43 20 11 19
100 16 196
987
36 6 6 14 8 36 24 1W 12
10-6 12 1J
460 24 6 6 8
14-7 1
9
72 27 255
278 42
+
0 12 90±
287 40
130
235
411 21
0
10±
58
grav
el(?
).
.. .
.do _
. ___ ..
.
d
o ..
. .
.....d
o _
__ . .
....
All
uviu
m (
grav
el)-
_ ..d
o. -..
. ..
Yak
ima
basa
lt. .
..
do. .
..d
o.-
_ . _
__
All
uviu
m (
grav
el,
coar
se, u
n-
sort
ed).
Cem
ente
d ba
salt
grav
el(?
).
7.5
7.8 1 55 51.8
4.0
5.3 5.6
60 52.9 3.7
6.4
3 11.1 9.0 .6 2.4
6-13
-51
6-13
-51
4-11
-48
4-22
-51
5- 7
-51
5- 7
-51
5- 7
-51
5- 4
-51
6-
-29
4-24
-46
5- 4
-51
5- 2
-51
5- 2
-51
5- 2
-51
5- 1
-51
5-21
-51
5- 1
-51
R R N T T N R R R R T T N R B R R R N T T
15 30
ii
20 40 5
D D NU
Irr
Irr
NU
(D)
D D D NU
(D)
Irr
Irr
NU
D D D D D NU
Irr
Irr
Rep
orte
d to
go
dry
in
late
sum
mer
. O
p.
Gra
vel
to 6
0 ft
, ba
salt
to 2
30 f
t. P
umpe
d 16
8 gp
m f
or 1
hr,
dd
154
ft;
tem
p re
port
ed
60°
F.
IHhr,
dd20ft
, "f
ull
" re
cove
ry i
n 30
se
c; A
, O
, L
.
test
wel
l.
Ran
d fr
om 1
56 t
o 15
8ft
.
"Rli
ght
flow
" at
235
ft,
whi
ch s
topp
ed a
s tfl
dr
illi
ng p
roce
eded
>
to
app
roxi
mat
ely
500
CO
ft;
pum
ped
360
gpm
S
in
194
5; 8
-inc
h pe
r
fora
ted
line
r 15
5-25
5 M
ft
. >
27.5
ft;
L.
i>
Op.
Op.
Op. fo
r hr.
Fil
led
wit
h ro
cks
to 2
ft;L
.
pum
ped
1,26
0 gp
m
for
4+
hr,
dd 1
40 f
t;
L.
pum
ped
350
gpm
, dd
70
ft;
L.
co

TAB
LE 4
. R
ecor
ds o
f re
pres
enta
tive
wel
ls i
n A
htan
um V
alle
y, Y
akim
a C
ount
y, W
ash.
C
onti
nued
Wel
lO
wne
r or
Ten
ant
Topography
Altitude
of
land- surface
datum
(feet)
Type
of
wella I
*3 S?
Diameter of
well (inche
s)
Depth
of
casing (fee
t)
Wat
er-b
eari
ng z
one(
s)
Depth to
top (feet
)Thicknes
s (feet)
Form
atio
n an
d M
ater
ial
Wat
er le
vel
Depth
(feet below
land
- surface datum
)Date
meas
ured
Pum
p
1
EH
Horsepower
Use
of
waterO
H
Rem
arks
^ 1̂
T.
12 N
., R
. 16
E. C
onti
nued
§ ~*
18K
1...
18
LL
Ap
Ap
2,11
0
2,13
0
Dr
Dg
343 18
8-5 36
315 15
±4
14
Yak
ima
basa
lt ..
..
Allu
vium
(sa
nd
and
grav
el).
Flow
s
3
5- 1
-51
T S
20Ir
r
D
Flow
sta
rted
at
dept
h g
of
320
ft; r
epor
ted
flow
90
gpm
, 2-2
0-46
; ^
pum
ped
220
gpm
, dd
<1
116f
t;Cp,
L.
>
Supp
lies
5± f
amili
es.
H
Soil
to 4
ft,
sand
and
H
gr
avel
to 1
8 ft
. &
T.
12 N
., R
. 17
E.
jrj
H
1B2.
...
1D
L...
1E
3..
..
1G
2....
1J4-
.IL
L....
1M2 .
...
1N
1..._
1P
1
2A
L..
.
Lan
e Fe
rgus
on ..
..
H.
C. W
ilson
. ....
O. J
. B
ayle
. .....
Lym
an L
enni
ng-
ton.
B
. E
. Sn
ellin
g ...
..
Lym
an L
enni
ng-
ton.
R
. Sh
aw. .
.......
Art
hur
Fulb
righ
t.
Spri
ngbr
ook
Dai
ry.
S. T
. R
ay ..
....
...
Ub
Ub
Ub
Ub
Ub
Ap
Ap
Ap
Ap
Ap
Ub
1,31
0
1,35
0
1,36
0 1,
360
1,28
0
1,28
0 1,
320
1,36
0 1,
350
1,30
0
1,40
0
Dg
Dr S Dr
Dn
Dr
Dr
Dr
17
180 47
159
200 15
33 4 77 79
198
72 6 48 6
6-5 1J
4 6 96
6 6 6
6
180
100±
200 20
10 197± 29
7 3±
Cem
ente
d ba
salt
grav
el.
Elle
nsbu
rg fo
rma
tio
n.
mat
ion.
E
llens
burg
form
a
tion
(coa
ise
sand
).
Allu
vium
(sa
nd
and
grav
el).
Cem
ente
d ba
salt
grav
el.
Allu
vium
(?)
Elle
nsbu
rg fo
rma
tio
n.
9.0
65 2.2
60 5.3
9.6 .9
5.0
2.1
70
6-29
-51
10-
-48
6-29
-51
5-29
-51
7- 2
-51
6- 1
-51
5-16
-51
6-22
-51
1951
S P S T J S S S S S P
1 1 H H
D,
S
D S D D D,
Irr
D D,
Irr
D,
Ind
D, Ir
r,
Ind
D
Cem
ente
d ba
salt
grav
el
|5
from
6 to
17
ft.
3
Supp
lies
2 fa
mili
es.
3 1 H -J
Supp
lies
3 st
ores
and
CO
3
fam
ilies
. M
Su
pplie
s 3
fam
ilies
, 3
spri
nkle
rs, a
nd
smal
l dai
ry;
tem
p 61
° F;
Cp.

2J2
2J3
2K1.
_._
2N
1-.
..
2P
1 -
2P
2 -
2Q
1 -
2Q
3 -
2R
1-.
--
2R
2..-.
3A
1 -
3B1_
._..
301
3D
l..-
_
3E
1.....
3J1
3M
2 .
3M
3-.
..
3N
l..-
_
4F
1._
Flo
yd
Wil
lard
-
-d
o-.
- ..
.
Gil
bert
Orc
hard
s,
Inc.
Gil
bert
Orc
hard
s,
Inc.
C
onra
d K
uhl
J. A
. R
icha
rtz,
Jr.
Ruth
Kerl
... .
....
E.
Spo
hn__
-._ ..
..
Flo
ydW
illa
rd--
-.
Fra
nk G
lasp
ey _
_
Ola
f L
awri
e .......
Hen
ry C
arls
on _
_
M.
W.
Bee
cham
--
N.
S. K
elly
- ......
E.
H.
Lov
estr
and.
G
. E
. C
lase
n ......
A.
V.
Ander
son.
F.
T.
Tis
sell
___
Car
l N
ystr
om ..
_..
C.
R.
Ho
ltzi
ng
er
Ub
Ub
Ub
Ub
Ap
Ap
Ap
Ap
Ap
Ap
Ub
Ub
Ub
Ub
Ub
Ub
Ub
Ub
Ub
Ub
1,40
0
1,40
0
1,46
0
1,39
0
1,38
0
1,38
0
1,39
0
1,38
0
1,35
0
1,32
5
1,51
0
1,54
0
1,55
0
1,58
0
1,58
0 1,
510
1,56
0
1,60
0
1,60
0
1,63
0
Dr
Dr
Dr
Dr
Dg
Dg
Dr
Dg
Dr
Dg
Dr
Dr
Dr
Dr
Dr
Dr
Dr
Dr
Dr
Dr
92 94 160 11 16 75 16 48 9
107 92 319
125 90
16
0
118
262
100 80
6 6 6 6 4 6 6 36 6 36 6 6 5H 6 6 6 6 6 6
6-4
40 40 42 60 90 40±
60 60
90±
Of)
_i_
13 90±
300±
Elle
nsbu
rg f
orm
atio
n (b
lack
sa
nd).
- _
do-
- _
__
- _
tion(
?)
Elle
nsbu
rg f
orm
atio
n (?
). A
lluvi
um (
grav
el)
. __ d
o-
__
grav
el(?
).
and
grav
el) .
Allu
vium
(?)
(coa
rse
grav
el).
tion(
?).
tion
(sa
nd).
(?).
tion(
?).
- .
do
. _
.
tion.
tion.
tion(
?) (
sand
an
d gr
avel
).
55.6
50 60+
36.8
2.4
5.7
5.0
20 2.5
20.1
11.4
15 11.3
17.6
20 182 2.
8
7- 6
-51
0-29
-51
5-16
-61
6-16
-51
5-17
-51
5-17
-51
9-
-50
5-24
-51
6-29
-51
6-27
-51
1948
12-
5-51
6-28
-51
6-
-51
1946
6-28
-51
P J P P S S C S T J C S S P S S S S P S S
1 \^ % y* H 1 M 3 1 1^4 H % 1 w y* w * 3 M M
UN
(Ir
r)
D D D D,
Irr
D,
Irr
D Irr
D,
Ind
Irr
D D D,
S
D D D D D D D
Cem
ente
d gr
avel
to
abou
t 90
ft.
Cem
ente
d gr
avel
to
abou
t 90
ft.
Wat
erre
port
ed to
hav
esl
ight
odo
r of
H2S
.Su
pplie
s 2
fam
ilies
;fo
rmer
ly u
sed
for
irri
gatio
n; p
umpe
d50
gpm
, dd
90
ft.
Supp
lies
3 fa
mili
es;
Cp
Irri
gate
s ab
out
H a
cre
of b
erri
es.
Irri
gate
s 1 a
cre
ofpa
stur
e.
Cp.
Tes
ted
at 1
50-2
00 g
pmea
rly
in ir
riga
tion
sea
son,
dd
10
ft;
sand
and
grav
el to
bot
tom
.Su
pplie
s fr
ozen
fo
odlo
cker
s, t
aver
n, a
ndga
rage
; pu
mn
capa
cit
y re
port
ed 3
0 gp
m.
Tem
p 55
° F;
aq
uife
rte
st;
Cp.
Cem
ente
d gr
avel
toab
out 9
0 ft
.P
ump
capa
city
re
port
ed 3
^ g
pm.
Tem
p 54
° F.
Pum
ped
3^5
gpm
, dd
Supp
lies
3 fa
mili
es;
pum
ped
90 g
pm f
or4
hr,
dd 3
3 ft
.P
umpi
ng w
hen
mea
sur
ed;
supp
lies
2fa
mili
es.
Rep
orte
d to
hav
epu
mpe
d sa
ndoc
casi
onal
ly.
td CO M o £ > -<1

TAB
LE 4
. R
ecor
ds o
f re
pres
enta
tive
wel
ls i
n A
htan
um V
alle
y, Y
akim
a C
ount
y, W
ash.
C
onti
nued
Wel
lO
wne
r or
Ten
ant
Topography
Altitude
of
land- surface
datum
(feet)
Type
of
well
a o> "3^
Diameter
of
well (inche
s;
Depth
of
casing (fee
t)
Wat
er-b
eari
ng z
one(
s)
Depth to
top (feet
)Thicknes
s (feet)
Form
atio
n an
d M
ater
ial
Wat
er le
vel
Depth
(feet below
land-
surface datum
)Date
meas
ured
Pum
p
S EH
Horsepower
Use
of
waterO H
Eem
arks
^ 0
O
T.
12 N
., R
. 17
E. C
onti
nued
§ i
4H
2-.
..
4P1 __
5B1 .....
5E1 .
....
6F
2 .
.
6J1
-...
.
J, E
. B
orto
n &
Sons
.
__ d
o ...
....
......
L.
H.
Man
sper
ger.
C.
E. K
uhnk
e....
Coh
odas
, Lan
cas
te
r, F
rank
Co.
do..
. .......
...
E.
L.
Len
ingt
on..
Otis
Bai
ley.
__
_ .
Pete
r Pa
n A
rend
onk.
Gilb
ert
Orc
hard
s,
Inc.
E
. F.
Mor
ozzo
Geo
rge
Wea
ver .
...
Ub
Ub
Ub
Ub
Ub
Ub
V V
Ub
Ub
V
V
1,60
0
1,59
0
1,59
0
1,63
0
1,60
0
1,60
0
1,56
0
1,62
0
1,65
0
1,74
0
1,68
0
1,68
0
Dr
Dr
Dr
Dr
Dr
Dg
Dr
Dr
Dr
Dr
Dr
Dr
360
235
101
240
397 39
170
117
215
315
159
140
6 6 6 48 6 6 6 6 6 6
80 235 0 77 10 294 44
140
110
160
204
306
140
"Few
fe
et" 10 10
Elle
nsbu
rg f
orm
a
tion
(san
d).
- d
o..
....
. .
Elle
nsbu
rg f
orm
a
tion
(?).
Elle
nsbu
rg fo
rma
tio
n (s
and)
. __ d
o _
. ...
.
Cem
ente
d gr
avel
Elle
nsbu
rg fo
rma
tio
n (s
and)
.
Elle
nsbu
rg fo
rma
tio
n.
Elle
nsbu
rg fo
rma
tio
n (s
and
and
grav
el).
Elle
nsbu
rg f
orm
a
tion.
E
llens
burg
form
a
tion
(san
d).
Elle
nsbu
rg f
orm
a
tion.
172 9 11
.9
6 79
190
200 30 55
8-16
-46
6-26
-51
6-25
-51
9- 2
-47
6-
-51
6-19
-51
1950
T T
J P
P S T P
P P N
J
5 3 1 1 2 5
D, I
nd
Ind
D,
Ind
D
D D
D,
Irr
D,
S
D,
Irr
D NU
D
Supp
lies
frui
t pac
king
3
pl
ant.
Pum
ped
72
°
gpm
for
10
min
, dd
^ 15
ft.
^
Supp
lies
frui
t pac
king
>
pl
ant.
H
Supp
lies
frui
t pac
king
H
pl
ant;
pum
ped
13}4
J*
gp
m, d
d 54
ft.
Supp
lies
2 fa
mili
es.
j>
Supp
lies
seve
ral
fam
- n
ili
es;
pum
p ca
paci
ty
^
lepo
rted
50
gpm
. g
Su
pplie
s 2
fam
ilies
; 3
ce
men
ted
grav
el to
^
abou
t 15
ft.
S
Pum
ped
300
gpm
. dd
35ft
;tem
p54°
F;C
p,
5
L.
>
Pum
ped
48 g
pm f
or 1
J4
L,
hr;
dd 3
5 ft
. g
Pum
ps 9
.6 g
pm.
^
>
To b
e us
ed fo
r irr
i- 02
ga
tion;
L.
H
Pene
trat
ed m
ostly
cl
ay w
ith 3
or
4 th
in w
ater
-bea
ring
sa
nd la
yers
; ca
sing
pe
rfor
ated
fro
m 1
20
to 1
40 ft
; C
p.
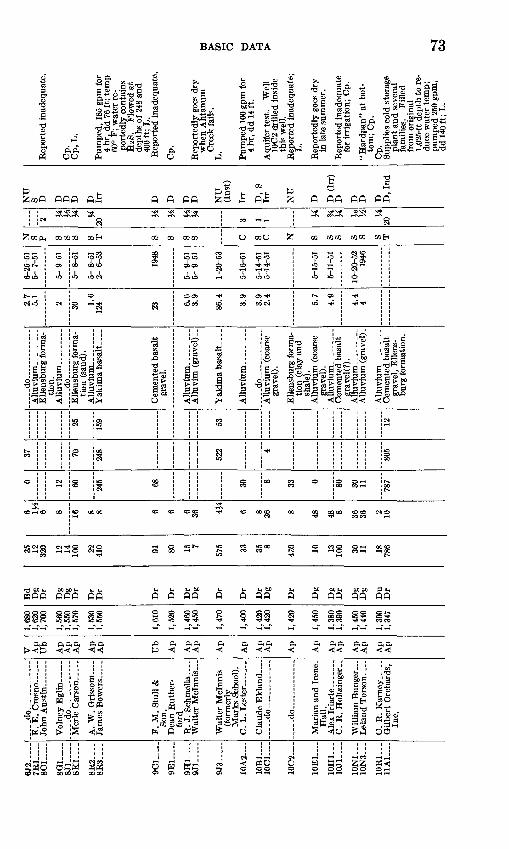
6J2
7R1
8C1 _
_
8G1 .
....
8J1
8K
1..
..
8R
2....
8R
3-.
..
901 .....
9E
1 .
_
9H
1-.
..9J
1
9J3-
10A
2-
10B
1-
10C
1
1002
10
E1 .
10H
1
10J1
10N
1...
10N
3-.
10
R1..
.11A
1 _
.d
o
E.
E.
Oro
sno ..
....
John
Aus
tin ..
....
.
Vol
ney
Egli
n
__
do.
- _
......
Mer
le C
arso
n...
A.
W.
Qri
ssom
....
Jam
es B
ower
s ___
__
F.
M.
Stu
ll &
Son
.D
ean
Rut
her
ford
R.
J. S
chm
ella
--
Wal
ter
Mcl
nnis
_
Wal
ter
Mcl
nnis
(for
mer
lyM
arks
Sch
ool)
.C
. L
. L
este
r. .
Cla
ude
Ekl
and-
_ _
do
.... .
.. ..
.
d
o
Mar
ian
and
Iren
e .
Hal
l.A
lex
Iria
rte.
. ___
__C
. R
. H
oltz
inge
r..
Wil
liam
Hun
ger _
L
elan
d T
orso
n. _
C.
R.
Kar
ney __
Gil
bert
Orc
hard
s,In
c.
V Ap
Ub
Ap
Ap
Ap
Ap
Ap
Ub
Ap
Ap
Ap
Ap
Ap
AP
A rk
A
P
Ar»
A
P
Ap
Ap
Ap
AP
A
p
Ap
Ap
1,68
01,
620
1,70
0
1,56
01,
550
1,57
0
1,53
01,
550
1,61
0
1,52
0
1,46
01,
450
1,47
0
1,40
0
1,42
01,
420
1,42
0
1,45
0
1,38
01,
390
1,45
01,
440
1,39
01,
347
Bd
Dg
Dr
Dg
Dg
Dr
Dr
Dr
Dr
Dr
Dr
Dg
Dr
Dr
Dr
Dg
Dr
Dg
Dg
Dr
Dg
Dg
Dn
Dr
35 12 320 12 14 100 22 410 91 80 15 7
575 33 35 8
470 10 13 100 30 11 18 786
6 1*_
6 8 16 8 8 6 6 6 36 VA 8 36 48 48 8 36 36 2 10
0 12 60 245 68 sn 8 33 0 80 30 11 787
37
70 248
522 4
805
25 159 53 12
do
___
Ell
ensb
urg
form
ati
on.
All
uviu
m. _
_ . _
_ _
_ d
o .. _
__
_E
llen
sbur
g fo
rma
ti
on (
sand
).
Yak
ima
basa
lt- _
Cem
ente
d ba
salt
grav
el.
All
uv
ium
.-.-
. ...
d
o
grav
el).
tion
(cl
ay a
nd
shal
e).
grav
el).
grav
el(?
).
Cem
ente
d ba
salt
grav
el,
Ell
ens
bu
rg f
orm
atio
n.
2.7
5.1
2 30 1.6
124 23 6.
63.
9
86.4
3.9
3.9
2.4
5.7
4.9
4.4
4
6-25
-51
5- 7
-51
5- 9
-51
5- 8
-51
5- 8
-51
2- 6
-53
1948
5- 9
-51
5-9-
51
1-20
-53
5-16
-51
5-14
-51
5-14
-51
5-15
-51
5-11
-51
10-2
0-52
1946
N S P S S 8 S T S S S S n s n N S S s s s s T
2 W
Vi y* y*20
% M VA % 3 1 1
M % M to % W20
NU
S D D
D D
D Irr
D D D D NU
(Ins
t)
Irr
D,
SIr
r
NU
D D (
InD D D D D
, In
<
Rep
orte
d in
adeq
uate
.
Op.
C
p, L
.
Pum
ped,
185
gpm
for
4
hr,
dd 7
6 ft
; te
mp
60°
F;
wat
er r
e
port
edly
con
tain
s H
zS.
Flo
wed
at
dept
hs o
f 24
8 an
d 40
0 ft
; L
.R
epor
ted
inad
equa
te.
Cp.
Rep
orte
dly
goes
dry
w
hen
Ah
tan
um
C
reek
fai
ls.
L.
Pum
ped
100
gpm
for
4
hr,
dd 1
4 ft
.
Aqu
ifer
tes
t.
Wel
l 10
C2
dril
led
insi
de
this
wel
l.R
epor
ted
inad
equa
te;
L.
Rep
orte
dly
goes
dry
in
lat
e su
mm
er.
Rep
orte
d in
adeq
uate
fo
r ir
riga
tion
; C
p.
"Har
dpan
" at
bot
to
m;
Cp.
Cp.
Sup
plie
s co
ld s
tora
ge
pla
nt
and s
ever
al
fam
ilie
s.
Fil
led
from
ori
gina
l 1,
025-
ft de
pth
to r
e
duce
wat
er t
emp;
pu
mpe
d 25
0 gp
m,
dd!4
0ft
;L.
CO

TAB
LE 4
. R
ecor
ds o
f re
pres
enta
tive
wel
ls i
n A
htan
um V
alle
y,
Yak
ima
Cou
nty,
Was
h. C
onti
nued
<
!
Wel
lO
wne
r or
Ten
ant
Topography
Altitude
of
land- surfac
e datum
(feet)
Type
of
well1 o
Diameter of
well (inche
s)
Depth of
casing (fee
t/
Wat
er-b
eari
ng z
one(
s)
P. o o i? g-g
P
"
Thickness (feet
)Fo
rmat
ion
and
Mat
eria
l
Wat
er le
vel
Depth
(feet below
land-
surface datum
)Date
meas
ured
Pum
p
P.
Horsepower
Use
of
water
0
H
Rem
arks
2
O
T.
12 N
., R
. 17
E. C
onti
nued
§ t
11A
8--
11A
9--
11
B2--
11C
1 ....
11
D1
...
11
D4
...
11M
1 ...
11
N2
...
12C
1 .
1
2D
8--
12H
3~~r
r
12K
1...
Scho
ol D
istr
ict
128.
..d
o ..... .
W.
H.
Neu
mis
e-
ter.
S
hirl
ey W
ard--
. .
Man
uel
MeC
ully
.
Ern
est
Bit
z.. .
....
Shi
rley
War
d ......
Phi
llip
Meyer
H
enry
Din
zl _
_
Oti
s G
oode
__
_ .
H.
E.
Bro
wn
ley-
Alle
n S
hock
ley-
.-.
E.
S. S
hock
ley.
...
Ap
Ap
Ap
Ap
Ap
Ap
Ap
Ap
Ap
Ap
Ap
Ap
Ap
Ap
Ap
1,33
0
1,33
0
1,36
0
1,37
0 1,
380
1,37
0
1,39
0
1,38
0 1,
360
1,30
0 1,
330
1,32
0 1,
280
1,29
0 1,
300
Dr
Dr
Dn
Dg
Dg
Dr
Dr
Dg
Dr
Dg
Dg
Dr
Dr
Dg
Dn
30
101 11 14
10 390 30 10
35 8 8 26
25 12
6
6-4 2 36
96 10 6 30 6
36-6
36
6 8 8 2
30 35 4
26 33±
3
4+
Allu
vium
. ....._
._
Cem
ente
d ba
salt
grav
el.
do. . _
_ ..
Allu
vium
(gr
avel
)
Elle
nsbu
rg fo
rma
tio
n (?
).
Cem
ent b
asal
t gr
avel
(gr
avel
an
d sa
nd).
Allu
vium
(gr
avel
) .
....-d
o..... ..
..A
lluvi
um, .
_._.
.._..
.. .d
o ..
..
__
_ d
o .....
9 25 4.5
1.2
10 4 4.4
4.3
3.1 .9
5.8
1.6
3 1.1
6-
-51
6-
-51
5-17
-51
5-16
-51
3- -
46
4-24
-53
5-16
-51
7-16
-58
5-25
-51
5-25
-51
5-28
-51
5-29
-51
5-29
-51
5-29
-51
T C S C T C S S C
C S N S R
0 5 1
20
2 1 3 H
Inst
NU
Irr
D
Irr
Irr
Irr
D NU
(D)
Irr
Irr
D NU
D
D
aSu
pplie
s 2
scho
ol
3
build
ings
. °
Rep
orte
d in
adeq
uate
^
for s
choo
l sup
ply.
<$ H
Ir
riga
tes
5H a
cres
J^
w
hen
surf
ace
wat
er
fails
. «>
O
rigi
nally
flow
ed b
ut
H
stop
ped
in 1
930;
re-
2
port
ed f
illed
fro
m
^.
800-
ft de
pth
in 1
946;
%
at
pre
sent
dep
th,
3
pum
ped
510
gpm
, dd
£5
42 f
t. S
Pu
mpe
d 50
gpm
for
8
. hr
, dd
2 ft;
L.
<*
Cp.
S
Pe
netr
ated
13±
ft o
f S
"h
ardp
an"
abov
e ^t
aq
uife
r. ~
Irri
gate
s J4
acr
e.
Irri
gate
s %
± a
cre.
S
T
emp
49°
F. C
p.
;>
Wel
l fill
ed b
y ca
ving
02
to
25
ft; o
rigi
nally
M
19
2 ft
dee
p; p
umpe
d
1800
± gp
m f
or 4
8 hr
, dd
32 ft
. C
p.
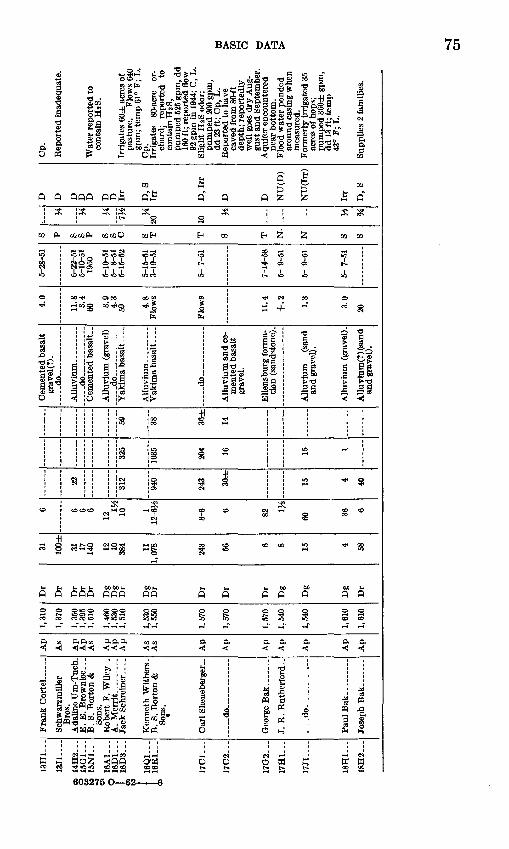
iqT
i
14H
2--.
15N
1...
16
D1
...
16D
3-,-
16Q
1---
16R
1.-
.
17
O1
17O
*>
17G
2
17H
1--.
17J1
-
18H
1-.-
Bro
s.
Ada
line
Um
-Tuc
h.
Sons
. R
ober
t F
. W
iley
_.
Jack
Seh
rein
er.-
-.
Ken
neth
Wit
hers
.B
. 8.
Bor
ton
&
Sons
.
.. d
o-.
. ...
d
o..... ..
...
An
As
Ap
Ap
As
An
Ap
Ap
As
As
Ap
An
An
An
An
Ap
An
1,31
0
1,37
0
1,35
0 1,
395
1,51
0
1,46
01,
530
1,51
0
1,53
01,
550
1,67
0
1,57
0
1,57
0
1,54
0
1,54
0
1,61
0
1,61
0
Dr
Dr
Dr
Dr
Dr
Dg
Dg
Dr
Dg
Dr
Dr
Dr
Dr
Dg
Dg
Dg
Dr
31 100±
31
17 140 12 10 384 11
1,07
8
OJQ 56 6 8 15 4
lift
6 6 6 6
121J
410
112
-6^
ft ft 6 82 1J
4
60 36 6
22 312
940
243 30
±
15 4 40
_
.
325
1035
204 16 15 1
59 38
36±
14
Cem
ente
d ba
salt
grav
el (?
).
__
do .. _
__
All
uviu
m. .
___
____
.....d
o _
_ _
Cem
ente
d bas
alt.
.
. .
do.... ..
.
Yak
ima
basa
lt- ...
Yak
ima
bas
alt.
._.
__
do _
All
uviu
m a
nd
ce
men
ted
basa
lt
grav
el.
Ell
ensb
urg
form
ati
on (
sand
ston
e).
All
uviu
m
(san
dan
d g
rave
l).
All
uviu
m (
grav
el).
and
gra
vel)
.
4.0
11.8
3.
460 3.
94.
359 4.
8F
low
s
11.4
+.2 1.3
3.0
20
5-28
-51
6-22
-51
5-10
-51
1950
5-10
-51
5- 8
-51
5-15
-52
5-16
-51
3-19
-51
5- 7
-51
7-14
-58
5- 9
-51
5- 9
-51
5- 7
-51
S P S S P S S c S T
T S T N-
N S S
X"w
M 7H
M20
10
M V* H
D D D
D D D D Irr
D,
SIr
r
D,
Irr
D D NU
(D)
NU
(Irr
)
Irr
D,
S
Cp.
Wat
er r
epor
ted
toco
ntai
n H
zS.
Irri
gate
s 60
± a
cres
of
past
ure.
Fl
ows
640
gpm
; te
mp
61°
F; L
. C
p.Ir
riga
tes
80-a
cre
or
char
d;
repo
rted
to
co
ntai
n H
zS,
pum
ped
525
gpm
, dd
160
ft; r
epor
ted
flow
92
gpm
in
1944
; C
, L
.
pum
ped
200
gpm
, dd
23
ft;
Cp,
L.
a
cave
d fr
om 8
0-f t
00
de
pth;
rep
orte
dly
H
wel
l go
es d
ry A
ug-
gust
and
Sep
tem
ber.
M
near
bot
tom
. 1-3
arou
nd c
asin
g w
hen
mea
sure
d.
For
mer
ly i
rrig
ated
35
acre
s of
hop
s;
pum
ped
360±
gpm
, dd
13
ft;
tem
p 43
° F;
L.

(*} J3td Q M W <O § BO HOO
i ' i ' i r ' ' i ! i
5 f o , 1 f j" 1 ||
i if I ^t | |i Pi f5ff Pi P' ~ F ^B 1 i *?f£ ££ £ £ £ £ ££££££
i §H- t--
i i § I § i i§ ill0 00 0 0 0 0 0 00 000 B "SB n n B "" "" ^f B'lW
tj EStj co en o to o ooo ooeoo
?o >-> 001-' * ao * i-> M ^ ^ iS-^ tS^
CO
<Si
Cemented basaltgravel. Alluvium. __ ..
S «
r rr r Oi Cn
1-^ H^
w 00
en co
!*.. <! Oi i^ tOCO OS O Cn OO WO
H~
CO g
to o oo o os
H-
^§ g§ P^B X§X§P. P.B s ^ B p-
Ji <! <D Cn to >fk O to O) to Cn
M tO I-1 CO ~i os oo i ' **j n en en en co en h-* I-1 IO I-1 OH-1
^O^ ^ 2, O co
) en i O
s
o
Alluvium (silt) __ Alluvium (gravel). Alluvium _ .. _ . __ do_- _____
to o os
n en 5<
J3 OJCDtd
! »i0 SO 0 3* ^ 0 ^ 0^ 000
p. "_ H cj w dq §
SD t±¥3 fi B* CT 03 pf ** * i * w® HO^SS'O^S3 ».rt- rt-
isiili ^pn n i Hljlj i i| 1J I 2 (2 1?" ' S 8= 2. ° oj "M S.? ̂ S " §
5. »> S B S °C: Pco^ »<S S, »ST B P KgS ogfi ^
H
b
CO
K
Io
ITopography
Altitude of land- surface datum (feet)
Type of well
Depth of well (feet)
Diameter of well (inches)
Depth of casing (feet)
Depth to top (feet)
Thickness (feet)
Formation and Material
Depth (feet below land- surface datum)
Date meas ured
Type
Horsepower
1
f
I
<
1
Use of water
Remarks
h
> tJ
& 4
K
«C
Cr
«s5 t* «Cr0
1̂.
1
1?*
§^.
&
I
i
r 8r«<?
a
0s sC"1
2s ^
s
crt
o
HSVA1 'MONVJ,HV 'aJSUlOHD '92,

2L1-
. ...
2N1 .
2Q1 -.
SO
U
SE
S
3F1 .....
3H
1..._
3K4_
___
3M3 ..
..
4F
1.
4R
1.-
..6A
1 .
.
602.-
603 -
607
--.
5D1_
__-
6E
2--
.
6E
3-.
--5G
1..--
6
O2
.
5H1_
__.
5J1
...-
. 6J3
-
6M
1-
5M2.
...
5M3.
...
5M5_
...
Rile
y K
elly
. ...
...
L.
C.
Moo
rehe
ad
Roy
Pur
vian
ce ..
..
Har
old
Arm
st
rong
D
. F
. W
oern
er ..
..
R.
E.
Dav
is _
__
Her
man
Cen
ter .
..
Dav
id P
atti
son...
R.
B.
Shoe
mak
er.
J. H
. R
etti
g... .
Cla
ire
Van
Eat
on,
-....d
o .
.
-do.
.. .
Mau
rice
Ren
vill
e.
A.
J. M
owat
t__ _
Mrs
. Fl
ora
Rus
h..
H.
E.
And
erso
n.. .
Joel
Ric
hwin
e._ _
G.
E.
Stew
art _
_ ...
Geo
rge
Ash
baug
h.
Ben
jam
in W
agne
r.
Ap
Ap
An
AP
A
p
Ap
Ap
Ap
Ap
Ap
AP
A
n
Ap
Ap
Ar>
Ap
Ap
An
Ap
Ap
Ap
Ap
An
Ap
Ap
AP
Ap
1,05
0
1,06
0 1,
040
1,10
5 1,
100
1,10
0
1,07
01,
080
1,10
0
1,13
0
1,10
0 1,
180
1,19
0
1,19
0
1,19
0
1,21
0
1,20
5
1,20
01,
190
1,19
0
1,18
0
1,17
0 1,
165
1,21
0
1,20
5 1,
210
1,21
0
Dg
Dn
D
r
Dg
D
n
Dg
Dn
Dg
Dg
Dg
Dn
D
g
Dg
Dr
DR
Dn
Dg
Dr
Dn
D
g
Dn
Dg
Dr
Dg
Dg
D
g
Dg
15 13 41
11 13 g 18 9 15 12 27 11
13 285 15 20 17 27 10 20 18 280 16 9 15 14
48 1H 8 16 1J4
on 1J
448 48±
36 2 48
24 8 14 36 6 1J4
30 154
30 8 79 36 72 AQ
15 41 12 27 12 205 18 203
-
3 3 17 275 6 7
9 12 g 5 10+
15+
Allu
vium
(si
lt?).
--
Allu
viu
m (?
)--.
.
-do .
-d
o . ..
.- d
o
and
sand
).
All
uviu
m (
grav
el
and
sand
).
(gra
vel?
)
grav
el.
grav
el (?
).
and
grav
el).
__
___ d
o.-
--. .
and
grav
el) .
Elle
nsbu
rg f
orm
a
tion
(san
d).
. .d
o--
----
and
grav
el).
6 8.0
5.4
5.5
4.7
5.8
5.2
5.9
5 9
3.8
4.8
4.5
6.8
9 4
7.0
8.4
4 7.5
21
Flo
oded
7.1
5.6
5-30
-52
7-26
-51
7-27
-51
7-18
-51
7-18
-51
7-18
-51
7-26
-51
7-20
-51
7-18
-51
7-14
-51
7-18
-51
7-20
-51
7- g
-51
7- 9
-51
7- 9
-51
7- 9
-51
9-26
-51
2- 3
-53
7-11
-51
7-12
-51
7-12
-51
C s s s s s s C N C s N C N N S T C S T S T T C C C
754
__ V
i
J4 %
~2~~ 1 3 H 2 1 H 2 Vi
3 3 \y> i "
i
Irr,
S
D D.I
nd
NU
(D)
S Irr
D Irr
NU
(Irr
)Ir
r
D Irr
Irr
NU
(Ir
r)
NU
(Ir
r)
D Irr
D,
SD Ir
r
D,
S
Irr
Irr
Irr
Irr
Irr
Irr
"Soil
" to
bo
tto
m;
pu
mp
ed 2
00 g
pm
for
4 h
r, d
d
6 ft
; pe
rfo
rate
d e
ver
y 1
.5 f
t to
bott
om
.
Sup
plie
s h
om
e an
dd
airy
.
Rep
ort
ed i
nad
equat
e;so
il t
o 6
ft,
grav
el t
o9ft
.
Pum
ped
50 g
pm f
or4
hr,
dd 2
ft.
Cav
ing
badl
y.
Aqu
ifer
tes
t.
Pum
ped
100
gpm
for
4 hr
, dd
8 f
t; re
port
edse
ldom
use
d.
Dri
lled
insi
de w
ell
5C7.
C
emen
ted
grav
el t
o 28
5 ft
.R
epor
ted
inad
equa
te
for
irri
gatio
n.W
ell 7
C3
drill
ed i
nsid
eth
is w
ell.
Pum
ped
200
gpm
for
4hr
, dd
2 f
t.
Cp.
Soil
to 3
ft;
pum
ped
250
gpm
, dd
2 f
t; C
.P
umpe
d 16
gpm
, dd
"sm
all.
"A
quif
er
test
; C
, L
.B
aile
d 50
gpm
; L
.
Soil
to 6
ft; p
umpe
d 25
0 gp
m fo
r 4 h
r, d
d 14
ft.
Yie
ld le
ss t
han
go g
pm.
Rep
orte
d dd
0.5
ft.
Soil
to 6
ft,
"har
dpan
"to
7 f
t.
w CD O |i-3 <]
~J

O5O5 OS OS O5 OS
SS S^ P3 -
J. R. Pittman _____ ,Riley Tyler _ _ _ Ernest Estes J. W. Mudd... _ W. G. Campbell.. Mrs. Lillian
££££££to to ' to to to to (^ Ol Cj« OO H^ JS*
dd dd d d Jq QTq 0q P QTq OTQ
O5 O5td O f bO
O5 O5 O5 O5 O5 Ol
^ S bO ^ ^ S
« | - 22 ^ ?w 5 S<? hj^ P 51 1-3 n
s -Sp! ill! Cfl J3 CD i *£T 03-;! p O oj J |
£ £
I 1
> > > > d x
§ i i i g 1
d Odd dd dd orq OTQ orq orq rrqorq +1+1
COO fcO-^J l fcO
S£ S ife S£ S£ O O 00 bO O O
« s
f! *COI O5 .H-!
do---. _- __ do---.. _._.._. Alluvium.- __ . Alluvium (gravel,
loose). Alluvium.- do-.-.
OS W OS >K to
O5O I-1 & Q
XS S S £_j{Q CQCQ 1-3 i-3
Ol Oi
goo OJ
M
-§ §
n- H- CD S 5 cS
W I-1 hK O5 00 00 O5 O5
= - . 8 .
f<I CD-1- +
> -^_ § _ ° __
i S" 3^ 3 § 4| B 3 B 2*5 ^. 5. »<2 »<5&^
i i^l ^ilp' m^ g o" g rjL'S'
1 &EL & £.' p.
CO tO
O5 W 00 ~J bO
H-
f V "T* r ii i f f f f " i ^ Ol CJ1 Ol CJi Cn *» CJi
CQ "-.Si CQCQCQ Q CQ «H gj
~ £* M 1 * " | *** ~ £ "I
§S STST 5|§_» s? s! o ffd ds: HH " d » d
CQC1 hj hj "flCQQ CQCQ hjCQ
IT TO' Ef H w a SI? » B § §"2 »2c:M2i5*''c;
«!! p p 9«rl r sgSll ^i-8-a?Ii *11! Hi_H P "" S1 ^'coS1 5 ¥» iwSg M ^ >-l CO >-t O P- I ct-
T. 12 N., R. IS E. Continued
1
O
»S I
Topography
Altitude of land- surface datum (feet)
Type of well
Depth of well (feet)
Diameter of well (inches)
Depth of casing (feet)
Depth to top (feet)
Thickness (feet)
Formation and Material
Depth (feet below land- surface datum)
Date meas ured
Type
Horsepower
Water-bearing zone(s)
Water level
c
Use of water
Remarks
h > 6. \f
h
(r
c<sc
c o cc e
«
§
I
O «
i? ?s»
i<c
h
«
?
{C"N-
C<n P
HONVXHV '

6R2.
_.
6R
3-.
..
7A1
7B
2-
7E
1_
.
7J1
7K
1_
_-
7M
1....
7Q
2
8A
1 .
_
8B
1_
.
Q"T
\O
8G
1--
-.
8J1
-
8K
1....
8N
1..
._
9L
1..
.....d
o......
Fre
d X
. S
avag
e.
Gen
e W
oodc
ock ...
Mrs
. M
ary
Rny
der.
A.
W.
Knig
ht.
....
H.
B.
Fai
rban
ks ..
Mrs
. T
ony
Cou
pal.
Ver
non
Mon
dor .
..
Car
rel
Mort
on....
....
.do..
..
.....
P.
J. V
etsc
h
_
Will
iam
Ada
m ..
..
Wal
ter
R. R
eady
..
Ap
Ap
Ap
Ap
Ap
Ap
Fp
Ap
Ap
Ap
Ap
Ap
Ap
Ap
Ap
Ap
Ap
As
1,23
0
1,22
5
1,22
5
1,24
0 1,
260
1 26
0
1,23
0
1,24
0
1,26
0
1,26
0 1,
180
1,18
0
1,21
01,
200
1,20
01,
210
1,27
0
1,21
0
Dg
Dr
Dg
Dg
Dg
Dr
Dr
Dg
Dg
Dg
Dr
Dr
grg
Dg
Dr
Dg
Dr
12 21 14 15
12
30 362 15 16 20
100
635 17
10
3 38 85 60 49
36 3 36 37
30 6
8-6 72 36 60
10 12 48
6 5 6 36 6
....
do
- _--
_--
_
Allu
vium
(gr
avel
) .
All
uv
ium
....
.....
....do... .
.. ..
. ...
.A
lluvi
um (
grav
el) .
Elle
nsbu
rg f
orm
a
tion
(san
d).
Allu
vium
(gr
avel
) .
.-.d
o..
.. ..
....
...
....
do
... ..
. ...
.E
llens
burg
form
a
tion
(san
d).
... .
do
....
.. .
.. .
All
uviu
m.. __ ..
.
tion
(san
d).
Allu
vium
(?)_
-. _
tion
(san
d).
Cem
ente
d ba
salt
grav
el (?
) (s
and
and
grav
el).
7.5
7.9
4.9
4.4
2.6 .3 6.9
6.5
8.4
4.3
12 8.0
8.6
22.2
20
7-11
-51
7-11
-51
7-11
-51
6- 2
-51
6- 2
-51
5-15
-51
6- 1
-51
6- 2
-51
6- 1
-51
7-13
-51
7-11
-51
7-18
-51
7-12
-51
10-
-50
0 S R C R R S T C N 0 J T R R R R P J
1 H
H 3 W W W
10 5 1 5 W V>.
¥>,
\\ M
D,
Irr
D Irr
D Irr
D
Irr
Irr
NU
(Ir
r)
Irr
D
Irr
D D Irr
D NU
(D)
D
Pum
ping
whe
n m
eas
ured
.
pene
trat
ed 2
"har
d-
pan
" la
yers
abo
ve
aqui
fer.
Ir
riga
tes
12 a
cres
of
past
ure
and
7 ac
res
of a
lfal
fa.
Irri
gate
s 1
acre
.R
oil
to 3
}^ f
t, g
rave
l to
23l
/2 f
t, c
emen
ted
grav
el t
o 27
± f
t.
Irri
gate
s 40
acr
es
duri
ng d
ry s
um
mer
s; m
ay f
low
oc
casi
onal
ly;
pum
ped
280
gpm
for
se
vera
l ho
urs,
dd
110
ft;
cem
ente
d gr
avel
to
340
ft.
W
Ori
gina
lly
20 f
t de
ep;
>
soil
to 1
0 ft
; pu
mps
GO
12
0± g
pm;
tem
p 52
° H
F
; C
p.
"
4+
hr,
dd
15 f
t; s
oil
>
to 6
ft.
i-3
>
Pum
ped
85 g
pm,
dd 2
7 ft
;L.
Irri
gate
s 30
acr
es o
fnu
rser
y an
d pa
stur
e;
pum
ped
300±
gpm
, dd
43±
ft;
Cp,
L.
Pen
etra
ted
sand
and
1or
2 l
ayer
s of
"h
ardpan
" fo
r en
tire
de
pth.
Wat
er r
epor
ted
poll
uted
. T
emp
61°
F;
Cp.

TAB
LE 4
. R
ecor
ds o
f re
pres
enta
tive
wel
ls i
n A
htan
um V
alle
y, Y
akim
a C
ount
y, W
ash.
C
onti
nued
00
Wel
lO
wne
r or
Ten
ant
Topography
Altitude of
land- surfa
ce datum (feet
)
"3 o EH
Depth of
well (fee
t)
Diameter
of
well (inch
es)
ho .s "3 5? Is
Wat
er-b
eari
ng z
one(
s)
Depth
to
top (feet
)Thicknes
s (feet)
Form
atio
n an
d M
ater
ial
Wat
er l
evel
Depth
(feet below
land-
surface datum
)Dat
e meas
ured
Pum
p
a >> EH
Horsepower
Use
of
water0 W
Rem
arks
2 O
O $
T.
12 N
., R
. 18
E. C
onti
nued
§ i
10D
1__-
10D
2_._
10H
1.-
-
11D
1--
-
11
E1
_
11E
2 __
HJl
-__
_
12
C1
-
12E
1 _ _
12K
1_._
Axe
l E
rick
son __
_
_do .
____
____
_
Mas
ters
on
Pah
osta
&
Parc
hese
W
ollo
ack.
R
. L
. M
cDou
gal,
Sr.
S. H
. Sc
hrei
ner _
_
Fre
d W
estb
urg _
_
A.
W.
Sapp
____
___
Har
ry Q
imm
aka-
-
Thu
rman
S
chut
tle.
W
ade
Lan
gell _
_
As
As
As
Ap
As
As
As
Ap
As
As
1,15
0
1,15
0
1,20
0
1,10
0
1,17
0
1,18
5
1,19
0
1,11
0
1,10
5
1,14
0
Dr
Dg
Dr
Dg
Dr
Dr
Dg,
Dr
Dr
Dr
Dr
300 24
100 17
213
183
127
245 72
225
8 96 6 6 5 6 6 8 6 5
68 151
165 80 45 55
220±
205
180
245 60
8 3+ 8+
Elle
nsbu
rg f
orm
a
tion
(san
dy
clay
).
Elle
nsbu
rg f
orm
a
tion
(san
d an
d gr
avel
).
Elle
nsbu
rg f
orm
a
tion
(san
d).
Cem
ente
d ba
salt
gr
avel
(?) .
Elle
nsbu
rg f
orm
a
tion
(san
d).
Elle
nsbu
rg f
orm
a
tion
(san
d).
Elle
nsbu
rg
form
atio
n (?
).
15.9
13.8
65.6
10.6
85 105 66
.6
25
7-18
-51
7-18
-51
7-20
-51
7-27
-51
9- 9
-46
7-25
-52
7-31
-51
5-
-50
T C
P P T J T S P
10
10
y* 5 %
3 Y2 \%
Irr
NU
(I
rr)
NU
(D
)
D,
Ind
D,
Irr
D
D Irr
D,
S
D
3
Cem
ente
d gr
avel
2
ab
ove
aqui
fer;
°
casi
ng p
erfo
rate
d ^
8-68
ft
. <j §
W
Jt
i
Supp
lies
2 ho
mes
and
H
da
iry.
H
A
t 12
7-ft
dept
h w
ater
^
leve
l 85
ft, p
umpe
d *-*
36
gpm
, dd
35
ft;
H
supp
lies
3 fa
mili
es
£5
and
irri
gate
s 8
acre
s PI
of
orc
hard
; C
, L
. . 1
Dug
to 6
0 ft
. T
op o
f L|
"c
emen
t ro
ck"
M
laye
r at
60
ft.
^
Soil
to 1
5 ft
, ce
men
ted
~ gr
avel
to 2
45 f
t. P
umpe
d 12
0 gp
m
5
for
1 hr
, dd
15
ft,
>!
"ful
l re
cove
ry"
in
oc
5 se
c.
hj
Cp.
P

17
C1
-
18D
1.-
-
As
Ap
1,28
0
1,30
0
Dr
Dr
60
28
4 6
6560±
5+
Elle
nsbu
rg f
orm
a
tion
(san
dsto
ne).
Cem
ente
d ba
salt
gr
avel
(?).
47.3
9.3
7-13
-51
5-28
-51
J P
%D
, S
D
Ori
gina
lly 6
5 ft
dee
p;
soil
to 8
ft,
sand
st
one
to 6
5 ft
; re
port
edly
dri
lled
in 1
day
. C
p.
T.
12 N
., R
. 19
E.
5E1_
___.
5E
2_
_
5F
1_
_
5F
2_
5M1_
_
5M2.
_
5N
1._
._
6A
1 _
La
Cas
a M
ote
l.. _
_
Sta
te o
f W
ash
in
gto
n,
Dep
t.
of H
igh
way
s.
__ d
o.... ...
... ..
.
Cit
y o
f U
nio
n
Gap
.
- d
o- ... .....
Cit
y o
f U
nio
n
Gap
.
N.
C.
Ro
ot.
.. _
_ .
Ap
Ap
Ap
Ap
Ap
Ap
Ap
Ap
980
980
980
980
980
980
975
990
Dg
Dr
Dr
Dr
Dr
Dr
Dr
Dg
8 68 26 75
215
217
370 7
36 6 6 6
12-1
0
12-1
0 12 3
68 26 75
215
198
370 9
187
174
Allu
vium
(s
and
and
grav
el).
A
lluvi
um (
grav
el).
-..-
do......... .
Cem
ente
d ba
salt
gr
avel
(?).
C
emen
ted
basa
lt
grav
el.
. d
o.
Cem
ente
d ba
salt
gr
avel
(sa
nd
and
grav
el) .
Allu
vium
(gr
avel
).
5.3 6 6 20
10 10
Flo
ws
4.2
6-22
-51
7- 3
-46
7-22
-49
7-10
-47
10-1
0-51
6-22
-51
S J P P T T T S
H
3 3 3 30 30 40 M
Irr
Ind
Irr
D
PS
PS PS
Irr
Irri
gate
s la
wn
and
flow
ers;
pum
ping
w
hen
mea
sure
d.
Supp
lies
refr
iger
a
tion
equi
pmen
t fo
r co
ld s
tora
ge
war
ehou
se;
pum
ped
104
gpm
for
1 h
r,
dd 1
1 ft
.
5C
asin
g pr
obab
ly
CO
perf
orat
ed.
S
Alt
erna
te p
umpi
ng
wit
h w
ell
5M2;
M
pu
mpe
d 45
0 gp
m,
^
dd 5
6 ft
; te
mp
J
57°
F; L
. f£
P
umpe
d 76
0 gp
m,
dd 8
0 ft
; ei
ther
w
ell
5M1
or 5
M2
yiel
ds a
ppro
xi
mat
ely
192,
000
gpd
in w
inte
r; L
.
Rep
orte
d fl
owin
g 62
gp
m,
1950
; re
po
rted
dd
72 f
t pu
mpi
ng 9
70 g
pm;
repo
rted
pH
7.3
, ha
rdne
ss 3
1 pp
m;
L.
Irri
gate
s la
wn
and
gard
en;
casi
ng
slot
ted
7-9
ft.
00

iito
(sandstone) (sandstone)
1t-
%£
Congdon Orchards.
o
ia -j
to
wo
gg
8
Ellensburg for mation (sand stone, blue).
8
T
5
51
At 873 ft flowed 13 gpm; at 1220 ft flowed 112 gpm; at 1252 ft flowed 300 gpm in 1912; flowed 50 gpm in
£J O
i
sf M p
* ®
5
Ti O
8O
I
toO Nt->
gcn
*5S-
i1££
i
CO
T
S
S5
!
S5d
for meat packin plant. Oil test well; flow intermittently;
£H W "N
Cl Oi Oi
s l!H
wj
HP
1p 1
> > > o wo
i §ia aa i -ip
CO 00
at oo h-
CO 00tO Cn
> 0>£* ? o £"
§ Ittl
fl ^*l< P3 CD ^^ ,
P ^!-to i-1
00 O O5
S J£0 ^co
M 5
P DWft ft
hd co
lltsf ill §If-i |3(I<'rB«D.g -^P-ft
!'»§" °-ao| g>« ||D 5| 8| ^1(D K T> ?^ ^-O
O3
M
S
oi
> a
ia>-j
S
,^
to
oH-
+>-
'*"£'p < ftp
T5
w1-1
r?wCO
SO
Soil to 7 ft, "hard- pan" to 10 ft;
B ?
Topography
Altitude of land- surface datum (feet)
Type of well
Depth of well (feet)
Diameter of well (inches)
Depth of casing
Depth to top (feet)
Thickness (feet)
Depth (feet below land- surface datum)
Date meas ured
Type
Horsepower
Use of water
w g !**
? o8- 5,
S3
^ S-
sI
£
O§!±13 C
KOKVJLHV (HajLVA\'jLQOIOaQ

29Q
1 .
QO
Tl
QO
T>
1
32
R1
-.-
33L
3 ....
33L
4. ..
.
33M
1 ...
33N
1-.-
oq
'M'O
34J1
-
34M
1 ...
35J1
____
35
R1..
.
36J1
- 36J2
.
36K
1...
36P2
__
Est
ate.
G.
E.
Ste
war
t __
.do....
.do..
...
-
Scho
ol.
R.
H.
Cro
w _
_ .
E.
J. C
raw
ford
.
Edg
ar A
. P
ears
on.
Ser
vice
.
ton
Fis
h H
atch
er
y.
R.
L.
Epper
son.-
.A
lHort
W
pll
np
r
Tho
mas
H.
Pol
lock
.
Ap
Ap
AP
Ap
Ap
Ap
Ap
Ap
Ap
Ap
Ap
Ap
Ap
Ap
Ap
Ap
Ap
Ap
Ap
Ap
Ap
1,19
0
1,19
0
1,22
01,
190
1,18
0
1,17
0
1,17
0
1,16
01,
170
1,18
0
1,18
0
1,18
0
1,10
0 1,
130
1,07
0
1 06
0
1,04
01,
030
1,04
0 1,
050
1,04
0
Dr
Dr
Dr
Dg
Dg
Dr
Dr
Dg
Dr
Dg
Dg
Dr
Dg
Dr
Dr
Dr
Dn
Dg
Dg
Dr
1267 25
7 w 9 22 17 137 34 on
613 15 17 10
17 69 65 87 28 16
15 45
6-3.
5 6 6 48
72-4 36 10 6 3 8 30 30 8 30 8 6 6 6 18
is 6
22 20 49.5
35 600
...... .
16
800
1,00
01,
050
119 5 3 3 4
±
55 12
18+
30+
17+
17+
ll"
8 4+
tion
.
tion
(?).
.... d
o..-.. ..
Ell
ensb
urg
form
ati
on (
sand
and
gr
avel
).
All
uviu
m (
grav
el)
and
grav
el).
tion
(sa
nd a
nd
grav
el).
A
lluv
ium
(gr
avel
).
....
do
..
All
uviu
m- _
.....
All
uviu
m (
sand
an
d gr
avel
).
grav
el(?
).
....do..--
All
uviu
m (
sand
and
grav
el).
All
uviu
m (
grav
el).
Cem
ente
d ba
salt
grav
el(?
) (s
and
and
grav
el).
+42 9.
94.
6
10 12.0
16 9.8
10 2 4.9
11.4
6.2
1.7
6.9
6.1
6.2
7.5
10.9 7.7
8- -
1898
8- 1
-51
8- 1
-51
8- 1
-51
4- 9
-48
8- 1
-51
12-
-45
12-
6-51
12-
6-51
8- 2
-51
12-
6-51
8- 2
-51
8- 3
-51
8- 3
-51
8- 2
-51
8- 2
-51
8- 2
-51
T S S s c T T S C c T C s c s J s c s s N
5 M» J4 H 2 3 7^ V>
,?: 5 3 1 V*
10
M» %?:
% y*
Irr
D,
Irr
D D D,
Irr
Irr
Irr
D Irr
last
In
to D
In
to D D PS
Irr
D NU
about
1,25
0 ft
; fl
owed
tem
p 80
°F.
Sup
plie
s 3
hom
es.
wel
l.
4nr,
dd 8
ft;
tem
p 54
°F;
Cp.
7 ft
: L
. P
umpe
d 30
0 gp
m f
or4
hr,
dd
80 f
t; L
.
Soil
to 5
ft.
Sup
plie
s sc
hool
and
hosp
ital
; pu
mpe
d bd
27
5 gp
m,
dd 8
ft;
L.
>
Pu
mp
ed 2
75 g
pm,
dd
0018
ft.
3
Pum
ped
120
gpm
for
4h
r, d
d ab
out
4 ft
. Q
>
P
umpe
d 45
0 gp
m f
or
t-g
3 h
r, d
d to
17
ft;
L.
>
Irri
gate
s la
rge
law
n.
Sup
plie
s 3
fam
ilie
s.P
umpi
ng c
onti
nu
ousl
y, d
d 3%
ft;
re
po
rted
ly t
his
wel
l an
d w
ell
13/1
9-31
M1
sup
ply
38
hom
es.
Rep
orte
d in
adeq
uate
for
irri
gati
on.
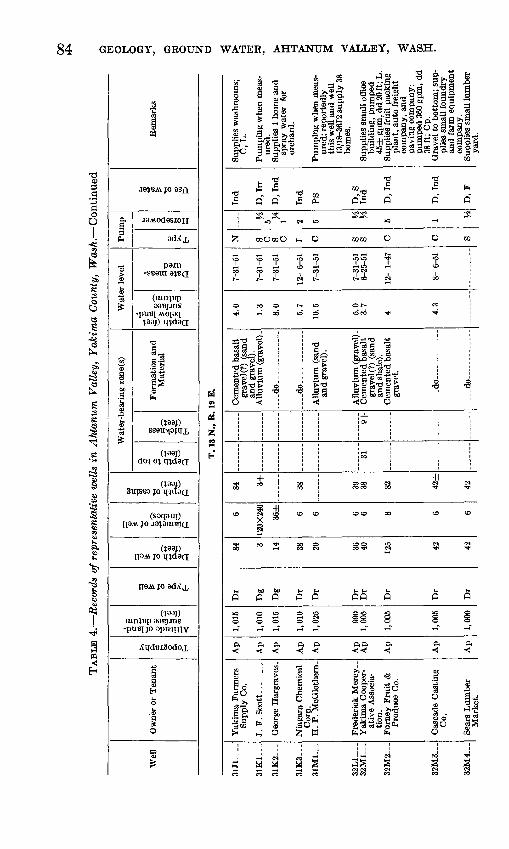
TAB
LE 4
. R
ecor
ds o
f re
pres
enta
tive
wel
ls i
n A
htan
um V
alle
y, Y
akim
a C
ount
y, W
ash
. C
onti
nued
O
Wel
lO
wne
r or
Ten
ant
Topography
Altitude
of
land- surf
ace datum (fee
t)
Type
of
well
Depth of
well (fee
t)
Diameter
of
well (inche
s)
Depth
of
casing (fee
t)
Wat
er-b
eari
ng z
one(
s)
Depth to
top
(feet)
Thickness (fee
t)F
orm
atio
n an
d
Mat
eria
l
Wat
er l
evel
Depth
(feet below
land
- surface datum
)Date
meas
ured
Pum
p
1Horsepow
erUse
of
wate
r
O
f
0
OR
emar
ks
~ O
O d i i ^
T.
13 N
., R
. 19
E.
°
31J1
-
31K
2.--
31K
3...
31M
1-.
32L
1....
32
M1_
_.
32M
2
32M
3...
32M
4
Yak
ima
Far
mer
s S
uppl
y C
o.
J. F
.Sco
tt..
.. .
..
Geo
rge
Har
grav
es.
Nia
gara
Che
mic
al
Cor
p.
H.
P.
McG
loth
ern.
Fre
deri
ck M
ercy
Y
akim
a C
oope
r
ativ
e A
ssoc
ia
tion
. F
orne
y F
ruit
&
Pro
duce
Co.
Cas
cade
Cas
ting
C
o.
Sear
s L
umbe
r M
arke
t.
Ap
Ap
Ap
Ap
Ap
Ap
Ap
Ap
Ap
Ap
1,01
5
1,01
0
1,01
5
1,01
0
1,02
5
990
1,00
5
1,00
5
1,00
5
1,00
0
Dr
Dg
Dg
Dr
Dr
Dr
Dr
Dr
Dr
Dr
84 3 14 38
20 36
40 125 42
42
6
120X
240
36±
6 6 6 6 8 6 6
84 3+
38 39
38 82 42
±
42
319+
Cem
ente
d ba
salt
gr
avel
(?)
(san
d an
d gr
avel
).
All
uviu
m (
grav
el).
.do.-
..
.
-do--. .
All
uviu
m (
sand
an
d gr
avel
).
All
uviu
m (
grav
el) .
C
emen
ted
basa
lt
grav
el(?
) (s
and
and
sha
le) .
C
emen
ted
basa
lt
grav
el.
..
do
..
.
d
o ..
.
4.0
1.3
8.0
5.7
10.5 5.0
3.7
4 4.3
7-31
-51
7-31
-51
7-31
-51
12-
6-51
7-31
-51
7-31
-51
6-25
-51
12-
1-47
8- 6
-51
N S C
S C J C S S C C S
H
5 y*
2 5 5 1 H
Ind
D,
Irr
D,
Ind
Ind
PS
D,
S In
d
D,
Ind
D,
Ind
D,
F
Sup
plie
s w
ashr
oom
s;
>
C,
L.
H
M
Pum
ping
whe
n m
eas-
JS
ur
ed.
Sup
plie
s 1
hom
e an
d
p*.
spra
y w
ater
fo
r H
or
char
d.
^
Pum
ping
whe
n m
eas-
H
ur
ed;
repo
rted
ly
h|3
this
wel
l an
d w
ell
«
13/1
8-36
J2 s
upply
38
hom
es.
^
Sup
plie
s sm
all
offi
ce
E
buil
ding
, pu
mpe
d M
45±
gpm
,dd20ft
;L.
|J
Sup
plie
s fr
uit
pack
ing
^T1
plan
t, a
uto
frei
ght
com
pany
, an
d
S
pavi
ng c
ompa
ny:
;>
pum
ped
360
gpm
, dd
oo
38
ft;
Cp.
hj
G
rave
l to
bot
tom
; su
p
plie
s sm
all
foun
dry
and
farm
equ
ipm
ent
com
pany
. S
uppl
ies
smal
l lum
ber
yard
.
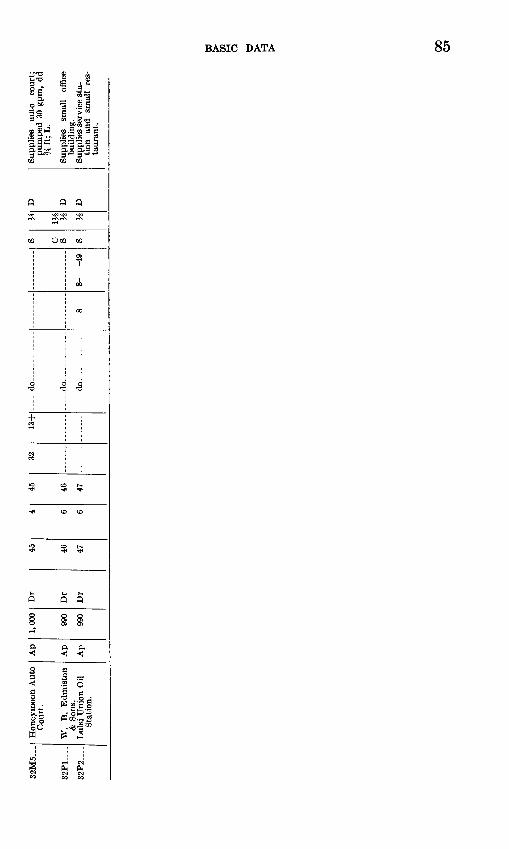
qoT
Vr^
qo
"pt
qo
po
Cou
rt.
& S
ons.
Stat
ion.
Ap
An
An
1 0
00
090
09
0
Dr
Dr
Dr
45 46 47
4 6 6
45 46 47
32114-__ d
o _
_ -
. -d
o .
.. ..
. ...
.
.. _
do
88-
-4
9
S c s 8
H m % M
D D D
pum
ped
30 g
pm,
dd
% f
t; L
.
build
ing.
tion
and
smal
l re
s
taur
ant.
00

86 GEOLOGY, GROUND WATER, AHTANUM VALLEY, WASH.
TABLE 5. Materials penetrated by representative wells in the Ahtanum Valley
Most of the information in this table was obtained from records made by well drillers at the time the wells were constructed, although some information was supplied from memory by drillers and well owners. A few of the wells were visited during construction, and samples were examined by the writer. The rec ords were edited for consistency of terminology and presentation and for conformance with the strati- graphic units described in the text but were not changed otherwise. For the purpose of clarity, the writer's interpretations have been added in parentheses after some of the drillers'designations.
MaterialsThick
ness(feet)
Depth(feet) Materials
Thickness(feet)
Depth(feet)
12/15-13R1
[William Mondor. About 1 mile southwest of Tampico. Altitude about 2,180 ft. Drilled by N. C. Jann-sen, 1939. Casing, 16-in to 50 ft]
Alluvium:
Gravel, cemented, and boul-
Basalt, hard _________
43
30
cq
*9
8287
140
Ellensburg formation (unamed
Yakima basalt:38
20
459
2349
178
198203248257280329
12/16-8H1
[Vernon Mondor. About 1 mile northeast of Tampico. Altitude about 2,250 ft. Drilled by N. C. Jannsen, 1926. Casing, 10-in to 200 ft, 8-in to 380 ft; no perforations]
Yakima basalt:300
20300320
Yakima basalt continuedRac«lt 60 380
12/16-13D1
[HerkeBros. About 6 miles west-southwest of Wiley. Altitude about 1,800 ft. Drilled by Oscar Boehler.Casing, 14-in to 27 ft]
Alluvium: Soil 17 17
1Q
Yakima basalt (Wenas? basalt
Basalt, black, water-bearing- .Ill
10 6
130140 146
12/16-15F1
[Arthur Hanses. About 2.5 miles east of Tampico. Altitude about 1,900 ft. Drilled by A. A. Durand, 1945. Casing, 10-in to 71 ft, 6-in to 278 ft]
Soil.
Basalt, broken, water-bearing.
"Rock" (basalt?) _ . _ ......Basalt, hard __________
5
1819
621
11OT
19
77
1531
5
23qc
4162 7081
174
270
285316
"Good water-bearing forma-
152555
114
6208
131249
19
331356411412426
432452460473485534535544

BASIC DATA 87TABLE 5. Materials penetrated by representative wells in the Ahtanum
Valley Continued
MaterialsThick
ness (feet)
Depth (feet) Materials
Thick ness (feet)
Depth(feet)
12/16-18B4
[Frank Mayfleld. Tamplco. Altitude about 2,116 ft. Drilled by N. C. Jannsen. Casing, 8-in.]
Alluvium:
Cemented basalt gravel:
9 41
10 33
9 50
60 93
Cemented basalt gravel Con.
Clay and sand ________
21 41 11 30
114 155 166 196
12/16-18C1
[Garrison and Hazen. About 0.5 mile west of Tampico. Altitude about 2,200 i't. Drilled by A. A. Durand, 1945. Casing, 14-in to 80 ft, 10-in to 250 ft, 7-in to 287 ft. Perforated from 165 ft to 287 ft]
Alluvium and cemented basalt gravel, undlflerentiated:
Rock (cemented basalt
Boulders and cemented ba-
Yakima basalt (Wenas? basalt member) :
17 3
318
16 13
7 20
30
17 20
2341
57 7077 97
127
Yakima basalt (Wenas? basalt member) Continued
Basalt Ellensburg formation (unnamed
member) :Clay.-...
Yakima basalt: Basalt, broken, water-bearing. Basalt, solid ______ .......
Basalt, broken, water-bearing.
10 23 29
21
11 15 27
5 19
137 160 189
210
221 236 263 268 287
12/16-18G1
[Frank A. Mondor. About 0.25 mile south of Tampico. Altitude about 2,107 It. Drilled by N. C. Jannsen, 1926. Casing, 12-in to 40 ft, perforated from 20 ft to 40 ft]
Alluvium:
Gravel, cemented, and "hard-
37
7420
81054
87
8
37
111131
139149203
211218
226
Cemented basalt gravel Con.
Clay... ....... . .-.. .
Clay..
83
106
146
97743
23423'24"25C26"27S37(37"38]384

88 GEOLOGY, GROUND WATER, AHTANUM VALLEY, WASH.
TABLE 5. Materials penetrated by representative wells in the Ahtanum Voile y Continued
MaterialsThick
ness (feet)
Depth(feet) Materials
Thickness(feet)
Depth(feet)
12/16-18K1
[HerkeBros. About 0.5 mile south of Tampico. Altitude about 2,110 ft. Drilled by A. A. Durand, 1946. Casing. 8-in to 55 ft, 6^1-in from 59 ft to 208 ft, 5-in from 170 to 315 ft; perforations from 162 ft to 164 ft, from 166 ft to 170 ft, from 200 ft to 204 ft, and from 208 ft to 315 ft]
Alluvium and cemented basalt gravel (?), undifferentiated:
Sand, brown, and black,
Shale......-.-.-.-...-......
OE
14179
1816
OO
725142434
OK
49667593
139164
202236
Yakima basalt (Wenas? basalt member) : Continued
"Rock," brown (basalt?). __10
14
237
225
81
95
249263
286293
295320328329
338343
12/17-1G2
[B. E. Snelling. About 0.5 mile west of Ahtanum. Altitude about 1,280 it. Drilled by F. Riebe & W. G. Ludwig. Casing, 6-in to 60 ft, 5-in to 200 ft]
Cemented basalt gravel and Ellensburg(?) formation undif-
ferentiated:
Clay.........................Sand.... ........... ......
2080
100
Cemented basalt gravel and Ellensburg(?) formation undif- ferentiated: Continued
3197200
12/17-5B1
[E. L. Lenington. About 3.5 miles west-northwest of Wiley, in Cotton wood Canyon. Altitude about 1,560 ft. Drilled by F. Riebe. Casing, 6-in to 77 ft]
Alluvium and cemented basalt gravel, undifferentiated:
38 38
Ellensburg formation: Clay, brown, pumiceous, __ . Sand.... ...... ......
122 10
16( 17(
12/17-6F2
[R. F. Morozzo. About 5 miles west of Wiley, in Cotton wood Canyon. Altitude about 1,680 ft. Drilled by Oscar Boehler, 1950. Casing, 6-in to 44 ft]
Ellensburg formation: Clay, blue, sandy.----. ...Sand.......................
302
109
30v>
159
Yakima basalt (Wenas? basalt
12/17-8K1
[Merle Carson. About 3.5 miles west of Wiley. Altitude about 1,570 feet. Drilled by N. C. Jamisen.Casing, 6-in to 60 ft]
Alluvium:
Ellensburg formation:5520
OA
7595
Yakima basalt:5 100
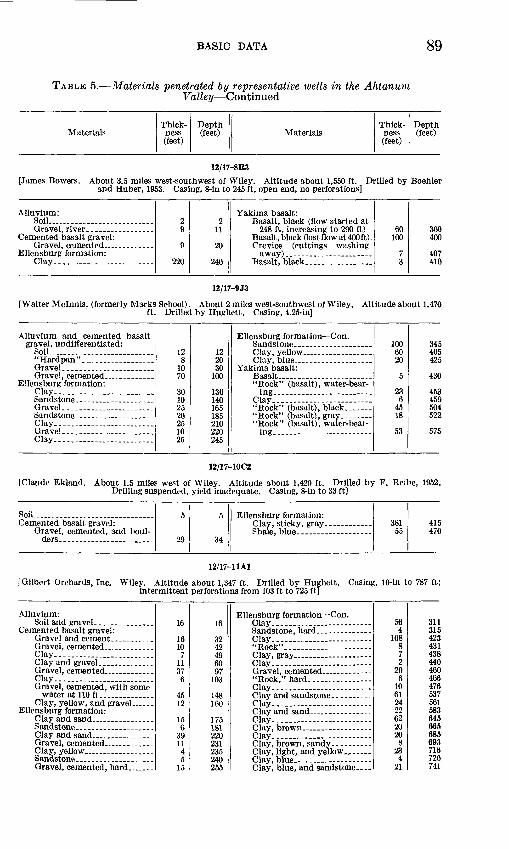
BASIC DATA 89
TABLE 5. Materials penetrated by representative wells in the Ahtanum Valley Continued
MaterialsThick
ness(feet)
Depth(feet) Materials
Thickness(feet)
Depth(feet)
12/17-8R3[James Bowers. About 3.5 miles west-southwest of Wiley. Altitude about 1,550 ft. Drilled by Boehler
and Huber, 1953. Casing, 8-in to 245 ft, open end, no perforations]
Alluvium: Soil............... .........
Cemented basalt gravel: Gravel, cemented __ ___ ..
Ellensburg formation:Clay.....-.. - .
29
9
220
211
20
240
Yakima basalt:
Basalt, black (lost flow at 400ft).60
100
73
300400
407410
12/17-9J3
[Walter Mclnnis, (formerly Marks School). About 2 miles west-southwest of Wiley. Altitude about 1,470 ft. Drilled by Hughett. Casing, 4.25-in]
Alluvium and cemented basalt
Soil.......... ..............
Ellensburg formation: Clay.........................
Clay........... ..............Gravel...-- __ ___ .. __ ..Clay.........................
128
70
30102520251025
1220Qn
100
1QA
140
ioc
210220245
Ellensburg formation Con.
"Dnealf-
"Rock" (basalt), water-bear-
Clay....... ...... ............
1006020
5
236
4518
53
345405425
430
453459504522
575
12/17-10C2
[Claude Ekland. About 1.5 miles west of Wiley. Altitude about 1,420 ft. Drilled by F. Reibe, 1952. Drilling suspended, yield inadequate. Casing, 8-in to 33 ft]
Soil ... 5
29
5
34
38155
415470
12/17-11A1
[Gilbert Orchards, Inc. Wiley. Altitude about 1,347 ft. Drilled by Hughett. Casing, 10-in to 787 ft; intermittent perforations from 103 ft to 725 ft]
Alluvium:
Clay....................
Clay................
Ellensburg formation:
Sandstone _____
Gravel, cemented, hard
16
1610
711Q7
AK
12
6QQ
45
15
16
to42AQ
6097
103
148160
175181220231235240255
Ellensburg formation Con. Clay.........................
Clay. ........................
Clay.. ..................... ..
Clay.........................
Clay.........................
Clay.. ................ .......
Clay.........................
Clav. blue, and sandstone __
564
108872
206
10612422622020
8234
21
311315423431438440460466476537561583645665685693716720741

90 GEOLOGY, GROUND WATER, AHTANUM VALLEY, WASH.
TABLE 5. Materials penetrated by representative wells in the Ahtanum Valley Continued
MaterialsThick
ness(feet)
Depth(feet) Materials
Thickness(feet)
Depth(feet)
12/17-11 Al Continued
Ellensburg formation Con.
Clay and sandstone, water-
1Q
2620
12
838
710
785OAK
817
858
869
Yakima basalt Continued
Shale, blue, and "rock,"
904
22
69
13633
959963985
9911,0001,0131,0191,0221,025
12/17-11D4
[Ernest Bitz. About 1 mile west of Wiley. Altitude about 1,390 ft. Drilled by J. E. White, 1953. Casing, 6-in to 30 ft. Perforated with 1 slot per ft for entire depth]
Soil. .................... ....... 4 422
42630
12/17-16D3
[Jack Schreiner. About 3 miles west-southwest of Wiley. Altitude about 1,510 ft. Drilled by Ralph Cassel, 1952. Casing, 10-in to 312 ft; unperforated]
Alluvium:
Ellensburg formation:oo
1058
32
42100
Ellensburg formation Con. Clay--
Yakima basalt:
79754625
4217
179254300325
367384
12/17-16R1
[B. S. Borton & Sons. About 3 miles southwest of Wiley. Altitude about 1,550 ft. Drilled by Durand & Son, 1944. Casing, 12-in to 183 ft, 8-in from 180 ft to 699 ft, 6W in from 744 ft to 940 ft]
Clay, brown (loess?) and soil.. _ Cemented basalt gravel:
Gravel, clay, and boulders _
Boulders and sand ______ .Sand.... -
Gravel and sand, cemented.
Gravel, coarse, boulders, and
Clay..... .............Clay, sand, gravel, and
boulders.. _____ ..
20
52 21
77
91
4162816
14
17
68
22
8
20
72 9398
105112
1 3°.
1 371 *\3
181197201215
000
3nn304
OOQ
337
Cemented basalt gravel Con.
Ellensburg formation:
Cl&v stick v brown
Clay-.-- - - -
Clay...- --------
Basalt, black, water-bearing Basalt, hard, black .
16
325
302010301515381771
3312111
4
2423
741
5
353
385390420440450480495510548565636639670691702706
730753760801 806

BASIC DATA 91
TABLE 5. Materials penetrated by representative wells in the Ahtanum Valley Continued
MaterialsThick
ness(feet)
Depth(feet) Materials
Thickness(feet)
Depth(feet)
12/17-16R1 Continued
Yakima basalt Continued
Basalt, "honeycomb" (vesic-
9
5342
6
42
3
11
10
815
820823C97
829836
842
848
851
862
872
Yakima basalt Continued
Basalt, black, water-bearing.
218
151919
62921
520
5 16
2153623
8C«
901916935954960989
1,0101,0151,0351,040 1,0561,0581,0591,0641,0671,0731,0751,078
12/17-17C1
[Carl Sheneberger. About 3.5 miles west-southwest of Wiley. Altitude about 1,573ft. Drilled by Boehler and Huber, 1948. Casing, 8-in to 166 ft, 6-in to 243 ft; perforated below 166 ft]
Alluvium: Soil .v^ucti&e g ctvtn____ ___________
Cemented basalt gravel: Gravel, cemented __ _-_. _ _
Ellensburg formation:Clay. ........................
11
14
92
5
30
122
Ellensburg formation Continued Clay, brown and yellow,
sticky..-.. __ - ---. - .-
Yakima basalt:
4823
11
48
170193
195243
12/17-17J1
[.T.R.Rutherford. About 3.5 miles southwest of Wiley. Altitude about 1,540 ft. Casing, 6-in to bottom]
Alluvium: Soil....--- ________________
8
Allu viu m C on tinue d Clay.-... -_ --- - 5 15
12/18-1M1[Yakima Farm Labor Camp. About 2 miles west of Union Gap. Altitude about 1,010 ft. Drilled by
Durand & Son, 1939. Casing, 10-in to 366 ft, 8-in from 366 ft to 555 ft; no perforations]
Alluvium: Soil . .
Gravel and clay, loose and
Gravel and clay, caving------
fift3275 O RV 7
61
196993
15 1220
3
67
12
3107
4655KO
7385
1051101 ^9
135
Cemented basalt gravel Con.
\ Clay, sandy, and gravel _ _ _
Clay, sandy, more gravel. ....
caving
528
52411
121013104 4
4
335
147175180204215
227237250260264 268
272
275310

92 GEOLOGY, GROUND WATER, AHTANUM VALLEY, WASH.
TABLE 5. Materials penetrated by representative wells in the Ahtanum Valley Continued
MaterialsThick
ness(feet)
Depth(feet) Materials
Thickness(feet)
Depth(feet)
12/18-1M1 Continued
Ellensburg formation Con.
1S
156211
4
513
7
1519
8
315333Q/tQ
410421425
430443450455470AGO
490
Ellensburg formation Con.
Sand, brown... _ -- ___
510155825
105
540
20
495505520525533535540550555
560600
620
12/I8-2E1
[LeRoy Sehreiner. About 3 miles west of Union Gap. Altitude about 1,080 ft. Cassel. Casing, 10-in to 86 ft, 8-in to 150 ft, and 6-in to 376 ft]
Drilled by Ralph
Alluvium: Soil
ferentiated:
Sand.-.----..--- _ ----------
1012
2380
510
1099
45125130140
Cemented basalt gravel and
Sand, gravel, and rocks, loose.
102580 404862
150175255 295343405
12/18-5J1
[Joel Richwine. About 1.7 miles east of Ahtanum. Altitude about 1,170 ft. Dug by owner, 1932.Casing, 30-in to 18 ft]
1S 13
171 18
12/18-5J3
[Oral Brown. About 5 miles west of Union Gap. Altitude about 1,165 ft. Drilled by Ralph Cassel, 1953.Casing, 8-in to 203 ft]
Soil
Clay...... ................
Clay..
Clay
10
764
10
1217
7
10
86on
100104116133137144
Clay...-
Gravel, cemented ..
4858
485
175
192197205253258
275280

BASIC DATA 93
TABLE 5. Materials penetrated by representative wells in the Ahtanum Valley Continued
MaterialsThick
ness(feet)
Depth(feet) Materials
Thickness(feet)
Depth(feet)
12/18-8A1
[Carrel Morton. About 2 miles southeast of Ahtanum. Altitude about 1,170 ft. Drilled by Joe Riebe,1943. Casing, 10-in to 20 ft]
Soil.... 12
878
12
2098
2 100
12/18-8B1
[Carrel Morton. About 1.7 miles southeast of Ahtanum. Altitude about 1,180 ft. Drilled by Joe Riebe,1937. Casing, 12-in to 22 ft]
Dirt.. - Cemented basalt gravel:
10±
20±
10±
30±Sand, argillaceous, yellow. ... 605± 63,
12/18-11E1
[S. II. Schreiner. About 3 miles west-southwest of Union Gap. Altitude about 1,170 ft. Drilled by Ralph Cassel, 1946, Casing, 5-in to 151 ft; unperforated]
Soil 10
100
45
10
110
1520158
170190205213
12/18-11E2
[Fred Westburg. About 3 miles west-southwest of Union Gap. Altitude about 1,186 ft. Drilled by W. G. Ludwig, 1952. Casing, 6-in to 165 ft; unperforated]
Soil.... ....... ......
Gravel and boulders, poorly
6
60 66
174
Basalt, black (boulders) -.. _33
3
177180
183
12/19-5M1
[City of Union Gap. Altitude about 930 ft. Drilled by A. A. Durand, 1936. Casing, 12-in to 80 ft, 10-in to 208 ft; perforated from 159 ft to 214 ft]
Alluvium:15
855
100
Cemented basalt gravel Con.701723
175192215
12/19-5M2
[City of Union Gap. Altitude about 980 ft. Drilled by A. A. Durand, 1936. Casing, 12-in to 83 ft, 10-in to 198 ft; perforated from 142 ft to 197 ft]
Soil
Clay .Gravel, cemented, caving __ Gravel, cemented, and boul-
4
. 46' 13
42
40
CA
6368
110
9311413
159190204217

94 GEOLOGY, GROUND WATER, AHTANUM VALLEY, WASH.
TABLE 5. Materials penetrated by representative wells in the Ahtanum Valley Continued
MaterialsThick
ness(feet)
Depth(feet) Materials
Thickness(feet)
Depth(feet)
12/19-5N1
[City of Union Gap. Altitude about 975 ft. Drilled by N. C. Jannsen, 1949. Casing, 12-in to 370 ft; perforated from 130 ft to 138 ft and from 182 ft to 361 ft]
Alluvium:
15
62893
91
27556467
Cemented basalt gravel Con.
Clay...-.- ----------
9
10520
1549
7682
187207361370
12/19-17C1
[Miocene Petroleum Co. About 1 mile south of the City of Union Gap. Altitude about 950 ft. Drilled by N. C. Jannsen, 1929. Casing, 12.5-in to 711 ft, 10-in to 1,045 ft; no perforations]
Alluvium:21 21
Yakima basalt:3,779 3,800
13/18-28L1
[Congdon Orchard. About 3 miles northeast of Ahtanum. Altitude about 1,160 ft. Drilled by N. C. Jannsen, 1912. Casing, 10.5-in to 284 ft, 8.25-in to 769 ft, 6.5-in to 1,026 ft, 5.25-in to 1,227 ft]
Alluvium:
Gravel and boulders, ce mented and sandstone _ ..
Sandstone and gravel, soft Mud, with boulders on one
92
22
2526CO
228
235
12
15102016
82 1124122915
5421
6
9
33
5884
1Q7
10A
210212247
32400 C
350360
one
409
491CftO
538KR7
582586eon
600601655676
682
Ellensburg formation Con.
Clay-.--- ---------
Clay, sticky, stiff _______
to 993 ft.. .. - -- -
Sandstone, hard, coarse, and blue shale in alternating layers
1,220ft--... - Sandstone, with 1 layer of
white sand, and 1 layer of
122938
2
910
5675
102
1095
14
9346
8131169
54350
27
32
694723761763
772782787793800805815817827836841855
948994
1,0021,0151,0261,0951,1001,1431,193
1,220
1,252

BASIC DATA 95
TABLE 5. Materials penetrated by representative wells in the Ahtanum Voile y Continued
MaterialsThick
ness(feet)
Depth(feet) Materials
Thickness(feet)
Depth(feet)
13/18-33L2
[Q. E. Stewart. About 2 miles east-northeast of Ahtanum. Altitude about 1,170 ft. Dug, 1945. Casing,36-in to 20 ft]
Alluvium: Dirt-- - . 4
549
A lluvium Con.11 21
13/18-33L3
[O. E. Stewart. About 2.5 miles northeast of Ahtanum. Altitude about 1,170 ft. Drilled by Fred Riebe, 1948. Casing, 10-in to 49.5 ft, perforated with torch from 10 ft to 49.5 ft]
Soil 4
203015
4
245469
302018
99119137
13/18-33M1
[Rainier State School. About 1 mile east-northeast of Ahtanum. Altitude about 1,180 ft. Drilled by Hughett. Casing, 8-in to 600 ft; perforated from 500 ft to 600 ft]
Alluvium: Soil - . . ...... ....Clay... ..
Clay-.-. ..... -
Clay...- _ -
23
19
90192420
2326
45loe
154178198
Ellensburg formation Con.
Clay... Sand. ____ ~Clay... r -
Clay...-. -
47132
14614847633
245377391452500547610613
13/18-34M1
. A. Pearson. About 2.5 miles east-northeast of Ahtanum. Altitude about 1,130ft. Dug, 194S. Casing,30-in to 18 ft]
Alluvium: Silt, fine .... ...... 5 5
78
Alluvium Continued10 18
13/19-31J1
[Yakima Farmers Supply Co. About 1 mile northwest of Union Gap. Altitude about 1,015 ft. Drilled by J. E. White, 1951. Casing, 6-in to 84 ft; perforated from 75 ft to 84 ft]
Alluvium:
Cemented basalt gravel (?) and Ellensburg formation, undiffer-
17
266
17
192531
Cemented basalt gravel(?) and
entiated Continued Sand, medium, water-bearing. 15
1917
2
46 6582
84

96 GEOLOGY, GROUND WATER, AHTANUM VALLEY, WASH.
TABLE 5. Materials penetrated by representative wells in the Ahtanum Valley Continued
MaterialsThick
ness(feet)
Depth(feet) Materials
Thickness(feet)
Depth(feet)
13/19-32M1
[Yakima Cooperative Association. About 1 mile north of Union Gap. Altitude about 1,010 ft. Drilled by J. E. White, 1951. Casing 6-in to 38 ft; unperforated]
Alluvium:
Cemented basalt gravel(?) and
entiated:26
17
1925
Cemented basalt gravel (?) and
entiated Continued
Sand and shale, water-bear-6
9
31
40
13/19-32M5
[Honeymoon Auto Court. About 1 mile north of Union Gap. Alt!tuae about 1,000ft. Drilled by Shook-man, 1942. Casing, 4-in to 15 ft]
Soil.
24
OK
31
113
3245
TABLE 6. Chemical analyses, in parts per million, of ground water in the AhtanumValley
[Analyses by U.S. Geological Survey]
Well.-
Silica (SiOj)______. ________Iron (Fe) 1 --..-----------.--Total iron (Fe)______ ______Manganese (Mn)
Magnesium (Mg) _Sodium (Na) _Potassium (K) .Bicarbonate (HC0 3)Sulfate (S04) - - _Chloride (Cl)______________Fluoride (F)_'______________Nitrate (N03) __________ __Dissolved solids
Noncarbonate hardness. Percent sodium.Specific conductance (mi-
cromhos at 25° C) _ _pH_____ __________________
12/1&- 13D1
8/30/51
Yakima basalt
54 .02 .06.00
16 9.7
10 1. 8
116 4.4 3.0
. 2 1. 6
158 80 0
21
1947.7
12/1&- 17J1
8/30/51
Uncon- solidatecl alluvium
47 . 11
.00 10 5.8 5.6 3.7
74 2.4
. 7
. 2 1.0
113 49 0
19
98 7.3
12/17- 16R1
4/18/52
Yakima basalt
38 .24.27.00
12 6.6 7.2 3. 1
85 4.4 1. 2
. 3
. 2 115 57 0
20
1367. 9
12/18- 5G2
8/29/51
Un con solidated alluvium
52 .03
.28 23 12 19 5.3
160 8.0
11 .2
1. 5 211 107
0 27
2857. 2
12/18- 5J1
8/29/51
Uncon- solidated alluvium
51 .02
.00 24 14 16 5.6
180 5. 1 2. 5 .3
1. 8 209 117
0 22
284 7.2
12/18- 11E1
8/30/51
Ellens- burg for mation
61.03
.00 30 16 9.6 3.2
133 29 18
.3 2. 7
235 141 32 13
315 7.3
13/19- 31J1
8/29/51
Ce mented gravel
39 .02
.00 34 11 12
4. 8 116 21 26
.3 6.0
211 130 35 16
320 7.3
In solution when soialyzed.

BASIC DATA 97
TABLE 7. Field analyses, in parts per million, of water from wells in the AhtanumValley '
Well
12/15-13R1___12/16-8N1____
9M1___.15M1___17D1___17K1___18K1___
12/17-1L1___.1P1____2N1____2Q1____2R2____5B1__._6Jl __8Jl_-__8K1___.9E1____10J1____10N3___10R1___11M1___12E1___12K1___13H1__.15N1___16Q1___17C1-..
12/18-1M1____5G1___.6F4____6G2_.__7K1____8B1____9L1____12E1___18D1._.
12/19-6E1____13/18-33L1___13/19-32M2___
Depth (feet)
32930
4320-12
343337Q
759
170140
14100
80100
111810261231
14011
243620
111515
6354972285022
125
Principal aquifer
BasaltCemented gray el (?) _ _ ___
_____do__ _____________________________BasaltGravel _____
_____do__ _-_-_-_-_-_-_-___-___________BasaltGravel and sand _ _Alluvium(?) __________ _ _____________Ellensburg(?) formation _
_____do___.__ _________________________
_-_-_do_-____________ _________________Alluvium _Sand_____- ___________________________
Alluvium. _ ____ do __ ____-__do__________________ __________________do_._____________________________Cemented gravel (?) _ _ _
Alluvium _ _Basalt _Sand _ _ _ _ _ _ _Alluvium ___
_____do__________________ __________________do_______ ________________________SandGravel and sand _ _Sand______- __________________________Cemented gravel(?)Sand _ __
Chloride
8488
1068
2412
610
88
20686686656
1420
88
1010
810
6102026181614
Hard ness (as CaCOs)
95105180
548555Q 1!
2659585
13574
135170607580
13590
1151101001251951201356082
112130120110202266240255235148103
Analyses approximate only; not made under laboratory control.


INDEX
Page Acknowledgments_...______________ 5Ahtanum Creek, drainage area...__........ 7,8
inflow of water..____________ 12,27-30 irrigation use......__..__.__ 12,13,30-31outflow of water__..._________ 28-30
Ahtanum-Moxee subbasin__________ 3,4,6,19, 22,23,25,37,39,62,63
Ahtanum Ridge.. 6, 7,14,15,16,17,19,22,23, 25,37,40 Ahtanum Ridge anticline - .__ 6,16,22,23,24 Ahtanum Valley, geologic history._........ 24-25
location. ______.,_ _..._....._._____________ 3physiography___ ______________ __. 6-7structure_..___________________ 22-24
Alluvium, ground water in.-.._____ 43-49,63 ground-water withdrawals_______ 56-58 lithology and occurrence___-_.---_---. 7,21-22 pumping tests on wells in ___________ 45-47quality of water in__-..._____________ 59-62water-level fluctuations_________ 49,50,51
Aquifers, properties-.----___--.__________ 31-32recharge___________ ________ 33-34
Artesian water, denned____.._._____ 33occurrence..__________ 36,39,40,43,53,55
Artesian well, flowing, defined,.. ______. 33
Bibliography. 66
Canal system________________ 8, 28,30-31 Cascade Mountains..________ 6,8,11,18,24,25 Cemented basalt gravel, age__________ 21
geologic history..______. __......._ 25ground water in. ___________ 42-43,54,55 ground-water withdrawals___ 42,43,54,55,58 lithology and occurrence______________ 19-21quality of water in__._.__--.__.._ 59-62
Columbia River basalt.____________ 16 Cone of depression, defined.-..--_-._.---_ 35 Cowiche gravel-...-._------------____- 21Cowiche Mountain..._____________ 6,14,37 Cowiche Mountain anticline____ 6,8,21,22,37,41
Discharge, defined____________ ____ 34-35See also Ground water.
Donald Pass-.__________________ 25
Ellensburg formation, age..________ 16,18-19 geologic history__-------_-______-- 24-25ground water in.__._.._______ 39-42,55 ground-water withdrawals_____ 41,54,55,58 lithology and occurrence....________._____ 16-19quality of water in.________ - ____ 59-62 water-level fluctuations__________ 50-51 wells in_________________ 39-40,54,55
Evaporation...__.____ 11,25,26,28,34,44,48, 55
Page Farming---.-.-_-___--_____--____------------- 12Fluminicola u'illiamsi.--...... __-____-_ ___ 16Folding......-..-. -. - 6,22-23,24-25
Gaging stations..__... .... 4,26,27,30,64-65Ooniobasis kettlemanensis-.............. ____ 16Ground water, confined.. __ 33,34,36,39,40,42,43
defined 31discharge.---.---------------------.--- 26,
32,33,34-35,38,39,41,42,43,44,47-49,62-63movement__... 23,
26,32,33,34,35,36,38,41,42,43,44,46-47occurrence. See particular formation.recharge. 28,32,33-34,37-38,40-41,42, 43,52,53withdrawals____..__ 35,
38-39,41, 43,49,53,54,56-57, 58-59,65yield.. --- ___ 32,36,39,41,42,43,53,54,55, 56
Growing season__.________--.-_-____---___- 11
Hardpan. 22
Impermeability, defined . _ ---- 32Irrigation, available water for 2,
4,12,13,31,53,54,55,56history. 12-13ground-water use 38-39,
41,43,49,53,54,56,58-59,65quality of water for_____... 60,62surface-water use.. 30-31
Loess. 22,25Lower valley, development of ground-water
resources... ... _. ------- 55-58physiography... 6-7,16-17 wells...___________-- 36,39,42,43,46,55-56
Mammut (Miomastodori) merriami. Manastash formation . -_
Narrows 7,23,36,37,40
Palouse formation. ... . . - 22 Permeability, defined....------ .. 32Phyreatophytes. ..... ..... .... 11-12,48,57Piezometric surface, defined. 33,34 Pliauchenia merriami.................... ___.- 19Porosity, defined-. . ----- 32Precipitation 8-10,25, 26,37,40,65Previous investigations -__-_ ___ 4 Pumping test, wells in alluvium 45-46
Quality of water, chemical concentration. _.. - 59general character... ---------- .- 59-61suitability __.-- .. 60,62
99

100 INDEX
PageRattlesnake Hills_______________ 6 Recharge, defined..__.________._. 33-34
See also Ground water. Runoff______________________ 25-30,62
Sedge Ridge ............._.. 6,8,14,16,17,22,37Specific capacity, defined.-.__-..-_______ 36 Specific yield, defined---.--_............... 32Sphaeriumsp............. _____._____ 16Streamflow records............ 26, 27,28,29,30,62,64Streams.. _________________ 7-8,
26-30,43, 44,47-48,50, 56, 57, 62-63,64-65Structural features.. ____________ 6, 22-24, 25Surface water, inflow. ---.-.._---. 27-28,29,30, 64-65
irrigation agreements..................... 12-13outflow..........._._.____.._....._. 28-30, 64-65
Surface-water use. See Irrigation.
Tampico.--.-----._..........._ 7,8,10,12,26,27Temperature, atmospheric____---.-___-.. 10-11
ground water________.__....___ 60Tieton andesite..___..._____._____.. 21Transmissibility, defined_..-------.-._... 32Transpiration, discharge by.____ 34-35,48-49,57
Union Gap. . 6,7, 8,12,15,22, 23,38, 42,55, 62,65 Upland benches, development of ground-
water resources,__.__.. ___.... 54-55 physiography_____..__.______ 7 wells.. ................._..._ 36,39,54-55
Page Upper valley, development of ground-water
resources-______________ 53-54 physiography._________.......... 7wells.....__._.................... 36,37,53
Vadose water, defined... -.__.._.-.._.. 31 Vegetation___._________ 11-12,35,48,56,57 Viviparus leiostracta........... ._._ - _. 16Volcanism_.---..._.__---....__... 24
Water-level fluctuations-. -- 49-53 Water table..__________________ 25,
32-33,34,35,36, 43,44,48,49,50, 56,57 Well capacity, defined __.______.. 36 Well-numbering system._..-..---__-_.. 5-6 Wenas basalt member of the Yakima basalt-. 15,
19,36,37,38Wide Hollow Creek... . 7-8,27,28,29,30,62,63,64 Wiley-- . 12,39
Yakima-- .. 3,6Yakima basalt, age _... 16
geologic history.-... 24-25 ground water in.......____ 15,36-39,53, 54,55ground-water withdrawals. 36,38, 52,53,54,55,58 lithology and occurrence_. -... ...- 14-16 quality of water in___........._... 59-62water-level fluctuations_. ._ 52-53 wells... .. 36,37,38,53,54,55
Yakima River, ground-water discharge to.... 62-63
Zone of aeration, defined.--.- - ..-.-- 31
U.S. GOVERNMENT PRINTING OFFICE; 1962 O 603275


Related Documents