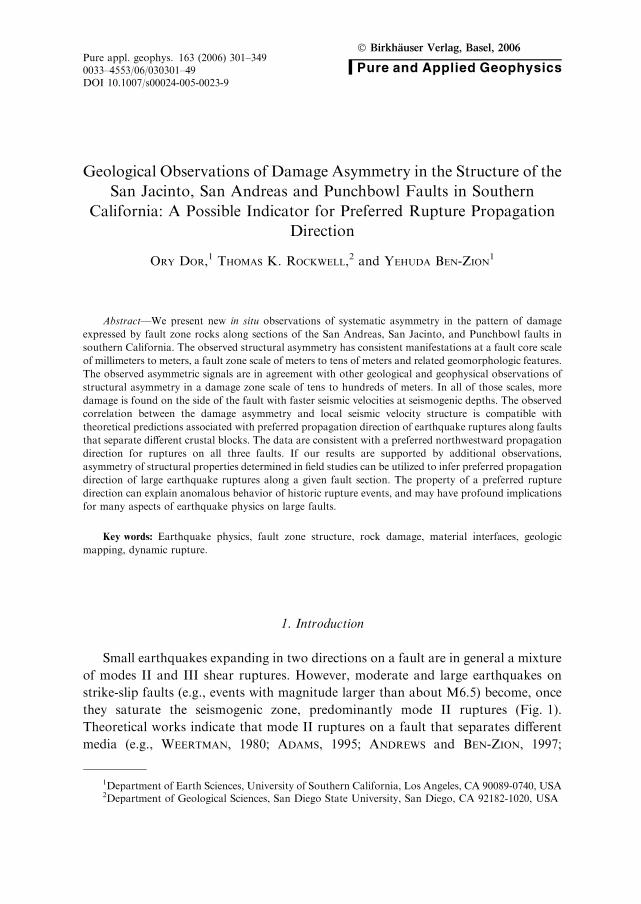
Geological Observations of Damage Asymmetry in the Structure of the San Jacinto, San Andreas and Punchbowl Faults in Southern California: A Possible Indicator for Preferred Rupture Propagation Direction ORY DOR, 1 THOMAS K. ROCKWELL, 2 and YEHUDA BEN-ZION 1 Abstract—We present new in situ observations of systematic asymmetry in the pattern of damage expressed by fault zone rocks along sections of the San Andreas, San Jacinto, and Punchbowl faults in southern California. The observed structural asymmetry has consistent manifestations at a fault core scale of millimeters to meters, a fault zone scale of meters to tens of meters and related geomorphologic features. The observed asymmetric signals are in agreement with other geological and geophysical observations of structural asymmetry in a damage zone scale of tens to hundreds of meters. In all of those scales, more damage is found on the side of the fault with faster seismic velocities at seismogenic depths. The observed correlation between the damage asymmetry and local seismic velocity structure is compatible with theoretical predictions associated with preferred propagation direction of earthquake ruptures along faults that separate different crustal blocks. The data are consistent with a preferred northwestward propagation direction for ruptures on all three faults. If our results are supported by additional observations, asymmetry of structural properties determined in field studies can be utilized to infer preferred propagation direction of large earthquake ruptures along a given fault section. The property of a preferred rupture direction can explain anomalous behavior of historic rupture events, and may have profound implications for many aspects of earthquake physics on large faults. Key words: Earthquake physics, fault zone structure, rock damage, material interfaces, geologic mapping, dynamic rupture. 1. Introduction Small earthquakes expanding in two directions on a fault are in general a mixture of modes II and III shear ruptures. However, moderate and large earthquakes on strike-slip faults (e.g., events with magnitude larger than about M6.5) become, once they saturate the seismogenic zone, predominantly mode II ruptures (Fig. 1). Theoretical works indicate that mode II ruptures on a fault that separates different media (e.g., WEERTMAN, 1980; ADAMS, 1995; ANDREWS and BEN-ZION, 1997; 1 Department of Earth Sciences, University of Southern California, Los Angeles, CA 90089-0740, USA 2 Department of Geological Sciences, San Diego State University, San Diego, CA 92182-1020, USA Pure appl. geophys. 163 (2006) 301–349 0033–4553/06/030301–49 DOI 10.1007/s00024-005-0023-9 Ó Birkha ¨ user Verlag, Basel, 2006 Pure and Applied Geophysics

Welcome message from author
This document is posted to help you gain knowledge. Please leave a comment to let me know what you think about it! Share it to your friends and learn new things together.
Transcript
Geological Observations of Damage Asymmetry in the Structure of the
San Jacinto, San Andreas and Punchbowl Faults in Southern
California: A Possible Indicator for Preferred Rupture Propagation
Direction
ORY DOR,1 THOMAS K. ROCKWELL,2 and YEHUDA BEN-ZION1
Abstract—We present new in situ observations of systematic asymmetry in the pattern of damage
expressed by fault zone rocks along sections of the San Andreas, San Jacinto, and Punchbowl faults in
southern California. The observed structural asymmetry has consistent manifestations at a fault core scale
of millimeters to meters, a fault zone scale of meters to tens of meters and related geomorphologic features.
The observed asymmetric signals are in agreement with other geological and geophysical observations of
structural asymmetry in a damage zone scale of tens to hundreds of meters. In all of those scales, more
damage is found on the side of the fault with faster seismic velocities at seismogenic depths. The observed
correlation between the damage asymmetry and local seismic velocity structure is compatible with
theoretical predictions associated with preferred propagation direction of earthquake ruptures along faults
that separate different crustal blocks. The data are consistent with a preferred northwestward propagation
direction for ruptures on all three faults. If our results are supported by additional observations,
asymmetry of structural properties determined in field studies can be utilized to infer preferred propagation
direction of large earthquake ruptures along a given fault section. The property of a preferred rupture
direction can explain anomalous behavior of historic rupture events, and may have profound implications
for many aspects of earthquake physics on large faults.
Key words: Earthquake physics, fault zone structure, rock damage, material interfaces, geologic
mapping, dynamic rupture.
1. Introduction
Small earthquakes expanding in two directions on a fault are in general a mixture
of modes II and III shear ruptures. However, moderate and large earthquakes on
strike-slip faults (e.g., events with magnitude larger than about M6.5) become, once
they saturate the seismogenic zone, predominantly mode II ruptures (Fig. 1).
Theoretical works indicate that mode II ruptures on a fault that separates different
media (e.g., WEERTMAN, 1980; ADAMS, 1995; ANDREWS and BEN-ZION, 1997;
1Department of Earth Sciences, University of Southern California, Los Angeles, CA 90089-0740, USA2Department of Geological Sciences, San Diego State University, San Diego, CA 92182-1020, USA
Pure appl. geophys. 163 (2006) 301–3490033–4553/06/030301–49DOI 10.1007/s00024-005-0023-9
� Birkhauser Verlag, Basel, 2006
Pure and Applied Geophysics
Used Distiller 5.0.x Job Options
This report was created automatically with help of the Adobe Acrobat Distiller addition "Distiller Secrets v1.0.5" from IMPRESSED GmbH. You can download this startup file for Distiller versions 4.0.5 and 5.0.x for free from http://www.impressed.de. GENERAL ---------------------------------------- File Options: Compatibility: PDF 1.2 Optimize For Fast Web View: Yes Embed Thumbnails: Yes Auto-Rotate Pages: No Distill From Page: 1 Distill To Page: All Pages Binding: Left Resolution: [ 600 600 ] dpi Paper Size: [ 481.89 680.315 ] Point COMPRESSION ---------------------------------------- Color Images: Downsampling: Yes Downsample Type: Bicubic Downsampling Downsample Resolution: 150 dpi Downsampling For Images Above: 225 dpi Compression: Yes Automatic Selection of Compression Type: Yes JPEG Quality: Medium Bits Per Pixel: As Original Bit Grayscale Images: Downsampling: Yes Downsample Type: Bicubic Downsampling Downsample Resolution: 150 dpi Downsampling For Images Above: 225 dpi Compression: Yes Automatic Selection of Compression Type: Yes JPEG Quality: Medium Bits Per Pixel: As Original Bit Monochrome Images: Downsampling: Yes Downsample Type: Bicubic Downsampling Downsample Resolution: 600 dpi Downsampling For Images Above: 900 dpi Compression: Yes Compression Type: CCITT CCITT Group: 4 Anti-Alias To Gray: No Compress Text and Line Art: Yes FONTS ---------------------------------------- Embed All Fonts: Yes Subset Embedded Fonts: No When Embedding Fails: Warn and Continue Embedding: Always Embed: [ ] Never Embed: [ ] COLOR ---------------------------------------- Color Management Policies: Color Conversion Strategy: Convert All Colors to sRGB Intent: Default Working Spaces: Grayscale ICC Profile: RGB ICC Profile: sRGB IEC61966-2.1 CMYK ICC Profile: U.S. Web Coated (SWOP) v2 Device-Dependent Data: Preserve Overprint Settings: Yes Preserve Under Color Removal and Black Generation: Yes Transfer Functions: Apply Preserve Halftone Information: Yes ADVANCED ---------------------------------------- Options: Use Prologue.ps and Epilogue.ps: No Allow PostScript File To Override Job Options: Yes Preserve Level 2 copypage Semantics: Yes Save Portable Job Ticket Inside PDF File: No Illustrator Overprint Mode: Yes Convert Gradients To Smooth Shades: No ASCII Format: No Document Structuring Conventions (DSC): Process DSC Comments: No OTHERS ---------------------------------------- Distiller Core Version: 5000 Use ZIP Compression: Yes Deactivate Optimization: No Image Memory: 524288 Byte Anti-Alias Color Images: No Anti-Alias Grayscale Images: No Convert Images (< 257 Colors) To Indexed Color Space: Yes sRGB ICC Profile: sRGB IEC61966-2.1 END OF REPORT ---------------------------------------- IMPRESSED GmbH Bahrenfelder Chaussee 49 22761 Hamburg, Germany Tel. +49 40 897189-0 Fax +49 40 897189-71 Email: [email protected] Web: www.impressed.de
Adobe Acrobat Distiller 5.0.x Job Option File
<< /ColorSettingsFile () /AntiAliasMonoImages false /CannotEmbedFontPolicy /Warning /ParseDSCComments false /DoThumbnails true /CompressPages true /CalRGBProfile (sRGB IEC61966-2.1) /MaxSubsetPct 100 /EncodeColorImages true /GrayImageFilter /DCTEncode /Optimize true /ParseDSCCommentsForDocInfo false /EmitDSCWarnings false /CalGrayProfile () /NeverEmbed [ ] /GrayImageDownsampleThreshold 1.5 /UsePrologue false /GrayImageDict << /QFactor 0.9 /Blend 1 /HSamples [ 2 1 1 2 ] /VSamples [ 2 1 1 2 ] >> /AutoFilterColorImages true /sRGBProfile (sRGB IEC61966-2.1) /ColorImageDepth -1 /PreserveOverprintSettings true /AutoRotatePages /None /UCRandBGInfo /Preserve /EmbedAllFonts true /CompatibilityLevel 1.2 /StartPage 1 /AntiAliasColorImages false /CreateJobTicket false /ConvertImagesToIndexed true /ColorImageDownsampleType /Bicubic /ColorImageDownsampleThreshold 1.5 /MonoImageDownsampleType /Bicubic /DetectBlends false /GrayImageDownsampleType /Bicubic /PreserveEPSInfo false /GrayACSImageDict << /VSamples [ 2 1 1 2 ] /QFactor 0.76 /Blend 1 /HSamples [ 2 1 1 2 ] /ColorTransform 1 >> /ColorACSImageDict << /VSamples [ 2 1 1 2 ] /QFactor 0.76 /Blend 1 /HSamples [ 2 1 1 2 ] /ColorTransform 1 >> /PreserveCopyPage true /EncodeMonoImages true /ColorConversionStrategy /sRGB /PreserveOPIComments false /AntiAliasGrayImages false /GrayImageDepth -1 /ColorImageResolution 150 /EndPage -1 /AutoPositionEPSFiles false /MonoImageDepth -1 /TransferFunctionInfo /Apply /EncodeGrayImages true /DownsampleGrayImages true /DownsampleMonoImages true /DownsampleColorImages true /MonoImageDownsampleThreshold 1.5 /MonoImageDict << /K -1 >> /Binding /Left /CalCMYKProfile (U.S. Web Coated (SWOP) v2) /MonoImageResolution 600 /AutoFilterGrayImages true /AlwaysEmbed [ ] /ImageMemory 524288 /SubsetFonts false /DefaultRenderingIntent /Default /OPM 1 /MonoImageFilter /CCITTFaxEncode /GrayImageResolution 150 /ColorImageFilter /DCTEncode /PreserveHalftoneInfo true /ColorImageDict << /QFactor 0.9 /Blend 1 /HSamples [ 2 1 1 2 ] /VSamples [ 2 1 1 2 ] >> /ASCII85EncodePages false /LockDistillerParams false >> setdistillerparams << /PageSize [ 576.0 792.0 ] /HWResolution [ 600 600 ] >> setpagedevice

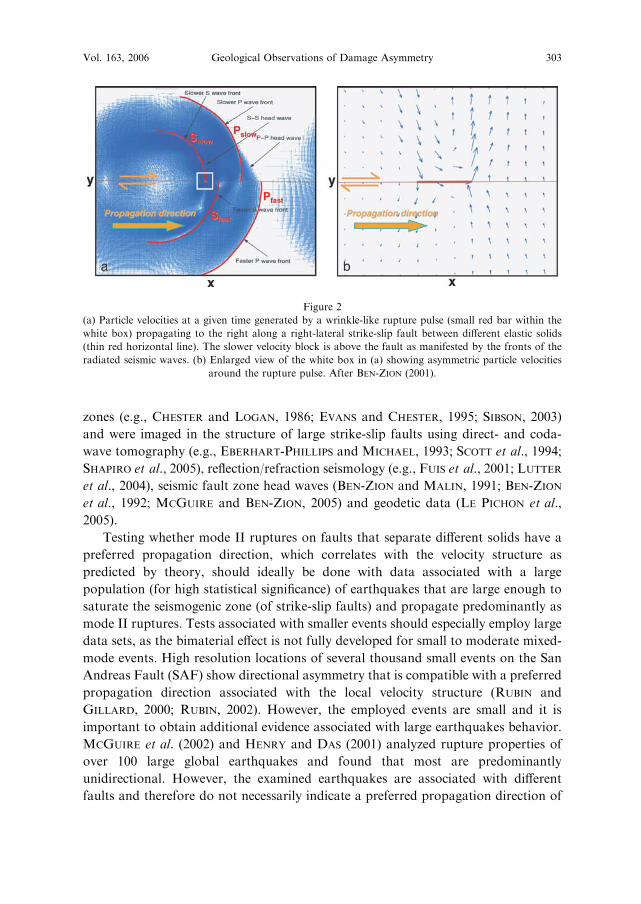
COCHARD and RICE, 2000; BEN-ZION and HUANG, 2002; SHI and BEN-ZION, 2006)
tend to evolve with continued propagation to a narrow ‘‘wrinkle-like’’ pulse that
propagates preferentially in the direction of slip on the compliant side of the fault
(Fig. 2). Characteristic features of the wrinkle-like pulse include: (1) strong dynamic
reduction of normal stress at the propagating tip, (2) asymmetric particle motion on
the different sides of the fault, (3) self-sharpening with propagation distance, and
(4) preferred direction of rupture propagation and associated directivity effects.
Properties (1)–(3) can produce tensile components of particle motion, leading in
some conditions to ‘‘opening modes’’ of rupture. Property (4) can lead to strong
directivity effects and associated asymmetric ground motion. ANOOSHEHPOOR and
BRUNE (1999) observed features (1)–(4) of the wrinkle-like rupture in laboratory
experiments of sliding on an interface between two different foam rubber blocks. If
these properties characterize ruptures on natural faults, they would have fundamen-
tal consequences for many aspects of earthquake dynamics, including effective
constitutive laws, suppression of branching, the heat flow paradox, short rise-time of
earthquake slip, and expected seismic shaking hazard (BEN-ZION and ANDREWS,
1998; BEN-ZION, 2001). It is thus important to test the above theoretical predictions
with detailed in situ observations.
Large fault zones that accommodated significant slip have interfaces that separate
different media (BEN-ZION and SAMMIS, 2003, and references therein) due to the
production of damaged fault zone material and the juxtaposition of different rock
bodies across the fault. Such material interfaces are seen directly in exhumed fault
M > 7
mode IImo
de
III
M < 6.5
Figure 1
Schematic illustration of rupture modes of small to moderate (M £ 6.5) and large (M ‡ 7) earthquakes on a
strike-slip fault. Earthquakes smaller than about M6.5 propagate as mixed modes II and III rupture
(bottom), while ruptures of M>7 earthquakes saturate the seismogenic zone and then propagate
predominantly as mode II rupture (top).
302 O. Dor et al. Pure appl. geophys.,
zones (e.g., CHESTER and LOGAN, 1986; EVANS and CHESTER, 1995; SIBSON, 2003)
and were imaged in the structure of large strike-slip faults using direct- and coda-
wave tomography (e.g., EBERHART-PHILLIPS and MICHAEL, 1993; SCOTT et al., 1994;
SHAPIRO et al., 2005), reflection/refraction seismology (e.g., FUIS et al., 2001; LUTTER
et al., 2004), seismic fault zone head waves (BEN-ZION and MALIN, 1991; BEN-ZION
et al., 1992; MCGUIRE and BEN-ZION, 2005) and geodetic data (LE PICHON et al.,
2005).
Testing whether mode II ruptures on faults that separate different solids have a
preferred propagation direction, which correlates with the velocity structure as
predicted by theory, should ideally be done with data associated with a large
population (for high statistical significance) of earthquakes that are large enough to
saturate the seismogenic zone (of strike-slip faults) and propagate predominantly as
mode II ruptures. Tests associated with smaller events should especially employ large
data sets, as the bimaterial effect is not fully developed for small to moderate mixed-
mode events. High resolution locations of several thousand small events on the San
Andreas Fault (SAF) show directional asymmetry that is compatible with a preferred
propagation direction associated with the local velocity structure (RUBIN and
GILLARD, 2000; RUBIN, 2002). However, the employed events are small and it is
important to obtain additional evidence associated with large earthquakes behavior.
MCGUIRE et al. (2002) and HENRY and DAS (2001) analyzed rupture properties of
over 100 large global earthquakes and found that most are predominantly
unidirectional. However, the examined earthquakes are associated with different
faults and therefore do not necessarily indicate a preferred propagation direction of
Figure 2
(a) Particle velocities at a given time generated by a wrinkle-like rupture pulse (small red bar within the
white box) propagating to the right along a right-lateral strike-slip fault between different elastic solids
(thin red horizontal line). The slower velocity block is above the fault as manifested by the fronts of the
radiated seismic waves. (b) Enlarged view of the white box in (a) showing asymmetric particle velocities
around the rupture pulse. After BEN-ZION (2001).
Vol. 163, 2006 Geological Observations of Damage Asymmetry 303
large events on a given fault section. Testing the latter can, at present, be done only
with geological studies that search for predicted signals that might reflect the
cumulative effect of many large ruptures.
POLIAKOV et al. (2002) examined the stress field near the tip of a semi-infinite
crack propagating in one direction with constant velocity, and found that off-fault
damage is predicted to occur primarily in the tensional quadrant of the assumed
propagation direction, in a zone that depends on the principal prestress directions,
rupture velocity and frictional parameters. RICE et al. (2005) extended the results
for the case of a steady unidirectional slip pulse. YAMASHITA (2000), DALGUER
et al. (2003) and ANDREWS (2005) performed numerical calculations of dynamic
ruptures on a fault in a homogenous solid with spontaneous generation of damage
in the material off the fault. In such cases, ruptures propagate as symmetric
bilateral cracks and damage in a single event is produced primarily in anti-
symmetric triangular zones, with width proportional to rupture length, in the two
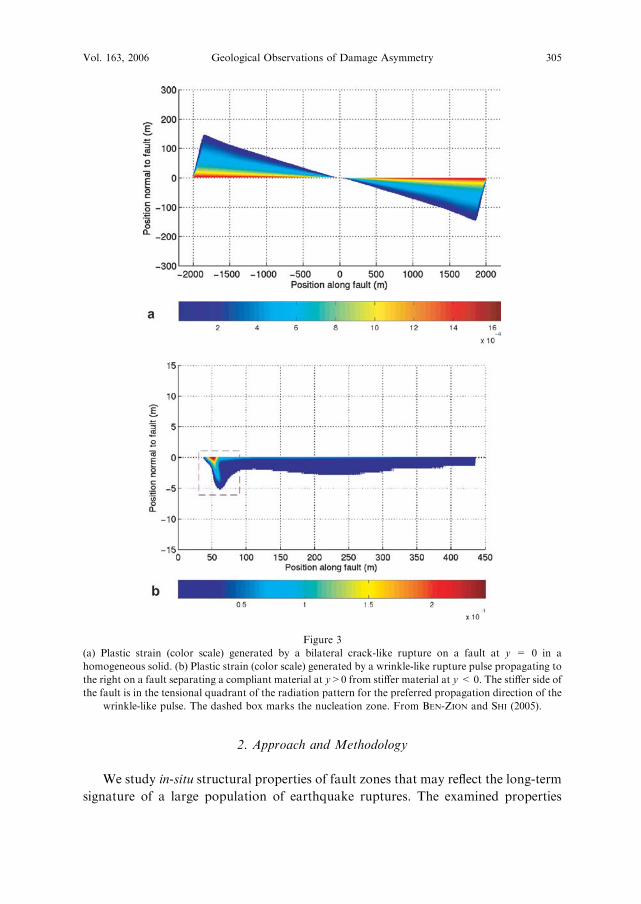
tensional quadrants (Fig. 3a). If earthquakes on a given fault section propagate
predominately as such bilateral ruptures, or as unilateral ruptures without a
preferred propagation direction, the cumulative pattern of rock damage generated
by many events will be approximately symmetric across the fault. On the other
hand, if earthquakes on a given fault section have a preferred propagation
direction, due to any mechanism, the cumulative damage pattern will be
asymmetric, with more damage in the tensional quadrant associated with the
preferred propagation direction.
BEN-ZION and SHI (2005) performed simulations of ruptures along a material
interface with spontaneous generation of damage in the bulk and showed that in such
cases damage is generated primarily on the stiffer side of the fault, which for the
preferred propagation direction is persistently in the tensional quadrant of the
radiated seismic field. The damage is generated in a strip of approximately constant
width that is related to the pulse width (Fig. 3b). The cumulative damage generated
by many such ruptures is expected to be similar to the asymmetric pattern of
Figure 3b, with significantly more damage on the side of the fault with higher seismic
velocity. The above results provide clear predictions that can be tested in the field by
performing geologic observations of symmetry properties of rock damage across
large strike-slip faults.
In the following sections, we present systematic in situ observations of symmetry
properties of rock damage in the structure of large strike-slip faults of the San
Andreas system in southern California. The observations indicate overall a consistent
damage asymmetry across the Principal Slip Surface of a given fault section at several
scales. The observed sense of damage asymmetry at these scales correlates with
available information on the seismic velocity structure as predicted by the theory of
rupture along a material interface. The results open up the possibility of inferring
preferred directions of rupture propagation of large earthquakes on large fault
sections from geologic field observations.
304 O. Dor et al. Pure appl. geophys.,
2. Approach and Methodology
We study in-situ structural properties of fault zones that may reflect the long-term
signature of a large population of earthquake ruptures. The examined properties
Figure 3
(a) Plastic strain (color scale) generated by a bilateral crack-like rupture on a fault at y = 0 in a
homogeneous solid. (b) Plastic strain (color scale) generated by a wrinkle-like rupture pulse propagating to
the right on a fault separating a compliant material at y>0 from stiffer material at y< 0. The stiffer side of
the fault is in the tensional quadrant of the radiation pattern for the preferred propagation direction of the
wrinkle-like pulse. The dashed box marks the nucleation zone. From BEN-ZION and SHI (2005).
Vol. 163, 2006 Geological Observations of Damage Asymmetry 305
include the intensity and style of wall-rock and gouge damage, the orientation and
density of fractures, the presence and orientation of subsidiary faults, and
geomorphologic features. Because these properties can be affected by local fault
geometry and complexity, the recognition of persistent asymmetry that is indepen-
dent of local site effects requires documentation of multiple signals at multiple scales
at several locations along a relatively straight fault segment.
We utilized both natural and excavated exposures for our studies. In general,
active faults generate detritus that tends to obscure or bury the fault and immediate
damage zone, and we found this to be the case along the San Andreas and San
Jacinto faults. In contrast, the Punchbowl fault, an older inactive strand of the San
Andreas system, is incised and easy to study in natural exposures.
Scales of Observations: We discuss primarily two types of observations associated
with different scales. The first type includes observations on the near-field damage of
millimeters to meter fault core scale within gouge zones and their immediately
adjacent wall-rocks. We refer to gouge as crushed and ground-up rock produced by
shear. Increasing displacement tends to reduce the grain size (ENGELDER, 1974;
BIEGEL et al., 1989) and may enhance the development of shear fabric, possibly due
to the competency contrast between the wall-rocks and the gouge material
(GOODWIN and TIKOFF, 2002). Well-developed gouge zones, like most of those
described in this paper, do not display primary structures, probably due to the
accommodation of large shear strain. The composition of a gouge zone is derived
from the adjacent wall-rocks but it often also contains translocated (pedogenic) clay
and other material that migrate from the surface environment into the fault,
especially if it is close to the ground surface. Such alien material often has blackish
organic appearance. The gouge zones of the active faults studied here are typically
dominated by claylike unlithified material, which behaves plastically when moistened
and contains very small amounts of visible porphyroclasts (unless otherwise stated).
Hence, some of the described gouge elements match the definition of SCHOLZ (2002)
for foliated gouge, modified after SIBSON (1977), although we also commonly observe
cohesive and stiff gouge elements that do not fall into any of Scholz’s categories. The
examined gouge layers of the active faults are the zones that accommodate most of
the displacement along the fault, and are therefore the surface analogue of the fault
core, with concentrated slip, in the structure of several exhumed faults (e.g., CHESTER
et al., 1993). We use the term ‘proto-gouge’ to describe a fault zone layer within or
close to the fault gouge or core in which the fabric and the composition are in an
intermediate stage between a typical gouge and the local wall-rock.
The second type of observations is made on the distribution of secondary faulting
and associated features in the meters to tens of meters fault zone scale. A fault zone
includes mesoscopic fractures and small secondary faults, typically extending to a
distance of about 50 to 70 m from the fault core (e.g., SCHULZ and EVANS, 2000). We
discuss also a third type of observations, made on the distribution of damage to the
bounding rocks in the tens to hundreds of meters damage zone scale. This type of
306 O. Dor et al. Pure appl. geophys.,
observation includes zones of pulverized rocks and seismic fault zone trapping
structures, with considerably more damage than the background damage of the
country rocks.
Frame of Reference for Symmetry Properties: Our frame of reference for
descriptions and measurements of symmetry properties is the currently active or
most recently active Principal Slip Surface (PSS). In the fault core scale, it is the
major through-going slip surface within the fault core that appears to accommo-
date most of the displacement during the current phase of faulting, or the life
time of the evolving gouge. In the fault zone scale, the PSS is the most dominant
and most recently active strand among the secondary faults that compose the
fault zone (indicated mostly by the geomorphology). The PSS usually, but not
necessarily, coincides with the major lithological boundary. In the damage zone
scale, symmetry is examined with respect to the zone that accommodates the
majority of the long-term displacement. We use the active (or most recently
active) slip zone because the composition and structure of faults generally evolve
with time, and we are interested in structural features that were produced in the
current or most recent phase of faulting, which may be correlated with available
information on the current velocity structure. We cannot always distinguish
between different generations of damage and this is another reason to perform
observations on several scales and establish a consistency along a given fault
section.
The symmetry of structural properties is evaluated by comparing intensity and
style of deformation between the two sides of the PSS. In most of the gouge
exposures, there is usually one continuous surface that becomes clearly visible when
pieces and fragments of gouge are peeled away. When more than a single significant
slip surface is present within the fault core, we describe symmetry properties with
respect to the PSS that is the most continuous and dominant. We assume that every
faulting event includes motion on the currently-active coherent slip surfaces, perhaps
with ongoing destruction or overprinting of older, previously-active slip surfaces.
Evidence for such behavior can be frequently seen in trench logs of paleoseismic
studies, where the relative timing of events is known and one can see the destruction
or overprinting of an older slip surface by a younger trace (e.g., ROCKWELL et al.,
1990).
Overview of Investigation Sites: For our first set of sites along the San Jacinto
fault, we worked along a stretch of fault with deeply incised geomorphology resulting
from a recent stream capture. In that place the fault is poorly exposed but could be
accessed with minimal work. We mapped the damage in a road-cut and in backhoe
and hand-excavated pits, focusing on the mm to m fault core scale damage. For the
San Andreas fault zone, we studied several exposures at the core scale along recently
active traces, and also opened trenches in bedrock at a number of localities to explore
the tens of meters wide fault zone scale damage. In a parallel study, we examined the
broader damage zone scale that may extend hundreds of meters from the principal
Vol. 163, 2006 Geological Observations of Damage Asymmetry 307
slip surface and includes such characteristics as pulverization of rocks (DOR et al.,
2006; BRUNE, 2001; WILSON et al., 2005) and chemical alterations. In the Punchbowl
fault within and in the vicinity of the Devil’s Punchbowl County Park, we studied
symmetry properties of the fault core with respect to the ultracataclasite layer
(CHESTER and CHESTER, 1998) as well as fault zone scale distribution of damage.
Observations of symmetry properties in the microscale are also a natural component
of a study of this kind, but are beyond the scope of this paper and are left for future
studies.
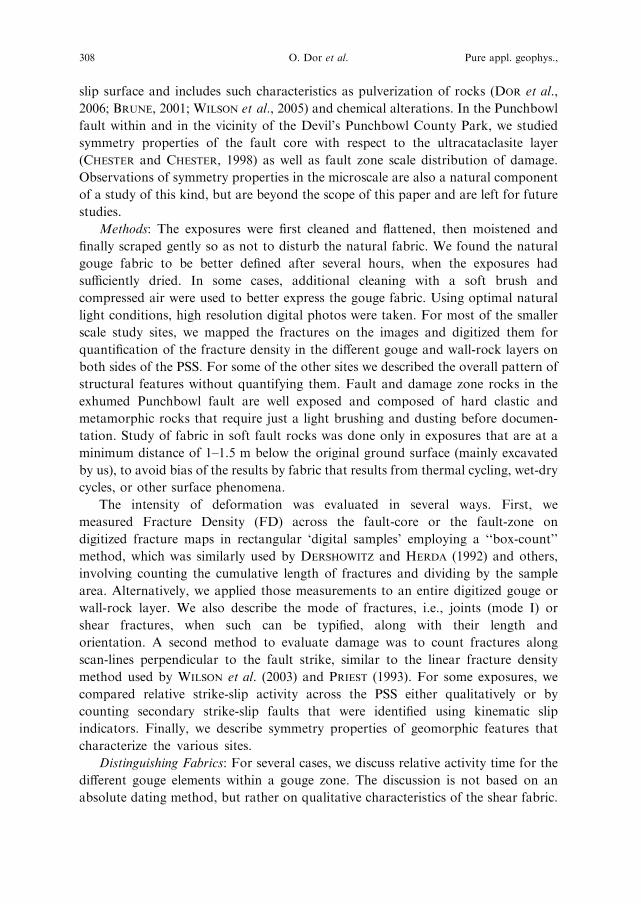
Methods: The exposures were first cleaned and flattened, then moistened and
finally scraped gently so as not to disturb the natural fabric. We found the natural
gouge fabric to be better defined after several hours, when the exposures had
sufficiently dried. In some cases, additional cleaning with a soft brush and
compressed air were used to better express the gouge fabric. Using optimal natural
light conditions, high resolution digital photos were taken. For most of the smaller
scale study sites, we mapped the fractures on the images and digitized them for
quantification of the fracture density in the different gouge and wall-rock layers on
both sides of the PSS. For some of the other sites we described the overall pattern of
structural features without quantifying them. Fault and damage zone rocks in the
exhumed Punchbowl fault are well exposed and composed of hard clastic and
metamorphic rocks that require just a light brushing and dusting before documen-
tation. Study of fabric in soft fault rocks was done only in exposures that are at a
minimum distance of 1–1.5 m below the original ground surface (mainly excavated
by us), to avoid bias of the results by fabric that results from thermal cycling, wet-dry
cycles, or other surface phenomena.
The intensity of deformation was evaluated in several ways. First, we
measured Fracture Density (FD) across the fault-core or the fault-zone on
digitized fracture maps in rectangular ‘digital samples’ employing a ‘‘box-count’’
method, which was similarly used by DERSHOWITZ and HERDA (1992) and others,
involving counting the cumulative length of fractures and dividing by the sample
area. Alternatively, we applied those measurements to an entire digitized gouge or
wall-rock layer. We also describe the mode of fractures, i.e., joints (mode I) or
shear fractures, when such can be typified, along with their length and
orientation. A second method to evaluate damage was to count fractures along
scan-lines perpendicular to the fault strike, similar to the linear fracture density
method used by WILSON et al. (2003) and PRIEST (1993). For some exposures, we
compared relative strike-slip activity across the PSS either qualitatively or by
counting secondary strike-slip faults that were identified using kinematic slip
indicators. Finally, we describe symmetry properties of geomorphic features that
characterize the various sites.
Distinguishing Fabrics: For several cases, we discuss relative activity time for the
different gouge elements within a gouge zone. The discussion is not based on an
absolute dating method, but rather on qualitative characteristics of the shear fabric.
308 O. Dor et al. Pure appl. geophys.,
The most recently active principal shear zone, as defined by the surface geomor-
phology, tends to break out and can be expressed with a scaly fabric (AGAR et al.,
1989), with highly sheared and polished anastomosing facoidal lenses of gouge, and
abundant evidence of shear in the form of striae and mullions on curviplanar
surfaces. In contrast, what we interpret as older shears tend to be considerably more
cohesive and either do not have as easily recognized parting surfaces or the surfaces
are compressed and welded. We have found that gouge with high moisture content
appears to behave plastically, whereas lower moisture content gouges tend to have
more brittle characteristics (undoubtedly fluctuates with the seasons). Nevertheless,
the PSS along the active fault core expresses highly sheared parting surfaces even
when the moisture content is high, while older shears tend to develop good parting
surfaces only when relatively dry. Overall, the more cohesive fractures were found
away from the active zone of the gouge when the active zone could be identified
independently. In contrast, the less cohesive shear fractures were found within the
more moistened and more plastic gouge elements. In the presence of several gouge
layers embedded within the fault zone, the one that can be correlated with the
geomorphically active trace of the fault is typically the more moistened/plastic, which
presents relatively incohesive fractures. We use these criteria when the active or the
most recently active zone of the gouge cannot be identified independently.
3. Field Observations
We discuss our field observations by fault zones, starting with the exposures
along the San Jacinto fault near Anza. We then describe the several sites we studied
along the San Andreas and the Punchbowl faults, an inactive ancestral strand of the
San Andreas fault system.
3.1 The San Jacinto Fault
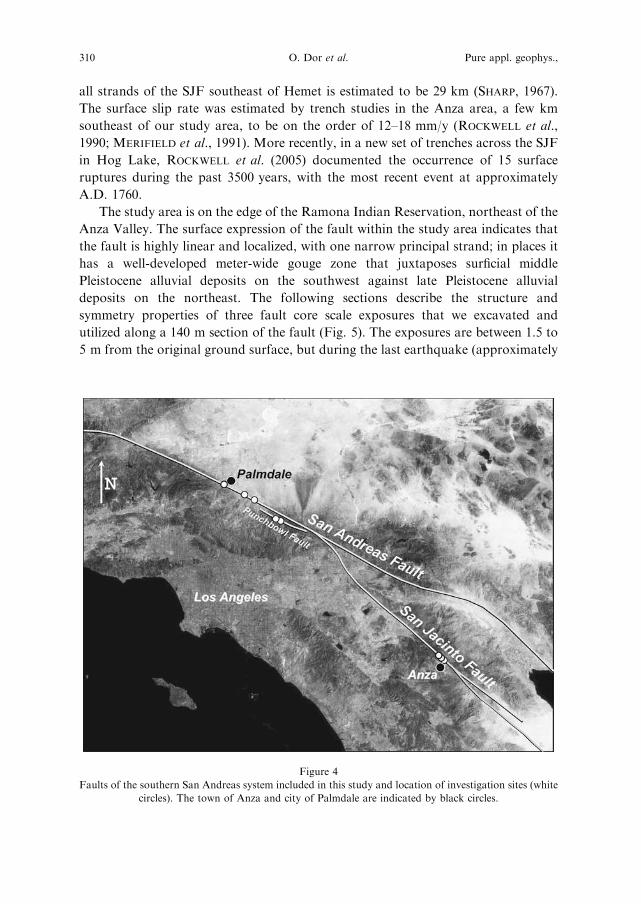
The San Jacinto fault (SJF) is a primary strand of the San Andreas fault south of
the Transverse Ranges (Fig. 4) and is currently the most active fault zone in southern
California (CROWELL, 1962; ALLEN et al., 1965; SANDERS and KANAMORI, 1984). The
20-km long Anza section of the SJF is known as the Anza Seismicity gap (BRUNE,
1968; SANDERS and KANAMORI, 1984) and includes the study area. This section of the
fault is well expressed by geomorphic features and the fault is relatively simple with
only one major active strand, the Clark fault (ROCKWELL et al., 1990), that separates
surficial tonalite and other leucocratic plutonic rocks on the northeast against
gabbroic and more melanocratic rocks to the southwest (SHARP, 1967). These
lithologies probably do not extend very deep below the surface, as the local velocity
structure indicates faster basement velocities at seismogenic depths on the northeast-
ern side of the fault (SCOTT et al., 1994). The total right-lateral displacement across
Vol. 163, 2006 Geological Observations of Damage Asymmetry 309
all strands of the SJF southeast of Hemet is estimated to be 29 km (SHARP, 1967).
The surface slip rate was estimated by trench studies in the Anza area, a few km
southeast of our study area, to be on the order of 12–18 mm/y (ROCKWELL et al.,
1990; MERIFIELD et al., 1991). More recently, in a new set of trenches across the SJF
in Hog Lake, ROCKWELL et al. (2005) documented the occurrence of 15 surface
ruptures during the past 3500 years, with the most recent event at approximately
A.D. 1760.
The study area is on the edge of the Ramona Indian Reservation, northeast of the
Anza Valley. The surface expression of the fault within the study area indicates that
the fault is highly linear and localized, with one narrow principal strand; in places it
has a well-developed meter-wide gouge zone that juxtaposes surficial middle
Pleistocene alluvial deposits on the southwest against late Pleistocene alluvial
deposits on the northeast. The following sections describe the structure and
symmetry properties of three fault core scale exposures that we excavated and
utilized along a 140 m section of the fault (Fig. 5). The exposures are between 1.5 to
5 m from the original ground surface, but during the last earthquake (approximately
Figure 4
Faults of the southern San Andreas system included in this study and location of investigation sites (white
circles). The town of Anza and city of Palmdale are indicated by black circles.
310 O. Dor et al. Pure appl. geophys.,
245 years ago) their depth was about twice the current one based on estimates of
local erosion rates.
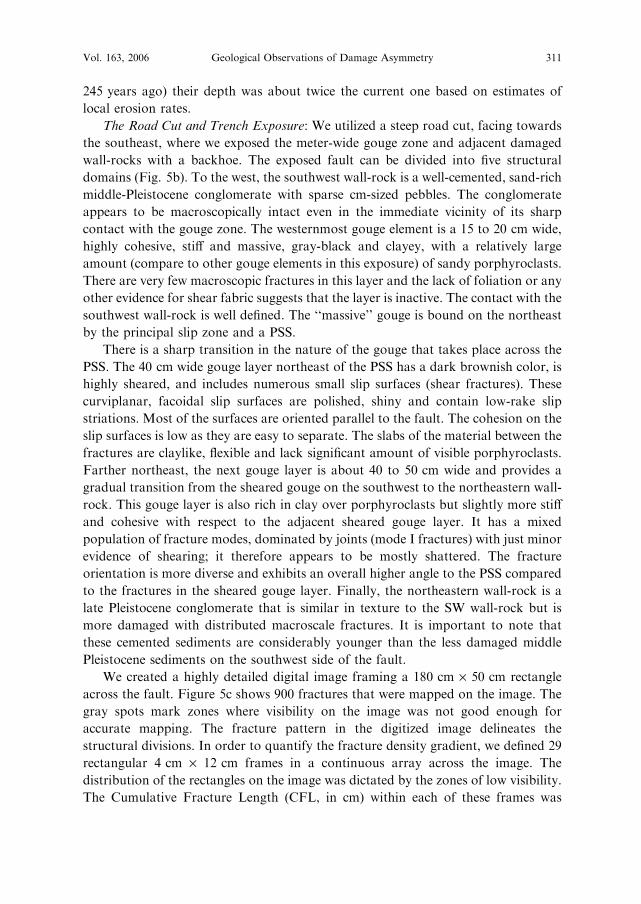
The Road Cut and Trench Exposure: We utilized a steep road cut, facing towards
the southeast, where we exposed the meter-wide gouge zone and adjacent damaged
wall-rocks with a backhoe. The exposed fault can be divided into five structural
domains (Fig. 5b). To the west, the southwest wall-rock is a well-cemented, sand-rich
middle-Pleistocene conglomerate with sparse cm-sized pebbles. The conglomerate
appears to be macroscopically intact even in the immediate vicinity of its sharp
contact with the gouge zone. The westernmost gouge element is a 15 to 20 cm wide,
highly cohesive, stiff and massive, gray-black and clayey, with a relatively large
amount (compare to other gouge elements in this exposure) of sandy porphyroclasts.
There are very few macroscopic fractures in this layer and the lack of foliation or any
other evidence for shear fabric suggests that the layer is inactive. The contact with the
southwest wall-rock is well defined. The ‘‘massive’’ gouge is bound on the northeast
by the principal slip zone and a PSS.
There is a sharp transition in the nature of the gouge that takes place across the
PSS. The 40 cm wide gouge layer northeast of the PSS has a dark brownish color, is
highly sheared, and includes numerous small slip surfaces (shear fractures). These
curviplanar, facoidal slip surfaces are polished, shiny and contain low-rake slip
striations. Most of the surfaces are oriented parallel to the fault. The cohesion on the
slip surfaces is low as they are easy to separate. The slabs of the material between the
fractures are claylike, flexible and lack significant amount of visible porphyroclasts.
Farther northeast, the next gouge layer is about 40 to 50 cm wide and provides a
gradual transition from the sheared gouge on the southwest to the northeastern wall-
rock. This gouge layer is also rich in clay over porphyroclasts but slightly more stiff
and cohesive with respect to the adjacent sheared gouge layer. It has a mixed
population of fracture modes, dominated by joints (mode I fractures) with just minor
evidence of shearing; it therefore appears to be mostly shattered. The fracture
orientation is more diverse and exhibits an overall higher angle to the PSS compared
to the fractures in the sheared gouge layer. Finally, the northeastern wall-rock is a
late Pleistocene conglomerate that is similar in texture to the SW wall-rock but is
more damaged with distributed macroscale fractures. It is important to note that
these cemented sediments are considerably younger than the less damaged middle
Pleistocene sediments on the southwest side of the fault.
We created a highly detailed digital image framing a 180 cm · 50 cm rectangle
across the fault. Figure 5c shows 900 fractures that were mapped on the image. The
gray spots mark zones where visibility on the image was not good enough for
accurate mapping. The fracture pattern in the digitized image delineates the
structural divisions. In order to quantify the fracture density gradient, we defined 29
rectangular 4 cm · 12 cm frames in a continuous array across the image. The
distribution of the rectangles on the image was dictated by the zones of low visibility.
The Cumulative Fracture Length (CFL, in cm) within each of these frames was
Vol. 163, 2006 Geological Observations of Damage Asymmetry 311
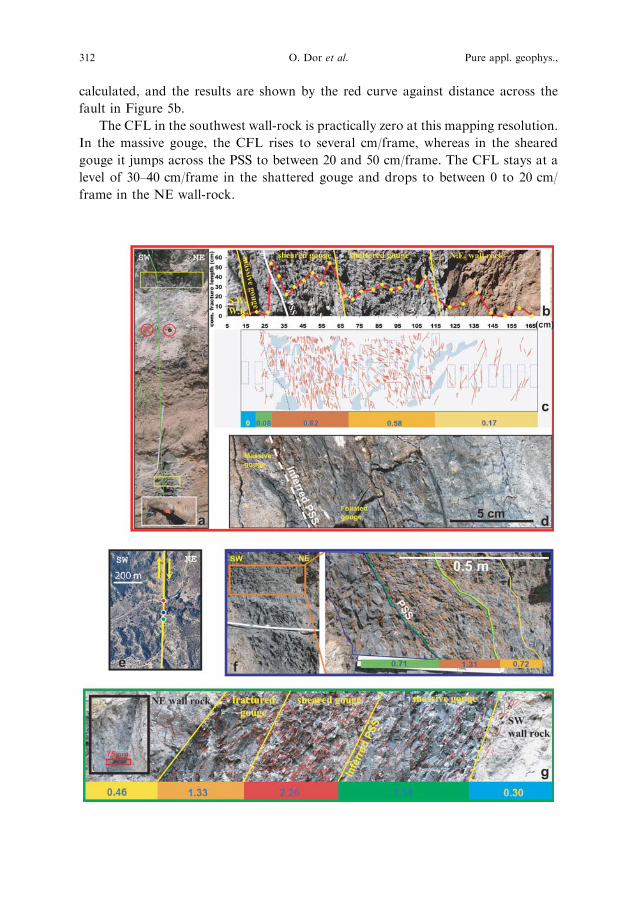
calculated, and the results are shown by the red curve against distance across the
fault in Figure 5b.
The CFL in the southwest wall-rock is practically zero at this mapping resolution.
In the massive gouge, the CFL rises to several cm/frame, whereas in the sheared
gouge it jumps across the PSS to between 20 and 50 cm/frame. The CFL stays at a
level of 30–40 cm/frame in the shattered gouge and drops to between 0 to 20 cm/
frame in the NE wall-rock.
312 O. Dor et al. Pure appl. geophys.,
To correspond with the structure of the fault zone, the CFL curve was divided
along the length axis into domains corresponding to the above structural divisions.
Each structural domain was assigned a FD index in units of cm/cm2 based on the
sum of the cumulative fracture length from all the frames within a domain, divided
by the cumulative area of all the frames within the domain. The FD index values for
the structural domains are as follows: SW wall-rock: 0; massive gouge: 0.08; sheared
gouge: 0.82; shattered gouge: 0.58; and NE wall-rock: 0.17. The results indicate that
the structural division can be reasonably considered as fracture density division. It is
especially interesting that the FD in the northeast wall-rock is higher than the FD in
the massive gouge.
We extended the road cut exposure downward by digging a trench on the side of
the road three meters below the location of the exposure described above (Figure 5a).
We estimated the bottom of the trench to be about five meters below the original
ground surface prior to the excavation of the road. The gouge width shrinks from
one meter in the road cut to only 15 cm at the base of the trench. The structural
division of the gouge in the road cut can in general be applied to the gouge in the
trench, but it is substantially more compressed and the PSS cannot be identified
macroscopically (Fig. 5d). The visible cracks in Figure 5d were developed upon
dehydration of the exposure face and it is not clear to what extent their pattern is
controlled by the gouge fabric. The relatively cohesive and massive gray gouge layer
Figure 5
Structural units and fracture density in the gouge of the San Jacinto fault zone south of the Ramona Indian
Reservation. The colors of the different frames orrespond to the colors of the circles in the small location
map (panel e). Red frame: (a) Panoramic view showing the upper and lower road cut exposures with the
inferred location of the PSS (green) and the analyzed frames (yellow boxes) presented to the right (panels b
and c). In the center of the panel the fault is covered with debris. (b) A cross fault view of the gouge and
damage zone, with a division to 5 structural domains. The red graph shows the trend of fracturing intensity
across the fault. Each yellow dot indicates the cumulative fracture length (CFL) in cm measured in the
rectangle frame right below it in the middle panel. (c) A digitized fracture map of the upper panel. Light
blue spots mark zones with insufficient visibility for detailed mapping. Dashed line marks the PSS. The
rectangles are samples of CFL. The numbers on the lower horizontal bar give fracture density (FD)
calculated for each of the structural domains from the upper panel by dividing the CFL from all the
samples in the domain with the cumulative area of the used samples. A sharp contrast exists between the
FD of the sheared and massive gouge. Note also that the FD of the NE wall-rock is higher than the FD of
the massive gouge. (d) The gouge 3 m below the upper road cut narrows down to 15 cm but maintains its
structural division. Massive, gray, 1 cm wide gouge appears on the SW and highly foliated (sheared) gouge
appears on the NE. Blue frame: (f) The ‘‘Cliff’’ exposure, 100 m southeast of the road cut. The picture on
the left shows the artificial exposure with difference between the dark cohesive gouge on the left to the
fractured gouge on the right. The framed zone is 70 cm wide. The structural division in the digitized map
on the right is consistent with the structural division shown for the road cut (red frame), with similar trend
of the FD indicated by the numbers at the colored bar at the bottom of the panel. Green frame: (g) Digital
fracture map in artificial exposure (inset) 140 m SE of the road cut. The gouge and adjacent wall-rocks
were divided into 5 structural domains that can be correlated to the structural division of the road cut
exposure (red frame). The PSS is not clear here but based on the other two exposures with similar
structure, the PSS should be between the massive and the sheared gouge. The FD index is shown for each
domain on the lower colored bar. Higher damage is on the NE side of the fault.
b
Vol. 163, 2006 Geological Observations of Damage Asymmetry 313
on the southwest side of the zone is only 1 cm wide and shows no original visible
fractures. The next gouge layer is more brownish and exhibits dense foliation with
fracture spacing in the sub-millimeter scale, and we correlate this layer upward to the
sheared gouge in the road cut. The FD of these gouge layers can be studied and
quantified only on the microscale, which is beyond the scope of this paper.
The Cliff Exposure: The ‘‘Cliff’’ exposure is 100 m southeast of the road cut
exposure on a natural steep slope facing to the southeast. We manually excavated the
fault to a depth of 1.5 m below and away from the slope; this area was not accessible
to a backhoe. The exposure was cleaned following the procedure described above,
and a sequence of digital photos was taken across it upon which the fractures were
mapped and digitized. The 70-cm-wide gouge zone at this exposure can be divided
into three distinct structural domains, and each domain can be correlated to the
gouge domains in the road cut. The structural domains also coincide with the
divisions in fracture density domain (Fig. 5f). This division is sharp and continuous
enough, and the quality of the digital image is sufficiently good, to enable us to
directly calculate the FD of the structural domains without using a continuous array
of digital samples.
The gouge layer on the southwest side of the PSS is massive and highly cohesive,
gray dark and rich in clasts. It is especially stiff and brittle. The layer contains
fractures that are relatively large, showing inconsistent orientations, but no
macroscopic foliation and shear fabric. We measured a FD of 0.71 for this unit.
Many of the fractures are incohesive and they seem to have fresh faces of recently
broken material; therefore, they may have been created when the outcrop was
excavated, possibly due to the material stiffness. We therefore conjecture that the
actual in situ FD is less than the measured FD. The gouge layer on the northeast side
of the PSS is highly sheared and characterized by a higher value of FD of 1.31. It is
much less cohesive, sparse with porphyroclasts and contains many anastomosing
shear fractures with curvy faces and stria; the fractures are relatively small, giving to
the gouge a flaky texture. The majority of the fracture population is parallel to the
fault. Farther to the northeast, the next gouge layer is a transition from the sheared
gouge to the northeast wall-rock, with a FD of 0.72. The fractures orientation in this
gouge layer are less uniform with respect to orientation of fractures in the sheared
gouge immediately to the southwest side but more internally consistent with respect
to those of the massive gouge from the southwest side of the PSS. Their surfaces are
also more cohesive and do not have a fresh appearance. Thus, unlike fractures in the
massive gouge, the fractures in this gouge layer are believed to be part of the original
rock fabric prior to excavation, and therefore more related to faulting. We suspect
that the FD contrast between this gouge layer and the massive gouge is higher than
we measured.
The SE Exposure: The southeast exposure is an additional 40 m to the southeast
from the ‘‘Cliff’’ exposure. The outcrop faces to the northwest, opposite the direction
of the two previously described exposures. We manually excavated an exposure to a
314 O. Dor et al. Pure appl. geophys.,
depth of about 1.5 m away from the current slope surface (this site was also not
accessible by backhoe) and performed the same analysis as in the other exposures.
Here the fault zone is similar in its structural division, in its FD distribution and in
the sense of asymmetry to those presented for the road cut, trench and Cliff
exposures (Fig. 5g). The FD indexes on the southwest side of the PSS are 0.3 for the
southwest wall-rock and 1.14 for the massive gouge. Northeast of the PSS, the FD
indices are 2.26 for the sheared gouge, 1.33 for the shattered gouge, and 0.46 for the
northeast wall-rock.
Summary: All the three exposures along a 140 m long section of the San Jacinto
fault near Anza exhibit consistent and distinct structural division and sense of
asymmetry, with the northeast side of the fault always more damaged, regardless of
the slope aspect or depth of the exposure. In each of the three studied exposures, the
gouge on the northeast side of the PSS is highly sheared, followed by a more
shattered gouge layer farther to the northeast. The gouge layer on the southwest side
of the PSS is always cohesive and massive and appears to be inactive. Fracture
density analysis highlights and confirms the apparent structural division and the
sense of asymmetry.
3.2 The Mojave Section of the San Andreas Fault
The San Andreas fault system, in a cross section that includes our study area in
the Mojave, contains in its broader sense the San Gabriel fault on the south side of
the San Gabriel Mountains and several parallel strands on the north side of the San
Gabriel Mountains. The latter include the currently active SAF and the Little Rock,
Punchbowl, southern and northern Nadeau faults, as well as several other smaller
faults. These faults all exhibit a zone with faulting-related structural features that
measures tens of meters in width (CHESTER and LOGAN, 1986; CHESTER et al., 2004),
and they can potentially have damage zones at a scale of �100 m that correspond to
the observed low velocity trapping structures for several faults (e.g., BEN-ZION et al.,
2003; PENG et al., 2003; LEWIS et al., 2005), and to the �100 m wide zone of
pulverized fault zone rocks observed for the SAF (WILSON et al., 2005; DOR et al.,
2006). A broader damage zone that reflects the entire deformation history of a large
fault can consist of a few km wide region with enhanced anisotropy and reduced
density and elastic moduli (BEN-ZION and SAMMIS, 2003; FIALKO, 2004; PENG and
BEN-ZION, 2004).
The San Andreas fault system in southern California has accommodated
altogether about 240 km of displacement, based on the separation of the correlative
Neenach and Pinnacles volcanic rocks (MATTHEWS, 1976), but this may not include
50–60 km of slip on the San Gabriel fault. The displacement may be even larger, in
excess of 300 km, based on the separation of Pelona schist and other basement units
(DIBBLEE, 1989). The displacement was accommodated on the ancestral faults of the
system, and subsequently on the modern elements of the SAF as they developed
Vol. 163, 2006 Geological Observations of Damage Asymmetry 315
(POWELL and WELDON, 1992). Each fault remains a narrow zone of discontinuity
along which local dip-slip adjustments have occurred, sometimes into Holocene times
(BARROWS et al., 1985).
The individual displacement values on each of the primary strands of the San
Andreas fault system in the central and southeastern Mojave are only partially
constrained in most cases. The San Gabriel fault accounts for about 50 to 60 km of
the total slip, whereas the Punchbowl and Nadeau group of faults accounts for 44
and 16 km, respectively. The Little Rock fault has only a minimum value of 21 km of
displacement, and the currently active trace of the SAF appears to have only 21 km
of slip based on the displacement of the late Pliocene Juniper Hills formation. The
discrepancy between the sum of those displacements (�160 km) to the assumed total
�300 km could be accounted for by additional displacement on the Little Rock fault,
displacement on the Hitchbrook fault northwest of our study area, and larger earlier
displacement on the current SAF (BARROWS et al., 1985) or on the Clemens Well,
Fenner and San Francisquito faults (POWELL and WELDON, 1992).
The broad SAF system in the study area is therefore a 7 km wide zone of
extended deformation, and with the San Gabriel fault the zone is >30 km wide. This
broad zone experienced several generations of deformation after the middle Miocene,
with complex partitioning of displacement between its components; each deforma-
tion phase could have overprinted its signature on rocks within the system.
Individual rock bodies are therefore likely to have recorded a complex displacement
and deformation history. The existence of numerous geometrical perturbations at
many scales, from the big bend to smaller step-overs, and interaction between the
main trace to subsidiary faults all influence the faulting pattern. Even rocks along a
relatively straight portion of the fault may carry in their ‘geological memory’ an
imprint from a zone of structural complexity farther along the fault. In such a
complex system with very large displacement, the velocity structure across the fault
may have changed several times. A single rock body juxtaposed along the fault could
have experienced a contrasting velocity structures over time, and maybe even have
experienced an opposite preferred rupture propagation direction, leaving contradict-
ing long-term signals in its fabric.
The task of finding a coherent geological signal along such a fault that records the
long-term behavior is rather challenging. It is particularly complex in the active
environment of the SAF zone with sparse bedrock exposures, even in the arid
portions of the Mojave Desert. As we anticipated the signal to be noisy and possibly
confusing, we searched for evidence of several types and at several scales.
We present here observations from three sites in the Little Rock to Palmdale area,
spanning a 20 km long section of the fault. At two of the sites near Little Rock,
observations are on the fault core scale, and at one site near Palmdale the
observations are at the fault zone scale. We also refer to observations in the damage
zone scale made along the entire 140 km fault section of the Mojave in a parallel
study (DOR et al., 2006). The sites are not on the geometrically simplest section of the
316 O. Dor et al. Pure appl. geophys.,

fault, nor are all of the sites on the currently active strand of the SAF, but the region
has a semi-arid climate that provides opportunities for examination of the fault in
bedrock exposures with minimal excavation.
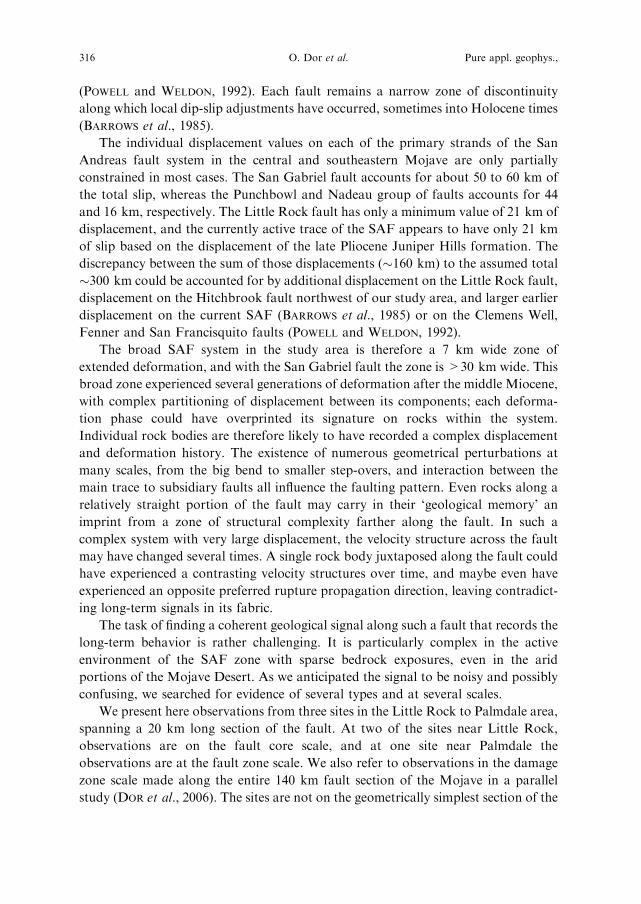
The Little Rock Paleoseismic Site: The Little Rock site, in the vicinity of E. 96th
St. south of the town of Little Rock (Fig. 4), hosted an investigation of the Holocene
slip rate of the SAF (SCHWARTZ and WELDON, 1986; WELDON and FUMAL, 2005).
They excavated a system of trenches and exposed several parallel strands of the fault,
including the one that accommodated the 1857 rupture. According to their
unpublished mapping, only one strand that separates bedrock units was found at
the bottom of the trench system. This strand of the SAF is about 5 to 8 meters north
of the 1857 strand and below an active channel (Fig. 6a). We re-trenched and
exposed the upper 60 cm of this bed rock fault zone, which is cut across by middle
Holocene (3.5 ka) unconsolidated alluvial deposits (Tom Fumal, pers. comm., 2004).
This fault strand juxtaposes granite on the northeast against the conglomeratic
late Pliocene Juniper Hills formation. These two units are separated by a 5 cm wide
soft and claylike dark brown gouge zone with distributed shear fabric, and a
through-going PSS inclined about 60� to the southwest (Fig. 6b). This strand
probably represents the post-Pliocene long-term SAF in this area. Individual
earthquakes may still occupy shallow branches close to the ground surface, as
indicated by nearby faults within young sediments.
The Juniper Hills conglomerate of the southwestern block is essentially intact. A
10 cm long pebble located immediately south of the gouge was reoriented parallel to
the PSS and shows no macroscopic fractures. Damage in the northeastern block is
substantially more intense. The granite is pulverized, with the original grain-scale
fabric preserved. The rock has a powder-like texture similar to the one that
characterizes the outcrops of Tejon Lookout granite in Tejon Pass (WILSON et al.,
2005) and in other localities along the Mojave section of the SAF (DOR et al., 2006).
In addition, cm-to-meter long fractures cut sporadically through the rock mass. This
texture and fabric disappear within 30 to 40 m from the contact of the northeastern
block with the gouge. The rock belt immediately northeast of the gouge is gray, have
powdery-plastic texture, and seems to include a mixture of siliceous material from the
granite on the northeast and claylike material from the gouge on the southwest. This
belt exhibits a diffuse contact with the granite and a sharp contact with the gouge
zone. We interpret this as a proto-gouge layer, representing an intermediate
development stage between the granitic protolith and the clay-rich gouge.
The history of deformation in the northeastern block of this fault is unknown and
the granite could have been pulverized and fractured during a previous episode of
faulting. Some of this deformation could therefore have occurred against other rock
bodies and along other fault strands. Nevertheless, the fault core, which is the zone
that accommodated the recent displacement and experienced mineralogical and
textural changes associated with slip along this fault strand, includes in addition to
the PSS and gouge, a proto-gouge layer of reworked granite within the northeastern
Vol. 163, 2006 Geological Observations of Damage Asymmetry 317
block; no similar changes or damage to the rock can be identified within the Juniper
Hills conglomerate. The fault core here is the result of a limited history of faulting, as
indicated by a narrow gouge, and was not likely developed within the granite during
a previous faulting phase. The smooth transition from pulverized granite to the
proto-gouge layer immediately adjacent to the PSS indicates that this layer and the
PSS are genetically related. Hence, the fault core that is associated with slip along
this fault strand, during which the fault juxtaposed the Juniper Hills conglomerate
and the granite, was developed entirely on the northeast side of the PSS. The
asymmetric structure of the fault core with respect to the PSS indicates that the
creation of ‘fault core scale’ damage during SAF earthquakes favors the northeastern
side of the fault in this location.
Little Rock Creek Site: The active strand of the SAF southwest of the town of
Little Rock and north of the Little Rock reservoir (Fig. 7) has strong geomorphic
expression with a right-lateral deflection of 600 m in the channel of Little Rock
Figure 6
(a) Paleoseismicity site south of the town of Little Rock (after WELDON and FUMAL, 2005). The active
strand of the SAF is marked by the line with the slip sense marks; the amount of channel deflection is
indicated. The red heavy line represents the re-trenched strip and the yellow box marks the location of the
trench exposure shown in (b). The line with triangles is a thrust fault, footwall to the north. (b). The trench
exposure in the yellow box of (a). The PSS is within a 5 cm wide gouge zone separating the Juniper Hill
Fm. from pulverized granite. The intense damage zone (fault core) related to displacement of this fault
outside the gouge is exclusively within the granite. The damage is asymmetrically located on the NE side of
the fault.
318 O. Dor et al. Pure appl. geophys.,

Creek. Bedrock outcrops with expression of fault zone features are absent from this
active fault environment due to burial by young sediments. However, 300 m south of
the currently active strand, a continuous exposure of a parallel, presumably inactive
strand of the SAF can be traced for several hundred meters. This fault is especially
prominent on the southeast wall of the Little Rock channel, where the gouge zone is
more than 6 meters wide. It continues in a relatively straight manner toward the
southeast, branching locally into two parallel strands. Along most of its exposed
length, the fault expresses a 1–2 m wide gouge zone, separating slightly metamor-
phous granodiorite on the northeast from fine sandstones interbedded with shale on
the southwest. The sandstone-shale sequence is plastically deformed with fold limbs
at the meter scale. The time of activity of this ancestral fault strand is unknown but
there are no obvious geomorphic features to indicate significant Holocene slip.
Figure 7
Locations of the Little Rock Creek study site and features of the SAF near by. The location of the trench is
marked by a vertical white box.Note the�600 mdeflection of the Little RockCreek channel by the active strand
of the SAF. The trench was excavated 300 meters to the south, across an inactive strand of the fault.
Vol. 163, 2006 Geological Observations of Damage Asymmetry 319

We manually excavated a 1.2-m-deep and 4-m-long trench (Fig. 8) covering the
span of the fault core, across the gouge zone and the adjacent wall-rocks where the
fault is expressed as a single straight lineament. The fault core here has a composite
structure with several fault rock layers; each of them has a distinct lithology, texture
and color. We applied the box-count methods for each of the layers within the fault
core, using rectangular zones with homogeneous texture and minimum irregularities
for FD analysis.
On the northeast, the granodiorite is pulverized, exhibiting textures similar to
those found in the pulverized Tejon Lookout granite at Tejon Pass (WILSON et al.,
2005). However, the width of the pulverized zone is substantially narrower and
extends to between several tens of cm to several meters from the gouge. The fractures
here are in the submicron scale and therefore mesoscale fracture mapping is not
effective for reliable FD analysis. Nevertheless, the FD must be high at the fine scale.
Adjacent to the northeast wall-rock, there is a 90-cm-wide, fine cataclasite that is
macroscopically alike the ultracataclasite described for the Punchbowl fault
(CHESTER and CHESTER, 1998) but here it includes sparse large clasts. It contains
dense fracture population, dominated by joints (mode I cracks) in the mm scale, with
a FD of 6.8.
Figure 8
Trench log from the Little Rock Creek site and digitized fracture maps of framed zones from the different
gouge layers within the gouge zone. The numbers in the rectangles indicate the fracture density (cm/cm2).
There is a clear trend of decreasing FD from NE to SW. The fractures in the NE pulverized granodiorite
are in the microscale.
320 O. Dor et al. Pure appl. geophys.,
The next three gouge layers to the southwest, with a cumulative width of one
meter, differ in their color (from northeast to southwest: gray, blue and brown) but
share the same general texture and overall clayey composition. The gouge layers are
stiff and cohesive but contain a curvy and apparently bended shear fractures. The
fractures also appear to be well-welded (cohesive) and are therefore probably recently
inactive. They are on average parallel to the orientation of the fault. The FD values
of the three layers from northeast to southwest are 5.5, 3.2 and 2.9, respectively.
Farther southwest, a 75-cm-wide gouge layer is probably the most recently active
shear zone based on its similarity to the active gouge zone in other places. The
fractures are small to medium in the cm scale (1–7 cm long); they are curved, shiny
and have slip striations with low rakes. The fracture surfaces are less cohesive with
respect to fracture surfaces in the other gouge layers and the clayey flakes between
them are flexible. Based on this texture and the above similarity, it is possible that
this gouge layer was the main zone to participate in slip events during earthquakes on
the modern SAF until fairly recently. This gouge layer has a through-going slip
surface, which we interpret as the most recent PSS within the fault zone, dipping 65�and located slightly to the northeast from the center of the layer. Nevertheless, its FD
of 2.4 is somewhat less than those of the gouge layers to the northeast. The sheared
gouge layer is separated from the southwest host rock by a 20-cm-wide layer of
slightly more massive gouge. Finally on the southwest, there is a broken sandstone
unit with FD of 1.6. Fractures are relatively large and have no preferred orientation.
Overall, the fracture density within the gouge decreases systematically from the
northeast to the southwest. Although we are not sure whether the entire structure
and damage pattern was developed during the activity period of the current PSS, it
appears that throughout the history of this fault strand, damage accumulated
preferentially on the northeast side of the fault.
West Palmdale Trench Site: Between Highway 14 and Tierra Subida road in
Palmdale, the SAF juxtaposes surficial Quaternary alluvial deposits on the southwest
against similar deposits with slivers of the sandstone member of the late Pliocene
Anaverde formation on the northeast (BARROWS et al., 1985). A series of deflected
channels, benches and linear ridges attest to the localized nature of the fault in this
area, with only minor indications for small-scale step-overs and active secondary
parallel strands.
We excavated a 45-m-long trench with a general trend of 200�, perpendicular tothe strike of the fault, in order to expose the structure of the fault zone. The trench
crosses the fault where it deflects an active channel by about 15 m. Fortunately, the
sedimentary and crystalline bedrock that host the fault are either exposed on the
surface or just shallowly buried. Due to extensive damage and pulverization, we
found excavation through those rocks to be remarkably easy, except in places where
the backhoe had to penetrate old and tremendously cohesive gouge zones associated
with inactive fault strands.
Vol. 163, 2006 Geological Observations of Damage Asymmetry 321
Two fault structures dominate the trench exposure. One is a massive dip-slip
fault zone with a minimum horizontal width of 21 m. The second structure, which
occupies much of the rest of the trench, manifests strike-slip faulting related to the
active SAF. A detailed description of structural features, their relations within the
trench exposure, and their general geological context is presented below and
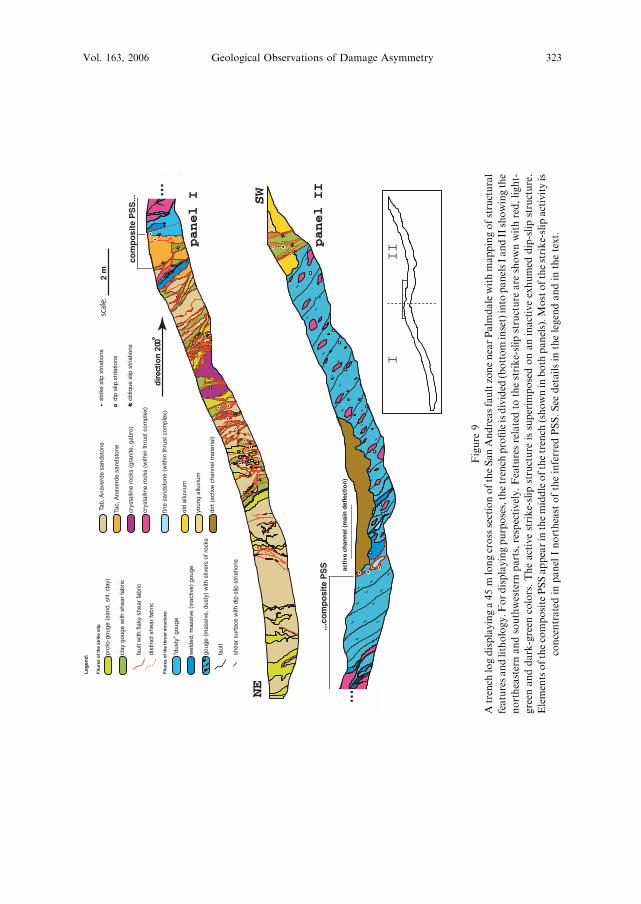
corresponds to Figure 9.
A primary interpreted aspect of these two structures is that the dip-slip structure
is inactive, as indicated by the fabric of its gouge, by the lack of geomorphic evidence
for its activity and by a cluster of relatively young strike-slip faults that cross-cut its
gouge fabric and juxtaposes it against young sediments. In contrast, the strike-slip
structure has several active or recently active components, as indicated by their
correlation with surface geomorphic features and by the nature of their fabric at
several scales (consistent with the discussed indicative fabrics in section 2). Structural
relationships indicate that the strike-slip structure is superimposed on the dip-slip
structure.
The distribution of bedrock and other lithologic units exposed in the trench is
shown in Figure 9. Sandstone of the Anaverde formation (light brown and orange)
appears in the northeastern half of the trench. Several slivers of granite and gabbro
(dark purple) appear within the sandstone, separated from it by strike-slip faults.
Finally, an assemblage of crystalline rocks is present on the southwest side of the
main fault as slivers within the dip-slip fault zone (pink). All of the sedimentary and
crystalline rocks yield powdery substance upon light pressure suggesting that they
were pervasively pulverized (Dor et al., 2006). Pleistocene (and younger?) alluvial
material crops out at the southern end of the trench (yellow). Shallow soil and recent
alluvium were not included in the trench log except in the active channel area (dark
brown). Structural features include faults (red and black lines), shear fabric and its
orientation (red and black small bars), gouge zones (color coded according to type)
and slip striations with a separate symbol for strike-slip, dip-slip and oblique-slip,
marked where kinematic indicators were observed.
Features related to the dip-slip fault appear mainly in the southwest and central
parts of the trench. They comprise a wide dip-slip fault zone parallel to the strike of
the SAF and dipping 35� to the southwest. Dark blue zones in Figure 9 represent
massive and extremely cohesive, clayey and heavily welded dark brown to black
gouge, having large planar slip surfaces that are parallel to the overall structure. The
more pronounced, dominant and continuous surfaces appear as black heavy lines
that in most cases separate the massive gouge from other units. Smaller shear
surfaces (short black bars) within the gouge and along the major slip surfaces show a
consistent set of pure dip-slip striations. The striations are clearly printed as long,
straight and parallel mini troughs and ridges into the gouge surfaces (mullions), and
are often associated with linear gypsum crystal growth. Zones in light blue are gouge
layers of the same nature as above, also having a substantial amount of silty material.
In its main part (south of the central part of Figure 9), this gouge is shown with
322 O. Dor et al. Pure appl. geophys.,
dir
ecti
on
200
com
po
site
PS
S...
Leg
end
:
Fit
ure
s o
f th
e st
rike
slip
prot
o-go
uge
(san
d, s
ilt, c
lay)
clay
gou
ge w
ith s
hear
fabr
ic
faul
t with
flak
y sh
ear
fabr
ic
dist
inct
she
ar fa
bric
Fit
ure
s o
f th
e th
rust
str
uct
ure
:
"dus
ty"
goug
e
wel
ded,
mas
sive
(in
activ
e) g
ouge
goug
e (m
assi
ve, d
usty
) w
ith s
liver
s of
roc
ks
faul
t
shea
r su
rfac
e w
ith d
ip s
lip s
tria
tions
Tab,
Ana
verd
e sa
ndst
one
Tac,
Ana
verd
e sa
ndst
one
crys
talli
ne r
ocks
(gr
anite
, gab
ro)
crys
talli
ne r
ocks
(w
ithin
thru
st c
ompl
ex)
fine
sand
ston
e (w
ithin
thru
st c
ompl
ex)
old
allu
vium
youn
g al
luvi
um
dirt
(ac
tive
chan
nel m
ater
ial)
strik
e sl
ip s
tria
tions
dip
slip
str
iatio
ns
obliq
ue s
lip s
tria
tions
2 m
NE
acti
ve c
han
nel
(m
ain
def
lect
ion
)
...co
mp
osi
te P
SS
SW
IIIpanel I
panel II
Figure
9
Atrench
logdisplayinga45m
longcrosssectionoftheSanAndreasfaultzonenearPalm
dalewithmappingofstructural
featuresandlithology.F
ordisplayingpurposes,thetrench
profileisdivided
(bottom
inset)into
panelsIandIIshowingthe
northeasternandsouthwestern
parts,respectively.Featuresrelatedto
thestrike-slip
structure
are
shownwithred,light-
green
anddark-green
colors.Theactivestrike-slip
structure
issuperim
posedonaninactiveexhumed
dip-slipstructure.
ElementsofthecompositePSSappearin
themiddleofthetrench
(shownin
both
panels).M
ostofthestrike-slip
activityis
concentratedin
panelInortheastoftheinferred
PSS.See
detailsin
thelegendandin
thetext.
Vol. 163, 2006 Geological Observations of Damage Asymmetry 323
dotted lines and elongated pink patches, representing and generalizing numerous slip
surfaces and slivers of crystalline rock inside the gouge, respectively.
Strike-slip faulting dominates in the northeastern and central part of the trench
and is manifested by several tens of strike-slip faults and fault segments (red lines)
with various inclinations from 30� to vertical, dipping both to the north and to the
south. These faults are typically narrow and localized (0.5 to 4 cm wide), defined
by brown-red to brown-dark, incohesive gouge layers with flaky fabric and small
(mm to cm scale) shear surfaces that display mostly horizontal to oblique slip
striations. The material itself is soft, claylike and appears to lack visible
porphyroclasts. The strike-slip faults are surrounded or bounded by additional
two types of gouge zones: the first type (green) is brown to dark-brown and has
clayey soft content with some silty material. In places, it exhibits shear fabric
parallel to the orientation of the nearest fault (dashed red lines). The second type
appears to be a ‘‘proto-gouge’’ (light green). Those gouge elements are normally
gray or light brown and seem to have smaller amounts of clayey material with
respect to silt; their visible clasts content is higher than that of the other gouge
elements and may bring them marginally under the definition of breccia (SIBSON,
1977). They lack distinct shear fabric and preserve some of the grain fabric of the
host rock (in most places, the arkosic member of the Anaverde Fm.). The
relationship of the ‘proto-gouge’ units to strike-slip faulting is indicated by their
close association with the other darker and sheared gouge units, with the strike-slip
faults themselves, and by their subvertical orientation. These three gouge types
seem to reflect different maturity stages of gouge zones and they all appear to be
associated with recent faulting.
We attribute the PSS to one of the following two candidates (Fig. 9). The first is
the isolated strike-slip fault immediately below the northern end of the active
channel; this fault was the major carrier of displacement during at least the last
several earthquakes as indicated by its strong geomorphic signature. Associated with
this fault is a 15 m large deflection of the channel and additional geomorphic features
along strike, such as aligned notches and other deflected channels. It reactivates two
or more ancient slip surfaces within the dip-slip structure, while stepping from one
surface to the other, creating an overall steeper inclination than the host surfaces.
The other candidate for the PSS is one of the vertical faults that bound the sliver of
fine-grained sandstone (orange) on the top of the hill approximately at the center of
the trench. Those faults juxtapose distinctive lithological units (the coarse against the
fine-grained members of the Anaverde formation and the entire northern sequence of
rocks against the major part of the dip-slip structure). They also separate the same set
of units in another trench, located �100 m to the east, where they also correlate with
the dominant geomorphic expression for recent faulting. Due to this uncertainty with
regard to the definition of the PSS, we refer to the zone that includes both candidates
as the composite PSS zone.
324 O. Dor et al. Pure appl. geophys.,
The distribution of strike-slip features across the fault zone in Figure 9 shows
that strike-slip activity is drastically stronger and more intense on the northeast side
of the composite PSS with respect to strike-slip activity on its southwest side. Only
three vertical strike-slip faults clustered in a one-meter-wide belt appear southwest of
the composite PSS. They most probably slipped during young SAF activity as they
separate the dip-slip complex from young (late Quaternary?) alluvial material.
However, they do not have a clear geomorphic signature that indicates recent
activity. The ground surface outside of the trench southwest of this belt is covered
with old alluvium and soil, and shows no indication of recent fault activity as well.
From the northeastern side of the composite PSS, several tens of strike-slip faults cut
through the exposed rocks. They have most probably been active during recent SAF
events and may have accommodated a fraction of the displacement. This is suggested
by the fresh appearance of their shear fabric, which is alike to the fabric found in the
faults of the composite PSS and in other active gouge zones (such as the gouge of the
road cut exposure along the SJF near Anza, as described above). The association of
this large group of faults with the active faults of the composite PSS is supported not
only by their textural similarity, but also by an overall decrease of their local density
as a function of distance from the major active area of the fault zone. A dense group
of faults is clustered around slivers of crystalline rocks north of the PSS and their
density decreases for the adjacent five meters to the north, after which the density
further decreases over the next few meters. They become more diffuse with larger
volumes of the host rock between them, and the last seven northern meters or so of
the trench exhibit sparse direct evidence for shear, although there are several proto-
gouge zones that may indicate minor strike-slip activity. The overall trend is
therefore of gradual decrease in strike-slip activity from the composite PSS toward
the northeast.
In addition, a ‘fault zone valley’ is correlated with the zone of intense strike-slip
activity and can be partially inferred from the profile of the trench in Figure 9. There
is no lithological reason for the development of such a valley on this side of the fault
zone, as rocks on the valley side of the fault are sandstones and crystalline rocks that
are likely more resistant to erosion than the alluvial material on the other side of the
fault. Therefore, we attribute this effect to the increase in damage, and in particular,
the partial pulverization of the rock and the weakness of the active gouge zones on
the northeastern side of the fault zone, thereby enhancing the erosion.
To eliminate the possibility that this pattern reflects a local step-over or another
site-related complexity, we opened another trench 100 m to the southeast. We
observed there similar distribution of structural properties and geomorphic features,
confirming the general asymmetric nature of the fault zone structure in the area.
Summary: We observe asymmetry of structural properties in three different
exposures along the Mojave section of the SAF. Two of the observations (Little
Rock Paleoseismicity site and in Little Rock Creek) are at the scale of cm to meters
(fault core scale), whereas the site west of Palmdale is at the scale of meters to 10s of
Vol. 163, 2006 Geological Observations of Damage Asymmetry 325
meters (fault zone scale). Asymmetry has a unique form in each of the exposures, but
they all share the same sense: the northeastern side of the PSS is systematically more
damaged.
3.3 The Punchbowl Fault
The Punchbowl fault is an inactive, exhumed strand of the San Andreas system in
the central Transverse ranges of Southern California (Fig. 4). The fault has a long
wavelength sinuous trace, dips steeply to the southwest, and was primarily a right-
lateral strike-slip fault with a minor reverse component (CHESTER and LOGAN, 1986).
The Punchbowl fault is parallel to the SAF and it is truncated to the northwest and
to the southeast by the active SAF. Most of the Punchbowl trace is positioned about
5 km southwest of the SAF. The Punchbowl fault is therefore considered to be part
of the SAF system (DIBBLEE, 1968, 1987). It juxtaposes along much of its length
Precambrian to Cretaceous rocks of the San Gabriel basement complex against
arkosic sandstones and conglomerates of the Miocene-Pliocene Punchbowl forma-
tion. The Punchbowl fault and the SAF form the boundaries of the Punchbowl basin,
which was most likely created as a pull-apart basin in which the Punchbowl
formation accumulated to a thickness of more than 1 km (NOBLE, 1954; WOOD-
BURNE, 1975). Subsidiary faults within the formation suggest that deposition of this
unit was contemporaneous with the movement on the Punchbowl fault (Chester,
unpublished mapping, 1995). According to WELDON et al. (1993), at least half of the
displacement on the fault occurred during the Pliocene and Pleistocene, during and
after the deposition of the Punchbowl formation. The overall right lateral
displacement on the Punchbowl fault complex is assumed to be of the order of 40
to 50 km, with 44 km proposed by SCHULZ and EVANS (2000) and CHESTER et al.
(2004) based on the separation of the San Francisquito formation and the Fenner
faults (DIBBLEE, 1967, 1968), and in agreement with the offset of the Punchbowl
basin from its inferred sediment source (WELDON et al., 1993).
The Punchbowl fault zone has a well-defined structure with damage intensity that
increases progressively from the outer fault zone toward the fault core and the
ultracataclasite layer (CHESTER et al., 1993). Several workers have shown that shear
is restricted to the fault core, the zone that includes the ultracataclasite layer and a
zone, up to a few meters wide, of foliated cataclasite on both sides of the
ultracataclasite layer (CHESTER et al., 1993; SCHULZ and EVANS, 1998; CHESTER and
CHESTER, 1998). An argument in favor of localization is the continuous lithology
across each block adjacent to the fault compared to the sharp contrast in lithology on
both sides of the narrow contact zone (CHESTER et al., 2004). Additional support
comes from fabric analyses that show sharp mechanical and mineralogical
boundaries between the ultracataclasite and the host rock (CHESTER et al., 1993).
Detailed ultracataclasite studies have shown that slip was further localized at the last
stages of faulting, macroscopically and microscopically, on a prominent slip surface
326 O. Dor et al. Pure appl. geophys.,
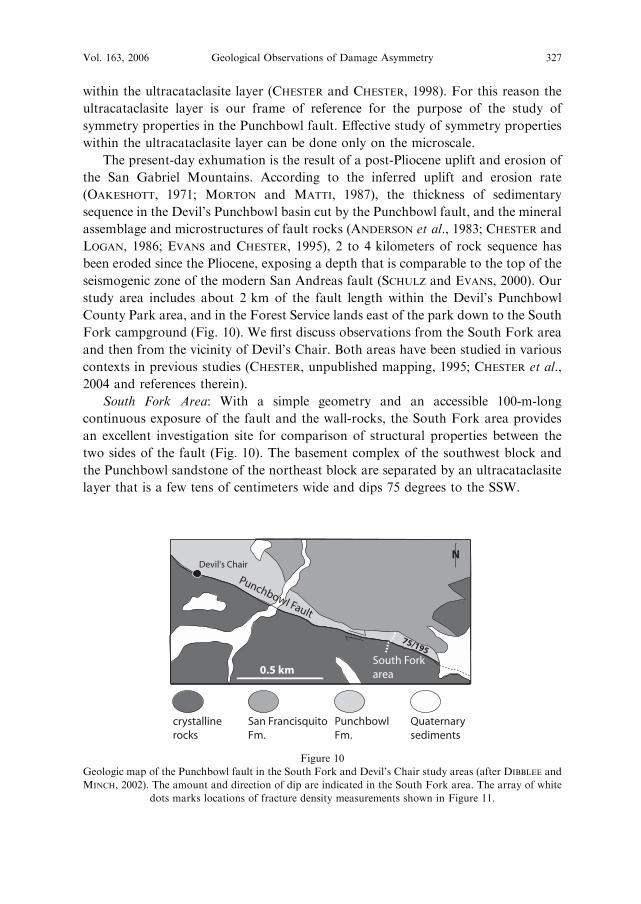
within the ultracataclasite layer (CHESTER and CHESTER, 1998). For this reason the
ultracataclasite layer is our frame of reference for the purpose of the study of
symmetry properties in the Punchbowl fault. Effective study of symmetry properties
within the ultracataclasite layer can be done only on the microscale.
The present-day exhumation is the result of a post-Pliocene uplift and erosion of
the San Gabriel Mountains. According to the inferred uplift and erosion rate
(OAKESHOTT, 1971; MORTON and MATTI, 1987), the thickness of sedimentary
sequence in the Devil’s Punchbowl basin cut by the Punchbowl fault, and the mineral
assemblage and microstructures of fault rocks (ANDERSON et al., 1983; CHESTER and
LOGAN, 1986; EVANS and CHESTER, 1995), 2 to 4 kilometers of rock sequence has
been eroded since the Pliocene, exposing a depth that is comparable to the top of the
seismogenic zone of the modern San Andreas fault (SCHULZ and EVANS, 2000). Our
study area includes about 2 km of the fault length within the Devil’s Punchbowl
County Park area, and in the Forest Service lands east of the park down to the South
Fork campground (Fig. 10). We first discuss observations from the South Fork area
and then from the vicinity of Devil’s Chair. Both areas have been studied in various
contexts in previous studies (CHESTER, unpublished mapping, 1995; CHESTER et al.,
2004 and references therein).
South Fork Area: With a simple geometry and an accessible 100-m-long
continuous exposure of the fault and the wall-rocks, the South Fork area provides
an excellent investigation site for comparison of structural properties between the
two sides of the fault (Fig. 10). The basement complex of the southwest block and
the Punchbowl sandstone of the northeast block are separated by an ultracataclasite
layer that is a few tens of centimeters wide and dips 75 degrees to the SSW.
Devil's Chair
Punchbowl Fault
South Forkarea
75/195
N
0.5 km
crystalline rocks
San Francisquito Fm.
Punchbowl Fm.
Quaternary sediments
Figure 10
Geologic map of the Punchbowl fault in the South Fork and Devil’s Chair study areas (after DIBBLEE and
MINCH, 2002). The amount and direction of dip are indicated in the South Fork area. The array of white
dots marks locations of fracture density measurements shown in Figure 11.
Vol. 163, 2006 Geological Observations of Damage Asymmetry 327
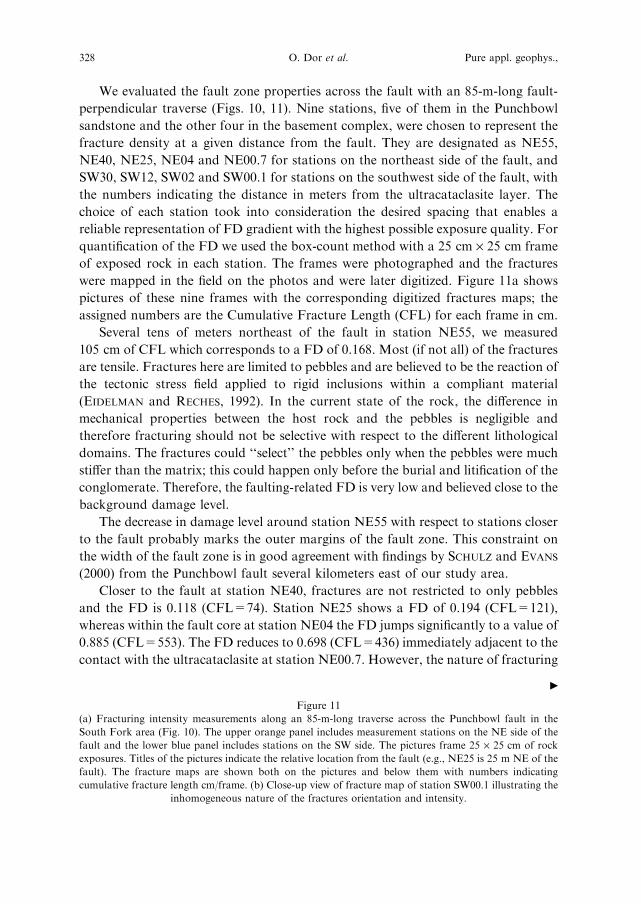
We evaluated the fault zone properties across the fault with an 85-m-long fault-
perpendicular traverse (Figs. 10, 11). Nine stations, five of them in the Punchbowl
sandstone and the other four in the basement complex, were chosen to represent the
fracture density at a given distance from the fault. They are designated as NE55,
NE40, NE25, NE04 and NE00.7 for stations on the northeast side of the fault, and
SW30, SW12, SW02 and SW00.1 for stations on the southwest side of the fault, with
the numbers indicating the distance in meters from the ultracataclasite layer. The
choice of each station took into consideration the desired spacing that enables a
reliable representation of FD gradient with the highest possible exposure quality. For
quantification of the FD we used the box-count method with a 25 cm · 25 cm frame
of exposed rock in each station. The frames were photographed and the fractures
were mapped in the field on the photos and were later digitized. Figure 11a shows
pictures of these nine frames with the corresponding digitized fractures maps; the
assigned numbers are the Cumulative Fracture Length (CFL) for each frame in cm.
Several tens of meters northeast of the fault in station NE55, we measured
105 cm of CFL which corresponds to a FD of 0.168. Most (if not all) of the fractures
are tensile. Fractures here are limited to pebbles and are believed to be the reaction of
the tectonic stress field applied to rigid inclusions within a compliant material
(EIDELMAN and RECHES, 1992). In the current state of the rock, the difference in
mechanical properties between the host rock and the pebbles is negligible and
therefore fracturing should not be selective with respect to the different lithological
domains. The fractures could ‘‘select’’ the pebbles only when the pebbles were much
stiffer than the matrix; this could happen only before the burial and litification of the
conglomerate. Therefore, the faulting-related FD is very low and believed close to the
background damage level.
The decrease in damage level around station NE55 with respect to stations closer
to the fault probably marks the outer margins of the fault zone. This constraint on
the width of the fault zone is in good agreement with findings by SCHULZ and EVANS
(2000) from the Punchbowl fault several kilometers east of our study area.
Closer to the fault at station NE40, fractures are not restricted to only pebbles
and the FD is 0.118 (CFL=74). Station NE25 shows a FD of 0.194 (CFL=121),
whereas within the fault core at station NE04 the FD jumps significantly to a value of
0.885 (CFL=553). The FD reduces to 0.698 (CFL=436) immediately adjacent to the
contact with the ultracataclasite at station NE00.7. However, the nature of fracturing
Figure 11
(a) Fracturing intensity measurements along an 85-m-long traverse across the Punchbowl fault in the
South Fork area (Fig. 10). The upper orange panel includes measurement stations on the NE side of the
fault and the lower blue panel includes stations on the SW side. The pictures frame 25 · 25 cm of rock
exposures. Titles of the pictures indicate the relative location from the fault (e.g., NE25 is 25 m NE of the
fault). The fracture maps are shown both on the pictures and below them with numbers indicating
cumulative fracture length cm/frame. (b) Close-up view of fracture map of station SW00.1 illustrating the
inhomogeneous nature of the fractures orientation and intensity.
c
328 O. Dor et al. Pure appl. geophys.,
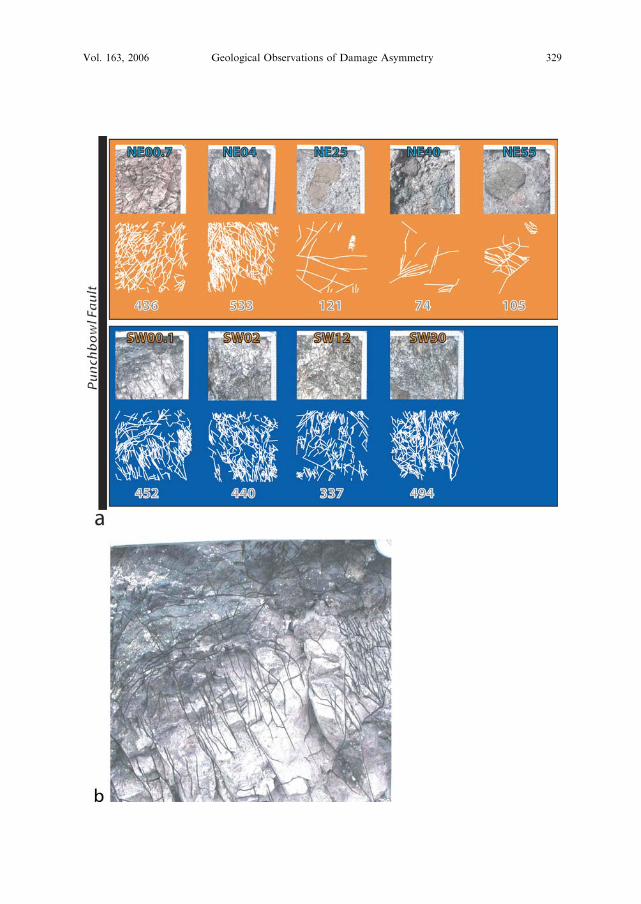
Vol. 163, 2006 Geological Observations of Damage Asymmetry 329
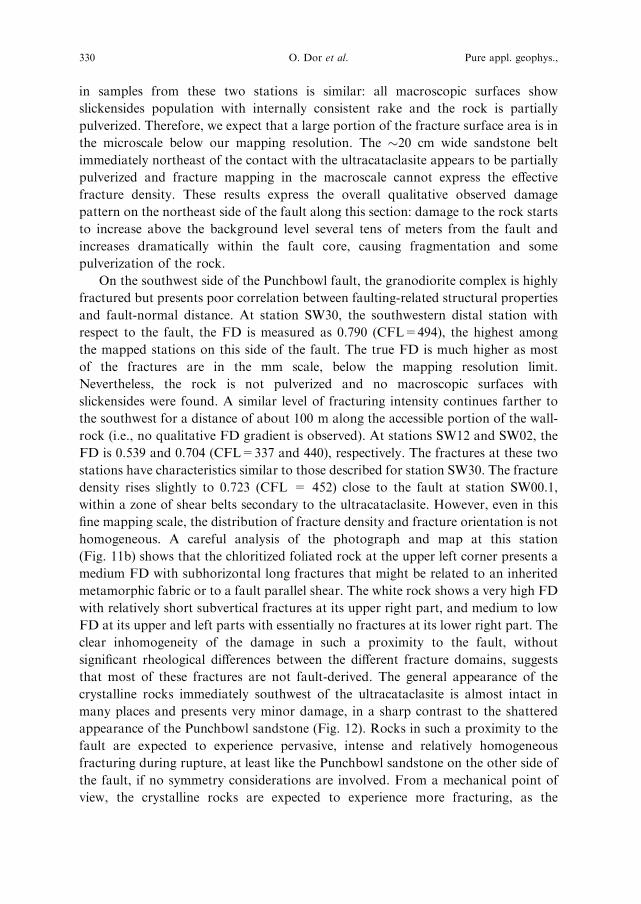
in samples from these two stations is similar: all macroscopic surfaces show
slickensides population with internally consistent rake and the rock is partially
pulverized. Therefore, we expect that a large portion of the fracture surface area is in
the microscale below our mapping resolution. The �20 cm wide sandstone belt
immediately northeast of the contact with the ultracataclasite appears to be partially
pulverized and fracture mapping in the macroscale cannot express the effective
fracture density. These results express the overall qualitative observed damage
pattern on the northeast side of the fault along this section: damage to the rock starts
to increase above the background level several tens of meters from the fault and
increases dramatically within the fault core, causing fragmentation and some
pulverization of the rock.
On the southwest side of the Punchbowl fault, the granodiorite complex is highly
fractured but presents poor correlation between faulting-related structural properties
and fault-normal distance. At station SW30, the southwestern distal station with
respect to the fault, the FD is measured as 0.790 (CFL=494), the highest among
the mapped stations on this side of the fault. The true FD is much higher as most
of the fractures are in the mm scale, below the mapping resolution limit.
Nevertheless, the rock is not pulverized and no macroscopic surfaces with
slickensides were found. A similar level of fracturing intensity continues farther to
the southwest for a distance of about 100 m along the accessible portion of the wall-
rock (i.e., no qualitative FD gradient is observed). At stations SW12 and SW02, the
FD is 0.539 and 0.704 (CFL=337 and 440), respectively. The fractures at these two
stations have characteristics similar to those described for station SW30. The fracture
density rises slightly to 0.723 (CFL = 452) close to the fault at station SW00.1,
within a zone of shear belts secondary to the ultracataclasite. However, even in this
fine mapping scale, the distribution of fracture density and fracture orientation is not
homogeneous. A careful analysis of the photograph and map at this station
(Fig. 11b) shows that the chloritized foliated rock at the upper left corner presents a
medium FD with subhorizontal long fractures that might be related to an inherited
metamorphic fabric or to a fault parallel shear. The white rock shows a very high FD
with relatively short subvertical fractures at its upper right part, and medium to low
FD at its upper and left parts with essentially no fractures at its lower right part. The
clear inhomogeneity of the damage in such a proximity to the fault, without
significant rheological differences between the different fracture domains, suggests
that most of these fractures are not fault-derived. The general appearance of the
crystalline rocks immediately southwest of the ultracataclasite is almost intact in
many places and presents very minor damage, in a sharp contrast to the shattered
appearance of the Punchbowl sandstone (Fig. 12). Rocks in such a proximity to the
fault are expected to experience pervasive, intense and relatively homogeneous
fracturing during rupture, at least like the Punchbowl sandstone on the other side of
the fault, if no symmetry considerations are involved. From a mechanical point of
view, the crystalline rocks are expected to experience more fracturing, as the
330 O. Dor et al. Pure appl. geophys.,
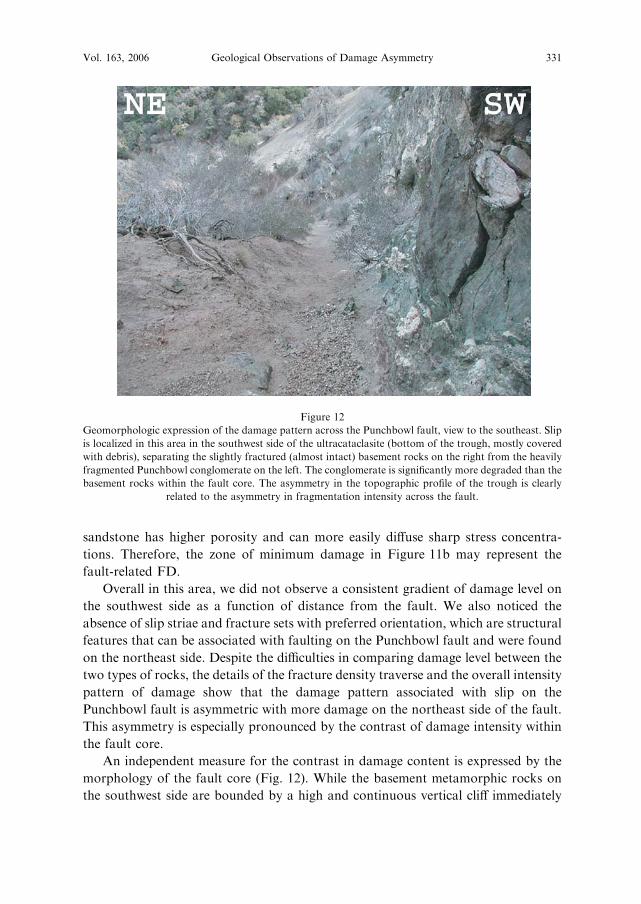
sandstone has higher porosity and can more easily diffuse sharp stress concentra-
tions. Therefore, the zone of minimum damage in Figure 11b may represent the
fault-related FD.
Overall in this area, we did not observe a consistent gradient of damage level on
the southwest side as a function of distance from the fault. We also noticed the
absence of slip striae and fracture sets with preferred orientation, which are structural
features that can be associated with faulting on the Punchbowl fault and were found
on the northeast side. Despite the difficulties in comparing damage level between the
two types of rocks, the details of the fracture density traverse and the overall intensity
pattern of damage show that the damage pattern associated with slip on the
Punchbowl fault is asymmetric with more damage on the northeast side of the fault.
This asymmetry is especially pronounced by the contrast of damage intensity within
the fault core.
An independent measure for the contrast in damage content is expressed by the
morphology of the fault core (Fig. 12). While the basement metamorphic rocks on
the southwest side are bounded by a high and continuous vertical cliff immediately
Figure 12
Geomorphologic expression of the damage pattern across the Punchbowl fault, view to the southeast. Slip
is localized in this area in the southwest side of the ultracataclasite (bottom of the trough, mostly covered
with debris), separating the slightly fractured (almost intact) basement rocks on the right from the heavily
fragmented Punchbowl conglomerate on the left. The conglomerate is significantly more degraded than the
basement rocks within the fault core. The asymmetry in the topographic profile of the trough is clearly
related to the asymmetry in fragmentation intensity across the fault.
Vol. 163, 2006 Geological Observations of Damage Asymmetry 331
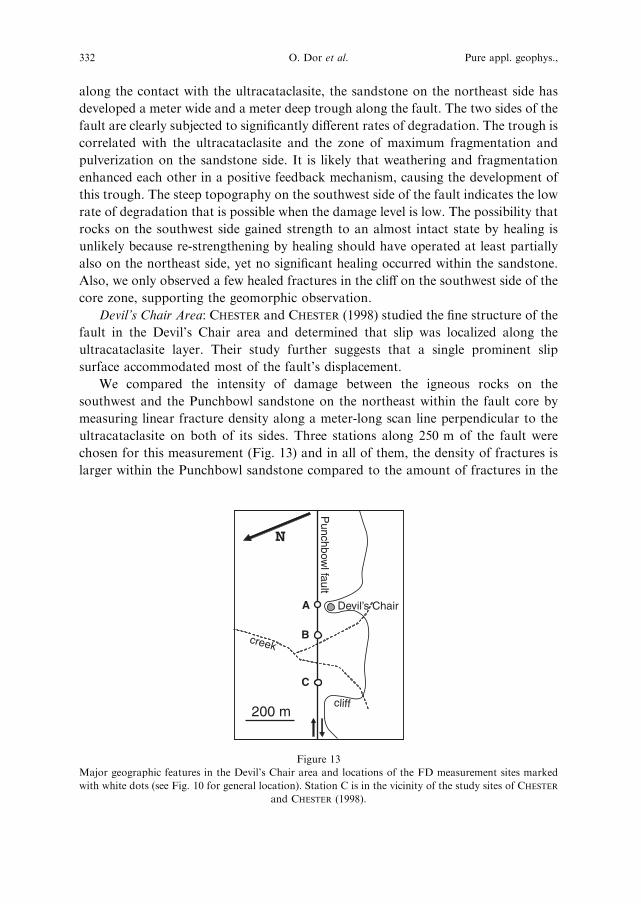
along the contact with the ultracataclasite, the sandstone on the northeast side has
developed a meter wide and a meter deep trough along the fault. The two sides of the
fault are clearly subjected to significantly different rates of degradation. The trough is
correlated with the ultracataclasite and the zone of maximum fragmentation and
pulverization on the sandstone side. It is likely that weathering and fragmentation
enhanced each other in a positive feedback mechanism, causing the development of
this trough. The steep topography on the southwest side of the fault indicates the low
rate of degradation that is possible when the damage level is low. The possibility that
rocks on the southwest side gained strength to an almost intact state by healing is
unlikely because re-strengthening by healing should have operated at least partially
also on the northeast side, yet no significant healing occurred within the sandstone.
Also, we only observed a few healed fractures in the cliff on the southwest side of the
core zone, supporting the geomorphic observation.
Devil’s Chair Area: CHESTER and CHESTER (1998) studied the fine structure of the
fault in the Devil’s Chair area and determined that slip was localized along the
ultracataclasite layer. Their study further suggests that a single prominent slip
surface accommodated most of the fault’s displacement.
We compared the intensity of damage between the igneous rocks on the
southwest and the Punchbowl sandstone on the northeast within the fault core by
measuring linear fracture density along a meter-long scan line perpendicular to the
ultracataclasite on both of its sides. Three stations along 250 m of the fault were
chosen for this measurement (Fig. 13) and in all of them, the density of fractures is
larger within the Punchbowl sandstone compared to the amount of fractures in the
A
B
C
200 mcliff
creek
Punchbow
l fault
Devil’s Chair
Figure 13
Major geographic features in the Devil’s Chair area and locations of the FD measurement sites marked
with white dots (see Fig. 10 for general location). Station C is in the vicinity of the study sites of CHESTER
and CHESTER (1998).
332 O. Dor et al. Pure appl. geophys.,
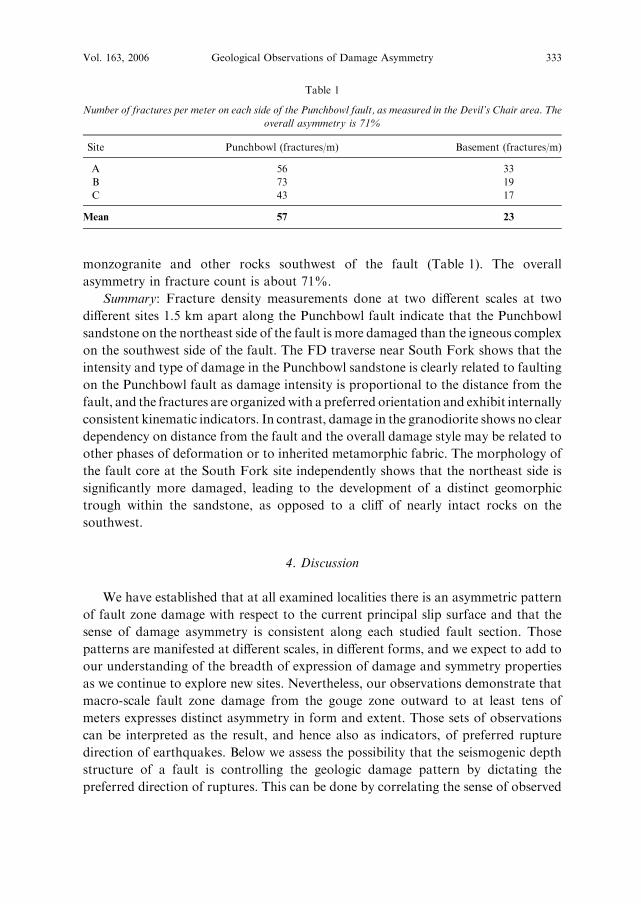
monzogranite and other rocks southwest of the fault (Table 1). The overall
asymmetry in fracture count is about 71%.
Summary: Fracture density measurements done at two different scales at two
different sites 1.5 km apart along the Punchbowl fault indicate that the Punchbowl
sandstone on the northeast side of the fault is more damaged than the igneous complex
on the southwest side of the fault. The FD traverse near South Fork shows that the
intensity and type of damage in the Punchbowl sandstone is clearly related to faulting
on the Punchbowl fault as damage intensity is proportional to the distance from the
fault, and the fractures are organizedwith a preferred orientation and exhibit internally
consistent kinematic indicators. In contrast, damage in the granodiorite shows no clear
dependency on distance from the fault and the overall damage style may be related to
other phases of deformation or to inherited metamorphic fabric. The morphology of
the fault core at the South Fork site independently shows that the northeast side is
significantly more damaged, leading to the development of a distinct geomorphic
trough within the sandstone, as opposed to a cliff of nearly intact rocks on the
southwest.
4. Discussion
We have established that at all examined localities there is an asymmetric pattern
of fault zone damage with respect to the current principal slip surface and that the
sense of damage asymmetry is consistent along each studied fault section. Those
patterns are manifested at different scales, in different forms, and we expect to add to
our understanding of the breadth of expression of damage and symmetry properties
as we continue to explore new sites. Nevertheless, our observations demonstrate that
macro-scale fault zone damage from the gouge zone outward to at least tens of
meters expresses distinct asymmetry in form and extent. Those sets of observations
can be interpreted as the result, and hence also as indicators, of preferred rupture
direction of earthquakes. Below we assess the possibility that the seismogenic depth
structure of a fault is controlling the geologic damage pattern by dictating the
preferred direction of ruptures. This can be done by correlating the sense of observed
Table 1
Number of fractures per meter on each side of the Punchbowl fault, as measured in the Devil’s Chair area. The
overall asymmetry is 71%
Site Punchbowl (fractures/m) Basement (fractures/m)
A 56 33
B 73 19
C 43 17
Mean 57 23
Vol. 163, 2006 Geological Observations of Damage Asymmetry 333
damage asymmetry to the local velocity structure at depth, since this correlation is an
expected outcome of rupture along a material interface (BEN-ZION and SHI, 2005).
4.1 Asymmetry of Structural Properties in Light of Velocity Structure
The San Jacinto Fault, Anza: The gouge fabric found in the three studied
exposures on the SJF near Anza shows that the northeastern side of the current PSS
is more damaged. This sense of asymmetry is consistent with high resolution seismic
imaging by LEWIS et al. (2005), based on fault zone trapped waves recorded across
the three branches of the SJF south of Anza. Their inversion results indicate the
existence of �100 wide fault zone trapping structures at the different branches that
extend to a depth of about 3.5 km. The seismic imaging shows further that the
trapping structure at each of the branches is not centered on the surface trace of the
fault, but is offset 50–100 m to the northeast. The results imply that more damaged
fault zone material is present on the northeast side of each fault. The damage
asymmetry in our geological mapping and the seismic trapped waves study is
compatible with northwestward rupture propagation direction, with the primary
tensional quadrant of most rupture events on the northeast side of the fault.
The local velocity structure of the Anza seismic gap was imaged by SCOTT et al.
(1994), who showed that at depths of 3 km, 6 km and to some extent also 9 km, the
northeast side of the fault has faster seismic velocities. This is the side that has more
damaged rock in our geological studies and in the seismic imaging of LEWIS et al.
(2005). These results are in agreement with regional imaging of MAGISTRALE and
SANDERS (1995) and SHAPIRO et al. (2005), who show the same sense of velocity
contrast in the Anza area and farther to the southeast. The existence of more rock
damage on the side of the fault that has faster seismic velocity at seismogenic depth is
expected if a material interface controls the preferred propagation direction on the
fault.
The San Andreas Fault in the Mojave: The consistency of our gouge and fault zone
scale observations from the Palmdale-Little Rock area of the SAF most probably
reflects the asymmetric damage pattern across the fault in this area with the
northeastern side more damaged. This conclusion probably also applies for the entire
Mojave section of the fault, based on the compatibility of the sense of asymmetry
discussed in this work with results associated with pulverized fault zone rocks. DOR
et al. (2006) mapped the distribution of pulverized rocks along a 140-km-long section
of the SAF in the Mojave, overlapping with our study area. They found that the
pulverized rock is a systematic structural feature of the fault that can be found, with just
a few exceptions,wherever crystalline rocks crop outwithin up to 200 m from the active
trace of the fault. The distribution of the outcrops with respect to the fault was found to
be asymmetric, with most of the pulverized rock exposures being on the northeastern
side of the fault. This pattern may reflect, at least partially, the current distribution of
available exposures. Nevertheless, in several places where comparison is possible
334 O. Dor et al. Pure appl. geophys.,
between the two sides of the fault, pulverization is more intense and the zone of
pulverization iswider on theNE side of the fault, supporting the near-fieldmacroscopic
observations presented here. This combined multi-scale set of observations suggests
that the northeastern side of the SAF in the Mojave has accumulated more damage at
various scales and forms during repeated ruptures. A possible explanation for this
damage distribution pattern is that most of the ruptures during the recent geological
history of the fault propagated from southeast to northwest in theMojave area, having
their tensional quadrant on the northeastern side of the fault.
The velocity structure along the Mojave section of the SAF has been studied to
some extent. SHAPIRO et al. (2005) cross-correlated ambient seismic noise at USArray
stations and constructed tomographic images of principal geologic units in
California. Their 7.5 and 15 s period images based on surface waves indicate that
overall, the Mojave block shows higher seismic velocities with respect to the
southwest side of the fault. This velocity contrast continues farther to the southeast
and is of opposite sense to the velocity contrast across the SAF northwest of the big
bend. As part of the Los Angeles Region Seismic Experiment (LARSE), FUIS et al.
(2001) report for line 1 (crossing the SAF slightly southeast of our study areas) that
in contrast to velocities below the San Gabriel Mountains, velocities to 10 km depth
below the Mojave are consistently higher than average laboratory velocities for the
Pelona schist, and therefore the Pelona schist does not appear to be present in the
Mojave desert beneath line 1. This agrees with aeromagnetic data along this transect.
Line 2 of the LARSE experiment crossed the SAF in the Elizabeth Lake area,
northwest of our west Palmdale site. LUTTER et al. (2004) report for line 2 that
although poorly resolved, basement velocities at depth are higher north of the SAF.
That inference is also supported by gravity data along the transect. FUIS et al. (2003)
show generalized velocity cross sections based on lines 1 and 2, with the Mojave side
having 8–10% faster seismic velocities at depth. If these two studies are represen-
tative of the entire Mojave segment, the faster velocity side of the fault at seismogenic
depth correlates with the side of the fault that expresses more damage, as expected
for rupture along a material interface (BEN-ZION and SHI, 2005).
In both studied sections of the SAF and the SJF, the asymmetry of structural
damage may reflect a preferred propagation direction associated with contrasting
elastic properties at depth. Across both the SAF and the SJF, the velocity contrast
continues farther southeast of the study areas, where ruptures could have nucleated
in order to propagate to the northwest through our investigation sites.
The Punchbowl Fault: The excess in fault–related damage on the northeast side
of the Punchbowl fault compared to its southwest side in the studied area
suggests that more paleoearthquakes propagated to the northwest than to the
southeast when the fault was active. The velocity structure of the Punchbowl fault
at seismogenic depth is unknown. Based on our observed damage pattern we
estimate that the southwest side of the fault has slower seismic velocity at depth
with respect to the Mojave side.
Vol. 163, 2006 Geological Observations of Damage Asymmetry 335
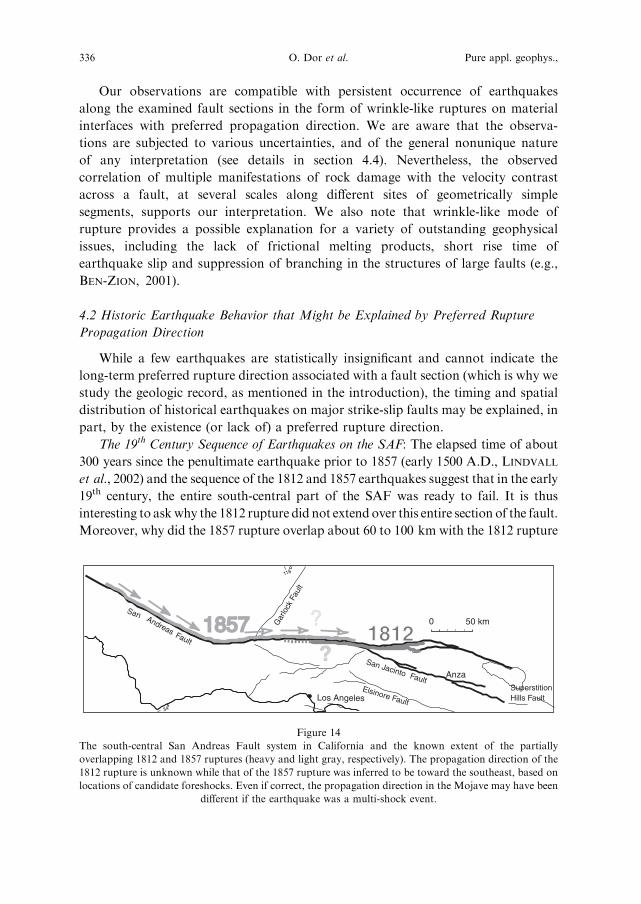
Our observations are compatible with persistent occurrence of earthquakes
along the examined fault sections in the form of wrinkle-like ruptures on material
interfaces with preferred propagation direction. We are aware that the observa-
tions are subjected to various uncertainties, and of the general nonunique nature
of any interpretation (see details in section 4.4). Nevertheless, the observed
correlation of multiple manifestations of rock damage with the velocity contrast
across a fault, at several scales along different sites of geometrically simple
segments, supports our interpretation. We also note that wrinkle-like mode of
rupture provides a possible explanation for a variety of outstanding geophysical
issues, including the lack of frictional melting products, short rise time of
earthquake slip and suppression of branching in the structures of large faults (e.g.,
BEN-ZION, 2001).
4.2 Historic Earthquake Behavior that Might be Explained by Preferred Rupture
Propagation Direction
While a few earthquakes are statistically insignificant and cannot indicate the
long-term preferred rupture direction associated with a fault section (which is why we
study the geologic record, as mentioned in the introduction), the timing and spatial
distribution of historical earthquakes on major strike-slip faults may be explained, in
part, by the existence (or lack of) a preferred rupture direction.
The 19th Century Sequence of Earthquakes on the SAF: The elapsed time of about
300 years since the penultimate earthquake prior to 1857 (early 1500 A.D., LINDVALL
et al., 2002) and the sequence of the 1812 and 1857 earthquakes suggest that in the early
19th century, the entire south-central part of the SAF was ready to fail. It is thus
interesting to askwhy the 1812 rupture did not extendover this entire section of the fault.
Moreover, why did the 1857 rupture overlap about 60 to 100 km with the 1812 rupture
0 50 km
34
118
San Andreas
Los Angeles
Gar
lock
Fau
lt
San Jacinto FaultElsinore Fault
1812181218571857
Anza
Fault
Superstition Hills Fault
?
?
Figure 14
The south-central San Andreas Fault system in California and the known extent of the partially
overlapping 1812 and 1857 ruptures (heavy and light gray, respectively). The propagation direction of the
1812 rupture is unknown while that of the 1857 rupture was inferred to be toward the southeast, based on
locations of candidate foreshocks. Even if correct, the propagation direction in the Mojave may have been
different if the earthquake was a multi-shock event.
336 O. Dor et al. Pure appl. geophys.,
(Fig. 14), overshooting several meters of slip into the rupture zone of the earlier
earthquake only 45 years later (WELDON et al., 2002; FUMAL et al., 1993)? And why is
the inferred rupture direction for the 1857 Ft. Tejon earthquake (SIEH, 1978b; AGNEW
and SIEH, 1978) the opposite of our inferred preferred rupture direction for theMojave?
To address these questions we need to examine the available information. Seismic
imaging of the SAF near Parkfield shows 5–20% lower seismic velocity in the
seismogenic zone on the northeast side of the fault (e.g., BEN-ZION et al., 1992;
EBERHART-PHILLIPS and MICHAEL, 1993). Therefore, a southeastward propagation
direction of large (M > 7) earthquakes is expected in that area according to the
model of rupture along a material interface. Nucleation in the Carrizo plain and
southeastward propagation was inferred by SIEH (1978b) for the 1857 earthquake. In
the last 40% or so of its final length, the rupture propagated in the Mojave, against
our assumed long-term preferred rupture direction inferred from the observed rock
damage asymmetry. High resolution seismic imaging of the SAF south of the
Parkfield area is lacking, but as mentioned earlier the regional imaging by SHAPIRO
et al. (2005) and traverses of the LARSE experiment (FUIS et al., 2003) suggest that
the sense of velocity contrast observed for the Parkfield area flips somewhere toward
the Mojave. It is thus plausible that the last part of the 1857 event propagated into a
zone of opposite sense of velocity contrast in the Mojave area, and was finally
arrested toward Cajon Pass. A support for this comes from the slip function of this
earthquake (SIEH, 1978a). The displacement peaked at �8–9 m around Wallace
Creek, then subsided to �6–7 m along the southern Carrizo plain and dropped to
�3 m passing Tejon Pass into the Mojave with values as low as 1–1.5 m in
Wrightwood. The 1812 earthquake has an unknown propagation direction, but from
the correlation between the sense of damage asymmetry and the apparent velocity
contrast we speculate that this earthquake propagated to the northwest. The strong
velocity contrast in the vicinity of its southeastern most known part (SHAPIRO et al.,
2005), is compatible with northwestward propagation direction. If this is correct, the
1812 rupture was presumably arrested in the northwestern edge of the Mojave due to
a change in the velocity structure, and thus did not leave evidence in the paleoseismic
record of Frazier Mountain (LINDVALL et al., 2002). More details about the velocity
structure of the SAF in this area and additional paleoseismic data about the 1812
rupture are needed in order to clarify more aspects of this problem. We also note that
with the limited available information on the rupture history of the 1857 earthquake,
it is possible that this earthquake was a compound event with two (or more) shocks.
The first and largest one nucleating in the northwestern Carrizo plain, propagating
southeastward and arresting somewhere in the northwestern Mojave (maybe due to
its entrance into a zone of decrease and then a change in the velocity contrast); the
other shock, responding to the large stress transfer of the first one and overriding
part of the previously yielded 1812 rupture zone, nucleating in the southeastern
Mojave and propagating toward the northwest. A two-shock scenario as above is
Vol. 163, 2006 Geological Observations of Damage Asymmetry 337
compatible with the known velocity structure along the rupture length and with the
geological signal for preferred rupture direction in the Mojave.
The 20th Century Sequence of Earthquakes on the North Anatolian Fault
(NAF): During the past century, the NAF experienced a remarkable sequence of
ruptures that began with the great 1939 (M7.9) earthquake near Erzincan and
proceeded westward with earthquakes in 1942, 1943, 1944, 1951, 1957, 1967,
1999a, and 1999b. STEIN et al. (1997) attributed this rupture sequence to
successive failures of fault segments due to stress transfer from failed neighboring
segments. However, the 1943 earthquake did not nucleate in the region of stress
increase but rather at the opposite end of the final rupture, far to the west.
Similarly, the 1999 August earthquake nucleated near the head of Izmit Bay and
ruptured bilaterally with the main rupture directed eastward toward the earlier
failures. This was followed by the continuation of rupture to the east in the
November 1999 Duzce earthquake.
The general westward migration of the earthquakes is an expected outcome of
rupture along a material interface at the NAF, if the southern block is generally the
side with lower seismic velocity (e.g., SENGOR et al., 2005). However, three events
of the 1939–1999 sequence ruptured eastward against the overall unzipping
direction of the fault. The 1943 and the 1999a earthquakes also nucleated away
from the area of largest inferred stress-transfer loading. The loading, nucleation and
rupture scenarios of these events are similar to the experimental setting and results of
ANOOSHEHPOOR and BRUNE (1999) with two different foam rubber blocks. This
suggests that the rupture directions of those events are controlled by a reversed local
velocity structure (i.e., lower seismic velocity north of the fault). If correct, we expect
in those fault sections that more damage is present in the southern block with the
assumed faster seismic velocity, and opposite sense of damage asymmetry at the
other rupture zones along the fault. These expectations can be tested with detailed
field observations of the type discussed in Section 3.
4.3 Possible Related Observations
In the European Alps, study of the exhumed Gole Larghe fault showed a distinct
asymmetry that was interpreted as the result of preferred direction of rupture
propagation (DI TORO et al., 2005). The Gole Larghe fault branches to the east from
the large right lateral Tonale fault into a tonalitic intrusion. Right-lateral slip along the
Gole Larghe fault took place at a depth of 9–11 km about 30 Ma ago (DI TORO and
PENNACCHIONI, 2004) and was at least in part seismic as indicated by numerous veins
of pseudotachylytes. DI TORO et al. (2005) studied the orientation of over 600 injected
veins filled with pseudotachylytes, branching from several secondary faults of the Gole
Larghe fault zone and exposed in the glaciated outcrops of upper Val di Genova. They
found that veins are asymmetrically distributed with respect to the fault, with 67.7% of
the veins intruding the southern bounding block. They concluded that those veins were
338 O. Dor et al. Pure appl. geophys.,
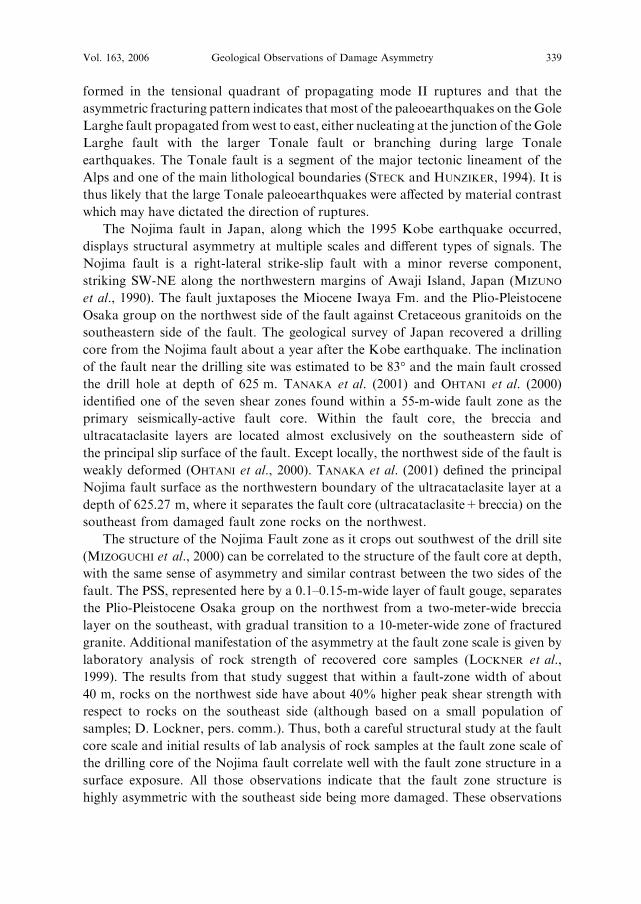
formed in the tensional quadrant of propagating mode II ruptures and that the
asymmetric fracturing pattern indicates that most of the paleoearthquakes on theGole
Larghe fault propagated fromwest to east, either nucleating at the junction of theGole
Larghe fault with the larger Tonale fault or branching during large Tonale
earthquakes. The Tonale fault is a segment of the major tectonic lineament of the
Alps and one of the main lithological boundaries (STECK and HUNZIKER, 1994). It is
thus likely that the large Tonale paleoearthquakes were affected by material contrast
which may have dictated the direction of ruptures.
The Nojima fault in Japan, along which the 1995 Kobe earthquake occurred,
displays structural asymmetry at multiple scales and different types of signals. The
Nojima fault is a right-lateral strike-slip fault with a minor reverse component,
striking SW-NE along the northwestern margins of Awaji Island, Japan (MIZUNO
et al., 1990). The fault juxtaposes the Miocene Iwaya Fm. and the Plio-Pleistocene
Osaka group on the northwest side of the fault against Cretaceous granitoids on the
southeastern side of the fault. The geological survey of Japan recovered a drilling
core from the Nojima fault about a year after the Kobe earthquake. The inclination
of the fault near the drilling site was estimated to be 83� and the main fault crossed
the drill hole at depth of 625 m. TANAKA et al. (2001) and OHTANI et al. (2000)
identified one of the seven shear zones found within a 55-m-wide fault zone as the
primary seismically-active fault core. Within the fault core, the breccia and
ultracataclasite layers are located almost exclusively on the southeastern side of
the principal slip surface of the fault. Except locally, the northwest side of the fault is
weakly deformed (OHTANI et al., 2000). TANAKA et al. (2001) defined the principal
Nojima fault surface as the northwestern boundary of the ultracataclasite layer at a
depth of 625.27 m, where it separates the fault core (ultracataclasite+breccia) on the
southeast from damaged fault zone rocks on the northwest.
The structure of the Nojima Fault zone as it crops out southwest of the drill site
(MIZOGUCHI et al., 2000) can be correlated to the structure of the fault core at depth,
with the same sense of asymmetry and similar contrast between the two sides of the
fault. The PSS, represented here by a 0.1–0.15-m-wide layer of fault gouge, separates
the Plio-Pleistocene Osaka group on the northwest from a two-meter-wide breccia
layer on the southeast, with gradual transition to a 10-meter-wide zone of fractured
granite. Additional manifestation of the asymmetry at the fault zone scale is given by
laboratory analysis of rock strength of recovered core samples (LOCKNER et al.,
1999). The results from that study suggest that within a fault-zone width of about
40 m, rocks on the northwest side have about 40% higher peak shear strength with
respect to rocks on the southeast side (although based on a small population of
samples; D. Lockner, pers. comm.). Thus, both a careful structural study at the fault
core scale and initial results of lab analysis of rock samples at the fault zone scale of
the drilling core of the Nojima fault correlate well with the fault zone structure in a
surface exposure. All those observations indicate that the fault zone structure is
highly asymmetric with the southeast side being more damaged. These observations
Vol. 163, 2006 Geological Observations of Damage Asymmetry 339
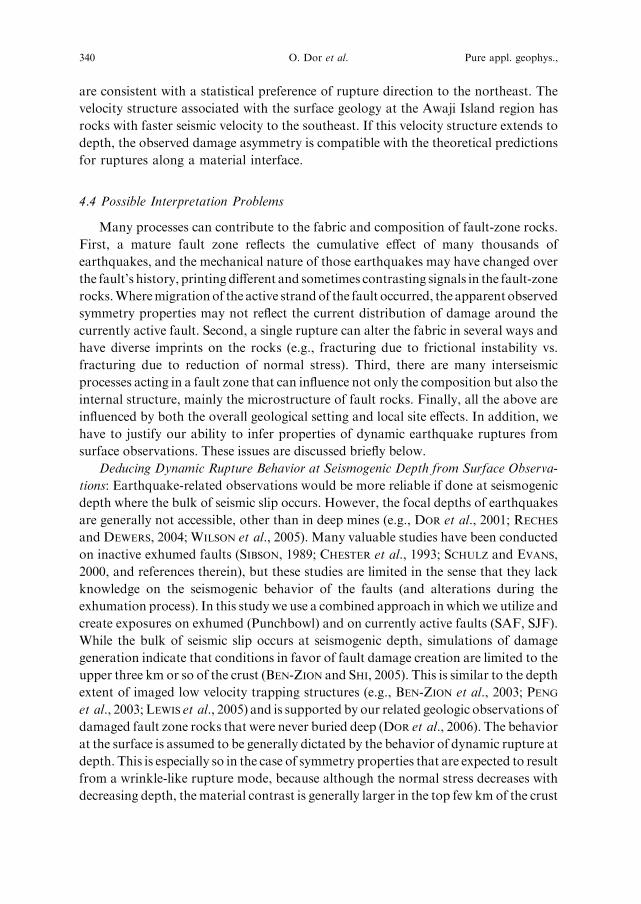
are consistent with a statistical preference of rupture direction to the northeast. The
velocity structure associated with the surface geology at the Awaji Island region has
rocks with faster seismic velocity to the southeast. If this velocity structure extends to
depth, the observed damage asymmetry is compatible with the theoretical predictions
for ruptures along a material interface.
4.4 Possible Interpretation Problems
Many processes can contribute to the fabric and composition of fault-zone rocks.
First, a mature fault zone reflects the cumulative effect of many thousands of
earthquakes, and the mechanical nature of those earthquakes may have changed over
the fault’s history, printing different and sometimes contrasting signals in the fault-zone
rocks.Wheremigrationof the active strandof the fault occurred, the apparent observed
symmetry properties may not reflect the current distribution of damage around the
currently active fault. Second, a single rupture can alter the fabric in several ways and
have diverse imprints on the rocks (e.g., fracturing due to frictional instability vs.
fracturing due to reduction of normal stress). Third, there are many interseismic
processes acting in a fault zone that can influence not only the composition but also the
internal structure, mainly the microstructure of fault rocks. Finally, all the above are
influenced by both the overall geological setting and local site effects. In addition, we
have to justify our ability to infer properties of dynamic earthquake ruptures from
surface observations. These issues are discussed briefly below.
Deducing Dynamic Rupture Behavior at Seismogenic Depth from Surface Observa-
tions: Earthquake-related observations would be more reliable if done at seismogenic
depth where the bulk of seismic slip occurs. However, the focal depths of earthquakes
are generally not accessible, other than in deep mines (e.g., DOR et al., 2001; RECHES
and DEWERS, 2004; WILSON et al., 2005). Many valuable studies have been conducted
on inactive exhumed faults (SIBSON, 1989; CHESTER et al., 1993; SCHULZ and EVANS,
2000, and references therein), but these studies are limited in the sense that they lack
knowledge on the seismogenic behavior of the faults (and alterations during the
exhumation process). In this study we use a combined approach in which we utilize and
create exposures on exhumed (Punchbowl) and on currently active faults (SAF, SJF).
While the bulk of seismic slip occurs at seismogenic depth, simulations of damage
generation indicate that conditions in favor of fault damage creation are limited to the
upper three km or so of the crust (BEN-ZION and SHI, 2005). This is similar to the depth
extent of imaged low velocity trapping structures (e.g., BEN-ZION et al., 2003; PENG
et al., 2003; LEWIS et al., 2005) and is supported by our related geologic observations of
damaged fault zone rocks that were never buried deep (DOR et al., 2006). The behavior
at the surface is assumed to be generally dictated by the behavior of dynamic rupture at
depth. This is especially so in the case of symmetry properties that are expected to result
from a wrinkle-like rupture mode, because although the normal stress decreases with
decreasing depth, the material contrast is generally larger in the top few km of the crust
340 O. Dor et al. Pure appl. geophys.,
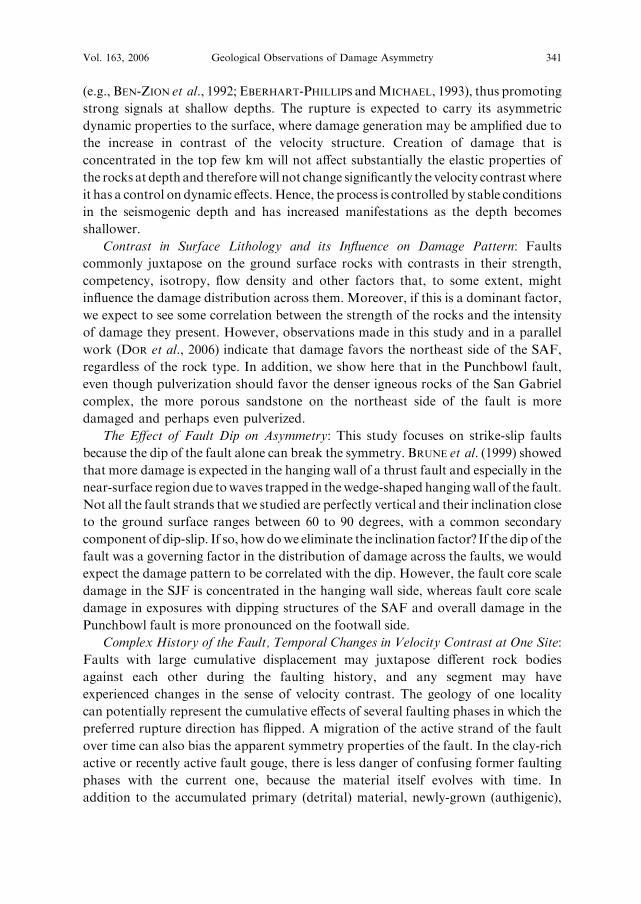
(e.g., BEN-ZION et al., 1992; EBERHART-PHILLIPS andMICHAEL, 1993), thus promoting
strong signals at shallow depths. The rupture is expected to carry its asymmetric
dynamic properties to the surface, where damage generation may be amplified due to
the increase in contrast of the velocity structure. Creation of damage that is
concentrated in the top few km will not affect substantially the elastic properties of
the rocks at depth and thereforewill not change significantly the velocity contrastwhere
it has a control on dynamic effects. Hence, the process is controlled by stable conditions
in the seismogenic depth and has increased manifestations as the depth becomes
shallower.
Contrast in Surface Lithology and its Influence on Damage Pattern: Faults
commonly juxtapose on the ground surface rocks with contrasts in their strength,
competency, isotropy, flow density and other factors that, to some extent, might
influence the damage distribution across them. Moreover, if this is a dominant factor,
we expect to see some correlation between the strength of the rocks and the intensity
of damage they present. However, observations made in this study and in a parallel
work (DOR et al., 2006) indicate that damage favors the northeast side of the SAF,
regardless of the rock type. In addition, we show here that in the Punchbowl fault,
even though pulverization should favor the denser igneous rocks of the San Gabriel
complex, the more porous sandstone on the northeast side of the fault is more
damaged and perhaps even pulverized.
The Effect of Fault Dip on Asymmetry: This study focuses on strike-slip faults
because the dip of the fault alone can break the symmetry. BRUNE et al. (1999) showed
that more damage is expected in the hanging wall of a thrust fault and especially in the
near-surface region due towaves trapped in thewedge-shaped hangingwall of the fault.
Not all the fault strands that we studied are perfectly vertical and their inclination close
to the ground surface ranges between 60 to 90 degrees, with a common secondary
component of dip-slip. If so, howdowe eliminate the inclination factor? If the dip of the
fault was a governing factor in the distribution of damage across the faults, we would
expect the damage pattern to be correlated with the dip. However, the fault core scale
damage in the SJF is concentrated in the hanging wall side, whereas fault core scale
damage in exposures with dipping structures of the SAF and overall damage in the
Punchbowl fault is more pronounced on the footwall side.
Complex History of the Fault, Temporal Changes in Velocity Contrast at One Site:
Faults with large cumulative displacement may juxtapose different rock bodies
against each other during the faulting history, and any segment may have
experienced changes in the sense of velocity contrast. The geology of one locality
can potentially represent the cumulative effects of several faulting phases in which the
preferred rupture direction has flipped. A migration of the active strand of the fault
over time can also bias the apparent symmetry properties of the fault. In the clay-rich
active or recently active fault gouge, there is less danger of confusing former faulting
phases with the current one, because the material itself evolves with time. In
addition to the accumulated primary (detrital) material, newly-grown (authigenic),
Vol. 163, 2006 Geological Observations of Damage Asymmetry 341
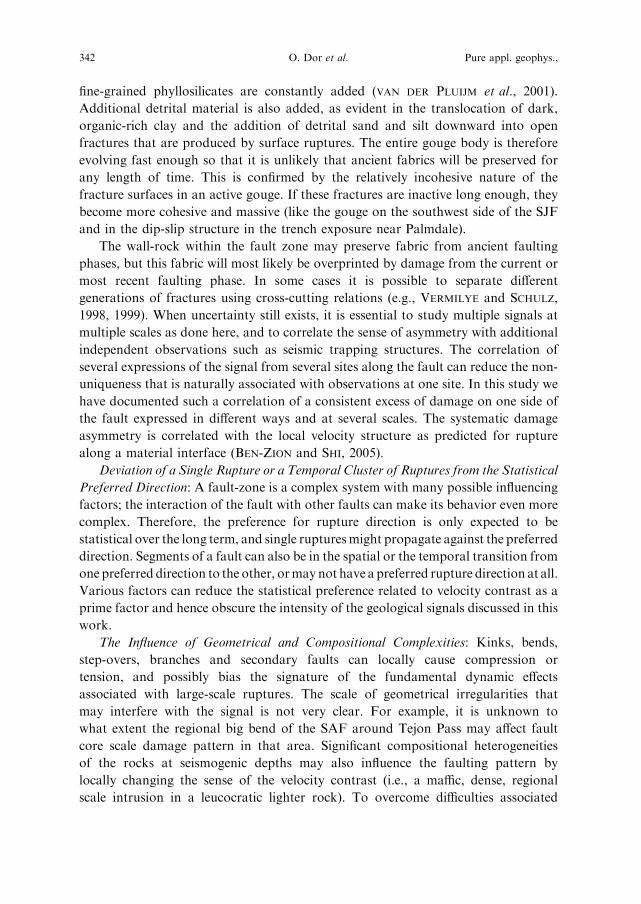
fine-grained phyllosilicates are constantly added (VAN DER PLUIJM et al., 2001).
Additional detrital material is also added, as evident in the translocation of dark,
organic-rich clay and the addition of detrital sand and silt downward into open
fractures that are produced by surface ruptures. The entire gouge body is therefore
evolving fast enough so that it is unlikely that ancient fabrics will be preserved for
any length of time. This is confirmed by the relatively incohesive nature of the
fracture surfaces in an active gouge. If these fractures are inactive long enough, they
become more cohesive and massive (like the gouge on the southwest side of the SJF
and in the dip-slip structure in the trench exposure near Palmdale).
The wall-rock within the fault zone may preserve fabric from ancient faulting
phases, but this fabric will most likely be overprinted by damage from the current or
most recent faulting phase. In some cases it is possible to separate different
generations of fractures using cross-cutting relations (e.g., VERMILYE and SCHULZ,
1998, 1999). When uncertainty still exists, it is essential to study multiple signals at
multiple scales as done here, and to correlate the sense of asymmetry with additional
independent observations such as seismic trapping structures. The correlation of
several expressions of the signal from several sites along the fault can reduce the non-
uniqueness that is naturally associated with observations at one site. In this study we
have documented such a correlation of a consistent excess of damage on one side of
the fault expressed in different ways and at several scales. The systematic damage
asymmetry is correlated with the local velocity structure as predicted for rupture
along a material interface (BEN-ZION and SHI, 2005).
Deviation of a Single Rupture or a Temporal Cluster of Ruptures from the Statistical
Preferred Direction: A fault-zone is a complex system with many possible influencing
factors; the interaction of the fault with other faults can make its behavior even more
complex. Therefore, the preference for rupture direction is only expected to be
statistical over the long term, and single rupturesmight propagate against the preferred
direction. Segments of a fault can also be in the spatial or the temporal transition from
one preferred direction to the other, ormay not have a preferred rupture direction at all.
Various factors can reduce the statistical preference related to velocity contrast as a
prime factor and hence obscure the intensity of the geological signals discussed in this
work.
The Influence of Geometrical and Compositional Complexities: Kinks, bends,
step-overs, branches and secondary faults can locally cause compression or
tension, and possibly bias the signature of the fundamental dynamic effects
associated with large-scale ruptures. The scale of geometrical irregularities that
may interfere with the signal is not very clear. For example, it is unknown to
what extent the regional big bend of the SAF around Tejon Pass may affect fault
core scale damage pattern in that area. Significant compositional heterogeneities
of the rocks at seismogenic depths may also influence the faulting pattern by
locally changing the sense of the velocity contrast (i.e., a maffic, dense, regional
scale intrusion in a leucocratic lighter rock). To overcome difficulties associated
342 O. Dor et al. Pure appl. geophys.,
with geometrical perturbations, we selected sites with minimum structural
complexities in sections of the faults that are relatively straight, simple and
vertical. Nevertheless geometrical irregularities can occur at all scales. It is
therefore important to show consistency in multi-signal multi-scale observations
along a fault section. Our results from the examined exposures show an overall
consistent pattern of damage asymmetry that is independent of known or
unknown structural and compositional complexities in the vicinity of a particular
exposure.
Finally, we emphasize that while single ruptures can produce asymmetric damage
pattern at various scales (e.g., JOHNSON et al., 1997;VERMILYE andSCHULZ, 1998, 1999;
RECHES and LOCKNER, 1994), the observations discussed in this work reflect clearly the
imprint of a large population of earthquakes. This is attested by the intensity, multi-
signal and multi-scale nature of the observations (from fault core to geomorphic
signatures), and by the observed fabrics and field relations which indicate that certain
fault zone components were active at different time periods.
5. Conclusions
We have made numerous in situ observations of damage asymmetry at various
scales along three major faults in southern California. We attempted to develop a
methodology to infer systematic structural asymmetry at different scales (recognizing
various potential interpretation problems), and use the observations to test the
hypothesis that large earthquake ruptures on strike-slip faults that separate different
crustal blocks have a preferred propagation direction (e.g., WEERTMAN, 1980;
ANDREWS and BEN-ZION, 1997; RANJITH and RICE, 2001; BEN-ZION and HUANG,
2002; SHI and BEN-ZION, 2006). The results indicate that the observed sense of
asymmetry is correlated with the local velocity structure, where known, and suggests
that the asymmetry is the long-term result from a preferred dynamic rupture
direction, in agreement with the theoretical predictions. In addition, we pointed out
with examples of historic rupture events from the San Andreas and North Anatolian
faults, that the property of a preferred rupture direction may partially explain the
distribution in time and space of large earthquake ruptures and their nucleation
points. The inferences that were presented here could possibly apply to other large
strike-slip faults, where geological studies of symmetry properties may be utilized to
infer on possible preferred propagation directions of earthquake ruptures.
The propagation of earthquakes as wrinkle-like ruptures in a preferred direction
can have fundamental implications for many aspects of earthquake physics and
hazard. The interaction between slip and normal stress along a material interface can
dynamically reduce the frictional strength, potentially to zero, making material
interfaces mechanically favored surfaces for rupture propagation (e.g., BEN-ZION,
2001; BRIETZKE and BEN-ZION, 2005). This may affect strongly the effective
Vol. 163, 2006 Geological Observations of Damage Asymmetry 343

constitutive laws, short rise-time of earthquake slip, the generated frictional heat,
suppression of branching, the evolution of fault zones, and expected seismic shaking
hazard.
The geological signals for preferred rupture direction are highly diverse. In this
paper, we presented several such signals based on observations in the gouge and fault
zone scales of large strike-slip faults in southern California. In a parallel study by DOR
et al. (2006), we discuss additional observations associated with pulverized fault zone
rocks. Further progress in theory can provide more detailed predictions on expected
properties of the damage that may be tested further by additional multi-disciplinary
multi-scale observations. A continuing feedback between theoretical predictions and
field observations can lead to the recognition of new types of signals thatmay be used to
deduce fundamental properties of earthquake behavior from in situ observations of
fault zone structure.
Acknowledgements
We thank Jim Brune for useful discussions that sharpened our description of the
results, and Joe Ibarzabal for allowing us to work in his property near Tierra Subida
Road in Palmdale. The paper benefited from useful comments by Judi Chester,
Diane Moore, Rasool Anooshehpoor and Nathan Benesh. The work was funded by
the National Science Foundation (grant EAR-0409048) and the Southern California
Earthquake Center (based on NSF cooperative agreement EAR-8920136 and United
States Geological Survey cooperative agreement 14-08-0001-A0899).
REFERENCES
ADAMS, G.G. (1995), Self-excited oscillations of two elastic half spaces sliding with constant coefficient of
friction, J. Appl. Mech. 62, 867–872.
AGAR, S.M., PRIOR, D.J., and BEHRMANN, J.H. (1989), Back-scattered electron imagery of the tectonic
fabrics of some fine-grained sediments: Implications for fabric nomenclature and deformation processes.
Geology 17, 901–904.
AGNEW, D.C. and SIEH, K.E. (1978), A documentary study of the felt effects of the great California
earthquake of 1857. Bull. Seismol. Soc. Am. 68, 6, 1717–1729.
ALLEN, C.R., AMAND, P.St., RICHTER, C.F., and NORDQUIST, J.M. (1965), Relationship between seismicity
and geological structure in the Southern California region, Bull. Seismol. Soc. Am. 55, 753–797.
ANDERSON, J.L., OSBOURNE, R.H., and PALMER, D.F. (1983), Cataclastic rocks of the San Gabriel fault: An
expression of deformation at deeper level in the San Andreas fault zone, Tectonophysics 98, 209–251.
ANDREWS, D.J. (2005), Rupture dynamics with energy loss outside the slip zone, J. Geophys. Res. 110,
B01307, doi:10.1029/2004JB003191.
ANDREWS, D.J. and BEN-ZION, Y. (1997), Wrinkle-like slip pulse on a fault between different materials,
J. Geophys. Res. 102, 553–571.
ANOOSHEHPOOR, A. and BRUNE, J.N. (1999), Wrinkle-like Weertman pulse at the interface between two
blocks of foam rubber with different velocities, Geophys. Res. Lett. 23, 2025–2028.
BARROWS, A.G., KAHLE, J.E., and BEEBY, D.J. (1985), Earthquake hazard and tectonic history of the San
Andreas fault zone, Los Angeles County, California, Open File Report 85–10 LA., California Department
of Conservation, Division of Mines and Geology.
344 O. Dor et al. Pure appl. geophys.,
BEN-ZION, Y. (2001), Dynamic rupture in recent models of earthquake faults, J. Mech. Phys. Solids. 49,
2209–2244.
BEN-ZION, Y. and ANDREWS, D.J. (1998), Properties and implications of dynamic rupture along a material
interface, Bull. Seismol. Soc. Am. 88, 1085–1094.
BEN-ZION, Y. and HUANG, Y. (2002), Dynamic rupture on an interface between a compliant fault zone layer
and a stiffer surrounding solid, J. Geophys. Res. 107, 2042, doi: 10.1029/2001JB000254.
BEN-ZION, Y., KATZ, S., and LEARY, P. (1992), Joint inversion of fault zone head waves and direct P arrivals
for crustal structure near major faults, J. Geophys. Res. 97, 1943–1951.
BEN-ZION, Y, and MALIN, P. (1991), San Andreas fault zone head waves near Parkfield, California, Science
251, 1592–1594.
BEN-ZION, Y., PENG, Z., OKAYA, D., SEEBER, L., ARMBRUSTER, J.G., OZER, N., MICHAEL, A.J., BARIS, S.,
and AKTAR, M. (2003), A shallow fault zone structure illuminated by trapped waves in the Karadere-Dusce
branch of the north Anatolian fault, Western Turkey, Geophys. J. Int. 152, 699–717.
BEN-ZION, Y. and SAMMIS, C.G. (2003), Characterization of fault zones, Pure Appl. Geophys. 160,
677–715.
BEN-ZION, Y. and SHI, Z. (2005), Dynamic rupture on a material interface with spontaneous generation of
plastic strain in the bulk, Earth. Plan. Sci. Lett. 236, 486–496, doi: 10.1016/j.epsl.2005.03.025.
BIEGEL, R.L., SAMMIS, C.G., and DIETERICH, J.H. (1989), The frictional properties of a simulated gouge
having a fractal particle distribution, J. Structural Geol. 11, 827–846.
BRIETZKE, G.B. and BEN-ZION, Y. (2005), Examining tendencies of in-plane rupture to migrate to material
interfaces, submitted to Geophys. J. Int.
BRUNE, J.N., ANOOSHEHPOOR, R., and ZENG, Y. (1999), Ground motions for shallow angle thrust faults.
Final technical report, University of Nevada at Reno, Seismological Laboratory, United States.
BRUNE, J.N. (1968), Seismic moment, seismicity, and rate of slip along major fault zones, J. Geophys. Res.
73, 777–784.
BRUNE, J.N. (2001), Fault normal dynamic loading and unloading: an explanation for ‘‘non-gouge’’ rock
powder and lack of fault-parallel shear bands along the San Andreas fault, EOS Trans. Am. Geophys.
Union 82, Abstract.
CHESTER, F.M. (1995), unpublished mapping.
CHESTER, F.M. and LOGAN, J.M. (1986), Implications for mechanical properties of brittle faults from
observation of the Punchbowl fault zone. California, Pure. Appl. Geophys. 124, 79–106.
CHESTER, F.M. and CHESTER, J.S. (1998), Ultracataclasite structure and friction processes of the Punchbowl
fault, San Andreas system, California, Tectonophysics 295, 199–221.
CHESTER, F.M., EVANS J.P., and BIEGEL, R.L. (1993), Internal structure and weakening mechanisms of the
San Andreas fault, J. Geophys. Res. 98, 771–786.
CHESTER, F.M., CHESTER, J.S., Kirschner, D.L., SCHULZ, S.E., and EVANS, J.P. (2004), Structure of large-
displacement strike-slip fault zones in the brittle continental crust. In (Karner, Gary D., Taylor, Brian,
Driscoll, Neal W., Kohlstedt, David L., eds.), Rheology and Deformation in the Lithosphere at
Continental Margins, (Columbia University Press, New York, MARGINS Theoretical and Experimen-
tal Earth Science Series 1, 223–260).
COCHARD, A. and RICE, J.R. (2000), Fault rupture between dissimilar materials: Ill-posedness, regulari-
zation, and slip-pulse response, J. Geophys. Res. 101, 25,321–25,336.
CROWELL, J.C. (1962), Displacement along the San Andreas fault, California, Spec. Pap. Geol. Soc. Am. 71,
61 pp.
DALGUER, L.A., IRIKURA, K., and RIERA, J. (2003), Simulation of tensile crack generation by 3-D dynamic
shear rupture propagation during an earthquake, J. Geophys. Res. 108(B3), 2144, doi:10.1029/
2001JB001738.
DERSHOWITZ, W.S. and HERDA, H.H. (1992), Interpretation of fracture spacing and intensity, Proc. U.S.
Symp. Rock Mech., 33rd, 757–766.
DIBBLEE, T.W. Jr. (1967), Displacements on the San Andreas fault system in the San Gabriel, San
Bernardino, and San Jacinto Mountains, southern California. (in Conference on geologic problems of San
Andreas fault system, Stanford, Calif., Proc. Stanford Univ. Pubs. Geol. Sci. v. 11, p. 260–276, illus).
DIBBLEE, T.W. (1968),Displacement on the San Andreas fault system in the San Gabriel, San Bernardino and
San Jacinto Mountains, Southern California. In (Dickinson, W.R. and A. Grantz, eds.), Proc. Conf.
Vol. 163, 2006 Geological Observations of Damage Asymmetry 345
Geologic Problems of San Andreas fault system, Geological Science, 11 (Stanford University
Publications, 1968), 260–278.
DIBBLEE, T.W., Jr. (1987), Geology of the Devil’s Punchbowl, Los Angeles County, California, Geological
Soc. Am. Centennial Field Guide Cordilleran Section, 207–210.
DIBBLEE, T.W., Jr. (1989), The San Andreas Fault and major rock terranes of California displaced by it and
its tectonics. In (Baldwin, E. Joan, et al.), Annual Field Trip Guidebook. South Coast Geological
Society, Vol. 17, Vol. 1, 223–275.
DIBBLEE, T.W. and MINCH, J.A. (2002), Geologic map of the Valyermo quadrangle, Los Angeles County,
California: DIBBLEE Geological Foundation, Map DF-80, scale 1:24000.
DI TORO, G., NIELSEN, S., and PENNACCHIONI1, G. (2005), Earthquake rupture dynamics frozen in exhumed
ancient fault, submitted to Nature.
DI TORO, G. and PENNACCHIONI, G. (2004), Superheated friction-induced melts in zoned pseudotachylytes
within the Adamello tonalites (Italian Southern Alps), J. Struct. Geol. 26, 1783–1801.
DOR, O., RECHES, Z., VAN ASWEGEN, G., and BOSMAN, K. (2001), Earthquake Rupture at the Focal Depth
of M = 5.1 and M = 3.7 Earthquakes in Gold Mines, South Africa, EOS Trans. Amer. Geophys. Union.
81, Abstract.
DOR, O., BEN-ZION, Y., ROCKWELL, T.K., and BRUNE J.N. (2006), Pulverized rocks in the Mojave section of
the San Andreas Fault Zone, Earth Planet. Sci. Lett., in review.
EBERHART-PHILLIPS, D. and MICHAEL, A.J. (1993), Three-dimensional velocity structure, seismicity and
fault structure in Parkfield region, central California. J. Geophys. Res. 98, 9, 15,737–15,758.
EIDELMAN, A. and RECHES, Z. (1992), Fratured pebbles: a new stress indicator. Geology., 20, 4, 307–310.
ENGELDER, J.T. (1974),Cataclasis and the generation of fault gouge, Geol. Soc. Am. Bull. 85, 10, 1515–1522.
EVANS, J.P. and CHESTER, F.M. (1995), Fluid-rock interaction in faults of the San Andreas system—infer-
ences from San-Gabriel fault rock geochemistry and microstructures. J. Geophys. Res. 100, 13007–13020
FIALKO, Y. (2004), Probing the mechanical properties of seismically active crust with space geodesy: Study of
the co-seismic deformation due to the 1992 Mw7.3 Landers (southern California) earthquake, J. Geophys.
Res. 109, doi:10.1029/2003JB002756.
FUIS, G.S., RYBERG, T., GODFREY, N., OKAYA, D.A., and MURPHY, J.M. (2001), Crustal structure and
tectonics from the Los Angeles basin to the Mojave Desert, southern CA, Geology 29, 15–18.
FUIS, G.S., CLAYTON, R.W., DAVIS, P.M., RYBERG, T., LUTTER, W.J., OKAYA, D.A., HAUKSSON, E.,
PRODEHL, C., MURPHY, J.M., BENTHIEN, M.L., BAHER, S.A., KOHLER, M.D., THYGESEN, K., SIMILA, G.,
and KELLER, G.R. (2003), Fault systems of the 1971 San Fernando and 1994 Northridge earthquakes,
southern California: Relocated aftershocks and seismic images from LARSE II, Geology 31, 171–174.
FUMAL, T.E., PEZZOPANE, S.K., WELDON, R.J.II, and SCHWARTZ, D.P. (1993), A 100-year average
recurrence interval for the San Andreas fault at Wrightwood, California, Science 259, 199–203.
GOODWIN, L.B. and TIKOFF, B. (2002), Competency contrast, kinematics, and the development of foliations
and liniations in the crust, J. Struc. Geol. 24, 1065–1085.
HENRY, C. and DAS, S. (2001), Aftershock zones of large shallow earthquakes: Fault dimensions, aftershock
area expansion, and scaling relations, Geophys. J. Int. 147, 272–293.
JOHNSON, A.V., FLEMING, R.W., CRUIKSHANK, K.M., MARTOSUDARMO, S.Y., JOHNSON, N.A., JOHNSON,
K.M., and WEI, W. (1997) Analecta of structures formed during the 28 June 1992 Landers, Big Bear,
California earthquake sequence, USGS Open File Report 97–94.
LE PICHON, X., KREEMER, C., and CHAMOT-ROOKE, N. (2005), Asymmetry in elastic properties and the
evolution of large continental strike-slip faults, J. Geophys Res. 110, xB03405 MAR 19.
LEWIS, M., PENG, Z., BEN-ZION, Y., and VERNON, F. (2005), Shallow seismic trapping structure in the San
Jacinto fault zone near Anza, California, Geophys. J. Int. 162, 867–881, doi:10.1111/j.1365–
246X.2005.02684.x.
LINDVALL, S.C., ROCKWELL, T.K., DAWSON, T.E., HELMS, J.G., and BOWMAN, K.W. (2002), Evidence for
two surface ruptures in the past 500 years on the San Andreas fault at Frazier Mountain, California, Bull.
Seismol. Soc. Am. 92, 7, 2689–2703.
LOCKNER, D., NAKA, H., TANAKA, H., ITO, H., and IKEDA, R. (1999), Permeability and strength of core
samples from the Nojima fault of the 1995 Kobe Earthquake, In Proc. of Internat. Wrkshp on the Nojima
fault Core and Borehole Data Analysis, Tsukuba, Japan, Nov. 22–23, USGS Open File Report 00–129
(H. Ito, K. Fujimoto, H. TANAKA, and D. LOCKNER, eds.) pp. 147–152.
346 O. Dor et al. Pure appl. geophys.,
LUTTER, W.J., FUIS, G.S., RYBERG, T., OKAYA, D.A., CLAYTON, R.W., DAVIS, P.M., PRODEHL, C.,
MURPHY, J.M., LANGENHEIM, V.E., BENTHIEN, M.L., GODFREY, N.J., CHRISTENSEN, N.I., THYGESEN,
K., THURBER, C.H., SIMILA, G., and KELLER, G.R. (2004), Upper crustal structure from the Santa
Monica Mountains to the Sierra Nevada, Southern California: Tomographic results from the Los Angeles
Regional Seismic Experiment, Phase II (LARSE), Bull. Seismol. Soc. Am. 94, 619–632.
MATTHEWS, V. (1976), Correlation of the Pinnacles and Neenach volcanic formations and their bearing on the
San Andreas fault problem, Am. Assoc. Petro. Geol. Bull. 60, 2128–2141.
MCGUIRE, J. and BEN-ZION, Y. (2005), High-resolution imaging of the Bear Valley section of the San
Andreas fault at seismogenic depths with fault-zone head waves and relocated seismicity, Geophys. J. Int.
163, 152–164, doi: 10.1111/j.1365-246X.2005.02703.x.
MCGUIRE, J.J., ZHAO, L., and JORDAN, T.H. (2002), Predominance of unilateral rupture for a global catalog
of large earthquakes, Bull. Seismol. Soc. Am. 92, 3309–3317.
MAGISTRALE, H. and SANDERS, C. (1995), P wave image of the Peninsular Ranges batholith, southern
California, Geophys. Res. Lett. 22, 2549–2552.
MERIFIELD, P.M., ROCKWELL, T.K., and LOUGHMAN, C.C. (1991), A slip rate based on trenching studies,
San Jacinto fault zone near Anza, California. In Engineering Geology and Geotechnical Engineering 27
(James McCalpin, ed.), pp. 28-1–28-21.
MIZOGUCHI, K., HIROSE, T., and SHIMAMOTO, T. (2000), Internal and permeability structures of Nojima
fault zone: Data correlation from surface and core samples, journal data.
MIZUNO, K., HATTORI, H., SANGAWA, A., and TAKAHASHI, Y. (1990), Geology of the Akashi district,
quadrangle-series (in Japanese with English abstract), scale 1:50,000, 90 pp., Geol. Surv. Jpn., Tsukuba,
Japan.
MORTON, D.M. and MATTI, J.C. (1987), The Cucamonga fault zone, geologic setting and Quaternary
history, USGS Professional Paper, 1339
NOBLE, L.F. (1954), Geology of the Valyermo Quadrangle and vicinity, Map GQ-50, USGS.
OAKESHOFTT (1971)
OHTANI, T., FIJIMOTO, K., ITO, H., TANAKA, H., TOMIDA, N., and HIGUCHI, T. (2000) Fault rocks and past
to recent fluid characteristics from the borehole survey of the Nojima rupture in the 1995 Kobe earthquake,
southwest Japan, J. Geophys. Res. 105, B7, 16,161–16,171.
PENG, Z., BEN-ZION, Y., MICHAEL, A. J., and ZHU, L. (2003),Quantitative analysis of seismic trapped waves
in the rupture zone of the 1992 Landers, California earthquake: Evidence for a shallow trapping structure,
Geophys. J. Int. 155, 1021–1041.
PENG, Z. and BEN-ZION, Y. (2004), Systematic analysis of crustal anisotropy along the Karadere-Duzce
branch of the north Anatolian fault, Geophys. J. Int. 159, 253–274, doi: 10.1111/j.1365-
246X.2004.02379.x.
POLIAKOV, A.N., DMOWSKA, B.R., and RICE, J.R. (2002), Dynamic shear rupture interactions with fault
bends and off-axis secondary faulting, J. Geophys. Res. 107.
POWELL, R.E. and WELDON, R.J. (1992), Evolution of the San Andreas Fault. Annu. Rev. Earth Planet. Sci.,
20, 431–468.
PRIEST, S.D., Discontinuity Analysis for Rock Engineering (Chapman and Hall, New York 1993) 473 pp.
RANJITH, K. and RICE, J.R. (2001), Slip dynamics at an interface between dissimilar materials., J. Mech.
Phys. Solids. 49(2), 341–361.
RECHES, Z. and DEWERS, T.A. (2004), Gouge formation by dynamic pulverization during earthquakes.
Submitted to EPSL.
RECHES, Z. and LOCKNER, D.A. (1994), The nucleation and growth of faults in brittle rocks, J. Geophys.
Res. 99, 18,159–18,173.
RICE, J.R., SAMMIS, C.G., and PARSONS, R. (2005), Off-fault secondary failure induced by a dynamic slip
pulse, Seismol. Soc. Am. Bull. 95, 109–134.
ROCKWELL, T.K., LOUGHMAN, C., and MERIFIELD, P. (1990), Late Quaternary rate of slip along the San
Jacinto fault zone, Southern California, J. Geophys. Res. 95, 6, 8593–8605.
ROCKWELL, T., SEITZ, G., RAGONA, D., DAWSON, T., FANEROS, G., VERDUGO, D., and ALTANGEREL, O.
(2005), Investigation of segment controls on the rupture history of the southern San Jacinto fault, Seismol.
Res. Lett. 76, 254.
Vol. 163, 2006 Geological Observations of Damage Asymmetry 347
RUBIN, A. (2002), Aftershocks of microearthquakes as probes of the mechanics of rupture, J. Geophys. Res.
107, 10.1029/2001JB0000496.
RUBIN, A. and GILLARD, D. (2000), Aftershock asymmetry/rupture directivity along central San Andreas
fault microearthquakes, J. Geophys. Res. 105, 19,095–19,109.
SANDERS, C.O. and KANAMORI, H. (1984), A seismotectonic analysis of the Anza seismic gap, San Jacinto
fault zone, Southern California, J. Geophys. Res. 89, 5873–5890.
SCHOLZ, C.H. The Mechanics of Earthquakes and Faulting (New York, Cambridge University Press, 2002)
2nd ed. 471 pp.
SCHULZ, S.E. and EVANS, J.P. (1998), Spatial variability in microscopic deformation and composition of the
Punchbowl fault, Southern California: Implications for mechanisms, fluid-rock interaction, and fault
morphology. Tectonophysics 295, 223–244.
SCHULZ, S.E. and EVANS, J.P. (2000), Mesoscopic structure of the Punchbowl fault, Southern California and
the geologic and geophysical structure of active strike-slip faults, J. Struct. Geol. 22, 913–930.
SCHWARTZ, D.P. and WELDON, R.J. (1986), Late Holocene slip rate on the Mojave segment of the San
Andreas fault zone, Littlerock, CA; Preliminary results, EOS Trans. Am. Geophys. Union 67, Abstract.
SCOTT, J.S., MASTERS, T.G., and VERNON, F.L. (1994), 3-D velocity structure of the San Jacinto fault zone
near Anza, California – I. P waves, Geophys. J. Int. 119, 611–626.
SENGOR, A.M.C., TUYSUZ, O., IMREN, C., SAKLNC, M., EYIDOGAN, H., GORUR, N., LE PICHON, X., and
RANGIN, C. (2005), The North Anatolian fault: A new look, Annu. Rev. Earth Planet. Sci. 33, 37–112.
SHARP, R. (1967), The San Jacinto fault in southern California, Geol. Soc. Am. Bull. 78, 705–730.
SHAPIRO, N.M., CAMPILLO, M., STEHLY, L., and RITZWOLLER, M.H. (2005), High-resolution surface-wave
tomography from ambient seismic noise, Science 307, 1615–1618.
SHI, Z. and BEN-ZION, Y. (2006), Dynamic rupture on a bimaterial interface governed by slip-weakening
friction, Geophys. J. Int., 165, doi: 10.1111/j.1365-246x.2006.02853.x.
SIBSON, R.H. (1977), Fault rocks and fault mechanisms, J. Geol. Soc. London 133, 191–213.
SIBSON, R.H. (1989), Earthquake faulting as a structural process, J. Struct. Geol. 11, 1–14.
SIBSON, R.H. (2003), Thickness of the seismic slip zone, Seismol. Soc. Am. Bull. 93, 1169–1178.
SIEH, K.H. (1978a), Slip along the San Andreas fault associated with the great 1857 earthquake, Bull.
Seismol. Soc. Am. 68, 5, 1421–1447.
SIEH, K.H. (1978b), Central California foreshocks of the great 1857 earthquake, Bull. Seismol. Soc. Am. 68,
6, 1731–1749.
STECK, A. and HUNZIKER, J. (1994), The Tertiary structural and thermal evolution of the Central Alps;
Compressional and extensional structures in an orogenic belt, Tectonophysics 238, 1–4, 229–254.
STEIN, R.S., BARKA, A.A., and DIETERICH, J.H. (1997), Progressive failure on the North Anatolian fault
since 1939 by earthquake stress triggering, Geophys. J. Int. 128, 594–604.
TANAKA, H., FUJIMOTO, K., OHTANI, T., and ITO, H. (2001), Structural and chemical characteristics of
shear zones in the freshly activated Nojima Fault, Awaji Island, southwest Japan, J. Geophys. Res. 106, B5,
8789–8810.
VAN DER PLUIJM, B.A., HALL, C.M., VROLIJK, P.J., PEVEAR, D.R., and COVEY, M.C. (2001), The dating of
shallow faults in the Earth’s crust, Nature 412, 6843, 172–175.
VERMILYE, J.M. and SCHULZ, C.H. (1998), The Process zone: A microstructural view of fault growth,
J. Geophys. Res. 103, 6, 12,223–12,237.
VERMILYE, J.M. and SCHULZ, C.H. (1999), Fault propagation and segmentation: insight from the
microstructural examination of a small fault, J. Struc. Geol. 21, 1623–1636.
WEERTMAN, J. (1980), Unstable slippage across a fault that separates elastic media of different elastic
constants, J. Geophys. Res. 85, 1455–1461.
WELDON, R.J. and FUMAL, T.E. (2005) Slip rate of the San Andreas fault near Littlerock, California, 2005
SCEC Annual Meeting, Proc. and Abstracts, XV.
WELDON, R.J., MEISLING, K.E., and ALEXANDER, J. (1993), A speculative history of the San Andreas fault
in the central Transverse ranges, California. In (Powell, R.E., WELDON, R.J. and J.C. MATTI, Eds), The
San Andreas Fault System: Displacement, Palinspastic Reconstruction, and Geologic Evolution. Geol. Soc.
Am. Memoir 178, 161–198.
348 O. Dor et al. Pure appl. geophys.,
WELDON, R.J., II, FUMAL, T.E., POWERS, T.J., PEZZOPANE, S.K., SCHARER, K.M., HAMILTON, J.C. (2002),
Structure and Earthquake Offsets on the San Andreas Fault at the Wrightwood, California, Paleoseismicity
Site. Bull. Seis. Soc. Am., 92, 2704–2725.
WILSON, B., DEWERS, T., RECHES, Z., and BRUNE, J. (2005), Particle size and energetics of gouge from
earthquake rupture zones, Nature 434, 749–752.
WILSON, J.E., CHESTER, J.S., and CHESTER, F.M. (2003), Microfracture analysis of fault growth and wear
processes, Punchbowl Fault, San Andreas system, California, J. Struc. Geol. 25, 11, 1855–1873.
WOODBURNE, M.O. (1975), Cenozoic stratigraphy of the transverse ranges and adjacent areas, Southern
California, GSA, Special Paper.
YAMASHITA, T. (2000), Generation of microcracks by dynamic shear rupture and its effects on rupture growth
and elastic wave radiation, Geophys. J. Int. 143, 395–406.
(Received: 16 March 2005; accepted: 9 June 2005)
Published Online First: February 8, 2006
To access this journal online:
http://www.birkhauser.ch
Vol. 163, 2006 Geological Observations of Damage Asymmetry 349
Related Documents