Geological Investigations of the Vermillion Creek Coal Bed in the Eocene Niland Tongue of the Wasatch Formation, Sweetwater County, Wyoming U.S. GEOLOGICAL SURVEY PROFESSIONAL PAPER 1314A-L

Welcome message from author
This document is posted to help you gain knowledge. Please leave a comment to let me know what you think about it! Share it to your friends and learn new things together.
Transcript
Geological Investigations of the Vermillion Creek Coal Bed in the Eocene Niland Tongue of the Wasatch Formation, Sweetwater County, Wyoming
U.S. GEOLOGICAL SURVEY PROFESSIONAL PAPER 1314A-L
Geological Investigations of the Vermillion Creek Coal Bed in the Eocene Niland Tongue of the Wasatch Formation, Sweetwater County, Wyoming By H. W. ROEHLER, Technical Editor, and P. L. MARTIN, Manuscript Editor
U.S. GEOLOGICAL SURVEY PROFESSIONAL PAPER 1314A-L
Studies of the composition, resources, and paludal-lacustrine origin of a high-sulfur, radioactive coal bed in the Vermillion Creek basin
UNITED STATES GOVERNMENT PRINTING OFFICE, WASHINGTON 1987
DEPARTMENT OF THE INTERIOR
Donald Paul Hodel, Secretary
U.S. GEOLOGICAL SURVEY
Dallas L. Peck, Director
Library of Congress Cataloging in Publication Data Main entry under title:
Geological investigations of the Vennillion Creek coal bed in the Eocene Niland Tongue of the Wasatch Fonnation, Sweetwater County, Wyoming.
(Geological Survey professional paper; P1314A-L) Includes bibliographies. Supt. of Docs. No.: I 19.16:1314A-L 1. Geology, Stratigraphic-Eocene. 2. Coal-Geology-Wyoming-Sweetwater County. 3. Geology
Wyoming-Sweetwater County. I. Roehler, Henry W. II. Series: Geological Survey professional paper; 1314. QE692.2.G46 1986 557.87'85 83--600331
For sale by the Books and Open-File Reports Section
U.S. Geological Survey Federal Center
Box 25425 Denver, CO 80225
CONTENTS
[Letters designate the chapters]
Page
(A) Introduction, by H. W. Roehler. . . . . . . . . . . . . . . 1 (B) Structure and stratigraphy, by H. W. Roehler. . . . . . . 13 (C) Paleoenvironments and sedimentology, by H. W. Roehler. 25 (D) Palynology ofthe Vermillion Creek coal bed and associated strata, by DouglasJ. Nichols. 47 (E) Paleoecology, by Eleanora Iberall Robbins. . . . . . . . . . . . . . . . . . . . . . . . 75 (F) Petrographic and physical properties of coal and rock samples, by R. W. Stanton,
J. A. Minkin, and T. A. Moore. . . . . . . . . . . . . . . . . . . . . . . . . . . 105 (G) Element geochemistry, by Joseph R. Hatch. . . . . . . . . . . . . . . . . . . . . . . 121 (H) Organic geochemistry and organic petrography, by Neely H. Bostick, Joseph R. Hatch,
Ted A. Daws, Alonza H. Love, Sister Carlos M. Lubeck, and Charles N. Threlkeld. . . . . . . . . . . . . . . . . . . . . . . . . . . . . . . . . . . . . . . . . . 133
(I) Sulfur isotopic data, by R. 0. Rye. . . . . . . . . . . . . . . . . . . . . . . . . . . . 165 (J) Uranium in the Vermillion Creek core samples, by J. S. Leventhal and R. B. Finkelman . 171 (K) Results of exploratory drilling, by Ricky T. Hildebrand. 179 (L) Coal resources, by Margaret S. Ellis. . . . . . . . . . . . . . . . . . . . . . . . . 191
III
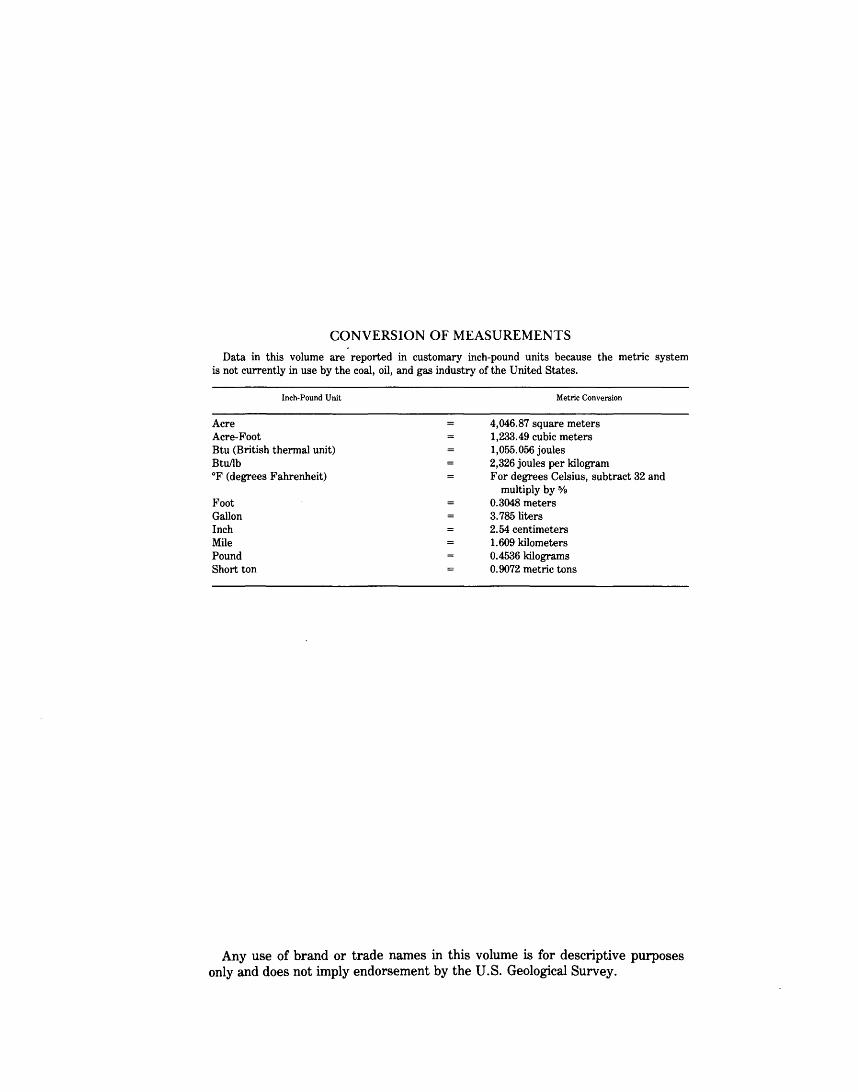
CONVERSION OF MEASUREMENTS
Data in this volume are reported in customary inch-pound units because the metric system is not currently in use by the coal, oil, and gas industry of the United States.
Acre Acre-Foot
Inch-Pound Unit
Btu (British thermal unit) Btullb °F (degrees Fahrenheit)
Foot Gallon Inch Mile Pound Short ton
Metric Conversion
4,046.87 square meters 1,233.49 cubic meters 1,055.056 joules 2,326 joules per kilogram For degrees Celsius, subtract 32 and
multiply by % 0.3048 meters 3. 785 liters 2.54 centimeters 1.609 kilometers 0.4536 kilograms 0.9072 metric tons
Any use of brand or trade names in this volume is for descriptive purposes only and does not imply endorsement by the U.S. Geological Survey.

Introduction By H. W. ROEHLER
GEOLOGICAL INVESTIGATIONS OF THE VERMILLION CREEK COAL BED IN THE EOCENE NILAND TONGUE OF THE WASATCH FORMATION, SWEETWATER COUNTY, WYOMING
U.S. GEOLOGICAL SURVEY PROFESSIONAL PAPER 1314-A

Geologic and geographic setting Location of study area . . . . . Purpose of investigations . . . .
CONTENTS
Discussion of chapte~ in the professional paper . History of investigations . . . . . . . . . . . . .
Early mines . . . . . . . . . . . . . . . . . . Previous mapping and sampling of the coal
References cited . . . . . . . . . . . . . . . . . .
ILLUSTRATIONS
Page
3 3 5 6 7 7 8
10
Page
PLATE 1. Geologic map of the Chicken Creek SW quadrangle . . . . . . . . . . . . . . . . . . . . . . . . . . . . . . . . In pocket FIGURE 1. Map of southwest Wyoming, northeast Utah, and northwest Colorado showing the location of the study area . . . 4
2. Map of the Vermillion Creek basin showing major structural features, outcrops of the Niland Tongue of the Wasatch Formation, and location of the study area . . . . . . . . . . . . . . . . . . . . . . . . 5
3. Photograph of coal outcrops near the Canyon Creek mine . . . . . . . . . . . . . . . . . . 6 4. Measured section of outcrops of the Vermillion Creek coal near the Canyon Creek mine 7 5. Photograph of coal outcrops near the Rife Ranch mine . . . . . . . . . . . . . . . . . . 8 6. Measured section of outcrops of the Vermillion Creek coal near the Rife Ranch mine . . . 9 7. Photograph of the Erickson mine workings . . . . . . . . . . . . . . . . . . . . . . . . . . 10 8. Photograph of outcrops of the Vermillion Creek coal bed one-half mile south of the Erickson mine 11 9. Measured section of outcrops of the Vermillion Creek coal one-half mile south of the Erickson mine 11
2
GEOLOGICAL INVESTIGATIONS OF THE VERMILLION CREEK COAL BED IN THE EOCENE NILAND TONGUE OF THE
WASATCH FORMATION, SWEETWATER COUNTY, WYOMING
INTRODUCTION
By H. W. ROEHLER
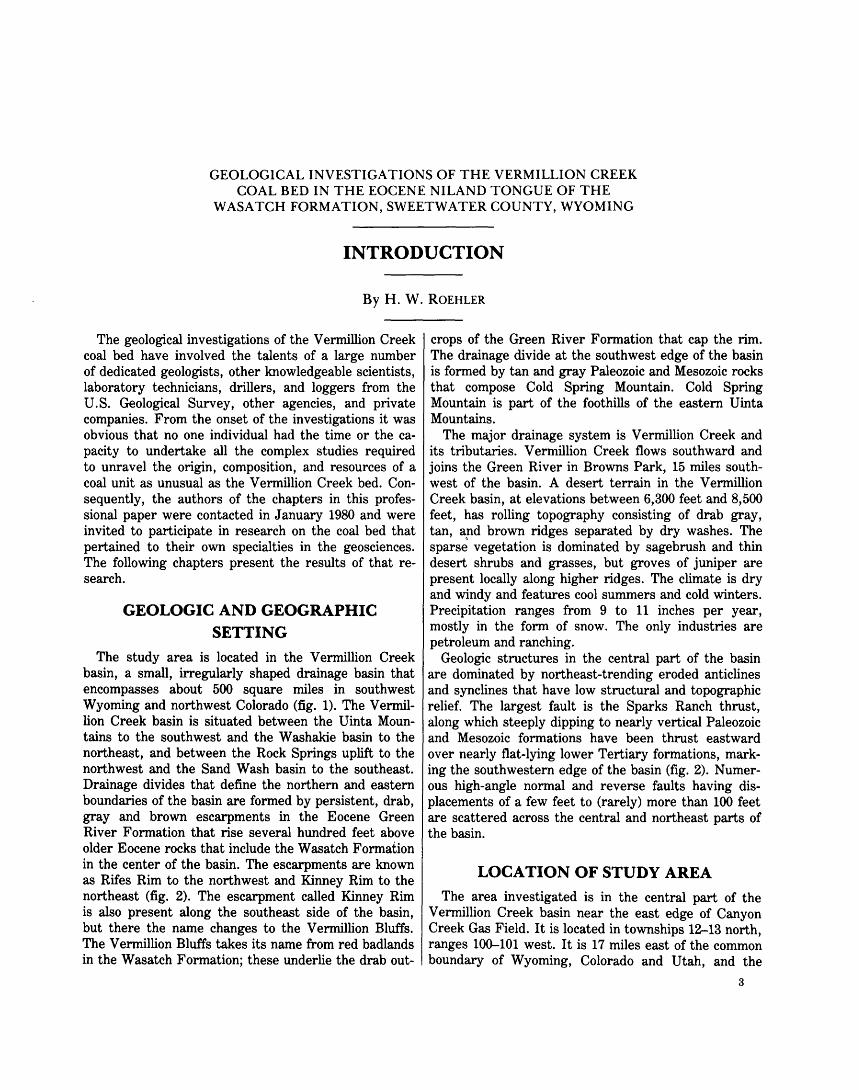
The geological investigations of the Vermillion Creek coal bed have involved the talents of a large number of dedicated geologists, other knowledgeable scientists, laboratory technicians, drillers, and loggers from the U.S. Geological Survey, other agencies, and private companies. From the onset of the investigations it was obvious that no one individual had the time or the capacity to undertake all the complex studies required to unravel the origin, composition, and resources of a coal unit as unusual as the Vermillion Creek bed. Consequently, the authors of the chapters in this professional paper were contacted in January 1980 and were invited to participate in research on the coal bed that pertained to their own specialties in the geosciences. The following chapters present the results of that research.
GEOLOGIC AND GEOGRAPHIC SETTING
The study area is located in the Vermillion Creek basin, a small, irregularly shaped drainage basin that encompasses about 500 square miles in southwest Wyoming and northwest Colorado (fig. 1). The Vermillion Creek basin is situated between the Uinta Mountains to the southwest and the Washakie basin to the northeast, and between the Rock Springs uplift to the northwest and the Sand Wash basin to the southeast. Drainage divides that define the northern and eastern boundaries of the basin are formed by persistent, drab, gray and brown escarpments in the Eocene Green River Formation that rise several hundred feet above older Eocene rocks that include the Wasatch Formation in the center of the basin. The escarpments are known as Rifes Rim to the northwest and Kinney Rim to the northeast (fig. 2). The escarpment called Kinney Rim is also present along the southeast side of the basin, but there the name changes to the Vermillion Bluffs. The Vermillion Bluffs takes its name from red badlands in the Wasatch Formation; these underlie the drab out-
crops of the Green River Formation that cap the rim. The drainage divide at the southwest edge of the basin is formed by tan and gray Paleozoic and Mesozoic rocks that compose Cold Spring Mountain. Cold Spring Mountain is part of the foothills of the eastern Uinta Mountains.
The major drainage system is Vermillion Creek and its tributaries. Vermillion Creek flows southward and joins the Green River in Browns Park, 15 miles southwest of the basin. A desert terrain in the Vermillion Creek basin, at elevations between 6,300 feet and 8,500 feet, has rolling topography consisting of drab gray, tan, and brown ridges separated by dry washes. The sparse vegetation is dominated by sagebrush and thin desert shrubs and grasses, but groves of juniper are present locally along higher ridges. The climate is dry and windy and features cool summers and cold winters. Precipitation ranges from 9 to 11 inches per year, mostly in the form of snow. The only industries are petroleum and ranching.
Geologic structures in the central part of the basin are dominated by northeast-trending eroded anticlines and synclines that have low structural and topographic relief. The largest fault is the Sparks Ranch thrust, along which steeply dipping to nearly vertical Paleozoic and Mesozoic formations have been thrust eastward over nearly flat-lying lower Tertiary formations, marking the southwestern edge of the basin (fig. 2). Numerous high-angle normal and reverse faults having displacements of a few feet to (rarely) more than 100 feet are scattered across the central and northeast parts of the basin.
LOCATION OF STUDY AREA
The area investigated is in the central part of the Vermillion Creek basin near the east edge of Canyon Creek Gas Field. It is located in townships 12-13 north, ranges 100-101 west. It is 17 miles east of the common boundary of Wyoming, Colorado and Utah, and the
3

4 VERMILLION CREEK COAL BED, WYOMING
....
...J w co
.... (/)
:::> a: :I: ....
42°
Kemmerer o
GREEN RIVER BASIN
25
WASHAKIE BASIN
50 MILES
FIGURE 1.- Location of the study area. Areas of parallel investigations by other authors are shown by diagonal and horizontal lines. The paleogeographic distribution and axis of deposition of the Niland Tongue of the Wasatch Formation are indicated by stippling and by a line with opposing arrows. Drill holes discussed in the text are indicated by well symbols.
south boundary is one-half mile north of the WyomingColorado State line. The study area is accessible by Wyoming Highway 430. Forty-nine miles southeast of Rock Springs, Wyo., a gravel road branches from Highway 430 and continues one mile eastward to the office of the Canyon Creek Gas Field. From the field office a maze of gravel roads branches in all directions to gas wells and production facilities. Several of these roads provide access to the study area.
The area investigated embraces 34 square miles, but the geographic distribution of the Vermillion Creek coal bed is known to be much larger. The coal bed has been identified in outcrops of the Niland Tongue of the Wasatch Formation for many miles west, north, and east of the study area in Wyoming and for short distances southward into Colorado. The areal distribution of outcrops of the Niland Tongue in the Vermillion Creek basin is shown on figure 2.

INTRODUCTION (ROEHLER) 5
109000' 45'
41°15'
41000'
EXPLANATION
Outcrop of Niland Tongue of Wasatch Formation
Boundary of study area
Fault
Anticline
Syncline
Highway
Improved gravel Road
~ Abandoned coal mines : 1. Canyon Creek 2 . Unnamed 3. Rife Ranch 4 . Erickson
~=
FIGURE 2.-Major structural features, outcrops of the Niland Tongue of the Wasatch Formation, and the location of the study area in the Vermillion Creek basin.
PURPOSE OF INVESTIGATIONS
This volume presents results of investigations by the U.S. Geological Survey into coal deposits in the Rock Springs coal field. These investigations provide geological information for use in predicting the occurrence, quality, and quantity of coal in the Rock Springs field, and they provide economic and engineering data for environmental management of public lands, for coal leasing, and for coal mine design and operation. The V ermillion Creek coal bed was investigated in the V ermillion Creek basin for both economic and scientific
reasons. The coal bed thickens in the study area to more than 11 feet across an area of low structural relief and minimal overburden, making it ideally suited for surface and underground mining. The coal is valuable as a source of large amounts of energy if used as boiler fuel, but its unique composition makes it possibly more valuable as feedstock for a petrochemical industry. The coal will yield between 20 and 40 gallons of crude oil per ton of coal by retorting, a yield comparable to that of oil shale. The bed is of interest from a research standpoint because it has an unusual origin and composition. It overlies, underlies, and intertongues with oil
6 VERMILLION CREEK COAL BED, WYOMING
..... ... .. -J41t;!;f . f"" ---.'-'
--
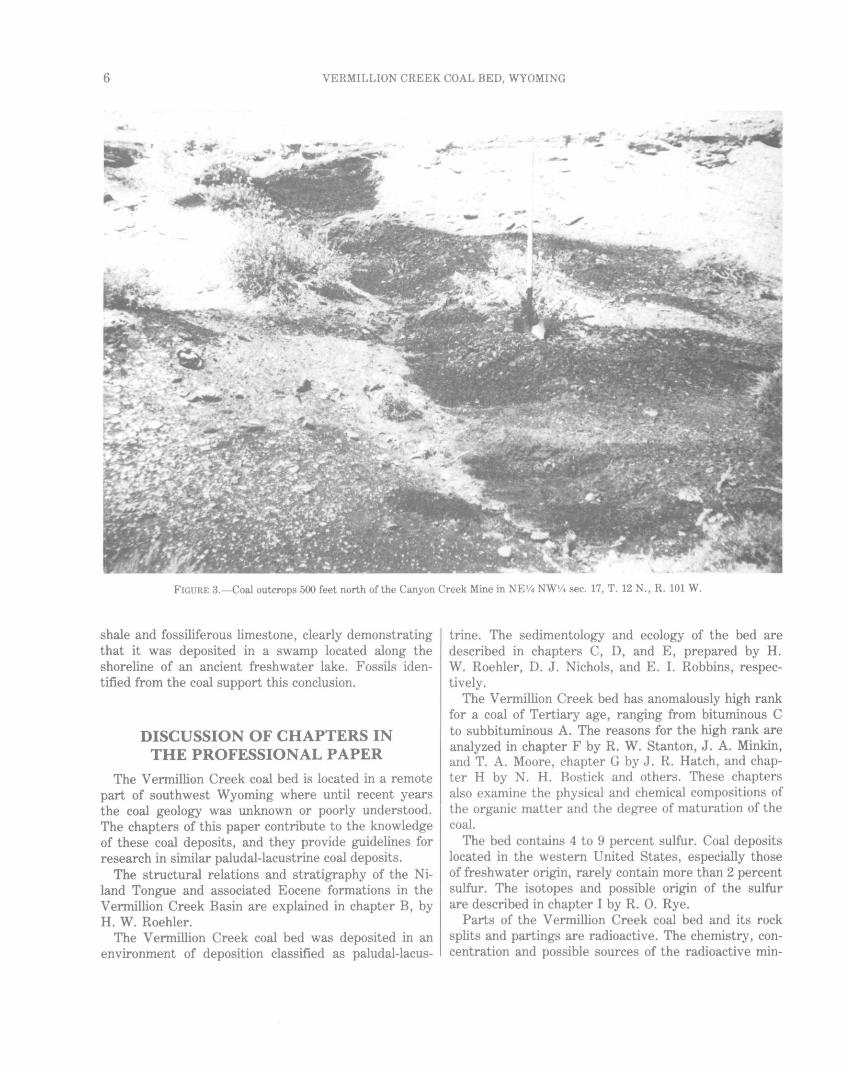
FIGURE 3.-Coal outcrops 500 feet north of the Canyon Creek Mine in NE 1/ 4 NW% sec. 17, T. 12 N., R. 101 W.
shale and fossiliferous limestone, clearly demonstrating that it was deposited in a swamp located along the shoreline of an ancient freshwater lake. Fossils identified from the coal support this conclusion.
DISCUSSION OF CHAPTERS IN THE PROFESSIONAL PAPER
The Vermillion Creek coal bed is located in a remote part of southwest Wyoming where until recent years the coal geology was unknown or poorly understood. The chapters of this paper contribute to the knowledge of these coal deposits, and they provide guidelines for research in similar paludal-lacustrine coal deposits.
The structural relations and stratigraphy of the Niland Tongue and associated Eocene formations in the Vermillion Creek Basin are explained in chapter B, by H. W. Roehler.
The Vermillion Creek coal bed was deposited in an environment of deposition classified as paludal-lacus-
trine. The sedimentology and ecology of the bed are described in chapters C, D, and E, prepared by H. W. Roehler, D. J. Nichols, and E. I. Robbins, respectively.
The Vermillion Creek bed has anomalously high rank for a coal of Tertiary age, ranging from bituminous C to subbituminous A. The reasons for the high rank are analyzed in chapter F by R. W. Stanton, J. A. Minkin, and T. A. Moore, chapter G by J. R. Hatch, and chapter H by N. H. Bostick and others. These chapters also examine the physical and chemical compositions of the organic matter and the degree of maturation of the coal.
The bed contains 4 to 9 percent sulfur. Coal deposits located in the western United States, especially those of freshwater origin, rarely contain more than 2 percent sulfur. The isotopes and possible origin of the sulfur are described in chapter I by R. 0. Rye.
Parts of the Vermillion Creek coal bed and its rock splits and partings are radioactive. The chemistry, concentration and possible sources of the radioactive min-
INTRODUCTION (ROEHLER) 7
erals are investigated in chapter J by J. S. Leventhal and R. B. Finkelman.
Chapters K and L, prepared by R. T. Hildebrand and Margaret S. Ellis, respectively, discuss coal exploration techniques, resources, and engineering data. This information provides a basis for coal leasing by the Federal Government and for safe and profitable mine planning and development.
HISTORY OF INVESTIGATIONS
EARLY MINES
Coal from the Vermillion Creek bed has been utilized locally by ranchers in the Vermillion Creek basin since the late 1800's, when several small "wagon mines" were ·opened to obtain coal for use as stove fuel. Joe Graham, whose ranch is located at the west edge of the basin, has knowledge of the mining history. The Graham family mined the Vermillion Creek coal bed on Canyon Creek in sec. 17, T. 12 N., R. 101 W., 3% miles west of the study area (no. 1, fig. 2). Mr. Graham (oral communication, May 1979) stated:
The Canyon Creek Mine was opened before 1900. Any rancher who wanted coal did his own mining. The family began working the mine in 1926. In 1945 the mine went in about 100 feet north from the entry and then turned west for about 300 feet. The mine filled with water in the late 1940's and was abandoned.
The coal bed had two partings. The upper was about 2 inches thick and was yellow. The lower was about 6 inches thick. There were several feet of good coal above the upper parting.
The coal burned good, but the sulfur in it corroded the stove grates, and they had to be replaced every couple years.
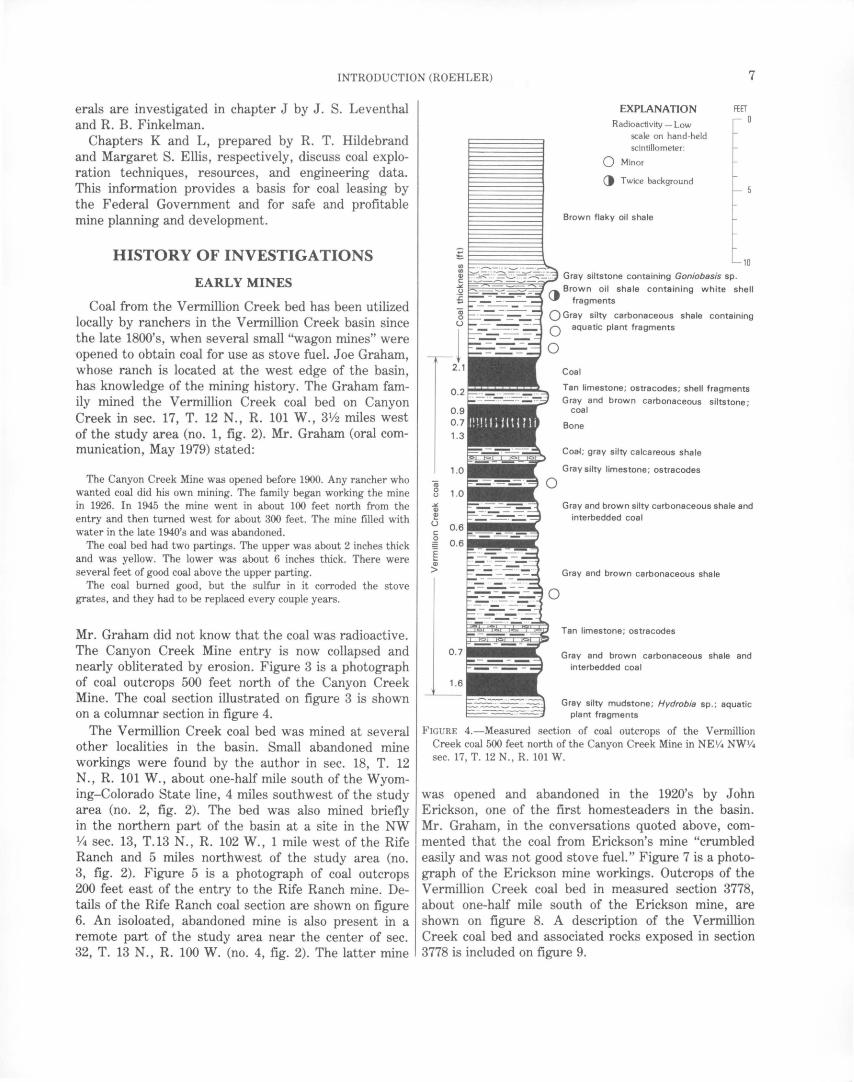
Mr. Graham did not know that the coal was radioactive. The Canyon Creek Mine entry is now collapsed and nearly obliterated by erosion. Figure 3 is a photograph of coal outcrops 500 feet north of the Canyon Creek Mine. The coal section illustrated on figure 3 is shown on a columnar section in figure 4.
The Vermillion Creek coal bed was mined at several other localities in the basin. Small abandoned mine workings were found by the author in sec. 18, T. 12 N., R. 101 W., about one-half mile south of the Wyoming-Colorado State line, 4 miles southwest of the study area (no. 2, fig. 2). The bed was also mined briefly in the northern part of the basin at a site in the NW %sec. 13, T.13 N., R. 102 W., 1 mile west of the Rife Ranch and 5 miles northwest of the study area (no. 3, fig. 2). Figure 5 is a photograph of coal outcrops 200 feet east of the entry to the Rife Ranch mine. Details of the Rife Ranch coal section are shown on figure 6. An isoloated, abandoned mine is also present in a remote part of the study area near the center of sec. 32, T. 13 N., R. 100 W. (no. 4, fig. 2). The latter mine
EXPLANATION
Radioactivity - Low scale on hand-held scintillometer:
0 Minor
() Twice background
Brown flaky oil shale
Gray siltstone containing Goniobasis sp.
~~~~~~()~ Brown oil shale containing white shell fragments
0 Gray silty carbonaceous shale containing aquatic plant fragments
Coal
Tan limestone; ostracodes; shell fragments
Gray and brown carbonaceous siltstone; coal
Bone
Coal; gray silty calcareous shale
Gray silty limestone; ostracodes
Gray and brown silty carbonaceous shale and interbedded coal
Gray and brown carbonaceous shale
Tan limestone; ostracodes
Gray and brown carbonaceous shale and interbedded coal
Gray silty mudstone; Hydrobia sp.; aquatic plant fragments
FIGURE 4_-Measured section of coal outcrops of the Vermillion Creek coal 500 feet north of the Canyon Creek Mine in NE V4 NWV4 sec. 17, T. 12 N., R. 101 W.
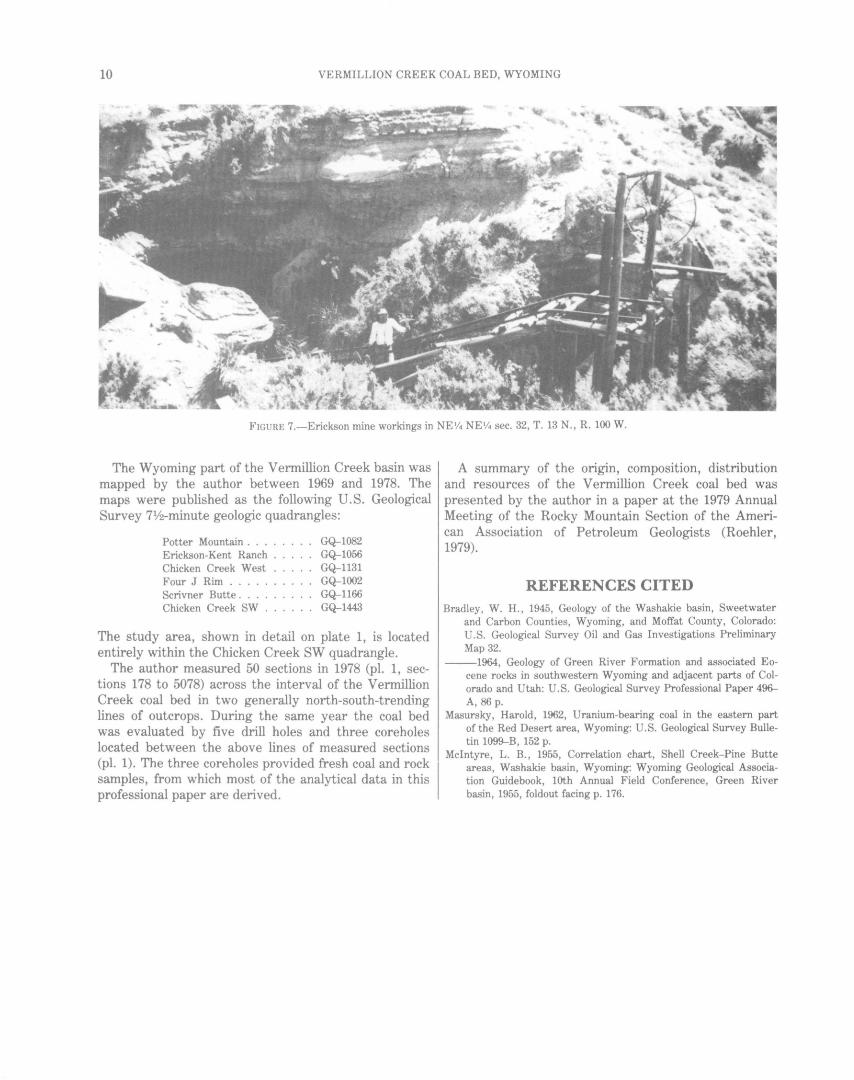
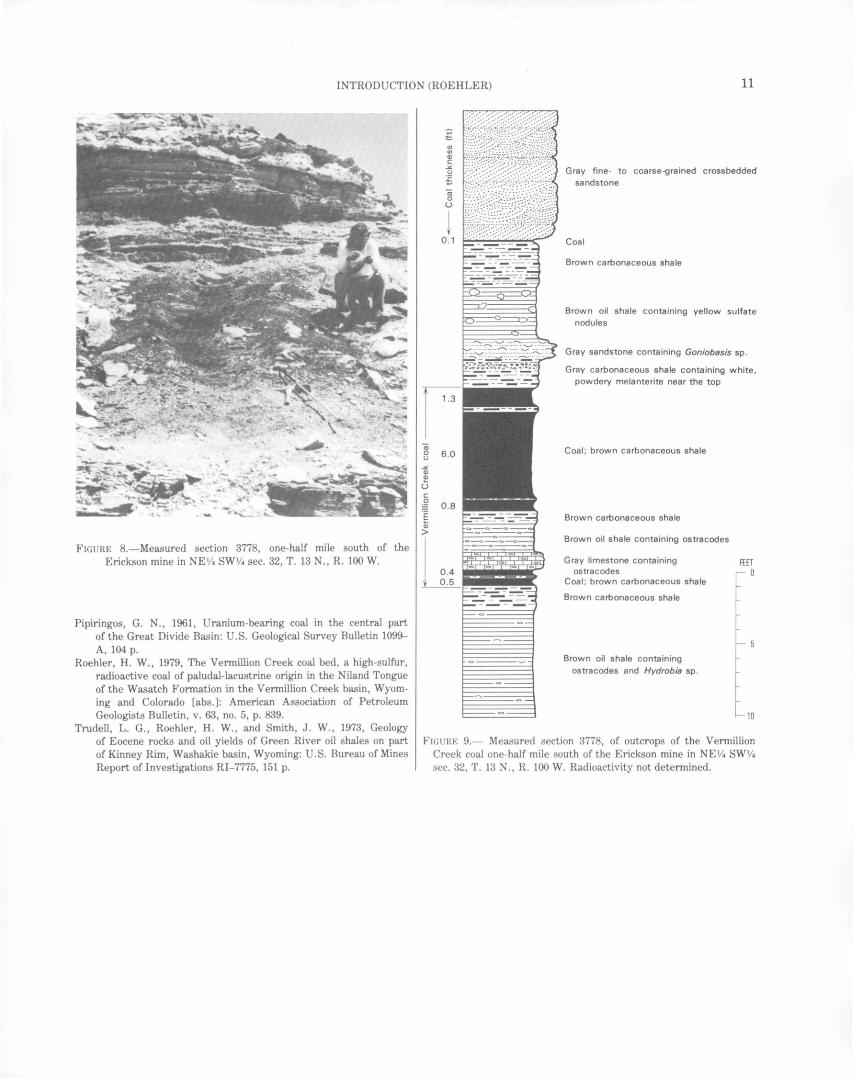
was opened and abandoned in the 1920's by John Erickson, one of the first homesteaders in the basin. Mr. Graham, in the conversations quoted above, commented that the coal from Erickson's mine "crumbled easily and was not good stove fuel." Figure 7 is a photograph of the Erickson mine workings. Outcrops of the Vermillion Creek coal bed in measured section 3778, about one-half mile south of the Erickson mine, are shown on figure 8. A description of the Vermillion Creek coal bed and associated rocks exposed in section 3778 is included on figure 9.

8 VERMILLION CREEK COAL BED, WYOMING
FIGURE 5.-Coal outcrops 200 feet east of the Rife Ranch mine in SE lf4 NW1/4 sec. 12, T. 13 N., R. 102 W.
PREVIOUS MAPPING AND SAMPLING OF THE COAL
Coal beds in the Niland Tongue of the Wasatch Formation have been investigated in southwest Wyoming for several decades by geologists working in the Great Divide, Washakie, and Vermillion Creek basins. Results of these investigations reveal that the rank and composition of coal beds in the tongue vary from basin to basin. As a means of comparing their physical and chemical properties, proximate analyses are included in discussions of the coal beds in following paragraphs.
Coal beds in the Niland Tongue in the Great Divide and Washakie basins were investigated by Pipiringos (1961) and Masursky (1962). Pipiringos and Masursky named, mapped, and provided stratigraphic, analytical, and resource data for nine radioactive lignite beds, none of which is particularly similar to the bituminoussubbituminous Vermillion Creek coal bed in the study area. A typical analysis of one of the lignites, the
Luman No. 2 bed, from a core hole in sec. 24, T. 24 N., R. 96 W. (Pipiringos, 1961, table 4, sample D-97527) is as follows:
Moisture, as received Volatile matter . . Fixed carbon . Ash .... .
Total .. . Sulfur, total. . Heating value. . .
22.9 32.4 31.0 13.7
100.0 2.2
8,430
wt pet wt pet wt pet wt pet wt pet wt pet Btullb
In 1945, Bradley reported the presence of a 6-footthick bed of canneloid coal a few miles southwest of Wamsutter, Wyo., in T. 19 N., R. 94 W., in the northern part of the Washakie basin. This canneloid coal is in the upper 75 feet of the Niland Tongue at a stratigraphic level very near that of the Vermillion Creek coal bed. It was mined briefly in sec. 7, T. 19 N., R. 94 W. The author visited the mine in 1972 and found the workings collapsed. In 1964, Bradley (p. A25) pub-

INTRODUCTION (ROEHLER) 9
a; 0 u
Vl Vl Q) c:
.:./. u
~ a; 0 u
~ 2 .1 ~ u c: 0.6 ~ .E ~ 3.8
L
Brown oil shale containing Goniobasis sp .; Lampsilis sp. and Viviparus sp .
Coal; brown carbonaceous shale
Gray carbonaceous siltstone
Brown carbonaceous shale
Gray soft siltstone
Gray mudstone
Gray sandstone
10
EXPLANATION Radioactivity- Low
scale on hand-held scintillometer:
Q Minor
() Twice background
• Off scale
FIGURE 6.-Measured section of outcrops of the Vennillion Creek coal 200 feet east of the Rife Ranch mine in SE lf4 NWV4 sec. 12, T. 13 N. , R. 102 W.
lished an analysis of a sample of coal that had been collected from the working face of the mine:
Moisture, as received Volatile matter . Fixed carbon . Ash ...
Total .. . Sulfur ... . . (Heating value not reported.)
9.9 wt pet 45.0 wt pet 40.7 wt pet 4.4 wt pet
100.0 wt pet 3.6 wt pet
The values for the Wamsutter bed are similar to those of the Vermillion Creek bed analyzed in corehole No. 8 in the study area:
Moisture , as received Volatile matter . Fixed carbon . Ash .. . . .
Total .. . Sulfur, total. . Heating value .
12.5 38.4 39.4 9.7
100.0 6.9
10,366
wt pet wt pet wt pet wt pet wt pet wt pet Btullb
The stratigraphic position and analytical data of the Wamsutter and Vermillion Creek coal beds suggest that they are possibly chronostratigraphic equivalents, even though the beds are more than 50 miles apart on opposite sides of the Washakie basin. Both beds are comparably situated near the Eocene depositional axis of the Niland Tongue, as shown on figure 1.
The Vermillion Creek coal bed is apparent on an electric-lithologic log of the Shell Oil Company Pine Butte 33--35 oil and gas test well drilled in sec 35, T. 15 N., R. 99 W. (Mcintyre, 1955). This dry hole is in the western part of the Washakie basin about 10 miles northeast of the study area. The coal exhibits high resistivity on the electric log of the hole, but on the lithologic log cuttings samples from the coal bed were incorrectly identified as gilsonite.
An analysis of the Vermillion Creek bed that is important for classifying the coal came from the U.S. Bureau of Mines Washakie basin corehole No. 1A. drilled in 1969 in sec. 24, T. 14 N., R. 100 W. (Trudell and others, 1973). Cores taken in this hole for oil shale analysis included the Vermillion Creek coal bed at 775.9 to 778.0 feet. The analysis of the coal indicates that it is nonagglomerating and has a moist, mineral-matterfree heating value of 12,850 Btu per pound. Samples of the core collected at 775.9 and 778.0 feet yielded 24.8 and 22.8 gallons of oil per ton, respectively, on assay by Fischer retort method. The coal was classified as high-volatile bituminous C. The analysis revealed an unusually high sulfur content and high heating value:
Moisture, as received Volatile matter . Fixed carbon . Ash .... .
Total .. . Sulfur, total. . Heating value.
3.0 36.8 43.8 16.4
100.0 7.8
10,410
wt pet wt pet wt pet wt pet wt pet wt pet Btullb
Interest in the analytical data from this corehole led to additional studies of the Vermillion Creek coal bed by the U.S. Geological Survey.
10 VERMILLION CREEK COAL BED, WYOMING
FIGURE 7.-Erickson mine workings in NE 1/4 NEV4 sec. 32, T. 13 N., R. 100 W.
The Wyoming part of the Vermillion Creek basin was mapped by the author between 1969 and 1978. The maps were published as the following U.S. Geological Survey 71f2-minute geologic quadrangles:
Potter Mountain . . . . Erickson-Kent Ranch Chicken Creek West Four J Rim .... Scrivner Butte . . . Chicken Creek SW
GQ-1082 GQ-1056 GQ-1131 GQ-1002 GQ-1166 GQ-1443
The study area, shown in detail on plate 1, is located entirely within the Chicken Creek SW quadrangle.
The author measured 50 sections in 1978 (pl. 1, sections 178 to 5078) across the interval of the Vermillion Creek coal bed in two generally north-south-trending lines of outcrops. During the same year the coal bed was evaluated by five drill holes and three coreholes located between the above lines of measured sections (pl. 1). The three coreholes provided fresh coal and rock samples, from which most of the analytical data in this professional paper are derived.
A summary of the ongm, composition, distribution and resources of the Vermillion Creek coal bed was presented by the author in a paper at the 1979 Annual Meeting of the Rocky Mountain Section of the American Association of Petroleum Geologists (Roehler, 1979).
REFERENCES CITED Bradley, W. H., 1945, Geology of the Washakie basin, Sweetwater
and Carbon Counties, Wyoming, and Moffat County, Colorado: U.S. Geological Survey Oil and Gas Investigations Preliminary Map 32.
--1964, Geology of Green River Formation and associated Eocene rocks in southwestern Wyoming and adjacent parts of Colorado and Utah: U.S. Geological Survey Professional Paper 496-A, 86p.
Masursky, Harold, 1962, Uranium-bearing coal in the eastern part of the Red Desert area, Wyoming: U.S. Geological Survey Bulletin lO~B, 152 p.
Mcintyre, L. B., 1955, Correlation chart, Shell Creek-Pine Butte areas, Washakie basin, Wyoming: Wyoming Geological Association Guidebook, lOth Annual Field Conference, Green River basin, 1955, foldout facing p. 176.
INTRODUCTION (ROEHLER) 11
FIGURE 8.-Measured section 3778, one-half mile south of the Erickson mine in NE 1/4 SWV4 sec. 32, T. 13 N., R. 100 W.
Pipiringos, G. N., 1961, Uranium-bearing coal in the central part of the Great Divide Basin: U.S. Geological Survey Bulletin 1099-A, 104 p.
Roehler, H. W., 1979, The Vermillion Creek coal bed, a high-sulfur, radioactive coal of paludal-lacustrine origin in the Niland Tongue of the Wasatch Formation in the Vermillion Creek basin, Wyoming and Colorado [abs.]: American Association of Petroleum Geologists Bulletin, v. 63, no. 5, p. 839.
Trudell, L. G., Roehler, H. W., and Smith, J. W., 1973, Geology of Eocene rocks and oil yields of Green River oil shales on part of Kinney Rim, Washakie basin, Wyoming: U.S. Bureau of Mines Report of Investigations RI-7775, 151 p.
ro 0 (.)
~ Q) Q)
u
Vl Vl Q) c ~ (.)
~ ro 0 u
~ 0.1
6.0
0.8
Gray fine - to coarse-grained crossbedded sandstone
Coal
Brown carbonaceous shale
Brown oil shale containing yellow sulfate nodules
Gray sandstone containing Goniobasis sp.
Gray carbonaceous shale containing white, powdery melanterite near the top
Coal; brown carbonaceous shale
Brown carbonaceous shale
Brown oil shale containing ostracodes
Gray limestone containing ostracodes
Coal; brown carbonaceous shale
Brown carbonaceous shale
Brown oil shale containing ostracodes and Hydrobia sp.
FIGURE 9.- Measured section 3778, of outcrops of the Vermillion Creek coal one-half mile south of the Erickson mine in NE 1/4 SW1/ 4
sec. 32, T. 13 N., R. 100 W. Radioactivity not determined.

Structure and Stratigraphy By H. W. ROEHLER
GEOLOGICAL INVESTIGATIONS OF THE VERMILLION CREEK COAL BED IN THE EOCENE NILAND TONGUE OF THE WASATCH FORMATION, SW.EETWATER COUNTY, WYOMING
U.S. GEOLOGICAL SURVEY PROFESSIONAL PAPER 1314-B
CONTENTS
Abstract .................. . Structures in the Vermillion Creek basin . Structures in the study area . . . . . . . . Stratigraphy of Eocene rocks in the Vermillion Creek basin . Stratigraphy of the Niland Tongue of the Wasatch Formation.
Vermillion Creek basin . . Study area ....... . Vermillion Creek coal bed
References cited . . . . . . . .
ILLUSTRATIONS
FIGURE 10. Geologic map of the Vermillion Creek basin and adjacent areas . . . . . . . . 11. Diagram showing age and regional correlation of Eocene formations ..... . 12. North-south cross section of the Niland Tongue in the Vermillion Creek basin 13. East-west cross section of the Niland Tongue in the Vermillion Creek basin . 14. Index map of the Vermillion Creek basin showing locations of cross sections . 15. Photograph of outcrops of the Niland Tongue in the northwest part of the study area 16. Photograph of outcrops of the Niland Tongue in the southeast part of the study area . 17. Composite section of the Niland Tongue and associated Eocene rocks on Vermillion Creek 18. Generalized isopach map of the Vermillion Creek coal bed in the Vermillion Creek basin .
Page
15 15 17 17 18 18 20 22 23
14
Page
16 17 18 19 20 21 21 22 22
GEOLOGICAL INVESTIGATIONS OF THE VERMILLION CREEK COAL BED IN THE EOCENE NILAND TONGUE OF THE
WASATCH FORMATION, SWEETWATER COUNTY, WYOMING
STRUCTURE AND STRATIGRAPHY
' By H. W. ROEHLER
ABSTRACT
Structures in surface rocks in the Vermillion Creek basin are mostly northeast-trending anticlines and synclines that are cut by northwest-trending faults. The fold structures are eroded and exhibit low structural relief. Lower and middle Eocene rocks are well exposed and comprise intertongued stratigraphic subdivisions of the Wasatch and Green River Formations. The Vermillion Creek coal bed is in the upper part of the Niland Tongue of the Wasatch Formation. The bed is named for exposures of canneloid-like coal along Vermillion Creek in the study area in the central part of the basin.
STRUCTURES IN THE VERMILLION CREEK BASIN
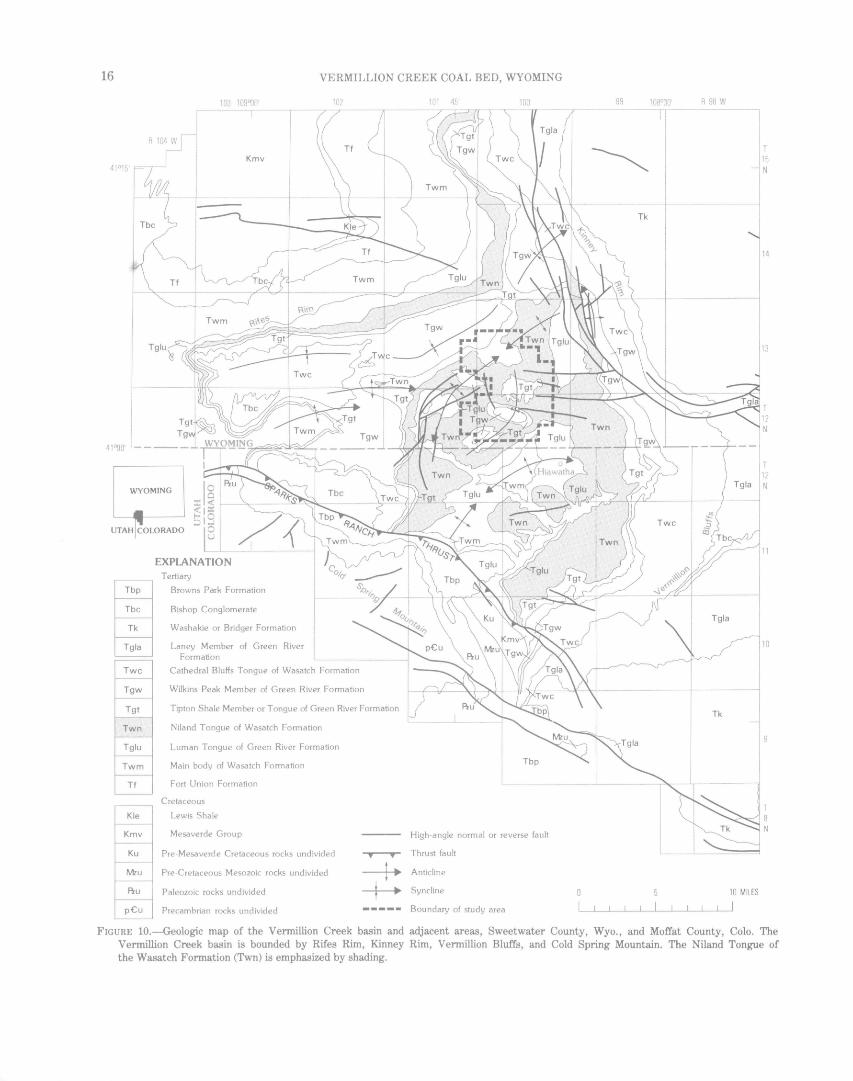
The Vermillion Creek basin, including the study area in the central part of the basin, is broadly folded and is cut by several normal and reverse faults. Folds and faults are mostly alined either northwest or northeast. The directions of these structural trends correspond to regional lineaments described by Thomas (1971) as resulting from the orogenic coupling of basement plates. Symmetrical folds mostly trend northeast and characterize the central parts of the basin, whereas faults mostly trend northwest and are concentrated at the northeast and southwest margins of the basin. The structural relief of the basin is about 2,500 feet, as illustrated on a contour map of Tertiary rocks prepared by Gras (1955). The salient structural features are shown on figure 10.
Anticlines and synclines in the basin have low structural and topographic relief. The Wasatch and Green River Formations, which are exposed at the surface, dip between 2° and 6° on the flanks. Some of the folds have doubly plunging axes and exhibit structural closure; others have fault closure or are structurally open.
The trace of the Sparks Ranch thrust fault extends for several miles along the southwest edge of the basin. The fault was active during the Laramide orogeny and is believed to be a concave-upward surface of fracture
which increases in dip from nearly horizontal at depth to nearly vertical at the surface. Its estimated displacement is 3-5 miles to the northeast. Mesozoic and Paleozoic rocks nearly 15,000 feet thick are exposed in the thrust plate south of the basin in T. 10 N., R. 100-101 W. Cretaceous rocks near the toe of the thrust are vertical to overturned, but the dips decrease in progressively older formations toward the southwest within the thrust plate. Thus, outcrops of pre-Cretaceous Mesozoic formations in the plate dip about 45° northeastward, but Paleozoic formations dip only about 25° northeastward. High-angle imbricate faults, which displace the upper Tertiary Browns Park Formation and roughly parallel the thrust-fault trace, attest to a relaxation of the compressional forces responsible for the thrust movements and to a late Tertiary collapse of the thrust plate.
High-angle normal and reverse faults that have displacements of less than 10 to more than 500 feet occur in T. 12-15 N., R. 99-101 W. in the central and northeast parts of the basin. Many of these faults die out downward in subsurface rocks, mostly in Upper Cretaceous shales. The high-angle faults appear to be genetically related to the Sparks Ranch thrust.
Most of the structural deformation of the Vermillion Creek basin took place early in the Tertiary Period. A large number of the presently exposed fold and fault structures appeared during or shortly after the end of the Eocene Epoch. However, some anticlines now producing oil and gas were present prior to the beginning of the Tertiary Period, and some of the high-angle faults are clearly of middle Tertiary age. Thrusting movements along the Sparks Ranch fault began during the Paleocene Epoch and continued intermittently into the early part of the Eocene Epoch. The structural development of the basin ended in the middle Tertiary, and the basin since has been modified only by regional uplift and degradation.
15
16 VERMILLION CREEK COAL BED, WYOMING
103 109000' 1L7
J r· T-I
Kmv
41000'
WYOMING
UTAH COLORADO
EXPLANATION Tertiary
Browns Park Formation
Bishop Conglomerate
Washakie or Bridger Formation
Laney Member of Green River Formation
Cathedral Bluffs Tongue of Wasatch Formation
Wilkins Peak Member of Green River Formation
Tipton Shale Member or Tongue of Green River Formation
Niland Tongue of Wasatch Formation
Luman Tongue of Green River Formation
Main body of Wasatch Formation
Fort Union Formation
Cretaceous
Lewis Shale
Mesaverde Group
Pre -Mesaverde Cretaceous rocks undivided
Pre -Cretaceous Mesozoic rocks undivided
Paleozoic rocks undivided
Precambrian rocks undivided
101 4'' 100
Tbp
High-angle normal or reverse fault
Thrust fault
Anticline
Syncline
Boundary of study area
89 108°30' R 98 W -T
~
Tk t
-l ~~
10 MILES
I
13
11
10
N
FIGURE 10.-Geologic map of the Vermillion Creek basin and adjacent areas, Sweetwater County, Wyo., and Moffat County, Colo. The Vermillion Creek basin is bounded by Rifes Rim, Kinney Rim, Vermillion Bluffs, and Cold Spring Mountain. The Niland Tongue of the Wasatch Formation (Twn) is emphasized by shading.
STRUCTURE AND STRATIGRAPHY (ROEHLER) 17
STRUCTURES IN THE STUDY AREA
The Canyon Creek-Trail anticlinal trend crosses the northern part of the study area in a northeast direction in T. 12-13 N., R. 100--101 W. (pl. 1). In sec. 20, T. 13 N., R. 100 W., a saddle is developed along the fold axis; it is this structural sag that separates the Canyon Creek gas field from the Trail gas field. The plunges of the anticlinal axes toward the saddle range from less than 1 o to slightly more than 2°, but in the vicinity of the saddle in the north-central part of the study area the rocks are nearly flat lying.
The southern part of the study area is located almost entirely within the Hiawatha syncline. Dips on the limbs of the syncline range between 1 o and 3°, except in part of the southeast limb where the dips increase rapidly to more than 6° toward the Hiawatha anticline. The axis of the Hiawatha syncline is offset in two places by west-trending high-angle faults. The more southern of these faults, in sees. 2, 3, 8, 9, and 10, T. 12 N., R. 100 W., is a reverse fault with an estimated throw between 40 and 120 feet. It causes a major eastward offset of the structure contours (shown on pl. 1) between 6, 900 and 7,200 feet, in the structurally lowest part of the syncline. The fault also causes displacement of the synclinal axis and changes the direction of the trend of the axis from northeast on the south side of the fault to north on the north side of the fault. The northern fault, in sees. 33, 34, and 35, T. 13 N., R. 100 W., is a normal fault that dips 56° northward and has a maximum throw of about 50 feet. Other small high-angle normal and reverse faults are present near the east and west boundaries of the study area, but only those in SE% sec. 27, T. 13 N., R. 100 W. and in NE% sec. 6, T. 12 N., R. 100 W. displace the Vermillion Creek coal bed.
STRATIGRAPHY OF EOCENE ROCKS IN THE VERMILLION CREEK BASIN
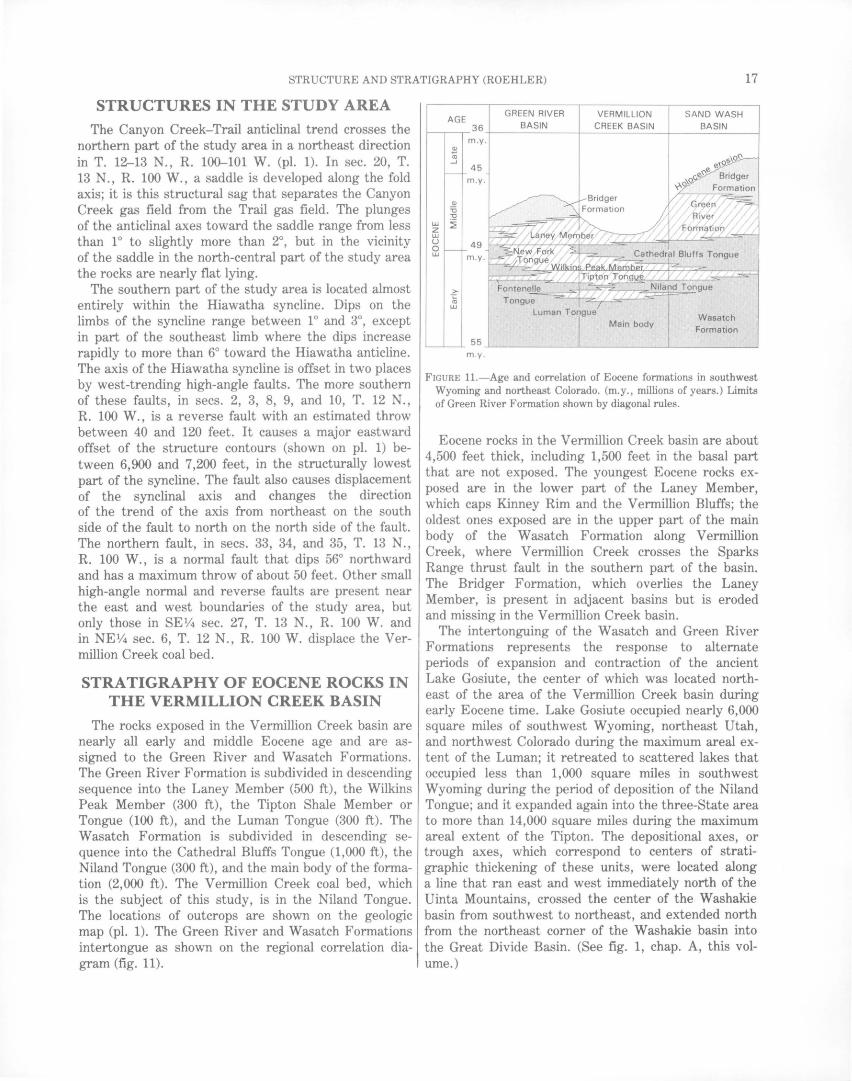
The rocks exposed in the Vermillion Creek basin are nearly all early and middle Eocene age and are assigned to the Green River and Wasatch Formations. The Green River Formation is subdivided in descending sequence into the Laney Member (500 ft), the Wilkins Peak Member (300 ft), the Tipton Shale Member or Tongue (100 ft), and the Luman Tongue (300 ft). The Wasatch Formation is subdivided in descending sequence into the Cathedral Bluffs Tongue (1,000 ft), the Niland Tongue (300 ft), and the main body of the formation (2,000 ft). The Vermillion Creek coal bed, which is the subject of this study, is in the Niland Tongue. The locations of outcrops are shown on the geologic map (pl. 1). The Green River and Wasatch Formations intertongue as shown on the regional correlation diagram (fig. 11).
SAND WASH BASIN
Wasatch Formation
FIGURE 11.-Age and correlation of Eocene fonnations in southwest Wyoming and northeast Colorado. (m.y., millions of years.) Limits of Green River Fonnation shown by diagonal rules.
Eocene rocks in the Vermillion Creek basin are about 4,500 feet thick, including 1,500 feet in the basal part that are not exposed. The youngest Eocene rocks exposed are in the lower part of the Laney Member, which caps Kinney Rim and the Vermillion Bluffs; the oldest ones exposed are in the upper part of the main body of the Wasatch Formation along Vermillion Creek, where Vermillion Creek crosses the Sparks Range thrust fault in the southern part of the basin. The Bridger Formation, which overlies the Laney Member, is present in adjacent basins but is eroded and missing in the Vermillion Creek basin.
The intertonguing of the Wasatch and Green River Formations represents the response to alternate periods of expansion and contraction of the ancient Lake Gosiute, the center of which was located northeast of the area of the Vermillion Creek basin during early Eocene time. Lake Gosiute occupied nearly 6,000 square miles of southwest Wyoming, northeast Utah, and northwest Colorado during the maximum areal extent of the Luman; it retreated to scattered lakes that occupied less than 1,000 square miles in southwest Wyoming during the period of deposition of the Niland Tongue; and it expanded again into the three-State area to more than 14,000 square miles during the maximum areal extent of the Tipton. The depositional axes, or trough axes, which correspond to centers of stratigraphic thickening of these units, were located along a line that ran east and west immediately north of the Uinta Mountains, crossed the center of the Washakie basin from southwest to northeast, and extended north from the northeast corner of the Washakie basin into the Great Divide Basin. (See fig. 1, chap. A, this volume.)

18 VERMILLION CREEK COAL BED, WYOMING
A A'
G) 0 00 0 G) ® @ @ I I I
.. ·.~. . ·. ~· ..... .
Luma~ Tongue
Main body Wasatch Formation
DEPOSITIONAL ENVIRONMENT
D LACUSTRINE D PALUDAL D FLOOD PLAIN 100
50
5 MILES
FIGURE 12.-North-south cross section of the Niland Tongue and main body of the Wasatch Formation and the Tipton Shale Member and Luman Tongue of the Green River Formation showing intertonguing relations and depositional environments. Heavy lines are coal beds. See figure 14 for locations of sections.
STRATIGRAPHY OF THE NILAND TONGUE
OF THE WASATCH FORMATION
VERMILLION CREEK BASIN
The Niland Tongue of the Wasatch Formation was named by Pipiringos (1955) for 400 feet of coal, clay shale, siltstone, sandstone, and oil shale exposed along the southern margin of the Niland basin (part of the
Great Divide Basin) in T. 24 N., R. 95-96 W. Pipiringos (1961) later mapped outcrops of the Niland Tongue southward across the Great Divide Basin into the northern part of the Washakie basin. From there the author (Roehler, 1973) mapped the tongue westward and southward around the western part of the Washakie basin into the Vermillion Creek basin. The thickness, composition, and type exposures of the Niland Tongue in its type area closely resemble those of the tongue in the Vermillion Creek basin.
STRUCTURE AND STRATIGRAPHY (ROEHLER) 19
B
@@@(15)0'6)@ I I 1rr1
j\:;:_··:. ·.-.::.:l LACUSTRINE
@ @ I I
DEPOSITIONAL ENVIRONMENT
D PALUDAL
@@@ I I I
D FLOOD PLAIN
B'
@ @ @@ I I I I
.. ···<_::::.;·;:._::·:· __ :·_::_::-:.=.:. :··>'
, . . . ···~·.·:.::: .:-: .. ~.-·
:;.,=;::===::::=:::=.._.~ .. . -::.·::
FEET 150
100
50
5 MILES
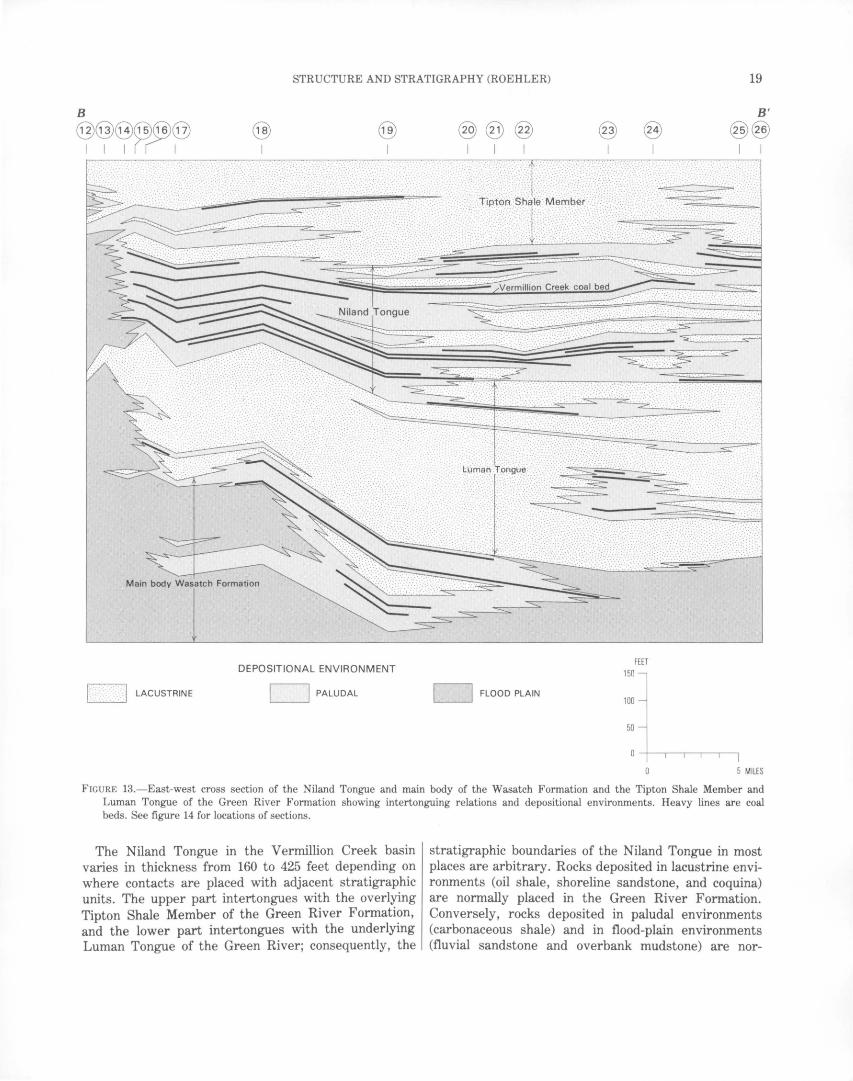
FIGURE 13.-East-west cross section of the Niland Tongue and main body of the Wasatch Formation and the Tipton Shale Member and Luman Tongue of the Green River Formation showing intertonguing relations and depositional environments. Heavy lines are coal beds. See figure 14 for locations of sections.
The Niland Tongue in the Vermillion Creek basin varies in thickness from 160 to 425 feet depending on where contacts are placed with adjacent stratigraphic units. The upper part intertongues with the overlying Tipton Shale Member of the Green River Formation, and the lower part intertongues with the underlying Luman Tongue of the Green River; consequently, the
stratigraphic boundaries of the Niland Tongue in most places are arbitrary. Rocks deposited in lacustrine environments (oil shale, shoreline sandstone, and coquina) are normally placed in the Green River Formation. Conversely, rocks deposited in paludal environments (carbonaceous shale) and in flood-plain environments (fluvial sandstone and overbank mudstone) are nor-
20 VERMILLION CREEK COAL BED, WYOMING
EXPLANATION Measured Grid location 108°45' section Section(s) Township Range
0 Measured section number north west
Boundary of study area 1 14,15-- 15 101 2 36---- 15 101
Highway 3 31,32,33 14 100
Improved gravel road 4 35---- 14 100
2----- 13 100 5 32---- 13 99 6 5,6,7--- 12 99 7 6----- 11 99 8 8----- 11 99 9 20,28,29 11 99
10 27,34-- 11 100 Creek basin 11 8,9---- 10 100
12 8----- 12 103 13 36---- 13 104
31---- 13 103 14 25---- 13 104 15 25---- 13 104 16 25----- 13 104 17 19,20--- 13 103 18 13----· 13 103
7-----· 13 102 19 5----- 13 101
11,12,13 13 102 0 5 MILES 20 26---- 13 101 I I I I 21 24,25-- 13 101
19---- 13 100 22 32---- 13 100 23 22,27-- 12 100 24 11---- 12 100 25 31,32-- 13 99 26 19,20-- 13 99
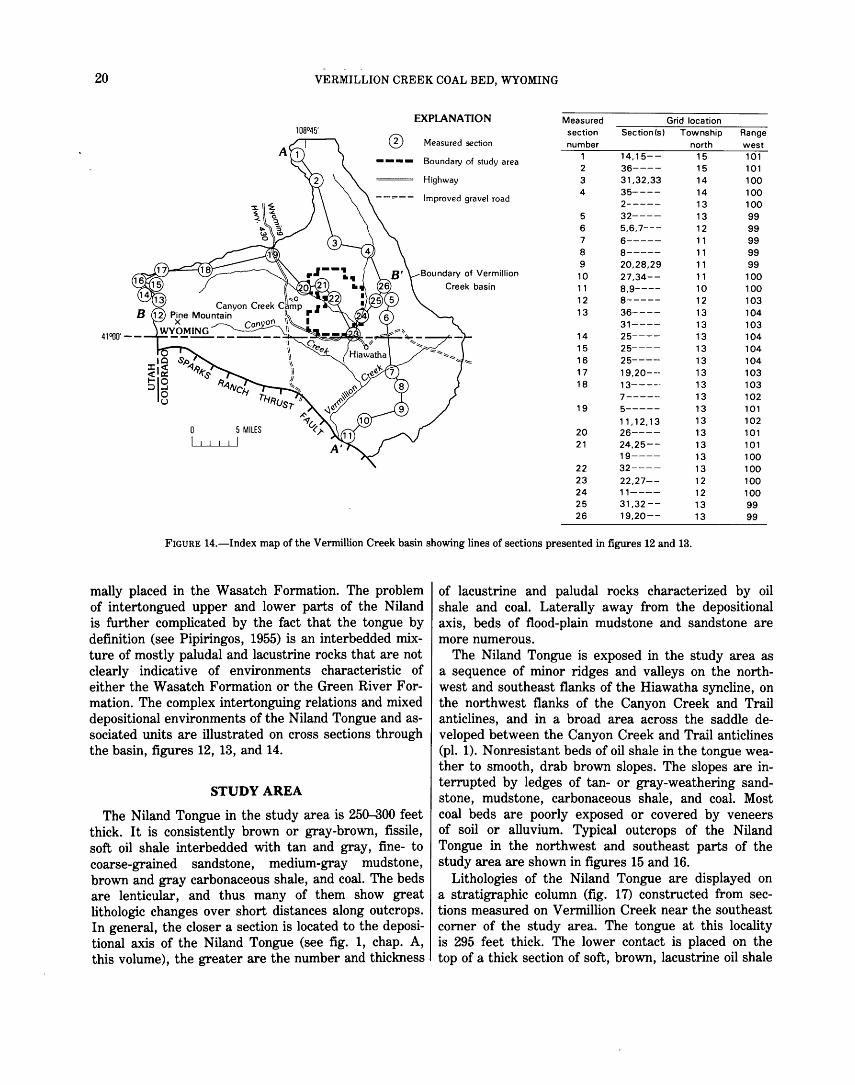
FIGURE 14.-Index map of the Vermillion Creek basin showing lines of sections presented in figures 12 and 13.
mally placed in the Wasatch Formation. The problem of intertongued upper and lower parts of the Niland is further complicated by the fact that the tongue by definition (see Pipiringos, 1955) is an interbedded mixture of mostly paludal and lacustrine rocks that are not clearly indicative of environments characteristic of either the Wasatch Formation or the Green River Formation. The complex intertonguing relations and mixed depositional environments of the Niland Tongue and associated units are illustrated on cross sections through the basin, figures 12, 13, and 14.
STUDY AREA
The Niland Tongue in the study area is 25<h'300 feet thick. It is consistently brown or gray-brown, fissile, soft oil shale interbedded with tan and gray, fine- to coarse-grained sandstone, medium-gray mudstone, brown and gray carbonaceous shale, and coal. The beds are lenticular, and thus many of them show great lithologic changes over short distances along outcrops. In general, the closer a section is located to the depositional axis of the Niland Tongue (see fig. 1, chap. A, this volume), the greater are the number and thickness
of lacustrine and paludal rocks characterized by oil shale and coal. Laterally away from the depositional axis, beds of flood-plain mudstone and sandstone are more numerous.
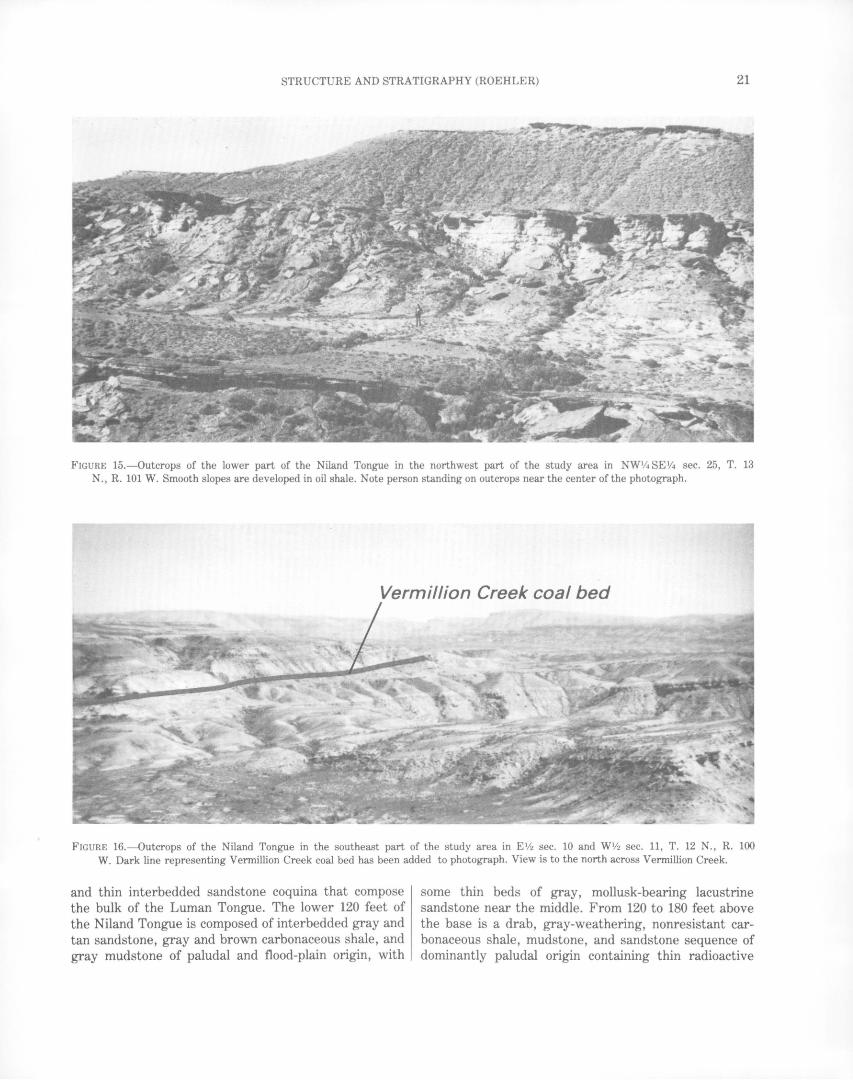
The Niland Tongue is exposed in the study area as a sequence of minor ridges and valleys on the northwest and southeast flanks of the Hiawatha syncline, on the northwest flanks of the Canyon Creek and Trail anticlines, and in a broad area across the saddle developed between the Canyon Creek and Trail anticlines (pl. 1). Nonresistant beds of oil shale in the tongue weather to smooth, drab brown slopes. The slopes are interrupted by ledges of tan- or gray-weathering sandstone, mudstone, carbonaceous shale, and coal. Most coal beds are poorly exposed or covered by veneers of soil or alluvium. Typical outcrops of the Niland Tongue in the northwest and southeast parts of the study area are shown in figures 15 and 16.
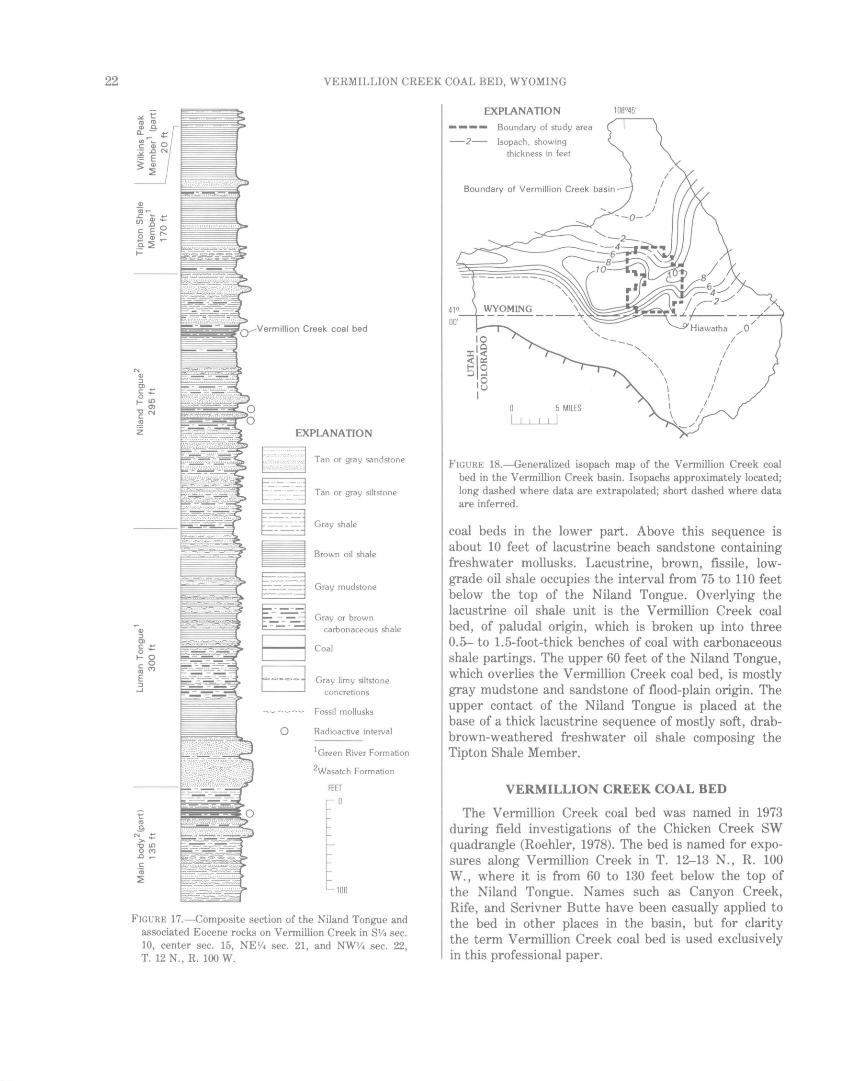
Lithologies of the Niland Tongue are displayed on a stratigraphic column (fig. 17) constructed from sections measured on Vermillion Creek near the southeast corner of the study area. The tongue at this locality is 295 feet thick. The lower contact is placed on the top of a thick section of soft, brown, lacustrine oil shale
STRUCTURE AND STRATIGRAPHY (ROEHLER) 21
FIGURE 15.-0utcrops of the lower part of the Niland Tongue in the northwest part of the study area in NWl/4 SEV4 sec. 25, T. 13 N., R. 101 W. Smooth slopes are developed in oil shale. Note person standing on outcrops near the center of the photograph.
Vermillion Creek coal bed
FIGURE 16.-0utcrops of the Niland Tongue in the southeast part of the study area in Elfz sec. 10 and WVz sec. 11, T. 12 N., R. 100 W. Dark line representing Vermillion Creek coal bed has been added to photograph. View is to the north across Vermillion Creek.
and thin interbedded sandstone coquina that compose the bulk of the Luman Tongue. The lower 120 feet of the Niland Tongue is composed of interbedded gray and tan sandstone, gray and brown carbonaceous shale, and gray mudstone of paludal and flood-plain origin, with
some thin beds of gray, mollusk-bearing lacustrine sandstone near the middle. From 120 to 180 feet above the base is a drab, gray-weathering, nonresistant carbonaceous shale, mudstone, and sandstone sequence of dominantly paludal origin containing thin radioactive
22 VERMILLION CREEK COAL BED, WYOMING
Q)
::J Cl r:: .... o.,_ 1-0 r::O coC"'l
E ::J
..J
0
EXPLANATION
Tan or gray sandstone
Tan or gray siltstone
Gray shale
Brown oil shale
Gray mudstone
Gray or brown carbonaceous shale
Coal
Gray limy siltstone concretions
Fossil mollusks
Radioactive interval
1 Green River Formation
2Wasatch Formation
FIGURE 17.-Composite section of the Niland Tongue and associated Eocene rocks on Vermillion Creek in SV4 sec. 10, center sec. 15, NEV4 sec. 21, and NW1/4 sec. 22, T. 12 N., R. 100 W.
EXPLANATION 108°45'
Boundary of study area
-2- Isopach , showing thickness in feet
Boundary of Vermillion Creek basin
5 MILES I
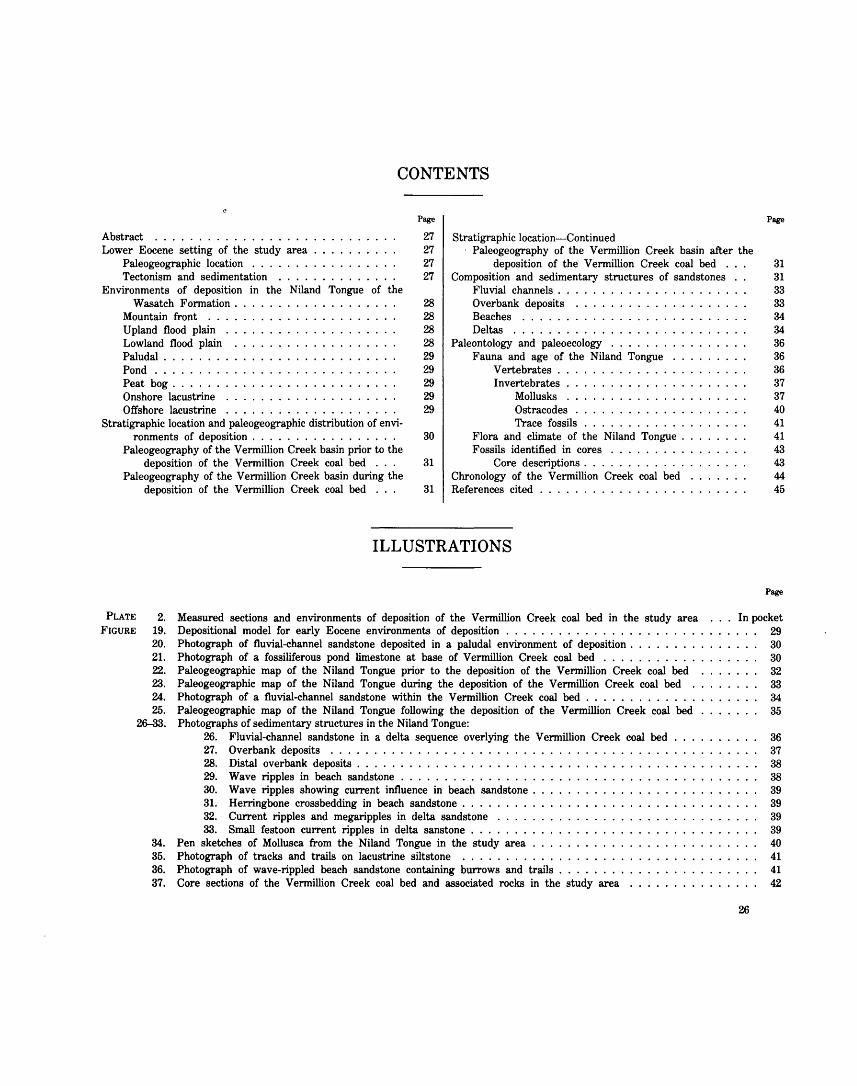
FIGURE 18.-Generalized isopach map of the Vermillion Creek coal bed in the Vermillion Creek basin. Isopachs approximately located; long dashed where data are extrapolated; short dashed where data are inferred.
coal beds in the lower part. Above this sequence is about 10 feet of lacustrine beach sandstone containing freshwater mollusks. Lacustrine, brown, fissile, lowgrade oil shale occupies the interval from 75 to 110 feet below the top of the Niland Tongue. Overlying the lacustrine oil shale unit is the Vermillion Creek coal bed, of paludal origin, which is broken up into three 0.5- to 1.5-foot-thick benches of coal with carbonaceous shale partings. The upper 60 feet of the Niland Tongue, which overlies the Vermillion Creek coal bed, is mostly gray mudstone and sandstone of flood-plain origin. The upper contact of the Niland Tongue is placed at the base of a thick lacustrine sequence of mostly soft, drabbrown-weathered freshwater oil shale composing the Tipton Shale Member.
VERMILLION CREEK COAL BED
The Vermillion Creek coal bed was named in 1973 during field investigations of the Chicken Creek SW quadrangle (Roehler, 1978). The bed is named for exposures along Vermillion Creek in T. 12-13 N., R. 100 W., where it is from 60 to 130 feet below the top of the Niland Tongue. Names such as Canyon Creek, Rife, and Scrivner Butte have been casually applied to the bed in other places in the basin, but for clarity the term Vermillion Creek coal bed is used exclusively in this professional paper.

STRUCTURE AND STRATIGRAPHY (ROEHLER) 23
The coal has been classified as canneloid. Fresh samples typically have noticeable low density and conchoidal fracture. Cleats are present locally in parts of the bed. Many of the fractures on the outcrop are filled with jarosite, gypsum, or melanterite. The coal normally has shale partings and at some locations is broken up into benches by beds of carbonaceous shale or, less commonly, by sandstone, oil shale, or limestone. The best exposures are usually found where the bed is overlain by ledges of resistant sandstone, but at one locality near the center of NW% sec. 5, T. 12 N., R. 100 W., the outcrops have eroded to a haystack-shaped mound.
The approximate thickness and areal distribution of the Vermillion Creek coal bed in the Vermillion Creek basin are indicated on an isopach map (fig. 18). The isopachs on figure 18 are drawn from data derived from widely spaced measured sections and drill holes. The map is small scale and is deliberately generalized to show only the basic east-west trend of coal thickening and the inferred locations of wedge-outs prior to deformation and the erosion of parts of the Niland Tongue. Isopachs of the Vermillion Creek coal bed in the study area are shown in detail by Ellis (this volume).
REFERENCES CITED
Gras, V. B., 1955, Vermillion Creek basin area, Sweetwater County, Wyoming, and Moffat County, Colorado: Wyoming Geological Association Guidebook, lOth Annual Field Conference, Green River basin, 1955, p. 177-181.
Pipiringos, G. N., 1955, Tertiary rocks in the central part of the Great Divide Basin, Sweetwater County, Wyoming: Wyoming Geological Association Guidebook, lOth Annual Field Conference Green River basin, 1955, p. 100-104.
--1961, Uranium-bearing coal in the central part of the Great Divide Basin: U.S. Geological Survey Bulletin 1099--A, 104 p.
Roehler, H. W., 1973, Mineral resources in the Washakie basin Wyoming, and Sand Wash basin, Colorado: in Symposium and core seminar on the geology and mineral resources of the greater Green River basin: Wyoming Geological Association Guidebook, 25th Annual Field Conference, 1973, p. 47-56.
--1978, Geologic map of the Chicken Creek SW quadrangle, Sweetwater County, Wyoming, and Moffat County, Colorado: U.S. Geological Survey Geologic Quadrangle Map GQ-1443, scale 1:24,000.
Thomas, G. E., 1971, Continental plate tectonics--southwest Wyoming, in Symposium on Wyoming tectonics and their economic significance: Wyoming Geological Association Guidebook, 23d Annual Field Conference, 1971, p. 103--123.


Paleoenvironments and Sedimentology By H. W. ROEHLER
GEOLOGICAL INVESTIGATIONS OF THE VERMILLION CREEK COAL BED IN THE EOCENE NILAND TONGUE OF THE WASATCH FORMATION, SWEETWATER COUNTY, WYOMING
U.S. GEOLOGICAL SURVEY PROFESSIONAL PAPER 1314-C
CONTENTS
Page Page
Abstract ...... . 27 Stratigraphic location-Continued Lower Eocene setting of the study area
Paleogeographic location . . . . . . . Tectonism and sedimentation . . . .
27 Paleogeography of the Vermillion Creek basin after the
Environments of deposition in the Niland Tongue of the Wasatch Formation .
Mountain front . . . Upland flood plain . Lowland flood plain Paludal .. Pond ....... . Peat bog ..... . Onshore lacustrine Offshore lacustrine
Stratigraphic location and paleogeographic distribution of environments of deposition . . . . . . . . . . . . . . . . .
Paleogeography of the Vermillion Creek basin prior to the deposition of the Vermillion Creek coal bed . . .
Paleogeography of the Vermillion Creek basin during the deposition of the Vermillion Creek coal bed . . .
27 deposition of the Vermillion Creek coal bed . 27 Composition and sedimentary structures of sandstones
Fluvial channels .. 28 Overbank deposits 28 Beaches ..... . 28 Deltas ...... . 28 Paleontology and paleoecology 29 Fauna and age of the Niland Tongue 29 Vertebrates . 29 Invertebrates . 29 Mollusks . 29 Ostracodes
Trace fossils 30 Flora and climate of the Niland Tongue .
Fossils identified in cores . . . . . . . . . 31 Core descriptions . . . . . . . . . . . .
Chronology of the Vermillion Creek coal bed 31 References cited . . . . . . . . . . . . . . . . .
ILLUSTRATIONS
PLATE 2. Measured sections and environments of deposition of the Vermillion Creek coal bed in the study area FIGURE 19. Depositional model for early Eocene environments of deposition . . . . . . . . . . . . . . .
20. Photograph of fluvial-channel sandstone deposited in a paludal environment of deposition . . . . . . . . 21. Photograph of a fossiliferous pond limestone at base of Vermillion Creek coal bed . . . . . . . . . . . 22. Paleogeographic map of the Niland Tongue prior to the deposition of the Vermillion Creek coal bed 23. Paleogeographic map of the Niland Tongue during the deposition of the Vermillion Creek coal bed . 24. Photograph of a fluvial-channel sandstone within the Vermillion Creek coal bed . . . . . . . . . . . . . 25. Paleogeographic map of the Niland Tongue following the deposition of the Vermillion Creek coal bed
26--33. Photographs of sedimentary structures in the Niland Tongue: 26. Fluvial-channel sandstone in a delta sequence overlying the Vermillion Creek coal bed 27. Overbank deposits ....... . 28. Distal overbank deposits . . . . . . . . . . . . . . . . . . . . . 29. Wave ripples in beach sandstone ............... . 30. Wave ripples showing current influence in beach sandstone . 31. Herringbone crossbedding in beach sandstone . . . . 32. Current ripples and megaripples in delta sandstone . . . . 33. Small festoon current ripples in delta sanstone . . . . . . .
34. Pen sketches of Mollusca from the Niland Tongue in the study area 35. Photograph of tracks and trails on lacustrine siltstone . . . . . . . . 36. Photograph of wave-rippled beach sandstone containing burrows and trails . 37. Core sections of the Vermillion Creek coal bed and associated rocks in the study area
31 31 33 33 34 34 36 36 36 37 37 40 41 41 43 43 44 45
Page
In pocket 29 30 30 32 33 34 35
26
36 37 38 38 39 39 39 39 40 41 41 42
GEOLOGICAL INVESTIGATIONS OF THE VERMILLION CREEK COAL BED IN THE EOCENE NILAND TONGUE OF THE
WASATCH FORMATION, SWEETWATER COUNTY, WYOMING
PALEOENVIRONMENTS AND SEDIMENTATION
By H. W. ROEHLER
ABSTRACT
The Vermillion Creek coal bed and associated rocks in the Niland Tongue of the Wasatch Formation in the Vermillion Creek basin were deposited in mountain front, upland flood-plain, lowland flood-plain, paludal, pond, peat bog, onshore lacustrine, and offshore lacustrine environments. The environments have characteristic lithofacies and biofacies. The origin, composition, stratigraphic location, paleontology, and paleogeographic distribution of the environments are described and illustrated by photographs, diagrams, maps, and sections. The data indicate that the early Eocene climate in the area of the Vermillion Creek basin was warm and temperate. The landscape was forested between areas of grasslike and shrublike vegetation. Terrestrial and aquatic animal life was abundant and diverse.
LOWER EOCENE SETTING OF THE STUDY AREA
PALEOGEOGRAPHIC LOCATION
The study area during the lower part of the Eocene Epoch was located north of the eastern end of the Uinta Mountains at the southern edge of a large intermontane basin that roughly corresponds to the Holocene greater Green River basin. The ancient basin incorporated nearly 20,000 square miles of what are now the Green River, Great Divide, Washakie, and Sand Wash basins and the Rock Springs uplift in southwest Wyoming and in adjacent parts of northeast Utah and northwest Colorado. (See chap. A, this volume, fig. 1.) The topographically lowest parts of the ancient basin were at elevations from 1,000 to 2,000 feet above sea level, while the highest mountains surrounding the basin were at elevations of about 5,000 feet above sea level. The closest sea was more than 300 miles southeast of the study area in the Mississippi embayment.
Parts of the basin in which the Niland Tongue of the Wasatch Formation was deposited were periodically flooded by freshwater lakes. These lakes are stages of Lake Gosiute, an Eocene lake which persisted intermittently for more than 6 million years. The depositional history of Lake Gosiute has been described by Bradley (1964), and the areal distribution and geometry of
freshwater and saltwater stages of the lake have been outlined by Roehler (1965) and by Sullivan (1980). During the earliest of the lake stages, the freshwater Luman lake stage, Lake Gosiute trended generally northeast and covered about 6,000 square miles of the southern and central parts of the ancient intermontane basin. The Luman lake stage (Luman Tongue of the Green River Formation) lasted for more than 2 million years, and ended when the lake began to recede and dry up. Large swamps, peat bogs, and restricted, shallow freshwater lakes subsequently occupied the former basin of the Luman lake, and the sediments that filled this depression compose the . Niland Tongue of the Wasatch Formation. (See chap. A, this volume, fig. 1.) The small freshwat~r Niland lakes were ephemeral and dispersed, and the largest was less than 50 miles across. The swamps and peat bogs that developed along the shores and among the Niland lakes gave way laterally from the area of the former Luman lake basin first to flood plains and then to low rolling hills toward surrounding mountains. The foothills of the mountains were formed by alluvial fans and pediments that rose a few hundred feet above the basin floor. Above the foothills was a rugged mountain terrain of hogback and flat-iron ridges composed of mostly Paleozoic and Mesozoic limestone, sandstone, and shale that were interrupted in places by canyons, on the bottom of which were fast, basinward-flowing streams.
TECTONISM AND SEDIMENTATION
Patterns of intermittent mountain uplift and erosion accompanied by basin subsidence and sediment accumulation are evident in the Eocene rock record. Tectonic activity in the mountains surrounding the basin is evidenced by thrusting and by the large size and number of boulders and cobbles composing the ancient alluvial faris in the foothills of the mountains. Sugarloaf Butte, Colo., SW% sec. 15, T. 11 N., R. 101 W., in the southern part of the Vermillion Creek basin a few miles southwest of the study area, is the eroded remnant of
27
28 VERMILLION CREEK COAL BED, WYOMING
one of these fans. The texture and lithologic composition of the clasts composing the alluvial fans reveal the progression and intensity of the erosional peeling of sedimentary formations from nearby upwarped mountain source areas and also record the times when basement rocks in the mountain cores were breached. Finetextured clastic sediments and minerals in solution were carried away from the mountains and deposited by aggrading distributary streams at basin depocenters. A rapid accumulation of sediments in the V ermillion Creek Basin is indicated by a section of Eocene rocks that is nearly 4,500 feet thick. Eocene rocks in the adjacent Washakie basin are even thicker, exceeding 9,000 feet. In such a setting of active tectonism and deep sediment burial, diagenesis was rapid, as presumably was the maturation rate for the Vermillion Creek coal bed.
ENVIRONMENTS OF DEPOSITION IN THE NILAND TONGUE OF
THE WASATCH FORMATION
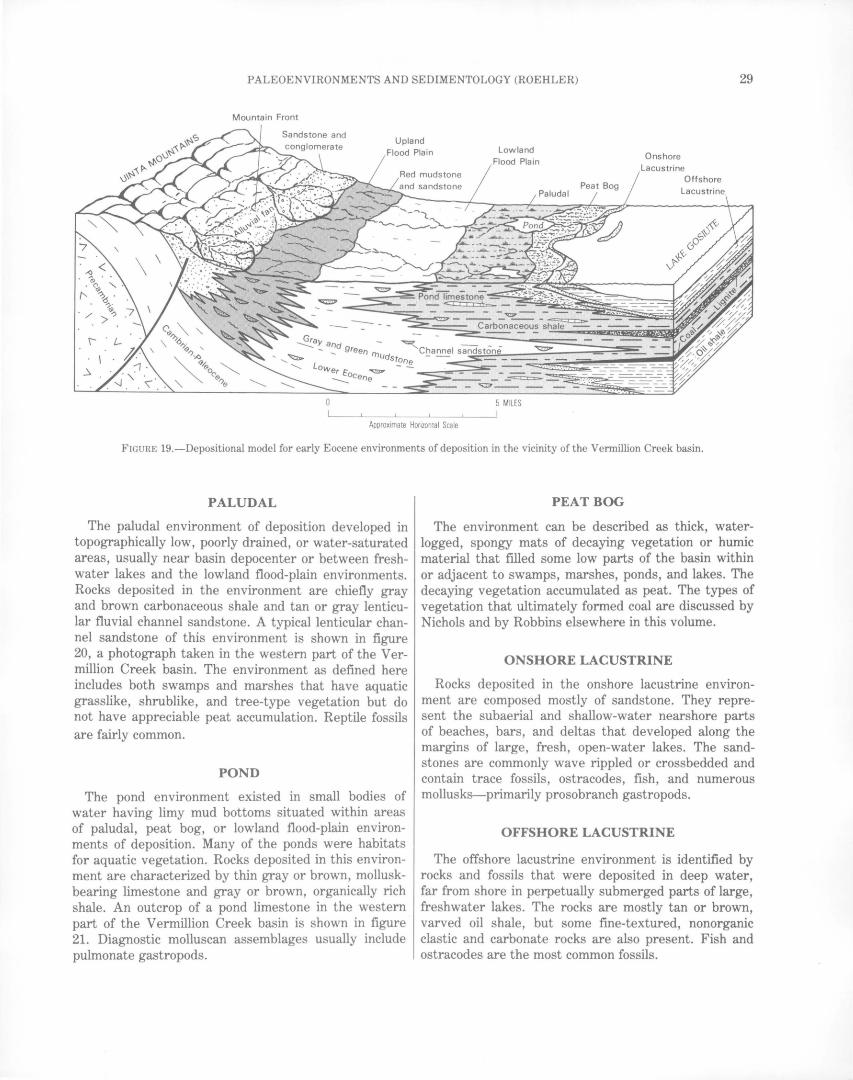
The term environment of deposition refers to the distinct physical, chemical, and biological conditions that existed at the time and· place of deposition, and these include the climate, topography, drainage patterns, fauna and flora, and the amount of tectonism, volcanism, erosion, or deposition of the sediments. Seven freshwater environments of deposition are identified in the Niland Tongue in the Vermillion Creek basin. These are (1) mountain front (includes alluvial fans and pediments), (2) upland flood plain (includes fluvial channels and interchannel areas), (3) lowland flood plain (includes fluvial channel and interchannel areas), (4) paludal (includes fluvial channels, swamps·, and marshes), (5) pond, (6) peat bog (coal-forming), (7) onshore lacustrine (includes beaches, bars and deltas), and (8) offshore lacustrine (includes organic-rich and carbonate-rich lake water and bottom sediments). The intertonguing relations and areal distribution of the rocks deposited in these environments of deposition are illustrated diagrammatically by figure 19. The rocks that characterize the various environments of deposition are commonly heterogeneous, but in general, the overall size of clastic material increases toward mountain source areas, whereas carbonate and carbonaceous beds increase in number and thickness toward basin depocenters. The paleoenvironmental classification system used here is based on the lithofacies; but, as demonstrated later under the heading "Paleontology and paleoecology," most of the environments of deposition also have characteristic biofacies.
MOUNTAIN FRONT
The mountain-front environment of deposition existed near the bases of mountains at the basin margins. Rocks deposited in this environment are mostly thick beds of cobbles and boulders that alternate with thinner beds of sandstone and mudstone. The largest clasts are commonly several feet across, rounded, very poorly sorted, and composed of several different lithologies. The conglomeratic sequence is normally red, but gray or brown colors predominate locally. The coarse clastics were deposited where the high gradients and high water velocities of mountain streams abruptly decreased as the streams entered more flat-lying basin areas. The resulting change in flow regime greatly reduced the sediment load carrying capacity of the streams. Coarse clastic material was consequently dumped at the foot of the mountains to form alluvial fans or fanglomerates. Where the fans coalesced, pediments developed. Fossils are rare.
UPLAND FLOOD PLAIN
The upland flood-plain environment was located basinward of mountain fronts. The rocks of this environment were deposited in areas of moderately high relief by low-sinuosity streams that occasionally overflowed their banks. The distinguishing feature of these rocks is their red color. The color resulted from oxidized iron and aluminum compounds in areas of welldrained, well-aerated, deeply weathered (lateritic) soils. The rocks are mostly sandstone and mudstone. The sandstones are either lenticular, trough cross bedded channel deposits with scoured bases or flat-bedded overbank deposits. The mudstones are either flat-bedded overbank deposits, generally interbedded with sandstone and siltstone, or interchannel mudflat deposits. Plant and animal fossils are present in the rocks, but they are not common.
LOWLAND FLOOD PLAIN
Rocks of the lowland flood-plain environment are primarily differentiated from those of the upland floodplain environment by the absence of red coloration. The lowland flood-plain environment developed in moderately low topographic areas where soils were moist or water-saturated; iron and aluminum compounds in such areas were reduced, becoming gray or green in color. Rocks of this environment are normally situated between the red upland flood-plain facies toward basin margins and the paludal facies toward basin centers. They are mostly lenticular fluvial channel sandstone and overbank sandstone, siltstone, and mudstone. Mammal fossils are abundant in these rocks.
PALEOENVIRONMENTS AND SEDIMENTOLOGY (ROEHLER) 29
Mountain Front
Sandstone and Upland
Flood Plain Lowland Flood Plain
Onshore Lacustrine
Offshore
5 MILES
Approximate Horizontal Scale
FIGURE 19.-Depositional model for early Eocene environments of deposition in the vicinity of the Vermillion Creek basin.
PALUDAL
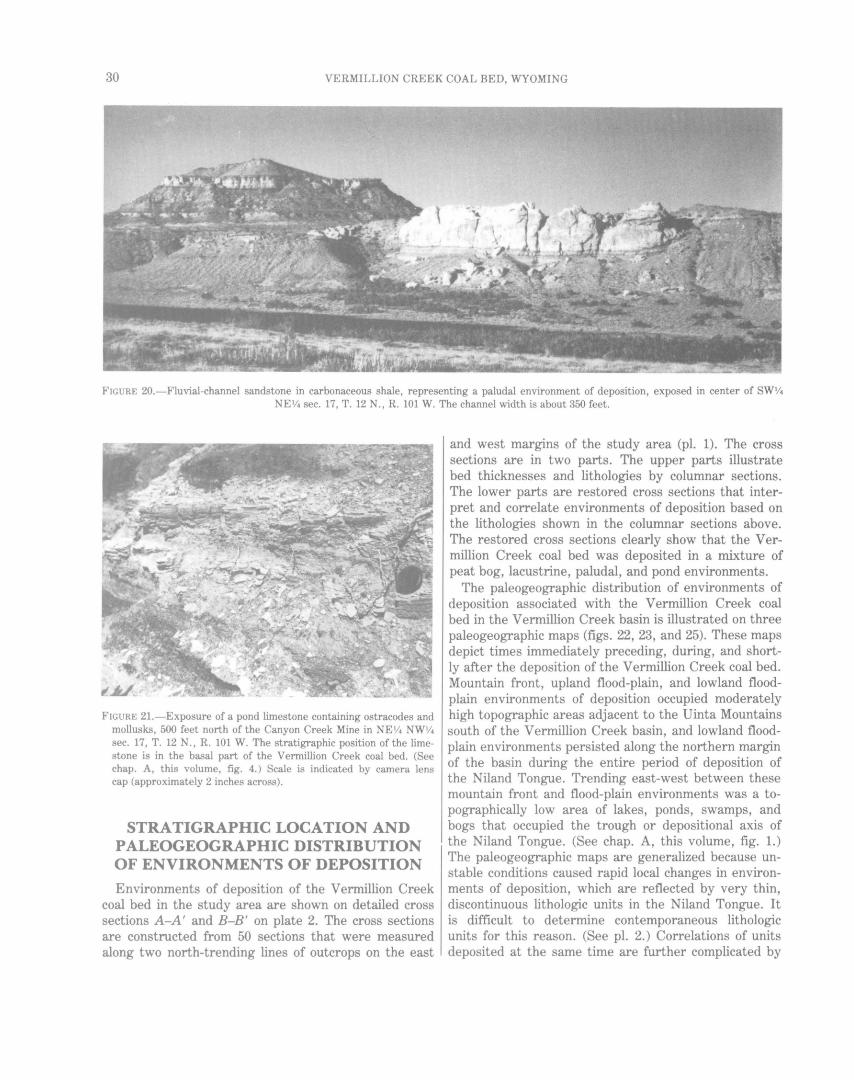
The paludal environment of deposition developed in topographically low, poorly drained, or water-saturated areas, usually near basin depocenter or between freshwater lakes and the lowland flood-plain environments. Rocks deposited in the environment are chiefly gray and brown carbonaceous shale and tan or gray lenticular fluvial channel sandstone. A typical lenticular channel sandstone of this environment is shown in figure 20, a photograph taken in the western part of the V ermillion Creek basin. The environment as defined here includes both swamps and marshes that have aquatic grasslike, shrublike, and tree-type vegetation but do not have appreciable peat accumulation. Reptile fossils are fairly common.
POND
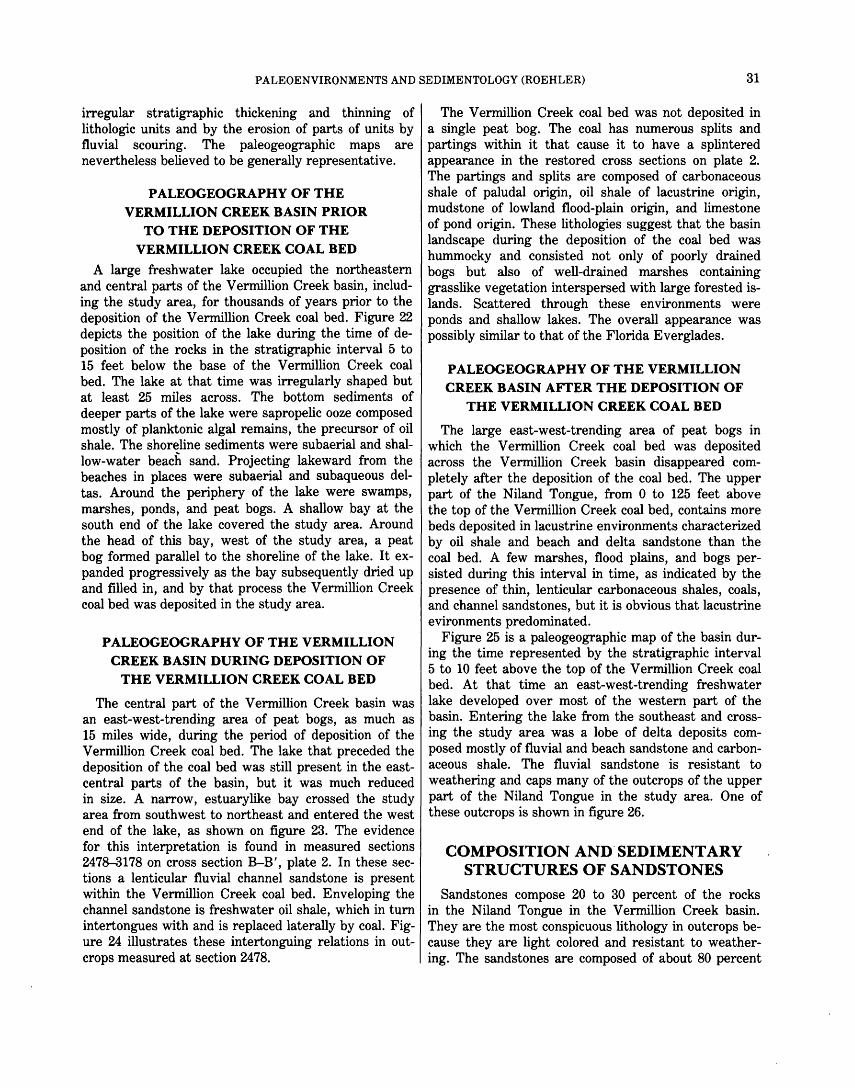
The pond environment existed in small bodies of water having limy mud bottoms situated within areas of paludal, peat bog, or lowland flood-plain environments of deposition. Many of the ponds were habitats for aquatic vegetation. Rocks deposited in this environment are characterized by thin gray or brown, molluskbearing limestone and gray or brown, organically rich shale. An outcrop of a pond limestone in the western part of the Vermillion Creek basin is shown in figure 21. Diagnostic molluscan assemblages usually include pulmonate gastropods.
PEATBOG
The environment can be described as thick, waterlogged, spongy mats of decaying vegetation or humic material that filled some low parts of the basin within or adjacent to swamps, marshes, ponds, and lakes. The decaying vegetation accumulated as peat. The types of vegetation that ultimately formed coal are discussed by Nichols and by Robbins elsewhere in this volume.
ONSHORE LACUSTRINE
Rocks deposited in the onshore lacustrine environment are composed mostly of sandstone. They represent the subaerial and shallow-water nearshore parts of beaches, bars, and deltas that developed along the margins of large, fresh, open-water lakes. The sandstones are commonly wave rippled or crossbedded and contain trace fossils, ostracodes, fish, and numerous mollusks-primarily prosobranch gastropods.
OFFSHORE LACUSTRINE
The offshore lacustrine environment is identified by rocks and fossils that were deposited in deep water, far from shore in perpetually submerged parts of large, freshwater lakes. The rocks are mostly tan or brown, varved oil shale, but some fme-textured, nonorganic clastic and carbonate rocks are also present. Fish and ostracodes are the most common fossils.
30 VERMILLION CREEK COAL BED, WYOMING
FIGURE 20.-Fluvial-channel sandstone in carbonaceous shale, representing a paludal environment of deposition, exposed in center of SW114 NE 1/4 sec. 17, T. 12 N., R. 101 W. The channel width is about 350 feet.
FIGURE 21.-Exposure of a pond limestone containing ostracodes and mollusks, 500 feet north of the Canyon Creek Mine in NE 114 NWV4 sec. 17, T. 12 N., R. 101 W. The stratigraphic position of the limestone is in the basal part of the Vermillion Creek coal bed. (See chap. A, this volume, fig. 4.) Scale is indicated by camera lens cap (approximately 2 inches across).
STRATIGRAPHIC LOCATION AND PALEOGEOGRAPHIC DISTRIBUTION OF ENVIRONMENTS OF DEPOSITION
Environments of deposition of the Vermillion Creek coal bed in the study area are shown on detailed cross sections A-A' and B-B' on plate 2. The cross sections are constructed from 50 sections that were measured along two north-trending lines of outcrops on the east
and west margins of the study area (pl. 1). The cross sections are in two parts. The upper parts illustrate bed thicknesses and lithologies by columnar sections. The lower parts are restored cross sections that interpret and correlate environments of deposition based on the lithologies shown in the columnar sections above. The restored cross sections clearly show that the V ermillion Creek coal bed was deposited in a mixture of peat bog, lacustrine, paludal, and pond environments.
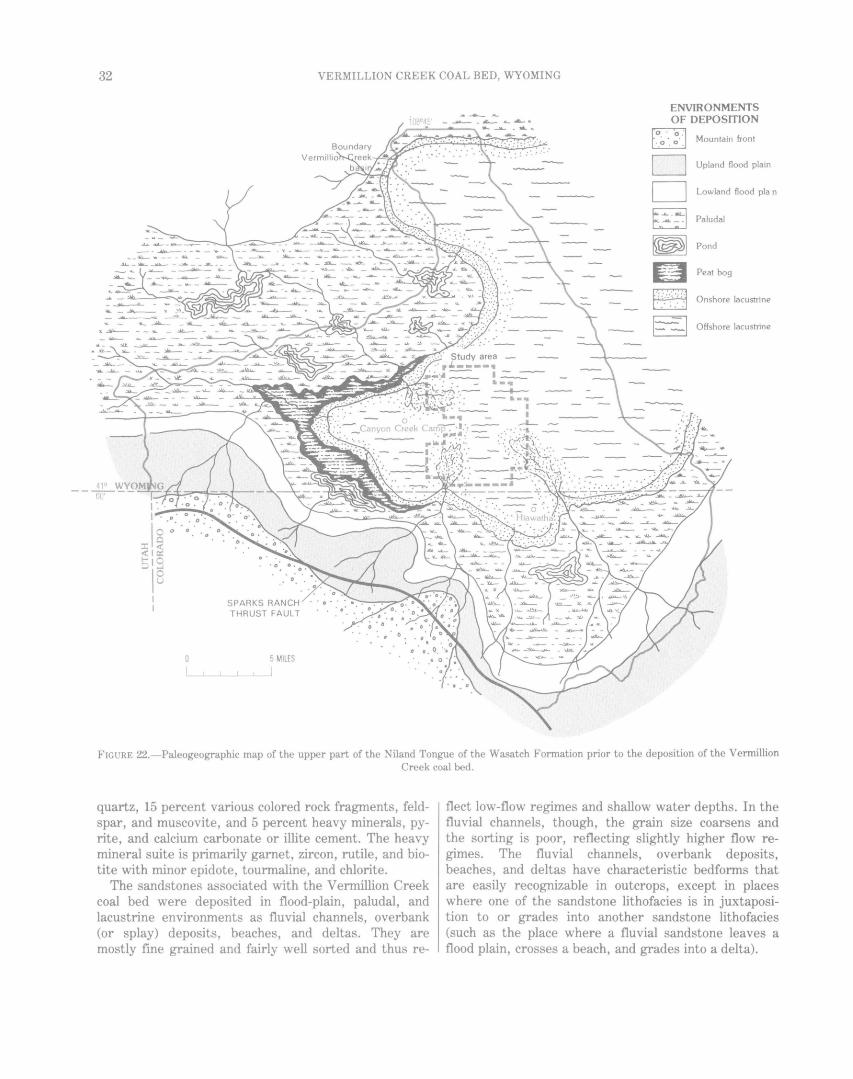
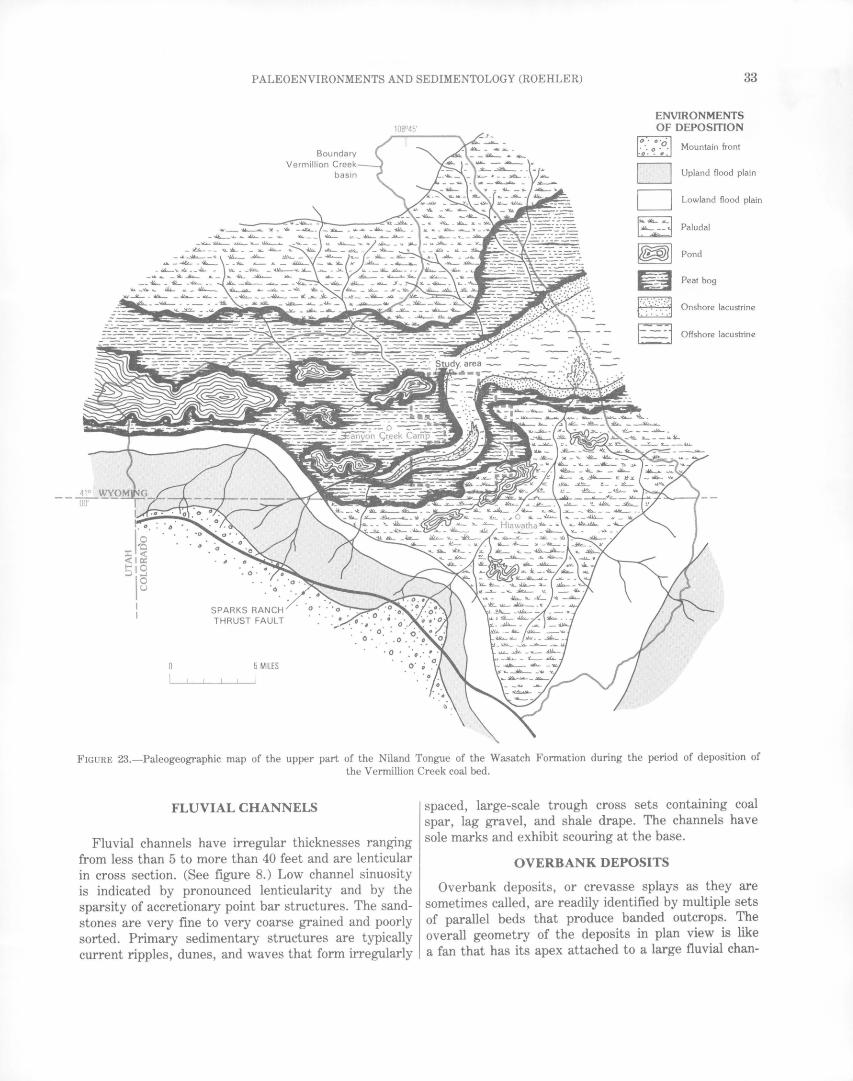
The paleogeographic distribution of environments of deposition associated with the Vermillion Creek coal bed in the Vermillion Creek basin is illustrated on three paleogeographic maps (figs. 22, 23, and 25). These maps depict times immediately preceding, during, and shortly after the deposition of the Vermillion Creek coal bed. Mountain front, upland flood-plain, and lowland floodplain environments of deposition occupied moderately high topographic areas adjacent to the Uinta Mountains south of the Vermillion Creek basin, and lowland floodplain environments persisted along the northern margin of the basin during the entire period of deposition of the Niland Tongue. Trending east-west between these mountain front and flood-plain environments was a topographically low area of lakes, ponds, swamps, and bogs that occupied the trough or depositional axis of the Niland Tongue. (See chap. A, this volume, fig. 1.) The paleogeographic maps are generalized because unstable conditions caused rapid local changes in environments of deposition, which are reflected by very thin, discontinuous lithologic units in the Niland Tongue. It is difficult to determine contemporaneous lithologic units for this reason. (See pl. 2.) Correlations of units deposited at the same time are further complicated by
PALEOENVIRONMENTS AND SEDIMENTOLOGY (ROEHLER) 31
irregular stratigraphic thickening and thinning of lithologic units and by the erosion of parts of units by fluvial scouring. The paleogeographic maps are nevertheless believed to be generally representative.
PALEOGEOGRAPHY OF THE VERMILLION CREEK BASIN PRIOR
TO THE DEPOSITION OF THE VERMILLION CREEK COAL BED
A large freshwater lake occupied the northeastern and central parts of the Vermillion Creek basin, including the study area, for thousands of years prior to the deposition of the Vermillion Creek coal bed. Figure 22 depicts the position of the lake during the time of deposition of the rocks in the stratigraphic interval 5 to 15 feet below the base of the Vermillion Creek coal bed. The lake at that time was irregularly shaped but at least 25 miles across. The bottom sediments of deeper parts of the lake were sapropelic ooze composed mostly of planktonic algal remains, the precursor of oil shale. The shoreline sediments were subaerial and shallow-water beach sand. Projecting lakeward from the beaches in places were subaerial and subaqueous deltas. Around the periphery of the lake were swamps, marshes, ponds, and peat bogs. A shallow bay at the south end of the lake covered the study area. Around the head of this bay, west of the study area, a peat bog formed parallel to the shoreline of the lake. It expanded progressively as the bay subsequently dried up and filled in, and by that process the Vermillion Creek coal bed was deposited in the study area.
PALEOGEOGRAPHY OF THE VERMILLION CREEK BASIN DURING DEPOSITION OF
THE VERMILLION CREEK COAL BED
The central part of the Vermillion Creek basin was an east-west-trending area of peat bogs, as much as 15 miles wide, during the period of deposition of the Vermillion Creek coal bed. The lake that preceded the deposition of the coal bed was still present in the eastcentral parts of the basin, but it was much reduced in size. A narrow, estuarylike bay crossed the study area from southwest to northeast and entered the west end of the lake, as shown on figure 23. The evidence for this interpretation is found in measured sections 2478-3178 on cross section B-B', plate 2. In these sections a lenticular fluvial channel sandstone is present within the Vermillion Creek coal bed. Enveloping the channel sandstone is freshwater oil shale, which in turn intertongues with and is replaced laterally by coal. Figure 24 illustrates these intertonguing relations in outcrops measured at section 24 78.
The Vermillion Creek coal bed was not deposited in a single peat bog. The coal has numerous splits and partings within it that cause it to have a splintered appearance in the restored cross sections on plate 2. The partings and splits are composed of carbonaceous shale of paludal origin, oil shale of lacustrine origin, mudstone of lowland flood-plain origin, and limestone of pond origin. These lithologies suggest that the basin landscape during the deposition of the coal bed was hummocky and consisted not only of poorly drained bogs but also of well-drained marshes containing grasslike vegetation interspersed with large forested islands. Scattered through these environments were ponds and shallow lakes. The overall appearance was possibly similar to that of the Florida Everglades.
PALEOGEOGRAPHY OF THE VERMILLION CREEK BASIN AFTER THE DEPOSITION OF
THE VERMILLION CREEK COAL BED
The large east-west-trending area of peat bogs in which the Vermillion Creek coal bed was deposited across the Vermillion Creek basin disappeared completely after the deposition of the coal bed. The upper part of the Niland Tongue, from 0 to 125 feet above the top of the Vermillion Creek coal bed, contains more beds deposited in lacustrine environments characterized by oil shale and beach and delta sandstone than the coal bed. A few marshes, flood plains, and bogs persisted during this interval in time, as indicated by the presence of thin, lenticular carbonaceous shales, coals, and channel sandstones, but it is obvious that lacustrine evironments predominated.
Figure 25 is a paleogeographic map of the basin during the time represented by the stratigraphic interval 5 to 10 feet above the top of the Vermillion Creek coal bed. At that time an east-west-trending freshwater lake developed over most of the western part of the basin. Entering the lake from the southeast and crossing the study area was a lobe of delta deposits composed mostly of fluvial and beach sandstone and carbonaceous shale. The fluvial sandstone is resistant to weathering and caps many of the outcrops of the upper part of the Niland Tongue in the study area. One of these outcrops is shown in figure 26.
COMPOSITION AND-SEDIMENTARY STRUCTURES OF SANDSTONES
Sandstones compose 20 to 30 percent of the rocks in the Niland Tongue in the Vermillion Creek basin. They are the most conspicuous lithology in outcrops because they are light colored and resistant to weathering. The sandstones are composed of about 80 percent
32 VERMILLION CREEK COAL BED, WYOMING
SPARKS RANCH THRUST FAULT
5 MILES
ENVIRONMENTS OF DEPOSITION
~ Mountain front
CJ Upland flood plain
CJ Lowland flood pian
§Paludal
~~Pond
£~ Peatbog
tf?i· :~ J Onshore lacustrine
1- -, Offshore lacustrine
FIGURE 22.-Paleogeographic map of the upper part of the Niland Tongue of the Wasatch Formation prior to the deposition of the Vermillion Creek coal bed.
quartz, 15 percent various colored rock fragments, feldspar, and muscovite, and 5 percent heavy minerals, pyrite, and calcium carbonate or illite cement. The heavy mineral suite is primarily garnet, zircon, rutile, and biotite with minor epidote, tourmaline, and chlorite.
The sandstones associated with the Vermillion Creek coal bed were deposited in flood-plain, paludal, and lacustrine environments as fluvial channels, overbank (or splay) deposits, beaches, and deltas. They are mostly fine grained and fairly well sorted and thus re-
fleet low-flow regimes and shallow water depths. In the fluvial channels, though, the grain size coarsens and the sorting is poor, reflecting slightly higher flow regimes. The fluvial channels, overbank deposits, beaches, and deltas have characteristic bedforms that are easily recognizable in outcrops, except in places where one of the sandstone lithofacies is in juxtaposition to or grades into another sandstone lithofacies (such as the place where a fluvial sandstone leaves a flood plain, crosses a beach, and grades into a delta).
PALEOENVIRONMENTS AND SEDIMENTOLOGY (ROEHLER) 33
SPARKS RANCH THRUST FAULT
5 MILES
10S045'
·O
ENVIRONMENTS OF DEPOSITION
~ Mountain front
D Upland flood plain
D Lowland flood plain
1?:-2-j ,..._ Paludal
~~Pond
~~ Peat bog
r·~-,~· ~.·:.::::1 Onshore lacustrine
1-;:s -j Offshore lacustrine
FIGURE 23.-Paleogeographic map of the upper part of the Niland Tongue of the Wasatch Formation during the period of deposition of the Vermillion Creek coal bed.
FLUVIAL CHANNELS
Fluvial channels have irregular thicknesses ranging from less than 5 to more than 40 feet and are lenticular in cross section. (See figure 8.) Low channel sinuosity is indicated by pronounced lenticularity and by the sparsity of accretionary point bar structures. The sandstones are very fine to very coarse grained and poorly sorted. Primary sedimentary structures are typically current ripples, dunes, and waves that form irregularly
spaced, large-scale trough cross sets containing coal spar, lag gravel, and shale drape. The channels have sole marks and exhibit scouring at the base.
OVERBANK DEPOSITS
Overbank deposits, or crevasse splays as they are sometimes called, are readily identified by multiple sets of parallel beds that produce banded outcrops. The overall geometry of the deposits in plan view is like a fan that has its apex attached to a large fluvial chan-

34 VERMILLION CREEK COAL BED, WYOMING
FIGURE 24.-Fluvial-channel sandstone within the Vermillion Creek coal bed on the north bank of Horseshoe Wash in the lower part of measured section 2478 in SE1/4NEI/4SE% sec. 12, T. 12 N., R. 101 W. The lower part of the coal bed has been trenched in the right-center of the photograph.
nel by a breach, or crevasse. A trunk stream passed through the crevasse before branching into small distributaries that formed a drainage network not unlike a small delta. The overbank sediments that poured through the crevasse came to rest upon flood plains and in swamps. In outcrops the overbank deposits are formed by successions of sandstone, siltstone, and mudstone. The sandstones were the first to be deposited. Most of them are 1 to 5 feet thick, fine upward, and are interbedded at the top with siltstone and mudstone. Each accumulation of sandstone, siltstone, and mudstone represents one stage of overbank flooding and deposition. The stages are stacked one upon the other and are cyclic repetitions of seasonal floods or periodic torrential rains. The deposits fine upward because coarser sandstone material was deposited during periods of peak flooding in high flow regimes. As the floods ebbed, the load-carrying capacity progressively decreased to where siltstone and finally mudstone were deposited. This vertical grading of sediments is also repeated horizontally from the proximal to distal parts of the overbank deposits.
Figures 27 and 28 are photographs of overbank deposits in the Niland Tongue in the northwest and central parts of the study area. In figure 27, note that thicker bands of sandstone exposed in the cliff face are the basal units of distinct stages of overflow, and that each of the thicker bands of sandstone is overlain by thin-bedded siltstone and mudstone. Figure 28 shows the distal part of an overbank deposit, where thin flat
beds of sandstone are interbedded with carbonaceous shale; at the top of figure 28 is a small distributarychannel sandstone that has steeply dipping foresets indicating a right-to-left (northward) flow direction.
BEACHES
Beach sandstones in the study area are usually fine grained and less than 10 feet thick. Most of them contain prosobranch gastropod fossils. The sandstones are generally massive and consist of thick sets of wave ripples and megaripples, as shown in figures 29 and 30. Many of the ripples and megaripples appear to be oriented in directions tangential to the beaches, which suggests that the Eocene winds were from multiple onshore directions. Changes in wind directions sometimes caused the development of herringbone crossbedding, as shown in figure 31.
The thick sets of wave-rippled sandstone that compose the bulk of the beaches are in places interrupted by thinner sets of current ripples and megaripples, as shown in figure 30. The current ripples are believed to result from the numerous minor distributary streams that flowed into the lakes and influenced sedimentation in shallow-water, near-shore beach areas.
DELTAS
River delta sandstones deposited along the shores of lakes in the study area are very fme to very coarse grained, lenticular, and as much as 30 feet thick. They
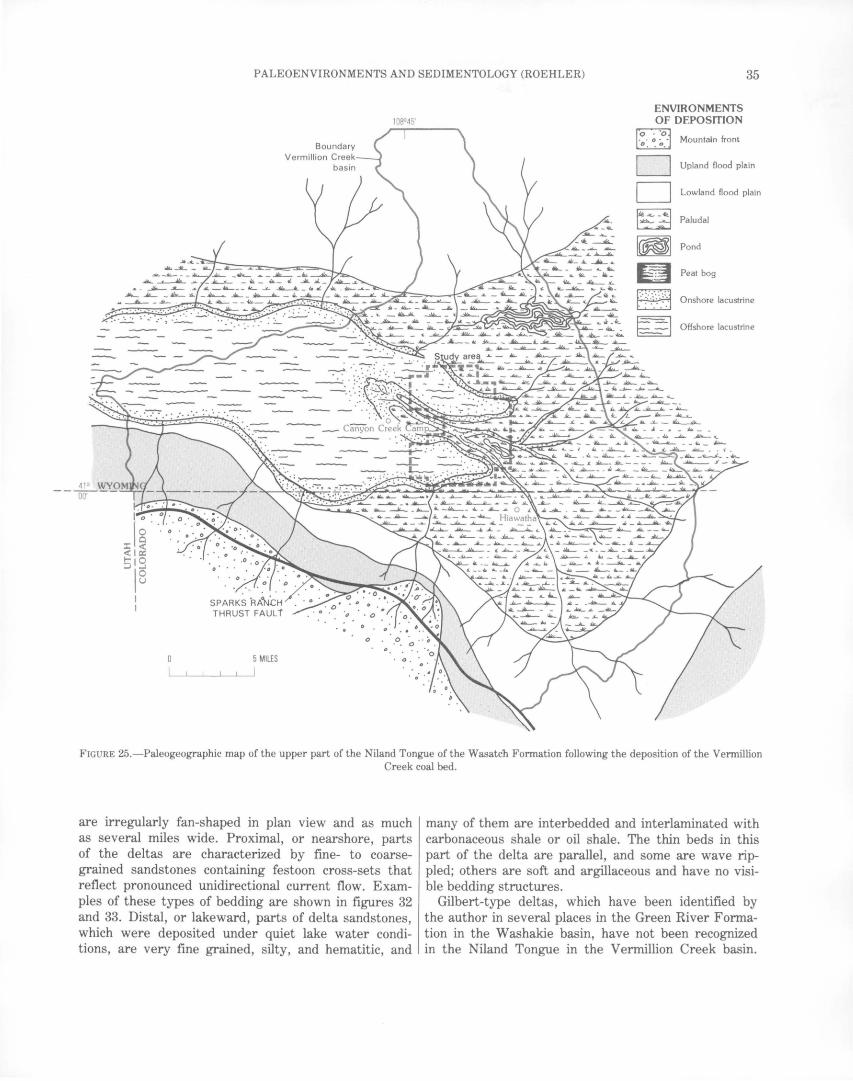
PALEOENVIRONMENTS AND SEDIMENTOLOGY (ROEHLER) 35
10S045'
• 0
0
5 MILES
ENVIRONMENTS OF DEPOSITION
~ Mountain front
D Upland flood plain
D Lowland flood plain
~Paludal
1m Pond
~ Peatbog
p::;;g Onshore lacustrine
b I Offshore lacustrine
FIGURE 25.-Paleogeographic map of the upper part of the Niland Tongue of the Wasatch Formation following the deposition of the Vermillion Creek coal bed.
are irregularly fan-shaped in plan view and as much as several miles wide. Proximal, or nearshore, parts of the deltas are characterized by fine- to coarsegrained sandstones containing festoon cross-sets that reflect pronounced unidirectional current flow. Examples of these types of bedding are shown in figures 32 and 33. Distal, or lakeward, parts of delta sandstones, which were deposited under quiet lake water conditions, are very fine grained, silty, and hematitic, and
many of them are interbedded and interlaminated with carbonaceous shale or oil shale. The thin beds in this part of the delta are parallel, and some are wave rippled; others are soft and argillaceous and have no visible bedding structures.
Gilbert-type deltas, which have been identified by the author in several places in the Green River Formation in the Washakie basin, have not been recognized in the Niland Tongue in the Vermillion Creek basin.
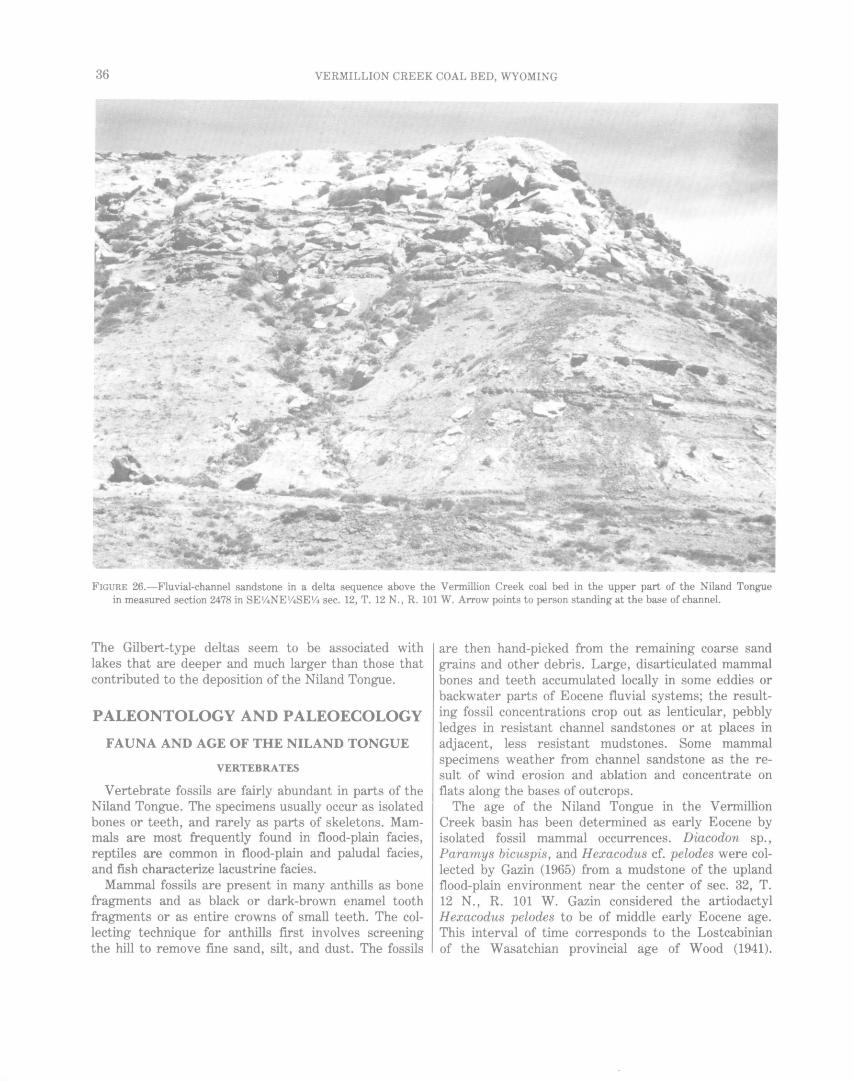
36 VERMILLION CREEK COAL BED, WYOMING
FIGURE 26.-Fluvial-channel sandstone in a delta sequence above the Vennillion Creek coal bed in the upper part of the Niland Tongue in measured section 2478 in SE 1!aNEV4SE1/4 sec. 12, T. 12 N., R. 101 W. Arrow points to person standing at the base of channel.
The Gilbert-type deltas seem to be associated with lakes that are deeper and much larger than those that contributed to the deposition of the Niland Tongue.
PALEONTOLOGY AND PALEOECOLOGY
FAUNA AND AGE OF THE NILAND TONGUE
VERTEBRATES
Vertebrate fossils are fairly abundant in parts of the Niland Tongue. The specimens usually occur as isolated bones or teeth, and rarely as parts of skeletons. Mammals are most frequently found in flood-plain facies, reptiles are common in flood-plain and paludal facies, and fish characterize lacustrine facies.
Mammal fossils are present in many anthills as bone fragments and as black or dark-brown enamel tooth fragments or as entire crowns of small teeth. The collecting technique for anthills first involves screening the hill to remove fine sand, silt, and dust. The fossils
are then hand-picked from the remaining coarse sand grains and other debris. Large, disarticulated mammal bones and teeth accumulated locally in some eddies or backwater parts of Eocene fluvial systems; the resulting fossil concentrations crop out as lenticular, pebbly ledges in resistant channel sandstones or at places in adjacent, less resistant mudstones. Some mammal specimens weather from channel sandstone as the result of wind erosion and ablation and concentrate on flats along the bases of outcrops.
The age of the Niland Tongue in the Vermillion Creek basin has been determined as early Eocene by isolated fossil mammal occurrences. Diacodon sp., Paramys bicuspis, and H exacodus cf. pelodes were collected by Gazin (1965) from a mudstone of the upland flood-plain environment near the center of sec. 32, T. 12 N., R. 101 W. Gazin considered the artiodactyl H exacodus pelodes to be of middle early Eocene age. This interval of time corresponds to the Lostcabinian of the Wasatchian provincial age of Wood (1941).
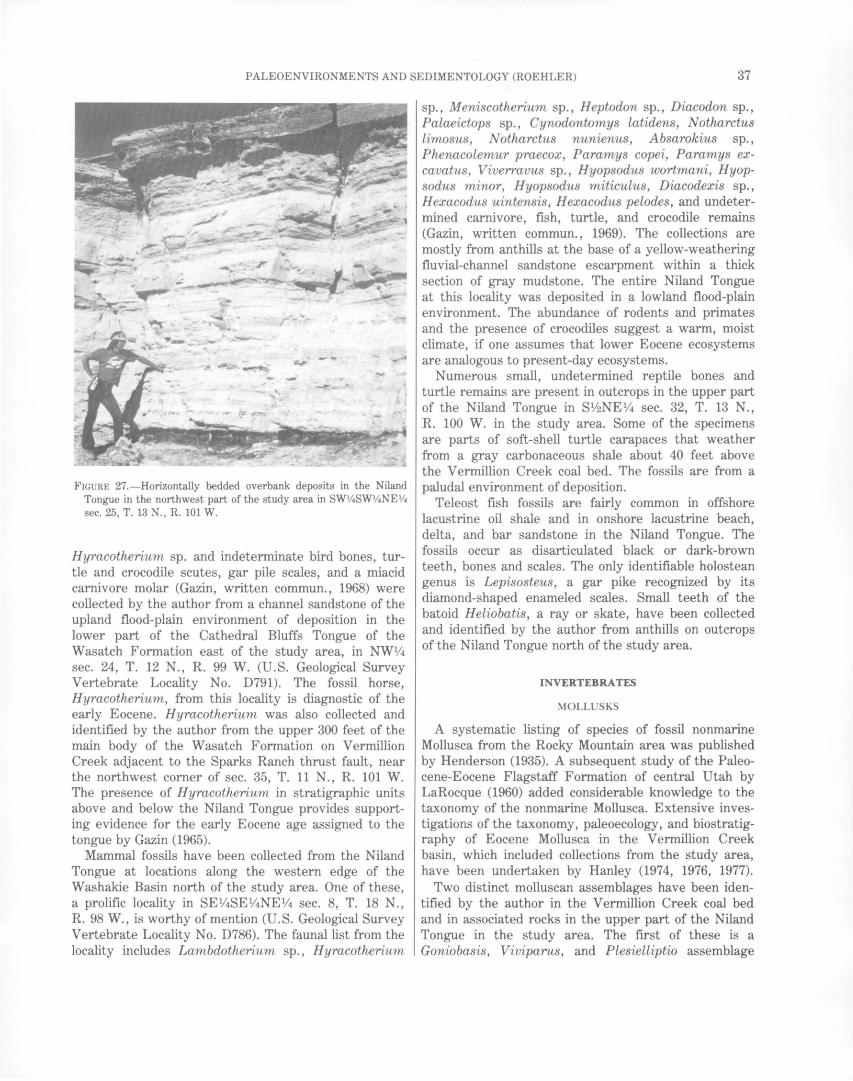
PALEOENVIRONMENTS AND SEDIMENTOLOGY (ROEHLER) 37
...,: ---- -
FIGURE 27.-Horizontally bedded overbank deposits in the Niland Tongue in the northwest part of the study area in SWY4SW1.4NE1.4 sec. 25, T. 13 N., R. 101 W.
Hyracotherium sp. and indeterminate bird bones, turtle and crocodile scutes, gar pile scales, and a miacid carnivore molar (Gazin, written commun., 1968) were collected by the author from a channel sandstone of the upland flood-plain environment of deposition in the lower part of the Cathedral Bluffs Tongue of the Wasatch Formation east of the study area, in NW% sec. 24, T. 12 N., R. 99 W. (U.S. Geological Survey Vertebrate Locality No. D791). The fossil horse, Hyracotherium, from this locality is diagnostic of the early Eocene. Hyracotherium was also collected and identified by the author from the upper 300 feet of the main body of the Wasatch Formation on Vermillion Creek adjacent to the Sparks Ranch thrust fault, near the northwest corner of sec. 35, T. 11 N., R. 101 W. The presence of Hyracotherium in stratigraphic units above and below the Niland Tongue provides supporting evidence for the early Eocene age assigned to the tongue by Gazin (1965).
Mammal fossils have been collected from the Niland Tongue at locations along the western edge of the Washakie Basin north of the study area. One of these, a prolific locality in SE%SE%NE% sec. 8, T. 18 N., R. 98 W., is worthy of mention (U.S. Geological Survey Vertebrate Locality No. D786). The faunal list from the locality includes Lambdotherium sp., Hyracotherium
sp., M eniscotherium sp., H eptodon sp., Diacodon sp., Palaeictops sp., Cynodontomys latidens, N otharctus limosus, N otharctus nunienus, Absarokius sp., Phenacolemur praecox, Paramys copei, Paramys excavatus, Viverravus sp., Hyopsodus wortmani, Hyopsodus minor, Hyopsodus miticulus, Diacodexis sp., H exacodus uintensis, H exacodus pelodes, and undetermined carnivore, fish, turtle, and crocodile remains (Gazin, written commun., 1969). The collections are mostly from anthills at the base of a yellow-weathering fluvial-channel sandstone escarpment within a thick section of gray mudstone. The entire Niland Tongue at this locality was deposited in a lowland flood-plain environment. The abundance of rodents and primates and the presence of crocodiles suggest a warm, moist climate, if one assumes that lower Eocene ecosystems are analogous to present-day ecosystems .
Numerous small, undetermined reptile bones and turtle remains are present in outcrops in the upper part of the Niland Tongue in S1/2NE% sec. 32, T. 13 N., R. 100 W. in the study area. Some of the specimens are parts of soft-shell turtle carapaces that weather from a gray carbonaceous shale about 40 feet above the Vermillion Creek coal bed. The fossils are from a paludal environment of deposition.
Teleost fish fossils are fairly common in offshore lacustrine oil shale and in onshore lacustrine beach, delta, and bar sandstone in the Niland Tongue. The fossils occur as disarticulated black or dark-brown teeth, bones and scales. The only identifiable holostean genus is Lepisosteus, a gar pike recognized by its diamond-shaped enameled scales. Small teeth of the batoid Heliobatis, a ray or skate, have been collected and identified by the author from anthills on outcrops of the Niland Tongue north of the study area.
INVERTEBRATES
MOLLUSKS
A systematic listing of species of fossil nonmarine Mollusca from the Rocky Mountain area was published by Henderson (1935). A subsequent study of the Paleocene-Eocene Flagstaff Formation of central Utah by LaRocque (1960) added considerable knowledge to the taxonomy of the nonmarine Mollusca. Extensive investigations of the taxonomy, paleoecology, and biostratigraphy of Eocene Mollusca in the Vermillion Creek basin, which included collections from the study area, have been undertaken by Hanley (1974, 1976, 1977).
Two distinct molluscan assemblages have been identified by the author in the Vermillion Creek coal bed and in associated rocks in the upper part of the Niland Tongue in the study area. The first of these is a Goniobasis, Viviparus, and Plesielliptio assemblage

38 VERMILLION CREEK COAL BED, WYOMING
FIGURE 28.--0verbank deposits composed of interbedded sandstone and carbonaceous shale in the Niland Tongue 25 feet above the Vermillion Creek coal bed in SWV4NEV4NE 1i4 sec. 32, T. 13 N., R. 100 W., 350 feet northeast of the Erickson mine. Width of photograph is about 4ft.
FIGURE 29.-Wave ripples in beach sandstone in the Niland Tongue in center of S1/2SWY4NEV4 sec. 25, T. 13 N., R. 101 W. Camera lens cap (approximately 2 inches across) is used for scale.
diagnostic of the onshore and offshore lacustrine environments of deposition. Oil shale and beach sandstone that overlie, underlie, and are interbedded with the
Vermillion Creek coal bed have coquinas and layers containing 75 percent or more of the turreted prosobranch gastropod Goniobasis, lesser numbers of the large, massively spired prosobranch gastropod Viviparus, and a few of the large unionid pelecypod P lesielliptio. Hanley (oral communication, 1977) believes that Goniobasis and Viviparus were hardy as regards temperature but had little tolerance for water salinity. Hanley (1976, p. 250) reports that living unionids generally require fresh, clean, oxygenated, shallow, calcium-rich, permanent-water habitats that have a current, a pH greater than 7, a stable substrate, a food source, and at least seasonably warm temperatures.
A second molluscan assemblage, diagnostic of the pond and marsh environments characterized by limestone and slightly carbonaceous shale, consists of the planorbid gastropods Biomphalaria, Omalodiscus, and Gyraulus, as well as the sphaeriid bivalve Sphaerium (commonly termed a fingernail clam) and the tiny hy-
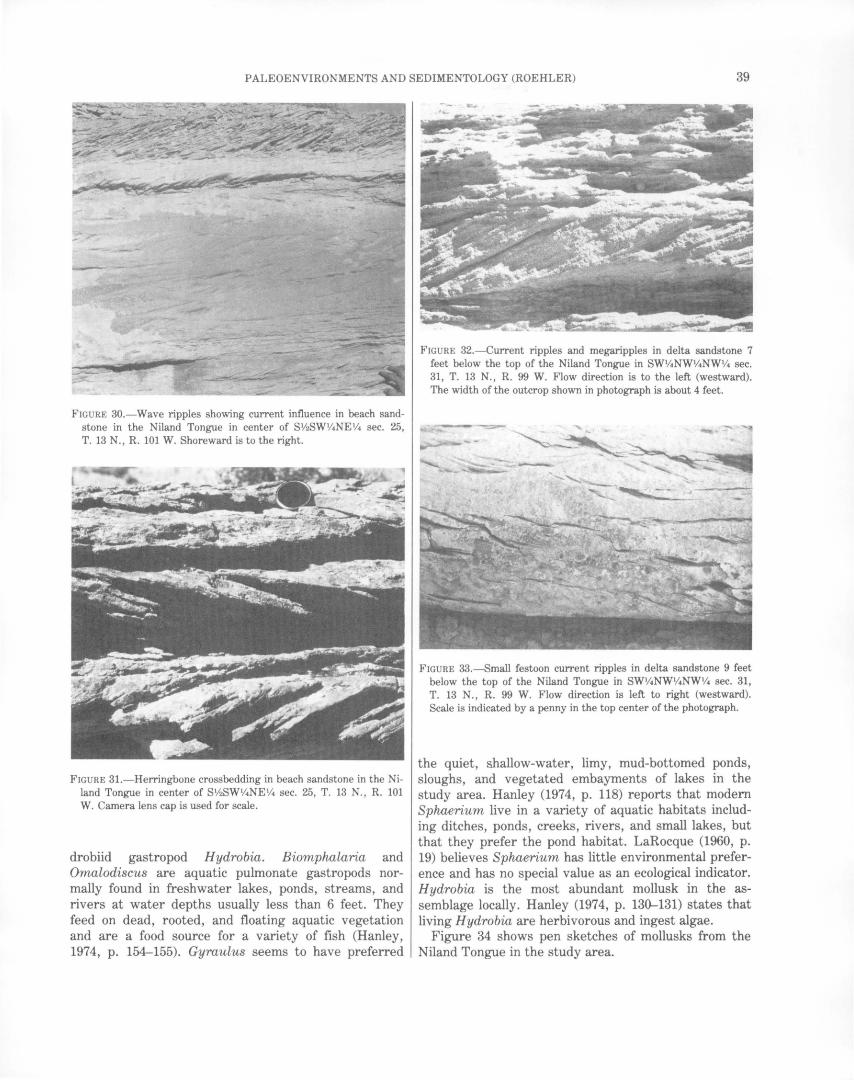
PALEOENVIRONMENTS AND SEDIMENTOLOGY (ROEHLER) 39
FIGURE 31.-Herringbone crossbedding in beach sandstone in the Niland Tongue in center of S1/zSWV4NE 1/4 sec. 25, T. 13 N., R. 101 W. Camera lens cap is used for scale.
drobiid gastropod Hydrobia. Biomphalaria and Omalodiscus are aquatic pulmonate gastropods normally found in freshwater lakes, ponds, streams, and rivers at water depths usually less than 6 feet. They feed on dead, rooted, and floating aquatic vegetation and are a food source for a variety of fish (Hanley, 1974, p. 154-155). Gyraulus seems to have preferred
FIGURE 32.-Current ripples and megaripples in delta sandstone 7 feet below the top of the Niland Tongue in SW1/4NWV4NW!f4 sec. 31, T. 13 N., R. 99 W. Flow direction is to the left (westward). The width of the outcrop shown in photograph is about 4 feet.
FIGURE 33.-Small festoon current ripples in delta sandstone 9 feet below the top of the Niland Tongue in SW1/4NWV4NW1/4 sec. 31, T. 13 N., R. 99 W. Flow direction is left to right (westward). Scale is indicated by a penny in the top center of the photograph.
the quiet, s.hallow-water, limy, mud-bottomed ponds, sloughs, and vegetated embayments of lakes in the study area. Hanley (1974, p. 118) reports that modern Sphaerium live in a variety of aquatic habitats including ditches, ponds, creeks, rivers, and small lakes, but that they prefer the pond habitat. LaRocque (1960, p. 19) believes Sphaerium has little environmental preference and has no special value as an ecological indicator. Hydrobia is the most abundant mollusk in the assemblage locally. Hanley (1974, p. 130--131) states that living Hydrobia are herbivorous and ingest algae.
Figure 34 shows pen sketches of mollusks from the Niland Tongue in the study area.
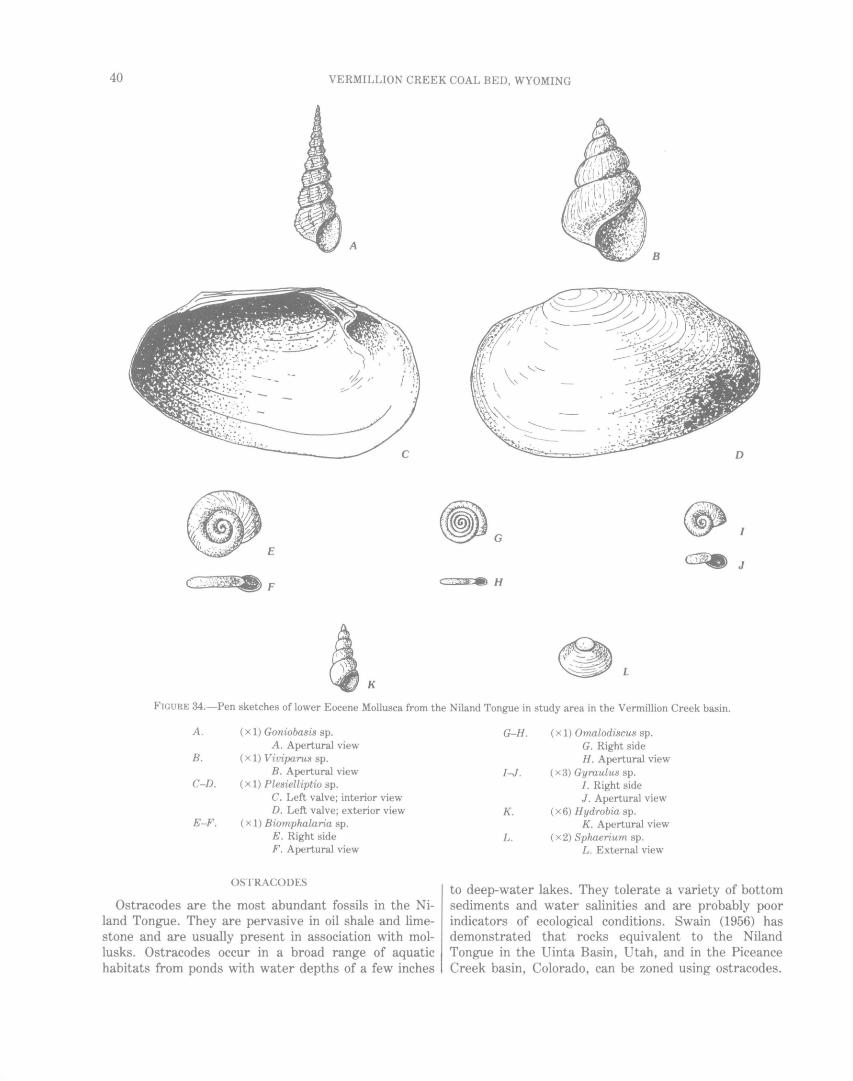
40 VERMILLION CREEK COAL BED, WYOMING
E
A
A tiK
B
~J
FIGURE 34.-Pen sketches of lower Eocene Mollusca from the Niland Tongue in study area in the Vermillion Creek basin.
A.
B.
C-D.
E-F.
( x 1) Goniobasis sp. A. Apertural view
( x 1) Viviparus sp. B. Apertural view
( x 1) Plesielliptio sp. C. Left valve; interior view D. Left valve; exterior view
( x 1) Biomphalaria sp. E. Right side F. Apertural view
OSTRACODES
Ostracodes are the most abundant fossils in the Niland Tongue. They are pervasive in oil shale and limestone and are usually present in association with mollusks. Ostracodes occur in a broad range of aquatic habitats from ponds with water depths of a few inches
G-H.
1-J.
K.
L.
( x 1) Omalodiscus sp. G. Right side H. Apertural view
( x 3) Gyraulus sp. I. Right side J. Apertural view
(x6) Hydrobia sp. K. Apertural view
(x2) Sphaerium sp. L. External view
to deep-water lakes. They tolerate a variety of bottom sediments and water salinities and are probably poor indicators of ecological conditions. Swain (1956) has demonstrated that rocks equivalent to the Niland Tongue in the Uinta Basin, Utah, and in the Piceance Creek basin, Colorado, can be zoned using ostracodes.
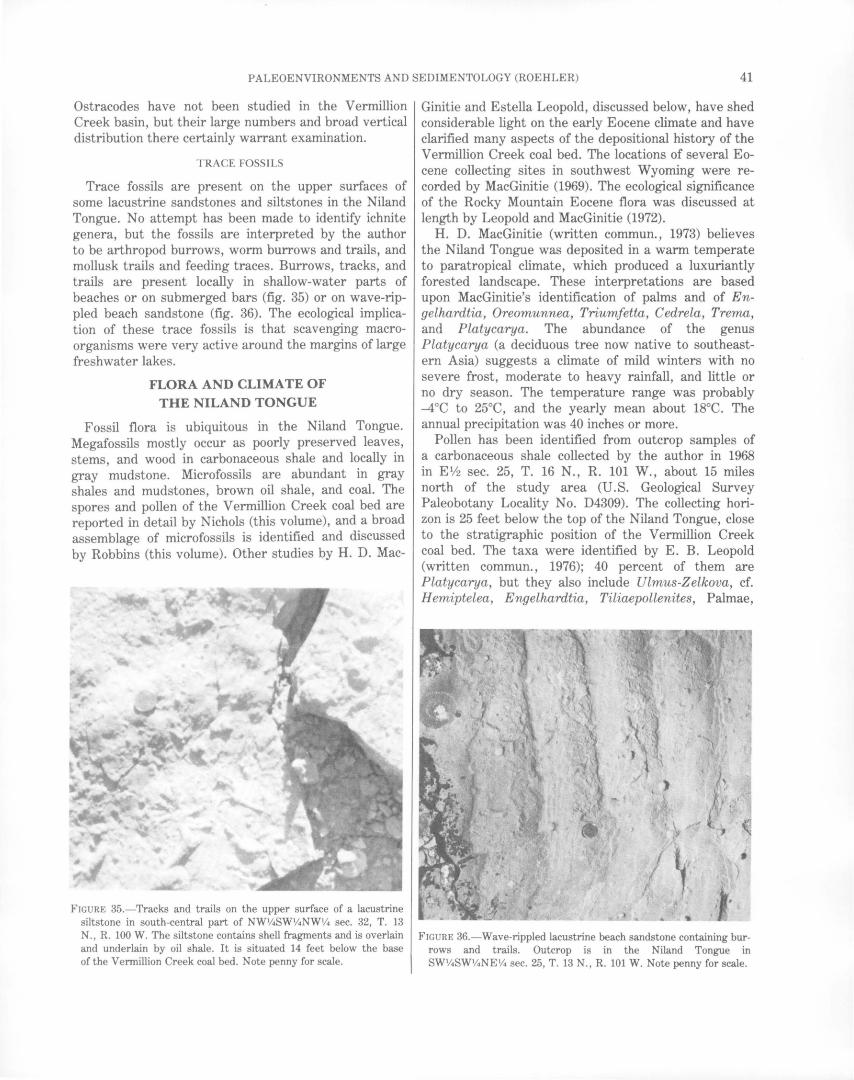
PALEOENVIRONMENTS AND SEDIMENTOLOGY (ROEHLER) 41
Ostracodes have not been studied in the Vermillion Ginitie and Estella Leopold, discussed below, have shed Creek basin, but their large numbers and broad vertical considerable light on the early Eocene climate and have distribution there certainly warrant examination. clarified many aspects of the depositional history of the
TRACE FOSSILS
Trace fossils are present on the upper surfaces of some lacustrine sandstones and siltstones in the Niland Tongue. No attempt has been made to identify ichnite genera, but the fossils are interpreted by the author to be arthropod burrows, worm burrows and trails, and mollusk trails and feeding traces. Burrows, tracks, and trails are present locally in shallow-water parts of beaches or on submerged bars (fig. 35) or on wave-rippled beach sandstone (fig. 36). The ecological implication of these trace fossils is that scavenging macroorganisms were very active around the margins of large freshwater lakes.
FLORA AND CLIMATE OF THE NILAND TONGUE
Fossil flora is ubiquitous in the Niland Tongue. Megafossils mostly occur as poorly preserved leaves, stems, and wood in carbonaceous shale and locally in gray mudstone. Microfossils are abundant in gray shales and mudstones, brown oil shale, and coal. The spores and pollen of the Vermillion Creek coal bed are reported in detail by Nichols (this volume), and a broad assemblage of microfossils is identified and discussed by Robbins (this volume). Other studies by H. D. Mac-
FIGURE 35.-Tracks and trails on the upper surface of a lacustrine siltstone in south-central part of NW1/4SWV4NWV4 sec. 32, T. 13 N., R. 100 W. The siltstone contains shell fragments and is overlain and underlain by oil shale. It is situated 14 feet below the base of the V ennillion Creek coal bed. Note penny for scale.
Vermillion Creek coal bed. The locations of several Eo-cene collecting sites in southwest Wyoming were recorded by MacGinitie (1969). The ecological significance of the Rocky Mountain Eocene flora was discussed at length by Leopold and MacGinitie (1972).
H. D. MacGinitie (written commun., 1973) believes the Niland Tongue was deposited in a warm temperate to paratropical climate, which produced a luxuriantly forested landscape. These interpretations are based upon MacGinitie's identification of palms and of Engelhardtia, Oreomunnea, Triumfetta, C edrela, Trema, and Platycarya. The abundance of the genus Platycarya (a deciduous tree now native to southeastern Asia) suggests a climate of mild winters with no severe frost, moderate to heavy rainfall, and little or no dry season. The temperature range was probably -4oC to 25°C, and the yearly mean about 18°C. The annual precipitation was 40 inches or more.
Pollen has been identified from outcrop samples of a carbonaceous shale collected by the author in 1968 in Elf2 sec. 25, T. 16 N., R. 101 W., about 15 miles north of the study area (U.S. Geological Survey Paleobotany Locality No. D4309). The collecting horizon is 25 feet below the top of the Niland Tongue, close to the stratigraphic position of the Vermillion Creek coal bed. The taxa were identified by E. B. Leopold (written commun., 1976); 40 percent of them are Platycarya, but they also include Ulmus-Zelkova, cf. Hemiptelea, Engelhardtia, Tiliaepollenites, Palmae,
FIGURE 36.-Wave-rippled lacustrine beach sandstone containing burrows and trails. Outcrop is in the Niland Tongue in SW1/4SW1/4NE 1/4 sec. 25, T. 13 N., R. 101 W. Note penny for scale.

42 VERMILLION CREEK COAL BED, WYOMING
Feet VC-7
VC-5 105.0 Feet
88.0
k 90.0 =®
~<0(
A u
~ @)
<!D(
95.0
55.0
100.0
60.0
105.0
64 7 @>@C) <D'-
107.0 ....E:::::::::=:::==:a
EXPLANATION
Lithology
[Ji/Xi·Ft:;j Sandstone
[~ .. -· .. -~ Siltstone
~ Carbonaceous siltstone
~Shale ~ Slightly carbonaceous shale
~ Carbonaceous shale
~ Oilshale
~~ Carbonaceous oil shale
!!! Coal
Coal with inclusions
~~ Limestone
Fossils
A Root casts
C> Ostracodes
t6 Prosobranch gastropods
@ Aquatic pulmonate gastropods
@ Pelecypods
u Burrows
~ Fish scales, bones , and teeth
® Charophytes
~ Turtles
FIGURE 37.-Core sections of the Vermillion Creek coal bed and associated rocks in the study area in the Vermillion Creek basin. The locations of coreholes are shown on plate 1.
Triatriopollenites granulatus, Pistillipollenites, Subtriporopollenites, cf. Taxodiaceae, Meliaceae cf. Cedrela, cf. Ostrya-Carpinus p4, cf. Picrodendron, Ericales, Tricolpites cf. anguloluminosus, Eucommia,
Trema, cf. Castanea, Alnus, Cardiospermum, Liliales cf. Yucca, and Pinus. Leopold believes the pollen assemblage indicates a moist, subtropical, forested landscape similar to that postulated above by MacGinitie.
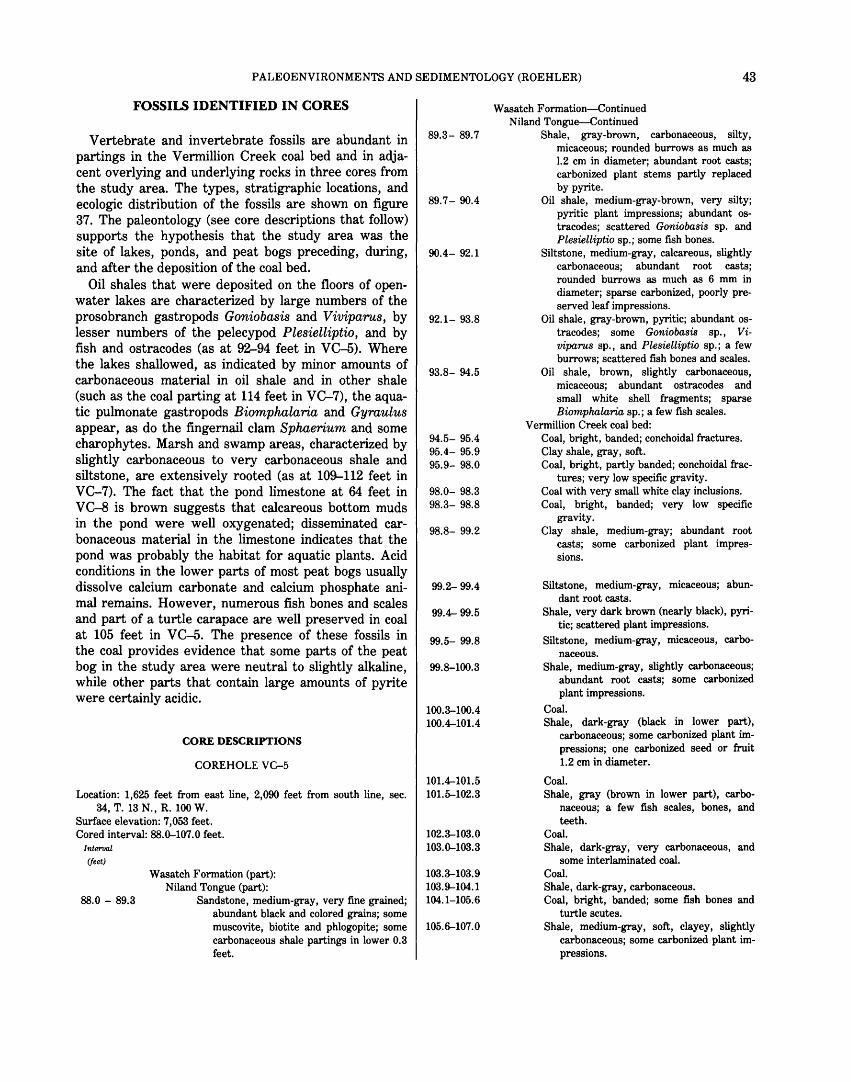
PALEOENVIRONMENTS AND SEDIMENTOLOGY (ROEHLER) 43
FOSSilS IDENTIFIED IN CORES
Vertebrate and invertebrate fossils are abundant in partings in the Vermillion Creek coal bed and in adjacent overlying and underlying rocks in three cores from the study area. The types, stratigraphic locations, and ecologic distribution of the fossils are shown on figure 37. The paleontology (see core descriptions that follow) supports the hypothesis that the study area was the site of lakes, ponds, and peat bogs preceding, during, and after the deposition of the coal bed.
Oil shales that were deposited on the floors of openwater lakes are characterized by large numbers of the prosobranch gastropods Goniobasis and Viviparus, by lesser numbers of the pelecypod Plesielliptio, and by fish and ostracodes (as at 92-94 feet in VC-5). Where the lakes shallowed, as indicated by minor amounts of carbonaceous material in oil shale and in other shale (such as the coal parting at 114 feet in VC-7), the aquatic pulmonate gastropods Biomphalaria and Gyraulus appear, as do the fingernail clam Sphaerium and some charophytes. Marsh and swamp areas, characterized by slightly carbonaceous to very carbonaceous shale and siltstone, are extensively rooted (as at 109-112 feet in VC-7). The fact that the pond limestone at 64 feet in VC-8 is brown suggests that calcareous bottom muds in the pond were well oxygenated; disseminated carbonaceous material in the limestone indicates that the pond was probably the habitat for aquatic plants. Acid conditions in the lower parts of most peat bogs usually dissolve calcium carbonate and calcium phosphate animal remains. However, numerous fish bones and scales and part of a turtle carapace are well preserved in coal at 105 feet in VC--5. The presence of these fossils in the coal provides evidence that some parts of the peat bog in the study area were neutral to slightly alkaline, while other parts that contain large amounts of pyrite were certainly acidic.
CORE DESCRIPTIONS
COREHOLE VC-5
Location: 1,625 feet from east line, 2,090 feet from south line, sec. 34, T. 13 N., R. 100 W.
Surface elevation: 7,053 feet. Cored interval: 88.0-107.0 feet.
Interval
(feet)
Wasatch Formation (part): Niland Tongue (part):
88.0 - 89.3 Sandstone, medium-gray, very fine grained; abundant black and colored grains; some muscovite, biotite and phlogopite; some carbonaceous shale partings in lower 0.3 feet.
89.3- 89.7
89.7- 90.4
90.4- 92.1
92.1- 93.8
93.8- 94.5
94.5- 95.4 95.4- 95.9 95.9- 98.0
98.0- 98.3 98.3- 98.8
98.8- 99.2
99.2-99.4
99.4-99.5
99.5- 99.8
99.8-100.3
100.3-100.4 100.4-101.4
101.4-101.5 101.~102.3
102.3-103.0 103.0-103.3
103.3-103.9 103.9--104.1 104.1-105.6
105.6--107.0
Wasatch Formation-Continued Niland Tongue-Continued
Shale, gray-brown, carbonaceous, silty, micaceous; rounded burrows as much as 1.2 em in diameter; abundant root casts; carbonized plant stems partly replaced by pyrite.
Oil shale, medium-gray-brown, very silty; pyritic plant impressions; abundant ostracodes; scattered Goniobasis sp. and Plesielliptio sp.; some fish bones.
Siltstone, medium-gray, calcareous, slightly carbonaceous; abundant root casts; rounded burrows as much as 6 mm in diameter; sparse carbonized, poorly preserved leaf impressions.
Oil shale, gray-brown, pyritic; abundant ostracodes; some Goniobasis sp., Viviparus sp., and Plesielliptio sp.; a few burrows; scattered fish bones and scales.
Oil shale, brown, slightly carbonaceous, micaceous; abundant ostracodes and small white shell fragments; sparse Biomphalaria sp.; a few fish scales.
Vermillion Creek coal bed: Coal, bright, banded; conchoidal fractures. Clay shale, gray, soft. Coal, bright, partly banded; conchoidal frac
tures; very low specific gravity. Coal with very small white clay inclusions. Coal, bright, banded; very low specific
gravity. Clay shale, medium-gray; abundant root
casts; some carbonized plant impressions.
Siltstone, medium-gray, micaceous; abundant root casts.
Shale, very dark brown (nearly black), pyritic; scattered plant impressions.
Siltstone, medium-gray, micaceous, carbonaceous.
Shale, medium-gray, slightly carbonaceous; abundant root casts; some carbonized plant impressions.
Coal. Shale, dark-gray (black in lower part),
carbonaceous; some carbonized plant impressions; one carbonized seed or fruit 1.2 em in diameter.
Coal. Shale, gray (brown in lower part), carbo
naceous; a few fish scales, bones, and teeth.
Coal. Shale, dark-gray, very carbonaceous, and
some interlaminated coal. Coal. Shale, dark-gray, carbonaceous. Coal, bright, banded; some fish bones and
turtle scutes. Shale, medium-gray, soft, clayey, slightly
carbonaceous; some carbonized plant impressions.
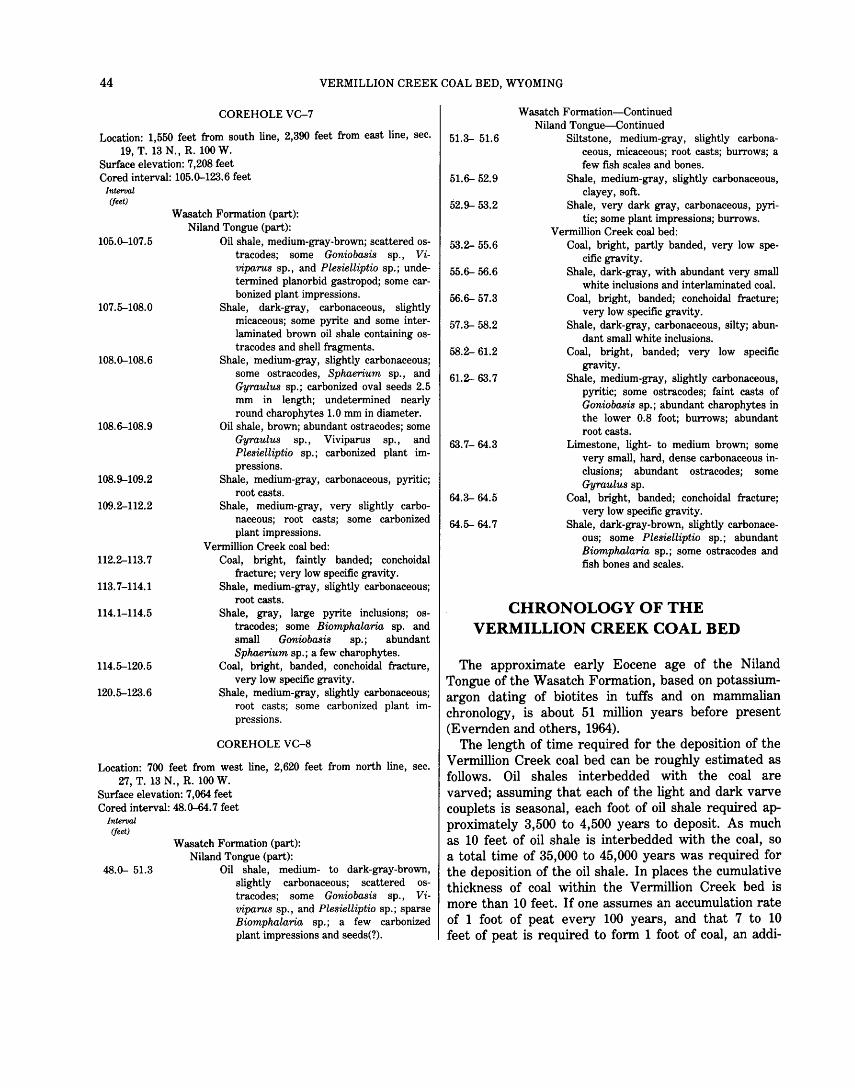
44 VERMILLION CREEK COAL BED, WYOMING
COREHOLE VC-7
Location: 1,550 feet from south line, 2,390 feet from east line, sec. 19, T. 13 N., R. 100 W.
Surface elevation: 7,208 feet Cored interval: 105.0-123.6 feet
Interval (feet)
Wasatch Formation (part): Niland Tongue (part):
105.0-107.5 Oil shale, medium-gray-brown; scattered os-tracodes; some Goniobasis sp., Viviparus sp., and Plesielliptio sp.; undetermined planorbid gastropod; some carbonized plant impressions.
107.5--108.0 Shale, dark-gray, carbonaceous, slightly micaceous; some pyrite and some interlaminated brown oil shale containing ostracodes and shell fragments.
108.0-108.6 Shale, medium-gray, slightly carbonaceous; some ostracodes, Sphaerium sp., and Gyraulus sp.; carbonized oval seeds 2.5 mm in length; undetermined nearly round charophytes 1.0 mm in diameter.
108.6--108.9 Oil shale, brown; abundant ostracodes; some Gyraulus sp., Viviparus sp., and Plesielliptio sp.; carbonized plant impressions.
108.9--109.2 Shale, medium-gray, carbonaceous, pyritic; root casts.
109.2-112.2 Shale, medium-gray, very slightly carbo-naceous; root casts; some carbonized plant impressions.
Vermillion Creek coal bed: 112.2-113.7 Coal, bright, faintly banded; conchoidal
fracture; very low specific gravity. 113.7-114.1 Shale, medium-gray, slightly carbonaceous;
root casts. 114.1-114.5 Shale, gray, large pyrite inclusions; os-
tracodes; some Biomphalaria sp. and small Goniobasis sp.; abundant Sphaerium sp.; a few charophytes.
114.5--120.5 Coal, bright, banded, conchoidal fracture, very low specific gravity.
120.5--123.6 Shale, medium-gray, slightly carbonaceous; root casts; some carbonized plant impressions.
COREHOLE VC-8
Location: 700 feet from west line, 2,620 feet from north line, sec. 27, T. 13 N., R. 100 W.
Surface elevation: 7,064 feet Cored interval: 48.0-64.7 feet
Interval (feet)
48.0- 51.3
Wasatch Formation (part): Niland Tongue (part):
Oil shale, medium- to dark-gray-brown, slightly carbonaceous; scattered ostracodes; some Goniobasis sp., Viviparus sp., and Plesielliptio sp.; sparse Biomphalaria sp.; a few carbonized plant impressions and seeds(?).
Wasatch Formation-Continued Niland Tongue-Continued
51.3-- 51.6 Siltstone, medium-gray, slightly carbona-ceous, micaceous; root casts; burrows; a few fish scales and bones.
51.6-- 52.9 Shale, medium-gray, slightly carbonaceous, clayey, soft.
52.9-- 53.2 Shale, very dark gray, carbonaceous, pyri-tic; some plant impressions; burrows.
Vermillion Creek coal bed: 53.2- 55.6 Coal, bright, partly banded, very low spe-
cific gravity. 55.6-- 56.6 Shale, dark-gray, with abundant very small
white inclusions and interlaminated coal. 56.6-- 57.3 Coal, bright, banded; conchoidal fracture;
very low specific gravity. 57.3-- 58.2 Shale, dark-gray, carbonaceous, silty; abun-
dant small white inclusions. 58.2- 61.2 Coal, bright, banded; very low specific
gravity. 61.2- 63.7 Shale, medium-gray, slightly carbonaceous,
pyritic; some ostracodes; faint casts of Goniobasis sp.; abundant charophytes in the lower 0.8 foot; burrows; abundant root casts.
63.7- 64.3 Limestone, light- to medium brown; some very small, hard, dense carbonaceous inclusions; abundant ostracodes; some Gyraulus sp.
64.3-- 64.5 Coal, bright, banded; conchoidal fracture; very low specific gravity.
64.5-- 64.7 Shale, dark-gray-brown, slightly carbonace-ous; some Plesielliptio sp.; abundant Biomphalaria sp.; some ostracodes and fish bones and scales.
CHRONOLOGY OF THE VERMILLION CREEK COAL BED
The approximate early Eocene age of the Niland Tongue of the Wasatch Formation, based on potassiumargon dating of biotites in tuffs and on mammalian chronology, is about 51 million years before present (Evernden and others, 1964).
The length of time required for the deposition of the Vermillion Creek coal bed can be roughly estimated as follows. Oil shales interbedded with the coal are varved; assuming that each of the light and dark varve couplets is seasonal, each foot of oil shale required approximately 3,500 to 4,500 years to deposit. As much as 10 feet of oil shale is interbedded with the coal, so a total time of 35,000 to 45,000 years was required for the deposition of the oil shale. In places the cumulative thickness of coal within the Vermillion Creek bed is more than 10 feet. If one assumes an accumulation rate of 1 foot of peat every 100 years, and that 7 to 10 feet of peat is required to form 1 foot of coal, an addi-
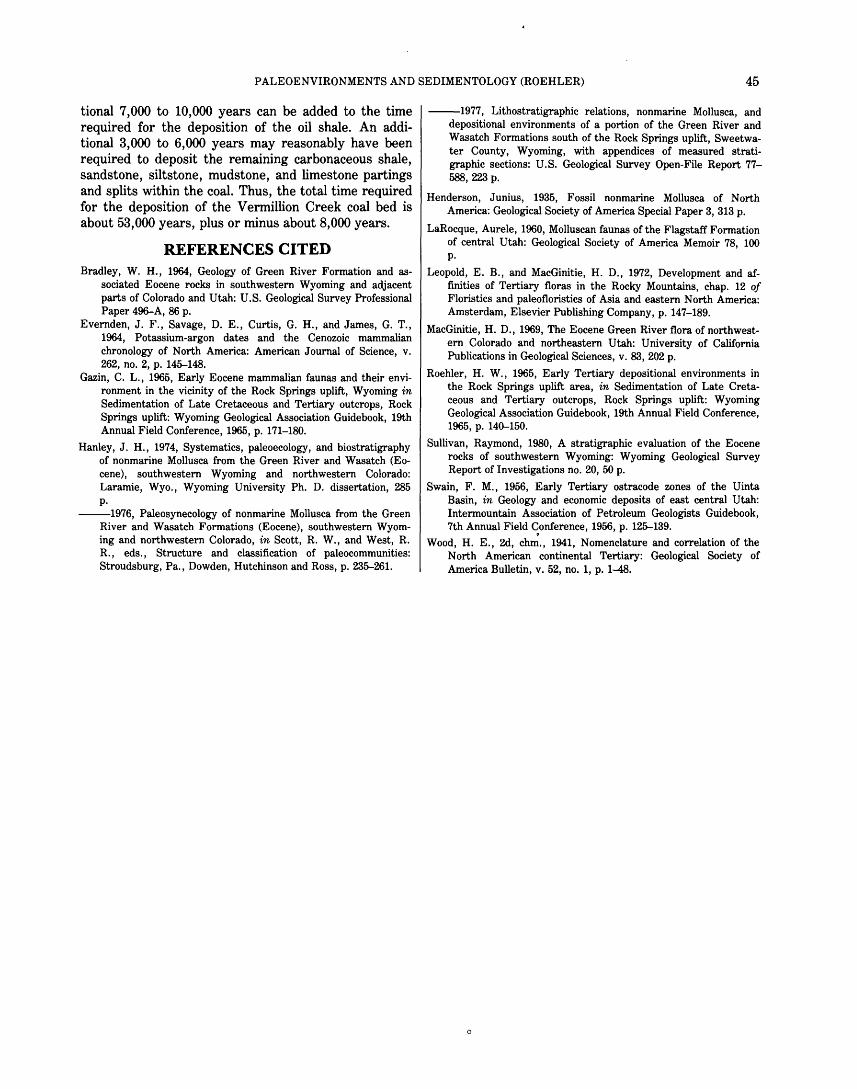
PALEOENVIRONMENTS AND SEDIMENTOLOGY (ROEHLER) 45
tional 7,000 to 10,000 years can be added to the time required for the deposition of the oil shale. An additional 3,000 to 6,000 years may reasonably have been required to deposit the remaining carbonaceous shale, sandstone, siltstone, mudstone, and limestone partings and splits within the coal. Thus, the total time required for the deposition of the Vermillion Creek coal bed is about 53,000 years, plus or minus about 8,000 years.
REFERENCES CITED Bradley, W. H., 1964, Geology of Green River Formation and as
sociated Eocene rocks in southwestern Wyoming and adjacent parts of Colorado and Utah: U.S. Geological Survey Professional Paper 496-A, 86 p.
Evernden, J. F., Savage, D. E., Curtis, G. H., and James, G. T., 1964, Potassium-argon dates and the Cenozoic mammalian chronology of North America: American Journal of Science, v. 262, no. 2, p. 145--148.
Gazin, C. L., 1965, Early Eocene mammalian faunas and their environment in the vicinity of the Rock Springs uplift, Wyoming in Sedimentation of Late Cretaceous and Tertiary outcrops, Rock Springs uplift: Wyoming Geological Association Guidebook, 19th Annual Field Conference, 1965, p. 171-180.
Hanley, J. H., 1974, Systematics, paleoecology, and biostratigraphy of nonmarine Mollusca from the Green River and Wasatch (Eocene), southwestern Wyoming and northwestern Colorado: Laramie, Wyo., Wyoming University Ph. D. dissertation, 285 p.
--1976, Paleosynecology of nonmarine Mollusca from the Green River and Wasatch Formations (Eocene), southwestern Wyoming and northwestern Colorado, in Scott, R. W., and West, R. R., eds., Structure and classification of paleocommunities: Stroudsburg, Pa., Dowden, Hutchinson and Ross, p. 235--261.
--1977, Lithostratigraphic relations, nonmarine Mollusca, and depositional environments of a portion of the Green River and Wasatch Formations south of the Rock Springs uplift, Sweetwater County, Wyoming, with appendices of measured stratigraphic sections: U.S. Geological Survey Open-File Report 77-588, 223 p.
Henderson, Junius, 1935, Fossil nonmarine Mollusca of North America: Geological Society of America Special Paper 3, 313 p.
LaRocque, Aurele, 1960, Molluscan faunas of the Flagstaff Formation of central Utah: Geological Society of America Memoir 78, 100 p.
Leopold, E. B., and MacGinitie, H. D., 1972, Development and affinities of Tertiary floras in the Rocky Mountains, chap. 12 of Floristics and paleofloristics of Asia and eastern North America: Amsterdam, Elsevier Publishing Company, p. 147-189.
MacGinitie, H. D., 1969, The Eocene Green River flora of northwestern Colorado and northeastern Utah: University of California Publications in Geological Sciences, v. 83, 202 p.
Roehler, H. W., 1965, Early Tertiary depositional environments in the Rock Springs uplift area, in Sedimentation of Late Cretaceous and Tertiary outcrops, Rock Springs uplift: Wyoming Geological Association Guidebook, 19th Annual Field Conference, 1965, p. 140-150.
Sullivan, Raymond, 1980, A stratigraphic evaluation of the Eocene rocks of southwestern Wyoming: Wyoming Geological Survey Report of Investigations no. 20, 50 p.
Swain, F. M., 1956, Early Tertiary ostracode zones of the Uinta Basin, in Geology and economic deposits of east central Utah: Intermountain Association of Petroleum Geologists Guidebook, 7th Annual Field Conference, 1956, p. 125--139.
Wood, H. E., 2d, ch~., 1941, Nomenclature and correlation of the North American continental Tertiary: Geological Society of America Bulletin, v. 52, no. 1, p. 1-48.
0

Palynology of the Vermillion Creek Coal Bed and Associated Strata By DOUGLAS]. NICHOLS
GEOLOGICAL INVESTIGATIONS OF THE VERMILLION CREEK COAL BED IN THE EOCENE NILAND TONGUE OF THE WASATCH FORMATION, S\VEETWATER COUNTY, WYOMING
U.S. GEOLOGICAL SURVEY PROFESSIONAL PAPER 1314-D
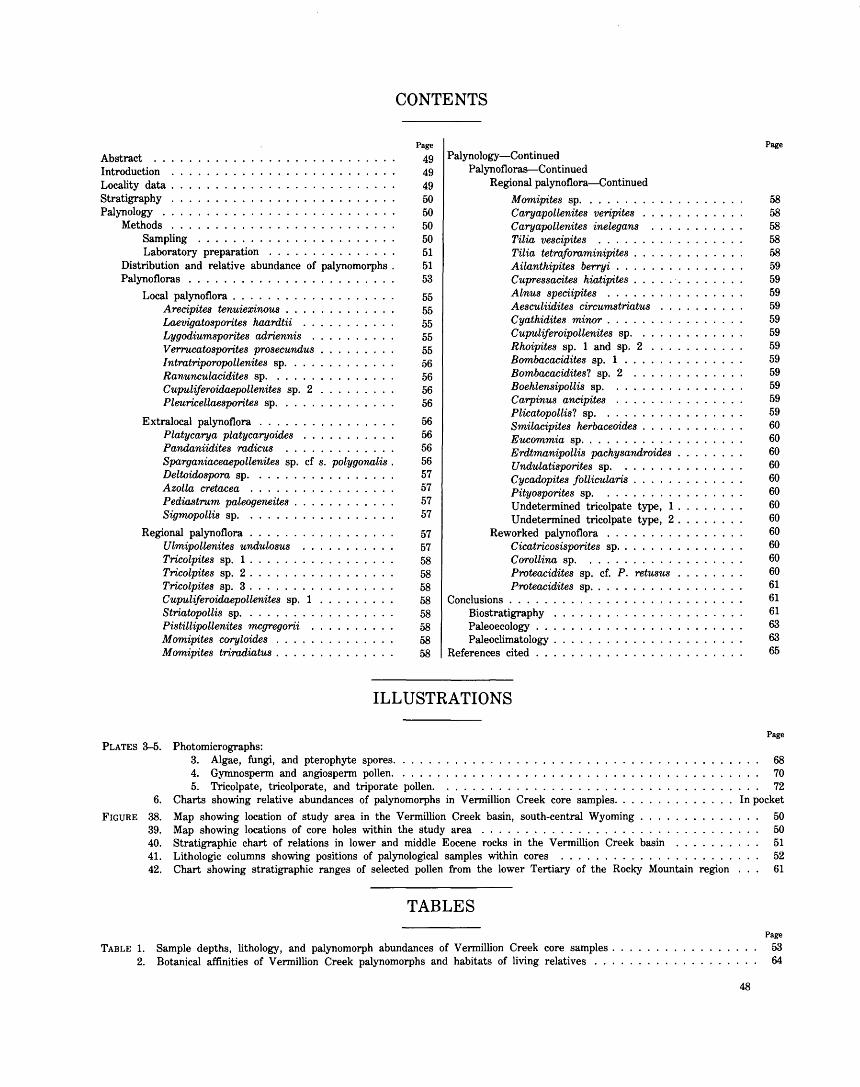
CONTENTS
Abstract ... Introduction . Locality data . Stratigraphy Palynology . .
Methods . Sampling Laboratory preparation
Distribution and relative abundance of palynomorphs . Palynofloras . . . . . . . . . . .
Local palynoflora . . . . . . . . Arecipites tenuiexinous . . Laevigatosporites haardtii Lygodiumsporites adriennis V errucatosporites prosecundus Intratriporopollenites sp .... Ranunculacidites sp. . . . . . Cupuliferoidaepollenites sp. 2 Pleuricellaesporites sp. . .
Extralocal palynoflora ..... Platycarya platycaryoides Pandaniidites mdicus . . Sparganiaceaepollenites sp. cf s. polygonalis . Deltoidospora sp. . . . . . Azolla cretacea . . . . . . Pediastrum paleogeneites . Sigmopollis sp. . . . . . .
Regional palynoflora . . . . . . Ulmipollenites undulosus Tricolpites sp. 1 . Tricolpites sp. 2 . . . . . . Tricolpites sp. 3 . . . . . . Cupuliferoidaepollenites sp. 1 Striatopollis sp. . . . . . . . Pistillipollenites mcgregorii Momipites coryloides . Momipites trimdiatus . . . .
Page
49 49 49 50 50 50 50 51 51 53
55 55 55 55 55 56 56 56 56
56 56 56 56 57 57 57 57
57 57 58 58 58 58 58 58 58 58
Palynology-Continued Palynofloras-Continued
Regional palynoflora-Continued
Momipites sp. . . . . . . . Caryapollenites veripites . Caryapollenites inelegans Tilia vescipites . . . . . Tilia tetraforaminipites . Ailanthipites berryi ... Cupressacites hiatipites . Alnus speciipites . . . . Aesculiidites circumstriatus Cyathidites minor . . . . . Cupuliferoipollenites sp. . Rhoipites sp. 1 and sp. 2 Bombacacidites sp. 1 . Bombacacidites? sp. 2 Boehlensipollis sp. Carpinus ancipites Plicatopollis? sp. . Smilacipites herbaceoides . Eucommia sp. . . . . . . . Erdtmanipollis pachysandroides Undulatisporites sp. Cycadopites follicularis . . . . Pityosporites sp. . . . . . . . Undetermined tricolpate type, 1 . Undetermined tricolpate type, 2 .
Reworked palynoflora . . . Cicatricosisporites sp ...... . Corollina sp. . ........ . Proteacidites sp. cf. P. retusus Proteacidites sp. .
Conclusions Biostratigraphy . Paleoecology . . . Paleoclimatology .
References cited . . .
ILLUSTRATIONS
PLATES 3--5. Photomicrographs: 3. Algae, fungi, and pterophyte spores ..... . 4. Gymnosperm and angiosperm pollen. . . . . . 5. Tricolpate, tricolporate, and triporate pollen.
6. Charts showing relative abundances of palynomorphs in Vermillion Creek core samples. .
FIGURE 38. Map showing location of study area in the Vermillion Creek basin, south-central Wyoming 39. Map showing locations of core holes within the study area . . . . . . . . . . . . . . . . . . 40. Stratigraphic chart of relations in lower and middle Eocene rocks in the Vermillion Creek basin 41. Lithologic columns showing positions of palynological samples within cores . . . . . . . . . . . . . 42. Chart showing stratigraphic ranges of selected pollen from the lower Tertiary of the Rocky Mountain region
TABLES
TABLE 1. Sample depths, lithology, and palynomorph abundances of Vermillion Creek core samples . 2. Botanical affinities of Vermillion Creek palynomorphs and habitats of living relatives . . .
Page
58 58 58 58 58 59 59 59 59 59 59 59 59 59 59 59 59 60 60 60 60 60 60 60 60 60 60 60 60 61 61 61 63 63 65
Page
68 70 72
In pocket
48
50 50 51 52 61
Page
53 64
GEOLOGICAL INVESTIGATIONS OF THE VERMILLION CREEK COAL BED IN THE EOCENE NILAND TONGUE OF THE
WASATCH FORMATION, SWEETWATER COUNTY, WYOMING
PALYNOLOGY OF THE VERMILLION CREEK COAL BED AND ASSOCIATED STRATA
By DOUGLAS J. NICHOLS
ABSTRACT
Fifty-four species of spores, pollen, fungi, and algal palynomorphs were identified from the Vermillion Creek coal bed and associated strata, including underlying and overlying deposits and partings within the coal. The stratigraphic distribution and relative abundances of these plant microfossils were determined in samples from three cores.
The palynomorph assemblage, which is late early Eocene in age, includes 8 species of pterophyte spores, 4 species of gymnosperm pollen, 39 species of angiosperm pollen, 2 species of algal coenobia or cysts, and 1 species of fungal spore. The assemblage is dominated by the pollen species Platycarya platycaryoides and Arecipites tenuiexinous. Associations of taxa form the basis of classification of the total assemblage; it is classified into four components: the local, extralocal, regional, and reworked palynofloras. Species that are members of the local and extralocal palynofloras constitute assemblages that have paleoecological significance; bios~ratigraphically important species are members of the regional palynoflora. Ten species appear to have biostratigraphic importance, based on their stratigraphic ranges in the Rocky Mountain region. The record of their occurrence in a well-dated stratigraphic section is a contribution to Tertiary biostratigraphy in the central Rockies.
Palynologic evidence supplements stratigraphic, sedimentologic, geochemical, coal petrographic and other paleontologic evidence on the nature of the depositional environment. The Vermillion Creek coal was deposited in a paludal environment adjacent to a nonsaline lacustrine system. Evidence from botanical affinities of palynomorph species and habitats of living relatives indicates that the region had a moist subtropical climate in late early Eocene time.
INTRODUCTION
Palynological study of the Vermillion Creek coal bed and associated strata was undertaken as part of the interdisciplinary geological investigation of the composition and origin of the coal organized by H. W. Roehler. Palynomorphs (plant microfossils including spores of pterophytes, pollen of angiosperms and gymnosperms, cysts and coenobia of algae, and spores of fungi) occurring in the coal, its partings, and in underlying and overlying deposits were identified and described from
three cores that penetrate the coal bed and adjacent strata. The palynological study supplements the stratigraphic, sedimentologic, geochemical, coal petrographic, and other paleontologic studies discussed in other chapters of this professsional paper by providing additional evidence on the nature of the depositional environment of the Vermillion Creek coal bed. Further, the taxonomic descriptions and photomicrographs of palynomorphs provide documentation of a well-dated palynoflora of early Eocene age and contribute to the knowledge of Tertiary palynostratigraphy of the Rocky Mountain region.
LOCALITY DATA
The Vermillion Creek coal bed occurs in the V ermillion Creek basin of south-central Wyoming and northwestern Colorado. The study area is located in the central part of the basin in Sweetwater County, Wyo., just north of the Wyoming-Colorado State line (fig. 38). The area is part of the Rock Springs coal field. Samples analyzed in this study were collected from three cores drilled by the U.S. Geological Survey as part of its program of investigation and assessment of coal resources. Sampled cores are designated VC-5, VC-7, and VC-8.
Core hole VC-5 is located in sec. 34, T. 13 N., R. 100 W., Sweetwater County. U.S. Geological Survey (USGS) paleobotany locality number D6310 has been assigned to palynological samples from a 10.5-ft interval within core VC-5. Core hole VC-7 is located in sec. 19, T. 13 N., R. 100 W. USGS paleobotany locality number D6311 has been assigned to palynological samples from a 10-ft interval within core VC-7. Core hole VC-8 is located in sec. 27, T. 13 N., R. 100 W. USGS paleobotany locality number D6312 has been assigned to palynological samples from a 12.5-ft interval within core VC-8. These localities are shown on figure 39.
49
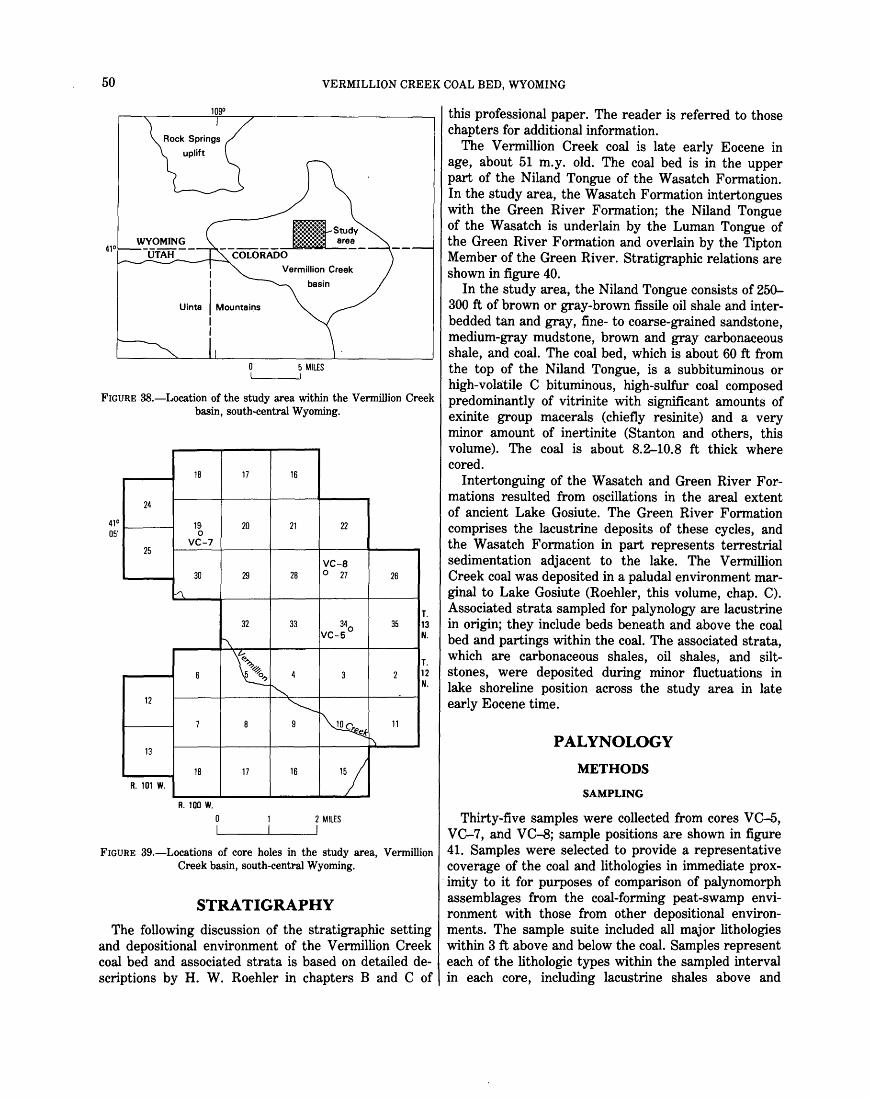
50 VERMILLION CREEK COAL BED, WYOMING
Uinta
I I
I Mountair:~s I I
5 MILES
FIGURE 38.-Location of the study area within the Vermillion Creek basin, south-central Wyoming.
41° 05'
24
25
12
13
R. 101 W.
18
19, 0
VC-7
30
h
6
7
18
R. 100 W.
17
20
29
32
~
~ ~ ""
8
17
0
16
21 22
VC-8 28 0 27
33 34 VC-5°
4 3
"----. 9 k k
16 15/ 2 MILES
26
35
2
11
1'\
T. 13 N.
T. 2
N. 1
FIGURE 39.-Locations of core holes in the study area, Vermillion Creek basin, south-central Wyoming.
STRATIGRAPHY
The following discussion of the stratigraphic setting and depositional environment of the Vermillion Creek coal bed and associated strata is based on detailed descriptions by H. W. Roehler in chapters B and C of
this professional paper. The reader is referred to those chapters for additional information.
The Vermillion Creek coal is late early Eocene in age, about 51 m.y. old. The coal bed is in the upper part of the Niland Tongue of the Wasatch Formation. In the study area, the Wasatch Formation intertongues with the Green River Formation; the Niland Tongue of the Wasatch is underlain by the Luman Tongue of the Green River Formation and overlain by the Tipton Member of the Green River. Stratigraphic relations are shown in figure 40.
In the study area, the Niland Tongue consists of 250-300ft of brown or gray-brown fissile oil shale and interbedded tan and gray, fine- to coarse-grained sandstone, medium-gray mudstone, brown and gray carbonaceous shale, and coal. The coal bed, which is about 60ft from the top of the Niland Tongue, is a subbituminous or high-volatile C bituminous, high-sulfur coal composed predominantly of vitrinite with significant amounts of exinite group macerals (chiefly resinite) and a very minor amount of inertinite (Stanton and others, this volume). The coal is about 8.2-10.8 ft thick where cored.
Intertonguing of the Wasatch and Green River Formations resulted from oscillations in the areal extent of ancient Lake Gosiute. The Green River Formation comprises the lacustrine deposits of these cycles, and the Wasatch Formation in part represents terrestrial sedimentation adjacent to the lake. The Vermillion Creek coal was deposited in a paludal environment marginal to Lake Gosiute (Roehler, this volume, chap. C). Associated strata sampled for palynology are lacustrine in origin; they include beds beneath and above the coal bed and partings within the coal. The associated strata, which are carbonaceous shales, oil shales, and siltstones, were deposited during minor fluctuations in lake shoreline position across the study area in late early Eocene time.
PALYNOLOGY
METHODS
SAMPLING
Thirty-five samples were collected from cores VC-5, VC-7, and VC-8; sample positions are shown in figure 41. Samples were selected to provide a representative coverage of the coal and lithologies in immediate prox-
. imity to it for purposes of comparison of palynomorph assemblages from the coal-forming peat-swamp environment with those from other depositional environments. The sample suite included all major lithologies within 3 ft above and below the coal. Samples represent each of the lithologic types within the sampled interval in each core, including lacustrine shales above and
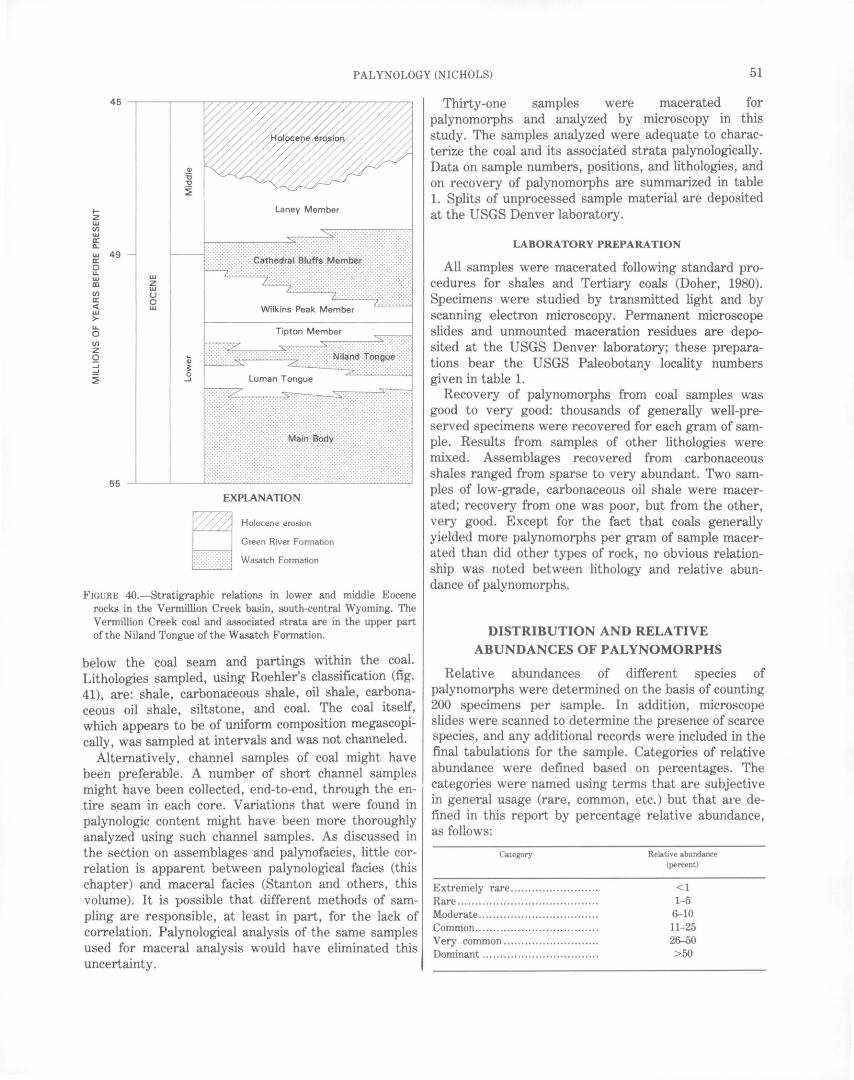
PALYNOLOGY (NICHOLS) 51
Q)
:0 "0
~
1- Laney Member z w CJ) w a: a... w 49 a: 0 u.. w w co z CJ)
w u a: 0 <{ w w
·' · -~~~~~~~ :~!~~~~ ~~ I! ii Wilkins Peak Member
>-u.. 0 Tipton Member CJ)
z 0 Q; :J ....J ~
~ 0
....J
55
EXPLANATION
FIGURE 40.-Stratigraphic relations in lower and middle Eocene rocks in the Vermillion Creek basin, south-central Wyoming. The Vermillion Creek coal and associated strata are in the upper part of the Niland Tongue of the Wasatch Formation.
below the coal seam and partings within the coal. Lithologies sampled, using Roehler's classification (fig. 41), are: shale, carbonaceous shale, oil shale, carbonaceous oil shale, siltstone, and coal. The coal itself, which appears to be of uniform composition megascopically, was sampled at intervals and was not channeled.
Alternatively, channel samples of coal might have been preferable. A number of short channel samples might have been collected, end-to-end, through the entire seam in each core. Variations that were found in palynologic content might have been more thoroughly analyzed using such channel samples. As discussed in the section on assemblages and palynofacies, little correlation is apparent between palynological facies (this chapter) and maceral facies (Stanton and others, this volume). It is possible that different methods of sampling are responsible, at least in part, for the lack of correlation. Palynological analysis of the same samples used for maceral analysis would have eliminated this uncertainty.
Thirty-one samples were macerated for palynomorphs and analyzed by microscopy in this study. The samples analyzed were adequate to characterize the coal and its associated strata palynologically. Data on sample numbers, positions, and lithologies, and on recovery of palynomorphs are summarized in table 1. Splits of unprocessed sample material are deposited at the USGS Denver laboratory.
LABORATORY PREPARATION
All samples were macerated following standard procedures for shales and Tertiary coals (Dober, 1980). Specimens were studied by transmitted light and by scanning electron microscopy. Permanent microscope slides and unmounted maceration residues are deposited at the USGS Denver laboratory; these preparations bear the USGS Paleobotany locality numbers given in table 1.
Recovery of palynomorphs from coal samples was good to very good: thousands of generally well-preserved specimens were recovered for each gram of sample. Results from samples of other lithologies were mixed. Assemblages recovered from carbonaceous shales ranged from sparse to very abundant. Two samples of low-grade, carbonaceous oil shale were macerated; recovery from one was poor, but from the other, very good. Except for the fact that coals generally yielded more palynomorphs per gram of sample macerated than did other types of rock, no obvious relationship was noted between lithology and relative abundance of palynomorphs.
DISTRIBUTION AND RELATIVE ABUNDANCES OF PALYNOMORPHS
Relative abundances of different species of palynomorphs were determined on the basis of counting 200 specimens per sample. In addition, microscope slides were scanned to determine the presence of scarce species, and any additional records were included in the final tabulations for the sample. Categories of relative abundance were defined based on percentages. The categories were named using terms that are subjective in general usage (rare, common, etc.) but that are defined in this report by percentage relative abundance, as follows:
Category
Extremely rare ........................ . Rare ...................................... .. Moderate ................................ .. Common .............................. .... . Very common ................... ...... .. Dominant ................................ .
Relative abundance (percent)
<1 1-5
6-10 11-25 26-50 >50

52
Feet
105.0
110.0
A
8 95.0
c D
E
F 115.0
G
H I
100.0
J 120.0
K
L M
N
105.0 0
123.6
107.0
VERMILLION CREEK COAL BED, WYOMING
VC-7 (06311)
A
8
c
D
E
F
G
H
Feet VC - 8
(06312) EXPlANATION
Lithology
~Sandstone
~Siltstone
~ Carbonaceous siltstone
~Shale ~ Slightly carbonaceous shale
~ Carbonaceous. shale
1!11 Oil shale
• Carbonaceous oil shale
!!!!! Coal
Coal with inclusions
Ill Limestone
FIGURE 41.-Positions of palynological samples within cores VC-5, VC-7, and VC-8 in the Vermillion Creek coal bed and associated strata of the Niland Tongue of the Wasatch Formation. Samples include shale, carbonaceous shale, oil shale, carbonaceous oil shale, siltstone, and coal. Sample numbers listed in table 1 consist of the "D" number shown at the top of each core followed by the one-letter suffix shown at each sample site along the core.
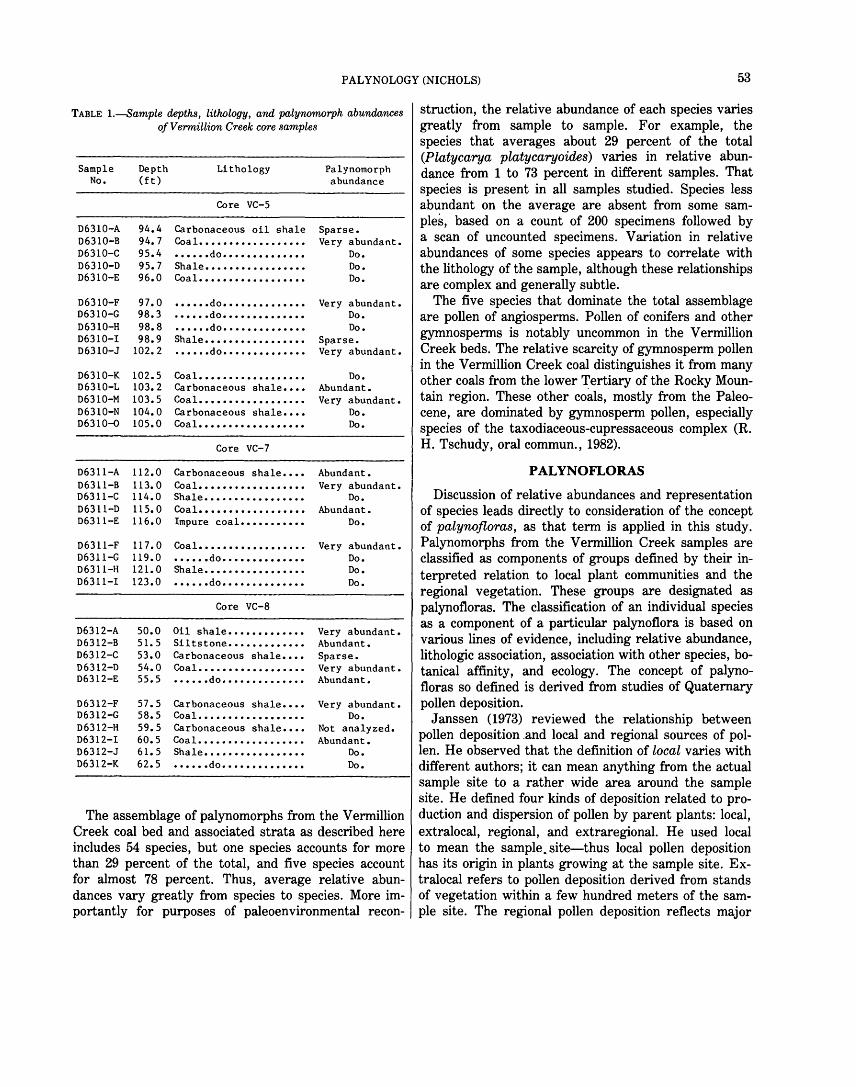
PALYNOLOGY (NICHOLS) 53
TABLE 1.-Sample depths, lithology, and palynomorph abundances of Vermillion Creek core samples
Sample Depth Lithology Palynomorph No. (ft) abundance
Core VC-5
D6310-A 94.4 Carbonaceous oil shale Sparse. D6310-B 94.7 Coal •••••••••••••••••• Very abundant. D6310-C 95.4 •••••• do •••••••••••••• Do. D6310-D 95.7 Shale ••••••••••••••••• Do. D6310-E 96.0 Coal •••••••••••••••••• Do.
D6310-F 97.0 •••••• do • ••••••••••••• Very abundant. D6310-G 98.3 •••••• do •••••••••••••• Do. D6310-H 98.8 ••••• • do • ••••••••••••• Do. D6310-I 98.9 Shale ••••••••••••••• • • Sparse. D6310-J 102.2 •••••• do •••••••••••••• Very abundant.
D6310-K 102.5 Coal •••••••••••••••••• Do. D6310-L 103.2 Carbonaceous shale •••• Abundant. D6310-M 103.5 Coal ••••••••••••••• • • • Very abundant. D6310-N 104.0 Carbonaceous shale •••• Do. D6310-o 105.0 Coal •••••••••••••• • • • • Do.
Core VC-7
D6311-A 112.0 Carbonaceous shale •••• Abundant. D6311-B 113.0 Coal ••••••••••••• • • • • • Very abundant. D6311-C 114.0 Shale ••••••••••••••••• Do. D6311-D 115.0 Coal •••••••••••.•• • • • • Abundant. D6311-E 116.0 Impure coal ••••••••••• Do.
D6311-F 117.0 Coal •••••••••••••••••• Very abundant. D6311-G 119.0 •••••• do • ••••••••••••• Do. D6311-H 121.0 Shale ••••••••••••••••• Do. D6311-I 123.0 •••••• do •••••••••••••• Do.
Core VC-8
D6312-A 50.0 Oil shale ••••••••••••• Very abundant. D6312-B 51.5 Siltstone ••••••••••••• Abundant. D6312-C 53.0 Carbonaceous shale •••• Sparse. D6312-D 54.0 Coal •••••••••••••••••• Very abundant. D6312-E 55.5 •••••• do •••••••••••••• Abundant.
D6312-F 57.5 Carbonaceous shale •••• Very abundant. D6312-G 58.5 Coal •••••••••••••••• •. Do. D6312-H 59.5 Carbonaceous shale •••• Not analyzed. D6312-I 60.5 Coal ••••••••••••••• •. • Abundant. D6312-J 61.5 Shale ••••••••••••••••• Do. D6312-K 62.5 •••••• do •••••••••••••• Do.
struction, the relative abundance of each species varies greatly from sample to sample. For example, the species that averages about 29 percent of the total (Platycarya platycaryoides) varies in relative abundance from 1 to 73 percent in different samples. That species is present in all samples studied. Species less abundant on the average are absent from some samples, based on a count of 200 specimens followed by a scan of uncounted specimens. Variation in relative abundances of some species appears to correlate with the lithology of the sample, although these relationships are complex and generally subtle.
The five species that dominate the total assemblage are pollen of angiosperms. Pollen of conifers and other gymnosperms is notably uncommon in the Vermillion Creek beds. The relative scarcity of gymnosperm pollen in the Vermillion Creek coal distinguishes it from many other coals from the lower ~ertiary of the Rocky Mountain region. These other coals, mostly from the Paleocene, are dominated by gymnosperm pollen, especially species of the taxodiaceous-cupressaceous complex (R. H. Tschudy, oral commun., 1982).
PALYNOFLORAS
Discussion of relative abundances and representation of species leads directly to consideration of the concept of palynofloras, as that term is applied in this study. Palynomorphs from the Vermillion Creek samples are classified as components of groups defined by their interpreted relation to local plant communities and the regional vegetation. These groups are designated as palynofloras. The classification of an individual species as a component of a particular palynoflora is based on various lines of evidence, including relative abundance, lithologic association, association with other species, botanical affinity, and ecology. The concept of palynofloras so defined is derived from studies of Quaternary pollen deposition.
Janssen (1973) reviewed the relationship between pollen deposition .and local and regional sources of pollen. He observed that the definition of local varies with different authors; it can mean anything from the actual
----------------------r sample site to a rather wide area around the sample site. He defined four kinds of deposition related to pro-
The assemblage of palynomorphs from the Vermillion duction and dispersion of pollen by parent plants: local, Creek coal bed and associated strata as described here extralocal, regional, and extraregional. He used local includes 54 species, but one species accounts for more to mean the sample. site-thus local pollen deposition than 29 percent of the total, and five species account has its origin in plants growing at the sample site. Exfor almost 78 percent. Thus, average relative abun- tralocal refers to pollen deposition derived from stands dances vary greatly from species to species. More im- of vegetation within a few hundred meters of the samportantly for purposes of paleoenvironmental recon- ple site. The regional pollen deposition reflects major
54 VERMILLION CRE;EK COAL BED, WYOMING
vegetation types and exists as a background concentration. He defined extraregional pollen deposition as derived from sources outside the area of consideration.
Janssen pointed out that these concepts are difficult to apply in the fossil record because important factors may be unknown: effects of overrepresentation and underrepresentation of pollen due to differential pro~uctivity of various species and the distribution of parentplant communities. Despite these difficulties, the concepts may have value even in the pre-Quaternary, and I have made an initial attempt to apply them to the Eocene in this study. Janssen reasoned that only if the nature of either the local or the regional vegetation is known can the nature of the other be inferred through studies of pollen deposition. He recognized that in paleoecological studies the nature of the regional vegetation may be unknown and modern analogs of plant communities may not exist, even for the Quaternary. Janssen concluded that a useful approach is to analyze the stratigraphic arrangement of assemblages of locally derived pollen. Species groups in these assemblages then may be compared with modern plant communites.
An objective of the study of the Vermillion Creek coal is to determine the nature of the plant community of the coal-forming peat swamp. Following Janssen's reasoning, it would be necessary to know the nature of the regional palynoflora (as the term is used in this report) in order to interpret the local palynoflora. Little published information is available on the regional palynoflora of the Eocene of Wyoming, however, and certainly nothing comparable to the pollen diagrams Janssen used in his interpretations of Quaternary vegetation. It was necessary, therefore, to establish criteria for recognition of components of palynofloras using relative abundances, lithologic associations, and other data. My criteria depart somewhat from Janssen's, hence the term paly,noflora may not be exactly equivalent to pollen deposition. Janssen's stratigraphic approach proved useful in recognition of plant communities in the vicinity of the sample sites.
By analogy with the concepts and definitions of Janssen (1973), the total assemblage (all species identified in the Vermillion Creek samples) is interpreted to consist of three components: local, extralocal, and regional. Janssen's concept of extraregional is merged with my concept of a regional palynoflora. To this list of components of the total assemblage may be added one other: reworked palynomorphs. The classification and the criteria that follow were established with specific reference to the Vermillion Creek coal bed and associated strata.
The local palynoflora (as defined here) refers to palynomorphs produced by plants living in the coalforming peat swamp. This definition focuses attention
on the Vermillion Creek coal-the subject of this professional paper-and is consistent with the views of Faegri and Iversen (1964) and Janssen (1973) regarding local and regional pollen deposition. These authors assert that pollen from local sources predominates in peat samples and that the regional vegetation is reflected in lacustrine sediments. The local palynoflora has the following characteristics: (1) relative abundances of commonly occurring species are high and irregular; (2) greatest abundances are found in coal samples; (3) certain rarely occurring diagnostic species are present; (4) masses of specimens derived from individual sporangia or anthers are present, giving evidence of deposition in place and minimum transport; and (5) the association of species appears to represent a single plant community. The local palynoflora is useful in the analysis of the paleoecology of the coal-forming peat swamp.
The extralocal palynoflora (as defined here) refers to palynomorphs produced by plant communities on the periphery of the peat swamp. Such communities were within the depositional basin and probably were within a few hundred meters of the sample sites. The extralocal palynoflora has the following characteristics: (1) relative abundances of certain species are greater than is normal for the same species in the regional palynoflora; (2) relative abundances vary with lithology and are greater in noncoal lithologies; and (3) the association of species appears to represent one or more plant community. The extralocal palynoflora may be relevant to paleoecological analysis.
The regional palynoflora (as defined here) refers to palynomorphs produced by plants living outside the depositional basin. Palynomorphs from sources defined as extraregional by Janssen (1973) are included in this definition of regional. The regional palynoflora has the following characteristics: (1) relative abundances of commonly occurring species are reasonably consistent; (2) occurrences and relative abundances are unrelated to lithology, and (3) the species present include familiar lower Tertiary types known from contemporaneous deposits of the region. The regional palynoflora is important in biostratigraphy.
The reworked palynoflora consists of palynomorphs eroded from older rocks and redeposited along with palynomorphs produced by plants living at or near the site of deposition of the Vermillion Creek beds. The reworked palynoflora does not represent plants living in the Rocky Mountain region during late early Eocene time. Its significance may relate to sedimentologic events.
Individual species that compose the local, extralocal, regional, and reworked palynofloras are listed in the following sections, and their distributions, relative abundances, and botanical affinities are discussed.
PALYNOLOGY (NICHOLS) 55
LOCAL PALYNOFLORA Areoipites tenuie:xinous Leffingwell
Plate 4, figure 5, 17
Arecipites texuiexinous is one of the three most abundant species of the Vermillion Creek samples. It is present in all samples studied. It tends to be somewhat more abundant in the coal than in associated lithologies, constituting 10 percent or more of the specimens in all but one coal sample. (In this sample the percentage of A. tenuiexinous is suppressed by a flood of Platycarya pollen.) In 11 of 16 coal samples analyzed, Arecipites tenuiexinous accounts for 25 percent or more of the assemblage, and in two samples, D6311-G and D6312--D, it is the dominant species in the assemblage, constituting more than 50 percent of the specimens. It is less abundant in noncoallithologies, although it is still well represented.
The pattern of distribution suggests that the plant that produced Arecipites tenuiexinous pollen lived adjacent to and perhaps in the coal-forming swamps of the Vermillion Creek basin; the parent plant may have been a major contributor to the peat deposits that eventually were coalified. This interpretation is supported by the presence of coherent masses of Arecipites pollen in some samples. Masses of A. tenuiexinous pollen were observed in four samples; one is illustrated in plate 4, figure 17. These masses of undispersed pollen were each produced by a single anther of a parent plant that presumably lived at the site of deposition; otherwise the masses would likely have been broken up by transport. Three occurred in coal and one at the bottom of a shale parting, suggesting that the parent plant lived near or in the swamp. The presence of masses of pollen of a single species in sample residues obviously has implications for relative abundance statistics, but interestingly, the masses observed in this study are not in the samples that have the greatest relative abundance of Arecipites tenuiexinous.
The relative abundance of Arecipites tenuiexinous provides some evidence of its botanical affinity, if certain assumptions and generalizations are made. Pollen of this morphology is produced by modern species of Palmae and Liliaceae, plants of rather different habit and habitat. Most modern palms are arboreal, anemophilous species of tropical regions, whereas most lilies are herbaceous, entomophilous, and cosmopolitan in distribution. The great abundance of A. tenuiexinous pollen in the Vermillion Creek samples suggests it may be overrepresenting the actual number of plants producing pollen. Overrepresentation is characteristic of anemophilous plants, including palms. (Alternatively, A. tenuiexinous might represent a liliaceous species that, being entomophilous, is actually underrepresented
by the extremely abundant pollen. The alternative interpretation envisions prodigious numbers of lilies inhabiting the region, and hence is less likely to be correct.)
The abundance of vitrinite in the coal (Stanton and others, this volume) indicates that the coal originated from predominantly woody tissues. Together, the abundance of vitrinite and relative abundance of Arecipites pollen in the coal indicate that the swamp flora consisted largely of palms. Interpretation of A. tenuiexinous as pollen of palms has important implications concerning the paleoclimatology of the region.
Laevigatosporites haard.W (Potonie & Venita) Thomson & Pflug Plate 3, figure 5
Laevigatosporites haardtii is present in all but one sample examined. It is common in the peat-swamp deposits, constituting 10 to more than 25 percent of the specimens in the assemblages in most coal and shale parting samples. The species is rare to extremely rare in clastic rocks above and below the coal bed. On the basis of this pattern of distribution, Laevigatosporites haardtii is interpreted to represent ferns that were indigenous to the environment of coal deposition. These ferns may have contributed to the accumulation of the coal-forming peat. Masses of the spores, which represent contents of whole sporangia, indicate that the parent plant lived at the site of deposition; transport would tend to break up clusters of spores. Masses of spores were observed in samples from the coal and from shale partings in the coal.
Lygod.ium.sporites adriennis (Potome & Gelletich) Potonie Plate 3, figure 3
Lygodiumsporites adriennis is a consistently occurring component of Vermillion Creek assemblages, especially in coal samples, although it usually constitutes less than 5 percent of the assemblage. It is interpreted as representing a fern species indigenous to the coal swamp.
Verruoatosporites proseoundus Elsik Plate 3, figures 4, 9
Verrucatosporites prosecundus is more restricted in distribution and considerably less abundant in the Vermillion Creek material than is Laevigatosporites haardtii. It occurs primarily in coal or carbonaceous shale samples but nowhere constitutes as much as 10 percent of the assemblage. A mass of spores of this species (pl. 3, fig. 9) was found in the shale parting in core VC-8 (sample D6312--F). V. prosecundus apparently was produced by a plant that was a minor constituent of the indigenous coal-swamp flora.
56 VERMILLION CREEK COAL BED, WYOMING
lntratriporopollenites sp. Plate 5, figure 6
Intratriporopollenites sp. is present in most samples of the Vermillion Creek coal and associated strata, ranging in relative abundance from extremely rare to moderate, but not exceeding 10 percent of the count in any sample. It is interpreted as a member of the local palynoflora because fluctuations in its relative abundance appear to be related to development of the swamp flora. This species probably represents a fossil species in the early Tertiary tiliaceous-sterculiaceous complex. It is closer to the Tiliaceae and may represent a fossil species in the lineage leading to the modern genus Tilia.
Ranunoulacidites sp. Plate 5, figure 1
Specimens of Ranunculacidites sp. are extremely rare in the Vermillion Creek samples. They occur only in coal and shale partings within the coal seam and may represent a plant indigenous to the peat-forming swamp. Thus the species is interpreted as part of the local palynoflora. Distinctive operculate colpi characterize specimens of this species.
Cupuliferoid.aepollenites sp. 2 Plate 4, figures 7, 16
Pollen of this species closely resembles Cupuliferoidaepollenites sp. 1 but is larger; specimens are 15 micrometers or more in greatest dimension. A mass of C. sp. 2 pollen (pl. 4, fig. 16) was found, indi-cating that this species is indigenous to the Vermillion Creek flora, because the mass presumably was derived from a single anther of a plant living close to the site of deposition. The pollen mass is interpreted as evidence that C. sp. 2 is part of the local palynoflora. The more abundant C. sp. 1 is classified as part of the regional palynoflora on the basis of its pattern of occurrence.
Pleurioellaesporites sp. Plate 3, figure 1
Pleuricellaesporites sp. is present in some Vermillion Creek coal and shale samples, ranging from extremely rare to moderate in relative abundance. Fungal spores of this type are notably common in sample D6311-A, a coal sample from the top of core VC-7, along with hyphae and other fungal remains. Fossil fungi tend to be more common at the top of the coal beds at each locality cored, possibly as a result of paleoenvironmental conditions toward the end of coal deposition in the Vermillion Creek swamps.
EXTRALOCALPALYNOFLORA
Platycarya platyoaryoides (Roohe) Frederiksen & Christopher
Plate 4, figure 18; Plate 5, figure 21
Platycarya platycaryoides is the most abundant species in Vermillion Creek assemblages. This species occurs in all samples studied. It constitutes 25 percent of the count in half of the samples and exceeds 50 percent in six samples. It tends to be more abundant in shales than in coals, but it amounted to 73 percent of the assemblage in coal sample D6310-F (core VC--5).
Living species of Platycarya are anemophilous, and fossil species are assumed to be also. Therefore, the fossil pollen P. platycaryoides might be somewhat overrepresentative in the palynoflora, so the percentage abundance of pollen would not directly reflect the number of plants producing it. Masses of P. platycaryoides pollen (pl. 4, fig. 18) were found in three samples, of which two are shales from beneath the coal bed. These masses represent most or all of the contents of single anthers. The parent plants must have been living near the site of deposition, or long-distance transport would have tended to break up masses of pollen. The evidence suggests that plants producing P. platycaryoides occupied the areas immediately peripheral to the coal-forming swamp rather than living in the swamp. On this basis P. platycaryoides is classified as part of the extralocal palynoflora. It may represent a forest community at the edge of the swamp.
Pand.aniidites radious Leffingwell Plate 5, figure 24
Pandaniidites radicus ranges in abundance from extremely rare to common in the Vermillion Creek samples. It occurs both in coal and clastic rocks, but is more abundant in the clastics. The plants that produced this pollen are interpreted as swamp-margin vegetation. Elsik (1968), Leffingwell (1971), and Jarzen (1978) attributed fossil pollen of this morphology to the modern genus Pandanus (Pandanaceae), tropical marsh plants. Except for the distinctive pore, specimens of Pandaniidites radicus Leffingwell closely resemble specimens of Smilacipites herbaceoides Wodehouse.
Spargani8ffl8Apollenites sp. of. 8. polygonalis Thiergart
Plate 5, figure 12
Pollen of this morphology is characteristic of the Sparganiaceae (burreed family) and certain species of the Typhaceae (cattail family). The Sparganiaceae and
PALYNOLOGY (NICHOLS) 57
Typhaceae are families of marsh plants. In samples in which it occurs, Sparganiaceaepollenites sp. cf. S. polyganalis ranges in abundance from extremely rare to moderate. Its pattern of distribution-present in most shale samples and more abundant in shales than in coals-suggests that it was produced by plants growing on the periphery of the coal swamp. This pattern is consistent with the interpretation that the pollen has typhalean affinity and was produced by marsh plants.
Deltoidospora sp. Plate 3, figure 2
Deltoidospora sp. ranges in abundance from extremely rare to moderate in some samples from the Vermillion Creek cores and is anomalously very common in shale sample D6310-D. It is notably absent from coal samples and occurs almost exclusively in associated noncoal lithologies. Based on its pattern of relative abundance, this species is interpreted to be part of the extralocal palynoflora. It probably represents a stand of vegetation (ferns) at the margin of the swamp. Thus this species differs from Lygodiumsporites adriennis not only in morphology but in distribution and relative abundance and, presumably, in ecology.
Azolla oretacea Stanley Plate 3, figure 13
In "the Vermillion Creek beds, Azolla cretacea was found only in the lacustrine shale samples from beneath the coal in VC-7. Its presence is indicative of a freshwater (nonsaline) depositional environment. The anchor-shaped glochidia are characteristic of the species. Glochidia separated from massulae also were observed in Vermillion Creek samples in the present study. This species is interpreted as representing the lacustrine environment adjacent to the coal-forming swamp. Tschudy (1961) discussed probable conspeci:fic specimens from Paleocene and Eocene rocks in Colorado and Wyoming.
Pediastrum paleogeneites Wilson & Hoffmeister Plate 3, figure 10
Pediastrum paleogeneites is a fossil species of the living genus Pediastrum, multicellular chlorophytalean algal coenobia. Living species of Pediastrum are planktonic algae characteristic of permanent or semipermanent pools of freshwater (Smith, 1950). Pediastrum paleogeneites is extremely rare in the Vermillion Creek samples, as indicated by percentage abundance counts. Pediastrum is believed to be indi-
genous to the depositional environment of the V ermillion Creek beds because of its association with other freshwater fossils. It is significant paleoenvironmentally, even in low numbers. Several specimens were observed in sample D6311-H, shale underlying the coal in cores VC-7 and VC-8. Like Azolla cretacea, P. paleogeneites represents the lacustrine environment adjacent to the Vermillion Creek swamp.
Sigmopollis sp. Plate 3, figures 11-12
Sigmopollis sp. is the dominant palynomorph in sample D6312-A, oil shale of lacustrine origin overlying the coal in core VC-8. It was not observed in coal samples from the same core, although it constituted more than 5 percent of the assemblage in the uppermost coal sample in core VC-7. Its distribution relative to lithology is significant.
Palynomorphs of this type were first described by Hedlund (1965) from ~acustrine shale of Tertiary age from Nevada, and Piel (1971) described another species of Sigmopollis from the Oligocene of British Columbia. Hedlund (1965) described the species S. hispidus from coaly beds associated with lacustrine oil shales. In the Vermillion Creek beds, Sigmopollis sp. is most abundant in shale of lacustrine origin. The molluscan assemblage from this shale indicates that it was deposited in a freshwater environment (Roehler, this volume). Thus Sigmopollis is indicative of fresh (nonsaline) aquatic environments including, but not restricted to, environments of coal deposition. Species of this genus are most likely algal spores or cysts. Morphologically similar forms described by Pals and others (1980, p. 407) were interpreted as indicative of shallow, eutrophic freshwater.
REGIONAL PALYNOFLORA
Ulmipollenites undulosus Wolff Plate 5, figure 25
The abundance of Ulmipollenites undulosus is notably constant in the Vermillion Creek coal and associated strata. It was observed in all but one sample studied, and its relative abundance is rare or moderate in most samples. The relative abundance shows no pattern that can be correlated with lithofacies. The species is classified as part of the regional palynoflora on the basis of its pattern of occurrence. Specimens have from three to five pores; forms having three pores are most common.
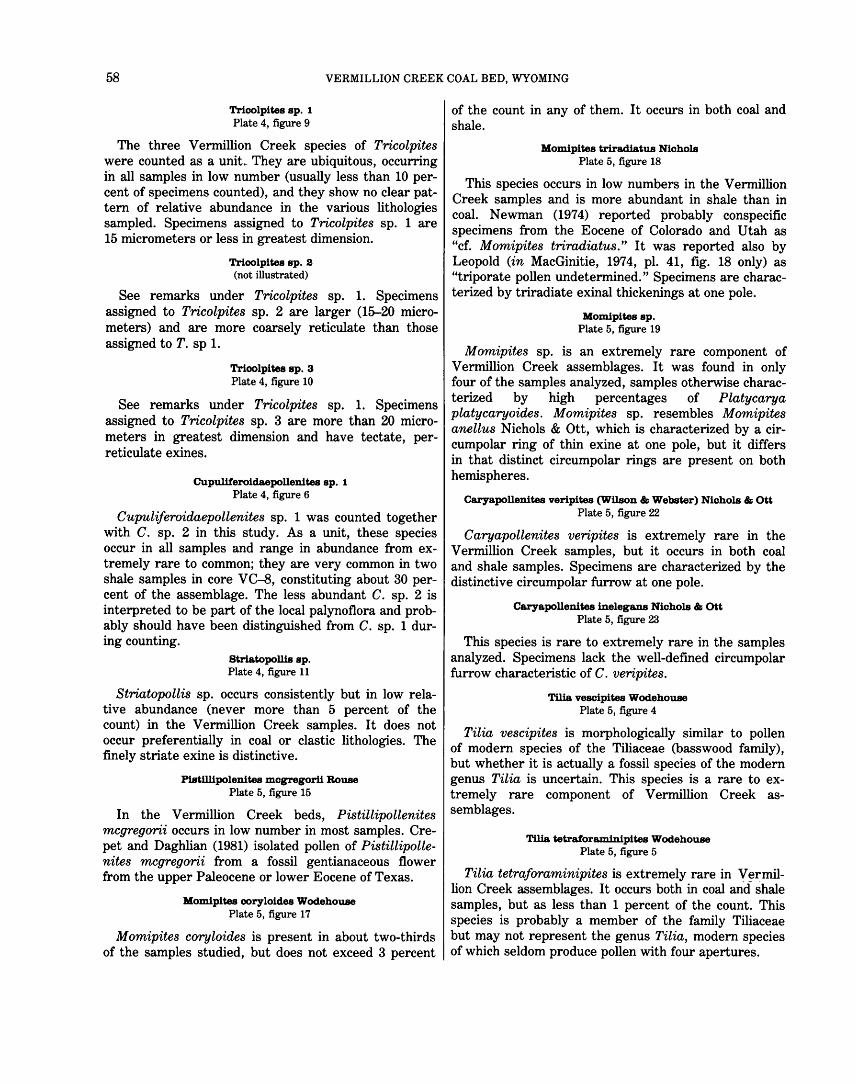
58 VERMILLION CREEK COAL BED, WYOMING
Tricolpites sp. 1 of the count in any of them. It occurs in both coal and Plate 4, figure 9 shale.
The three Vermillion Creek species of Tricolpites were counted as a unit .. They are ubiquitous, occurring in all samples in low number (usually less than 10 percent of specimens counted), and they show no clear pattern of relative abundance in the various lithologies sampled. Specimens assigned to Tricolpites sp. 1 are 15 micrometers or less in greatest dimension.
Tricolpites sp. 2 (not illustrated)
See remarks under Tricolpites sp. 1. Specimens assigned to Tricolpites sp. 2 are larger (15-20 micrometers) and are more coarsely reticulate than those assigned toT. sp 1.
Tricolpites sp. 3 Plate 4, figure 10
See remarks under Tricolpites sp. 1. Specimens assigned to Tricolpites sp. 3 are more than 20 micrometers in greatest dimension and have tectate, perreticulate exines.
Cupuliferoidaepollenites sp. 1 Plate 4, figure 6
Cupuliferoidaepollenites sp. 1 was counted together with C. sp. 2 in this study. As a unit, these species occur in all samples and range in abundance from extremely rare to common; they are very common in two shale samples in core VC-8, constituting about 30 percent of the assemblage. The less abundant C. sp. 2 is interpreted to be part of the local palynoflora and probably should have been distinguished from C. sp. 1 during counting.
Striatopollis sp. Plate 4, figure 11
Striatopollis sp. occurs consistently but in low relative abundance (never more than 5 percent of the count) in the Vermillion Creek samples. It does not occur preferentially in coal or clastic lithologies. The finely striate exine is distinctive.
Pistillipolenites mcgregorii Bouse Plate 5, figure 15
In the Vermillion Creek beds, Pistillipollenites rncgregorii occurs in low number in most samples. Crepet and Daghlian (1981) isolated pollen of Pistillipollenites rncgregorii from a fossil gentianaceous flower from the upper Paleocene or lower Eocene of Texas.
Momipites coryloides Wod.ehouse Plate 5, figure 17
Momipites coryloides is present in about two-thirds of the samples studied, but does not exceed 3 percent
Momipites triradiatus Nichols Plate 5, figure 18
This species occurs in low numbers in the Vermillion Creek samples and is more abundant in shale than in coal. Newman (1974) reported probably conspecific specimens from the Eocene of Colorado and Utah as "cf. Momipites triradiatus." It was reported also by Leopold (in MacGinitie, 1974, pl. 41, fig. 18 only) as "triporate pollen undetermined." Specimens are characterized by triradiate exinal thickenings at one pole.
Momipites sp. Plate 5, figure 19
Momipites sp. is an extremely rare component of Vermillion Creek assemblages. It was found in only four of the samples analyzed, samples otherwise characterized by high percentages of Platycarya platycaryoides. Momipites sp. resembles Momipites anellus Nichols & Ott, which is characterized by a circumpolar ring of thin exine at one pole, but it differs in that distinct circumpolar rings are present on both hemispheres.
Caryapollenites veripites (Wilson & Webster) Nichols & Ott Plate 5, figure 22
Caryapollenites veripites is extremely rare in the Vermillion Creek samples, but it occurs in both coal and shale samples. Specimens are characterized by the distinctive circumpolar furrow at one pole.
Caryapollenites inelegan.s Nichols & Ott Plate 5, figure 23
This species is rare to extremely rare in the samples analyzed. Specimens lack the well-defmed circumpolar furrow characteristic of C. veripites.
Tilia vesoipites Wod.ehouse Plate 5, figure 4
Tilia vescipites is morphologically similar to pollen of modern species of the Tiliaceae (basswood family), but whether it is actually a fossil species of the modern genus Tilia is uncertain. This species is a rare to extremely rare component of Vermillion Creek assemblages.
Tilia tetraforaminipites Wod.ehouse Plate 5, figure 5
Tilia tetraforaminipites is extremely rare in Vermillion Creek assemblages. It occurs both in coal and shale samples, but as less than 1 percent of the count. This species is probably a member of the family Tiliaceae but may not represent the genus Tilia, modern species of which seldom produce pollen with four apertures.
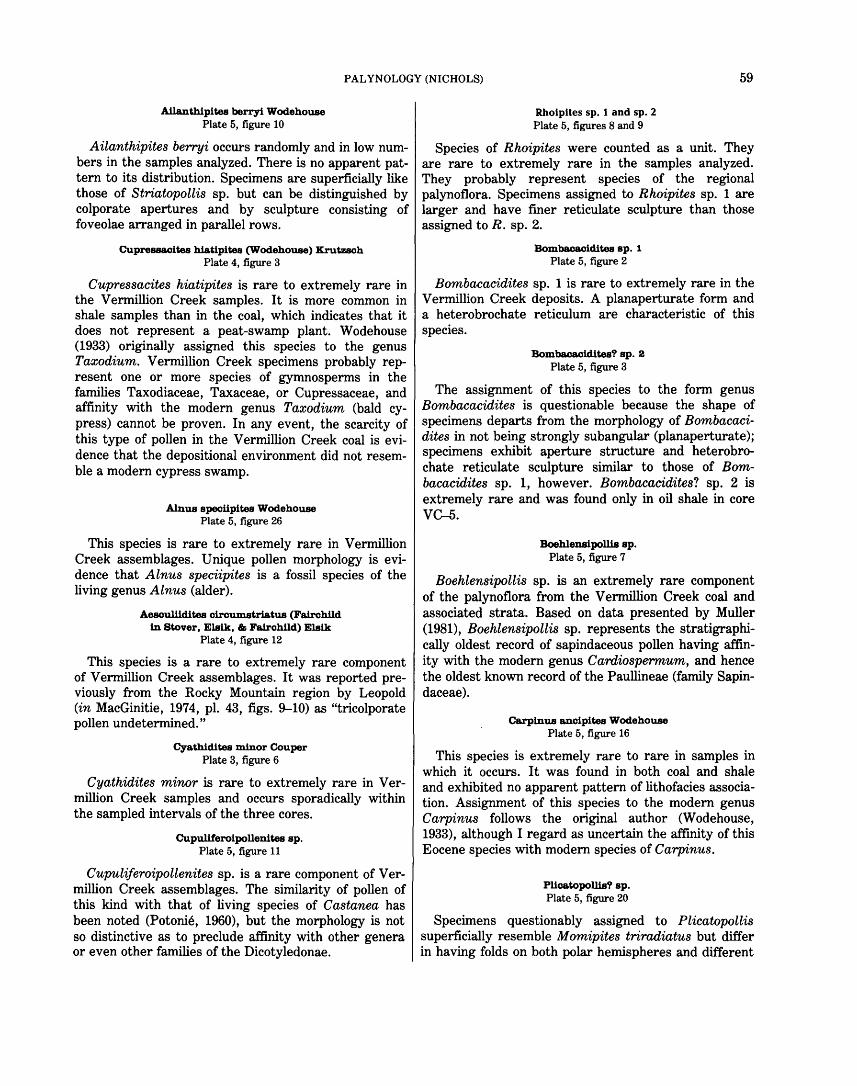
PALYNOLOGY (NICHOLS) 59
Ailanthipites berryi Wodehouse Plate 5, figure 10
Ailanthipites berryi occurs randomly and in low numbers in the samples analyzed. There is no apparent pattern to its distribution. Specimens are superficially like those of Striatopollis sp. but can be distinguished by colporate apertures and by sculpture consisting of foveolae arranged in parallel rows.
Cupressacites hiatipites (Wodehouse) Krutzsoh Plate 4, figure 3
Cupressacites hiatipites is rare to extremely rare in the Vermillion Creek samples. It is more common in shale samples than in the coal, which indicates that it does not represent a peat-swamp plant. Wodehouse (1933) originally assigned this species to the genus Taxodium. Vermillion Creek specimens probably represent one or more species of gymnosperms in the families Taxodiaceae, Taxaceae, or Cupressaceae, and affinity with the modern genus Taxodium (bald cypress) cannot be proven. In any event, the scarcity of this type of pollen in the Vermillion Creek coal is evidence that the depositional environment did not resemble a modern cypress swamp.
Alnus speoiipites Wodehouse Plate 5, figure 26
This species is rare to extremely rare in Vermillion Creek assemblages. Unique pollen morphology is evidence that Alnus speciipites is a fossil species of the living genus Alnus (alder).
Aesoullidites oircumstriatus (Fairchild in Stover, Elsik, & Fairchild) Elsik
Plate 4, figure 12
This species is a rare to extremely rare component of Vermillion Creek assemblages. It was reported previously from the Rocky Mountain region by Leopold (in MacGinitie, 1974, pl. 43, figs. 9-10) as "tricolporate pollen undetermined."
Cyathidites minor Couper Plate 3, figure 6
Cyathidites minor is rare to extremely rare in V ermillion Creek samples and occurs sporadically within the sampled intervals of the three cores.
Cupuliferoipollenites sp. Plate 5, figure 11
Cupuliferoipollenites sp. is a rare component of V ermillion Creek assemblages. The similarity of pollen of this kind with that of living species of Castanea has been noted (Potonie, 1960), but the morphology is not so distinctive as to preclude affinity with other genera or even other families of the Dicotyledonae.
Rhoipites sp. 1 and sp. 2 Plate 5, figures 8 and 9
Species of Rhoipites were counted as a unit. They are rare to extremely rare in the samples analyzed. They probably represent species of the regional palynoflora. Specimens assigned to Rhoipites sp. 1 are larger and have fmer reticulate sculpture than those assigned to R. sp. 2.
Bombaoaoidites sp. 1 Plate 5, figure 2
Bombacacidites sp. 1 is rare to extremely rare in the Vermillion Creek deposits. A planaperturate form and a heterobrochate reticulum are characteristic of this species.
Bombaoaoidites? sp. 2 Plate 5, figure 3
The assignment of this species to the form genus Bombacacidites is questionable because the shape of specimens departs from the morphology of Bombacacidites in not being strongly subangular (planaperturate); specimens exhibit aperture structure and heterobrochate reticulate sculpture similar to those of Bombacacidites sp. 1, however. Bombacacidites? sp. 2 is extremely rare and was found only in oil shale in core VC-5.
Boehlensipollis sp. Plate 5, figure 7
Boehlensipollis sp. is an extremely rare component of the palynoflora from the Vermillion Creek coal and associated strata. Based on data presented by Muller (1981), Boehlensipollis sp. represents the stratigraphically oldest record of sapindaceous pollen having affinity with the modern genus Cardiospermum, and hence the oldest known record of the Paullineae (family Sapindaceae).
Carpinus anoipites Wodehouse Plate 5, figure 16
This species is extremely rare to rare in samples in which it occurs. It was found in both coal and shale and exhibited no apparent pattern of lithofacies association. Assignment of this species to the modern genus Carpinus follows the original author (Wodehouse, 1933), although I regard as uncertain the affinity of this Eocene species with modern species of Carpinus.
Plioatopollis? sp. Plate 5, figure 20
Specimens questionably assigned to Plicatopollis superficially resemble Momipites triradiatus but differ in having folds on both polar hemispheres and different
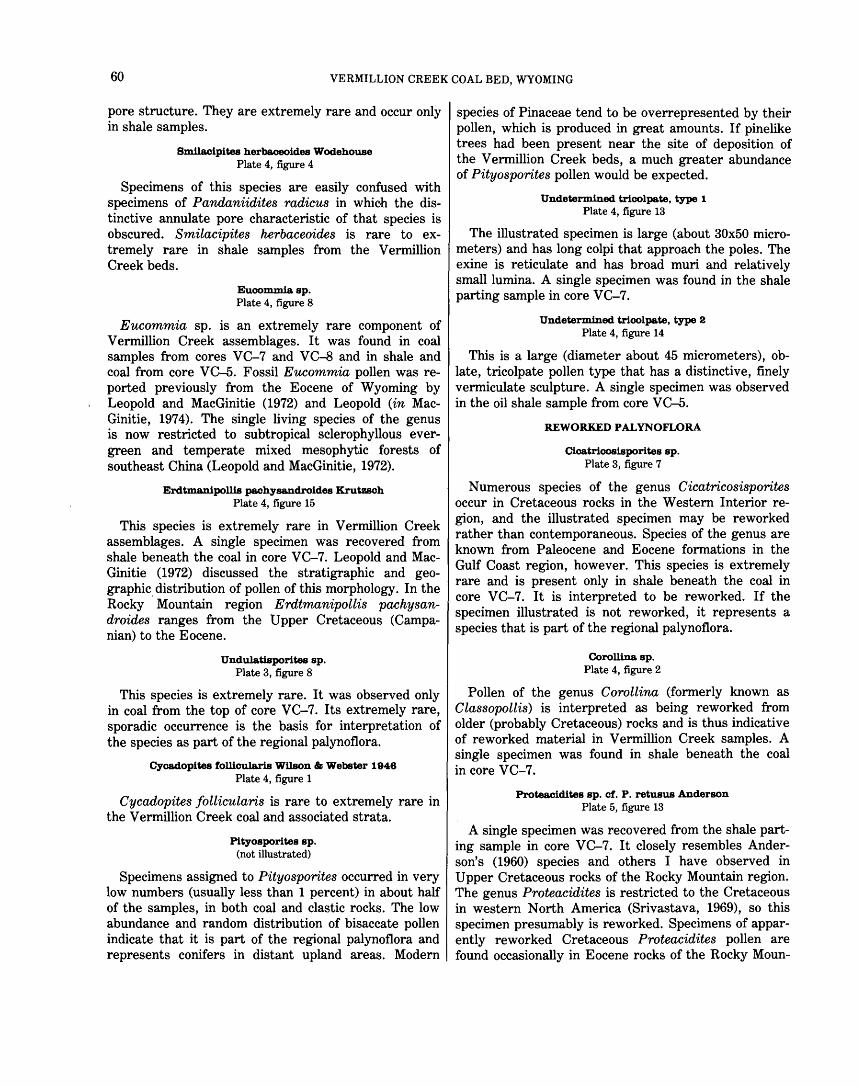
60 VERMILLION CREEK COAL BED, WYOMING
pore structure. They are extremely rare and occur only in shale samples.
Smilacipites herbaoeoides Wodehouse Plate 4, figure 4
Specimens of this species are easily confused with specimens of Pandaniidites radicus in which the distinctive annulate pore characteristic of that species is obscured. Smilacipites herbaceoides is rare to extremely rare in shale samples from the Vermillion Creek beds.
Eucommia sp. Plate 4, figure 8
Eucommia sp. is an extremely rare component of Vermillion Creek assemblages. It was found in coal samples from cores VC-7 and VC-8 and in shale and coal from core VC-5. Fossil Eucommia pollen was reported previously from the Eocene of Wyoming by Leopold and MacGinitie (1972) and Leopold (in MacGinitie, 1974). The single living species of the genus is now restricted to subtropical sclerophyllous evergreen and temperate mixed mesophytic forests of southeast China (Leopold and MacGinitie, 1972).
Erdtmanipollis paohysandroides Krutzsoh Plate 4, figure 15
This species is extremely rare in Vermillion Creek assemblages. A single specimen was recovered from shale beneath the coal in core V C-7. Leopold and MacGinitie (1972) discussed the stratigraphic and geographic. distribution of pollen of this morphology. In the Rocky Mountain region Erdtmanipollis pachysandroides ranges from the Upper Cretaceous (Campanian) to the Eocene.
Undulatisporites sp. Plate 3, figure 8
This species is extremely rare. It was observed only in coal from the top of core VC-7. Its extremely rare, sporadic occurrence is the basis for interpretation of the species as part of the regional palynoflora.
Cycadopites follioularis Wilson & Webster 1946 Plate 4, figure 1
Cycadopites follicularis is rare to extremely rare in the Vermillion Creek coal and associated strata.
Pityosporites sp. (not illustrated)
Specimens assigned to Pityosporites occurred in very low numbers (usually less than 1 percent) in about half of the samples, in both coal and clastic rocks. The low abundance and random distribution of bisaccate pollen indicate that it is part of the regional palynoflora and represents conifers in distant upland areas. Modern
species of Pinaceae tend to be overrepresented by their pollen, which is produced in great amounts. If pinelike trees had been present near the site of deposition of the Vermillion Creek beds, a much greater abundance of Pityosporites pollen would be expected.
Undetermined tricolpate, type 1 Plate 4, figure 13
The illustrated specimen is large (about 30x50 micrometers) and has long colpi that approach the poles. The exine is reticulate and has broad muri and relatively small lumina. A single specimen was found in the shale parting sample in core VC-7.
Undetermined tricolpate, type 2 Plate 4, figure 14
This is a large (diameter about 45 micrometers), oblate, tricolpate pollen type that has a distinctive, finely vermiculate sculpture. A single specimen was observed in the oil shale sample from core VC-5.
REWORKED PALYNOFLORA
Cioatrioosisporites sp. Plate 3, figure 7
Numerous species of the genus Cicatricosisporites occur in Cretaceous rocks in the Western Interior region, and the illustrated specimen may be reworked rather than contemporaneous. Species of the genus are known from Paleocene and Eocene formations in the Gulf Coast region, however. This species is extremely rare and is present only in shale beneath the coal in core VC-7. It is interpreted to be reworked. If the specimen illustrated is not reworked, it represents a species that is part of the regional palynoflora.
Corollina sp. Plate 4, figure 2
Pollen of the genus Corollina (formerly known as Classopollis) is interpreted as being reworked from older (probably Cretaceous) rocks and is thus indicative of reworked material in Vermillion Creek samples. A single specimen was found in shale beneath the coal in core VC-7.
Proteacidites sp. of. P. retusus Anderson Plate 5, figure 13
A single specimen was recovered from the shale parting sample in core VC-7. It closely resembles Anderson's (1960) species and others I have observed in Upper Cretaceous rocks of the Rocky Mountain region. The genus Proteacidites is restricted to the Cretaceous in western North America (Srivastava, 1969), so this specimen presumably is reworked. Specimens of apparently reworked Cretaceous Proteacidites pollen are found occasionally in Eocene rocks of the Rocky Moun-
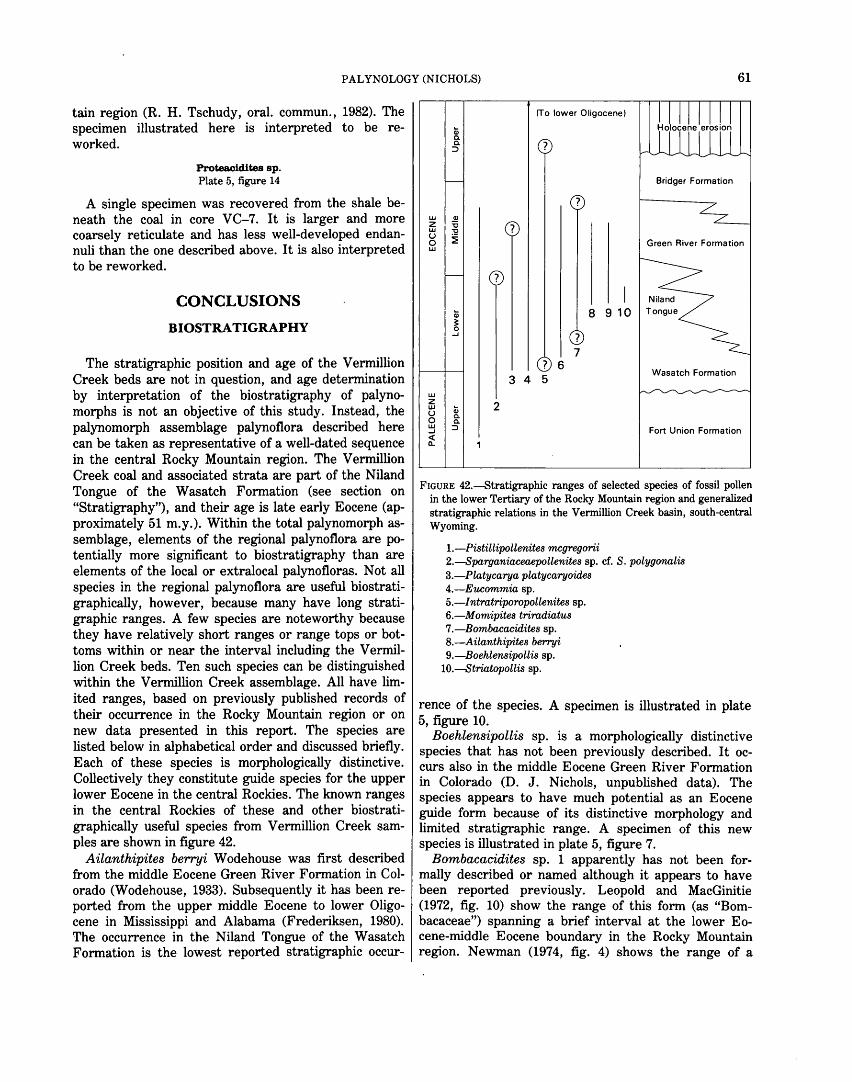
PALYNOLOGY (NICHOLS) 61
tain region (R. H. Tschudy, oral. commun., 1982). The specimen illustrated here is interpreted to be reworked.
Proteacidites sp. Plate 5, figure 14
A single specimen was recovered from the shale beneath the coal in core VC-7. It is larger and more coarsely reticulate and has less well-developed endannuli than the one described above. It is also interpreted to be reworked.
CONCLUSIONS
BIOSTRATIGRAPHY
The stratigraphic position and age of the Vermillion Creek beds are not in question, and age determination by interpretation of the biostratigraphy of palynomorphs is not an objective of this study. Instead, the palynomorph assemblage palynoflora described here can be taken as representative of a well-dated sequence in the central Rocky Mountain region. The Vermillion Creek coal and associated strata are part of the Niland Tongue of the Wasatch Formation (see section on "Stratigraphy"), and their age is late early Eocene (approximately 51 m.y.). Within the total palynomorph assemblage, elements of the regional palynoflora are potentially more significant to biostratigraphy than are elements of the local or extralocal palynofloras. Not all species in the regional palynoflora are useful biostratigraphically, however, because many have long stratigraphic ranges. A few species are noteworthy because they have relatively short ranges or range tops or bottoms within or near the interval including the V ermillion Creek beds. Ten such species can be distinguished within the Vermillion Creek assemblage. All have limited ranges, based on previously published records of their occurrence in the Rocky Mountain region or on new data presented in this report. The species are listed below in alphabetical order and discussed briefly. Each of these species is morphologically distinctive. Collectively they constitute guide species for the upper lower Eocene in the central Rockies. The known ranges in the central Rockies of these and other biostratigraphically useful species from Vermillion Creek samples are shown in figure 42.
Ailanthipites berryi Wodehouse was first described from the middle Eocene Green River Formation in Colorado (Wodehouse, 1933). Subsequently it has been reported from the upper middle Eocene to lower Oligocene in Mississippi and Alabama (Frederiksen, 1980). The occurrence in the Niland Tongue of the Wasatch Formation is the lowest reported stratigraphic occur-
w Q)
2 :0 w "0
g ~ w
w 2 w u 0 w ...J <( a..
Qj a. a.
::::>
2
(To lower Oligocene)
?
? 6 3 4 5
?
? 7
8 9 10
Green River Formation
Fort Union Formation
FIGURE 42.--Stratigraphic ranges of selected species of fossil pollen in the lower Tertiary of the Rocky Mountain region and generalized stratigraphic relations in the Vermillion Creek basin, south-central Wyoming.
!.-Pistillipollenites mcgregorii 2.-Sparganiaceaepollenites sp. cf. S. polygonal is 3.-Platycarya platycaryoides 4.-Eucommia sp. 5.-lntratriporopollenites sp. 6.-Momipites triradiatus 7.-Bombacacidites sp. 8.-Ailanthipites berryi 9.-Boehlensipollis sp.
10.-Striatopollis sp.
renee of the species. A specimen is illustrated in plate 5, figure 10.
Boehlensipollis sp. is a morphologically distinctive species that has not been previously described. It occurs also in the middle Eocene Green River Formation in Colorado (D. J. Nichols, unpublished data). The species appears to have much potential as an Eocene guide form because of its distinctive morphology and limited stratigraphic range. A specimen of this new species is illustrated in plate 5, figure 7.
Bombacacidites sp. 1 apparently has not been formally described or named although it appears to have been reported previously. Leopold and MacGinitie (1972, fig. 10) show the range of this form (as "Bombacaceae") spanning a brief interval at the lower Eocene-middle Eocene boundary in the Rocky Mountain region. Newman (1974, fig. 4) shows the range of a
62 VERMILLION CREEK COAL BED, WYOMING
probably conspecific taxon (as Bombacacidites) through his Eocene zones E-2 to E-5 in the western Uinta basin, Utah, and from uppermost zone E-1 through E-5 in the Piceance basin, Colorado. The Niland Tongue occurrence reported here may be within the range described by Newman or slightly older. The earliest occurrence of this species appears to have regional biostratigraphic significance in the Rockies. A specimen is illustrated in plate 5, figure 2.
Eucommia sp. is not to be confused with any species of the Mesozoic genus Eucommiidites. It is an Eocene guide form that has regional significance. It appears first in the basal Eocene in Colorado (Newman, 1974) and North Dakota (Leopold and MacGinitie, 1972). The youngest published occurrence of Eucommia pollen in North American is a lower Oligocene record from Colorado (Leopold and MacGinitie, 1972). The extant genus Eucommia is no longer indigenous to North America, having become extinct in Tertiary time. A specimen of the Vermillion Creek species is illustrated in plate 4, figure 8.
Intratriporopollenites sp. may have been noted previously in the form of records of the genus Tilia in the Rocky Mountain region. Appearance of pollen resembling that of modern Tilia has been used to mark the Paleocene-Eocene boundary in North America (Leopold and MacGinitie, 1972; Newman, 1974, 1980; Rouse, 1977), although pollen of this morphology occurs first in the Paleocene in Europe (Mai, 1961) and in the southeastern United States (Frederiksen, 1979). Through detailed taxonomic work, Mai (1961) defined seven species of Intratriporopollenites that have biostratigraphic value in Paleocene to Pliocene strata in central Europe. The biostratigraphic utility of pollen of I ntratriporopolleni.tes or "Tilia" in western North America also will depend upon careful taxonomic analysis. Additional species of Intratriporopollenites need to be defined in the Paleogene of North America, and taxonomic revision of fossil species assigned to Tilia is required. A specimen of the Vermillion Creek species is illustrated in plate 5, figure 6.
Momipites triradiatus Nichols was first described from strata of latest Paleocene age in Texas (Nichols, 1973). Subsequently it was recorded (as cf. Momipites triradiatus) in Colorado and Utah by Newman (1974). Newman noted that its first appearance in the Rockies in part characterized his lowermost Eocene zone E-1. Newman's data (1974, figs. 2-4) indicate that this species ranges through the lower and middle Eocene. It is not to be confused with the superficially similar Paleocene species Momipites triorbicularis and M. ventifluminis described respectively by Leffingwell (1971) and Nichols and Ott (1978). A specimen of M. triradiatus from the Vermillion Creek beds is illustrated in plate 5, figure 18.
Pistillipollenites mcgregorii Rouse had a wide geographic range in North America, Europe, and northern Asia, according to records of occurrence cited by Rouse and Srivastava (1970). The species ranges from late Paleocene to middle Eocene based on these records and those of Leopold and MacGinitie (1972) and Newman (1974); the Cretaceous occurrence reported by Hedlund (1966) is not this species (Crepet and Daghlian, 1981). This species has the greatest value as a guide fossil for intercontinental correlation of any of the species in the Vermillion Creek assemblages. A specimen of this species is illustrated in plate 5, figure 15.
Platycarya platycaryoides (Roche) Frederiksen & Christopher, the most abundant species in the V ermillion Creek beds, is an excellent example of a guide fossil: it is morphologically distinctive, stratigraphically restricted, abundant, and widely distributed. The firstappearance horizon in the Rocky Mountain region is taken to be coincident with the Paleocene-Eocene boundary (Leopold and MacGinitie, 1972; Tschudy, 1976; Leopold, cited in Hickey, 1977; Soister and Tschudy, 1978; Newman, 1980). Platycarya is one of the most important paleoclimatic indicators in the central Rockies because of its apparent sensitivity to conditions of temperature and moisture; it became extinct in the region in response to climatic change (Leopold and MacGinitie, 1972). The date of extinction of Platycarya in the Rockies is in dispute, however. Leopold and MacGinitie (1972) gave a middle Eocene date. They suggested that extinction was the result of a change from a moist, subtropical climate to one that was dryer and cooler. Newman (1980), who regarded the extinction event as a major regional biostratigraphic datum, gave an early Eocene date. He suggested that extinction resulted from a change from a moist subtropical climate to a dry subtropical climate. Final resolution of the problem will depend on precise age determinations of paleoclimatic phases and relevant rock units and on more extensive knowledge of Eocene palynostratigraphy. A specimen of the Vermillion Creek species of Platycarya is illustrated in plate 5, figure 21..
Sparganiaceaepollenites sp. cf. S. polygonal is Thiergart first appears in the stratigraphic record at or near the Paleocene-Eocene boundary. Its occurrence may be influenced by paleoenvironment, however. Its botanical affinity suggests that it was produced by plants growing in or near peat-forming swamps. The species was first described from Miocene brown coal in Germany (Thiergart, 1937). A similar form occurs in coal of latest Paleocene age in Montana (Wilson and Webster, 1946). Pollen closely resembling the Vermillion Creek specimens and probably conspecific with them was reported from lignite-bearing strata of early Eocene age in North Dakota by Bebout (1977). Bebout's specimens
PALYNOLOGY (NICHOLS) 63
first appeared at the Paleocene-Eocene boundary. Thus this species may characterize Eocene rocks in western North America, but it could be absent from facies not associated with coal-depositional environments of that age. A specimen of this species is illustrated in plate 5, figure 12.
Striatopollis sp. has not been reported previously, and thus its stratigraphic range has not been established. Its value as a guide fossil can be affirmed only through future studies on Eocene rocks in the Rocky Mountain region. As of this writing, the species appears to be a guide to the upper lower Eocene. A specimen of this new species is illustrated in plate 4, figure 11.
PALEOECOLOGY
The depositional environment of the Vermillion Creek beds has been determined by Roehler (this volume, chap. C), primarily on the basis of stratigraphic relations and sedimentology. Peat that was later coalified was deposited in a swamp adjacent to a nonsaline lacustrine system. This interpretation is . supported by the presence of species of palynomorphs that are related to modern aquatic, swamp, and marsh plants. The palynology of the coal and associated strata provides more specific evidence on the nature of the plant communities that lived in the swamp and in the surrounding region. The most important kind of evidence is the relative abundance of certain species of palynomorphs that constitute the assemblages in individual samples.
The interpreted paleoecological significance of important palynomorphs can be summarized as follows. The angiosperms Arecipites tenuiexinous Leffingwell and Intratriporopollenites sp. and the ferns Laevigatosporites haardtii (Potonie & V enitz) Krutzsch, Lygodiumsporites adriennis (Potonie & Gelletich) Potonie, and V errucatosporites prosecundus Elsik represent the local peat-forming swamp flora. The fern Deltoidospora sp. apparently grew outside the swamp. Angiosperms Pandaniidites radicus Leffingwell and Sparganiaceaepollenites sp. cf. S. polygonal is Thiergart were produced by a local marsh flora growing marginal to the swamp. The ubiquitous angiosperm Platycarya platycaryoides (Roche) Frederiksen & Christopher probably represents a stand of forest vegetation growing at the edge of the swamp. Finally, the fern Azolla cretacea Stanley, the alga Pediastrum paleogeneites Wilson & Hoffmeister, and the presumed alga Sigmopollis sp. inhabited the freshwater lacustrine environment of ancient Lake Gosiute. These species are components of assemblages that are evidence of various plant communities and depositional environments. The assemblages occur repetitively in the cores, indicating
that the communities and environments migrated back and forth across the coring sites through time in response to changing ecological conditions.
Although the same samples were not analyzed for both palynomorphs and macerals, I attempted to correlate palynomorph assemblages (palynofacies) with maceral facies as recognized in the Vermillion Creek coal by Stanton and others (this volume). Results were ambiguous. The stratigraphic distribution of palynofacies in cores VC-5, VC-7, and VC--8 bears no clear relation to the distribution of maceral facies defined by Stanton and others (this volume) in the same cores. This may be because maceral facies and palynofacies reflect different aspects of the depositional environment. Previous studies of Tertiary coals have shown a correlation between maceral content and palynomorph content, however. (For example, see Nichols and Traverse, 1971.) The samples used for palynologic and petrographic analysis of the coal were not the same, but this seems an inadequate explanation for the discrepancy. A possible explanation is that maceral assemblages, which were autochthonous in origin, were more sensitive to local paleoenvironmental changes within the Vermillion Creek swamp than were the palynomorph assemblages, which are at least in part allochthonous, having been produced not only by the local plants of the peat swamp, but also by the extralocal and regional plant communities.
PALEOCLIMATOLOGY
Paleoclimatic interpretations of early Tertiary environments based on paleofloristics usually depend upon the determination of botanical affinity of fossil plants and on the assumption that genera or families have not changed ecological preferences or tolerances in tens of millions of years. There may be little theoretical foundation for such an assumption, however. The following interpretations are presented with this caveat. A conservative approach to determination of botanical affinity has been taken in this study. Only pollen that has unique or highly characteristic morphology has been indicated to have close affinity with living taxa. Table 2 lists palynomorph species for which affinity has been determined with reasonable certainty and shows the general ecological regime inhabited by living species of the family named. Concordance of the data lends support to the interpretation. The evidence indicates that the Vermillion Creek beds were deposited in a moist subtropical climate.
In interpreting the paleoclimatic history of the Rocky Mountain region, Leopold and MacGinitie (1972) reasoned that the presence of fossil pollen of Platycarya is especially significant. They concluded that Platycarya pollen :indicated conditions of constant
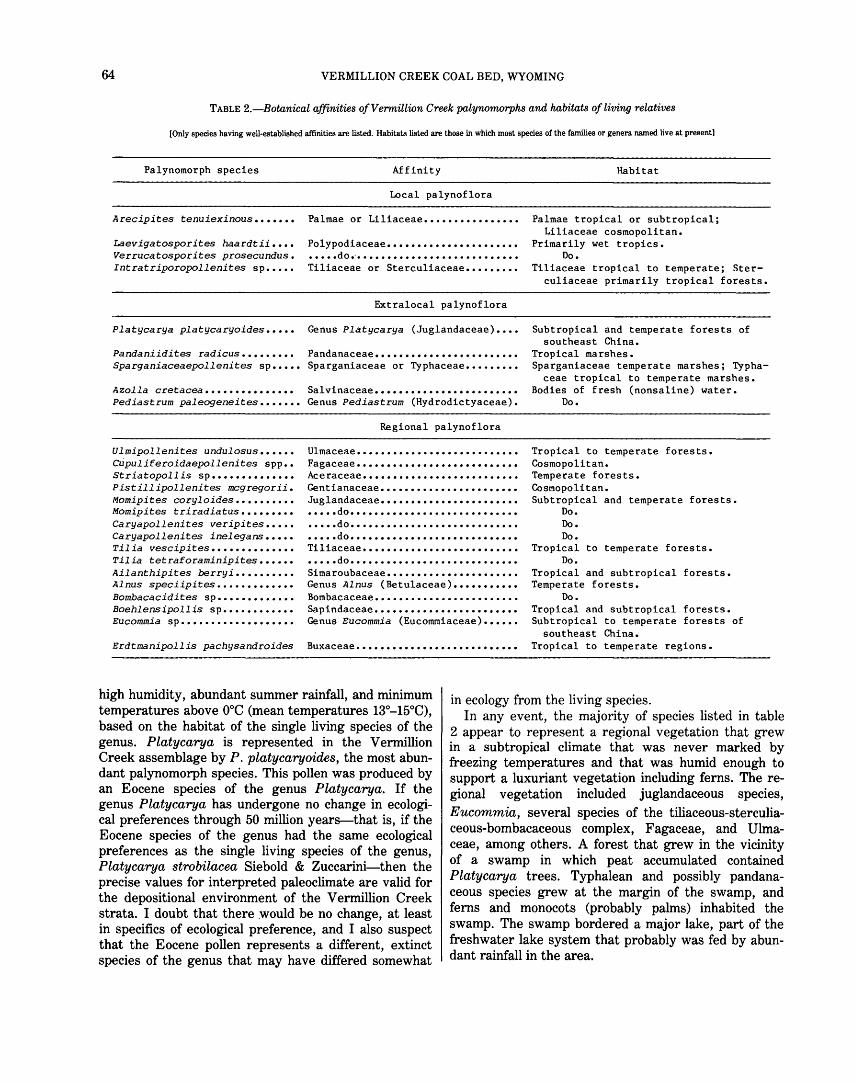
64 VERMILLION CREEK COAL BED, WYOMING
TABLE 2.-Botanical affinities of Vermillion Creek palynorrwrphs and habitats of living relatives
[Only species having well-established affinities are listed. Habitats listed are those in which most species of the families or genera named live at present]
Palynomorph species Affinity Habitat
Local palynoflora
Arecipites tenuiexinous ••••••• Palmae or Liliaceae •••••••••••••••• Palmae tropical or subtropical; Liliaceae cosmopolitan.
Laevigatosporites haardtii •••• Verrucatosporites prosecundus. Intratriporopollenites sp •••••
Polypodiaceae...................... Primarily wet tropics. • •••• do.·........................... Do. Tiliaceae or Sterculiaceae......... Tiliaceae tropical to temperate; Ster
culiaceae primarily tropical forests.
Extralocal palynoflora
Platycarya platycaryoides ••••• Genus Platycarya (Juglandaceae).... Subtropical and temperate forests of southeast China.
Pandaniidites radicus......... Pandanaceae•••••••••••••••••••••••• Sparganiaceaepollenites sp ••••• Sparganiaceae or Typhaceae •••••••••
Azolla cretacea ••••••••••••••• Salvinaceae •••••••••••••••••••••••• Pediastrum paleogeneites ••••••• Genus Pediastrum (Hydrodictyaceae).
Ulmipollenites undulosus •••••• Cupuliferoidaepollenites spp •• Striatopollis SP•••••••••••••• Pistillipollenites mcgregorii. Momipites coryloides •••••••••• Momipites triradiatus ••••••••• Caryapollenites veripites ••••• Caryapollenites inelegans ••••• Tilia vescipites •••••••••••••• Tilia tetraforaminipites •••••• Ailanthipites berryi •••••••••• Alnus speciipites ••••••••••••• Bombacacidites sp ••••••••••••• Boehlensipollis sp •••••••••••• Eucommia sp •••••••••••••••••••
Erdtmanipollis pachysandroides
Regional palynoflora
Ulmaceae ••••••••••••••••••••••••••• Fagaceae ••••••••••••••••••••••••••• Aceraceae •••••••••••••••••••••••••• Gentianaceae ••••••••••••••••••••••• Juglandaceae••••••••••••••••••••••• • •••• do • ••••••••••••••••••••••••••• • •••• do •••••••••••••••••••••••••••• • •••• do • ••••••••••••••••••••••••••• Tiliaceae •••••••••••••••••••••••••• • •••• do •••••••••••••••••••••••••••• Simaroubaceae •••••••••••••••••••••• Genus Alnus (Betulaceae) ••••••••••• Bombacaceae •••••••••••••••••••••••• Sapindaceae •••••••••••••••••••••••• Genus Eucommia (Eucommiaceae) ••••••
Buxaceae •••••••••••••••••••••••••••
Tropical marshes. Sparganiaceae temperate marshes; Typha
ceae tropical to temperate marshes. Bodies of fresh (nonsaline) water.
Do.
Tropical to temperate forests. Cosmopolitan. Temperate forests. Cosmopolitan. Subtropical and temperate forests.
Do. Do. Do.
Tropical to temperate forests. Do.
Tropical and subtropical forests. Temperate forests.
Do. Tropical and subtropical forests. Subtropical to temperate forests of
southeast China. Tropical to temperate regions.
high humidity, abundant summer rainfall, and minimum temperatures above ooc (mean temperatures l3°-l5°C), based on the habitat of the single living species of the genus. Platycarya is represented in the Vermillion Creek assemblage by P. platycaryoides, the most abundant palynomorph species. This pollen was produced by an Eocene species of the genus Platycarya. If the genus Platycarya has undergone no change in ecological preferences through 50 million years-that is, if the Eocene species of the genus had the same ecological preferences as the single living species of the genus, Platycarya strobilacea Siebold & Zuccarini-then the precise values for interpreted paleoclimate are valid for the depositional environment of the Vermillion Creek strata. I doubt that there would be no change, at least in specifics of ecological preference, and I also suspect that the Eocene pollen represents a different, extinct species of the genus that may have differed somewhat
in ecology from the living species. In any event, the majority of species listed in table
2 appear to represent a regional vegetation that grew in a subtropical climate that was never marked by freezing temperatures and that was humid enough to support a luxuriant vegetation including ferns. The regional vegetation included juglandaceous species, Eucommia, several species of the tiliaceous-sterculiaceous-bombacaceous complex, Fagaceae, and Ulmaceae, among others. A forest that grew in the vicinity of a swamp in which peat accumulated contained Platycarya trees. Typhalean and possibly pandanaceous species grew at the margin of the swamp, and ferns and monocots (probably palms) inhabited the swamp. The swamp bordered a major lake, part of the freshwater lake system that probably was fed by abundant rainfall in the area.

PALYNOLOGY (NICHOLS) 65
REFERENCES CITED
Anderson, R. Y., 1960, Cretaceous-Tertiary palynology, eastern side of the San Juan basin, New Mexico: New Mexico Bureau of Mines and Mineral Resources Memoir 6, 58 p., 11 pls.
Bebout, J. W., 1977, Palynology of the Paleocene-Eocene Golden Valley Formation of western North Dakota: University Park, Pa., Pennsylvania State University Ph. D. dissertation, 391 p.
Crepet, W. L., and Daghlian, C. P., 1981, Lower Eocene and Paleocene Gentianaceae--Floral and palynological evidence: Science, v. 214, p. 75-77.
Doher, L. 1., 1980, Palynomorph preparation procedures currently used in the paleontology and stratigraphy laboratories, U.S. Geological Survey: U.S. Geological Survey Circular 830, 29 p.
Elsik, W. C., 1968, Palynology of a Paleocene Rockdale lignite, Milam County, Texas. I. Morphology and taxonomy: Pollen et Spores, v. 10, p. 263-314, pls. 1-15.
Faegri, K.nut, and Iversen, Johs., 1964, Textbook of pollen analysis (2d ed.): New York, Hafner, 237 p.
Frederiksen, N. 0., 1979, Paleogene sporomorph biostratigraphy, northeastern Virginia: Palynology, v. 3, p. 129-167, 4 pls.
--1980, Sporomorphs from the Jackson Group (upper Eocene) and adjacent strata of Mississippi and western Alabama: U.S. Geological Survey Professional Paper 1084, 75 p., 16 pls.
Hedlund, R. W., 1965, Sigmopollis hispidus gen. et sp. nov. from Miocene sediments, Elko County, Nevada: Pollen et Spores, v. 7, p. 89-92, 1 pl.
--1966, Palynology of the Red Branch Member of the Woodbine Formation (Cenomanian), Bryan County, Oklahoma: Oklahoma Geological Survey Bulletin 112, 69 p., 10 pls.
Hickey, L. J., 1977, Stratigraphy and paleobotany of the Golden Valley Formation (early Tertiary) of western North Dakota: Geological Society of America Memoir 150, 183 p.
Janssen, C. R., 1973, Local and regional pollen deposition, in Birks, H.J.B., and West, R. G., eds .. Quaternary plant ecology: New York, John Wiley and Sons, p. 31-42.
Jarzen, D. M., 1978, Some Maestrichtian palynomorphs and their phytogeographical and paleoecological implications: Palynology, v. 2, p. 29-38, 1 pl.
Leffingwell, H. A., 1971, Palynology of the Lance (Late Cretaceous) and Fort Union (Paleocene) Formations of the type Lance area, Wyoming, in Kosanke, R. M., and Cross, A. T., eds., Symposium on palynology of the Late Cretaceous and early Tertiary: Geological Society of America Special Paper 127, p. 1-64, 10 pls.
Leopold, E. B., and MacGinitie, H. D., 1972, Development and affinities of Tertiary floras in the Rocky Mountains, in Graham, Alan, ed., Floristics and paleofloristics of Asia and eastern North America: Amsterdam, Elsevier, p. 147-200.
MacGinitie, H. D., 1974, An early middle Eocene flora from the Yellowstone-Absaroka volcanic province, northwestern Wyoming: University of California Publications in Geological Sciences, v. 108, 103 p., 45 pls.
Mai, D. H., 1961, Uber eine fossile Tiliaceen-Bliite und tilioden Pollen aus dem deutschen Tertiar: Geologie, v. 10, no. 32, p. 54-93, pls. 9-12.
Muller, Jan, 1981, Fossil pollen records of extant angiosperms: Botanical Review, v. 47, no. 1, p. 1-142.
Newman, K. R., 19.74, Palynomorph zones in early Tertiary formations of the Piceance Creek and Uinta basins, Colorado and Utah: Rocky Mountain Association of Geologists 1974 Guidebook, p. 47-55.
--1980, A Paleocene time scale for the Rocky Mountains [abs.]: American Association of Petroleum Geologists Bulletin, v. 64, p. 757.
Nichols, D. J., 1973, North American and European species of Momipites ("Engelhardtia") and related genera: Geoscience and Man, v. 7, p. 10:>-117, 1 pl.
Nichols, D. J., and Ott, H. L., 1978, Biostratigraphy and evolution of the Momipites-Caryapollenites lineage in the early Tertiary in the Wind River Basin, Wyoming: Palynology, v. 2, p. 94-112, 2 pls.
Nichols, D. J., and Traverse, Alfred, 1971, Palynology, petrology, and depositional environments of some early Tertiary lignites in Texas: Geoscience and Man, v. 3, p. 37-48.
Pals, J. P., Van Geel, Bas, and Delfos, A., 1980, Paleoecological studies on the Klokkeweel bog near Hoogkarspel (Province of Noord-Holland): Review of Palaeobotany and Palynology, v. 30, no. 3/4, p. 371-418, 5 pls.
Piel, K. M., 1971, Palynology of Oligocene sediments from central British Columbia: Canadian Journal of Botany, v. 49, no. 11, p. 1885-1920, pls. 1-17.
Potonie, Robert, 1960, Synopsis der Gattungen der Sporae dispersae. III. Teil-Nachtrage, Sporites, Fortsetzung Pollenites mit Generalregister zu Teil I-III: Geologisches Jahrbuch Beihefte 39, 189 p., 9 pls.
Rouse, G. E., 1977, Paleogene palynomorph ranges in western and northern Canada, in Elsik, W. C., ed., Contributions of stratigraphic palynology (with emphasis on North America): American Association of Stratigraphic Palynologists Contributions Series, no. 5A, p. 48-65, 2 pls.
Rouse, G. E., and Srivastava, S. K., 1970, Detailed morphology, taxonomy, and distribution of Pistillipollenites macgregorii: Canadian Journal of Botany, v. 48, p. 287-292.
Smith, G. M., 1950. The fresh-water algae of the United States, 2d ed.: New York, McGraw-Hill, 719 p.
Soister, P. E., and Tschudy, R. H., 1978, Eocene rocks in Denver basin: Rocky Mountain Association of Geologists Guidebook, 1978 Field Conference, p. 231-235.
Srivastava, S. K., 1969, Upper Cretaceous proteaceous pollen from the Edmonton Formation, Alberta (Canada) and their paleoecologic significance: Canadian Journal of Botany, v. 47, p. 1571-1578.
Thiergart, Friedrich, 1937, Die Pollenflora der Niederlausitzer Braunkohle, besonders im Profil der Grube Marga bei Senftenberg: J ahrbuch der Preussisches Geologisches Landesanstalt, v. 58, p. 232-351, pls. 22-30.
Tschudy, R. H., 1961, Palynomorphs as indicators of facies environments in Upper Cretaceous and lower Tertiary strata, Colorado and Wyoming: Wyoming Geological Association Guidebook, 16th Annual Field Conference 1961, p. 53-59.
--1976, Pollen changes near the Fort Union-Wasatch boundary, Powder River basin: Wyoming Geological Association Guidebook, 28th Annual Field Conference, 1976, p. 7:>-81.
Wilson, L. R., and Webster, R. M., 1946, Plant microfossils from a Fort Union coal of Montana: American Journal of Botany, v. 33, p. 271-278.
Wodehouse, R. P., 1933, Tertiary pollen, II. The oil shales of the Green River Formation: Torrey Botanical Club Bulletin, v. 60, p. 479-524.

PLATES 3-5
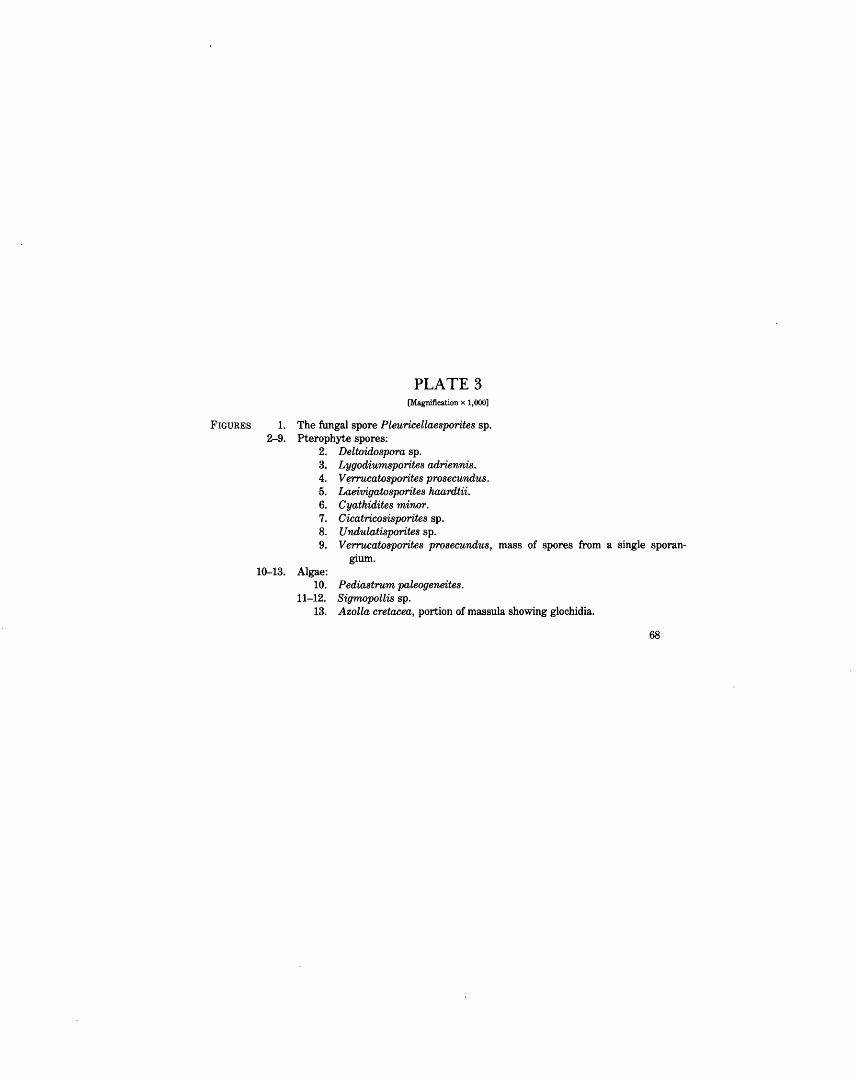
PLATE 3 [Magnification x 1,000]
FIGURES 1. The fungal spore Pleuricellaesporites sp. 2-9. Pterophyte spores:
2. Deltoidospora sp. 3. Lygodiumsporites adriennis. 4. Vf!rrucatosporites prosecundus. 5. Laeivigatosporites kaardtii. 6. Cyathidites minor. 7. Cicatricosisporites sp. 8. Undulatisporites sp. 9. Verrucatosporites prosecundus, mass of spores from a single sporan
gium. 1~13. Algae:
10. Pediastrum paleogeneites. 11-12. Sigmopollis sp.
13. Azolla cretacea, portion of massula showing glochidia.
68
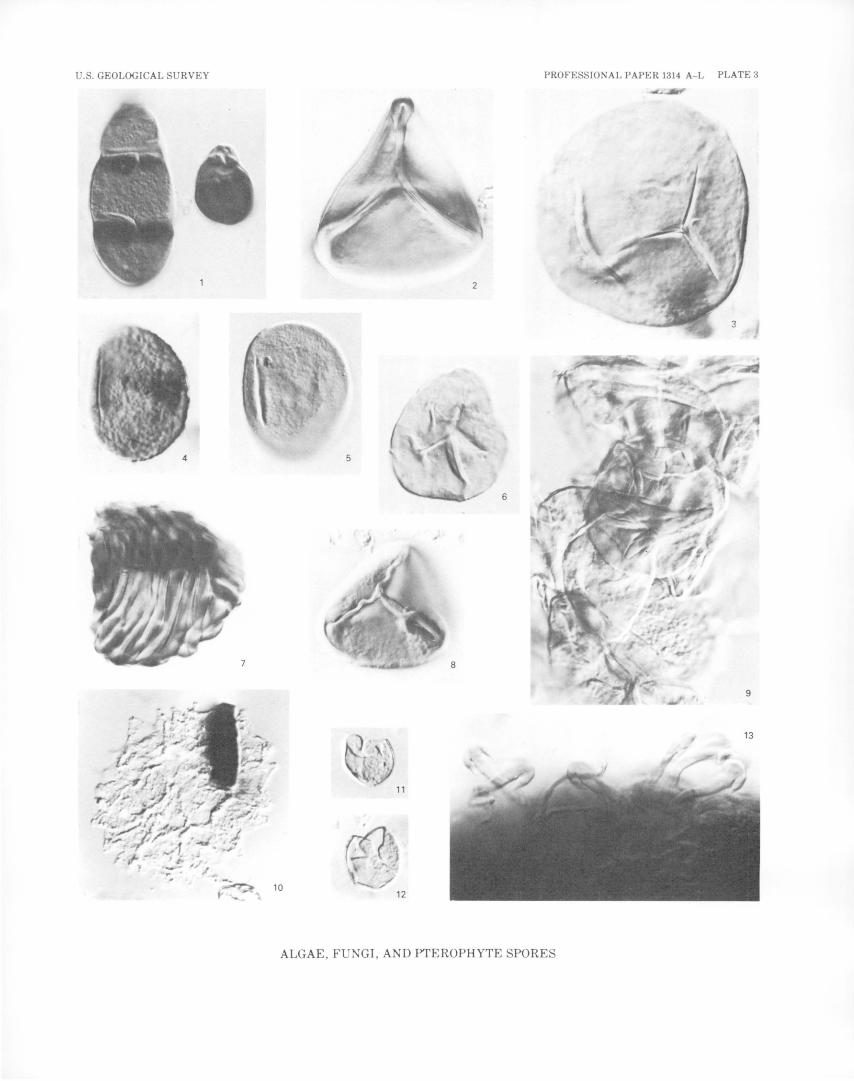
U.S. GEOLOGICAL SURVEY PROFESSIONAL PAPER 1314 A- L PLATE 3
2
5
6
8
13
11
•• 10 /
12
ALGAE, FUNGI, AND PTEROPHYTE SPORES
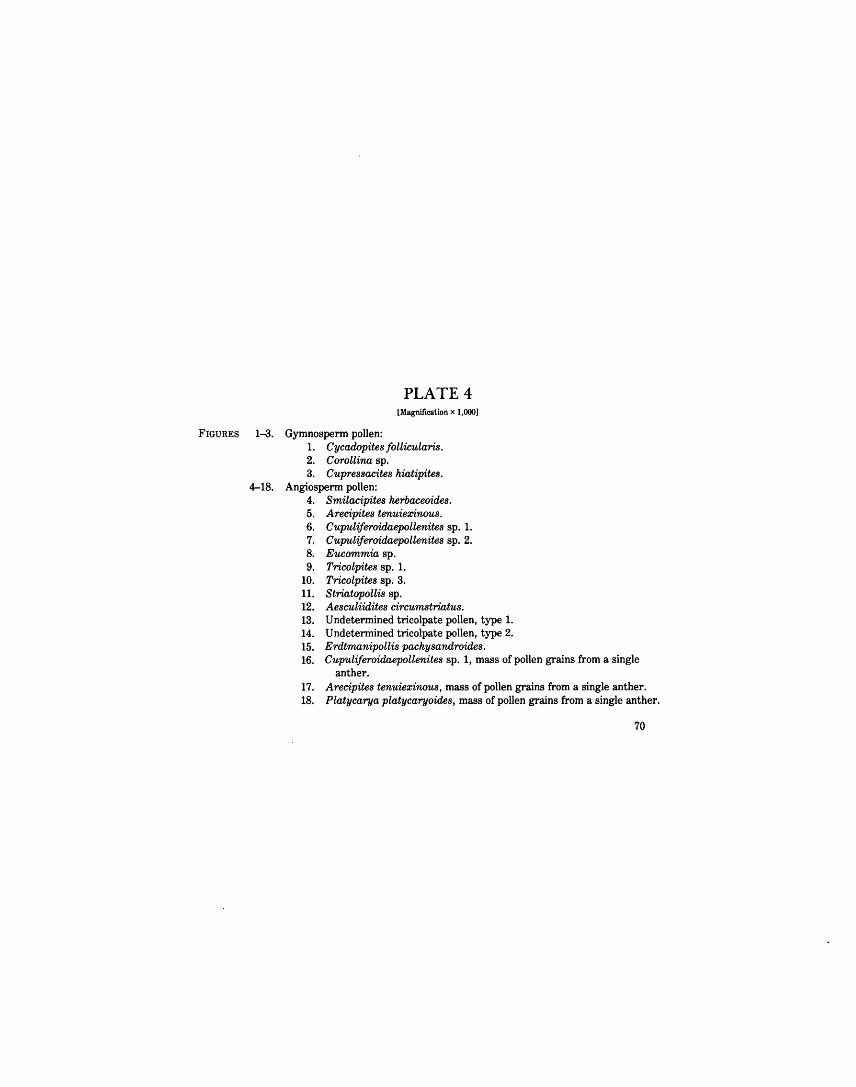
PLATE 4 [Magnification x 1,000]
FIGURES 1--3. Gymnosperm pollen: 1. Cycadopites follicularis. 2. Corollina sp. 3. Cupressacites hiatipites.
4-18. Angiosperm pollen: 4. Smilacipites herbaceoides. 5. Arecipites tenuiexinous. 6. Cupuliferoidaepollenites sp. 1. 7. Cupuliferoidaepollenites sp. 2. 8. Eucommia sp. 9. Tricolpites sp. 1.
10. Tricolpites sp. 3. 11. Striatopollis sp. 12. Aesculiidites circumstriatus. 13. Undetermined tricolpate pollen, type 1. 14. Undetermined tricolpate pollen, type 2. 15. Erdtmanipollis pachysandroides. 16. Cupuliferoidaepollenites sp. 1, mass of pollen grains from a single
anther. 17. Arecipites tenuiexinous, mass of pollen grains from a single anther. 18. Platycarya platycaryoides, mass of pollen grains from a single anther.
70
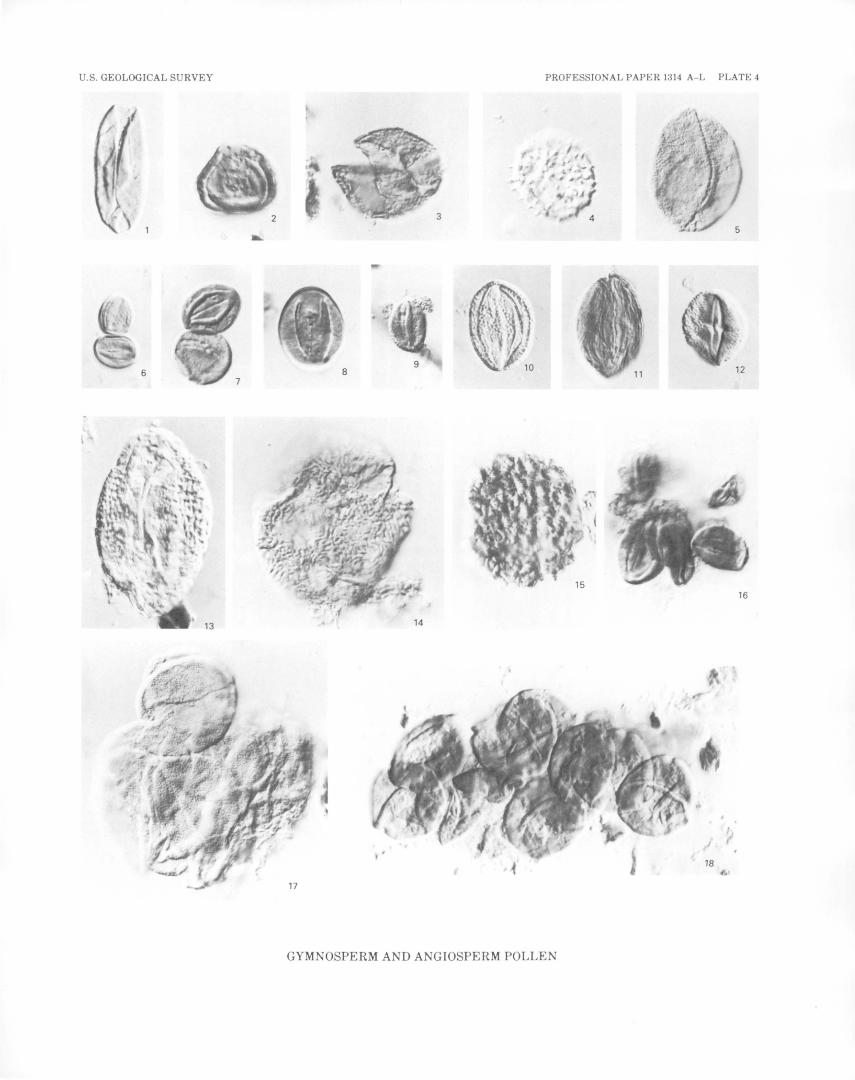
U.S. GEOLOGICAL SURVEY PROFESSIONAL PAPER 1314 A-L PLATE 4
9 6 8
16
GYMNOSPERM AND ANGIOSPERM POLLEN

PLATE 5 [Magnification x 1,000]
FIGURES 1-11. Colpate and colporate angiosperm pollen: 1. Ranunculacidites sp. 2. Bombacacidites sp. 1. 3. Bombacacidites? sp. 2. 4. Tilia vescipites. 5. Tilia tetraformainipites. 6. Intratriporopollenites sp. 7. Boehlensipollis sp. 8. Rhoipites sp. 1. 9. Rhoipites sp. 2.
10. Ailanthipites berryi. 11. Cupuliferoipollenites sp.
12-26. Porate angiosperm pollen: 12. Sparganiaceaepollenites sp. cf. S. polygonalis. 13. Proteacidites sp. cf. P. retusus. 14. Proteacidites sp. 15. Pistillipollenites mcgregorii. 16. Carpinus ancipites. 17. Momipites coryloides. 18. Momipites triradiatus. 19. Momipites sp. 20. Plicatopollis? sp. 21. Platycarya platycaryoides. 22. Caryapollenites veripites. 23. Caryapollenites inelegans. 24. Pandaniidites radicus. 25. Ulmipollenites undulosus. 26. Alnus speciipites.
72

U.S. GEOLOGICAL SURVEY PROFESSIONAL PAPER 1314 A-L PLATE 5
7 10
11 13
16
21 24
TRICOLPATE, TRICOLPORATE, AND TRIPORATE POLLEN

1
1
1
1
1
1
1
1
1
1
1
1
1
1
1
1
1
1
1
1
1
1
1
1
1
1
1
1
1
1
1
1
1
1
1
1
1
1
1
1
1
1
1
1
1
1
1
1
1
1
1
1
1
1
1
1
1
1
1
1
1
1
1
1
1
1
1
1
1
1
Paleoecology of the Niland Tongue By ELEANORA IBERALL ROBBINS
GEOLOGICAL INVESTIGATIONS OF THE VERMILLION CREEK COAL BED IN THE EOCENE NILAND TONGUE OF THE WASATCH FORMATION, SWEETWATER COUNTY, WYOMING
U.S. GEOLOGICAL SURVEY PROFESSIONAL PAPER 1314-E
CONTENTS
Abstract .......... . Purpose and scope of paper Acknowledgments . . . Methodology . . . . . . . . .
Sampling methods Slide preparation techniques . Identification procedures Preservation of tissues
Previous investigations . . . Data ............ .
Rocks in the watershed of the Niland Tongue Fossils of the Niland Tongue
Microorganisms Invertebrates . . Vertebrates . . . Vascular plants .
Minerals of the Niland Tongue Organic matter content of Niland Tongue samples Color and degradation of organic tissues .
Amorphous organic matter Coaly particles . . . . . . . . . . . . .
Page
77 Data-Continued 77 Color and degradation of orgnic tissues-Continued 77 Pollen and spores . . . . . . 78 Other vascular plant tissues . . . . . . . . . 78 Interpretations . . . . . . . . . . . . . . . . . . . . . . 78 Ecosystem concepts as applied to the fossil record . 78 The scope of an ecosystem 78 Nutrient input ..... . 78 Energy transfer . . . . . . 78 The concept of wetlands . 78 Paleoecology of the Niland Tongue 80 Upland communities ... 80 Wetland communities . . . . 80 Paludal environments . . 82 Lacustrine environments 82 Depositional factors . . . . . . . . 84 Water chemistry . . . . . . . 85 Preservation of the organic tissues 86 Postdepositional burial and thermal alteration 86 Conclusions . . . 86 References cited . . . . . . . . . . . . . . . . . . .
ILLUSTRATIONS
PLATES 7-9. Photomicrographs of tissues and minerals from the Vermillion Creek cores: 7. Remains of algae, fungi, and bacteria. 8. Remains of zooplankton and insects. . . . . . . . . . . . . . . . . 9. Remains of vascular plants. . . . . . . . . . . . . . . . . . . . . .
FIGURE 43. Columnar sections showing lithology and macrofossils in cores from the Vermillion Creek basin .
TABLES
TABLE 3. Lithology, mineralogy, and organic matter content of samples from the Vermillion Creek cores 4. Microorganisms of the Vermillion Creek basin . . . . . . . . . . . . . . . . . . . 5. Remains of aquatic and terrestrial organisms from the Vermillion Creek cores . . . . . . . . . . 6. Invertebrates and vertebrates collected from the Vermillion Creek basin . . . . . . . . 7. Presumed activity period, size, and trophic level of vertebrates from the Vermillion Creek basin
76
Page
86 86 86 86 86 86 87 87 87 87 88 88 90 92 92 92 92 93 93
Page
98 100 102 79
Page
81 82 83 84 89

GEOLOGICAL INVESTIGATIONS OF THE VERMILLION CREEK COAL BED IN THE EOCENE NILAND TONGUE OF THE
WASATCH FORMATION, SWEETWATER COUNTY, WYOMING
PALEOECOLOGY OF THE NILAND TONGUE
By ELEANORA IBERALL ROBBINS
ABSTRACT
The association of microorganisms, plants, and animals in rocks representing different environments can be used to reconstruct communities of interacting organisms that lived during the deposition of the Niland Tongue of the Wasatch Formation in the Vermillion Creek basin. Terrestrial animal communities can be reconstructed by examining fossil teeth of arboreal and terrestrial animals such as rodents, insectivores, creodonts, condylarths, tapirs, horses, artiodactyla, carnivores, and primates. Pollen and spores indicate the presence of forest or shrub communities of plants that occupied floodplains, talus slopes, and mountainous terrains surrounding the basin.
The swamp or paludal ecosystem is preserved in coals and carbonaceous shales. Remains of organisms of the swamp communities consist of bacteria and fungi; algae; invertebrates such as pelecypods, gastropods, ostracodes, and insects; vertebrates such as a hardshelled turtle and crocodiles; and vascular plant remains.
Aquatic communities are found in dark shale and are represented by the remains of bacteria and fungi; algae; invertebrates such as pelecypods, gastropods, and insects; and vertebrates such as crocodiles, fish, and a soft-shelled turtle. No vascular macrophytes (rooted aquatic vegetation) could be identified in the pollen and spore assemblage. Charophytes are abundant and show that colonies of the aquatic alga lived on the lake bottoms.
The great variety of organisms suggests that the environment had a high input of nutrients. The phosphate-rich Phosphoria Formation, which could serve as a good source of nutrients, cropped out in the watershed of the Niland Tongue basin. The ostracode-crocodile association, calcareous charophytes, and good preservation of plant tissues and palynomorphs put limits on the alkaline geochemical environment in which the lacustrine rocks were deposited.
The palynomorphs in the Niland Tongue rocks are dark yellow and light brown in color. These colors suggest that rocks containing them have been buried deeper in the past than they are today.
PURPOSE AND SCOPE OF PAPER
This paper documents the occurrence of microorganisms, plants, and animals that lived in different environments within the drainage basin of the Niland Tongue of the Wasatch Formation. Their occurrence is significant because the organisms, their excretions, and their degradation products contributed to many of the sedimentary economic deposits in the basin.
Because the biologic communities and most of their
component genera are now extinct, their interrelationships must be inferred. However, interpretational errors are easy to make in paleoecology, because many organisms live on substrates composed of transported material. Autochthonous, transported, and reworked organisms can all be deposited in the same sediment. The study of similar modern environments and living organisms presents a powerful and informative analog, and so forms the basis for interpretations presented here. Transported sediments and biota are part of the nutrient budget of living organisms. Furthermore, a death assemblage of one group of organisms can serve as food or substrate for another group of organisms. So data concerning the presence and preservation of hard parts and tissues, coupled with understandings of energy transfer in modern ecosystems can be used to interpret tectonic, hydrologic, sedimentological, geochemical, and biological processes that may have interacted to maintain the communities that lived and were deposited in south-central Wyoming during early Eocene time.
ACKNOWLEDGMENTS
Many of the insights in this paper and all of the inspiration come from the brilliant teacher H. W. Roehler. R. J. Cuffey (Pennsylvania State University) clarified muddy thinking, J. H. Hanley (U.S. Geological Survey) added useful comments on the taxonomy of mollusks, and J. F. Eisenberg (U.S. National Museum) provided invaluable data on the mammals in the collection. I also thank C. J. Hillson (Pennsylvania State University), Eric Fisher (California State University at Fullerton), and R. G. Robbins (U.S. National Museum), who aided with the identification of unknown plant and animal parts. Several of the photographs were specially processed by Deborah Dwornik to bring out important details.
77
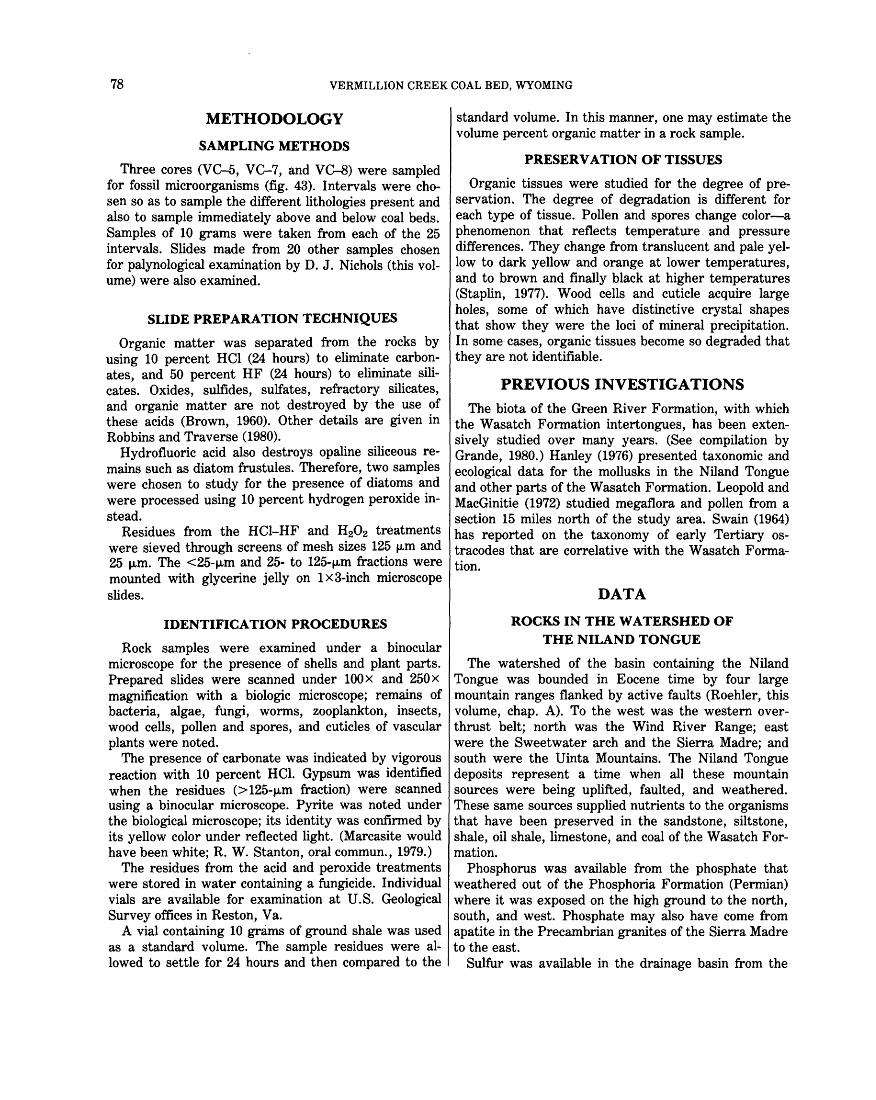
78 VERMILLION CREEK COAL BED, WYOMING
METHODOLOGY
SAMPLING METHODS
Three cores (VC-5, VC-7, and VC-8) were sampled for fossil microorganisms (fig. 43). Intervals were chosen so as to sample the different lithologies present and also to sample immediately above and below coal beds. Samples of 10 grams were taken from each of the 25 intervals. Slides made from 20 other samples chosen for palynological examination by D. J. Nichols (this volume) were also examined.
SLIDE PREPARATION TECHNIQUES
Organic matter was separated from the rocks by using 10 percent HCl (24 hours) to eliminate carbonates, and 50 percent HF (24 hours) to eliminate silicates. Oxides, sulfides, sulfates, refractory silicates, and organic matter are not destroyed by the use of these acids (Brown, 1960). Other details are given in Robbins and Traverse (1980).
Hydrofluoric acid also destroys opaline siliceous remains such as diatom frustules. Therefore, two samples were chosen to study for the presence of diatoms and were processed using 10 percent hydrogen peroxide instead.
Residues from the HCl-HF and H202 treatments were sieved through screens of mesh sizes 125 ~m and 25 ~m. The <25-~m and 25- to 125-~m fractions were mounted with glycerine jelly on 1 x 3-inch microscope slides.
IDENTIFICATION PROCEDURES
Rock samples were examined under a binocular microscope for the presence of shells and plant parts. Prepared slides were scanned under 100x and 250x magnification with a biologic microscope; remains of bacteria, algae, fungi, worms, zooplankton, insects, wood cells, pollen and spores, and cuticles of vascular plants were noted.
The presence of carbonate was indicated by vigorous reaction with 10 percent HCI. Gypsum was identified when the residues (> 125-~m fraction) were scanned using a binocular microscope. Pyrite was noted under the biological microscope; its identity was confirmed by its yellow color under reflected light. (Marcasite would have been white; R. W. Stanton, oral commun., 1979.)
The residues from the acid and peroxide treatments were stored in water containing a fungicide. Individual vials are available for examination at U.S. Geological Survey offices in Reston, V a.
A vial containing 10 grams of ground shale was used as a standard volume. The sample residues were allowed to settle for 24 hours and then compared to the
standard volume. In this manner, one may estimate the volume percent organic matter in a rock sample.
PRESERVATION OF TISSUES
Organic tissues were studied for the degree of preservation. The degree of degradation is different for each type of tissue. Pollen and spores change color-a phenomenon that reflects temperature and pressure differences. They change from translucent and pale yellow to dark yellow and orange at lower temperatures, and to brown and finally black at higher temperatures (Staplin, 1977). Wood cells and cuticle acquire large holes, some of which have distinctive crystal shapes that show they were the loci of mineral precipitation. In some cases, organic tissues become so degraded that they are not identifiable.
PREVIOUS INVESTIGATIONS
The biota of the Green River Formation, with which the Wasatch Formation intertongues, has been extensively studied over many years. (See compilation by Grande, 1980.) Hanley (1976) presented taxonomic and ecological data for the mollusks in the Niland Tongue and other parts of the Wasatch Formation. Leopold and MacGinitie (1972) studied megaflora and pollen from a section 15 miles north of the study area. Swain (1964) has reported on the taxonomy of early Tertiary ostracodes that are correlative with the Wasatch Formation.
DATA
ROCKS IN THE WATERSHED OF THE NILAND TONGUE
The watershed of the basin containing the Niland Tongue was bounded in Eocene time by four large mountain ranges flanked by active faults (Roehler, this volume, chap. A). To the west was the western overthrust belt; north was the Wind River Range; east were the Sweetwater arch and the Sierra Madre; and south were the Uinta Mountains. The Niland Tongue deposits represent a time when all these mountain sources were being uplifted, faulted, and weathered. These same sources supplied nutrients to the organisms that have been preserved in the sandstone, siltstone, shale, oil shale, limestone, and coal of the Wasatch Formation.
Phosphorus was available from the phosphate that weathered out of the Phosphoria Formation (Permian) where it was exposed on the high ground to the north, south, and west. Phosphate may also have come from apatite in the Precambrian granites of the Sierra Madre to the east.
Sulfur was available in the drainage basin from the
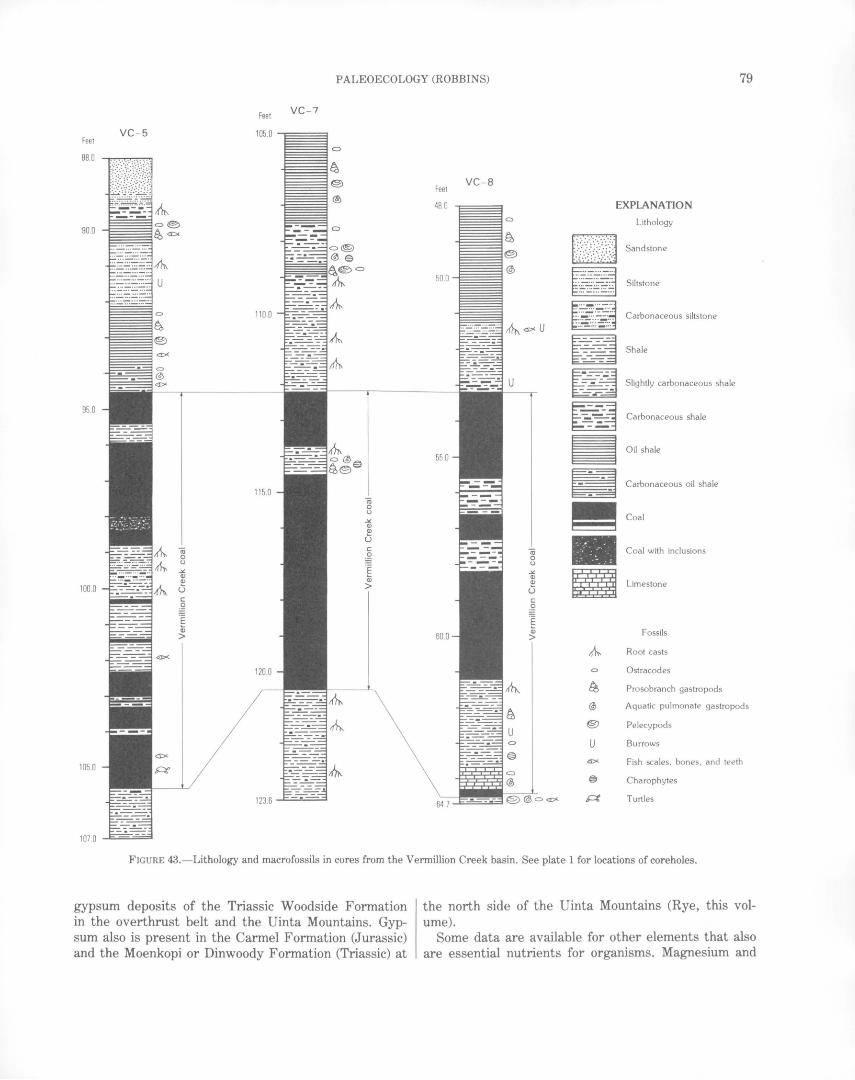
PALEOECOLOGY (ROBBINS) 79
VC - 5 Feet
88.0
~ 90.0
=® ~<De
u
C>
~ @)
ax
95.0
100.0
105.0
107.0
Feet VC-7
105.0
-ro 0 u
.:.(. Q) Q) u c
~ .E 03 >
55.0
60.0
64 7 O<i£7'..
EXPLANATION
• ~ . . .
~ ~ ~ ~ ~ ~
II • !!I
Lithology
Sandstone
Siltstone
Carbonaceous siltstone
Shale
Slightly carbonaceous shale
Carbonaceous shale
Oil shale
Carbonaceous oil shale
Coal
Coal with inclusions
• Limestone
Fossils
A Root casts
Ostracodes
~ Prosobranch gastropods
@ Aquatic pulmonate gastropods
@) Pelecypods
u Burrows
~ Fish scales, bones, and teeth
® Charophytes
~ Turtles
FIGURE 43.-Lithology and macrofossils in cores from the Vermillion Creek basin. See plate 1 for locations of coreholes.
gypsum deposits of the Triassic Woodside Formation in the overthrust belt and the Uinta Mountains. Gypsum also is present in the Carmel Formation (Jurassic) and the Moenkopi or Dinwoody Formation (Triassic) at
the north side of the Uinta Mountains (Rye, this volume).
Some data are available for other elements that also are essential nutrients for organisms. Magnesium and
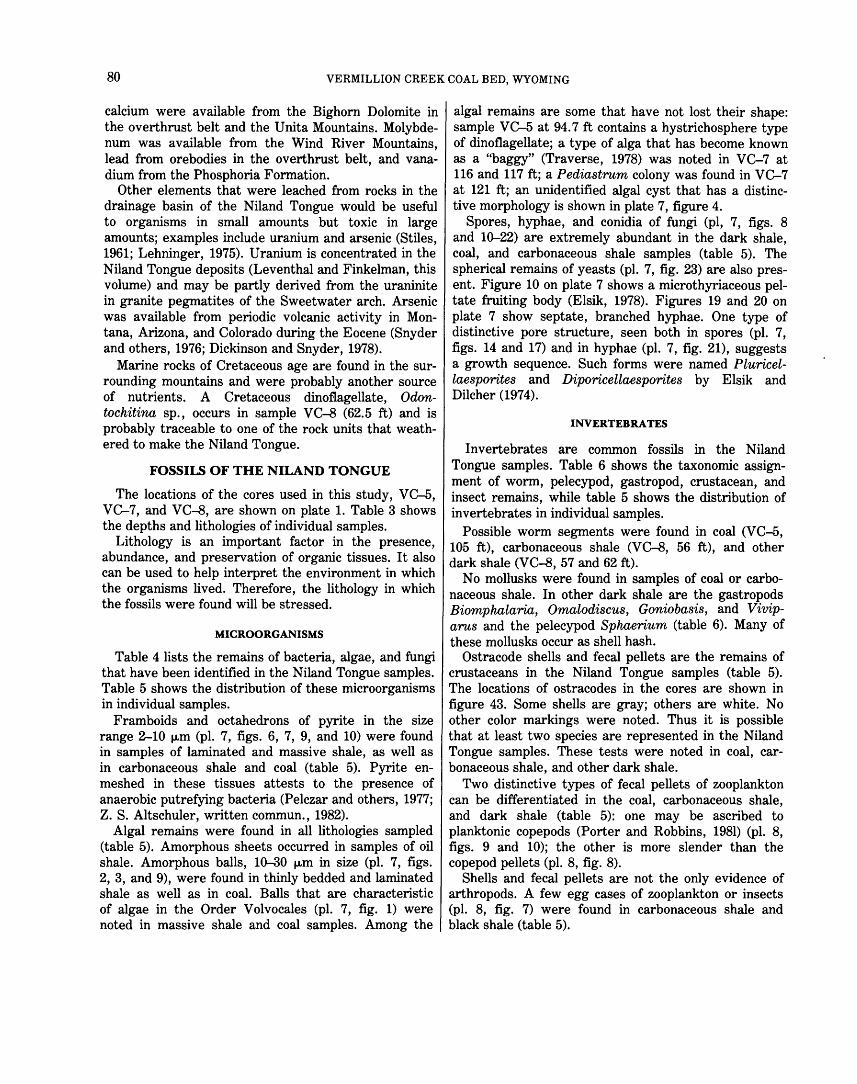
80 VERMILLION CREEK COAL BED, WYOMING
calcium were available from the Bighorn Dolomite in the overthrust belt and the U nita Mountains. Molybdenum was available from the Wind River Mountains, lead from orebodies in the overthrust belt, and vanadium from the Phosphoria Formation.
Other elements that were leached from rocks in the drainage basin of the Niland Tongue would be useful to organisms in small amounts but toxic in large amounts; examples include uranium and arsenic (Stiles, 1961; Lehninger, 1975). Uranium is concentrated in the Niland Tongue deposits (Leventhal and Finkelman, this volume) and may be partly derived from the uraninite in granite pegmatites of the Sweetwater arch. Arsenic was available from periodic volcanic activity in Montana, Arizona, and Colorado during the Eocene (Snyder and others, 1976; Dickinson and Snyder, 1978).
Marine rocks of Cretaceous age are found in the surrounding mountains and were probably another source of nutrients. A Cretaceous dinoflagellate, Odontochitina sp., occurs in sample VC-8 (62.5 ft) and is probably traceable to one of the rock units that weathered to make the Niland Tongue.
FOSSILS OF THE NILAND TONGUE
The locations of the cores used in this study, VC-5, VC-7, and VC--8, are shown on plate 1. Table 3 shows the depths and lithologies of individual samples.
Lithology is an important factor in the presence, abundance, and preservation of organic tissues. It also can be used to help interpret the environment in which the organisms lived. Therefore, the lithology in which the fossils were found will be stressed.
MICROORGANISMS
Table 4 lists the remains of bacteria, algae, and fungi that have been identified in the Niland Tongue samples. Table 5 shows the distribution of these microorganisms in individual samples.
Framboids and octahedrons of pyrite in the size range 2-10 J.Lm (pl. 7, figs. 6, 7, 9, and 10) were found in samples of laminated and massive shale, as well as in carbonaceous shale and coal (table 5). Pyrite enmeshed in these tissues attests to the presence of anaerobic putrefying bacteria (Pelczar and others, 1977; Z. S. Altschuler, written commun., 1982).
Algal remains were found in all lithologies sampled (table 5). Amorphous sheets occurred in samples of oil shale. Amorphous balls, 10-30 J.Lm in size (pl. 7, figs. 2, 3, and 9), were found in thinly bedded and laminated shale as well as in coal. Balls that are characteristic of algae in the Order Volvocales (pl. 7, fig. 1) were noted in massive shale and coal samples. Among the
algal remains are some that have not lost their shape: sample VC-5 at 94.7 ft contains a hystrichosphere type of dinoflagellate; a type of alga that has become known as a "baggy" (Traverse, 1978) was noted in VC-7 at 116 and 117ft; a Pediastrum colony was found in VC-7 at 121 ft; an unidentified algal cyst that has a distinctive morphology is shown in plate 7, figure 4.
Spores, hyphae, and conidia of fungi (pi, 7, figs. 8 and 10--22) are extremely abundant in the dark shale, coal, and carbonaceous shale samples (table 5). The spherical remains of yeasts (pl. 7, fig. 23) are also present. Figure 10 on plate 7 shows a microthyriaceous peltate fruiting body (Elsik, 1978). Figures 19 and 20 on plate 7 show septate, branched hyphae. One type of distinctive pore structure, seen both in spores (pl. 7, figs. 14 and 17) and in hyphae (pl. 7, fig. 21), suggests a growth sequence. Such forms were named P luricellaesporites and Diporicellaesporites by Elsik and Dilcher (1974).
INVERTEBRATES
Invertebrates are common fossils in the Niland Tongue samples. Table 6 shows the taxonomic assignment of worm, pelecypod, gastropod, crustacean, and insect remains, while table 5 shows the distribution of invertebrates in individual samples.
Possible worm segments were found in coal (VC-5, 105 ft), carbonaceous shale (VC--8, 56 ft), and other dark shale (VC-8, 57 and 62 ft).
No mollusks were found in samples of coal or carbonaceous shale. In other dark shale are the gastropods Biomphalaria, Omalodiscus, Goniobasis, and Viviparus and the pelecypod Sphaerium (table 6). Many of these mollusks occur as shell hash.
Ostracode shells and fecal pellets are the remains of crustaceans in the Niland Tongue samples (table 5). The locations of ostracodes in the cores are shown in figure 43. Some shells are gray; others are white. No other color markings were noted. Thus it is possible that at least two species are represented in the Niland Tongue samples. These tests were noted in coal, carbonaceous shale, and other dark shale.
Two distinctive types of fecal pellets of zooplankton can be differentiated in the coal, carbonaceous shale, and dark shale (table 5): one may be ascribed to planktonic copepods (Porter and Robbins, 1981) (pl. 8, figs. 9 and 10); the other is more slender than the copepod pellets (pl. 8, fig. 8).
Shells and fecal pellets are not the only evidence of arthropods. A few egg cases of zooplankton or insects (pl. 8, fig. 7) were found in carbonaceous shale and black shale (table 5).
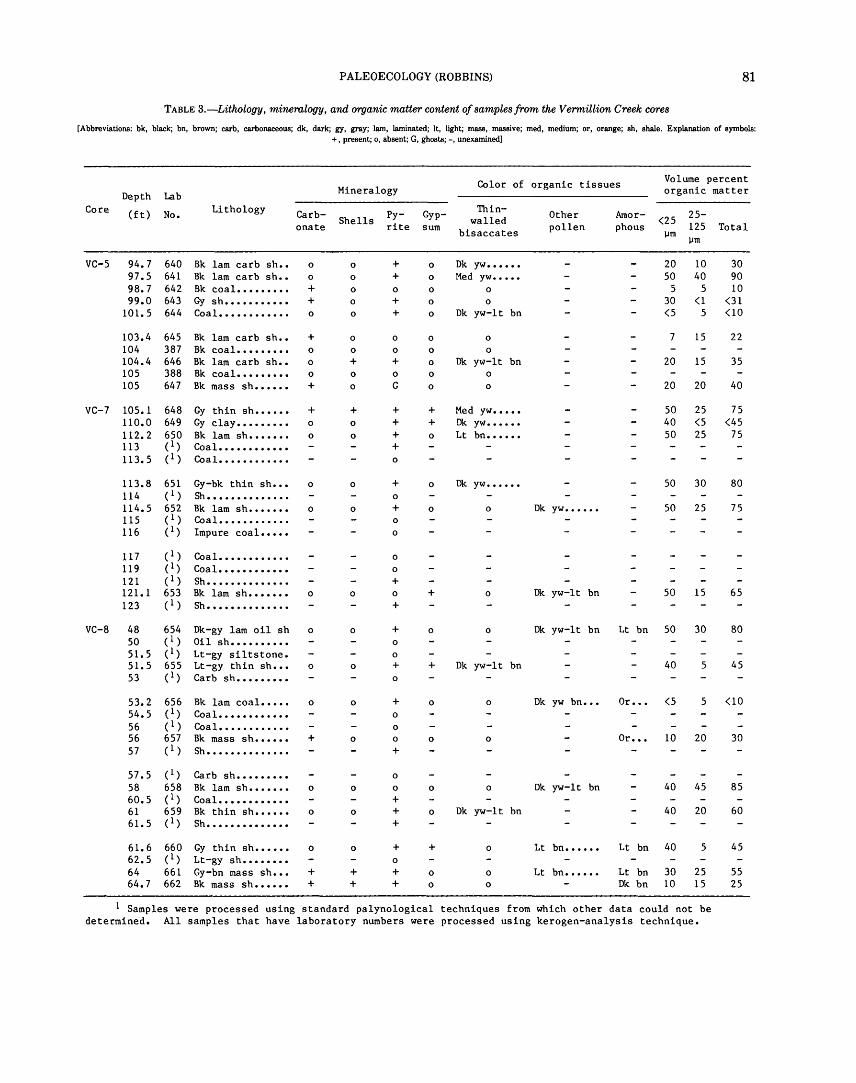
PALEOECOLOGY (ROBBINS) 81
TABLE 3.-Lithology, mineralogy, and organic matter content of samples from the Vermillion Creek cores
[Abbreviations: bk, black; bn, brown; carb, carbonaceous; dk, dark; gy, gray; lam, laminated; It, light; mass, massive; med, medium; or, orange; sh, shale. Explanation of symbols: +, present; o, absent; G, ghosts;-, unexamined]
Core
vc-s
VC-7
VC-8
Depth Lab
(ft)
94.7 97.5 98.7 99.0
101.5
103.4 104 104.4 105 105
105.1 110.0 112.2 113 113.5
113.8 114 114.5 115 116
117 119 121 121.1 123
48 so 51.5 51.5 53
53.2 54.5 56 56 57
57.5 58 60.5 61 61.5
61.6 62.5 64 64.7
No. Lithology
640 Bk lam carb sh •• 641 Bk lam carb sh •• 642 Bk coal ••••••••• 643 Gy sh ••••••••••• 644 Coal ••••••••••••
645 Bk lam carb sh •• 387 Bk coal ••••••••• 646 Bk lam carb sh •• 388 Bk coal ••••••••• 647 Bk mass sh ••••••
648 Gy thin sh •••••• 649 Gy clay ••••••••• 650 Bk lam sh ••••••• ( 1 ) Coal •••••••••••• ( 1) Coal ••••••••••••
651 Gy-bk thin sh ••• (l) Sh •••••••••••••• 652 Bk lam sh ••••••• ( 1 ) Coal •••••••••••• ( 1) Impure coal •••••
( 1 ) Coal •••••••••••• ( 1 ) Coal •••••••••••• ( 1 ) Sh •••••••••••••• 653 Bk lam sh ••••••• ( 1 ) Sh ••••••••••••••
654 Dk-gy lam oil sh ( 1 ) Oil sh •••••••••• (l) Lt-gy siltstone. 655 Lt-gy thin sh ••• ( 1 ) Carb sh •••••••••
656 Bk lam coal ••••• ( 1) Coal •••••••••••• ( 1 ) Coal •••••••••••• 657 Bk mass sh •••••• ( 1 ) Sh ••••••••••••••
( 1 ) Carb sh ••••••••• 658 Bk lam sh ••••••• ( 1 ) Coal •••••••••••• 659 Bk thln sh •••••• ( 1) Sh ••••••••••••••
660 Gy thin sh •••••• ( 1 ) Lt-gy sh •••••••• 661 Gy-bn mass sh ••• 662 Bk mass sh ••••••
Carbonate
0
0
+ + 0
+ 0
0
0
+
+ 0
0
0
0
0
0
0
0
+
0
0
0
+ +
Mineralogy
Shells
0
0
0
0
0
0
0
+ 0
0
+ 0
0
0
0
0
0
0
0
0
0
0
0
+ +
Pyrite
+ + 0
+ +
0
0
+ 0
G
+ + + + 0
+ 0
+ 0
0
0
0
+ 0
+
+ 0
0
+ 0
+ 0
0
0
+
0
0
+ + +
+ 0
+ +
Gypsum
0
0
0
0
0
0
0
0
0
0
+ + 0
0
0
+
0
+
0
0
0
0
+
0
0
Color of organic tissues
Thinwalled
bisaccates
Dk yw •••••• Med yw •••••
0
0
Dk yw-lt bn
0
0
Dk yw-lt bn 0
0
Med yw ••••• Dk yw •••••• Lt bn ••••••
Dk yw ••••••
0
0
0
Dk yw-lt bn
0
0
Other pollen
Dk yw ••••••
Dk yw-lt bn
Dk yw-lt bn
Dk yw bn •••
o Dk yw-lt bn
Dk yw-lt bn
0
0
0
Lt bn ••••••
Lt bn ••••••
Amorphous
Lt bn
Or •••
Or •••
Lt bn
Lt bn Dk bn
Volume percent organic matter
<25 ~m
20 so
5 30 <S
7
20
20
so 40 so
so
so
so
so
40
<S
10
40
40
40
30 10
25-125 Total ~m
10 40
5 <1
5
15
15
20
25 <S 25
30
25
15
30
5
5
20
45
20
5
25 15
30 90 10
<31 <10
22
35
40
75 <45
75
80
75
65
80
45
<10
30
85
60
45
55 25
Samples were processed using standard palynological techniques from which other data could not be determined. All samples that have laboratory numbers were processed using kerogen-analysis technique.
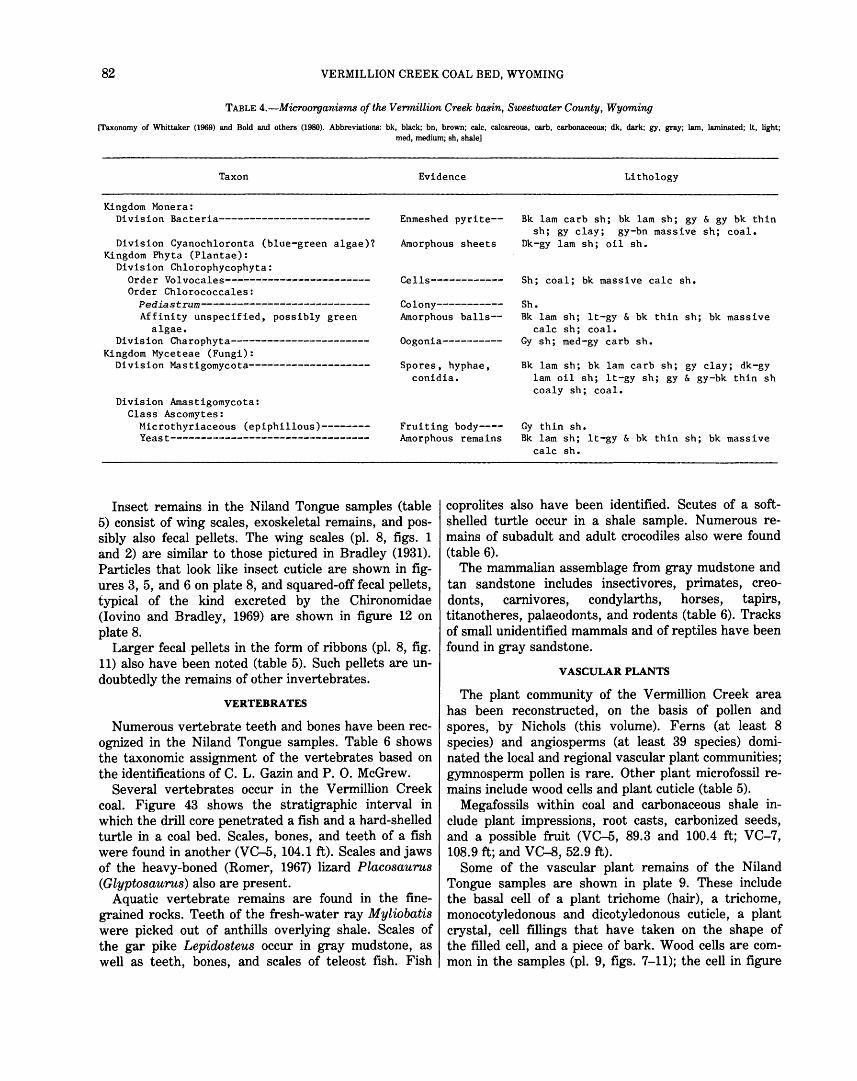
82 VERMILLION CREEK COAL BED, WYOMING
TABLE 4.-Microorganisms of the Vermillion Creek basin, Sweetwater County, Wyoming
[Taxonomy of Whittaker (1969) and Bold and others (1980). Abbreviations: bk, black; bn, brown; calc, calcareous, carb, carbonaceous; dk, dark; gy, gray; lam, laminated; It, light; med, medium; sh, shale]
Taxon Evidence Litho logy
Kingdom Monera: Division Bacteria------------------------- Enmeshed pyrite-- Bk lam carb sh; bk lam sh; gy & gy bk thin
sh; gy clay; gy-bn massive sh; coal. Division Cyanochloronta (blue-green algae)? Amorphous sheets Dk-gy lam sh; oil sh.
Kingdom Phyta (Plantae): Division Chlorophycophyta:
Order Volvocales-----------------------Order Chlorococcales:
Cells------------ Sh; coal; bk massive calc sh.
Pediastrum---------------------------- Colony----------- Sh. Affinity unspecified, possibly green
algae. Amorphous balls-- Bk lam sh; lt-gy & bk thin sh; bk massive
calc sh; coal. Division Charophyta----------------------
Kingdom Myceteae (Fungi): Oogonia---------- Gy sh; med-gy carb sh.
Division Mastigomycota-------------------- Spores, hyphae, Bk lam sh; bk lam carb sh; gy clay; dk-gy conidia. lam oil sh; lt-gy sh; gy & gy-bk thin sh
coaly sh; coal. Division Amastigomycota:
Class Ascomytes: Microthyriaceous (epiphillous)-------- Fruiting body---- Gy thin sh. Yeast--------------------------------- Amorphous remains Bk lam sh; lt-gy & bk thin sh; bk massive
calc sh.
Insect remains in the Niland Tongue samples (table 5) consist of wing scales, exoskeletal remains, and possibly also fecal pellets. The wing scales (pl. 8, figs. 1 and 2) are similar to those pictured in Bradley (1931). Particles that look like insect cuticle are shown in figures 3, 5, and 6 on plate 8, and squared-off fecal pellets, typical of the kind excreted by the Chironomidae (Iovino and Bradley, 1969) are shown in figure 12 on plate 8.
Larger fecal pellets in the form of ribbons (pl. 8, fig. 11) also have been noted (table 5). Such pellets are undoubtedly the remains of other invertebrates.
VERTEBRATES
Numerous vertebrate teeth and bones have been recognized in the Niland Tongue samples. Table 6 shows the taxonomic assignment of the vertebrates based on the identifications of C. L. Gazin and P. 0. McGrew.
Several vertebrates occur in the Vermillion Creek coal. Figure 43 shows the stratigraphic interval in which the drill core penetrated a fish and a hard-shelled turtle in a coal bed. Scales, bones, and teeth of a fish were found in another (VC-5, 104.1 ft). Scales and jaws of the heavy-boned (Romer, 1967) lizard Placosaurus (Glyptosaurus) also are present.
Aquatic vertebrate remains are found in the finegrained rocks. Teeth of the fresh-water ray Myliobatis were picked out of anthills overlying shale. Scales of the gar pike Lepidosteus occur in gray mudstone, as well as teeth, bones, and scales of teleost fish. Fish
coprolites also have been identified. Scutes of a softshelled turtle occur in a shale sample. Numerous remains of subadult and adult crocodiles also were found (table 6).
The mammalian assemblage from gray mudstone and tan sandstone includes insectivores, primates, creodonts, carnivores, condylarths, horses, tapirs, titanotheres, palaeodonts, and rodents (table 6). Tracks of small unidentified mammals and of reptiles have been found in gray sandstone.
VASCULAR PLANTS
The plant community of the Vermillion Creek area has been reconstructed, on the basis of pollen and spores, by Nichols (this volume). Ferns (at least 8 species) and angiosperms (at least 39 species) dominated the local and regional vascular plant communities; gymnosperm pollen is rare. Other plant microfossil remains include wood cells and plant cuticle (table 5).
Megafossils within coal and carbonaceous shale include plant impressions, root casts, carbonized seeds, and a possible fruit (VC-5, 89.3 and 100.4 ft; VC-7, 108.9 ft; and VC-8, 52.9 ft).
Some of the vascular plant remains of the Niland Tongue samples are shown in plate 9. These include the basal cell of a plant trichome (hair), a trichome, monocotyledonous and dicotyledonous cuticle, a plant crystal, cell fillings that have taken on the shape of the filled cell, and a piece of bark. Wood cells are common in the samples (pl. 9, figs. 7-11); the cell in figure
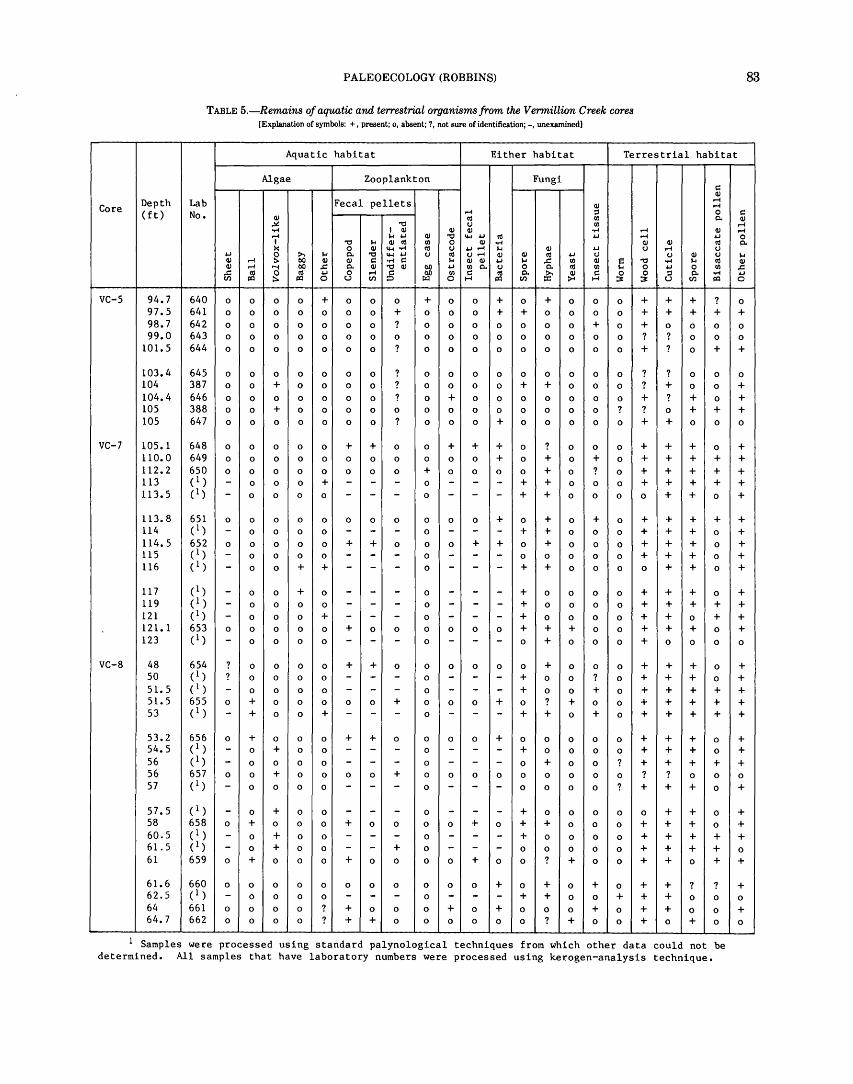
PALEOECOLOGY (ROBBINS)
TABLE 5.-Remains of aquatic and terrestrial organisms from the Vermillion Creek cores [Explanation of symbols: +, present; o, absent; ? , not sure of identification; -, unexamined]
83
Aquatic habitat Either habitat Terrestrial habitat
Algae Zooplankton Fungi c:: Q)
Depth Lab Fecal pellets .-4
Core Q) .-4
(ft) No. .-4 ::s 0 Q) <ll Ul Q.. ~ "C C) Ul ~ I Q) Q) Q) ..... .-4 Q) .-4 ~ ~ Q) "C ~ ~ <ll ~ .-4 ~ I "C ~ Q) <ll Ul 0 Q) ~ Q) Q) <ll >< 0 Q) ~~ <ll C) ~.-4 ~ Q) ~ C) .-4 C)
~ g :;.., ~ Q.. "C ~~ C) <ll C).-4 Q) Q) <ll ~ C) C) Q) C) Q) .-4 CIO Q) Q) c:: ..... c:: ~ Q) Q) ~ ~ ,t: Ul Q) a "C ..... ~ <ll Q) .-4 '"-l CIO ,t: Q.. Q) "C Q) CIO ~ Ul Q.. C) 0 Q.. <ll Ul ~ 0 ~ 0 Ul ,t: <ll g <ll ~ 0 .-4 :5 CIO Ul c:: <ll Q..
~ Q) c:: 0 0 ::s Q.. ~ en 1:0 1:0 0 u en r..::l 0 H 1:0 en ~ H ::3 ::3 u en 1:0
vc-s 94.7 640 0 0 0 0 + 0 0 0 + 0 0 + 0 + 0 0 0 + + + ? 97.5 641 0 0 0 0 0 0 0 + 0 0 0 + + 0 0 0 0 + + + + 98.7 642 0 0 0 0 0 0 0 ? 0 0 0 0 0 0 0 + 0 + 0 0 0
99.0 643 0 0 0 0 0 0 0 0 0 0 0 0 0 0 0 0 0 ? ? 0 0
101.5 644 0 0 0 0 0 0 0 ? 0 0 0 0 0 0 0 0 0 + ? 0 +
103.4 645 0 0 0 0 0 0 0 ? 0 0 0 0 0 0 0 0 0 ? ? 0 0
104 387 0 0 + 0 0 0 0 ? 0 0 0 0 + + 0 0 0 ? + 0 0
104.4 646 0 0 0 0 0 0 0 ? 0 + 0 0 0 0 0 0 0 + ? + 0
lOS 388 0 0 + 0 0 0 0 0 0 0 0 0 0 0 0 0 ? ? 0 + + lOS 647 0 0 0 0 0 0 0 ? 0 0 0 + 0 0 0 0 0 + + 0 0
VC-7 105.1 648 0 0 0 0 0 + + 0 0 + + + 0 ? 0 0 0 + + + 0
110.0 649 0 0 0 0 0 0 0 0 0 0 0 + 0 + 0 + 0 + + + + 112.2 650 0 0 0 0 0 0 0 0 + 0 0 0 0 + 0 ? 0 + + + + 113 ( 1 ) - 0 0 0 + - - - 0 - - - + + 0 0 0 + + + + 113.5 (1) - 0 0 0 0 - - - 0 - - - + + 0 0 0 0 + + 0
113.8 651 0 0 0 0 0 0 0 0 0 0 0 + 0 + 0 + 0 + + + + 114 (l) - 0 0 0 0 - - - 0 - - - + + 0 0 0 + + + 0
114.5 652 0 0 0 0 0 + + 0 0 0 + + 0 + 0 0 0 + + + 0
115 ( l) - 0 0 0 0 - - - 0 - - - 0 0 0 0 0 + + + 0
116 ( l ) - 0 0 + + - - - 0 - - - + + 0 0 0 0 + + 0
117 (l) - 0 0 + 0 - - - 0 - - - + 0 0 0 0 + + + 0
119 ( 1 ) - 0 0 0 0 - - - 0 - - - + 0 0 0 0 + + + + 121 (1) - 0 0 0 + - - - 0 - - - + 0 0 0 0 + + 0 + 121. 1 653 0 0 0 0 0 + 0 0 0 0 0 0 + + + 0 0 + + + 0
123 (l) - 0 0 0 0 - - - 0 - - - 0 + 0 0 0 + 0 0 0
VC-8 48 654 ? 0 0 0 0 + + 0 0 0 0 0 0 + 0 0 0 + + + 0 so ( l) ? 0 0 0 0 - - - 0 - - - + 0 0 ? 0 + + + 0
51.5 ( l ) - 0 0 0 0 - - - 0 - - - + 0 0 + 0 + + + + 51.5 655 0 + 0 0 0 0 0 + 0 0 0 + 0 ? + 0 0 + + + + 53 ( 1 ) - + 0 0 + - - - 0 - - - + + 0 + 0 + + + +
53.2 656 0 + 0 0 0 + + 0 0 0 0 + 0 0 0 0 0 + + + 0 54.5 ( l ) - 0 + 0 0 - - - 0 - - - + 0 0 0 0 + + + 0
56 (l) - 0 0 0 0 - - - 0 - - - 0 + 0 0 ? + + + + 56 657 0 0 + 0 0 0 0 + 0 0 0 0 0 0 0 0 0 ? ? 0 0
57 (l) - 0 0 0 0 - - - 0 - - - 0 0 0 0 ? + + + 0
57.5 ( l ) - 0 + 0 0 - - - 0 - - - + 0 0 0 0 0 + + 0 58 658 0 + 0 0 0 + 0 0 0 0 + 0 + + 0 0 0 + + + 0
60.5 ( 1 ) - 0 + 0 0 - - - 0 - - - + 0 0 0 0 + + + + 61.5 ( l) - 0 + 0 0 - - + 0 - - - 0 0 0 0 0 + + + + 61 659 0 + 0 0 0 + 0 0 0 0 + 0 0 ? + 0 0 + + 0 +
61.6 660 0 0 0 0 0 0 0 0 0 0 0 + 0 + 0 + 0 + + ? ? 62.5 ( l ) - 0 0 0 0 - - - 0 - - - + + 0 0 + + + 0 0
64 661 0 0 0 0 ? + 0 0 0 + 0 + 0 0 0 + 0 + + 0 0 64.7 662 0 0 0 0 ? + + 0 0 0 0 0 0 ? + 0 0 + 0 + 0
1 Samples were processed using standard palynological techniques from which other data could not be determined. All samples that have laboratory numbers were processed using kerogen-analysis technique.
c:: Q)
.-4
.-4 0 Q..
~ Q) ,t: ~ 0
0
+ 0
0
+
0
+ + + 0
+ + + + +
+ + + + +
+ + + + 0
+ + + + +
+ + + 0
+
+ + + 0
+
+ 0
+ 0
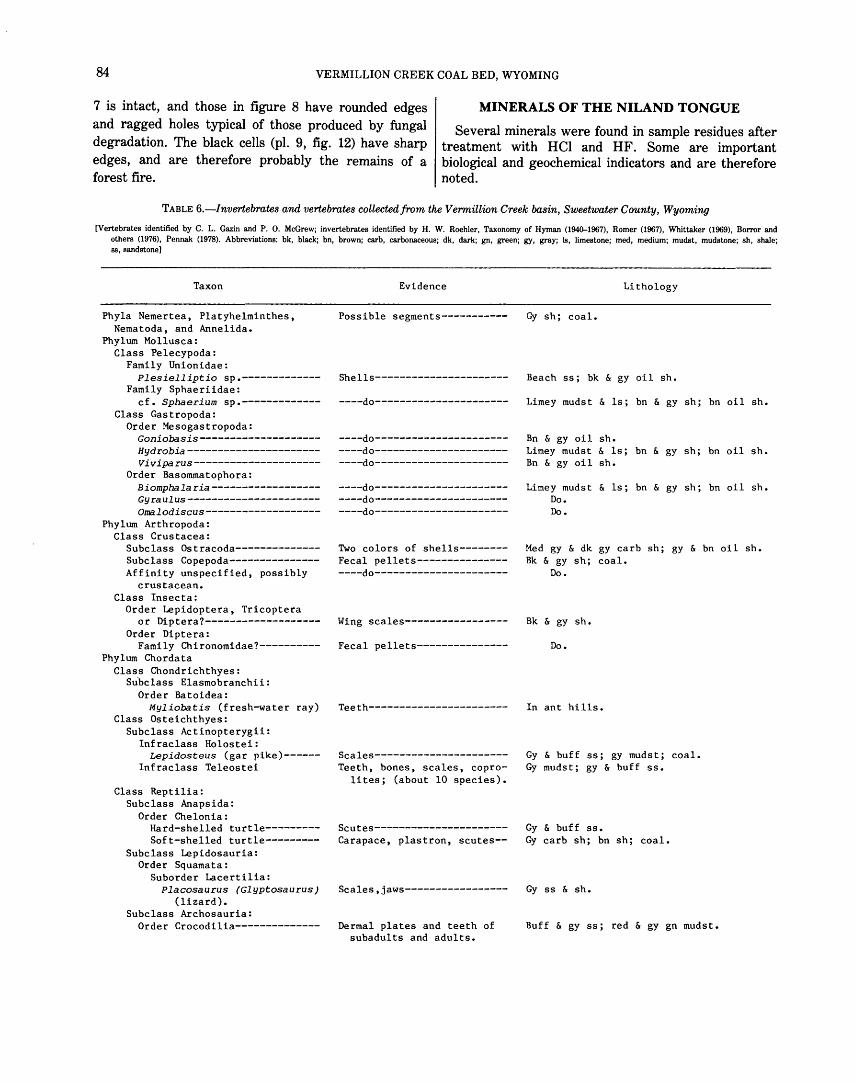
84 VERMILLION CREEK COAL BED, WYOMING
7 is intact, and those in figure 8 have rounded edges and ragged holes typical of those produced by fungal degradation. The black cells (pl. 9, fig. 12) have sharp edges, and are therefore probably the remains of a forest fire.
MINERALS OF THE NILAND TONGUE
Several minerals were found in sample residues after treatment with HCl and HF. Some are important biological and geochemical indicators and are therefore noted.
TABLE 6.-Invertebrates and vertebrates collected from the Vermillion Creek basin, Sweetwater County, Wyoming
[Vertebrates identified by C. L. Gazin and P. 0. McGrew; invertebrates identified by H. W. Roehler, Taxonomy of Hyman (1940-1967), Romer (1967), Whittaker (1969), Borror and others (1976), Pennak (1978). Abbreviations: bk, black; bn, brown; carb, carbonaceous; dk, dark; gn, green; gy, gray; ls, limestone; med, medium; mudst, mudstone; sh, shale; ss, sandstone]
Taxon
Phyla Nemertea, Platyhelminthes, Nematoda, and Annelida.
Phylum Mollusca: Class Pelecypoda:
Family Unionidae: Plesielliptio sp.------------
Family Sphaeriidae: cf. Sphaerium sp.------------
Class Gastropoda: Order Mesogastropoda:
Goniobasis-------------------Hydrobia----------------------Viviparus---------------------
Order Basommatophora: Biomphalaria-----------------Gyraulus---------------------Omalodiscus-------------------
Phylum Arthropoda: Class Crustacea:
Subclass Ostracoda-------------Subclass Copepoda--------------Affinity unspecified, possibly
crustacean. Class Insecta:
Order Lepidoptera, Tricoptera or Diptera?------------------
Order Diptera: Family Chironomidae?---------
Phylum Chordata Class Chondrichthyes:
Su.bclass Elasmobranchii: Order Batoidea:
Myliobatis (fresh-water ray) Class Osteichthyes:
Subclass Actinopterygii: Infraclass Holostei:
Lepidosteus (gar pike)-----Infraclass Teleostei
Class Reptilia: Subclass Anapsida:
Order Chelonia: Hard-shelled turtle--------Soft-shelled turtle--------
Subclass Lepidosauria: Order Squamata:
Suborder Lacertilia: Placosaurus (Glyptosaurus)
(lizard). Subclass Archosauria:
Order Crocodilia--------------
Evidence
Possible segments-----------
Shells----------------------
----do----------------------
----do--------------------------do--------------------------do----------------------
----do--------------------------do--------------------------do----------------------
Two colors of shells-------Fecal pellets-------------------do----------------------
Wing scales-----------------
Fecal pellets---------------
Teeth-----------------------
Scales----------------------Teeth, bones, scales, copro
lites; (about 10 species).
Scutes----------------------Carapace, plastron, scutes--
Lithology
Gy sh; coal.
Beach ss; bk & gy oil sh.
Limey mudst & ls; bn & gy sh; bn oil sh.
Bn & gy oil sh. Limey mudst & ls; bn & gy sh; bn oil sh. Bn & gy oil sh.
Limey mudst & ls; bn & gy sh; bn oil sh. Do. Do.
Med gy & dk gy carb sh; gy & bn oil sh. Bk & gy sh; coal.
Do.
Bk & gy sh.
Do.
In ant hills.
Gy & buff ss; gy mudst; coal. Gy mudst; gy & buff ss.
Gy & buff ss. Gy carb sh; bn sh; coal.
Scales,jaws----------------- Gy ss & sh.
Dermal plates and teeth of Buff & gy ss; red & gy gn mudst. subadults and adults.

PALEOECOLOGY (ROBBINS) 85
TABLE 6.-lnvertebrates and vertebrates collected from the Vermillion Creek basin, Sweetwater County, Wyoming-Continued
Taxon Evidence Lithology
Phylum Chordata--Continued: Class Mammalia:
Subclass Theria: Infraclass Eutheria:
Order Insectivora: Diacodon------------------ Teeth----------------------- Gy mudst; tan ss. Palaeictips--------------- ----do---------------------- Do.
Order Primates: Suborder Plesiadapoidea:
Phenacolemur-------------- ----do---------------------- Do. Suborder Lemuroidea:
Notharctus--------------- ----do---------------------- Do. Suborder Tarsioidei:
Absarokius---------------- ----do---------------------- Do. Cynodontomys-------------- ----do---------------------- Do.
Order Creodonta: Suborder Hyaenodontia------- ----do---------------------- Do.
Order Carnivora: Suborder Fissipedia:
Infraorder Miacoidea: Viverravus-------------- Molar----------------------- Do.
Order Condylarthra: Hyopsodus------------------- Teeth----------------------- Do. Meniscotherium-------------- ----do---------------------- Do.
Order Perissodactyla: Superfamily Equoidea:
Hyracotherium------------- ----do---------------------- Do. Superfamily Tapiroidea:
Heptodon------------------ ----do---------------------- Do. Superfamily Brontotherioidea:
Lambdotherium------------- ----do---------------------- Do. Order Artiodactyla:
Suborder Palaeodonta: Diacodexis--------------- ----do---------------------- Do. Hexacodus----------------- ----do---------------------- Do.
Order Rodentia: Suborder Sciuromorpha:
Paramys------------------- ----do---------------------- Do.
Table 3 shows the presence of pyrite, carbonate, and gypsum in each sample. Pyrite is ubiquitous and occurs in several forms: small octahedrons and framboids are enmeshed in tissues; detrital forms of pyrite are octahedrons, pyritohedrons, and framboids. The presence of carbonate is also noted in table 3. Gypsum was observed under the binocular microscope in the HCl-HF residues. It appears as radiating balls about 1 mm across and as radiating encrustations. None was noted replacing pyrite.
the tissues. Presently, the principal method for expressing the organic content of rocks is by weight percent of organic carbon. Petroleum-producing rocks have at least 0.6 weight percent organic carbon (Tissot and Welte, 1978). A coal must have less than 50 weight percent ash (as received), and hence the organic content, including carbon, will be 50 weight percent or greater (American Society for Testing and Materials, 1981).
ORGANIC MATTER CONTENT OF NILAND TONGUE SAMPLES
The organic content of a rock is a useful parameter in paleoenvironmental and paleoecological analysis. It can be a measure of the productivity of the environment in which the organisms lived as well as a measure of the ability of the depositional medium to preserve
The determination of weight percent organic carbon is a relatively expensive chemical procedure. Six coal samples from the Vermillion Creek coal bed were analyzed (H. W. Roehler, written commun., 1980), and their weight percentages of carbon (dry, ash free, which includes carbonate carbon) ranged from 70.8 to 74.6 and had a mean of 73.3. Fixed carbon on an asreceived basis ranged from 25.9 to 39.4. Fixed carbon does not include carbonate carbon, but does represent
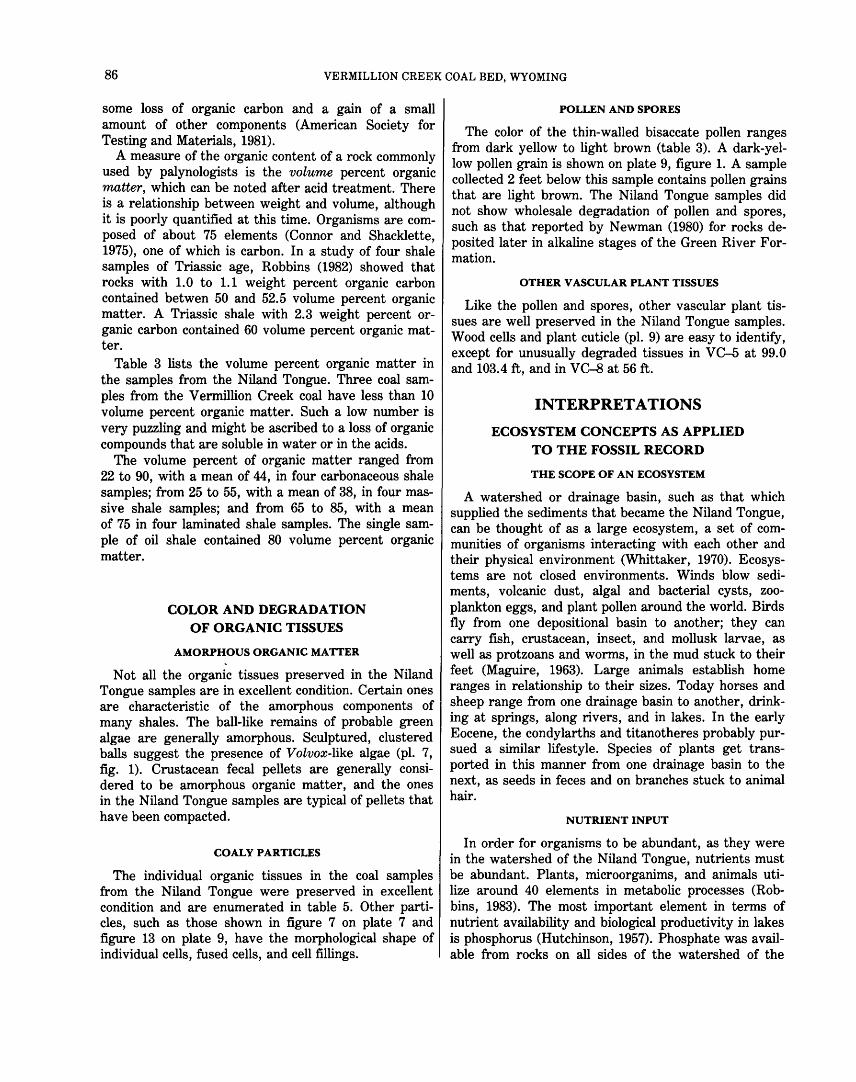
86 VERMILLION CREEK COAL BED, WYOMING
some loss of organic carbon and a gain of a small amount of other components (American Society for Testing and Materials, 1981).
A measure of the organic content of a rock commonly used by palynologists is the volume percent organic matter, which can be noted after acid treatment. There is a relationship between weight and volume, although it is poorly quantified at this time. Organisms are composed of about 75 elements (Connor and Shacklette, 1975), one of which is carbon. In a study of four shale samples of Triassic age, Robbins (1982) showed that rocks with 1. 0 to 1.1 weight percent organic carbon contained betwen 50 and 52.5 volume percent organic matter. A Triassic shale with 2.3 weight percent organic carbon contained 60 volume percent organic matter.
Table 3 lists the volume percent organic matter in the samples from the Niland Tongue. Three coal samples from the Vermillion Creek coal have less than 10 volume percent organic matter. Such a low number is very puzzling and might be ascribed to a loss of organic compounds that are soluble in water or in the acids.
The volume percent of organic matter ranged from 22 to 90, with a mean of 44, in four carbonaceous shale samples; from 25 to 55, with a mean of 38, in four massive shale samples; and from 65 to 85, with a mean of 75 in four laminated shale samples. The single sample of oil shale contained 80 volume percent organic matter.
COLOR AND DEGRADATION OF ORGANIC TISSUES
AMORPHOUS ORGANIC MATTER
Not all the organic tissues preserved in the Niland Tongue samples are in excellent condition. Certain ones are characteristic of the amorphous components of many shales. The ball-like remains of probable green algae are generally amorphous. Sculptured, clustered balls suggest the presence of Volvox-like algae (pl. 7, fig. 1). Crustacean fecal pellets are generally considered to be amorphous organic matter, and the ones in the Niland Tongue samples are typical of pellets that have been compacted.
COALY PARTICLES
The individual organic tissues in the coal samples from the Niland Tongue were preserved in excellent condition and are enumerated in table 5. Other particles, such as those shown in figure 7 on plate 7 and figure 13 on plate 9, have the morphological shape of individual cells, fused cells, and cell fillings.
POLLEN AND SPORES
The color of the thin-walled bisaccate pollen ranges from dark yellow to light brown (table 3). A dark-yellow pollen grain is shown on plate 9, figure 1. A sample collected 2 feet below this sample contains pollen grains that are light brown. The Niland Tongue samples did not show wholesale degradation of pollen and spores, such as that reported by Newman (1980) for rocks deposited later in alkaline stages of the Green River Formation.
OTHER VASCULAR PLANT TISSUES
Like the pollen and spores, other vascular plant tissues are well preserved in the Niland Tongue samples. Wood cells and plant cuticle (pl. 9) are easy to identify, except for unusually degraded tissues in VC-5 at 99.0 and 103.4 ft, and in VC-8 at 56 ft.
INTERPRETATIONS
ECOSYSTEM CONCEPTS AS APPLIED TO THE FOSSIL RECORD
THE SCOPE OF AN ECOSYSTEM
A watershed or drainage basin, such as that which supplied the sediments that became the Niland Tongue, can be thought of as a large ecosystem, a set of communities of organisms interacting with each other and their physical environment (Whittaker, 1970). Ecosystems are not closed environments. Winds blow sediments, volcanic dust, algal and bacterial cysts, zooplankton eggs, and plant pollen around the world. Birds fly from one depositional basin to another; they can carry fish, crustacean, insect, and mollusk larvae, as well as protzoans and worms, in the mud stuck to their feet (Maguire, 1963). Large animals establish home ranges in relationship to their sizes. Today horses and sheep range from one drainage basin to another, drinking at springs, along rivers, and in lakes. In the early Eocene, the condylarths and titanotheres probably pursued a similar lifestyle. Species of plants get transported in this manner from one drainage basin to the next, as seeds in feces and on branches stuck to animal hair.
NUTRIENT INPUT
In order for organisms to be abundant, as they were in the watershed of the Niland Tongue, nutrients must be abundant. Plants, microorganims, and animals utilize around 40 elements in metabolic processes (Robbins, 1983). The most important element in terms of nutrient availability and biological productivity in lakes is phosphorus (Hutchinson, 1957). Phosphate was available from rocks on all sides of the watershed of the
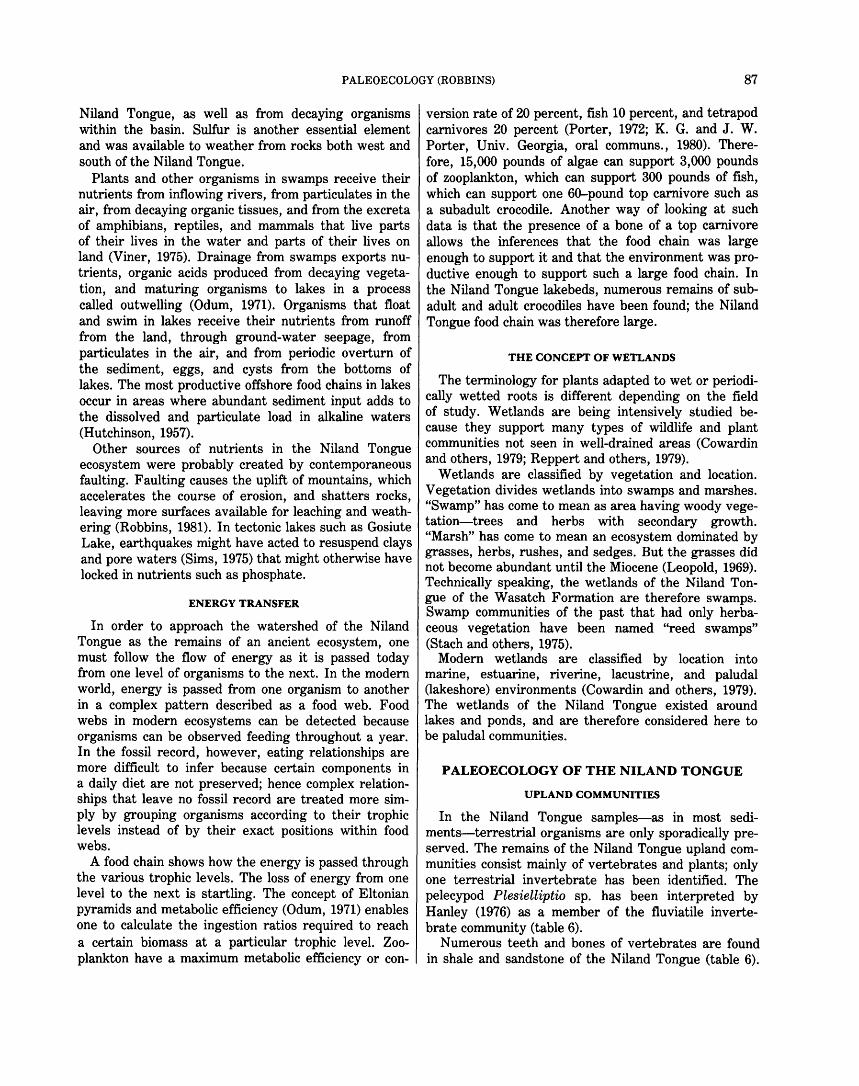
PALEOECOLOGY (ROBBINS) 87
Niland Tongue, as well as from decaying organisms within the basin. Sulfur is another essential element and was available to weather from rocks both west and south of the Niland Tongue.
Plants and other organisms in swamps receive their nutrients from inflowing rivers, from particulates in the air, from decaying organic tissues, and from the excreta of amphibians, reptiles, and mammals that live parts of their lives in the water and parts of their lives on land (Viner, 1975). Drainage from swamps exports nutrients, organic acids produced from decaying vegetation, and maturing organisms to lakes in a process called outwelling (Odum, 1971). Organisms that float and swim in lakes receive their nutrients from runoff from the land, through ground-water seepage, from particulates in the air, and from periodic overturn of the sediment, eggs, and cysts from the bottoms of lakes. The most productive offshore food chains in lakes occur in areas where abundant sediment input adds to the dissolved and particulate load in alkaline waters (Hutchinson, 1957).
Other sources of nutrients in the Niland Tongue ecosystem were probably created by contemporaneous faulting. Faulting causes the uplift of mountains, which accelerates the course of erosion, and shatters rocks, leaving more surfaces available for leaching and weathering (Robbins, 1981). In tectonic lakes such as Gosiute Lake, earthquakes might have acted to resuspend clays and pore waters (Sims, 1975) that might otherwise have locked in nutrients such as phosphate.
ENERGY TRANSFER
In order to approach the watershed of the Niland Tongue as the remains of an ancient ecosystem, one must follow the flow of energy as it is passed today from one level of organisms to the next. In the modem world, energy is passed from one organism to another in a complex pattern described as a food web. Food webs in modern ecosystems can be detected because organisms can be observed feeding throughout a year. In the fossil record, however, eating relationships are more difficult to infer because certain components in a daily diet are not preserved; hence complex relationships that leave no fossil record are treated more simply by grouping organisms according to their trophic levels instead of by their exact positions within food webs.
A food chain shows how the energy is passed through the various trophic levels. The loss of energy from one level to the next is startling. The concept of Eltonian pyramids and metabolic efficiency (Odum, 1971) enables one to calculate the ingestion ratios required to reach a certain biomass at a particular trophic level. Zooplankton have a maximum metabolic efficiency or con-
version rate of 20 percent, fish 10 percent, and tetrapod carnivores 20 percent (Porter, 1972; K. G. and J. W. Porter, Univ. Georgia, oral communs., 1980). Therefore, 15,000 pounds of algae can support 3,000 pounds of zooplankton, which can support 300 pounds of fish, which can support one 60-pound top carnivore such as a subadult crocodile. Another way of looking at such data is that the presence of a bone of a top carnivore allows the inferences that the food chain was large enough to support it and that the environment was productive enough to support such a large food chain. In the Niland Tongue lakebeds, numerous remains of subadult and adult crocodiles have been found; the Niland Tongue food chain was therefore large.
THE CONCEPT OF WETLANDS
The terminology for plants adapted to wet or periodically wetted roots is different depending on the field of study. Wetlands are being intensively studied because they support many types of wildlife and plant communities not seen in well-drained areas (Cowardin and others, 1979; Reppert and others, 1979).
Wetlands are classified by vegetation and location. Vegetation divides wetlands into swamps and marshes. "Swamp" has come to mean as area having woody vegetation-trees and herbs with secondary growth. "Marsh" has come to mean an ecosystem dominated by grasses, herbs, rushes, and sedges. But the grasses did not become abundant until the Miocene (Leopold, 1969). Technically speaking, the wetlands of the Niland Tongue of the Wasatch Formation are therefore swamps. Swamp communities of the past that had only herbaceous vegetation have been named "reed swamps" (Stach and others, 1975).
Modern wetlands are classified by location into marine, estuarine, riverine, lacustrine, and paludal (lakeshore) environments (Cowardin and others, 1979). The wetlands of the Niland Tongue existed around lakes and ponds, and are therefore considered here to be paludal communities.
PALEOECOLOGY OF THE NILAND TONGUE
UPLAND COMMUNITIES
In the Niland Tongue samples-as in most sediments-terrestrial organisms are only sporadically preserved. The remains of the Niland Tongue upland communities consist mainly of vertebrates and plants; only one terrestrial invertebrate has been identified. The pelecypod Plesielliptio sp. has been interpreted by Hanley (1976) as a member of the fluviatile invertebrate community (table 6).
Numerous teeth and bones of vertebrates are found in shale and sandstone of the Niland Tongue (table 6).
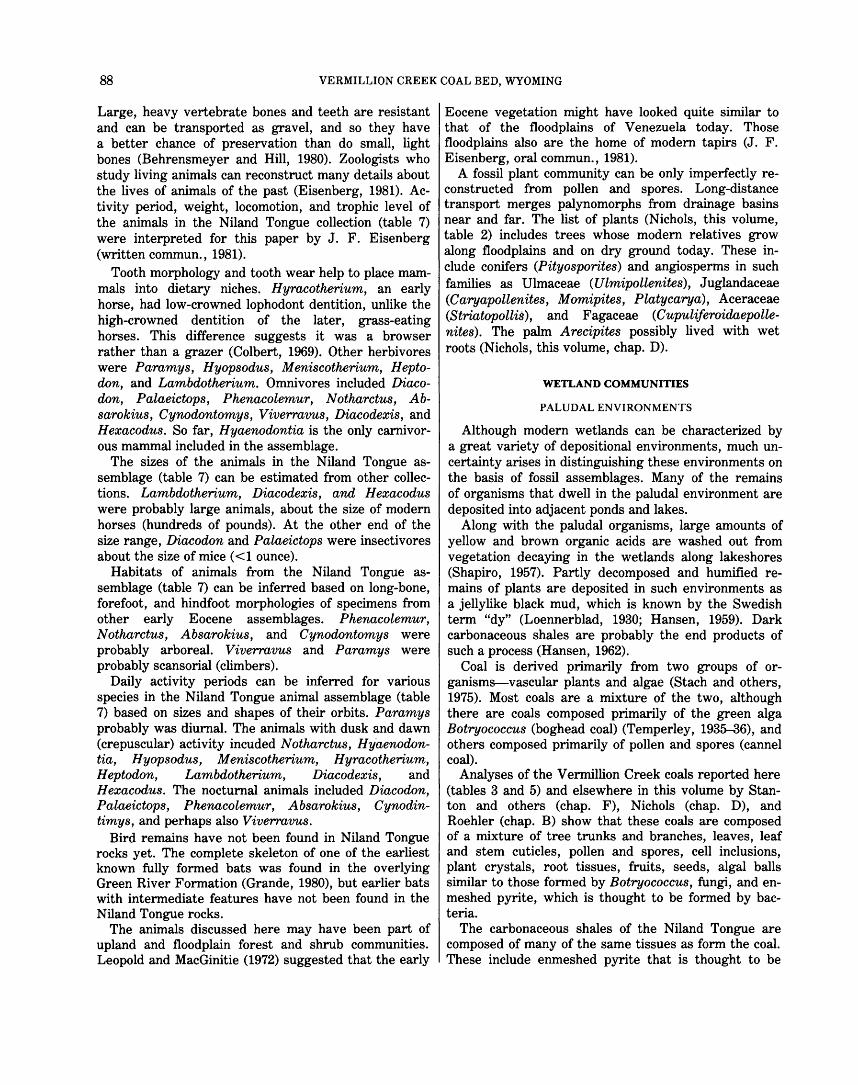
88 VERMILLION CREEK COAL BED, WYOMING
Large, heavy vertebrate bones and teeth are resistant and can be transported as gravel, and so they have a better chance of preservation than do small, light bones (Behrensmeyer and Hill, 1980). Zoologists who study living animals can reconstruct many details about the lives of animals of the past (Eisenberg, 1981). Activity period, weight, locomotion, and trophic level of the animals in the Niland Tongue collection (table 7) were interpreted for this paper by J. F. Eisenberg (written commun., 1981).
Tooth morphology and tooth wear help to place mammals into dietary niches. H yracotherium, an early horse, had low-crowned lophodont dentition, unlike the high-crowned dentition of the later, grass-eating horses. This difference suggests it was a browser rather than a grazer (Colbert, 1969). Other herbivores were Paramys, Hyopsodus, Meniscotherium, Heptodon, and Lambdotherium. Omnivores included Diacodon, Palaeictops, Phenacolemur, Notharctus, Absarokius, Cynodontomys, Viverravus, Diacodexis, and Hexacodus. So far, Hyaenodontia is the only carnivorous mammal included in the assemblage.
The sizes of the animals in the Niland Tongue assemblage (table 7) can be estimated from other collections. Lambdotherium, Diacodexis, and H exacodus were probably large animals, about the size of modern horses (hundreds of pounds). At the other end of the size range, Diacodon and Palaeictops were insectivores about the size of mice ( <1 ounce).
Habitats of animals from the Niland Tongue assemblage (table 7) can be inferred based on long-bone, forefoot, and hindfoot morphologies of specimens from other early Eocene assemblages. Phenacolemur, Notharctus, Absarokius, and Cynodontomys were probably arboreal. Viverravus and Paramys were probably scansorial (climbers).
Daily activity periods can be inferred for various species in the Niland Tongue animal assemblage (table 7) based on sizes and shapes of their orbits. Paramys probably was diurnal. The animals with dusk and dawn (crepuscular) activity incuded Notharctus, Hyaenodontia, Hyopsodus, Meniscotherium, Hyracotherium, Heptodon, Lambdotherium, Diacodexis, and Hexacodus. The nocturnal animals included Diacodon, Palaeictops, Phenacolemur, Absarokius, Cynodintimys, and perhaps also Viverravus.
Bird remains have not been found in Niland Tongue rocks yet. The complete skeleton of one of the earliest known fully formed bats was found in the overlying Green River Formation (Grande, 1980), but earlier bats with intermediate features have not been found in the Niland Tongue rocks.
The animals discussed here may have been part of upland and floodplain forest and shrub communities. Leopold and MacGinitie (1972) suggested that the early
Eocene vegetation might have looked quite similar to that of the floodplains of Venezuela today. Those floodplains also are the home of modern tapirs (J. F. Eisenberg, oral commun., 1981).
A fossil plant community can be only imperfectly reconstructed from pollen and spores. Long-distance transport merges palynomorphs from drainage basins near and far. The list of plants (Nichols, this volume, table 2) includes trees whose modern relatives grow along floodplains and on dry ground today. These include conifers (Pityosporites) and angiosperms in such families as Ulmaceae (Ulmipollenites), Juglandaceae (Caryapollenites, Momipites, Platycarya), Aceraceae (Striatopollis), and Fagaceae (Cupuliferoidaepollenites). The palm Arecipites possibly lived with wet roots (Nichols, this volume, chap. D).
WETLAND COMMUNITIES
PALUDAL ENVIRONMENTS
Although modern wetlands can be characterized by a great variety of depositional environments, much uncertainty arises in distinguishing these environments on the basis of fossil assemblages. Many of the remains of organisms that dwell in the paludal environment are deposited into adjacent ponds and lakes.
Along with the paludal organisms, large amounts of yellow and brown organic acids are washed out from vegetation decaying in the wetlands along lakeshores (Shapiro, 1957). Partly decomposed and humified remains of plants are deposited in such environments as a jellylike black mud, which is known by the Swedish term "dy" (Loennerblad, 1930; Hansen, 1959). Dark carbonaceous shales are probably the end products of such a process (Hansen, 1962).
Coal is derived primarily from two groups of organisms-vascular plants and algae (Stach and others, 1975). Most coals are a mixture of the two, although there are coals composed primarily of the green alga Botryococcus (boghead coal) (Temperley, 1935--36), and others composed primarily of pollen and spores (cannel coal).
Analyses of the Vermillion Creek coals reported here (tables 3 and 5) and elsewhere in this volume by Stanton and others (chap. F), Nichols (chap. D), and Roehler (chap. B) show that these coals are composed of a mixture of tree trunks and branches, leaves, leaf and stem cuticles, pollen and spores, cell inclusions, plant crystals, root tissues, fruits, seeds, algal balls similar to those formed by Botryococcus, fungi, and enmeshed pyrite, which is thought to be formed by bacteria.
The carbonaceous shales of the Niland Tongue are composed of many of the same tissues as form the coal. These include enmeshed pyrite that is thought to be

PALEOECOLOGY (ROBBINS) 89
TABLE 7.-Presumed activity period, size, and trophic level of vertebrates from the Vermillion Creek basin, Sweetwater County, Wyoming
[From J. F. Eisenberg, written commun., 1981; and Colbert, 1969]
Presumed activity period of taxon Estimated weight (lb)
Nocturnal Crepuscular Diurnal <O.l 0.1- 01.3-
0.3 1-2
2- 20-20 200
Locomotion Trophic level
Diacodon---------------------------Palaeictops------------------------
x----------------------------- Terrestrial x----------------------------- ----do-----
Insectivore/omnivore. Do.
Absarokius------------------------- ------x----------------------- Arboreal Do. Cynodontomys----------------------- ------x----------------------- ----do-- Do. ----------------------------Paramys ------------x----------------- Scansorial Frugivore/granivore.
Frugivore/omnivore. Phenacolemur----------------------- ------------------x----------- Arboreal -------------Notharctus-----------Viverravus-------------------------------------Hyodsodus-------------
----------.--------x----------- ----do-- Do. Do. -----------------------x------ Scansorial
-----------------------x------ Terrestrial Frugivore/herbivore. ------------~eniscotherium-------- -----------------------x------ ----do----- Do. -------------Hyracotherium--------- -----------------------x------ ----do----- Herbivore/browser. -------------Heptodon-------------- -----------------------x------ ----do----- Do. -------------Hyaenodontia---------- -----------------------x------ ----do----- Carnivore.
Frugivore/omnivore. -------------Diacodexis------------ -----------------------------x ----do------------------Hexacodus------------- -----------------------------x ----do----- Do. -------------Lambdotherium--------- -----------------------------x ----do----- Herbivore/browser.
formed by bacteria, fungal spores and hyphae, algae, zooplankton fecal pellets, wood cells, cuticle of vascular plants, and pollen and spores (table 5).
Microorganisms such as the bacteria, algae, and fungi found in the paludal deposits of the Niland Tongue are known to play numerous roles within living ecosystems. However, knowledge of simple fossil microorganisms is not well developed, primarily because their taxonomic treatment requires live culturing, a technique impossible with long-dead organisms. Therefore, the functions of microorganisms that live on land, in swamps, and in water will be described together here under paludal communities.
Bacteria, algae, and fungi fill many niches within and on plants. Bacteria and algae are known to supply nitrogen to many plants (Bold and others, 1980), while mycorrhizal fungi supply organic sources of carbon (Harley, 1969). Lichens composed of intergrown algae and fungi live on leaves as substrates. Some species of bacteria and fungi infect plants through wounds, and others degrade dead plants into inorganic matter (Shigo, 1967; Whittaker, 1970). All of these functions presumably were performed in the Eocene swamps, and so fossil evidence of such activities and organisms can be sought in the Niland Tongue deposits.
Bacteria that lyse (split open) upon death, instead of forming endospores, do not leave morphologically identifiable remains. They do leave mineral evidence of their former presence, particularly pyrite framboids composed of octahedrons, and individual octahedrons enmeshed in tissues. Sulfur in the form of H2S is released from sulfur proteins by the enzymatic activity of many heterotrophic putrefying bacteria (Pelczar and
others, 1977). If iron is present in the water, as is true in many sedimentary environments, then enmeshed pyrite framboids or octahedrons can form as a byproduct of bacterial metabolism (Z. S. Altschuler, written commun., 1982). A bacterial colony therefore probably can reproduce its way through an individual cell, leaving pyrite behind to show the pathway. One such cell is shown on plate 7, figure 6.
Fungi are common in wetlands (Sparrow, 1960). Certain fungi have preservable hyphae or spores, particularly those that have chitin in their tissues. Wall structures and spores are not usually different enough morphologically to permit the differentiation of terrestrial from aquatic fungi (D. J. Royse, Pennsylvania State Univ., oral commun., 1981). However, the distinctive fruiting bodies of the microthyriaceous fungi have been found on leaves elsewhere, so fungi of this type are considered to be terrestrial ascomycetes (Elsik, 1978). Figure 10 on plate 7 shows the remains of a fungus 'that probably lived on a leaf of a plant growing in the Vermillion Creek swamp.
Fungi are common in most Eocene rocks. Elsik (1978) suggested that the fungi were abundant during the Eocene because of high humidity and rainfall. Detailed taxonomy has been done on the Eocene fungi of the Gulf Coast (Elsik, 1977a and b, 1978; Elsik and Dilcher, 1974), work that will be useful in delineating the history of fungi in the Niland Tongue.
Very few algae retain their cellular morphology in rocks. The most abundant algae in lake waters and swamps, blue-green and green algae (Palmer, 1977) are seldom preserved in an identifiable form unless they
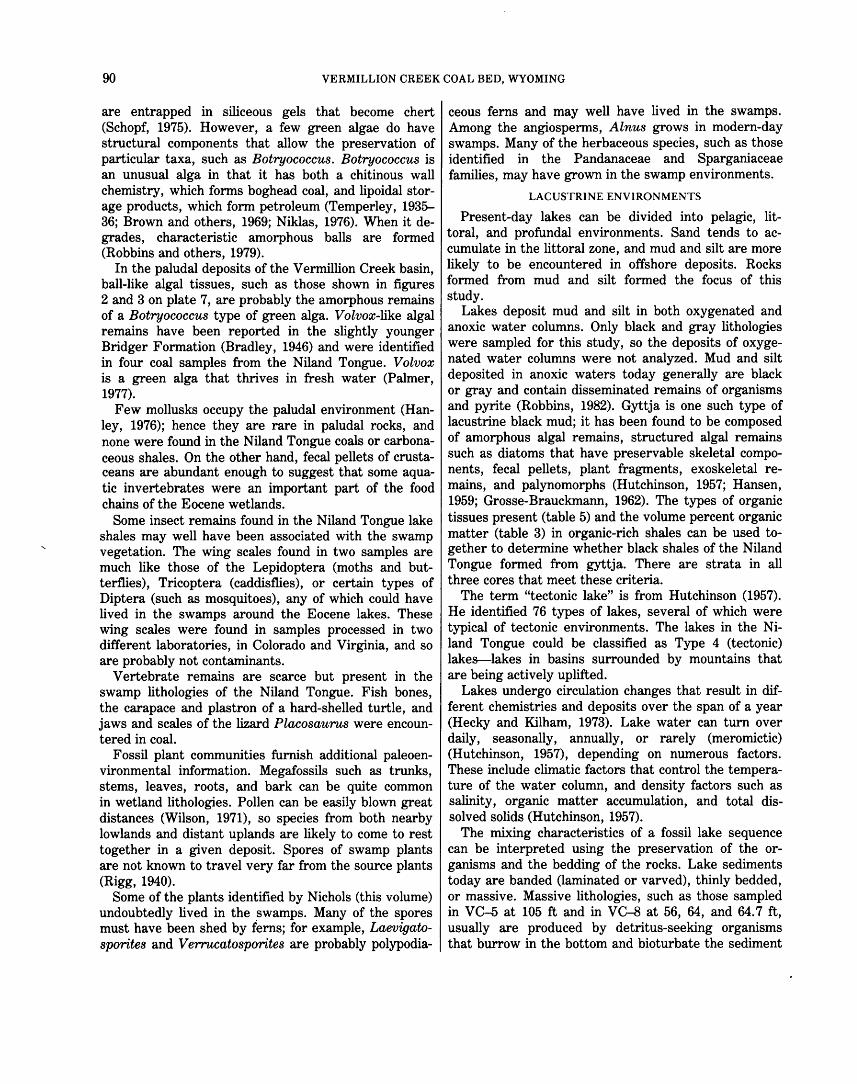
90 VERMILLION CREEK COAL BED, WYOMING
are entrapped in siliceous gels that become chert (Schopf, 1975). However, a few green algae do have structural components that allow the preservation of particular taxa, such as Botryococcus. Botryococcus is an unusual alga in that it has both a chitinous wall chemistry, which forms bog head coal, and lipoidal storage products, which form petroleum (Temperley, 1935--36; Brown and others, 1969; Niklas, 1976). When it degrades, characteristic amorphous balls are formed (Robbins and others, 1979).
In the paludal deposits of the Vermillion Creek basin, ball-like algal tissues, such as those shown in figures 2 and 3 on plate 7, are probably the amorphous remains of a Botryococcus type of green alga. Volvox-like algal remains have been reported in the slightly younger Bridger Formation (Bradley, 1946) and were identified in four coal samples from the Niland Tongue. Volvox is a green alga that thrives in fresh water (Palmer, 1977).
Few mollusks occupy the paludal environment (Hanley, 1976); hence they are rare in paludal rocks, and none were found in the Niland Tongue coals or carbonaceous shales. On the other hand, fecal pellets of crustaceans are abundant enough to suggest that some aquatic invertebrates were an important part of the food chains of the Eocene wetlands.
Some insect remains found in the Niland Tongue lake shales may well have been associated with the swamp vegetation. The wing scales found in two samples are much like those of the Lepidoptera (moths and butterflies), Tricoptera (caddisflies), or certain types of Diptera (such as mosquitoes), any of which could have lived in the swamps around the Eocene lakes. These wing scales were found in samples processed in two different laboratories, in Colorado and Virginia, and so are probably not contaminants.
Vertebrate remains are scarce but present in the swamp lithologies of the Niland Tongue. Fish bones, the carapace and plastron of a hard-shelled turtle, and jaws and scales of the lizard Placosaurus were encountered in coal.
Fossil plant communities furnish additional paleoenvironmental information. Megafossils such as trunks, stems, leaves, roots, and bark can be quite common in wetland lithologies. Pollen can be easily blown great distances (Wilson, 1971), so species from both nearby lowlands and distant uplands are likely to come to rest together in a given deposit. Spores of swamp plants are not known to travel very far from the source plants (Rigg, 1940).
Some of the plants identified by Nichols (this volume) undoubtedly lived in the _swamps. Many of the spores must have been shed by ferns; for example, Laevigatosporites and V errucatosporites are probably polypodia-
ceous ferns and may well have lived in the swamps. Among the angiosperms, Alnus grows in modern-day swamps. Many of the herbaceous species, such as those identified in the Pandanaceae and Sparganiaceae families, may have grown in the swamp environments.
LACUSTRINE ENVIRONMENTS
Present-day lakes can be divided into pelagic, littoral, and profunda! environments. Sand tends to accumulate in the littoral zone, and mud and silt are more likely to be encountered in offshore deposits. Rocks formed from mud and silt formed the focus of this study.
Lakes deposit mud and silt in both oxygenated and anoxic water columns. Only black and gray lithologies were sampled for this study, so the deposits of oxygenated water columns were not analyzed. Mud and silt deposited in anoxic waters today generally are black or gray and contain disseminated remains of organisms and pyrite (Robbins, 1982). Gyttja is one such type of lacustrine black mud; it has been found to be composed of amorphous algal remains, structured algal remains such as diatoms that have preservable skeletal components, fecal pellets, plant fragments, exoskeletal remains, and palynomorphs (Hutchinson, 1957; Hansen, 1959; Grosse-Brauckmann, 1962). The types of organic tissues present (table 5) and the volume percent organic matter (table 3) in organic-rich shales can be used together to determine whether black shales of the Niland Tongue formed from gyttja. There are strata in all three cores that meet these criteria.
The term "tectonic lake" is from Hutchinson (1957). He identified 76 types of lakes, several of which were typical of tectonic environments. The lakes in the Niland Tongue could be classified as Type 4 (tectonic) lakes-lakes in basins surrounded by mountains that are being actively uplifted.
Lakes undergo circulation changes that result in different chemistries and deposits over the span of a year (Hecky and Kilham, 1973). Lake water can turn over daily, seasonally, annually, or rarely (meromictic) (Hutchinson, 1957), depending on numerous factors. These include climatic factors that control the temperature of the water column, and density factors such as salinity, organic matter accumulation, and total dissolved solids (Hutchinson, 1957).
The mixing characteristics of a fossil lake sequence can be interpreted using the preservation of the organisms and the bedding of the rocks. Lake sediments today are banded (laminated or varved), thinly bedded, or massive. Massive lithologies, such as those sampled in VC-5 at 105 ft and in VC-8 at 56, 64, and 64.7 ft, usually are produced by detritus-seeking organisms that burrow in the bottom and bioturbate the sediment
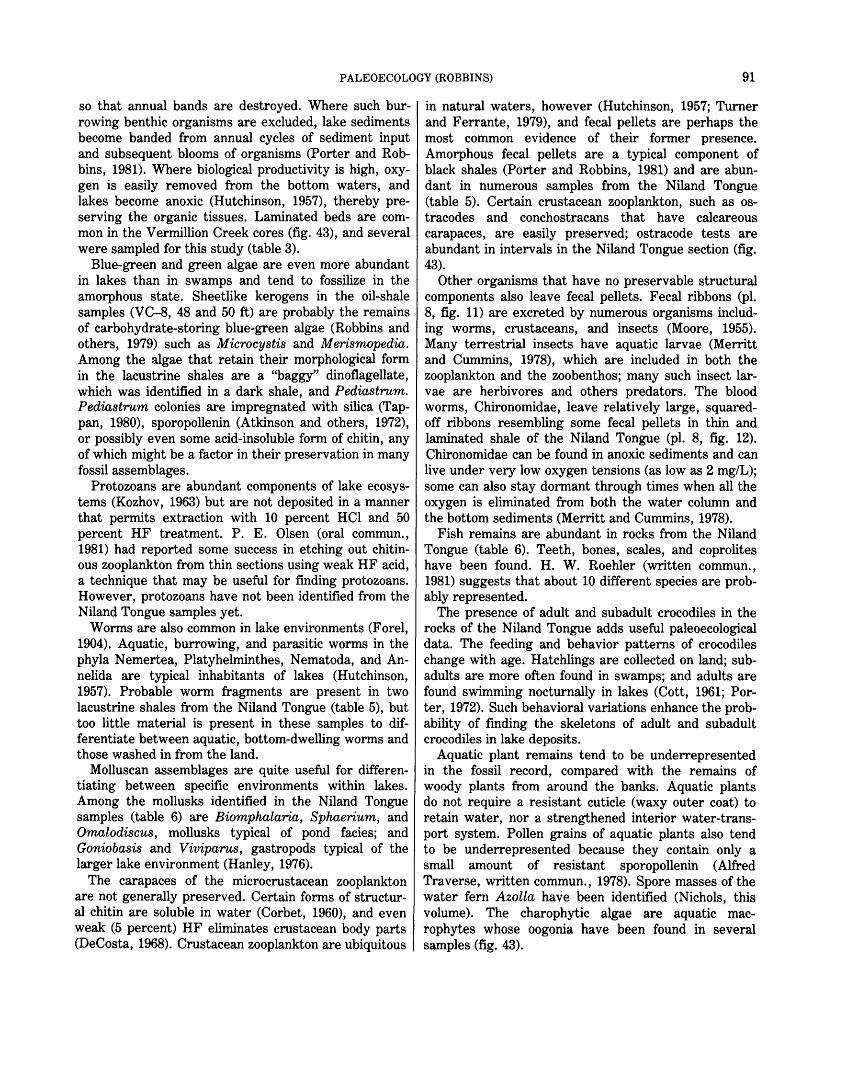
PALEOECOLOGY (ROBBINS) 91
so that annual bands are destroyed. Where such burrowing benthic organisms are excluded, lake sediments become banded from annual cycles of sediment input and subsequent blooms of organisms (Porter and Robbins, 1981). Where biological productivity is high, oxygen is easily removed from the bottom waters, and lakes become anoxic (Hutchinson, 1957), thereby preserving the organic tissues. Laminated beds are common in the Vermillion Creek cores (fig. 43), and several were sampled for this study (table 3).
Blue-green and green algae are even more abundant in lakes than in swamps and tend to fossilize in the amorphous state. Sheetlike kerogens in the oil-shale samples (VC-8, 48 and 50ft) are probably the remains of carbohydrate-storing blue-green algae (Robbins and others, 1979) such as Microcystis and Merismopedia. Among the algae that retain their morphological form in the lacustrine shales are a "baggy" dinoflagellate, which was identified in a dark shale, and Pediastrum. Pediastrum colonies are impregnated with silica (Tappan, 1980), sporopollenin (Atkinson and others, 1972), or possibly even some acid-insoluble form of chitin, any of which might be a factor in their preservation in many fossil assemblages.
Protozoans are abundant components of lake ecosystems (Kozhov, 1963) but are not deposited in a manner that permits extraction with 10 percent HCl and 50 percent HF treatment. P. E. Olsen (oral commun., 1981) had reported some success in etching out chitinous zooplankton from thin sections using weak HF acid, a technique that may be useful for finding protozoans. However, protozoans have not been identified from the Niland Tongue samples yet.
Worms are also common in lake environments (Forel, 1904). Aquatic, burrowing, and parasitic worms in the phyla N emertea, Platyhelminthes, Nematoda, and Annelida are typical inhabitants of lakes (Hutchinson, 1957). Probable worm fragments are present in two lacustrine shales from the Niland Tongue (table 5), but too little material is present in these samples to differentiate between aquatic, bottom-dwelling worms and those washed in from the land.
Molluscan assemblages are quite useful for differentiating between specific environments within lakes. Among the mollusks identified in the Niland Tongue samples (table 6) are Biomphalaria, Sphaerium, and Omalodiscus, mollusks typical of pond facies; and Goniobasis and Viviparus, gastropods typical of the larger lake environment (Hanley, 1976).
The carapaces of the microcrustacean zooplankton are not generally preserved. Certain forms of structural chitin are soluble in water (Corbet, 1960), and even weak (5 percent) HF eliminates crustacean body parts (DeCosta, 1968). Crustacean zooplankton are ubiquitous
in natural waters, however (Hutchinson, 1957; Turner and Ferrante, 1979), and fecal pellets are perhaps the most common evidence of their former presence. Amorphous fecal pellets are a typical component of black shales (Porter and Robbins, 1981) and are abundant in numerous samples from the Niland Tongue (table 5). Certain crustacean zooplankton, such as ostracodes and conchostracans that have calcareous carapaces, are easily preserved; ostracode tests are abundant in intervals in the Niland Tongue section (fig. 43).
Other organisms that have no preservable structural components also leave fecal pellets. Fecal ribbons (pl. 8, fig. 11) are excreted by numerous organisms including worms, crustaceans, and insects (Moore, 1955). Many terrestrial insects have aquatic larvae (Merritt and Cummins, 1978), which are included in both the zooplankton and the zoobenthos; many such insect larvae are herbivores and others predators. The blood worms, Chironomidae, leave relatively large, squaredoff ribbons resembling some fecal pellets in thin and laminated shale of the Niland Tongue (pl. 8, fig. 12). Chironomidae can be found in anoxic sediments and can live under very low oxygen tensions (as low as 2 mg/L); some can also stay dormant through times when all the oxygen is eliminated from both the water column and the bottom sediments (Merritt and Cummins, 1978).
Fish remains are abundant in rocks from the Niland Tongue (table 6). Teeth, bones, scales, and coprolites have been found. H. W. Roehler (written commun., 1981) suggests that about 10 different species are probably represented.
The presence of adult and subadult crocodiles in the rocks of the Niland Tongue adds useful paleoecological data. The feeding and behavior patterns of crocodiles change with age. Hatchlings are collected on land; subadults are more often found in swamps; and adults are found swimming nocturnally in lakes (Cott, 1961; Porter, 1972). Such behavioral variations enhance the probability of finding the skeletons of adult and subadult crocodiles in lake deposits.
Aquatic plant remains tend to be underrepresented in the fossil record, compared with the remains of woody plants from around the banks. Aquatic plants do not require a resistant cuticle (waxy outer coat) to retain water, nor a strengthened interior water-transport system. Pollen grains of aquatic plants also tend to be underrepresented because they contain only a small amount of resistant sporopollenin (Alfred Traverse, written commun., 1978). Spore masses of the water fern Azolla have been identified (Nichols, this volume). The charophytic algae are aquatic macrophytes whose oogonia have been found in several samples (fig. 43).

92 VERMILLION CREEK COAL BED, WYOMING
DEPOSITIONAL FACTORS
WATER CHEMISTRY
In the samples studied, the waters of the Niland Tongue lakes can be interpreted as often having been mildly alkaline based on biological evidence supplemented with mineralogical evidence. The lakes contained crocodiles and abundant ostracodes, typical fauna of alkaline lakes (Hutchinson, 1957; Robbins, 1982), as well as the calcareous oogonia of charophytes. Charophytes (fig. 43) must have alkaline conditions and high CaC03 (Reid and Wood, 1976). Also, shells composed of calcite are well preserved, and a varied molluskan fauna is present (table 6).
Because calcareous ostracodes and siliceous diatoms often are not preserved in the same environment (J. P. Bradbury, oral commun., 1981; G. W. Andrews, oral commun., 1982), samples that had no ostracodes (VC-5, 101.5 ft and VC-7, 121.1 ft) were studied with the hope that some diatoms may have been preserved. Diatoms can be typical inhabitants of alkaline lakes (Hecky and Kilham, 1973), but none were found in the Niland Tongue samples. Nor have diatoms ever been found in the lacustrine rocks of the overlying Green River Formation (G. W. Andrews, oral commun., 1982). Lacustrine diatoms are rare in the fossil record until the Oligocene (J. P. Bradbury, oral commun., 1982).
When lake systems become saline and highly alkaline, blue-green algae tend to dominate (Pearsall, 1922; Brown, 1971). Amorphous sheets identified in the two Niland Tongue oil-shale samples studied (table 5) may be the remains of blue-green algae. Pediastrum species, which dominate eutrophic water under highphosphate and high-nitrate conditions (Serruya, 1978), were rare in the Vermillion Creek samples (VC-7, 121 ft). Therefore, the rock samples studied probably were not deposited under strongly alkaline conditions.
Carbonate was recognized by its vigorous reaction to 10 percent HCl in 8 of the 25 samples studied for amorphous remains (table 3). Although calcite and dolomite both require at least mildly alkaline conditions in order to precipitate from solution (Garrels and Christ, 1965), carbonate also can be introduced by a variety of postdepositional processes. No authigenic minerals higher up the saline series have been reported. Gypsum was found in the acid residues of some samples (table 3). Whether the gypsum has eroded from the drainage basin (allogenic), precipitated in pore spaces after burial (authigenic), or precipitated in pore spaces during the life of the lakes (endogenic) cannot be determined.
The lakes were anoxic at least at some times. Pyrite was found in samples from all three cores (table 3); the organic tissues are in excellent conditions in most samples; and many beds retained their laminations.
However, some beds are massive dark shales (fig. 43) that have no fine laminations; these imply bioturbation and hence lake overturn and aerobic conditions. Consistent with such an interpretation, the massive dark shales also have less pyrite and a lower volume of organic matter than the laminated beds (table 3). The oil shale and laminated sequences (fig. 43) attest to intermittent meromictic conditions in which bands were laid down in response to such environmental factors as changing chemical conditions, annual nutrient availability, or consequent changes in the abundances of organisms and their remains (Porter and Robbins, 1981).
PRESERVATION OF THE ORGANIC TISSUES
Pollen and spores were encountered in all but 6 of the 44 samples studied from the Niland Tongue. The wall structures were well preserved and taxonomic treatment was possible. (See Nichols, this volume.) Wholesale degradation of pollen and spores such as that reported by Newman (1980) for rocks deposited in the overlying Green River Formation was not observed in the Niland Tongue. Both Newman (1980) and Robbins and Traverse (1980) have discussed the relationship between tissue destruction and high alkalinity of lake waters.
The plant tissues in the coals are in excellent condition, which suggests they were deposited under relatively neutral to acidic pH, and anoxic Eh (Stach and others, 1975). Vascular plant wood cells and cuticle are generally well preserved (pl. 9) in other lithologies, except in VC-5 at 99.0 and 103.4 ft, and in VC-8 at 56 ft. Carbonate was present in all three samples that contained degraded plant tissues.
POSTDEPOSITIONAL BURIAL AND THERMAL ALTERATION
Coaly particles.-The subbituminous coals studied here from the Niland Tongue are composed of many unstructured particles (pl. 7, fig. 7; and pl. 9, fig. 13). The usual explanation for the apparent lack of structural detail in coals is that liquefied components of degradation products, such as humic and fulvic acids, have precipitated in all available spaces within the peaty sediment. However, the particles in the Niland Tongue look like lignified wood cells that have been fused by heat. Experiments with many types of lignins show that no sharp melting point exists; fractions begin to soften between 80° and 120°C, and melting has been observed between 140° and 150°C (Brauns, 1952).
Pollen and spores.-The color of the Niland Tongue thin-walled bisaccate pollen ranges from dark yellow (pl. 9, fig. 1) to light brown (table 6). Most pollen is translucent and pale yellow when shed, and darkens with increasing depth of burial and geothermal gra-
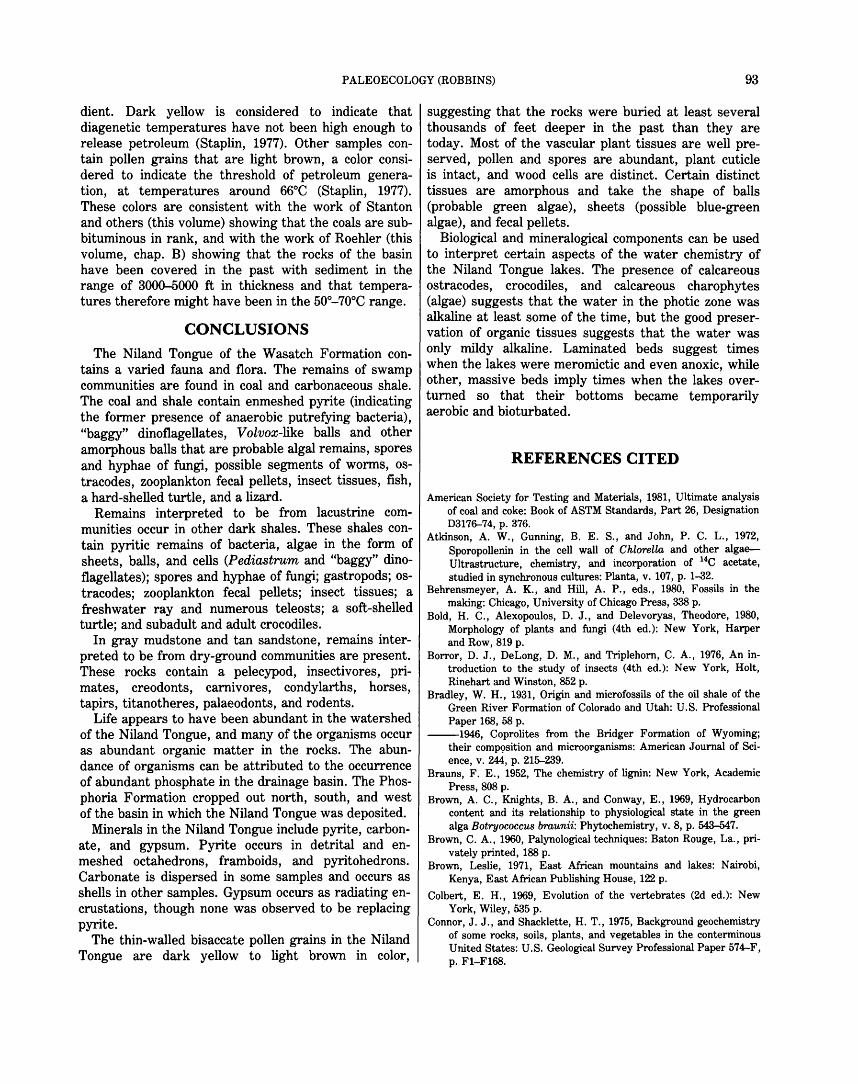
PALEOECOLOGY (ROBBINS) 93
dient. Dark yellow is considered to indicate that diagenetic temperatures have not been high enough to release petroleum (Staplin, 1977). Other samples contain pollen grains that are light brown, a color considered to indicate the threshold of petroleum generation, at temperatures around 66°C (Staplin, 1977). These colors are consistent with the work of Stanton and others (this volume) showing that the coals are subbituminous in rank, and with the work of Roehler (this volume, chap. B) showing that the rocks of the basin have been covered in the past with sediment in the range of 3000--5000 ft in thickness and that temperatures therefore might have been in the 50°-70°C range.
CONCLUSIONS
The Niland Tongue of the Wasatch Formation contains a varied fauna and flora. The remains of swamp communities are found in coal and carbonaceous shale. The coal and shale contain enmeshed pyrite (indicating the former presence of anaerobic putrefying bacteria), "baggy" dinoflagellates, Volvox-like balls and other amorphous balls that are probable algal remains, spores and hyphae of fungi, possible segments of worms, ostracodes, zooplankton fecal pellets, insect tissues, fish, a hard-shelled turtle, and a lizard.
Remains interpreted to be from lacustrine communities occur in other dark shales. These shales contain pyritic remains of bacteria, algae in the form of sheets, balls, and cells (Pediastrum and "baggy" dinoflagellates); spores and hyphae of fungi; gastropods; ostracodes; zooplankton fecal pellets; insect tissues; a freshwater ray and numerous teleosts; a soft-shelled turtle; and subadult and adult crocodiles.
In gray mudstone and tan sandstone, remains interpreted to be from dry-ground communities are present. These rocks contain a pelecypod, insectivores, primates, creodonts, carnivores, condylarths, horses, tapirs, titanotheres, palaeodonts, and rodents.
Life appears to have been abundant in the watershed of the Niland Tongue, and many of the organisms occur as abundant organic matter in the rocks. The abundance of organisms can be attributed to the occurrence of abundant phosphate in the drainage basin. The Phosphoria Formation cropped out north, south, and west of the basin in which the Niland Tongue was deposited.
Minerals in the Niland Tongue include pyrite, carbonate, and gypsum. Pyrite occurs in detrital and enmeshed octahedrons, framboids, and pyritohedrons. Carbonate is dispersed in some samples and occurs as shells in other samples. Gypsum occurs as radiating encrustations, though none was observed to be replacing pyrite.
The thin-walled bisaccate pollen grains in the Niland Tongue are dark yellow to light brown in color,
suggesting that the rocks were buried at least several thousands of feet deeper in the past than they are today. Most of the vascular plant tissues are well preserved, pollen and spores are abundant, plant cuticle is intact, and wood cells are distinct. Certain distinct tissues are amorphous and take the shape of balls (probable green algae), sheets (possible blue-green algae), and fecal pellets.
Biological and mineralogical components can be used to interpret certain aspects of the water chemistry of the Niland Tongue lakes. The presence of calcareous ostracodes, crocodiles, and calcareous charophytes (algae) suggests that the water in the photic zone was alkaline at least some of the time, but the good preservation of organic tissues suggests that the water was only mildy alkaline. Laminated beds suggest times when the lakes were meromictic and even anoxic, while other, massive beds imply times when the lakes overturned so that their bottoms became temporarily aerobic and bioturbated.
REFERENCES CITED
American Society for Testing and Materials, 1981, Ultimate analysis of coal and coke: Book of ASTM Standards, Part 26, Designation D3176-74, p. 376.
Atkinson, A. W., Gunning, B. E. S., and John, P. C. L., 1972, Sporopollenin in the cell wall of C hlorella and other algaeUltrastructure, chemistry, and incorporation of 14C acetate, studied in synchronous cultures: Planta, v. 107, p. 1-32.
Behrensmeyer, A. K., and Hill, A. P., eds., 1980, Fossils in the making: Chicago, University of Chicago Press, 338 p.
Bold, H. C., Alexopoulos, D. J., and Delevoryas, Theodore, 1980, Morphology of plants and fungi (4th ed.): New York, Harper and Row, 819 p.
Borror, D. J., DeLong, D. M., and Triplehorn, C. A., 1976, An introduction to the study of insects (4th ed.): New York, Holt, Rinehart and Winston, 852 p.
Bradley, W. H., 1931, Origin and microfossils of the oil shale of the Green River Formation of Colorado and Utah: U.S. Professional Paper 168, 58 p.
--1946, Coprolites from the Bridger Formation of Wyoming; their compc;>sition and microorganisms: American Journal of Science, v. 244, p. 215-239.
Brauns, F. E., 1952, The chemistry of lignin: New York, Academic Press, 808 p.
Brown, A. C., Knights, B. A., and Conway, E., 1969, Hydrocarbon content and its relationship to physiological state in the green alga Botryococcus braunii: Phytochemistry, v. 8, p. 543-547.
Brown, C. A., 1960, Palynological techniques: Baton Rouge, La., privately printed, 188 p.
Brown, Leslie, 1971, East African mountains and lakes: Nairobi, Kenya, East African Publishing House, 122 p.
Colbert, E. H., 1969, Evolution of the vertebrates (2d ed.): New York, Wiley, 535 p.
Connor, J. J., and Shacklette, H. T., 1975, Background geochemistry of some rocks, soils, plants, and vegetables in the conterminous United States: U.S. Geological Survey Professional Paper 574-F, p. F1-F168.
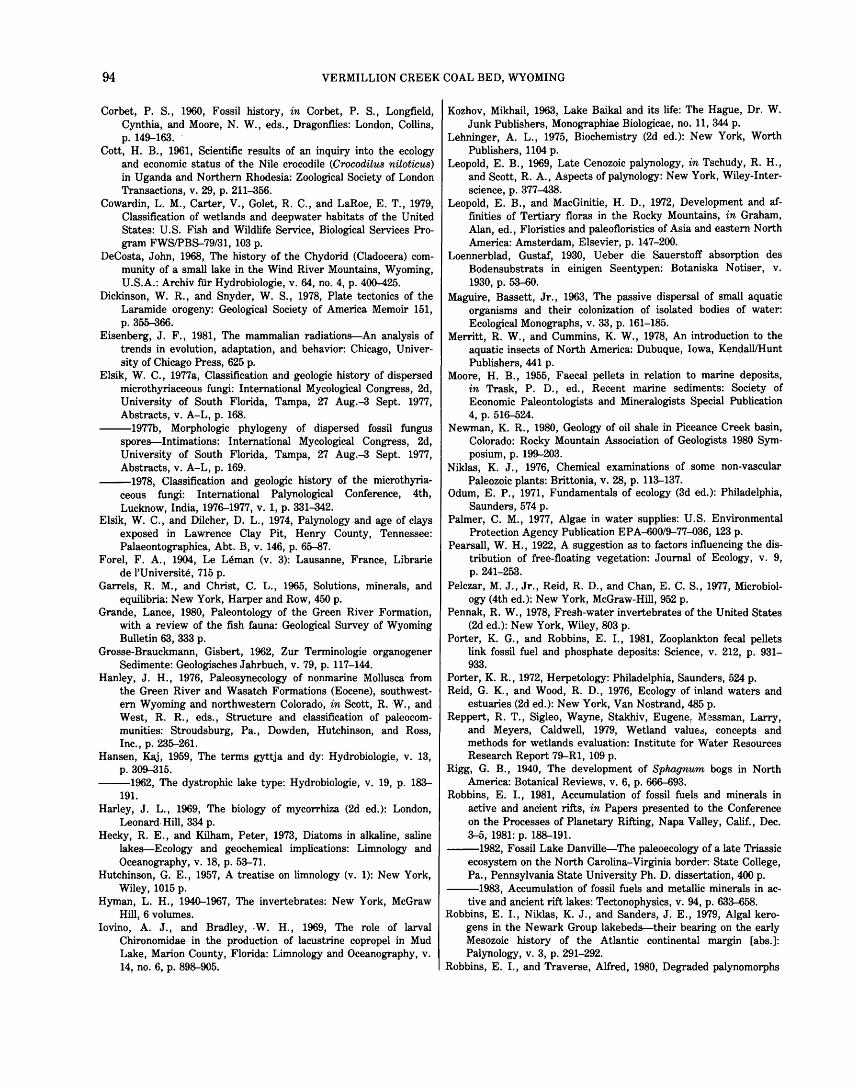
94 VERMILLION CREEK COAL BED, WYOMING
Corbet, P. S., 1960, Fossil history, in Corbet, P. S., Longfield, Cynthia, and Moore, N. W., eds., Dragonflies: London, Collins, p. 149-163.
Cott, H. B., 1961, Scientific results of an inquiry into the ecology and economic status of the Nile crocodile (Crocodilus niloticus) in Uganda and Northern Rhodesia: Zoological Society of London Transactions, v. 29, p. 211--356.
Cowardin, L. M., Carter, V., Golet, R. C., and LaRoe, E. T., 1979, Classification of wetlands and deepwater habitats of the United States: U.S. Fish and Wildlife Service, Biological Services Program FWS/PBS-79/31, 103 p.
DeCosta, John, 1968, The history of the Chydorid (Cladocera) community of a small lake in the Wind River Mountains, Wyoming, U.S.A.: Archiv ftir Hydrobiologie, v. 64, no. 4, p. 400-425.
Dickinson, W. R., and Snyder, W. S., 1978, Plate tectonics of the Laramide orogeny: Geological Society of America Memoir 151, p. 355--366.
Eisenberg, J. F., 1981, The mammalian radiations-An analysis of trends in evolution, adaptation, and behavior: Chicago, University of Chicago Press, 625 p.
Elsik, W. C., 1977a, Classification and geologic history of dispersed microthyriaceous fungi: International Mycological Congress, 2d, University of South Florida, Tampa, 27 Aug.--3 Sept. 1977, Abstracts, v. A-L, p. 168.
--1977b, Morphologic phylogeny of dispersed fossil fungus spores-Intimations: International Mycological Congress, 2d, University of South Florida, Tampa, 27 Aug.--3 Sept. 1977, Abstracts, v. A-L, p. 169.
--1978, Classification and geologic history of the microthyriaceous fungi: International Palynological Conference, 4th, Lucknow, India, 1976-1977, v. 1, p. 331--342.
Elsik, W. C., and Dilcher, D. L., 1974, Palynology and age of clays exposed in Lawrence Clay Pit, Henry County, Tennessee: Palaeontographica, Abt. B, v. 146, p. 65--87.
Forel, F. A., 1904, Le Leman (v. 3): Lausanne, France, Librarie de l'Universite, 715 p.
Garrels, R. M., and Christ, C. L., 1965, Solutions, minerals, and equilibria: New York, Harper and Row, 450 p.
Grande, Lance, 1980, Paleontology of the Green River Formation, with a review of the fish fauna: Geological Survey of Wyoming Bulletin 63, 333 p.
Grosse-Brauckmann, Gisbert, 1962, Zur Terminologie organogener Sedimente: Geologisches Jahrbuch, v. 79, p. 117-144.
Hanley, J. H., 1976, Paleosynecology of nonmarine Mollusca from the Green River and Wasatch Formations (Eocene), southwestern Wyoming and northwestern Colorado, in Scott, R. W., and West, R. R., eds., Structure and classification of paleocommunities: Stroudsburg, Pa., Dowden, Hutchinson, and Ross, Inc., p. 235-261.
Hansen, Kaj, 1959, The terms gyttja and dy: Hydrobiologie, v. 13, p. 309-315.
--1962, The dystrophic lake type: Hydrobiologie, v. 19, p. 183-191.
Harley, J. L., 1969, The biology of mycorrhiza (2d ed.): London, Leonard. Hill, 334 p.
Hecky, R. E., and Kilham, Peter, 1973, Diatoms in alkaline, saline lakes-Ecology and geochemical implications: Limnology and Oceanography, v. 18, p. 53-71.
Hutchinson, G. E., 1957, A treatise on limnology (v. 1): New York, Wiley, 1015 p.
Hyman, L. H., 1940-1967, The invertebrates: New York, McGraw Hill, 6 volumes.
Iovino, A. J., and Bradley, ·W. H., 1969, The role of larval Chironomidae in the production of lacustrine copropel in Mud Lake, Marion County, Florida: Limnology and Oceanography, v. 14, no. 6, p. 898-905.
Kozhov, Mikhail, 1963, Lake Baikal and its life: The Hague, Dr. W. Junk Publishers, Monographiae Biologicae, no. 11, 344 p.
Lehninger, A. L., 1975, Biochemistry (2d ed.): New York, Worth Publishers, 1104 p.
Leopold, E. B., 1969, Late Cenozoic palynology, in Tschudy, R. H., and Scott, R. A., Aspects of palynology: New York, Wiley-Interscience, p. 377-438.
Leopold, E. B., and MacGinitie, H. D., 1972, Development and affinities of Tertiary floras in the Rocky Mountains, in Graham, Alan, ed., Floristics and paleofloristics of Asia and eastern North America: Amsterdam, Elsevier, p. 147-200.
Loennerblad, Gustaf, 1930, Ueber die Sauerstoff absorption des Bodensubstrats in einigen Seentypen: Botaniska N otiser, v. 1930, p. 53-60.
Maguire, Bassett, Jr., 1963, The passive dispersal of small aquatic organisms and their colonization of isolated bodies of water: Ecological Monographs, v. 33, p. 161-185.
Merritt, R. W., and Cummins, K. W., 1978, An introduction to the aquatic insects of North America: Dubuque, Iowa, Kendall/Hunt Publishers, 441 p.
Moore, H. B., 1955, Faecal pellets in relation to marine deposits, in Trask, P. D., ed., Recent marine sediments: Society of Economic Paleontologists and Mineralogists Special Publication 4, p. 516-524.
Newman, K. R., 1980, Geology of oil shale in Piceance Creek basin, Colorado: Rocky Mountain Association of Geologists 1980 Symposium, p. 199-203.
Niklas, K. J., 1976, Chemical examinations of some non-vascular Paleozoic plants: Brittonia, v. 28, p. 113-137.
Odum, E. P., 1971, Fundamentals of ecology (3d ed.): Philadelphia, Saunders, 574 p.
Palmer, C. M., 1977, Algae in water supplies: U.S. Environmental Protection Agency Publication EPA-600/9-77-036, 123 p.
Pearsall, W. H., 1922, A suggestion as to factors influencing the distribution of free-floating vegetation: Journal of Ecology, v. 9, p. 241-253.
Pelczar, M. J., Jr., Reid, R. D., and Chan, E. C. S., 1977, Microbiology (4th ed.): New York, McGraw-Hill, 952 p.
Pennak, R. W., 1978, Fresh-water invertebrates of the United States (2d ed.): New York, Wiley, 803 p.
Porter, K. G., and Robbins, E. 1., 1981, Zooplankton fecal pellets link fossil fuel and phosphate deposits: Science, v. 212, p. 931-933.
Porter, K. R., 1972, Herpetology: Philadelphia, Saunders, 524 p. Reid, G. K., and Wood, R. D., 1976, Ecology of inland waters and
estuaries (2d ed.): New York, Van Nostrand, 485 p. Reppert, R. T., Sigleo, Wayne, Stakhiv, Eugene: M.3ssman, Larry,
and Meyers, Caldwell, 1979, Wetland value.:~, concepts and methods for wetlands evaluation: Institute for Water Resources Research Report 79-R1, 109 p.
Rigg, G. B., 1940, The development of Sphagnum bogs in North America: Botanical Reviews, v. 6, p. 666--693.
Robbins, E. 1., 1981, Accumulation of fossil fuels and minerals in active and ancient rifts, in Papers presented to the Conference on the Processes of Planetary Rifting, Napa Valley, Calif., Dec. 3-5, 1981: p. 188-191.
--1982, Fossil Lake Danville-The paleoecology of a late Triassic ecosystem on the North Carolina-Virginia border: State College, Pa., Pennsylvania State University Ph. D. dissertation, 400 p.
--1983, Accumulation of fossil fuels and metallic minerals in active and ancient rift lakes: Tectonophysics, v. 94, p. 633-658.
Robbins, E. 1., Niklas, K. J., and Sanders, J. E., 1979, Algal kerogens in the Newark Group lake beds-their bearing on the early Mesozoic history of the Atlantic continental margin [abs.]: Palynology, v. 3, p. 291-292.
Robbins, E. 1., and Traverse, Alfred, 1980, Degraded palynomorphs
PALEOECOLOGY (ROBBINS) 95
from the Dan River (North Carolina)-Danville (Virginia) basin, in Price, Van, Jr., Thayer, P. A., and Ranson, W. A., eds., Geological investigations of Piedmont and Triassic rocks, central North Carolina and Virginia: Carolina Geological Society Field Trip Guidebook, Oct. 11-12, 1980, Paper X, p. 1-11.
Romer, A. S., 1967, Vertebrate paleontology: Chicago, University of Chicago Press, 468 p.
Schopf, J. W., 1975, Precambrian paleobiology-Problems and perspectives: Earth and Planetary Sciences Annual Review, v. 3, p. 213-249.
Serruya, Colette, ed., 1978, Lake Kinneret--Lake of Tiberius, Sea of Galilee: The Hague, Dr. W. Junk, Monographiae Biologicae, no. 32, 501 p.
Shapiro, Joseph, 1957, Chemical and biological studies on the yellow organic acids of lake water: Limnology and Oceanography, v. 2, p. 161-179.
Shigo, A. L., 1967, Succession of organisms in discoloration and decay of wood, in Romburger, J. A., and Miicola, P., eds.: International Reviews of Forestry Research, v. 2, p. 237-299.
Sims, J. D., 1975, Determining earthquake recurrence intervals from deformational structures in young lacustrine sediments: Tectonophysics, v. 29, p. 141-152.
Snyder, W. S., Dickinson, W. R., and Silberman, M. L., 1976, Tectonic implications of space-time patterns of Cenozoic magmatism in the western United States: Earth and Planetary Science Letters, v. 32, p. 91-106.
Sparrow, F. K., 1960, Aquatic phycomycetes: Ann Arbor, Mich., University of Michigan Press, 1187 p.
Stach, Erich, Mackowsky, M. T., Teichmueller, Marlies, Taylor, G. H., Chandra, D., and Teichmueller, Rolf, 1975, Coal petrology: Berlin, Gebriider Borntraeger, 428 p.
Staplin, F. L., 1977, Interpretation of thermal history from color of particulate organic matter-A review: Palynology, v. 1, p. 9-18.
Stiles, Walter, 1961, Trace elements in plants: Cambridge, The University Press, 249 p.
Swain, F. M., 1964, Early Tertiary freshwater Ostracoda from Colorado, Nevada, and Utah, and their stratigraphic distribution: Journal of Paleontology, v. 38, p. 256-280.
Tappan, Helen, 1980, The paleobiology of plant protists: San Francisco, Freeman, 1028 p.
Temper ley, B. N., 1935--36, The boghead controversy and the morphology of the boghead algae: Transactions of the Royal Society of Edinburgh, v. 58, pt. 3, p. 855-868.
Tissot, B. P., and Welte, D. H., 1978, Petroleum formation and occurrence: New York, Springer-Verlag, 538 p.
Traverse, Alfred, 1978, Palynological analysis of DSDP leg 42B (1975) cores from the Black Sea: Initial Reports of the Deep Sea Drilling Project, v. 42, p. 993-1015.
Turner, J. T., and Ferrante, J. G., 1979, Zooplankton fecal pellets in aquatic ecosystems: BioScience, v. 29, no. 11, p. 670-677.
Viner, A. B., 1975, The supply of minerals to tropical rivers and lakes (Uganda), in Hasler, A. D., ed., Coupling of land and water systems: New York, Springer-Verlag, p. 227-261.
Whittaker, R. H., 1969, New concepts of kingdoms of organisms: Science, v. 163, p. 150-160.
--1970, Communities and ecosystems: London, Macmillan, 162 p.
Wilson, L. R., 1971, Palynological techniques in deep-basin stratigraphy: Shale Shaker, v. 21, p. 124-139.

PLATES 7-9
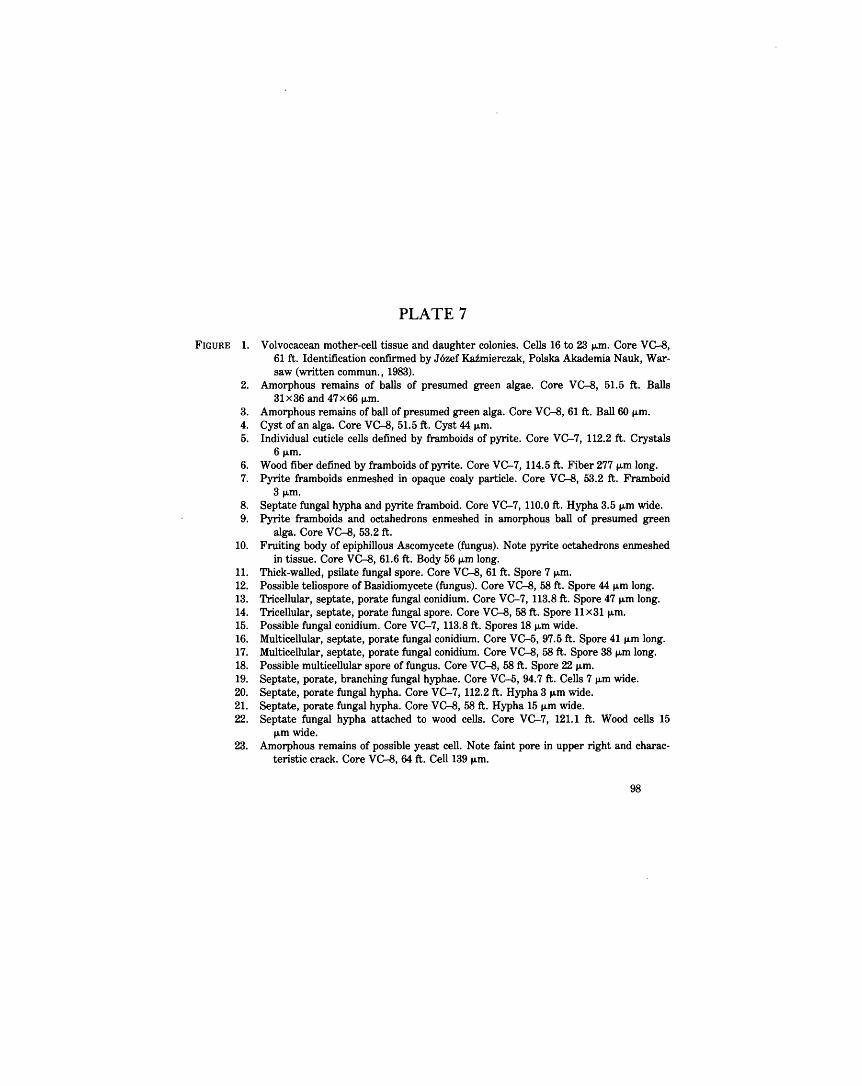
PLATE 7
FIGURE 1. Volvocacean mother-cell tissue and daughter colonies. Cells 16 to 23 f.Lm. Core VG-8, 61 ft. Identification confirmed by J 6zef KaZmierczak, Polska Akademia N auk, Warsaw (written commun., 1983).
2. Amorphous remains of balls of presumed green algae. Core VG-8, 51.5 ft. Balls 31X36 and 47X66 f.Lm.
3. Amorphous remains of ball of presumed green alga. Core VG-8, 61 ft. Ball 60 f.Lm. 4. Cyst of an alga. Core VG-8, 51.5 ft. Cyst 44 f.Lm. 5. Individual cuticle cells defined by framboids of pyrite. Core VC-7, 112.2 ft. Crystals
6f.Lm. 6. Wood fiber defined by framboids of pyrite. Core VC-7, 114.5 ft. Fiber 277 f.Lm long. 7. Pyrite framboids enmeshed in opaque coaly particle. Core VG-8, 53.2 ft. Framboid
3f.Lm. 8. Septate fungal hypha and pyrite framboid. Core VC-7, 110.0 ft. Hypha 3.5 f.Lm wide. 9. Pyrite framboids and octahedrons enmeshed in amorphous ball of presumed green
alga. Core VG-8, 53.2 ft. 10. Fruiting body of epiphillous Ascomycete (fungus). Note pyrite octahedrons enmeshed
in tissue. Core VG-8, 61.6 ft. Body 56 f.Lm long. 11. Thick-walled, psilate fungal spore. Core VG-8, 61ft. Spore 7 f.Lm. 12. Possible teliospore of Basidiomycete (fungus). Core VG-8, 58 ft. Spore 44 f.Lm long. 13. Tricellular, septate, porate fungal conidium. Core VC-7, 113.8 ft. Spore 47 f.Lm long. 14. Tricellular, septate, porate fungal spore. Core VG-8, 58 ft. Spore 11X31 f.Lm. 15. Possible fungal conidium. Core VC-7, 113.8 ft. Spores 18 f.Lm wide. 16. Multicellular, septate, porate fungal conidium. Core VC-5, 97.5 ft. Spore 41 f.Lm long. 17. Multicellular, septate, porate fungal conidium. Core VG-8, 58 ft. Spore 38 f.Lm long. 18. Possible multicellular spore of fungus. Core VG-8, 58 ft. Spore 22 f.Lm. 19. Septate, porate, branching fungal hyphae. Core VC-5, 94.7 ft. Cells 7 f.Lm wide. 20. Septate, porate fungal hypha. Core VC-7, 112.2 ft. Hypha 3 f.Lm wide. 21. Septate, porate fungal hypha. Core VG-8, 58 ft. Hypha 15 f.Lm wide. 22. Septate fungal hypha attached to wood cells. Core VC-7, 121.1 ft. Wood cells 15
...,m wide. 23. Amorphous remains of possible yeast cell. Note faint pore in upper right and charac
teristic crack. Core VG-8, 64 ft. Cell 139 f.Lm.
98
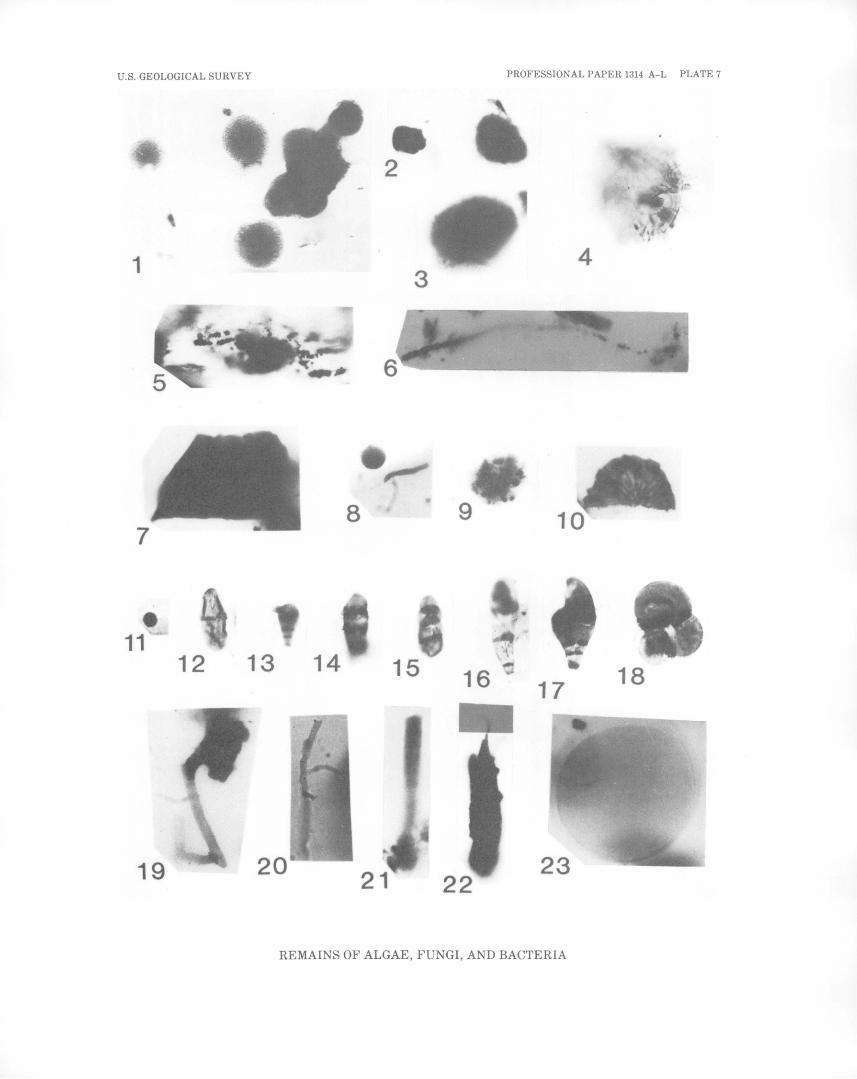
U.S. GEOLOGICAL SURVEY PROFESSIONAL PAPER 1314 A-L PLATE 7
2
1 3
4
8
11 12 13 14 15 18 16 17
19 20 23
REMAINS OF ALGAE, FUNGI, AND BACTERIA
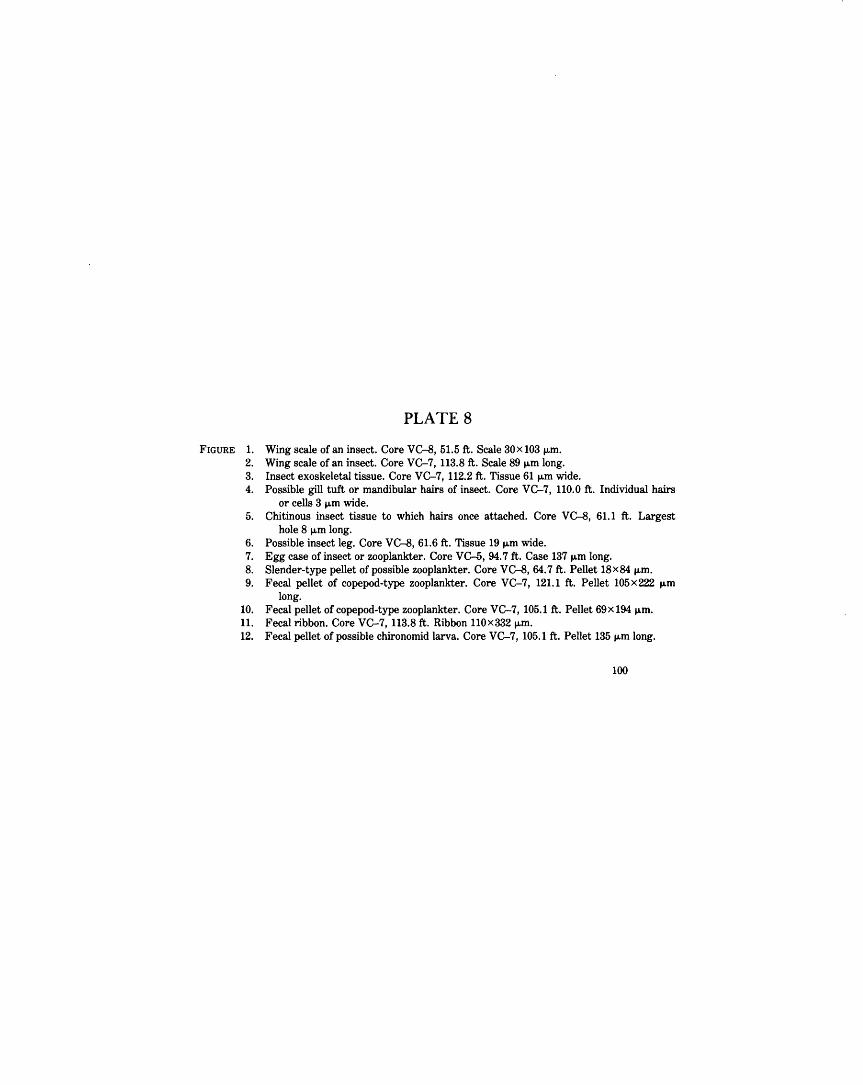
PLATE 8
FIGURE 1. Wing scale of an insect. Core VC-8, 51.5 ft. Scale 30x 103 J.Lffi. 2. Wing scale of an insect. Core VG-7, 113.8 ft. Scale 89 J.Lffi long. 3. Insect exoskeletal tissue. Core VG-7, 112.2 ft. Tissue 61 J.Lffi wide. 4. Possible gill tuft or mandibular hairs of insect. Core VG-7, 110.0 ft. Individual hairs
or cells 3 J.Lffi wide. 5. Chitinous insect tissue to which hairs once attached. Core VC-8, 61.1 ft. Largest
hole 8 J.Lffi long. 6. Possible insect leg. Core VC-8, 61.6 ft. Tissue 19 J.Lffi wide. 7. Egg case of insect or woplankter. Core VG-5, 94.7 ft. Case 137 J.Lffi long. 8. Slender-type pellet of possible zooplankter. Core VC-8, 64.7 ft. Pellet 18X84 J.Lffi. 9. Fecal pellet of copepod-type zooplankter. Core VG-7, 121.1 ft. Pellet 105x222 J.Lffi
long. 10. Fecal pellet of copepod-type zooplankter. Core VG-7, 105.1 ft. Pellet 69x 194 J.Lffi. 11. Fecal ribbon. Core VG-7, 113.8 ft. Ribbon 110x332 J.Lffi. 12. Fecal pellet of possible chironomid larva. Core VG-7, 105.1 ft. Pellet 135 J.Lffi long.
100
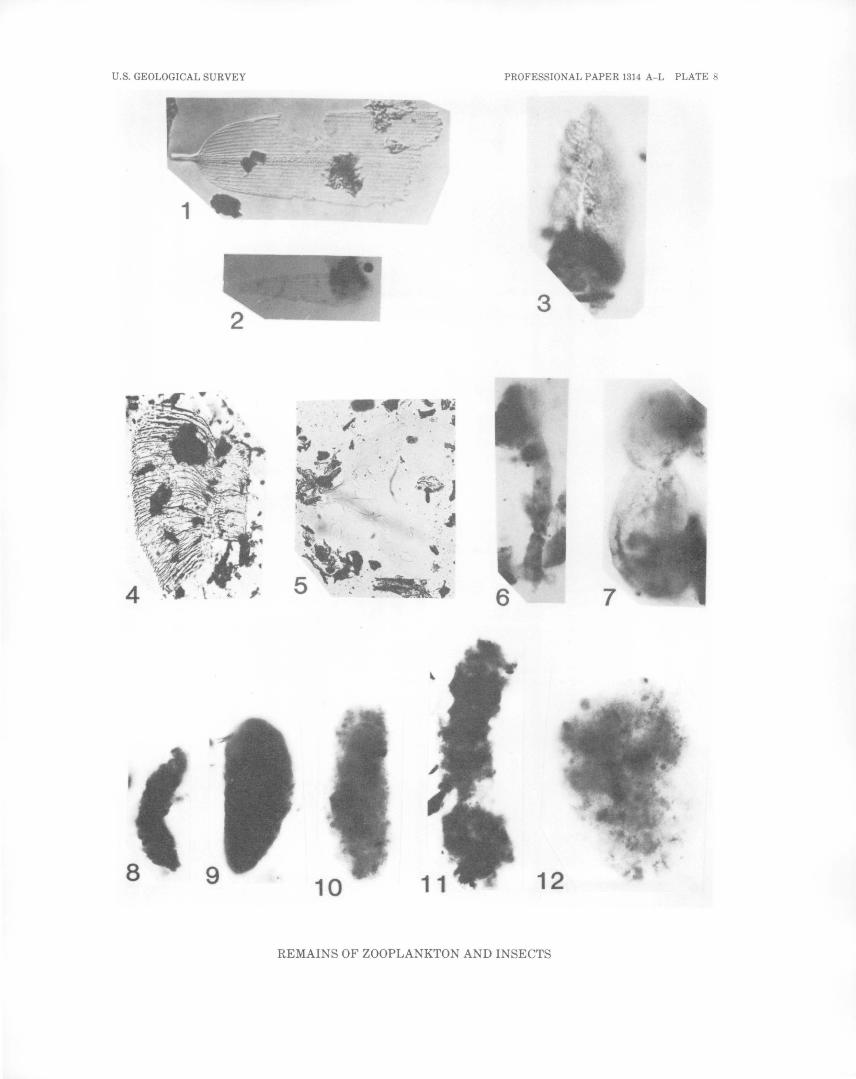
U.S. GEOLOGICAL SURVEY PROFESSIONAL PAPER 1314 A-L PLATE 8
' . . . • '# ' . . .
2 '"".;.~ !'•"'
12
REMAINS OF ZOOPLANKTON AND INSECTS
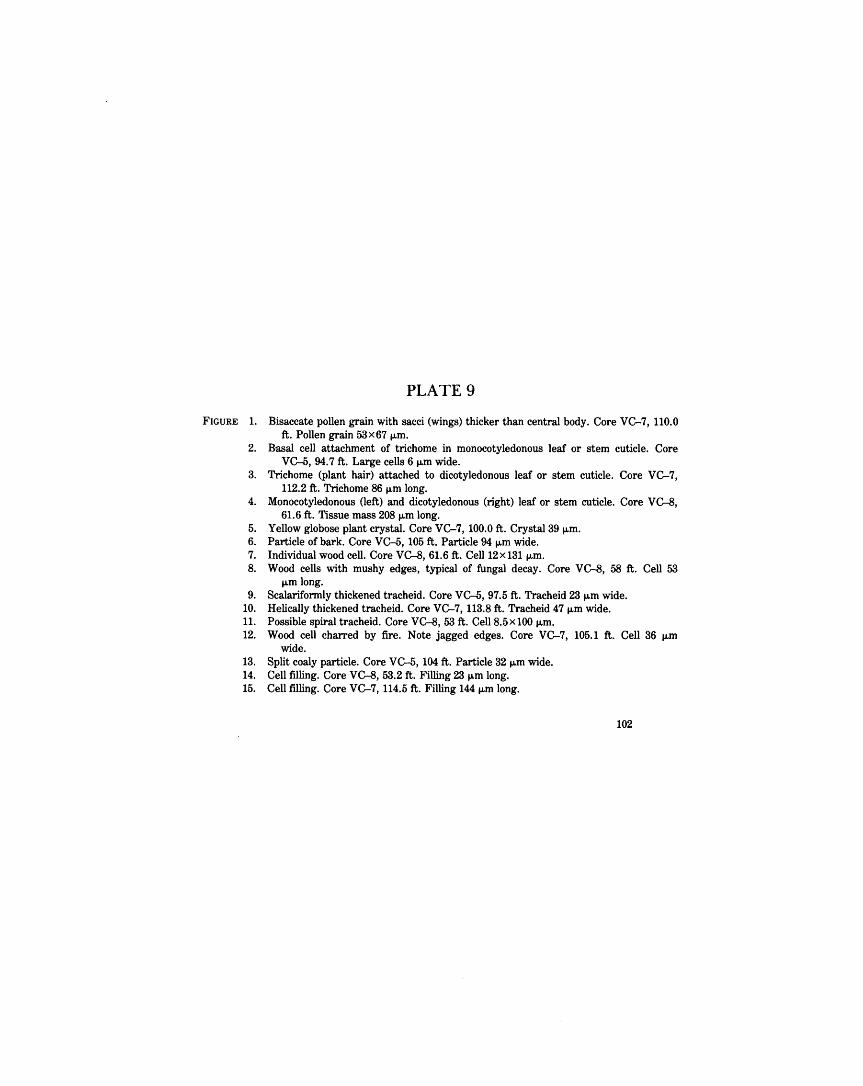
FIGURE 1.
2.
3.
4.
5. 6. 7. 8.
9. 10. 11. 12.
13. 14. 15.
PLATE 9
Bisaccate pollen grain with sacci (wings) thicker than central body. Core VC-7, 110.0 ft. Pollen grain 53 x 67 J.Lm.
Basal cell attachment of trichome in monocotyledonous leaf or stem cuticle. Core VC-5, 94.7 ft. Large cells 6 J.Lm wide.
Trichome (plant hair) attached to dicotyledonous leaf or stem cuticle. Core VC-7, 112.2 ft. Trichome 86 J.Lm long.
Monocotyledonous (left) and dicotyledonous (right) leaf or stem cuticle. Core VC-8, 61.6 ft. Tissue mass 208 J.Lm long.
Yellow globose plant crystal. Core VC-7, 100.0 ft. Crystal39 J.Lm. Particle of bark. Core VC-5, 105 ft. Particle 94 J.Lm wide. Individual wood cell. Core VC-8, 61.6 ft. Cell12x131 J.Lm. Wood cells with mushy edges, typical of fungal decay. Core VC-8, 58 ft. Cell 53
J.Lm long. Scalariformly thickened tracheid. Core VC-5, 97.5 ft. Tracheid 23 J.Lm wide. Helically thickened tracheid. Core VC-7, 113.8 ft. Tracheid 47 J.Lm wide. Possible spiral tracheid. Core VC-8, 53 ft. Cell 8.5 x 100 J.Lm. Wood cell charred by fire. Note jagged edges. Core VC-7, 105.1 ft. Cell 36 J.Lm
wide. Split coaly particle. Core VC-5, 104 ft. Particle 32 J.Lm wide. Cell filling. Core VC-8, 53.2 ft. Filling 23 J.Lm long. Cell filling. Core VC-7, 114.5 ft. Filling 144 J.Lm long.
102
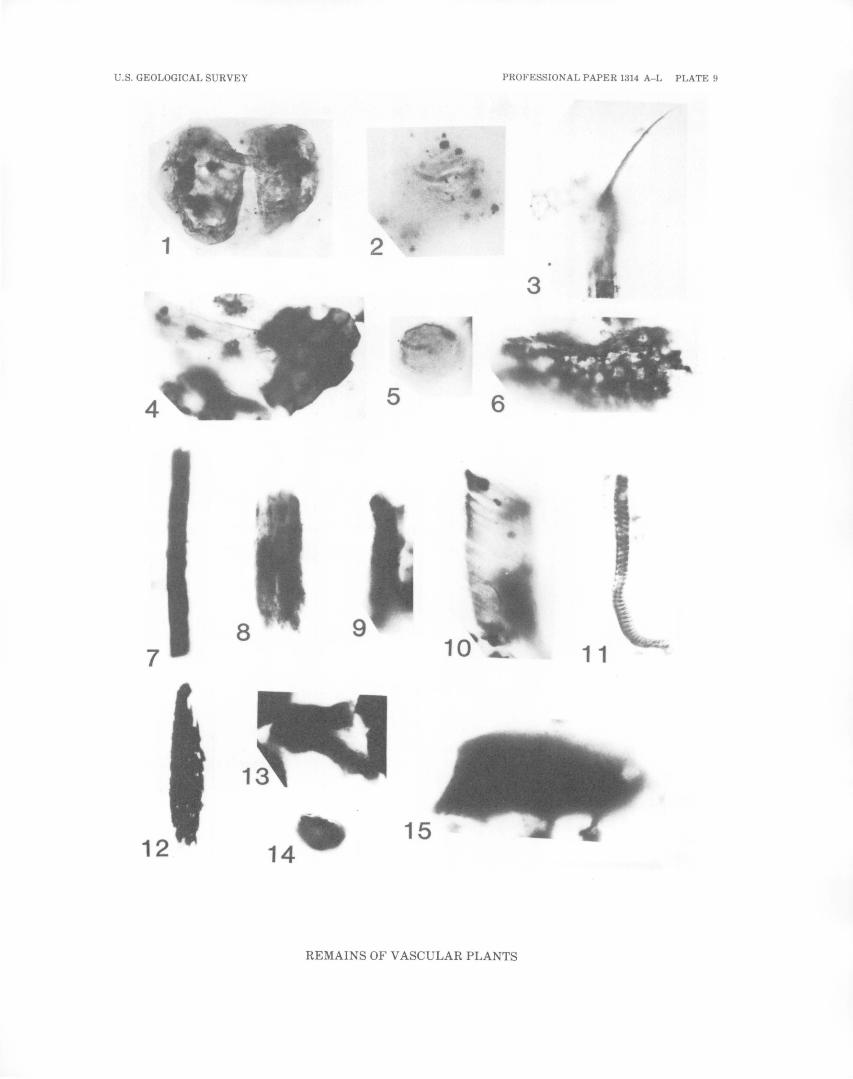
U.S. GEOLOGICAL SURVEY PROFESSIONAL PAPER 1314 A-L PLATE 9
•
2
3
5
8 9 7 1 1
12 14 15
REMAINS OF VASCULAR PLANTS


Petrographic and Physical Properties of Coal and Rock Samples By R. W. STANTON,]. A. MINKIN, and T. A. MOORE
GEOLOGICAL INVESTIGATIONS OF THE VERMILLION CREEK COAL BED IN THE EOCENE NILAND TONGUE OF THE WASATCH FORMATION, SWEETWATER COUNTY, WYOMING
U.S. GEOLOGICAL SURVEY PROFESSIONAL PAPER 1314-F
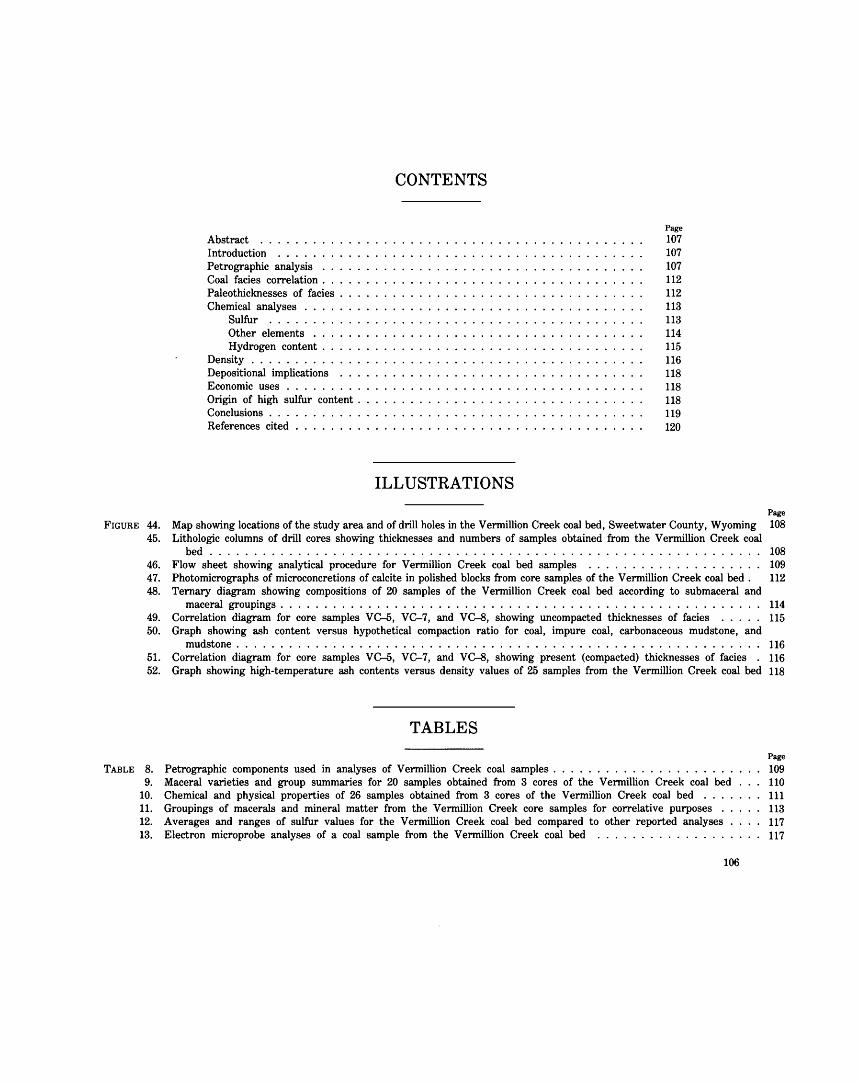
Abstract ...... . Introduction . . . . . Petrographic analysis Coal facies correlation . Paleothicknesses of facies . Chemical analyses .
Sulfur ...... . Other elements . . Hydrogen content .
Density ........ . Depositional implications Economic uses . . . . . . Origin of high sulfur content . Conclusions . . . References cited . . . . . . . .
CONTENTS
ILLUSTRATIONS
Page
107 107 107 112 112 113 113 114 115 116 118 118 118 119 120
FIGURE 44. Map showing locations of the study area and of drill holes in the Vermillion Creek coal bed, Sweetwater County, Wyoming 45. Lithologic columns of drill cores showing thicknesses and numbers of samples obtained from the Vermillion Creek coal
bed ............................................................. .
Page
108
108 46. Flow sheet showing analytical procedure for Vermillion Creek coal bed samples . . . . . . . . . . . . . . . . . . . . 109 47. Photomicrographs of microconcretions of calcite in polished blocks from core samples of the Vermillion Creek coal bed . 112 48. Ternary diagram showing compositions of 20 samples of the Vermillion Creek coal bed according to submaceral and
maceral groupings . . . . . . . . . . . . . . . . . . . . . . . . . . . . . . . . . . . . . . . . . . . . . . . . . . . . . . . 114 49. Correlation diagram for core samples VC-5, VC-7, and VC-8, showing uncompacted thicknesses of facies . . . . . 115 50. Graph showing ash content versus hypothetical compaction ratio for coal, impure coal, carbonaceous mudstone, and
mudstone . . . . . . . . . . . . . . . . . . . . . . . . . . . . . . . . . . . . . . . . . . . . . . . . . . . . . . . . . . . . 116 51. Correlation diagram for core samples VC-5, VC-7, and VC-8, showing present (compacted) thicknesses of facies . 116 52. Graph showing high-temperature ash contents versus density values of 25 samples from the Vermillion Creek coal bed 118
TABLES
Page
TABLE 8. Petrographic components used in analyses of Vermillion Creek coal samples . . . . . . . . . . . . . . . . . . . . . 109 9. Maceral varieties and group summaries for 20 samples obtained from 3 cores of the Vermillion Creek coal bed 110
10. Chemical and physical properties of 26 samples obtained from 3 cores of the Vermillion Creek coal bed . . . 111 11. Groupings of macerals and mineral matter from the Vermillion Creek core samples for correlative purposes . 113 12. Averages and ranges of sulfur values for the Vermillion Creek coal bed compared to other reported analyses 117 13. Electron microprobe analyses of a coal sample from the Vermillion Creek coal bed . . . . . . . . . . . . . . 117
106
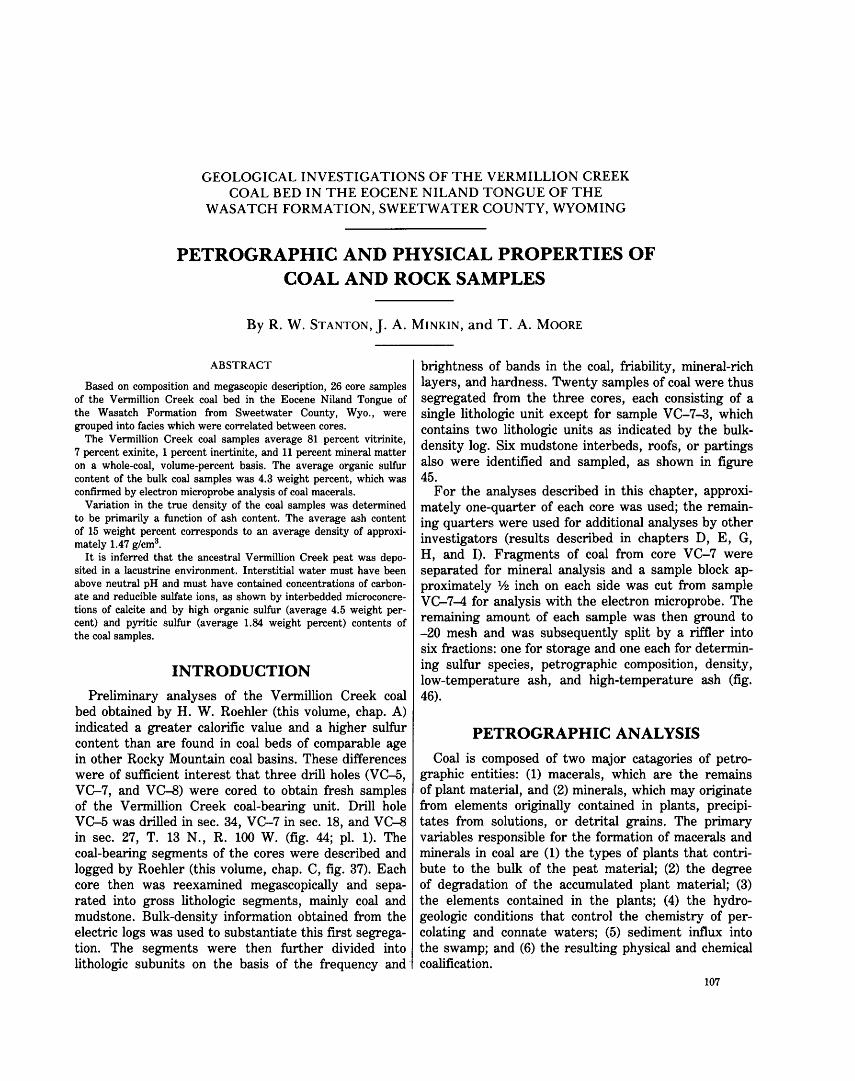
GEOLOGICAL INVESTIGATIONS OF THE VERMILLION CREEK COAL BED IN THE EOCENE NILAND TONGUE OF THE
WASATCH FORMATION, SWEETWATER COUNTY, WYOMING
PETROGRAPHIC AND PHYSICAL PROPERTIES OF COAL AND ROCK SAMPLES
By R. W. STANTON,]. A. MINKIN, and T. A. MOORE
ABSTRACT
Based on composition and megascopic description, 26 core samples of the Vermillion Creek coal bed in the Eocene Niland Tongue of the Wasatch Formation from Sweetwater County, Wyo., were grouped into facies which were correlated between cores.
The Vermillion Creek coal samples average 81 percent vitrinite, 7 percent exinite, 1 percent inertinite, and 11 percent mineral matter on a whole-coal, volume-percent basis. The average organic sulfur content of the bulk coal samples was 4.3 weight percent, which was confirmed by electron microprobe analysis of coal macerals.
Variation in the true density of the coal samples was determined to be primarily a function of ash content. The average ash content of 15 weight percent corresponds to an average density of approximately 1.47 g/cm3•
It is inferred that the ancestral Vermillion Creek peat was deposited in a lacustrine environment. Interstitial water must have been above neutral pH and must have contained concentrations of carbonate and reducible sulfate ions, as shown by interbedded microconcretions of calcite and by high organic sulfur (average 4.5 weight percent) and pyritic sulfur (average 1.84 weight percent) contents of the coal samples.
INTRODUCTION
Preliminary analyses of the Vermillion Creek coal bed obtained by H. W. Roehler (this volume, chap. A) indicated a greater calorific value and a higher sulfur content than are found in coal beds of comparable age in other Rocky Mountain coal basins. These differences were of sufficient interest that three drill holes (VC-5, VC-7, and VC-8) were cored to obtain fresh samples of the Vermillion Creek coal-bearing unit. Drill hole VC-5 was drilled in sec. 34, VC-7 in sec. 18, and VC-8 in sec. 27, T. 13 N., R. 100 W. (fig. 44; pl. 1). The coal-bearing segments of the cores were described and logged by Roehler (this volume, chap. C, fig. 37). Each core then was reexamined megascopically and separated into gross lithologic segments, mainly coal and mudstone. Bulk-density information obtained from the electric logs was used to substantiate this first segregation. The segments were then further divided into lithologic subunits on the basis of the frequency and ·
brightness of bands in the coal, friability, mineral-rich layers, and hardness. Twenty samples of coal were thus segregated from the three cores, each consisting of a single lithologic unit except for sample VC-7-3, which contains two lithologic units as indicated by the bulkdensity log. Six mudstone interbeds, roofs, or partings also were identified and sampled, as shown in figure 45.
For the analyses described in this chapter, approxi-mately one-quarter of each core was used; the remaining quarters were used for additional analyses by other investigators (results described in chapters D, E, G, H, and 1). Fragments of coal from core VC-7 were separated for mineral analysis and a sample block approximately % inch on each side was cut from sample VC-7-4 for analysis with the electron microprobe. The remaining amount of each sample was then ground to -20 mesh and was subsequently split by a riffler into six fractions: one for storage and one each for determining sulfur species, petrographic composition, density, low-temperature ash, and high-temperature ash (fig. 46).
PETROGRAPHIC ANALYSIS
Coal is composed of two major catagories of petrographic entities: (1) macerals, which are the remains of plant material, and (2) minerals, which may originate from elements originally contained in plants, precipitates from solutions, or detrital grains. The primary variables responsible for the formation of macerals and minerals in coal are (1) the types of plants that contribute to the bulk of the peat material; (2) the degree of degradation of the accumulated plant material; (3) the elements contained in the plants; (4) the hydrogeologic conditions that control the chemistry of percolating and connate waters; (5) sediment influx into the swamp; and (6) the resulting physical and chemical coalification.
107
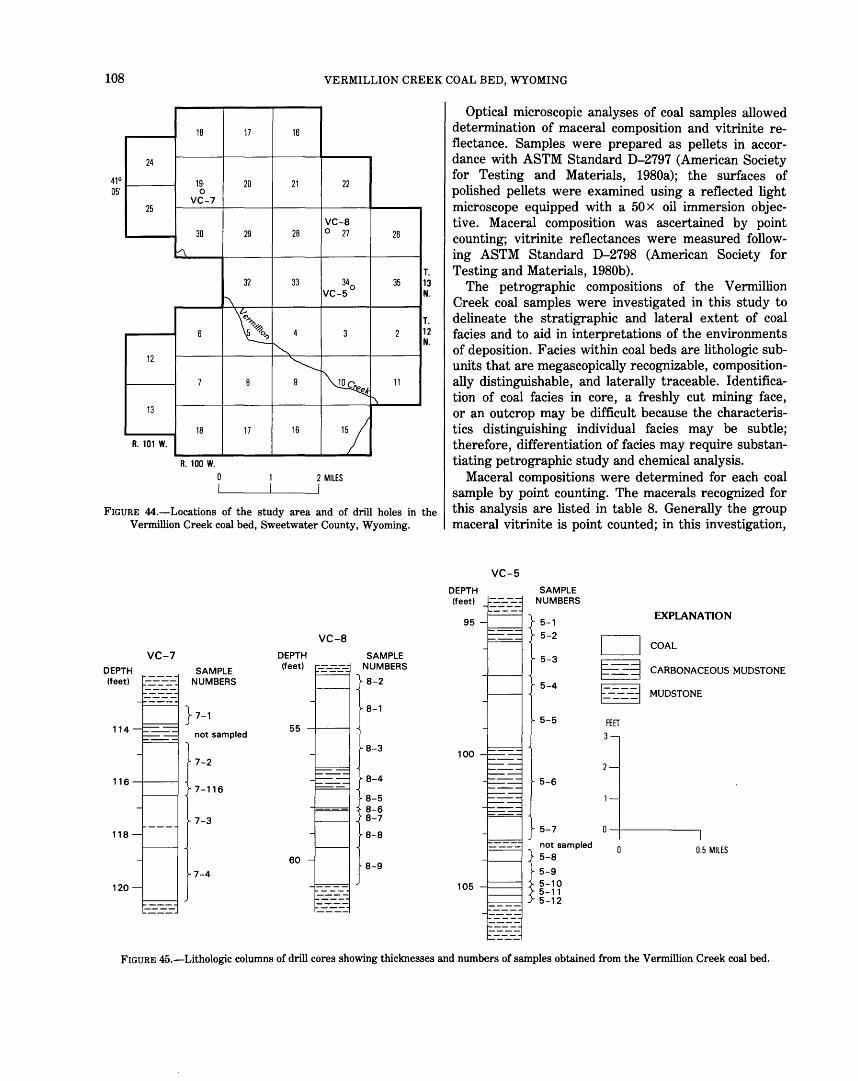
108 VERMILLION CREEK COAL BED, WYOMING
41° 05'
24
25
12
13
R. 101 W.
18
19 0
VC-7
30
"'\.
6
7
18
R. 100 W.
17
20
29
32
1\
~ 8
17
0
16
21 22
VC-8 28 0 27
33 340 VC-5
4 3
"" ~ 9 k If
16 '1 2 MILES
26
35
2
11
1\
T. 13 N.
1 T. 2
N.
FIGURE 44.-Locations of the study area and of drill holes in the Vermillion Creek coal bed, Sweetwater County, Wyoming.
VC-8 VC-7 DEPTH SAMPLE
DEPTH SAMPLE (feet) NUMBERS
(feet) NUMBERS 8-2
} 7-1 8-1
114 not sampled 55
8-3
7-2
116 8-4 7-116
8-5 8-6
7-3 8-7
118 8-8
60 8-9
7-4 120
Optical microscopic analyses of coal samples allowed determination of maceral composition and vitrinite reflectance. Samples were prepared as pellets in accordance with ASTM Standard D-2797 (American Society for Testing and Materials, 1980a); the surfaces of polished pellets were examined using a reflected light microscope equipped with a 50x oil immersion objective. Maceral composition was ascertained by point counting; vitrinite reflectances were measured following ASTM Standard D-2798 (American Society for Testing and Materials, 1980b).
The petrographic compositions of the Vermillion Creek coal samples were investigated in this study to delineate the stratigraphic and lateral extent of coal facies and to aid in interpretations of the environments of deposition. Facies within coal beds are lithologic subunits that are megascopically recognizable, compositionally distinguishable, and laterally traceable. Identification of coal facies in core, a freshly cut mining face, or an outcrop may be difficult because the characteristics distinguishing individual facies may be subtle; therefore, differentiation of facies may require substantiating petrographic study and chemical analysis.
Maceral compositions were determined for each coal sample by point counting. The macerals recognized for this analysis are listed in table 8. Generally the group maceral vitrinite is point counted; in this investigation,
VC-5 DEPTH SAMPLE (feet) NUMBERS
95 5-1 EXPLANATION
5-2 D COAL
5-3
~ CARBONACEOUS MUDSTONE
5-4
~ MUDSTONE -
5-5
100
5-6
5-7 ---
1 ~~~ •ampled 0.5 MILES
5-9
105 5-10 5-11 5-12
FIGURE 45.-Lithologic columns of drill cores showing thicknesses and numbers of samples obtained from the Vermillion Creek coal bed.
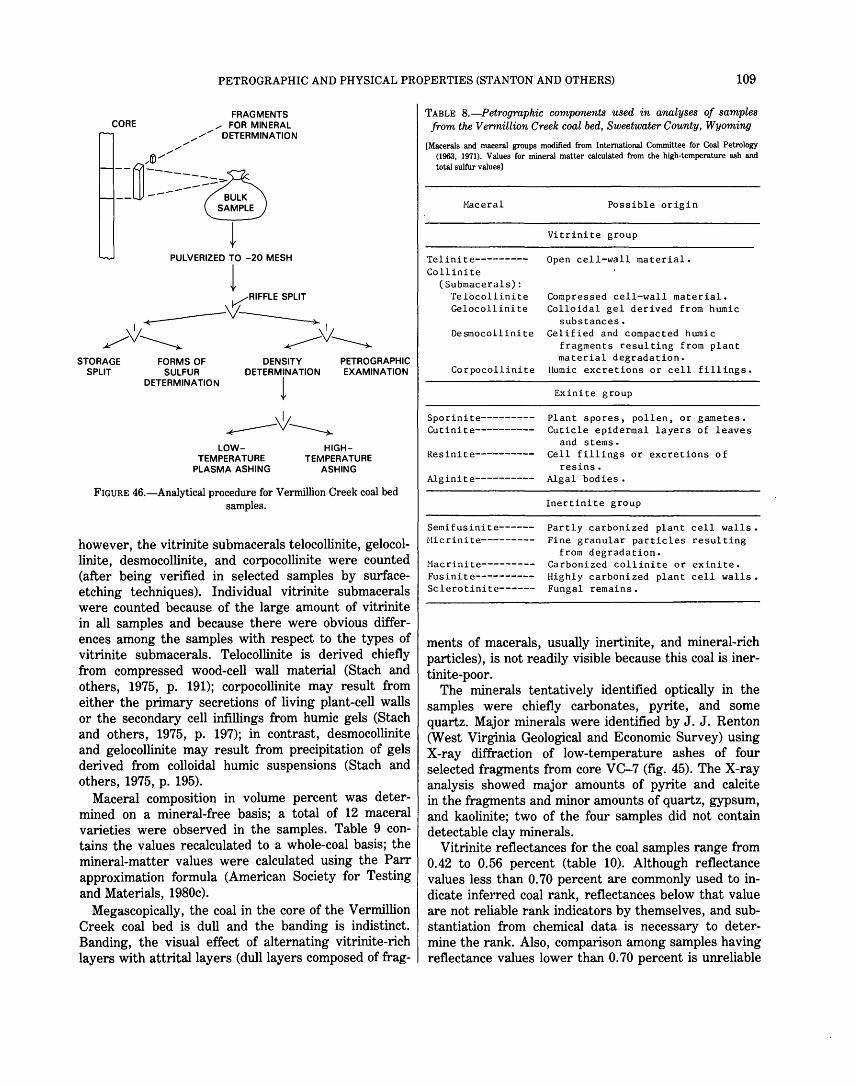
PETROGRAPHIC AND PHYSICAL PROPERTIES (STANTON AND OTHERS) 109
CORE
t PULVERIZED TO -20 MESH
l ~RIFFLE SPLIT
1~\/~1 ~\/------.,_ ~'\/~
STORAGE SPLIT
FORMS OF SULFUR
DETERMINATION
DENSITY PETROGRAPHIC DETERMINATION EXAMINATION
LOWTEMPERATURE
PLASMA ASHING
l
HIGHTEMPERATURE
ASHING
FIGURE 46.-Analytical procedure for Vermillion Creek coal bed samples.
however, the vitrinite submacerals telocollinite, gelocollinite, desmocollinite, and corpocollinite were counted (after being verified in selected samples by surfaceetching techniques). Individual vitrinite submacerals were counted because of the large amount of vitrinite in all samples and because there were obvious differences among the samples with respect to the types of vitrinite submacerals. Telocollinite is derived chiefly from compressed wood-cell wall material (Stach and others, 1975, p. 191); corpocollinite may result from either the primary secretions of living plant-cell walls or the secondary cell infillings from humic gels (Stach and others, 1975, p. 197); in contrast, desmocollinite and gelocollinite may result from precipitation of gels derived from colloidal humic suspensions (Stach and others, 1975, p. 195).
Maceral composition in volume percent was determined on a mineral-free basis; a total of 12 maceral varieties were observed in the samples. Table 9 contains the values recalculated to a whole-coal basis; the mineral-matter values were calculated using the Parr approximation formula (American Society for Testing and Materials, 1980c).
Megascopically, the coal in the core of the Vermillion Creek coal bed is dull and the banding is indistinct. Banding, the visual effect of alternating vitrinite-rich layers with attritallayers (dull layers composed of frag-
TABLE B.-Petrographic components used in analyses of samples from the Vermillion Creek coal bed, Sweetwater County, Wyoming
[Macerals and maceral groups modified from International Committee for Coal Petrology (1963, 1971). Values for mineral matter calculated from the high-temperature ash and total sulfur values]
Maceral
Telinite--------Collinite
(Submacerals): Telocollinite Gelocollinite
De smocollini te
Corpoco.llinite
Sporinite--------Cutinite----------
Resinite----------
Alginite----------
Possible origin
Vitrinite group
Open cell-wall material.
Compressed cell-wall material. Colloidal gel derived from humic
substances. Gelified and compacted humic
fragments resulting from plant material degradation.
l~mic excretions or cell fillings.
Exinite group
Plant spores, pollen, or gametes. Cuticle epidermal layers of leaves
and stems. Cell fillings or excretions of
resins. Algal bodies •
Inertinite group
Semifusinite------ Partly carbonized plant cell walls. Micrinite--------- Fine granular particles resulting
from degradation. Macrinite--------- Carbonized collinite or exinite. Fusinite---------- Highly carbonized plant cell walls. Sclerotinite------ Fungal remains.
ments of macerals, usually inertinite, and mineral-rich particles), is not readily visible because this coal is inertinite-poor.
The minerals tentatively identified optically in the samples were chiefly carbonates, pyrite, and some quartz. Major minerals were identified by J. J. Renton (West Virginia Geological and Economic Survey) using X-ray diffraction of low-temperature ashes of four selected fragments from core VC-7 (fig. 45). The X-ray analysis showed major amounts of pyrite and calcite in the fragments and minor amounts of quartz, gypsum, and kaolinite; two of the four samples did not contain detectable clay minerals.
Vitrinite reflectances for the coal samples range from 0.42 to 0.56 percent (table 10). Although reflectance values less than 0. 70 percent are commonly used to indicate inferred coal rank, reflectances below that value are not reliable rank indicators by themselves, and substantiation from chemical data is necessary to determine the rank. Also, comparison among samples having reflectance values lower than 0. 70 percent is unreliable

110 VERMILLION CREEK COAL BED, WYOMING
TABLE 9.-Maceral varieties and group summaries for 20 samples obtained from three cores of the Vermillion Creek coal bed
[All data in volume percent, whole-coal basis. T, less than 5 counts in 1000; -,less than 1 count in 1000]
Vitrinite Exinite Inertinite Group summary
'0 c ItS -Q) ItS QJ.&J Q) w..-t
Sample Q) .&J·~ .&J Q) ::s .&J ·~ c ·~ Q) Q) .&JS
No. ·~ c·~ c .&J .&J .&Jw c ·~..-I ·~ ·~ ·~ Q) ItS 0 ·~ ..-t..-1 ..-I Q) c Q) Q) c Q) .&J e~ ..-I ..-tO ..-I .&J Q) Q) Q) ·~ .&J .&J Q) ·~ .&J ·~ ..-I ou 0 ·~ .&J .&J .&J Ul ·~ ·~ .&J .&J ·~ Q) c ..-tw 0 uo u c ·~ ·~ ·~ ::s c c ·~ 0 c .&J ·~ ItS w u 0..-t 0 ·~ c c c ~ ·~ ·~ c w ·~ ·~ .&J wItS 0 S«l 0.. w ·~ ·~ ·~ ·~ '-I w ·~ Q) w c w Q)jl,
..-I Ult:TI w 0 .&J Ul 0'1 e u u Ul ..-I .&J ·~ Q) c-Q) Q) 0 0.. ::s Q) ..-I Q) ·~ ItS ::s u ·~ >C c ·~ 8 c u tJ) u p::: oCt tJ) ::£ ::£ rz.. tJ) ::> til H ::£
VC-5-1 67 5 10 1 1 4 -- 1 T T -- -- 82 6 1 11 3 43 5 38 T T 6 -- T 1 T -- -- 86 7 2 5 4 46 4 8 2 T 3 -- 1 -- -- T -- 58 5 1 36 5 61 6 15 1 T 8 T T 1 1 -- -- 81 9 1 9 7 44 14 26 1 T 3 -- 1 T T T -- 84 4 1 11 8 69 4 18 1 -- 3 -- 2 1 T -- -- 91 3 2 4 9 60 1 4 2 T 1 T T -- 1 -- -- 65 3 1 31
10 68 3 5 1 1 2 -- T -- -- -- -- 75 4 T 21 12 46 4 11 1 T 13 T 3 -- 1 T 1 60 15 5 20
Weighted average 1 54 6 20 1 T 5 -- 1 T T -- -- 80 6 2 14
VC-7-1 51 29 6 1 1 4 -- 1 -- 1 -- -- 86 6 1 7 2 48 -- 32 2 3 7 -- 1 T 1 -- -- 80 12 2 6
116 28 33 18 1 T 1 -- T -- -- -- -- 79 2 T 19 3 60 7 15 1 T 9 -- T T 1 -- -- 82 10 1 7 4 62 4 14 1 T 3 -- 1 1 1 -- T 80 5 3 12
weighted average 1 55 9 18 1 1 6 -- 1 1 1 -- -- 82 8 1 9
VC-8-1 68 5 14 1 1 5 -- T -- T T -- 87 7 1 5 3 63 3 19 1 1 5 -- 1 T T -- -- 85 7 2 6 5 30 19 38 T -- 7 -- 1 1 -- -- -- 87 7 2 4 7 74 5 11 1 T 2 -- T T -- -- -- 90 3 T 7 8 44 7 7 3 T 2 -- -- -- T -- -- 58 5 1 36 9 63 3 16 1 T 3 -- 1 -- -- T -- 82 5 1 12
Weighted average 1 59 6 17 1 1 4 -- 1 T T T -- 82 6 1 12
1Adjusted on the basis of sample thickness.
because differneces in values may not be significant. However, on the basis of reflectance data, the Vermillion Creek coal can be assigned an approximate rank within the subbituminous or high-volatile C bituminous range.
The weighted averages for each core (representing a complete coal bed sample) differ only slightly in maceral group content (vitrinite, exinite, inertinite) (table 9). However, when the submacerals of the vitrinite are considered, .the coal in core VC-8 contains, on the average, more telocollinite than coal in the other two cores.
All samples were observed using blue-light illumination for identification of the fluorescent, hydrogen-rich macerals (exinite). Resinite is the only exinite maceral variety observed in significant concentrations (greater
than 2 percent). Little, if any, alginite was recognized in the coal samples. Algae may have been in the depositional environment but were not preserved.
Inertinite macerals, particularly fusinite, are not common in the samples of the Vermillion Creek coal bed. Such macerals are believed to originate as a result of carbonization, usually due to dehydration or combustion (forest fires). The lack of these macerals suggests highly reducing, constantly wet conditions of the ancestral peat.
Many of the samples examined, particularly sample number VC-7-116, contain microconcretions of calcite (identified optically and later confirmed by X-ray) interlayered with the macerals (figs. 47A and B). Calcite cell fillings are scarce and cleat or fracture infillings

PETROGRAPHIC AND PHYSICAL PROPERTIES (STANTON AND OTHERS) 111
TABLE 10.-C hemical and physical properties of 26 samples obtained from three cores of the Vermillion Creek coal bed, Sweetwater County, 'wyoming
[--, not analyzed]
Sample number
Forms of sulfurl (weight percent of whole coal)
Organic Sulfate Pyritic Total
Density2 (g/cm3,
dry basis)
Ash content (weight pet of whole coal)
Low temp.3 ( <100°C)
High temp. 4
(7 50°C)
R 5 0
(pet)
Coal interval thickness (inches)
VC-5-1 2 3 4
5 6 7 8
9 10 11 12
Weighted avg.7
VC-7-1 2
116 3 4
Weighted avg.7
VC-8-2 1 3 4 5
6 7 8 9
Weighted avg. 7
3.58
4.64 2.64
4.12
5.14 4.74
2.61 2.90
4.27 4.11
3.63 4.31 2.27 4.36 4.27 4.17
5.22 5.17
4.08
4.84 2.43 4.60 4.51
1.75
1. 09 1.25
.27
.OS
.19
.58
.32
1.52 .76
.54
.27
.10
.09
.81
.34
.22
.33
.21
.12
.34
.71
.36
6. 77
2.20 3.57
1.07
.22 1.09
3.23 3.90
6.31 2.55
3.48 .91 .91 .47
1.84 1.21
1.42 1.08
1.73
.60 2.16 2.94 1. 77
12.1
7.93 7.36
5.46
5.41 6.02
6.42 7.13
12.1 7.4
7.65 5.49 2.69 4.92 6.92 5.74
6.86 6.58
6.03
5.56 4.93 8.25 6.64
1. 51 2.42 1.38 1.79
1.42
1.42 1.37
1.70 1.65 2.33 1.57 1. 51
1.41 1.39 1.64 1.39 1.47 1.44
2.05 1.37 1.38 2.09 1.38
1.91 1.40 1.58 1.41 1.42
16.1 92.4 14. 1 56.5
19.0 99.8 24.1
6 6.6
49.9 34.6 87.3 37.8 26.0
15.7 13.6 44.9 12.3 21.3 17.3
63.8 9.60
12.4 71.5 6.84
66.8 14.0 54.5 17.7 18.7
14.4 87.6
6.91 45.7
13. 1 91.3 16.1 4.05
41.0 29.1 86.2 24.9 18.3
7.89 8.31
29.3 9.67
16.5 12.3
42.0 5.18 8.09
59.7 4.37
51.6 9.21
47 .o 16.7 14.8
0.42
.45
.45
.47
.46
.41
.47
.45
.49
.56
.48
.49
.47
.so
.49
.49
.so
.47
.46
.48
6.0 6.0
15.6 8.4
12.0 3.0
10.8 4.8
9.6 2.4 3.6 3.6
8 73.2
8.4 18.0 6.0
24.0 24.0
8 88.8
6.0 18.0 18.0
.8 9.6
1. 2 4.8
12.0 16.8
8 85.2
Iu.s. Geological Survey analytical laboratories: project leader, F. Brown; anaylyst, H. Smith. 2sy helium gas comparison pycnometry; analyst, N. Teaford. 3sy oxygen plasma ashing (<150°C). 4Analysis performed following ASTM standard D-3174. SMean maximum vitrinite reflectance determined following ASTM Standard D-2798. Gvalue interpolated from regression of high-temperature ash values versus low-temperature ash values. 7weighted by respective coal thicknesses in core. 8Total coal bed thickness.
are absent. In other coal beds, epigenetic calcite commonly occurs as cleat or fracture linings, and syngenetic pyrite occurs as cell fillings in inertinite macerals. Because most of the calcite microconcretions observed in the Vermillion Creek coal samples are interbedded with bands of desmocollinite and gelocollinite (fig. 47B), the calcite in this coal bed is interpreted to have been deposited syngenetically.
The abundance of vitrinite macerals derived from humic gels (gelocollinite and desmocollinite) suggests a
high amount of organic degradation during the peat stage. Well-preserved peat, resulting in high amounts of telocollinite, would be expected in an environment of reducing acid conditions. In contrast, reducing but alkaline conditions (high pH, low Eh) would be most favorable for bacterial degradation of wood and a relative enrichment of resinite and sporinite, the more resistant exinite macerals (Cecil and others, 1982). The latter condition must have existed during development of the Vermillion Creek peat. Moreover, the water
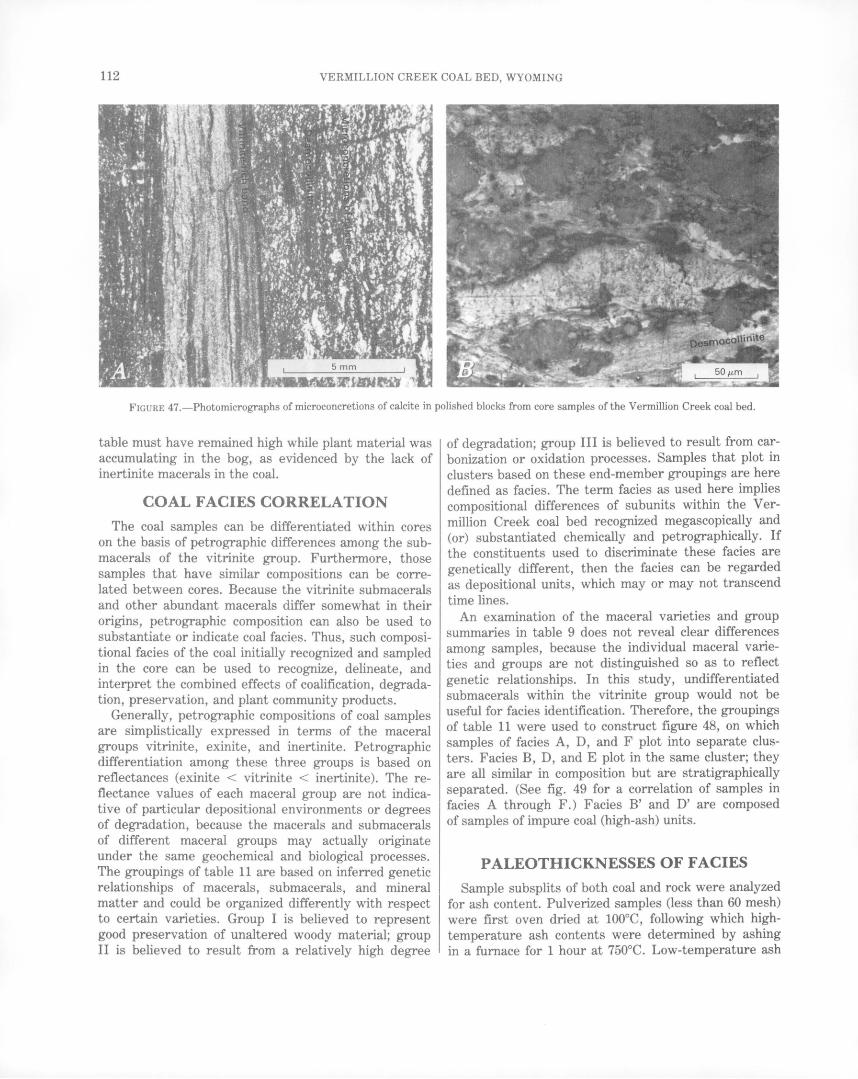
112 VERMILLION CREEK COAL BED, WYOMING
FIGURE 47 .-Photomicrographs of microconcretions of calcite in polished blocks from core samples of the Vermillion Creek coal bed.
table must have remained high while plant material was accumulating in the bog, as evidenced by the lack of inertinite macerals in the coal.
COAL FACIES CORRELATION
The coal samples can be differentiated within cores on the basis of petrographic differences among the submacerals of the vitrinite group. Furthermore, those samples that have similar compositions can be correlated between cores. Because the vitrinite submacerals and other abundant macerals differ somewhat in their origins, petrographic composition can also be used to substantiate or indicate coal facies. Thus, such compositional facies of the coal initially recognized and sampled in the core can be used to recognize, delineate, and interpret the combined effects of coalification, degradation, preservation, and plant community products.
Generally, petrographic compositions of coal samples are simplistically expressed in terms of the maceral groups vitrinite, exinite, and inertinite. Petrographic differentiation among these three groups is based on reflectances (exinite < vitrinite < inertinite). The reflectance values of each maceral group are not indicative of particular depositional environments or degrees of degradation, because the macerals and submacerals of different maceral groups may actually originate under the same geochemical and biological processes. The groupings of table 11 are based on inferred genetic relationships of macerals, submacerals, and mineral matter and could be organized differently with respect to certain varieties. Group I is believed to represent good preservation of unaltered woody material; group II is believed to result from a relatively high degree
of degradation; group III is believed to result from carbonization or oxidation processes. Samples that plot in clusters based on these end-member groupings are here defined as facies. The term facies as used here implies compositional differences of subunits within the V ermillion Creek coal bed recognized megascopically and (or) substantiated chemically and petrographically. If the constituents used to discriminate these facies are genetically different, then the facies can be regarded as depositional units, which may or may not transcend time lines.
An examination of the maceral varieties and group summaries in table 9 does not reveal clear differences among samples, because the individual maceral varieties and groups are not distinguished so as to reflect genetic relationships. In this study, undifferentiated submacerals within the vitrinite group would not be useful for facies identification. Therefore, the groupings of table 11 were used to construct figure 48, on which samples of facies A, D, and F plot into separate clusters. Facies B, D, and E plot in the same cluster; they are all similar in composition but are stratigraphically separated. (See fig. 49 for a correlation of samples in facies A through F.) Facies B' and D' are composed of samples of impure coal (high-ash) units.
PALEOTHICKNESSES OF FACIES
Sample subsplits of both coal and rock were analyzed for ash content. Pulverized samples (less than 60 mesh) were first oven dried at 100°C, following which hightemperature ash contents were determined by ashing in a furnace for 1 hour at 750°C. Low-temperature ash
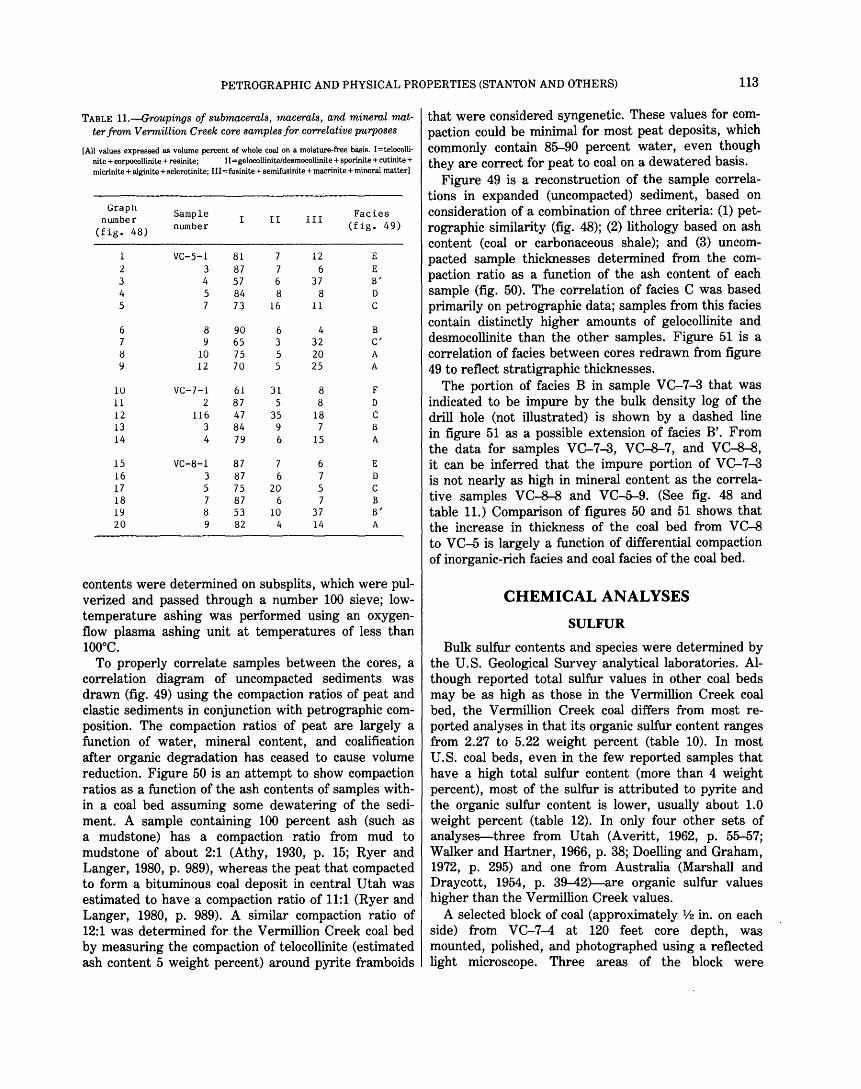
PETROGRAPHIC AND PHYSICAL PROPERTIES (STANTON AND OTHERS) 113
TABLE 11.-Groupings of submacerals, macerals, and mineral mat-ter from Vermillion Creek core samples for correlative purposes
[All values expressed as volume percent of whole coal on a moisture-free basis. I=telocolli-nite + corpocollinite + resinite; II= gelocollinite/desmocollinite + sporinite + cutinite + micrinite+ alginite+ sclerotinite; III= fusinite + semifusinite + macrinite +mineral matter]
Graph Sample Facies number I II III (fig. 48) number (fig. 49)
VC-5-1 81 7 12 E
2 3 87 7 6 E 3 4 57 6 37 B' 4 5 84 8 8 D 5 7 73 16 11 c
6 8 90 6 4 B 7 9 65 3 32 C' 8 10 75 5 20 A 9 12 70 5 25 A
10 VC-7-1 61 31 8 F 11 2 87 5 8 D 12 116 47 35 18 c 13 3 84 9 7 B 14 4 79 6 15 A
15 VC-8-1 87 7 6 E
16 3 87 6 7 D 17 5 75 20 5 c 18 7 87 6 7 B 19 8 53 10 37 B' 20 9 82 4 14 A
contents were determined on subsplits, which were pulverized and passed through a number 100 sieve; lowtemperature ashing was performed using an oxygenflow plasma ashing unit at temperatures of less than 100°C.
To properly correlate samples between the cores, a correlation diagram of uncompacted sediments was drawn (fig. 49) using the compaction ratios of peat and clastic sediments in conjunction with petrographic composition. The compaction ratios of peat are largely a function of water, mineral content, and coalification after organic degradation has ceased to cause volume reduction. Figure 50 is an attempt to show compaction ratios as a function of the ash contents of samples within a coal bed assuming some dewatering of the sediment. A sample containing 100 percent ash (such as a mudstone) has a compaction ratio from mud to mudstone of about 2:1 (Athy, 1930, p. 15; Ryer and Langer, 1980, p. 989), whereas the peat that compacted to form a bituminous coal deposit in central Utah was estimated to have a compaction ratio of 11:1 (Ryer and Langer, 1980, p. 989). A similar compaction ratio of 12:1 was determined for the Vermillion Creek coal bed by measuring the compaction of telocollinite (estimated ash content 5 weight percent) around pyrite framboids
that were considered syngenetic. These values for compaction could be minimal for most peat deposits, which commonly contain 85-90 percent water, even though they are correct for peat to coal on a dewatered basis.
Figure 49 is a reconstruction of the sample correlations in expanded (uncompacted) sediment, based on consideration of a combination of three criteria: (1) petrographic similarity (fig. 48); (2) lithology based on ash content (coal or carbonaceous shale); and (3) uncompacted sample thicknesses determined from the compaction ratio as a function of the ash content of each sample (fig. 50). The correlation of facies C was based primarily on petrographic data; samples from this facies contain distinctly higher amounts of gelocollinite and desmocollinite than the other samples. Figure 51 is a correlation of facies between cores redrawn from figure 49 to reflect stratigraphic thicknesses.
The portion of facies B in sample VC-7-3 that was indicated to be impure by the bulk density log of the drill hole (not illustrated) is shown by a dashed line in figure 51 as a possible extension of facies B'. From the data for samples VC-7-3, VC-8-7, and VC-8-8, it can be inferred that the impure portion of VC-7-3 is not nearly as high in mineral content as the correlative samples VC-8-8 and VC-5-9. (See fig. 48 and table 11.) Comparison of figures 50 and 51 shows that the increase in thickness of the coal bed from V C-8 to VC-5 is largely a function of differential compaction of inorganic-rich facies and coal facies of the coal bed.
CHEMICAL ANALYSES
SULFUR
Bulk sulfur contents and species were determined by the U.S. Geological Survey analytical laboratories. Although reported total sulfur values in other coal beds may be as high as those in the Vermillion Creek coal bed, the Vermillion Creek coal differs from most reported analyses in that its organic sulfur content ranges from 2.27 to 5.22 weight percent (table 10). In most U.S. coal beds, even in the few reported samples that have a high total sulfur content (more than 4 weight percent), most of the sulfur is attributed to pyrite and the organic sulfur content is lower, usually about 1.0 weight percent (table 12). In only four other sets of analyses-three from Utah (Averitt, 1962, p. 55-57; Walker and Hartner, 1966, p. 38; Doelling and Graham, 1972, p. 295) and one from Australia (Marshall and Draycott, 1954, p. 39-42)--are organic sulfur values higher than the Vermillion Creek values.
A selected block of coal (approximately Y2 in. on each side) from VC-7-4 at 120 feet core depth, was mounted, polished, and photographed using a reflected light microscope. Three areas of the block were
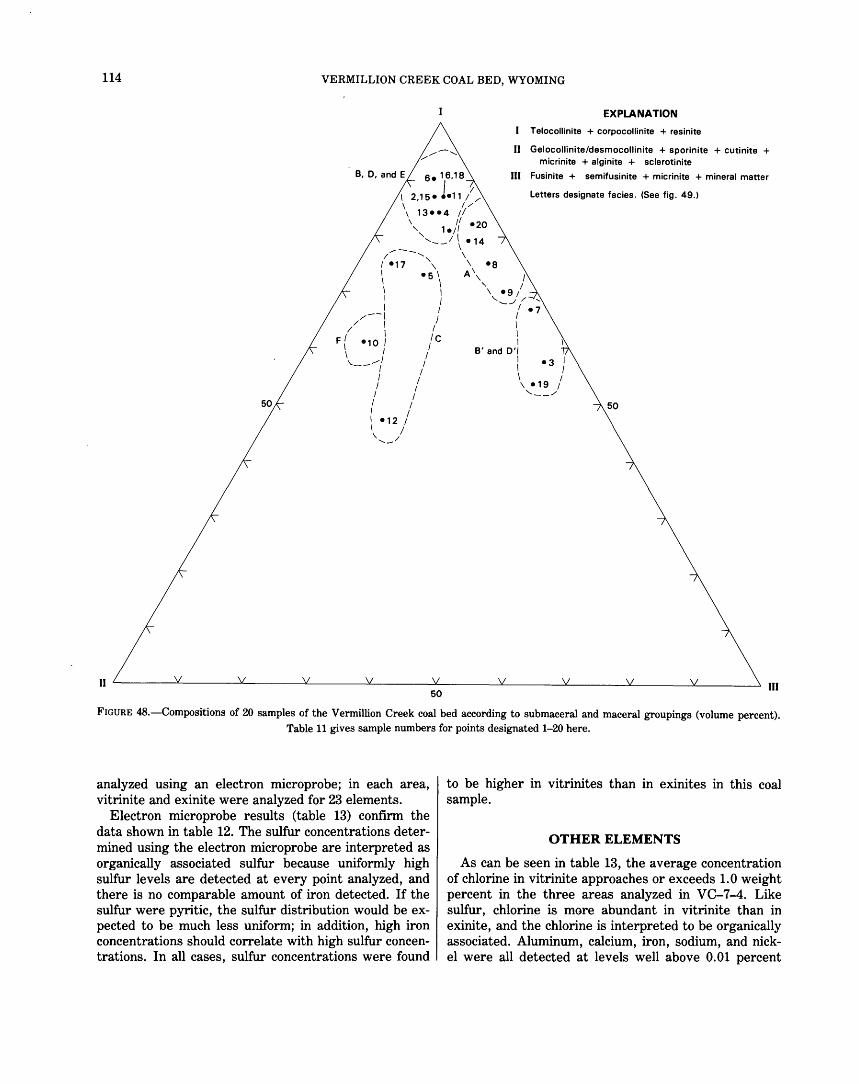
114 VERMILLION CREEK COAL BED, WYOMING
,...- ....... /
EXPLANATION
Telocollinite + corpocollinite + resinite
II Gelocollinite/desmocollinite + sporinite + cutinite + micrinite + alginite + sclerotinite
B,D,andE 6 .16,18
\ 2,15 .1.11 //
Ill Fusinite + semifusinite + micrinite + mineral matter
Letters designate facies. (See fig. 49.) \ I' \ 13••4 II \ II •20 ' 1e;/ '-, I\ • 14 -~ \
50
II
------/ ' I •11 "\ I •5 \ I \ \ I I I I I
--I /./ I j
/ I I F/ •101 IC
I 1 I \ I '- .---1 I --I
I I I I I I I I I / I •12 I I I \ / '-~
50
\
' •a A\ '- I
\ •91 '-..__../ r '
I • 7 I I I I
B' and D'l I •3 I I I I \ •19 1 , __ ./
50
Ill
FIGURE 48.-Compositions of 20 samples of the Vermillion Creek coal bed according to submaceral and maceral groupings (volume percent). Table 11 gives sample numbers for points designated 1-20 here.
analyzed using an electron microprobe; in each area, vitrinite and exinite were analyzed for 23 elements.
Electron microprobe results (table 13) confirm the data shown in table 12. The sulfur concentrations determined using the electron microprobe are interpreted as organically associated sulfur because uniformly high sulfur levels are detected at every point analyzed, and there is no comparable amount of iron detected. If the sulfur were pyritic, the sulfur distribution would be expected to be much less uniform; in addition, high iron concentrations should correlate with high sulfur concentrations. In all cases, sulfur concentrations were found
to be higher in vitrinites than in exinites in this coal sample.
OTHER ELEMENTS
As can be seen in table 13, the average concentration of chlorine in vitrinite approaches or exceeds 1. 0 weight percent in the three areas analyzed in VC-7-4. Like sulfur, chlorine is mare abundant in vitrinite than in exinite, and the chlorine is interpreted to be organically associated. Aluminum, calcium, iron, sodium, and nickel were all detected at levels well above 0.01 percent
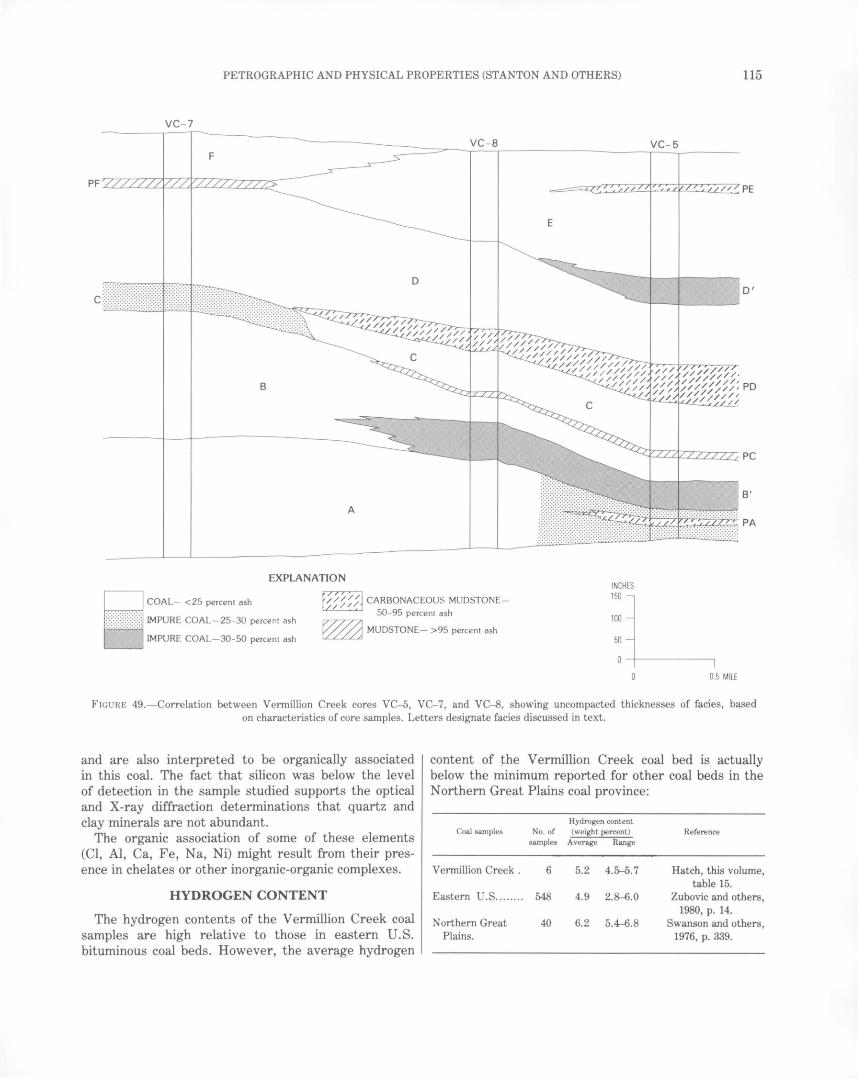
PETROGRAPHIC AND PHYSICAL PROPERTIES (STANTON AND OTHERS) 115
VC - 7
EXPLANATION
CARBONACEOUS MUDSTONE-50 -95 percent ash
~ MUDSTONE- >95 percent ash
E
VC-5
INCHES
150L 100 50 0 0.5 MILE
FIGURE 49.-Correlation between Vermillion Creek cores VC-5, VC-7, and VC-8, showing uncompacted thicknesses of facies, based on characteristics of core samples. Letters designate facies discussed in text.
and are also interpreted to be organically associated in this coal. The fact that silicon was below the level of detection in the sample studied supports the optical and X-ray diffraction determinations that quartz and clay minerals are not abundant.
The organic association of some of these elements (Cl, AI, Ca, Fe, Na, Ni) might result from their presence in chelates or other inorganic-organic complexes.
HYDROGEN CONTENT
The hydrogen contents of the Vermillion Creek coal samples are high relative to those in eastern U.S. bituminous coal beds. However, the average hydrogen
content of the Vermillion Creek coal bed is actually below the minimum reported for other coal beds in the Northern Great Plains coal province:
Hydrogen content Coal samples No. of (weight percent) Reference
samples Average Range
Vermillion Creek . 6 5.2 4.5-5.7 Hatch, this volume, table 15.
Eastern U.S ........ 548 4.9 2.8-6.0 Zubovic and others, 1980, p. 14.
Northern Great 40 6.2 5.4-6.8 Swanson and others, Plains. 1976, p. 339.
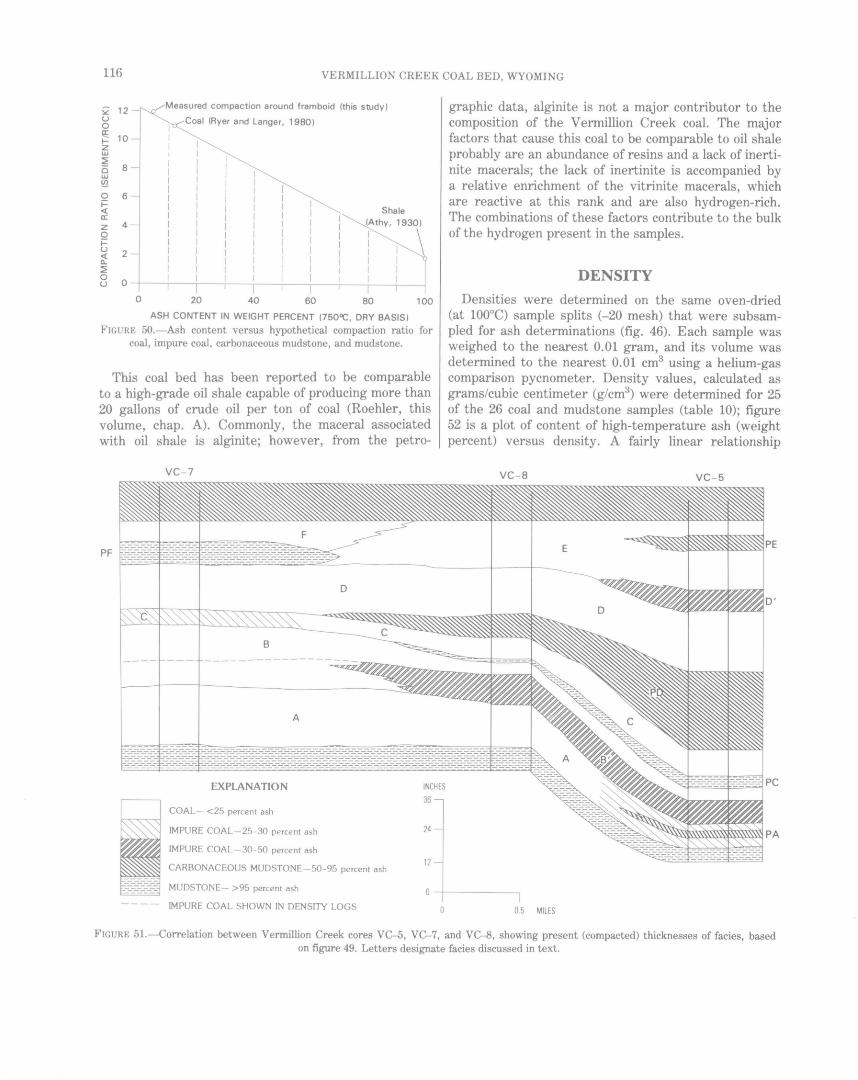
116 VERMILLION CREEK COAL BED, WYOMING
~ u 0 ~ I-z w ::!: 5 w !a 0 i= <( a: z 0 i= u <( ~
::!: 0 u
12
10
8
6
4
2
0
0
Measured compaction around framboid (this study)
Coal (Ryer and Langer, 1980)
Shale (A thy, 1930)
20 40 60 80 100
ASH CONTENT IN WEIGHT PERCENT (7500C, DRY BASIS)
FIGURE 50.-Ash content versus hypothetical compaction ratio for coal, impure coal, carbonaceous mudstone, and mudstone.
This coal bed has been reported to be comparable to a high-grade oil shale capable of producing more than 20 gallons of crude oil per ton of coal (Roehler, this volume, chap. A). Commonly, the maceral associated with oil shale is alginite; however, from the petro-
VC - 7
A
EXPLANATION
COAL- <25 percent ash
IMPURE COAL - 25 - 30 percent ash
IMPURE COAL- 30 - 50 percent ash
CARBONACEOUS MUDSTONE - 50 -95 percent ash
MUDSTONE- >95 percent ash
IMPURE COAL SHOWN IN DENSITY LOGS
INCHES
36
24
12
graphic data, alginite is not a major contributor to the composition of the Vermillion Creek coal. The major factors that cause this coal to be comparable to oil shale probably are an abundance of resins and a lack of inertinite macerals; the lack of inertinite is accompanied by a relative enrichment of the vitrinite macerals, which are reactive at this rank and are also hydrogen-rich. The combinations of these factors contribute to the bulk of the hydrogen present in the samples.
DENSITY
Densities were determined on the same oven-dried (at 100°C) sample splits (-20 mesh) that were subsampled for ash determinations (fig. 46). Each sample was weighed to the nearest 0.01 gram, and its volume was determined to the nearest 0.01 cm3 using a helium-gas comparison pycnometer. Density values, calculated as grams/cubic centimeter (g/cm3) were determined for 25 of the 26 coal and mudstone samples (table 10); figure 52 is a plot of content of high-temperature ash (weight percent) versus density. A fairly linear relationship
VC-8 VC-5
0.5 MILES
FIGURE 51.-Correlation between Vermillion Creek cores VC-5, VC-7, and VG---8, showing present (compacted) thicknesses of facies, based on figure 49. Letters designate facies discussed in text.
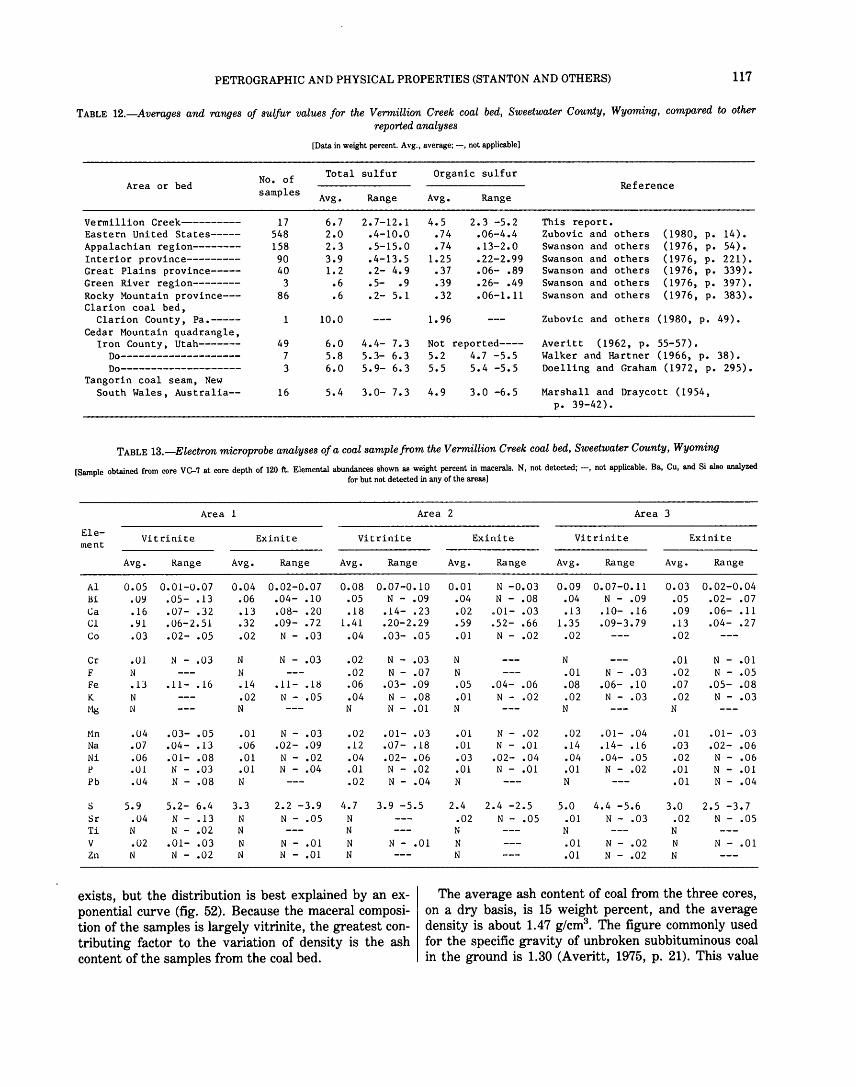
PETROGRAPHIC AND PHYSICAL PROPERTIES (STANTON AND OTHERS) 117
TABLE 12.-Averages and ranges of sulfur values for the Vermillion Creek coal bed, Sweetwater County, Wyoming, compared to other reported analyses
[Data in weight percent. Avg., average;--, not applicable]
No. of Total sulfur Organic sulfur Area or bed
samples Reference
Avg. Range Avg. Range
Vermillion Creek---------- 17 6.7 2.7-12.1 4.5 2.3 -5.2 This report. Eastern United States----- 548 2.0 .4-10.0 • 74 .06-4.4 Zubovic and others (1980, p. 14). Appalachian region-------- 158 2.3 .5-15.0 .74 .13-2.0 Swanson and others (1976, p. 54). Interior province--------- 90 3.9 .4-13.5 1.25 .22-2.99 Swanson and others (1976, p. 221). Great Plains province----- 40 1.2 • 2- 4.9 .37 .06- .89 Swanson and others (1976, P• 339). Green River region-------- 3 .6 .s- .9 .39 .26- .49 Swanson and others (1976, p. 397). Rocky Mountain province--- 86 .6 .2- 5.1 .32 .06-1.11 Swanson and others (1976, P• 383). Clarion coal bed,
Clarion County, Pa.----- 10.0 1.96 Zubovic and others (1980, p. 49). Cedar Mountain quadrangle,
Iron County, Utah------- 49 6.0 4.4- 7.3 Not reported---- Averitt (1962, p. 55-57). Do-------------------- 7 5.8 5.3- 6.3 5.2 4.7 -5.5 Walker and Hartner (1966, p. 38). Do-------------------- 3 6.0 5.9- 6.3 s.s 5.4 -5.5 Doelling and Graham (1972, p. 295).
Tangorin coal seam, New South Wales, Australia-- 16 5.4 3.0- 7.3 4.9 3.0 -6.5 Marshall and Draycott (1954,
p. 39-42).
TABLE 13.-Electron microprobe analyses of a coal sample from the Vermillion Creek coal bed, Sweetwater County, Wyoming
[Sample obtained from core VC-7 at core depth of 120 ft. Elemental abundances shown as weight percent in macerals. N, not detected; --, not applicable. Ba, Cu, and Si also analyzed for but not detected in any of the areas]
Area Area 2 Area 3
Ele-ment Vitrinite Exinite Vitrinite Exinite Vitrinite Exinite
Avg. Range Avg. Range Avg. Range Avg. Range Avg. Range Avg. Range
Al o.os 0.01-0.07 0.04 0.02-0.07 0.08 0.07-0.10 0.01 N -0.03 0.09 0.07-0.11 0.03 0.02-0.04 Hi .o~ .os- .13 .06 .04- .10 .05 N - .09 .04 N - .08 .04 N - .09 .os .02- .07 Ca .16 .07- .32 .13 .08- .20 .18 .14- .23 .02 .01- .03 .13 .10- .16 .09 .06- .11 Cl .91 .06-2.51 .32 .09- .72 1.41 .20-2.29 .59 .52- .66 1.35 .09-3.79 .13 .04- .2 7 Co .03 .02- .05 .02 N - .03 .04 .03- .05 .01 N - .02 .02 .02
Cr .01 N - .03 N N - .03 .02 N - .03 N N .01 N - .01 F N N .02 N - .07 N .01 N - .03 .02 N - .os Fe .13 .11- .16 .14 .11- .18 .06 .03- .09 .05 .04- .06 .08 .06- .10 .07 .05- .08 K N .02 N - .05 .04 N - .08 .01 N - .02 .02 N - .03 .02 N - .03 Mg N N N N - .01 N N N
t-1n .04 .03- .05 .01 N - .03 .02 .01- .03 .01 N - .02 .02 .01- .04 .01 .01- .03 Na .07 .04- .13 .06 .02- .09 .12 .07- .18 .01 N - .01 .14 .14- .16 .03 .02- .06 Ni .06 .01- .08 .01 N - .02 .04 .02- .06 .03 .02- .04 .04 .04- .OS .02 N - .06 l:' .01 N - .03 .01 N - .04 .01 N - .02 .01 N - .01 .01 N - .02 .01 N - .o 1 Pb .04 N - .08 N .02 N - .04 N N .01 N - .04
s 5.9 5.2- 6.4 3.3 2.2 -3.9 4.7 3.9 -5.5 2.4 2.4 -2.5 5.0 4.4 -5.6 3.0 2.5 -3.7 Sr .04 N - .13 N N - .05 N Ti N N - .02 N N v .02 .01- .03 N N - .01 N N -Zn N N - .02 N N - .01 N
exists, but the distribution is best explained by an exponential curve (fig. 52). Because the maceral composition of the samples is largely vitrinite, the greatest contributing factor to the variation of density is the ash content of the samples from the coal bed.
.02 N - .05 .01 N - .03 .02 N - .05 N N N
.01 N .01 N - .02 N N - .01 N .01 N - .02 N
The average ash content of coal from the three cores, on a dry basis, is 15 weight percent, and the average density is about 1.47 g/cm3
• The figure commonly used for the specific gravity of unbroken subbituminous coal in the ground is 1.30 (Averitt, 1975, p. 21). This value
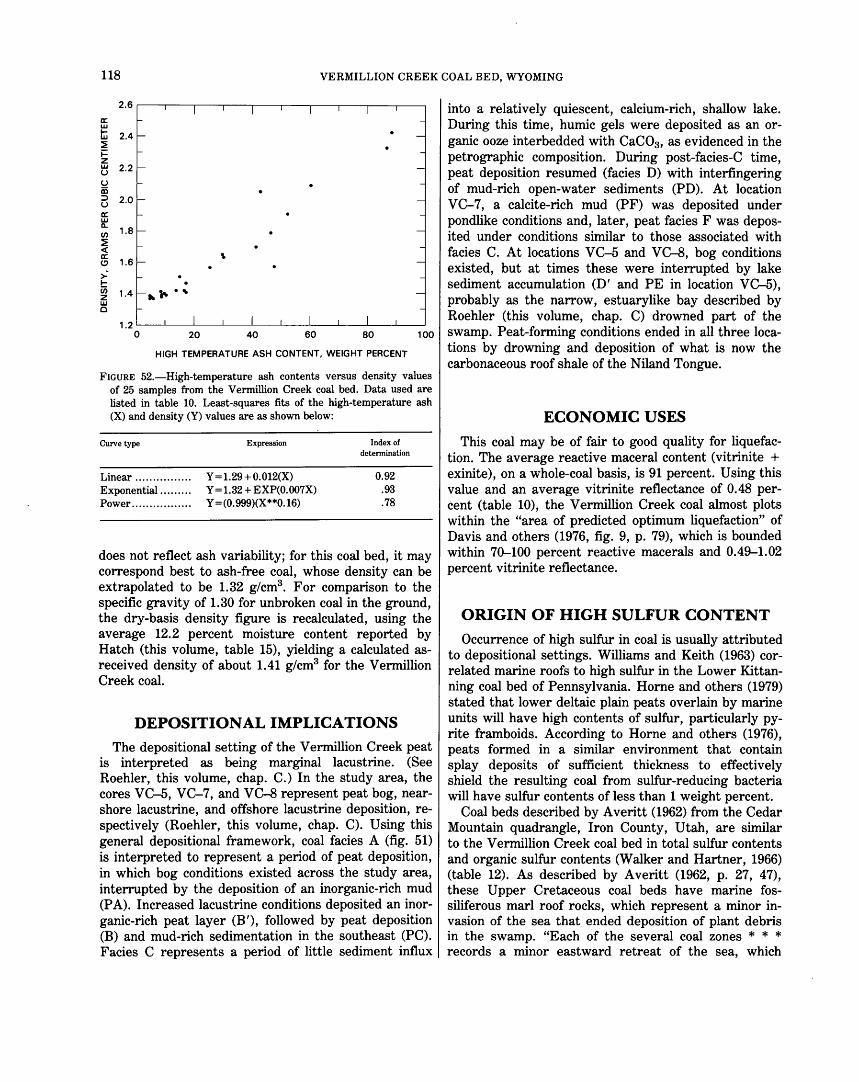
118 VERMILLION CREEK COAL BED, WYOMING
2.6
a: w t:i 2.4 ::::;: i= z w 2.2 u u iii :> 2.0 u a: w ll..
1.8 (/)
::::;: <(
' a: 1.6 (!)
> 1-ii) 1.4 ... "" . ' z w 0
1.2 0 20 40 60 80 100
HIGH TEMPERATURE ASH CONTENT, WEIGHT PERCENT
FIGURE 52.-High-temperature ash contents versus density values of 25 samples from the Vermillion Creek coal bed. Data used are listed in table 10. Least-squares fits of the high-temperature ash (X) and density (Y) values are as shown below:
Curve type
Linear ............... . Exponential ........ . Power ................ .
Expression
Y = 1.29 + 0.012(X) Y = 1.32 + EXP(O. 007X) Y = (0. 999)(X**0.16)
Index of detennination
0.92 .93 .78
does not reflect ash variability; for this coal bed, it may correspond best to ash-free coal, whose density can be extrapolated to be 1.32 g/cm3
• For comparison to the specific gravity of 1.30 for unbroken coal in the ground, the dry-basis density figure is recalculated, using the average 12.2 percent moisture content reported by Hatch (this volume, table 15), yielding a calculated asreceived density of about 1.41 g/cm3 for the Vermillion Creek coal.
DEPOSITIONAL IMPLICATIONS
The depositional setting of the Vermillion Creek peat is interpreted as being marginal lacustrine. (See Roehler, this volume, chap. C.) In the study area, the cores VC-5, VC-7, and VC-8 represent peat bog, nearshore lacustrine, and offshore lacustrine deposition, respectively (Roehler, this volume, chap. C). Using this general depositional framework, coal facies A (fig. 51) is interpreted to represent a period of peat deposition, in which bog conditions existed across the study area, interrupted by the deposition of an inorganic-rich mud (P A). Increased lacustrine conditions deposited an inorganic-rich peat layer (B'), followed by peat deposition (B) and mud-rich sedimentation in the southeast (PC). Facies C represents a period of little sediment influx
into a relatively quiescent, calcium-rich, shallow lake. During this time, humic gels were deposited as an organic ooze interbedded with CaC03, as evidenced in the petrographic composition. During post-facies-C time, peat deposition resumed (facies D) with interfingering of mud-rich open-water sediments (PD). At location VC-7, a calcite-rich mud (PF) was deposited under pondlike conditions and, later, peat facies F was deposited under conditions similar to those associated with facies C. At locations VC-5 and VC-8, bog conditions existed, but at times these were interrupted by lake sediment accumulation (D' and PE in location VC-5), probably as the narrow, estuary like bay described by Roehler (this volume, chap. C) drowned part of the swamp. Peat-forming conditions ended in all three locations by drowning and deposition of what is now the carbonaceous roof shale of the Niland Tongue.
ECONOMIC USES
This coal may be of fair to good quality for liquefaction. The average reactive maceral content (vitrinite + exinite), on a whole-coal basis, is 91 percent. Using this value and an average vitrinite reflectance of 0.48 percent (table 10), the Vermillion Creek coal almost plots within the "area of predicted optimum liquefaction" of Davis and others (1976, fig. 9, p. 79), which is bounded within 70-100 percent reactive macerals and 0.49-1.02 percent vitrinite reflectance.
ORIGIN OF HIGH SULFUR CONTENT
Occurrence of high sulfur in coal is usually attributed to depositional settings. Williams and Keith (1963) correlated marine roofs to high sulfur in the Lower Kittanning coal bed of Pennsylvania. Horne and others (1979) stated that lower deltaic plain peats overlain by marine units will have high contents of sulfur, particularly pyrite framboids. According to Horne and others (1976), peats formed in a similar environment that contain splay deposits of sufficient thickness to effectively shield the resulting coal from sulfur-reducing bacteria will have sulfur contents of less than 1 weight percent.
Coal beds described by Averitt (1962) from the Cedar Mountain quadrangle, Iron County, Utah, are similar to the Vermillion Creek coal bed in total sulfur contents and organic sulfur contents (Walker and Hartner, 1966) (table 12). As described by Averitt (1962, p. 27, 47), these Upper Cretaceous coal beds have marine fossiliferous marl roof rocks, which represent a minor invasion of the sea that ended deposition of plant debris in the swamp. "Each of the several coal zones * * * records a minor eastward retreat of the sea, which
PETROGRAPHIC AND PHYSICAL PROPERTIES (STANTON AND OTHERS) 119
created for a short time the nearshore swampy environment necessary for plant accumulation" (Averitt, 1962, p. 27). A similar stratigraphic relation in the Greta coal measures of New South Wales, Australia, is described by Marshall and Draycott (1954, p. 2). The highorganic-sulfur Tangorin seam lies between Permian marine rocks. Marshall and Draycott (1954, p. 4, 33) petrographically characterized the vitrinite of the Tangorin seam as lacking well-preserved cellular tissues and as being predominantly a variety of vitrinite that resulted from a generally high degree of disintegration, which is directly associated with an unusually high organic-sulfur content.
Although Marshall and Draycott (1954) and Averitt (1962) did not discuss the causes for the high organicsulfur contents, the implication of their descriptions is that associated marine waters may have been the primary source of the sulfur.
In marked contrast, the Vermillion Creek coal bed is not overlain by marine units and is not associated with a marine environment. Moreover, pyrite framboids are the dominant form of sulfides in all of the Vermillion Creek samples, in exception to the relationship between marine waters and the presence of framboids suggested by Horne and others (1979, p. 566). Cecil and others (1981) proposed that sulfur enrichment in peat is the result of the prevailing pH and Eh and other geochemical parameters of the peat-forming environment; under such a model, high sulfur in coal is a result of the geochemical rather than the depositional environment. The activities of bacteria that degrade organic matter, produce H2S, and fix sulfur in peat are optimum at a pH above 4.5 (Baas Becking and others, 1960). The marine environment is a special case within the geochemical model for sulfur in coal as proposed by Cecil and others (1981).
Data from the Vermillion Creek coal bed are consistent with a ·model similar to that proposed by Cecil and others (1981). In high-pH, peat-forming environments (lacustrine or nearshore marine), increased bacterial activity may create humic gels and substances that might be predecessors to such vitrinite submacerals as gelocollinite and desmocollinite. Conversely, lowEh conditions (as inferred from the lack of inertinite macerals such as fusinite in the samples) might indicate high water levels that prevailed during accumulation of organic matter and the early stages of peat formation. Peat developing in such a high-pH, low-Eh geochemical environment probably would also be high in sulfur content, particularly if the swamp waters contained large amounts of dissolved sulfate. Finally, in accord with the model of Cecil and others (1981), if iron were available and the proper microbe activity were present, pyrite could form. However, in the absence
or scarcity of iron, H2S could be incorporated into the organic matter or escape into the overlying waters; the gas could also be complexed organically in the premaceral humic gels.
The high sulfur content of the Vermillion Creek coal bed may have resulted from high levels of bacterial reduction in an aqueous environment that had a high content of dissolved solids and that at times became sufficiently alkaline to deposit microconcretions of calcite interlayered with desmocollinite. Marshall and Draycott (1954, p. 11) also describe irregular syngenetic microconcretions and epigenetic cleat coatings of carbonate, calcite, and siderite in the Tangorin seam. Formation of pyrite in the Vermillion Creek coal bed was limited by the availability of iron, which may have been controlled, in turn, by the amount and type of clays suspended in the waters. The availability of hy- . drogen sulfide, the limited availability of iron, a high degree of bacterial degradation of plant tissues, and associated, presumably sulfate-rich lake water theoretically provided the conditions necessary for sulfur to form organic complexes and be concentrated within humic gel substances that were precursors of the submacerals of the vitrinite group.
CONCLUSIONS
The Vermillion Creek coal bed is compositionally unique. It has a high organic-sulfur content in macerals that resulted largely from the degradation of woody plant parts in a nonmarine, lacustrine environment. The causes for the high sulfur content of the Vermillion Creek coal bed cannot be explained satisfactorily in the general terms of a depositional environment even as unusual as this environment may have been. The data resulting from this study support the geochemical model suggested by Cecil and others (1981).
Density determinations of samples show that the average density for this coal is 1.47 g/cm3 on a dry basis, 1.41 g/cm3 on a calculated as-received basis, and 1.32 g/cm3 if extrapolated to an ash-free basis.
Megascopically recognized coal facies were substantiated by maceral and chemical composition data and were correlated and interpreted as depositional subunits of the coal bed.
The best economic use of this coal is difficult to assess. Although liquefaction of the coal appears possible, the high organic and pyritic sulfur content could cause problems in plant design: it might cause corrosion of components and create effluents that could adversely affect the environment. Because the organic sulfur is intimately associated with the vitrinite submacerals, total sulfur content could not be reduced to levels lower than the amount of organic sulfur by physical methods.

120 VERMILLION CREEK COAL BED, WYOMING
In addition, because much of the pyrite occurs as framboids embedded in vitrinite, complete removal of the pyrite by physical means might not be possible without a substantial decrease in total coal recovery. Depending on the process used, the incomplete removal of pyrite may or may not be a problem in liquefaction.
REFERENCES CITED
American Society for Testing and Materials, 1980a, Standard method of preparing coal samples for microscopical analysis by reflected light, ASTM designation D 2797: 1980 Annual Book of ASTM Standards, part 26, p. 367-371.
--1980b, Standard method for microscopical determination of the reflectance of the organic components in a polished specimen of coal, ASTM designation D 2798: 1980 Annual Book of ASTM Standards, part 26, p. 372-375.
--1980c, Standard method for microscopical determination of volume percent of physical components of coal, ASTM designation D 2799: 1980 Annual Book of ASTM Standards, part 26, p. 376-379.
Athy, L. F., 1930, Density, porosity, and compaction of sedimentary rocks: American Association of Petroleum Geologists Bulletin, v. 14, no. 1, p. 1-24.
Averitt, Paul, 1962, Geology and coal resources of the Cedar Mountain Quadrangle, Iron County, Utah: U.S. Geological Survey Professional Paper 389, 72 p.
--1975, Coal resources of the United States, January 1, 1974: U.S. Geological Survey Bulletin 1412, 131 p.
Baas Becking, L. G. M., Kaplan, I. R., and Moore, D., 1960, Limits of the natural environment in terms of pH and oxidation-reduction potentials: Journal of Geology, v. 68, no. 3, p. 243-284.
Cecil, C. B., Stanton, R. W., Dulong, F. T., 1981, Geology of contaminants in coal-Phase I report of investigations: U.S. Geological Survey Open-File Report 81-953-A, 92 p.
Cecil, C. B., Stanton, R. W., Dulong, F. T., and Renton, J. J., 1982, Geologic factors that control mineral matter in coal, in Filby, R. H., ed., Proceedings of ANS/ACS atomic and nuclear methods in fossil energy research: New York, Plenum Press, p. 323-336. .
Davis, Alan, Spackman, William, and Given, P. H., 1976, The influence of the properties of coals on their conversion into clean fuels: Energy Sources, v. 3, no. 1, p. 55--81.
Doelling, H. H., and Graham, R. L., 1972, Southwestern Utah coal fields-Alton, Kaiparowits Plateau and Kolob-Harmony: Utah Geological and Mineralogical Survey Monograph Series No. 1, 333p.
Horne, J. C., Ferm, J. C., Caruccio, F. T., and Baganz, B. P., 1979, Depositional models in coal exploration and mine planning in the Appalachian region, in Ferm, J. C., and Horne, J. C., eds., Carboniferous depositional environments in the Appalachian region: Columbia, S.C., University of South Carolina, p. 544-575.
Horne, J. C., Howell, D. J., and Baganz, B. P., 1976, Splay deposit as an economic factor in coal mining: Geological Society of America Abstracts with Programs, v. 8, p. 927.
International Committee for Coal Petrology, 1963, International handbook of coal petrography: Paris, Centre National de la Recherche Scientifique, looseleaf, not paginated.
--1971, International handbook of coal petrography-Supplement to the second edition: Paris, Centre National de la Recherche Scientifique, looseleaf, not paginated.
Marshall, C. E., and Draycott, A., 1954, Petrographic, chemical, and utilisation studies of the Tangorin high organic sulfur seam, Greta Coal Measures, New South Wales: University of Sydney, Department of Geolog;v and Geophysics Memoir 1954/1, 66 p.
Ryer, T. A., and Langer, A. W., 1980, Thickness change involved in the peat-to-coal transformation for a bituminous coal of Cretaceous age in central Utah: Journal of Sedimentary Petrology, v. 50, no. 3, p. 987-992.
Stach, E., Mackowsky, M.-Th., Teichmuller, Marlies, Taylor, G. H., Chandra, D., and Teichmuller, Rolf, 1975, Stach's textbook of coal petrology: Berlin, Gebruder Borntraeger, 428 p.
Swanson, V. E., Medlin, J. H., Hatch, J. R., Coleman, S. L., Wood, G. H., Jr., Woodruff, S. D., and Hildebrande, R. T., 1976, Collection, chemical analysis, and evaluation of coal samples in 1975: U.S. Geological Survey Open-File Report 76-468, 503 p.
Walker, F. E., and Hartner, F. E., 1966, Forms of sulfur in U.S. coals: U.S. Bureau of Mines Information Circular 8301, 51 p.
Williams, E. G., and Keith, M. L., 1963, Relationship between sulfur in coals and the occurrence of marine roof beds: Economic Geology, v. 58, p. 720-729.
Zubovic, Peter, Oman, C. L., Bragg, L. J., Coleman, S. L., Rega, N. H., Lemaster, M. E., Rose, H. L., Golightly, D. W., and Puskas, John, 1980, Chemical analysis of 659 coal samples from the eastern United States: U.S. Geological Survey Open-File Report 80-2003, 513 p.
Element Geochemistry By JOSEPH R. HATCH
GEOLOGICAL INVESTIGATIONS OF THE VERMILLION CREEK COAL BED IN THE EOCENE NILAND TONGUE OF THE WASATCH FORMATION, SWEETWATER COUNTY, WYOMING
U.S. GEOLOGICAL SURVEY PROFESSIONAL PAPER 1314-G
Abstract ............. . Introduction . . . . . . . . . . . . Analytical and statistical methods Discussion . . . Conclusions . . . References cited
CONTENTS
ILLUSTRATION
Page 123 123 123 124 128 131
Page
FIGURE 53. Flow chart showing sequence of sample preparation and chemical analyses . . . . . . . . . . . . . . . . . . . . . . . . 127
TABLES
Page
TABLE 14. Locations of core holes and descriptions of samples from the Vermillion Creek coal bed . . . . . . . . . . . . . . . . 124 15. Proximate and ultimate analyses and heat-of-combustion, forms-of-sulfur, and ash-fusion-temperature determinations for
six coal samples from the Vermillion Creek coal . . . . . . . . . . . . . . . . . . . . . . . . . . . . . . . . . . . . . . 125 16. Ash and major-, minor-, and trace-element composition of six coal samples and one coaly shale sample from the Vermillion
Creek coal . . . . . . . . . . . . . . . . . . . . . . . . . . . . . . . . . . . . . . . . . . . . . . . . . . . . . . . . . . . 126 17. Arithmetic and geometric means, observed ranges, and geometric deviations of proximate and ultimate analyses, heat
of combustion, forms of sulfur, and ash-fusion temperatures of six Vermillion Creek coal samples . . . . . . . . . 128 18. Arithmetic and geometric means, observed ranges, and geometric deviations of contents of ash and 35 elements in six
Vermillion Creek coal samples . . . . . . . . . . . . . . . . . . . . . . . . . . . . . . . . . . . . . . . . . . . . . . . . 128 19. Geometric means and geometric deviations of proximate, ultimate, and forms-of-sulfur analyses, heats of combustion, and
calculated moist, mineral-matter-free Btullb and moisture-free H/C and 0/C ratios for five sets of Rocky Mountain and midcontinent subbituminous A and high-volatile C bituminous coals . . . . . . . . . . . . . . . . . . . . . . . . 129
20. Geometric mean contents and geometric deviations of 35 elements for five sets of Rocky Mountain and midcontinent sub-bituminous A and high-volatile C bituminous coals . . . . . . . . . . . . . . . . . . . . . . . . . . . . . . . . 130
122
GEOLOGICAL INVESTIGATIONS OF THE VERMILLION CREEK COAL BED IN THE EOCENE NILAND TONGUE OF THE
WASATCH FORMATION, SWEETWATER COUNTY, WYOMING
ELEMENT GEOCHEMISTRY
By jOSEPH R. HATCH
ABSTRACT
Coal from the Eocene Vermillion Creek deposit is characterized by high sulfur content (mean=5.5 percent), high ash content (mean=16.3 percent), and an apparent rank of high-volatile C bituminous coal. Compared to low-sulfur Upper Cretaceous and Paleocene Rocky Mountain coals of similar rank, the Vermillion Creek coal has significantly higher contents of S, Ca, K, Fe, As, Be, Cd, Co, Cr, Cu, Mn, Ni, Sb, Sc, Se, U, V, Y, Yb, and Zn and a significantly lower content of oxygen.
Vermillion Creek coal is very similar in composition to equivalent rank, Middle Pennsylvanian high-sulfur coals from Iowa and Missouri. Relatively high ash, sulfur, and minor- and trace-element contents of the Vermillion Creek, Iowa, and Missouri coals are primarily due to near-neutral pH conditions in the ancestral peat swamps. At near-neutral pH conditions (6--8), the activity of sulfate-reducing bacteria is at a maximum, leaching of detrital minerals is at a minimum, and carbonates can precipitate.
High-sulfur coals and roll-type uranium deposits are both characterized by elevated contents of U, Mo, V, Se, and Be, suggesting similar reduction and precipitation processes in both environments.
Compared to Iowa and Missouri high-sulfur coals, the Vermillion Creek coal has significantly higher U, Mo, V, and As contents, suggesting that portions of these four elements in the Vermillion Creek coal may have been introduced by supergene enrichment processes.
INTRODUCTION
This chapter reports major-, minor-, and trace-element analyses on samples from the Vermillion Creek coal deposit, Sweetwater County, Wyo. The Vermillion Creek coal is part of the Niland Tongue of the Eocene Wasatch Formation (Roehler, this volume, chap. B). Element analyses of coal are important, as they (a) may indicate possible environmental contamination and coal utilization problems, (b) are used to assess the potential for byproduct element recovery, and, (c) when compared to elemental analyses of other coals, give insight into geochemical factors that control coal composition. The last of these three uses for coal element analyses is the discussion topic for this chapter. Seven samples (six coal and one coaly shale) from core holes VC-5, VC-7, and VC-8 were made available for detailed elemental analyses. Core hole locations, depth intervals
sampled, and brief descriptions for these samples are listed in table 14.
ANALYTICAL AND STATISTICAL METHODS
Proximate and ultimate analyses and heat-of-combustion, air-dried-loss, forms-of-sulfur, free-swelling-index, and ash-fusion-temperature determinations for the six coal samples are listed in table 15. Analyses for 525°C ash content and contents of 40 major, minor, and trace elements in whole coal from the seven samples are listed in table 16. Whole-coal data for all elements except As, Cl, Co, Cr, F, Hg, P, Sb, Se, Th, and U were calculated from analyses of coal ash. Figure 53 is a flowchart showing the sequence of sample preparation and chemical analyses.
Analytical results for elements determined by sixstep spectrographic analysis are to be identified with geometric brackets whose boundaries are 12, 8.3, 5.6, 3.8, 2.6, 1.8, 1.2, etc., but are reported arbitrarily as midpoints of these brackets: 10, 7, 5, 3, 2, 1.5, 1, etc. The precision of a reported value is approximately plus or minus one bracket at 68 percent or two brackets at 95 percent confidence.
Twenty-three additional elements not listed in table 16 were looked for during spectographic analysis, but not found. These elements and their lower limits of determination in ppm are Ag (1); Pd (5); Bi, In, and Sn (20); Au, Ho, Tm (50); Lu (70); Dy, Er, Gd, Pt, Re, and Tl (100); Eu, Hf, Pr, Sm, and W (200); Tb (700); Ta (1,000); and Te (5,000).
U nweighted statistical summaries of the analytical data for the six coal samples in tables 15 and 16 are listed in tables 17 and 18 respectively. Data summaries for Ga, Ge, La, Nb, and Ph contents in Vermillion Creek coal were not included in table 18 because these elements were not detected in a sufficient number of samples for the calculation of meaningful statistics.
123
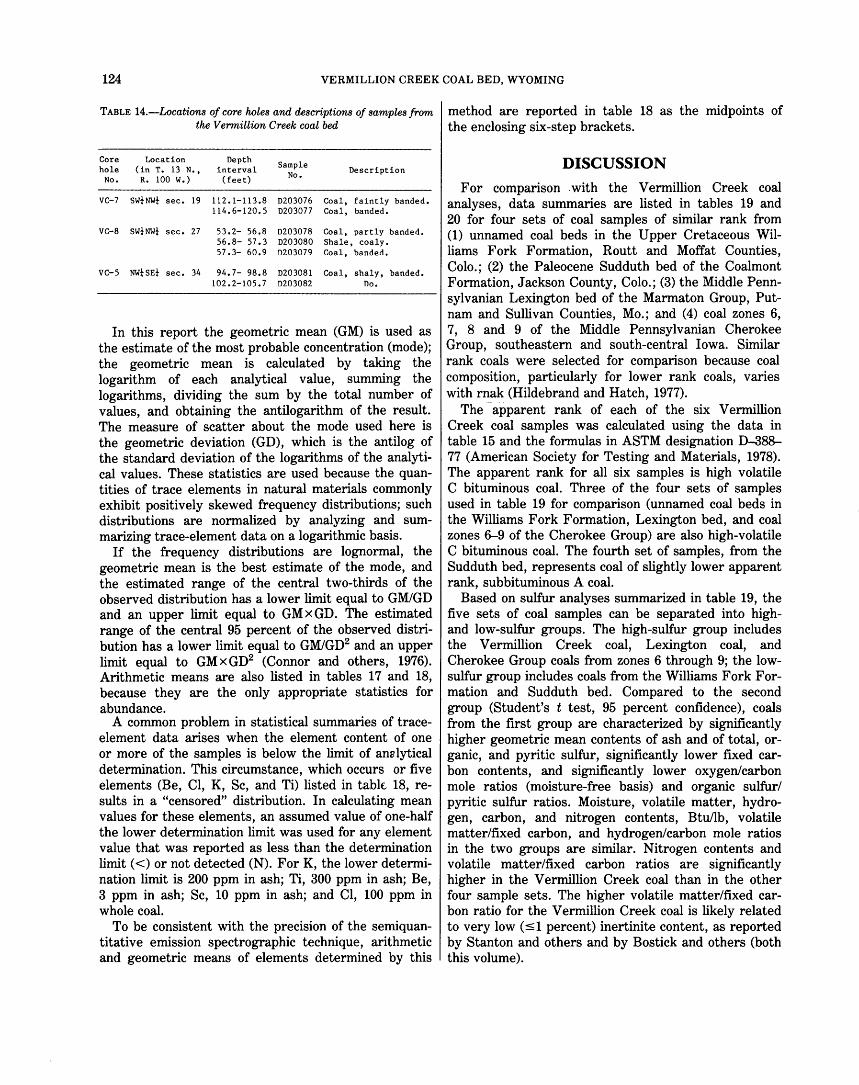
124 VERMILLION CREEK COAL BED, WYOMING
TABLE 14.-Locations of core holes and descriptions of samples from method are reported in table 18 as the midpoints of the Vermillion Creek coal bed the enclosing six-step brackets.
Core Location Depth Sample hole (in T. 13 N., interval Description No. R. 100 w.) (feet) No.
VC-7 SWtNWt sec. 19 112.1-113.8 D203076 Coal, faintly banded. 114.6-120.5 D203077 Coal, banded.
VC-8 SWtNWt sec. 27 53.2- 56.8 D203078 Coal, partly banded. 56.8- 57.3 D203080 Shale, coaly. 57.3- 60.9 D203079 Coal, banded.
VC-5 NWtSEt sec. 34 94.7- 98.8 D203081 Coal, shaly, banded. 102.2-105.7 D203082 no.
In this report the geometric mean ( G M) is used as the estimate of the most probable concentration (mode); the geometric mean is calculated by taking the logarithm of each analytical value, summing the logarithms, dividing the sum by the total number of values, and obtaining the antilogarithm of the result. The measure of scatter about the mode used here is the geometric deviation (GD), which is the antilog of the standard deviation of the logarithms of the analytical values. These statistics are used because the quantities of trace elements in natural materials commonly exhibit positively skewed frequency distributions; such distributions are normalized by analyzing and summarizing trace-element data on a logarithmic basis.
If the frequency distributions are lognormal, the geometric mean is the best estimate of the mode, and the estimated range of the central two-thirds of the observed distribution has a lower limit equal to GM/GD and an upper limit equal to GMxGD. The estimated range of the central 95 percent of the observed distribution has a lower limit equal to GM/GD2 and an upper limit equal to GM x GD2 (Connor and others, 1976). Arithmetic means are also listed in tables 17 and 18, because they are the only appropriate statistics for abundance.
A common problem in statistical summaries of trace-element data arises when the element content of one or more of the samples is below the limit of an8lytical determination. This circumstance, which occurs or five elements (Be, Cl, K, Sc, and Ti) listed in tablE. 18, results in a "censored" distribution. In calculating mean values for these elements, an assumed value of one-half the lower determination limit was used for any element value that was reported as less than the determination limit ( <) or not detected (N). For K, the lower determination limit is 200 ppm in ash; Ti, 300 ppm in ash; Be, 3 ppm in ash; Sc, 10 ppm in ash; and Cl, 100 ppm in whole coal.
To be consistent with the precision of the semiquantitative emission spectrographic technique, arithmetic and geometric means of elements determined by this
DISCUSSION
For comparison .with the Vermillion Creek coal analyses, data summaries are listed in tables 19 and 20 for four sets of coal samples of similar rank from (1) unnamed coal beds in the Upper Cretaceous Williams Fork Formation, Routt and Moffat Counties, Colo.; (2) the Paleocene Sudduth bed of the Coalmont Formation, Jackson County, Colo.; (3) the Middle Pennsylvanian Lexington bed of the Marmaton Group, Putnam and Sullivan Counties, Mo.; and (4) coal zones 6, 7, 8 and 9 of the Middle Pennsylvanian Cherokee Group, southeastern and south-central Iowa. Similar rank coals were selected for comparison because coal composition, particularly for lower rank coals, varies with rnak (Hildebrand and Hatch, 1977).
The -apparent rank of each of the six Vermillion Creek coal samples was calculated using the data in table 15 and the formulas in ASTM designation D--388-77 (American Society for Testing and Materials, 1978). The apparent rank for all six samples is high volatile C bituminous coal. Three of the four sets of samples used in table 19 for comparison (unnamed coal beds in the Williams Fork Formation, Lexington bed, and coal zones 6--9 of the Cherokee Group) are also high-volatile C bituminous coal. The fourth set of samples, from the Sudduth bed, represents coal of slightly lower apparent rank, subbituminous A coal.
Based on sulfur analyses summarized in table 19, the five sets of coal samples can be separated into highand low-sulfur groups. The high-sulfur group includes the Vermillion Creek coal, Lexington coal, and Cherokee Group coals from zones 6 through 9; the lowsulfur group includes coals from the Williams Fork Formation and Sudduth bed. Compared to the second group (Student's t test, 95 percent confidence), coals from the first group are characterized by significantly higher geometric mean contents of ash and of total, organic, and pyritic sulfur, significantly lower fixed carbon contents, and significantly lower oxygen/carbon mole ratios (moisture-free basis) and organic sulfur/ pyritic sulfur ratios. Moisture, volatile matter, hydrogen, carbon, and nitrogen contents, Btu!lb, volatile matter/fixed carbon, and hydrogen/carbon mole ratios in the two groups are similar. Nitrogen contents and volatile matter/fixed carbon ratios are significantly higher in the Vermillion Creek coal than in the other four sample sets. The higher volatile matter/fixed carbon ratio for the Vermillion Creek coal is likely related to very low ( :S 1 percent) inertinite content, as reported by Stanton and others and by Bostick and others (both this volume).

TABLE 15.-Proximate and ultimate analyses and heat-of-combustion, forms-of-sulfur, and ash-fusion-temperature determinations for six coal samples from the Vermillion Creek coal
[Moat analyses are reported three ways: first, as received; second, moisture free; and third, moisture and ash free. The fourth figure shown for heat of combustion represents a recalculation to a moist, ash-free basis. Analyses by chemists of the U.S. Department of Energy, Coal Analysis Section, Pittsburgh, Pa., under the direction of Forrest E. Walker]
Proximate analyses (percent) Ultimate analyses Heat of Air-Forms of sulfur
Free Ash-fusion temperature (°C) Mole ratios 1 (percent) Sample (percent) com bus- dried swel- (dry basis)
No. Mois- Volatile Fixed tion loss ling Initial Soft-Ash Sul- Py- Or- Fluid ture matter carbon H c N 0 s (Btu/lb) (pet) fate ritic ganic index deformation ening Hc/Cc Oc/Cc
0203076 12.1 40.1 37.9 9.9 5.6 56.7 2.0 19.2 6.6 10,430 2.6 0.11 4.25 2.23 o.s 1,005 1,025 1,095 0.89 0.13 45.7 43.0 11.3 4.9 64.5 2.2 9.5 7.5 11,870 .12 4.84 2.53 51.5 48.5 --- 5.5 72.8 2.5 10.7 8.5 13,390 .14 5.45 2.86
11,800 trj
0203077 14.9 38.5 35.3 11.3 5.7 ss.o 1.9 21.9 4.1 9, 720 5.3 .06 1.07 3.01 .s 1,345 1,365 1,390 .91 .12 t"" trj
45.3 41.4 13.3 4.8 64.7 2.2 10.2 4.9 11,420 .07 1.25 3.54 a:: 52.2 47.8 -- 5.5 74.6 2.5 11.8 5.6 13,170 .08 1.44 4.08 trj
z 11,150 ~ 0
0203078 12.5 38.4 39.4 9.7 5.6 56.9 1.8 19.0 6.9 10,370 2.6 .14 3.42 3.38 .s 1,055 1,090 1,200 .87 .11 trj 0 43.9 45.0 11.1 4.8 65.0 2.1 9.1 7.9 11,840 .16 3.91 3.86 0
49.4 50.6 --- 5.4 73.1 2.3 10.2 8.9 13,330 .18 4.40 4.34 ::z= 11,690 trj
a:: ~
0203079 11.1 33.5 29.2 26.2 4.7 46.8 1.5 16.2 4.6 8,360 3.0 .08 1.89 2.62 .s 1,100 1,140 1,320 .83 .078 00 ~
37.6 33.0 29.4 3.9 52.7 1.7 7.2 5.2 9,400 .09 2.13 2.95 ~
53.3 46.7 --- s.s 74.6 2.4 10.1 7.3 13,310 .13 3.02 4.17 ~
11,820 s > '-3
0203081 u.s 34.6 31.6 22.3 5.1 49.1 1.6 15.8 6.1 8,800 2.7 .12 2.95 2.99 .s 1,090 1,110 1,360 .91 .12 0 39.1 35.7 25.2 4.4 55.5 1.8 6.3 6.8 9,940 .14 3.33 3.38 ,e:; 52.3 47.7 --- 5.8 74.1 2.4 8.5 9.2 13,290 .18 4.45 4.52
11,760
0203082 11.2 33.1 25.9 29.8 4.5 41.8 1.3 17.3 5.3 7,580 3.4 .11 2.53 2.68 .s 1,065 1,095 1,160 .86 .12 37.2 29.3 33.5 3.6 4 7.1 1.5 8.3 6.0 8,530 .12 2.85 3.02 56.0 44.0 --- 5.5 70.8 2.2 12.5 9.0 12,830 .18 4.28 4.54
11,370
1The following correction equations have been used:
Hcalculated = Hanalytical - 0.014 ash + 0.018 Spyritic (44/40 Ca) + 0.014 so3 .
Ccalculated = Canalytical - 1214° Ca. 0calculated = 100 - (1 •13 ash+ 0 •47 Spyritic + Nanalytical + Ccalculated + Hcalculated + Sorganic).
The term 44/40 Ca replaces the co2 , and 12/40 Ca replaces the 12/44 co2, in the British Standard Formulas (Given and Yarzab, 1978, eqs. 2, 3a, 5, and 9). Ca is the amount of calcium above an assumed 0.5-percent noncarbonate Ca base level. so3 is the sulfate content in coal ash, reported on a whole-coal basis.
~ ~ cr.
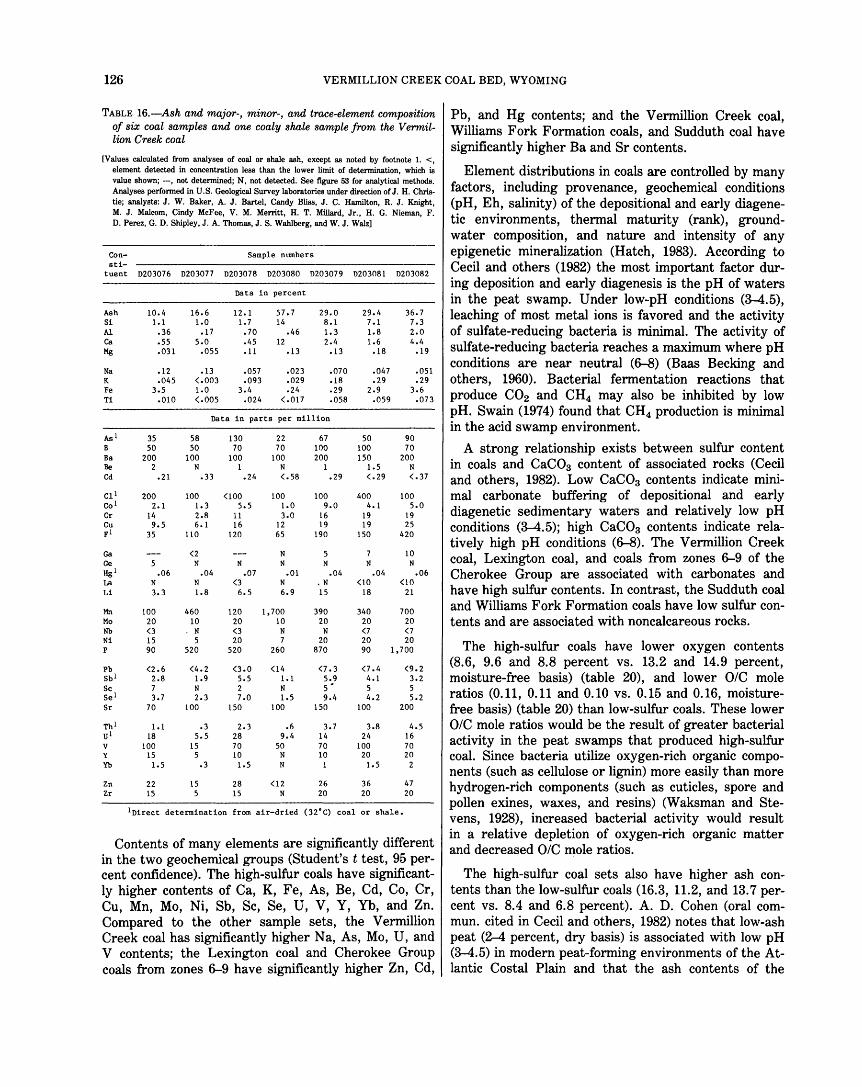
126 VERMILLION CREEK COAL BED, WYOMING
TABLE 16.-Ash and major-, minor-, and trace-element composition of six coal samples and one coaly shale sample from the V ermillion Creek coal
[Values calculated from analyses of coal or shale ash, except as noted by footnote 1. <, element detected in concentration less than the lower limit of determination, which is value shown; -, not determined; N, not detected. See figure 53 for analytical methods. Analyses performed in U.S. Geological Survey laboratories under direction of J. H. Christie; analysts: J. W. Baker, A. J. Bartel, Candy Bliss, J. C. Hamilton, R. J. Knight, M. J. Malcom, Cindy McFee, V. M. Merritt, H. T. Millard, Jr., H. G. Nieman, F. D. Perez, G. D. Shipley, J. A. Thomas, J. S. Wahlberg, and W. J. Walz]
Consti-
Sample numbers
tuent D203076 D203077 D203078 D203080 D203079 0203081 D203082
Ash Si Al Ca Mg
Na K Fe Ti
As 1
B Ba Be Cd
Ga Ge Hgl
La Li
Mn Mo Nb Ni p
Pb sb 1
Sc se 1
Sr
Zn Zr
10.4 1.1
.36
.55
.031
.12
.045 3.5
.010
35 50
200 2
.21
200 2.1
14 9.5
35
5 .06
N 3.3
100 20 <3 15 90
(2.6 2.8 7 3. 7
70
1.1 18
100 15 1.5
22 15
16.6 1.0
.17 5.0
.055
.13 (.003 1.0 (.005
Data in percent
12.1 1. 7
.70
.45
.11
.057
.093 3.4
.024
57.7 14
.46 12
.13
.023
.029
.24 (.017
29.0 8.1 1.3 2.4
.13
.070
.18
.29
.058
Data in parts per million
58 50
100 N
.33
100 1.3 2.8 6.1
110
<2 N
.04 N 1.8
460 10
. N 5
520
<4.2 1.9 N 2.3
100
.3 5.5
15 5
.3
15 5
130 70
100 1
.24
<100 5.5
11 16
120
N .07
<3 6.5
120 20 <3 20
520
(3.0 5.5 2 7 .o
150
2.3 28 70 10 1.5
28 15
22 70
100 N <.58
100 1.0 3.0
12 65
N N
.01 N 6.9
1,700 10 N 7
260
<14 1.1 N 1.5
100
.6 9.4
50 N N
<12 N
67 100 200
1 .29
100 9.0
16 19
190
N .04
,N 15
390 20 N
20 870
<7 .3 5.9 5. 9.4
150
3. 7 14 70 10
1
26 20
29.4 7.1 1. 8 1.6
.18
.047
.29 2.9
.059
50 100 150
1.5 <.29
400 4.1
19 19
150
N .04
(10 18
340 20 <7 20 90
(7.4 4.1 5 4.2
100
3.8 24
100 20 1.5
36 20
36.7 7.3 2.0 4.4
.19
.051
.29 3.6
.073
90 70
200 N <.37
100 5.0
19 25
420
10 N
.06 (10
21
700 20 (7
20 1 '700
<9.2 3.2 5 5.2
200
4.5 16 70 20
2
47 20
1oirect determination from air-dried (32"C) coal or shale.
Contents of many elements are significantly different in the two geochemical groups (Student's t test, 95 percent confidence). The high-sulfur coals have significantly higher contents of Ca, K, Fe, As, Be, Cd, Co, Cr, Cu, Mn, Mo, Ni, Sb, Sc, Se, U, V, Y, Yb, and Zn. Compared to the other sample sets, the Vermillion Creek coal has significantly higher N a, As, Mo, U, and V contents; the Lexington coal and Cherokee Group coals from zones 6-9 have significantly higher Zn, Cd,
Pb, and Hg contents; and the Vermillion Creek coal, Williams Fork Formation coals, and Sudduth coal have significantly higher Ba and Sr contents.
Element distributions in coals are controlled by many factors, including provenance, geochemical conditions (pH, Eh, salinity) of the depositional and early diagenetic environments, thermal maturity (rank), groundwater composition, and nature and intensity of any epigenetic mineralization (Hatch, 1983). According to Cecil and others (1982) the most important factor during deposition and early diagenesis is the pH of waters in the peat swamp. Under low-pH conditions (3-4.5), leaching of most metal ions is favored and the activity of sulfate-reducing bacteria is minimal. The activity of sulfate-reducing bacteria reaches a maximum where pH conditions are near neutral (6-8) (Baas Becking and others, 1960). Bacterial fermentation reactions that produce C02 and CH4 may also be inhibited by low pH. Swain (1974) found that CH4 production is minimal in the acid swamp environment.
A strong relationship exists between sulfur content in coals and CaC03 content of associated rocks (Cecil and others, 1982). Low CaC03 contents indicate minimal carbonate buffering of depositional and early diagenetic sedimentary waters and relatively low pH conditions (3-4.5); high CaC03 contents indicate relatively high pH conditions (6-8). The Vermillion Creek coal, Lexington coal, and coals from zones 6-9 of the Cherokee Group are associated with carbonates and have high sulfur contents. In contrast, the Sudduth coal and Williams Fork Formation coals have low sulfur contents and are associated with noncalcareous rocks.
The high-sulfur coals have lower oxygen contents (8.6, 9.6 and 8.8 percent vs. 13.2 and 14.9 percent, moisture-free basis) (table 20), and lower 0/C mole ratios (0.11, 0.11 and 0.10 vs. 0.15 and 0.16, moisturefree basis) (table 20) than low-sulfur coals. These lower 0/C mole ratios would be the result of greater bacterial activity in the peat swamps that produced high-sulfur coal. Since bacteria utilize oxygen-rich organic components (such as cellulose or lignin) more easily than more hydrogen-rich components (such as cuticles, spore and pollen exines, waxes, and resins) (Waksman and Stevens, 1928), increased bacterial activity would result in a relative depletion of oxygen-rich organic matter and decreased 0/C mole ratios.
The high-sulfur coal sets also have higher ash contents than the low-sulfur coals (16.3, 11.2, and 13.7 percent vs. 8.4 and 6.8 percent). A. D. Cohen (oral commun. cited in Cecil and others, 1982) notes that low-ash peat (2-4 percent, dry basis) is associated with low pH (3-4.5) in modern peat-forming environments of the Atlantic Costal Plain and that the ash contents of the
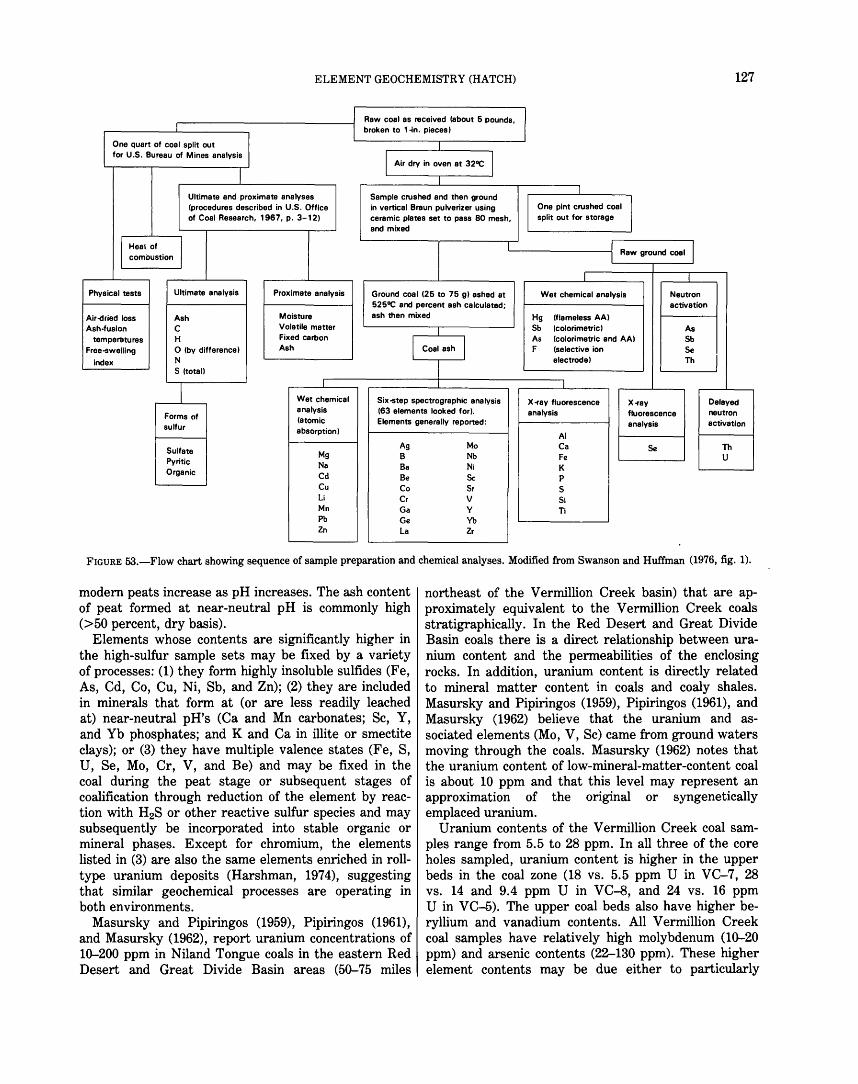
ELEMENT GEOCHEMISTRY (HATCH) 127
Raw coal as received (about 5 pounds,
I I broken to 1-in. pieces)
I Ono quon of oool ••'" out I for U.S. Bureau of Mines analysis I Air dry in oven at 320C I
I I
Ultimate and proximate analyses Sample crushed and then ground I
I I (procedures described in U.S. Office in vertical Braun pulverizer using One pint crushed coal of Coal Research, 1967, p. 3-121 ceramic plates set to pass 80 mesh, split out for storage
and mixed
I Heat of I I I Raw ground coal I combustion
I I
Physical tests Ultimate analysis Proximate analysis Ground coal 125 to 75 gl ashed at Wet chemical analysis Neutron 5250C and percent ash calculated; activation
Air-dried loss Ash Moisture ash then mixed Hg (flameless AAI Ash-fusion c Volatile matter I Sb (colorimetric I As
temperatures H Fixed carbon
I Coal ash I As (colorimetric and AAI Sb
Free-swelling 0 (by difference I Ash F (selective ion Se
index N electrode) Th S (total)
I I I
I Wet chemical Six-step spectrographic analysis X -ray fluorescence X-ray Delayed
Forms of analysis (63 elements looked for). analysis fluorescence neutron
sulfur (atomic Elements generally reported: analysis activation absorption)
AI
Sulfate Ag Mo Ca Se Th
Pyritic Mg B Nb Fe u Na Ba Ni K Organic Cd Be Sc p Cu Co Sr s Li Cr v 51 Mn Ga y Tl Pb Ge Yb Zn La Zr
FIGURE 53.-Flow chart showing sequence of sample preparation and chemical analyses. Modified from Swanson and Huffman (1976, fig. 1).
modern peats increase as pH increases. The ash content of peat formed at near-neutral pH is commonly high (>50 percent, dry basis).
Elements whose contents are significantly higher in the high-sulfur sample sets may be fixed by a variety of processes: (1) they form highly insoluble sulfides (Fe, As, Cd, Co, Cu, Ni, Sb, and Zn); (2) they are included in minerals that form at (or are less readily leached at) near-neutral pH's (Ca and Mn carbonates; Sc, Y, and Yb phosphates; and K and Ca in illite or smectite clays); or (3) they have multiple valence states (Fe, S, U, Se, Mo, Cr, V, and Be) and may be fixed in the coal during the peat stage or subsequent stages of coalification through reduction of the element by reaction with H2S or other reactive sulfur species and may subsequently be incorporated into stable organic or mineral phases. Except for chromium, the elements listed in (3) are also the same elements enriched in rolltype uranium deposits (Harshman, 1974), suggesting that similar geochemical processes are operating in both environments.
Masursky and Pipiringos (1959), Pipiringos (1961), and Masursky (1962), report uranium concentrations of 10-200 ppm in Niland Tongue coals in the eastern Red Desert and Great Divide Basin areas (50-75 miles
northeast of the Vermillion Creek basin) that are approximately equivalent to the Vermillion Creek coals stratigraphically. In the Red Desert and Great Divide Basin coals there is a direct relationship between uranium content and the permeabilities of the enclosing rocks. In addition, uranium content is directly related to mineral matter content in coals and coaly shales. Masursky and Pipiringos (1959), Pipiringos (1961), and Masursky (1962) believe that the uranium and associated elements (Mo, V, Sc) came from ground waters moving through the coals. Masursky (1962) notes that the uranium content of low-mineral-matter-content coal is about 10 ppm and that this level may represent an approximation of the original or syngenetically emplaced uranium.
Uranium contents of the Vermillion Creek coal samples range from 5.5 to 28 ppm. In all three of the core holes sampled, uranium content is higher in the upper beds in the coal zone (18 vs. 5.5 ppm U in VC--7, 28 vs. 14 and 9.4 ppm U in VC-8, and 24 vs. 16 ppm U in VC-5). The upper coal beds also have higher beryllium and vanadium contents. All Vermillion Creek coal samples have relatively high molybdenum (10-20 ppm) and arsenic contents (22-130 ppm). These higher element contents may be due either to particularly
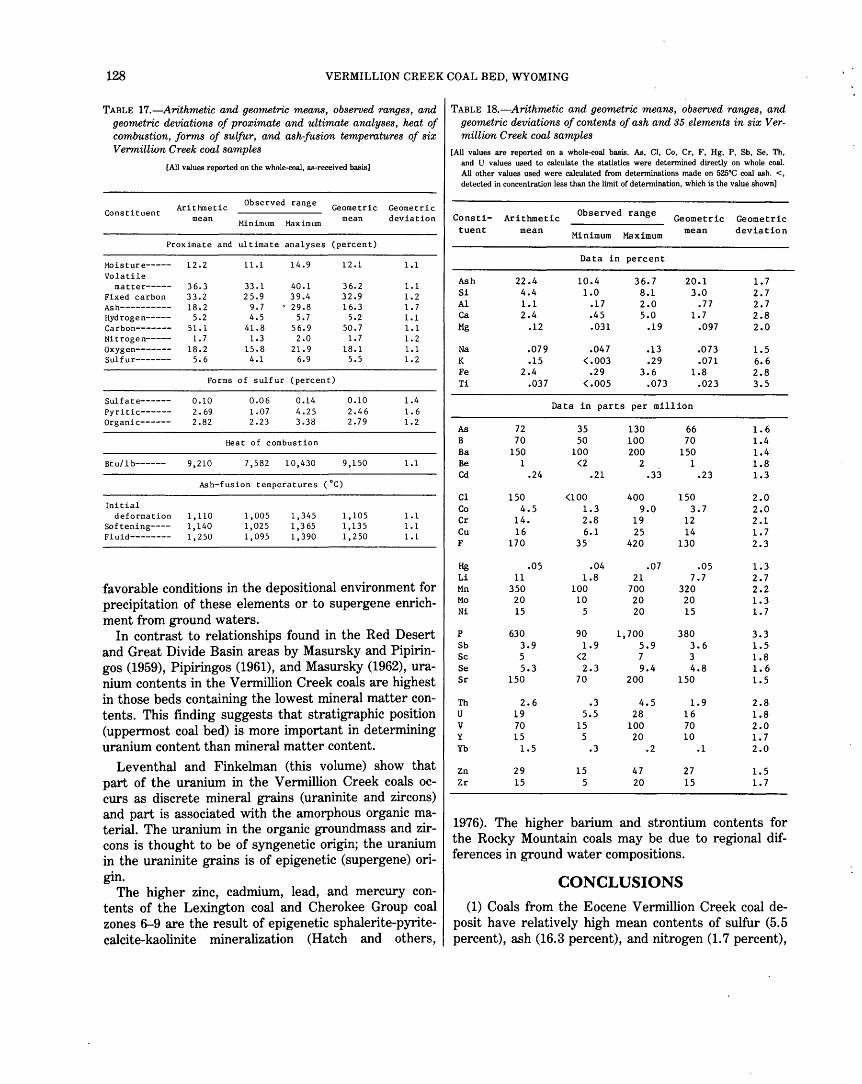
128 VERMILLION CREEK COAL BED, WYOMING
TABLE 17.-Arithmetic and geometric means, observed ranges, and geometric deviations of proximate and ultimate analyses, heat of combustion, forms of sulfur, and ash-fusion temperatures of six Vermillion Creek coal samples
[All values reported on the whole-coal, liB-received baBis]
Constituent Arithmetic mean
Observed range
Minimum Maximum
Geometric mean
Proximate and ultimate analyses (percent)
Moisture----- 12.2 11.1 14.9 12.1 Volatile
matter----- 36.3 33.1 40.1 36.2 Fixed carbon 33.2 25.9 39.4 32.9 Ash---------- 18.2 9.7 29.8 16.3 Hydrogen----- 5.2 4.5 5.7 5.2 Carbon------- 51.1 41.8 56.9 50.7 Nitrogen----- 1.7 1.3 2.0 1.7 Oxygen------- 18.2 15.8 21.9 18.1 Sulfur------- 5.6 4.1 6.9 5.5
Forms of sulfur (percent)
Sulfate------ 0.10 0.06 0.14 0.10 Pyritic------ 2. 69 1.07 4.25 2.46 Organic------ 2.82 2.23 3.38 2.79
Heat of combustion
Btu/ 1 b------ 9,210 7,582 10,430 9,150
Ash-fusion temperatures ( OC)
Initial deformation 1,110 1,005 1,345 1,105
Softening---- 1,140 1,025 1,365 1,135 Fluid-------- 1,250 1,095 1,390 1,250
Geometric deviation
1.1
1.1 1.2 1.7 1.1 1.1 1.2 1.1 1.2
1.4 1.6 1.2
1.1
1.1 1.1 1.1
favorable conditions in the depositional environment for precipitation of these elements or to supergene enrichment from ground waters.
In contrast to relationships found in the Red Desert and Great Divide Basin areas by Masursky and Pipiringos (1959), Pipiringos (1961), and Masursky (1962), uranium contents in the Vermillion Creek coals are highest in those beds containing the lowest mineral matter contents. This finding suggests that stratigraphic position (uppermost coal bed) is more important in determining uranium content than mineral matter content.
Leventhal and Finkelman (this volume) show that part of the uranium in the Vermillion Creek coals occurs as discrete mineral grains (uraninite and zircons) and part is associated with the amorphous organic material. The uranium in the organic groundmass and zircons is thought to be of syngenetic origin; the uranium in the uraninite grains is of epigenetic (supergene) origin.
The higher zinc, cadmium, lead, and mercury contents of the Lexington coal and Cherokee Group coal zones 6-9 are the result of epigenetic sphalerite-pyritecalcite-kaolinite mineralization (Hatch and others,
TABLE lB.-Arithmetic and geometric means, observed ranges, and geometric deviations of contents of ash and 35 elements in six V er-million Creek coal samples
[All values are reported on a whole-coal baBis. As, Cl, Co, Cr, F, Hg, P, Sb, Se, Th, and U values used to calculate the statistics were detennined directly on whole coal. All other values used were calculated from determinations made on 525•c coal aBh. <, detected in concentration less than the limit of determination, which is the value shown]
Consti- Arithmetic Observed range Geometric Geometric
tuent mean Minimum Maximum mean deviation
Data in percent
Ash 22.4 10.4 36.7 20.1 1.7 Si 4.4 1.0 8.1 3.0 2.7 Al 1.1 .17 2.0 .77 2.7 Ca 2.4 .45 5.0 1.7 2.8 Mg .12 .031 .19 .097 2.0
Na .079 .047 .13 .073 1.5 K .15 <.003 .29 .071 6.6 Fe 2.4 .29 3.6 1.8 2.8 Ti .037 (.005 .073 .023 3.5
Data in parts per million
As 72 35 130 66 1.6 B 70 50 100 70 1.4 Ba 150 100 200 150 1.4 Be 1 <2 2 1 1.8 Cd .24 .21 .33 .23 1.3
Cl 150 <100 400 150 2.0 Co 4.5 1.3 9.0 3.7 2.0 Cr 14. 2.8 19 12 2.1 Cu 16 6.1 25 14 1.7 F 170 35 420 130 2.3
Hg .05 .04 .07 .05 1.3 Li 11 1.8 21 7.7 2.7 Mn 350 100 700 320 2.2 Mo 20 10 20 20 1.3 Ni 15 5 20 15 1.7
p 630 90 1, 700 380 3.3 Sb 3.9 1.9 5.9 3.6 1.5 Sc 5 <2 7 3 1.8 Se 5.3 2.3 9.4 4.8 1.6 Sr 150 70 200 150 1.5
Th 2.6 .3 4.5 1.9 2.8 u 19 5.5 28 16 1.8 v 70 15 100 70 2.0 y 15 5 20 10 1.7 Yb 1.5 .3 .2 .1 2.0
Zn 29 15 47 27 1.5 Zr 15 5 20 15 1.7
1976). The higher barium and strontium contents for the Rocky Mountain coals may be due to regional differences in ground water compositions.
CONCLUSIONS
(1) Coals from the Eocene Vermillion Creek coal deposit have relatively high mean contents of sulfur (5.5 percent), ash (16.3 percent), and nitrogen (1. 7 percent),
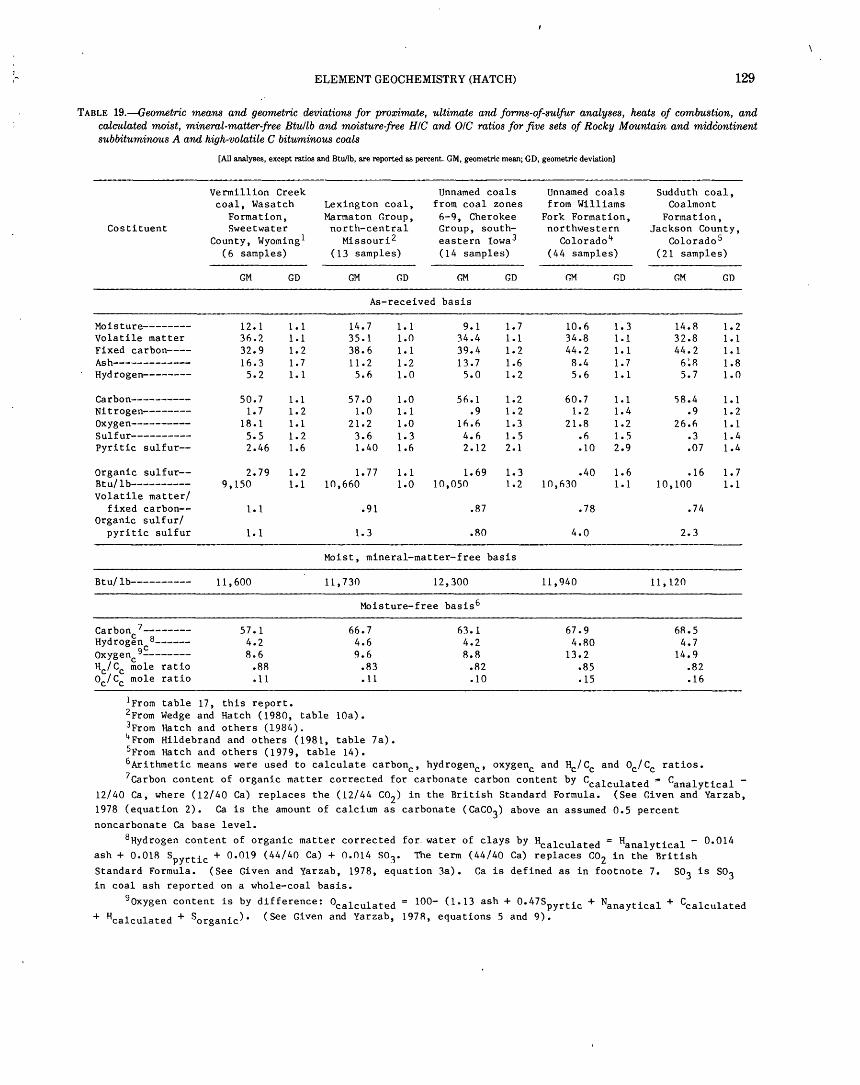
ELEMENT GEOCHEMISTRY (HATCH) 129
TABLE 19.-Geometric means and geometric deviations for proximate, ultimate and forms-of-sulfur analyses, heats of combustion, and calculated moist, mineral-matter-free Btullb and moisture-free HIC and 0/C ratios for five sets of Rocky Mountain and midContinent subbituminous A and high-volatile C bituminous coals
[All analyses, except ratios and Btullb, are reported as percent. GM, geometric mean; GD, geometric deviation]
Vermillion Creek Unnamed coals coal, Wasatch Lexington coal, from coal zones
Formation, Marmaton Group, 6-9, Cherokee Costituent Sweetwater north-central Group, south-
County, Wyoming 1 Missouri 2 eastern Iowa 3
(6 samples) (13 samples) (14 samples)
GM GD GM GD GM GD
As-received basis
Moisture-------- 12. 1 1. 1 14.7 1. 1 9.1 Volatile matter 36.2 1.1 35.1 1.0 34.4 Fixed carbon---- 32.9 1. 2 38.6 1. 1 39.4 Ash------------- 16.3 1.7 11.2 1.2 13.7 Hydrogen-------- 5.2 1. 1 5.6 1. 0 s.o
Carbon---------- so. 7 1.1 57.0 1.0 56.1 Nitrogen-------- 1.7 1. 2 1.0 1.1 .9 Oxygen---------- 18.1 1.1 21.2 1.0 16.6 Sulfur---------- s.s 1.2 3.6 1. 3 4.6 Pyritic sulfur-- 2.46 1.6 1.40 1.6 2.12
Organic sulfur-- 2.79 1.2 1. 77 1. 1 1.69 Btu/lb---------- 9,150 1.1 10,660 1.0 10,050 volatile matter/
fixed carbon-- 1. 1 .91 .87 Organic sulfur/
pyritic sulfur 1. 1 1. 3 .80
Moist, mineral-matter-free
Btu/lb---------- 11,600 11,730 12,300
Moisture-free basis6
Carbon 7-------- 57.1 66.7 Hydrog~n 8 ______ 4.2 4.6 Oxygen 9~------- 8.6 9.6 c Hc/Cc mole ratio .88 .83 oc/Cc mole ratio .11 .11
1From table 17, this report. 2 From Wedge and Hatch (1980, table lOa). 3From Hatch and others (1984). 4 From Hildebrand and others (1981, table 7a). 5From Hatch and others (1979, table 14).
63.1 4.2 8.8
.82
.10
1. 7 1.1 1.2 1.6 1. 2
1.2 1. 2 1. 3 1.5 2.1
1. 3 1. 2
basis
Unnamed coals from Williams
Fork Formation, northwestern
Colorado 4
(44 samples)
GM GD
10.6 1.3 34.8 1.1 44.2 1. 1 8.4 1.7 5.6 1. 1
60.7 1.1 1.2 1.4
21.8 1.2 .6 1.5 .10 2.9
.40 1. 6 10,630 1.1
.78
4.0
11,940
67.9 4.80
13.2 .85 .15
Sudduth coal, Coalmont
Formation, Jackson County,
Colorado 5
(21 samples)
GM GD
14.8 1.2 32.8 1. 1 44.2 1. 1 6~R 1. 8 5.7 1. 0
'58.4 1. 1 .9 1. 2
26.6 1. 1 .3 1. 4 .07 1.4
.16 1.7 10,100 1.1
.74
2.3
11, 120
68.5 4.7
14.9 .82 .16
6Arithmetic means were used to calculate carbone, hydrogenc, oxygene and Hc/Cc and Oc/Cc ratios. 7carbon content of organic matter corrected for carbonate carbon content by Ccalculated = Canalytical -
12/40 Ca, where (12/40 Ca) replaces the (12/44 co2) in the British Standard Formula. (See Given and Yarzab, 1978 (equation 2). Ca is the amount of calcium as carbonate (Caco3) above an assumed 0.5 percent noncarbonate Ca base level.
BHydrogen content of organic matter corrected for. water of clays by Hcalculated = Hanalytical - 0.014 ash+ 0.018 Spyrtic + 0.019 (44/40 Ca) + 0.014 so3• The term (44/40 Ca) replaces C02 in the British Standard Formula. (See Given and Yarzab, 1978, equation 3a). Ca is defined as in footnote 7. so3 is so3 in coal ash reported on a whole-coal basis.
90xygen content is by difference: Ocalculated = 100- (1.13 ash+ 0.47Spyrtic + Nanaytical + Ccalculated + Hcalculated + Sorganic). (See Given and Yarzab, 1978, equations 5 and 9).
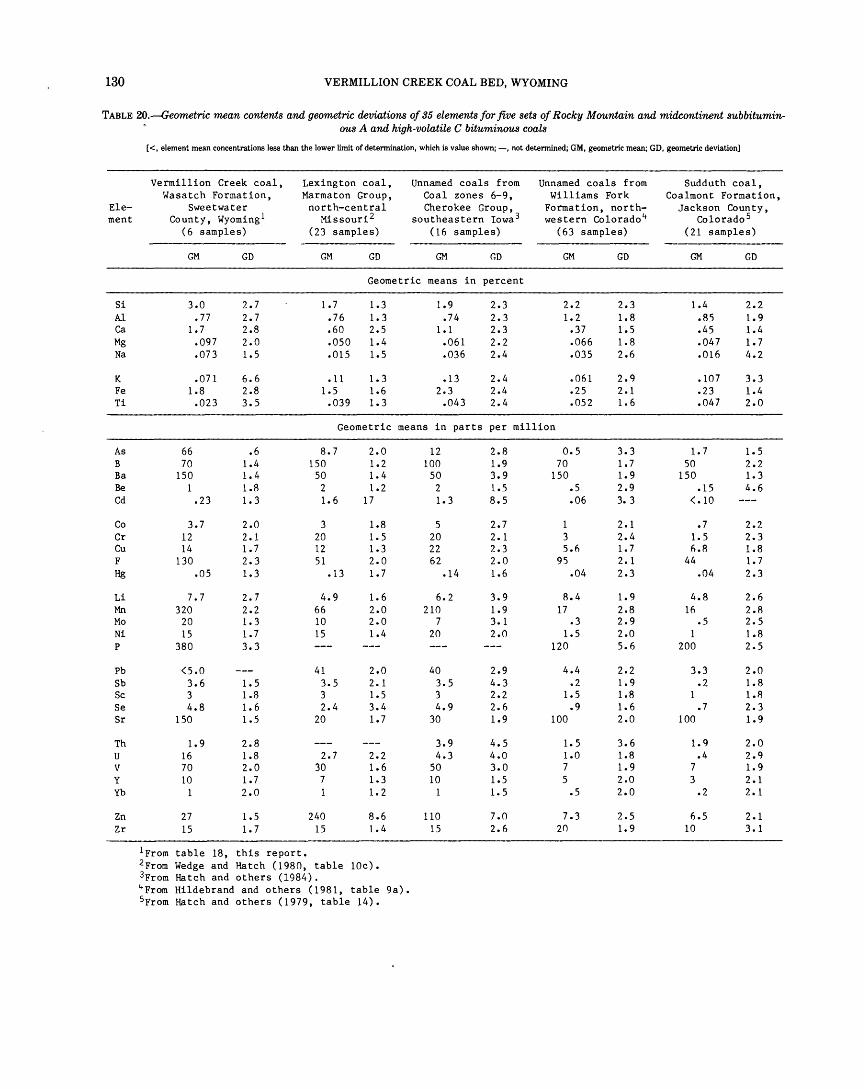
130 VERMILLION CREEK COAL BED, WYOMING
TABLE 20.-Geometric mean contents and geometric deviations of 35 elements for five sets of Rocky Mountain and midcontinent subbitumin-ous A and high-volatile C bituminous coals
[ <, element mean concentrations less than the lower limit of determination, which is value shown; -, not determined; GM, geometric mean; GD, geometric deviation]
Vermillion Creek coal, Lexington coal, Unnamed coals from Unnamed coals from Sudduth coal, Wasatch Formation, Marmaton Group, Coal zones 6-9, Williams Fork Coalmont Formation,
Ele- Sweetwater north-central Cherokee Group, Formation, north- Jackson County, ment County, Wyoming 1 Missouri 2 southeastern Iowa 3 western Colorado 4 Colorado 5
( 6 samples) (23 samples) (16 samples) ( 63 samples) (21 samples)
GM GD GM GD GM GD GM GD GM GD
Geometric means in percent
Si 3.0 2.7 1.7 1.3 1.9 2.3 2.2 2.3 1.4 2.2 A1 .77 2.7 • 76 1.3 • 74 2.3 1. 2 1.8 .85 1. 9 Ca 1.7 2.8 .60 2.5 1.1 2.3 .37 1.5 .45 1.4 Mg .097 2.0 .050 1.4 .061 2.2 .066 1. 8 .047 1.7 Na .073 1.5 .015 1. s .036 2.4 .035 2.6 .016 4.2
K .071 6.6 .ll 1. 3 .13 2.4 .061 2.9 .107 3.3 Fe 1.8 2.8 1.S 1.6 2.3 2.4 .2S 2.1 .23 1. 4 Ti .023 3.S .039 1.3 .043 2.4 .OS2 1. 6 .047 2.0
Geometric means in parts per million
As 66 .6 8.7 2.0 12 2.8 o.s 3.3 1.7 1.5 B 70 1.4 1SO 1.2 100 1.9 70 1.7 so 2.2 Ba 1SO 1. 4 so 1.4 so 3.9 150 1. 9 1SO 1. 3 Be 1 1.8 2 1.2 2 1.S .s 2.9 .15 4.6 Cd .23 1. 3 1. 6 17 1. 3 8.S .06 3. 3 <.10
Co 3.7 2.0 3 1.8 s 2.7 1 2.1 .7 2.2 Cr 12 2.1 20 l.S 20 2. 1 3 2.4 1. s 2.3 Cu 14 1.7 12 1.3 22 2.3 s.o 1.7 o.B 1. 8 F 130 2.3 51 2.0 62 2.0 95 2.1 44 1.7 Hg .os 1.3 .13 1.7 .14 1.6 .04 2.3 .04 2.3
Li 7.7 2.7 4.9 1. 6 6.2 3.9 8.4 1.9 4.8 2.6 Mn 320 2.2 66 2.0 210 1.9 17 2.8 16 2.8 Mo 20 1. 3 10 2.0 7 3. 1 .3 2.9 .s 2.5 Ni 15 1.7 1S 1.4 20 2.0 1. 5 2.0 1 1. 8 p 380 3.3 120 S.6 200 2.5
Pb <s.o 41 2.0 40 2.9 4.4 2.2 3.3 2.0 Sb 3.6 1. s 3.S 2.1 3.S 4.3 .2 1. 9 .2 1. 8 Sc 3 1.8 3 1.5 3 2.2 1.5 1.8 1 1.8 Se 4.8 1.6 2.4 3.4 4.9 2.6 .9 1.6 .7 2.3 Sr 150 1.5 20 1.7 30 1.9 100 2.0 100 1.9
Th 1. 9 2.8 3.9 4.S 1.5 3.6 1. 9 2.0 u 16 1.8 2.7 2.2 4.3 4.0 1.0 1.8 .4 2.9 v 70 2.0 30 1. 6 so 3.0 7 1. 9 7 1.9 y 10 1.7 7 1.3 10 l.S 5 2.0 3 2.1 Yb 2.0 1 1.2 1 1. 5 .s 2.0 .2 2.1
Zn 27 1.S 240 8.6 110 7.0 7.3 2.5 6.S 2.1 Zr lS 1.7 15 1. 4 lS 2.6 20 1. 9 10 3.1
1From table 18, this report. 2 From Wedge and Hatch (1980, table 10c). 3From Hatch and others (1984). 4 From Hildebrand and others (1981' table 9a). SFrom Hatch and others (1979, table 14).
ELEMENT GEOCHEMISTRY (HATCH) 131
and have an apparent rank of high-volatile C bituminous coal.
(2) Elemental analyses of Vermillion Creek coal samples are similar to analyses of equivalent rank highsulfur Middle Pennsylvanian coals from Iowa and Missouri.
(3) Compared to equivalent rank low-sulfur Rocky Mountain coals, the high-sulfur coals have significantly higher contents of Ca, Fe, As, Be, Cd, Co, Cr, Cu, Mn, Mo, Ni, Sb, Sc, Se, U, V, Y, Yb, and Zn and significantly lower oxygen contents. The elemental composition of coal is thought to be strongly dependent on the pH of the environment of deposition, as stabilities and solubilities of minerals and activities of sulfate-reducing and other bacteria are pH dependent. Relatively low pH (3-4.5) of swamp waters produces low sulfur, ash, and minor- and trace-element contents; relatively high pH (6--8) produces high sulfur, ash, and minor- and trace-element contents in coal.
(4) High-sulfur coals and roll-type uranium deposits are both enriched in U, Mo, V, Se, and Be, suggesting that similar gebc;hemical processes (reduction by H2S of metals in oxidized, relatively soluble valence states to relatively insoluble lower valence states) are operating in both environments.
(5) The Vermillion Creek coal has significantly higher U, Mo, and As contents than the Iowa and Missouri high-sulfur sample sets. In the Red Desert and Great Divide Basin areas, coals stratigraphically equivalent to the Vermillion Creek coal have supergene enrichment of U, Mo, V, and Sc. Part of the U, Mo, V, and As in the Vermillion Creek coals may also be due to supergene enrichment.
REFERENCES CITED American Society for Testing and Materials, 1978, Standard specifica
tions for classification of coals by rank (ASTM designation D-388-77): 1978 Annual book of ASTM standards, pt. 26, p. 220-224.
Baas Becking, L. G. M., Kaplan, I. R., and Moore, Derek, 1960, Limits of the natural environment in terms of pH and oxidationreduction potentials: Journal of Geology, v. 68, p. 243-284.
Cecil, C. B., Stanton, R. W., Dulong, F. T., and Renton, J. J., 1982, Geologic factors that control mineral matter in coal, in Proceedings of ANS/ACS Symposium on Atomic and Nuclear Methods in Fossil Energy Research: Plenum Press, p. 323--336.
Connor, J. J., Keith, J. R., and Anderson, B. M., 1976, Trace-metal variation in soils and sagebrush in the Powder River basin, Wyoming and Montana: U.S. Geological Survey Journal of Research, v. 4, no. 1, p. 49--59.
Given, P. H., and Yarzab, R. F., 1978, Analysis of the organic substances of coals-Problems posed by the presence of mineral
matter, chap. 20 of Karr, Clarence, Jr., ed., Analytical methods for coal and coal products: New York, Academic Press, v. 2, p. 3--41.
Harshman, E. N., 1974, Distribution of elements in some roll-type uranium deposits, in Formation of uranium ore deposits: International Atomic Energy Agency Proceedings Series, no. STI/PUB/ 374, p. 169-183.
Hatch, J. R., 1983, Geochemical processes that control minor and trace element composition of United States coals, in Shanks, W. C. III, ed., Cameron volume on unconventional mineral deposits: New York, American Institute of Mining, Metallurgical, and Petroleum Engineers, p. 89-98.
Hatch, J. R., Avcin, M. J., and VanDorpe, P. E., 1984, Element geochemistry of Cherokee Group coals (Middle Pennsylvanian) from south-central and southeastern Iowa: Iowa Geological Survey Technical Paper 5, 108 p.
Hatch, J. R., Avcin, M. J., Wedge, W. K., and Brady, L. L., 1976, Sphalerite in coals from southeastern Iowa, Missouri, and southeastern Kansas: U.S. Geological Survey Open-File Report 76-796, 26 p.
Hatch, J. R., Madden, D. H., and Mfolter, R. H., 1979, Chemical analyses of coal and coal-associated rock samples from the Coalmont Formation, McCallum and Coalmont areas, North Park, Jackson County, Colorado: U.S. Geological Survey Open-File Report 79-1099, 42 p.
Hildebrand, R. T., Garrigues, R. S., Meyer, R. F., and Reheis, M. C., 1981, Geology and chemical analyses of coal and coalassociated rock samples, Williams Fork Formation (Upper Cretaceous), northwestern Colorado: U.S. Geological Survey Open-File Report 81-1348, 103 p.
Hildebrand, R. T., and Hatch, J. R., 1977, The distribution of sodium and alkaline-earth elements in coal of the Rocky Mountain and northern Great Plains provinces: Geological Society of America Abstracts with Programs, v. 9, no. 7, p. 1015--1016.
Masursky, Harold, 1962, Uranium-bearing coal in the eastern part of the Red Desert area, Wyoming: U.S. Geological Survey Bulletin 1099-B, 149 p.
Masursky, Harold, and Pipiringos, G. N., 1959, Uranium-bearing coal in the Red Desert area, Sweetwater County, Wyoming: U.S. Geological Survey Bulletin 1055--G, p. 181-215.
Pipiringos, G. N., 1961, Uranium-bearing coal in the central part of the Great Divide Basin: U.S. Geological Survey Bulletin 1099-A, 104 p.
Swain, F. M., 1974, Marsh gas from the Atlantic Coastal Plain, United States, in Tissot, B., and Bienner, F., eds., Advances in Organic Geochemistry 1973: International Meeting on Organic Geochemistry, Programme and Abstracts, no. 6, p. 673--687.
Swanson, V. E., and Huffman, Claude, Jr., 1976, Guidelines for sample collecting and analytical methods used in the U.S. Geological Survey for determining chemical composition of coal: U.S. Geological Survey Circular 735, 11 p.
U.S. Office of Coal Research, 1967, Methods of analyzing and testing coal and coke: U.S. Bureau of Mines Bulletin 638, 85 p.
Waksman, S. A., and Stevens, K. R., 1928, Contribution to the chemical composition of peat-11. Chemical composition of various peat profiles: Soil Science, v. 26, p. 239-251.
Wedge, W. K., and Hatch, J. R., 1980, Chemical composition of Missouri coals: Missouri Division of Geology and Land Survey Report of Investigations 63, 102 p.


Organic GeOchemistry and Organic Petrography By NEELY H. BOSTICK, JOSEPH R. HATCH, TED A. DA WS, ALONZA H. LOVE, SISTER CARLOS M. LUBECK, and CHARLESN.THRELKELD
GEOLOGICAL INVESTIGATIONS OF THE VERMILLION CREEK COAL BED IN THE EOCENE NILAND TONGUE OF THE WASATCH FORMATION, SWEETWATER COUNTY, WYOMING
U.S. GEOLOGICAL SURVEY PROFESSIONAL PAPER 1314-H
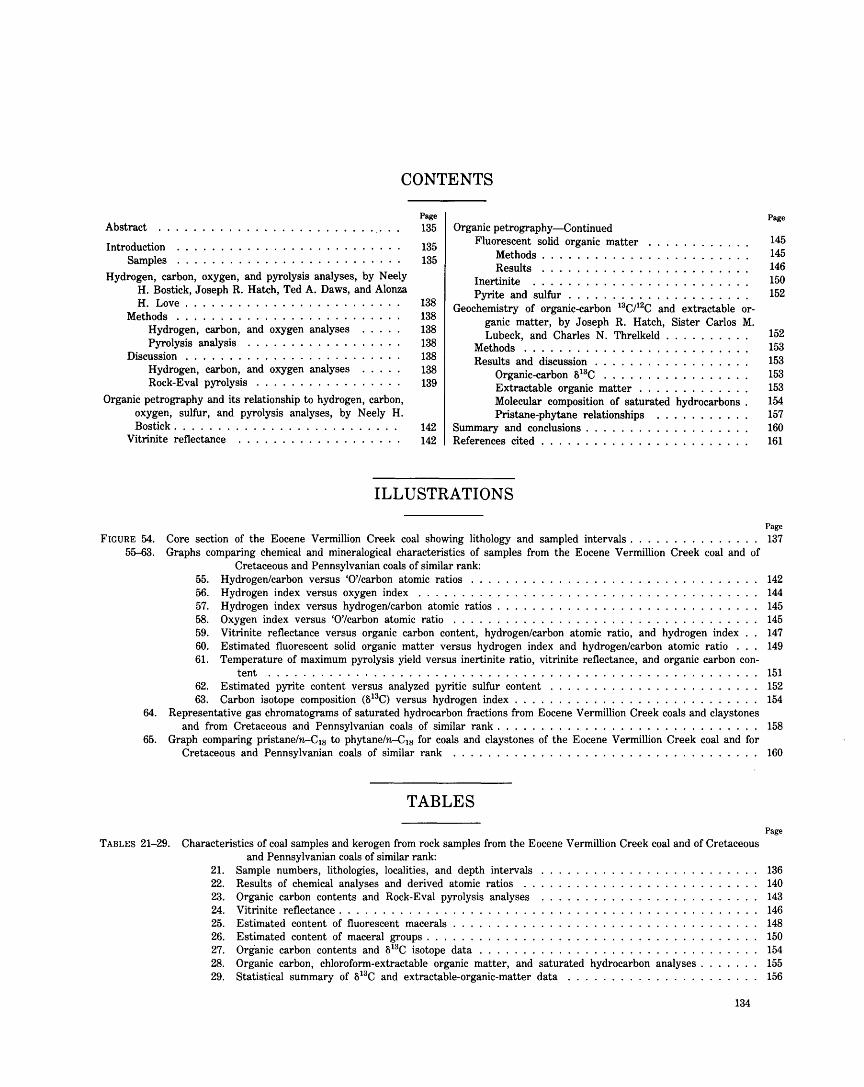
CONTENTS
Abstract ..
Introduction Samples
Hydrogen, carbon, oxygen, and pyrolysis analyses, by Neely H. Bostick, Joseph R. Hatch, Ted A. Daws, and Alonza H. Love ................... .
Methods .................... . Hydrogen, carbon, and oxygen analyses Pyrolysis analysis . . . . . . . . . . . . .
Discussion . . . . . . . . . . . . . . . . . . . . Hydrogen, carbon, and oxygen analyses Rock-Eval pyrolysis . . . . . . . . . . . .
Organic petrography and its relationship to hydrogen, carbon, oxygen, sulfur, and pyrolysis analyses, by Neely H. Bostick ......................... .
Vitrinite reflectance
Page
135
135 135
138 138 138 138 138 138 139
142 142
Organic petrography-Continued Fluorescent solid organic matter
Methods . Results ...
Inertinite Pyrite and sulfur
Geochemistry of organic-carbon 13C/12C and extractable organic matter, by Joseph R. Hatch, Sister Carlos M. Lubeck, and Charles N. Threlkeld
Methods ........ . Results and discussion . . . . .
Organic-carbon 813C .... Extractable organic matter Molecular composition of saturated hydrocarbons . Pristane-phytane relationships
Summary and conclusions . References cited . . . . . . . . . . . . .
ILLUSTRATIONS
Page
145 145 146 150 152
152 153 153 153 153 154 157 160 161
Page
FIGURE 54. Core section of the Eocene Vermillion Creek coal showing lithology and sampled intervals . . . . . . . . . . . . . . . 137 55-63. Graphs comparing chemical and mineralogical characteristics of samples from the Eocene Vermillion Creek coal and of
Cretaceous and Pennsylvanian coals of similar rank: 55. Hydrogen/carbon versus '0'/carbon atomic ratios . . . 142 56. Hydrogen index versus oxygen index . . . . . . . . . 144 57. Hydrogen index versus hydrogen/carbon atomic ratios 145 58. Oxygen index versus '0'/carbon atomic ratio . . . . . 145 59. Vitrinite reflectance versus organic carbon content, hydrogen/carbon atomic ratio, and hydrogen index 147 60. Estimated fluorescent solid organic matter versus hydrogen index and hydrogen/carbon atomic ratio . 149 61. Temperature of maximum pyrolysis yield versus inertinite ratio, vitrinite reflectance, and organic carbon con-
tent . . . . . . . . . . . . . . . . . . . . . . . . . . . . . . . . 151 62. Estimated pyrite content versus analyzed pyritic sulfur content . . . . . . . . . . . . . . . . . . . . . . . . 152 63. Carbon isotope composition (813C) versus hydrogen index . . . . . . . . . . . . . . . . . . . . . . . . . . . . 154
64. Representative gas chromatograms of saturated hydrocarbon fractions from Eocene Vermillion Creek coals and claystones and from Cretaceous and Pennsylvanian coals of similar rank . . . . . . . . . . . . . . . . . . . . . . . . . . . . . . 158
65. Graph comparing pristane/n-C18 to phytane/n-C18 for coals and claystones of the Eocene Vermillion Creek coal and for Cretaceous and Pennsylvanian coals of similar rank . . . . . . . . . . . . . . . . . . . . . . . . . . . . . . . . . . . 160
TABLES 21-29.
TABLES
Characteristics of coal samples and kerogen from rock samples from the Eocene Vermillion Creek coal and of Cretaceous and Pennsylvanian coals of similar rank:
21. Sample numbers, lithologies, localities, and depth intervals 22. Results of chemical analyses and derived atomic ratios . . 23. Organic carbon contents and Rock-Eval pyrolysis analyses 24. Vitrinite reflectance . . . . . . . . . . . . . 25. 26. 27. 28. 29.
Estimated content of fluorescent macerals . . . Estimated content of maceral groups . . . . . . Organic carbon contents and 813C isotope data Organic carbon, chloroform-extractable organic matter, and saturated hydrocarbon Statistical summary of 813C and extractable-organic-matter data ......... .
analyses .
134
Page
136 140 143 146 148 150 154 155 156
GEOLOGICAL INVESTIGATIONS OF THE VERMILLION CREEK COAL BED IN THE EOCENE NILAND TONGUE OF THE
WASATCH FORMATION, SWEETWATER COUNTY, WYOMING
ORGANIC GEOCHEMISTRY AND ORGANIC PETROGRAPHY
By NEELY H. BOSTICK, JOSEPH R. HATCH, TED A. DAWS, ALONZA H. LOVE, SISTER CARLOS M. LUBECK, and CHARLES N. THRELKELD
ABSTRACT
The chemical and petrographic methods commonly used in petroleum source-rock evaluation are applied to coals and associated shales of the Eocene Vermillion Creek coal deposits and to some Cretaceous and Pennsylvanian coals for comparison. The Vermillion Creek coals and shales contain dominantly humic organic matter originating from woody plant tissues except for one shale unit above the coals, which contains hydrogen-rich kerogen that is mostly remains of filamentous algae, of likely lacustrine origin. The coals have two unusual features-very low inertinite content and high sulfur content compared to mined western coals. However, neither of these features points to the limnic setting reported for the Vermillion Creek sequence.
The vitrinite reflectance of Vermillion Creek shales is markedly lower than that of the coals and is inversely proportional to the H/C ratio of the shales. We conclude that the type of vitrinite in hydrogen-rich samples has low reflectance.
Rock-Eval pyrolysis results, analyses of H, C, and N, petrographic observations, isotope composition of organic carbon, and amounts and compositions of the CHCl:;extractable organic matter all suggest mixtures of two types of organic matter in the Vermillion Creek coals and clay shales: (1) isotopically heavy (813C= -26.3 per mil), hydrogen-deficient, terrestrial organic matter, as was found in the coals, and (2) isotopically light (813C= --32 per mil), hydrogen-rich organic matter similar to that found in one of the clay-shale samples.
The different compositions of the Vermillion Creek coal, the unnamed Williams Fork Formation coals, and coals from the Middle Pennsylvanian Marmaton and Cherokee Groups are apparently caused by differences in original plant composition, alteration of organic matter related to different pH conditions of the peat swamps, and slightly different organic maturation levels.
INTRODUCTION
This chapter reports results of analyses of some organic-geochemical and organic-petrographic properties of coal and coal-associated rock samples from the Eocene Vermillion Creek coal deposit. The Vermillion Creek coal has an apparent rank of high-volatile C bituminous coal (Hatch, this volume) and has a high sulfur content (arithmetic mean=5.6 percent).
Organic-geochemical and petrographic properties were studied by techniques used in routine petroleumsource-rock evaluation, including total and organic carbon determinations; hydrogen, nitrogen, and sulfur
analyses; Rock-Eval pyrolysis (yielding estimates of relative hydrogen/carbon and oxygen/carbon ratios and maturation indices); organic petrography (organic type, vitrinite reflectance, and fluorescence); determination of organic-carbon 13C/12C ratios; extraction of soluble organic matter (bitumen) in CHC13; and column and gas chromatography of the bitumen.
We compare properties of organic matter in the V ermillion Creek coal with those in the coal-associated rocks and in other coals of similar rank to show similarities and differences in the original types of organic matter and to show the effects of different inferred geochemical environments. Comparison samples include low-sulfur ( < 1 percent S) unnamed coals from the Upper Cretaceous Williams Fork Formation, Moffat and Rio Blanco Counties, Colorado, and high-sulfur (>2 percentS) unnamed coals from the Middle Pennsylvanian Marmaton and Cherokee Groups, south-central Iowa.
This study was initiated by H. W. Roehler, of the U.S. Geological Survey, who believed that Vermillion Creek coals would be unusual because of their limnic paleosetting. Whether the analyses we report truly support that assessment or not depends largely on one's point of reference. The Vermillion Creek coals do contain more sulfur and less inertinite (and consequently have slightly higher hydrogen content and calorific value) than most western coals, and the overlying shale is a true algal-rich oil shale characteristic of limnic sediments.
SAMPLES
The Vermillion Creek coal, claystone, and shale samples are from three sites (VC-5, VC-7, and VC--8) within a total distance of 4 miles, Sweetwater County, southwestern Wyoming. Sample numbers, depth intervals represented, lithology, and exact localities for twenty coal, claystone, and shale samples are listed on table 21. Figure 54 illustrates the positions of individual
135
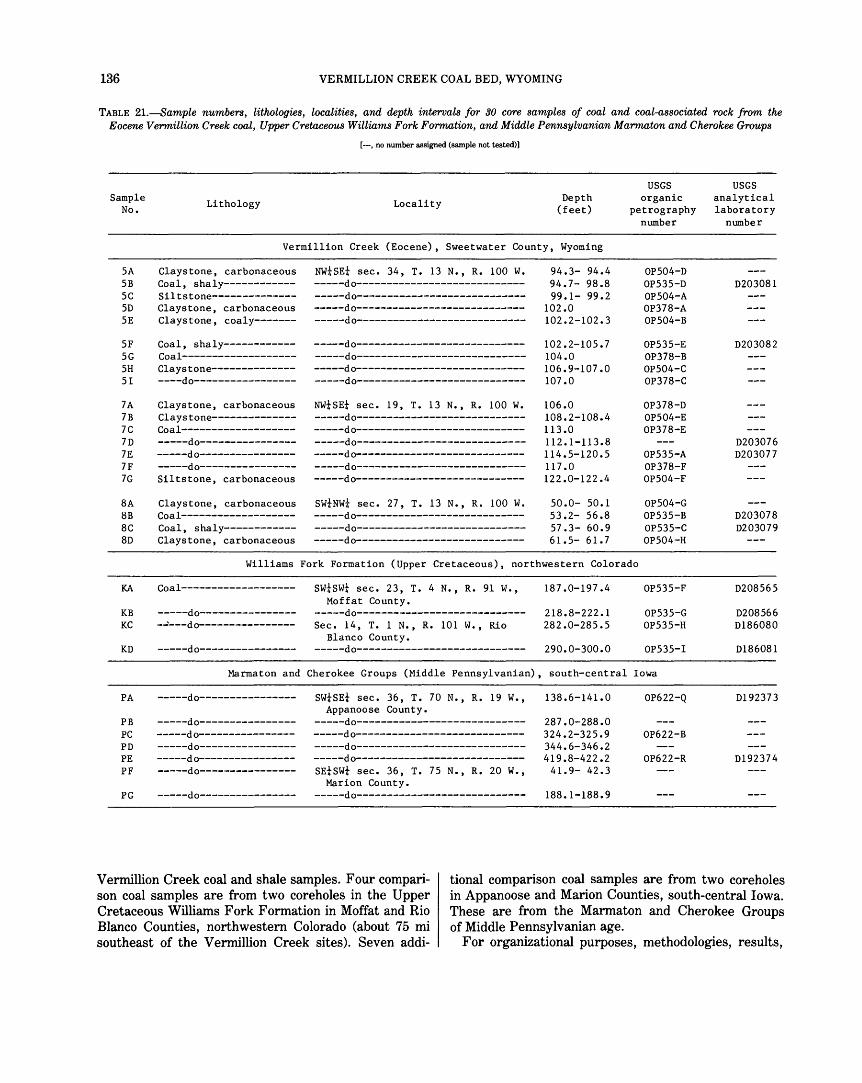
136 VERMILLION CREEK COAL BED, WYOMING
TABLE 21.-Sample numbers, lithologies, localities, and depth intervals for 30 core samples of coal and coal-associated rock from the Eocene Vermillion Creek coal, Upper Cretaceous Williams Fork Formation, and Middle Pennsylvanian Marmaton and Cherokee Groups
Sample No.
5A 5B 5C 5D 5E
5F 5G 5H 51
7A 7B 7C 7D 7E 7F 7G
8A 8B 8C 8D
KA
KB KC
KD
PA
PB PC PD PE PF
PG
[-,no number assigned (sample not tested)]
Lithology Locality Depth (feet)
Vermillion Creek (Eocene), Sweetwater County, Wyoming
Claystone, carbonaceous Coal, shaly-----------Siltstone-------------Claystone, carbonaceous Claystone, coaly-------
Coal, shaly------------Coal-------------------Claystone------------------do-----------------
Claystone, carbonaceous Claystone--------------Coal-----------------------do---------------------do---------------------do----------------Siltstone, carbonaceous
Claystone, carbonaceous Coal-------------------Coal, shaly-----------Claystone, carbonaceous
NWtSEt sec. 34, T. 13 N., R. 100 W. -----do---------------------------------do---------------------------------do---------------------------------do----------------------------
-----do---------------------------------do---------------------------------do---------------------------------do----------------------------
NWtSEt sec. 19, T. 13 N., R. 100 W. -----do---------------------------------do---------------------------------do---------------------------------do---------------------------------do---------------------------------do----------------------------
SWtNWt sec. 27, T. 13 N., R. 100 W. -----do---------------------------------do---------------------------------do----------------------------
94.3- 94.4 94.7- 98.8 99.1- 99.2
102.0 102.2-102.3
102.2-105.7 104.0 106.9-107.0 107.0
106.0 108.2-108.4 113.0 112.1-113.8 114.5-120.5 117 .o 122.0-122.4
50.0- 50.1 53.2- 56.8 57.3- 60.9 61.5- 61.7
USGS organic
petrography number
OP504-D OP535-D OP504-A OP378-A OP504-B
OP535-E OP378-B OP504-C OP378-C
OP378-D OP504-E OP378-E
OP535-A OP378-F OP504-F
OP504-G OP535-B OP535-C OP504-H
Williams Fork Formation (Upper Cretaceous), northwestern Colorado
Coal------------------- swtswt sec. 23, T. 4 N.' R. 91 w., 187.0-197.4 OP535-F Moffat County.
-----do---------------- -----do---------------------------- 218.8-222.1 OP535-G -~---do---------------- Sec. 14, T. 1 N., R. 101 w.' Rio 282.0-285.5 OP535-H
Blanco County. -----do---------------- -----do---------------------------- 290.0-300.0 OP535-I
Marmaton and Cherokee Groups (Middle Pennsylvanian), south-central Iowa
-----do---------------- swtsEt sec. 36, T. 70 N., R. 19 w., Appanoose County.
-----do---------------- -----do---------------------------------do---------------- -----do---------------------------------do---------------- -----do---------------------------------do---------------- -----do---------------------------------do---------------- SEtswt sec. 36, T. 75 N., R. 20 w.,
Marion County. -----do---------------- -----do----------------------------
138.6-141.0
287.0-288.0 324.2-325.9 344.6-346.2 419.8-422.2
41.9- 42.3
188.1-188.9
OP622-Q
OP622-B
OP622-R
USGS analytical laboratory
number
D203081
D203082
D203076 D203077
D203078 D203079
D208565
D208566 D186080
D186081
D192373
D192374
Vermillion Creek coal and shale samples. Four comparison coal samples are from two coreholes in the Upper Cretaceous Williams Fork Formation in Moffat and Rio Blanco Counties, northwestern Colorado (about 75 mi southeast of the Vermillion Creek sites). Seven addi-
tional comparison coal samples are from two coreholes in Appanoose and Marion Counties, south-central Iowa. These are from the Marmaton and Cherokee Groups of Middle Pennsylvanian age.
For organizational purposes, methodologies, results,

ORGANIC GEOCHEMISTRY AND ORGANIC PETROGRAPHY (BOSTICK AND OTHERS) 137
Feet VC - 7
VC - 5 105.0 Feet
0
88.0 A- ~
@) Feet
VC-8 @>
48 .0 ~ 90.0
8
u A
~ @)
~
= @
A <P"
D c
8
55.0
8
E
Cl
~ ~
@
~ ,p< u
u
~ u 0
®
0
@
€:>@ 0 <D(.
EXPLANATION
Lithology
11:?/:~:.~\}?~;~ Sandstone
~L _ ... -~ Siltstone
~ Carbonaceous siltstone
~Shale
~ Slightly carbonaceous shale
~ Carbonaceous shale
~~~ Oilshale
~~~ Carbonaceous oil shale
!!!! Coal
Coal with inclusions
• Limestone
Fossils
A Root casts
Ostracodes
~ Prosobranch gastropods
@ Aquatic pulmonate gastropods
® Pelecypods
u Burrows
4D< Fish scales, bones , and teeth
® Charophytes
P€ Turtles
FIGURE 54.-Core sections of the Eocene Vermillion Creek coal showing lighology and sampled intervals. Letters refer to samples described in table 21. Corehole locations described in table 21 and shown on plate 1.
and discussions have been divided into three parts: (1) hydrogen, carbon, sulfur, and approximate oxygen analyses and Rock-Eva! pyrolysis, (2) organic petrog-
raphy and its relationship to hydrogen, carbon, oxygen, and pyrolysis analyses, and (3) organic-carbon 13C/12C and extractable-organic-matter analyses.

138 VERMILLION CREEK COAL BED, WYOMING
HYDROGEN,CARBON,OXYGEN,AND ROCK-EVAL PYROLYSIS ANALYSES
By NEELY H. BOSTICK, jOSEPH R. HATCH,
TED A. DAWS, and ALONZA H. LOVE
Methods
HYDROGEN, CARBON, AND OXYGEN AN""LYSES
The hydrogen, carbon, and oxygen analyses are in two groups: (a) coals (ash content as high as 33 percent) analyzed by standard procedures of the U.S. Bureau of Mines (U.S. Office of Coal Research, 1967) (sample size 200 mg) and (b) coals and kerogens from shales analyzed at the U.S. Geological Survey (USGS) on a Perkin-Elmer 240 CHN analyzer (sample size 1-3 mg). For both groups, oxygen is estimated by difference (shown as '0' in our figures and tables). The U.S. Bureau of Mines (USBM) analyzes air-dry (30°-35°C) coal, but reports analyses calculated to a moisture-free basis (based on moisture removal at 105°C, 1-1¥2 hours), and these calculated values are shown on table 22 (labeled "USBM"). The USGS analyses of coal (USGS-C on table 22) were on air-dry samples (storage in Denver) and were not recalculated. The kerogen from shale samples (USGS-K on table 22) had been treated with HCl and HF, subjected to heavy-liquid separation, and dried overnight at about 30°C in a vacuum.
We do not have any separate study that shows the influence of these diverse ways of handling samples. The nine coal samples analyzed by both agencies show no systematic difference in H/C, but most USBM analyses have somewhat higher '0' and lower '0' /C than the corresponding USGS analyses.
The USGS-K samples (shales plus one coal) have a higher average H/C ratio than the other two sample groups, but four of these that have very low ash contents (5D, 5E, 7C, and coal 5G) have H/C as low as those of low-ash coals from the other groups. This suggests that the USGS-K samples that gave mineralclean kerogen had vitrinitic kerogen and had moisture reduced to a level comparable to that of the air-dried samples.
We tried to find ways to adjust for the high mineral content of some samples. (See "ash" on table 22.) Such an adjustment might be done analytically but would require separate quantitative analyses of the different minerals present or chemical ways of estimating them. Given and Y arzab (1978) and N eavel and others (1980) give examples and discussions of such work. We did include "corrected" values in table 22, and the methods used for these corrections are explained in the table footnotes. For most samples the correction is less than the likely analytical uncertainty. We hope that this cor-
rection will at least make the reader aware of the problem.
In many reports, analyses of H, C, and 0 are displayed on diagrams of atomic ratios, such as H/C versus 0/C (van Krevelen diagram) or H/C versus (H -2·0)/C (Leyfman and Vassoyevich, 1980). We have used our corrected values to make figure 55. The "oxygen" is by difference (see footnote 7, table 22), and considering the high mineral content of some samples, we have labeled these analyses '0', to indicate they may be imprecise for use as oxygen values.
Ash content of the coals and kerogens was determined in two ways. Samples analyzed by the U.S. Bureau of Mines were given about 5 hours combustion time and reached a fmal temperature of 750°C, as described in U.S. Office of Coal Research (1967). For the USGS analyses, though, coals or kerogen concentrates of about 16--50 g were ashed in porcelain crucibles at 450°C for 20 to 24 hours. The ash was allowed to cool in a vacuum desiccator and the weight loss was recorded. The samples were heated further for 2 hours and weighed. This procedure was repeated until a stable ash weight was reached, and the weight loss was used to calculate percent ash.
PYROLYSIS ANALYSIS
Pyrolysis assay was by Rock-Eval using the method of Espitalie and others (1977). Results are given in table 23 in terms of yields of volatile hydrocarbons (HC), pyrolitic HC, and carbon dioxide. When the last two of these are normalized by total organic carbon (TOC), the results are the hydrogen index (Hi), mgHC/ gTOC, and the oxygen index (Oi), mgC02/gTOC, respectively. These indices are approximately proportional to the elemental H/C and 0/C ratios of organic matter and can be used in a van Krevelen-type diagram (fig. 56) to evaluate type of organic matter (Tissot and Welte, 1978).
DISCUSSION
HYDROGEN, CARBON, AND OXYGEN ANALYSES
We make four main observations about hydrogen, carbon, and oxygen contents of the studied samples:
(1) With the scales of H/C and '0' IC we have used in figure 55, most of data scatter seems to be in '0'/C. This '0' /C scatter is also seen in the data of samples for which we have repeat analyses (table 22), and we conclude that it is largely the result of preparation and analytical problems--especially the high mineral content of some of the kerogens and coals. The range of H/C, however, mostly represents real differences in type of organic matter in the samples.
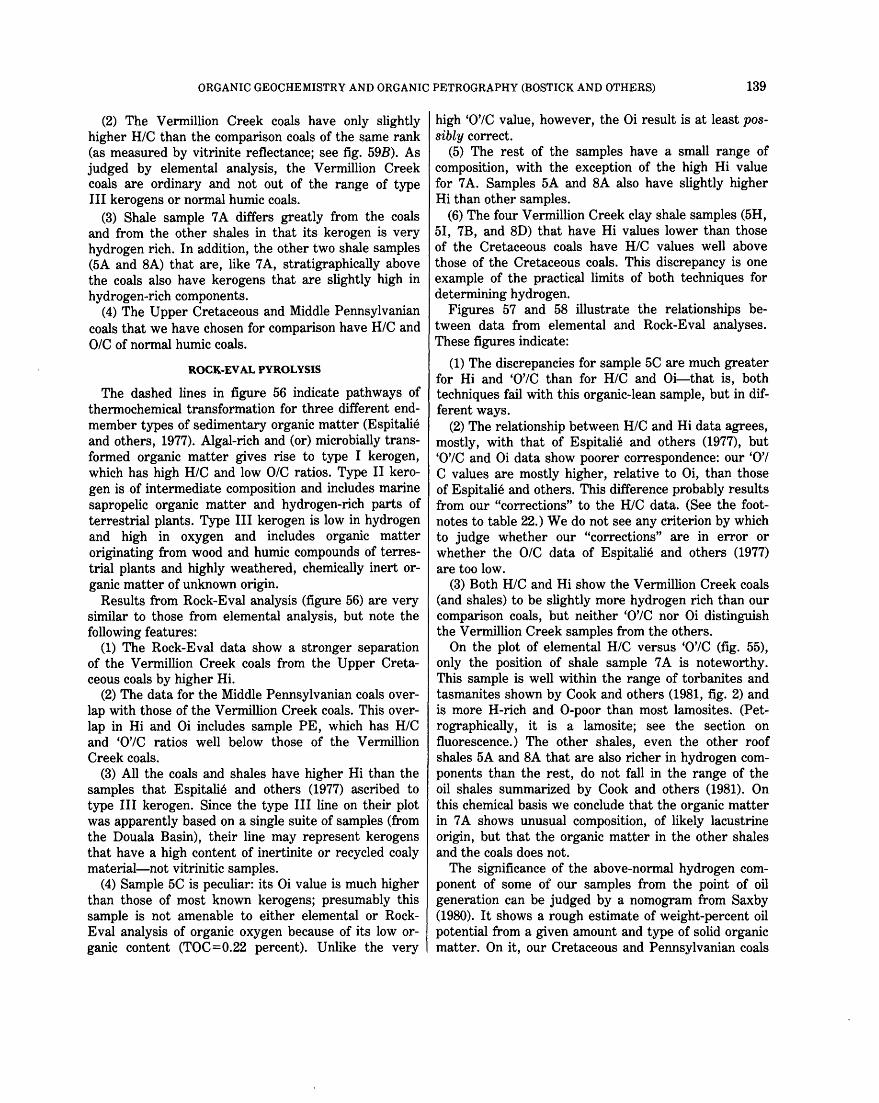
ORGANIC GEOCHEMISTRY AND ORGANIC PETROGRAPHY (BOSTICK AND OTHERS) 139
(2) The Vermillion Creek coals have only slightly higher H/C than the comparison coals of the same rank (as measured by vitrinite reflectance; see fig. 59B). As judged by elemental analysis, the Vermillion Creek coals are ordinary and not out of the range of type III kerogens or normal humic coals.
(3) Shale sample 7 A differs greatly from the coals and from the other shales in that its kerogen is very hydrogen rich. In addition, the other two shale samples (5A and 8A) that are, like 7 A, stratigraphically above the coals also have kerogens that are slightly high in hydrogen-rich components.
(4) The Upper Cretaceous and Middle Pennsylvanian coals that we have chosen for comparison have H/C and 0/C of normal humic coals.
ROCK-EV AL PYROLYSIS
The dashed lines in figure 56 indicate pathways of thermochemical transformation for three different endmember types of sedimentary organic matter (Espitalie and others, 1977). Algal-rich and (or) microbially transformed organic matter gives rise to type I kerogen, which has high H/C and low 0/C ratios. Type II kerogen is of intermediate composition and includes marine sapropelic organic matter and hydrogen-rich parts of terrestrial plants. Type III kerogen is low in hydrogen and high in oxygen and includes organic matter originating from wood and humic compounds of terrestrial plants and highly weathered, chemically inert organic matter of unknown origin.
Results from Rock-Eval analysis (figure 56) are very similar to those from elemental analysis, but note the following features:
(1) The Rock-Eval data show a stronger separation of the Vermillion Creek coals from the Upper Cretaceous coals by higher Hi.
(2) The data for the Middle Pennsylvanian coals overlap with those of the Vermillion Creek coals. This overlap in Hi and Oi includes sample PE, which has H/C and '0' IC ratios well below those of the Vermillion Creek coals.
(3) All the coals and shales have higher Hi than the samples that Espitalie and others (1977) ascribed to type III kerogen. Since the type III line on their plot was apparently based on a single suite of samples (from the Douala Basin), their line may represent kerogens that have a high content of inertinite or recycled coaly material-not vitrinitic samples.
(4) Sample 5C is peculiar: its Oi value is much higher than those of most known kerogens; presumably this sample is not amenable to either elemental or RockEva! analysis of organic oxygen because of its low organic content (TOC=0.22 percent). Unlike the very
high '0'/C value, however, the Oi result is at least possibly correct.
(5) The rest of the samples have a small range of composition, with the exception of the high Hi value for 7 A. Samples 5A and 8A also have slightly higher Hi than other samples.
(6) The four Vermillion Creek clay shale samples (5H, 51, 7B, and 8D) that have Hi values lower than those of the Cretaceous coals have H/C values well above those of the Cretaceous coals. This discrepancy is one example of the practical limits of both techniques for determining hydrogen.
Figures 57 and 58 illustrate the relationships between data from elemental and Rock-Eval analyses. These figures indicate:
(1) The discrepancies for sample 5C are much greater for Hi and '0'/C than for H/C and Oi-that is, both techniques fail with this organic-lean sample, but in different ways.
(2) The relationship between H/C and Hi data agrees, mostly, with that of Espitalie and others (1977), but '0' /C and Oi data show poorer correspondence: our '0' I C values are mostly higher, relative to Oi, than those of Espitalie and others. This difference probably results from our "corrections" to the H/C data. (See the footnotes to table 22.) We do not see any criterion by which to judge whether our "corrections" are in error or whether the 0/C data of Espitalie and others (1977) are too low.
(3) Both H/C and Hi show the Vermillion Creek coals (and shales) to be slightly more hydrogen rich than our comparison coals, but neither '0' IC nor Oi distinguish the Vermillion Creek samples from the others.
On the plot of elemental H/C versus '0'/C (fig. 55), only the position of shale sample 7 A is noteworthy. This sample is well within the range of torbanites and tasmanites shown by Cook and others (1981, fig. 2) and is more H-rich and 0-poor than most lamosites. (Petrographically, it is a lamosite; see the section on fluorescence.) The other shales, even the other roof shales 5A and 8A that are also richer in hydrogen components than the rest, do not fall in the range of the oil shales summarized by Cook and others (1981). On this chemical basis we conclude that the organic matter in 7 A shows unusual composition, of likely lacustrine origin, but that the organic matter in the other shales and the coals does not.
The significance of the above-normal hydrogen component of some of our samples from the point of oil generation can be judged by a nomogram from Saxby (1980). It shows a rough estimate of weight-percent oil potential from a given amount and type of solid organic matter. On it, our Cretaceous and Pennsylvanian coals

TABLE 22.-Results of chemical analyses and derived atomic ratios for coal and rock samples from the Vermillion Creek Coal, the Williams Fork Formation, and the Marrnaton and Cherokee Groups
[All values, except ratios, in percent.-, not determined. Arrows indicate no separate determination was made, and value shown above ( tf) or below (U) was used for calculations]
Sample No.
SA
SB
sc SD
SE
SF
SG
SH
SI
7A
7B
7C
7D
7E
Type of
analysis1
Ash
USGS-K 15.9
ca2 so32
USBM 25.2 1.6 1.9 USGS-C 30.5 tt tt USGS-C tt tt tt
USGS-K 69.3
USGS-K 7.2
USGS-K .8
USBM 33.5 4.4 2.8 USGS-c 29.1 tt tt USGS-C tt tt tt USGS-C tt tt tt
USGS-K 3.5 tt tt
USGS-K 23.3
USGS-K 25.9
USGS-K 6.7
USGS-K 25.1
USGS-C 2.1 ++ ++ USBM 11.3 .55 1.3
USBM 13.3 5.0 4.6 USGS-C 13.5 tt tt USGS-C tt tt tt USGS-C tt tt tt
7F USGS-C .5 tt tt
7G USGS-K 33.0
SA USGS-K 12.1
8B USBM 11.1 .45 1.0 USGS-C 12.0 tt tt USGS-C tt tt tt
Mineral matter3
19.4
30.0 36.0 tt
79.7
9.5
2.3
39.2 34.2 tt tt
5.4
27.7
30.7
9.0
29.8
3.8
15.0
15.6 15.8 tt tt
2.0
38.7
15.1
14.4 15.4 tt
Hydrogen
Ana- Calculytical lated4
5.25
4.4 3.57 3.08
1.34
4.79
4. 77
3.6 3.67 2.99 3.56
4.79
4.55
4.41
8.98
4.53
s.os 4.9
4.8 4.35 4.79 4.19
5.04
4.23
5.74
4.8 4.63 4.65
5.07
4. 1 3.25 2.76
.42
4.73
4.80
3.3 3.42 2.74 3.31
4.90
4.27
4.09
8.93
4.22
5.09
4.9
4.8 4.33 4. 77 4.17
5.23
3.81
5.62
4.7 4.55 4.67
Carbon
Ana- Calculytical lateds
N
Vermillion Creek
58.7
55.5 42.8 38.2
4.5
65.4
70.2
47.1 46.8 41.7 47.2
68.0
53.8
51.6
72. 1
52.5
69.3
64.5
64.7 60.3 61.4 61.9
58.9
55.2 42.5 37.9
4.7
65.6
70.4
45.9 45.6 40.5 46.0
66.8
54.0
51.8
72.3
52.7
69.3
64.5
63.4 59.0 60.1 60.6
1.97
1. 8 1.50 l. 33
.45
2.24
2.43
1. 5 1.60 1. 37 1.62
2.29
1.64
1.76
1. 61
1. 87
2.59
2.2
2.2 2.00 2.24 2.24
70.2 2.75
49.0 1.67
62.5 2.08
Total
6.8 tt tt
6.0 tt tt tt
7.5
4.9 tt tt tt
71.5
48.8
62.4
65.0 58.3 61.7
65.0 58.3 61.7
2.1 7.9 2. 03 tt 2.13 tt
Sulfur6
Pyritic
3.33 tt tt
2.85 tt tt tt
4.84
1. 25 tt tt tt
3.91 tt tt
H/cs 'o'7
Organic Ana- Calculytical lated
3.47 tt tt
11.7
5.37 13.3 18.5
1. 07
.95 1.00
.97 Sample SB average------
3.15 tt tt tt
11.8 3.57
14.9 .88
17.1 • 82
6.94 12.0 18.0 11.7
.92
.94
.86
.91 Sample SF average------
2.66
3.65 tt tt tt
17.6 .85
9.40 1.01
8.72 1.03
5.23 1.49
8.48 1.04
16. 3 • 8 7
10.8
10.4 15.2 13.5 13.5
.91
.89
.87
.94
.81 Sample 7E average------
3.99 tt tt
16.9
3.87
11.7
9.79 15.7 12.2
.85
1.04
1.10
.89
.95
.90 Sample 8B average------
1.03
.90
.92
.87
.90
1. 07
.87
.82
.86
.90
.81
.86
.86
.88
.95
.95
1.48
.96
.88
.90
.91
.88
.95
.83 • 89
.89
.93
1.08
.87
.94
.89
.90
'o';cs
0.15
.07
.23
.37
.22
1.90
.17
.18
.11
.20
.33
.19
.21
.20
.13
• 13
.05
• 12
.18
.13
.12 • 19 • 17 .17 .16
.18
.06
.14
.11
.20
.15 • 15
......... ~ 0
< tr:l ~ r:s: -t"1 t"1 -0 z (i ~ tr:l tr:l ~ (i 0 > t"4 to tr:l
_t:::j
~ 0 r:s: z ~

8C USBM USGS-c USGS-C
29.4 2.4 28.3 tt tt tt
1.7 tt tt
8D USGS-K 15.6
KA USBM USGS-C USGS-C USGS-C
KB USBM
KC
USGS-C USGS-C
USBM USGS-C USGS-C
4.5 0.66 4. 6 tt tt tt tt tt
0.45 tt tt tt
6. 5 • 44 1. 0 5.9 tt tt tt tt tt
11.5 .43 7. 6 tt tt tt
.49 tt tt
KD USBM 8.3 .53 .54 USGS-C 6.7 tt tt USGS-C tt tt tt
PA USBM
PE USBM
12.0 1.1 0.72
14.3 .80 .82
34.2 33.0 tt
19.0
5.2 5.3 tt tt
7.6 6.9 tt
13.1 8.7 tt
9.4 7. 6 tt
14.4
18.1
3. 9 3.65 3.85
s.oo
5.4 5.17 4.78 4.97
5.1 4.71 4.68
4.7 4.75 4.68
4.8 4.91 4.66
4.4
4.3
3.6 3.35 3.55
4.83
5.3 5.12 4.73 4.92
s.o 4.65 4.62
4.6 4.65 4.58
4.7 4.83 4.58
4.3
4.2
52.7 49.8 50.6
59.4
52.1 49.2 so.o
59.6
1.7 1.68 1.74
1.32
5.2 tt tt
Williams Fork Formation
72.8 68.3 68.3 67.2
70.9 62.3 65.7
69.4 69.0 68.4
72.1 70.9 67.9
72.8 68.3 68.3 67.2
70.9 62.3 65.7
69.4 69.0 68.4
72.1 70.9 67.9
1.9 1.53 1. 49 1.46
1.9 1. 40 1.48
1.4 1.33 1.31
0.40 tt tt tt
1.0 tt tt
.so tt tt
1.5 .so 1.36 tt 1. 30 tt
Marmaton and Cherokee Groups
64.9
63.5
64.7
63.4
1. 1
1.3
5.3
7.3
2.13 tt tt
0.18 tt tt tt
• 57 tt tt
.24 tt tt
.14 tt tt
1.74
4.11
3.07 tt tt
5.29 9.69 8.63
.89
.88
.91 Sample 8C average------
0.22 tt tt tt
11.8
14.6 19.6 20.0 21.0
1.01
0.89 0.91
.84
.89 Sample KA average------
.43 tt tt
14.1 24.3 20.8
.86
.91
.85 Sample KB average------
.26 tt tt
11.3 16.0 16.7
• 81 .83 .82
Sample KC average------
.36 tt tt
11.9 14.9 18.2
.80
.83
.82 Sample KD average------
3.56
3.19
12.0
9.82
0.81
.81
.82 tt
.85 • 83
.97
0.88 0.90
.83
.88
.87
.85
.90 • 84 .86
.79
.81
.80
.80
.78
.82
.81
.80
0.79
.79
.08
.15
.13
.12
.15
0.15 .22 .22 .23 .21
.15
.29
.24
.23
.12
.17
.18
.16
.12
.16
.20
.16
0.14
.12
1u.s. Geological Survey analyses performed on vacuum-dried kerogen (USGS-K) or on air-dried coal (USGS-C). U.S. Bureau of Mines analyses (USBM) performed on air-dried coal, recalculated to moisture-free basis.
2 In dry coal, calculated from analyses of ash. 3ealculated from a modified Parr formula (Given and Yarzab, 1978, p. 12): Mineral matter = 1.13 ash+ 0~47 pyritic sulfur, where the
chlorine term has been omitted. See also footnote 6. 4 Corrected for water of clays by formula of Given and Yarzab (1978, p. 24): Hcorrected = Hanalytical - 0.014 ash+ 0.018 Spyritic +
0.019 (44/40 Ca) + 0.014 so 3• The term 44/40 Ca replaces G0 2 in the formula of the British Standards, and the value used for Ca is the amount above an assumed 0.5 percent base level of noncarbonate calcium. For kerogen samples (USGS-K), which were macerated with HCl and HF, the carbonate term was zero. See also footnote 6.
SAil coal samples (USBM and USGS-C) were corrected for influence of Caco3 on carbon by the formula of Given and Yarzab (1978, p. 8): Ccorrected = Canalytical- 12/40 Ca. The term 12/40 Ca replaces the 12/44 co2 of the British Standards formula, and Ca is defined as in footnote 4. Kerogen samples (USGS-K) were treated with HCl (7A required several treatments) and so are not corrected.
6 For USGS-c samples that were also analyzed by the USBM (shown by tt), the USBM sulfur values have been used in calculations of mineral matter, corrected hydrogen and '0'; all other USGS samples (shown by --) were assigned assumed values of 6.0, 3.0 and 3.0 percent, respectively, for total, pyritic, and organic sulfur in the calculations.
7Approximately oxygen by difference, calculated by '0' = 100- (mineral matter+ N + Ccorrected + Hcorrected + Sorganic). The high mineral content of these samples makes this measurement an imprecise indicator of actual oxygen content.
8Atomic H/C ratios= 12 x weight percent H/C. Atomic '0'/C ratio= (12/16) x weight percent '0'/C.
0 ~ Q
> z -0 Q trj 0 0 ::I: trj
~
~ ~ ~
> z Cl 0 ~
62 z -0 'i:l trj 1-3 ~ 0 Q ~ > 'i:l ::I: ~
'@ 0
~ -0 ~
> z Cl 0 1-3 ::I: trj ~ !!3
...... ~ ......
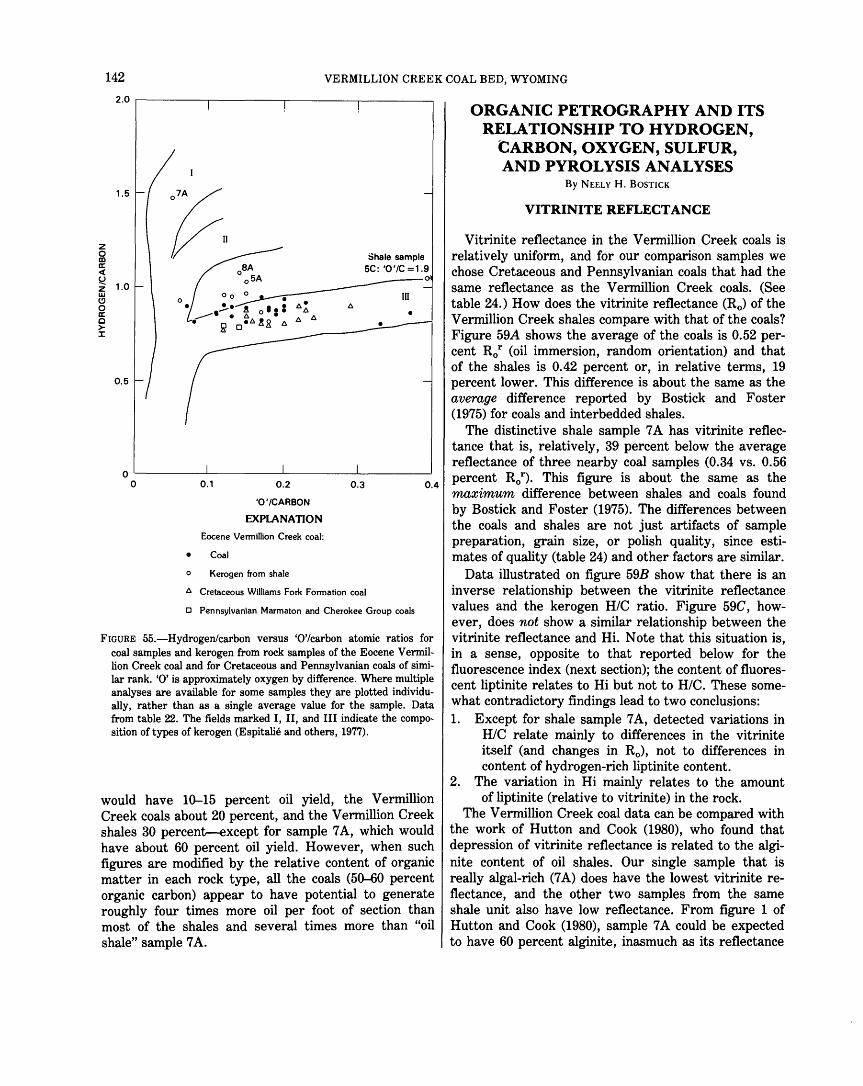
142 VERMILLION CREEK COAL BED, WYOMING
2.0 .------.------,--------.-----~
1.5
z ~ a: < ~ z 1.0 w C)
0 a: c > J:
0.5
Shale sample 5C: '0'/C =1.9
o~---~----~----~----~
0
• 0
0.1 0.2
'0'/CARBON
EXPlANATION
Eocene Vennillion Creek coal:
Coal
Kerogen from shale
0.3
t:. Cretaceous Williams Fork Fonnation coal
D Pennsylvanian Marmaton and Cherokee Group coals
0.4
FIGURE 55.-Hydrogen/carbon versus '0'/carbon atomic ratios for coal samples and kerogen from rock samples of the Eocene V ermillion Creek coal and for Cretaceous and Pennsylvanian coals of similar rank. '0' is approximately oxygen by difference. Where multiple analyses are available for some samples they are plotted individually, rather than as a single average value for the sample. Data from table 22. The fields marked I, II, and III indicate the composition of types of kerogen (Espitalie and others, 1977).
would have 10-15 percent oil yield, the Vermillion Creek coals about 20 percent, and the Vermillion Creek shales 30 percent-except for sample 7 A, which would have about 60 percent oil yield. However, when such figures are modified by the relative content of organic matter in each rock type, all the coals (50-60 percent organic carbon) appear to have potential to generate roughly four times more oil per foot of section than most of the shales and several times more than "oil shale" sample 7 A.
ORGANIC PETROGRAPHY AND ITS RELATIONSHIP TO HYDROGEN,
CARBON, OXYGEN, SULFUR, AND PYROLYSIS ANALYSES
By NEELY H. BOSTICK
VITRINITE REFLECTANCE
Vitrinite reflectance in the Vermillion Creek coals is relatively uniform, and for our comparison samples we chose Cretaceous and Pennsylvanian coals that had the same reflectance as the Vermillion Creek coals. (See table 24.) How does the vitrinite reflectance (R0 ) of the Vermillion Creek shales compare with that of the coals? Figure 59A shows the average of the coals is 0.52 percent R0 r (oil immersion, random orientation) and that of the shales is 0.42 percent or, in relative terms, 19 percent lower. This difference is about the same as the average difference reported by Bostick and Foster (1975) for coals and interbedded shales.
The distinctive shale sample 7 A has vitrinite reflec-tance that is, relatively, 39 percent below the average reflectance of three nearby coal samples (0.34 vs. 0.56 percent R0 r). This figure is about the same as the maximum difference between shales and coals found by Bostick and Foster (1975). The differences between the coals and shales are not just artifacts of sample preparation, grain size, or polish quality, since estimates of quality (table 24) and other factors are similar .
Data illustrated on figure 59B show that there is an inverse relationship between the vitrinite reflectance values and the kerogen H/C ratio. Figure 59C, however, does not show a similar relationship between the vitrinite reflectance and Hi. Note that this situation is, in a sense, opposite to that reported below for the fluorescence index (next section); the content of fluorescent liptinite relates to Hi but not to H/C. These somewhat contradictory findings lead to two conclusions: 1. Except for shale sample 7 A, detected variations in
H/C relate mainly to differences in the vitrinite itself (and changes in R0 ), not to differences in content of hydrogen-rich liptinite content.
2. The variation in Hi mainly relates to the amount of liptinite (relative to vitrinite) in the rock.
The Vermillion Creek coal data can be compared with the work of Hutton and Cook (1980), who found that depression of vitrinite reflectance is related to the alginite content of oil shales. Our single sample that is really algal-rich (7 A) does have the lowest vitrinite reflectance, and the other two samples from the same shale unit also have low reflectance. From figure 1 of Hutton and Cook (1980), sample 7A could be expected to have 60 percent alginite, inasmuch as its reflectance

ORGANIC GEOCHEMISTRY AND ORGANIC PETROGRAPHY (BOSTICK AND OTHERS) 143
TABLE 23.-0rganic carbon contents and Rock-Eval pyrolysis analyses for 31 coal and coal-associated rock samples from the Eocene Vermillion Creek coal, Upper Cretaceous Williams Fork Formation, and Middle Pennsylvanian Marmaton and Cherokee Groups
[HC, hydrocarbon]
Rock-Eval pyrolysis (mg/g sample) Sample
No.
Organic carbon1
(pet) Volatile HC (S 1)
Pyrolitic HC2 (S2)
Temperature of maximum pyrolysis
yield
SA B c D E
F G H I
7A B c D E F G
8A B c D
KA KB KC KD
PA PB PC PD PE PF PG
4.8 50.2
.22 7 .8·
19.6
42.1 56.4 3.8 2.6
4.2 1.5
64.0 58.2 57.7 59.0
1.8
3.3 58.4 47.6
1.3
68.2 67.0 64.4 66.9
62.1 63.4 52.8 52.5 61.4 46.8 45.3
lAir-dried basis.
0.042 .28 .033 .13 .18
1. 77 .023 .008
.30
.048 2.22
0
.16
.15
.42
.028
0 .015 .57
1:18 2.50
.68 2.08 1.50 1.37
.28
2rncludes HC-like compounds.
12.5 121
.012 16.9 45.4
94.5 4.6 2.8
29.3 2. 1
124
122 4.0
9.1 137 122
1.2
vermillion Creek
0.67 7.1
.28 1.1 4.0
9.6 .47 .34
1.2 .51
16
13 .37
.93 8.3 7.4
.31
440 429 424 428 430
430 431 434
442 443 431
430 442
443 425 423 434
Williams Fork Formation
103 97.1 88.4 94.1
12 13 12 15
437 437 443 440
Marmaton and Cherokee Groups
85.6 139 99.9
122 125 70.4 57.2
5.8 11 s.s 8.0 8.8 5.3 4.4
424 422 433 424 432 430 428
3s2/organic carbon (mg/g); only two figures are significant. 4 s3/organic carbon (mg/g); only two figures are significant. 5s1/(S1 + S2) •
Hydrogen index 3
259 240
5 217 232
168 122 108
697 141 194
207 221
277 234 256 93
150 144 137 141
138 220 189 233 204 150 126
Oxygen index4
14 14
128 13 20
17 12 13
29 34 25
23 21
28 14 15 24
18 20 18 23
9 17 10 15 14 11 10
Production index 5
0.003 .002 • 7 3 .008 .004
0
.02
.oos
.003
.01
.02
.02
.02
.01
.02
.001
.003
.02
0 .002 .006
0.01 .02 .007 .02 .01 .02 .oos
is depressed 40 percent below that of alginite-free samples. But 7 A contains only a modest 4 percent total organic carbon, and only part of this may represent alginite. It is apparently not the actual presence of algi-
nite that causes the difference in vitrinite reflectance, as concluded by Hutton and Cook (1980). Rather, the environment in which algae may be abundant and preserved may provide the condition for preferential for-

144 VERMILLION CREEK COAL BED, WYOMING
EXPLANATION
Eocene Vermillion Creek coal:
900 • Coal
o Kerogen from shale
~ Cretaceous Williams Fork Formation coal
800 o Pennsylvanian Marmaton and Cherokee Group coals
z 0 al et: <( u u 700 o 7A z <( (!) et: 0 .!2l (/) 600 z 0 al et: <( u 0 et: c >- 500 J: u i= ::i 0 et: >-a.. 400 Cl .s X w c ~ z 300 w (!)
05A o SA
0 et: c I •
>- • J: •o 0
oj 0 0
200 0 •
~1 •
• ~~ ~ 0
100 0 III
oL---~ ____ _L ____ _L ____ ~ ____ L_ __ ~ ____ _L ____ J_ ____ L_ __ ~~--~-----L----~----~--~
0 30 60 90 120 150
OXYGEN INDEX (mg C02tg ORGANIC CARBON)
FIGURE 56.-Hydrogen index versus oxygen index of coal and rock samples from the Eocene Vermillion Creek coal and of Cretaceous and Pennsylvanian coals of similar rank. Based on Rock-Eval pyrolysis data from table 23. Lines I, II, and III show types of kerogen according to Espitalie and others (1977).
mation of low-reflectance vitrinite. In this regard, see Lapo's 1978 paper on variation in the properties of vitrinite.
Kalkreuth (1982) describes Cretaceous coals in British Columbia, some of which contain large amounts of liptinite and have relatively depressed reflectance of their vitrinite. He finds that anomalously low vitrinite reflectance correlates with high content of liptinite, even if the liptinite group contains little alginite. Perhaps coincidentally, he observed this relation in
some coals that, like the Vermillion Creek coals, have an extremely low content of inertite (mostly less than 1 percent). He ascribes the lowering of vitrinite reflectance to the diffusion of bitumens into the vitrinite. That explanation has been placed high on the list of likely causes of unusually low vitrinite reflectance by those of us who have analyzed vitrinite in the oil-rich parts of the Illinois and Los Angeles basins. However, in the Vermillion Creek section, our Rock-Eval analyses do not show high bitumen peaks in low-reflect-
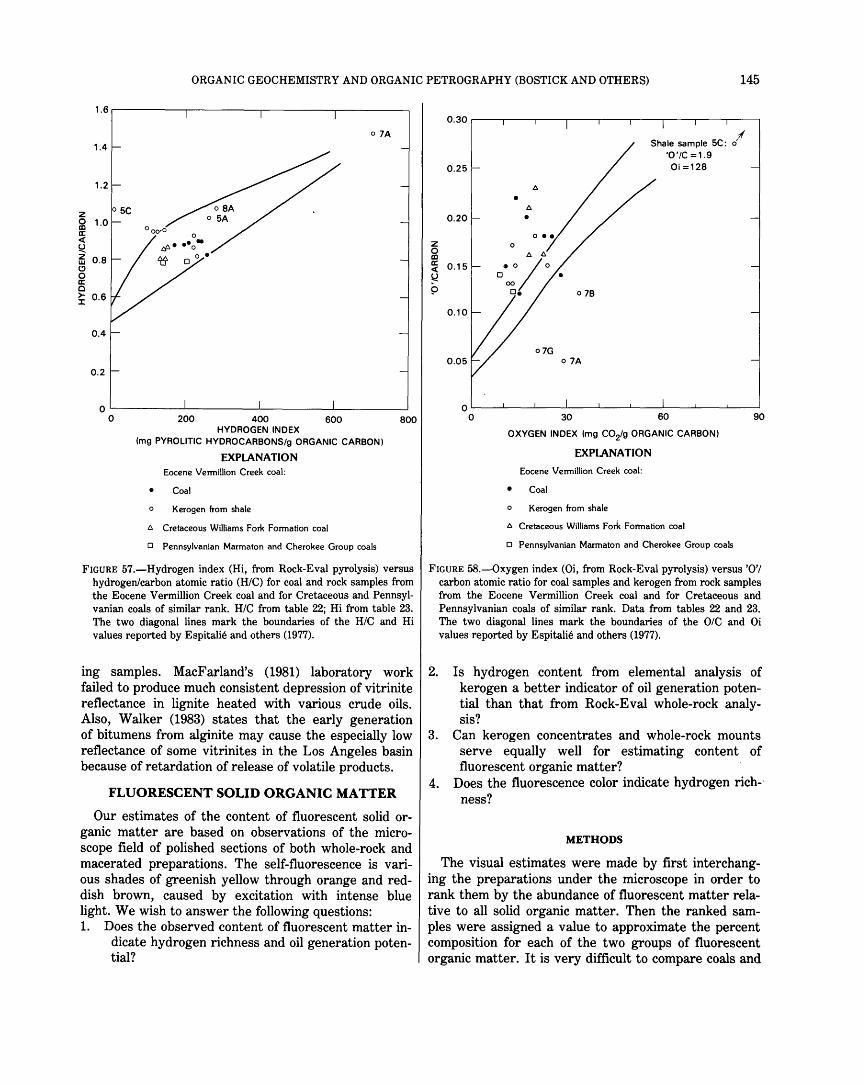
ORGANIC GEOCHEMISTRY AND ORGANIC PETROGRAPHY (BOSTICK AND OTHERS) 145
1.6.---------.---------.----------.---------.
z 0 al a: <(
~
1.4
1.2
~ 0.8 C)
0 a: 0 ~ 0.6
0.4
0.2
o 7A
0~--------~--------~---------L--------~ 0 200 400 600 800
HYDROGEN INDEX (mg PYROLITIC HYDROCARBONS/g ORGANIC CARBONI
EXPLANATION Eocene Vermillion Creek coal:
• Coal
o Kerogen from shale
6. Cretaceous Williams Fork Formation coal
0 Pennsylvanian Marmaton and Cherokee Group coals
FIGURE 57.-Hydrogen index (Hi, from Rock-Eval pyrolysis) versus hydrogen/carbon atomic ratio (H/C) for coal and rock samples from the Eocene Vermillion Creek coal and for Cretaceous and Pennsylvanian coals of similar rank. H/C from table 22; Hi from table 23. The two diagonal lines mark the boundaries of the H/C and Hi values reported by Espitalie and others (1977).
ing samples. MacFarland's (1981) laboratory work failed to produce much consistent depression of vitrinite reflectance in lignite heated with various crude oils. Also, Walker (1983) states that the early generation of bitumens from alginite may cause the especially low reflectance of some vitrinites in the Los Angeles basin because of retardation of release of volatile products.
FLUORESCENT SOLID ORGANIC MATTER
Our estimates of the content of fluorescent solid organic matter are based on observations of the microscope field of polished sections of both whole-rock and macerated preparations. The self-fluorescence is various shades of greenish yellow through orange and reddish brown, caused by excitation with intense blue light. We wish to answer the following questions: 1. Does the observed content of fluorescent matter in
dicate hydrogen richness and oil generation potential?
z 0 al a: <(
~ 9
0.30
;f Shale sample 5C: o
'0'/C =1.9 0.25 0i=128
6.
• 6.
0.20 •
0.15
0 7B
0.10
0.05
o~--~--~--~--~----L---~---L--~--~
0 30 60
OXYGEN INDEX (mg C02/g ORGANIC CARBONI
EXPLANATION
Eocene Vermillion Creek coal:
• Coal
o Kerogen from shale
6. Cretaceous Williams Fork Formation coal
o Pennsylvanian Marmaton and Cherokee Group coals
90
FIGURE 58.-0xygen index (Oi, from Rock-Eval pyrolysis) versus '0'/ carbon atomic ratio for coal samples and kerogen from rock samples from the Eocene Vermillion Creek coal and for Cretaceous and Pennsylvanian coals of similar rank. Data from tables 22 and 23. The two diagonal lines mark the boundaries of the 0/C and Oi values reported by Espitalie and others (1977).
2. Is hydrogen content from elemental analysis of kerogen a better indicator of oil generation potential than that from Rock-Eval whole-rock analysis?
3. Can kerogen concentrates and whole-rock mounts serve equally well for estimating content of fluorescent organic matter?
4. Does the fluorescence color indicate hydrogen rich-· ness?
METHODS
The visual estimates were made by first interchanging the preparations under the microscope in order to rank them by the abundance of fluorescent matter relative to all solid organic matter. Then the ranked samples were assigned a value to approximate the percent composition for each of the two groups of fluorescent organic matter. It is very difficult to compare coals and

146 VERMILLION CREEK COAL BED, WYOMING
TABLE 24.-Vitrinite reflectance of coal and rock samples from the Vermillion Creek coal,· Williams Fork Formation, and Marmaton and Cherokee Groups
Sample No.
SA
B c D E
F G II
H I
7A II
B c
E F II
G
8A B c D
KA B c D
PA PC PE
Vitrinite reflectance 1
(R0
, percent)
Avg.
No. of measure
ments
Vermillion Creek
0.43 .40 .47 .36 .49 .53
.49
.56
.53
.40
.40
.34
.30
.46
.57
.so
.61
.59
.44
.41
.51
.51
.42
0.49 .47 .ss .52
0.35-.51 .32-.46 .37-.54 .26-.46 .40-.58 .46-.62
.40-.59
.48-.67
.46-.64
.34-.47
.33-.48
.23-.35
.23-.32
.37-.56
.49-.62
.43-.60
.so-.72
.52-.64 • 36-.52
.34-.48
.42-.58 • 41-.59 .35-.51
0.03 .04 .os .os .os .04
.04
.04
.os
.03
.04
.13
.06
.os
.03
.04
.os
.os
.03
.03
.04
.04
.04
55 54 48 53 52 64
75 48 59 65 49
33 10 53 59
74 74 65 55
57 80 74 53
Williams Fork Formation
0.41-.59 .39-.56 .46-.64 .45-.61
0.04 .04 .04 .04
81 85 74 78
Marmaton and Cherokee Groups
0.48 .46 .52
0.39-.55 .40-.57 .43-.59
0.04 .04 .04
100 125 96
Quality4
PASLV PGH
78594 123 78594 123 24679 614 76794 122 66778 314 78599 324
26589 116 87568 314 58678 313 78596 122 58568 313
53657 615 52262 304 45784 212 77557 113
45599 214 57688 311 87774 111 77584 123
75598 122 34599 124 34589 124 76594 122
45699 214 45679 125 77599 325 44579 124
57789 115 46699 413 48689 213
1Reflectance of vitrinite grains at random orientation, oil immersion objective.
2Range of values, first-cycle vitrinite constituent group.
3standard deviation. 4 0perator subjective evaluation (scale 1 to 9
of increasing quality or abundance) of Polish, Abundance (in the preparation), Size, e~se of picking first-cycle ("Low gray")-vitrinite, certainty that it is v:ltrinite (not solid bitumen, for instance), abundartce of Pyrite in organic grains, abundance of organic-Groundmass, and amount of "High gray" matter seen but not included in the meas~rements (inertinite in coals).
shales in this respect because brightly fluorescent organic matter shines from well below the polished surface in mounts of kerogen from shale or of crushed whole shales-but not of coal. It was especially difficult to tell whether the fine fluorescent filaments of shale sample 7 A were on or beneath the mount surface. On the other hand, in coals it is easier to see weakly fluorescent organic matter than in mounts of kerogen or shale. I tried to strike a balance between these factors. Because of these difficulties, (1) the coals may have more fluorescent organic matter than shown on table 25, and (2) some shales, especially sample 7 A, no doubt have an even higher proportion of their organic matter as fluorescent algal liptinite than estimated. It is presumed that the estimates on whole-rock mounts tend to represent the organic matter content in the rock more accurately than the organic type. However, estimates on kerogen concentrates are good for determining type but have a flaw too, for the kerogen recovery may be less than half of the solid organic matter in some rocks.
RESULTS
Table 25 lists in four columns the estimated content of orange and yellow fluorescent constituents separately for macerated and whole-rock (including coal) samples. The right half of the table lists two ways of summing the estimates: double weighting of yellow and equal weighting .
A program of family regression analysis was used to fit a straight line and seven equations of curves to these data. As is apparent from figure 60, the analysis showed that it is more likely that a relation with predictive value exists between fluorescent content and hydrogen index from Rock-Eval (Hi) than between fluorescent content and H/C. Also, in relation to Hi, a fluorescence index based on observation of both whole-rock and kerogen mounts is better than either alone. And a fluorescence index based on kerogen alone seems better related to H/C than one based on mounts of whole rock or a combination.
However, formal use of statistical tests of the fluorescence/hydrogen relation is questionable for the following reasons: 1. The single sample 7 A stands so completely apart
from the other samples (yet the analytical values for it are apparently reliable).
2. Sample 5C would have to be deleted (at least from H/C; there is 69 percent ash in the kerogen).
3. The number of samples is small. Nonetheless, the statistical trials do support the fol
lowing conclusions:
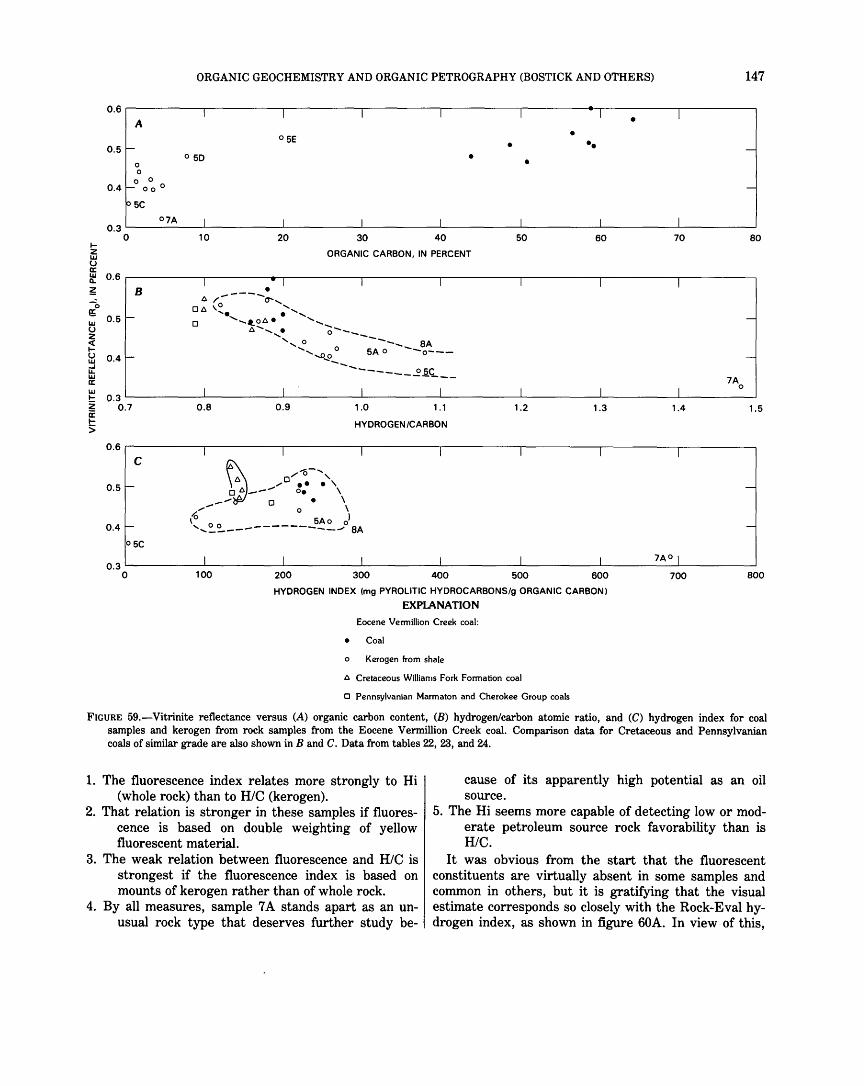
ORGANIC GEOCHEMISTRY AND ORGANIC PETROGRAPHY (BOSTICK AND OTHERS) 147
0.6 1 I I I T T T A •
• 0 5E • •• 0.5 1-- -0 50 • • 0
0
0.4 0 0
I- 0 0 ° -
~5C
07A I I I I I I I 0.3
0 10 20 30 40 50 60 70 80 1-z ORGANIC CARBON, IN PERCENT w u a: w 0.6 Q.. I • • I I I I l T ~ B
6 /; ----o--, 0 ~
0.5 I-06 '..... • .................. -w 0 ............. ~6· ..................
u 6 ...... ,. o-----z < ', o --..... _ SA 1- ''.....t>.,s> 0 5A o -o---u 0.4 I- -w
-------- 05C ...J LL w ------ 7A a:
I I I I I I I 0
w 1- 0.3 2 0.7 0.8 0.9 1.0 1 .1 1.2 1.3 1.4 1.5 a: 1- HYDROGEN /CARBON >
0.6 l I I I I l I c ~ ~-, ,o '
0.5 1- ,....o ••• ' -__ .... oe \
-- 0 • \ ..... - 0 \
I-(0 5Ao o1
-0.4 ' ..... ~~------------..- M 05C
0.3 I I I I I I 7AO I
0 100 200 300 400 500 600 700 800
HYDROGEN INDEX (mg PYROLITIC HYDROCARBONS/g ORGANIC CARBONI
EXPlANATION
Eocene Vermillion Creek coal:
• Coal
0 Kerogen from shale
6 Cretaceous Williams Fork Formation coal
0 Pennsylvanian Marmaton and Cherokee Group coals
FIGURE 59.-Vitrinite reflectance versus (A) organic carbon content, (B) hydrogen/carbon atomic ratio, and (C) hydrogen index for coal samples and kerogen from rock samples from the Eocene Vermillion Creek coal. Comparison data for Cretaceous and Pennsylvanian coals of similar grade are also shown in B and C. Data from tables 22, 23, and 24.
1. The fluorescence index relates more strongly to Hi (whole rock) than to H/C (kerogen).
2. That relation is stronger in these samples if fluorescence is based on double weighting of yellow fluorescent material.
3. The weak relation between fluorescence and H/C is strongest if the fluorescence index is based on mounts of kerogen rather than of whole rock.
4. By all measures, sample 7 A stands apart as an unusual rock type that deserves further study be-
cause of its apparently high potential as an oil source.
5. The Hi seems more capable of detecting low or moderate petroleum source rock favorability than is HI C.
It was obvious from the start that the fluorescent constituents are virtually absent in some samples and common in others, but it is gratifying that the visual estimate corresponds so closely with the Rock-Eval hydrogen index, as shown in figure 60A. In view of this,
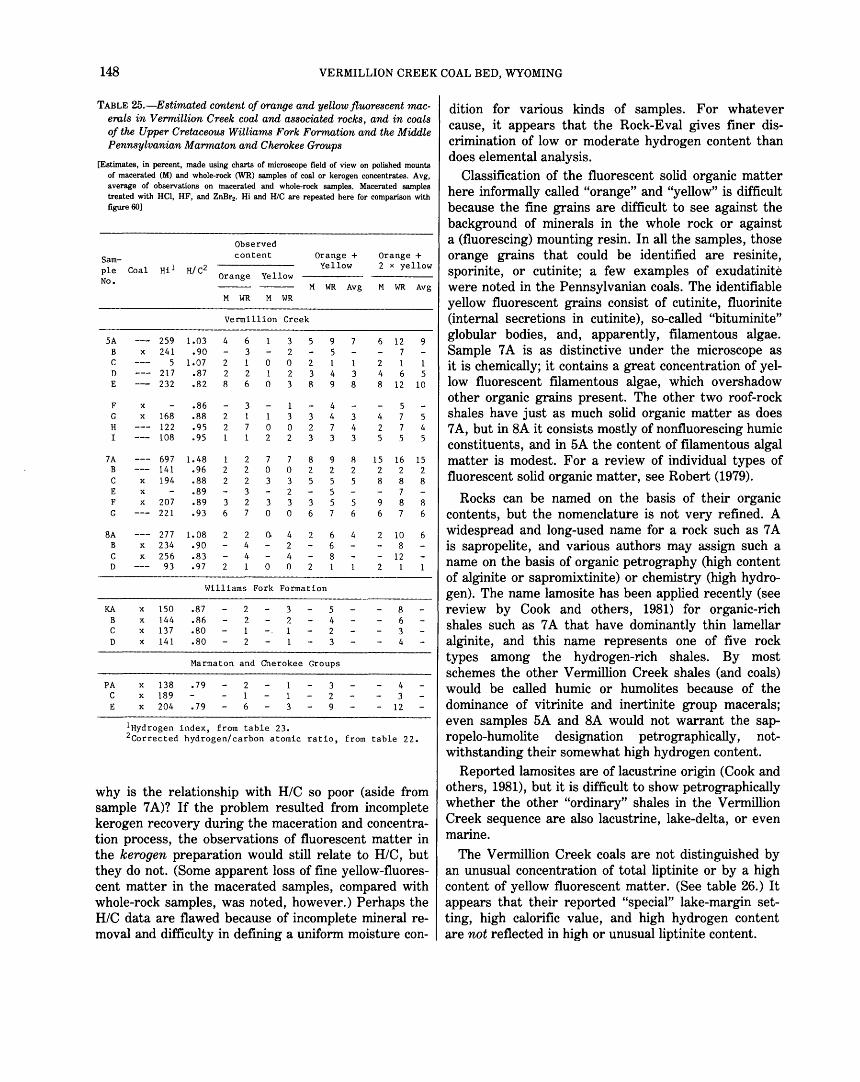
148 VERMILLION CREEK COAL BED, WYOMING
TABLE 25.-Estimated content of orange and yellow fluorescent macerals in Vermillion Creek coal and associated rocks, and in coals of the Upper Cretaceous Williams Fork Formation and the Middle Pennsylvanian Marmaton and Cherokee Groups
[Estimates, in percent, made using charts of microscope field of view on polished mounts of macerated (M) and whole-rock (WR) samples of coal or kerogen concentrates. Avg, average of observations on macerated and whole-rock samples. Macerated samples treated with HCl, HF, and ZnBr2• Hi and H/C are repeated here for comparison with figure 60]
Sam-ple Coal No.
SA B X
c D E
F X
G X
H I
7A B
c X
E X
F X
G
8A B X
c X
D
KA X
B X
c X
D X
PA X
c X
E X
259 241
5 217 232
168 122 108
697 141 194
207 221
277 234 256 93
150 144 137 141
138 189 204
1.03 .90
1.07 .87 .82
.86
.88
.95
.95
1.48 .96 .88 .89 .89 .93
1.08 .90 .83 .97
Observed content
Orange Yellow
M WR M WR
Orange + Yellow
M WR Avg
Vermillion Creek
4 6 3
2 1 0 2 2 1 8 6 0
3 2 1 2 0 1 2
1 2 7 2 2 0 2 2 3
3 3 2 3 6 7 0
2 2 <> 4 4 1 0
3 2 0 2 3
1 3 0 2
7 0 3 2 3 0
4 2 4 0
5
2 3 8
3 2 3
8 2 5
3 6
2
9 5 1 1 4 3 9 8
4 4 3 7 4 3 3
9 R 2 2 5 5 5 5 5 7 6
6 4 6 8 1
Williams Fork Formation
.87 2 3 5
.86 2 2 4
.80 1 1 2
.80 2 3
Marmaton and Cherokee Groups
.79 2 1 3 1 1 2
.79 6 3 9
1Hydrogen index, from table 23.
Orange + 2 x yellow
M WR Avg
6 12 9 7
2 1 1 4 6 5 8 12 10
5 4 7 5 2 7 4 5 5 5
15 16 15 2 2 2 8 8 8
7 9 8 8 6 7 6
2 10 6 8
- 12 2 1
8 6 3 4
4 3
- 12
2Corrected hydrogen/carbon atomic ratio, from table 22.
why is the relationship with H/C so poor (aside from sample 7 A)? If the problem resulted from incomplete kerogen recovery during the maceration and concentration process, the observations of fluorescent matter in the kerogen preparation would still relate to H/C, but they do not. (Some apparent loss of fine yellow-fluorescent matter in the macerated samples, compared with whole-rock samples, was noted, however.) Perhaps the H/C data are flawed because of incomplete mineral removal and difficulty in defining a uniform moisture con-
dition for various kinds of samples. For whatever cause, it appears that the Rock-Eval gives finer discrimination of low or moderate hydrogen content than does elemental analysis.
Classification of the fluorescent solid organic matter here informally called "orange" and "yellow" is difficult because the fine grains are difficult to see against the background of minerals in the whole rock or against a (fluorescing) mounting resin. In all the samples, those orange grains that could be identified are resinite, sporinite, or cutinite; a few examples of exudatinite were noted in the Pennsylvanian coals. The identifiable yellow fluorescent grains consist of cutinite, fluorinite (internal secretions in cutinite), so-called "bituminite" globular bodies, and, apparently, filamentous algae. Sample 7 A is as distinctive under the microscope as it is chemically; it contains a great concentration of yellow fluorescent filamentous algae, which overshadow other organic grains present. The other two roof-rock shales have just as much solid organic matter as does 7 A, but in 8A it consists mostly of nonfluorescing humic constituents, and in 5A the content of filamentous algal matter is modest. For a review of individual types of fluorescent solid organic matter, see Robert (1979).
Rocks can be named on the basis of their organic contents, but the nomenclature is not very refined. A widespread and long-used name for a rock such as 7 A is sapropelite, and various authors may assign such a name on the basis of organic petrography (high content of alginite or sapromixtinite) or chemistry (high hydrogen). The name lamosite has been applied recently (see review by Cook and others, 1981) for organic-rich shales such as 7 A that have dominantly thin lamellar alginite, and this name represents one of five rock types among the hydrogen-rich shales. By most schemes the other Vermillion Creek shales (and coals) would be called humic or humolites because of the dominance of vitrinite and inertinite group macerals; even samples 5A and 8A would not warrant the sapropelo-humolite designation petrographically, notwithstanding their somewhat high hydrogen content.
Reported lamosites are of lacustrine origin (Cook and others, 1981), but it is difficult to show petrographically whether the other "ordinary" shales in the Vermillion Creek sequence are also lacustrine, lake-delta, or even marine.
The Vermillion Creek coals are not distinguished by an unusual concentration of total liptinite or by a high content of yellow fluorescent matter. (See table 26.) It appears that their reported "special" lake-margin setting, high calorific value, and high hydrogen content are not reflected in high or unusualliptinite content.
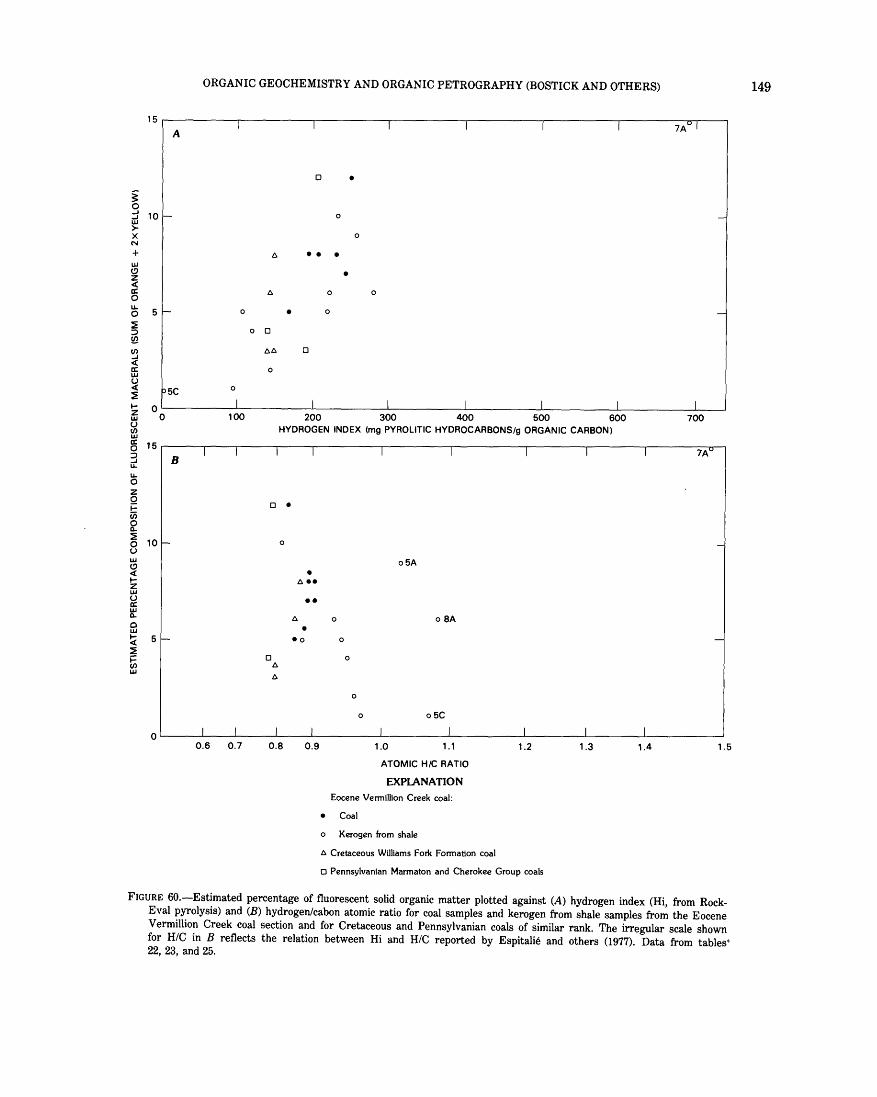
ORGANIC GEOCHEMISTRY AND ORGANIC PETROGRAPHY (BOSTICK AND OTHERS)
15~-------.-~-------,-~-------,-~-------~~------~,--------,,------~7A~.u~l---, A
~ 0 ::1 10 '-w >X N
+ w (!) z < a: 0
~ 5 r~ :::> !B If)
~ a: w u <
0 •
0 0
0
0
0 •
0 -
0
• • • •
0 0
0 -
0
~ oL-------L'------~~------~1~------~~------~'~----~~~----~=1~~ ~ 0 1 00 200 300 400 500 600 700
I'5C
~ HYDROGEN INDEX (mg PYROLITIC HYDROCARBONS/g ORGANIC CARBON) w ~ 15~---~~~~----~~--~~-------,I-------,,--------TI ______ TI------~~----77A~~v'l 2 8 u.. 0 z 0 ;:::: ii5 ~ ~ 10 ru w (!) < 1-z w u a: w 0..
0 w ~ 5 r-~
~ w
0 •
0
• 6 ••
•• 6 0
• •o o
0 0 6
6
-
o5A
o SA
-
0
0 o5C
I 1 1 I 1 l I I I OL_ __ _L __ _L __ ~~--L_ ______ L-------~------~------~----~--------~ 0.6 0.7 0.8 0.9 1.0 1.1 1.2 1.3 1.4 1.5
ATOMIC H/C RATIO
EXPLANATION Eocene Vennillion Creek coal:
• Coal
o Kerogen from shale
6 Cretaceous Williams Fork Fonnation coal
0 Pennsylvanian Marmaton and Cherokee Group coals
FIGURE 60.-Estimated percentage of fluorescent solid organic matter plotted against (A) hydrogen index (Hi, from RockEva} pyrolysis) and (B) hydrogen/cabon atomic ratio for coal samples and kerogen from shale samples from the Eocene Vermillion Creek coal section and for Cretaceous and Pennsylvanian coals of similar rank. The irregular scale shown for H/C in B reflects the relation between Hi and H/C reported by .Espitalie and others (1977). Data from tables• 22, 23, and 25.
149
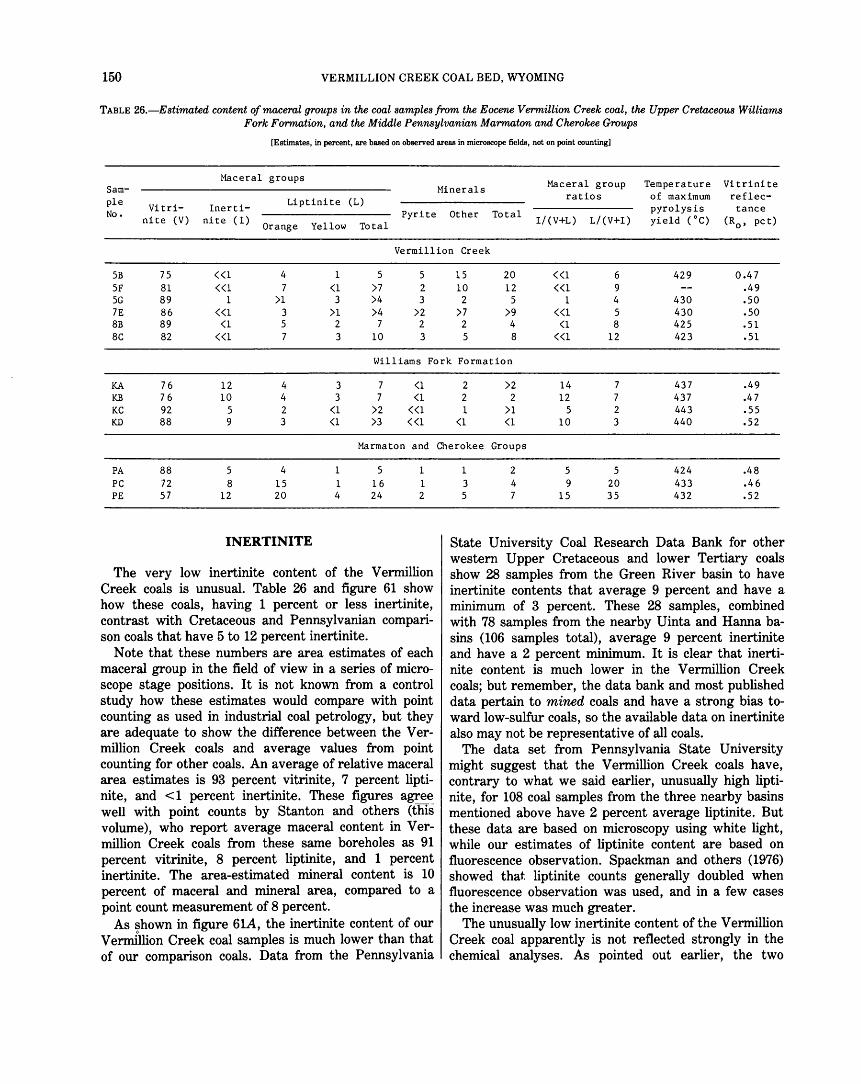
150 VERMILLION CREEK COAL BED, WYOMING
TABLE 26.-Estimated content of maceral groups in the coal samples from the Eocene Vermillion Creek coal, the Upper Cretaceous Williams Fork Formation, and the Middle Pennsylvanian Marmaton and Cherokee Groups
[Estimates, in percent, are based on observed areas in microscope fields, not on point counting]
Maceral groups Maceral group Temperature Vitrinite Sam- Minerals ratios of maximum reflec-ple
Vi tri- Inerti- Liptinite (L) pyrolysis tance No. Pyrite Other Total nite (V) ni te (I) Orange Yellow Total I/ (V+L) L/(V+I) yield (°C) (R
0, pet)
Vermillion Creek
SB 75 ((1 4 1 5 5 15 20 <<1 6 429 0.4 7 SF 81 «1 7 (1 >7 2 10 12 «1 9 .49 SG 89 1 >1 3 >4 3 2 5 1 4 430 .so 7E 86 «1 3 >1 >4 >2 >7 >9 «1 5 430 .so 8B 89 (1 5 2 7 2 2 4 (1 8 425 .51 8C 82 «1 7 3 10 3 5 8 «1 12 423 .51
Williams Fork Formation
KA 76 12 4 3 7 (1 KB 76 10 4 3 7 (1 KC 92 5 2 (1 >2 «1 KD 88 9 3 (1 >3 <<1
Marmaton and
PA 88 5 4 5 1 PC 72 8 15 1 16 1 PE 57 12 20 4 24 2
INERTINITE
The very low inertinite content of the Vermillion Creek coals is unusual. Table 26 and figure 61 show how these coals, having 1 percent or less inertinite, contrast with Cretaceous and Pennsylvanian comparison coals that have 5 to 12 percent inertinite.
Note that these numbers are area estimates of each maceral group in the field of view in a series of microscope stage positions. It is not known from a control study how these estimates would compare with point counting as used in industrial coal petrology, but they are adequate to show the difference between the V ermillion Creek coals and average values from point counting for other coals. An average of relative maceral area estimates is 93 percent vitrinite, 7 percent liptinite, and < 1 percent inertinite. These figures agree well with point counts by Stanton and others (this volume), who report average maceral content in Vermillion Creek coals from these same boreholes as 91 percent vitrinite, 8 percent liptinite, and 1 percent inertinite. The area-estimated mineral content is 10 percent of maceral and mineral area, compared to a point count measurement of 8 percent.
As shown in figure 61A, the inertinite content of our V ermfllion Creek coal samples is much lower than that of our comparison coals. Data from the Pennsylvania
2 >2 14 7 437 .49 2 2 12 7 437 .4 7 1 >1 5 2 443 .55
(1 (1 10 3 440 .52
Cherokee Groups
1 2 5 5 424 .48 3 4 9 20 433 .46 5 7 15 35 432 .52
State University Coal Research Data Bank for other western Upper Cretaceous and lower Tertiary coals show 28 samples from the Green River basin to have inertinite contents that average 9 percent and have a minimum of 3 percent. These 28 samples, combined with 78 samples from the nearby Uinta and Hanna basins (106 samples total), average 9 percent inertinite and have a 2 percent minimum. It is clear that inertinite content is much lower in the Vermillion Creek coals; but remember, the data bank and most published data pertain to mined coals and have a strong bias toward low-sulfur coals, so the available data on inertinite also may not be representative of all coals.
The data set from Pennsylvania State University might suggest that the Vermillion Creek coals have, contrary to what we said earlier, unusually high liptinite, for 108 coal samples from the three nearby basins mentioned above have 2 percent average liptinite. But these data are based on microscopy using white light, while our estimates of liptinite content are based on fluorescence observation. Spackman and others (1976) showed that. liptinite counts generally doubled when fluorescence observation was used, and in a few cases the increase was much greater.
The unusually low inertinite content of the Vermillion Creek coal apparently is not reflected strongly in the chemical analyses. As pointed out earlier, the two

ORGANIC GEOCHEMISTRY AND ORGANIC PETROGRAPHY (BOSTICK AND OTHERS) 151
w 15 I I u I "" I !:::: z i= t. Q..
o::; i= + 10 - t. -<w 0 a:: .... w-.... ~ -a:: ~ .... .... -a::~ 5- 0 KCt. -w-. zw _ ....
z i= a:: w A • . ,: I I ~ 0 • 0.55 I I I I
w- KCt. wu!z t-Zw 0 t. -<u • • ~t>ffi 0.50 r- ' -
t. t-Wo.. 0 • t. >~ 0 0
a::!;.
B I I I I 0.45
75 .... I I I I z w • u • a:: • w • Q..
~ 50 - • -
• z 0 a:l a:: < u 25 - -u 0 z < (.!)
0 5A a:: 7~ 08A 0 c o I 10 ~ I I 0 0 0
420 425 430 435 440 445
TEMPERATURE OF MAXIMUM PYROLYSIS YIELD (T max), IN DEGREES CELSIUS
EXPlANATION
Eocene Vermillion Creek coal:
• Coal
0 Kerogen from shale
t::. Cretaceous Williams Fork Formation coal
Cl Pennsylvanian Marmaton and Cherokee Group coals
FIGURE 61.-Temperature of maximum pyrolysis yield plotted against (A) inertinite ratio, (B) vitrinite reflectance, and (C) organic carbon content of samples from the Eocene Vermillion Creek coal. A and B show coal samples only, compared to Cretaceous and Pennsylvanian coals of similar rank. C shows coal samples and kerogen from associated rock samples. Data from tables 23 and 26.
measures of hydrogen/carbon show only slight relative elevation in the Vermillion Creek coals compared to the other coals. Moreover, a simple calculation shows that no significant elevation could be expected. The average hydrogen content is reported to be about 3 percent in inertinite and 4 percent in vitrinite (van Krevelen, 1961). If all the inertinite in an average coal sample
(roughly 10 percent) were replaced by vitrinite the resulting increase in hydrogen content would be on the order of 0.1 percent-well below detection in the hydrogen measurements.
However, the great spread in maximum-yield temperatures (Tmax) from Rock-Eval pyrolysis may be a result of the low inertinite content. Notice on figure 61A that the Vermillion Creek coals have T max lower than all but one of the comparison coal samples, the one that has low inertinite content. T max from RockEva! pyrolysis is used as an indicator of maturation, but a comparison of T max to vitrinite reflectance, another index of maturation (fig. 61B), shows that reflectance is uniform and unrelated to T max except in the one Cretaceous coal at the right. We conclude that at the low rank of these samples, T max is strongly increased by increased inertinite content. Tissot and Welte (1978, p. 454) point out that T max is higher in type I and II (hydrogen-rich) kerogen than in vitrinite kerogen of the same maturation. Our data indicate that even a modest inertinite content raises T max' and the content of recycled or prealtered vitrinite (essentially inertinite) in kerogens commonly reaches 50 percent.
Figure 61C shows T max of coal and shale samples from the three boreholes in the Vermillion Creek section. Of the five shale samples that have T max greater than that of the coals and other shales, three are the roof shales that have elevated hydrogen content; this finding agrees with Tissot and Welte's (1978) observation of higher Tmax values in hydrogen-rich kerogen. No unusual features were noted in the other two samples (7B and 7G) that could account for their elevated Tmax·
The question of chemical "reductivity" of coals has been prominent in literature on coals since the 1950's (Korzhenevskaya and others, 1979). The term is not well defined, but the features that are reported to distinguish coals with "reduced" vitrinite from ordinary ones of the same level of catagenesis are: higher volatile content, caking value, and calorific value, elevated hydrogen and carbon (lower oxygen), higher pyrite content (especially fine pyrite in vitrinite), and lower vitrinite reflectance (Ginzburg and others, 1976). The reported limnic paleosetting and the presence of some of the above features in, the Vermillion Creek coals led us to anticipate that data from them might help us understand and define "reductivity." However, the Vermillion Creek coals appear to be very uniform, especially with respect to vitrinite reflectance, and the properties that are ascribed to some "reduced" coals are explained in the Vermillion Creek coals by the extremely low inertinite content. So "reduced" coals cannot be identified with certainty in our Vermillion Creek samples.
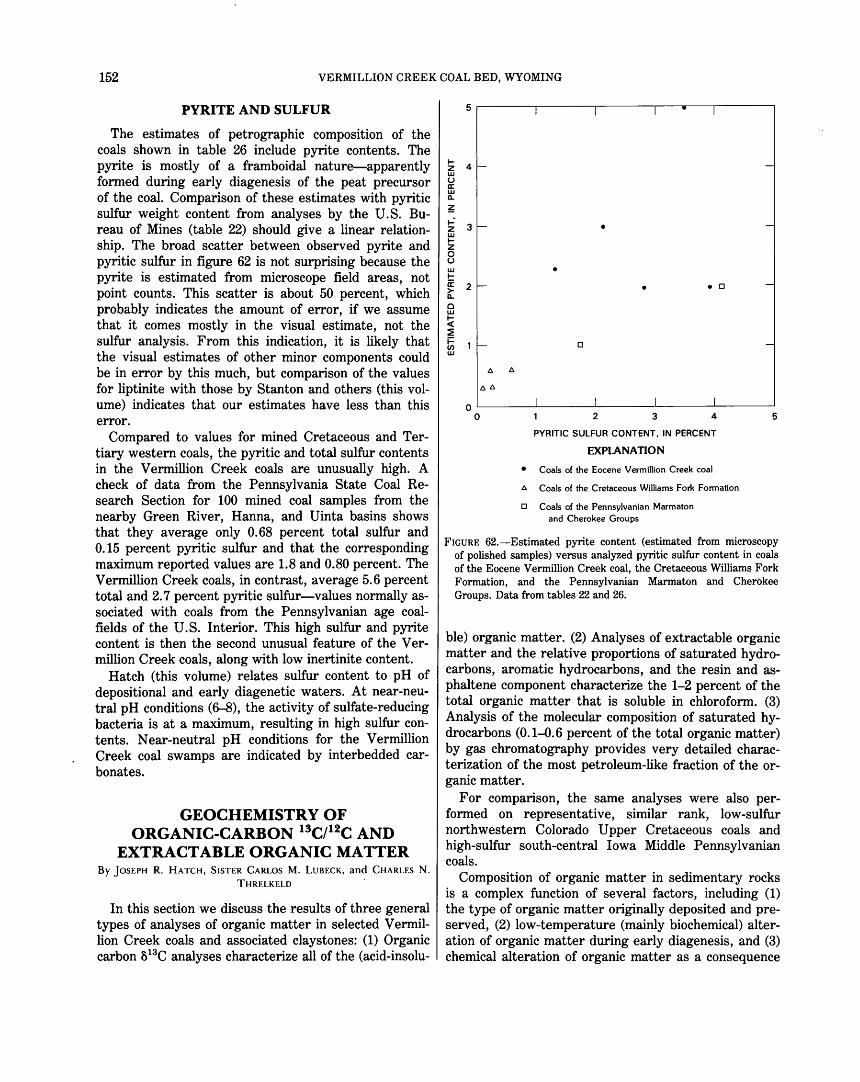
152 VERMILLION CREEK COAL BED, WYOMING
PYRITE AND SULFUR
The estimates of petrographic composition of the coals shown in table 26 include pyrite contents. The pyrite is mostly of a framboidal nature-apparently formed during early diagenesis of the peat precursor of the coal. Comparison of these estimates with pyritic sulfur weight content from analyses by the U.S. Bureau of Mines (table 22) should give a linear relationship. The broad scatter between observed pyrite and pyritic sulfur in figure 62 is not surprising because the pyrite is estimated from microscope field areas, not point counts. This scatter is about 50 percent, which probably indicates the amount of error, if we assume that it comes mostly in the visual estimate, not the sulfur analysis. From this indication, it is likely that the visual estimates of other minor components could be in error by this much, but comparison of the values for liptinite with those by Stanton and others (this volume) indicates that our estimates have less than this error.
Compared to values for mined Cretaceous and Tertiary western coals, the pyritic and total sulfur contents in the Vermillion Creek coals are unusually high. A check of data from the Pennsylvania State Coal Research Section for 100 mined coal samples from the nearby Green River, Hanna, and Uinta basins shows that they average only 0.68 percent total sulfur and 0.15 percent pyritic sulfur and that the corresponding maximum reported values are 1.8 and 0.80 percent. The Vermillion Creek coals, in contrast, average 5. 6 percent total and 2. 7 percent pyritic sulfur-values normally associated with coals from the Pennsylvanian age coalfields of the U.S. Interior. This high sulfur and pyrite content is then the second unusual feature of the V ermillion Creek coals, along with low inertinite content.
Hatch (this volume) relates sulfur content to pH of depositional and early diagenetic waters. At near-neutral pH conditions (6-8), the activity of sulfate-reducing bacteria is at a maximum, resulting in high sulfur contents. Near-neutral pH conditions for the Vermillion Creek coal swamps are indicated by interbedded carbonates.
GEOCHEMISTRY OF ORGANIC-CARBON 13C/12C AND
EXTRACT ABLE ORGANIC MATTER By jOSEPH R. HATCH, SISTER CARLOS M. LUBECK, and CHARLES N.
THRELKELD .
In this section we discuss the results of three general types of analyses of organic matter in selected V ermillion Creek coals and associated claystones: (1) Organic carbon 813C analyses characterize all of the (acid-insolu-
5~-----~,-----.-,-----.-,-, • .--,,------,
!z 4-w u a: w a.. ~
~ 3-w 1-z 0 u w 1-a: 2-~ 0 w
~ ~
t; 1 '--w
•
-
• -
• • 0 -
0 -
QL-----~'~----~'------~'------~'----~ 0 2 3 4
PYRITIC SULFUR CONTENT, IN PERCENT
EXPlANATION
• Coals of the Eocene VermUlion Creek coal
t:. Coals of the Cretaceous Williams Fork Formation
O Coals of the Pennsylvanian Marmaton and Cherokee Groups
5
FIGURE 62.-Estimated pyrite content (estimated from microscopy of polished samples) versus analyzed pyritic sulfur content in coals of the Eocene Vermillion Creek coal, the Cretaceous Williams Fork Formation, and the Pennsylvanian Marmaton and Cherokee Groups. Data from tables 22 and 26.
ble) organic matter. (2) Analyses of extractable organic matter and the relative proportions of saturated hydrocarbons, aromatic hydrocarbons, and the resin and asphaltene component characterize the 1-2 percent of the total organic matter that is soluble in chloroform. (3) Analysis of the molecular composition of saturated hydrocarbons (0.1--0.6 percent of the total organic matter) by gas chromatography provides very detailed characterization of the most petroleum-like fraction of the organic matter.
For comparison, the same analyses were also performed on representative, similar rank, low-sulfur northwestern Colorado Upper Cretaceous coals and high-sulfur south-central Iowa Middle Pennsylvanian coals.
Composition of organic matter in sedimentary rocks is a complex function of several factors, including (1) the type of organic matter originally deposited and preserved, (2) low-temperature (mainly biochemical) alteration of organic matter during early diagenesis, and (3) chemical alteration of organic matter as a consequence
ORGANIC GEOCHEMISTRY AND ORGANIC PETROGRAPHY (BOSTICK AND OTHERS) 153
of elevated temperatures and extended times associated with burial in sedimentary basins. The effects of these factors on the organic geochemical properties of coals are being actively investigated (Brooks and Smith, 1967, 1969; Leythauser and Welte, 1969; Allan and others, 1977; and Durand and others, 1977). Analyses of the Vermillion Creek coals, coal-associated rocks, and comparison coals were undertaken primarily to evaluate effects of the original organic-matter type and low-temperature (systematic, early diagenetic) alteration on the ultimate composition of organic matter. By comparing the Vermillion Creek coals with other coals of similar apparent rank, variations due to thermal alteration are minimized.
METHODS
Organic carbon 13CP2C ratios were determined by standard techniques. An oven-dried ( 40°C) powdered sample was reacted with 2N HCl to dissolve carbonate. The residue was centrifuged, decanted, washed three times, dried, and combusted with excess oxygen in an apparatus similar to that described by Kaplan and others (1970). The resulting C02 was purified, and isotope ratios were determined using a 6-inch Niertype double-collecting mass spectrometer equipped with a dual inlet system. Results are reported in the usual 8 notation relative to the PDB marine-carbonate standard.
To determine the amount of extractable organic matter (bitumen), pulverized samples ( < 100 mesh) were extracted with chloroform (CHC13) in a Soxhlet apparatus for 20 to 24 hours. Sulfur was removed from the extract solution by refluxing with polished copper metal. The filtered extract solution, or an aliquot, was evaporated under nitrogen to an arbitrarily defined solvent-free point, and the weight of the total extract was used to calculate the bitumen concentration. The bitumen isolated was chromatographed on silica gel, eluting successively with heptane, benzene, and a benzenemethanol solution to collect the saturated hydrocarbon, aromatic hydrocarbon, and resin-asphaltene fractions, respectively.
The saturated hydrocarbon fractions were analyzed further by gas chromatography using 50 m x 0.031 mm capillary column (SE54) and a programmed temperature increase from 80° to 300°C at 4° per minute. Identifications of peaks on the resultant chromatograms are based primarily on relative retention times. Measurements of peak heights above baseline were used to calculate the carbon preference index (CPI) (Bray and Evans, 1961) and the pristane/phytane, pristane/n-C18
and phytane/n-C18 ratios.
1RESUL TS AND DISCUSSION
ORGANIC-CARBON &uc
Organic-carbon 813C values for selected samples are listed in table 27, are statistically summarized in table 29, and are plotted versus the hydrogen index (from table 23) in figure 63. The 813C values for organic carbon in the four claystone samples from the Vermillion Creek coal section are all isotopically lighter and more variable ( -27.2 to -32.1 per mil, mean = -28.7 per mil) than those of the five coal samples ( -26.1 to -26.5 per mil, mean = -26.3 per mil).
The claystone samples show a trend of decreasing 813C with increasing apparent hydrogen content (hydrogen index) of the organic matter (fig. 63). This relationship suggests a mixing of two different kinds of organic matter: a relatively hydrogen-deficient component, similar to terrestrial higher plant organic matter in coals (813C= -26.3 per mil), and a hydrogen-rich component of probable aquatic plant and bacterial origin, similar to organic matter in claystone sample 7 A (813C=-32.1 per mil). The organic-carbon 813C of this sample is comparable to that of Green River Formation oil shales ( -32 per mil; Silverman and Epstein, 1958).
The mean organic-carbon 813C of the Vermillion Creek coal ( -26.3 per mil) is almost identical to that of the Upper Cretaceous Williams Fork Formation coals ( -26.4 per mil, table 27), and both of these values are almost 2 per mil lighter than the mean for the Middle Pennsylvanian samples -24.6 per mil). These differences in organic-carbon 813C are similar to differences noted in Carboniferous and Cretaceous rocks of the Russian platform by Galimov and others (1975). This isotopic difference is not believed to reflect any major differences in the Pennsylvanian peat-swamp environments, but may reflect either warmer temperatures (Sackett and others, 1965) during formation of the Middle Pennsylvanian peats or depletion of 12C in atmospheric and hydrospheric C02 reservoirs by prolific production and preservation of organic matter during the Pennsylvanian.
It is noteworthy that mean organic-carbon 813C for the high-sulfur Vermillion Creek coals ( -26.3 per mil) is the same as for the low-sulfur Williams Fork Formation coals ( -26.4 per mil). Apparently the processes responsible for sulfate reduction do not affect organiccarbon 813C.
EXTRACTABLE ORGANIC MATTER
Results of solvent extractions and subsequent column and gas chromatography analyses for selected samples are listed in table 28 and summarized in table 29. The coals and claystones from the Vermillion Creek coal

154 VERMILLION CREEK COAL BED, WYOMING
TABLE 27.---0rganic carbon contents and 19C isotope data for 15 coal and coal-associated rock samples from the Eocene Vermillion Creek coal, the Upper Cretaceous Williams Fork Formation, and the Middle Pennsylvanian Marmaton and Cherokee Groups
Sample No. Organic carbon (percent)l ol3c (permil)2
SA SB SD SF 51
7A 7D 7E 8C
KC KD
PB PD PF PG
Vermillion Creek
4.8 50.2 7.8
42.1 2.6
4.2 58.2 57.7 47.6
Williams Fork Formation
64.4 66.9
Marmaton and Cherokee Groups
lAir-dried basis.
63.4 52.5 46.8 45.3
-28.5 -2& 3 -27.3 -26. 4 -27.2
-32.1 -26.3 -26.1 -26.5
-26.4 -26.4
-25.33 -24.60 -24.88 -24.58
2Results are relative to the PDB marine-carbonate standard.
have similar proportions of extractable organic matter (21 and 22 mg bitumen/g organic C, respectively). The compositions of the bitumens, however, are different; bitumens from clay shales have a higher proportion of hydrocarbons than those from coals (saturated HC+aromatic HC=55 and 36 percent, respectively) and a much higher saturated HC/aromatic HC ratio (1.2 vs. 0.44). These differences are also consistent with a relatively greater contribution of organic matter from terrestrial higher plants for the coals and a greater aquatic plant, bacterial input for the Vermillion Creek coal-associated claystones.
The proportions of bitumen to organic carbon for the two comparison coal sample sets (Williams Fork Formation, 17 mg/g organic C; Marmaton and Cherokee Groups, 20 mg/g organic C) are similar to that of the Vermillion Creek coal. The total hydrocarbon proportion of the bitumen is the same in Vermillion Creek coal and Williams Fork Formation coal (36 percent), but is higher in the Marmaton Group and Cherokee Group coals (50 percent). Saturated HC/aromatic HC ratios in bitumen for the Vermillion Creek (0.44) and Marmaton and Cherokee Groups (0.38). coals are simi-
u M (Q
0 0
-25 0
0
-26 • A ••• •
-27
-28
-29
-30
-31
-32 o,
-33~~~~~~~~~~~~~~~~~~~~
0 200 400 600 800 HYDROGEN INDEX (PYROLITIC HYDROCARBONS/ORGANIC CARBON)
EXPLANATION
Eocene Vermillion Creek coal:
• Coal
o Kerogen from shale
A Cretaceous Williams Fork Formation coal
01 Pennsylvanian Marmaton and Cherokee Group coals
FIGURE 63.-Relationship of organic carbon isotope composition (813C) to the hydrogen index (Hi) for coal and associated rocks of the Eocene Vermillion Creek coal and for Cretaceous and Pennsylvanian coals of similar rank. The diagonal line has a correlation coefficient of 0.98 with the four Vermillion Creek rock samples. Full data are on tables 23 and 27.
lar; both are higher than ratios for Williams Fork Formation coals (0.28).
MOLECULAR COMPOSITION OF SATURATED
HYDROCARBONS
Chromatograms of saturated hydrocarbons (heptane elutes) extracted from selected Vermillion Creek coals and claystones are displayed in figure 64. All of the samples were run under the same instrumental· conditions, although the amount of sample injected and the attenuation of detector response have been adjusted to produce comparable displays. Chromatograms from the three Vermillion Creek coal samples are very similar and are characterized by high isoprenoid content (primarily pristane), high pristane/phytane ratios (average 5.4), and a strong predominance of the odd-carbonnumbered n-alkanes (n--C25, n--C27, n--C29, and n--Cs1;

TABLE 28.-0rganic carbon, chloroform-extractable organic matter, and saturated hydrocarbon analyses for coal and rock samples from the Eocene Vermillion Creek coal, the Upper Cretaceous Williams Fork Formation, and the Middle Pennsylvanian Marmaton and Cherokee Groups
[HC, hydrocarbon. Hydrocarbon ratios determined from relative heights of peaks above baseline]
Chloroform extracts (ppm) Total Sam- Organic Saturated and bitumen Saturated HC Pristane Pristane Phytane ple carbon 1 aromatic HC CPI 2
Total Saturated Aromatic Resins + Organic C Aromatic HC Phytane n-C18 n-C18 (pet) Total bitumen No. bitumen HC HC Asphaltenes ( mg/ g)
Vermillion Creek
SB 50.2 8,240 1,080 2,260 3,880 16 0.48 0.40 2.3 6.4 11 1. 8 SD 7.8 1,530 290 310 930 20 .92 .39 3.4 3.3 9.0 2.R SF 42.1 9,620 1,490 3,270 3 4,860 22 .46 .49 2.5 5.6 9.9 1. 8 51 2.6 650 210 190 3 250 25 1.1 .62 2.7 4.9 <).4 2.0
7A 4.2 850 370 210 270 20 1. 8 .68 1. 8 1. 8 3.3 1.9 7D 58.2 19,400 2,190 3,870 3 13,300 33 .57 .31 2.5 5.8 15 2.7 7E 57.7 14,600 1.200 2,850 3 10,500 25 .45 .28 2.1 6.0 15 2.2 8C 47.6 7,290 590 1,890 3,030 15 .31 .34 2.1 3.8 8.3 2.2
Williams Fork Formation
KA 68.2 12,600 560 2,560 7,910 19 0.21 0.25 4.0 8.8 10 1.1 KB 67.0 12,300 580 2,730 7,270 18 .21 .27 4.1 11 25 2.9 KC 64.4 10,000 1,070 3,900 5,080 16 .27 .so 2.4 12 19 1. 7 KD 66.9 11' 700 1,260 4,400 6,030 17 .29 .49 2.2 14 28 1.9
Marmaton and Cherokee Groups
PA 62.1 20,200 3,020 5,830 8,840 32 0.51 0.50 (4) 6.6 17 2.6 PB 63.4 17,500 990 5,170 6,490 28 .19 .49 ( 4) 2.4 2.4 1.0 PC 52.8 8, 710 1,130 2,830 4,100 16 .40 .so ( 4) 6.4 7.1 1. 1 PD 52.5 11 '400 2,100 3,890 5,490 22 .54 .52 ( 4) 5.6 7.6 1. 4 PG 45.3 4,610 630 1,860 2,110 10 .34 .54 (4) 6.2 7.2 1.2
lAir-dried basis
1 C2s+C27+C29+C31 C2s+C27+C2s+C31 2carbon preference index (modified from Bray and Evans, 1961): CPI =- ( + )
2 C24+C26+C2s+C3o C26+C2s+C3o+C32 3These resin + asphaltene values determined by difference. (Total bitumen- (saturated+ aromatic HC).) 4CPI for Marmaton and Cherokee Groups could not be calculated because of low n-alkane contents.
0 ~ 0 > z -0 0 tr:l 0 0 ~ tr:l a:: -00 t-3 ~ ~
> z t:! 0 ~ 0 > z -0 "'t:! tr:l t-3 ~ 0 0 ~ > "'t:! ~ ~ '@ 0 00 t-3 -0 ~
> z t:! 0 t-3 ~ tr:l ~ Y.J
1-' 01 01
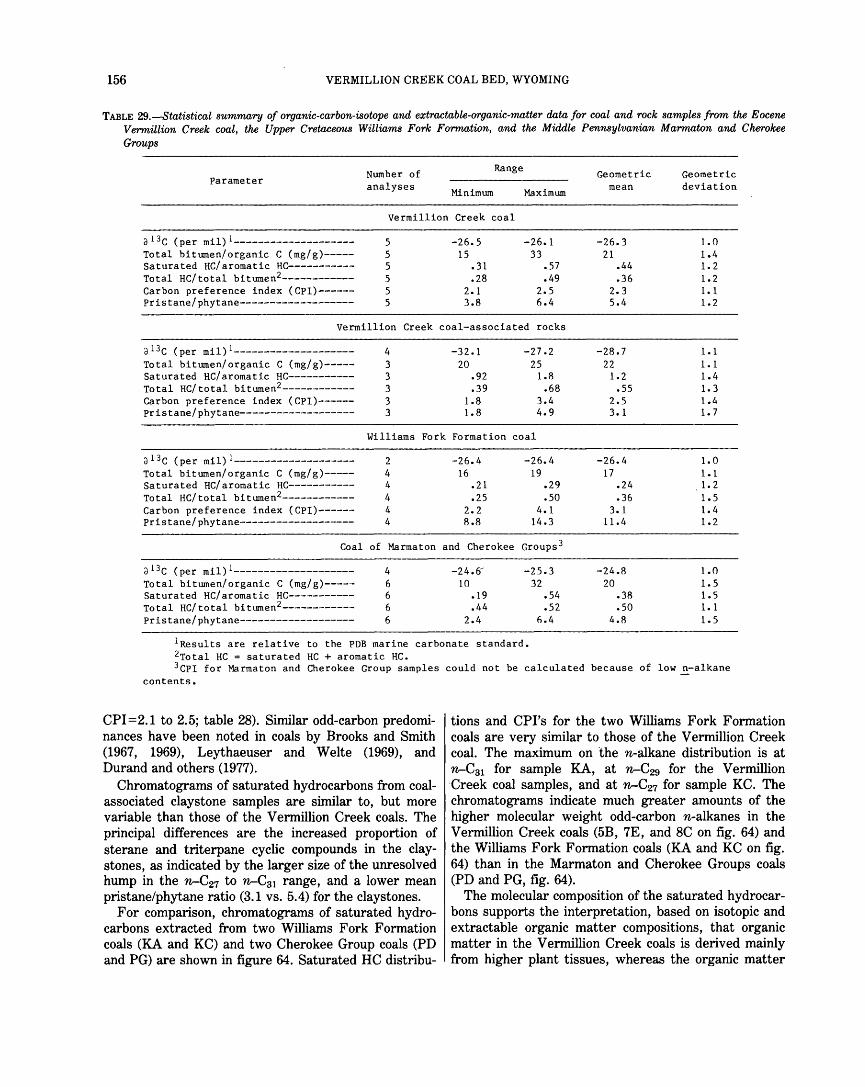
156 VERMILLION CREEK COAL BED, WYOMING
TABLE 29.-Statistical summary of organic-carbon-isotope and extractable-organic-matter M.ta for coal and rock samples from the Eocene Vermillion Creek coal, the Upper Cretaceous Williams Fork Formation, and the Middle Pennsylvanian Marmaton and Cherokee Groups
Parameter Number of analyses
Range
Minimum Maximum
Geometric mean
Geometric deviation
Vermillion Creek coal
a13c (per mil) 1-------------------Total bitumen/organic C (mg/g)----Saturated HC/aromatic HC----------Total HC/total bitumen2-----------Carbon preference index (CPI)-----Pristane/phytane-------------------
5 5 5 5 5 5
Vermillion
a 13c (per mil) 1-------------------- 4
Total bitumen/ organic c (mg/g)----- 3 Saturated HC/aromatic HC----------- 3 Total HC/total bitumen2------------ 3 Carbon preference index (CPI)------ 3 Pristane/phytane------------------- 3
Creek
-26.5 15
.31
.28 2.1 3.8
-26.1 33
.57 • 49
2.5 6.4
coal-associated rocks
-32.1 -27.2 20 25
.92 1.8
.39 .68 1.8 3.4 1. 8 4.9
-26.3 21
.44
.36 2.3 5.4
-28.7 22
1. 2 .55
2.5 3. 1
1. 0 1.4 1. 2 1. 2 1.1 1. 2
1.1 1. 1 1.4 1.3 1.4 1.7
Williams Fork Formation coal
al3c (per mil) 1-------------------- 2 Total bitumen/organic c (mg/g)----- 4 Saturated HC/aromatic HC----------- 4 Total HC/total bitumen2------------ 4 Carbon preference index (CPI)------ 4 Pristane/phytane------------------- 4
Coal of Marmaton
al3c (per mil) 1-------------------- 4 Total bitumen/organic c (mg/g)----- 6 Saturated HC/aromatic HC----------- 6 Total HC/total bitumen2------------ 6 Pristane/phytane------------------- 6
-26.4 -26.4 16 19
.21 .29
.25 .so 2.2 4.1 8.8 14.3
and Cherokee Groups 3
-24.o -25.3 10 32
.19 .54
.44 .52 2.4 f>.4
-26.4 17
.24
.36 3.1
11.4
-24.8 20
.38
.so 4.8
1. 0 1.1
. 1. 2 1. 5 1. 4 1.2
1.0 1. 5 1.5 1. 1 1. 5
1Results are relative to the PDB marine carbonate standard. 2Total HC = saturated HC + aromatic HC. 3cpr for Marmaton and Cherokee Group samples could not be calculated because of low n-alkane
contents.
CPI =2.1 to 2.5; table 28). Similar odd-carbon predominances have been noted in coals by Brooks and Smith (1967, 1969), Leythaeuser and Welte (1969), and Durand and others (1977).
Chromatograms of saturated hydrocarbons from coalassociated claystone samples are similar to, but more variable than those of the Vermillion Creek coals. The principal differences are the increased proportion of sterane and triterpane cyclic compounds in the claystones, as indicated by the larger size of the unresolved hump in the n-C27 to n-C31 range, and a lower mean pristane/phytane ratio (3.1 vs. 5. 4) for the claystones.
For comparison, chromatograms of saturated hydrocarbons extracted from two Williams Fork Formation coals (KA and KC) and two Cherokee Group coals (PD and PG) are shown in figure 64. Saturated HC distribu-
tions and CPI's for the two Williams Fork Formation coals are very similar to those of the Vermillion Creek coal. The maximum on the n-alkane distribution is at n-C31 for sample KA, at n-C29 for the Vermillion Creek coal samples, and at n-C27 for sample KC. The chromatograms indicate much greater amounts of the higher molecular weight odd-carbon n-alkanes in the Vermillion Creek coals (5B, 7E, and 8C on fig. 64) and the Williams Fork Formation coals (KA and KC on fig. 64) than in the Marmaton and Cherokee Groups coals (PD and PG, fig. 64).
The molecular composition of the saturated hydrocarbons supports the interpretation, based on isotopic and extractable organic matter compositions, that organic matter in the Vermillion Creek coals is derived mainly from higher plant tissues, whereas the organic matter

ORGANIC GEOCHEMISTRY AND ORGANIC PETROGRAPHY (BOSTICK AND OTHERS) 157
in the claystones (particularly that in sample 7 A) also has a component derived from algae and bacteria. The odd-carbon numbered n-alkanes (n-C27 to n-C31) that predominate in the Vermillion Creek and Williams Fork Formation coals and in clay shale samples 5D and 51 have been shown by Eglinton (1969) to be derived from leaf waxes of the flowering plants (angiosperms). The sterane-triterpane compounds that are much more prominent in sample 7 A may originate in part from plants; the main sources, however, are prokaryotic organisms, in particular, microbial life in the upper layers of young sediments (Ensminger and others, 1972, and Van Dorsselaer and others, 1974).
The chromatogram from sample 7 A strongly resembles chromatograms from relatively immature Green River Formation samples published by Tissot and others (1977, fig. 9b; 1978, fig. 5) and Tissot and Welte (1978, fig. IV 3.2b). These authors interpret these chromatograms to represent a mixture of organic matter derived from higher plants, algae, and microorganisms. The low contents of the n-alkanes (n-C27 to n-C31) in the Pennsylvanian coals are noteworthy (fig. 64, PD and PG). This deficiency can be attributed to changes in plant communities from Pennsylvanian through Cretaceous and Eocene time: Pennsylvanian age swamps were dominated by calamites and giant lycopods, but angiosperms dominated peat swamps of Late Cretaceous age or younger (Teichmuller, 1950).
The n-alkane distributions are affected by small differences in thermal maturity as well as by the source of the organic matter. CPI's decrease as the level of thermal maturation increases, because equal amounts of both odd- and even-carbon-numbered n-alkanes are generated. In addition, according to Brooks and Smith (1967; 1969) and Leythaeuser and Welte (1969), the nalkane carbon-number maximum is strongly dependent on thermal maturation level, shifting to lower carbon numbers with increased maturation level. The slightly higher maximum of sample KA (n-C31) would be the result of a slightly lower thermal maturity, and, conversely, the slightly lower maximum for sample KC (nC27) reflects a slightly higher thermal maturity compared to the Vermillion Creek coals (n-C29). The same relative maturity levels are shown by CPI and average vitrinite reflectance measurements: average R0 is 0.48 for samples KA and KB, 0.50 for five Vermillion Creek coal samples, and 0.53 for samples KC and KD.
PRISTANE-PHYT ANE RELATIONSHIPS
, Average pristane/phytane (Pr/Ph) ratios are significantly higher in the low-sulfur Williams Fork Formation coals (11.4) than in either of the high-sulfur coal sets: Pr/Ph averages 5.4 in Vermillion Creek coal, 4.8 in Marmaton and Cherokee Groups coals, and 3.1 in the
coal-associated clay-shale samples. To aid in comparisons between samples, pristane and phytane peak heights for all samples were normalized relative to nC18. The resulting ratios, listed in table 28, were plotted in figure 65. On this figure, the coal samples are separated along two lines based on sulfur content: the 4 low-sulfur Williams Fork Formation coals plot along a line (a) below the line (b) representing 11 high-sulfur Vermillion Creek, Marmaton Group, and Cherokee Group coal samples. Two Vermillion Creek clay-shale samples (5D and 7A) plot above and to the left of the high sulfur coal line; the third clay-shale sample (51) plots close to this line.
The positions of the samples on figure 65 depend on the relative amounts of pristane and phytane or pristane-phytane precursor components contributed to the environment or produced during early diagenesis. For the coals and claystones discussed, most changes in Pr/ Ph ratios are determined by pristane variability: pristane/n-C18 ratios have an approximate 12-fold range (2.4 to 28), whereas phytane/n-C18 ratios have only a threefold range (0.91 to 2.9). In other words, Pr/Ph ratios mainly reflect the abundance of pristane.
The absolute and relative abundances of the acyclic isoprenoid hydrocarbons, pristane and phytane, also reflect several factors: source of the organic matter, early diagenetic alteration, and thermal maturity, An important isoprenoid precursor is phytanic acid, derived from the side chain of chlorophyll a. One hypothesis explains different relative abundances of pristane and phytane as an effect of different phytanic acid decomposition pathways. Decarboxylation of phytanic acid to yield pristane is favored by less reducing, more oxidizing conditions, and reduction of phytanic acid to phytane is favored by more reducing conditions (Brooks and Smith, 1969; Welte and Waples, 1973). ·According to this hypothesis, pristane/phytane ratios indicate redox conditions of the depositional environment (Didyk and others, 1978). Attention, however, has recently been drawn to an important alternative source of phytane. A distinct lineage of microorganisms known as archaebacteria, which includes methanogens, extreme halophiles, and acid hot-spring bacteria, has cell-wall membrane lipids composed of phytanyl ethers and other likely phytane precursors (Nissenbaum and others, 1972; Fox and others, 1980, 1982; and Chappe and others, 1980, 1982; and Brassell and others, 1981). Therefore, although the pristane/phytane ratio probably is not a simple indicator of redox conditions in the depositional environments, there is a strong association between the relative inputs of various types of organic matter and the nature of the depositional environment.
In the samples analyzed for this study, the pristane/ phytane ratios are highest in the low-sulfur Upper
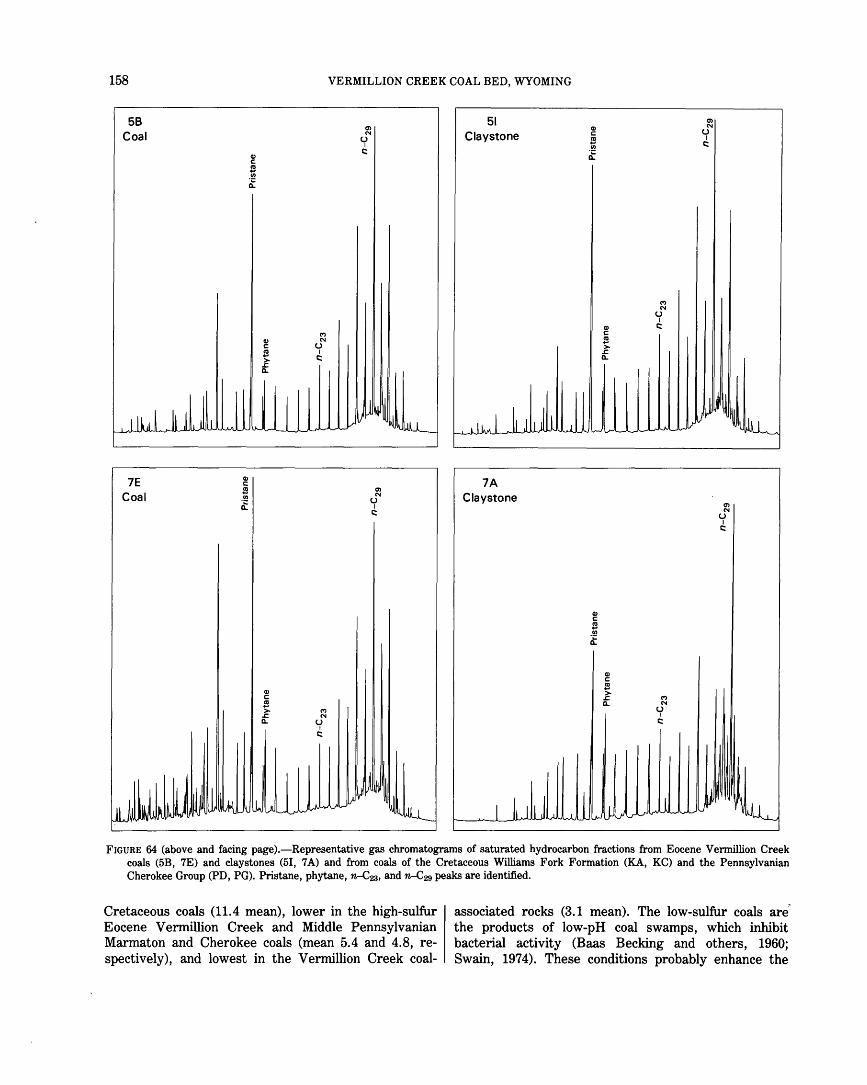
158 VERMILLION CREEK COAL BED, WYOMING
58 Coal
7E Coal
Q) c: ~ > .c. c..
Q) c: ~
M N
u I
c::
> M .C. N c.. u
I c::
0) N
u I
c::
0) N
u I
c::
51 Q)
Claystone c: ~ Ul
;t
Ll~~ I ll J ItA 1 .1
7A Claystone
Q) c: ~ Ul
;t
I II Ill .I ~ 1 l
0) N
u I
c::
M N
u I
Q) c:: c: ~ > .c.
c..
vJ~~~ l! ~~
0) N
u I
c::
Q) c: ~ > .c. M
c.. N u
I c::
lJ..Jv--- 1 J~ \,~
FIGURE 64 (above and facing page).-Representative gas chromatograms of saturated hydrocarbon.fractions from Eocene Vermillion Creek coals (5B, 7E) and claystones (51, 7A) and from coals of the Cretaceous Williams Fork Formation (KA, KC) and the Pennsylvanian Cherokee Group (PD, PG). Pristane, phytane, n-C23, and n-C29 peaks are identified.
Cretaceous coals (11.4 mean), lower in the high-sulfur Eocene Vermillion Creek and Middle Pennsylvanian Marmaton and Cherokee coals (mean 5.4 and 4.8, respectively), and lowest in the Vermillion Creek coal-
associated rocks (3.1 mean). The low-sulfur coals are the products of low-pH coal swamps, which inhibit bacterial activity (Baas Becking and others, 1960; Swain, 1974). These conditions probably enhance the

ORGANIC GEOCHEMISTRY AND ORGANIC PETROGRAPHY (BOSTICK AND OTHERS) 159
KA Coal
KC Coal
Q) c B Cll
;t
Q) c B Cll
;t
('I) N
u I
c::
('I) N
u I
c::
en N
u I
c::
en N
u I
c::
apparent contributions of terrestrial higher plants input because subsequent organic diageneses would be inhibited by the more sterile conditions. In contrast, the high-sulfur coals are products of nearly neutral pH swamps in which the organic matter reflects both terrestrial plant input and subsequent anaerobic bacterial activity. The pristane/phytane ratios suggest the Vermillion Creek coal-associated rocks, compared with the
PO Coal
PG Coal
Q) c B Cll
;t
Q) c B Cll
;t
Q) c !!! > ~ a..
Q) c !!! > ~ a..
en N
u I
c::
en N
u I
c::
coals, received a lower contribution from terrestrial higher plants and a higher contribution from aquatic algae and (or) bacteria.
Brooks and others (1969), Allan and others (1977), and Boudou (1981) show that Pr/Ph ratios are als·o a function of the thermal maturation level of the organic matter. Pr/Ph ratios increase significantly (5 to lOx) as the carbon content of coals (dry, mineral-matter-free
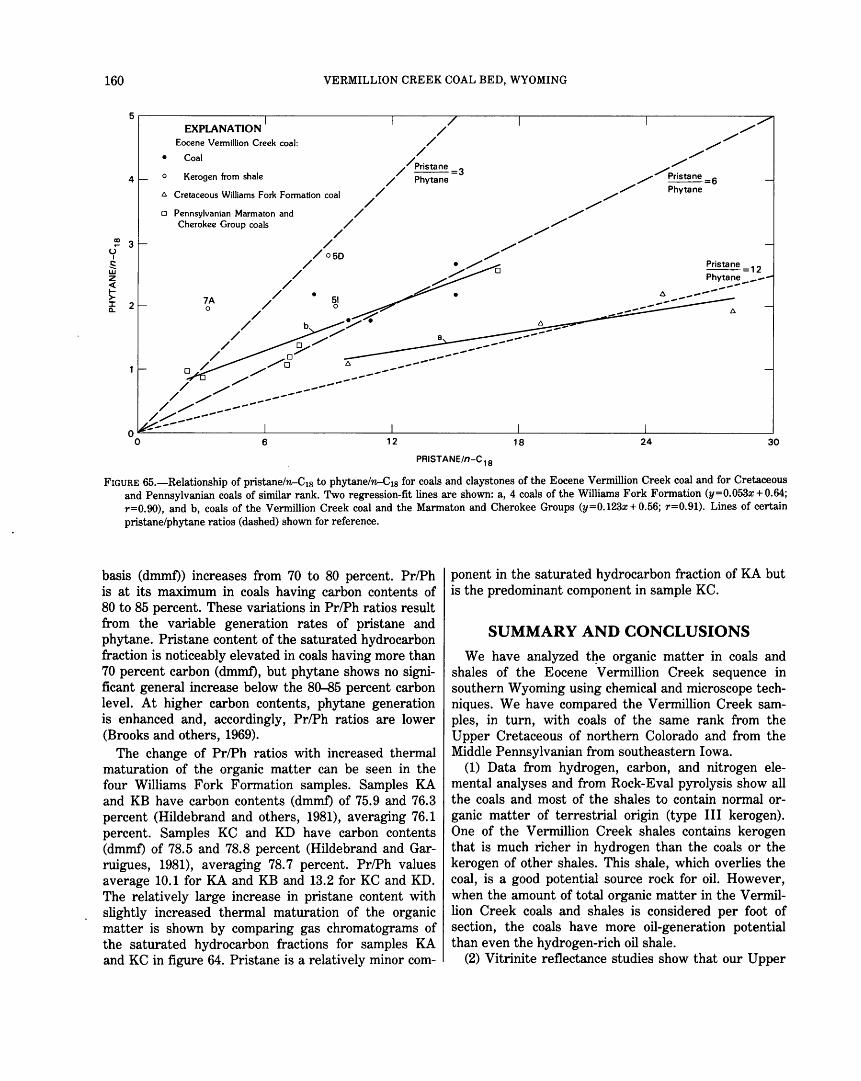
160 VERMILLION CREEK COAL BED, WYOMING
4
Q) 3 u
I s. w z < >: ~ 2
EXPlANATION Eocene Vermillion Creek coal:
• Coal
0 Kerogen from shale
A Cretaceous Williams Fork Formation coal
o Pennsylvanian Marmaton and Cherokee Group coals
7A 0
/
/ /
/ /
/ /
/ /050
/
• 51 0
/ /
/
/ /
/ //Pristane =3
/ Phytane
• -----
Pristane = 12 Phytane __ ----A --.._. ------
/ /
/
/ ~7. b / ..................... ......
/ --~ ------~8 A --------
~ --~- ----
/ ~ ------/ ./ .................. --/ - ----/~~-------
/
--0~------------~---------------L--------------~--------------L-------------~ 0 24 30 6 12 18
PRIST ANE/n-C 18
FIGURE 65.-Relationship of pristane/n-C18 to phytane/n-C18 for coals and claystones of the Eocene Vermillion Creek coal and for Cretaceous and Pennsylvanian coals of similar rank. Two regression-fit lines are shown: a, 4 coals of the Williams Fork Formation (y=0.053x + 0.64; r=0.90), and b, coals of the Vermillion Creek coal and the Marmaton and Cherokee Groups (y=0.123x+0.56; r=0.91). Lines of certain pristane/phytane ratios (dashed) shown for reference.
basis (dmmf)) increases from 70 to 80 percent. Pr/Ph is at its maximum in coals having carbon contents of 80 to 85 percent. These variations in Pr/Ph ratios result from the variable generation rates of pristane and phytane. Pristane content of the saturated hydrocarbon fraction is noticeably elevated in coals having more than 70 percent carbon (dmmf), but phytane shows no significant general increase below the 80-85 percent carbon level. At higher carbon contents, phytane generation is enhanced and, accordingly, Pr/Ph ratios are lower (Brooks and others, 1969).
The change of Pr/Ph ratios with increased thermal maturation of the organic matter can be seen in the four Williams Fork Formation samples. Samples KA and KB have carbon contents (dmmf) of 75.9 and 76.3 percent (Hildebrand and others, 1981), averaging 76.1 percent. Samples KC and KD have carbon contents (dmmf) of 78.5 and 78.8 percent (Hildebrand and Garruigues, 1981), averaging 78.7 percent. Pr/Ph values average 10.1 for KA and KB and 13.2 for KC and KD. The relatively large increase in pristane content with slightly increased thermal maturation of the organic matter is shown by comparing gas chromatograms of the saturated hydrocarbon fractions for samples KA and KC in figure 64. Pristane is a relatively minor com-
ponent in the saturated hydrocarbon fraction of KA but is the predominant component in sample KC.
SUMMARY AND CONCLUSIONS
We have analyzed tl}e organic matter in coals and shales of the Eocene Vermillion Creek sequence in southern Wyoming using chemical and microscope techniques. We have compared the Vermillion Creek samples, in turn, with coals of the same rank from the Upper Cretaceous of northern Colorado and from the Middle Pennsylvanian from southeastern Iowa.
(1) Data from hydrogen, carbon, and nitrogen elemental analyses and from Rock-Eval pyrolysis show all the coals and most of the shales to contain normal organic matter of terrestrial origin (type III kerogen). One of the Vermillion Creek shales contains kerogen that is much richer in hydrogen than the coals or the kerogen of other shales. This shale, which overlies the coal, is a good potential source rock for oil. However, when the amount of total organic matter in the V ermillion Creek coals and shales is considered per foot of section, the coals have more oil-generation potential than even the hydrogen-rich oil shale.
(2) Vitrinite reflectance studies show that our Upper
ORGANIC GEOCHEMISTRY AND ORGANIC PETROGRAPHY (BOSTICK AND OTHERS) 161
Cretaceous and Middle Pennsylvanian comparison coals have the same level of organic maturity as the V ermillion Creek coals. The shales of the Vermillion Creek sequence have lower vitrinite reflectance than the coals, however. Vitrinite reflectance in the shales is inversely proportional to the H/C ratio but shows no systematic relation to the index of fluorescent solid organic constituents or to the Rock-Eval hydrogen index (except for organic-rich sample 7 A). We conclude that the type of vitrinite in the high-H/C samples has lower reflectance-not that lower reflectance is caused by the mere presence of alginite or other liptinite or by polish problems.
(3) The samples of this study are slightly more hydrogen rich than the "type III" kerogen of Espitalie and others (1977) yet fall in the normal coal range. We conclude that Espitalie's type III samples may have included more inertinite or reworked vitrinite.
(4) The Vermillion Creek coals have an unusually low inertinite content. The very low inertinite content of the Vermillion Creek coals leads to slightly higher than normal hydrogen content, heat of combustion, and volatile-matter content and to a lower T max in the RockEva! analysis. Although many features of the Vermillion Creek coals are those of "reduced" coals, the low inertinite content accounts for most of these features. Hence, we cannot identify these coals as "reduced."
(5) The high sulfur content of the Vermillion Creek coals is confirmed by microscopic observation of the abundant pyrite. The pyrite is mostly of fine framboidal type (a characteristic of "reduced coals") rather than cleat-filling or nodule pyrite. The high pyrite and low inertinite contents are the two features that distinguish the Vermillion Creek coals from most mined Cretaceous and Tertiary coals of the West.
(6) Estimates of content of fluorescent organic matter in the shales and coals show that the one very hydrogen-rich shale contains kerogen that is mostly filamentous algal remains. This is the only geochemical indication of lacustrine origin in the Vermillion. Creek coal and shale section we have studied. We would call this one shale unit above the coals "oil shale" or "lamosite." It is of the same general type as much of the oil shale of the Green River Formation.
(7) Mean organic-carbon-isotope composition (o13C) for the Vermillion Creek coal samples is -26.3 per mil (PDB). The 813C values for the Vermillion Creek claystone samples are all more negative ( -27.2 to -32.1 per mil, mean = -28.7 per mil). Organic-carbon-isotope composition of the claystone samples is related to the apparent hydrogen richness of the organic matter as measured by the Rock-Eval hydrogen index: the higher the hydrogen index, the more negative the 813C. This relationship suggests a mixture of isotopically heavier,
hydrogen-deficient terrestrial organic matter with isotopically lighter, hydrogen-rich aquatic organic matter.
(8) Differences between coal and clay-shale sample sets show that saturated HC/aromatic HC and total HC/total bitumen ratios and saturated hydrocarbon distributions are dependent on the composition of the original organic matter. Saturated hydrocarbon distributions are also sensitive to minor differences in maturation levels of the organic matter. This sensitivity is shown by shifts in the maximum for the n-C15 alkanes and by changes in pristane/phytane ratios.
(9) In these sediments, pristane/phytane ratio variability appears to be primarily a function of pristane content, as phytane contents remain relatively constant. Lower Pr/Ph ratios in high-sulfur coals suggest bacterial contribution of phytane or phytane-precursor compounds.
REFERENCES CITED Allan, J., Bjorlo!fy, J., and Douglas, A. G., 1977, Variation in the con
tent and distribution of high molecular weight hydrocarbons in a series of coal macerals of different ranks, in Campos, R. and Goni, J., eds., Advances in organic geochemistry 1975: Madrid, Enadimsa, p. 633-654.
Baas Becking, L. G. M., Kaplan, I. R., and Moore, Derek, 1960, Limits of the natural environment in terms of pH and oxidationreduction potentials: Journal of Geology, v. 68, p. 243-284.
Bostick, N. H., and Foster, J. N., 1975, Comparison of vitrinite reflectance in coal seams and in kerogen of sandstones, shales, and limestones in the same part of a sedimentary section, in Alpern, Boris, ed., Petrographie de la matiere organique des sediments, relations avec la paleotemperature et le potentiel petrolier: Paris, Centre National de la Recherche Scientifique, p. 13-25.
Boudou, Jean-Paul, 1981, Diagenese organique de sediments deltaiques (Delta de la Mahakam-Indonesie): Orleans, France, L'Universite D'Orleans, Ph. D. thesis, 196 p.
Brassell, S. C., Wardroper, A. M. K., Thomson, I. D., Maxwell, J. R., and Eglinton, G., 1981, Specific acyclic isoprenoids as biological markers of methanogenic bacteria in marine sediments: Nature, v. 290, p. 693-696.
Bray, E. E., and Evans, E. D., 1961, Distribution of n-paraffins as a clue to the recognition of source beds: Geochimica et Cosmochimica Acta, v. 22, p. 2-15.
Brooks, J. D., Gould, K., and Smith, J. W., 1969, lsprenoid hydrocarbons in coal and petroleum: Nature, v. 222, p. 257-259.
Brooks, J. D., and Smith, J. W., 1967, The diagenesis of plant lipids during the formation of coal, petroleum and natural gas-1. Changes in the n-paraffin hydrocarbons: Geochimica et Cosmochimica Acta, v. 31, p. 2389-2397.
--1969, The diagenesis of plant lipids during the formation of coal, petroleum and natural gas-11. Coalification and the formation of oil and gas in the Gippsland Basin: Geochimica et Cosmochima Acta, v. 33, p. 1183-1194.
Chappe, B., Albrecht, P., and Michaelis, W., 1982, Polar lipids of Archaebacteria in sediments and petroleums: Science, v. 217, no. 4554, p. 65--66.
Chappe, B., Michaelis, W., and Albrecht, P., 1980, Molecular fossils of Archaebacteria as selective degradation products of kerogen, in Douglas, A. G., and Maxwell, J. R., eds., Advances in organic geochemistry 1979: Oxford, Pergamon Press, p. 265-274.
162 VERMILLION CREEK COAL BED, WYOMING
Cook, A. C., Hutton, A. C., and Sherwood, N. R., 1981, Classification of oil shales: Bulletin des Centres de Recherches Exploration-Production Elf-Aquitaine, v. 5, no. 2, p.353-381.
Didyk, B. M., Simoneit, B. R. T., Brassell, S. C., and Eglinton, G., 1978, Organic geochemical indicators of paleoenvironmental conditions of sedimentation: Nature, v. 272, p. 216-222.
Durand, B., Nicaise, G., Roucache, J., Vanderbroucke, M., and Hagemann, H. W., 1977, Etude geochimique d'une serie de charbons, in Campos, R., and Goni, J., eds., Advances in organic geochemistry 1975: Madrid, Enadimsa, p. 601-631.
Eglinton, Geoffrey, 1969, Hydrocarbons and fatty acids in living organisms and recent and ancient sediments, in Schenck, P. A., and Havenaar, 1., eds., Advances in organic geochemistry 1968: Oxford, Pergamon Press, p. 1-24.
Ensminger, A., Albrecht, P., Ourisson, G., Kimble, B. J., Maxwell, J. R., and Eglinton, G., 1972, Homohopane in Messel oil shaleFirst identification of a C31 pentacyclic triterpane in natureBacterial origin of some triterpanes in ancient sediments?: Tetrahedron Letters, v. 36, p. 3861-3864.
Espitalie, J., Laporte, J. L., Madec, M., Marquis, F., Leplat, P., Paulet, J., and Boutefeu, A., 1977, Methode rapide de caracterisation des roches meres de leur potentiel petrolier et de leur degre d'evolution: Revue de l'lnstitut Francais du Petrole, v. 32, no. 1, p. 23-42.
Fox, G. E., Stackebrandt, E., Hespell, R. B., Gibson, J., Maniloff, J., Dyer, T. A., Wolfe, R. S., Balch, W. E., Tanner, R. S., Magrum, L. J., Zablen, L. B., Blakemore, R., Gupta, R., Bonen, L., Lewis, B. J., Stahl, D. A., Luehrsen, K. R., Chen, K. N., Woese, C. R., 1980, The phylogeny of Prokaryotes: Science, v. 209, no. 4455, p. 457-463.
Galimov, E. M., Migdisov, A. A., and Ronov, A. B., 1975, Variatsii izotopnogo sostava karbonatnogo i organicheskogo ugleroda osadochnykh porod v istorii Zemli: [Variations of the isotopic composition of carbonate and organic carbon of sedimentary rocks in the history of the Earth]: Geokhimiia, 1975, no. 3, p. 323-342 (in Russian).
Ginzburg, A. 1., Lapo, A. V., and Letushova, I. A., 1976, Ratsional'nyi kompleks petrograficheskikh i khimicheskikh metodov issledovaniia uglei i goriuchikh slantsev [Coordinated petrographic and chemical methods of analyzing coals and oil shales]: Leningrad, Nedra, 168 p.
Given, P. H., and Yarzab, R. F., 1978, Analysis of the organic substances of coals-Problems posed by the presence of mineral matter, chap. 20 of Karr, Clarence, Jr., ed., Analytical methods for coal and coal products: New York, Academic Press, v. 2, p. 3-41.
Hildebrand, R. T., and Garrigues, R. S., 1981, Geology and chemical analyses of coal, Mesa Verde Group (Cretaceous), Lower White River coal field, Moffat and Rio Blanco Counties, Colorado: U.S. Geological Survey Open-File Report 81--597, 26 p.
Hildebrand, R. T., Garrigues, R. S., Meyer, R. F., and Reheis, M. C., 1981, Geology and chemical analyses of coal and coal-associated rock samples, Williams Fork Formation (Upper Cretaceous), northwestern Colorado: U.S. Geological Survey OpenFile Report 81-1348, 94 p.
Hutton, A. C., and Cook, A. C., 1980, Influence of alginite on the reflectance of vitrinite from Joadja, N. S. W., and some other coals and oil shales containing alginite: Fuel, v. 59, no. 10, p. 711-714.
Kalkreuth, W. D., 1982, Rank and petrographic composition of selected Jurassic-Lower Cretaceous coals of British Columbia, Canada: Bulletin of Canadian Petroleum Geology, v. 30, no. 2, p. 112-139.
Kaplan, I. R., Smith, J. W., and Ruth, E., 1970, Carbon and sulfur
concentration and isotopic composition in Apollo 11 lunar samples, in Levinson, A. A., ed., Proceedings of the Apollo 11 lunar scientific conference: Geochimica et Cosmochimica Acta, supp. 1, v. 2, p. 1317-1329.
Korzhenevskaya, Ye. S., Drozdova, I. N., and Lapo, A. V., 1979, K voprosu o "vosstanovlennosti" ugley (v aspekte fiteral'nogo analiza) [The question of coal ''reductivity" (from the view of phyteral analysis)], in Vassoyevich, N. B., and Timofeyev, P. P., eds., Nakopleniye i preobrazovaniye sedikakhitov: Moscow, Izdatel'stvo Nauka, p. 105--111.
Lapo, A. V., 1978, Comparative characteristics of vitrinites of Carboniferous coals of the Ukraine and Jurassic coals of Siberia: Fuel, v. 57, no. 3, p. 17~183.
Leyfman, I. Ye., and Vassoyevich, N. B., 1980, Novaya diagramma dlya sopostavleniya goryuchikh iskopayemykh i ikh predshestvennikov po atomnym sootnosheniyam vodorode: Akademia Nauk SSSR, Doklady, v. 253, no. 3, p. 674-678. (English translation, 1982, A new diagram for comparing fuel minerals and their precursors in terms of hydrogen atomic ratios: Doklady Earth Science Sections, v. 253, p. 115--118).
Leythaeuser, Detlev, and Welte, D. H., 1969, Relation between distribution of heavy n-paraffins and coalification in Carboniferous coals from the Saar District, Germany, in Schenck, P. A., and Havenaar, 1., eds., Advances in organic geochemistry 1968: Oxford, Pergamon Press, p. 42~0.
MacFarland, D. R., 1981, Organic/organic and organic/mineral interactions in petroleum source rocks and coals: Golden, Colo., Colorado School of Mines, M.S. thesis, 180 p.
Neavel, R. C., Hippo, E. J., Smith, S. E., and Miller, R. N., 1980, Coal characterization research-Sample selection, preparation, and analysis: American Chemical Society, Division of Fuel Chemistry, Preprints, Las Vegas mtg., Aug. 1980, v. 25, no. 3, p. 246-257.
Nissenbaum, Arie, Baedecker, M. J., and Kaplan, I. R., 1972, Organic geochemistry of Dead Sea sediments: Geochimica et Cosmochimica Acta, v. 36, no. 7, p. 70~728.
Robert, Paul, 1979, Classification des matieres organiques en fluorescence-Application aux roches-meres petrolieres: Bulletin des Centres de Recherches Exploration-Production Elf-Aquitaine, v. 3, no. 1, p. 22~263. (English translation, 1981, Classification of organic matter by means of fluorescence; Application to hydrocarbon source rocks: International Journal of Coal Geology, v. 1, no. 2, p. 101-137.)
Sackett, W. M., Eckelmann, W. R., Bendor, M. L., and Be, A. W. H., 1965, Temperature dependence of carbon isotope composition in marine plankton and sediments: Science, v. 148, no. 3667, p. 235--237.
Saxby, J. D., 1980, Atomic H/C ratios and the generation of oil from coals and kerogens: Fuel, v. 59, no. 5, p. 305--307.
Silverman, S. R., and Epstein, Samuel, 1958, Carbon isotopic compositions of petroleums and other sedimentary organic materials: American Association of Petroleum Geologists Bulletin, v. 42, no. 5, p. 998--1012.
Spackman, William, Davis, Alan, and Mitchell, G. D., 1976, The fluorescence of liptinite macerals: Brigham Young University Geology Studies, v. 22, pt. 3, p. 5~ 75.
Swain, F. M., 1974, Marsh gas from the Atlantic Coastal Plain, United States, in Tissot, B., and Bienner, F., eds., Advances in Organic Geochemistry 1973: International Meeting on Organic Geochemistry, Programme and Abstracts, no. 6, p. 67~7.
Teichmiiller, Marlies, 1950, Zum petrographischen Aufau und Werdegang der Weichbraunkohle [Petrographic composition and origin of lignites]: Geologisches Jahrbuch, v. 64, p. 42~.
Tissot, B. P., Deroo, G., and Hood, A., 1978, Geochemical study
ORGANIC GEOCHEMISTRY AND ORGANIC PETROGRAPHY (BOSTICK AND OTHERS) 163
of the Uinta Basin-Fonnation of petroleum from the Green River Fonnation: Geochimica et Cosmochimica Acta, v. 42, no. 10, p. 1469-1485.
Tissot, B. P., Durand, B., Espitalie, J., and Combaz, A., 1974, Influence of nature and diagenesis of organic matter in fonnation of petroleum: American Association of Petroleum Geologists Bulletin, v. 58, no. 3, p. 499-506.
Tissot, B. P., Pelet, R., Roucache, J., and Combaz, A., 1977, Alkanes as geochemical fossil indicators of geological environments, in Campos, R., and Gofii, J., eds., Advances in organic geochemistry 1975: Madrid, Enadimsa, p. 117-154.
Tissot, B. P., and Welte, D. H., 1978, Petroleum fonnation and occurrence-A new approach to oil and gas exploration: New York, Springer-Verlag, 538 p.
U.S. Office of Coal Research, 1967, Methods of analyzing and testing coal and coke: U.S. Bureau of Mines Bulletin 638, 85 p.
Van Dorsselaer, A., Ensminger, A., Spyckerelle, C., Dastillung, M., Sieskind, 0., Arpino, P., Albrecht, P., Ourisson, G., Brooks, P. W., Gaskell, S. J., Kimble, B. J., Philip, R. P., Maxwell, J. R., and Eglinton, G., 1974, Degraded and extended hopane derivatives (C27 to C35) as ubiquitous geochemical markers: Tetrahedron Letters, v. 14, p. 1349-1352.
van Krevelen, D. W., 1961, Coal-Typology, chemistry, physics, constitution: Amsterdam, Elsevier Publishing Co., 514 p.
Walker, A. L., 1983, Comparison of anomalously low vitrinite reflectance values with other thennal maturation indices at Playa del Rey, California: Seattle, Wash., University of Washington M.S. thesis, 180 p.
Welte, D. H., and Waples, D. W., 1973, Uber die Bevorzugung geradzahliger n-Alkane in Sedimentgesteinen [The preference for even-numbered n-alkanes in sedimentary rocks]: Naturwissenschaften, v. 60, p. 516-517.

Sulfur Isotopic Data By R. 0. RYE
GEOLOGICAL INVESTIGATIONS OF THE VERMILLION CREEK COAL BED IN THE EOCENE NILAND TONGUE OF THE WASATCH FORMATION, SWEETWATER COUNTY, WYOMING
U.S. GEOLOGICAL SURVEY PROFESSIONAL PAPER 1314-I
CONTENTS
Abstract ...................... . Concentration and origin of sulfur in the coal Sulfur isotopic data Conclusions . . . References cited . .
ILLUSTRATION
Page
167 167 167 168 168
Page
FIGURE 66. Photographs showing outcrop of melanterite above the Vermillion Creek coal bed . . . . . . . . . . . . . . . . . . . . 169
TABLES
Page
TABLE 30. The 8348 values of sedimentary gypsum from the Unita Mountains and in soluble sulfate from the Niland Tongue 168 31. Proximate analyses and 834S values of pyrite, organic sulfur and soluble sulfate from corehole VC-8 . . . 168
166
GEOLOGICAL INVESTIGATIONS OF THE VERMILLION CREEK COAL BED IN THE EOCENE NILAND TONGUE OF THE
WASATCH FORMATION, SWEETWATER COUNTY, WYOMING
SULFUR ISOTOPIC DATA
By R. 0. RYE
ABSTRACT
Preliminary sulfur isotope data have been determined for samples of the Vermillion Creek coal bed and associated rocks in the V ermillion Creek basin and for samples of evaporites collected from Jurassic and Triassic formations that crop out in the nearby Uinta Mountains. The data are inconclusive, but it is likely that the sulfur in the coal was derived from the evaporites.
CONCENTRATION AND ORIGIN OF SULFUR IN THE COAL
The Vermillion Creek coal bed is characterized by very high sulfur content. Sulfur concentrations typically range from 4 to 8 weight percent, and the organic content exceeds 3 weight percent in many samples. These sulfur concentrations are exceptionally high for Tertiary coals in the Western United States, which typically have less than 1 weight percent sulfur (Swanson and others, 1976).
It is generally accepted that most sulfur enters the coal-forming environment as seawater sulfate (Wanless and others, 1969; Casagrande and others, 1977). Consequently, freshwater coals like those in the Vermillion Creek coal bed typically have low sulfur concentrations. An exception could occur if the drainage basin in which the coal was deposited included a source of sulfate such as evaporite units or older pyrite-rich rocks that were undergoing oxidation. The purpose of this chapter is to present preliminary sulfur isotope data on the various occurences of sulfur in the Vermillion Creek coal bed and on possible evaporite sources.
SULFUR ISOTOPIC DATA
Sulfur isotope analyses were made on pyrite, organic sulfur, and soluble sulfate from coal in the VC-8 corehole. In addition, selenite (CaS04 ·2H20) and melanterite (FeS04 ·7H20) from carbonaceous shale overlying the coal were analyzed. Samples of sedimentary gypsum from the Jurassic Carmel Formation and the Triassic Woodside Formation in the nearby Uinta Mountains were also analyzed. The sample localities,
descriptions, and 834S values of these samples are given in tables 30 and 31.
The Vermillion Creek coal bed has soluble sulfate concentrations that typically range from 0.06 to 0.14 weight percent sulfur. In corehole VC-8, the sulfate has a 834S of -3.2 to -12.2 per mil. These values are distinctly different than the 834S values of the organic sulfur (7.0 to 9.9 per mil) and are also lower than the 834S values of the coexisting pyrite (-2.0 to 4.2 per mil). Concentrations of sulfate also occur in several phases in carbonaceous shale (samples UC-3 and UC-4) overlying the Vermillion Creek coal bed. The 834S of the melanterite that occurs 1. 5 feet above the top of the coal bed (fig. 66) is -5.3 per mil, while that of the selenite 8 feet above the top of the coal is -8.5 per mil. The soluble sulfate, melanterite, and selenite are undoubtedly derived from the recent oxidation of pyrite by ground water. Low-temperature oxidation of pyrite to sulfate can occur without significant fractionation (Field, 1966). However, if intermediate sulfur species are formed during the oxidation, secondary sulfates and sulfides can have a wide range of isotopic compositions (Granger and Warren, 1969).
Sedimentary gypsum is exposed in the Triassic Woodside Formation (sample UC-1) and the Jurassic Carmel Formation (sample UC-2) along the north side of the Uinta Mountains. During deposition of the Niland Tongue in Eocene time, the exposures of these formations were probably much more extensive than they are today. The Woodside has lenses of gypsum as much as 30 feet thick and an aggregate thickness of gypsum as great as 160 feet. The gypsum beds in the Carmel reach thicknesses of 5 feet and have an aggregate thickness of about 40 feet The 834S of a small gypsum nodule in the Woodside is 27.1 per mil, and a lens of gypsum from the Carmel has a 834S of 16.1 per mil.
The 834S of the Woodside gypsum nodule is much larger than typical values for Triassic age seawater sulfate and is probably not representative of the average
167

168 VERMILLION CREEK COAL BED, WYOMING
TABLE 30.-The fl4S values of sedimentary gypsum from the Uinta Mountains and of soluble sulfate from the Niland Tongue of the Wasatch Formation in the Vermillion Creek basin
Sam- 0 3~+s
ple Sample description Stratigraphic position Geographic location (per No. mil)
UC-1 Red-stained gypsum nodule About 100 ft above base of Road cut along Sheep Creek, 5 mi. S. of 27.1 Manila, Utah. SWtNEtNEt sec. 12, T. from red mudstone. Triassic Woodside Formation. 2 N., R. 19 E., Daggett County, Utah.
UC-2 Pink and white vein and About 100 ft below top of Road cut along Highway 44, 4 mi S. of 16.5 bedded gypsum from gray Jurassic Carmel Formation. Manila, Utah. North-central part of mudstone. sec. 6, T. 2 N., R. 20 E., Daggett
County, Utah.
UC-3 White, powdery melanterite 1.5 ft above Vermillion Creek East slopes of a small tributary to -4.3 from carbonaceous shale. coal bed in upper 150 ft of
Niland Tongue. Vermillion Creek. swtNEtswt sec. 32, T. 13 N. R. 100 w., Sweetwater County, Wyo.
UC-4 Selenite crystals from 8 ft above Vermillion Creek Between measured sections 2478 and 2778 -7.5 on a small tributary of Horseshoe carbonaceous shale. coal bed in upper 150 ft of
Niland Tongue. Wash. NEtNEtSEt sec. 12, T. 12 N.,
TABLE 31.-Proximate analyses and fl4S values of pyrite, organic sulfur, and soluble sulfate from corehole VC-8 in the Vermillion Creek coal bed
Sample Weight pet sulfur 1 Sample
0 J~+s (per mil) 2
interval Py- Organic Sul- depth Py- Organic Sul-(feet) rite sulfur fate
(feet) rite sulfur fate
53.2-56.8 3.42 3.38 0.14 55.5 4.2 9.9 - 3.2
57.3-60.9 1.89 2.62 .08 58.0 - .1 7.6 -12.2 60.0 -2.0 7.0 - 4.3
1 Proximate analyses on coal, as received. 2 o34 s analyses by Global Geochemistry, Inc.
Isotopic composition of the formation. The sulfur isotopic composition has probably been enriched in 834S by secondary or local processes involving closed-system reduction of sulfate by bacteria during the formation of the nodule. The 834S value of the gypsum lens from the Carmel Formation is typical of Jurassic seawater sulfate (Claypool and others, 1980).
Sulfur occurs in coal primarily as pyrite and as organic sulfur. High- and low-sulfur coals are normally distinguished on the basis of their organic sulfur concentrations (Price and Shieh, 1979). The 834S values of pyrite and organic sulfur from the Vermillion Creek coal bed are distinctly different (table 31), although there is a positive correlation between them. A similar correlation has been observed in the high-sulfur coals from the Illinois basin by Price and Shieh (1979). They interpreted the correlation to indicate that the organic sulfur in high-sulfur coals is only partly inherited from
R. 101 W., Sweetwater County, Wyo.
plant material and that a considerable portion of it comes from isotopically lighter H2S that is formed from bacterial reduction of seawater sulfate, and which is also involved in the formation of pyrite.
CONCLUSIONS
The sulfur isotope values for the pyrite and organic sulfur from the Vermillion Creek coal bed are similar to those obtained by Price and Shieh (1979) for the Pennsylvanian coals of the Illinois basin. The 834S of seawater sulfate in the Pennsylvanian was probably only a few per mil lower than in the Triassic and Jurassic (Claypool and others, 1980). Thus, the preliminary sulfur isotope data of the Vermillion Creek coal bed are consistent with the derivation of" most of the sulfur from the dissolution of the Triassic-Jurassic evaporites in the Uinta Mountains. Even though the sulfur may have been derived from evaporites, a more detailed stable isotope study is necessary to understand the geochemical processes that resulted in such high sulfur concentrations in a coal bed that was deposited in a fresh-water environment.
REFERENCES CITED Casagrande, D. J., Siefert, Kristine, Berschinski, Charles, and Sut
ton, Nell, 1977, Sulfur in peat-forming systems of the Okefenokee Swamp and Florida Everglades-Origins of sulfur in coal: Geochimica et Cosmochimica Acta, v. 41, p. 161-167.
Claypool, G. E., Holser, W. T., Kaplan, I. R., Sakai, Hitoshi, and Zak, Israel, 1980, The age curves of sulfur and oxygen isotopes in marine sulfate and their mutual interpretation: Chemical Geology, v. 28, p. 199-259.
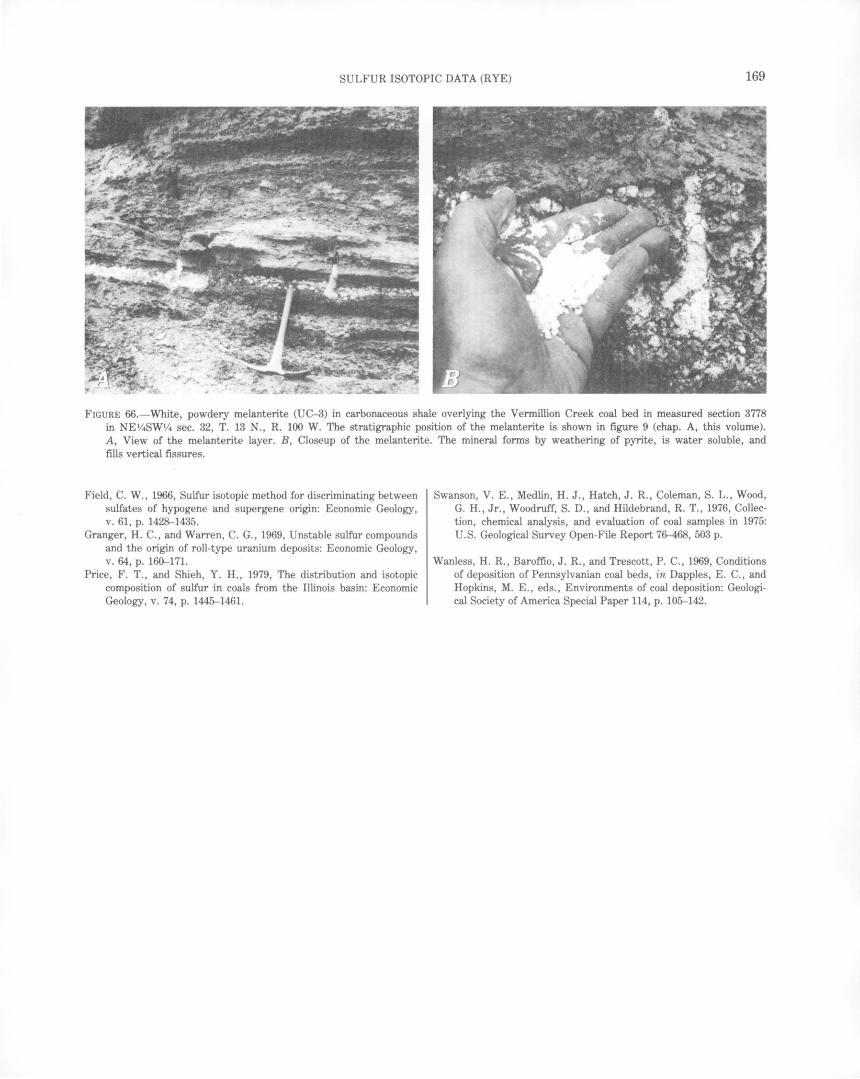
SULFUR ISOTOPIC DATA (RYE) 169
FIGURE 66.-White, powdery melanterite (UC-3) in carbonaceous shale overlying the Vermillion Creek coal bed in measured section 3778 in NE 1/4SW1/4 sec. 32, T. 13 N., R. 100 W. The stratigraphic position of the melanterite is shown in figure 9 (chap. A, this volume). A, View of the melanterite layer. B, Closeup of the melanterite. The mineral forms by weathering of pyrite, is water soluble, and fills vertical fissures.
Field, C. W., 1966, Sulfur isotopic method for discriminating between sulfates of hypogene and supergene origin: Economic Geology, v. 61, p. 1428-1435.
Granger, H. C., and Warren, C. G., 1969, Unstable sulfur compounds and the origin of roll-type uranium deposits: Economic Geology, v. 64, p. 160--171.
Price, F. T., and Shieh, Y. H., 1979, The distribution and isotopic composition of sulfur in coals from the Illinois basin: Economic Geology, v. 74, p. 1445-1461.
Swanson, V. E., Medlin, H. J., Hatch, J. R., Coleman, S. L., Wood, G. H., Jr., Woodruff, S. D., and Hildebrand, R. T., 1976, Collection, chemical analysis, and evaluation of coal samples in 1975: U.S. Geological Survey Open-File Report 76-468, 503 p.
Wanless, H. R., Baroffio, J. R., and Trescott, P. C., 1969, Conditions of deposition of Pennsylvanian coal beds, in Dapples, E. C., and Hopkins, M. E., eds., Environments of coal deposition: Geological Society of America Special Paper 114, p. 105-142.

Uranium in the Vermillion Creek Core Samples By]. S. LEVENTHAL and R. B. FINKELMAN
GEOLOGICAL INVESTIGATIONS OF THE VERMILLION CREEK COAL BED IN THE EOCENE NILAND TONGUE OF THE WASATCH FORMATION, SWEETWATER COUNTY, WYOMING
U.S. GEOLOGICAL SURVEY PROFESSIONAL PAPER 1314-J
Abstract ..... . Introduction . . . . Analytical methods
Uranium analysis Carbon analysis . Fission-track analysis . Pyrolysis gas chromatography .
Results ......... . Uranium and carbon .... Fission tracks . . . . . . . . Pyrolysis of organic matter
Discussion . . . References cited . . . . . . . . .
CONTENTS
ILLUSTRATIONS
Page
173 173 173 173 173 173 174 174 174 175 176 176 177
FIGURE 67. Gamma-ray and density logs for cores VC-5, VC-7, and VC-8 .................. . 68. Photomicrographs of fission tracks in Lexan showing uranium in Vermillion Creek core samples . 69. Pyrolysis gas chromatograms of one shale and two coal samples . . . . . . . . . . . . . . . . . . .
TABLE
TABLE 32. Organic carbon, ash, uranium, and thorium contents of shale and coal samples from Vermillion Creek cores
172
Page
174 176 177
Page
175
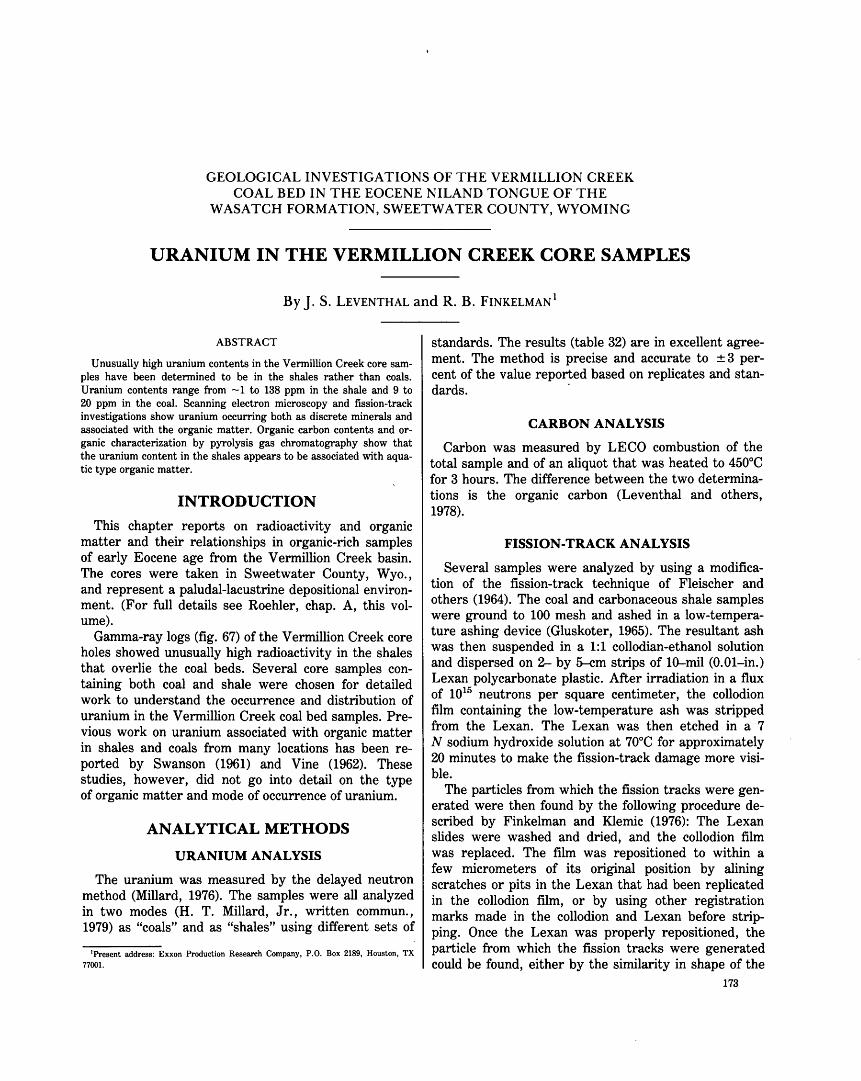
GEOLOGICAL INVESTIGATIONS OF THE VERMILLION CREEK COAL BED IN THE EOCENE NILAND TONGUE OF THE
WASATCH FORMATION, SWEETWATER COUNTY, WYOMING
URANIUM IN THE VERMILLION CREEK CORE SAMPLES
By j. S. LEVENTHAL and R. B. FINKELMAN 1
ABSTRACT
Unusually high uranium contents in the Vermillion Creek core samples have been determined to be in the shales rather than coals. Uranium contents range from -1 to 138 ppm in the shale and 9 to 20 ppm in the coal. Scanning electron microscopy and fission-track investigations show uranium occurring both as discrete minerals and associated with the organic matter. Organic carbon contents and organic characterization by pyrolysis gas chromatography show that the uranium content in the shales appears to be associated with aquatic type organic matter.
INTRODUCTION
This chapter reports on radioactivity and organic matter and their relationships in organic-rich samples of early Eocene age from the Vermillion Creek basin. The cores were taken in Sweetwater County, Wyo., and represent a paludal-lacustrine depositional environment. (For full details see Roehler, chap. A, this volume).
Gamma-ray logs (fig. 67) of the Vermillion Creek core holes showed unusually high radioactivity in the shales that overlie the coal beds. Several core samples containing both coal and shale were chosen for detailed work to understand the occurrence and distribution of uranium in the Vermillion Creek coal bed samples. Previous work on uranium associated with organic matter in shales and coals from many locations has been reported by Swanson (1961) and Vine (1962). These studies, however, did not go into detail on the type of organic matter and mode of occurrence of uranium.
ANALYTICAL METHODS
URANIUM ANALYSIS
The uranium was measured by the delayed neutron method (Millard, 1976). The samples were all analyzed in two modes (H. T. Millard, Jr., written commun., 1979) as "coals" and as "shales" using different sets of
1Present address: Exxon Production Research Company, P.O. Box 2189, Houston, TX 77001.
standards. The results (table 32) are in excellent agreement. The method is precise and accurate to ± 3 percent of the value reported based on replicates and stan-dards. ·
CARBON ANALYSIS
Carbon was measured by LECO combustion of the total sample and of an aliquot that was heated to 450°C for 3 hours. The difference between the two determinations is the organic carbon (Leventhal and others, 1978).
FISSION-TRACK ANALYSIS
Several samples were analyzed by using a modification of the fission-track technique of Fleischer and others (1964). The coal and carbonaceous shale samples were ground to 100 mesh and ashed in a low-temperature ashing device (Gluskoter, 1965). The resultant ash was then suspended in a 1:1 collodian-ethanol solution and dispersed on 2- by 5-em strips of 10-mil (0.01-in.) Lexan polycarbonate plastic. After irradiation in a flux of 1015 neutrons per square centimeter, the collodion film containing the low-temperature ash was stripped from the Lexan. The Lexan was then etched in a 7 N sodium hydroxide solution at 70°C for approximately 20 minutes to make the fission-track damage more visible.
The particles from which the fission tracks were generated were then found by the following procedure described by Finkelman and Klemic (1976): The Lexan slides were washed and dried, and the collodion film was replaced. The film was repositioned to within a few micrometers of its original position by alining scratches or pits in the Lexan that had been replicated in the collodion film, or by using other registration ~arks made in the collodion and Lexan before strippmg. Once the Lexan was properly repositioned, the particle from which the fission tracks were generated could be found, either by the similarity in shape of the
173

174 VERMILLION CREEK COAL BED, WYOMING
80
1-w w 100 u. !; J: 1- +-fl.. w 0
120
INCREASING RESPONSE ------+
FIGURE 67.---Gamma-ray and density logs for cores VC-5, VC-7, and VC-8 from the Vermillion Creek coal. Arrows mark depths of samples described in table 32.
particle and the area damaged by fission tracks (generally for grains greater than 20 micrometers in diameter) or by the proximity of tracks and the particle from which they were generated to the registration marks.
This was done by measuring bearing and distance with a micrometer ocular.
These techniques allow the rapid location of microscopic uranium-bearing particles and the determination of some of their optical characteristics (index of refraction of collodion= 1.54). A particle thus located can be recovered for subsequent analysis by carefully scribing around it while it is in view under the microscope, removing the collodion chip containing the grain to a glass slide, and dissolving the collodion by means of amyl acetate from a micropipet, again keeping the particle in view under the microscope. Use of surgical scalpels and long-working-distance petrographic objectives facilitate this procedure.
The fission damage can take the form of individual tracks, as much as 20 J.Lm long, or coherent clusters of tracks, referred to as stars (fig. 68A). The density of the fission tracks in the stars is proportional to the concentration of uranium. The stars are generated by small ( <5-J.Lm) uranium-bearing mineral grains; their shape reflects the emanation of fission tracks from a point source (fig. 68A). The individual tracks (fig. 68B) represent exceedingly small concentrations of uranium, perhaps individual atoms. Uranium atoms that were bound to the organic constituents in the coal probably are a major contributor to the population of individual fission tracks.
A number of the uranium-bearing minerals from the Vermillion Creek core samples were extracted from the collodion and examined by a scanning electron microscope (SEM) equipped with an energy-dispersive X-ray detector (EDX). X-ray powder-diffraction patterns were obtained from several of the uranium-bearing minerals, using a mounting technique described by Finkelman (1978).
PYROLYSIS GAS CHROMATOGRAPHY
Pyrolysis gas chromatography was used to characterize the insoluble complex organic matter. Pyrolysis gas chromatography involves rapidly heating a powdered sample (1-5 mg) in helium to 750°C and analyzing the volatile (up to C30) molecules formed by bond breaking. Pyrolysis gas chromatography has been used to identify sources of organic matter (Leventhal, 1976) and to relate these sources to uranium content of shales (Leventhal, 1981).
RESULTS
URANIUM AND CARBON
Table 32 lists uranium and thorium concentrations and organic carbon content for seven samples. Uranium concentrations range from 0.8 to 137 ppm in the shales

URANIUM (LEVENTHAL AND FINKELMAN) 175
TABLE 32.---0rganic carbon, ash, uranium, and thorium contents of shale and coal samples from Vermillion Creek cores
[Analysts: Mark Stanton (organic C), Hugh Millard (U, Th), and R. B. Finkelman (ash).-, not detennined]
Core- Depth 1 Organic Sample type carbon hole (feet) (pet)
Ash (pet)
u
Coal basis 2
(ppm) Th
Shale (ppm) basis 2
VC-5 96.0 Shale----------------------------------- • 76 17.0 16.7 <6 3 96.5 Coal------------------------------------ 68 3.0
82.5
9.34 9.36 <5
VC-7 3 109.4 Carbonaceous shale---------------------- 16.6 137 138 <26
VC-8 53.5 Carbonaceous shale containing coal------ 40.1 73.6 74.7 <17 54.0 Carbonaceous shale---------------------- 16.2 16.7 <7 55.5 Coal------------------------------------ 66.0 19.9 19.8 <8
3 57.5 Carbonaceous shale containing coal layer 20.8 74.0 .78 .90 <2
1 Samples represent a 2- to 3-inch interval below the indicated depth. 2 Analyzed relative to standards for coal or shale. 3 Sample also analyzed by pyrolysis gas chromatography (see fig. 4) and by
methods. fission-track and SEM
and from 9 to 20 ppm in the coals. The concentration of thorium was below the level of determination in all samples (2 to 26 ppm) because of uranium interference.
Results for uranium content reported by Hatch elsewhere in this volume (table 16) appear to be different from our data (table 32) because they are reported on a different basis. We took samples representing a small portion of the lithologic section ( -2-3 in.), and he took a "channel" type sample of the entire lithologic unit. Both sampling techniques are valid and reliable, but for our purposes we sampled the extremely high- and low-radioactivity (U content) samples, which were limited to short intervals.
The carbonaceous shale in corehole VC-7, approximately 7 ft above a coal bed, contains 138 ppm U. Another shale sample from approximately 2 ft above the coal (53.5 ft in VC-8) contains 74 ppm U. The related coal in this hole contains only 20 ppm U. The uranium content of the coal samples analyzed here does not appear to be related to their organic carbon ·content; this finding is in contrast to the relationship found in marine shale by Swanson (1961) and Vine (1962).
FISSION TRACKS
Only a few ( -5) percent of the fission tracks in the coal sample from VC-5 were associated with pointsource stars, many of which had moderately high track densities. However, the particles generating these stars were extremely small (1J.t.m or less!) and therefore difficult to manipulate and characterize. The combination of small particle size and moderate track density is indicative of minerals that have a high uranium concentration. Only one particle could be extracted from the collodion and analyzed. Energy dispersive analysis
of this micron-sized, brownish grain indicated major U, and traces of Pb, S, and Si. It is probably a uraninite particle.
In contrast to the VC-5 coal sample, the carbonaceous shale sample from VC-7 had virtually no moderate-track-density stars. The vast majority of the fission tracks were either isolated or in diffuse clusters. All the clusters appeared to be generated from weakly birefringent, colorless to brownish, filmy material. Energy dispersive analysis of one of these particles indicates major Fe and S. We were unable to obtain X-ray diffraction patterns of these clusters. They are probably X-ray-amorphous iron sulfates, which are common artifacts of the low-temperature ashing procedure. They can be created by the oxidation of iron sulfides or, more likely, by the oxidation of organically bound sulfur and iron. The uranium could have become associated with these particles either during the low-temperature ashing procedure or during the preparation of the collodion films.
At least 50 percent of the tracks in the shale sample from VC-8 (57.5 ft) were asociated with moderate- to high-track-density. point-source stars. Unfortunately, we were unable to isolate or characterize any of the particles that generated the stars.
Several other Vermillion Creek samples were analyzed by the fission-track technique. In the sample from VC-7, only about 1 percent of the tracks were in coherent clusters and the remainder were isolated tracks. Four uranium-bearing grains were examined in the SEM-EDX system. Three proved to be zircons, the fourth a rare-earth-bearing silicate. Calculations based on track density indicate that the zircons contained 1,000-2,000 ppm uranium. Four other uranium-bearing

176 VERMILLION CREEK COAL BED, WYOMING
-
FIGURE 68.-Photomicrographs of fission tracks in Lexan showing uranium expressed predominantly as point-source stars (A) and as single tracks and clusters (B). Samples represented are from 57.5 ft in core VC-8 (A) and from 109.4 ft in core VC-7 (B). Longest fission tracks are 20 ~m.
grains in this sample were optically identified as zircons. Several surface samples of coal were analyzed, and one of these produced virtually all isolated tracks. Two uranium-bearing grains from this sample were optically identified as zircons.
PYROLYSIS OF ORGANIC MATTER
Figure 69 shows the pyrograms for the three core holes. Organic material in the shale from VC-7, which has the highest uranium content, shows a distinct n-alkane (long-chain carbon-molecule) component-typical of aquatic microorganisms. The coal-containing samples from 57.5 ft in VC-8 and 96.5 ft in VC-5 show much lower amounts of n-alkanes and more aromatic (or cyclic) type pyrolysis products, which are typical of bituminous coal (J. S. Leventhal, unpub. data). The coal is lower in uranium than the superjacent shale
(table 32). However, these coal and shale samples are anomalously high in their uranium content relative to average coals (Hatch and Swanson, 1977) and shales.
DISCUSSION
Normally, the delayed neutron technique gives results for thorium, but when the absolute amount (ppm) of thorium is less than that of uranium (ppm), the thorium results are used only as the upper limit. The fact that the Vermillion Creek samples show very low thorium contents is evidence of solution transport for uranium, rather than detrital input of thorium and uranium. The lack of discrete uranium minerals in the fission-track analyses supports the suggestion of uranium adsorption on organic matter. In this study we found that the shales had more uranium than the coals, which

URANIUM (LEVENTHAL AND FINKELMAN) 177
Corehole VC-5, 96.5 feet Coal, 900°C pyrolysis
INCREASING TEMPERATURE-
FIGURE 69.-Pyrolysis gas chromatograms of one shale and two coal samples from the Vermillion Creek coal bed. Numbers on top chromatogram refer to n-alkene and n-alkane doublets that predominate in that shale sample but not in the coal samples. Open triangles mark changes in scale.
contain a greater proportion of terrestrial organic material. These results are in contrast to the findings of a recent study of black shales by Leventhal (1981). This result can probably be explained in two ways: (1) the coals formed under conditions unfavorable to uranium concentration (such as low pH) and/or (2) there was insufficient sulfide present to precipitate the uranium.
Fission-track analyses show that the bulk of the uranium in the coal from VC-5 and the shale from VC-7 was expressed as isolated fission tracks (as in fig. 68B). Therefore, it is probable that most of the uranium in these samples was associated with organic matter. Such an association is consistent with suggestions based on Th/U ratios that there is little detrital input of these elements. The only other sample analyzed by fissiontrack methods (VC-8, 57.5 ft) had most of its uranium expressed as point-source stars (fig. 68A).
It is interesting to note that only the coal sample from VC-5 contained uraninite particles. Micron-sized uraninite crystals have also been found in the Laredo coal from Missouri (Finkelman, 1981). It is probable that the uraninite particles in these samples are authigenic phases precipitated by the reduction of mobile U + 6 ions to U + 4 ions. It is certainly possible that the moderate- to high-track-density point-source stars produced by the carbonaceous shale from 57.5 ft in VC-8 were generated by uraninite particles, and we cannot rule out the possibility of uraninite in the shale from VC-5. The VC-5 shale has only about 1180 the organic
carbon content of the underlying, uraninite-bearing coal (table 32); hence, in order to sample equal amounts of organic matter, we would have needed a shale sample 80 times as large as the coal sample. However, we used roughly equal weights of each sample. If any uraninite is present in the shale from VC-5, it also would have precipitated from uranium in solution.
There are several possible sources for the uranium in the Vermillion Creek core samples. Masursky (1962) suggests the Precambrian age Granite Mountains of central Wyoming, which show higher than average U and evidence (Rosholt and Bartel, 1969; Stuckless and Nkomo, 1978) of substantial uranium loss based on U/ Pb isotopic measurements. Other possible sources are the arkose of the Paleocene and Eocene Battle Spring Formation, which is derived from the granite of the Granite Mountains, and the Permian Phosphoria Formation. The relative amounts of phosphorus and uranium in the Vermillion Creek coal and shale (Hatch, this volume) are quite different from those of the Phosphoria Formation (Sheldon, 1963). This difference may, of course, be due to deposition of the phosphorus and uranium under different environmental conditions in different parts of the basin.
REFERENCES CITED Finkelman, R. B., 1978, Detennination of trace element sites in the
Waynesburg coal by SEM analysis of accessory minerals: Scanning Electron Microscopy, 1978, v. 1, p. 143-148.
--1981, Modes of occurrence of trace elements in coal: U.S. Geological Survey Open-File Report 81-99, 322 p.
Finkelman, R. B., and Klemic, Harry, 1976, Brannerite from the Perin Haven Junction uranium occurrence, Carbon County, Pennsylvania: U.S. Geological Survey Journal of Research, v. 4, no. 6, p. 715--716.
Fleischer, R. L., Price, P. B., Walker, R. M., and Hubbard, E. L., 1964, Track registration in various solid-state nuclear track detectors: Physical Review, v. 133, no. 5A, p. 1443--1449.
Gluskoter, H. J., 1965, Electric low-temperature ashing of bituminous coal: Fuel, v. 44, no. 4, p. 285--291.
Hatch, J. R., and Swanson, V. E., 1977, Trace elements in Rocky Mountain <;oals, in Murray, D. K., ed., Geology of Rocky Mountain coals: Denver, Colo., Colorado Geological Survey, p. 143-163.
Leventhal, J. S., 1976, Stepwise pyrolysis gas chromatography of kerogen in sedimentary rock: Chemical Geology, v. 18, p. 5--20.
--1981, Pyrolysis gas chromatography-mass spectrometry to characterize organic matter and its relationship to uranium content of Appalachian Devonian black shales. Geochimica et Cosmochimica Acta, v. 45, p. 883-889.
Leventhal, J. S., Crock, J. G., Mountjoy, W., Thomas, J. A., Shawe, V. E., Briggs, P. H., Wahlberg, J. S., and Malcolm, M. J., 1978, Preliminary analytical results for a new U.S. Geological Survey Devonian Ohio Shale Standard, SD0-1: U.S. Geological Survey Open-File Report 78-447, 13 p. ·
Masursky, Harold, 1962, Uranium-bearing coal in the eastern part of the Red Desert area, Wyoming: U.S. Geological Survey Bulletin 1099-B, p. B1-B152.
178 VERMILLION CREEK COAL BED, WYOMING
Millard, H. T., Jr., 1976, Detennination of uranium and thorium in USGS standard rocks by delayed neutron technique, in Flanagan, F. J., ed., Descriptions and analyses of eight new USGS rock standards: U.S. Geological Survey Professional Paper 840, p. 61~6.
Rosholt, J. N., and Bartel, J. A., 1969, Uranium, thorium and lead systematics in the Granite Mountains, Wyoming: Earth and Planetary Science Letters, v. 7, p. 144-147.
Sheldon, R. P., 1963, Physical stratigraphy and mineral resources of Pennian rocks in western Wyoming: U.S. Geological Survey Professional Paper 313-B, p. 49-273.
Stuckless, J. S., and Nkomo, I. T., 1978, Uranium-lead isotope systematics in uraniferous alkali rock granite from the Granite Mountains, Wyoming-Implications for uranium source rocks: Economic Geology, v. 73, p. 427-444.
Swanson, V. E., 1961, Geology and geochemistry of uranium in marine black shales-A review: U.S. Geological Survey Professional Paper 356-C, p. 67-112.
Vine, J. D., 1962, Geology of uranium in coaly carbonaceous rocks: U.S. Geological Survey Professional Paper 356--D, p. 113-170.

Results of Exploratory Drilling By RICKY T. HILDEBRAND
GEOLOGICAL INVESTIGATIONS OF THE VERMILLION CREEK COAL BED IN THE EOCENE NILAND TONGUE OF THE WASATCH FORMATION, SWEETWATER COUNTY, WYOMING
U.S. GEOLOGICAL SURVEY PR.OFESSIONAL PAPER 1314-K
Abstract ............ . Description of drilling program
Rotary drilling procedure .
CONTENTS
Core drilling procedure and sample collection Description of geophysical logs . . . . .
Logging methods . . . . . . . . . . Interpretation of geophysical logs .
References cited . . . . . . . . . . . . .
ILLUSTRATIONS
Page
181 181 181 181 181 182 182 185
Page
FIGURE 70. Map showing drill hole locations and outcrop of the Vermillion Creek coal bed . . . . . . . . . . . . . . . . . . . . 182 71. Lithologic and geophysical logs from eight drill holes in the Vermillion Creek basin, Sweetwater County, Wyoming . . 183
TABLE
Page
TABLE 33. Drill hole numbers, location, surface elevations, and depths drilled for eight drill holes in the Vermillion Creek basin 182
180
GEOLOGICAL INVESTIGATIONS OF THE VERMILLION CREEK COAL BED IN THE EOCENE NILAND TONGUE OF THE
WASATCH FORMATION, SWEETWATER COUNTY, WYOMING
RESULTS OF EXPLORATORY DRILLING
By RICKY T. HILDEBRAND
ABSTRACT
Eight exploratory holes were drilled in the Vermillion Creek basin, southern Sweetwater County, Wyo., to aid in interpreting the subsurface stratigraphy of the Vermillion Creek coal bed. Lithologic logs based on cuttings and geophysical logs (natural gamma, density, and caliper) were made for each drill hole. Core samples of the Vermillion Creek coal bed and associated strata (roof rock, floor rock, and partings) were collected from three drill holes for geochemical and petrographic analysis. The geophysical logs indicate the presence of anomalous radioactive zones in the strata surrounding the Vermillion Creek coal bed.
DESCRIPTION OF DRILLING PROGRAM
The U.S. Geological Survey conducted exploratory drilling in the Vermillion Creek basin between May 25 and June 6, 1978, as a part of its geological investigation of the V ennillion Creek coal bed. Eight exploratory holes were drilled within the study area in southern Sweetwater County, Wyo., approximately 50 miles southeast of Rock Springs. The locations of the drill holes and the outcrop pattern of the Vermillion Creek coal bed are shown in figure 70. Table 33 contains descriptive data on the drill holes, including location, ground elevation, cored intervals, and depth drilled for each hole.
ROTARY DRILLING PROCEDURE
All drilling in the study area was performed by a government-owned, portable (truck-mounted) drill rig. The rotary holes were drilled using compressed air and a 5.5-inch-diameter, carbide-toothed rotary bit.
Drill cuttings were collected from each hole at 5-foot intervals using a fine-mesh wire strainer, following the guidelines given in Hobbs (1979). The cuttings were then used to construct a preliminary lithologic log of the hole at the drill site to detennine the general subsurface stratigraphy and to help interpret the signatures of the various lithologies on the geophysical logs. Because of the shallow depths of the holes, no lag-time corrections for the emerging cuttings were needed.
Samples of the cuttings were collected in cloth sandsample bags and labeled with the drill hole number and depth interval represented.
CORE DRILLING PROCEDURE AND SAMPLE COLLECTION
Three of the drill holes, VC--5, VC-7, and VC-8, were "twinned" (re-drilled and partly cored within a few yards of the initial drill hole) to obtain fresh samples from the Vermillion Creek coal bed and associated rock. The twinning procedure allowed accurate predetermination of the desired cored intervals. Each of the cored holes was drilled with compressed air, using a rotary bit to reach the designated depth. Then the desired intervals were cored, using a 3-inch-i.d., 10-foot-long, conventional core barrel fitted with a diamond-studded bit.
Core samples of coal and rock from the three core holes were collected and described following the procedures outlined in Swanson and Huffman (1976) and Hobbs (1979). Each core was placed in a wooden tray immediately after recovery and described, noting the type and thickness of each lithologic unit. The length of core was then sectioned, placed in a partitioned cardboard core box, and labeled, noting in particular the orientation of the core and the interval represented. Core samples of coal were wrapped in heavy (6 mil) plastic sheeting sealed with duct tape to minimize drying and oxidation of the coal and to prevent contamination.
The strata cored in the V ennillion Creek basin proved to be fairly competent during the drilling operations, allowing a core recovery of greater than 95 percent. A total of 50.6 feet of core was collected for study.
DESCRIPTION OF GEOPHYSICAL LOGS
Geophysical logs were run in each rotary drill hole to determine the subsurface stratigraphy of the V ermillion Creek coal bed and associated rocks (fig. 71).
181
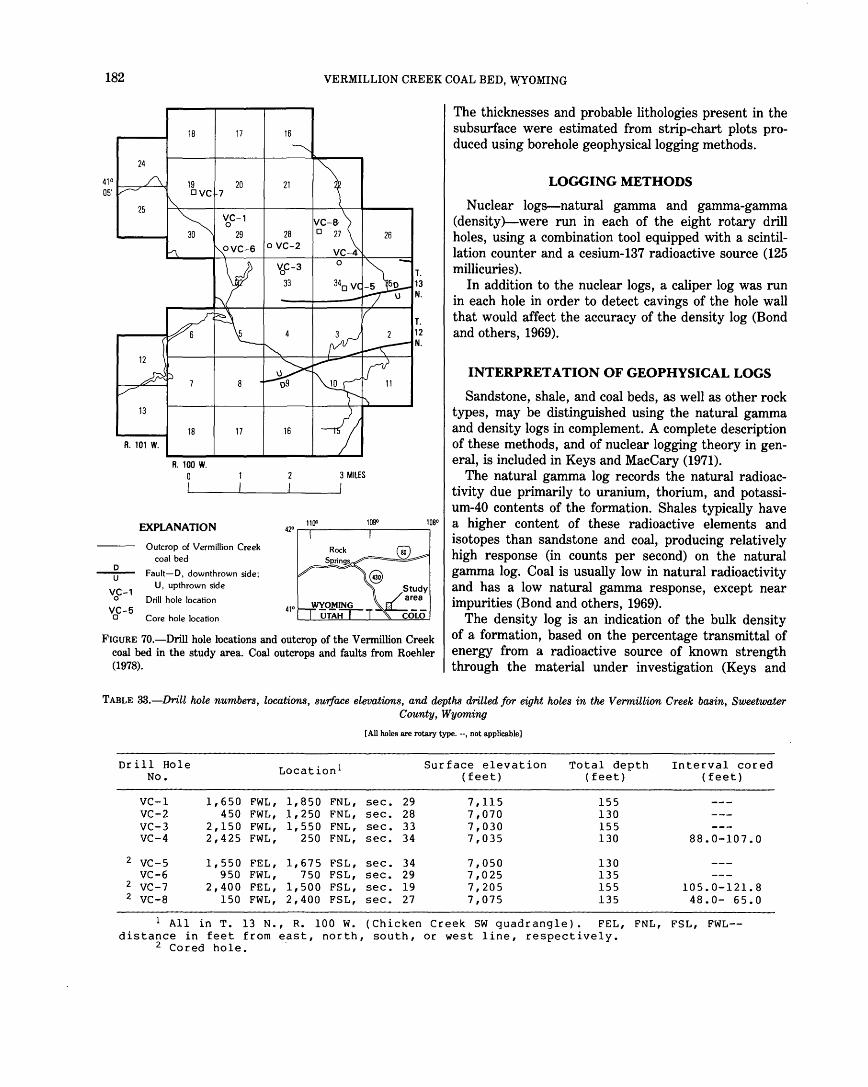
182
18 17
41° 19 20 05' ovc 7
25
13
18 17
R. 101 W.
R. 100 W. 0
EXPLANATION
Outcrop of Vermillion Creek coal bed
D Fault-0, downthrown side; --u-
VC-1 U, upthrown side
0 Drill hole location VC-5
0 Core hole location
16
21
'bC-3 33
16
110" 42"
VERMILLION CREEK COAL BED, wYOMING
26
0 T. 13 N.
T. 12 N.
11
3 MILES
109° 108°
The thicknesses and probable lithologies present in the subsurface were estimated from strip-chart plots produced using borehole geophysical logging methods.
LOGGING METHODS
Nuclear logs--natural gamma and gamma-gamma (density)-were run in each of the eight rotary drill holes, using a combination tool equipped with a scintillation counter and a cesium-137 radioactive source (125 millicuries).
In addition to the nuclear logs, a caliper log was run in each hole in order to detect cavings of the hole wall that would affect the accuracy of the density log (Bond and others, 1969).
INTERPRETATION OF GEOPHYSICAL LOGS
Sandstone, shale, and coal beds, as well as other rock types, may be distinguished using the natural gamma and density logs in complement. A complete description of these methods, and of nuclear logging theory in general, is included in Keys and MacCary (1971).
The natural gamma log records the natural radioactivity due primarily to uranium, thorium, and potassium-40 contents of the formation. Shales typically have a higher content of these radioactive elements and isotopes than sandstone and coal, producing relatively high response (in counts per second) on the natural gamma log. Coal is usually low in natural radioactivity and has a low natural gamma response, except near impurities (Bond and others, 1969).
FIGURE 70.-Drill hole locations and outcrop of the Vermillion Creek
The density log is an indication of the bulk density of a formation, based on the percentage transmittal of energy from a radioactive source of known strength through the material under investigation (Keys and
coal bed in the study area. Coal outcrops and faults from Roehler (1978).
TABLE 33.-Drill hole numbers, locations, surface elevations, and depths drilled for eight holes in the Vermillion Creek basin, Sweetwater County, Wyoming
Drill Hole No.
VC-1 VC-2 VC-3 VC-4
2 VC-5 VC-6
2 VC-7 2 VC-8
1,650 450
2,150 2,425
1,550 950
2,400 150
FWL, FWL, FWL, FWL,
FEL, FWL, FEL, FWL,
Location 1
1,850 FNL, 1,250 FNL, 1,550 FNL,
250 FNL,
1,675 FSL, 750 FSL,
1,500 FSL, 2,400 FSL,
[All holes are rotary type. --, not applicable]
Surface elevation (feet)
sec. 29 7,115 sec. 28 7,070 sec. 33 7,030 sec. 34 7,035
sec. 34 7,050 sec. 29 7,025 sec. 19 7,205 sec. 27 7,075
Total depth (feet)
155 130 155 130
130 135 155 135
Interval cored (feet)
88.0-107.0
105.0-121.8 48.0- 65.0
1 All in T. 13 N., R. 100 W. (Chicken Creek SW quadrangle). FEL, FNL, FSL, FWL-distance in feet from e.ast, north, south, or west line, respectively.
2 Cored hole.

1-w w Ll..
25
50
~ 75 I 1--Cl. w a
100
125
150
C) C)
NATURAL GAMMA
RESULTS OF EXPLORATORY DRILLING (HILDEBRAND) 183
DRILL HOLE VC-1
LOCATION: 1,650 ft from west line, 1,850 ft from north line, sec . 29, T_ 13 N. , R. 100 W .
GROUND ELEVATION (EST. ): 7,115 ft
C)
g C"l
GAMMA-GAMMA (DENSITY)
COUNTS PER SECOND
C) C)
q
CAL
g 6 7 8 ...,
IN.
TOTAL DEPTH: 1 55 ft
STRIP LOG LITHOLOGIC DESCRIPTION
Wasatch Formation (part): Niland Tongue (part):
0 - 44 ft - Gray, partially calcareous siltstone interbedded with dark-brown carbonaceous shale and gray to brown, coarse- to very fine-grained sandstone
44- 51 ft-Vermillion Creek coal bed
51-106 ft -Gray to brown shale interbedded with dark-brown to black carbonaceous shale and gray, finegrained to silty calcareous sandstone
106 - 124ft-Gray, very fine grained, soft argillaceous sandstone and gray sandy siltstone
1 24- 129 ft - Coal interbedded w ith black coaly shale
129- 155 ft - Brown, partially silty shale interbedded with gray calcareous siltstone and dark-brown calcareous shale
EXPLANATION OF STRIP LOG PATTERNS
Oil shale
Coal
:;:~ Carbonaceous shale
Sandstone
----_-_-_-_-_ Shale
-:::-=-=-=- Siltstone, silty sandstone , silty shale , or interbedded siltstone , sandstone , and shale
FIGURE 71.-Geophysical logs and lithologic descriptions for drill holes VG-1 through VC-8 in the Vermillion Creek basin, Sweetwater County, Wyo. Logging speed for all wells was 20ft/min. Time constant for all gamma logs is 3 seconds. CAL, caliper log (hole diameter).

184 VERMILLION CREEK COAL BED, WYOMING
DRILL HOLE VC-2
LOCATION: 450ft from west line. 1,250 ft from north line, sec. 28, T . 13 N., A. 100 W.
1-w w u...
25
50
~ 75 :I:
tL w 0
100
125
0
~
NATURAL GAMMA
0 0 g 0 0 N .., ..,. 0
fil
GROUND ELEVATION (EST.): 7,070 ft
co 0 co fil coo
...; N
GAMMA~AMMA (DENSITY)
0 0 0
~ 0 N
COUNTS PER SECOND
CAL
1 l L l l 0 0 5 6 7 8 0 0 q o.n
IN.
TOTAL DEPTH: 1 30 ft
STRIP LOG LITHOLOGIC DESCRIPTION
Green River Formation (part):
Tipton Shale Member (part):
0 - 18 ft-Dark-brown flaky oil shale
Wasatch Formation (part):
Niland Tongue (part):
18-34 ft-Gray, very fine grained, partially calcareous sandstone interbedded with black carbonaceous shale
34-51 ft-Gray, very fine grained, soft argillaceous sandstone
51-90ft-Gray, partially sandy siltstone and dark-brown to black carbonaceous shale
90-98 ft-Vermillion Creek coal bed
98-1 30 ft -Gray to brown shale interbedded with gray sandy siltstone, gray, fine-grained calcareous sandstone, and black carbonaceous shale
FIGURE 71.-Geophysicallogs and lithologic descriptions for drill holes-Continued.
MacCary, 1971). Coal has a lower density than sandstone, which in turn is less dense than shale. Porosity, degree of induration, and variation in composition also affect the response of the density log. In many cases the thickness of a coal bed can be accurately determined from the density log (Bond and others, 1969).
Results of the natural gamma logs from the V ermillion Creek basin indicate that the Vermillion Creek coal bed emits more gamma radiation than normal. Uranium-bearing coal of Eocene age is known in the Red Desert to the northeast of the Vermillion Creek basin (Masursky and Pipiringos, 1959). Radioactive zones are
present in the study area in the strata overlying the Vermillion Creek coal bed, and partings within the coal bed also emit high amounts of gamma radiation.
Approximate bulk density and ash content of coal can be determined from a density log, but these parameters cannot be calculated for the Vermillion Creek coal bed because the logging tool used has not been calibrated. Only the relative difference in density between the various lithologic units is available from these density logs. The thickness of the Vermillion Creek coal bed in each hole is indicated in figure 71; it ranges from 5 to 10 feet.
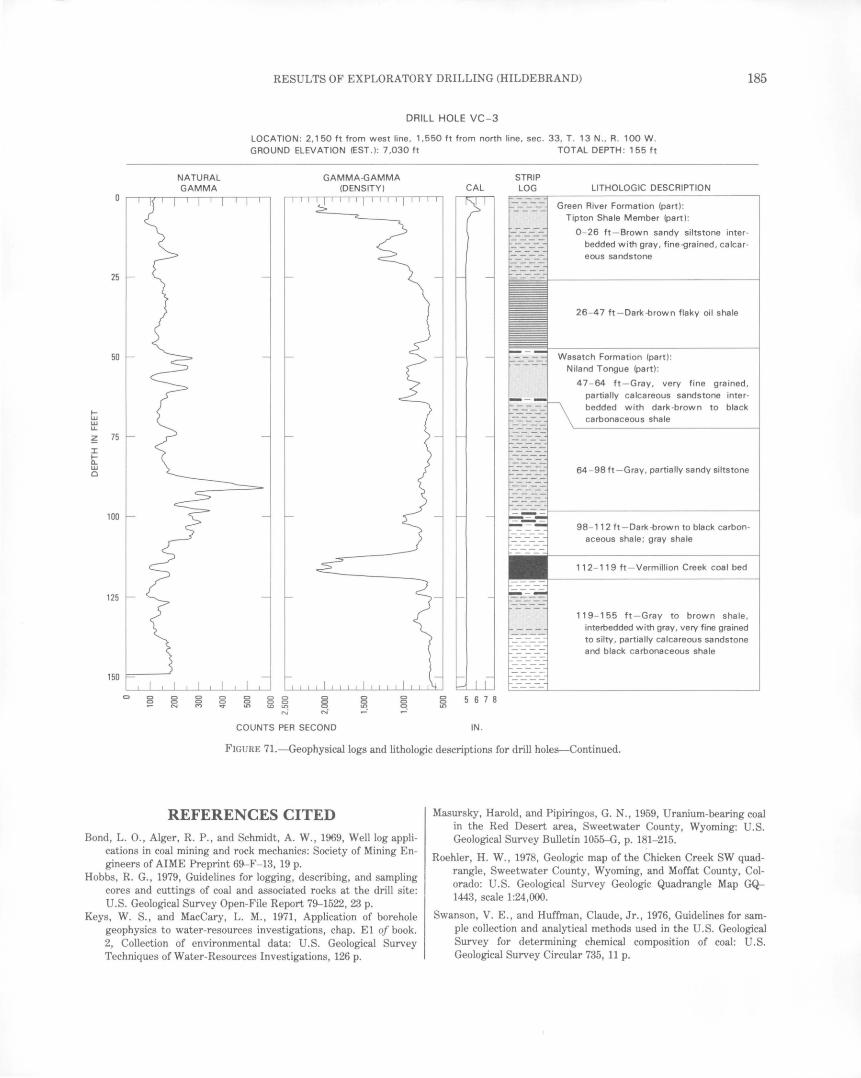
RESULTS OF EXPLORATORY DRILLING (HILDEBRAND) 185
DRILL HOLE VC-3
LOCATION : 2,150 ft from west line , 1,550 ft from north line , sec. 33, T. 13 N., R. 100 W. GROUND ELEVATION (EST.): 7,030 ft TOTAL DEPTH: 155ft
1-w w u.
~ I 1-a.. w 0
25
50
75
100
125
0 0 g
N
NATURAL GAMMA
0 g 0 0
0 0 (t:J o.n
N
GAMMA-GAMMA (DENSITY)
COUNTS PER SECOND
CAL
5 6 7 8
IN.
STRIP LOG LITHOLOGIC DESCRIPTION
Green River Formation (part): Tipton Shale Member (part):
0 - 26 ft -Brown sandy siltstone interbedded with gray, finei:Jrained, calcareous sandstone
26 - 47 ft-Dark-brown flaky oil shale
Wasatch Formation (part) : Niland Tongue (part):
47 - 64 ft - Gray, very fine grained, partially calcareous sandstone interbedded with dark -brown to black carbonaceous shale
64 - 98ft-Gray, partially sandy siltstone
98- 112 ft -Dark -brown to black carbonaceous shale; gray shale
112- 119 ft - Vermillion Creek coal bed
119- 155 ft-Gray to brown shale, interbedded with gray, very fine grained to silty, partially calcareous sandstone and black carbonaceous shale
FIGURE 71.-Geophysicallogs and lithologic descriptions for drill holes-Continued.
REFERENCES CITED Bond, L. 0., Alger, R. P., and Schmidt, A. W. , 1969, Well log appli
cations in coal mining and rock mechanics: Society of Mining Engineers of AIME Preprint 69-F- 13, 19 p.
Hobbs, R. G., 1979, Guidelines for logging, describing, and sampling cores and cuttings of coal and associated rocks at the drill site: U.S. Geological Survey Open-File Report 79-1522, 23 p.
Keys, W. S., and MacCary, L. M. , 1971, Application of borehole geophysics to water-resources investigations, chap. E1 of book. 2, Collection of environmental data: U.S. Geological Survey Techniques of Water-Resources Investigations, 126 p.
Masursky, Harold, and Pipiringos, G. N., 1959, Uranium-bearing coal in the Red Desert area, Sweetwater County, Wyoming: U.S. Geological Survey Bulletin 1055--G, p. 181-215.
Roehler, H. W., 1978, Geologic map of the Chicken Creek SW quadrangle, Sweetwater County, Wyoming, and Moffat County, Colorado: U.S. Geological Survey Geologic Quadrangle Map GQ-1443, scale 1:24,000.
Swanson, V. E., and Huffman, Claude, Jr., 1976, Guidelines for sample collection and analytical methods used in the U.S. Geological Survey for determining chemical composition of coal: U.S. Geological Survey Circular 735, 11 p.
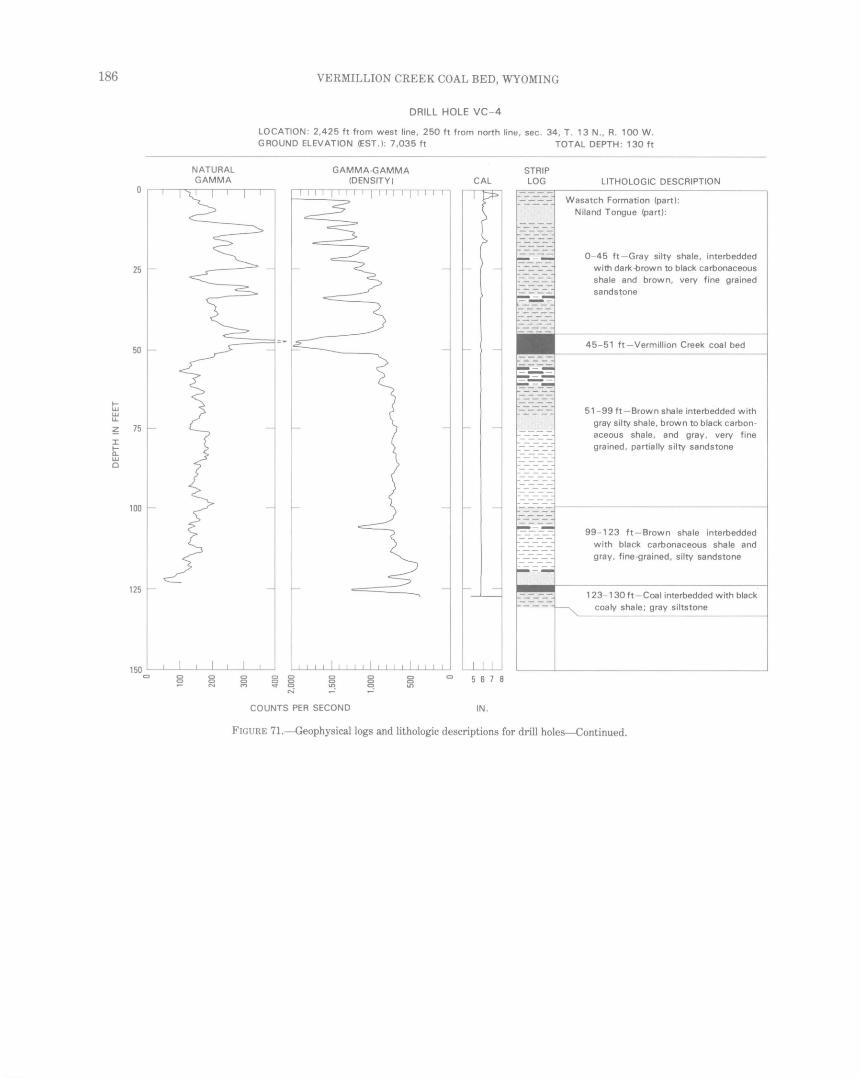
186
tw w u..
25
50
~ 75 :::r: f-a.. w 0
100
125
NATURAL GAMMA
VERMILLION CREEK COAL BED, WYOMING
DRILL HOLE VC-4
LOCATION: 2,425 ft from west line, 250ft from north lintl, sec . 34, T. 13 N., R. 100 W. GROUND ELEVATION (EST . ): 7,035 ft TOTAL DEPTH: 130ft
GAMMA-GAMMA (DENSITY) CAL
STRIP LOG LITHOLOGIC DESCRIPTION
Wasatch Formation (part): Niland Tongue (part):
0-45 ft-Gray silty shale, interbedded with dark-brown to black carbonaceous shale and brown, very fine grained sands~one
45- 51 ft-Vermillion Creek coal bed
51 - 99ft - Brown shale interbedded with gray silty shale, brown to black carbonaceous shale, and gray, very fine grained, partially silty sandstone
99- 123 ft-Brown shale interbedded with black carbonaceous shale and gray, fine-grained, silty sandstone
123- 130 ft-Coal interbedded with black coaly shale; gray siltstone
150 '---'---'---'-----'--'---'------'-----' 0 g ~ g ~ g
c-i
COUNTS PER SECOND
0 0 q
5 6 7 8
IN.
FIGURE 71.-Geophysicallogs and lithologic descriptions for drill holes-Continued.

1-w w u.
~ I 1-a.. w 0
25
50
75
100
125
NATURAL GAMMA
RESULTS OF EXPLORATORY DRILLING (HILDEBRAND)
DRILL HOLE VC - 5
LOCATION: 1,550 ft from east line, 1,675 ft from south line, sec. 34, T . 13 N., R. 100 W . GROUND ELEVATION (EST . ): 7 ,050 ft TOTAL DEPTH : 130ft
GAMMA-GAMMA (DENSITY)
COUNTS PER SECOND
CAL
IN.
STRIP LOG
~-~
------~
-_-_-_-
-----_-_-_-_-_-
-_-_-_-:,
r-_-_-_-_ r----~---_;;
r-=-=-=-= ~=======
LITHOLOGIC DESCRIPTION
Green River Formation (part): Tipton Shale Member (part):
0 23ft Dark-brown, flaky , fossiliferous
oil shale
Wasatch Formation (part) : Niland Tongue (part) :
23- 60 ft - Gray shale interbedded with dark-brown to black carbonaceous shale
60 - 95 ft - Gray, very fine grained sand stone interbedded with gray, partially silty shale and brown to black carbon aceous shale
95 105 ft Vermillion Creek coal bed ; gray shale parting
105- 130 ft - Light - to dark -gray shale interbedded with black carbonaceous shale , brown silty shale, and gray, very fine grained sandstone
FIGURE 71.-Geophysicallogs and lithologic descriptions for drill holes-Continued.
187

188
1-w w u.
25
50
~ 75 ::t: h:: w 0
100
125
NATURAL GAMMA
0 0
0 0 N
VERMILLION CREEK COAL BED, WYOMING
DRILL HOLE VC - 6
LOCATION: 950ft from west line, 750ft from south line, sec. 29, T. 13 N., A. 100 W . GROUND ELEVATION (EST.): 7,025 ft TOTAL DEPTH : 135ft
GAMMA-GAMMA (DENSITY)
0 0 0 ....;
COUNTS PER SECOND
0 0 s
CAL
~ 5 6 7 8
IN .
STRIP LOG LITHOLOGIC DESCRIPTION
Wasatch Formation (part): Niland Tongue (part):
0 - 21 ft - Brown, partially silty shale
21 - 31 ft - Vermillion Creek coal bed; black carbonaceous shale
31 - 84 ft - Brown, partially silty shale interbedded with gray, very fine grained, calcareous sandstone and brown to black carbonaceous shale
84- 103 ft -Gray, very fine grained, soft, argillaceous sandstone; gray sandy siltstone
103- 108 ft-Coal and interbedded black coaly shale
108- 135 ft - Gray, fine-grained calcareous sandstone interbedded with brown to black, partially silty, carbonaceous shale
FIGURE 71.-Geophysicallogs and lithologic descriptions for drill holes-Continued.
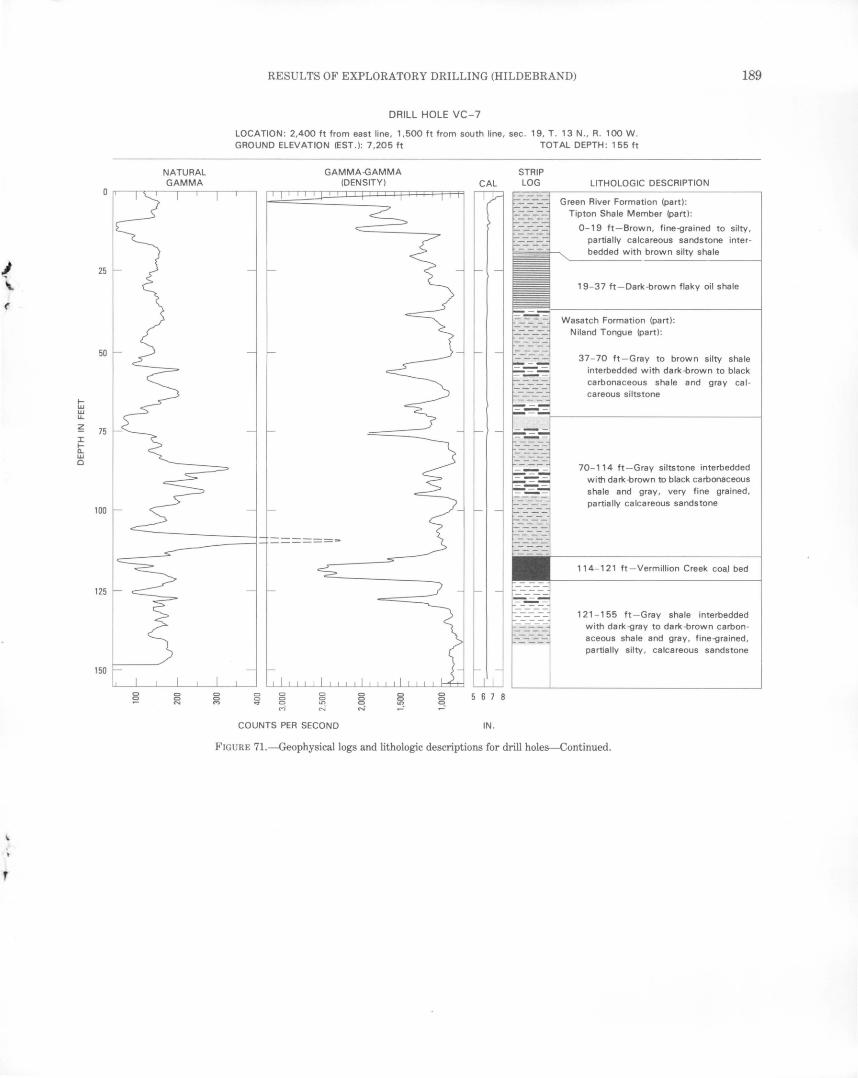
)
(
r
1-w w u..
~ I 1-a.. w 0
25
50
75
100
125
150
0 0
NATURAL GAMMA
0 g
RESULTS OF EXPLORATORY DRILLING (HILDEBRAND) 189
DRILL HOLE VC- 7
LOCATION: 2,400 ft from east line , 1,500 ft from south line, sec . 19, T. 13 N., R. 100 W. GROUND ELEVATION (EST . ): 7,205 ft TOTAL DEPTH: 155ft
0 0 0 c->
GAMMA-GAMMA (DENSITY)
0 g <'i
COUNTS PER SECOND
0 0 q
CAL
6 7
IN.
STRIP LOG LITHOLOGIC DESCRIPTION
Green River Formation (part): Tipton Shale Member (part):
0 - 19 ft-Brown, fine-grained to silty, partially calcareous sandstone interbedded with brown silty shale
19- 37 ft-Dark-brown flaky oil shale
Wasatch Formation (part): Niland Tongue (part):
37- 70 ft-Gray to brown silty shale interbedded with dark-brown to black carbonaceous shale and gray cal careous siltstone
70- 1 14 ft - Gray siltstone interbedded with dark-brown to black carbonaceous shale and gray , very fine grained, partially calcareous sandstone
114- 121 ft-Vermillion Creek coal bed
121 - 155 ft - Gray shale interbedded with dark-gray to dark-brown carbonaceous shale and gray, fine-grained, partially silty, calcareous sandstone
FIGURE 71.-Geophysicallogs and lithologic descriptions for drill holes-Continued.
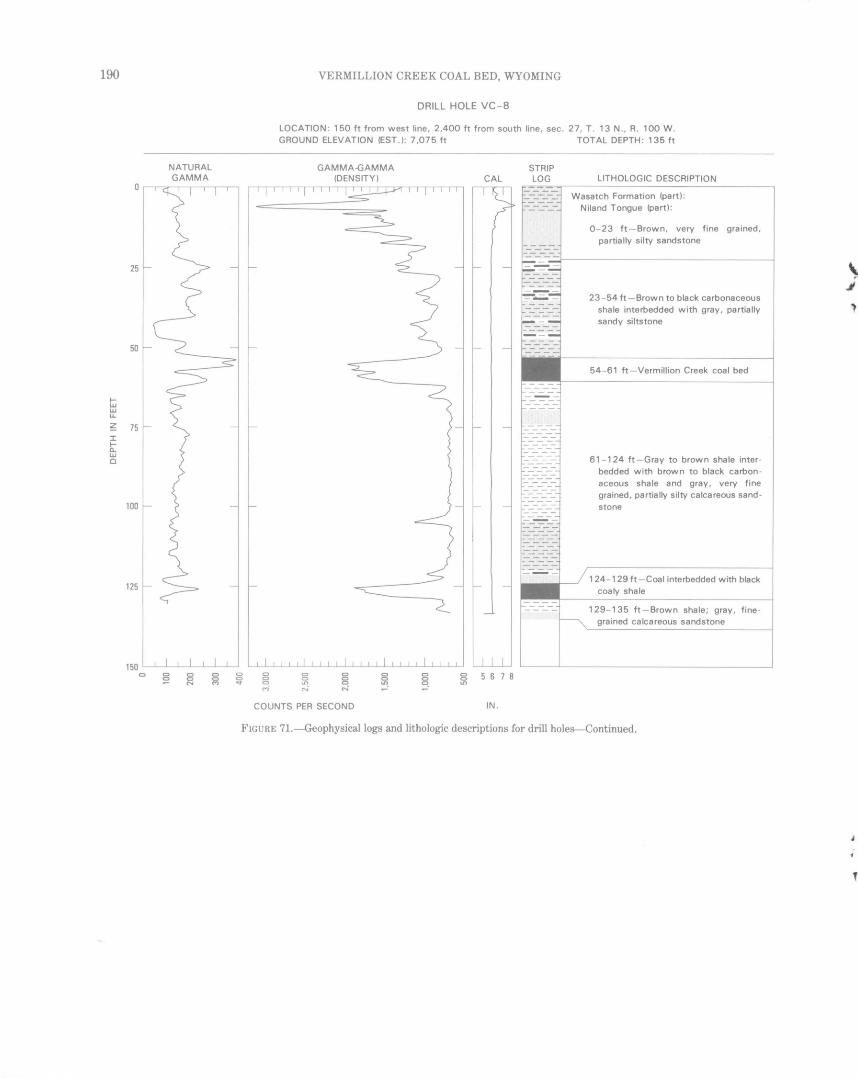
190
..... w w u..
25
50
~ 75 I
b:
NATURAL GAMMA
VERMILLION CREEK COAL BED, WYOMING
DRILL HOLE VC - 8
LOCATION: 150ft from west line, 2,400 ft from south line, sec. 27, T . 13 N., R. 100 W. GROUND ELEVATION (EST . ): 7,075 ft TOTAL DEPTH: 135ft
GAMMA-GAMMA (DENSITY) CAL
STRIP LOG LITHOLOGIC DESCRIPTION
Wasatch Formation (part): Niland Tongue (part):
0 - 23 ft-Brown, very fine grained, partially silty sandstone
23 - 54 ft -Brown to black carbonaceous shale interbedded with gray, partially sandy siltstone
54- 61 tt - Vermillion Creek coal bed
~ 61 - 124 ft -Gray to brown shale inter-
100
125
150 0 0 0
~ ~ 0 (")
0 0 0 0 0 0 0 0 '<!' 0 LC'> 0
<"'i N N
COUNTS PER SECOND
0 0 0
~ ~ ~ 5 6 7 8
IN.
bedded with brown to black carbonaceous shale and gray, very fine grained, partially silty calcareous sand stone
124- 129 tt - Coal interbedded with black coaly shale
129-135 ft - Brown shale; gray, tinegrained calcareous sandstone
FIGURE 71.-Geophysicallogs and lithologic descriptions for drill holes-Continued.
-~ r· I
I ~
Coal Resources By MARGARET S. ELLIS
GEOLOGICAL INVESTIGATIONS OF THE VERMILLION CREEK COAL BED IN THE EOCENE NILAND TONGUE OF THE WASATCH FORMATION, SWEETWATER COUNTY, WYOMING
U.S. GEOLOGICAL SURVEY PROFESSIONAL PAPER 1314-L
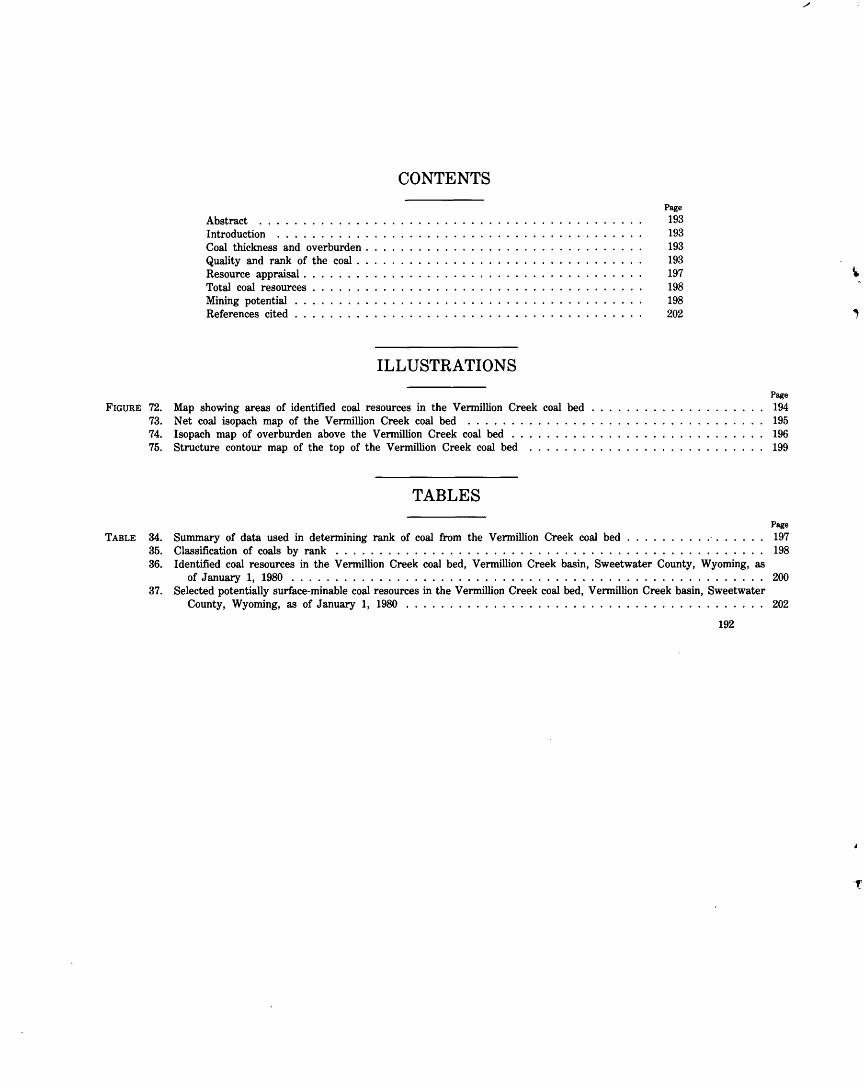
Abstract ............ . Introduction . . . . . . . . . . . Coal thickness and overburden . Quality and rank of the coal . Resource appraisal . . Total coal resources . Mining potential References cited . . .
CONTENTS
ILLUSTRATIONS
FIGURE 72. Map showing areas of identified coal resources in the V ennillion Creek coal bed 73. Net coal isopach map of the V ennillion Creek coal bed . . . . . . . 74. Isopach map of overburden above the Vennillion Creek coal bed .. 75. Structure contour map of the top of the V ennillion Creek coal bed
TABLES
Page
193 193 193 193 197 198 198 202
Page
194 195 196 199
Page
TABLE 34. Summary of data used in detennining rank of coal from the Vennillion Creek coal bed .......... ·. . . . . . 197 35. Classification of coals by rank . . . . . . . . . . . . . . . . . . . . . . . . . . . . . . . . . . . . . . . . . . . . . . . . . 198 36. Identified coal resources in the Vennillion Creek coal bed, Vennillion Creek basin, Sweetwater County, Wyoming, as
of January 1, 1980 . . . . . . . . . . . . . . . . . . . . . . . . . . . . . . . . . . . . . . . . . . . . . . . . . . . . . . 200 37. Selected potentially surface-minable coal resources in the Vennillion Creek coal bed, Vennillion Creek basin, Sweetwater
County, Wyoming, as of January 1, 1980 . . . . . . . . . . . . . . . . . . . . . . . . . . . . . . . . . . . 202
192
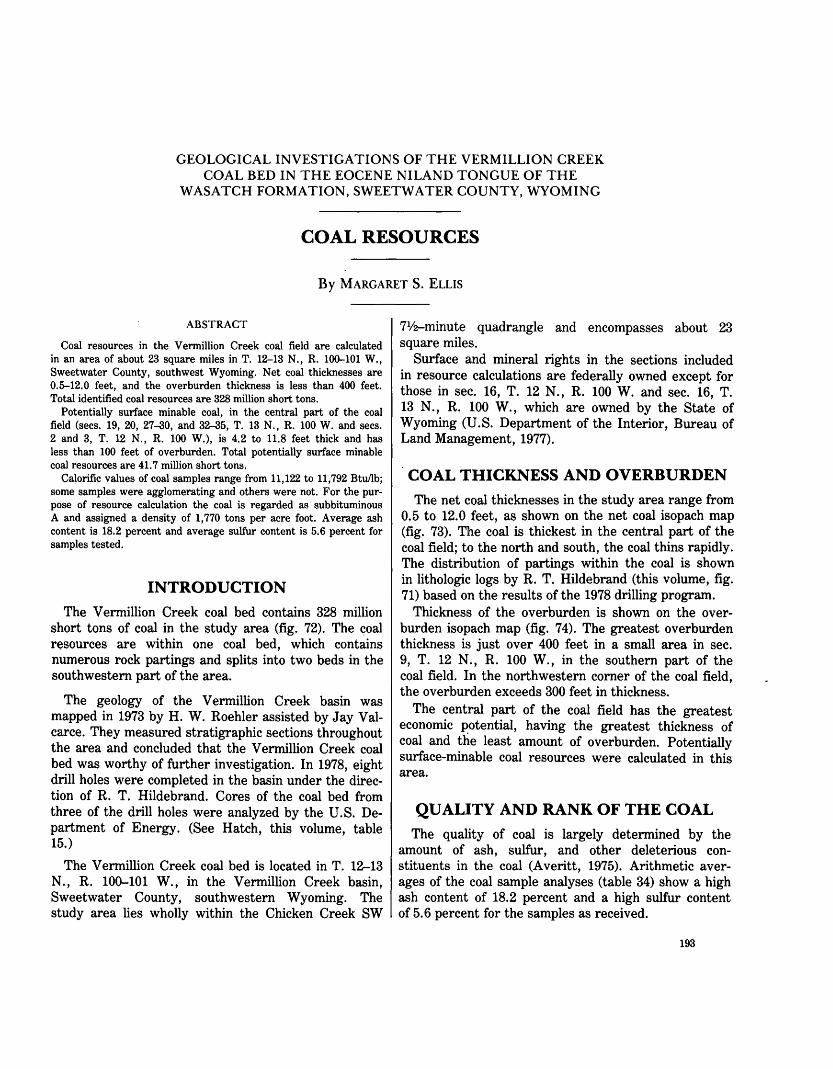
GEOLOGICAL INVESTIGATIONS OF THE VERMILLION CREEK COAL BED IN THE EOCENE NILAND TONGUE OF THE
WASATCH FORMATION, SWEETWATER COUNTY, WYOMING
COAL RESOURCES
By MARGARET S. ELLIS
ABSTRACT
Coal resources in the Vermillion Creek coal field are calculated in an area of about 23 square miles in T. 12-13 N., R. 100-101 W., Sweetwater County, southwest Wyoming. Net coal thicknesses are 0.5-12.0 feet, and the overburden thickness is less than 400 feet. Total identified coal resources are 328 million short tons.
Potentially surface minable coal, in the central part of the coal field (sees. 19, 20, 27--30, and 32-35, T. 13 N., R. 100 W. and sees. 2 and 3, T. 12 N., R. 100 W.), is 4.2 to 11.8 feet thick and has less than 100 feet of overburden. Total potentially surface minable coal resources are 41.7 million short tons.
Calorific values of coal samples range from 11,122 to 11,792 Btullb; some samples were agglomerating and others were not. For the purpose of resource calculation the coal is regarded as subbituminous A and assigned a density of 1,770 tons per acre foot. Average ash content is 18.2 percent and average sulfur content is 5.6 percent for samples tested.
INTRODUCTION
The Vermillion Creek coal bed contains 328 million short tons of coal in the study area (fig. 72). The c;oal r~sources are within one coal bed, which contains numerous rock partings and splits into two beds in the southwestern part of the area.
The geology of the Vermillion Creek basin was mapped in 1973 by H. W. Roehler assisted by Jay Valcarce. They measured stratigraphic sections throughout the area and concluded that the Vermillion Creek coal bed was worthy of further investigation. In 1978, eight drill holes were completed in the basin under the direction of R. T. Hildebrand. Cores of the coal bed from three of the drill holes were analyzed by the U.S. Department of Energy. (See Hatch, this volume, table 15.)
The Vermillion Creek coal bed is located in T. 12-13 N., R. 100-101 W., in the Vermillion Creek basin, Sweetwater County, southwestern Wyoming. The study area lies wholly within the Chicken Creek SW
7112-minute quadrangle and encompasses about 23 square miles.
Surface and mineral rights in the sections included in resource calculations are federally owned except for those in sec. 16, T. 12 N., R. 100 W. and sec. 16, T. 13 N., R. 100 W., which are owned by the State of Wyoming (U.S. Department of the Interior, Bureau of Land Management, 1977).
COAL THICKNESS AND OVERBURDEN
The net coal thicknesses in the study area range from 0.5 to 12.0 feet, as shown on the net coal isopach map (fig. 73). The coal is thickest in the central part of the coal field; to the north and south, the coal thins rapidly. The distribution of partings within the coal is shown in lithologic logs by R. T. Hildebrand (this volume, fig. 71) based on the results of the 1978 drilling program.
Thickness of the overburden is shown on the overburden isopach map (fig. 74). The greatest overburden thickness is just over 400 feet in a small area in sec. 9, T. 12 N., R. 100 W., in the southern part of the coal field. In the northwestern corner of the coal field, the overburden exceeds 300 feet in thickness.
The central part of the coal field has the greatest economic potential, having the greatest thickness of coal and the least amount of overburden. Potentially surface-minable coal resources were calculated in this area.
QUALITY AND RANK OF THE COAL
The quality of coal is largely determined by the amount of ash, sulfur, and other deleterious constituents in the coal (Averitt, 1975). Arithmetic averages of the coal sample analyses (table 34) show a high ash content of 18.2 percent and a high sulfur content of 5.6 percent for the samples as received.
193
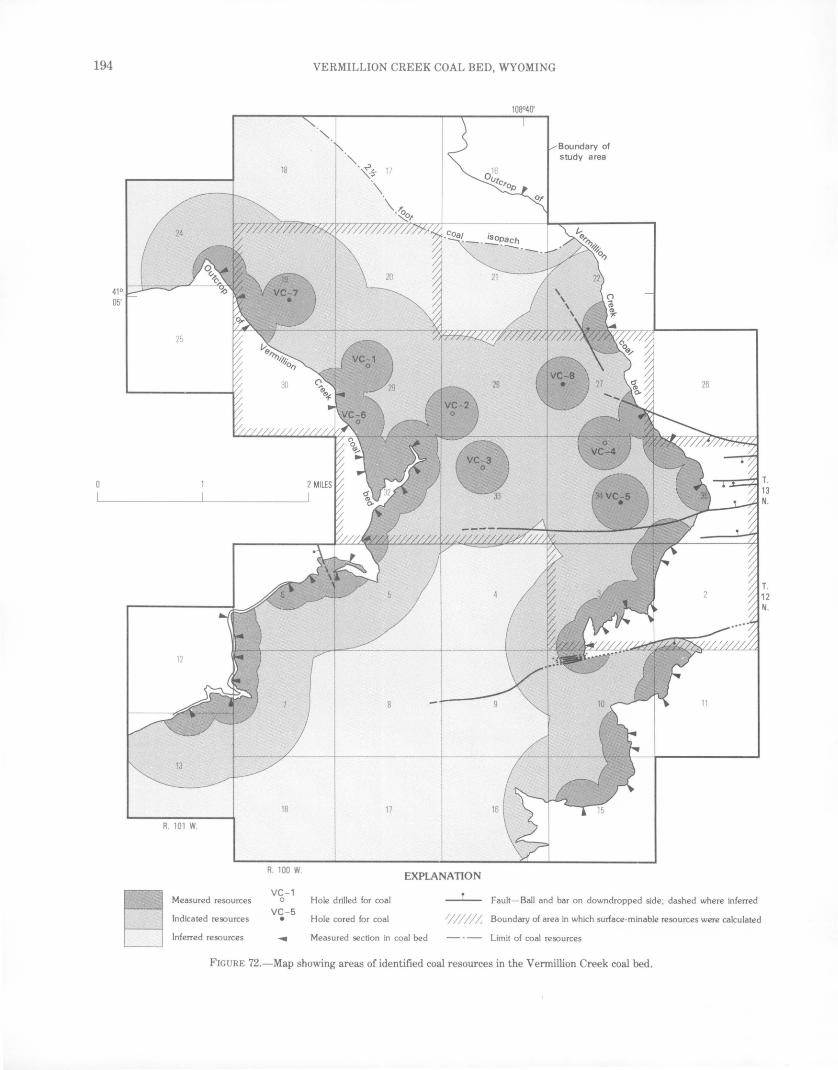
194
41° 05'
Measured resources
Indicated resources
Inferred resources
R. 100 W.
VC - 1 0
VC-5 •
VERMILLION CREEK COAL BED, WYOMING
EXPLANATION
Hole drilled for coal
Hole cored for coal
Measured section in coal bed
_.r__ Fault-Ball and bar on downdropped side; dashed where inferred
1 I I I I I/, Boundary of area in which surface-minable resources were calculated
Limit of coal resources
FIGURE 72.-Map showing areas of identified coal resources in the Vennillion Creek coal bed.

I
I p
(
9.0 3.0
COAL RESOURCES (ELLIS)
R. 100 W. EXPLANATION
Net coal isopach line-Hachures on side where coal thins. Contour interval 1 foot
Fault-Ball and bar on downdropped side; dashed where inferred
Measured thicknesses-Plus signs show where data were incomplete Thickness of net coal in feet
Thickness of rock in partings in feet
VC-1 0
VC-5 •
.....
FIGURE 73.-Net coal isopach map of the Vermillion Creek coal bed.
195
Hole drilled for coal
Hole cored for coal
Limit of resources
Measured section of coal bed
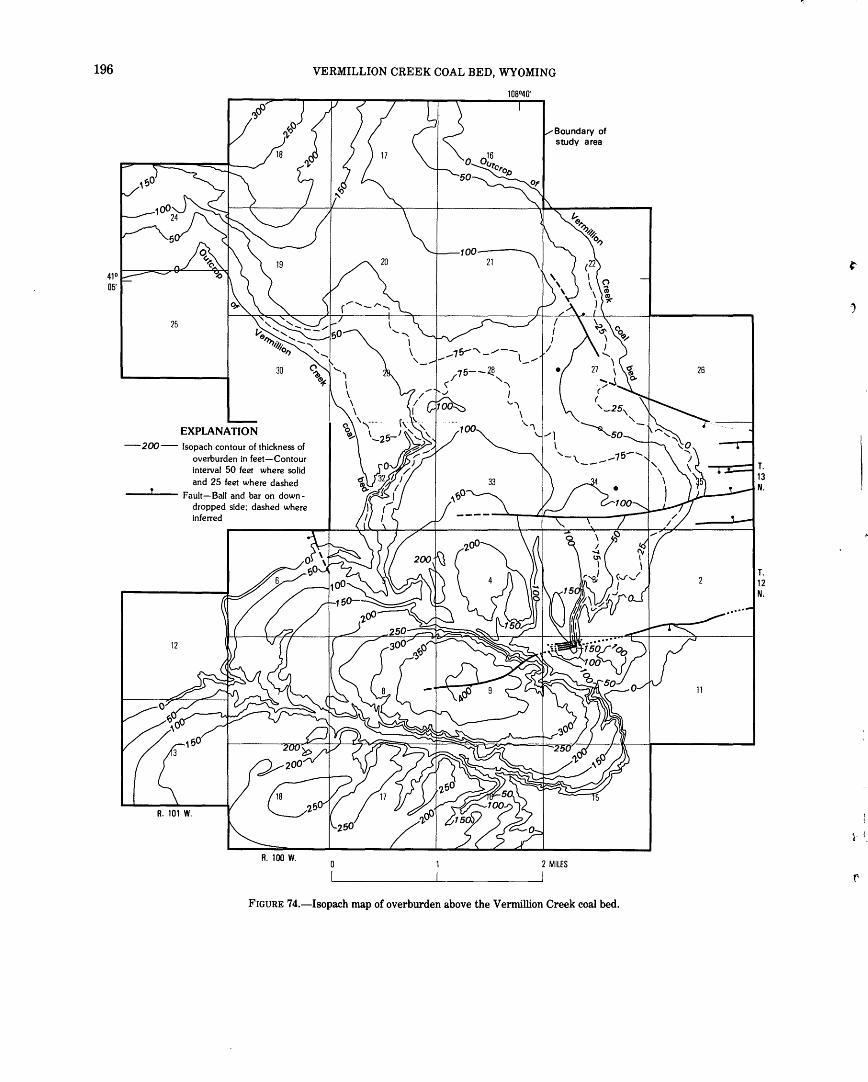
196
25
30
EXPLANATION
-200- Isopach contour of thickness of overburden in feet-Contour interval 50 feet where solid and 25 feet where dashed
--L...-- Fault-Ball and bar on downdropped side; dashed where inferred
12
R. 100 W.
VERMILLION CREEK COAL BED, WYOMING
2 MILES
FIGURE 74.-Isopach map of overburden above the Vermillion Creek coal bed.
26
11
T. 12 N.
~- t
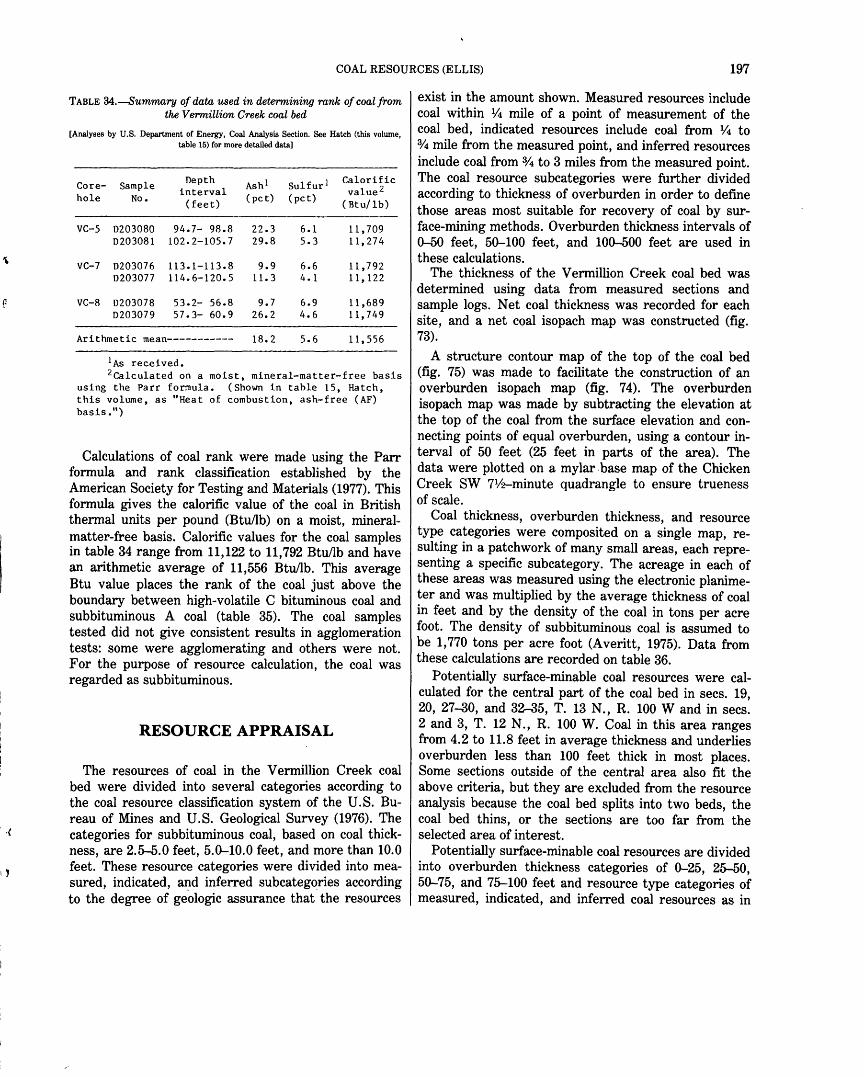
r-
I )
COAL RESOURCES (ELLIS) 197
TABLE 34.-Summary of data used in determining rank of coal from the Vermillion Creek coal bed
[Analyses by U.S. Department of Energy, Coal Analysis Section. See Hatch (this volume, table 15) for more detailed data]
Core- Sample Depth Ash 1 Sulfur 1 Calorific interval value 2
hole No. (feet) (pet) (pet) ( Rtu/ lb)
vc-5 0203080 94.7- 98.8 22.3 6.1 11,709 0203081 102.2-105.7 29.8 5.3 11,274
VC-7 0203076 113.1-113.8 9.9 6.6 11,792 0203077 114 • 6- 1 2 0 • 5 11.3 4.1 11, 122
VC-8 0203078 53.2- ·56.8 9.7 6.9 11,689 0203079 57.3- 60.9 26.2 4.6 11,749
Arithmetic mean----------- 18.2 5.6 11,556
1As received. 2Calculated on a moist, mineral-matter-free basis
using the Parr formula. (Shown in table 15, Hatch, this volume, as "Heat of combustion, ash-free (AF) basis.")
Calculations of coal rank were made using the Parr formula and rank classification established by the American Society for Testing and Materials (1977). This formula gives the calorific value of the coal in British thermal units per pound (Btullb) on a moist, mineralmatter-free basis. Calorific values for the coal samples in table 34 range from 11,122 to 11,792 Btullb and have an arithmetic average of 11,556 Btu/lb. This average Btu value places the rank of the coal just above the boundary between high-volatile C bituminous coal and subbituminous A coal (table 35). The coal samples tested did not give consistent results in agglomeration tests: some were agglomerating and others were not. For the purpose of resource calculation, the coal was regarded as subbituminous.
RESOURCE APPRAISAL
The resources of coal in the Vermillion Creek coal bed were divided into several categories according to the coal resource classification system of the U.S. Bureau of Mines and U.S. Geological Survey (1976). The categories for subbituminous coal, based on coal thickness, are 2.5-5.0 feet, 5.0--10.0 feet, and more than 10.0 feet. These resource categories were divided into measured, indicated, a:r:td inferred subcategories according to the degree of geologic assurance that the resources
exist in the amount shown. Measured resources include coal within 1f4 mile of a point of measurement of the coal bed, indicated resources include coal from 114 to % mile from the measured point, and inferred resources include coal from 3/4 to 3 miles from the measured point. The coal resource subcategories were further divided according to thickness of overburden in order to define those areas most suitable for recovery of coal by surface-mining methods. Overburden thickness intervals of 0--50 feet, 50--100 feet, and 100--500 feet are used in these calculations.
The thickness of the Vermillion Creek coal bed was determined using data from measured sections and sample logs. Net coal thickness was recorded for each site, and a net coal isopach map was constructed (fig. 73).
A structure contour map of the top of the coal bed (fig. 75) was made to facilitate the construction of an overburden isopach map (fig. 74). The overburden isopach map was made by subtracting the elevation at the top of the coal from the surface elevation and connecting points of equal overburden, using a contour interval of 50 feet (25 feet in parts of the area). The data were plotted on a mylar. base map of the Chicken Creek SW 71/2-minute quadrangle to ensure trueness of scale.
Coal thickness, overburden thickness, and resource type categories were composited on a single map, resulting in a patchwork of many small areas, each representing a specific subcategory. The acreage in each of these areas was measured using the electronic planimeter and was multiplied by the average thickness of coal in feet and by the density of the coal in tons per acre foot. The density of subbituminous coal is assumed to be 1, 770 tons per acre foot (Averitt, 1975). Data from these calculations are recorded on table 36.
Potentially surface-minable coal resources were calculated for the central part of the coal bed in sees. 19, 20, 27--30, and 32--35, T. 13 N., R. 100 Wand in sees. 2 and 3, T. 12 N., R. 100 W. Coal in this area ranges from 4.2 to 11.8 feet in average thickness and underlies overburden less than 100 feet thick in most places. Some sections outside of the central area also fit the above criteria, but they are excluded from the resource analysis because the coal bed splits into two beds, the coal bed thins, or the sections are too far from the selected area of interest.
Potentially surface-minable coal resources are divided into overburden thickness categories of 0--25, 25-50, 50--75, and 75--100 feet and resource type categories of measured, indicated, and inferred coal resources as in

198 VERMILLION CREEK COAL BED, WYOMING
TABLE 35.-Classification of coals by rank
[American Society for Testing and Materials Standard D38S-77. This classification does not include a few coals, principally nonbanded varieties, that have unusual physical and chemical properties and that have either fixed carbon or calorific values within the limits of the subbituminous or high-value bituminous ranks; all of these have either <48 percent fixed carbon or >15,500 Btu/lb. Leaders(-) indicate category is not used in determining rank of group]
Coal class and group
I. Anthracitic: 1. Meta-anthracite-----------2. Anthracite----------------3. Semianthracite3-----------
II. Bituminous: 1. Low-volatile bituminous---2. Medium-volatile bituminous 3. High-volatile A bituminous 4. High-volatile B bituminous 5. High-volatile C bituminous
III. Subbituminous: 1. Subbituminous A-----------2. Subbituminous B-----------3. Subbituminous C-----------
IV. Lignitic: 1. Lignite A-----------------2. Lignite B-----------------
1Dry, mineral-matter-free basis.
Fixed carbon
limits, 1 percent (2_- <)
)98 92-98 86-92
78-86 69-78
<69
Volatile matter
limits, 1 percent () - ~)
(2 2- 8 8-14
14-22 22-31 )31
Calorific value
limits, 2 Btu/lb (2_- <)
5 )14,000 5 13,000-14,000
11' 500-13,000 10' 500-11 '500
10,500-11' 500 9,500-10,500 8,300- 9,500
6,300- 8,300 <6,300
Agglomerating character
Nonagglomerating. Do. Do.
Commonly agglomerating. 4
Do. 4
Do. 4
Do. 4
Do. 4
Agglomerating.
Nonagglomerating Do. Do.
Do. Do.
2Moist, mineral-matter-free basis. ("Moist" coal retains its natural inherent moisture but has no visible water on its surface.)
3If agglomerating, classify in low-volatile group of the bituminous class. 4These groups may contain nonagglomerating varieties, though these are especially rare in the
high-volatile C group. 5Coals having fixed carbon )69 percent are classified according to fixed carbon, regardless of
calorific value.
previous resource calculations. Resource calculations were made on the electronic planimeter as described above. Data from these calculations are recorded in table 37.
TOTAL COAL RESOURCES
Total coal resources for the area measured are 328 million short tons. The reserve base includes coal resources for which the coal is greater than or equal to 5 feet in thickness. The Vermillion Creek coal bed has a reserve base of 194 million short tons. Coal resources for areas where the coal exceeds 10 feet in thickness are 8.27 million short tons, of which 3.05 million short tons are overlain by less than 50 feet of overburden. Potentially surface-minable coal resources total 41.7 million short tons. Of this total, 3.30 million short tons of coal are overlain by less than 50 feet of overburden.
MINING POTENTIAL
Surface mining is most applicable to the Vermillion Creek coal field because the overburden is thin and the rocks in the overburden are incompetent and easily removed. Selective mining techniques are recommended because of the large number of partings within the coal.
Underground mining may present considerable problems. The overburden is thin and the roof rock is primarily oil shales, carbonaceous shales, and mudstones. These rock types are considered incompetent roof materials and are prone to collapse.
Mining considerations include the proximity of the coal field to a source of water and transportation. The Vermillion Creek coal field is located in an arid region about 20 miles northeast of the nearest adequate water source, which is the Green River in Browns Park. The area is also about 35 miles south of the nearest point of the Union Pacific Railroad, 8 miles southwest of Bitter Creek, Wyo.
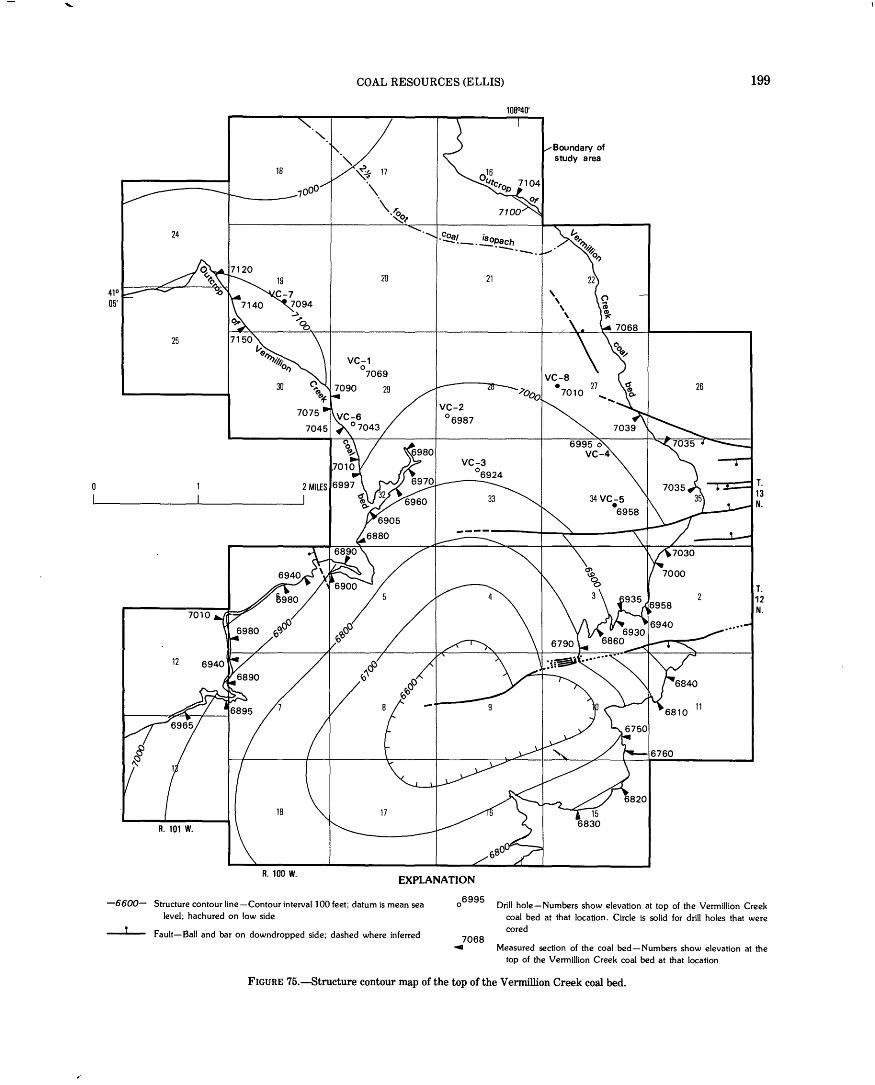
41° 05'
24
25
12
18
30
R. 100 W.
COAL RESOURCES (ELLIS)
20 21
EXPLANATION
26
199
T. 12 N.
-6600- Structure contour line-Contour intervallOO feet; datum is mean sea level; hachured on low side
o6995
Drill hole-Numbers show elevation at top of the Vermillion Creek coal bed at that location. Circle is solid for drill holes that were cored
Fault-Ball and bar on downdropped side; dashed where inferred 7068 ..... Measured section of the coal bed-Numbers show elevation at the top of the Vermillion Creek coal bed at that location
FIGURE 75.-Structure contour map of the top of the Vermillion Creek coal bed.
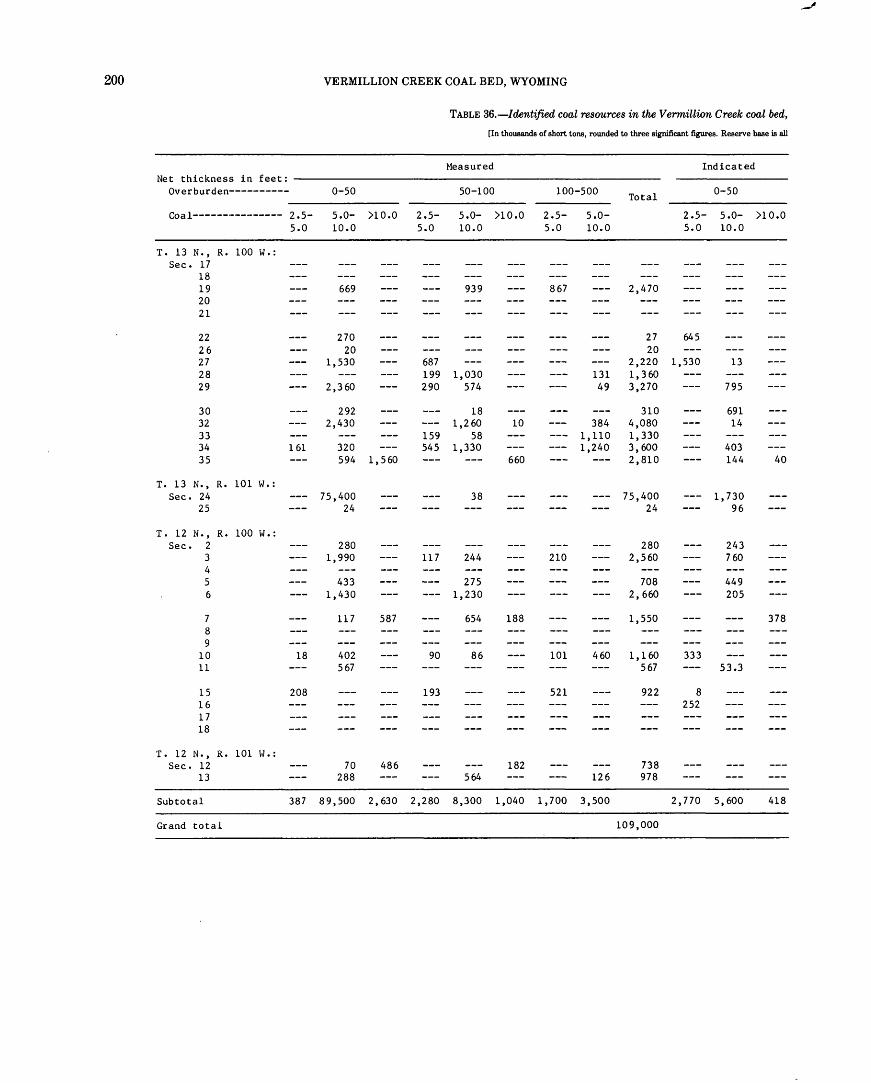
200 VERMILLION CREEK COAL BED, WYOMING
TABLE 36.-ldentified coal resources in the Vermillion Creek coal bed,
[In thousands of short tons, rounded to three significant figures. Reserve base is all
Measured Indicated Net thickness in feet:
Overburden---------- 0-50 50-100 100-500 Total 0-50
Coal--------------- 2.5- 5.0- )10.0 2.5- 5.0- )10.0 2.5- 5.0- 2.5- 5.0- )10.0 5.0 10.0 5.0 10.0 5.0 10.0 5.0 10.0
T. 13 N., R. 100 W.: Sec. 17
18 19 669 939 867 2,470 20 21
22 270 27 645 26 20 20 27 1,530 687 2,220 1,530 13 28 199 1,030 131 1,360 29 2,360 290 574 49 3,270 795
30 292 18 310 691 32 2,430 1,260 10 384 4,080 14 33 159 58 1,110 1,330 34 161 320 545 1,330 1,240 3, 600 403 35 594 1, 560 660 2,810 144 40
r. 13 N., R. 101 w.: Sec. 24 75,400 38 75,400 1,730
25 24 24 96
T. 12 N.' R. 100 W.: Sec. 2 280 280 243
3 1,990 117 244 210 2,560 760 4 5 433 275 708 449 6 1,430 1,230 2, 660 205
7 117 587 654 188 1,550 378 8 9
10 18 402 90 86 101 460 1,160 333 11 567 567 53.3
15 208 193 521 922 8 16 252 17 18
T. 12 N.' R. 101 W.: Sec. 12 70 486 182 738
13 288 564 126 978
Subtotal 387 89,500 2, 630 2,280 8,300 1,040 1,700 3,500 2,770 5,600 418
Grand total 109,000
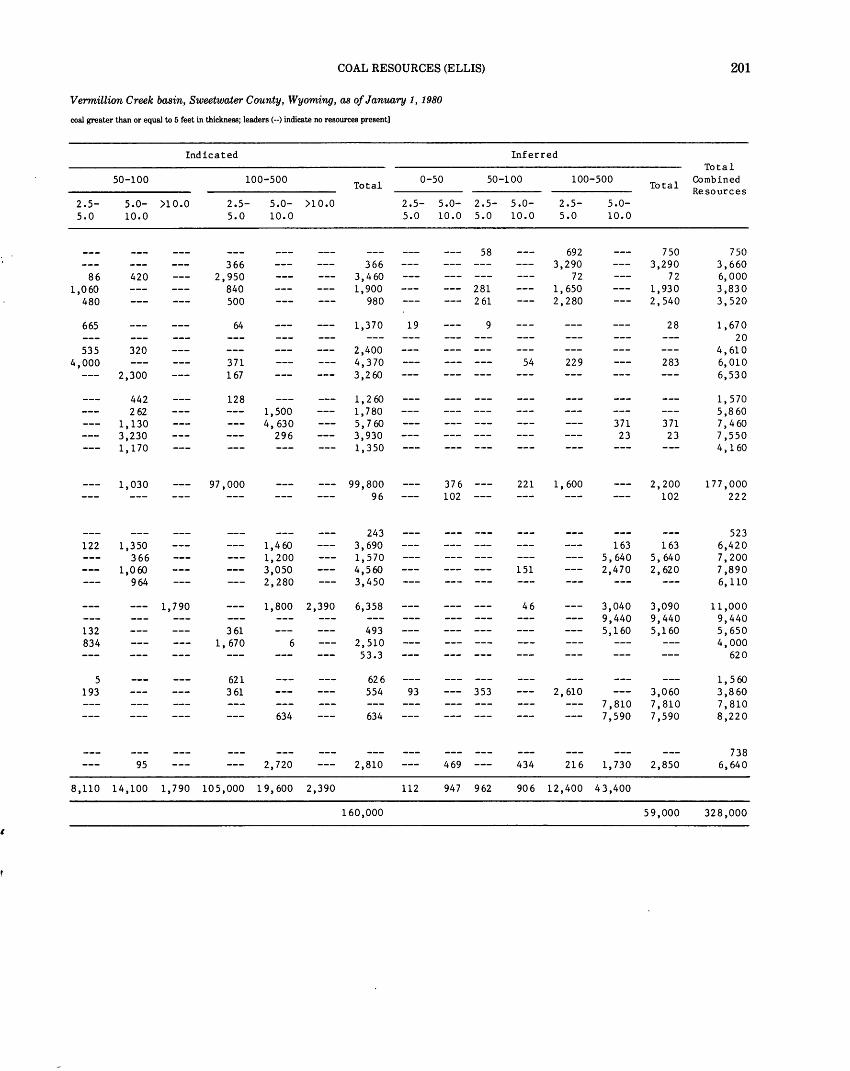
COAL RESOURCES (ELLIS) 201
Vermillion Creek basin, Sweetwater County, Wyoming, as of January 1, 1980
coal greater than or equal to 5 feet in thickness; leaders(--) indicate no resources present]
Indicated Inferred Total
50-100 100-500 Total
0-50 50-100 100-500 Total
Combined Resources
2.5- 5.o- )10.0 2.5- 5.o- )10.0 2.5- 5.o- 2.5- 5.0- 2.5- 5.o-5.0 10.0 5.0 10.0 5.0 10.0 5.0 10.0 5.0 10.0
58 692 750 750 366 366 3,290 3,290 3,660
86 420 2,950 3,460 72 72 6,000 1,060 840 1,900 281 1,650 1, 930 3,830
480 500 980 2 61 2,280 2,540 3,520
665 64 1,370 19 9 28 1,670 20
535 320 2,400 4, 610 4,000 371 4,370 54 229 283 6, 010
2,300 167 3,260 6,530
442 128 1,260 1,570 2 62 1,500 1,780 5,860
1,130 4, 630 5, 7 60 371 371 7, 460 3,230 296 3,930 23 23 7,550 1,170 1,350 4,160
1,030 97,000 99,800 376 221 1, 600 2,200 177,000 96 102 102 222
243 523 122 1,350 1,460 3, 690 163 163 6,420
366 1,200 1,570 5, 640 5, 640 7,200 1,060 3,050 4,560 151 2,470 2, 620 7,890
964 2,280 3,450 6, llO
1, 790 1,800 2,390 6,358 46 3,040 3,090 11,000 9,440 9,440 9,440
132 3 61 493 5,160 5,160 5,650 834 1, 670 6 2,510 4,000
53.3 620
5 621 626 1, 560 193 3 61 554 93 353 2, 610 3,060 3,860
7,810 7,810 7,810 634 634 7,590 7,590 8,220
738 95 2,720 2,810 469 434 216 1,730 2,850 6,640
8,110 14,100 1,790 105,000 19,600 2,390 112 947 962 906 12,400 43,400
160,000 59,000 328,000
l
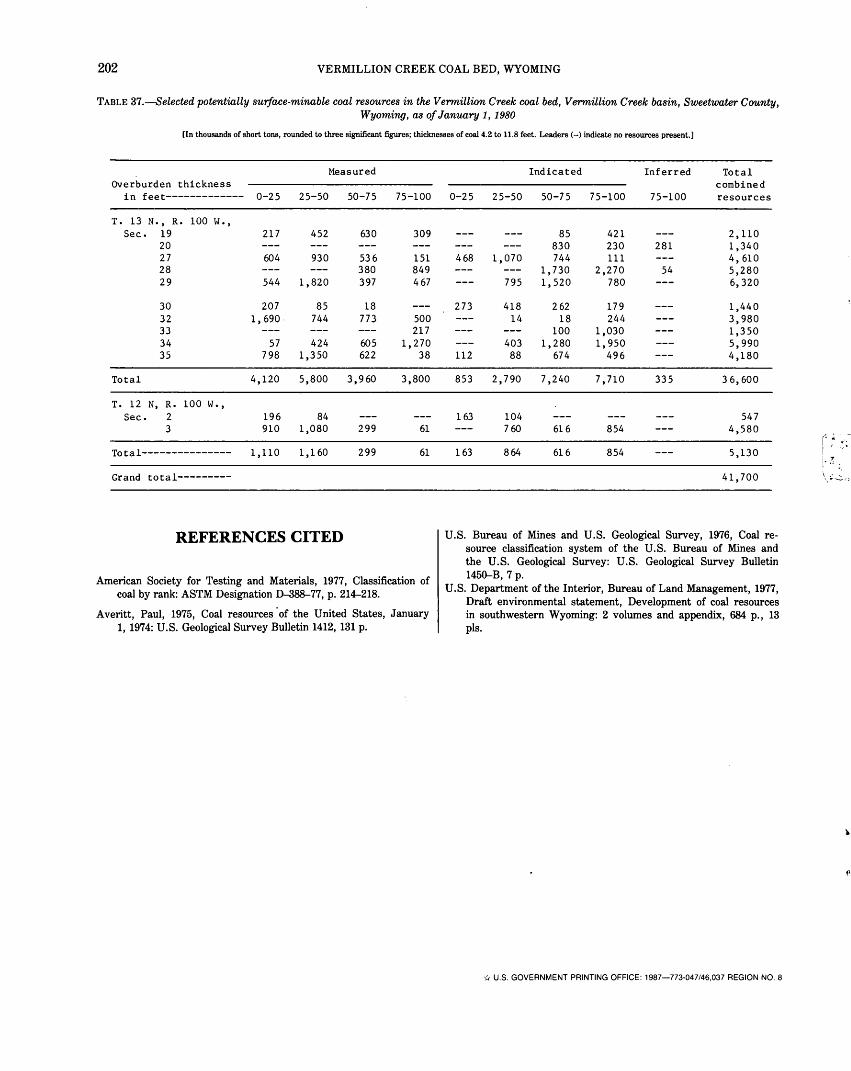
REFERENCES CITED
American Society for Testing and Materials, 1977, Classification of coal by rank: ASTM Designation D--388--77, p. 214-218.
Averitt, Paul, 1975, Coal resources ·of the United States, January 1, 1974: U.S. Geological Survey Bulletin 1412, 131 p.
U.S. Bureau of Mines and U.S. Geological Survey, 1976, Coal resource classification system of the U.S. Bureau of Mines and the U.S. Geological Survey: U.S. Geological Survey Bulletin 1450-B, 7 p.
U.S. Department of the Interior, Bureau of Land Management, 1977, Draft environmental statement, Development of coal resources in southwestern Wyoming: 2 volumes and appendix, 684 p., 13 pls.
u U.S. GOVERNMENT PRINTING OFFICE: 1987-773·047/46,037 REGION NO.8
Related Documents