(This is a sample cover image for this issue. The actual cover is not yet available at this time.) This article appeared in a journal published by Elsevier. The attached copy is furnished to the author for internal non-commercial research and education use, including for instruction at the authors institution and sharing with colleagues. Other uses, including reproduction and distribution, or selling or licensing copies, or posting to personal, institutional or third party websites are prohibited. In most cases authors are permitted to post their version of the article (e.g. in Word or Tex form) to their personal website or institutional repository. Authors requiring further information regarding Elsevier’s archiving and manuscript policies are encouraged to visit: http://www.elsevier.com/copyright

Welcome message from author
This document is posted to help you gain knowledge. Please leave a comment to let me know what you think about it! Share it to your friends and learn new things together.
Transcript

(This is a sample cover image for this issue. The actual cover is not yet available at this time.)
This article appeared in a journal published by Elsevier. The attachedcopy is furnished to the author for internal non-commercial researchand education use, including for instruction at the authors institution
and sharing with colleagues.
Other uses, including reproduction and distribution, or selling orlicensing copies, or posting to personal, institutional or third party
websites are prohibited.
In most cases authors are permitted to post their version of thearticle (e.g. in Word or Tex form) to their personal website orinstitutional repository. Authors requiring further information
regarding Elsevier’s archiving and manuscript policies areencouraged to visit:
http://www.elsevier.com/copyright

Author's personal copy
International Journal of Applied Earth Observation and Geoinformation 14 (2011) 22–32
Contents lists available at SciVerse ScienceDirect
International Journal of Applied Earth Observation andGeoinformation
jo u rn al hom epage: www.elsev ier .com/ locate / jag
Hyperspectral remote sensing of evaporate minerals and associated sedimentsin Lake Magadi area, Kenya
Gayantha R.L. Kodikaraa,∗, Tsehaie Woldaib, Frank J.A. van Ruitenbeekb, Zack Kuriac,Freek van der Meerb, Keith D. Shepherdd, G.J. van Hummele
a Department of Oceanography and Marine Geology, Faculty of Fisheries & Marine Science and Technology, University of Ruhuna, Sri Lankab University of Twente, Faculty of Geo-information Science and Earth Observation (ITC), Hengelosesestraat 99, P.O. Box 6, 7500AA Enschede, The Netherlandsc Department of Geology, University of Nairobi, Nairobi, Kenyad World Agroforestry Centre (ICRAF), P.O. Box 30677-00100, Nairobi, Kenyae Institute for Nanotechnology (MESA+), University of Twente, The Netherlands
a r t i c l e i n f o
Article history:Received 1 September 2010Accepted 18 August 2011
Keywords:HyperionLake MagadiMTMFSurface mineral mappingMagadiiteKenyaite
a b s t r a c t
Pleistocene to present evaporitic lacustrine sediments in Lake Magadi, East African Rift Valley, Kenya werestudied and mapped using spectral remote sensing methods. This approach incorporated surface mineralmapping using space-borne hyperspectral Hyperion imagery together with laboratory analysis, includingvisible, near-infrared diffuse reflectance spectroscopy (VNIR) measurements and X-ray diffraction forselected rock and soil samples of the study area. The spectral signatures of Magadiite and Kenyaite,which have not been previously reported, were established and the spectral signatures of trona, chertseries, volcanic tuff and the High Magadi bed were also analyzed.
Image processing techniques, MNF (Minimum Noise Fraction) and MTMF (Mixture Tuned Matched Fil-tering) using a stratified approach (image analysis with and without the lake area), were used to enhancethe mapping of evaporates. High Magadi beds, chert series and volcanic tuff were identified from theHyperion image with an overall mapping accuracy of 84.3%. Even though, the spatial distribution ofevaporites and sediments in Lake Magadi area change in response to climate variations, the mineralogyof this area has not been mapped recently. The results of this study shows the usefulness of the hyper-sspectral remote sensing to map the surface geology of this kind of environment and to locate promisingsites for industrial open-pit trona mining in a qualitative and quantitative manner.
© 2011 Elsevier B.V. All rights reserved.
1. Introduction
Lake Magadi, a dry alkaline saline lake, located in the East AfricanRift Valley in Kenya (Fig. 1A) contains the most concentrated brinesfound in the African Rift Valley (Warren, 2006). It contains a largeamount of trona (Na2CO3·NaHCO3·2H2O), chert (SiO2), Magadi-ite (NaSi7O13(OH)3·3H2O) and Kenyaite (NaSi11O20.5(OH)4·3H2O).Little Magadi, or Lake Nasikie Engeda, lies 1.6 km north of Lake Mag-adi from which it is separated by a narrow horst (Fig. 1C). LittleMagadi is perennially saline, while Lake Magadi is intermittentlydry. Hydrothermal circulation associated with the numerous activealkaline volcanoes and their feeder faults, supply hot alkaline brinesto the many hot springs situated along the edge of the lakes andthis system is responsible for the ongoing geochemical evolutionof the area (Warren, 2006). The Pleistocene and Holocene historyof the Magadi basin sediments and their geochemical evolution isfully described in the work of Baker (1958) and Eugster (1969). The
∗ Corresponding author. Tel.: +94 415674048.E-mail address: gayantha [email protected] (G.R.L. Kodikara).
recent geologic history is better understood by studying the spa-tial distributions of minerals in the area. The interpretation andreconstruction of this geochemical evolution, however, is difficultto establish due to variation in mineralogy (e.g., not easily recogniz-able in the field) and the large spatial extent that limits accessibility(Warren, 2006).
Alternatively, access to relatively inexpensive satellite-bornemulti-spectral and hyper-spectral data have created new opportu-nities for the regional mapping of mineralogy, geological structuresand rock types including alteration products (Hewson et al., 2005;Vaughan et al., 2005). Such datasets provide identification of differ-ent surface expressions and mapping possibilities for minerals inthe hydroxyl, silicate, sulfate, carbonate and iron oxide groups cov-ering large areas and in inaccessible terrains. It has been appliedin efflorescent salt crusts in Death Valley, California using air-borne hyperspectral and space-borne multispectral imagery to mapthe different surface saline materials (Crowley, 1993; Crowley andHook, 1996).
The motivation of this research was to evaluate the identifica-tion and mapping capability of various evaporites and precipitatesin Lake Magadi area using space-borne hyperspectral Hyperion data
0303-2434/$ – see front matter © 2011 Elsevier B.V. All rights reserved.doi:10.1016/j.jag.2011.08.009

Author's personal copy
G.R.L. Kodikara et al. / International Journal of Applied Earth Observation and Geoinformation 14 (2011) 22–32 23
Fig. 1. Location of the Kenya Rift in the East African Rift System (A) and structural sketch of the Kenya rift and location of the Magadi Lake (B) (modified after Turdu et al.(1999)). (C) Geological Map of Lake Magadi (modified after Baker (1958) and Eugster and Jones (1968)).
and their spectral characteristics. In addition to that, the resultantmap will be useful for the mining industry to show areas that arefavourable for the formation of lacustrine mineral deposits and forplanning access for trona mining.
1.1. Geologic setting
Lake Magadi (Fig. 1) is located in the deepest depression of theKenyan Rift in Kenya, surrounded by hills formed by Pleistocenealkali trachyte flows. The valleys of the Lake Magadi and Little Mag-adi Lake are covered by a series of Lake Beds dating from the middlePleistocene to present. They consist of vast deposits of trona, bed-ded cherts and High Magadi beds derived from Magadiite horizons(Fig. 1C).
Mineral precipitation, re-solution, re-precipitation and reac-tions, which are common in this environment, can be understoodbased on the hydrology and aqueous geochemistry of the area.Atmospheric precipitation, overland flow and percolation of watercan react with alkali trachyte terrains and this process can be illus-trated by the reaction of albite feldspar with water and aqueousCO2 (Jones et al., 1977):
NaAlSi3O8(s) + 2H2O(aq) + CO2(aq) = Na+(aq)
+ HCO−3(aq) + 3SiO2(aq) + Ai(OH)3(aq)
After accumulation of these solutes in the lake from rainfall andhydrolysis, the waters are subjected to evaporation, either at thesurface or by capillarity processes. This chemistry is ideal for ongo-ing trona precipitation at higher salinities (Warren, 2006). Trona isthe first Na-carbonate mineral to precipitate in equilibrium withconcentrating lake brines.
3Na+(aq) + HCO3−
(aq) + CO2−3(aq)2H2O → Na2CO3− NaHCO3− 2H2O(s)
(Trona)
The composition of the Magadi-trona is straightfor-ward. It consists of trona crystals (sodium sesquicarbonate –Na2CO3·NaHCO3·2H2O), sodium fluoride (NaF), and rarely smallamounts of common salts (NaCl) (Baker, 1958). These tronadeposits extend for approximately 47 km2 in area with 7–50 mthickness. The Trona is locally known as the “Evaporite Series”which is made up of cm-scale stacked, upward-pointing andgrowth-aligned trona crystals (Warren, 2006).
Precipitation of chert is not straightforward. It can occurthrough two types of hydrous sodium silicate intermediateproducts called Magadiite (NaSi7O13(OH)3·3H2O) and Kenyaite(NaSi11O20.5(OH)4·3H2O). Magadiite occurs in substantial quanti-ties, typically as beds, mounds and nodules. Kenyaite only occurs asnodules in the bedded Magadiite in the High Magadi bed (Warren,

Author's personal copy
24 G.R.L. Kodikara et al. / International Journal of Applied Earth Observation and Geoinformation 14 (2011) 22–32
Fig. 2. Crystallized trona (A001) and its powdered form (B002). One-Euro coin isused for scale.
2006). The precipitation of Magadiite is represented by the follow-ing reaction (Eugster, 1969).
7H4SiO4(aq) + Na+(aq) = NaSi7O13(OH)3.3H2O(s) + 9H2O(aq) + H+
(aq)(Magadiite)
The conversion of Magadiite to chert (SiO2) through dehydrationand sodium loss may involve Kenyaite (NaSi11O20.5(OH)4·3H2O) asan intermediate phase,
22NaSi7O13(OH)3− 3H2O(s)+8H+(aq)
(Magadiite)
→ 14NaSi11O20.5(OH)4− 3H2O(s)+8Na+(aq)
+33H2O(Kenyaite)
NaSi11O20.5(OH)4.3H2O(s) + H+(aq)
(Kenyaite)
→ 11SiO2(s)
(Chert)
+ Na+(aq)
+ 5 1/2H2O
or it may directly produce a silica phase (Eugster, 1969).
NaSi7O13(OH)3.3H2O(s) + H+(aq)
(Magadiite)
→ 7SiO2(s)(chert)
+ Na+(aq) + 5H2O
Outcrops of High Magadi beds are located in the alluvial flats andat the foot of the hills surrounding Lake Magadi. The mineralogy ofHigh Magadi is characterized by detrital silicate, saline minerals,calcite, sodium silicates, including Magadiite, Kenyaite, chert andzeolites (Surdam and Eugster, 1976).
Fig. 3. Surface evaporates at sample location of P018.
Fig. 4. Reflectance spectra of Trona samples. Arrows indicate absorption features oftrona.
1.2. Mapping minerals with hyperspectral remote sensing
Reflectance spectroscopy offers a rapid, inexpensive and non-destructive tool for determining the mineralogy of rock and soilsamples (Gaffey, 1985; Salisbury and D’Aria, 1992; Van der Meer,2001). In the visible and shortwave infra-red wavelength region(0.4–2.5 �m), iron-, hydroxyl-, sulfate-, water and carbonate bear-ing minerals display diagnostics spectral features (Clarck et al.,1990; Van der Meer, 2001). The absorption features (position,shape, depth and width) are controlled by the particulate crystalstructure in which the absorbing species is contained and by thechemical structure of the material (Van der Meer, 2001). There-fore, absorption features are used to identify the type of mineral inreflectance spectroscopy and Imagine spectrometry is used to mapthose minerals (Kruse, 1988).

Author's personal copy
G.R.L. Kodikara et al. / International Journal of Applied Earth Observation and Geoinformation 14 (2011) 22–32 25
Fig. 5. (A) Crystal casts in chert plates from Southern end of Lake Magadi. (B) Laminated green chert from northern part of the Lake Magadi. (C) Pillow chert near to Magaditown. (D) Chert dykes from North-eastern part of Lake Magadi. (E). Green beds from southern part of Lake Magadi. (F). High Magadi Beds from southern part of Lake Magadi.
Imaging spectrometry which is defined as “the simultaneousacquisition of images in many narrow, contiguous spectral bands”(Goetz et al., 1985) allows extraction of a detailed spectrum foreach picture element (pixel) of the image. High spectral res-olution reflectance spectra collected by imaging spectrometersallow direct identification of individual materials based upon theirreflectance characteristics such as absorption band depth, bandposition, asymmetry of the absorption features, etc. Mapping of sur-face reflectance in an imaging spectrometer data set with knowndiagnostic reflectance spectra of minerals is basically done usingspectral matching techniques or sub-pixel classification techniques(Van der Meer, 2006). Two groups of spectral matching techniqueshave been developed: deterministic empirical measures, includingspectral angle mapper (SAM), spectral correlation measures (SCM),Euclidean distance measures (ED), and Mixture Tuned Matched Fil-tering (MTMF) method (Mason, 2002); and Stochastic measuresevaluating the statistical distributions of spectral reflectance val-ues of target end members (Van der Meer, 2006). In this paper theMixture Tuned Matched Filtering (MTMF) method was used to mapsurface mineral of the study area.
The main advantage of the MTMF method, unlike traditionalspectra mixture modeling, is the ability to map a single known tar-get without knowing the other background end member signatures(Kruse, 2003).
1.3. Hyperion satellite sensor imagery
Hyperion is the first Earth-orbiting imaging spectrometer,which was launched onboard the Earth Observing 1 (EO-1) satel-lite on November 21, 2000. Operating across the full solar-reflectedspectrum, the nominal spectral coverage ranges from 0.4 �m to2.5 �m, with 10 nm sampling and spectral response functions (Kinget al., 2003). The radiometric range of Hyperion spans from zero tothe maximum Lambertian reflected radiance with 12 bits of digi-tization (King et al., 2003). The Hyperion push broom instrumentcaptures the image frame spectra from an area of 30 m along-trackby 7.7 km cross-track (Pearlman et al., 2003). Hyperion has onetelescope, slit and two grating spectrometers: one spectrometerwith 70 channels in the VNIR wavelength region (0.4–1.0 �m) with
silicon detector array and one spectrometer with 172 channels inSWIR wavelength region (0.9–2.5 �m) with an HgCdTe detectorarray (Biggar et al., 2003). The 196 unique channels covering VNIR(band 8–57) and SWIR (band 77–224) regions are calibrated from242 total channels (Hubbard et al., 2003).
2. Methods
The identification and mapping of evaporate minerals and asso-ciated sediments in the Lake Magadi area, involved the collectionof rocks and soils in the field, their analyses using reflectancespectroscopy and X-ray diffraction, and the processing and inter-pretation of Hyperion hyperspectral satellite imagery.
2.1. Field rock/ soil sampling
Fieldwork was conducted in the Lake Magadi area in July andAugust 2008. 84 rock and soil samples, representative for theentire study area, were collected from relatively homogeneous bareland areas having spatial extent larger than 60 m × 60 m. In addi-tion, several other samples were collected without considering thehomogeneity and the spatial extent of the sample location due tothe geological interest of the area. Each sample location was alsosubjected to land cover and geomorphologic analysis, GPS data col-lection and field photographs.
2.2. Spectral reflectance analysis
The soil and rock samples were dried in the open air. Oncedried, all soil samples were crushed and passed through a 2 mmsieve. Reflectance spectra of the 26 soil samples and 58 rocksamples were acquired using Multi Purpose Analyzer – FourierTransformed Spectrometer (MPA – FTIR) and Vertex-70 FTIR instru-ment spectrometer fitted with a diffuse reflectance accessory overthe wavelength range from 350 to 2500 nm. All the rock and soilsamples were grouped based on their spectral signatures and thephysical properties/appearance of the samples. The position, shape,depth and width of absorption features are used to identify the

Author's personal copy
26 G.R.L. Kodikara et al. / International Journal of Applied Earth Observation and Geoinformation 14 (2011) 22–32
Fig. 6. Reflectance spectra of siliceous rocks (P006 1 and S032: chert with smallcavities filled by carbonate minerals, P019 1: Dyke chert, S008: Quartz chert, P035and S047: Pillow chert, P017: Laminated chert, P024: Laminated green chert).
mineralogy from field samples as well as to extract mineralogicalinformation from the Hyperion image.
2.3. X-ray diffraction analysis
The mineralogical interpretation of the reflectance spectra wasverified using X-ray diffraction analyses of 15 samples that wererepresentative of the different categories of rocks and soils. Thediffraction patterns of the samples were described in terms of threesets of parameters: (1) the position of the diffraction maxima, (2)the peak intensities, and (3) the intensity distribution as a functionof diffraction angle. These three pieces of information were usedto identify and quantify the mineralogy of the sample by match-ing with the ICDD (International Centre for Diffraction Data) PDF(Powder Data File) database (Jenkins, 2000).
2.4. Processing and interpretation of the Hyperion satelliteimagery
The radiometrically corrected Hyperion image that wasacquired on 30th June, 2008 was processed as follows:
Fig. 7. Reflectance spectra of Kenyaite and Magadiite rock samples.
a) Fixing of bad pixels and bands. Bad pixels and bands are outliersin mean response and/or variance in response in a given image(Mason, 2002). Their values were replaced by interpolation withits nearest left and right specially row neighbours. If the cell hadgood neighbours on one side only, the replacement was done byextrapolation.
b) Gain and offset correction for columns. The correction was doneassuming the response mean and standard deviation of eachimage-column to be the same.
c) Atmospheric correction using Fast Line-of-sight AtmosphericAnalysis of Spectral Hypercubes (FLAASH). The FLAASH modulewas performed with and without spectral polishing. The out-put image that was derived with spectral polishing was usedafter analyzing reflectance spectra. The parameters used for theFLAASH module are summarized in Table 1.
d) EFFORT polishing (Empirical Flat Field Optimal ReflectanceTransformation) was performed after the atmospheric correctionto reduce systematic linear errors in the data by finding a reason-ably large set of calibration pixels for which the “true” spectra canbe estimated. It calculates a correction gain and/or offset usingleast-squares regression between the calibration pixels (true)and actual spectra (Mason, 2002), so the spectra appear morelike spectra of real materials. 1000 calibration spectra with 14polynomial orders were used to correct the data.
e) Identification of scene spectral end members. The first step of thisprocess was to perform a minimum noise fraction (MNF) trans-formation to determine the inherent dimensionality of the imagedata. The MNF transform uses two principal component transfor-mations. While the first transformation decorrelates and rescalesthe noise in the data, the second is performed for the noisiestdata (ITT ENVI, 2007). Based on MNF results, the lower orderMNF bands are usually set aside and the higher order bands areselected for further processing. These were used for selection ofpure end members. The pixel purity index (PPI) was used to iden-tify the most spectrally pure or extreme pixels in the imagery. Anauto cluster algorithm in the n-dimensional visualizer, a softwaretool to visualize point clouds in multi-dimensional feature space,was then used to find the end member spectra, Mean spectra ofclusters were then extracted to act as end members for mappingminerals, and
f) Generation of surface compositional map using Mixture TunedMatched Filtering (MTMF) and Minimum Noise Fraction (MNF)method (Mason, 2002). MTMF algorithm was applied to MNF

Author's personal copy
G.R.L. Kodikara et al. / International Journal of Applied Earth Observation and Geoinformation 14 (2011) 22–32 27
Fig. 8. (A) Sedimentary deposits at sample location P031. (B) Continuum removed reflectance spectrum of sedimentary rock sample P031 (solid line). Dashed lines show the(Si–OH) absorption feature of chert and the CO3 absorption feature of carbonate material in the matrix. (C) Continuum removed reflectance spectra of different silty-claysedimentary rock samples.
Table 1FLAASH input parameters applied on Hyperion radiance image.
Parameter Used value/type Parameter Used value/type
Acquired date 2008/06/30 Atmospheric model TropicalAcquired time 07:23:05 Atmospheric zone RuralGround elevation 0.738 km Aerosol model RuralScene centre latitude −1.994429 MODTRAN resolution 15 cm s−1
Scene centre longitude 36.277371 Output 10,000
data with the help of image end member spectra derived fromn-dimensional space.
3. Results
3.1. Spectral properties
3.1.1. Spectral properties of evaporitesSix evaporite samples, including trona beds and surface evap-
orites, were analyzed (see Figs. 2 and 3) to determine spectral
characteristics of evaporites. A sample containing crystallized trona(B012) was used to verify the mineralogy by X-ray diffraction. TheVNIR spectrum of the trona sample (Fig. 4, B012) exhibits absorp-tion features at 1.50 �m, 1.74 �m, 1.94 �m, 2.03 �m, 2.22 �m, and2.39 �m. These are characteristic for trona and are also present inall evaporate samples in Fig. 4.
3.1.2. Spectral properties of siliceous rocksSiliceous rocks were analyzed and characterized using
reflectance spectra, X-ray diffraction patterns and descriptions of
Table 2Error matrix resulting from surface mineral mapping.
Ground truth
Classification data Trona High Magadi bed Chert Total Error of commission (%) User accuracy (%)
Trona 5 0 0 5 0 100High Magadi bed 1 7 4 12 41.6 58.3Chert 0 0 15 15 0 100Total 6 7 19 32Error of omission (%) 16.6 0 21.0 Overall accuracy = 84.3%Producer accuracy (%) 83.3 100 78.9

Author's personal copy
28 G.R.L. Kodikara et al. / International Journal of Applied Earth Observation and Geoinformation 14 (2011) 22–32
Fig. 9. The MTMF rule Images 13 (A), 16 (B), 4 (C) and false colour composite of these rule images (R: 4, G: 13, B: 16) (D). Green, blue and pink colours represent the differenttypes/stages of evaporates. Red colours represent the chert beds. (E) Spectral plot of selected field sample spectra and image reflectance spectra of different surface materialsthat were represented by different colours (A001: Crystallized trona, B012: Powdered form of Trona, P006: Chert). (For interpretation of the references to colour in this figurelegend, the reader is referred to the web version of this article.)
hand specimens. They were grouped into the following types ofchert: (a) Laminated chert (sample P017, Fig. 5A), (b) Laminatedgreen chert (sample P024, Fig. 5B), (c) Pillow chert (Samples S047and P035, Fig. 5C), (d) Dyke chert (Samples P019 01, Fig. 5D), (e)Green beds (sample P030, Fig. 5E), (f) Quartz chert and (g) HighMagadi beds (sample S037, Fig. 5F)
All Samples from all seven groups of siliceous rocks have thesame type of reflectance spectra (Fig. 6). Each spectrum containsabsorption features at 1.42, 1.91, 2.21 and 2.46 �m. All samplescontain molecular water as well as hydroxyl bonds due to the1.9 �m molecular water absorption feature and 1.4 �m hydroxylion absorption feature. In addition to these four (main) commonabsorption features, samples P019 01, S008 and P006 01 showedanother two absorption features at 1.16 �m and 1.25 �m. Thecauses of these two absorption features were not studied.
3.1.3. Spectral properties of Magadiite and KenyaiteThe mineral Magadiite was identified by X-ray diffraction in
one of the samples (P032). The reflectance spectrum of thissample (Fig. 7) contains two absorption features other than thehydroxyl (1.40 �m) and water (1.90 �m) absorption feature inthe shortwave infrared region. A narrow absorption feature at1.46 �m and broad and shallow Si–OH absorption feature near2.22 �m.
The mineral Kenyaite was also identified in one of the samples(P036) using X-ray diffraction.
The reflectance spectrum of this sample also exhibits a broadSi–OH absorption feature around 2.22 �m. In addition to that, itshows another two absorption features at 1.15 �m and 1.46 �m.The absorption feature at 1.46 �m is unique for Kenyaite as wellas Magadiite and stronger than that of Magadiite. No spectra that

Author's personal copy
G.R.L. Kodikara et al. / International Journal of Applied Earth Observation and Geoinformation 14 (2011) 22–32 29
Fig. 10. (A) Colour composite of Hyperion MNF bands 2, 4 and 6 after masking out the lake area. (B) Continuum removed image reflectance spectra of different surfacematerials and reflectance spectra of field samples (P004: volcanic tuff, P030: green beds, P006: Chert), (C) Colour composite of MNF bands 1, 3 and 5, after masking out thelake area. (D) Image reflectance spectra of different surface materials and reference spectra (P031: Sedimentary rocks composed of natrocarbonatite volcanic ash, USGS D &USGS G: Dry and Green vegetation spectra from the USGS reflectance library). (E) Colour composite of MNF bands 4, 5 and 6 after masking out the lake area (Note: black smallarrows indicate the position of characteristic absorption features of the image spectra related to the selected field spectra. Black arrows with round head show extractedreference image spectra with corresponding locations). (For interpretation of the references to colour in this figure legend, the reader is referred to the web version of thisarticle.)
were collected from other soil and rock samples show this 1.46 �mabsorption.
The absorption feature at 1.15 �m is only present in the Kenyaitespectrum (Fig. 7).
3.1.4. Spectral properties of other sedimentary rocksSedimentary rock, which is composed of chert pebbles and
natro-carbonatite volcanic ash (such as sample P031; Fig. 8A),show mixed absorption features within the 2.1–2.5 �m wavelengthregion (Fig. 8B). A wide absorption feature at around 2.22 �m is dueto Si–OH groups in chert and the absorption at 2.34 �m is relatedto the carbonate in the matrix (Aines and Rossman, 1984). Spectraof other sedimentary rocks, such as tuffaceous materials that werecollected from Lake Magadi area show a common absorption fea-ture at 2.30 �m indicating that Mg minerals are more common inigneous rock environment. The spectra of rock samples S021 andP003 show another absorption feature at 2.37 �m (may be dueto Mg–OH bonds) while rock sample P038 shows an absorptionfeature at 2.34 �m which is related to carbonate. The reflectancespectrum of rock sample S030, a silty clay sedimentary rock, shows
only one absorption feature at 2.30 �m which is probably relatedto the Mg-OH bond of the minerals of the rock.
3.2. Spectral analysis and mapping results
A false colour composite of MTMF rule Images 4, 13 and16(Fig. 9) can be used to discriminate the evaporites series and chertbeds in the area according to their general spectral shape and char-acteristic spectral features. Spectra MF01 and MF02 show spectralshape and features similar to the trona (e.g., sample A001) andevaporates (e.g., sample B012). Spectrum MF03 shows a broad2.2 �m feature related to the presence of chert (e.g., sample P006).Based on their spectral characteristics, the different colours in thefalse colour composite image can be interpreted as follows: Greenand blue represent the different types or stages of evaporites ofthe area, red colours represent the chert beds and magenta coloursdepict the combination of volcanic & siliceous rock types (chertseries) on the surface.
The area covered by the lake shows high spectral variation andthis attenuates the spectral dimensionality of the surrounding area.As a result of this, MNF eigen images do not show clear features
Author's personal copy
30 G.R.L. Kodikara et al. / International Journal of Applied Earth Observation and Geoinformation 14 (2011) 22–32
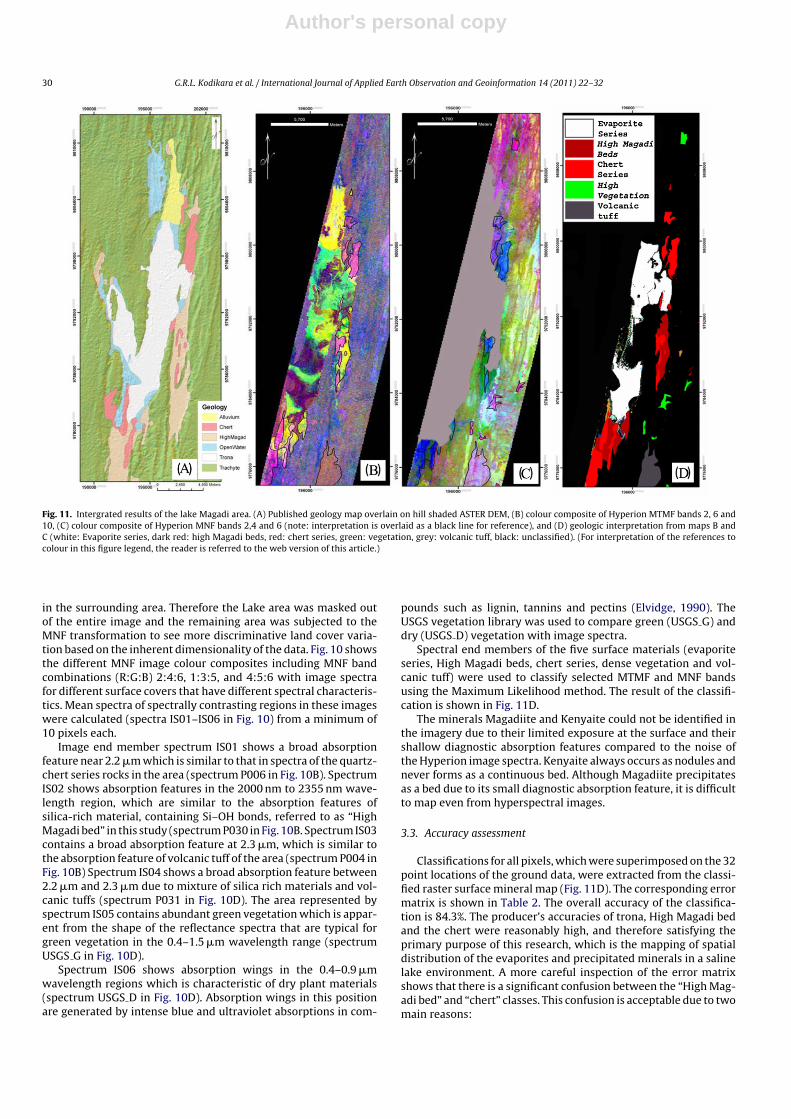
Fig. 11. Intergrated results of the lake Magadi area. (A) Published geology map overlain on hill shaded ASTER DEM, (B) colour composite of Hyperion MTMF bands 2, 6 and10, (C) colour composite of Hyperion MNF bands 2,4 and 6 (note: interpretation is overlaid as a black line for reference), and (D) geologic interpretation from maps B andC (white: Evaporite series, dark red: high Magadi beds, red: chert series, green: vegetation, grey: volcanic tuff, black: unclassified). (For interpretation of the references tocolour in this figure legend, the reader is referred to the web version of this article.)
in the surrounding area. Therefore the Lake area was masked outof the entire image and the remaining area was subjected to theMNF transformation to see more discriminative land cover varia-tion based on the inherent dimensionality of the data. Fig. 10 showsthe different MNF image colour composites including MNF bandcombinations (R:G:B) 2:4:6, 1:3:5, and 4:5:6 with image spectrafor different surface covers that have different spectral characteris-tics. Mean spectra of spectrally contrasting regions in these imageswere calculated (spectra IS01–IS06 in Fig. 10) from a minimum of10 pixels each.
Image end member spectrum IS01 shows a broad absorptionfeature near 2.2 �m which is similar to that in spectra of the quartz-chert series rocks in the area (spectrum P006 in Fig. 10B). SpectrumIS02 shows absorption features in the 2000 nm to 2355 nm wave-length region, which are similar to the absorption features ofsilica-rich material, containing Si–OH bonds, referred to as “HighMagadi bed” in this study (spectrum P030 in Fig. 10B. Spectrum IS03contains a broad absorption feature at 2.3 �m, which is similar tothe absorption feature of volcanic tuff of the area (spectrum P004 inFig. 10B) Spectrum IS04 shows a broad absorption feature between2.2 �m and 2.3 �m due to mixture of silica rich materials and vol-canic tuffs (spectrum P031 in Fig. 10D). The area represented byspectrum IS05 contains abundant green vegetation which is appar-ent from the shape of the reflectance spectra that are typical forgreen vegetation in the 0.4–1.5 �m wavelength range (spectrumUSGS G in Fig. 10D).
Spectrum IS06 shows absorption wings in the 0.4–0.9 �mwavelength regions which is characteristic of dry plant materials(spectrum USGS D in Fig. 10D). Absorption wings in this positionare generated by intense blue and ultraviolet absorptions in com-
pounds such as lignin, tannins and pectins (Elvidge, 1990). TheUSGS vegetation library was used to compare green (USGS G) anddry (USGS D) vegetation with image spectra.
Spectral end members of the five surface materials (evaporiteseries, High Magadi beds, chert series, dense vegetation and vol-canic tuff) were used to classify selected MTMF and MNF bandsusing the Maximum Likelihood method. The result of the classifi-cation is shown in Fig. 11D.
The minerals Magadiite and Kenyaite could not be identified inthe imagery due to their limited exposure at the surface and theirshallow diagnostic absorption features compared to the noise ofthe Hyperion image spectra. Kenyaite always occurs as nodules andnever forms as a continuous bed. Although Magadiite precipitatesas a bed due to its small diagnostic absorption feature, it is difficultto map even from hyperspectral images.
3.3. Accuracy assessment
Classifications for all pixels, which were superimposed on the 32point locations of the ground data, were extracted from the classi-fied raster surface mineral map (Fig. 11D). The corresponding errormatrix is shown in Table 2. The overall accuracy of the classifica-tion is 84.3%. The producer’s accuracies of trona, High Magadi bedand the chert were reasonably high, and therefore satisfying theprimary purpose of this research, which is the mapping of spatialdistribution of the evaporites and precipitated minerals in a salinelake environment. A more careful inspection of the error matrixshows that there is a significant confusion between the “High Mag-adi bed” and “chert” classes. This confusion is acceptable due to twomain reasons:

Author's personal copy
G.R.L. Kodikara et al. / International Journal of Applied Earth Observation and Geoinformation 14 (2011) 22–32 31
◦ Though chert is not always observed in the field with large spatialextent, it is always found with the silica-rich High Magadi bed(spatial association).
◦ The reflectance spectra of chert and High Magadi bed are rela-tively similar due to presence of SiO2 as the main constituent;hence it is difficult to differentiate them using remote sensingmethods (spectral resemblance).
4. Discussion
This study demonstrated the possibility of mapping evapor-ite minerals and associated sediments in Lake Magadi area usingspace-borne hyperspectral Hyperion data. Spatial distribution ofchert and High Magadi beds in the mineral map is superimposedwith the published geology map of the area (Fig. 11). Volcanic tuff,which is not recorded in published geological maps known to theauthors, can be seen in southern part of the study area in derivedmineral map, close to the Lenderut volcano (Fig. 1B). Alluvium ter-races in the northern part of Lake Magadi study area, however,were not identified and categorized using remote sensing due totheir inhomogeneity of surface minerals (materials). Some of theareas (e.g., contact zones between areas) were left unclassified tofacilitate mapping of only the homogeneous surface materials.
Even though most of the precipitates and evaporites showcharacteristic spectral features reflecting the mineralogy of thematerial, several of them could not be identified because of lack ofspectral information related to the mineralogy of some of the evap-orites. While the fine-grained silica rich sedimentary rock, chert,exhibits a broad absorption feature at 2.2 �m, other siliceous mate-rials such as green beds, diatomite and High Magadi beds exhibita combination of a broad absorption feature at 2.2 �m and a nar-row feature at 2.3 �m. The main evaporite mineral in the studyarea, trona, commonly exhibits 6 absorption features at 1.50-, 1.74-, 1.94-, 2.03-, 2.22- and 2.39-�m. Not only the position and shape ofthe absorption feature, but also the general shape of the reflectancespectra can be used to identify mineral precipitates and evaporitesin the study area.
Chert, diatomite, High Magadi beds, green beds and trona wereidentified using reflectance spectra. Chert was mapped from theHyperion image based on its 2.2 �m broad absorption feature inSWIR region. Diatomite, green beds and High Magadi beds show arelatively similar general spectral shape and absorption features.In addition, diatomite and green bed did not show large spatialextents and identification in the field was solely based on smallspots within the High Magadi beds. Diatomite was identified only inone location covering an approximately 2 m × 8 m area. Thereforediatomite, green beds and High Magadi beds were mapped as oneunit and referred to as the High Magadi bed.
5. Conclusions
Not all the ground mineralogy that was identified by reflectancespectra could be mapped. This is due to factors such as the spec-tral resolution of the image, the spectral resolution of diagnosticabsorption features of the field reflectance spectra, noise in theimage, spatial extent of the ground target, spatial resolution of theimage, and accuracy of image prepossessing stages.
Furthermore, geologic surfaces are often partially covered withnon-geologic materials or composed of mixtures of mineralswith varying grain sizes and differing degree of compaction andweathering. These factors greatly influence the remote spectralmeasurements and limit the number of pixels that can be classifiedand mapped.
The overall shape of the laboratory/library spectra was dif-ferent from the image spectra, probably due to the presence of
variable mineral mixtures, grain size variations, residual atmo-spheric absorption features, desert varnish top of the rock surface,and calibration error of laboratory spectrometer and/or Hyperioninstrument. These spectral differences point to the advantage ofusing image spectra rather than library/laboratory as reference inMTMF processing.
The area that had very high spectral variation attenuated thespectral dimensionality of the surrounding low spectral variationarea of the Hyperion image. Image processing in two steps, withand without (masking out) the high spectral variation area, couldsuccessfully overcome this problem, allowing extraction of infor-mation from the entire image.
Acknowledgements
The authors would like to thank NASA for making the Hyperionimage of the area freely available for research, and Boudewijn deSmeth, Chris Hecker for their assistance during the paper prepa-ration. We highly appreciate technical support from the WorldAgroforestry Centre (ICRAF), in particular from Mr. Elvis Weullow,and from the Department of Geology, University of Nairobi, Kenya.
References
Aines, R.D., Rossman, G.R., 1984. Water in minerals? A peak in the infrared. Journalof Geophysical Research 89 (B6), 4059–4071.
Baker, B.H., 1958. Geology of the Magadi area. Report Geologycal survey of Kenya42.
Biggar, S.F., Thome, K.J., Wisniewski, W., 2003. Vicarious radiometric calibration ofEO-1 sensors by reference to high-reflectance ground targets. IEEE Transactionson Geoscience and Remote Sensing 41 (6), 1174–1179.
Clarck, R.N., King, T.V.V., Klejwa, M., Swayze, G.A., 1990. High spectral resolutionreflectance spectroscopy of minerals. Journal of Geophysical Research 95 (B8),12,653–12,680.
Crowley, J.K., 1993. Mapping playa evaporite minerals with AVIRIS data: a first reportfrom Death Valley, California. Remote Sensing of Environment 44, 337–356.
Crowley, J.K., Hook, S.J., 1996. Mapping playa evaporite minerals and associated sed-iments in Death Valley, California, with multispectral thermal infrared images.Journal of Geophysical Research 101 (B1), 643–660.
Elvidge, C.D., 1990. Visible and near infrared reflectance characteristics of dry plant.International Journal of Remote Sensing 11 (10), 1775–1795.
Eugster, H.P., 1969. Inorganic bedded cherts from the Magadi area. Kenya: Contri-butions Mineralogy Petrology 22, 1–31.
Eugster, H.P., Jones, B.F., 1968. Gels composed of sodium–aluminium silicate, LakeMagadi Kenya. Science 161, 160–163.
Gaffey, S.J., 1985. Reflectance spectroscopy in the visible and near-infrared(0.35–2.55 pm): applications in carbonate petrology. Geology 13, 270–273.
Goetz, A.F.H., Vane, G., Solomon, J.E., Rock, B.N., 1985. Imaging spectrometry for earthremote sensing. Science 228 (4704), 1147–1153.
Hewson, R.D., Cudahy, T.J., Mizuhiko, S., Ueda, K., Mauger, A.J., 2005. Seamless geo-logical map generation using ASTER in the Broken Hill-Curnamona province ofAustralia. Remote Sensing of Environment 99 (1–2), 159–172.
Hubbard, B.E., Crowley, J.K., Zimbelman, D.R., 2003. Comparative alteration min-eral mapping using visible to shortwave infrared (0.4–2.4 m) hyperion, ALI, andASTER imagery. IEEE Transactions on Geoscience and Remote Sensing 41 (6),1401–1410.
I.T.T.ENVI, 2007. ENVI User’s Guide, v. 4.4.Jenkins, R., 2000. X-ray Techniques: Overview. Encyclopedia of Analytical Chemistry.
John Wiley & Sons Ltd.Jones, B.F., Eugster, H.P., Rettig, S.L., 1977. Hydrochemistry of the Lake Magadi basin,
Kenya. Geochimica et Cosmochimica Acta 41, 53–72.King, M.D., et al. (Eds.), 2003. EOS Data Products Hand Book, vol. 1. NASA/Goddard
Space Flight Center.Kruse, F.A., 1988. Use of airborne imaging spectrometer data to map minerals asso-
ciated with hydrothermally altered rocks in the northern Grapevine Mountains,Nevada, and California. Remote Sensing of Environment 24 (1), 31–51.
Kruse, F.A., 2003. Preliminary Results- Hyperspectral Mapping of Coral Reef SystemsUsing EO-1 Hyperion. JPL Publication 04-6, Buck Island, U.S. Virgin Islands, pp.157–173.
Mason, P., 2002. MMTG A-list hyperspectral data processing software. In: ManualVersion 1.0. CSIRO Division of Exploration and Mining, p. 103.
Pearlman, J.S., et al., 2003. Hyperion, a space-based imaging spectrometer. IEEETransactions on Geoscience and Remote Sensing 41 (6), 1160–1173.
Salisbury, J.W., D’Aria, D.M., 1992. Emissivity of terrestial materials in the 8–14 �matmospheric window. Remote Sensing of Environment 42, 83–106.
Surdam, R.C., Eugster, H.P., 1976. Mineral reactions in the sedimentary depositsof the Lake Magadi region, Kenya. Geological Society of America Bulletin 87,1739–1752.

Author's personal copy
32 G.R.L. Kodikara et al. / International Journal of Applied Earth Observation and Geoinformation 14 (2011) 22–32
Turdu, C.L., et al., 1999. Influence of preexisting oblique discontinuitieson the geometry and evolution of extensional fault patterns: evi-dence from the Kenya rift using SPOT imagery. Geoscience of RiftSystems-Evolution of East Africa: AAPG Studies in Geology 44, 173–191.
Van der Meer, F., 2001. Spectral matching using pixel cross-correlograms for theanalysis of LANDSAT TM data. International Journal of Applied Earth Observationand Geoinformation 3 (2), 197–202.
Van der Meer, F., 2006. The effectiveness of spectral similarity measures for theanalysis of hyperspectral imagery. International Journal of Applied Earth Obser-vation and Geoinformation 8, 3–17.
Vaughan, R.G., Hook, S.J., Calvin, W.M., Taranik, J.V., 2005. Surface mineral mappingat Steamboat Springs, Nevada, USA, with multi-wavelength thermal infraredimages. Remote Sensing of Environment 99 (1–2), 140–158.
Warren, J.K., 2006. Evaporites: Sediments, Resources and Hydrocarbons. Springer,p. 1032.
Related Documents