AJ Smith, S Massuel and DW Pollock March 2012 Geohydrology of the Tamala Limestone Formation in the Perth Region: Origin and role of secondary porosity Water Foundation, Western Australia

Welcome message from author
This document is posted to help you gain knowledge. Please leave a comment to let me know what you think about it! Share it to your friends and learn new things together.
Transcript

AJ Smith, S Massuel and DW Pollock
March 2012
Geohydrology of the Tamala Limestone Formation in the
Perth Region: Origin and role of secondary porosity
Water Foundation, Western Australia

Water for a Healthy Country Flagship Report series ISSN: 1835-095X
Australia is founding its future on science and innovation. Its national science agency, CSIRO, is a powerhouse of ideas, technologies and skills.
CSIRO initiated the National Research Flagships to address Australia’s major research challenges and opportunities. They apply large scale, long term, multidisciplinary science and aim for widespread adoption of solutions. The Flagship Collaboration Fund supports the best and brightest researchers to address these complex challenges through partnerships between CSIRO, universities, research agencies and industry.
Consistent with Australia’s national interest, develop science and technologies that improve the social, economic and environmental outcomes from water, and deliver $3 billion per year in net benefits for Australia by 2030. The work contained in this report is collaboration between CSIRO and Western Australian Department of Water, Cockburn Sound Management Council, Town of Cottesloe, Peel-Harvey Catchment Council, Water Corporation, Swan Catchment Council and City of Melville. For more information about Water for a Healthy Country Flagship or the National Research Flagship Initiative visit www.csiro.au/org/HealthyCountry.html
Citation: Smith AJ, Massuel S and Pollock DW (2011) Geohydrology of the Tamala Limestone Formation in the Perth region: Origin and role of secondary porosity. CSIRO: Water for a Healthy Country National Research Flagship. 63 pp.
Copyright and Disclaimer
© 2011 CSIRO To the extent permitted by law, all rights are reserved and no part of this publication covered by copyright may be reproduced or copied in any form or by any means except with the written permission of CSIRO.
Important Disclaimer:
CSIRO advises that the information contained in this publication comprises general statements based on scientific research. The reader is advised and needs to be aware that such information may be incomplete or unable to be used in any specific situation. No reliance or actions must therefore be made on that information without seeking prior expert professional, scientific and technical advice. To the extent permitted by law, CSIRO (including its employees and consultants) excludes all liability to any person for any consequences, including but not limited to all losses, damages, costs, expenses and any other compensation, arising directly or indirectly from using this publication (in part or in whole) and any information or material contained in it. The views expressed are not necessarily the views of the Government of Western Australian, nor the Water Foundation.
Cover Image:
© 2008 CSIRO Description: Images of Tamala Limestone.

Tamala Limestone Geohydrology Page iii
CONTENTS 1. Project Description .......................................................................................................... 1
1.1. Introduction .............................................................................................................................. 1
1.2. This report ................................................................................................................................ 1
2. Tamala Limestone Formation ......................................................................................... 3 2.1. Definition .................................................................................................................................. 3
2.2. Geological setting .................................................................................................................... 3
2.3. Lithology ................................................................................................................................... 6
2.4. Proposed depositional model ................................................................................................... 7
2.5. Timing of deposition ................................................................................................................. 9
3. Review of existing hydrologic information .................................................................. 13 3.1. Borehole lithology records ..................................................................................................... 13
3.2. Hydraulic conductivity measurements ................................................................................... 14
3.3. Groundwater transport investigations .................................................................................... 16 3.3.1. Contaminated sites .................................................................................................................. 16 3.3.2. Treated-wastewater infiltration ................................................................................................. 19
4. Field investigations ........................................................................................................ 23 4.1. Fremantle Prison tunnels ....................................................................................................... 24
4.1.1. Visual evidence of secondary porosity .................................................................................... 25 4.1.2. Tunnel water level and water temperature .............................................................................. 25 4.1.3. Flow measurements ................................................................................................................ 28 4.1.4. Tunnel resistivity survey .......................................................................................................... 30
4.2. Below watertable cores .......................................................................................................... 32 4.2.1. Site selection ........................................................................................................................... 33 4.2.2. Coring procedure ..................................................................................................................... 33 4.2.3. Borehole completion ................................................................................................................ 34 4.2.4. Core logging ............................................................................................................................ 35 4.2.5. Down-hole conductivity and gamma logs ................................................................................ 36
4.3. Nuclear Magnetic Resonance surveys .................................................................................. 38 4.3.1. East Rockingham .................................................................................................................... 39 4.3.2. Fremantle Park ........................................................................................................................ 39 4.3.3. Perry Lakes ............................................................................................................................. 39 4.3.4. White Hill Road ........................................................................................................................ 40
5. Analysis of aquifer tidal propagation ........................................................................... 45 5.1. Dual-medium model ............................................................................................................... 47
5.2. Model application to mainland sites ....................................................................................... 49
5.3. Model application to Garden Island ....................................................................................... 51
5.4. Conclusions............................................................................................................................ 53
6. Synthesis of Tamala Limestone geohydrology ........................................................... 54 6.1. Implication for managed aquifer recharge ............................................................................. 57
References ............................................................................................................................ 59
Appendices ........................................................................................................................... 63

Tamala Limestone Geohydrology Page iv
LIST OF FIGURES Figure 2-1. Major tracks of carbonate eolianite in the world (after: Brooke 2001). ................................. 3
Figure 2-2. Cenozoic stratigraphic column of the Perth region. .............................................................. 4
Figure 2-3. Onshore and potential offshore submarine distribution of Tamala Limestone in the Perth region. ...................................................................................................................................... 5
Figure 2-4: Lateral extent of Tamala Limestone in the Perth region. ...................................................... 5
Figure 2-5. a) Carbonate particles of marine origin in the Tamala Limestone from Shark Bay, including quartz, porcelaneous and Elphidium-like foraminifers, and red algae (after: Le Guern and Davaud 2005) and b) scanning electron micrograph showing micritic meniscus cement in eolianite from Libya, precipitated after dissolution of aragonite and high-magnesium calcite particles by under-saturated percolating water (after: McLaren and Gardner, 2004). ................................................................................................................................ 6
Figure 2-6. Tamala Limestone features: a) cross bedding, b) calcreted roots, c) calcrete layer, known as kankar or cap rock, and d) paleosol. ............................................................................. 7
Figure 2-7. Proposed model of carbonate eolianite deposition along the Western Australian coastline: a) lowstand sea level, terra rossa soil and terrigenous coastal dunes develop on eroded previous deposits; b) sea-level rise, terrigenous flux is insufficient for progradation, transgression creates shallow-marine conditions, carbonate production begins, and wave action mobilizes the sediment forming transgressive-phase eolianites; c) highstand sea level, coral reefs weaken wave action, carbonate sediment accumulates in a low-energy foreshore zone, no eolianite is produced; d) sea-level fall, lowered wave base passes through the reefs and reworks accumulated carbonate sediments to form regressive-phase eolianites, carbonate production decreases with bathymetry and finally stops at the edge of the platform. ............................................................................................................ 8
Figure 2-8. Meteor quarry in Nowergup: a) cross bedding planes, sedimentation discontinuity and solution pipes; b) cross section of a solution pipe filled with roots. Fremantle Prison tunnel: c) discontinuity at approximately 15-m depth below ground surface; d) paleo-solution pipe open from the discontinuity down to the roof of the tunnel at approximately 20-m depth. Hamelin Bay: e) terra rossa paleosol. ..................................................... 9
Figure 2-9. Age measurements of carbonate eolianites showing a general pattern of decreasing age seaward and offshore. ................................................................................................. 11
Figure 2-10. Paleo-sea level interpretations during the late Pleistocene and Holocene from Australian studies; the compromise curve is interpretive and follows the curve of Pillan et al. (1998) without reproducing the short-period variations for age >250 Ka, and from 0 to 250 Ka the curve is the smoothed average of all the curves shown. .................................... 12
Figure 2-11. Perth basin cross section and relative sea level change derived from Australian studies; sporadic dating of surface deposits indicates that carbonate eolianite age decreases seaward and offshore. .................................................................................................. 12
Figure 3-1. Boreholes lithology logs within the Perth region; approximately seven percent of lithology logs located within the Tamala Limestone contain at least one term describing secondary porosity within the drilled depth of the formation. ................................................................ 14
Figure 3-2. Contaminated site locations. ............................................................................................... 18
Figure 3-3. Interpreted plume geometries at contaminated sites in the Perth region. .......................... 19
Figure 3-4. Treated-wastewater infiltration sites. .................................................................................. 22
Figure 3-5. Groundwater observation wells and interpreted watertable contours at the Gordon Road WWTP. ........................................................................................................................... 22
Figure 4-1. Field investigation sites. ...................................................................................................... 23
Figure 4-2. Map of the Fremantle Prison tunnel network and instrument locations: dry sections of the tunnels are rendered in light grey; pressure data loggers are indicated by red symbols; circle – Micro-Diver, square – Baro-Diver. ....................................................................... 24

Tamala Limestone Geohydrology Page v
Figure 4-3. Inside the aquifer at the Fremantle Prison tunnels: a) tunnel section and exposed watertable, b) eolianite beds at the watertable, c) living tree root, d) rhizoliths, e) shell bed within shaft S1. .................................................................................................................. 25
Figure 4-4. Fremantle Prison tunnel water level: a) detrended time series, b) spectral composition of the detrended data. ....................................................................................................... 27
Figure 4-5. Sea level at Fremantle Fishing Boat Harbour: a) detrended time series, b) spectral composition of the detrended data. ..................................................................................... 27
Figure 4-6. Dilution gauging attempt: a) measurement location, b) salt (NaCl)
concentration 2C versus time, c) water electrical conductivity profile before and one hour
after salt injection. ................................................................................................................................. 28
Figure 4-7. Survey of groundwater inflow temperature: a) investigated tunnel section, b) results for a 5-m profile measured continuously for 3 days. ............................................................. 30
Figure 4-8. Tunnel resistivity survey: a) resistivity line in tunnel section NE2, b) and c) electrode configuration on the tunnel bed, c) resistivity section. ....................................................... 32
Figure 4-9. Coring photos: a) Sonic 200 series MINI rig at White Hill Road, b) extraction of core sample into plastic sock, c) extracted core samples in a core tray. .............................................. 34
Figure 4-10. Examples of eolianite ypes in core samples: a) weakly cemented sand, b) well cemented with dissolutional porosity, c) well cemented with open bedding planes, d) calcrete cap rock. .............................................................................................................................. 35
Figure 4-11. Examples of calcarenite rock clasts from the core samples: a) grainstone from Fremantle Park at 6-m depth, b) calcrete cap rock from Perry Lakes at 9-m depth, c) wackestone from Perry Lakes at 27.5-m depth, d) coarse-grained calcarenite with secondary void structures from Fremantle Park at 29.5-m depth, e) fine to medium-grained calcarenite with dissolution porosity and water-smoothed surfaces from White Hill Road at 15.7-m depth, f) calcarenite disk indicating open bedding planes from Fremantle Park at 28.5 m depth. ............................................................................................................................ 37
Figure 4-12. East Rockingham VC-Javelin results: a) water content as a function of T2* and depth, b) total water content with depth, c) generalised lithology. ................................................. 41
Figure 4-13. Fremantle Park VC-Javelin results: a) water content as a function of T2* and depth, b) total water content with depth, c) generalised lithology. ........................................................ 42
Figure 4-14. Perry Lakes VC-Javelin results: a) water content as a function of T2* and depth, b) total water content with depth, c) generalised lithology. ........................................................ 43
Figure 4-15. White Hill Road VC-Javelin results: a) water content as a function of T2* and depth, b) total water content with depth, c) generalised lithology. ........................................................ 44
Figure 5-1. Tidal efficiency (TE) and lag within the Tamala Limestone at three sites in the Perth region (see Figure 5-2 for the site locations); the plotted line shows the analytic solution of Ferris (1951). ....................................................................................................................... 45
Figure 5-2. Location map for tidal propagation studies. ........................................................................ 46
Figure 5-3. Modelled tidal propagation at the Fremantle Prison tunnel and Halls Wastewater Treatment Plant; results are for the O1 and K1 tidal constituents and model parameters are listed in Table 5-3......................................................................................................... 50
Figure 5-4. Modelled tidal propagation on Garden Island; results are for the O1 and K1 tidal constituents (model parameters are listed in Table 5-4). .............................................................. 52
Figure 6-1. Conceptualisation of palaeo-watertable fluctuation within the Tamala Limestone and associated diagenetic zones. ....................................................................................... 54

Tamala Limestone Geohydrology Page vi
Figure 6-2. Tamala Limestone characteristics superimposed on the Vacher and Mylroie (2002) diagram for eogenetic and telogenetic karst development. The graph region is referred to as the n-D space, where n is porosity and D is equivalent pore diameter. For given porosity (vertical axis) and hydraulic conductivity (slanted solid lines) of the karst formation the diagram indicates the corresponding equivalent pore diameter (horizontal axis) and pore-tube density (slanted dashed lines) based on an equivalent porous medium model consisting of straight parallel tubes. ............................................................................. 55
LIST OF TABLES Table 3-1. Summary of borehole lithology records within the Perth region. ......................................... 14
Table 3-2. Measured hydraulic conductivity of Tamala Limestone in the Perth region. ....................... 15
Table 3-3. Model-calibrated values of hydraulic conductivity for Tamala Limestone. ........................... 16
Table 3-4. Summary of treated wastewater infiltration in the Perth region. .......................................... 21
Table 3-5. Selected groundwater monitoring results at the Gordon Road WWTP. .............................. 21
Table 4-1. Tidal efficiency within the Fremantle Prison tunnel network. ............................................... 26
Table 4-2. Relationship between NMR signal decay rate and characteristic grain size and sediment types (adapted from: Roy and Lubczynski 2003). ................................................................. 38
Table 5-1. Tidal efficiency (TE) and lag in the Tamala Limestone in the Fremantle Prison tunnels and at the Halls Head Wastewater Treatment Plant (data are plotted Figure 5-1). ................. 46
Table 5-2. Tidal efficiency (TE) and lag in the Tamala Limestone on Garden Island (data are plotted in Figure 5-1). ...................................................................................................................... 47
Table 5-3. Examples of model parameter combinations which achieve acceptable matches between modelled and observed tidal propagation at the Fremantle Prison tunnel and Halls Wastewater Treatment Plant (selected model results are plotted in Figure 5-3). ............................................................................................................................................ 51
Table 5-4. Examples of model parameter combinations which achieve acceptable matches between modelled and observed tidal propagation on Garden Island and selected model results are plotted in Figure 5-4. .................................................................................. 53

Tamala Limestone Geohydrology Page vii
ACKNOWLEDGEMENTS This work was funded by CSIRO, the Western Australian Water Foundation and in-kind contributions from the Western Australian Department of Water (DoW), Cockburn Sound Management Council (CSMC), Town of Cottesloe (ToC), Peel-Harvey Catchment Council (PHCC), Western Australian Water Corporation (WC), Perth Region NRM (PRNRM) and City of Melville (CoM).
Oversight and feedback on work in progress was provided by members of the project Reference Group:
Chris O’Boy (DoW)
Dr Tom Rose (CSMC)
Geoff Trigg (ToC)
Damien Postma (PHCC)
Dr Bruce Hamilton (PRNRM)
Jeff Major, Karen Barlow, Carolyn Hills and Brigette Hagen from DoW provided assistance with contract management and project coordination on behalf of the Western Australian Water Foundation.
Special thanks are extended to Mr Bill Bowker (Property Manager, Fremantle Prison) for arranging permission to access the prison tunnels on behalf of Fremantle Prison, and we are grateful to the tunnel tour guides for their valuable assistance.
Site access and drilling permissions were kindly provided by the Western Australian Department of Environment and Conservation for the field site at White Hill Road, Bouvard; the Western Australian Land Authority (LandCorp) for the field site within the East Rockingham Industrial Park, East Rockingham; City of Fremantle for the field site at Fremantle Park, Fremantle; and Town of Cambridge for the field site at Perry Lakes, Floreat.
The authors are grateful to Don McFarlane (CSIRO), Peter Dillon (CSIRO) and Dirk Mallants (CSIRO) for providing valuable reviews of the draft report.
CSIRO thanks Lloyd Townley, Director of NTEC Environmental Technology (NTEC), for facilitating the timely completion of the write up of this report under a subcontract from CSIRO to NTEC following the change of employment of Tony Smith from CSIRO to NTEC on 2 September 2011.

Tamala Limestone Geohydrology Page viii
UNITS OF MEASUREMENT
INITIALISATIONS
Measurement unit Description
°C Degrees Celsius
d Days
GL Gigalitres
ha Hectare
hr Hours
KL Kilolitres
Ka Thousand years before present
km Kilometres
L Litres
m Metres
Ma Million years before present
mg Milligrams
ML Megalitre (1000 litres)
mS Millisiemens
s Second
Acronym Meaning
AAR Amino acid racemization
EC Electrical conductivity
MAR Managed aquifer recharge
MIS Marine isotope stage
NMR Nuclear magnetic resonance
PHRAMS Peel-Harvey regional aquifer modelling system
PRAMS Perth regional aquifer modelling system
PSL Present sea level
SWL Static water level
TDS Total dissolved solids
TE Tidal efficiency
TL Thermoluminescence
TN Total nitrogen
TP Total phosphorus
U/Th Uranium-thorium
WIN Water information database
WWTP Waste water treatment plant

Tamala Limestone Geohydrology Page ix
MATH NOTATION
Symbol Meaning
B Saturated aquifer thickness
c Solute concentration
C Integration constant
d Distance from tidal boundary
G Tidal head fluctuation (complex valued)
H Tidal head fluctuation (complex valued)
h Hydraulic head
k Hydraulic conductivity
L Aquifer length
P Period
Q Volumetric flow
S Aquifer storage coefficient
t Time
V Volume
w Volume fraction of conducting medium
x 1D spatial coordinate
X Normalised 1D spatial coordinate
Linear inter-media transfer coefficient
Fluctuating component of hydraulic head (complex valued)
Fluctuating component of hydraulic head (complex valued)
Non-dimensional group
Fluctuation storage capacity (complex valued)
Effective transmissivity of conducting medium
Angular frequency

Tamala Limestone Geohydrology Page x
EXECUTIVE SUMMARY The Tamala Limestone formation is the world’s most extensive eolianite deposit,
extending from Cape Range on the central coast of Western Australia to Albany on the south coast. In the Perth region, the Pleistocene to Holocene carbonate eolianites of the Tamala Limestone extend up to 10 kilometres (km) inland of the modern coast and up to 40 km or more offshore in their submarine extent.
During the past 500,000 years eustatic sea level has fluctuated by more than 100 metres (m) on five occasions, varying from approximately 120 m below present sea level to approximately 10 m above present sea level. This has caused cyclic inundation of Tamala Limestone by the sea and associated fluctuation of the inshore watertable within the formation. Contemporary sea level is at an interglacial high stand and the present-day watertable is estimated to be within 2–6 m of the palaeo-watertable maximum.
Although surface exposures of Tamala Limestone are extensively investigated by geologists, the present-day sub-aerial zone has not been subjected to prolonged saturated conditions and does not provide suitable evidence for developing conceptual models for the aquifer pore-system and geohydrology below the modern watertable where the formation has undergone different diagenesis.
The Eogenetic Karst model developed for carbonate eolianite aquifers of Bahamas and Bermuda is considered to provide the best conceptual model for pore-system development and geohydrology of the Tamala Limestone Formation in the Perth region. According to the equivalent porous medium model of Vacher and Mylroie (2002) the Tamala Limestone can be classified as an eogenetic karst of early- to mid-development.
Eogenetic karst develops through meteoric diagenesis at the location of sediment deposition and is characterised by dual porosity that consists of many connected channels within a matrix of interparticle porosity. According to this theory, diffuse solutional attack of eolianites with large primary porosity leads to a diffuse-flow aquifer rather than one dominated by conduit flow.
Evidence considered in this study connecting the Tamala Limestone to the eogenetic karst model includes the geohydrological similarities between Tamala Limestone, Lucayan Limestone (Bahamas) and carbonate eolianites of Bermuda; plus evidence of a predominantly diffusive flow matrix based on sub-surface visual observations, full-depth coring, geophysical surveys, and analysis of aquifer tidal propagation.
Assessing risk associated with Managed Aquifer Recharge (MAR) into Tamala Limestone depends fundamentally on the adopted geohydrological conceptual model. The eogenetic karst model implies a dispersive flow paradigm, except in areas where cavern development and large-scale conduit flow is prevalent. Tamala Limestone has large to very large transmissivity owing to a well-developed dual-pore system and there is potential for recharge water to move rapidly away from infiltration and injection sites under forced hydraulic gradients induced by those operations.
There is sufficient evidence in this study to suggest that conventional single-medium models are inadequate for the purpose of assessing MAR into Tamala Limestone. The dual-medium approach provides a plausible explanation of observed tidal propagation at coastal sites and this approach has proven to be a better alternative for explaining observed mass transport in groundwater at field sites where the aquifer contains small-scale preferential flow pathways. This approach is not implemented in most popular groundwater simulation software and will require the development specialised groundwater modelling capability or acquisition of specialised services.

Tamala Limestone Geohydrology Page 1
1. PROJECT DESCRIPTION
1.1. Introduction Approximately 15 percent of Australia is karstic, including the coastal strip of carbonate eolianites in Western Australia that stretch from Cape Range on the central coast to Albany on the south coast. Also known as Tamala Limestone, this major coastal aquifer unit in the Perth region exhibits secondary porosity that is highly conductive to groundwater flow, and which might cause significant departures from the porous-medium approximations on which conventional groundwater flow and transport assessments are based.
The groundwater level under Perth is falling in response to increasing groundwater use and long-term rainfall decline caused by climate change. It is estimated that over $520 million of capital assets rely on the shallow groundwater resource. Of particular concern are coastal areas where seawater intrusion might become a significant problem in the next five to ten years. The coastal strip also contains the major wastewater treatment plants that each year discharge around 100 gigalitres (GL) of treated effluent into the Indian Ocean. Infiltration of effluent into aquifers totalling around 4 to 5 GL/yr occurs in several coastal settlements but the fate of the recharge water is not well investigated or evaluated. As a result, the operation of these facilities does not provide a reliable basis for evaluating the risk of larger scale managed aquifer recharge (MAR).
Although it is acknowledged that economic and public acceptance issues are critical factors in planning and implementing future MAR projects, there needs to be an accompanying evaluation of the hydrogeological suitability of the superficial aquifer for MAR. The Environmental Protection Authority (EPA 2005) expects that environmental assessments of proposed MAR facilities will be based on scientifically sound studies to predict groundwater mixing and dispersion in the aquifer.
Part of the work conducted for this study identifies the hydraulic potential for artificial recharge within the greater Perth region (Smith and Pollock 2010). The coastal strip of Tamala Limestone, extensive parts of the Gnangara groundwater mound and smaller parts of the Jandakot groundwater mound were found to be potentially suitable for small (<1 ML/d) to large scale (>10 ML/d) artificial recharge facilities. The presence of sandy surface soils and moderate to very large aquifer transmissivity allow large infiltration and injection rates and promote lateral spreading of recharge mounds rather than excessive vertical rise toward ground surface. The opportunity for MAR on the Gnangara groundwater mound, which has experienced average storage decline of 20 GL/yr since 1979 (Department of Environment 2005) is restricted by the lack of available significant water sources. Use of treated wastewater from the coastal treatment plants would require new conveyance infrastructure and ongoing pumping costs to be a viable supply for MAR schemes on the Gnangara mound. There is opportunity to use the treated wastewater to mitigate saltwater intrusion near the coast and to off-set a portion of the groundwater pumping from private and public wells. Despite the potential benefits of water recycling by this method the potential risks to groundwater users and the environment due to preferential flow in the Tamala Limestone and attenuation rates of contaminants in the treated wastewater has been inadequately understood. This knowledge gap contributes uncertainty and public concern about the potential health risks posed by proposed MAR schemes that involve treated wastewater and untreated stormwater.
1.2. This report Despite the perception of risk associated with MAR in Tamala Limestone due to preferential flow through secondary porosity features a detailed geohydraulic characterisation of these carbonate eolianites has not been attempted. The information contained in this report documents a number of investigations that were undertaken in this study to begin to address this knowledge gap. The report is presented in six sections including this introduction as the first section. Section 2 is a summary of the literature review of the Tamala Limestone formation conducted for this study. A conceptual depositional model is presented based on

Tamala Limestone Geohydrology Page 2
the review and eustacy during the depositional history of the formation. Section 3 considers existing sources of information that provide evidence of the formation’s geohydraulic characteristics. It includes reviews of borehole lithology records contained in the State Water Information database, permeability measurements from various previous investigations, comparisons of known contaminant plume geometries, and review of groundwater monitoring at existing wastewater infiltration facilities located over Tamala Limestone. Section 4 presents results, analysis and discussion of new sources of information acquired for this study. The new information includes investigations at the Fremantle Prison tunnels, which provide a unique view inside the Tamala Limestone aquifer at the watertable; acquisition and analysis of limestone cores collected from ground surface to the base of the formation and through the full saturated depth; and ground-based and down-hole nuclear magnetic resonance (NMR) measurements at the coring locations. Section 5 considers evidence of dual-medium behaviour based on observations of tidal propagation at several study sites within the Perth region and proposes a simple dual-medium model that can replicate the observed behaviour. Section 6 is a summary of the main conclusions of the study, which are also summarised in the Key Findings section at the front of the report. To the extent possible, the summaries present an assessment of the potential risks associated with MAR in the Tamala Limestone based on the evidence produced in this study.

Tamala Limestone Geohydrology Page 3
2. TAMALA LIMESTONE FORMATION
2.1. Definition The unit was firstly known as the Coastal Limestone (Saint-Smith 1912; Teichert 1950) and was described as a grainstone exhibiting large-scale cross bedding. Logan et al. (1970) proposed the name Tamala Eolianite to describe the formation in the Shark Bay area of the Carnarvon Basin. Eolianite is a consolidated sedimentary rock consisting of mineral granular material deposited by the wind, such as dune sand cemented below groundwater level by calcite (Brooke 2001). Playford and Cockbain (1976) subsequently proposed the current name Tamala Limestone preferring the lithologic rather than genetic term. The type locality is at Womerangee Hill on Tamala Station located south of Shark bay at latitude 26°54'15"S. The name Tamala Limestone more generally refers to Quaternary coastal carbonate eolianites in all of coastal Western Australia, encompassing widespread and voluminous marine and eolian carbonate deposits extending more than 1000 kilometres (km) from Cape Range on the central coast to Albany on the south coast. Brooke (2001) refers to the Australian carbonate eolianite as “the world’s most extensive eolianite deposits” (Figure 2-1).
The Tamala Limestone has been the subject of numerous significant studies and related studies of late Quaternary sea level change. The close proximity to the margin of the Yilgarn Craton has been interpreted to suggest minimal tectonic instability during the Quaternary. Most studies focused on the geology and stratigraphy of the formation (e.g., Fairbridge 1948, 1950; Teichert 1947, 1950; Fairbridge and Teichert 1953; Logan et al. 1970, Playford et al. 1975; Playford and Cockbain 1976; Playford and Leech 1977; Semeniuk 1983; Playford 1990, 1997; Kendrick et al. 1991; Brooke 2001; Price et al. 2001; Murray-Wallace 2002; Tapsell et al. 2003; Hearty 2003; and Hearty and O’Leary 2008). Investigation has been focused on the outcrop geology, with relatively few studies of the formation’s hydraulic properties below the present day watertable. Small water-table gradients within the limestone near the coast suggest very large hydraulic conductivity. The few pumping test interpretations gathered in the literature give values from hundreds to thousands of metres per day (Davidson 1995).
Figure 2-1. Major tracks of carbonate eolianite in the world (after: Brooke 2001).
2.2. Geological setting In the Perth Basin, the Quaternary deposits parallel the present coastline and are bounded in the East by the Darling fault, which separates the basin from the adjoining Archaean Yilgarn Craton. The marine sequences increase in both age and elevation eastward. The Tamala Limestone forms the coastal strip up to 10 km inland, and unconformably overlies the

Tamala Limestone Geohydrology Page 4
Cretaceous and Tertiary formations (Leederville Formation, Osborne Formation, Lancelin Formation and Bassendean Sand; Figure 2-2 ). Most of the formation lies under the present sea level, extending up to 30 km offshore from the present coastline (Brooke et al. 2006). Along the coastal margin, Tamala Limestone is unconformably overlayed by the Becher Sand and Safety Bay Sand.
The formation represents a vast complex of former dunes that rise up to 258 metres (m) elevation, forming outcrops tens of metres thick in the south and probably over 150 m thick in the Naturaliste Region and Hutt River area (Playford et al. 1975; Playford and Cockbain 1976). Dune units are often interspersed with shallow-marine units in shore-parallel ridges. The most extensive of these is the Spearwood Dune System; however, there are also several lines of islands and offshore reefs (Figure 2-4).
Figure 2-2. Cenozoic stratigraphic column of the Perth region.

Tamala Limestone Geohydrology Page 5
Figure 2-3. Onshore and potential offshore submarine distribution of Tamala Limestone in the Perth region.
Figure 2-4: Lateral extent of Tamala Limestone in the Perth region.
Tamala Limestone Geohydrology Page 6
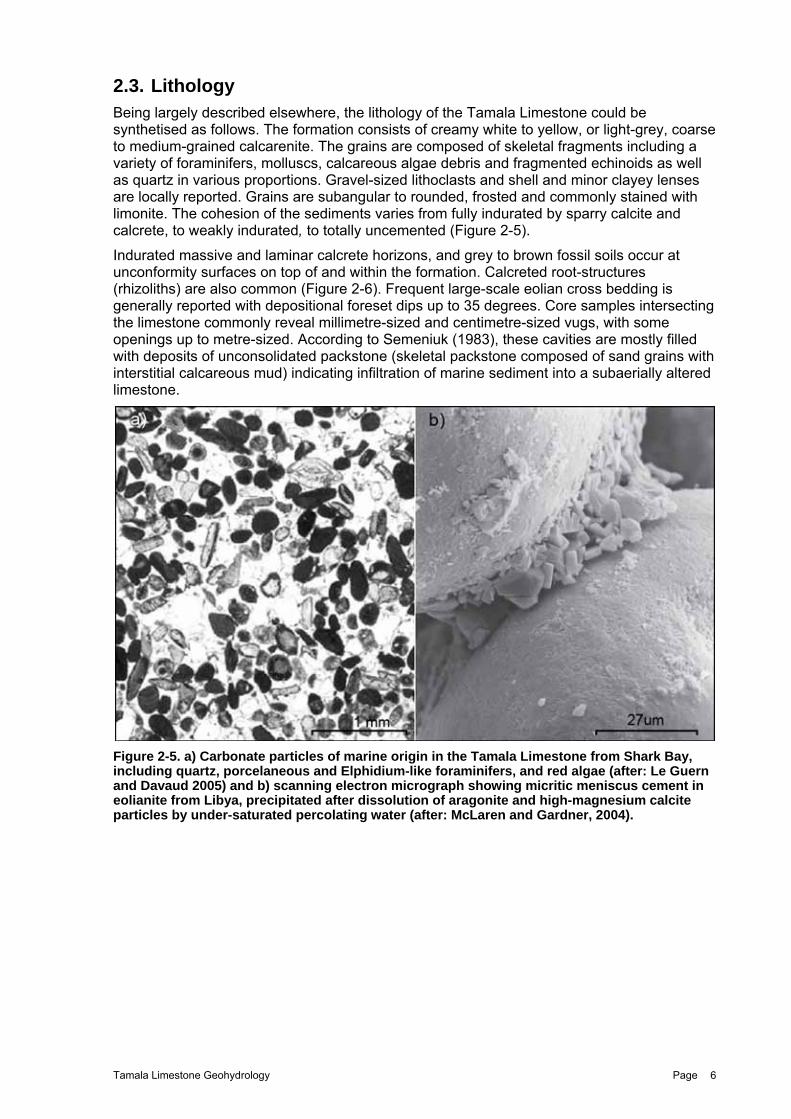
2.3. Lithology Being largely described elsewhere, the lithology of the Tamala Limestone could be synthetised as follows. The formation consists of creamy white to yellow, or light-grey, coarse to medium-grained calcarenite. The grains are composed of skeletal fragments including a variety of foraminifers, molluscs, calcareous algae debris and fragmented echinoids as well as quartz in various proportions. Gravel-sized lithoclasts and shell and minor clayey lenses are locally reported. Grains are subangular to rounded, frosted and commonly stained with limonite. The cohesion of the sediments varies from fully indurated by sparry calcite and calcrete, to weakly indurated, to totally uncemented (Figure 2-5).
Indurated massive and laminar calcrete horizons, and grey to brown fossil soils occur at unconformity surfaces on top of and within the formation. Calcreted root-structures (rhizoliths) are also common (Figure 2-6). Frequent large-scale eolian cross bedding is generally reported with depositional foreset dips up to 35 degrees. Core samples intersecting the limestone commonly reveal millimetre-sized and centimetre-sized vugs, with some openings up to metre-sized. According to Semeniuk (1983), these cavities are mostly filled with deposits of unconsolidated packstone (skeletal packstone composed of sand grains with interstitial calcareous mud) indicating infiltration of marine sediment into a subaerially altered limestone.
Figure 2-5. a) Carbonate particles of marine origin in the Tamala Limestone from Shark Bay, including quartz, porcelaneous and Elphidium-like foraminifers, and red algae (after: Le Guern and Davaud 2005) and b) scanning electron micrograph showing micritic meniscus cement in eolianite from Libya, precipitated after dissolution of aragonite and high-magnesium calcite particles by under-saturated percolating water (after: McLaren and Gardner, 2004).

Tamala Limestone Geohydrology Page 7
Figure 2-6. Tamala Limestone features: a) cross bedding, b) calcreted roots, c) calcrete layer, known as kankar or cap rock, and d) paleosol.
2.4. Proposed depositional model The concept of speleogenesis governed by stratification has been considered for some time (Lowe 1992, 2000). More recently, Filipponi et al. (2009) demonstrated the role of inception horizons in karst conduit formation. Within Tamala Limestone, cross-bedding deposits, paleosols and calcrete layers are likely to act as inception horizons. According to White (1994) and Hearty and O’Leary (2008) these features are a source of preferential flow development, rock dissolution and possibly cave formation.
The term carbonate eolianites is used here as the generally accepted term to describe lithified, carbonate coastal dunes of Quaternary age, encompassing shallow-marine and terrestrial facies, of predominantly eolian origin. The question of whether carbonate eolianites were deposited under conditions of high or low sea level has been controversial (e.g., Logan et al. 1970; Playford and Cockbain 1976; Playford 1990; Kendrick et al. 1991; Bastian 1996; Brooke 2001; Price et al. 2001; Kindler and Mazzolini 2001; Hearty 2003; Bateman et al. 2004). Hearty and O’Leary (2008) and Mylroie (2008) recently presented convincing arguments and produced a relevant depositional model for Bahamian carbonate eolianites.
For the Western Australia margin, a proposed depositional model is summarized in Figure 2-7. A stratigraphic cycle begins when sea level is raised above the continental platform,

Tamala Limestone Geohydrology Page 8
flooding the initial depositional surface and creating submarine space for sedimentation associated with eustacy and subsidence (Figure 2-7b). The terrigenous influx rate determines whether transgression, regression or a stationary shoreline is produced. A low terrigenous influx generates a retrograding depositional system (transgression) and creates a shallow marine environment on low-gradient platforms. Rapid relative sea level rise and subsidence intensify this phenomenon. Carbonate production begins and sediment is produced. Wave action reworks sediments into beaches, which become the source area for early development of eolianites. Because the reefs have not grown up to the wave base, and because coastal aggradation does not fill newly created spaces, the lagoon and beach environment is constantly mobilized to form voluminous transgressive-phase eolianites. These early eolianites are commonly notched by waves as the transgression persists. During the following sea level highstand, as aggradation continues, the bathymetry is reduced (decreasing available space) and reefs grow up to wave base, creating a more quiescent environment. Wave energy decreases, causing a reduction of sediment mobilization and a decrease in production of eolianites (Figure 2-7c). When sea level falls, accumulated shallow-marine sediments are reworked by the regressing shoreline forming the so called regressive-phase eolianites (Figure 2-7d). During the long-duration sea level lowstand, erosion of the lithified eolianites generates an epikarst over which atmospheric dust accumulates, forming a terra rossa paleosol (Figure 2-7a).
According to Mylroie (2008) structural and diagenetic differences exist between transgressive-phase and regressive-phase eolianites. Structural features described in the depositional model were observed at different sites visited during the study, including Meteor quarry in Nowergup, the Fremantle Prison tunnels, and Hamelin Bay. Examples can be seen in Figure 2-8.
Figure 2-7. Proposed model of carbonate eolianite deposition along the Western Australian coastline: a) lowstand sea level, terra rossa soil and terrigenous coastal dunes develop on eroded previous deposits; b) sea-level rise, terrigenous flux is insufficient for progradation, transgression creates shallow-marine conditions, carbonate production begins, and wave action mobilizes the sediment forming transgressive-phase eolianites; c) highstand sea level, coral reefs weaken wave action, carbonate sediment accumulates in a low-energy foreshore zone, no eolianite is produced; d) sea-level fall, lowered wave base passes through the reefs and reworks accumulated carbonate sediments to form regressive-phase eolianites, carbonate production decreases with bathymetry and finally stops at the edge of the platform.

Tamala Limestone Geohydrology Page 9
Figure 2-8. Meteor quarry in Nowergup: a) cross bedding planes, sedimentation discontinuity and solution pipes; b) cross section of a solution pipe filled with roots. Fremantle Prison tunnel: c) discontinuity at approximately 15-m depth below ground surface; d) paleo-solution pipe open from the discontinuity down to the roof of the tunnel at approximately 20-m depth. Hamelin Bay: e) terra rossa paleosol.
2.5. Timing of deposition The proposed depositional model suggests that carbonate eolianites were deposited shortly before and after interglacial highstands if large rates of carbonate production were possible. Other authors have similarly reasoned that sediments were deposited when sea level rapidly changed (e.g., Bateman et al. 2004; Loope and Abbeg 2001). Except for a few tropical coasts, present-day wind energy in coastal areas is sufficient to develop dunes (Loope and Abbeg 2001). Thus, the shallow-water carbonate production rate remains as the critical factor influencing eolianite production. This must be large enough to sustain the generation of extensive and thick dune deposits. Carbonate production is dependent on sea temperature and bathymetry. Production and accumulation rates can respectively reach 100 metres per thousand years, and 20 metres per thousand years in shallow reefs under tropical conditions (Smith and Nelson 2003).
The Tamala Limestone represents a radical change in the nature of sedimentation in the Perth Basin during the Pleistocene. The predominantly siliciclastic environment of deposition of the Pliocene and Early Pleistocene (e.g., Ascot Formation and Yoganup Formation) changed to a strong carbonate environment. Kendrick et al. (1991) give as a probable explanation the development of a coastal plain caused by coastal progradation during Late Pliocene and Early Pleistocene. This process might have reduced the injection of terrestrial

Tamala Limestone Geohydrology Page 10
clastics into the nearshore zone and enhanced the carbonate signal in submarine sediments. The development of a coastal plain was accompanied by an increased sea surface temperature (activated Leeuwin Current) which could have facilitated higher rates of carbonate production during the Middle Pleistocene. During the transgressive event of the Late Pleistocene (Marine Isotope Substage 5e) inshore surface temperatures were probably at least 2 degrees Celsius (°C) greater than today.
Dravis (1996) observed a lithification rate of 10–20 centimetres (cm) in 10 years for Bhamian carbonate eolianites. Kindler and Mazzolini (2001) suggest that the models of carbonate eolianite formation that imply the remobilization of subtidal sands following a sea-level fall, can only be verified if climatic conditions were arid enough to greatly reduce the rate of meteoric diagenesis. The arid climatic conditions of Western Australia could have favoured production of eolianites by delaying cementation of its marine source sediments and by reducing the watertable elevation, allowing sediment deflation.
Age dating of the Tamala Limestone and corals using various methods (e.g., Uranium-thorium (U/Th) dating, Thermoluminescence (TL) dating, and Amino Acid Racemization (AAR) dating) have been conducted to link the deposits with sea level (Kendrick et al. 1991; Stirling et al. 1995; Price et al. 2001; Hearty 2003; Hearty and O’Leary 2008). Most of these dating results are consistent with the timing of carbonate eolianite formation proposed by the depositional model. Hearty (2003) defined six age units within Tamala Limestone, with the most recent eolianites being deposited approximately ten thousand years before present (10 Ka) during Marine Isotope Stage 1 (MIS 1). Measured eolianite age on the mainland decreases seaward and is youngest on Rottnest Island, approximately 20 km offshore from the present-day coastline (Figure 2-9). The main periods of carbonate eolianite deposition appear to correspond to MIS 5e (~125 Ka), MIS 7 (~200 Ka), MIS 9 (~330 Ka) and MIS 11 (~420 Ka) on the mainland, and MIS 1 (~15 Ka), MIS 5a (~80 Ka) and MIS 5c (~100 Ka) on Rottnest Island. The Marine Isotope Stages can be seen in Figure 2-10.
A summary of relative sea-level history around the western and southern Australian shelves during the past 4.5 thousand years is given in Figure 2-10. The graph represents sea-level interpretations compiled from a number of different studies, including Stirling et al. (1995), Chappell et al. (1996), Wolanski and Chappell (1996), Winograd et al. (1997), Pillans et al. (1998), Fleming et al. (1998), Lambeck and Chappell (2001), Belperio et al. (2002), Murray-Wallace (2002), Bateman et al. (2004), Sloss et al. (2007) and Semeniuk (2008). In Figure 2-11, the compromise sea-level curve and the MIS eolianite deposition periods are overlaid on the Tamala Limestone cross section as a reference for possible interpretation of unconformities in the carbonate eolianites and diagenesis.

Tamala Limestone Geohydrology Page 11
Figure 2-9. Age measurements of carbonate eolianites showing a general pattern of decreasing age seaward and offshore.

Tamala Limestone Geohydrology Page 12
Figure 2-10. Paleo-sea level interpretations during the late Pleistocene and Holocene from Australian studies; the compromise curve is interpretive and follows the curve of Pillan et al. (1998) without reproducing the short-period variations for age >250 Ka, and from 0 to 250 Ka the curve is the smoothed average of all the curves shown.
Figure 2-11. Perth basin cross section and relative sea level change derived from Australian studies; sporadic dating of surface deposits indicates that carbonate eolianite age decreases seaward and offshore.

Tamala Limestone Geohydrology Page 13
3. REVIEW OF EXISTING HYDROLOGIC INFORMATION
3.1. Borehole lithology records Within the extent of the greater Perth region (Figure 3-1) the Western Australian Government WIN (Water INformation) database contains more than sixty-thousand lithology records that constitute information for more than nine-thousand borehole locations. The individual lithology records are descriptive and relate to a specified elevation interval within a borehole. A large variety of textual descriptors are used to portray the composition, texture, colour, fabric, etc. of the rock samples retrieved during drilling. The lithology records can also contain descriptions of secondary porosity, particularly when the scale of dissolution features is visually obvious within the rock samples or when the presence of voids, cavities and large permeability affect the progress of drilling. Examples include sudden variation of drilling resistance and loss of circulation of drilling fluids. These phenomena are variously recorded in drilling records using terms such as vuggy, cavernous, karstic, etc.
The automated method of Pollock et al. (2011) analyses a database of descriptive lithology records using a regular expression. Details of the method and the concept of parsing text using regular expressions are given in the paper. In this study, the method is applied to identify the existence of the following terms within the WIN database lithology records:
vug, vugh or vuggy
solution channel or pipe
dissolution
void; cavity, cavities or cavern
loss or lost circulation
karst or karstic
speleotherm
The selected terms are based on an informal procedure to identify the most common descriptors contained in the database. Variations and misspellings are accommodated by the regular expression. A summary of results is presented in Table 3-1 and Figure 3-1.
A total of 9,584 borehole records, consisting of 62,376 lithology records were analysed. Approximately 48 percent of the borehole locations are found to lie within the recognised extent of Tamala Limestone. These locations are plotted in Figure 3-1 using a blue symbol. Within the Tamala Limestone, approximately 300 borehole records (7 percent) are found to contain at least one of the above secondary-porosity descriptor in at least one lithology record. These locations are plotted in Figure 3-1 using a yellow symbol. The lithology records constituting the remaining 4,233 borehole records (93 percent) do not contain any of the specified secondary-porosity descriptors.
The results of the analysis should be treated as indicative because there is no formal requirement or standard for reporting of karst features by drillers. Accurate recording of this type of information is generally dependent on the circumstance under which the drilling was completed and the purpose of the drilling.

Tamala Limestone Geohydrology Page 14
Table 3-1. Summary of borehole lithology records within the Perth region.
Figure 3-1. Boreholes lithology logs within the Perth region; approximately seven percent of lithology logs located within the Tamala Limestone contain at least one term describing secondary porosity within the drilled depth of the formation.
3.2. Hydraulic conductivity measurements Groundwater pumping tests conducted within the Tamala Limestone reveal that the formation is extremely transmissive. A summary of the data compiled for this study is contained in Table 3-2. The range of associated hydraulic conductivity values is of the order
Number Percentage Number Percentage
Borehole lithology logs containingat least one descriptor ofsecondary porosity
339 4% 300 7%
Borehole lithology logs containingno descriptors of secondaryporosity
9,245 96% 4,233 93%
Perth region(see map)
Tamala Limestone extent(see map)

Tamala Limestone Geohydrology Page 15
102–103 m/d, which is beyond the range normally expected for most consolidated materials other than fractured and weathered rock (Bouwer 1978). Unconsolidated parts of the formation are predominantly medium-texture quartz sand with hydraulic conductivity values that are typically of order of magnitude 101 m/d. The much larger values of hydraulic conductivity obtained from the pumping tests indicate enhanced permeability zones that are connected over length scales of hundreds of metres to kilometres.
Pleistocene carbonate eolianites of the Bahamian Archipelago, known as the Lucayan Limestone, also exhibit very large hydraulic conductivity associated with dissolutional secondary porosity. The Lucayan Limestone is the principal water-supply aquifer throughout the Archipelago. Whitaker and Smart (1997) summarised 244 single-well pumping tests conducted on fourteen islands and found geometric means of hydraulic conductivity on individual islands varying from 2 m/d for Exuma (15 tests) up to 1,200 m/d for Grand Bahama Island (74 tests). The mean hydraulic conductivity of the Lucayan Limestone for the entire Archipelago based on all of the 244 pumping tests was 160 m/d. The largest estimate from a single test was 13,000 m/d. Hydraulic conductivity values for the Tamala Limestone (Table 3-2) vary within a comparable range, suggesting that secondary porosity development and diagenetic permeability enhancement within the two formations may be similar.
Contrasts in hydraulic conductivity of Pleistocene carbonate eolianites of Bermuda have also been investigated by Vacher (1978) and Vacher et al. (1990). Vacher (1978) inferred a factor 14 difference in the estimated hydraulic conductivities of the Paget (younger) and Belmont (older) carbonate eolianites making up the north and south coasts of Bermuda. Fitting of a Dupuit-GhybenHerzberg model to the observed saltwater interface position (Vacher et al. 1990) indicated bulk hydraulic conductivity values for the Paget and Belmont units of 80 m/d and 1,000 m/d, respectively. These values are also broadly consistent with the large hydraulic conductivity measurements within Tamala Limestone and Lucayan Limestone.
Pumping test results for the Tamala Limestone are supported by calibrated values of hydraulic conductivity derived from local-scale and regional-scale groundwater modelling within the greater Perth region. The model-derived values summarised in Table 3-3 fall within the range 20 m/d to 3,000 m/d.
Table 3-2. Measured hydraulic conductivity of Tamala Limestone in the Perth region.
Transmissivity
m2/dayHydraulic condictivity
m/d
Kwinana *2,000–5,000 100–250 Slug tests Walker (1994)
Kwinana 40,000 *2,000 Pumping test Nield (1999)
Kwinana 9,000–54,200 *450–2,710 Pumping tests PPK (2000)
Perry Lake 1,009–7,620 27–205 Pumping tests Rich (2004)
Floreat *2,000 100 Pumping tests Bekele et al. (2006)
Lake Preston 180–1,189 14–80 Pumping tests Commander (1988)
Yanchep *36,000 1,800 Pumping tests Rockwater (2005)* equivalent value for 20-m thick aquifer
Test results
Localtion Method Reference

Tamala Limestone Geohydrology Page 16
Table 3-3. Model-calibrated values of hydraulic conductivity for Tamala Limestone.
3.3. Groundwater transport investigations Two distinct views exist regarding groundwater movement within Tamala Limestone, though neither is necessarily correct. In the first, the eolianite is conceptualised as containing vughs, cavities and caverns that make predictions of groundwater flow and transport difficult and unreliable. This viewpoint is based predominantly on drilling evidence and observations of void structures in surface outcrops of Tamala Limestone, and maintains that detailed investigation of local karst features is required to understand and predict groundwater flow. The second contrary viewpoint is based on the apparent absence of empirical evidence of karst flows after more than 180 years of groundwater utilisation. Despite continual use of the coastal groundwater system since the Swan River Colony was established in 1829 there is no history of karst flow management in relation to groundwater supply. Nonetheless, it is recognised that the formation is extremely transmissive owing to secondary porosity development, and hydraulic gradients are very small, which can make the determination of groundwater flow direction difficult.
The purpose of this section is to explore the above issues by considering evidence from existing groundwater transport investigations. This involves review of groundwater monitoring at contaminated sites in the Perth region, and review of groundwater monitoring at wastewater treatment plants were infiltration of treated wastewater into Tamala Limestone is practiced.
3.3.1. Contaminated sites
The review of contaminated sites in the Perth region reveals that it is relatively uncommon to have sufficient groundwater monitoring information to accurately map the geometry of a contaminated groundwater plume. Nine studies are identified in which the shape of the plume is relatively well known; however, even in these studies the details of groundwater transport at the local scale are based on interpolation between limited numbers of observation points. The nine site locations are indicated on the map in Figure 3-2 and a graphical summary of the interpolated plume geometries can be seen in Figure 3-3. The plumes are numbered arbitrarily from 1 to 9 for convenience.
Only two of the nine plumes are known to be located within Tamala Limestone calcarenite. These are the northern and southern nitrogen plumes (7 and 8) which discharge into Cockburn Sound within the Northern Harbour boating marina (PPK 2000). Other plumes within the extent of the Tamala Limestone are mostly contained within unconsolidated sandy deposits. The Canning Bridge hydrocarbon plume (6) is present within Tamala Limestone sand and other fluvial deposits associated with the Swan-Canning River estuary channel (Westbrook et al. 2005). These include shelly horizons and clay layers. Similarly, the Jolimont trichloroethene plume (4) is contained within upper unconsolidated Tamala Limestone sands (Benker et al. 1997) which are alternatively referred to as the Spearwood Dunes (Davidson 1995). The Kwinana mixed chlorophenal plume (9) is present within a shallow sand aquifer in the Safety Bay Sand and is reported to be separated from the underlying Tamala Limestone calcarenite by a 1–2 m thick silty aquitard (Davis et al. 2007) .
Localtion Groundwater model Calibrated hydraulic conductivity of Tamala
Limestonem/d
Reference
Kwinana Cockburn Groundwater Area model 400–3,000 Nield (1999)
Kwinana Norther Harbour groundwater model 900 PPK (2000)
Perth region PRAMS 75–850 Davidson and Yu (2006)Smith and Pollock (2010)
Peel-Harvey region PHRAMS 20 URS (2009)Smith and Pollock (2010)
PHRAM - Peel-Harvey Regional Aquifer Modelling System, PRAMS - Perth Regional Aquifer Modelling System

Tamala Limestone Geohydrology Page 17
The other four plumes (1, 2, 3 and 5) are all located east of the Tamala Limestone formation within the Bassendean Sand.
The direction of groundwater transport and plume development at all sites is reported as being generally consistent with the regional groundwater flow directions. These are indicated by the arrows in Figure 3-3. A notable feature of the comparison of plume shapes is the difference between their widths; the plumes within the Tamala Limestone are generally broader than those in the Bassendean Sand. This is particularly evident for both of the Northern Harbour nitrogen plumes. It is also evident that the flow axis of the southern Northern Harbour plume is off-set to the south of its source location. The northern plume emanates from a diffuse source area defined by the geometry of former biosolids drying beds at the Woodman Point Wastewater Treatment Plant. The southern plume emanates from a point source where wastewater was formerly injected into the Tamala Limestone under licence. It is narrower than the northern plume but nonetheless broad for a point source. For example, compare the much narrower plumes in the Bassendean Sand at Eden Hill (Davis et al. 1999) and Dianella ( B. Patterson (CSIRO Land and Water) 2009, pers. comm.). The extent of lateral spreading of both of the Northern Harbour plumes within the Tamala Limestone calcarenite is suggestive of macro-dispersion, which might be attributable to tortuous flow through zones of enhance hydraulic conductivity. The shape and dispersion of the plumes suggests that the scale of tortuosity is much larger than the interstitial matrix scale. It is also possible that forced hydraulic gradients resulting from the infiltration and injection at these sites might be responsible for enhanced lateral spreading of the plumes.
There is no obvious evidence of unusual transport phenomena caused by large conduit systems or connected cavern systems within the Tamala Limestone at the contaminated sites. Nevertheless, the scope of the review is limited to a small number of locations and the results do not provide definite evidence of either macro-dispersion within the formation or an absence of large-scale karst features.

Tamala Limestone Geohydrology Page 18
Figure 3-2. Contaminated site locations.

Tamala Limestone Geohydrology Page 19
Figure 3-3. Interpreted plume geometries at contaminated sites in the Perth region.
3.3.2. Treated-wastewater infiltration
The Perth region contains more than fifteen wastewater treatment plants that process approximately 120 GL of wastewater every year (335 ML/d). Although most of the treated wastewater is discharge to the marine environment via ocean outfalls, four treatment plants within the Perth region use infiltration basins as the principal disposal method. All four plants service coastal communities that overlie the Tamala Limestone (Figure 3-4). A review of the infiltration practices and related groundwater monitoring information at the sites was conducted to ascertain if obvious patterns of groundwater movement within the Tamala Limestone are evident. Unfortunately, there is insufficient groundwater information to enable detailed mapping of treated-wastewater plumes at these facilities. An overview of the review is presented in this section, and additional supporting information is contained in Appendix A.
Table 3-4 presents a synopsis of the infiltration practices and groundwater monitoring activities at the Gordon Road, Halls Head, Caddadup and Yanchep wastewater treatment plants (WWTP). At all four plants, the treated wastewater is discharged into shallow unlined basins where it is lost through infiltration and percolation to the underlying watertable, and through direct evaporation. Each facility has several basins to allow sequential use of the

Tamala Limestone Geohydrology Page 20
basins, and alternating drying, scraping and rejuvenation. The hydraulic loading rates at the plants vary from what can be considered as a small-scale artificial recharge facility (less than 1 ML/d) to a medium-scale facility (1 to 10 ML/d). In total, the four plants process approximately 12 ML of wastewater each day, with Gordon Road processing around two-thirds of the total (8.2 ML/d).
Groundwater monitoring at the infiltration facilities is conducted to comply with operating licence conditions. The number of groundwater observation wells at each site varies from three at Yachep to ten or more at Gordon Road and Caddadup. Groundwater samples are collected 2 to 4 times per year and analysed for salinity (total dissolved solids and electrical conductivity) and nutrient concentrations (nitrogen species and total nitrogen and total phosphorus). The quality of the treated wastewater is also monitored.
Groundwater monitoring at the Gordon Road infiltration facility indicates a broad groundwater mound beneath the basins (Figure 3-5). The geometry of the mound to the north and west of the basins is unclear due to insufficient observations. Application of the Glover (1961) basin infiltration solution provides an estimate for aquifer transmissivity of approximately 3200 m2/d in the region of the Gordon Road facility. The equivalent hydraulic conductivity for an assumed 20-m saturated thickness is 160 m/d. The solution assumes an infiltration area of 5.5 ha, an average infiltration rate of 0.15 m/d, an aquifer specific yield of 0.3, and a watertable rise of approximately 1 m at a radial distance of 250 m from the centre of the recharge area after 1 year of operation. Groundwater in the aquifer to the east of the basins—between the basins and Harvey Estuary—has similar salinity to the treated wastewater but has lower concentrations of total oxidised nitrogen (Table 3-5). This may indicate dilution or transformation of nitrogen in the treated wastewater during its passage through the aquifer. Elevated groundwater salinities and nitrogen concentrations in observation wells 1/88 and 4/88, and in the production well, indicate that there may be a contaminant plume emanating from the biosolids bed. Overall, there is insufficient groundwater data to infer a detailed picture of the movement of treated wastewater within the Tamala Limestone in the vicinity of the Gordon Road infiltration facility.
Less information is available at the other infiltration sites. A small watertable mound is evident beneath the infiltration basins at Halls Head (Toze et al. 2003); however, the groundwater quality data is inadequate to delineate the plume of treated wastewater within the aquifer. Application of the Glover (1961) basin infiltration solution provides an estimate for aquifer transmissivity of approximately 4600 m2/d in the region of the Halls Head facility. The solution assumes an infiltration area of 2 ha, an average infiltration rate of 0.14 m/d, an aquifer specific yield of 0.3, and a watertable rise of approximately 0.3 m at a radial distance of 106 m from the centre of the recharge area after 1 year of operation. The equivalent hydraulic conductivity for an assumed 20-m saturated thickness is 230 m/d. At the Caddadup facility, there is insufficient groundwater-level information to establish the local watertable contours and groundwater flow directions. At the Yanchep infiltration site, the small hydraulic loading of approximately 3–4 L/s (0.3 ML/d) appears to have an indiscernible effect on the local watertable elevation and groundwater flow direction.
Thus, despite managed wastewater recharge into the Tamala Limestone of approximately 4.5 GL each year, clear delineation of treated wastewater plumes in the aquifer is difficult due to the large transmissivity of the formation, the indistinct quality of the treated wastewater relative to the ambient groundwater quality, the limited number of groundwater observation sites, and the positioning of infiltration facilities close to coastal discharge areas. Specifically, the groundwater monitoring at these facilities does not provide particular insight about secondary porosity in Tamala Limestone or the possibility of preferential groundwater flow within the formation under artificially-induced hydraulic gradients. The watertable mounds beneath the Gordon Road and Halls Head recharge basins are generally low and broad, with apparent symmetric geometries. This is indicative of large hydraulic conductivity; however, it is concluded that not much else about the geohydrology can be inferred from the available groundwater information. Additional parameters to discriminate reclaimed water presence and fraction at groundwater observation wells would assist in reducing uncertainty at those sites.

Tamala Limestone Geohydrology Page 21
Table 3-4. Summary of treated wastewater infiltration in the Perth region.
Table 3-5. Selected groundwater monitoring results at the Gordon Road WWTP.
Measurement frequency
L/s ML/d GL/yr Per year
Gordon Road Tertiary 95 8.2 3.0 10 SWL, pH, NH4, NO3+NO2, TN, TP, TDS, E.coli
4
Halls Head Tertiary 32 2.8 1.0 6 SWL, pH, TN, TP, TDS, EC
4
Caddadup Activated sludgePond (pre-2008)
13 1.1 0.4 12 SWL, pH, NH4, NO3+NO2, TN, TP, TDS
4
Yanchep Advanced secondary
3.5 0.3 0.1 3 SWL, pH, TN, TP, TDS, EC
2
SWL - standing water level, NH4 - ammonium, NO3+NO2 - nitrate and nitrite, TN - total nitrogen, TP - total phosphorus,TDS - total dissolves solids, E.coli - Escherichia coli , EC - electrical conductivity
Wastewater treatment plant
Wastewater treatment type
Monitoredattribute
Average inflow rate2008–2009
Number of observation
wells
Average SWLJan'04–Apr'10
Average ECJul'08–Jun'10
Average NO3+NO2Jul'08–Jul'10
m AHD mS/m mg/L
1/98 0.7 69 1.3
3/98 0.6 74 <0.05
1/01 75 3.6
2/98 0.8 79 <0.05
3/88 1.0 79 3
4/97 1.0 83 2.8
1/97 1.0 85 2.7
2/97 1.0 85 2.8
4/88 0.8 101 7
3/97 0.9 104 2.5
PB (Jul'08–Jun'09) 125 9
1/88 1.1 138 26
Pond water (Jul'08–Jun'09) 78 8.4
Observation well
SWL - standing water level, EC - electrical conductivity, NO3+NO2 - nitrate and nitrite

Tamala Limestone Geohydrology Page 22
Figure 3-4. Treated-wastewater infiltration sites.
Figure 3-5. Groundwater observation wells and interpreted watertable contours at the Gordon Road WWTP.

Tamala Limestone Geohydrology Page 23
4. FIELD INVESTIGATIONS The field investigations undertaken in this study were conducted at the four field sites indicated in Figure 4-1. Various factors influenced the number and locations of these sites, including: the objective to collect eolianite samples from below the watertable and over the full saturated depth of the formation; the potential for obtaining good quality nuclear magnetic resonance (NMR) measurements, which are susceptible to electromagnetic interference associated with industrial and urban infrastructure; the thickness of unsaturated formation between the watertable and ground surface; and the amount of drilling that was possible within the limits of the project budget. Further detail is given in the following sections.
Figure 4-1. Field investigation sites.

Tamala Limestone Geohydrology Page 24
Figure 4-2. Map of the Fremantle Prison tunnel network and instrument locations: dry sections of the tunnels are rendered in light grey; pressure data loggers are indicated by red symbols; circle – Micro-Diver, square – Baro-Diver.
4.1. Fremantle Prison tunnels The Fremantle Prison tunnels (Figure 4-2) were dug manually during the early 1870s to provide the first centralised water supply for the township of Fremantle. Vertical shafts were sunk to the watertable within the prison grounds, and horizontal collector tunnels were excavated within the zone of watertable fluctuation. Work on the tunnels continued for around 20 years (1872–1894) resulting in a total tunnel length of around 1 km. Groundwater drainage into the tunnel system was lifted to the surface using pumps. In 1888, the supply capacity of the system was 1,632 KL/day, which is equivalent to approximately 19 L/s or 0.6 GL/yr. A brief summary of additional historical information relating to the prison water supply system is contained in Appendix B.
Within the context of the present study, the prison tunnels represent a 1-km gallery network that provides a unique in-situ view of the Tamala Limestone formation at the present-day watertable elevation. Compared to a vertical borehole, which provides an essentially one-dimensional vertical profile of the formation at a single location, the tunnels afford a three-dimensional view at depths of 1–2 m above and below the watertable. Only the southern section of the tunnel network (south of tunnel E6) is safe for access and investigation. Access is made through the main shaft S7. South of S7, the tunnels are navigable by small punts (Figure 4-3a) and tours are conducted daily. Tunnels NW1, NW2 and NE2 are at a

Tamala Limestone Geohydrology Page 25
slightly higher elevation and are only occasionally flooded. The watertable rises to a maximum of approximately 0.3 m above the base of these tunnels during winter. The preferred location for investigations conducted in this study was the maintenance tunnel N1 (between S5 and S1) as it is less disturbed by the tours.
4.1.1. Visual evidence of secondary porosity
Visual and photographic inspection of around 500 metres of the tunnel network did not reveal evidence of dissolutional porosity structures at scales greater than a few millimetres. This observation appears to be consistent with the absence of any historical documentation of karst intersection during digging and excavation works. Carbonate dissolution along bedding planes, which provide inception horizons in karst development (Lowe 2000, Filipponi et al. 2009) appeared to be the most likely structural feature supporting secondary porosity enhancement under saturated flow conditions; an example can be seen in Figure 4-3b.
Despite intersection of only 1–2 m thickness of saturated formation, groundwater drains rapidly into the tunnels system when it is pumped; indicating large hydraulic conductivity within a relatively thin zone that does not exhibit visual evidence of secondary porosity development at scales greater than millimetres. Attempts to dewater tunnel sections to allow for renovation and improvement works were reported to have been mostly ineffective (B Bowker (Property Manager, Fremantle Prison) 2009, pers. comm.). There was no evidence of significant seepage faces above the watertable, which confirmed that groundwater flows easily through the formation. Overall, it is apparent that the large permeability of the Tamala Limestone at the location of the tunnels is probably not attributable to discrete dissolutional features such as solution pipes and cavities.
Figure 4-3. Inside the aquifer at the Fremantle Prison tunnels: a) tunnel section and exposed watertable, b) eolianite beds at the watertable, c) living tree root, d) rhizoliths, e) shell bed within shaft S1.
4.1.2. Tunnel water level and water temperature
Water level and temperature in the tunnels were measured hourly at the four locations shown in Figure 4-2 using Micro-Diver pressure data loggers (Schlumberger Water Services). A water-level scale for manual readings was also installed in shaft S1. Barometric pressure and air temperature in the tunnels were monitored in shaft S7 using a Baro-Diver (Schlumberger

Tamala Limestone Geohydrology Page 26
Water Services). Water conductivity was measured opportunistically at different locations using a Horiba U-10 instrument.
Despite being a distance of 800 to 900 m from the ocean a small tidal response is evident in the tunnel water level. This fluctuation represents the propagation of diurnal tidal fluctuation in the ocean at the aquifer boundary and into the inshore formation up to a distance of 1 km or greater, and is further evidence of extremely large permeability. Table 4-1 list the tidal efficiencies for the five main diurnal tidal constituents Q1, O1, P1, S1 and K1, which are 2.1–2.3 percent. The tunnel therefore experiences daily tidal fluctuation equivalent to around 2 percent of the ocean tide. Water level records in the tunnels and in Fremantle Fishing Boat Harbour can be seen in Figure 4-4 and Figure 4-5. The time series were firstly de-trended and then the amplitudes of the tidal constituents were determined by discrete Fourier analysis. Tidal efficiency for each constituent is calculated as the ratio of the amplitude in the tunnel to the amplitude in the ocean expressed as a percentage. A brief description of the tidal method and discrete Fourier analysis is contained in Appendix P.
Observed propagation of the tidal signal between the ocean and tunnel system is characterised by the amplitude attenuation, as described above, as well as the time lag between daily minimum and maximum levels in the ocean and aquifer. Discrete Fourier analysis provides estimates of amplitude attenuation and time lag in the tunnels that are consistent with other study sites in the Perth region; however, the results from all of these sites are inconsistent with the theory of tidal propagation in single-porosity media. This characteristic of the eolianites is examined in more detail in Section 5, wherein a dual-medium model of the eolianites is proposed. The dual-medium model can reproduce the observed relations between amplitude attenuation and phase lag at each of the study sites, and suggests that the eolianites behave similarly to a fractured conducting medium. According to this model the aquifer is composed of a very permeable conducting medium that is in contact with a much less permeable medium that can locally store and release groundwater, and by this mechanism exchange groundwater with the conducting medium.
Table 4-1. Tidal efficiency within the Fremantle Prison tunnel network.
Diurnal tidal constituents
Frequency1/d
Periodd
Sea level amplitude
cm
Tunnel water level amplitude
cm
Tidal efficiencypercent
Q1 0.9023 1.1082 3.4 0.07 2.2%
O1 0.9375 1.0667 11.6 0.25 2.1%
P1 0.9961 1.0039 3.9 0.09 2.3%
S1 1.0078 0.9922 15.1 0.33 2.2%
K1 1.0195 0.9808 13.9 0.33 2.3%

Tamala Limestone Geohydrology Page 27
Figure 4-4. Fremantle Prison tunnel water level: a) detrended time series, b) spectral composition of the detrended data.
Figure 4-5. Sea level at Fremantle Fishing Boat Harbour: a) detrended time series, b) spectral composition of the detrended data.

Tamala Limestone Geohydrology Page 28
4.1.3. Flow measurements
During the course of investigating the tunnel network an observable water movement from the south to north was evident; illustrating the local gradient of the watertable from southeast to northwest, and associated ‘short circuiting’ of groundwater flow through the tunnels. Several attempts were made to measure the flow in the tunnels and to detect preferential points of subaqueous inflow and outflow across the tunnel walls, as a means for providing observable evidence of preferential groundwater flow through the eolianites.
Salt dilution gauging
Despite the suspected lack of water mixing in the flooded tunnel sections, a dilution stream flow gauging was attempted to estimate the open-channel flow in a section of the tunnel using the slug injection method. The flow Q was estimated by adding a sodium-chloride (NaCl) solution of known concentration 1C to the flow and measuring the dilution of the solution at a known distance downstream, where the chemical is assumed to have completely mixed with the stream flow. A measured volume V of the NaCl solution was added to the tunnel flow as quickly as possible in a single ‘slug’ and the downstream NaCl concentration 2C was measured as electrical conductivity and inferred from Kohlrausch's law to construct a graph of 2C versus time. Provided all the NaCl injected passed through the sampling cross-section, the flow was then estimated as:
2
1
)(2
1t
tdttC
VCQ (1)
where
1t is the time when NaCl was first detectable 2t is the time when NaCl ceased to be detectable
Figure 4-6. Dilution gauging attempt: a) measurement location, b) change in salt (NaCl) concentration versus time, c) water electrical conductivity profile before and one hour after salt injection.

Tamala Limestone Geohydrology Page 29
Several attempts were conducted at different locations using various concentrations. The determination of 2t was each time critical because the concentration did not recover to initial salinity within the measurement period.
Figure 4-6b shows the change in concentration 2C with time after injection of 1 L of solution at 100 g/L in shaft S7; note that the plot shows change in concentration 0.585 2][ CC g/L, where 0.585 g/L is the initial background concentration of the tunnel water. The time 2t was set when the value of 2C had stabilised and the integral was evaluated numerically as the area under the curve in Figure 4-6c. Equation (1) gave the corresponding flow rate
2.1Q L/s (184 m3/d). The final concentration of the tunnel water was 0.615 g/L, which is approximately 5 percent larger than the initial concentration. The electrical conductivity profile in Figure 4-6c indicates the stagnation of some solute at the bottom of the section. Consequently, the calculated discharge represents an upper limit as only a fraction of the salt passed through the control point.
Float gauging
Float observations were conducted in the tunnel using a small cylindrical float with diameter 5.4 cm and height 8 cm. In operation, approximately 7 cm of the float was underwater. To make a velocity measurement, the time taken for the float to pass a line normal to the flow direction, from its leading edge to its trailing edge, was recorded using a stop-watch. The float was released far enough upstream to attain a constant velocity at the measurement position. Thus, the velocity of the float is calculated as the diameter of the float (travel distance) divided by the time of travel. This procedure was repeated at several locations across the tunnel width. The corrected velocity of flow in each section is calculated by multiplying the float velocity by a correction coefficient, which is normally based on the shape of the flow vertical cross section, and the relative depth of immersion of the float. The adjustment factor 0.85F for smooth channel shaped cross sections is adopted (Buchanan and Somers 1969). The total discharge is computed by multiplying the area of the section by the average of the mean velocities.
The measured average velocity 37 m/d at the boat landing area at S7 is consistent with the observations of the tunnel guides who observe daily drift of the tour punts (small open boats) of approximately 40 m/d. The computed total discharge at this section of the tunnel is 0.42 L/s (36 m3/d). At the ‘upstream’ end of the tunnel, which terminates as a dead end at the southern-most extent of the tunnel system, the computed discharge is approximately 0.19 L/s (16.8 m3/d) and around half the value at the boat landing. The wetted cross-section area of the tunnel used for these calculations is 0.98 m2.Although the computed flows are much smaller than those estimated by dilution gauging, the magnitude of the flow estimates in relation to the very small hydraulic gradient suggest large diffuse flow capacity of the eolianite formation.
Temperature
In karst hydrology, temperature monitoring is commonly used to detect the presence of ephemeral groundwater springs and preferential flow through fractures, cavities and pipes. The water movement through secondary porosity is faster with less interaction with the matrix than water travelling through primary porosity. As a consequence, the dynamic of heat transfer is different and a slight contrast of temperature can appear between the two sources before a new balance is reached. A localised contrast of groundwater temperature after recharge is therefore a good indication of possible preferential flow paths. Such evidence should then be confirmed by other more conclusive investigations, such as direct flow measurements, indirect tracer measurements and geophysics.
Temperature investigations were conducted in the tunnels using an array of one hundred data loggers (Thermochron iButtons) that are each capable of recording the temperature with a discrete precision of 0.125°C. The loggers were attached to PVC pipes and arranged with uniform 5-cm spacing along the pipes. With the pipes submerged against the tunnel wall, it was possible to record 5-m long temperature profile over 20 days with a spatial resolution of 5 cm and a temporal resolution of 5 minutes (see Figure 4-7). The operation was repeated

Tamala Limestone Geohydrology Page 30
four times to cover a 25-m long profile in a section of the tunnels transverse to the expected groundwater flow direction.
The loggers recorded expected diurnal change in water temperature but revealed the absence of significant local contrast in water temperature (greater than 0.250°C). The result suggests the absence of localised conduit or fracture flow in the investigated section of the tunnels. The homogeneity of the temperature profile indicates that groundwater flow by lateral diffusion through horizontal open bedding planes may be dominant.
Figure 4-7. Survey of groundwater inflow temperature: a) investigated tunnel section, b) results for a 5-m profile measured continuously for 3 days.
4.1.4. Tunnel resistivity survey
A resistivity survey of dry tunnel section NE2 (Figure 4-8a) was undertaken to detect evidence of local heterogeneity that might signify the presence of larger scale karst features in the eolianites below the base of the tunnel network. According to Archie’s Law, the resistivity of the aquifer depends on the quality of the groundwater, the formation porosity and the nature of the rock. Variation in the bulk resistivity of the ground therefore indicates a change in one or more of these properties. Resistivity surveys are normally conducted at the ground surface to infer geological and hydrogeological information about the underlying ground to a depth determined by the survey configuration. In this study, the tunnel network provided a unique opportunity to acquire resistivity information directly below a subterranean surface corresponding approximately to the plane of the aquifer watertable.
The survey was conducted using a Syscal Pro Multi Channel Resistivity Meter connected to 61 electrodes and a multiplexer. The current was injected through an electrode couple (A and B) and the resulting potential difference was measured with a second electrode couple (M and N). The field procedures, electrode arrays and interpretation technique are detailed in Loke (2000). A 60-m long resistivity profile was obtained using a Wenner configuration with electrodes at 1-m spacing (Figure 4-8b and c). The Wenner data sets have been interpreted using the RES2DINV inversion software (Loke 2000). This produced the cross-section panel

Tamala Limestone Geohydrology Page 31
of modelled resistivity shown in Figure 4-8d, which penetrates to a maximum depth of approximately 10 m below the base of the tunnel section with a resistivity range of 20-500 ohm.m.
The presence of singular structures such as conduits or fractures below the water table would be characterized by lower resistivity patches. No such significant anomalies are evident in the inverse-model resistivity profile (Figure 4-8d) providing further evidence that secondary porosity is probably restricted to open bedding planes.

Tamala Limestone Geohydrology Page 32
Figure 4-8. Tunnel resistivity survey: a) resistivity line in tunnel section NE2, b-c) electrode configuration on the tunnel bed and d) resistivity sections.
4.2. Below watertable cores During the review of existing information sources it became apparent that contemporary conceptualisation of the Tamala Limestone is influenced by visual observations of surface outcrops and cuttings made for quarries and civil engineering works. It is also apparent that the current watertable elevation is probably within several metres of the maximum palaeo-

Tamala Limestone Geohydrology Page 33
watertable elevation, and that surface outcrops and cuttings above the watertable have not been subjected to the same saturated lateral flows and associated dissolutional diagenesis as deeper parts of the formation—including the current saturated aquifer zone. No existing or previous investigations of palaeo-watertable elevation in the coastal eolianites or previous comparative investigations of secondary porosity development above and below the modern watertable zone were identified in this study. On this basis, a decision was made to acquire continuous cores of the eolianite from ground surface to the base of the formation to secure rock samples over its full thickness and within the zone that is relevant to groundwater flow and transport.
4.2.1. Site selection
More than twenty prospective coring locations within the greater Perth region were identified based on land ownership and access, total coring depth, distance from the ocean, and their relative locations. Ultimately, four coring locations were sought with shallow depth to groundwater, to avoid coring large thicknesses of unsaturated formation above the watertable, and where access by drilling equipment was feasible and permission of the land management authority could be obtained. It was desirable that the coring sites were at various distances from the ocean to compare sites with and without the sea water interface. An east-west transect of coring location across the inshore width of the formation could not be identified and therefore a spread of four sites from north to south was pursued.
Prior to final selection of the coring sites an opportunity arose to acquire NMR (Nuclear Magnetic Resonance) measurements using a Vista Clara GMR system under trial by CSIRO. Trial measurements at prospective coring sites indicated that the instrument was adversely affected by electromagnetic noise in most built-up settings. On this basis, the three coring sites at White Hill Road, East Rockingham and Perry Lakes (Figure 4-1) were selected away from urbanisation to allow acceptable-quality NMR data to be acquired. The fourth coring site at Fremantle Park was selected to coincide with other investigations within the Fremantle Prison tunnel network (refer to Section 4.1). Subsequently, additional high resolution down-hole NMR (Nuclear Magnetic Resonance) measurements were acquired from all four core holes using a Vista Clara Javelin system which was trialled by CSIRO as part of a comparative evaluation of the Vista Clara instrument systems and NMR techniques.
Site access and drilling permissions were obtained from the Western Australian Department of Environment and Conservation for White Hill Road, the Western Australian Land Authority (LandCorp) for East Rockingham industrial Park, City of Fremantle for Fremantle Park and Town of Cambridge for Perry Lakes.
4.2.2. Coring procedure
Coring at the four field sites was conducted by Boart Longyear using a Sonic 200 series MINI rig (Figure 4-9a). A schematic overview of the coring procedure can be seen in Appendix C. In situ rock samples were collected by first advancing the 100-mm diameter coring barrel with no fluids air or mud. A 150-mm diameter casing override barrel was then advanced to the same depth and the core barrel retrieved for sample extrusion. The samples were extruded into plastic socks by vibration of the core barrel (Figure 4-9b) and then laid out in core trays and photographed for later reference (Figure 4-9c).
The sonic coring method was selected in preference to diamond core drilling in an attempt to avoid fluid escape and sample loss that is commonly experienced during diamond coring in variably lithified formations with secondary porosity. A key objective of the coring was to retrieve continuous sample from above the watertable to the base of the formation. The sonic coring method was successful in acquiring continuous sample but the sonic vibrations were too percussive and caused almost complete break-up of the formation. Although changes in the formation structure and porosity are evident from inspection of the samples, a deficiency of the coring was a failure to obtain in situ columns of rock that preserved the void structures over representative thicknesses of the formation.
The total length of core sample is approximately 120 m with an average coring depth of approximately 30 m at each site. Although low drilling resistance and well-developed

Tamala Limestone Geohydrology Page 34
secondary porosity was encountered in some layers, there was no evidence of large cavities within any of the four core holes in the form of either total loss of drilling resistance or missing sample.
Figure 4-9. Coring photos: a) Sonic 200 series MINI rig at White Hill Road, b) extraction of core sample into plastic sock, c) extracted core samples in a core tray.
4.2.3. Borehole completion
Graphical borehole construction logs for the four core holes are contained in Appendix D. Each borehole is backfilled with gravel to the estimated position of the Quaternary-Cretaceous unconformity and the hole within the Tamala Limestone formation is screened with slotted 80-mm diameter class 9 PVC from the top of the gravel backfill to above the watertable. The remaining section of the core hole is lined with un-slotted 80-mm class 9 PVC. All sections of PVC pipe are bell jointed. The annulus between the bore casing and the

Tamala Limestone Geohydrology Page 35
150-mm diameter borehole is backfilled with gravel to approximately 1 m above the slotted section of the casing. The remainder of the annulus contains a bentonite seal. The head works of each completed borehole consist of a 1.5-m section of 175-mm diameter galvanised steel casing with lockable cap. The top of the steel casing section is finished slightly below ground surface and is set within a concrete pad with hinged galvanised cover plate that sits flush with the concrete pad. Photographs of the head works can be seen in Appendix D.
4.2.4. Core logging
Graphical core logs are contained in Appendix E. They include the core tray numbers T1 to T43 that relate directly to the high resolution core tray images acquired using CSIRO’s HyChipsTM system*. Examples of high-resolution images and the reduced resolution images for each of the core trays are contained in Appendix G, H, I and J. HyChips is an integrated hardware and software system that produces high density spectral reflectance measurements and continuous high resolution colour imagery of solid drill core or drilling chips and powders. The sample reflectance measurements can be related to a library of mineral reflectance spectra to identify mineral groups present in the sample. The system identifies the relative abundance of a suite of minerals that have characteristic reflectance spectra in the visible-near-infrared to short-wave-infrared regions.
Figure 4-10. Examples of eolianite types in core samples: a) weakly cemented sand, b) well cemented with dissolutional porosity, c) well cemented with open bedding planes, d) calcrete cap rock.
The HyChips scans of the eolianite cores† show predominantly carbonate group minerals; however, the system is not suitable for distinguishing the relative abundances of individual carbonate minerals without additional assays on the core sample, which have not been conducted. The core sample contains a variety of eolianite types varying from weakly cemented sand, to well cemented eolianite with dissolutional porosity and open bedding planes, to calcrete cap rock. Examples of these forms can be seen in Figure 4-10. It is expected that this variation is indicative of a wide range of porosity types and associated permeabilities within the eolianites over spatial scales of a few meters and less. The graphical coring logs in Appendix E also indicate the depths within the cores at which larger rocks samples are available for further analysis. Examples are given in Figure 4-11. The * http://www.csiro.au/services/HyChips.html † The HyChips data files for the four cores from White Hill Road, East Rockingham, Fremantle Park and Perry Lakes are available by request to CSIRO. Each dataset is approximately 1 GB.The data files can be viewed and explored using CSIRO’s free TSG (The Spectral Geologist) Viewer available from http://www.thespectralgeologist.com/tsg_viewer.htm.

Tamala Limestone Geohydrology Page 36
largest dimension of these samples is around 100 mm, which corresponds to the diameter of the coring barrel.
4.2.5. Down-hole conductivity and gamma logs
Graphical down-hole conductivity and gamma logs for each of the cased boreholes, as completed after coring, are contained in Appendix F. The coastal sea water interface is evident at White Hill Road and Fremantle Park at depths of approximately 15 m and 23 m below ground surface, respectively. Crystallised salt was also evident in the dried core samples for these sites. The Fremantle borehole is located approximately 480 m from Fremantle Harbour (see Appendix L), which represents the shortest distance to the ocean from the borehole. The White Hill Road borehole is located approximately 2,500 m from the ocean to the west and a similar distance to the Harvey Estuary to the east (see Appendix N). Based on this evidence, the groundwater system between the ocean and estuary appears to be a freshwater lens that is replenished only by local rainfall and with sea water intrusion beneath most of the peninsula. Sea water intrusion at this distance from the coast also indicates extremely small hydraulic gradient and very large aquifer transmissivity.

Tamala Limestone Geohydrology Page 37
Figure 4-11. Examples of calcarenite rock clasts from the core samples: a) grainstone from Fremantle Park at 6-m depth, b) calcrete cap rock from Perry Lakes at 9-m depth, c) wackestone from Perry Lakes at 27.5-m depth, d) coarse-grained calcarenite with secondary void structures from Fremantle Park at 29.5-m depth, e) fine to medium-grained calcarenite with dissolution porosity and water-smoothed surfaces from White Hill Road at 15.7-m depth, f) calcarenite disk indicating open bedding planes from Fremantle Park at 28.5 m depth.

Tamala Limestone Geohydrology Page 38
4.3. Nuclear Magnetic Resonance surveys Application of Nuclear Magnetic Resonance (NMR) methods is an emerging field in geohydrology that directly targets the measurement of in situ formation porosity and the associated spectra of pore scales containing the water. The NMR method is most well known in medical imaging. It was developed for hydrogeological application during the early 1980’s but commercial systems have only been available since the late 1990’s (Fitzpatrick et al. 2011).
In this study the ground-based Vista Clara GMR* (VC-GMR) system was used at White Hill Road, East Rockingham and Perry Lakes to obtain average vertical profiles of formation water content. Plotted results are contained in Appendix K, L, M and N. The extent of horizontal spatial averaging and depth of vertical profile obtained is dependent on the configuration of the Detection Loop, in terms of the loop geometry and size. Figure-eight configurations with 90–100 m lengths were used at Perry Lakes and East Rockingham resulting in vertical water content profiles from ground surface to 50–60 m depth. A square-loop configuration with approximate side length of 30 m was used at White Hill Road producing a vertical water content profile from ground surface to approximately 50 m depth.
The Vista Clara Javelin† (CV-Javelin) system was used to acquire down-hole water content profiles at all four coring sites. Plotted results are contained in Appendix K, L, M and N, and in Figure 4-12 to Figure 4-15 below. The lateral radius of investigation at which the probe is sensitive to water content varies from 5.5–7.5 inches (140–190 mm) dependent on the NMR probe diameter, which is generally expected to be beyond the gravel-pack zone for a 6 inch (150 mm) diameter borehole with radius 3 inches (76 mm). The vertical water content profiles were built by sequentially lowering the NMR probe using a discrete elevation interval and collecting 10 minutes of data to produce a measurement at each depth.
Both the VC-GMR and VC-Javelin results are presented graphically as matrix plots in which water content is plotted as a function of vertical depth and the T2* NMR signal decay rate. This is accompanied by three separate water content plots giving vertical profiles of bound water, free water and total water content. In this terminology, bound water is considered to be formation water contained in small-permeability sediments such as silt and clay. Measurements with short T2* values indicate water in fine-texture sediments and measurements with long T2* values indicate water in coarse-texture sediments. Table 4-2, adapted from Roy and Lubczynski (2003) lists the expected relationships between sediment texture classes, characteristic grain sizes and the T2* NMR decay rate. These relations are superimposed on Figure 4-12 to Figure 4-15.
Table 4-2. Relationship between NMR signal decay rate and characteristic grain size and sediment types (adapted from: Roy and Lubczynski 2003).
* http://www.vista-clara.com/instruments.html † http://www.vista-clara.com/instruments.html
Sediment Characteristic grain size
mm
NMR signal
decay rate T2*s
LOG10(T2*)
Capillary water 0.003 -2.5
Sandy clays < 0.05 0.003–0.03 -2.5 to -1.5
Clayey sands, very fine sands 0.05–0.1 0.03–0.06 -1.5 to -1.2
Fine sands 0.1–0.25 0.06–0.12 -1.2 to -0.9
Medium sands 0.25–0.5 0.12–0.18 -0.9 to -0.7
Coarse and gravelly deposits 0.5–2 0.18–0.3 -0.7 to -0.5
Gravel deposits > 2 0.3–0.6 -0.5 to -0.2
Surface water body 0.6–1.5 -0.2 to 0.2

Tamala Limestone Geohydrology Page 39
4.3.1. East Rockingham
The ground-based VC-GMR and down-hole VC-Javlin results for East Rockingham are contained in Appendix K and Figure 4-12 below.
The VC-GMR results were acquired using an approximate 95-m long figure-eight Detection Loop, which yielded profiles of water content to a depth of approximately 60 m below ground surface. The base of the Tamala Limestone Formation is evident as a distinct change in the water content profile at 25–30 m depth. This is consistent with the depth of the base of the formation which was intersected at approximately 29 m depth during coring. Within the saturated part of the Tamala Limestone the total water content varies within the range 30–40 percent and the T2* signal decay rates are indicative of coarse sediment texture and characteristic grain sizes greater than approximately 1 mm. The maximum water content of approximately 40 percent at 8–15 m depth corresponds to a layer of fine sand; this is in apparent contradiction to the T2* values indicative of coarse and gravelly deposits. Below the base of the Tamala Limestone the total water content is generally less than 20 percent.
The VC-Javelin results indicate total water contents of approximately 30 percent within the main eolianite zones at depths below 16 m. This indicates total porosity of approximately 30 percent. Two sandy zones at depths 5–7 m and 8–15 m have larger water contents of approximately 40–50 percent. Three zones with larger bound water contents, indicating larger portions of fine-textured sediment are evident at depths of approximately 7 m, 16 m and 23 m. A transitional fine-textured zone with bound water content of approximately 30 percent and total water content of approximately 50 percent is evident at 15.5–16.5 m depth between overlying sand and underlying eolianite. Visual confirmation can be found in the HyChips image of tray 15 in Appendix G. A fine-textured carbonate zone with bound water content of approximately 30 percent and total water content of approximately 40 percent is evident at depth 22.5–25.5 m. This zone can be seen in the HyChips image of tray 17 in Appendix G.
Overall, the NRM measurements at East Rockingham indicate that the formation porosity (total water content) of the eolianite is 30–40 percent. In the conductive zones 25–30 percent of the void space has dimensions characteristic of gravel-size deposits and around 5 percent of the void space has dimensions characteristic of fine-texture sediment such as clayey sand and sandy clay. In the less conductive zones the porosity is also 30–40 percent but 25–30 percent of the void space has dimensions characteristic of fine-textured sediment.
4.3.2. Fremantle Park
VC-Javelin results for Fremantle Park are presented in Figure 4-13 and Appendix L. Reliable VC-GMR measurements were not possible due to electromagnetic noise from urban infrastructure.
Eolianite is evident over the full depth of the bore hole with a relatively uniform total water-content profile of approximately 30–40 percent. The T2* NMR signal decay rate is indicative of coarse grain and gravelly deposits, which suggests grain sizes and pore void dimensions greater than 1 mm. A distinctive zone of large porosity is evident just below the watertable at depth 6.5–7.5 m where the total water content is approximately 50 percent. The profile of bound water content varies mostly in the range 0–10 percent with apparent layering at thickness scales of 1–2 m and less. This is evident as pseudo-periodic variation of the bound water content with depth.
Overall, the NRM measurements at Fremantle Park indicate that the formation porosity (total water content) of the eolianite is 30–40 percent, and increasing to 50 percent in zones of enhanced porosity. At most depths approximately 30 percent of the void space has dimensions characteristic of gravel-size deposits and 5–10 percent of the void space has dimensions characteristic of fine-texture sediment such as clayey sand and sandy clay.
4.3.3. Perry Lakes
VC-GMR and VC-Javelin results for Perry Lakes are contained in Appendix M and in Figure 4-14 below.

Tamala Limestone Geohydrology Page 40
The VC-GMR measurements were acquired using an approximate 90-m long figure-eight Detection Loop that yielded profiles of water content to a depth of approximately 50 m below ground surface. The apparent base of the Tamala Limestone Formation is evident from a distinctive change in the T2* distribution at a depth of approximately 20 m. This is around 10 m above the elevation of the base of the formation intersected during coring and could indicate large local variation of the Tertiary-Cretaceous unconformity in the area. A distinctive dual-mode distribution of water content is evident between 5 m and 10 m depth, consisting of approximately 10 percent bound water and 20 percent mobile water. It is possible that this is a characteristic of the lake bed sediments and indicates their depth.
The VC-Javelin results exhibit variations of 20–40 percent total water content and 5–20 percent bound water content. A zone of greater porosity with total water content of approximately 40 percent is evident at 11.5–13 m depth. A zone of relatively low total water content of 20 percent, with bound water content of around 15 percent is evident at approximately 15–18 m depth. In comparison with Fremantle Park a larger portion of the total water content exists as bound water in clay and fine textured sediments. If the bore hole is representative of the local hydrogeology then it is expected that the aquifer is this area is also relatively less conductive.
Overall, the NRM measurements at Perry Lakes indicate that the formation porosity (total water content) of the eolianite is 20–40 percent. At most depths 10–20 percent of the void space has dimensions characteristic of fine-texture sediment such as clayey sand and sandy clay. The portion of void space with dimensions characteristic of gravel-size deposits varies from approximately 15–30 percent.
4.3.4. White Hill Road
VC-GMR and VC-Javelin results for White Hill Road are contained in Appendix N and Figure 4-15 below.
The VC-GMR measurements were acquired using a square Detection Loop with a side length of approximately 30 m, providing profiles of water content to a depth of approximately 50 m. The base of the Tamala Limestone Formation is apparent at a depth of approximately 20–25 m, which is comparable to the 25 m depth at which the Tertiary-Cretaceous unconformity was encountered at the nearby coring location. Eolianite is present over most of the saturated depth with fine sands at the base of the formation. The total water content within the eolianite is 30–40 percent based on the VC-GMR results.
VC-Javelin results also indicate total water content of 30–40 percent within the eolianite with several zones of large porosity of up to 50 percent, including zones at 6–8 m, 9–11.5 m and 14–15 m depths. These zones of increased water content are characterised by larger T2* decay rates, indicating that the greater porosity is associated with larger void spaces. The total water content is reduced to around 20 percent and the bound water content is around 15 percent at approximately 20 m depth where a fine sandy zone is present. The same reduction of water content at this depth is evident in the VC-GMR results. Elsewhere the bound water content in the eolianite is around 5 percent or less.
Overall, the NRM measurements at White Hill Road indicate that the formation porosity (total water content) of the eolianite is 30–40 percent, and increasing to 50 percent in zones of enhanced porosity. At most depths approximately 5 percent of the void space has dimensions characteristic of fine-texture sediment and the remainder of the void space has dimensions characteristic of gravel-size deposits.

Tamala Limestone Geohydrology Page 41
Figure 4-12. East Rockingham VC-Javelin results: a) water content as a function of T2* and depth, b) total water content with depth, c) generalised lithology.

Tamala Limestone Geohydrology Page 42
Figure 4-13. Fremantle Park VC-Javelin results: a) water content as a function of T2* and depth, b) total water content with depth, c) generalised lithology.

Tamala Limestone Geohydrology Page 43
Figure 4-14. Perry Lakes VC-Javelin results: a) water content as a function of T2* and depth, b) total water content with depth, c) generalised lithology.

Tamala Limestone Geohydrology Page 44
Figure 4-15. White Hill Road VC-Javelin results: a) water content as a function of T2* and depth, b) total water content with depth, c) generalised lithology.

Tamala Limestone Geohydrology Page 45
5. ANALYSIS OF AQUIFER TIDAL PROPAGATION Observation and measurement of tidal responses in Tamala Limestone within the Perth region reveals that the formation does not propagate tidal fluctuation in a way that is consistent with a single-porosity aquifer model (e.g., Smith and Hick 2001, Trefry and Bekele 2004). In particular, it is observed that the lag of the tidal response in the aquifer is smaller than expected compared to the degree of amplitude attenuation, or vice versa. This behaviour is significant and can be seen in Figure 5-1, which is based on the summary data compiled in Table 5-1 and Table 5-2. The three study sites are indicated on the location map in Figure 5-2.
Figure 5-1 depicts the relationship between amplitude attenuation and phase lag for propagation of tidal water-level fluctuation from the coast into an inshore aquifer. Generally, the amplitude is predicted to attenuate exponentially with increasing distance from the coast, while the lag is predicted to increase linearly. This produces a linear relationship on a semi-log plot. A basic overview of the theory is contained in Appendix P. The plotted line in Figure 5-1 indicates the relationship predicted by the analytic solution of Ferris (1951) which applies to a one-dimensional, semi-infinite and homogeneous aquifer with uniform transmissivity. The data compiled from observations of tidal water-level fluctuations in Tamala Limestone show a relationship that is generally unexplained by the Ferris model, and by more complex two-dimensional and inhomogeneous single-medium models (e.g., Trefry and Bekele 2004). The relationship between amplitude and phase attenuation at the field sites is surprisingly consistent despite their distinctive locations. This provides a clue about the nature of groundwater flow within the formation, which is explored further in this section.
A simplified dual-medium model is proposed that can reproduce the observations at each field site. The concept of a dual-medium system is also consistent with the results from the coring and geophysical investigations, which suggest that the large transmissivity of the formation is related to the presence of connected zones of large permeability within less permeable rock.
Figure 5-1. Tidal efficiency (TE) and lag within the Tamala Limestone at three sites in the Perth region (see Figure 5-2 for the site locations); the plotted line shows the analytic solution of Ferris (1951).
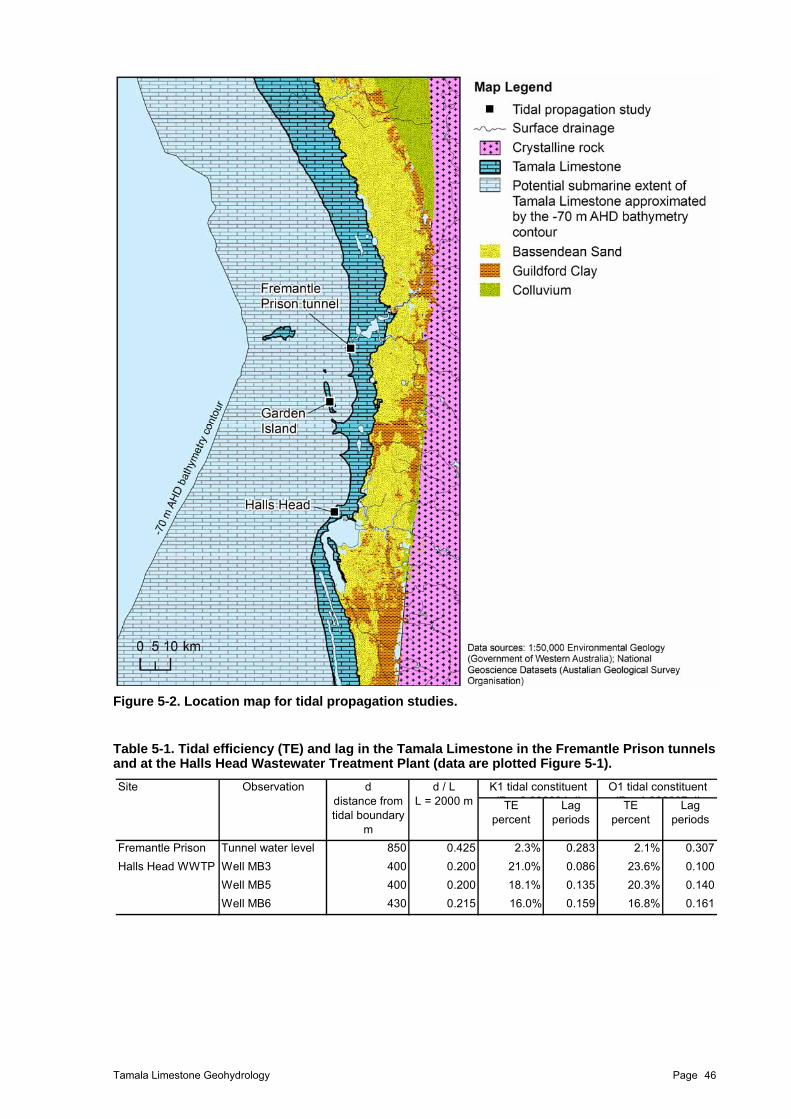
Tamala Limestone Geohydrology Page 46
Figure 5-2. Location map for tidal propagation studies.
Table 5-1. Tidal efficiency (TE) and lag in the Tamala Limestone in the Fremantle Prison tunnels and at the Halls Head Wastewater Treatment Plant (data are plotted Figure 5-1).
TEpercent
Lagperiods
TEpercent
Lagperiods
Fremantle Prison Tunnel water level 850 0.425 2.3% 0.283 2.1% 0.307
Well MB3 400 0.200 21.0% 0.086 23.6% 0.100
Well MB5 400 0.200 18.1% 0.135 20.3% 0.140
Well MB6 430 0.215 16.0% 0.159 16.8% 0.161
K1 tidal constituent(P 0 980834 d)
O1 tidal constituent(P 1 066667 d)
Halls Head WWTP
Site Observation ddistance from tidal boundary
m
d / LL = 2000 m

Tamala Limestone Geohydrology Page 47
Table 5-2. Tidal efficiency (TE) and lag in the Tamala Limestone on Garden Island (data are plotted in Figure 5-1).
5.1. Dual-medium model The dual-medium concept is based on the idea of a simple composite model consisting of two porous media in contact with one another. This can be conceptualised as either a low permeability storage medium containing a continuous network formed by a large permeability conducting medium, or alternatively a large permeability conducting medium containing discontinuous ‘blocks’ of a low permeability storage medium. The concept assumes the presence of mobile water within the conducting medium that is in contact with regions of less mobile water within the storage medium. The conducting medium is thus spatially continuous and both stores and conducts water at the aquifer scale. The storage medium is effectively discontinuous and is only considered to be capable of storing and releasing water locally.
For one-dimensional flow the linear partial differential equations describing coupled head and storage variation in the two media are (Warren and Root 1963)
t
hwShh
x
hwkB
1
1212
12
)( (1)
t
hSwhh
2221 )1()( (2)
where
),(1 txh is hydraulic head distribution in the primary medium [L] ),(2 txh is hydraulic head distribution in the secondary medium [L] 1S and 2S are storage coefficients of primary and secondary media [1] k is the hydraulic conductivity of the primary medium [L2/T] B is the saturated aquifer thickness [L] w is the primary medium volume fraction [1] is a first-order linear transfer coefficient [1/T]
Derivation of (1) and (2) neglects flow in the storage medium at the aquifer scale, which is assumed to be spatially discontinuous due to disruption by the conducting medium. The inter-media transfer coefficient reflects the local conductance (bulk conductivity) of the storage medium. By virtue of mathematical linearity, a periodic tidal excitation of (1) and (2) causes a periodic aquifer response with the same frequency components and no harmonics. Considering the case of single-frequency boundary excitation, the fluctuation responses in the two media can be written in complex notation as
tih exp11 (3)
d1west coast
m
d2east coast
m
TEpercent
Lagperiods
TEpercent
Lagperiods
MB6 278 1028 1306 0.213 11.9% 0.120 5.9% 0.219
MB8 278 1039 1317 0.211 10.8% 0.283 11.3% 0.272
MB7 333 1000 1333 0.250 6.9% 0.199 7.4% 0.186
MB11 483 833 1317 0.367 1.4% 0.325 0.8% 0.297
MB5 583 750 1333 0.438 0.7% 0.407 0.3% 0.375
MB3 761 556 1317 0.578 2.4% 0.238 2.5% 0.232
MB2 833 472 1306 0.638 4.0% 0.229 4.0% 0.192
MB1 944 361 1306 0.723 9.4% 0.135 10.3% 0.126
Distance from tidalboundary
Observation well
K1 tidal constituent(P = 0.980834 d)
O1 tidal constituent(P = 1.066667 d)
L(= d1 + d2)
m
d1 / L

Tamala Limestone Geohydrology Page 48
tih exp22 (4) where
1 and 2 are complex-valued heads P 2 is the angular frequency [1/T] P is the period of fluctuation [T] t is time [T] 1i
The physical amplitudes and phase angles of the complex heads are obtained from the moduli and arguments of the complex values. Substitutions of the complex forms (3) and (4) into (1) and (2) yields the following complex-valued differential equations describing water-level fluctuation in the aquifer
0)( 21112
12
dx
d (5)
0)( 2122 (6) where
wkB is the effective transmissivity of the conducting medium [L2/T] 11 wSi is the storage capacity of the conducting medium [1/T] 22 )1( Swi is the storage capacity of the storage medium [1/T]
Both of the storage terms are complex valued. The coupled system described by (5) and (6) has a general analytic solution; however, it is useful to first develop equivalent non-dimensional equations and to define the key non-dimensional groups. Non-dimensional forms of (5) and (6) can be written as
0)( 21212
12
1
dX
d (7)
0)( 2132 (8)
where
LxX , such that L is a characteristic aquifer length [L] )()( 11 LXX )()( 22 LXX
The non-dimensional parameter groups that control the system behaviour are
12
1 L , controlling propagation of fluctuation through the conducting medium 12 and 23 , controlling transfer between the two media.
With further re-arrangement and substitution, (7) and (8) can be re-written as
012
2
12
adX
d (9)
12 b (10) where
)()1( 31132 a )1( 33 b

Tamala Limestone Geohydrology Page 49
The general analytic solutions of equations (9) and (10) are
aXCaXCX sinhcosh)( 211 (11)
aXbCaXbCX sinhcosh)( 212 (12)
where 1C and 2C are integration constants that depend on the choice of boundary conditions. The hydraulic head amplitudes are evaluated as 1 and 2 , and the corresponding phase angles of hydraulic head are 1arg and 2arg .
5.2. Model application to mainland sites Provided L is chosen large enough and tidal fluctuation in the aquifer at that distance from the coast can be assumed to be completely attenuated, appropriate boundary conditions for mainland locations such as the Fremantle Prison tunnels and Halls Head WWTP are
H )0(1 (13)
01
1
XdX
d (14)
where H is the complex-valued tidal head representing tidal water-level fluctuation at the coast. Thus, a tidal head condition is imposed on the coastal boundary of the model and zero tidal flow is assumed across the inland boundary. Substitution of the boundary conditions into (11) and (12) and evaluation of the integration constants gives the following solutions for the distribution of hydraulic-head fluctuation in the two media
a
aaXHX
cosh
cosh)(1 (15)
a
aaXbHX
cosh
cosh)(2 (16)
For a given aquifer geometry, defined by L and B , and for a given tidal constituent, defined by its period P , evaluation of (15) and (16) is dependent on the set of five parameters k , 1S ,
2S , w and .
Table 5-3 lists selected combinations of model parameters for which suitable matches between modelled (equations 15 and 16) and observed tidal propagation are achieved. Selected results from the table are also plotted in Figure 5-3. A unique calibration of the model is not possible because the model has five independent parameters ( 21 ,,,, SkSw ) that can be varied in different combinations to fit only two sets of observations (Fremantle Prison and Halls Head WWTP).
For a range of plausible unconfined storage coefficient values between 0.1 and 0.3 , tidal propagation is controlled primarily by the hydraulic conductivity of the conducting medium k , the volume fraction of the conducting medium w , and the inter-media transfer coefficient . Thus, for 2.021 SS (corresponding to simulations m1 to m4 in Table 5-3) the model can be calibrated to the observed data at the Fremantle Prison tunnels and Halls Head WWTP using parameter values in the ranges 48,000–6,000k m/d, 0.045–25.0w and
1.5–5.0 1/d, respectively. For example, simulation m1 represents the case in which the conducting medium has 6,000k m/d and occupies 25 percent of the aquifer. In comparison, simulation m4 represents the case in which the conducting medium has
,00084k m/d and occupies 4.5 percent of the aquifer. The equivalent average (or bulk) hydraulic conductivity of the formation, calculated as Bk ave , also increases over this range such that 2,160–1,500ave k m/d, respectively. This corresponds to the upper range of values for hydraulic conductivity of the formation determined from pumping tests and regional groundwater flow modelling (Table 3-2 and Table 3-3). An acceptable calibration of the model cannot be achieved for 3,000k m/d; however, calibrations exist for ,00084k m/d and 0.045w .

Tamala Limestone Geohydrology Page 50
It is notable that feasible values of 2S for the storage medium are limited to the approximate range 0.1 to 0.3 . Larger values are unrealistic, and smaller values result in reduced transfer of water between the two media, such that the behaviour of the conducting medium becomes less dependent on the storage medium, and tidal propagation in the conducting medium approaches the behaviour of a single-medium model. The dual-medium model is less sensitive to variation of 1S of the conducting medium because it represents a smaller fraction of the aquifer and variation of 1S can be compensated by adjustment of 2S .
Figure 5-3. Modelled tidal propagation at the Fremantle Prison tunnel and Halls Wastewater Treatment Plant; results are for the O1 and K1 tidal constituents and model parameters are listed in Table 5-3.

Tamala Limestone Geohydrology Page 51
Table 5-3. Examples of model parameter combinations which achieve acceptable matches between modelled and observed tidal propagation at the Fremantle Prison tunnel and Halls Wastewater Treatment Plant (selected model results are plotted in Figure 5-3).
5.3. Model application to Garden Island For a long narrow island, such as Garden Island, tidal fluctuation of the aquifer water level is influence by two tidal boundaries; one on the west coast of the island and one on the east coast. The corresponding boundary conditions are
H )0(1 (17)
G )1(1 (18)
where H and G are complex-valued tidal heads representing the tidal water-level fluctuations on each side of the island. In this case, the solutions for hydraulic head fluctuation in the two media are
a
aaXH
a
aXGX
sinh
sinh
sinh
sinh)(1 (19)
a
aaXbH
a
aXbGX
sinh
sinh
sinh
sinh)(2 (20)
If H and G are synchronous and have the same amplitude (i.e., HG ) the above solutions simplify to
2
21 cosh
cosh)(
a
a aXHX (21)
2
22 cosh
cosh)(
a
a aXbHX (22)
Thus, for a given aquifer geometry and tidal constituent, evaluation of (21) and (22) is dependent on the set of five parameters k , 1S , 2S , w and .
Table 5-4 lists selected combinations of model parameters for which suitable matches between modelled (equations 21 and 22) and observed tidal propagation are achieved for Garden Island. Selected results from the table are also plotted in Figure 5-4.
For the case 2.021 SS (simulations g1 to g4 in Table 5-4) acceptable calibrations of the model to observed data are achieved with parameter values in the ranges
48,000–6,000k m/d, 0.015–1.0w and 1.2–9.0 1/d, respectively. The corresponding values of 720–006ave k m/d are smaller than for the mainland sites, and fall within the mid range of values for hydraulic conductivity of the formation determined from pumping tests and regional groundwater flow modelling (Table 3-2 and Table 3-3). An
Storagemedium
w S1 km/d
(= w.k.B)
m2/d
kave
(= / B)m/d
S2
m1 2000 20 1.0 0.5 0.25 0.2 6,000 30,000 1,500 0.2
m2 2000 20 1.0 0.9 0.15 0.2 12,000 36,000 1,800 0.2
m3 2000 20 1.0 1.2 0.09 0.2 24,000 43,200 2,160 0.2
m4 2000 20 1.0 1.5 0.045 0.2 48,000 43,200 2,160 0.2
m5 2000 20 1.0 0.5 0.17 0.1 6,000 20,400 1,020 0.1
m6 2000 20 1.0 0.15 0.08 0.3 6,000 9,600 480 0.3
Pd
Bm
Lm
Simulation α1/d
α - transfer coefficient, B - aquifer saturated thickness, k - hydraulic conductivity, L - aquifer length, P - tidal period,S - storage coefficient, T - transmissivity, w - volume fraction
Conductingmedium

Tamala Limestone Geohydrology Page 52
acceptable calibration cannot be achieved with 3,000k m/d; however, model calibrations exist for ,00084k m/d and 0.015w .
As discussed above for the mainland sites, calibration values of 2S for the storage medium are restricted to the approximate range 0.1 to 0.3 , whereas the model is less sensitive to variation of 1S of the conducting medium.
Figure 5-4. Modelled tidal propagation on Garden Island; results are for the O1 and K1 tidal constituents (model parameters are listed in Table 5-4).

Tamala Limestone Geohydrology Page 53
Table 5-4. Examples of model parameter combinations which achieve acceptable matches between modelled and observed tidal propagation on Garden Island and selected model results are plotted in Figure 5-4.
5.4. Conclusions Observed tidal propagation in Tamala Limestone in the Perth region is found to be poorly simulated using conventional groundwater flow equations for a single-medium aquifer. The available data are better explained by a dual-medium concept in which regional groundwater is partitioned within two connected domains; one domain consisting of a conductive pore system with preferential flow pathways and the other domain consisting of a non-conducting pore system that can only store and release water. This characteristic of tidal propagation in the Tamala Limestone is important evidence that should be considered as part of any theory of groundwater flow in the formation. It is apparent from the simplified modelling in this report that the interconnected zones are likely to comprise less than 25 percent of the formation volume, and possibly around 10 percent. The dual-medium model predicts average bulk hydraulic conductivities for the formation that are the same order of magnitude as values determined from pumping tests. The large variation in the pumping test results, which give values of hydraulic conductivity in the range 20 m/d to 3,000 m/d (Table 3-2) are likely to reflect natural variation of permeability between locations as well as the extent of the conducting network intersected by a particular well screen.
Storagemedium
w S1 km/d
(= w.k.B)
m2/d
kave
(= / B)m/d
S2
g1 1320 20 1.0 0.9 0.1 0.2 6,000 12,000 600 0.2
g2 1320 20 1.0 1.0 0.05 0.2 12,000 12,000 600 0.2
g3 1320 20 1.0 1.1 0.03 0.2 24,000 14,400 720 0.2
g4 1320 20 1.0 1.2 0.015 0.2 48,000 14,400 720 0.2
g5 1320 20 1.0 0.5 0.06 0.1 6,000 7,200 360 0.1
g6 1320 20 1.0 1.0 0.15 0.3 6,000 18,000 900 0.3
α1/d
α - transfer coefficient, B - aquifer saturated thickness, k - hydraulic conductivity, L - aquifer length, P - tidal period,S - storage coefficient, T - transmissivity, w - volume fraction
Conductingmedium
Pd
Bm
Lm
Simulation

Tamala Limestone Geohydrology Page 54
6. SYNTHESIS OF TAMALA LIMESTONE GEOHYDROLOGY The age of Tamala Limestone in the Perth region is estimated to be Middle Pleistocene to Holocene based on dating of modern surface deposits. Age measurements vary from less than 7 Ka on Rottnest Island to greater than 380 Ka on the mainland but rocks at the base of the formation are logically older. During its history of deposition, diagenesis and erosion, the formation has been subjected to repeated inundation by the sea. Reconstructions of eustatic sea level for the Quaternary Period exhibit major glacial-interglacial cycles of roughly 100 Ka. During the past 500 Ka sea level has fluctuated by more than 100 m on five occasions, varying from approximately 120 m below present sea level up to around 10 m above present sea level. On the Western Australian coast, sea level was completely below the base of the Tamala Limestone as recently as 10 Ka.
Cyclic inundation of the Tamala Limestone by the sea, and consequent fluctuation of the aquifer watertable within the onshore extent of the formation is expected to have influenced diagenesis and associated evolution of secondary porosity, particularly with respect to diagenesis under conditions of saturated lateral flow and vertical unsaturated flow. The submarine extent of the formation is assumed to contain pre-dominantly static sea water, except where underlying artesian aquifers might discharge continental groundwater at the base of the formation. Nevertheless, there is effectively no information about the hydrogeology and geohydrology of the present-day submarine extent of the formation.
Figure 6-1. Conceptualisation of palaeo-watertable fluctuation within the Tamala Limestone and associated diagenetic zones.
The present-day onshore extent of the Tamala Limestone contains a freshwater aquifer with an active regional flow system and a long seawater interface that persists as a tongue of salt water up to several kilometres inshore from the coast in some areas. Present sea level is at an interglacial high stand, and it is hypothesised in this study that the position of the present-day watertable is likely to be lower though relatively close to the palaeo-watertable maximum (Figure 6-1). Evidence from Western Australian sites (Murray-Wallace 2002) indicates that sea-level maxima of 2–6 m above present sea level occurred during MIS 5e (~125 Ka) and greater than 1 m above present sea level during MIS 7 (~200 Ka). It follows that the degree of secondary porosity development in the Tamala Limestone should increase with depth below the present-day watertable due to more frequent exposure to palaeo-watertables and meteoric diagenesis associated with lateral saturated flow. It is also apparent that modern outcrops of Tamala Limestone and exposures of the formation in quarries and road cuttings might not provide appropriate visual models of pore system evolution below the watertable.
Vacher and Mylroie (2002) distinguish between pore-system evolution and characteristics within eogenetic and telogenetic karsts, as illustrated in Figure 6-2. Eogenetic karst is the result of meteoric diagenesis in the vicinity of sediment deposition and is characterised by
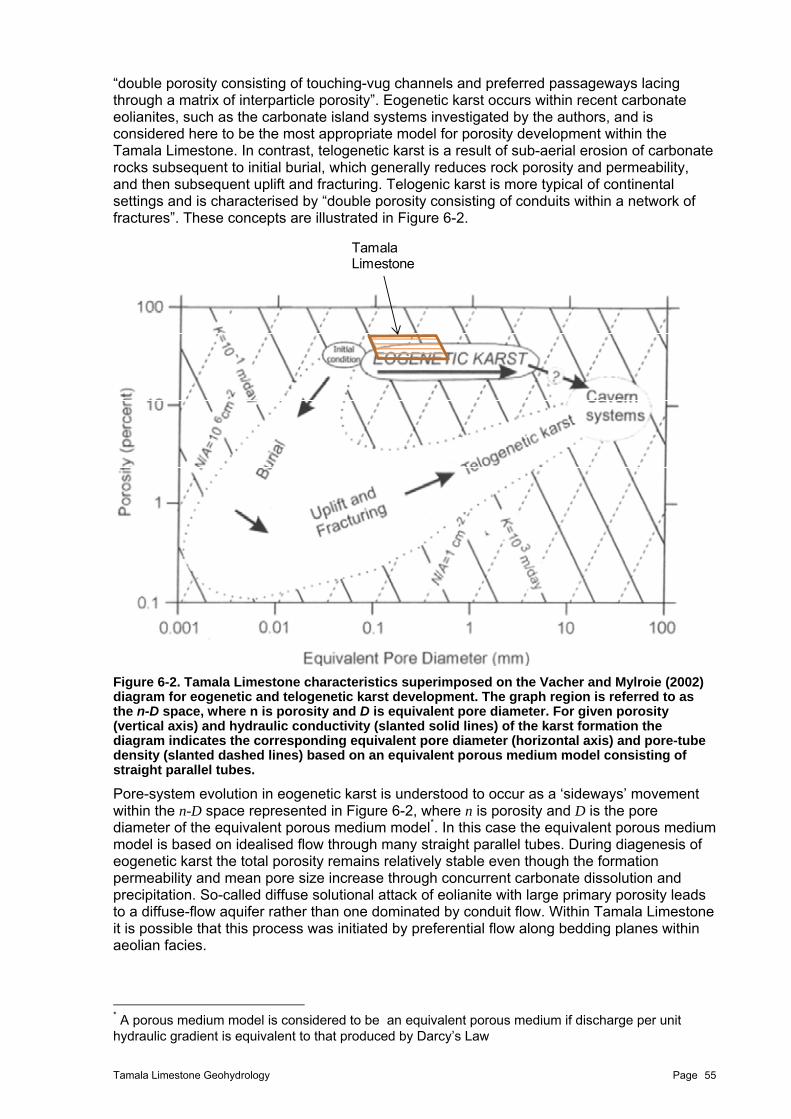
Tamala Limestone Geohydrology Page 55
“double porosity consisting of touching-vug channels and preferred passageways lacing through a matrix of interparticle porosity”. Eogenetic karst occurs within recent carbonate eolianites, such as the carbonate island systems investigated by the authors, and is considered here to be the most appropriate model for porosity development within the Tamala Limestone. In contrast, telogenetic karst is a result of sub-aerial erosion of carbonate rocks subsequent to initial burial, which generally reduces rock porosity and permeability, and then subsequent uplift and fracturing. Telogenic karst is more typical of continental settings and is characterised by “double porosity consisting of conduits within a network of fractures”. These concepts are illustrated in Figure 6-2.
Figure 6-2. Tamala Limestone characteristics superimposed on the Vacher and Mylroie (2002) diagram for eogenetic and telogenetic karst development. The graph region is referred to as the n-D space, where n is porosity and D is equivalent pore diameter. For given porosity (vertical axis) and hydraulic conductivity (slanted solid lines) of the karst formation the diagram indicates the corresponding equivalent pore diameter (horizontal axis) and pore-tube density (slanted dashed lines) based on an equivalent porous medium model consisting of straight parallel tubes.
Pore-system evolution in eogenetic karst is understood to occur as a ‘sideways’ movement within the n-D space represented in Figure 6-2, where n is porosity and D is the pore diameter of the equivalent porous medium model*. In this case the equivalent porous medium model is based on idealised flow through many straight parallel tubes. During diagenesis of eogenetic karst the total porosity remains relatively stable even though the formation permeability and mean pore size increase through concurrent carbonate dissolution and precipitation. So-called diffuse solutional attack of eolianite with large primary porosity leads to a diffuse-flow aquifer rather than one dominated by conduit flow. Within Tamala Limestone it is possible that this process was initiated by preferential flow along bedding planes within aeolian facies.
* A porous medium model is considered to be an equivalent porous medium if discharge per unit hydraulic gradient is equivalent to that produced by Darcy’s Law
TamalaLimestone

Tamala Limestone Geohydrology Page 56
The Tamala Limestone is characterised by hydraulic conductivity 100–2,000 m/d and porosity 0.3–0.5, and plots on the Vacher and Mylroie (2002) diagram in the region that is typical of eogenetic karst of early to mid-development. The corresponding equivalent pore diameter in this zone of the diagram is D = 0.1–1 mm with corresponding pore tube density of 100–10,000 per cm2. Cavern systems in Tamala Limestone also exist in some areas, such as the Wanneroo-Yanchep ‘karst belt’ (Csaky 2003) which contains 140 caves within the Australian Speleological Federation’s Karst Index Database, indicating more advanced dissolutional diagenesis in those areas.
Several lines of investigation in this study suggest that the eogenetic karst model is an appropriate conceptual model for the Tamala Limestone, as outlined following:
Hydraulic conductivity measurements of Tamala Limestone are consistent with eogenetic karst development in Pleistocene carbonate eolianites of the Bahamian Archipelago studied by Whitaker and Smart (1997) and in Pleistocene carbonate eolianites of Bermuda investigated by Vacher (1978) and Vacher et al. (1990).
Apparent enhanced lateral spreading of groundwater contamination plumes within calcarenite in Tamala Limestone at Northern Harbour, compared to plumes located in sandy parts of the formation and in Bassendean Sand, indicate a predominantly dispersive flow system that is characterised by macro-dispersion caused by tortuous flow through zones of enhance hydraulic conductivity. The geometries of the plumes at Northern Harbour suggest that the scale of tortuosity is considerably larger than the interstitial matrix scale. There is no evidence of unusual transport phenomena associated with large-scale karst features at the contaminated sites reviewed in this study.
Visual and photographic inspections of approximately 500 metres of the tunnel network system beneath the Fremantle Prison site, which traverses the Tamala Limestone Formation within the zone of contemporary water-table fluctuation found no evidence of dissolutional porosity structures at scales greater than millimetres. These observations are consistent with the lack of historical documentation of karst intersection during the manual digging and excavation works. Carbonate dissolution within bedding planes, which can act as inception horizons (Lowe 2000, Filipponi et al. 2009) appears to be the most likely structural control on the pore system development. The resistivity survey of tunnel section NE2 did not detect large-scale voids below the watertable. Diurnal tidal efficiency of 2–2.5 percent in the tunnel system at 800–900 m from Fremantle Harbour provides additional evidence that the formation is extremely transmissive despite the apparent lack of large-scale karst features.
No large-scale voids were intersected during the drilling of four full-depth cores of Tamala Limestone at White Hill Road, East Rockingham, Fremantle Park and Perry Lakes. Well-developed secondary-porosity zones and small drilling resistances were encountered at some depths. Where intact rock clasts of enhanced-porosity zones were recovered, open void spaces of scale millimetres to a few centimetres are evident, including voids spaces with water-smoothed surfaces.
NMR results at the four coring locations indicate that total water contents in Tamala Limestone are consistently 30 to 40 percent, with signal decay rates that are indicative of gravel-sized (> 2 mm grain size) deposits. Distinctive zones of enhanced porosity with total water content of approximately 50 percent also occur. This is consistent with the theory of eogenetic karst development in which the total porosity remains relatively stable, from the initial primary matrix porosity to mature pore-system development, at the same time that the formation permeability increases through the evolution of larger, though fewer, connected void spaces.
Observed tidal propagation in the Tamala Limestone is inconsistent with the theory of groundwater flow in a single-medium aquifer. Tidal propagation from the coast into the inshore aquifer is better explained by a dual-medium concept in which regional groundwater flow is conceptualised as occurring predominantly within a continuous network of large-permeability conducting medium contained within a much less permeable storage medium, as proposed by the eogenetic karst model.

Tamala Limestone Geohydrology Page 57
6.1. Implication for managed aquifer recharge Selecting appropriate methods for assessing water-quality risks associated with Managed Aquifer Recharge (MAR) into the Tamala Limestone relies on the adoption of an appropriate geohydrological conceptual model. The eogenetic karst model implies a dispersive flow paradigm that is suitable in areas where the flow occurs predominantly through the formation pore system rather than connected caverns and large scale conduits. Though dispersive flow is assumed, analysis and prediction of the mixing behaviour of infiltrated or injected recharge water within Tamala Limestone might not be predictable using a conventional single-medium advection-dispersion transport model. Experience elsewhere (e.g., Feehley et al. 2000) suggests that dual-medium mass-transfer models provide better simulations of observed mass transport in very heterogeneous aquifers with small-scale preferential flow pathways, including early breakthrough of mass and extended ‘tailing’ of mass concentration in time. This approach provides a rational starting point for exploring better methods for predicting groundwater transport within Tamala Limestone.
In conventional single-medium advection-dispersion models the mass transport is controlled by the groundwater flow equation and its parameters, which determine the advective component of the mass transport, and a dispersion coefficient tensor applied to the gradient of mass concentration, which determines the dispersive component. Via these two processes the mass is spread simultaneously in the direction of the flow (advection) and in the direction opposite to the mass concentration gradient (hydrodynamic dispersion). The magnitude of the dispersion coefficient can be formulated as being either independent or dependent on the flow velocity; however, it acts only to spread mass at a rate that is proportional to the concentration gradient. By this smearing mechanism the advection-dispersion approach attempts to simulate the true advective transport along preferential flow pathways that exist at scales much smaller than can be practically represented in the flow model. Simulating and predicting groundwater mass transport using this type of conventional advection-dispersion model requires calibration of dispersion coefficients by comparing observed and simulated mass concentrations throughout the model domain. As the scale of investigation gets larger and involves mass transport over larger distances, the magnitude of the dispersion coefficients required to calibrate models also tend to get larger.
The dual-medium mass-transfer approach partitions the flow and associated mass transport into two domains, doubling the number of material property parameters and introducing new parameters that control the transfer of fluid and mass between the two media. For example, the proposed dual-medium model for tidal propagation in Tamala Limestone presented in Section 5 introduces an aquifer volume fraction ( w ) which describes the relative volumetric portions of the two media, and a fluid-transfer coefficient ( ) which describes the rate of fluid transfer between the two media as a linear function of the head difference. A similar mass-transfer coefficient appears in dual-medium mass transport models, such as the mass transfer rate coefficient used by Feehley et al. (2000). The mass transfer coefficient is applied to the concentration difference between the two media to simulate a mass flux between them; however, direct advective transport of mass between media due to the fluid transfer is not considered. Simunek et al. (2003) reviewed analogous dual-porosity and dual-permeability models for preferential unsaturated flow and mass transport in the vadoze zone. These models also use independent mass-transfer coefficients that are not explicitly coupled to the fluid transfer between the media.
To the authors’ knowledge dual-medium mass transport models have not been used to investigate or predict groundwater transport in the Tamala Limestone. These methods could have practical applications at MAR sites but intensive groundwater monitoring is required to collect adequate water quality data to test their efficacy and to enable determination of realistic values of the model parameters—especially the media volume fraction and transfer coefficients. The ensuing challenge would be to collect this information at a sufficient number of sites to establish if each site is unique or if the dual-medium properties of the Tamala Limestone are broadly consistent between locations that share other typology. Even if suitable field data is not available for model calibration, the application of dual-medium models with a range of plausible parameter values could provide an indication of the

Tamala Limestone Geohydrology Page 58
uncertainty inherent in using a conventional single-medium groundwater model to assess the potential impacts of proposed MAR.
Overall, it is clear that Tamala Limestone has large to very large transmissivity owing to a well-developed dual pore system and there is potential for introduced recharge water to move rapidly away from infiltration and injection sites under forced hydraulic gradients induced by those operations. The evidence gathered in this study suggests that, except where cavern development is known to be prevalent, the eogenetic karst conceptual model and the dispersive flow and transport paradigm are an appropriate starting point for assessing the potential impacts of proposed MAR. There is sufficient evidence to suggest that conventional single-medium models might be inadequate for this purpose and are likely to provide only first-order estimations of flow and mass transport. The dual-medium approach is not implemented in most groundwater simulation software and assessment of potential dual-porosity flow and mass transport at proposed MAR sites will require specialised groundwater modelling capability and services that are not mainstream.

Tamala Limestone Geohydrology Page 59
REFERENCES
Barber, C., Davis, G. B., Buselli, G. And Height, M. I. 1991. Monitoring and predicting the development of leachate plumes in groundwater: A case study on alternative strategies. Water Resources Series No. 5, Division of Water Resources, CSIRO.
Bastian, L. V. 1996. Residual soil mineralogy and dune subdivision, Swan Coastal plain, Western Australia. Australian Journal of Earth Sciences 43: 31–44.
Bateman, M. D., Holmes, P.J., Carr, A. S., Horton, B. P. and Jaiswal, M. K. 2004. Aeolianite and barrier dune construction spanning the last two glacial-interglacial cycles from the southern Cape coast, South Africa. Quaternary Science Reviews 23(14-15): 1681–1698.
Belperio, A. P., Harvey, N. and Bourman, R. P. 2002. Spatial and temporal variability in the Holocene sea-level record of the South Australian coastline. Sedimentary Geology 150(1-2): 153–169.
Benker, E., Davis, G. B. And Barry, D. A. 1997. Factors controlling the distribution and transport of trichlorethene in a sand aquifer: hydrogeology and results of an in situ transport experiment. Journal of Hydrology 202:315–340.
Bouwer, H. 1978. Groundwater Hydrology. McGraw-Hill.
Brooke, B. 2001. The distribution of carbonate eolianite. Earth-Science Reviews 55(1-2): 135–164.
Brooke, B., Creasey, J. and Sexton, M. 2006. Geomorphology of the Perth coast and Rottnest shelf – a regional analysis of palaeoshoreline features. In: Proceedings of the CoastGis'06. Wollongong and Sydney, Australia.
Buchanan, T. J. and Somers, W. P. 1969. Discharge measurements at gauging stations. USGS—TWRI Book 3, Chapter A8.
Chappell, J., Omura, A., Esat, T., McCulloch, M., Pandilfi, J., Ota, Y. And Pillans, B. 1996. Reconciliation of late Quaternary sea levels derived from coral terraces at Huon Peninsula with deep sea oxygen isotope records. Earth and Planetary Science Letters 141(1-4): 227–236.
Csaky, D. 2003. Review of karst hazards in the Wanneroo area, Perth, Western Australia. Minerals and Geohazards Division, Geoscience Australia.
Davidson, W. A. 1995. Hydrogeology and groundwater resources of the Perth Region, Western Australia. Bulletin 142, Western Australia Geological Survey.
Dravis, J. 1996. Rapidity of freshwater calcite cementation—implications for carbonate diagenesis and sequence stratigraphy. Sedimentary Geology 107: 1–10.
Davis, G. B., Barber, C., Power, T. R., Thierrin, J., Patterson, B. M., Rayner, J. L. And Wu, Q. 1999. The variability and intrinsic remediation of a BTEX plume in anaerobic sulphate-rich groundwater. Journal of Contaminant Hydrology 36:265–290.
Davis, G. B., Bastow, T., Fisher, S. J., Franzmann, P. D., Zappia, L. R., Puhakka, J. A. And Trefry, M. G. 2007. Investigation of the persistence and degradability of chlorphenol and chlorophenoxy acids in groundwater. GQ07: Securing Groundwater in Urban and Industrial Environemnts. Proceedings of the 6th International Groundwater Quality Conference, Fremantle, Western Australia, 2–7 December 2007.
Department of Environment, 2005. Section 46 Progress Report—State of the Gnangara Mound, Department of Environment, Western Australia.
Fairbridge, R. W. 1948. Notes on the geomorphology of the Pelsart Group of the Houtman’s Abrolhos Islands. Journal of the Royal Society of Western Australia 33: 1–36.
Fairbridge, R. W. and Teichert, C. 1953. Soil horizons and marine bands in the Coastal Limestones of Western Australia. Journal of the Royal Society of New South Wales 86: 68–87.
Feehley, C. D., Zheng, C. And Molz, F.J. 2000. A dual-domain mass transfer approach for modelling solute transport in heterogeneous aquifers: Application to the Macrodispersion Experiment (MADE) site. Water Resources Research 36(9): 2501–2515.
Ferris J. G. 1951. Cyclic fluctuations of water level as a basis for determining aquifer transmissibility. General Assembly Brussels: International Association of Scientific Hydrology 33(2): 148–155.
Filipponi, M., Jeannin, P. Y. and Tacher, L. 2009. Evidence of inception horizons in karst conduit networks. Geomorphology 106(1-2): 86–99.
Fitzpatrick, A., Cahill, K. and Munday, T. 2011. Magnetic resonance soundings and NMR logging of a limestone aquifer - the Tamala Limestone, Western Australia. SAGEEP 2011, Symposium on the Application of Geophysics to Engineering and Environmental Problems. April 10-14, 2011, Charleston, South Carolina, USA.

Tamala Limestone Geohydrology Page 60
Fleming, K., Johnston, P., Zwartz, D., Yokoyama, Y., Lambeck, K. and Chappell, J. 1998. Refining the eustatic sea-level curve since the Last Glacial Maximum using far- and intermediate-field sites. Earth and Planetary Science Letters 163: 327–342.
Glover, R. E. 1961. Mathematical derivations as pertains to groundwater recharge. Fort Collins, Colorado: Agriculture Research Services, United States Department of Agriculture.
Hearty, P. J., 2003. Stratigraphy and timing of eolianite deposition on Rottnest Island, Western Australia. Quaternary Research 60(2): 211–222.
Hearty, P. J. and O'Leary, M. J. 2008. Carbonate eolianites, quartz sands, and Quaternary sea-level cycles, Western Australia: A chronostratigraphic approach. Quaternary Geochronology 3(1-2): 26–55.
Kendrick, G. W., Wyrwoll, K. H. and Szabo, B. J. 1991. Pliocene-Pleistocene coastal events and history along the western margin of Australia. Quaternary Science Reviews 10(5): 419–439.
Kindler, P. and Mazzolini, D. 2001. Sedimentology and petrography of dredged carbonate sands from Stocking Island (Bahamas). Implications for meteoric diagenesis and eolianite formation. Palaeogeography, Palaeoclimatology, Palaeoecology 175: 369–379.
Lambeck, K. and Chappell, J. 2001. Sea level change through the last glacial cycle. Science 292: 679–686.
Le Guern, P. and Davaud, E. 2005. Recognition of ancient carbonate wind deposits: lessons from a modern catalogue, Chrissi Island, Crete. Sedimentology 52:915–926.
Logan, B. W., Read, J. F. and Davies, G. R. 1970. History of carbonate sedimentation, Quaternary Epoch. Shark Bay, Western Australia. In: AAPG Special Volumes; Volume M13; Carbonate Sedimentation and Environments, Shark Bay, Western Australia: 38–84.
Loke, M. H. 2000. Electrical imaging surveys for environmental and engineering studies. Technical note of Geotomo Software (accessed at www.geoelectrical.com).
Loope, D. B. and Abegg, F. E., 2001. Recognition and geologic preservation of ancient carbonate eolianites. In: F. E. Abegg, P. M. Harris and D. B Loope (Editors) Modern and Ancient Carbonate Eolianites. SEPM Special Publication, Vol. 71: 3–16.
Lowe, D. J. 1992. The origin of limestone caverns: an inception horizon hypothesis. PhD Thesis, Manchester Polytechnic, United Kingdom.
Lowe, D. J. 2000. Role of stratigraphic elements in speleogenesis: the speleoinception concept. In: A. B. Klimchouk, D. C. Ford, A. N. Palmer and W. Dreybrodt (Editors) Speleogenesis, evolution of karst aquifers, National Speleological Society, Huntsville (Alabama).
McLaren, S. and Garner, R. 2004. Late Quaternary vadose carbonate diagenesis in coastal and desert dune and beach sands: Is there a palaeoclimatic signal? Earth Surface Processes and Landforms 29: 1441–1458.
Murray-Wallace, C. V. 2002. Pleistocene coastal stratigraphy, sea-level highstands and neotectonism of the southern Australian passive continental margin - a review. Journal of Quaternary Science 17(5-6): 469–489.
Mylroie, J. E. 2008. Late Quaternary sea-level position: Evidence from Bahamian carbonate deposition and dissolution cycles. Quaternary International 183: 61–75.
Pillans, B., Chappell, J. and Naish, T. R. 1998. A review of the Milankovitch climatic beat: template for Plio-Pleistocene sea-level changes and sequence stratigraphy. Sedimentary Geology 122(1-4): 5–21.
Patterson, B., Franzmann, P., Davis, G., Elbers, J., and Zappia, L. 2000. Evaluating in situ bioaugmentation of atrazine-contaminated groundwater. in: Bjerg, P., Engesgaard, P., and Krom, T. (eds), Groundwater 2000, 6-8 June 2000, Copenhagen, Denmark. Rotterdam: Balkema: 381-382.
Patterson, B. M., Cohen, E., Prommer, H. Thomas, D. G., Rhodes, S. and McKinley, A. J. 2007. Origin of a mixed brominated ethene groundwater plume: contaminant degradation pathways and reactions. Enviroinmental Science &Technology 41, 1352–1358.
Playford, P. E., 1990. Geology of the Shark Bay area, Western Australia. In: P. F. Berry, S. D. Bradshaw and B. R. Wilson (Editors) Research in Shark Bay. Report of the France-Australe Bicentenary Expedition Committee.
Playford, P. E. 1997. Geology and hydrology of Rottnest Island, Western Australia. in: H. L. Vacher and T. Quinn (Editors.) Geology and Hydrology of Carbonate Islands. Developments in Sedimentology 54, Elsevier, London: 783–810.
Playford, P. E., Cope, R. N., Cockbain, A. E., Low, G. H., Lowry, D. C. 1975. Phanerozoic. In: Geology of Western Australia. Memoir 2, Western Australia Geological Survey: 223–432.
Playford, P. E. and Cockbain, A. E. 1976. Geology of the Perth Basin, Western Australia. Bulletin 124, Western Australia Geological Survey.
Playford, P. E. and Leech, R. E. J. 1977. Geology and Hydrogeology of Rottnest Island. Report 6, Western Australia Geological Survey.

Tamala Limestone Geohydrology Page 61
Pollock, D. W., Barron, O. V. And Donn, M. J. 2011. 3D exploratory analysis of descriptive lithology records using regular expressions. Computers & Geosciences doi:10.1016/j.cageo.2011.06.018.
PPK. 2000. Jervoise Bay Project groundwater recovery plan. PPK Environment and Infrastructure, report to Department of Commerce and Trade, Western Australia.
Price, D. M., Brooke, B. P. and Woodroffe, C. D. 2001. Thermoluminescence dating of aeolianites from Lord Howe Island and South-West Western Australia. Quaternary Science Reviews 20(5-9): 841–846.
Roy, J. and Lubczynski, M. 2003. The magnetic resonance sounding technique and its use for groundwater investigation. Hydrogeology Journal 11: 455–465.
Saint-Smith, E. C. 1912. Geological reconnaissance of a portion of the South-West Division of Western Australia. Bulletin 44, Western Australia Geological Survey.
Salama, R. B., Davis, G. B. And Barber, C. 1989. Characterizing the hydrogeological variability of a sand aquifer in the region of a domestic waste disposal site. Groundwater Management: Quantity and Quality, Proceedings of the Benidorn Symposium, October 1980). IAHS Publ. no. 188.
Semeniuk, V. 1983. The Quaternary stratigraphy and geological history of the Australind-Leschenault inlet area. Journal of the Royal Society of Western Austrlia 66(3): 71–83.
Semeniuk, V. 2008. Holocene sedimentation, stratigraphy, biostratigraphy, and history of the Canning coast, north-western Australia. Royal Society of Western Australia.
Simunek, J., Jarvis, N. J., van Genuchten, M. Th. and Gärdenäs, A. 2003. Review and comparison of models for describing non-equillibrium and preferential flow and transport in the vadoze zone. Journal of Hydrology 272: 14–35.
Sloss, C., Murray-Wallace, C. And Jones, B. 2007. Holocene sea-level change on the southeast coast of Australia: a review. Holocene 17(7): 999–1014.
Smith, A. J., and W. P. Hick. 2001. Hydrogeology and aquifer tidal propagation in Cockburn Sound, Western Australia. Technical Report 06/01, CSIRO Land and Water.
Smith, A. J., and D. W. Pollock. 2010. Artificial recharge potential of the Perth region superficial aquifer: Lake Preston to Moore River. CSIRO: Water for a Healthy Country National Research Flagship.
Smith, A. M. and Nelson, C. S. 2003. Effects of early sea-floor processes on the taphonomy of temperate shelf skeletal carbonate deposits. Earth-Science Reviews 63(1-2): 1–31.
Stirling, C. H., Esat, T. M., McCulloch, M. T. and Lambeck, K. 1995. High-precision U-series dating of corals from Western Australia and implications for the timing and duration of the Last Interglacial. Earth and Planetary Science Letters 135(1-4): 115–130.
Tapsell, P., Newsome, D. and Bastian, L. 2003. Origin of yellow sand from Tamala Limestone on the Swan Coastal Plain, Western Australia. Australian Journal of Earth Sciences 50(3): 331–342.
Teichert, C. 1947. Contributions to the geology of Houtman’s Abrolhos, Western Australia. Proc. Linn. Soc. NSW, 71: 145–195.
Teichert, C. 1950. Late Quaternary changes of sea-level at Rottnest Island, Western Australia. Proceedings of the Royal Society of Victoria 59: 63–79.
Toze, S,, Hanna, J,, Smith, A., and Hick, W. 2003. Halls Head Wastewater Treatment Plant indirect treated wastewater reuse scheme. Client Report to Water Corporation Western Australia, October 2002. CSIRO Land and Water.
Trefry, M. G., and Bekele, E. 2004. Structural characterization of an island aquifer via tidal methods. Water Resources Research 40(1), W01505, doi:10.1029/2003WR002003.
Vacher, H. L. 1978. Hydrogeology of Bermuda -- Significance of an across-the-island variation in permeability. Journal of Hydrology 39(3-4): 207–226.
Vacher, H. L., Bengtsson, T. O. and Plummer, L. N. 1990. Hydrology of meteoric diagenesis: Residence time of meteoric ground water in island fresh-water lenses with application to aragonite-calcite stabilization rate in Bermuda. Geological Society of America Bulletin 102(2): 223–232.
Vacher, H. and Mylroie, J. 2002. Eogenetic karst from the perspective of an equivalent porous medium. Carbonates and Evaporites 17(2): 182–196.
Warren, J. E. and Root, P. J. 1963. The behaviour of naturally fractured reservoirs. Society of Petroleum Engineers Journal 2: 245-255.
Westbrook, S. J., Rayner, J. L., Davis, G. B., Clement, T.P., Bjerg, P. L. And Fisher, S. J. 2005. Interaction between shallow groundwater, saline surface water and contaminant discharge at a seasonally and tidally forced estuarine boundary. Journal of hydrology 302: 255–269.
Whitaker, F. F. and Smart, P. L. 1997. Climatic control of hydraulic conductivity of Bahamian limestones. Ground Water 35(5): 859–868.

Tamala Limestone Geohydrology Page 62
White, S. Q. 1994. Speleogenesis in aeolian calcarenite - a case-study in western Victoria. Environmental Geology 23(4): 248–255.
Winograd, I. J., Landwehr, J. M., Ludwig, K. R., Coplen, T. B. and Riggs, A. C. 1997. Duration and structure of the past four interglaciations. Quaternary Research 48(2): 141–154.
Wolanski, E. and Chappell, J. 1996. The response of tropical Australian estuaries to a sea level rise. Journal of Marine Systems 7(2-4): 267–279.

Tamala Limestone Geohydrology Page 63
APPENDICES
List of appendices A Selected groundwater monitoring information for Perth-region wastewater infiltration
sites located over Tamala Limestone
B Fremantle Prison historical water information
C Sonic coring procedure
D Borehole construction logs
E Coring logs
F Downhole conductivity and gamma logs
G East Rockingham core tray images
H Fremantle Park core tray images
I Perry Lakes core tray images
J White Hill Road core tray images
K East Rockingham NMR results: VC-GMR and VC-Javelin
L Fremantle Park NMR results: VC-Javelin
M Perry Lakes NMR results: VC-GMR and VC-Javelin
N White Hill Road NMR results: VC-GMR and VC-Javelin
P Tidal Method

Related Documents