GOVERNMENT OF TAMILNADU GEOGRAPHY A publication under Free Textbook Programme of Government of Tamil Nadu Department of School Education HIGHER SECONDARY SECOND YEAR Untouchability is Inhuman and a Crime TN_GOVT_XII_GEOGRAPHY_FRONT.indd 1 21-02-2019 11:36:30

Welcome message from author
This document is posted to help you gain knowledge. Please leave a comment to let me know what you think about it! Share it to your friends and learn new things together.
Transcript
GOVERNMENT OF TAMILNADU
GEOGRAPHY
A publication under Free Textbook Programme of Government of Tamil Nadu
Department of School Education
HIGHER SECONDARY SECOND YEAR
Untouchability is Inhuman and a Crime
TN_GOVT_XII_GEOGRAPHY_FRONT.indd 1 21-02-2019 11:36:30

Government of TamilNadu
First Edition - 2019
(Published under new syllabus)
Tamil NaduTextbook and Educational Services Corporationwww.textbooksonline.tn.nic.in
State Council of Educational Research and Training© SCERT 2019
Printing & Publishing
Content Creation
II
The wisepossess all
NOT FOR SALE
TN_GOVT_XII_GEOGRAPHY_FRONT.indd 2 21-02-2019 11:36:30
III
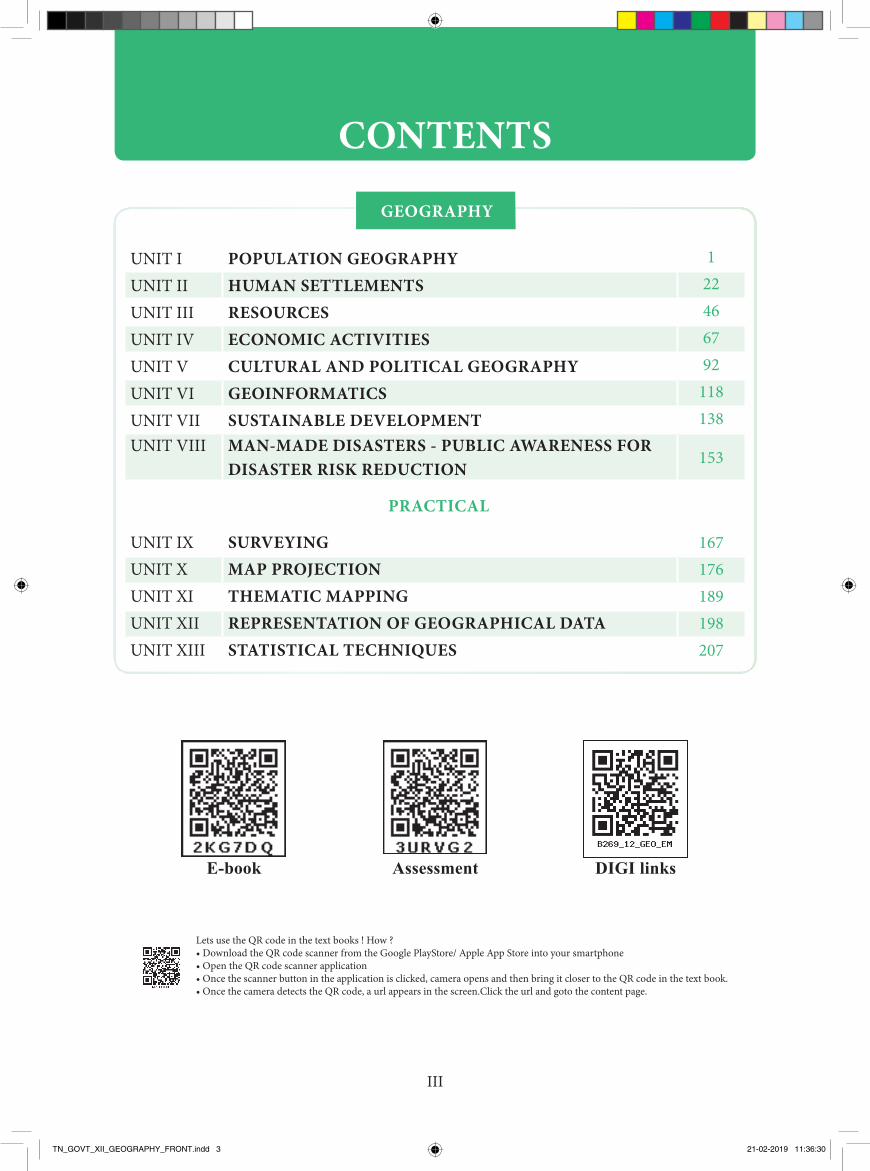
E-book Assessment DIGI links
GEOGRAPHY
PRACTICAL
Lets use the QR code in the text books ! How ?• Download the QR code scanner from the Google PlayStore/ Apple App Store into your smartphone• Open the QR code scanner application• Once the scanner button in the application is clicked, camera opens and then bring it closer to the QR code in the text book. • Once the camera detects the QR code, a url appears in the screen.Click the url and goto the content page.
UNIT I POPULATION GEOGRAPHY 1
UNIT II HUMAN SETTLEMENTS 22
UNIT III RESOURCES 46
UNIT IV ECONOMIC ACTIVITIES 67
UNIT V CULTURAL AND POLITICAL GEOGRAPHY 92
UNIT VI GEOINFORMATICS 118
UNIT VII SUSTAINABLE DEVELOPMENT 138UNIT VIII MAN-MADE DISASTERS - PUBLIC AWARENESS FOR
DISASTER RISK REDUCTION153
UNIT IX SURVEYING 167UNIT X MAP PROJECTION 176UNIT XI THEMATIC MAPPING 189UNIT XII REPRESENTATION OF GEOGRAPHICAL DATA 198UNIT XIII STATISTICAL TECHNIQUES 207
CONTENTS
TN_GOVT_XII_GEOGRAPHY_FRONT.indd 3 21-02-2019 11:36:30

1Population Geography
1.1 Introduction
1.2 Distribution of population
1.3 Density of Population
1.4 Growth of world population
1.5 Composition of Population
1.6 Migration1.7 Overpopulation
1.8 Measures to control overpopulation
Unit Overview
Learning Objectives
➢ Know the attributes
of population.
➢ Understand the
distribution of the
world population.
➢ Judge the cause and
e� ect of population growth.
➢ Estimate the problems of over
population.➢ Elucidate the pull and push factors of
migration.
1.1. IntroductionDo you know that 3,60,000 persons born
every day in the world? Four births take place
every second in the world. Professor Stephen
Hawking thinks the human species will have
to populate a new planet within 100 years if it
is to survive,' the BBC confi rmed.
'With climate change, overdue asteroid
strikes, epidemics and population growth, our
own planet is increasingly precarious,' the
news outlet continued.
Human being is an important element of the
environment and is probably the latest occupant
of the earth, as its evolution took place less than
two million years ago. Although distribution
and growth of human population are in� uenced
greatly by the physical environment, they have
tremendous capacity to modify the physical
environment. Demography is the statistical
study of human population. It includes the study
of size, structure and distribution of population
as well as changes in time and location in
response to birth, migration, aging and death.
‘Population explosion’ is one of the greatest
challenges that we are facing today.
1.2 Distribution of world
populationPeople have inhabited the earth for several
thousands of years, but for a long period of
time, their numbers remained limited. It is
only during last few hundred years that human
population has increased at an alarming rate.
Population is spread unevenly across the
continents. Only a few areas support large
Population Geography
1UNIT
TN_GOVT_XII_Geography_chapter 01.indd 1
2/14/2019 10:56:19 AM
Introduction
Th e subject to be
discussed in the
lesson is introduced
Resources
USA is the major producer of solar cells at
present. It is simply the energy provided by the
sun, which makes production of solar electricity
possible. Solar power in India is a fast developing
industry. The country's solar installed capacity reached
26 GW as of 30 September 2018. India expanded its
solar-generation capacity 8 times from 2,650 MW on
26 May 2014 to over 20 GW as on 31 January 2018.
The country added 3 GW of solar capacity in 2015-
2016, 5 GW in 2016-2017 and over 10 GW in 2017-
2018, with the average current price of solar electricity
dropping to 18% below the average price of its coal-
fired counterpart.
Kamuthi, the World’s
largest single solar power plant!
Kamuthi Solar Power Project is a
photovoltaic power station spread over an
area of 2,500 acres (10 km2) in Kamuthi,
Ramanathapuram district. The project was
commissioned by Adani Power. With a
generating capacity of 648 MW at a single
location, The Kamuthi Solar Power Project
was completed on 21 September 2016.
Around 8,500 workers installed an average
of 11 MW of capacity per day to complete
the project within 8 months. The entire solar
park is connected to a 400 kV substation of
the Tamil Nadu Transmission Corp. The solar
panels are cleaned daily by a self-charged
robotic system.
Most devastating nuclear
accidents
1. Three mile Island- March
28, 1979, USA
2. Chernobyl - April 29,1986,Russia
3. Fukushima Daiich- March 11,2011,Japan
Hydel PowerHydro electricity is produced by using the
potential energy of water falling from a certain
height. The falling water spins the turbine blades
and energy is produced. It is a clean eco friendly
and renewable source of energy. It contributes
nearly 7% of the world electricity production.
China has the largest potential followed by
Brazil, Indonesia, Canada and Zaire. China is
the largest producer of Hydro electricity in the
world, followed by Canada.
Non conventional or Renewable sources of
Energy:
All regions of the world are facing the twin
problems of fast increasing demand for energy
and limited supplies and rapidly depleting
conventional sources of energy. Under these
circumstances, non conventional sources of
energy are getting more importance. These
sources are renewable, clean and non-polluting.
They are solar, wind, geothermal, wave, tidal
energy, bio-gas etc.
Solar energyIt is based on mechanical conversion
of solar energy into electricity. It is available
in abundance but only in the recent period it
gets more importance due to technological
development. Solar energy is used for various
purposes.
Noor Complex is the world’s
largest concentrated solar power
(CSP) plant, located in the Sahara
Desert. 53
TN_GOVT_XII_Geography_chapter03.indd 53
2/14/2019 11:10:46 AM
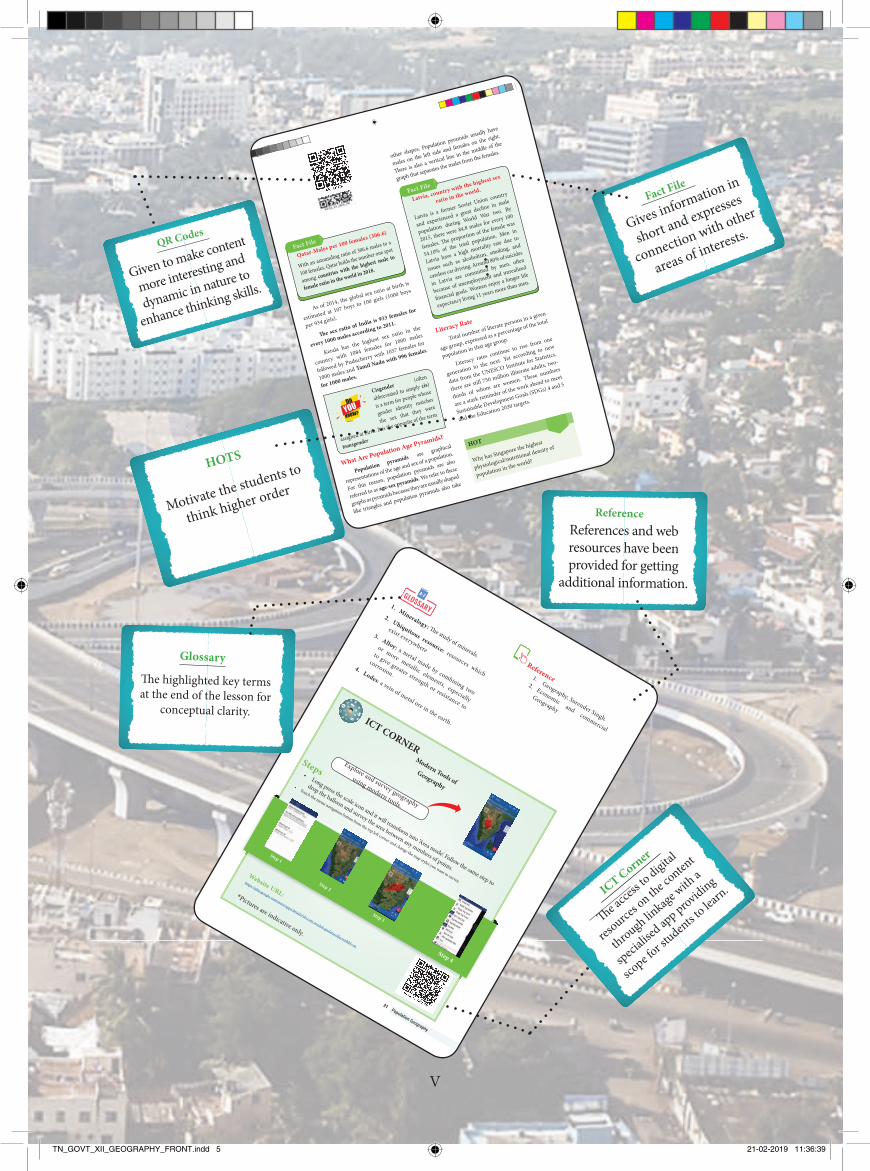
Unit Overview
Provides the major
components of the
unit to be learned.
Learning Objectives
At the begining of
each lesson it provides
the scope of lesson.
Case Study
Provides detailed account of an aspect related to the topic .
Do You Know ?
Provides additional
information related to the
subject in boxes to stir up the
curiosity of students.
HOW TO USE THE BOOK.......
IV
TN_GOVT_XII_GEOGRAPHY_FRONT.indd 4 21-02-2019 11:36:35
21Population Geography
Modern Tools of Geography
Steps• Long press the scale icon and it will transform into ‘Area mode’. Follow the same step to
drop the balloon and survey the area between any numbers of points.
• Touch the menu navigation button from the top le� corner and change the map styles you want to survey. Website URL:
https://play.google.com/store/apps/details?id=com.osedok.gisdatacollector&hl=en
ICT CORNER
*Pictures are indicative only.
Explore and survey geography
using modern tools.
Step 1
Step 3
Step 4
Step 2
Reference1. Geography, Surender Singh.
2. Economic and commercial
Geography
1. Mineralogy: � e study of minerals.
2. Ubiquitous resource: resources which
exist everywhere
3. Alloy: a metal made by combining two
or more metallic elements, especially
to give greater strength or resistance to
corrosion.4. Lodes: a vein of metal ore in the earth.
TN_GOVT_XII_Geography_chapter 01.indd 21
2/14/2019 11:36:14 AM
21 Population Geography
Qatar-Males per 100 females (306.6)
With an astounding ratio of 306.6 males to a
100 females, Qatar holds the number one spot
among countries with the highest male to
female ratio in the world in 2018.
Fact File
As of 2014, the global sex ratio at birth is
estimated at 107 boys to 100 girls (1000 boys
per 934 girls).
The sex ratio of India is 933 females for
every 1000 males according to 2011.
Kerala has the highest sex ratio in the
country with 1084 females for 1000 males
followed by Puducherry with 1037 females for
1000 males and Tamil Nadu with 996 females
for 1000 males.
Cisgender (often
abbreviated to simply cis)
is a term for people whose
gender identity matches
the sex that they were
assigned at birth. It is the opposite of the term
transgender
What Are Population Age Pyramids?
Population pyramids are graphical
representations of the age and sex of a population.
For this reason, population pyramids are also
referred to as age-sex pyramids. We refer to these
graphs as pyramids because they are usually shaped
like triangles and population pyramids also take
other shapes. Population pyramids usually have
males on the left side and females on the right.
There is also a vertical line in the middle of the
graph that separates the males from the females.
Latvia, country with the highest sex
ratio in the world.
Latvia is a former Soviet Union country
and experienced a great decline in male
population during World War two. By
2015, there were 84.8 males for every 100
females. The proportion of the female was
54.10% of the total population. Men in
Latvia have a high mortality rate due to
issues such as alcoholism, smoking, and
careless car driving. Around 80% of suicides
in Latvia are committed by men, often
because of unemployment and unrealized
financial goals. Women enjoy a longer life
expectancy living 11 years more than men.
Fact File
Literacy Rate
Total number of literate persons in a given
age group, expressed as a percentage of the total
population in that age group.
Literacy rates continue to rise from one
generation to the next. Yet according to new
data from the UNESCO Institute for Statistics,
there are still 750 million illiterate adults, two-
thirds of whom are women. These numbers
are a stark reminder of the work ahead to meet
Sustainable Development Goals (SDGs) 4 and 5
and the Education 2030 targets.
HOT
Why has Singapore the highest
physiological/nutritional density of
population in the world?
TN_GOVT_XII_Geography_chapter 01.indd 21
2/14/2019 11:17:41 AM
Glossary
Th e highlighted key terms at the end of the lesson for
conceptual clarity.
ReferenceReferences and web resources have been provided for getting
additional information.
QR Codes
Given to make content
more interesting and
dynamic in nature to
enhance thinking skills.
Fact File
Gives information in
short and expresses
connection with other
areas of interests.
ICT Corner
Th e acce
ss to digita
l
resource
s on th
e conten
t
through linkage w
ith a
specialis
ed app providing
scope fo
r students t
o learn.
HOTS
Motivate the students to
think higher order
V
TN_GOVT_XII_GEOGRAPHY_FRONT.indd 5 21-02-2019 11:36:39
VI
��UPS
C c
ivil
serv
ice
exam
inat
ions
con
duct
ed b
y G
ovt.
of in
dia.
��T
amiln
adu
Publ
ic S
ervi
ce C
omm
issi
on G
roup
se
rvic
es E
xam
inat
ions
con
duct
ed b
y G
ovt.o
f Ta
miln
adu.
��T
each
ers
Rec
ruitm
ent B
oard
,Sch
ool e
duca
tion
and
Col
legi
ate
educ
atio
n,G
ovt.o
f Tam
ilnad
u.
���D
epar
tmen
t of G
eogr
aphy
, Uni
vers
ity o
f Mad
ras,
Che
pauk
, Che
nnai
– 6
00 0
05.
���D
epar
tmen
t of G
eogr
aphy
, Mad
urai
Kam
araj
Uni
vers
ity, M
adur
ai -
625
021.
���D
epar
tmen
t of G
eogr
aphy
,Bha
rath
idas
anU
nive
rsity
,Tiru
chira
ppal
li - 6
20 0
24.
���D
epar
tmen
t of G
eogr
aphy
, Cen
tral U
nive
rsity
of T
amil
Nad
u, T
hiru
varu
r –61
0 00
5. ���D
epar
tmen
t of E
nviro
nmen
tal R
emot
e Se
nsin
g an
d C
arto
grap
hy, M
adur
ai K
amar
ajU
nive
rsity
, Mad
urai
- 62
5 02
1.
���D
epar
tmen
t of G
eogr
aphy
, Pre
side
ncy
Col
lege
(Aut
onom
ous)
,Che
nnai
– 6
00 0
05.
���D
epar
tmen
t of G
eogr
aphy
,Que
en M
ary’
s C
olle
ge (A
uton
omou
s), C
henn
ai -
600
004.
���D
epar
tmen
t of G
eogr
aphy
,Bha
rath
i Wom
en’s
Col
lege
(Aut
onom
ous)
, 85,
Pra
kasa
mSa
lai,
Che
nnai
-600
108
. ���D
epar
tmen
t of G
eogr
aphy
, Tou
rism
and
Tra
vel M
anag
emen
t, M
adra
s C
hris
tian
Col
lege
(Au
tono
mou
s), T
amba
ram
, Che
nnai
- 60
0 05
9.
���D
epar
tmen
t of G
eogr
aphy
, Gov
ernm
ent A
rts C
olle
ge (A
uton
omou
s),S
alem
– 6
36 0
07.
���D
epar
tmen
t of G
eogr
aphy
,Sri
Vija
y Vi
dyal
aya
Col
lege
of A
rts a
nd S
cien
ce, N
alla
mpa
lli, D
harm
apur
i – 6
3680
7. ���D
epar
tmen
t of G
eogr
aphy
,Arig
nar A
nna
Gov
ernm
ent A
rts C
olle
ge, N
amak
kal –
637
002.
���D
epar
tmen
t of G
eogr
aphy
, Gov
ernm
ent A
rts C
olle
ge (A
uton
omou
s), C
oim
bato
re -
641
018.
���D
epar
tmen
t of G
eogr
aphy
, Nirm
ala
Col
lege
for W
omen
(Aut
onom
ous)
, Coi
mba
tore
– 6
41 0
18.
���D
epar
tmen
t of G
eogr
aphy
, Bha
rath
iar U
nive
rsity
Arts
& S
cien
ce C
olle
ge, A
mai
kula
m,
P
ulia
mPa
rai (
P.O
.), G
udal
ur -
643
212.
���D
epar
tmen
t of G
eogr
aphy
, Gov
ernm
ent A
rts C
olle
ge (A
uton
omou
s), K
arur
– 6
39 0
05.
���D
epar
tmen
t of G
eogr
aphy
, Per
iyar
E.V
.R. C
olle
ge (A
uton
omou
s), T
iruch
irapp
alli
– 62
0 02
3.
���D
epar
tmen
t of G
eogr
aphy
,Gov
ernm
ent A
rts C
olle
ge,T
hiru
veru
mbu
r, Ti
ruch
irapp
alli
– 6
20 0
22.
���D
epar
tmen
t of G
eogr
aphy
,Kun
dava
iNac
hiar
Gov
ernm
ent A
rts C
olle
ge fo
r Wom
en (A
uton
omou
s), T
hanj
avur
- 61
3 00
7.
���D
epar
tmen
t of G
eogr
aphy
, A.V
.V.M
Sri
Push
pam
Col
lege
(Aut
onom
ous)
,Poo
ndi -
613
503
, Tha
njav
ur D
istri
ct.
���D
epar
tmen
t of G
eogr
aphy
, Gov
ernm
ent A
rts C
olle
ge (A
uton
omou
s), K
umba
kona
m- 6
12 0
02.
���D
epar
tmen
t of G
eogr
aphy
, Gov
ernm
ent A
rts C
olle
ge fo
r Wom
en (A
uton
omou
s), K
umba
kona
m -
612
002.
���D
epar
tmen
t of G
eogr
aphy
,SriM
eena
kshi
Gov
ernm
ent A
rts C
olle
ge fo
r Wom
en (A
uton
omou
s),M
adur
ai –
624
002
���D
epar
tmen
t of G
eogr
aphy
, MVM
Gov
ernm
ent A
rts C
olle
ge fo
r Wom
en, D
indi
gul -
624
008
.. ���D
epar
tmen
t of G
eogr
aphy
, Gov
ernm
ent A
rts C
olle
ge fo
r Wom
en, N
ilako
ttai -
624
208
, Din
digu
l Dis
trict
.
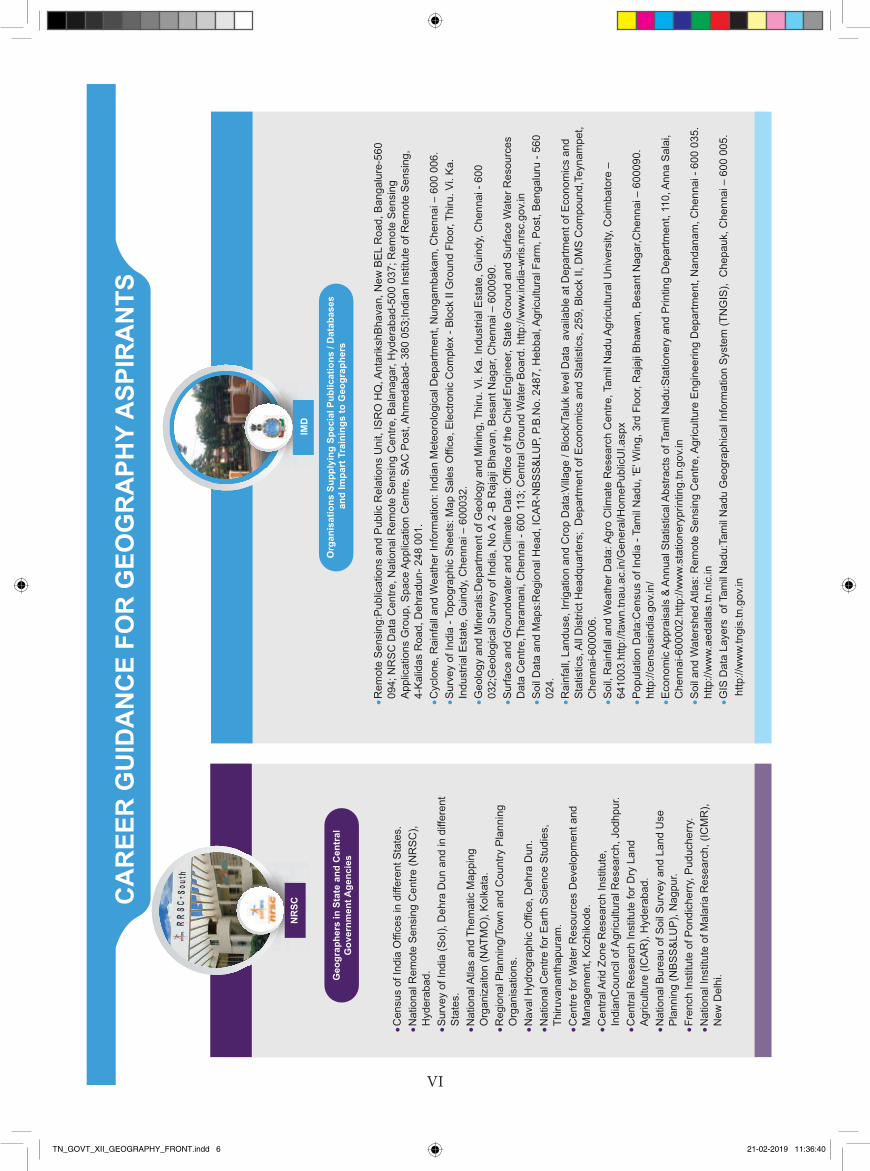
CA
REE
R G
UID
AN
CE
FOR
GEO
GR
APH
Y A
SPIR
AN
TS
Geo
grap
hers
in S
tate
and
Cen
tral
Gov
ernm
ent A
genc
ies
��Cen
sus
of In
dia
Offi
ces
in d
iffer
ent S
tate
s.��N
atio
nal R
emot
e Se
nsin
g C
entre
(NR
SC),
Hyd
erab
ad.
��Sur
vey
of In
dia
(SoI
), D
ehra
Dun
and
in d
iffer
ent
Stat
es.
��Nat
iona
l Atla
s an
d Th
emat
ic M
appi
ng
Org
aniz
aito
n (N
ATM
O),
Kolk
ata.
��Reg
iona
l Pla
nnin
g/To
wn
and
Cou
ntry
Pla
nnin
g O
rgan
isat
ions
.��N
aval
Hyd
rogr
aphi
c O
ffice
, Deh
ra D
un.
��Nat
iona
l Cen
tre fo
r Ear
th S
cien
ce S
tudi
es,
Thiru
vana
ntha
pura
m.
��Cen
tre fo
r Wat
er R
esou
rces
Dev
elop
men
t and
M
anag
emen
t, Ko
zhik
ode.
��Cen
tral A
rid Z
one
Res
earc
h In
stitu
te,
Indi
anC
ounc
il of
Agr
icul
tura
l Res
earc
h, J
odhp
ur.
��Cen
tral R
esea
rch
Inst
itute
for D
ry L
and
Agric
ultu
re (I
CAR
), H
yder
abad
.��N
atio
nal B
urea
u of
Soi
l Sur
vey
and
Land
Use
Pl
anni
ng (N
BSS&
LUP)
, Nag
pur.
��Fre
nch
Inst
itute
of P
ondi
cher
ry, P
uduc
herry
.��N
atio
nal I
nstit
ute
of M
alar
ia R
esea
rch,
(IC
MR
), N
ew D
elhi
.
��Rem
ote
Sens
ing:
Publ
icat
ions
and
Pub
lic R
elat
ions
Uni
t, IS
RO
HQ
, Ant
arik
shBh
avan
, New
BEL
Roa
d, B
anga
lure
-560
09
4; N
RSC
Dat
a C
entre
, Nat
iona
l Rem
ote
Sens
ing
Cen
tre, B
alan
agar
, Hyd
erab
ad-5
00 0
37; R
emot
e Se
nsin
g Ap
plic
atio
ns G
roup
, Spa
ce A
pplic
atio
n C
entre
, SAC
Pos
t, Ah
med
abad
- 380
053
;Indi
an In
stitu
te o
f Rem
ote
Sens
ing,
4-
Kalid
as R
oad,
Deh
radu
n- 2
48 0
01.
��Cyc
lone
, Rai
nfal
l and
Wea
ther
Info
rmat
ion:
Indi
an M
eteo
rolo
gica
l Dep
artm
ent,
Nun
gam
baka
m, C
henn
ai –
600
006
.��S
urve
y of
Indi
a - T
opog
raph
ic S
heet
s: M
ap S
ales
Offi
ce, E
lect
roni
c C
ompl
ex -
Bloc
k II
Gro
und
Floo
r, Th
iru. V
i. Ka
. In
dust
rial E
stat
e, G
uind
y, C
henn
ai –
600
032.
��Geo
logy
and
Min
eral
s:D
epar
tmen
t of G
eolo
gy a
nd M
inin
g, T
hiru
. Vi.
Ka. I
ndus
trial
Est
ate,
Gui
ndy,
Che
nnai
- 60
0 03
2;G
eolo
gica
l Sur
vey
of In
dia,
No
A 2
-B R
ajaj
i Bha
van,
Bes
ant N
agar
, Che
nnai
– 6
0009
0.��S
urfa
ce a
nd G
roun
dwat
er a
nd C
limat
e D
ata:
Offi
ce o
f the
Chi
ef E
ngin
eer,
Stat
e G
roun
d an
d Su
rface
Wat
er R
esou
rces
D
ata
Cen
tre,T
hara
man
i, C
henn
ai -
600
113;
Cen
tral G
roun
d W
ater
Boa
rd. h
ttp://
ww
w.in
dia-
wris
.nrs
c.go
v.in
��S
oil D
ata
and
Map
s:R
egio
nal H
ead,
ICAR
-NBS
S&LU
P, P
.B.N
o. 2
487,
Heb
bal,
Agric
ultu
ral F
arm
, Pos
t, Be
ngal
uru
- 560
02
4.��R
ainf
all,
Land
use,
Irrig
atio
n an
d C
rop
Dat
a:Vi
llage
/ Bl
ock/
Talu
k le
vel D
ata
ava
ilabl
e at
Dep
artm
ent o
f Eco
nom
ics
and
Stat
istic
s, A
ll D
istri
ct H
eadq
uarte
rs;
Dep
artm
ent o
f Eco
nom
ics
and
Stat
istic
s, 2
59, B
lock
II, D
MS
Com
poun
d,Te
ynam
pet,
C
henn
ai-6
0000
6.��S
oil,
Rai
nfal
l and
Wea
ther
Dat
a: A
gro
Clim
ate
Res
earc
h C
entre
, Tam
il N
adu
Agric
ultu
ral U
nive
rsity
, Coi
mba
tore
–
6410
03.h
ttp://
taw
n.tn
au.a
c.in
/Gen
eral
/Hom
ePub
licU
I.asp
x��P
opul
atio
n D
ata:
Cen
sus
of In
dia
- Tam
il N
adu,
'E' W
ing,
3rd
Flo
or, R
ajaj
i Bha
wan
, Bes
ant N
agar
,Che
nnai
– 6
0009
0.
http
://ce
nsus
indi
a.go
v.in
/��E
cono
mic
App
rais
als
& An
nual
Sta
tistic
al A
bstra
cts
of T
amil
Nad
u:St
atio
nery
and
Prin
ting
Dep
artm
ent,
110,
Ann
a Sa
lai,
Che
nnai
-600
002.
http
://w
ww.
stat
ione
rypr
intin
g.tn
.gov
.in��S
oil a
nd W
ater
shed
Atla
s: R
emot
e Se
nsin
g C
entre
, Agr
icul
ture
Eng
inee
ring
Dep
artm
ent,
Nan
dana
m, C
henn
ai -
600
035.
ht
tp://
ww
w.ae
datla
s.tn
.nic
.in��G
IS D
ata
Laye
rs o
f Tam
il N
adu:
Tam
il N
adu
Geo
grap
hica
l Inf
orm
atio
n Sy
stem
(TN
GIS
), C
hepa
uk, C
henn
ai –
600
005
.
http
://w
ww.
tngi
s.tn
.gov
.in
Org
anis
atio
ns S
uppl
ying
Spe
cial
Pub
licat
ions
/ D
atab
ases
and
Impa
rt T
rain
ings
to G
eogr
aphe
rs
IMD
Com
petit
ive
exam
inat
ions
com
pris
ing
Geo
grap
hy s
ubje
ct m
atte
r are
list
ed b
elow
UPS
C
TNPC
TRB
Uni
vers
ities
and
Col
lege
s O
fferin
g B
.Sc.
, M.S
c., i
n G
eogr
aphy
and
M
.Tec
h Pr
ogra
mm
e in
Geo
info
rmat
ics
in T
amil
Nad
u
UM
NR
SC
TN_GOVT_XII_GEOGRAPHY_FRONT.indd 6 21-02-2019 11:36:40
VII
��UPS
C c
ivil
serv
ice
exam
inat
ions
con
duct
ed b
y G
ovt.
of in
dia.
��T
amiln
adu
Publ
ic S
ervi
ce C
omm
issi
on G
roup
se
rvic
es E
xam
inat
ions
con
duct
ed b
y G
ovt.o
f Ta
miln
adu.
��T
each
ers
Rec
ruitm
ent B
oard
,Sch
ool e
duca
tion
and
Col
legi
ate
educ
atio
n,G
ovt.o
f Tam
ilnad
u.
���D
epar
tmen
t of G
eogr
aphy
, Uni
vers
ity o
f Mad
ras,
Che
pauk
, Che
nnai
– 6
00 0
05.
���D
epar
tmen
t of G
eogr
aphy
, Mad
urai
Kam
araj
Uni
vers
ity, M
adur
ai -
625
021.
���D
epar
tmen
t of G
eogr
aphy
,Bha
rath
idas
anU
nive
rsity
,Tiru
chira
ppal
li - 6
20 0
24.
���D
epar
tmen
t of G
eogr
aphy
, Cen
tral U
nive
rsity
of T
amil
Nad
u, T
hiru
varu
r –61
0 00
5. ���D
epar
tmen
t of E
nviro
nmen
tal R
emot
e Se
nsin
g an
d C
arto
grap
hy, M
adur
ai K
amar
ajU
nive
rsity
, Mad
urai
- 62
5 02
1.
���D
epar
tmen
t of G
eogr
aphy
, Pre
side
ncy
Col
lege
(Aut
onom
ous)
,Che
nnai
– 6
00 0
05.
���D
epar
tmen
t of G
eogr
aphy
,Que
en M
ary’
s C
olle
ge (A
uton
omou
s), C
henn
ai -
600
004.
���D
epar
tmen
t of G
eogr
aphy
,Bha
rath
i Wom
en’s
Col
lege
(Aut
onom
ous)
, 85,
Pra
kasa
mSa
lai,
Che
nnai
-600
108
. ���D
epar
tmen
t of G
eogr
aphy
, Tou
rism
and
Tra
vel M
anag
emen
t, M
adra
s C
hris
tian
Col
lege
(Au
tono
mou
s), T
amba
ram
, Che
nnai
- 60
0 05
9.
���D
epar
tmen
t of G
eogr
aphy
, Gov
ernm
ent A
rts C
olle
ge (A
uton
omou
s),S
alem
– 6
36 0
07.
���D
epar
tmen
t of G
eogr
aphy
,Sri
Vija
y Vi
dyal
aya
Col
lege
of A
rts a
nd S
cien
ce, N
alla
mpa
lli, D
harm
apur
i – 6
3680
7. ���D
epar
tmen
t of G
eogr
aphy
,Arig
nar A
nna
Gov
ernm
ent A
rts C
olle
ge, N
amak
kal –
637
002.
���D
epar
tmen
t of G
eogr
aphy
, Gov
ernm
ent A
rts C
olle
ge (A
uton
omou
s), C
oim
bato
re -
641
018.
���D
epar
tmen
t of G
eogr
aphy
, Nirm
ala
Col
lege
for W
omen
(Aut
onom
ous)
, Coi
mba
tore
– 6
41 0
18.
���D
epar
tmen
t of G
eogr
aphy
, Bha
rath
iar U
nive
rsity
Arts
& S
cien
ce C
olle
ge, A
mai
kula
m,
P
ulia
mPa
rai (
P.O
.), G
udal
ur -
643
212.
���D
epar
tmen
t of G
eogr
aphy
, Gov
ernm
ent A
rts C
olle
ge (A
uton
omou
s), K
arur
– 6
39 0
05.
���D
epar
tmen
t of G
eogr
aphy
, Per
iyar
E.V
.R. C
olle
ge (A
uton
omou
s), T
iruch
irapp
alli
– 62
0 02
3.
���D
epar
tmen
t of G
eogr
aphy
,Gov
ernm
ent A
rts C
olle
ge,T
hiru
veru
mbu
r, Ti
ruch
irapp
alli
– 6
20 0
22.
���D
epar
tmen
t of G
eogr
aphy
,Kun
dava
iNac
hiar
Gov
ernm
ent A
rts C
olle
ge fo
r Wom
en (A
uton
omou
s), T
hanj
avur
- 61
3 00
7.
���D
epar
tmen
t of G
eogr
aphy
, A.V
.V.M
Sri
Push
pam
Col
lege
(Aut
onom
ous)
,Poo
ndi -
613
503
, Tha
njav
ur D
istri
ct.
���D
epar
tmen
t of G
eogr
aphy
, Gov
ernm
ent A
rts C
olle
ge (A
uton
omou
s), K
umba
kona
m- 6
12 0
02.
���D
epar
tmen
t of G
eogr
aphy
, Gov
ernm
ent A
rts C
olle
ge fo
r Wom
en (A
uton
omou
s), K
umba
kona
m -
612
002.
���D
epar
tmen
t of G
eogr
aphy
,SriM
eena
kshi
Gov
ernm
ent A
rts C
olle
ge fo
r Wom
en (A
uton
omou
s),M
adur
ai –
624
002
���D
epar
tmen
t of G
eogr
aphy
, MVM
Gov
ernm
ent A
rts C
olle
ge fo
r Wom
en, D
indi
gul -
624
008
.. ���D
epar
tmen
t of G
eogr
aphy
, Gov
ernm
ent A
rts C
olle
ge fo
r Wom
en, N
ilako
ttai -
624
208
, Din
digu
l Dis
trict
.
CA
REE
R G
UID
AN
CE
ICM
R
Geo
grap
hers
in S
tate
and
Cen
tral
Gov
ernm
ent A
genc
ies
��Cen
sus
of In
dia
Offi
ces
in d
iffer
ent S
tate
s.��N
atio
nal R
emot
e Se
nsin
g C
entre
(NR
SC),
Hyd
erab
ad.
��Sur
vey
of In
dia
(SoI
), D
ehra
Dun
and
in d
iffer
ent
Stat
es.
��Nat
iona
l Atla
s an
d Th
emat
ic M
appi
ng
Org
aniz
aito
n (N
ATM
O),
Kolk
ata.
��Reg
iona
l Pla
nnin
g/To
wn
and
Cou
ntry
Pla
nnin
g O
rgan
isat
ions
.��N
aval
Hyd
rogr
aphi
c O
ffice
, Deh
ra D
un.
��Nat
iona
l Cen
tre fo
r Ear
th S
cien
ce S
tudi
es,
Thiru
vana
ntha
pura
m.
��Cen
tre fo
r Wat
er R
esou
rces
Dev
elop
men
t and
M
anag
emen
t, Ko
zhik
ode.
��Cen
tral A
rid Z
one
Res
earc
h In
stitu
te,
Indi
anC
ounc
il of
Agr
icul
tura
l Res
earc
h, J
odhp
ur.
��Cen
tral R
esea
rch
Inst
itute
for D
ry L
and
Agric
ultu
re (I
CAR
), H
yder
abad
.��N
atio
nal B
urea
u of
Soi
l Sur
vey
and
Land
Use
Pl
anni
ng (N
BSS&
LUP)
, Nag
pur.
��Fre
nch
Inst
itute
of P
ondi
cher
ry, P
uduc
herry
.��N
atio
nal I
nstit
ute
of M
alar
ia R
esea
rch,
(IC
MR
), N
ew D
elhi
.
��Rem
ote
Sens
ing:
Publ
icat
ions
and
Pub
lic R
elat
ions
Uni
t, IS
RO
HQ
, Ant
arik
shBh
avan
, New
BEL
Roa
d, B
anga
lure
-560
09
4; N
RSC
Dat
a C
entre
, Nat
iona
l Rem
ote
Sens
ing
Cen
tre, B
alan
agar
, Hyd
erab
ad-5
00 0
37; R
emot
e Se
nsin
g Ap
plic
atio
ns G
roup
, Spa
ce A
pplic
atio
n C
entre
, SAC
Pos
t, Ah
med
abad
- 380
053
;Indi
an In
stitu
te o
f Rem
ote
Sens
ing,
4-
Kalid
as R
oad,
Deh
radu
n- 2
48 0
01.
��Cyc
lone
, Rai
nfal
l and
Wea
ther
Info
rmat
ion:
Indi
an M
eteo
rolo
gica
l Dep
artm
ent,
Nun
gam
baka
m, C
henn
ai –
600
006
.��S
urve
y of
Indi
a - T
opog
raph
ic S
heet
s: M
ap S
ales
Offi
ce, E
lect
roni
c C
ompl
ex -
Bloc
k II
Gro
und
Floo
r, Th
iru. V
i. Ka
. In
dust
rial E
stat
e, G
uind
y, C
henn
ai –
600
032.
��Geo
logy
and
Min
eral
s:D
epar
tmen
t of G
eolo
gy a
nd M
inin
g, T
hiru
. Vi.
Ka. I
ndus
trial
Est
ate,
Gui
ndy,
Che
nnai
- 60
0 03
2;G
eolo
gica
l Sur
vey
of In
dia,
No
A 2
-B R
ajaj
i Bha
van,
Bes
ant N
agar
, Che
nnai
– 6
0009
0.��S
urfa
ce a
nd G
roun
dwat
er a
nd C
limat
e D
ata:
Offi
ce o
f the
Chi
ef E
ngin
eer,
Stat
e G
roun
d an
d Su
rface
Wat
er R
esou
rces
D
ata
Cen
tre,T
hara
man
i, C
henn
ai -
600
113;
Cen
tral G
roun
d W
ater
Boa
rd. h
ttp://
ww
w.in
dia-
wris
.nrs
c.go
v.in
��S
oil D
ata
and
Map
s:R
egio
nal H
ead,
ICAR
-NBS
S&LU
P, P
.B.N
o. 2
487,
Heb
bal,
Agric
ultu
ral F
arm
, Pos
t, Be
ngal
uru
- 560
02
4.��R
ainf
all,
Land
use,
Irrig
atio
n an
d C
rop
Dat
a:Vi
llage
/ Bl
ock/
Talu
k le
vel D
ata
ava
ilabl
e at
Dep
artm
ent o
f Eco
nom
ics
and
Stat
istic
s, A
ll D
istri
ct H
eadq
uarte
rs;
Dep
artm
ent o
f Eco
nom
ics
and
Stat
istic
s, 2
59, B
lock
II, D
MS
Com
poun
d,Te
ynam
pet,
C
henn
ai-6
0000
6.��S
oil,
Rai
nfal
l and
Wea
ther
Dat
a: A
gro
Clim
ate
Res
earc
h C
entre
, Tam
il N
adu
Agric
ultu
ral U
nive
rsity
, Coi
mba
tore
–
6410
03.h
ttp://
taw
n.tn
au.a
c.in
/Gen
eral
/Hom
ePub
licU
I.asp
x��P
opul
atio
n D
ata:
Cen
sus
of In
dia
- Tam
il N
adu,
'E' W
ing,
3rd
Flo
or, R
ajaj
i Bha
wan
, Bes
ant N
agar
,Che
nnai
– 6
0009
0.
http
://ce
nsus
indi
a.go
v.in
/��E
cono
mic
App
rais
als
& An
nual
Sta
tistic
al A
bstra
cts
of T
amil
Nad
u:St
atio
nery
and
Prin
ting
Dep
artm
ent,
110,
Ann
a Sa
lai,
Che
nnai
-600
002.
http
://w
ww.
stat
ione
rypr
intin
g.tn
.gov
.in��S
oil a
nd W
ater
shed
Atla
s: R
emot
e Se
nsin
g C
entre
, Agr
icul
ture
Eng
inee
ring
Dep
artm
ent,
Nan
dana
m, C
henn
ai -
600
035.
ht
tp://
ww
w.ae
datla
s.tn
.nic
.in��G
IS D
ata
Laye
rs o
f Tam
il N
adu:
Tam
il N
adu
Geo
grap
hica
l Inf
orm
atio
n Sy
stem
(TN
GIS
), C
hepa
uk, C
henn
ai –
600
005
.
http
://w
ww.
tngi
s.tn
.gov
.in
Org
anis
atio
ns S
uppl
ying
Spe
cial
Pub
licat
ions
/ D
atab
ases
and
Impa
rt T
rain
ings
to G
eogr
aphe
rs
IMD
Com
petit
ive
exam
inat
ions
com
pris
ing
Geo
grap
hy s
ubje
ct m
atte
r are
list
ed b
elow
UPS
C
TNPS
CTR
B
Uni
vers
ities
and
Col
lege
s O
fferin
g B
.Sc.
, M.S
c., i
n G
eogr
aphy
and
M
.Tec
h Pr
ogra
mm
e in
Geo
info
rmat
ics
in T
amil
Nad
u
UM
TN_GOVT_XII_GEOGRAPHY_FRONT.indd 7 21-02-2019 11:36:41

TN_GOVT_XII_GEOGRAPHY_FRONT.indd 8 21-02-2019 11:36:41
1.1 Introduction1.2 Distribution of population1.3 Density of Population1.4 Growth of world population1.5 Composition of Population1.6 Migration1.7 Overpopulation1.8 Measures to control overpopulation
Unit Overview Learning Objectives
➢ Know the attributes of population.
➢ Understand the distribution of the world population.
➢ Judge the cause and e� ect of population growth.
➢ Estimate the problems of over population.
➢ Elucidate the pull and push factors of migration.1.1. Introduction
Do you know that 3,60,000 persons born every day in the world? Four births take place every second in the world. 'Professor Stephen Hawking thinks the human species will have to populate a new planet within 100 years if it is to survive,' the BBC confi rmed.
'With climate change, overdue asteroid strikes, epidemics and population growth, our own planet is increasingly precarious,' the news outlet continued.
Human being is an important element of the environment and is probably the latest occupant of the earth, as its evolution took place less than two million years ago. Although distribution and growth of human population are infl uenced greatly by the physical environment, they have tremendous capacity to modify the physical environment. Demography is the statistical
study of human population. It includes the study of size, structure and distribution of population as well as changes in time and location in response to birth, migration, aging and death. ‘Population explosion’ is one of the greatest challenges that we are facing today.
1.2 Distribution of world population
People have inhabited the earth for several thousands of years, but for a long period of time, their numbers remained limited. It is only during last few hundred years that human population has increased at an alarming rate.
Population is spread unevenly across the continents. Only a few areas support large
Population Geography
1UNIT
TN_GOVT_XII_Geography_chapter 01.indd 1 21-02-2019 11:51:41

XII Geography 2
concentration of people while vast areas support few people. A large number of factors influence the distribution and growth of population over the earth’s surface.
The factors influencing the distribution of population
1. Relief
Rugged mountains pose various obstacles such as unsuitable conditions for the construction of rail-roads and highways, unfavourable conditions for agricultural crops because of short growing season, lack of cultivable land and snowy winters do not encourage large settlement areas. Hence, the mountainous areas support a few people. On the other hand, a large concentration of population is found in the fertile lowlands such as the Ganges and Brahmaputra in India, Hwang-Ho in China and plains of North-Western Europe and the USA. This is mainly due to flat level land which is fertile, favourable conditions for agriculture, long growing seasons and suitable condition for the settlement.
2 Accessibility
Areas with well developed transport infrastructure and links through road, rail, shipping, canals and air are likely to be more densely populated than areas which are poorly connected with transport network.
In earlier times, in the absence of water transport, all islands remained virtually uninhabited. One of the reasons why mountains are not inhabited by people is lack of accessibility.
3. Adequate water supply
Population distribution is affected very much by the presence or absence of water in any region. Water supply is essential for human survival and development. Areas which have sufficient water tend to have denser population
than areas which are dry or suffer from regular drought. Well watered regions of the Great Northern plains of India are densely populated whereas drought prone areas of Sahara are sparsely populated.
4. Soil
Fertile alluvial soils of river valleys throughout the world have encouraged dense settlement of population because they support agricultural activities. The high density of population in parts of East and South-East Asia is dependent mainly on fertile soil. For example, dense population is found in the Ganges valley of India, in Indus valley of Pakistan and Hwang-Ho valley of China. On the other hand, desert soil of Sahara region is sparsely populated.
5. Economic and political factors
Unfavourable economic condition, unemployment, religious intolerance, conflicts and wars do not favour more population.
The patterns of Population Distribution
The analysis of the pattern of population distribution and density is fundamental to the study of demographic characteristics of any area. The population distribution refers to the way the people are spread over the earth’s surface. The population distribution is uneven worldwide. Ten most populous countries of the world together make up nearly 60% of the world’s population.
1.3 Density of PopulationAbsolute numbers do not give any
indication of the impact of population on the land and its resources. The number of persons living per unit of land areas gives a better picture. This is expressed in the form of density of population per sq.km of land area.
Density of population = Total population Total area of the country
TN_GOVT_XII_Geography_chapter 01.indd 2 21-02-2019 11:51:41
Population Geography3
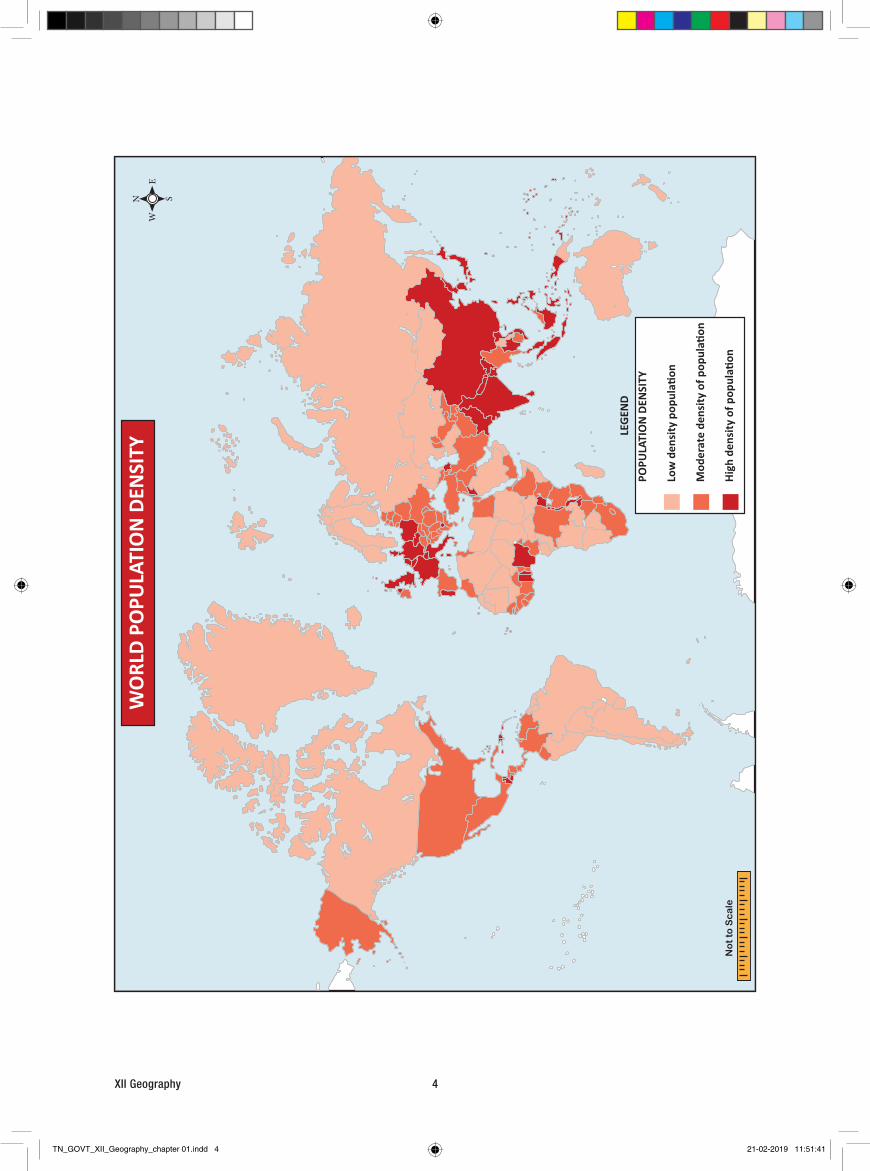
It is obtained by dividing the total land area by the total population, the quotient being the number of people per square kilometre. Compared with simple arithmetic density, physiological or nutritional density is a more refined method of calculating man-land ratios.
Physiological or Nutritional density is the ratio between total population and total cropped area. The total arable land in the world is 13.3% and the nutritional density of the world is 325 per sq.km of land. The total percentage of arable land is 48.83 in India and its nutritional density is 753 per sq.km of land. Singapore has the highest nutritional density of population of 440,998 per sq.km of land the world. The areas of density of population can be divided into three as follows:
1. High density areas of population Fertile plains with favourable climate
and highly industrialised and urbanised areas are generally densely populated. There are four major areas of high density of population with more than 100 persons per sq.km. Areas include:
a. Eastern Asia, including china, Japan and Republic of Korea.
b. Southern Asia, comprising India, Bangladesh and Sri Lanka.
c. North-Eastern part of the United States of America.
d. Central and North-Western Europe. Of the four regions given, the first
two i.e. Eastern Asia and South Asia have high density of population due to favourable environmental conditions such as favourable climate, fertile soil and large areas of plains which encourage the growth of agriculture. The plains and river valleys of India and China are densely populated. In the last two groups i.e. North Eastern United States of America and North – Western Europe
which are densely populated due to the concentration of manufacturing industries.
HOTS
Why has Singapore the highest physiological/nutritional density of population in the world?
2. Moderate density areas of populationThe areas of moderate density of
population have between 10 and 80 persons per sq.km. The areas of moderate density of population include Central part of the United States of America, Tropical Western Africa, Western blocks of Russia, Eastern Europe, Deccan Plateau of India, Central China, Southern portion of the Plateau of Mexico, North-Eastern Brazil and Central Chile, The above areas are characterised by the well developed agricultural activities, favourable climate, fertile soils, fishing, etc,.
3. Low density areas of populationAbout half the area of the world has
population less than 10 persons per sq.km. Certain vast areas remain completely uninhabited. The main areas are
a. Amazon forest region of South America and Congo forest region of Africa.
b. Arctic area of Canada, Greenland and the Polar regions.
c. Great deserts of the world i.e. Sahara, Kalahari, Arabia, Great desert of Australia, Atacama Desert of South America, desert regions of Western United States and Thar Desert of India.
d. High mountainous regions in all continents.
e. Antarctica.
TN_GOVT_XII_Geography_chapter 01.indd 3 21-02-2019 11:51:41
XII Geography 4
POPU
LATI
ON
DEN
SITY
Low
den
sity
pop
ula�
on
Mod
erat
e de
nsity
of p
opul
a�on
High
den
sity
of p
opul
a�on
WO
RLD
POPU
LATI
ON
DEN
SITY
LEG
END
EW
N S
No
t to
Sc
ale
TN_GOVT_XII_Geography_chapter 01.indd 4 21-02-2019 11:51:41
Population Geography5
Australia with an average density of population of 2 persons per sq.km is one of the most sparsely populated countries of the world. However, inhabitants of these areas have high standard of living. The reasons for low density of population are
a. Bad and unfavourable environment conditions for human settlement.
b. Lack of economic activities.c. Lack of transport and communication.d. Government policy.
Terms related population
1. Population: A group of individuals of the same species occupying a particular geographic area.
2. People: The members of a particular nation, community, or ethnic group.
3. Crude Birth rate (Natality Rate): Number of live births per thousand people in a year.
4. Crude Death Rate (Mortality Rate): Number of deaths per thousand people in a year.
5. Net Migration Rate: the formula for net migration rate is simple:
N = 1000 × (I – E) / PN= net migration rateE= number of people emigrating out of
the countryI= number of people immigrating into
the countryP= the estimated mid-year population
6. Fertility Rate: is the number of live births expected per 1000 women in their life times in a specified geographic area and for a specific point in time, usually a calendar year. Niger has the highest fertility rate of 6.49 while Singapore has the lowest fertility rate of 0.83. Can you guess why there is variation between these countries?
7. Dependency ratio:
Number of dependents in a population divided by the number of working age people. It’s a calculation which groups those aged under 15 with those over 65 years as the ‘dependants’ and classifying those aged 15-64 years as 'the working-age population'.
8. Growth Rate: = CBR – CDR +/- Net Migration Rate/ 1000
South Sudan has the highest population growth rate of 3.83% in 2017.
9. Rate of Natural Increase (RNI) = CBR-CDR (No Migration)
CBR>CDR = ↑ population
RNI usually expressed as % e.g., 2% = 2/100 = 20/1000
RNI ≠ population growth if migration significant
10. Adult Literacy Rate: The Adult literacy index (ALI) is a statistical measure used to determine how many adults can read and write in a certain area or nation. Adult literacy is one of the factors in measuring the Human Development Index (HDI) of each nation, along with life expectancy, education, and standard of living. Burkina faso has the lowest literacy rate of 21.8% ( 2015). How does literacy rate affect the standard of living of a country?
11. Life expectancy rate: Life expectancy equals the average number of years a person born in a given country is expected to live. As of 2015, the country with the highest life expectancy is Monaco at 89.52 years; the country with the lowest is Chad at 49.81 years.
TN_GOVT_XII_Geography_chapter 01.indd 5 21-02-2019 11:51:42
XII Geography 6
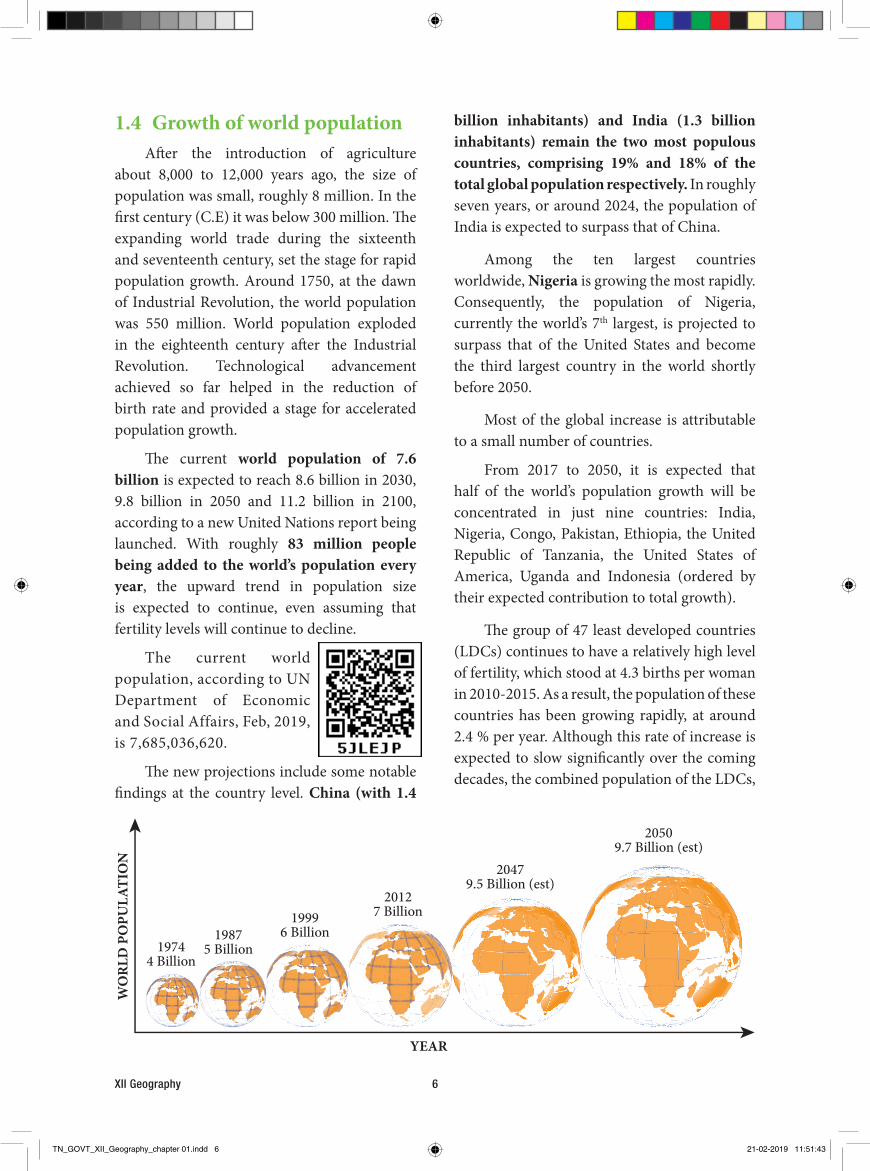
1.4 Growth of world populationAfter the introduction of agriculture
about 8,000 to 12,000 years ago, the size of population was small, roughly 8 million. In the first century (C.E) it was below 300 million. The expanding world trade during the sixteenth and seventeenth century, set the stage for rapid population growth. Around 1750, at the dawn of Industrial Revolution, the world population was 550 million. World population exploded in the eighteenth century after the Industrial Revolution. Technological advancement achieved so far helped in the reduction of birth rate and provided a stage for accelerated population growth.
The current world population of 7.6 billion is expected to reach 8.6 billion in 2030, 9.8 billion in 2050 and 11.2 billion in 2100, according to a new United Nations report being launched. With roughly 83 million people being added to the world’s population every year, the upward trend in population size is expected to continue, even assuming that fertility levels will continue to decline.
The current world population, according to UN Department of Economic and Social Affairs, Feb, 2019, is 7,685,036,620.
The new projections include some notable findings at the country level. China (with 1.4
billion inhabitants) and India (1.3 billion inhabitants) remain the two most populous countries, comprising 19% and 18% of the total global population respectively. In roughly seven years, or around 2024, the population of India is expected to surpass that of China.
Among the ten largest countries worldwide, Nigeria is growing the most rapidly. Consequently, the population of Nigeria, currently the world’s 7th largest, is projected to surpass that of the United States and become the third largest country in the world shortly before 2050.
Most of the global increase is attributable to a small number of countries.
From 2017 to 2050, it is expected that half of the world’s population growth will be concentrated in just nine countries: India, Nigeria, Congo, Pakistan, Ethiopia, the United Republic of Tanzania, the United States of America, Uganda and Indonesia (ordered by their expected contribution to total growth).
The group of 47 least developed countries (LDCs) continues to have a relatively high level of fertility, which stood at 4.3 births per woman in 2010-2015. As a result, the population of these countries has been growing rapidly, at around 2.4 % per year. Although this rate of increase is expected to slow significantly over the coming decades, the combined population of the LDCs,
19744 Billion
19875 Billion
19996 Billion
20127 Billion
20479.5 Billion (est)
20509.7 Billion (est)
YEAR
WO
RLD
PO
PULA
TIO
N
TN_GOVT_XII_Geography_chapter 01.indd 6 21-02-2019 11:51:43
Population Geography7
roughly one billion in 2017, is projected to increase by 33 % between 2017 and 2030, world population will reach 9.7 billion in 2050.
Similarly, Africa continues to experience high rates of population growth. Between 2017 and 2050, the populations of 26 African countries are projected to expand to at least double their current size.
The concentration of global population growth in the poorest countries presents a considerable challenge to governments in implementing the 2030 Agenda for Sustainable Development, which seeks to end poverty and hunger, expand and update health and education systems, achieve gender equality and women’s empowerment, reduce inequality and ensure that no one is left behind.
Population in the world is currently ( 2019) growing at a rate of around 1.09% per year (down from 1.12% in 2017 and 1.14% in 2016). It is estimated to reach 1% by 2023, less than 0.5% by 2052, and 0.25% in 2076. In 2100, it should be only 0.09% or an addition of only 10 million people to a total population of 11.2 billion. World population will, therefore, continue to grow in the 21st century.
Doubling Time of population
Doubling time is the amount of time it takes for a given quantity of population to double in size at a constant growth rate. We can find the doubling time for a population undergoing exponential growth by using the Rule of 70. It is because the population of a country becomes
TN_GOVT_XII_Geography_chapter 01.indd 7 21-02-2019 11:51:43
XII Geography 8
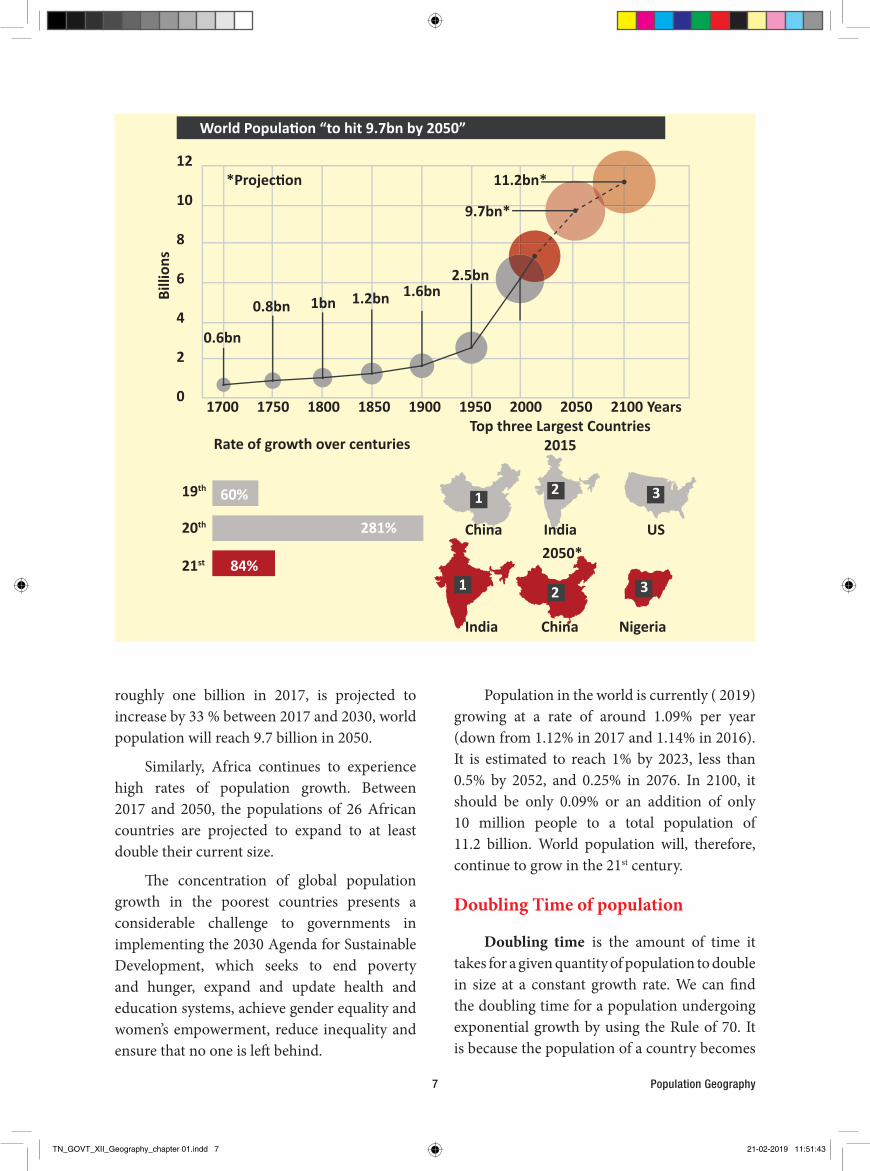
double in 70 years if the growth rate is 1%. Thus, we divide 70 by the growth rate and we get the doubling time of population growth rate. For example if the growth rate is 2.08, divide 70 by 2.08 and we get 33.6 years as the doubling time of population.
World population has doubled in 40 years from 1959 ( 3 billion) to 1999 ( 6 billion). It is now estimated that it will take another nearly 40 years to increase by another 50% to become 9 billion by 2037. The latest world population projections indicate that world population will reach 10 billion persons in the year 2055 and 11 billion in the year 2088.
World Population MilestonesAccording to the United Nations, the 6
billion figure was reached on October 12, 1999 (celebrated as the Day of 6 Billion). World population reached 7 Billion on October 31, 2011. The current world population is 7.7 billion as of Feb 2019 according to the most recent United Nations estimates. The United Nations projects world population to reach 8 billion in 2023 and 10 billion in the year 2056.
Regional division on the basis of growth rate
On the basis of the growth rate of population the world can be divided into the following three types of areas:
1. Areas of Low Growth RateDeveloped countries like US, Canada,
Japan, Australia, New Zealand and countries of western Europe have a low growth rate of population in these countries is due to low birth rates and low death rates. The difference between the birth rate and the death rate in these countries is the lowest.
2. Areas of Moderate Growth RateThis category includes the developing
countries like Pakistan, Afghanistan, Brazil, Bolivia,
Mongolia, Indonesia and many other Africa and South American countries, where the growth rate of nearly 2 % is also included among these countries though the growth rate here has started declining.
3. Areas of High Growth RateCountries like Mexico, Iran, Colombia,
Venezuela, Peru, Libya, Algeria, Sudan, Kenya and Kuwait make this category. In fact, most of the African countries with a growth rate of 3% fall in this category.
Population Concepts
i) Over population: situation whereby the population is considered too large for the available resources.
ii) Under – population: a situation where the population is less than the available resources of a country.
iii) Optimum – population: a situation where the number of people that can be supported is the same as the available resources.
India - Population
• The current population of India is 1,363,413,725 as of Feb 19, 2019, based on the latest United Nations estimates.
• India population is 17.74% of the total world population.
• India ranks number 2 in the list of countries (and dependencies) by population.
• The population density in India is 455 per Km2.
• 33.6 % of the population is urban (460,249,853 people in 2019)
Fact File
TN_GOVT_XII_Geography_chapter 01.indd 8 21-02-2019 11:51:43

Population Geography9
1.5 Composition of PopulationComposition of Population includes sex
ratio, literacy rate, age pyramids etc.
Sex RatioThe sex ratio is the ratio of males to females
in a population.
Qatar-315 Males per 100 females (2019)
With an astounding ratio of 315 males to a 100 females, Qatar holds the number one spot among countries with the highest male to female ratio in the world in 2018.
Fact File
As of 2014, the global sex ratio at birth is estimated at 107 boys to 100 girls (1000 boys per 934 girls).
The sex ratio of India is 933 females for every 1000 males according to 2011.
Kerala has the highest sex ratio in the country with 1084 females for 1000 males followed by Puducherry with 1037 females for 1000 males and Tamil Nadu with 996 females for 1000 males.
Cisgender (often abbreviated to simply cis) is a term for people whose gender identity matches the sex that they were
assigned at birth. It is the opposite of the term transgender.
What Are Population Age Pyramids?Population pyramids are graphical
representations of the age and sex of a population. For this reason, population pyramids are also referred to as age-sex pyramids. We refer to these graphs as pyramids because they are usually shaped like triangles and population pyramids also take
other shapes. Population pyramids usually have males on the left side and females on the right. There is also a vertical line in the middle of the graph that separates the males from the females.
Latvia, country with the highest sex ratio in the world.
Latvia is a former Soviet Union country and experienced a great decline in male population during World War two. By 2015, there were 84.8 males for every 100 females. The proportion of the female was 54.10% of the total population. Men in Latvia have a high mortality rate due to issues such as alcoholism, smoking, and careless car driving. Around 80% of suicides in Latvia are committed by men, often because of unemployment and unrealized financial goals. Women enjoy a longer life expectancy living 11 years more than men.
Fact File
Literacy Rate Total number of literate persons in a given
age group, expressed as a percentage of the total population in that age group.
Literacy rates continue to rise from one generation to the next. Yet according to new data from the UNESCO Institute for Statistics, there are still 750 million illiterate adults, two-thirds of whom are women. These numbers are a stark reminder of the work ahead to meet Sustainable Development Goals (SDGs) 4 and 5 and the Education 2030 targets.
Literacy rate variations between states in India
India's literacy rate is at 74.04%. Kerala has achieved a literacy rate of 93.91%. Bihar is the least literate state in India, with a literacy of 63.82%. Several other social indicators of the two states are
TN_GOVT_XII_Geography_chapter 01.indd 9 21-02-2019 11:51:43
XII Geography 10
correlated with these rates, such as life expectancy at birth (71.61 for males and 75 for females in Kerala, 65.66 for males and 64.79 for females in Bihar), infant mortality per 1,000 live births (10 in Kerala, 61 in Bihar), birth rate per 1,000 people (16.9 in Kerala, 30.9 in Bihar) and death rate per 1,000 people (6.4 in Kerala, 7.9 in Bihar).
Six Indian states account for about 70% of all illiterates in India: Uttar Pradesh, Bihar, Madhya Pradesh, Rajasthan, Andhra Pradesh and West Bengal. Slightly less than half of all Indian illiterates (48.12%) are in the six Hindi-speaking states of Uttar Pradesh, Bihar, Rajasthan, Madhya Pradesh, Jharkhand and Chhattisgarh.
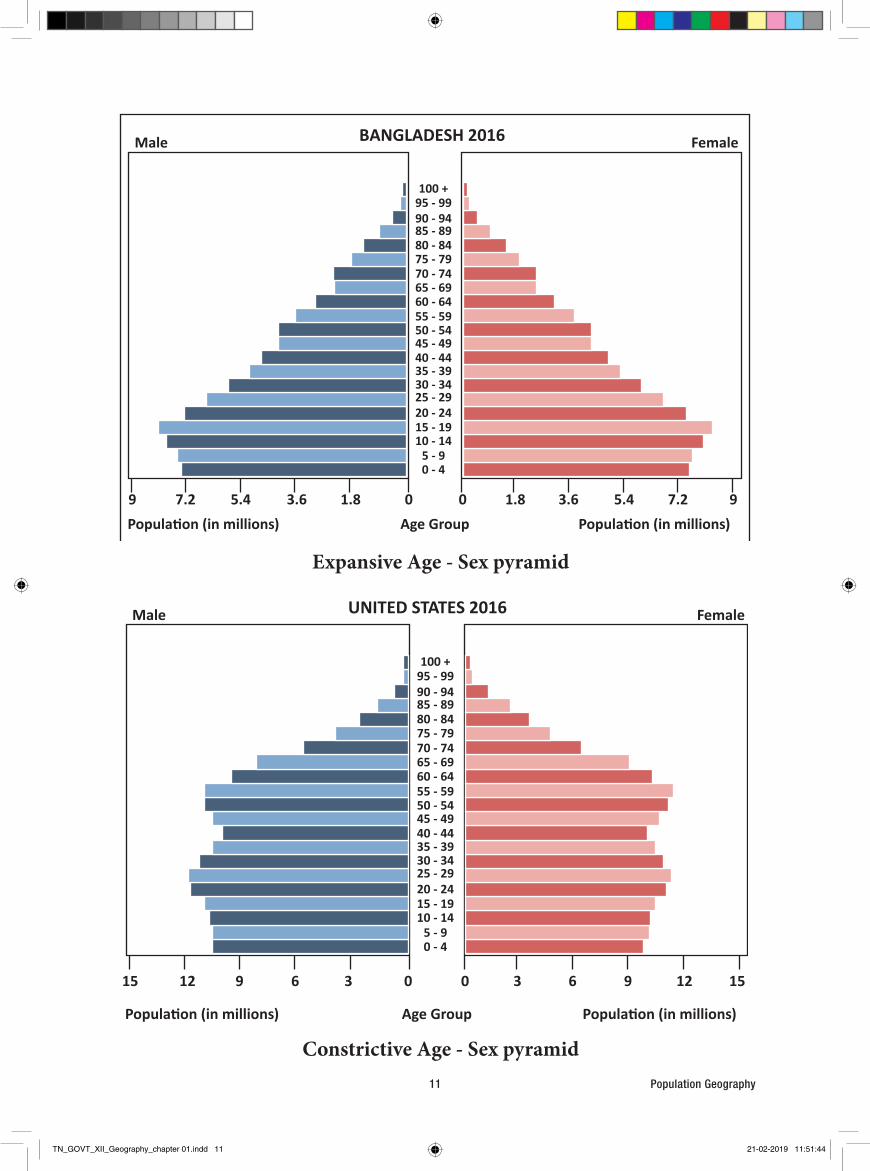
Age - Sex pyramids
There are three types of Age - Sex pyramids: expansive, constrictive, and stationary.
Expansive Age - Sex pyramids depict populations that have a larger percentage of people in younger age groups. Populations with this shape usually have high fertility rates with lower life expectancies. Many third world countries have expansive Age - Sex pyramids. Such a population pyramid is a characteristic of newly developing countries such as Afghanistan, Bangladesh, Kenya, and some countries of Latin America.
Constrictive Age - Sex pyramids are named so because they are constricted at the bottom. There is a lower percentage of younger people. Constrictive Age - Sex pyramids show declining birth rates, since each succeeding age group is getting smaller and smaller. The United States has a constrictive Age - Sex pyramid.
Tripura literacy success
Presently Tripura has the highest literacy rate in India, 94.65 percent. According to the 2011 census, literacy level was 93.91 percent in Kerala and 91.58 percent in Mizoram, among the most literate states in the country. The national literacy rate, according to the 2011 census, was 74.04 percent. The Tripura success story is attributed to the involvement of local government bodies, including Gram panchayats, NGOs and local clubs under the close supervision of the State Literacy Mission Authority (SLMA) headed by the chief minister. Tripura attained 87.75 percent literacy in the 2011 census, from the 12th position in the 2001 census to the 4th position in the 2011 census. Among projects implemented by the state government to increase literacy in the state are
• 10,000 anganwadi centres have 100 percent enrollment.
• Policy of no fail till class VIII to prevent children from dropping out.
• Midday meals in all schools with an eclectic menu for all days of the week to attract more students.
• No tuition fee in government colleges.
The holistic education system, implemented with equal interest in Agartala, remote areas and the tribal autonomic areas makes sure that people in Tripura do not just become literate but educated, officials emphasized. One pointer to the government's interest in education is the near-total absence of child labour in Tripura.
TN_GOVT_XII_Geography_chapter 01.indd 10 21-02-2019 11:51:44
Population Geography11
Male Female
Age Group
03 36 69 912 1215 150
Populaon (in millions)Populaon (in millions)
0 - 4
20 - 24
40 - 44
50 - 54
60 - 64
70 - 74
80 - 84
90 - 94
30 - 34
10 - 145 - 9
15 - 19
25 - 29
35 - 39
45 - 49
55 - 59
65 - 69
75 - 79
85 - 89
95 - 99100 +
UNITED STATES 2016
Male Female
Age Group09 91.83.6 3.65.4 5.47.2 7.21.80
Popula�on (in millions)Popula�on (in millions)
0 - 4
20 - 24
40 - 44
50 - 54
60 - 64
70 - 74
80 - 84
90 - 94
30 - 34
10 - 145 - 9
15 - 19
25 - 29
35 - 39
45 - 49
55 - 59
65 - 69
75 - 79
85 - 89
95 - 99100 +
BANGLADESH 2016
Expansive Age - Sex pyramid
Constrictive Age - Sex pyramid
TN_GOVT_XII_Geography_chapter 01.indd 11 21-02-2019 11:51:44

XII Geography 12
Immigration leads to an increased growth rate of population, emigration lowers the growth rate of population in the source region. Mexico’s emigration problem is a unique one, with more than 98% of all Mexican migrants living in the U.S.A, the country with which Mexico shares a border that runs 3110 km in length. The Mexican emigration rate increased substantially since the 1960s and, with more than 11% of Mexicans living abroad, Mexico is the country with the largest number of emigrants in the world. According to estimates from the UN 2015 report, in 2013, the United States, Germany and Russia had the largest number of immigrants of any country, while Tuvalu and Tokelau had the lowest immigrant.
Types of migration1 Net Migration
Net Migration is the difference between immigration (in-migration) and emigration (out-migration).
Stationary Age - Sex pyramids are those that show a somewhat equal proportion of the population in each age group. There is not a decrease or increase in population; it is stable. Austria has a stationary Age - Sex pyramid.
The Purpose of the Age - Sex PyramidThe purpose of making this Age - Sex
pyramid is to find out the comparison between the number of men and women, the number of workers, and the structure of the population in a country quickly. In addition, the creation of the Age - Sex Pyramid also has a purpose to assist the government in taking development policies.
1.6 Migration Migration means the movement of people
from one place to the other. It is an important control of population growth after fertility and mortality. Migration of people into an area from outside is called immigration or in-migration while movement out of an area to other regions is called emigration or out-migration.
Male Female
Age Group
0 0 73 146146 219219 292292 365365 73
Popula�on (in millions)Popula�on (in millions)
0 - 4
20 - 24
40 - 44
50 - 54
60 - 64
70 - 74
80 - 84
90 - 94
30 - 34
10 - 145 - 9
15 - 19
25 - 29
35 - 39
45 - 49
55 - 59
65 - 69
75 - 79
85 - 89
95 - 99100 +
AUSTRIA 2016
Stationary Age - Sex pyramid
TN_GOVT_XII_Geography_chapter 01.indd 12 21-02-2019 11:51:44

Population Geography13
Positive value of net migration is that more people coming in and population growth, for example, 44% of North America and 88% of Europe. Negative value of migration is more people coming out and population decline.
2 International MigrationEmigration is an indicator of economic and
or social failures of a society. It is a crossing of a national boundary. It is easier to control and monitor. There are laws to control or inhibit these movements. Between 2 million and 3 million people emigrate each year. Between 1965 and 2000, 175 million people have migrated: it accounts for 3% of the global population.
3 Internal MigrationIt occurs within a country. It is crossing
of population within domestic jurisdictional boundaries. It is the movement of people between states or provinces. There is little government control over internal migration.
4 Local MigrationLocal migration is the migration of the people
within state or district. No state boundaries are crossed in the local migration. It happens for several reasons such as buying a new house in the same town or city, difficult to research since they are usually missed in census data. It is based on change of income or lifestyle. Americans change residence every 5 to 7 years.
5 Voluntary migrationVoluntary migration is where the migrant
makes the decision to move. Most migration is voluntary.6 Involuntary migration
It is a forced migration in which the migrant has no role in the decision-making process. It includes mostly slavery. It is estimated that about 11 million African slaves were brought to the Americas between 1519 and 1867. In 1860, there were close to 4 million slaves in the United States. People involve in the involuntary migration are refugees due to military conscription, children
of migrants, people in the situations of divorce or separation.
Brain Drain Brain drain is related to educationally specific
selective migrations. Some countries are losing the most educated segment of their population. It can be both a benefit for the receiving country and a problem to the country of origin.
Receiving country: it is getting highly qualified labor which is contributing to the economy right away. It promotes economic growth in strategic sectors: science and technology. It does not have to pay education and health costs, for example, 30% of Mexicans with a PhD are in the US.
Country of origin: Education and health costs are not paid back to the country of origin. It is losing potential leaders and talent: Between 15 and 40% of a graduating class in Canada will move to the US. It has long term impact on economic growth. It has the possibility of getting remittances. Many brain drain migrants have skills which they can’t use at home: The resources and technology may not be available there. The specific labor market is not big enough.
Causes of MigrationWe can divide factors causing migrations into
two groups of factors as push and pull Factors.
Push and Pull factorsPush and pull factors are those factors which
either forcefully push people into migration or attract them. A push factor is forceful, and a factor which relates to the country from which a person migrates. A pull factor is something concerning the country to which a person migrates. It is generally a benefit that attracts people to a certain place. Push and Pull factors are usually considered as north and south poles on a magnet.
TN_GOVT_XII_Geography_chapter 01.indd 13 21-02-2019 11:51:44
XII Geography 14
Push Factors: Not enough jobs, few opportunities, desertification, famine/ drought, political fear/ persecution, poor medical care, loss of wealth, natural disasters, death threats, slavery, pollutions, poor housing, landlords, bullying and poor chances of finding courtship
Pull Factors: job opportunities, better living conditions, political and or religious freedom, enjoyment, education, better medical care, security, family links, industry, better chances of finding courtship.
1.7 OverpopulationOverpopulation is the state whereby the
human population rises to an extent exceeding the carrying capacity of the ecological setting. In an overpopulated environment, the numbers of people might be more than the available essential materials for survival such as transport, water, shelter, food or social amenities. This regularly contributes to environmental deterioration, worsening in the quality of life, or even the disintegration of the population.
Due to immigration, the decline in mortality rates, medical breakthroughs, and increased birth rates, populations will always increase and eventually gives rise to overpopulation.
Impacts of OverpopulationOverpopulation thus contributes to some
of the most compelling environmental problems which encompass:
1. Depletion of Natural Resources
As human population keeps on increasing, exhaustible natural resources such as arable land, coral reefs, fresh water, fossil fuels, and forests continue to drop sharply. This creates competitive demands on the vital life-sustaining resources and contributes to an incredible decline in the quality of life.
2. Accelerated Habitat Loss
The increased loss of the ecosystems including wetlands, wildlife, rainforests, coral reefs, aquatic life forms, and grasslands are highly influenced by overpopulation. For example, rainforests originally covered 14% of the entire earth’s surface. Today, rainforest only cover about 6% of the earth’s surface and scientists’ project it may even become less in the next four decades judged by the current rate of vegetation removal, logging, and deforestation. Besides, due to environmental pollution, 30% of the ocean reefs have been lost because of acidification and global warming since 1980. Also, more than half of the original wetlands have been lost.
3. Amplified Climate Change and Global Warming
The more the number of people, the more the number of vehicles and industries would be. Furthermore, more population tends to increased use of energy sources such as coal and firewood which contributes to increased greenhouse gas emissions.
Hence, because of the accumulation of human generated green house gases and carbon footprint in the atmosphere, the planet has continued to witness amplified global warming and climate change. The effects of climate change and global warming are resulting in extreme hunger, drought, flooding, and loss of habitat.
4. Loss of Biodiversity
Overpopulation has caused encroachment into frontier forests and destruction of natural ecosystems that has led to the mass extinction of species. The number of threatened species persists to multiply in number whereas some have completely gone extinct. This is because of human activities such as acidifying water, over exploitation of natural resources, pollution, over fishing, poaching, and destruction of natural systems which are necessary for the survival of different species.
TN_GOVT_XII_Geography_chapter 01.indd 14 21-02-2019 11:51:44
Population Geography15
5. Decrease of fresh water
The unrelenting nature of overpopulation on the earth has destroyed most of the world’s fresh systems. Most of the lakes, streams, rivers and ground water making up fresh water have been polluted. According to the global outlook of water resources, these activities influenced by over population have only left less than 1% of the planet’s fresh water readily accessible for human utilization.
Water vulnerability is already affecting many overpopulated nations, especially in some developing countries, as the demands for water tend to be more than the accessible water. Millions of fish species from freshwater ecosystems are on the verge of extinction. Thus, as human inhabitants rise in number, so will the problem of quality freshwater accessibility.
6. Lower Life Expectancy and Diminished Quality of Life
Overpopulation lowers the standards of living since it creates stress on the vital resources for survival and increases the difficulty of accessing the consistent supply of quality food, water, energy, health, security and shelter. Consequently, it makes the poor to become poorer, and they often opt for poor living conditions to survive.
Eventually, it gives rise to lower life expectancy. The situation is serious in developing nations such as southern Asia and sub-Saharan Africa where most of the poor populations submit to inadequate and poor diets.
7. Rise in Unemployment, Crime Rate, and Violence
In overpopulated nations, the available jobs are fewer than the overall job seeking population. This contributes to high levels of unemployment. In turn, lack of unemployment leads to elevated crime rates because of theft, drug cartels, and militia groups which are exploited as options
for attaining basic resources and necessities such as food, good living standards, and wealth. Violence and conflicts arise when people start competing for the available limited resources.
8. Increased Intensive FarmingAs population has grown over the years,
farming practices have evolved to produce enough food to feed larger numbers of people. However, intensive farming methods also cause damage to local ecosystems and the land, which may pose problems in the future.
1.8 Measures to control overpopulation
Here are some unique solutions to overpopulation:
1. Creating Awareness CampaignsUsing both social and mainstream media,
we can clearly tell people around the world the truth about overpopulation crises and what must be done to solve them the right way.
2. Promotion of Adopting childAdoption become a consideration for
family planning, particularly among socially conscientious communities. And today, it has become a de-facto solution for people who are interested in starting a family, yet having concerns about overpopulation.
3. Aiming for Single-Child FamiliesAccording to statistics, hundreds of
thousands of people are being added to the planet every day, which is an unsustainable rate. Hence, it is need of hour we should aim for single-child families.
4. National Security issueOver populated countries should treat
population boom as an issue of national security. As you can see, similar to food insecurity and climate change, uncontrolled and rapid population growth can be a national security threat in a way that it results to instability.
TN_GOVT_XII_Geography_chapter 01.indd 15 21-02-2019 11:51:44

XII Geography
7. Census: an official count or survey, especially of a population.
8. Gender equality: It is the vision that men and women should be treated equally in social, economic and all other aspects of society, and to not be discriminated against on the basis of their gender.
9. Sustainable development: is a way for people to use resources without the resources running out.
10. Population explosion: a sudden, large increase in the size of a population.
5. Changing Social Norms
Some couple choose not to have children and we have to respect their decision. This way we will be able to help curb the problem of overpopulation.
6. Providing Tax Benefits or Concessions
Governments of various countries can come up with various regulations and policies related to tax exemption to help solve overpopulation. For example, they can waive certain parts of income tax or lower income tax rates for couples who have one or two children.
1. Life expectancy: average number of years a person is expected to live.
2. Global warming: unusual increase of earth’s temperature due to the heat trapped in the atmosphere by green house gases.
3. Arable land : land under cultivation.
4. Social Norms: Pattern of behavior in a particular group, community, or culture, accepted as normal and to which an individual is accepted to conform.
5. Overpopulation: population exceeding the carrying capacity of its ecological niche.
6. Worldometers: show estimated current numbers based on statistics and projections from the most reputable official organization.
16
TN_GOVT_XII_Geography_chapter 01.indd 16 21-02-2019 11:51:44
Population Geography
ExerciseI. Choose the correct answer1. _____________ is the statistical study of human population. It includes the study of
size, structure and distribution of population as well as changes in time and location in response to birth, migration, aging and death.
a) Demography b) Geography
c) Anthropogeography d) Bio Geography
2. Which of the following are not densely populated areas?
a) The Ganges valley, Brahmaputra valley, and Eastern Asia.
b) The Ganges valley, Brahmaputra and NE USA.
c) Sahara, Eastern Siberia and Patagonia region.
d) Brahmaputra valley, Hwang – Ho valley and North Western Europe
3. Which one of the following is/are moderate density area/s? Answer by using the codes given.
a) Central part of the United States of America, Tropical Western Africa, Western blocks of Russia, Eastern Europe,
b) Deccan Plateau of India, Central China, Southern portion of the Plateau of Mexico,
c) North-Eastern Brazil and Central Chile, Tropical Western Africa, Western blocks of Russia, Eastern Europe,
d) Amazon forest region of South America and Congo forest region of Africa,Arctic area of Canada and Greenland and the Polar regions.
A) ii) and iii) only B) i) and ii) only
C) i), ii) and iii) only D) ii), iii) and iv) only
4. One of the following statements is untrue?
A) The total arable land in the world is 13.3% and the nutritional density of the world is 325 per sq.km of land.
B) The total percentage of arable land is 48.83 in India and its nutritional density is 753 per sq.km of land.
C) Singapore has the highest nutritional density of population of 440,998 per sq.km of land in the world.
D) Singapore has the highest percentage of arable land in the world.
5. Match List - I to List - II and answer the following using the codes given.
List -I List -II
a) Niger i) Lowest literacy rate
b) Singapore ii) Highest sex ratio
c) Burkina faso iii)Highest fertility rate
d) Latvia iv) Highest nutritional density
17
TN_GOVT_XII_Geography_chapter 01.indd 17 21-02-2019 11:51:44
XII Geography 18
1 2 3 4A) (iii) (iv) (i) (ii)B) (i) (ii) (iii) (iv)C) (iv) (iii) (ii) (i)D) (ii) (iv) (i) (iii)
6. Consider the following statements and answer the right option from the given.Statement: A large proportion of the world’s population growth occurs in less developed countries.Reason: The less developed countries have high birth rate and low death rate.
a) Statement is right but reason is wrong.b) Statement is wrong but reason is right.c) Both statement and reason are right.d) Both statement and reason are wrong.
7. Consider the following statements carefully and answer the right option from the given below. Brain drain is concerned,
Statement –I. The receiving country is getting highly qualified labour.Statement –II. Education and health costs are not paid back to the country of origin.Statement –III. Receiving country is losing potential leaders and talent.
a) Statement – I, II and III are right.b) Statement – I, II and III are wrong.c) Statement – I is right and statement –II and III are wrong.d) Statement – I and II are right and statement III is wrong.
8. One among the given is not a solution to overpopulation.a) Creating and Implementing National and Worldwide Multi-Media Overpopulation
Awareness Campaignsb) Aiming for Single-Child Families.c) Treating it as a National Security issued) Encouraging large family.
9. Odd one out. a) Mexico has the largest number of emigrants in the world while According to estimates
from the UN 2015 report, in 2013, the United States had the largest number of immigrants of any country
b) Qatar has the highest male to female ratio in the world while Latvia has highest female to male ratio in the world.
c) Tripura has the highest literacy rate while Bihar has the lowest literacy rate in India. d) Rise in Unemployment, Crime Rate, and Violence is due to under population.
10. All of the following statements are correct except,
a) India’s population is 17.74% of the total world population.b) The population density in India is 350 per Km2 (1,180 people per mi2).c) 33.2 % of the population is urban (449,945,237 people in 2018)d) India ranks number 2 in the list of countries (and dependencies) by population.
TN_GOVT_XII_Geography_chapter 01.indd 18 21-02-2019 11:51:44

Population Geography19
II. Very short answer11. List the factors influencing the distribution of population
12. Calculate the doubling time of world population if the growth rate is 1.09%.
13. Mention the four reasons for low density of population.
14. Write any three characteristics of Shanty town.
15. What is the sex ratio of India according to census 2011? Which three states/Union Territories have favourable sex ratio in India?
III. Short answer 16. Given below is age structure of India and calculate the dependency ratio of India. Write an
inference out of the result you get.
Age structure Percentage
0-14 years 27.34%
15-64 years 66.42 %
65 years and over 6.24% (2017 estimate)
17. Mention any three differences between expansive population pyramid and stationary population pyramid.
18. Name six Indian states which account for about 70% of all illiterates in India.
19. Differentiate push factor from pull factor as cause of migration.
20. Define the physiological density of population.
IV. Answer the following in detail21. Read the diagram given below carefully and answer the following questions.
TN_GOVT_XII_Geography_chapter 01.indd 19 21-02-2019 11:51:44
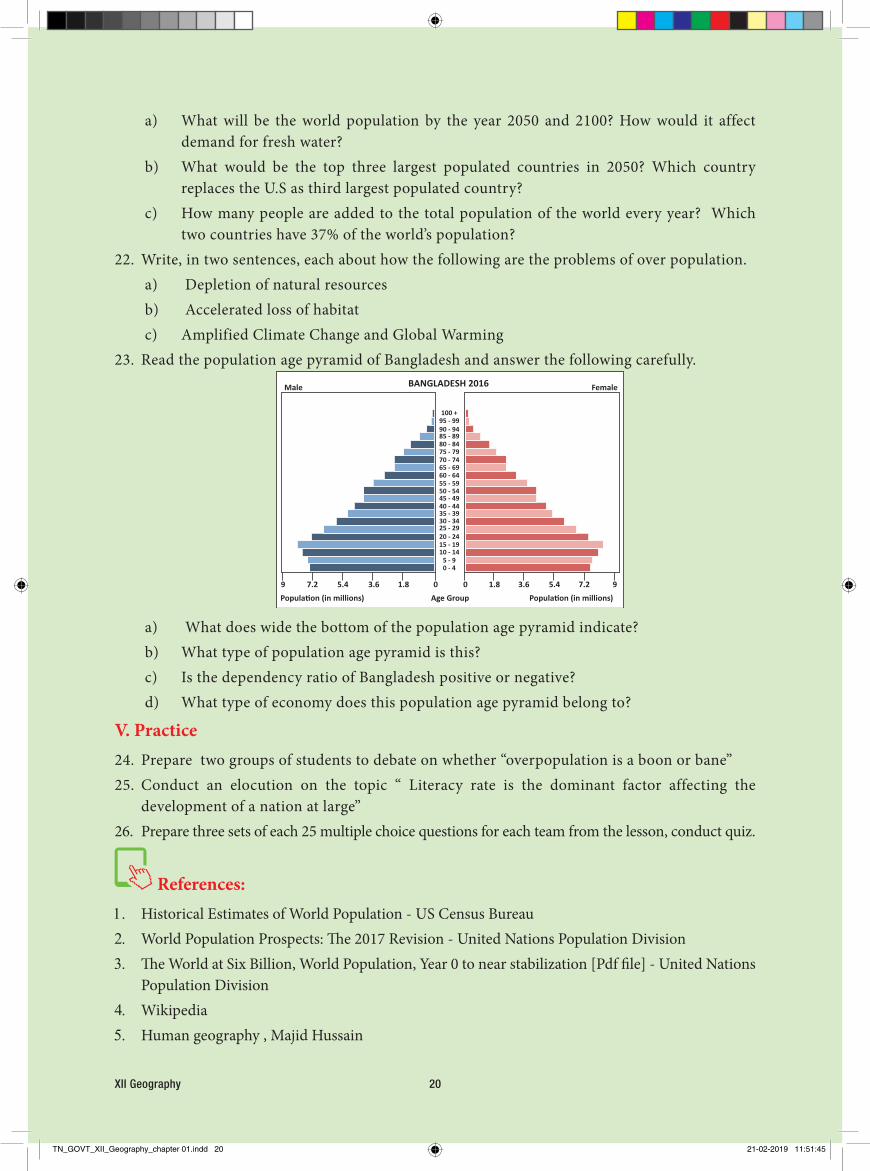
XII Geography 20
a) What will be the world population by the year 2050 and 2100? How would it affect demand for fresh water?
b) What would be the top three largest populated countries in 2050? Which country replaces the U.S as third largest populated country?
c) How many people are added to the total population of the world every year? Which two countries have 37% of the world’s population?
22. Write, in two sentences, each about how the following are the problems of over population.a) Depletion of natural resourcesb) Accelerated loss of habitatc) Amplified Climate Change and Global Warming
23. Read the population age pyramid of Bangladesh and answer the following carefully.Male Female
Age Group09 91.83.6 3.65.4 5.47.2 7.21.80
Popula�on (in millions)Popula�on (in millions)
0 - 4
20 - 24
40 - 44
50 - 54
60 - 64
70 - 74
80 - 84
90 - 94
30 - 34
10 - 145 - 9
15 - 19
25 - 29
35 - 39
45 - 49
55 - 59
65 - 69
75 - 79
85 - 89
95 - 99100 +
BANGLADESH 2016
a) What does wide the bottom of the population age pyramid indicate?b) What type of population age pyramid is this? c) Is the dependency ratio of Bangladesh positive or negative?d) What type of economy does this population age pyramid belong to?
V. Practice 24. Prepare two groups of students to debate on whether “overpopulation is a boon or bane” 25. Conduct an elocution on the topic “ Literacy rate is the dominant factor affecting the
development of a nation at large” 26. Prepare three sets of each 25 multiple choice questions for each team from the lesson, conduct quiz.
References:1. �Historical Estimates of World Population - US Census Bureau2. World Population Prospects: The 2017 Revision - United Nations Population Division3. �The World at Six Billion, World Population, Year 0 to near stabilization [Pdf file] - United Nations
Population Division4. �Wikipedia 5. Human geography , Majid Hussain
TN_GOVT_XII_Geography_chapter 01.indd 20 21-02-2019 11:51:45
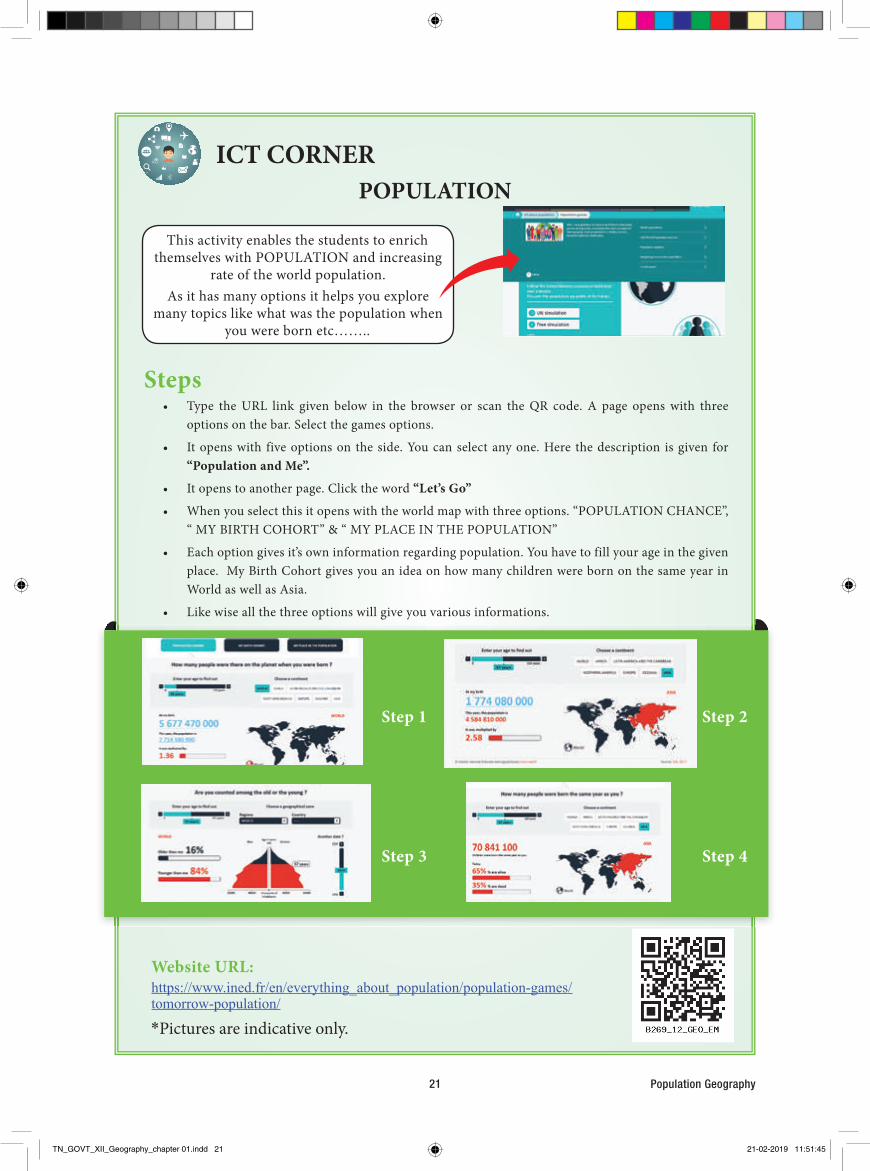
Population Geography21
POPULATION
Steps• Type the URL link given below in the browser or scan the QR code. A page opens with three
options on the bar. Select the games options.
• It opens with five options on the side. You can select any one. Here the description is given for “Population and Me”.
• It opens to another page. Click the word “Let’s Go”
• When you select this it opens with the world map with three options. “POPULATION CHANCE”, “ MY BIRTH COHORT” & “ MY PLACE IN THE POPULATION”
• Each option gives it’s own information regarding population. You have to fill your age in the given place. My Birth Cohort gives you an idea on how many children were born on the same year in World as well as Asia.
• Like wise all the three options will give you various informations.
Website URL:https://www.ined.fr/en/everything_about_population/population-games/tomorrow-population/
ICT CORNER
*Pictures are indicative only.
This activity enables the students to enrich themselves with POPULATION and increasing
rate of the world population. As it has many options it helps you explore
many topics like what was the population when you were born etc……..
Step 1 Step 2
Step 3 Step 4
TN_GOVT_XII_Geography_chapter 01.indd 21 21-02-2019 11:51:45

22
In simpler term we can define settlement as any form of human habitation which ranges from a single dwelling to a large city.
A human settlement is defined as a place inhabited more or less permanently. It includes building in which they live or use and the streets through which they travel. It also includes the temporary camps of the hunters and herders. It may consist of only a few dwelling units called hamlets or big cluster of building called urban cities.
2.1. Introduction Look at the front image of an oasis. It is an aerial view of the Huacachina oasis in Ica, Peru, 300 km south of Lima. Th e settlement is home to 96 residents, who live around the lake.Now let us discuss on 1. Why the most oases are having hardly
100 residents or less? 2. How do people live in an oasis identify
the direction at night? 3. What are the comforts and discomforts
the people of Oasis experience? 4. Could you list some factors favouring
settlements?
2.1. Introduction
2.2. Origin and development of Settlement
2.3. Site and Situation
2.4. Pattern of Rural Settlement
2.5. Classification of Rural Settlement
2.6. Urban Settlement
2.7. The concentric zone theory
2.8. Urbanization of the World and India
2.9. Problems of Urbanization
Unit Overview Learning Objectives
➢ Identify various types of rural settlements.
➢ Di� erentiate site from situation.
➢ Understand various types of settlements in India.
➢ Establish the relationship between settlement types based on relief, climate and building materials.
➢ Analyse the distribution patterns of rural and urban settlements.
➢ Understand the models of urban land use
HumanSettlements
2UNIT
TN_GOVT_XII_Geography_chapter 02.indd 22 21-02-2019 12:00:07
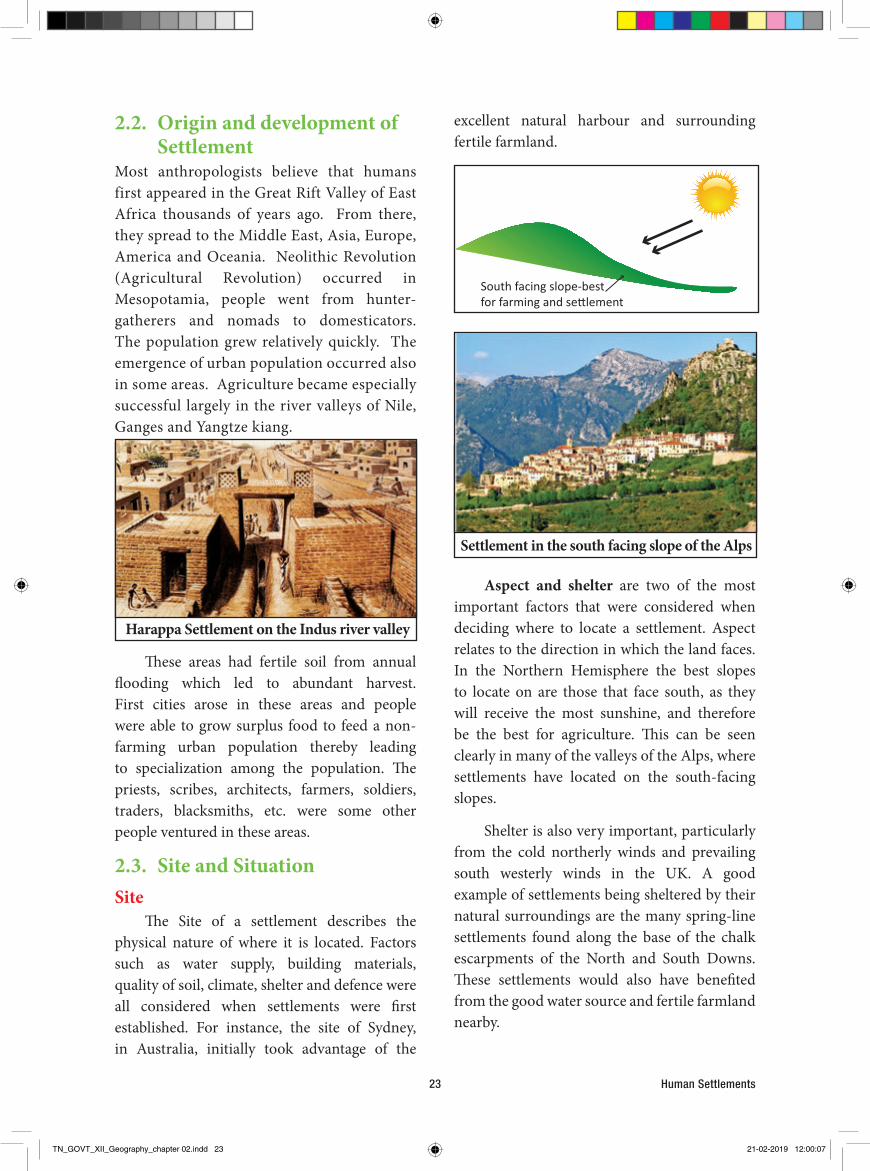
Human Settlements23
2.2. Origin and development of Settlement
Most anthropologists believe that humans first appeared in the Great Rift Valley of East Africa thousands of years ago. From there, they spread to the Middle East, Asia, Europe, America and Oceania. Neolithic Revolution (Agricultural Revolution) occurred in Mesopotamia, people went from hunter-gatherers and nomads to domesticators. The population grew relatively quickly. The emergence of urban population occurred also in some areas. Agriculture became especially successful largely in the river valleys of Nile, Ganges and Yangtze kiang.
Harappa Settlement on the Indus river valley
These areas had fertile soil from annual flooding which led to abundant harvest. First cities arose in these areas and people were able to grow surplus food to feed a non-farming urban population thereby leading to specialization among the population. The priests, scribes, architects, farmers, soldiers, traders, blacksmiths, etc. were some other people ventured in these areas.
2.3. Site and Situation Site
The Site of a settlement describes the physical nature of where it is located. Factors such as water supply, building materials, quality of soil, climate, shelter and defence were all considered when settlements were first established. For instance, the site of Sydney, in Australia, initially took advantage of the
excellent natural harbour and surrounding fertile farmland.
South facing slope-bestfor farming and se�lement
South facing slope-bestfor farming and se�lement
Settlement in the south facing slope of the Alps
Aspect and shelter are two of the most important factors that were considered when deciding where to locate a settlement. Aspect relates to the direction in which the land faces. In the Northern Hemisphere the best slopes to locate on are those that face south, as they will receive the most sunshine, and therefore be the best for agriculture. This can be seen clearly in many of the valleys of the Alps, where settlements have located on the south-facing slopes.
Shelter is also very important, particularly from the cold northerly winds and prevailing south westerly winds in the UK. A good example of settlements being sheltered by their natural surroundings are the many spring-line settlements found along the base of the chalk escarpments of the North and South Downs. These settlements would also have benefited from the good water source and fertile farmland nearby.
TN_GOVT_XII_Geography_chapter 02.indd 23 21-02-2019 12:00:07

XII Geography 24
Welsh valleys, which tend to extend along the flat valley floor, rather than up the steep valley sides. Spring line settlements in the North and South Downs, England are also good examples of wet point sites.
4. DefenceIn medieval times, defence was one of the
most important factors influencing the site of a settlement. The relief of the land often proved to be the best form of defence. Edinburgh castle sits on the top of a glacial crag, in an almost perfect position to defend itself, with very little chance for the attackers. In Italy, there are many walled hill-top villages, whilst the Maoris in New Zealand built their settlements (called Pa's) on the top of steep hills to prevent being attacked. In India, Ichhapur Defence Estate is a census town in Barrackpore, West Bengal.
The other common natural feature used for defence is water, and in particular rivers. Both Shrewsbury and Durham are very good examples of where a meander of the river has formed an area of land bounded by water on three sides. This provided both cities with excellent defence, as they only had a thin neck of land to defend.
Castle built on top ofglacial crag
Steep cliffsmade aack
virtuallyimpossible
Holyrood House(the Queen’s Residence)
The RoyalMile
1. Water supplyWater supply is probably the single most
important factor in deciding where a settlement might be located. Not only do rivers provide a source of clean drinking water, they also provide a food source through fishing, and a transport route. Most of the world's largest cities are located on rivers, especially the point at which they reach the sea, as this was often the first point that explorers landed.
2. Dry point sitesA dry point site is one that is slightly raised
from the surrounding area, meaning that it is less likely to flood. Ely in Cambridgeshire, England, is a good example of dry point site.
Se�lement built on
raised mound to avoid flooding
e.g. Ely, Cambridgeshire, EnglandSe�lement
built on raised mound
to avoid flooding
e.g. Ely, Cambridgeshire, England
3. Wet point sitesWet point site refers to any site that has
access to water, usually through being beside a river. Towns would either grow up along the river or clustered near the point at which the river enters the sea. Examples of wet point sites include the towns and villages of the
Dry point site
TN_GOVT_XII_Geography_chapter 02.indd 24 21-02-2019 12:00:10
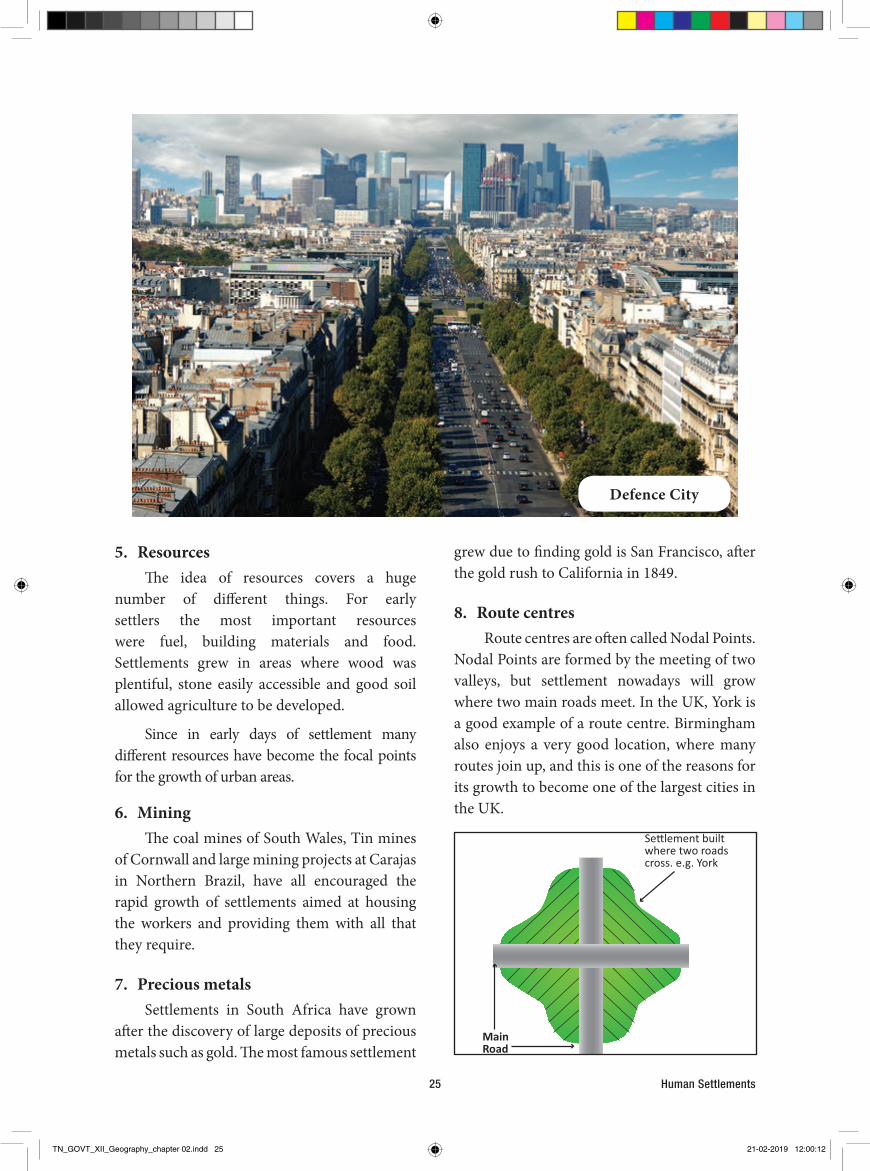
Human Settlements25
grew due to finding gold is San Francisco, after the gold rush to California in 1849.
8. Route centresRoute centres are often called Nodal Points.
Nodal Points are formed by the meeting of two valleys, but settlement nowadays will grow where two main roads meet. In the UK, York is a good example of a route centre. Birmingham also enjoys a very good location, where many routes join up, and this is one of the reasons for its growth to become one of the largest cities in the UK.
Se�lement builtwhere two roadscross. e.g. York
Main Road
5. ResourcesThe idea of resources covers a huge
number of different things. For early settlers the most important resources were fuel, building materials and food. Settlements grew in areas where wood was plentiful, stone easily accessible and good soil allowed agriculture to be developed.
Since in early days of settlement many different resources have become the focal points for the growth of urban areas.
6. MiningThe coal mines of South Wales, Tin mines
of Cornwall and large mining projects at Carajas in Northern Brazil, have all encouraged the rapid growth of settlements aimed at housing the workers and providing them with all that they require.
7. Precious metalsSettlements in South Africa have grown
after the discovery of large deposits of precious metals such as gold. The most famous settlement
Defence City
TN_GOVT_XII_Geography_chapter 02.indd 25 21-02-2019 12:00:12
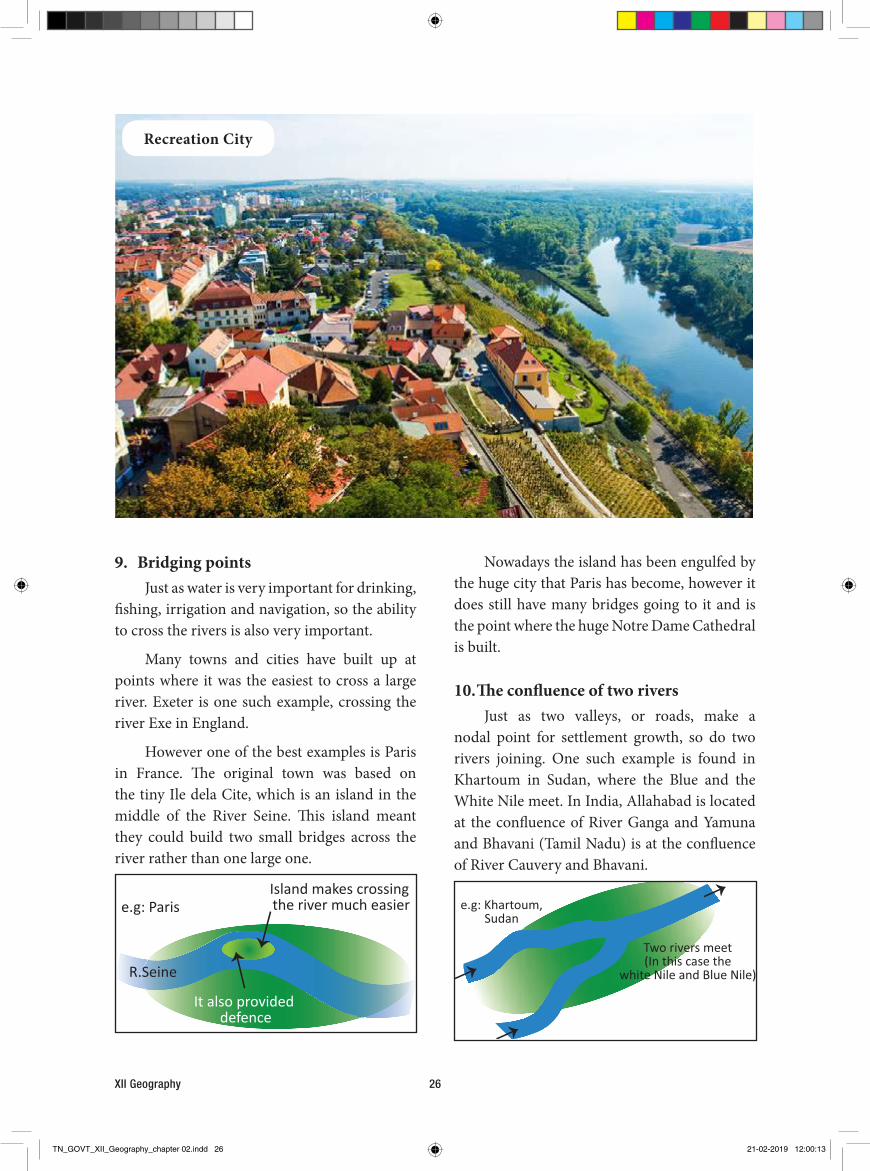
XII Geography 26
Nowadays the island has been engulfed by the huge city that Paris has become, however it does still have many bridges going to it and is the point where the huge Notre Dame Cathedral is built.
10. The confluence of two riversJust as two valleys, or roads, make a
nodal point for settlement growth, so do two rivers joining. One such example is found in Khartoum in Sudan, where the Blue and the White Nile meet. In India, Allahabad is located at the confluence of River Ganga and Yamuna and Bhavani (Tamil Nadu) is at the confluence of River Cauvery and Bhavani.
9. Bridging pointsJust as water is very important for drinking,
fishing, irrigation and navigation, so the ability to cross the rivers is also very important.
Many towns and cities have built up at points where it was the easiest to cross a large river. Exeter is one such example, crossing the river Exe in England.
However one of the best examples is Paris in France. The original town was based on the tiny Ile dela Cite, which is an island in the middle of the River Seine. This island meant they could build two small bridges across the river rather than one large one.
Recreation City
TN_GOVT_XII_Geography_chapter 02.indd 26 21-02-2019 12:00:13
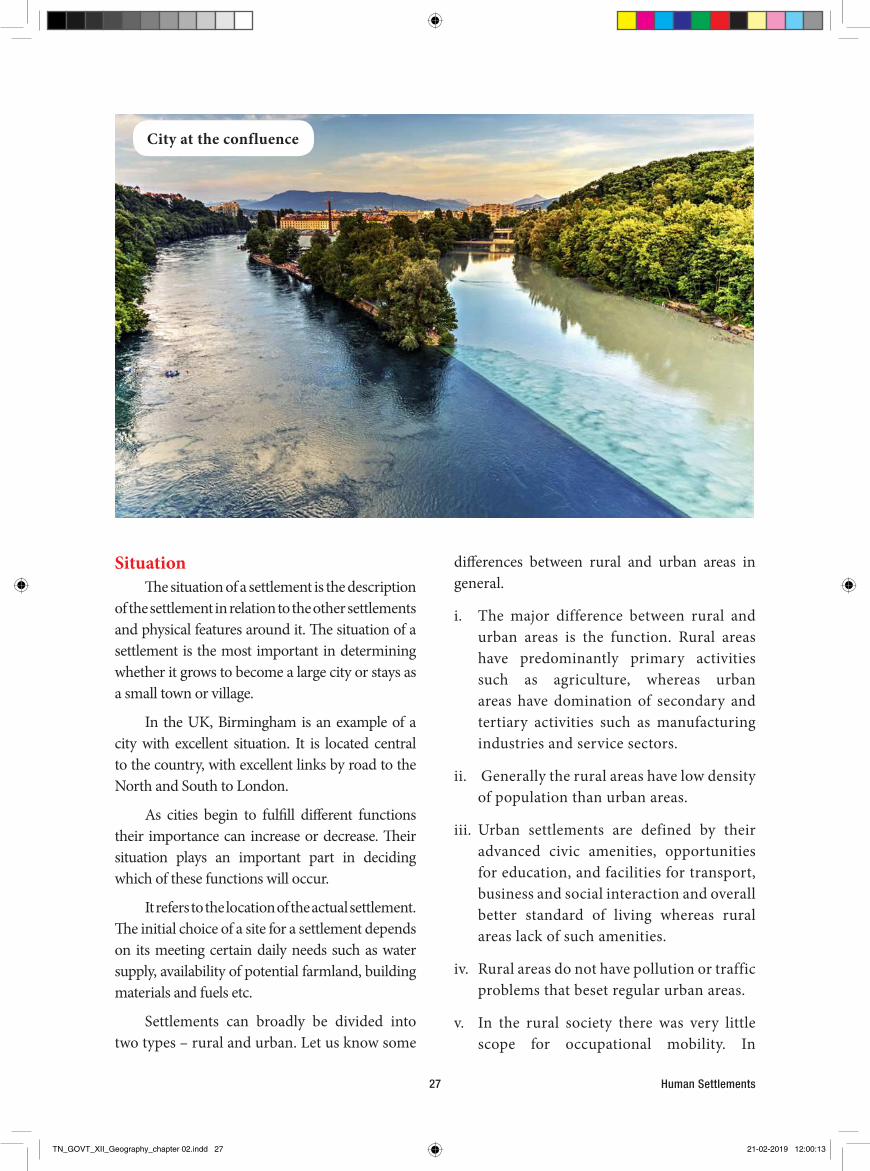
Human Settlements27
differences between rural and urban areas in general.
i. The major difference between rural and urban areas is the function. Rural areas have predominantly primary activities such as agriculture, whereas urban areas have domination of secondary and tertiary activities such as manufacturing industries and service sectors.
ii. Generally the rural areas have low density of population than urban areas.
iii. Urban settlements are defined by their advanced civic amenities, opportunities for education, and facilities for transport, business and social interaction and overall better standard of living whereas rural areas lack of such amenities.
iv. Rural areas do not have pollution or traffic problems that beset regular urban areas.
v. In the rural society there was very little scope for occupational mobility. In
SituationThe situation of a settlement is the description
of the settlement in relation to the other settlements and physical features around it. The situation of a settlement is the most important in determining whether it grows to become a large city or stays as a small town or village.
In the UK, Birmingham is an example of a city with excellent situation. It is located central to the country, with excellent links by road to the North and South to London.
As cities begin to fulfill different functions their importance can increase or decrease. Their situation plays an important part in deciding which of these functions will occur.
It refers to the location of the actual settlement. The initial choice of a site for a settlement depends on its meeting certain daily needs such as water supply, availability of potential farmland, building materials and fuels etc.
Settlements can broadly be divided into two types – rural and urban. Let us know some
City at the confluence
TN_GOVT_XII_Geography_chapter 02.indd 27 21-02-2019 12:00:13
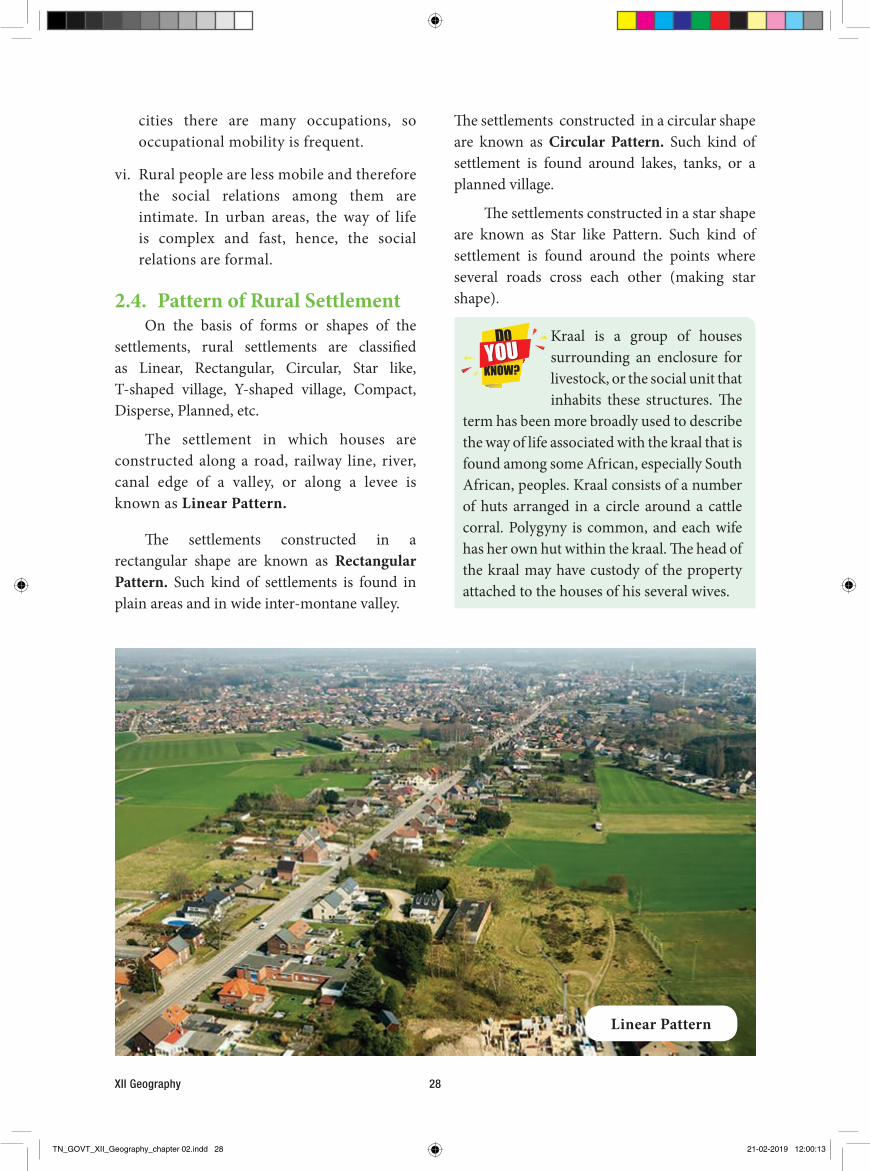
XII Geography 28
The settlements constructed in a circular shape are known as Circular Pattern. Such kind of settlement is found around lakes, tanks, or a planned village.
The settlements constructed in a star shape are known as Star like Pattern. Such kind of settlement is found around the points where several roads cross each other (making star shape).
cities there are many occupations, so occupational mobility is frequent.
vi. Rural people are less mobile and therefore the social relations among them are intimate. In urban areas, the way of life is complex and fast, hence, the social relations are formal.
2.4. Pattern of Rural SettlementOn the basis of forms or shapes of the
settlements, rural settlements are classified as Linear, Rectangular, Circular, Star like, T-shaped village, Y-shaped village, Compact, Disperse, Planned, etc.
The settlement in which houses are constructed along a road, railway line, river, canal edge of a valley, or along a levee is known as Linear Pattern.
The settlements constructed in a rectangular shape are known as Rectangular Pattern. Such kind of settlements is found in plain areas and in wide inter-montane valley.
Kraal is a group of houses surrounding an enclosure for livestock, or the social unit that inhabits these structures. The
term has been more broadly used to describe the way of life associated with the kraal that is found among some African, especially South African, peoples. Kraal consists of a number of huts arranged in a circle around a cattle corral. Polygyny is common, and each wife has her own hut within the kraal. The head of the kraal may have custody of the property attached to the houses of his several wives.
Linear Pattern
TN_GOVT_XII_Geography_chapter 02.indd 28 21-02-2019 12:00:13
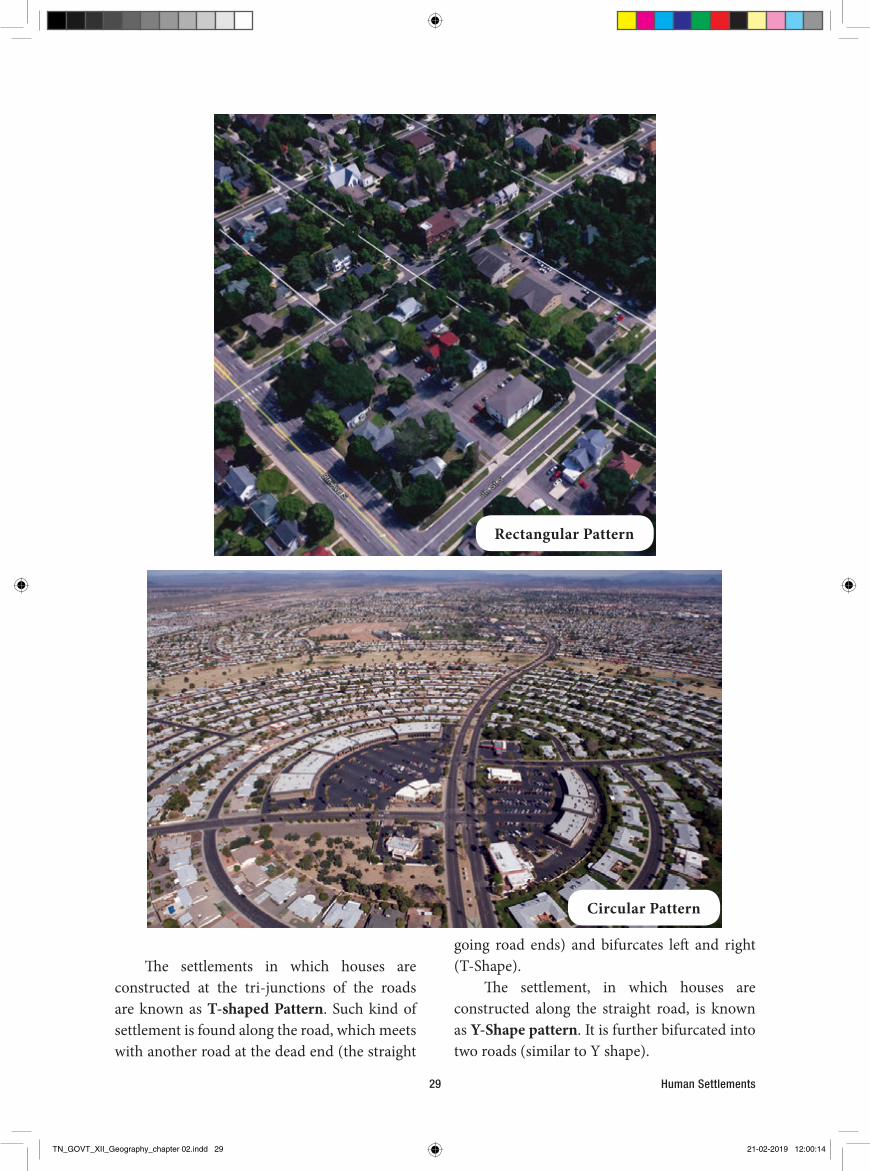
Human Settlements29
going road ends) and bifurcates left and right (T-Shape).
The settlement, in which houses are constructed along the straight road, is known as Y-Shape pattern. It is further bifurcated into two roads (similar to Y shape).
The settlements in which houses are constructed at the tri-junctions of the roads are known as T-shaped Pattern. Such kind of settlement is found along the road, which meets with another road at the dead end (the straight
Rectangular Pattern
Circular Pattern
TN_GOVT_XII_Geography_chapter 02.indd 29 21-02-2019 12:00:14
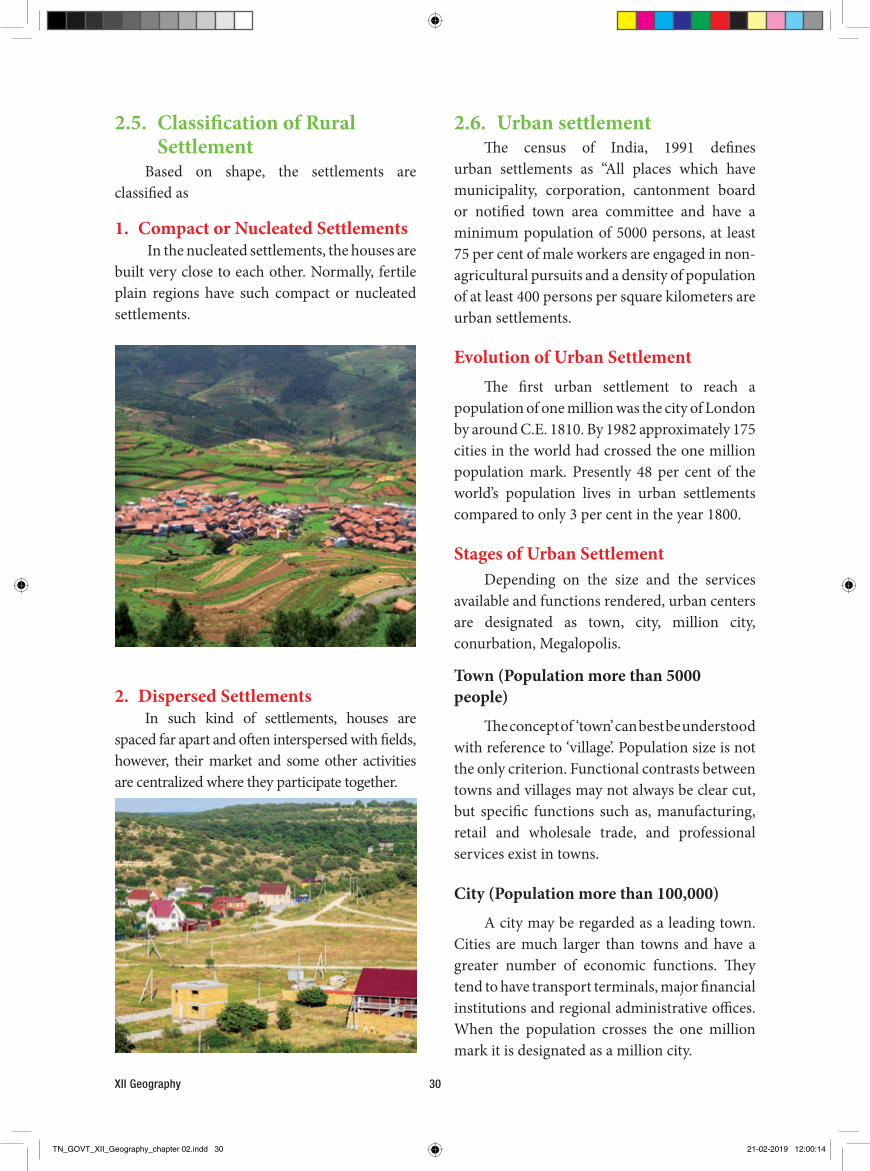
XII Geography 30
2.5. Classification of Rural Settlement
Based on shape, the settlements are classified as
1. Compact or Nucleated Settlements In the nucleated settlements, the houses are
built very close to each other. Normally, fertile plain regions have such compact or nucleated settlements.
2. Dispersed SettlementsIn such kind of settlements, houses are
spaced far apart and often interspersed with fields, however, their market and some other activities are centralized where they participate together.
2.6. Urban settlementThe census of India, 1991 defines
urban settlements as “All places which have municipality, corporation, cantonment board or notified town area committee and have a minimum population of 5000 persons, at least 75 per cent of male workers are engaged in non-agricultural pursuits and a density of population of at least 400 persons per square kilometers are urban settlements.
Evolution of Urban SettlementThe first urban settlement to reach a
population of one million was the city of London by around C.E. 1810. By 1982 approximately 175 cities in the world had crossed the one million population mark. Presently 48 per cent of the world’s population lives in urban settlements compared to only 3 per cent in the year 1800.
Stages of Urban SettlementDepending on the size and the services
available and functions rendered, urban centers are designated as town, city, million city, conurbation, Megalopolis.
Town (Population more than 5000 people)
The concept of ‘town’ can best be understood with reference to ‘village’. Population size is not the only criterion. Functional contrasts between towns and villages may not always be clear cut, but specific functions such as, manufacturing, retail and wholesale trade, and professional services exist in towns.
City (Population more than 100,000)
A city may be regarded as a leading town. Cities are much larger than towns and have a greater number of economic functions. They tend to have transport terminals, major financial institutions and regional administrative offices. When the population crosses the one million mark it is designated as a million city.
TN_GOVT_XII_Geography_chapter 02.indd 30 21-02-2019 12:00:14

Human Settlements31
MEX
ICO
GUA
TEM
ALA
EOG
OLA
NEW
YO
RK
CHIG
ACO
TORO
NTO
LON
DON
MAS
COW
PARI
S
ABID
JAN LU
ANDA
LAG
OS
JIDDARI
YADH
CAIR
OBA
GHDA
DTE
HERA
N
ISTA
NBU
LKA
BUL
SURA
TM
UM
BAI
CHEN
NAI
BAN
GKO
KHO
CHI
MIN
H
TOKY
O
DHAK
A
BEIJI
NG
MAN
ILA
SEO
UL
SHAN
GHA
I
HON
G K
ON
G
JAKA
RTA
BAN
DUN
G
DELH
ILO
S AN
GEL
ES
LIM
A
SAN
TIAG
OSAO
PAU
LO
BUEN
OS
AIRE
S
BELO
HO
RIZO
NLE
RIO
DE
JAN
EIRO
MIL
LIO
N C
ITIE
S O
F TH
E W
ORL
D
5102030 1525
URB
AN P
OPU
LATI
ON
[Mill
ion]
5 - <
8 m
illio
n
8 - <
10
mill
ion
10 m
illio
n
EW
N S
No
t to
Sc
ale
TN_GOVT_XII_Geography_chapter 02.indd 31 21-02-2019 12:00:14
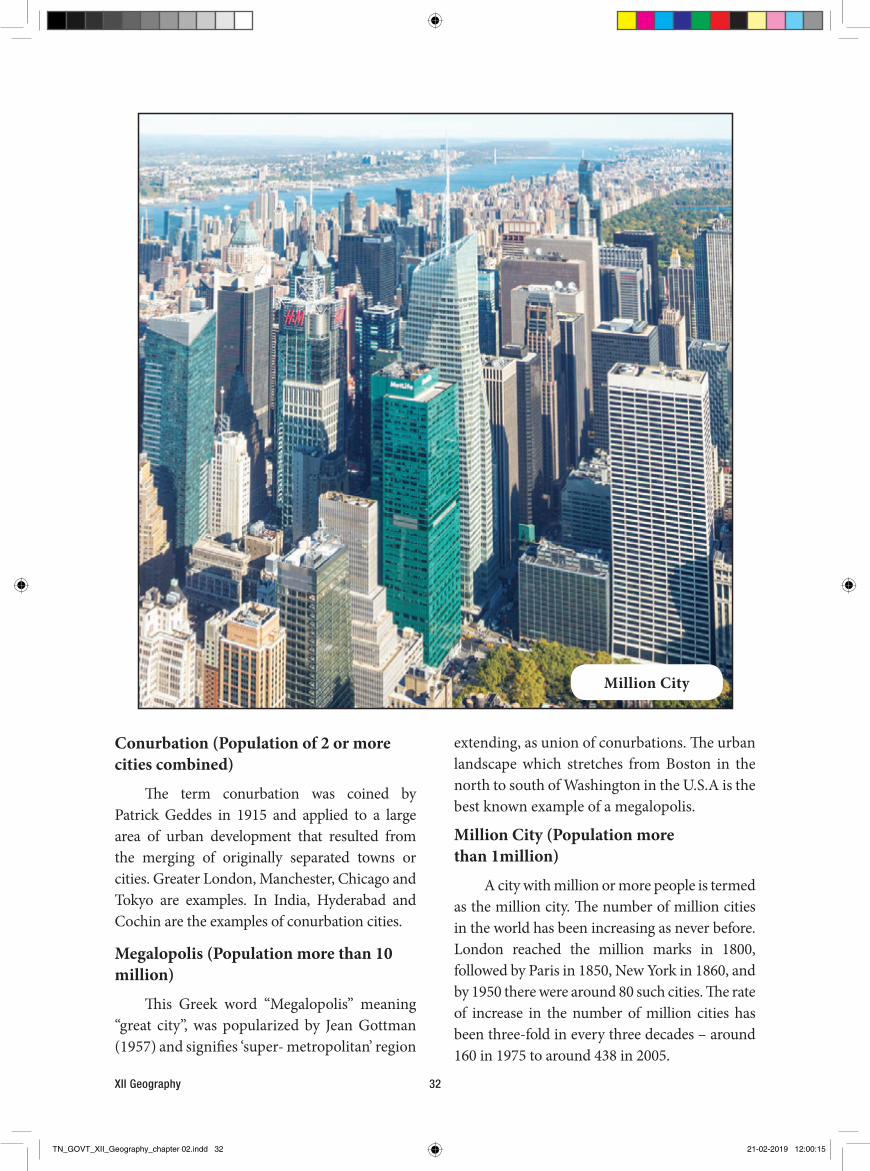
XII Geography 32
extending, as union of conurbations. The urban landscape which stretches from Boston in the north to south of Washington in the U.S.A is the best known example of a megalopolis.
Million City (Population more than 1million)
A city with million or more people is termed as the million city. The number of million cities in the world has been increasing as never before. London reached the million marks in 1800, followed by Paris in 1850, New York in 1860, and by 1950 there were around 80 such cities. The rate of increase in the number of million cities has been three-fold in every three decades – around 160 in 1975 to around 438 in 2005.
Conurbation (Population of 2 or more cities combined)
The term conurbation was coined by Patrick Geddes in 1915 and applied to a large area of urban development that resulted from the merging of originally separated towns or cities. Greater London, Manchester, Chicago and Tokyo are examples. In India, Hyderabad and Cochin are the examples of conurbation cities.
Megalopolis (Population more than 10 million)
This Greek word “Megalopolis” meaning “great city”, was popularized by Jean Gottman (1957) and signifies ‘super- metropolitan’ region
Million City
TN_GOVT_XII_Geography_chapter 02.indd 32 21-02-2019 12:00:15
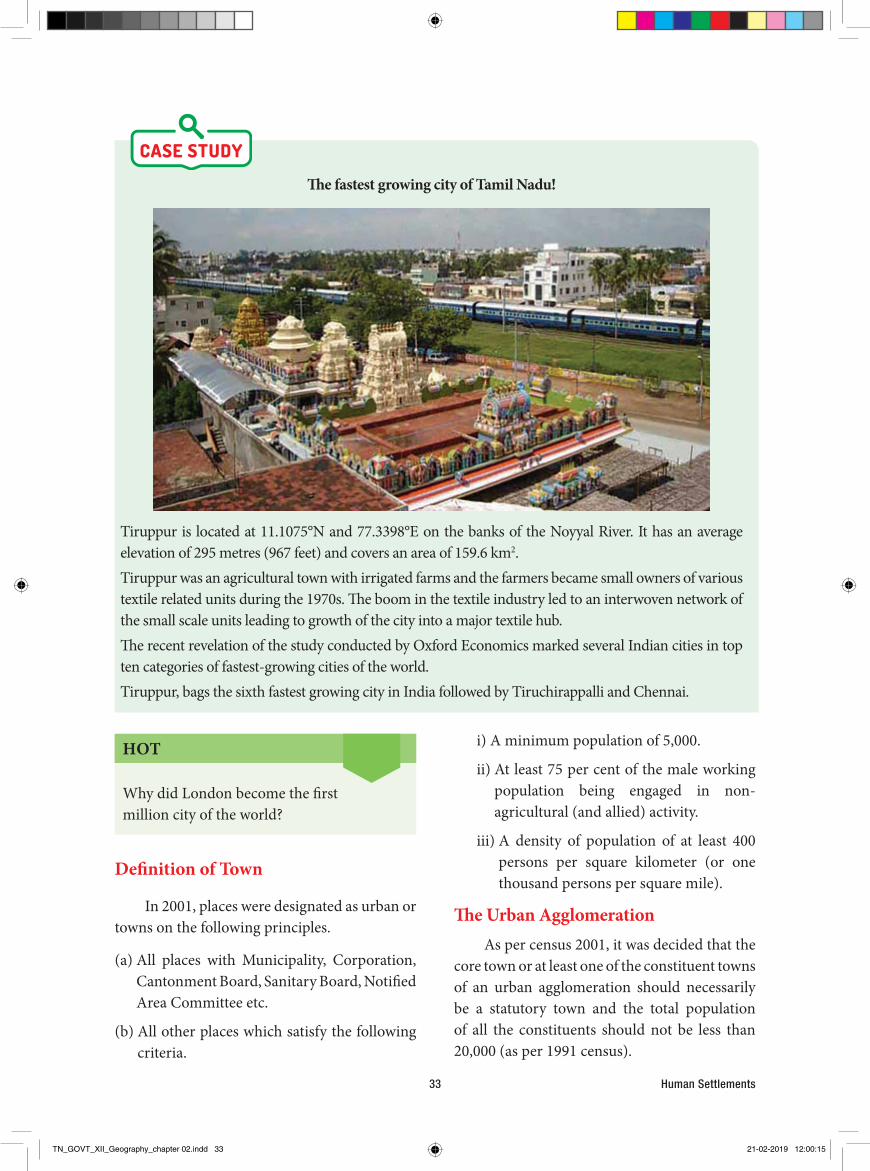
Human Settlements33
i) A minimum population of 5,000.
ii) At least 75 per cent of the male working population being engaged in non-agricultural (and allied) activity.
iii) A density of population of at least 400 persons per square kilometer (or one thousand persons per square mile).
The Urban AgglomerationAs per census 2001, it was decided that the
core town or at least one of the constituent towns of an urban agglomeration should necessarily be a statutory town and the total population of all the constituents should not be less than 20,000 (as per 1991 census).
HOT
Why did London become the first million city of the world?
Definition of Town
In 2001, places were designated as urban or towns on the following principles.
(a) All places with Municipality, Corporation, Cantonment Board, Sanitary Board, Notified Area Committee etc.
(b) All other places which satisfy the following criteria.
The fastest growing city of Tamil Nadu!
Tiruppur is located at 11.1075°N and 77.3398°E on the banks of the Noyyal River. It has an average elevation of 295 metres (967 feet) and covers an area of 159.6 km2.Tiruppur was an agricultural town with irrigated farms and the farmers became small owners of various textile related units during the 1970s. The boom in the textile industry led to an interwoven network of the small scale units leading to growth of the city into a major textile hub.The recent revelation of the study conducted by Oxford Economics marked several Indian cities in top ten categories of fastest-growing cities of the world. Tiruppur, bags the sixth fastest growing city in India followed by Tiruchirappalli and Chennai.
TN_GOVT_XII_Geography_chapter 02.indd 33 21-02-2019 12:00:15
XII Geography 34
were made up of independent urban units not necessarily contiguous to one another but were to some extent inter-dependent. The data for such town groups became incomparable from census to census as the boundaries of the towns themselves changed and the intermediate areas were left out of account; this concept came for criticism at one of the symposium of the International Geographic Union in 1968 and the concept of Standard Urban Area came to be developed for adoption at the 1971 Census. If data for this Standard Area were to be made available in the next two or three successive censuses, it is likely to yield much more meaningful picture to study urbanisation around large urban nuclei.
Ecumenopolis (Ecumeno means world; polis means city) is a single city encompassing the whole world that is held to
be a possibility of the future.
Basis for classification of urban settlements
The definition of urban areas varies from one country to another. Some of the common bases of classification are size of population, occupational structure and Administrative setup.
Population size
In India the size of population, density of 400 persons per sq km and share of non-agricultural workers are taken into consideration.
Occupational structureIn India if more than 50 per cent of its
economically productive population is engaged in non-agricultural pursuits.
Administration SetupFor example, in India, a settlement of any
size is classified as urban, if it has a municipality, Cantonment Board or Notified Area Council.
Urban agglomeration is a continuous urban spread constituting a town and its adjoining urban outgrowths (OGs), or two or more physical contiguous towns together and any adjoining urban outgrowths of such towns. Examples of Outgrowth are railway colonies, university campuses, port area, military camps etc. that may have come up near a statutory town or city but within the revenue limits of a village or villages contiguous to the town or city. With these two basic criteria having been met, the following are the possible different situations in which urban agglomerations could be constituted.
i) A city or town with one or more contiguous outgrowths.
ii) Two or more adjoining towns with or without their outgrowths.
iii) A city and one or more adjoining towns with their outgrowths all of which form a continuous spread.
Standard urban areaA new concept that had been developed
for the 1971 Census for the tabulation of certain urban data was the Standard Urban Area.
The essential of a Standard Urban Area are:
(i) It should have a core town of a minimum population size of 50,000.
(ii) The contiguous areas made up of other urban as well as rural administrative units should have close mutual socio- economic links with the core town and
(iii) The probabilities are that this entire area will get fully urbanized in a period of two to three decades.
The idea is that it should be possible to provide comparable data for a definite area of urbanization continuously for three decades which would give a meaningful picture. This replaced the concepts of Town Group that was in vogue at the 1961 Census. The town groups
TN_GOVT_XII_Geography_chapter 02.indd 34 21-02-2019 12:00:15
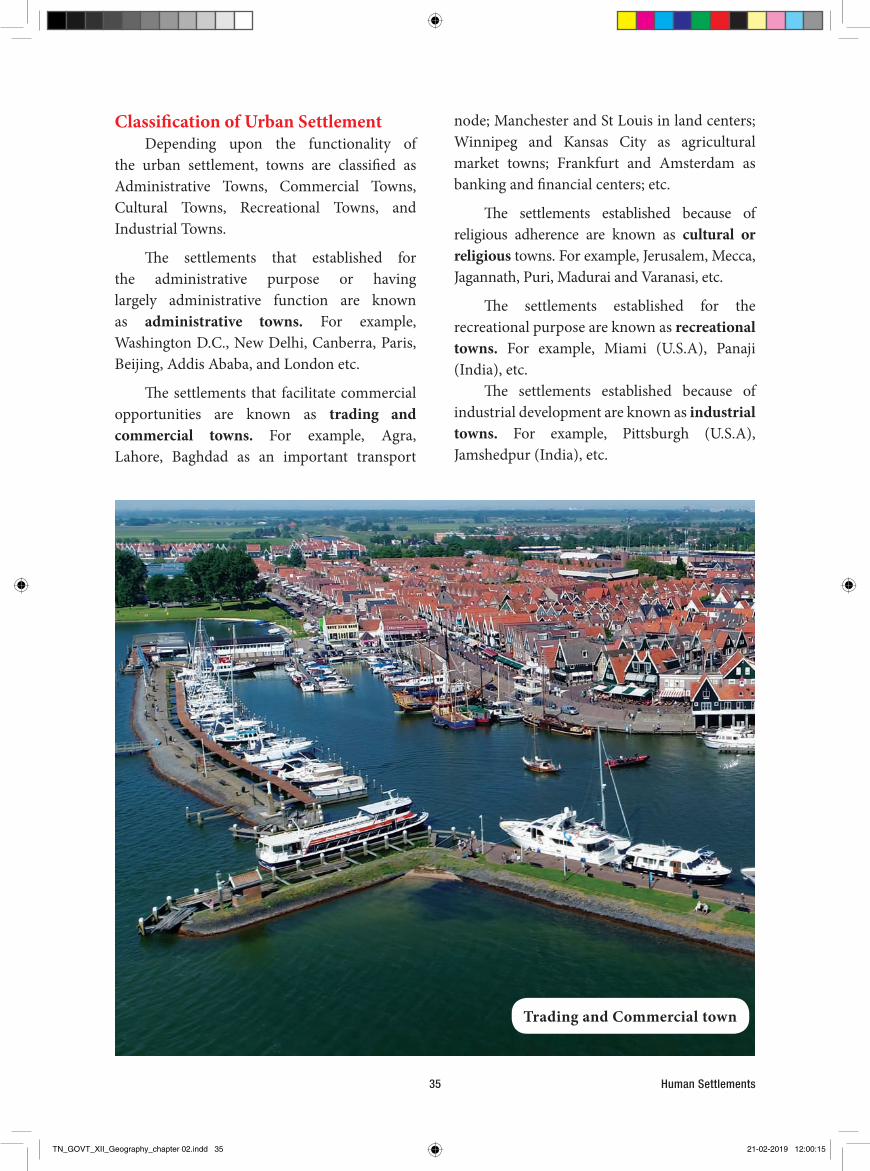
Human Settlements35
node; Manchester and St Louis in land centers; Winnipeg and Kansas City as agricultural market towns; Frankfurt and Amsterdam as banking and financial centers; etc.
The settlements established because of religious adherence are known as cultural or religious towns. For example, Jerusalem, Mecca, Jagannath, Puri, Madurai and Varanasi, etc.
The settlements established for the recreational purpose are known as recreational towns. For example, Miami (U.S.A), Panaji (India), etc.
The settlements established because of industrial development are known as industrial towns. For example, Pittsburgh (U.S.A), Jamshedpur (India), etc.
Classification of Urban SettlementDepending upon the functionality of
the urban settlement, towns are classified as Administrative Towns, Commercial Towns, Cultural Towns, Recreational Towns, and Industrial Towns.
The settlements that established for the administrative purpose or having largely administrative function are known as administrative towns. For example, Washington D.C., New Delhi, Canberra, Paris, Beijing, Addis Ababa, and London etc.
The settlements that facilitate commercial opportunities are known as trading and commercial towns. For example, Agra, Lahore, Baghdad as an important transport
Trading and Commercial town
TN_GOVT_XII_Geography_chapter 02.indd 35 21-02-2019 12:00:15

XII Geography 36
B. The city has a single centre.C. Growth is accomplished by a simple
extension of each zone outwards into the next zone.
The characteristic features of each of the five zones can be described as follows.
Zone A: The central business district (C.B.D)
It is the heart of the urban community where the commercial, social and civic activities are concentrated. The heart of the C.B.D. or the downtown core has office buildings, departmental stores, theatres, hotels, banks and civic government buildings, while outside this core are warehouses and light industry.
Zone B: The transition zone next to the C.B.D
It is the transition zone where the central business activities and factories mix and invade an area of aging residential dwellings. This is
2.7 The concentric zone theoryThis theory was given by Ernest Burgess in
1925. He envisaged that the development of a city outwards from a centre in concentric zones in a ripple-like fashion. He made the following assumptions:
A
CBD (Central Business District)
Zone of Transi�on
BURGESS MODEL
Residen�al (lower class)
Residen�al (Middle class)
Residen�al (Upper class)
BCDE
A. The city grows outwards in the form of five concentric zones or rings as long as there are no physical barriers, such as rivers or hills to distort the pattern.
Recreational town, Volendum, Netherlands and Industrial town
TN_GOVT_XII_Geography_chapter 02.indd 36 21-02-2019 12:00:16
Human Settlements37
It is predominantly the process by which towns and cities are formed and become larger as more people begin living and working in central areas. Although the two concepts are sometimes used interchangeably, urbanization should be distinguished from urban growth. Urbanization is "the proportion of the total national population living in areas classed as urban," while urban growth refers to "the absolute number of people living in areas classed as urban". The United Nations projected that half of the world's population would live in urban areas at the end of 2008. It is predicted that by 2050 about 64% of the developing world and 86% of the developed world will be urbanized.
That is equivalent to approximately 3 billion urbanites by 2050, much of which will occur in Africa and Asia. Notably, the United Nations has also recently projected that nearly all global population growth from 2017 to 2030 will be absorbed by cities, about 1.1 billion new urbanites over the next 13 years.
Urbanisation in India began to accelerate after independence, due to the country's adoption of a mixed economy, which gave rise to the development of the private sector. Urbanisation is taking place at a faster rate in India. Population residing in urban areas in India, according to 1901 census, was 11.4%. This count increased to 28.53% according to 2001 census, and crossing 30% as per 2011 census, standing at 31.16%. According to a survey by UN State of the World Population report in 2007, by 2030, 40.76% of country's population is expected to reside in urban areas. As per World Bank, India, along with China, Indonesia, Nigeria, and the United States, will lead the world's urban population surge by 2050.
Mumbai saw large scale rural-urban migration in the 20th century. Mumbai, in 2018, accommodates 22.1 million people, and
also the zone of residential decay where the new migrants come and live because the rents are low and transportation costs to the workplace are minimal. Thus, these are the sites of urban slums.
Zone C: The zone of independent working men’s home
This zone is inhabited by the blue-collar workers who are generally the second generation migrants. These people have the capacity to own their individual houses away from the C.B.D., but still live within easy access of their workplace. Here, the family groups are more stable and crime rates are lower.
Zone D: The zone of better residenceThe next concentric zone has middle and
upper class residences which are approximately 15 to 20 minutes by public transport from zone 1.
Zone E: The commuter zoneThis outer zone encircles the city and lies
beyond the continuous built-up areas. Much of this zone is still an open space and is often located beyond the city limits. Here, small villages, surrounded by open country, gradually become suburbs. Since people in this zone work in the C.B.D., the commuter zone is located within one hour’s travelling time from the centre of the city.
Burgess stressed that the outward growth of the city implies that each zone is not static. Business activities expand into the transition zone which forces low income groups to move outwards. This group, then, displaces the middle class and the wealthy that, in turn, are forced to move outwards.
2.8. Urbanization of the World and India
Urbanisation refers to the population shift from rural to urban residency, the gradual increase in the proportion of people living in urban areas and the ways in which each society adapts to this change.
TN_GOVT_XII_Geography_chapter 02.indd 37 21-02-2019 12:00:16
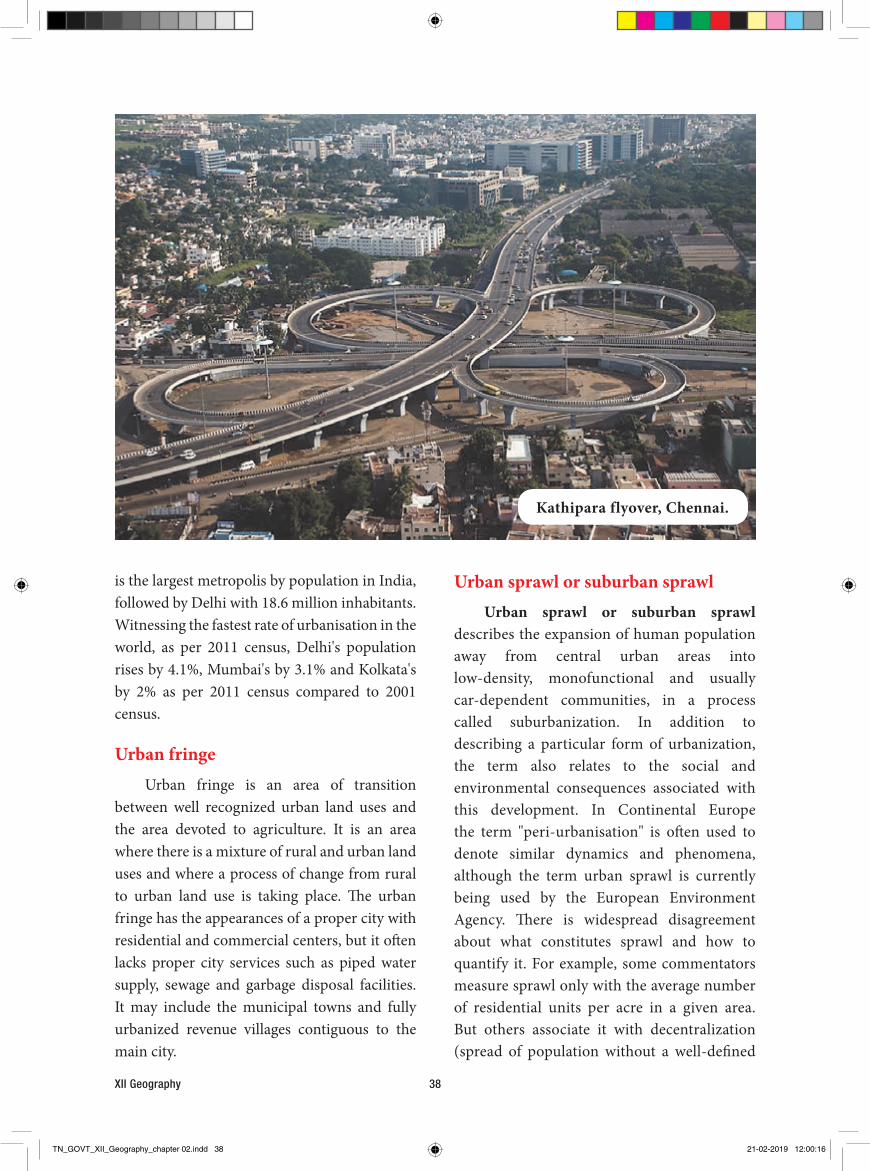
XII Geography 38
Urban sprawl or suburban sprawl Urban sprawl or suburban sprawl
describes the expansion of human population away from central urban areas into low-density, monofunctional and usually car-dependent communities, in a process called suburbanization. In addition to describing a particular form of urbanization, the term also relates to the social and environmental consequences associated with this development. In Continental Europe the term "peri-urbanisation" is often used to denote similar dynamics and phenomena, although the term urban sprawl is currently being used by the European Environment Agency. There is widespread disagreement about what constitutes sprawl and how to quantify it. For example, some commentators measure sprawl only with the average number of residential units per acre in a given area. But others associate it with decentralization (spread of population without a well-defined
is the largest metropolis by population in India, followed by Delhi with 18.6 million inhabitants. Witnessing the fastest rate of urbanisation in the world, as per 2011 census, Delhi's population rises by 4.1%, Mumbai's by 3.1% and Kolkata's by 2% as per 2011 census compared to 2001 census.
Urban fringe Urban fringe is an area of transition
between well recognized urban land uses and the area devoted to agriculture. It is an area where there is a mixture of rural and urban land uses and where a process of change from rural to urban land use is taking place. The urban fringe has the appearances of a proper city with residential and commercial centers, but it often lacks proper city services such as piped water supply, sewage and garbage disposal facilities. It may include the municipal towns and fully urbanized revenue villages contiguous to the main city.
Kathipara flyover, Chennai.
TN_GOVT_XII_Geography_chapter 02.indd 38 21-02-2019 12:00:16

Human Settlements39
jams and poor infrastructure force the people to move out to new areas.
Lower House Tax Rates: Cities will usually have high property taxes, and you can usually avoid these taxes by living in the outer suburbs because the taxes are usually lower than they are in other situations.
Rise in Population Growth: Another factor that contributes towards urban sprawl is rise in population growth. As number of people in a city grows beyond capacity, the local communities continue to spread farther and farther from city centers.
Consumer Preferences: People in high income groups have stronger preferences toward larger homes, more bedrooms, bigger balconies and bigger lawns. This also causes urban sprawl as this option is not available in crowded cities. People generally look out for low-density residential areas where they can get home according to their preference.
centre), discontinuity (leap frog development), segregation of uses, and so forth.
Causes of Urban SprawlUrban sprawl can be caused by many
factors. They are:
Lower Land Rates: Lower cost land and houses in the outer suburbs of the cities, because the centers of urban development have really made people want to stop settling in these areas and want to venture further out.
Rise in Standard of Living: There are also increases in standards of living and average family incomes, which means that people have the ability to pay more to travel and commute longer distances to work and back home.
Lack of Urban Planning: People love to find areas that are less trafficked and more calm, which leads them to sprawl out to other sections of the town. Unprecedented development, cutting of trees, loss of green cover, long traffic
Smart city of the future
TN_GOVT_XII_Geography_chapter 02.indd 39 21-02-2019 12:00:16
XII Geography 40
institutions, hospitals, parks, playgrounds, and recreational facilities are quite under great stress.
3. UnemploymentUnemployment is the state of being
involuntarily out of work. In India, the rate of urban unemployment which is more than 3 per cent annually is increasing progressively. According to one estimate, about 25 per cent of the workers in the urban centres are unemployed. The high rate of unemployment and under-employment often leads to high rate of crime.
4. Problem of TransportTransport bottlenecks and traffic
congestion are the major problems of most of the Indian cities. The larger a town grows the more important its functions become. The workers and commuters need more transport facilities. Unfortunately, the roads in most of the cities, especially in the old towns (down-towns) are narrow which cannot cope with the growing pressure of passengers, travelers, and commuters. The number of private vehicles is rising steeply. It leads to traffic congestion, delays, irritation, and tension. If the number of vehicles is allowed to increase at the present rate without widening and upgrading the roads, the whole transport system of the major cities may collapse.
5. The Energy CrisisThe shortage of energy reduces the
industrial production of goods and their distribution. In fact, energy depends on the industrial growth, efficiency of the transport and human comfort. The peak power demand in the metropolises, million and class one cities is increasing day by day and power situation is not geared to meet it.
6. Inadequacy of Water SupplyWater is the first and foremost necessity of
human life. In fact, water is life, and man cannot survive without it. The average per capita consumption of water in Kolkata is 250 litres, in Mumbai175 litres and only 80 litres in Delhi as
2.9. Problems of UrbanizationIndia has the second largest urban
population in the world only after China. India’s urban population (about 28% of the total population) is almost equal to the total population of USA. The rate of urban growth is on the upswing. People in large number are arriving in the mega and metropolitan cities, swelling urban India by more than five per cent annually. This stupendous growth of population is the cause of numerous socio-economic and environmental problems. Some of the important problems of urban India have been briefly presented below:
1. Problem of space and scarcity of residential accommodationThe growing population demands more
space which is not easily available because of physical and geographical constraints. The scarcity of space leads to high price of land and high rents for offices and residential accommodations. Since people cannot afford high rents, it is the main cause of unwanted growth of slums.
According to one estimate, there is an annual shortage of about two million houses in Indian cities. This has forced low income group people to live in slums or occupy footpaths and road pavements. The number of such slums and pavement dwellers is rising in the metropolitan cities of India.
2. Inadequacy of Social AmenitiesIn most of the cities of India, there is growth
and not urbanisation. In fact, the number of people is increasing in the cities while the infrastructural facilities and civic amenities are quite inadequate. With greater concentration of people in urban places, the social amenities like housing, electricity, drinking water, transport, sanitation, sewage disposal, educational
TN_GOVT_XII_Geography_chapter 02.indd 40 21-02-2019 12:00:16

Human Settlements41
and urban places. Unfortunately, most of the garbage is dumped into the rivers or along their banks. The cities like Mumbai, Kolkata, and Chennai continue to discharge a major part of their garbage into the sea.
8. Increase in CrimesIncreasing urban crimes are disturbing
the peace of modern cities. According to sociologists, unemployment is the main cause of crimes in urban areas. The unemployed youths indulge in crime like abduction, extortion, kidnapping, murder, pick-pocketing, rape, robbery, snatching, and theft. The slums are especially infested with unemployed criminals who, in due course of time, become habitual offenders. Material culture, growing consumerism, selfishness, stiff competition, lavishness, increasing socio-economic disparities, rising unemployment and loneliness are some of the main reasons of this menace.
against 1200 litres in Los Angles and 1100 litres in Chicago. The acute scarcity of water in the urban places of India may be appreciated from the fact that in Chennai, Hyderabad, Jaipur, Jodhpur, Nagpur, Shimla, Solan, Surat, Udaipur, Vadodara, etc., only one to two hours of water supply in a day is permitted. The National Capital (New Delhi) also regulates water supply to only about four hours a day.
7. Environmental PollutionEnvironmental pollution is the other serious problem of all the million and mega-cities. It is not only air-pollution caused by smoke emitted from vehicles, factories and houses; water and noise pollutions are equally serious. The scarcity of dumping grounds makes the rural-urban fringe unhygienic and less conducive for human health. The problem of garbage disposal (hazardous plastics, metal and package) is thus quite serious in most of the Indian cities
1. Oasis: a green spot in the desert.
2. Urban sprawl: the spread of city buildings and houses into an area that used to be countryside.
3. Agglomeration: An extended town area consisting of the built-up area of a central place and any suburbs linked by continuous urban area.
4. Crime: an action or omission which constitutes an offence and is punishable by law.
5. Energy crisis: any significant bottleneck in the supply of energy resources to an economy.
6. Smart city: an urban area that uses different types of electronic data collection sensors to supply information which is used to manage assets and resources efficiently.
7. Unemployment: The state of being unemployed.
8. Site: a point or an area on the Earth's surface or elsewhere.
9. Anthropologist: a person engaged in the practice of anthropology.
10. Conurbation: Area of urban development resulted from merging of two cities.
41XII Geography
TN_GOVT_XII_Geography_chapter 02.indd 41 21-02-2019 12:00:16

XII Geography 42
ExerciseI. Choose the correct answer
1. Most anthropologists believe that hundreds of thousands of years ago humans first appeared in a) The Euphrates and Tigris valley
b) The Indus valley of Asia
c) The Great Rift Valley in East Africa
d) The Nile valley of Africa
2. The first urban settlement to reach a population of one million (Million city) is a) London b) Parisc) New York d) Tokyo
3. It is predicted that by 2050 about the developing world and the developed world will be urbanized toa) 74% & 76% respectivelyb) 64% & 86% respectivelyc) 54% & 96% respectivelyd) 44% & 66% respectively
4. As per 2011 census, which one of the following is correct? a) Delhi's population rose by 4.1%, b) Mumbai's by 5.1%c) Kolkata's by 4%d) Chennai’s by 5%
5. One of the following statements is untrue regarding the concentric zone theory model.
A
BCDE
a) This model was given by Ernest Burgess in 1925.b) Letter E in the model indicates medium – class Residential c) He envisaged that the development of a city outwards from a centre in concentric zones in a
ripple like fashion.d) Letter B in the model indicates Zone in Transition
6. Consider the statements given below and choose the right option from the given.Statement I: Urban fringe is an area of transition between well recognized urban land uses and
the area devoted to agriculture.
TN_GOVT_XII_Geography_chapter 02.indd 42 21-02-2019 12:00:16
Human Settlements43
Statement II: Urban sprawl or suburban sprawl describes the expansion of human populations away from central urban areas into low-density, monofunctional and usually car-dependent communities, in a process called suburbanization.
a) Statement - I is right. Statement - II is wrong. b) Statement - I is wrong. Statement - II is right.c) Statement - I and Statement - II are right.
d) Statement - I and Statement - II are wrong.
7. Match list – I to list – II and answer using the codes given. List -I List – II
a) Administrative town i) Pittsburghb) Recreational Town ii) Beijingc) Religious Town iii) Miamid) Industrial Town iv) Jerusalem
a) b) c) d)a) i) ii) iii) iv) b) iii) iv) i) ii)c) iv) iii) ii) i)d) ii) iii) iv) i)
8. Which one of the following statements is false about urbanization?a) The high rate of unemployment and under-employment often leads to high rate of crime.
b) With greater concentration of people in urban places, the social amenities are quite under great stress.
c) The scarcity of dumping grounds makes the rural-urban fringe organically rich and more conducive for human health.
d) The scarcity of space leads to high price of land and high rents for offices and residential accommodations.
9. Which of the following is/are an essential characteristic/s of a Standard Urban Area?(i) It should have a core town of a minimum population size of 50,000,
(ii) The contiguous areas made up of other urban as well as rural administrative units should have close mutual socio- economic links with the core town and
(iii) The probabilities are that this entire area will get fully urbanized in a period of two to three decades.
(i), (ii) and (iii) (i) and (iii) only
(ii) and (iii) only (iii) only
10. One of the following statements is incorrect about the dispersed settlement.a) Houses are spaced far apart.b) Often interspersed with fields.
TN_GOVT_XII_Geography_chapter 02.indd 43 21-02-2019 12:00:16

XII Geography 44
c) Their market and some other activities are centralized where they participate together.d) Found in the fertile river valley.
II. Very brief answer11. Differentiate site from situation.12. List the types of rural settlement.13. Who defined the term conurbation? Give an example of conurbation.14. Mention any two differences between CBD and commuter zone.15. Who proposed the Concentric Zone theory and what are the assumptions made by him?
III. Brief answer 16. Differentiate nucleated settlement from dispersed settlement.17. Write a note on Megalopolis.18. Mention any three characteristics of a standard urban area.19. Write any three causes of Urban sprawl.20. Define million city and give an example.
IV. Detailed answer 21. How is rural settlement different from urban settlement?22. Describe the pattern of rural settlement.23. Explain the problems of urbanization.Practice24. Discuss in group the causes and effects of social issues due to urbanization.25. Debate on the topic: life is better in village or city.
Reference 1. Human Geography, Majid Husain.2. Introduction to Geography, Getis Getis Fellmann.3. Geography of Settlements, R.Y.Singh.
Web reference http://censusindia.gov.in/Data_Products/Library/Indian_perceptive_link/Census_Terms_link/censusterms.html.
Report of ‘Manual on Vital Statistics (Govt. of India).
TN_GOVT_XII_Geography_chapter 02.indd 44 21-02-2019 12:00:16
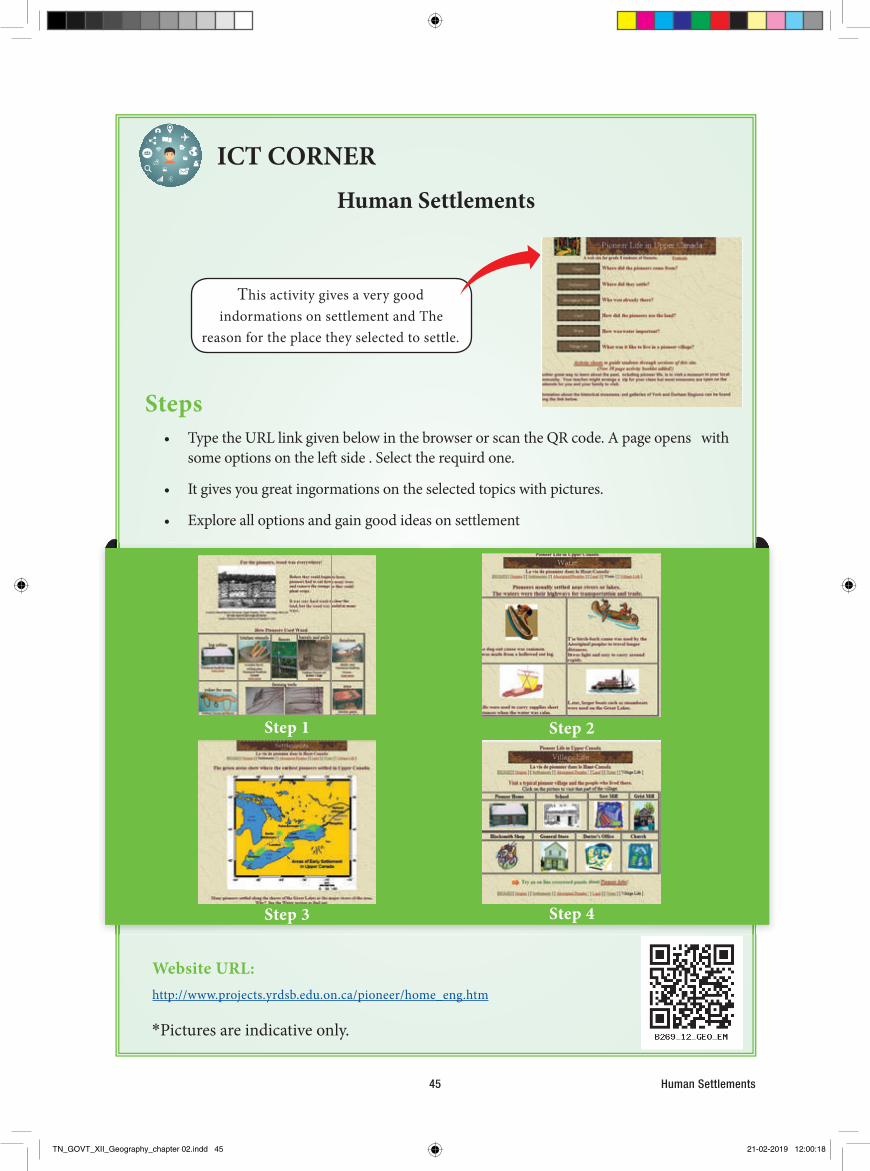
Human Settlements45
Human Settlements
Steps• Type the URL link given below in the browser or scan the QR code. A page opens with
some options on the left side . Select the requird one.
• It gives you great ingormations on the selected topics with pictures.
• Explore all options and gain good ideas on settlement
Website URL:http://www.projects.yrdsb.edu.on.ca/pioneer/home_eng.htm
ICT CORNER
*Pictures are indicative only.
This activity gives a very good indormations on settlement and The
reason for the place they selected to settle.
Step 1 Step 2
Step 3 Step 4
TN_GOVT_XII_Geography_chapter 02.indd 45 21-02-2019 12:00:18
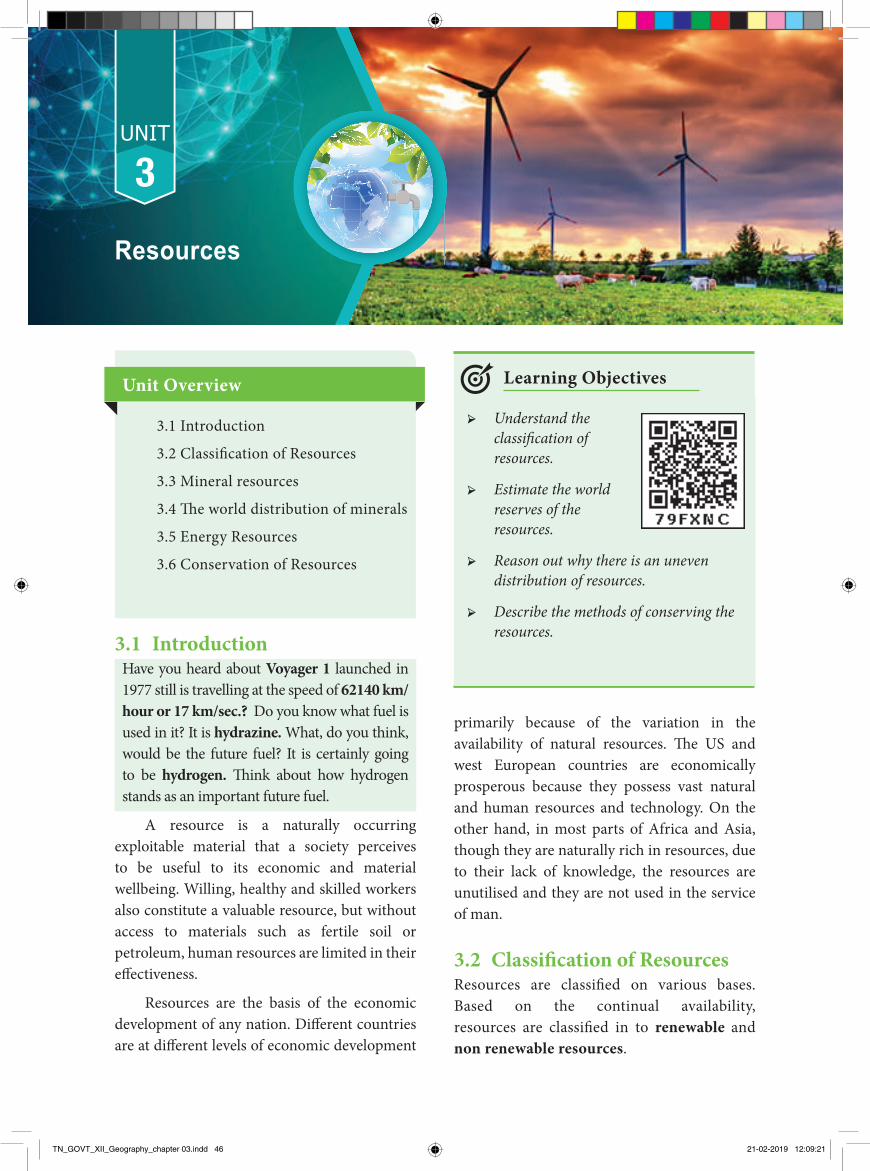
primarily because of the variation in the availability of natural resources. Th e US and west European countries are economically prosperous because they possess vast natural and human resources and technology. On the other hand, in most parts of Africa and Asia, though they are naturally rich in resources, due to their lack of knowledge, the resources are unutilised and they are not used in the service of man.
3.2 Classifi cation of ResourcesResources are classifi ed on various bases. Based on the continual availability, resources are classifi ed in to renewable andnon renewable resources.
3.1 Introduction Have you heard about Voyager 1 launched in 1977 still is travelling at the speed of 62140 km/hour or 17 km/sec.? Do you know what fuel is used in it? It is hydrazine. What, do you think, would be the future fuel? It is certainly going to be hydrogen. Th ink about how hydrogen stands as an important future fuel.
A resource is a naturally occurring exploitable material that a society perceives to be useful to its economic and material wellbeing. Willing, healthy and skilled workers also constitute a valuable resource, but without access to materials such as fertile soil or petroleum, human resources are limited in their eff ectiveness.
Resources are the basis of the economic development of any nation. Diff erent countries are at diff erent levels of economic development
Learning Objectives
➢ Understand the classi� cation of resources.
➢ Estimate the world reserves of the resources.
➢ Reason out why there is an uneven distribution of resources.
➢ Describe the methods of conserving the resources.
Resources
3UNIT
3.1 Introduction
3.2 Classifi cation of Resources
3.3 Mineral resources
3.4 Th e world distribution of minerals
3.5 Energy Resources
3.6 Conservation of Resources
Unit Overview
TN_GOVT_XII_Geography_chapter 03.indd 46 21-02-2019 12:09:21
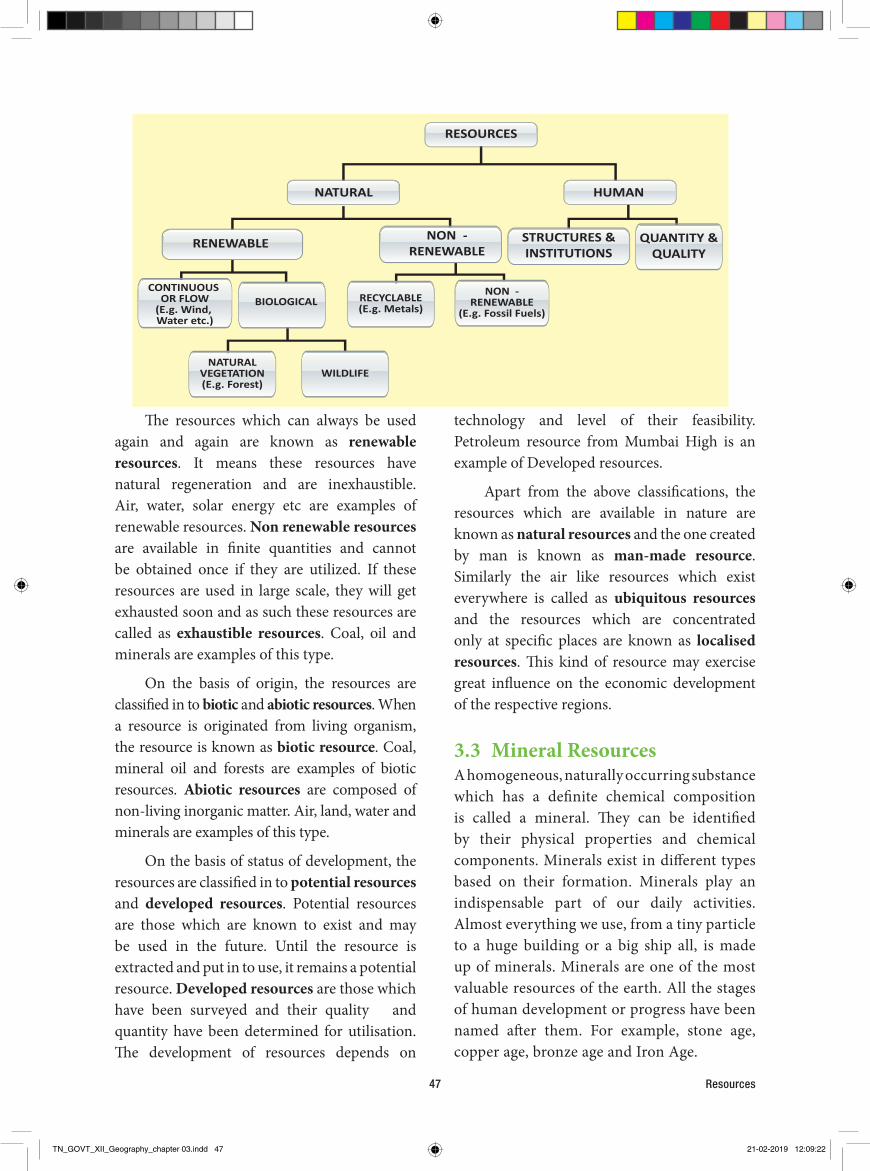
Resources47
The resources which can always be used again and again are known as renewable resources. It means these resources have natural regeneration and are inexhaustible. Air, water, solar energy etc are examples of renewable resources. Non renewable resources are available in finite quantities and cannot be obtained once if they are utilized. If these resources are used in large scale, they will get exhausted soon and as such these resources are called as exhaustible resources. Coal, oil and minerals are examples of this type.
On the basis of origin, the resources are classified in to biotic and abiotic resources. When a resource is originated from living organism, the resource is known as biotic resource. Coal, mineral oil and forests are examples of biotic resources. Abiotic resources are composed of non-living inorganic matter. Air, land, water and minerals are examples of this type.
On the basis of status of development, the resources are classified in to potential resources and developed resources. Potential resources are those which are known to exist and may be used in the future. Until the resource is extracted and put in to use, it remains a potential resource. Developed resources are those which have been surveyed and their quality and quantity have been determined for utilisation. The development of resources depends on
technology and level of their feasibility. Petroleum resource from Mumbai High is an example of Developed resources.
Apart from the above classifications, the resources which are available in nature are known as natural resources and the one created by man is known as man-made resource. Similarly the air like resources which exist everywhere is called as ubiquitous resources and the resources which are concentrated only at specific places are known as localised resources. This kind of resource may exercise great influence on the economic development of the respective regions.
3.3 Mineral ResourcesA homogeneous, naturally occurring substance which has a definite chemical composition is called a mineral. They can be identified by their physical properties and chemical components. Minerals exist in different types based on their formation. Minerals play an indispensable part of our daily activities. Almost everything we use, from a tiny particle to a huge building or a big ship all, is made up of minerals. Minerals are one of the most valuable resources of the earth. All the stages of human development or progress have been named after them. For example, stone age, copper age, bronze age and Iron Age.
TN_GOVT_XII_Geography_chapter 03.indd 47 21-02-2019 12:09:22

XII Geography 48
They are exhaustible or non renewable. Besides, they are distributed very unevenly. They are generally found in the form of ores. The ore contains several impurities. Minerals are separated from the ores involving a number of distinct processes.
A country’s economic development is depending on the minerals. There are several types of minerals, but according to their characteristics and commercial use.
Uses of MineralsMinerals are basic and essential raw
materials in our daily lives and are vital for economic, social and technological development. They are used,
• In the construction of buildings, bridges and settlement.
• As raw materials in industries• As fuels• In the manufacture of defence equipments.• In the field of communication like
manufacturing telephone, wires, cables, electronic devices etc.
• In making of alloys for various purposes.• In making of ornaments.• In the manufacture of fertilizers, pesticide,
fungicides etc.
Mode of Occurrence of MineralsMinerals are generally found in ‘Ores’. It is actually an accumulation of any mineral mixed with other elements. Minerals generally occur in many forms. They are
1. Veins and lodesMinerals generally occur in the cracks, crevices, faults and joints of the igneous and metamorphic rocks. Minerals in smaller occurrence are called a ‘Vein’ and a larger occurrence is called a ‘lode, for example, Copper and Gold are found in lodes and veins.
Copper Lodes
TN_GOVT_XII_Geography_chapter 03.indd 48 21-02-2019 12:09:23

Resources49
Gold veins
2. Beds or LayersMinerals that are formed as a result of deposition, accumulation and concentration generally occur in horizontal layers. E.g. Coal, Potash, etc.
Coal
Bauxite
Residual mass of weathered particlesWhen the decomposed rocks are washed away by water, the soluble particles are removed, leaving a mass containing ores. Such occurrences are called residual mass. E.g. Bauxite
3. Alluvial deposits or placer depositsTh ese are the deposits found in the sands of valley fl oor and at the foot hills. Th ese deposits consist of the minerals such as Gold, Silver and Platinum.
Platinum
3.4 Th e world distribution of minerals Metallic Minerals
Th e minerals which contain metal in them are called as metallic minerals.
Iron - OreIt is the basic mineral and the backbone of industrial development of the world. Iron Ore is the most widely distributed element of the earth’s crust and it rarely occurs in a free state. It is found as the composition of many rocks and minerals. Iron-ore makes up 4.6% of the earth crusts. Iron is found in the form ofIron - ore. Th ey are classifi ed into 4 categories.(i) Magnetite: It is red in colour and has
72% of pure Iron (ii) Hematite: It is black in colour and has
70% of pure Iron (iii) Limonite: Its colour varies from dark
brown to yellow and has 50% of pure iron.(iv) Siderite: It is brown in colour and
contains only 30% of pure iron is present.
TN_GOVT_XII_Geography_chapter 03.indd 49 21-02-2019 12:09:25
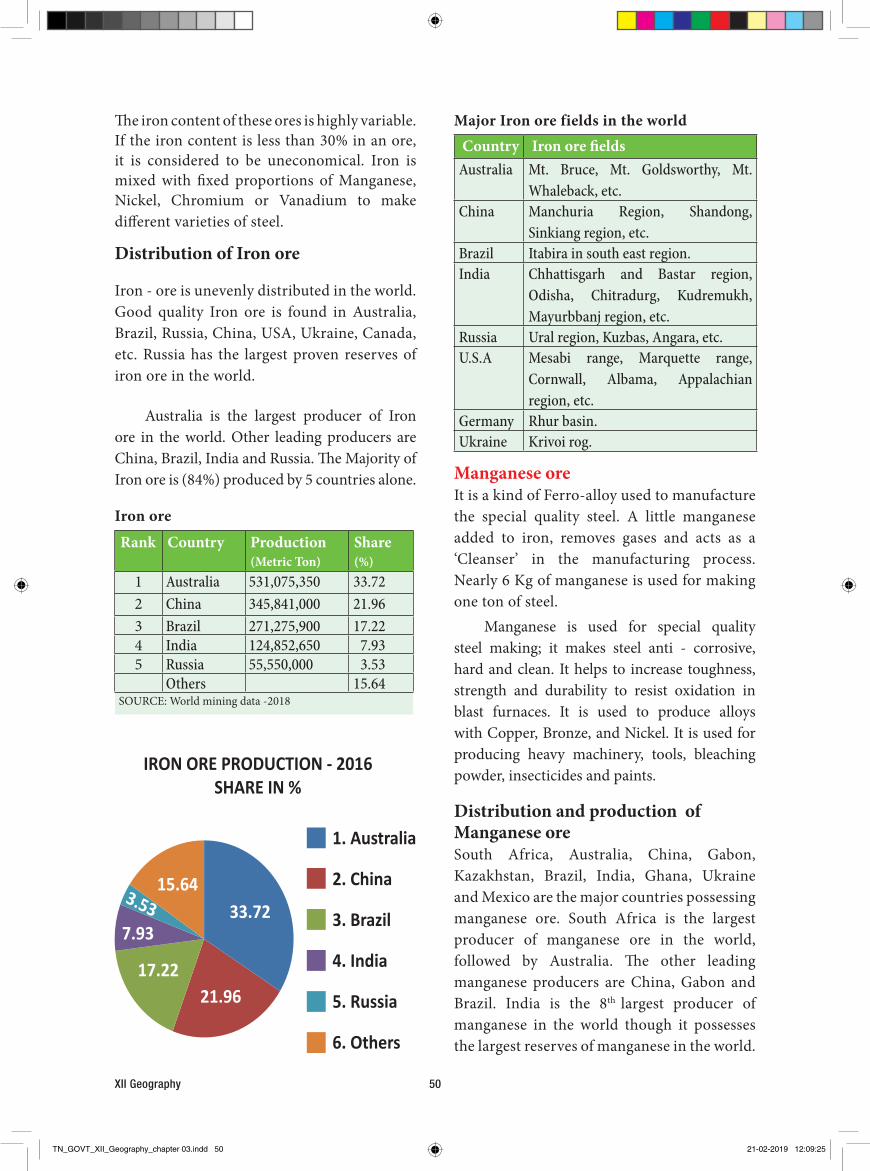
XII Geography 50
Major Iron ore fields in the world Country Iron ore fieldsAustralia Mt. Bruce, Mt. Goldsworthy, Mt.
Whaleback, etc.China Manchuria Region, Shandong,
Sinkiang region, etc.Brazil Itabira in south east region.India Chhattisgarh and Bastar region,
Odisha, Chitradurg, Kudremukh, Mayurbbanj region, etc.
Russia Ural region, Kuzbas, Angara, etc.U.S.A Mesabi range, Marquette range,
Cornwall, Albama, Appalachian region, etc.
Germany Rhur basin.Ukraine Krivoi rog.
Manganese oreIt is a kind of Ferro-alloy used to manufacture the special quality steel. A little manganese added to iron, removes gases and acts as a ‘Cleanser’ in the manufacturing process. Nearly 6 Kg of manganese is used for making one ton of steel.
Manganese is used for special quality steel making; it makes steel anti - corrosive, hard and clean. It helps to increase toughness, strength and durability to resist oxidation in blast furnaces. It is used to produce alloys with Copper, Bronze, and Nickel. It is used for producing heavy machinery, tools, bleaching powder, insecticides and paints.
Distribution and production of Manganese oreSouth Africa, Australia, China, Gabon, Kazakhstan, Brazil, India, Ghana, Ukraine and Mexico are the major countries possessing manganese ore. South Africa is the largest producer of manganese ore in the world, followed by Australia. The other leading manganese producers are China, Gabon and Brazil. India is the 8th largest producer of manganese in the world though it possesses the largest reserves of manganese in the world.
The iron content of these ores is highly variable. If the iron content is less than 30% in an ore, it is considered to be uneconomical. Iron is mixed with fixed proportions of Manganese, Nickel, Chromium or Vanadium to make different varieties of steel.
Distribution of Iron ore
Iron - ore is unevenly distributed in the world. Good quality Iron ore is found in Australia, Brazil, Russia, China, USA, Ukraine, Canada, etc. Russia has the largest proven reserves of iron ore in the world.
Australia is the largest producer of Iron ore in the world. Other leading producers are China, Brazil, India and Russia. The Majority of Iron ore is (84%) produced by 5 countries alone.
Iron ore
Rank Country Production (Metric Ton)
Share (%)
1 Australia 531,075,350 33.722 China 345,841,000 21.963 Brazil 271,275,900 17.224 India 124,852,650 7.935 Russia 55,550,000 3.53
Others 15.64SOURCE: World mining data -2018
1. Australia
IRON ORE PRODUCTION - 2016SHARE IN %
2. China
3. Brazil
4. India
5. Russia
6. Others
33.72
21.9617.22
7.93
15.643.53
TN_GOVT_XII_Geography_chapter 03.indd 50 21-02-2019 12:09:25
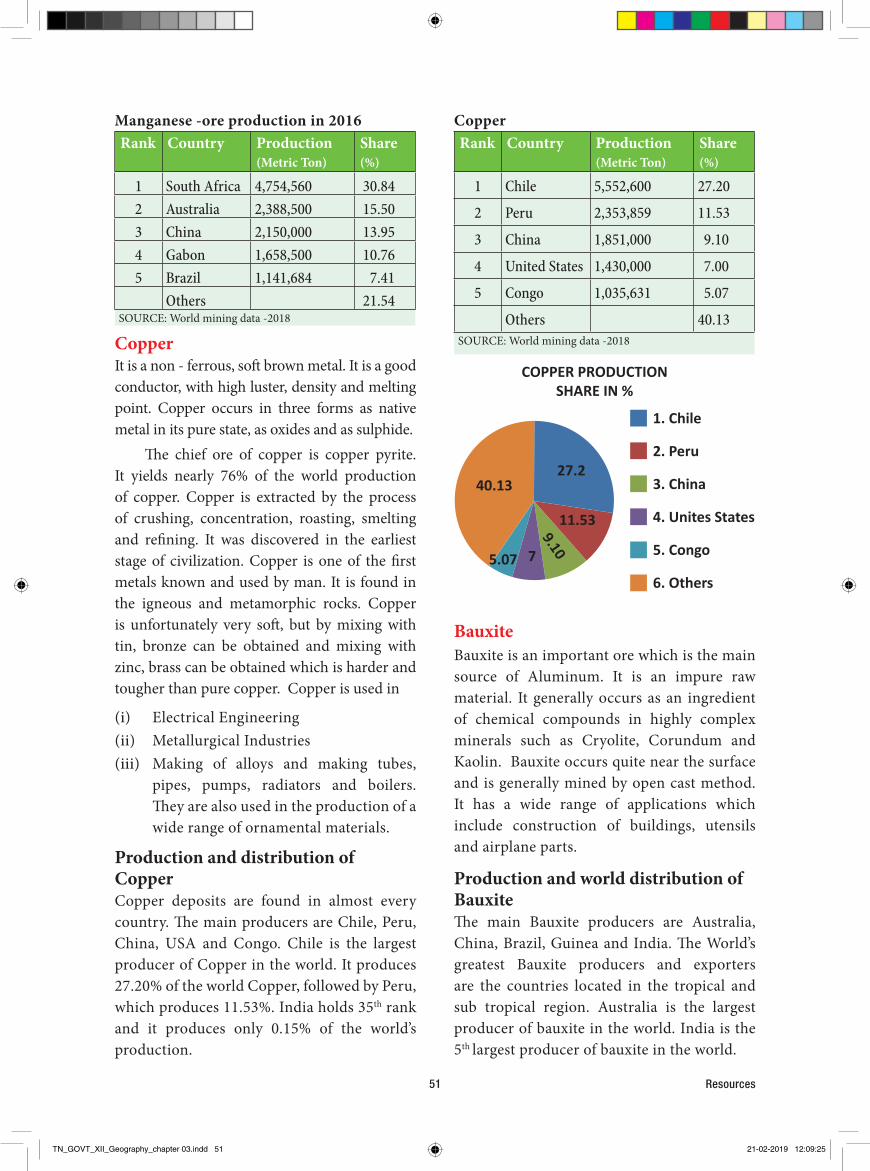
Resources51
Manganese -ore production in 2016Rank Country Production
(Metric Ton)Share (%)
1 South Africa 4,754,560 30.842 Australia 2,388,500 15.503 China 2,150,000 13.954 Gabon 1,658,500 10.765 Brazil 1,141,684 7.41
Others 21.54SOURCE: World mining data -2018
CopperIt is a non - ferrous, soft brown metal. It is a good conductor, with high luster, density and melting point. Copper occurs in three forms as native metal in its pure state, as oxides and as sulphide.
The chief ore of copper is copper pyrite. It yields nearly 76% of the world production of copper. Copper is extracted by the process of crushing, concentration, roasting, smelting and refining. It was discovered in the earliest stage of civilization. Copper is one of the first metals known and used by man. It is found in the igneous and metamorphic rocks. Copper is unfortunately very soft, but by mixing with tin, bronze can be obtained and mixing with zinc, brass can be obtained which is harder and tougher than pure copper. Copper is used in
(i) Electrical Engineering(ii) Metallurgical Industries(iii) Making of alloys and making tubes,
pipes, pumps, radiators and boilers. They are also used in the production of a wide range of ornamental materials.
Production and distribution of CopperCopper deposits are found in almost every country. The main producers are Chile, Peru, China, USA and Congo. Chile is the largest producer of Copper in the world. It produces 27.20% of the world Copper, followed by Peru, which produces 11.53%. India holds 35th rank and it produces only 0.15% of the world’s production.
CopperRank Country Production
(Metric Ton)Share (%)
1 Chile 5,552,600 27.20
2 Peru 2,353,859 11.53
3 China 1,851,000 9.10
4 United States 1,430,000 7.00
5 Congo 1,035,631 5.07
Others 40.13SOURCE: World mining data -2018
1. Chile
2. Peru
3. China
4. Unites States
5. Congo
6. Others
COPPER PRODUCTIONSHARE IN %
27.2
11.53
5.07
40.13
7
9.10
BauxiteBauxite is an important ore which is the main source of Aluminum. It is an impure raw material. It generally occurs as an ingredient of chemical compounds in highly complex minerals such as Cryolite, Corundum and Kaolin. Bauxite occurs quite near the surface and is generally mined by open cast method. It has a wide range of applications which include construction of buildings, utensils and airplane parts.
Production and world distribution of BauxiteThe main Bauxite producers are Australia, China, Brazil, Guinea and India. The World’s greatest Bauxite producers and exporters are the countries located in the tropical and sub tropical region. Australia is the largest producer of bauxite in the world. India is the 5th largest producer of bauxite in the world.
TN_GOVT_XII_Geography_chapter 03.indd 51 21-02-2019 12:09:25

XII Geography 52
BAUXITE (ORE)
Rank Country Production MT
Share in%
1 Australia 83,516,578 29.312 China 65,000,000 22.813 Brazil 39,244,200 13.774 Guinea 31,117,131 10.925 India 24,664,632 8.66
Others 14.53
GoldGold is a precious metal which occurs in alluvial or placer deposits or as reefs or lodes in the underground. Gold is used extensively for jewellery and also in dentistry, glass and porcelain dyes, in medicines and other industries. The purity of gold is expressed in terms of carat. China, Australia, Russia, USA and Canada are the leading producers of gold in the world. India ranked 33rd position in the gold production in 2016.
Gold
Rank Country Production MT
Share in%
1 China 453,500 14.112 Australia 282,421 8.793 Russia 262,380 8.164 United states 222,211 6.915 Canada 165,034 5.13
Others 56.90
1. China
2. Australia
3. Russia
4. Unites States
5. Canada
6. Others
14.118.79
8.16
6.915.13
56.9
GOLD PRODUCTIONSHARE IN %
Fool’s Gold refers to pyrite of Iron Sulphide because of its similarity in shape and colour to actual gold.
PlatinumPlatinum is a rare metal. It is costlier than gold. It has a very high melting point. It is a heavy, malleable, ductile, highly inactive, silverish, white transaction metal. It is one of the densest metal almost twice as dense as lead. Platinum is found with other rare metals such as osmium, Palladium, Iridium and rhodium. Platinum is also used in industrial applications. South Africa is the largest producer of platinum in the world. The other leading producers are Russia, Zimbabwe, Canada and USA.
PlatinumRank Country Production
KgShare in%
1 South Africa 133,241 71.752 Russia 21,860 11.773 Zimbabwe 15,110 8.144 Canada 9,300 5.015 USA 3,891 2.10
Others 1.33
Non- metallic mineralsThe minerals which do not contain metal in them are called as non metallic minerals.
MicaMica is a Latin word micare means to shine, to flash or to glitter. Mica has a crystalline and layered structure and can be split into very thin sheets. It does not react to water, acids, oil or solvents. It is lightweight, flexible and strong. It can resist extremely high temperatures or sudden changes in temperature and is able to withstand high voltages and insulate with low power loss. It can absorb or reflect light, which enables a decorative effect and protects against ultra-violet (UV) light.
TN_GOVT_XII_Geography_chapter 03.indd 52 21-02-2019 12:09:26
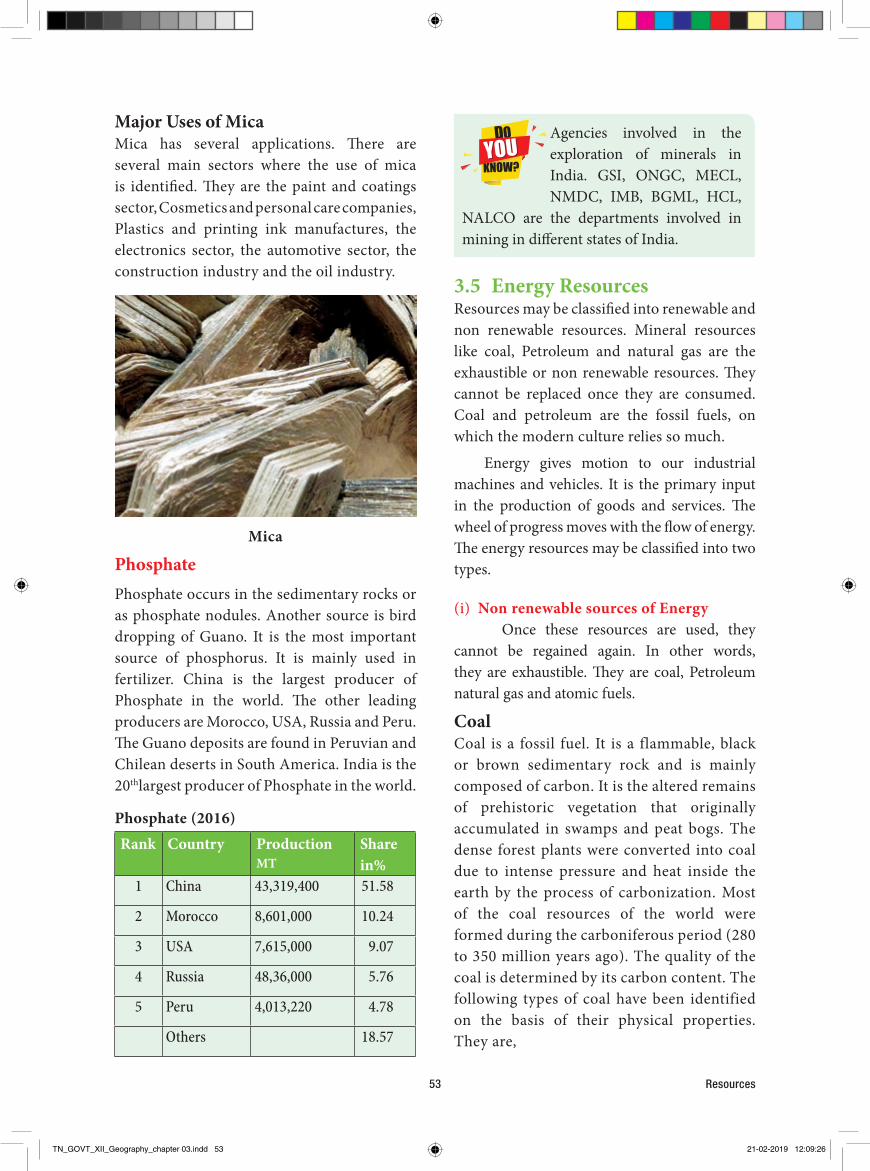
Resources53
Major Uses of MicaMica has several applications. There are several main sectors where the use of mica is identified. They are the paint and coatings sector, Cosmetics and personal care companies, Plastics and printing ink manufactures, the electronics sector, the automotive sector, the construction industry and the oil industry.
Mica
PhosphatePhosphate occurs in the sedimentary rocks or as phosphate nodules. Another source is bird dropping of Guano. It is the most important source of phosphorus. It is mainly used in fertilizer. China is the largest producer of Phosphate in the world. The other leading producers are Morocco, USA, Russia and Peru. The Guano deposits are found in Peruvian and Chilean deserts in South America. India is the 20thlargest producer of Phosphate in the world.
Phosphate (2016)Rank Country Production
MTShare in%
1 China 43,319,400 51.58
2 Morocco 8,601,000 10.24
3 USA 7,615,000 9.07
4 Russia 48,36,000 5.76
5 Peru 4,013,220 4.78
Others 18.57
Agencies involved in the exploration of minerals in India. GSI, ONGC, MECL, NMDC, IMB, BGML, HCL,
NALCO are the departments involved in mining in different states of India.
3.5 Energy ResourcesResources may be classified into renewable and non renewable resources. Mineral resources like coal, Petroleum and natural gas are the exhaustible or non renewable resources. They cannot be replaced once they are consumed. Coal and petroleum are the fossil fuels, on which the modern culture relies so much.
Energy gives motion to our industrial machines and vehicles. It is the primary input in the production of goods and services. The wheel of progress moves with the flow of energy. The energy resources may be classified into two types.
(i) Non renewable sources of EnergyOnce these resources are used, they
cannot be regained again. In other words, they are exhaustible. They are coal, Petroleum natural gas and atomic fuels.
CoalCoal is a fossil fuel. It is a flammable, black or brown sedimentary rock and is mainly composed of carbon. It is the altered remains of prehistoric vegetation that originally accumulated in swamps and peat bogs. The dense forest plants were converted into coal due to intense pressure and heat inside the earth by the process of carbonization. Most of the coal resources of the world were formed during the carboniferous period (280 to 350 million years ago). The quality of the coal is determined by its carbon content. The following types of coal have been identified on the basis of their physical properties. They are,
TN_GOVT_XII_Geography_chapter 03.indd 53 21-02-2019 12:09:26
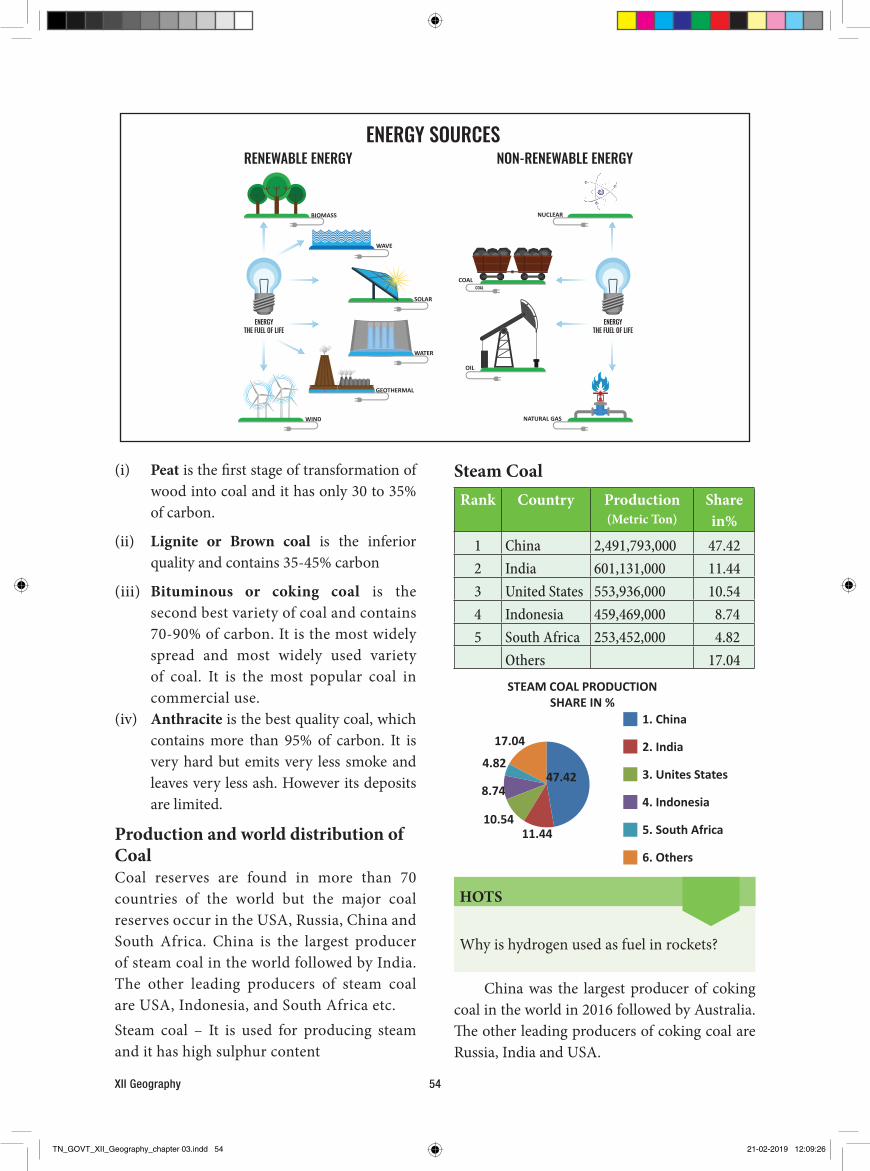
XII Geography 54
(i) Peat is the first stage of transformation of wood into coal and it has only 30 to 35% of carbon.
(ii) Lignite or Brown coal is the inferior quality and contains 35-45% carbon
(iii) Bituminous or coking coal is the second best variety of coal and contains 70-90% of carbon. It is the most widely spread and most widely used variety of coal. It is the most popular coal in commercial use.
(iv) Anthracite is the best quality coal, which contains more than 95% of carbon. It is very hard but emits very less smoke and leaves very less ash. However its deposits are limited.
Production and world distribution of CoalCoal reserves are found in more than 70 countries of the world but the major coal reserves occur in the USA, Russia, China and South Africa. China is the largest producer of steam coal in the world followed by India. The other leading producers of steam coal are USA, Indonesia, and South Africa etc. Steam coal – It is used for producing steam and it has high sulphur content
Steam CoalRank Country Production
(Metric Ton)Share in%
1 China 2,491,793,000 47.422 India 601,131,000 11.443 United States 553,936,000 10.544 Indonesia 459,469,000 8.745 South Africa 253,452,000 4.82
Others 17.04
1. China
2. India
3. Unites States
4. Indonesia
5. South Africa
6. Others
STEAM COAL PRODUCTIONSHARE IN %
17.04
4.82
8.74
10.5411.44
47.42
HOTS
Why is hydrogen used as fuel in rockets?
China was the largest producer of coking coal in the world in 2016 followed by Australia. The other leading producers of coking coal are Russia, India and USA.
TN_GOVT_XII_Geography_chapter 03.indd 54 21-02-2019 12:09:26
Resources55
forms. Liquid petroleum may be in the form of crude oil. The solid form may be mineral waxes or asphalts. The gaseous form is natural gas. It is a main source of energy in the World due to its multiple uses. The human activities are directly or indirectly depend on the use of petroleum or its sub products.
Formation and occurrence of mineral oilIt is formed by slow chemical and bio chemical decomposition of the remains of organic matter in sedimentary rocks. It is found in the pores of the sedimentary rocks. Oil is lighter than water hence, floats over water. Drilling of oil wells is the hole drilled in the earth’s crust and when it reaches the rock cap, the natural gas comes out first with a great pressure. When the pressure of gas subsides, petroleum starts flowing out when the pressure of natural gas is released.
Petroleum reserves of the worldThe west Asia or Middle East is has the largest petroleum reserves, which is about 60% of the world’s oil reserve. The total estimated world’s oil reserves in 2008 were 1,243 (109 bbl). Saudi Arabia, Canada, Iran, Iraq and Kuwait have large reserves of petroleum.
Production and world distribution of petroleum
The petroleum producing countries of the world can be grouped in to five geographical regions:(i) West Asia (or) middle East region (ii) American region(iii) Russian region(iv) East & south Asian region and(v) African region
Saudi Arabia is the largest oil producer of the world with 13.62% of the world output of oil. Russia is the second largest producer in the world. India is placed at 24th position in petroleum production in the world. The distribution of oil is naturally uneven; Middle
Coking Coal
Rank Country Production MT
Share in%
1 China 591,998,000 54.67
2 Australia 189,302,000 17.48
3 Russia 83,800,000 7.74
4 India 61,661,000 5.69
5 United States 50,645,000 4.68
Others 9.74
Major coal mining centres Country Mining centres
China Shansi, Shantung, Fushun, Shenyang, etc.
India Bokaro, Jaria, Korba, Ranikanch, Singreni, etc.
U.S.A Arkansas, Colorodo, Illionois, Indiana, Michigan etc.
Australia Bowen Basin, Brisbane, Canberra, Sydney, New-castle, Tasmania, etc.
Russia Moscow-Tula region, Chokot Basin, Ob basin, etc.
TradeThe main exporters of coal in the world are Australia, Indonesia, Russia, Colombia and South Africa and the main importers are China, India, Japan, Korea and Germany.
Uses of CoalMan has used coal for hundreds of years. But it has gained importance only after industrial revolution. It contributes about 25% of global energy demand. Coal is used for various purposes. It is used as a source of steam energy, electrical energy, domestic fuel, metallurgical coke, chemical industries and byproducts such as Ammonium sulphate, Naphthalene, Phenol, Benzene, etc.
Petroleum (or) Mineral oilPetroleum is a mineral that exists under the surface of the earth in liquid, solid and gaseous
TN_GOVT_XII_Geography_chapter 03.indd 55 21-02-2019 12:09:26
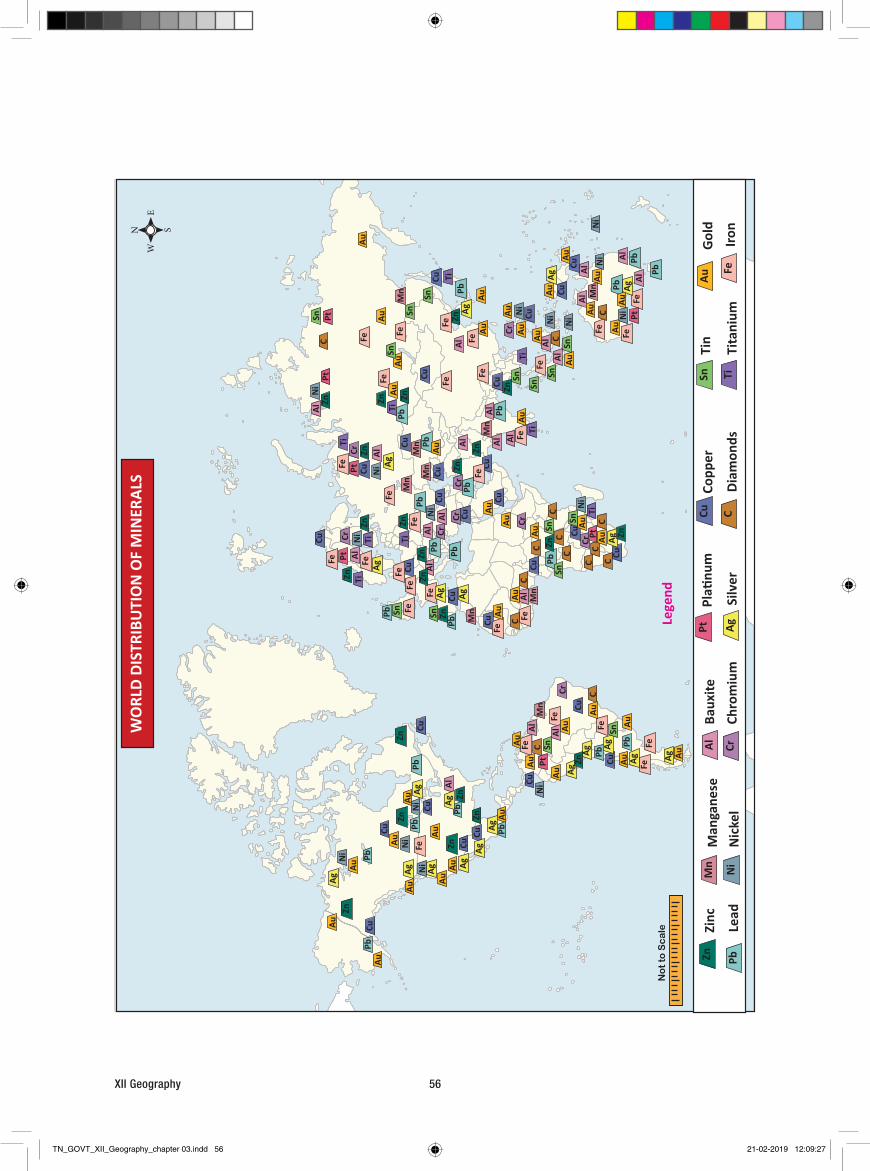
XII Geography 56
Cu
Cu
Cu
Cu
Cu
CuCu
Cu
Cu
CuCu
Cu
Cu
Cu
Cu
Cu
Cu
Cu
Cu
Cu
Cu
Cu
Fe
Fe
Fe
Fe
FeFe
Fe
Fe
Fe
Fe
Fe
Fe
Fe
FeFe
Fe
Fe
FeFe
Fe
FeFe
FeFe
Fe
Fe
Fe
Fe
Fe
FePb
PbPb
PbPb
Pb
Pb
Pb
Pb
Pb
Pb
Pb
Pb
Al
Al
Al
Al
AlAl
Al
Al
AlAl
Al
Al
Al
AlAl
AlAl
Al
Al
Al
Al
CrCr
Cr
CrCr
CrCr
Cr
Cr
Cu
Cu
Cu
Cu
CuCu
Cu
C
CC
CC
CC
CC
C
C
CC
CC
Au
Au
Au
Au
Au
Au
Au
Au
Au
Au
Au
AuAu
Au
Au
Au
Au
Au
Au
Au
Au
Au
Au
AuAu
AuAu
Au
Au
AuAu
Au
Au
Au
Au
Au
Au
Au
Au
Au
AuAu
Au
PbPb
Pb
Pb
Pb
Pb
Pb
Pb
Pb
Mn
Mn
Mn
Mn
Mn
Mn
Mn
Mn
Mn
Ni
Ni
Ni
Ni
Ni
Ni
Ni
Ni
Ni
Ni
Ni
Ni
Ni
Ni
Ni
Ni
Pt
PtPt
PtPt
Pt
Pt
Ag
Ag
Ag
Ag
Ag
Ag
Ag Ag Ag
AgAg
Ag
Ag
AgAg
Ag
Ag
Ag Ag
Ag
Ag
Sn
SnSn
Sn
Sn
Sn
Sn
Sn
Sn
Sn Sn
Sn
Sn
SnSn
TiTi Ti
Ti
TiTi
Ti
Ti
Ti
Zn
Zn
Zn
Zn
Zn
Zn
Zn
Zn
Zn
Zn
Zn
ZnZn
Zn
Zn
Zn
Zn
Zn
Zn
ZnZn
Zn
Zn
WO
RLD
DIST
RIBU
TIO
N O
F M
INER
ALS
EW
N S
Lege
ndN
ot
to S
ca
le
Baux
iteCh
rom
ium
Copp
er
Diam
onds
Gol
dIro
nLe
adM
anga
nese
Nic
kel
Pla�
num
Silv
er
Tin
Tita
nium
Zinc
Al Cr
Cu C
Au
FePb
Mn Ni
Pt Ag
Sn Ti
Zn
TN_GOVT_XII_Geography_chapter 03.indd 56 21-02-2019 12:09:27
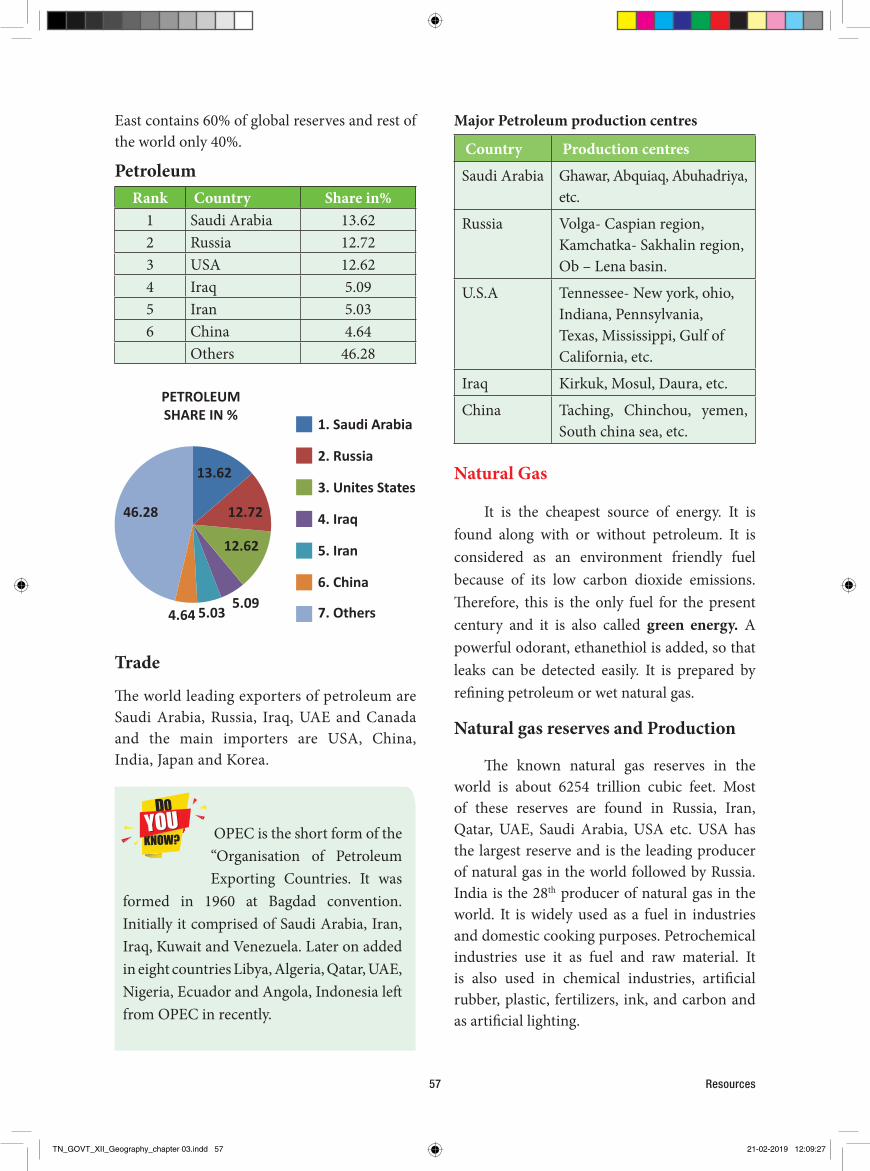
Resources57
Major Petroleum production centres
Country Production centres
Saudi Arabia Ghawar, Abquiaq, Abuhadriya, etc.
Russia Volga- Caspian region, Kamchatka- Sakhalin region, Ob – Lena basin.
U.S.A Tennessee- New york, ohio, Indiana, Pennsylvania, Texas, Mississippi, Gulf of California, etc.
Iraq Kirkuk, Mosul, Daura, etc.
China Taching, Chinchou, yemen, South china sea, etc.
Natural Gas
It is the cheapest source of energy. It is found along with or without petroleum. It is considered as an environment friendly fuel because of its low carbon dioxide emissions. Therefore, this is the only fuel for the present century and it is also called green energy. A powerful odorant, ethanethiol is added, so that leaks can be detected easily. It is prepared by refining petroleum or wet natural gas.
Natural gas reserves and Production
The known natural gas reserves in the world is about 6254 trillion cubic feet. Most of these reserves are found in Russia, Iran, Qatar, UAE, Saudi Arabia, USA etc. USA has the largest reserve and is the leading producer of natural gas in the world followed by Russia. India is the 28th producer of natural gas in the world. It is widely used as a fuel in industries and domestic cooking purposes. Petrochemical industries use it as fuel and raw material. It is also used in chemical industries, artificial rubber, plastic, fertilizers, ink, and carbon and as artificial lighting.
East contains 60% of global reserves and rest of the world only 40%.
PetroleumRank Country Share in%
1 Saudi Arabia 13.622 Russia 12.723 USA 12.624 Iraq 5.095 Iran 5.036 China 4.64
Others 46.28
1. Saudi Arabia
2. Russia
3. Unites States
4. Iraq
5. Iran
6. China
7. Others
PETROLEUMSHARE IN %
13.62
12.72
12.62
5.095.034.64
46.28
Trade
The world leading exporters of petroleum are Saudi Arabia, Russia, Iraq, UAE and Canada and the main importers are USA, China, India, Japan and Korea.
OPEC is the short form of the “Organisation of Petroleum Exporting Countries. It was
formed in 1960 at Bagdad convention. Initially it comprised of Saudi Arabia, Iran, Iraq, Kuwait and Venezuela. Later on added in eight countries Libya, Algeria, Qatar, UAE, Nigeria, Ecuador and Angola, Indonesia left from OPEC in recently.
TN_GOVT_XII_Geography_chapter 03.indd 57 21-02-2019 12:09:27

XII Geography 58
Most devastating nuclear accidents
1. Three mile Island- March 28, 1979 USA
2. Chernobyl - April 29,1986,Russia3. Fukushima Daiich- March 11,2011,Japan
Renewable sources of Energy:All regions of the world are facing the twin
problems of fast increasing demand for energy and limited supplies and rapidly depleting conventional sources of energy. Under these circumstances, non conventional sources of energy are getting more importance. These sources are renewable, clean and non-polluting. They are solar, wind, geothermal, wave, tidal energy, bio-gas etc.
Hydel PowerHydro electricity is produced by using the
potential energy of water falling from a certain height. The falling water spins the turbine blades and energy is produced. It is a clean eco friendly and renewable source of energy. It contributes nearly 7% of the world electricity production. China has the largest potential followed by Brazil, Indonesia, Canada and Zaire. China is the largest producer of Hydro electricity in the world, followed by Canada.
Solar energyIt is based on mechanical conversion
of solar energy into electricity. It is available in abundance but only in the recent period it gets more importance due to technological development. Solar energy is used for various purposes.
Noor Complex is the world’s largest concentrated solar power (CSP) plant, located in the Sahara Desert.
Natural gas Rank Country Production
(Metric.Ton)
Share (%)
1 United States 755,010 20.56
2 Russia 641,000 17.453 Iran 202,440 5.514 Qatar 181,250 4.945 Canada 157,179 4.28
Other 47.26
TradeRussia, Qatar, Norway, Canada and Algeria
are the leading exporters of Natural gas in the world. Japan, Germany, China, Italy and Turkey are the leading importers of natural gas.
Nuclear EnergyIt is commonly said, this energy holds
the key of future. Energy contained within the nucleus of an atom is called nuclear energy. Heavy metals like Uranium, Thorium, Radium, Plutonium and Lithium are the main sources of nuclear energy. However Uranium is the most important source of nuclear energy. The nuclear energy production was started first in USA in 1950. Nuclear energy now provides about 11% of the World’s electricity. At present there are more than 450 operable fission reactors in the world. The world’s first commercial nuclear power station Calder Hall at Wind scale, England was opened in 1956.
Uranium (U3O8)
Rank Country Production (Metric.Ton)
Share (%)
1 Kazakhstan 29,113 38.892 Canada 16,666 22.263 Australia 7,352 9.82
4 Namibia 4,308 5.755 Niger 4,101 5.48
Others 17.80
TN_GOVT_XII_Geography_chapter 03.indd 58 21-02-2019 12:09:27
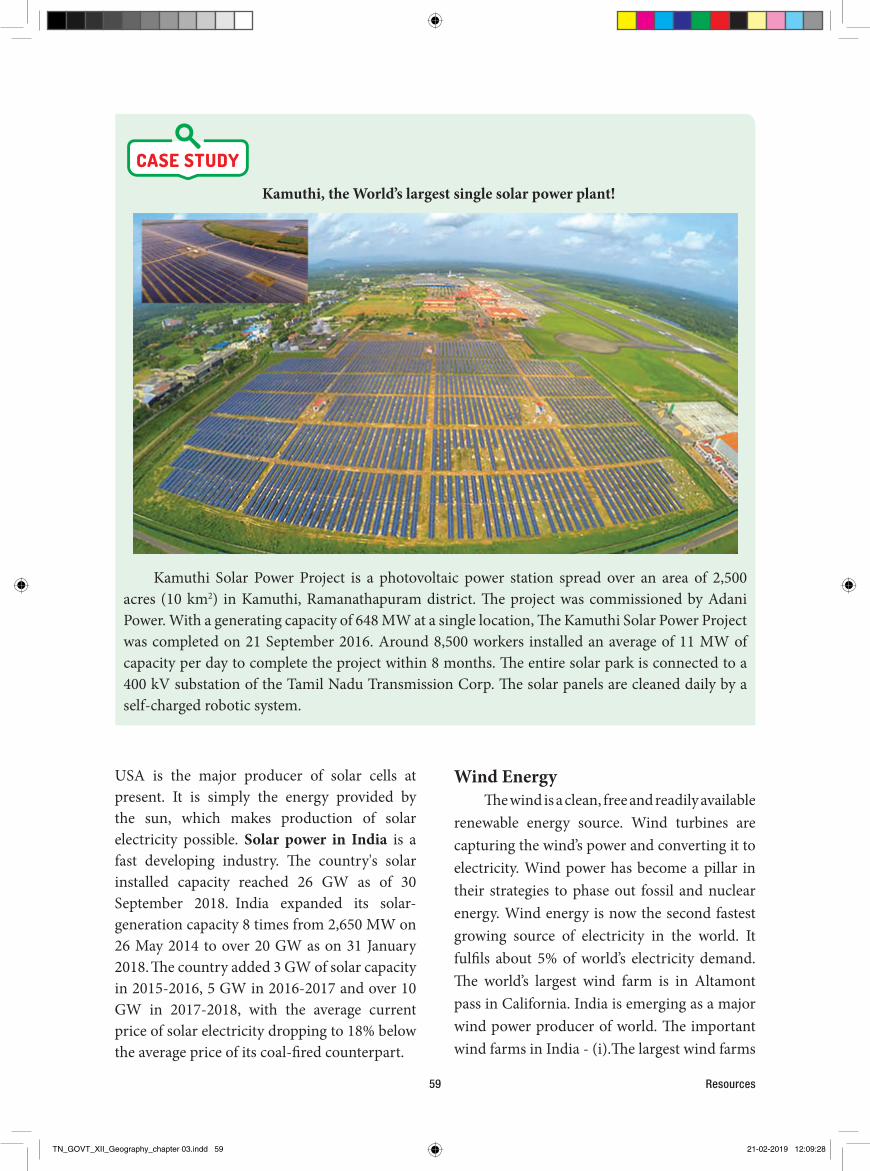
Resources59
Wind EnergyThe wind is a clean, free and readily available
renewable energy source. Wind turbines are capturing the wind’s power and converting it to electricity. Wind power has become a pillar in their strategies to phase out fossil and nuclear energy. Wind energy is now the second fastest growing source of electricity in the world. It fulfils about 5% of world’s electricity demand. The world’s largest wind farm is in Altamont pass in California. India is emerging as a major wind power producer of world. The important wind farms in India - (i).The largest wind farms
USA is the major producer of solar cells at present. It is simply the energy provided by the sun, which makes production of solar electricity possible. Solar power in India is a fast developing industry. The country's solar installed capacity reached 26 GW as of 30 September 2018. India expanded its solar-generation capacity 8 times from 2,650 MW on 26 May 2014 to over 20 GW as on 31 January 2018. The country added 3 GW of solar capacity in 2015-2016, 5 GW in 2016-2017 and over 10 GW in 2017-2018, with the average current price of solar electricity dropping to 18% below the average price of its coal-fired counterpart.
Kamuthi, the World’s largest single solar power plant!
Kamuthi Solar Power Project is a photovoltaic power station spread over an area of 2,500 acres (10 km2) in Kamuthi, Ramanathapuram district. The project was commissioned by Adani Power. With a generating capacity of 648 MW at a single location, The Kamuthi Solar Power Project was completed on 21 September 2016. Around 8,500 workers installed an average of 11 MW of capacity per day to complete the project within 8 months. The entire solar park is connected to a 400 kV substation of the Tamil Nadu Transmission Corp. The solar panels are cleaned daily by a self-charged robotic system.
TN_GOVT_XII_Geography_chapter 03.indd 59 21-02-2019 12:09:28
XII Geography 60
mangrove, are the 3 sites identified as potential areas for tidal power generation in India.
Geo Thermal EnergyGeo thermal energy is derived from the
natural heat of the earth. The United States is the world's largest producer, and the largest geothermal development in the world is The Geysers north of San Francisco in California, the U.S.
In India, exploration and study of geothermal fields started in 1970. The GSI (Geological Survey of India) has identified 350 geothermal energy locations in the country. The most promising of these is in Puga valley of Ladakh. The estimated potential for geothermal energy in India is about 10000 MW. There are seven geothermal provinces in India: the Himalayas, Sohana, West coast, Cambay, Son-Narmada-Tapti (SONATA), Godavari, and Mahanadi.
3.6 Conservation of ResourcesIt takes millions of years for the formation
of minerals. Compared to the present rate of consumption, the replenishment rate of minerals is very slow. Hence, mineral resources are finite and non- renewable. Due to this, it is important to conserve the mineral resources.
Ways of Conserving Resources
• Controlling population growth will reduce the demand for resources.
• Creating social awareness regarding the importance of conservation of resources.
in India are Muppandal in Kanyakumari District of Tamil Nadu and Jaisalmer wind park in Rajasthan. They are the first and second largest wind farms of India. Based on the location of its generation it is classified into
1. Onshore wind energy and
2. Offshore wind energy
1. Onshore wind energy –Energy generated from the plants located on the land is known as onshore wind energy. Onshore wind has the advantage of being one of the most affordable renewable energy sources. It is cheaper than any other renewable source of energy but it requires more area to install than any other energy.
2. Offshore wind energy –It refers to the use of wind farms developed in seas and oceans. The largest offshore wind farms are currently in the U.K and Germany. These two countries installed 2/3 capacity. London Array is the largest offshore wind farm in the world. The first offshore wind farm is planned near Dhanuskodi in Tamil Nadu.
Tidal energy - It is a renewable energy powered by the natural raise and fall of ocean water. Its production is very small. The first tidal power station was located in La Rance in France. The largest tidal power station is at Sihwa Lake in South Korea and it is the largest tidal power producer in the world. There are three different category of sources from which the tidal energy is generated. The sources are tidal streams, barrages and tidal lagoons.
India’s first attempt to harness tidal power for generating electricity would be in the form of a 3MW plant at the Durgaduani creek in sunderbans delta of West Bengal. The Gulf of Kutch and Cambay in Gujarat and the Ganges delta in sunderbans, the world’s largest
TN_GOVT_XII_Geography_chapter 03.indd 60 21-02-2019 12:09:28
• Reusing and recycling of resources.
• Using the renewable source of energy as an alternative to non- renewable resources.
• Developing the usage methods which minimize the wastages.
1. Mineralogy: The study of minerals.
2. Ubiquitous resource: resources which exist everywhere
3. Alloy: a metal made by combining two or more metallic elements, especially to give greater strength or resistance to corrosion.
4. Lodes: a vein of metal ore in the earth.
5. Exhaustible: Resources of which a finite quantity is in existence.
6. Mineraloids: A rock with an aggregate of one or more minerals.
• Propagating the environmental ill effects caused by various products.
• Choosing the products with less packaging.
7. Nuclear power: The use of nuclear reactions that release nuclear energy to generate heat, produce electricity in a nuclear power plant.
8. Silicon material: Silicon is a chemical element with symbol Si and atomic number 14. It is a hard and brittle crystalline solid with a blue-grey metallic lustre.
9. Odorant: a substance used to give a particular odour to a product.
10. Corrosive: substance that will destroy other substances with which it comes into contact by means of a chemical reaction.
Resources61
TN_GOVT_XII_Geography_chapter 03.indd 61 21-02-2019 12:09:28
XII Geography 62
ExerciseI. Choose the correct answer
1. Pick out the statement which is untrue about the renewable resources.
a) The resources which can always be available for use after their usage.
b) Resources have natural regeneration and are inexhaustible.
c) Air, water, solar energy etc are examples for renewable resources.
d) Available in finite quantities and cannot be obtained once if they are utilized.
2. Identify the one which is untrue about the minerals.
a) Minerals generally occur in the cracks, crevices, faults and joints of the igneous and metamorphic rocks.
b) Mineral in smaller occurrence in the joints of the rocks is called a ‘Vein’.
c) Mineral in a larger occurrence in the joints of the rocks is called a ‘load.
d) When the decomposed rocks are washed away by water, the soluble particles are removed, leaving a mass containing ores. Such occurrences are called residual mass.
3. Consider the following statements and choose the correct answer.
i) Good quality Iron ore is found in Australia, Brazil, Russia, China, USA, Ukraine, Canada, etc.
ii) Russia has the third largest proven reserves of iron ore in the world.
iii) Australia is the largest producer of Iron ore in the world.
iv) The Majority of Iron ore is (84%) produced by 10 countries alone.
a) i) and ii) only b) i) and iii) only
c) iii) and iv) only d) i) and iv) only
4. Which of the following is incorrectly stated?
a) Saudi Arabia is the largest oil producer of the world.
b) Russia is the second largest oil producer in the world.
c) India is the 4th largest producer of oil in the world.
d) The Middle East contains 60% of global reserves.
XII Geography 62
TN_GOVT_XII_Geography_chapter 03.indd 62 21-02-2019 12:09:28
Resources63
5. Identify the incorrect statement from the following
a) Peat is the first stage of transformation of wood into coal and it has only 30 to 35% of carbon.
b) Lignite or Brown coal is the inferior quality and contains 35-45% carbon.
c) Bituminous or coking coal is the most popular coal in commercial use.
d) Anthracite is very hard but emits more smoke and leaves very less ash.
6. Consider the following and choose the correct option
Assertion (A): Great dairing regions are located in the wet areas of the cool temperate region.
Reasoning (R): Cool temperate regions have nutritious grass and there is great demand for milk products.
a) Both A and B are correct but R is not the correct explantion of A.
b) Both A and B are correct and R is the correct explantion of A.
c) A is true but R is false.
d) R is true but A is false.
7. Identify the one which is incorrectly matched
Mineral Characteristics
a) Calcium - The structural element.
b) Magnesium - It is the bright and shining mineral.
c) Sodium - The oxygen carrier and an energy mineral.
d) Potassium - Another solvent mineral and heart mineral.
e) Chlorine - It is a cleanser.
8. Which of the following statements are incorrect?
i) Hydropower is a clean eco friendly and renewable source of energy.
ii) It contributes nearly 17% of the world electricity production.
iii) China has the largest potential of hydro power followed by Brazil, Indonesia, Canada and Zaire.
iv) Canada is the largest producer of Hydro electricity in the world, followed by China.
a) i, ii, and iii only.
b) ii, iii and iv only.
c) ii and iv only.
d) i and ii only.
Resources63
TN_GOVT_XII_Geography_chapter 03.indd 63 21-02-2019 12:09:28
XII Geography 64
9. Which of the following is not a method of conservation of minerals?
a) Controlling population growth to reduce demand for minerals.
b) Creating social awareness regarding conservation of minerals.
c) Reusing and recycling of minerals.
d) Encouraging the use and acceptance of minerals which are not essential.
10. Pick the Odd one out.
a) Choose products with less packaging.
b) Choose products with recyclable or reusable packaging.
c) Carry use and throw shopping bags or boxes.
d) Say 'no' to unnecessary plastic bags and other packaging.
II Very short answer
11. How do you differentiate veins from lodes of occurrence of minerals?
12. Why is the anthracite coal the best of its kind?
13. Name any four leading oil producers of the world.
14. Mention any two places of tidal energy production in India.
15. Which countries produce 50% of world’s sheep wool?
III Short answer
16. What are the uses of Mica?
17. Write a note on hydelpower.18. State any three uses of minerals.19. Mention any three ways of conserving resources. 20. Where is the world’s single largest solar power plant in the world? Write about the solar energy
production in India.
IV Detailed answer 21. Classify and describe iron ore.22. List out the methods of conservation of mineral resources. 23. In what different ways can resources be reused?
XII Geography 64
TN_GOVT_XII_Geography_chapter 03.indd 64 21-02-2019 12:09:28
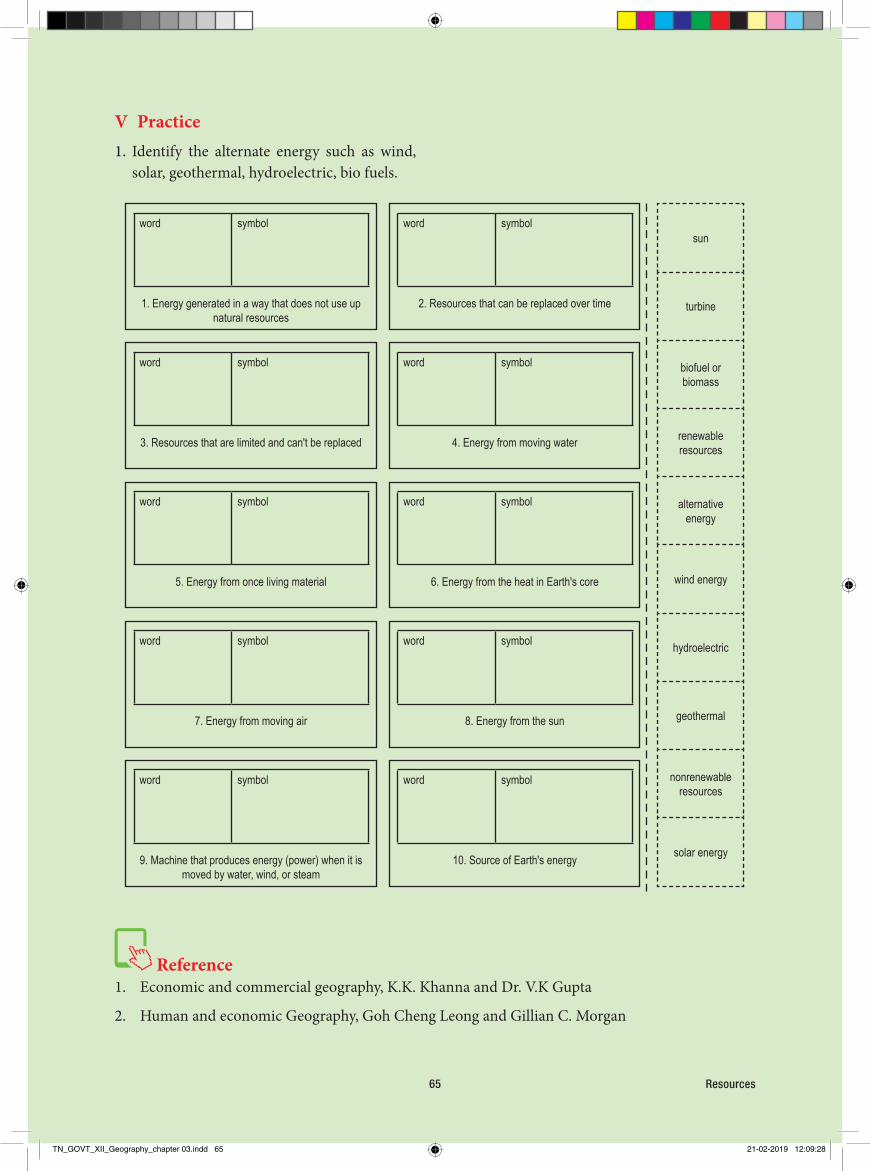
Resources65
V Practice 1. Identify the alternate energy such as wind,
solar, geothermal, hydroelectric, bio fuels.
1. Energy generated in a way that does not use up natural resources
word symbol
3. Resources that are limited and can't be replaced
word symbol
5. Energy from once living material
word symbol
7. Energy from moving air
word symbol
9. Machine that produces energy (power) when it is moved by water, wind, or steam
word symbol
2. Resources that can be replaced over time
word symbol
4. Energy from moving water
word symbol
6. Energy from the heat in Earth's core
word symbol
8. Energy from the sun
word symbol
10. Source of Earth's energy
word symbol
sun
turbine
biofuel or biomass
renewable resources
alternative energy
wind energy
hydroelectric
geothermal
nonrenewable resources
solar energy
Resources65
Reference1. Economic and commercial geography, K.K. Khanna and Dr. V.K Gupta
2. Human and economic Geography, Goh Cheng Leong and Gillian C. Morgan
TN_GOVT_XII_Geography_chapter 03.indd 65 21-02-2019 12:09:28

XII Geography 66
RESOURCES
Steps• Type the URL link given below in the browser or scan the QR code. A page opens
with many resources available and “play game” option.
• It opens with resources on the top and the categorizing buckets at the bottom.
• You have to drag the resources and put them in the bucket. When you drag the resources and drop them in the bucket, the bucket labelled itself for the first droppings.
• After that you have to drag and drop the objects correctly in the bucket.
• After you completed your droppings you click the bucket it gives you the score.
Website URL:https://www.brainpop.com/games/sortifynaturalresources/
ICT CORNER
*Pictures are indicative only.
Th is activity enables the students to enrich themselves about
Resources available in the world and able to categorise them as the headings given in
the activities.
Step 1 Step 2
Step 3 Step 4
TN_GOVT_XII_Geography_chapter 03.indd 66 21-02-2019 12:09:29
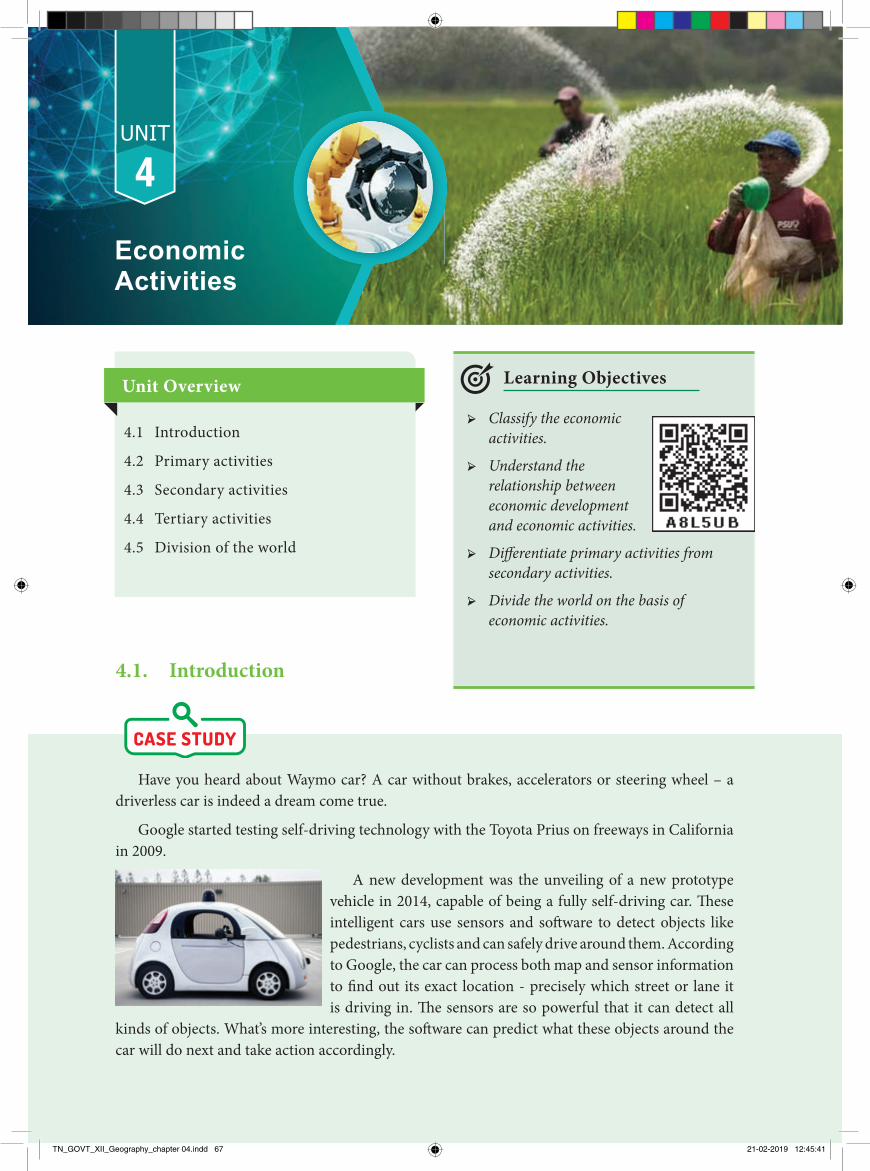
Economic Activities67
4.1 Introduction
4.2 Primary activities
4.3 Secondary activities
4.4 Tertiary activities
4.5 Division of the world
Unit Overview Learning Objectives
➢ Classify the economic activities.
➢ Understand the relationship between economic development and economic activities.
➢ Di� erentiate primary activities from secondary activities.
➢ Divide the world on the basis of economic activities.
EconomicActivities
4UNIT
4.1. Introduction
Have you heard about Waymo car? A car without brakes, accelerators or steering wheel – a driverless car is indeed a dream come true.
Google started testing self-driving technology with the Toyota Prius on freeways in California in 2009.
A new development was the unveiling of a new prototype vehicle in 2014, capable of being a fully self-driving car. Th ese intelligent cars use sensors and soft ware to detect objects like pedestrians, cyclists and can safely drive around them. According to Google, the car can process both map and sensor information to fi nd out its exact location - precisely which street or lane it is driving in. Th e sensors are so powerful that it can detect all
kinds of objects. What’s more interesting, the soft ware can predict what these objects around the car will do next and take action accordingly.
TN_GOVT_XII_Geography_chapter 04.indd 67 21-02-2019 12:45:41
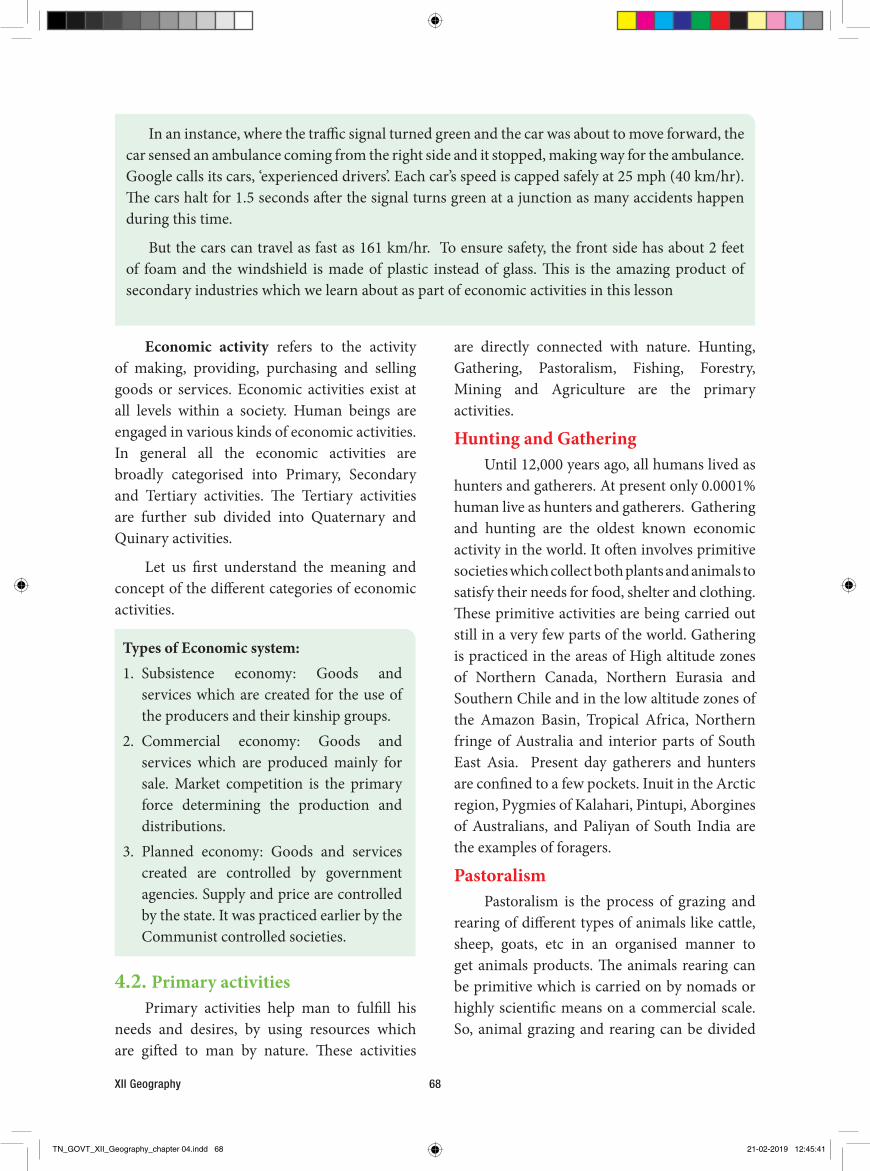
XII Geography 68
Economic activity refers to the activity of making, providing, purchasing and selling goods or services. Economic activities exist at all levels within a society. Human beings are engaged in various kinds of economic activities. In general all the economic activities are broadly categorised into Primary, Secondary and Tertiary activities. The Tertiary activities are further sub divided into Quaternary and Quinary activities.
Let us first understand the meaning and concept of the different categories of economic activities.
Types of Economic system:1. Subsistence economy: Goods and
services which are created for the use of the producers and their kinship groups.
2. Commercial economy: Goods and services which are produced mainly for sale. Market competition is the primary force determining the production and distributions.
3. Planned economy: Goods and services created are controlled by government agencies. Supply and price are controlled by the state. It was practiced earlier by the Communist controlled societies.
4.2. Primary activitiesPrimary activities help man to fulfill his
needs and desires, by using resources which are gifted to man by nature. These activities
are directly connected with nature. Hunting, Gathering, Pastoralism, Fishing, Forestry, Mining and Agriculture are the primary activities.
Hunting and GatheringUntil 12,000 years ago, all humans lived as
hunters and gatherers. At present only 0.0001% human live as hunters and gatherers. Gathering and hunting are the oldest known economic activity in the world. It often involves primitive societies which collect both plants and animals to satisfy their needs for food, shelter and clothing. These primitive activities are being carried out still in a very few parts of the world. Gathering is practiced in the areas of High altitude zones of Northern Canada, Northern Eurasia and Southern Chile and in the low altitude zones of the Amazon Basin, Tropical Africa, Northern fringe of Australia and interior parts of South East Asia. Present day gatherers and hunters are confined to a few pockets. Inuit in the Arctic region, Pygmies of Kalahari, Pintupi, Aborgines of Australians, and Paliyan of South India are the examples of foragers.
PastoralismPastoralism is the process of grazing and
rearing of different types of animals like cattle, sheep, goats, etc in an organised manner to get animals products. The animals rearing can be primitive which is carried on by nomads or highly scientific means on a commercial scale. So, animal grazing and rearing can be divided
In an instance, where the traffic signal turned green and the car was about to move forward, the car sensed an ambulance coming from the right side and it stopped, making way for the ambulance. Google calls its cars, ‘experienced drivers’. Each car’s speed is capped safely at 25 mph (40 km/hr). The cars halt for 1.5 seconds after the signal turns green at a junction as many accidents happen during this time.
But the cars can travel as fast as 161 km/hr. To ensure safety, the front side has about 2 feet of foam and the windshield is made of plastic instead of glass. This is the amazing product of secondary industries which we learn about as part of economic activities in this lesson
TN_GOVT_XII_Geography_chapter 04.indd 68 21-02-2019 12:45:41
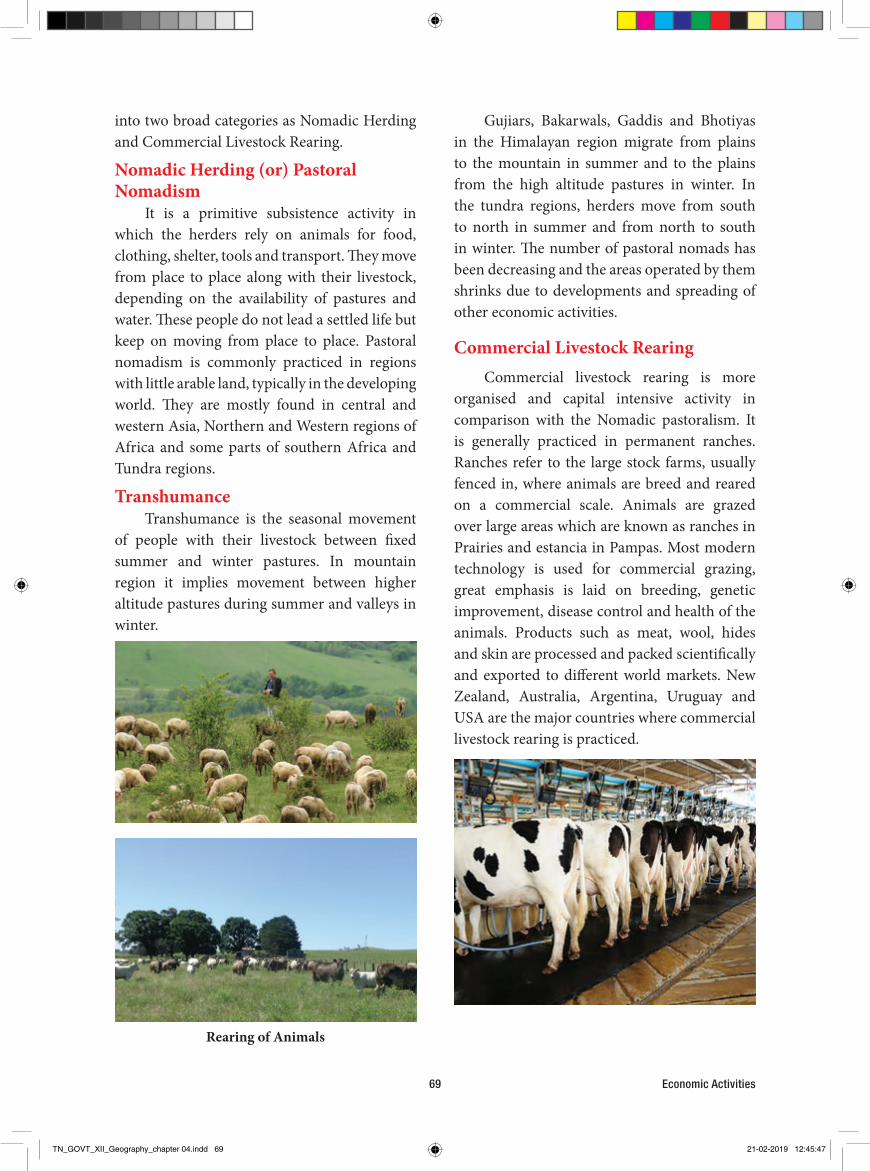
Economic Activities69
Gujiars, Bakarwals, Gaddis and Bhotiyas in the Himalayan region migrate from plains to the mountain in summer and to the plains from the high altitude pastures in winter. In the tundra regions, herders move from south to north in summer and from north to south in winter. The number of pastoral nomads has been decreasing and the areas operated by them shrinks due to developments and spreading of other economic activities.
Commercial Livestock RearingCommercial livestock rearing is more
organised and capital intensive activity in comparison with the Nomadic pastoralism. It is generally practiced in permanent ranches. Ranches refer to the large stock farms, usually fenced in, where animals are breed and reared on a commercial scale. Animals are grazed over large areas which are known as ranches in Prairies and estancia in Pampas. Most modern technology is used for commercial grazing, great emphasis is laid on breeding, genetic improvement, disease control and health of the animals. Products such as meat, wool, hides and skin are processed and packed scientifically and exported to different world markets. New Zealand, Australia, Argentina, Uruguay and USA are the major countries where commercial livestock rearing is practiced.
into two broad categories as Nomadic Herding and Commercial Livestock Rearing.
Nomadic Herding (or) Pastoral Nomadism
It is a primitive subsistence activity in which the herders rely on animals for food, clothing, shelter, tools and transport. They move from place to place along with their livestock, depending on the availability of pastures and water. These people do not lead a settled life but keep on moving from place to place. Pastoral nomadism is commonly practiced in regions with little arable land, typically in the developing world. They are mostly found in central and western Asia, Northern and Western regions of Africa and some parts of southern Africa and Tundra regions.
TranshumanceTranshumance is the seasonal movement
of people with their livestock between fixed summer and winter pastures. In mountain region it implies movement between higher altitude pastures during summer and valleys in winter.
Rearing of Animals
TN_GOVT_XII_Geography_chapter 04.indd 69 21-02-2019 12:45:47

XII Geography 70
AgricultureAgriculture is the most fundamental form of
human activity and includes not only cultivation of crops but also the domestication of animals. The following are the major agricultural types and their characteristic features.
Shift ing Cultivation
Shift ing Cultivation is a kind of traditional farming practiced by tribes in the hilly and forest regions. It is practiced especially in tropical Africa. In this farming an area of ground is cleared of vegetation and cultivated for a few years and then abandoned for a new area until its fertility has been naturally restored. Th ey are called with diff erent names in diff erent regions as follows Shift ing Cultivation in Northeast India.
Employees of the economic activity called as Economic Activity NamePrimary Red collarSecondary Blue collarTertiary Pink collarQuaternary White collarQuinary Gold collar
TN_GOVT_XII_Geography_chapter 04.indd 70 21-02-2019 12:45:47
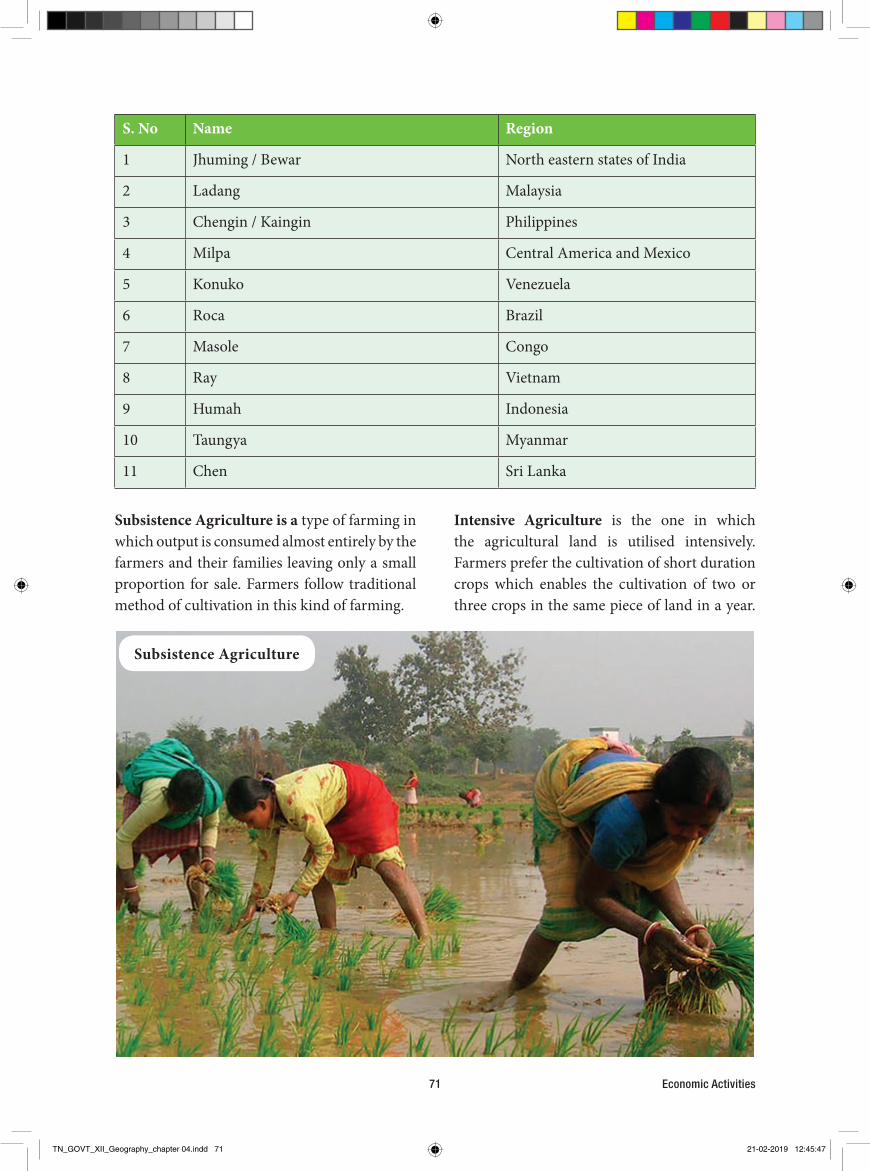
Economic Activities71
Intensive Agriculture is the one in which the agricultural land is utilised intensively. Farmers prefer the cultivation of short duration crops which enables the cultivation of two or three crops in the same piece of land in a year.
Subsistence Agriculture is a type of farming in which output is consumed almost entirely by the farmers and their families leaving only a small proportion for sale. Farmers follow traditional method of cultivation in this kind of farming.
S. No Name Region
1 Jhuming / Bewar North eastern states of India
2 Ladang Malaysia
3 Chengin / Kaingin Philippines
4 Milpa Central America and Mexico
5 Konuko Venezuela
6 Roca Brazil
7 Masole Congo
8 Ray Vietnam
9 Humah Indonesia
10 Taungya Myanmar
11 Chen Sri Lanka
Subsistence Agriculture
TN_GOVT_XII_Geography_chapter 04.indd 71 21-02-2019 12:45:47
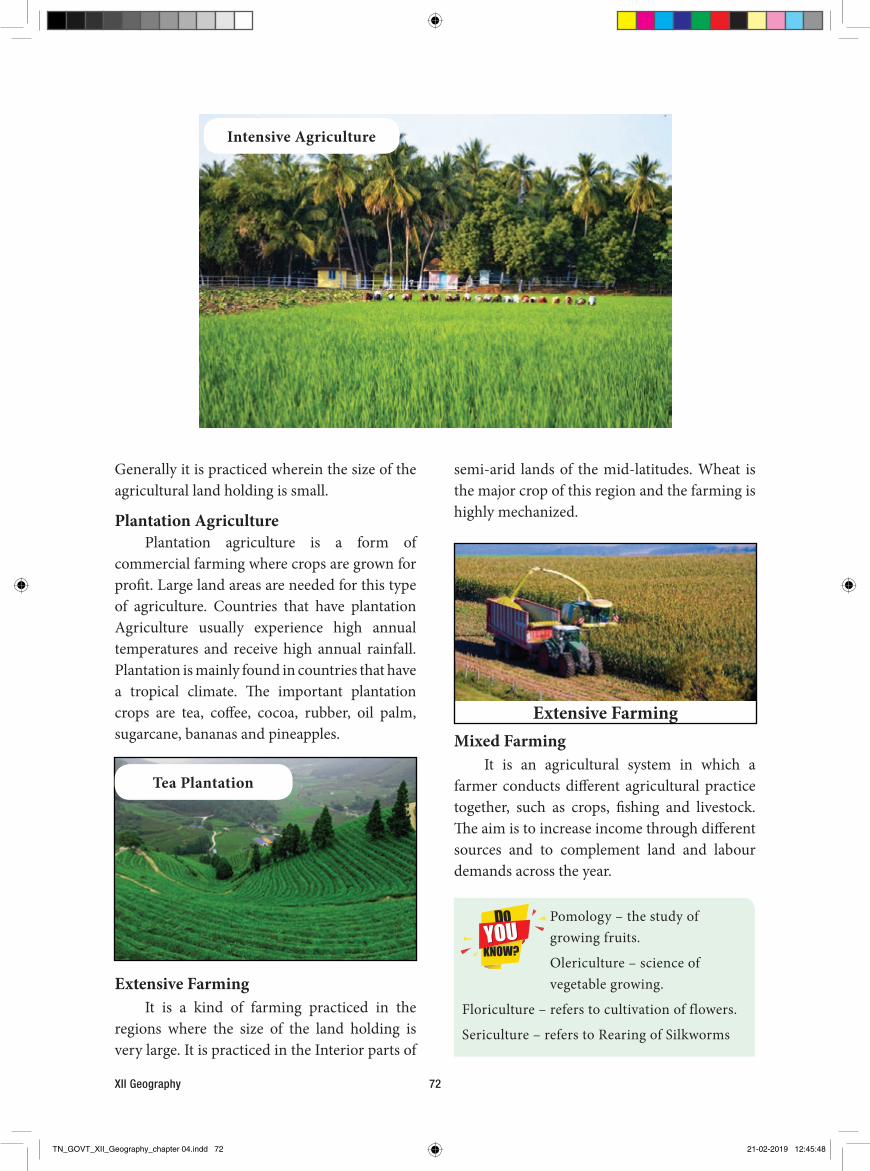
XII Geography 72
semi-arid lands of the mid-latitudes. Wheat is the major crop of this region and the farming is highly mechanized.
Extensive FarmingMixed Farming
It is an agricultural system in which a farmer conducts different agricultural practice together, such as crops, fishing and livestock. The aim is to increase income through different sources and to complement land and labour demands across the year.
Pomology – the study of growing fruits.
Olericulture – science of vegetable growing.
Floriculture – refers to cultivation of flowers.
Sericulture – refers to Rearing of Silkworms
Generally it is practiced wherein the size of the agricultural land holding is small.
Plantation Agriculture Plantation agriculture is a form of
commercial farming where crops are grown for profit. Large land areas are needed for this type of agriculture. Countries that have plantation Agriculture usually experience high annual temperatures and receive high annual rainfall. Plantation is mainly found in countries that have a tropical climate. The important plantation crops are tea, coffee, cocoa, rubber, oil palm, sugarcane, bananas and pineapples.
Extensive FarmingIt is a kind of farming practiced in the
regions where the size of the land holding is very large. It is practiced in the Interior parts of
Tea Plantation
Intensive Agriculture
TN_GOVT_XII_Geography_chapter 04.indd 72 21-02-2019 12:45:48
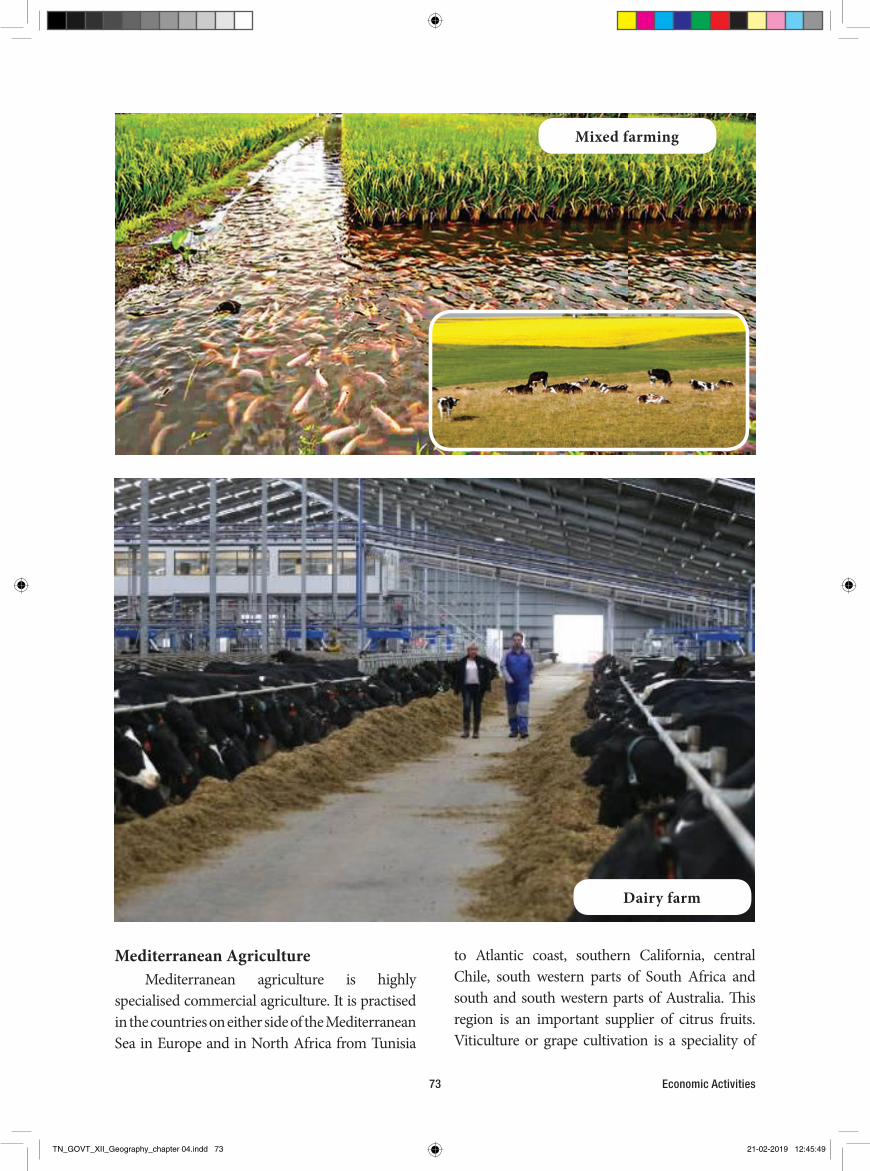
Economic Activities73
Dairy farm
Mediterranean AgricultureMediterranean agriculture is highly
specialised commercial agriculture. It is practised in the countries on either side of the Mediterranean Sea in Europe and in North Africa from Tunisia
to Atlantic coast, southern California, central Chile, south western parts of South Africa and south and south western parts of Australia. This region is an important supplier of citrus fruits. Viticulture or grape cultivation is a speciality of
Mixed farming
TN_GOVT_XII_Geography_chapter 04.indd 73 21-02-2019 12:45:49

XII Geography 74
Von Thunen model of agricultureThe Von Thunen model of agricultural land
use was created by the farmer, landowner, and economist Von Thunen in 1826 in a book called The Isolated State. Von Thunen model was created before industrialization and is based on the following limiting assumptions:
The city is located centrally within an "Isolated State" that is self-sufficient and has no external influences.
➢ The Isolated State is surrounded by an unoccupied wilderness.
➢ The land of the State is completely flat and has no rivers or mountains to interrupt the terrain.
➢ The soil quality and climate are consistent throughout the State.
➢ Farmers in the Isolated State transport their own goods to market via ox cart, across the land, directly to the central city. Therefore, there are no roads.
➢ Farmers act to maximize profits.
Ranching and Livestock
Grains and Field Crops
Forests
Dairy Farming
MarketGardening
MarketUrban Centre
In an Isolated State with the foregoing statements being true, Von Thunen hypothesized that a pattern of rings around the city would develop based on land cost and transportation cost.
the Mediterranean region. Best quality wines in the world with distinctive flavours are produced from high quality grapes in various countries of this region. The inferior grapes are dried into raisins and currants. This region also produces olives and figs. The advantage of Mediterranean agriculture is that more valuable crops such as fruits and vegetables are grown in winters when there is great demand in European and North American markets.
Horticulture
Specialised cultivation of flowers, vegetables and fruits is called horticulture. It is also termed as “truck farming”. These crops are grown on small farms which are well connected to the markets by cheap and efficient means of transportation. It is labour and capital intensive crops. The main areas are northwest Europe, northern eastern USA and Mediterranean region. The study of grape cultivation is known as viticulture.
Viticulture
TN_GOVT_XII_Geography_chapter 04.indd 74 21-02-2019 12:45:49

Economic Activities75
minerals in ancient times was largely confined to making of tools, utensils and weapons. The actual development of mining began with the industrial revolution and its importance is continuously increasing.
Types of Mining
Open-pit or opencast miningOpen pit mining involves mining minerals
ore that can be found near the surface layer of the site. Some quarries can be over 1000 meters deep. This form of mining doesn’t require tunneling into the earth and is a simple method of mining that yields high production.
Surface MiningSurface mining is the process of mining
the ores found on the surface of the earth. In this process, any unwanted soil is stripped off from the land and the ore beneath is extracted. Surface mining often leaves behind large areas of infertile land and waste rock as 70% of the mined earth is waste materials.
Underground or sub surface mining/Shaft mining
Sub-surface mining involves the digging of a network of shafts and tunnels into the earth to reach and extract the deposit of mineral ore beneath the earth. In comparison to other methods, underground mines impacts are less on the environment and are more harmful to those working within them. In modern practice, underground mines are pre-assessed for oxygen toxicity levels and a system of ventilation machines and protocols are in place to ensure workplace safety.
In-Situ MiningIt is a rarely used method of mining
material. It is also called as solution mining. It is the process of pumping a solution into the ore body, which dissolves the ore and is then extracted by a second pump. This method is used most in mining uranium deposits.
The Four RingsRing 1: Dairying and intensive farming
occur in the ring closest to the city. Because vegetables, fruit, milk, and other dairy products must get to market quickly, they would be produced close to the city. The first ring of land is also more expensive, so the agricultural products would have to be highly valuable ones and the rate of return is maximized.
Ring 2: Timber and firewood would be produced for fuel and building materials in the second zone. Before industrialization and coal power, wood was a very important fuel for heating and cooking. Wood is very heavy and difficult to transport, so it is located as close to the city as possible.
Ring 3: The third zone consists of extensive field crops such as grains for bread. As grains last longer than dairy products and they are much lighter than fuel, to reduce transport costs, they can be located farther from the city.
Ring 4: Ranching is located in the final ring surrounding the central city. Animals can be raised far from the city because they are self-transporting.
What the Model Tells Us?Even though the Von Thunen model was
created in a time before factories, highways, and even railroads, it is still an important model in geography. The Von Thunen model is an excellent illustration of the balance between land cost and transportation costs. When one gets closer to a city, the price of land increases. The farmers of the Isolated State balance the cost of transportation, land, and profit and produce the most cost-effective product for market. Of course, in the real world, things do not happen as they would in a model.
MiningThe process of extracting minerals from
the earth crust is known as mining. The discovery of minerals in the history of human development is reflected in many stages in terms of copper, Bronze and Iron age. The use of
TN_GOVT_XII_Geography_chapter 04.indd 75 21-02-2019 12:45:49

XII Geography 76
Drilling
4.3 Secondary Activities Secondary sector transforms the raw
materials obtained from the primary sector into consumer goods. So it consists of manufacturing and industrial activities. Since it adds value for the raw materials, it is also called as value addition sector. Industries consume large quantities of energy and require factories and machinery to convert the raw materials into goods and products. The secondary sector supports both the primary and tertiary sectors.
Factors affecting location of Industries1. Availability of raw-materials or nearness to
raw-materials: Availability of raw materials or nearness to raw materials is a primary factor which governs location of industries. An industry is located in a place where raw materials are available in abundance and at cheaper rates. It is more so for the weight loosing and bulky raw materials. For example, oil refinery factories are established at Visakhapatnam because oil is imported through Vizag port.
2. Availability of power: Availability of power is another important factor of concentration or location of industries. In olden days steam was used for running industries. As
a result industry is established near the coal mines. But with the invention of electricity, today industries are located in any place where electricity is available. Industries like aluminum units are located near the hydroelectric projects.
3. Transport costs Transport costs also influence the location of industries. Industries incur transport costs for bringing raw-materials and for sending the finished goods into the markets. It is economical to start an industry near the area where transport costs are minimum and low. Raw-materials which are heavy and occupy large place, require huge cost for transporting them. So an industry must be located near the area where the transport costs are minimal.
4. Nearness to the market: This is a chief factor governing the location of an industry in modern period. Several advantages are secured when an industry is established near the market. Production can be carried on in accordance with the changes in the consumers’ tastes. Economies of transport can be secured in importing raw-materials.
5. Availability of labour: Labour is required for organizing the productive affairs of an industry. The entrepreneurs like to start industries in those areas where labour is abundantly available. The growth of cotton textile industry near Bombay is due to the availability of cheap labour.
6. Government policy: The policy of government also influences the location of industries. The Government may establish an industry on political considerations by giving several incentives. It provides finance, land, water, and transport and communication facilities in backward regions with a view to developing them. It also provides tax concession, marketing consultancy, export and import facilities.
TN_GOVT_XII_Geography_chapter 04.indd 76 21-02-2019 12:45:49
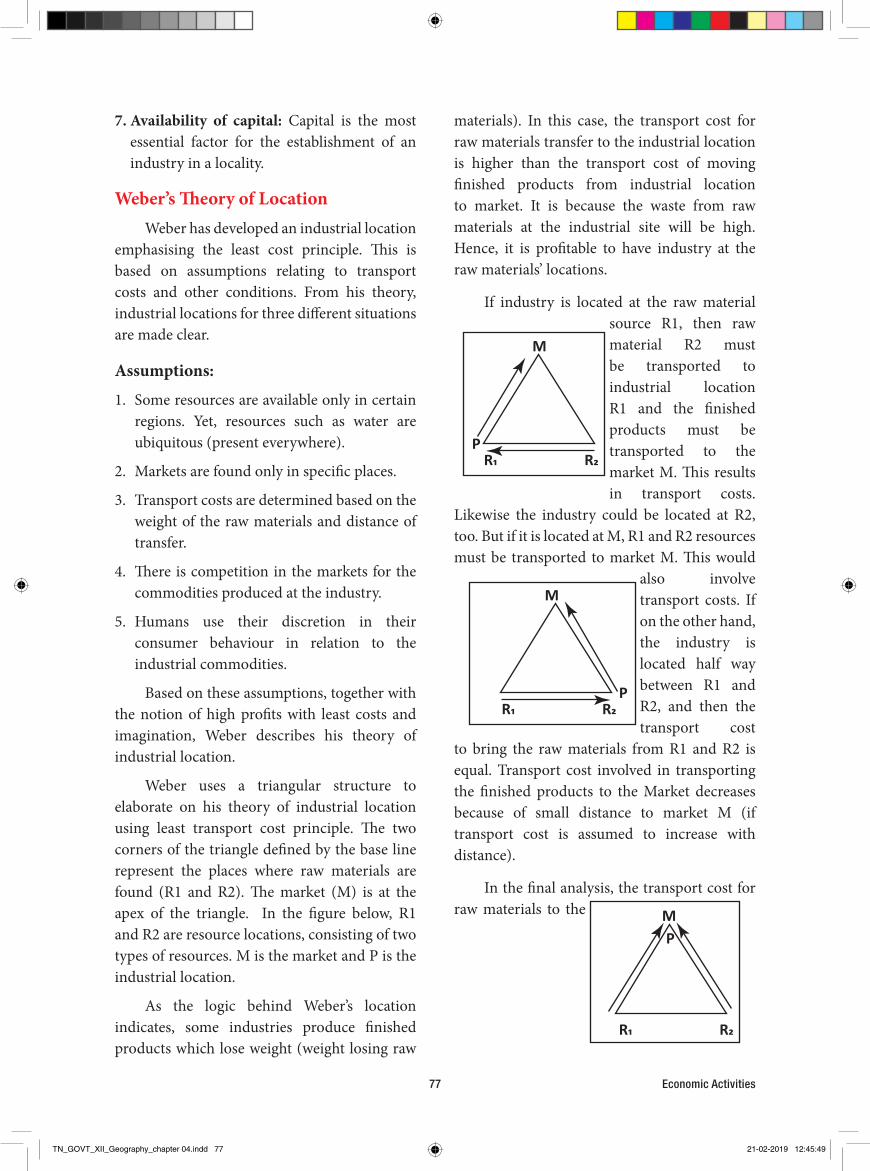
Economic Activities77
materials). In this case, the transport cost for raw materials transfer to the industrial location is higher than the transport cost of moving finished products from industrial location to market. It is because the waste from raw materials at the industrial site will be high. Hence, it is profitable to have industry at the raw materials’ locations.
If industry is located at the raw material source R1, then raw material R2 must be transported to industrial location R1 and the finished products must be transported to the market M. This results in transport costs.
Likewise the industry could be located at R2, too. But if it is located at M, R1 and R2 resources must be transported to market M. This would
also involve transport costs. If on the other hand, the industry is located half way between R1 and R2, and then the transport cost
to bring the raw materials from R1 and R2 is equal. Transport cost involved in transporting the finished products to the Market decreases because of small distance to market M (if transport cost is assumed to increase with distance).
In the final analysis, the transport cost for raw materials to the
7. Availability of capital: Capital is the most essential factor for the establishment of an industry in a locality.
Weber’s Theory of LocationWeber has developed an industrial location
emphasising the least cost principle. This is based on assumptions relating to transport costs and other conditions. From his theory, industrial locations for three different situations are made clear.
Assumptions:
1. Some resources are available only in certain regions. Yet, resources such as water are ubiquitous (present everywhere).
2. Markets are found only in specific places.
3. Transport costs are determined based on the weight of the raw materials and distance of transfer.
4. There is competition in the markets for the commodities produced at the industry.
5. Humans use their discretion in their consumer behaviour in relation to the industrial commodities.
Based on these assumptions, together with the notion of high profits with least costs and imagination, Weber describes his theory of industrial location.
Weber uses a triangular structure to elaborate on his theory of industrial location using least transport cost principle. The two corners of the triangle defined by the base line represent the places where raw materials are found (R1 and R2). The market (M) is at the apex of the triangle. In the figure below, R1 and R2 are resource locations, consisting of two types of resources. M is the market and P is the industrial location.
As the logic behind Weber’s location indicates, some industries produce finished products which lose weight (weight losing raw
M M
M M
P
P P
P
P
P
R� R� R� R�
M
M
Weber’s Theory
R� R�
R� R�R� R� R� R�
M M
M M
P
P P
P
P
P
R� R� R� R�
M
M
Weber’s Theory
R� R�
R� R�R� R� R� R�
M M
M M
P
P P
P
P
P
R� R� R� R�
M
M
Weber’s Theory
R� R�
R� R�R� R� R� R�
TN_GOVT_XII_Geography_chapter 04.indd 77 21-02-2019 12:45:49
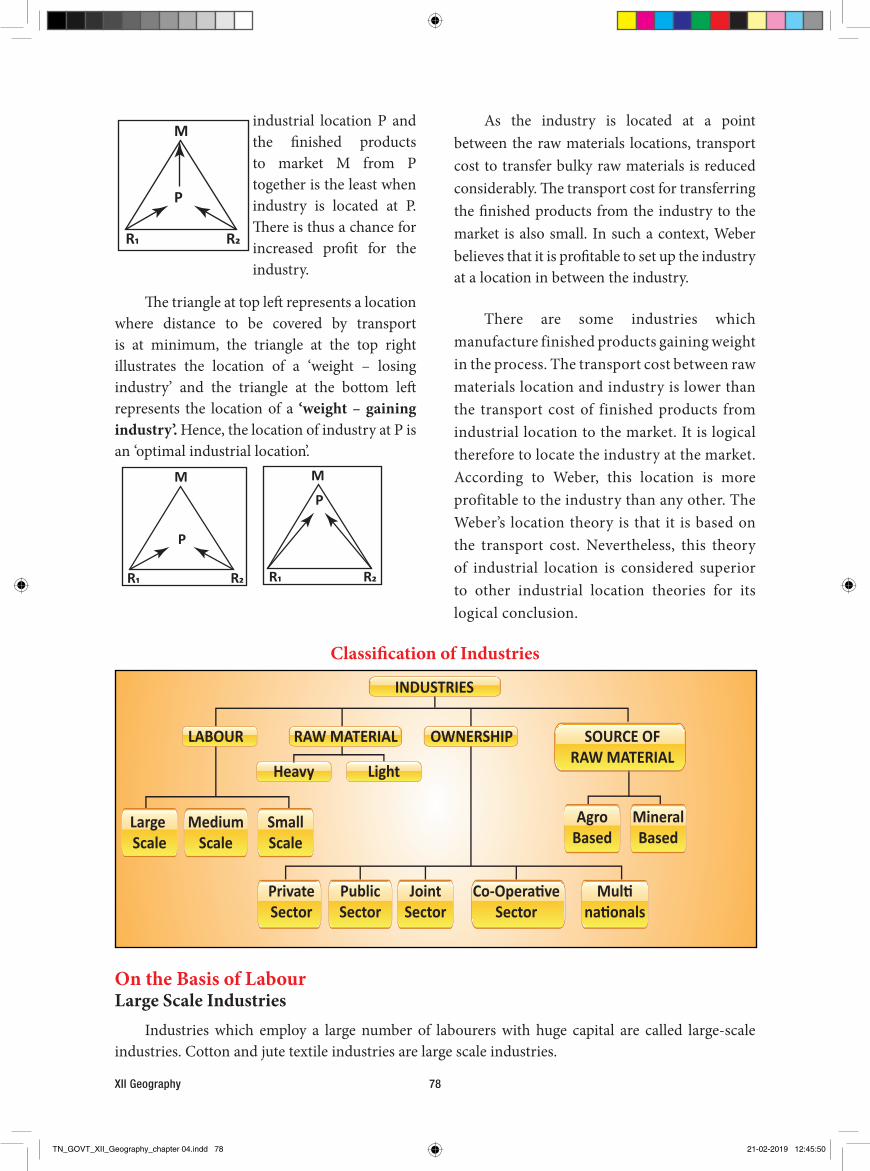
XII Geography 78
As the industry is located at a point between the raw materials locations, transport cost to transfer bulky raw materials is reduced considerably. The transport cost for transferring the finished products from the industry to the market is also small. In such a context, Weber believes that it is profitable to set up the industry at a location in between the industry.
There are some industries which manufacture finished products gaining weight in the process. The transport cost between raw materials location and industry is lower than the transport cost of finished products from industrial location to the market. It is logical therefore to locate the industry at the market. According to Weber, this location is more profitable to the industry than any other. The Weber’s location theory is that it is based on the transport cost. Nevertheless, this theory of industrial location is considered superior to other industrial location theories for its logical conclusion.
industrial location P and the finished products to market M from P together is the least when industry is located at P. There is thus a chance for increased profit for the industry.
The triangle at top left represents a location where distance to be covered by transport is at minimum, the triangle at the top right illustrates the location of a ‘weight – losing industry’ and the triangle at the bottom left represents the location of a ‘weight – gaining industry’. Hence, the location of industry at P is an ‘optimal industrial location’.
Classification of Industries
On the Basis of Labour Large Scale Industries
Industries which employ a large number of labourers with huge capital are called large-scale industries. Cotton and jute textile industries are large scale industries.
M M
M M
P
P P
P
P
P
R� R� R� R�
M
M
Weber’s Theory
R� R�
R� R�R� R� R� R�
M M
M M
P
P P
P
P
P
R� R� R� R�
M
M
Weber’s Theory
R� R�
R� R�R� R� R� R�
M M
M M
P
P P
P
P
P
R� R� R� R�
M
M
Weber’s Theory
R� R�
R� R�R� R� R� R�
TN_GOVT_XII_Geography_chapter 04.indd 78 21-02-2019 12:45:50
Economic Activities79
Alkalies Ltd., or Oil India Ltd. fall in the group of joint sector industries.
Co-operative Sector Industries
Industries owned and run co-operatively by a group of people who are generally producers of raw materials of the given industry such as a sugar mill owned and run by farmers are called co-operative sector industries.
On the Basis of Source of Raw Materials
Agro Based Industries
Agro based industries are those industries which obtain raw-material from agriculture. Cotton textile, jute textile, sugar and vegetable oil are representative industries of agro-based group of industries.
Mineral Based Industries
The industries that receive raw materials primarily from minerals such as iron and steel, aluminium and cement industries fall in this category.
Pastoral-Based Industries
These industries depend upon animals for their raw material. Hides, skins, bones, horns, shoes, dairy, etc. are some of the pastoral-based industries.
Forest Based Industries
Paper card-board, lac, rayon, resin, tanning of leather, leave- utensils, basket industries are included in this type of industries.
Classification based on Nature of products
Based on the nature of products it is classified into basic industries and consumer goods. Basic industries are manufacturing goods by using them as raw materials are basic industries. For example Iron and steel machines for textile industry. Consumer industries are
Small Scale Industries
Industries which employ a small number of labourers with small investments are called small scale industries. They include nut & bolt making, coir making, plastic bags industries, dying industry, match box making, weaving industry are some examples for small scale industries
Cottage Industries
Those industries whose labour force consists of family units or individuals working at home with their own equipments are called cottage industries. It is a small and often informally organized industry. The industries like weaving and pottery are the examples this category. On the Basis of size of raw-Material and Finished Goods
Heavy Industries
Industries which use heavy and bulky raw-materials and produce products of the same category are called heavy industries. Iron and steel industry presents a good example of heavy industries.
Light Industries
The light industries use light raw-materials and produce light finished products. Electric fans, sewing machines are light industries.
On the basis of Ownership Private Sector Industries
Industries owned by individuals or firms such as Bajaj Auto or TISCO situated at Jamshedpur are called private sector industries.
Public Sector Industries
Industries owned by the state and its agencies like Bharat Heavy Electricals Ltd., or Bhilai Steel Plant or Durgapur Steel Plant are public sector industries.
Joint Sector Industries
Industries owned jointly by the private firms and the state or its agencies such as Gujarat
TN_GOVT_XII_Geography_chapter 04.indd 79 21-02-2019 12:45:50
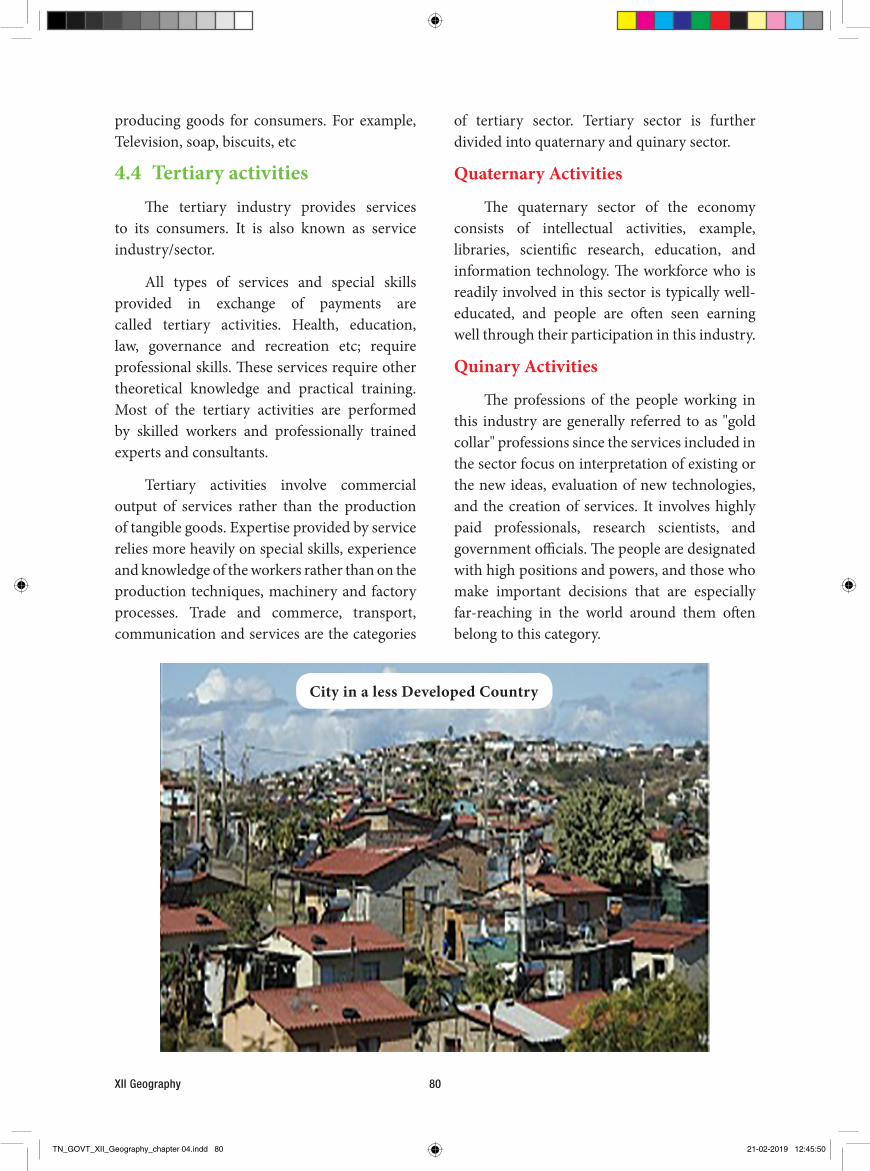
XII Geography 80
of tertiary sector. Tertiary sector is further divided into quaternary and quinary sector.
Quaternary Activities
The quaternary sector of the economy consists of intellectual activities, example, libraries, scientific research, education, and information technology. The workforce who is readily involved in this sector is typically well-educated, and people are often seen earning well through their participation in this industry.
Quinary Activities
The professions of the people working in this industry are generally referred to as "gold collar" professions since the services included in the sector focus on interpretation of existing or the new ideas, evaluation of new technologies, and the creation of services. It involves highly paid professionals, research scientists, and government officials. The people are designated with high positions and powers, and those who make important decisions that are especially far-reaching in the world around them often belong to this category.
producing goods for consumers. For example, Television, soap, biscuits, etc
4.4 Tertiary activitiesThe tertiary industry provides services
to its consumers. It is also known as service industry/sector.
All types of services and special skills provided in exchange of payments are called tertiary activities. Health, education, law, governance and recreation etc; require professional skills. These services require other theoretical knowledge and practical training. Most of the tertiary activities are performed by skilled workers and professionally trained experts and consultants.
Tertiary activities involve commercial output of services rather than the production of tangible goods. Expertise provided by service relies more heavily on special skills, experience and knowledge of the workers rather than on the production techniques, machinery and factory processes. Trade and commerce, transport, communication and services are the categories
City in a less Developed Country
TN_GOVT_XII_Geography_chapter 04.indd 80 21-02-2019 12:45:50
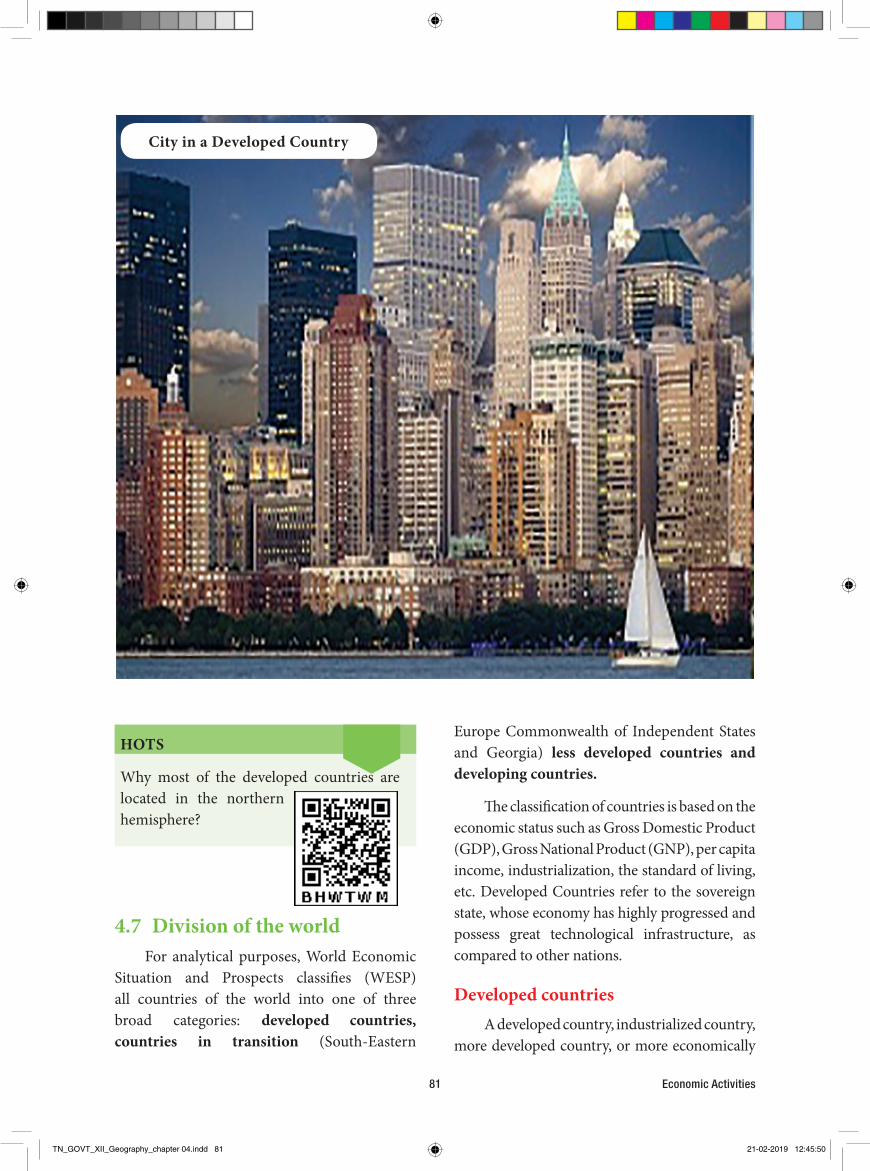
Economic Activities81
HOTS
Why most of the developed countries are located in the northern hemisphere?
4.7 Division of the worldFor analytical purposes, World Economic
Situation and Prospects classifies (WESP) all countries of the world into one of three broad categories: developed countries, countries in transition (South-Eastern
Europe Commonwealth of Independent States and Georgia) less developed countries and developing countries.
The classification of countries is based on the economic status such as Gross Domestic Product (GDP), Gross National Product (GNP), per capita income, industrialization, the standard of living, etc. Developed Countries refer to the sovereign state, whose economy has highly progressed and possess great technological infrastructure, as compared to other nations.
Developed countriesA developed country, industrialized country,
more developed country, or more economically
City in a Developed Country
TN_GOVT_XII_Geography_chapter 04.indd 81 21-02-2019 12:45:50
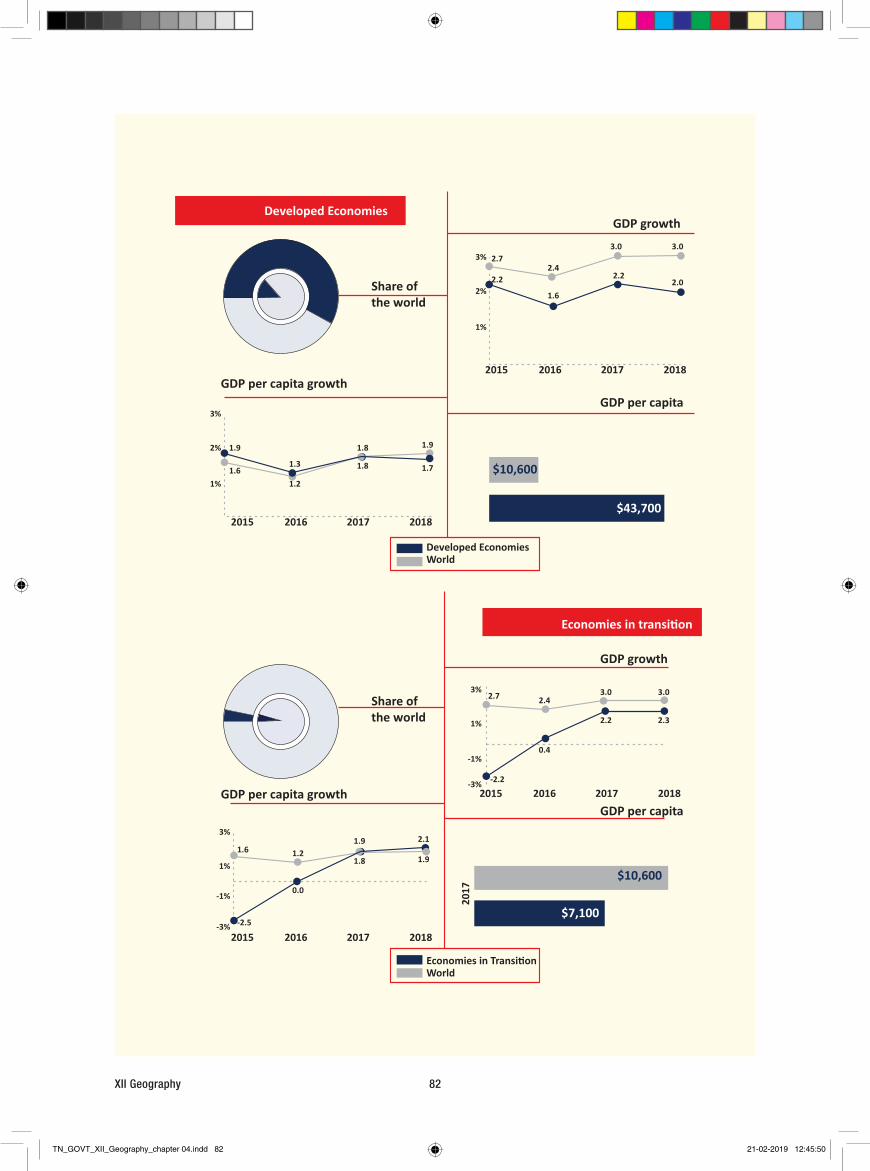
XII Geography 82
Developed EconomiesGDP growth
Share ofthe world
Share ofthe world
GDP per capitaGDP per capita growth
GDP per capita growthGDP per capita
Economies in transi�on
GDP growth
Economies in Transi�onWorld
Developed EconomiesWorld
$7,100
$43,700
$10,600
$10,600
2015 2016 2017-3% -2.5
-2.2
0.4
2.2 2.3
2.42.7
1.6
2.2 2.22.0
1.6
2.72.4
3.0 3.0
1.2
1.3 1.8
1.8
1.7
1.91.9
3.03.0
0.0
1.8 1.9
1.9 2.11.21.6
3%
-1%
1%
2017
2018
2015 2016 2017 2018
2015 2016 2017 2018
2015 2016 2017-3%
3%
-1%
1%
1%
2%
3%
1%
2%
3%
2018
TN_GOVT_XII_Geography_chapter 04.indd 82 21-02-2019 12:45:50

Economic Activities83
countries in the world. A country is classified among the Least Developed Countries if it meets three criteria.
• Poverty – adjustable criterion based on GNI per capita averaged over three years. As of 2018 a country must have GNI per capita less than US$1,025 to be included on the list, and over $1,230 to graduate from it.
• Human resource weakness (based on indicators of nutrition, health, education and adult literacy).
• Economic vulnerability (based on instability of agricultural production, instability of exports of goods and services, economic importance of non-traditional activities, merchandise export concentration, handicap of economic smallness, and the percentage of population displaced by natural disasters).
The world’s 10 biggest economies in 2017
The economy of the United States is the largest in the world. At $18 trillion, it represents a quarter share of the global economy (24.3%), according to the latest World Bank figures.
China follows, with $11 trillion, or 14.8% of the world economy. Japan is in third place with an economy of $4.4 trillion, which represents almost 6% of the world economy. European countries take the next three places on the list: Germany in fourth position, with a $3.3 trillion economy; the United Kingdom in fifth with $2.9 trillion; and France in sixth with $2.4 trillion. India is in seventh place with $2 trillion, and Italy in eighth with an economy of over $1.8 trillion. Ninth place goes to Brazil, with an almost $1.8 trillion economy. And in 10th is Canada, with an economy of over $1.5 trillion. The economy of the United States is larger than the combined economies of numbers three to 10 on the list.
developed country (MEDC), is a country that has a developed economy and advanced technological infrastructure relative to other less industrialized nations. Most commonly, the criteria for evaluating the degree of economic development are gross domestic product (GDP), gross national product (GNP), the per capita income, level of industrialization, amount of widespread infrastructure and general standard of living.
Developed countries have generally post-industrial economies, meaning the service sector provides more wealth than the industrial sector. As of 2015, advanced economies comprise 60.8% of global GDP based on nominal values and 42.9% of global GDP based on purchasing-power parity (PPP) according to the International Monetary Fund. In 2017, the ten largest advanced economies by GDP in both nominal and PPP terms were Australia, Canada, France, Germany, Italy, Japan, South Korea, Spain, the United Kingdom, and the United States.
Countries in transitionA country in transition economy or
transitional economy is an economy which is changing from a centrally planned economy to a market economy. Transition economies undergo a set of structural transformations intended to develop market-based institutions. These include economic liberalization, where prices are set by market forces rather than by a central planning organization. The process has been applied in the former Soviet Union and Eastern bloc countries of Europe and some Third world countries, and detailed work has been undertaken on its economic and social effects.
The Least Developed CountriesThe Least Developed Countries is a list
of countries that, according to the United Nations, exhibit the lowest indicators of socioeconomic development, with the lowest Human Development Index ratings of all
TN_GOVT_XII_Geography_chapter 04.indd 83 21-02-2019 12:45:50
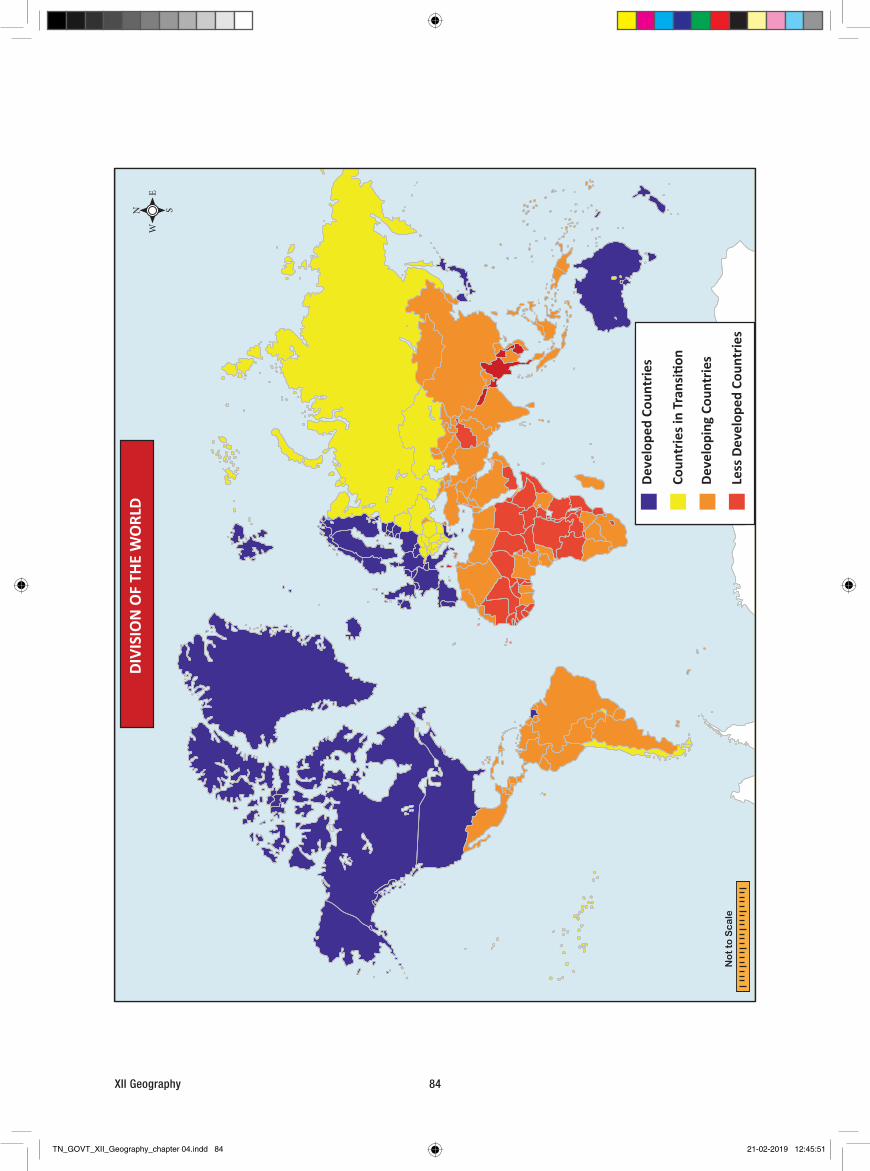
XII Geography 84
Deve
lope
d Co
untr
ies
Coun
trie
s in
Tran
si�o
n
Deve
lopi
ng C
ount
ries
Less
Dev
elop
ed C
ount
ries
DIVI
SIO
N O
F TH
E W
ORL
D E
W
N S
No
t to
Sc
ale
TN_GOVT_XII_Geography_chapter 04.indd 84 21-02-2019 12:45:51
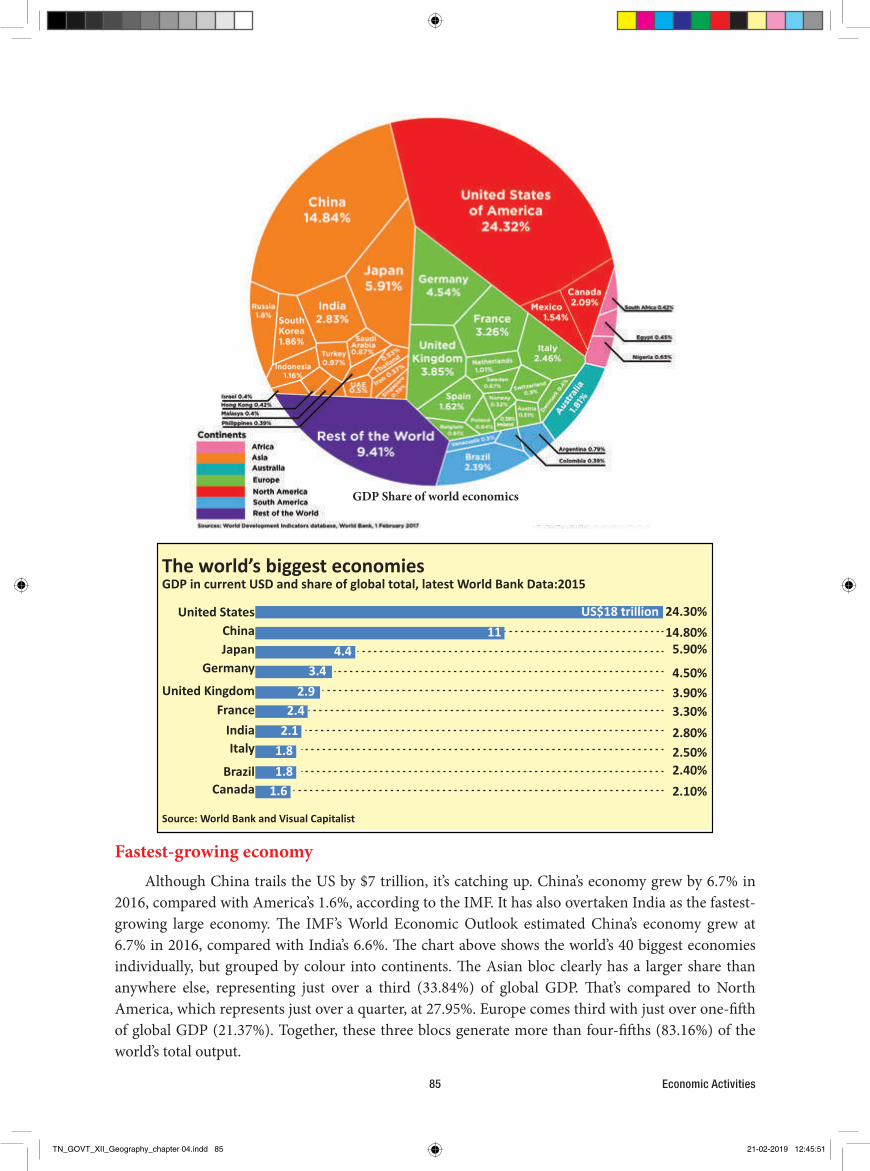
Economic Activities85
GDP Share of world economics
Fastest-growing economyAlthough China trails the US by $7 trillion, it’s catching up. China’s economy grew by 6.7% in
2016, compared with America’s 1.6%, according to the IMF. It has also overtaken India as the fastest-growing large economy. The IMF’s World Economic Outlook estimated China’s economy grew at 6.7% in 2016, compared with India’s 6.6%. The chart above shows the world’s 40 biggest economies individually, but grouped by colour into continents. The Asian bloc clearly has a larger share than anywhere else, representing just over a third (33.84%) of global GDP. That’s compared to North America, which represents just over a quarter, at 27.95%. Europe comes third with just over one-fifth of global GDP (21.37%). Together, these three blocs generate more than four-fifths (83.16%) of the world’s total output.
The world’s biggest economiesGDP in current USD and share of global total, latest World Bank Data:2015
United StatesChinaJapan
Germany
United KingdomFrance
IndiaItaly
BrazilCanada
US$18 trillion11
24.30%14.80%
5.90%
4.50%3.90%3.30%2.80%2.50%2.40%2.10%
Source: World Bank and Visual Capitalist
4.43.4
2.92.4
2.11.81.8
1.6
TN_GOVT_XII_Geography_chapter 04.indd 85 21-02-2019 12:45:51
1. Quarries – Large deep pit stone and other materials are extracted from.
2. Sovereign state - state with borders where people live, and where a government makes laws and talks to other sovereign states.
3. Shellac - resin secreted by the female lac bug, on trees in the forests
4. Debt - a sum of money that is owed or due.
5. Protocol - a set of rules that governs the communications between computers on a network.
6. Malnutrition - Lack of sufficient nutrients in the body.
7. Poverty - the state of being extremely poor.
8. Gross domestic Product - the final value of the goods and services produced within the geographic boundaries of a country during a specified period of time
9. Standard of living - the degree of wealth and material comfort available to a person or community.
10. Gross National Product (GNP) - the value of all finished goods and services produced in a country in one year by its nationals.
XII Geography 86
TN_GOVT_XII_Geography_chapter 04.indd 86 21-02-2019 12:45:52
Economic Activities87
ExerciseI. Choose the correct answer
1. Viticulture or grape cultivation is a speciality ofa) The Pampas region b) The savannah regionc) The Sahara region d) The Mediterranean region
2. Which one of the following includes the developed countries?a) Australia, Kenya, Pakistan, Germany and Italyb) Australia, Canada, France, Germany and Italyc) Australia, Sri Lanka, Thailand, Germany and Italyd) Pakistan, Sri Lanka, France, Germany and Italy
3. Which one is wrongly matched?a) Foragers — Regionb) Inuit — Arctic regionc) Pygmies — Kalaharid) Aborigines — South Americae) Paliyan — South India
4. According to Vanthunen’s model of agriculture theory, the order of the four rings from the urban centre is
a) Grains and Field crops, Market, forests, dairy farming and ranching. b) Forests Market, Grains and Field crops dairy farming and ranching.c) Market, dairy farming, forests, Grains and Field crops and ranching.d) Ranching, Market, forests, Grains and Field crops and dairy farming.
5. Which one of the following is not the characteristic of the Least Developed countries?a) low Gross Domestic Product b) high literacy rate c) unequal distribution of income d) high level of unemployment
6. All of the following are the assumptions of Vanthunen’s model of agriculture theory except,
a) The Isolated State is surrounded by an unoccupied wilderness.b) The land of the State is completely flat and has no rivers or mountains to interrupt the terrain.
TN_GOVT_XII_Geography_chapter 04.indd 87 21-02-2019 12:45:52
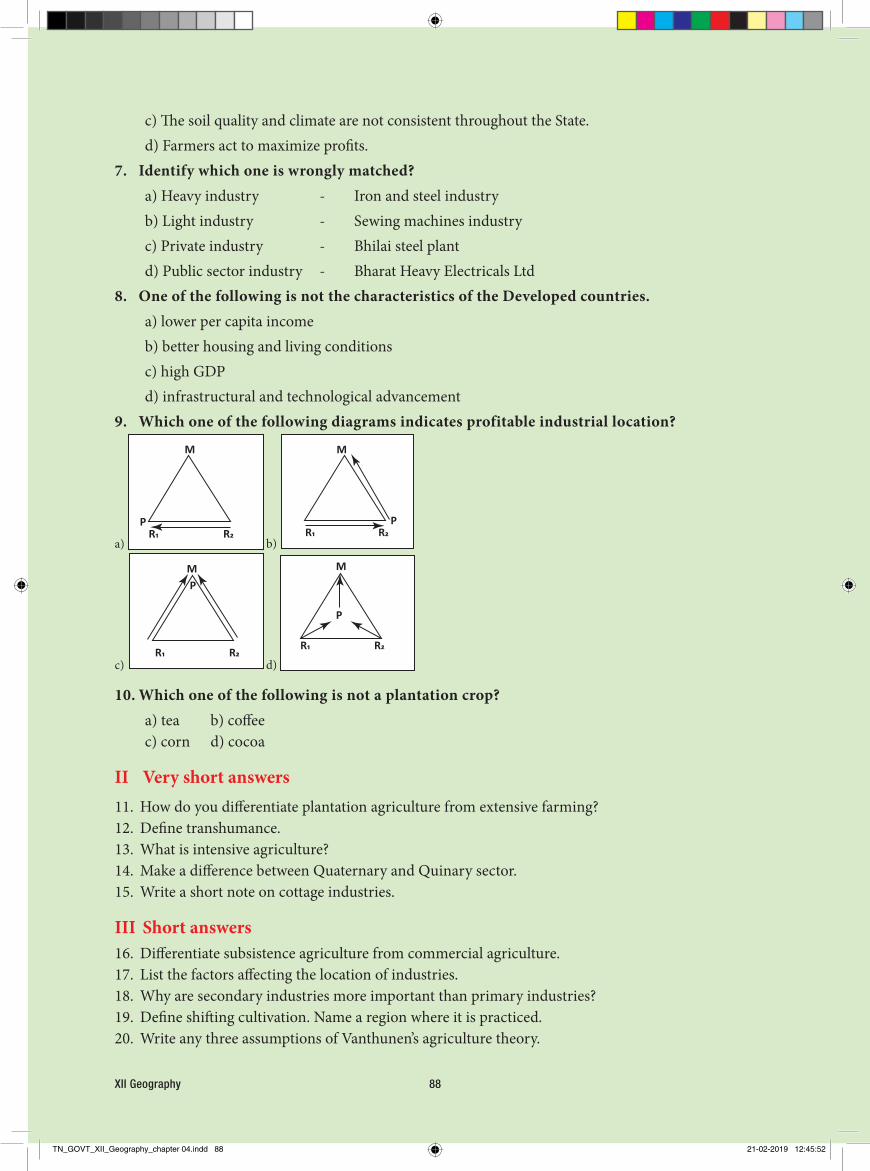
XII Geography 88
c) The soil quality and climate are not consistent throughout the State.d) Farmers act to maximize profits.
7. Identify which one is wrongly matched?a) Heavy industry - Iron and steel industryb) Light industry - Sewing machines industryc) Private industry - Bhilai steel plantd) Public sector industry - Bharat Heavy Electricals Ltd
8. One of the following is not the characteristics of the Developed countries.a) lower per capita income b) better housing and living conditions c) high GDP d) infrastructural and technological advancement
9. Which one of the following diagrams indicates profitable industrial location?
M
P
R� R�
PM
R� R�
M
PR� R�
M
PR� R�
a)
c)
b)
d)
10. Which one of the following is not a plantation crop?a) tea b) coffeec) corn d) cocoa
II Very short answers11. How do you differentiate plantation agriculture from extensive farming?12. Define transhumance.13. What is intensive agriculture?14. Make a difference between Quaternary and Quinary sector.15. Write a short note on cottage industries.
III Short answers 16. Differentiate subsistence agriculture from commercial agriculture.17. List the factors affecting the location of industries.18. Why are secondary industries more important than primary industries?19. Define shifting cultivation. Name a region where it is practiced.20. Write any three assumptions of Vanthunen’s agriculture theory.
TN_GOVT_XII_Geography_chapter 04.indd 88 21-02-2019 12:45:52
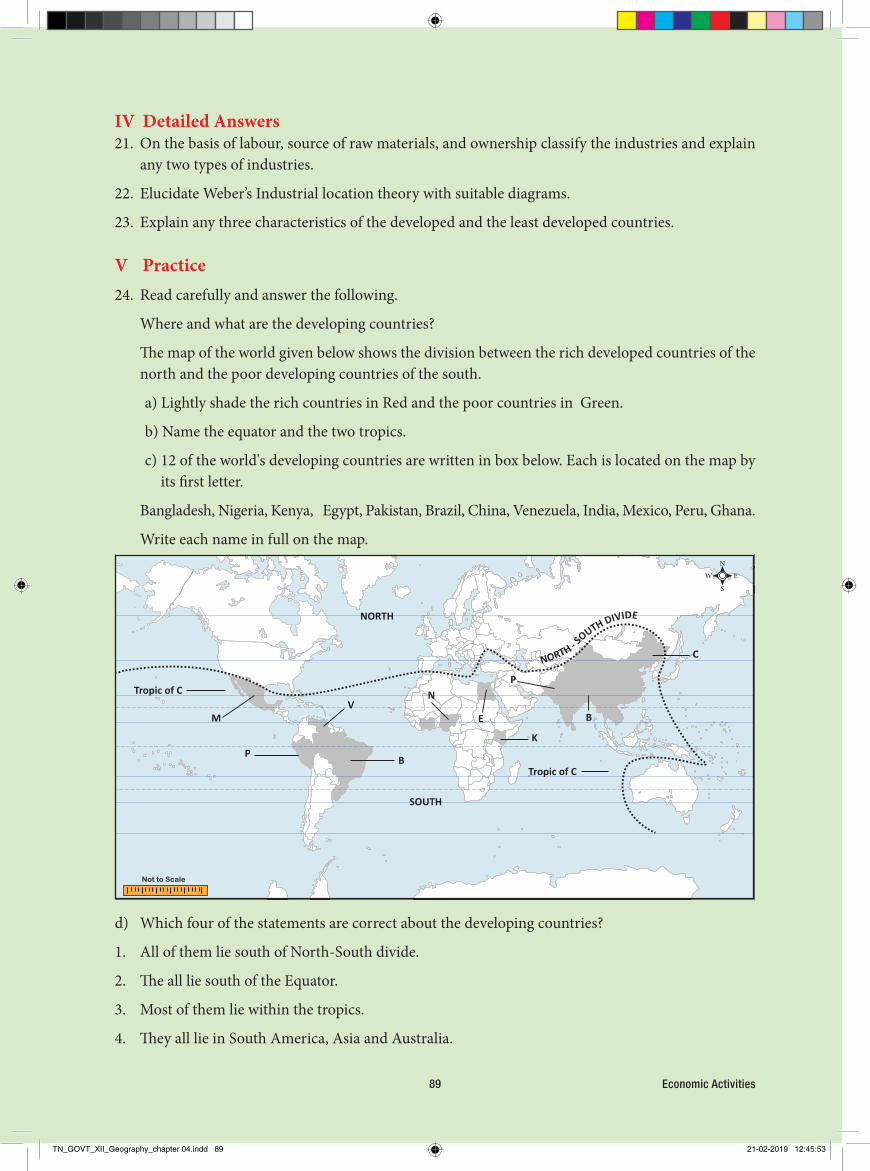
Economic Activities89
IV Detailed Answers21. On the basis of labour, source of raw materials, and ownership classify the industries and explain
any two types of industries.
22. Elucidate Weber’s Industrial location theory with suitable diagrams.
23. Explain any three characteristics of the developed and the least developed countries.
V Practice 24. Read carefully and answer the following.
Where and what are the developing countries?
The map of the world given below shows the division between the rich developed countries of the north and the poor developing countries of the south.
a) Lightly shade the rich countries in Red and the poor countries in Green.
b) Name the equator and the two tropics.
c) 12 of the world's developing countries are written in box below. Each is located on the map by its first letter.
Bangladesh, Nigeria, Kenya, Egypt, Pakistan, Brazil, China, Venezuela, India, Mexico, Peru, Ghana.
Write each name in full on the map.
NORTH
SOUTH
NORTH - SOUTH DIVIDE
P
P
V
B
B
C
N
K
EM
Tropic of C
Tropic of C
EW
N
S
Not to Scale
d) Which four of the statements are correct about the developing countries?
1. All of them lie south of North-South divide.
2. The all lie south of the Equator.
3. Most of them lie within the tropics.
4. They all lie in South America, Asia and Australia.
TN_GOVT_XII_Geography_chapter 04.indd 89 21-02-2019 12:45:53

XII Geography 90
5. None are found in Europe and North America.
6. They all lie in South America, Asia and Africa.
Reference 1. Economic and commercial geography, K.K. Khanna and Dr. V.K Gupta
2. Human and economic Geography, Goh Cheng Leong and Gillian C. Morgan
Web reference1. https://www.un.org/development/desa/dpad/
2. www.weforum.org/agenda/2017/03/worlds-biggest-economies-in-2017/
TN_GOVT_XII_Geography_chapter 04.indd 90 21-02-2019 12:45:53
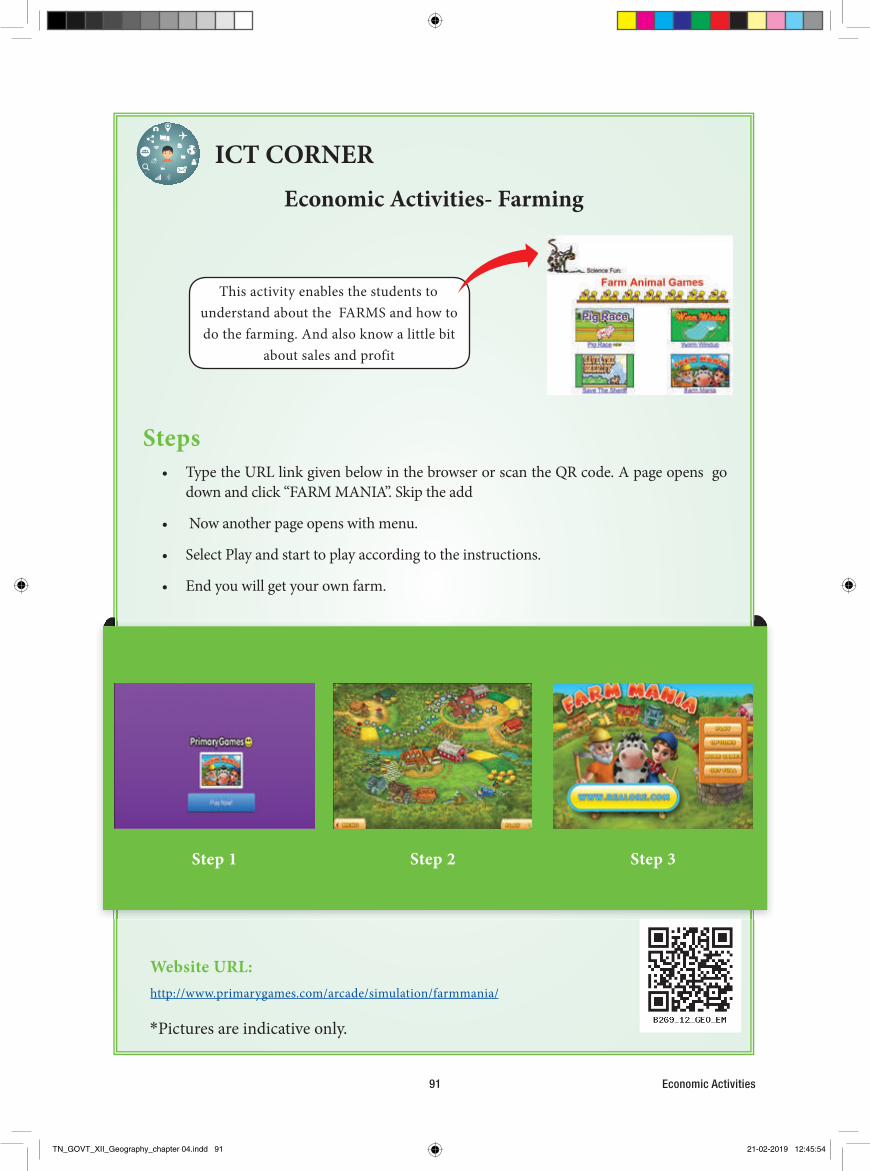
Economic Activities91
Economic Activities- Farming
Steps• Type the URL link given below in the browser or scan the QR code. A page opens go
down and click “FARM MANIA”. Skip the add
• Now another page opens with menu.
• Select Play and start to play according to the instructions.
• End you will get your own farm.
Website URL:http://www.primarygames.com/arcade/simulation/farmmania/
ICT CORNER
*Pictures are indicative only.
This activity enables the students to understand about the FARMS and how to do the farming. And also know a little bit
a bout sales and profit
Step 1 Step 2 Step 3
TN_GOVT_XII_Geography_chapter 04.indd 91 21-02-2019 12:45:54
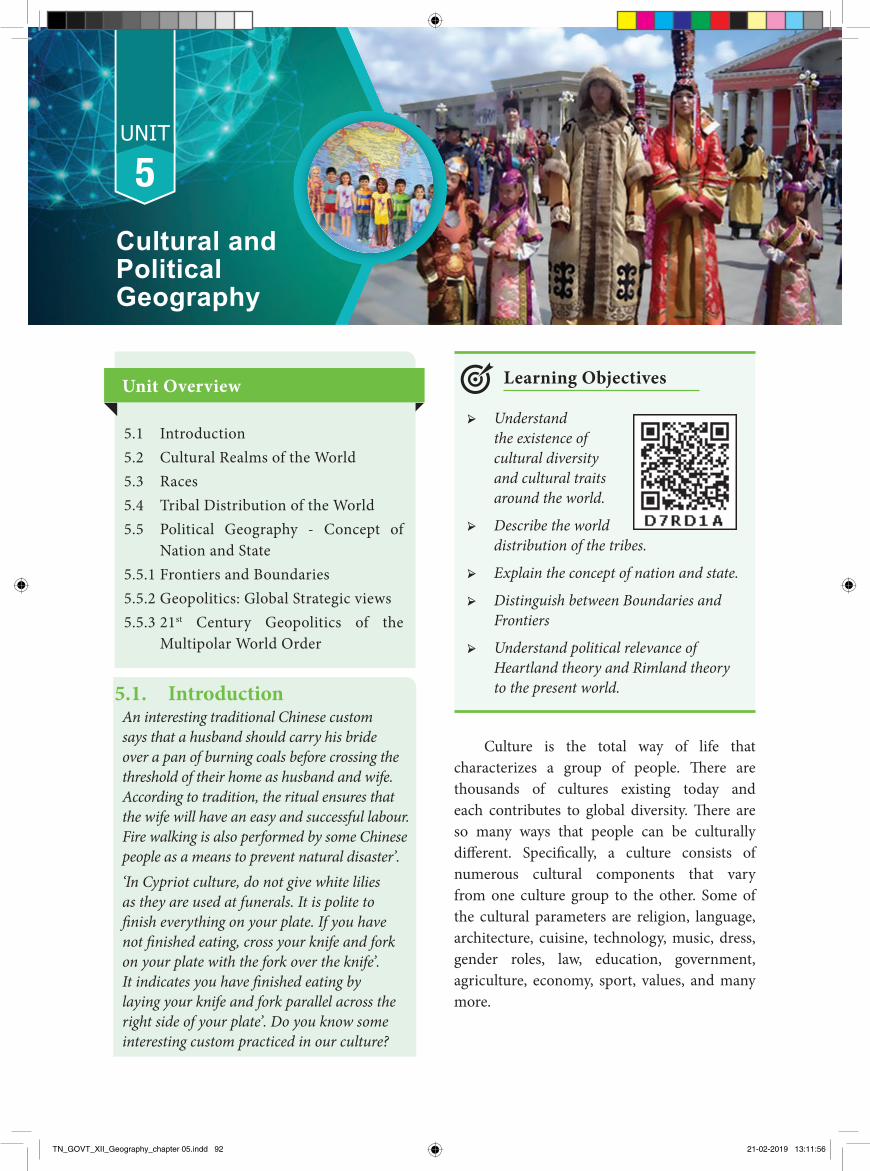
Culture is the total way of life that characterizes a group of people. Th ere are thousands of cultures existing today and each contributes to global diversity. Th ere are so many ways that people can be culturally diff erent. Specifi cally, a culture consists of numerous cultural components that vary from one culture group to the other. Some of the cultural parameters are religion, language, architecture, cuisine, technology, music, dress, gender roles, law, education, government, agriculture, economy, sport, values, and many more.
5.1. IntroductionAn interesting traditional Chinese custom says that a husband should carry his bride over a pan of burning coals before crossing the threshold of their home as husband and wife. According to tradition, the ritual ensures that the wife will have an easy and successful labour. Fire walking is also performed by some Chinese people as a means to prevent natural disaster’.‘In Cypriot culture, do not give white lilies as they are used at funerals. It is polite to � nish everything on your plate. If you have not � nished eating, cross your knife and fork on your plate with the fork over the knife’. It indicates you have � nished eating by laying your knife and fork parallel across the right side of your plate’. Do you know some interesting custom practiced in our culture?
Learning Objectives
➢ Understand the existence of cultural diversity and cultural traits around the world.
➢ Describe the world distribution of the tribes.
➢ Explain the concept of nation and state.
➢ Distinguish between Boundaries and Frontiers
➢ Understand political relevance of Heartland theory and Rimland theory to the present world.
5.1 Introduction5.2 Cultural Realms of the World5.3 Races5.4 Tribal Distribution of the World5.5 Political Geography - Concept of
Nation and State5.5.1 Frontiers and Boundaries5.5.2 Geopolitics: Global Strategic views5.5.3 21st Century Geopolitics of the
Multipolar World Order
Unit Overview
Cultural andPoliticalGeography
5UNIT
TN_GOVT_XII_Geography_chapter 05.indd 92 21-02-2019 13:11:56
Cultural and Political Geography93
Culture RegionA culture region is a portion of Earth
that has common cultural elements and has distinct cultural authority from other regions.Any number of cultural components may be used to define culture regions. A map of world religions, for example, includes a shaded area in South Asia where Hinduism is dominant.
Culture regions differ greatly in size. Some are exceedingly large, like the Islamic culture region that encompasses millions of square km of North Africa and Southwest Asia. Some are very small, like Spanish Harlem, which encompasses about three square km of Manhattan. Many others are of intermediate size, like the Corn Belt, which occupies a portion of the mid western United States.
Cultural DiffusionCultural diffusion is the spread of cultural
beliefs and social activities from out group of people to another. Mixing of world culture through different ethnicities, religions and nationalities has only increases with advanced communication, transport and technology.
Cultural LandscapeCultural Landscapes have been defined
by the World Heritage Committee as “cultural properties representing the combined works of nature and of man”.
The World Heritage Committee has identified and adopted three categories of cultural landscape. The three categories extracted from the Committee’s Operational Guidelines, are as follows:
(i) “A landscape designed and created intentionally by man”.
(ii) An “organically evolved landscape” which may be a “relict (or fossil) landscape” or a “continuing landscape”;
(iii) An “associative cultural landscape” which may be valued because of the “religious, artistic or cultural associations of the natural element”.
Cultural InteractionCultural interaction focuses on the
relationships that often exist between cultural components that characterize a given community. Different factors interact with each other and give rise to prevalent trait.
What language do you speak? What dress do you wear? What food do you like? What is the structure of the house you live in? For the above question by searching the answer we can learn the culture of a human society.
Culture shapes our identity and influences our behaviours. Culture refers to the sharing language, beliefs, values, norms, behaviours and material objects, which are passed from one generation to the next generation. Cultural geography is the branch of human geography which deals about the areal organization of various cultural aspects in relation to total environment. Some of the cultural aspects are as follows:
LanguageLanguage plays great force in socialization
and historical transmission, which is the primary instrument for transmitting culture. Human can bind any group of people through the network of interaction. Languages are in written or oral form. India (780) has the world's second highest number of languages, after Papua New Guinea (839).
CustomsCustom in law is the established pattern of
behavior that can be objectively verified within a particular social setting. A claim can be carried out in defense of what has always been done and accepted by law. It becomes characteristic of the group of people performing the act.
TN_GOVT_XII_Geography_chapter 05.indd 93 21-02-2019 13:11:56
XII Geography 94
Cultural Heritage typesCultural Heritage can be distinguished in:
Built Environment (Buildings, Townscapes, and Archaeological remains), Natural Environment (Rural landscapes, Coasts and shorelines, agricultural heritage) and Artefacts (Books & Documents, Objects, and Pictures).
Cultural diversityCultural diversity refers to having different
cultures, respect to each other differences. Cultural diversity is important; because of work place and show increasingly consist of various cultural, racial and ethnic groups. We can learn from one another but first we must have a level of understanding. Cultural diversity exists in many countries around the world, but it can be challenging and, at times, problematic. Through this lesson, you will learn how to define cultural diversity and explore some of the ways in which it influences society.
Cultural TraitsA cultural trait is a characteristic of
human action that's acquired by people socially and transmitted via various modes of communication. Cultural traits are things that allow for a part of one culture to be transmitted to another. There are millions of culture traits, a trait can be an object, a technique, a belief or an attitude. Culture traits are interrelated with each other, their collective function forms culture complex.
5.2 Cultural Realms of the World
Cultural realm refers to a type of cultural region. Cultural region is a continuous geographical area characterized by cultural homogeneity. It may be classified into three categories as macro, meso and micro region. Cultural realm is classified based on the attitude, religious belief, language, racial
Habit is a similar word which is adopted by an individual and it has been adopted by most of the people of the ethnic group or society.
NormsNorms refers to attitude and behaviours
that are considered normal, typical or average within the group. Cultural norms are the standards we live by. They are the shared expectations and rules that guide behaviour of people within social groups. Cultural norms are learned and reinforced from parents, friends, teachers and others while growing up in a society. Norms often differ across cultures, contributing to cross-cultural misunderstandings.
ValuesValues refer to intangible quality or beliefs
accepted and endorsed by a society. A culture's values are its ideas about what is good, right, fair, and just. Sociologists disagree, however, on how to conceptualize values. Conflict theory focuses on how values differ between groups within a culture, while functionalism focuses on the shared values within a culture.
Cultural Heritage
Cultural Heritage is an expression of the ways of living developed by a community and passed on from generation to generation, including customs, practices, places, objects, artistic expressions and values. Cultural Heritage is often expressed as either Intangible or Tangible Cultural Heritage. As part of human activity Cultural Heritage produces tangible representations of the value systems, beliefs, traditions and lifestyles. As an essential part of culture as a whole, Cultural Heritage, contains these visible and tangible traces form antiquity to the recent past.
TN_GOVT_XII_Geography_chapter 05.indd 94 21-02-2019 13:11:56
Cultural and Political Geography95
group, technological development, etc. There are twelve Cultural realms in the modern world. Let us discuss some of them briefly.
Occidental RealmOccidental culture is the culture of
the European society. It is influenced, to a great extent, by Christianity. It has regional modifications on the basis of varying levels of industrialisation, political and economic thought, colonisation, commercialisation, urbanisation, and development of transport system, land development of social, political and economic institutions.
In many parts of the occidental culture, the impact of non-religious factors, particularly the effect of modernisation, is so great that the religious values are sidelined. Post- industrial Europe is fast emerging as a society where traditional values are nearly abandoned. The occidental culture covers a vast area. It is further divided into six sub-regions considering the impact of regional environment.
(I) West European is the most industrialised and urbanised culture.
(ii) Continental European culture is influenced by different political and economic thoughts, while Christianity remains an important influence.
(iii) Mediterranean Europe includes countries lying to the south of the Alps. It is the region of dominance of Christianity.
(iv) Anglo-American and
(v) Australian cultural realms are practically the offspring’s of west European culture. Both are inhabited by migrants from west Europe. There are only some regional differences.
(vi) Latin American culture is very similar to the Mediterranean culture. It is the only region of occidental culture which lies in the
tropics and is underdeveloped. It became a part of the occidental culture as a result of conversion of tribes into Christianity. The colonial languages, Spanish and Portuguese, have become the state languages. Regional architecture has been influenced by the Spanish and Portuguese styles. Practically all countries maintain economic, cultural and social ties with the Mediterranean countries.
Islamic Cultural RealmThe Islamic Cultural Realm is influenced
by Islamic values. It covers a vast geographical area from Morocco in the west to Pakistan in the east. The population is sparsely distributed due to inhospitable environment. The coasts, river basins and oases have been the cradles of Arabian culture in this realm. The British call it the Middle-East while the Germans call it a region of oriental culture. This cultural realm lies between the traditional Indian culture in the east and the modernised European culture in the west.
Islamic culture is highly orthodox and based on traditional beliefs, the impact of which can be seen in high female illiteracy rates. These countries have very high per capita incomes, but the level of modernisation is very low.
Indie Cultural RealmIndie Cultural Realm is the culture of the
Indian sub-continent. Baker called it a sub-continental culture, while D. Stamp used the term paddy culture. This cultural realm is well-defined; it lies between Himalayas in the north, Indian Ocean in the south and Hindukush Mountains in the west.
This cultural realm is characterized by joint family, village community, caste system, semi- feudal land relations, subsistence agriculture, paddy farming, seasonal climate changes and agricultural season coming at the same time all over the region. The culture of this region is
TN_GOVT_XII_Geography_chapter 05.indd 95 21-02-2019 13:11:56

XII Geography 96
Folk CultureCulture traits that are traditional, no longer
widely practiced by a large number of people, and generally isolated in small, often rural, areas.
5.3 RacesThe race is a group of people with more or
less permanent distinguishing characteristics. There are skin colour and hair colour to which persons concerned attach certain interpretations. Objectives and s cientific classification are the division of mankind in to racial groups should be done on the basis of measurable physical features and qualities inherited from a common ancestor. The important features on the basis of which the races are identified and classified include skin colour, stature, shape of head, face, nose, eye, type of hair, and blood group. Human races are classified in to four broad groups: 1. Negroid, 2. Caucasoid, 3. Mongoloid and 4. Australoid.
HOTS
If human being originated from one point, Africa and spread to rest of the world, how could they become different races?
1. The NegroidThey are usually called as "black race". They
have the darkest skin tone than other races, and other common characteristics are the slopped forehead, thick lips, wide nose, and dark hairs. They are living in Sub-Sahara Africa.
2. The MongoloidThey have the folding eye lids, almond
shaped eyes, yellowish skin tone, and V shaped cheeks. Native Americans and Eskimo are also classified as Mongoloid. Compared to the other races, they have the least body hair, least body odour, and smallest limb ratio. Their facial structure is likely to adapt cold mild wind. They are living in East Asia.
greatly influenced by Vedic values. Though the region is inhabited by various communities, the social system has the hidden impact of Vedic cultural values.
East Asian CultureThis culture is basically a Buddhist culture
with regional modifications. True Buddhist culture can be seen in South Korea and Japan. Even these two countries have felt the impact of industrialisation, urbanisation and modernisation. The culture of mainland China has modified the Buddhist system. This culture was adopted after the Second World War.
South-East Asian CultureIt is a transitional culture lying at a place
where different cultures have intermingled. Dominance of Buddhism can be seen in Myanmar, Thailand and Vietnam. Influence of Christianity can be seen in the Philippines and of Indie culture over islands of Indonesia. The Islamic influence is evident in Malaysia and the Indonesian islands. No other region has such peculiarities.
Meso-African CultureThis culture is also known as the Negro
culture. It principally includes tropical Africa. Similar cultural systems can be seen among the American Red Indians, Latin American tribes, Australian aboriginals and several tribes of Asia-Pacific region.
Historian Toynbee has used the term ‘marginalised culture’ for these traditional culture units. Some geographers even include Eskimos under this cultural realm. Thus, it is a widely scattered cultural realm characterised by marginalised and relatively isolated communities.
Major Culture HearthsAreas from which important culture
traits, including ideas, technology, and social structures, are originated.
TN_GOVT_XII_Geography_chapter 05.indd 96 21-02-2019 13:11:56
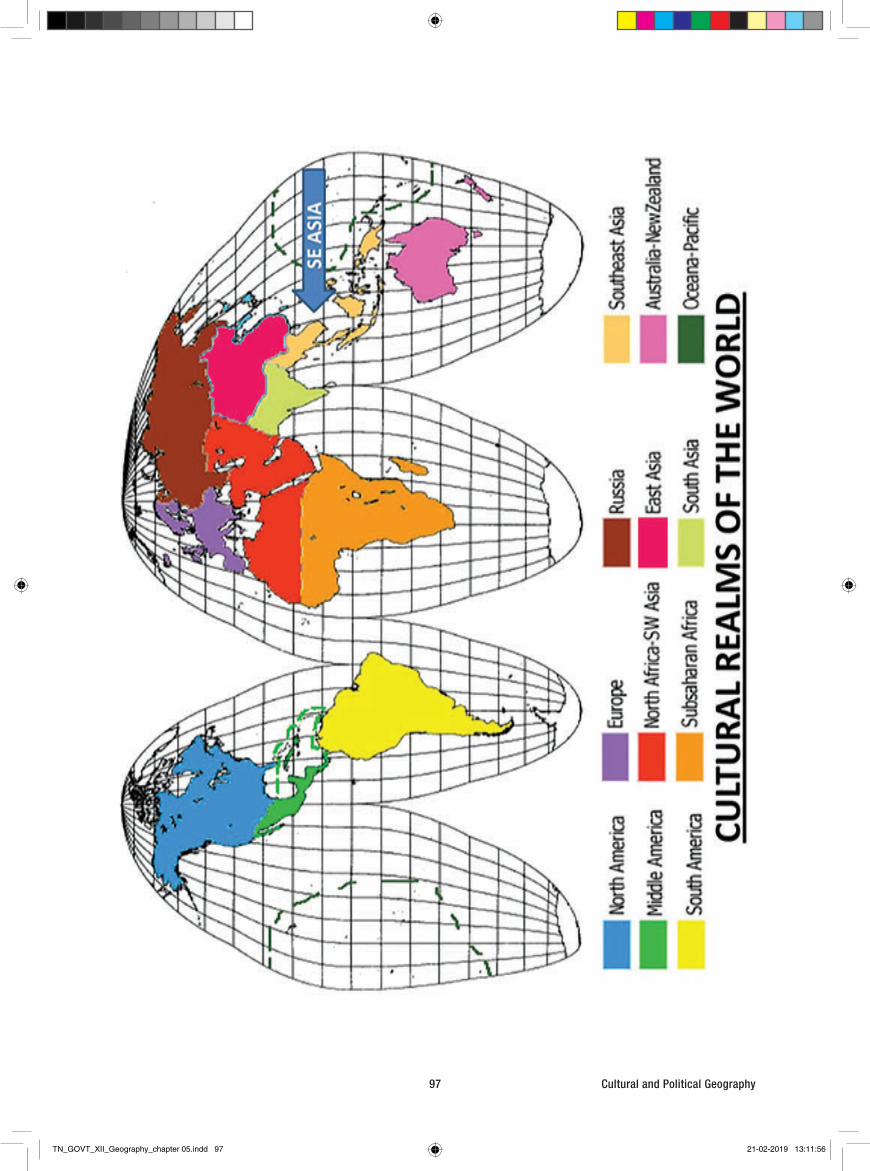
Cultural and Political Geography97
TN_GOVT_XII_Geography_chapter 05.indd 97 21-02-2019 13:11:56
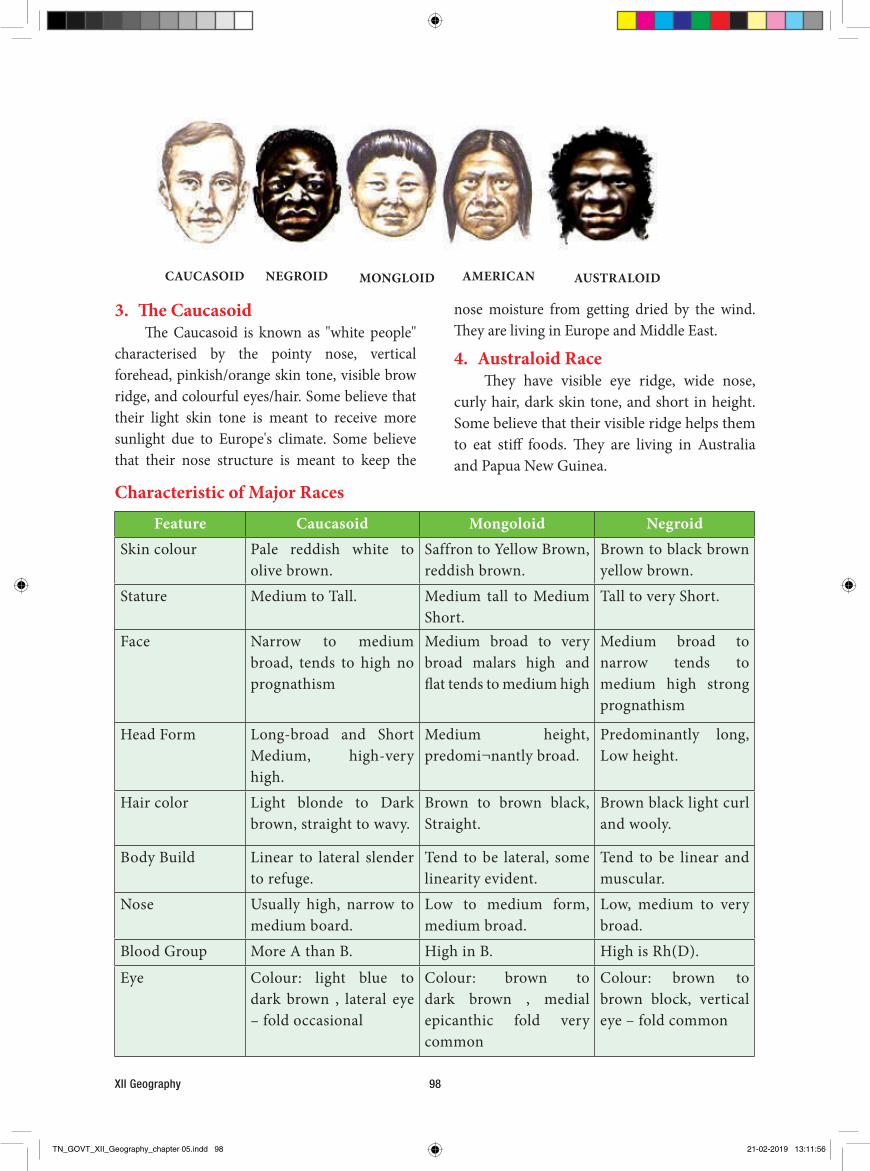
XII Geography 98
nose moisture from getting dried by the wind. Th ey are living in Europe and Middle East.
4. Australoid RaceTh ey have visible eye ridge, wide nose,
curly hair, dark skin tone, and short in height. Some believe that their visible ridge helps them to eat stiff foods. Th ey are living in Australia and Papua New Guinea.
3. Th e CaucasoidTh e Caucasoid is known as "white people"
characterised by the pointy nose, vertical forehead, pinkish/orange skin tone, visible brow ridge, and colourful eyes/hair. Some believe that their light skin tone is meant to receive more sunlight due to Europe's climate. Some believe that their nose structure is meant to keep the
Characteristic of Major Races
Feature Caucasoid Mongoloid NegroidSkin colour Pale reddish white to
olive brown.Saffron to Yellow Brown, reddish brown.
Brown to black brown yellow brown.
Stature Medium to Tall. Medium tall to Medium Short.
Tall to very Short.
Face Narrow to medium broad, tends to high no prognathism
Medium broad to very broad malars high and fl at tends to medium high
Medium broad to narrow tends to medium high strong prognathism
Head Form Long-broad and Short Medium, high-very high.
Medium height, predomi¬nantly broad.
Predominantly long, Low height.
Hair color Light blonde to Dark brown, straight to wavy.
Brown to brown black, Straight.
Brown black light curl and wooly.
Body Build Linear to lateral slender to refuge.
Tend to be lateral, some linearity evident.
Tend to be linear and muscular.
Nose Usually high, narrow to medium board.
Low to medium form, medium broad.
Low, medium to very broad.
Blood Group More A than B. High in B. High is Rh(D).
Eye Colour: light blue to dark brown , lateral eye – fold occasional
Colour: brown to dark brown , medial epicanthic fold very common
Colour: brown to brown block, vertical eye – fold common
CAUCASOID NEGROID MONGLOID AMERICAN AUSTRALOID
TN_GOVT_XII_Geography_chapter 05.indd 98 21-02-2019 13:11:56
Cultural and Political Geography99
EthnicityEthnicity is a concept referring to a shared
culture and a way of life. This can be reflected in language, religion, material culture such as clothing and cuisine, and cultural products such as music and art. Ethnicity is often a major source of social cohesion and social conflict. The world is home to thousands of different ethnic groups, from the Han Chinese (the largest ethnic group in the world) to the smallest indigenous groups, some of which include only a few dozen people. Almost all of these groups possess a shared history, language, religion, and culture, which provide group members with a common identity.
India is a unique country with great diversity in ethnicities, race, religion, language, culture, cuisine and in every other aspect of the human society. Indian civilization is one of the oldest in the world and primarily consists of the Indo-Aryans of North India and the Dravidians of South India, the people of the Indus Valley Civilization while the former migrated to the country at about 1800 BC. As India has such a diverse cultural demographic, it makes sense that the country is also.
DravidiansThe Dravidian people are any native
speakers of the Dravidian languages in the Indian Subcontinent. Almost all the Dravidians live in the southern part of India. The five major ethnic groups of Dravidian people in India are Tamil, Telugu, Kannada, Malayalam, and Tulu.
The ancient Indus Valley civilization in India was believed to have been of Dravidian origin in northern India, but then the Dravidian people were pushed south when the Indo-Aryans came in and the Kuru Kingdom in northern Indian arose. Later South India was dominated by the three Dravidian kingdoms of the Cheras, Cholas, and the Pandyas. These three kingdoms have been shown to sponsor the growth of literature, music, and the arts and to have done extensive trading. The three
kingdoms also supported and were tolerant of Buddhism, Jainism, and Hinduism. The major languages spoken by the Dravidian people are Tamil, Telugu, Kannada, Malayalam, and Brahui.
Arabic script Brahui is the only Dravidian language which is not known to have been written
in a Brahmi based script, instead, it has been written in the Arabic script since the second half of the 20th century in Iran Pakistan and Afghanistan.
ReligionReligion is not a vague fear or unknown
powers not the child of terror, but rather a relation of all the members of a community to a power that has the good of the community at heart and protects its law and moral order. Religion produces a distinct attitude towards life which affects the further development of the society. Indeed most cultural situations show the mutual interaction between religion and socio-economic and politico-cultural factors.
Classification of religionReligion may be classified based on the
belief in god. Monotheistic: the followers of monotheism believe in a single god (Islam, Christianity). Polytheistic: the followers of polytheism believe in many gods (Hinduism). Another classification is on the basis of areas of origin such as Eastern religion, Western religion, far Eastern religion, African religion, Indian religion, etc. Geographers generally classify religions into following;
• Universalizing religions – Christianity, islam, Buddhism.
• Ethnic religions – Hinduism, shintoism (Japan), Chinese faiths, Judaism.
• Tribal or traditional religions – animism, shamanism, secular (non religious and atheists).
TN_GOVT_XII_Geography_chapter 05.indd 99 21-02-2019 13:11:56
XII Geography 100
Jainism is also born in India as a reaction to orthodox Hinduism. It was founded by Lord Mahavir who was a Contemporary of Lord Buddha. Its followers are mostly concentrated in India. It is an offshoot of Hinduism which was established in the 15th century by Guru Nanak. It remained confined to Punjab state and has accepted Gurumukhi as its language.
Tribal ReligionsTribal religions are the special forms of
ethnic religion. The tribal people are generally in the Neolithic stage of social development. Tribal people are strikingly different and diverse in their culture, social and economic life. They cherish their own distinct and have maintained a close relationship to the land and natural environment. Most of them live according to their traditions and are engaged in food gathering, hunting, fishing, primitive agriculture etc, there are about 300 million indigenous people worldwide, constituting about four percent of the total population of the world living in more than sixty countries.
The percentage of tribal to total population is as high as over 90 percent in Greenland, 66
percent in Bolivia and 40 percent in Peru. In India share of tribal people to total population is 8.2 percent.
Sometimes the tribal people are being termed as the fourth world. The first – second and third world believed that “the land belongs to the people” whereas the fourth world believes that “the people belongs to the land”.
5.4 Tribal Distribution in worldSome major tribal group of the world
particularly who are living and struggling
1. Equatorial Forest region: Pigmy, Semang, Sakai, Boro, Papuan, etc.
2. Grasslands: Masai, Kyrghizs, etc.
Major religions of the world
Major religions of the world are classified based on the followers. They are Christianity, Islam, Hinduism, Buddhism, and Judaism. Other important religions include Chinese folk religions, Sikhism, Confucianism, Shintoism etc,.
Christianity is a universal religion which has the largest number of followers in the world. They are spread in Europe, Anglo America, Latin America, Africa, Asia and Oceania. Its sacred book is “Bible”. Islam is the second largest religion of the world. The largest concentration of the Islam is in the South West Asia, Central Asia, South Asia and South East Asia Followed by the North Africa. Shia and Sunni are its two main sects. Its sacred book is Kuran.
Hinduism is the oldest ethnic religion of the world which was founded about 3000 B.C (B.C.E) in India. Today it has over 8 million followers in the world but main concentration is in India and Nepal. Nearly 99 percent of the total Hindu population is concentrated in south Asia. Its sacred books include the Vedas, the Upanishads, the Epics, the Ramayana and Mahabharata, and the Bhagavad Gita. Buddhism is also one of the oldest religions of India which was founded by Lord Buddha around 525 B.C (B.C.E). Its spread in several Asian countries (China, Myanmar, India, Srilanka, japan, Mangolia, korea and South East Asian countries) due to its liberal philosophy. Its two main sects are Hinayana and Mahayana.
Judaism is the oldest Monotheistic faith which is regarded as the parent of Christianity. It originates 4000 years ago in the Middle East. At present it has about 14 million followers living in U.S.A, Europe and Asia. Chinese religions include two main beliefs called Confucianism and tao-ism. Confucianism was established by Confucious (551-479 B.C (BCE)). Taoism was established by Lao Tse (604-517 B.C (BCE)).
TN_GOVT_XII_Geography_chapter 05.indd 100 21-02-2019 13:11:56

Cultural and Political Geography101
The Masai of east Africa belong to the pastoral society and are known as the best and most typical cattle herders not only of Africa but also of the world. Masai people are tall and slender with ling feet, hands and fingers. Their skin colour ranges from light chocolate to dark brown. They have high and long head, thin face and nose. Their lips are less thick than that of Negroid people. Masai occupy the interior plateau of the equatorial Africa. The territory of the Masai lies between 1ºN and 6ºS latitudes and covers all the rift valleys in this region.
BedouinIn Arabic, Bedouin means desert dwellers.
The Bedouins are most important among the tribal of South West-Asia and North Africa. They are pastoral nomads and keep camel, sheep, goats, horse etc. The Bedouins occupy the desert areas of the Arabian Peninsula including Saudi Arabia, Yemen, Oman, Syria and Jordan. The Bedouins belongs to the mixture of Mediterranean and Armenian races. They are medium stature people with long narrow face, prominent nose, dark eyes and hair. Their complexion is wheatish to pale.
BushmanBushman is the tribal people of Kalahari
Desert in southern Africa who are still engaged in hunting and gathering economics. They are on constant run for both food and water. Their homeland Kalahari Desert lies in Botswana, Namibia and southern Angola. The bushman
3. Tropical deserts: Bedowin, Bushman, Aborigines etc.
4. Mountainous region: Bhotia, gujjar, Naga etc.
5. Monsoon regions: Gonds, Santhals, Todas, Bhils, etc.
6. Arctic cold regions: Eskimo, Lapp, Alute, Chukchi etc.
PigmiesThe pigmies are Negroid people and are
also called Negrillos. They are the nearest approximation of human being to animal. They are short stature, flat nosed, wooly haired, long headed and black people. The average height of men and women are found 150cm. So they are also called dwarf. The pigmies are those who live in scattered parts of tropical Central Africa. They are found in many sub-groups in the equatorial forest region of Africa mainly in Congo basin 3ºN and 3ºS latitudes along both sides of the equator. In addition some groups of Pigmies are also found in the forests of Philippines and New Guinea.
Masai
TN_GOVT_XII_Geography_chapter 05.indd 101 21-02-2019 13:11:56
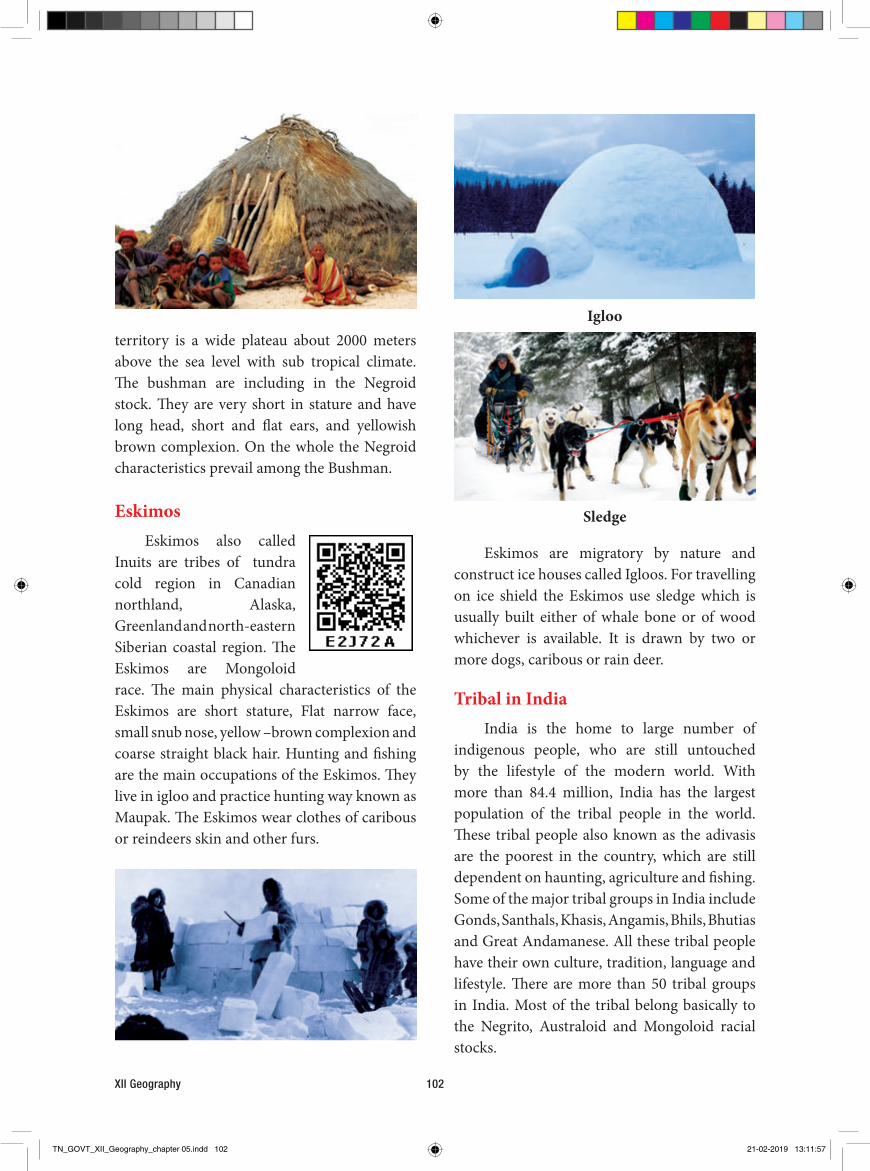
XII Geography 102
Igloo
Sledge
Eskimos are migratory by nature and construct ice houses called Igloos. For travelling on ice shield the Eskimos use sledge which is usually built either of whale bone or of wood whichever is available. It is drawn by two or more dogs, caribous or rain deer.
Tribal in IndiaIndia is the home to large number of
indigenous people, who are still untouched by the lifestyle of the modern world. With more than 84.4 million, India has the largest population of the tribal people in the world. These tribal people also known as the adivasis are the poorest in the country, which are still dependent on haunting, agriculture and fishing. Some of the major tribal groups in India include Gonds, Santhals, Khasis, Angamis, Bhils, Bhutias and Great Andamanese. All these tribal people have their own culture, tradition, language and lifestyle. There are more than 50 tribal groups in India. Most of the tribal belong basically to the Negrito, Australoid and Mongoloid racial stocks.
territory is a wide plateau about 2000 meters above the sea level with sub tropical climate. The bushman are including in the Negroid stock. They are very short in stature and have long head, short and flat ears, and yellowish brown complexion. On the whole the Negroid characteristics prevail among the Bushman.
EskimosEskimos also called
Inuits are tribes of tundra cold region in Canadian northland, Alaska, Greenland and north-eastern Siberian coastal region. The Eskimos are Mongoloid race. The main physical characteristics of the Eskimos are short stature, Flat narrow face, small snub nose, yellow –brown complexion and coarse straight black hair. Hunting and fishing are the main occupations of the Eskimos. They live in igloo and practice hunting way known as Maupak. The Eskimos wear clothes of caribous or reindeers skin and other furs.
TN_GOVT_XII_Geography_chapter 05.indd 102 21-02-2019 13:11:57
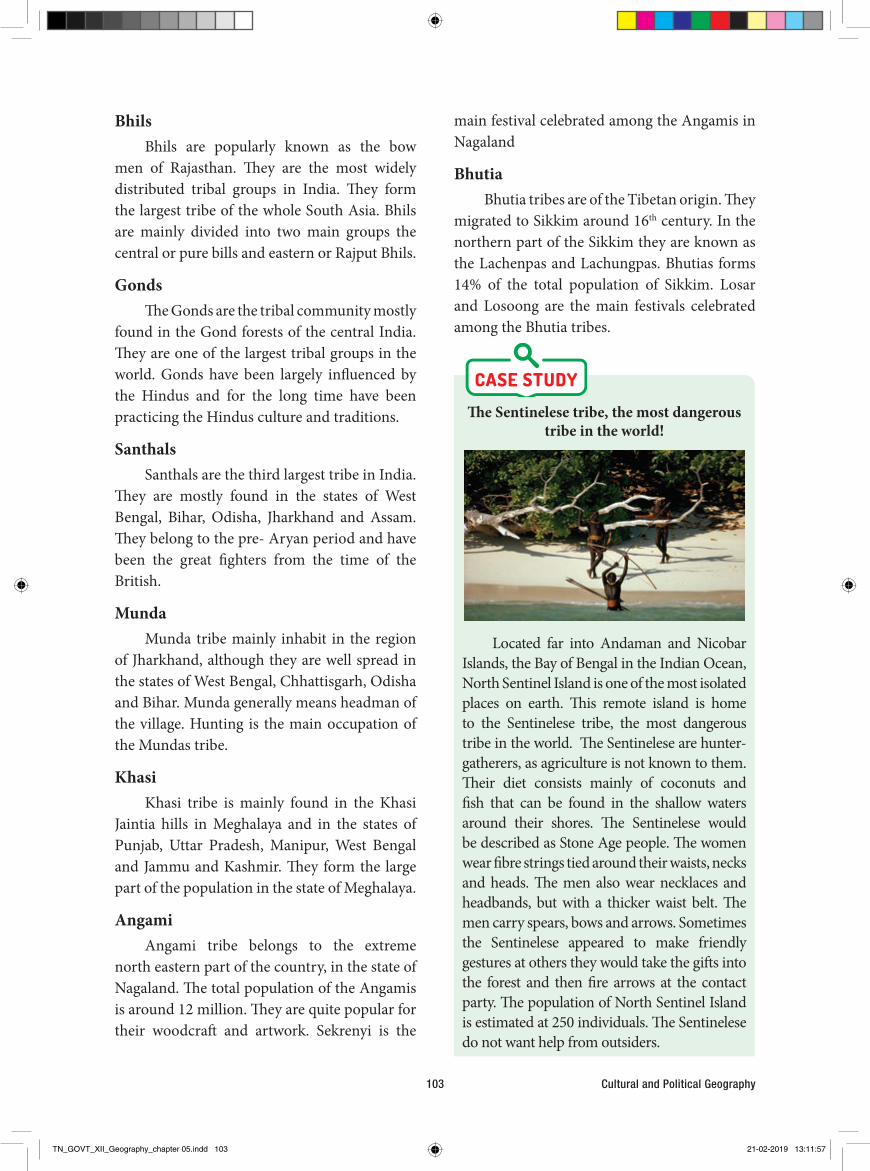
Cultural and Political Geography103
main festival celebrated among the Angamis in Nagaland
BhutiaBhutia tribes are of the Tibetan origin. They
migrated to Sikkim around 16th century. In the northern part of the Sikkim they are known as the Lachenpas and Lachungpas. Bhutias forms 14% of the total population of Sikkim. Losar and Losoong are the main festivals celebrated among the Bhutia tribes.
The Sentinelese tribe, the most dangerous tribe in the world!
Located far into Andaman and Nicobar Islands, the Bay of Bengal in the Indian Ocean, North Sentinel Island is one of the most isolated places on earth. This remote island is home to the Sentinelese tribe, the most dangerous tribe in the world. The Sentinelese are hunter-gatherers, as agriculture is not known to them. Their diet consists mainly of coconuts and fish that can be found in the shallow waters around their shores. The Sentinelese would be described as Stone Age people. The women wear fibre strings tied around their waists, necks and heads. The men also wear necklaces and headbands, but with a thicker waist belt. The men carry spears, bows and arrows. Sometimes the Sentinelese appeared to make friendly gestures at others they would take the gifts into the forest and then fire arrows at the contact party. The population of North Sentinel Island is estimated at 250 individuals. The Sentinelese do not want help from outsiders.
BhilsBhils are popularly known as the bow
men of Rajasthan. They are the most widely distributed tribal groups in India. They form the largest tribe of the whole South Asia. Bhils are mainly divided into two main groups the central or pure bills and eastern or Rajput Bhils.
GondsThe Gonds are the tribal community mostly
found in the Gond forests of the central India. They are one of the largest tribal groups in the world. Gonds have been largely influenced by the Hindus and for the long time have been practicing the Hindus culture and traditions.
SanthalsSanthals are the third largest tribe in India.
They are mostly found in the states of West Bengal, Bihar, Odisha, Jharkhand and Assam. They belong to the pre- Aryan period and have been the great fighters from the time of the British.
MundaMunda tribe mainly inhabit in the region
of Jharkhand, although they are well spread in the states of West Bengal, Chhattisgarh, Odisha and Bihar. Munda generally means headman of the village. Hunting is the main occupation of the Mundas tribe.
KhasiKhasi tribe is mainly found in the Khasi
Jaintia hills in Meghalaya and in the states of Punjab, Uttar Pradesh, Manipur, West Bengal and Jammu and Kashmir. They form the large part of the population in the state of Meghalaya.
AngamiAngami tribe belongs to the extreme
north eastern part of the country, in the state of Nagaland. The total population of the Angamis is around 12 million. They are quite popular for their woodcraft and artwork. Sekrenyi is the
TN_GOVT_XII_Geography_chapter 05.indd 103 21-02-2019 13:11:57

XII Geography 104
the largest group of tribes and boast a rich oral tradition of Folk tales, songs and poetry. These tribes are Hindu and belong to the shiva sect.
Kota: The Kotas are mainly concentrated in the Tiruchigadi area in the Nilagiri hills. They are distinguished by their colourful Folk dances and are basically musicians, who play at Badaa funerals. They are mainly engaged in producing handicrafts. These tribes of Tamil Nadu are expert iron smiths, potters and carpenters. In order to maintain distance and status in society, the Kotas implement elaborate tattoos.
Kurumbas: The Kurumbas tribes of this state inhabit the intermediate valleys and forests in Villages and were known for their black magic and witchcraft in the past. Their way of living today has changed from their original gathering and hunting existence to working in Coffee and Tea plantations as labourers. Kurumbas are perhaps the only main caste in southern India that has a specialized and distinctive Kurumbas Language.
Irula: The Irula tribes of Tamil Nadu occupy the lower slopes and forests at the base of the Nilgiri Hills. They constitute the second largest group of tribes after the Badagas and are similar to the Kurumbas in many ways. This tribe produces honey, fruits, herbs, roots, gum, dyes etc., and trades them with the people in the plains. In the recent times the Irulas help in catching snakes and collect the snake venom.
Paliyan: They are of the food gathering communities of Tamil Nadu. It is believed that the Paliyan originally belonged to the Palani hills. They are distributed in the districts of Madurai, Tanjavour, Pudukkottai, Tirunelveli and Coimbatore.
LanguageLanguage is an identification mark for
different cultures. Because language is essential to communication, it strongly influences
ChenchuChenchu inhabit in the Nallamalai hills,
which have been the part of the Nagarjuna Sagar Tiger Sanctuary for centuries in Andhra Pradesh, India. They are mainly found in the districts of Mahabubnagar, Nalgonda, Praksham, Guntur, and Kurnool.
Great AndamaneseGreat Andamanese is the Negrito tribe
inhabitant in the Andaman group of Islands. They form the largest population among the other tribes found in these islands. According to the census the population of Great Andamanese is now limited to few individuals.
Tribals in TamilnaduTribes of Tamil Nadu are concentrated
mainly in the district of Nilgiris. Of all the distinct tribes, the Kodas, the Thodas, the Irulas, the Kurumbas and the Badagas form the larger groups, who mainly had a pastoral existence. Other tribes include, Kattunayakan and Paliyan amongst others.
According to census 2011, tribal population in Tamil Nadu is 7, 94,697. There are around 38 tribes and sub-tribes in Tamil Nadu. The tribal people are predominantly farmers and cultivators and they are much dependant on the forest lands.
Toda: Men from the family of the tribes are occupied in milking and grazing their large herds of buffaloes. Their settlements are known as ‘Munds’. They do not worship any god and their consciousness is cosmic. They live in Nilgiris. Today, there are about a thousand Todas left.
Badaga: The Badagas belong to the backward class and are not classified as tribal. They are an agricultural community, dwelling in the higher plateau of the Nilgiris district in the state of Tamil Nadu. They are engaged in tea cultivation and potato growing. They form
TN_GOVT_XII_Geography_chapter 05.indd 104 21-02-2019 13:11:57
Cultural and Political Geography105
6. Dravidian- malayo – Polynesian- - a. Dravidian, b. Malayan, c. Melanesian, d. Micronesian, e. Polynesian, f. Austro-Asiatic.
7. Palaeo Asiatic- a.Yukaghir
As many as half of the world’s 7,000 languages are expected to be extinct by the end of this
century; it is estimated that one language dies out every 14 days.
Major Languages of IndiaIndia has a rich Linguistic heritage and
has heterogeneous ethnic and social groups, which have their own languages and dialects. According to census of India 1961, there were 187 languages spoken by various sections of Indian society. 23 major languages were spoken by about 97 percent population of the country. 22 languages excluding English are mentioned in the eighth schedule of the constitution of India as follows; Kashmiri, Punjabi, Hindi, Urdu, Bengali, Assamese, Guajarati, Marathi, Kannada, Tamil, Telugu, Malayalam, Sindhi, Sanskrit, Oriya, Nepali, Kongani, Manipuri, Bodo, Dogri, Maithili and Santali of these languages, 14 were initially included in the Constitution. Subsequently, Sindhi was added in 1967 by 21st constitutional amendment act; Konkani, Manipuri and Nepali were added in 1992 by 71st Constitutional Amendment Act; and Bodo, Dogri, Maithili and Santali were added in 2003 by 92nd Constitutional Amendment Act. Indian Languages belong mainly to four linguistic families
1. Austric – Munda, Mon-Khmer
2. Dravidan – Tamil, Telugu, Kannada, Malayalam, Gondi, kurukh, orean, etc.
3. Sino- Tibetan- Bodo, Karen, Manipuri, etc.
4. Indo - Aryan – Hindi, Urdu, Sans.
the sort of political, social and economic we create. As a result, economic and religious system frequently follows patterns of language distribution and political borders quite often parallel linguistic boundaries. In modern times linguistic diffusion has been facilitated by trade, tourism, media and international organizations. It has helped in the development of the linguistic pluralism. The greatest linguistic diversity is attributed to heterogeneous societies.
Tamil is one of the longest-surviving classical languages in the world. The earliest period of
Tamil literature, Sangam literature, is dated from 300 BC (BCE) – AD (CE) 300. It has the oldest extant literature among Dravidian languages.
Major linguistic Families of the World
The classification of languages by origin and historical development is known as a genetic classification. The languages which are the descendants of common ancestral language are called proto – language.
G.L. Trage has classified the languages of the world into 7 linguistic phylum and 30 linguistic families. Linguistic families are further classified in to sub families of languages, which denote major languages.
1. Indo-European - a. Indo-Iranian, b. Latin or Romantic, c. Germanic, d. Balto –Slavic, e. Celtic, f. Hellenic
2. Sino-Tibetan - a. Chinese, b. Tibetan, c. Burman
3. Afro-Asiatic – a. Semitic, b. Egyptian, c. Cushitic, d. Chadic
4. African – a. Niger – Congo (Atlantic, Voltaic, Benu-Nagar)
b. Sudanic (Chari-Nile, Saharan,) c. Click Languages (Khoisan)5. Ural-Altaic - a. Finno-Igric, b. Turkic,
c. Mangolic, d. Tunguzic
TN_GOVT_XII_Geography_chapter 05.indd 105 21-02-2019 13:11:57
XII Geography 106
the state. Many people are familiar with the old and familiar dialects of Tamil such as Chennai, Coimbatore, Madurai and Tirunelveli.
5.5 Political Geography - Concept of Nation and State
NationA nation is a group of people who see
themselves as a cohesive and coherent unit based on shared cultural or historical criteria. Nations are socially constructed units, not given by nature. Their existence, definition, and members can change dramatically based on circumstances. Nations in some ways can be thought of as “imagined communities” that are bound together by notions of unity that can pivot around religion, ethnic identity, language, cultural practice and so forth.
StateA State is an independent, sovereign
government exercising control over a certain spatially defined and bounded area, whose borders are usually clearly defined and internationally recognized by other states.
Vaishali was established as a republic by the 6th century B.C (BCE), prior to the birth of
Gautama Buddha in 563 B.C (BCE), making it the world's first republic.
Nation-StateThe nation state is a system of organization
defined by geography, politics and culture. The nation is cultural identity that is shared by the people, and the state is the governing administration. A nation state must have a shared national identity, physical borders, and a single government.
A nation-state is a political unit with a well-defined territory, inhabited by a people who are well-organised, possess sufficient powers and
DialectA distinct linguistic form peculiar to a
region or social group but which nevertheless, can be understood by speakers of other forms of the same language. The two main types of dialects are the geographic dialect, spoken by the people of the same area or locality, and the social dialect used by people of the same social class, educational level or occupational group.
Major dialects in India More than 40 languages or dialects in India
are considered to be endangered and are believed to be heading towards extinction as only a few thousand people speak them officials said.
According to a report of the census Directorate, there are 22 scheduled languages and 100 non –scheduled languages in India. The scheduled languages are 11 from Andaman and Nicobar, Seven from Manipur and Four from Himachal Pradesh. There are 42 languages spoken by less than 10,000 people. Some other languages also are in endangered position in India.
Major dialects in Tamil NaduTamil is an interesting language with a
range of native dialects. The language has several charming improvisations in different regions of
UNESCO’S five levels of language risk:Safe: Widely spokenVulnerable: Not spoken by children outside the home (600 languages)Definitely endangered: Children not speaking (646 languages)Severely endangered: Only spoken by oldest generations (527 languages)Critically endangered: Spoken by only a few members of the oldest generation, often semi-speakers (577 languages)
Fact File
TN_GOVT_XII_Geography_chapter 05.indd 106 21-02-2019 13:11:57
Cultural and Political Geography107
consider themselves to be a nation by virtue of certain binding factors which may be emotional and which are reflected in law and governance.
5.5.1 Frontiers and BoundariesFrontiers: International frontiers and
boundaries separate land, rivers and lakes subject to different sovereignties. In 1900 frontiers had almost disappeared and had been replaced by boundaries that are lines. A Frontier is a politico geographical area, lying beyond defined borders of a political unit into which expansion could take place
Types of BoundariesBoundaries can be classified according to
their relationship with the cultural landscape. Some boundaries were established prior to the permanent occupation of areas by the present inhabitants. In some cases patterns of settlement were already developing so that the boundary ultimately established has a different relationship to the cultural realities of the area involved. This classification is known as the functional or genetic classification of boundaries.
Different between Frontier and Boundary
Frontier Boundary1. Natural 1. Mostly Anthropogenic2. Areal Concept 2. Linear Concept3. Frontiers have no political dispute 3. Boundaries vary often disputable by the
rival nations4. Frontier generally has mountainous area,
desert, marshes, etc. Thus, inhabitable4. But boundaries have no such criteria
5. Frontiers are dynamic 5. Boundaries are static because once fixed, they hardly change
Boundaries: A boundary is a line demarcating the recognised limit of an established political unit, administrative region or geographical region e. g a state, country or district.
China has the maximum number of neighbours touching its border. The 14
countries touching its border are: India, Pakistan, Afghanistan, Tajikistan, Kyrgyzstan, Kazakhstan, Mongolia, Russia, North Korea, Vietnam, Laos, Myanmar, Bhutan and Nepal
Canada, the world’s second largest country, shares the longest international land
border with the United States. The Canada-US land border is 8,893 km long.
Genetic Classification of the boundaries1. Antecedent BoundariesThe boundaries drawn before the cultural-political realm.
Such boundaries were non-contentious. E .g, N. Africa and the state boundaries of USA.
2. The Subsequent Boundaries When the cultural realms are fully developed & political boundaries are contentious.
Such boundaries are irregular or amorphic boundaries.E.g. the countries of Europe.
3. Superimposed Boundaries When a political boundary divides a homogenous cultural region and across the
TN_GOVT_XII_Geography_chapter 05.indd 107 21-02-2019 13:11:57
Related Documents