Geography Revision Guide: Natural Hazards Part A: Hazards definitions Q1. What is a natural hazard? A natural event that threatens people or has the potential to cause damage, destruction and death Q2. What different hazards are there? See diagram on the right – the ones in red are the ones that we will focus on. Q3. What factors will influence the severity of a hazard? - Poverty: Some people have no choice but to live in a particular location. Poor people tend to end up living on unstable slopes (landslides). Inability to build properly to mitigate impacts. Inability to respond after the event. - Farming: Some areas are good for farming (volcanic ash near a Volcano; fertile soil on a river floodplain). People live there because When times are good, then people prosper. The problem comes when the eruption occurs/ flood arrives. - Urbanisation: More people living in close proximity (high population density). This puts people at risk – e.g. Haiti earthquake, 2010. - Climate change: areas are becoming more prone to hazards (floods, droughts, famine etc.) TIP: KEEP THINKING ABOUT THE DIFFERENCES BETWEEN HIC v. LIC IN A QUESTION SUCH AS THIS. Part B: Plate Tectonic Theory Q4. Why do we get volcanoes and earthquakes? It is all to do with PLATE TECTONICS. This is a relatively new theory (only really been around for 100 years and been universally accepted for the last 40-50 years) and it looks at the structure of the Earth and examines how vast areas of rock or PLATES can move. To understand this theory you need to have an idea of the structure of the Earth. The diagram on the right shows this. The crust floats on the semi-molten rocks of the Mantle. The high temperatures in the Mantle result in convection currents that enable the crust to move. Q5. New tectonic theories (see discussion PTO) Types of Hazard Tectonic hazards: volcanoes, earthquakes & tsunami Biohazards: e.g. wildfires Geomorpholo gical: landslides, flooding etc Atmospheric: Tropical storms (hurricanes, tornadoes etc.

Welcome message from author
This document is posted to help you gain knowledge. Please leave a comment to let me know what you think about it! Share it to your friends and learn new things together.
Transcript
Geography Revision Guide: Natural Hazards Part A: Hazards definitions
Q1. What is a natural hazard?
A natural event that threatens people
or has the potential to cause damage, destruction and death
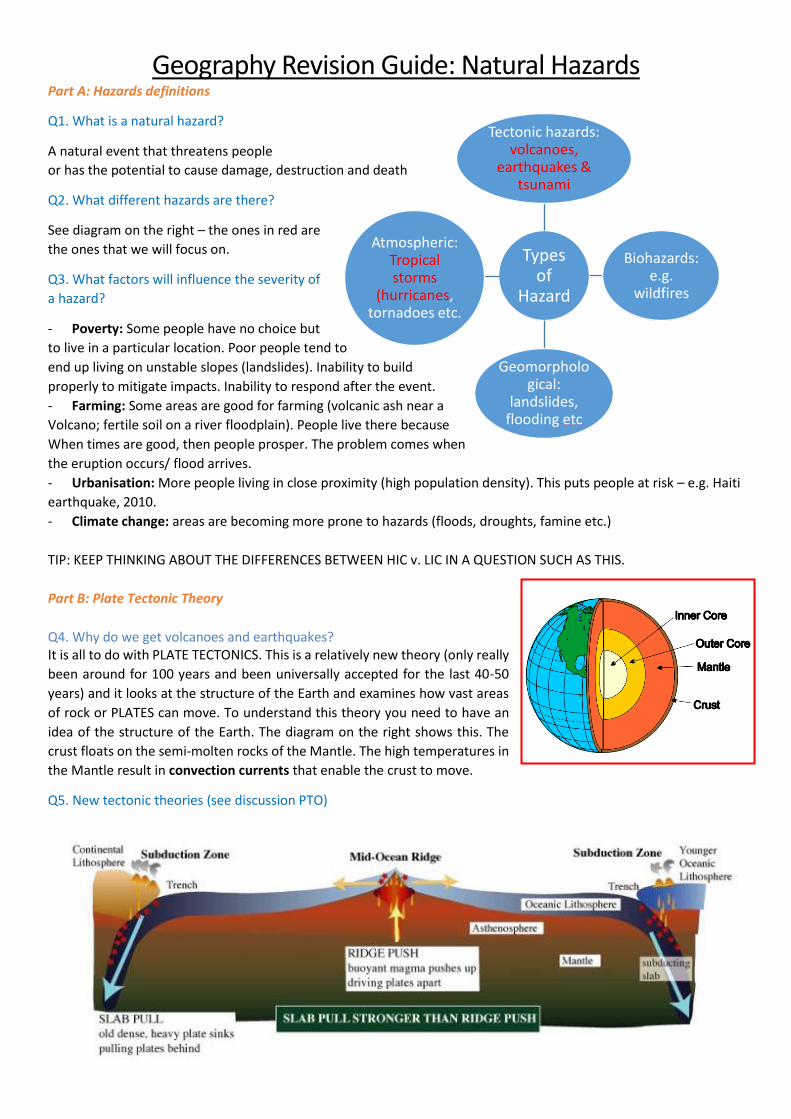
Q2. What different hazards are there?
See diagram on the right – the ones in red are
the ones that we will focus on.
Q3. What factors will influence the severity of
a hazard?
- Poverty: Some people have no choice but
to live in a particular location. Poor people tend to
end up living on unstable slopes (landslides). Inability to build
properly to mitigate impacts. Inability to respond after the event.
- Farming: Some areas are good for farming (volcanic ash near a
Volcano; fertile soil on a river floodplain). People live there because
When times are good, then people prosper. The problem comes when
the eruption occurs/ flood arrives.
- Urbanisation: More people living in close proximity (high population density). This puts people at risk – e.g. Haiti
earthquake, 2010.
- Climate change: areas are becoming more prone to hazards (floods, droughts, famine etc.)
TIP: KEEP THINKING ABOUT THE DIFFERENCES BETWEEN HIC v. LIC IN A QUESTION SUCH AS THIS.
Part B: Plate Tectonic Theory
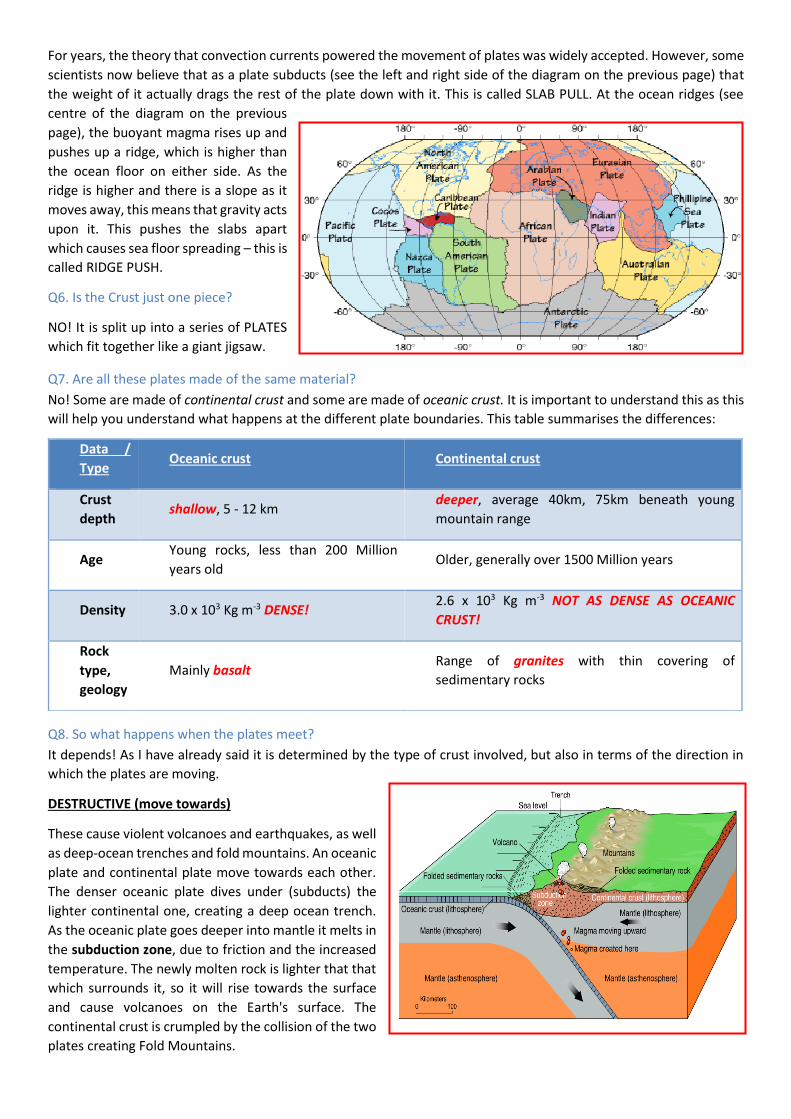
Q4. Why do we get volcanoes and earthquakes? It is all to do with PLATE TECTONICS. This is a relatively new theory (only really
been around for 100 years and been universally accepted for the last 40-50
years) and it looks at the structure of the Earth and examines how vast areas
of rock or PLATES can move. To understand this theory you need to have an
idea of the structure of the Earth. The diagram on the right shows this. The
crust floats on the semi-molten rocks of the Mantle. The high temperatures in
the Mantle result in convection currents that enable the crust to move.
Q5. New tectonic theories (see discussion PTO)
Types of
Hazard
Tectonic hazards: volcanoes,
earthquakes & tsunami
Biohazards: e.g.
wildfires
Geomorphological:
landslides, flooding etc
Atmospheric: Tropical storms
(hurricanes, tornadoes etc.
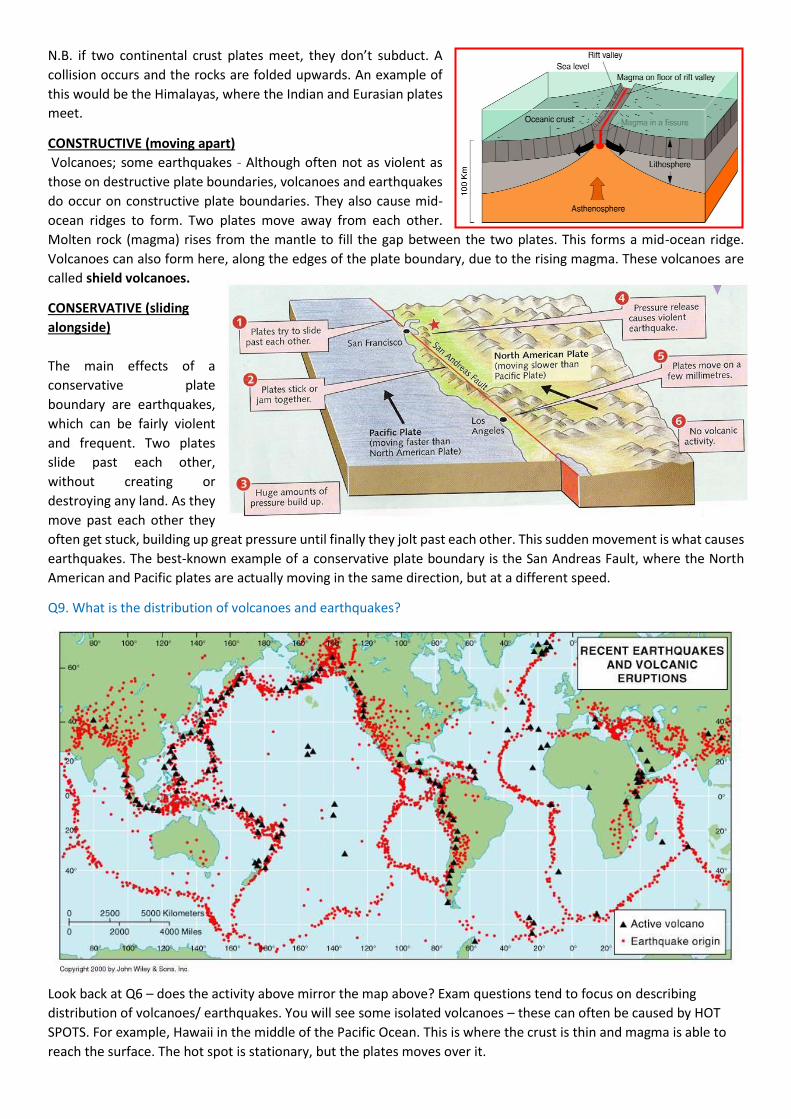
For years, the theory that convection currents powered the movement of plates was widely accepted. However, some
scientists now believe that as a plate subducts (see the left and right side of the diagram on the previous page) that
the weight of it actually drags the rest of the plate down with it. This is called SLAB PULL. At the ocean ridges (see
centre of the diagram on the previous
page), the buoyant magma rises up and
pushes up a ridge, which is higher than
the ocean floor on either side. As the
ridge is higher and there is a slope as it
moves away, this means that gravity acts
upon it. This pushes the slabs apart
which causes sea floor spreading – this is
called RIDGE PUSH.
Q6. Is the Crust just one piece?
NO! It is split up into a series of PLATES
which fit together like a giant jigsaw.
Q7. Are all these plates made of the same material?
No! Some are made of continental crust and some are made of oceanic crust. It is important to understand this as this
will help you understand what happens at the different plate boundaries. This table summarises the differences:
Q8. So what happens when the plates meet?
It depends! As I have already said it is determined by the type of crust involved, but also in terms of the direction in
which the plates are moving.
DESTRUCTIVE (move towards)
These cause violent volcanoes and earthquakes, as well
as deep-ocean trenches and fold mountains. An oceanic
plate and continental plate move towards each other.
The denser oceanic plate dives under (subducts) the
lighter continental one, creating a deep ocean trench.
As the oceanic plate goes deeper into mantle it melts in
the subduction zone, due to friction and the increased
temperature. The newly molten rock is lighter that that
which surrounds it, so it will rise towards the surface
and cause volcanoes on the Earth's surface. The
continental crust is crumpled by the collision of the two
plates creating Fold Mountains.
Data /
Type Oceanic crust Continental crust
Crust
depth shallow, 5 - 12 km
deeper, average 40km, 75km beneath young
mountain range
Age Young rocks, less than 200 Million
years old Older, generally over 1500 Million years
Density 3.0 x 10³ Kg m-3 DENSE! 2.6 x 10³ Kg m-3 NOT AS DENSE AS OCEANIC
CRUST!
Rock
type,
geology
Mainly basalt Range of granites with thin covering of
sedimentary rocks
N.B. if two continental crust plates meet, they don’t subduct. A
collision occurs and the rocks are folded upwards. An example of
this would be the Himalayas, where the Indian and Eurasian plates
meet.
CONSTRUCTIVE (moving apart)
Volcanoes; some earthquakes - Although often not as violent as
those on destructive plate boundaries, volcanoes and earthquakes
do occur on constructive plate boundaries. They also cause mid-
ocean ridges to form. Two plates move away from each other.
Molten rock (magma) rises from the mantle to fill the gap between the two plates. This forms a mid-ocean ridge.
Volcanoes can also form here, along the edges of the plate boundary, due to the rising magma. These volcanoes are
called shield volcanoes.
CONSERVATIVE (sliding
alongside)
The main effects of a
conservative plate
boundary are earthquakes,
which can be fairly violent
and frequent. Two plates
slide past each other,
without creating or
destroying any land. As they
move past each other they
often get stuck, building up great pressure until finally they jolt past each other. This sudden movement is what causes
earthquakes. The best-known example of a conservative plate boundary is the San Andreas Fault, where the North
American and Pacific plates are actually moving in the same direction, but at a different speed.
Q9. What is the distribution of volcanoes and earthquakes?
Look back at Q6 – does the activity above mirror the map above? Exam questions tend to focus on describing
distribution of volcanoes/ earthquakes. You will see some isolated volcanoes – these can often be caused by HOT
SPOTS. For example, Hawaii in the middle of the Pacific Ocean. This is where the crust is thin and magma is able to
reach the surface. The hot spot is stationary, but the plates moves over it.
Q10. What are the different volcanoes found at the plate boundaries?
SHIELD and COMPOSITE volcanoes. The differences in their characteristics are due to their location and the type of
magma feeding them. Shield volcanoes have BASIC LAVA, whereas Composite volcanoes have ACID LAVA. Basic lava
is runny and therefore doesn’t allow pressure to build up producing effusive eruptions; acid lava is the opposite as it
is rich in silica and therefore is very sticky. Pressure can build up and eruptions are explosive. The diagrams below
summarise the differences between the two. COMPOSITE at DESTRUCTIVE boundaries. SHIELD at CONSTRUCTIVE
boundaries
Part C: The effects/responses of tectonic hazards varies due to economic wealth
Q11. What are the primary and secondary effects of an earthquake?
• Primary effects are those that occur immediately as the earthquake happens- they occur due to the immediate
shaking of the ground – e.g. damage to roads and building
• Secondary effects are the result of primary effects (ground shaking) and can be even more devastating then the
primary ones – they include fire, landslides and tsunami.
Q12. What are the immediate and long-term responses to a tectonic hazard?
Immediate: straight away. Things such as search and rescue, providing medical care, food, water and shelter
Long-term: after the event. Rebuilding/ reconstruction – trying to get people’s lives back to normal (or better)
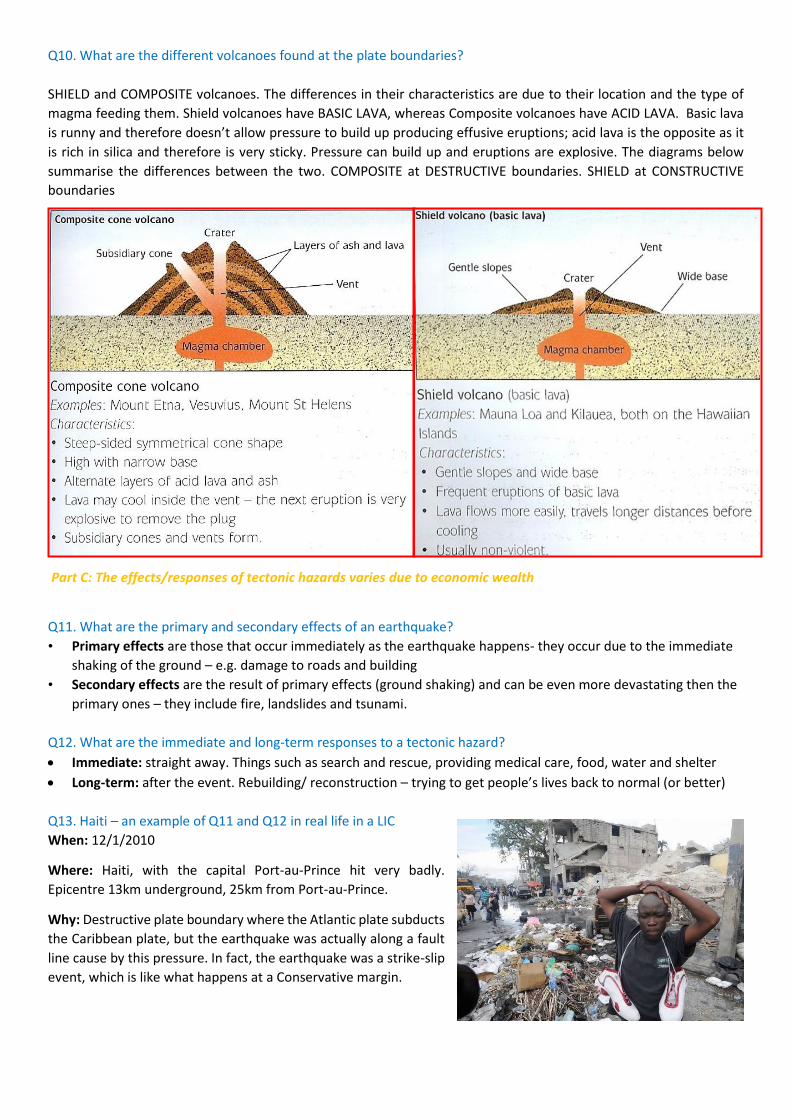
Q13. Haiti – an example of Q11 and Q12 in real life in a LIC
When: 12/1/2010
Where: Haiti, with the capital Port-au-Prince hit very badly.
Epicentre 13km underground, 25km from Port-au-Prince.
Why: Destructive plate boundary where the Atlantic plate subducts
the Caribbean plate, but the earthquake was actually along a fault
line cause by this pressure. In fact, the earthquake was a strike-slip
event, which is like what happens at a Conservative margin.
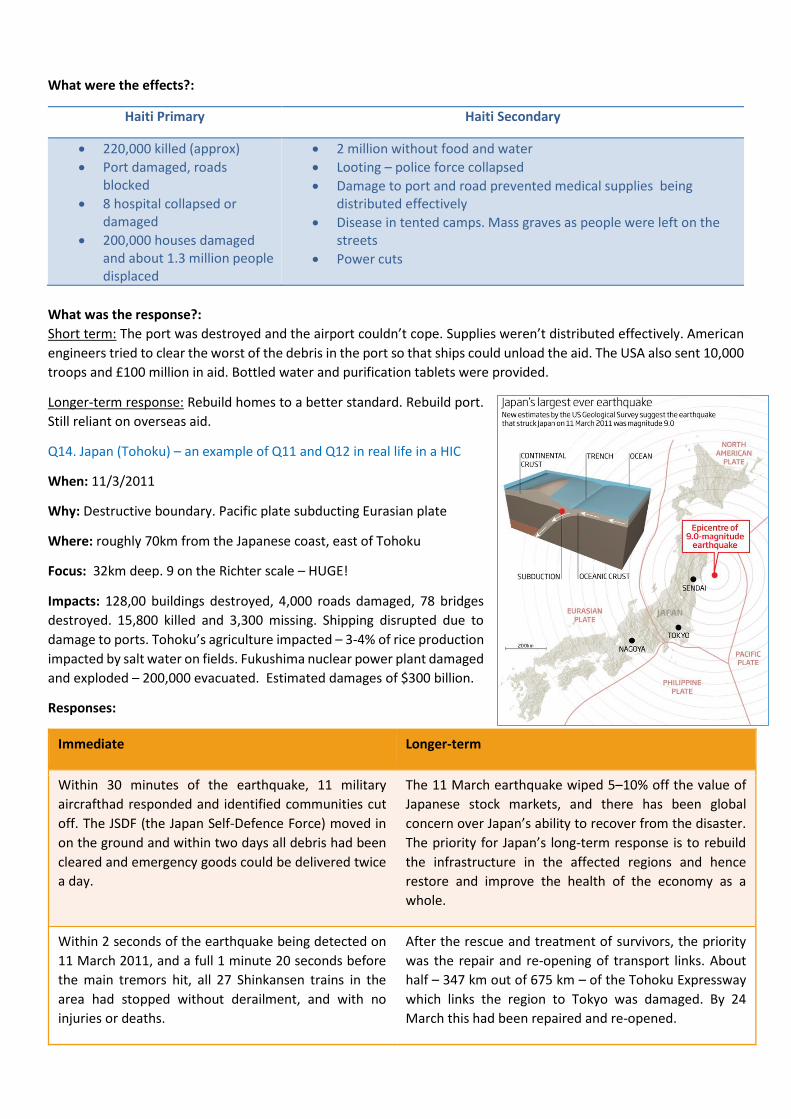
What were the effects?:
Haiti Primary Haiti Secondary
220,000 killed (approx)
Port damaged, roads blocked
8 hospital collapsed or damaged
200,000 houses damaged and about 1.3 million people displaced
2 million without food and water
Looting – police force collapsed
Damage to port and road prevented medical supplies being distributed effectively
Disease in tented camps. Mass graves as people were left on the streets
Power cuts
What was the response?:
Short term: The port was destroyed and the airport couldn’t cope. Supplies weren’t distributed effectively. American
engineers tried to clear the worst of the debris in the port so that ships could unload the aid. The USA also sent 10,000
troops and £100 million in aid. Bottled water and purification tablets were provided.
Longer-term response: Rebuild homes to a better standard. Rebuild port.
Still reliant on overseas aid.
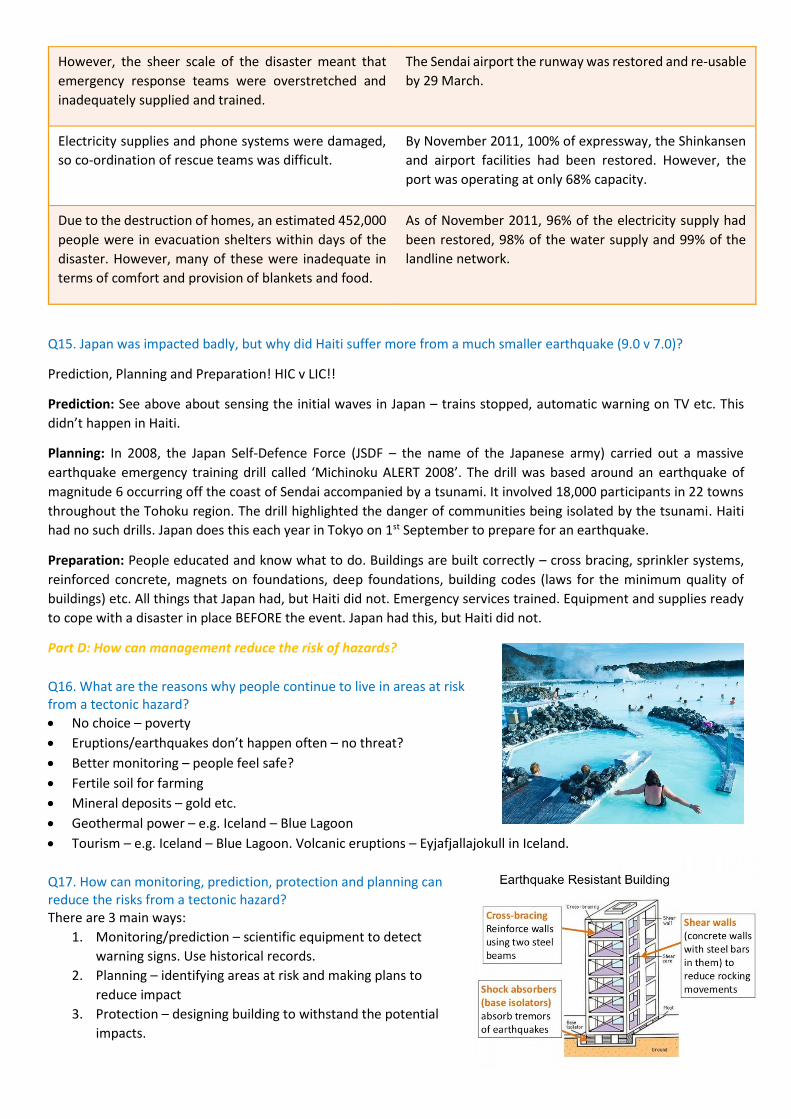
Q14. Japan (Tohoku) – an example of Q11 and Q12 in real life in a HIC
When: 11/3/2011
Why: Destructive boundary. Pacific plate subducting Eurasian plate
Where: roughly 70km from the Japanese coast, east of Tohoku
Focus: 32km deep. 9 on the Richter scale – HUGE!
Impacts: 128,00 buildings destroyed, 4,000 roads damaged, 78 bridges
destroyed. 15,800 killed and 3,300 missing. Shipping disrupted due to
damage to ports. Tohoku’s agriculture impacted – 3-4% of rice production
impacted by salt water on fields. Fukushima nuclear power plant damaged
and exploded – 200,000 evacuated. Estimated damages of $300 billion.
Responses:
Immediate Longer-term
Within 30 minutes of the earthquake, 11 military
aircrafthad responded and identified communities cut
off. The JSDF (the Japan Self-Defence Force) moved in
on the ground and within two days all debris had been
cleared and emergency goods could be delivered twice
a day.
The 11 March earthquake wiped 5–10% off the value of
Japanese stock markets, and there has been global
concern over Japan’s ability to recover from the disaster.
The priority for Japan’s long-term response is to rebuild
the infrastructure in the affected regions and hence
restore and improve the health of the economy as a
whole.
Within 2 seconds of the earthquake being detected on
11 March 2011, and a full 1 minute 20 seconds before
the main tremors hit, all 27 Shinkansen trains in the
area had stopped without derailment, and with no
injuries or deaths.
After the rescue and treatment of survivors, the priority
was the repair and re-opening of transport links. About
half – 347 km out of 675 km – of the Tohoku Expressway
which links the region to Tokyo was damaged. By 24
March this had been repaired and re-opened.
However, the sheer scale of the disaster meant that
emergency response teams were overstretched and
inadequately supplied and trained.
The Sendai airport the runway was restored and re-usable
by 29 March.
Electricity supplies and phone systems were damaged,
so co-ordination of rescue teams was difficult.
By November 2011, 100% of expressway, the Shinkansen
and airport facilities had been restored. However, the
port was operating at only 68% capacity.
Due to the destruction of homes, an estimated 452,000
people were in evacuation shelters within days of the
disaster. However, many of these were inadequate in
terms of comfort and provision of blankets and food.
As of November 2011, 96% of the electricity supply had
been restored, 98% of the water supply and 99% of the
landline network.
Q15. Japan was impacted badly, but why did Haiti suffer more from a much smaller earthquake (9.0 v 7.0)?
Prediction, Planning and Preparation! HIC v LIC!!
Prediction: See above about sensing the initial waves in Japan – trains stopped, automatic warning on TV etc. This
didn’t happen in Haiti.
Planning: In 2008, the Japan Self-Defence Force (JSDF – the name of the Japanese army) carried out a massive
earthquake emergency training drill called ‘Michinoku ALERT 2008’. The drill was based around an earthquake of
magnitude 6 occurring off the coast of Sendai accompanied by a tsunami. It involved 18,000 participants in 22 towns
throughout the Tohoku region. The drill highlighted the danger of communities being isolated by the tsunami. Haiti
had no such drills. Japan does this each year in Tokyo on 1st September to prepare for an earthquake.
Preparation: People educated and know what to do. Buildings are built correctly – cross bracing, sprinkler systems,
reinforced concrete, magnets on foundations, deep foundations, building codes (laws for the minimum quality of
buildings) etc. All things that Japan had, but Haiti did not. Emergency services trained. Equipment and supplies ready
to cope with a disaster in place BEFORE the event. Japan had this, but Haiti did not.
Part D: How can management reduce the risk of hazards?
Q16. What are the reasons why people continue to live in areas at risk from a tectonic hazard?
No choice – poverty
Eruptions/earthquakes don’t happen often – no threat?
Better monitoring – people feel safe?
Fertile soil for farming
Mineral deposits – gold etc.
Geothermal power – e.g. Iceland – Blue Lagoon
Tourism – e.g. Iceland – Blue Lagoon. Volcanic eruptions – Eyjafjallajokull in Iceland.
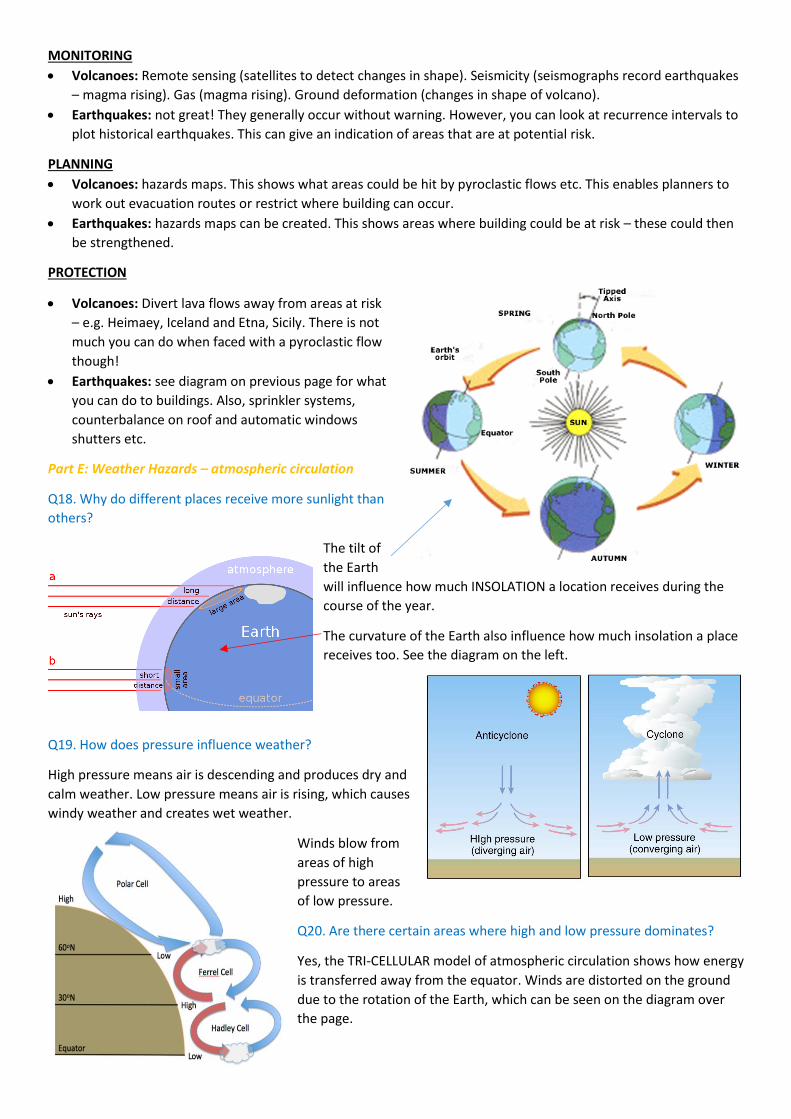
Q17. How can monitoring, prediction, protection and planning can reduce the risks from a tectonic hazard? There are 3 main ways:
1. Monitoring/prediction – scientific equipment to detect
warning signs. Use historical records.
2. Planning – identifying areas at risk and making plans to
reduce impact
3. Protection – designing building to withstand the potential
impacts.
MONITORING
Volcanoes: Remote sensing (satellites to detect changes in shape). Seismicity (seismographs record earthquakes
– magma rising). Gas (magma rising). Ground deformation (changes in shape of volcano).
Earthquakes: not great! They generally occur without warning. However, you can look at recurrence intervals to
plot historical earthquakes. This can give an indication of areas that are at potential risk.
PLANNING
Volcanoes: hazards maps. This shows what areas could be hit by pyroclastic flows etc. This enables planners to
work out evacuation routes or restrict where building can occur.
Earthquakes: hazards maps can be created. This shows areas where building could be at risk – these could then
be strengthened.
PROTECTION
Volcanoes: Divert lava flows away from areas at risk
– e.g. Heimaey, Iceland and Etna, Sicily. There is not
much you can do when faced with a pyroclastic flow
though!
Earthquakes: see diagram on previous page for what
you can do to buildings. Also, sprinkler systems,
counterbalance on roof and automatic windows
shutters etc.
Part E: Weather Hazards – atmospheric circulation
Q18. Why do different places receive more sunlight than
others?
The tilt of
the Earth
will influence how much INSOLATION a location receives during the
course of the year.
The curvature of the Earth also influence how much insolation a place
receives too. See the diagram on the left.
Q19. How does pressure influence weather?
High pressure means air is descending and produces dry and
calm weather. Low pressure means air is rising, which causes
windy weather and creates wet weather.
Winds blow from
areas of high
pressure to areas
of low pressure.
Q20. Are there certain areas where high and low pressure dominates?
Yes, the TRI-CELLULAR model of atmospheric circulation shows how energy
is transferred away from the equator. Winds are distorted on the ground
due to the rotation of the Earth, which can be seen on the diagram over
the page.
Can you work out why the rainforests are where they
are?
Why is it hot and dry about 30 degrees north or south
of the equator?
Why do we often experience cloudy and wet weather
in the UK?
These questions can be understood by looking at
questions 18-20.
Part F: Tropical storms
Q21. Where are tropical storms located?
See the World map below. Note that they have
different names in different parts of the World.
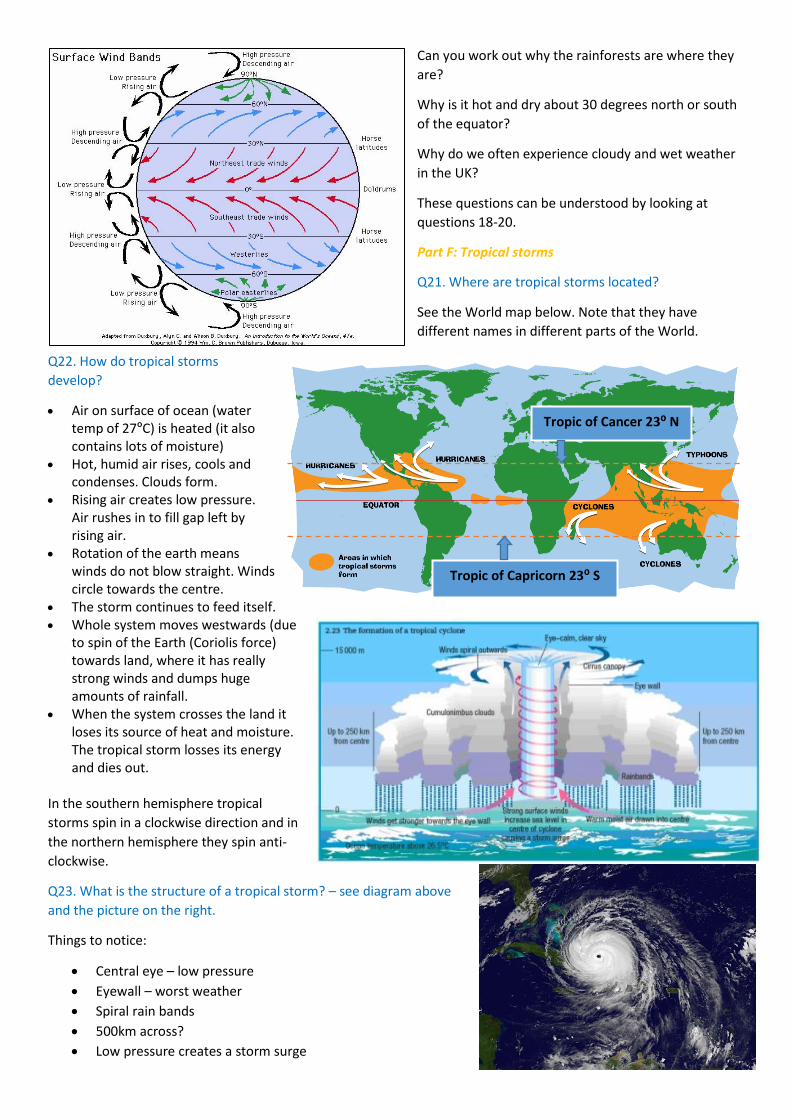
Q22. How do tropical storms
develop?
Air on surface of ocean (water temp of 27ºC) is heated (it also contains lots of moisture)
Hot, humid air rises, cools and condenses. Clouds form.
Rising air creates low pressure. Air rushes in to fill gap left by rising air.
Rotation of the earth means winds do not blow straight. Winds circle towards the centre.
The storm continues to feed itself. Whole system moves westwards (due
to spin of the Earth (Coriolis force) towards land, where it has really strong winds and dumps huge amounts of rainfall.
When the system crosses the land it loses its source of heat and moisture. The tropical storm losses its energy and dies out.
In the southern hemisphere tropical
storms spin in a clockwise direction and in
the northern hemisphere they spin anti-
clockwise.
Q23. What is the structure of a tropical storm? – see diagram above
and the picture on the right.
Things to notice:
Central eye – low pressure
Eyewall – worst weather
Spiral rain bands
500km across?
Low pressure creates a storm surge
Tropic of Capricorn 23⁰ S
Tropic of Cancer 23⁰ N
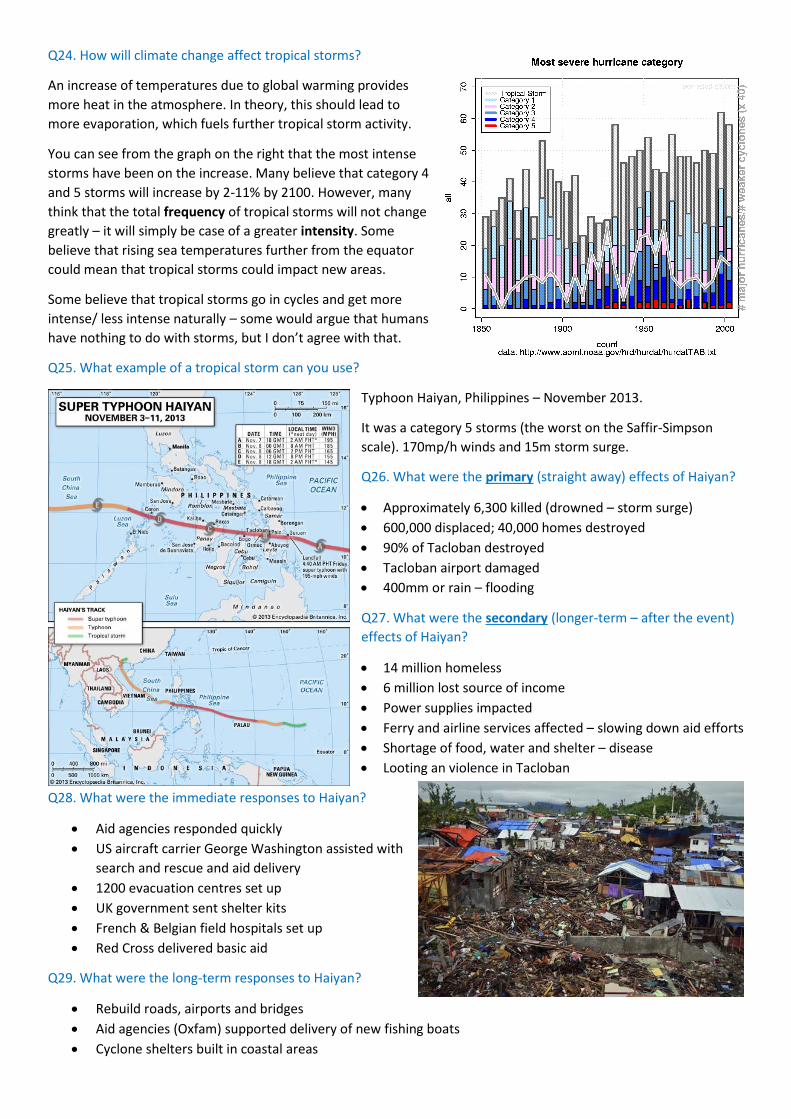
Q24. How will climate change affect tropical storms?
An increase of temperatures due to global warming provides
more heat in the atmosphere. In theory, this should lead to
more evaporation, which fuels further tropical storm activity.
You can see from the graph on the right that the most intense
storms have been on the increase. Many believe that category 4
and 5 storms will increase by 2-11% by 2100. However, many
think that the total frequency of tropical storms will not change
greatly – it will simply be case of a greater intensity. Some
believe that rising sea temperatures further from the equator
could mean that tropical storms could impact new areas.
Some believe that tropical storms go in cycles and get more
intense/ less intense naturally – some would argue that humans
have nothing to do with storms, but I don’t agree with that.
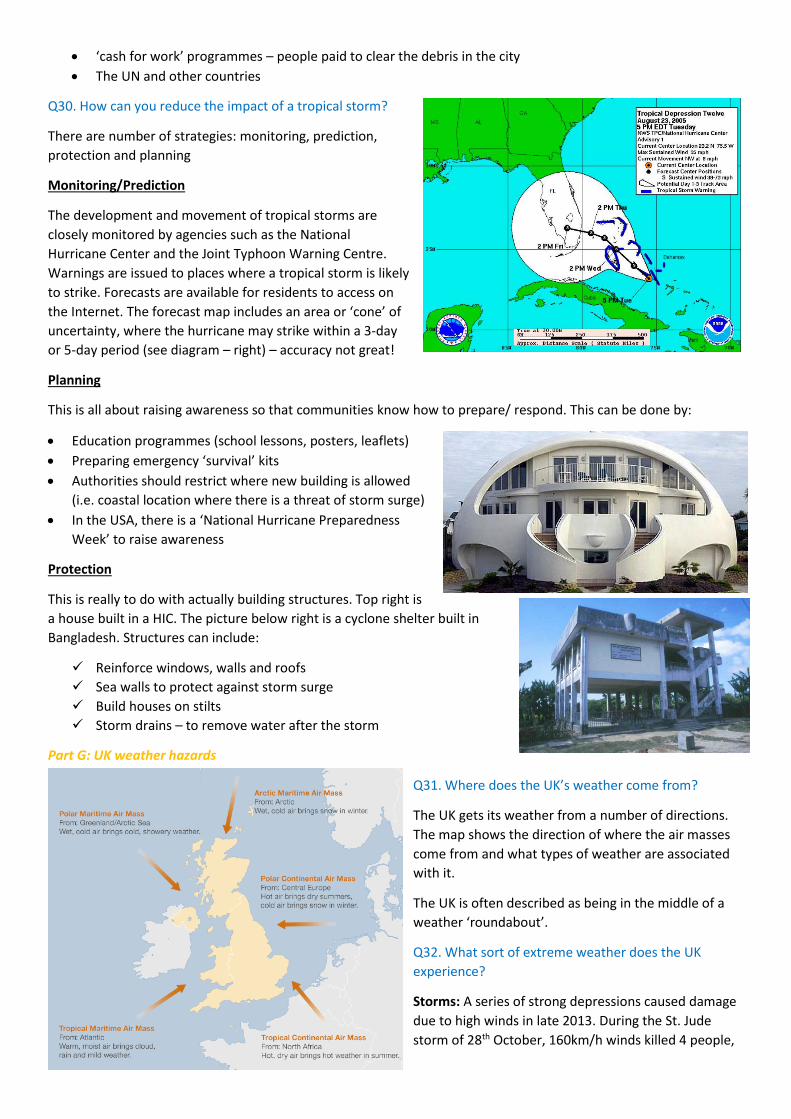
Q25. What example of a tropical storm can you use?
Typhoon Haiyan, Philippines – November 2013.
It was a category 5 storms (the worst on the Saffir-Simpson
scale). 170mp/h winds and 15m storm surge.
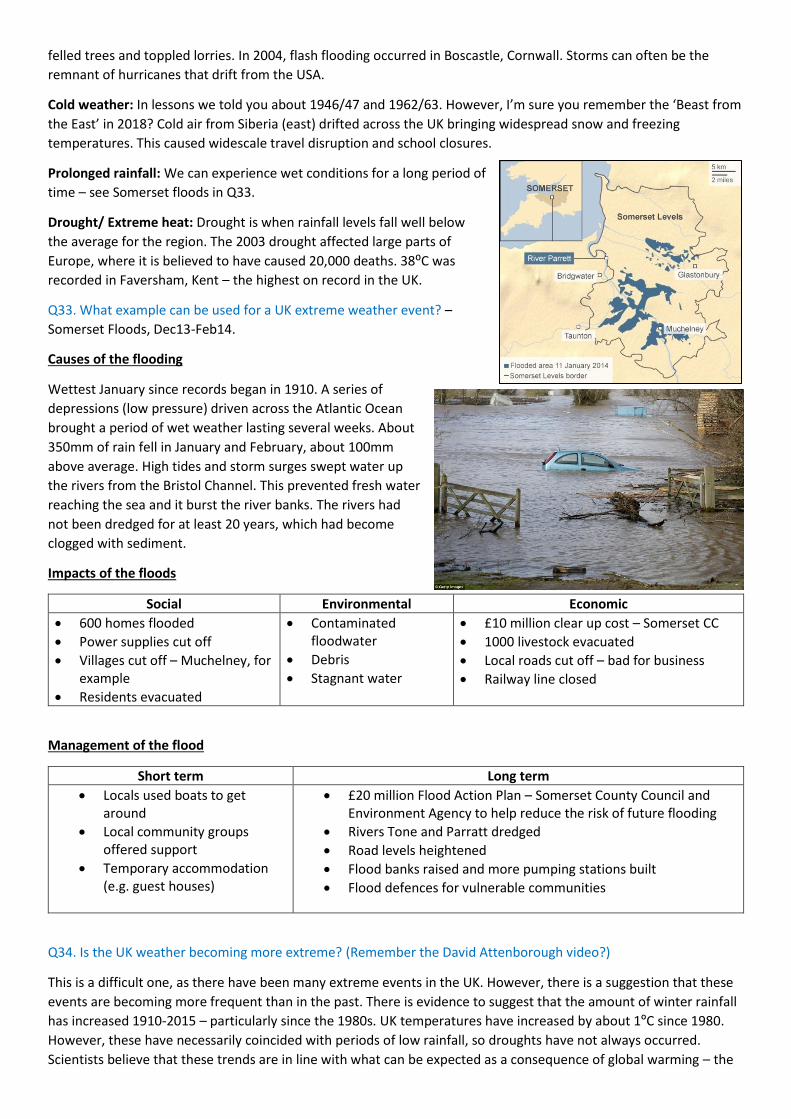
Q26. What were the primary (straight away) effects of Haiyan?
Approximately 6,300 killed (drowned – storm surge)
600,000 displaced; 40,000 homes destroyed
90% of Tacloban destroyed
Tacloban airport damaged
400mm or rain – flooding
Q27. What were the secondary (longer-term – after the event)
effects of Haiyan?
14 million homeless
6 million lost source of income
Power supplies impacted
Ferry and airline services affected – slowing down aid efforts
Shortage of food, water and shelter – disease
Looting an violence in Tacloban
Q28. What were the immediate responses to Haiyan?
Aid agencies responded quickly
US aircraft carrier George Washington assisted with
search and rescue and aid delivery
1200 evacuation centres set up
UK government sent shelter kits
French & Belgian field hospitals set up
Red Cross delivered basic aid
Q29. What were the long-term responses to Haiyan?
Rebuild roads, airports and bridges
Aid agencies (Oxfam) supported delivery of new fishing boats
Cyclone shelters built in coastal areas
‘cash for work’ programmes – people paid to clear the debris in the city
The UN and other countries
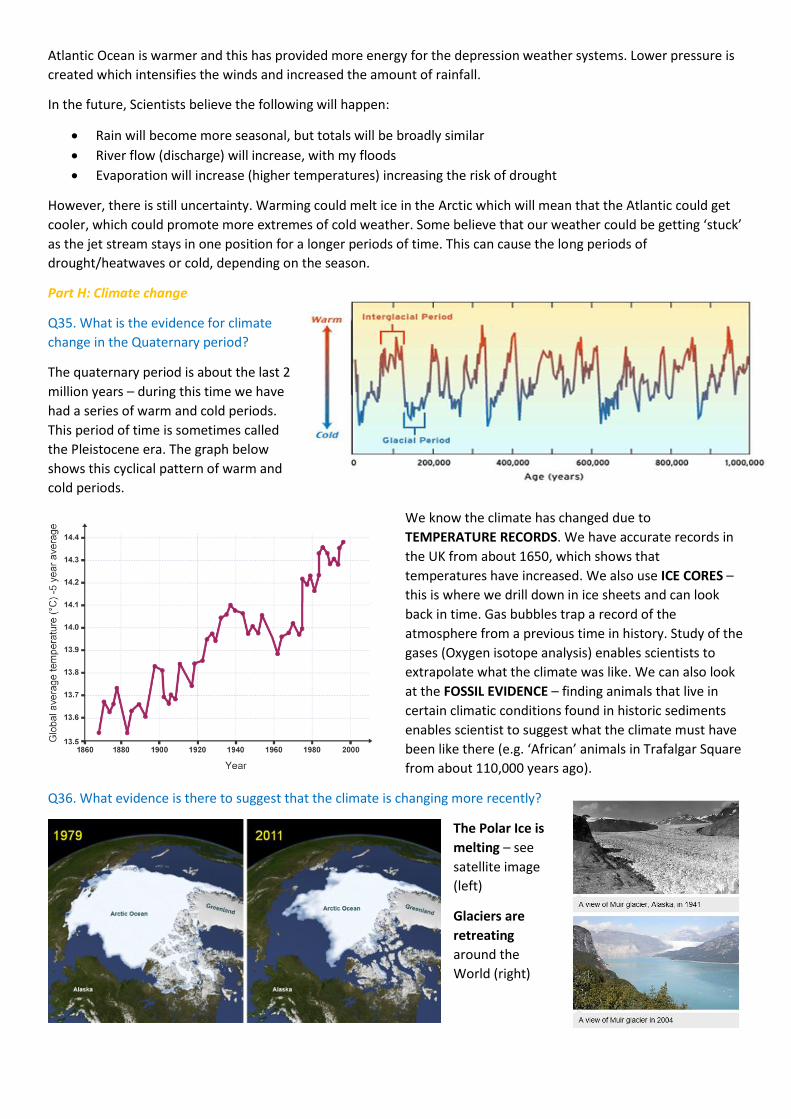
Q30. How can you reduce the impact of a tropical storm?
There are number of strategies: monitoring, prediction,
protection and planning
Monitoring/Prediction
The development and movement of tropical storms are
closely monitored by agencies such as the National
Hurricane Center and the Joint Typhoon Warning Centre.
Warnings are issued to places where a tropical storm is likely
to strike. Forecasts are available for residents to access on
the Internet. The forecast map includes an area or ‘cone’ of
uncertainty, where the hurricane may strike within a 3-day
or 5-day period (see diagram – right) – accuracy not great!
Planning
This is all about raising awareness so that communities know how to prepare/ respond. This can be done by:
Education programmes (school lessons, posters, leaflets)
Preparing emergency ‘survival’ kits
Authorities should restrict where new building is allowed
(i.e. coastal location where there is a threat of storm surge)
In the USA, there is a ‘National Hurricane Preparedness
Week’ to raise awareness
Protection
This is really to do with actually building structures. Top right is
a house built in a HIC. The picture below right is a cyclone shelter built in
Bangladesh. Structures can include:
Reinforce windows, walls and roofs
Sea walls to protect against storm surge
Build houses on stilts
Storm drains – to remove water after the storm
Part G: UK weather hazards
Q31. Where does the UK’s weather come from?
The UK gets its weather from a number of directions.
The map shows the direction of where the air masses
come from and what types of weather are associated
with it.
The UK is often described as being in the middle of a
weather ‘roundabout’.
Q32. What sort of extreme weather does the UK
experience?
Storms: A series of strong depressions caused damage
due to high winds in late 2013. During the St. Jude
storm of 28th October, 160km/h winds killed 4 people,
felled trees and toppled lorries. In 2004, flash flooding occurred in Boscastle, Cornwall. Storms can often be the
remnant of hurricanes that drift from the USA.
Cold weather: In lessons we told you about 1946/47 and 1962/63. However, I’m sure you remember the ‘Beast from
the East’ in 2018? Cold air from Siberia (east) drifted across the UK bringing widespread snow and freezing
temperatures. This caused widescale travel disruption and school closures.
Prolonged rainfall: We can experience wet conditions for a long period of
time – see Somerset floods in Q33.
Drought/ Extreme heat: Drought is when rainfall levels fall well below
the average for the region. The 2003 drought affected large parts of
Europe, where it is believed to have caused 20,000 deaths. 38⁰C was
recorded in Faversham, Kent – the highest on record in the UK.
Q33. What example can be used for a UK extreme weather event? –
Somerset Floods, Dec13-Feb14.
Causes of the flooding
Wettest January since records began in 1910. A series of
depressions (low pressure) driven across the Atlantic Ocean
brought a period of wet weather lasting several weeks. About
350mm of rain fell in January and February, about 100mm
above average. High tides and storm surges swept water up
the rivers from the Bristol Channel. This prevented fresh water
reaching the sea and it burst the river banks. The rivers had
not been dredged for at least 20 years, which had become
clogged with sediment.
Impacts of the floods
Social Environmental Economic
600 homes flooded
Power supplies cut off
Villages cut off – Muchelney, for example
Residents evacuated
Contaminated floodwater
Debris
Stagnant water
£10 million clear up cost – Somerset CC
1000 livestock evacuated
Local roads cut off – bad for business
Railway line closed
Management of the flood
Short term Long term
Locals used boats to get around
Local community groups offered support
Temporary accommodation (e.g. guest houses)
£20 million Flood Action Plan – Somerset County Council and Environment Agency to help reduce the risk of future flooding
Rivers Tone and Parratt dredged
Road levels heightened
Flood banks raised and more pumping stations built
Flood defences for vulnerable communities
Q34. Is the UK weather becoming more extreme? (Remember the David Attenborough video?)
This is a difficult one, as there have been many extreme events in the UK. However, there is a suggestion that these
events are becoming more frequent than in the past. There is evidence to suggest that the amount of winter rainfall
has increased 1910-2015 – particularly since the 1980s. UK temperatures have increased by about 1ºC since 1980.
However, these have necessarily coincided with periods of low rainfall, so droughts have not always occurred.
Scientists believe that these trends are in line with what can be expected as a consequence of global warming – the
Atlantic Ocean is warmer and this has provided more energy for the depression weather systems. Lower pressure is
created which intensifies the winds and increased the amount of rainfall.
In the future, Scientists believe the following will happen:
Rain will become more seasonal, but totals will be broadly similar
River flow (discharge) will increase, with my floods
Evaporation will increase (higher temperatures) increasing the risk of drought
However, there is still uncertainty. Warming could melt ice in the Arctic which will mean that the Atlantic could get
cooler, which could promote more extremes of cold weather. Some believe that our weather could be getting ‘stuck’
as the jet stream stays in one position for a longer periods of time. This can cause the long periods of
drought/heatwaves or cold, depending on the season.
Part H: Climate change
Q35. What is the evidence for climate
change in the Quaternary period?
The quaternary period is about the last 2
million years – during this time we have
had a series of warm and cold periods.
This period of time is sometimes called
the Pleistocene era. The graph below
shows this cyclical pattern of warm and
cold periods.
We know the climate has changed due to
TEMPERATURE RECORDS. We have accurate records in
the UK from about 1650, which shows that
temperatures have increased. We also use ICE CORES –
this is where we drill down in ice sheets and can look
back in time. Gas bubbles trap a record of the
atmosphere from a previous time in history. Study of the
gases (Oxygen isotope analysis) enables scientists to
extrapolate what the climate was like. We can also look
at the FOSSIL EVIDENCE – finding animals that live in
certain climatic conditions found in historic sediments
enables scientist to suggest what the climate must have
been like there (e.g. ‘African’ animals in Trafalgar Square
from about 110,000 years ago).
Q36. What evidence is there to suggest that the climate is changing more recently?
The Polar Ice is
melting – see
satellite image
(left)
Glaciers are
retreating
around the
World (right)
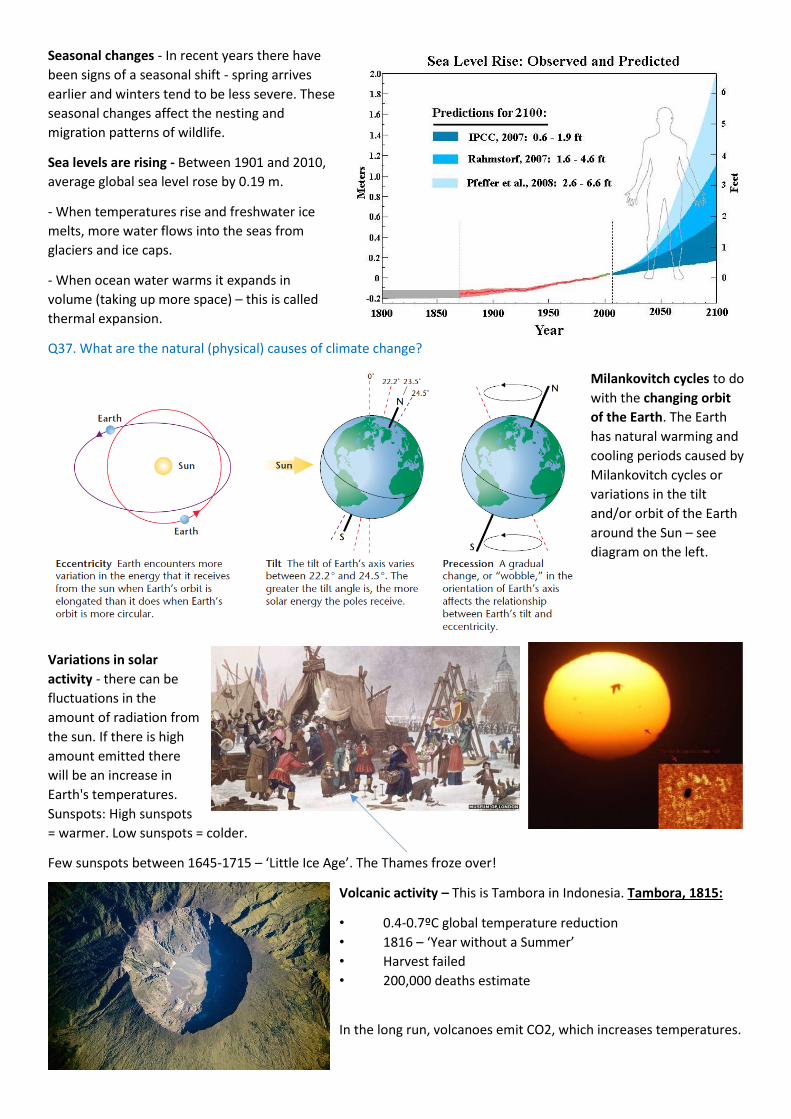
Seasonal changes - In recent years there have
been signs of a seasonal shift - spring arrives
earlier and winters tend to be less severe. These
seasonal changes affect the nesting and
migration patterns of wildlife.
Sea levels are rising - Between 1901 and 2010,
average global sea level rose by 0.19 m.
- When temperatures rise and freshwater ice
melts, more water flows into the seas from
glaciers and ice caps.
- When ocean water warms it expands in
volume (taking up more space) – this is called
thermal expansion.
Q37. What are the natural (physical) causes of climate change?
Milankovitch cycles to do
with the changing orbit
of the Earth. The Earth
has natural warming and
cooling periods caused by
Milankovitch cycles or
variations in the tilt
and/or orbit of the Earth
around the Sun – see
diagram on the left.
Variations in solar
activity - there can be
fluctuations in the
amount of radiation from
the sun. If there is high
amount emitted there
will be an increase in
Earth's temperatures.
Sunspots: High sunspots
= warmer. Low sunspots = colder.
Few sunspots between 1645-1715 – ‘Little Ice Age’. The Thames froze over!
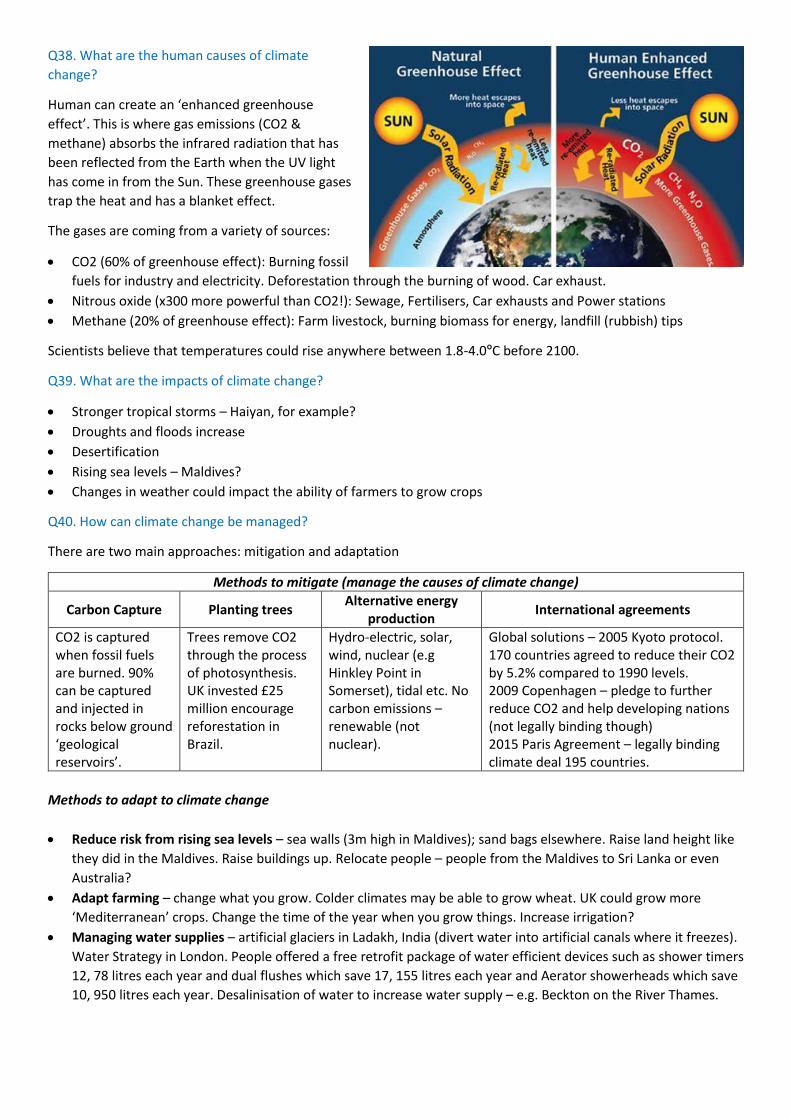
Volcanic activity – This is Tambora in Indonesia. Tambora, 1815:
• 0.4-0.7ºC global temperature reduction
• 1816 – ‘Year without a Summer’
• Harvest failed
• 200,000 deaths estimate
In the long run, volcanoes emit CO2, which increases temperatures.
Q38. What are the human causes of climate
change?
Human can create an ‘enhanced greenhouse
effect’. This is where gas emissions (CO2 &
methane) absorbs the infrared radiation that has
been reflected from the Earth when the UV light
has come in from the Sun. These greenhouse gases
trap the heat and has a blanket effect.
The gases are coming from a variety of sources:
CO2 (60% of greenhouse effect): Burning fossil
fuels for industry and electricity. Deforestation through the burning of wood. Car exhaust.
Nitrous oxide (x300 more powerful than CO2!): Sewage, Fertilisers, Car exhausts and Power stations
Methane (20% of greenhouse effect): Farm livestock, burning biomass for energy, landfill (rubbish) tips
Scientists believe that temperatures could rise anywhere between 1.8-4.0ºC before 2100.
Q39. What are the impacts of climate change?
Stronger tropical storms – Haiyan, for example?
Droughts and floods increase
Desertification
Rising sea levels – Maldives?
Changes in weather could impact the ability of farmers to grow crops
Q40. How can climate change be managed?
There are two main approaches: mitigation and adaptation
Methods to mitigate (manage the causes of climate change)
Carbon Capture Planting trees Alternative energy
production International agreements
CO2 is captured when fossil fuels are burned. 90% can be captured and injected in rocks below ground ‘geological reservoirs’.
Trees remove CO2 through the process of photosynthesis. UK invested £25 million encourage reforestation in Brazil.
Hydro-electric, solar, wind, nuclear (e.g Hinkley Point in Somerset), tidal etc. No carbon emissions – renewable (not nuclear).
Global solutions – 2005 Kyoto protocol. 170 countries agreed to reduce their CO2 by 5.2% compared to 1990 levels. 2009 Copenhagen – pledge to further reduce CO2 and help developing nations (not legally binding though) 2015 Paris Agreement – legally binding climate deal 195 countries.
Methods to adapt to climate change
Reduce risk from rising sea levels – sea walls (3m high in Maldives); sand bags elsewhere. Raise land height like
they did in the Maldives. Raise buildings up. Relocate people – people from the Maldives to Sri Lanka or even
Australia?
Adapt farming – change what you grow. Colder climates may be able to grow wheat. UK could grow more
‘Mediterranean’ crops. Change the time of the year when you grow things. Increase irrigation?
Managing water supplies – artificial glaciers in Ladakh, India (divert water into artificial canals where it freezes).
Water Strategy in London. People offered a free retrofit package of water efficient devices such as shower timers
12, 78 litres each year and dual flushes which save 17, 155 litres each year and Aerator showerheads which save
10, 950 litres each year. Desalinisation of water to increase water supply – e.g. Beckton on the River Thames.
Related Documents
![Hazards case studies revision[1]](https://static.cupdf.com/doc/110x72/5591a7111a28abd4098b475f/hazards-case-studies-revision1.jpg)