[212] The Condor 107:212–227 q The Cooper Ornithological Society 2005 GEOGRAPHY OF SPRING LANDBIRD MIGRATION THROUGH RIPARIAN HABITATS IN SOUTHWESTERN NORTH AMERICA SUSAN K. SKAGEN 1,7 ,JEFFREY F. KELLY 2 ,CHARLES VAN RIPER III 3 ,RICHARD L. HUTTO 4 , DEBORAH M. FINCH 5 ,DAVID J. KRUEPER 6 , AND CYNTHIA P. MELCHER 1 1 U.S. Geological Survey, Fort Collins Science Center, Fort Collins, CO 80526 2 Oklahoma Biological Survey & Department of Zoology, University of Oklahoma, Norman, OK 73019 3 U.S. Geological Survey, Southwest Biological Science Center Sonoran Desert Research Station, University of Arizona, Tucson, AZ 85721 4 Avian Science Center, Division of Biological Sciences, University of Montana, Missoula, MT 59812 5 U.S.D.A. Forest Service, Rocky Mountain Research Station, Albuquerque, NM 87106 6 U.S. Fish & Wildlife Service Region 2, Albuquerque, NM 87103 Abstract. Migration stopover resources, particularly riparian habitats, are critically impor- tant to landbirds migrating across the arid southwestern region of North America. To explore the effects of species biogeography and habitat affinity on spring migration patterns, we syn- thesized existing bird abundance and capture data collected in riparian habitats of the border- lands region of the U.S. and Mexico. We determined the importance of geographic factors (longitude and latitude) in explaining variation in abundances and capture rates of 32 long- distance and three short-distance migrant species. Abundances and capture rates of 13 and 11 species, respectively, increased with increasing longitude, and four species’ abundance and capture rates decreased with increasing longitude. Riparian associates, but not nonriparian species, were more abundant in western sites. Their abundance patterns were only weakly influenced by species biogeography. In contrast, biogeography did influence abundance pat- terns of nonriparian birds, suggesting that they choose the shortest, most direct route between wintering and breeding areas. We hypothesize that riparian obligate birds may, to some degree, adjust their migration routes to maximize time spent in high-quality riparian zones, but they are able to find suitable habitat opportunistically when crossing more hostile landscapes. In contrast, nonriparian birds adhere more closely to a hierarchical model in which the migratory route is determined by biogeographic constraints. Conservation of riparian habitats is necessary to meet future habitat stopover requirements of many western Neotropical migrant birds. We advocate a coordinated research effort to further elucidate patterns of distribution and habitat use so that conservation activities can be focused effectively. Key words: desert southwest, geography, Nearctic-Neotropical migrants, riparian hab- itat, spring migration, stopover sites. Geografı ´a de la Migracio ´n de Primavera de Aves Terrestres a Trave ´s de Ha ´bitats Riparios en el Sudoeste de Norteame ´rica Resumen. Los recursos que sirven como paradas migratorias, especialmente los ha ´bitats riparios, son crı ´ticamente importantes para las aves migratorias terrestres a trave ´s de la regio ´n a ´rida del sudoeste de Norteame ´rica. Para explorar los efectos de la biogeografı ´a de las especies y la afinidad de ha ´bitat sobre los patrones de migracio ´n de primavera, sinteti- zamos los datos existentes de abundancia y capturas de aves colectados en ha ´bitats riparios en la zona fronteriza entre Estados Unidos y Me ´xico. Determinamos la importancia de factores geogra ´ficos (latitud y longitud) en explicar la variacio ´n en las abundancias y en las tasas de captura de 32 especies migratorias de larga distancia y 3 de corta distancia. Las abundancias y tasas de captura de 13 y 11 especies, respectivamente, aumentaron con el aumento de la longitud, y cuatro especies mostraron una disminucio ´n con el aumento de la longitud. Las aves asociadas a los ambientes riparios fueron ma ´s abundantes en los sitios del oeste que las especies no riparias, y su abundancia so ´lo se vio levemente influenciada por la biogeografı ´a de las especies. De modo contrastante, la biogeografı ´a sı ´ influencio ´ los patrones de abundancia de las especies de aves no riparias, lo que sugiere que e ´stas esco- gieron la ruta ma ´s corta y directa entre las a ´reas de invernada y de reproduccio ´n. Propo- nemos la hipo ´tesis de que las aves de ha ´bitat ripario obligatorias pueden, hasta cierto grado, ajustar sus rutas migratorias para maximizar el tiempo en zonas riparias de alta calidad, pero Manuscript received 25 August 2004; accepted 4 February 2005. 7 E-mail: susanp[email protected]

Welcome message from author
This document is posted to help you gain knowledge. Please leave a comment to let me know what you think about it! Share it to your friends and learn new things together.
Transcript
[212]
The Condor 107:212–227q The Cooper Ornithological Society 2005
GEOGRAPHY OF SPRING LANDBIRD MIGRATION THROUGHRIPARIAN HABITATS IN SOUTHWESTERN NORTH AMERICA
SUSAN K. SKAGEN1,7, JEFFREY F. KELLY2, CHARLES VAN RIPER III3, RICHARD L. HUTTO4,DEBORAH M. FINCH5, DAVID J. KRUEPER6, AND CYNTHIA P. MELCHER1
1U.S. Geological Survey, Fort Collins Science Center, Fort Collins, CO 805262Oklahoma Biological Survey & Department of Zoology, University of Oklahoma, Norman, OK 73019
3U.S. Geological Survey, Southwest Biological Science Center Sonoran Desert Research Station,University of Arizona, Tucson, AZ 85721
4Avian Science Center, Division of Biological Sciences, University of Montana, Missoula, MT 598125U.S.D.A. Forest Service, Rocky Mountain Research Station, Albuquerque, NM 87106
6U.S. Fish & Wildlife Service Region 2, Albuquerque, NM 87103
Abstract. Migration stopover resources, particularly riparian habitats, are critically impor-tant to landbirds migrating across the arid southwestern region of North America. To explorethe effects of species biogeography and habitat affinity on spring migration patterns, we syn-thesized existing bird abundance and capture data collected in riparian habitats of the border-lands region of the U.S. and Mexico. We determined the importance of geographic factors(longitude and latitude) in explaining variation in abundances and capture rates of 32 long-distance and three short-distance migrant species. Abundances and capture rates of 13 and 11species, respectively, increased with increasing longitude, and four species’ abundance andcapture rates decreased with increasing longitude. Riparian associates, but not nonriparianspecies, were more abundant in western sites. Their abundance patterns were only weaklyinfluenced by species biogeography. In contrast, biogeography did influence abundance pat-terns of nonriparian birds, suggesting that they choose the shortest, most direct route betweenwintering and breeding areas. We hypothesize that riparian obligate birds may, to some degree,adjust their migration routes to maximize time spent in high-quality riparian zones, but theyare able to find suitable habitat opportunistically when crossing more hostile landscapes. Incontrast, nonriparian birds adhere more closely to a hierarchical model in which the migratoryroute is determined by biogeographic constraints. Conservation of riparian habitats is necessaryto meet future habitat stopover requirements of many western Neotropical migrant birds. Weadvocate a coordinated research effort to further elucidate patterns of distribution and habitatuse so that conservation activities can be focused effectively.
Key words: desert southwest, geography, Nearctic-Neotropical migrants, riparian hab-itat, spring migration, stopover sites.
Geografıa de la Migracion de Primavera de Aves Terrestres a Traves de Habitats Riparios en elSudoeste de Norteamerica
Resumen. Los recursos que sirven como paradas migratorias, especialmente los habitatsriparios, son crıticamente importantes para las aves migratorias terrestres a traves de laregion arida del sudoeste de Norteamerica. Para explorar los efectos de la biogeografıa delas especies y la afinidad de habitat sobre los patrones de migracion de primavera, sinteti-zamos los datos existentes de abundancia y capturas de aves colectados en habitats ripariosen la zona fronteriza entre Estados Unidos y Mexico. Determinamos la importancia defactores geograficos (latitud y longitud) en explicar la variacion en las abundancias y en lastasas de captura de 32 especies migratorias de larga distancia y 3 de corta distancia. Lasabundancias y tasas de captura de 13 y 11 especies, respectivamente, aumentaron con elaumento de la longitud, y cuatro especies mostraron una disminucion con el aumento de lalongitud. Las aves asociadas a los ambientes riparios fueron mas abundantes en los sitiosdel oeste que las especies no riparias, y su abundancia solo se vio levemente influenciadapor la biogeografıa de las especies. De modo contrastante, la biogeografıa sı influencio lospatrones de abundancia de las especies de aves no riparias, lo que sugiere que estas esco-gieron la ruta mas corta y directa entre las areas de invernada y de reproduccion. Propo-nemos la hipotesis de que las aves de habitat ripario obligatorias pueden, hasta cierto grado,ajustar sus rutas migratorias para maximizar el tiempo en zonas riparias de alta calidad, pero
Manuscript received 25 August 2004; accepted 4 February 2005.7 E-mail: [email protected]

SPRING MIGRATION IN SOUTHWESTERN NORTH AMERICA 213
tambien son capaces de encontrar habitats adecuados de manera oportunista al cruzar pai-sajes mas hostiles. De modo contrastante, las aves no riparias se adhieren mas cercanamentea un modelo jerarquico en el cual la ruta migratoria es determinada por restricciones bio-geograficas. La conservacion de los habitats riparios es necesaria para cumplir los requeri-mientos futuros de las paradas durante la migracion de muchas aves migratorias Neotropi-cales del oeste. Abogamos por un esfuerzo de investigacion coordinado para elucidar lospatrones de distribucion y de uso de habitat de manera que las actividades para la conser-vacion puedan ser enfocadas de manera eficiente.
INTRODUCTION
The critical importance of migration stopover re-sources to en route landbirds in the western UShas recently come to the forefront of avian re-search and conservation (Hutto 1998, 2000, Ska-gen et al. 1998, Yong et al. 1998, Kelly et al.1999, Finch and Yong 2000). Long-distance mi-gration is energetically costly, and migratorybirds either must refuel frequently or carry largefat reserves while traveling between winteringand breeding areas. Loss of suitable stopoverhabitat may increase competition for limitedfood resources, increase energetic stress, inhibitmigration, and increase mortality, ultimately re-ducing reproductive success on the breedinggrounds (Evans et al. 1991, Moore and Yong1991, Moore et al. 1995). Petit (2000) noted thatidentification of high-priority stopover sites andmigration habitats critical to the long-term per-sistence of migrating species is necessary beforecomprehensive strategies for species protectioncan be completed. Effective conservation plan-ning for Neotropical migrant landbirds must in-corporate information on migration as well asbreeding and wintering resource needs.
Recent evidence suggests that several attri-butes of migration are tied to species-specificbiogeographic features, which include the sizeof its breeding range and distance between win-tering and breeding areas. For example, abun-dances and variation in abundances of landbirdsat stopover sites in the southwestern U.S. arestrongly related to the proximity of those sitesto species’ breeding ranges (Skagen et al. 1998,Kelly et al. 1999). Geographic locations used bymany landbirds during spring migration mayalso vary regionally depending on location ofwintering areas. Western Mexico comprises asubstantial portion of the wintering range ofmany landbird species (Hutto 1980, 1985) thatbreed across the western U.S. and Canada.These species, such as vireos and flycatchers,winter along the Pacific coast of Mexico westand south of the Sierra Madre Occidental from
southern Sonora to Guatemala (Barlow 1980[vireos], Fitzpatrick 1980 [flycatchers], Hutto1980, 1992). Further, genetically distinct racesof some migrants that are broadly distributed intheir breeding ranges, such as Common Yellow-throat (Geothlypis trichas) and Yellow-breastedChats (Icteria virens), show segregation in win-tering areas, with western breeders wintering inwestern Mexico and eastern breeders winteringalong the Atlantic coast of Mexico and CentralAmerica (Lovette et al. 2004). Western bird pop-ulations wintering in western Mexico may re-quire migration stopover sites within a relativelyrestricted area in the southwestern U.S. andnorthern Mexico as they travel north along thewestern edge of the Sierra Madre Occidental.
In the arid southwestern U.S., many migrantspecies, including western wood warblers, de-pend on riparian vegetation to provide stopoverresources in spring (Kelly and Hutto 2005) eventhough it comprises less than 1% of the westernlandscape (Knopf et al. 1988, Skagen et al.1998). Some landbirds are obligate riparian spe-cies whereas others use riparian vegetation fac-ultatively (Dobkin and Wilcox 1986). Anthro-pogenic disturbances to western riparian ecosys-tems, such as modification of natural flow re-gimes, development in flood plains, grazing,conversion of lands to agriculture, and forestclearing, are pervasive and increasing as a resultof human population growth in the region(Fleischner 1994, Poff et al. 1997, Skagen et al.,in press). The resulting loss and modification ofnative riparian forests reduces migration stop-over resources and can ultimately contribute tofuture population declines in western birds (Oh-mart 1994, Moore et al. 1995). Protection, man-agement, and restoration of these sensitive andthreatened habitats—and the species that dependon them—are important concerns for many fed-eral and state agencies and nongovernmental or-ganizations (Rich et al. 2004, The Nature Con-servancy 2004).
This project represents a synthesis of severalwestern migration studies, is an initial step in
214 SUSAN K. SKAGEN ET AL.
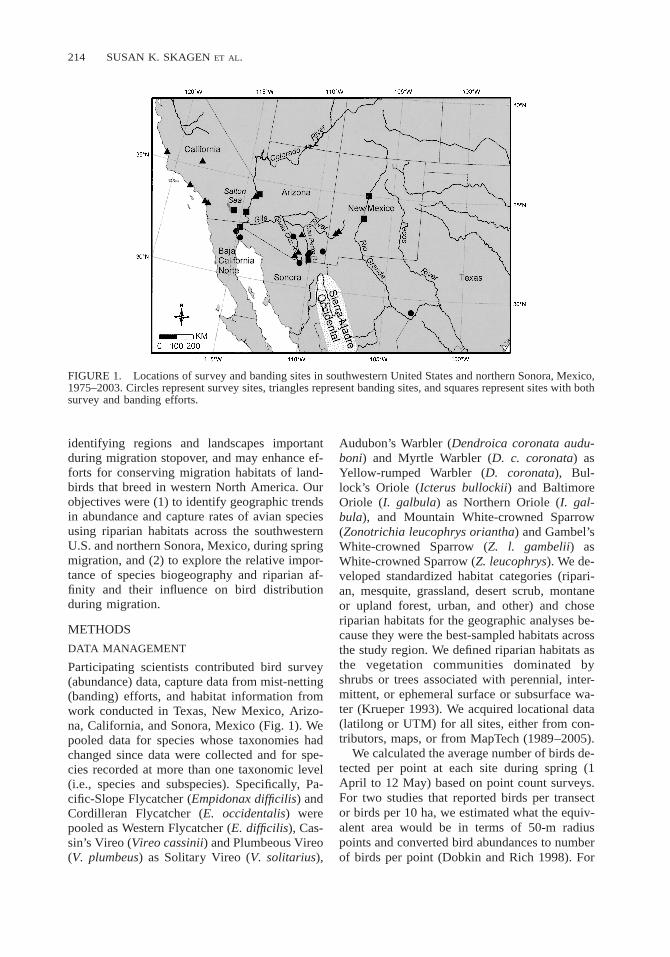
FIGURE 1. Locations of survey and banding sites in southwestern United States and northern Sonora, Mexico,1975–2003. Circles represent survey sites, triangles represent banding sites, and squares represent sites with bothsurvey and banding efforts.
identifying regions and landscapes importantduring migration stopover, and may enhance ef-forts for conserving migration habitats of land-birds that breed in western North America. Ourobjectives were (1) to identify geographic trendsin abundance and capture rates of avian speciesusing riparian habitats across the southwesternU.S. and northern Sonora, Mexico, during springmigration, and (2) to explore the relative impor-tance of species biogeography and riparian af-finity and their influence on bird distributionduring migration.
METHODS
DATA MANAGEMENT
Participating scientists contributed bird survey(abundance) data, capture data from mist-netting(banding) efforts, and habitat information fromwork conducted in Texas, New Mexico, Arizo-na, California, and Sonora, Mexico (Fig. 1). Wepooled data for species whose taxonomies hadchanged since data were collected and for spe-cies recorded at more than one taxonomic level(i.e., species and subspecies). Specifically, Pa-cific-Slope Flycatcher (Empidonax difficilis) andCordilleran Flycatcher (E. occidentalis) werepooled as Western Flycatcher (E. difficilis), Cas-sin’s Vireo (Vireo cassinii) and Plumbeous Vireo(V. plumbeus) as Solitary Vireo (V. solitarius),
Audubon’s Warbler (Dendroica coronata audu-boni) and Myrtle Warbler (D. c. coronata) asYellow-rumped Warbler (D. coronata), Bul-lock’s Oriole (Icterus bullockii) and BaltimoreOriole (I. galbula) as Northern Oriole (I. gal-bula), and Mountain White-crowned Sparrow(Zonotrichia leucophrys oriantha) and Gambel’sWhite-crowned Sparrow (Z. l. gambelii) asWhite-crowned Sparrow (Z. leucophrys). We de-veloped standardized habitat categories (ripari-an, mesquite, grassland, desert scrub, montaneor upland forest, urban, and other) and choseriparian habitats for the geographic analyses be-cause they were the best-sampled habitats acrossthe study region. We defined riparian habitats asthe vegetation communities dominated byshrubs or trees associated with perennial, inter-mittent, or ephemeral surface or subsurface wa-ter (Krueper 1993). We acquired locational data(latilong or UTM) for all sites, either from con-tributors, maps, or from MapTech (1989–2005).
We calculated the average number of birds de-tected per point at each site during spring (1April to 12 May) based on point count surveys.For two studies that reported birds per transector birds per 10 ha, we estimated what the equiv-alent area would be in terms of 50-m radiuspoints and converted bird abundances to numberof birds per point (Dobkin and Rich 1998). For

SPRING MIGRATION IN SOUTHWESTERN NORTH AMERICA 215
spring capture data, we calculated number ofcaptures per 100 mist-net hours for each site. Weeliminated all records of ‘flyovers’ and birds re-captured within one week of initial capture.
For each survey site, bird species that com-prised 90% of the sightings were categorized bytheir migration distance (using range maps in theBirds of North America [BNA] species accounts,Poole and Gill 1992–2003). We categorized spe-cies as long-distance migrants (L) if all or themajority of a species breeds north of 458N lati-tude, short-distance migrants (S) if a portion ofthe species’ population breeds only as far northas 418N latitude, and resident or local breedersif most individuals breed locally (some breed asfar north as 368N latitude).
We selected 32 species of long-distance mi-grants and three species of short-distance mi-grants that were commonly detected during sur-veys or captured at banding sites. We catego-rized breeding and wintering distributions of theselected species relative to longitudinal gradientsusing range maps in the BNA accounts (Table1). We also defined the northern and eastern lim-its of the breeding ranges; for species with dis-junct breeding ranges, we defined eastern extentof the western portion of the breeding range.Wintering distributions were categorized bywest-to-east extent (Table 1).
Referring to habitat descriptions in the BNAaccounts, we also assigned all species to one ofthree ‘riparian affinity’ categories: (1) riparianobligates and ‘associates,’ generally linked withriparian habitats (emphasis on western portion ofspecies’ range for species that extend east of1008W longitude), (2) not considered a riparian-associated species, per se, but often found in ri-parian woodlands or other riparian habitats, and(3) generally not associated with riparian habi-tats. In some contexts, we refer to riparian affin-ity categories 2 and 3 as ‘nonriparian species.’For five species with little or no information onmigration habitat use (Table 1), we assumed asimilar degree of riparian association during mi-gration as exhibited during the breeding season(Greenberg 1983).
STATISTICAL ANALYSES
Modeling avian abundance and capture rates.We described geographical patterns of severalsummary metrics, count totals, and capture ratesof 35 species using data collected in riparianhabitats west of 1008W longitude. For each anal-
ysis, we used AIC model-selection techniquesand model averaging (Burnham and Anderson2002) to determine the relative importance ofseveral explanatory variables and to estimate themagnitude of their effects. Because this work isexploratory, we modeled all combinations of in-dependent variables. Relative abundance esti-mates of birds were loge-transformed (ln) to im-prove normality and stabilize variance.
Although we were primarily interested in geo-graphic variables (longitude and latitude) to ex-plain spatial patterns in bird abundances andcapture rates during migration, we identifiedseveral additional covariates that potentiallyconfounded the resulting spatial patterns. There-fore, in addition to longitude and latitude, weconsidered the following explanatory variablesfor inclusion in candidate models to explain sur-vey data: effort (total number of survey-pointvisits or number of mist-net hours, ln-trans-formed), median date of surveys, extent of can-opy, elevation, and riparian habitat type. Extentof canopy was classified as 1 5 sparse structuralcanopy, primarily shrubs and small, scatteredtrees; 3 5 extensive tree canopy (gallery for-ests); and 2 5 intermediate between canopyclasses 1 and 3. Riparian type was categorizedas 1 5 low elevation (,560 m) or mainstemrivers, 2 5 higher elevation tributary rivers, and3 5 higher elevation tributary creeks.
We ran Pearson and Spearman rank correla-tions for all possible variable pairs and retainedonly one variable from pairs that were stronglycorrelated (z r z . 0.50). For survey sites, lon-gitude and elevation were negatively correlated(r14 5 20.75) as were longitude and ripariantype (r14 5 20.77); western sites were predom-inantly low-elevation, mainstem river habitats,whereas higher–elevation, lower-order rivers oc-curred farther east. We retained longitude for in-clusion in models because it was our primaryvariable of interest. Survey effort and extent ofcanopy were positively correlated (r14 5 0.65);several studies focused on gallery cottonwood(Populus spp.) forests. To decide which of thesetwo variables to include in the candidate modelsfor each of the selected species, we ran univar-iate linear regression models (species abundanceby ln[effort]; species abundance by canopy) andchose the model with the lowest residual sum ofsquares (RSS). We followed a similar process todetermine whether to use median date or the

216 SUSAN K. SKAGEN ET AL.
TABLE 1. Commonly detected migrant species categorized with respect to breeding and wintering distributionsand riparian affinity.
SpeciesSpecies
code
Breedingdistribu-
tioncategorya
Northernextent
(degreeslatitude)b
Easternextent
(degreeslongi-tude)c
Winterdistribu-
tioncategoryd
Riparianaffinity
categorye
Western Wood-Pewee (Contopus sordidulus) WEWP 1 66 97 3 2Gray Flycatcher (Empidonax wrightii) GRFL 1 51 105 2 3Hammond’s Flycatcher (E. hammondii) HAFL 1 67 103 3 3Dusky Flycatcher (E. oberholseri) DUFL 1 60 104 2 3Western Flycatcher (E. difficilis)f WEFL 1 60 104 2 1Western Kingbird (Tyrannus verticalis) WEKI 1 55 93 1 2Bell’s Vireo (Vireo bellii) BEVI 3 48 86 1 1Solitary Vireo (V. solitarius)f SOVI 2 54 103 1 2Warbling Vireo (V. gilvus) WAVI 2 65 103 1 2Northern Rough-winged Swallow (Stelgidopteryx
serripennis) NRWS 3 55 50 2 1Ruby-crowned Kinglet (Regulus calendula) RCKI 2 68 103 3 3Hermit Thrush (Catharus guttatus) HETH 2 67 102 3 2Orange-crowned Warbler (Vermivora celata) OCWA 2 68 103 3 2Nashville Warbler (V. ruficapilla) NAWA 2 57 112 2 3Yellow Warbler (Dendroica petechia) YWAR 3 67 54 2 1Yellow-rumped Warbler (D. coronata) YRWA 2 70 102 3 3Black-throated Gray Warbler (D. nigrescens) BTYW 1 52 102 2 3Townsend’s Warbler (D. townsendi) TOWA 1 67 113 3 3Hermit Warbler (D. occidentalis) HEWA 1 48 119 2 3MacGillivray’s Warbler (Oporornis tolmiei) MGWA 1 61 101 2 2Common Yellowthroat (Geothlypis trichas) COYE 3 62 54 3 1Wilson’s Warbler (Wilsonia pusilla) WIWA 2 70 105 2 1Yellow-breasted Chat (Icteria virens) YBCH 3 55 102 2 1Western Tanager (Piranga ludoviciana) WETA 1 65 100 2 3Green-tailed Towhee (Pipilo chlorurus) GTTO 1 48 103 3 3Spotted Towhee (P. maculatus) SPTO 1 53 98 3 3Chipping Sparrow (Spizella passerina) CHSP 3 67 64 3 3Brewer’s Sparrow (S. breweri) BRSP 1 62 102 3 3Song Sparrow (Melospiza melodia) SOSP 3 62 102 3 1Lincoln’s Sparrow (M. lincolnii) LISP 2 67 104 3 1White-crowned Sparrow (Zonotrichia leucophrys) WCSP 2 71 102 3 3Black-headed Grosbeak (Pheucticus melanocephalus) BHGR 1 55 97 2 2Lazuli Bunting (Passerina amoena) LAZB 1 53 98 1 2Northern Oriole (Icterus galbula) NOOR 1 52 93 2 1Lesser Goldfinch (Carduelis psaltria) LEGO 1 46 97 3 2
a Breeding distribution category: 1 5 western North America only; 2 5 western North America and easternCanada (sometimes including extreme northern or northeastern U.S.); 3 5 more easterly distributions, generallycontinent- or U.S.-wide, but one species (Bell’s Vireo) is limited to south-central U.S.
b Northern-most latitude of breeding range.c Eastern-most longitude of breeding range.d Winter distribution category: 1 5 primarily Mexico, west of the Sierra Madre Occidental or south of the
Central Volcanic Belt, and along the Pacific Coast; 2 5 primarily in Mexico or Central America, with at leastone third of the Mexican distribution as in category 1 and the remainder more easterly; 3 5 significantly moreeasterly distribution than in categories 1 and 2, either throughout Mexico or extending into Central and SouthAmerica (based on Howell and Webb 1995).
e Riparian affinity category: 1 5 riparian obligates and ‘associates’, generally linked with riparian habitats; 25 not considered a riparian-associated species, per se, but often found in riparian woodlands or other riparianhabitats; and 3 5 generally not associated with riparian habitats (based on BNA accounts). For five species withlittle or no information on migration habitats (Western Kingbird, Northern Rough-winged Swallow, Townsend’sWarbler, Spotted Towhee, and White-crowned Sparrow), we assumed a similar degree of riparian associationduring migration as exhibited during the breeding season.
f We pooled data for species whose taxonomies had changed since data were collected.

SPRING MIGRATION IN SOUTHWESTERN NORTH AMERICA 217
quadratic of median date, using the form withthe lowest AIC value.
Explanatory variables considered for inclu-sion in candidate models for capture data werelongitude, latitude, effort (number of mist-nethours, ln-transformed), and median date of cap-ture efforts. Effort and median date were corre-lated (r17 5 20.58). For each species, we decid-ed which of these variables (effort, median date,or the quadratic of median date) to incorporateinto the final set of candidate models by runningregression models and choosing the model withthe lowest AIC value.
We determined the magnitude of effect forvariables and covariates by model-averaging co-efficients across all models containing the vari-able of interest (Burnham and Anderson 2002;Eq. 5.7). Model averaging is a valuable ap-proach to evaluating relationships when there isa high degree of model uncertainty (severalmodels within the set of candidate models havesubstantial weight; Burnham and Anderson2002). Because analyses yielded 235 species-variable combinations, we developed a methodfor scoring whether a variable (or covariate) hadan effect on the abundance or capture rates of agiven species. We calculated 95% and 90% con-fidence intervals (CI) and scored the magnitudeof each effect. Each species-variable combina-tion was assigned an effect score of 0 (no effect)if the 90% CI clearly spanned zero, 1 (smalleffect) if the 90% CI did not span zero, and 2(large effect) if the 95% CI did not span zero.When either the survey or capture data yieldedmany zeros (.50%) for a given species (n 5 5in survey dataset, n 5 11 in capture dataset), wealso ran logistic regressions to compare with thelinear regression results. If the effect of longi-tude was similar between the two regression ap-proaches, we reported the linear regression co-efficients and used them in subsequent analyses;otherwise, we dropped the species from furtheranalyses.
Species biogeography and riparian affinity. Wealso explored the influence of breeding and win-tering distribution and habitat affinity on the lon-gitudinal patterns of count totals and capture ratesduring spring migration for 35 species. To do so,we regressed a derived response variable (coef-ficients for longitude from the previous analyses;higher values represent greater abundances orcapture rates in the west) against four predictorvariables: (1) northern extent of breeding distri-
bution (8N latitude), (2) eastern extent of breedingdistribution (8W longitude), (3) winter distribu-tion category, and (4) riparian affinity, again inbalanced sets of candidate models. We then mod-el-averaged coefficients, computed 95% and 90%confidence intervals, and scored the effect of eachvariable as described above. All analyses wereconducted in SYSTAT 9.1. Means 6 SE are re-ported unless otherwise specified.
For post-hoc analyses on survey sites in theU.S., we used the National Land Cover Data(Multi-Resolution Land Characteristics Consor-tium 2000) to quantify area of riparian habitatin 18 latilong blocks encompassing 10 surveysites in the United States. The National LandCover Data are derived from early to mid-1990sLandsat Thematic Mapper satellite data withspatial resolution of 30 m. We used the classi-fications of ‘‘woody wetlands’’ and ‘‘deciduousforest’’ as a best indication of riparian forests(M. L. Scott, pers. comm.). Woody wetlands aredefined as ‘‘areas where forest or shrubland veg-etation accounts for 25%–100% of the cover andthe soil or substrate is periodically saturatedwith, or covered with, water,’’ and deciduousforest is defined as ‘‘areas dominated by treesgenerally greater than 5-m tall, and greater than20% of total vegetation cover. More than 75%of the tree species shed foliage simultaneouslyin response to seasonal change.’’
RESULTS
Avian survey data were contributed from 15 ri-parian sites ranging geographically from the Sal-ton Sea, California, to Big Bend National Park,Texas (Fig. 1). During spring migration, all sitesvaried in species richness (range 43–178 spe-cies), mean abundances of birds (range 6.9–24.8birds per point), and percentage of birds thatwere long-distance migrants (range 26%–89%)and migrants in general (range 47%–94%; Table2). The most common species across all siteswere Mourning Doves (Zenaida macroura),Red-winged Blackbirds (Agelaius phoeniceus),Brown-headed Cowbirds (Molothrus ater), andYellow-rumped Warblers. Song Sparrows (Me-lospiza melodia), Common Yellowthroats, andYellow Warblers (Dendroica petechia) were of-ten common at the more westerly sites. Speciescomposition also varied considerably amongsites. Abundances are presented for 35 speciesat each of the study sites, progressing from westto east across the study range; abundances for

218 SUSAN K. SKAGEN ET AL.
TABLE 2. Avian survey effort during spring migration (1 Apr to 12 May), number of species, bird abundance,and percentage of migrants (long-distance migrants [L] and all migrants [L 1 S]) at bird survey sites acrosssouthwestern United States and northern Sonora, Mexico.
Study site Site Code
Longi-tude
(degreesW)
Ripar-ian
typea
Numberof seasons
(years)
Total pointcounts,numberof visits
Numberof
species
Numberof birds
per pointcount
Percentmigrants
(L, L 1 S)
Salton Sea, Cali-fornia
SSCA 115.5 1 1 (1999) 152, 8 101 14.0 86, 88
Baja California,Mexico
BCMX 115.1 1 2 (2000–2001) 72, 4 46 9.0 50, 55
Sonora, Mexico CRHI 114.9 1 1 (2002) 256, 1 103 19.9 64, 73Sonora, Mexico CRVR 114.7 1 1 (2000) 67, 3 72 24.8 89, 94Colorado River,
Cibola NWR,Arizona
CIAZ 114.7 1 5 (1999–2003) 480, 30 81 15.5 47, 52
Colorado River,Bill WilliamsNWR, Arizona
BWAZ 114.0 1 4 (1999–2002) 224, 16 82 16.6 40, 61
Santa Cruz River,Arizona
SCAZ 111.3 2 3 (2001–2003) 64, 8 47 15.0 61, 78
Santa Cruz River,Sonora, Mexico
SCMX 110.7 2 1 (2001) 26, 1 50 16.0 39, 71
Southeast Arizona,high elevationriparian
HEAZ 110.2 3 4 (1989, 1991, 1993,1994)
838, 22 131 6.9 48, 68
San Pedro River,Arizona; low el-evation riparian
LEAZ 110.1 2 4 (1989, 1991, 1993,1994)
3587, 22 178 17.8 49, 68
San Pedro River,Arizona
SPAZ 110.1 2 6 (1986–1991) 1925b, 36 174 16.6 44, 63
Chiricahua Moun-tains, Arizona
CMAZ 109.3 3 2 (1975, 1978) 72c, 1 43 9.9 44, 47
Rio Grande,Bosque delApache NWR,New Mexico
BANM 106.9 2 5 (1994–1998) 540, 25 107 12.2 68, 85
Rio Grande, RioGrande NatureCenter, NewMexico
RGNM 106.7 2 3 (1994–1996) 774, 37 128 15.5 78, 83
Big Bend NationalPark, Texas
BBNP 103.2 2 3 (1995–1997) 90, 6 66 11.5 26, 62
a Riparian type: 1 5 low elevation (,560 m) or mainstem rivers, 2 5 higher elevation tributary rivers, and3 5 higher elevation tributary creeks.
b Data transformed from transects to point count equivalents.c Summary data transformed to point count equivalents.
any one species ranged from 0 to 20.9 birds per10 point counts (Table 3). Site-specific abun-dances and percentage of representation for allspecies are available from SKS.
Avian capture data were contributed from 18riparian sites, ranging geographically fromsouthern California to Texas; site locationsranged between 31–368N latitude and 106–1218W longitude (Fig. 1). Mist-net hours totaled44 032 across all sites (mean 2446 6 1032,range 60–14 099) with the greatest effort at sites
along the Rio Grande, New Mexico, and at Cal-ifornia sites. Capture rates averaged 73.7 birdsper 100 mist-net hours (6 13.6, range 11.6–238.3). Capture rates were lowest at sites withthe most extensive effort (r 5 0.48, df 5 17,regression coefficient 5 0.64 6 0.29), presum-ably because the effort extended into times ofthe season or day when capture rates were lower.Capture rates were highest when the timing ofmist-netting effort coincided with peak migra-tion of abundant species.
SPRING MIGRATION IN SOUTHWESTERN NORTH AMERICA 219
Influence of predictor variables on avianabundance and capture rates. Number of spe-cies at survey sites was best predicted by canopycover (regression coefficient 5 34.77 6 10.34,large effect, r2 of global model 5 0.57), recog-nizing that canopy cover and survey effort werestrongly correlated. Percent of birds that werelong-distance migrants increased with increasinglatitude (regression coefficient 5 7.02 6 3.16,large effect, r2 of global model 5 0.47). Therewere no other effects of predictor variables (lon-gitude, latitude, extent of canopy or survey ef-fort, and median date or its quadratic) on theseor other survey summary variables (number ofbirds per point count, percent migrants, numberof long-distance migrants per point count, totalnumber of migrants per point count).
For species with many (.50%) zero counts,effects of longitude on survey data were similarin linear and logistic regression models for fourof five species, thus we retained linear regres-sion results for Dusky Flycatcher (Empidonaxoberholseri), Hammond’s Flycatcher (Empido-nax hammondii), Hermit Warbler (Dendroicaoccidentalis), and Western Flycatcher; we elim-inated Spotted Towhee from further analyses ofsurvey data. For species with many zeros in cap-ture analyses, effects of longitude were also sim-ilar between linear and logistic-regression mod-els for nine of 11 species. We retained linearregression results for Northern Oriole, WesternKingbird (Tyrannus verticalis), Bell’s Vireo(Vireo bellii), Gray Flycatcher (Empidonaxwrightii), Townsend’s Warbler (Dendroica town-sendi), Western Tanager (Piranga ludoviciana),Western Wood-Pewee (Contopus sordidulus),Solitary Vireo, and Brewer’s Sparrow (Spizellabreweri), and omitted Hermit Warbler andNorthern Rough-winged Swallow (Stelgidop-teryx serripennis) from further capture analyses.
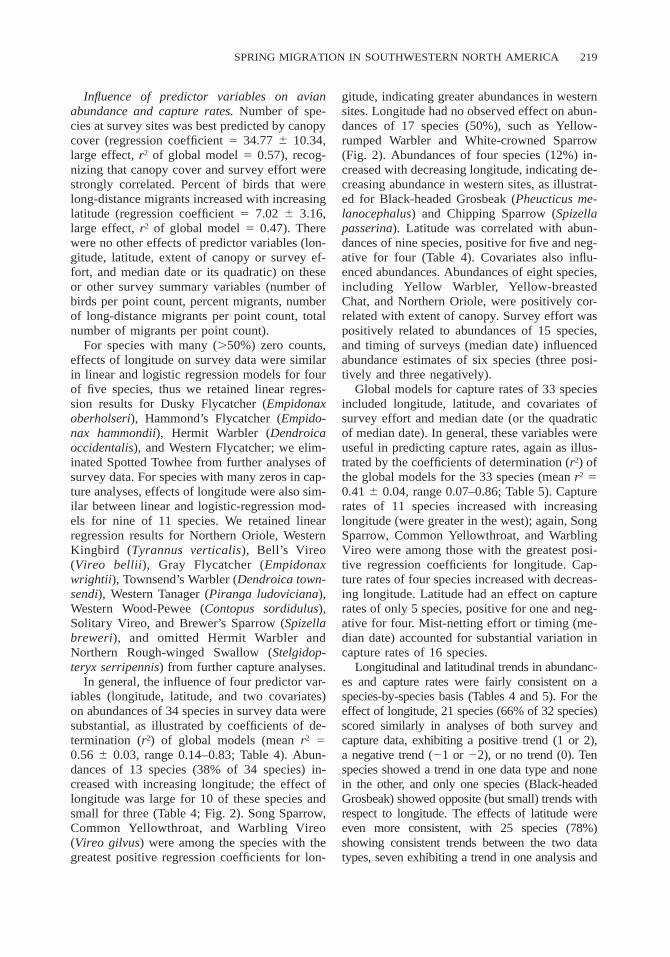
In general, the influence of four predictor var-iables (longitude, latitude, and two covariates)on abundances of 34 species in survey data weresubstantial, as illustrated by coefficients of de-termination (r2) of global models (mean r2 50.56 6 0.03, range 0.14–0.83; Table 4). Abun-dances of 13 species (38% of 34 species) in-creased with increasing longitude; the effect oflongitude was large for 10 of these species andsmall for three (Table 4; Fig. 2). Song Sparrow,Common Yellowthroat, and Warbling Vireo(Vireo gilvus) were among the species with thegreatest positive regression coefficients for lon-
gitude, indicating greater abundances in westernsites. Longitude had no observed effect on abun-dances of 17 species (50%), such as Yellow-rumped Warbler and White-crowned Sparrow(Fig. 2). Abundances of four species (12%) in-creased with decreasing longitude, indicating de-creasing abundance in western sites, as illustrat-ed for Black-headed Grosbeak (Pheucticus me-lanocephalus) and Chipping Sparrow (Spizellapasserina). Latitude was correlated with abun-dances of nine species, positive for five and neg-ative for four (Table 4). Covariates also influ-enced abundances. Abundances of eight species,including Yellow Warbler, Yellow-breastedChat, and Northern Oriole, were positively cor-related with extent of canopy. Survey effort waspositively related to abundances of 15 species,and timing of surveys (median date) influencedabundance estimates of six species (three posi-tively and three negatively).
Global models for capture rates of 33 speciesincluded longitude, latitude, and covariates ofsurvey effort and median date (or the quadraticof median date). In general, these variables wereuseful in predicting capture rates, again as illus-trated by the coefficients of determination (r2) ofthe global models for the 33 species (mean r2 50.41 6 0.04, range 0.07–0.86; Table 5). Capturerates of 11 species increased with increasinglongitude (were greater in the west); again, SongSparrow, Common Yellowthroat, and WarblingVireo were among those with the greatest posi-tive regression coefficients for longitude. Cap-ture rates of four species increased with decreas-ing longitude. Latitude had an effect on capturerates of only 5 species, positive for one and neg-ative for four. Mist-netting effort or timing (me-dian date) accounted for substantial variation incapture rates of 16 species.
Longitudinal and latitudinal trends in abundanc-es and capture rates were fairly consistent on aspecies-by-species basis (Tables 4 and 5). For theeffect of longitude, 21 species (66% of 32 species)scored similarly in analyses of both survey andcapture data, exhibiting a positive trend (1 or 2),a negative trend (21 or 22), or no trend (0). Tenspecies showed a trend in one data type and nonein the other, and only one species (Black-headedGrosbeak) showed opposite (but small) trends withrespect to longitude. The effects of latitude wereeven more consistent, with 25 species (78%)showing consistent trends between the two datatypes, seven exhibiting a trend in one analysis and

220 SUSAN K. SKAGEN ET AL.
TA
BL
E3.
Mea
nnu
mbe
rof
bird
spe
r10
poin
tco
unts
bysu
rvey
site
for
35sp
ecie
san
dth
ree
ripa
rian
affi
nity
(RA
)ca
tego
ries
.S
peci
esco
des
are
pres
ente
din
Tabl
e1
and
site
code
sar
epr
esen
ted
inTa
ble
2.D
ashe
dli
nes
indi
cate
that
agi
ven
spec
ies
was
not
dete
cted
atth
atsi
te.
Exc
ept
for
valu
es,
0.1,
bird
spe
rpo
int
are
repo
rted
toon
ede
cim
alpl
ace.
Spe
cies
code
Sit
e,lo
ngit
ude
(deg
rees
W)
SS
CA
,11
5.5
BC
MX
,11
5.1
CR
HI,
114.
9C
RV
R,
114.
7C
IAZ
,11
4.7
BW
AZ
,11
4.0
SC
AZ
,11
1.3
SC
MX
,11
0.7
HE
AZ
,11
0.2
LE
AZ
,11
0.1
SPA
Z,
110.
1C
MA
Z,
109.
3B
AN
M,
106.
9R
GN
M,
106.
7B
BN
P,10
3.2
WE
WP
0.1
–0.
30.
50.
050.
10.
3–
0.2
0.9
1.8
0.2
0.3
0.3
–G
RF
L–
–0.
1–
0.1
––
0.1
0.2
0.5
–0.
10.
40.
1–
HA
FL
0.1
––
–0.
1–
––
0.2
0.2
0.3
–0.
020.
03–
DU
FL
––
––
––
––
0.2
0.4
0.2
–0.
22.
2–
WE
FL
0.4
–1.
12.
62.
21.
1–
–0.
10.
3–
––
––
WE
KI
1.4
6.7
7.6
0.7
2.5
0.3
2.2
0.4
1.6
2.4
1.9
––
–4.
7B
EV
I–
––
–0.
19.
12.
20.
41.
62.
41.
9–
––
4.7
SO
VI
––
0.3
–0.
2–
–0.
40.
90.
71.
70.
50.
2–
0.3
WA
VI
1.3
0.2
1.9
0.9
0.7
0.7
––
0.3
1.0
1.6
–0.
10.
3–
NR
WS
2.8
–0.
6–
0.2
0.9
1.3
–0.
11.
60.
5–
4.6
1.4
–R
CK
I1.
30.
20.
030.
31.
11.
0–
–0.
61.
71.
512
.60.
31.
00.
1H
ET
H0.
1–
–0.
20.
050.
2–
–0.
10.
10.
21.
40.
030.
9–
OC
WA
4.7
0.1
0.4
2.8
3.3
3.0
0.8
–0.
30.
50.
50.
50.
10.
30.
1N
AW
A0.
7–
0.2
4.9
1.8
0.5
––
0.04
0.1
0.03
––
–0.
1Y
WA
R0.
6–
0.6
0.9
0.1
1.0
6.7
7.9
6.6
20.9
13.1
–0.
20.
4–
YR
WA
8.0
0.6
0.4
2.4
4.7
2.7
0.3
–2.
45.
23.
80.
53.
32.
31.
1B
TY
W0.
5–
0.1
0.5
0.6
––
–0.
10.
30.
511
.6–
0.1
–T
OW
A0.
3–
0.7
0.2
0.7
0.1
0.1
–0.
10.
30.
30.
4–
––
HE
WA
0.1
–0.
10.
3–
––
0.02
0.03
0.01
0.5
––
––
MG
WA
––
0.2
–0.
1–
–0.
040.
10.
3–
0.3
0.4
––
CO
YE
11.2
1.3
3.1
15.0
2.5
9.4
3.1
–1.
45.
57.
4–
0.4
0.1
0.7
WIW
A2.
81.
11.
89.
44.
01.
84.
40.
41.
76.
06.
11.
40.
80.
31.
3Y
BC
H–
––
–1.
88.
21.
7–
0.8
3.5
5.4
–0.
30.
14.
3W
ET
A0.
90.
20.
90.
91.
00.
7–
–0.
20.
40.
5–
0.03
1.4
–G
TT
O0.
03–
––
–0.
10.
4–
0.2
0.9
1.6
–0.
20.
20.
2S
PT
O–
––
––
––
–1.
80.
01–
0.2
11.8
2.0
–C
HS
P0.
03–
–0.
30.
10.
9–
0.8
0.6
3.8
1.0
–2.
04.
31.
0B
RS
P0.
1–
–0.
71.
20.
2–
–0.
10.
10.
02–
0.9
0.01
1.2
SO
SP
16.5
2.6
13.8
5.6
1.9
15.8
10.6
–0.
25.
02.
8–
–0.
0–
LIS
P0.
2–
0.1
––
0.1
––
0.6
1.2
1.3
–0.
030.
1–
WC
SP
1.5
0.6
0.5
6.1
1.6
0.9
0.8
2.5
0.1
1.1
0.7
–1.
42.
10.
3B
HG
R0.
4–
0.2
0.2
0.7
0.2
––
1.4
0.6
0.4
–2.
56.
00.
1L
AZ
B0.
7–
0.1
0.3
0.3
0.2
0.4
–0.
20.
40.
3–
0.1
0.2
–N
OO
R0.
62.
70.
20.
53.
64.
44.
60.
80.
32.
72.
8–
0.5
0.2
0.0
LE
GO
0.1
0.1
––
0.1
2.1
5.4
0.4
1.3
2.6
0.6
–0.
40.
90.
4R
Aa
135
.17.
721
.334
.016
.451
.834
.69.
513
.449
.141
.31.
46.
82.
611
.0R
A2
8.8
7.1
11.0
5.6
8.0
6.8
9.1
0.8
5.3
8.1
8.3
2.9
4.4
9.0
1.3
RA
313
.61.
63.
016
.613
.07.
11.
63.
46.
915
.011
.025
.420
.615
.74.
0

SPRING MIGRATION IN SOUTHWESTERN NORTH AMERICA 221
←a Riparian affinity category: 1 5 riparian obligates and ‘associates’, generally linked with riparian habitats; 2
5 not considered a riparian-associated species, per se, but often found in riparian woodlands or other riparianhabitats; and 3 5 generally not associated with riparian habitats.
none in the other, and no species exhibiting op-posite trends.
Influence of species biogeography and habitataffinity on migration patterns. Riparian affinityinfluenced geographic patterns of abundance andcapture rates during migration. In both surveyand capture data, riparian associates (riparian af-finity category 1) were more abundant at sitesin the west than farther east (as illustrated bygreater regression coefficients for longitude inprevious analyses) than were nonriparian species(Table 6). Mean longitude regression coeffi-cients for riparian associates were 0.15 6 0.05(n 5 10) and 0.11 6 0.05 (n 5 9) for surveyand capture data, contrasting with coefficientsfor nonriparian species (riparian affinity cate-gory 3; mean coefficient 5 0.03 6 0.03, n 514, and 20.003 6 0.03, n 5 14, for survey andcapture data, respectively).
Species biogeography was also correlatedwith migration abundance patterns in the surveyanalyses. In general, species with more westerlybreeding ranges had higher migration counts inthe western sites than did species whose rangesextended further east, as illustrated by the largepositive effect of eastern extent of breedingrange (8W longitude) on longitude regression co-efficients from previous analyses (where highervalues represent greater abundances in the west,Table 6). This trend was not apparent in the cap-ture data.
When riparian associates were evaluated in-dependently, none of the three biogeographicfactors influenced west-east abundance patternsfrom migration surveys (all effect scores of 0).However, all three geographic factors influencedwest-east migration abundance patterns of spe-cies in riparian affinity categories 2 and 3 (Table6). Birds that breed farther north, or have morewesterly breeding ranges or wintering distribu-tions, tended to exhibit greater abundances atmore westerly sites during migration. The cap-ture analyses revealed no similar effects of bio-geographic factors on capture rates.
Because geographic factors did not appear toinfluence west-east abundance patterns of ripar-ian birds, we conducted post-hoc analyses to de-
termine whether extent of riparian habitat inlandscapes surrounding the sites influenced ri-parian bird abundances. We estimated the areaof riparian forest in the surrounding landscapefor a subset of 10 survey sites with availableNational Land Cover Data (NLCD). The amountof riparian cover in the 18 latilong blocks sur-rounding the sites ranged from 0.01% to 0.49%.Total abundances of 10 riparian species werepositively related to the percent cover of riparianhabitat (regression coefficient 5 6.68 6 3.31, r2
5 0.34). In this analysis, the Salton Sea had thelargest residual, which indicated many more ri-parian birds than expected based on the extentof riparian habitat.
DISCUSSION
There is general agreement that riparian habitatsare critically important to en route landbirdscrossing arid and semi-arid landscapes in south-western North America (Skagen et al. 1998,Finch and Yong 2000, Flannery et al. 2004). Infact, during spring migration, avian communitiesin some riparian sites are comprised of approx-imately 90% en route migrants (Flannery et al.2004). Across the range of our study, however,riparian sites differed substantially with respectto many attributes of avian community structureduring the spring migration period, includingspecies richness and composition, densities, andthe proportion of en route species. Extent ofcanopy cover in the study sites strongly influ-enced species richness, with gallery cottonwoodforests of multilayered vegetation hosting thegreatest numbers of species; however, this trendmay be due, in part, to the extensive survey ef-fort in gallery forests.
Our findings suggest that migration patternsin the western United States-Mexico border re-gion are complex. Several species, such as theYellow Warbler and the Song Sparrow, varied inabundance across the range of the study. In gen-eral, riparian associates were more abundant atsites in the western part of the study range thanat sites in the east and were only minimally in-fluenced by species biogeography. In contrast,abundance patterns of nonriparian species were

222 SUSAN K. SKAGEN ET AL.
TABLE 4. Fit of global model and effects of longitude and latitude (model-averaged coefficient 6 SE andeffect score) on abundance estimates of 34 species from survey data. Species are listed by descending order ofcoefficient for longitude. See Table 1 for species codes.
Species codeRiparianaffinitya
Globalmodel r2
Longitude
CoefficientEffectscoreb
Latitude
CoefficientEffectscoreb
SOSP 1 0.83 0.42 6 0.09 2c –0.23 6 0.25 0c
COYE 1 0.62 0.27 6 0.10 2c –0.22 6 0.28 0c
WEFL 1 0.52 0.24 6 0.07 2 0.06 6 0.21 0c
NOOR 1 0.58 0.23 6 0.08 2 –0.08 6 0.23 0c
WAVI 2 0.79 0.21 6 0.04 2c –0.09 6 0.12 0c
YWAR 1 0.58 0.20 6 0.12 1c –0.66 6 0.32 –1NAWA 3 0.40 0.19 6 0.08 2c 0.02 6 0.23 0c
OCWA 2 0.46 0.19 6 0.07 2 0.26 6 0.20 0c
WEKI 2 0.67 0.17 6 0.07 2 –0.25 6 0.19 0c
WETA 3 0.62 0.16 6 0.06 2c 0.28 6 0.16 0c
WIWA 1 0.46 0.12 6 0.06 1c –0.25 6 0.17 0c
TOWA 3 0.50 0.12 6 0.05 2c –0.11 6 0.14 0c
LAZB 2 0.40 0.08 6 0.05 1c 0.17 6 0.13 0WCSP 3 0.14 0.07 6 0.08 0 0.23 6 0.20 0BTYW 3 0.27 0.07 6 0.10 0 –0.01 6 0.26 0c
YRWA 3 0.56 0.06 6 0.07 0c 0.17 6 0.19 0c
BEVI 1 0.60 0.04 6 0.11 0c –0.77 6 0.25 –2HAFL 3 0.82 0.03 6 0.02 0c –0.12 6 0.06 1c
HEWA 3 0.43 0.03 6 0.04 0 –0.01 6 0.11 0LISP 1 0.76 0.03 6 0.04 0 –0.18 6 0.11 0c
RCKI 3 0.46 0.03 6 0.09 0c 0.24 6 0.24 0c
WEWP 2 0.52 0.01 6 0.05 0c –0.03 6 0.14 0c
YBCH 1 0.52 –0.01 6 0.12 0c –0.55 6 0.29 –1MGWA 2 0.48 –0.03 6 0.05 0c 0.21 6 0.11 1GTTO 3 0.81 –0.03 6 0.04 0 –0.34 6 0.10 –2c
SOVI 2 0.62 –0.04 6 0.06 0c 0.07 6 0.16 0c
BRSP 3 0.16 –0.05 6 0.08 0c –0.02 6 0.21 0c
HETH 2 0.37 –0.05 6 0.06 0c 0.25 6 0.16 0c
LEGO 2 0.62 –0.05 6 0.07 0c –0.21 6 0.19 0c
GRFL 3 0.76 –0.06 6 0.02 –2 0.01 6 0.07 0c
NRWS 1 0.60 –0.07 6 0.09 0 0.57 6 0.21 2BHGR 2 0.77 –0.11 6 0.06 –1 0.42 6 0.15 2DUFL 3 0.74 –0.12 6 0.04 –2c 0.26 6 0.12 1CHSP 3 0.71 –0.16 6 0.07 –2 –0.01 6 0.21 0c
a Riparian affinity category: 1 5 riparian obligates and ‘associates’, generally linked with riparian habitats; 25 not considered a riparian-associated species, per se, but often found in riparian woodlands or other riparianhabitats; and 3 5 generally not associated with riparian habitats.
b Effect score based on whether CI spans zero: 0 5 no effect, 1 5 small effect (90% CI does not span zero),2 5 large effect (95% CI does not span zero).
c Effect scores are consistent between survey and capture data.
strongly influenced by biogeographical attri-butes, including the extent and locations ofbreeding and wintering ranges.
A current paradigm of habitat selection duringmigration implies that species biogeography,weather patterns, and prevailing winds are ofoverriding importance at large spatial scales(Hutto et al. 1985, Moore and Aborn 2000). Thisparadigm espouses a hierarchical view in whicha migrant follows a migration route that mini-
mizes its flight time and distance, uses broad-scale habitat factors (such as food availability)as initial cues for selecting habitats, and selectsactual foraging sites at a finer spatial scale basedon intrinsic habitat factors (Hutto 1985, Mooreet al. 1995). Our findings for nonriparian speciesare consistent with this hypothesis.
Our finding that many riparian associates in-creased in abundance in western riparian zonesrelative to those in the intermountain west con-
SPRING MIGRATION IN SOUTHWESTERN NORTH AMERICA 223
FIGURE 2. Mean number of birds per 10 point counts by longitude for six bird species detected at 15 surveysites in southwestern United States and northern Sonora, Mexico, 1975–2003. Examples of species whose abun-dances A) increased with increasing longitude, B) appeared unaffected by longitude, and C) increased withdecreasing longitude.
tradicts expectations based primarily on patternsof species biogeography, and instead suggeststhat riparian associates refined their direct mi-gration paths to coincide with areas that providethe best riparian stopover habitat. Most individ-uals are ‘‘programmed’’ to follow a migratorypathway between their breeding and nonbreed-ing areas (Moore et al. 1995), but the evolutionof currently-used migration paths may have beeninfluenced by intrinsic factors that determinesuitability of stopover habitat along the way(Hutto 1985). We hypothesize that riparian as-sociates trade off time and distance minimiza-tion (Alerstam and Lindstrom 1990; Lindstromand Alerstam 1992) to enhance the probabilityof encountering riparian habitats, whereas non-riparian birds minimize time and distance un-
constrained by distribution of riparian vegetationon the landscape. We do not know whether birdsare unwavering in their adherence to historical,largely innate migration routes or whether theyare capable of actively making refinements inecological time in response to landscape change.Berthold et al. (1992) describe a novel migrationroute of Blackcap (Sylvia atricapilla), illustrat-ing that migratory changes can evolve rapidly.Active refinements in habitat selection are con-sistent with, although at a larger scale than, ob-servations of foraging plasticity and small-scalemovements near stopover sites (Martin and Karr1990, Wiedner 1992).
By viewing the extent of riparian habitat inthe landscapes surrounding our study sites, wemay gain insight into our observed westerly

224 SUSAN K. SKAGEN ET AL.
TABLE 5. Fit of global model and effects of longitude and latitude (model-averaged coefficient 6 SE andeffect score) on capture rates of 33 species from banding data. Species are listed by descending order ofcoefficient for longitude. See Table 1 for species codes.
Species codeRiparianaffinitya
Globalmodel r2
Longitude
CoefficientEffectscoreb
Latitude
CoefficientEffectscoreb
SOSP 1 0.68 0.35 6 0.07 2c 0.21 6 0.26 0c
WEFL 1 0.40 0.26 6 0.20 0 –0.40 6 0.33 0c
WAVI 2 0.51 0.21 6 0.09 2c –0.45 6 0.30 0c
COYE 1 0.66 0.18 6 0.09 1c 0.05 6 0.29 0c
WETA 3 0.41 0.16 6 0.08 1c –0.25 6 0.29 0c
LEGO 2 0.22 0.15 6 0.09 0c 0.05 6 0.34 0c
WIWA 1 0.15 0.15 6 0.10 1c 0.02 6 0.35 0c
NAWA 3 0.55 0.14 6 0.07 1c –0.39 6 0.24 0c
YWAR 1 0.33 0.13 6 0.07 1c –0.26 6 0.26 0BHGR 2 0.23 0.13 6 0.08 1 –0.26 6 0.27 0OCWA 2 0.37 0.11 6 0.09 0 –0.22 6 0.32 0c
TOWA 3 0.62 0.11 6 0.04 2c –0.14 6 0.13 0c
HAFL 3 0.63 0.09 6 0.06 0c –0.76 6 0.19 –2c
LAZB 2 0.62 0.09 6 0.03 2c –0.28 6 0.12 –2BTYW 3 0.58 0.08 6 0.04 1 –0.17 6 0.15 0c
WEWP 2 0.26 0.06 6 0.04 0c 0.15 6 0.13 0c
NOOR 1 0.05 0.05 6 0.08 0 0.23 6 0.28 0c
SOVI 2 0.42 0.04 6 0.04 0c –0.16 6 0.14 0c
WEKI 2 0.23 0.03 6 0.03 0 –0.05 6 0.10 0c
SPTO 3 0.43 0.02 6 0.09 0 –0.04 6 0.30 0BEVI 1 0.13 0.01 6 0.06 0c –0.25 6 0.18 0RCKI 3 0.57 0.01 6 0.04 0c –0.04 6 0.14 0c
HETH 2 0.19 –0.02 6 0.07 0c –0.35 6 0.22 0c
YRWA 3 0.46 –0.02 6 0.07 0c –0.02 6 0.23 0BRSP 3 0.42 –0.03 6 0.03 0c 0.11 6 0.09 0c
GRFL 3 0.07 –0.03 6 0.04 0 –0.01 6 0.13 0c
MGWA 2 0.08 –0.02 6 0.08 0c 0.18 6 0.33 0CHSP 3 0.45 –0.05 6 0.06 0 –0.18 6 0.20 0c
YBCH 1 0.48 –0.06 6 0.09 0c –0.73 6 0.26 –2c
WCSP 3 0.86 –0.09 6 0.04 –1 0.30 6 0.14 1LISP 1 0.30 –0.11 6 0.06 –1 –0.28 6 0.23 0c
DUFL 3 0.46 –0.20 6 0.06 –2c 0.03 6 0.24 0GTTO 3 0.84 –0.21 6 0.04 –2 –0.46 6 0.13 –2c
a Riparian affinity category: 1 5 riparian obligates and ‘associates’, generally linked with riparian habitats; 25 not considered a riparian-associated species, per se, but often found in riparian woodlands or other riparianhabitats; and 3 5 generally not associated with riparian habitats.
b Effect score based on whether CI span zero: 0 5 no effect, I 5 small effect (90% CI does not span zero),2 5 large effect (95% CI does not span zero).
c Effect scores are consistent between survey and capture data.
trends in abundance and capture rates. In gen-eral, sites with more riparian forest in the sur-rounding landscape yielded greater abundancesof riparian birds, and sites with little riparian for-est had few riparian birds, as would be expectedif birds chose landscapes with greater extents ofsuitable habitats. At the Salton Sea, however,many more riparian birds were present than ex-pected based solely on extent of riparian habitat,suggesting that migrants also concentrate at oa-ses in landscapes with limited riparian vegeta-
tion. We view these findings as preliminary be-cause of the limited ability of NLCD to resolvethe smaller narrower riparian habitat patches.
The accuracy of NLCD depictions of riparianvegetation in the western United States is un-tested. For San Pedro River survey sites, wecompared estimates of extent of riparian basedon NLCD data with an estimate based on theArizona Statewide Riparian Inventory and Mon-itoring database (ASRIM) in a delineated areaof comparable size (Skagen et al. 1998). Also
SPRING MIGRATION IN SOUTHWESTERN NORTH AMERICA 225
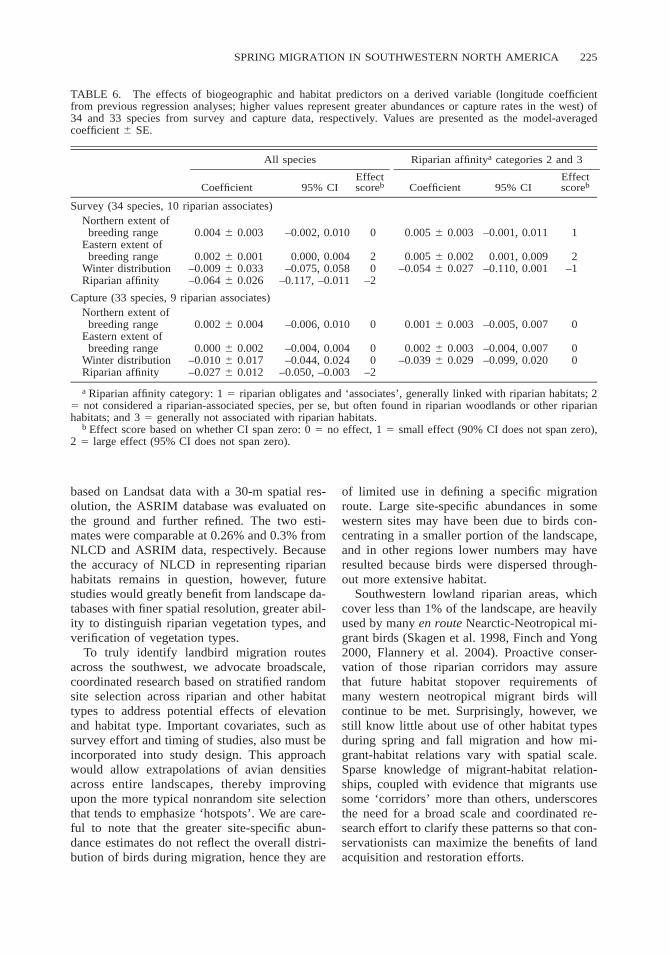
TABLE 6. The effects of biogeographic and habitat predictors on a derived variable (longitude coefficientfrom previous regression analyses; higher values represent greater abundances or capture rates in the west) of34 and 33 species from survey and capture data, respectively. Values are presented as the model-averagedcoefficient 6 SE.
All species
Coefficient 95% CIEffectscoreb
Riparian affinitya categories 2 and 3
Coefficient 95% CIEffectscoreb
Survey (34 species, 10 riparian associates)Northern extent of
breeding range 0.004 6 0.003 –0.002, 0.010 0 0.005 6 0.003 –0.001, 0.011 1Eastern extent of
breeding range 0.002 6 0.001 0.000, 0.004 2 0.005 6 0.002 0.001, 0.009 2Winter distribution –0.009 6 0.033 –0.075, 0.058 0 –0.054 6 0.027 –0.110, 0.001 –1Riparian affinity –0.064 6 0.026 –0.117, –0.011 –2
Capture (33 species, 9 riparian associates)Northern extent of
breeding range 0.002 6 0.004 –0.006, 0.010 0 0.001 6 0.003 –0.005, 0.007 0Eastern extent of
breeding range 0.000 6 0.002 –0.004, 0.004 0 0.002 6 0.003 –0.004, 0.007 0Winter distribution –0.010 6 0.017 –0.044, 0.024 0 –0.039 6 0.029 –0.099, 0.020 0Riparian affinity –0.027 6 0.012 –0.050, –0.003 –2
a Riparian affinity category: 1 5 riparian obligates and ‘associates’, generally linked with riparian habitats; 25 not considered a riparian-associated species, per se, but often found in riparian woodlands or other riparianhabitats; and 3 5 generally not associated with riparian habitats.
b Effect score based on whether CI span zero: 0 5 no effect, 1 5 small effect (90% CI does not span zero),2 5 large effect (95% CI does not span zero).
based on Landsat data with a 30-m spatial res-olution, the ASRIM database was evaluated onthe ground and further refined. The two esti-mates were comparable at 0.26% and 0.3% fromNLCD and ASRIM data, respectively. Becausethe accuracy of NLCD in representing riparianhabitats remains in question, however, futurestudies would greatly benefit from landscape da-tabases with finer spatial resolution, greater abil-ity to distinguish riparian vegetation types, andverification of vegetation types.
To truly identify landbird migration routesacross the southwest, we advocate broadscale,coordinated research based on stratified randomsite selection across riparian and other habitattypes to address potential effects of elevationand habitat type. Important covariates, such assurvey effort and timing of studies, also must beincorporated into study design. This approachwould allow extrapolations of avian densitiesacross entire landscapes, thereby improvingupon the more typical nonrandom site selectionthat tends to emphasize ‘hotspots’. We are care-ful to note that the greater site-specific abun-dance estimates do not reflect the overall distri-bution of birds during migration, hence they are
of limited use in defining a specific migrationroute. Large site-specific abundances in somewestern sites may have been due to birds con-centrating in a smaller portion of the landscape,and in other regions lower numbers may haveresulted because birds were dispersed through-out more extensive habitat.
Southwestern lowland riparian areas, whichcover less than 1% of the landscape, are heavilyused by many en route Nearctic-Neotropical mi-grant birds (Skagen et al. 1998, Finch and Yong2000, Flannery et al. 2004). Proactive conser-vation of those riparian corridors may assurethat future habitat stopover requirements ofmany western neotropical migrant birds willcontinue to be met. Surprisingly, however, westill know little about use of other habitat typesduring spring and fall migration and how mi-grant-habitat relations vary with spatial scale.Sparse knowledge of migrant-habitat relation-ships, coupled with evidence that migrants usesome ‘corridors’ more than others, underscoresthe need for a broad scale and coordinated re-search effort to clarify these patterns so that con-servationists can maximize the benefits of landacquisition and restoration efforts.

226 SUSAN K. SKAGEN ET AL.
ACKNOWLEDGMENTS
We are very grateful to the generous individuals whoprovided or prepared data and ideas for this project,including S. Allerton, W. C. Barrow, Jr., G. Bodner, C.T. Collins, C. Kristina Ecton, E. Gomez-Limon, C. E.Gordon, K. J. Gutzwiller, D. L. Hawksworth, R. Haz-lewood, O. Hinojosa-Huerta, W. H. Howe, D. Kaschu-be, W. Leitner, L. McGrath, M. Means, C. O’Brien, M.L. Scott, W. Turner, H. A. Walker, N. Warnock, and S.Wilbor. T. Giles and D. Schneider provided data man-agement and GIS support. Funding for this meta-anal-ysis was provided by the U.S. Geological SurveyQuick Response Program (recommended by the U.S.Fish and Wildlife Service Region 6, USFWS HelenaField Office, and Sonoran Joint Venture) and PPL-Montana. Funding for collection of the Tucson areadata was provided by the Arizona Fish and Game De-partment, and funding for the Santa Cruz River sur-veys in Sonora was provided by the Programme Eco-regional-Desierto Sonorense, Sonora. We thank theTucson Bird Count volunteers for their many hours ofdata collection, the Arizona Audubon Society for theirsurvey data from the Santa Cruz River in Arizona, aswell as the bird banders who captured birds at MAPSstations in the desert southwest region: B. Allen, S.Bakeman, T. Campbell, C. Gugagli, A. Hubbard, J.Kahl, C. Otahal, N. Paloma, W. Sakai, M. Whitfield.
LITERATURE CITED
ALERSTAM, T., AND A. LINDSTROM. 1990. Optimal birdmigration: the relative importance of time, energyand safety, p. 331–351. In E. Gwinner [ED.], Birdmigration: physiology and ecophysiology. Spring-er-Verlag, New York.
BARLOW, J. C. 1980. Patterns of ecological interactionsamong migrant and resident vireos on the winter-ing grounds, p. 79–107. In A. Keast and E. S.Morton [EDS.], Migrant birds in the Neotropics:ecology, behavior, distribution, and conservation.Smithsonian Institution Press, Washington, DC.
BERTHOLD, P., A. J. HELBIG, G. MOHR, AND U. QUER-NER. 1992. Rapid microevolution of migratory be-haviour in a wild bird species. Nature 360:668–670.
BURNHAM, K. P., AND D. R. ANDERSON. 2002. Modelselection and inference: a practical information-theoretic approach. 2nd ed. Springer, New York.
DOBKIN, D. S., AND A. C. RICH. 1998. Comparison ofline-transect, spot-map, and point-count surveysfor birds in riparian habitats of the Great Basin.Journal of Field Ornithology 69:430–443.
DOBKIN, D. S., AND B. A. WILCOX. 1986. Analysis ofnatural forest fragments: riparian birds in the Toi-yabe Mountains, Nevada, p. 293–300. In J. Verner,M. L. Morrison, and C. J. Ralph [EDS.], Wildlife2000: modeling habitat relationships of terrestrialvertebrates. The University of Wisconsin Press,Madison, WI.
EVANS, P. R., N. C. DAVIDSON, T. PIERSMA, AND M. W.PIENKOWSKI. 1991. Implication of habitat loss atmigration staging posts for shorebird populations.Acta International Ornithological Congress 20:2228–2235.
FINCH, D. M., AND W. YONG. 2000. Landbird migrationin riparian habitats of the Middle Rio Grande: acase study. Studies in Avian Biology 20:88–98.
FITZPATRICK, J. W. 1980. Wintering of North Americantyrant flycatchers in the Neotropics, p. 67–78. InA. Keast and E. S. Morton [EDS.], Migrant birdsin the Neotropics: ecology, behavior, distribution,and conservation.Smithsonian Institution Press,Washington, DC.
FLANNERY, M. E., S. L. GUERS, T. GARDALI, N. NUR,AND G. R. GEUPEL. 2004. Landbird migration atthe Salton Sea: the value of desert riparian habitat.Studies in Avian Biology 27:106–115.
FLEISCHNER, T. L. 1994. Ecological costs of livestockgrazing in western North America. ConservationBiology 8:629–644.
GREENBERG, R. 1983. The role of neophobia in deter-mining the degree of foraging specialization insome migrant warblers. American Naturalist 122:444–453.
HOWELL, S. N. G., AND S. WEBB. 1995. A guide to thebirds of Mexico and northern Central America.Oxford University Press, Oxford, UK.
HUTTO, R. L. 1980. Winter habitat distribution of mi-gratory landbirds in western Mexico, with specialreference to small, foliage-gleaning insectivores,p. 181–203. In A. Keast and E. S. Morton [EDS.],Migrant birds in the Neotropics: ecology, behav-ior, distribution and conservation. Smithsonian In-stitution Press, Washington, DC.
HUTTO, R. L. 1985. Habitat selection by nonbreeding,migratory landbirds, p. 455–476. In M. L. Cody[ED.], Habitat selection in birds. Academic Press,Inc., Orlando, FL.
HUTTO, R. L. 1992. Habitat distributions of migratorylandbird species in western Mexico, p. 221–239.In J. M. Hagan III and D. W. Johnston [EDS.],Ecology and conservation of Neotropical migrantlandbirds. Smithsonian Institution Press, Washing-ton, DC.
HUTTO, R. L. 1998. On the importance of stopoversites to migrating birds. Auk 115:823.
HUTTO, R. L. 2000. On the importance of en routeperiods to the conservation of migratory land-birds. Studies in Avian Biology 20:109–114.
KELLY, J. F., AND R. L. HUTTO. 2005. On songbirdmigration in western North America: a case studyof wood warblers. Condor 107:197–211.
KELLY, J. F., R. SMITH, D. M. FINCH, F. R. MOORE, AND
W. YONG. 1999. Influence of summer biogeogra-phy on wood warbler stopover abundance. Condor101:76–85.
KNOPF, F. L., R. R. JOHNSON, T. RICH, F. B. SAMSON,AND R. C. SZARO. 1988. Conservation of riparianecosystems in the United States. Wilson Bulletin100:272–284.
KRUEPER, D. J. 1993. Effects of land use practices onwestern riparian ecosystems, p. 321–330. In D. M.Finch and P. W. Stangel [EDS.], Status and man-agement of Neotropical migratory birds. USDAForest Service General Technical Report RM-229.
LINDSTROM, A., AND T. ALERSTAM. 1992. Optimal fatloads in migrating birds: a test of the time-mini-
SPRING MIGRATION IN SOUTHWESTERN NORTH AMERICA 227
mization hypothesis. American Naturalist 140:477–491.
LOVETTE, I. J., S. M. CLEGG, AND T. B. SMITH. 2004.Limited utility of mtDNA markers for determiningconnectivity among breeding and overwinteringlocations in three neotropical migrant birds. Con-servation Biology 18:156–166.
MARTIN, T. E., AND J. R. KARR. 1990. Behavioral plas-ticity of foraging maneuvers of migratory war-blers: multiple selection periods for niches? Stud-ies in Avian Biology 13:353–359.
MAPTECH, INC. [ONLINE]. 1989–2005. Maptech Map-Server Maps and Charts. ,http://mapserver.maptech.com/homepage/index.cfm. (26 January2004).
MOORE, F. R., AND D. A. ABORN. 2000. Mechanismsof en route habitat selection: how do migrantsmake habitat decisions during stopover? Studiesin Avian Biology 20:34–42.
MOORE, F. R., S. A. GAUTHREAUX JR., P. KERLINGER,AND T. R. SIMONS. 1995. Habitat requirements dur-ing migration: important link in conservation, p.121–144. In T. Martin and D. M. Finch, [EDS.],Ecology and management of Neotropical migra-tory birds. Oxford University Press, New York.
MOORE, F. R., AND T. R. SIMONS. 1992. Habitat suit-ability and stopover ecology of Neogropical land-bird migrants, p. 345–355. In J. M. Hagan III andD. W. Johnson [EDS.], Ecology and conservationof Neotropical migrant landbirds. Smithsonian In-stitution Press, Washington, DC.
MOORE, F. R., AND W. YONG. 1991. Evidence of food-based competition among passerine migrants dur-ing stopover. Behavioral Ecology and Sociobiol-ogy 28:85–90.
MULTI-RESOLUTION LAND CHARACTERISTICS CONSOR-TIUM. 2000. National Land Cover Characterization.,http://landcover.usgs.gov/natllandcover.asp. (10February 2005).
OHMART, R. D. 1994. The effects of human-inducedchanges on the avifauna of western riparian hab-itats. Studies in Avian Biology 15:273–285.
PETIT, D. R. 2000. Habitat use by landbirds along Ne-arctic-Neotropical migration routes: implicationsfor conservation of stopover habitats. Studies inAvian Biology 20:109–114.
POFF, L. N., J. D. ALLAN, M. B. BAIN, J. R. KARR, K.L. PRESTEGAARD, B. D. RICHTER, R. E. SPARKS,AND J. C. STROMBERG. 1997. The natural flow re-gime: a paradigm for river conservation and res-toration. Bioscience 47:769–784.
RICH, T. D., C. J. BEARDMORE, H. BERLANGA, P. J.BLANCHER, M. S. W. BRADSTREET, G. S. BUTCHER,D. W. DEMAREST, E. H. DUNN, W. C. HUNTER, E.E. INIGO-ELIAS, J. A. KENNEDY, A. M. MARTELL,A. O. PANJABI, D. N. PASHLEY, K. V. ROSENBERG,C. M. RUSTAY, J. S. WENDT, AND T. C. WILL.2004. Partners in Flight North American LandbirdConservation Plan. Cornell Laboratory of Orni-thology. Ithaca, NY.
SKAGEN, S. K., R. HAZLEWOOD, AND M. L. SCOTT. Inpress. The importance and future condition ofwestern riparian ecosystems as migratory birdhabitat. In C. J. Ralph and T. D. Rich [EDS.], Birdconservation implementation and integration inthe Americas. USDA Forest Service GeneralTechnical Report RM-191.
SKAGEN, S. K., C. P. MELCHER, W. H. HOWE, AND F. L.KNOPF. 1998. Comparative use of riparian corri-dors and oases by migrating birds in southeast Ar-izona. Conservation Biology 12:896–909.
THE NATURE CONSERVANCY. 2004. Conservation by de-sign: Sonoran Desert ecoregional plan. ,http://nature.org/aboutus/howwework/cbd/science/art14339.html. (26 January 2005).
WIEDNER, D. S., P. KERLINGER, D. A. SIBLEY, P. HOLT,J. HOUGH, AND R. CROSSLEY. 1992. Visible morn-ing flights of Neotropical landbird migrants atCape May, New Jersey. Auk 109:500–510.
YONG, W., D. M. FINCH, F. R. MOORE, AND J. F. KELLY.1998. Stopover ecology and habitat use of migra-tory Wilson’s Warblers. Auk 115:829–842.
Related Documents