SOURCES OF IRRIGATION AND MANAGEMENT OF WATER FOR AGRICULTURAL DEVELOPMENT IN UTTAR PRADESH THESIS. SUBMITTED FOR THE AWARD OF THE:DEGREE OF N ; , GEOGRAPHY ;.- Submihedi By \\ _ SUMAN) , LATA v ;gnderthe.Suparvfsion'.bf' PROF~HTIFZUIURAWMAN (CHAIRMAN) tSIS DEPARTMENT OF GEOGRAPHY ALIGARH MUSLIM UNIVERSITY ALIGARH (U.P.) INDIA 2013

Welcome message from author
This document is posted to help you gain knowledge. Please leave a comment to let me know what you think about it! Share it to your friends and learn new things together.
Transcript

SOURCES OF IRRIGATION AND MANAGEMENT OF WATER FOR AGRICULTURAL DEVELOPMENT
IN UTTAR PRADESH
THESIS. SUBMITTED FOR THE AWARD OF THE:DEGREE OF
N;, GEOGRAPHY ;.-
SubmihediBy
\\ _ SUMAN),LATA v
;gnderthe.Suparvfsion'.bf'
PROF~HTIFZUIURAWMAN (CHAIRMAN)
tSIS
DEPARTMENT OF GEOGRAPHY ALIGARH MUSLIM UNIVERSITY
ALIGARH (U.P.) INDIA
2013

v~atx0 And L,1.
11 NOV 2014
T8961

DR. HIFZUR RAHMAN DEPARTMENT OF GEOGRAPHY
(M.A., Ph.Q) ALIGARH MUSLIM UNIVERSITY PmolessorsodCha/nnan ♦ m^i ALIGARH(U.P.)-202002, IND14
Dated: l,q Jury fp/3
CERTIFICATE
This is to certify that Miss. Snman Late has completed her research work entitled `Sources of Irrigation and Management of Water for
Agricultural Development in Uttar Pradesh". The thesis submitted by Miss. Lata is for the award of the degree of Doctor of Philosophy in Geography.
The results embodied in the thesis, to the best of my knowledge, have not been submitted elsewhere in any form. The present research work in my opinion is fit for evaluation.
(Prof. Hifzur Rahman) Chairman
Contests: Office 0571-2700623, Mob. 91-9219076263, Res. 0571-2407295 and Email- [email protected]@-all.com
ACKNOWLEDGMENTS
My first thank is to Almighty God, who made my life more bountiful during these five years. May your name be exalted, honoured, and glorified!
I would like to thank all people who have helped and inspired me during my doctoral work.
I gratefully acknowledge Chairman, Department of Geography and supervisor, Prof. Hifzur Rah man for his advice, supervision, and crucial contribution, which made him a backbone of this research and so to this thesis. I have been amazingly fortunate to
A. have an advisor who gave me the freedom to explore on my own and at the same time the guidance to recover when my steps faltered. His involvement with his originality has triggered and nourished my intellectual maturity that I will benefit from, for a long time to came. In addition, he was always accessible and willing to help his students with their research. Bence, research life became smooth and rewarding for me.
I owe my sincere thooks to Prof. Mohd. Farooq Siddiqui (Recd.), Department of Geography, Aligarh Muslim University, Aligarh for time to time evaluating the work. It is also a pleasure to mention the names of Prof. Farasal Ali Siddiqui, Prof. Ali Mohammad and Prof. Abdul Munir for their supervision, advice, and guidance from the very early stage of this research as well as giving me extraordinary experiences through out the work.
At deepest gratitude is due to the Department of Geography that provided the support and equipment I have needed to produce and complete my thesis. I am grateful to the seminar incharge, Mrs. Talat Kannez and librarians in the Geography Department, for helping the department to run smoothly and for assisting me in many different ways. Lab Assistant in Cartography Mr. Munney Khan and Mr. Javed helped me a lot during the map making stage. I am thankful to very generous, Mr. Ashfaque, University Computer Centre, AM. U., Aligarh, whom I consulted at the times when to take help in statistical calculations.
It is not possible to thank individually all the officials and non.officials who have been helpful in placing at my disposal all the desired materials connected with my research work. Nevertheless, my sincere thanks are due to the library of Council of Scientific and Industrial Research (CSIR) and the Indian Agricultural Research Institute
JL (LARD in New Delhi; Maulana Azad Library and Seminar Library of the Department, AM. U. Aligarh.
Thanks are also due to the Director General of Observatories, Indian Meteorological Department, New Delhi, who has kindly placed at my disposal all the relevant climate records and data I also appreciate the job done by the departments-Irrigation Department, Agricultural Department (Krishi Bhawan), Directorate of (~ Agriculture and Economics and Water and Land Management Institute (WALMI), Lucknow for providing me secondary data which I needed in my research.
My deepest respects are to my roommate and one of my best friends Dr. (Mrs.) Shikha Chauhan, Women Scientist, Department of Science and Technology (DST), Department of Physics, AM. U. Aligarh. She has always been a source of inspiration to ~g me at Sarojini Naidu Hall. I, here, appreciate her for giving me encouragement and care during long three and more years in the hostel.
I am grateful to my best friend, Dr. Deepika Varshney, for reading my thesis; commenting on my views and helping me understand and enrich my ideas. With her enthusiasm, inspiration, and great efforts to explain, things became clear and simple.
W Throughout my thesis-uniting period, she provided encouragement, sound advice, good teaching and lots of good ideas.
I with to acknowledge the support of Dr. Kaneez Zaman (senior) in the collection of secondary data. Thanks are also due to Zafar Igbal (Junior), Department of Geography, Mr. Arun Pratap Singh (elder brother), Assistant professor at Jahangirabad Trust VV4
College of Engineering and Technology. Barabanki, and Mr. Chandra Veer Shekhar (younger brother), who helped me during the field surveys. I again want to thank Ms. Deepika Varshney, who accompanied me during all the tedious field surveys. I sincerely want to thank Mr. and Mrs. Umar Mumtgj along with their family who provided me homely accommodation and care during one of my field surveys at Barabanki. I also mention the name of Mr. Om Prahash Kannarjjia, Assistant Development Officer, Sikandarpur Sarosi, Unnan, providing me assistance during the survey.
Thanks are due to all my lab buddies at the Department of Geography who made __VV__ it a convivial place to work. In particular, I would like to thank Dr. Anisur Rehman and
Dr. Kamal Asif (seniors) for their friendly help and co-operation in the past five years. I owe my personal thanks to Mrs. Sanam Hasseb (PkD. student in Department of Statistics) who helped me, whenever, I faced problems in understanding statistical calculations. She patiently explained me the formulas of statistics used in the thesis.
I am indebted to my many friends for providing a stimulating and fan environment in which to learn and grow. I am especially grateful to Anjali Garg, Tarab Nairn, Mrs. Naima Umar, Dr. (Mrs.) Nadia Anis, Dr. Menka, Tuhina Islam, Bushara Bono, Mahoish Anjum, Naareen Bono, Zeba Nisar, Bulbul Nargis Sultana, Ullas P. Dr. ZahirAbbas, Junaidur Rahman, Naiyer Zaidi, Md. Shamshad and Dr. Abu Ishaq PKat Aligarh.
I wish to thank my best friends in high school and intermediate (Sweety Jain, Ritu Jain and Madhu), and my best friends as graduate and post-graduate students (Sadaf An/urn, Fouzia Zahoor, Nazia Usmani, Nayala Usmant, Sana Afreen, Huma Rieman, Syed Saema, Nosheen Naz and Huma Khurshid), for helping me get through the difficult times, and for all the emotional support, camaraderie, entertainment, and caring they provided.
Lastly, and most importantly. I wish to thank my parents, Mrs. Ganga Shri (mother) and Mr. Chandan Singh (father), for their faith in me and for supporting me throughout all my studies at University. I have no suitable words that can fully describe A my mother's everlasting love to me. To them I dedicate this thesis. I feel proud of my brother Mr. Arun Pratap Singh, for his talents. He had been a role model for me to follow
~$ unconsciously and has always been one of my best counsellors. Finally. I appreciate the financial support from University Grants Commission
(UGC) for awarding me JRF and SRF positions during the entire course since 14'" December, 2009 till end of the work.
While all these people have contributed in diverse ways in bringing this study to a successful completion, I absolve all of them from any shortcomings of this thesis; all shortcomings are entirely my responsibility.
Dated: 10 .0 6 . 2013 (8aman Lata)
r
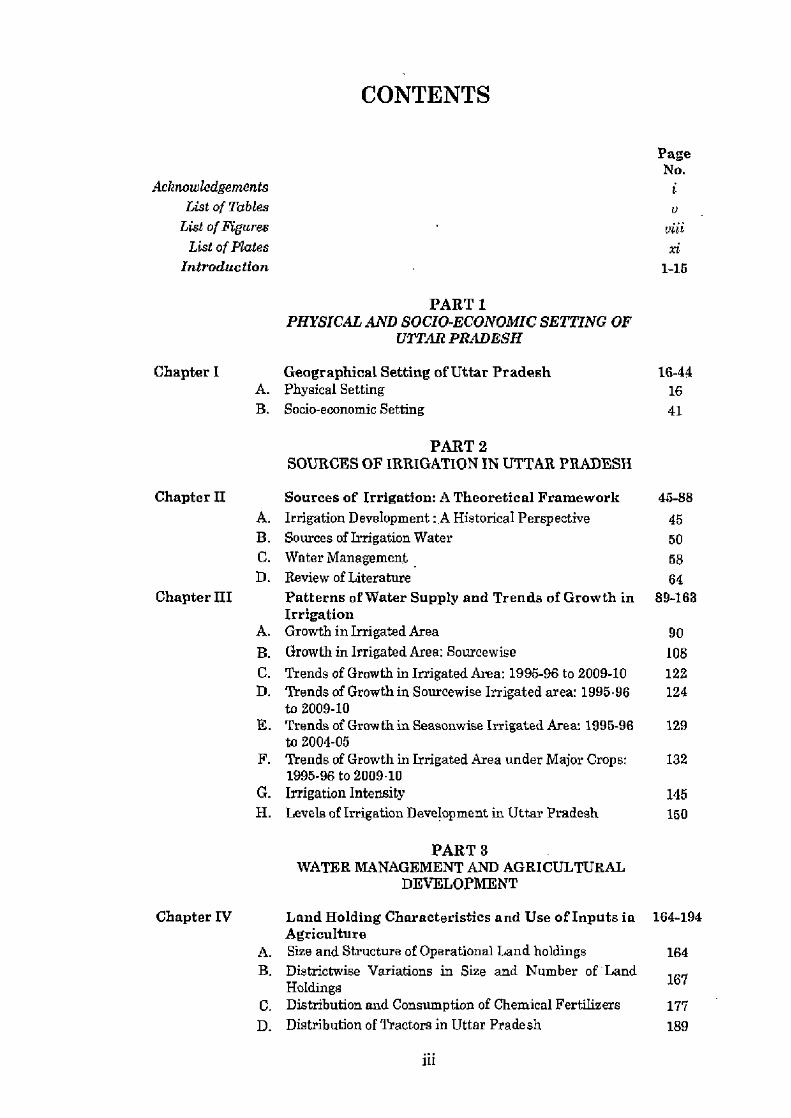
CONTENTS
Page No.
Acknowledgements I List of Tables o
List of Figures viii List of Plates xi
Introduction 1-15
PART 1 PHYSICAL AND SOCIO-ECONOMIC SETTING OF
UTTAR PRADESH
Chapter I Geographical Setting of Uttar Pradesh 16-44 A. Physical Setting 16 B. Socio-economic Setting 41
PART 2 SOURCES OF IRRIGATION IN UTTAR PRADESH
Chapter II Sources of Irrigation: A Theoretical Framework 45-88 A. Irrigation Development: A Historical Perspective 45 B. Sources of Irrigation Water 50 C. Water Management 58 D. Review of Literature 64
Chapter III Patterns of Water Supply and Trends of Growth in 89-163 Irrigation
A. Growth in Irrigated Area 90 B. Growth in Irrigated Area: Sourcewise 108 C. Trends of Growth in Irrigated Area: 1995-96 to 2009-10 122 D. Trends of Growth in Sourcewise Irrigated area: 1995-96 124
to 2009-10 E. Trends of Growth in Seasonwise Irrigated Area 1995-96 129
to 2004-05 F. Trends of Growth in Irrigated Area under Major Crops: 132
1995-96 to 2009-10 G. Irrigation Intensity 145 H. Levels of Irrigation Development in Uttar Pradesh 150
PART 3 WATER MANAGEMENT AND AGRICULTURAL
DEVELOPMENT
Chapter IV Land Holding Characteristics and Use of Inputs in 164-194 Agriculture
A. Size and Structure of Operational Land holdings 164 B. Districtwise Variations in Size and Number of Land 167 Holdings C. Distribution and Consumption of Chemical Fertilizers 177 D. Distribution of Tractors in Uttar Pradesh 189
iii
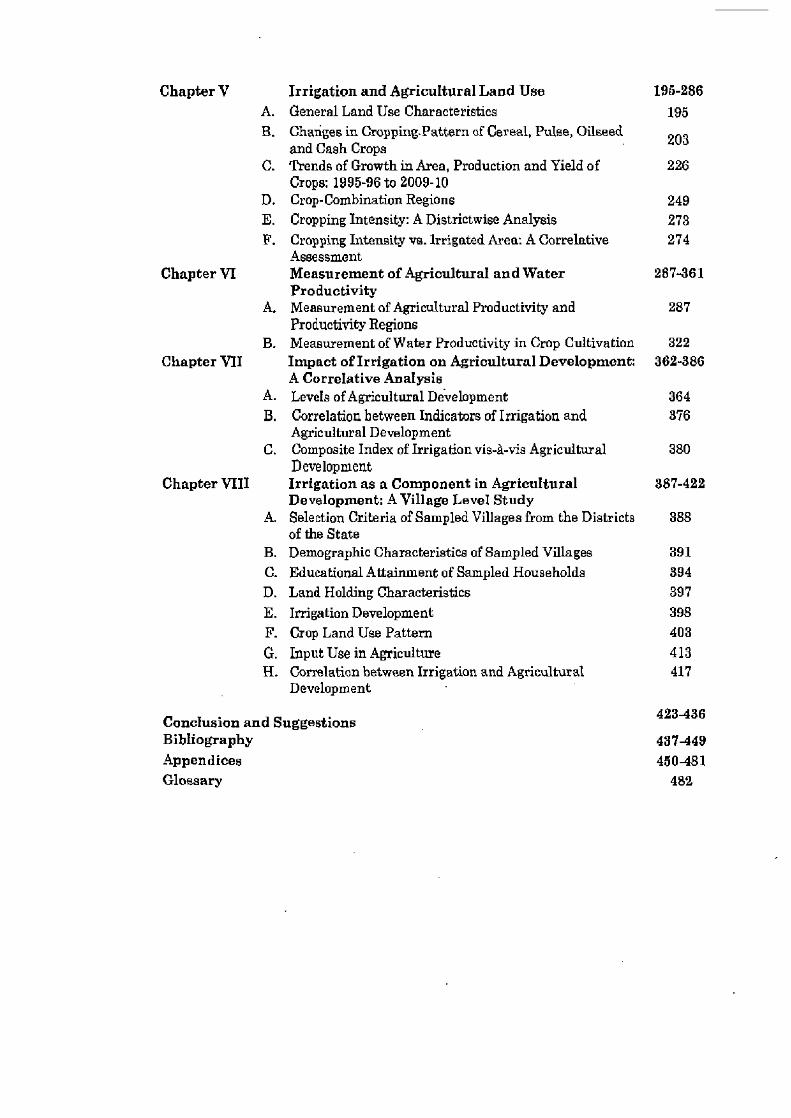
Chapter V Irrigation and Agricultural Land Use 195-286 A. General Land Use Characteristics 195 B. Changes in Cropping_Pattern of Cereal, Pulse, Oilseed 203 and Cash Crops C. Trends of Growth in Area, Production and Yield of 226
Crops: 1995-96 to 2009-10 D. Crop-Combination Regions 249 E. Cropping Intensity: A Districtwise Analysis 273 F. Cropping Intensity vs. Irrigated Area: A Correlative 274
Assessment Chapter VI Measurement of Agricultural and Water 287-361
Productivity A. Measurement of Agricultural Productivity and 287
Productivity Regions B. Measurement of Water Productivity in Crop Cultivation 322
Chapter VII Impact of Irrigation on Agricultural Development: 362-386 A Correlative Analysis
A. Levels of Agricultural Development 364 B. Correlation between Indicators of Irrigation and 376
Agricultural Development C. Composite Index of Irrigation vis-a-via Agricultural 380
Development Chapter VIII Irrigation as a Component in Agricultural 387-422
Development: A Village Level Study A. Selection Criteria of Sampled Villages from the Districts 388
of the State B. Demographic Characteristics of Sampled Villages 391 C. Educational Attainment of Sampled Households 394 D. Land Holding Characteristics 397 E. Irrigation Development 398 F. Crop Land Use Pattern 403 G. Input Use in Agriculture 413 H. Correlation between Irrigation and Agricultural 417
Development
Conclusion and Suggestions 423-036 Bibliography 437-449 Appendices 450481 Glossary 482
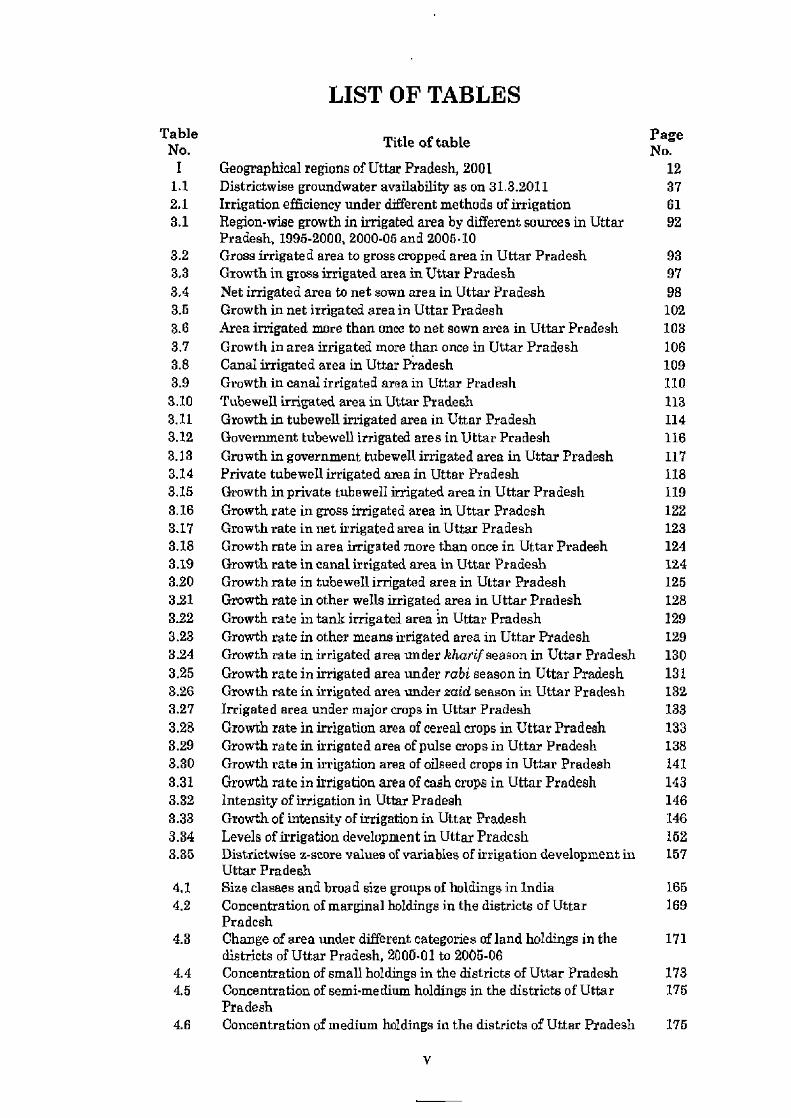
LIST OF TABLES Table
Title of table Page No.
I Geographical regions of Uttar Pradesh, 2001 12 1.1 Distrietwise groundwater availability as on 31.3.2011 37 2.1 Irrigation efficiency under different methods of irrigation 61 3.1 Region-wise growth in irrigated area by different sources in Uttar 92
Pradesh, 1995-2000, 2000-05 and 2005-10 3.2 Gross irrigated area to gross cropped area in Uttar Pradesh 93 3,3 Growth in gross irrigated area in Uttar Pradesh 97 3.4 Net irrigated area to net sown area in Uttar Pradesh 98 3.5 Growth in net irrigated area in Uttar Pradesh 102 3.6 Area irrigated more than once to net sown area in Uttar Pradesh 103 3.7 Growth in area irrigated more than once in Uttar Pradesh 106 3.8 Canal irrigated area in Uttar Pradesh 109 3.9 Growth in canal irrigated area in Uttar Pradesh 110 3.10 Tubewell irrigated area in Uttar Pradesh 113 3.11 Growth in tubewell irrigated area in Uttar Pradesh 114 3.12 Government tubewell irrigated area in Uttar Pradesh 116 3.13 Growth in government tubewell irrigated area in Uttar Pradesh 117 3.14 Private tubewell irrigated area in Uttar Pradesh 118 3.15 Growth in private tubewell irrigated area in Uttar Pradesh 119 3.16 Growth rate in gross irrigated area in Uttar Pradesh 122 3.17 Growth rate in net irrigated area in Uttar Pradesh 123 3.18 Growth rate in area irrigated more than once in Uttar Pradesh 124 3.19 Growth rate in canal irrigated area in Uttar Pradesh 124 3.20 Growth rate in tubewell irrigated area in Uttar Pradesh 125 3.21 Growth rate in other wells irrigated area in Uttar Pradesh 128 3.22 Growth rate in tank irrigated area in Uttar Pradesh 129 3.23 Growth rate in other means irrigated area in Uttar Pradesh 129 3.24 Growth rate in irrigated area under kharif season in Uttar Pradesh 130 3.25 Growth rate in irrigated area under rabi season in Uttar Pradesh 131 3.26 Growth rate in irrigated area under zaid season in Uttar Pradesh 132 3.27 Irrigated area under major crops in Uttar Pradesh 133 3.28 Growth rate in irrigation area of cereal crops in Uttar Pradesh 133 3.29 Growth rate in irrigated area of pulse crops in Uttar Pradesh 138 3.30 Growth rate in irrigation area of oilseed crops in Uttar Pradesh 141 3.31 Growth rate in irrigation area of cash crops in Uttar Pradesh 143 3.32 Intensity of irrigation in Uttar Pradesh 146 3.33 Growth of intensity of irrigation in Uttar Pradesh 146 3.34 Levels of irrigation development in Uttar Pradesh 152 3.35 Distrietwise z-score values of variables of irrigation development in 157
Uttar Pradesh 4.1 Size classes and broad size groups of holdings in India 165 4.2 Concentration of marginal holdings in the districts of Uttar 169
Pradesh 4.3 Change of area under different categories of land holdings in the 171
districts of Uttar Pradesh, 2000-01 to 2005-06 4.4 Concentration of small holdings in the districts of Uttar Pradesh 173 4.5 Concentration of semi-medium holdings in the districts of Uttar 175
Pradesh 4.6 Concentration of medium holdings in the districts of Uttar Pradesh 175
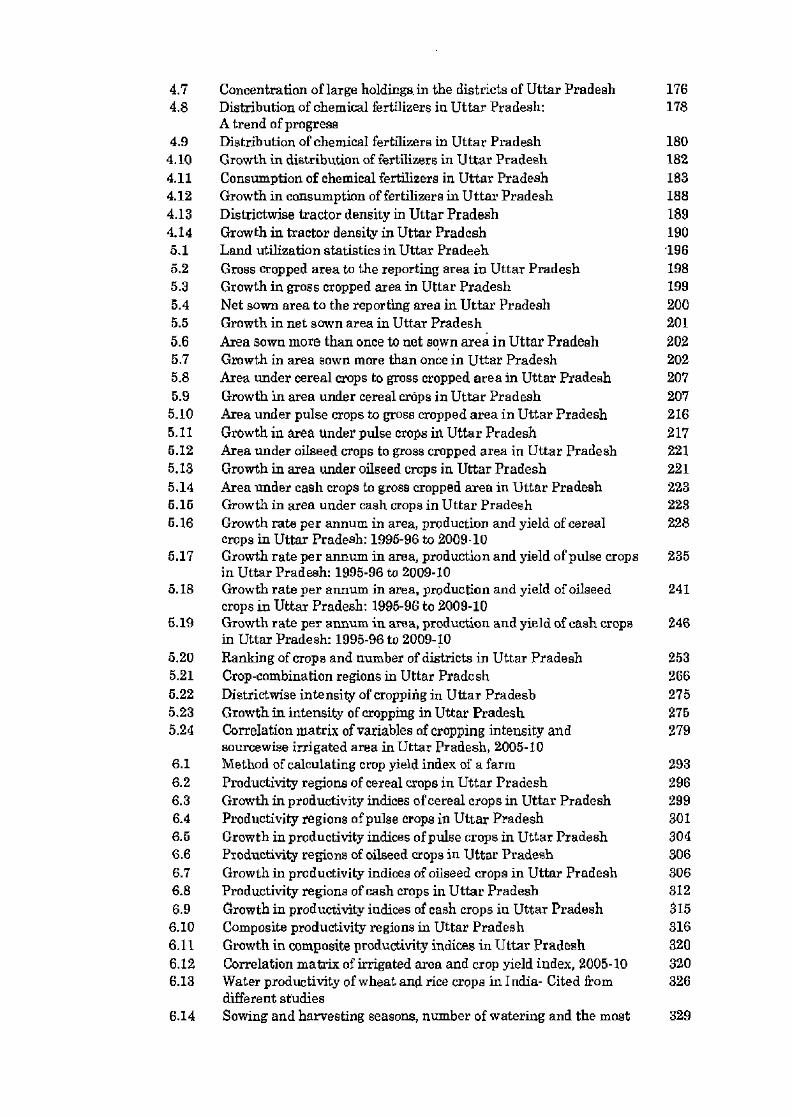
4.7 Concentration of large holdings, in the districts of Uttar Pradesh 176 4.8 Distribution of chemical fertilizers in Uttar Pradesh: 178
A trend of progress 4.9 Distribution of chemical fertilizers in Uttar Pradesh 180 4.10 Growth in distribution of fertilizers in Uttar Pradesh 162 4.11 Consumption of chemical fertilizers in Uttar Pradesh 183 4.12 Growth in consumption of fertilizers in Uttar Pradesh 188 4.13 Districtwise tractor density in Uttar Pradesh 189 4.14 Growth in tractor density in Uttar Pradesh 190 5.1 Land utilization statistics in Uttar Pradesh 196 5.2 Gross cropped area to the reporting area in Uttar Pradesh 198 5.3 Growth in gross cropped area in Uttar Pradesh 199 5.4 Net sown area to the reporting area in Uttar Pradesh 200 5.5 Growth in net sown area in Uttar Pradesh 201 5.6 Area sown more than once to net sown area in Uttar Pradesh 202 5.7 Growth in area sown more than once in Uttar Pradesh 202 5.8 Area under cereal crops to gross cropped area in Uttar Pradesh 207 5.9 Growth in area under cereal crops in Uttar Pradesh 207 5.10 Area under pulse crops to gross cropped area in Uttar Pradesh 216 5.11 Growth in area under pulse crops in Uttar Pradesh 217 5.12 Area under oilseed crops to gross cropped area in Uttar Pradesh 221 5.13 Growth in area under oilseed crops in Uttar Pradesh 221 5.14 Area under cash crops to gross cropped area in Uttar Pradesh 223 6.15 Growth in area under cash crops in Uttar Pradesh 228 6.16 Growth rate per annum in area, production and yield of cereal 228
crops in Uttar Pradesh: 1995-96 to 2009-10 5.17 Growth rate per annum in area, production and yield of pulse crops 235
in Uttar Pradesh: 1995-96 to 2009-10 6.18 Growth rate per annum in area, production and yield of oilseed 241
crops in Uttar Pradesh: 1995-96 to 2009-10 5.19 Growth rate per annum in area, production and yield of cash crops 246
in Uttar Pradesh: 1995-96 to 2009-10 5.20 Ranking of crops and number of districts in Uttar Pradesh 253 5.21 Crop-combination regions in Uttar Pradesh 266 5.22 Distrietwise intensity of cropping in Uttar Pradesh 275 5.23 Growth in intensity of cropping in Uttar Pradesh 275 5.24 Correlation matrix of variables of cropping intensity and 279
sourcewise irrigated area in Uttar Pradesh, 2005-10 6.1 Method of calculating crop yield index of a farm 293 6.2 Productivity regions of cereal crops in Uttar Pradesh 296 6.3 Growth in productivity indices of cereal crops in Uttar Pradesh 299 6.4 Productivity regions of pulse crops in Uttar Pradesh 301 6.5 Growth in productivity indices of pulse crops in Uttar Pradesh 304 6.6 Productivity regions of oilseed crops in Uttar Pradesh 306 6.7 Growth in productivity indices of oilseed crops in Uttar Pradesh 306 6.8 Productivity regions of cash crops in Uttar Pradesh 312 6.9 Growth in productivity indices of cash crops in Uttar Pradesh 315 6.10 Composite productivity regions in Uttar Pradesh 316 6.11 Growth in composite productivity indices in Uttar Pradesh 320 6.12 Correlation matrix of irrigated area and crop yield index, 2005-10 320 6.13 Water productivity of wheat and rice crops in India- Cited from 326
different studies 6.14 Sowing and harvesting seasons, number of watering and the most 329
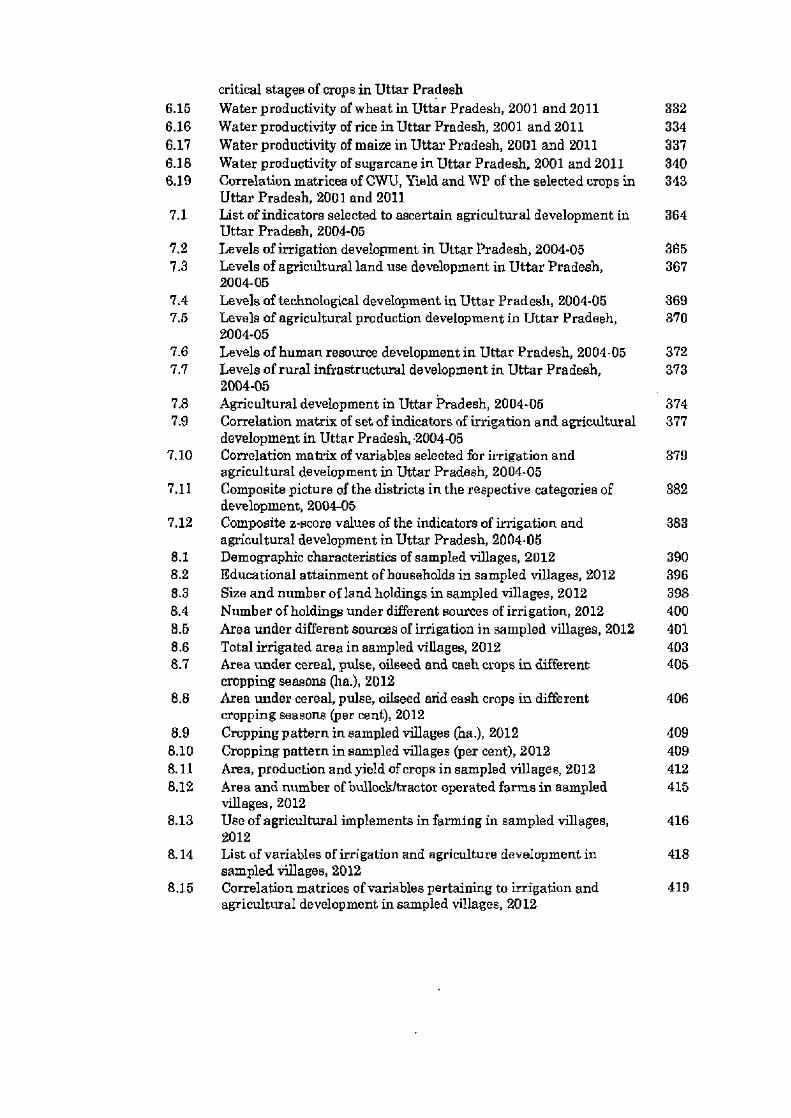
critical stages of crops in Uttar Pradesh 6.15 Water productivity of wheat in Uttar Pradesh, 2001 and 2011 332 6.16 Water productivity of rice in Uttar Pradesh, 2001 and 2011 334 6.17 Water productivity of maize in Uttar Pradesh, 2001 and 2011 337 6.18 Water productivity of sugarcane in Uttar Pradesh, 2001 and 2011 340 6.19 Correlation matrices of CWU, Yield and WP of the selected crops in 343
Uttar Pradesh, 2001 and 2011 7.1 List of indicators selected to ascertain agricultural development in 364
Uttar Pradesh, 2004-05 7.2 Levels of irrigation development in Uttar Pradesh, 2004-05 365 7.3 Levels of agricultural land use development in Uttar Pradesh, 367
2004-05 7.4 Levels of technological development in Uttar Pradesh, 2004-05 369 7.5 Levels of agricultural production development in Uttar Pradesh, 370
2004-05 7.6 Levels of human resource development in Uttar Pradesh, 2004-05 372 7.7 Levels of rural infrastructural development in Uttar Pradesh, 373
2004-05 7.8 Agricultural development in Uttar Pradesh, 2004-05 374 7.9 Correlation matrix of set of indicators of irrigation and agricultural 377
development in Uttar Pradesh, 2004-05 7.10 Correlation matrix of variables selected for irrigation and 379
agricultural development in Uttar Pradesh, 2004-05 7.11 Composite picture of the districts in the respective categories of 382
development, 2004-05 7.12 Composite z-score values of the indicators of irrigation and 383
agricultural development in Uttar Pradesh, 2004.05 8.1 Demographic characteristics of sampled villages, 2012 390 8.2 Educational attainment of households in sampled villages, 2012 396 8.3 Size and number of land holdings in sampled villages, 2012 398 8.4 Number of holdings under different sources of irrigation, 2012 400 8.5 Area under different sources of irrigation in sampled villages, 2012 401 8.6 Total irrigated area in sampled villages, 2012 403 8.7 Area under cereal, pulse, oilseed and cash crops in different 405
cropping seasons (he.), 2012 8.8 Area under cereal, pulse, oilseed and cash crops in different 406
cropping seasons (per cent), 2012 8.9 Cropping pattern in sampled villages the.), 2012 409 8.10 Cropping pattern in sampled villages (per cent), 2012 409 8.11 Area, production and yield of crops in sampled villages, 2012 412 8.12 Area and number of bullockitractox operated farms in sampled 415
villages, 2012 8.13 Use of agricultural implements in farming in sampled villages, 416
2012 8.14 List of variables of irrigation and agriculture development in 418
sampled villages, 2012 8.15 Correlation matrices of variables pertaining to irrigation and 419
agricultural development in sampled villages, 2012

LIST OF FIGURES Fi gure Title of figure Page
No. No. I. Uttar Pradesh: Administrative Divisions, 2001 11 1.1 Uttar Pradesh: Geology 20 1.2 Uttar Pradesh: Drainage 23 1.3 Uttar Pradesh: Annual Temperature 28 1.4 Uttar Pradesh: Annual Rainfall 29 1.5 Uttar Pradesh: Soils 33 1.6 Uttar Pradesh: Distribution of Workers by Category of Work and 43
Sex, 2001 3.1 Uttar Pradesh: Irrigated Area 91 3.2 Uttar Pradesh: Growth in Irrigated Area 91 3.3 Uttar Pradesh: Gross Irrigated Area, 1995-2000 94 3.4 Uttar Pradesh: Gross Irrigated Area, 2000-05 95 3.5 Uttar Pradesh: Gross Irrigated Area, 2005-10 96 3.6 Uttar Pradesh: Net Irrigated Area, 1995-2000 99 3.7 Uttar Pradesh: Net Irrigated Area, 2000-05 100 3.8 Uttar Pradesh: Net Irrigated Area, 2005-10 101 3.9 Uttar Pradesh: Area Irrigated More Than Once, 1995-2000 104 3.10 Uttar Pradesh: Area Irrigated More Than Once, 2000-05 105 3.11 Uttar Pradesh: Area Irrigated More Than Once, 2005-10 107 3.12 Uttar Pradesh: Sourcewise Irrigated Area, 1995-2000 111 3.13 Uttar Pradesh: Sourcewise Irrigated Area, 2000-05 112 3.14 Uttar Pradesh: Sourcewise Irrigated Area, 2005-10 115 3.15 Uttar Pradesh: Growth in Canal Irrigated Area, 1995-96 to 2009-10 126 3.16 Uttar Pradesh: Growth in Tubewell Irrigated Area, 1995-96 to 2009- 127
10 3.17 Uttar Pradesh: Growth in Irrigated Area of Cereal Crops, 1996-96 to 134
2009-10 3.18 Uttar Pradesh: Growth in Irrigated Area of Pulse Crops, 1995-96 to 139
2009-10 3.19 Uttar Pradesh: Growth in Irrigated Area of Oilseeds Crops, 1995-96 142
to 2009-10 3.20 Uttar Pradesh: Growth in Irrigated Area of Cash Crops, 1995-96 to 144
2009-10 3.21 Uttar Pradesh: Irrigation Intensity, 1995-2000 147 3.22 Uttar Pradesh: Irrigation Intensity, 2000-05 148 3.23 Uttar Pradesh: Irrigation Intensity, 2005-10 149 3.24 Uttar Pradesh: Levels of Irrigation Development, 1995-2000 153 3.25 Uttar Pradesh: Levels of Irrigation Development, 2000-05 154 3.26 Uttar Pradesh: Levels of Irrigation Development, 2005-10 156 4.1 Uttar Pradesh: Area and Number of Operational Land Holdings by 168
Different Size Classes, 2000-01 and 2005-06 4.2 Uttar Pradesh: Area Under Marginal Holdings, 2000-01 170 4.3 Uttar Pradesh: Area Under Marginal Holdings, 2005-06 170 4.4 Uttar Pradesh: Area Under Small Holdings, 2000-01 174 4.5 Uttar Pradesh: Area Under Small Holdings, 2005-06 174 4.6 Uttar Pradesh: Fertilizer Distribution in'000 Metric Tonnes, 1950-51 179
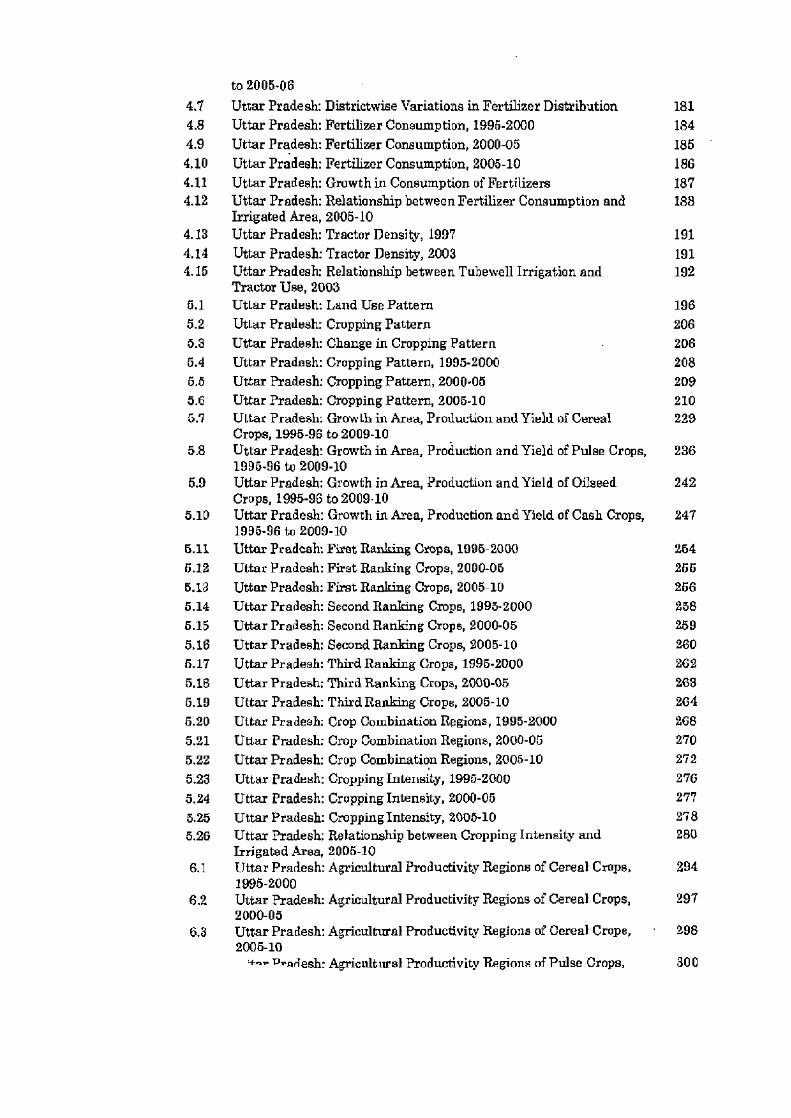
to 2005-06 4.7 Uttar Pradesh: Distrietwise Variations in Fertilizer Distribution 181 4.8 Uttar Pradesh: Fertilizer Consumption, 1995-2000 184 4.9 Uttar Pradesh: Fertilizer Consumption, 2000-05 185 4.10 Uttar Pradesh: Fertilizer Consumption, 2005-10 186 4.11 Uttar Pradesh: Growth in Consumption of Fertilizers 187 4.12 Uttar Pradesh: Relationship between Fertilizer Consumption and 188
Irrigated Area, 2005-10 4.13 Uttar Pradesh: Tractor Density, 1997 191 4.14 Uttar Pradesh: Tractor Density, 2003 191 4.15 Uttar Pradesh: Relationship between Tubewell Irrigation and 192
Tractor Use, 2003 6.1 Uttar Pradesh: Land Use Pattern 196 5.2 Uttar Pradesh: Cropping Pattern 206 5.3 Uttar Pradesh: Change in Cropping Pattern 206 5.4 Uttar Pradesh: Cropping Pattern, 1995-2000 208 5.5 Uttar Pradesh: Cropping Pattern, 2000-05 209 5.6 Uttar Pradesh: Cropping Pattern, 2005-10 210 5.1 Uttar Pradesh: Growth in Area, Produel on and Yield of Cereal 229
Crops, 1995-9G to 2009-10 5.8 Uttar Pradesh: Growth in Area, Production and Yield of Pulse Crops, 286
1995-96 to 2009-10 6.9 Uttar Pradesh: Growth in Area, Production and Yield of Oilseed 242
Crops, 1995-96 to 2009-10 5.10 Uttar Pradesh: Growth in Area, Production and Yield of Cash Crops, 247
1995-96 tc 2009-10 5.11 Uttar Pradesh: First Ranking Crops, 1096-2000 264 6.12 Uttar Pradesh: First Ranking Crops, 2000-05 266 5.13 Uttar Pradesh: First Ranking Crops, 2005-10 266 5.14 Uttar Pradesh: Second Ranking Crops, 1995-2000 258 5.15 Uttar Pradesh: Second Ranking Crops, 2000-05 259 5.16 Uttar Pradesh: Second Ranking Crops, 2005-10 260 6.17 Uttar Pradesh: Third Ranking Crops, 1995-2000 262 5.16 Uttar Pradesh; Third Ranking Crops, 2000-05 263 5.19 Uttar Pradesh: Third Ranking Crops, 2005-10 264 5.20 Uttar Pradesh: Crop Combination Regions, 1995-2000 268 5.21 Uttar Pradesh: Crop Combination Regions, 2000-05 270 5.22 Uttar Pradesh: Crop Combination Regions, 2005-10 272 5.23 Uttar Pradesh: Cropping Intensity, 1990-2000 276 5.24 Uttar Pradesh: Cropping Intensity, 2000-05 277 5.25 Uttar Pradesh: Croppinglntensity, 2005-10 278 5.26 Uttar Pradesh; Relationship between Cropping Intensity and 280
Irrigated Area, 2005-10 6.1 l Ittar Pradesh: Agricultural Productivity Regions of Cereal Crops. 294
1995-2000 6.2 Uttar Pradesh: Agricultural Productivity Regions of Cereal Crops, 297
2000-05 6.3 Uttar Pradesh: Agricultural Productivity Regions of Cereal Crops, 298
2005-10 «^^ O"ndesh: Agricultural Productivity Regions of Pulse Crops, 300

6.5 Uttar Pradesh: Agricultural Productivity Regions of Pulse Crops, 302 2000-05
8.6 Uttar Pradesh: Agricultural Productivity Regions of Pulse Crops, 303 2005-10
6.7 Uttar Pradesh: Agricultural Productivity Regions of Oilseed Crops, 307 1996-2000
6.8 Uttar Pradesh: Agricultural Productivity Regions of Oilseed Crops, 308 2000-05
6.9 Uttar Pradesh: Agricultural Productivity Regions of Oilseed Crops, 309 2005-10
6.10 Uttar Pradesh: Agricultural Productivity Regions of Cash Crops, 311 1995-2000
6.11 Uttar Pradesh: Agricultural Productivity Regions of Cash Crops, 313 2000-05
6.12 Uttar Pradesh: Agricultural Productivity Regions of Cash Crops, 314 2005-10
6.13 Uttar Pradesh: Agricultural Productivity Regions Based on 317 Composite Yield Index, 1995-2000
6.14 Uttar Pradesh: Agricultural Productivity Regions Based on 818 Composite Yield Index, 2000-05
6.15 Uttar Pradesh: Agricultural Productivity Regions Based on 319 Composite Yield Index, 2005-10
6.16 Uttar Pradesh: Relationship between Crop Yield Indices and 321 Irrigated Area, 2005-10
6.17 Uttar Pradesh: Water Productivity of Wheat, 2001 330 6.18 Uttar Pradesh: Water Productivity of Wheat 2011 330 6.19 Uttar Pradesh: Water Productivity of Rice, 2001 335 6.20 Uttar Pradesh: Water Productivity of Rice, 2011 335 6.21 Uttar Pradesh: Water Productivity of Maize, 2001 338 6.22 Uttar Pradesh: Water Productivity of Maize, 2011 338 6.23 Uttar Pradesh: Water Productivity of Sugarcane, 2001 341 6.24 Uttar Pradesh: Water Productivity of Sugarcane, 2011 341 6.25 Uttar Pradesh: Relationship among CWU, Yield and WP of Wheat, 344
Rice, Maize and Sugarcane Crops, 2001 6.26 Uttar Pradesh: Relationship among CWU, Yield and WP of Wheat, 346
Rice, Maize and Sugarcane Crops, 2011 7.1 Uttar Pradesh: Irrigation Development, 2004-05 866 7.2 Uttar Pradesh: Agricultural Land Use Development, 2004.05 366 7.3 Uttar Pradesh: Technology Development, 2004-05 368 7.4 Uttar Pradesh: Agricultural Production Development, 2004-05 368 7.5 Uttar Pradesh: Human Resource Development, 2004-05 371 7.6 Uttar Pradesh: Rural Infrastructure Development, 2004-05 371 7.7 Uttar Pradesh: Overall Agricultural Development, 2004-05 375 7.8 Uttar Pradesh: Relationship between indicators of Irrigation and 378
Agricultural Development, 2004-05 7.9 Uttar Pradesh: Irrigation Development vis-a-vis Agricultural 381
Development, 2004-05 8.1 Hierarchy of Villages Selected from the Districts of the State, 2012 389 8.2 Educational Status of Total Respondents in Sampled Villages, 2012 394 8.3 Educational Attainment of Households in Sampled Villages of Uttar 396
Pradesh,2012
7

LIST OF PLATES
Plate No. Title of plate Page No.
1 •
Rocky terrain in Kalauli Teer Dana village of Hamirpur 395 district Kachoha houses in Kalauli Teer Darin village of Hamirpur
2 • district 396
3. Primary school in Tara Gav village of Allahabad district 395 Poor condition of roads in Kalauli Teer Darin village of 395 4' Hamirpur district
5 Canal passing through Mohammadpur Bahun village of Barabanki district 402
6. Tubewell in Tara Gav village of Allahabad district 402 7. Wheat crop grown in Kakethal village of Aligarh district 402
Mustard crop grown in Asnahara village of Siddharthnagar 402 8 • district
9. Sugarcane cultivation in Darbara village of Bijnor district 407
10. Ripened mustard and rapeseed in Kalauli Teer Daria of 407 Hamirpur district Ripened grew in Kalauli Teer Dada Village of Hamirpur 11. district 407
12. Arhar grown in Tara Gav village of Allahabad district 407
13. Bullocks used in farming operations in Kalauli Teer Darin 414 village of Hamirpur district
Use of tractors in farming operation in Kakethal village of 14. Aligarh district 414
15. Disc harrow in Ujrai village of Agra district 414
16. Use of cultivator in Mohammadpur Bahun village of 414 Barabanki district

INTRODUCTION
INTRODUCTION
Irrigation is a key driver of agricultural production. It is a continuous and
reliable supply of water to crops in accordance with their moisture needs. Since the
very beginning of plant cultivation, over 10,000 years ago, water has enabled farmers
to increase crop yields by reducing their dependence on rainfall distribution patterns,
thus boosting the average crop production while decreasing the inter-annual
variability (Turner, 2004). In most of the tropical and subtropical countries
agriculture depends upon monsoon and irrigation is regarded as inevitable resource.
In India, rainfall is quite erratic in terms of time and quantity. The reason is that, it
depends on nature and hence,, rainfall is rarely matched as per the need of crops in
terms of time and magnitude in the entire cultivated area. Whereas, the provision of
irrigation is far ahead to rainfall because it can be ascertained and its quantity can be
appropriate as per the need of a crop (Verma, 1993). In major parts of the country,
agriculture is carried out under rain-fed conditions. Sometimes in many areas
production of crop is not possible without the provision of irrigation and in other
areas supplemented irrigation makes it possible to maintain crop production at a
reasonable level to avoid crop failure due to uncertain rainfall. Irrigation has helped
in increasing agricultural output in and and semi-arid environments and stabilized
food production and prices of crops (Cal and Rosegrant, 2003).
Usefulness and importance of irrigation can be appreciated by the fact that
without irrigation, it would have been impossible for India to become self-sufficient
in food to support huge population of the country. Main cause of agricultural
prosperity in the state of Punjab is water available for irrigation. Similarly, the Nile is
the source of food and prosperity in Egypt (Asawa, 2005).
Availability and access to irrigation has been considered essential for crop
production. Rapid expansions in irrigated areas in recent past, coupled with
availability and access to new technology in the form of use of high-yielding
varieties (HYVs), fertilizers and irrigation through tubewells and other underground
water extraction mechanism since mid 1960s and 1970s were major underlying
factors for the success of Green Revolution in India as well as in other Asian
countries. An easy access to irrigation facilitated intensification of cropping practices
and inputs used, thus paving the way for the modernization' of agricultural sector.
About 60 per cent of rice and 40 per cent of wheat production in developing
countries come from irrigated lands. The success of agriculture through irrigation has
large implications on reduction of poverty and maintenance of food security in a
nation (Bhattarai et al., 2002).
Irrigation helps in ensuring food security. This experience has been achieved
during the phase of green revolution in many of the developing countries. Increase in
food production has helped in increasing per capita income and improving nutrition
and health at national level. Irrigated agriculture accounts for about 72 per cent at
global level and 90 per cent of water withdrawals in developing countries. However,
irrigated agriculture faces a number of challenges. Water availability for irrigation is
also threatened by non-agricultural water uses (domestic, industrial, environmental
etc.). Further, water pollution and groundwater mining have increased the risk for
meeting irrigation water needs (Cal, 2005).
Demand of water in agricultural sector in India always remains high for
growing food and non-food crops to feed the millions and for other needs of human
population. Southwest monsoon has overwhelming impact on climate of India, and a
major part of rain is received during the'rainy season. Of the total amount of rainfall
70 to 90 per cent of it is received during the months of July to September (Dhindwal
and Kumar, 2005). Onset of monsoon each year however, remains uncertain and the
rainfall received is highly erratic in nature. Sometimes, failure of monsoon causes
drought conditions that adversely affect agriculture over extensive areas of the
country.
Drought is a perennial feature in many parts of India. There have been
frequent occurrences of droughts in India with the failure of monsoon. The most
prominent years on record are 1877, 1899, 1918, 1972, 1979, 1987 and 2002.
Amongst, the drought of 1987 was one of the worst in the country. In recent years,
the drought of 2002 ranked fifth in terms of its magnitude (Poorest Areas Civil
Society, 2012). Consequently, the famine conditions, for example, in 1899 and 1900
led to the formation of the Irrigation Commission by the government in 1901. One of
the major recommendations of this commission was to develop irrigation to reduce
the impact of drought and minimising the chances of famine through increased
agricultural production. More and more areas were brought under cultivation which
led to increase in land use intensity. But, there was no significant impact on
productivity of three major crops of wheat, mustard and gram. Wheat yield did not
change until 1965 and that of rapeseed and mustard until 1985. However, a dramatic
2
change in productivity of wheat started from 1970 and there has been a slow growth
of productivity of wheat in recent years (Desai and Pujari, 2007).
After independence, public irrigation works were taken up in all parts of the
country. However, in the same period irrigation development under private aegis in
low and medium rainfall regions occurred at much higher pace. To some extent,
regional differences in irrigation development on farmer's own account may be
ascribed to the difference in state and institutional support provided to the farmers for
establishing their own wells and tubewells. Thus, state plans for rural electrification
and programmes for subsidised finance to dig wells, and to install tubewells and
pumpsets by small and marginal farmers made a difference to the rise of private
groundwater irrigation in different states of India (Dhawan, 1988).
Electric operated tubewells gained importance with the new agricultural
strategy initiated during green revolution period in the country. Tubewells are
considerably more expansive than primitive forms of irrigation. It is estimated that in
India per hectare cost of tubewell irrigation is about twice to that of canal irrigation.
Moreover, these wells can only be installed where electric power to operate them is
available. Relatively, less wasteful in human and animal labour and time, they are
doing a great deal to revolutionize rural life in parts of the northern plains of the
country. They make possible to exploit a considerable amount of underground water,
which in turn may promote a more productive agriculture (Cantor, 1967).
While securing the first position in terms of irrigated area in the world,
different regions of India have started facing sever water scarcity. Demand of water
in agriculture for a number of purposes has increased. In several areas, the number of
wells and pumpsets has increased rapidly and at the same time the average depth of
water table has lowered down progressively (Dick and Svendsen, 1991).
Consequently, the water available for future use is declining at a faster rate.
Agriculture continues to account for a,major share of the water demand in India
which consumes over 80 per cent of the available water (Amarasinghe et at., 2008).
Though India has the largest irrigated area in the world, the coverage of irrigation is
only about 40 per cent of the gross cropped area (Bhaduri et al., 2008). One of the
main reasons for the low coverage of irrigation is the predominant use of flood
(conventional) method of irrigation, where water use efficiency is very low. The
estimates of Indian National Committee on Irrigation and Drainage (1994) indicate
that water use efficiency under `flood method' of irrigation is only about 35 to 40 per
3
cent losses in huge conveyance and distribution of water.
The research work presented in the thesis deals with 'Sources of Irrigation
and Management of Water for Agricultural Development in Uttar Pradesh'. The state
of U.P. is one of the leading states of the country where the main occupation of the
rural masses is agriculture. Agriculture supports food and fibre needs to the
population which amounts about 166 millions (Census of India, 2001) and irrigation
is also highly developed, next to the states of Punjab and Haryana. But the
availability of water is inadequate because of over-extraction and over-use,
especially the groundwater. Wisefull use and conservation can save water which can
further be used to irrigate the crops grown under double and triple farming practices.
Although an intensive work on water management in irrigation has been well taken
by several scholars working in various disciplines like agricultural economics and
disciplines in agricultural sciences, but in geography the attention to this aspect has
little been paid. Keeping in mind, an attempt has been made to study this aspect with
geographical orientation in 70 districts of the state. This work is an amalgamation of
three aspects: sources and growth of irrigation, water management and agricultural
development, and to identify the underlying causes of spatio-temporal variations in
irrigation and agricultural development. .
Significance and scope of the study
The significance of present study is to deal with aspects of agriculture,
irrigation and water management, without which agriculture can not be foreseen with
uncertain rainfall in the state. The study confines to examine districtwise variations
in growth of major sources of irrigation, area, production and yield of major crops by
taking quinquennial averages for three periods of time for measuring productivity of
crops and computing the growth rate per annum for the period of fifteen years. The
crop-combinations for the respective districts of the state were determined by
applying the Kikukazu Doi's method (1957) in order to suggest the most suitable
combination of the districts to obtain the maximum returns. Though the state is
potentially rich in surface and groundwater sources of irrigation, but these potentials
vary districtwise. The study emphasizes the water management issues to optimise the
crop yields in relation to the required levels of irrigation and attempts to expand its
sphere in adopting the method of calculating water productivity tof four major crops
selected thereby, creating potential for increasing water productivity of crops in low
4
productivity regions of the state. At the end of the thesis, a separate chapter has been
devoted to take into account the village level irrigation sources and their impact on
agricultural development in the regions as to show a ground picture at micro-level.
Objectives
The following objectives were taken into consideration to the aforesaid problem:
• To study the regional variations in sources of irrigation and to examine the growth of irrigation (gross and net irrigated area) in the state during the period that extends over fifteen years.
• To study crop and seasonwise (kharif, rabi and zaid) growth of irrigated area in districts of the state.
• To compute the inter-district variations in intensity of irrigation and the levels of irrigation development on the basis of some selected variables.
• To examine the cropping patterns of major crops and districtwise variations in cropping intensity.
• To compute linear growth rates in area, production and yield of all the 18
crops grown in the districts of the state.
• To rank the crops according to their areal strength and to determine the crop-combination regions in the state.
• To assess the impact of irrigation on land use pattern and changes, and
fertilizer consumption.
• To measure agricultural productivity (on the basis of crops categorised as
cereal, pulse, oilseed and cash cops) and demarcate productivity regions in
the state.
• To examine crop water requirements and water productivity of major crops
namely, wheat, rice, maize and sugarcane, and to analyze the relationship
between water requirements, water productivity and crop yields during
triennium ending years of 2001 and 2011.
• To identiTy the levels of agricultural development on the basis of some 21
selected variables, as well as to establish a relationship with irrigation and
agricultural development.
• To assess the sources of irrigation and their impact at micro-level by selecting
few villages from individual districts of the state.
5
Data sources
The study is based on fifteen years of data from 1995-96 to 2009-10.
Quinquennial averages of data for three periods of time, viz. 1995-96 to 1999-2000,
2000-01 to 2004-05 and 2005-06 to 2009-10 have been taken into consideration. For
the study, map of Uttar Pradesh showing 70 districts have been obtained from Census
of India, 2001 to show spatial variations in the data. Data needed for the
comprehensive analysis were collected principally from various official sources:
• Bulletin of Agricultural Statistics of Uttar Pradesh ( from 1995-96 to 2009-
10), published by the Directorate of Agriculture, Lucknow, Uttar Pradesh.
• Districtwise Statistical Abstracts (from 1995-96 to 2009-10), Directorate of
Economics and Statistics (Yojana Bhawan), Lucknow, Uttar Pradesh.
• Agriculture Census (2000-01 and 2005-06), Department of Agriculture and
Cooperation. Ministry of Agriculture, New Delhi.
• District Census Handbook (1991 and 2001), Directorate of Census Operation,
Lucknow, Uttar Pradesh.
• Varshik Prashasan Prativedan (Hindi) 1995-96 and 2004-05, Chief Engineer,
Irrigation Department, Lucknow, Uttar Pradesh.
• Data pertaining to temperature, rainfall and other aspects of weather and
climate used in the study were taken from the website of Indian
Meteorological Department, Pune for the respective years.
• Data for the districts namely, Auraiya, Baghpat, Balrampur, Chandauli,
Chitrakoot, G.B.Nagar, Hathras, J.P.Nagar, Kannauj, Kaushambi, S.K.Nagar,
S.R.Nagar and Shrawasti were not available for the years 1995-96 and 1996-
97 as these districts created in the year 1997. Data for tractors were obtained
from Agricultural Census for the years 1997 and 2003.
Methodology
The statistical techniques employed for the comprehensive analysis of the
data are as follows:
• Simple percentage method -
• Intensity of irrigation
• Composite z-score technique
The levels of development in the state were computed by applying the
Composite z-score technique. In statistical terms, standard score indicates
6
how many standard deviations on observation or datum are above or below
the mean. It is a dimensionless quantity which is derived by subtracting the
population mean from an individual raw score and then dividing the
difference by the population standard deviation. This conversion process is
called 'standardizing' or `normalizing'. The standard deviation is the unit of
measurement of z-values, z-scores, normal scores and standardized variables;
the use of `Z' is because the normal distribution is also known as the "Z
distribution." The quantity of z represents the distance between the raw score
and the population mean in units of the standard deviations. Z is negative
when the raw score is below the mean and positive when it is above the
mean. Computation of z-score can be done by applying the formula:
where,
Z; = standard score for in' observation
X; = original value of the observation
X = mean for the values of X
a =Standard deviation of X
The values of standard scores thus obtained for different indicators
were aggregated to obtain the Composite Standard Scores for each district so
as to ascertain the regional disparities in the development on a common scale.
The values of composite standard scores can be computed by applying the
formula: _ TI i m Zil
i=1
where,
j the district
m=set of indicators
Zii=Standard score of the i b and j'a indicators
• Simple linear regression technique
This technique was applied to show the impact of different irrigation
related variables on agricultural development. Regression technique is a
mathematical measure of average relationship between two or more variables
7
in terms of original units of the data. Degree of regression coefficient
determines the magnitude of one variable over the other. Regression goes
beyond correlation by adding prediction capabilities. The coefficient of
determination (R2) is the square of the correlation coefficient. Its value may
vary from zero to one. It has the advantage over the correlation coefficient in
the sense that, it may be interpreted directly as the proportion of variance in
the dependent variable that can be accounted for by the regression equation.
For example, the r-squared value of 0.49 means that 49 per cent of the
variance in the dependent variable can be explained by the regression
equation. The other 51 per cent is unexplained. It can be expressed by the
equation as:
Y=a+bX
where,
X= explanatory variable or independent variable
Y= dependent variable
a=intercept
b=slope of the line
• In order to compute the rate of growth front a long series of data, Least-
Square Method was applied for the above periods of time which provide the
reliable growth values indicating the positive and negative trends in irrigated
area in each district of the state. Computing the rate of growth with the least
square method growth explains, wherever there is a sufficiently long time
series to permit a reliable calculation. No growth rate is calculated if more
than half the observations in a period are missing.
The least square growth rate 'r' is estimated by fitting a least square
regression trend line to the logarithmic annual values of the variable in the relevant period. The regression equation takes the following form:
In Xt =a+bt,
which is equivalent to the logarithmic transformation of the compound
growth equation, Xt= Xo (1+r) t.
In the above equation, X is the variable, t is time, and a = log Xo, and
b = In (l+r) are the parameters to be estimated. If b* is the least square
E
estimate of b, the average annual growth rate (r) is obtained as [exp (b*) 1] and is multiplied by 100 to express in percentage.
The calculated growth rate is an average rate that is a representative of
the available observations over the entire period of time. It does not
necessarily match the actual growth rate between any two periods.
• Crop-combination regions were delineated with the help of Doi's method.
• Cropping intensity
An index of intensity of cropping can be calculated with the help of
following formula:
GCA Cropping Intensity (CI)
= NSA 100
where,
GCA= Gross cropped area
NSA Net sown area
• Crop productivity regions have been carved out using Yang's Crop Yield
Index method.
• Districtwise Consumptive Water Use (CWU) and Water Productivity (WP) of
wheat, rice and sugarcane were computed by adopting the formula referred to
as by Amarasinghe and Sharma (2009).
• Karl Pearson's coefficient of correlation (r) was used to calculate the strength
of relationship between the variables (Johnston, 1978), and finally t-test was
done to test the significance level between the components. If a `computed
value' is greater than the `tabulated value' of `t' at any desired level (0.01 or I
per cent level, and 0.05 or 5 per cent level), the correlation coefficient is
considered to be significant.
r = £xy / (I(£x2). (Ey2)
r. n — 2 = 1—rz
Where n= number of observations.
7
• For conducting primary surveys, the samples derived for the study are based
on purposive stratified random sampling technique. A total of nine villages
namely, Kakethal, Mohammadpur Bahun, Husainganj, Darbara, Dostinagar,
Tara Gay, Ujral, Asnahara and Kalauli Teer Daria were surveyed from nine
districts of Aligarh, Barabanki, Azamgarh, Bijnor, Unnao, Allahabad, Agra,
Siddharthnagar and FIamirpur, respectively. At least three villages were
selected from developed, moderately developed and least developed districts in terms of irrigation and agricultural development so as to cover different
agro-climatic regions of the state. Data from individual villages were
collected by visiting the respective villages and contacting the individual
farmer during the rabi (winter) season. Surveys were conducted during the
months of January, February, March and mid-April in 2012, with the help of a
structured questionnaire (Appendix, I). The detailed discussions were held
with the village heads and also the incharge officials of the Irrigation
Department in respective villages.
• Techniques used to interpret the results and making cognition better and
effective were, for example, the Statistical Package for Social Sciences
(SPSS) Version 16, and diagrams and maps were drawn using Arc View GIS
Version 3.2 and Microsoft Office Excel 2003 and 2007.
Study area With a total area of 240,928 sq. km., the state of Uttar Pradesh forms the
northern part of the country extending from 23°52' to 29°45' N latitudes and 77°4' to
84°38' E longitudes. It is the fifth largest and the most populous state of the country
with a population of 166.2 million (Census of India, 2001). Forming a part of the
most fertile Ganga Plain, it contributes a major share to agricultural production in the
country. The state is divided into 70 administrative districts that according to Census
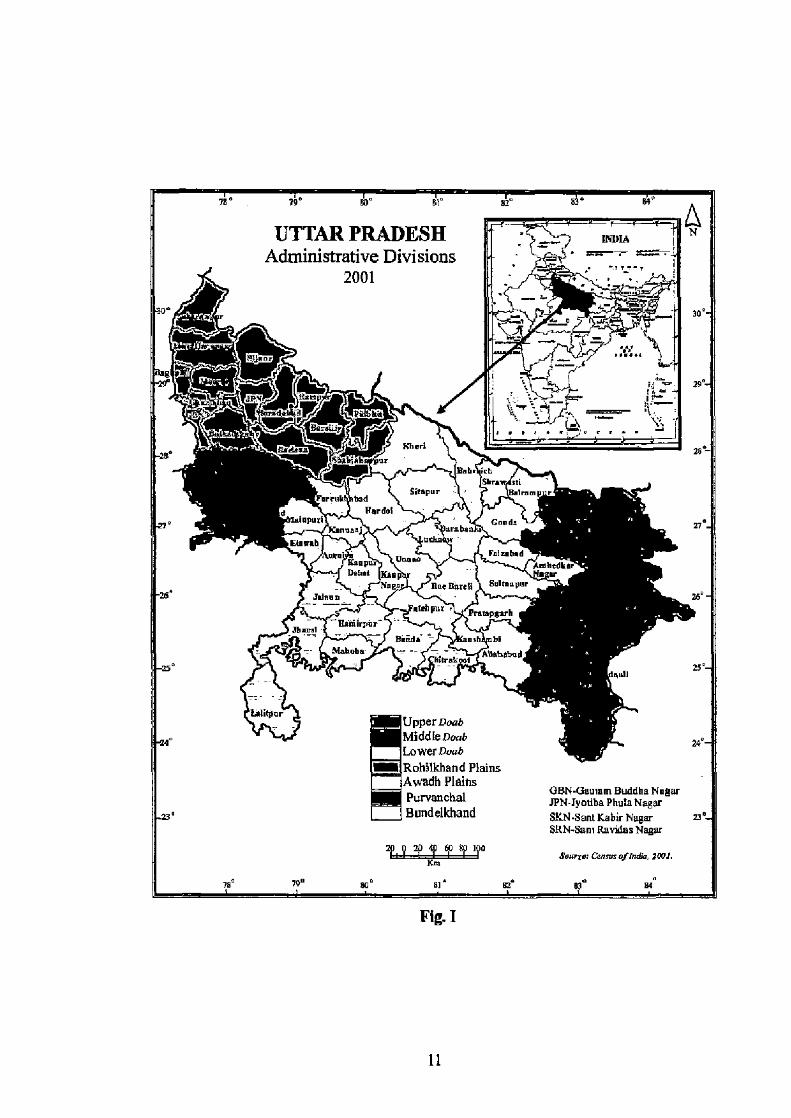
2001 have been grouped into the following five geographical regions (Table I, Fig.
I). These constitute as: 1. The Ganga-Yamuna Doab, which can further be divided into three parts:
upper, middle, and lower. Geologically, the whole region forms part of the alluvial Indo-Gangetic trough. Being most fertile region of the state, it covers an area of
approximately 60,500 sq. km. and its length attains 805 km. and width 97 km.
10
UTTARPRADESH M° N A
Administrative Divisions 2001
30°
Fljeoa
iPV m®p
+vsfill
Lvn Ifber3
Bnhr kh Sn
ruk bvd Siropur eelmm
Perdol ~ppuri nvj arabn Gonda aj
u.c.b u°nw p°I.Nd
NabP° AbM4er Uehel
Na n nae n¢rtlli BWhopvr
38° .IJnv M° - -- _ tldi PUr , Preupgarh
miiirpr --
B.nde — mb bE = :Nbb. _ -_ Atlehpbnd h-tr -
qWl
iifl _nr Uppernaeb It
MiddleDOab Lower Daub Rohilkhand Plains A%mdh Plains Purvanchal GBN-6euthm Buddha Nagar
JPN-lyetibe Photo N, r Baadelkhand StcNsnauabk NUper v°
SRN-Sant Raviilss Neger
. 9 W P P 40 sn::.vn: (a.,u: lrnm. rwr. Km
s°
INBIA
•rig, f e
e r°m
IT_
Fig. I
11

Table I Geouranhical re¢ions of Uttar Pradesh. 2001 S. No. Name of region No. ofdistricts Area
Per cent) Population
Per cent Density
(Persons/sq. km) Ganga-Yamuna Doab 23 27.86 32.60 820 a. Upper doab 7 7.68 10.82 1017 b. Middle doab 6 8.16 8.94 762 c. Lower doab 10 12.02 12.85 717
II. Rohilkhand plains 8 12.56 12.74 708 111. Awadh plains IS 25.92 24.20 714 IV. Bundelkhand region 7 12.21 4.96 277 V. Purvanchal region 17 21.45 25.50 935
Source: Census oflndia, 2001.
II. Rohilkhand plains lie on upper Ganga alluvium plain and cover an area of
about 25,000 sq. km. It is bounded by the Ganga river on the south and Uttarakhand
to its west, Nepal on the north and Awadh plains forms its eastern boundary.
III. Awadh plains designated as United Provinces of Agra and Oudh before
independence lie in the centre of the state, and cover an area of 26 per cent of the
state. From agricultural point of view, it is less fertile than doab, but the soil
characteristics are far better than the Purvanchal region.
IV. Bundelkhand region covers an area of 12.21 per cent of the state and
spreads over 7 southern districts and possesses only 4.96 per cent population of the
state. This part of the state is economically backward, barren and unproductive hilly
terrain dominating the landscape.
V. Purvanchal region covers an area of 21.45 per cent and lies at the eastern
end. It is the most densely populated part of the state having density of population of
935 persons/sq. km.
Organization of the study
The entire work presented in the thesis has been divided into three parts, and
each part contains different chapters. Part one consists of only one chapter which
deals with general description of physical and socio-economic setting of Uttar
Pradesh. Part two consists of two chapters-second and third. Chapter second deals
with the conceptual framework of irrigation water supply more specifically surface
and groundwater sources in the state. Third chapter is devoted to deal with the
patterns of water supply and growth in irrigated area. This chapter also focuses on
intensity of irrigation and levels of irrigation development in the state on the basis of
some selected variables.
12
Part three deals with the aspects of water management and agricutrurat
development, and it has been divided into five chapters. Chapter four has been
devoted to deal with land holding characteristics and input use in agriculture, and
chapter five focuses on spatio-temporal variations in agricultural land use pattern,
crop-combination regions and cropping intensity. In chapter six, agricultural
productivity regions based on major categories of crops, viz, cereals, pulses, oilseeds
and cash crops and composite productivity by aggregating all crops were computed
by applying Yang's Crop Yield Index method. Water requirements and water
productivity of four major crops of wheat, rice, maize and sugarcane were also
computed. An attempt to establish relationship among the variables of irrigation
development with the variables of agricultural development has also been made and
results are presented in chapter seven. Chapter eight presents some results indicating
the impact of different sources of irrigation on farming in villages selected from
different parts of the state.
Conclusion and suggestions to the research problem find its place at the end
of the thesis, followed by bibliography and appendices.
13
References
1, Amarasinghe, U.A. and Sharma, B.R. (2009). Water Productivity of Food Grains in India: Exploring Potential Improvements. In: Water Productivity Improvements in Indian Agriculture: Potentials, Constraints and Prospects (Eds. M.D. Kumar and U.A. Amarasinghe), International Water Management Institute (IWMI), Colombo, Sri Lanka, pp.13-54.
2. Amarasinghe, U.A., Shah, T. and Malik, R.P.S. (2008). India's Water Futures: Drivers of Change, Scenarios and Issues. In: India's Water Future: Scenarios and Issues (Eds, U.A. Amarasinghe, T. Shah and R.P.S. Malik), IWMI, Colombo, Sri Lanka, pp. 3-24.
3. Asawa, G.L. (2005). Irrigation and Water Resources Engineering, New Age International Publishers, New Delhi.
4. Bhaduri, A., Amarasinghe, U. and Shah, T. (2008). Groundwater Expansion in Indian Agriculture: Past Trends and Future Opportunities. In: India 5 Water Future: Scenarios and Issues (Eds. U.A. Amarasinghe, T. Shah and R.P.S. Malik), IWMI, Colombo, Sri Lanka, pp. 181-196.
5. Bhattarai, M., Sakthivadivel, R. and Hussain, 1. (2002). Irrigation Impacts on Income Inequality and Poverty Alleviation: Policy Issues and Options for Improved Management of Irrigation Systems, Working Paper 39, IWMI, Colombo, Sri Lanka.
6, Cai, X. and Rosegrant, M.W. (2003), World Water Productivity: Current Situation and Future Options. In: Water Productivity in Agriculture: Limits and Opportunities for Improvement (Eds. J.W. Kijne, R, Barker and D. Molden), IWMI, CABI, UK, pp.163-178.
7. Cai, X. (2005). Risk in Irrigation Water Supply and the Effects on Food Production, Journal of the American Water Resources Association, Vol. 41, No. 1, pp. 679-692.
8. Cantor, L.M. (1967). A World Geography of Irrigation, Oliver and Boyd, London.
9. Census of India (2001), Uttar Pradesh, Administrative Atlas, Volume I, Directorate of Census Operations, Uttar Pradesh.
10. Desai, B.K. and Pujari, B.T. (2007). Sustainable Agriculture: A Vision for Future, New India Publishing Agency, New Delhi.
11. Dhawan, B.D. (1988). Impact of Irrigation on Farm Economy in High Rainfall Areas: The Kal Project, Economic and Political Weekly, Vol. 23, No. 52/53, pp. A173-175, A177-180.
14
12. Dhindwal, R.K. and Kumar, S. (2005). Evaluation of Drip and Surface Irrigation in Sugarcane under Semi-arid Conditions, Journal of Water Management, Vol. 13, No. 1, pp. 21-26.
13. Dick, R.M. and Svendsen, M. (Eds.) (1991). Future Directions for Indian Irrigation: Research and Policy Issues, International Food Policy Research Institute (IFPRI), Washington, D.C.
14. Poorest Areas Civil Society (PACS) Programme (2001-2008). Droughts in India: Challenges and Initiatives (http://www.empowerpoor.org/downloads/droughtl.pdt) Assessed on 28 July 2012.
15. Johnston, R.J. (1978). Multivariate Statistical Analysis in Geography: A Primer on the General Linear Model, Longman Inc., New York.
16. Turner, N.C. (2004). Agronomic Options for Improving Rainfall-use Efficiency of Crop in Dtyland Farming Systems, Journal of Experimental Botany, Vol. 55, No. 407, pp. 2413-2425.
17. Verma, N.M.P. (1993). Irrigation in India: Themes on Development, Planning, Performance and Management, M.D. Publications Pvt. Ltd., New Delhi.
15
w
CHAPTER Geographical Setting of
Uttar Pradesh
~i,
CHAPTERI
GEOGRAPHICAL SETTING OF UTTAR PRADESH
A. Physical Setting a. Administrative set up
The state of Uttar Pradesh forms a part of Ganga plain. It covers an area of
2,40,928 sq. km. According to Census 2001, population of the state was 166.2
million accounting for 16.4 per cent of the country's population, although the state
accounts for only 7.5 per cent of the geographical area of the country. In 2011, the
population of the state has reached to 199.6 million (provisional) with the decadal
growth rate of 20.09 per cent (Census of India, 2011). Situated in the Ganga plain
and drained by a number of rivers, the state has had a long history of human
settlement. The fertile plain of Ganga has a very high population density of 689
persons per sq. kin, which is more than twice the national average of 324 persons.
Garlanded by the rivers Ganga and the Yamuna, the state lies in north-central part of
the country. It is a landlocked state, and is bordered by the state of Uttarakhand and
the country of Nepal to its north, the state of Bihar in the east, Jharkhand and
Chhattisgarh to its southeast, Madhya. Pradesh to the south, and Rajasthan and
Haryana, and the national capital territory of Delhi to its west. It was created'as the
United Provinces on 1 April 1937 with the passing of the States Reorganisation Act
and it was renamed as Uttar Pradesh on January 26, 1950, when India became a
republic. Since then the state is known as Uttar Pradesh (literally, the "Northern
State").
In 1991, the state comprised of 63 districts. On 9th November 2000, nine
districts of the erstwhile state were transferred to newly created state of Uttaranchal
also known as Uttarakhand (comprising 13 districts of hilly region, as well as the
district of Hardwar). The state of Uttar Pradesh now organized into 70 districts, 300
tahsils and 813 development blocks. There are 52,028 village panchayats in the state
covering 97,134 inhabited villages. Lucknow is the capital of the state. The
remaining of 54 districts of 1991 increased to 70 in 2001 due to emergence of 16
new districts within the state. The districts of Meerut, Moradabad, Farrukhabad,
Etawah, Hamitpur, Banda, Allahabad, Deoria, Bahraich and Gonda were bifurcated,
and as a result 10 new districts namely, Baghpat, Jyotiba Phule Nagar (J.P.Nagar),
16
Kannauj, Auraiya, Mahoba, Chitrakoot, Kaushambi, Kushinagar, Shrawasti and
Balrampur were formed. Besides, 2 new districts namely, Sant Ravidas Nagar
(Bhadohi) (S.R.Nagar) and Chandauli were carved out from the Varanasi district.
Remaining of 4 new districts namely, Gautam Buddha Nagar (G.B.Nagar), Hathras,
Ambedkar Nagar and Sant Kabir Nagar (S.K.Nagar) were formed by taking area
from more than one adjoining districts. District G.B. Nagar was formed in the year
1997 by carving out of entire Dadri tahsil (excluding 5 villages), 6 villages of Hapur
tahsil (both belong to Ghaziabad district), 152 villages and 3 towns of Sikandrabad,
104 villages and 3 towns of Khuga tahsil (both from Bulandshahr). Whereas;
Hatlnas district was also created in 1997 by transferring of entire Hathras tahsil, 162
villages, 3 towns of Sikandrabad tahsil of Aligarh district and 134 villages, 2 towns
of Sadabad tahsil of district Mathura. Similarly, Ambedkar Nagar district was formed
in 1997 by the merger of entire Akbarpur, Jalalpur and Tanda tahsils of Faizabad
district and 26 villages of Burhanpur tahsil of Azamgarh district. District S.K.Nagar
was also formed in 1997 by transferring the entire Khalilabad tahsil, 131 villages of
Basti tahsil of Basti district and 161 villages of Bansil tahsil of Siddharthnagar
district. Besides these, some inter-district changes were also occurred during the
decade of 1991-2001. At the time of preparation of Census 2001, the state was
divided into 70 districts and these districts were grouped into 17 revenue divisions
(Census of India, 2001).
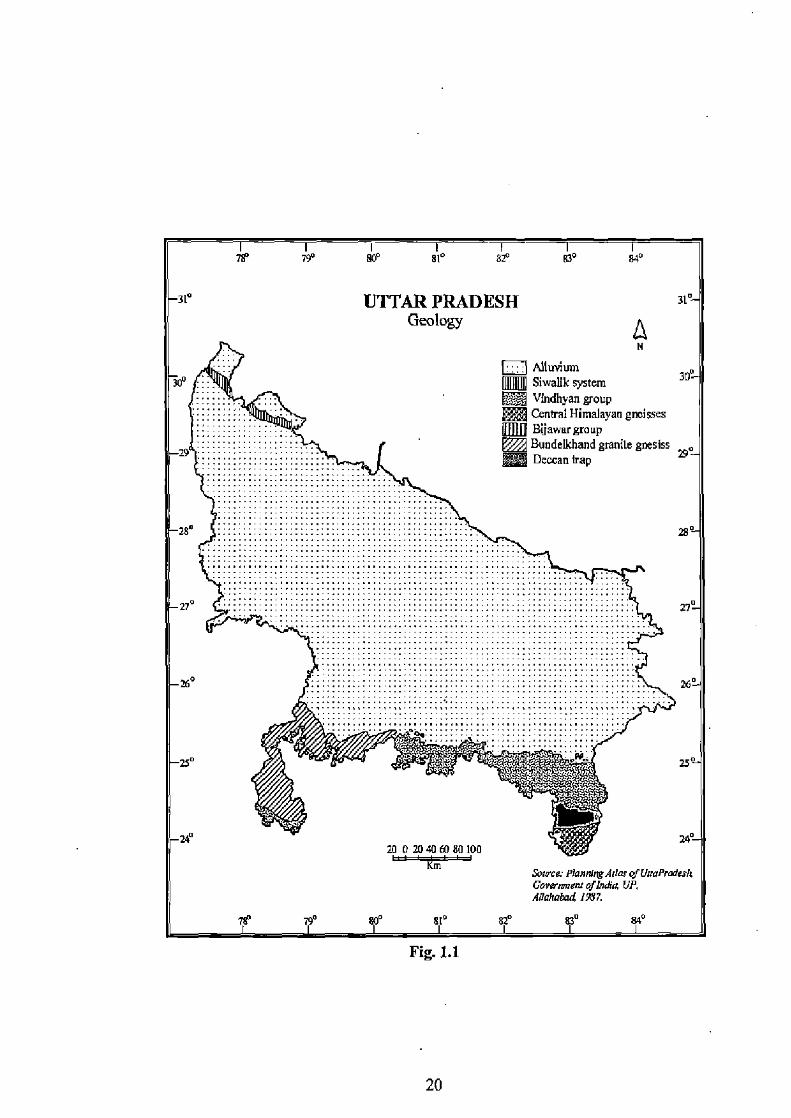
b. Structure and relief
Structurally, the state of Uttar Pradesh can be divided into two distinct
hypsographical regions:
i. The Ganga plain in the north
The state of Uttar Pradesh is a part of the Ganga Plain which lies between the
Himalayas in the north and Deccan Plateau in the south. The Ganga plain forms the
most important area from the economic point of view, which stretches across the
entire length of the state from west to east. It is characterized by highly fertile
alluvial soils, having a flat topology broken by numerous lakes, rivers and ponds.
The region is made of alluvium brought by the Himalayan rivers, the Ganga, the
Yamuna and the Ramganga and tributaries of these rivers. A vast expanse of alluvium
of Tertiary and Quaternary age with a general elevation of about 600 metres above
17
mean sea level constitutes the plain. Alluvium is a generalized term for
unconsolidated sediments consisting of a mixture of sand, silt, boulders and pebbles.
The plain forms an elongated belt all along the southern boundary of the Uttarakhand
state starting from the base of the hills and continues into the state of Uttar Pradesh.
The level surface of the plain commanded and traversed by the glacial-fed perennial
rivers of the Himalayas. With the absence of any marked surface irregularities on the
plain, rain water sinks into ground, while percolation of water in sub-surface also
contributes to maintain water level which can be tapped and offers facility for the
construction of canals (Williamson, 1925). The area is very promising from
hydrogeological point of view having substantial groundwater resources and forms
the major source of agriculture and industrial development (Bhatia, 2010).
The entire alluvial plain can be divided into three sub-regions. The first lies in
the eastern tract consisting of 14 districts; they are subjected to periodical floods and
droughts, classified as scarcity areas. These districts have the highest density of
population which gives the lowest per capita land. The other two regions, the central
and the western are comparatively better with well-developed irrigation systems.
They suffer from the problems of water logging and large-scale water user tracts. The
Ganga plain is watered by the Yamuna, the Ganga and its major tributaries, the
Ramganga, the Gomati, the Ghaglua and the Gandak. The entire plain made up of
alluvium and is very fertile. The chief crops cultivated are rice, wheat, pearl millet,
gram, and barley. Sugarcane is the chief cash crop grown in the region.
The alluvium tract which forms one of the three main physiographic divisions
of India separates the peninsular from the extra-peninsular region and covers an area
estimated to be about 850,000 sq. km. The area is geologically uninteresting, but
being a rich agricultural tract is of great importance in human history. It is a synclinal
basin formed concomitantly with the elevation of the Himalayas to its north.
According to Eduard Suess, a great Austrian geologist, it is a `fore-deep'
formed in front of the resistant mass of the peninsula when the Tethyan sediments
were thrust southward and compressed against them. According to a second view by
Sir Sydney Burrard (formerly the Surveyor General of India), the plains represent a
rift-valley bounded by parallel faults on either side. A third and more recent view
with regard to this region is that, it is a `sag in the crust formed between the
northward drifting Indian continent and the comparatively soft sediments
accumulated in the Tethyan basin, when the latter were crumpled and lifted up into a
18
mountain system (Krishnan, 1956).
The exact depth of alluvium has not been ascertained, but recent gravity,
magnetic and seismic explorations show that, its thickness varies from less than
1,000 to over 2,000 meters. In width, alluvial plains vary from a maximum of 480
km. in the west to less than 144 km. in the east. The floor is not structurally uniform
but is segmented by ridges and hollows due to faulting. Magnetic survey reveals
local highs and lows, all of which dip steeply to the north. In 130 borings, the depth
from surface to bed-rock was found to range between 90 and 390 meters. The depth
of alluvium is at its maximum between Delhi and the Rajrnahal Hills, and it is
shallow in Rajputana and between Rajmakal and Assam (Wadia, 1919). The deposits
covering the Indo-Gangetic basin are composed of gravels, sands and clays with
remains of animals and plants. These sands and gravels constitute aquifers. The older
alluvium (called bhangar in the Ganga valley) is rather dark coloured and generally
rich in concretions and nodules of impure calcium carbonate known as kankar in
northern India. The kankar concretions are seen in all shapes and sizes from small
grains to lumps as large as the size of human head. The older alluvium was
accumulated on slightly elevated terraces, generally above the flood level, the river
having cut through it to a lower level. It belonged to Middle to Upper Pleistocene
age. The newer alluvium (called khadar) is light coloured and poor in calcareous
matter. It contains lenticular beds of sand and gravel and peat beds. It merges with
insensible gradations into the recent or deltaic alluvia and assigned to belong with an
Upper Pleistocene age (Krishnan, 1956).
ii. The Vindhyan hills and plateau of the south
The southern fringe of Gangs plain is demarcated with the presence of
Vindhyan hills and plateau. This region consists of the districts of Jhansi, Jalaun,
Hamirpur and Banda (Fig. 1.1). It forms the upper border of central Indian plateau.
Low hills and rocky spurs of the Vindhyachal Mountains amidst the jungles of
stunted trees give this tract a distinct character. The soils of lowlands consist partly of
the Ganga alluvium and partly of the detritus of Deccan trap. These are the mar and
kabar soils (a characteristic feature of central India) and the parka and rakar are the
deteriorated black soils. The mar is a rich dark coloured friable soil with a large
number of minute kankar nodules mixed in its texture. It contains a high proportion
of organic matter and characterized with an extraordinarily high moisture retentive
19
N
Alluhmn Siwalik system Vindhyan group Central Himalayan gneisses Bijawargraup Bundelkhand granite gnesiss Deccan trap
UTTAR PRADESH Geology n
7
20 020 40 E0 80 100 Km
Cowen ningArias P UvaPratluq Covamnnuofn&z UP.
AI(ahaWQ 1987.
Fig.1.1
20
power. The kabar is a stiff tenacious soil containing a large percentage of clay and
deficient in sand. Because of its hardness, it is difficult to work. The parua is a light
sandy soil, whereas, rakar is stony, generally marked with the presence of large
kankar nodules. Parts of the districts of .lhansi, Harnirpur and Banda have mixed red
and black soils. Under the heavier type of soils, large accumulation of calcium
carbonate is seen mixed with the soil. In the light or sandy type of formations, soils
are shallow and large size stones are present in them. The soils contain sufficient
quantity of potash and lime, but are poor in P205 and nitrogen. These areas receive a
little amount of rainfall and water scarcity is widespread. The amount of rain in this
region varies between 80 and 100 cm. Dry farming is practiced over a large area.
This sub-region is important for the cultivation of gram, wheat and gram as a
mixture, linseed, ill and jowar crops. This sub-region is known as gram producing
area, both in terms of quantity and quality. The Betwa and Ken rivers join the
Yamuna river from the southwest in this region (Mirchandani, 1971).
c. Drainage
The most holy and sacred rivers of India, the Ganga and Yamuna flow
through the state and join at Allahabad. These two rivers along with their numerous
tributaries and distributaries form a rivorine alluvial land known as the upper and the
middle Ganga plain. Other than these two, the Ramganga, Son, Betwa, Gandak,
Rapti, Gomti, Ghaglua, Rind etc. are the other important rivers. The state lies within
one major basin i.e., `the Garage basin' which is further divided into sub-basins like
the Yamuna, Gomti, Ramganga, Ghaghra-Gandak, Betwa, Son, Tons and Ken.
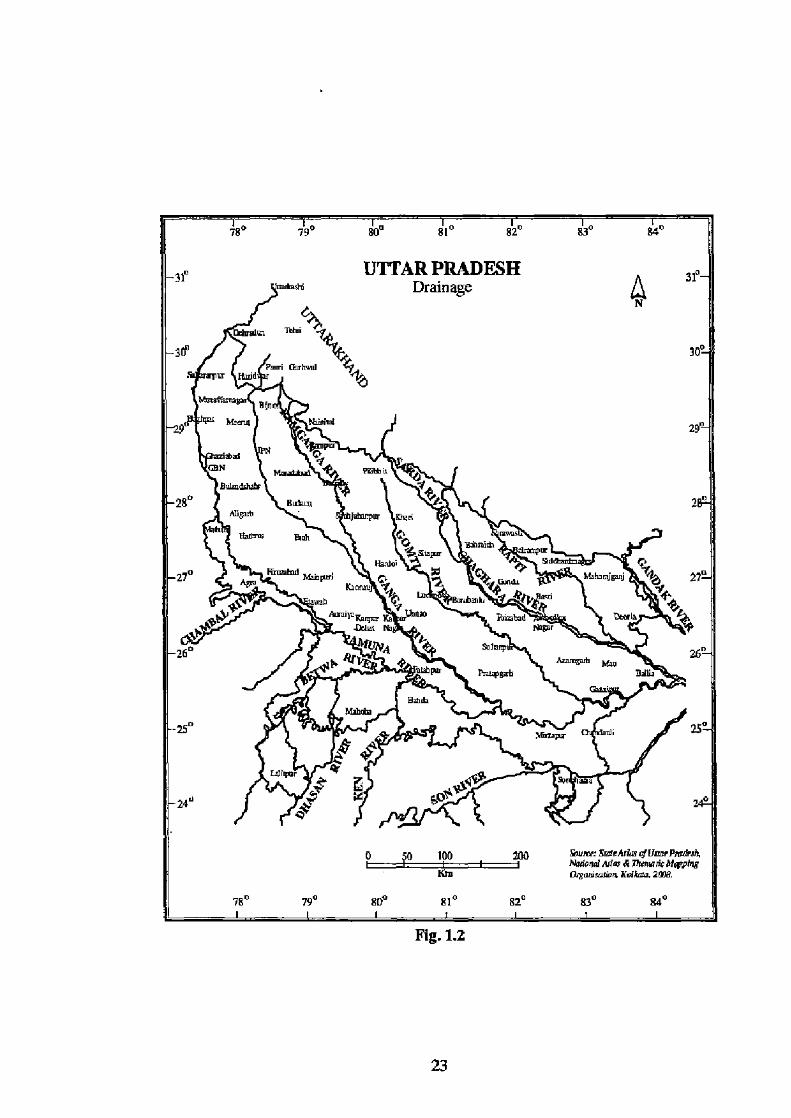
The dendritic pattern of drainage follows the general slope of the landform,
i.e. from northwest to southeast. With the exception of right bank tributary of the
Yamuna, almost all the rivers have their origin in the Himalayas (Fig. 1.2). Other
rivers namely, the Son, Betwa, Ken, etc. have their origin in the hills of central India.
With the exception of river Ghaghara, these rivers flow in more or less straight
courses across the plain and somewhere forming meanders' and 'ox-bow' lakes. The
entire land of the state lies in catchment area of river Ganga and its principal
tributaries namely, the Yarnuna, Ramgavga, Sarda, Gomti, Saryu and the Ghaghra.
i. The Gangs
The Ganga originates from Gaumukh in the Gangotri glacier at an elevation
21
of about 7,010 m. above mean sea level. It enters into the plain at Haridwar.
Following the general slope of the land, it flows towards the south and southeast up
to Allahabad and then continues towards the east until it passes into the state of Bihar
on its onward journey to West Bengal. Its total length is 2,525 km, of which 1,450
km lies in the state of Uttar Pradesh. The Ganga basin covers an area of 8,61,404 sq.
km., of which nearly 34.2 per cent lies in the state. Its principal tributaries are the
Yamuna on its right and the Ramganga, Gomti and Saryu rivers on the left side. The
headwork situated on the Upper Ganga Canal is one of the most important litigation
works in the state and is providing irrigation to 0.7 million hectares (Shafi, 1984).
ii. The Yamuna
Although Yamuna itself is a tributary of the Ganga, it is the second most
important river of the state. The Yamuna (which combines the waters of the beheaded
Saraswati) has its source at Yamunotri in the Uttarkashi district (now in the state of
Uttarakhand). The river passing through Siwaliks enters the western plain at
Faizabad and from there it flows roughly parallel to the Ganga for 1,384 km.to join it
at Allahabad. The Yamuna forms die natural boundary between Uttar Pradesh and
Haryana states, and enters the district of Mathura in the north and passes through
Agra and Etawah, forming the northern boundary of Jalaun, Hamirpur, Banda
districts and the southern boundary of Etawah, Kanpur, Fatehpur and parts of
Allahabad, where it joins the Ganga. Its course is 1,376 km long and the entire basin
covers an area of 320 thousand sq. km. in Uttar Pradesh. Important tributaries of the
river Yamuna are the Chambal, Betwa and Ken which originate from the Deccan
plateau. Historically, important places like Delhi, Agra, holy places like Mathura and
Allahabad are situated on its bank.
iii. The Ghaghara
The snow-fed Ghaghara has its source near the Gurla Mandhata peak, south
of Lake Manasarovar in Tibet. The river flows in a southerly direction parallel to
Ganga up to Chapra before joining it. The total catchment area of the river isl,27,950
sq. km. This river has a high flood frequency and usually shifts its course several
times. The river Sarda or the Chauka which forms the boundary between Uttar
Pradesh and Nepal is the main tributary which joins it on the right bank. River Saryu
is another important tributary of the Ghaghara, on whose bank lies the historical city
22
SO° 81° 82° 83° 86°
31° UTTAR PRADESIl 3 j0 Drainage
rdn
30 30°
N ryepe P®i fevhcfl ~t
R9n
M.mv Nilmw 29°
Gq w GBN y~y PmwLL
ewmawo- 9~
28° Rmm 282 ^R~^ }~vrw rnen
h owc4
27° mme M±.°1 C9 'W.a.~m 27°
Kao n 9 'Pt~ Ramm~ei yQ'pi
4 p ami ro mea, 9
2fi° 3 h
emm enca°
ss° ^~
G~ T LJiar
Spl ° 24
0 $D 100 ]DO &iPb+aAalavyoveePmenh, Wd°md Ar(m ST M(yD1°e .2
Km o°A.,mun xw}au. 2me
78° 79° 800 81" 82° 83° 84°
Fig. 1.2
23
of Ayodhya. Two other important tributaries of it are the Rapti and the Gandak
iv. The Ramganga
River Ramganga rises in the Garhwai district (now in Uttarakhand) at an
altitude of 3,110 m. above mean sea level and enters the plain near Kalagarh. It joins
the Ganga at Kannauj after traversing a distance of 596 km. The Ramganga basin
covers an area of 32,496 sq. km. The Ramganga flows for a total length of about
1,080 km., the upper half of which lies in Nepal and the lower half in Uttar Pradesh.
The most important tributaries are the Sarda, the Rapti and the Little Gandak.
v. The Gomti
River Gomati also called Gumti, is the tributary of the Ganga river. It rises
near Mainkot, about 3 km east of Pilibhit town in the Pilibhit district of the state at an
elevation of 200m and drains the area lying between the Ramganga and the Sarda in
the upper reaches and lower down area between the Ganga and the Ghagham. After
flowing through a southerly course for a distance of about 24 km., it joins the Ganga,
near Kannauj in the Farrukhabad district. The total length of the river from the source
to its outfall into the Ganga is 596 km. and the entire length of it lies in the state. The
important tributaries of Gomti are the Khoh, the Langan, the Aril, the Kosi, the
Deoha and the Sai.
vi. The Sarda
It is formed by two streams the Kuthiayankti and Kalapatu near the indo-
Tibetan border at an elevation of 5,250 m. The river flows in a southwesterly
direction for some distance forming the boundary between India and Nepal, In this
reach it receives the Dhauli Ganga, the Khoprang, the Sarju and the Ladhiya on its
right and the Chumlia on its left bank. It debouches into the plains after passing
through a series of rapids. Entering the plains, the Sarda continues to form the
boundary between India and Nepal for a short distance flowing over a boulder bed.
Thereafter, it flows in a southeasterly direction through the district of Pilibbit in a
tortous and constantly changing course. One of the most important irrigation systems
in Uttar Pradesh, irrigating lands in the Gomti-Ghaghara Doah emanates from this
river from Banbassa head works.
24
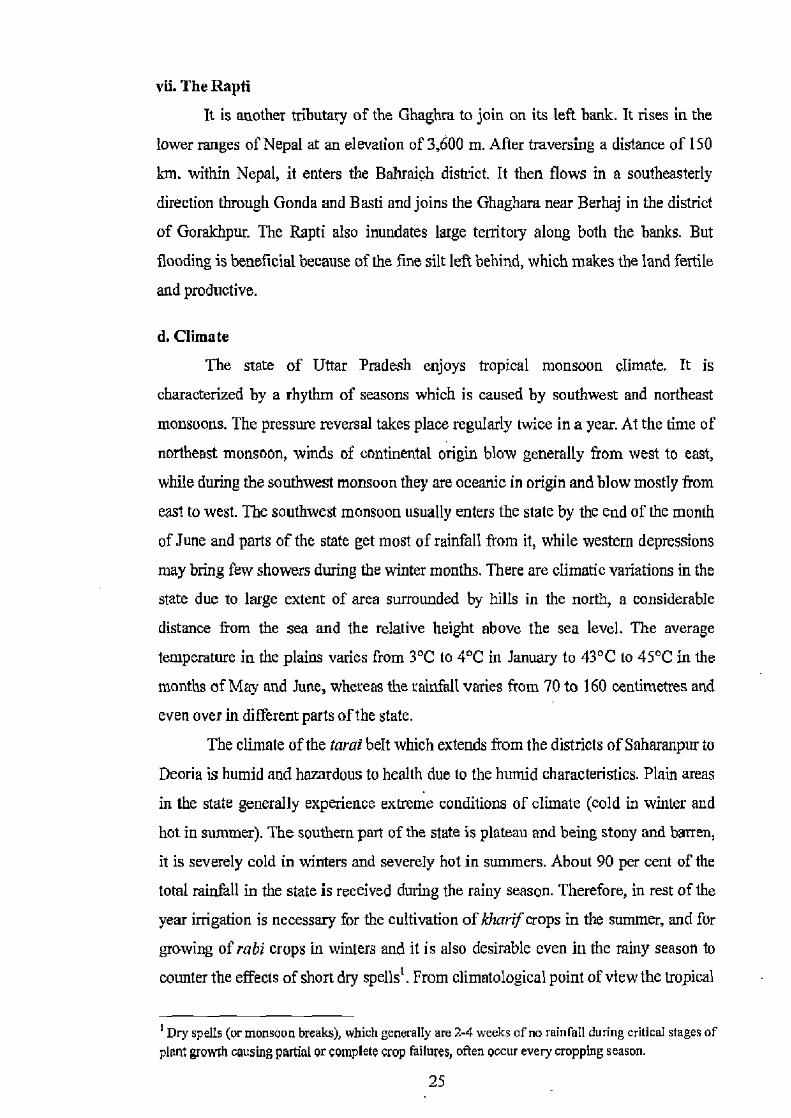
vii. The Rapti
It is another tributary of the Ghaghra to join on its left bank. It rises in the
lower ranges of Nepal at an elevation of 3,600 m. After traversing a distance of 150
km. within Nepal, it enters the Bahraich district. It then flows in a southeasterly
direction through Gonda and Basti and joins the Ghaghara near Berhaj in the district
of Gorakhpur. The Rapti also inundates large territory along both the banks. But
flooding is beneficial because of the fine silt left behind, which makes the land fertile
and productive.
d. Climate
The state of Uttar Pradesh enjoys tropical monsoon climate. It is
characterized by a rhythm of seasons which is caused by southwest and northeast
monsoons. The pressure reversal takes place regularly twice in a year. At the time of
northeast monsoon, winds of continental origin blow generally from west to east,
while during the southwest monsoon they are oceanic in origin and blow mostly from
east to west. The southwest monsoon usually enters the state by the end of the month
of June and parts of the state get most of rainfall from it, while western depressions
may bring few showers during the winter months. There are climatic variations in the
state due to large extent of area surrounded by hills in the north, a considerable
distance from the sea and the relative height above the sea level. The average
temperature in the plains varies from 3°C to 4°C in January to 43°C to 45°C in the
months of May and June, whereas the rainfall varies from 70 to 160 centimetres and
even over in different parts of the state.
The climate of the tarai belt which extends from the districts of Saharanpur to
Dentin is humid and hazardous to health due to the humid characteristics. Plain areas
in the state generally experience extreme conditions of climate (cold in winter and
hot in summer). The southern part of the state is plateau and being stony and batten,
it is severely cold in winters and severely hot in summers. About 90 per cent of the
total rainfall in the state is received during the rainy season. Therefore, in rest of the
year irrigation is necessary for the cultivation of kharif crops in the summer, and for
growing of rabi crops in winters and it is also desirable even in the rainy season to
counter the effects of short dry spells'. From climatological point of view the tropical
Dry spells (or monsoon breaks), which generally are 2-4 weeks of no rainfall during critical stages of plant growth causing partial or complete crop failures, often occur every cropping season.
25

monsoon climate has three distinct seasons:
i. The cold weather season (October to February)
ii. The hot weather season (March to mid-June)
iii. The rainy season (Mid-June to September)
i. The cold weather season
The cold season in the state starts from the month of October every year.
During the months of October and November, the entire northwestern part of the
country including the whole of the Ganga valley remains under the high pressure
belt. The prevailing direction of the winds is from west to east, owing to pressure
distribution and the influence exerted by the Himalayan relief. The chief climatic
characteristics of this season are a fall in temperature and the prevalence of dry and
chilly (westerly) winds and clear skies. Occasionally, the western depressions bring
rains accompanying with them cold waves of winds and register temperatures below
freezing point. Seasonal variations in temperature in parts of the state are well
marked. The mean minimum temperature in the month of November at stations
Aligarh, Bareilly, Allahabad and Bahraich ranges between 50 and 10° C, but mean
maximum temperature ranges between 29° and 33°C. The month of December
records a further decrease in day and night temperatures, with the minimum
temperature at some places fall below 2°C in the month of January, while the mean
maximum temperatures vary between 25° C and 27°C (Fig. 1.3).
An important feature of the cold weather season is the occurrence of frost and
hail. Frost is locally known as pala, which usually occurs in the month of January,
when rabi crops are immature and they are liable to injury. Hail occasionally may
occur and it can damage the plants when they are at the stage of flowering. In these
months heavy fog locally known as kQhra often occurs at night and lasts until the
morning with the sun rise. In the month of February, there is seen a clear sky. By the
end of the month of February the temperature begins to increase, but it still remains
colder than November. The month of December is quite cold. By the end of
December and even first half of January, some western depressions enter in the
northern parts of India through Iran, Afghanistan, and Pakistan and move eastward to
cover the entire Ganga plains. Snow may occur on high ranges in Himalayas and rain
in sub-mountain tracks and the adjoining areas. These depressions create cloudy
weather and blowing of cold waves accompanied by light min in plains of the state
26
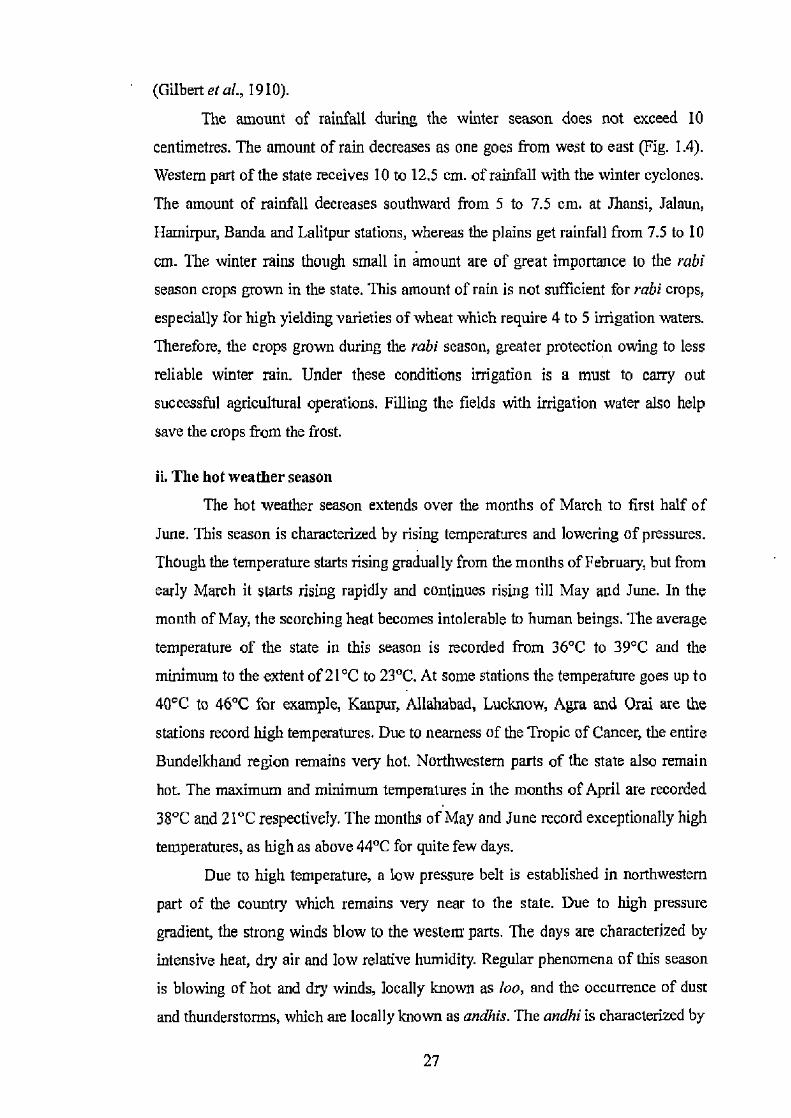
(Gilbert et al., 1910).
The amount of rainfall during the winter season does not exceed 10 centimetres. The amount of rain decreases as one goes from west to east (Fig. 1.4). Western part of the state receives 10 to 12.5 cm. of rainfall with the winter cyclones. The amount of rainfall decreases southward from 5 to 7.5 cm, at Jhansi, Jalaun, Hamirpur, Banda and Lalitpur stations, whereas the plains get rainfall from 7.5 to 10
cm. The winter rains though small in amount are of great importance to the rabi season crops grown in the state. This amount of rain is not sufficient for rabi crops, especially for high yielding varieties of wheat which require 4 to 5 irrigation waters. Therefore, the crops grown during the rabi season, greater protection owing to less reliable winter rain. Under these conditions irrigation is a must to carry out successful agricultural operations. Filling the fields with irrigation water also help save the crops from the frost.
ii. The hot weather season The hot weather season extends over the months of March to first half of
June. This season is characterized by rising temperatures and lowering of pressures. Though the temperature starts rising gradually from the months of February, but from early March it starts rising rapidly and continues rising till May and June. In the month of May, the scorching heat becomes intolerable to human beings. The average temperature of the state in this season is recorded from 36°C to 39°C and the minimum to the extent of 21°C to 23°C. At some stations the temperature goes up to 40°C to 46°C for example, Kanpur, Allahabad, Lucknow, Agra and Oral are the stations record high temperatures. Due to nearness of the Tropic of Cancer, the entire Bundelkhand region remains very hot. Northwestern parts of the state also remain hot. The maximum and minimum temperatures in the months of April are recorded 38°C and 21°C respectively. The months of May and June record exceptionally high temperatures, as high as above 44°C for quite few days.
Due to high temperature, a low pressure belt is established in northwestern part of the country which remains very near to the state. Due to high pressure
gradient, the strong winds blow to the western parts. The days are characterized by intensive heat, dry air and low relative humidity. Regular phenomena of this season is blowing of hot and dry winds, locally known as loo, and the occurrence of dust and thunderstorms, which are locally known as and/its. The andhi is characterized by
27
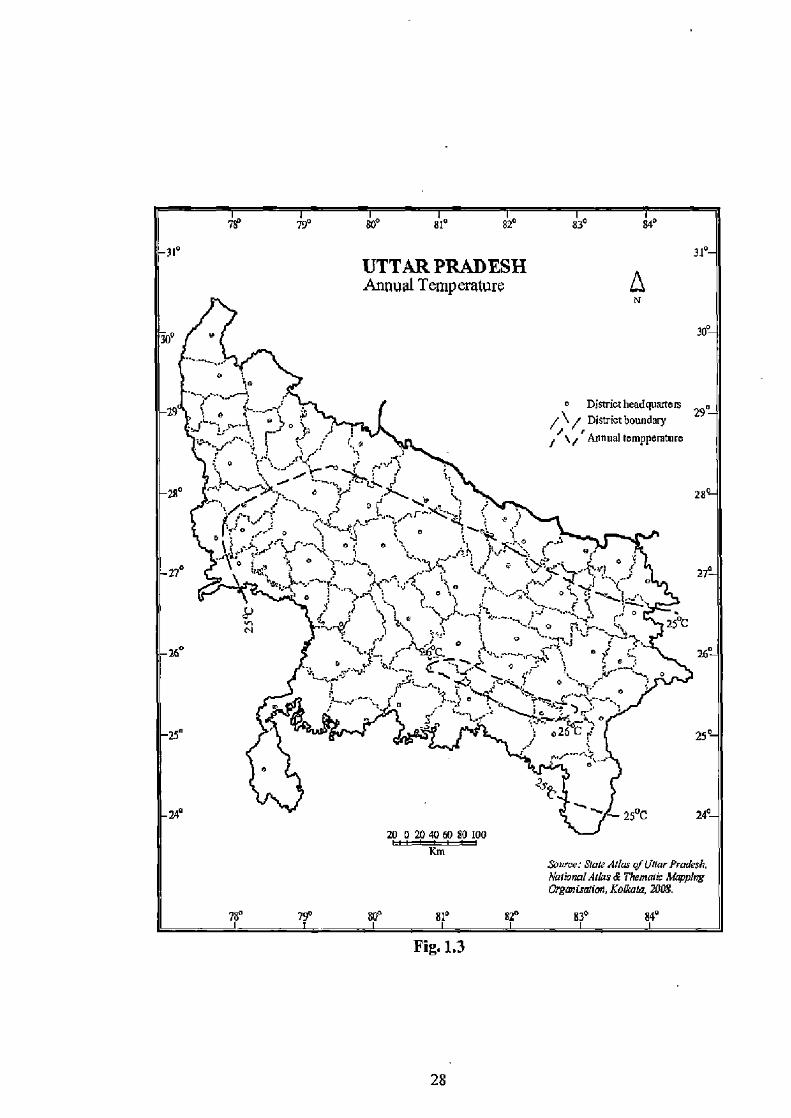
7fi 79° 60° el° 82° 830 SM1°
31° 31°
UTTAR PRADESH Annual Temperature p
~° 3U°
29 1 \yam - Z ./ _ ° Diwict headq°uters 29° o i" ° yO /\/ District boundty
sue ✓'°'.; ~` }'' "~ t~ ® //\/~ Mmu.I Iemppem[ure r 1'f rywc
1.
w. ~..~,~"1 f1 ~. ~
~ HIJ
155 5 *- .,"„ 2~e ° r`.: •- .4 • ~•.
t O _r'M1..t
es: of
.~ u• i. &
ss. ° 36Va .• 25
74° `' 25°C 24°- 20 0 20 40 W 8o too
3ovrzr: &aw Allus ofPradeth. m. National AtWs & TAemalk Mappkg O/gmtumion• Kolkata, 7008.
78° 79° 80° 810 SP a3° 84°
Fig. 1.3
28
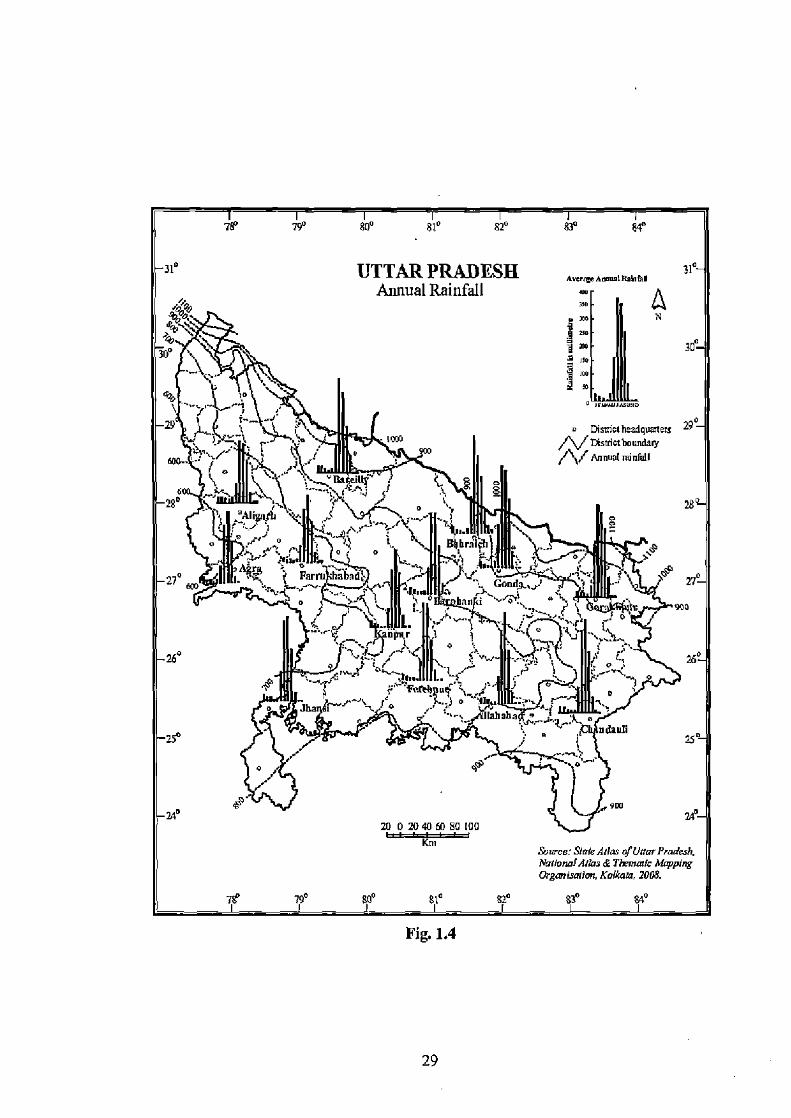
79 79° 8o° 81° 82° 83° 84°
J1° UTTARPRADESH Annual Rainfall 0
N
r l J
- ); } ' loco smclheaC9vaneu 79°
Nmsmctboutry
6OG.: / ° 900 n/l Mouul rvinfell
280 - Al
t ` L °' 411 26
270
I ~ (~
dha ....f"e fro ,:Y--2 o ''.'. . ~•. 4- „ ahaba
v l ° ,F vdauli 25"
0 / 0 ar q
9W 24e .we
20 0 2O 40 EO SO 100 K
3,uce:Sml j &Trmailc ivpinh. No1ara1Aobr &T1emmtc 8flgpng &gañvallvn, Kvlkam, 2008.
76° 790 80° B° S2° SY° 84°
Fig. 1.4
29
huge cloud of dust which obstructs the visibility in the atmosphere. These storms are
caused by the interaction between the dryland winds of the upper strata and the damp
sea winds which creeps into the lower strata. These storms are short-lived and
frequently end-up with the light showers of rain. Sometimes, they are accompanied
by hails and thunderstorms which modify the weather of the area for a short period of
time.
Total average rainfall in hot weather season is small. It ranges from 100 mm
(at the northern stations) to 20 rain (at the stations in the extreme southwest), This
rain benefits maize and fodder crops grown in parts of the state. The amount of rain
decreases from east to west, due to increasing distance from the sea, as the air gets
progressively drier. Gradually, easterly winds are replaced by the west winds,
reducing the precipitation due to accompanying storms. Rainfall received during hot
weather season gives a temporary relief from the heat and helps in sowing of early
rice crop. In the mouth of June, hot weather season becomes more intensified and
continued heat and dryness of air causes unbearable conditions.
iii. The rainy season
Due to excessive heat of summer months, a low pressure is developed in
northern parts of India and by the middle of June a complete reversal takes place in
the months of air movement. The rainy season in the state normally starts with in the
second week of the month of June, when the southwest monsoon enters in the state.
Sometimes the onset of monsoon may take place in the last week of July. The Bay of
Bengal branch, which enters in the eastern parts of the state through Bihar plains
known as 'purba' provides the first rain by the end of June. This is the season of
general rains, which is characterized by the arrival of moisture laden oceanic currents
from the Bay of Bengal; a fall in temperature is experienced with cool air and
rainfall. With the burst of monsoon a complete change in weather is brought about
with an immediate fall in temperature and an upward trend in relative humidity. The
maximum and minimum temperatures gradually fall from 44°C and 27°C in June to
about 30°C and 25°C in the month July. The relative humidity remains over 70 per
cent throughout the rainy season. Rainfall days alternate with rainless gaps of a day
or two in months of the year as they receive more than 50 per cent of total annual
rainfall. The average rainfall amount to 75 cm. and it decreases westward and
southwards.
30
In the months of September, rains normally slacken and the rainless intervals
become longer and the day temperature varies. Humidity, however, remains high due
to very little movement of air. High humidity and cloudy weather make the heat
intolerable. October is the month of retreating monsoon, but mean maximum
temperatures remain as high as in September. Rainfall, though scanty is useful for
rabi season crops and helpful for the maturity of late rice. Rainfall in the months of
June and September is irregular affecting the agricultural practices of kharif and rabi
season crops, whereas, continuous rainfall for several days may create flood
conditions, which results in sheet and gully erosion and often floods in rivers, destroy
the standing crops and bring loss to life and property.
e. Soils
Soil is a vital natural resource and backbone of agriculture. Soils make
available food, fodder and fuel for meeting the basic needs of human and animal
beings. With increase in human and animal population, the demand for food has also
increased. However, the capacity of soil to produce food is limited and limits on
production are set by intrinsic characteristics, agro-ecological setting, use and
management. This demands systematic appraisal of soil resources with respect to
their distribution, characteristic and yield potential, which are very important for
developing effective land use systems for augmenting agricultural production on a
sustainable basis (FAO, 1993).
The state comprises of two distinct physiographic regions from north to
south, which are: (1) the Ganga plain and (2) the Vindhyan hills and plateau. It
covers almost three-fourth area of the Ganga plain, which is very deep and gently
slopes from northwest to southeast. Elevated areas as now seen of the plain were
filled with older alluvium (bhangar), and relatively lower grounds with new
alluvium (khadar) along the courses of main rivers and their tributaries. The
Vindhyan hills and plateau lies at the southern end of the Ganga plain. It forms part
of the foreland of the Deccan tract. Its northern border is formed by the river Yamuna
and parts of the Ganga river. A great variety of soil is found in different parts of the
state (Fig. 1.5). These may divided into following types:
I. Rhabar soils
Bhabar group of soils forms a narrow belt of alluvial fans which extends from
31

west to east, immediately adjacent to outer spurs of the Himalayas in the districts of
Saharanpur and Bijnor. These soils have developed under a sub-humid and moist
climate which becomes dry during summer months. These soils were formed by the
alluvium transported from the adjoining Siwalik and Himalayan ranges comprising
sand stones in rapid state of weathering and conglomerates interstratified with
boulders along with purple shales and clays.
These soils are underlain by small or large sized pebbles and coarse gravel
detritus. Dark grey, coarse gravelly to fine silty calcareous bhabar soils are rich in
plant nutrients but are excessively drained due to occurrence of boulders. Therefore,
the cultivation on these soils is hampered by non-availability of the requisite amount
of moisture from the soil.
u. Tarai soils
The term 'tarai' refers to a moist or wet area. The taro! region is the sub-
montane tract situated along the southern boundary of the Siwalik mountain ranges.
The narrow belt of taro! soil is situated at the southern side of the bhabar soil and
extends from the district of Saharanpur in the west to Deoria in the extreme northeast
and cover about 5.7 per cent of the total area of the state. These soils are young and
virgin as well as rich in humus. This tract can be divided into (i) northwestern tarai
extending from the districts of Saharanpur to Kheri, and (ii) northeastern tarai
extending from Babraich to Deoria (Pathak, 1991). The climate of the tarsi area is
sub-humid which characterises as damp and unhealthy with annual precipitation
ranging from 1,000-1,500 mm, a maximum of it occurred during the months of July
to September. Soils are saturated during rainy months and remain quite moist during
the winter due to high level of underground water. Soils of western and eastern tarsi
are productive and possess essential of plant nutrients, specially the nitrogen which
gets depleted within few years of intensive cultivation. These soils are responsive to
fertilization and well suited to multiple cropping.
iii. Alluvial soils
Alluvial soils which cover nearly 61.2 per cent of the total land area in the
state. They occur in the central, eastern, western and southern portions of the state
with river Yamuna as its western and southwestern boundary for most of its expanse
with the exception of a portion of Agra and Mathura districts, and river Gandak as its
32

UT TAR PRADFSH Soils
zi vu-
m o 2040 w m too
Sr: Y8m0i¢Ad. q UCah Ga. , ,fb&z vr. Jffdcbcg f%7
Fig. 1.5
33

eastern boundary separating it from the state of Bihar. These are very deep and were
formed due to the transformation of alluvium deposited by the Ganga and the
Yamuna rivers and their tributaries including the Ghaghara and Gandak. These soils
vary in fertility characteristics considerably, but they have been developed from mild
or strongly calcareous parent material.
The nature of soils in alluvial areas differs widely from district to district.
These soils have been broadly classified into different soil associations and
nomenclated on the basis of the river family which has contributed to the deposition
and development. These soils in general are classified as: (i) Riverine soils or
Kadhars and the recent alluvium (ii) Soils of flat lands (iii) Soils of uplands, and (iv)
Soils of low lands. Although there are wide variations in soil characteristics from
district to district, but the broad zonal features of soil associations remain more or
less the same.
The soils belonging to the alluvium of recent accumulation are greyish to ash
grey in colour, light textured and calcareous. Flat land soils are neutral to moderately
alkaline, calcareous and have an accumulation of lime concretion at varying depths
in lower layers of the soil profile. Sub-soil of the profile exhibits marked mottling
resulting from the reducing environment prevailing in these soils and due to partial
water logging. Soils of the uplands exhibit zonal characters and their profiles show a
distinct evidence of maturity. Illuviation of sesquioxides and lime to `B' horizon and
accumulation of clay in lower layers is very profoundly exhibited by the soil profiles.
These soils are permeable and excessively drained and are neutral to slightly acidic
in reaction.
Low land soils are found in depressions within the uplands. They are grey to
dark grey in colour, clay loam to clay in texture. Invariably, they have an alluviated
horizon of finer clay as well as a layer of calcareous nodules. Ferrogenous mottlings
are extensively evidenced in the sub-soils. The soils of the Ganga family differ from
each other and of the Yamuna family. With reference to morphological features and
agricultural behaviour, they also differ on the basis of their parent materials.
The Ganga alluvium has been formed by quite a wide variety of Himalayan
rocks, whereas much of the alluvium of Yamuna owes its origin from the basaltic
rocks of central India through which the Yamuna river flows in southwestern parts of
the state. The recent alluvium belonging to this family is of black in colour, fine in
texture and shows a marked uniformity at all depths. The flat-land soils are loam to
34
clay loam in texture and profoundly display the profile. Upland soils of the family
show an advanced stage of maturity having a zone of calcium carbonate
accumulation in lower depths. The soils of this family can be named as `tropical
chernozems'. With respect to parent material, alluvium found in the northeastern
tracts of the state laid down by the rivers Gandak and Chaghara genetically differs
from the soils of Ganga plain. The soils in the Gandak and Ghaghara plains are
highly calcareous in nature. A predominating pedogenic processes in this family
includes remarkable calcification and decalcification. The bottom soil contains
calcium carbonate to the extent of 50 per cent. The flat-lands have a surface horizon
devoid of lime with accumulation of calcium carbonate in nodular form in lower
horizons. The upland soils are completely devoid of lime, excessively drained and
the soil profile exhibits features of the advanced stage of maturity.
Agriculturally, these alluvial soils of the state are highly productive and
constitute one of the most fertile formations of the country. These soils respond very
well to manuring and have widely adaptable cropping patterns in various agro-
climatic regions, also they have immense potential for increased production and it is
from these soils that the agricultural production levels can be achieved with the use
of high-yielding variety of seeds and adopting improved practices of cultivation.
iv. Bundelkhand soils
The Bundelkhand region of the state lies on the southwest of the river
Yamuna. The soils of this tract are entirely different from those of the state as a
whole, since they differ geologically from the rest as being non-alluvial in nature.
Bundellctand soils occupy 10.9 per cent area of the state. These soils mainly occur in
the districts of Jhansi, 7alaun, Hamirpur and Banda. These soils have developed from
the Vindhyan rocks abounding in gneiss and granites of the Deccan trap with highly
ferruginous beds and often soft limestone.
Four broad soil associations have been recognized in this area, which differ
from each other in respect of colour, texture, parent material, depth and crop
adaptability. These are: (i) Bundelkhand coarse grained reddish brown soils, (ii)
Bundelkhand coarse grained grey to greyish brown, (iii) Bundelkhand clayey loam
black, and (iv) Bundelkhand clayey black soils, which can be distinguished with
local names as: rakar, parwa, kabar and mar.
Bundelkhand soils in general are devoid of moisture and organic matter and,
35
therefore, can afford only short duration crops. This has been the main reason of
backwardness in agricultural development in the region.
v. Vindhyan soils
The soils of Vindhyan region occur in the south of river Ganga in the
southern tracts in the districts of Mirzapur, Varanasi and Allahabad, although its area
does not exceed more than 5 per cent of the total area of the state. The Vindhyan
system of rocks comprises of Vindhyan and Kaimur sandstones, shales, mixed
conglomerates, calcareous and haematitic slates, schists, gneisses, carboniferous
rocks and to some extent the limestones in weathered form to make up the Vindhyan
soils. The soils of the Vindhyan region can broadly be classified in three categories
as: (i) Vindhyan uplands, (ii) Vindhyan flats, and (iii) Vindhyan lowlands.
vi. Aravali soils
Aravali soils occupy 0.21 per cent area of the state and occur at the southwest
comer of Agra district. Various formations of Vindhyan sandstones (including
Kaimur group as the lowest member and Bhander group as the highest member in the
outer spurs of Central Indian Hills occurring in Bharatpur and Dholpur districts of
the state of Rajasthan) were weathered to form the Aravali soils, The soils are coarse
gravel sands or even loamy sands depending on their location and topography. They
are locally known as bhur. These soils support scanty sowing of crops and wherever
agriculture is practiced, only inferior crops are grown.
1. Groundwater sources
According to the estimates, the groundwater resources of the state constitute
76,138 million cubic meters (m.c.m.) of which 48,208 m.c.m. (about 63 per cent) are
utilisable. In the districts of Baghpat and Agra, the net drafts were 556 and 980
m.c.m. which were higher than their net potential, therefore, the groundwater use in
these districts exceeds to 100 per cent, which sometime reaches to the most critical
level. This situation arises because overexploitation of groundwater resources and
leads to decrease in groundwater table. In the districts namely, Saharanpur, Budaun,
Fatehpur, Muzafamagar, Moradabad, G.B.Nagar of doab region groundwater use is
well developed which consist of 89.72, 87.33, 86.56, 86.45, 84.98 and 81.89 per cent
respectively. The districts which utilize less than 50 per cent of groundwater
resources include Banda (48 per cent), Balrampur (46.27), Lucknow (45.2),
36
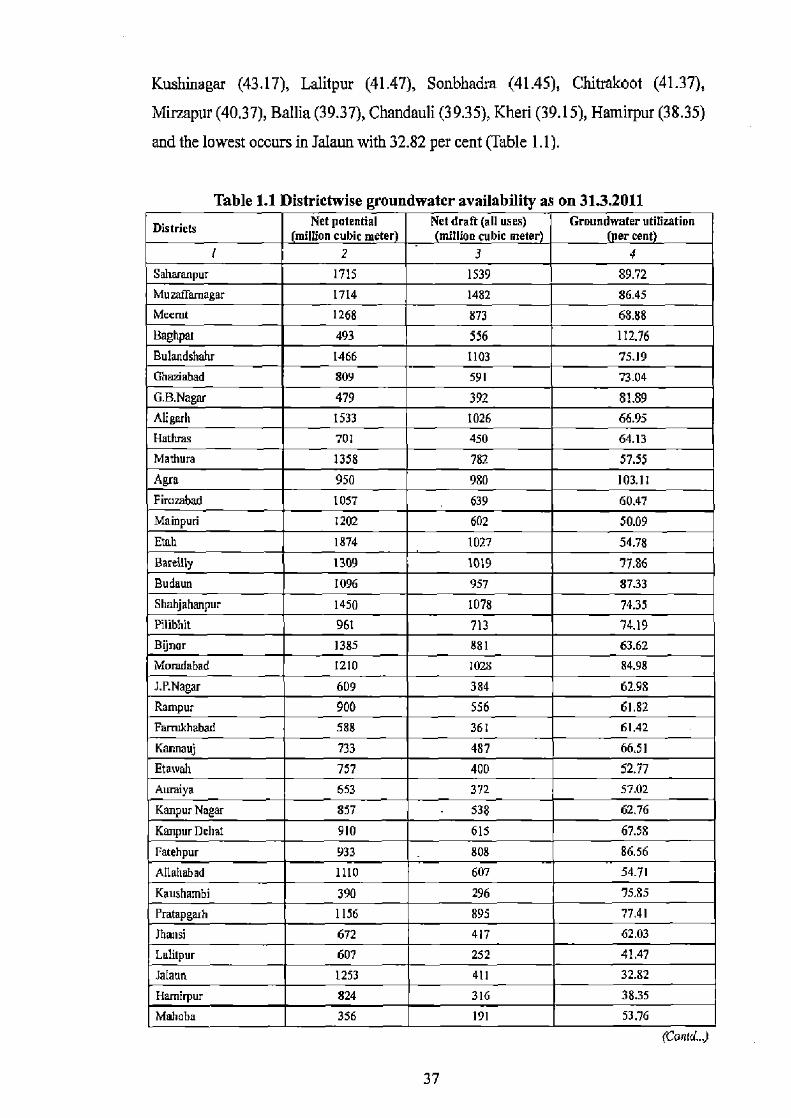
Kushinagar (43.17), Lalitpur (41.47), Sonbhadra (41.45), Chitrakoot (41.37),
Mirzapur (40.37), Ballia (39.37), Chandauli (39.35), Kheri (39.15), Hamirpur (38.35)
and the lowest occurs in Jalaun with 32.82 per cent (Table 1.1).
Table 1.1 Distrietwise groundwater availability as on 31.3.2011 Districts Net potential
million cubic meter Net draft (all uses)
million cubic meter Groundwater utilization
(per cent 2 3 4
Saharanpur 1715 1539 89.72 Mumfarnagar 1714 1482 86.45 Mccrut 1268 873 68.88 Baghpat 493 556 112.76 Bulandshahr 1466 1103 75.19 Ghaziabad 809 591 73.04 G.B.Nagar 479 392 81.89 Aligarh 1533 1026 66.95 Hatluas 701 450 64.13 Mathura 1358 782 57.55 Agra 950 980 103.11 Firczabad 1057 639 60.47 Mainpuri 1202 602 50.09 Etch 1874 1027 54.78 Bareilly 1309 1019 17.86 Budaun 1096 957 87.33 ShzAjah&npur 1450 1078 74.35 Pilibhir 961 713 74.19 Bijnor 1385 881 63.62 Momadabad 1210 1028 84.98 J.P.Nagar 609 384 62.98 Rampur 900 556 61.82 Farrukhabad 588 361 61.42 Kannauj 733 487 66.51 Etatvah 757 400 52.77 Auraiya 653 372 57.02 KanpurNagar 857 538 62.76 KanpurDchat 910 615 67.58 Fatehpur 933 808 86.56 Allehahad 1110 607 54.71 Kaushambi 390 296 75.85 Pratapgmh 1156 895 77.41 Jhmtsi 672 417 62.03 Lalilpur 607 252 41.47 Jataun 1253 411 32.82 Hamirpur 824 316 38.35 Mnhaha 356 191 53.76
(Canfd..)
if
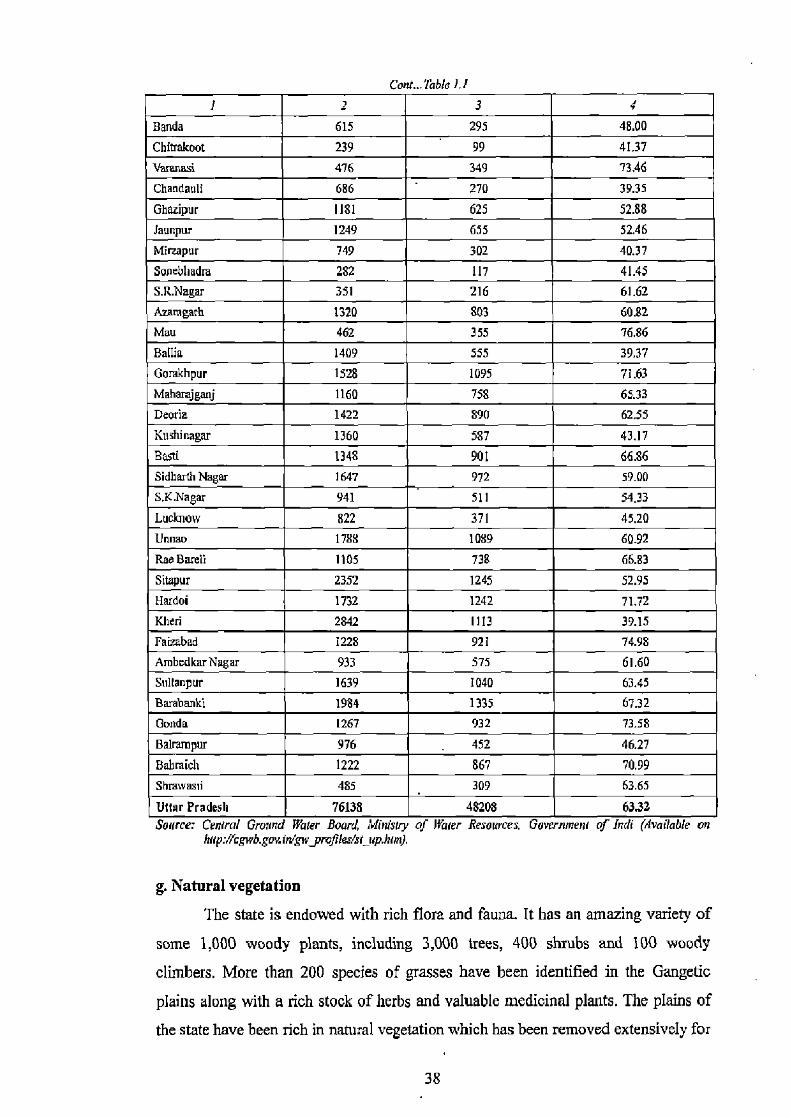
Cont., Table 1.1
1 2 3 4 Banda 615 295 48.00 Chitrukoot 239 99 41.37 varenaai 476 349 73.46 Chandauli 686 270 39.35 Ghazipur 1181 625 52.88 Jaunpur 1249 655 52.46 Mirzapur 749 302 40.37 Sanebliadre 282 117 41.45 S.R.Nagar 351 216 61.62 Aumgash 1320 S03 60.52 Mau 462 355 76.86 Ballia 1409 555 39.37 Gamkhpur 1528 1095 71.63
j 1160 758 65.33 1422 890 62.55
r 1360 587 43.17
VMah=jg=j,
1348 901 66.86 agar 1647 972 59.00
941 511 54.33 822 371 45.20 1788 1089 60.92
Rae Barell 1105 738 66.83 Sitapur 2352 1245 52.95 Hardoi 1732 1242 71.72 Kheri 2842 1113 39.15 Faizabad 1228 921 74.98 AmbedkarNegar 933 575 61.60 Sultanpur 1639 1040 63.45 Barabanki 1984 1335 67.32 Gonda 1267 932 73.58 Balrampur 976 452 46.27 Babraich 1222 867 70.99 Shrawasti 485 309 63.65
Uttar Pradesh 76133 48208 63.32 3orlrce: L nlral Urauna Water tloan( Winislry of Wafer Resources. UovCrnmenf of Ina, (AVQUabIe on
hap://cgwb.gov iWgwyrofrles/sf up.hlm).
g. Natural vegetation
The state is endowed with rich flora and fauna. It has an amazing variety of
some 1,000 woody plants, including 3,000 trees, 400 shrubs and 100 woody
climbers. More than 200 species of grasses have been identified in the Gangetic
plains along with a rich stock of herbs and valuable medicinal plants. The plains of
the state have been rich in natural vegetation which has been removed extensively for
meeting out wide-ranging needs of the people. Only a few patches of natural forests
are now seen scattered here and there in the plains. About 7 per cent of the
geographical area of Uttar Pradesh was under forest cover during 2001-05. The
Himalayan region and the tarai and hhabar areas consist most of the forests.
The Vindhyan forests consist of mainly the scrubs. In the districts of Jaunpur,
Ghazipur and Ballia are free from forest lands, whereas 31 other districts have a
lesser area under forest cover.
New the snow line, there are forests of rhododendrons and Betula utilis
(bhojpafra). Below them are the forests of silver fir, spruce, deodar, chir and oak. On
the foothills and in the tarai-bhabhar area the forests have sal and gigantic haldu
trees. Along river courses the sheesham grows in abundance. The Vindhyan forests
consist of dhak, teak, mahua, salai, chironji and tendu. The hill forests also have a
large variety of medicinal herbs. Sal, chit, deodar and sain yield building timber and
railway sleepers. Chir also yield resin, the chief source of resin and turpentine. Sisso
is mostly used in furniture making, while the khair yields kattha, which is used with
betel leaves for chewing. Sexual and gutel are used as matthwood and kanju in the
plywood industry. Babul provides the principal tanning material in the state. Some of
the grasses, such as baib and bamboo are raw materials used in paper industry. Tendu
leaves are used in making of brdis (Indian cigarettes), and cane in baskets and
furniture making.
The transitional belt running along the entire length of the state, the Carat and
bhabhar areas are rich in forests. The bhabhar tract gives a place to the larai area,
which is covered with tall elephant grasses and thick forests interspersed with
marshes and swamps.
Tropical moist deciduous forests are found in the moist region of tarai. They
grow in areas which record 100 to 150 cm. of rainfall annually, with an average
temperature between 26 and 27°C and have a considerable degree of humidity. A
special feature of the forests is that deciduous trees of uneven size grow on higher
altitudes. Lower regions have several species interspersed with bamboo, climbers,
rand and ever green shrubs. Main trees which grow in tarai are: sal, ber, gular,
jhingal, palas, mahua, semal, dhak, amla, jamun, etc.
Tropical dry deciduous forests are found in all parts of the plains and usually
in central, eastern and western parts. Since sun-light reaches the ground in
abundance, shrubs and grasses also grow here. Large tracts of these forests have been
M
removed making land available for cultivation. Important trees grow here are: sal,
palas, amaltas, bel, anjeer etc. Neem, peepal, sheesham, mango, jamun, babool, imli
(Tamarind) etc. usually found along river banks.
Tropical thorny forests are mostly found in southwestern parts of the state.
Such forests are confined to the areas which have low annual rainfall (50-70 cm.),
mean annual temperatures between 25 and 27°C and low humidity (less than 47 per
cent). Widely scattered thorny trees, mainly, babool and euphorbias are extensively
found here. The trees are generally small and form open dry forests. Important trees
of the region are phulai, khair, kokke, dhaman, danjha, neem, etc. These trees yield
various types of resins and gums.
Herbs obtained from these forests include some medicinal plants, like
Rauwolfia serpentina, Viala serpens, podophyllum, hexandrum and Ephecra
gerardiana.
h. Fauna
The variegated topography and climate of the state is conducive for upkeep of
enormous varieties of animal life. Animals depend on forests not only for food but
also for their habitat. Its avifauna is among the richest in the country. Animals found
in jungles of the state include the tiger, leopard, wild bear, sloth bear, chital, sambhar,
jackal, porcupine, jungle cat, hare, squirrel, monitor lizards and fox. These can be
seen in all but the highest mountain ranges. The most common birds include the
crow, pigeon, dove, jungle fowl, black partridge, house sparrow, peafowl, blue jay,
parakeet, kite, mynah, quail, bulbul, kingfisher and woodpecker.
Certain animals are found in special habitats. The elephants are confined to
tai-al and the foothills. The chinkara and the sandgrouse prefer to live in dry climate,
and are natives of the Vindhyan forests. The musk deer and the brown bear are found
in the higher Himalayas. Among the game birds resident of the state are the snipe,
comb duck, grey duck, cotton teat and whistling teal,
Several species of wildlife have become extinct in the state. Among them are
the lions of the Ganga plain and rhinoceros of the tarai. The fate of many species has
become uncertain, including the tigers, black bucks, musk deer, swamp dee ,
bustards, pink-headed ducks, chits and mural pheasants and four-homed antelopes.
Although a determined enforcement of laws against poaching and hunting has
yielded some results, the wildlife population today in the state is alarmingly low.
S
To preserve its wild life, the state has established Dudhwa National Park in
Kheri district and 12 game sanctuaries, the Corbett Park, which is a major tourist
attraction.
B. Sucio-economic Setting
a. Population
Population of the state has become more than double since 1951 putting
tremendous pressure on resources and infrastructure. As per 2001 Census, the
population accounted for 166.19 million persons of which 87.56 million were males,
and 78.63 million females as against 132.06 million persons with 70.39 million
males and 61.66 million female in 1991, showing a net increase of 34.136 millions.
The state of Uttar Pradesh is the most populous state of India. The Allahabad district
is most populous with a population of 4.94 million persons followed by Kanpur
Nagar (4.13 million), Azamgarh (3.95 million), Jaunpur (3.91 million) and
Gorakhpur (3.78 million). Mahoba with a population of 0.70 million, however, is the
least populous district of the state.
All India level decadal growth during 1991-2001 was 21.5 per cent, whereas
the growth rate in respect of the state of Uttar Pradesh was 4.3 per cent higher than
that of the national level. This rate was 25.4 per cent during 1971-81 and 25.6 per
cent during 1981-91, which slightly increased to 25.8 per cent during 1991-2001.
The growth rates of rural-urban components of population for the state were 24.06
and 32.88 per cent during the same periods, respectively. It implies that rural
population growth rate was slightly lower than the overall growth rate (25.80 per
cent) by 1.74 per cent, whereas the urban population growth rate was higher by 7.08
per cent.
Demography of the state is marked with an adverse sex ratio, high fertility
and mortality rates, a high proportion of children and a slow process of demographic
change. The sex-ratio as measured is the number of females per thousand males.
According to 2001 Census, there is predominance of males over females, having a
sex-ratio of 898 (904 for rural and 879 urban areas). The corresponding figures for
1991 were 876 (879 and 864 respectively). The proportion of children below 7 years
of age constituted 19.03 per cent of the total population, which was significantly
higher than the national average of 15.9 per cent. The highest figure was recorded for
Chitrakoot (23.5 per cent) and lowest for Kanpur Nagar (17.2 per cent).
41

b. Literacy
Literacy is an important indicator of socio-economic characteristics of the
country. It has a direct bearing on the expansion of technology. A person who has
attained 7 years and above who can both read and write with understanding in any
language is considered to be as literate. The state of Uttar Pradesh does not show
much better position in education. According to 2001 Census, the literacy was
merely 57.36 per cent. Showing some signs of improvement, the state assumed
literacy rate of 69.72 per cent, inching closer to the national average (74.04 per cent)
in Census 2011(Times of India, 2011). The literacy rate was higher in urban areas in
comparison to rural areas, which was 70.61 per cent versus 53.68 per cent. Male
literacy rate in total, Waal and urban areas of the state were 70.23, 68.01 and 78.13
per cent respectively, which were higher than the corresponding rates of female
literacy, accounting for 42.97, 37.74 and 62.05 per cent respectively. It is observed
that Kanpur Nagar ranked at top with 77.63 per cent in overall literacy rate, whereas
it was lowest in Shrawasti with 34.25 per cent. In rural areas of the state, the district
of Antalya recorded the highest literacy rate (69.54 per cent) and Balranpur (32.09
per cent) was at the bottom. Following the same trend, the district of Sonbhadra tops
in the literacy rate among the districts in the urban areas with 83.58 per cent. The
district of Kanpur Nagar achieved the highest record in male literacy with 91.39 per
cent and female literacy 79.76 per cent in comparison to other districts of the state.
c. Occupational structure
The tern `occupation' connotes the exact function of work that an individual
performs in a sector. The Census of India has followed the UNO system of
categorizing different occupations under 9 major heads. These categories are
conventionally grouped into three major groups as: primary, secondary and tertiary.
Primary group of occupation includes: (i) cultivation, (ii) agricultural labourers, (iii)
livestock, forestry, fishing hunting and plantations, orchards and allied activities, and
(iv) mining and quarrying; a secondary group of occupation comprises: (va)
household industry, (vb) other than household industry and (vi) constructional work;
and tertiary group of occupation comprises of: (vii) trade and commerce, (viii)
transport, storage and communications, and (ix) services.
42
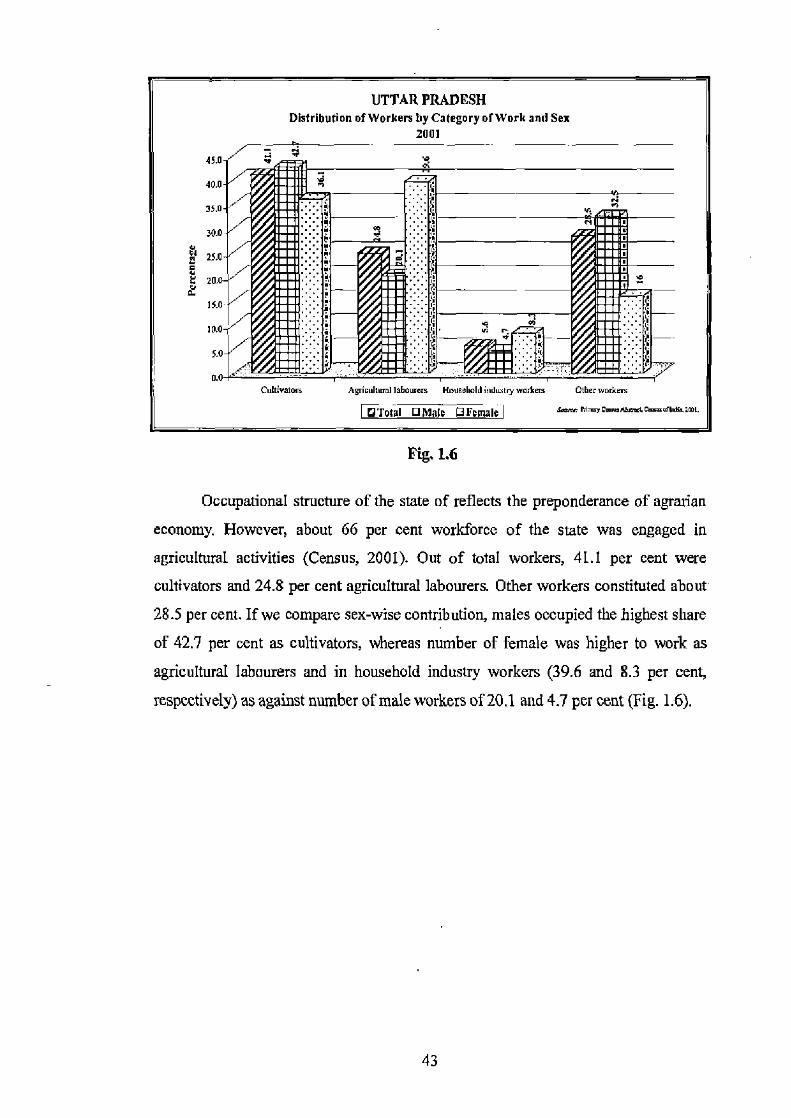
Fig. 1.6
Occupational structure of the state of reflects the preponderance of agrarian
economy. However, about 66 per cent workforce of the state was engaged in
agricultural activities (Census, 200I). Out of total workers, 41.1 per cent were
cultivators and 24.8 per cent agricultural labourers. Other workers constituted about
28.5 per cent. If we compare sex-wise contribution, males occupied the highest share
of 42.7 per cent as cultivators, whereas number of female was higher to work as
agricultural labourers and in household industry workers (39.6 and 8.3 per cent,
respectively) as against number of male workers of 20.1 and 4.7 per cent (Fig. 1.6).
43
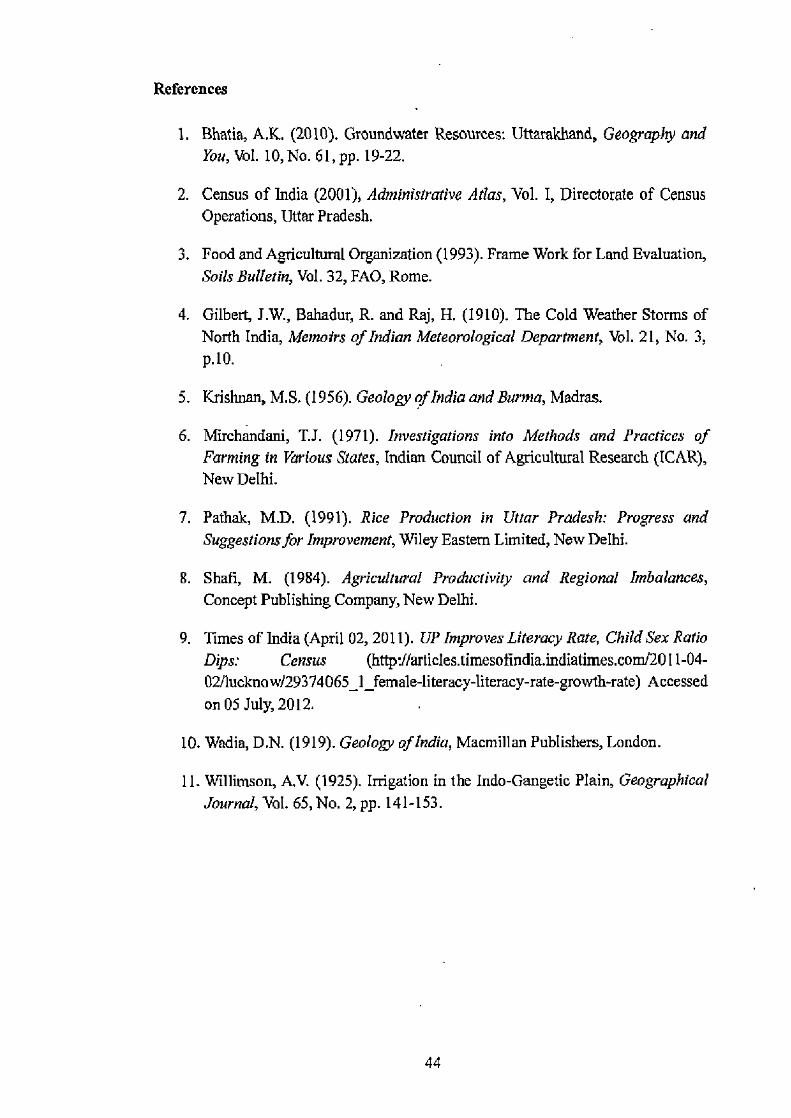
References
1. Bhatia, A.K. (2010). Groundwater Resources: Uttarakhand, Geography and You, Vol. 10, No. 6I, pp. 19-22.
2. Census of India (2001), Administrative Atlas, Vol. I, Directorate of Census Operations, Uttar Pradesh.
3. Food and Agricultural Organization (1993). Frame Work for Land Evaluation, Soils Bulletin, Vol. 32, FAO, Rome.
4. Gilbert, I.W., Bahadur, R. and Raj, H. (1910). The Cold Weather Storms of North India, Memoirs of Indian Meteorological Department, Vol. 21, No. 3, p.10.
5. Krishnan, M.S. (1956). Geology of India and Burma, Madras.
6. Mirchandani, T.J. (1971). Investigations into Methods and Practices of Farming in Various States, Indian Council of Agricultural Research (ICAR), New Delhi.
7. Pathak, M.D. (1991). Rice Production in Uttar Pradesh: Progress and Suggestions for Improvement, Wiley Eastern Limited, New Delhi.
S. Shafi, M. (1984). Agricultural Productivity and Regional Imbalances, Concept Publishing Company, New Delhi.
9. limes of India (April 02, 2011). UP Improves Literacy Rate, Child Sex Ratio Dips: Census (http:/larticles.timesofindia.indiadmes.com/2011-04- 02/1ucknow129 3 7 4 065_]_female-literacy-literacy-rate-growth-rate) Accessed on 05 July, 2012.
10. Wadia, D.N. (1919). Geology of India, Macmillan Publishers, London.
11. Willimson, A.V. (1925). Irrigation in the Indo-Gangetic Plain, Geographical Journal, Vol. 65, No. 2, pp. 141-153.
44
WW
CHAPTER II
Sources oflrrigation: A Theoretical Framework
CHAPTER II SOURCES OF IRRIGATION: ATHEORETICAL FRAMEWORK
This chapter is a conceptual work which focuses on the development of irrigation in India in different periods of time-pre-historic, medieval and during plan periods in which construction and development of various sources of irrigation was made to make agriculture productive.
A. Irrigation Development; A Historical Perspective a. Irrigation development in India
India is endowed with vast water resources amounting to 400 million hectare meter (m ham) per year. Out of this, 215 m ham will go as percolation to recharge groundwater, 115 in ha m forms surface water and 70 in ha m goes as immediate evaporation (Goud, 1989). India is the largest user of groundwater resources in the world. As per estimates, approximately 230 cubic km of water per year is used which is more than a quarter of the total world consumption of water from this resource. Historical records contain many successes, failures and challenges to large-scale irrigation schemes. Some of the known examples are: the Mesopotarnia, the Nile delta and the Indo-Gangetic plain (Wichelns and Oster, 2006).
Irrigation is practiced in India since ancient times. Sufficient proofs of this are available from Indian history, which confirm that irrigation was practised not only during Mughals and Aryans periods, but also during the period of Pandavas
(about 3150 B.C.). Vedas and ancient Indian scriptures contain references of wells, canals, tanks and dams used for irrigation. In medieval period, rapid advances were made in the construction of inundation canals. Ghiyasuddin Tughlaq who ruled during 1220-1250 is considered to be the first north Indian ruler who encouraged the digging of canals. Irrigation development during British rule began with the renovation, improvement and extension of existing canal works. The government of India also ventured into new projects namely, the Upper Ganga Canal, the Upper
Bari Doab Canal and Krishna and Godavari Delta Systems, which were all river-diversion works of considerable extent (Kumar, 2007).
The most earliest and the simplest form of irrigation is raising water from a lake, river or well, and pouring it over the land. The water may be raised by
45
mechanical power, from brawny arms of the peasant to the latest devices of the
pumps. The earliest Egyptian sculptures show water was raised by a bucket attached
to one end of a long pole, turning on an axis with a heavy counterpoise at the other
end. Another method, largely used in northern India is the shallow bucket suspended
between two strings, held by men who thus bale up the water. A step higher is the
water-wheel, with buckets or pots on endless chains around it, operated by one or a
pair of bullocks. Yet another method of water-raising is very common in India from
wells where the spring level may be as deep as 30 meters. A large leathern bag is let
down the well by a rope passing over a pulley and raised by a pair of bullocks, which
hauls the bag up, as they run down a slope the depth of the well. The average cost of
masonry well in India varies, according to the depth required. But it is obvious that in
many places the geological structure of the land is such that well-sinking is
impracticable. Most favourable conditions are found in broad alluvial plains of a
deltaic river, the subsoil of which may be counted as containing a constant supply of
water.
The great plains of northern India are well adapted for irrigation. The Ganga
Canal, opened in 1854, at a time when there was not a km. of railway and hardly a
steam engine, has a length of about 158 thousand km, including distributing
channels. The Upper Ganga Canal takes out from the right bank of the Ganga at
Haridwar where a dam has been constructed across the river. The main channel and
principal branches have a total length of about 900 km irrigating about a million ha.,
mainly in the districts of Saharanpur, Muzaffamagar, Meerut and Bulandshahr down
to Mainpuri in U.P. It was supplemented in 1878 by a lower canal, drawn from the
same river about 200 km further down, and these two canals now irrigate between
them about 760 thousand km annually. The lower Ganga Canal takes off on the right
bank of the river Ganga at Naraura (Bulandshahr) by constructing a dam across the
river. The main and principal branches run over 1,000 km, while the distributaries are
over 5,000 km. The system irrigates over half of a million ha. in central and of lower
Ganga-Yamuna doab in the districts of Aligarh, Etah, Etawah, Mainpuri,
Farrukhabad, Kanpur, Fatehpur and right down to Allahabad. The Sarda Canal, takes
out from the Sarda at Banbasa in Nainital district, which was opened in 1928 and
extended in 1941, is the most extensive (12,267 km in total length) system in the
state, irrigating 0.59 million ha. in the Ganga-Uhaghara doab region of the eastern
Rohilkhand and Awadh plains up to Rae Bareli district and even goes beyond to
46
Azamgarh district. On all these canals reflect the engineering work of a very high
class (Moncrieff, 1905; Singh, 2003).
The 1980s witnessed ambitious government programs to promote private
tubewells, supported by soft loans to farmers and rural electrification. Farmers across
the Indo-Gangetic Basin (IGB) continued to adopt high yielding varieties of cereal
crops, initially wheat with moderate to high water demand, followed by rice with
very high water demand. The rice-wheat rotation that is now the most prevalent
cropping pattern in the IGB resulted from a combination of high and assured
procurement prices and subsidized inputs (not least energy for groundwater).
Additionally, the general shift to a flat rate electricity tariff for agricultural use in
most states induced new entrants to the groundwater economy (Scott and Sharma,
2009).
T'abewell irrigation, through modem Water Extraction Mechanisms (WEMs)
has been vital to food security and sustainable livelihoods in India due to reliable and
comparatively better efficiency than canal irrigation. Since installation and
maintenance require huge capital, its distribution is highly skewed towards large
farmers and, resource poor farmers have to rely on them for irrigation, resulting into
an emergence of an informal water market (Srivastava et al., 2009).
The government of India after independence assigned high priority to the development of irrigation potentials, which increased from 22.6 m ha in 1950-51 to
95 m ha in 1999-2000, with net irrigated area of 57 m ha. The irrigated area accounts
for about 40 per cent of the net cultivated land with 55 per cent of foodgrains
production (Yadav, 2005).
b. Irrigation development in Uttar Pradesh
Uttar Pradesh is an important agricultural state of India. Main sources of
irrigation in the state are canals and tubewells. In addition to these, tanks and other
wells are also used for irrigation. The government of India first took the initiative in
installing tubewells in 1930's after the installation of hydroelectric generation at the
head of Ganga Canal. The first drillings were made in the district of Meerut and
Rohilkhand belonging to the divisions of western U.P. By 1936, 732 tubewells were
installed; by 1939, 1,474; by 1946, 1,847; and by 1950, 2,305 tubewells which
irrigated about 300,000 ha of agricultural lands. Of the tubewells operating in 1951,
most of them were confined in western region. The tubewells were installed first
47
where they could be expected to show highest returns in terms of low cost of
construction (including provision of electricity) and in terms of maximum expected
benefits through increased crop production. To this end, the tubewells were located
on positions giving the largest commandable area, and in areas away from canal and
other sources of irrigation. Of nearly 4,000 tubewells installed during 1950s, 1,500
were in western region, 350 in central region, and 2,100 in eastern region. As a
consequence, by 1960-61, the western region accounted for only 58 per cent of the
tubewells and the eastern region for 35 per cent. In the following decade, the number
of tubewells increased to over 10,000 by 1971. It should also be noted that some
parts of central and eastern U.P. were deep or inaccessible water tables, these
conditions to some extent hindered the development of tubewells. In addition in the
eastern region, the smaller holdings, higher rainfall, a less water-intensive cropping
pattern (mainly in rabi season), and low economic resources of cultivators, tended to
make the running of tubewells and full utilization problems in eastern areas
(Dhawan, 1973).
One of the greatest advantages that western U.P. has over eastern U.P. is the
public investment in canal irrigation. In the 19th Century, the west received large
amounts of public investment for irrigation, while the east received very little.
Between 1830 and 1880, the eastern Yamuna, Lower Ganga and Agra canals were
constructed in western U.P., allowing for larger tracts of land to be irrigated than via
the traditional wells, ponds and tanks. In 1950-51, the land area watered by canal
irrigation in the west was 12 times greater than in the east. The development of the
Sharda Sabayak and Gandak irrigation projects improved canal irrigation in the east
and the ratio of canal irrigated area between east and west decreased from 12:1 in the
early 1950's to about 5:1 in the early 1960's.The ratio continued to decline in the mid
1970s, to 2.5:1 and by the mid-1980's, it was almost equal. I Iowever, by the time the
east caught up to the west in this regard, the expansion of tubewells seen as a
necessity for the timely irrigation for the new HYVs had taken off in the west
(Sharma and Poleman, 1993) and canal irrigation was no longer the preferred mode
of irrigation (Pant, 2004). The cast again found itself behind the west in this form of
irrigation. In 2001-02, the proportion of net irrigated area watered by canals was
significantly higher in the east than in the west (Bajpai and Volavka, 2005).
The Free Boring Scheme (FBS) in the state was started in 1984-85 and by
2001-02 the total number of free borings stood at 2.5 million. Of this 0.85 million
48
(33.2 per cent) were installed in the western region and 1.14 million (45.2 per cent)
in the eastern region, and the rest of 21.6 million installed in the remaining parts of
the state. It was also found that about 35 per cent borings were completed by the end
of 2002; the areas were mainly inhabited by SCs and STs population. In another
studies conducted by Shah (2001) and Ballabh and Choudhary (2003) were of the
opinion that FBS was a great success not only from the view point of groundwater
development in eastern U.P., but it greatly contributed in making groundwater
accessible to rural poor and marginal farmers (Pant, 2005).
c. Irrigation development during Five Year Plans
India has invested heavily in the development of infrastructure for irrigation
since independence. Considerable amount was spent for the development of
irrigation in the Five Year Plans (FYP). Irrigation accounted for an expenditure of!
4,560 million during the First FYP and the irrigation potentials created were of the
order of 3.66 million ha. The expenditure on major, medium and minor irrigation
projects during Second and Third FYP were ! 5,220 and 7 9,090 million,
respectively. An irrigation potential of 2.83 million ha. and 4.52 million ha, were
created during the Second and Third FYP, respectively. The expenditure in Annual
Plans (1966-69) and Fourth FYP (1969-74) accounted for 7 7,600 million and 17,500
million, respectively, A total irrigation potential of 3,49 and 7.10 million ha. were
created in the annual plans and Fourth Five Year Plan.
The expenditure in the Fifth FYP was 7 30,730 million and 7.92 million ha.
of irrigation potentials were created. An amount of! 25,530 million were spent on
irrigation in the annual plans of 1978-79 and 1979-80. A potential of 4.48 million ha.
was created in the annual plan of 1978-1980. During the Sixth FYP, the total
expenditure incurred on irrigation was 7 93,180 million, and a potential of 11.30
million ha. was created. During the Seventh FYP, the total expenditure on irrigation
was 143,600 million and the potential of 13 million ha. was created in the Seventh
Plan. The outlay on major, medium and minor irrigation projects during Eight and
Ninth FYP was 7 3,66,490 and ! 6,36,820 million (including flood control),
respectively.
An irrigation potential of 95.40 million ha. was created during 2000-2001.
The total outlay on irrigation and flood control in Tenth Plan (2002-2007) was kept at
i` 9,57,430 million. The total outlay for irrigation in the Eleventh Plan (2007-12) was
49
kept at Z 23,23,110 million. Substantial expenditure has gone in for developing the
major and medium irrigation potentials, especially the major river valley projects,
like the Bhakra Nangal Project (Punjab), Seas Project (Punjab and Haryana),
Hirakund Dam Project (Orrisa), Damodar Valley Corporation Project (Bihar and
West Bengal), Nagarjunasagar Project (Andhra Pradesh and Karnataka), etc.
However, minor irrigation continued to occupy an important place as its share in total
irrigation potentials of 102.8 million ha. was created by the end of Tenth Plan (2006-
07) was 58.8 per cent (60.4 million ha.) (Somashekaraiah, 2011).
B. Sources of Irrigation Water
a. Irrigation by surface water sources
History of irrigation begins with the application of water to the fields in some
kind of irrigation methods. Surface irrigation is the oldest and most common method
of irrigation. In all methods of irrigation (canals, tanks, ponds, lakes, etc.), water is
either ponded on the soil or flows continuously over the soil surface for the entire
duration of irrigation (Asawa, 1999). Surface water conveyed from reservoirs
through canals to farmers' fields tend to be inflexible in terms of timing and delivery,
as a result farmers decisions making with regard to which crops to be planted, when
and which area will have a limited water supply by canal water. Groundwater sources
of irrigation, on the other hand, enjoy a considerable flexibility. However, a major
benefit associated with receiving surface water is that irrigation charges tend to be
relatively low given that federal or state governments have to incurred the cost of
infrastructure development and in many cases continue to subsidize canal irrigational
operation costs (Wester, 2008; Scott etal., 2010).
In surface irrigation methods, less than 50 per cent of water released reaches
the plants. In major irrigation projects, the overall efficiency ranges from 30-40 per
cent. These low efficiencies may be accounted for in part by water conveyance losses
due to seepage, evaporation and non-beneficial uses. The losses are also partly the
result of poor farm distribution of water due to inadequate land preparation and lack
of farm know how in application of water, with consequent excess application and
deep percolation (Sivanappan, 1994).
i. Canals Canals have been used for irrigation at first to convey water from one place to
50
another. The ancient civilizations in Sri Lanka, Egypt, China, Persia, India and the
Roman Empire, all build remarkably complex network of canals, many of them still
work today look feeble. The great canal systems of India developed under the British
planning and administration during the 19a' century were not only masterpieces of
administrative organization, but extended the frontiers of civil engineering works
beyond that had gone before (Laycock, 2007).
A canal is defined as an artificial channel constructed on the ground to carry
water from a river or another canal or a reservoir to the field. An irrigation canal
carries water from its source to agricultural fields. Based on nature of source of
supply, canal can either be a permanent. or an inundation canal. A permanent canal
has a continuous source of water supply. Such canals are also called perennial canals.
An inundation canal (or non-perennial canal) draws its supply from a river only
during the high stages of a river (Asawa, 1999). The western part of Uttar Pradesh
especially the Ganga-Yamuna doab was the focus for a substantial part of canal
building activity during the 19th century. At that time canal was a costly experiment
(Stone Ian, 1984).
ii. Tanks
Tanks are the most important traditional sources of surface water supply for
irrigation and other livelihood purposes over the centuries in India. Typically, tanks
are relatively small in size, shallow reservoirs used to store catchment rainfall and
use it to irrigate crops during dry spells, and enable the crops to be grown in dry
season that require more water (Vaidyanathan, 2006). Unlike the other surface
sources of irrigation, tanks are low cost source of irrigation and predominantly
managed by farmers themselves. However, in spite of having many advantages, the
area under tank irrigation has consistently declined in the country since
independence. It has created tremendous hardships to poor farmers, who mostly
dependant on tank irrigation for crop cultivation (Narayanamoorthy, 2008). As tanks
play an important role in increasing the recharging capacity of wells, its adverse
impact on groundwater irrigation has been realized particularly in parts of south
India (Narayanamoorthy, 1993; Vaidyanathan, 2001).
At present a rapid development of well or bore-well irrigation in tank
command area is one of the important reasons for appalling condition of tank
irrigation. The tanks have been managed by rich and resourceful farmers for long
51
times through community participation. But owing to recent development in
groundwater irrigation, community participation in tank related activities has
drastically reduced (Janakrajan, 1993; Narayanarnoorthy, 2008). Farmers have
started neglecting the works associated with tank irrigation only after the massive
development of bore-wells/tubewells; the installation of them began during the mid-
sixties with the advent of green revolution in the country. Unlike dug-wells, supply
of water from bore-wells is made assure as they draw water from deep aquifers. This
provides greater benefit to farmers and hence, most of resourceful farmers started
installation of bore-wells at possible locations hence, discouraged tank related
irrigation.
b. Irrigation by ground water sources
The main source of groundwater storage on earth is rainfall, a part of it is
penetrated beneath the surface, another is evaporated and goes into the atmosphere,
and some of it takes a runs off over the surface. The portion of water penetrated into
the layers of earth is stored as ground water. Therefore, groundwater is that portion of
water beneath the surface of the earth that can be lifted through wells, tunnels or
drainage galleries or that it can flow naturally on the earth's surface. Groundwater
has been an important resource for human use throughout the ages and today
groundwater constitutes a major source for municipalities, industries, suburban
homes and agricultural farms. The depth of groundwater may range from I m or less
to 1000 m even more. Groundwater accounts for major portion of the world's fresh
water supplies. Estimates of global water supply show that groundwater represents
about 0.6 per cent of the world's fresh waters (Mahajan, 1989).
Groundwater plays a unique and critical role in supporting smallholder
economy. In India, some 60 per cent of irrigated areas are served by groundwater
wells. Number of mechanized wells and tubewells increased from less than a million
in 1960 to 19 million until 2000 (Shah, 2007). During British rule in India (which
includes India, Pakistan and Bangladesh), they accounted for over 30 per cent of
irrigated land, even in 1903 when only 14 per cent of cropped area was irrigated.
With the rise of tubewell technology and modem pumps, groundwater use reached to
unthinkable levels after 1950; consequently, by the mid-1990s, irrigated areas
through underground water sources (in India, Pakistan and Bangladesh) were much
larger than anywhere else in the world. In Indian subcontinent, groundwater use
52

increased from 10-12 km3 before 1950 to 240-260 km3 in 2000 (Shah, 2005).
Groundwater wells provided irrigation to 10 million ha. in 1970 and now serve over
35 million ha. of net irrigated area. Surface irrigation sources (tanks and canals) that
had dominated to irrigate agricultural lands in India for decades ago now gave way to
groundwater irrigation. However, increase in groundwater irrigated lands on an
average Indian district after 1970 has been so large that groundwater irrigation
contributed much to increase value of agricultural output per hectare, compared with
surface irrigation. During the later half of the 200' century, large-scale tubewell
irrigation development occurred only in canal irrigated areas. Tubewell density is
high throughout the Ganga basin in India, which possesses a high groundwater table
and very high population density. Groundwater table is also high in other parts of the
country such as in the states of Tamilnadu, Andhra Pradesh and Karnataka which
possess insufficient water resources but population densities are high. On the other
hand, in parts of central India, least available resources have been developed; and
tubewell density is also low (Shah, 2007).
After independence, public investments in canal irrigation projects were
concentrated in few pockets, leaving the rest rain-fed fanning. In contrast, the
development of groundwater irrigation had a significant `equalizing effect'. It also
emerged as a biggest drought mitigator; during the 1960's, a major drought reduced
India's food production by 30-40 per cent, forcing India into an embarrassing `ship to
mouth' dependence on US PL 480 wheat. Groundwater development has thus been a
major restorer of India's national pride and confidence in feeding its people. Almost
everywhere in the subcontinent, groundwater contribution to irrigated area exceeded
to that of surface water. In northwestern parts of India, despite massive investments
in canal irrigation, the bulk of the irrigation is delivered by wells and tubewells.
Another key feature in groundwater irrigation in India has been its supplemental
nature, which is also more productive as compared to surface irrigation, because it
offers individual farmer irrigation `on demand' which few surface systems can offer;
and because its use entails significant incremental cost of lift, farmers tend to
economize the use and maximize the application efficiency. Evidence from India
suggests that, crop yield per cubic metre of water applied on groundwater-irrigated
farms tend to be 1.2-3 times higher than that applied on surface water-irrigated
farms. The best farm level productivity performance of course is obtained by those
who use water in ajudicious combination of surface and groundwater (Shah, 2007).
53
Groundwater irrigation has contributed in much of the increase in the net
irrigated area of the country over the last few decades. In the past, surface water
irrigation had played a significant role in increasing the net irrigated area. However
from mid-60s, the proportion of surface water to net irrigated area has decreased and
in the last decade alone it has decreased largely by 23 per cent. This is largely due to
incompletion of planned irrigation projects and poor maintenance of the existing
surface irrigation infrastructure (Gulati et al., 1999). A popular belief is that surface
water recharge is a necessary condition for the expansion of groundwater-irrigated
area. Groundwater pumping costs generally depend on the water table level, which
means that as the groundwater stock is increased, marginal extraction costs fall
(Sharma et al., 2008).
Tubewells are the only suitable means of groundwater resource use.
Tubewells fall in two broad categories: the state/public (deep) and the private
(shallow). The state tubewells tap water from deep confined aquifers (more than 100
in below ground level) are large in size and are fitted with high powered water lifting
pumps (17.5 horse power capacity), whereas, the private tubewells tap water from
shallow aquifers (less than 60 m below ground level) and are small in size and are
fitted with small power pumps, typically of 3 to 5 m hp capacity. The average
discharge of a deep tubewell in area reaches about 150 m3 per hour, whereas, that of
a shallow tubewell 30 m3 per hour. The average cost of installation of state tubewell
is much higher as compared to private tubewells (in 1983 its cost was around ?
600,000, and that of a private electric-tubewell was around! 12,000). Deep or large
tubewells are not suited to majority of farmers in India who are mostly poor and have
very small land holdings. These farmers afford to neither install such costly
tubewells nor make full use of them, since their holdings are not only small but also
divided and fragmented. Of course, the state can install and administer large
tubewells for collective use of farmers (Dick and Svendsen, 1991).
Groundwater can widely be distributed with the installation of tubewells and
provides instant and assured source of irrigation to farmers. It provides a status to
irrigation supply and helps in controlling waterlogging and salinisation, as it is seen
in canal command areas. Groundwater development is a major activity of minor
irrigation programme. It is mainly a cultivator's own programme implemented
primarily through individual and cooperative efforts. Finances for such programmes
are made available from different institutional sources (Asawa, 2005).
54
Groundwater irrigation is provided to fields both from dug wells and
tubewells. Dug wells can be distinguished by their water-lifting mechanism, depth
and masonry status; while the tubewells by ownership status, motive power and
depth. Tubewells now dominate as the groundwater irrigation in the Ganga plain.
Over time, productivity of groundwater-irrigated lands has risen much faster than
that of surface-irrigated lands. Firstly, HYV technology has been biased in favour of
farmers having an access to private means of irrigation. Secondly, the composition of
groundwater irrigation tends to change much more than in the case with pubic
surface irrigation. While in the alluvial tracts tubewells have displaced dug wells. In
hard rock areas dug wells have been deepened and equipped with power pump-sets
(in the first phase diesel-driven pump-sets displaced traditional water lifts and in a
later phase these are being substituted by electric pumpsets) (Dhawan, 1985).
Studies conducted in south Asia show that the benefits from groundwater are
more equitable than large-scale surface irrigation systems. The cost of irrigation
water per unit of land is nearly 20 times higher in case of groundwater irrigation than
in surface irrigation (Shah, 2001). Despite this, farmers are increasingly expanding
groundwater use because of its reliability, timely availability and control on demand
due to less transaction costs involved (Bhattarai etal., 2002). It is available at or near
the place of use and consequently, does not require water distribution network.
Further, there is less fluctuation in supply, and it is generally free of turbidity and
bacterial pollution (Cantor, 1967). Losses due to evaporation, which are very large in
surface storages, are negligible when water is stored below the ground. Losses in
conveyances are also quite small because welts have relatively small commands, so
that for the sake of water needs it is transported over very short distances. All this
makes less water in water use and higher productivity per unit water (Vaidyanathan,
2006).
Over the period 1951-2007, irrigated area from major projects in India has
increased 3.5 times, from groundwater 6.3 and tanks 1.9 times. Construction of large
number of major, medium and minor irrigation projects through the FYPs, rural
electrification, subsidized power and tubewell revolution in the Ganga plains since
1980s have led to significant development of irrigation in the country. Consequently,
foodgrains production increased 4.5 times from 50.82 million tonnes (rot) in 1950 to
230.67 rot in 2007-08, thereby imparting food security in the country (Sharma,
2009). Over the last quarter of century, 89 per cent of the total increment in net
55
irrigated area was contributed using groundwater through private investment; 75 per
cent share was of tubewell irrigation only (Samra and Sharma, 2009). The
groundwater schemes comprise of dug wells, dug-cum-bore wells, shallow and deep
tubewells and filter points, each having command areas of I and 5 ha. Third Census
of Minor Irrigation Schemes constructed during 2000-01 reveals that about 80 per
cent dug wells were constructed with the investment from the farmers own savings.
Subsidies are also made available for installation of groundwater schemes to weaker
sections of farmers. The construction, operation and maintenance of groundwater
schemes are done wholly by farmers themselves. Now groundwater irrigation is
under the direct control of the farmers and is amenable to precision agriculture and
higher irrigation efficiency of 70-80 per cent compared to 25-45 per cent in canal
irrigated areas (Sharma, 2009).
By 1970, the population pressure on farm lands in many parts of India
became so inexorable that farmers everywhere felt bound to intensive cropping on
small farm holdings twice, or even thrice every year. Population pressure on farm
lands then flagged off India's tubewell revolution. Especially, western and
northwestern parts of country had a centuries old tradition of irrigating lands with
wells. Even in 1900, India had some 4 million ha. under groundwater irrigation. At
the time of independence, the areas irrigated by groundwater and surface water were evenly balanced. Between 1960 and 1985, India invested in irrigation projects many
times more capital in real terms than the Britishers had invested during the entire 110
year period between 1830 and 1940. Yet, even according to the government of
India's figures, over 60 per cent of irrigated areas are today served by groundwater.
Remote sensing data as well as national sample survey suggest that as much as 75-80
per cent of India's irrigated area today is served by groundwater wells. Until 1960,
Indian farmers owned just a few tens of thousands of mechanical pumps using diesel
or electricity to pump water; today it has over 20 million modem water extraction
structures.
Irrigation constitutes the main use of water and presently accounts for 84 per
cent of total water withdrawals. The share of withdrawal by the domestic and
industrial sectors in India is quite low, but it is expected to increase on account of
increasing urbanization and industrialization. Currently, groundwater has received preference over surface water as a source of irrigation as well as for use in domestic
and industrial sectors, due to features, like dependability of supply, widespread
56
distribution, ease of availability in the proximity of place of use, natural availability
in pure form etc. Moreover, due to inadequate dam storage capacities and poor
maintenance of the public irrigation infrastructures, contribution of public surface
irrigation is declining. On the other hand, the use of groundwater is increasing.
Presently about 65 per cent of irrigation and about 90 per cent of domestic and
industrial water requirements are met through private groundwater sources.
Consequently, important aspects relating to groundwater like its scientific
management, conservation and augmentation tend to be neglected by the general
public (Government of India, 2012).
In recent decades, the advent of cheaper pumping technology and new seed-
fertilizer technology in agriculture combined with active encouragement (by
extending electricity to rural areas, loans at low interest, and subsidized electricity)
has led to a phenomenal expansion in groundwater exploitation for agriculture in the
entire subcontinent. The area under well/tubewell irrigation in India has increased
much faster than under other sources, whereas, the area irrigated by tanks and other
minor sources declined between the early 1950's and 1990's, that under canals
doubled even as area under wells and tubewells more than quadrupled
(Vaidyanathan, 2006).
The first large scale venture in the development of groundwater for irrigation
was taken in 1934 when a project of construction of about 1500 public deep
tubewells in Ganga basin was initiated. Groundwater is gaining importance as a
reliable water resource to meet the needs for irrigation as well as of drinking and
industry. The contribution of groundwater to irrigated agriculture is about 50 per cent
and it meets out a major part of our domestic and industrial needs. Overexploitation
of groundwater in certain regions has resulted in progressive lowering of water table
and a consequent decline in the yield and productivity of wells. In canal command
areas, increased recharge due to over irrigation and inadequate exploitation of
groundwater, the water table is progressively rising, creating waterlogging and
salinity problems (Sharma, 2000). India stands as the biggest user of groundwater for agriculture in the world.
Groundwater irrigation has expanded at a very rapid rate in India since the 1970s.
The data of the Minor Irrigation Census 2001 shows growing number of groundwater
irrigation structures (wells and tubewells) in the country. Their numbers stood at
around 18.5 million in 2001, of which tubewells accounted for 50 per cent (Shah,
57

2009). The share of groundwater in net irrigated area has also risen. Of the addition
to net irrigated area of 29.75 million ha. between 1970 and 2007, groundwater
accounted for 24.02 million ha. (80per cent). On an average, between 2000-01 and
2006-07, about 61 per cent of the irrigation in the country was sourced from
groundwater. The share of surface water has declined from 60per cent in the 1950s to
30 per cent in the first decade of 21't century (Kulkami and Krishnan, 2011).
With the development of irrigation by tubewells and bore wells from 1980s,
water intensive crops like sugarcane, rice and coconut started to replace crops like
maize, cotton and groundnut in many parts of the country. This expansion of
groundwater has been a factor in changing cropping pattern and in raising
agricultural production and productivity. It has also helped in sustaining subsistence
cropping for millions of small and marginal farmers. It has, therefore, played an
important role in poverty reduction. As a result, at present in India, there are about 19
million groundwater structures and 7,900 m3/year water is extracted from each
structure (Sharma, 2000).
C. Water Management
Water management at present time is supposed to be a crucial importance
with new developments in agricultural technology. It is now recognized that, the
performance of many of the earlier irrigation systems in the country is inadequate to
meet the expanding water requirements of agricultural operations. There exists a gap
in actual utilization of created potentials, for some of the irrigation projects. Apart
from this, another significant deficiency regarding use of irrigation water is that even
from the irrigation potential that has been actually harnessed; the production benefits
derived are found to be much below the optimum. In many areas, problems of
waterlogging and salinity damage were also quite severe (Dantwala, 1986).
Over exploitation of groundwater beyond the sustainability limits in several
parts of the country has resulted in widespread and progressive depletion of its levels
in selected pockets of 370 (61 per cent) out of 603 districts in the country. In 15 per
cent of blocks, the annual extraction of groundwater exceeds the annual recharge and
in 4 per cent of blocks, it is more than 90 per cent. Reduction in groundwater supply,
saline water encroachment, drying up of springs and shallow aquifers, increased cost
of pumping by replacing centrifugal pumps with expensive submersible pumps,
reduction in free flow, weakening drought protection and even local land subsidence
58
in some places are threatening the sustainability of aquifers. Further, the practice of
sale of water, either in cash or on crop sharing basis has also encouraged the rich
farmers to construct deep tubewells and over pumping the groundwater. Rapid
decline in groundwater levels in the drier parts of the country is a matter of concern.
It has also reported that declining groundwater level could reduce India's harvest by
25 per cent or more (Sharma, 2009).
Sustainable groundwater development and management in the overexploited
regions needs to be taken up by incorporating artificial recharge to groundwater and
rainwater harvesting, management of salinity ingress in coastal aquifers, conjunctive
use of surface water and groundwater, management of poor/marginal quality
groundwater, water conservation by increasing water use efficiency, regulation of
groundwater development, etc (Sharma, 2009).
For economic betterment of people, living in drought prone areas with
miserable living conditions, the government implemented several programmes and
Drought Prone Area Programme (DPAP) has been one of them. The DPAP covered
556 blocks spreading in over 74 districts in the country. Under this programme 25 to
50 per cent subsidies on digging of wells, installation of pumpsets, etc. were
provided to small and marginal farmers (Reddy etal., 1986).
The DPAP is considered to be one of the earliest area development
programmes which were launched by the central government in 1973-74 to tackle
special problems faced by fragile areas, which were very often affected by severe
drought conditions. The basic objectives of the programme were to minimize the
adverse effects of drought on production of crops and livestock and productivity of
land, water and human resources, thereby ultimately leads to drought proofing of
affected areas. The programme aimed at promoting overall economic development
and improving the socio-economic conditions of poor and disadvantage sections
inhabiting drought prone areas through the creation, widening and equitable
distribution of resource base and increased employment opportunities. The objectives
of the programme are addressed by taking up development works through watershed
approach for land development, water resource development and aforestation/pasture
development. The recent impact assessment studies sponsored by the ministry have
revealed that, with the implementation of watershed projects under drought prone
areas programme, the overall productivity of land and groundwater table has
increased and there has been a significant impact on checking of soil erosion by
59
water and wind. The DPAP during 1994-95 covered 627 blocks of 96 districts in 13
states, 384 new blocks were brought into purview of this programme and 64 were
transferred to District Drought Prone Area Programme (DDPAP) to Desert
Development Programme (DDP). Consequently, coverage of the programme was
extended to 947 blocks of 164 districts in 13 states. With the reorganisation of states,
districts and blocks, at present the programme is under implementation in 972 blocks
of 182 districts in 16 states namely, Andhra Pradesh, Bihar, Chhattisgarh, Gujarat,
Himachal Pradesh, Jammu and Kashmir, Jharkhand, Karnataka, Madhya Pradesh,
Maharashtra, Orissa, Tamil Nadu, Rajasthan, Uttaranchal, Uttar Pradesh and West
Bengal.
The centrally sponsored Command Area Development Programme (CADP)
was initially introduced in 1974 with 60 irrigation projects in 13 states with a
Cultural Command Area of about 15 million ha. The programme now covers 156
projects in 20 states and two Union Territories, covering a CCA of 20.7 million ha. in
the country (Misra, 1993).
The Centrally-Sponsored Command Area Development (CAD) project was
launched in 1974-75, with the main objectives of improving the utilization of created
irrigation potential and optimizing agriculture production and productivity from
irrigated lands on a sustainable basis, by integrating all functions related with
irrigated agriculture through a multi-disciplinary team under an area development
authority. The CAD programme was initiated with 60 major and medium irrigation
projects. So far, 314 irrigation projects with a Culturable Command Area (CCA) of
about 28.68 million ha. have been included under the programme, out of which 136
projects are ongoing. The CAD programme was restructured and renamed as
`Command Area Development and Water Management Programme (CADWMP)
from 1 April, 2004.
a. Micro-irrigation sources
Micro-irrigation (MI) introduced primarily to save water and increase the
water use efficiency in agriculture, which includes both drip and sprinkler method of
irrigation. It is proved to be an efficient method in saving water and increasing water
use efficiency as compared to conventional surface methods of irrigation, where
water use efficiency is only about 35-40 per cent. Micro-irrigation has emerged as an
ideal technology, through which the required amount of water is applied to the root
m
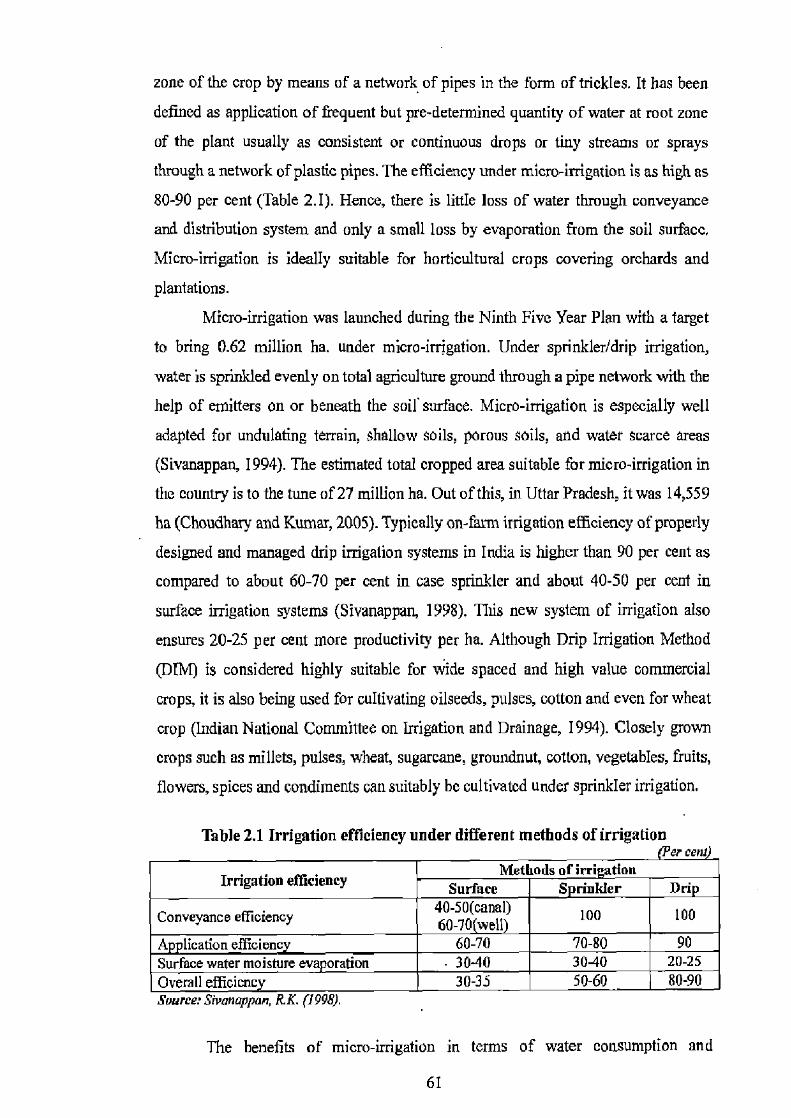
zone of the crop by means of a network of pipes in the form of trickles. It has been
defined as application of frequent but pre-determined quantity of water at root zone
of the plant usually as consistent or continuous drops or tiny streams or sprays
through a network of plastic pipes. The efficiency under micro-irrigation is as high as
80-90 per cent (Table 2.1). Hence, there is little loss of water through conveyance
and distribution system and only a small loss by evaporation from the soil surface.
Micro-irrigation is ideally suitable for horticultural crops covering orchards and
plantations.
Micro-irrigation was launched during the Ninth Five Year Plan with a target
to bring 0.62 million ha. under micro-irrigation. Under sprinkler/drip irrigation,
water is sprinkled evenly on total agriculture ground through a pipe network with the
help of emitters on or beneath the soil surface. Micro-irrigation is especially well
adapted for undulating terrain, shallow soils, porous soils, and water scarce areas
(Sivanappan, 1994). The estimated total cropped area suitable for micro-irrigation in
the country is to the tune of 27 million ha. Out of this, in Uttar Pradesh, it was 14,559
ha (Choudhary and Kumar, 2005). Typically on-farm irrigation efficiency of properly
designed and managed drip irrigation systems in India is higher than 90 per cent as
compared to about 60-70 per cent in case sprinkler and about 40-50 per cent in
surface irrigation systems (Sivanappan, 1998). This new system of irrigation also
ensures 20-25 per cent more productivity per ha. Although Drip Irrigation Method
(DIM) is considered highly suitable for wide spaced and high value commercial
crops, it is also being used for cultivating oilseeds, pulses, cotton and even for wheat
crop (Indian National Committee on Irrigation and Drainage, 1994). Closely grown
crops such as millets, pulses, wheat, sugarcane, groundnut, cotton, vegetables, fruits,
flowers, spices and condiments can suitably be cultivated under sprinkler irrigation.
Table 2.1 Irrigation efficiency under different methods of irrigation 131<. .o„n
Irrigation efficiency Methods of irri lion Surface Sprinkler Drip
Conveyance efficiency
40-50(canal) 60-70(well) 100 100
Application efficiency 60-70 70-80 90 Surface water moisture evaporation . 30-40 30-40 20-25 Overall efficiency 30-35 50-60 80-90 Source, Sivanappan, R.K. (1998).
The benefits of micro-irrigation in terms of water consumption and
6I

productivity gains are substantial in comparison to the same crops cultivated under
flood method of irrigation (Narayanamoorthy, 2001). Micro-irrigation also entails a
reduction in energy (electricity) consumption, weed problems, soil erosion and cost
of cultivation. Investment in micro-irrigation is also economically viable, even
without availing the state subsidy. Today, the coverage of drip (2.13 per cent) and
sprinkler (3.30 per cent) method of irrigation is very meagre to their total potentials,
which is estimated to be 21.01 million ha. for drip and 50.22 million ha. for sprinkler
irrigation method.
There are distinct characteristics differences between the two methods in
terms of flow rate, pressure requirement, wetted area and mobility. While drip
method supplies water directly to the root zone of the crop through a network of
pipes with the help of emitters, sprinkler irrigation method (SIM) sprinkles water
similar to rainfall into the air through nozzles, which subsequently breaks into small
water drops and fall on the field surface. Unlike flood irrigation method, DIM
supplies water directly to the root zone of the crop, instead of land, and therefore, the
water losses which may occur through evaporation and in distribution are completely
absent (Narayanamoorthy, 1996, 1997 and Dhawan, 2002).
Though a remarkable growth is seen in adoption of micro-irrigation over the
last 15 years, its share to the gross irrigated area in the country is only to negligible
per cent as of today. Among various reasons of the slow progress of adoption of this
new technology, its capital-intensive nature seems to be one of the main deterrent
factors. Micro-irrigation technology requires fixed investment that varies from T
20,000 to Z 55,000 per ha depending upon the nature of crops (wide or narrow
spaced) and the material to be used in the system. As farmers are getting water on
low cost from public irrigation system and also from well irrigation (because of free
and flat-rate electricity tarift), there is less incentive to them to adopt this capital-
intensive technology, unless it is necessary.
Scientists at the Tamil Nadu Agricultural University (TNAU), Coimbatore,
have conducted large-scale demonstrations on the fanners' field for various crops
and received encouraging responses from the farmers (NCID, 1994). However, the
adoption of drip method of irrigation was very slow till mid-eighties mainly because
of lack of promotional activities from the State and Central governments. DIM was
initially introduced in early 1970s by the agricultural universities and other research
institutions in India with the aim to 'increase the water use efficiency in crop
62
cultivation. The development of drip irrigation was very slow in the initial years and
a significant development is now seen especially since 1990s.
Micro-irrigation is not only suitable for those areas that are presently under
cultivation, but it can also be operated efficiently in undulating terrain, rolling
topography, hilly areas, barren lands and areas which have shallow soils
(Sivanappan, 1994). The important crops that are suitable for DIM are pulse,
groundnut and other oilseed crops, sugarcane, fruits, vegetables, flowers, condiments
and spices, cotton, etc. In fact, the state of Uttar Pradesh, Rajasthan and Punjab
together account for 50.26 per cent of India's total potential area under drip method
of irrigation. As the characteristics of sprinkler method of irrigation somewhat
different from drip method, but drip method is highly suitable for widely spaced
horticulture and other crops. Sprinkler irrigation can be used in closely grown crops
like cereals and millets besides using for horticultural crops. Therefore, the potential
area for sprinkler irrigation in India can. be much higher than that available for drip
irrigation, because of predominant cultivation of cereal crops under irrigated
conditions.
Drip irrigation can precisely apply water and chemicals to crops at low
pressure and, thus has the potential to save water, energy and chemicals. However,
the high installation cost combined with lack of awareness about drip tape placement,
flow rates, efficiency rates of chemicals delivered through drip system in different
soil types raises growers' concern to shift crop production and provide water to crops
through drip irrigation. Chemicals applied through drip irrigation system can
influence residue levels in tubers or affect breakdown and movement. Drip irrigation
can deliver chemicals in small doses directly to roots of the crop; chemical use can
also be reduced (Pereira and Pires, 2011).
According to the estimates, the state of U.P. alone accounts for about 27.70
per cent in the India's total potential, followed by Rajasthan, Punjab, Haryana, M.P.
and Bihar. The state level position will be changed completely, if we exclude areas of
cereal crops from the estimates. For instance, in U.P. state, the potential area will
come down from 13.95 million ha. to 9.37 million ha., if area under cereal is
excluded from the estimates. Similarly, the potential of Punjab would be only 1.82
million ha., instead of 5.37 million ha. It is expected that, the large scale adoption of
sprinkler irrigation may not take place immediately given the low canal water rates
and electricity tariff (Narayanamoorthy, 2012).
.63
D. Review of Literature
Some of the previous studies undertaken are reviewed as follows:
a. Irrigation and agriculture development
Cantor (1967) in his book A World Geography ofIrrigation' has outlined the
history of irrigation and its development, and further attempted to describe the
methods (both traditional and modem) through which water is applied to land. His
work also deals with the conditions of irrigated agriculture in different regions of the
world, i.e. Monsoon Asia, South-West Asia, Europe and Russia, Africa, North
America, Latin America and Australasia.
Dastane and Patil (1968) in their study concluded that the water requirements
of crops are essential to realize the full potential of yields. They emphasized that,
water is needed for obtaining maximum yield of crops.
Cliff (1977) in his study to measure the progress of irrigation in the state of
U.P., examined the development of irrigation facilities in historical perspective,
particularly in Post-Independence period and pointed out significant differences in
the nature and state of irrigation in different regions of the state, and also accounted
for the underlying causes of these differences.
Dhawan (1977) has focused on the regional differences in tubewell expansion
in five major states namely, Punjab, Haryana, Uttar Pradesh, Bihar and West Bengal
covering extensive area of the plains formed by the Ganga and the Indus rivers. He
examined that, the development of tubewell irrigation has been due to certain forces
which are behind the installation of tubewells. The forces which have made
investment on installation of private tubewells have been much more profitable in
western plains than the eastern one. A comparative study of eastern and western parts
of U.P. has also been done to find out intra-regional differences in tubewell growth.
Dhawan (1979) made an attempt to ascertain trends in tubewell irrigation
during the planning period (1951-78) and analyzed the chief factors determining the
trends. He has mentioned that, private tubewell irrigation was emphasized with the
beginning of the First Five-Year Plan, since then the installation of private tubewells
has risen steadily.
Narain and Roy (1980) have examined the impact of irrigation and labour
availability on multiple cropping in selected states of India. They have further
examined the importance of irrigation in multiple cropping on overall production of
64
crops and its relationship with the quantity of water and type of irrigation by
applying statistical techniques of multiple regression and correlation.
Agarwal (1984) attempted to measure the impact of tractors and tubewells on
cropping intensity applying two indexes (the conventional and crop duration index)
for Indian Punjab taking data of 237 farms for the year 1971-72. As measured by
both indices, she comes out with the results that relative to bullocks and canal
irrigation, tractors and tubewells are respectively associated with higher cropping
intensities. The study also indicates that owned tractors have an advantage over hired
ones and the effect of tubewells is substantially greater than of tractors.
Chambers (1984) in his study on 'Irrigation Management: End, Means and
Opportunities' proposed five focal objectives and criteria. These objectives were:
productivity, especially of water; equity especially in its distribution; long-term
stability, both environmental and through maintenance of works; carrying capacity,
reflecting the size of population supported at a decent and secure level; and well being, including health, amenity, nutrition and psychic factors. He also suggested
three major opportunities, so all can gain. First, the professional training and
incentives of irrigation managers; second, search for ways through which farmers of
head reach can gain while receiving less water; and third, distribution of land to
landless and very small farmers at the time when the provision of irrigation water is
made available.
Giri and Malik (1984), while taking into consideration economic aspects have
compared public sources of irrigation with that of private sources in Nadia district of
West Bengal during 1983-84 cropping season. For this, they selected two deep
tubewells and three shallow tubewells from the homogenous tract of the district. The
study reveals a large inequality in land ownership within deep tubewell command
area in which majority of the farmers belonged to small and marginal size-groups.
The study indicates greater inequality in land distribution in areas served by private
sources of irrigation than in areas served by public sources of irrigation, but the
cropping intensity has been much higher in areas served by shallow tubewells.
Sidhu et al. (1984) in their study on economic analysis of different sources of
irrigation in the districts of Punjab compared the operation and performance of
different farm categories. The study indicates a positive relationship between the
degree of water supply flexibility and reliability and use of fertilizer, irrigation and
other inputs. The study concludes that the performance of farmers having diesel plus
Fi

electric alternative was much better compared with all other categories.
Thakur and Kumar (1984) examined the economic efficiency of different
irrigation systems in western Uttar Pradesh. They observed that irrigation coupled
with better water management in crop production has increased the yield and use of
inputs. The study has been undertaken with objectives like, the effect of irrigation on
cropping intensity, cropping pattern, use of inputs, yield and income, total change in
crop production due to irrigation system into its constituent causal forces like water
management and changes in input levels and measure the returns to water
management through different sources of irrigation. The study concludes with some
suggestions that timely and adequate water supply can improve the productivity of
land and inputs on private tubewell irrigated farms as compared to state tubewell
irrigated farms and canal irrigated farms.
Dhawan (1985) in a statewise analysis of performance of Indian irrigation
during two consecutive drought years of 1972-73 and 1974-75 has pointed out that
during these years irrigation worked as protective agent to drought.
Donde (1985) has considered the benefits of irrigation in two drought prone
districts of Haryana namely, Bhiwani and Mohindergarh. He is of the opinion that the
provision of irrigation reduces the fluctuations in crop output during the periods of
drought and produces positive results to cropping intensity, change in cropping
pattern, use of modern inputs, returns on investment etc. Irrigation reduces the extent
of unirrigated area and adds the extent of irrigated area.
Jairath (1986) tried to focus on social factors in evaluating the role of
technology on production in the districts of Punjab during the period of 1965-70. He
investigated the role of irrigation technologies in yield in different regions. The study
clearly demonstrates that irrigation from private tubewells is more efficient to that of
canals. This is mainly due to that private ownership of tubewells enables a greater
control over time and quantity of irrigation in water uses. He further points out that
large landowners have a relative advantage over the smaller ones. Poor productivity
in the districts is characterized by the dominance of small holdings despite of high
level of private irrigation. In the districts with high level of public irrigation and
dominated by large holdings, one finds, a medium level of productivity giving the
higher productive potential to large holdings.
Evans (1986) while evaluating the impact of irrigation and crop improvement
in temperate and tropical environments argued that irrigation has created new
66
opportunities as well as challenges for plant breeders. In temperate environment the
primary emphasis is on raising yield potential, especially as irrigation enhances the
use of inputs but in tropical environment, breeding for greater yield potential and
more comprehensive pest and disease resistance are important. However, shortening
the length of life cycle, reducing its sensitivity to seasonal signals and increasing
yield per day maybe more important than raising yield per crop because of the scope
for multiple cropping made possible by irrigation in the tropics because of the limited constraints by low temperatures.
Pawar and Shinde (1986) have highlighted spatio-temporal development of
different sources of irrigation during the. period of 1951-55 and 1976-81 and
evaluated the intensity of irrigation, growth and regional differences in Maharashtra.
To increase the intensity of irrigation and to remove regional imbalances, they put
emphasis an efficient utilization of water resources in the state.
Rao and Ali (1986) have examined the impact of irrigation on cropping
pattern in Karimnagar district of Andhra Pradesh under command area of
Sreeramsagar Project in 1984. A sample of fifty households from three villages was
taken randomly, each one from the Head-Reach-Area (HRA), Middle-Reach-Area
(MRA), and Tail-End-Area (TEA). A village of less irrigated area (LIA) was also
chosen for comparison. The study highlights that impact of irrigation was not
diffused in an equitable manner to all categories of farmers. The performance of
TEAs has to be placed at last and below LIAs; on the other hand MRAs performance
is almost nearer to HRAs.
In another study by Rao (1986) entitled `Irrigation: A Clue for Rural
Development' in Malaprabha command area in Karnataka concludes that a shift from
subsistence farming to market oriented cropping coupled with HYV seeds and more
remunerative crops is evident in Konnur village. Other direct benefits like increase in
per capita income, especially in lower land holdings were observed which were due
to proper water management and optimum use of inputs.
Reddy et al. (1986) examined the role of minor irrigation in drought prone
district of Telangana region of Andhra Pradesh covered by two financial institutions;
the Primary Agricultural Development Bank (PADS) and the Union Bank of India
(UBI). A total of 17 villages were surveyed. The study reveals that there is a
considerable impact of investments in Drought Prone Area Development and raising
the living standards of farming community. Besides, direct benefits achieved change
67
in cropping pattern, increased yield and accruing tremendous incremental income.
They have also enhanced the employment opportunities to agricultural labourers in
the study area.
Singh and Azam (1986) examined the growth of irrigation and crop output in
western Uttar Pradesh during the period of 1960 to 1980. The study reveals that,
there has been a high positive correlation in irrigation and crop output that was due to
an increase in irrigation, mainly with privately owned tubewells; this was reflected
owing to an increase in number of tubewells.
Dhawan (1988) has focused his attention on to study the impact of Kai
irrigation project in the Konkan region (known for very high rainfall) on the crop
economy using the parameters to aggregate .crop output, national income generation,
income from crop enterprise and labour employment by taking a sample of 14
villages. He argued that returns to irrigation can be substantial despite gross
underutilization of irrigation potential occurring primarily in kharif season. Siddiqui (1988) investigated the role of water management in food crop
production in Uttar Pradesh during 1983-84. The study proved that the state can
increase its production to a large extent if adequate and assured irrigation facilities are available to fertile lands. In his opinion, assured irrigation can help to a greater
extent the adoption of certain agricultural innovations like chemical fertilizers and
manures, new varieties of seeds, plant protection chemicals, as all of these require
assured irrigation waters. For managing water resources, he has suggested measures
to reduce the loss of irrigation water through evaporation and seepage, and new
techniques may be adopted in lifting of water to high levels in an optimum economic
way. He has also emphasized to test the water quality, as poor quality of water for
irrigation can increase soil salinity and may cause permanent damage to crops.
Singh et a?. (1988) examined the inter-district variations to assess the overall
development of irrigation considering growth of irrigated area, sourcewise irrigated
area and intensity of irrigation during the period of 1960 to 1985 in western U.P. The
study reveals that after green revolution period tremendous increase in tubewell
irrigation was observed.
Oppen et al. (1989) have evaluated the impact of Tawa Irrigation project on
agricultural production in Hoshangabad district of Madhya Pradesh. The project has
been considerably helpful in increasing agricultural productivity and market sale of
commodities produced in the region.

Misra and Tripathi (1989) have examined the impact of agricultural
development on regional economy of Basti district of U.P. by using z-score
technique. For the analysis, they selected five indicators in 32 development blocks of
the district for two points of time, i.e. 1979-80 and 1984-85. They considered the
levels of agricultural development in the district of Basti on the basis of adoption of
modern technology, use of agricultural inputs, proliferation of post-harvest
technology, co-operative societies, financial institutions and marketing facilities,
coupled with concomitant rise and diversification of animal husbandry that led to
growth in agricultural income of the farmers.
Mishra (1990) analyzed management of water for agriculture in Barmer
district of Rajasthan. He suggested that proper conservation of rainwater in situ
reviewing of existing agricultural practices and cropping system can help much to
improve water management in arid environment.
Singh and Azam (1990) have tried to compare the cost and benefit of canal
and tubewell irrigation in Aligarh district of western U.P. The study concludes that
the benefits accrued from irrigation were highest on farms which were irrigated by
private tubewells, especially electric operated, and lowest on farms taking water on
hire basis from diesel operated private tubewells.
Verna (1990) examined the impact of irrigation on agricultural structure and
productivity in U.P. The author in his study categorized different non-hill districts of
the state on the basis of a range of 20 per cent irrigation level (as a per cent of gross
irrigated area to gross cropped area) and related it with the variables pertaining to
agricultural structure and productivity. The study concludes that the assured
provision of irrigation has increased the extent of multiple cropping, rate of
mechanization in farming, raising yield of crops and also helped in
commercialization of agriculture.
Prasad and Mahto (1991) examined the impact of irrigation development in
Boreya village of Ranchi district of Bihar. Basically located on a hilly terrain, the
village has registered a significant increase in the number of sources and area under
irrigation. After 1960, the village started developing and expanded rapidly owing to
the establishment of large and small industries in Ranchi. The urban large scale
migration of people took place from outside, and as a consequence, a remarkable
development was seen accounting for 57 per cent cropped area received irrigation.
Dhawan and Datta (1992) examined the impact of irrigation development on
LS]

multiple cropping in 14 states of India by using multiple regression technique for
seven quinquennial periods: 1953-57, 1958-62, 1963-65, 1968-72, 1973-77, 1978-82
and 1983-87. The analysis reveals a positive relationship between irrigation and
cropping intensity.
Khanna (1992) in her paper on Sustainable Agricultural Development' took
the problems of tradition and commercial agriculture. The study was conducted in
the traditional agricultural areas of Banaskanta in a semi-arid zone of north Gujarat
and Panchmahals in hilly zone of eastern Gujarat and in the commercial agricultural
areas: Surat and Kheda of south Gujarat. She pointed out that commercialization of
agriculture is not the solution to bring higher yields from the low yields in crop
output, hunger and poverty, but the unequal distribution of seeds, implements, water,
fertilizer, land, social services are the root causes of these problems.
Sivanappan (1994) examined the prospects of applying water to agriculture
through micro-irrigation in India. As has been emphasized that micro-irrigation, if
used extensively can save water about 40-80 per cent and yield can also be increased
up to 100 per cent. It is suitable for growing high value crops like fruit, vegetable and
plantation crops in hilly and undulating tracts, coastal sand terrain and to a great
extent in the water scarce areas of south and western India.
Soundaram (1994) has made an assessment of needs and development of
irrigation facilities in Tamil Nadu state. For determining the irrigation requirements
in the districts of the state, he adopted the methodology used by More and Shinde
(1988) and identified the districts that should be given highest priority in irrigation
development.
Tyagi (1994) examined agricultural development in Aligarh district for the
period from 1974-75 to 1984-85 by selecting 7 indicators: the yield of crop per
hectare, proportion of irrigated area to gross cultivated area, consumption of
fertilizers (kg/ha), number of implements used in agricultural operations, proportion
of area under high-yielding varieties of seeds to gross cultivated area, percentage of
gross cultivated area to net cultivated area and percentage of gross irrigated area to
net irrigated area. It was realized that the identification of areas, according to
differential levels of development, typology and dimension of backwardness are
crucial for the implementation of plans.
Khan (1997) empirically tested the relationship between levels of agricultural
development and technological and institutional changes in the districts of western
U.P. The study reveals that the change in technological and institutional variables is
directly proportional to the change in overall development of agriculture in the study
area.
Karunakaran and Palanisami (1998) in a study of Tamil Nadu state by using
data from 1969-70 to 1993-94 concluded that there is a close relationship between
irrigation development and intensity of cropping. The results were also confirmed by
taking a cross section regression analysis with different sources of irrigation.
Besides, canal and tank irrigation, dug well irrigation have also shown positive
impact on cropping intensity.
Bhattarai et al. (2002) explored some conceptual and policy issues pertaining
to impact of irrigation on crop production, farm income, income distribution and
poverty alleviation. They also argued that improved irrigation is a powerful
instrument for reducing rural poverty, not only through increased yield and farm
returns, but also through providing increased rural employment and livelihood within
a region.
Narayanamoorthy and Deshpandey (2003) on the basis of their study have
confirmed the role of irrigation development on agricultural wages through increased
demand for labour, cropping intensity and shift in cropping pattern from low value
crops to high value crops. Statewise cross section data pertaining to five points of
time: 1972-73, 1977-78, 1983, 1987-88 and 1993-94 for India were used. The study
shows that, there is a positive impact of irrigation on real wages of agricultural
labourers. Irrigation also helps to narrow down the difference between the statutory
minimum wages and prevailing wage rates. The gender wage differential is
becoming narrow at a faster rate in the states where provision of irrigation is higher.
Pant (2004) in his study on Trends in Groundwater Irrigation in Eastern and
Western U.P.' examined significant changes that have been taken place during the
twenty years, these include changes' in socio-economic aspects, groundwater
irrigation, productivity of crops and changing face of rural elites. The study shows
that there has been a decline in high cast supremacy, in terms of owning of modem
agricultural implements, and the backward castes are surging ahead in such
ownerships.
Sisodia and Kumar (2004) in their study on the scenario of agricultural
development in eastern U.P. have drawn an inference that, the productivity of
different crops has increased with the increase in area under irrigation. Yield of rice
71
has increased more than twice during the last two decades (1980-81 and 2000-01).
Similar trends were also recorded for wheat and other crops (maize, gram, mustard,
peas and lentil).
Vakulabbaranam (2004) in a study of `Agriculture Growth and Irrigation in
Telangana Region' examined and pointed that agricultural growth corresponds with
growth in irrigation during the period of 1970 to 2001, although in perception the
region suffers from insufficiency of irrigation is also valid. In district level analysis,
he has mentioned that most of growth has been due to expansion of well irrigation
using private capital, which has adverse implications on groundwater. He has
suggested that remedial steps have to be taken in irrigation improvements in order to
counter the losses to poor cultivators (small and marginal farmers) in the region.
Dhindwal et al. (2005) studied the performance of sugarcane crop under three
methods of irrigation, viz, drip method, border strip and ridge and furrow, each with
four moisture regimes. Field experiments were conducted at the research farm of
CCS Haryana Agricultural University, Hisar during 1997-98 and 1998-99. They
found that under drip irrigation method, the average cane yields of both first and
ratoon crops were 16-18 per cent higher and simultaneously using 12 to 30 per cent
less irrigation water than the surface methods of irrigation. There was substantial
saving of water (17-29 per cent) under drip method. Drip irrigation gave substantially
higher irrigation water productivity than the other methods of irrigation in both crop
seasons.
Singh (2006) has outlined some key issues and options for agricultural
development in rain-fed areas in India. Watershed development approach adopted in
1980's was the key strategy for the development of these areas. Further, the re-
orientation policies and strategies with proper technology, institutions and
infrastructure policies are needed. Such re-orientations are crucial steps for achieving
food security and for relieving pressure on land, water and vegetation.
Singh and Singh (2006) examined the structure, determinants and efficiency
of groundwater market and suggested policy options for realization of equitable
benefits in western U.P. Primary data from 180 farms were collected out from Meerut
district during 1994-95. The study finds that both owners of the WEMs and buyers of
the groundwater were 6enefltted on one way or the other by working of water
markets. The buyers have an inverse relationship with farm size. The electric
operated WEMs dominate the use of groundwater for irrigation. Significant factors
72
governing the groundwater-selling to the farmers were: the size of owned operational
holdings, number of fragmented farms, joint-ownership of WEMs and horse power
per unit of land.
Power and Pujari (2007) conducted the study to ascertain the role of irrigation
facilities and its impact on agricultural productivity of Shirol tahsil of Kolhapur
district in Maharashtra. They found that, the productivity of cash crops of sugarcane
and soyabean was higher in the region, which happens to be moderate in previous
years. The rate of increase in productivity has been due to growth in irrigation
facilities in the region. High productivity was more profound in areas adjacent to the
river banks, where intensity of irrigation was high.
Munir and Rukhsana (2008) in their study considering the districts of western
U. P. calculated the trends in foodgrains availability and agricultural development by
computing the composite z-score values. They considered the following indicators
as: net area sown to total cultivated area, irrigated area by canals and tubewells to the
total cultivated area (in percentage), cropping intensity and fertilizers consumption.
They concluded that the availability of foodgrains was high due to the use of HYV of
seeds and fertilizer consumption, low availability of foodgrains was due to high
density of population, high rate of urbanization and small size of land holdings.
Rahman ci al. (2008) computed the trends and levels of diffusion of irrigation
and its impact on agriculture in the districts of Upper Ganga-Yamuna doab of U.P.
The levels of diffusion of irrigation were computed by applying the z-score technique
and the trends computed were depicted on logistic curves.
Srivastava et al. (2009) examined groundwater extraction and water use
efficiency in Central Plain Zone (CPZ) of U.P. under different water-market regimes
(self-users; self-users and buyers; only buyers; self-users and sellers), where water-
intensive cropping pattern is followed. Most of the resource-poor farmers (small and
marginal) buy water from the WEMs owners to apply to cultivation of crops. Due to
the sowing of water intensive crops as paddy, wheat and sugarcane, groundwater
table has lowered down which poses a constraint to the sustainability of agriculture.
Kumar (2009) examined the inter-district and inter-regional disparities in
agricultural development in 70 districts of U.P. by using a composite index. The
study reveals that the districts of western region are most developed and the districts
of Bundelkhand region are least developed, both in case of output based and input
based indicators considered for agricultural development. He, further, suggested that
73
a huge investment is needed in building of agricultural infrastructure and for inputs
in development of agriculture in backward areas.
Namin at al. (2009) enumerated levels of development by calculating
composite indices for the districts of Andhra Pradesh state, considering an optimum
combination of 50 socio-economic indicators for the year 2001-02. Development
levels were estimated separately for agricultural sector, infrastructural facilities and
overall socio-economic sector.
Rahman and Parvin (2009) examined the growth of irrigated area and its
impact on foodgrain production during last three decades (from 1980-81 to 2006-07)
by applying a number of statistical methods (mean, percentage, linear and
exponential growth). In the study area surface water sources have sharply declined
due to lack of new surface irrigation project and ineffectiveness of earlier projects.
Whereas, underground water sources provided irrigation to more than 70 per cent of
total irrigated area under Shallow Tubewells (STWs) with the government's
withdrawal of restrictions on tubewell setting rules, encouraging the private sector
and the cost effectiveness of Chinese engines, which have been affordable to small
and medium farmers. Irrigated area increased to three times and cropping intensity
from 154 to 176 per cent.
Mondal (2010) examined the role of irrigation in crop diversification in the
state of West Bengal in the period of 1990-91 to 2004-05 by applying the Gibbs-
Martin's Crop Diversification Index (1962). Irrigation intensity was measured by
considering 8 major crops of aus paddy, aman paddy, boro paddy, jute, wheat,
oilseeds, pulses and potato. He concluded that the value of crop diversification index
has increased as a result of increase in intensity of irrigation, but exceptions were
also observed in some districts.
Pervaiz et al. (2010) in their study on 'Productivity Enhancement through
Ti bewell Irrigation' analyzed the effect of tubewell irrigation on agricultural
productivity in North West Frontier Province (NWFP) of Pakistan. Four districts
were randomly selected and 291 respondents were interviewed from 12 selected
villages taking into account the criteria that respondents were having their own
tubewells, The availability of water in the study area changed the cropping pattern
and land use intensity has also been increased. The application of green revolution
technology package increased considerably with tubewell irrigation in the study area.
Aregay and Minjuan (2012) in a study entitled `Impact of Irrigation on
74
Fertilizer Use Decision of Farmers in China: A Case Study in Weihe River' using
ordinary least square model confirmed that fertilizers use has a significant
relationship with irrigation. They also concluded that policies to improve irrigation
water efficiency can have an impact on fertilizer use efficiency.
Raman and Kumari (2012) analyzed district level and regional level
disparities in agricultural development in Uttar Pradesh by applying United Nations
Development Programme (UNDP) methodology for two cross section years of 1990-
91 and 2008-09 and considering 13 development indicators.
Singh and Singh (2012) measured, levels of agricultural development in
Chandauli district of U.P. by applying z-score technique for the periods of 1994-95
and 2004-05. Following a similar approach, Rahman and Lata (2012) in their studies
have computed the levels of irrigation development in U.P., and in another study the
impact of irrigation on cropping intensity has been examined in different districts of
the state.
b. Water management and water productivity
Some of the previous studies ever undertaken on water management and
water productivity also invite attention.
Gadgil and Deosthali (1990) analyzed water need and water availability in
hybrid jowar during various stages of its growth in Pune. The study reveals that
during mid-season stage of hybrid jowar, water requirement exceeds the water
availability. This phase during the growth is regarded a very critical period, when
water stress can drastically affect yields, therefore, it demands a protective irrigation
for better yields.
Singh and Salvia (1993) studied the use of water resources for agriculture in
western U.P. The study suggests that if water is used with scientific management,
crop yields can be multiplied many times.
Sharma or at. (2001) computed water productivity for wheat crop of U.P. for
which Water Productivity values ranged between 0.48 and 0.71 kg/m3, with the
median value of 0.64 kg/m3. Bastiaanssen et at. (2003) analyzed crop WP at various
irrigation-system scales in the Indus basin of Pakistan by applying remote sensing
and GIS technologies. Their study found high variability in crop WP at the scale of
small canal-command areas. Tuong and Bouman (2003) also found that WP for rice
at scale levels larger than the field varies widely but less than at the field level.
75

Cal et at. (2003) have analysed variations in WP of rice and other cereal crops
for 36 countries of the world. The results of analysis of the WP for rice ranged from
0.15 to 0.60 kg/m3, and for other cereal crops it was from 0.2 to 2.4 kg/m3 in 1995.
The projections made from 1995-2025 for the global average water productivity of
rice and other cereal crops will increase from 0.39 to 0.52 and from 0.67 to 1.01
kg/m' respectively.
Hussain et al. (2003) analyzed land and water productivity variations of
wheat crop in western Inds-Gangetic plains of India and Pakistan. Their study relates
to Bhakra Canal System (BCS) in Kaithal Irrigation Circle in India, and the Lower
Jhelum Canal System (LJCS) in Chaj sub-basin in Pakistan. This study analyses
variations in wheat yields in almost similar environments of both the systems and
assesses the range of factors affecting wheat yields and profitability of wheat
production in selected irrigation systems in India and Pakistan. Average wheat yield
in India was somewhat higher (4.48 tons/ha) than in Pakistan (4.11 tons/ha).The
average productivity of consumed water was similar in both countries to the tune of
1.36 kg/m3 for India and 1.37 kg/m; for Pakistan. However, average productivity of
diverted water is higher for BCS-India (1.47 kg/m3) than that of LJCS-Pakistan (1.1
kglrn3). They added that location specific factors such as soil salinity, land quality
and rainfall, factors such as seed variety, application of recommended doses of
weedicides, planting dates and groundwater quality were contributory factors in yield
differences.
Kijne et al. (2003) reported that data on water productivity with respect to
evapotranspiration (WPm) show considerable variations in wheat (0.6-1.9 kg/m3),
maize (1.2-2.3 kg/m3), rice (0.5-1.1 kg/m3), forage sorghum (7-8 kg/m3) and potato
tubers (6.2-11.6 kg/m3) with incidental outliers obtained under experimental
conditions. Data pertaining to field-level water productivity per unit of water applied
(WP;m), are lower than WPET and vary over on even wider range. For example,
grain WPtms for rice varied from 0.05 to 0.6 kg/m3, for sorghum from 0.05 to 0.3
kg/m3, and for maize from 0.2 to 0.8 kg/m'. The variability occurs because of the
data were collected from different farms located in different environments and under
different crop management systems. These affected the yield of the crops and the
amount of water supplied to them.
Ahniad et al. (2004) examined the spatio-temporal variations in crop water
productivity for rice-wheat cropping system of Pakistan's Punjab. Water productivity
per unit of gross inflow ranged from 0.17.to 038-"kg/m3 for rice and 0.78 to 2.03
kg/m3 for wheat. Spatio-temporal variations were due to differences in water use,
sowing date of crops, fertilizer's use, soil quality and socio-economic conditions,
whereas amount and incidence of rainfall emerged as the most important factor for
ascertaining temporal changes in water productivity.
Choudhary and Kumar (2005) analyzed the role of micro-irrigation over the
conventional methods of irrigation. According to them, micro-irrigation, if applied
ensures increase in crop yield, higher quality of crop, less water and energy
consumption, less fertilizers use, reduced leaching and nm-off, less growth of weeds
and soil compaction.
Rockstrom et al. (2007) while assessing the water challenge of a new green
revolution in developing countries, quantified the relative contribution from
infiltrated green water and in rain-fed agriculture and blue water from irrigation, and
how water productivity gains can go in reducing pressure on fresh water resources.
They suggested that WP gains may reduce additional water needs in agriculture, with
16 per cent in 2015 and 45 per cent by 2050. They further add that, despite an
optimistic irrigation development, most of the additional water will originate from rain-fed production.
Shah (2007) has examined groundwater development in south Asian
economies and described its role in the growth of agricultural and socio-economic
development. He is also concerned with the groundwater's over-exploitation and has
suggested some methods, if taken can help to reduce groundwater use. He also
suggests to the government that switching over to the technology of water
development to management can help in reducing the overutilization of groundwater.
According to him, water management practices, such as groundwater recharge and
rainwater harvesting can be much helpful.
Faire and Faci (2009) evaluated the effect of moderate deficit irrigation
created by increasing the interval between irrigations at different growth stages in maize crop development, grain yield and on yield-irrigation relationship. For this
purpose, they conducted two yield experiments in 1995 and 1996 in loam soil in
parts of northeast Spain to monitor the responses of maize to deficit irrigation with
surface water irrigation in three phases of crop growing season: vegetative, flowering
and grain field. Results obtained show that flowering stage was the most sensitive
stage to water deficit, leading a reduction in biomass, yield and harvest index. They
77
concluded that yield reductions were manifested lowering number of grains per
square metre. Irrigation water use efficiency (IWUE) was higher under treatments
with full irrigation at the time of flowering.
Amarasinghe et al. (2010) found some potential improvements in water
productivity of foodgrains in 403 districts belonging to different states of India,
which varied between 0.11 and 1.01 kglm3. Study finds that the maximum yield
function is based on consumptive water use, and it further explores the potential
improvements in water productivity to bridge the gap between actual and maximum
yields, keeping CWU constant or changing the maximum yield and adjusting the
CWU using supplementary or deficit irrigation.
Akinbile et al. (2011) examined the trends in rice production and water use
efficiency pattern for attaining self-sufficiency in Malaysia. It was estimated that
Malaysia will attain 100 per cent self-sufficiency in rice production by 2015, the rice
yield per capita must be increased from the current level of 82.3 to 106 kg of rice per
capita, and per hectare yield must be increased from 3.6 in 2008 to 5.0 tonnes by
2015.
Karrou et al. (2012) in a study entitled Yield and Water Productivity of Maize
and Wheat under Deficit and Raised Bed Irrigation Practices in Egypt' highlighted
the role of drip irrigation (DI) and raised bed (RB) irrigation practices in saving
water as compared to the full irrigation in Nile delta of Egypt in two different
seasons during the years 2005-06 and 2006-07. DI resulted in saving of 1600 m3
water/ha in maize and 1500 m3 water/ha in wheat. The study concluded that a
substantial amount of water can be saved by applying DI with no significant effect on
yields especially in wheat, whereas, RB remains a more promising technique for both
the crops.
m
References
1. Agarwal, B. (1984). Tractors, Tubewells and Cropping Intensity in the Indian Punjab, The Journal of Development Studies, Vol. 20, No. 4, pp. 290-302.
2. Ahmad, M. D., I, Masih and H. Turral (2004). Diagnostic Analysis of Spatial and Temporal Variations in Crop Water Productivity: A Field Scale Analysis of the Rice-Wheat Cropping System of Punjab, Pakistan, Journal ofApplied Irrigation Science, Vol. 39, No.1, pp. 43-63.
3. Akinbile, C.O., Abd EI-Latif, K.M., Abdullah, R. and Yusoff (2011). Rice Production and Water Use Efficiency for Self-Sufficiency in Malaysia: A Review, 7l 'ends in Applied Sciences Research, Vol. 6, No. 10, pp. 1127-1140.
4. Amarsinghe, U.A., Malik, R.P.S. and Shrma, B.R. (2010). Overcoming Growing Water Scarcity: Exploring Potential Improvements in Water Productivity in India, Natural Resources Forum, Vol. 34, No. 3, pp. 188-199.
5. Aregay, F. A. and Minjuan, Z. (2012). Impact of Irrigation on Fertilizer Use Decision of Farmers in China: A Case Study in Weihe River Basin, Journal of Sustainable Development, Vol. 5; No. 4, pp. 74-82.
6. Asawa, G.L. (1999). Elementary irrigation engineering, New Age International Publishers, New Delhi.
7. Asawa, G.L. (2005). Irrigation and Water Resources Engineering, New Age International Publishers, New Delhi.
8. Bajpai, N. and Volavka, N. (2005). Agricultural Performance in Uttar Pradesh: A Historical Account, CGSD Working Paper No. 23, Centre on Globalization and Sustainable Development, The Earth Institute, Columbia.
9. Ballabh, V. and ChoudhaM K. (2003). Groundwater and Agriculture Production: A Comparative Study of Eastern UP, Bihar and West Bengal, IWMI-TATA Water Policy Programme, Anand.
10. Bastiaanssen, W., Abroad, M.D. and Tahir, Z. (2003). Upsealing Water Productivity in Irrigated Agriculture. In: Water Productivity in Agriculture: Limits and Opportunities for Improvement (Eds. J.W. Kijne, R. Barker and D. Molden), IWMI, CABI, UK, pp. 289-300.
11. Bhattarai, M., Sakthivadivel, R. and Hussain, I. (2002). Irrigation Impacts on Income Inequality and Poverty Alleviation: Policy Issues and Options for Improved Management of Irrigation Systems, Working Paper 39, IWMI, Colombo, Sri Lanka.
79

12. Cai, X. and Rosegrant, M.W. (2003). World Water Productivity: Current Situation and Future Options. In: Water Productivity in Agriculture: Limits and Opportunities for Improvement (Eds. J.W. Kijne, R. Barker and D. Molden), CABI, IWMI, UK, pp. 163-178.
13. Cantor, L.M. (1967). A World Geography of Irrigation. Oliver and Boyd, London.
14. Chambers, R. (1984). Irrigation Management: Ends, Means and Opportunities, Paper For the Workshop on Productivity and Equity in Irrigation Systems in India, Giri Institute of Development Studies, Lucknow, 21-23 September 1982.
15, Choudhary, M.L. and Kumar, R. (2005). Role of Efficient Water Management Technologies, Journal of Water Management, Vol. 13, No. 2, pp. 73-78.
16. Clift, C. (1977). Progress of Irrigation in Uttar Pradesh: East-West Differences, Economic and Political Weekly, Vol. 12, No. 39, pp. A83-A90.
17.Dantwala, M.L. (1986). Indian Agricultural Development since Independence, Oxford and I.B.H. Publishing Co, New Delhi.
18. Dastane, N,G. and Patil, V.S. (1968). Water Need of Crops, India Farming, Vol. 17, No. 10, pp. 34-36.
19. Dhawan, B.D. (1973). Demand for Irrigation: A Case Study of Government Tubewells in UP, Indian Journal ofAgricultural Economics, Vol. 28, No. 2, pp. 59-67.
20. Dhawan, B.D. (1977). Tubewell Irrigation in the Gangetic Plains, Economic and Political Weekly, Vol. 12, No. 39, pp. A 91-104.
21. Dhawan, B.D. (1979). Trends in Tubewell Irrigation: 1951-78, Economic and Political Weekly, Vol. 14, No. 51/52, pp. A143,154-147,149,151-154.
22. Dhawan, B.D. (1985). Irrigation Impact on Farm Economy, Economic and Political Weekly, Vol. 20, No. 39, pp. A 124-128.
23. Dhawan, B.D. (1985). Irrigation Performance during Drought, Economic and Political Weekly, Vol. 20, No. 28, pp. A1191-1196.
24. Dhawan, B.D. (1988). Irrigation in India's Agriculture Development: Productivity, Stability, Equity, Sage Publications, New Delhi.
25. Dhawan, B.D. (2002). Technological Change in Indian Irrigated Agriculture: A Study of Water Saving Methods, Commonwealth Publishers, New Delhi.
80
26. Dhawan, B.D. and Datta H.S. (1992). Impact of Irrigation on Multiple Cropping, Economic and Political Weekly, Vol. 27, No. 13, pp. A15-18.
27. Dhindwal, A.S., Kumar, R. and Kumar, S. (2005). Evaluation of Drip and Surface Irrigation in Sugarcane under Semi-arid Conditions, Journal of Water Management, Vol. 13, No. 1, pp. 21-26.
28. Dick, R.M. and Svendsen, M. (Eds.) (1991). Future Directions for Indian Irrigation: Research and Policy Issues, International Food Policy Research Institute (IFPRI), Washington, D.C.
29. Donde, W.B. (1985). Benefits of Irrigation, Agricultural Situation in India, Vol. 40, No. 4, pp. 377-379.
30. Evans, L.T. (1986). Irrigation and Crop Improvement in Temperate and Tropical Environment, Philosophical Transactions of the Royal Society of London, Vol. 316, No. 1537, pp. 319-330.
31. Faire, I. and Faci, J.M. (2009). Deficit Irrigation in Maize for Reducing Agricultural Water Use in a Mediterranean Environment, Agricultural Water Management, Vol, 96, No. 3, pp. 383-394,
32. Gadgil, A. and Deosthali, V. (1990). Determination of Net Irrigation Requirement with Reference to Hybrid Jowar: An Agro-Meteorological Approach, Annals, Vol. 10, No. 1, pp. 23-27.
33. Gibbs, J.P. and Martin, W.T. (1962). Urbanisation Technology, and the Division of Labour: International Patterns, American Sociological Review, Vol. 27, pp. 667-677.
34. Giri, A.K. and Mallik, G. (1984). Some Economic Aspects of Public Sources of Irrigation-A Comparison with Private Sources of Irrigation, Indian Journal ofAgricultural Economics, Vol. 39, No. 3, pp. 512-520.
35. 001 (2008). Institutional Framework for Regulating Use of Ground Water in India, Final Report, Ministry of Water Resources, Government of India, Institute for Resource Management and Economic Development, New Delhi (http:!(www.indiawaterportal.arg/sites/indiawaterportal.orglflle.s/Institutionalp er cem2OFramework_Groundwater_IRMED.MoWR_2008.pdI) Accessed on 15 January, 2012.
36. Goad, J.V. (1989). Water Resources of India and Karnataka: Problems and Prospects, Agricultural Situation in India, Vol. No. 6, pp. 327-327.
37. Gulati, A., Meinzen-Dick, R and Rajus, K. V. (1999). From Top Down to Bottoms Up: Institutional Reforms in Indian Canal Irrigation, Institute of
81

Economic Growth, New Delhi.
38, Hussain, I., Saktluvadivel, R., Amarasinghe, U., Mudasser, M. and Molden, D. (2003). Land and Water Productivity of Wheat in the Western Indo-Gangetic Plain of India and Pakistan: A Comparative Analysis, Research Report 65, IWMI, Colombo, Sri Lanka.
39. INCID (1994). Drip Irrigation in India, Indian National Committee on Irrigation and Drainage, New Delhi.
40. Jairath, J. (1986). Social Conditions of Technology Use: A Study of Irrigation and Production in Punjab, 1965=1970, Economic and Political Weekly, Vol. 21, No. 13, pp. A26-37.
41. Janakarajan, S. (1993). Economic and Social Implication on Groundwater Irrigation: Some Evidence from South India, India Journal of Agricultural Economics, Vol. 48, No. 1, pp. 65-75.
42. Karrou, M., Oweis, T., Enein, A.E. and Sherif, M. (2012). Yield and Water Productivity of Maize and Wheat under Deficit and Raised Bed Irrigation Practices in Egypt, African Journal ofAgricultural Research, Vol. 7, No. 11, pp. 1755-1760.
43. Karunakaran, Kit and Palanisami, K. (1998). An Analysis of Impact of Irrigation on Cropping Intensity in Tamil Nadu, Indian Economic Review, Vol. 33, No. 2, pp. 207-220.
44. Khan, W. (1997). Agricultural Development in Western Uttar Pradesh, The Indian Geographical Journal, Vol. 72, No. 2, pp. 146-149.
45. Khanna, S. (1992). Sustainable Agricultural Development: A Comparison between Commercial and Traditional Agricultural Systems, National Geographer, Vol. 27, No. 2, pp. 147-157.
46. Kijne, J-W., Barker, R. and Molden, D. (2003). Water Productivity in Agriculture: Limits and Opportunities for Improvements, CABI, UK.
47. Kulkarni, H., Shahkar, P.S.V. and Krishnan, S. (2011). India's Groundwater Challenge and the Way Forward, Economic and Political Weekly, Vol. 46, No. 2, pp. 37-38.
48. Kumar, M.D. (2007). Groundwater Management in India: Physical, Institutional and PolicyAlternatives, Sage Publications, New Delhi.
49. Kumar, S. (2009). Inter-regional and Inter-district Disparities in Agricultural
82
Development: A Study of Uttar Pradesh, India Journal of Regional Science, Vol. 41, No. 1, pp. 22-36.
50. Laycock, A. (2007). Irrigation Systems: Design, Planning and Construction, CABI, UK.
51. Mahajan, G. (1989). Evaluation and Development of Ground Water, Ashish Publishing House, New Delhi.
52. Misra, B.N. and Tripathi, S.N. (1989). Level of Agricultural Development and Its Contribution to Regional Economy in Basil District, U-P., National Geographer, Vol. 24, No. 2, pp. 97-108.
53. Misra, D.C. (1993). Agricultural'Extension for Irrigated Commands in India, Agricultural Situation in India, Vol. 48, No. 4, pp.231-243.
54. Misra, K.M. (1990). Irrigation and Economic Development, Ashish Publication House, New Delhi.
55. Monerieff, C.S. (1905). Irrigation, Science, Vol. 22, No. 567, pp.577-590.
56. Mondal, T.K. (2010). Crop Diversification and Irrigation Intensity: A Study of West Bengal, India (1990-91 to 2004-05), Asian Profile, Vol. 38, No. 6, pp.553-563.
57. More, K.S. and Shinde, D. (1988). Irrigation Potential and development in Maharashtra, Geographical Review ofIndia, Vol. 48, No. 1, pp. 164-167.
58. Munir, A. and Rukhsana (2008). Spatio-Temporal Analysis of Foodgrains Availability and Agricultural Development in Western Uttar Pradesh, Indian Journal of Regional Science, Vol. 40, No. 1, pp.1-12.
59. Narain, D. and Roy, S. (1980). Impact of Irrigation and Labour Availability on Multiple Cropping: A Case Study of India, Research Report 20, IPRI, Washington D.C., USA.
60. Narain, P. Sharma, S.D., Rai, S.C. and Bhatia, V.K. (2009). Inter-district Variation of Socio-economic Development in Andhra Pradesh, Journal of the Indian Society ofAgricultural Statistics, Vol. 63, N Io.1, pp. 35-42.
61. Narayanamoorthy, A. (1993). Competition for Borewell Water and its Impact on Tank: Some Observations, Proceedings of the 15`r' Congress on Irrigation and Drainage, The Hague, The Netherlands, International Commission on Irrigation and Drainage, New Delhi, pp. 557-566.
62. Narayanamoorthy, A. (1996). Evaluation of Drip Irrigation System in Maharashtra, Mimeograph Series No. 42, Agro-Economic Research Centre,
83
Gokhale Institute of Politics and Economics, Pone, Maharashtra.
63. Narayanamoorthy, A. (1997). Economic Viability of Drip Irrigation: An Empirical Analysis from Maharashtra, Indian Journal of Agricultural Economics, Vol. 52, No. 4, pp. 728-739.
64. Narayanamoorthy, A. (2001). Impact of Drip Irrigation on Sugarcane Cultivation in Maharashtra, Agro-Economic Research Centre, Gokhale Institute of Politics and Economics, Pune.
65. Narayanamoorthy, A. (2008). Tank Irrigation in India: Status, Trends and Issues. In: Democratisation of Water (Eds. B.K. Thapliyal, S.S.P. Sharma, P.S. Ram and U.H. Kumar), Serials Publication, New Delhi, pp. 383-417.
66. Narayanamoorthy, A. (2012). Potential for Drip and Sprinkler Irrigation in India (http://nrlp.iwmi.org/PDocs/DReports/Phase_01/12.per cent20Waterper cent2OSavingsper cent2OTechnologiesper cent20-per cent2ONarayanmoorthy.pdf) Accessed on 13 January, 2012.
67. Narayanamoorthy, A. and Deshpandey, R.S. (2003). Irrigation Development and Agricultural Wages: An Analysis across States, Economic and Political Weekly, Vol. 38, No. 39, pp. 3716-3722.
68. Oppen, M.V., Kashive and Wightman, W.R. (1989). Impact of Tawa Irrigation Project on Agricultural Production, Agricultural Situation in India, Vol. 44, No. 6, pp. 271-272.
69. Pant, N. (2004). Trends in Groundwater Irrigation in Eastern and Western Uttar Pradesh, Economic and Political Weekly, Vol. 39, No. 31, pp. 3463-68.
70. Pant, N. (2005). Control of and Access to Groundwater in UP, Economic and Political Weekly, Vol. 40, No. 26, pp. 2672-80.
71. Pawar, C.T. and Pujari, A. A. (2007). Impact of Irrigation on Agricultural Productivity: A Micro Level Analysis. In: Ffty Years on Indian Agriculture: Determinants of Production (Eds. A. Mohammad, A. Munir and S.H. Siddiqui), Vol. II, Concept Publishing Company, New Delhi, pp.165-174.
72. Pawar, C.T. and Shinde, S.D. (1986). Irrigation in Maharashtra: Spatio-Temporal Perspective, The National Geographical Journal of India, Vol. 32, No. 2, pp. 105-110.
73. Pereira, A. and Pires, L. (2011). Evapotranspiration and Water Management for Crop Production. In: Evapotranspiration-From Measurements to Agricultural and Environmental Applications (Ed. G. Gerosa), InTech Publisher (cdn. Intechopen.conilpdfs/22694/ln Tech-
84
Evpotrnspition_ader_maagementjorcrop_prodnction.pdfl Accessed on April 12, 2012, p. 410.
74. Pervaiz, U., Akrarn, M., Nawab, K., Khan, A., Khan, M.Z. and N. Muhammad (2010). Productivity Enhancement through Tubewell Irrigation, Sarhad Journal ofAgriculture, Vol. 26, No. 1, pp. 97-102.
75. Prasad, N. and Mahto, A. (1991). Impact of Irrigation Development in a Hilly Area of Chotanagpur, India Journal of Regional Science, Vol. 23, No. 1, pp. 107-115.
76. Rahman, F., Siddiqui, A.R. and Ansari, A.H. (2008). Diffusion of Irrigation and its Impact on Agriculture: A Case Study, Indian Journal of Regional Science, Vol. 40, No. 1, pp. 43-52.
77. Rahman, M.W. and Parvin, L. (2009). Impact of Irrigation on Food Security in Bangladesh for the Past Three Decades, Journal of Water Resource and Protection, Vol. 1, No. 3, pp. 216-225.
78. Raman, R. and Kumari, R. (2012). Regional Disparity in Agricultural Development: A District Level Analysis for Uttar Pradesh, Journal of Regional Development and Planning, Vol. 1, No. 2, pp. 71-90.
79. Rao, C.S.K. and Ali, M.I. (1986). Impact of Irrigation on Cropping Pattern, Kurukshetra, Vol. 34, No. 11 and 12, pp. 37-40.
80. Rao, D.V. (1986). Irrigation: A Clue for Rural Development, Kurukshetra, Vol. 34, No. 11-12, pp. 14-70.
81. Reddy, R.R., Rao, N.V.N. and Sarma, P.V.S.R.L. (1986). Role of Minor Irrigation in Drought Prone Area Development, Kurukshetra, Vol. 34, No. 11 and 12, pp. 20-24.
82. Rockstrom, J., Lannerstad and Falkenmark, M. (2007). Assessing the Water Challenge of a New Green Revolution in Developing Countries, Proceedings of the National Academy of Sciences of the United States of America, Vol. 104, No. 15, pp. 6253-6260.
83. Samna, J.S. and Sharma, K.D. (2009). In National Groundwater Congress, Central Ground Water Board, New Delhi.
84. Scott, C.A. and Sharma, B. (2009), Energy Supply and the Expansion of Groundwater Irrigation in the Indus-Ganges Basin, International Journal of River Basin Management, Vol. 7, No: 1, pp.1-6.
85. Scott, C.A., Dall'erba, S. and Caravantes, R.D. (2010). Groundwater Rights in Mexican Agriculture: Spatial Distribution and Demographic Determinants,
85
The Professional Geographer, Vol. 62, No. 1, pp. 1-15.
86. Shah, T. (2001). Wells and Welfare in Ganga Basin: Essay on Public Policy and Private Initiative in Eastern Uttar Pradesh, India, Research Report 54, IWMI, Colombo, Sri Lanka.
87. Shah, T. (2005). Groundwater and Human Development: Challenges and Opportunities in Livelihoods and Environment, Water, Science and Technology, Vol. 51, No. 8, pp. 27-37.
88. Shah, T. (2007). The Groundwater Economy of South Asia: An Assessment of Size, Significance and Socio-ecological Impacts. In: The Agricultural Groundwater Revolution: Opportunities and Threats to Development, (Eds. M. Giordano and K.G. Villholth), IWMI, Colombo, Sri Lanka, pp. 7-36.
89. Shah, T. (2009). Taming the Anarchy: Groundwater Governance in South Asia. Resources for the Future Press (RFF), Washington D.C.
90. Sharma, B.R., Rao, K.V. and Vittal, K.P.R. (2008). Converting Rain into Gain: Opportunities for Realizing the Potential of Rain-fed Agriculture in India. In: India's Water Future: Scenarios and Issues (Eds. U.A. Amarasinghe, T.Shah and RP.S. Malik), IWMI, Colombo, Sri Lanka, pp. 169-180.
91. Sharma, K.D. (2009). Groundwater Management for Food Security, Current Science, Vol. 96, No. 11, pp. 1444-1447.
92. Sharma, N.K., Samra, J.S. and Singh, H.P. (2001). Influence on Boundary Plantation of Poplar (Populusdeltoids M.) on Soil-water Use and Water Use Efficiency of Wheat, Agriculture Water Management, Vol. 51, No. 3, pp. 173-185.
93. Sharma, R and Poleman, T. T. (1993). The New Economics of India's Green Revolution: Income and Employment Diffusion in Uttar Pradesh, Cornell University Press, Ithaca, New York.
94. Sharma, S.K. (2000). Spatial Framework and Economic Development: A Geographical Perspective on Resources and Regional Disparities in Madhya Pradesh, Northern Book Centre, New Delhi.
95. Siddiqui, F.A. (1988). Water Management and Food Crop Production in Uttar Pradesh, The Geographer, Vol. 36, No. 2, pp. 44-50.
96. Sidhu, D.S., Chand, R. and Kaul, J. K. (1984). An Economic Analysis of Various Sources of Irrigation in Punjab, Indian Journal of Agricultural Economics, Vol. 39, No. 3, pp. 506-511.
86
97. Singh, A.L. and Azam, S.F. (1986). Correlation of Irrigation and Crop Output in Western Uttar Pradesh, The Geographer, Vol. 32, No. 1, pp. 93-104.
98. Singh, A.L. and Azam, S.F. (1990). Economics of Irrigation from Canals and Tubewells in Aligarh District, The Geographer, Vol. 37, No. 1, pp.23-34.
99. Singh, A.L. and Salvia, L. (1993). Utilization of Water Resources for Agricultural Purposes in Western Uttar Pradesh, Indian Journal of Regional Sciences, Vol. 25, No. 1, pp. 49-58.
100. Singh, A.L., Azam, S.F. and Hashmi, S.N. (1988). Inter-district Variations in the Development of Irrigation in Western Uttar Pradesh, National Geographer, Vol. 23, No. 1, pp.45-53.
101. Singh, D.R. and Singh, R.P. (2006). Structure, Determinants and Efficiency of Groundwater Markets in Western Uttar Pradesh, Agricultural Economics Research Review, Vol. 19, No. 1, pp. 129-144.
102. Singh, H. (2006). Policy Issues for Agricultural Development of Rain-fed Area in India, Agricultural Situation in India, Vol.63, No.5, pp. 301-307.
103. Singh, RL. (2003). India: A Regional Geography, National Geographical Society of India, Varanasi.
104. Singh, V. and Singh, J. (2012). Levels of Agricultural Development and its Correlates in Chandauli District (Uttar Pradesh), National Geographical Journal oflndia, Vol. 58, No. 3, pp. 13-24.
105. Sisodia, B.V.S. and Kumar, S. (2004). Scenario of Agricultural Development in Eastern Uttar Pradesh, Agricultural Situation in India, Vol. 60, No. 11, pp.715-721.
106. Sivanappan, R.K. (1994). Prospects of Micro-irrigation in India, Irrigation and Drainage Systems, Vol. 8, No. 1, pp.49-58.
107. Sivanappan, R.K. (1998). Irrigation Water Management for Sugarcane, in VSI, pp.11 100-II 125.
108. Somashekaraiah, N. T. (2011). Development of Irrigation during Five-Year Plans in India, Kurukshetra, Vol. 59, No. 4, pp.3-5.
109. Soundaram, S.V. (1994). Need for Irrigation and its Development in Tamilnadu, Geographical Review ofindia, Vol. 56, No. 3, pp.60-64.
110. Srivastava, S.K., Kumar, Rand Singh, R.P. (2009). Extent of Groundwater Extraction and Irrigation Efficiency on Farms under Different Water-market Regimes in Central Uttar Pradesh, Agricultural Economics Research Review,
87
Vol. 22, No.1, pp. 87-97.
111. Stone Ian (1984). Canal Irrigation in British India: Perspectives on Technology Change in q Peasant Economy, Cambridge University Press, UK.
112. Thakur, J. and Kumar, P. (1984). A Comparative Study of Economic Efficiency of Different Irrigation Systems in Western Uttar Pradesh, Indian Journal ofAgricultural Economics, Vol. 39, No. 3, pp. 521-527.
113. Thong, T.P. and Bouman, B.A.M. (2003), Rice Production in Water Scarce Environments. In: Water Productivity in Agriculture: Limits and Opportunities for Improvement (Eds. J.W. Kijue, R. Barker and D. Mglden), IWMI, CABI, UK, pp. 53-67.
114. Tyagi, S. (1994). Levels of Agricultural Development in Aligarh district, Indian Journal of Regional Science, Vol. 26, No. 1, pp. 9-16.
115. Vaidyanathan, A. (Ed.). (2001). Tanks ofSouth India, Centre for Science and Environment, New Delhi.
116. Vaidyanathan, A. (Ed.). (2006). India's Water Resources: Contemporary Issues on Irrigation, Oxford University Press, New Delhi.
117. Vakulabharanam, V. (2004). Agricultural Growth and Irrigation in Telangana: A Review of Evidence, Economic and Political Weekly, Vol. 39, No. 13, pp. 1421-26.
118. Verma, N.M.P. (1990). Irrigation Change and Agricultural Development: An Impact Analysis, Uppal Publishing House, New Delhi.
119. Wester, P. (2008). Shedding the Waters, Wageningen University, Wageningen, The Netherlands.
120. Wichelns, D. and Oster, J.D. (2006). Sustainable Irrigation is Necessary and Achievable, but Direct Costs and Environmental Impacts can be Substantial, Agricultural Water Management, Vol. 86, No. 3, pp.114-127.
121. Yadav, J.S.P. (2005). Efficient and Eco-friendly Management of Water Resources for Sustainable High Production, Journal of Water Management, Vol.13, No. 2, pp. 61-72.
88
CHAPTER III Patterns of Water Supply and Trends of Growth in
Irrigation
cc
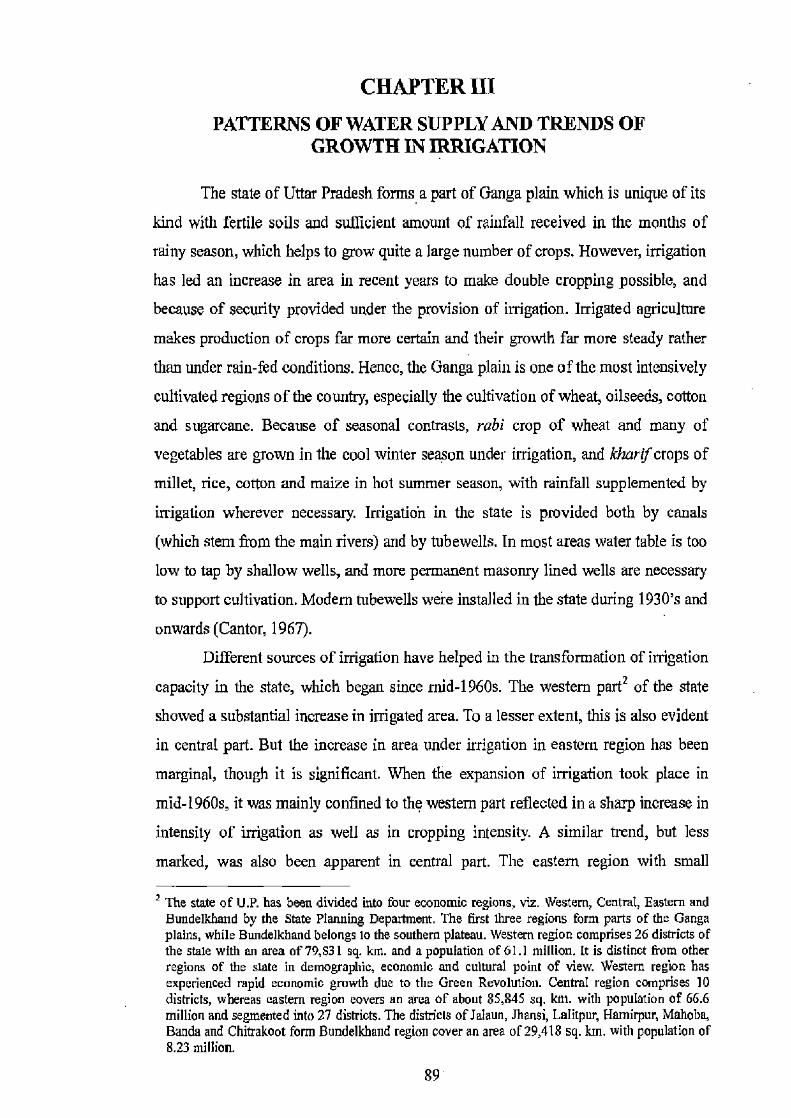
CHAPTER III PATTERNS OF WATER SUPPLY AND TRENDS OF
GROWTH IN IRRIGATION
The state of Uttar Pradesh forms a part of Ganga plain which is unique of its
kind with fertile soils and sufficient amount of rainfall received in the months of
rainy season, which helps to grow quite a large number of crops. However, irrigation
has led an increase in area in recent years to make double cropping possible, and
because of security provided under the provision of irrigation. Irrigated agriculture
makes production of crops far more certain and their growth far more steady rather
than under rain-fed conditions. Hence, the Ganga plain is one of the most intensively
cultivated regions of the country, especially the cultivation of wheat, oilseeds, cotton
and sugarcane. Because of seasonal contrasts, rabi crop of wheat and many of
vegetables are grown in the cool winter season under irrigation, and kharif crops of
millet, rice, cotton and maize in hot summer season, with rainfall supplemented by
irrigation wherever necessary. Irrigation in the state is provided both by canals
(which stem from the main rivers) and by tubewells. In most areas water table is too
low to tap by shallow wells, and more permanent masonry lined wells are necessary
to support cultivation. Modem tubewells were installed in the state during 1930's and
onwards (Cantor, 1967).
Different sources of irrigation have helped in the transformation of irrigation
capacity in the state, which began since mid-1960s. The western part2 of the state
showed a substantial increase in irrigated area. To a lesser extent, this is also evident
in central part. But the increase in area under irrigation in eastern region has been
marginal, though it is significant. When the expansion of irrigation took place in
mid-1960s, it was mainly confined to the western part reflected in a sharp increase in
intensity of irrigation as well as in cropping intensity. A similar trend, but less
marked, was also been apparent in central part. The eastern region with small
The state of U.P. has been divided into four economic regions, viz. Western, Central, Eastern and Bundelkhand by the State Planning Department. The first three regions form parts of the Ganga plains, while Bundelkhand belongs to the southern plateau. Western region comprises 26 districts of the state with an area of 79,831 sq. km. and a population of 61.1 million. It is distinct from other regions of the state in demographic, economic and cultural point of view. Western region has experienced rapid economic growth due to the Green Revolution. Central region comprises 10 districts, whereas eastern region covers an area of about 85,845 sq. km. with population of 66.6 million and segmented into 27 districts. The districts of Ialaun, .Thansi, Lalitpur, Humirpur, Mahoba, Banda and Chitrakoot form Bundelkhand region cover an area of 29,418 sq. km, with population of 8.23 million.
89

increase in irrigated area experienced a little change in these two factors (Clift,
1977). During the past several years, power supply in rural areas of eastern part of
the state has been far from satisfactory. As a result, state tubewells (deep) remained
highly inefficient in performance. Whereas, the private (shallow) tubewells most
suited to the holding structure, because ofsmall in size and Low cost, allowed the
farmers for irrigating the fields. The economic cost of irrigating through state
tubewells appears to be higher than that through private tubewells because state
tubewells have fixed rates per hour and are inefficient (Dick and Svendsen, 1991).
In this chapter, an attempt has been made to examine the trends of growth and
patterns in irrigated areas of different regions of the state-western, central, eastern
and Bundelkhand during 15 years of period from 1995-96 to 2009-10. Growth rates
in irrigated areas through different sources of irrigation and for major crops were
computed for individual districts of the state. For computing the annual growth rate
for the selected period least square method was applied. Thereafter, intensity of
irrigation and irrigation development are examined for the periods 1995-2000, 2000-
05 and 2005-10.
A. Growth in Irrigated Area
a. Gross irrigated area
Gross irrigated area refers to sum total of area under various irrigated crops
taken together during the current year. This is the aggregate area of individual
irrigated crops raised during the year, even if two or more crops have been raised on
the same land in different seasons during the year under consideration. Actual gross
irrigated area in the state was 17.69 million ha. during 1995-2000 that rose to 18.23
and 19.24 million ha. during the periods of 2000-05 and 2005-10, registering growth
of 3.06 and 5.52 per cent during 1995-2000 to 2000-05 and 2000-05 to 2005-10,
respectively. Region-wise comparisons of growth in gross irrigated area show that
growth was highest in the central region of the state being 12.06 and 7.57 per cent for
the above periods, respectively, as against the western region which showed a lowest
as well as negative growth of -2.11 and 4 per cent in respective periods of study
(Table 3.1). From Figs 3.1 and 3.2 showing gross irrigated area to gross cropped area
during 1995-2000, 2000-05 and 2005-10 and growth during two successive growth
periods of 1995-2000 to 2000-05 and 2000-05 to 2005-10, it is revealed that, the
percentage of gross irrigated area in the state was 67.59 per cent during 1995-2000,
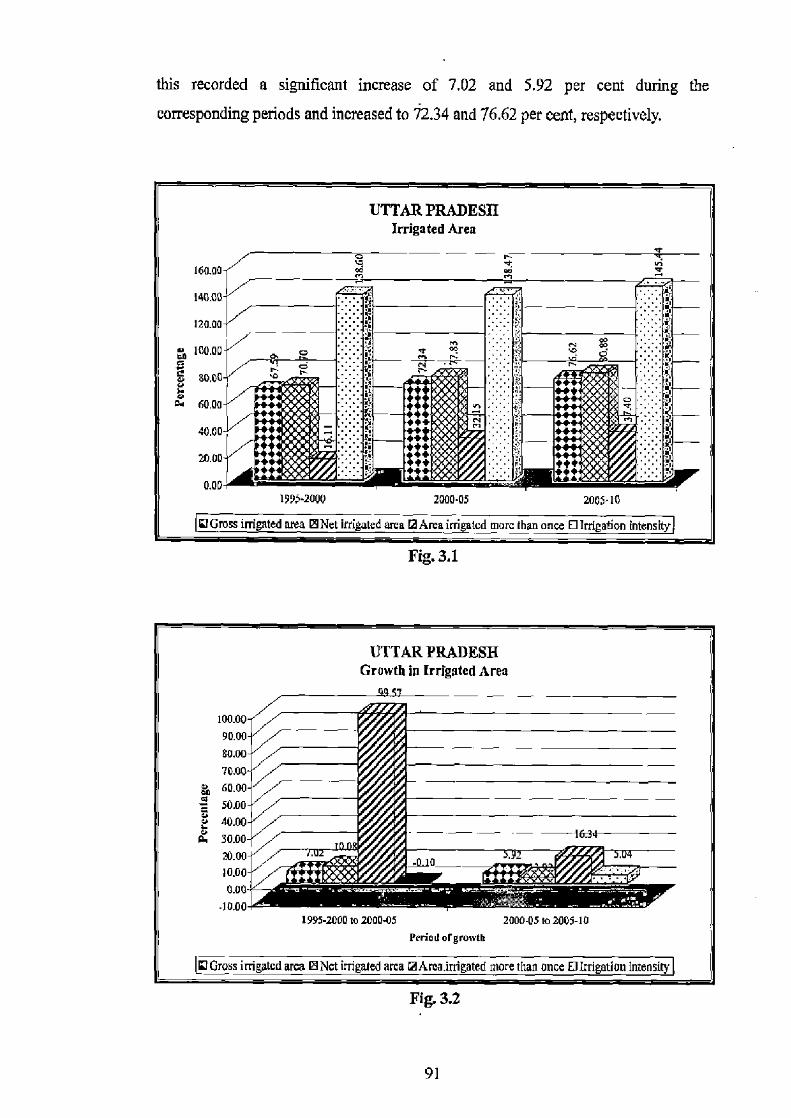
this recorded a significant increase of 7.02 and 5.92 per cent during the
corresponding periods and increased to 12.34 and 76.62 per cent, respectively.
rig. e.r
UTTARPRADESH Growth in Irrigated Area
100.00 90.00 80.00 70.00 60.00 iCØ/H m 50.00
i 40.00 0. 30.00 - — - 1634-
20.00 10.00
o.00 1995-3000 to 200005 2000-05102005-10
Period ergmwth
Loss irrigated area ® Net irngaied area 2Araa.irdgaled more than once ©Icrigatioa intensity
Fig. 3.2
91

Table 3.1 Region wise growth in irrigated area by different sources in Uttar Pradeab,1995.2000, 2000-05 and 2005.10 (Pere n)
Regius brad Canal Tibewell
Ot8erw¢If Tank Otherrint NIA(Ya) MTOIA(ha I GIA(ha) Government
31?
Priv t
72.89
Total
1995.2000 17.18 76,76 396 004 2.08 5567,60. 28,35,iG9 84,03,115
2000-U5 14,28 131 76.07 7838 6.23 009 1.01 '5,5323 27,07,074 8226,045
2007.10 13.41 I,S6 14.87 76.43 9.57 0,06 0.47 55$9,716 31,31,269 85,55,243
Growth1 .16.92 •3948 4.37 2.19 57.23 30.35 -51.49 -0.26 -453 •2,11
arvvhII •5,63 •32.59 •L58 •2.49 53.72 •34.78 -53.27 424 1530 4.p0
1995•2Wi 29.85 4.21 63,33 67.74 0.55 0.35 1.51 20,89,970 9,48,226 3038,196
20X05 1150 262 7213 75.45 1.22 OJe 0.75 23,68,801 10,75,840 34,04,611
203.10 20.91 1.68 7641 109 0,67 0.21 0.06 25,13,83 11,48388 362,221
Orwt61 -23.30 •37.83 14.65 11.38 122,64 47.40 -83.41 1334 9.24 12.06
6511 440 •3591 491 349 -44,90 14,42 -7350 6,12 10.57 757
1993.210 5399 4A2 634 10.96 23.44 ISS IO.P7 8,35,274 66,410 9,01,684 ro
4.20 10,42 14,63 27.31 6,80 4.67 9,37,566 60,441 9,98,076 3000-03 4638
2007.10 3854 4.35 2053 ]4.$S 27.78 7,14, 1,63 9,96,197 38,537 I%54,735
Gmmd61 •14.09 4.87 39.46 33.54 (A36 339.82 •53.62 1215 -8.99 1068
Growth II •1690 3.39 96,67 70.06 096 4.88 •6456 6.25 •315 3,65
1995-118 16,95 9.92 59B4 68.76 IS5 1.62 1.12 39,53,502 13,97$73 53,51,375
20M 23.72 7.7E 6719 7233 1,Ot 1.02 0.36 40,70,199 13,37,433 36,07,632
2003.10 1193 4.84 69.93 1470 2,17 I. I9 023 41,81,101 11,89,652 39,70.153
•11.99 -42.38 14,17 602 29.:8 -36.65 -68.18 2.95 9.93
-&37 -1332 3.91 2.46 1.92
4.79
13.p1 •35.89 2.72 16.41 6,48
24 8 7.86 62A0 6816 3.93 0.71 2.22 1,24,46,331 52,48,018 1,16,94,370
g
Groch
21.16 3,SB 67.92 7137 3,51 0,89 0.93 1.2929,801 53,4,789 1,82,36,325
19,40 2.83 69.48 7231 691 ON 0A1 1,32,30847 61,17,846 i,92,42,930
-14.98 -39.00 8.84 4,5 4,61 25.67 •58.02 3.88 1.7 3.06
.&32 -ml 'e,30 112 25.11 9,65 •56.35 233 1455 5.52 Smerae B )lain o/AgrlcilwSSmrudes (vrkxs isms), Directorate afAgri¢uIhue, LuSow. Nt¢:NIA-Ntirrigaletl¢re3MOIA-MdRirrigatedrtlhar.onc;GIA-0ms9icrigadaz•3;l-1995.700to200005;Il•1OOOOSm20.10.
92
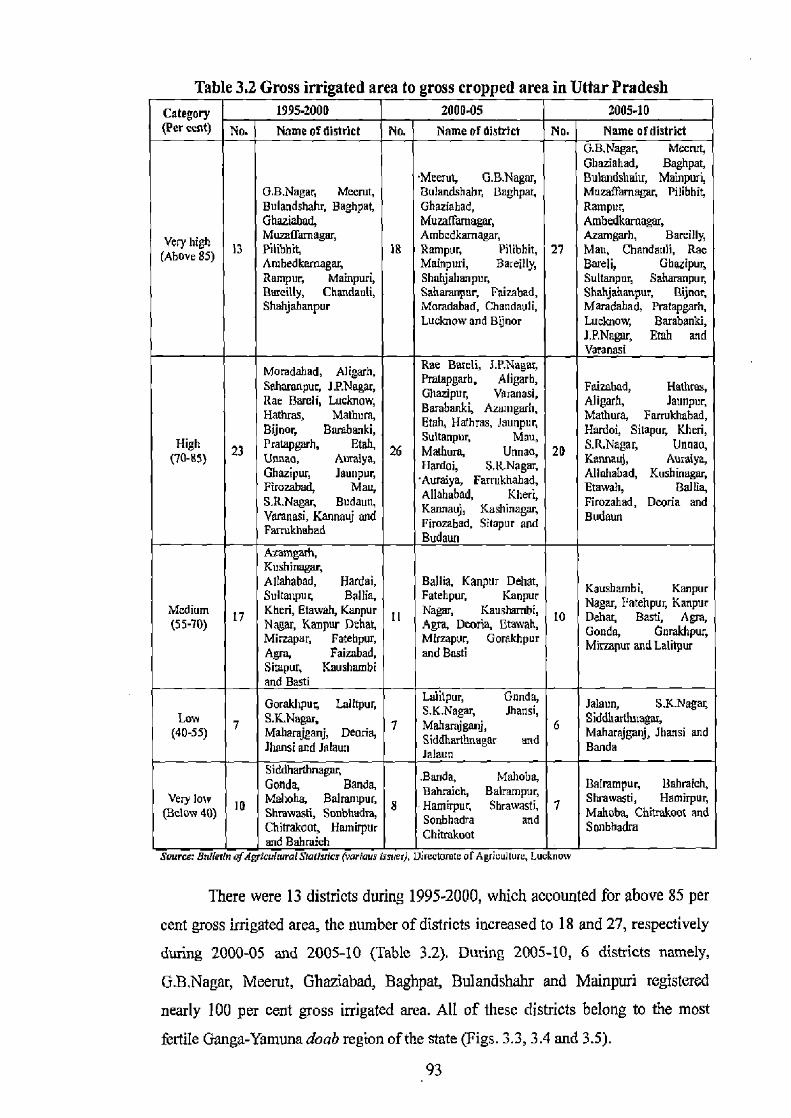
Table 3,2 Gross irrigated area to gross cropped area in Uttar Pradesh Category 1995.2000 2000.05 200510
(Percent) No. Name of district No. Name of district No. Name at district G.B.Nagar, Meerut, Ghaziabad, Baghpat
-Meerut, G.B.Nagar, 8atBndsbabg Mainpuri, G.B.Nagar, Meerut, Bulandshahr, Baghpat, Muraffamagar, Pilibhit, Bulandshahr, Baghpat, Ghaziabad, Rampur Ghaziabad, Mura(Famagar, Ambedkarnagar,
Very high Muzafamagar Ambedkamagar Azamgarh, Bamillg (Above 85 13 Pilibhik is Rampur, Pilibhit, 27 Man, Chandatdi, Rae
Ambedkamagar, Mainpuri, Bareillg Bareli, Ghazipui Rampur, Mainpuri, Shahjahanpur, Sultanpur, Saharanpur, Barcilly, Chandauli, Saharanpur, Faizahad, Shahjahanpur, Bijnorr, Shahjahanpur Moradabad, Chandauli, Moradabad, Pratapgarh,
Luclmow and Bijnor Lucknow, Barabanki, 1.P.Nagar, Rash and Varanasi
Moradabad, Aligarh, Rae Bareli, J.P.Nagar,
Saharanpur, J.P.Nagar, Pmtapgarh, Aligarh, Faizabad, Hathres, Rae Bareli, Lucknow, Ghaapu5 Varanasi, Aligarh, Jaunpur, Hathras, Mathum, Barabanki, Azamgarh,
Etah, Hathras, Jsunpuq Mathuta, Farmkhabad, Bijnor, Barabanki,
Sultanpur, Man, Hardoi, Sitapur, Kheri,
High
23 Pratrpgarh, Etch, 26 Marburg Unnao, 20 S.R.Nagar, Unnao,
(70-85) Unnao, Auralya, Hardoi, 5.1tNBgaq
Kannauj, Au a, Ghazipur, Jeunpar,
'Auraiya, FarrakhB6Bd, Allahabad, Kushinagay
Firovzbad, Mau, Allahabad, Kheri, Etowah, Botha,
Budaun, Varanagar, Kannauj, Kushinagar, Deoria and Budaunad,
Varnish, KMnallj Nrd Silapur and Budaun Farrvkhabad Budaunad,
Budaun Axamgarh, Kushinagar, Allahabad, Handal, Ballia, Kanpur Dehat, Kaushamhi, Kanpur Sultanpu, Sallie, Fatehpur, Kanpur Nagar, Patehpur, Kanpur Mcdium
(55-70) 17 Kheri, Etawah, Kanpur
11 Nagar, Keushambi,
10 Debar, Basti, Agra, Nagar, Kanpur Dehm, Agra, Deoria, Ctawah, Gonda, Guraupur, Mirzapur, Fatehpur, Mirzapur, Gorakhpur Mirmpur and Lalilpur Agra, Faizhbad, and Bassi Situpur, Kaushambi and Basti
Gorakhpuy lalitpar, Laiitpuy Gonda, S.K.Nagar, Jhansi, Jalaun, S.K.Nagat
Low 7 S.KNagan 7 Mahara 6 Siddha lagar, (40-55) Mabarajeanj, Deoria, 1~1' Siddharthnugar and Maharajganj, Jhansi and
Jhansi and Jalaun lalaun
Banda
Siddherthnagar, Mahoba, ,Banda, Gonda, Banda Hr ahaich, Bairampur, Balrampur, Bahraich, Very low 10 Mahubn, Salrampuy 8 Hamtrpur, Shrawasti, 7 5hravB5ti, H oot and
(Below 40) Shrawasti, Sonbhudrq 5onbhadra and Malmba, Cht1BkDot and Chitrakoot, Hamirpur Chitrakoot Sonbhadra and Bahraich
Source:Hn(letln ofAgriculmral Statistics (various issii 9, Uirectomte or Agriculture, Lucknow
There were 13 districts during 1995-2000, which accounted for above 85 per cent gross irrigated area, the number of districts increased to 18 and 27, respectively during 2000-05 and 2005-10 (Table 3.2). During 2005-10, 6 districts namely, G.B.Nagar, Meerut, Ghaziabad, Baghpat, Bulandshahr and Mainpuri registered nearly 100 per cent gross irrigated area. All of these districts belong to the most
fertile Ganga-Yamuna doab region of the state (Figs. 3.3, 3.4 and 3.5).
93
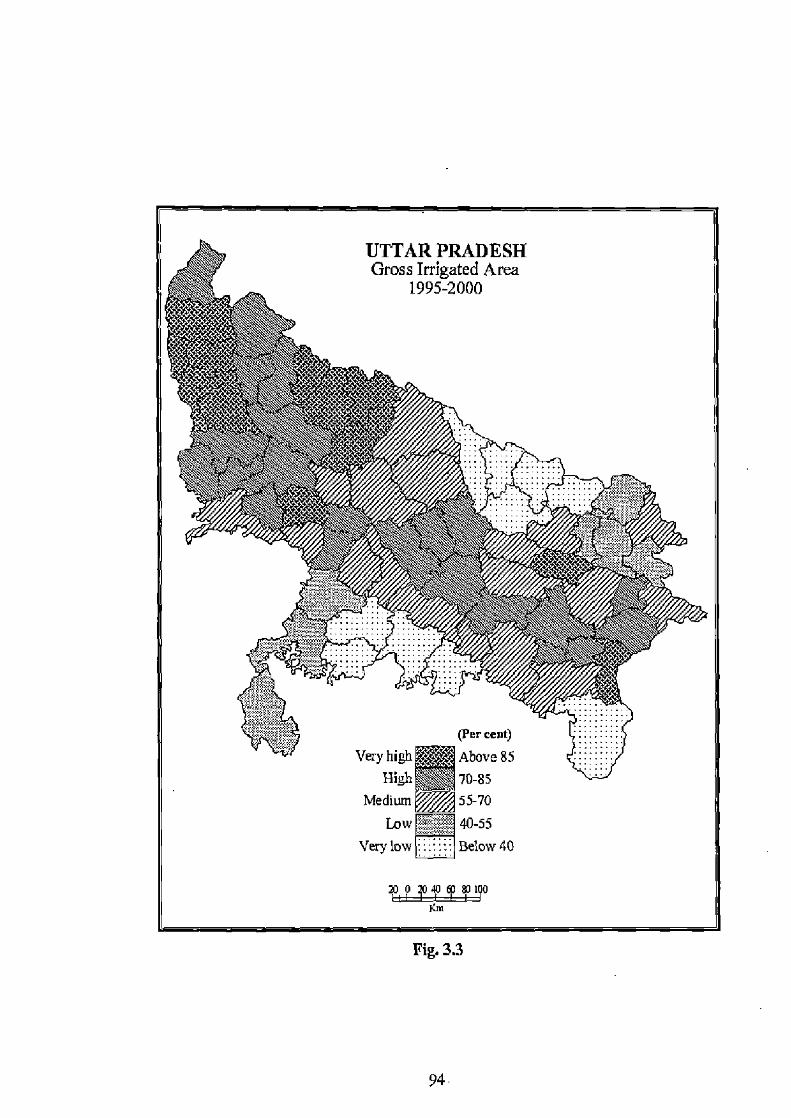
UTTAR PRADESH Gross Irrigated Area
1995-2000
Wq
(Per cent)
Very high Above 85
High 70-85
Medium 55-70
Low o5 Very low ::.::Bel : Below 40
Fig. 3.3
94.
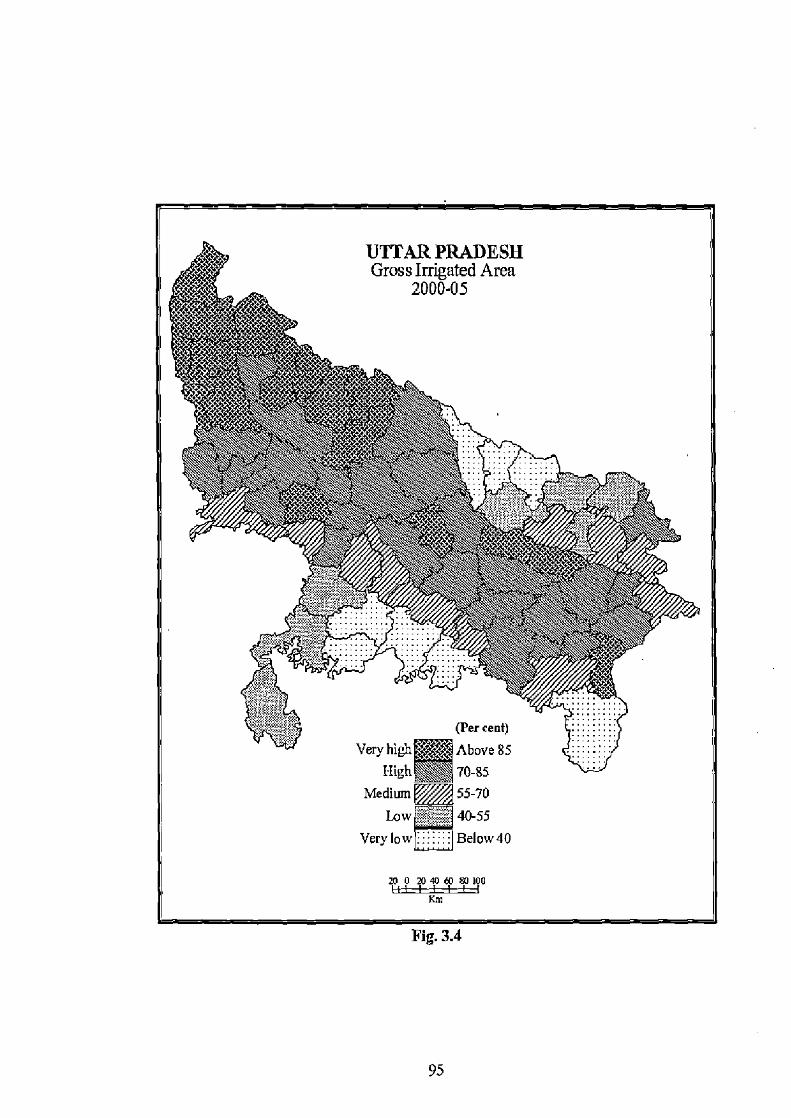
IMARPRADESH Gross Irrigated Area
2000-05
iIfltttLaStk
~!n
(Percent)
Very high Above 85 FIigh 70-85
Medium 55-70 Low ' - 40-55
Very low ii Below40
m 0 zu SU w &I IOU
Krn
Fig. 3.4
95

S r i
- RY
4 _ /y
Fig. 3.5
m
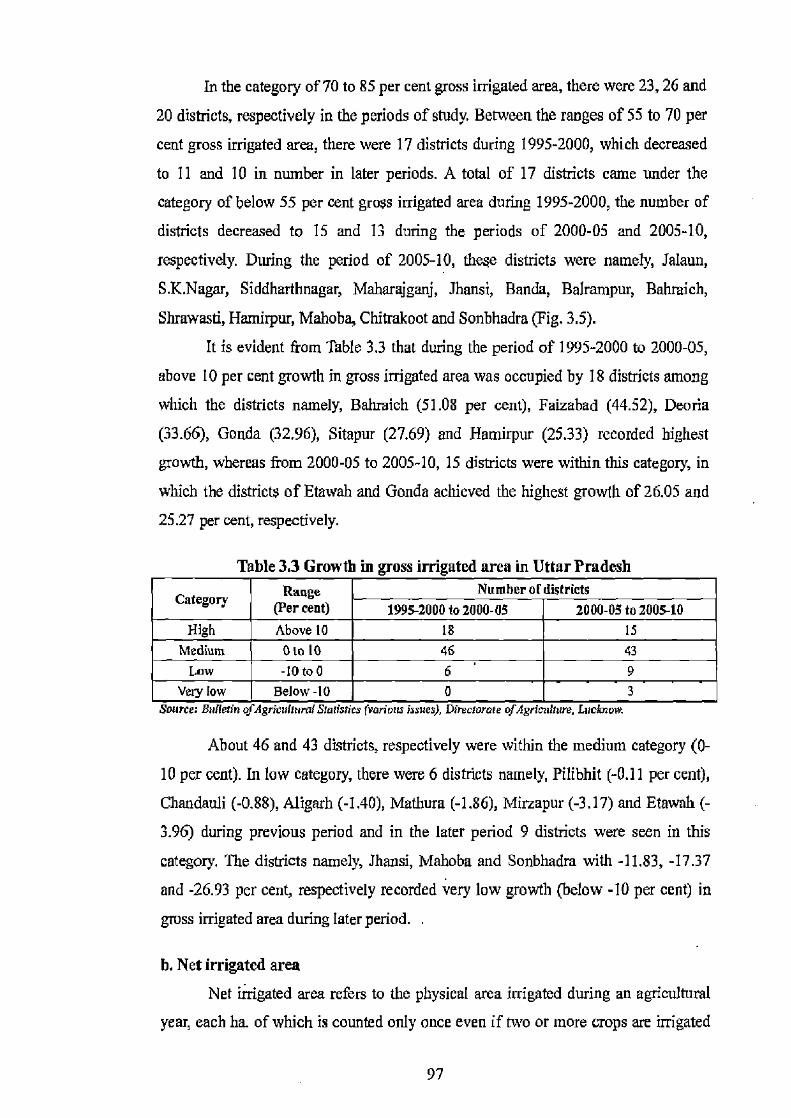
In the category of 70 to 85 per cent gross irrigated area, there were 23, 26 and
20 districts, respectively in the periods of study. Between the ranges of 55 to 70 per
cent gross irrigated area, there were 17 districts during 1995-2000, which decreased
to 11 and 10 in number in later periods. A total of 17 districts came under the
category of below 55 per cent gross irrigated area during 1995-2000, the number of
districts decreased to 15 and 13 during the periods of 2000-05 and 2005-10,
respectively. During the period of 2005-10, these districts were namely, Jalaun,
S.K.Nagar, Siddharthnagar, Mabarajganj, Jhansi, Banda, Balrampur, Bahraich,
Shrawasti, Hamirpur, Mahoba, Chitrakoot and Sonbhadra (Fig. 3.5).
It is evident from Table 3.3 that during the period of 1995-2000 to 2000-05,
above 10 per cent growth in gross irrigated area was occupied by 18 districts among
which the districts namely, Bahraich (51.08 per cent), Faizabad (44.52), Deoria
(33.66), Gonda (32.96), Sitapur (27.69) and Hamirpur (25.33) recorded highest
growth, whereas from 2000-05 to 2005-10, 15 districts were within this category, in
which the districts of Etawah and Gonda achieved the highest growth of 26.05 and
25.27 per cent, respectively.
Table 3.3 Growth in gross irrigated area in Uttar Pradesh
Category Rage (Per cent)
Number o( districts 1995-2000 to 2000-05 2000-05 to 2005-10
High Above 10 18 15 Medium O to 10 46 43
Low -IO to0 6 9
Very low Below -10 0 3 Ziarrce: nmienrt of HgocaaWrar sraroncs lvaHoiu Issues), Uareeiorate of ngrimomure, Lucrmow.
About 46 and 43 districts, respectively were within the medium category (0-
10 per cent). In low category, there were 6 districts namely, Pilibhit (-0.11 per cent),
Chandauli (-0.88), Aligarh (-1.40), Mathura (-1.86), Mirzapur (-3.17) and Etowah (-
3.96) during previous period and in the later period 9 districts were seen in this
category. The districts namely, Jhansi, Mahoba and Sonbhadra with -11.83, -17.37
and -26.93 per cent, respectively recorded very low growth (below -10 per cent) in
gross irrigated area during later period. .
It Net irrigated area
Net irrigated area refers to the physical area irrigated during an agricultural
year, each ha. of which is counted only once even if two or more crops are irrigated
97
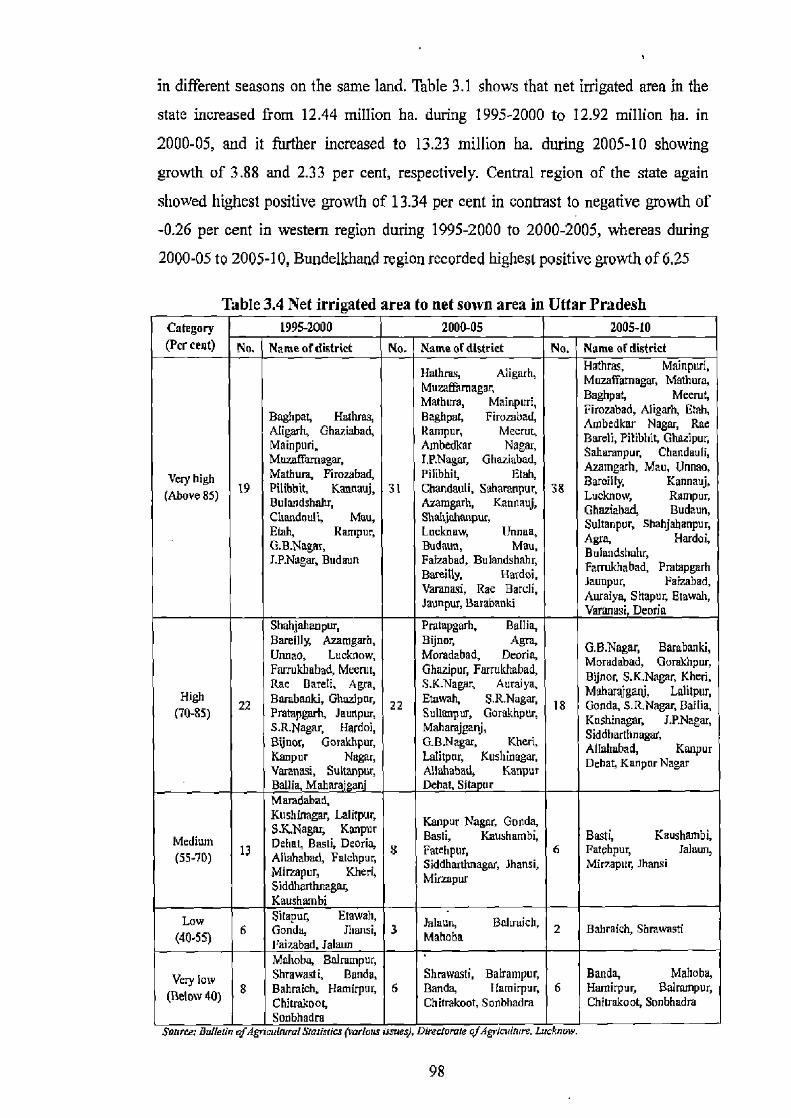
in different seasons on the same land. Table 3.1 shows that net irrigated area in the
state increased from 12.44 million ha. during 1995-2000 to 12.92 million ha. in
2000-05, and it further increased to 13.23 million ha. during 2005-10 showing
growth of 3.88 and 2.33 per cent, respectively. Central region of the state again
showed highest positive growth of 13.34 per cent in contrast to negative growth of -0.26 per cent in western region during 1995-2000 to 2000-2005, whereas during
2000-05 to 2005-10, Bundelhhand region recorded highest positive growth of 6.25
Table 3.4 Net irrigated area to net sown area in Uttar Pradesh Category 1995-2000 2000-05 2005-10
(Per cent) Name of district No. Name of district No. Name of district
Huthres, Aligarh, Hathras, Mainpud,
Muha&hmagaz, Muzaffamagar, Math,
Mathurs, Mainpuri, Baghpay Meerut,
[19
Baghpat, Hathres, Baghpat, Firozabad, mbe bad, Aligarh, Enda, Aligarh, Ghaz.iabad, Rarapur, Meerut, ro nbedkar Nagar, Rae Mainpuri, Ambedkar Nagar, Bareti, Pitibhit. Ghazipur, Muzaffaruagar, I.P.Nagar, Ghaziabad, Siaureaphq C, Un man,
Very high Mathum, Firozabad, Pilibhit, Elnh, A~mgarh, Mau, Unnaq Kannauj,
(Above 85) Pilibnds Kannuuj, 31 Ahanloult, SaKannauj, 38 Lueluly, Rampur, Bulnndshahr, Azamgarh, Kannauj, Ghaziabad, Ghazizbad, Budaun,
Chandauli, Mau, Shahjahanpur, Sultanpuy Shahjahanpuy
Etah, Rampup Lucknow, Ilnnaa, Agra, Hardoi, G.B.Nagar, Budaun, Mau, J.P.Nagar. Budaun Faizabad, Bulandshahr, Bunikhab d,
Bareilly, Hardoi, Farnikhabad, d, Pratapgad,
Varanasi, Rae Barcli, Auraiya, , Etowah,
Varanasi S Etawah, Jaunpur, Barabanki
Dona
Varanasi, Deorin Sbahjahanpur, Pratapgwh, Ballia, Bareilly, Azamgarh, Bijnor, Agra, G.B.Nagar, Barabanki, Unnao. Lucknow, Moradabad, Deorin,
Moradabad, Gorakhpur, F&rrui:hebad, Meerut, Ghazipur, Farrukhabad, Rae Bareti, Ara, S.K.Nagar, Auraiya, S.anj, q Kheri, Mabar
Lnlitpur, High 22 Bambanki, Ghazipur, 22 Etowah. S.R.Nagar, 18 Gonda, Gonda, S.R.Nag Sallie, (70.85) Pmtapgarh, luuftpor, Sulumpur, Gorakhpur, Khsumnm J.P.Nagar, l.P.Nagar, S.R.Nagar, Hardoi, Mahamjganj, Siddhdmhreles, Bijnor, Gorakhpur, G.B.Nagar, Kheri, Apahabad, Kanpur Kanpur Nagar, lalitpur, Kusbinagar, Dehat, Kanpur Nagar Varanasi, Sultanpur, Allahsbad, Kanpur
Billie, Mahar&' Dehat. Sits ur Moradabad, Kushinagar, Lalitpur, spur Nagar, Gonda,
Medium S.K.Nagz, Kaaptrr gasti, Kaushambi, Bnsti, 6aushambi, 13 Dehat, Basti, Deoria, S Fatchpur, 6 Fatehpur, Jalaun,
(55-70) Allahabad, Fatchpur, Siddhanhnagar, Jhansi, Mirzapur, Jhansi
Mirzapur, Kheri, Ml~pm Siddhanhnaga,
Kaushambi
Low Simpur, Etawah, Jalaun, Baluuich,
(40.55) 6 Gonda, Iharsi, 3 Mahoba 2 Babraich, Sarawasin
Paizabad, Jalaun
Mnhoba, Balrampur, Very low Shrawasti, Banda, Shmwasti, Balrampur, Banda, Mahoba,
Bahraich, Hamirpur, 6 Banda, Hamirpur, 6 Hamirpur, Balrmnpur, (Below 40) Chitmkoot, Caitrakuxt, Sonnhadm Ghiiraknog Snftbhadre Sonbhadra
Shatz: Bulletin ofAgvicWnurcl Stasiseics (eartour issues), Drzse(oruie of 4gdmrtarzx. Lu'Hnmv.

Na ~r~~~~•
,T
~l~ k2~~
y h
11
Fig. 3.6

UTTAR PRADESH Net Irrigated Area
2000-05
(Per cent HH Very high Above 85
High 70-85 Medium ® 55-70
Low 40-55 Bel Below 40 Very Iow
20 0 m Ia au 8) X00 HI
Kin
Fig. 3.7
100

UTTAR PRADESH Net Irrigated Area
2005-10
(5enq
Very high Above85
High 70-8
0-8
5
Medium ® 55-70
Low 40-55 Very low ;^~H Below 40
J 0 m au as so 100
ii I Km
101
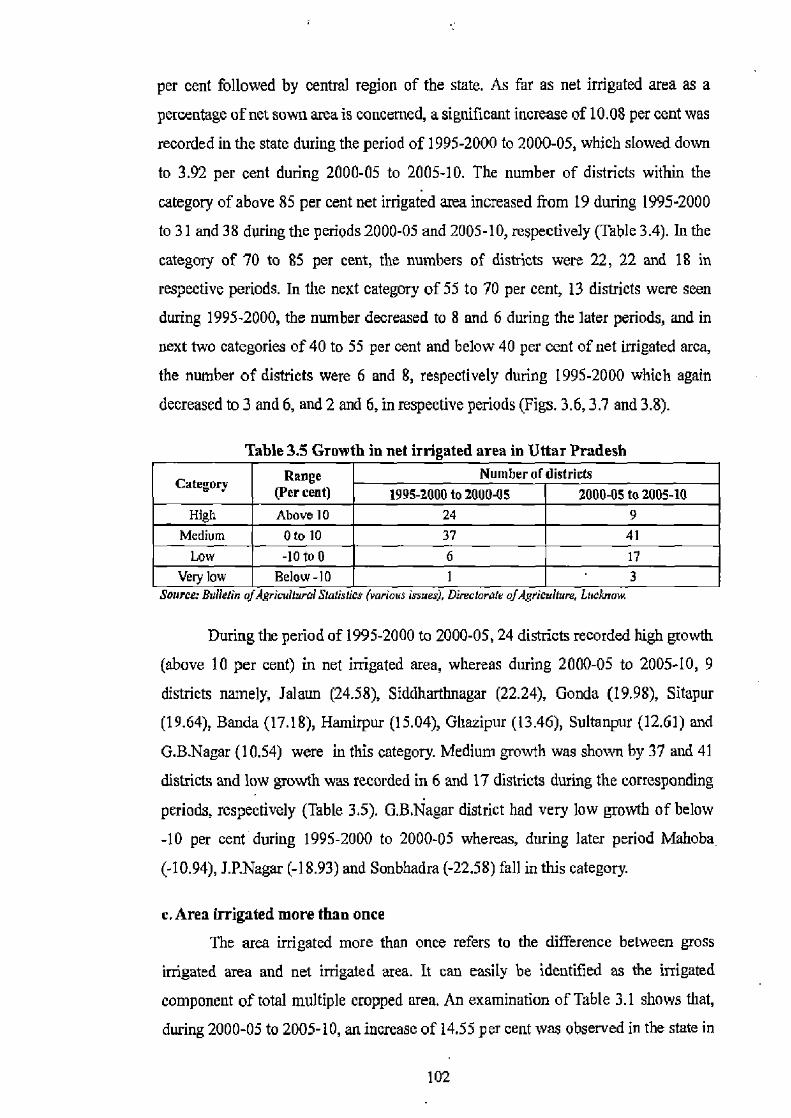
per cent followed by central region of the state. As far as net irrigated area as a
percentage of net sown area is concerned, a significant increase 01 10.08 per cent was
recorded in the state during the period of 1995-2000 to 2000-05, which slowed down
to 3.92 per cent during 2000-05 to 2005-10. The number of districts within the
category of above 85 per cent net irrigated area increased from 19 during 1995-2000
to 31 and 38 during the periods 2000-05 and 2005-10, respectively (Table 3.4). In the
category of 70 to 85 per cent, the numbers of districts were 22, 22 and 18 in
respective periods. In the next category of 55 to 70 per cent, 13 districts were seen
during 1995-2000, the number decreased to 8 and 6 during the later periods, and in
next two categories of 40 to 55 per cent and below 40 per cent of net irrigated area,
the number of districts were 6 and 8, respectively during 1995-2000 which again
decreased to 3 and 6, and 2 and 6, in respective periods (Figs. 3.6, 3.7 and 3.8).
Table 3.5 Growth in net irrigated area in Uttar Pradesh
Category Range (Per cent)
Number of districts 1995-2000 to 2000-05 2000-05 to 2005-10
High Above 10 24 9 Medium 0 to 10 37 41
Low -10100 6 17 Very low Below -10 1 3
Source: Bidlelin ofAgneulfial Ska(istiCS (various issuer), Directorate ofAgnevhure, Lucknow.
During the period of 1995-2000 to 2000-05, 24 districts recorded high growth
(above 10 per cent) in net irrigated area, whereas during 2000-05 to 2005-10, 9
districts namely, Jalaun (24.58), Siddharthnagar (22.24), Gonda (19.98), Sitapur
(19.64), Banda (17.18), Hamirpur (15.04), Ghazipur (13.46), Sultanpur (12.61) and
G.B.Nagar (10.54) were in this category. Medium growth was shown by 37 and 41
districts and low growth was recorded in 6 and 17 districts during the corresponding
periods, respectively (Table 3.5). G.B.Nagar district had very low growth of below
-10 per cent during 1995-2000 to 2000-05 whereas, during later period Mahoba
(-10.94), J.P.Nagar (-1 8.93) and Sonbhadra (-22.58) fall in this category.
c. Area irrigated more than once
The area irrigated more than once refers to the difference between gross
irrigated area and net irrigated area. It can easily be identified as the irrigated
component of total multiple cropped area. An examination of Table 3.1 shows that,
during 2000-05 to 2005-10, an increase of 14.55 per cent was observed in the state in
102

area irrigated more than once, as compared to growth of 1.77 per cent in the previous
period. Highest increase of 9.98 and 16.41 per cent respectively was seen in eastern
region of the state during the corresponding periods. Contrary to this, high negative
growth of -8.99 and -3.15 per cent was occurred in Bundelkhand region during the
respective periods of study.
Table 3.6 Area irrigated more than once to net sown area in Uttar Pradesh Category 1995-2000 2000-05 2005-10 (Per cent) No. Name of district No. Name of district Na. Name of district
Rnpur, Mainpuri, Bulandshahr, Etah,
Very high HolgqdVhsLu, Aampur Bulandshahr. Romper, Bambanki, Chandauli, (Above 65) 3 and Moradabad 4 Ghaziabud and 12 Moradabad, Pilibhjt,
Ambedkar Nagar Ambedkar Nagar, Azamgarh, Ghaziabad and Shahjahan ur
Pilibhit, Ghaeiabad, Moradabad, Baghpat, Baghpat, Chandauli, Pilibhit, Barabanki, Baghpat, G.B.Nagar,
High 9 Bmeilly, Barateulci, 10 Bareilly, Meerut, 8 Mau, Bareilly, (50-65) Shahjahanpur, Shahfahanpur, Ghazipur, Meerut.
Muraffamagar and Chandauli, Mainpurl J.P.Nagar and Varanasi Meerut and Ghazipur
MwaMamagar, Saharanpur, Faizabad, Sultanpur,
htainpurj, Saharanpur, Azamgorh, Foizabad, Rae Bareli, Jaunpur, Aligarh, Lucknow, Lucknow, Mau, Rae Aligarh,
Medium 10 Ptatapgarh, Rae Batch 17 Bareli, Allahabad,
14 Muzanamagar.
(35-50) and J.ENagar, Etah, Pmtepgarh, Auraiya, Allahabad, Saharanpur, Ghazipur and Jaunpur Sullanpug Aligarh, Auraiya, Hardoi,
Etah, Kushiitagar, Lucknow, Kwshingar, Jaunpur, G.B.Nagar Etowah and Ballia and Etawah
Varannv, Kuslinaar, Khcri, Deoria, Silapuy Khcri, Mirrepm, Bijnor, J.P.Nagar, Sitapur, Prarapgarh, S.R.Nagar, Ballia, Dnnao, Mau, Varanasi, Khcri, Budear, Bijnor, Allahubad, Azamgarh, Hardot S.R.Nagar, Hathms, tJnnao, G.B.Nagar, Sultanpur, Radaun, Mirzapur, Kannauj, Farrukeahad, Low Hatteras, Faizabad, IS
Hatteras, Lamru, eijnor, Ballia, 20 Kanpur
(20-35) 25 Fatehpur, Budaun, Na gar, Kannauj, S.R.Nagar, Fatehpur, Kannauj, Nagaa Firozabad,
Mirmpug Farrukhabad, Hardoi, Farrukhabad, Kanpur Nagar, Kanpur Detest Basti, andu
Bast,
Elawah, Sitapur, Kanpur Kanpur
Nagar, Maamm and Kanpur Dehat
and Mathurz De but and Kanpur Debut
Bssti, Pirozabad, Kaushambi, Deoria,
Firozabad, Kaushainbi, Banda, Gonda, Gonda, Gonkhpus, Basil, Banda, Sonebhadra Batrampur, Banda, S.K.Nagar, Maharajganj, Deoria, Sonebhadra, Mahanjganj, Agra, (iomkhpur, Aga, Gonda, Gomkhpur, Bahreich, Sanebhedra, Very low Batrampur, Bahraich
21 Maharajganj, Agra, 16 Shrnwasti, Jolson,
(Below 20) 21 S.K.Nagar,Chitrakoot, Bahraich, BhngwaVti, Shrawasi, Hamirpur, SK.Nagar, Jib Cpil
gar,
Nagar,
Sidharth Nagar, Mahoba,
Sidharh Nagar,
ah Moha,Hamupur
Lalitpur, Jalaun and Chitrukoot, Hamirpur
, Jalaun andLalihpur
Jhansi Mahoba, Jhansi and Latin ur
Source: Bulletin ufAgrind/ural Statistics (various issues), Directorate of Agriculture. wcRnuw
103
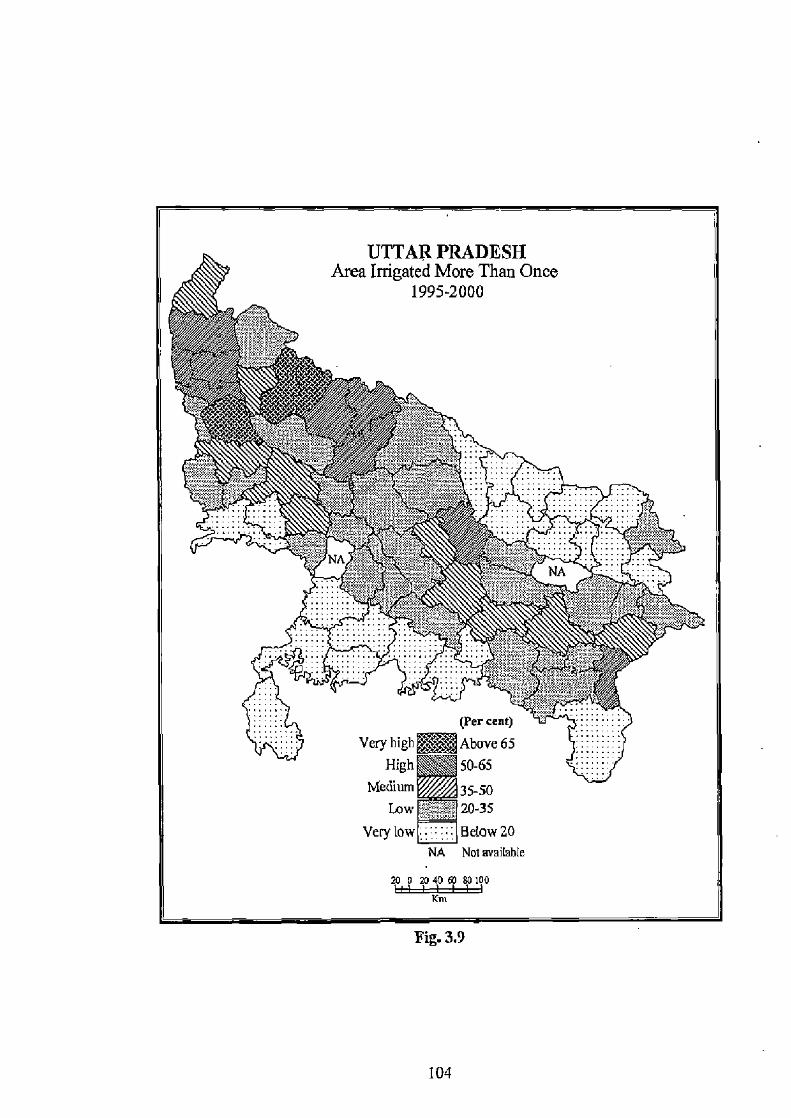
UTTAR PRADESH Area Irrigated More Than Once
1995-2000
RTaV
TrgIpaa 4 USss w.ry ~ya i54,
w
~f 4`Sw
NA NA
~s ~ t a ~
s
(Percent)
Very high Above 65 High 50.65
Medium 35-50 Low 20-35
Very tow=Below 20 NA Not availahle
m o 23406083100 Ku'
Fig. 3.9
104

UTTAR PRADESH Area Irrigated More Than Once
2000-05
tee, cer
(Percent)
Very high Above 65 High 50-65
Medium35-50 Low 20-35 R Very low Below 20
I 0 2040 w m i00
Km
Fig. 3.10
105
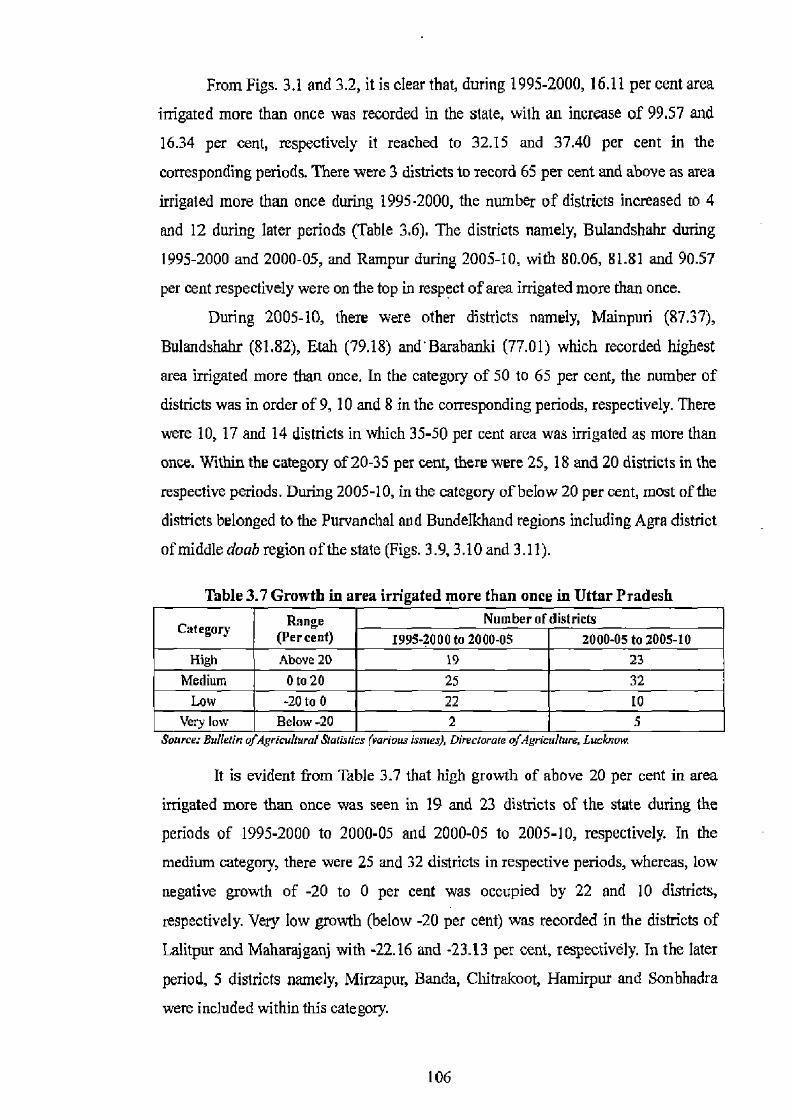
From Figs. 3.1 and 3.2, it is clear that, during 1995-2000, 16.11 per cent area
irrigated more than once was recorded in the state, with an increase of 99.57 and
16.34 per cent, respectively it reached to 32.15 and 37.40 per cent in the
corresponding periods. There were 3 districts to record 65 per cent and above as area
irrigated more than once during 1995-2000, the number of districts increased to 4
and 12 dining later periods (Table 3.6). The districts namely, Bulandshahr during
1995-2000 and 2000-05, and Rampur during 2005-10, with 80.06, 81.81 and 90.57
per cent respectively were on the top in respect of area irrigated more than once.
During 2005-10, there were other districts namely, Mainpuri (87.37),
Bulandshahr (81.82), Etah (79.18) and'Barabanki (77.01) which recorded highest
area irrigated more than once. In the category of 50 to 65 per cent, the number of
districts was in order of 9, 10 and 8 in the corresponding periods, respectively. There
were 10, 17 and 14 districts in which 35-50 per cent area was irrigated as more than
once. Within the category 01 20-35 per cent, there were 25, 18 and 20 districts in the
respective periods. During 2005-10, in the category of below 20 per cent, most of the
districts belonged to the Purvanchal and Bundelkhand regions including Agra district
of middle doab region of the state (Figs. 3.9, 3.10 and 3.11).
Table 3.7 Growth in area irrigated more than once in Uttar Pradesh
Category Range (Percent) Number of districts
I995-2000 to 2000-05 2000-05 to 2005-10 High Above 20 19 23
Medium 0 to 20 25 32 Low -20 to 0 22 10
Very low Below -20 2 5 Sconce: Bulletin ofggrieultural Statistics (various issues), Directorate ofdgricul(ure, Lucknow.
It is evident from Table 3.7 that high growth of above 20 per cent in area
irrigated more than once was seen in 19 and 23 districts of the state during the
periods of 1995-2000 to 2000-05 and 2000-05 to 2005-10, respectively. In the
medium category, there were 25 and 32 districts in respective periods, whereas, low
negative growth of -20 to 0 per cent was occupied by 22 and 10 districts,
respectively. Very low growth (below -20 per cent) was recorded in the districts of
Lalitpur and Mahavajganj with -22.16 and -23.13 per cent, respectively. In the later
period, 5 districts namely, Mirzapur, Banda, Chitrakoot, Hanvirpur and Sonbhadra
were included within this category.
106
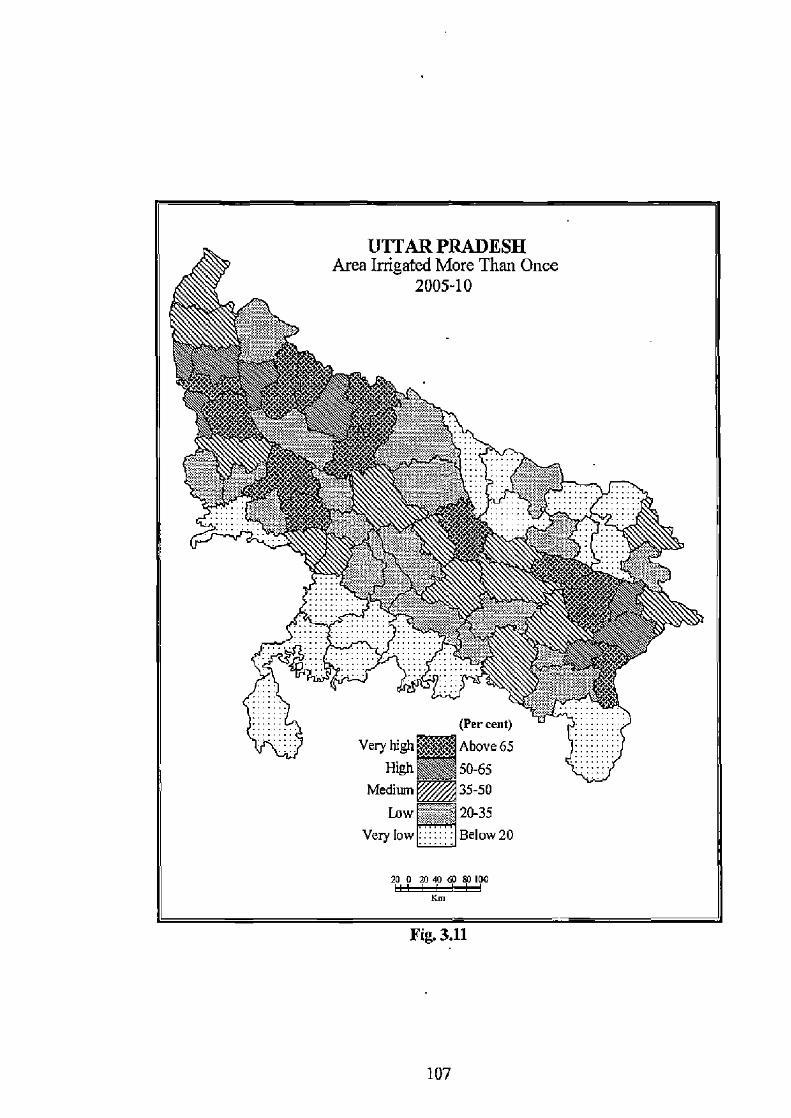
UTTAR PRADESH Area Irrigated More Than Once
2005-10 ro;~5
tom.
44 (Percent)
Very high A6ove65 High 50-65
Medium ® 35-50
Low B0-35 Very low Below 20
10 0 m w w &1'00
Km
Fig. 3.11
107
B. Growth in Irrigated Area: Sourcewise
Uttar Pradesh is fortunate to have different sources of irrigation: canals,
tubewells (government and private), other wells, tanks and other means (ponds, lakes
etc.). The main sources of irrigation in the state are tubewells and canals occupying
about 72 and 19 per cent of net irrigated area, respectively. Sourcewise irrigated area
in the state during the periods of 1995-2000, 2000-05 and 2005-10 is shown in Table
3.1.
a, Irrigated area by canals
Canal irrigation in the country is one of the principal methods of irrigation
used for growing of crops. Next to tubewells, canal is the major source of irrigation
in the state. Canal irrigation is only possible in areas that have large level plains and
deep fertile soils which are drained by perennial rivers. As a result, canal irrigation is
limited to plain areas of northern India, valleys of Indian peninsular plateau and
costal lowlands.
It is depicted in Table 3.8 that, during 1995-2000, the districts of Chandauli
(92.41 per cent) and Sonbhadra (82.57) of Purvanchal region, and Jalaun (80.47) of
Bundelkhand recorded the highest canal irrigated area (above 80 per cent to the net
irrigated area) whereas, during 2000-05 and 2005-10, only two districts of Sonbhadra
(87.50 and 86.87) and Chandauli (85.30 and 85.83), respectively received highest
irrigation from canals. Within the next category of 60 to 80 per cent irrigated area
under this source, 2 districts namely, Mirzapur (74.87 per cent) and Banda (67.87)
were having canal irrigation during 1995-2000 and Jalaun (73.53), Mirzapur (66.67)
and Banda (61.09) during 2000-05, and Mirzapur (60.08) during 2005-10. In the
category of 40 to 60 per cent, there were 14, 8 and 9 districts, respectively during
these periods. Quite a large number of districts, 15, 16 and 16 districts in the
categories of 20 to 40 per cent and 36, 41 and 42 districts in the category of below 20
per cent were found during 1995-2000, 2000-05 and 2005-10, respectively.
It is clear from Table 3.1 that, in canal irrigation the state registered a
negative growth of -14.98 and -8.32 per cent, respectively during the periods of
1995-2000 to 2000-05 and 2000-05 to 2005-10. While examining the region-wise
growth, the central region (the districts of Awadh plains) recorded highest negative
growth of -23.3 per cent in 1995-2000 to 2000-05 whereas, during the period of
2000-05 to 2005-10, the Bundelkhand region of the state registered the highest
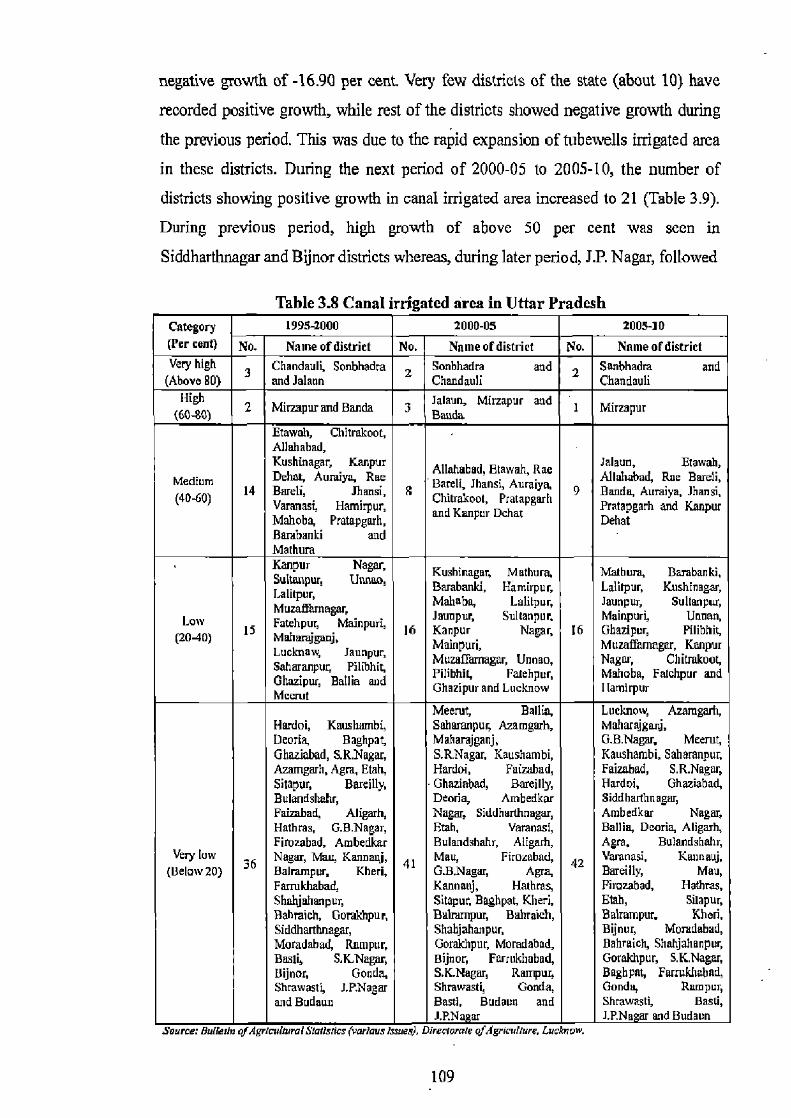
negative growth of -16.90 per cent. Very few districts of the state (about 10) have recorded positive growth, while rest of the districts showed negative growth during the previous period. This was due to the rapid expansion of tubewells irrigated area in these districts. During the next period of 2000-05 to 2005-10, the number of districts showing positive growth in canal irrigated area increased to 21 (Table 3.9). During previous period, high growth of above 50 per cent was seen in Siddharthnagar and Bijnor districts whereas, during later period, J.P. Nagar, followed
Table 3.8 Canal irrigated area in Uttar Pradesh Category 1995-2000 2000-05 2005-10
(Percent) No. Name of district No. Name of district No. Name of district Very high Chandauli, Sonbhadra Sonbhadra and Sonbhadra and
(Above 80) 3 and Jalaun 2 Chandauli 2 Chandauli
2 Mirzapur and Banda 3 Jalaun,Mirzapur and I Mirzapur (60 0) Etawah, Chitrakoot, Allah abad, Kushinagar, Kanpur Allahabud, Eluwah, Rae Jalaun, Etawah,
Medium Dehat, Aumiya, Rae Bzreli, Jhansi, Auraiya, Mlalwbad, Rae Bareli, (40-60)
14 Barth, Jhansi, S Chitrakool, Pratapgarh
9 Banda, Auraiya, Jhansi, Varanasi, Hamirpur, and Kanpur Dehat pratapgarh and Kanpur Mahoba, Pratapgarh, Dehat Barnbanki and Mathurn
• Kanpur Nagar, Sultunpur, unnoo, Kushinagar, Mathura, Malhum, Barzbanki,
Ialilpur, Barabanki Hamirpur, Lalilpur, Kushinagar,
MuznR'amager, Mahoba, Lalitpur, Jaunpur, Sultnnpur, Low Fetehpar, Mainpuri, Jaunpur Sultanpur, Mainpuri, Nnnen,
15 (2040) M~.j~j 16 Kanpur Nagar, 16 Ghazipuq Pilibhit
Muzaffamagar, Kanpurr
Lucknow, Jaunpuq Mainpuri,
Saharanpur Pilihhi5 Muza[Famagar, Unnao, Nagar, Chitmkoot,
Ghazipur, Ballia and Pihbhit, Farehpur, Mahoba, Fatchpur and
Mccrut Ghazipur and Lucknow Ilamirpur
Meerut, Bailin, Lucknow, Avamgarh, Haiti, Kaushambi, Saharanpur Azamgarh, Maharajganj, Deoria, Baghpat, Maharajganj, G.B.Nagar, Meerut, Ghaziabad, S.R.Nagar, S.R.Nagar, Kaushambi, Kaushambi, Saharanpur, Azamgarh, Agra, Etah, Hardoi, Faizabad, Faizabad, S.R.Nagar, Sitapur, Bareilly, Ghaziabad, Bareilly, Hardoi, Ghaaiabad, Bulandshahr, Deoria, Ambedkar Siddharthnagar, Faizahad, Aligarh, Nagar, Siddhurlpnagan, Ambedkar Nagar, Hathras, G.B.Nagar, Stab, Varanasi, Ballia, Deoria, Aligarh, Firozabad, Ambedkar Bulandshahr, Aligarh, Agra, Butandshahr,
Very law 36
Nagar, Mau, Kairrauj, Al
Mau, Firozabad, G.B.Nagar, Aga, 42 Varanasi, Kannauj,
(Below20) Balrewpur, Kheri, Bareilly, Mau, Famkhabad, Kannanj, Hathras, Firozabad, Hathras, Shahjahanpur, Sitapu4 Baghpat, Kheri, Etah, Sitapur, Bahraich, Gorakhpur, Bahmnpur, Babraich, Bahampur, Kheri, Siddharthnagar, Shahjahanpur, Bijaar, Moradabad,
Moradabad, Rnmpur, Gorakhpur, Moradabad, Bahraich, Shahjahanpur,
Bassi, 3.KNagar, Bijnor, Farrukhabed, Gorakhpur. S.K.Nagar,
Bijnor, Gonda, S.K.Nagar, Rampuy Baghpnt, Farrukhabud, Shmwasti, J.P.Naaar Shrewasti, Gonda, Gonda, Rampur, and Budauu Bassi, Budaun and Shrewastl. Basti,
J.P.Na ar J.RNagar and Budaun Source: Hmkrrn of AgrIcuUvrat Stavancy ryN/ous issue , mrerlormre OJ M$/nfuuare. UMTWOM.
109
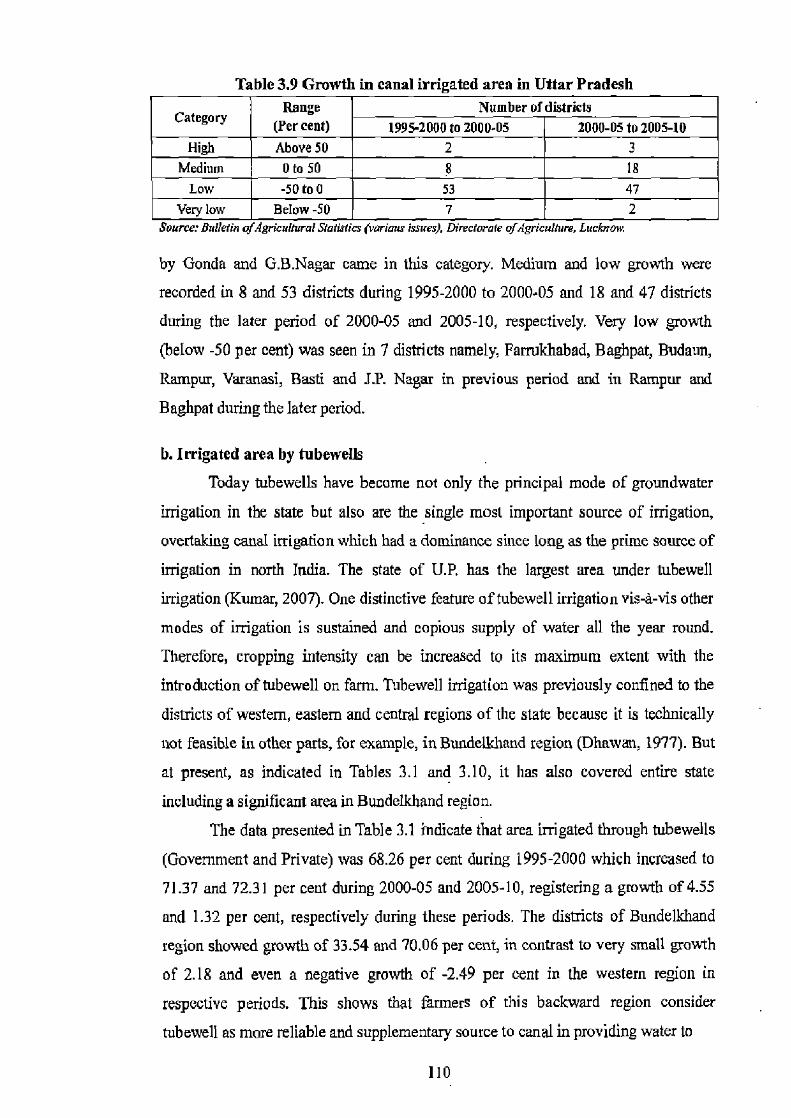
Table 3.9 Growth in canal irrigated area in Uttar Pradesh
Category Range (Per cent)
Number of districts 1995-2000 to 2000.05 2000-05 to 2005-10
High Above 50 2 3 Medium 0 to 50 8 18
Low -50 to 0 53 47 Very low Below-50 7 2
Source: Buieith qt Agncu(Nrai Stafufics (various isgres). Dimciorale of Agricullure, Lucbrow.
by Gonda and G.B.Nagar came in this category. Medium and low growth were
recorded in 8 and 53 districts during 1995-2000 to 2000-05 and 18 and 47 districts
during the later period of 2000-05 and 2005-10, respectively. Very low growth
(below -50 per cent) was seen in 7 districts namely, Farrukhabad, Baghpat, Budaun,
Rampur, Varanasi, Basti and J.P. Nagar in previous period and in Rampur and
Baghpat during the later period.
Ii. Irrigated area by tubewells
Today tubewells have become not only the principal mode of groundwater
irrigation in the state but also are the single most important source of irrigation,
overtaking canal irrigation which had a dominance since long as the prime source of
irrigation in north India. The state of U.P. has the largest area under tubewell
irrigation (Kumar, 2007). One distinctive feature of tubewell irrigation vis-a-vis other
modes of irrigation is sustained and copious supply of water all the year round.
Therefore, cropping intensity can be increased to its maximum extent with the
introduction of tubewell on farm. Tubewell irrigation was previously confined to the
districts of western, eastern and central regions of the state because it is technically
not feasible in other parts, for example, in Bundelkhand region (Dhawan, 1977). But
at present, as indicated in Tables 3.1 and 3.10, it has also covered entire state
including a significant area in Bundelkhand region.
The data presented in Table 3.1 indicate that area irrigated through tubewells
(Government and Private) was 68.26 per cent during 1995-2000 which increased to
71.37 and 72.31 per cent during 2000-05 and 2005-10, registering a growth of 4.55
and 1.32 per cent, respectively during these periods. The districts of Bundelkhand
region showed growth of 33.54 and 70.06 per cent, in contrast to very small growth
of 2.18 and even a negative growth of -2.49 per cent in the western region in
respective periods. This shows that farmers of this backward region consider
tubewell as more reliable and supplementary source to canal in providing water to
110
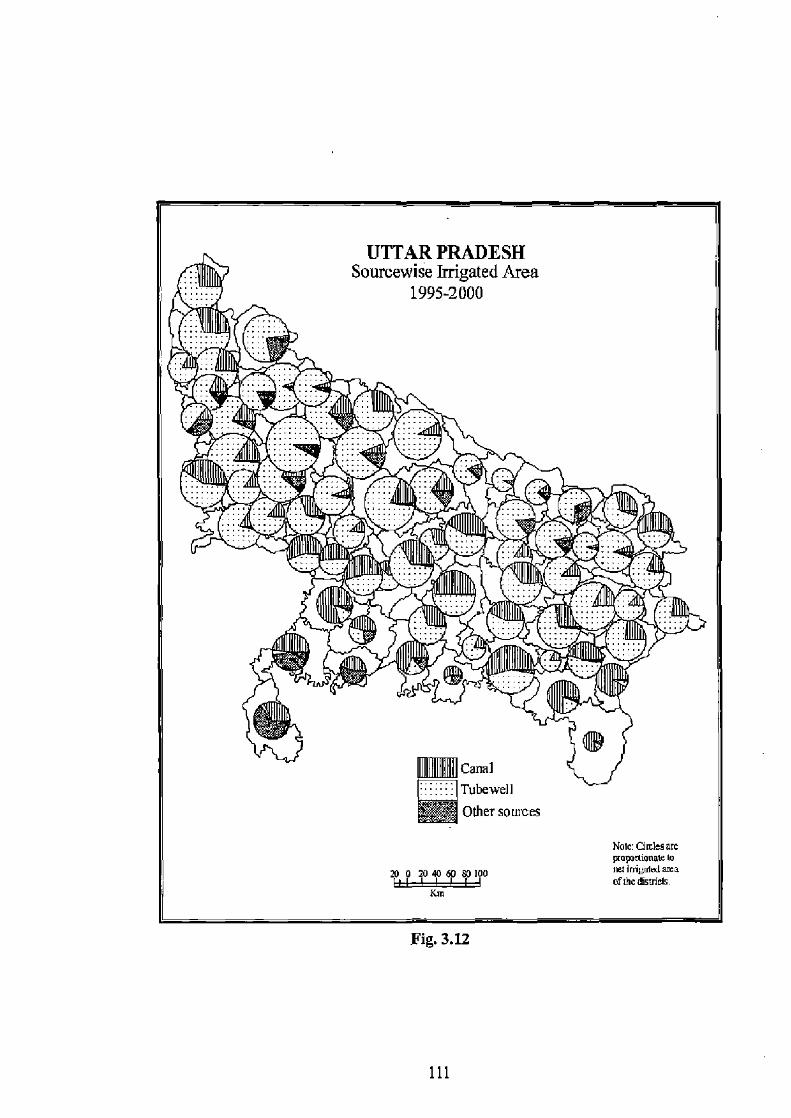
Pig. 3.12
111
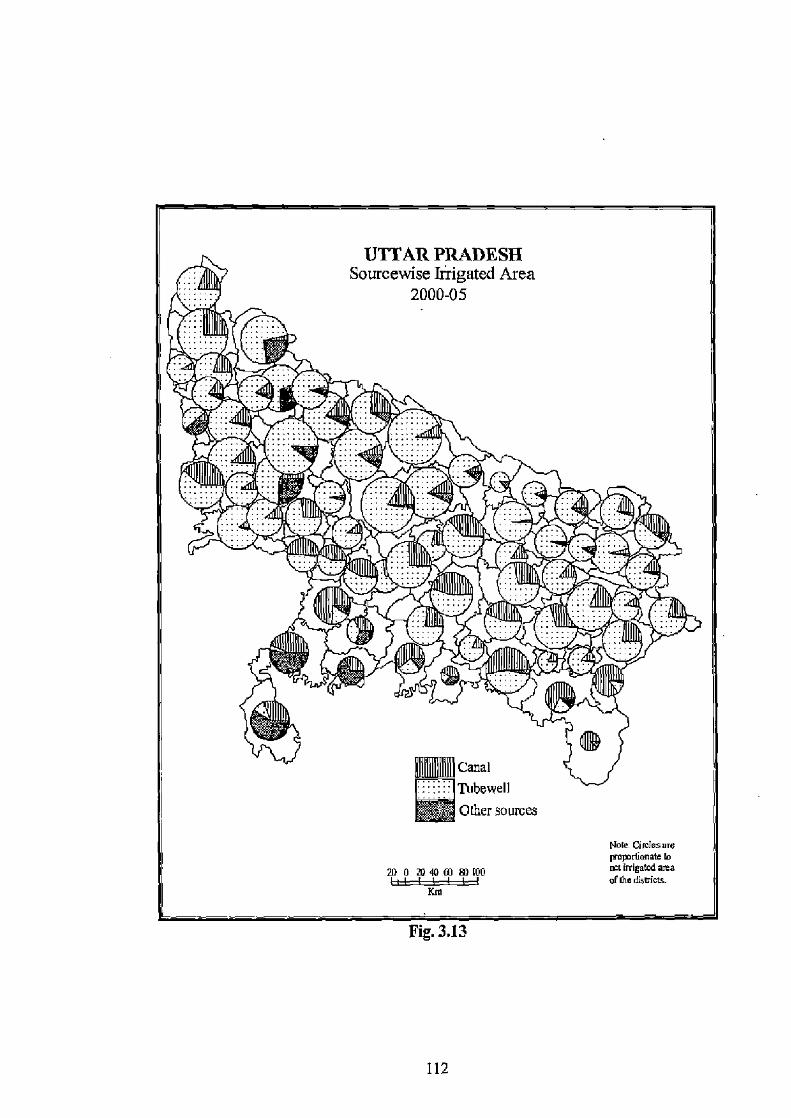
Fig. 3.13
112
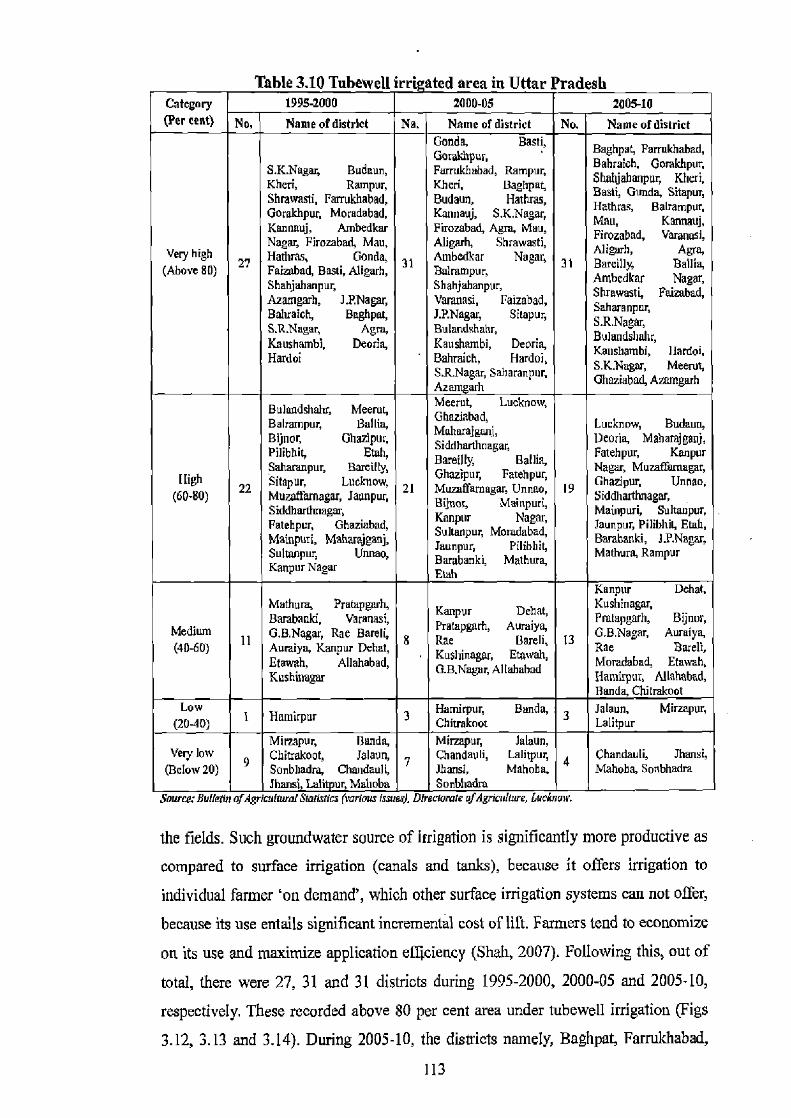
Table 3.10 Tubewell irrigated area in Uttar Pradesh Category 1995-2000 2000-05 2005-10 (Percent) No. Name of district No. e of district No. Name of district
Basti, Baghpat, Farrukhabad, S.K.Naga, Budaua, ur' abad, Rampur, Bahraich, Gorakhpur, Kheri, Rampur, Baghpat, Shahjahanpur, Kheri, Shrawasti, Farrukhabad, HatMaz,
rAmbOdkarNjgu,
Basil, Gonda, Sitapuy Gorakhpur, Moradabad, , S.K.Nagar, Hathrm, Balrampuj, Kannauj, Ambedkar ad, Agra, Mau, Man, Kar auj,
Firezabad, Varanasi, Nagar, Firmzbad, Mau, Shrawasti, Aligarh, Aga, Very high 27
Hathras, Gonda, 31 ar Nagar, Bulpur, 31 Bareilly, Ballia, (Above 80) Faimbad, Basti, Aligarh, Ambedkar Nagar, Shatiahanpuy Shzhjahanpur, Azamgarh, 1.P.Nagar, Varanasi, Faizabad, Sahar as[i, Faizabad,
Saharanpur. Baltraich, Baghpal, J.P.Nagar, Sitapur, S.R.Nagar, S.R.Nagac, Agra, Bulandshahr, Kaushambi, Deoria, Kaushambi, Deoria, Kaushashdv,
anshambi, Hardoi. Hardoi Bahrsich, Hardoi, S.K.Nagar, Meerut, S.R.Nagar, Saharanpur. Ghaziahatl, Azturtgarh Azam arh Bulandshahr, Meerut, Meerut, Lucknow, Balrampur, BaIIia, Ghazlabad,
Mahorajgue: Lucknow, Budaun, Bi)nor, Ghazipur, Siddhmlhnagm, Peoria, MahaKanpur
Etoh, Sahar it, Bareilly, Ballia, Fa[ehpuq Kanpur Saharanpur. Bazeilly, Ghazipur, Fatehpo,, Nagar, MuzafThmagar,
IJigh 22 Sitapur, Lucknow, 21 19 Ghazlpur, Unnao,
(60-80) Muzoffamagar, Jzunpur, Minor, agar, Unnna, SidihautheagSt, Siddharthnagar, Munpur, i, Sul, Etat, Fatehpur, Ghaziabad, Suhenpur, Morcriehcri, Jaunpuy Pilibhiy Bash, Mainputi, Msharajgari, Jaunpur, Pilibhit, Barabanki, J.P.Nagar, Sulmnpu5 Unnao, Bambanki, Mathurq Mathurn, Rampur Kanpur Nagar E
Kanpur Dehat, Mathure, Pratapgarh, Kanpur Dehat, p, Kushinagar, Barabanki, Varanasi, Pratapgarh, Auraiyq Medium
Pralapgarh, Bijnur,
11 G.B.Nagar, Rae Dehat, 8 Rae Bareli, 13 G.B.Nagar, Aursiya,
(40-60) Auraiya, Kanpur Ilrhat, Kusltinagar, Etowah, Rae Bard, Etawah, Allahabad, G.B.Nagar, Allahahai Moradabad, Etawah, Kushhmgnr Hamhpur, Allahabad,
Banda, Chilrakoot Low
1 Humirpur 3 Hamlrpur, Banda, 3
Ialaun, Mirzapur, (2040) Chitmknot Lalitpur
Mirzapur, Handa, Mirzapur, lalaun, Very low 9 Chittakoot, J21aun, 7 Chandauli, Lalitpuc 4 Chmul-Ii, Jhansi,
(Below 20) Sonbledra, Chandauli, Jbansi, Mahoba, Mahoba, 5onbhadra Jhsnsi Lalilpur, Mahoba Son6lands
Source: Buffoon ofggrunhuraf SWtttics (various Issues), DIre1arite oJAgrttu(hnc, Luckemv.
the fields. Such groundwater source of irrigation is significantly more productive as
compared to surface irrigation (canals and tanks), because it offers irrigation to
individual farmer 'on demand', which other surface irrigation systems can not offer,
because its use entails significant incremental cost of lift. Farmers tend to economize
on its use and maximize application efficiency (Shah, 2007). Following this, out of
total, there were 27, 31 and 31 districts during 1995-2000, 2000-05 and 2005-10,
respectively. These recorded above 80 per cent area under tubewel1 irrigation (Figs
3.12, 3.13 and 3.14). During 2005-10, the districts namely, Baghpat, Farrukhabad,
113
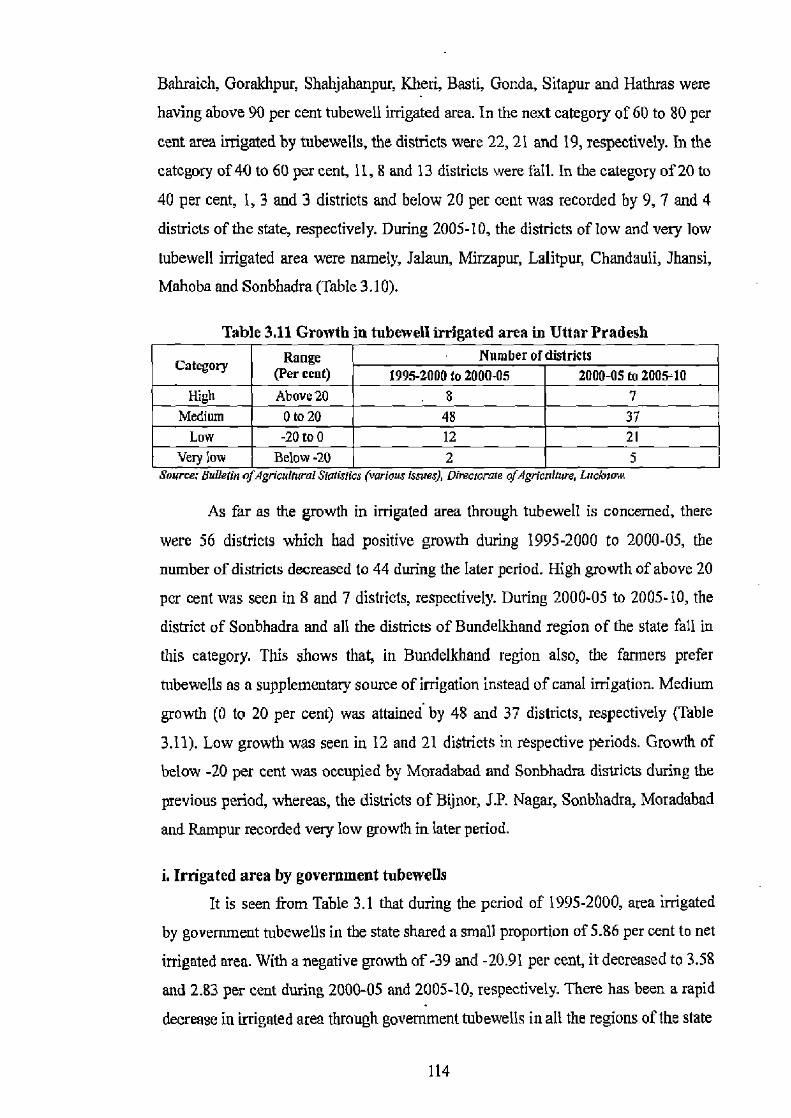
Bahraich, Gorakhpur, Shahjahanpur, Kheri, Basti, Gonda, Sitapur and Hathras were
having above 90 per cent tubewell irrigated area. In the next category of 60 to 80 per
cent area irrigated by tubewells, the districts were 22, 21 and 19, respectively. In the
category of 40 to 60 per cent, 11, 8 and 13 districts were fall. In the category of 20th
40 per cent, 1, 3 and 3 districts and below 20 per cent was recorded by 9, 7 and 4
districts of the state, respectively. During 2005-10, the districts of low and very low
tubewell irrigated area were namely, Jalaun, Mirzapur, Lalitpur, Chandauli, Jhansi,
Mahoba and Sonbhadra (Table 3.10).
Table 3.11 Growth in tubewell irrigated area in Uttar Pradesh
Category Rang (Per cent) Number of districts
1995-2000 to 2000-05 2000-05 to 2005-10 High Above20 8 7
Medium 0 to 20 48 37 Low -20 to 0 12 21
Very low Below -20 2 5 Aaurre,, Hutterm aj Agricultural $tattrflcs (various rssues), a/Eiiomte of Agre:111a e, Luc/Paw.
As far as the growth in irrigated area through tubewell is concerned, there
were 56 districts which had positive growth during 1995-2000 to 2000-05, the
number of districts decreased to 44 during the later period. High growth of above 20
per cent was seen in 8 and 7 districts, respectively. During 2000-05 to 2005-10, the
district of Sonbhadra and all the districts of Bundelkhand region of the state fall in
this category. This shows that, in Bundelkhand region also, the farmers prefer
tubewells as a supplementary source of irrigation instead of canal irrigation. Medium
growth (0 to 20 per cent) was attained by 48 and 37 districts, respectively (Table
3.11). Low growth was seen in 12 and 21 districts in respective periods. Growth of
below -20 per cent was occupied by Moradabad and Sonbhadra districts during the
previous period, whereas, the districts of Bijnor, J.P. Nagar, Sonbhadra, Moradabad
and Rampur recorded very low growth in later period.
i. Irrigated area by government tubewells
It is seen from Table 3.1 that during the period of 1995-2000, area irrigated
by government tubewells in the state shared a small proportion of 5.86 per cent to net
irrigated area. With a negative growth of -39 and -20.91 per cent, it decreased to 3.58
and 2.83 per cent during 2000-05 and 2005-10, respectively. There has been a rapid
decrease in irrigated area through government tubewells in all the regions of the state
114
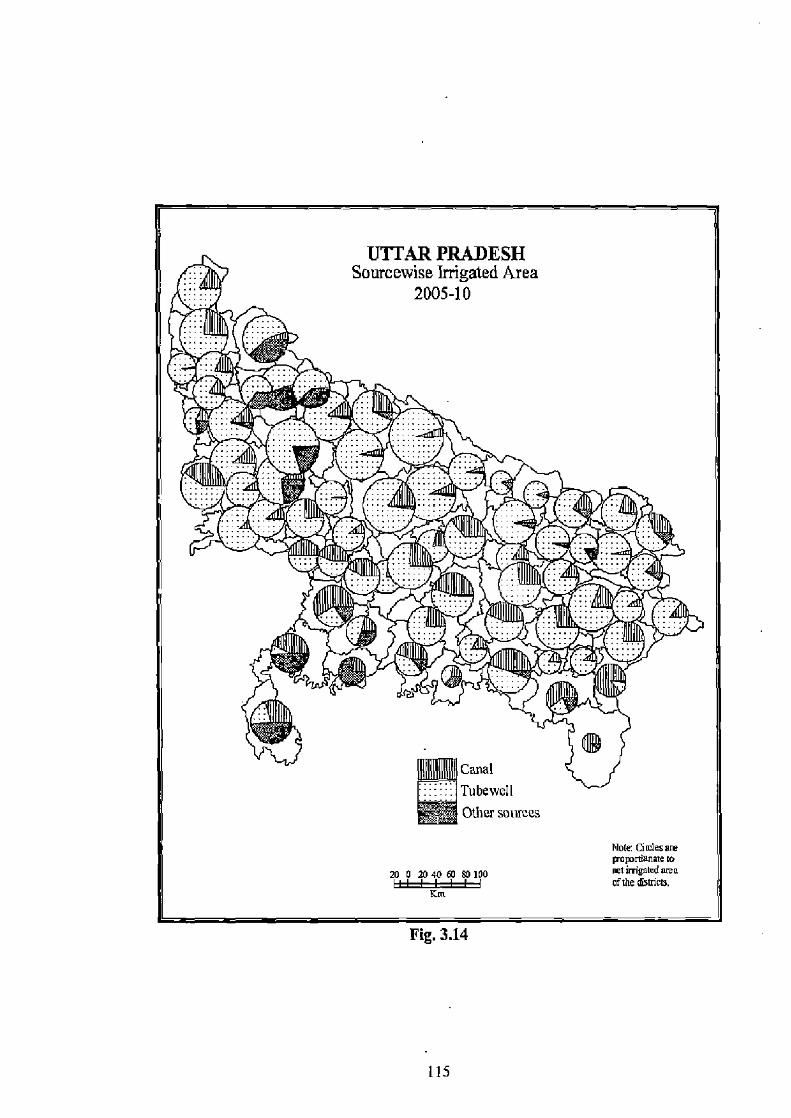
Fig. 3.14
115
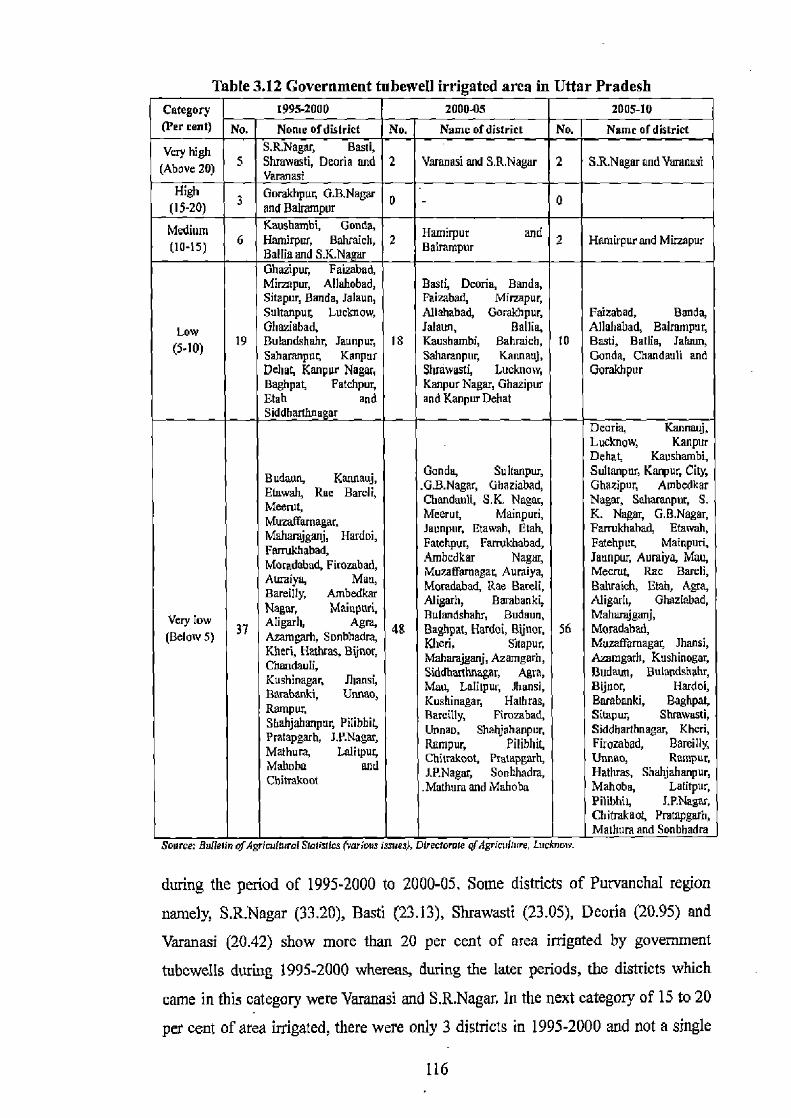
Table 3.12 Government tubewell irrigated area in Uttar Pradesh Category 1995-2000 2000-05 2005-10
No. Name ofdistrict No. Name of district No. Name of district
5 S.R.Nagar, Basci,
Shrawasti, Deoria and 2 Varanasi and S.R.Nagar 2 S.R.Nagar andVaranasi Varanasi
Gorakhpur, G.B.Nagar 0 - 0 3 and Balmmper Kaushambi, Gonda, Hami ur and 6 Hamirpur, Balvaich, 2 Balm pur 2 Hamirpur and Mirz pur Ballia and S.K.N. ar Ghazlpur, Faizabad, Mirmpur, Allahabad, I Basl4 Dcoria, Banda, Sisaper, Banda, lalawn, Faizabad, Mirzapur, Sultanpur, Lucknow, Allahabad, Gorakhpur, Faizabad, Banda,
Low Ghaziabad, lalaun, Ballia, Allahabad, Balrnmpur,
(5-10) 19 Bulandshahr, Jaunpur 18 Kaushambi, Bahraich, 10 Bassi, Ballia, lalaun,
Saharanpur, Kanpur Saharanpur, Kannnauj, Ganda, Chandauli and Dehat Kanpur Nagar, Shrawasti, Lucknow, Gorakhpur Baghpat, Fatehpuy Kanpur Nagar, Ghaaipur
Etah and and Kanpur Dehat Siddharlhna ar
Dearia, Kannauj, Lucknow, Kanpur Dehat, Kaushambi,
Budaun, Kumauj, Ganda, Sultanpur, Sultanpur, Kanpur, City,
Etowah, Rae Barcli, .G.B.Nagar, Ghaziabad, Ghazipur, Ambedkar Meewt Chandauti, S.K. Nagar, Nagar, Saharanpur, S.
Muzaffaraagac, Meerut, Mainiluri, K. Nagar, G.B.Nagur,
Mahamjganj, Hardoi, Jaunpnn Etowah, Utah, Farmkhahad, Etowah,
Farrukhabad, Fatehpur, Famtkbabad, Fatehpur, Mainpuri,
Mocndab~, Firozabad, Anibcdkar Nagar, Jaunpur Aumiya, Mau,
Morada, Mau, Muzaffamagar, Aumiya, Meerut, Roc Bare i,
Auraiyy, Ambedkar Moradabad, Rae Bareli, Babraich, Etch, Agra,
Nag, Maiapuri, Aligarh, Barabanki, Aligarh, Ghaziabad, Very low Apgarh Age Bulandshahr, Budaun, Maharajganj,
(Below 5) 37 Aramgarh Sonbhadra, 48 Baghpat, HaMoi, Bijnor, 56 Moradabad,
Kheri, Hathias, Bijnor, Kheri, Sicapur, Muzaffiemagar, Jhansi,
Ch an Mahaalganj, Azamgarh, Ammgarh, Kushinagar, ago Kush
Siddhanhngar, Agra, Budaun, Bulaodshahr, Kushinnki, Undue, Bwabanki, Unnao, J ibras, aga,Pw, Ba,tb Hardoi,
Kushinagey Ha , Barabanki, Baghpat, Rampar
Shahjahanpur, Pilibhif, ly' Firozabad, llnna Siterm, Shmwasti,
Prntapgarh, 1.P.Nagar, Dame, Shahjohanpur, Siddharthnagar, Khcd,
Mathura, Lalitpur Rampur, tapgarit, Firozabad, Bampur,
Mahoba and ChilrekoQs, Prztupgarh, Unnno, Random,
J.P.Nagar, Sonbhadra, Hathras, Shahjahnnpur, Cbhrakuot .Mathum and Mahoba Mahoba, Lalitpur, Pillbhit, 7.P.Nagar, Chitrakoot, Pratapgarh, Mathura and Sonbhadra
Souree.. Bupelin ofAgr .aunol Sl.091 s (various issues), OVecromk of Agigaa,re, Lncknoy.
during the period of 1995-2000 to 2000-05. Some districts of Purvanchal region namely, S.R.Nagar (33.20), Basti (23.13), Shrawasti (23.05), Deoria (20.95) and Varanasi (20.42) show more than 20 per cent of area irrigated by government tubewells during 1995-2000 whereas, during the later periods, the districts which
came in this category were Varanasi and S.R.Nagar. In the next category of 15 to 20 per cent of area irrigated, there were only 3 districts in 1995-2000 and not a single
116
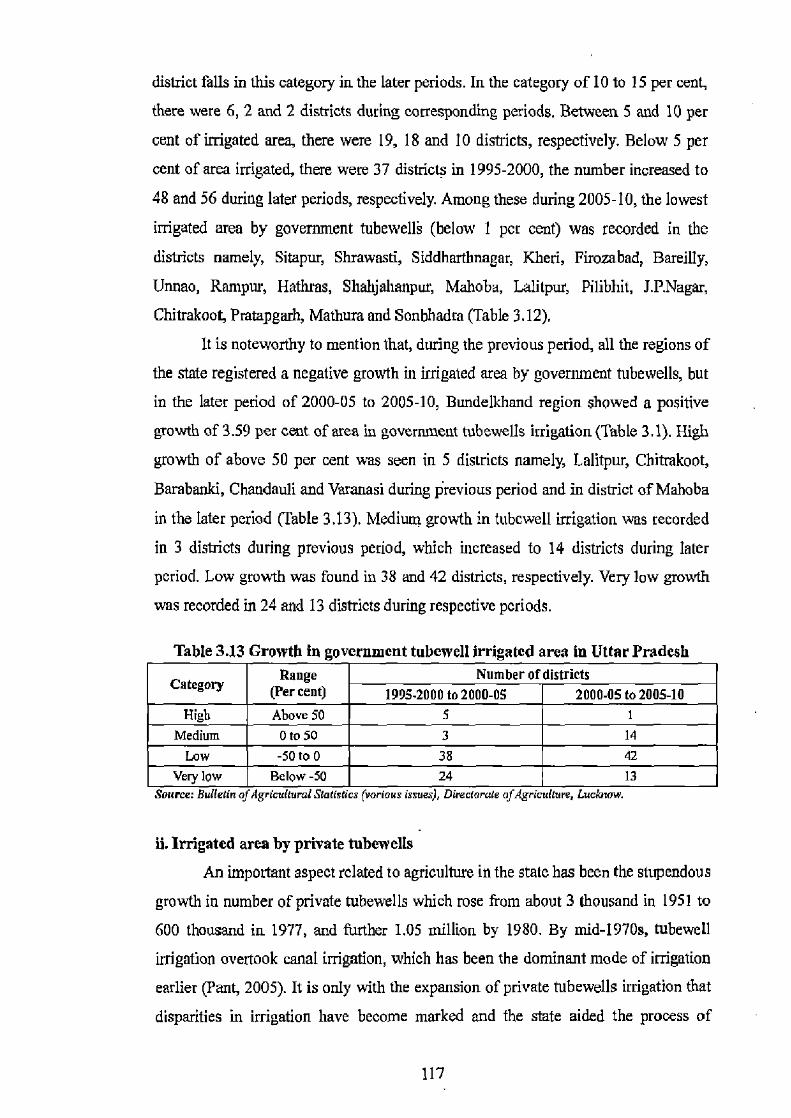
district falls in this category in the later periods. In the category of 10 to 15 per cent,
there were 6, 2 and 2 districts during corresponding periods. Between 5 and 10 per
cent of irrigated area, there were 19, 18 and 10 districts, respectively. Below 5 per
cent of area irrigated, there were 37 districts in 1995-2000, the number increased to
48 and 56 during later periods, respectively. Among these during 2005-10, the lowest
irrigated area by government tubewells (below I per cent) was recorded in the
districts namely, Sitapur, Shrawasti, Siddharthnagar, Kheri, Firozabad, Bareilly,
Unnao, Rampur, Hathras, Shahjahanpur, Mahoba, Lalitpur, Pilibhit, J.P.Nagar,
Chitrakoot, Pratapgarh, Mathura and Sonbhadra (Table 3.12).
It is noteworthy to mention that, during the previous period, all the regions of
the state registered a negative growth in irrigated area by government tubewells, but
in the later period of 2000-05 to 2005-10, Bundelkhand region showed a positive
growth of 3.59 per cent of area in government tubewells irrigation (Table 3.1). High
growth of above 50 per cent was seen in 5 districts namely, Lalitpur, Chitmkoot,
Barabanki, Chandauli and Varanasi during previous period and in district of Mahoba
in the later period (Table 3.13). Medium growth in tubewell irrigation was recorded
in 3 districts during previous period, which increased to 14 districts during later
period. Low growth was found in 38 and 42 districts, respectively. Very low growth
was recorded in 24 and 13 districts during respective periods.
Table 3.13 Growth in government tubewell irrigated area in Uttar Pradesh
Category Range (Per cent)
Number of districts 1995-2000 to 2000-05 2000-05 to 2005-10
High Above 50 5 1 Medium 0 to 50 3 14
Low -50 to 0 38 42 Very low Below -50 24 13
Source: Buaetiu of Agricultural S'tatis/ics (various issues), Directorate of Agr(cuaure, Luclamw.
ii. Irrigated area by private tubewells
An important aspect related to agriculture in the state has been the stupendous
growth in number of private tubewells which rose from about 3 thousand in 1951 to
600 thousand in 1977, and further 1.05 million by 1980. By mid-1970s, tubewell
irrigation overtook canal irrigation, which has been the dominant mode of irrigation
earlier (Pant, 2005). It is only with the expansion of private tubewells irrigation that
disparities in irrigation have become marked and the state aided the process of
117
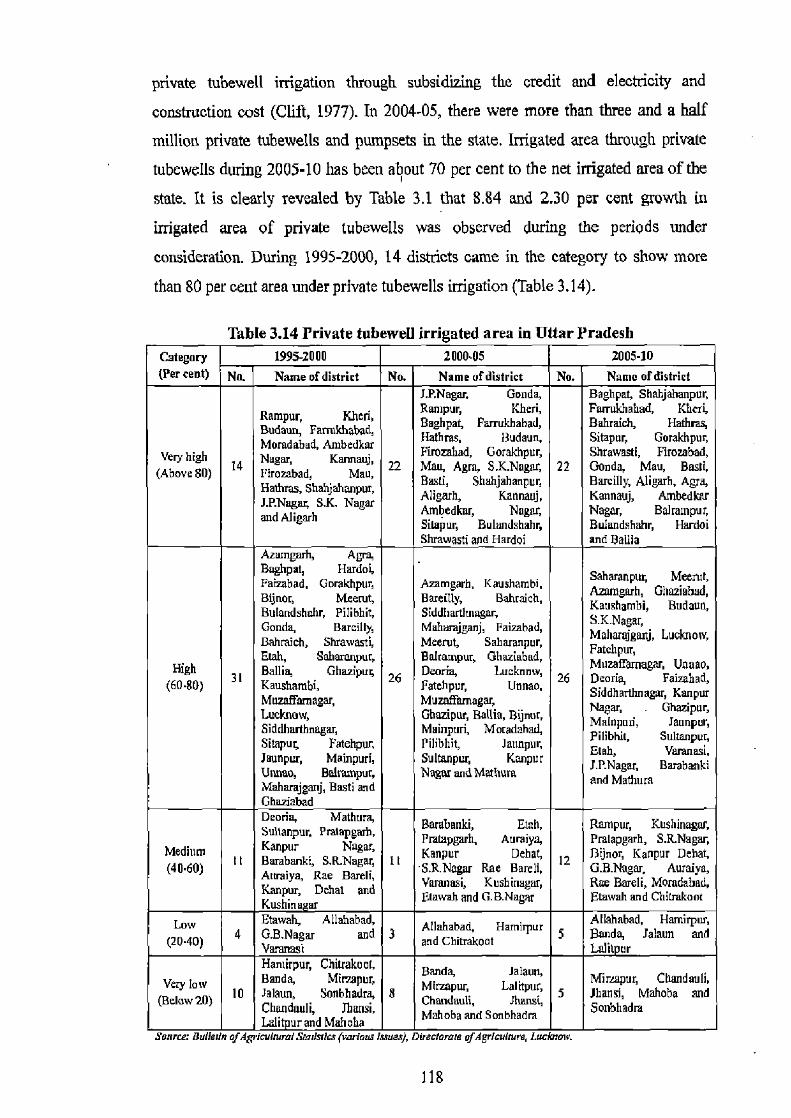
private tubewell irrigation through subsidizing the credit and electricity and
construction cost (CGft, 1977). In 2004-05, there were more than three and a half
million private tubewells and pumpsets in the state. Irrigated area through private
tubewells during 2005-10 has been about 70 per cent to the net irrigated area of the
state. It is clearly revealed by Table 3.1 that 8.84 and 2.30 per cent growth in
irrigated area of private tubewells was observed during the periods under
consideration. During 1995-2000, 14 districts came in the category to show more
than 80 per cent area under private tubewells irrigation (Table 3.14).
Table 3.14 Private tubewell irrigated area in Uttar Pradesh Category 1995-2000 2000.05 2005-10 (Per cent) No. Name of district No. Name of district No. Name ofdistriet
J.P.Nagar, Gonda, Baghpat, Shahjahanpur,
Rampur, Kheri, Ranrpur, Kheri, Farrukhabad, Kheri, Kherl Budaun, Fartuk Bughpat, Farrukhahad, Buhraich, Hathras,
Momdabad, Ambedkar Hffihres, 13udaun, Sitapur, Gorakhpuc Very high Nagar, Kibedka, Firozabad, Gorakhpur, Shrawasti, Firorsbad,
(Above 80) 14 Pirozabad, Mau, 22 Mau, Agra, S.K.Nagur, 22 Gonda, Mau, BasiL Basti, Shahjahanpur, Barcilly, Aligarh, Agra, Hathrac, ,, anpur,
1.P.Nagar S.K., S.K. Nagar Aligarh, Kannauj, Kannauj, Ambedkar andAligarh Ambedkar, Nagar, Nagar, Balrampur,
Silepur, Bulundshahry Bulandshahr, Hardoi Shrawastj and Hardoi and Gallia
Azamgarh, Agra, Bughpay Hardo4 Saharanpur, Meerut, Faizabad, Gmakhpur, Aumgarb, Kaushambi, qurngarh, Ghaziabad, Bijnor, Meenrt, Bareilly, Bahraich, Kaushambi, Budaun, Bulandshuhr, Pilibhit, Siddhartlmagar, 3K Gonda, Barcilly, Mahmajganj, Faiaabad, Mahar
arujga LucJmow, Bahraich, Shravasti, Meerut, Saharanpur, Fatchpur,
High E1ab, Saharanpur, Bahampur, Ghaziabad, Muzeffb
Mn¢at,umagn, 31 Ballia, Ghazipuy 26 Deoria, Lucknvw, 26
i abad, Fa'va (60-g0) Kaushambi, Fatehpur, Unnao, Siddha, p ur
Siddhvrllmegar, Kanpur Muvafsmagar, Muzaffemagay Nagar, Ghazipur, Lucknow, Ghazipur, Bettie, Bijnur, Mainpuri, Jaunpur, Siddharthnsgar, Mainpuri, Moradahad, Pilibhit, Sultanpur, Sitapur, Fatehpw, Pilibbit, Jaunpur, Etah, Varanasi, Jaunpur, Mainpuri, Sultanpur, Kanpur 1p.Nagaz, Barnhanki Unvau, Bu1nunpcs, Nagar and Mathuen and Mathura MH'ij2ar9, Basti and Ghaziabact Deoria, Mathura, Barabanki, Etah, Rampur, Kushinagar, Sultanpur, Pratapgarh, Pwmpgarh, Aumiya, Pralapgarh, S.R.Nagar,
Medium Kanpur Nagar, I3ijvor, KanpurDehat, (40.60) 11 Barabanki, S.R.Nagar, 11 Kanpur Derhealt
i 12 G.B. Nagar, A
Anraiyg, Rae Bareli, Rae Bagar, V Tana i Yatmlesi Kcskiinegra,
ra abad, Rae Bareli, Mod, Kanpur, Dehat and Ftawah and G.B.Nagar gtawah and Chitrakoot Kushina ar
Lour Etowah, Allababad, Allahsbsd, Harahpur Allahabad, Harm ur.
(20-40) 4 G.B.Nngnr and 3 and Chitrakoot 5 Banda, Jalaun and Varanasi Hamirpur, Chitrakaot, Banda, Jalaun,
Very low 4' Banda, Mirzapur, Mirzapur, Lalitpur, Mirzapur,Chandau1i,
79.2haud.
(Below 20) 10 Jalaun, Sonbhadra, 8 Chand.h, Jheavu, ihansioba and Chsndurlfi, fiaysi, Mahoba and sunbhxdm Lalitpurand Mahoba
Seise: Balkan ofAgricultumi starm(es (carious Issues), Directorate ojAgrlcuUUm, Luc.Vroiv.
118
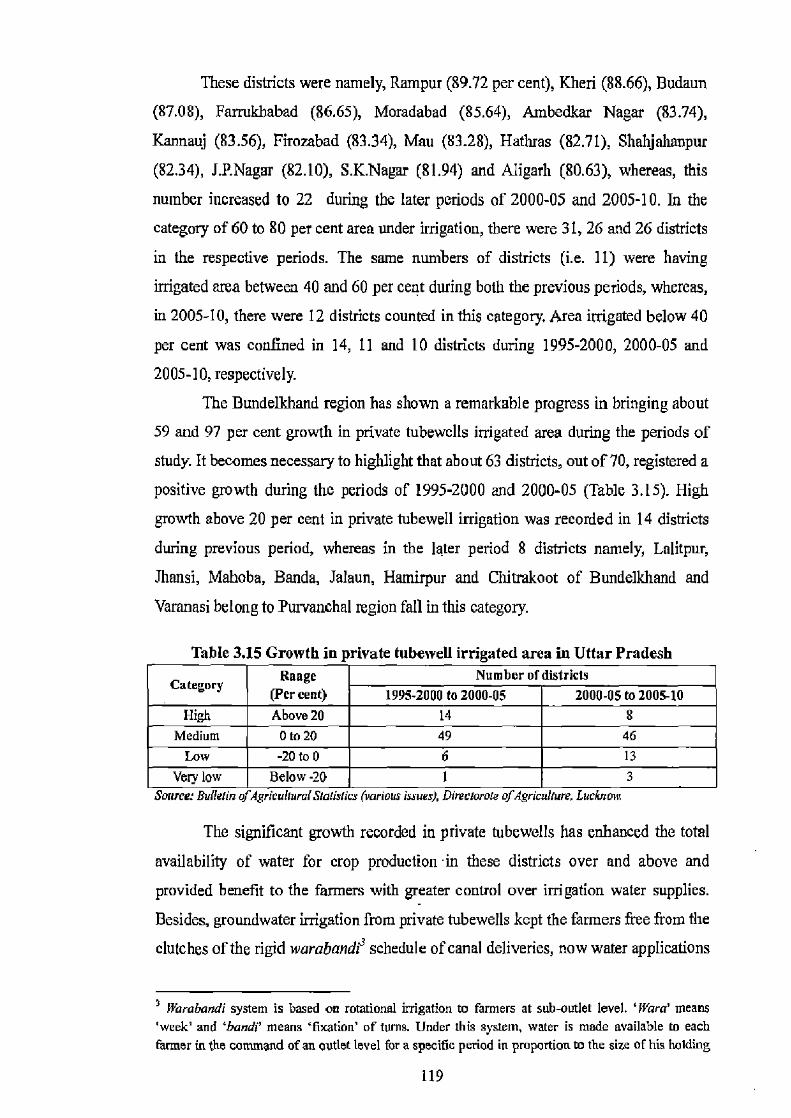
These districts were namely, Rampur (89.72 per cent), Kheri (88.66), Budaun
(87.08), Farrukbabad (86.65), Moradabad (85.64), Ambedkar Nagar (83.74),
Kannauj (83.56), Firozabad (83.34), Mau (83.28), Hathras (82.71), Shahjahanpur
(82.34), J.P.Nagar (82.10), S.K.Nagar (81.94) and Aligarh (80.63), whereas, this
number increased to 22 during the later periods of 2000-05 and 2005-10. In the
category of 60 to 80 per cent area under irrigation, there were 31, 26 and 26 districts
in the respective periods. The same numbers of districts (i.e. 11) were having
irrigated area between 40 and 60 per cent during both the previous periods, whereas,
in 2005-10, there were 12 districts counted in this category, Area irrigated below 40
per cent was confined in 14, 11 and 10 districts during 1995-2000, 2000-05 and
2005-10, respectively.
The Bundelkhand region has shown a remarkable progress in bringing about
59 and 97 per cent growth in private tubewells irrigated area during the periods of
study. It becomes necessary to highlight that about 63 districts, out of 70, registered a
positive growth during the periods of 1995-2000 and 2000-05 (Table 3.15). High
growth above 20 per cent in private tubewell irrigation was recorded in 14 districts
during previous period, whereas in the later period 8 districts namely, Lalitpur,
Jhansi, Mahoba, Banda, Jalaun, Hamirpur and Chitrakoot of Bundelkhand and
Varanasi belong to Purvanchal region fall in this category.
Table 3.15 Growth in private tubewell irrigated area in Uttar Pradesh
Category Range (Per cent)
Number of districts 1995-2000 to 2000-05 2000-05 to 2005-10
High Above 20 14 8 Medium 0 to 20 49 46
Low -20 to 0 6 13 Very low Below-20 I 3
Surive: Bulletin ofAgricuhuru1 Statistics (various roues), Direcforoie nf'Agricolture, Lucknow
The significant growth recorded in private tubewells has enhanced the total
availability of water for crop production in these districts over and above and
provided benefit to the farmers with greater control over irrigation water supplies.
Besides, groundwater irrigation from private tubewells kept the farmers free from the
clutches of the rigid warabandi schedule of canal deliveries, now water applications
Warabandi system is based on rotational irrigation to farmers at sub-outlet level. 'Mara' means 'week' and `bandi' means `fixation' of turns. Under this system, water is made available to each farmer in the command of an outlet level for a specific period in proportion to the sin of his holding
119
can be more closely matched according to the crop water needs (Dick, 1994).
Medium growth was found in 49 and 46 districts and low growth was recorded in 6
and 13 districts, respectively in the corresponding periods. Very low growth in 1995-
2000 to 2000-05 was recorded in the district of Sonbhadra, whereas during later
period, the districts of Moradabad, J.P.Nagar and Rampur belonged to this category
c. Irrigated area by other wells
Irrigation by other wells in the state showed positive growth of 40.61 and
25.11 per cent registering a very high growth in the central region (122.64 per cent)
during the periods of 1995-2000 to 2000-05 followed by the western region (57.23
and 53.72 per cent) during the respective periods (Table 3.1). The districts namely,
Jhansi (39.88 per cent), Lalitpur (37.42), Mahoba (35.87), Bijnor (21.34), G.B.Nagar
(20.52) had more than 20 per cent area under irrigation by other wells during 1995-
2000. The number of districts increased to 8 in the period 2000-05 by adding 3 more
districts namely, Hamirpur (24.88), Etah (24.74) and Moradabad (21.27), and in
2005-10 the number of districts increased to 11. There were 57, 47 and 49 districts of
the state in the category of below 5 per cent irrigated area under other wells in the
respective periods. The remaining districts belonged to in between the two ranges.
Out of total districts, 45 and 39 districts respectively have registered a significant
increase in irrigated area under other wells during the study periods of 1995-2000 to
2000-05 and 2000-05 to 2005-10, and rest of the districts showed decreasing trend.
d. Irrigated area by tanks
Tank irrigation is one of the oldest and significant sources of irrigation in
India (Palanisanvy and Balasubramanyan, 1998). Water obtained from tanks has
multiple uses, for drinking (rural and urban communities) and livestock, fish culture,
recharge of ground water, control of floods etc. (Gurunathan and Shamnugam, 2006).
This system has a special significance to marginal and small farmers who depend
solely on tank irrigation. Tanks in the Indian context inextricably linked to the socio-
cultural aspects of rural life and have historically been an indispensable part of the
village habitat, sustaining its socio-ecological balance (Sakthivadivel et a7, 2004).
However, tank irrigation has consistently declined since independence. This decline
and according to the schedule of turns of the farriers prepared in advance. In the year 1980-8I, Government of India established 45 Command Area Development Authorities (CADA) for 75 irrigation projects.
120
can be seen equally in the shape of decrease in the relative importance of tanks and
other modes of irrigation. At the same time today there is alarm, that these valuable
and extensive resources are in a state of near collapse, contributing to
increased drought vulnerability in some of the poorest districts in the country. The
reason for drastic reduction of area under tank irrigation might be the urban
agglomeration due to this, in different parts of the country; tanks situated near the
cities are encroached for housing and other non-agricultural purposes. This could be
one of the reasons for drastic reduction of area under tank irrigation in the state
(Narayanamoorthy, 2008).
Table 3.1 shows that, the percentage of tank irrigated area from the net
irrigated area during the periods of 1995-2000, 2000-05 and 2005-10. There exists an
insignificant proportion of tank irrigated area in the state being 0.71, 0.89 and 0.97
per cent during the corresponding periods, respectively. Overall growth in tank
irrigated area has 25.67 and 9.65 per cent, respectively during these periods. When
we consider the distrietwise situation, three districts namely, Basti (9.52), Gonda
(8.35) and Balrampur (7.38) during 1995-2000; five districts namely, Chitrakoot
(16.56), Lalitpur (12.87), Mahoba (12.78), Siddharthnagar (6.26) and Shrawasti
(5.16) during 2000-05, gained 5 per cent and above irrigated area by tanks. During
2005-10, the number of districts increased from 5 to 6 by adding Basti district in this
category, whereas, rest of the districts showed below 5 per cent area of irrigated by
this source.
Of the total of 70 districts, 30 and 20 districts, respectively recorded a
positive growth during 1995-2000 to 2005-10 and 2000-05 to 2005-10, and rest of the districts showed negative growth in tank irrigated area.
e. Irrigated area by other means (ponds and lakes etc.)
Irrigated area by other means accounted for only 2.22 per cent during 1995-
2000, and it further decreased to 0.93 and 0.41 per cent, respectively during 2000-05
and 2005-10 which is relatively very small in proportion to canals and tubewells
irrigated area. During 1995-2000, there were 10 districts namely, Lalitpur (24.81 per
cent), Mahoba (16.71), G.B.Nagar (15.65), Chitrakoot (13.75), Sitapur (11.46),
Bareilly (8.55), Budaun (7.95), Shahjahanpur (6.31), Jbansi (6.19) and Banda (5.54)
which bad above 5 per cent of area irrigated through this source. This extant
decreased to 2 districts namely, Lalitpur (11.51) and Mahoba (8.26) during the period
121
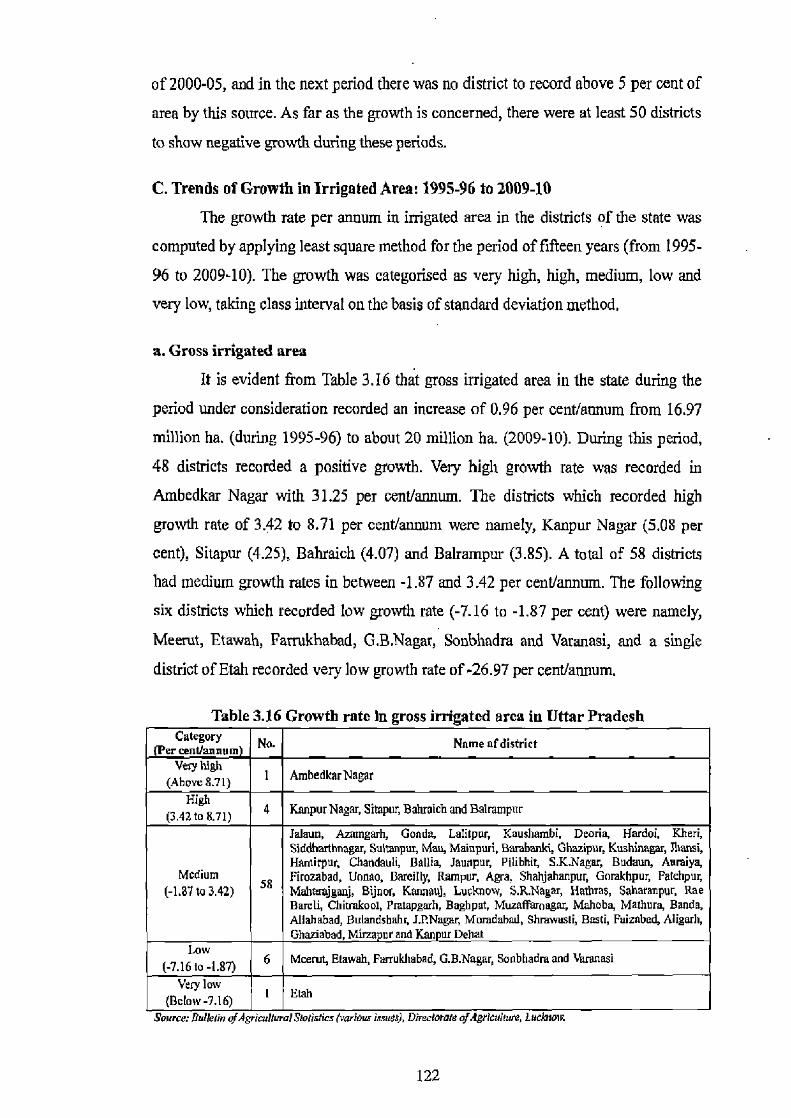
of 2000-05, and in the next period there was no district to record above 5 per cent of
area by this source. As far as the growth is concerned, there were at least 50 districts
to show negative growth during these periods.
C. Trends of Growth in Irrigated Area: 1995-96 to 2009-10
The growth rate per annum in irrigated area in the districts of the state was
computed by applying least square method for the period of fifteen years (from 1995-
96 to 2009-10). The growth was categorised as very high, high, medium, low and
very low, taking class interval on the basis of standard deviation method.
a. Gross irrigated area
It is evident from Table 3.16 that gross irrigated area in the state during the
period under consideration recorded an increase of 0.96 per cent/annum from 16.97
million ha. (during 1995-96) to about 20 million ha. (2009-10). During this period,
48 districts recorded a positive growth. Very high growth rate was recorded in
Ambedkar Nagar with 31.25 per cent/annum. The districts which recorded high
growth rate of 3.42 to 8.71 per cent/annum were namely, Kanpur Nagar (5.08 per
cent), Sitapur (4.25), Bahraich (4.07) and Balrampur (3.85). A total of 58 districts
had medium growth rates in between -1.87 and 3.42 per cent/annum. The following
six districts which recorded low growth rate (-7.16 to -1.87 per cent) were namely,
Meerut, Etawah, Farrukhabad, G.B.Nagar, Sonbhadra and Varanasi, and a single
district of Etah recorded very low growth rate of -26.97 per centlannum.
Table 3.16 Growth rate in gross irrigated area in Uttar Pradesh Category No. Name of district (Per cent/annum Very high
(Above 8.71) I AmbedkerNagar
High (3.42 to 8.71) 4 Kanpur Nagar, Simpur, Baluaich and Balrampur
Jalaun, Aemngarh, Gonda, Lalitpur, Kausharnbi, Deoria, Hardoi, Kheri, Siddharthnagar, Sultanpur, Mau, Mainpuri, Barabanki, Ghaaipur, Kushinegar, noresi, Harnirpur, Chandauli, Ballia, Jaunpur, Pilibhit, S.K.Nagar, Budaun, Aumiya,
Medium Firoaabad, Unnao, Bareilly, Rampur, Agra, Shahjahanpur, Gorakhpur, Fatchpur, (-1.37 to3.42) 58 Mahaaajgmj, Bijaor, Kannauj, Lucknow, S.R.Nagar, Hatbras, Saharanpur, Rae
Barcn, Chitmkout, Pratapgarh, Baghpat, Muzaffarnagar, Mahoba, Mathura, Bands, Allahabad, Bulandshahr, LPNagmq Momdabad, Shrewasti, Basti, Faizabad, Aligurh, Ghaziabad, Mirzapur and Kan ur Dehat
Low (-7.1610 -187) 6 Mrenrt, Elawah, Fmmkhabad, G.B.Nagar, Sontihadm and Varanasi
Very low (Below-7.16) I Gtah
Source: Ectle6n oJAgrrieathmQl Sofrstics (vmloca Issuea), Directorate ofAgticuhure, Lucbcam
122
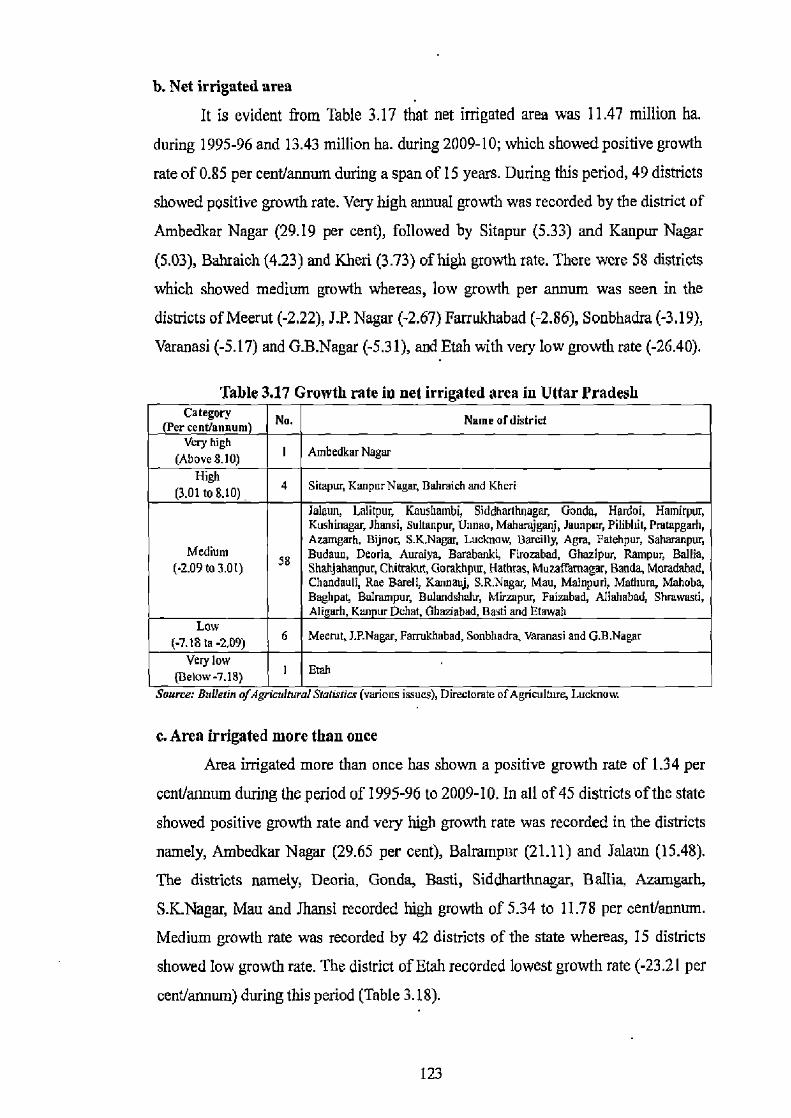
b. Net irrigated area
It is evident from Table 3.17 that net irrigated area was 11.47 million ha.
during 1995-96 and 13.43 million ha. during 2009-10; which showed positive growth
rate of 0.85 per cent/annum during a span of 15 years. During this period, 49 districts
showed positive growth rate. Very high annual growth was recorded by the district of
Ambedkar Nagar (29.19 per cent), followed by Sitapur (5.33) and Kanpur Nagar
(5.03), Bahraich (4.23) and Kheri (3.73) of high growth rate. There were 58 districts
which showed medium growth whereas, low growth per annum was seen in the
districts of Meerut (-2.22), J.P. Nagar (-2.67) Farrukhabad (-2.86), Sonbhadra (-3.19),
Varanasi (-5.17) and G.B.Nagar (-5.31), and Etah with very low growth rate (-26.40).
Table 3.17 Growth rate in net irrigated area in Uttar Pradesh (;.[.gory No. Name ofdhtrict er centl annuL Very high
I Ambedkar Nagar (Above 810) High
(3.01 t0 8.10) 4 Sitapur, KanpurNagar, Bahraich and Khcri Jalaun, Lalitpur, Kaushambi, Siddharthnagar, Gonda, Hardoi, Hamirpur, Kushinagar, )hansi, Sultanpur, Uaneo, Mehnmj8anj, Jaunpvr, PiIibhiy Pratapgarh, Azamgarh, Bijnor, S.K.Nagar, Lucknaw, hardily, Agra, Fatehpur, Saharanpur,
Medium 58
Budaun, Deoria. Auraiya, Barabanki, Pirombad. Ghazipur, Rampur, Ballia, (•2.09 to 3.01) Shahjahanpur, Chitrakut, Gorekhpur, Hathras, Muraffamagar, Banda, Moradabad,
Chandauli, Rae Bareli, Kannauj, S.R.Nagar, Mau, Mainpuri, Mathura, Mahoba, Baghpa4 Balmmpur, Bulandshahr, Mirzapur, Fai2abad, Allahebad, Shmwosti, Aligarh, Kanpur Dehat, Ghaziabad, Basti and Btawah FLow
6 Meerut, J.P.Nagar, Fanukhabad, Sonbhadra, Varanasi and G.B.Nagar (-17.18 to -2 09) ery low
I low-7.78) Enh ource: tRtlffitm of Agncltural itaMncc (Various ,SSUCS), VveCwm tc m AgnCuImcc, Luchnaw.
c. Area irrigated more than once
Area irrigated more than once has shown a positive growth rate of 1.34 per
cent/annum during the period of 1995-96 to 2009-10. In all of 45 districts of the state
showed positive growth rate and very high growth rate was recorded in the districts
namely, Ambedkar Nagar (29.65 per cent), Bahampur (21.11) and Jalaun (15.48).
The districts namely, Deoria, Gonda, Basti, Siddharthnagar, Ballia, Azamgarh,
S.K.Nagar, Mau and Jhansi recorded high growth of 5.34 to 11.78 per cent/annum.
Medium growth rate was recorded by 42 districts of the state whereas, 15 districts
showed low growth rate. The district of Etah recorded lowest growth rate (-23.21 per
cent/annum) during this period (Table 3.18).
123
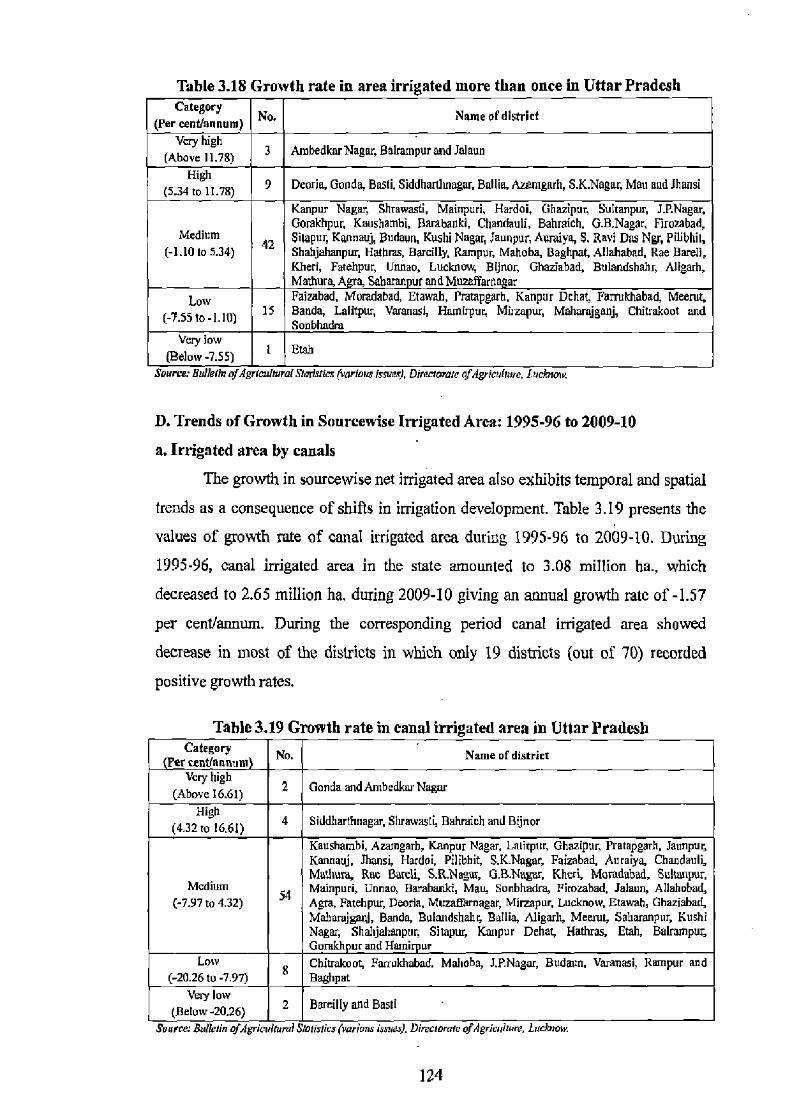
Table 3.18 Growth rate in area irrigated more than once in Uttar Pradesh Category
Na Name of district (Per cent/annum) Very high
(Above 11.78) 3 AmbedkarNagm, Bchampurand Jalaun
High (5.34 to 11.78) 9 Deoriu, Gonda, Belli, Siddhanlmagar, Ballio, Aztmgmh, S.K.Nagar, Mau and Jhansi
Kanpur Nagar, Shrawasti, Mainpuri, Hardoi, Ghazipur, Sultanpur, J.P.Nagar, Gorakhpur, Kaushambi, Barabanki, Chandauli, Bahreich, G.B.Nagar, Firozabad,
Medium 42
Simpuc Kapnauj, Budaun, Kushi Nagar, Jaunpur, Auraiya, S. Ravi Das Ngq Pilibhit, (-1.10105.34) Sbabjclmmpur, Halhms, Barcilly, Rampur, Mahoba, Baghpat, Allahabad, Rae Bareli,
Khen, Fatehpur, Unnao, Lucknow, Bijnor, Ghaziabad, Bulandshahr, Aligarh, Mathura, Aa, Saharan jr and Mu2affarna ar
Low Faizabad, Moradabad, Etawab, Prampgarh, Kanpur Dehat, Farrukdabad, Meerut, (-7.55 to.1.10) 15 Banda, Lalitpur Varanasi,Hnmirpur, Mirzapur, Mahamjganj, Chitrakoot and
Sonbhadra Very low
(Below 755) Etch
Source: uurrerm ofAgrlen/nmar smrtsncs pnriova isuer/, Diremmare ofdgricultwe, Luck me
D. Trends of Growth in Sourcewise Irrigated Area: 1995-96 to 2009-10 a. Irrigated area by canals
The growth in sourcewise net irrigated area also exhibits temporal and spatial
trends as a consequence of shifts in irrigation development. Table 3.19 presents the
values of growth rate of canal irrigated area during 1995-96 to 2009-10. During
1995-96, canal irrigated area in the state amounted to 3.08 million ha., which
decreased to 2.65 million ha. during 2009-10 giving an annual growth rate of -1.57 per cent/annum. During the corresponding period canal irrigated area showed
decrease in most of the districts in which only 19 districts (out of 70) recorded
positive growth rates.
Table 3.19 Growth rate in canal irrigated area in Uttar Pradesh Category
Per centlannum No. Name of district Very high
(Above 16.61) 2 Gonda and Ambedku Nagar
High (4.32 to 16.61) 4 Siddharthnagar, Slnaouti, Bahraich and Bijnor
Kaushambi, Azamgarh, Kanpur Nagar, Lalitpur, Ghazipur, Pratapgarh, Jaunpur, Kaunauj, Jhansi Hardoi, Pilibbit, S.K.Nagar, Faizabad, Auraiya, Chandauli, Mathura, Ran Barth, S.R.Nagar, G.B.Nagsr, Kheri, Moradabad, Sultanpur,
Medium 54
Mainpuri, Unrao, Barnbanki, Mau, Sonbhadra, Firozabad, Jalaun, Allehabad, (-7.97 to 4.32) Agra, Fatehpur, Deoria, MuzeIThrnagar, Mirzapur, Lucknow, Etawah, Ghaziabad,
Mahamjganj, Banda, Bulandshahr, Ballia, Aligarh, Meerut, Saharanpur, Kushi Nagar, Shalljahanpur, Silnpur, Kanpur Dehat, Hathras, Etah, Balrarnpur, Gonrkh ur and Hamirpur
Low 8
Chivakoot, Farrukhabad, Mahoba, J.P.Nagar, Budzun, Varanasi, Rampur and (-20.26 to-7.97) Baghpat
Very low (Below-20.26) 2 Bareilly and Bash i '
SonME rmtenn aJAgnunurni Jtaltsrre9 (varlvu sms/, Dircctorme gt dgr,cnIlure, LUcMOV..
124
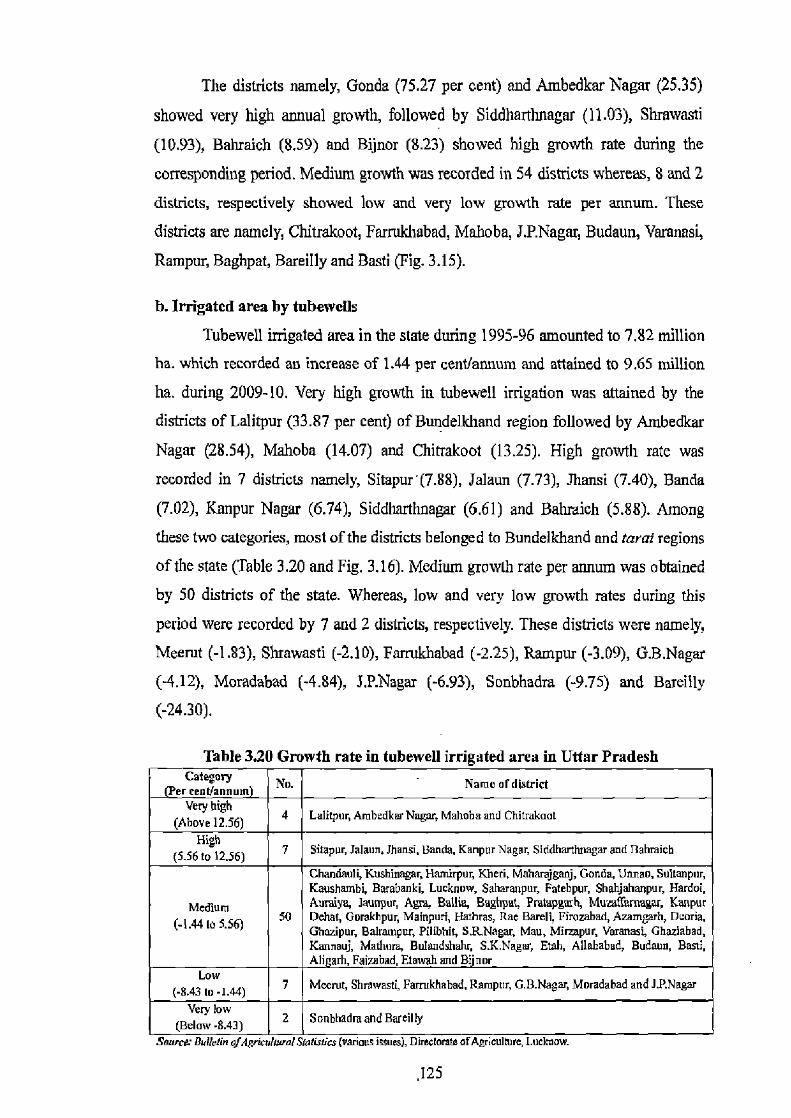
The districts namely, Gonda (75.27 per cent) and Ambedkar Nagar (25.35)
showed very high annual growth, followed by Siddhartlmagar (11.03), Shrawasti
(10.93), Bahraich (8.59) and Bijnor (8.23) showed high growth rate during the
corresponding period. Medium growth was recorded in 54 districts whereas, 8 and 2
districts, respectively showed low and very low growth rate per annum. These
districts are namely, Chitrakoot, Farnddtabad, Mahoba, J.P.Nagar, Budaun, Varanasi,
Rampur, Baghpat, Bareilly and Basti (Fig. 3.15).
b. Irrigated area by tubewells
Tubewell irrigated area in the state during 1995-96 amounted to 7.82 million
he. which recorded an increase of 1.44 per cent/annum and attained to 9.65 million
ha. during 2009-10. Very high growth in tubewell irrigation was attained by the
districts of Lalitpur (33.87 per cent) of Bundelkhand region followed by Ambedkar
Nagar (28.54), Mahoba (14.07) and Chitrakoot (13.25). High growth rate was
recorded in 7 districts namely, Sitapur (7.88), Jalaun (7.73), Jhansi (7.40), Banda
(7.02), Kanpur Nagar (6.74), Siddharthnagar (6.61) and Babraich (5.88). Among
these two categories, most of the districts belonged to Bundelkhand and tarsi regions
of the state (Table 3.20 and Fig. 3.16). Medium growth rate per annum was obtained
by 50 districts of the state. Whereas, low and very low growth rates during this
period were recorded by 7 and 2 districts, respectively. These districts were namely,
Meerut (-1.83), Shrawasti (-2.10), Farrukhabad (-2.25), Rampur (-3.09), G.B.Nagar
(-4.12), Moradabad (-4.84), J.P.Nagar (-6.93), Sonbhadra (-9.75) and Bareilly
(-24.30).
Table 3.20 Growth rate in tubewell irrigated area in Uttar Pradesh Category
ereent(annurn No. Name of district
Very high (Above 12.56) 4 Lalitpur, Ambedkar Nagar, Mahoba and Chitrakoot
High (5.56 to 12.56) 7 Sitapur, Jalaun, Jhansi, Banda, Kanpur Nagar, Siddharthnagar and Hahraich
Chandauli, Kushinagan Harnirpuq Kberi, Maharajganj, Gonda, Unnao, Sultanpor, Kaushambi, Barabanki, Lucknow, Saharanpur, Fatehpur, Shahjahanpur, Hardoi,
MeffIt1m Auraiya, Jaunpur, Agra, Balliq Baghpat, Pratapgach, Muwffarnag r, Kanpur
(-1.44 to 5.56) 50 Deha4 Gomkhpur, Mainpuri, Hathras, Rae Barra, Firozabad, Azamgarh, D oria, Ghazipur, Balrampur, Pilihit, S.R.Nagar, Mau, Mirzapur, Varanasi, Ghaziabad, Kannauj, Medium Bdandshahr, S.K.Negar, Etah, Allahabad, Budaun, Bast, Aligarh, Faizabad, Etawah and Minor
Low (-8.43 to .1.44) 7 Mcerut, Shrawasti, Farrukhabad. Rampnr, C.II.Nagar, Moradabad and 1.P.Negar
Very low (Below-8.43) 2 Sonbhadmand Bareilly
Soutt'L' Bulletin oJAgricu!Iwa15'thrlics (VAnou ues), lUW1IN9tt OtAAntU1a1ze, LUCknow.
125
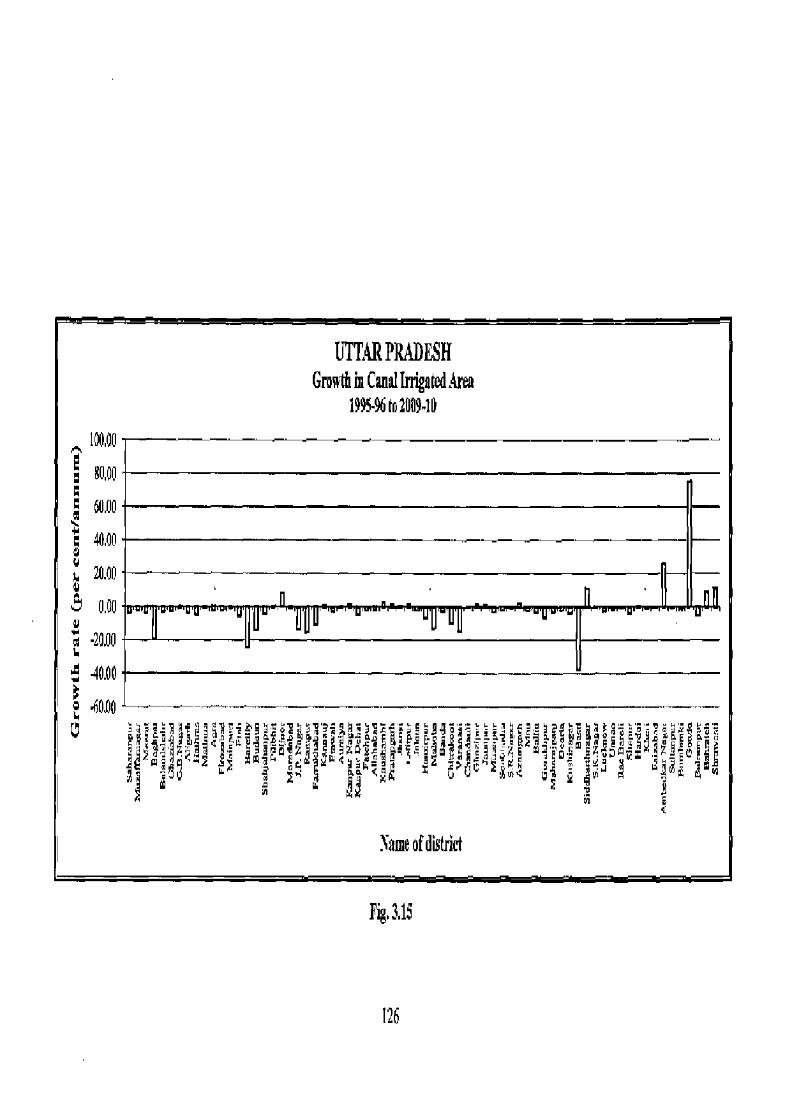
UTTAR PRADESH Growth m Canal Irrigated Area
1995.6to200945
100,00
~ 8400
WAO ~
a0A0 u w 7A.00
0.00 ri
•20.00
10.00
G ;L 9b{'
3~qi E_T]py JA PC' G e ~A P A AA9ili^~9L{~e E iA90.E'~3]~`s Ge ~i~ n Wd ~~ }A BJgg1 eg 4 C a9 y ? s~x[ +] 6~c gQ
m E
Same of district
Fie, 3,15
126

UTTAR PRADESH Growth in Tubowcll Irrigated Area
1995•96to2009.10
4U,00 - 30.00
10.00
5 0.00
-10.00
-20.00 - a ( •30.00 --
'Jq~~:
_.~ y., y OC~iL L L9 Oi Od L ymWO G P1CLL~.'i
d " a Name of district
Fig,3,16
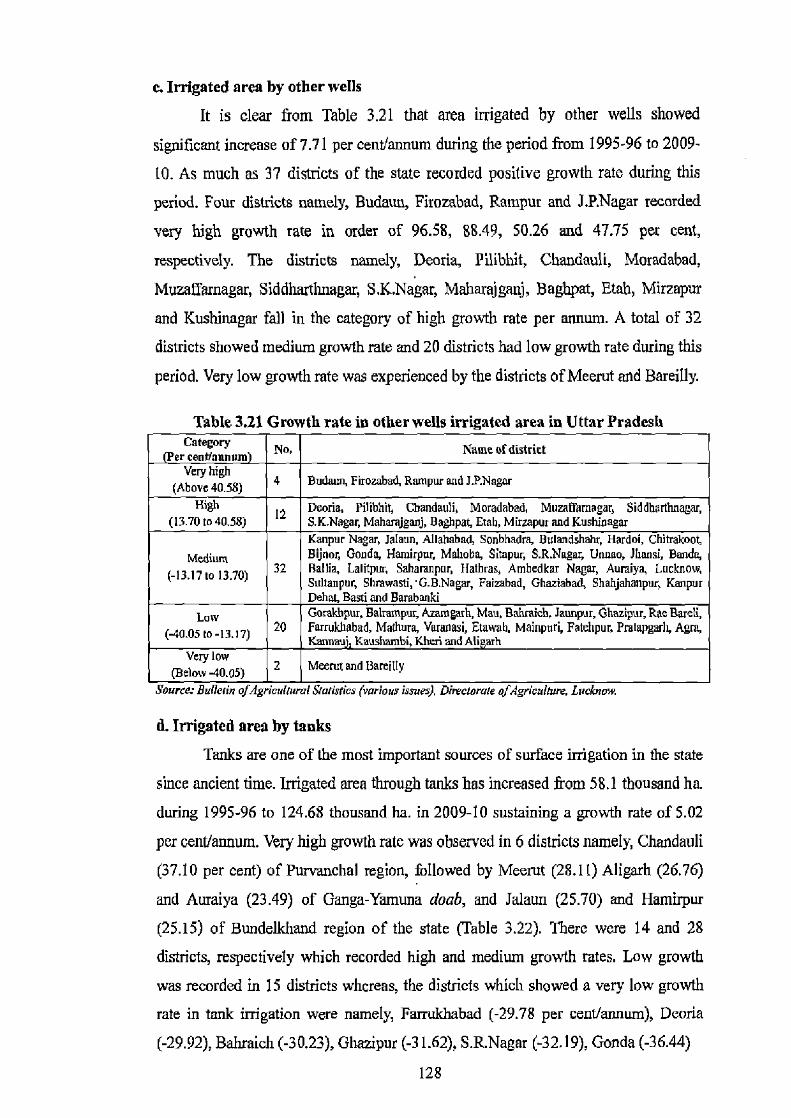
c. Irrigated area by other wells
It is clear from Table 3.21 that area irrigated by other wells showed
significant increase of 7.71 per cent/annum during the period from 1995-96 to 2009-
[0. As much as 37 districts of the state recorded positive growth rate during this
period. Four districts namely, Budaun, Firozabad, Rampur and J.P.Nagar recorded
very high growth rate in order of 96.58, 88.49, 50.26 and 47.75 per cent,
respectively. The districts namely, Deoria, Pilibhit, Chandauli, Moradabad,
Muzaffarnagar, Siddhartlmagar, S.K.Nagar, Maharajganj, Baghpat, Etah, Mirzapur
and Kushinagar fall in the category of high growth rate per annum. A total of 32
districts showed medium growth rate and 20 districts had low growth rate during this
period. Very low growth rate was experienced by the districts of Meerut and Bareilly.
Table 3.21 Growth rate in other wells irrigated area in Uttar Pradesh Category No. Name of district er cen Uannum Very high
(Above 40.58) 4 Buduuq Firozabad, Rampur and J.P.Nagar
High 12 Deoria, Pilibhit, Chandauli, Moradabad, Murafiamagar, Siddharthnagar,
(13.70 to 40.55) S.K.Nagar, Mahamjganj, Baghpat, Etah, Mirzapur and Kushinagar Kanpur Nagar, Jalaun, Allahabad, Sonbhadra, Bulandshaln, Hardoi, Chitrakoot,
med'a u Bijnor, Gonda, Hamirpur, Mehoba, Sitapur, S.R.Nagar, Unnuo, jhunst, Banda,
(-13.17 to 13.70) 32 eaIlia, Lalitpur, Saharanpur, 1lathras, Ambedkar Nagar, Auraiya, Lucknmq Sultaupur, Shrawasti, G.B.Nagar, Faizabad, Ghaziabad, Shahjahanpuy Kanpur Dehat, Basti and Barubanki
Law Gorakbpur, Balrampm, Ammgarh, Mau. Bahreich, Jaunpur, Ghazipur, Rae Barell, (-40.05 to-13.17) 20 Farrukhabad, Matwra, Varanasi, Etawah, Mainpuri, Fatelipur, Ptatapgarh, Agra,
Kannmi Kayshambi, Khcri and Aligarh Very low
(Below-00.05) 2 Meemt and Bareilly
Source: Bulletin of Agricultural statistics (various issues), Dimelorate of Agriculhue. Lucknaw.
d. Irrigated area by tanks
Tanks are one of the most important sources of surface irrigation in the state
since ancient time. Irrigated area through tanks has increased from 58.1 thousand ha.
during 1995-96 to 124.68 thousand ha. in 2009-10 sustaining a growth rate of 5.02
per cent/annum. Very high growth rate was observed in 6 districts namely, Chandauli
(37.10 per cent) of Purvanchal region, followed by Meerut (28.11) Aligarh (26.76)
and Auraiya (23.49) of Ganga-Yamuna doab, and Jalaun (25.70) and Hamirpur
(25.15) of Bundelkl and region of the state (Table 3.22). There were 14 and 28
districts, respectively which recorded high and medium growth rates. Low growth
was recorded in 15 districts whereas, the districts which showed a very low growth
rate in tank irrigation were namely, Farrukhabad (-29.78 per cent/annum), Deoria
(-29.92), Bahraich (-30.23), Ghazipur (-31.62), S.R.Nagar (-32.19), Gonda (-36.44)
128
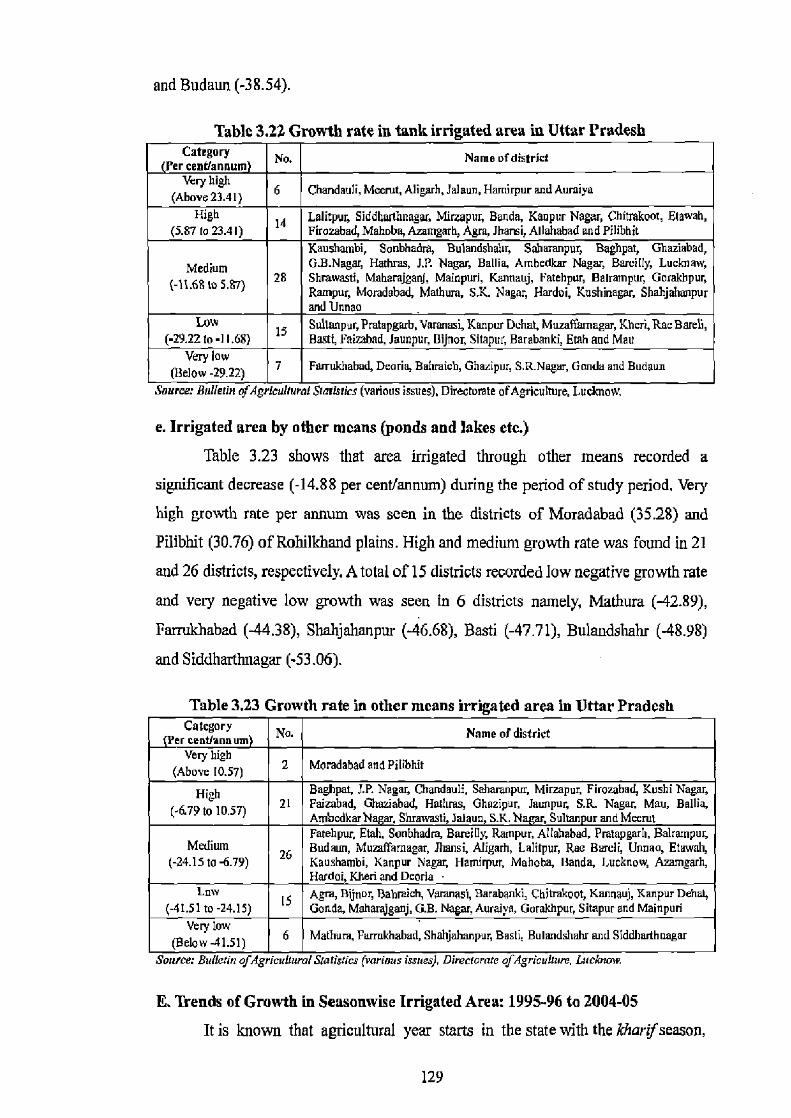
and Budaun (-38.54).
Table 3.22 Growth rate in tank irrieated area in Uttar Pradesh Category
(Per cont/annum) No. Name of district
Very high (Ahove23.41) 6 Chandauli, Meerut, Aligarh, Moor, Hamnpur and Aumiya
High 14
Lalitpur, Siddhaohnagw, Mirzapur, Banda, Kanpur Nagar, Chitrakoot, Elawah, (5.87 la 23.41) Firosabad,Malabo, Aremgarh,Agra, Jhansi, Allahabad and Pilibbit
Kaushambi, Sonbhadra, Bulandshahr, Saharanpur, Baghpat, Ghaziabad, Medium G.B.Nagar, Hathms, J.P. Nagar, Billie, Ambedkar Nagar, Bareilly, Lucknow,
(-t1.68 to 5.87) 28 Shrawasti, Maharnjganj, Mainpuri, Kannauj, Fatehpur, Balrampur, Gorakbpur, Rampur, Moradabad, Mathum, S.K. Nagar, Hardoi, Kushinagar, Shahjabunpur and Unnao
Law Sultanpur, Pratapgarh, Varanasi, Kanpur Dchat, Mazaffsmagar, Khcri, Rac Bareli, (-29.2210 -11.68) 15 Basti, Faizabad, Jaunpur, Bijnor, Sitapur, Barabanki, Etah and Mau
Very low (Below -29.22) 7 Farrukhabad, Deoria, Bahraich, Ghazipur, S.R.Nagw, Gonda and Budaun
Source: Mason ty Agricultural JhR5Ucs (various issues). Directorate of Agriciaire, LUCknow,
e. Irrigated area by other means (ponds and lakes etc.)
Table 3.23 shows that area irrigated through other means recorded a significant decrease (-14.88 per cent/annum) during the period of study period. Very
high growth rate per annum was seen in the districts of Moradabad (35.28) and Pilibhit (30.76) of Rohilkhand plains. High and medium growth rate was found in 21
and 26 districts, respectively. A total of 15 districts recorded low negative growth rate and very negative low growth was seen in 6 districts namely, Mathura (-42.89),
Parrukhabad (-44.38), Shahjahanpur (-46.68), Basti (-47.71), Bulandshahr (-48.98)
and Siddharthnagar (-53.06).
Table 3.23 Growth rate in other means irrigated area in Uttar Pradesh Category
(Per_teat/anmum) No. Name of district Very high
(Above 10.57) 2 Maradabad and Pilibhit
High Baghpet, J.P. Nagar, Chandaul, Saharanpur, Mirzapur, Firozabad, Kushi Nagar,
(-6.79 to 10.57) 21 Faizabad, Ghoziabad, Haeuus, Ghazipur, Jaunpur, S.R. Nagar Mau, Ballia, AmbcdkarN ar, Shrawasti, Johan, S.K. Nar, Suhan ur and Meerut Fatehpur, Etah, Sonbhadra, BareUly, Rmnpur, Allahabad, Pratapgarli, Balrampu4
Medium Budaun, Mumflhrnagar, Jhansi, Aligarh, Lalilpur, Rae Bureli, Unnao, Etowah, (-24.15 to-6.79) 26 Kaushaetbi, Kanpur Nagar, Hamirpur, Mahoba, Ilanda, Lucknow, Azamgarh,
Hardoi, Kheri and Deoria Low
15 Agra, Bijnor, Bahraich, Vomnasi, Barabanki, Chitrukoot, Kannauj, Kanpur Dehal,
(-41.51 to -24.15) Gonda, Maharajgenj, G.H. Nagar, Auraiva, Gorakhpur, Sitapur and Mainpuri Very low
(Below-41.51) 6 Mathura, Farrukhabad, Shahjahanpur, Bash. Bulandshahr and Siddhmthnagar
Sorrrce: Bulletin o/Agricullural Statistics (var(ous Issues). Directorate of Agrlcuaum, Lneknow,
E. Trends of Growth in Seasonwise Irrigated Area: 1995-96 to 2004-05 It is known that agricultural year starts in the state with the kharif season,
129
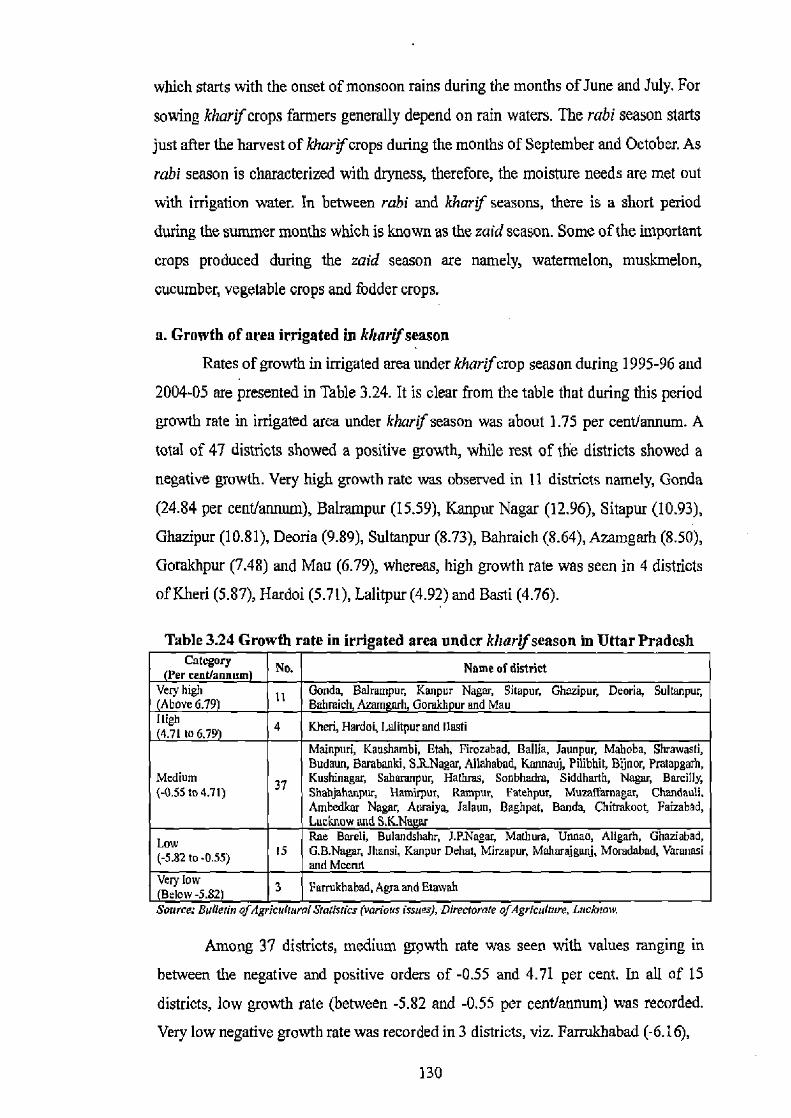
which starts with the onset of monsoon rains during the months of June and July. For
sowing kharif crops farmers generally depend on rain waters. The rabi season starts
just after the harvest of kharif crops during the months of September and October. As
rabi season is characterized with dryness, therefore, the moisture needs are met out
with irrigation water. In between rabi and kharif seasons, there is a short period
during the summer months which is known as the zaid season. Some of the important
craps produced during the zaid season are namely, watermelon, muskmelon,
cucumber, vegetable crops and fodder crops.
a. Growth of area irrigated in kltariifseason
Rates of growth in irrigated area under kharif crop season during 1995-96 and
2004-05 are presented in Table 3.24. It is clear from the table that during this period
growth rate in irrigated area under kharif season was about 1.75 per cent/annum. A
total of 47 districts showed a positive growth, while rest of the districts showed a
negative growth. Very high growth rate was observed in 11 districts namely, Gonda
(24.84 per cent/annum), Balrampur (15.59), Kanpur Nagar (12.96), Sitapur (10.93),
Ghazipur (10.81), Deoria (9.89), Sultanpur (8.73), Bahmich (8.64), Azamgarh (8.50),
Qorakhpur (7.48) and Mau (6.79), whereas, high growth rate was seen in 4 districts
of Kheri (5.87), Hardoi (5.71), Lalitpur (4.92) and Basil (4.76).
Table 3.24 Growth rate in irrigated area under kharif season in Uttar Pradesh
Category No. Name of district (Per cent/annum Very high Gonda, Balrampu; Kanpur Nagar, Silapur, Ghazipur, Deoria, Sultanpur, Above 6.79) Bahmich Azamgxirh, Gorakh ur and Mau
4.71 l 4.71
0 6.79) 4 Kheri, Hardoi, Einiipu[ and liasti Mainpuri, Kaushambi, Etah, Firozabad, ralila, Jaunpur, Mahoba, Shrawasli, Budaun, Barabanki, S.RNagar, Allahabad, Kunnauj, Pilibhit, Bijnor, Pratapgarh,
Medium 37 Kushinagar, Saharanpur, Halhms, Sonbhadm, Siddharth, Nag., Barcilly, (-0.55 to 4.71) Shabjahanpur, Ham rput, Rampur, Fatehpus, Muzaffarnagar, Chandauli,
Ambedkar Nagar, Aumiya, Jalaun, Baghpat, Banda, Chitrakoot Faizabad, Lucknow and SK.Nag Rae Bereli, Bulandshahr, LP.Nagar, Mathurs, Unnao, Aligarh, Ghaziabad,
-0.55) IS G.B.Nagar, Ihansi, Kanpur Dehat, Mirzapur, Maharajganj, Moradabad, Varmtasi and Mceml
Very low 3 Farrukhabad, Agra and Etowah Below-5.82 Source: Bulletin ofAgricultural Statistics (various issues), Directorate ofAgriculture, Lucknow.
Among 37 districts, medium growth rate was seen with values ranging in
between the negative and positive orders of -0.55 and 4.71 per cent. In all of 15
districts, low growth rate (between -5.82 and -0.55 per cent/annum) was recorded.
Very low negative growth rate was recorded in 3 districts, viz. Farrukhabad (-6.16),
130
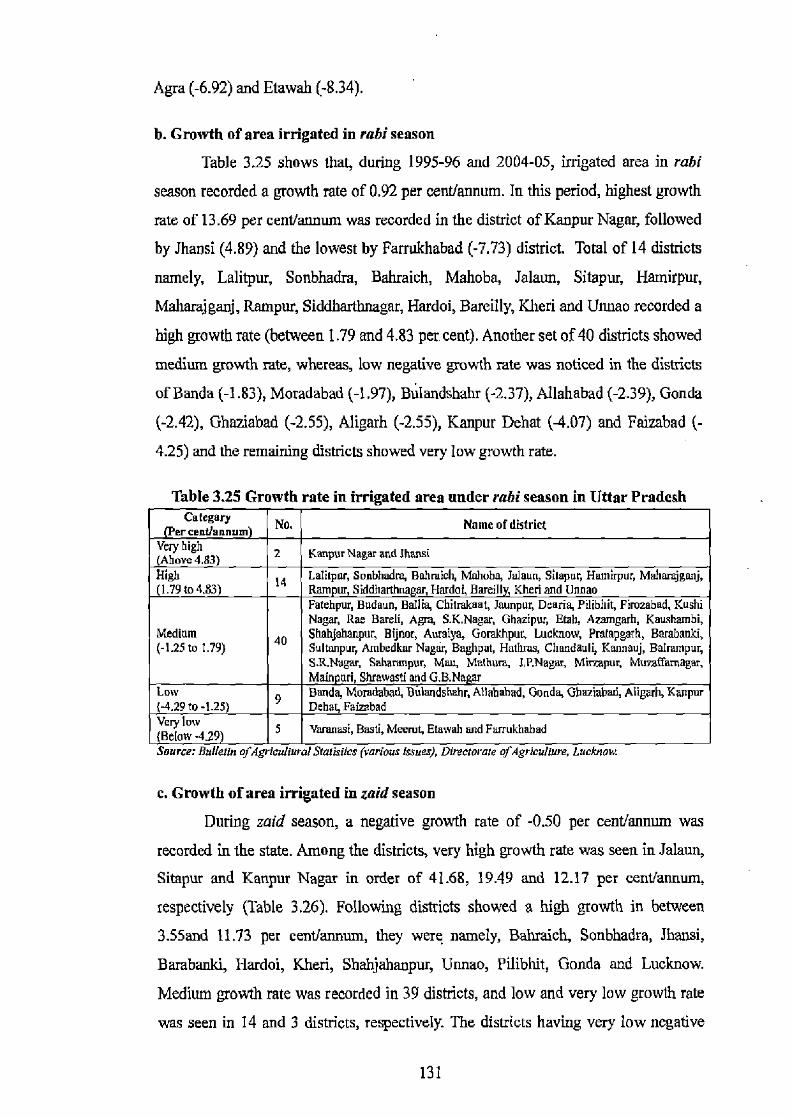
Agra (-6.92) and Etawah (-8.34).
b. Growth of area irrigated in rabi season
Table 3.25 shows that, during 1995-96 and 2004-05, irrigated area in rabi
season recorded a growth rate of 0.92 per cent/annum. In this period, highest growth
rate of 13.69 per cent/annum was recorded in the district of Kanpur Nagar, followed
by Jhansi (4.89) and the lowest by Fatrukhabad (-7.73) district. Total of 14 districts
namely, Lalitpur, Sonbhadra, Bahraich, Mahoba, Jalaun, Sitapur, Hamirpur,
Maharajganj, Rampur, Siddharthnagar, Hardoi, Barcilly, Kheri and tinnao recorded a
high growth rate (between 1.79 and 4.83 per cent). Another set of 40 districts showed
medium growth rate, whereas, low negative growth rate was noticed in the districts
of Banda (-1.83), Moradabad (-1.97), Bulandshahr (-2.37), Allahabad (-2.39), Gonda
(-2.42), Ghaziabad (-2.55), Aligarh (-2.55), Kanpur Dehat (-4.07) and Faizabad (-
4.25) and the remaining districts showed very low growth rate.
Table 3.25 Growth rate in irrigated area under rabi season in Uttar Pradesh Category
(Per cent/annum) No. Name of district
Very high (Above 4.83) 2 Kanpur Nagar andlharut
High 14 Lalilpur, Sonbhadra, Bahraich, Mahoba, Jalaun, Silapur, Hamirpur Maharajganj, (1.79 to 4.83 Rampur, Siddharthna sq Hardoi, Bareill , Kheri and Unnao
Fatehpur, Budaun, Ballia, Chitrakoot, Jaunpur, Deoria, Pilihhit, Firozabud, Kushi Nagar, Rae Bareh, Agrq S.K.Nagar, Ghazipur, Etah, Azamgarh, Kaushambi,
Medium 40 Shahjahanpur, Bijnor, Auraiya, Gorakhpur, Lucknow, Pratapgarh, Barabanii, (-1.25 to 1.79) Sultanpur, Ambedknr Nagar, Baghpat, Hathms, Chandauli, Kannouj, Bahampur,
S.R.Nagar, Saharanpur, Men, Mathure, I.P.Nagar, Mirzapur, Muzzffamagar, Main uri, Shrawasti and G.B.Nagnr
Low Banda, Moradabad, Bulandsha4r, Allahabad, Oonda, Ghaziabad, AIIgad~, Kanpur -4.29 to-1.25) Dehat, Faizabad Very )ow (Below-4.29) 5 Varanasi, Basti, Meerut, Etawah and Farrukhabad
Source: Bulletin oJAgrieuaural Statistics (various issues), Direetoi aie of Agriculture, Lucknow.
c. Growth of area irrigated in zaid season
During zaid season, a negative growth rate of -0.50 per cent/annum was
recorded in the state. Among the districts, very high growth rate was seen in Jalaun, Sitapur and Kanpur Nagar in order of 41.68, 19.49 and 12.17 per cent/annum,
respectively (Table 3.26). Following districts showed a high growth in between
3.55and 11.73 per cent/annum, they were namely, Babraich, Sonbhadra, Jhansi,
Barabanki, I-lardoi, Kheri, Shahjahanpur, Unnao, Pilibhit, Gonda and Lucknow.
Medium growth rate was recorded in 39 districts, and low and very low growth rate
was seen in 14 and 3 districts, respectively. The districts having very low negative
131
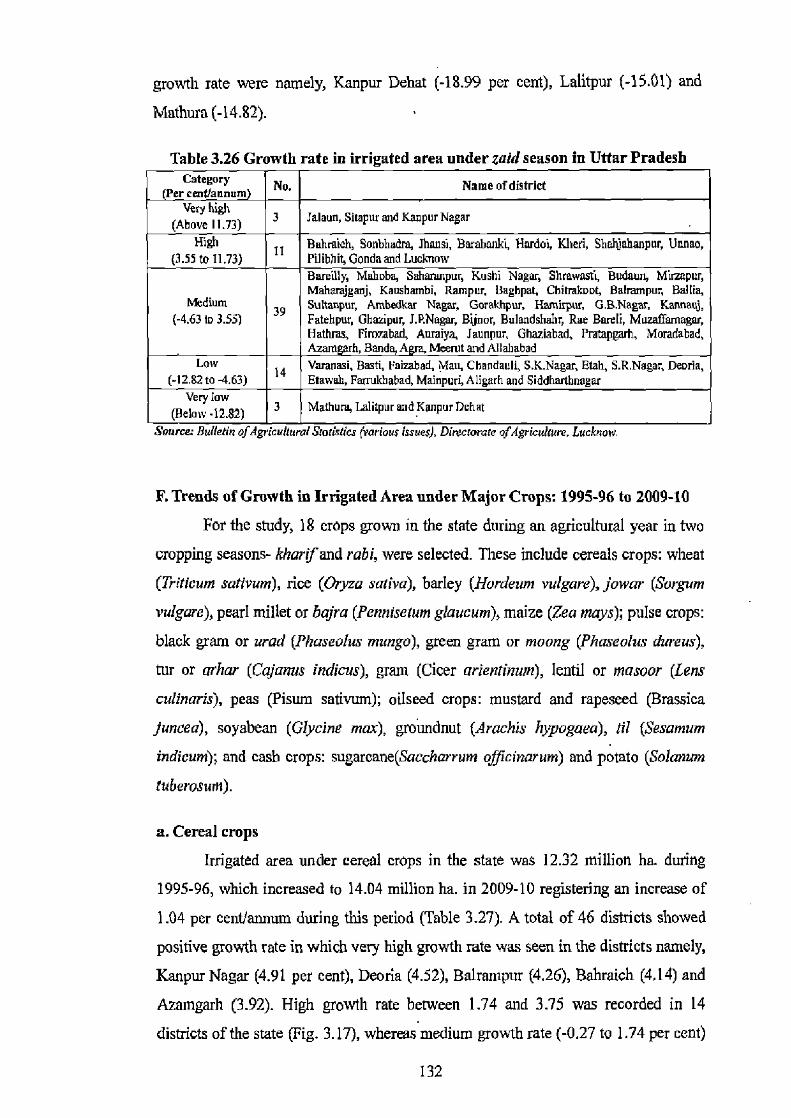
growth rate were namely, Kanpur Dehat (-18.99 per cent), Lalitpur (-15.01) and
Mathura (-14.82).
Table 3.26 Growth rate in irrigated area under Zaid season in Uttar Pradesh Category No. Name of district Per cent/annum Very high
(Above 11.73) 3 Jalaun, Simpur and Kanpur Nagar
High Buhraich, Sonbhudra, Jhansi, Barabunki, Hardoi, Kheri, Shahjahanpur, Unnao, (3.55 to 11.73) 11 Pilibhi4 Gonda and Luclmow
Bareilly, Maboba, Saharanpur, Kushi Nagur, Shrawasti, Budaun, Mirmpur, Maharejganj, Kaushambi, Romper, Baghpat. Chitmkoot, Balrampur, Ballia,
Medium 39 Suttanpur, Ambedkar Nagar, Gorakhpur, Hareirpur, G.B.Nagzr. Kannauj, (-4.63 to 3.55) Fatehpur, Ghazipur, J.P.Nugar, Bijnor, Bulandshahr, Rae Bareli, Muzaffarnagar,
Hathras, Fimrabad, Aumiya, Jaunpur, Ohaziabad, Pratapgady Moradabad, Azam rh, Band A Meerut and Allahzbad
Low 14
Varanasi, Basti, F me, aivzbad, M Chandauli, S.K.Nagar, Fish, S.R.Nagar, Deoria, (-12.8210 4.63) Etowah, Farrukhabad, Mainpuri, Aligarh and Siddharamagar
Very low (Below-12.82) 3 Mathura, Lalitpur and Kanpur Dchat
SCUMMC' Uuuettn of Agricullurai b(att#K5 (various issues). Dfrectoratc aJ Agriculture. Lucknow.
F. Trends of Growth in Irrigated Area under Major Crops: 1995-96 to 2009-10
For the study, 18 crops grown in the state during an agricultural year in two
cropping seasons- kharif and rabi, were selected. These include cereals crops: wheat
(Triticum sativum), rice (Oryza saliva), barley (Hordeum vulgare), jowar (Sorgwn
vulgare), pearl millet or bajra (Pennisetum glaucum), maize (Zea mays); pulse crops:
black gram or urad (Phaseolus mungo), green gram or moong (Phaseolus dureus),
tur or arhar (Cajanus indicus), gram (Cicer arientinuw), lentil or masoor (Lens
culinaris), peas (Pisum sativum); oilseed crops: mustard and rapeseed (Brassica
juncea), soyabean (Glycine max), groundnut (Arachis hypogaea), hi (Sesamum
indicum); and cash crops: sugarcane(Saccharrum officinarurn) and potato (Sola:um
tuberosum).
a. Cereal crops
Irrigated area under cereal crops in the state was 12.32 million he. during
1995-96, which increased to 14.04 million he. in 2009-10 registering an increase of
1.04 per cent/annum during this period (Table 3.27). A total of 46 districts showed
positive growth rate in which very high growth rate was seen in the districts namely,
Kanpur Nagar (4.91 per cent), Deoria (4.52), Balrampur (4.26), Bahraich (4.14) and
Azamgarh (3.92). High growth rate between 1.74 and 3.75 was recorded in 14
districts of the state (Fig. 3.17), whereas medium growth rate (-0.27 to 1.74 per cent)
132

was recorded in 32 districts of the state. Remaining two sets of 14 and 5 districts had
low and very low growth rate during this period (Table 3.26).
Table 3.27 Irrigated area under major crops in Uttar Pradesh (Percent)
Major crops 1995-2000 2 2005-10 Annual growth rate
Wheat 94.73 97.54 0.77 Rice 64.84 79.29 1.96 Pearl millet (bajra) 5.63 7.74 2.75 Maize 29.34 32.50 -1.53 Sorghum (jowar) 1.73 0.71 -5.62 Barley 59.94 69.01 -3.72 Cereal crops 73.75 82.19 1.04 Gram 16.18 14.73 -3.97 Lentil (masoor) 9.95 11.49 134 Black gram (urad) 22.01 12.58 -2.15 Pigeon pea (arhar) 12.60 14.07 13.21 -1.97 Peas 66.28 75.47 80.38 0.21 Green gram (moong) 75.97 58.51 50.86 -8.22 Pulse crops 25.49 23.84 23,57 -1.86 Mustard and Rapeseed 74.11 74.86 80.39 -1.38 Sesamum (iii) 0.77 0.53 D.53 3.25 Groundnut 0.97 1.12 2.36 0.96 Soyabean 121 1.09 1.01 -17.49 Oilseed crops 54.63 54.97 51.78 -1.36 Sugarcane Potato
89.22 90.31 92.82 0.86 99.40 99.60 99.77 227
Cash crops 91.02 91.89 94.14 1.13 Source: Bulletin ofAgricvltura( Statistics (various issues), Directorate ofAgricuffure, Lucknow.
Table 3.28 Growth rate in irrigated area of cereal crops in Uttar Pradesh Category No Name of district (Per cent/annum) Very high
(Above 3.75) 5 Kanpur Nagar, Deoria, Balmmpur, Bahraich and Aramgarh
High 14 Sitapur, Gonda, Siddharthngar,, falcon, Kaushambi, Hardoi, Mainpuri, Ebb, (1.74 to 3.75) Kushinagar, lalitpur, Bembanki, Jeunpur. oania and S.K.Nagar
Rampur, Goraklrpug Kheri, Shansi. Glrazipur, Sultanpur, Auraiys, Shahjahanpur, Medium Pilibhit, Budaun, Agra, Mau, Bareilly, Firombad, Maharajgsrnj, S.R.Nagac
(027 tot 74) 32 Chandauli, Unnao, Mathura, Ksnnauj, Hemnpur, Bijnor, Fatehpur, Arnbedkar Nagar, Pratapgazh, Hathros, Lucknow, Moradabad, Chitrakao4 Aligarh, Mahoba and Banda
Low 14 Shrawasii, Baghpm, BulunJshahr, Allahabad, Rae Bareli, Bashi, Kanpur Dehaq (-2.28 to -0.27) Faiezbad, JP.Nagar, Muzaffmmagay Ghaziabad, Saharanpur, Mirzapur, Etowah
Very low (Below-2.28) 5 Farrekhabad, Meerut, G.B.Nagar, Varanasi and Sonbhadra
Source: Bulletin aJAgricultural Statistics (various issues), Directorate Df4gritu7urre, Lucknow.
133
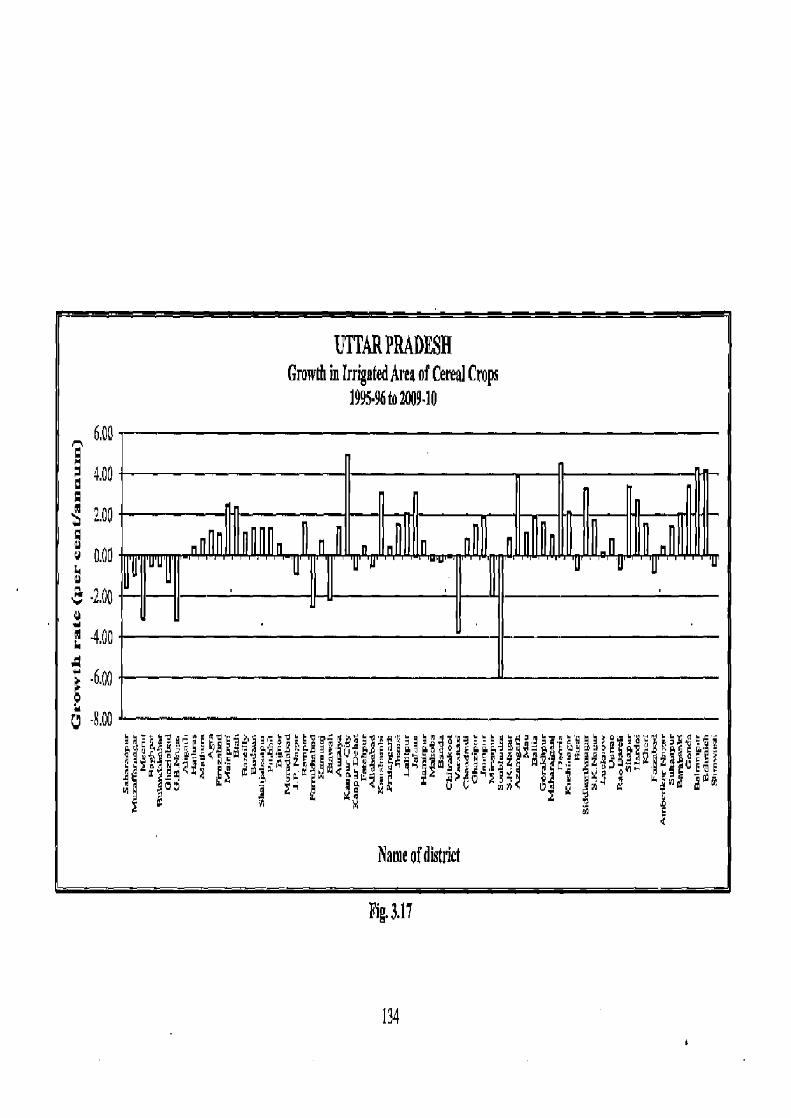
MARPRADESH Growth in Irrigated Area of Cereal Crops
1995.96 to 21g9.10
6,00
c4.00
?.00
.ktur w 0.00 *Ii W
.
' uu1D
V 8-2.30
~1 I00
" I
6.00
I~~a E~ iE h u H SVl V u 4~
Name of district
Fig. 3.17
134
The districts possessing very low growth rate were namely, Farrukhabad
(-2.54), Meerut (-3.16), G.B.Nagar (-3.19), Varanasi (-3.75) and Sonbhadra (-5.95).
As far as the percentage of crop-wise irrigated area to crop-wise cultivated area is
concerned, among cereal crops, wheat acquired strikingly high percentage to the
extent of 97.54 per cent under irrigation. Rice and barley had 79.29 and 69.01 per
cent irrigated area to the total crop area in the state during 2005-10. During 1995-
2000, irrigated area under these crops was in order of 94.73, 64.84 and 59.94 per
cent, respectively.
Wheat is the most irrigated crop and is grown in all the districts of the state
during rabi season. During 1995-2000, 2000-05 and 2005-10, there were 61, 66 and
65 districts, respectively which recorded above 80 per cent of irrigated area under
wheat. Out of which 17 districts acquired 100 per cent irrigated area under wheat
during the period 2005-10. In the next category of 70 to 80 per cent of area under
wheat irrigation, there were 4,2 and 4 districts whereas, in the next category of 60 to
70 per cent, there were 3 districts namely, Shrawasti, Bahraich and Mahoba during
1995-2000. During 2000-05, there has been a single district of Mahoba which was
included within this category. In the category of below 40 per cent, only the district
of Sonbhadra recorded very low irrigated area under wheat crop during period under
consideration.
Barley is also an important crop grown in rabi season in the state, and
registered above 80 per cent irrigated area in 21 districts during 1995-2000 and 27
and 33 in 2000-05 and 2005-10, respectively. Among these, the districts of Meerut,
Baghpat, Bulandshahr, Ohaziabad, G.B.Nagar, Aligarh, Hathras, Mainpuri and
Siddharthnagar registered 100 per cent irrigation during 2005-10. Most districts of
this category belonged to western parts of the state, including a few eastern districts
namely, Siddharthnagar, Azamgarh, Deoria, Ambedkar Nagar, Mau and Jaunpur.
During 1995-2000 and 2000-05, there were 13, 11 and 14 districts, respectively in
the category of 60 to 80 per cent of irrigated area in barley. There were 12 districts in
the next category of 40 to 60 per cent during 1995-2000 and 2000-05, but the number
of districts decreased to 6 during the later period. In 13, 10 and 8 districts, the
irrigated area in barley was 20 to 40 per cent. There were II, 10 and 9 districts which
accounted for below 20 per cent of area irrigated under barley crop respectively
during the corresponding periods of study.
135
Rice is an important crop grown in the state during kharif season. During
1995-2000, about 37 districts recorded very high irrigated area (above 80 per cent) to
the total area under the crop, and the number of districts increased to 47 and 52
during 2000-05 and 2005-10, respectively. Within this category, 7 districts namely,
Meerut, Baghpat, Bulandshahr, Ghaziabad, G.B.Nagar, Etawah and Auraiya recorded
100 per cent irrigated area during 2005-10. Within the range of 60 to 80 per cent of
area irrigated, there were 10 districts during 1995-2000, but the number of districts
decreased to 6 and 2 during later periods, respectively. In the next category of 40 to
60 per cent, there were 8 districts during 1995-2000, the number of districts further
decreased to 2 and 4 in the next periods. The number of districts with irrigated area
below 20 per cent was 15 and 13 during 1995-2000 and 2000-05, and 8 districts
namely, Chitralsoot, Bahmichy S.K.Nagar, Shrawasti, Maharafiganfi, Mahoba, Lalitpur
and Siddharthnagar fall in this category during 2005-10.
Maize is also an important kharif season crop which secured 29.34, 30.12 and
32.5 per cent irrigated area to its total cropped area in the state during 1995-2000,
2000-05 and 2005-10, respectively. During the period of 2005-10, there were 14
districts namely, Meerut (100 per cent), Baghpat (100), Bulandshahr (100),
Ghaziabad (100), G.B.Nagar (100), Hathras (99.95), Mainpuri (97.98),
Muzaffamagar (96.05), Aligarh (94.10), and Etah (91.83), Mathura (89.15), Etawah
(85.20), Firozabad (82.73) and J.P.Nagar (81.27) of west U.P., which accounted for
more than 80 per cent of irrigated area under maize as compared to number of
districts as 8 and 10 , respectively during the previous periods. There were 4, 7 and 4
districts in the category of 60 to 80 per cent irrigated area, whereas, 7, 6 and 3
districts, respectively, which received irrigation on 40 to60 per cent area under maize
crop in the respective periods. In the next category of 20 to 40 per cent, the number
of districts was in order of 8, 6 and 9, respectively. Below 20 per cent of irrigated
area was seen in 43, 41 and 40 districts of the state, respectively.
Annual growth rates in cropwise irrigated area during the period of 1995-96
to 2009-10 are presented in Appendix B. It is noticed that, bajra, rice and wheat
showed a positive growth rate of 2.75, 1.96 and 0.77 per cent/annum during study
period, whereas, negative growth rate was seen in irrigated area of maize (-1.53 per
cent), jowar (-5.62) and barley (-3.72). Bajra is a rain-fed crop which registered
very high annual growth rate (above 15.95 per cent) in irrigated areas of 6 districts
namely, Auraiya (27.59), Kannauj (25.53), Kanpur Nagar (23.98), Firozabad (19.36),
136
Shahjahanpur (18.69) and Agra (17.64). In the next category of growth ranging
between 6.01 and 15.95 per cent/annum, there were 7 districts namely, Budaun,
J.P.Nagar, Etah, Hathras, Etawah, Mainpuri and Azamgarh, which recorded high
growth rate. Medium growth rate was visible in nearly 48 districts of the state. Low
growth rate was recorded in 4 districts and very low growth mte was attained by the
districts namely, G.B.Nagar (-14.28), Ghaziabad (-17.43), Meerut (-20.38), Kanpur
Dehat (-23.25) and Allahabad (-29.62).
Though rice is a kharif season crop, still it recorded a high irrigated area
during the period of 1995-96 to 2009-10. Irrigated area under rice showed a positive
growth of 1.96 per cent/annum during this period. The districts namely, Balrampur
(53.55), S.K.Nagar (51.67), Gonda (30.27) and Deoria (23.78) recorded a very high
growth of above 20.07 per cent/annum. The districts showing high growth from 9.04
to 20.07 per centlannum namely, were Agra, Hathras, Bulandshahr, Gorakhpur,
Babraich, Aligarh and Azamgarh. Medium growth rate were found in 46 districts.
Low growth rate was confined to 12 districts and very low growth rate in the district
of Siddharthnagar (-20.05).
Out of 70 districts of the state, wheat recorded a positive growth rate in 47
districts. Very high growth rate of above 2.89 per cent was recorded in 4 districts
namely, Kanpur Nagar (5.00), Bahraich (3.91), Siddharthnagar (333) and Jalaun
(3.14). High growth rate was achieved by 17 districts, whereas, medium and low
growth was attained by 33 and 9 districts, respectively. The districts having very low
growth rate of below -2.11 per cent were namely, Mirzapur, Basti, G.B.Nagar,
Meerut, Varanasi, Farrukhabad and Mau.
b. Pulse crops
Growth of irrigated area under pulse crops can be examined from Table 3.29
and Fig. 3.18. It is quite clear that irrigated area under pulse crops during the year
1995-96 was 0.78 million ha., which decreased to the tune of -1.86 per cent/annum
and reached to 0.52 million ha. in 2009-10. Very high growth rate (above 2.75) was
seen in 7 districts namely, Banda (6.30), Kanpur Nagar (5.46), Hardoi (4.26),
Lalitpur (4.20), Fatehpur (3.62), Kaushambi (3.62) and Chitrakoot (3.48). High and
medium growth rate per annum was recorded in Ii and 33 districts, respectively
during the study period. Low growth rate was seen in 16 districts and a very low
growth in Gonda, Agra and Shrawasti districts with -10.72, -12.00 and -15.34 per
137
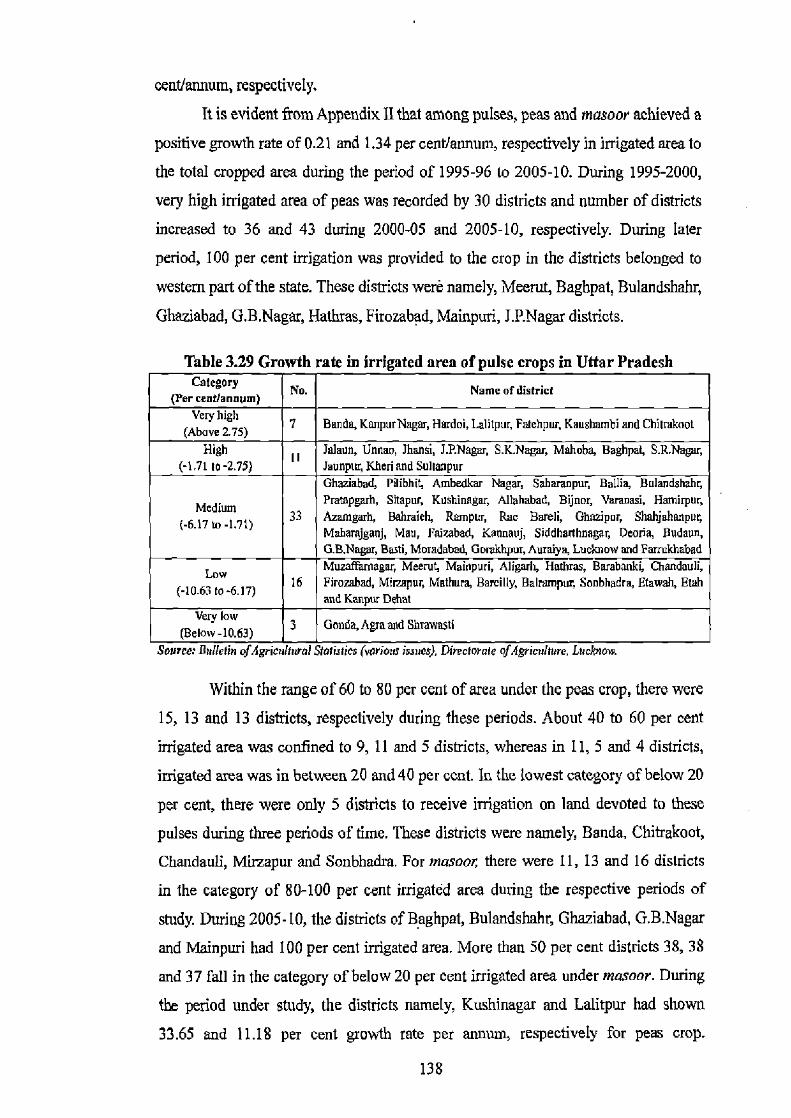
aeat/annum, respectively.
It is evident from Appendix II that among pulses, peas and masoor achieved a
positive growth rate of 0.21 and 1.34 per cent/annum, respectively in irrigated area to
the total cropped area during the period of 1995-96 to 2005-10. During 1995-2000,
very high irrigated area of peas was recorded by 30 districts and number of districts
increased to 36 and 43 during 2000-05 and 2005-10, respectively. During later
period, 100 per cent irrigation was provided to the crop in the districts belonged to
western part of the state. These districts were namely, Meerut, Baghpat, Bulandshahr,
Ghaziabad, G.B.Nagar, Hathras, Firozabad, Mainpuri, J.P.Nagar districts.
Table 3.29 Growth rate in irrigated area of pulse crops in Uttar Pradesh Category No. Name of district (Per cult/annum) Veryhigh
(Above 2.75) 7 Banda, KanpurNagar, Hardoi, Lalitpur, Falehpuq Kaushambi and Chitrakoot
High Jalaun, Unnat .Rani, J.P.Nagm, S.K.Nagar, Mahoba, Baghpat, S.R.Nagm, (-171 to -2.75) Jaunpur Kheri and Sultanpur
Ghaziabad, Pilibhit Ambedkar Nagar, Saharanpur, Ballia, Bulandshahr,
Medium Pratop€arh, Sitapur. Kushinagar, Allahabad, Bijnor, Varanasi, Hamirpur
(-6.17 to-1.71) 33 Azamgarh, Bahmieh, Rampur, Rae Bareli, Ghraipur, Shnhjahenpur, Maharajganj, Mau, Faizabad, Kannauj, Siddhanhnagg Deena, Budaun, QB.Nagm, Basti, Mmadabad, Gomkhpur, Aursiya, Lucknow and Farrukhabad
Low Muzaffarhagar, Meerut, Mainpuri, Aligarh, Hathras, Bare6.onkb Chandauli,
(-10.63 to-6.17) 16 Firozahad, Miimpur, Mathura, Barcilly, Ralrampur, Sonbhadra, Etawah, Etah and Kanpur Dehat
Very low 3 Gonda, Agmznd 5hrmvasti (Below-10.63)
Source: Bulletin ofAgrieultura! Statisties (various issues), D(zectozuIe DEAaziadrure, Lvcknow.
Within the range of 60 to 80 per cent of area under the peas crop, there were
15, 13 and 13 districts, respectively during these periods. About 40 to 60 per cent
irrigated area was confined to 9, 11 and 5 districts, whereas in 11, 5 and 4 districts,
irrigated area was in between 20 and 40 per cent. In the lowest category of below 20
per cent, there were only 5 districts to receive irrigation on land devoted to these
pulses during three periods of time. These districts were namely, Banda, Chitrakoot,
Chandauli, Mirzapur and Sonbhadra. For mascot, there were 11, 13 and 16 districts
in the category of 80-100 per cent irrigated area during the respective periods of
study. During 2005-10, the districts of Baghpat, Bulandshahr, Ghaziabad, G.B.Nagar
and Mainpuri had 100 per cent irrigated area. More than 50 per cent districts 38, 38
and 37 fall in the category of below 20 per cent irrigated area under masoor. During
the period under study, the districts namely, Kushinagar and Lalitpur had shown
33.65 and 11.18 per cent growth rate per annum, respectively for peas crop.
138
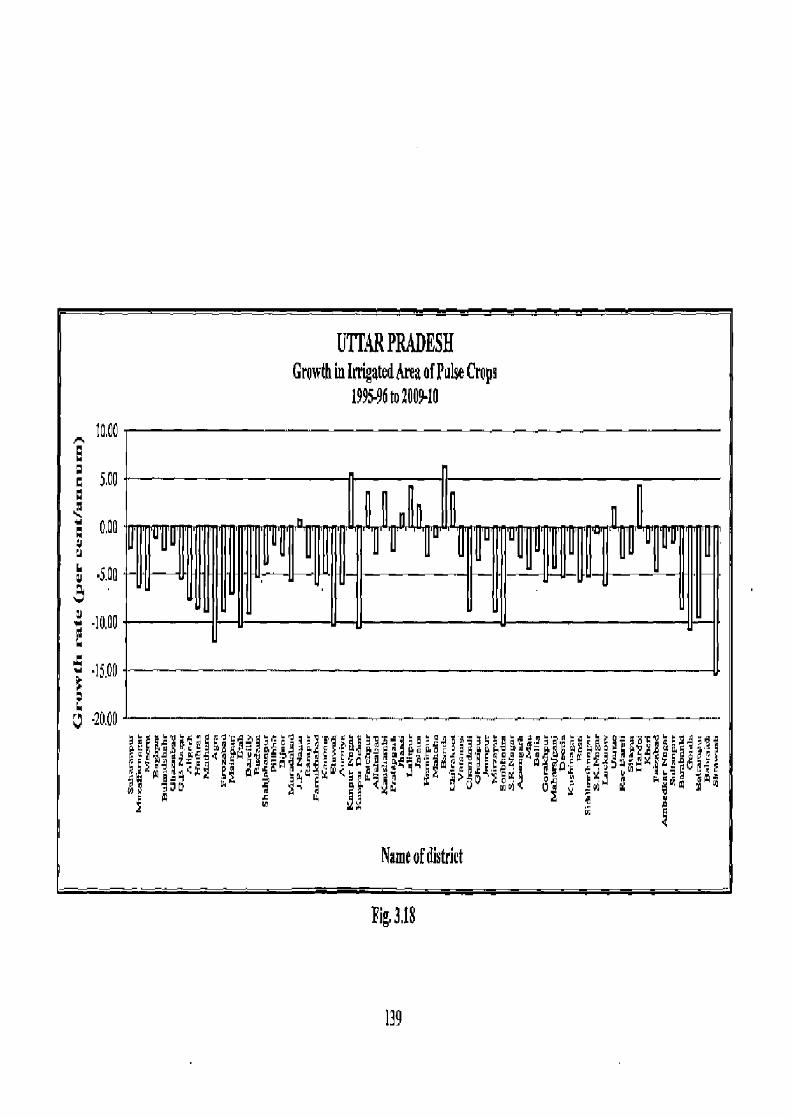
UTTAR PRADESH Growth in Irrigated Area of Pulse Crops
MR
199596 to 20U910
p. E
5.00 ii M
"q 0.00 _______ H II U fllrDju.fuip.
U
TF
gil. m f ii L jjU' jJ ''!f! •S.Q~ yy
-- •150U
,y5LC F O •n P6 T ~PS Gya4~! Tg0 ]qIcf' p5
]5'0~~3~Y~Fn~~A ~iS i"g
.F ~c .Fi~]~_y ~OC4p C:Y']''SJi
Nn ~JI1 " I
N p[
Name of district
Fig. 3.18
139
A total number of 18 districts had shown a high growth rate. Medium growth was
recorded in 31 districts, whereas low growth rate was seen in 12 districts and very
low in 7 districts. These districts were namely, Etawah, Aligarh, Auraiya, Hathras,
Baghpat, Mathura and Etab.
The districts of Kushinagar (36.97) and Unnao (14.28) recorded very high
growth in masoor during this period. A good number of districts (43) recorded
medium growth. In 10 districts low growth rate was seen and 4 districts namely,
Mirzapur, Allahabad, Shrawasti and Sonbhadra were characterized very low growth.
Among other pulses, moong recorded a negative growth rate of -8.22 per centlannum
in irrigated area, as compared to gram (-3.97), urad ( -2.15) and arhar (-1.97). In
case of gram, 6 districts namely, Mahoba, Faizabad, Banda, Hamirpur, Kushinagar
and Chitrakoot recorded very high growth of above 2.97 per centlannum. I-ligh and
medium growth rate was recorded by 17 and 26 districts, respectively. Whereas, low
and very low growth rate was seen in 16 and 5 districts, respectively. During the
study period, 25 and 10 districts respectively showed a positive growth rate for urad
and arhar crops.
c. Oilseed crops
Table 3.30 showed that irrigated area under oilseeds also recorded negative
growth rate of -1.36 per centlannum from 1995-96 to 2009-I0. Out of 70 districts of
the state, 42 districts showed negative growth rates. The districts of Lalitpur (25.12
per cent) and Bijnor (8.03) showed very high growth rate (Fig. 3.19). High growth
rate was seen in 16 districts, whereas medium growth rate was in 36 districts of the
state. Low growth rate was recorded in 14 districts namely, Chandauli, Balrampur,
S.R.Nagar, Mirzapur, Varanasi, Aligarh, Firozabad, Farrukhabad, Banda, Rampur,
Hathras, G.B.Nagar, Chitrakoot and Allahabad. The districts of Shrawasti and
Sonbhadra were characterized with negative growth of -14.56 and -20.82 per cent.
Among oilseed crops, mustard and rapeseed acquired the highest irrigated
area in the state with 74.11, 74.86 80.39 per cent during the periods of 1995-2000,
2000-05 and 2005-10, respectively followed by groundnut, soyabean and ill with
2.36, 1.01 and 0.53 per cent of area irrigated, respectively during the later period. In
case of mustard and rapeseed, as many as 35, 37 and 43 districts, respectively
recorded 80 per cent and above area under irrigation. In the next categories of 60 to
80 per cent and 40 to 60 per cent of irrigated area, there were 13, 15 and 7 districts
140
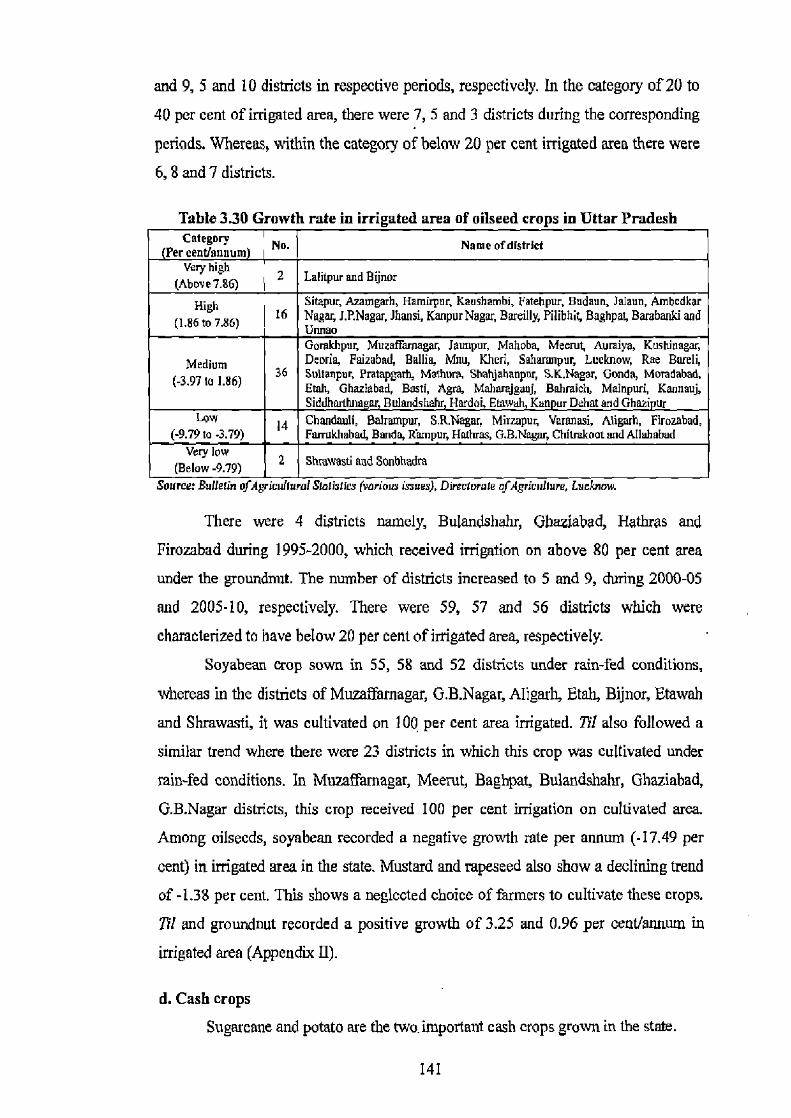
and 9, 5 and 10 districts in respective periods, respectively. In the category of 20 to
40 per cent of irrigated area, there were 7, 5 and 3 districts during the corresponding
periods. Whereas, within the category of below 20 per cent irrigated area there were
6, 8 and 7 districts.
Table 3.30 Growth rate in irrigated area of oilseed crops in Uttar Pradesh Category
(Percent/annum) No. Name ofdtstriet Very high
2 Lalilpur and Bijnor (Above7.86) iugh Sitapui Azamgarh, Hamirpur, Kaushambi, Fatehpur, Budaun, Jalaun, Ambedkar
(1.86 to 7.86) 16 Naga, J.P.Nagar, Jhansi, Kanpur Nagar, Bareilly, Pilibhit, Baghpai, Bamban$i and unnau Gornkhpur, Muzaffarnagar, Jaunpur, Mahoba, Meerut, Auraiya, Kushinagar,
Medium Deoria, Faizabad, Ballie, Mau, Kheri, Saharanpur, Lucknow, Rae Bureli,
(-3.9710 1.86) 36 Sultanpur, Pratap8aTh, Mathura, Shahjahanpm, S.K.Nagar, Gonda, Moradabad,
Etah, Ghaziabad, Best!, Agra, Mahamjgauj, Bahmich Mainpuri, Kannauj, Siddhartime ar Bulandshahr, Hardoi Etawah, Kanpur Dehat and Ghazi ur
Low 14 Chaadauli, Balrempur, S.RNagar, Mirzapur, Varanasi, Aligarh, Firozabad, (-9.79 to -3.79) Fmmkhabad, Benda, Rampur, Hmhras, G.B.Nagar, Chiuxkoot and Allahabad
Very low (Below.9.79) 2 Shmwasti and Sonbhadra
SoUrce: Bulletin of Agricullural Statistics (various issuesJ, Directorate eJ Agriculture, Lucknow.
There were 4 districts namely, Bulandsliahr, Ghaziabad, Hathras and
Firozabad during 1995-2000, which received irrigation on above 80 per cent area
under the groundnut. The number of districts increased to 5 and 9, during 2000-05
and 2005-10, respectively. There were 59, 57 and 56 districts which were
characterized to have below 20 per cent of irrigated area, respectively.
Soyabean crop sown in 55, 58 and 52 districts under rain-fed conditions,
whereas in the districts of Muzafarnagar, G.B.Nagar, Aligarh, Etab, Bijnor, Etawah
and Shrawasti, it was cultivated on 100 per cent area irrigated. Ti! also followed a
similar trend where there were 23 districts in which this crop was cultivated under
rain-fed conditions. In Muzaffarnagar, Meerut, Baghpat, Bulandshahr, Ghaziabad,
G.B.Nagar districts, this crop received 100 per cent irrigation on cultivated area
Among oilseeds, soyabean recorded a negative growth rate per annum (-17.49 per
cent) in irrigated area in the state. Mustard and rapeseed also show a declining trend
of -1.38 per cent. This shows a neglected choice of farmers to cultivate these crops.
71! and groundnut recorded a positive growth of 3.25 and 0.96 per cent/annum in
irrigated area (Appendix 11).
d. Cash crops
Sugarcane and potato are the two, important cash crops grown in the state.
141
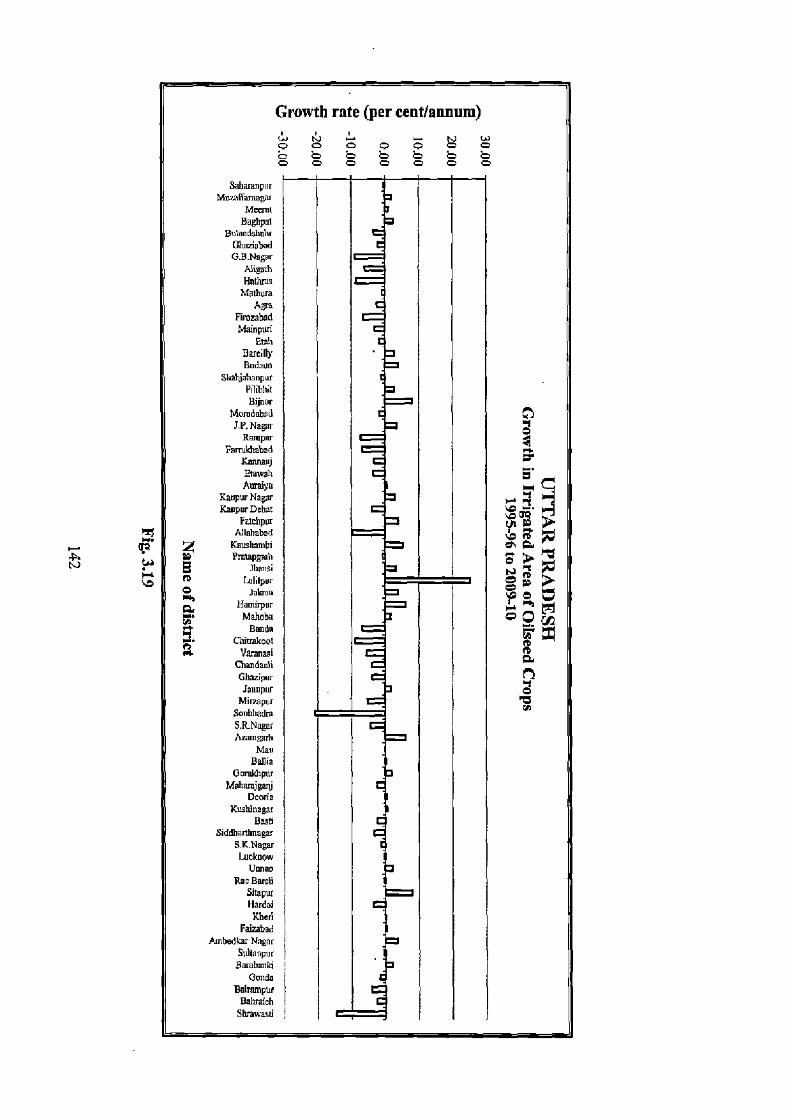
Growth rate (per cent /annum) J
N • N O O Q O O O
0 0 0 0 0 O O O O O O O
3thamnper MwaIYimia ar
Meervl Bapppm
{ BtllenaalW Chovabd GAM gxr
AliSarh Hell. c Mahwa
Apa Firozabod M
inpth Et 6H 6
B euda
awiw
SluLj ii PiTibl
Bitd
Napur R A mpw
Fmrvld,abad I:m✓auj S Fawah C
- Aa,Y Kanyw
Nagir N 1
Kwpw Deha[ = ~O pp
Allahebatl Z Y.auslmmbi =
emap¢ah b mans'
A hlilpur O
2, lamtln = o Mann Banda ~f
Cltiaakaat -.
aaauli Gh Gha'Wr = fl Iawpur Mbha
Sonbl~admdre S.RNager /vumgerb
Man Bahia
GweWrpir Mahn j6aaj
oacda Kusbinagar
e ¢War
gac OW mo
ara1i pw
rdcl heri L
~d&~aW
bad ., nr por
anki ntla pm rn
ase
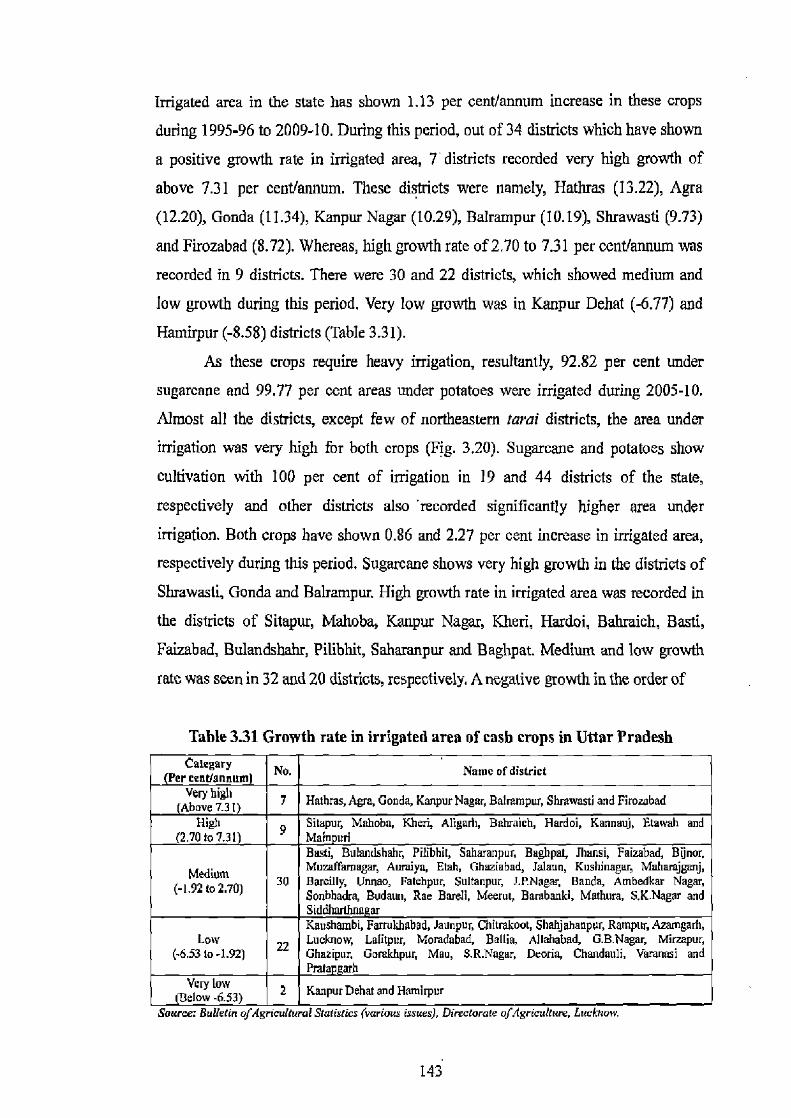
Irrigated area in the state has shown 1.13 per cent/annum increase in these crops
during 1995-96 to 2009-10. During this period, out of 34 districts which have shown
a positive growth rate in irrigated area, 7 districts recorded very high growth of
above 7.31 per cent/annum. These districts were namely, Hathras (13.22), Agra
(12.20), Gonda (11.34), Kanpur Nagar (10.29), Balrampur (10.19), Shrawasti (9.73)
and Firozabad (8.72). Whereas, high growth rate of 2.70 to 7.31 per cent/annum was
recorded in 9 districts. There were 30 and 22 districts, which showed medium and
low growth during this period. Very low growth was in Kanpur Dehat (-6.77) and
Hamirpur (-8.58) districts (Table 3.31).
As these crops require heavy irrigation, resultantly, 92.82 per cent under
sugarcane and 99.77 per cent areas under potatoes were irrigated during 2005-10.
Almost all the districts, except few of northeastern tarai districts, the area under
irrigation was very high for both crops (Fig. 3.20). Sugarcane and potatoes show
cultivation with 100 per cent of irrigation in 19 and 44 districts of the state,
respectively and other districts also 'recorded significantly higher area under
irrigation. Both crops have shown 0.86 and 2.27 per cent increase in irrigated area,
respectively during this period. Sugarcane shows very high growth in the districts of
Shmwasti, Gonda and Balrampur. High growth rate in irrigated area was recorded in
the districts of Sitapur, Mahoba, Kanpur Nagar, Kheri, Hardoi, Bahraich, Basti, Faizabad, Bulandshahr, Pilibhit, Saharanpur and Baghpat. Medium and low growth
rate was seen in 32 and 20 districts, respectively. A negative growth in the order of
Table 3.31 Growth rate in irrigated area of cash crops in Uttar Pradesh Category No. Name of district er centlannum Very high
Above 7.31) 7 Hathras, Agra, Gonda, Kanpur Nagar, Balrampur, Shrawasti and Firozabad
High 9
Sitapur, Mehoba, Kheri, Aligarh, Bahraich, Hardoi, Kannauj, Etowah and (2.70 to 7.31 Main uri
Bassi, Bulandshahr, Pilbhil, Saharanpur, Baghpal, Jhansi, Faizabad, Bijnor, Medium Muza famegar, Auraiye, Etah, Ghuziabad, Jalaun, Kushinagar, Maharejganj,
(-1.92 to 2.70) 30 Bareilly, Unnan, Falehpur, Sultanpur, J.P.Nagar, Banda, Ambedkar Nagar, Sonbhadra, Budaun, Rae Bareli, Meerut' Barabanki, Mathura, S.K.Nagar and Siddhanhn¢ ar Kaushambi, Farrukhabad, Jaunpur, Chitrakoot, Shahjahanpur, Rampuy Azamgarh,
Low Lucknow, Lulitpur, Momdabad, Ballia, Allahabad, G.B.Nagar, Mirzapur, (-6.53 to-1.92) Ghazipur, Gomkhpur, Mau, S.R.Nagar, Deoria, Chandauli, Varanasi and
Prato arh Very tow
Below -6.53) 2 Kanpur Dehat and Hamirpur
Bourse: btuelm of Agncuthirot ManaruS (VarwOus Issues), U , C(Orafe of AgrICUIWre. LuctaloW..
143

Growth rate (per cent/annum)
o n o n o in oo o
0 o o
O 0 0
o 0
Sabaraapoa
Mxry
Haghyal
Ru1ondahahs Gnzvabad
G.. Nagar Aligarh
Nalhuu
Melburu ©
Fmrubad Maiupud EI ah
EII] G arc II] Odd aim
Bdnor
Mcradaba Jr.
J.P. Nagar
Fmrokhaba
bad
Raopw =
Kaenauj
EtarvaM1 Anrai a
-
ICanrur Nappy
Faliabar
r -
N ,~y ItanpurDebal
Kamlbmbi
msan i
= T ~ a a1
m WOW Jahun
Hero Mahobe R Rands
CMlak—t va
o
pi
O "+ fl y~y y I'a1 tr'
co.,adam ahaz itir lau,iwnr = ap
Mirc+pir = 3ouybadra
SANayv Anjjrh
Mao Hpllia
Guakhpur
Ma D a
Kwithgpr B. Bps
Sid S.K.Nagar bKckagar
acknmn UMxo
RaeHUreb
Sitapar Hardoi
Ken
Kbad
Fa ad 4a NnhedYarNapaz
Sulianpur amil
B iw
nd
Gopar
BRah mmh
xnry
snawatli
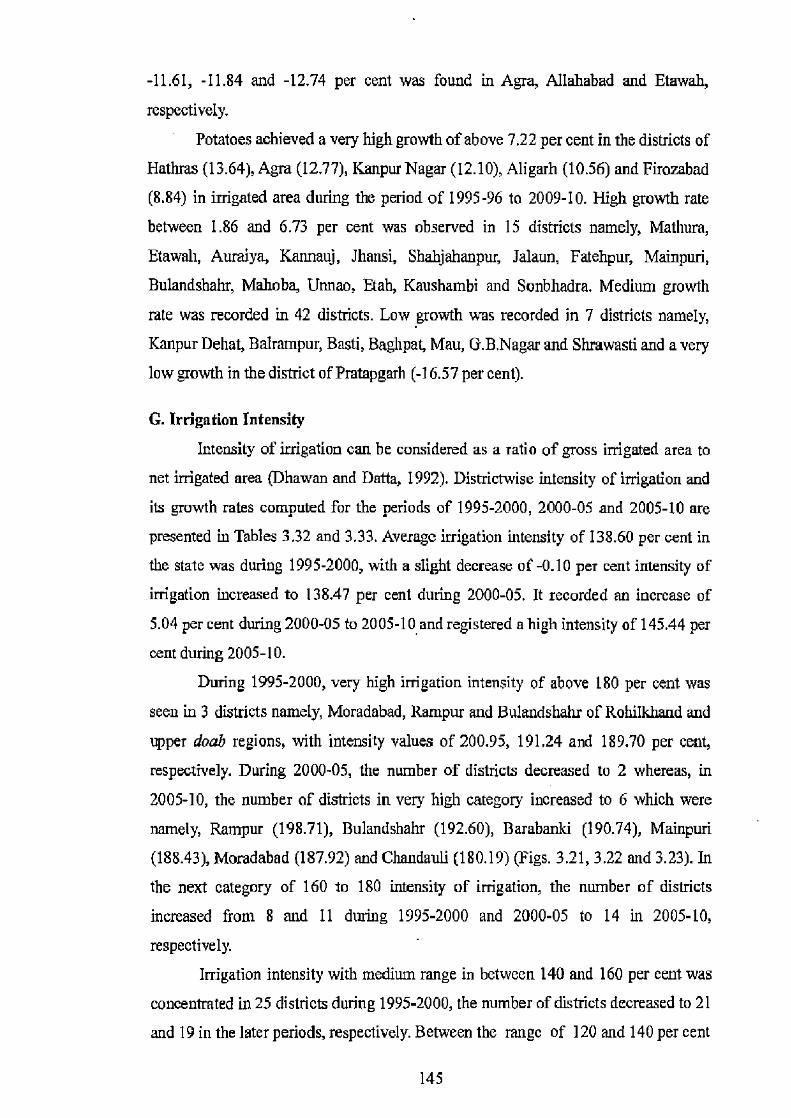
-11.61, -11.84 and -12.74 per cent was found in Agra, Allahabad and Etawah,
respectively.
Potatoes achieved a very high growth of above 7.22 per cent in the districts of
Hathras (13.64), Agra (12.77), Kanpur Nagar (12.10), Aligarh (10.56) and Firozabad
(8.84) in irrigated area during the period of 1995-96 to 2009-10. High growth rate
between 1.86 and 6.73 per cent was observed in 15 districts namely, Mathura,
Etawah, Auraiya, Kannauj, Jhansi, Shahjahanpur, Jalaun, Fatehpur, Mainpuri,
Bulandshahr, Mahoba, Unnao, Etah, Kaushambi and Sonbhadra. Medium growth
rate was recorded in 42 districts. Low growth was recorded in 7 districts namely,
Kanpur Dehat, Balrampur, Basti, Baghpat, Mau, G.B.Nagar and Shrawasti and a very
low growth in the district of Pmtapgarh (-16.57 per cent).
G. Irrigation Intensity
Intensity of irrigation can be considered as a ratio of gross irrigated area to
net irrigated area (Dhawan and Datta, 1992). Districtwise intensity of irrigation and
its growth rates computed for the periods of 1995-2000, 2000-05 and 2005-10 are
presented in Tables 3.32 and 3.33. Average irrigation intensity of 138.60 per cent in
the state was during 1995-2000, with a slight decrease of -0.10 per cent intensity of
irrigation increased to 138.47 per cent during 2000-05. It recorded an increase of
5.04 per cent during 2000-05 to 2005-10 and registered a high intensity of 145.44 per
cent during 2005-10.
During 1995-2000, very high irrigation intensity of above 180 per cent was
seen in 3 districts namely, Moradabad, Rampur and Bulandshahr of Rohilkbaad and
upper doab regions, with intensity values of 200.95, 191.24 and 189.70 per cent,
respectively. During 2000-05, the number of districts decreased to 2 whereas, in
2005-10, the number of districts in very high category increased to 6 which were
namely, Rampur (198.71), Bulandshahr (192.60), Barabanki (190.74), Mainpuri
(188.43), Moradabad (187.92) and Chandauli (180.19) (Figs. 3.21, 3.22 and 3.23). In
the next category of 160 to 180 intensity of irrigation, the number of districts
increased from 8 and 11 during 1995-2000 and 2000-05 to 14 in 2005-10,
respectively.
Irrigation intensity with medium range in between 140 and 160 per cent was
concentrated in 25 districts during 1995-2000, the number of districts decreased to 21
and 19 in the later periods, respectively. Between the range of 120 and 140 per cent
145

Table 3.32 Intensity of irrigation in Uttar Pradesh Category 1995-2000 2000-05 2005-10 (Per cent) No. Name of district No. Name of district No. Name of district
Rmnpur,
Very high 3
Moradabad, Rampur 2
Bu]andshahr and 6 Bulandshahr, Barabanki, Mainpuri, (Above 180) and Bulandshahr Rampur Moradabad and Chandauli
Moradabad, Barabanki, Pilibhit, Ghaziabad, Pilibhit, Barnbanki, Chaziabad, Hardily, Shahjahanpuy Bareilly, Ghazia6ad, Ambedkar Nagar, C.B.Nagnr, J.P.Nagar,
High 8 11 14
h, Ambedkar Nagar, (160-180) Shandauli,
Chendeuli, Meerut ShahjaMeerut
Baghpat, Meemr, Baghpat, Nagar, Ambedkar Nagar Chandauli and Bareilly, Mau,
Ghuzipur Varanasi, Balmmpur, Ghazi ur and Meerut
Faizabad, Baghpat, Kheri, Murffifarnagar, Allahabad, Mainpuri, A)lahabad, Faixabad, Saharanpur, Kushinagar, Mirzapur, Jaunpuy Sultanpuc Pmtapgarh, Mirzapur, Faizabad, Saharanpur, Kushinaga4 Rae Mainpuri, Kushinagar, Azamgarh, Aureiya, Bareli, Aligarh, Etalr,
Medium Rae Bareli, Allahabad, Sultanpur, Ram Barcli, Baltic, Aurniya,
(140.160) 25 Lucknow, Jaunpur, 21 Pratapgarh, Sitapur, 19 Muvattamagar
Ghazipur, Varanasi, Mau, Muzaffarnzgzq Hardoi, Etawah, J.P.Nagar, Etawah, Lucknow, G.B.Nagar, Salwwrpur, Sitapur, Fntehpur, Jaunpu , Sonbhadra, Lucknow, Fatehpur, Aumiya, Etab, Kheri, Fatchpur and Kheri, S.R.Nagar and Aligarh, Ballia, Etah Deoria Sonbbadra and Bijnor Sullanpur, Banda, Aligarh, Varanasi, Sleeper, Bijnor, Unnao, Azamgarh,
S.k.Nagar, Banda, Mirzapur, Pratapgarh,
Man, G.B.Nagm, J.P.Nagar, Hardoi, Budaun, Kanpur S.R.Nagar, Handal, Kanpur Nagar, Budaun, Nagar, Unnao,
Low i7 Kanpur Belw, 19 Bijnor, RaI1ia, Unnao, 17 Kanumaj,
(120-140) Fanukhahad, Budaun, 8i1raznPur, Hatnras, Fafrukhabad, Basti,
Kanpur Nagar, Hutteras, Kteu5hambi, Kunnauj, Kuushambi, Fehakhabad, Kanpur
Dehat, Kaanauj, Basti, anpur chad K D Hatteras, Basti, Kaushambi, Mathura Banda, PrrozsbaQ Mathura Mathura, Gonda Firwabad, Deoria,
Etawah, Fimzabad, MabamJgonj, Deoria, Gonda, Sonbhadra, Bahmich, Gonda,
Gorakhpur, Bahraich, Gorakhpur, Bahmich,
Garakhpur, M~~ Shrawasti, S.K.Nagar,
Very low Balrainpur, dam] ' Bgrawa5tr, Cteitmkooz, Mahamjgnnj, Agra, (Below 120) 17 Chitrakoot, Agar, 17 Agra, S .K.Nte ter, 14 n Jalaun, ~~i~koo1,
Shrawasti, S.K.Nateaq Hamirpur, Jnlnun, MahDba, Jhansi, Hamirpur, Mahoba, Muhoba, Hamirpur, Siddharthnagar, Siddhaythnagac ,Ihansi Siddhanlnntear and Jahun, Jhansi and and En1rlpuz LaNtpur Lalitpm
Source: BuFaain ofAgmultusa1 Statistics (various issues), Direcka(c cAgricultu,e, Lucknow.
Table 3.33: Growth of intensity of irrigation in Uttar Pradesh
Category Range
(per cent)
Number of districts 1995.2000 to 2000-05 2000-05 to 2005-10
High Above l0 1 12 Medium 0 to 10 - 34 37
Low -10 to 0 33 20
Very low Below-10 2 1 Source. sultana of.4gricMmra! Statistics (various issuer), Directorate ofAgriculfure, Lucknow.
146
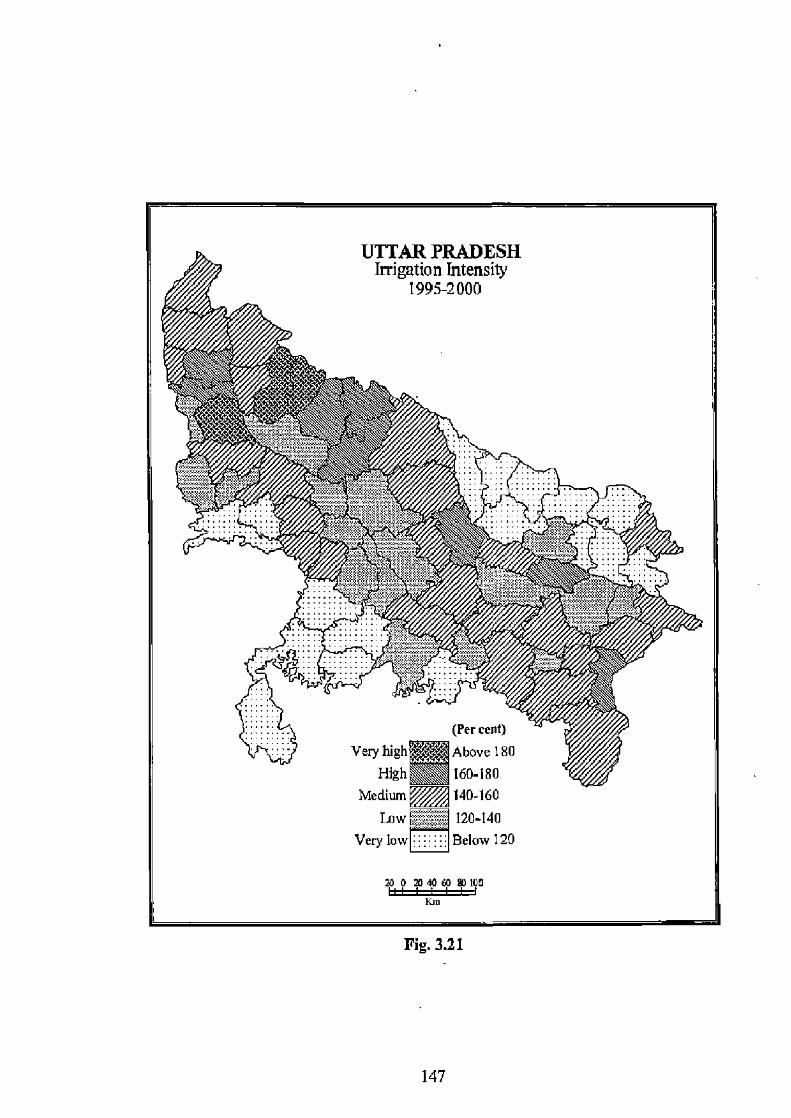
UTTAR PRADESH Irrigation Intensity
1995-2000
bA
kE3 ils~bk T"
(Per cent)
Very high Above 180
High 160-180
Medium 140-160
Law ]e
Very ]ow Bellowow 120
M o m 40 (0 In lit wii
Fig. 3.21
147
UTTAR PRADESH Irrigation Intensity
2000-05 y Ley
iti8. u.
~MM
t(~
-
lla~t'~4.R'
aiy
(Percent) Very high Above 180
High 160-180 Medium M 140-160
Low 120-140 Very low HH Below 120
200 2040 €0 10O
Km
Fig. 3.22
148
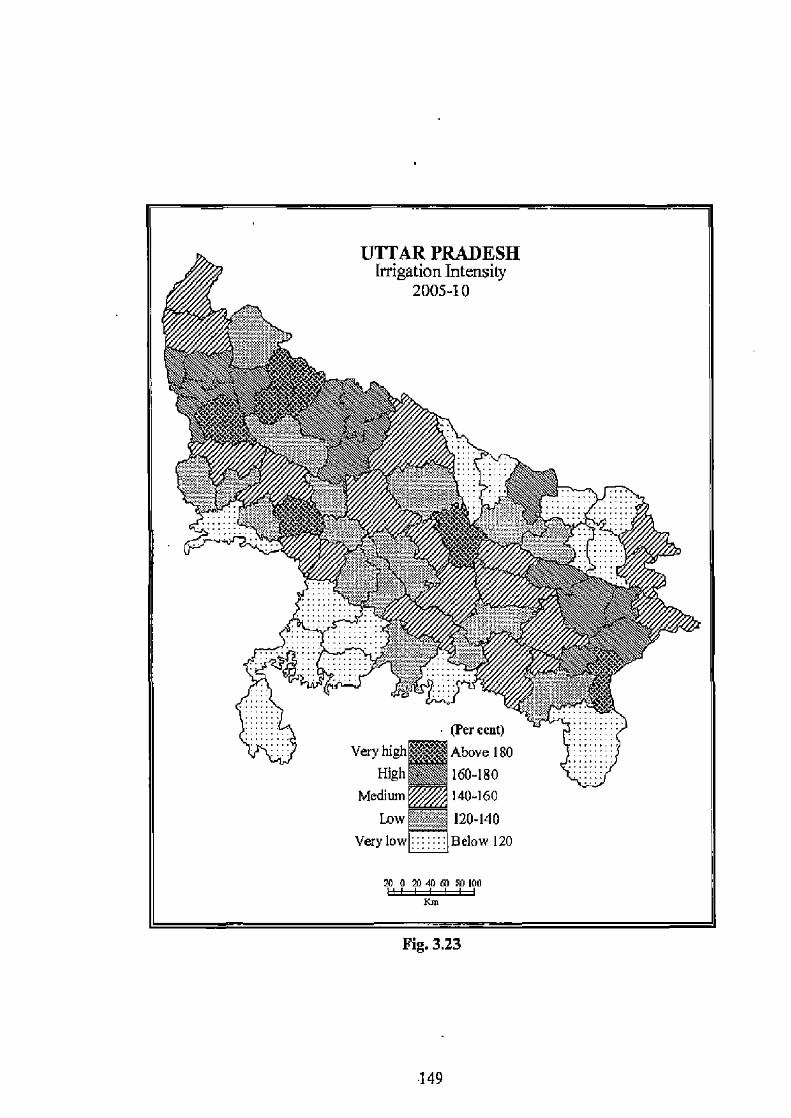
UTTAR PRADESH Irrigation Intensity
2005-10
(Per cent)
Very high Above ISO
High 160-180 Medium m 140-160
Low
120-140
Very low Below 120
Fig. 3.23
149

irrigation intensity, the number of districts in 2005-10 was 17, as against 17 and 19 in
1995-2000 and 2000-05, respectively. While in very low category of irrigation
intensity, the number remained 17 as in both previous periods, but it decreased to 14
during 2005-10. The districts were namely, Sonbhadra (119.89), Goraklapur (113.46),
Bahraich (109.38), Shrawasti (108.85), -S.K.Nagar (108.22), Maharajganj (107.99),
Agra (106.75), Jalaun (105.90), Chitrakoot (105.01), Mahoba (102.45), Jhansi
(102.29), Hamirpur (102.10), Siddharthnagar (101.47) and Lalitpur (100.64).
It is evident from Table 3.33 that high growth with the value of above 10 per
cent was noticed in single district of Balrampur during the period of 1995-2000 to
2000-05 whereas, during 2000-05 to 2005-10, the number of districts increased to 12
in this category; these were namely, J.P.Nagar, Balrampur, Etawab, Mainpuri, Deoria,
Varanasi, G.B.Nagar, Azamgarh, Ballia, Chandauli, Mau and Barabanki. Out of total
70 districts, 34 and 37 districts respectively formed the next category of growth, i.e.
0 to 10 per cent in the corresponding periods. Negative growth of between -10100
per cent was occupied by 33 districts during the previous period, which incorporated
to 20 districts in the later period. A negative growth below -10 per cent was seen in
Moradabad (-11.74) and Etawah (-18.08) districts during 1995-2000 to 2000-05, and
in Sonbhadra (-17.02) during later period.
H. Levels of Irrigation Development in Uttar Pradesh
In comparison to other states of India, the state of U.P. is well endowed with
irrigation facilities. In spite of surface as well as groundwater available in the state,
there are some disparities in irrigation development in different regions of the state.
Variations do exist in the quality of soil, amount of rainfall, receptiveness of
flooding, and accessibility to groundwater (Cliff, 1977). The levels of irrigation
development in 70 districts of the state were computed by applying the Composite z-
score technique. In statistical terms, standard score indicates that, how many standard
deviations on observation or datum are above or below the mean. The value of z is
negative when the raw score is below the mean and positive when it is above the
mean.
For an assessment of irrigation development in individual districts of the
state, four variables were selected, they are: (i) gross irrigated area to gross cropped
area (in percentage), (ii) net irrigated area to net sown area (in percentage), (iii)
irrigated area more than once to net sown area (in percentage), and (iv) gross
150
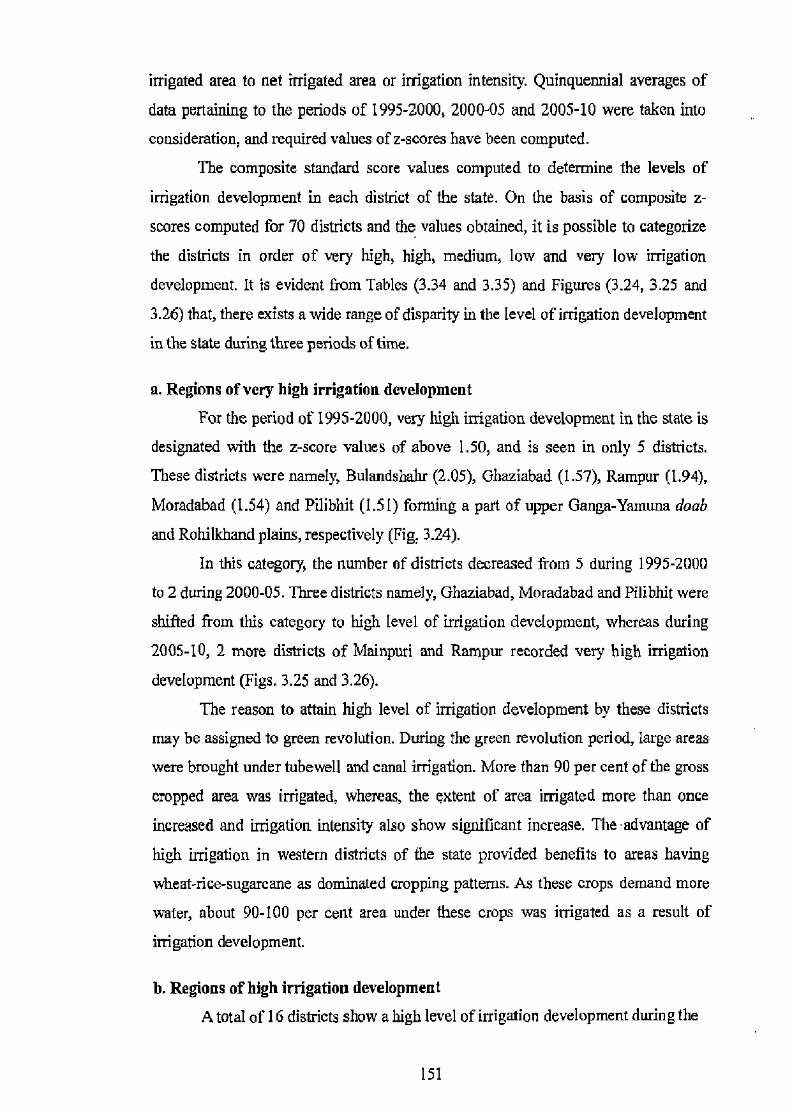
irrigated area to net irrigated area or irrigation intensity. Quinquennial averages of
data pertaining to the periods of 1995-2000, 2000-05 and 2005-10 were taken into
consideration, and required values of z-scores have been computed.
The composite standard score values computed to determine the levels of
irrigation development in each district of the state. On the basis of composite z-
scores computed for 70 districts and the values obtained, it is possible to categorize
the districts in order of very high, high, medium, low and very low irrigation
development. It is evident from Tables (3.34 and 3.35) and Figures (3.24, 3.25 and
3.26) that, there exists a wide range of disparity in the level of irrigation development
in the state during three periods of time.
a. Regions of very high irrigation development
For the period of 1995-2000, very high irrigation development in the state is
designated with the z-score values of above 1.50, and is seen in only 5 districts.
These districts were namely, Bulandshahr (2.05), Ghaziabad (1.57), Rampur (1.94),
Moradabad (1.54) and Pilibhit (1.51) forming a part of upper Ganga-Yamuna doab
and Rohilkhand plains, respectively (Fig, 3.24).
In this category, the number of districts decreased from 5 during 1995-2000
to 2 during 2000-05. Three districts namely, Ghaziabad, Moradabad and Pilibhit were
shifted from this category to high level of irrigation development, whereas during
2005-10, 2 more districts of Mainpuri and Rampur recorded very high irrigation
development (Figs. 3.25 and 3.26).
The reason to attain high level of irrigation development by these districts
may be assigned to green revolution. During the green revolution period, large areas
were brought under tubewell and canal irrigation. More than 90 per cent of the gross
cropped area was irrigated, whereas, the extent of area irrigated more than once
increased and irrigation intensity also show significant increase. The advantage of
high irrigation in western districts of the state provided benefits to areas having
wheat-rice-sugarcane as dominated cropping patterns. As these crops demand more
water, about 90-100 per cent area under these crops was irrigated as a result of
irrigation development.
b. Regions of high irrigation development
A total of 16 districts show a high level of irrigation development during the
151

Table 3.34 Levels of irrigation development in Uttar Pradesh Category 1995-200D 2000-05 2005-10
(zscores) No. Name of district No. Name of district No. Name ofdistrict
V~h~ BuIandsluh, Rampur, Bulendshahr and
(Above 1.50) Ghaziabad, 2 Rampur 2 Mainpuri and Rampur
Moradabad, Pilibbit Bulandshahr.
Gheziabad, Ambedkar Chandauli, Pilibhil,
Baghpat, Nagar, Baghpat, Barabanki,
Muzaffamagar, Meerut, Pilibhi1 Ghaziabad, Ambedkar, Chandauli, Meerut, Moradabad, Bareillg Nagar, Morsdsbad,
High Bareill Shah ahan Y J ~r' Shahjabaupur, Baghpat Azamgarh.
16 Mainpuri, Barabanki, 20 Barabanki, Mainpuri, 23
G.B.Nagar, (O.SO tol.50) Aligarh, Saharanpur, Aligarh, Chandauli, Shahjahanpur,
gar, Lucknuw, Muzatfamagar, Mccmt, Etah, Mau,
Rae Bareli, G.B.Nugar, Rae B Saharanpur, Uliazipur, Bareilly, Gbazipur,
Etch, Pratapgarh Fat tab ad, Azamgarli, Muzaffarttagar, Rac Lucknuw, Aligarh, Barcli, J.P.Nagar, Rae Bareli, G.B.Nagar Varanasi, Sultanpur,
Faizabad, Aligrh Ghazipup Ambedkar
Mau, Elah, Nagar, Hathras, Jaunpu, Bijnor, Pr h, 1'BN8gaz' Saharanpur, Jaunpur,
Unnao, Varanasi, Mau, Jaunpu, SuDanpur, Lucinuw, Hardol,
Kushinagar, Auraiya, Allahabad, Auraiya, Allahebad,
Azsmgarh, Mathura, Varanasi, Hathras, Ilathms, Pratapgarh,
Kannauj, Budaun, Kushinagar, tlardoi, Etawah, Kushinzgar, Medium Kheri, Ballia, Kheri, Bijnor, Unnao, Bijnor, Simper,
(-DMeto 0.50) 29 28 S.R.Nagar, Kheri, 24 Unnao, Kheri,
Farrukhabad, Budaun, Sitapur, Kannauj, Bahia,
S.R.Nagar, Sultanpur, Kannauj, Mathes, Deoria, Mirzapur, Aumiya, Fnrrukhabad, Bnlli4 Budaun, Budeun, S.ILNagar,
Hardoi, Firombad, Firozabad, Elzwah, Mathura, Firozabad,
Fatehpur, Faizabad, Fatehpur, Mirzapur, Fatehpur, Kanpur
Kanpur Nagar, Elawah, Kanpur Nagar, Nagar, Kanpur Behat, Sita ur Kanpur Behar
Kaushambi, Kanpur Basti, Kaushambi, Deoria, Bassi, Debat, Basti, Gonda, Agra, Gorakhpur, Kaushambi, Mirzapur, Agta,
Low Maharajgaoj, Deoria, Gorakhpur, Agra. Gorakhpur,
(-1.50 to-0.50) 12 S.K.Nagar, Banda, 13 Gonda, Maharajganj, 13 S,K.Nagar, Lalitpur, Gonda, S.K.Nagm, Lalitpur Maharajgunj, Lalilpur, Snnebhadre, Banda, Balrampur, Balrampur, Siddharthnagar Jhansi, Siddharthnagar Siddharthnagar,
Jalaun
Jttansi, Jalaun, Soubhadra, Jalaun, Banda, lhansi,
Bahraich, Shrawasti, Very low S
Balrampuc Mahoba, y
Bahmich, Mahoba, 8 Irpur, Mahoba, (Below-1.50) Shrawasti, Bahraich, Shrawasli, Hamirpur,
Chilrakool, Humirpur Chitrakoot Ch
iftakotrakoot
Source: BuPerin ofdgricu(mral Stalisfics (various issues), Directoate ofAgricuINrF Lucknow.
period of 1995-2000. Out of these, 5 districts namely, Baghpat (with z-score 1.47),
Muzaffantagar (1.24), Meerut (1.17), Saharanpur (0.87) and G.B. Nagar (0.63) were
concentrated mainly in upper doab, 2 districts of Aligarh (0.82) and Etah (0.57) in
middle doab, and one district of Mainpuri (1.04) belong to lower doab. Four districts,
Barabanki (0.98), Lucknow (0.65), Rae Bareli (0.65) and Pratapgarh (0.57) formed
the part ofAwadh plains, and 3 districts namely, Bareilly (1.15), Shahjahanpur (1.10)
152
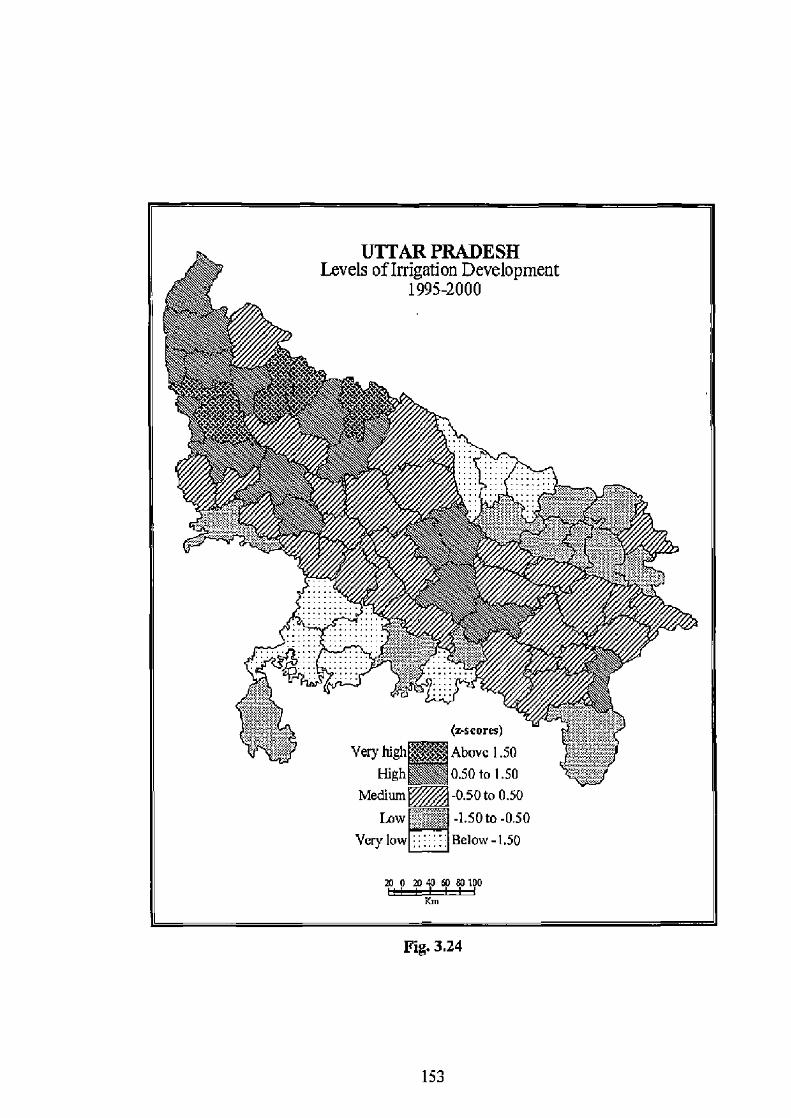
UTTAR PRADESH Levels of Irrigation Development
1995-2000
IM
(z-scores)
Very high Abovc 1.50
High 0.50 to 1.50 Medium®-0.50 to 0.50
Low -1.50 to -0.50
Very low H Below-1.50
Fig. 3.24
153
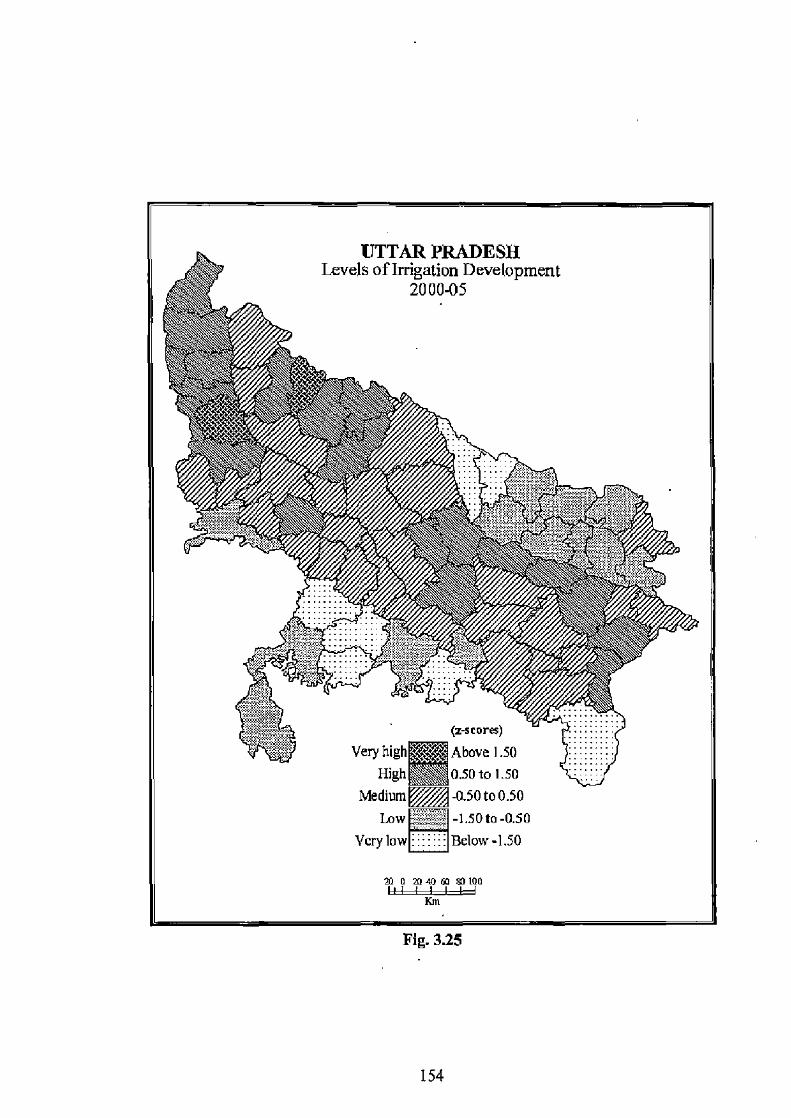
UTTAR PTRADESH Levels of Irrigation Development
2000-05
(z-scores)
Very high Above I.50
High 0.50 to I50 Medium ® -0.50 to 0.50
Low -1.50 to-0.50
Very low n Below-1.50
w o ai aom SHOD
Km
Fig. 3.25
154
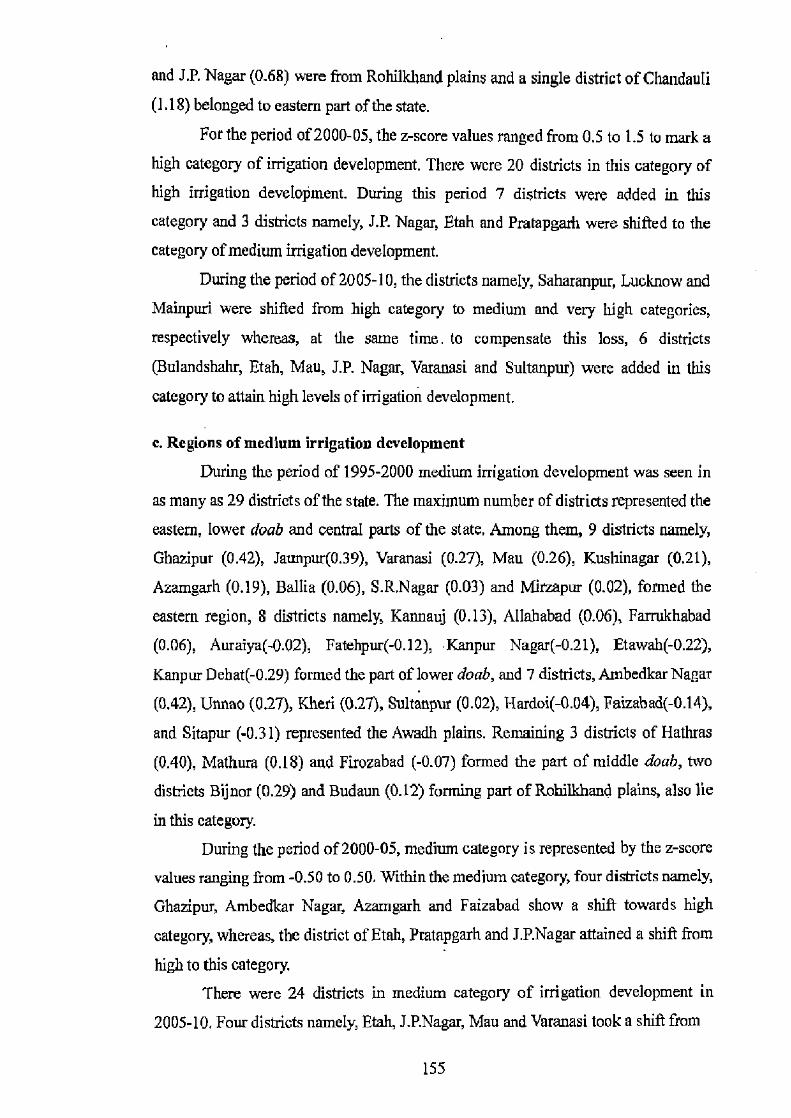
and J.P. Nagar ((168) were from Rohilkhand plains and a single district of Chandauli
(1.18) belonged to eastern part of the state.
For the period of 2000-05, the z-score values ranged from 0.5 to 1.5 to mark a
high category of irrigation development. There were 20 districts in this category of
high irrigation development. During this period 7 districts were added in this
category and 3 districts namely, J.P. Nagar, Etah and Pratapgarh were shifted to the
category of medium irrigation development.
During the period of 2005-10, the districts namely, Saharanpur, Lueknow and
Mainpuri were shifted from high category to medium and very high categories,
respectively whereas, at the same time, to compensate this loss, 6 districts
(Bu]andshahr, Etah, Mau, J.P. Nagar, Varanasi and Sultanpur) were added in this
category to attain high levels of irrigation development.
c. Regions of medium irrigation development
During the period of 1995-2000 medium irrigation development was seen in
as many as 29 districts of the state. The maximum number of districts represented the
eastern, lower doab and central parts of the state. Among them, 9 districts namely,
Ghazipur (0.42), Jaunpur(0.39), Varanasi (0.27), Mau (0.26), Kushinagar (0.21),
Azamgarh (0.19), Ballia (0.06), S.R.Nagar (0.03) and Mirzapur (0.02), formed the
eastern region, 8 districts namely, Kannauj (0.13), Allahabad (0.06), Farrukhabad
(0.06), Auraiya(-0.02), Fatehpur(-O.12),Kanpur Nagar(-0.21), Etawah(-0.22),
Kanpur Debat(-0.29) formed the part of lower doab, and 7 districts, Ambedkar Nagar
(0.42), Unnao (0.27), Kheri (0.27), Sultanpur (0.02), Eardoi(-0.04), Faizabad(-0.14),
and Sitapur (-0.31) represented the Awadh plains. Remaining 3 districts of Hathras
(0.40), Mathura (0.18) and Firozabad (-0.07) formed the part of middle doab, two
districts Bijnor (0.29) and Budaun (0.12) forming part of Rohilkhand plains, also lie
in this category.
During the period of 2000-05, medium category is represented by the z-score
values ranging from -0.50 to 0.50. Within the medium category, four districts namely,
Ghazipur, Ambedkar Nagar, Azarngarh and Faizabad show a shift towards high
category, whereas, the district of Etah, Pratapgarh and J.P.Nagar attained a shift from
high to this category. There were 24 districts in medium category of irrigation development in
2005-10, Four districts namely, Etah, J.P.Nagar, Mau and Varanasi took a shift from
155

UTTAR PRADESH Levels of Irrigation Development
2005-10
(nscur6) Very high Above 1.50
High 0.50 to 1 50 Medium -0.50 to 0.50
Low - 4Ss=-1.5oto-0.50 Very low ; H Below-1.50
soo mroom mmo Km
Fig. 3.26
156
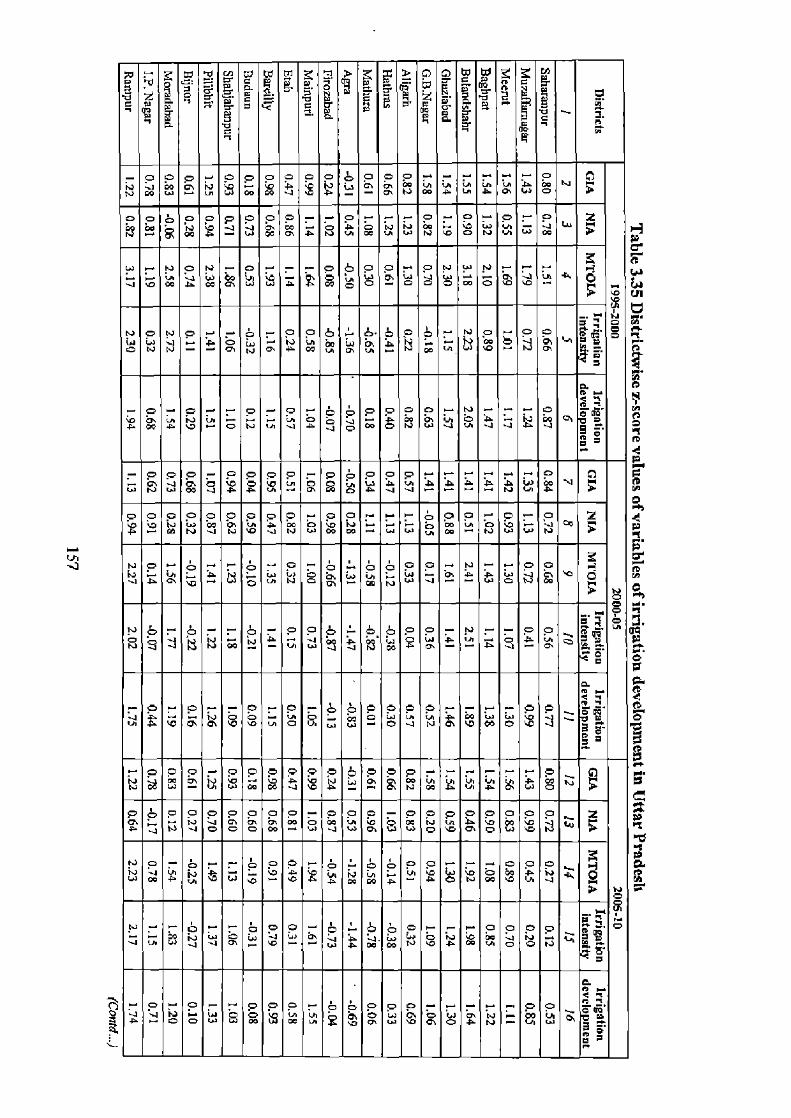
mw wwmn a acinww m '~ -m'' E c v e z w a 0 7 '' a ° _ e c' ~ e' z g a ~° 2 ~ ~' ~ '~ o .~ a ~ a. + ~ 6 ~
0 o o .- o O o c b o 0 - r r n o 1.i Jw T N ~➢ - ~O J
.p N P N G Q W O Y 'G A -
Z
N N J OE A b J W a T A W A N
A iJ W to j - p~ O - u J A A O O- O O '~
b
{Y q Y N O 2 pC N ci
L
p o O O o o - N- o e F V O N P O J J~ V g CO P N J p g e
C) N J a o p o So 0 o a a a a a a w a v ~. UI
o 0 o 0 o 0 0 p 0_ o o .-. o o a .- o '- o 'z a w N = N o ' 1 N ° w N CM w Y
-4 t rn L d IJ G - Q_ A_ P C\ b Q b O N Gl - B W to
O O
O O 0 0 0 0 0 0 0- N r- O O r a-
- Rp'
0. < i
- - O-- O- O_ b O O O O O- _ O O.p
T 'D b Vh O N - N Cs O~1 _
SM R b g y O J S O \C J a
CO y]
N W w w - 00 q j ' p A Wq
N W A H A P W N - O' Y
O p O O O O O O O- O O O- 0 0 0 0 0 00 0_ C'
N N O q
W J O J A O ~D P O W 504
O-. O
- 0 0 0 n
W W A b b
bO'_p
O LA O
4 O N '000 V U J W L } A - a e
4. - O ... - O O O O_ O O O r- ^_ O O 0 O ry
6
_ O_ - O O O o O O -_ -__ O O Th A J O O W O N_ W a g
A 3 0 R ° r.
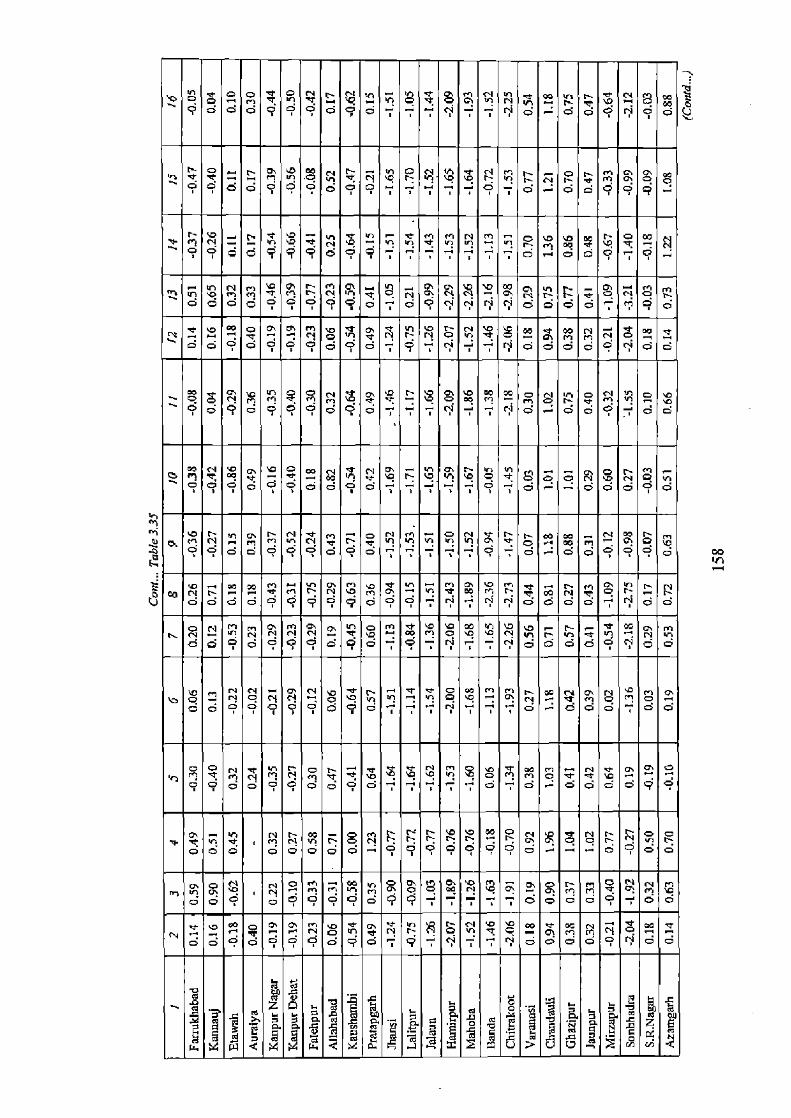
~ OO OO OO G OO OO OO O O O '-' N N OO ~ OO OO O CI OO
o n c o a o o p o a o= d Z
c n Q o o
^l ~
h G
0 O C
M O 0 o
M O
N o
N O
iQi p
- P ~
vl O .+
- N P
P O
O c N
O ry
b N
W S N
ry. G
n O O
0 G
O O ~'
N M
O O O
-. O C ' 9d
O N M M Q
O O O
rn C
m O
~G OO
< O OO C W n
N OO O
O Q C O C
00 o
N o
m Oo
Q p Oo
'CO o
m O
Nq o
V1 9
Q C
b r --- l N b O 0 0 0 N b N -
N N1 N - Vl h Vol P P p N 4~ N
py N r O M h N b M P r - < W F R - N b O r N r
ry N N N - Q O b M '!t
m O b b e N r Ifl - vPi N N OO OO 9d OO 4 OO OO OO O - CI n N OO O OO OO O c p OO
00 . n o ry N =~ r r P P o ~e a N P4 m o m O
0d9999090 T00000 0
h O M 0
O P 0
N N 0
O N 0
M 0
N 0 0 0
P O m o 0 9
O
m
-
O o]
- 0 < 0 0
G\
O
C
O
O
O
p P o
vi d N 1~ C fJ o
n
0 0 0 o o 0 0 0 - - - - o 0 0 0 0 0
y.~ T Eb s
11111
e
00 00
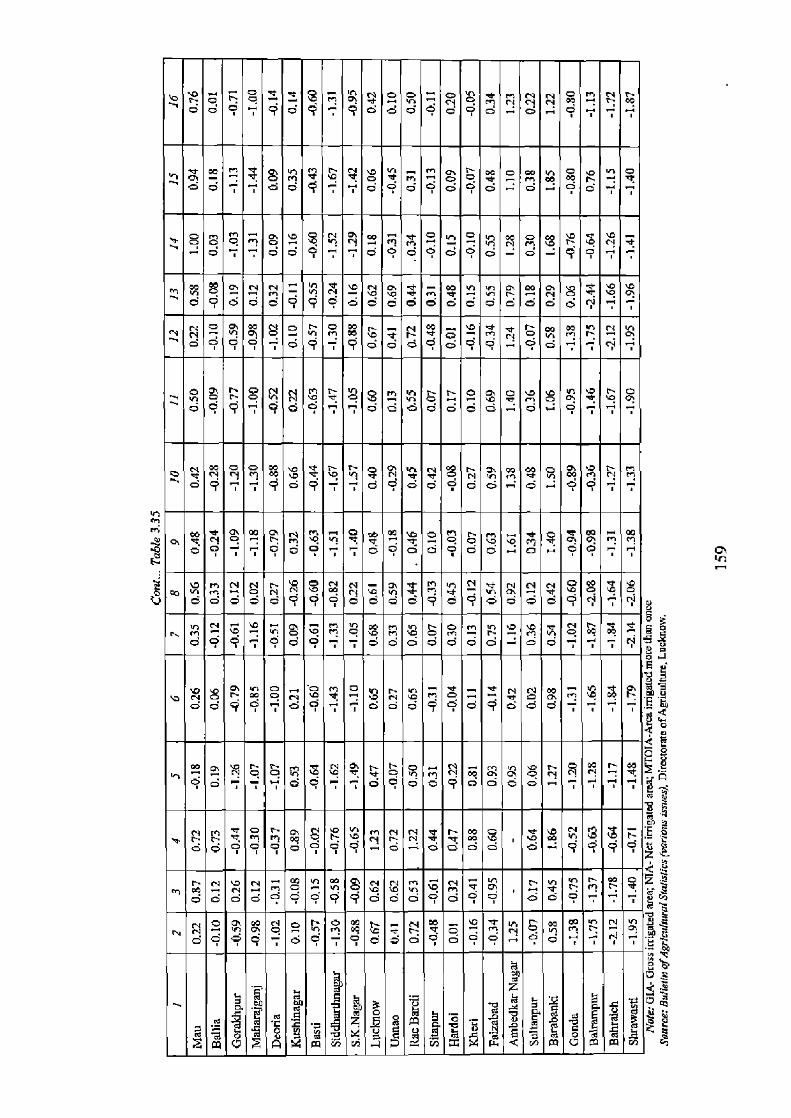
b cc
O 1~ Q'r
O 9 Q
d O
b Q~
m Q Q
a O
O
OO
O
OO O Q N
O O, O
edmil N ..
N O O
.-4 .v
h OOH 00
0 - P -
O eo~l O
V Q
b O O 0
V 0
m^ 0
O 0
O 0 0
d O O
4 0 0 0 nl g b b h N wr M M Q Q n N- O r D N d
• d9 O O O 9 9 Q O O C O C C C d a d O N
-^
_
N N- q• G~ NO - o q-
W 4
b o
d c
M1 o
v 0 o
Q d o
N O c
fl r
o C r o 0 vNi Cl tN-~ b< O m„
CI
h t~ O C~ O
Od •O D O a b OOH,
O d N R ^
N OM W R
6 O
P Q
b Vf -rd
d N O
Y O O
d O O N
O h OO
m J
d O
VOi 9 98
h N m
fp - Q o] N M b - O» M O fl h M .. C O g W-
09 9 0 9 n n p O
-.
O O O O o D .i O O •-
m Cl o h N b m N
G r< m m N vii t N b
O 00 G C C O O O O O O O O O O O C [J - t
0 0 9 9 o o .. - O o o g o o q O o o-- -
- - O
P O O O
b O H
4 ymj y
O O O
O
O Q - O
P O I O
O O
N ^
O h V
M r O
~'1 N
r N d F Po~ C
~
N h O O OO O OO .J. 4 R
dddd99999ddd9d9 oo9 ff ^
ry n a h a o M N N 4n m m
T In

this category to the category of high development and Mirzapur shifted to low
category. On the other hand, the districts namely, Deoria, Lucknow, and Saharanpur
of low and high categories, respectively were added to this category (Fig. 3.26).
d. Regions of low irrigation development
During 1995-2000, there were altogether 12 districts which formed the low
category of irrigation development. These districts are namely, Basti (with z-score
value -0.60), Kaushambi (-0.64), Agra (-0.70), Gorakhpur (-0.79), Maharajganj (-
0.85), Deoria (-1.00), S.K.Nagar (-1.10), Banda (-1.13), Lalitpur (-1.14), Gonda (-
1.31), Sonbhadra (-1.36), and Siddharthnagar (-1.43).
Low category of irrigation development was seen with z-score values within
the range of -1.50 to 0.50 during 2000-05. A slight change is visible within this
category, that out of 12 districts during the period of 1995-2000, the district
Sonbhadra has shown a shift to very low category, and the districts of Jhansi and
Balrampur were included within this category.
During 2005-10, three districts namely, Jhansi, Banda and Deoria were
shifted from low category to very low and medium categories, respectively, whereas,
the districts of Jalaun, Kanpur Dehat and Mirzapur were added to this category.
e. Regions of very low irrigation development
There were 8 districts marked with very low irrigation development during
the period of 1995-2000.Out of these districts namely, Jhansi (with -1.51, z-score
value), Jalaun (-1.54), Mahoba (-1.68), Hamirpur (-2.00) and Chitrakoot (-1.63)
belonged to Bundelkhand region; the districts of Balrampur (-1.65), Shrawasti (-
1.79), and Bahraich (-1.84) represent the Awadh plains.
Very low irrigation development with the range of below -1.50 z-score values
was seen in 7 districts during 2000-05. During the period of 2005-10, one more
district namely, Jhansi of Bundelkhand was added to this category (Fig.3.26).
The Bundelkhand region is least developed region in irrigation development,
although the provision of irrigation in this region has extraordinarily been made.
Only one-seventh of net cultivated area of the region during I950-51 was irrigated.
But with the efforts and monetary help provided by the government, the poor farmers
in the area are now adopting the practices of irrigation (Siddiqi, 1992). In very low
irrigation development districts, gross irrigated area accounted for only 40 per cent of
160

gross cropped area, with a very negligible area put as `area irrigated more than once'.
The reason for very low irrigation development is due to traditional base of fanning
with meagre irrigation facilities. Further, in the rocky substratum, underground water
resources are also meagre, therefore, the farming depends mainly irrigation by
canals.
161
References
1. Cantor, L.M. (1967). A World Geography of Irrigation, Oliver and Boyd, London.
2. Clil, C. (1977). Progress of Irrigation in Uttar Pradesh: East-West Differences, Economic and Political Weekly, Vol. 12, No. 39, pp. A83-A90.
3. Dhawan, B. D. and Data H.S. (1992). Impact of Irrigation on Multiple Cropping, Economic and Political Weekly, Vol. 27, No. 13, pp. A15-18.
4. Dhawan, B.D. (1977). Tubewell Irrigation in the Gangetic Plains, Economic and Political Weekly, Vol. 12, No. 39, pp. A91-104.
5. Dick, R.M. and Svendsen, M. (Eds.) (1991). Future Directions for Indian Irrigation: Research and Policy Issues, International Food Policy Research Institute, Washington, D.C.
6. Dick, R.M., (1994). Private Tubewell Development and Groundwater Markets in Pakistan: A District-level Analysis, The Pakistan Development Review, Vol. 33, No. 4, pp. 857-869.
7. Gumnathan, A. and Shanmugam, C.R, (2006). Customary Rights and their Relevance in Modem Tank Management: Select Cases in Tamil Nadu, Paper prepared for the Workshop entitled 'Water, Law and the Commons' organized from 8 to 10 December 2006 by the International Environmental Law Research Centre (ILERC), New Delhi.
8. Kumar, S. (2007). Development of Irrigation in India, Kurukshetra, Vol. 56, No. 2, pp. 42-43.
9. Narayanamoorthy, A. (2008). Tank Irrigation in India: Status, Trends and Issues. In: Democratisation of Water (Eds. B.K. Thaplyal, S.S.P. Sharma, P.S. Ram and U.H. Kumar), Serials Publication, New Delhi, pp. 383-417.
10. Palanisamy, K. and Balasubramaniyan, R. (1998). Common Property and Private Prosperity: Tank vs. Private Wells in Tamil Nadu, Indian Journal of Agricultural Economics, Vol. 53, No. 4, pp. 600-613.
11. Pant, N. (2005). Control of and Access to Groundwater in UP, Economic and Political Weekly, Vol. 40, No. 26, pp. 2672-2680.
12. Sakthivadivel, Gomathinayagam, P., Shah, T. (2004). Rejuvenating Irrigation Tanks through Local Institutions; Economic and Political weekly, Vol. 39, No. 31, pp. 3521-3526.
162
13. Shah, T. (2007). The Groundwater Economy of South Asia: An Assessment of Size, Significance and Socio-ecological Impacts. In: The Agricultural Groundwater Revolution: Opportunities and Threats to Development, (Eds. M. Giordano and K.G. Villholth), IWMI, Colombo, Sri Lanka, pp. 7-36.
14. Siddiqi, M.F. (1992). Agricultural Practices and Agricultural Change in Bundelkhand. In: New Dimensions in Agricultural Geography: Landuse and Agricultural Planning (Ed. N. Mohammad), Vol. 4, Concept Publishing Company, New Delhi, pp. 313-322.
163
CHAPTER IV I-and Holding Characteristics
and Use of Inputs in Agriculture

CHAPTER IV
LAND HOLDING CHARACTERISTICS AND USE OF INPUTS IN AGRICULTURE
Land is a fundamental unit in agriculture without which no crop can be
produced. Understanding of land ownership and size of operational holdings are
important in agrarian class structure (Rawal, 2008). In the context of the strategy for
agricultural development, knowledge of structure and characteristics of agricultural
holdings is imperative for responsive and efficient planning and implementation of
the programmes. For this purpose, it is essential to have information about
operational holdings as it is distinct from ownership holdings. The information about
ownership holding is useful to have an idea of the distribution of wealth but the
operational holding is more important in implementation of agricultural development
programmes. It has been attempted to preface in this chapter with the consideration
of operational land holdings, their size and structure in respective districts of the
state.
A. Size and Structure of Operational Land Holdings
An operational holding is defined as all land which is used wholly or partly
for agricultural production and is operated as one technical unit by one person alone
or with others without regard to the title, legal form, size or location'. The `technical
unit' has been defined as 'that unit which is under the same management and has the
same means of production such as labour force, machinery and animals' (GOI,
1992). Thus, an operational holding consists of all land cultivated by a particular
operational holder irrespective of whether he owns it or not. In other words, an
operational holding consists of land owned and self-operated and taken on lease from
others for cultivation. The land owned and leased out will not form part of a
particular operational holder. This land will be included in the area of the operational
holding of the person(s) who has taken on lease for cultivation.
The average size of land holdings in India is small, it is due to sub-divisions,
and the primary cause of these sub-divisions is the pressure of population on land,
apart from the existing laws of inheritance in vogue among Hindu and Muslim and
other communities in the country (Gadkary, 1957). With increasing urbanization and
industrial demand, and subsequent pressure on the availability of cultivable land, the
164
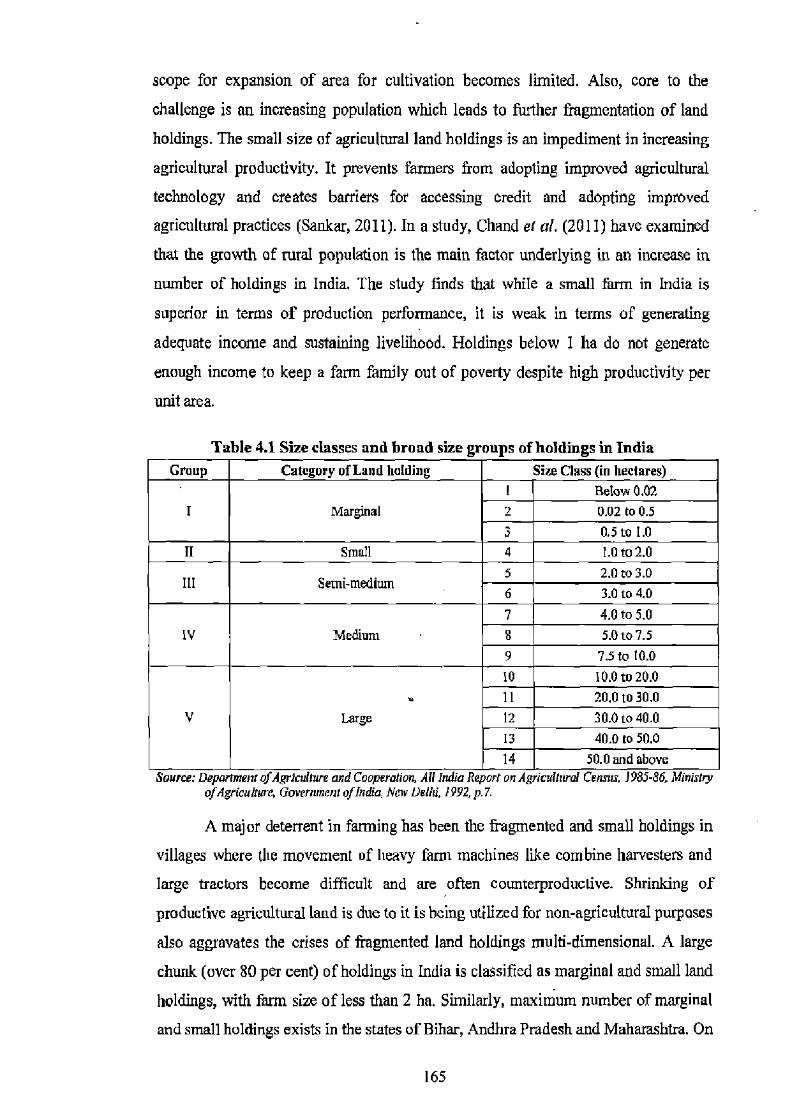
scope for expansion of area for cultivation becomes limited. Also, core to the
challenge is an increasing population which leads to further fragmentation of land
holdings. The small size of agricultural land holdings is an impediment in increasing
agricultural productivity. It prevents farmers from adopting improved agricultural
technology and creates barriers for accessing credit and adopting improved
agricultural practices (Sankar, 2011). In a study, Chand of al. (2011) have examined
that the growth of rural population is the main factor underlying in an increase in
number of holdings in India. The study finds that while a small farm in India is
superior in terms of production performance, it is weak in terms of generating
adequate income and sustaining livelihood. Holdings below I Its do not generate
enough income to keep a farm family out of poverty despite high productivity per
unit area.
Table 4.1 Size classes and broad size erouns of holdings in India Group Category of Land holding Size Class (in hectares)
I Marginal I Below 0.02 2 0.02 to 0.5 3 0.5 to I.0
it Small 4 1.0 to2.0
III Semi-medium 5 2.0 to 3.0 6 3.0 to4.0
IV Medium 7 4.0 to 5.0 8 5.O to7.5 9 7.5 to 10.0
V Large
10 10.0 to 20.0 11 20.0 to30.0 12 30.0 to 40.0 13 40.0 to 50.0 14 50.0 and above
Source: Department DfAgrieuIsug and Cooperation, All India Report on Agriculhirat Census, 7985-86, Ministry of9grfcoKure, Government ofIndia, Nov Delhi. 1992, p.7.
A major deterrent in farming has been the fragmented and small holdings in
villages where the movement of heavy f -nr machine like combine harvesters and
large tractors become difficult and are often counterproductive. Shrinking of
productive agricultural land is due to it is being utilized for non-agricultural purposes
also aggravates the crises of fragmented land holdings multi-dimensional. A large
chunk (over 80 per cent) of holdings in India is classified as marginal and small land
holdings, with farm size of less than 2 ha. Similarly, maximum number of marginal
and small holdings exists in the states of Bihar, Andhra Pradesh and Maharashtra. On
165
the other hand, the number of large holdings constitutes merely about l per cent of
total holdings and occupies approximately 13 per cent of total area, concentrated
mainly in the states of Rajasthan, Madhya Pradesh and Karnataka (Kapoor, 2011).
Further, the size of operational holdings determines not only farmer's own resources
available for investment, but also an access to credit facilities from the institutional
finance sources. It is generally accepted that the minimum size of holding on which
irrigation by tubewells can be profitably utilised is above I ha, a greater number of
cultivators below this line in eastern U.P. are adversely affected both in terms of
possible returns and access to credit facilities. The viability of a tubewell can be
affected by number of fragmented fields in which a farm is divided or scattered.
Commercialization of fanning on large size of holdings, proximity to urban markets
and expansion of canal irrigation all have given impetus to agriculture in western
parts in comparison to eastern parts of U.P. (C1iit, 1977).
With the incorporation of agricultural technology, crop production depends
an a number of factors, like HYV of seeds, chemical fertilizers, irrigation facilities
and agricultural implements, etc. But these factors can be applied effectively and
profitably on farms which have reasonable size. Size of land holdings makes farmers
to bear the risk for the use of chemical fertilizers and heavy implements and
machinery, which need high investments (Pal, 1992). Most of the small farmers who
are below poverty line belong to socially disadvantageous groups. A majority of
marginal and small farmers engage their holdings to cultivate mainly low value crops
on subsistence basis. Small size of land holdings and low yield of crops reduce the
capacity of farmers from producing surpluses, and use their resources in purchase of
HYV seeds and irrigation, that can support it. Highly fragmented holdings force
farmers to depend on water buyers rather than investing in their own irrigation
infrastructure, which would be economically inefficient due to poor utilization of the
potentials created (Kishore, 2004).
Whereas, large farmers are able to purchase tubewells because they can more
readily mobilise the financial resources for tubewell investment. Large farmers also
use more water on their own lands than are small and medium farmers, and have less
surplus waters to sell. Thus, the percentage of tubewell owners is higher with large
holdings, but the activity of water market may be greater where small and marginal
farmers predominant (Dick, 1994). Capital may have a positive effect, and land and
labour negative on the elasticity of gross value of output per unit of land. However, a
large amount of capital can easily compensate the negative effects and a positive
total relation between holding size and productivity. Large-size farms with capital-
intensive techniques can give higher productivity with increased land holdings,
especially with multiple cropping (Rao and Chotigeat, 1981).
B. Districtwise Variations in Size and Number of Land Holdings
There exists a substantial inequality in size and structure of holdings in
different regions of the state. According to Agricultural Census, a marginal land
holder possesses less than I ha and small holder in between l and 2 ha (Table 4.1).
Total area under all kinds of land holding in the state was 21.7 million ha. in 2000-
01, and it increased to 22.37 million ha. in 2005-06, registering an increase of 3.12
per cent during this period. Whereas, the number of holdings decreased from 17.98
millions to 17.79 millions recording a negative growth of -1.06 per cent during the
same period.
Out of the total area under land holdings, 76.90 and 78.04 per cent were
under the category of marginal holdings and small holdings constituted a share of
14.24 and 13.78 per cent in 2000-01 and 2005-06, respectively. Semi-medium
(between 2 and 4 ha) and medium holdings (between 4 and 10 ha) covered 6.58 and
2.13 per cent, and 6.17 and 1.89 per cent area in the state, respectively during the
corresponding periods. Only a small fraction of 0.15 and 0.12 per cent of area was
constituted under the large holdings in the state (Fig. 4.1).
During the period of 2000-01 to 2005-06, highest positive growth in area and
number being 1.48 and 5.54 per cent, respectively was noticed in the category of
marginal holdings, which was at the expanse of other categories of land holdings.
Thus, a bulk of farmers in the state belongs to marginal and small holding categories,
whereas the medium and large categories constituted small number of farmers.
Average size of land holding in the state was 0.80 during 2005-06, which varied
from a lowest holding of 0.42 ha in S.R.Nagar district and 1.71 ha in Mahoba
district. This shows that the holding size in the state is on continuous decline. This
size of land is too small to manage for efficient farming and land fragmentation has
further worsened the situation.
i. Marginal holdings (<1.0 ha.)
A perusal of Table 4.2 indicates that, during 2000-01, there were 26 districts
167
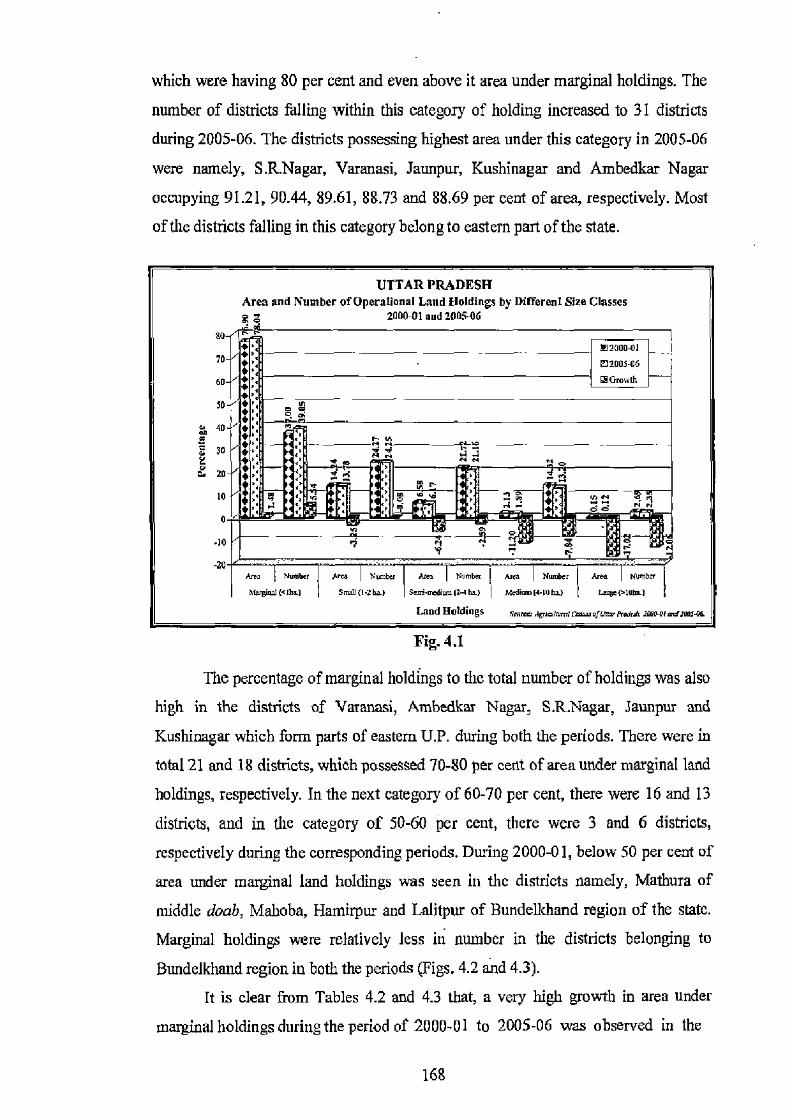
which were having 80 per cent and even above it area under marginal holdings. The
number of districts falling within this category of holding increased to 31 districts
during 2005-06. The districts possessing highest area under this category in 2005-06
were namely, S.R.Nagar, Varanasi, Jaunpur, Kushinagar and Ambedkar Nagar
occupying 91.21, 90.44, 89.61, 88.73 and 88.69 per cent of area, respectively. Most
of the districts falling in this category belong to eastern part of the state.
UTTAR PRADESH Area and Number of Operational Land Holdings by Different Size Classes g o 2000-01 and 2005-06
6
04 as a 3
i x
3
Land Holdings K., nnn".'rollm,,,or mx attj&3-m
Fig. 4.1
The percentage of marginal holdings to the total number of holdings was also
high in the districts of Varanasi, Ambedkar Nagar, S.R.Nagar, Jaunpur and
Kushinagar which form parts of eastern U.P. during both the periods. There were in
total 21 and 18 districts, which possessed 70-80 per cent of area under marginal land
holdings, respectively. In the next category of 60-70 per cent, there were 16 and 13
districts, and in the category of 50-60 per cent, there were 3 and 6 districts,
respectively during the corresponding periods. During 2000-01, below 50 per cent of
area under marginal land holdings was seen in the districts namely, Mathura of
middle doab, Mahoba, Hamirpur and Lalitpur of Bundelkhand region of the state.
Marginal holdings were relatively less in number in the districts belonging to
Bundelkhand region in both the periods (Figs. 4.2 and 4.3).
It is clear from Tables 4.2 and 4.3 that, a very high growth in area under
marginal holdings during the period of 2000-01 to 2005-06 was observed in the
♦ : ®2ouoni 2 . ~2005L6
p ♦ ®Growh
ct
Oy j1 + +
~ q r r N
Nu Number Ant N r*c, A.e Numhn N,., HwrD[e Me Numbs
s&o (cm.) 5milI(I.SAa) Sevihrt I24i¢) MdimlIPub) In¢(IOLL)
168
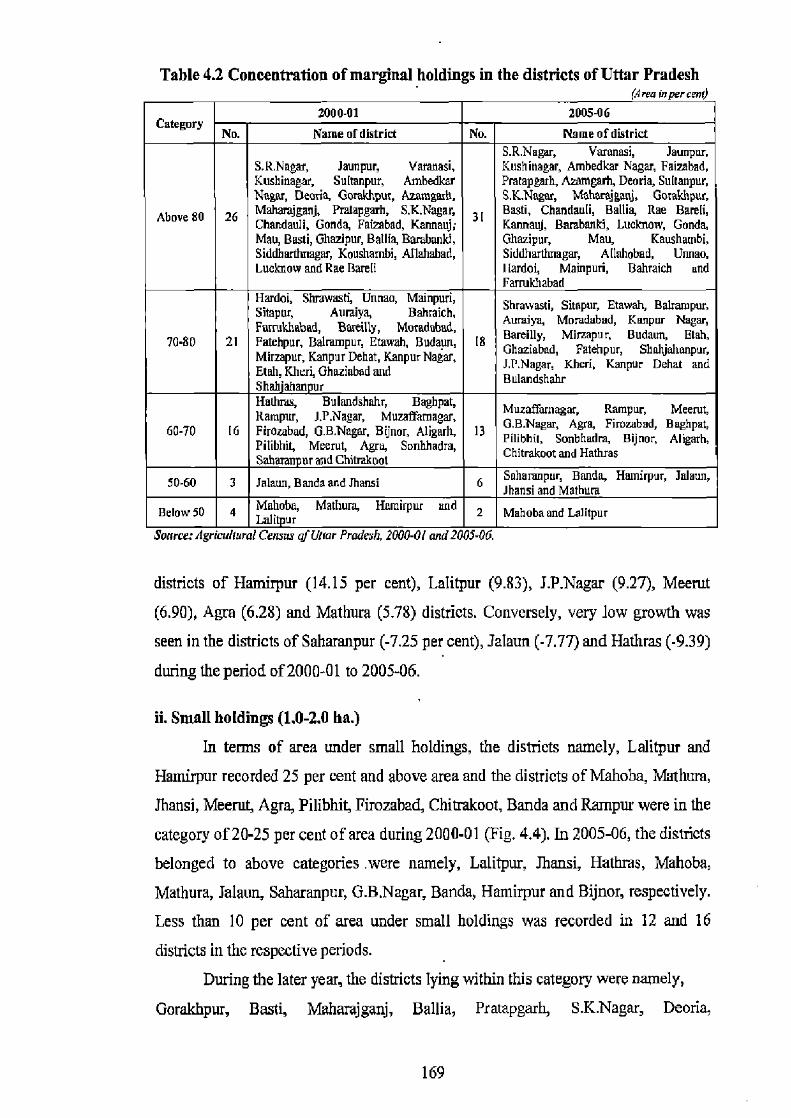
Table 4.2 Concentration of marginal holdings in the districts of Uttar Pradesh (Are. in peremO
2000-01 2005-06 Category
No. Name of district No. Name of district S.R.Nagar, Varanasi, Jaunpur,
S.R.Nagar, Jaunpur, Varanasi, Kushinagar, Ambedkar Nagar, Faiznbad, Kushinagar, Sultanpur, Ambedkar Pratapgarh, A>amgarh, Deoria, Sultanpur, Nagar, Deoda, Gorakhpur, Awmgmh, S.K.Nagar, Mthorejg,aLlj, Gorakhpur,
Above 80 26 Maharajganj, Pmtapgarh, S.K.Nagar, 31 Basti, Chandauli, Ballia, Rae Bareli, Chandauli, Gonda, Faiaabad, Kannauj; Kannauj, Barabanki, Lucknow, Gonda Mau, Busti, Ghazipur, Ballia, Barabmiki, Ghazipur, Mau, Kaushambi, Siddharthnagar, Kaushambi, Allahahad, Siddharthnagar, Allaimbad, Unnao, Lucknow and Rae Barth i I lardoi, Mainpuri, Bahraich and
Farrukhabad Hardoi, ShrnwasEL Unman, Maimpuri, Shrawasti, Sitnpur, Etowah, Bahampur, Sitapur, Aurdiya, Bahraich, Auraiya, Moridabad, Kanpur Nagar, Furrukhabad, Bweilly, Mosadubad, Bareilly, Mirzapur, Buchan, Etah, 70.8D 21 Fatehpur, Bahurnpur, Etawah, Buchan, 1S Ghaziabad, Fatehpur, Shahjalmnpur, Mirzapur, Kanpur Dehat, Kanpur Nagar, Jp,Nagar, lchcri, Kanpur Dehat and Etah, Kheri, Ghaziubad mid Bulandshahr Shah'ahanpur Hathras, Bulandshahr, Beghpay Maziffumngac, Rampur, Meerut, R npim, J.P.Nagar, Huraffarnagar, G.B.Nagar, Agra, Firowbad, Baghpat, 60-70 16 Firozabad, li.B.Nagar, Bijnor, Aligarh, 13 Pilibhit, Meerut, Agra, Sonbhadra, Said adra, Bijnor, Aligarh,
Chi[mkoot and Hativas Chitrakoot sabarnn ur and Ghitrakool
50-60 3 Jalaun, Banda and Jhansi 6 Saharanpur, Banda, Hamirpuy Jalaun, Jhanst and Mathura
Below 50 4 Mahoba, Mathura, Hamirpur and 2 Mahoba and Lalitpur Lail ur Source: Agrindlural Census of Uttar Pradesh, 2000-01 and2005-06.
districts of Hamirpur (14.15 per cent), Lalitpur (9.83), J.P.Nagar (9.27), Meerut
(6.90), Agra (6.28) and Mathura (5.78) districts. Conversely, very low growth was seen in the districts of Saharanpur (-7.25 per cent), Jalaun (-7.77) and Hathras (-9.39)
during the period of 2000-01 to 2005-06.
ii. Small holdings (1.0-2.0 ha.)
In terms of area under small holdings, the districts namely, Lalitpur and
Hamirpur recorded 25 per cent and above area and the districts of Mahoba, Mathura, .lhansi, Meerut, Agra, Pilibhit, Pirozabad, Chitrakoot, Banda and Raznpur were in the
category of 20-25 per cent of area during 2000-01 (Fig. 4.4). In 2005-06, the districts belonged to above categories were namely, Lalitpur, Jhansi, Hathras, Mahoba, Mathura, Jalaun, Saharanpur, G.B.Nagar, Banda, Hamirpur and Bijnor, respectively.
Less than 10 per cent of area under small holdings was recorded in 12 and 16
districts in the respective periods.
During the later year, the districts lying within this category were namely,
Gorakhpur, Basti, Maharajganj, Ballia, Pratapgarh, S.K.Nagar, Deoria,
169
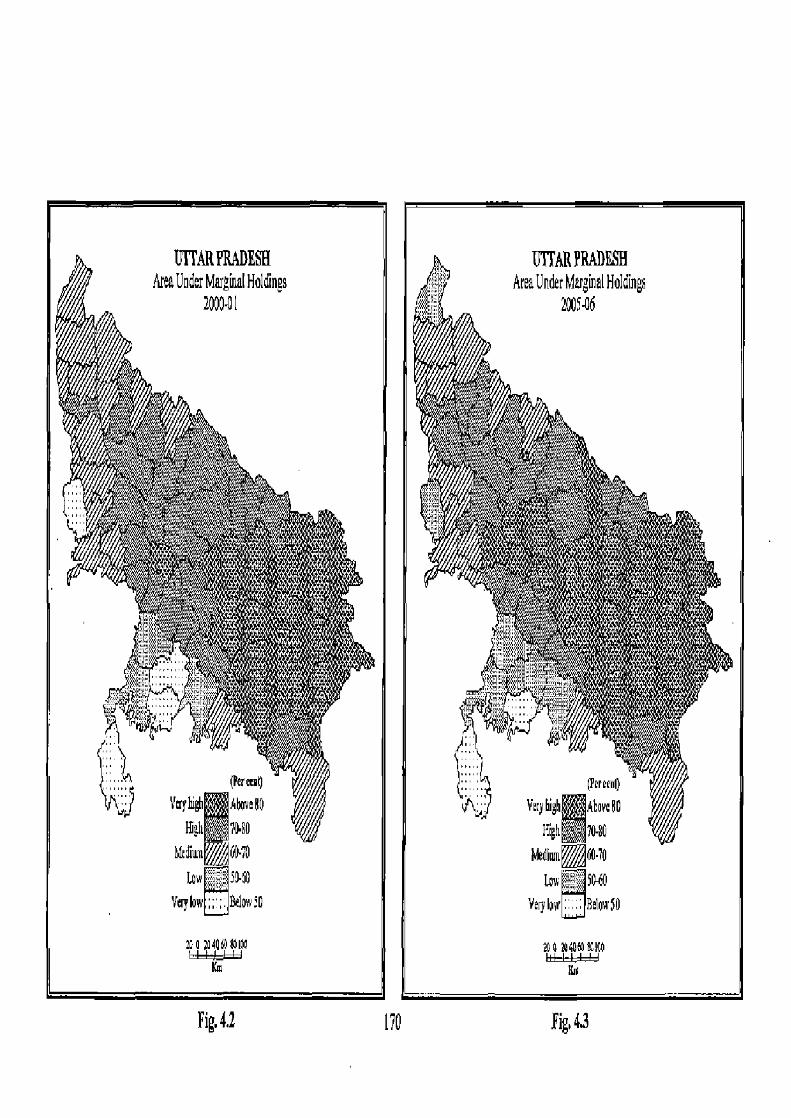
UTTARPRADESH Area Under Marginal Holdings
100041
.ia, aygb ~4,
re
Pfr RII)
Ycrhi Aho fl
EZeh 70.80
f~¢yiwn~6a~ sG Vaybw
towesa &ImviO
Km
Fig. 4,2
UTTAR PRADESH Area Under Marginal Holdings
2005M6
(Pereeno
V¢y gh Akovc80
High 704
Loge $ 50-o
Vwylow Below5
i 1O4Ot0wl6O
Fig, 43
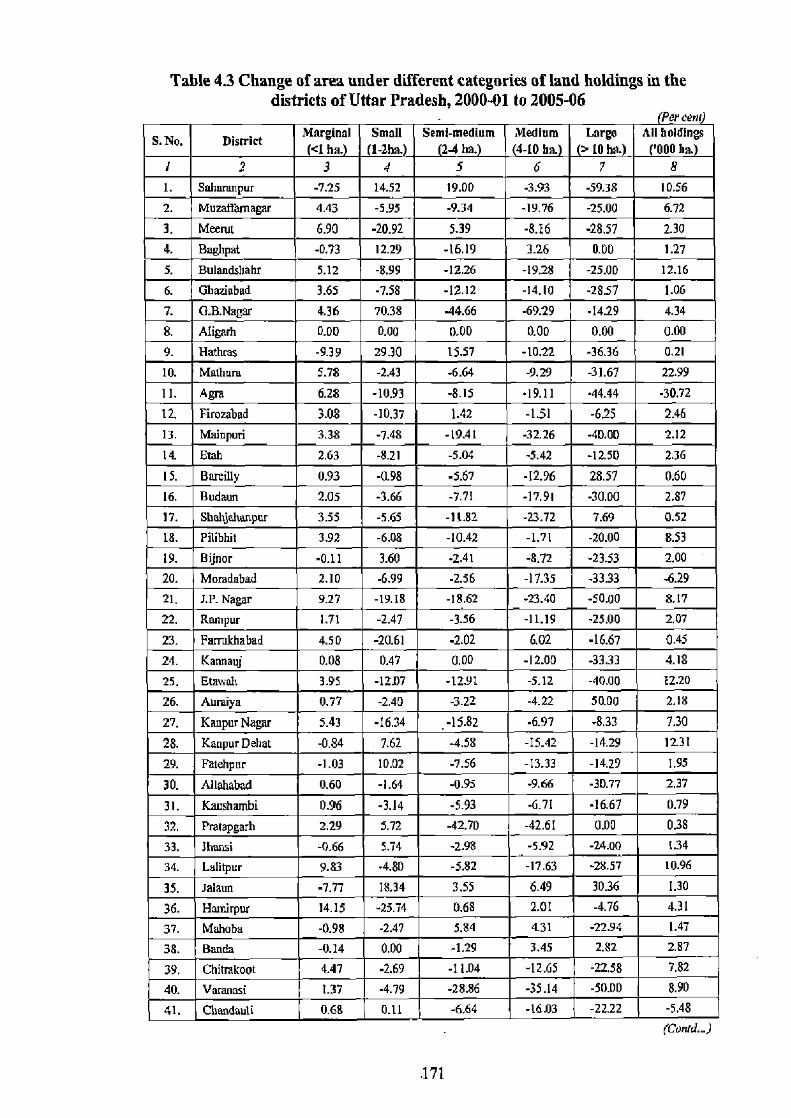
Table 4.3 Change of area under different categories of laud holdings in the districts of Uttar Pradesh, 2000-01 to 2005-06
(Per cent)
S. No. District Marginal <I ha.)
Small 1-bha.
Semi-medium (2-4 ha.)
Medium (4-10 ha.
Large (>10 ha.
All holdings ('000 ha.)
1 2 3 4 5 6 7 8 1. Saharanpur -7.25 14.52 19.00 -59.38 10.56 2. Muzarramagar 4.43 -5.95 -9.34 -25.00 6.72 3. Meerut 6.90 -20.92 5.39 -28.57 2.30 4. Bghpat -0.73 12.29 -16.19
R-3.93
0.00 1.27 5. Bulandshahr 5.12 -8.99 -12.26 -25.00 12.16 6. Ghaaebad 3.65 -7.58 -12.12 -28.57 1.06 7. G.B.Nagar 4.36 70.38 -44.66 -14.29 4.34 8. Aligarh 0.00 0.00 0.00 . 0.00 0.00 9. Hathras -9.39 29.30 15.57 -10.22 -36.36 0.21
10. Mathura 5.78 -2.43 -6.64 -9.29 -31.67 22.99 11. Agra 6.28 -10.93 -8.15 -19.11 -44.44 -30.72 12. Firozabud 3.08 -10.37 1.42 -1.51 -6.25 2.46 13. Mainpuri 3.38 -7.48 -19.41 -32.26 -40.00 2.12 14. Emil 2.63 -8.21 -5.04 -5.42 -12.50 2.36 15. Bareilly 0.93 -0.93 -5.67 -12.96 28.57 0.60 16. Hudaun 2.05 -3.66 -7.71 -17.91 -30.00 2.87 17. Shahjahanpur 3.55 -5.65 -11.82 -23.72 7.69 0.52 18. Pilibhit 3.92 -6.08 -10.42 -1.71 -20.00 8.53 19. Bijnor -0.11 3.60 -2.41 -8.72 -23.53 2.00 20. Moradabad 2.10 -6.99 -2.56 -17.35 -3333 -6.29 21. J. P. Nagar 9.27 -19.18 -18.62 -23.40 -50.00 8.17 22. Rampur 1.71 -2.47 -3.56 -11.19 -25.00 2.07 23. Farrukhabad 4.50 -20.61 -2.02 6.02 -16.67 0.45 24. Kannauj 0.08 0.47 0.00 -12.00 -33.33 4.18 25. Etawah 3.95 -12.07 -12.91 -5.12 -40.00 12.20 26. Amaiya 0.77 -2.40 -3.22 -4.22 50.00 2.18 27. KanpurNagar 5.43 -16.34 -15.82 -6.97 -8.33 7.30 28. KanpurDehat -0.84 7.62 -4.58 -15.42 -14.29 12.31 29. Fatehpnr -1.03 10.02 -7.56 -1333 -14.29 1.95
30. Allahabad 0.60 -1.64 -0.95 -9.66 -30.77 2.37
31. Kaushambi 0.96 -3.14 -5.93 -6.71 -16.67 0.79 32. Pratapgarh 2.29 5.72 42.70 -42.61 0.00 0.38 33. lhunsi -0.66 5.74 -2.98 -5.92 -24.00 1.34 34. Lalitpur 9.83 -4.80 -5.82 -17.63 -28.57 10.96
35. Jalaun -7.77 18.34 3.55 6.49 30.36 1.30
36. Hamirpur 14.15 -25.74 0.68 2.01 -4.76 4.31 37. Mahabu -0.98 -2.47 5.84 4.31 -22.94 1.47 38. Banda -0.14 0.00 -1.29 3.45 2.82 2.87
39. Chitmkoot 4.47 -2.69 -11.04 -12.65 -22.58 7.82
40. Varanasi 1.37 -4.79 -28.86 -35.14 -50.00 8.90
4t. ChmMnuli 0.68 0.11 -6.64 -16.03 -2222 -5.48 (Conk!...)
.171

Cant... Table 4.3 1 2 3 4 5 6 7 8
42. Ghazipur 0.35 -2.29 1.56 -8.87 0.00 2.66 43. -0.12 -1.21 11.67 -17.07 0.00 0.87 44. 3.82 -13.20 -8.16 -1.67 -23.03 1.35 45. 3.33 -0.45 -3.92 -21.51 -19.70 8.90 46. t-h
-0.03 -2.02 6.50 6.06 0.00 1.89 47. 1.48 -7.87 -10.31 -21.18 0.00 4.45 48. -0.78 0.95 14.22 -2.04 -50.00 6.23 49. 1.62 -7.91 -7.08 -10.20 -27.27 6.73 50. -0.57 6.70 -3.04 -3.39 0.00 0.61 51. Mahamjganj 0.34 0.52 -5.92 -15.66 -20.00 0.48 52. Deoria 0.40 0.44 -7.46 -13.92 -40.00 1.37 53. Kushivagar 0.25 -1.72 -1.48 -5.08 0.00 0.96 54. Uasti 2.76 -13.06 -15.53 -21.33 0.00 7.92 55. Siddharthnagar -0.99 2.81 12.14 0.00 33.33 1.41 56. S.K.Nagw 1.40 -10.22 2.93 -25.51 -40.00 0.96 57. Lucknow 3.49 -15.25 -15.04 -7.59 0.00 040 58. Unaao 2.25 -10.47 -4.I I -4.17 -16.67 8.41 59. Rae Bareli 4.74 -13.54 -27.26 -46.31 -25.00 6.81 60. Sitspur 2.38 -6.74 -6.81 -26.42 -20.00 6.27 61. Hardoi 1.27 -3.70 -5.77 -12,86 -12,50 2.86 62. Kheri 1.18 2.60 -14.60 -7.31 -10.00 7.01 63. Faimbad 4.80 -19.40 -32.61 -60.36 -66.67 5.14 64. AmbedkarNagar 0.83 -5.66 -6.88 -7.14 0.00 4.71 65. Sultanpur -0.93 1.63 24.48 -3.77 0.00 1.25 66. Barabanki 1.16 -4.11 -9.50 -7.61 0.00 4.63 67. Gonda -0.89 10.27 -7.43 -2.20 0.00 0.50 66. Balrempur 3.49 -8.04 -15.14 -10.83 -50.00 0.22 69. Bahraich 4.21 -12.93 -15.56 -18.40 -50.00 7.48 70. Shrawasti 0.92 -1.10 -6.71 -16.38 0.00 6.71
Unar Pradesh 0.92 0.92 0.92 0.92 0.92 3.12 Note: 1-2000-01,11-2005-06
Source: Agricultural Census, 2000-01 and 2005-06.
Chandauli, Sultanpur, Azamgarh, Faizabad, Ambedkar Nagar, Kushinagar, Varanasi,
Jaunpur and S.RNagar; all belong to eastern part of the state (Table 4.4 and Fig.
4.5).
Sizeable changes in area and number of small holdings were seen in the
district of G.B.Nagar which recorded a positive growth of 70.38 and 113.76 per
cent, respectively, and the lowest negative growth was recorded in Hamirpur district
with -25.74 and -23.10 per cent respectively during this period (Table 4.3).
172
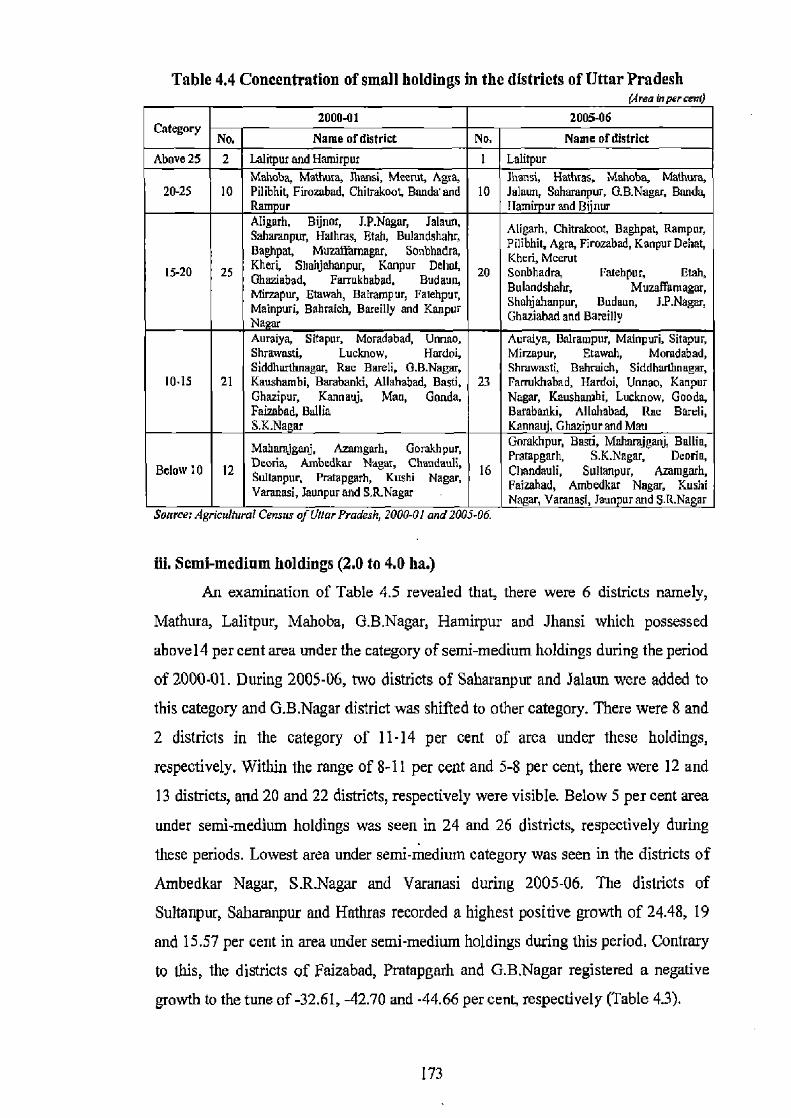
Table 4.4 Concentration of small holdings in the districts of Uttar Pradesh /Area inoerrend
2000-01 2005-06 Category
Na Name ofdistrict No. Name ufdietrict
Above 25 2 Lalitpur and Hamirpur 1 Lalitpur Mahoba, Mathura, Jhansi, Meerut, Agra, Jhansi, Hathras, Mahoba, Mathure,
20-25 10 Pilibhit, Firombad, Chitrakoot, Banda'and 10 Jalaun, Saharanpur, G.B.Nagar, Banda, Ram ur Ilamirpur and Bfnur Aligarh, Bijnor, J.P.Nagar, Jalaun, Aligarh, Chitrakoo; Baghpat, Rampur, Saharanpur, Halhras, Ftah, Bulandshahr, Pilibhit, Agra, Firoubad, Kanpur Dehat, eaghpm, Mutaffamagar, Sonbhadra, Mceru[
I5-20 25 Kherl Shahjahanpur, Kanpur Delias, 20 Gfiaziabad, Farrukhabad, Budaun,
Sonbhadra, FmehpM Gtah, Buland dra, gulandshahG Muaaffamagw, Mirzapur, Etawah, Bairampur, Fatehpur,
Mainpuri, Bahraich, Bareilly and Kanpur Shahjahad Budaun, J.P.Nagar, GM1aziabad and Bareilly and
reflly
Naar Auraiya, Sitapur, Moradabad, Unnao, Auraiya, Balrampur, Mainpuri, Sitapur, Shmwavti, Lucknow, Hardoi, Mirzapur, Etawah, Moradabad, SiddharOmagar, Rae Bareli, G.B.Nagar, Shrawasti, Bahraicb, Siddharlhnagar,
10-I5 21 Ksushambi, Barabanki, Allahabad, Basti, 23 Parmkhabad, Hardoi, Unnao, Kanpur Ghazipur, Kannauj, Mau, Gonda, Nagar, Kaushambi, Lucknow, Gonda, Faizabad, Ballia Barabanki, Allahabad, Rae Bareli, S.K.Na ar Kannau'. Ghazi ur and Man
Mahazajganj. Azamgarh. GorakhPUr, Gorakhpur, Bast, Mahamjganj, Ballia,
Deana, Ambedkar Nagar, Chandauli, Pratapgarh, S.K.Nagar, Deoria, 8dow IO 12 Sultanpur, Pratapgarh, Kushi Nagar, 16 Chandauli, Sultanpu4
Farahad, Ambedkar Nagar,
Kushi
Varanasi, Jaunpur and S.RNagm - Nagar, Varanasi, Jaun ur and S.R.Nagar .~aurce: ngricummar Lensus of uuar rraaesn, tuuu-ut ana [uuJ-uo.
iii. Semi-medium holdings (2.0 to 4.0 ha.)
An examination of Table 4.5 revealed that, there were 6 districts namely,
Mathura, Lalitpur, Mahoba, G.B.Nagar, Hamirpur and Jhansi which possessed
abovel4 per cent area under the category of semi-medium holdings during the period
of 2000-01. During 2005-06, two districts of Saharanpur and Jalaun were added to
this category and G.B.Nagar district was shifted to other category. There were 8 and
2 districts in the category of 11-14 per cent of area under these holdings,
respectively. Within the range of 8-11 per cent and 5-8 per cent, there were 12 and
13 districts, and 20 and 22 districts, respectively were visible. Below 5 per cent area
under semi-medium holdings was seen in 24 and 26 districts, respectively during
these periods. Lowest area under semi-medium category was seen in the districts of
Ambedkar Nagar, S.R.Nagar and Varanasi during 2005-06. The districts of
Sultanpur, Saharanpur and Hathras recorded a highest positive growth of 24.48, 19
and 15.57 per cent in area under semi-medium holdings during this period. Contrary
to this, the districts of Faizabad, Pratapgarh and G.B.Nagar registered a negative
growth to the tune of -32.61, -42.70 and -44.66 per cent, respectively (Table 4.3).
173
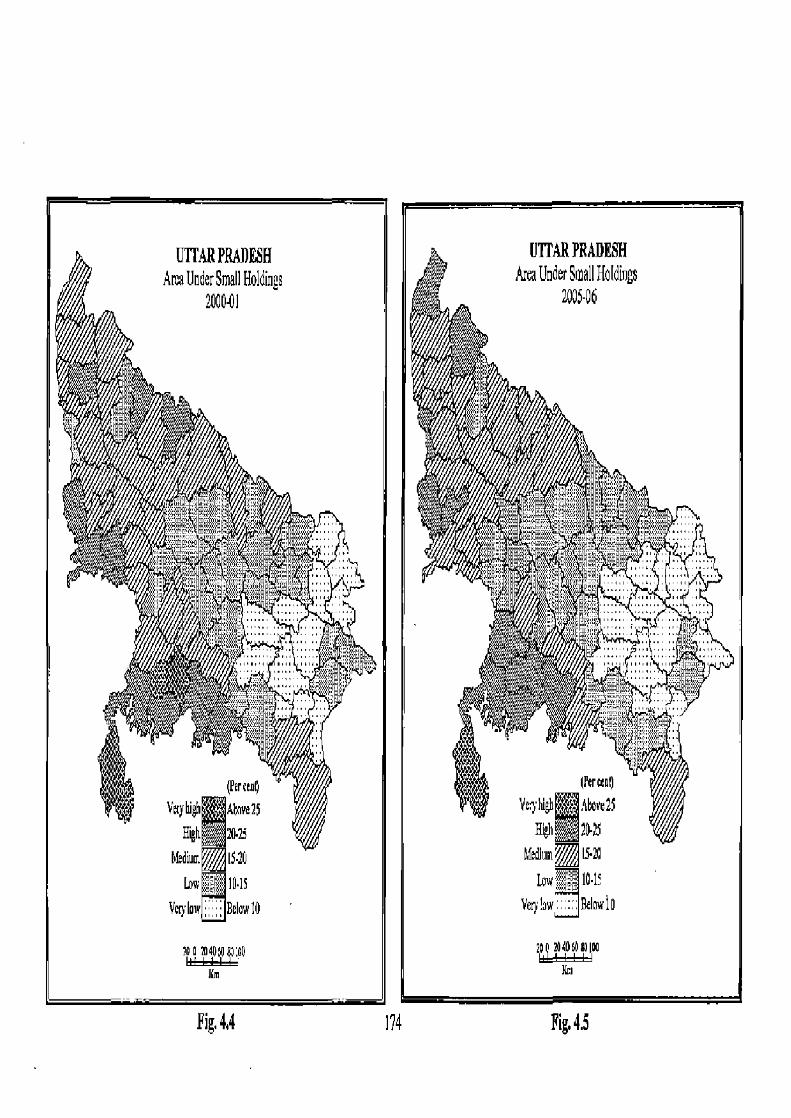
UTFAR PRADESH Area Under Small Holdings
2000-01
IP¢rcuo
Vtyhigh AYwe25
High 20.25
Mediut IS-20
w 10-15 Vrrylhw;,, BcIow10
UTTARPRADESH
Area Under Small Holdings 2Q5-6
wl
r t,~ 7CL(`
(Permof)
Vr}hgh Above2S
Hid 20•]5 hfedium 15.70
Law:, 10.1y Very!aw::::: Below1
2 ~aoWaloa
Km
Fig. 4,4 174 Fig 4.5
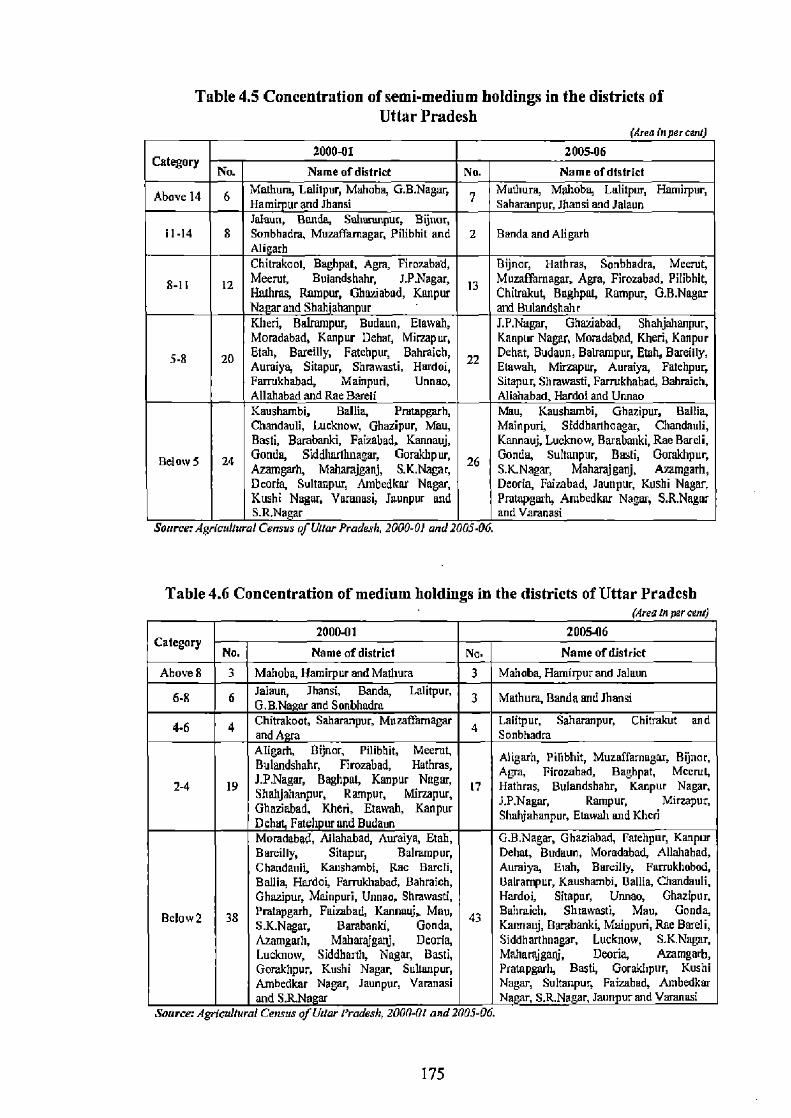
Table 4.5 Concentration of semi-medium holdings in the districts of Uttar Pradesh
(Area (nperctruj 2000-01 2005-06
Category No. Name ofdistrict No. Name nfdlstNCt
Above 14 6 Methuen, Lalilpur, Mahaha, G.B.Nagar, Mathura, Mahoba, Lalitpm, Hamirpur, Hamhpurand Jhansi Saharanpur, Jhansi and Jalaun Jalaun, Banda, Sahanmpur, Bijrwy
11-14 8 Sonbhadra, Muzaffarnagar, Pilibhit and 2 Banda and Aligarh Aligarh
Chitrakaot, Baghpat, Agra, Firozabad, Bijnor, Hathras, Sonbhadra, Meerut, S-11 12 Meemt, Bulandshahr, JP.Nagar, 13 Muzafarnagar, Agra, Firozabad, Pilibhit,
Hathms, Rampur, Ghaziabad, Kanpur Chivakut, Baghpat, Rampur, G.B.Nagar Nar and Shahjahanpur and Bulandshahr Kheri, Bairmupur, Budaua, Etowah, J.P.Nagar, Ghaziabad, Shahjahanpur, Moradabad, Kanpur Dehat, Mirzapur, Kanpur Nagar, Moradabad, Kheri, Kanpur
5.8 20 Etah, Bareilly, Fatehpur, Bahraich, 22 Dehat, Budaun, BaImmpur, Utah, Bareilly, Auraiya, Sitapur, Shmwasti, Hardoi, Elawah, Mirzapur, Auraiya, Fatehpur, Fmrukhabad, Mainpuri, Unnao, Sitapuq Shrawasti, Farrukhabad, Bahraich, Allahabad and Rae Bareli Allahabad, Hardoi and Urmao Kaushambi, Ballia, Prumpgarh, Mau, Kaushambi, Ghazipur, Bailin, Chandauli, Lucknow, Ghazipur, Mau, Mainpuri, Siddharlhnagar, Chandauli, Basti, Barabanki, Faizabad, Kannauj, Kannauj, Lucknow, Barabanki, Rae Bareli,
Below 24 Gonda, Siddhadhnagar, Gorakhpur, 26
Gonda, Sultanpur, Basti, Gorakhpur, ~mgarh, Maharajganj, S.K.Nagar, S.K.Nagar, Maharajganj, Aremgarh, Deoria, Sultanpur, Ambedkar Nagar, Deoria, Faizabad, Jaunpur, Kushi Nagar, Kushi Nag&, Varanasi, Jaunpur and Pmtapgarh, Ambedku Nagar, S.R.Nagar S.R.Nagar and Varanasi
Source: .4grictihura! Census of Ullur Pradesh, 2000-O) and2005-06.
Table 4.6 Concentration of medium holdings in the districts of Uttar Pradesh (Area in per rent)
2000-01 2009A6 Category
No. Name of district No. Name of district
Above 8 3 Mahoba, Ilamirpur and Mathura 3 Mahoba, Hamirpur and Jalaun
6-8 6 Jalaun, Jhansi, Banda, Lalitpur, 3 Mathura, Banda and Jhansi OB.Nagar and Sonbliadra
4.6 4 Chibakoot. Saharanpur, Musaffamagar Lalitpur, Saharanpur, Chitrakut and and A 4 Sonbhadra Aligarh, Bijnor, Pilibbit, Meemt, Aligarh, Pilibhit, Muzaffamegar, Bijaor, Bulandshahr, Firozabad, Hatteras,
Agra, Firorahad, Baghpat, Mccm1, 24 19
J.P.Nagar, Baghpat, Kanpur Nagar, 17 Hatteras, Bulantlshahg Kanpur Nagar,
Shahjahanpur, Rampur, Mirzapur, 1FNahar, Ranipur, Mirzapur, Ghaziabad, Kheri, Etowah, Kanpur and Shahjahanpur, Etawd Khcri Dehut, Fatehur and Budaun Moradabad, Allahabad, Auraiya, Etah, G.B.Nagar, Ghaziabad, Fatehpur, Kanpur
Bareilly, Sitapur, Balrumpur, Dehat, Budaun, Moradabad, Allahabad, Chandauli, Kaushambi, Rae Barcli, Auraiya, Etah, Bareilly, Farmkhabad, Ballia, Hatdoi, Farruklrabad, Bahmich, Balrampur, Kaushambi, Ballia, Chandauli, Ghazipur, Mainpuri, Unnao, Shmwasti, Hardoi, Sitapur, Unnao, Ghazipur,
Below2 33 Pmtspgarh, Faizabad, Kannauj. Mau, 43 Bzluaich, Shrawasti, Mau, Gonda, S.K.Nagar, Barabanki, Gonda, Kannauj, Barabanki, Mainpuri, Rae Bareli, Azamgarh, Maharajganj, Deoria, Siddharhnagar, Lucknow, S.K.Nagar, Lucknow, Siddharlh, Nagar, Bassi, Maharajganj, Deoria, Anmgarh, Gorakhpur, Kushi Nagar, Sultanpur, Pratapgarh, Basti, Gorakhpur, Kushi Ambedkar Nagar, Jaunpur, Varanasi Nagar, Sultanpur, Faizabad, Ambedkar and S.RNa ar Nagar, S.R.Nagor, Jaunpur and Varanasi
Source: Agricultural Census of Utar Pradesh, 2000-01 and 2005-06.
175
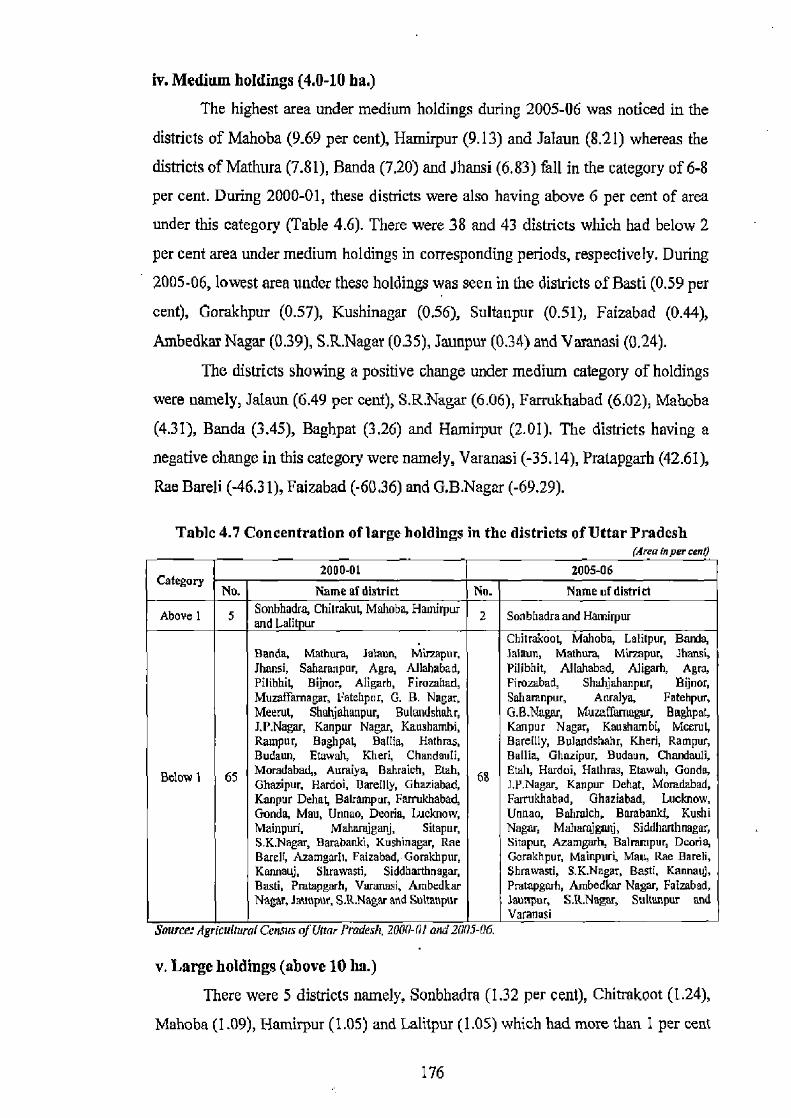
iv. Medium holdings (4.0-10 ha.)
The highest area under medium holdings during 2005-06 was noticed in the
districts of Mahoba (9.69 per cent), Hamirpur (9.13) and Jolson (8.21) whereas the
districts of Mathura (7.81), Banda (7.20) and Jhansi (6.83) fall in the category of 6-8 per cent. During 2000-01, these districts were also having above 6 per cent of area
under this category (Table 4.6). There were 38 and 43 districts which had below 2 per cent area under medium holdings in corresponding periods, respectively. During
2005-06, lowest area wider these holdings was seen in the districts of Basti (0.59 per
cent), Gorakhpur (0.57), Kushinagar (0.56), Sultanpur (0.51), Faizabad (0.44), Ambedkar Nagar (0.39), S.R.Nagar (0.35), Jaunpur (0.34) and Varanasi (0.24).
The districts showing a positive change under medium category of holdings
were namely, Jalatm (6.49 per cent), S.R.Nagar (6.06), Farrukhabad (6.02), Mahoba
(4.31), Banda (3.45), Baghpat (3.26) and Hamirpur (2.01). The districts having a
negative change in this category were namely, Varanasi (-35.14), Pratapgarh (42.61), Rae Bareli (-46.31), Faizabad (-60.36) and G.B.Nagar (-69.29).
Table 4.7 Concentration of large holdings in the districts of Uttar Pradesh (Area in per cent)
Category 2000-01
No. Name of district 2005-06
No. Name of district
Above 1 5 Sonbhadra, Chilrakut, Mahoba, Hamirpur 2 Sonbhadra and Hamirpur and Lali tpur Chitrakoot Mahoba, Lalilpur, Banda,
Banda, Mathura, Jalaun, Minapur, Jalaun, Mathura, Mirzapur, Jhansi, Jhansi, Saharanpur, Agra, Allababad, Pilibhit, Allahabad, Aligarh, Agra, Pilibhit, Bijnor. Aligarh, Firozabad, Firombad, Shahjahanpur, Bijnor, Muzaffamagar, Fatehpnr, G. B. Nagar, Saharanpur, Anralya, Fatehpur, Meenu, Shahjnhunpur, Bulamdshahr, G.B.Nagar, Muzaffurtmgar, Baghpat, J.P.Nagar, Kanpur Nagar, Kaushambi, Kanpur Nagar, Kaushambi, Mcemy Rampur, Baghpat, Ballfa, Hathras, Bareilly, Bulandshahq Kheri, Rampur, Budaun, Etawah, Kheri, Chandauli, Ballia, Ghazipur, Budaun, Chandauli,
Below 1 65 Moradabad,, Aumiya, Bahraich, Etah, Etalr, Hardoi, Hathras, Etowah, Gonda, Ghazipur, Hardoi, Bareitly, Ghgziahad, 6S J.P.Nagar, Kanpur Dehat, Momdabad, Kanpur Dehat, Bairampur, Farrukhabad, Farrukbabad, Dhaziabad, Lueknow, Gonda, Mau, Unnao, Deoda, Lucknow, Unaao, Bahmich, Barabanki, Kushi Mainpuri, Muhamjganj, Sitapur, Nagar, Mahamjgurtj, Siddltanhnngar, S.K.Nagar, Barabanki, Kushinagar, Rae Sitapur, Azamgarh, Balrampur, Dcoria, Bareli, Arnraach, Faizabad, Gorakhpur, Gorakhpur, Mainpud, Mau, Rae Bareli, Kannauj, Shmwasti, Siddharthnagar, Shrawasti, S.K.Nagar, Basti, Kannij, Basci, Pratapgarh, Varanasi, Ambedkar Pratapgorh, Ambedkar Nagar, Fatzabad, Nagar, Jarrnpur, S.R.Nagar and Suttat pur Jzunpur, S.R.Nagar, Sultunpur and
Varanasi Source: Agr(Crcttura( Census of Uttar Pradesh, 2000-III and 200)-06.
v. Large holdings (above 10 ha.)
There were 5 districts namely, Sonbhadra (1.32 per cent), Chitrakoot (1.24),
Mahoba (1.09), Hamirpur (1.05) and Laiitpur (1.05) which had more than 1 per cent
176
of area under large holdings during 2000-01, whereas only 2 districts namely,
Sonbhadra and Hamirpur formed this category during 2005-06 (Table 4.7).
Remaining districts during both the periods were characterized with having less than
1 per cent area under large holdings.
During the period of 2000-01 to 2005-06, a positive growth in area of large
holdings was seen in the districts of Auraiya (50 per cent), Siddharthnagar (33.33),
Jalaun (30.36), Bareilly (28.57), Shahjahanpur (7.69) and Banda (2.82), whereas
lowest negative growth was recorded in the districts of Faizabad (-66.67 per cent),
followed by Saharanpur (-59.38), Varanasi (-50), Mau (-50) and J.P.Nagar (-50).
C. Distribution and Consumption of Chemical Fertilizers
Fertilizers are the key inputs to augment crop productivity per unit of land. It
promotes profuse and deeper root system, which enables plants to extract large
quantity of water and nutrients from deeper soil layers (Majumdar, 2004). Irrigation
water is a complementary input to fertilizer. It adds moisture to the soil and improves
the diffusion of nutrients. Irrigation increases the absorption of organic nutrients by
plant roots. It is widely argued that, irrigation increases the responsiveness of
agricultural output to inputs and, therefore, it is positively correlated with input use
intensity. Irrigated cropping is usually accompanied by four to eightfold increase in
fertilizer application rates for irrigated crops in India. Irrigation and fertilizer
application are complimentary to each other. Additionally, heavier doses of fertilizer
are needed to maximize increase in yield by irrigation and greater evapotranspiration,
while irrigation is often needed to maximize the yield increase made possible by
fertilizers (Evans, 1986). The advent of green revolution in India has transformed its agrarian economy
from subsistence to market oriented farming. Increased use of fertilizers has been
both a cause and a consequence of this transformation. No doubt, the impact of
increased use of fertilizers on the growth of agricultural output is quite impressive.
Introduction of new technology in agriculture has also increased the demand for
inputs like fertilizers, HYVs, use of pesticides and insecticides and adoption of
recommended agronomic practices. Among the inputs of new technology package,
chemical fertilizers play an important role in increasing crop yields. The midterm
Assessment of 11th Plan notes that, the association between fertilizer consumption
and foodgrain production has weakened during the recent years due to imbalanced
177

use of nutrients and deficiency of micrdnutrients, which demands a careful
examination and policy action. This imbalance use of plant nutrients and neglect of
micro nutrient deficiencies in Indian soils has led to declining Fertilizer response and
deterioration of soil health. Implementation of new policy of nutrient-based subsidy
is likely to provide incentives for balanced use of fertilizers (Sankar, 2011). In
modem agricultural operations, a common practice is that, farmers apply both
chemical fertilizers and organic manures together for the growth of crops. In fact,
chemical fertilizers are recognised as the only source of plant nutrients (Mohanam, 2002).
a. Distribution of chemical fertilizers
On the whole, the distribution of chemical fertilizers has been marked with a
rapid increase since 1950-51. Its distribution amounted to 20.5 thousand metric
tonnes (mt) in 1950-51, which recorded an increase to 3,464.2 thousand mt in 2005-
06. Nitrogenous fertilizers constituted the largest share of 97.56 per cent in 1950-51,
this amount decreased to 70.40 per cent in 2005-06. Distribution of phosphoric
fertilizers increased from 2.44 to 23.78 per cent in respective years, and potash
fertilizers shared about 6 per cent in total distribution (Table 4.8 and Fig. 4.6).
Table 4.8 Distribution of chemical fertilizers in Uttar Pradesh; A trend of uroaress
Nitrogen(N20) Phosphorous(P2O5) Potash(K20) Total (NPK) Years mt Per cent mt Per cent mt Per cent mt 1950-51 20000 97.56 500 2.44 - - 20500 1960-61 281000 99.29 2000 0.71 - - 283000 1970-71 291000 70.80 75000 18.25 45000 10.95 411000 1980-81 860642 74.80 209338 18.19 80613 7.01 1150593 1990-91 1691883 75.34 455488 20.28 98348 4.38 2245719 2000-01 2206497 74.50 662083 22.35 93249 3.15 2961829 2005-06 2438671 70.40 823750 23.78 201836 5.83 3464257 Source: J'tatistical Abstract, 2UU8, State Directorate o/Agriculture. Lucknow.
Table 4.9 and Fig. 4.7 show the distribution of fertilizers in the state during
three periods of 1995-2000, 2000-05 and 2005-10. It is seen that, during 1995-2000,
there were 3 districts namely, Moradabad, Muzaffamagar, and Kheri which showed a
distribution of fertilizers well over 80 thousand mt. The number of districts increased
from 3 to 6 during 2000-05 and in 2005.10, there were 12 districts namely,
Shahjahanpur, Allahabad, Motadabad, Kheri, Sitapur, Muzaffamagar, Bulandshahr,
Barabanki, Pilibhit, Gorakhpur, Budaun and Etah included within this category. In
178
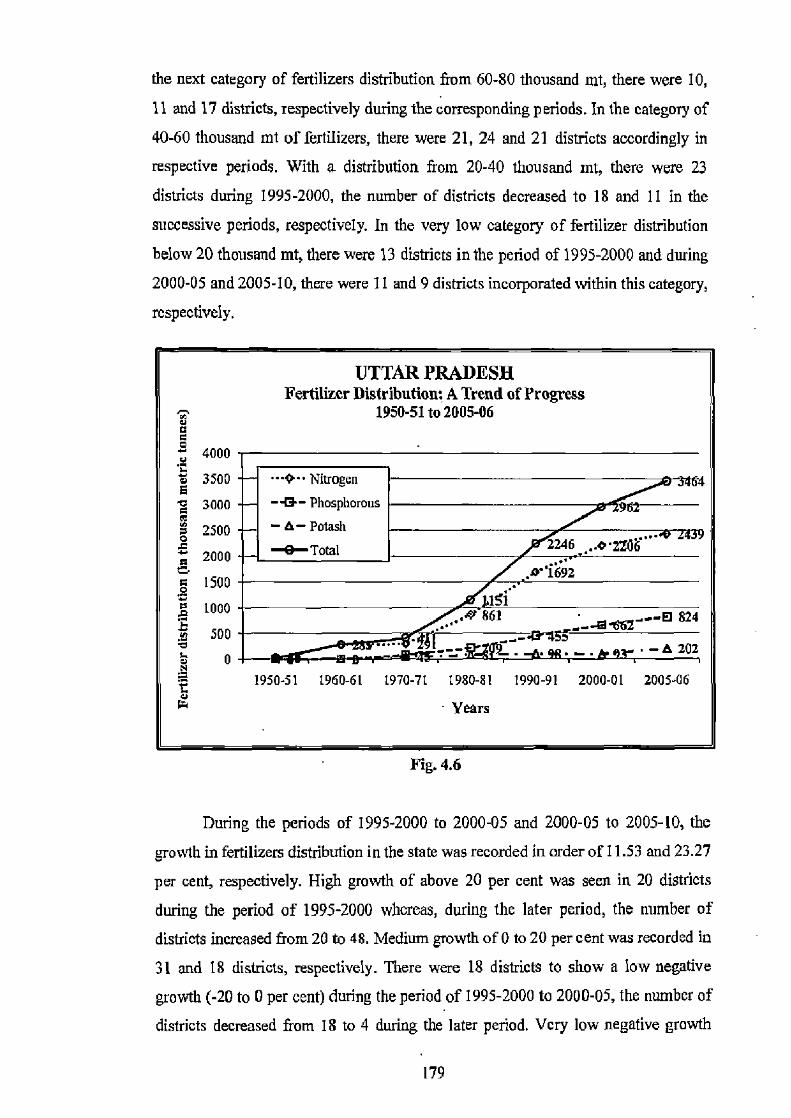
the next category of fertilizers distribution from 60-80 thousand mt, there were 10,
11 and 17 districts, respectively during the corresponding periods. In the category of
40-60 thousand mt of fertilizers, there were 21, 24 and 21 districts accordingly in
respective periods. With a distribution from 20-40 thousand mt, there were 23
districts during 1995-2000, the number of districts decreased to 18 and 11 in the
successive periods, respectively. In the very low category of fertilizer distribution
below 20 thousand mt, there were 13 districts in the period of 1995-2000 and during
2000-05 and 2005-10, there were 11 and 9 districts incorporated within this category,
respectively.
UTTAR PRADESH Fertilizer Distribution: A Trend of Progress
1950-51 to 2005-06
4000
d 3500 5
3000
2500
2000
1500
y L000
O 500
L O N
1950-51 1960.61 1970-71 1980-81 1990-91 2000-01 2005.06 u
• Years
Fig. 4.6
During the periods of 1995-2000 to 2000-05 and 2000-05 to 2005-10, the
growth in fertilizers distribution in the state was recorded in order of 11.53 and 23.27
per cent, respectively. High growth of above 20 per cent was seen in 20 districts
during the period of 1995-2000 whereas, during the later period, the number of
districts increased from 20 to 48. Medium growth of 0 to 20 per cent was recorded in
31 and 18 districts, respectively. There were 18 districts to show a low negative
growth (-20 to 0 per cent) during the period of 1995-2000 to 2000-05, the number of
districts decreased from 18 to 4 during the later period. Very low negative growth
••R•• Nitrogen
—e— Phosphorous
— e— Potash Total
4
962 -
-
2246 ,...zzo rY1692
y151 .~' 861 ..--662 ~O 824
. - e 202
179
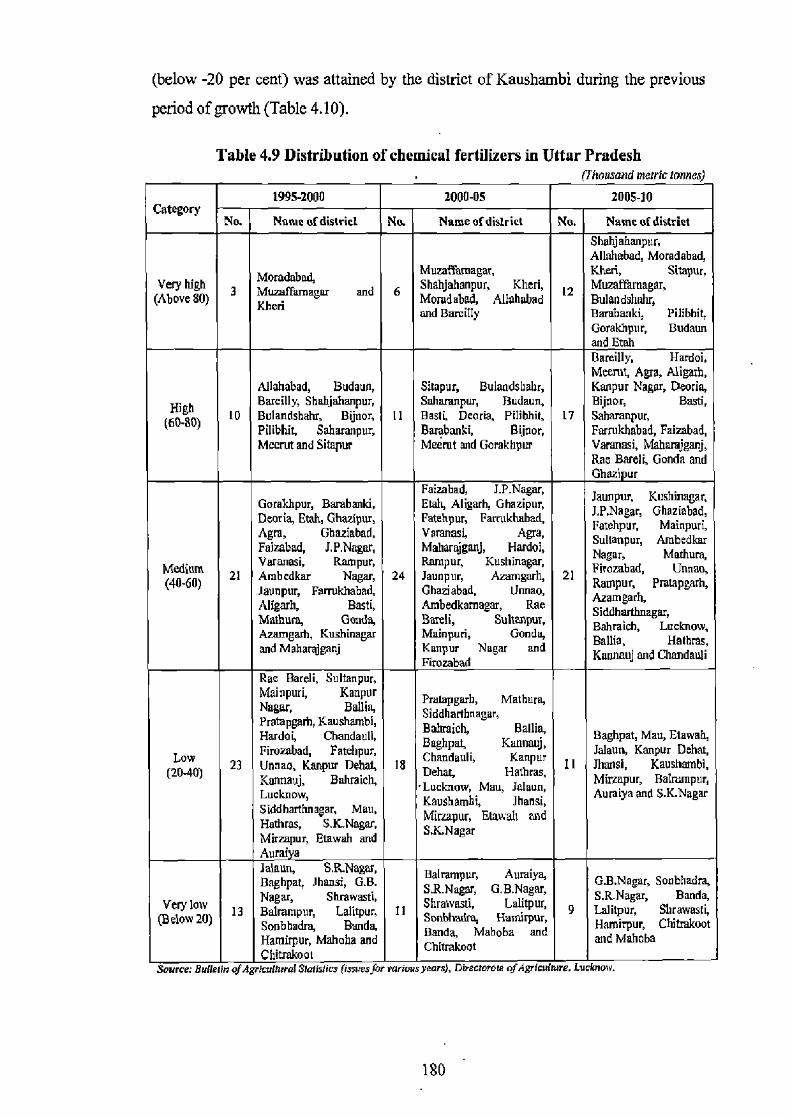
(below -20 per cent) was attained by the district of Kaushambi during the previous
period of growth (Table 4.10).
Table 4.9 Distribution of chemical fertilizers in Uttar Pradesh (Thousand metric ronnes)
1995-2000 2000-05 2005-10 Category
No. Name of district No. Name ofdislricc No. Name of district Shehjahanpur,
Allahabad, Moradabad,
Moradabad, MuzatTernagar, Kheri, Sitapur, Very high 3 agar and 6 Shahjahanpur, Kheri, l2 Muzaffarnagar,
(Above 80) iuien w ed Moradabad, Allahabad Barabanki, y and Barcilly Harebanki, Pilibhiy
Gorakhpur, Budaun
and Etah Bareilly, Hardoi, Meemt, Agra, Aligarh,
Allahabad, Budaun, Silapur, Bulandshalu, Kanpur Nagar, Deoria,
High Barcilly, Shahjahanpur, Saharanpur, Budaun, Bijnor, Basti,
(bo-S0) 10 Bulandshahr, Bijnor, 11 Basti, Decria, Pilibhh, 17 Saharanpur, PilibIr, Saharanpur, Bambanki, Bijnor, Farrukhabad, Faizabad, Mecrm and Sitapur Meerut and Gomkhpur Varanasi, Mahamjganj,
Rae Bareli, Gonda and Ghazi ur
Fi d,J.P-Naga, g
G uy B i, Emit, Aliarh, Ghazipur, Jz,
npur, Kushinagar, JP.Nagar, Ghaziabad, D
eoria,
Etah, Ghazipu
r, Fatehpur, Parrukhahad, Fatehpur, Mainpuri, Agra, Gbuiabad, Varanasi, Agra, Sultanpur, Ambedkar Faizabad, J.P.Nagar, Maharujganj, Hardoi, Nagar, Mathura, Medium
Varanasi, Ramp ur, Raur, Kushinagar, rnp Birozahad, Unnao,
(40 60) 21 Ambodkar Nagar, 24 Jaunpur, Azarngarh, 21 Rampur, Pralapgarh,
Jaunpur, Farrukhabad, Ghaziabad, IJnnao, Azam Aligarh, Basti, Ambedkamagar, Rae Sihrhadhrthnngnr, Mathura, Gonda, Bunch, Sultm pur, Azamgarh, Kushinagar Mainpuri, Gonda, Bahia, Lucknow,
a, and Maharnjganj Kanpur Nagar and inn auli scan ~d chnnhkuI_ Firozabad J
Rae Bareli, Sultanpur, Mainpuri, Kanpur pmmpgarh, Mathura, Nagar, Ballia, Siddharthnagar, Pratspgarb, Kaushambi, Bahraieh Bailie, Hardai, Chandauli, Beghpat, Kannauj, eaghpaq Mau, ,
Low Firozabad, Fatelipur, uli, Kanpur
Debar, Jalaun, Kanpur Dehat,
23 Unnao, Kanpur Dehat, KDrmvvj. Baheticlt,
IS Dehat, Hatteras, Delia, 11 Ilmnsi, Kaushambi,
'Lucknow, Mau, Jalaun, Mirzapur, Balnunpvr, Lucknow, Kaushambi, lhansi ,
Auraiya and S.K.Nagar
Siddharthnagar, Mau, Mirzapur,Etawalt and Hathras, S.K Nagar, •K.Nar S
.Nag ag
Mirzapur, Etawah and Auraiya
Jalaun, S.R.Nagar, Balram a pur, Auraiya, Bzghpat, Jhenv, G.B. S.R.Nagar, G.B.Nagar, G.B.Nagar, Sonbhadra,
Very low 13 Nagar, Shrawani, Bahmnpur, rawasti. II Shrnwnni, Lalitpur, 9
S.R.Nagar, Banda, hlitpur, Shrawasti,
(Below 20) Sonhhadra, Banda, Sonbhadm, Hamirpur, Chitrakoot
Hamirpur, Mahoba and Banda, Mahoba and and Mahe
and Mahoba Chitmkuat
Chirrakuot
Source: Bulletin of Slklllics(issuesfor various y ), Dbeuoiova ofAgrtcvrare. LVcicnow.
180
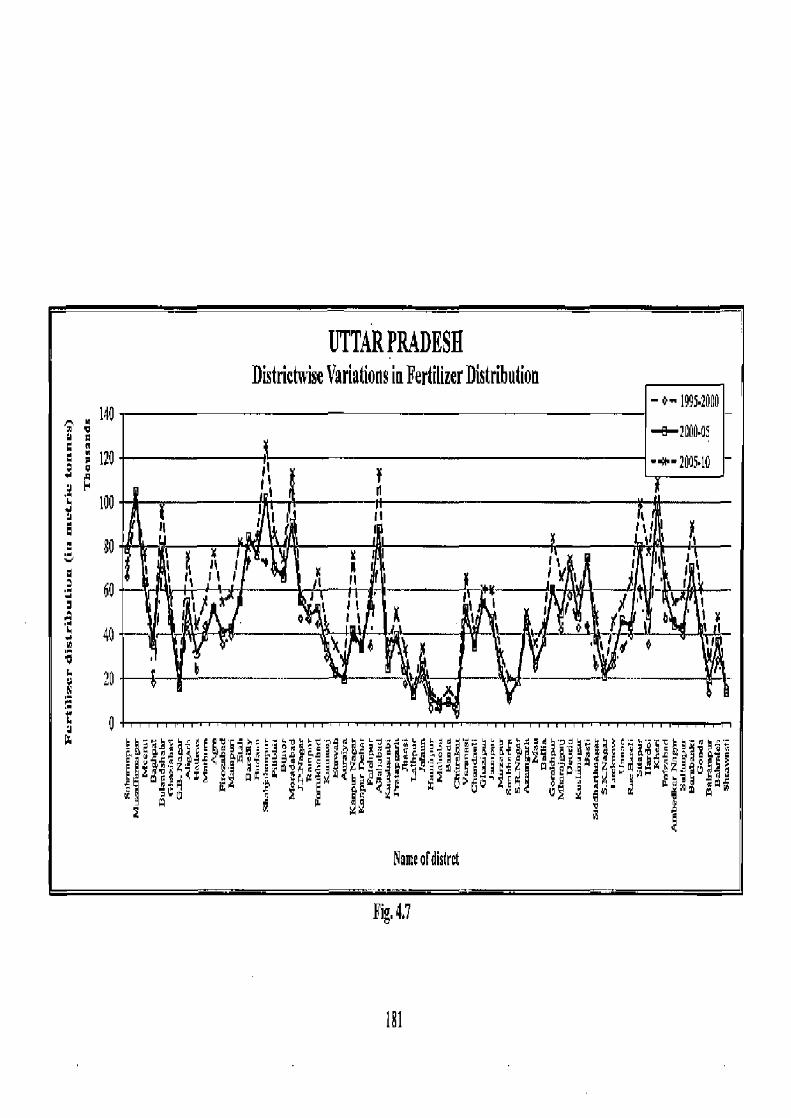
I 80
60
4Q
20
D
UTTAR PRADESH fliedrufwivP Variafinna in Farfilinar llisfrihnfinn
— o-1995.200
—B—?0U -*-200s.m
I .I A I1 ff 1! Y ~
A I II 1 l f X
II ' ! , _ _~ !! 1 '
~ I I Iv o it K I ) ck ' j ~
6 1
.- 3 hE•5eenpy y ;e. .o 3u =c~1 .r dlafi fic ,y ~ ~x c~ ?amA z y $
Nam oldisird
Fig. 4.7
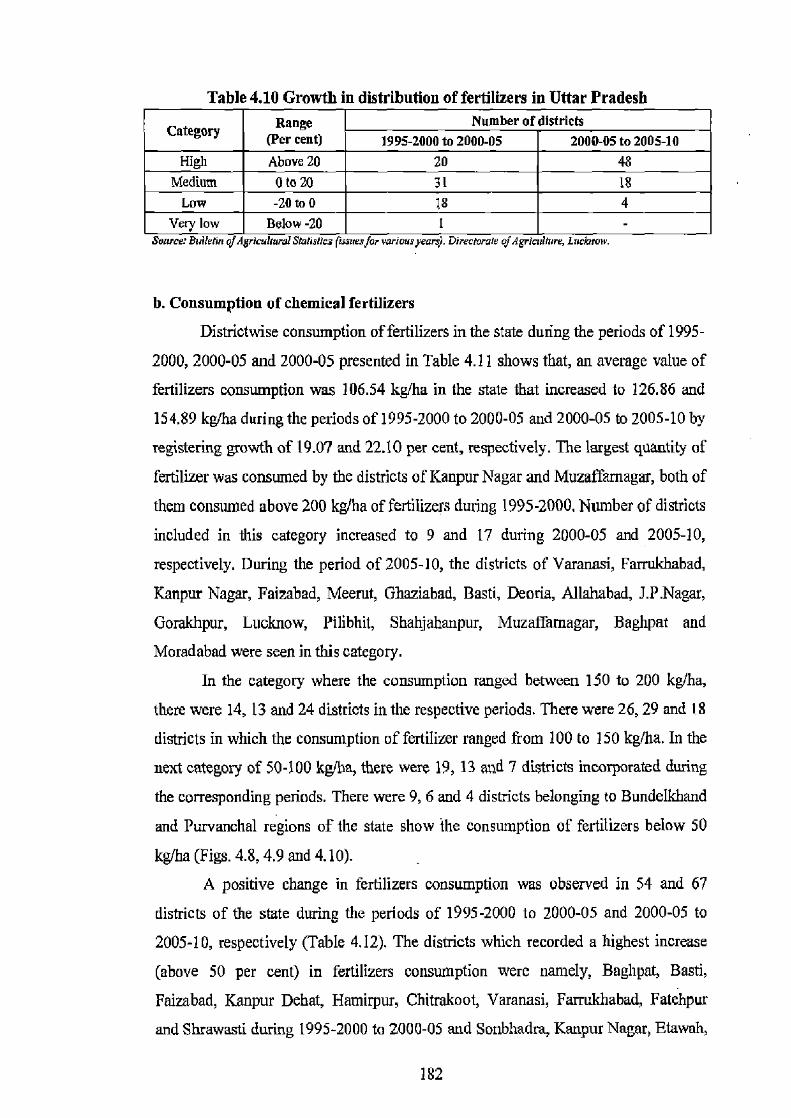
Table 4.10 Growth in distribution of fertilizers in Uttar Pradesh
Category Range (Per cent)
Number of districts 1995-2000 to 2000-05 2000-05 to 2005-10
High Above 20 20 48 Medium 0 to 20 31 18
Low -20 to 0 18 4 Very low Below-20 1 -
Sauce: Bulletin gjAgricuLural Statistics (issues for van iouryears). Directorate oJAgrindhne, LrOm..
b. Consumption of chemical fertilizers
Distrietwise consumption of fertilizers in the state during the periods of 1995-
2000, 2000-05 and 2000-05 presented in Table 4.11 shows that, an average value of
fertilizers consumption was 106.54 kg/ha in the state that increased to 126.86 and
154.89 kg/ha during the periods of 1995-2000 to 2000-05 and 2000-05 to 2005-10 by
registering growth of 19.07 and 22.10 per cent, respectively. The largest quantity of
fertilizer was consumed by the districts of Kanpur Nagar and Muzaffarnagar, both of
them consumed above 200 kg/ha of fertilizers during 1995-2000. Number of districts
included in this category increased to 9 and 17 during 2000-05 and 2005-10,
respectively. During the period of 2005-10, the districts of Varanasi, Farrukhabad,
Kanpur Nagar, Faizabad, Meerut, Ghaziabad, Basti, Deoria, Allahabad, J.P.Nagar,
Gorakhpur, Lucknow, Pilibhit, Shahjahanpur, Muzaffarnagar, Baghpat and
Moradabad were seen in this category.
In the category where the consumption ranged between 150 to 200 kg/ha,
there were 14, 13 and 24 districts in the respective periods. There were 26, 29 and IS
districts in which the consumption of fertilizer ranged from 100 to 150 kg/ha. In the
next category of 50-100 kglba, there were 19, 13 and 7 districts incorporated during
the corresponding periods. There were 9, 6 and 4 districts belonging to Bundelkhand
and Purvanchal regions of the state show the consumption of fertilizers below 50
kg/ha (Figs. 4.8, 4.9 and 4.10).
A positive change in fertilizers consumption was observed in 54 and 67
districts of the state during the periods of 1995-2000 to 2000-05 and 2000-05 to
2005-10, respectively (Table 4.12). The districts which recorded a highest increase
(above 50 per cent) in fertilizers consumption were namely, Baghpat, Basti,
Faizabad, Kanpur Debat, Hamirpur, Chitrakoot, Varanasi, Farrukhabad, Fatehpur
and Shrawasti during 1995-2000 to 2000-05 and Sonbhadra, Kanpur Nagar, Etowah,
182
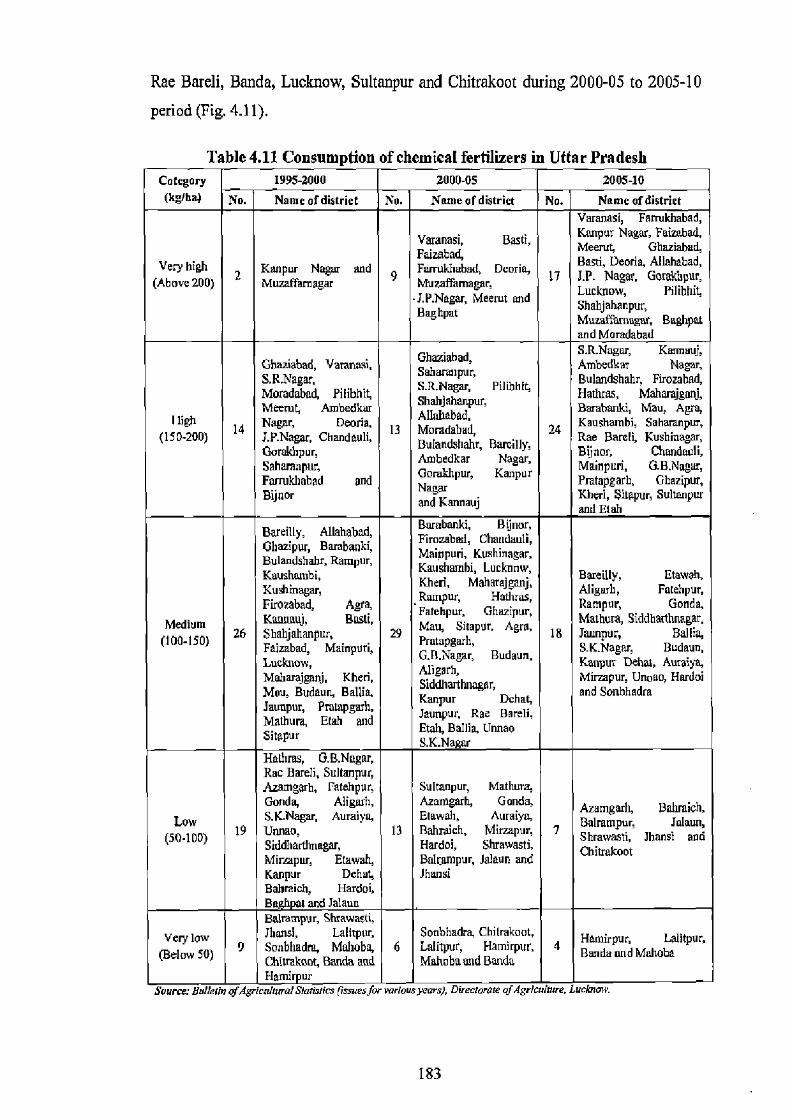
Rae Bareli, Banda, Lucknow, Sultanpur and Chitrakoot during 2000-05 to 2005-10 period (Fig. 4.11).
Table 4.11 Consumption of chemical fertilizers in Uttar Pradesh Category 1995-2000 2000-05 2005-10
(kg/ha) No. Name of district No. Name of district No. Name ofdistrict Varanasi, Farrukhabad,
Varanasi, Basti, spur Nagar, Faizabad, Faaran ad, Meerut, Ghazinbnd,
Very hi Kanpur Nagar and Fmrukhahad, Dcorin, Basti, Deorla, Allahabad,
ry 61r
(Above 200) 2 Muzaffarnagar 9 Muzaffmnagag 17 Nagar, Go[akbpur, Luc
•J.P.Nagar, Meerut and Lucknow, PilihhiS
Baghpat Muzafhanagu Muxafiarnngnr. Baghpaz and Moradabad
Ghaaiabad, S.R.Nugor, Karmauj, Ghaviatad, Vamnavi, Ambedkar Nagar, [email protected],
S.R.N pur, Firorabad, Hathrashahr,
Morad¢bnd Pilibhit, Shahj agar, Pilibhit, Shahjahanpur, Hara ss, Ma u, Agra,
Meerut, Ambedkwu Allohab3d. Bornbanki, Mau, Agra, Itigb
14 Nagar, Deoria, 13 Morsdabad, 24 Kaushambi, Saharanpur, (15D-200) L Chandauli, rsddopr, Rae Bareli, Chun agar,
Crorakhpur, RNagar. Ambedkar Ambedkar Nagar, CB.Na u r, Maine,
Saharanpur, Gorakhpur, Kanpur
Maiapuri, G.H.Nagar, FawaklIabnd and
Nagar Prrtapgarh, Lhazipur,
Bijuor and Kannauj Khed, Suoeut, Suhanpur and Emb
Bareilly, Allahabad, Barabanki, Bijnor, Chmtdauli,
Gllazipur, Barabatlki, Mainpbxd, Mainpun, Koshinogar, BulnnJsbaEr, Aarrpor, Kauslnhi, Lucknow, Kaushambi, Kheri,
heri, Maharajganj, Hmeilly, Etowah, Kushinagar, Hmhras, Aligarh Fatehpur, Firozabad, Agra, npur, Rampur, Gonda,
Medium Kam[au J• Basil, Fatehpur, Ghazipua, Mau, Shapur, Agra, Manpur, Siddhart
Ballia, (100-150)
26 Shahjahanpur, 29 is Wallin, S.K.N g Budaun, Faizabad, Mainpuri, G.R.Ngarh,
G.B.Nagaq Budaun, Lucknow, Aligarh,
Kanpur Kanpur Dehm, Awaipa, Kheri, Man, Unaao, Hardoi and Sony,
Man, Budaun, Ballie, Budaun, Sanpurtluwgsr, Kanpur Dehat, and Sonbhadra
Jaunpur, Pratapgarh, Jaunpur, Rae Bareli, Mathura, Etch and Etah, Ballia, Unnao
Sitapur S.K.Na
Hativas, G.B.Negar, Rae Bareli, Sullanpur, Aaamgarh, Fatehppr, Sultanpur, Mathura, Gonda, Aligarh, Azamgarh, Gonda, Azamgarh, Bahmich,
Low S.K.Nagar, Auraiya, Elawah, Auraiyn, Balmmpuy Ialau (50-1 DD)
19 UMao, 13 Rahrdich, Mirzapur, 7 d ]hausi and
Siddharthnagar, Hardoi, Shrawasti, Chmwicoo Chitrakoot Mirzapur, Etawah, Balrampur, lalaun and
Kanpur Dchat, Jhansi Bahmich, Hardoi, Baghpatond Jalauu Balrampuc, Shrawasti,
Very low Jhansi, Lalitpur, Sonbhadra, Chitrakoot, Lalitpug (Below 50) 9 Sanbhadm, Mahoba, 6 Laliryur, Hamiryu[,
Mahob¢ and Banda q Banda and
Banda wd Muhoba ~itrakoot, Banda and Ham ur
Source: Hu/lean $AyrinAnnal Sfrsfislics (?rsuesjw varioueyrnrs), Dvectorme ofAgr/culnne, Lucknow..
183
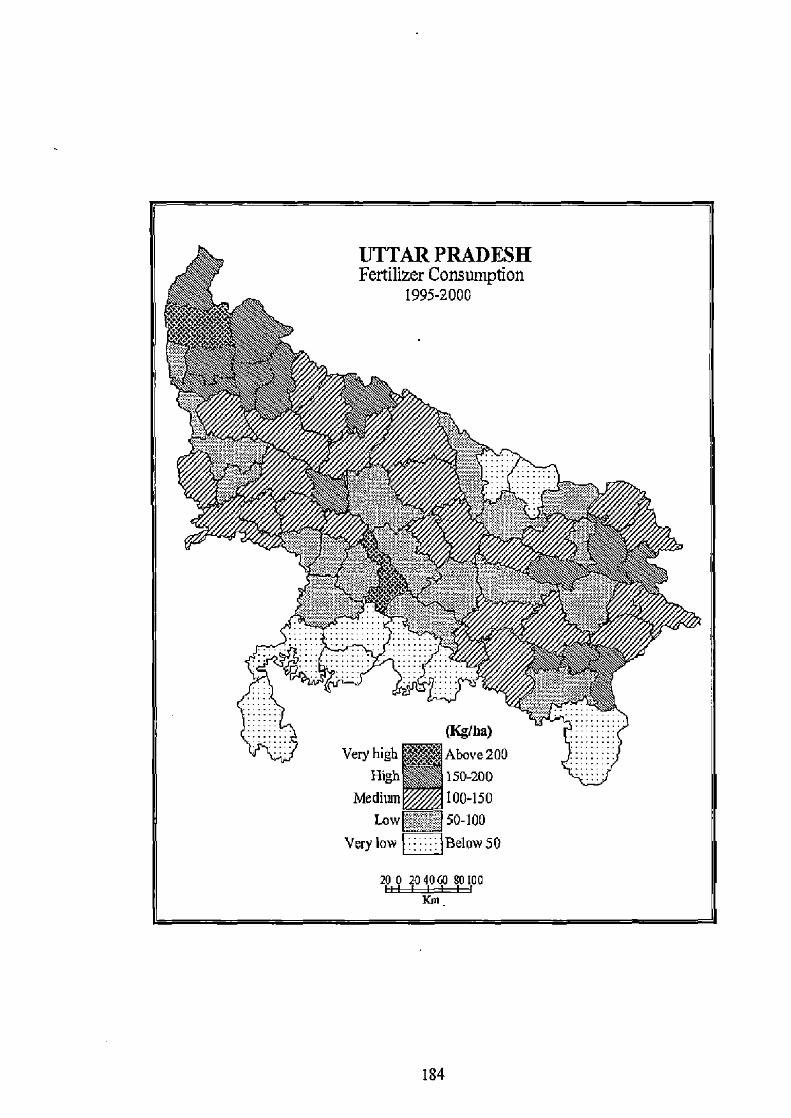
UTTAR PRADESH AllY Fertilizer Consumption
1995-2000
vK .,?.
.F "
rs -
(Kg/ha) Very high Above 200
High 150-200 Medium 100-150
LowM 50-100 Very lowBelow 50
20 0 20 4060 BO100 Km
184

Fig. 4.9
185
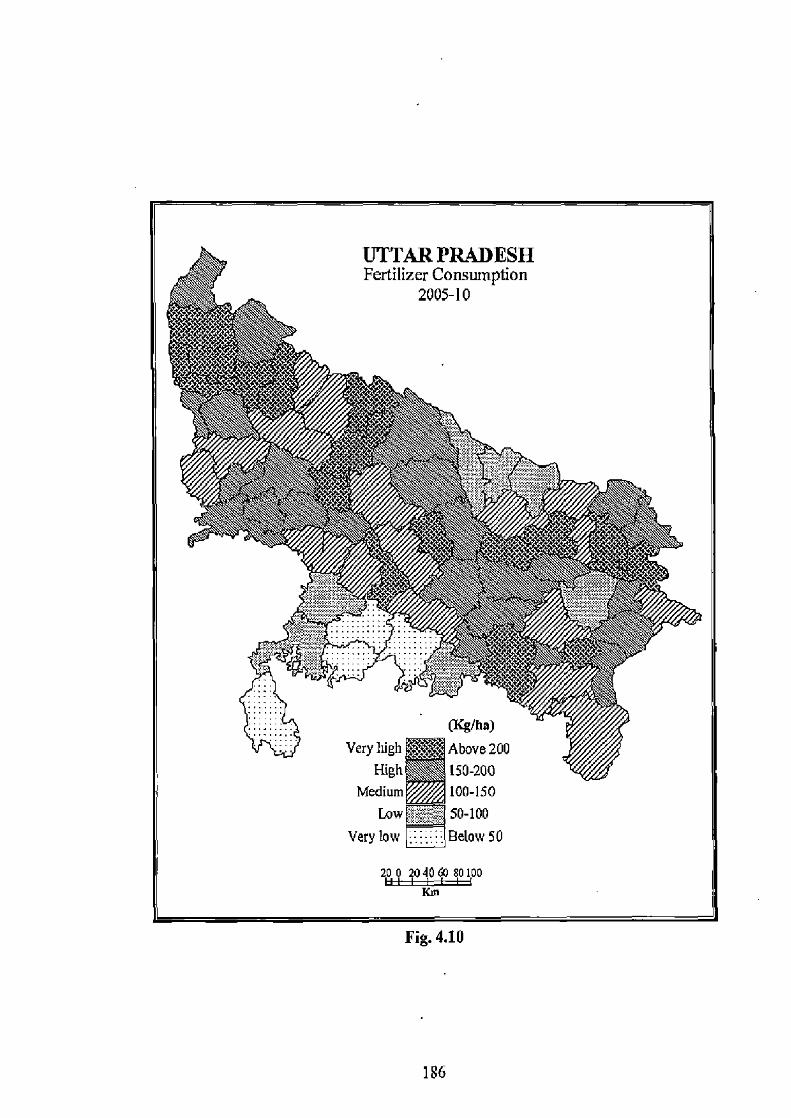
Fig. 4.10
186

UTTARPRADESH Growth in Consumption of Fertilizer
3D0A0
25D.00
V 20DOD
150.00
a 100.D0
C~
-SOHO 5 E-9
Name of district
..1995.6 t0 2000-05 —~2000.OS fo 2D05.10
i I I
e Senage 4 Ii~~.E~
x R R
°iaytiEa?z
Fig 4.11
187

Table 4.12 Growth in consumption of fertilizers in Uttar Pradesh
Category R8nge (Per cent)
Number of districts 1995-2000 to 2000-05 2000-05 to 2005-10
High Above 20 29 43 Medium 0 to 20 25 24 Low -201o0 15 3
Very low Helow -20 1 j - Source: 9n!!elin of 4gricutrura( Slat istics ((ssues for wrious years), Directorate ofAgricuilure, Laclma+v.
UTTAR PRADESH Relationship between Fertilizer Consumption and Irrigated Area
2005-10 450
400
350
300
.250 6 3
200 tJ
5
13 150
l00
50
a
20 4a 60 so IOU
Gross irrigated area (per cent)
Note: Numbers on the figure refer to the serial order ofthe districts listed to Table 4.3
Fig. 4.12
There exists a positive correlation between the fertilizers consumption and
gross irrigated area in the state with a coefficient value of 0.56 (Fig. 4.12).
Regression analysis also shows a positive linear relationship between both the
components, with the magnitude of 0.2974. This reveals that, the greater of irrigation
water led to high amount of fertilizer consumption in the state.
Y
Q U
27 063
Q 50 O 30 57 18 d6 17
p st Ott03! O Cm 2
O ss 29 49 Z t0 15 ai
ss 69 sb Ott Ors OC~fi~ a3
03 Q 3J
Q 30 Q lB O 34
188
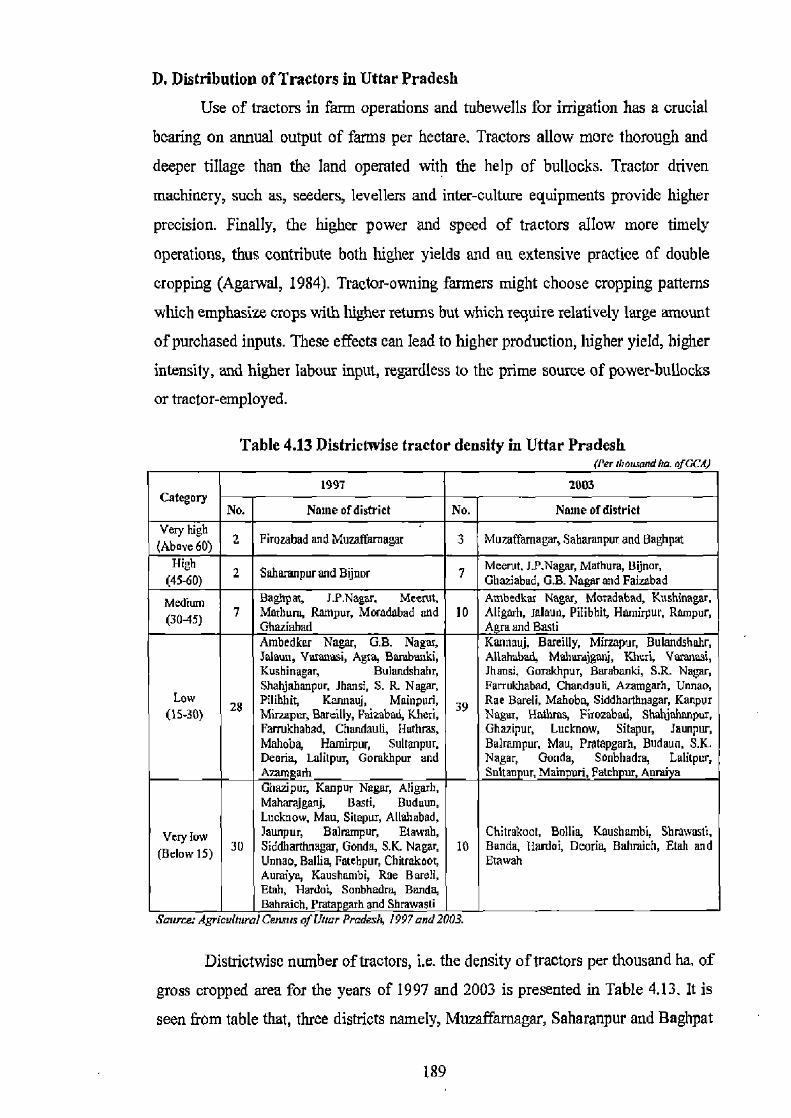
D, Distribution of Tractors in Uttar Pradesh
Use of tractors in farm operations and tubewells for irrigation has a crucial
bearing on annual output of farms per hectare. Tractors allow more thorough and
deeper tillage than the land operated with the help of bullocks. Tractor driven
machinery, such as, seeders, levellers and inter-culture equipments provide higher
precision. Finally, the higher power and speed of tractors allow more timely
operations, thus contribute both higher yields and an extensive practice of double
cropping (Agarwal, 1984). Tractor-owning farmers might choose cropping patterns
which emphasize crops with higher returns but which require relatively large amount
of purchased inputs. These effects can lead to higher production, higher yield, higher
intensity, and higher labour input, regardless to the prime source of power-bullocks or tractor-employed.
Table 4.13 Districtwise tractor density in Uttar Pradesh (Per evo,..,»,era. „rceAJ
1997 2003 Category
No. Name of district No. Name of district Very high (Above 60) 2 Pirouhad and Mundfarnagar 3 Muzzffamapyy Saharanpur and Baghpat
High 2 Saharanpur and Bijnur 2
Meerut, J.P.Nagar, Mathura, Bijnor, (45-60) Ghaziabad, G.B. Nagar and Faizabad MediUm Baghpat, J.P.Nagar, Meerul, Ambedkar Nagar, Moradabad, Knshinagar, (3045) 7 Mathum, Rampur, Moradabad and 10 Aligarh, Jalaun, Pilibhit, Hamirpur, Rampur,
Ghaziebad Agmand Basti Ambedker Nagar, G.B. Nagar, Kannauj, Bareilly, Mirzapur, Bulandshahr, Salami, Varanasi, Agta, Barabanki, Allahabad, Mahurajgon3, Khcri, Varanasi, Kushinagar. Bulandshahr, Jhansi, Gorakhpur, Barabanki, S.R. Nagar, Shahjahanpur, Jhansi, S. R. Nagar, Farrukhabad, Chandauri, Azamgarh, Unnao,
Low 2$ Pilibhit, Kannauj, Mainpuri, 39 Rae Bareli, Mahoba, Siddharthnagar, Kanpur (15-30) Minapur, Rareilly, Faizabad, Khcri, Nagur, Hathms, Firozabad, Shahjulompur,
Farrukhahad, Chandauli, [lathes, Ghvipur, Lucknow, Sitapur, Jaunpur, Mahoba, Hamirpur, Sultanpur. Balmrvpur, Mau, Pratapgarh, Budaun, S.K. Deoria, Lalitpur, Gorakhpur and Nagar, Gonda, Sonbhadra, Lalitpur, A,cam arh Sultan ur, Mahipuri, Fatchjnir, Aumiya Ghazipur, Kanpur Nagar, Aligarh, Maharajganj, Basti, Budaun, Lucknow, Mau, Sitapur, Allahabad,
Very low Jaunpur, Balrampur, Etowah, Chitrakeut, Ballia, Kaushambi, Shgawasti, (Below 15) 30 Siddharthnagar, Gonda, 5.K. Nagar, 10 Banda, Rardol, Deudu, Bahraich, Etah and
Unnao, Ballia, Fatehpur, Chitrakont, Etawah Auraiya, Kausharnbi, Rae Bareli, Etah, Hardoi, Sonbhadn, Banda, Bahraich, Pmm garh and Shrawcsd
.1'orncc Agricultural 6nsrss of Uaar Pradesh, /997 and 2UU3.
Districtwise number of tractors, i.e. the density of tractors per thousand ha, of
gross cropped area for the years of 1997 and 2003 is presented in Table 4.13. It is
seen from table that, three districts namely, Muzaffamagar, Saharanpur and Baghpat
189

of upper doab were outstanding to have higher number of tractors in order of 81, 81
and 69 per thousand ha of gross cropped area, respectively during 2003. In the year
1997, only two districts of Firozabad (87) and Muzaffarnagar (61) were fallen in this
category (Figs. 4.13 and 4.14). The districts of Saharanpur (55) and Bijnor (47) in
1997, and the districts namely, Meerut (57), J.P.Nagar (54), Mathura (51), Bijnor
(50), Ghaziabad (48), G.B.Nagar (48) and Faizabad (47) in 2003, were having large
number of tractors. There were 7 and 10 districts having 30-45 tractors per thousand
ha. of gross cropped area in the corresponding years, respectively. There were
altogether 28 and 39 districts in which there were 15-30 tractors per thousand ha. of
gross cropped area. Very poor districts in terms of tractors in use in the year 2003
were namely, Chitrakoot, Ballia, Kaushambi, Shrawas6, Banda, Hardoi, Deoria,
Bahraich, Etah and Etawah to have less than 15 tractors per thousand ha. of gross
cropped area.
Table 4.14 Growth in tractor density in Uttar Pradesh
Category ent P er No. Number of districts Shrawasti, Pratspgarh, Rae Bareli, 5oobhadra, Aligarh, Faizabad, Unnao, Basti, Allahabad, Siddharthnagar, Hamirpur, S.K. Nagar, Gonda, Maharajganj, Bairarapw, Jaunpur, Pilibhit, Sitapur,
High Above 50 37 Banda, Gorakhpur, G.B. Nagar, Fatehpur, Auraiya, Baghpat, Azamgarh, Kanpur Nagw, Lucknow, Mau, Meerut, Ghazipur, Kushinagar, Bah,aiety Bodaun, Hardoi, Chitrakoot, Ghaziabad and Bareia Mathuny Kennauj, Kheri, Mirzapur, Saharanpur, Ambcdkar Nagar, Chandauli, Kaushambi, Mahoba, J.P.Nagar, Fartukfiabad,
Medium 0 to 50 27 Hathras, Muzafiarnagar, Jalaun, Lalitpur, Agra, Ballia, Mmudabad, Jhansi, S.R. Nagar, Bulandshahr, Elah, Sultanpur, Barabanki, Varanasi, Bijnor and Shabjahan ur
Low -50 to 0 4 Rampur, Mainpuri, Dcaria and Etowah Very low Below-50 I Firozabad
Source: Agricultural Census of Uuor Pradesh, 1997 and 2003.
It is visible in Table 4.14 that out of 70 districts, there were 64 which showed
positive growth in tractor density. There were 37 districts which recorded high
positive growth of above 50 per cent, among which the districts namely, Shrawasti,
Pratapgarh, Rae Bareli, Sonbhadra, Aligarh, Faizabad, Unnao, Basti Allahabad,
Siddharthnagar, Hamirpur, and S.K.Nagar recorded above 100 per cent growth.
There were five districts namely, Rampur, Mainpuri, Deoria, Etawah and Firozabad
in which growth in tractor density was negative during this period.
From Fig. 4.15 it is evident that, there is a positive correlation between
tubewell irrigated area and use of tractors with coefficient value of 0.52 in the
190
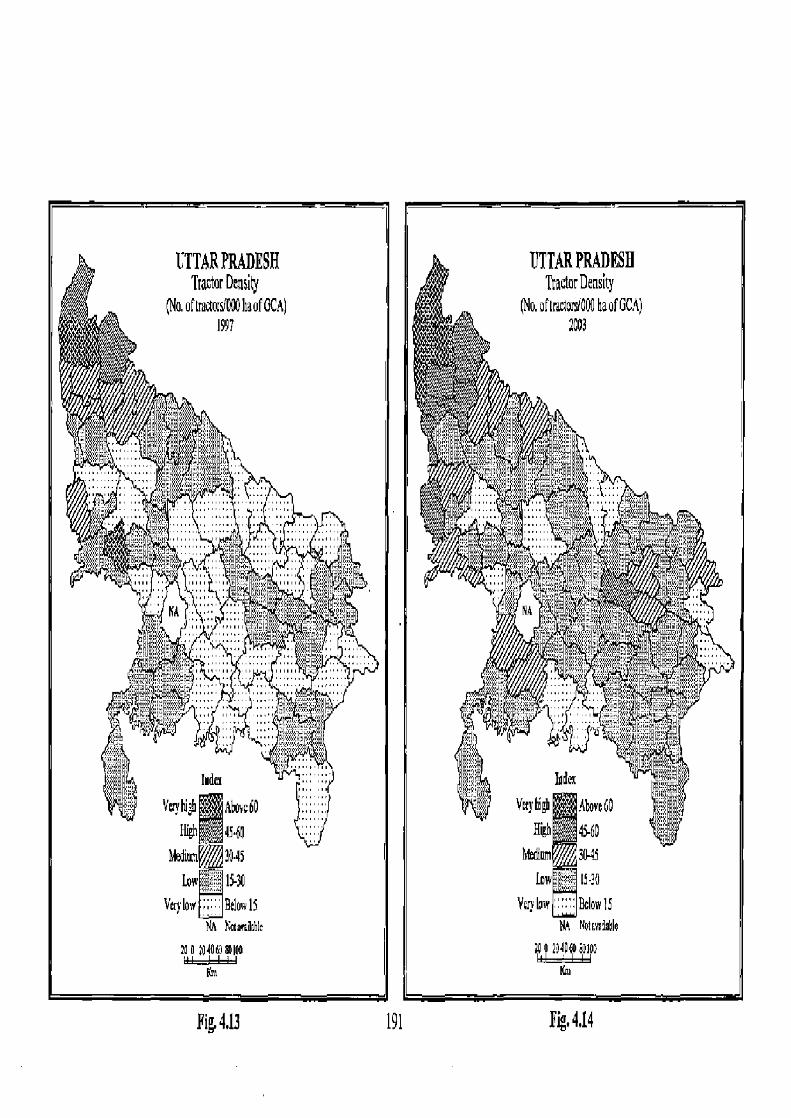
Fig. 4.13 191 Fig. 4.14
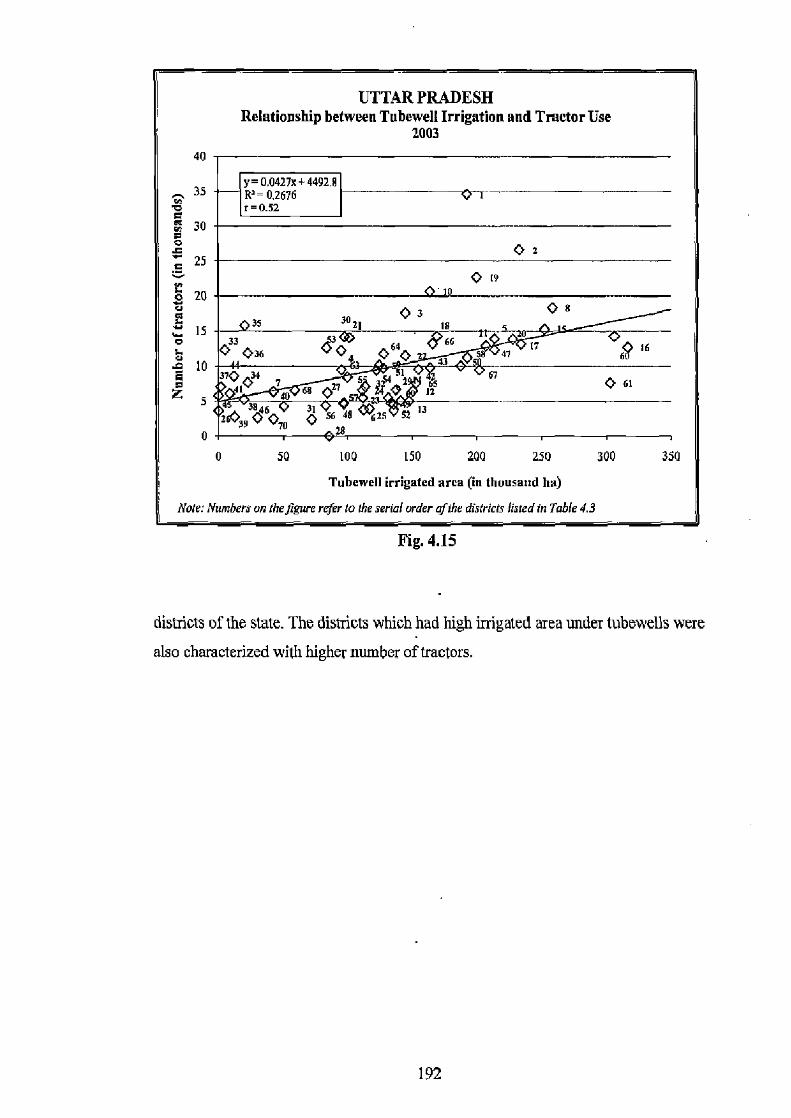
UTTAR PRADESH Relationship between Tubewell Irrigation and Tractor Use
2003
40
35
6 30
~ 25
o 20 CI
I- C
10
z 5
0
0 50 100 150 200 250 300 350
Tubewell irrigated area (in thousand ha)
Note: Numbers on the figure refer to the serial order ofthe districts listed in Table 4.3
Nag. 4.15
districts of the state. The districts which had high irrigated area under tubawells were
also characterized with higher number of tractors.
y=0.04272+4492.A
=0.52
0 2
t in 019
O 3 Q 8
35 A EI Ifl tt..
3]01434
700 5
a$d 1
~ QEx ~7 ~E 13 67 ~ LI
E493O Oro O dA ~L xs 5E 13 E8
192
References
1. Agarsval, B. (1984). Tractors, Tubewells and Cropping Intensity in the Indian Punjab, The Journal ofDevelopment Studies, Vol. 20, No. 4, pp. 290-302.
2. Chand, R., Prasanna, P.A.L. and Singh, A. (2011). Farm Size and Productivity: Understanding the Strengths of Smallholders and Improving their Livelihoods, Economic and Political Weekly, Vol. 46, No. 26-27, pp. 5-11.
3. Clift, C. (1977). Progress of Irrigation in Uttar Pradesh: East-West Differences, Economic and Political Weekly, Vol. 12, No. 39, pp. A83-A90.
4. Dick, R.M., (1994). Private Tubewell Development and Groundwater Markets in Pakistan: A District-level Analysis, The Pakistan Development Review, Vol. 33, No. 4, pp. 857-869.
5. Evans, L.T. (1986). Irrigation and Crop Improvement in Temperate and Tropical Environment, Philosophical Transactions of the Royal Society of London, Vol. 316, No. 1537, pp. 319-330.
6. Gadkary, D.A. (1957). Mechanical Cultivation in India, ICAR, New Delhi.
7. Government of India (1992). All India Report on Agricultural Census, 1985-86, Department of Agriculture and Co-operation, Ministry of Agriculture, New Delhi.
8. Kishore, A. (2004). Understanding Agrarian Impasse in Bihar, Economic and Political Weekly, Review of Agriculture, Vol. 39, No. 31, pp. 3484-3491.
9. Kapoor, R. (2011). Consolidation-A Critical Enabler for Efficient Farming. The Hindu (http://wcvw.thehindubusinessline.com/industry-and- economy/agri-bizJarticle202l516.ece) 16, May, 2011.
10. Majumdar, D.K. (2004). Irrigation Water Management: Principles and Practice, Prentic-Hall India Private Limited, New Delhi.
11. Mohanam, T.C. (2002). The Determinants of Fertilizer Consumption and its Growth, Northern Book Centre, New Delhi.
12. Pal, M. (1992). Land Productivity and Employment in Indian Agriculture, Mittal Publications, New Delhi.
13. Rao, V. and Chotigeat, T. (1981). The Inverse Relationship between Size of Land Holdings and Agricultural Productivity, American Journal of Agricultural Economics, Vol. 63, No. 3, pp. 571-574.
t93
14. Rawal V. (2008). Ownership Holdings of Land in Rural India: Putting the Record Straight, Economic and Political Weekly, Vol. 43, No. 10, pp. 44-47.
15. Sankar, U. (2011). Sustainable Development of Agriculture, The Indian Economy Review 2011, Vol. 8, No. 4, pp. 62-69.
194

CHAPTER V
Irrigation and Agricultural Gand Use
4
c2r 4rc
CHAPTER V
IRRIGATION AND AGRICULTURAL LAND USE
A. General Land Use Characteristics
Among all natural resources, land is considered to be the most significant and
basic resource, since it is limited. Land use and land cover pattems in a region are the
prerequisites for planning and implementation of effective land use policies and
schemes for sustainable regional development. Land cover is defined as the layer of
soils and biomass, including natural vegetation, crops and human structures, which
comprise the laud surface. Whereas, land use refers to the purposes for which
humans exploit the land cover. Land use/ cover change is the effect of many
interacting processes that are active over a wide range of scales in space and time.
Three types of causes in land use changes occur at different rates and at different
scales: (i) biophysical, (ii) economic and technological considerations, and (iii)
institutional and political arrangements (Suthakar and Bui, 2008).
In India, increasing pressure of population and consequently more demand
for food put a great pressure on land. This exerts a great pressure on forest lands,
fallow and other vacant lands, therefore, change is evident in land use (Singh, 1989).
The future scope of expansion of area in favour of agriculture seems to be very
limited. Whatever area which can be brought under cultivation would be marginal
and ecologically fragile, which unambiguously cannot compensate for land being
removed from cultivation due to urbanization and land degradation. Therefore, future
agricultural supplies and growth be targeted primarily from biological crop yields
and intensification of land use instead of areal expansion (00I, 2009).
Table 5.1 and Fig 5.1 show the land utilization in the state of U.P. during the
periods of 1995-2000, 2000-05 and 2005-10 and respective growth during 1995-2000
to 2000-05 and 2000-05 to 2005-10. Reporting area stands for which land use
statistics are available. Availability of land utilization figures is based on land
records, basically according to village papers. The total reporting area of the state
was 25.49, 24.20 and 23.90 million ha., respectively during the respective periods.
Agriculture will continue to remain as the dominant sector in the economy and to
support large population of the state. Of the total reporting area, net sown area
constituted 69.15, 69.14 and 68.42 per cent, registering growth rates of -0.01 and
195
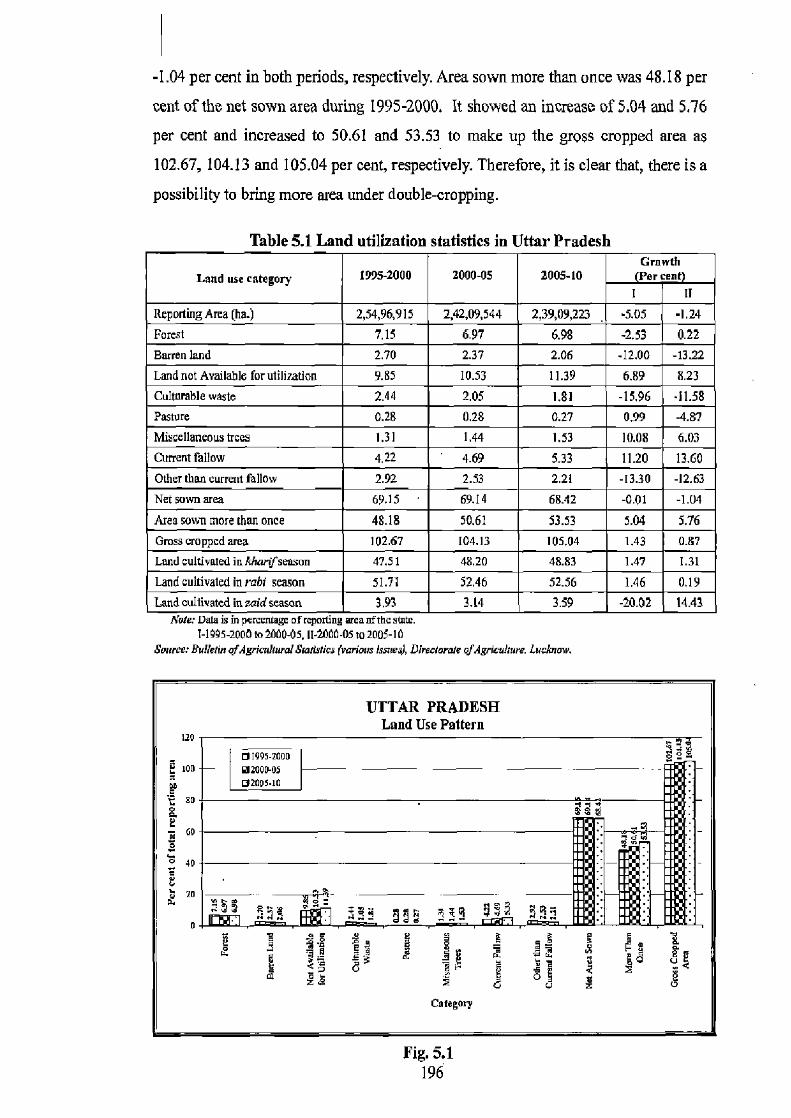
-1.04 per cent in both periods, respectively. Area sown more than once was 48.18 per
cent of the net sown area during 1995-2000. It showed an increase of 5.04 and 5.76
per cent and increased to 50.61 and 53.53 to make up the gross cropped area as
102.67, 104.13 and 105.04 per cent, respectively. Therefore, it is clear that, there is a
possibility to bring more area under double-cropping.
Table 5.1 Land utilization statistics in Uttar Pradesh
Land use category 1995-2000 2000-05 200510 Growth
cent) 1 11
Reporting Area (ha.) 2,54,96,915 2,42,09,544 2,39,09,223 -5.05 -1.24 Forest 7.15 6.97 6.98 -2.53 0.22 Barren land 2.70 2.37 2.06 -12.00 -13.22 Land not Available for utilization 9.85 10.53 11.39 6.89 8.23 Culturable waste 2.44 2.05 1.81 -15.96 -11.58 Pasture 0.28 0.28 0.27 0.99 -4.87 Miscellaneous trces 1.31 1.44 1.53 10.08 6.03 Cucrentfallow 4.22 4.69 5.33 11.20 13.60 Other Than current fallow 2.92 2.53 2.21 -13.30 -12.63 Net sawn area 69.15 69.14 68.42 -0.01 -1.04 Area sown more than once 48.18 50.61 53.53 5.04 5.76 Gross cropped ama 102.67 104.13 105.04 1.43 0.87 Land cultivated in k4anfseasun 47.51 48.20 48.83 1.47 1.31 Land cultivated in rabi season 51.71 52.46 52.56 1.46 0.19 Loadcultivated inzaidseason 3.43 3.14 3.59 -20.02 14.43
Note: Data ism percentage of reporting area ofthc state. 1-195-2000 to 2000-05.11-200-05 to 2005-10
Source: Bdezn gfAgricuhural Stwtsnc (various Issues), Directorate ofAgrlculmre, Luc/mow.
UTTAR PRADESH Land Use Pattern
120
mcosxcao I too awao-os - - -- - m ozeas.to ti ao ,
40
i m
m z a s y u Category
Fig. 5.1 196
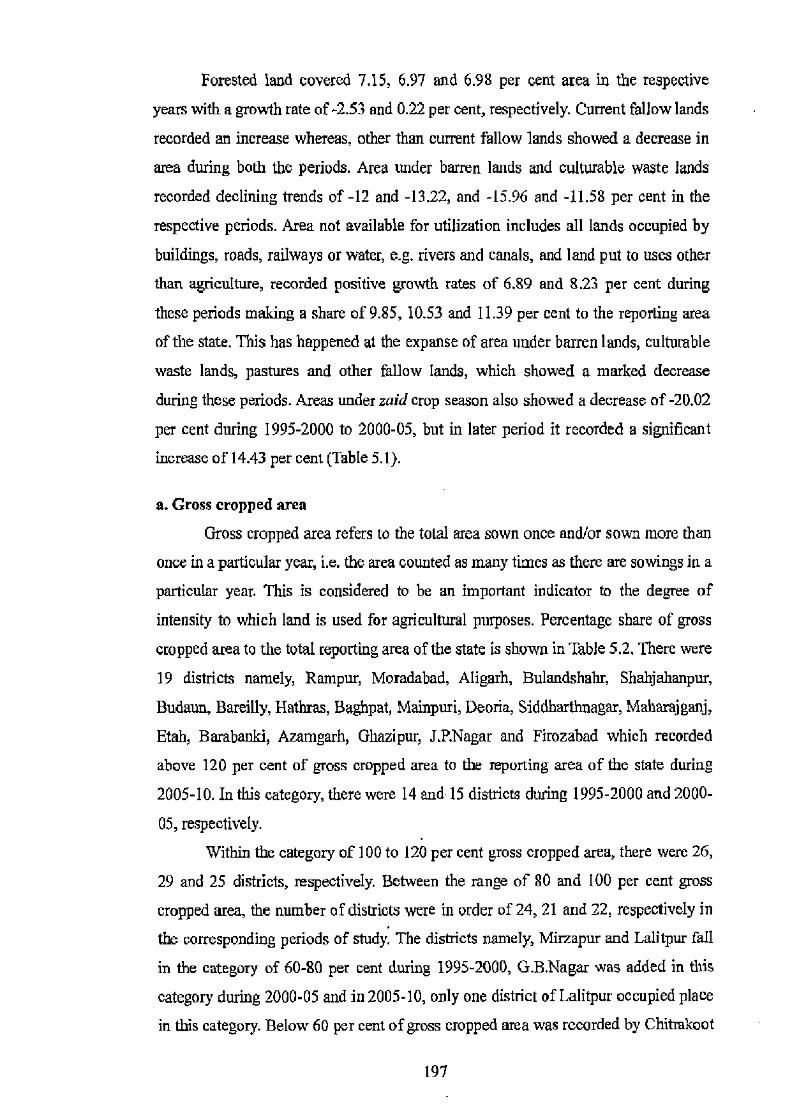
Forested land covered 7.15, 6.97 and 6.98 per cent area in the respective
years with a growth rate of -2.53 and 0.22 per cent, respectively. Current fallow lands
recorded an increase whereas, other than current fallow lands showed a decrease in
area during both the periods. Area under barren lands and culturable waste lands
recorded declining trends of -12 and -13.22, and -15.96 and -11.58 per cent in the
respective periods. Area not available for utilization includes all lands occupied by
buildings, roads, railways or water, e.g. rivers and canals, and land put to uses other
than agriculture, recorded positive growth rates of 6.89 and S.23 per cent during
these periods making a share of 9.85, 10.53 and 11.39 per cent to the reporting area
of the state. This has happened at the expanse of area under barren lands, culturable
waste lands, pastures and other fallow lands, which showed a marked decrease
during these periods. Areas under zaid crop season also showed a decrease of -20.02
per cent during 1995-2000 to 2000-05, but in later period it recorded a significant
increase of 14.43 per cent (Table 5.1).
a. Gross cropped area
Gross cropped area refers to the total area sown once and/or sown more than
once in a particular year, i.e. the area counted as many times as there are sowings in a
particular year. This is considered to be an important indicator to the degree of
intensity to which land is used for agricultural purposes. Percentage share of gross
cropped area to the total reporting area of the state is shown in Table 5.2. There were
19 districts namely, Rampur, Moradabad, Aligarh, Bulandshahr, Shahjahanpur,
Budaun, Bareilly, Hathras, Baghpat, Mainpuri, Deoria, Siddharthnagar, Maharajganj,
Etah, Barabanki, Azamgarh, Ghazipur, J.P.Nagar and Firozabad which recorded
above 120 per cent of gross cropped area to the reporting area of the state during
2005-10. In this category, there were 14 and 15 districts during 1995-2000 and 2000-
05, respectively.
Within the category of 100 to 120 per cent gross cropped area, there were 26,
29 and 25 districts, respectively. Between the range of 80 and 100 per cent gross
cropped area, the number of districts were in order of 24, 21 and 22, respectively in
the corresponding periods of study. The districts namely, Mirzapur and Lalitpur fall
in the category of 60-80 per cent during 1995-2000, G.B.Nagar was added in this
category during 2000-05 and in 2005-10, only one district of Lalitpur occupied place
in this category. Below 60 per cent of gross cropped area was recorded by Chitrakoot
197
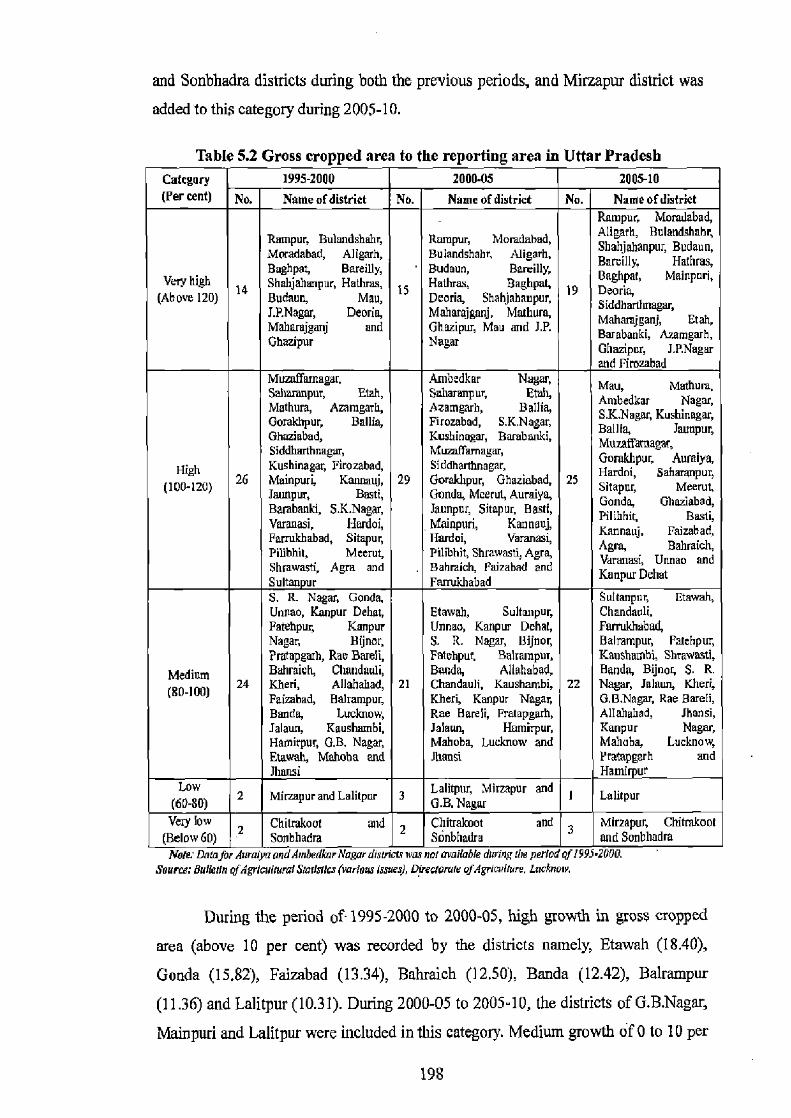
and Sonbhadra districts during both the previous periods, and Mirzapur district was
added to this category during 2005-10.
Table 5.2 Gross cropped area to the reporting area in Uttar Pradesh
Category 1995-2000 2000.05 2005-10 (Per cent) No. Name nfdistriet No. Name ofdistrict No. Name ofdiatrict
_ Rmnpur, Momdabad, Rampur, Bulandshahr, Ramped, Momdabnd, Aligarh, Bulandshahr. Moradahad, Aligarh, Bulandshahr, Aligarh, Barcilly, r, Budaun,
Very high Baghpat, Bareilly, Shahjah,mpur, Hat has,
Budaun, Bareilly, HoOvas, Baghpal,
Bamillyf Hathras, Daghpat, Mainpuri,
(Above 120) 14 Budaun, Mau, 15 Deoria, Shahjahanpur, 19 Deoria, Siddhanlmagm, J.P.Nagar, Deorie, Maharajgnnj. Mathum, Maharajganj, Etah, Mahamjganj and Ghazipur, Mau and J.P.
Nagar
Barabanki, A2amgarh, Ghaziply Ghazipm, 1.P.Nagar and Firozabad
Muafamagar, Ambedkar Nagar, Mau, Mathura, Saharanpn; Etzh, Saharanpur Field, Ambedkar Nagar, Mathura, Azamgarh, Azamgarh, Ballia, S.K.Naga, Kushinaga5 Goraldtpur, Ballia, Firozabad, S.K.Nagar, Ballia, Jaunpur, a Siddhrthn gm, Krihinupar, B
arubmki, MuEtfamagar, Mumifamagar, Gtnukhpur, A umiya, High Kush
inagai Fuozobud, , Siddharhnzgar, Hardni, Saharanpur,
(100-120) 26 Mainpuri, Kaauj, 29 Gorakhpur, Ghazwhad, 25 Meerut, J Basil, asti, Gonda, Meerut, Aumiya, Gonda, Ghavabad, Go nda,
Barabanki, S.K.Nagar, Jaunpur, Sitapur, Bash, Pilihhir, Besti, Vuranasi, Hurdoi, Mainpuri, Kannuuj, Kannauj. Farrukhabad, Sitapur boreal, Varanasi, Agra' Bahmtch' Baha ich,
Pilibhil, Meerut, Pilibhit, Shrawasti, Agra, Varanasi, Umao and Shrawasti, Agra and Bahniich, Faizabad and Kanpur Deha[ Sultan r Fanukhabad S. It Nagar, Gonda, Sullanphq Etawah, Unnao, Kanpur Dehat, Etawah, Sultmtpur, Chandauli, Fatehpur, Kanpur Unnao, Kanpur Debut, Farrukhabad, Nagar, Bijnor, S. R. Nagar, Bijnor, Balrampur, Fatehpur, Pralapgarh, Rae Bareli, Fatchpur, guIrampur, Kaushambi, Shrawasti,
Medium Bahrmah, Clamdauli, Banda, Allahubad, Banda, Bijnor, S. R.
(80100) 24 Kheri, Allehabad, 21 Chandauli, Kaushantbi, 22 Nagar, Jelaun, Kheri, Fairabad, Balrampur, Kheri, Kanpur Nagar, G.B.Nagar, Rae Bareli, Banda, Lucknow, Rae Bareli, Prampgmh, Allahabad, Jhansi, Jalami, Kaushembi, Jalaun, Harai,pur, Kanpur Nagar, Hamirpur, G.B. Nagar, Mahoba, Lucknow and Mahoba, Lucknow, Etawah, Mahoba and Jaansi Pratapgarh and Jhansi HandHamirpur
Low 2 Mirzapur and Lglitpur 3 Lalitpur, Mirzapur and I Lal_pur (60-80) G B Nagar Very low Chitrakoot and Chitraicoot and Mirzapur, Chitrakoot
(Below 60) 2 Sonhhadra 2 Sonbhadra 3 and South ,Vary Ua(QJyAmuIm OnoAoJWOmr NagaraTsmcLc Was nor u✓mWOIe mmnr ore peria of L,Y) &vv.
Source: flu/kiln of igrlculmm(Stattflks (wrrous issues), D - ac,ak afAgriculture, Lucknmv.
During the period of-1995-2000 to 2000-05, high growth in gross cropped
area (above 10 per cent) was recorded by the districts namely, Etawah (18.40),
Gonda (15.82), Faizabad (13.34), Bahraich (]2.50), Banda (12.42), Balrampur
(11.36) and Lalitpur (10.31). During 2000-05 to 2005-10, the districts of G.B.Naga
Mainpuri and Lalitpur were included in this category. Medium growth of 0 to 10 per
198

cent was seen in 41 and 36 districts, respectively in the corresponding periods. Low
growth was occupied in 20 districts during the previous period, whereas in the later
period, there were 29 districts which fall in the category of low growth of -10 to 0
per cent, and the districts of Mirzapur (-10.72) and Sonbhadra (-32) were
characterized with very low growth (below -10 per cent) during the later period
(Table Si).
Table 5.3 Growth in gross cropped area in Uttar Pradesh
Category Range (Per cent) Number ordistricts
1995-2000 to 2000-05 2000-05 to 2005-10 I{igh Above 10 7 3
Medium 0 to 10 41 36 Low -10 to 0 20 29
Very low Below-IC 0 2 .So rce: Xu(/etn Q1 Agticcatlwaf Mattson (various Issues). Direc1mate i$ Agriculture, Lucgrow.
b. Net sown area
Net sown area refers to the total area sown with crops and orchards in a single
year. Area sown more than once in the same year is counted only once. This area has
a special significance in agriculture because the agricultural production largely
depends upon this type of land use. During 1995-2000, the districts namely,
Moradabad, Baghpat, Rampur, Hathras, Mathura, Bareilly, Siddharthnagar, J.P.Nagar
and Deoria recorded above 80 per cent of net sown area in the state (Table 5.4).
During 2000-05, the number of districts remained 9 to be incorporated in this
category by adding 2 districts of Aligarh and Bulandshahr in place of the districts of
Deoria and J.P.Nagar. During the period of 2005-10, there were 9 districts namely,
Moradabad, Hathras, Rampur, Bulandshahr, Mathura, Aligarh, Baghpat, Bareilly and
Budaun to include within this category. Within the category of 70 to 80 per cent of
net sown area, there were 30, 32 and 28 districts, respectively during the period of
1995-2000, 2000-05 and 2005-10. In the category of 60 to 70 per cent net sown area,
there were 23, 23 and 25 districts to be incorporated in the respective periods.
Whereas, 50 to 60 per cent of area was recorded in 2, 4 and 6 districts, respectively.
Below 50 per cent of net sown area was seen in the districts of Chitrakoot, Lalitpur,
Mirzapur and Sonbhadra during 1995-2000. Two districts namely, Mirzapur and
Sonbhadra again formed part of this category during later periods, respectively.
It is seen from Table 5.5 that, high growth of above 5 per cent was secured by
199
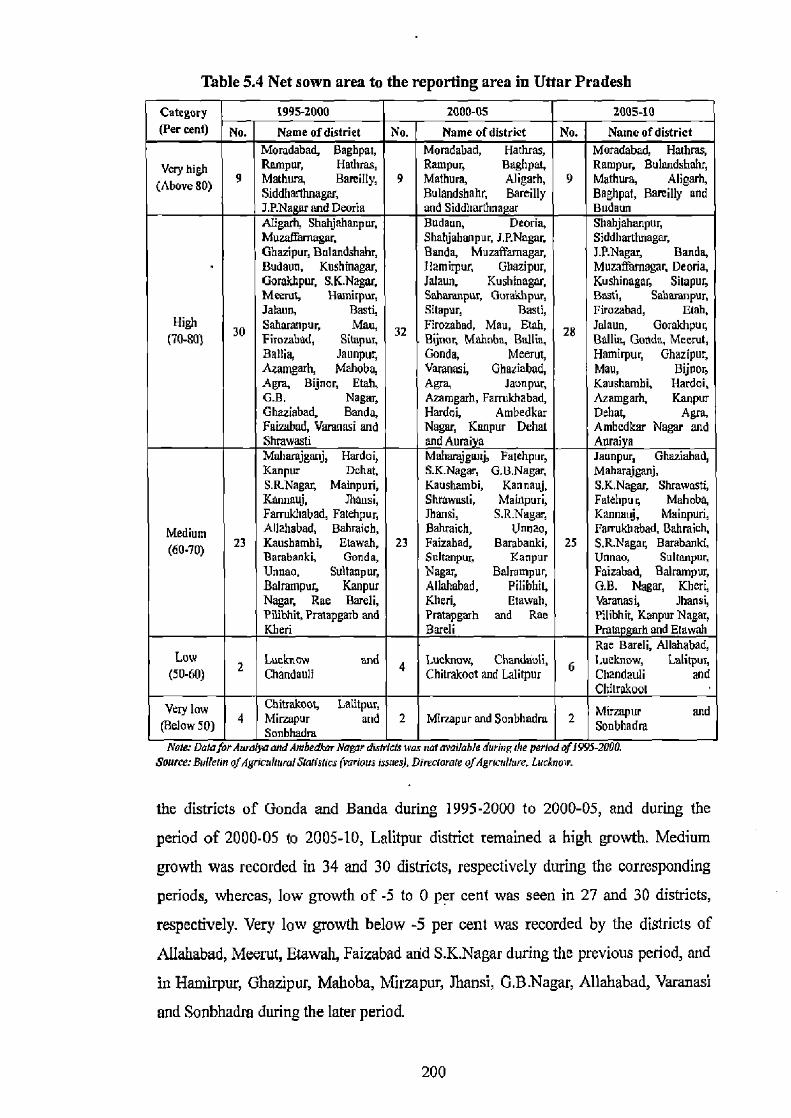
Table 5.4 Net sown area to the reporting area in Uttar Pradesh
Category 1995-2000 2000-05 2005-10 (Per cent) No. Name of district No. Name ofdistriet No. Name of district
Moradabad, Baghpat, Moradabad, Hathras, Moradabad, Hathras, yen, high Rampur, Hathras, Rampur, Baghpal, Rampur, Bulandsbahr,
(Above 80) 9 Mathura, Bareilly, 9 Mathura, Aligarh, 9 Mathura, Aligarh, Siddharlhnagar, Bulandsbahr, Bareilly Baghpat, Bareilly and J.P.Na ar and Deoria and Siddharthna ar Budaun Aligarh, Shahjahanpur, Bodeen, Deoria, Shahjahanpur Muzaffamagm, Shahjahanpur, J.P.Nagm, Siddhardmagar, Ghazipur, Bulandshahr, Banda, Muzsffamagar, ).P.Nagar, Banda, Budaun, Kushinagar, famirpur, Ghazipur, Muraffarnagar. Deena, Gorakhpur, S.K.Nagar, Jatsuo, Ku5hinagar, Kushinagar, Silapur, Meerut, Han irpar, Saharanpur, Gurakhpuy Bssti, Saharanpur, Jolaun, Bast!, Silapur, Bast!, Pirazabad, Etah,
High Saharanpur, Mau, Firozabad, Mau, Etah, Bijnnr, Mahoba, Ballia,
Jalaun, Gorakhpur, (70-80) 30 Ficorabad, Sitapuc, 32 28 Rallis, Gonda, Meerut,
Ballia, Jaunpur, Gonda, Meerut, Hamirpur, Ghazipur, Azmagarh, Mahoba, Varanasi, Ghauabed, Mau, Bijnor, Agra, Bijnor, Etah, Aga, Jaunpur, KaushambL Hardoi, G.B. Nagar, A>amgarh, Farrukhabad, Azamgarh, Kanpur Chazialead, Band¢, Hardol, Ambedkar Dehat, Agra, Fairvbad, Varanasi and Nagar, Kanpur Dehat Amhcdkar Nagar and Shrawasti and Aumi a Aumi a Maharajganj, Hardoi, M¢harajgm/j, Fatehpur, Jaunpm, Ghaziabad, Kanpur Dehat, S.K.Nagar, G.B.Nagar, Maharajganj, S.R.Nagar, Mainpuri, Kaushambi, Kannauj, S.K.Nagar, Shrawasti, Kannauj, Tbatsi, Shrawasti, Mainpuri, Fatehpu, Mahoba, Famtkhabad, Falehpur, Jbansi, S.R.Nagar, Kannauj, Mainpuri,
Medium Allahabad, Bahraich, Bahraich, Vnnao, Farrukhabad, Babraich, (50.70) 23 Kaushambi Etowah, 23 Faizabad, Barabanki, 25 S.R.Nagar, Barabanki,
Barabanki, Gonda, Sultanpur, Kanpur Unnao, Sultanpur, Unnao, Sultanpur, Nagar, Balinmpur, Faizabad, Balrampuy Bahampur, Kanpur Allahabad, Pilibhit, G.B. Nagar, Kheri, Nagar, Rae Bareli, Kheri, Elawah, Varanasi, Jhansi, Pilibhit, Pratapgach and Pratapgarh and Rae Pilibbit, Kanpur Nagar, Klieri Bareli Pratapgarh and Elawah
Rae Bareli, Allahabad, Low Lurkaow and
4 Lucknow, Chandauli, Lucknow, Lalitpur,
(50-60) 2 Chandauli Chitrakoot and lalitpur 6 Chandauli and Chitrakool
'Cl low Chitrakoot, Latilpur, Mirzapur and (Below 50) 4 Mirzapur and 2 Mirzapur and So¢bhadm 2 Sonbhadra Smrbhadrc
Nat. llnln for d...nWnn,M 4n4h0,* w Moor A:.elrl. m,...n, mrnilnFle In,;.,., eXe rerlMnr I00CM00 Source: Bu(febn of Agricurinro(Smliseirs (various issues), D/r&dorale ofAgrkedRVe, Lucknow.
the districts of Gonda and Banda during 1995-2000 to 2000-05, and during the
period of 2000-05 to 2005-10, Lalitpur district remained a high growth. Medium
growth was recorded in 34 and 30 districts, respectively during the corresponding
periods, whereas, low growth of -5 to 0 per cent was seen in 27 and 30 districts,
respectively. Very low growth below -5 per cent was recorded by the districts of
Allahabad, Meerut, Etawah, Faizabad and S.K.Nagar during the previous period, and
in Hamirpur, Ghazipur, Mahoba, Mirzapur, Jhansi, G.B.Nagar, Allahabad, Varanasi
and Sonbhadra during the later period.
200
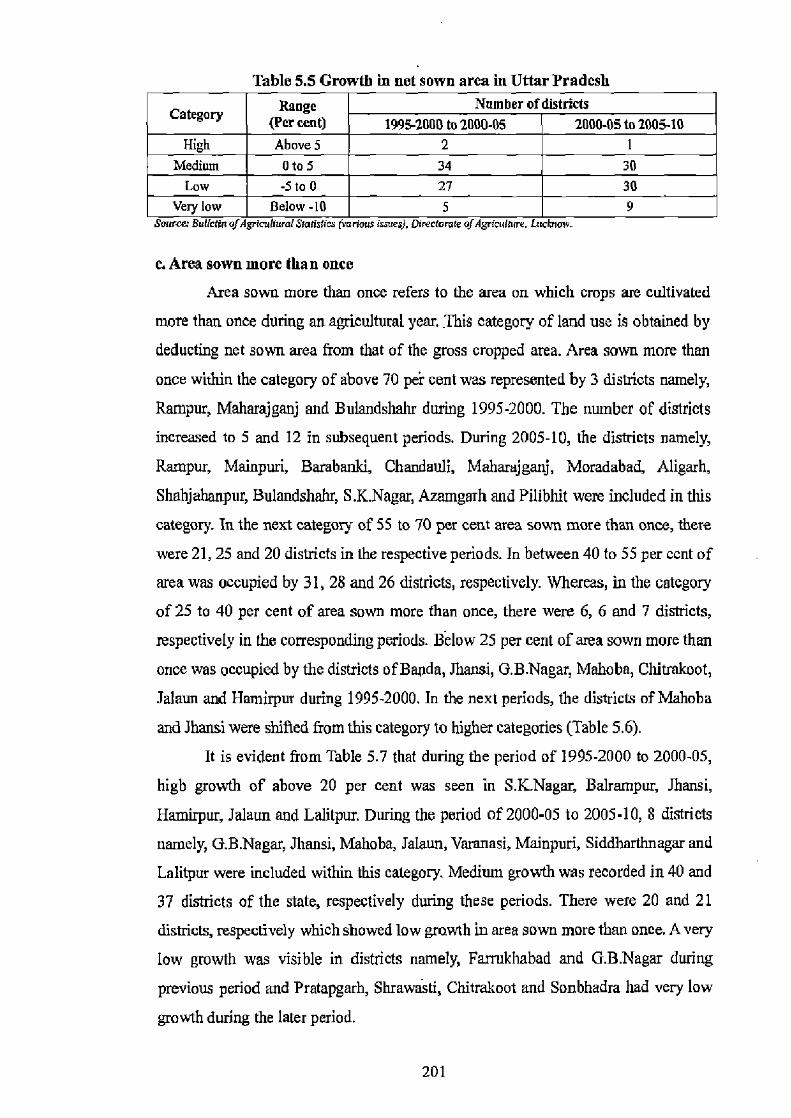
Table 5.5 Growth in net sown area in Uttar Pradesh
Category Range (Per cent)
Number of districts 1995-2000 to 2000-05 2000-0S to 2005-10
High Above 5 2 1 Medium 0 to 5 34 30
Low -5 to 0 27 30 Very low Below-10 5 9
Sartre: Bia Mn ofAgricilIuralStatistics( rious is t.c I. OuectQroIa ofAyriMa,rc. Lwknmv.
c. Area sown more than once
Area sown more than once refers to the area on which crops are cultivated
more than once during an agricultural year. This category of land use is obtained by
deducting net sown area from that of the gross cropped area. Area sown more than
once within the category of above 70 pei' cent was represented by 3 districts namely,
Rampur, Maharajganj and Bulandshahr during 1995-2000. The number of districts
increased to 5 and 12 in subsequent periods. During 2005-10, the districts namely,
Rampur, Mainpuri, Barabanki, Chandauli, Maharajganj, Moradabad, Aligarh,
Shahjahanpur, Bulandshahr, S.K.Nagar, Azamgarh and Pilibhit were included in this
category. In the next category of 55 to 70 per cent area sown more than once, there
were 21, 25 and 20 districts in the respective periods. In between 40 to 55 per cent of
area was occupied by 31, 28 and 26 districts, respectively. Whereas, in the category
of 25 to 40 per cent of area sown more than once, there were 6, 6 and 7 districts,
respectively in the corresponding periods. Below 25 per cent of area sown more than
once was occupied by the districts of Banda, Jhansi, G.B.Nagar, Mahoba, Chitrakoot,
Jalaun and Hamirpur during 1995-2000. In the next periods, the districts of Mahoba
and ihansi were shifted from this category to higher categories (Table 5.6).
It is evident from Table 5.7 that during the period of 1995-2000 to 2000-05,
high growth of above 20 per cent was seen in S.K.Nagar, Balrampur, Jhansi,
Hamirpur, Jalaun and Lalitpur. During the period of 2000-05 to 2005.10, 8 districts
namely, G.B.Nagar, Jhansi, Mahoba, Jalaun, Varanasi, Mainpuri, Siddharthnagar and
Lalitpur were included within this category. Medium growth was recorded in 40 and
37 districts of the state, respectively during these periods. There were 20 and 21
districts, respectively which showed low growth in area sown more than once. A very
low growth was visible in districts namely, Famrkhabad and G.B.Nagar during
previous period and Pratapgarh, Shrawasti, Chitrakoot and Sonbhadra had very low
growth during the later period.
201

Table 5.6 Area sown more than once to net sown area in Uttar Pradesh Category 1995-2000 2000-05 2005-10
(Percent) No. Name of district No. Name ofdistrie No. Name of district Rampur, Mainpuri, Barabanla, Chandauli,
Very high rY g 3 Rampur, Mahazajganj Rampur, Maharajganj, Mam ialganj, Moradabad, Aligarh,
(Above 70) and Bulandshahr 5 Barabanki, Chandauli and Momdebad
t2 Shahjahanpuy Bulandshahr, S.K.Nagar, Annmgarh and Pilibhit
Bara6mdi CAandauli Bulandshahr, Ambedkar Nagar S.K.Nagar, Budmrn, Ambedkar
Mau, Pilibhit, Bali, Pilibbit, Azamgarh, Nagar, Ghazipur, Aligarh, Kannauj, Migarh,i, Azamgarh, Mau, Aligarh, Budaun, Jaunpur Mau,
Varanasi, Etah, Il h Moradabad, Shahjahanpur, Bareilly,
Deoria, Mainpuri, illy, Etowah,
(55-70) 21 Shahjahanpuq 25 BaIli
a, Gbazipuy 20 Der
a, Aumya, iz Banilq,
Fcriznad, Sahaanpur, Gbaziobod, Utawah,
Auroiya, Kannauj,
Fab
a Froa6ad
,
, Baglipat, H,
s Budaun, Ghazi
artad, Hahle
Bgtepzt, Bahia, Etowah, Meerut BGonda, Faro ab,
Gnnur , Siddhortbnogar, Ballia and Hat}u35 F unpur
Jaun ur and Saharan ur and Kennauj
Sultznpur, Fanukteabrd, Rae B.H. Unnao,
Jaunpur, Dcoria, J.PNagar, Lucknow, Allahabad, Meerut, LP.Na ar, Lucknow, Faizzbad, Bthruich, Gorakhpur, Kanpur Nagar,
Kro,ga, hahanch, i
S
Hodo
, Shmwasti,
Kushn
nugar, Lucknow,
Ghazipur, Varanasi,
Mnzaffamagar, l
Meeru a
a
!rawq
Goltdapur la.ranpur, Firoubad pertapgrch, Su!tanrar. Batrampur,
GoSdir, ~nda, Saharanpur,
Mium Hardo,
Unnao, Gonda,
, Rue Barreli, Allahabad, Lfiitpur,Muzaffsmagar, (40-55) 31 Gurakhpur, Behraich, 28
Unaan, Pratapgarh, 26
Rae Bareli, Bassi, Kheri, Mu>ynemagar, Kheri, Balmmpur, Mathura, Kushinagsi M Sitapur, Bassi, Varanasi, Kheri, Agra, athum, Shrawaa0, Marburg
S.R. Nagar, Mirzapur,
S.R.Nagar, Sonhhsdra, Allahabad, Fatehpur,
"Paz Nagar, Agm, Siddharthnagar,
G.B.Naahad,
Janpur Kanpur Ala Kanpur Na ar, Kanpur
S.K.Nagar, d and Sonhha Sonhhadra g Dena 4 S.R.Nagar and Siddharthnagar and Agra Beall
Low Kanpur Dehat, Sitaper, Kanpur Dehat, Fatehpur, Mirzapur,
6 B9lrampur. Uijnor, 6 Falehpuy Lor , acid (25-40)
7
Pratapgarh, Shmwasti,
Lalitpur and Kaushambi Kaushambi, Bijnor and Kaushambi, Biinor and )hnnsi Mzhoba
Very low Banda, Jhansi, G.B.NagarMahoba, , Banda, Jalaun, Mahoba, Salami, Soabhadra,
(Below 25) 7 Chitrakao4 Jalauo and 6 Chiur, G.U.Nagsc and 5 Banda, Homirpur and
Hamirpur and __iu_k_ut Cterork_ot
Note: Dale fur Auruiyn oMArnbed.Fnr Nagar disVictc was not available during the period of 1995-2000. Suarce. 8reUetln Qflgricihhnql Statistics (Sriuus wsuzs), Direclvralc uf4gric,dhirc, Luelmmv.
Table 5.7 Growth in area sown more than once in Uttar Pradesh
Category Range Number of districts (Per cent) 1995-2000 to 2000-05 2000-05 to 2005-10
High Above20 6 8 Medium 0 to 20 40 37
Low -2o to 0 20 21
Very Low Below-20 2 4 Source Bullets' ofAgIculWmI SevunXs (various Issues), Dirervrate f.4gr,.dr,rv. Gmhnvrv.
202
B. Changes in Cropping Pattern of Cereal, Pulse, Oilseed and Cash Crops
Cropping pattern has always been a dynamic phenomenon. It may be defined
as the quality of crops grown usually on a plot of land during a particular agricultural year (Verma, 1993). It is a reflection of interplay of the complex physical, socio-
economic and technological factors. All these factors themselves keep on changing,
except physical ones, which are comparatively static. Thus, under the influence of
these factors, the cropping pattern also goes on changing, so much so that,
sometimes, it is entirely replaced after a long span of time (Singh, 1992). In other
words, cropping pattern in an area or a region keeps on changing in consonance with
change in agricultural practices, government policies and other related factors.
Changes in cropping pattern can be seen within the frame of factors like agro-
climatic conditions, technological, infrastructural and institutional environment and
profitability derived. New technologies, such as HYV seeds, can work with relative
price levels to change cropping patterns. Moreover, the role of inputs, such as
investment in irrigation infrastructure like the installation of tubewells, or the use of
new seeds and fertilizers make it possible to raise yields. This highlights the
importance of modem inputs in raising the value productivity of crops and changes
in cropping patterns (Bajpai and Volavka, 2005).
In general, the geographic patterns of agricultural land-use are the outcome of
concurrent interaction between the variable combinations pertaining to natural
conditions and human interactions. Interestingly the human interactions are
responsible mainly for dynamism in agricultural land-use and changing cropping
patterns. Technological changes of mid-sixties caused significant shifts in land
utilization in favour of crops like wheat and rice at the cost of area under coarse
grains, pulses and oilseeds. In addition, efficient cropping pattern implies the
profitable use of land, consequent upon the development of irrigation facilities and
application of modem modes of farm technology (Chhaukar and Mittal, 2007).
Consequently, this shift has been the combined effect of differential rates of
technological change among crops, irrigation bias of new technology causing shifts
of land from dry crops in favour of irrigated crops, and the associated policy of price
support system as well as market intervention by the government of certain crops.
Nevertheless, irrigation is one of the basic inputs on which the cropping pattern,
cropping intensity and agricultural output depends. It makes agriculture relatively
less dependent on rainfall and encourages farmers to switch on for double/multiple
203
cropping.
There is skewness in land distribution system in the country. Some are big
farmers and some are medium, small and marginal farmers. With the provision of
irrigation facility, there is a probability that big and medium farmers may take a shift
from subsistence households to surplus households because of increase in cropping
intensity and hence production. The small and marginal farmers may take a shift
from the deficit farm households to subsistence farm households. Thus, surplus
production of food and non-foodgrains over and above the domestic consumption
will come to market. Thus, irrigation has a potentiality to change cropping pattern
(Verma, 1993).
Changes in cropping pattern are measured by establishing the proportion of
total cropland occupied by individual crops in the state during three quinquennial
periods. Because of variations in crop data from year to year to enumerate cropping
pattern, the proportion of croplands devoted to each crop were averaged for three sets
of years: 1995-96 to 1999-2000, 2000-dI to 2004-05 and 2005-06 to 2009-10. The
distrietwise cropping patterns as per cent of area cultivated to gross cropped area are
presented in Appendices III, IV and V. There is a wide gap in percentage share of
cropland of four groups of crops: cereals, pulses, oilseeds and cash crops. Fig. 5.2
further shows that, cereal crops cover a major proportion of the gross cropped area
(about 68 per cent) indicating that cereals constitute a major share in cropland use in
the state. Among all the cereal crops, wheat and rice are the dominant crops covering
roughly around 60 per cent of the total cropped area in the state.
The main changes in relative importance of crops from 1995-2000 to 2000-05
are seen in the state , the decline of area under major pulses and oilseeds with a
negative growth of -1.86 and -22.32 per cent, and an increase in area under cereals
and cash crops to the time of 2.40 and 7.07 per cent, respectively. During the later
period from 2000-05 to 2005-10, area under cereals declined (-0.01 per cent) along
with area under pulse crops (-9.98 per cent). Contrary to this, oilseeds and cash crops
recorded an increase of 20.34 and 5.76 per cent, respectively.
The patterns of change (positive and negative order) in area within four
categories of crops indicate that, the highest decline during previous period in
cropland was observed in soyabean (-73.45), followed by moong, jowar, groundnut,
mustard and rapeseed, barley, arhar, peas, maize, gram and til to the tune of -37.98,
-26.60, -22.62, -22.58, -21.67, -17.81, -14.94, -14.78, -10.91 and -3.60 per cent,
204
respectively. Rice, wheat and bajra among cereals, and pulse crops of urad and
masoor showed a positive change in order of 5.07, 4.94 and 1.99, and 46.01 and
16.39 per cent, respectively. The increase in area was also observed in cash crops
(sugarcane and potato) with 7.91 and 3.15 per cent, respectively. During 2000-05 to
2005-10, a positive change was observed in wheat and bajra crops among the
cereals, with a change of 1.71 and 3.80 per cent, respectively, and oilseeds namely,
mustard and rapeseed (5.26 per cent) and til (144.67 per cent) also recorded a
positive change. Potatoes and sugarcane also showed a positive change of 17.84 and
3.28 per cent, respectively. Rest of the crops showed a negative change during this
period (Fig. 5.3).
a. Cereal crops
During 1995-2000, there were six districts namely, Chandauli (87.72 per
cent), Ambedkar Nagar (87.05), Siddharthnagar (86.71), Mau (86.25) Gorakhpur
(85.54) and S. K. Nagar (85.31) occupied more than 85 per cent area tinder cereals to
the gross cropped area. During the next period of 2000-05, the number of districts
increased to 9 namely, Siddharthnagar (89.49), Gorakhpur (89.09), Mau (88.76),
S.K.Nagar (88), Deoria (87.51), Azamgarh (87.05), Chandauli (86.95), and
S.R.Nagar (85.99) and Maharajganj (85.34). During the period of 2005-10, three
more districts were added namely, Ghazipur, Jaunpur and Pratapgarh to make up the
category consting 12 districts (Table 5.8). In the next category of area in between 70
and 85 per cent, there were 28, 30 and 27 districts, respectively counted in the
corresponding periods. In the category in which values of cropped area ranged in
between 55 and 70 per cent under cereals decreased to 17 districts during 2005-10;
and this decrease in number of districts continued from 24 and 19 during 1995-2000
and 2000-05, respectively. Whereas, in the range of 40-55 per cent and below 40 per
cent area under cereals, the number of districts were 4, 3 and 6 in previous category,
and number of districts 8, 9 and 8 in later in successive periods, respectively (Figs.
5.4, 5.5 and 5.6).
The proportion of area under cereals increased to 2.40 per cent during the
period of 1995-2000 to 2000-05. During 2000-05 to 2005-10, it recorded a decline of
-0.01 per cent. During previous period, the districts which recorded high growth of
above 10 per cent in area under cereals were namely, Faizabad, Deoria, Varanasi and
Aligarh with 33.15, 26.12, 23.02 and 10.04 per cent, respectively (Table 5.9). During
20S
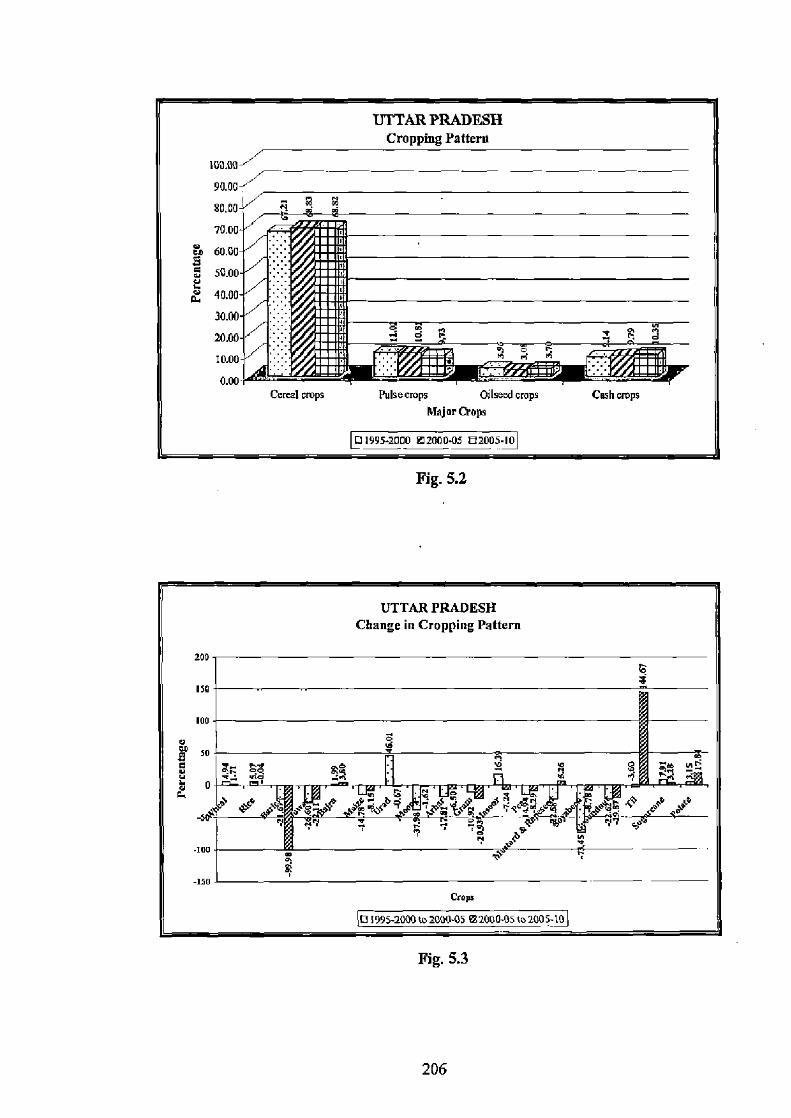
I. ,, 1 II
III
[••IaL
L.InIII ..Inl
..Imnnm nnmn.lm
Elm1 mlm
.nmII nnol
III
111 ] III I G II I
Fig. 5.2
UTTAR PRADESH Change in Cropping Pattern
200
150
100
U 50
4 4 ~W- ~ `~ '~,$ ~d'~ TOSa4
LJ
—~~~
I? Ong
00 St
-150
Goys
(1995-2000 to 2000.05 M200D-05 to 200S-0
Fig. 5.3
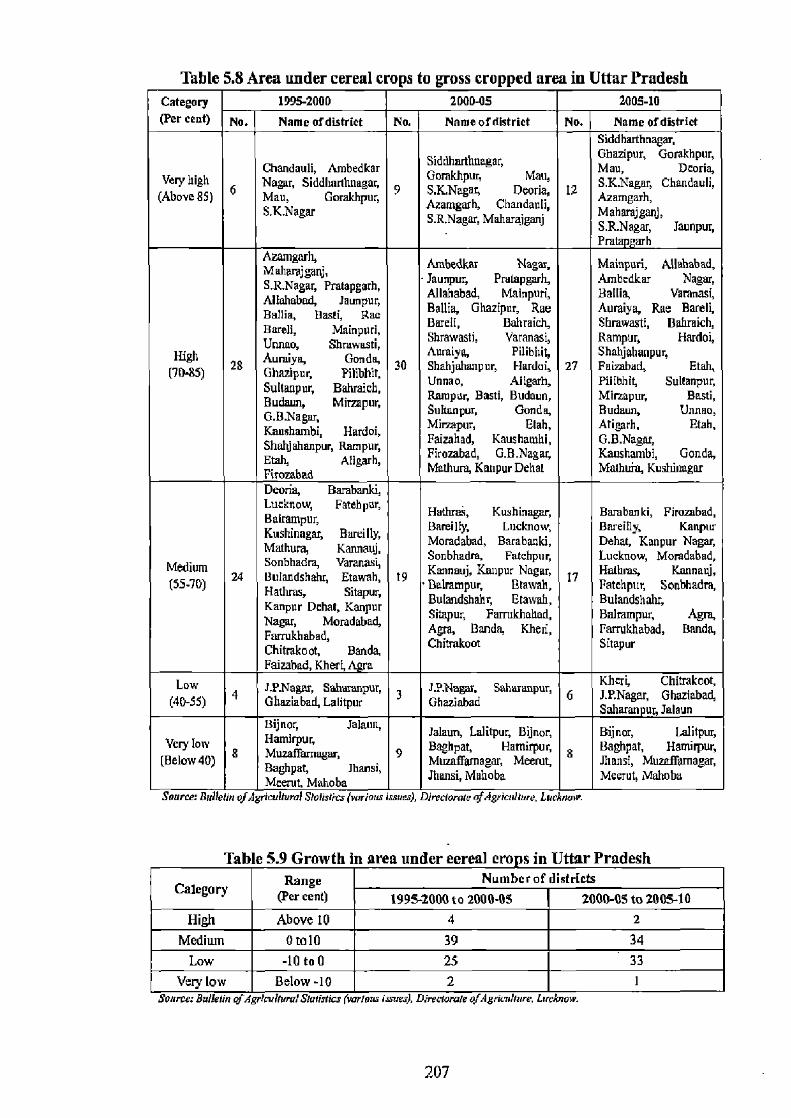
Table 5.8 Area under cereal crops to gross cropped area in Uttar Pradesh Category 1995-2000 2000-05 2005-10 (Per Cent) No. Name ofdistriet No. Name ofdistrict No. Name ofdistrict
Siddharthnagar,
Siddhadhnagay Ghazipur, Gorakhpur,
Very high ChandauliI Ambedkar Nagar, Sidd bodhnagar, Gomkh uy Ma u'
Man, Deoria, S.K.Nagar, Chandauli,
(Above85) 6 Mau, Gorakhpur, 9 S.K.Nagay peons, g 12 A h, S.K.Nagar Azamgmh, Chandauli, aharaj
Maharajganj, S.R.Nagny MehsraugooJ S.R.Nagar, 1aUnpur, Pratapjarh
A angUtb,
MahaJ J, Ambedkav Nagar, Mainpuri, Allahabad,
S.R.Nagar, Pratapgarh, -Jaunpur, Pratapgarh, Ambedkar Nagar,
Allahabad, Jaunpur, Allahabad, Mainpuri, Ballia, Varanasi, Ballia, Bassi, Rae Ballia, Ghazipur, Rae Auraiya, Rae Barth,
Bareli, Mainpuri, Barell, Bahraich, Shrawasti, Dehmich,
Unnao, Shrawasti, Shrawasti, Varanasi, Rampur, Hardoi, High Auraiya, Gonda, Auraiya, Pilibhlt, Shahjahanpur,
(70.85) 28 Ghazipur, Pilibhit, 30 Hsrdui, Unnanhanpur, 27 Fnlibbt, Etah,
Sullanpur, Bahreich, Unnaq Aligarh, PilibhiS Sultanpur,
Bodeen, Mirmpur, Muir Bassi, Gonda, Base, Bod a r, G.B.Nagar, Gonda, Mirza pur Aligarh, U Etao, Kaushambi, Hardol, Mirzapur, Elah, Aligarh, Efah,
Shahjahanpur, Rampur, Faizabad, Kaushambi, Kaushambi Etah, Aligarh, Fironbad, G.B.Nagar, Kaushambi, Gonda, Firozabad Math, Kanpur Dehal Malhuffn, Kushinagar
Deona, Barzbanki, Lucknow, Fatgihpur, Balrampur, Htr0aj, Kushinagar, 8wsbao ki, Firazbed,
Kushinagar, Bareilly, Bamilly, Lucknow, Bareilly, Kanpur
Mathura, Kannauj, Momdabad, Barabanki, Dehal, Kanpur Nagar,
Medium Sonbhadra, Varanasi, Sonbhadra, Fatcbpur, Kannauj, Kmlpur Nagar,
Lucknow, Momdabad, Halliias, Kannanj,
(55-70) 24 Haduus hahy Etowah, Hatluas, Sffseptrr,
19 • Balrampur, Btawah, 17 Fatehpui Sonbhadra,
Kanpur Dehat, Kanpur Bulandshahr, Etawah, Bulandshahr, Nagar, Moradabad, Sitapur, Farrukhabad, Balrampui Agra,
Parrukhabad, Agra, Banda, Kheri, Farrukhabad, Banda,
Chitrakoot, Banda, Chitmkoot Si[apur
Faizabad, Kheri, Agra Law
4 J.P.Nagm, Sahmmmpur,
3 J.P.Nagar, Saharanpur, 6
Kheri, Chitrakoot, 1. P.Nagar, GhaziaWA (40-55) Ghaziabad, Lalitpur Ghaziabad Saharanpur, Jalaun
Bijnor, Jelann, Hami r Jalaun, Lalitpur, Bijnor Bijnug lalilpuy
Very 40 8
Baghpat, Hemirpur, g
Baghpat, Hamirpuq (Below 40) • t, Jhanst, 9 Munsi,Mah ay Meerut, Mahobamagar,
Meerut Mahoba Jhansi, Mahoba Meerut' Mahoba Meerut Source: Bnileun ofAgricvhvral Slousucs (various is ), Directarme ofAgrbdt,ve. Lucknme.
Table 5.9 Growth in area under cereal crops in Uttar Pradesh
Category Range
(Per cent) Number of districts
1995-2000 to 2000-05 2000-05 to 2005-10 High Above 10 4 2
Medium 0tolo 39 34 Low -10 to 0 25 33
Very low Below-10 2 1 Source: Bulklin ofAgrfeu7Nm1 Smtisrice (various isnves), DirtclorateofA.grkidhre. Lvclmme.
207
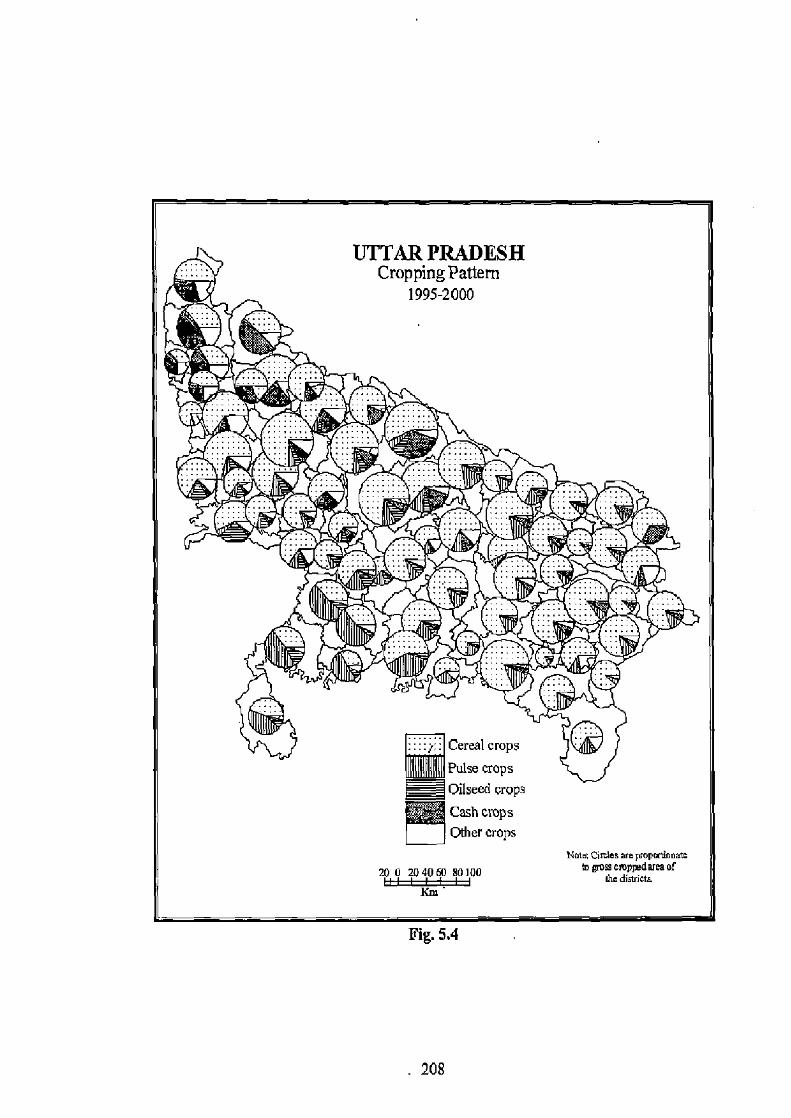
*r*C/ ? rS\ __
III ' k I I r4
fl RIIIIlIIIIIIII ' ..
Fig. 5.4
M.
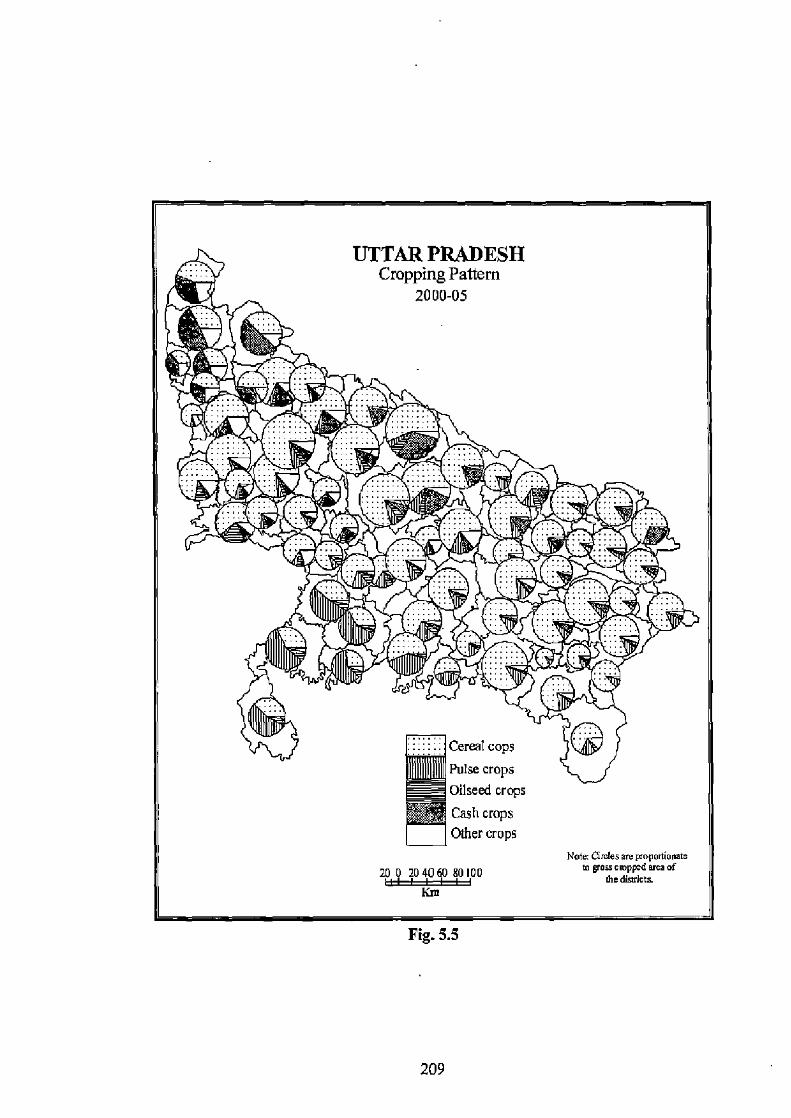
Yrj ~
,I®~~II I ''~ I~
IIIIIIIIIi~ II~ ~:{IMiu
1(I1VIIlI' ..
~"'~► ~'
)111111131j1111'
Fig. 5.5
209
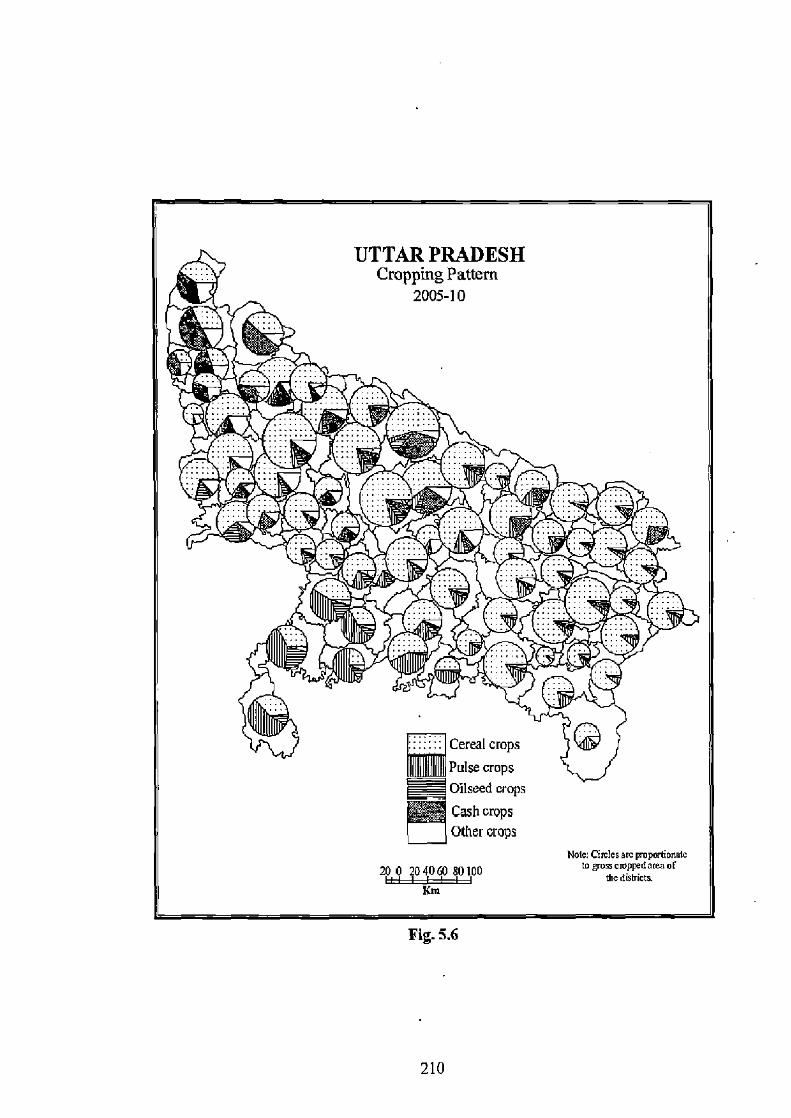
Fig. 5.6
210
the next period, 2 districts namely, Etowah and Ghazipur were included in this
category. In the next category of 0 to 10 per cent of growth, there were 39 and 34
districts, respectively, which were included in this category during both the periods
of study. As much as 25 and 33 districts of the state, respectively recorded a low
growth in between -10 and 0 per cent, whereas, in the next category of below -10 per
cent, the districts namely, Lalitpur and Mahoba recorded a negative growth of -13.56
and -18.22 per cent, respectively during previous period and during later period, a
single district of Mahoba falls in this category.
I. Wheat
Wheat constitutes an important staple crop in human food consumption. The
major wheat producing states in India are U.P., Punjab and Haryana contributing
nearly 80 per cent of the total wheat production in the country. With the adoption of
wheat and rice in India since Green Revolution, production of cereals including
production of wheat increased from a mete 8.6 million tonnes in 1960-61 to 73.53
million tonnes in 1999-2000. The country has witnessed a substantial change in past
4-5 decades, with an overall wheat production increased at a compounded annual
growth rate of 4.22 per cent during 1960-2010. The share of wheat in the Indian
foodgrains production has been around 35.5 per cent and covered alone about 22 per
cent of the total area under foodgrains (The Economic Times, 2012).
The area under wheat cultivation has increased from 9.75 million ha. in 1950-
5.1 to 27.4 million ha. in 1999-2000, showing a net increase of 181 per cent during
the entire period. This gain has been made possible at the expense of coarser rabi
crops (barley, gram etc.) and owing to increased irrigation facilities and profitability
derived from wheat cultivation. Green revolution has been synonym to wheat
revolution in India, enabling the country not only to attain self-sufficiency in
foodgrains, but also to generate some surpluses to be kept in buffer-stocks and even
for export.
U.P. contributes the highest share both in area and production of wheat in the
country. Most of the wheat production comes from areas of the Ganga-Yamuna doab
and of the Rohilkhand plains. Out of 100 wheat producing districts of the country, 43
belong to U.P. and 19 of them to western part of the state. In these districts, canal and
tubewell irrigation, greater use of HYV seeds, fertilizers and new farm techniques
have provided incentives to the farmers for the cultivation, of wheat (Raja, 2012).
211
Appendices III, IV and V show proportion of the area to gross cropped area
of individual crops grown in the state during the study periods, Wheat occupied 9.41
million ha. or about 36 per cent of the total cultivated area. An area 35.13, 36.87 and
37.50 per cent, respectively was devoted to wheat in the state during 1995-2000,
2000-05 and 2005-10. During 1995-2000, above 40 per cent of area was devoted to
wheat cultivation in the districts namely, Gorakhpur, S.R.Nagar, Unnao, G.B.Nagar,
Mathura, Mau, Ambedkar Nagar, Hardoi, Mainpuri, Azamgarh, Budaun, Pratapgarh,
Shahjahanpur, Rae Bareli, S.K.Nagar, Jaunpur. The number of districts in this
category increased to 25 and 26 during the later periods of 2000-05 and 2005-10,
respectively. Between the ranges of 35-40 per cent, the numbers of districts were 19,
19 and 20 in the corresponding periods, respectively. During 1995-2000, the districts
which had 30-35 per cent of area under wheat crop were 22, the number of districts
decreased from 22 to 14 and 12, respectively in the later periods. Within the category
of 25-30 per cent area under wheat, the numbers of districts were in order of 11, 8
and 10, respectively. Very small area under wheat (below 25 per cent) during the
respective periods was seen in Hamirpur and Sonbhadra which are characterized as
non-wheat growing districts of Bundelkhand during 1995-2000. During 2000-05, the
districts namely, Bijnor and Mahoba were added in this category whereas, in 2005-
10, only the districts of Lalitpur and Hamirpur belonged to this category.
Apositive growth in wheat sown area during the previous periods from 1995-
2000 to 2000-05 was recorded in 52 districts, in which high growth of above 10 per
cent occurred in 14 districts namely, Faizabad, Varanasi, Deoria, Bahraich, Jalaun,
Kanpur Dehat, Siddharthnagar, Rampur, Hardoi, Etah, Mathura, Aligarh, Hathras and
G.B.Nagar. During later period of 2000-05 to 2005-10, only 5 districts namely,
Etawah, Sonbhadra, Hamirpur, Ghazipur and Banda recorded high growth. Medium
growth between 0 to 10 per cent was observed in 38 and 40 districts in respective
periods. A negative and low growth of -10 to 0 per cent was seen in 15 and 24
districts, respectively. The districts having very low growth (below -10 per cent)
were namely, Mahoba (-13.91), Lalitpur (-15.61) and Balrampur (-18.79) during
previous period and during later period Mahoba was the only districts which was
included in this category.
H. Rice
Rice is also an important cereal food crop in India, which occupies about 24
212
per cent of gross cropped area of the country, and contributes 43 per cent to the total
foodgrains production of the country. Rice is not only a rich source of carbohydrate
and protein but also provides vitamins, minerals and fibres. It is cultivated in the
humid tropical and subtropical climate characterized by high temperature and high
relative humidity, resulting in changes in genetic integrity (Kapoor et at, 2011). The
northern region of India comprising the states of Punjab, Haryana, Uttar Pradesh and
Uttarakhand contributes significantly the country's rice production due to higher
productivity (Balasubramaniam and Kumar, 2010). Rice is the second largest crop
grown in the state next to wheat. It occupied 21.8, 22.9 and 22.89 per cent of total
cultivated area in the state during the periods of 1995-2000, 2000-05 and 2005-10,
respectively.
During the period of 1995-2000, the districts which had above 40 per cent
area under rice cultivation were namely, Siddharthnagar, Maharajganj, Chandauli,
S.K.Nagar, Ambedkar Nagar and Mau. During the next periods of 2000-05 and 2005-
10, the districts namely, Azamgarh and Deoria, respectively were added into this
category. In the next category of 30-40 per cent area under rice, the numbers of
districts were 16, 22 and 21, respectively during these periods. As much as 17, 12
and 11 districts were found in the category of 20-30 per cent during the
corresponding periods, respectively. In the category of 10-20 per cent of area under
rice cultivation, 12, 10 and 15 districts respectively were recorded, and the area
cultivated below 10 per cent was occupied by 19 districts during both the previous
periods. In the later period the districts were namely, Karmauj, Farrukhabad, Etah,
Chitrakoot, Muzaffarnagar, Firozabad, Hathras, Meerut, Baghpat, Lalitpur, Agra,
Jhansi, Jalaun, Mahoba and Hamirpur.
High growth of 20 per cent and above in area under rice was seen in 7
districts in each periods of the study. The districts included during the period of
1995-2000 to 2000-05 in this category were namely, Bulandshahr (116.35 per cent)
followed by Aligarh (63.57), Ghaziabad (35.52), Kaushambi (29.99), Faizabad
(27.85), Deoria (23.42), Balrampur (20.18). During the later period, the districts of
Agra (146.77), G.B.Nagar (102.29), Aligarh (54.57), Bulandshahr (39.59), Hathras
(27.72), Mathura (25.12) and Etawah (24.18) were included in this category. There
were 38 and 26 districts, respectively, which recorded medium growth (0-20 per
cent) during these periods. Low negative growth of -20 to 0 per cent was recorded in
21 and 30 districts of the state, respectively and very low negative growth of below
213
-20 per cent was seen in 4 and 7 districts, respectively. During later period, the
districts incorporated in this category were namely, Chitrakoot (-23.09), Baghpat
(-23.99), Sonbhadra (-31.60), Lalitpur (-52.87), Jalaun (-52.92), Mahoba (-73.47)
and Hamirpur (-80.71).
iii. Maize
Maize occupied 1.05 million ha. (4.04 per cent), 0.86 million ha. (3.45 per
cent) and 0.79 million ha. (3.17 per cent) area to the gross cultivated area in the state
during 1995-2000, 2000-05 and 2005-10, respectively. The district Kannauj secured
the highest acreage under maize crop during all the periods. In the next category of
area devoted 15-20 per cent, there were 4, 2 and 2 districts, respectively in the
corresponding periods. There were 4, 5 and 4 districts in which maize acquired 10-15
per cent area, respectively. There were 11, 10 and 9 districts during 1995-2000, 2000-
05 and 2005-10, respectively in which maize was cultivated on 5-10 per cent of
cropped land. Below 5 per cent of area cultivated under maize in the districts in
numbering were 50, 52 and 54, respectively during the periods under consideration.
During 1995-2000 to 2000-05, high growth of above 30 per cent in area
under maize was found in the districts of Kaushambi (126.33 per cent), Mahoba
(105.37), Faizabad (54.79), Deoria (50.91) and Kushinagar (38.29). During the
period of 2000-05 to 2005-10, three districts were found in this category namely,
Jhansi (33.40), Sonbhadra (33.03) and Balrampur (31.49). In next category of
medium growth (0-30 per cent), there were 16 and 10 districts, respectively included
in this category during respective periods. Low growth of -30-0 per cent was
recorded in 29 and 35 districts, respectively whereas, very low growth of below -30
per cent was seen in 20 and 22 districts, respectively.
iv. Pearl millet (bajra)
Bajra shared only about 3 per cent cropped area in the state during the
periods of 1995-2000, 2000-05 and 2005-10. Above 20 per cent area was occupied
by bajra in the districts of Agra and Firozabad during 1995-2000 and 2000-05, and
district of Budaun was added within this category during 2005-10 (Appendices III,
IV and V). In the next category of 15-20 per cent, the numbers of districts included
were 2 and 3, respectively during the previous periods. The districts covering 10-15
per cent area was represented by 5, 4 and 6, respectively during the corresponding
214
period of study. The districts with 5-10 per cent of area under bajra were in number
6, 5 and 6, respectively, whereas below 5 per cent of area was seen in 55, 56 and 55
districts.
The districts recorded high growth in area under bajra were namely,
Shrawasti (365.28 per cent), Siddharthnagar (133.15), Jhansi (99.26), Sonbhadra
(71.19), Sitapur (56.28), Lalitpur (53.99), Ambedkar Nagar (51.34) during 1995-
2000 to 2000-05, and during later period, only the district of the Banda retained a
high growth. Medium growth between 0 and 50 per cent was attained by 17 and 24
districts, respectively during the corresponding periods. Low negative growth of -50
to 0 per cent was seen in 33 and 30 districts, respectively, whereas the districts with
very low growth (below -50 per cent) were in number 12 and 15 in the respective
periods of study. During the later period, the districts were namely, Ghaziabad,
Balrampur, Lalitpur, G.B.Nagar, Meerut, Pilibhit, Atnbedkar Nagar, Gorakhpur,
Maharajganj, Saharanpur, Gonda, Bahraich, Muzaffamagar, Shrawasti and
Siddharthnagar.
b. Pulse crops
Pulses constitute an important component in human diet in India. They are
the major source of protein for vegetarians. In comparison to cereals (wheat and
rice), the percentage of protein in most pulses such as gram, urad and masoor is
much higher that contains 17.1, 24.0 and 25.1 per cent respectively, whereas, wheat
and rice have only 11.8 and 8.5 per cent respectively (Kachroo, 1970). Besides their
nutritive value, pulse crops contain an unique property of maintaining and restoring
soil fertility through biological nitrogen from the atmosphere as well as of
conserving and improving physical properties of soil by virtue of their deep and welt
spread root system (Khanna and Gupta, 1988). In spite of these peculiarities, the area
sown under pulses shows a declining trend in pulse crop producing regions of India.
The reasons for such decline in area under pulses are many. First, pulses are
cultivated generally on unirrigated area and poor quality land is devoted for
cultivation to them. Second, the crops have not received any breakthrough with
respect to high-yielding varieties of seeds. Whatsoever varieties available they have
narrow adaptability and highly susceptible to diseases. Third, inadequate availability
of certified seeds is a major obstacle in their wide spread adoption (Sundaram, 2010;
Shakeel and Hashmi, 2012). Fourth, when irrigation becomes available, farmers shift
215
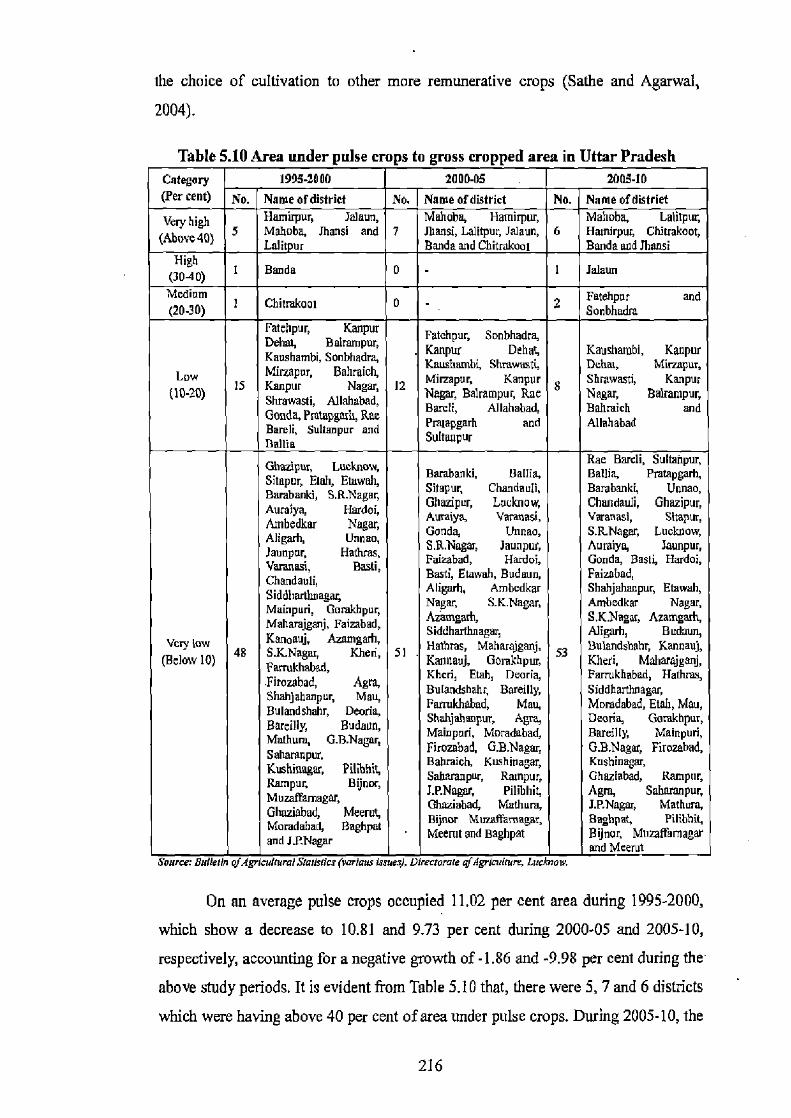
the choice of cultivation to other more remunerative crops (Bathe and Agarwal,
2004).
Table 5.10 Area under pulse crops to gross cropped area in Uttar Pradesh Category 1995-2000 2000-05 2005-10 (Per cent) No. Name of district No. Name of district No. Name of district
Very high Hamupur, Jalaun, Mahoba, Hamirpur, Mahoba, Lalitpur,
hi (Very 0) 5 Mahoba, Jhansi and 7 !band, ]alitpur, Jalaun, 6 Hamirpur, Chilmkoot, Lali ur Banda and Chitrakoot Banda and Jhansi
High (3040) t Banda 0 I Jalaun
Medium 1 Chivakoot 0 _ 2 Fatehpur and
(20-30) Sonbhadra Fatehpur, Kanpur Fatchpur, Sonbhadra, Dohat, Balrunpur, Kanpur par Debt, Kaushambi, Kanpur Kaushambi, Sorbhadra, Mirzapur, Bahraich, Kaushambi, Shrawasti, Dchal, Mirzapur,
Low Mirzapur, Kanpur S Shrawasti, Kanpur (10-20) 15 Kanpur Nagar, 12
Nagar, Balrampur, Rae Nagar, Balrampur, Shrawasli, Allahabad, 13=1, Allambad, llab.ich and Gonda, Pratapgarh, Rae Pratapgarh and Allahabad Ban:li, Sultanpur and Suitaapur Ballis
Ghazipur, Lucknow, Rae Barcli, Sultanpur,
Sitapur, Eiah, Emw¢h, Barn6anki, Ballia, Ballet, Pratapgarh,
Bareback!, S.R.Nagar, Sitapur, Chandauli, Barabanki, Uunao,
Aocobyn, Hardoi, Ghaapur, Lucknaw, Chandauli, Gbazipur,
Aulhedkar Nagar, Auraiya, Varanasi, Varanasi, Sitapur, Aligarh, Gone., Gonda, Unnao, S.R.Nagar, Lucknow,
Jaunpur, Bathras, S$.Nagar, Jaunpur, Auraiyu, 3aunpur, Varanasi Bras Faizabad, Hardui, Gonda, Basil, Hardoi,
Chandauli, Basti, Etowah, Badaun, Faizabad,
Siddbadhnagz, Aligarh, Ambedkar Shahjahanpu5 Etawah,
Mainpuri, Gmnk hpwy Nagar, S.K.Nagar, Ambedkar Nagar,
MzAoujganj• Faizabad, Agngorh, S.K.Nagar, Azamgarh,
Very ow Kanuauj, Aranlga h, Siddharthnagay Aligarh, Budaun,
48 51 Hathras, Maharajganj, Bulandshahr, Kannauj, elmv 10) S.KNager
o, d
Kheri, Faetahob, KanuauJ, Gorakhpur, Kheri, Mabaraj anL Firozabad, Agra, Kheri, Eflr, Deoria, Farcukhabhd, Hathrqv,
Shahjahanpuç Mau, Hunandshobq Bareilly, Siddl mbnagar,
Bulandshahr, Deoria, Fwtvkhebad, Mau, Momdnbad, Eteh, Mau,
Bareilly, Bud¢u, Shahjahncpoy Agra, Deoria, Goaakhpur,
Maahura, G.B.Nagay Mninpbn, Mo adabad, Bared y, Horopa d,
Saharanpur, Firoracb, G.B.Nagar, G.B.Nager, Hcnanbnd,
Saharaager, Pihhhit, Kushivagar, Kushivagar,
Rampur, Bijnor. Saharanpur, Saharanpur, Rampuy bad, Rampur, Agra,
Mwznffnmagar, J.P.Nagar, Pilibhi4 Agra, Saharanpur,
Ghaziwbad Meerut, Ghnoiebnd, Mrnbgca, J.P.Nagar, Madame,
Moradabad, Baghpat Minor Mavaggamagac, Bogbpat, Prnaga,
and1.P.Nagar Meerut and 8aghpat Hijnar, Mnnfl'arnagar and Meerut
Source: But/eln nJAgnsubtwrn! Strualbcr (periow unies). Directorate oJArkndMcq Lirckcmv.
On an average pulse crops occupied 11.02 per cent area during 1995-2000,
which show a decrease to 10.81 and 9.73 per cent during 2000-05 and 2005-10,
respectively, accounting for a negative growth of -1.86 and -9.98 per cent during the
above study periods. It is evident from Table 5.10 that, there were 5, 7 and 6 districts
which were having above 40 per cent of area under pulse crops. During 2005-10, the
216

districts namely, Mahoba, Lalitpur, Hamirpur, Chitrakoot, Banda and Jhansi of
Bundelkhand region were included in this category. In the next category of 30-40 per
cent of area under pulses, there were two districts of Banda and Jalaun to be counted
in this category during 1995-2000 and 2005-10, respectively. The district of
Chitrakoot acquired 20-30 per cent of area under pulses during 1995-2000 whereas,
during 2005-10, there was another set of districts namely, Fatehpur and Sonbhadra to
be included in this category. There were 15 districts to be included within the
category of 10-20 per cent of area under pulses cultivation during 1995-2000, the
number of districts decreased to 12 and 8 during later periods, respectively. Below
10 per cent area sown under pulses was seen in 48, 51 and 53 districts, respectively
during the corresponding periods of study.
With respect to growth, the districts namely, Moradabad, J.P.Nagar, Budaun,
Chitrakoot and Lalitpur were marked by high growth of above 20 per cent during the
previous periods and during the later period three districts namely, Bahraich,
Shabjahanpur and Sonbhadra were added to this category. Medium growth of 0 to 20
per cent was recorded by 11 and 8 districts, respectively in the respective periods.
Low negative growth of -20 to 0 per cent was seen in 28 and 33 districts,
respectively. Very low negative growth (below -20 per cent) was recorded by 26
districts during each periods, respectively (Table 5.11).
Table 5.11 Growth in area under pulse crops in Uttar Pradesh
Category Range (per cent)
Number of districts 1995-2000 to 2000-05 2000-05 to 2005-10
High Above 20 5 3 Medium 0 to 20 I1 8
Low -20 to 0 28 33 Very low Below -20 26 26
uowve. nuuenn of Igncuuura wruua fvarious rasw), unecIwwe Of 1gnC u,ve, tvclow.
i. Gram
Gram recorded a decrease in area from 3.56 to 3.17 per cent and further to
2.50 per cent during 1995-2000 to 2000-05 and 2005-10 with a negative growth of
-10.92 and -20.93 per cent, respectively. During 1995-2000, the districts of Hatturpur
and Banda recorded area sown above 20,per cent under gram. Two districts of
Chitrakoot and Mahoba were added in this category during the later periods. In the
next category of 15-20 per cent area sown under gram, there were 4 and 2 districts,
respectively during the previous periods. In the category of 10-15 per cent area sown
217
under gram, there were 3, 2 and 2 districts in the respective order, and in the next
category of 5-10 per cent of area, 5, 4 and 7 districts were included in the
corresponding periods, respectively. Below 5 per cent of area under gram, there were
48, 47 and 46 districts, respectively in the periods under consideration.
Positive growth under gram cultivated area was recorded in 8 districts
namely, Chitrakoot, Mahoba, Auraiya, Jhansi, Hamirpur, Banda, Varanasi and Jalaun
during 1995-2000 to 2000-05. During the later period from 2000-05 to 2005-10, the
districts of J.P. Nagar, Sonbhadra, Fatehpur and Banda districts recorded positive
growth. Remaining districts have shown negative growth during the periods under consideration.
ii. Lentil (masoor)
Masoor is a pulse crop which shared 2.26 per cent area in cultivation to the
total cultivated area of the state during 2005-10, as compared to 2.09 and 2.43 per
cent during 1995-2000 and 2000-05, respectively, recording a positive growth of
16.39 per cent during 1995-2000 to 2000-05 but a negative growth to the tune of -
7.24 per cent during 2000-05 to 2005-10 per cent. The districts in which masoor
occupied above 10 per cent of area during 1995-2000 were namely, Shrawasti,
Babraich, Jalaun and Hamirpur. During 2000-05, the district of Banda was added
within this category, and during the period of 2005-10, the district of Chitrakoot
replaced Jalaun. In the next category of 8-10 per cent of area, there were 2, 3 and 3
districts, respectively, An area of 6-8 per cent under this crop was seen in 3, 2 and 2
districts in the respective periods. There were 2, 4 and 5 districts, respectively to
show 4-6 per cent of area, whereas, 59, 56 and 55 districts recorded below 4 per cent
of area under the cultivation of masoor, respectively during the periods under
consideration.
During the period of 1995-2000 to 2000-05, there were 41 districts to record
a positive growth in masoor cultivated area, as against 21 districts during 2000-05 to
2005-10. The number of districts to show high growth of above 50 per cent in area
was seen in 20 districts during the previous period, the number decreased from 20 to
5 in this category during the later period of study. Medium growth was recorded by
21 and 16 districts in respective periods. Low negative growth of -50 to 0 per cent
was seen in 25 and 43 districts, respectively whereas, very low negative growth
(below -50 per cent) was recorded in 4 and 6 districts, respectively.
218
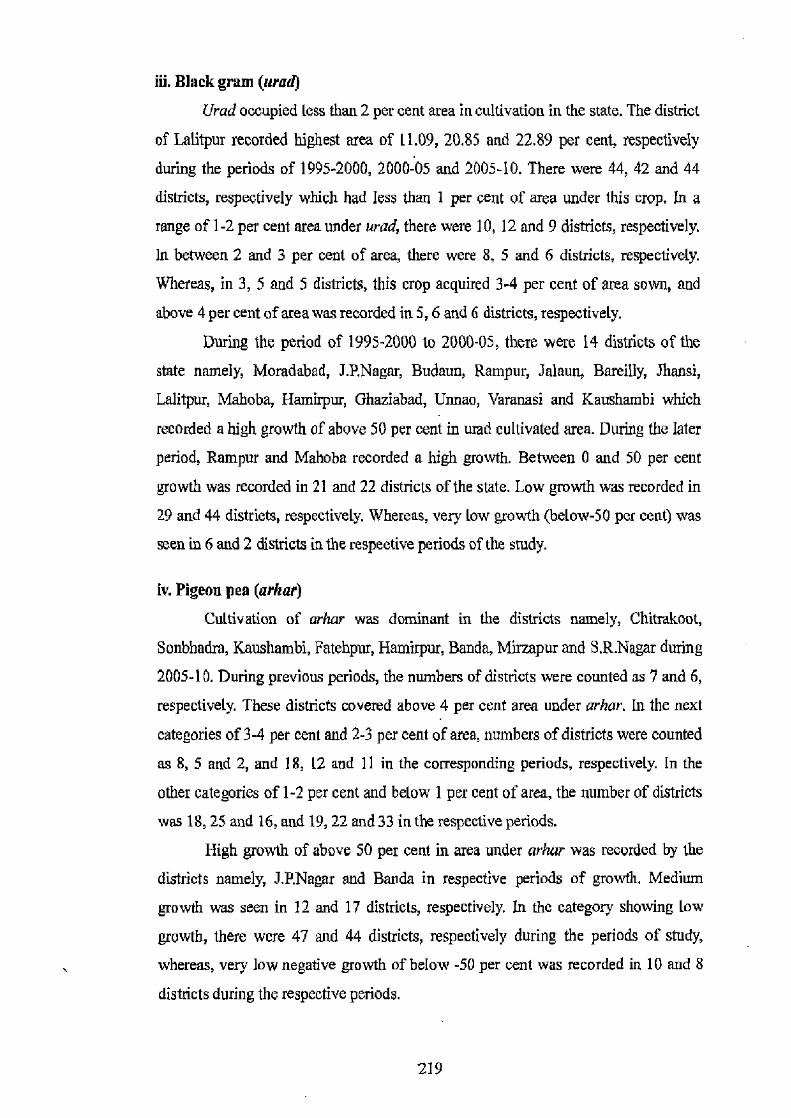
iii. Black gram (urad)
Urad occupied less than 2 per cent area in cultivation in the state. The district
of Laltpur recorded highest area of 11.09, 20.85 and 22.89 per cent, respectively
during the periods of 1995-2000, 2000-05 and 2005-10. There were 44, 42 and 44
districts, respectively which had less than I per cent of area under this crop. In a
range of 1-2 per cent area under urad, there were 10, 12 and 9 districts, respectively.
In between 2 and 3 per cent of area, there were 8, 5 and 6 districts, respectively.
Whereas, in 3, 5 and 5 districts, this crop acquired 3-4 per cent of area sown, and
above 4 per cent of area was recorded in 5, 6 and 6 districts, respectively.
During the period of 1995-2000 to 2000-05, there were 14 districts of the
state namely, Moradabad, J.P.Nagar, Budaun, Rampur, Jalaun, Bareilly, Jhansi,
Lalitpur, Mahoba, Hamirpur, Ghaziabad, Unnao, Varanasi and Kaushambi which
recorded a high growth of above 50 per cent in urad cultivated area. During the later
period, Rampur and Mahoba recorded a high growth. Between 0 and 50 per cent
growth was recorded in 21 and 22 districts of the state. Low growth was recorded in
29 and 44 districts, respectively. Whereas, very low growth (below-50 per cent) was
seen in 6 and 2 districts in the respective periods of the study.
iv. Pigeon pea (arbar)
Cultivation of arhar was dominant in the districts namely, Chitmkoot,
Sonbhadra, Kaushambi, Fatehpur, Hamirpur, Banda, Mirzapur and S.R.Nagar during
2005-10. During previous periods, the numbers of districts were counted as 7 and 6,
respectively. These districts covered above 4 per cent area under arhar. In the next
categories of 3-4 per cent and 2-3 per cent of area, numbers of districts were counted
as 8, 5 and 2, and 18, 12 and 11 in the corresponding periods, respectively. In the
other categories of 1-2 per cent and below I per cent of area, the number of districts
was 18, 25 and 16, and 19, 22 and 33 in the respective periods.
High growth of above 50 per cent in area under arhar was recorded by the
districts namely, J.P.Nagar and Banda in respective periods of growth. Medium
growth was seen in 12 and 17 districts, respectively. In the category showing low
growth, there were 47 and 44 districts, respectively during the periods of study,
whereas, very low negative growth of below -50 per cent was recorded in 10 and 8
districts during the respective periods.
219
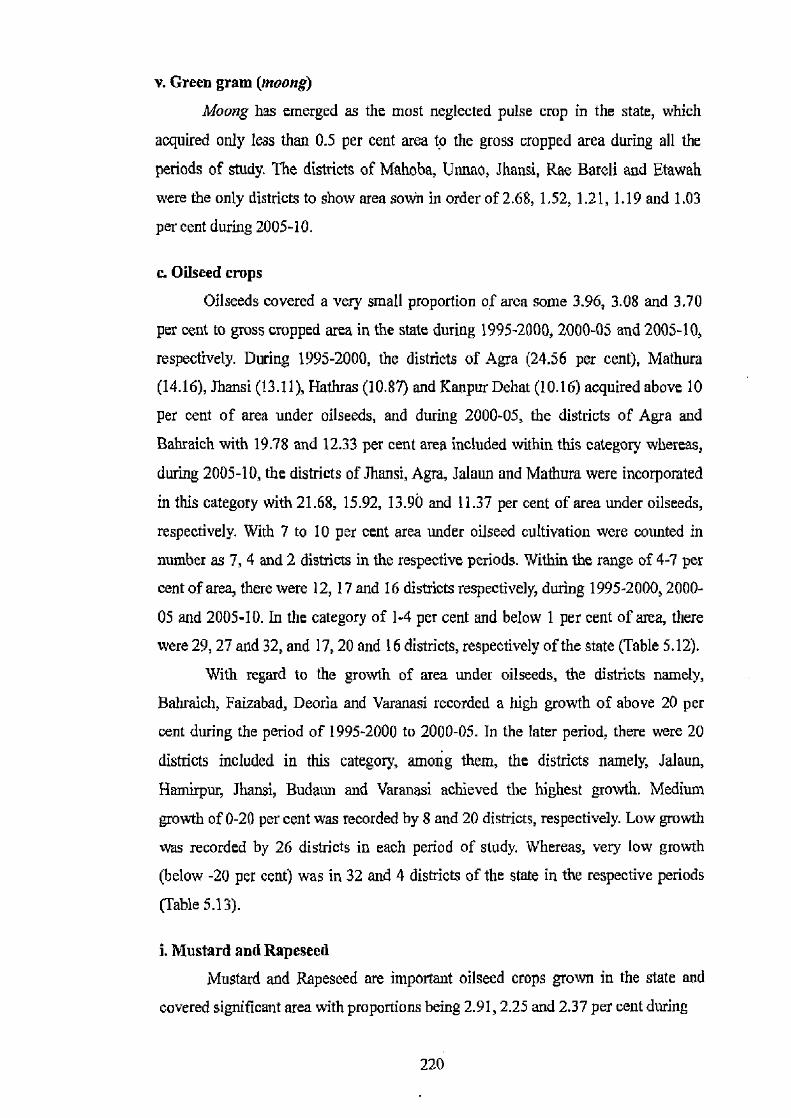
v. Green gram (moong)
Moong has emerged as the most neglected pulse crop in the state, which
acquired only less than 0.5 per cent area to the gross cropped area during all the
periods of study. The districts of Mahoba, Unnao, Jhansi, Rae Bareli and Etawah
were the only districts to show area sown in order of 2.68, 1.52, 1.21, 1.19 and 1.03
per cent during 2005-10.
c. Oilseed crops
Oilseeds covered a very small proportion of area some 3.96, 3.08 and 3.70
per cent to gross cropped area in the state during 1995-2000, 2000-05 and 2005-10,
respectively. During 1995-2000, the districts of Agra (24.56 per cent), Mathura
(14.16), Jhansi (13.11), Hathras (10.87) and Kanpur Dehat (10.16) acquired above 10
per cent of area under oilseeds, and during 2000-05, the districts of Agra and
Babraich with 19.78 and 12.33 per cent area included within this category whereas,
during 2005-10, the districts of Jhansi, Agra, Jalaun and Mathura were incorporated
in this category with 21.68, 15.92, 13.90 and 11.37 per cent of area under oilseeds,
respectively. With 7 to 10 per cent area under oilseed cultivation were counted in
number as 7, 4 and 2 districts in the respective periods. Within the range of 4-7 per
cent of area, there were 12, 17 and 16 districts respectively, during 1995-2000, 2000-
05 and 2005-10. In the category of 1-4 per cent and below I per cent of area, there
were 29, 27 and 32, and 17, 20 and 16 districts, respectively of the state (Table 5.12).
With regard to the growth of area under oilseeds, the districts namely,
Bahraich, Faizabad, Deoria and Varanasi recorded a high growth of above 20 per
cent during the period of 1995-2000 to 2000-05. In the later period, there were 20
districts included in this category, among them, the districts namely, Jalaun,
Hamirpur, Jhansi, Budaun and Varanasi achieved the highest growth. Medium
growth of 0-20 per cent was recorded by 8 and 20 districts, respectively. Low growth
was recorded by 26 districts in each period of study. Whereas, very low growth
(below -20 per cent) was in 32 and 4 districts of the state in the respective periods
(Table 5.13).
i. Mustard and Rapeseed Mustard and Rapeseed are important oilseed crops grown in the state and
covered significant area with proportions being 2.91, 2.25 and 2.37 per cent during
220
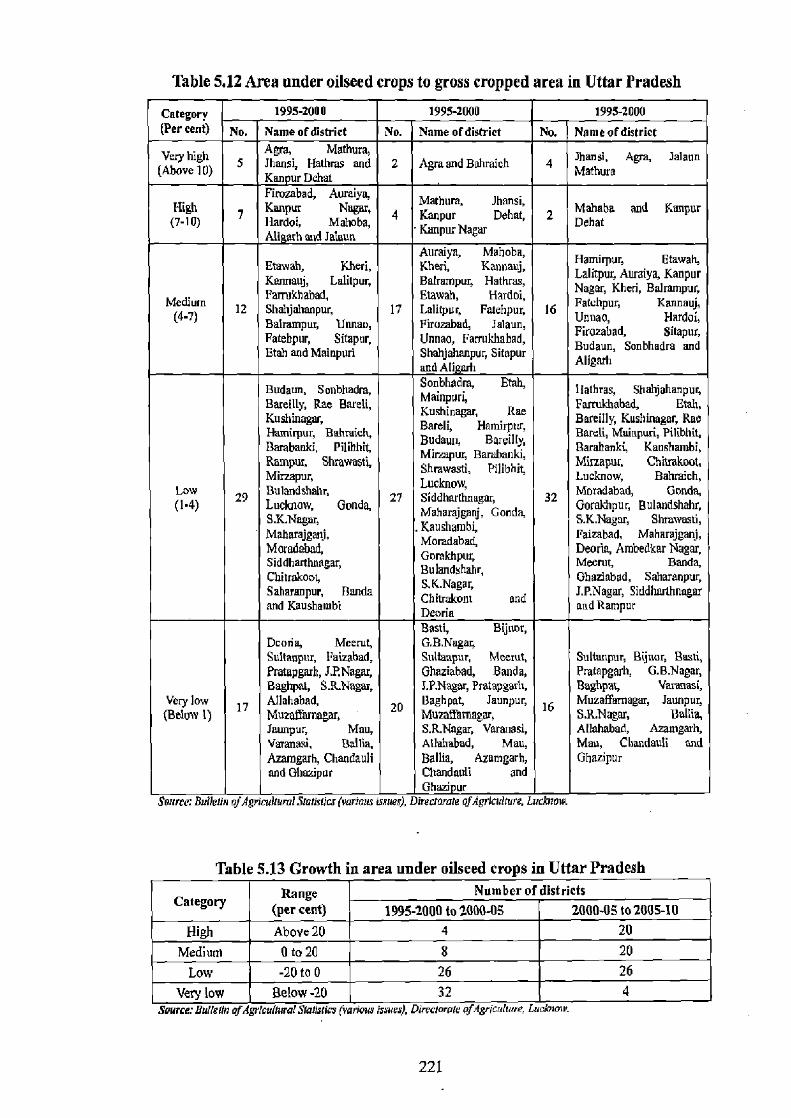
Table 5.12 Area under oilseed crops to gross cropped area in Uttar Pradesh
Category 1995-2000 1995-2000 1995-2000 (Percent) No. Name of district No. Name ofdistriet No. Name ofdistrict
Vbove1h 5 Agra, Mathum, lhansS Halhras and 2 Agra and Bahraich 4
Jhansi, Agra, Jalaun (Above lU) Kanpur Dehat Mathura
Finambad, Antalya, Mathum, Jhansi, High 7 Kanpur Negar, 4 Kanpur Dehat, 2 Mahoba and Kanpur (7-10) Handal, Mahoba, - wpm Nagar Dehat
Ali arh and Jalaun Auraiya, Mahoba, Hamirpur, Etawah, Etowah, Kheri, Kheri, Kannaaj, Lalitpur, Awaiya, Kanpur Kamwuj, Lelitpur, Balrempuy Hathras, Nagar, Kheri, Balrampur,
Medium Farrokhabad, Ewwah, Hardoi, 12 BhxhjohKpag 17
(4.7) Falitpuq Farehpuq 16 Fa nce, , Ka anauj,
Balrampur, Henan, Fvumbal, Jalaun, simper, Fatebpur, Sitapur, Unnao, Farrukhabad, Firozabad, Saaand Buchan, Etah and Mainpuri Shahjahanpuy Sitapur
andAli h A l garn, Bon6bedr¢ and Aligarh
Budaun, Sonbhadra, Sonbhadre, Etch, Ilathras, Shahjahanpur, Bareuly, Rae Bareli, Mainpur Fanakyyxhau, Kushin agar, Kushinagar, Rae R h, ,
Hamirpur, Hahr ddc Bareli, Hamirpur, Bareilly, KasMd, Rae Pil, Ha[eli, Muinpuri, Pllibblt,
PilibhB, Budawt, B1)', Baraaahki, Kausbambi, Rampur, Shrawasti, Mir Mirzapur, Barabmiki, Mirzapur, Shrawasti, Pilibhit, r, cMVaskh,
Lucknow, Luckno Bahraich, Low 29 IIuyallsbMxr, 27
Lucknow, S magay 32 Moradabad, Gonda,
(1-4) Gonda, S3CNaw, aharag Condo, Gomldtpur, BuShnsw ahr,
B.KNagm, Kanshajgalj, . Kaushamb S.K.Nagar, BbaaNvosti, Mabmjgmj
r, Faizabad, Maharajganj, Moradatlad, Gomk h
Gomkhpupuq Dearia, Ambedkar Nagar, SiddhanMagaz, Bulandshahr, Meerut, Banda, Sahava par S.K.Nagar, Ghaaabad, Saharanpur, Saharanpur, Handy Chitrakuot and I.P.Negay Siddharlhnagaz and Kausbambi Deorie and Rampur
Basti, Bijnar, Dcore, Meerut, G.B.Naga, Sutlanpur, Faizabad, Suaanpur, Meerut, Sultanpur, Hijnor, Baati, Pratupgarh, JP,Nagar, Ghaziabad, Banda, Pratapgarh, G.B.Nagar, Baghpat, S.RNagar, 1.P.Nagar, Pratapgarh, Bughpat, Varanasi,
Very low 17 Allahabad, 20 Baghpat, Jaunpur, 16 Muzaffamegar, Jaunpur, (Below 1) Muzaffamagar, Muzaffamagab S.R.Nagar, Ballia,
Jaunpur, Mau, S.R.Nagar, Varanasi, Allahabad, Azamgarh, Varanasi, Bollix, Allahabad, Mau, Mau, Chandauli and Aramgarh, Chandauli Ballia, Azamgarh, Ghazipur and Ghazipur Chandauli and
Ghajp it Source: Bulletin QJAgylcuimmml 3mierley (vaylaus issue), Directorate ofAgricKunre, Lucbmw.
Table 5.13 Growth in area under oilseed crops in Uttar Pradesh
Category Range (per cent)
I Number of districts t 1995-2000 to 2000-OS 2000-0S to 2005-10
High Above20 4 20 Medium 0 to 2C 8 20
Low -20 to 0 I 26 26 Very low Below -20 32 4
Source: Bulletin ofAgricultural Staasucs (vatlau, i5mre4, Directorate OJAgrmg(iilg 5ucxnmv.
221
1995-2000, 2000-05 and 2005-10, respectively. The district of Agra recorded the
highest area of 24.09, 19.47 and 15.54 per cent under these crops during the
corresponding periods, followed by the districts of Mathura, Kanpur Dehat, Etawah,
Auraiya, Balrampur and Kanpur Nagar whereas, the lowest area was in the district of
Mau (0.06 per cent) during all the periods. During 1995-2000 and 2000-05, there
were as much as 14 districts which recorded a positive growth and during the later
period, the number of districts increased from 14 to 44 in which, Lalitpur, .Thansi,
Budaun and Hamirpur recorded the highest growth (above 50 per cent). Remaining
districts of the state recorded a negative growth.
d. Cash crops
Sugarcane and potatoes selected constitute important cash crops in the state.
Sugar is probably an indigenous crop to India, the name of the crop itself comes from
Sanskrit language. In terms of raw cane, India is the largest producer in the world,
but the low saccharine content of the cane due to poor technique of extraction brings
its output in terms of sugar at third place, after the countries of Cuba and Brazil
(Spate and Learmontly 1967). Sugarcane occupies about 3.0 per cent of the total
cultivated area in the state, and it is one of the most important cash crops,
contributing about 7.5 per cent of the gross value of agricultural production in the
country. Potatoes are the world's fourth important food crop after wheat, rice and
maize because of their yield potentials and high nutritive value.
Potatoes constitute nearly half of the world's annual output of all root and
tuber crops. With an annual global production of about 300 million tonnes, potatoes
are economically important staple crop in developed and developing countries. India
ranks fourth in area and third largest country in the world in production of potatoes
after China and Russian Federation. About 90 per cent of the potato crops in India
are cultivated in Ganga plain, the period of cultivation spans over the months of
October until February-March.
It is seen from Table 5.14 that, during 1995-2000, 2000-05 and 2005-10, there
were 9, 9 and 10 districts, respectively which devoted above 20 per cent area under
cash crops to gross cropped area. During 2005-10, area devoted more than 20 per
cent under cash crops in the districts were namely, Bijnor (49.32, Muzaffamagar
(49.19), Meerut (45.32), Baghpat (42.43), Saharanpur (33.60), Kheri (31.27),
J.P.Nagar (29.56), Ghaziabad (29.54), Kushinagar (20.69) and Sitapur (20.19). In the
222

Table 5,14 Area under cash crops to gross cropped area in Uttar Pradesh 1995.2000 2000-05 2005-10
No. Name of district No. Name of district No. Name of district Bijnor Muzaffamagay Bijnor, Muzaffamagn,, Bijnor, Muaafthrngar Meerut, Baghpat, Meerut, Baghpat, Meerut, Baghpat, [(Above
9 J.P.Nagag Saturaupur, 9 Saharanpur, Kheri, 10 Saharanpur, Kheri, Kheri, Ghaziabad and Ghaziabad, J.P.Nagar J.PNagay Gheziabad,
Kannauj, Farnikdbad, and Ku
MQrodabart, Snapur Shapaq Farrukhawad, and BnreiIIy 4 3 BareillY and Kannauj 5 Bareilly and Gonda
and Gonda Balrampur, Pilibhit, Hathras,
Medium Farruktrabad, Kannauj, Moradabad, Pilibhit, bad, Firmaba (10.15)
4 Pilibhit and 7 Bahmich, Basti, 7 d Basti, Bulandshahr and
Burn,
Shahjahanpur . Bulandshahr and Agm Gonda
Bulandshahr, Rampur,
Ambedkar Nagar, Faizabad, Firozabad, Eoirahaq, Basti, Dnrabuski, Shahjahanpur, Hatteras,
5huhtahanpur, Hardui, Budaun, Firozabad, Aga, Romper, Rampuy Mahamjganj, Low 18 Azapgarh, Mao, ]4 Barzbanki, ID Dudaun Bambanki, , (5-10) Maherajganj, Mawarnjgonji Budaurs, spur Nagar,
Ghabgnr, Jaunpur, Hartloi, Namrsasi, Ambedkar Nagar and Banta, Deoria, Handal, Azantgarh, Jaunpur Etowah Balrampu , Faizabnd and Kanpur Nagar
and liathms Methura, Gonda, Mau, Ambedkar Aligarh, Azamgarh, Kanpur Nagar, Boteroltfii Varanasi, Varanasi, Agra, Nagar, Deoria, Buuia, Jaunpur, Mathura, Kaushambi, Salrongar, Gulta pur, Mn[hma,
Sultanpu5 Mainpuri, Sultanpu5 Mhazgun, S.K.Nagar, Fatehpur,
KanEhnm-1N Baoraa bate ur, Elur,
Mainpuri, Etah, Aligarh, Etowah,
Ekth, li Deoria Fatehpur, Binh,
S.R.Nagar, Dahrzich, S.t. S.[C.Nagnt, G.B.Nagar, Kaushambi, S.K.Nagar,
Lucknox; Gorakhpur, Luckno'% S a .R.Nagy
Shrawasti, Allahabad,
Very low AIahobadi Aligarh; Rae Bard, Prato arw, Rae Barely Lucknow,
36 gwnpm Dahay 36 Allahabad, Gorakhpur, 38 S.R.Nagar Auruiya, , (Below 5) Prarnggarw, Etowah, Aui aya, G.B.Nagar, Protapgarh,
Rae Bareli, G.B.Nagar, Siddharlhnagar,
Gorakhpur, Kanpur Auraiya, Unnao, Dchzt, Unnao, Siddhantuagar, ti, Unnat, Kanpur Mirzapur, Mirrapur, Shrawosti, Kanpur Drpur, Siddharthnagar, Chapdauli, Homirpuq Miand ul Hamvpuq
Chandauli, lalaun, Hamirpuy Mahtha, Jaland, Mehoba, Nahobni Snn Chandauh, Sonbhadm
Sonbhadra, Chitrakoot, Ba ds, Chivakoot, Banda,
Cpur and Bmda, Banda, Lalitpvr and Lalitpurand Jhansi Banda, ~d~~~~r and
Jharasi Jhansi Suture: Bultebn ofAgnvfivrol SIafiaiics (varituu isn,e J, Direcromre ofdgricul(ure, Luelaiorv.
Table 5.15 Growth in area under cash crops in Uttar Pradesh
Category Range (Per cent) Number of districts
1995-2000 to 2000-05 2000-05 to 200510
High Above20 12 11
Medium 0 to 20 26 27
tow -20 to 0 20 26
Very low Below -20 12 6 Source: Fri/kiln afAgrindhoa( Sblislics (curious isue). Direclorofe ofAgriculwre, Luc6nmw
next category of area under cash crops 15-20 per cent, there were 3, 4 and 5 districts in the corresponding periods of time. In between 10 and 15 per cent area under cash
223
crops it was seen in 4, 7 and 7 districts, respectively. Whereas, 5-10 per cent area
under cash crops was devoted in 18, )4 and 10 districts of the state during the periods
under consideration, respectively. Below 5 per cent of area under cash crops was
seen in 36, 36 and 38 districts during these periods, respectively. Lowest area under
cash crops occurred only in .Tani, Lalitpur, Banda and Chitrakoot districts of
Bundelkhand region of the state.
In terms of growth in area under cash crops, there were 12 and 11 districts,
respectively which registered high growth of more than 20 per cent during the
periods of study (Table 5.15). During later period, the districts showing high growth
were namely, Hathras, Agra, Etawah, Mahoba, Shrawasti, Firozabad, Aligarh,
Gonda, Banda, Balrampur and Sonbhadra. Medium growth in area under cash crops
was recorded in 26 and 27 districts, respectively and low growth was in 20 and 26
districts, respectively during both the periods of study. Very low growth (below -20
per cent) was recorded by 12 and 6 districts, respectively.
L Sugarcane
The state of Uttar Pradesh occupied first place both in area and production of
sugarcane in the country, followed by the state of Maharashtra, Tamil Nadu,
Karnataka and Andhra Pradesh. It accounted for 42.47 per cent of total area and
41.31 per cent of total production of sugarcane in the country. The maximum
concentration of sugarcane cultivation is seen in the upper Ganga-Yamuna doab,
Rohilkhand and the trans-Saryu plain which together account for 70 per cent of the
slates production. Amongst 100 leading sugarcane producing districts of the country,
33 belong to the state of Uttar Pradesh (Raja, 2012).
Within the state, the western region is considered to be the dominant producer
of sugarcane. In 1995-96, it produced over 80 million tonnes of sugarcane, while the
eastern region less than 13 million tonnes. This has been due to that, the western
region devoted an area under sugarcane almost 5 times the area under this crop in the
eastern region (1.2 million ha. vs. 0.25 million ha.), and about 97 per cent of this area
in the west was irrigated, whereas less than 90 per cent was irrigated in the east
(Bajpai and Volavka, 2005; Asawa, 2005).
Sugarcane occupied about 8 per cent area among the cultivated crops in the
state during the study periods. Very high concentration of the crop, above 10 per cent
of cultivated area, was seen in 13, 17 and 17 districts, respectively of the state during
224
1995-2000, 2000-05 and 2005-10. Districtwise concentration of the crop during
2005-10 was highest in Bijnor (49.14 per cent), Muzaffarnagar (48.75), Meerut
(43.50), Baghpat (42.29), Saharanpur (33.48), Kheri (31.09), J.P.Nagar (28.33),
Ghaziabad (27.50), Kushinagar (20.23), Sitapur (19.59), Balrampur (17.30), Bareilly
(14.88), Pdibhit (14.73), Gonda (14.40), Basti (12.30), Moradaball (12) and
Bulandshahr (10.70). In the category of 8-10 per cent of area under cultivation, there
were 2, 1 and 2 districts which were recorded in the respective periods. Within the
category of area 4-6 per cent, the number of districts were in order of 6, 7 and 4 in
the corresponding periods, respectively, whereas below 4 per cent of area it was seen
in 47, 44 and 47 districts, respectively.
During the period of 1995-2000 to 2000-05, high growth of above 20 per cent
in area under sugarcane was recorded in 11 districts, the number of districts
decreased to 7 during the later period. These districts were namely, Shrawasti (70.86
per cent), Mahoba (66.96), Gonda (41.13), Hardoi (28.15), Banda (25.84), Balrampur
(23.15) and Ambedkar Nagar (21.74). Medium growth (0 to 20 per cent) was
recorded by 18 and 17 districts, respectively during the corresponding periods
whereas, low negative growth (-20 to 0 per cent) was attained in 18 and 29 districts,
respectively. Very low negative growth was recorded in 23 and 17 districts of the
state during the periods of study.
ii. Potatoes
Potatoes occupied less than 2 per cent area of the total cropped area in the
state. The districts namely, Kannauj, Hathras, Farrukhabad, Firozabad and Agra
recorded the highest concentration of potatoes during all the periods (Appendices BI,
IV and V). All of the districts belong to the most fertile Ganga-Yamuna doab region
of the state. Comparatively, the lowest area under potatoes was seen in the districts
belong to Bundelkhand and Baghelkhand regions of the state.
As regards the growth of area under potatoes, the districts of Agra and
Hathras showed a high growth of 71.25 and 50.18 per cent during 1995-2000 to
2000-05, respectively. The district of Aligarh recorded highest growth of 110.09 per
cent during later period of study, followed by the districts of Hathras (103.06),
Btawah (74.20), Agra (73.34), Banda (62.24), Jalaun (57.67), Mathura (56.99) and
Firozabad (50.17). Medium growth between 0 and 50 per cent was recorded by 20
and 27 districts, respectively. Whereas, low negative growth (-50 to 0 per cent) was
225
seen in 47 and 35 districts during the corresponding periods of study, respectively.
Very low negative growth was attained by the district of Kanpur Dehat (-51.69 per
cent) during 1995-2000 to 2000-05.
C. Trends of Growth in Area, Production and Yield of Crops: 1995-96 to
2009-10
India has registered very significant increase in area and production of crops and
in yield of the crops per hectare during the last three-four decades. The entire credit
goes to new agricultural technology incorporated in Indian farming in the form of
green revolution which played vital role in heralding new era of transformation
agricultural arena (Misra and Kumar, 2007). The gains in agricultural production that
went along with the introduction of new technology lifted India from the status of a
food deficient country to a self sufficient one. The modem methods of irrigation and
seed-fertilizer technology that came through agricultural research and development
made it possible to increase crop yields, enabling the farmers to use existing land
more efficiently. The increase in yields and agricultural productivity in rural areas
have translated into development gains for the rural poor (Bajpai and Volavka, 2005).
Moreover, growth rates per annum in area, production and yield of major
crops, viz., cereals, pulses, oilseeds and cash crops were computed applying the
linear regression (least square growth rate) formula for a period of fifteen years, i.e.
from 1995-96 to 2009-10. Appendices VI, VI and VIII give the districtwise values of
growth rates of the crops considered in the state.
a. Trends of growth in area, production and yield under cereal crops
Area
Total area devoted to cereal crops during 1995-96 was 17.23 million ha. It
decreased to 17.05 million ha. during 2009-10. The area under cereals showed a
negative growth rate of -0.11 per cent1annum. During this period, there were 35
districts which recorded positive growth, while remaining districts showed a negative
growth. A single district Kanpur Nagar characterized with very high growth of 4.89
per cent/annum (Table 5.16 and Fig. 5.7). On the other hand, 6 districts namely,
Shrawasti (-2.97 per cent/annum), Meerut (-3.18), G.B.Nagar (-3.20), Sonbhadra
(-3.78), Varanasi (-4.22) and Farrukhabad (-4.37) recorded very low negative growth
of below -2.75 per cenUper annum. A total of 23 districts recorded high growth
which ranged between 0.48 and 2.09 per cent. In all, 25 districts recorded medium
growth between -1.14 and 0.48 per cent,. whereas, 15 districts registered a low
growth between -2.75 and -1.14 per cent.
Production
The production of cereal crops in the state increased from 35.85 million
tonnes during 1995-96 to 41.60 million tonnes during 2009-10, thus giving a growth
rate of 0.63 per cent/annum. During this period, there were 42 districts which
recorded a positive growth and the remaining districts were characterized with a
negative growth. To classify the districts into different category of growth, there
emerged five grades. The highest growth in production of cereals was recorded in
Kanpur Nagar, being 5.22 per cent, and the lowest in Varanasi with -5.53 per cent,
followed by the districts of Sonbhadra (-4.80 per cent/annum), Mahoba (-4.28),
Farrukhabad (-3.89) and Chitrakoot (-3.10). High growth in between 1.15 and 3.12
per cent per annum was recorded by 22 districts. The medium growth in between
-0.81 and 1.15 per cent/annum was seen in 28 districts, and 14 districts were
characterized with low negative growth that ranged between -2.77 and -0.81 (Table
5.16 and Fig. 5.7).
Yield
Districtwise growth of yield of cereals shows that, during this period, the
state recorded 0.74 per cent annual growth. During this period, very high growth was
recorded by the districts of Balrampur, Bahraich, Unnao and Shrawasti in order of
2.37, 2.32, 2.14 and 2.10 per cent, respectively. High growth in between 0.98 and
1.92 per cent was attained by 16 districts whereas, 34 districts recorded medium
growth in between 0.40 and 0.98 per cent. Low growth in yield of cereals was visible
in 9 districts. The districts of Chitrakoot (-3.10), Farrukhabad (-3.89), Mahoba
(4.28), Sonbhadra (-4.80) and Varanasi (-5.53) were characterized with very low
growth in yield of cereals (Fig. 5.7).
i. Wheat
Area
Appendix VI shows the growth rate per annum in area under individual crops.
Among them wheat shows an increase in area from 8.92 million ha.duringl995-96 to
9.51 million ha. in 2009-10 recording a growth rate of 0.32 per cent/annum. Kanpur
227
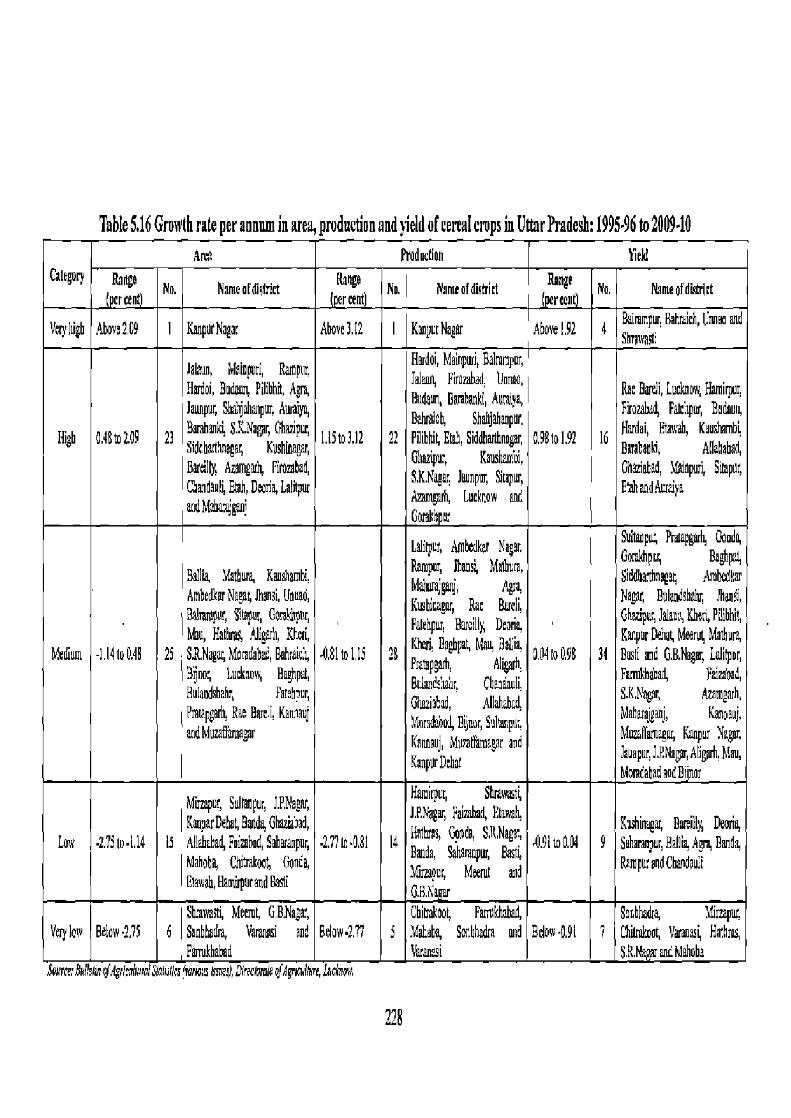
Table 5.16 Growth rate per annum in area, production and yield of cereal crops in Uttar Pradesh: 1995.96 to 2009.10 Area Production Yield
Category Raaga No. Namafdkkdel Range No. Namtafdisfrirt 7iame No. Name ofdWit ercent - erent teat
Vayhigh Ahovo209 I KanporNagar Above 3.12 I Kanpur Nagar Above 1.92 4 k~'pm'Bah~uh'Cmuoand Shraaµy1:
la a n, bls upuri, Ramptu, Haadoi, Mairzmi, BJmnpur,
Harp, Badwn, Pilibhh, Aar, 7eleun, Fimiubad, Unneo, Ric Bmeli, Cuokaow, } ,irpoy 7awp~iy Sk ij MaHpnr, Awaiya Hudaun, banbanki, Auraiys F n e6ud Fseapu, Budeuo, Bm~"MS'LNaga'Ghapw' Raluoith, Shahjabenpur, poi, Eawah, Kuuaembi High 0.48 at 2.09 23 Sidchanhnagar,, Kushroagar, 1.1Sto3.12 27 PilibMtE1g,Siddbafhougff, 0.98to1.91 16 Buabanld, Allahabad, Barallg Aaamgmh, Pimabad, Ghaztpu, KausMm'w,
npu S.K.begar, 7aoy Siupu, GWahaq 3&npuri, SBapny CSandaolsENh,Deria Lalkp A mgarh, Lmkrow hitandAcmiya
Gorakh u:
Lalilper, Ambodker Nagar, SSuItapu; Pwapgmh, Oauda,
31l rleRen, KenshamS. Bempar, Ihans4 Malhcm, M J A GomNpcy Bagp4 Sitldhainagay Amb i ar A ib
Amhedkaz Nagar, lhsnai, Unnad, Kishieagfim,, Rae Bueli, Nagar, Bu1anashaMy Jha91, Urvifur, Sllapor, GoraPli t r, palehpuy Bwcilly, J)oorie, Gharipuy Jalaua, Khtt4 Pilibhit, Mau, Halua ,41igHh, Kha, Kh¢ti. Ba b t Maq 10a, Kpur Dü Meew Mathum
M.ednm -LI41oO.48 25 SR.Nogayh4amdobac,Buhraci4 3ijno, Lucknuaµ Baghp
A.81orllS ?8 gp'' Pro pgarh, Allgoth; D04 to 0.99 31 Bassi mid 0.&Nagay Le1dlaor. SamNMah,rl zatao6ad, r, Bdand:haiu, Chzndauli, BulaMshahr, Set.hour. GI>aaiobad, AIIah&ud s.K.Ne9sy, A7amgn~h,
Prampgarly Rae B8re1, Kaniaoj Muacda'oud, 9aPrmai;, Mnharpjgaoj, Kaonapi. andMuzinluroa y Kannauj, hfualfam2gar and
mlfat Mimffamrgm, Kanpur Nagar,
Kanpur_rha lauopur,l.P.Nagar,Aligmh,Mau, MoraiehahaadBPnor
Mirrapur, Suhanpur, 1.P.Na_gar, Hamicr, Shawt4
KaupurDelzLBand;Glu5ad, 1.P.Nagm, Faiuo6ed, Elamb,, KnMiaa@oy Baraillg Oentts, Low •2,75to1.14 IS Allthabal,Pthbad,Saharanpnr, •2.771u ,0.81 14 HNIVM, Gmlda, S.RNag?,
Bmtda, Saha auptu, Basis 491w .04 9 Suharamur,Balli, Ai, Bands Mahoba, Chi7ako d fmn0a, .Knaaocy Meru[ and RampmandChaodau:i Ciomah, Ham rpwand BaB G.B.\ Sh:awas, Mcaml, G,B.Na;a', Chirnakool, Famlkhabe4 Socbhadra, Mirupuc
Very lc Below-2,7$ 6 l Snnbtortlm. Vetarorsi and Bdow•p.77 S MaLc , Socbharlya mid Below-0.9I 7 Chiuunoi Vamp 4 Ha.hras, Fambabod VuranS S.R. anr:Hohaha
Buuryey hVrtih of Agrl:3lrnn1 SWuhea S's Ism), Di,ntwd¢ of Agrilkn, luch1? s'
228
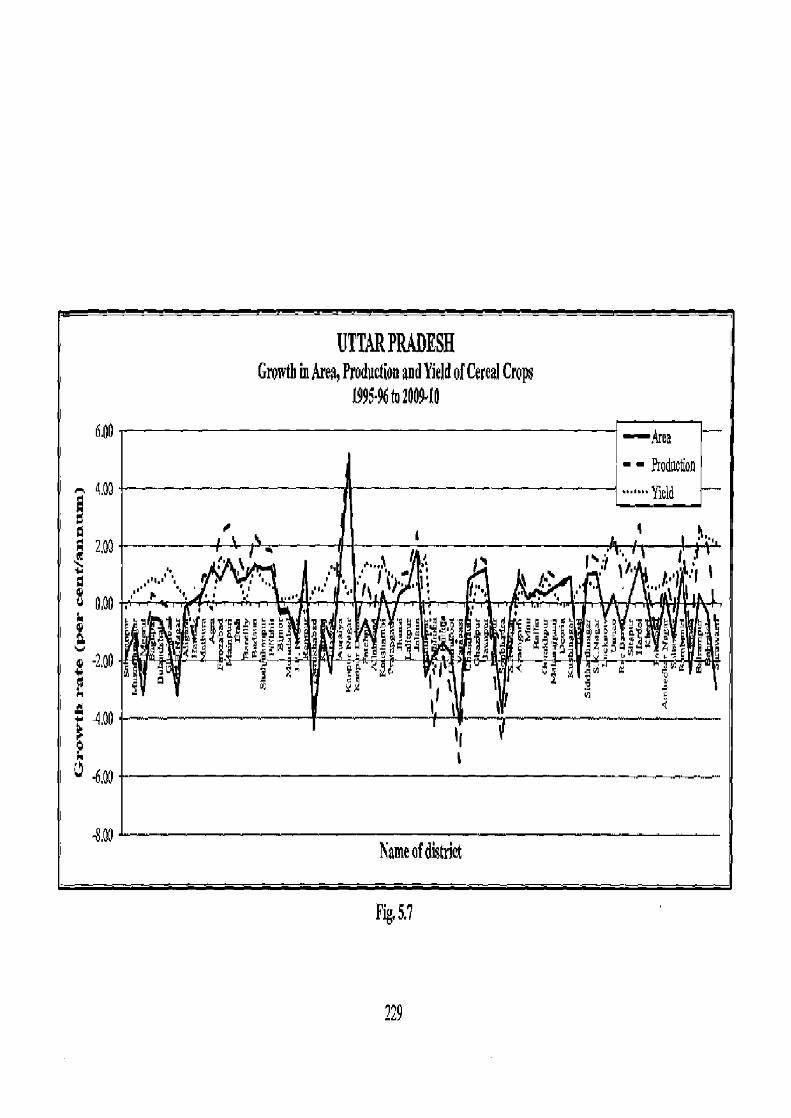
UTTAR PRADESH Growth in Area, Production and Yield of Cereal Crops
1995.96 to 100910
6.00 —qua
- - Ptoducflon Yield
r ;
~a,00•
y G , ' ° ra E393 ~~•~,~ t'~ai~mc~ o~ w 5E np 9
h_dQ , -[i d° 4 iry Eiji !2
fit` t I
I S t t ~r ~
I; 4 •6.00
x.00 Name of district
Pig, 5.7
?29
Nagar, Jalaun and Siddharthnagar with 4.93, 2.87 and 2.45 per cent/annum recorded
very high growth in area whereas, very low growth (below -2.15 per cent/annum)
was attained by the districts of Basti (-2.27), G.B.Nagar (-2.35), Meerut (-2.67),
Shrawasti (-3.43), Varanasi (-3.57) and Farrukhabad (-3.89). High, medium and low
growth rate per annum was recorded by 23, 25 and 13 districts, respectively.
Production
Production of wheat crop jumped from 21.81 to 27.02 million metric tonnes,
with an increase of 1.15 per cent during the same period. In terms of growth rate of
production, Kanpur Nagar recorded very high growth of 5.18 per cent/annum. High
growth rate between 1.64 and 3.44 per cent were characterized with as many as 24
districts whereas, 25 districts showed medium growth of -0.17 to 1.64 per
cent/annum. Low negative (-1.97 to -0.17 per cent/annum) and very low negative
growth (below -1.97 per cent/annum) in production of wheat was achieved by 12 and
8 districts, respectively.
Yield
Average yield per hectare of wheat shows an increase of 0.82 per cent/annum
during the period of 1995-96 to 2009-10. Very high growth rate of above 1.98 per
cent/annum was recorded in Balrampur (3.19 per cent), Sonbhadra (2.64), Kheri
(2.26) and Bahraich (2.04) districts of the state. High growth of 1.06 to 1.98 per cent
was seen in 11 districts namely, Barabanki, Pilibhit, Unnao, Sitapur, Hamirpur,
Shahjahanpur, Shrawasti, Rae Bareli, Lucknow, Hardoi and Kanpur Dehat. Whereas,
during the same period, medium (0.15 tol.06 per cent/annum) and low growth (-0.77
to 0.15 per cent/annum) in yield/ha were attained by 40 and 14 districts, respectively.
Very low growth (below -0.77 per cent/annum) was recorded by Mahoba district
(-2.71 per cent).
ii. Rice
Area
During the period of 1995-96 to 2009-10, there has been a marginal increase
of 0.06 per cent/annum in area under rice. The districts of Bulandshahr, Agra and
Aligarh recorded very high growth of above 6.26 per cent/annum in area This was
followed by high growth of 1.84 to 6.26 per cent/annum in the districts of
G.B.Nagar, Hathras, Kanpur Nagar, Mathura, Ghaziabad, Kaushambi, Hardoi,
230
Shahjahanpur, Balrampur and Jaunpur. Whereas, medium growth (-2.59 to 1.84 per
centlannum) in area under rice was seen in 46 districts. Low and very low growth
were recorded in 7 and 4 districts, respectively. These were 11 districts marked with
negative growth namely, Basil (-2.71 per cent), MuzafParnagar (-3.15), Saharanpur
(-3.32), Baghpat (-3.53), Chitrakoot (-4.50), Varanasi (-4.80), Sonbhadra (-6.67),
Lalitpur (-7.28), Jalaun (-10,07), Mahoba (-13.47) and Hamirpur (-19.80).
Production
Production of rice has recorded 0.12 per cent/annum increase during 1995-96
to 2009-10. The districts namely, Bulandshahr (11.03 per cent), Aligarh (10.83) and
Agra (10.23) have recorded a very high growth in production of rice during this
period. High growth between 2.29 and 7.53 per cent/annum for rice was recorded in
the districts namely, Mathura, Firozabad, Kanpur Nagar, Jhansi, t.B.Nagar,
Ghaziabad, Kaushambi, Hathras, Hardoi, Balrampur, Mainpuri and Auraiya whereas,
medium and low growth during the same period were seen in 42 and 6 districts,
respectively. Very low growth in negative order below -8.18 per cent was recorded
by the districts namely, Varanasi, Jalaun, Lalitpur, Sonbhadra, Chitrakoot, Mahoba
and Hamirpur.
Yield
Growth in average yield of rice in the state was marginal with 0.06 per
cent/annum during this period. It recorded very high growth of 6.13 and 5.38 per cent
in the districts namely, Jhansi and Firozabad, respectively. This was followed by 17
districts which were characterized with high growth. Medium and low growths were
recorded in 34 and 13 districts, respectively. Whereas, the districts namely,
S.R.Nagar (-2.92 per cent), Sonbhadra (-4.25), Varanasi (-4.25) and Chitrakoot
(-6.48) showed very low growth during this period.
HE Maize
Area Maize crop recorded a decrease of -2.66 per cent/annum in area from 1.08
million ha. during 1995-96 to 0.71 million ha. during 2009-10. The districts namely,
Mahoba, Kaushambi and Kanpur Nagar recorded very high growth of 14.55, 9.68
and 8.35 per cent, respectively. High growth between -1.50 and 6.75 per cent/annum
was noticed in total of 16 districts. Medium growth (-9.75 to -1.50 per cent) was
231
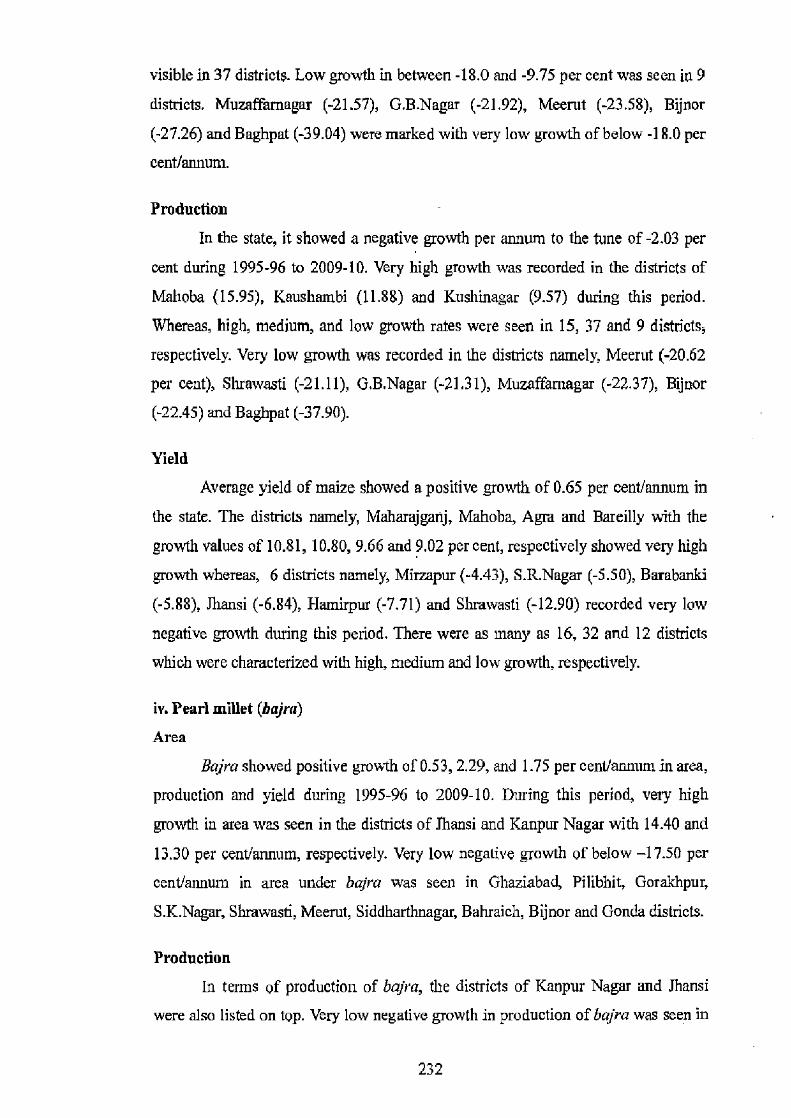
visible in 37 districts. Low growth in between -18.0 and -9.75 per cent was seen in 9
districts. Muzaffarnagar (-21.57), G.B.Nagar (-21.92), Meerut (-23.58), Bijnor
(-27.26) and Baghpat (-39.04) were marked with very low growth of below -18.0 per
centlannum.
Production -
In the state, it showed a negative growth per annum to the tune of -2.03 per
cent during 1995-96 to 2009-10. Very high growth was recorded in the districts of
Mahoba (15.95), Kaushambi (11.88) and Kushinagar (9.57) during this period.
Whereas, high, medium, and low growth rates were seen in 15, 37 and 9 districts;
respectively. Very low growth was recorded in the districts namely, Meerut (-20.62
per cent), Shrawasti (-21.11), G.B.Nagar (-21.31), Muzaffarnagar (-22.37), Bijnor
(-22.45) and Baghpat (-37.90).
Yield
Average yield of maize showed a positive growth of 0.65 per cent/annum in
the state. The districts namely, Maharajganj, Mahoba, Agra and Bareilly with the
growth values @1 10.81, 10.80, 9.66 and 9.02 per cent, respectively showed very high
growth whereas, 6 districts namely, Mirzapur (-4.43), S.R.Nagar (-5.50), Barabanki
(-5.88), Jhansi (-6.84), Hamirpur (-7.71) and Shrawasti (-12.90) recorded very low
negative growth during this period. There were as many as 16, 32 and 12 districts
which were characterized with high, medium and low growth, respectively.
iv. Pearl millet (bajra)
Area
Bajra showed positive growth of 0.53, 2.29, and 1.75 per cenllanmun in area,
production and yield during 1995-96 to 2009-10. During this period, very high
growth in area was seen in the districts of Jhansi and Kanpur Nagar with 14.40 and
13.30 per cent/annum, respectively. Very low negative growth of below —17.50 per
cent/annum in area under bajra was seen in Ghaziabad, Pilibbit, Gorakhpur,
S.K.Nagar, Shrawasti, Meerut, Siddharthnagar, Bahraich, Bijnor and Gonda districts.
Production
In terms of production of bajra, the districts of Kanpur Nagar and Jhansi
were also listed on top. Very low negative growth in production of bajra was seen in
232
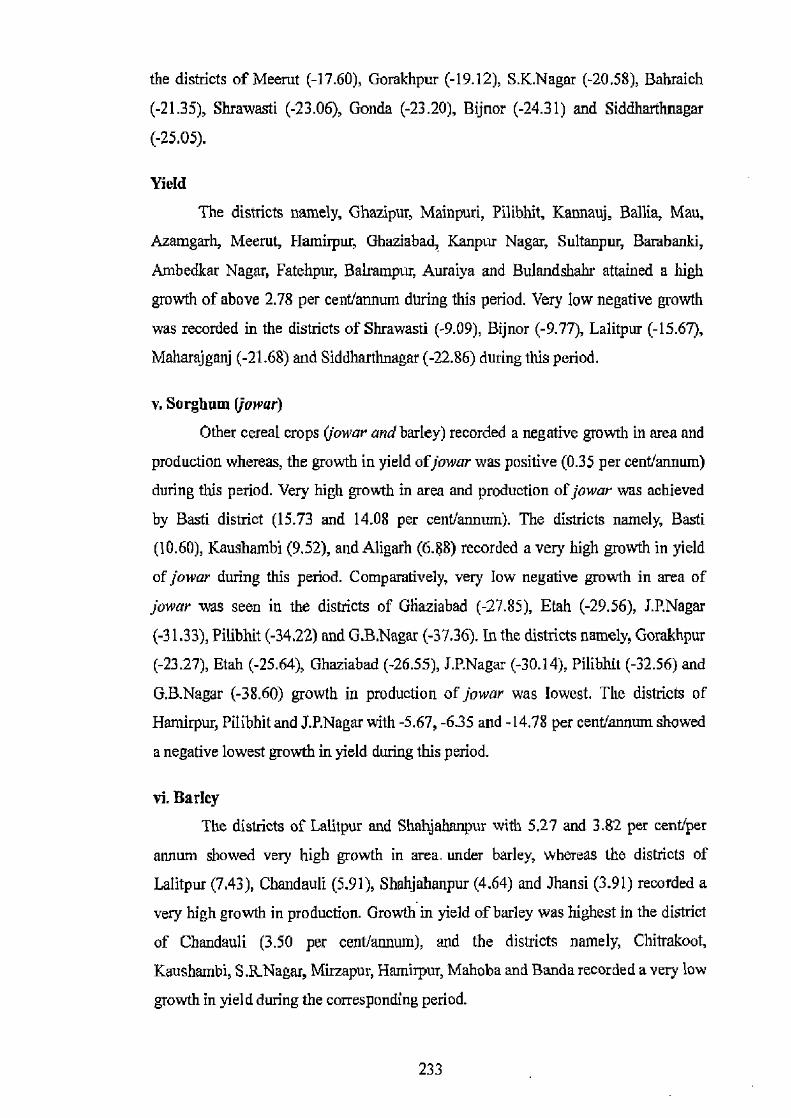
the districts of Meerut (-17.60), Gorakhpur (-19.12), S.K.Nagar (-20.58), Bahraich
(-21.35), Shrawasti (-23.06), Gonda (-23.20), Bijnor (-24.31) and Siddharthnagar
(-25.05).
Yield
The districts namely, Ghazipur, Mainpuri, Pilibhit, Kannauj, Ballia, Mau,
Azamgarh, Meerut, IIamirpur, Ghaziabad, Kanpur Nagar, Sultanpur, Bambanki,
Ambedkar Nagar, Fatehpur, Balrampur, Auraiya and Bulandshahr attained a high
growth of above 2.78 per centlannum dining this period. Very low negative growth
was recorded in the districts of Shrawasti (-9.09), Bijnor (-9.77), Lalitpur (-15.67),
Maharajganj (-21.68) and Siddharthnagar (-22.86) during this period.
v. Sorghum (jowar)
Other cereal crops (1'owar and barley) recorded a negative growth in area and
production whereas, the growth in yield of jowar was positive (0.35 per cent/annum)
during this period. Very high growth in area and production of jowar was achieved
by Basti district (15.73 and 14.08 per centlannum). The districts namely, Basti
(10.60), Kaushambi (9.52), and Aligarh (6.88) recorded a very high growth in yield
of jowar during this period. Comparatively, very low negative growth in area of
jowar was seen in the districts of Gliaziabad (-27.85), Etah (-29.56), J.P.Nagar
(-31.33), Pilbhit (-34.22) and G.B.Nagar (-37.36). In the districts namely, Gorakhpur
(-23.27), Etah (-25.64), Ghaziabad (-26.55), J.P.Nagar (-30.14), Pilibhit (-32.56) and
G.B.Nagar (-38.60) growth in production of jowar was lowest. The districts of
Hamirpur, Pilibbit and J.P.Nagar with -5.67, -6.35 and -14.78 per centiannum showed
a negative lowest growth in yield during this period.
vi. Barley The districts of Lalitpur and Shahjabanpur with 5.27 and 3.82 per cent/per
annum showed very high growth in area. under barley, whereas the districts of
Lalitpur (7.43), Chandauli (5.91), Shahjahanpur (4.64) and Jhansi (3.91) recorded a
very high growth in production. Growth in yield of barley was highest in the district
of Chandauli (3.50 per centlannum), and the districts namely, Chitrakoot,
Kaushambi, S.R.Nagar, Mirzapur, Hamhrpur, Mahoba and Banda recorded a very low
growth in yield during the corresponding period.
233
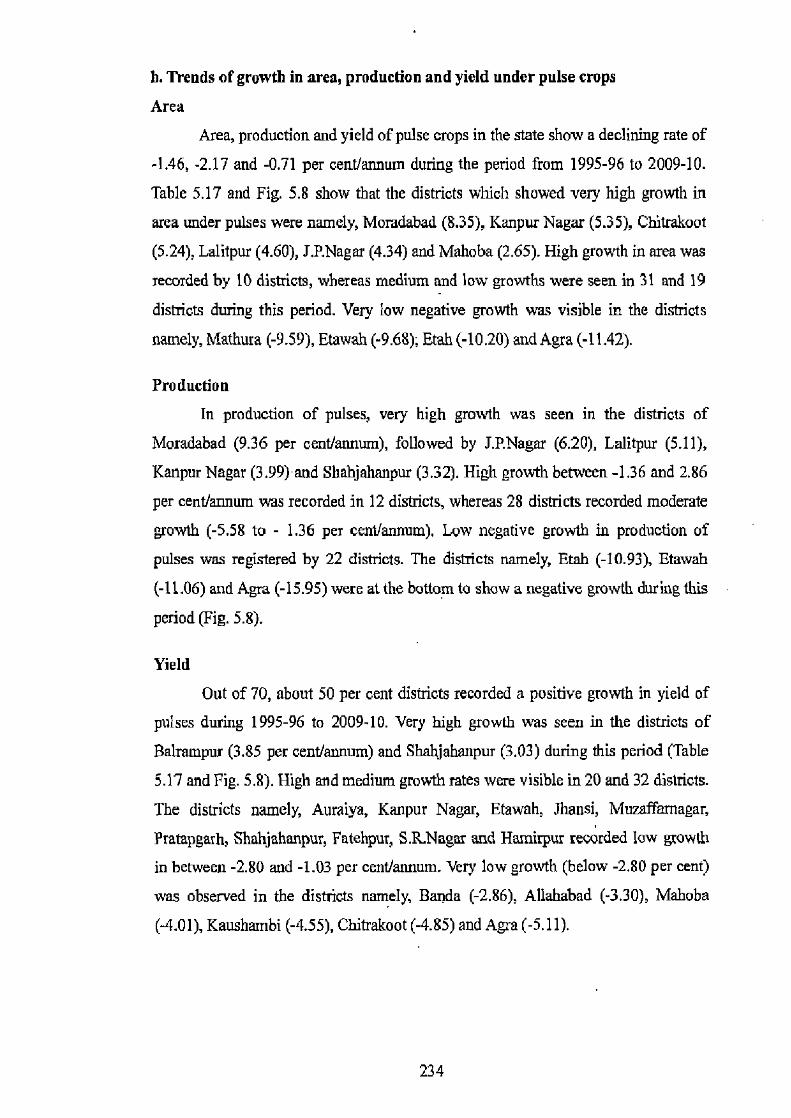
b. Trends of growth in area, production and yield under pulse crops
Area
Area, production and yield of pulse crops in the state show a declining rate of
-1.46, -2.17 and -0.71 per cent/annum during the period from 1995-96 to 2009-10.
Table 5.17 and Fig. 5.8 show that the districts which showed very high growth in
area under pulses were namely, Moradabad (8.35), Kanpur Nagar (5.35), Chitrakoot
(5.24), Lalitpur (4.60), J.P.Nagar (4.34) and Mahoba (2.65). High growth in area was
recorded by 10 districts, whereas medium and low growths were seen in 31 and 19
districts during this period. Very low negative growth was visible in the districts
namely, Mathura (-9.59), Etawah (-9.68); Etah (-10.20) and Agra (-11.42).
Production
in production of pulses, very high growth was seen in the districts of
Moradabad (9.36 per cent/annum), followed by J.P.Nagar (6.20), Lalitpur (5.11),
Kanpur Nagar (3.99) and Shahjahanpur (332). High growth between -1.36 and 2.86
per cent/annum was recorded in 12 districts, whereas 28 districts recorded moderate
growth (-5.58 to - 1.36 per cent/annum). Low negative growth in production of
pulses was registered by 22 districts. The districts namely, Etah (-10.93), Etawah
(-11.06) and Agra (-15.95) were at the bottom to show a negative growth during this
period (Fig. 5.8).
Yield
Out of 70, about 50 per cent districts recorded a positive growth in yield of
pulses during 1995-96 to 2009-10. Very high growth was seen in the districts of
Balrampur (3.85 per cent/annum) and Shahjahanpur (3.03) during this period (Table
5.17 and Fig. 5.8). High and medium growth rates were visible in 20 and 32 districts.
The districts namely, Auraiya, Kanpur Nagar, Etawah, Jhansi, Muzaffamagar,
Pratapgarh, Shahjahanpur, Fatehpur, S.ltNagar and Hamirpur recorded low growth
in between -2.80 and -1.03 per cent/annum. Very low growth (below -2.80 per cent)
was observed in the districts namely, Banda (-2.86), Allahabad (-3.30), Mahoba
(-4.01), Kaushambi (-4.55), Chitrakoot (-4.85) and Agra (-5.11).
234
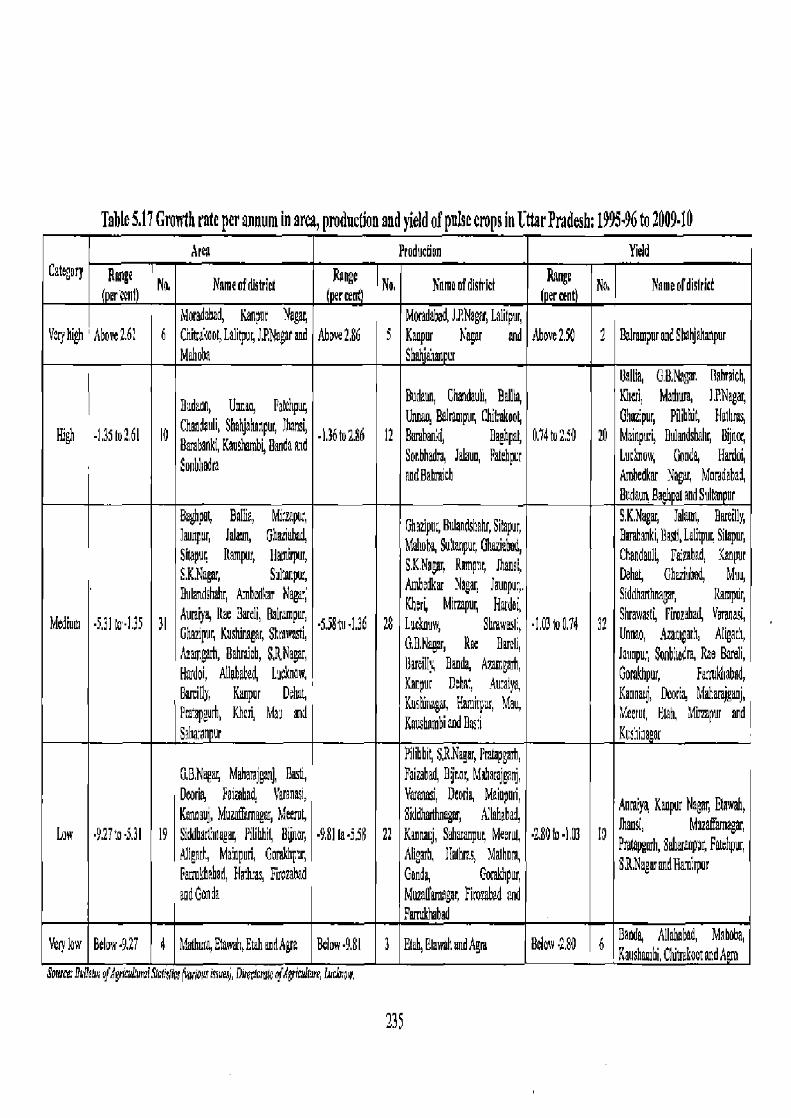
Janie 3.l r trawin rate per annum in area, proancuon no ylela 01 [rinse crops In Liar rrjaesn: Lim o to Gua9•la
Area Production Yid Categar
f arcgrsl Nn Nrimecfdstiirl No. Name nfdishin (cent
Na Ngmeofdislrio ferce
hlnrcdehad, Kanpur Nagar, M1,gdaIbad, JP,Nagt,, Lalitpur, Vsryhlgh Above 2.61 6 Chipataol,La1itpuS1P.Nagarand Se 2S 5 Kanpw Nagar and Above 29 2 BalrampurandShahjshmnpur
Mahaba Shahi6 an u Ballfa, G.BNagar. 8ahmicb,
Budaun, Uncap, Fatahpu Budauq 6hSuli, Bal1i Dad! Mariam, IP.Nagm,,
GhaWdgoIf, Shahjahatpur, lhansy Unuau, 8girom te4 pur, Chft Gha!ipw, POibhit, NaiIims, SEgh -1.35 to 61 10 Cwabaaki,Kaushamati Banda aad •l.36to2.96 12 &rnban4 Baehpat 0.74 to 21i 20 Mainpuri, BolandsWer,, Bijncr,
Sanbbara Sonbhadrd, Jahiuo, Palehpr Lucmow; Gonda, Hardai, wdBabraich An~bedkar Nagar, Moradahal,
Bcdaun.Ba sndSulnur BugIIpN BallE7 MczW.
GhaNpu;,Buidshhx,Sitapux, S.K.Nagar, Jadaur, Bm¢illy,
]wnpur, Jalmur, GheeiubaJ, Mehaba, Su'.tanpur, Glhuiicted, Buakanki,Bat,Lalitpu Silapur,
SMo Rmra tsi Rarr pur, Hamhp
g
us S .K.Nagar,
FS bad, 3SBpuy
e x u ar Vg~c Jsupu:. CDSi
h
d
a
M
nad
a
a
n
u
h
ç eh4 Gha2ud,
n
rrMau,
RulurtlShch knbcd4ar Naar , Khur4 MitW4 Hardoi,
Rupur,
Medium •5.31 w 1.35 31 Aurab be 31,4 Daly mpw, 'S.S810 •1.36 28 •1.03 a 0.14 32 Shrawa ty FhotabgQ Varanasi, Gha ipur Kushbear, SLrawasli,
Du.Naga Shmwsal,
g1,, Raz i, Unto, -yunari, AI t, Azatrgd, Bakst, SANagar, ByeII4 Banda Am gait,
budll go Jaunpu;, SnnhlA Rae Bareli,
Hardoi, NlahabA L'urkuaw Karpur H.ha', Au:iiR Corakhpsv, Fzrio'Alobad, Eareil~, Kanpur Dslm4
Kushinagar, Pirrnp , Mau Kannauj, Duoria, h1uCarajxanj,
Pre'qogorh, Khcri, Mai and KiushmmbianJ8rsii
l.etrul, hlah, 14arpur and Sdn ur Kcs:tiia az
Pilibhit, S.R Nagar, Prulapgarh, G.B.Nagw, Hgharjqqij, Besstl, Fai?8b?4, Bijr.or, Maharajga nj, Deoria Faivabad, Varanasi, Parana i, ACoo Maiupuri, Ap aiya Kaupur Nager, Elawah, Kaaeuj, Musa rn gm, Metro SiddhmMugm, lahahad,
A aosl, Muallamagar, Low •9,27o-5,31 19 Siddhartuaagm, Pilibhil, Bijnor, •9.Sltn.5.58 22 Kwnarj, Saharanpur. Me2ru1, •2,80to•L)3 19 PraNpgwh,Salw Faehpur, Nlgarh, Malopud, Cmakhpr, Allgatb, 1JalMs, Malhum, 3p,NugwandAan:~ur Farmkh bad, Betas, Firozabad Gonda, Cromkhpw, aadConda Muwfan5gar Pimzaba0 and
Farrahbad
Very low Below .927 4 Ma1hua,Et i i EtahunSAgr¢ &IowA,8I 3 Etah,Elawi.andAgra Bdow-2,80 6 Bards, Allahabad, Maho&a, Kgribcurbi, CNtrekoot 1,r A
SoiuccB lThvi ofAgSkur lSlcrgfft ~ulwrlaurismrea~, Dir¢rxrai mAgSJiU.e, lurlror.
235

UTTARPRADESH Growth in Ana, Production and Yield of Puts¢ Crops
1995.96 to 2009.10
1i.00 —Area - - Production 10A0 Yi¢1d
c ~ 19 5,00
b• I.
,,, 1, fl
PS 'IS 0.00
9 'a1 0A
4 ?E a xrls..E `a~A"
%$
•iouo _ < 3 ` tl
•?0.00 Name of district
Fig. 5.8
236
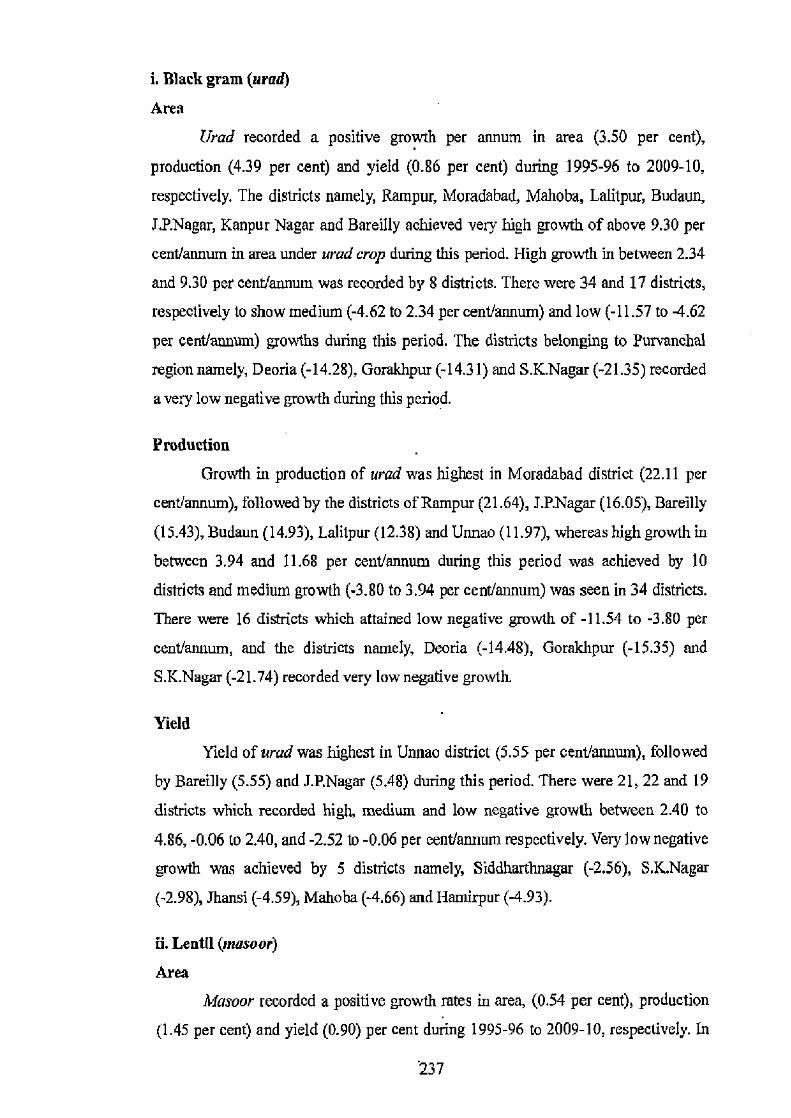
i. Black gram (urad)
Area
Urad recorded a positive growth per annum in area (3.50 per cent),
production (4.39 per cent) and yield (0.86 per cent) during 1995-96 to 2009-10,
respectively. The districts namely, Rampur, Moradabad, Mahoba, Lalitpur, Budaun,
J.P.Nagar, Kanpur Nagar and Bareilly achieved very high growth of above 9.30 per
cent/annum in area under urad crop during this period. High growth in between 2.34
and 9.30 per cent/annum was recorded by 8 districts. There were 34 and 17 districts,
respectively to show medium (-4.62 to 2.34 per cent/annum) and low (-11.57 to -4.62
per eent/annum) growths during this period. The districts belonging to Purvanebal
region namely, Deoria (-14.28), Gorakhpur (-14.31) and S.K.Nagar (-21.35) recorded
a very low negative growth during this period.
Production
Growth in production of urad was highest in Moradabad district (22.11 per
cent/annum), followed by the districts of Rampur (21.64), J.P.Nagar (16.05), Bareilly
(15.43), Budaun (14.93), Lalitpur (12.38) and Unnao (11.97), whereas high growth in
between 3.94 and 11.68 per cent/annum during this period was achieved by 10
districts and medium growth (-3.80 to 3.94 per cent/annum) was seen in 34 districts.
There were 16 districts which attained low negative growth of -11.54 to -3.80 per
cent/annum, and the districts namely, Deoria (-14.48), Gorakhpur (-15.35) and
S.K.Nagar (-21.74) recorded very low negative growth.
Yield
Yield of urad was highest in Unnao district (5.55 per cent/annum), followed
by Bareilly (5.55) and J.P.Nagar (5.48) during this period. There were 21, 22 and 19
districts which recorded high, medium and low negative growth between 2.40 to
4.86, -0.06 to 2.40, and -2.52 to -0.06 per centlannum respectively. Very low negative
growth was achieved by 5 districts namely, Siddhartlmagar (-2.56), S.K.Nagar
(-2.98), Jhansi (-4.59), Mahoba (-4.66) and Hamirpur (-4.93).
ii. Lentil (masoor)
Area
Masoor recorded a positive growth rates in area, (0.54 per cent), production
(1.45 per cent) and yield (0.90) per cent during 1995-96 to 2009-10, respectively. In
237
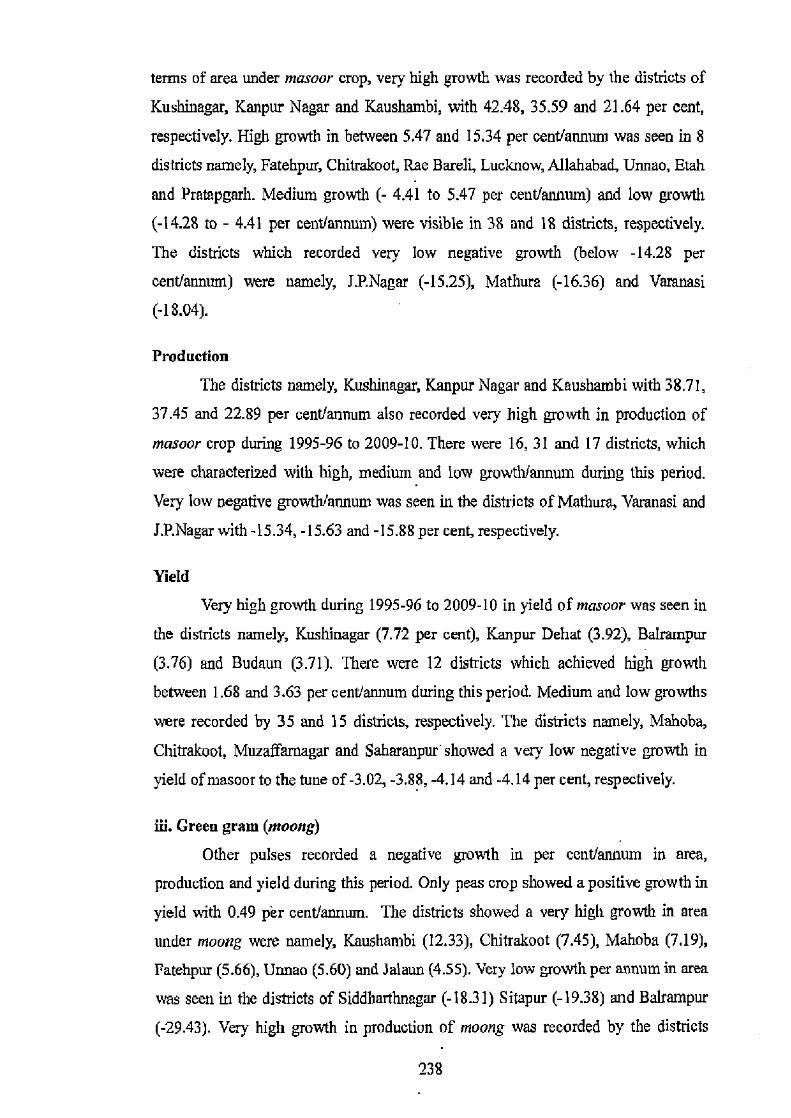
terms of area under masoor crop, very high growth was recorded by the districts of
Kushinagar, Kanpur Nagar and Kaushambi, with 42.48, 35.59 and 21.64 per cent,
respectively. High growth in between 5.47 and 15.34 per cent1annum was seen in 8
districts namely, Fatehpur, Chitrakoot, Rae Bareli, Lucknow, Allahabad, Unnao, Etah
and Pratapgarh. Medium growth (- 4.41 to 5.47 per cent/annum) and low growth
(-14.28 to - 4.41 per cent/annum) were visible in 38 and 18 districts, respectively.
The districts which recorded very low negative growth (below -14.28 per
cent/annum) were namely, J.P.Nagar (-15.25), Mathura (-16.36) and Varanasi
(-18.04).
Production
The districts namely, Kushinagar, Kanpur Nagar and Kaushambi with 38.71,
37.45 and 22.89 per cent/annum also recorded very high growth in production of
masoor crop during 1995-96 to 2009-10. There were 16, 31 and 17 districts, which
were characterized with high, medium and low growth/annum during this period.
Very low negative growth/annum was seen in the districts of Mathura, Varanasi and
J.P.Nagar with -15.34, -15.63 and -15.88 per cent, respectively.
Yield
Very high growth during 1995-96 to 2009-10 in yield of masoor was seen in
the districts namely, Kushinagar (7.72 per cent), Kanpur Dehat (3.92), Balrampur
(3.76) and Budaun (3.71). There were 12 districts which achieved high growth
between 1.68 and 3.63 per centlannum during this period. Medium and low growths
were recorded by 35 and 15 districts, respectively. The districts namely, Mahoba,
Chitrakoot, Muzaffamagar and Saharanpur showed a very low negative growth in
yield of masoor to the tune of -3.02, -3.88, -4.14 and -4.14 per cent, respectively.
iii. Green gram (moong)
Other pulses recorded a negative growth in per cent/annum in area,
production and yield during this period. Only peas crop showed a positive growth in
yield with 0.49 per cent/annum. The districts showed a very high growth in area
under moong were namely, Kaushambi (12.33), Chitrakoot (7.45), Mahoba (7.19),
Fatehpur (5.66), Unnao (5.60) and Jalaun (4.55). Very low growth per annum in area
was seen in the districts of Siddharthnagar (-18.31) Sitapur (-19.38) and Balrampur
(-29.43). Very high growth in production of moong was recorded by the districts
238
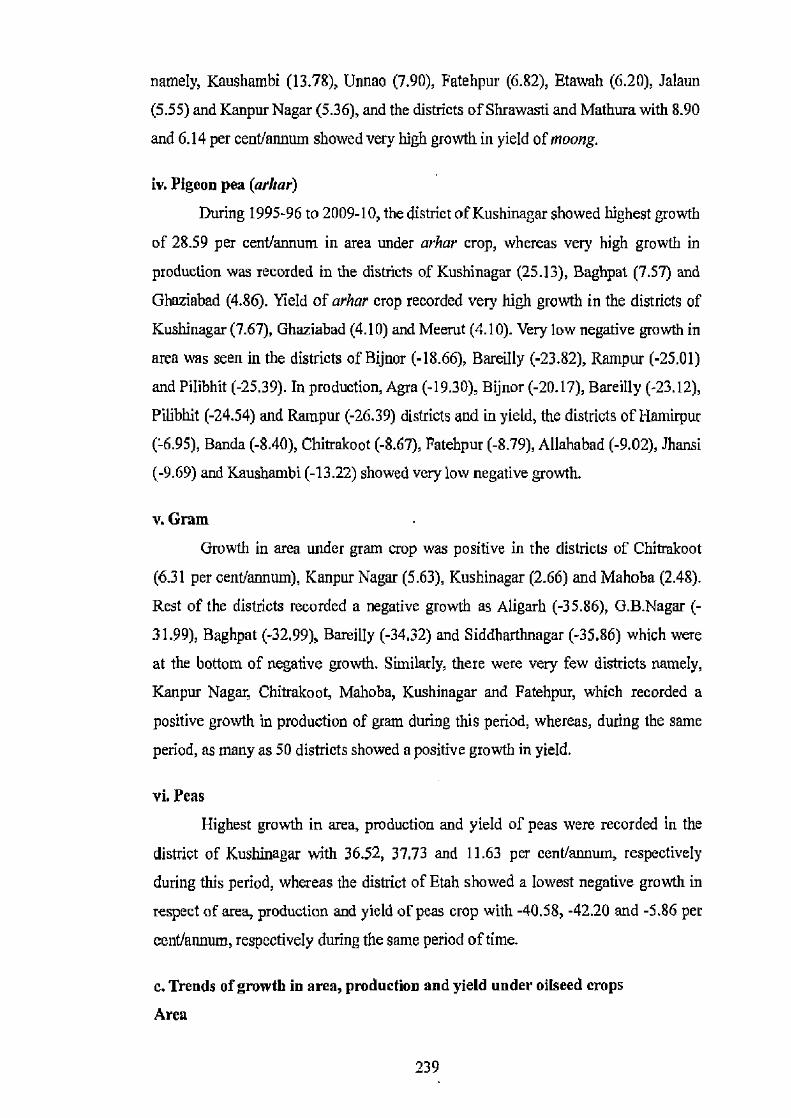
namely, Kaushambi (13.78), Unnao (7.90), Fatehpur (6.82), Etowah (6.20), Jalaun
(5.55) and Kanpur Nagar (5.36), and the districts of Shrawasti and Mathura with 8.90
and 6.14 per cent/annum showed very high growth in yield of moong.
iv. Pigeon pea (at/tar)
During 1995-96 to 2009-10, the district of Kushinagar showed highest growth
of 28.59 per cent/annum in area under arhar crop, whereas very high growth in
production was recorded in the districts of Kushinagar (25.13), Baghpat (7.57) and
Ghaziabad (4.86). Yield of arhar crop recorded very high growth in the districts of
Kushinagar (7.67), Ghaziabad (4.10) and Meerut (4.10). Very low negative growth in
area was seen in the districts of Bijnor (-18.66), Bareilly (-23.82), Rampur (-25.01)
and Pilibhit (-25.39). In production, Agra (-19.30), Bijnor (-20.17), Bareilly (-23.12),
Pilibhit (-24.54) and Rampur (-26.39) districts and in yield, the districts of Hamirpur
(.6.95), Banda (-8.40), Chitrakoot (-8.67), Fatehpur (-8.79), Allahabad (-9.02), Jhansi
(-9.69) and Kaushambi (-13.22) showed very low negative growth.
v. Gram
Growth in area under gram crop was positive in the districts of Chitrakoot
(6.31 per cent/annum), Kanpur Nagar (5.63), Kushinagar (2.66) and Mahoba (2.48).
Rest of the districts recorded a negative growth as Aligarh (-35.86), G.B.Nagar (-
31.99), Baghpat (-32.99), Bareilly (-34.32) and Siddbarthnagar (-35.86) which were
at the bottom of negative growth. Similarly, there were very few districts namely,
Kanpur Nagar, Chitrakoot, Mahoba, Kushinagar and Fatehpur, which recorded a
positive growth in production of gram during this period, whereas, during the same
period, as many as 50 districts showed a positive growth in yield.
vi. Peas
Highest growth in area, production and yield of peas were recorded in the
district of Kushinagar with 36.52, 37.73 and 11.63 per cent/annum, respectively
during this period, whereas the district of Etah showed a lowest negative growth in
respect of area, production and yield of peas crop with -40.58, -42.20 and -5.86 per
cent/annum, respectively during the same period of time.
c. Trends of growth in area, production and yield under oilseed crops
Area
239
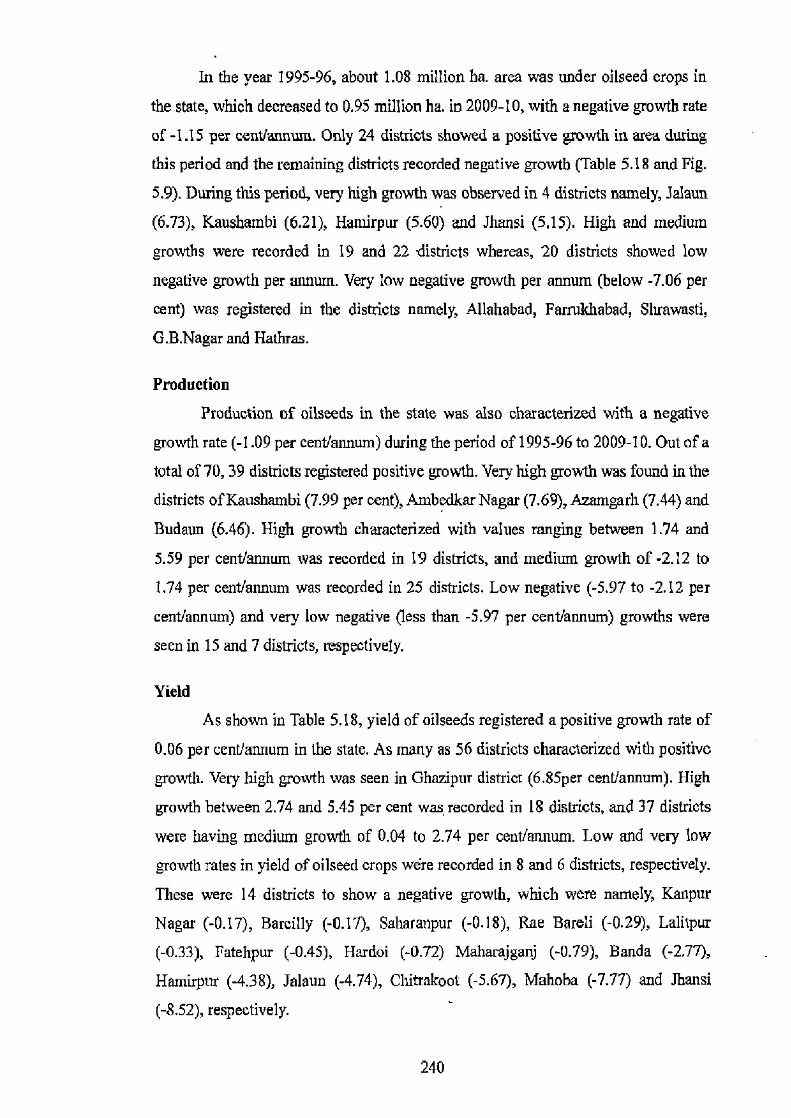
In the year 1995-96, about 1.08 million ha. area was under oilseed crops in
the state, which decreased to 0.95 million ha. in 2009-10, with a negative growth rate
of -1.15 per cent/annum. Only 24 districts showed a positive growth in area during
this period and the remaining districts recorded negative growth (Table 5.18 and Fig.
5.9). During this period, very high growth was observed in 4 districts namely, Jalaun
(6.73), Kaushambi (6.21), Hanilrpur (5.60) and Jhansi (5.15). High and medium
growths were recorded in 19 and 22 districts whereas, 20 districts showed low
negative growth per annum. Very low negative growth per annum (below -7.06 per
cent) was registered in the districts namely, Allahabad, Farruldtabad, Shrawasti,
G.B.Nagar and Hathras.
Production
Production of oilseeds in the state was also characterized with a negative
growth rate (-1.09 per cent/annum) during the period of 1995-96 to 2009-10. Out of a
total of 70,39 districts registered positive growth. Very high growth was found in the
districts of Kaushambi (7.99 per cent), Ambedkar Nagar (7.69), Azamgarh (7.44) and
Budaun (6.46). High growth characterized with values ranging between 1.74 and
5.59 per cent/annum was recorded in 19 districts, and medium growth of -2.12 to
1.74 per cent/annum was recorded in 25 districts. Low negative (-5.97 to -2.12 per
cent/annum) and very low negative (less than -5.97 per cent/annum) growths were
seen in 15 and 7 districts, respectively.
Yield
As shown in Table 5.18, yield of oilseeds registered a positive growth rate of
0.06 per cent/annum in the state. As many as 56 districts characterized with positive
growth. Very high growth was seen in Ghazipur district (6.85per cent/annum). High
growth between 2.74 and 5.45 per cent was. recorded in 18 districts, and 37 districts
were having medium growth of 0.04 to 2.74 per cent/annum. Low and very low
growth rates in yield of oilseed crops were recorded in S and 6 districts, respectively.
These were 14 districts to show a negative growth, which were namely, Kanpur
Nagar (-0.17), Bareilly (-0.17), Saharanpur (-0.18), Rae Barth (-0.29), Lalitpur
(-0.33), Fatehpur (-0.45), Hardoi (-0.72) Maharajganj (-0.79), Banda (-2.77),
Hamirpur (-438), Jalaun (-4.74), Chitrakoot (-5.67), Mahoba (-7.77) and Jhansi
(-8.52), respectively.
240
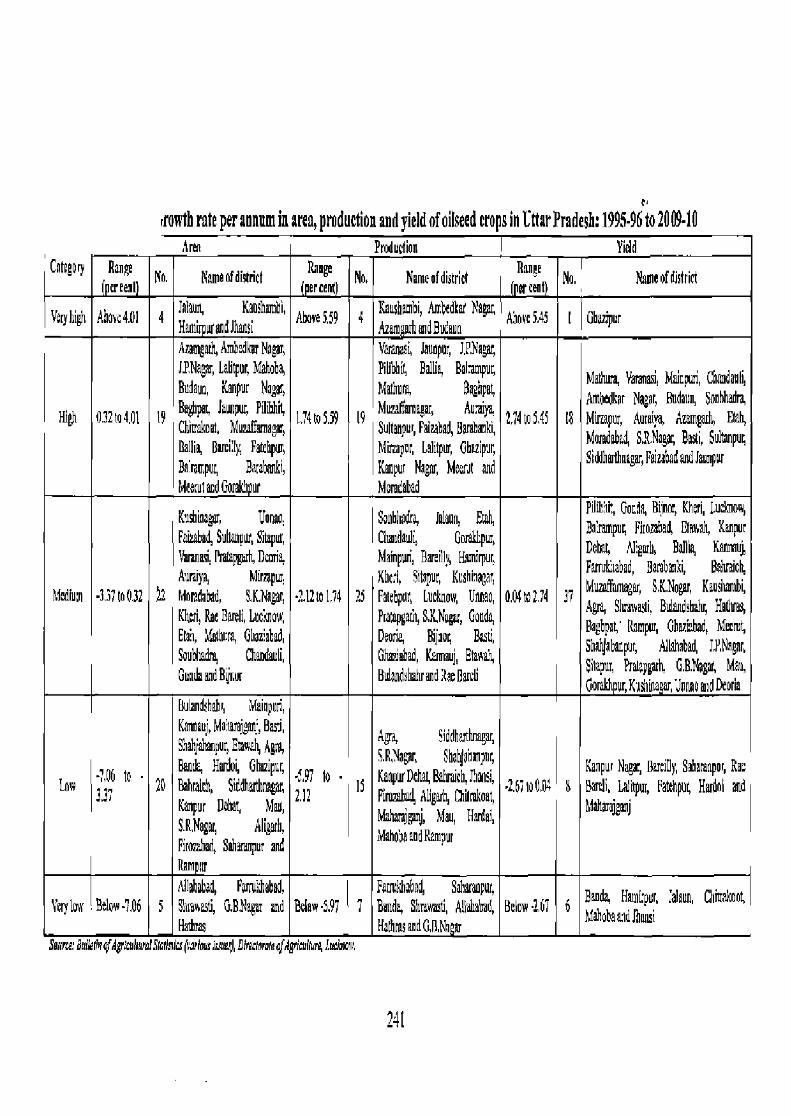
growth rate per annum in area, production and yield of oilseed crops in CttarPradesh:1995.96 to 2009.10 Arm eroaucrion I rieo
Category Range (per ceet
No. Name ofdigldtt ~ erceM No. Nameofdistriel Ranee ercent No, Name of district
Y¢ryhi~ Ahms4.01 4 Jthun, Kausbambi,
Ave 559 4 Kausbambi, Arcxdtar Nagar, Ma uh~dBacaun
AaovcSAS I Ghaaipur Hami MaadJhausi Aiemgarh, Amhclker Nagar, Verztasl, Jmmput, J.P,Nagar, J.RNagar,LahTur,Mahoba, Pilibhit, Bilia, Balarcpu,
Mehud Yamnas, Macpu, HaadauI Busnua, Kanpur Nagg, Melhurm, Begbpal adnam, , Nagr,, 8uclrnIn, Sadhhadrq
HI 012t4M1 9 B..pa. lnuupur, Pilihh ,
IAto5.59 19 Muzflmnagr, Auaya ,
2.N 5.4f 18 Mhqur, Aumfiya, AwFh, Etch, Chinakoot, Mu~ffamapay Sultanpur, Felechad, Baurhanki,
MdmclahhS' BGFNeaar' livi, Sahaopat' Rallik Bueitig Fmchpw, Mir par, Lalipu, Ghazipar,
9iddhmlhnaga,Faubada~ dau~m BeIert,pai, Barataeki, Kanpur Nag ra, Meerut and Meerut andGoitkh ur Mor abad
K sainagar, Unuao Soabhadra Julwn, Etuh, Pilih::r Cock Bilnm, nh¢rt, Luctmo%
Faiasbad,Sultanpur,Sitapur, ChrIauli, GorakLpur, BaUnmpns Firombad Etawah, Kanpur
Yamnasi, Pmtapguh, Dcmith, Mainpuri, Bareity, Hamirpur, Defa AI':gwh, Balfu Kanmb Debar; ad, Bamhan:ci, Bahia 1
Mcdiom -3.37 to 0.32 Aamya Mirpm;
2 25 Kh¢;I, SiaPur, Keahhasa4
Mumffamagar, S.K.Nagar, Kauslmmbi, Morndibad, SK.Nagar, •2.12t 1.74 Fmehpur, Lucknow, Uaaao, 0.04to274 37
Agm, Slvewavi, BulandshaIv, Hues, Kiwi Rae Barell, Luo&now, Pratippgarh, S,ILNugar, Gouda, Baghpat, 1Rampm, Ghrkhad, Mn Elan, ,Vadara, Ghaaahsd, Dearie, Bilkor, Besu,
ShahjahaeP r, elll abed, JY.NMgau, Such # Chandauli, G su'ah d Kvmauj Etaxu GoncandBijeur Bulandahahrand2darIi
8Ilapvr, Pvmepg ag G.B.P-0agid Mau, Gomkh ur,KashNa¢a JuncoaidDeas
Bmaddeti' MJapur, Karaaj,Mahmajgan',Basi, pDa SiddhenHaga, S:uahjahanpvt' Eta%A Agtu,
S.R,Vagm, Bhwhjabnpic r' to
Bank Hmdoy Ghuzipur, BM uh, Sirdha Y agar
-597 to - IS Kaapu Deha4Bauaah,Jhansi, Kanpur Naga, Barely, Shxranpor, Rao
Law 37 20
Kaapor DcSi blur 2.12 Firomhad, Aligarly Chkakoot, -ZMIO0,04 8 earth, LNUpur, falehpur, Hardol and
J~j, Mau, Bardei, hlaharajganj S.R,Nagor, Aligarh,
f ll ananmarapur Firouhad, Snhargur and clamor Nlahohad Ponu;hhad, FankM1a64 Sabmmoqut' Hamad, Hanpur, ;alaun, Chvamu
Yerylow Below-7.06 S Shmwufi, G.B.Nagar and Bdow-9.97 7 Ba da, Shricti, Alluhahad, Below-26. 6 MaM1OhaatdJhwsi Hathms NathmsandG,U.Na ar
Source: Sul@Pre gf4gr;mNureIsta keparSuticumJ, DlreemrcreofAgriaulmrq Laowm
241

UTTAR PRADESH Growth in Area, Production and Yield of Oilseed Crops
1995.96 to 2009.10 —Area
10.00 _ _ hoth ban 9.00 1.1111 Yield
fi.00 '1 1 II
II 4.00
;~; ;' r II 1 `1 I II II
'1 r! ' t a.ao t
2 u 0.00 , I ;II . ^ ~I I I I
II
v 71
-~.00 A ryp a yp el5
dFo 513 6._a 1~ Ii re .~ .y.~a
SP aC j !I
5 LI
°m 3 ~1~1 ry' asu f' W y ~i`
J FI~ '~~i~l ___ _ LR
•6.00 tl
— +~
•
8.00
—4--'
•lo.ao Name of district
Fig. 5.9
242
L Sesamum (tit)
Area
Among oilseeds, Iit recorded positive growth rate of 7.24, 7.71 and 0.44 per
cent/annum in area, production and yield during this period, respectively. There were
3 districts namely, Auraiya (46.96), Jhansi (26.70) and Jalaun (16.34) which recorded
very high growth in area. Higb growth between 5.06 and 14.67 per cent/annum was
seen in 13 districts whereas, medium growth of -4.54 to 5.06 per cent/annum was
recorded by 36 districts. Low negative growth between -14.15 and -4.54 per
cent/annum was achieved by 15 districts during this period. The districts namely,
Faizabad (-15.14), Ambedkar Nagar (-16.38) and Bijnor (-17.43) showed very low
negative growth.
Production
Growth in production of til is seen very high in the districts of Auraiya (43.96
per cent), Jhansi (23.35), Jalaun (22.03) and Unnao (14.68). Having high growth
between 5.06 and 14.49 per cent/annum, there were 13 districts included within this
range, whereas medium (-4.37 to 5.06 per cent/annum) and low (-13.80 to -4.37 per
cent/annum) growths were visible in 28 and 23 districts, respectively. The districts of
Bijnor and Bulandshahr were characterized with very low negative growth of-14.16
and -15.38 per cent/annum, respectively.
Yield
During the period of 1995-96 to 2009-10, very high growth in yield of til was
recorded in the districts namely, Bahraich (6.81 per cent/annum), Banda (6.52),
Unnao (5.98), Jalaun (4.89) and Hardoi (4.68). High, medium and low negative
growths were seen in 14, 25 and 24 districts, whereas the districts of Ambedkar
Nagar and Hathras attained very low negative growth to the tune of -5.10 and -5.27
per cent, respectively during this period.
it. Mustard and rapeseed
Area
Mustard and rapeseed are the most important oilseed crops grown in the state.
With respect to them, the state showed a negative growth both in area and production
with -2.25 and -0.37 per cent/annum, respectively. Very high growth in area of
243

mustard and rapeseed was seen in the districts of Lalitpur (15.64), Bijnor (6.23) and
Azamgarh (5.28). There were 17 districts which belonged to the next category of
high growth (0.76-4.67 per cent/annum). Medium growth in between -3.15 and 0.76
per cent/annum was seen in 29 districts. Low negative growth was occupied by 17
districts, and the districts namely, Farrukhabad (-8.25), G.B.Nagar (-8.80), Hathras
(-8.87) and Shrawasti (-9.02) were characterized with very low negative growth
during this period.
Production
Very high growth in production of mustard and rapeseed was attained by the
districts of Lalitpur (17.89 per cent/anntun), Bijnor (8.66), Azamgarh (8.17) and
Ambedkar Nagar (7.91). High growth between 3.16 and 7.51 per cent/annum, and
medium between -1.20 and 3.16 per cent/annum was attained by 17 and 27 districts,
respectively. There were 16 districts within the category of low negative growth
(-5.56 to -1.20 per cent/annum). The districts namely, Chitrakoot (-5.85), Rampur
(-5.86), Farrukhabad (-5.97), Shrawasti (-6.87), Hathras (-7.51) and G.B.Nagar
(-8.06) experienced very low negative growth.
Yield
Growth in yield of mustard and rapeseed was positive (1.92 per cent/annum)
in the state during this period. Out of 70, 65 districts have shown a positive growth.
Very high growth in yield of these crops was recorded in Varanasi (7.90), Ghazipur
(7.89) and Mathura (5.20) districts. Very, low negative growth during this period was
recorded by the districts namely, Mahoba (-0.98), Maharajganj (-1.42), Banda (-1.46)
and Chitrakoot (-4.24). High, medium and low growths were seen in 13, 35 and 15
districts, respectively.
d. Trends of growth in area, production and yield under cash crops
Area
Table 5.19 shows that area under cash crops in the state during 1995-96 to
2009-10 recorded a growth rate of 0.72 per centtannum. A total of 31 districts
attained a positive growth and negative growths were recorded in remaining of 39
districts. Very high growth was seen in 6 districts namely, Hathras (13.22 per cent),
Balrampur (12.99), Agra (12.20), Kanpur Nagar (10.31), Gonda (9.95) and Firozabad
(8.72). High growth between 2.34 and 6.73 per cent/annum was recorded in the
244
districts namely, Mahoba, Aligarh, Shrawasti, Sitapur, Karmauj, Etowah, Hardoi,
Bahraich and Mainpuri. As many as 31 districts achieved medium growth (-2.04 to
2.34 per centlannum) and low negative growth (-6.43 to -2.04 per centlannum) was
seen in 22 districts. The districts of Pratapgarh (-6.48 per cent) and Kanpur Dehat
(-6.77 per cent) recorded a very low negative growth per annum during this period
(Fig. 5.10).
Production
During 1995-96, the production of cash crops has been 128.84 million tonnes
which increased to 131.45 million tonnes during 2009-10 with a negative growth rate
of -0.31 per cent/annum. Total of 25 districts recorded a positive growth and rest of
the districts were characterized with negative growth. There were 7 districts namely,
Hathras (13.09 per cent), Balrampur (12.46), Gonda (10.21), Kanpur Nagar (9.41),
Agra (9.40), Firozabad (9.09) and Shrawasti (6.43) showing very high growth per
annum. High growth between 1.91 and 6.33 per cent/annum was seen in 8 districts
namely, Mahoba, Bahraich, Hardoi, Sitapur, Kannauj, Baghpat, Kheri and Mainpuri.
There were 30 districts, which were characterized with moderate growth of -2.50 to
1.91 per cent/annum, whereas the remaining 25 districts attained a low negative
growth in between -6.92 and -2.50 per cent/annum.
Yield
During 1995-96, the average yield of cash crops was 543.1 quintals per
hectare, which declined to 522.18 quintals per hectare during 2009-10 and attained a
negative growth rate of -0.41 per centlannum. Very high growth in cash crops during
this period was seen in the districts namely, Shrawasti (2.44 per cent), S.R.Nagar
(1.74) and Lucknow (1.32). High growth between 0.09 and 1.14 per cent/annum was
seen in 16 districts. A total of 32 districts were having medium growth ranging from
-0.97 to 0.09 per centlannum. Low negative growth (-2.02 to -0.97 per cent/annum)
was observed in 14 districts, and 5 districts namely, Allahabad (-2.06), Agra (-2.50),
Aligarh (-2.88), Jalaun (-3.28) and Mathura (-3.33) had very low negative growth
during this period.
1. Sugarcane
Area
During the 1995-96, area under sugarcane was 1.99 million ha. which
245
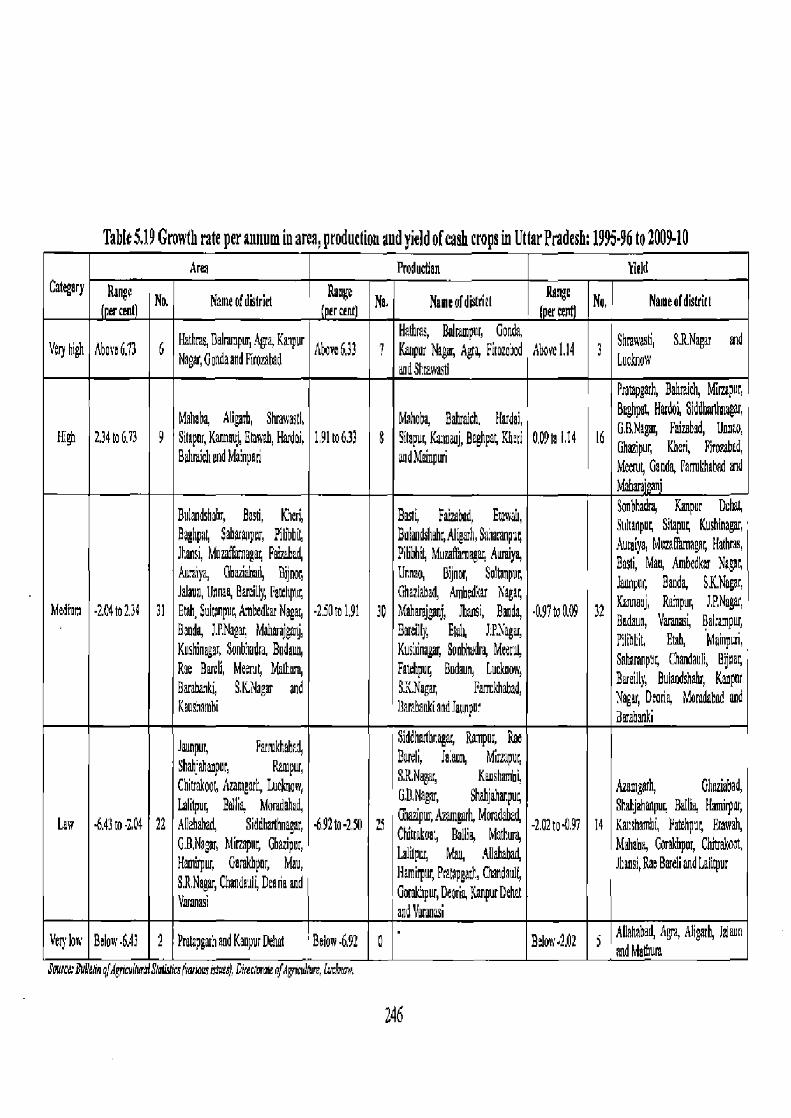
Tablt 5.19 Growth rate per annum in area, production and yield of cash crops in Ultar Pradesh: 1995.96 to 2009.10 Area Production field
Catrgory Rangc Nu Nameofdstrie erage No. Name ofdstricl cee No, Nnmeofdistrirt ~cenq ercent (per
Vcryhig Abva6.13 6 Hach Balran ~r, Agra Kai ur p p Move 6.33 ?
Helhres, Baliempur Goads, I~pur Nagy, Agra Fitoiabod Above 1.14 3
Shnwasti, SRN ar atd Nagar,GoudaaudPiogted
endBhrawastl Lucbow
Ppatalogsrh, Bahr?Jrh, Mirzapur,
h9ahoba Aliph, Shaaastl, Mahoba Bahath• Hadoi, Baghpe HaotiSlddanma~,
High 234 a 6.73 9 Shapor, Ka mau Etanah, Ha doi, 191 o 633 B Sitapus I~ivauj, B¢ghpes Kbai 009101.14 16 , Fa shad, Uuo o,
Gh~ipur K Pirmabed, BthraichendMainpun audMtinpuri
Fa Meduy GandQ fartu6ha6ad ~d
::Pup
M7hara .
Bubndshahr, Bast, KnerLL 8riri, Fuiwhad, Etmsah, Sombhanm, Kanpur M
Baghpat, Sak~mtipur, i~ltbhi6 Sultanpuc Silapur, Kushinagar,
Jkonsi, Mohmagar, Fa'vahad, BulouiItMr,Aligarh,Saau.~mpu, PIjithak' Auraiya, Maza12magar, Hathms,
Aoaiya, GhAZiek®tl, Bjtpg MuBijnc nagar; Aumya, Urnao,,
Ursa, Bijnu, Sopaupur, Basi, Mau Ambcd mr Nar, Jawryur, Baud, SK.Noge, Jaime, Unnao, Bamilly, fatehpur, Ghaalabad, Ambrd'ear Nagar, Ksnneuj, Ra npur, 1.P.Naga, Medium •2•e4to134 31 EtahSuIGinpur,AmbedkarNat, -2.50in1.91 30 Mahusjgaoj, JhsnSi, Banta, .0.97W0.B9 32 Badsun, Varanasi, Bat:ampur,
Banda, J.P.Nagar, Mahsrsfgsmj, Br y, Etalk J.P.\'agar, pJibCi4 , Map, Ku hinag r So baadra Bodeuw Kusitinagar, Sonbhadra, MearuL Batasmlosr, Chattlaull, Hirer,
Rae BareV, Meeray Menem, Fatthpuy Budann, Lucicnmv, Bah2ran•, Bulsndsbalu, Kaapnr Barabanki, S•K.Nogar and S.K.Negu, Psmkha6ad;
bair, Nag , 1 and Kausiacobi Ilarabankiaadlauapu, Nagar, Jaunpur, Fanukhabsl,
Bideltlns oJar, Ranpar, Ras
Shah'ahanpir, Rxpur, Bareli, Jaau,Mirzapur,
Chirakce6Aumgarh,Diekw, S.RNagar, Kaushambi GA.Nagar, Shahjaharpus
pzMgxh Ghzabad, Inlilpuy 8allia Morada6aS, I.IiIp 6ad
GharipurArangurMwadab4 , Ska}ah~npu5 Ba1Ge, Harp
Low 699w-we4 22
Siddharthnagar, -6,921a•2S0 GBh MI ur, Ghazi ur,
yS Coo ', Ballie, Mattun;
_202to-0.97 14 Kacshambi, Fatehpir, Erawah,
~P P Labtpu, Mau, .A1Iabsb2q Mahoba G Gktipor, Ghhttelcoor, Haurirpur, GorekhpDr, Mau, flamltlow,Pnlapgarh,Chandiulo Jhunsi,RaeBareHandLalitpur S.R.Nagar, Ciiaudaali, Dane and
pu D anata Varanasi andVa7pw,DeetiA andVwa i
VBpbw Bdow.5.43 2 Pratpgafl and KanpurPetal 'Below 492 0 - BJow.2.02 j Allahabad Aga Aligarh, laaem and Matl um
r..•.,..a•n....r r..:..:.. R...:..__...a r;...•_...n_...k_ r._i.._.. afpLMJlur F
246
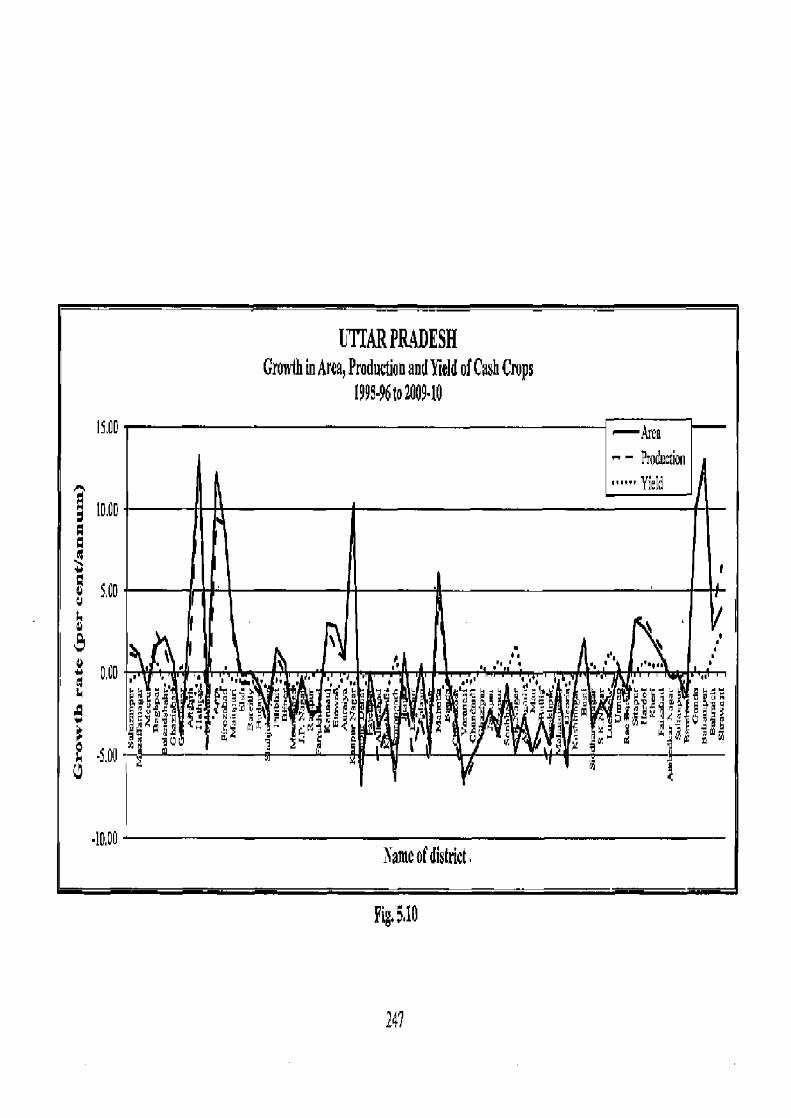
UITARPR4DESH Growth hi Area, Production and Yield of Cash Crops
195.96to2009.10 I500 —Area
— Produc on
lOM Yietd
~ a v s.00
. 0.00 :, . y
tSS
•i n p .~~.
11. FLU .a etl ma~
~
Rq..'uT •/.. • F119,,. d t1 L y~
AW'I" C y W ~S G~
~NW
~r wg '5
2 50U
U •Ia Name of district.
Pig. 5.10
247

registered a slight increase of 2.0 million ha. with a growth rate of 0.46 per
cent/annum. Growth in production of sugarcane was 0.11 per cent/annum. Contrary
to it, during this period, yield recorded a negative growth of -0.34 per cent/annum.
Very high growth in area of sugarcane was noticed in the districts of Balrampur
(14.24), Gonda (11.74), Shrawasti (8.79), Mahoba (6.44) and Kanpur Nagar (6.38).
High growth was seen in 14 districts, and 30 districts in the state recorded medium
growth in between -4.73 and 0.37 per cenUannum. There were 18 districts to show
low growth of -9.82 to -4.73 per cent/annum, whereas very low growth was recorded
in the districts namely, Agra (-11.55), Allahabad (-11.84) and Etawah (-12.76).
Production
As regards the growth in production of sugarcane, again the districts of
Balrampur (12.81 per cent/annum), Gonda (10.72) and Shrawasti (8.25) recorded
very high growth during this period. Very low negative growth was seen in the
districts ofAllahabad (-11.97), Agra (-12.14), Etawah (-13.05) and Jhansi (-17.17).
Yield
Very high growth per annum in yield of sugarcane was noticed in the districts
of Kaushambi (3.55 per cent), S.R.Nagar (3.13) and Unnao (1.92), whereas the
districts namely, Lalitpur (-3.73), 7alaun (-3.73) and Jhansi (-9.99) were included in
the category of districts showing very low growth per annum. I-Iigh, medium and low
growth rates were seen in 12,46 and 6 districts, respectively.
II. Potatoes
Area
Growth rates in area, production and yield of potatoes in the state were in
order of 1.95, 2.97 and 1.01 per cent/annum, respectively. Very high growth in area
under potato crop was recorded in the districts namely, Hathras (13.64), Agra
(12.77), Kanpur Nagar (12.10), Aligarh (10.56) and Firozabad (8.84). High and
medium growth rates of 1.78 to 6.64 and -3.08 to 1.78 per cent/annum were recorded
by 1I and 36 districts, respectively. Low growth (-7.94 to -3.08 per centlannum) was
seen in 16 districts, and the districts of Shrawasti (-10.41) and Pratapgarh (-16.57)
were characterized with very low negative growth.
248
Production Growth in production of potato was seen highest in the district of Hathras
with 14.10 per centlannum, followed by the districts of Kanpur Nagar (13.53),
Aligarh (10.75), Agra (10.36) and Firozabad (9.33). There were 12 districts which
attained high growth in between 3.03 and 8.13 per cent/annum. Medium growth of
-2.07 and 3.03 per cent/annum was recorded by 35 districts, and low negative growth
(-7.17 to -2.07 per centlannum) in production of potatoes was seen in 14 districts.
The districts namely, Baghpat with '-7.12 per cent/annum, Shrawasti (-7.20),
G.B.Nagar (-8.78) and Pratapgarh (-20.05) were characterized with very low
negative growth during this period.
Yield
Very high growth in yield of potatoes was recorded in the districts of
Siddhartlmagar (6.18 per cent/annum), Basti (6.18), S.K.Nagar (6.15), Gorakhpur
(4.90), Deoria (4.84) and Maharajganj (4.74). High growth in between 2.23 and 4.50
per centfannum was seen in 12 districts, and medium growth (-0.05 to 2.23 per
centlannum) was attained by 36 districts. Low negative growth (-2.32 to -0.05 per
cent/atmum) was noticed in 13 districts, and the districts namely, Kaushambi (-2.95),
Barabanki (-2.97) and Pratapgarh (-8.03) recorded very low negative growth.
D. Crop-Combination Regions
Generally, crops are grown in association with other crops. It is a rate
phenomenon that a single crop occupies the position in complete isolation in an
agricultural landscape. Ranking of crops and their spatial distribution bring out the
regional dominance of crops at a glance (Bhatia, 1965). The areal strength of crops
grown determines the cropping pattern and spatial variations in crops cultivated
present an overview of agricultural landscape in any region. With the delineation of
crop-combination regions, agricultural planning can be suggested for better
performance of farming. In order to increase productivity andto save soils from
fertility depletion, careful and judicious utilization of land by selecting an
appropriate crop combination is essential. It is therefore, advisable to identify, for
each agricultural set-up, a crop-combination which would give optimum agricultural
returns and provide employment to farmers and their dependents. By paying more
attention to the major constituent crops in a region, farmers can increase the
249
production of food and raw materials. While doing so, less important crops can be
excluded from the combination and land can be put to other remunerative crops
which perform well with less input (Thakur, 2007).
New agricultural technology incorporated within the frame of green
revolution in India during 1960's had played a very important role in changing the
cropping pattern and increasing productivity of land. The trio of green revolution-
high yielding verities of seeds (HYVs), irrigation water and chemical fertilizers has
played an important role. Moreover, substantial emphasis was given to increase the
quantum if irrigation water through surface and underground sources, and bring more
areas under irrigation. Consequently, the cropping pattern has completely changed
with the adoption of new farming technologies. Farmers are now in a position to
grow more remunerative crops with bringing a change in cropping pattern.
As a result of the diffusion of high-yielding varieties of rice and wheat in
many parts of the country, traditional subsistence agriculture has been transformed
into a market oriented economy. Now in most of the agro-climatic regions, the
farmers are concentrating their choice on a few crops with the intension of increasing
income from agriculture. The strength of monoculture has increased in the post-green
revolution period, while the increase in two-and-three-crop combination has also
recorded. Thus, after the adoption of high-yielding varieties of rice and wheat the
farmers are increasingly concentrating On a smaller number of crops. On the other
hand, there has been a significant decrease in the number of areal units with multi
crop combinations. This proves that, Indian farming is moving towards a market
oriented economy (I-Iusain, 1989).
This section of the thesis attempts to delineate the crop-combination regions
determined for the period of 1995-2000, 2000-05 and 2005-10. It has further been
attempted to put the individual crop on ranks to demarcate area acquired by a particular crop in order to put these crops as first, second and third rankings. The
crop-combination regions delineated for 70 districts of the state were based on Doi's
method for determining the crop-combinations.
To delineate crop-combination regions in the districts of Uttar Pradesh, the
entire exercise of crop-combination has been based on applying the Doi's method
instead of Weaver's method. Doi's method incorporates a slight improvement in
respect of computation of values in the combination analysis. His method substitutes
the variance (E d2/n) or least standard deviation) as it is contained in Weaver's
250
method, with the sum of square deviations (£d2). The computed value of individual
crop concentration characterized with lowest Pd2 will form the combination in the
analysis. Dai's One Sheet Table of critical values which he has provided in the study
was used, Use of the table requires only the summing up of actual percentages of
area for the crop, which are considered instead of finding the differences between
actual percentages and theoretical distribution, and then consult the table for the
critical value of next element at that accumulated percentage level. If the critical
value is higher than that of the actual percentage of crop area, the crop is not
considered, but if otherwise the value is lower than the crop percentage, crop will be
included in the combination.
Pioneering work for determining crop-combination was initiated by Weaver
(1954) in his study of Middle West of U.S.A. Since then this method was adopted to
delineate crop-combination regions in a number of studies pertaining to developed and developing countries of the world. Some attempts were also made to modify the
Weaver's method on the pretext to remove the inherent weakness of the method.
One of the early attempts was made to determine crop association regions by
Johnson (1958) in East Pakistan considering 3 major crops of wheat, barley and
maize, 3 oilseed crops, 6 pulse crops and 8 other field crops, and in addition 6
`orchard' crops were also considered. For the determination of crop-association
regions, a five-fold scale of relative importance was calculated for each crop, using
mean point in the scale as the percentage of total cultivated land occupied by the crop
in East Pakistan as a whole. Intensity of cultivation was calculated to show the
degree of correspondence between cropping intensity and crop-association in the
region. Raflullah (1965) examined the functional classification of towns in the
districts of Bulandshahr, Meerut, Muzaffarnagar and Saharanpur of upper Ganga-
Yamuna doab of Uttar Pradesh. He evolved a new formula by modifying the
Weaver's minimum deviation method for the determination of primary functional
combinations in selected towns of upper Ganga-Yamuna doab. Singh (1965) studied the crop-combination regions in the Malwa tract of
Punjab using Weaver's method of crop-combination regions. He added two
modifications in Weaver's method by selecting two sequential regions: Region I and
Region II for 4 crops: wheat, wheat-gram, gram and cotton. He delineated 22 crop-
combinations which were grouped into 9 units belonging to second order regions.
Ahmad and Siddiqi (1967) attempted to analyse the crop-association patterns in Luni
251
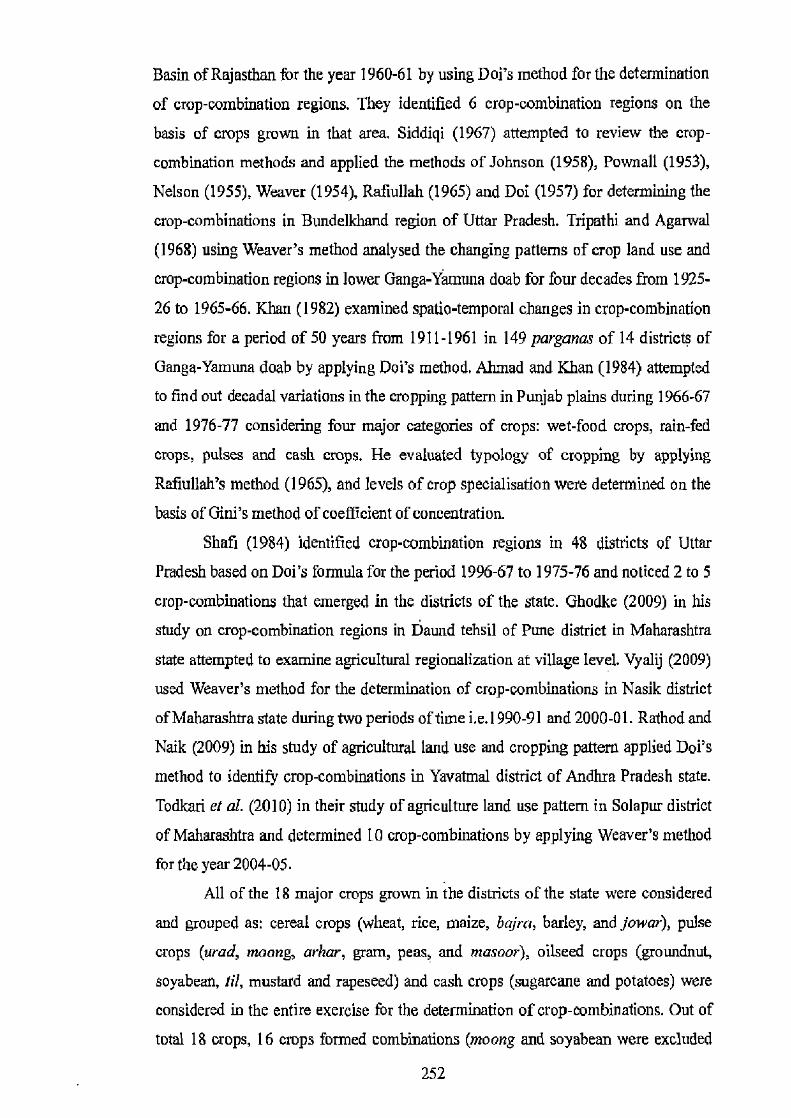
Basin of Rajasthan for the year 1960-61 by using Doi's method for the determination
of crop-combination regions. They identified 6 crop-combination regions on the
basis of crops grown in that area. Siddiqi (1967) attempted to review the crop-
combination methods and applied the methods of Johnson (1958), Pownall (1953),
Nelson (1955), Weaver (1954), Rafiullah (1965) and Doi (1957) for determining the
crop-combinations in Bundelkhand region of Uttar Pradesh. Tripathi and Agarwal
(1968) using Weaver's method analysed the changing patterns of crop land use and
crop-combination regions in lower Ganga-Yanruna doab for four decades from 1925-
26 to 1965-66. Khan (1982) examined spatio-temporal changes in crop-combination
regions for a period of 50 years from 1911-1961 in 149 parganas of 14 districts of
Ganga-Yamuna doab by applying Doi's method. Alunad and Khan (1984) attempted
to find out decadal variations in the cropping pattern in Punjab plains during 1966-67
and 1976-77 considering four major categories of crops: wet-food crops, rain-fed
crops, pulses and cash crops. He evaluated typology of cropping by applying
Rafiullah's method (1965), and levels of crop specialisation were determined on the
basis of Gini's method of coefficient of concentration.
Shafi (1984) identified crop-combination regions in 48 districts of Uttar
Pradesh based on Doi's formula for the period 1996-67 to 1975-76 and noticed 2 to 5
crop-combinations that emerged in the districts of the state. Ghodke (2009) in his
study on crop-combination regions in Daund tehsil of Pune district in Maharashtra
state attempted to examine agricultural regionalization at village level. Vyalij (2009)
used Weaver's method for the determination of crop-combinations in Nasik district
of Maharashtra state during two periods of time i.e. 1990-91 and 2000-01. Rathod and
Naik (2009) in his study of agricultural land use and cropping pattern applied Doi's
method to identify crop-combinations in Yavatmal district of Andhra Pradesh state.
Todkari et al. (2010) in their study of agriculture land use pattern in Solapur district
of Maharashtra and determined 10 crop-combinations by applying Weaver's method
for the year 2004-05.
All of the 18 major crops grown in the districts of the state were considered
and grouped as: cereal crops (wheat, rice, maize, bajra, barley, and jowar), pulse
crops (urad, moong, arhar, gram, peas, and masoor), oilseed crops (groundnut,
soyabean, tit, mustard and rapeseed) and cash crops (sugarcane and potatoes) were
considered in the entire exercise for the determination of crop-combinations. Out of
total 18 crops, 16 crops formed combinations (moong and soyabean were excluded
252
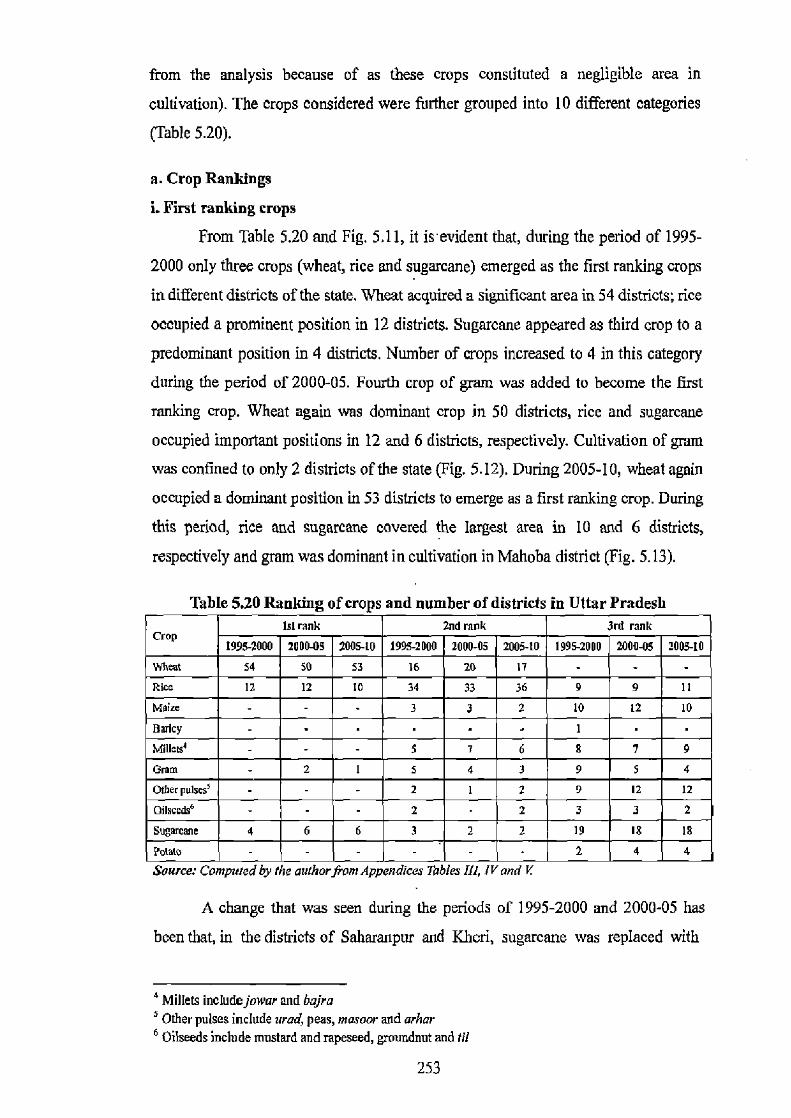
from the analysis because of as these crops constituted a negligible area in
cultivation). The crops considered were further grouped into 10 different categories
(Table 5.20).
a. Crop Rankings
i. First ranking crops
From Table 5.20 and Fig. 5.11, it is evident that, during the period of 1995-
2000 only three crops (wheat, rice and sugarcane) emerged as the first ranking crops
in different districts of the state. wheat acquired a significant area in 54 districts; rice
occupied a prominent position in 12 districts. Sugarcane appeared as third crop to a
predominant position in 4 districts. Number of crops increased to 4 in this category
during the period of 2000-05. Fourth crop of gram was added to become the first
ranking crop. Wheat again was dominant crop in 50 districts, rice and sugarcane
occupied important positions in 12 and 6 districts, respectively. Cultivation of gram
was confined to only 2 districts of the state (Fig. 5.12). During 2005-10, wheat again
occupied a dominant position in 53 districts to emerge as a first ranking crop. During
this period, rice and sugarcane covered the largest area in 10 and 6 districts,
respectively and gram was dominant in cultivation in Mahoba district (Fig. 5.13).
Table 5.20 Ranking of crops and number of districts in Uttar Pradesh 1st rank 2nd rank 3rd rank Crop
1995-2000 2000-09 2005-10 1995-2000 2000-05 2005-10 1995-2e00 2000-05 2005-10
wheat 54 50 53 16 20 I? - - - Rice 12 12 to 34 33 36 9 9 11
Mail - - - 3 3 2 10 12 10
Barley - - 1
Millets - - - 5 7 6 8 7 9
Gram - 2 1 5 4 3 9 5 4
ONerpuI., - - - 2 1 2 9 12 12
Oilseeds° - - - 2 - 2 3 3 2
Sugarcane 4 6 6 3 2 2 19 18 Is
PWno - - - - - - 2 4 4 J
Source: Computed by the auhorfrom Appendices Tables III, IV and V
A change that was seen during the periods of 1995-2000 and 2000-05 has
been that, in the districts of Saharanpur and Khcri, sugarcane was replaced with
4 Millets include jowar and bajra Other pulses include urad, peas, masoor and arhar
6 Oilseeds include mustard and rapeseed, groundnut and ill
253
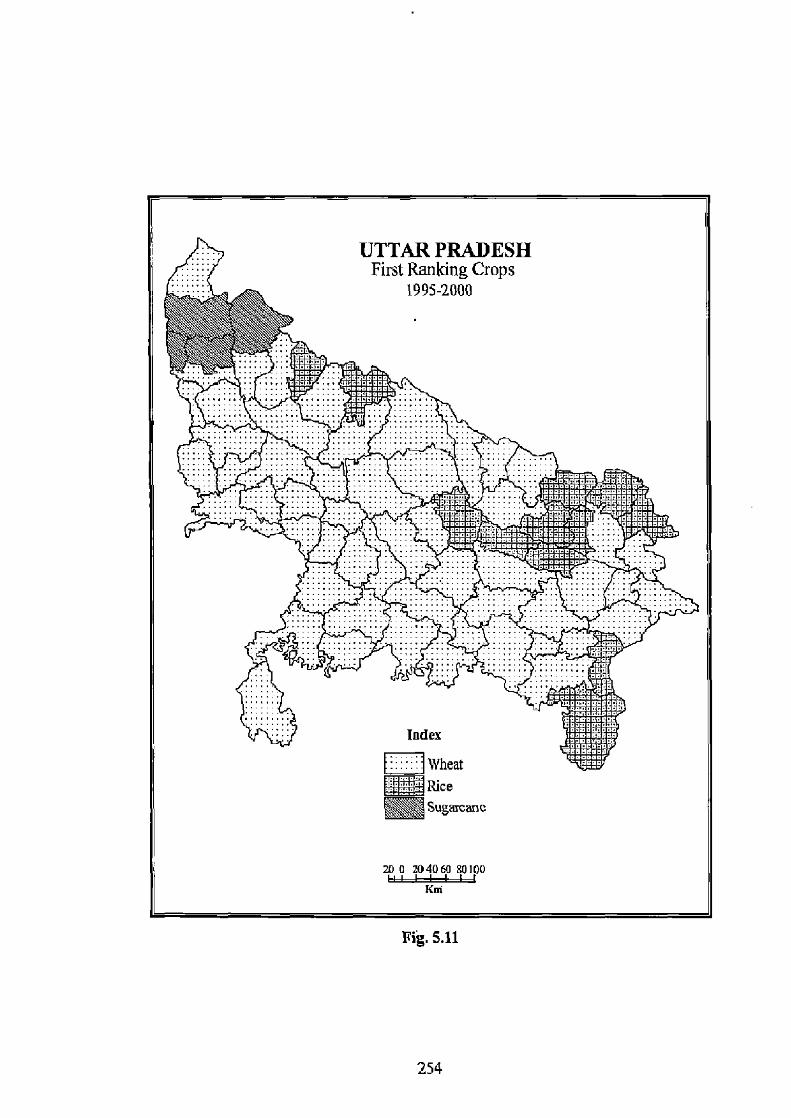
Fig. 5.11
254
Fig. 5.12
255

Fig. 5.13
256
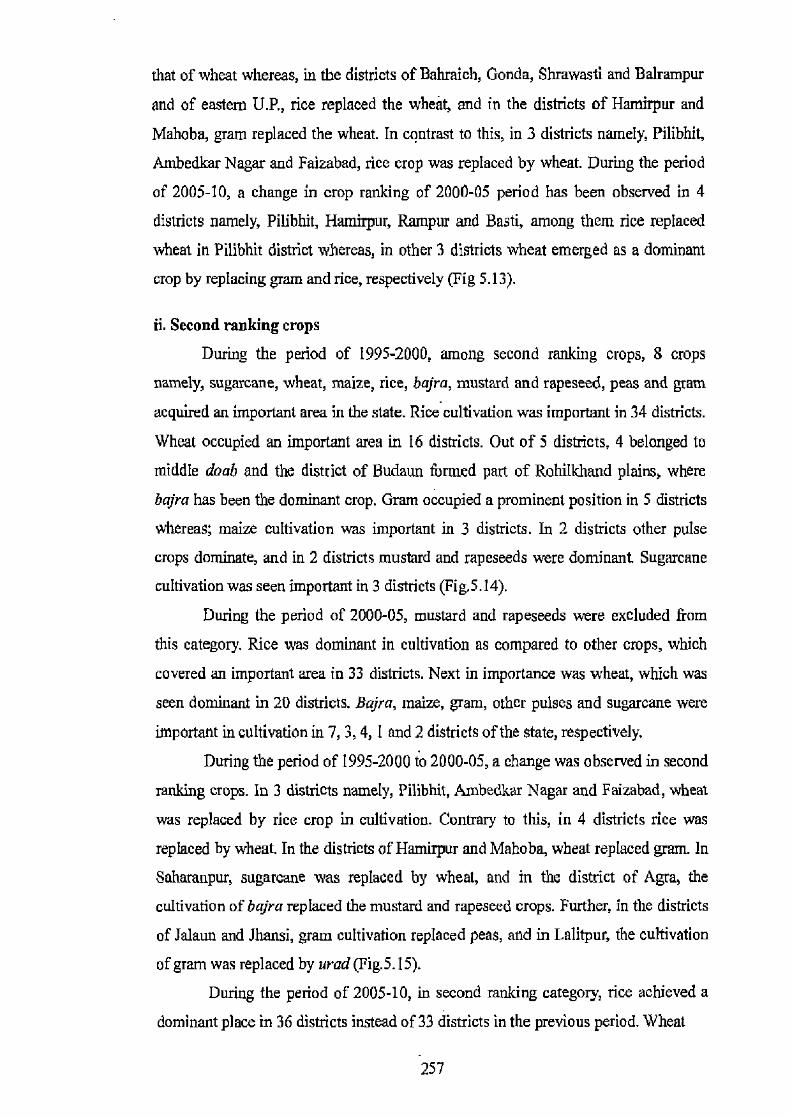
that of wheat whereas, in the districts of Bahraich, Gonda, Shmwasti and Balrampur
and of eastern U.P., rice replaced the wheat, and in the districts of Hamirpur and
Mahoba, gram replaced the wheat. In contrast to this, in 3 districts namely, Pilibhit,
Ambedkar Nagar and Faizabad, rice crop was replaced by wheat. During the period
of 2005-10, a change in crop ranking of 2000-05 period has been observed in 4
districts namely, Pilibhit, Hamirpur, Rampur and Basti, among them rice replaced
wheat in Pilibbit district whereas, in other 3 districts wheat emerged as a dominant
crop by replacing gram and rice, respectively (Fig 5.13).
ii. Second ranking crops
During the period of 1995-2000, among second ranking crops, 8 crops
namely, sugarcane, wheat, maize, rice, bajra, mustard and rapeseed, peas and gram
acquired an important area in the state. Rice cultivation was important in 34 districts.
Wheat occupied an important area in 16 districts. Out of 5 districts, 4 belonged to
middle doab and the district of Budaun formed part of Rohilkhand plains, where
bajra has been the dominant crop. Gram occupied a prominent position in 5 districts
whereas; maize cultivation was important in 3 districts. In 2 districts other pulse
crops dominate, and in 2 districts mustard and rapeseeds were dominant. Sugarcane
cultivation was seen important in 3 districts (Fig.5.14).
During the period of 2000-05, mustard and rapeseeds were excluded from
this category. Rice was dominant in cultivation as compared to other crops, which
covered an important area in 33 districts. Next in importance was wheat, which was
seen dominant in 20 districts. Bajra, maize, gram, other pulses and sugarcane were
important in cultivation in 7, 3, 4, 1 and 2 districts of the state, respectively.
During the period of 1995-2000 to 2000-05, a change was observed in second
ranking crops. In 3 districts namely, Pilibbit, Ambedkar Nagar and Faizabad, wheat
was replaced by rice crop in cultivation. Contrary to this, in 4 districts rice was
replaced by wheat. In the districts of Hamirpur and Mahoba, wheat replaced gram. In
Saharanpur, sugarcane was replaced by wheat, and in the district of Agra, the
cultivation of bajra replaced the mustard and rapeseed crops. Further, in the districts
of Jalaun and Jhansi, gram cultivation replaced peas, and in Lalitpur, the cultivation
of gram was replaced by urad (Fig.5.15).
During the period of 2005-10, in second ranking category, rice achieved a
dominant place in 36 districts instead of 33 districts in the previous period. Wheat
257
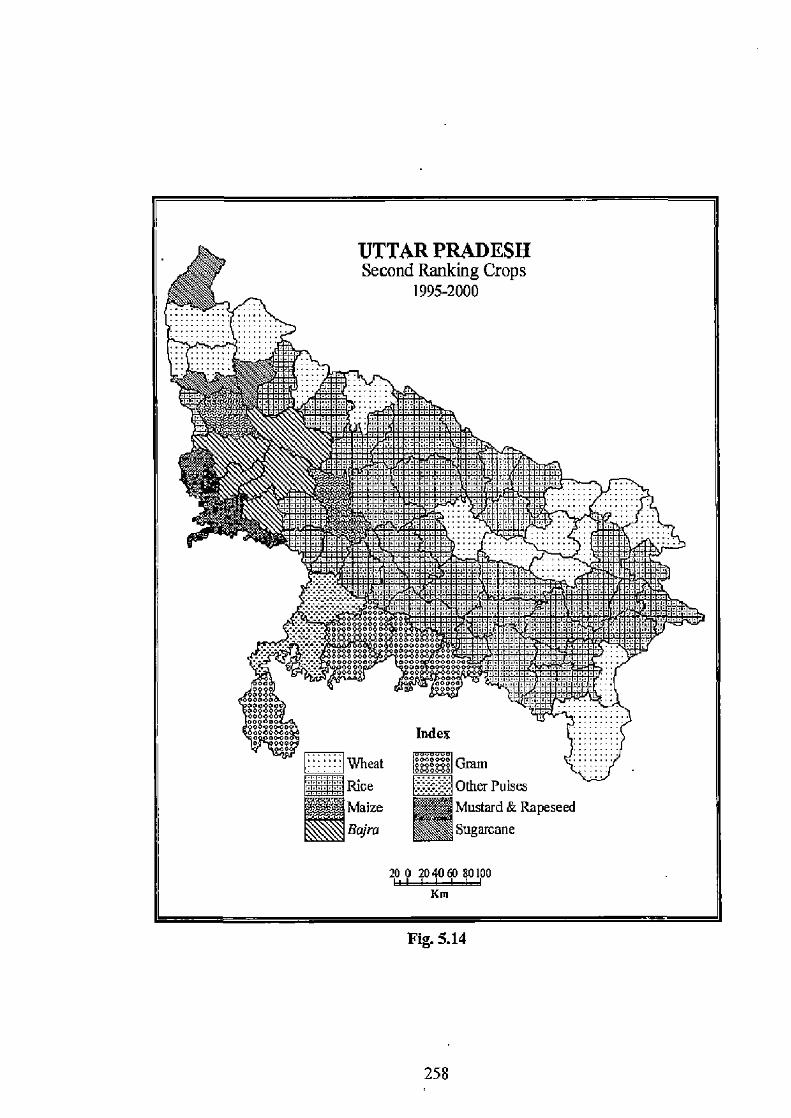
aa~
a ~almso ®a®ale ~
{
°~ \fie x~ icu E• upevm
°® adaEBW W _n i. ooafl . ppp r.nanu.00
..q ivvva...ev:Yv1e°PV°eeee,.
Y tae
~ p s,®° m® ® o` • m aBPa.J con om•4a°vev. E° er°`nceape." oa® fam'aw-
'sg'is3~aa,' in o.auu gnu. lids =m vu~°.. ru
"5 •l UflUThCflN ii
hem
II II
Fig. 5.14
258
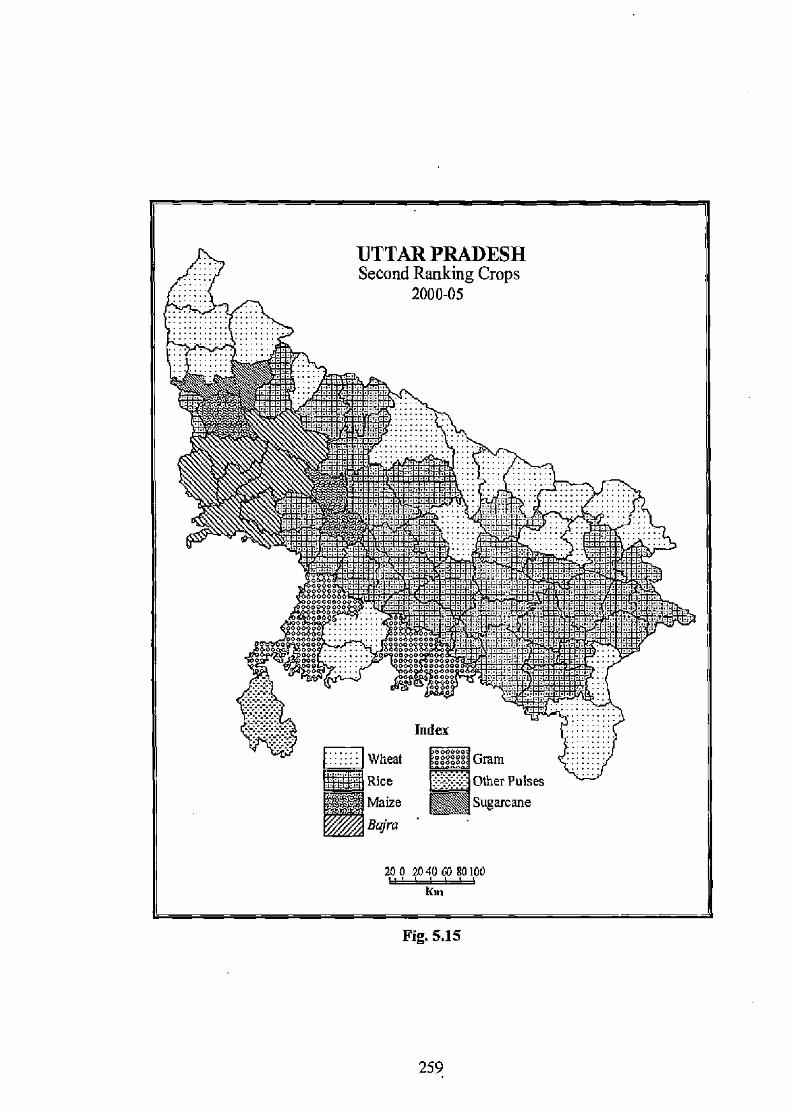
Fig. 5.15
259
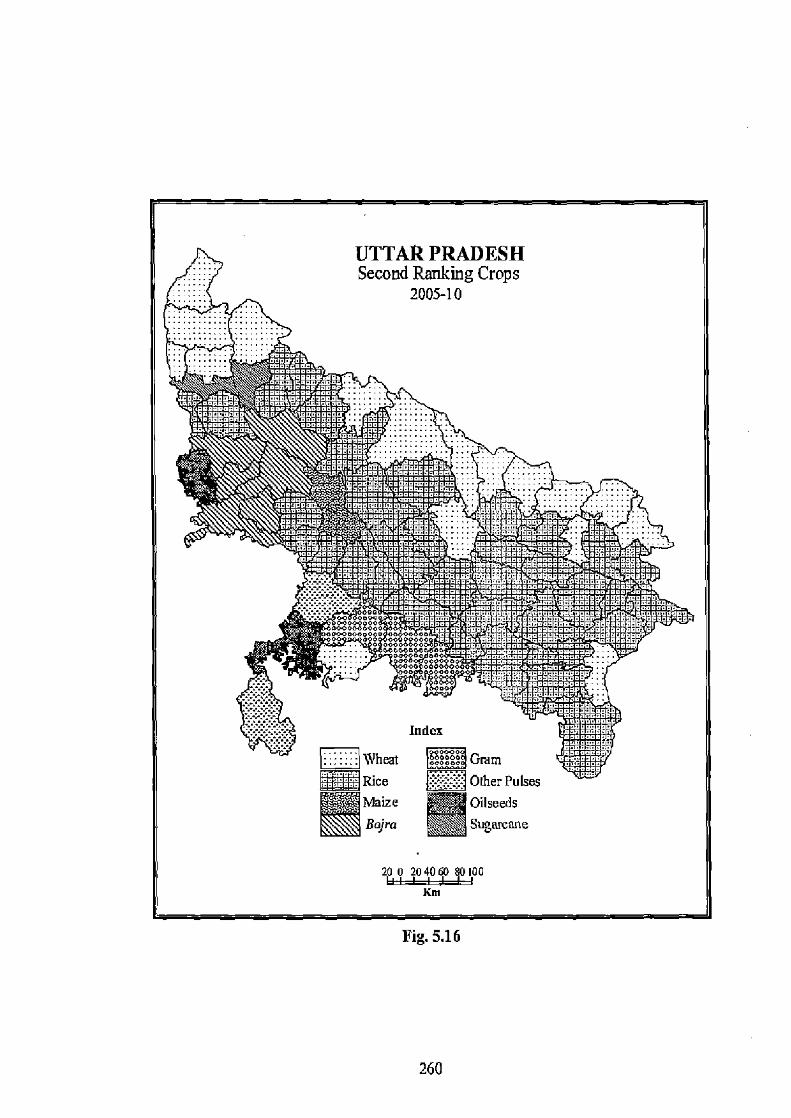
Fig. 5.16
260
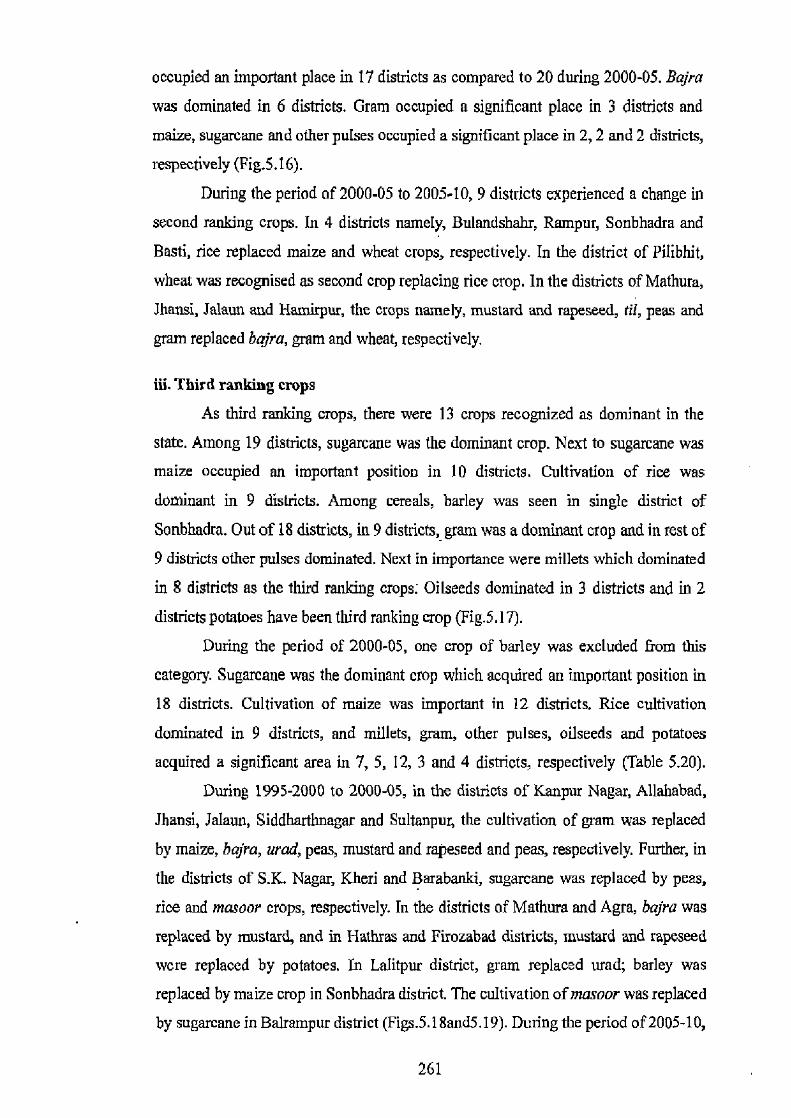
occupied an important place in 17 districts as compared to 20 during 2000-05. Bajra
was dominated in 6 districts. Gram occupied a significant place in 3 districts and
maize, sugarcane and other pulses occupied a significant place in 2, 2 and 2 districts,
respectively (Fig.5.16).
During the period of 2000-05 to 2005-10, 9 districts experienced a change in
second ranking crops. In 4 districts namely, Bulandshahr, Rampur, Sonbhadra and
Basti, rice replaced maize and wheat crops, respectively. In the district of Pilibhit,
wheat was recognised as second crop replacing rice crop. In the districts of Mathura,
Jhansi, Jalaun and Hamirpur, the crops namely, mustard and rapeseed, tif, peas and
gram replaced bajra, gram and wheat, respectively.
iii. Third ranking crops
As third ranking crops, there were 13 crops recognized as dominant in the
state. Among 19 districts, sugarcane was the dominant crop. Next to sugarcane was
maize occupied an important position in 10 districts. Cultivation of rice was
dominant in 9 districts. Among cereals, barley was seen in single district of
Sonbhadra. Out of 18 districts, in 9 districts, gram was a dominant crop and in rest of
9 districts other pulses dominated. Next in importance were millets which dominated
in S districts as the third ranking crops; Oilseeds dominated in 3 districts and in 2
districts potatoes have been third ranking crop (Fig.5.17).
During the period of 2000-05, one crop of barley was excluded from this
category. Sugarcane was the dominant crop which acquired an important position in
18 districts. Cultivation of maize was important in 12 districts. Rice cultivation
dominated in 9 districts, and millets, gram, other pulses, oilseeds and potatoes
acquired a significant area in 7, 5, 12, 3 and 4 districts, respectively (Table 5.20).
During 1995-2000 to 2000-05, in the districts of Kanpur Nagar, Allahabad,
Jhansi, Jalaun, Siddharthnagar and Sultanpur, the cultivation of gram was replaced
by maize, bajra, urad, peas, mustard and rapeseed and peas, respectively. Further, in
the districts of S.K. Nagar, Kheri and Barabanki, sugarcane was replaced by peas,
rice and masoor crops, respectively. In the districts of Mathura and Agra, bajra was
replaced by mustard, and in Hathras and Firozabad districts, mustard and rapeseed
were replaced by potatoes. In Lalitpur district, gram replaced urad; barley was
replaced by maize crop in Sonbhadra district. The cultivation of masoor was replaced
by sugarcane in Balrampur district (Figs.5.18and5.19). During the period of 2005-10,
261
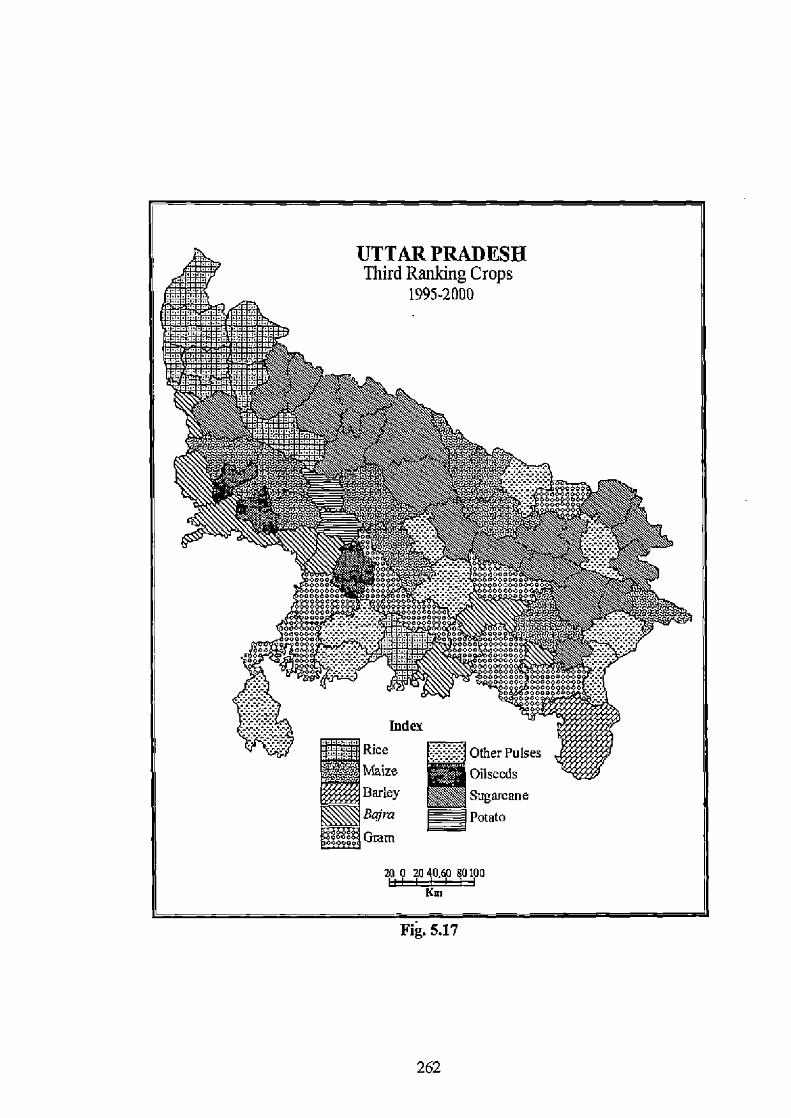
UTTAR PRADESH Third Ranking Crops
1995-2000
Index Rice Other Pulses Maize flOilseeds Barley Sugarcane Balm ®Potato
NM Grnm
w a za <a.w autea Km
5.17
262
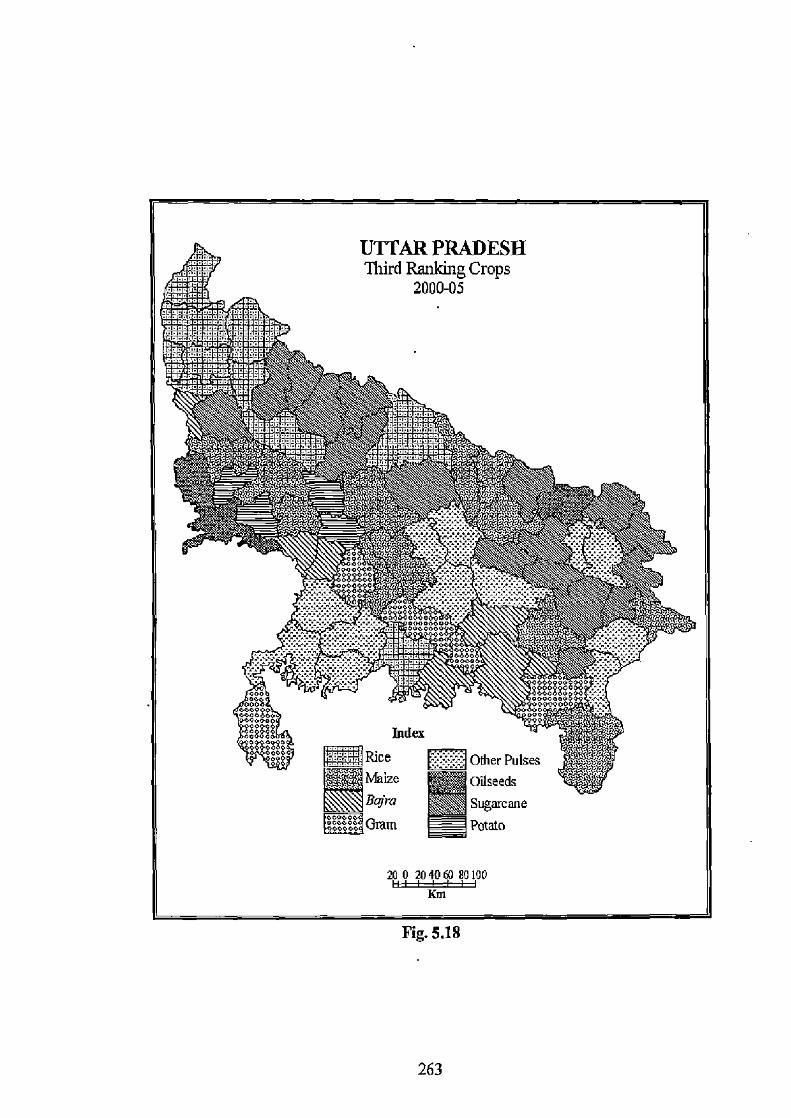
Fig. 5.18
263

Fig. 5.19
264
sugarcane was a dominant crop to cover a significant area in 18 districts of the state.
Next to sugarcane, other pulses, rice, maize and millets (bajra) were significant in
12, 11, 10 and 9 districts, respectively. Gram was dominant in 4 districts, and
potatoes and oilseeds were important crops in 4 and 2 districts, respectively.
During the period of 2000-05 to 2005-10, a prominent change was noticed in the state. In the districts of Mathura, Varanasi and Ghazipur, bajra replaced mustard
and rapeseed, sugarcane and masoor, respectively whereas, in S.K.Nagar, Sultanpur
and Gonda districts, sugarcane replaced peas and maize crops, respectively. Masoor
replaced jowar, mustard and rapeseed, and maize crop in the districts of Chitrakoot,
Siddhartlmagar and Shrawasti, respectively. Whereas, in Bulandshahr, Aligarh,
Lalitpur, Jalaun and Mahoba districts, crops of sugarcane, maize, gram and peas were
replaced by maize, rice, peas, ill and urad crops, respectively.
b. Crop-Combination Regions
Crop-combination regions based on Doi's method were delineated for the
periods of 1995-2000, 2000-05 and 2005-10 as shown in Figs. 5.20, 5.21 and 5.22.
Crop-combination regions in the districts of the state were ranged in numbers from 1
to 6 crops. Combination regions identified were as follows:
i. Single crop-combination/monoculture
During 1995-2000, the districts of Muzaffamagar and G.B.Nagar from upper
doab, and Bijnor belonging to Rohilkhand plains characterized with a single crop-
combination. In the districts of Muzaffarnagar and Bijnor, sugarcane was identified
as the dominant crop, and in G.B. Nagar district wheat occupied the dominant
position. During the period of 2000-05, a single crop-combination was visible in 8
districts as 5 new districts namely, Meerut, Baghpat, Mathura, Lucknow and Unnao
were added in this category (Figs.5.20 and 5.21). A change was noticed in the
percentage of area under sugarcane in Meerut and Baghpat districts, whereas, an
increase area was seen in wheat cultivation in the districts of Mathura, Lucknow and
Urn ao. During 2005-10, two new districts namely, S.R.Nagar and Gorakhpur in the
category, where wheat is a dominant crop, thereby, there has been an increase in
number of districts from 8 to 10 in monoculture combination (Fig. 5.22).
ii. Two crop-combinations Two crop-combinations were dominated in 31 districts of the state during
265
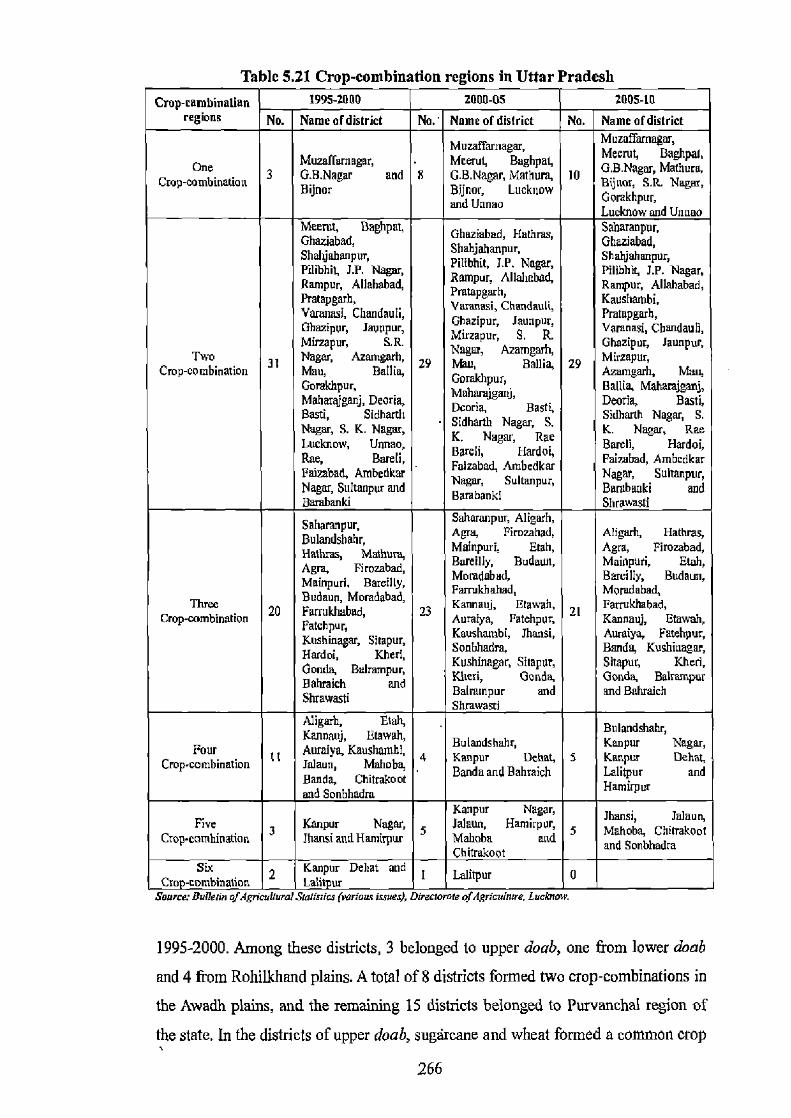
Table 5.21 Crop-combination regions in Uttar Pradesh Crop-combination 1995-2000 2000-05 2005-10
No. Name of district No. Name of district No. Name ofdistrict regions
Muzafi'arnagar, Meerut,magm,
Muzaflarnager, Meerut, Baghpe4 Meerut, Baghpa4 One G.B.Nagar and 8 G.B.Nagar, Mathum, 10 G.B.Nagar, Mathuru,
Crop-combination Bijnor Bijnor, Lucknow SR.Nag., Gnor,
and Unnao Go rakhpur, Lucknow and Unnao
Meerut, Baghpat, th Ghaziabad, Haras, Saharanpur, Ghaziabad, Sbahjahanpur, Ghaziabad, Shohjahanpur, 7P. Nagar, Shahjxhenpur, Pilibhit, J.P. Nam, ' Rampuy Al1altNmd, J.P. Nagar, Rarnpur, Allahabad, Rampur, Allahabad, Pmmpgmh Kampuq Pratapgarb, Chandau Kaushambi, Varanasi, Cliandauli, Chazipsi, r,
Mirzapur, Jaunpur, Pratapgmh, Ghazipur, Jaunpur,
Mirzapur, S. R. R. Varanaui, Chandauli, Mirzapur, S.R. Nagar, Azamgarh, Jaunpur, Mirzapur,
Two 31 Nagar, Azamgarb, 29 Mau, Bellia, 29 Mirzapur, Crop-combination Mau, Balliq Gohkhigr, Azxmgarh, Mat,,
GQrekipar, Mahamjgmii, MabaraBail, Maharajgxnj, Deoria, Dcoriq Rag S, Deoria, Deana, Basta, Basti, Sidharth Sidharth Nagar, S. Nagar, S. K. Nagar, SidharN Nagar,
K. Nagar, Rae RaSe K. Nagar, Rae Lueknow, Unnao, Ha[doi, Bazab Hardoi, Rue' Bsreh' Faiizabad, Ambedkar Pagan' Ah6cdkar Faiabad, Ambedkar Nagar, Salrsnpur, Nagar, Suhan and Nagar, Bu1renpun and Banzbsoki Bnrabanki and Bambanki Shrawasti
Saharanpur, Saharanpur, Aligwh,
Bu1sod56ahr, Agra, Firoaa6zd, Agadi, Hethnae,
Hathrns, Mathum, Mainlum, Elan, Agra, Firozabad,
Agra, Firozabad, Buchan, Morall y, Meanly,, Etuh,
Mainpud, Bareifty, Mundhbba, Banally, Buchan,
Buchan, Momdabad, Farrukhahad, Morukhaba, Three 20 Fertukua6od, 23 Kanyaj, Eta%ah. 21 Fartukkiabad,
Crop-combination Fatchpur, Auraiya, Fatehpur, Karaiya, Eehpur, g Kaushamai, ]hansi, Auradya, Fatehpur, Kashinagar, SKher! Hardoi, Kieri, Boobhwis Bands, KeSdmager,
Gonda, Ra1nsrnpnr, Kushingar, Sitapar, Sitwpur, Kheri,
Habsfich and Kheri, Gonda, Gonda, Bakampur
Shrawqsti Balrnmpur and and Balgaich Shrswnati
Aiigarh, Etah, Bulandsiiahr, Kannanj, Etowah, Bulandshqhr, Kanpur Nagar, Four ll Antalya, Kauslanobd, 4 Kanpur Dante, 5 Kanpur Dehat, Crop-combination Jalauri, Mahoba, Synch and Rahmfich Lebtiar and Banda, Bda, Chitrakoot Hamirpur and Sonbhadm Kanpur Nagar, Jhansi, Jalaun, Five
3 Kanpur Nagar,
5 Jalaun, Hamirpur, 5 Chitrakoot
Crop•combinatian ]hansi and Hamirpur Mahoba and and 5onbhadm and Son
Chitrakoot Six 2 Kanpur Dehat and I Lalitpur a Crop-combination Lalitpur
Source: Bulletin ofAgncuiural Statistic (variaur iuues), Directorate ofAgriculture, Luclmmv.
1995-2000. Among these districts, 3 belonged to upper doab, one from lower doab
and 4 from Rohilkhand plains. A total of 8 districts formed two crop-combinations in
the Awadh plains, and the remaining 15 districts belonged to Purvanchal region of
the state. In the districts of upper doab, sugarcane and wheat formed a common crop
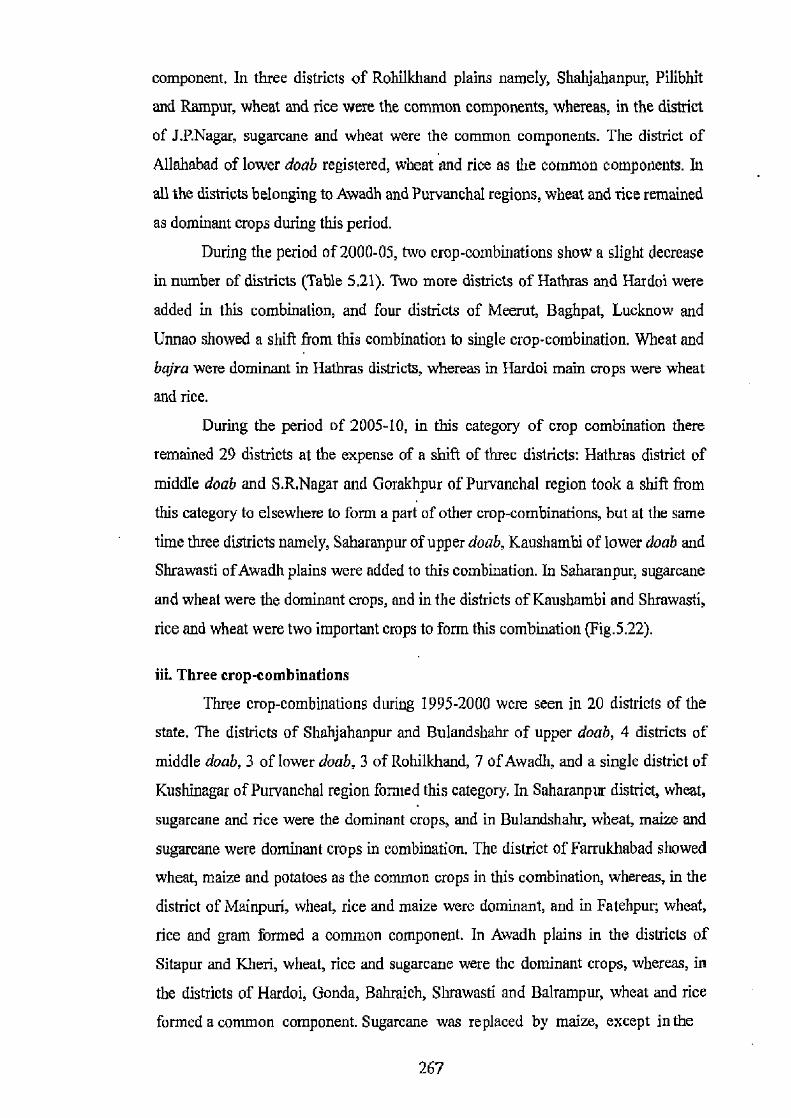
component. In three districts of Rohilkhand plains namely, Shahjahanpur, Pilibhit
and Rampur, wheat and rice were the common components, whereas, in the district
of J.P.Nagar, sugarcane and wheat were the common components. The district of
Allahabad of lower doab registered, wheat and rice as the common components. In
all the districts belonging to Awadh and Purvanchal regions, wheat and rice remained
as dominant crops during this period.
During the period of 2000-05, two crop-combinations show a slight decrease
in number of districts (Table 5.21). Two more districts of Hathras and Hardoi were
added in this combination, and four districts of Meerut, Baghpat, Lucknow and
Unnao showed a shift from this combination to single crop-combination. Wheat and
bajra were dominant in Hathras districts, whereas in Hardoi main crops were wheat
and rice.
During the period of 2005-10, in this category of crop combination there
remained 29 districts at the expense of a shift of three districts: Hathras district of
middle doab and S.R.Nagar and Gorakhpur of Purvanchal region took a shift from
this category to elsewhere to form a part of other crop-combinations, but at the same
time three districts namely, Saharanpur of upper doab, Kaushambi of lower doab and
Shrawasti ofAwadh plains were added to this combination. In Saharanpur, sugarcane
and wheat were the dominant crops, and in the districts of Kaushambi and Shrawasti,
rice and wheat were two important crops to form this combination (Fig.5.22).
iii. Three crop-combinations
Three crop-combinations during 1995-2000 were seen in 20 districts of the
state. The districts of Shahjahanpur and Bulandshahr of upper doab, 4 districts of
middle doab, 3 of lower doab, 3 of Rohilkhand, 7 of Awadh, and a single district of
Kushinagar of Purvanchal region fornied this category. In Saharanpur district, wheat,
sugarcane and rice were the dominant crops, and in Bulandshahr, wheat, maize and
sugarcane were dominant crops in combination. The district of Farrukhabad showed wheat, maize and potatoes as the common crops in this combination, whereas, in the
district of Mainpuri, wheat, rice and maize were dominant, and in Fatehpur; wheat,
rice and gram formed a common component. In Awadh plains in the districts of
Sitapur and Kheri, wheat, rice and sugarcane were the dominant crops, whereas, in
the districts of Hardoi, Gonda, Bahraich, Shrawasti and Balrampur, wheat and rice
formed a common component. Sugarcane was replaced by maize, except in the
267
UTTAR PRADESH Crop Combination Regions
1995.2000
Index 30 0 2060 40 80100 ji~W ~, quiiiiJili~y Iii11a.s;b w ®a a-RW; bS W; cWB; d-WR; c-WS
®®
BI a-R WM; b-RWS; c-S WR; d-W BMd; e-WMdB;1-W BM; g-W BP; h-W OR; i-WGR;j-WGU k-WMP; I-W MS; m-WRB; n-WRG; o-WRhf; p-WRMr, q-W RS; r-W SR
IV a-W BMMd; b-WBMR; c-WMPR; d-W RBMd; e-W &GB; f-W PsGMr; g-WGPsMr;h-W GRJ i-WGJR; j-RWByM; k-WMSR; I-WRGMd; m-WGRMr; n-RWVMMr, o-WRMS; p-WRMG q-WUPsM; r-WGMrJ ra
V a-WRGMIdM; b-WPsGGIP o-WGMrJPs; d-WRMGMd; e-WGPsMrU; f-GMMrJU; g-GW PsUMr h-WGJRMr i-W TUPsG; j-WPsFGMr; k-GWUPsMr; I-WGMrJA; m-W RMAG
VI a-WRMdGMJ; b-IVGUPsMMr; c-WUGPsMrM
Fig. 5.20
268
district of Balrampur, in which masoor was a component as third crop in the
combination.
During the period of 2000-05, the number of districts having three crop-
combinations increased from 20 to 23. A sum of 8 districts was added to this
combination, and 5 districts were shifted to other combinations. Two districts of
Aligarh and Etah of middle doab, 4 districts of Kannauj, Etawah, Auraiya and
Kaushambi from lower doab, the district of Jhansi from Bundelkhand and Sonbhadra
lying in eastern part of the state were added to this combination. The districts shifted
from this combination were namely, Bulandshahr, Hathras and Mathura belonging to
middle doab, and the districts of Jiardoi and Bahraich to Awadh region.
During 2005-10, three crop-combinations were identified in 2ldistricts of the
state. The districts namely, Saharanpur, Kaushambi, Jhansi, Sonbhadra and Shrawasti
were shifted from this combination to other combinations, and the districts of
Hathras, Banda and Bahraich were added to this category of three crop-
combinations. In Hathras, wheat, bajra and potatoes were dominant crops, and
wheat, gram and rice dominate in Banda district. The districts of Bahraich showed
rice, wheat and maize as dominant crop-combination (Fig. 5.22).
iv. Four crop-combinations
During 1995-2000, there were II districts belonged to the category of four
crop-combinations. The districts of Aligarh and Etah from middle doab, 4 districts of
Karreauj, Etawah, Auraiya and Kaushambi from lower doab, Jalaun, Mahoba, Banda
and Chitrakoot from Bundelkhand region, and Sonbhadra from Purvanchal region,
respectively formed this category of combination. In the districts of middle doab,
wheat, bajra and maize formed the common crops. In the districts of lower doab
namely, Etawah, Antalya and Kaushambi, wheat, rice and bajra were the common
components, and in the district of Kaushambi, gram formed fourth component.
District of Kannauj showed wheat, maize, potato and rice as components in this
combination. The districts of Jalaun and Mahoba followed the same combination,
except the district of Banda, in which wheat, gram, rice and jowar were the dominant
crops.
In Chitrakoot district, wheat, gram, jowar and rice were dominant crops to
form this combination, whereas, rice, wheat, barley and maize were the main
components in Sonbhadra district.
269
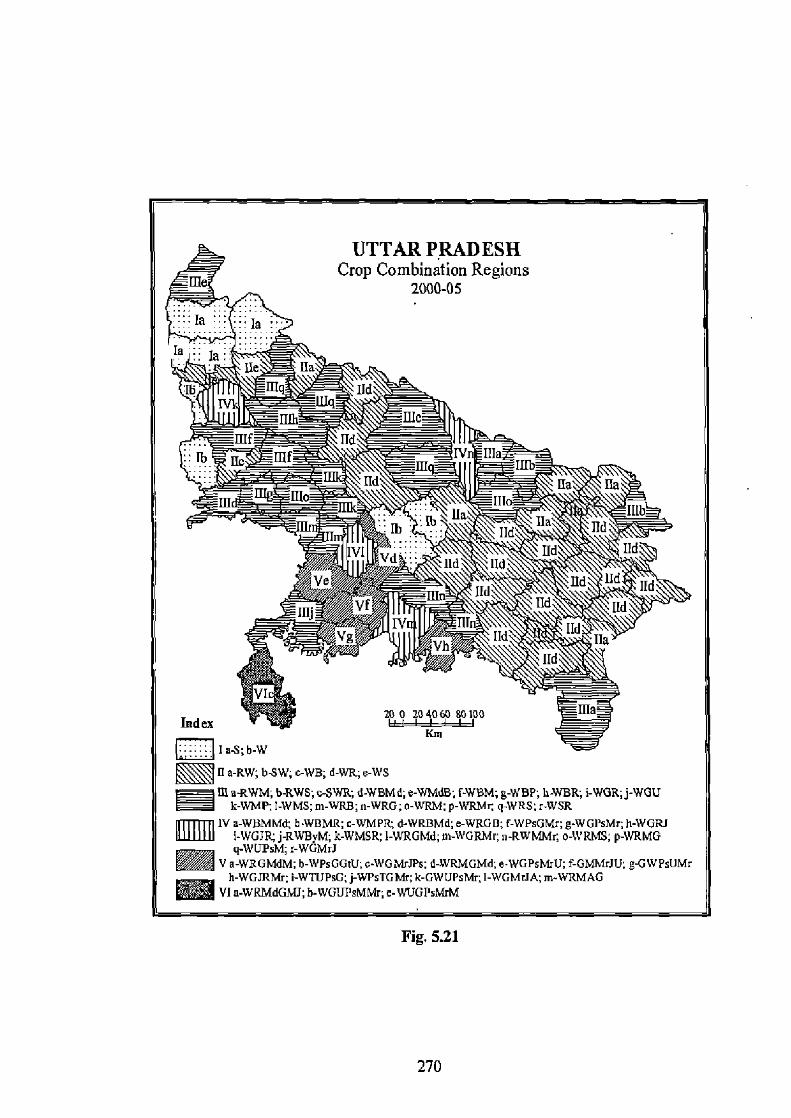
Fig. 5.21
270
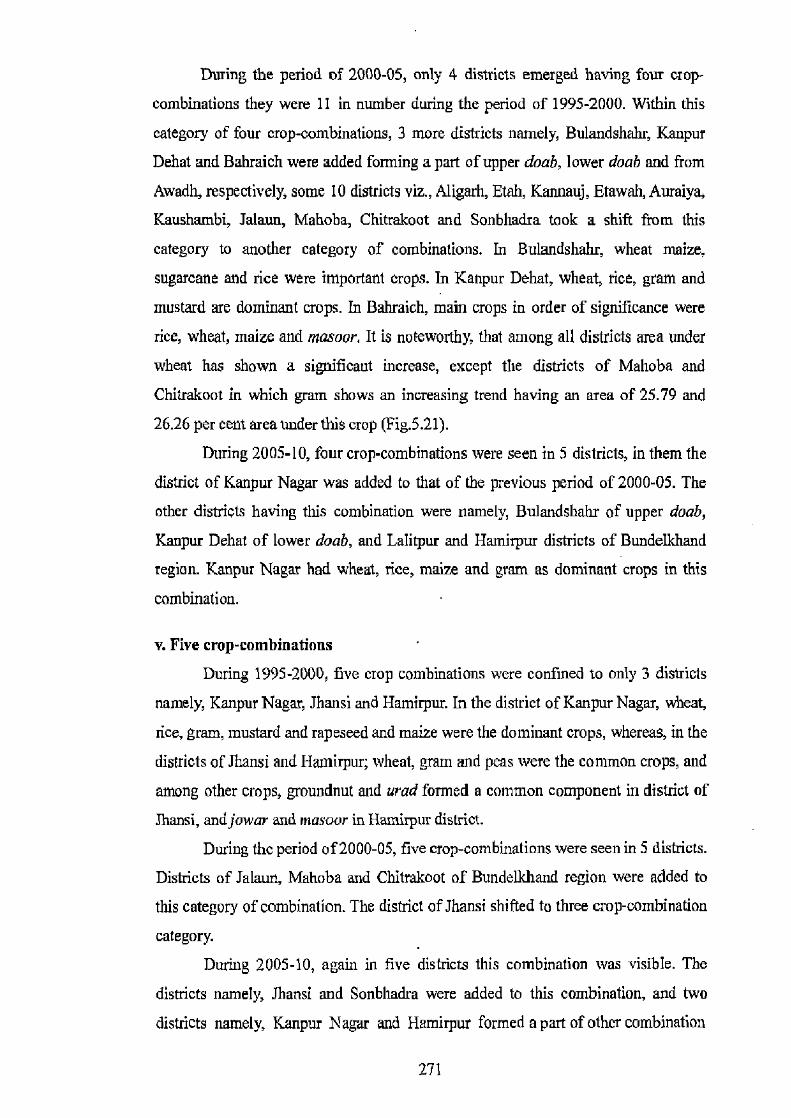
During the period of 2000-05, only 4 districts emerged having four crop-
combinations they were 11 in number during the period of 1995-2000. Within this
category of four crop-combinations, 3 more districts namely, Bulandshahr, Kanpur
Dehat and Bahraich were added forming a part of upper doab, lower doab and from
Awadh, respectively, some 10 districts viz., Aligarh, Etah, Kannauj, Etawah, Auraiya,
Kaushambi, Jalaun, Mahoba, Chitrakoot and Sonbhadra took a shift from this
category to another category of combinations. In Bulandshahr, wheat maize,
sugarcane and rice were important crops. In Kanpur Dehat, wheat, rice, gram and
mustard are dominant crops. In Bahraich, main crops in order of significance were
rice, wheat, maize and masoor. It is noteworthy, that among all districts area under
wheat has shown a significant increase, except the districts of Mahoba and
Chitrakoot in which grain shows an increasing trend having an area of 25.79 and
26.26 per cent area under this crop (Fig.5.21).
During 2005-10, four crop-combinations were seen in 5 districts, in them the
district of Kanpur Nagar was added to that of the previous period of 2000-05. The
other districts having this combination were namely, Bulandshahr of upper doab,
Kanpur Dehat of lower doab, and Lalitpur and Hamirpur districts of Bundelkhand
region. Kanpur Nagar had wheat, rice, maize and gram as dominant crops in this
combination.
v. Five crop-combinations
During 1995-2000, five crop combinations were confined to only 3 districts
namely, Kanpur Nagar, Jhansi and Hamirpur. In the district of Kanpur Nagar, wheat,
rice, gram, mustard and rapeseed and maize were the dominant crops, whereas, in the
districts of Jhansi and Hatnirpur; wheat, gram and peas were the common crops, and
among other crops, groundnut and urad formed a common component in district of
Jhansi, and jowar and masoor in Hamirpur district.
During the period of 2000-05, five crop-combinations were seen in 5 districts.
Districts of Jalaun, Mahoba and Chitrakoot of Bundelkhand region were added to
this category of combination. The district of Jhansi shifted to three crop-combination
category.
During 2005-10, again in five districts this combination was visible. The
districts namely, Jhansi and Sonbhadra were added to this combination, and two
districts namely, Kanpur Nagar and Hamirpur formed a part of other combination
271
i
UTTAR PRADESH nb Crop Combination Regions
2005-10
13
7aala is Ile Ild
I4 q IVo
Ulh_ Mc
III lid IIff lb
1IIq lab lid Na Ira Ind HIg o
III —
i lb :. Ib Ila [Id
IId . lb
IVI lld ...
lid
~
NP :- - lid Bd
Vj Ild lid lid lid
Vi lVr lid Ild
lid lid 15:; lid Ila
VI Ild
Nq ZO 104060 80100 Vm
Index
KM
IaS;b.W
Its-RW; bSW; c-WB; d-WR;-WS
®M a-RWM; b.R W5; c S WR; d-WBMd; a.WMdB; f-WBM; g-W BP; h-WBR; i-WGR;j-WGU k-WMP;I WMS;m-WRB;n-WRG; o-WRM;p-WRMr q-WRS;r-WSR
IV a-WBMMd; h-WBMR; FWMPR;d-WRBMd; a-WRGB; f-W PsGMr;g-W GPsMr;h-WGRJ i-WGJR; i-RWRYM; k-WMSR; f-WRGMd; m-WGRMr1 n-RWh1Mq o-W RMS; p-WRMG q-WIIPsM; rWGMrJ
V a-WRGMdM; b-WPsGGtU; c-WGMrJPs; d-WRMGMd; e-WGPsMrU; f-GMMrJU; g-GW PsUMr h-WGJRMr; i-W TUPsG; j-WPsTGMr; k-GWUPSMr; I.W GMrJA; m-WRMAG
VI a-W RMdGMJ; b-WGUPsMMr; c- W UGPsMrM
1}g. 522
272

regions (Fig.5.22).
vi. Six crop-combinations
During the period of 1995-2000, six crop-combinations were confined only to
two districts namely, Kanpur Dehat and Lalitpur of lower doab and Bundelkhand
region, respectively. In Kanpur Dehat, wheat, rice, mustard and rapeseed, gram,
maize and jowar formed this combination, and in Lalitpur, wheat, gram, urad, peas,
maize and masoor were the dominant crops. During the period of 2000-05, a single
district of Lalitpur was characterized with this crop-combination (Fig.5.21).
E. Cropping Intensity: A Districtwise Analysis
Cropping intensity in agriculture refers to the ratio of gross cropped area (i.e.
sum of area under all the crops in a given agricultural year) to net sown area, usually
expressed in percentages. It is proportion of area sown more than once (Sharma,
2000). Since time immemorial irrigation has been regarded as an essential part of
sound agricultural infrastructure. It encourages farmers to adopt scientific techniques
and go in for more intensive cropping thereby creating new opportunities for gainful
employment. Cropping intensity is one of the main attributes of agricultural
productivity because it is implicitly related to the expansion and intensification
processes of agricultural land use (Singh, 1994). Intensity of cropping implies the
degree of cropping or number of crops grown in the same plot during one
agricultural year. It is an indication of the total cropped area as distinguished from
the net sown area
The expansion of irrigation contributes an increase in cropping intensity in
the coming years. The increasing demand of food and fibre for ever increasing
population is realized as one of the demographic causes of agricultural
intensification. The availability of adequate irrigation facilities transforms the
subsistence agriculture landscape gradually into commercial one, making agrarian
economy as market oriented (Pawar and Slunde, 2007). An increase in irrigation
intensity contributes to the growth in overall cropping intensity. Consequently, India
has moved from the spectre of food imports and periodic famines to self-sufficiency,
since the early 1970s, food exports and progressively more diversified production
(GOI, 1999).
Districtwise values of cropping . intensity during the periods of 1995-2000,
273
2000-05 and 2005-10 are presented in Table 5.22. For the state of U.P., cropping
intensity during 1995-2000, was 146 per cent. Attaining a growth of 3.01 and 1.94
per cent, it increased to 151 and 154 per cent, respectively during the period of 2000-
05 and 2005-10. Very high cropping intensity (above 170 per cent) during 1995-2000
was observed in the districts namely, Rampur (181), Maharajganj (174) and
Bulandshahr (171). The districts included within this category were namely, Rampur
(185), Maharajganj (178), Barabanki (178), Chandauli (174) and Moradabad (171)
during 2000-05. During the period of 2005-10, number of districts in this category
increased tol3 with the addition of Mainpuri (188), Aligarh (173), Shahjahanpur
(171), Bulandshahr (171), S.K.Nagar (171), Azamgarh (171), Pilibhit (170) and
Budaun (170) districts.
There were 18 districts in the category of high cropping intensity (155 to 170
per cent) during the previous period, the number of districts increased in order of 25
and 21 during 2000-05 and 2005-10, respectively. High intensity of cropping was
confined to all areas belonging to western and eastern parts of the state, where
irrigation is well developed with high share of gross cropped area. In the category of
medium cropping intensity in between 140 and 155 per cent, the number of districts
decreased from 29 to 24 in later period. There were altogether 18 districts to
represent low and very low categories of cropping intensity during 1995-2000,
whereas, during 2000-05 and 2005-10, the number of districts decreased to 11 and
12, respectively (Figs. 5.23, 5.24 and 5.25).
During 1995-2000 to 2000-0S, there were 7 and S districts, respectively
which attained high growth of above 10 per cent in intensity of cropping. There were
41 and 40 districts, respectively which.recorded medium growth of 0-10 per cent
during these periods, respectively. Low growth in cropping intensity was recorded
in20 and 24 districts, whereas very low growth was seen in Sonbhadra district during
later period (Table 5.23).
F. Cropping Intensity vs. Irrigated area: Correlative Assessment
Karl Pearson's correlation of coefficient (r) teclmique was used and t-test was
performed to test the significance level between the components of irrigation and
cropping intensity. Simple linear regression technique was also applied to evaluate
the impact of irrigation (independent variable) on cropping intensity (dependent
variable). Table 5.24 shows coefficient values of the variables of cropping intensity,
274
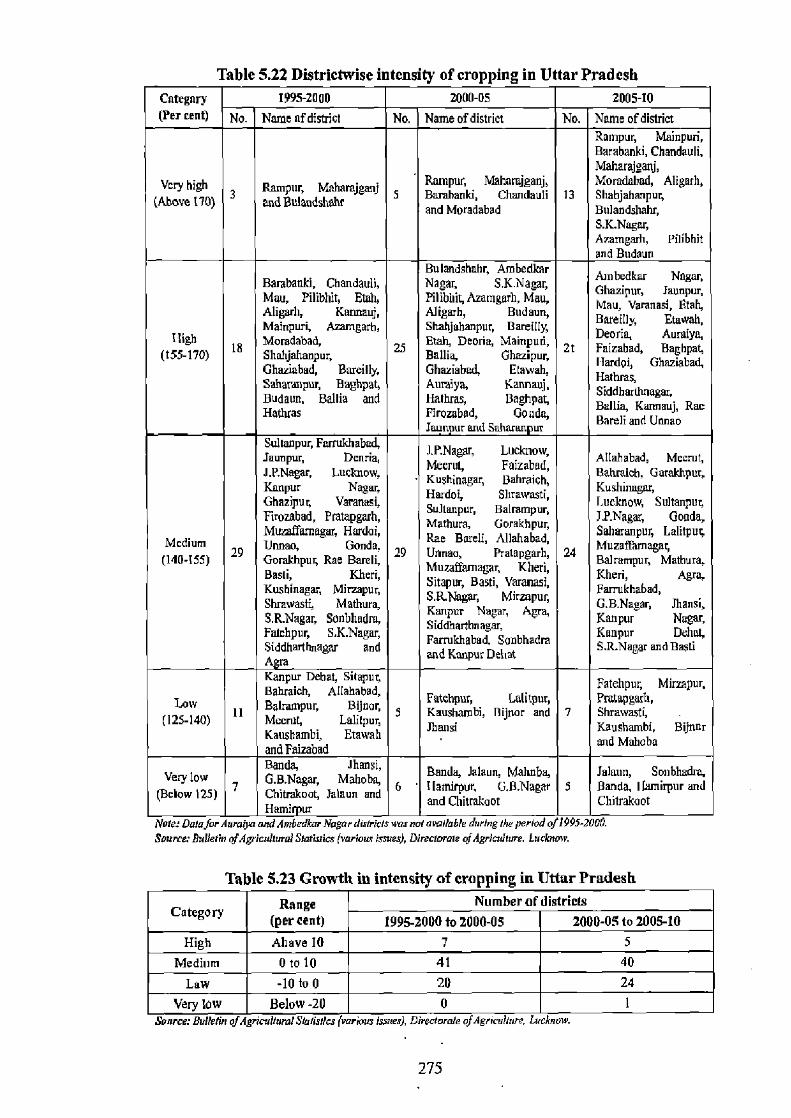
Table 5.22 Districtwise intensity of cropping in Uttar Pradesh Category 1995-2000 2000-05 2005-10
(Per cent) No. Name of district No. Name of district No. Name of district Rampur, Mainpuri, Barabanki, Chandauli, Maharajganj,
Very high pur, Whom ' Rampun Mahamjganj, Moradabad, Aligarh, (Above DO) 3 and Bu12ndshahr
5 Barabanki, Chandauli 13 Shahjahanpur,
and Moradabad Bulandshahr, S.KNagar, Azamgarh, Pilibhit
and Budaun Bulandshahr, Ambedkar
Atnbedkar Nagar, Barabanki, Chandauli, Nagar, S.K.Nagar, Ghazipur, Jaunpur, Mau, Pilibhit, Etah, Pilibhit, Aramgarh, Mau, Mau, Varanasi. Aligarh, Kannauj, Aligarh, Budaun, wah, illg Etowah,
High Mainpuri, Azamgarh, Shahjahanpur, Bareilly, Deoria, Deo Auraiya,
1B
Moradabad, Eta], Deoria, Mainpuri, 21 Fai zahad, Baghpat,
(155-170) Shahjahanpuq Ballia, Ghazipur, Il~oy Ghaziabad,
Chaziabad, Bareilly, Ghaziabad, Etowah, ur Saharanp, Baghpat, Auraiya, Kannanj, hr°s'
Budaun, Ballia and Halhras, Baghpat, Ballia, Kannau
Hatluas Firozabad, Goada, 7aun ur and Saharan ur
nna R. Bareli nd Bareli and Umao
Sulwnpur, Farnrkhabad, J.P.Nagar, Luckuow, Jaunpur, Deoria,
Meerul. Faizabad, A1lahzbad, Mecmt,
J.P.Nagar, Lucknow, Kushinaga5 Bahraich,
Bahraicb, Gura khpug
Kanpur Nagar, Hardot Shrawasti, KueMnagar,
Ghazipur, Varanasi, Sultanpur, Balrampur,
Lucknow, Sultonpur, Firozabad, Pratapgarh, Mathura, Gorakhpur, 7pNagw, Gonda,
Mumffernagar, Hardai, Rae Bareli, Allahabad, Saharunpuy Lalitpur, Medium
29 Unnno, Gonda.
29 Onneq protopgarh, 24 Mwicffwmwgar,
(140-I55) ur, Rae Bareli, Bash, Khasi, 8alrampuq Mathura, Bassi, Kheri, Kushinagar, Mirzapur, Sitapur, S. R.Na Basti, Varanasi,
Fareri, Agra, Farrukhabad,
Shrawasti, Mathura, gaq Mirmpu5 G.B.Nsgar, Jhansi, S.R.Nagar, Sonbhudra, Kanpur Kanpu Nagar, Agra, Kanpur Nagar, Fatchpur, S.K.Nagar,
Siddbwrthnagar, Farrukhabad, Sonbhadra
Kanpur Ds S.R.Nasaz and➢a
ti
Siddharthnagar and and Kanpur Dchat ti Agra
Kanpur Dehat, Sitapur, Fatehpur, Mithpur,
Low Bahraich, Allahabad,
Balrampui Bijnor, Fatehpur, Lalitpur, Pm[apgarh,
(125-140) 11 Mtxrnt, Cotitpny 5 Kanshomb;, Bijnwr and 7 Khnawonti,
Kaushambi, Etowah Jhansi Kwnshwmb;, Bijnor
and Faizabad and Mahaba
lowry Banda' Jhansi, GB.Nkgor, Mahn Banda, lalaun, Mahoba, Jataun, Sonbhadra,
FC~Vli
ow 125) 7
Ca;rnirpook 7alaun and d 6 llamirpur, G.B.Nagar 5 Banda, lfamirpur and
Hamirpur and chil,okoDt Ghit,okoot Note: Dalafor Aura9n and Ambedkur Nagar dlsnftts was not avalla6le during the period of1995-2000. Source: Bulletin ofAgntcoaums Sw iuia (varlour issues), Dirennrme oa'AgHudi e, Lucknmw.
Table 5.23 Growth in intensity of cropping in Uttar Pradesh
Category Range (percent)
Number of districts
1995-2000 to 2000-05 2000-05 to 2005-10
High Above 10 7 5 Medium 0 to 10 41 40
Low -10 to 0 20 24
Very low Below-20 0 Scarce: Bulletin cfAgnhnhnra! Statufkr (various lames), Di,eciorNa cfAgrrcuk.re, Lutknov.
275
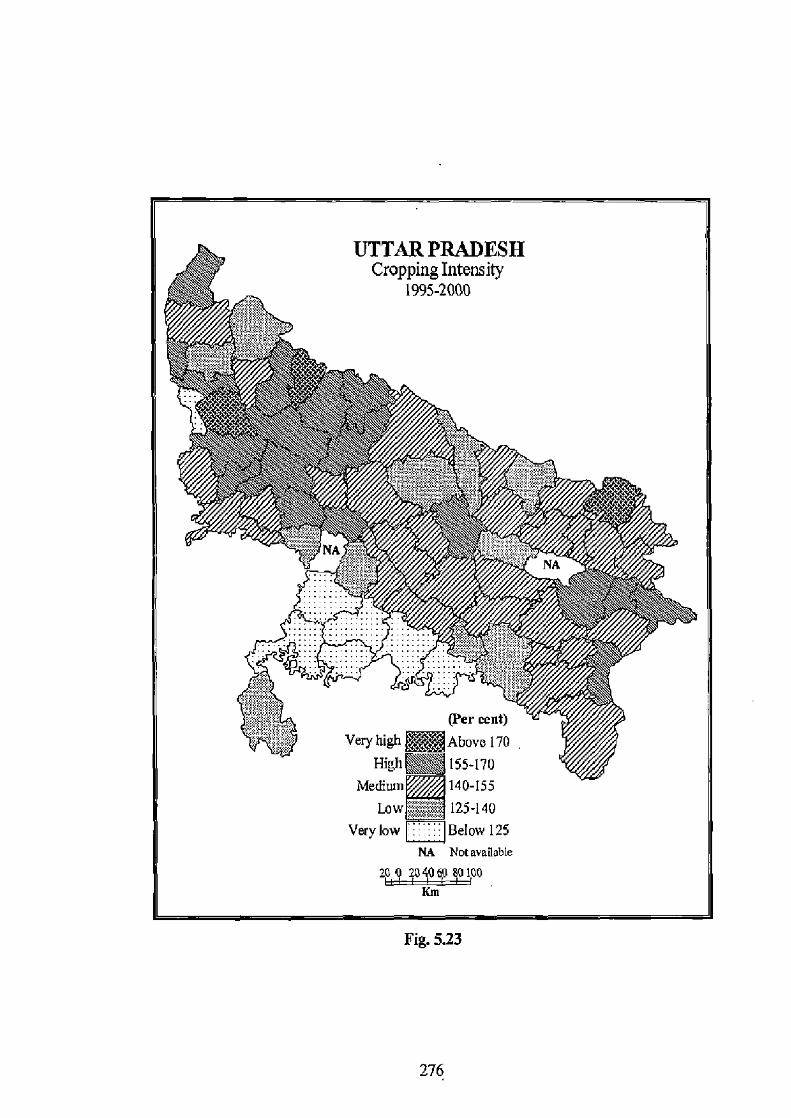
UTTAR PRADESH Cropping Intensity
1995-2060
.4 . NA
NA
fep fp.
t~
p.~c.
(Percent) Very high Above 170
High 155-170
Medium 140-155 Law `°-" 125-140
Very low EBeIow 125 NA Notavaiable
20 02040 fi0 810 Km
Fig. 5.23
276

I .
~~ - A
1.
_
'4,
1 1 .1 11
Fig. 5.24
277
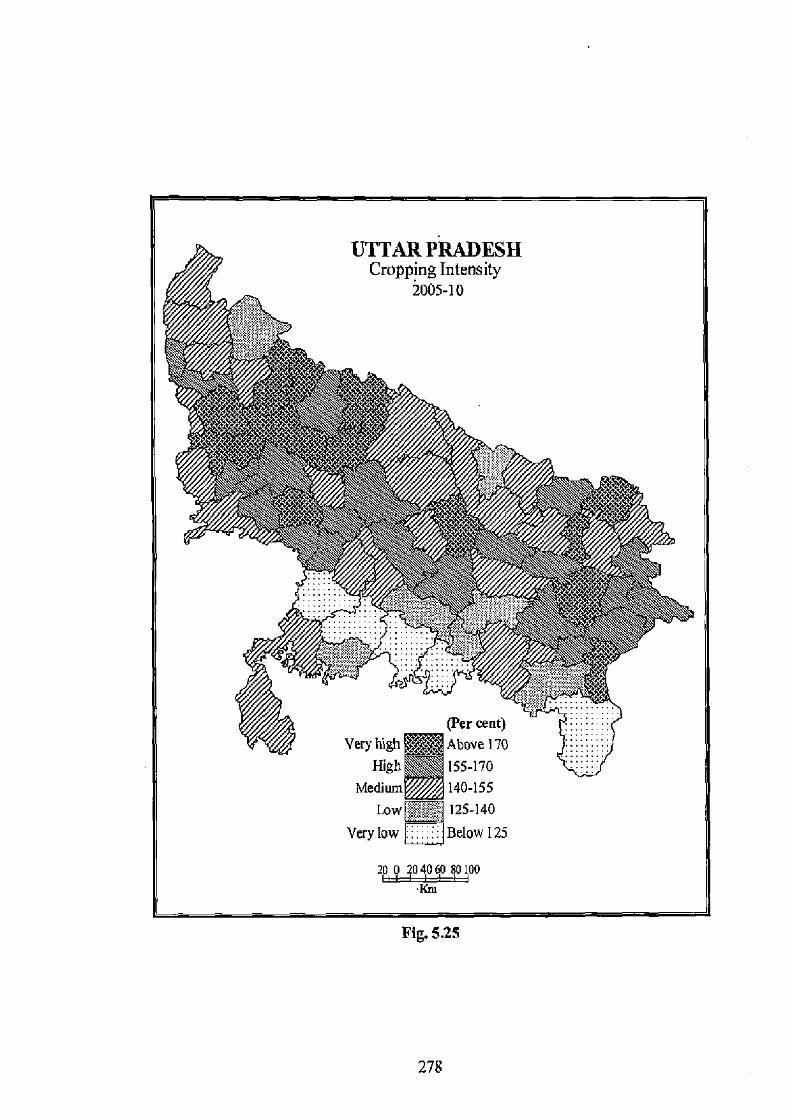
Fig. 5.25
278
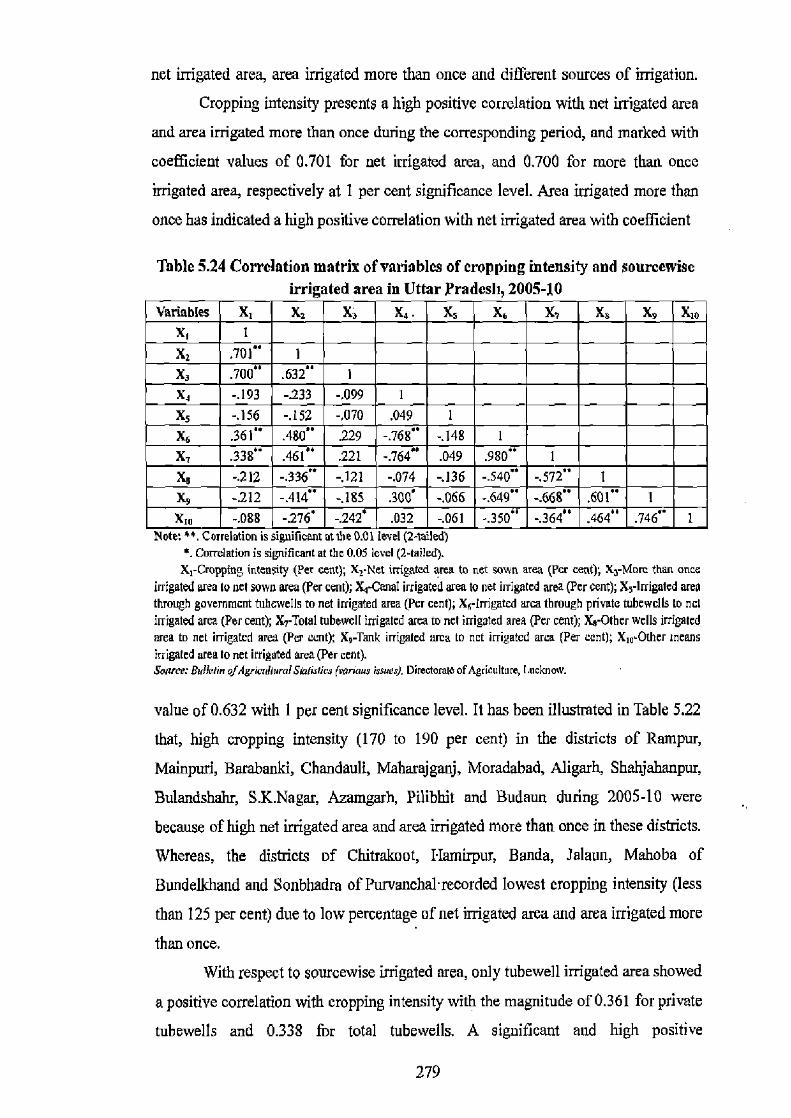
net irrigated area, area irrigated more than once and different sources of irrigation.
Cropping intensity presents a high positive correlation with net irrigated area
and area irrigated more than once during the corresponding period, and marked with
coefficient values of 0.701 for net irrigated area, and 0.700 for more than once
irrigated area, respectively at I per cent significance level. Area irrigated more than
once has indicated a high positive correlation with net irrigated area with coefficient
Table 5.24 Correlation matrix of variables of cropping intensity and sourcewisc irrigated area in Uttar kradesli, 2005-10
Variables X, xe x X a . Xs X 6 Xa X9 X,o x, 1 Xi .701" 1 X, .700 " .632 " 1 X4 -.193 -.233 -.099 1 Xs -.156 -.152 -,070 .049 1 X6 .361 .480 " 229 -.768' -.148 1 Xi .338 " .461" .221 -.764' .049 980" 1 Xa -.212 -336" -.121 -.074 -.136 -.540 " -.572" 1 ](s -212 -.414 -.185 .300 -.066 -.649 -.668 .601 1 X,u -.088 -.276' -.242 .032 -.061 -.350° -.364 " .464" .746 1
Note: •`. Correlation rs signrtean at the U.Ol levc (2-tealed) '. Correlation is significant at the 0.05 level (2-tailed). X,-Cropping intensity (Per cent); XrNet irrigated area to net sown area (Per cent); X -More than on
irrigated area to net sown area (Per cent); X4-Con1 irrigated area to net irrigated area (Per corm); X5-Irrigated area through government tubewells to net irrigated area (Per cent); XR irrigated arm through private tubewclls to net irrigated area (Per cent); X,-Toml tubewell irrigated area to net irrigated area (Per cent); Xe-Other wells irrigated area to net irrigated area (Per cent); X,-Tank irrigated area to not irrigated area (Per cent); X,u-Other means irrigated area to net irrigated area (Per cent). Source: Bulletin ofAgrimildural Statistics (utzriQis iv.,), Diredmatt Of2gnculture, I.tedmorv.
value of 0.632 with I per cent significance level. It has been illustrated in Table 5.22
that, high cropping intensity (170 to 190 per cent) in the districts of Rampur,
Mainpuri, Barabanki, Chandauli, Maharajganj, Moradabad, Aligarh, Shahjahanpur,
Bulanshahr, S.K.Nagar, Azamgarh, Piiibbit and Budatyv during 2005-10 were
because of high net irrigated area and area irrigated more than once in these districts.
Whereas, the districts of Chitrakoot, I Iamirpur, Banda, Jalaun, Mahoba of
Bundelkhand and Soobhadra of Purvanchal recorded lowest cropping intensity (less
than 125 per cent) due to low percentage of net irrigated area and area irrigated more
than once.
With respect to sourcewise irrigated area, only tubewell irrigated area showed
a positive correlation with cropping intensity with the magnitude of 0.361 for private
tubewells and 0.338 for total tubewells. A significant and high positive
279
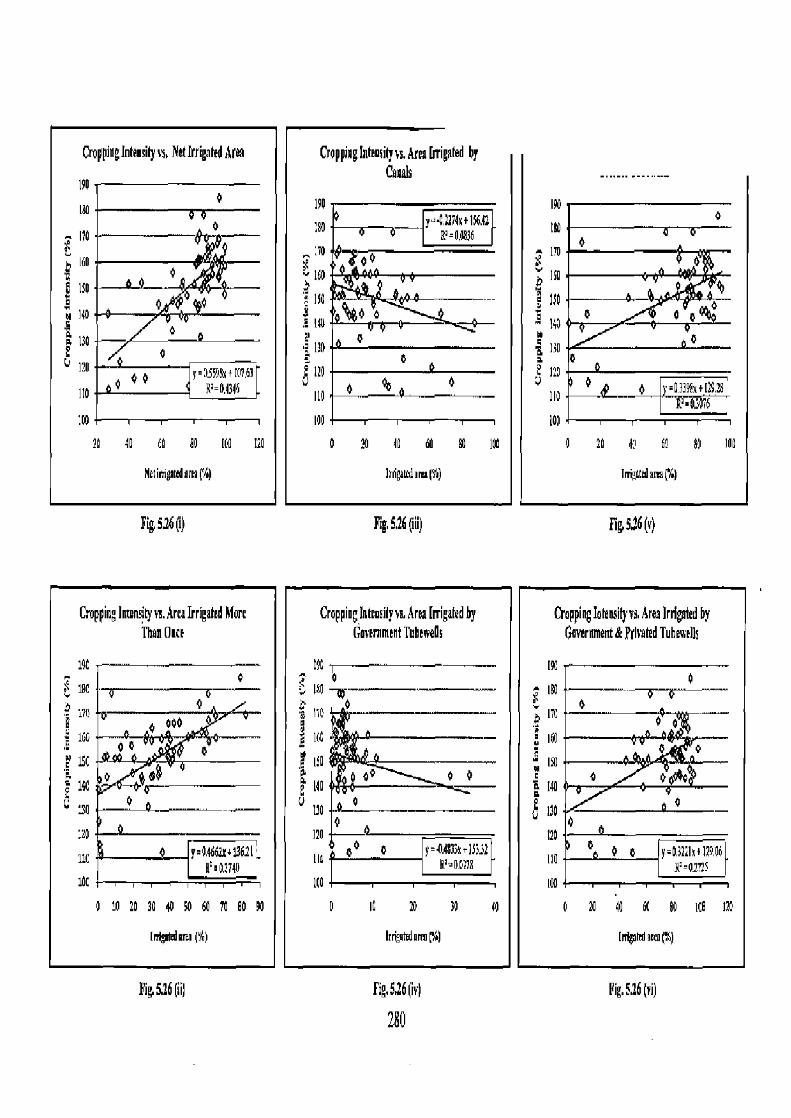
Croppiagln1eusiqvs. Area Fjiignted by Canals
Fig. 5,26 (io) Fig. 526 (v)
30 d0 60 m 100
I1dgdioajiaF°%0)
20 17 fi0 89 100
Imoutd am(w)
0
CroppinglnImsiq s5, Nttlrrigaled Area
90 0
I0 pp
170— 4
160
ISO ~9
p O ;IW A 130 0 e a
I'0 J=)s91Sv f101,fi1 0 O O R'=0.434h IIO
20 40 f0 80 NO CO
IIirtigmdert l`A)
Fig 914(i)
Cropping latunsitY vs. Arta Irrigated Mort CroppinglnleOSi1yw. Area Frrigafedhy CrDPPi ng Interally vs. Area Irrigated by Than Once CøveriintetTuhweOs Government&FrlvMedTubmeIk
19t I9C 19C • 1C
o 0 I&3
0
171 000 0
e 110 A M 0
166 0 0 O E 16C + — 160 0 0
i 1Sf 0 e If0 I50 F.
ea ®~ 00 p 0 0 0 14C —680 Q MO p0 o 140
30 --•..-- U 170 O IJO O - ?0 DO 0 120 0
1lC 9=0.4668+13611_ 00 0 A633vta'1 no y= N°=nai78 no O 0 0 Y=OiYIv~1294
9'e A:799 g:_02nt loc lf0 I I Im
0 10 Z0 30 90 5O 60 70 80 90 0 IC 10 30 40 010 40 fif 80 ICO 110
["dim %) nroalalaim (k) In1g*d omv()
fig 5.26 Qi Fig,$16 (v) pig. 5.26 (ri)
280
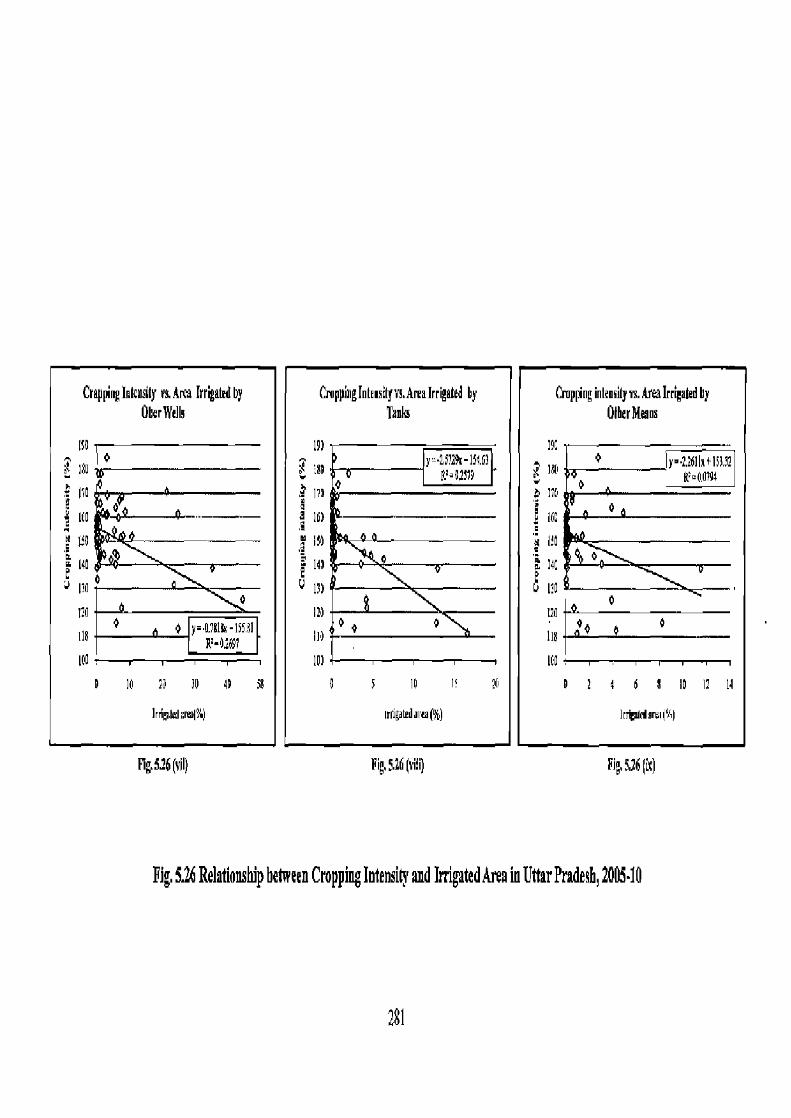
Cropping Inlcnsily vs. Area Irrgand by CrappingInleriglvs.Araa1rrigaled by Cropping inleusily vs. Area Irrigated by OherWdls
,~~'
Tanta
97 y-2,S12R-IS4.67
IBD A'=01119
OIherMeans
196 6 726II HS331 y=
I?i k00794
f0 d
180
t 110 3 ° 170
Ifi7 y° 16C
t!o — tl Ifo ° a eo n 140
u0 In 3 1!0 0
ID 4 °
° 0
I10 20
110
110 4 ymusIh-ISS31
IOU F-91697
10)
0 5 10 I 20 160
D 1 4 6 a 10 17 14 0 10 iJ 30 40 30
Irri iM riJ°6) IIAgacdarc(*) Irt4rl3mqViJ
}1g.5.$(vii) Fig, 5.26 (ehi) Fig, 5.16 p[)
Fig. 5.26 Relationship between Cropping Intensity and Irrigated Area in Uttar Pradesh, 200510
281
correlation of tubewell irrigated area was also found with net irrigated area and more
than once irrigated area (Table 5.24). A close look of table highlights the fact that
canal irrigated area in the state shows a low but negative relationship with cropping
intensity with the coefficient value of -0.193. A negative correlation was also
observed in canal irrigated area, net irrigated area and area irrigated more than once.
This shows that high tubewell irrigated area has played a powerful role in increasing
the net irrigated area in the districts that lead to high cropping intensity by putting
more land under irrigated cropping, in comparison to the districts which have high
irrigated area under canals because tubewells provide adequate and timely irrigation
and enhance the possibilities of double, triple or multiple cropping, and thus ease in
increasing the area under cultivation (Narayana et al. 1982). Irrigated area by other
wells and tanks presents a negative correlation. It may be concluded from Tables
5.22 and 5.24 that high cropping intensity in most of the districts of the state is an
outcome of adequate and reliable supply of irrigation with modem means irrigation.
The figures 5.26 (i) to 5.26 (ix) show the linear regression considering the
variables of irrigation and cropping intensity for the period of 2005-10. Figures i, ii,
v and vi show least but a positive relationship of cropping intensity with net irrigated
area, area irrigated more than once, private tubewells and total area irrigated by
tubewells at 43.46 per cent, 37.48 per cent, 30.76 and 27.25 per cent coefficient of
determination (R2), respectively.
It is depicted that the variances presented in the figures for the variables of
cropping intensity are explained by the -corresponding indicators of irrigation.
Similarly, Figures iii, iv, vii, viii and ix manifest a negative and inverse relationship
among the indicators of canal irrigated area, government tubewells irrigated area,
irrigated area by other wells, tank irrigated area and irrigation through other means
with cropping intensity byway of variances in order of 8.36, 2.78, 26.97, 25.79 and
7.94 per cent. These figures clearly explain the major role played by different
methods of irrigation on cropping intensity in the districts of the state.
282

References
1. Ahmad, A. and Siddiqi, M.F. (1967). Crop Association Patterns in the Luni Basin, The Geographer, Vol. 14, pp. 69-80.
2. Ahmad, Q.M. and Khan, M.F. (1984). Changes in the Cropping Patterns of the Punjab Plains, The Geographer, Vol. 31, No. 1, pp. 14-31.
3. Asawa, G.L. (2005). Irrigation and Water Resources Engineering, New Age International Publishers, New Delhi.
4. Bajpai, N. and Volavka, N. (2005). Agricultural Performance in Uttar Pradesh: A Historical Account, CGSD Working Paper No. 23, Centre on Globalization and Sustainable Development, The Earth Institute, Columbia.
5. Balasubramaniam, I. and Kumar, K.S.K. (2010). Climate Variability and Agricultural Productivity Case Study of Rice Yields in Northern India, Journal of Indian Association of Social Science Institutions, Vol. 29, No. 3 and 4, pp. 123-147.
6. Bhatia, S.S. (1965). Patterns of Crop Concentration and Diversification in India, Economic Geography, Vol. 41, No. 1, pp. 39-56.
7. Chhaukar, A.K. and Mittal, Y.K. (2007). Changing Pattern of Crop Land-use in Dadri Tahsil (Haryana) 1966-93. In: Fifty Years on Indian agriculture: Determinants of Production (Eds. A. Mohammad, A. Munir and S.H. Siddiqui), Vol. II, Concept Publishing Company, New Delhi, pp. 175-189.
8. Doi, K. (1957 and 1959). The Industrial structure of Japanese Prefractures, Proceedings ofIGU Regional Conference in Japan, pp. 310-316.
9. Ghodke, B,D, (2009). A Study of Crop Combination in Daund Tahsil in Pune District, Shod Samiksha our Mulyankan (Hindi) (International Research Journal), Vol. 1, No. 9, pp. 28-31'.
10. GOI (1999). Integrated Water Resource Development: A Plan for Action, Report of the National Commission on Integrated Water Resources Development, Vol. I, Ministry of Water Resources, New Delhi.
11. Government of India (2009). Uttar Pradesh: State Development Report (Vols. I and II), Planning Commission, New Delhi.
12. Husain, M. (1989). Diffusion of High Yielding Varieties of Rice and Wheat in India and Social Tension. In: Food Systems of the World (Eds. M. Shaft and A. Aziz), Rawat Publications, Jaipur, pp. 53-54.
283
13. Johnson, B.L.C. (1958). Crop Association Regions in East Pakistan, Geography, Vol. 42, pp. 86-103.
14. Kachroo, P. (1970). Pulse Crops of India, ICAR, New Delhi.
15. Kapoor, N., Arya, A., Siddiqui, M.A., Kumar, H. and Amir, A. (2011). Physiological and Biochemical Changes during Seed Deterioration in Aged Seeds of Rice (Oryza sativa L.), American Journal of Plant Physiology, Vol. 6, No.1, pp. 28-35.
16. Khan, S.A. (1982). Spatio-Temporal Changes in Crop Regions in Ganga-Yamuna Doab, The Geographer, Vol. 29, No. 1, pp. 57-69.
17. Khanna S.S. and Gupta, R.C. (1988). Raising Production of Pulses, Yojna, Vol. 32, No. 17, pp. 4-8.
18. Mathur, N. (July 30, 2012). Huge Stocks may Keep Wheat Prices in Check, The Economic Times (http://articles.economictimes.indiatimes.com/2012-07-30/news/32942530_1 wheat-production-wheat-prices-wheat-acreage) Accessed on 9 December, 2012.
19. Misra, H.N. and Kumar, R. (2007). Land-use Changes and Food Crop Productivity in India: A Spatio-Temporal Analysis. In: F(fry Years on Indian Agriculture: Determinants of Production (Eds. A. Mohammad., A. Munir and S.H. Siddiqui), Vol. II, Concept Publishing Company, New Delhi, pp. 266-282.
20. Narayana, D., Ratnam, V.C.V. and Nair, K.N. (1982). An Approach to Study of Irrigation: Case of Kanyakumari District, Economic and Political Weekly, Vol. 17, No. 39, pp. A85-A102.
21. Nelson, H.J. (1955). A Service Classification of American Cities, Economic Geography, Vol. 31, pp. 189-210.
22. Pawar, C.T. and Pujari, A. A. (2007). Impact of Irrigation on Agricultural Productivity: A Micro Level Analysis. In: Fifty Years on Indian Agriculture: Determinants of Production (Eds. A. Mohammad, A. Munir and S.H. Siddiqui), Vol. II, Concept Publishing Company, New Delhi, pp. 165-174.
23. Pownall, L.L. (1953). The Functions of New Zealand Towns, Annals of the Association ofAmerican Geographers, Vol. 43, No. 4, pp. 332-350.
24. Rafiullah, S.M. (1965). A New Approach to Functional Classification of Towns, The Geographer, Vol. 12, pp. 40-53.
25. Raja, K, (2012). Complete Information on Area and Production of Wheat in
284

India (http://www.preservearticles.com/2012020422629/completeinformation on-area and-production-of-wheat-in-india.html) Accessed on 8 February, 2012.
26. Raja, K. (2012). Complete information on the Area and Production of Sugarcane in India (http://www.preserveartirles.coni/2012020422702/ completeinformation-on-the-area-and productionof-sugarcane-in-india.html), Accessed on 29 May, 2012,
27. Rathod, H.B. and Naik, V.T. (2009). Agricultural Land Use Cropping Pattern in Yavatmal District, Shod Samiksha our Mulyankan (International Research Journal), Vol. 2, No. 6, pp. 780-782.
28. Sathe, D. and Agarwal, S. (2004). Liberalisation of Pulses Sector: Production, Prices and Imports, Economic and Political Weekly, Vol. 39, No. 30, pp. 3391-3397.
29. Shall, M. (1984). Agricultural Productivity and Regional Imbalances, Concept Publishing Company, New Delhi.
30. Shakeel, A. and Hashmi, N.I. (2012). Changing Spatial Pattern, Trend and Regional Imbalances in Pulse Production in Eastern Uttar Pradesh, India, .Journal of Agricultural Extension and Rural Development, Vol. 4, No. 7, pp. 129-140.
31. Sharma, K.R. (2000). Groundwater Management for Sustainable Agriculture, Indian Farming, Vol. 49, No. 11, pp. 42-46.
32. Siddiqi, M.F. (1967). Combinational Analysis: A Review of Methodology, The Geographer, Vol. 14, pp. 81-99.
33. Singh, H. (1965). Crop Combination Regions in the Malwa Tract of Punjab, Deccan Geographer, Vol. 3, pp. 21-30.
34. Singh, S. (1992). Dynamics of Cropping Pattern in Northern India. In: Spatial Dimensions of Agriculture (Ed. N. Mohammad), Concept Publishing Company, New Delhi.
35. Singh, S. (1994). Agricultural Development in India: A Regional Analysis, Kaushal Publications, Shillong.
36. Singh, V.R. (1989). Land-use Change in the Tarai Region of Uttar Pradesh, India. In: Land-use Change Proceedings of the Asahikawa-Sapporo International Symposium (Ed. R.D. Hill), Hong Kong University Press, pp. 63-76.
285
37. Spate, O.H.K. and Leamtonth, A.T.A. (1967). India, Pakistan and Ceylon: The Regions, Methuen and Co., London.
38. Sundaram, I.S. (2010). India Needs a Pulse Revolution, Facts for You, December, pp.10-12.
39. Suthakar, K. and Bui, E.N. (2008). Land Use/Cover Changes in the War-ravaged Jaffha Peninsula, Sri Lanka,. 1984-early 2004, Singapore Journal of Tropical Geography, Vol. 29, No. 2, pp. 205-220.
40. Thakur, R. (2007). Crop-Combination Regions in South Bihar Plain. In: A. Mohammad, A. Munir and H. Rehman (Eds.), Fifty Years of Indian Agriculture: Production and Self-sufficiency, Vol. I, Concept Publishing Company, New Delhi, pp. 310-322.
41. Todkari G.U., Suryawanshi S.P., Suryawanshi M.V. and Patil B.D. (2010). Agriculture Land Use Pattern in Solapur District of Maharashtra, International Journal ofAgriculture Sciences, Vol. 2, No. 2, pp.1-8.
42. Tripathi, V.B. and Agarwal, U. (1968). Changing Patterns of Crop Land Use in the Lower Ganga-Yamuna Doab, The Geographer, Vol.15, pp.128-140.
43. Verma, N.M.P. (1993). Irrigation in India: Themes on Development, Planning, Performance and Management, M.D. Publications, Pvt. Ltd, New Delhi.
44. Vyalij, P.Y. (2009). A Spatio-Temporal Analysis of Crop Combination in Nasik District of Maharashtra, Shod Samiksha our Mulyankan (Hindi) (International Research Journal), Vol. 2, No. 6, pp.775-777.
45. Weaver, J.C. (1954). Crop-Combination Regions in the Middle West, Geographic Review, Vol. 44, No. 2, pp. 175-200.
46. Weaver, J.C. (1954). Crop-Combination Regions for 1919 and 1929 in the Middle West, Geographical Review, Vol. 44, No. 4, pp. 560-572.
286
Chapter VI
/Measurement of Agricultural and Water Productivity
CHAPTER VI MEASUREMENT OF AGRICULTURAL AND WATER
PRODUCTIVITY
This chapter deals with the measurement of land and water productivity of
major crops that play a significant role in agricultural development in the state. Crop
productivity and demarcation of productivity regions have been considered by taking
into account major groups of crops-cereals, pulses, oilseeds and cash crops by
applying Yang's `crop yield index' method. Further, crop water requirements, i.e. the
evapotranspiration, during the crop growing seasons were calculated applying a
statistical formula devised for this purpose and water productivity for four major
crops of wheat, rice, maize and sugarcane were measured for each district of the
state. As there are substantial variations in water productivity, some measures have
also been put forward for increasing water productivity in the crops considered.
A. Measurement of Agricultural Productivity and Productivity Regions
a. The concept of agricultural productivity
Agricultural productivity refers to the output produced by a given level of
input(s) in the agricultural sector of a given economy (Fulginiti and Perrin, 1998). It
can be defined as the ratio of the index of total agricultural output to the index of
total input used in farm production (Olayide and Heady 1982; Shaft, 1984). It is,
therefore, a measure of efficiency with which inputs are utilised in production, other
things being equal. It is physical rather than a value concept that describes
relationship between output and the major inputs utilized in production (Zaman and
Rahman, 2009). Measurement of crop productivity is one of the important concepts to
examine the performance of agriculture and its transformation. It includes
ascertaining the impact of technological advancement, effective management of
available water resources and organizational set up for the agricultural production.
These factors in turn affect the relative productivity in a region, In order to mark out
variations in agricultural productivity, attention of many of the researchers and planners has been focused in India as well as in other countries of the world.
Productivity of the crop is judged not only from the view of quantity but also
variety and quality of crop produce. Irrigation water and its adequate availability not
287 .`~,`

only enhances productivity per hectare but also promotes adoption of new
agricultural technology embodied in the form of use of HYVs, fertilizers and plant
protection measures along with the practices of improved water management.
Accelerated development of irrigation may substantially boost the prospects for
raising agricultural production provided it is accompanied by appropriate
technological developments and more efficient water management. Another desirable
influence of irrigation is that, it induces a higher degree of stability in yields per
hectare and thereby, reduces fluctuations in production levels. Thus, irrigation
together with new technology package raises substantially the productive capacity of
land.
Agricultural productivity in India in terms of output per unit area and per
worker is low in comparison to the world averages and has attained the same status
for many decades. The most significant development in agricultural productivity in
India has been in recent years in the form of a shift from traditional based agriculture
to modem methods. Modem agriculture has ushered a change in techniques and use
of production inputs that were unknown to farmers few decades ago. This change has
increased considerably the yield per hectare of several crops and thereby average
productivity. However, the average yields of many crops are stilt below the world
averages and far behind the developed countries of Europe, Anglo America, and even
some Asian countries (Doorenbos and Pruitt, 1977). The unimpressive change in
average productivity in India is due to unequal diffusion of new agricultural
technology from one area and crop to another. In some regions, where the new
agriculture has taken a firm hold, productivity has recorded a remarkable increase,
whereas in other regions it has changed a little (Dayal, 1984).
b. Agricultural productivity and methods of its measurement
Definition and measurement of productivity in agriculture has always been
debatable. Analysis of agricultural productivity has attracted the attention of a large
number of geographers and economists working in this discipline. Many attempts
have been made to measure it and marked out the variations in food crop
productivity in India as well as in other countries of the world. In an earlier attempt,
Thompson (1926) measured productivity of British and Danish farming by taking
into consideration seven aspects related to farming: the yield per acre of crops; the
number of livestock per 100 acres; the gross production or output per 100 acres; the
288

production of arable land; the number of persons employed; the cost of production
expressed in terms of wages and labour costs, rent or interest an capital; and prices,
relative profitability and general economic conditions. Ganguli (1938) presented a
theoretical discussion for computing productivity in agriculture in the Ganga Valley
(India). Firstly, he took into account the area under any crops `A in a particular unit
area belonging to a certain region. This area is expressed as a proportion of the total
cropped area under all the selected crops. Secondly, Ganguli tried to obtain the index
number of yield. This is found by dividing the yield per hectare for the entire region
as the standard. This yield may be expressed as a percentage and the percentage may
be regarded as the index number of yield. Thirdly, the proportion of area under A and
the corresponding index number of yield were multiplied. There are two apparent
advantages of this method, i.e. (a) the relative importance of the crop A in that unit of
study, and (b) the yield of crop A in comparison to the regional standard. The product
thus obtained indicates actually an index of the contribution of crop A to the
productivity of the unit considered. Kendall (1939) treated it as a mathematical
problem and initiated a system of four coefficients (a) productivity coefficient, (b)
ranking coefficient, (c) money value coefficient and (d) starch equivalent or energy
coefficient. Kendall pointed out that the productivity coefficient and the ranking
coefficient are concerned only with the yield per acre, but are not in any way weighted according to the volume of production. He, therefore, evolved a measure of
crop productivity by using index number technique. In this technique the yield of
different crops are expressed in terms of some common units. Kendall pointed out
that, there are two common units which can be taken note of: first, the money value
`as expressed in price' and second, energy 'as expressed in starch value equivalent.'
Hirsch (1943) has suggested, `Crop Yield Index' as the basis of productivity
measurement. According to him, it expresses the average of yields of various crops
on a farm or in a locality relative to the yield of the same crops on another farm in a
second locality. Zobel (1950) has attempted to examine the labour productivity. He
considered productivity of labour as the ratio of total crop output to the total man-
hours consumed in the production of that output, resulting in an estimate of output
per man-hour. Stamp (1952) applied Kendall's ranking coefficient technique on an
international level to determine agricultural efficiency considering a number of
countries as well as some major crops. Huntington and Valkenburg (1952) considered
land productivity on the basis of acre yields of eight crops raised very widely in
289

Europe as a whole, and assumed as an index per 100 for it, and thus calculated the
specific yield index of each country. Stamp (1958) suggested a method for measuring
the agricultural productivity, i.e., to convert total agricultural production in calories.
The calorie intake is a measure of the general health of a person because it
determines the amount of heat and energy needed by the human body. Shafi (1960)
applied the technique 'ranking coefficient' of Kendall for measuring the agricultural
efficiency in the state of Uttar Pradesh taking into account eight food crops grown in
each of forty-eight districts of the state for two quinquennial years ending 1952 and
1957.
Loomis and Barton (1961) have measured United States agricultural input
and productivity in aggregate. To them, aggregate productivity depends upon
conceptually consistent measures of agricultural output and input. The measures of
inputs include all the production factors that depend directly on the decisions of
farmers. Meiburg and Brandt (1962) have surveyed the earlier indices relating to
agricultural output, e.g., output estimates of total productivity of the United States.
Mackenzie (1962) has measured the efficiency of production in Canadian agriculture
by using the coefficient of output relative to input. He mentioned that the concept of
productivity measurement in agriculture is difficult to define and even more difficult
to quantify.
Oommen (1962) while working out the trends of productivity in agriculture
of the state of Kerala (India) has measured productivity on the basis of yield per acre.
Enyedi (1964), while describing geographical types of agriculture in Hungary refers
to a formula for determining agriculture productivity. Herring (1964) has suggested
that the concept of productivity is based not only on the single relationship between
output and input but rather on the differences between two or more relationships, i.e.,
differences in the same agricultural region or sub-region as between successive
periods (in time), and between similar agricultural regions in different countries or
regions during the same period (in space).
Sapre and Deshpande (1964) have attempted to refine further the Kendall'a
`ranking coefficient method'. For this, they used 'weighted average of ranks' instead
of the simple average of ranks. Thus, it incorporates the proportion of crop area to
the total cropped area of the district. Khusro (1965) has linked assessment of
productivity with the output per unit of a single input and output per unit of cost of
all inputs in the agricultural production. Saran (1965) has applied Cobb-Douglas
290

`Production Function' approach for the measurement of productivity. The common
purpose of this function is to express input/output relationship between several inputs
and one output in the agricultural systems. Shaft (1965) has assessed the productivity
on the basis of labour population engaged in agriculture. According to him, it can be
computed by dividing the gross production in any unit area by the number of man-
hours or less precisely by the numbers employed in agriculture. Agarwal (1965) has
suggested 'Factorial Approach' while measuring agricultural efficiency in Bastar
district of Madhya Pradesh. A number of human controlled factors relating to
agricultural production as: crop superiority, crop commercialization, crop security,
land use intensity and power input have been selected, excluding the environmental
factors.
Dovring (1967) has measured the productivity of labour in the United States
agriculture in aggregate since 1919 to 1954 for the entire period, as well as
commodity-wise. Bhatia (1967) while assessing the changes and trends in
agricultural efficiency in Uttar Pradesh during 1953-1963 adopted Ganguli's method
of productivity measurement. Shaft (1967 and 1969) applied Stamp's `Standard
Nutrition Unit' technique for measuring the efficiency of agriculture in India. He
considered the district as the areal unit and has selected all the food crops grown in
the country. Sinha (1968) has adopted a standard deviation formula to determine
agricultural efficiency in India. For this purpose he selected all the twenty-five major
crops grown in the country these were grouped into as: cereals, pulses, oilseeds and
cash crops and specific yields per hectare of cereals, pulses and oilseeds were taken
into account.
Shaft (1970) attempted to compute the index of productivity coefficient
following the formula initiated by Enyedi for each district of India with regard to
twelve food crops. In another study Shafi (1972), while commenting on the formula
presented by Enyedi in determining productivity index of an area with reference to
the national scale pointed out that there are certain cases where the results obtained
by the formula are influenced by the magnitude of the area under a particular crop
when the yield of the district is either the same or is less than the national yield.
Reliman (1976) while examining the impact of mechanization on food crop
productivity in the districts of Uttar Pradesh applied Kendall's ranking coefficient
method.
Bhalla (1978) considered output per person on constant average price for
291

measuring the productivity of labour in Indian agriculture on the basis of nineteen
crops grown during the triennials 1962-65 and 1970-73 for each district of the
country. Singh (1979) devised a method for presenting a two-dimensional picture of
agricultural productivity comprising two components, viz., intensity and spread
considering three variables (i) yield, (ii) grain equivalent, and (iii) cropping system in
the districts of Andhra Pradesh state. Accordingly, a relative share of intensity and
spread for each micro unit (district) has been computed to the macro unit (state)
separately for the above three variables with the help of equations that have been
derived.
Bhalla and Tyagi (1989) followed a method of production aggregation (in
terms of money) which can be considered a method noticeable for showing
diversification in agricultural production patterns in India. However, there is still a
question among scholars whether total production of crops achieved on a piece of
land is considered, which a product of many factors like agro-ecological conditions
of land, technological enhancement and labour employed for agriculture. If it is a
result of combination of all such geographical factors, the question of isolating
effects of such different production factors is still debatable (Sharma, 2012). Rehman
and Hussain (2003) in their study of North Bihar Plain used Kendall's method of
ranking coefficient for measuring agricultural efficiency considering nine major
crops grown for two periods of 1990-95 and 1995-2000. Zanian and Rahman (2009),
and Utnar and Rehman (2011), while determining productivity regions in the Ganga-
Yamuna doab and in the state of U.P., respectively applied Yang's Crop Yield Index
method.
c. Agricultural Productivity Regions: Based on Crop Yield Index method
For the present study, productivity indices were calculated following Yang's
Crop Yield Index method (1965) for three consecutive periods of time, i.e. 1995-
2000, 2000-05 and 2005-10. Computation of crop yield index involved the yield of
all crops grown in the district compared with the average crop yield of the entire
region. Before calculating the crop yield index for a particular farm, the average
yield of each of the crops grown in the region must be determined. Then, by dividing
the yield per hectare of a crop on a particular farm by the average yield of the crop in
the region, a percentage figure is obtained which when multiplied by 100, gives the
index number, as shown in column 5 (Table 6.1). By using the area devoted, to each
292
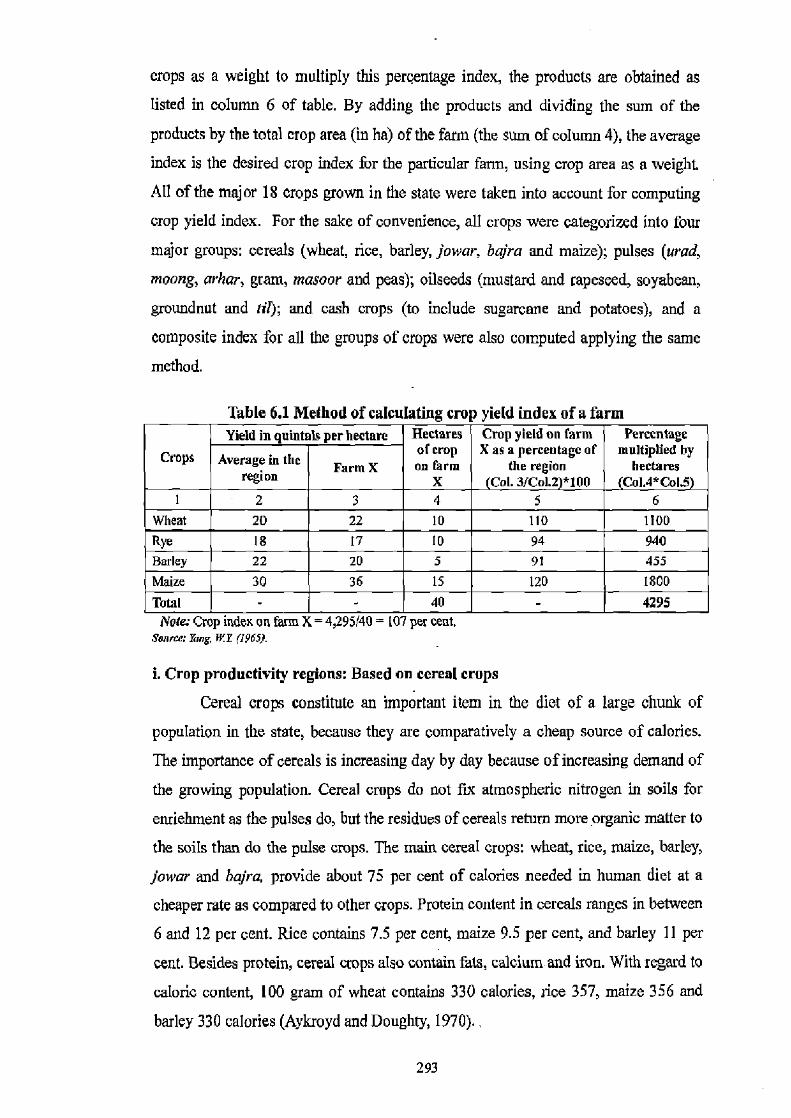
crops as a weight to multiply this percentage index, the products are obtained as
listed in column 6 of table. By adding the products and dividing the sum of the
products by the total crop area (in ha) of the farm (the sum of column 4), the average
index is the desired crop index for the particular faun, using crop area as a weight.
All of the major 18 crops grown in the state were taken into account for computing
crop yield index. For the sake of convenience, all crops were categorized into four
major groups: cereals (wheat, rice, barley, jowar, bajra and maize); pulses (urad,
moong, arhar, gram, masoor and peas); oilseeds (mustard and rapeseed, soyabean,
groundnut and ti!); and cash crops (to include sugarcane and potatoes), and a
composite index for all the groups of crops were also computed applying the same
method.
Table 6.1 Method of calculating crop yield index of a farm
Crops
Yield in quintals per hectare Hectares of crop on farm
X
Crop yield on farm X as a percentage of
the region Col. 3/CoL2 *100
Percentage multiplied by
hectares (CoI.4*CoIS)
Average in the region Farm X
1 2 3 4 5 6 Wheat 20 22 10 110 1100 Rye 18 17 10 94 940 Barley 22 20 5 91 455 Maize 30 36 15 120 1800
Total - - 40 - 4295 Nofe: Crop index on Win X = 4,29514U = [07 per cent.
So,wee: Y ng, WY (1965).
i. Crop productivity regions: Based on cereal crops
Cereal crops constitute an important item in the diet of a large chunk of
population in the state, because they are comparatively a cheap source of calories.
The importance of cereals is increasing day by day because of increasing demand of
the growing population. Cereal crops do not fix atmospheric nitrogen in soils for
enrichment as the pulses do, but the residues of cereals return more organic matter to
the soils than do the pulse crops. The main cereal crops: wheat, rice, maize, barley,
jowar and bajra, provide about 75 per cent of calories needed in human diet at a
cheaper rate as compared to other crops. Protein content in cereals ranges in between
6 and 12 per cent. Rice contains 7.5 per cent, maize 9.5 per cent, and barley 11 per
cent. Besides protein, cereal crops also contain fats, calcium and iron. With regard to
caloric content, 100 gram of wheat contains 330 calories, rice 357, maize 356 and
barley 330 calories (Aykroyd and Doughty, 1970)..
293
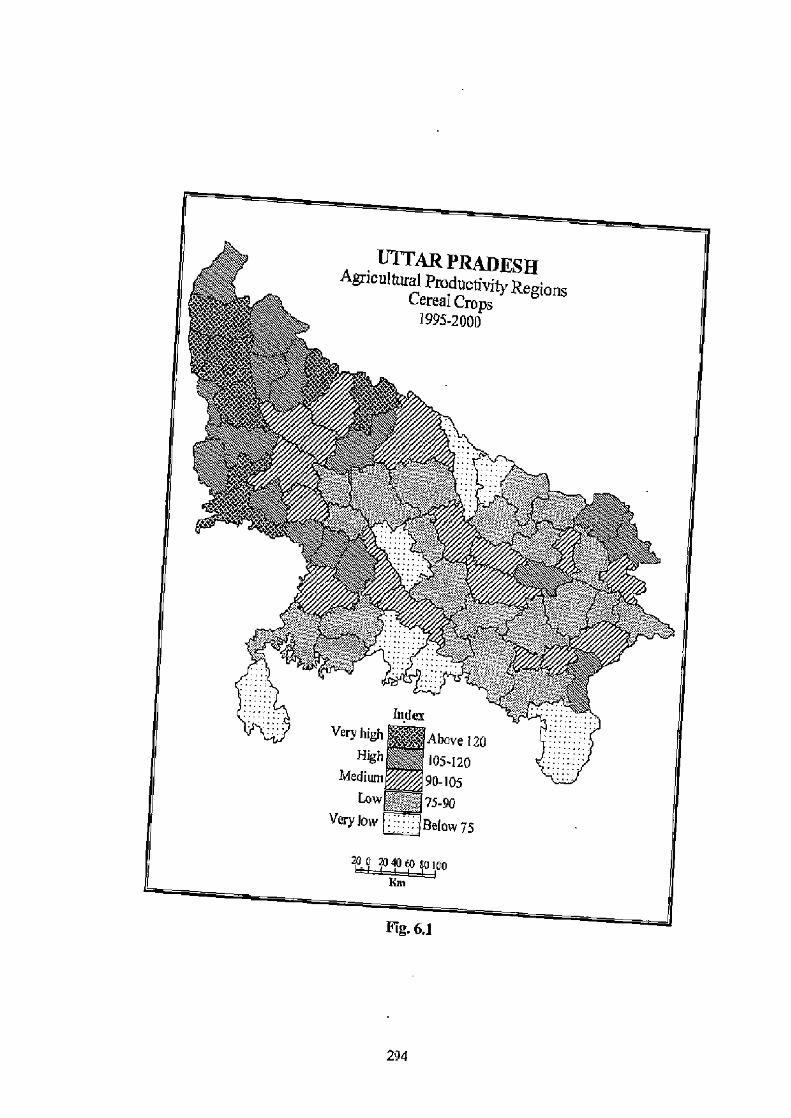
UTTAR PRADESH Agricultural Productivity Reg[cps
Cereal Crops 1995-2000
~a Index wl7 Very high Above 120
High 105.120
Medium 90-105 Cow's,: 75-90
Very 1°w LiBelow 75
mo JOo w.,
Fig. 6.1
294

Crop yield indices were computed on the basis of Yang's method for cereals,
pulses, oilseeds and cash crops during the periods of 1995-2000, 2000-05 and 2005-
10. During the period of 1995-2000, very high productivity of cereals was seen in the
districts of upper Ganga-Yamuna doab namely, Bulandshahr (132.35), Meerut
(13231), Baghpat (131.22), Ghaziabad (125.79) and Muzaffamagar (123.38), the
districts of Hathras (127.06) and Agra (122.69) of middle doab and two districts of
Rohilkhand plains namely, Pilibhit (122.79), and Rampur (120.22) also belonged to
this category. Following these, there were 16 districts which lie in the Ganga-
Yamuna doab and Rohilkhand plains of the state including some eastern districts
namely, Maharajganj, Kushinagar, Ambedkar Nagar and Chandauli, also recorded
high productivity with index values between 105 and 120, whereas, an equal number
of districts had medium productivity with index values in between 90 and 105, which
did not form a contiguous belt and scattered in all parts of the state, except the
districts of upper doab (Fig. 6.1). Low productivity (75-90) was marked in 22
districts, and 7 districts namely, Unnao (74.62), Chitrakoot (70.57), Shrawasti
(64.06), Banda (61.88), Bahraich (61.19), Lalitpur (60.82) and Sonbhadra (58.77)
characterized with very low productivity.
During the period of 2000-05, the highest productivity was recorded by
Bulandshahr district (133.16) of upper doab and the Lowest in Mahoba (57.81)
district of Bundelkhand region. Diving this period, the number of districts in the
category of high productivity (105-120) increased from 16 in 1995-2000 to 24 during
2000-05 (Table 6.2). It is evident from Fig. 6.2 that, the districts extending from
Saharanpur in the north up to Kanpur Nagar in the Cranga-Yamuna doab, almost all
the districts of Rohilkhand plains, and the districts Kheri and Barabanki of Awadh
plains, along with 3 eastern districts attained very high and high productivity during
this period. Medium productivity was seen in 14 districts, most of these were lie in
Awadh and Purvanchal regions. Low productivity was marked in 19 districts, and 3
districts of Bundelkhand region and Sonbhadra of Purvanchal formed a region of
very low productivity.
It is shown in Fig. 6.3 that, during 2005-10, very high productivity of cereal
crops was recorded in 10 districts which belonged entirely to the Ganga-Yamuna
doab and Rohilkhand plains. The district of Ghaziabad recorded the highest
productivity with an index value of 130.41.
295
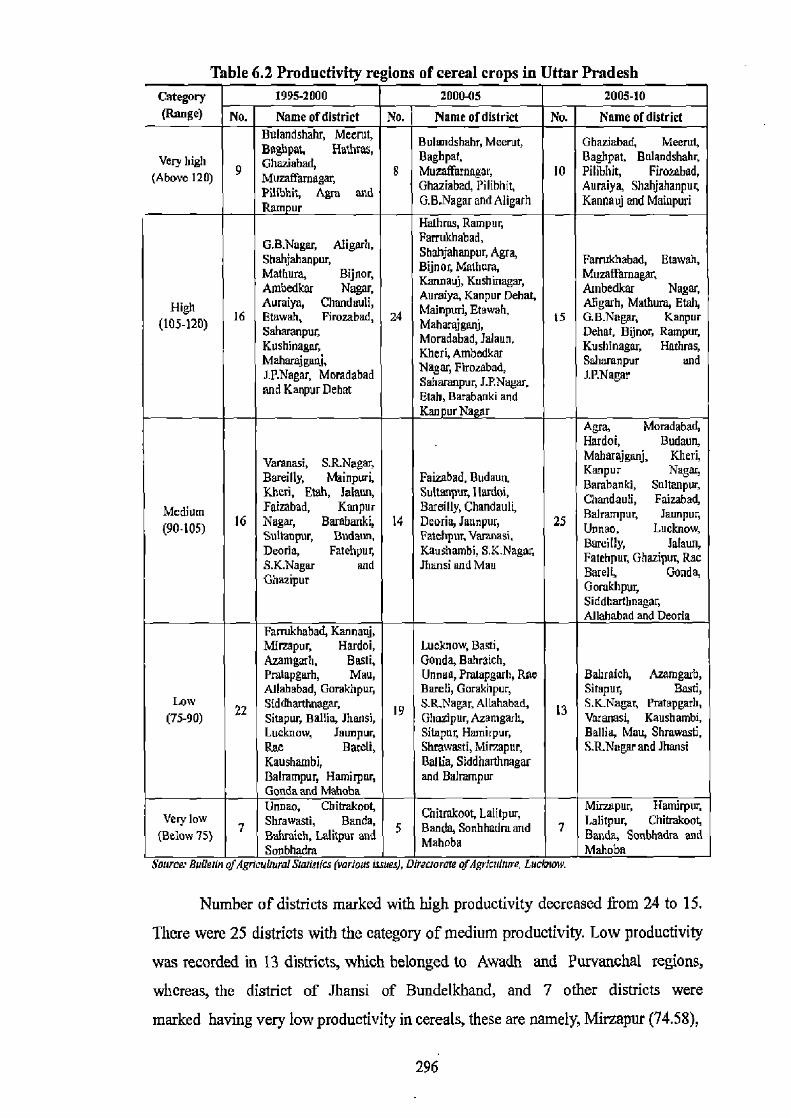
Table 6.2 Productivity regions of cereal crops in Uttar Pradesh Category 1995-2000 2000-03 2005-10
(Range) No. Name of district No. Name of district No. Name of district Bulandshahr, Meemt, Baghpat, Hathra5, Bulmidshahr, Meerut, Ghaziabad, Meerut,
Very high Mhazisban, Bag~pat, Begrpat, Bulandshshr,
(Above 1
20) 9
Muzaffarnagar, g Muzffama@ar, 10 Piibhit, Firoiabed,
Agra
and Ghaziabad, Pilibhit, Auraiya, ShahjahanpurPilibhik, Ram ur
G.B.Nagar and Aligarh Kandeuj and Mainpuri
tlalhras, Rampur,
G.B.Nagar, Aligarh, Fertukhabad,
Shahjahanpm , ra Shabjahanpur, Agra, Farrukhabad, Etowah,
Amboda, Nagar, Bijnor, Muthma, Kannauj, Kusfiinagar, Muzaffamagar,
Ambedkar N agar, Auraiya, Kanpur Dehal, Arnbedkar Nagar,
High Auwah, Chromba i, Mainpuri, Etawah, Ali uh, Mathura, Emh, g (105-120) 16 Saharan Firorabad, 24 Mt~j~j IS ay Kanpur Dehat,
S~ pw Moradabad, lalaun, Dehat, Bijrwr, Rampuq Kushinagar, Kheci,Ambenker Kushinagar, Hethand M~~j~j
Nagar, Firozabad, Saharanpur and 1.P.Nagar, Morzdabad Saharanpur, J.P.Nagar, 1.P.Nagar and Kanpur Dehm Etah, Barabanki and
Kan urNa r Agra, Momdabad, Hardoi, Budaun,
Varanasi, S.RNagar, Maharajganj, Kheri,
Bareilly, Mainpuri, Faizabad, Budaun, Kanpur Nagar, Barabanki, Sultanput Kheri, Etsh, ]slaw, Su1tanpur'lIardai, RhsWdauIi, Faizabad,
Medium Faizabad, Kanpur Baroilly, Chandauli, 8alrampur, (90-105) 16 Nagar, Bmabanki, 14 Beuria, Jaunpur, 25 Unnao, LnekWaw Lucknow, Sultanpur, Budaun, Fatehpur,Varnmsi, Benhpy, Deoda, Fatehpur, Kaushambi, S.K.Nagar, ur, Rae
S.K.Nagar and Jhansi and Mau Buell, Ghazipur, Rae Gonda, Ghazipur Gorakhpur, Gomkhpur,
Sitldharthnags, Allahabad and Death
Farnikhabad, Kannauj, Minpur, Hardoi, Lucknow, Bassi, Azamgarh, Bests, Gonda, Bahraich, Pratapgarh, Mau, Unnao, Pndapgarh, Rae Bahraich, Azamgurh, Allahabad, Gorakhpur, Bards, Gorakhpur, Sitapuy Basti,
LOW 22 Siddhart nagar, 19 S.RNagzr, Allahabad, 13 S.K-Nagar, Pratapgarh, (75-90) Sitapur, Ballia, Jhansi, Ghazipur, Azamgarh, Varanasi, Kaushambi,
Lucknow, Jaunpur, Sitapur, Hamirpur, Ballia, Mau, Shmwas6, Rae Bare(i, Shrawasti, Mirzapur, S.RNagar and Jhansi Kaushambi, Ballia, Siddharthnagar Balmmpur, Harnirpur, and Balrsmpur Gonda and Mahoba Unnao, Chifra&OI Chivakoot, Lallipur, Minupur, Hamirpur,
Very low 7 7
SIvawatts. Banda, 5 Banda, Sonhhadm and 7 Is1itpuq CbiicakooS (Below 75) Bnhraich, Lalitpur and
Mahoba Bantle, Sonbhadra and
Sonbhadra Mahoba Sumce: Rowan ofAgricultural Starissirs (various Issues), Direcctnrare ofAgdndnne, Luclaio ..
Number of districts marked with high productivity decreased from 24 to 15.
There were 25 districts with the category of medium productivity. Low productivity
was recorded in 13 districts, which belonged to Awadh and Purvanchal regions,
whereas, the district of Jhansi of Bundelkhand, and 7 other districts were
marked having very low productivity in cereals, these are namely, Mirzapur (74.58),
296
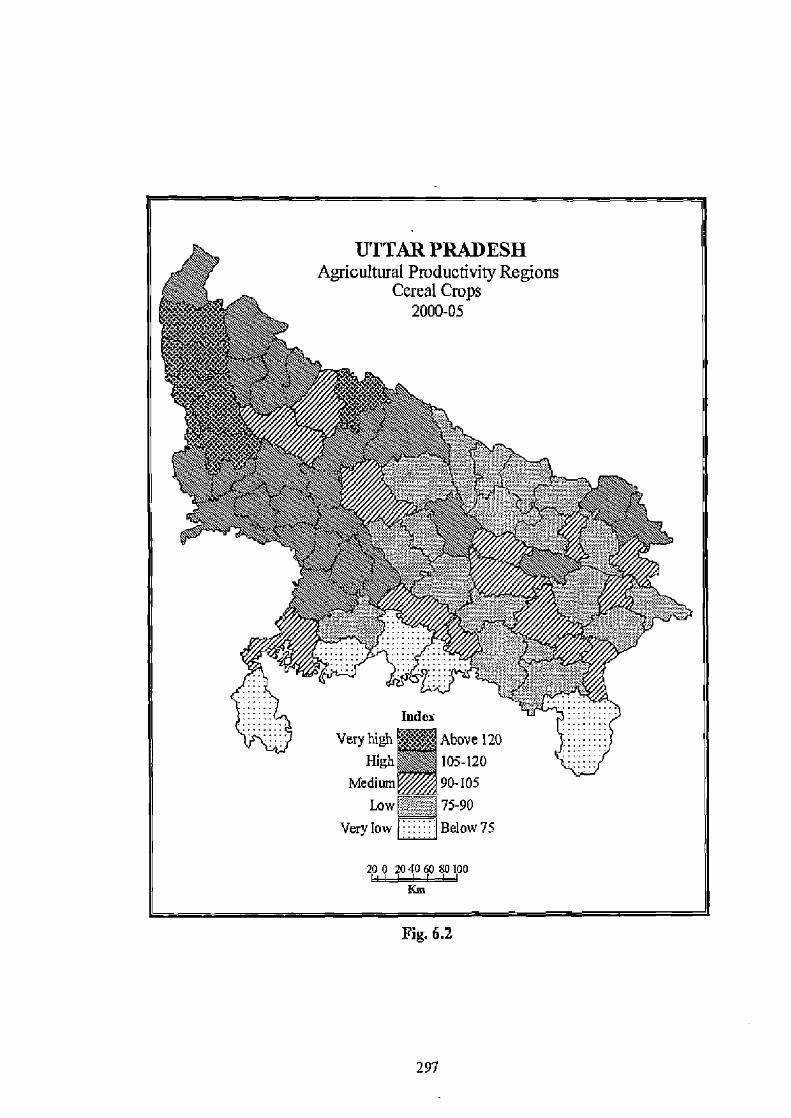
UTTAR PRADESH Agricultural Productivity Regions
Cereal Crops 2000-05
S_ Index
Very high Above 120
High 105-120
Medimn 90-105
Low ;t 75-90
Very low Below 75
20 200 40 b0 SO loo K.
Fig. 6.2
297
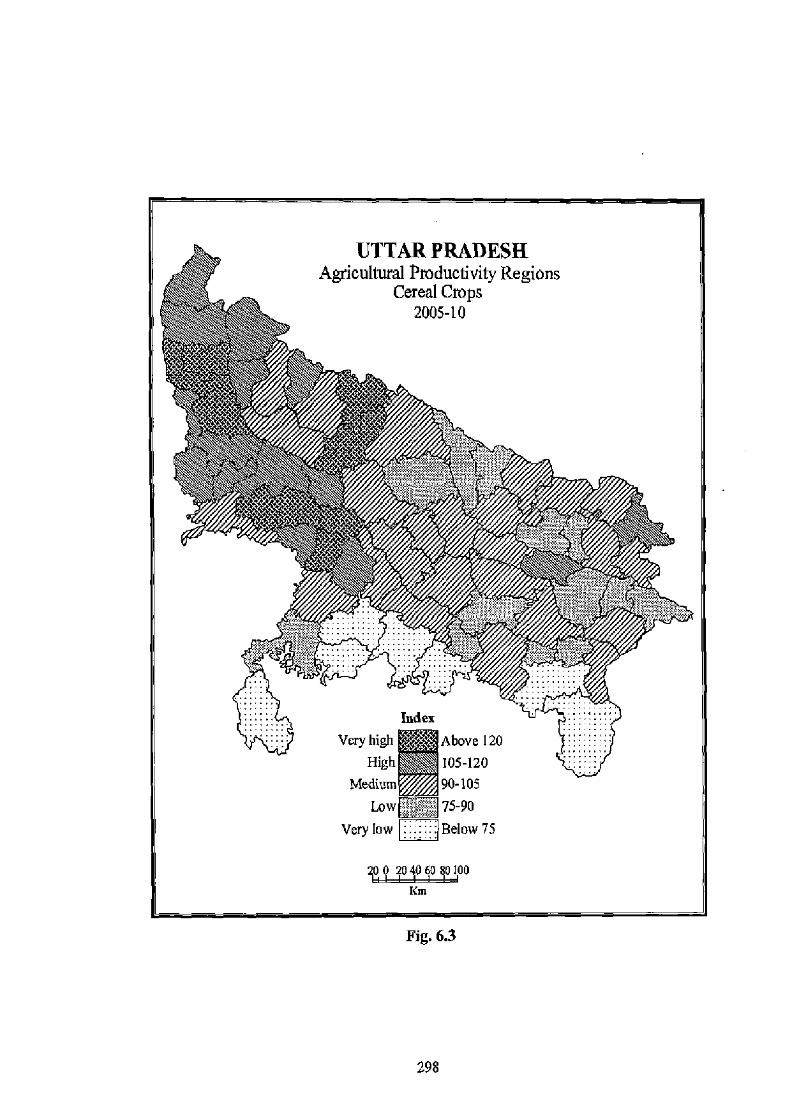
Fig. 6.3
298
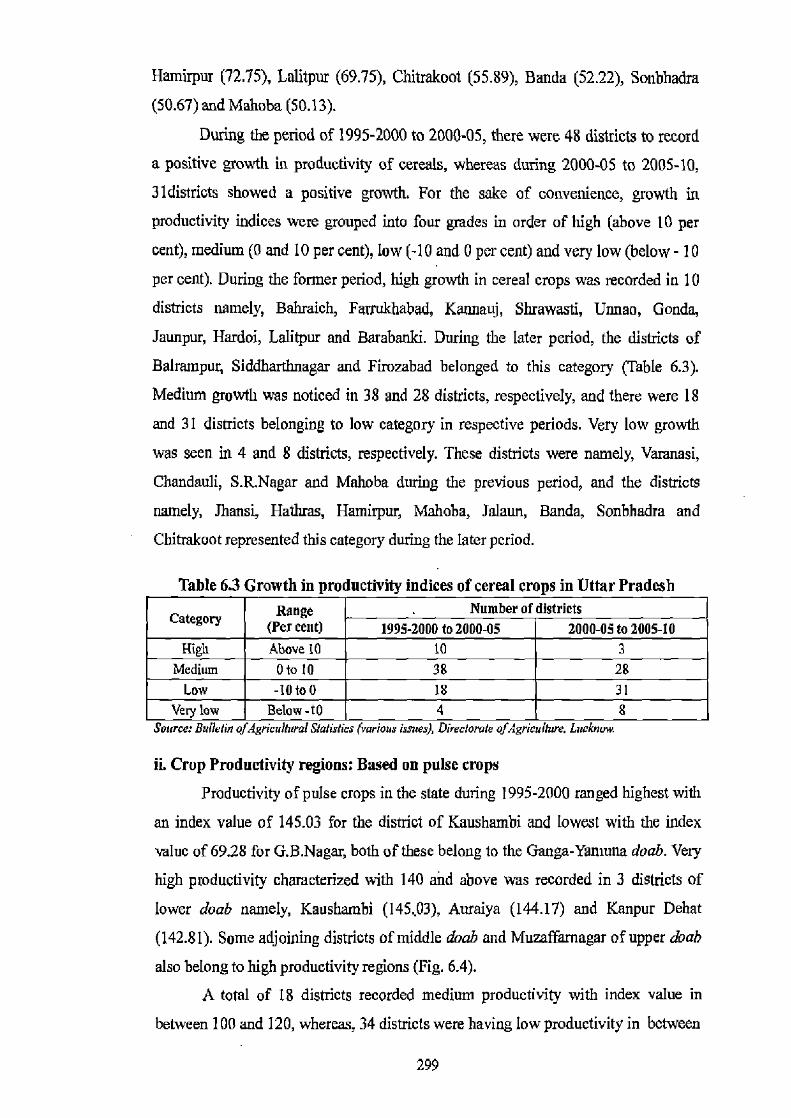
Hamirpur (72.75), Lalitpur (69.75), Chitrakoot (55.89), Banda (52.22), Sonbhadra
(50.67) and Mahoba (50.13).
During the period of 1995-2000 to 2000-05, there were 48 districts to record
a positive growth in productivity of cereals, whereas during 2000-05 to 2005-10,
3ldistricts showed a positive growth. For the sake of convenience, growth in
productivity indices were grouped into four grades in order of high (above 10 per
cent), medium (0 and 10 per cent), low (-10 and 0 per cent) and very low (below -10
per cent). During the former period, high growth in cereal crops was recorded in 10
districts namely, Bahraich, Farnikhabad, Kaanauj, Shrawasti, Unnao, Gonda,
Jaunpur, Hardoi, Lalitpur and Barabanki. During the later period, the districts of
Balrampur, Siddharthnagar and Firozabad belonged to this category (Table 6.3).
Medium growth was noticed in 38 and 28 districts, respectively, and there were 18
and 31 districts belonging to low category in respective periods. Very low growth
was seen in 4 and 8 districts, respectively. These districts were namely, Varanasi,
Chandauli, S.R.Nagar and Mahoba during the previous period, and the districts
namely, Jhansi, Hathras, Hamirpur, Mahoba, Jalaun, Banda, Sonbhadra and
Chitrakoot represented this category during the later period.
Table 6.3 Growth in productivity indices of cereal crops in Uttar Pradesh
Category Range (Per cent)
Number of districts 1995-2000 to 2000-05 2000-05 to 2005-10
High Above 10 to 3 Medium 0 to 10 38 28
Low -10 too 18 31 Very low Below -l0 4 8
)'mace: Bulletin aJAgriculh rat Statistics (various issues), Uireclorate ojAgriculhve. Liwknaw.
ii. Crop Productivity regions: Based on pulse crops
Productivity of pulse crops in the state during 1995-2000 ranged highest with
an index value of 145.03 for the district of Kaushambi and lowest with the index
value of 69.28 for G.B.Nagar, both of these belong to the Ganga-Yanmna doab. Very
high productivity characterized with 140 and above was recorded in 3 districts of
lower doab namely, Kaushambi (145:03), Auraiya (144.17) and Kanpur Dehat
(142.81). Some adjoining districts of middle doab and Muzaffamagar of upper doab
also belong to high productivity regions (Fig. 6.4).
A total of 18 districts recorded medium productivity with index value in
between 100 and 120, whereas, 34 districts were having low productivity in between
299
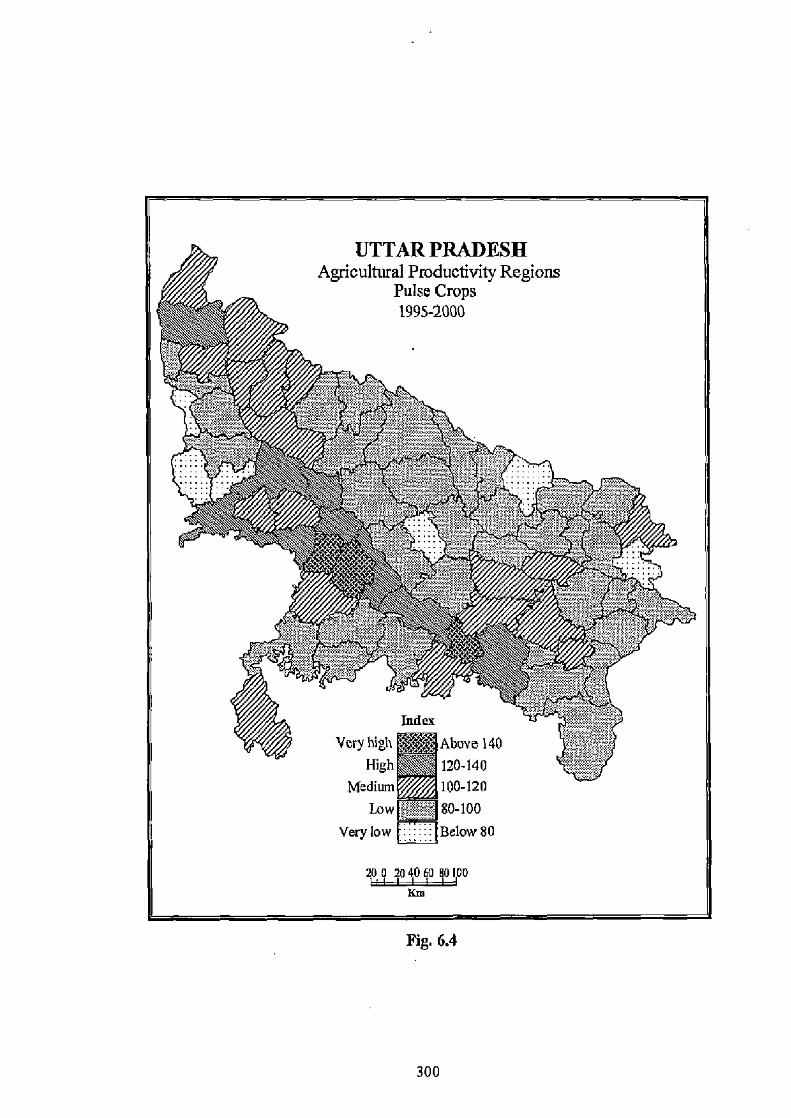
UTTAR PRADESH Agricultural Productivity Regions
Pulse Crops 1995-2000
Index Very high Above 140
High 120-140 Medium 100-120
Low 80-100 Very low Em: Below 80
200 204060 ROIo0
Fig. 6.4
300

Table 6.4 Productivity regions of pulse crops in Uttar Pradesh Category 1995-2000 2000-0S 2005-10 (Range) No. Name of district No. Name of district No. Name of district
Moradabod, J.P.Nagar, J.PNagar, Mumdabad, Very high Kaushm ubi, Auraiya Kanpur Dehat, Kanpur Dehat,
(Above 140) 3 and Kanpur Dehat Rampur, Bijnor, S p
Etawuh, Budaun and Etawah and Kannauj Kannauj Etawah, Agra, Kanpur Budaun, Facrukhabad,
High Na Muzalfam ar, Kannauj, Allahab d,
Kaushambi, Fateh u5 Bijnpu MaNagar, Kanpur Nagar,
(I20-140) 9 9 Auraiya, Kanpur 6 Farrukhabad, q Farrukhnbad and Etah
Nagar, rvar affam Firozabad and Rush and Eta and Muzafarn ar Ballia, Ghazipur, $ultaupur, Balmmpur, Kaushambi, G.B.Nagar, Mathara,
Bijnoi Chitrakoot, Bambauki, Sulmnpur, Bareilly, Lalitpui Mainpuri, Pratapgarh, Jalaun, Pmtapgarh, Inunpur, Shuhjahanpur, Saharanpur, J.P.Nagar, Ballia, A1lahabad, Varanasi, Patehpur, Moradabad, Rampuy Firozabad, Jaunpuq Hardoi, Ailahabad,
Medium Lalftpur, Sultanpup 17
Hardoi, Etah, 32
Agra, MuzaBMmga, (100-120) IS Jaunpur, Kushinagar, Sahamnpuq Ghazipur, Kheri, Hathns,
Firozabad, Julaun, Bnreilly, Varanasi, Faizabad, Unnao, Budaun, Ambedkar Faizabad, Barabanki, lalaun, Nagar, Varanasi and Shahjaharpur and Rae Bahraich, Baghpat, Meerut Bareli Ambedkar Nagar,
Meerut, Pratapgarh, Bulandshahr Ghaziabad, Pilibhit and Mau
Mirzapu, Ghazipur, Barabanki, Rae Barcli, Meerut Matt, Unnan, Hamirpur Faizabad, S.R.Nugaf, Lucknow, Jhansi, Banda, MaIiam1gom"
Mirzapur, Azamgarh, Rae Bareli, Mirzapur,
S.R.Nagar, Pilibhit, Baghpat, Pilibhit, Siddharlmagar,
Mau, Chandauli, Chitmkoot, Kheri, Lucknow, Basti,
Siddhartlmagar, Kushinagat, Sitapur, Gonda, S.KNagar,
Lon, Banda, Maharajganj, Azsmgarh, Chandauli,
34 Bareilly, Mahoba,
30 Jhansi, G.B.Nagar, 20
Sitapuy S.R.Nagar, (80-100) Bardo eUAmgarh,
Hardo4 Kber4 Lalilpur, Ghaziabad, Aligarh, Kushinagm,,
Baghpat, Shrawasti, Arnbedkar Nagar, Saharanpur,
Sitapur, Sonbbadra, Shrawasti, Babraich, Maharajganj,
Shahjulwnpur, Haduas, Hamirpur, Gorakhpur,, Jhansi,
S.K.Nagar, Bahraich, Bulandshahr, $unhhadra, Deorta and
Gorakhpur, (Jonda, Balmmpur Shrawasti
Ghaziabad, Unnao, Sonbhadm, Aligarh, Gonda and Mathurz Aligarh, Basti and
Bulandshahr Mahoba,
Very Ia. Mat ura, Hathras, Siddharthnagar, ( g ou4 Hamirpm, (Below 100) 6 Balmmpur, Lueknow, 7 S.K.Naa, 4 Benda and Mahoba Deariu, G.B.Nagar GoraUpur, Basti,
Chandauli and Deoria Source: Bulletin ofAgriculturaI Statistics (various issues). Directorate ofAgrieziltu e. Lucknow.
301
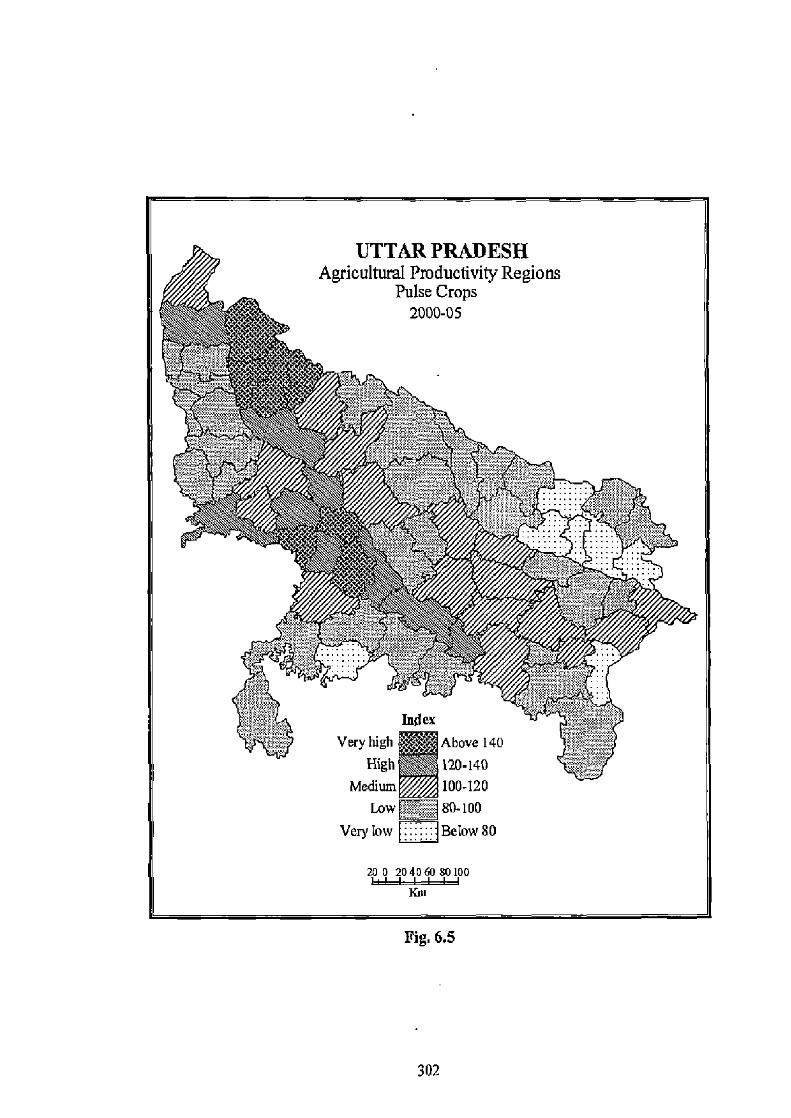
UTTAR PRADESH Agricultural Productivity Regions
Pulse Crops 2000-05
Index Very high Above 140
High 120-140 Medium I 100-120
Low 80-100 Very low Below 80
200 2040 60 80100
Km
Fig. 6.5
302
UYFAR PPADE5H Agricultural Productivity Regions
Pulse Crops 2005-10
Index
Very high Above 140
High 120-140
Medium 100-120 Low _180160
Very low Below 80
200 204060 90I00 w..
Fig. 6.6
303

the index values of 80 and 100, and 6 districts namely, Mathura, Hathras,
Balrampur, Lucknow, Deoria and G.B.Nagar recorded very low productivity indices
of 80 and below (Fig. 6.4).
During the period of 2000-05, the districts namely, Moradabad (164.27),
J.P.Nagar (158.42), Rampur (151.51) and Bijnor (147.56) of Rohilkhand plains got
shifted from medium to very high productivity category. Another set of 3 districts
namely, Kanpur Dehat (153.29), Etowah (143.48) and Kannauj (141.10) of lower
doab also follow the same pattern. Conversely, very low productivity in pulses was
seen in 7 districts namely, Mahoba (77.46), Siddharthnagar (77.35), S.K.Nagar
(72.26), Gorakhpur (71.54), Basti (71.54) Chandauli (69.06) and Deoria (67.53) of
Bundelhhand and Purvanchal regions, respectively (Fig. 6.5). Medium and low
productivity were recorded by 17 and 30 districts, respectively.
The districts namely, J.P.Nagar, Moradabad, Rampur and Budaun of
Rohilkhand, and Kanpur Dehat, Auraiya, Etawah and Kannauj of lower doab
recorded very high productivity during 2005-10 (Table 6.4). During this period, 6
adjoining districts belonging to former region also attained high productivity in pulse
crops. There were in total 32 districts, which recorded medium productivity, and low
productivity was confined to 20 districts to form a part of Awadh and Purvanchal
regions of the state, along with the districts of Saharanpur and Aligarh of doab and
Jhansi of Bundelldtand. Very low productivity was seen in 4 districts namely,
Chitrakoot, Hamirpur, Banda and Mahoba of Bundelkhand region (Fig.6.6).
Table 6.5 Growth in productivity indices of pulse crops in Uttar Pradesh
Category Range (Per cent)
Number of districts 1995-200Q to 2000-05 2000-05 to 2005-10
High Above 10 18 22 Medium Oto 10 24 24
Low -iotoo 14 12 Very low Below-10 14 12
Source: Bulletin ofAgricultural Slatislics (various issues), Directorate ofAgriculmre, Lucknow.
Table 6.5 shows that, during 1995-2000 to 2000-05, high growth in pulse
crops productivity above 10 per cent was recorded by 18 districts of the state, and
during later periods of 2000-05 to 2005-10, there were 22 districts, which belonged
to this category. Medium growth (0-10 per cent) was seen in 24 districts during both
the periods. There were 14 and 12 districts, respectively which were characterized
304
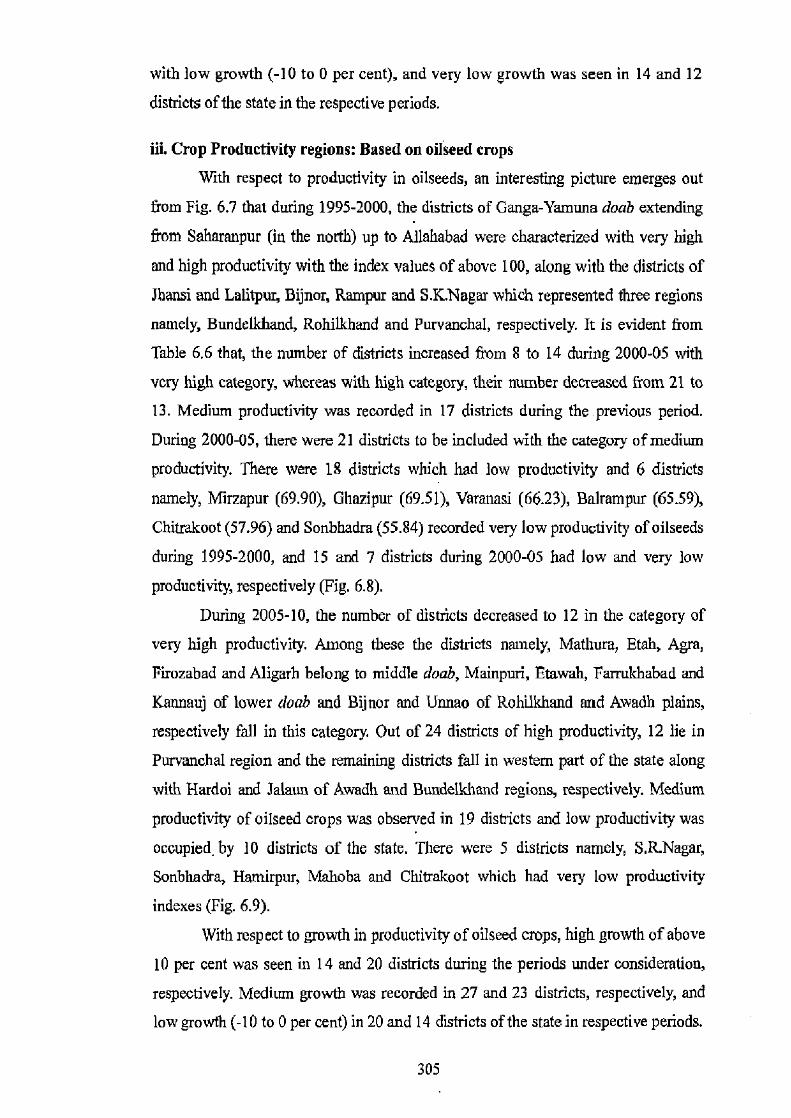
with low growth (-10 to 0 per cent), and very low growth was seen in 14 and 12
districts of the state in the respective periods.
iii. Crop Productivity regions: Based on oilseed crops
With respect to productivity in oilseeds, an interesting picture emerges out
from Fig. 6.7 that during 1995-2000, the districts of Ganga-Yamuna doab extending
from Saharanpur (in the north) up to Allahabad were characterized with very high
and high productivity with the index values of above 100, along with the districts of
Jhansi and Lalitpur, Bijnor, Rampur and S.K.Nagar which represented three regions
namely, Bundelkhand, Rohilkhand and Purvanchal, respectively. It is evident from
Table 6.6 that, the number of districts increased from 8 to 14 during 2000-0S with
very high category, whereas with high category, their number decreased from 21 to
13. Medium productivity was recorded in 17 districts during the previous period.
During 2000-05, there were 21 districts to be included with the category of medium
productivity. There were 1S districts which had low productivity and 6 districts
namely, Mirzapur (69.90), Ghazipur (69.51), Varanasi (66.23), Balrampur (65.59),
Chitrakoot (57.96) and Sonbhadra (55.84) recorded very low productivity of oilseeds
during 1995-2000, and 15 and 7 districts during 2000-05 had low and very low
productivity, respectively (Fig. 6.8).
During 2005-10, the number of districts decreased to 12 in the category of
very high productivity. Among these the districts namely, Mathura, Etah, Agra,
Firozabad and Aligarh belong to middle doab, Mainpuri, Etawah, Farrukhabad and
Kannauj of lower doab and Bijnor and Unnao of Rohilkhand and Awadh plains,
respectively fall in this category. Out of 24 districts of high productivity, 12 lie in
Purvanchal region and the remaining districts fall in western part of the state along
with Hardoi and Jalaun of Awadh and Bundelkhand regions, respectively. Medium
productivity of oilseed crops was observed in 19 districts and low productivity was
occupied. by 10 districts of the state. There were 5 districts namely, S.R.Nagar,
Sonbhadra, Hamirpur, Mahoba and Chitrakoot which had very low productivity
indexes (Fig. 6.9).
With respect to growth in productivity of oilseed crops, high growth of above
10 per cent was seen in 14 and 20 districts during the periods under consideration,
respectively. Medium growth was recorded in 27 and 23 districts, respectively, and
low growth (-10 to 0 per cent) in 20 and 14 districts of the state in respective periods.
305
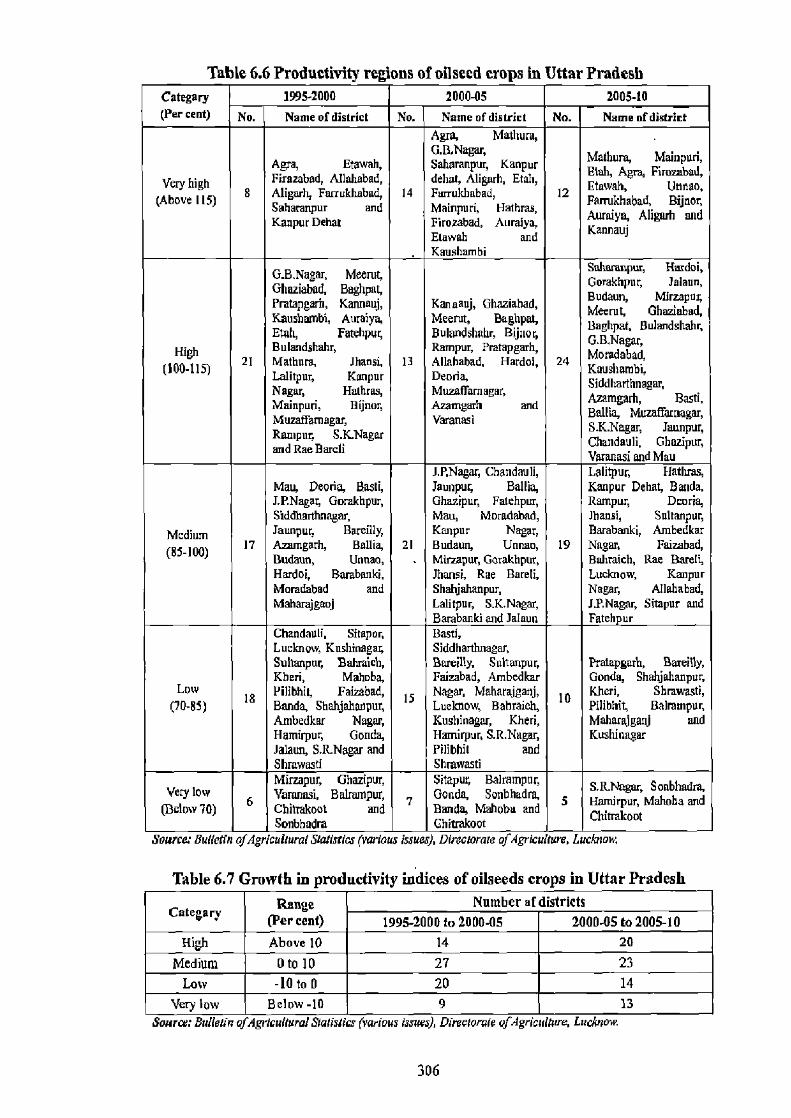
Table 6.6 Productivity regions of oilseed crops in Uttar Pradesh Category 1995-2000 2000-05 2005-10
(Per cent) No. Name of district No. Name of district No. Name of district Agra, Mathura, G.B.Nagar, Malhuru, Mainpud, Agra, Elawah, Sahmanpur, Kanpur E1ah, Agra, Firosabad,
Firozabad, Allahabad, delmt, Aligarh, Etaty ad Etowah, Unnao, Veove
(Above 115) 115) 8 Aligarh, Fatrukh¢b¢it 14 uri, , Main 12 Saharanpur and Mrinpurd, nralya, FmrukhabAl
pmaiyn, Aligarh and h and
Kanpur Dehal Firozabad, fluniand Kannauj Elawah and Kaushombi
G.B.Nagar, Meerut, Saherenpm, Hmdoi,
Ghuziabad, Beghpat, Gomkhpur, Jalaun,
Prntapgerh, Kannauj, Kannauj, Ghaziahad, Buchan, Mirzapur, Meerut, Kaushambi, Auraiya, Meetut, Baghpat, ulands bad, Baghpat, Sulandshahr, Etch, Fatehpu5 Bulandshuhr, Bijuor, G.B.Nagar,
w~ Bulandshahy Ram uy Pratapgarh,
Moradabad, (300-115)
21 Mothers, Jhansi, 13 Allahabad, Hardoi, 24 Kaushumbi,
Lothian, Kanpur Deuria, Siddharthnagar, Nagy Hmhras, MuuBarnaSOr, Azamgarh Bafi. Maintain, Bijnar, Annigarh and
annapur, Muzaffamagar, Varanasi
S.K.N ai S.K.Nagey Jaunpuy Rampur, S.lCNagar Chandeuli, Ghazipur, and Rae Barclf Varanasi and Mau
J.P.Nagar, Chandauli, Lalitpur, Hathras, Mau, Peoria, Basil, Jaunpur, Ballia, Kanpur Dehat, Banda, J.P.Nagar, Gnrakhpur, Ghaaipur, Fatehpm, Rampuy Deane, Siddharthnagar, Mau, Moradabad, Jhansi, Sultanpur,
Medium Jaunpur, Bare! fly, Kanpur Nagar, Barabanki, Ambedkar
(85-100) 17 Ammgarh, Gallia, 21 Buchan, Unnao, 19 Nagar, Faizabad, Budaun, Unnan, Mirzapur, Gorakhpur, Bahraieh, Rae Bareli, Hardoi, Barabanki, Jhansi, Rae Bareli, Luelmow, Kanpur Marsdabad and Shabjahanpur, Nagar, Allahabad, Mahar ganj Lalitpur S.K.Nagar, JP.Nagar Sitapur and
Barabanki and Jalaun Fateh ur Chandau0, Sitapur, Basti, Lucknow, Kushinagar, Siddharthnagar, Suhanpur, Bahraich, GursifIg Suhanpur, Pratapgarh, Bareilly, Kheri, Mahoba, Fairzbad, Ambedkar Gonda, Shahjahanpur,
Low PdlfbMI, Faivabad, Nagar, Maharajganj, Kheri, Shrawasti, (70-85) 18 Banda, Shahjahanpur, IS Lucknow, Bahraich, JO Pilibhit, Balnimpur,
Ambedkar Nagar, Kushinagar, Kheri, Maharajgaaj and Hamirpur, Gonda, Hamirpur, S.R.Nagar, Kushinagar Jalaun, SR-Nagai- and Pilibbi1 and Shrawasti Shrawasti
Very low Mirzapur, Ghazipur, Varanasi, Balmmprn,
Sitapur, Balrampur, Gonda, Soabhadra,
s.RNagsy Sordhadm,
(Below 70) 6 Chitrakoot and 7 Banda, Mahoba and 5 Chinakur, Mahoba and Chitrakoot Sonbhadra Chitrakoot
Sourcer Bulletin ofAgricultural Statistics (various issues), Directorate ofAgrkuiture, Luclmaw.
Table 6.7 Growth in productivity indices of oilseeds crops in Uttar Pradesh
Category Range (Per cent)
Number of districts 1995-2000 to 2000-05 2000-05 to 2005-10
High Above 10 14 20
Medium 0 to 10 27 23 Low -10 to 0 20 14
Very low Below -10 9 13 Source: Bulletin ejAgriculmral Slatislics (various isms), Direclorare afdgriculhrre, Lucknow.
306
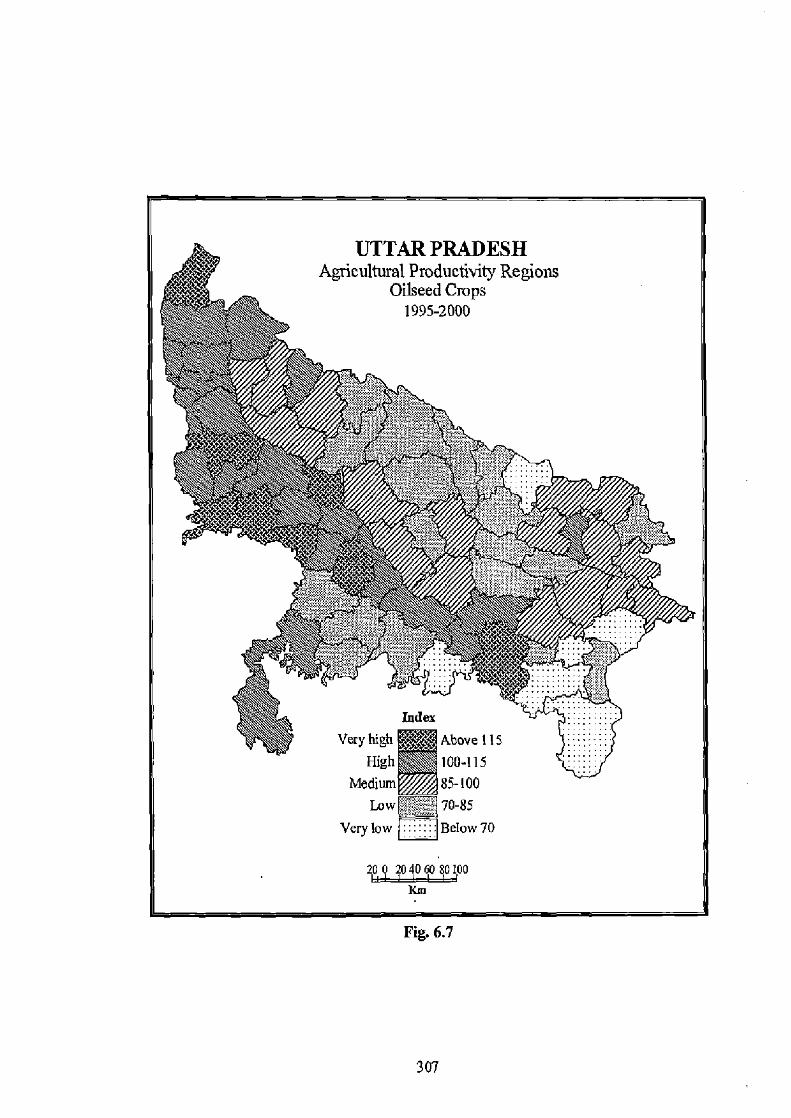
S. UTTAR PRADESH Agricultural Productivity Regions
Oilseed Crops 1995-2000
x8v { 4.YY
;
xc
Y ..~~.a I ~., i YS•.::
Index
Very high Abovell5 Highfl 100-115
Medium 85-100 Low 70-85
Very low Below 70
20 0 20, 4060 $01,00 km
Fig. 6.7
307
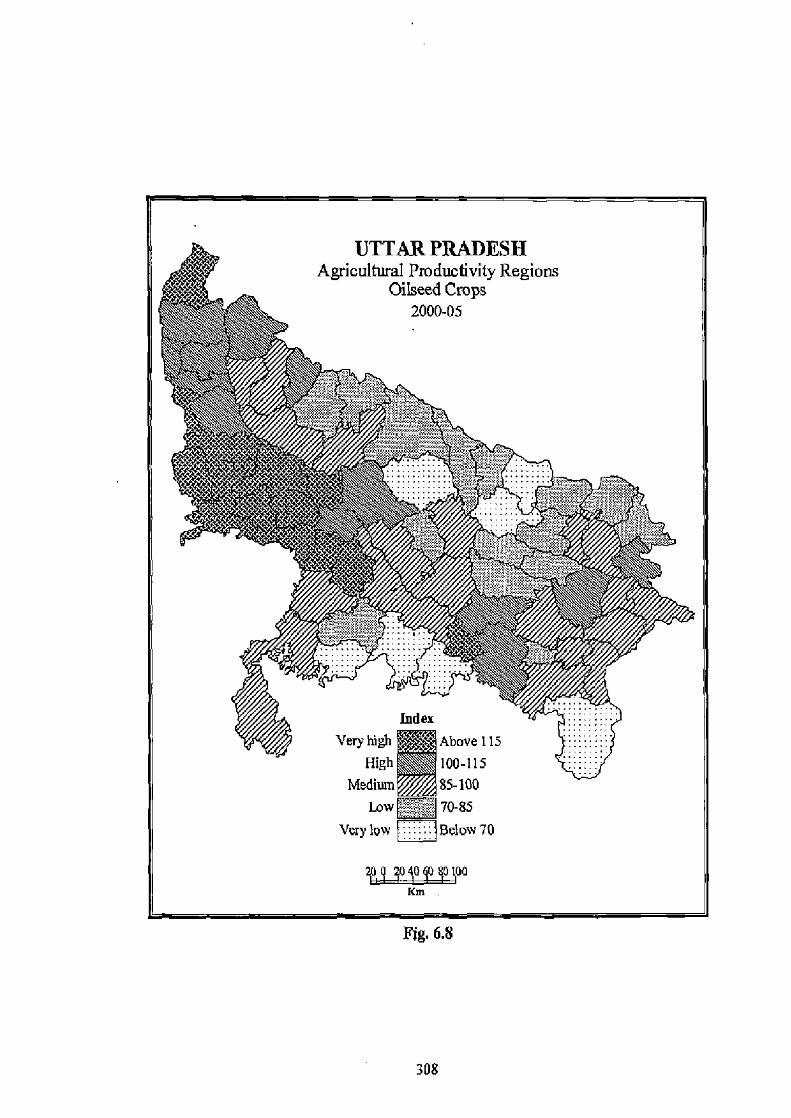
UTTAR PRADESH Agricultural Productivity Regions
Oilseed Crops 2000-05
Index
Very high Above 115
High 100-115
Medium 85-100 Low M ru 70-85
Very low Below 70
xoLL o loo Km
Fig. 6.8
308
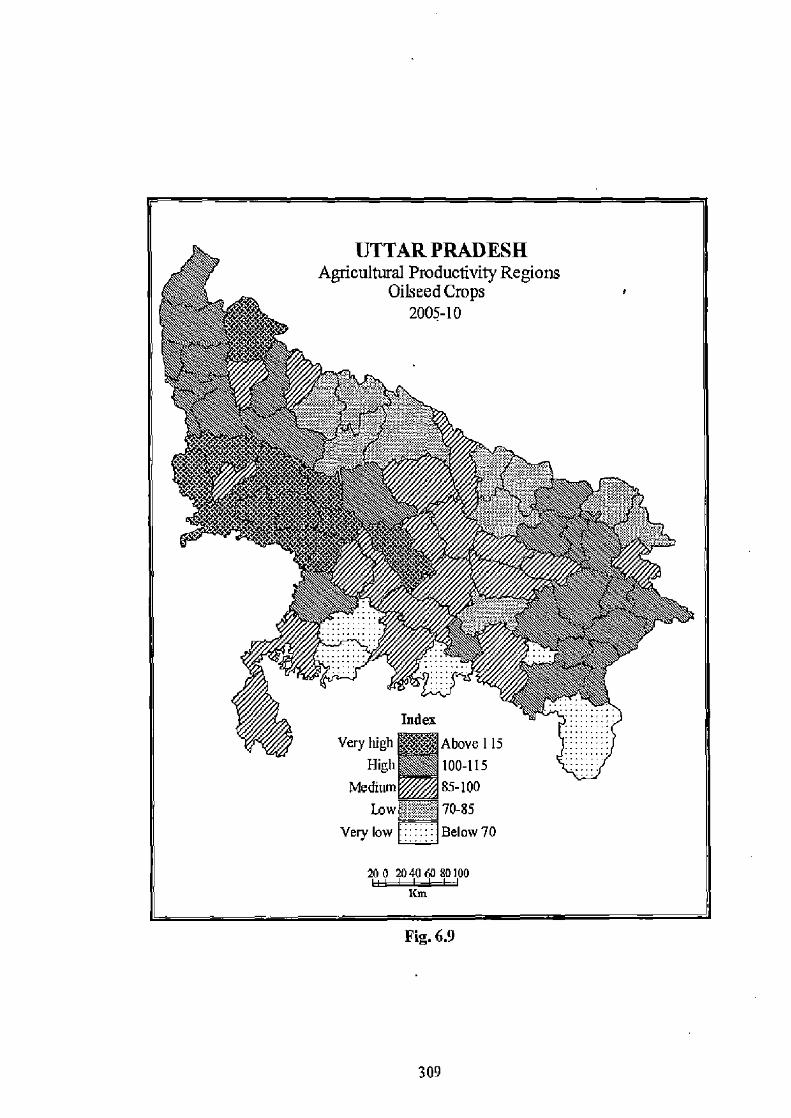
UTTAR PRADESII Agricultural Productivity Regions
Oilseed Crops 2005-10
Index
Very high Above 115
High 100-115
Medium 85-100 Low * 70-85
Very low Below 70
200 2040 60 80100 Km
Fig. 6.9
309
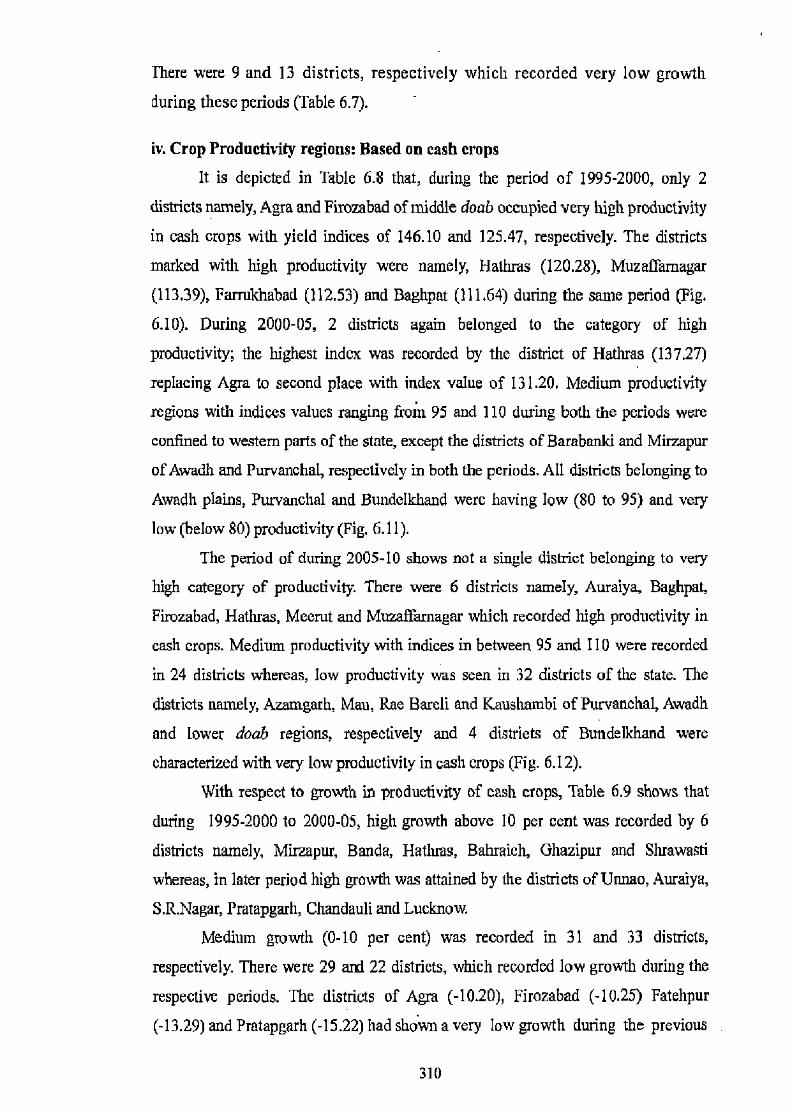
There were 9 and 13 districts, respectively which recorded very low growth
during these periods (Table 6.7). -
iv. Crop Productivity regions: Based on cash crops
It is depicted in Table 6.8 that, during the period of 1995-2000, only 2
districts namely, Agra and Fimzabad of middle doab occupied very high productivity
in cash crops with yield indices of 146.10 and 125.47, respectively. The districts
marked with high productivity were namely, Hathras (120.28), Muzaffamagar
(113.39), Farrukhabad (112.53) and Baghpat (111.64) during the same period (Fig.
6.10). During 2000-05, 2 districts again belonged to the category of high
productivity; the highest index was recorded by the district of Hathras (137.27)
replacing Agra to second place with index value of 131.20. Medium productivity
regions with indices values ranging from 95 and 110 during both the periods were
confined to western parts of the state, except the districts of Barabanki and Mirzapur
of Awadh and Purvanchal, respectively in both the periods. All districts belonging to
Awadh plains, Purvanchal and Bundelkhand were having low (80 to 95) and very
low (below 80) productivity (Fig. 6.11).
The period of during 2005-10 shows not a single district belonging to very
high category of productivity. There were 6 districts namely, Auraiya, Baghpat,
Firozabad, Hathras, Meerut and Muzaffarnagar which recorded high productivity in
cash crops. Medium productivity with indices in between 95 and 110 were recorded
in 24 districts whereas, low productivity was seen in 32 districts of the state. The
districts namely, Azamgarh, Mau, Rae Bareli and Kaushambi of Purvanchal, Awadh
and lower doab regions, respectively and 4 districts of Bundelkhand were
characterized with very low productivity in cash crops (Fig. 6.12).
With respect to growth in productivity of cash crops, Table 6.9 shows that
during 1995-2000 to 2000-05, high growth above 10 per cent was recorded by 6
districts namely, Mirzapur, Banda, Hathras, Bahraich, Ghazipur and Shrawasti
whereas, in later period high growth was attained by the districts of Unnao, Auraiya,
S.R.Nagar, Pratapgarh, Chandauli and Lucknow.
Medium growth (0-10 per cent) was recorded in 31 and 33 districts,
respectively. There were 29 and 22 districts, which recorded low growth during the
respective periods. The districts of Agra (-10.20), Firozabad (-10.25) Fatehpur
(-13.29) and Pratapgarh (-15.22) had shown a very low growth during the previous
310
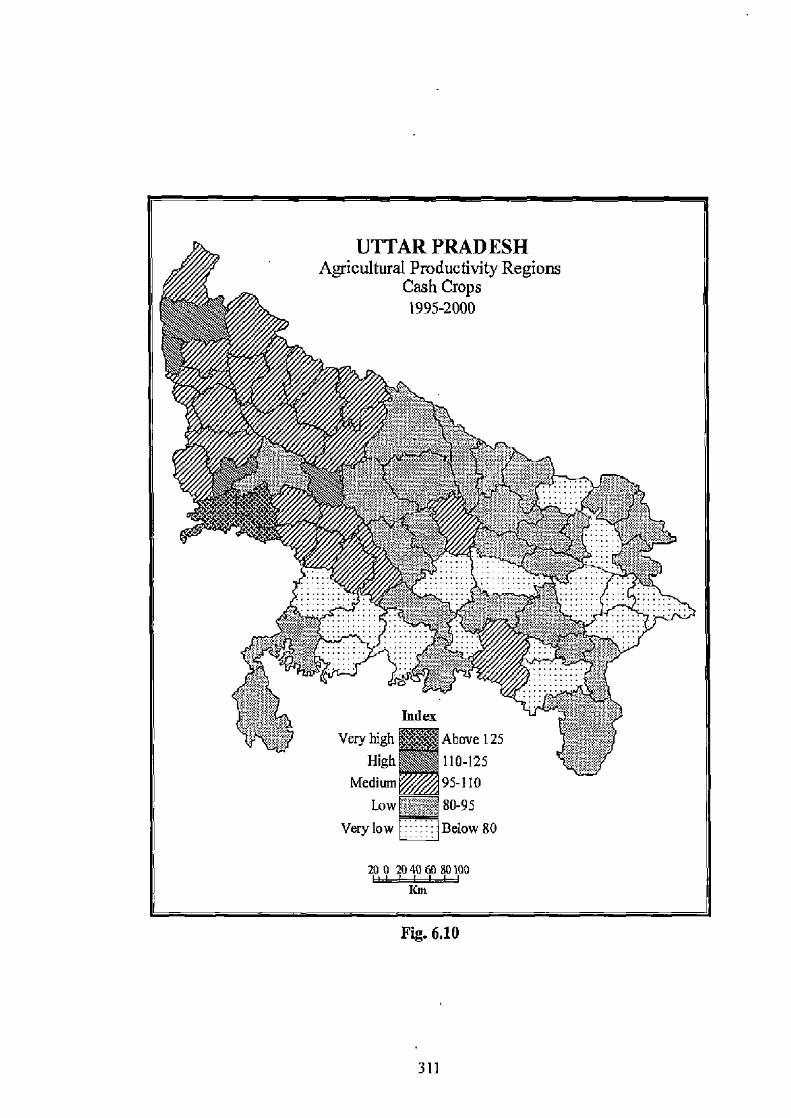
UTTAR PRADESH Agricultural Productivity Regions
Cash Crops
1995-2000
11 i ~(3
c g:. r • "a ~
W ~
,s Q Index Very high Above 125
%srr,
High 110-125 Mediwn 95-110
Low; 80-95
Very low :: Below 80
200 2040 60 80100 Kin
Fig. 6.10
311

Table 6.8 Productivity regions of cash crops in Uttar Pradesh Category 1995-2000 2000.05 2005-10
(Range) No. Name of district No. Name of district No. Name of district Very high
(Above 125) 2 Agra and Firozabad 2 Ilathras and Agra 0 -
Hathras, Muzaff abad, Farrukhabad, Auraiya, Baghpat, High
4
Mo2affnrziagwr, 6 Meerut, ' 6
Firozabad, Hathras, {1(0-125) Farcukhahzd and
Piroaaat
~d Meerut and
Baghpat ~p Chanalt Ghaziahad Muzaff at°agar
Saharanpur, Meerut, Ghaziabad, Kannaej, G.B.Nagar, Agra, G.B.Nagar, Aligarh, G.B.Nagar, Bijnor, Farrukhabad, Mathum, Antalya, Bijnor, Aligarh, Rampur, Saharanpur, Kanpur Moradabad, Pilibhit, Etawah, J.P.Nagay Dchat, £tawah, Etawah, Kannauj, Saharanpur, J.P.Nagar, Moradabad,
Medium Bulandshahr, Mothers, Budaun, Pilibhit, Bijnor,
(95-110) 23 Mathure, J.P.Nagar, 19 Mainpuri, 24 Aligarh, Kanpur Nagar, Mainpuri, Budaun, Bulandshahr, Auraiya, Budaun, Rampur, Eta!!,
Barely, Rampur, Pilibhit, Bareilly, Ghaziabad, Kanpur Nagar, Moradabad, Mirzapur, 6ulandshuhr, Kannauj, Kanpur Dchat, Kanpur Nagar and Vnnao, Khert, Shahjahanpur, KanpurDehat Sonbhadra, Bareilly Allahabad and and Shahjahanpur Bambanki
Kheri, Shahjshanpur, Siddharthnagar,
Jbansi, Kheci, Etch, Shrawasti, S.K.Nagar, S.K.Nagar,
Bassi, Balrampur, Jhansi, Sitapur, Maharajganj, Mainpuri,
Bassi,, Lstitpur, Galitpur, Sonbhadra, Jhansi, Mirzapur,
Kushitmgar, Sitapur, Maharajganj, Etah, S.R.Nagia, Hasti,
Maharajganj, Gonda, Faizabad, Balrampur, Sitapur, Kushinagar,
Maharajm Lucicnow, Bambanki, Bahraich, Gorakhpur,
Low LhctrooaDg 7aunpur, Kushinagar, Basil, Jaunpur, Shrawasli,
26 Ambedkar Nagar, 31 Bahraich, Allahabad, 32 Lucknow, Ghszipur,
(80-95) Faizabad, Sbrawass 6 CLiunkout, Chandauli, Balmmpur,
S.K. Nagar, Deoria, Siddharthnagar, Ilarelm, Deoria,
Sonbhadra, lJnnao, Jalaun, Ambedkar Lalitpur, Ballia,
Pratapgarh, Nagar, Gomkhpur, Faizabad, Gouda,
Pratpgar, Hardoi, llardoi, Deoria, Fatehpur, Varanasi,
Varanasi and Gonda, Ghazipur, Chitrakoot, Pratapgarh,
Bahraich Mahoba, Juunpuy Sultanpur, Ambedkar Banda, Man and Nagar, Allahabad and
Balliz Barabanki Gorakhpur,
Siddharthnagar, Rae Hamirpur, Sultanpur, Barell, Sultanpur, Lucknow, S.R.Nagar, Aiamgarh, Mau, Rae
aZ Mirzapur, Jalaun, g Very
low Fatah ur, Azam arh,
(Below 80) 15 A>amgarh, Bzllia, 12 Unnao, Varanasi, Chan, Chandauli, Rae Boreli,
8 Bareli, Kaushanda, Mahoba, Banda, Mahoba, S.B.Nagar, Hamirpur and Jahun Mau, Ghazipur, Kaushambi and
Kaushambi, Pmtapgarh HamiirpursndBenda _ _.
Source: Bulletin ofdgrleulturai Statistics (various Issues), Directorate ofAgrlcuuure, Luchmw.
period and in the later period, there were 9 districts namely, Barabanki, Ghaziabad,
Rae Bareh, Hathras, Agra, Mahoba, Hamirpur, Banda and Jalaun to be incorporated
in very low growth category.
v. Productivity regions: Based on composite yield index
It can be seen from Table 6.10 and Fig. 6.13 that, composite productivity
312
UTTAR PRADESH SI Agricultural Productivity Regions
Cash Crops
2000-05
•sba„ eye ,
Ott c ~a S
p I t t t iSB na
Y~e' 5d Pll 36
334;~
1~ xs •:s 13 ,
a
Index ~i z.f,•~~. t^~
Very high Above 125
High 110-125
Medium 95-110
Low oa.Kj 80-95
Very low Below 80
2l1 20, Q 40 EO 80100 Km
Fig. 6.11
313
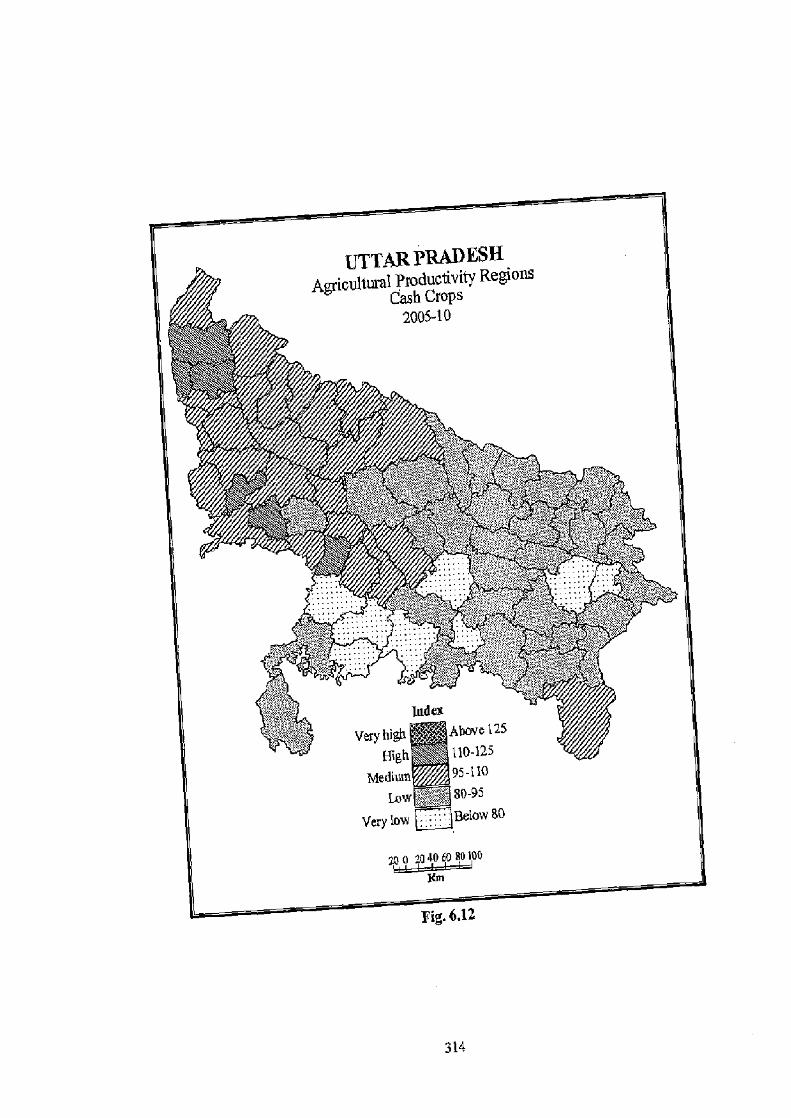
UTTAR PRADESH Agricultural Pr Ccopsty Regions
2005-10
Index Very high Above 125
ugh ll0-125 Medium 95-110
Low '•... 80-95 Very low
0 2a 40 60 80100
xm
Fig. 6.12
314
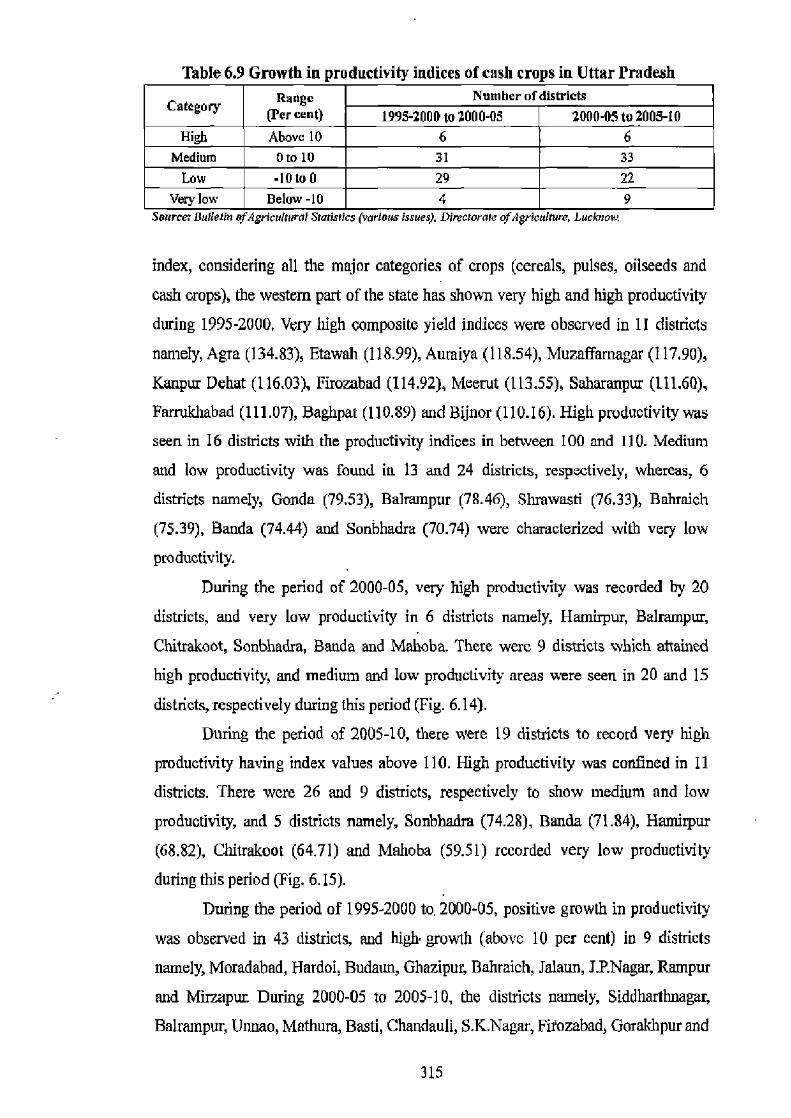
Table 6.9 Growth in productivity indices of cash crops in Uttar Pradesh
Category Range (Per cent)
Number of districts 1995-2000 to 2000-05 2000-05 to 2005-10
High Above 10 6 6 Medium am 10 31 33
Low -10 to 0 29 22 Very low Below-10 4 9
source: uunettn ofAgrncuuurat Btansncs (various issues). Directorate or Agricuuure. Lucmmw.
index, considering all the major categories of crops (cereals, pulses, oilseeds and
cash crops), the western part of the state has shown very high and high productivity
during 1995-2000. Very high composite yield indices were observed in 11 districts
namely, Agra (134.83), Etawah (118.99), Aumiya (118.54), Muzaffamagar (117.90),
Kanpur Dehat (116.03), Firozabad (114.92), Meerut (113.55), Saharanpur (111.60),
Farrukhabad (111.07), Baghpat (110.89) and minor (110.16). High productivity was
seen in 16 districts with the productivity indices in between 100 and 110. Medium
and low productivity was found in 13 and 24 districts, respectively, whereas, 6
districts namely, Gonda (79.53), Balrampur (78.46), Shrawasti (76.33), BahTaich
(75.39), Banda (74.44) and Sonbhadra (70.74) were characterized with very low
productivity.
During the period of 2000-05, very high productivity was recorded by 20
districts, and very low productivity in 6 districts namely, Hamirpur, Balrampur,
Chitrakoot, Sonbhadra, Banda and Mahoba. There were 9 districts which attained
high productivity, and medium and low productivity areas were seen in 20 and 15
districts, respectively during this period (Fig. 6.14).
During the period of 2005-10, there were 19 districts to record very high
productivity having index values above 110. High productivity was confined in 11
districts. There were 26 and 9 districts, respectively to show medium and low
productivity, and 5 districts namely, Sonbbadra (74.28), Banda (71.84), Hamirpur
(68.82), Chitrakoot (64.71) and Mahoba (59.51) recorded very low productivity
during this period (Fig. 6.15).
During the period of 1995-2000 to. 2000-05, positive growth in productivity
was observed in 43 districts, and high • growth (above 10 per cent) in 9 districts
namely, Moradabad, Hardoi, Budaun, Ghazipur, Bahraich, Jalaun, 7.P.Nagar, Rampur
and Mirzapur. During 2000-05 to 2005-10, the districts namely, Siddharthnagar,
Balrampur, Unnao, Mathura, Basti, Chandauli, S.K.Nagar, Firozabad, Gorakhpur and
315
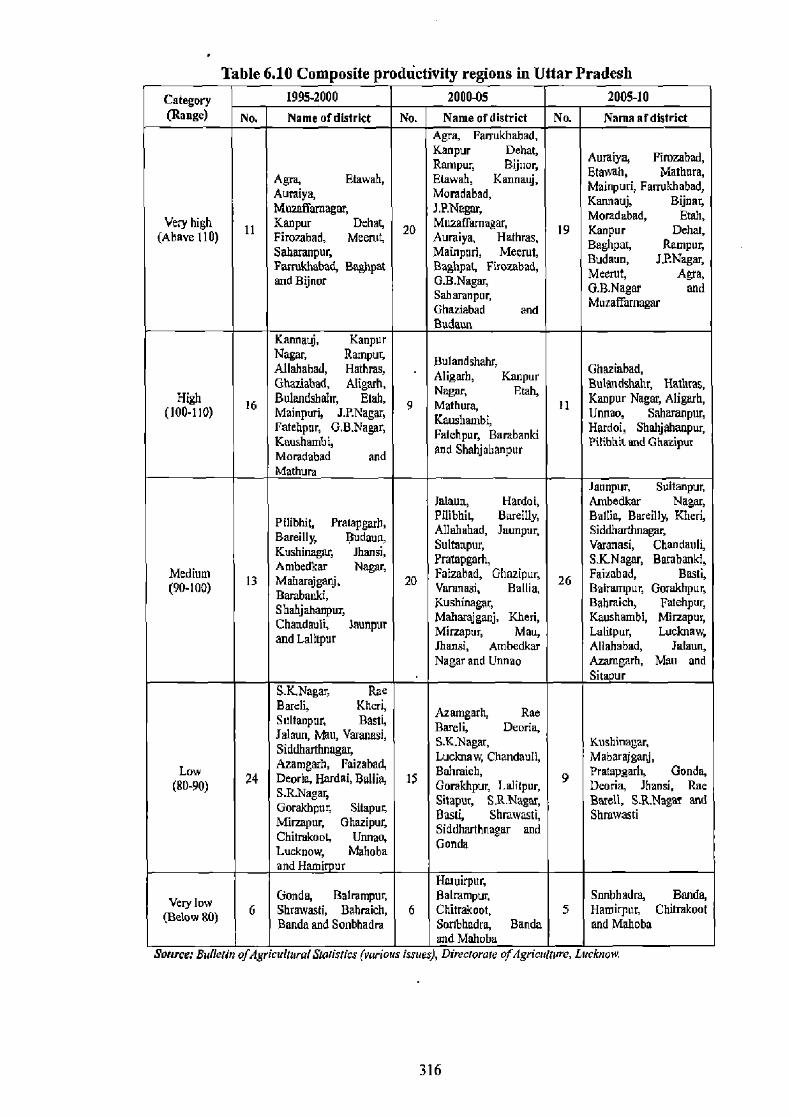
Table 6.10 Composite productivity regions in Uttar Pradesh Category 1995-2000 2000-05 2005-10
(Range) No. Name ofdistrict No. Name ofdistrict No. Name ofdistrict Agra, Fanukhabad, Kanpur Dehat, Rampuy Bljaoy Auraiya, Fimzabad,
Agra, Etaea Kannauj, Etawah, Mathura, td,
a
Etmvah, Auray, ad,
g
,
a J.P.N9
r,
Mainpuri Fam, ,
Muzaffamagar, Kannauj, Bijnor,
Very high Kanpur DehaS Muzaftornegor, ad, Etah, Kanpur (Above I10) 11 Firoaabad, Meerut, 20 Aumiya, Hathras, 19 Kanpur Dehat,
apar, Rampur, Saharanpur, Matnpuri, Meerut, LP. Fanukhabzd, Baghpat Baghpaz, Firuzabad, Mecrat , A a,
and Bijnor G.B.Nagaq Aand G.B.Na and
Saharanpur, MuzNagar Muzofflannogar Ghaziabad and
Budaun Karsnauj, Kanpur Nagar, Rampur,
Bulandshah5 Allahabad, Hathras, an Aligarh, Kanpur Gbaziabad, Ghaziabad, Aligafi, Bulandshahr, Hathras,
High Bulandshahr, Elah, 9 Etah
Matthhur 11 Kanpur Nagar, Aligarh, (100-110) Msinpuri, ].HNagar, bbi Urmao, Saharanpur,
Fatehpur, G.B.Nagar, Farehpur, Barabanki Hardoi, Shahjahanpur, Kawshambi, and Shahjahanpur Pilibhit and Ghazipur Morndabad and Mathurz
Jmmpur, Sultanpur, Jalaun, Hardoi, Ambedkar Nagar,
Pilibhit, Pratzpgarb, Pilibhit, Bareitly, Ba1Ba, Bareilly, Rherl, Bareilly, Bodauu, ~ahabad, Jaunpur, Siddharthnaguq
Kushinagar, Jhansi, Sulmnpur, Varanasi, Chandauli,
Ambedkar Nagar, Praiapgarh S.K.Nagar, Barabanki, Medium 13 Mabmajganj, 20 Faizabad, Ghazipuy
26 Faizabad, Busti,
(90.100) Barabmld,
Varanasi, Ballia, Baimmpur, Gorakhpuy
Shahjahanpur, Kushinagar, Bahmich, Fatehpur,
Chandauli, Jaunpm Maharajgznj, Kheri, Kaushambi, Mirzapur,
and Lalitiur Mirzapur, Mau, Lalitpur, Lucknow, Jhansi, Ambedkar Allahabad, Jalaun, Nagar and Unnzo Azamgarh, Man and
Sitapur S.KNagar, Rae Bareli, Kheri, Azamguh, Rae Sultanpur, Basti, Bareli, Deoria, Jalaun, Man, Varanasi, S.K.Nagar, Kushirregar, SiddhsrtMagar' Azamgarb, Faizabad,
Lucknow, Chandauli, Mahara' li, Low 24 Deoria, Bardoi, BuHi 15 Buhntich,
9 Pratapgararh, Gonda,
(80-90) SRNagar' Gorakhpur, Lalitpur, Deorm, Jhansi, Rae
Sitapur, Siraur, S.R.Nagar, p . Barak, S.R.Nagat and
Mirzapur, Ghazipur. Basil, Shrawasti, Shrawasti
Chivakao Unnao, b Siddhanhnagar and
Lucknow, Mahoba Gonda
and Hami ur tla nirpur,
Very low Gonda, Balrampur, Batrzmpur. Sonbhedra, Banda,
(Below 80) 6 Shrawasti, Bahraich, 6 Chitrakoot, 5 Hamirpur, Chihakoot Banda and Sonbhadm Sonbhndra, Banda and Mahoba
and Mahoba Source: Bulletin of4gr'irulztinz7 S/Ptistikr (various/sus), Directorate ofAgricufvre. Lucknow.
316
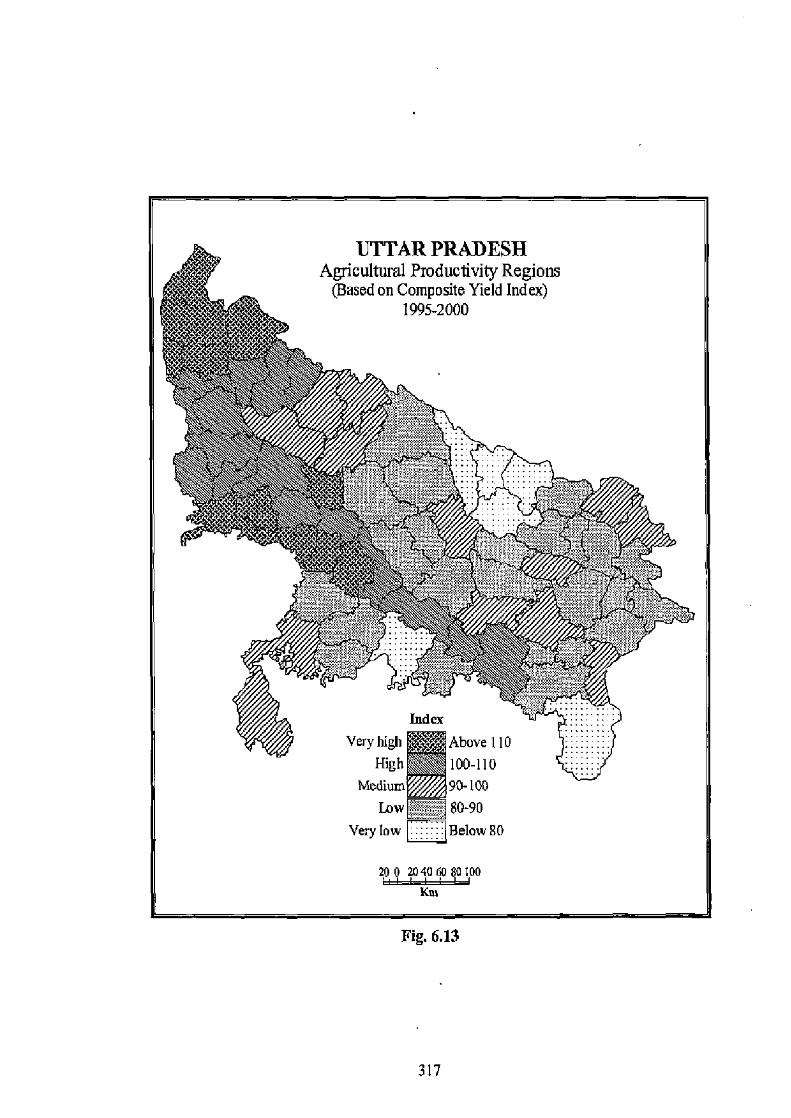
UTTAR PRADESH Agricultural Productivity Regions
(Based on Composite Yield Index) 1995-2000
•
y 5
1:.
Ind"
Very high Above 110
High 100-110
Medium 90-100
Cow 80-90
Very low Below 80
0 0 7A 40 0 $e 100
Km
Fig. 6.13
317
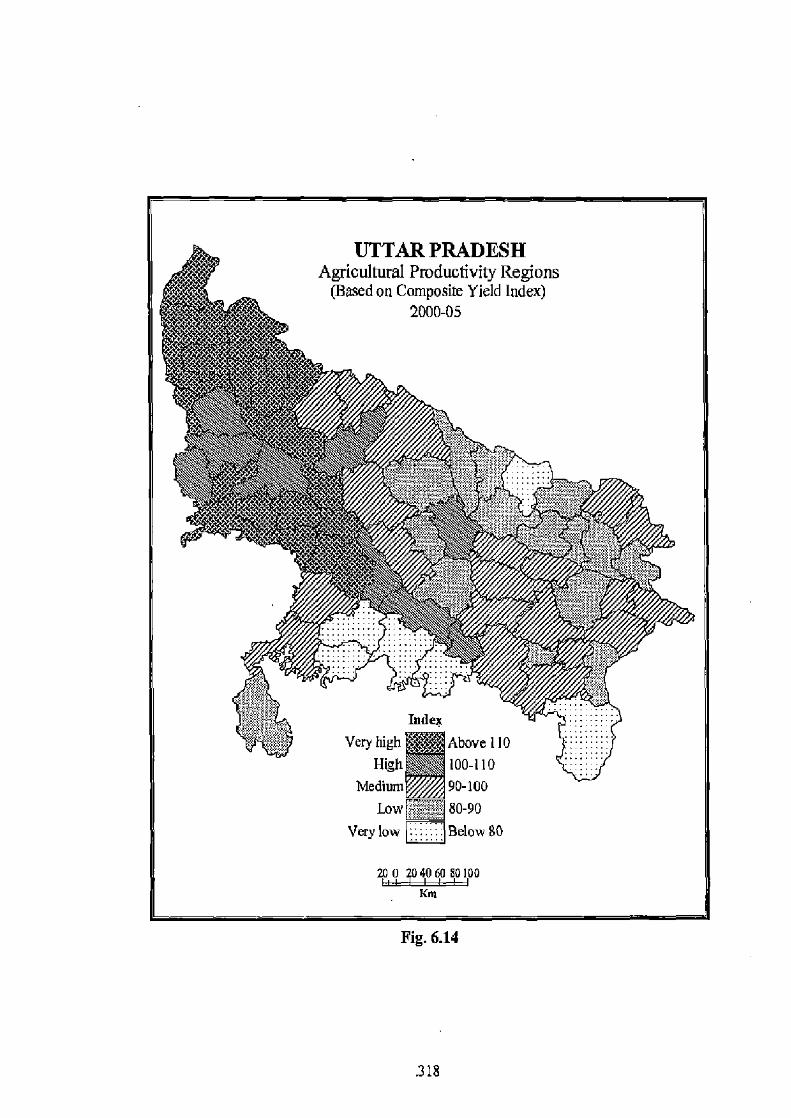
UTTAR PRADESH Agricultural Productivity Regions
(Based on Composite Yield Index) 2000-05
Index
Very high Above 110
High 100-110
Medium 90-100
Low 80-90
Very low Below 80
200 204060 00100 KM
Fig. 6.14
318
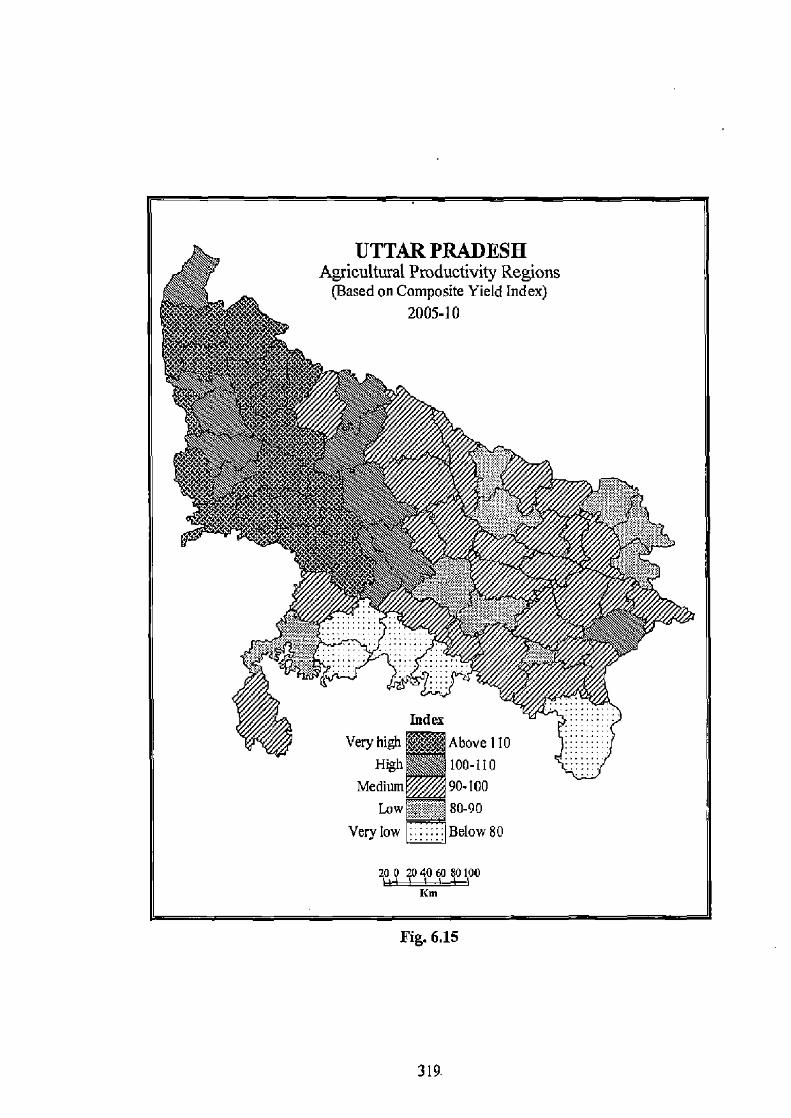
UTTAR PRADESH Agricultural Productivity Regions
(Based on Composite Yield Index) 2005-10
]ndes Very highIAbove 110
High100-110 Medium90-100
LOWZ4 80-90 Very low Below 80
200 20 40 60 80100
Km
Fig. 6.15
319.
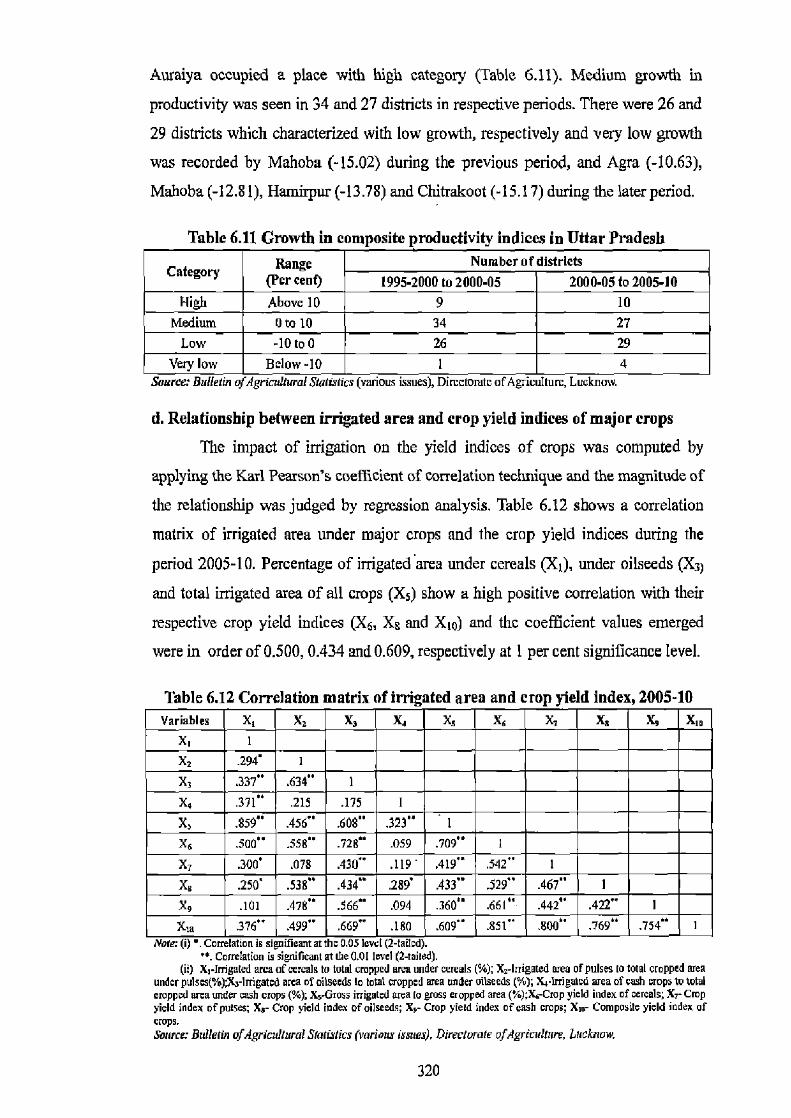
Auraiya occupied a place with high category (Table 6.11). Medium growth in
productivity was seen in 34 and 27 districts in respective periods. There were 26 and
29 districts which characterized with low growth, respectively and very low growth
was recorded by Mahoba (-15.02) during the previous period, and Agra (-10.63),
Mahoba (-12.81), Hamirpur (-13.78) and Chitrakoot (-15.17) during the later period.
Table 6.11 Growth in composite productivity indices in Uttar Pradesh
Category Range (Per cent)
Number of districts 1995-2000 to 2000-05 2000-05 to 2005-10
High Above 10 9 10
Medium 0 to 10 34 27
Low -10 to0 26 29
Very low Below -10 1 4 Source; Bulletin ofAgricu!(ura! Statistics (various issues), Dimctomftc ofAgriculram,Lucknow
d. Relationship between irrigated area and crop yield indices of major crops
The impact of irrigation on the yield indices of crops was computed by
applying the Karl Pearson's coefficient of correlation technique and the magnitude of
the relationship was judged by regression analysis. Table 6.12 shows a correlation
matrix of irrigated area under major crops and the crop yield indices during the
period 2005-10. Percentage of irrigated area under cereals (XI), under oilseeds (X3)
and total irrigated area of all crops (X5) show a high positive correlation with their
respective crop yield indices (X6, Xe and X10) and the coefficient values emerged
were in order of 0.500, 0.434 and 0.609, respectively at 1 per cent significance level.
Table 6.12 Correlation matrix of irrigated area and crop yield index, 2005-10 Variables X, Xa Xa Ty Xs X s Xt Xa X, X,a
X, 1
X z .294" 1
X, .337 " .634" 1
X4 .371" .215 .175 1
X s .859" .456" .608" .323" 1
X6 .500 " .558 " .72811 .059 .709'' 1
X i .300' .078 .430" .119 .419" .542" 1
X s .250' .538" .434 .289 .433" .529- .467 " 1
X, .101 .478" .566" .094 .360' .661" .442" .422" 1
X,o .376" .499" .669" .180 .609'' .8 11" 800' .769" .75411
1 note: tp -. Lortmanon ss sigmncanr at me o.u> mYCI tataneo).
". Cortelation is sign!Gravt at the 0.01 level (2-tailed). (ii) X,-Irrigated arcs of wreals to total cropped area under cereuls (%); X2-laigated area of pulses to total cropped area
under pulses(%);X,-litigated area of oilseeds to total cropped area under oilseeds (/); Xtdrtigelcd area of at crops to total cropped urea under cash crops (%); X,-Gross irrigated area Co gross cropped area (%);1L-Crop yield index of cereals; Xr Crop yield index of pulses; Xs- Crop yield index of oilseeds; X,- Crop yield index of cash crops; Xw- Composite yield index of crops. Swtrce: Bulletin ofAgricultural Statistics (various issues). Directorate ofAgriculmre. Lucknow.
320
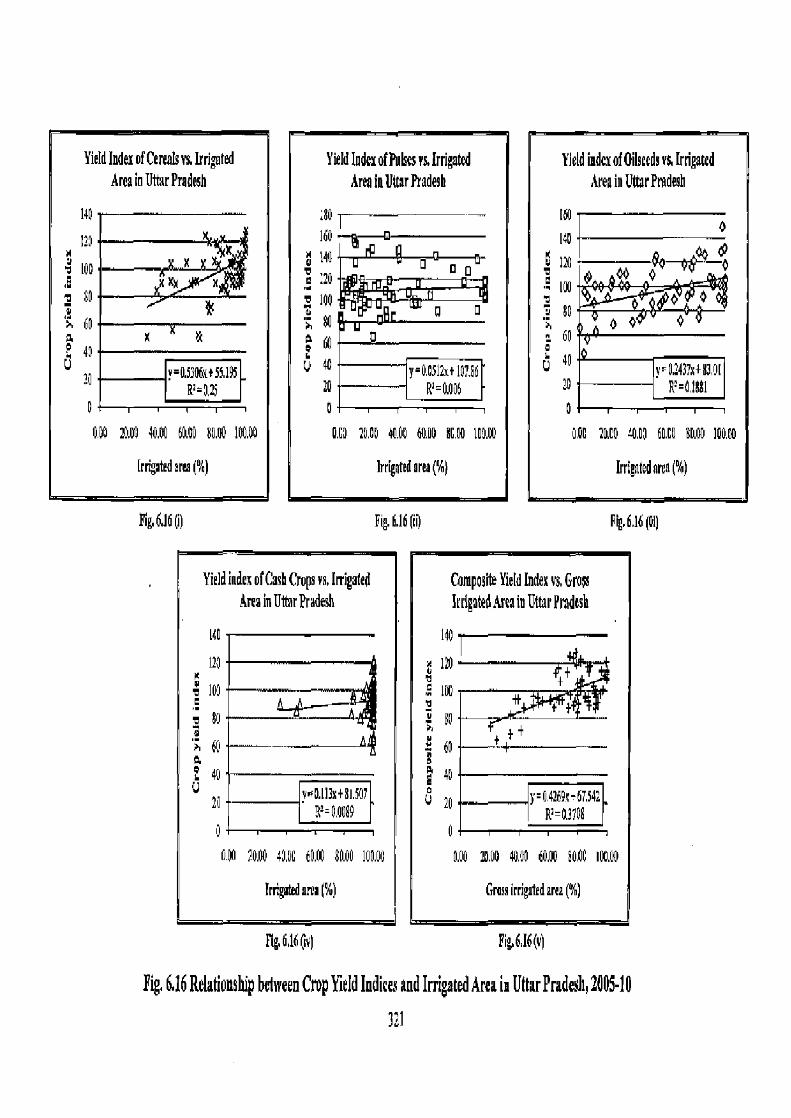
Yield Index of Cereals vs. Udgated Area in Uttar Pradesh
140
128 %
Is
IOp X xv a
s0 6 0
x 4r
°=aS3O6x+SS.19S
p R'=R2S
ODD 24D 40A0 6A0p 80.06 IOOAD
Irrigated area (%)
Fig, 616 (i)
Yield Index of Pulses rs, Irrigated Area in Uttar Pradesh
.80 ~—~--160
c:20 n o:
e I90 p 0 •r ga
y=00511x+10'.66
d0 R'=A006 0
0.D 2000 4€ 60AD 8CA0 10Er
Irrigated area (%)
Fig. 6.16 (i)
Yield index of Oilseeds vs, Irrigated Area in UdarPradesh
160 0
I:0 u 1~1• ~
Vim° o a
— 60 0 0 0
40 v=0?43?I-
20 R'=0,1881
0CC 10.00 40 60.00 6A00 100.00
Irrigated area (%)
Fig.6,16(III)
Yield index of Cash Crops vs, Irrigated Area in Uttar Pradesh
140
9 19'9
CO
r 6P A
06 40 u +o.n3x+81.507 20 v
~ B'=00089 p
0.00 20M 480C ROO 80.00 100.00
Irrigated area (°%)
flg4l6çrv)
CoteposRe Yield Index vs. Grog Irrigated Area in Uttar Pradesh
140E
l2O
urn
i, B0 +
3 40
~C p=04269,;101142 R'=03108
OK ID.00 40,D0 60.1q BOAC IIX. D
Gross irrigated area (%)
Fig. 6.16(v)
Pig. 616 Rclatlonship between Crop Yield Indices and Irrigated Area in Uttar Pradesh, 2005-10
721
This shows that, in the districts which were having high irrigated area, productivity
index values of crops were also high. Irrigated area under pulses and cash crops (X2
and X4), the correlation coefficient values with respective yield indices (XI and X9)
were positive but insignificant.
Linear relationship as depicted in Figs. 6.16 (i) to 6.16(v) shows that, there is
a positive and linear relationship between irrigated area and the yield index of all
crops, but the relationship emerged for pulses and cash crops was very weak. This
shows that productivity of pulses and sugarcane has not always high in those districts
where irrigated area under these crops is high. This indicates that, there are other
factors influencing agricultural productivity along with irrigation. These factors may
be size of holding, the fertility of soil, climate, HYV of seeds, fertilizer and farm
mechanization etc.
B. Measurement of Water Productivity in Crop Cultivation
Water is a crucial factor in plant growth It is an essential wealth and property
of any country that largely depends on efficient use of water for agricultural
production. Recently, the attention of researchers and scientists working in different
disciplines has been shifted from measuring the irrigation efficiency to measuring the
water productivity or `more crop per drop'. The patterns of water productivity in four
major crops of wheat, rice, maize and sugarcane grown in 70 districts of the state of
Uttar Pradesh has been statistically examined by adopting and applying the methods
described in Food and Agriculture Organization (FAO) and International Water
Management Institute (IWMI) studies, because the experimental data of elements of
weather and other related parameters cannot be gathered for such a vast state. For the
analysis, at first, districtwise total consumptive water use (CWU) for each crop was
computed taking into consideration the climatic parameters of evaporation and
transpiration along with the information of irrigation and crop-coefficient, then water
productivity (kg/m3) of four selected crops, which altogether constitute nearly 75 per
cent of total cropped area of the state, were worked out in the districts for triennium
ending years 2001 and 2011. It was also tried to evaluate the scope to improve water
productivity in water-scarce and water-rich regions of the state.
a. The concept of Water Productivity (WP)
With increasing population and changing consumption pattern, the demand of
322
water is rapidly increasing, and there has been an increasing pressure on available
water resources. The demand of water in agriculture always remains high to grow
food and non-food crops to feed the country's millions and for other agro-based
needs. Globally, 70 per cent of fresh water diverted for human use goes to agriculture
and irrigation water demand is still increasing because the area irrigated continues to
expand (FAO, 2002). Irrigation accounts for over 90 per cent of water consumption
in India itself, as in many South Asian countries (Rosegrant et at. 2002; FAO 2003).
At present, India's population is 1.12 billion, and is expected to reach 1.35 billion by
2025 (Hire, 2009). To produce more food using less water for such a large population
is one of the great challenges of 21s' century. Since the beginning of the green
revolution in India, irrigated agriculture has become a major contributor to
foodgrains production. It is expected that in coming future, irrigation will play a
major role in increasing the yield of crops and the amount of food needed to support
the country's growing population (Dehghanisanij el al., 2006). Moreover, crop
production can be increased many folds (4 to 10 times) if irrigation is provided to
areas lying in semi-arid tropics, where rainfall is inadequate, erratic, ill-distributed
and often leads to drought conditions. Water productivity is a new concept in agricultural water management
studies. World over, agriculture has very low water productivity when compared to
manufacturing and the situation is not different in India. Agriculture continues to be
the largest user of diverted water in the country (GOI, 1999). Moreover, productivity
of water in India is very low for major crops in terms of the amount of biomass
produced per unit of water depleted (Amarasinghe et al., 2008). Low yields in
tropical agro-ecosystem of India are explained and manifested by on-farm blue water
(irrigation) losses in terms of both surface runoff, limiting infiltration to the root zone
and percolation to groundwater, and on non-productive vapour flow component
(evaporation), reducing the productive vapour flow (plant transpiration). If all
amount of water accessible in the root zone could be used productively, i.e., without
non-productive vapour losses and nutrient deficiency, the potential yield in crops
would reach to its maximum (Rockstrom et ai., 2007). It can be inferred that future
crop production under irrigated conditions depends solely on efficient and judicious
use of water to realize the cherished gains from irrigation (Goud, 1989). In some
regions of the country, the expansion of surface water use appears to be approaching
the physical limit, and groundwater abstractions are increasingly exceeding rates of
323
replenishment Meanwhile, industrial and domestic water demand has been
increasing rapidly as a result of development and urbanization (Rosegrant et al.,
2000). Only one-third of agricultural production in India comes from rain-fed areas
that account for two-third of croplands. It is, therefore, needed to grow more crops by
using less water with high efficiency in these regions.
Water productivity has been defined as `crop production' per unit 'amount of
water used' (Molden, 1997). Concept of water productivity in agricultural production
systems is focused on `producing more food with the same water resources' or
'producing the same amount of food with less water resources'. Initially, irrigation
efficiency or water use efficiency was used to describe the performance of irrigation
systems. In agronomic terms, `water use efficiency' is defined as `the amount of
organic matter produced by a plant divided by the amount of water used by the plant
in producing it' (De Wit, 1958). However, in terminology used `water use efficiency'
does not follow the classical concept of `efficiency', which uses the same units for
input and output. Therefore, IWMI has proposed a change of the nomenclature from
`water use efficiency' to `water productivity'. Water productivity can further be
defined in several ways according to the purpose, scale and domain of analysis
(Molden et al. 2001; Bastiaanssen et at 2003).
In general term `Water Productivity' (WP) refers to the ratio of crop output to
water either diverted or consumed. In other words, it may be defined as, the ratio
between the actual yield achieved (Ya) and water use, expressed in kg/m3, but the
denominator may refer to the total water use (TWU), including rainfall (Pereira and
Pires, 2011). The major crop water productivity parameters used in literature are the
physical productivity of water expressed in kilogram of crop per cubic metre of water
diverted or depleted (kgim'); net or gross present value of the crop produced per
cubic metre of water (Rs/m3) known either as economic efficiency of water use or
combined physical and economic productivity of water and net or gross present value
of the crop produced against the value of the water diverted or depleted (Kijne et al.,
2003). However, this term is used with different meanings. According to Molden et
at. (2003) water productivity is scale dependent which can be analysed at the plant,
field, farm, system and basin level, and its value would change with the changing
scale of analysis.
Historically, three and a half century ago, the Flemish pharmacist van
Helmont found that water is essential input for plants to reach at a certain weight.
324
Later, another scientist Woodward was the first to relate the water loss during plant
growth to the gain in plant's dry weighty. In the middle of the 20th century, a
meteorologist named Penman gave this a new conceptual name of `water
productivity' or `crop per drop'. He introduced the concept of potential transpiration,
defined as water loss from an extended surface of a short green crop, actively
growing, completely shading the soil and never short of water. The ecologist De Wit
(1955) reasoned that, Penman's conditional "never short of water" meant that the
concept is of little value where water is limiting, as in dry-fanning and often for
shorter or longer periods in rain-fed agriculture. His approach was welcomed by
many dry farming researchers, but found little acceptance within the world of the
irrigation engineers. Later, Thotnthwaite (1944) complained about irrigation
engineers not distinguishing between actual and so called potential
evapotranspiration, a term he introduced at that time. This difference became less
important from the 1960's onwards, after Penman's formula became the "standard"
to aim at in the calculation of crop water requirements under irrigation engineers
worldwide. Since then, crop water requirements under irrigation were defined as the
water crops need to reach their final yields under unrestricted growth conditions, not
only of nutrients, pests and competition from weeds, also of the water for
transpiration and evaporation (Zoebl, 2006).
b. Factors affecting water productivity
Water Productivity varies from field to field and even region to region
depending upon the factors which influence crop-water requirements. These are
climate (sunshine and temperature, precipitation, humidity and wind speed), crop
water needs, type and soil texture etc. Crops grown in sunny and hot climate needs
more water per day than the crops grown in cloudy and moderately cool climate.
Thus, the highest crop water needs occur in areas characterized with hot, dry, windy
and sunny weather. The lowest water requirement occurs when it is cool, humid and
cloudy with little or without wind. Crop type has an influence on the duration of total
growing season (i.e. short duration crops like, peas which is matured within 90-100
days, and sugarcane which needs more than a year for its maturity), and on total crop
water requirements. The other factors influencing WP of crops are irrigation, field
' The weight of any plant (or other organism) part after all its water content has been removed by drying.
.325

water management, infrastructure and inputs including labour, fertilizers etc.
Table 6.13 Water Productivity of Wheat and Rice Crops in India- Cited from Different Studies
Crop/Location Min: Max. m
Median /m'
Experimental ea s Reference
Wheat Panniagar 0.86-1.31 1.11 1983-1985 Mishra et al.(1995) Uttar Pradesh 0.48-0.71 044 1993-1994 Sharma etal. (2001) Bhdua 1.23-1.49 1.36 2000-2001 Hussain et al. (2003) Kamal 0.27-0.82 0.67 1986-1988 Sharma etal. (1990) Pantnagar 1.06-1.23 1.11 1979-1985 Singh and Chauhan (1996) Rice Panmagar 0.80-0.99 0.89 1983-1984 Mishra et al. (1990) New Delhi 0.55-0.67 0.67 2001 Singh etal. (2002) Punjab 0.87-1.46 1.15 1996-1997 Singh et al. (2001) Source: Dehghanisanij at at (2006).
c. Consumptive Water Use (CWU) Every crop has its own agronomic requirements and water needs for
successful cultivation and gives maximum yield. The term `consumptive water use'
or `water requirements of crop' means the total quantity and the way in which a crop
requires water, from the time, it is sown to the time it is harvested. In general CWU
is the water required to meet the demand of evapotranspiration and metabolic
activities. Since water requirements in metabolic activities are insignificant (about 1
per cent). Therefore, water requirement of plant is considered to be equal to
Evapotranspiration (ET) (Mahmood andAhmad, 2005).Moreover, evapotranspiration
of water is the amount of water which crop transpires in course of its growth, and
which evaporates from the bare soil surface in the fields (Vaidyanathan and
Sivasubramaniyan, 2004).
As regards the demand for water or crop evapotranspiration mainly
determines the requirement of water for agriculture (Kumar et at., 2011). Every crop
requires a certain amount of water with a specific interval, throughout its growth
period. If the rain water is sufficient and timely, so as to fulfil the requirements, no
irrigation is required to raise that crop. But in a tropical country like India, the
rainfall is either insufficient or the water does not reaches with a fixed interval, as
required by the crop; certain crop may require irrigation. About 70 to 90 per cent of
rainfall in India is received during the rainy season from July to September. The
onset of monsoon each year, however, remains uncertain and the rainfall received is
326
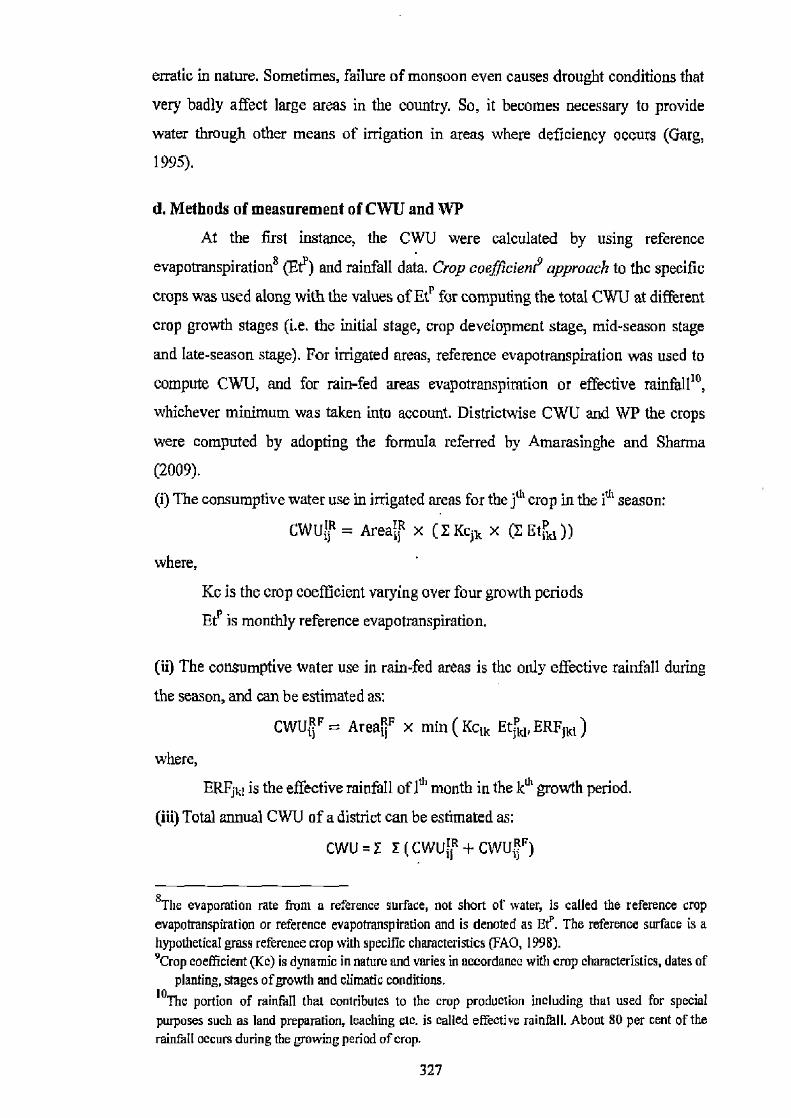
erratic in nature. Sometimes, failure of monsoon even causes drought conditions that
very badly affect large areas in the country. So, it becomes necessary to provide
water through other means of irrigation in areas where deficiency occurs (Garg,
1995).
d. Methods of measurement of CWU and WP
At the first instance, the CWU were calculated by using reference
evapotranspiration$
(Et) and rainfall data. Crop coefticient9 approach to the specific
crops was used along with the values of Etr for computing the total CWU at different
crop growth stages (i.e. the initial stage, crop development stage, mid-season stage
and late-season stage). For irrigated areas, reference evapotranspiration was used to
compute CWU, and for rain-fed areas evapotranspiration or effective rainfall10, whichever minimum was taken into account. Distrietwise CWU and WP the crops
were computed by adopting the formula referred by Alnarasinghe and Sharma
(2009).
(i) The consumptive water use in irrigated areas for the j1h crop in the 1" season:
CWU = Area; x (E Kcjk x (E Et))
where,
Kc is the crop coefficient varying over four growth periods
Et" is monthly reference evapotranspiration.
(ii) The consumptive water use in rain-fed areas is the only effective rainfall during
the season, and can be estimated as:
CWUR F = AreaRF x min ( KCtk Et jj, ERFIxt
where,
ERFiki is the effective rainfall of 1"' month in the kth growth period.
(iii) Total annual CWU of a district can be estimated as:
CWU = E E (CWUJR + CWURF)
8The evaporation rate from a reference surface, not short of water, is called the reference crop evapotranspiration or reference evapotranspiration and is denoted as Et'. The reference surface is a hypothetical grass reference crop with specific characteristics (FAO, 1998). °Crop coefficient (Kc) is dynamic in nature and varies in accordance with crop characteristics, dates of
planting, stages of growth and climatic conditions. IOThe portion of rainfall that contributes to the crop production including that used for special purposes such as land preparation, leaching etc. is called effective rainfall. About 80 per cent of the rainfall occurs during the growing period of crop.
327

(iv) Total WP of a district can be estimated as:
I average yield] x(Areaia+ Area') WP= cwu
Applying the formula, for computing the Consumptive Water Use (CWU) for
wheat crop in Saharanpur district:
1. CWU for irrigated wheat (IR) Area irrigated under wheat = 1,12,206 (in ha) Crop coefficient (Kc) for wheat = 0.85 Reference Evapotranspiration (Et") = 283 (mm.) i. CWU a — 1,12,206x 283
= 2,70,25,569 (ha.mm.) 2. CWU for rain-fed wheat (1W)
Rain-fed area under wheat= 8508 (in he.) Effective rainfall (ERF) = 31 (mm.) ii. CWU' 8,508x31
= 26,6181(hamm)
Total Consumptive Water use (TCWU) = i+ii = 2,70,25,569+2,66,181 — 2,72,91,750(ha.mm.)
3. Water Productivity(WP) for wheat WP_ yield(kg/ha)x(irrigated area+rain—fed area)
TCWU
(z,989)x(1,12,2o6+a,5n6) = 1.32 kg/m' 2,72,91,750
Therefore, the district of Saharanpur with WP value of 1.32 kg/r3 is more
efficient in water consumption in the state.
Z-score values of the crops were computed from the original WP values for
the years 2001 and 2011, so that the data can be put on a common scale for
comparison by applying composite z-score technique. Karl Pearson's coefficient of
correlation technique was applied to find out the strength of relationship between the
indicators, and the linear regression technique was used to establish the statistical
relationship.
Statistical information pertaining to area and yield of each crop considered in
the analysis were obtained for each district from office of the State Directorate of
Agriculture, Lucknow for three consecutive years and averaged for the periods of
328
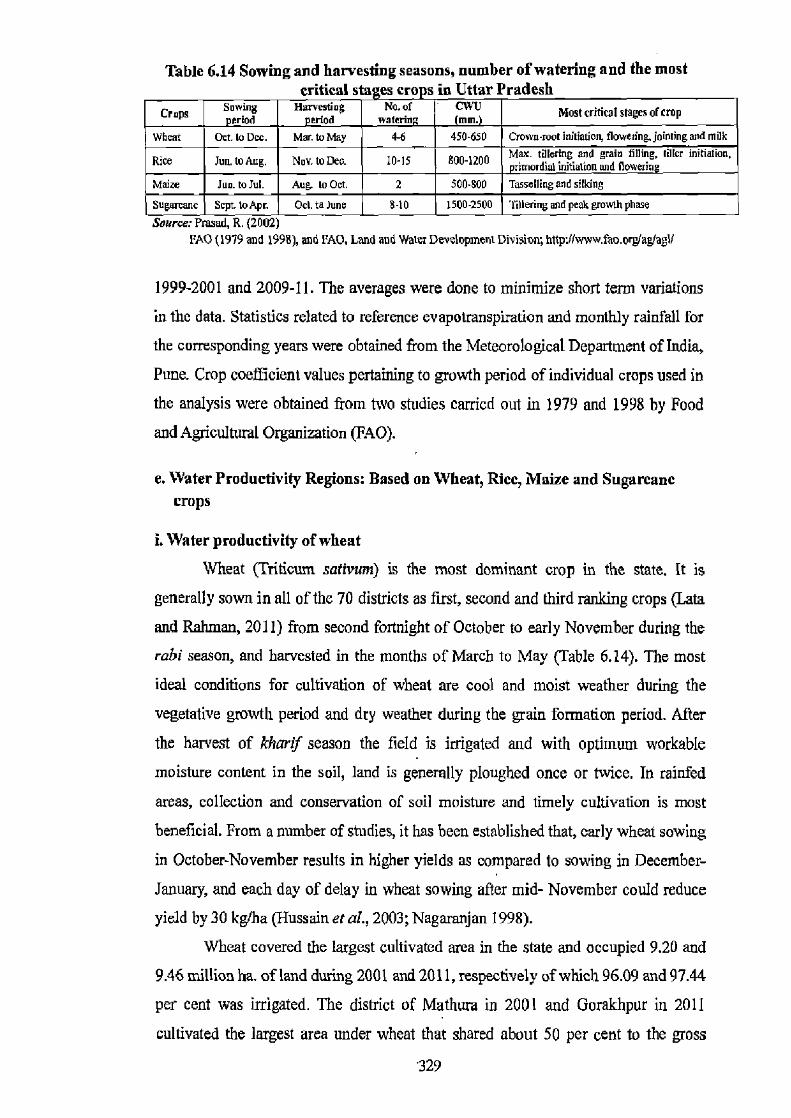
Table 6.14 Sowing and harvesting seasons, number of watering and the most critical staves crone in Uttar Pradesh
Crops Sowing period
Harvests period
No. of walerin
CWU mm. Most critical stages of[rop
Wheat Oct. Ia Dec. Mar. to May 4-6 450-650 Crown-root initiation, flowering, jointing and milk Rice Jun. to Aug. Nov. WDea. f0-15 800-1200 Max. tillereng and grain filling, tiller initiation,
rimordial vitiation and flowerin Maize lun. to Jul. Aug Io Oct. 2 500-800 Tasselling and sinking Sugwcane Sept. to Apr. Oct. to June 8-10 1500-2500 '1'itIering end peak growth phase Source: rlesud, K. (2U112)
FAO (1979 and 1998), and MO, Land and Water Development Division; hItpJ/www.fao.org/ag/aU
1999-2001 and 2009-11. The averages were done to minimize short term variations
in the data. Statistics related to reference evapotranspiration and monthly rainfall for
the corresponding years were obtained from the Meteorological Department of India,
Pone. Crop coefficient values pertaining to growth period of individual crops used in
the analysis were obtained from two studies carried out in 1979 and 1998 by Food
and Agricultural Organization (FAO).
e. Water Productivity Regions: Based on Wheat, Rice, Maize and Sugarcane crops
i. Water productivity of wheat
Wheat (Triticum sativum) is the most dominant crop in the state. It is
generally sown in all of the 70 districts as first, second and third ranking crops (Lata
and Rahman, 2011) from second fortnight of October to early November during the
rabi season, and harvested in the months of March to May (Table 6.14). The most
ideal conditions for cultivation of wheat are cool and moist weather during the
vegetative growth period and dry weather during the grain formation period. After
the harvest of kharif season the field is irrigated and with optimum workable
moisture content in the soil, land is generally ploughed once or twice. In rainfed
areas, collection and conservation of soil moisture and timely cultivation is most
beneficial. From a number of studies, it has been established that, early wheat sowing
in October-November results in higher yields as compared to sowing in December-
January, and each day of delay in wheat sowing after mid- November could reduce
yield by 30 kg/ha (Hussain et al., 2003; Nagaranjan 1998).
Wheat covered the largest cultivated area in the state and occupied 9.20 and
9.46 million ha. of land during 2001 and 2011, respectively of which 96.09 and 97.44
per cent was irrigated. The district of Mathura in 2001 and Gorakhpur in 2011
cultivated the largest area under wheat that shared about 50 per cent to the gross
329
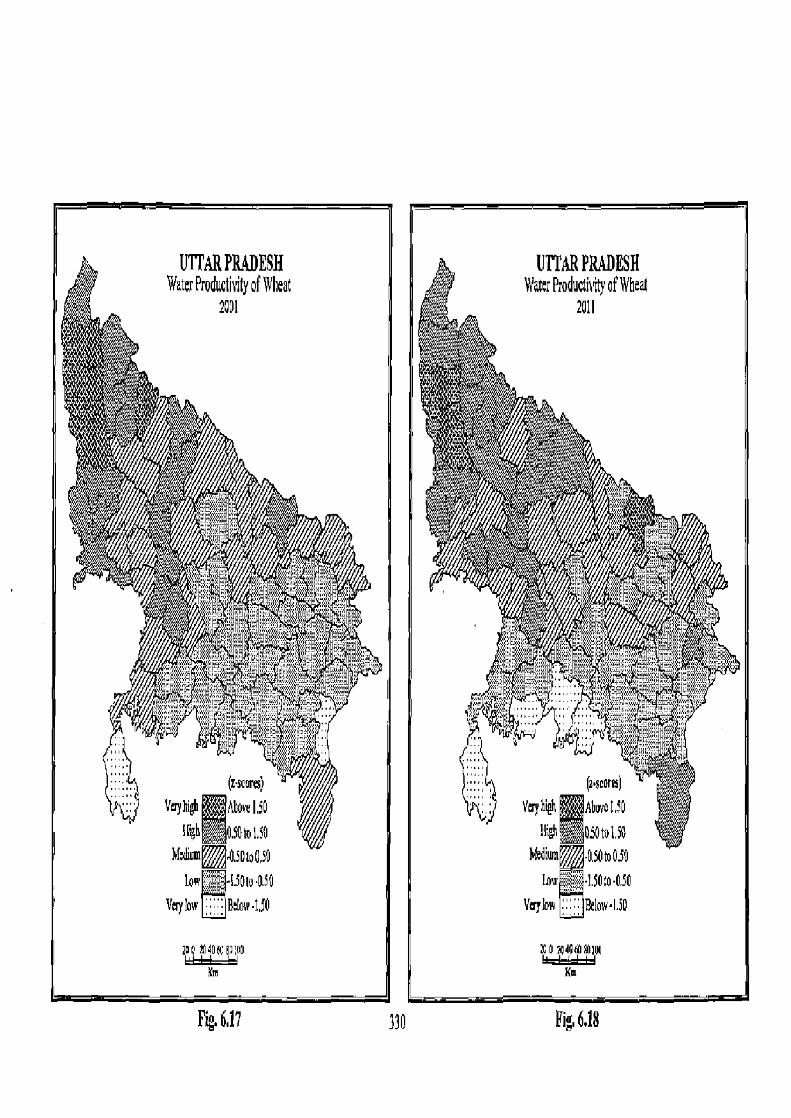
UTTAR PRADESH Water Producti ity of Wheat
20DI
Fi;.6.17 330 Fig. 6.18
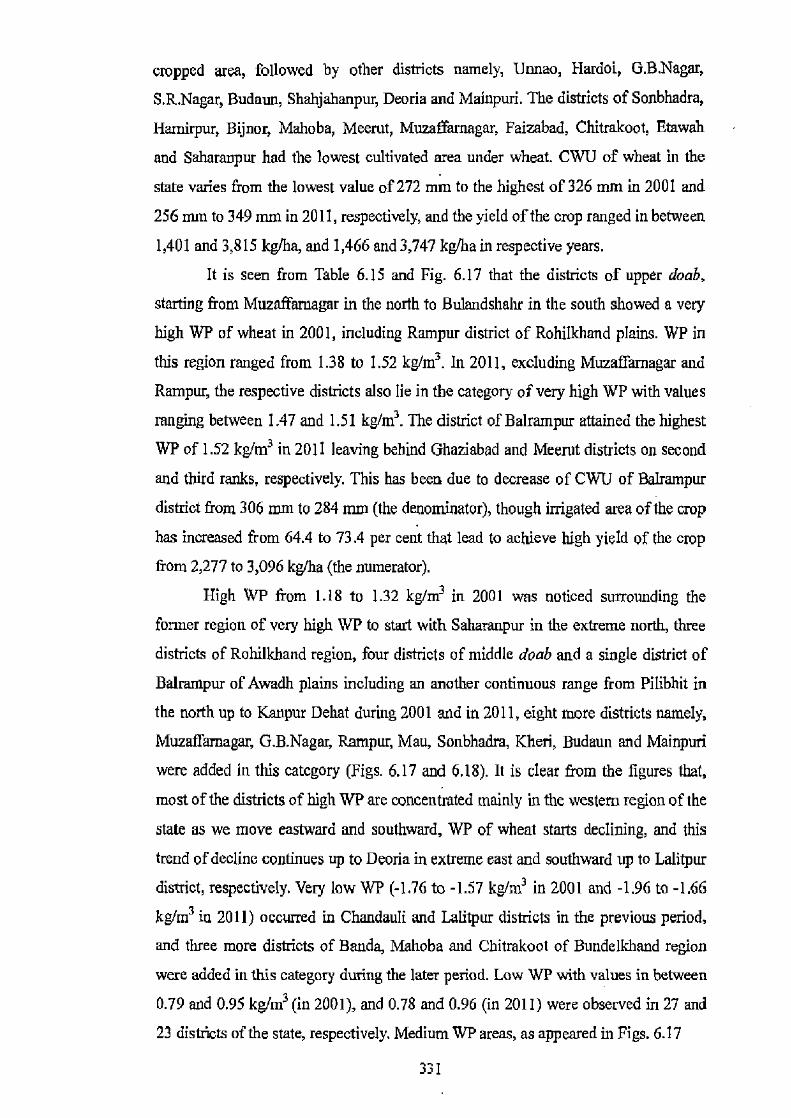
cropped area, followed by other districts namely, Unnao, Hardoi, G.B.Nagar,
S.R.Nagar, Budaun, Shahjahanpur, Deoria and Mainpuri. The districts of Sonbhadra,
Hamirpur, Bijnor, Mahoba, Meerut, Muzaffarnagar, Faizabad, Chitrakoot, Etawah
and Saharanpur had the lowest cultivated area under wheat. CWU of wheat in the
state varies from the lowest value of 272 mm to the highest of 326 mm in 2001 and
256 mm to 349 nun in 2011, respectively, and the yield of the crop ranged in between
1,401 and 3,815 kg/ha, and 1,466 and 3,747 kg/ha in respective years.
It is seen from Table 6.15 and Fig. 6.17 that the districts of upper doab,
starting from Muzaffatnagar in the north to Bulandshahr in the south showed a very
high WP of wheat in 2001, including Rampur district of Rohilkhand plains. WP in
this region ranged from 1.38 to 1.52 kg/m3. In 2011, excluding Muzaflamagar and
Rampur, the respective districts also lie in the category of very high WP with values
ranging between 1.47 and 1.51 kg/m'. The district of Balrampur attained the highest
WP of 1.52 kg/m' in 2011 leaving behind Ghaziabad and Meerut districts on second
and third ranks, respectively. This has been due to decrease of CWU of Balrampur
district from 306 man to 284 mm (the denominator), though irrigated area of the crop
has increased from 64.4 to 73.4 per cent that lead to achieve high yield of the crop
from 2,277 to 3,096 kg/ha (the numerator).
High WP from 1.18 to 1.32 kg/m3 in 2001 was noticed surrounding the
former region of very high WP to start with Saharanpur in the extreme north, three
districts of Rohilkhand region, four districts of middle doab and a single district of
Balrampur of Awadh plains including an another continuous range from Pilibbit in
the north up to Kanpur Dehat during 2001 and in 2011, eight more districts namely,
Muzafamagar, G.B.Nagar, Rampur, Mau, Sonbhadra, Kheri, Budaun and Mainpuri
were added in this category (Figs. 6.17 and 6.18). It is clear from the figures that,
most of the districts of high WP are concentrated mainly in the western region of the
state as we move eastward and southward, WP of wheat starts declining, and this
trend of decline continues up to Deoria in extreme east and southward up to Lalitpur
district, respectively. Very low WP (-1.76 to -1.57 kg/m3 in 2001 and -1.96 to -1.66
kg/tu3 in 2011) occurred in Chandauli and Lalitpur districts in the previous period,
and three more districts of Banda, Mahoba and Chitrakoot of Bundelkhand region
were added in this category during the later period. Low WP with values in between
0.79 and 0.95 kg/m (in 2001), and 0.78 and 0.96 (in 2011) were observed in 27 and
23 districts of the state, respectively. Medium WP areas, as appeared in Figs. 6.17
331
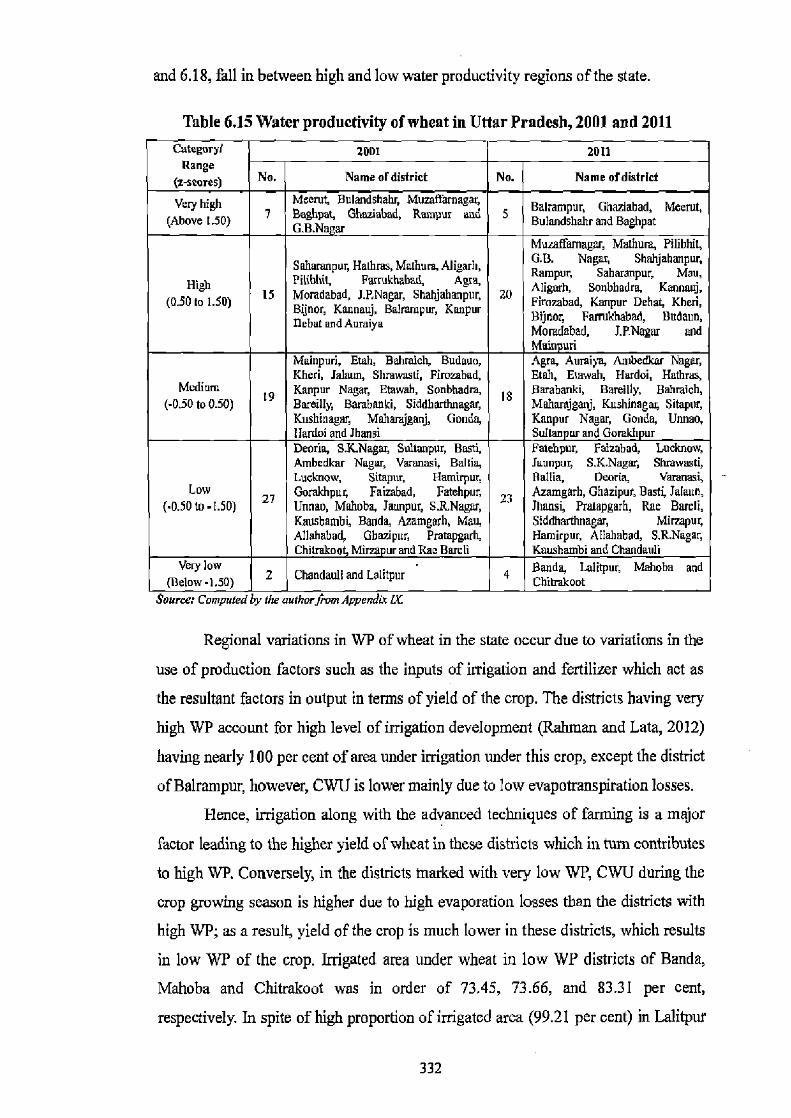
and 6.18, fall in between high and low water productivity regions of the state.
Table 6.15 Water productivity of wheat in Uttar Pradesh, 2001 and 2011 Category! 20D1 2011 Range
(zscums) No. Name or district No. Name ofdistrlct
Very high Meenu, Bulandshahy Muzanzrna ai Balrampur, Ghaziahad, Meerut, (Above 1.50) 7 lhghpeti Ghaziabad, Pamper and
G.B.Na ar 5 Bulandshahr and Baghpat
Mu`affamagar, Malhunt, PiUbhil,
Saharanpur, Hathras, Mather, ,Aligarh, G.B. Nagar, Shahjahanpur,
H~
Filibhtt, Parrukhabad, A e, ~npur, Saharanpur, Mau, Abgorh, Sonbhadrq Kaniwuj,
(0.50101.50) IS Moradabad, 1.RNagar, Shahjahanpur, 20 Firombad, Kanpur Dehat, Kheri, Bijnor, Kannauj, Balrampur, Kanpur Bjjc Fami1thabad, Budaun, Dehat and Auraiya Momdabad, J.P.Nagar and Main uri
Mainpuri, Etah, Bahmich, Budaun, Agra, Auraiya, Ambedkar Nagar, Kheri, Jalaun, Shrawasti, Fimzabad, Elah, Etawah, Herdui, Hathras,
Medium 19 Kanpur Nagar, Etowah, Sonbhadm, IS Bambanki, Bareilly, Bahrzich, (-050 to 0.50) Bareilig Barabanki, Siddharthnagar, Maharajganj, Kushinagar, Sitapor,
Kushinagay Maharajganj, Gonda, Kanpur Nagar, Gonda, Unnao, llardoi and Jhansi Sultanpur and Gorakh ur Deoria, S.KNagar, Sullanpur, Busti, Fatehpur, Falzabad, Lucknow, Ambedkar Nagar, Varanasi, Ballia, Jaunpur, S.K.Nagay Shrawasti, Luclmow, Sitaprq Hamirpur, Hatlia, Deoria, Varanasi,
Low 27 Gorakhpur, Faizabad, Fatehpur, 23 Azamgarh, Ghaziput, Basti, Jalaun, (-050 to-1.50) Unnao, Mahoba, Jaunpur, SJLNagar, Jhansi, Pratapgarh, Rae Bareli,
Kaushambi, Banda, Azamgath, Mau, Siddharthnagar, Mirzapur, Allahabad, Ghazipur, Pratapgarh, Hamirpur, Allahabad, S.R.Nagap Chitrkoot, Mirzapur end R. Barth Kaushambi and Chandauli
Very low ChandaWi and Lalitpur 4
Band; Lalitpur, Mahoba and (Below-1.50) Chitrakoot Chibakout
Source: Computed by the authorfrom Appendu 1K
Regional variations in WP of wheat in the state occur due to variations in the
use of production factors such as the inputs of irrigation and fertilizer which act as
the resultant factors in output in terms of yield of the crop. The districts having very
high WP account for high level of irrigation development (Rahman and Lata, 2012)
having nearly 100 per cent of area under irrigation under this crop, except the district
of Balrampur, however, CWU is lower mainly due to low evapotranspiration losses.
Hence, irrigation along with the advanced techniques of farming is a major
factor leading to the higher yield of wheat in these districts which in turn contributes
to high WE Conversely, in the districts marked with very low WP, CWU during the
crop growing season is higher due to high evaporation losses than the districts with
high WP; as a result, yield of the crop is much lower in these districts, which results
in low WP of the crop. Irrigated area under wheat in low WP districts of Banda,
Mahoba and Chitrakoot was in order of 73.45, 73.66, and 83.31 per cent,
respectively. In spite of high proportion of irrigated area (99.21 per cent) in Lalitpur
332
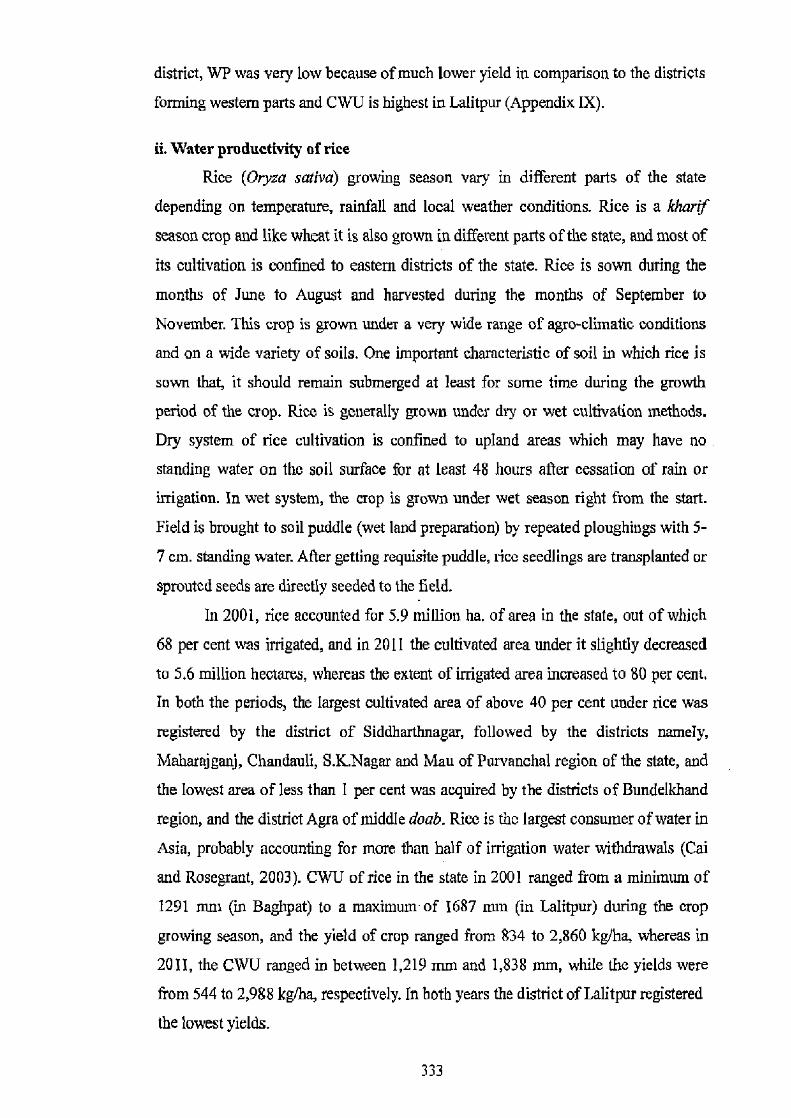
district, WP was very low because of much lower yield in comparison to the districts
forming western parts and CWU is highest in Lalitpur (Appendix IX).
ii. Water productivity of rice
Rice (Oryza sativa) growing season vary in different parts of the state
depending on temperature, rainfall and local weather conditions. Rice is a kharif
season crop and like wheat it is also grown in different parts of the state, and most of
its cultivation is confined to eastern districts of the state. Rice is sown during the
months of June to August and harvested during the months of September to
November. This crop is grown under a very wide range of agro-climatic conditions
and on a wide variety of soils. One important characteristic of soil in which rice is
sown that, it should remain submerged at least for some time during the growth
period of the crop. Rice is generally grown under dry or wet cultivation methods.
Dry system of rice cultivation is confined to upland areas which may have no
standing water on the soil surface for at least 48 hours after cessation of rain or
irrigation. In wet system, the crop is grown under wet season right from the start.
Field is brought to soil puddle (wet land preparation) by repeated ploughings with 5-
7 cm. standing water. After getting requisite puddle, rice seedlings are transplanted or
sprouted seeds are directly seeded to the field.
In 2001, rice accounted for 5.9 million ha. of area in the state, out of which
68 per cent was irrigated, and in 2011 the cultivated area under it slightly decreased
to 5.6 million hectares, whereas the extent of irrigated area increased to 80 per cent.
In both the periods, the largest cultivated area of above 40 per cent under rice was
registered by the district of Siddharthnagar, followed by the districts namely,
Maharajganj, Chandauli, S.K.Nagar and Mau of Purvanchal region of the state, and
the lowest area of less than I per cent was acquired by the districts of Bundelkhand
region, and the district Agra of middle doab. Rice is the largest consumer of water in
Asia, probably accounting for more than half of irrigation water withdrawals (Cai
and Rosegrant, 2003). CWU of rice in the state in 2001 ranged from a minimum of
1291 mm (in Baghpat) to a maximum of 1687 nun (in Lalitpur) during the crop
growing season, and the yield of crop ranged from 834 to 2,860 kg/ha, whereas in
2011, the CWU ranged in between 1,219 mm and 1,838 mm, while the yields were
from 544 to 2,988 kg/ha, respectively. In both years the district of Lalitpur registered
the lowest yields.
333
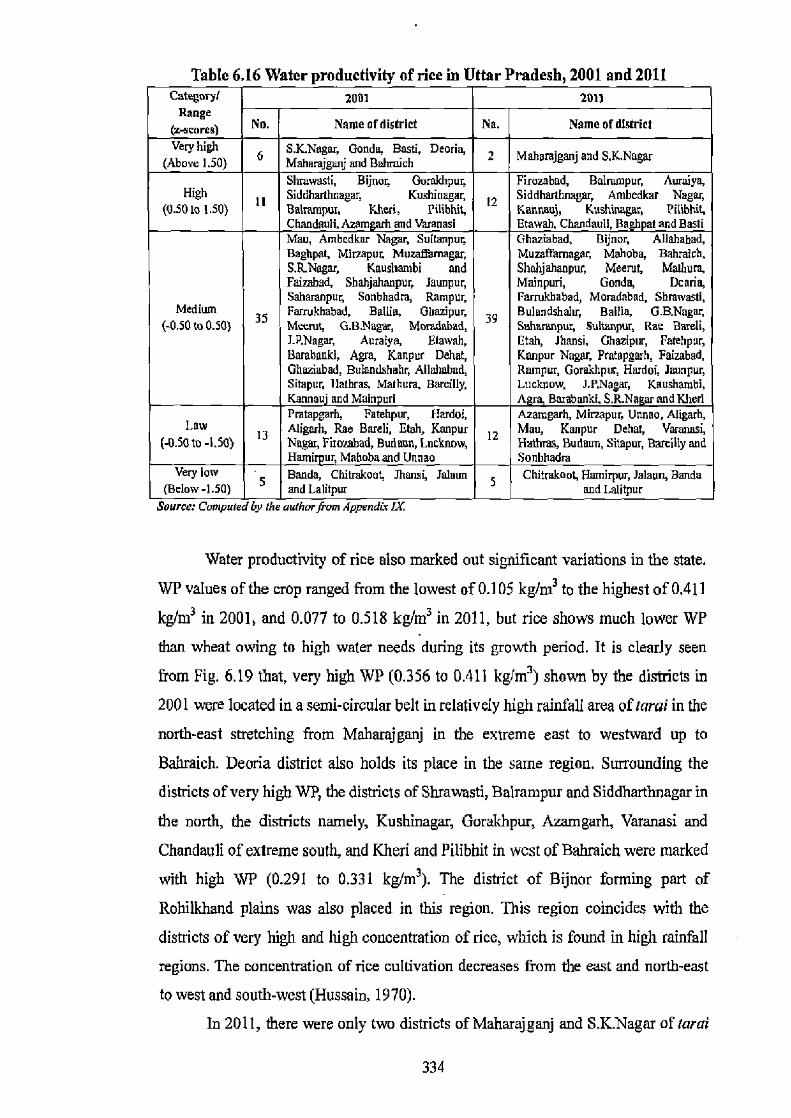
Table 6.16 Water oroductivity of rice in Uttar Pradesh, 2001 and 2011 category/ 2001 2013 Range
(zscores) No. Name of district No. Name of district
Very high 0
S.KNagar Gonda, Basti, Deoria, Maharajganj and Bahmich
2 Mahamjganj and S.K.Nagar (Above 1.50) Shrawasti, Bijaor, Gorakhpur, Firozabad, Balmmpur, Auraiya,
High It Siddharthnagar, Kushinagar, 12 Siddharlhnagar, Ambedar Nagar, (0.50 to 1.S0) Balrampur, Kheri, Pilibhit, Kannauj, Kush{naga5 Pilibhit,
Chandauli, Azamgarti and Varanasi Etawah, Chandauli, Bahpat and Basti Mau, Ambedkar Nagar, Suiranpur, Ghaziabad, Bijnor, Allahabad, Baghpat, Mirzapur, Muza~magar, Muzalfamagar, Mahoba, Bahraich, S.R.Nagar, Kaushambi and Shahjnhanpur, Meerut, Malhum, Faizabad, Shahjahanpur, Jaunpur, Mainpuri, Gonda, Denrin, Saharanpur, Sanbhadra, Rampur, Farrukhabad, Moradabad, Shmwasti,
Medium 35 Farrukhabad, Berlin, Ghazipur, 3Y Bulandshahr,, Ballia, G.B.Nagar, (-0.50 to 0.50) Meemt, G.B.Nagar, Mmadabad, Saharanpur, Sultanpur, Rae Bareli,
1P.Nagar, Auraiya, Btawah, Etah, Jhansi, Ghazipur, Fatehpur,
Barabanki, Agra, Kanpur Dehat, Kanpur Nagar, Pratapgarh, Fainabad, Gheziabad, Bulandshahr, Allahabad, Romper, Gorakhpur, Hardoi, Jaunpur, Sitapur. Ilarhras, Mathurn, Bareilly, Lucknow, J.P.Nagar, Kaushambi, Kannau and Mainpuri Ara, Barabanki, S.}t.Nagw and Kheri Pmtapgarh, Fatehpur, Hardoi, Azamgarh, Mirzapur, Unnao, Aligarh,
Low 13 Aligarh, Rae Bureli, Etah, Kanpur Kanpur Dehat, Varai, Mau Varanasi, (-0.50 to -1.50) Nagar, Fiiarspad, Butner, Lncknow, Hothrss, Budaun, Siupur, Bareilly and
HainirpurMahobaiidUnnao Sonhhadra Very low S Banda, Chitrakou[, Jhanai, Jalaun 5 Chitrakoor, Hamirpur, Jalaun, Banda
(Below-1.50) andtalitpur and Lalitpur Source: Computed by the mdhor from Appendix IX
Water productivity of rice also marked out significant variations in the state.
WP values of the crop ranged from the lowest of 0.105 kg/m3 to the highest of 0.411
kg/m3 in 2001, and 0.077 to 0.518 kg/m' 111 2011, but rice shows much lower WP
than wheat owing to high water needs during its growth period. It is clearly seen
from Fig. 6.19 that, very high WP (0.356 to 0.411 kg/m3) shown by the districts in
2001 were located in a semi-circular belt in relatively high rainfall area of tarai in the
north-east stretching from Maharajganj in the extreme east to westward up to
Babraich. Deoria district also holds its place in the same region. Surrounding the
districts of very high WP, the districts of Shrawasti, Balrampur and Siddharthnagar in
the north, the districts namely, Kushinagar, Gorakhpur, Azamgarh, Varanasi and
Chandauli of extreme south, and Kheri and Pilibhit in west of Bahraich were marked
with high WP (0.291 to 0.331 kg/m3). The district of Bijnor forming part of
Rohilkhand plains was also placed in this region. This region coincides with the
districts of very high and ]sigh concentration of rice, which is found in high rainfall
regions. The concentration of rice cultivation decreases from the east and north-east
to west and south-west (Hussain, 1970).
In 2011, there were only two districts of Maharajganj and S.K.Nagar of tarai
334
(ueam)
Wry high Abwe1.30
HO to I.5@ lbdwn
IB~W-130
ASOtQ0.5U
Low -13(0-oso v¢nbw
(z*rs)
Veryti0h AmLS0
NO a5oto150 MErum mASOws
Ina ,•1.S0to-0.S0 vvbw 9'Rlawd30
?Uo mlQ6salo Kq
UTTARPRADESH
UTTARPRADESH W'aterProducivity of Rice WaterPrcductivitp of Rice
200]
2011
Fib 6.19
335
Fig, £20
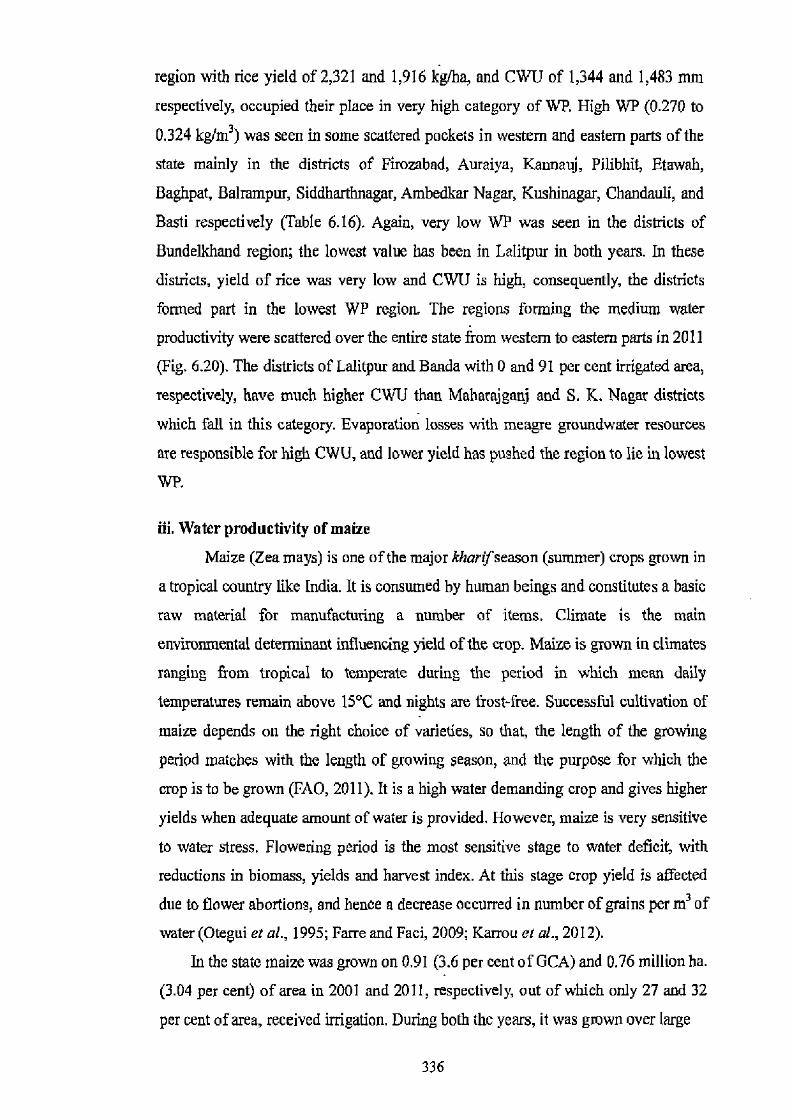
region with rice yield of 2,321 and 1,916 kg/ha, and CWU of 1,344 and 1,483 mm
respectively, occupied their place in very high category of WP. High WP (0.270 to
0.324 kg/m3) was seen in some scattered pockets in western and eastern parts of the
state mainly in the districts of Firozabad, Auraiya, Kannauj, Pilibhit, Etowah,
Baghpat, Balrampur, Siddharthnagar, Ambedkar Nagar, Kushina ar, Chandauli, and
Basti respectively (Table 6.16). Again, very low WP was seen in the districts of
Bundelkhand region; the lowest value has been in Lalitpur in both years. In these
districts, yield of rice was very low and CWU is high, consequently, the districts
formed part in the lowest WP region. The regions forming the medium water
productivity were scattered over the entire state from western to eastern parts in 2011
(Fig. 6.20). The districts of Lalitpur and Banda with 0 and 91 per cent irrigated area,
respectively, have much higher CWU than Maharajganj and S. K. Nagar districts
which fall in this category. Evaporation losses with meagre groundwater resources
are responsible for high CWU, and lower yield has pushed the region to lie in lowest
WP.
iii. Water productivity of maize
Maize (Zea mays) is one of the major kharifseason (summer) crops grown in
a tropical country like India. It is consumed by human beings and constitutes a basic
raw material for manufacturing a number of items. Climate is the main
environmental determinant influencing yield of the crop. Maize is grown in climates
ranging from tropical to temperate during the period in which mean daily
temperatures remain above 15°C and nights are frost-free. Successful cultivation of
maize depends on the right choice of varieties, so that, the length of the growing
period matches with the length of growing season, and the purpose for which the
crop is to be grown (FAO, 2011). It is a high water demanding crop and gives higher
yields when adequate amount of water is provided. However, maize is very sensitive
to water stress. Flowering period is the most sensitive stage to water deficit, with
reductions in biomass, yields and harvest index. At this stage crop yield is affected
due to flower abortions, and hence a decrease occurred in number of grains per m' of
water (Otegui et al., 1995; Pane and Faci, 2009; Karrou et al., 2012).
In the state maize was grown on 0.91 (3.6 per cent of GCA) and 0.76 million ha.
(3.04 per cent) of area in 2001 and 2011, respectively, out of which only 27 and 32
per cent of area, received irrigation. During both the years, it was grown over large
336
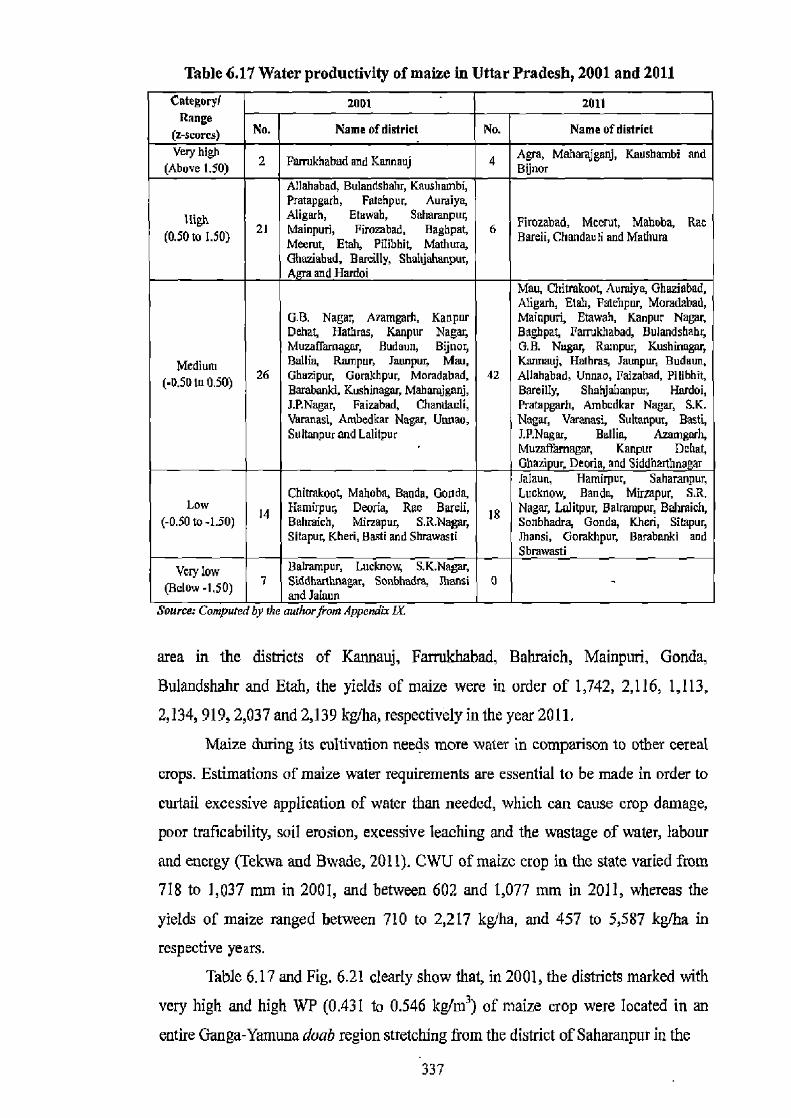
Table 6.17 Water productivity of maize in Uttar Pradesh, 2001 and 2011 Category/ 2001 2011
Range (z-scores) No. Name of district No. Name of district
Very high 2 Fa^nkhabad and Kannauj 4 Agra, Maharajganj, Ksusharnbi and
(Above 1.50) Bjjnor Allahabad, Bulandshaht Kausha,nbi, Pratapgarh, Fatehpur, Aumiya,
tti P* Aligarh, Etawab, SNwanpur, Firozabad, Meerut, Mahoba, Rae (0.50 to 1.50)
21 Mainpuri, Firozebad, Baghpat, 6 Bareli, Chundauli and Mathum Meerut, Etah, Pilibhit, Mathura,
Ghaziabnd, Bareilly, Shalrjahanpur, Agraandflardoi
Mau, Qtitrakoot, Aumiya, Obuziabad, Aligarh, Etab, Fatehpui Moradabad,
G.B. Nagar, Aeamgarh, Kanpur Mainpuri, Etawah, Kanpur Nagar, Dehat, Hathras, Kanpur Naga, Bagbpat, Farrukhabad, Bulandshahr, Muzaffamagar, Budaun, Bijuor, G.B. Nagar, Rmnpur, Kushinagay
Medium Ballia, Rampur, Jaunpur, Mau, Kannauj, Halb2s, Jaunpur, Budaun,
(•0.50 to 0.50) 26 Ghazipur, Gorakhpur, Moradabad, 42 Allahabad, Unnao, Paizabad, Pilibhit, Barabanki, Kushinaga,, Mahamjganj, Bareilly, Shahjahanpur, Hmdoi, J.P.Nagar, Faizabad, Chandauli, Pratapgarh, Ambcdkar Nagar, S.K. Varanasi, Ambedkar Nagar, Unnao, Nagar, Varanasi, Sultanpur, Basti, Soltanpur and Lalitpur J.P.Nagar, Bailin, Azamgarh,
Muzaffamagar, Kanpur Dehat, Ghazi1nr, Deoda, and Siddhanhna ar Jalaun, Hamirpur, Saharanpur,
Chitmkoot, Mahoba, Banda, Gonda, Lucknow, Banda, Mirzapur, S.R. Low 14 Hamirpu, Deoria, Rae Bareh, 18 Nagar, Lulitpor, Balrampur, Beinich,
(-0.50 to-150) Bahmich, Mirzapur, S.R.Nagar, Sonbhadra, Gonda, Kheri, Sitapur, Sitapur, Kheri, Basti and Shrawasti Jhansi, Gorakhpur, Barabanki and
Shrewssti
very low Balrampur, Lucknow, S.K.Nagar,
(Below-1.50) 7 Siddhanhnagar, Sonbhadra, Jhansi 0 - and Jalaun
Source: Computed by the au(har irons Appendix M.
area in the districts of Kannauj, Farmkhabad, Bahraich, Mainpuri, Gonda,
Bulandshahr and Etah, the yields of maize were in order of 1,742, 2,116, 1,113,
2,134, 919, 2,037 and 2,139 kg/ha, respectively in the year 2011.
Maize during its cultivation needs more water in comparison to other cereal
crops. Estimations of maize water requirements are essential to be made in order to
curtail excessive application of water than needed, which can cause crop damage,
poor traficability, soil erosion, excessive leaching and the wastage of water, labour
and energy (Tekwa and Bwade, 2011). CWU of maize crop in the state varied from
718 to 1,037 mm in 2001, and between 602 and 1,077 mm in 2011, whereas the
yields of maize ranged between 710 to 2,217 kg/ha, and 457 to 5,587 kg/ha in
respective years.
Table 6.17 and Fig. 6.21 clearly show that, in 2001, the districts marked with
very high and high WP (0.431 to 0.546 kg/m3) of maize crop were located in an
entire Ganga-Yamuna doab region stretching from the district of Saharanpur in the
337
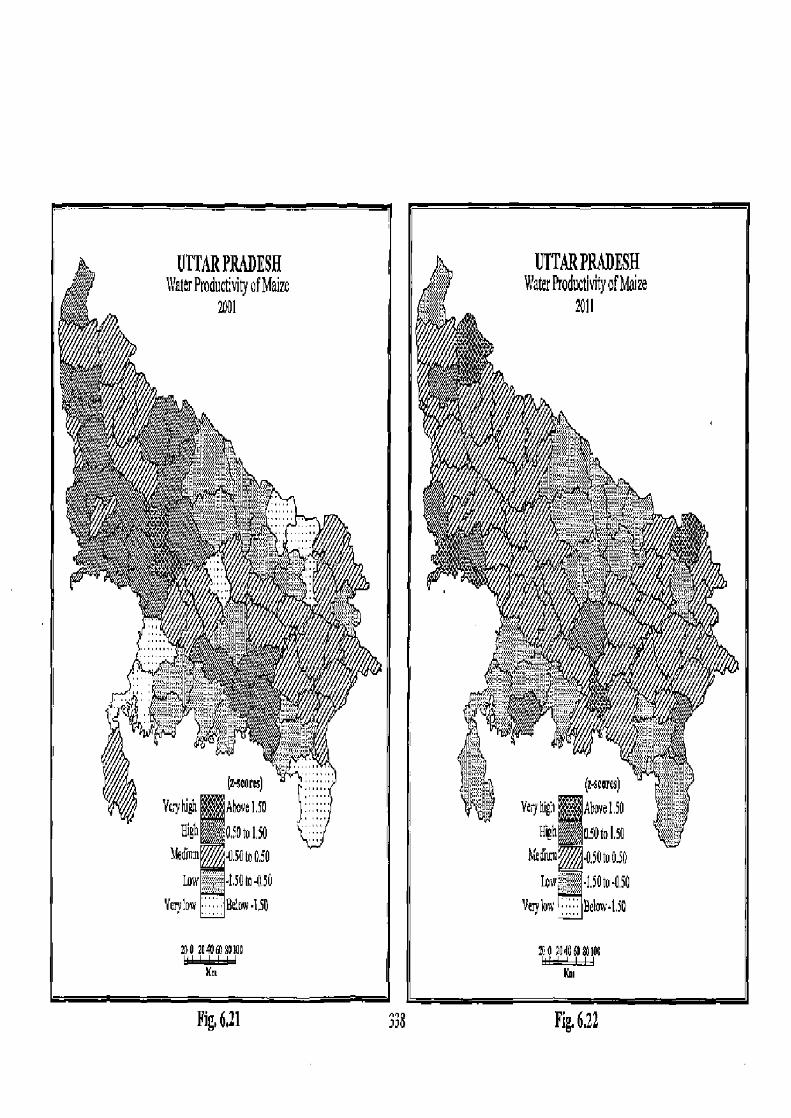
Fig, 611 333 Fig.6.22
MARPRADFSH Vcht& f roductMty of Maize
2011
( Mares) Vayhlgi Above15U
lfgh 0.30 to I.50
hs~~~.samoso I? iIISOm•aso
vtrybu EBebwl 5O
100 2U40flI0C III
north up to Allahabad in the south This belt is intermingled with the districts having
medium WP and covers most of the areas in Rohilkhand plains and Purvanchal
region of the state. A cluster of four districts namely, Bareilly, Pilibhit, Shahjahanpur
and Hatdoi also formed part in this category. In 2011, there were few districts
scattered all over the state belonged to this category of high and very high WP (0.58
to 1.76 kg)m3). These districts were namely, Agra, Maharajganj, Kaushambi, Bijnor,
Firozabad, Meerut, Mahoba, Rae Bareli, Chandauli and Mathura. Agra ranked first in
WP with crop yield of 5,031 kgJha and the lowest CWU of 602 mm in the growing
season. The district of Maharajganj, with the highest yield of 5,587 kg/ha ranked
second having highest WP. The districts with low and very low WP of maize formed
parts of northern districts of Awadh and Purvanchal regions, all of the Bundelkhand
districts, and districts forming the southeastern part of the state, appeared in this
region in both the years. In 2001, most of the districts having medium WP are located
in eastern UP. Awadh plains and few of them formed part in Rohilkhand and upper
daub regions of the state (Figs. 6.21 and 6.22).
d. Water productivity of sugarcane
Sugarcane (Saccarum officinarum) is one of the major cash crops grown in
the state. It can successfully be grown on a variety of soils, varying from sandy to
heavy clays, provided climate, soil texture and depth, and root developments are
favourable. Being a year long crop its water requirements usually remain very high
from 90 to 120 cm. during the entire growth period (Dhindwal and Kumar, 2005).
Soil moisture must be in good depth, without salt and compactness. If the soil is well
prepared, it can improve the tilth, which promotes a good germination stand and
ensures higher yields of the crop. Spring season planting is done in the state during
the months of February-March, and autumn season planting in September-October.
Its cultivation is propagated by vegetative methods, which involve the planting of
sections of the stem of immature cane: Buds on the setts germinated promote the
plants. The planting material is known as seed pieces' or `setts'. If planting setts are
good and healthy, rich in nutrients and free from pests and diseases, they can give
higher yields.
Sugarcane covered an area of about 2 million ha. (nearly 8 per cent of (ICA)
in the state, out of which 93 per cent of area was irrigated. It is seen from Figs. 6.23
and 6.24 that, WP of sugarcane varied in between 2.13 and 6.53 kg/m' in 2001, but it
339
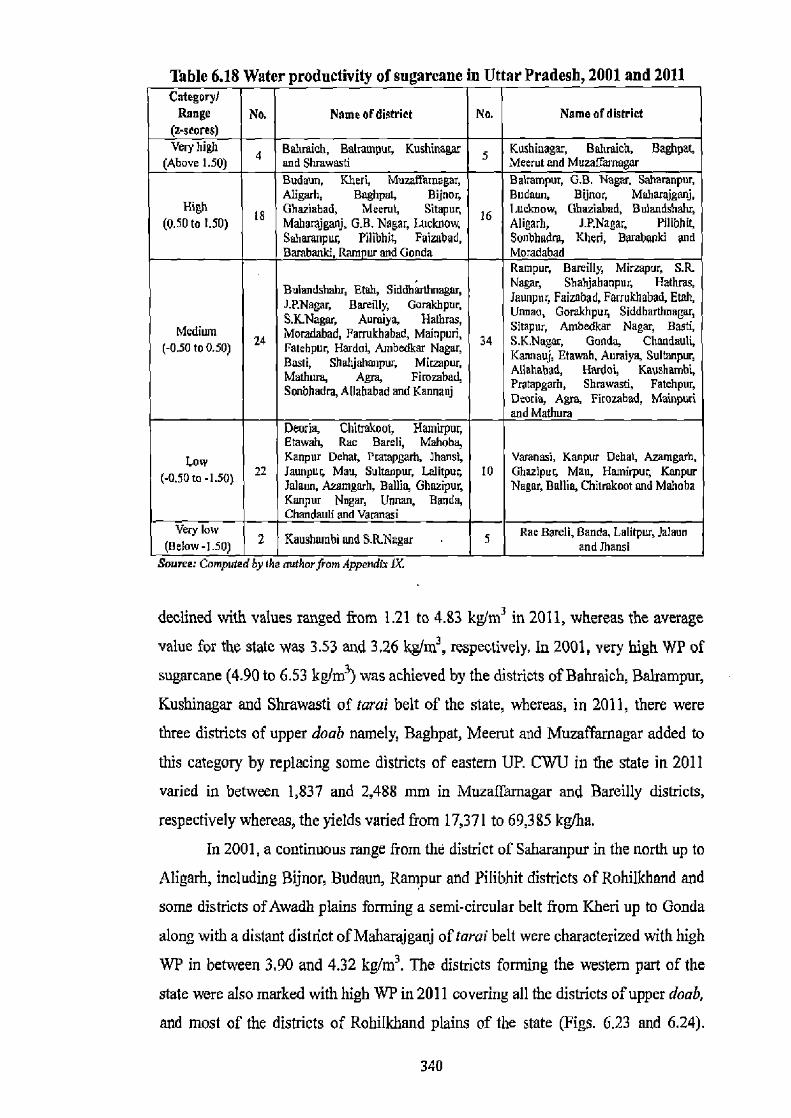
Table 6.18 Water productivity of sugarcane in Uttar Pradesh, 2001 and 2011 Category)
Range No. Name of district No. Name of district (z-scores) Very high 4 Bahraich, Balrampur, Kushinagar 5 Kushinagar, Bahraich, Baghpat,
(Above 1.50) and Shrawasti Meerut and Muzafarnagar Budaun, Kheri, MuzaB'arnagar, Balrampur, G.B. Nagar, Saharanpur, Aligarh, Baghpa4 Bijnor, Bodeen, Bijnor, Mahamjganj,
High 1s Ghaziabad, Meerut, Sitarer, 16 l.ucknow, Ghaziabad, Bulandshahy (0.50 to I.50) Maharajganj, G.B. Nagar, Lucknow, Aligarh, 1.P.Nagay Pilibbit,
Saharanpur, Pillbbit, Faizabad, Sonbhaara, Kheri, Saraband and Bambanki, Rampur and Gonda Moradabad
Rampur, Bareilly, Mirzapur, S.R. Bulandshahr, Etah, Siddharamagay Nagar, Shahjaharnpur, Halhras, J.P.Nagar, Bareilly,Good hpur, Jaunpur, Faizabad, Farrukhabad, Etah, S.lCNagar, Auroiya, Halhns, Unnao, torzklipu, SiddbaAthoasar,
Medium Moradabad, Parrukhahad, Mainpuri, Sitapur, Ambedkar Nagar, Basti, (-0.50 to 0.50) 24 Falehpur, Hardoi, Ambedkar Nagar, 34 S.K.Nugar, Gonda, Chandauli,
Etawah, Antalya, Suhaopnr, Bashi, Shalijahanpo4 Mir Mirzapur, Marirum, Agra, Firuzabod, Sonbbadra, Allahabad and Kanvauj
Aaehabad, Hardoi, Kauatehim, Frztapgarh, Shrawasti, Fatehpuy Deori% Agra, Ficozabtd, M1rnpunl and Mathes
Deos, Gbitr1koot, }1armnpnr, Etswah, Rae Barehi, Mnhobn,
Low Kanpur Dehal, Pratapgarlt, thansi, Varanasi, Kanpur Dehat, Avmgarli, (-0.50 to-1.50) 22 Jaunpur, Mau, Sultanpur, Lalitpur, 10 Ghazipur, Mau, Hamirpur, Kanpur
Jalaun, A•ramgarh, Ballia, Ghazipur, Nagar, Bailie, Chitrakoot and Muhoba Kanpur Nagar, Unnan, Banda, Chandauli and Varanasi
Very low 2 Keushambi and S.R.Nager 5 Rae Bareli, Banda, Lalitpur, Jalaun
(Below-1.50) andmansi Source: Computed by he author from Appendix IX.
declined with values ranged from 1.21 to 4.83 kg/ml in 2011, whereas the average
value for the state was 3.53 and 3,26 kg/m3, respectively. In 2001, very high WP of sugarcane (4.90 to 6.53 kglm3) was achieved by the districts of Bahraich, Balrampur,
Kushinagar and Shrawasti of tarai belt of the state, whereas, in 2011, there were
three districts of upper doab namely, Bagbpat, Meerut and Muzaffamagar added to
this category by replacing some districts of eastern UP. CWU in the state in 2011
varied in between 1,837 and 2,488 mm in Muzaffamagar and Bareilly districts,
respectively whereas, the yields varied from 17,371 to 69,385 kg/ha.
In 2001, a continuous range from the district of Saharanpur in the north up to
Aligarh, including Bijnor, Budaun, Rampur and Pilibhit districts of Rohilkhand and
some districts of Awadh plains forming a semi-circular belt from Kheri up to Gonda
along with a distant district of Maharajganj of tarai belt were characterized with high
WP in between 3.90 and 4.32 kg/m3. The districts forming the western part of the
state were also marked with high WP in 2011 covering all the districts of upper doab,
and most of the districts of Rohilkhand plains of the state (Figs. 6.23 and 6.24).
340
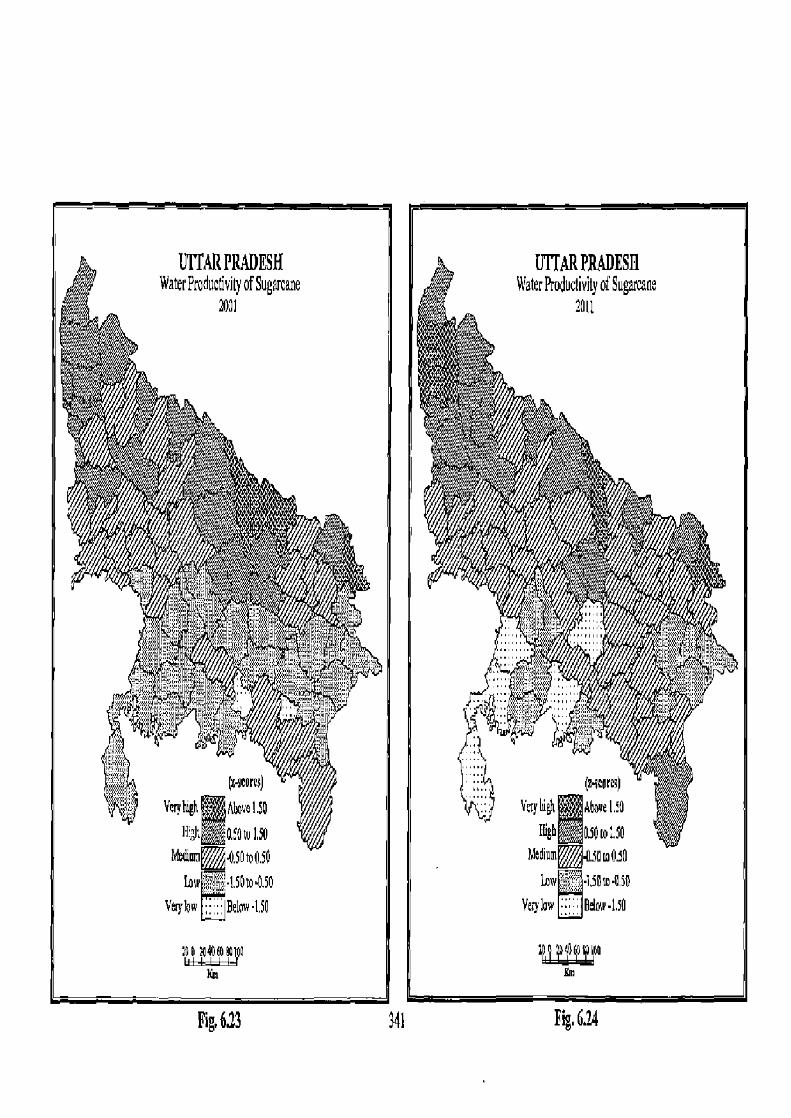
(weans) Very hi lvo 1.50
ar, a:owlw ~~~o.soma.so
!.Ow "C~, ,-ISOw&sO
V mw ~:,: Belo -Iso
Fig, 6.23 341 Fig. 6.24
LIFARPRADESH Water Productivity of Sugarcane
2001
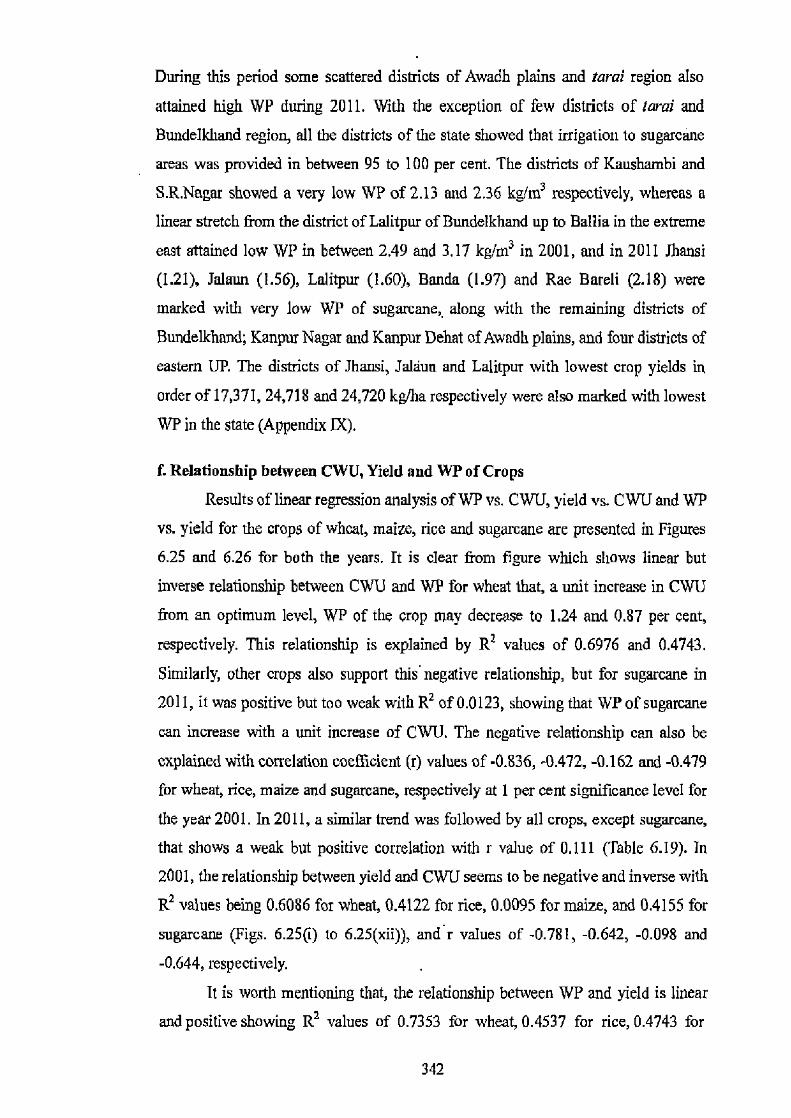
During this period some scattered districts of Awadh plains and tarai region also
attained high WP during 2011. With the exception of few districts of tat-al and
Bundelkhand region, all the districts of the state showed that irrigation to sugarcane
areas was provided in between 95 to 100 per cent. The districts of Kaushambi and
S.R.Nagar showed a very low WP of 2.13 and 2.36 kg/m3 respectively, whereas a
linear stretch from the district of Lalitpur of Bundelkhand up to Ballia in the extreme
east attained low WP in between 2.49 and 3.17 kg/m3 in 2001, and in 2011 Jhansi
(1.21), Jalaun (1.56), Lalitpur (1.60), Banda (1.97) and Rae Bareli (2.18) were
marked with very low WP of sugarcane, along with the remaining districts of
Bundelkhand; Kanpur Nagar and Kanpur Dehat of Awadh plains, and four districts of
eastern UP. The districts of Jhansi, Jalaun and Lalitpur with lowest crop yields in
order of 17,371, 24,718 and 24,720 kg/ha respectively were also marked with lowest
WP in the state (Appendix M.
f. Relationship between CWU, Yield and WP of Crops
Results of linear regression analysis of WP vs. CWU, yield vs. CWU and WP
vs. yield for the crops of wheat, maize, rice and sugarcane are presented in Figures
6.25 and 6.26 for both the years. It is clear from figure which shows linear but
inverse relationship between CWU and WP for wheat that, a unit increase in CWU
from an optimum level, WP of the crop may decrease to 1.24 and 0.87 per cent,
respectively. This relationship is explained by R2 values of 0.6976 and 0.4743.
Similarly, other crops also support this negative relationship, but for sugarcane in
2011, it was positive but too weak with Rz of 0.0123, showing that WP of sugarcane
can increase with a unit increase of CWU. The negative relationship can also be
explained with correlation coefficient (r) values of -0.836, -0.472, -0.162 and -0.479
for wheat, rice, maize and sugarcane, respectively at 1 per cent significance level for
the year 2001. In 2011, a similar trend was followed by all crops, except sugarcane,
that shows a weak but positive correlation with r value of 0.111 (Table 6.19). In
2001, the relationship between yield and CWU seems to be negative and inverse with
R2 values being 0.6086 for wheat, 0.4122 for rice, 0.0095 for maize, and 0.4155 for
sugarcane (Figs. 6.25(i) to 6.25(xii)), and r values of -0.781, -0.642, -0.098 and
-0.644, respectively.
It is worth mentioning that, the relationship between WP and yield is linear
and positive showing RZ values of 0.7353 for wheat, 0.4537 for rice, 0.4743 for
342
Table 6.19 Correlation matrices of CWU, Yield and WP of the selected crops in Uttar Pradesh, 2001 and 2011
Wheat Rice Ota¢e Sugarcane Indleston
CIW Yield WP CWU Yield NP CWU Yield WP CWU Yield WP
Year 200!
cwv 1 _ t - - t
-.098
_ 1
- t _ Yield -.781" I - -.642" 1 - - -.644 I -
WP .936' .856" I -.471 .673" 1 -.162 .979" 1 -.479" .687' 1
Year 2011
Yield -.581" 1 - -.009 1 - -.189 1 - .033 1 - WP j -.691' .850" I -.091 .700" 1 -.454" .920' Li .111 .891
Note: ". Correlation Is significant at the 0.01 level (1-ln1is4 Bunn: Compoledfrom data ghren In Appendix IX.
sugarcane, the and highest being 0.9587 for maize (Figs. 6.26 (i) and 6.26(xii)), and
with respective r values of 0.856, 0.673, 0.689, but exceptionally very high for
maize, i.e. 0.979. Similarly, in 2011, the values of r for WP vs. yield were, 0.850,
0.700, 0.891 and 0.920, respectively, at I per cent significance level. Thus, it can be
concluded on the basis of above results that, CWU is negatively correlated with yield
and WP of the crops (except for sugarcane in 2011), so with a slight decrease of
excess water provided to the crops as per their requirements can increase the yield
and certainly WP. In other words, yield and WP showed positive responses for all the
crops, therefore, a unit increase in yield of crop occurs; it will also increase its WE.
g. Scope for increasing yields and water productivity of major crops
Since the beginning of green revolution, many efforts have been made in
water management practices to achieve high irrigation efficiency in agriculture in the
country. One of the important schemes the Coordinated Research Scheme on Water
Management and Soil Salinity was started in 1967, at three centres namely, Hissar
(Bhakra Project), Siriguppa (Tungabhadra Project) and Chiplima (Hirakund Project
Area). The main thrust of the scheme was on rational use of water resources.
Experiments have shown that, the submergence of rice plant in water at more than 5
cm. is unnecessary. Maximum pay-off from irrigation in any crop comes from
watering at critical stages of plant growth. As shown in Table 6.14, in wheat, the
crown root initiation and ripening are very critical stages, and tillering, grain filling
and initial stages are the most sensitive for the rice crop. In another research project
on Coordinated Scheme for Cropping Patterns and Water Management, the main
343
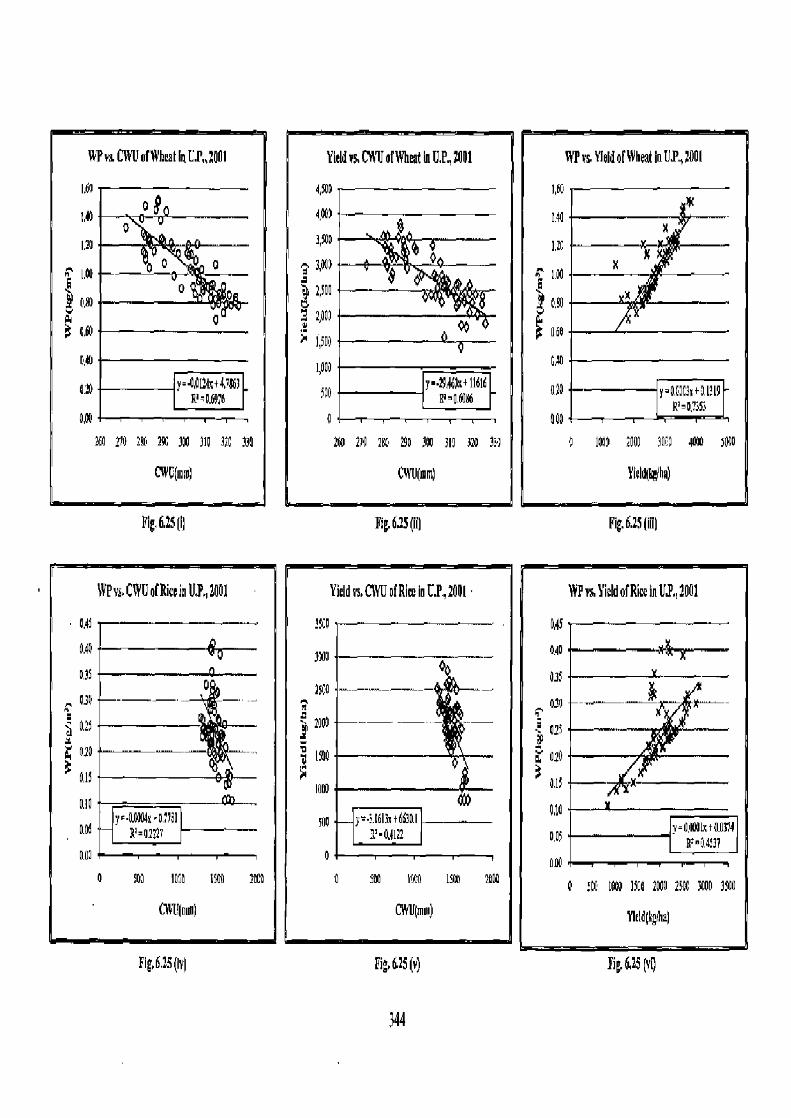
WPvs. CNN of wheat in e.r„2001
1.60 0
- b
fyo 0 0 LDD --p--
0 f!m
3 0~0
0~ Y'-0AI'As+Ul61
coo 160 % 2R0 49C 3% 310 31c 33
CWUlmml
Yield us,WTUfWAeatln UP, 1001 WPvs Yield ofWhMInUP.,1001
4,ms 1,60
4,W1
mo
ny 7,W8 y 0 190
e~ 1,f D0 V E DU M
N I'md'j 060
I,DDJ
ifD y•Y,{6JZ+11616 010 y=D,G7fix+0.I?I9 R C60Md rs uauo
No 270 zso ago Tao 3I Ym }rl 0 1%) 2000 Im:s 4ao0 sooD
CWO(mI Yicltl(I iha)
Big. 6.25 (I) Fi&6.15 (ii i Fig. 6.25 piii
IYPvs.CVUofRicein US, ,2001 Yield vs. CIWof Rice inC.P,2001 WP vs. Yicldof Rice inU3„2001
oes sfD 045
0.4U ---4,----_ 3)10 - _..._.._ 040
015 oaf -- 250
A o30 - -- k---
an
t
% aoo a 031
°~ 150 y a7D
Os 0.10
am ~
D.If %
O~U 0 ~
y~0.W04x Dfl31 &'=UP7P7
o0 }=d.161h+6610.1 M1'•O,d171 v=OIg01K+U0794
40S 007 0 0
5J IDfO I1 7000 0 A INFO Ilon low 0 :fP IOW IiCD 2000 130C 7000 7100
011(coo) CWU(mm) 1tld(klhi
Fig, 6.25(Iv)
Fi .6.15 (v)
1j1. 6.25 (VI)
344
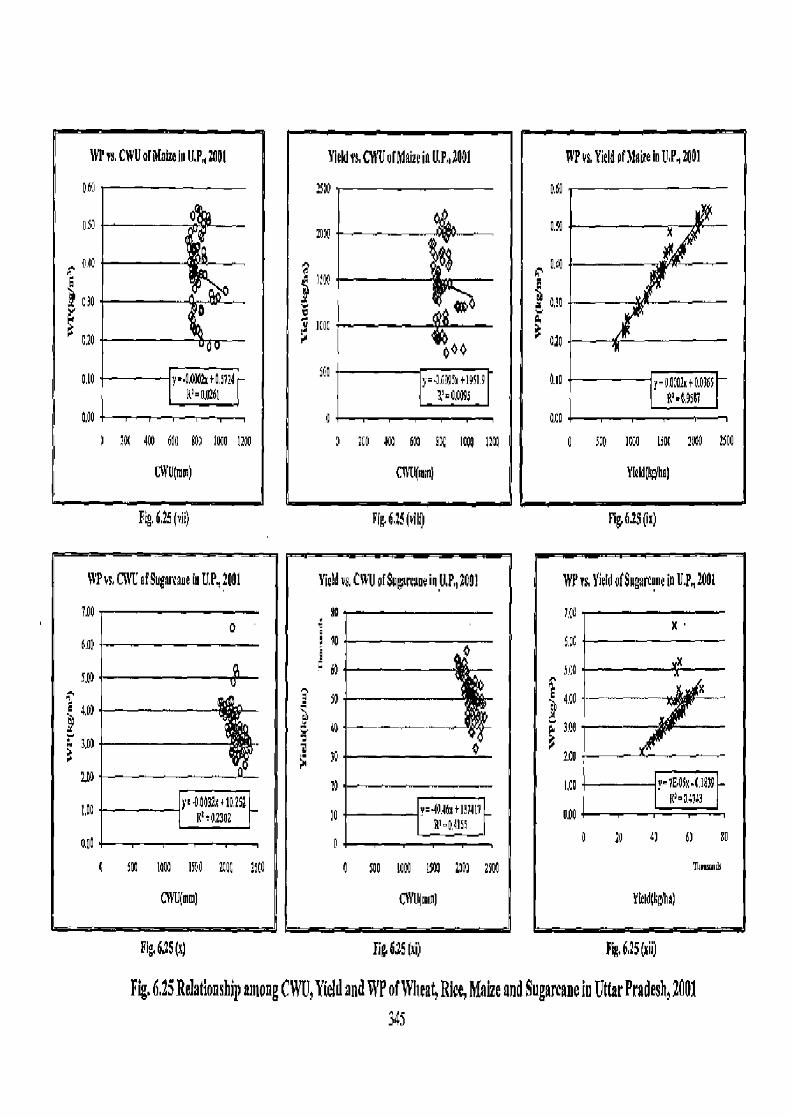
Fig. 6,29 ()
Fig. 6.25 (viii)
WPvs. CWt of Sugarcane ie UP, 2001
100
600
5W
3p1
2.tn
0.00
500 to IS( 2C 2t0
CWU(mo)
WP ra. CWU or Mail in UP, 30M
o6U
040
cao 0
U
U,10 y.UAOOhro!5724
s 10C 4W 660 BU9 NOD I2OU
CWU(mm)
Yi¢Id vs, CWU olMaize is UP„1001 WP vs. Yield 001s a in U,P, 2001
15 0.6O
1Uin
a OA
ap , a,!o V
ICUC + 00 3 010
SOU ,6ASw 4I I.9 0.IU r -oosot~ro.916s
d'=O,OJ9S R'•09SU
8 2(0 490 601 5% 1000 1100 0 570 IGuO WC 2WU SUn
C1S kmm) YkU(Y dIi
Flg.fi1S(ia)
WP vs Yield of Sugaran c in U P, 2001
nC n'
Yx
4.84
4.00 a
p 3N1
1.f0
I'le y=7EAfN•6,Ilz R'•a;i43
0 70 U 61 eC
nnm
Yieldlk~lla)
Fig, 6.26 (x) Fig 6S (xi) Fig, 6,25 ('ii)
Fig. 6.25 Relationship among CWU, Yield and WP of Wheat, Rice, Make and Sugarcane in Uttar Pradesh, 2001 345

WP i's ,CIYUo1WheatinU,$2011 Yield vs.('WUofWheatinCS,2011 WPvs.Yieldof\hoatin UP, 20(1
IA 4oto
® LKo 3Soo lAO
:0 30 0
IS " " % o I.Oa 6 Q ^ lffn 4 ~' IW
OE1 1x00 0-- b.89 %
0.69 n I500
p~
± 460 X
O4U 10 140
n2!J Y--0pt07e•3,6P99 3~ y-17A71x1B077,S R'-(3363
0.2) Y=O,W07K=0.0941 N'=41!17 R'=0.4.7?
0 00 o.00
o m I0Y no ;a :w >m mo Oro
I
C Ib0 33 3X 400 0 1000 SIN )000 4000
CWV(mm) C'U{mn) Yield (4gli0)
Fig. 6,26 O Pig, 6.26 (ii) Fig. 6.26 (iii)
WI' s.C\YUof Rice inIJ.P.,2011 Vreldr.CWUarRiyein UP, 2011 WPvs.YieldgfRiceinll.P.,1011
116c 350o ~~-----~-------- asa C sao-1 '~--- oso K
a40 uo3 • 4 0 0 0 R
s 00 g
i~
X
0 IXI I
L70
0.10 y=.3FAfK4b,18S1 S6a Y"e,Yt63K+7y67B 4.10 x y=86AfKtOLC1: K-`9A'Ufl9 R'=!E-0+ r-04w)
o.w I 0 o.ao
o suo laoo 1500 10 b SA lox Ism :0W 0 1000 :obf 3000 400
Cr4L(mm) MI(niM) Yi¢Idg al
Fig 6.26 (iv) Fig. 6.26 (v) flg.626 (vi)
346
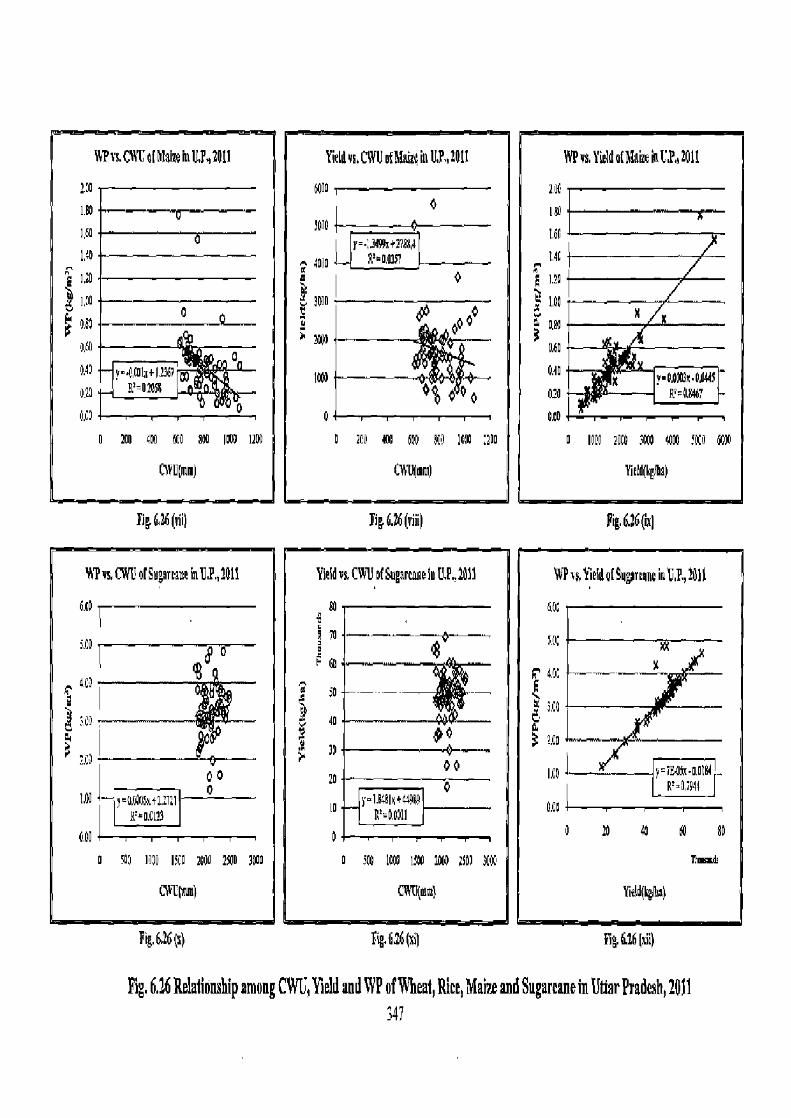
WFvs.CATofMainInU,P,2011 Vieldvs,C1YUo(Naiar,inU8,20U WPvm1'ivido(h1ai¢eioG,P.,tOlt
2.10 6p00 I.W ~ Imp
160 Y—;,7d99x+2788A I4f - 1'0 a aWO + ft'=001T _
E E L?0 1?o O 'I7WO p x 100 N 4c7 DO
so 20 obo
~a7
NN
IOOJ 0.d0 X vOAWri•GAWS 020
(ic) O OAO
0 200 400 d[0 eW I00 1200 0 2C0 100 600 609 ICIH :200 0 Poo IDW 3000 4000 !IXO ficW
CYU(mn) CWU(r) Yidd(Ye/ba)
Fig 626 (vii) Fig 6.26 (viii) Fig.Qt6('ai
V V& M of Sn' or we In E.P., 20 11 Yield vs.CWUo9SugarcaneinU.P.,201 WPi,Yieldat9ugorcmeinU,P.,1011
6L0 8
70 ----- 5Oc
~u W arc — H 3 ; 50
u 3co al 4o a
2 9 0 ,cu 0 — — --~—° 2r
00 0o to reo aotaf
20 t2H Q y t fOJSxr1.n21 10 y~R'40511 O.co fta.Cl29 R'=00811
400 0 I 10 40 CO 80
o Sol ION I5CO 1OUu 290 7W0 0 300 IWO I!W 2 250) 3000 Y+
MIMMI CWtI(turo) Yield(kglh4
Fig. 626(i) Fig. G26 (xl) Fig. 6.16 ixii)
Fig, 6.26 Relationship among CWV, Yield and SVP of Wheat, Rice, Maize and Sugareaue in UriarPradesh, 2011 347
objectives incorporated were to develop suitable cropping patterns for optimizing
efficiency of irrigation and other inputs in new irrigation command areas (Kanwar,
1972).
As mentioned earlier, WP is relatively a new concept and quite a large gap
exists in available knowledge and its beneficial applications (CGIAR, 2001a).
Therefore, to satisfy the growing demand for agricultural commodities, the attention
in this direction has to be shifted to potentials of improved management of water
resources that will increase WP (Kijne et al., 2003). According to Lee (1999)
`producing more from less' requires optimization of crops and all inputs. The highest
crop yield can be achieved by adopting HYVs, with optimal water supply, soil
fertility and crop production measures. Previous studies undertaken suggest that, WP
of crops can be increased by two possible ways. First, by decreasing the CWU of
crops or decreasing the denominator and second, by increasing the yield of crops or
increasing the numerator (see equation 4). Limited water supply in high water use
districts by using deficit irrigation can reduce the CWC, in which water supply is
less than the crop's full requirements, and mild stress is allowed during the stages of
growth that are less sensitive to moisture deficiency. Yield reduction in this method
will be limited; it is expected that additional benefits are gained by diverting the
saved water to irrigate other crops (FAO, 2011).
Supplemental irrigation is a key strategy to bridge dry spells in rain-fed
agriculture, and has the potential of increasing yields and minimizing risks for rain
induced yield losses. The existing evidence indicates that supplemental irrigation
ranging from 50-200 mmiseason is sufficient to mediate yield reducing dry spells in
most years and rain-fed systems, and thereby stabilize and optimize yield levels
(Joshi et al., 2005). Since irrigation water productivity is much higher when used
conjunctively with rainwater (supplemental), it is logical that under limited water
resources priority in water allocation may be given to supplementary irrigation
(Sharma et at., 2008).
Over centuries in India, irrigation waters were predominantly applied to crops
using conventional methods. Generally, with these methods of irrigation, water is
supplied through unlined canals and field channels to crops, where controllability of
water is not easily possible and therefore, conveyance and distribution losses are
substantial. Many studies based on experimental data suggest that, the crops
cultivated under micro-irrigation require relatively less amount of water to produce
348
one unit of output. One of the main reasons for adopting micro-irrigation in crop
cultivation is to save water and increase the efficiency of water use. Unlike
conventional methods of irrigation, micro-irrigation methods (both sprinkler and drip
irrigation) supply water to crop by using a pipe network along with drippers, emitters
and nozzles. As a result, supplying water directly to the crop or to the field, the
conveyance and distribution losses become absent under micro-irrigation method.
Drip irrigation method (DIM) appears to be more efficient (Dehghanisanij et
al., 2006). First, the evaporation and distribution losses of water are very minimum
or completely absent. Second, unlike flood method of irrigation (PIM), water is
supplied under DIM at a required time and at required level and thus, over-irrigation
is totally avoided. Third, under the conventional method of irrigation, water is
supplied for the whole cropland, whereas DIM irrigates only the plants, Apart from
reducing water consumption, drip method of irrigation also helps in reducing cost of
cultivation and improving productivity of crops as compared to the same crops
cultivated under flood method of irrigation (FAO, 2011). A large number of studies
have shown that sprinkler irrigation method (SIM) is suitable even for foodgrain
crops, such as wheat, maize, pulses and groundnut, etc. Thus, the adoption of micro
irrigation methods in the districts of the state can increase the gross irrigated area,
cropping intensity, and will help farmers to switch over to the cultivation of cash
crops.
L Wheat crop
An improvement in WP of wheat was noticed in 2011 in the districts of
Rohilkhand and Awadh plains of the state. These were having medium WP in 2001,
but attained high WP in 2011. Most of the districts of Purvanchal and Bundelkhand
regions attained more or less the same status. For enhancing WP in the districts of
Purvanchal region of high CWU (above 300 min)and lower yield, deficit irrigation
with improved water management practices and proportionate use of agricultural
inputs like fertilizers, if applied can increase the yield and WP of the crops.
Conversely, in rain-fed or water-stressed districts of Bundelkhand region, crop yields
can be increased by providing water through supplemental irrigation (SI) through
tubewells during the critical periods of crop growth (Table 6.14).
Studies at International Centre for Agricultural Research in Dry Areas
(ICARDA) have found that, applied as supplemental irrigation along with good
349
management practices, a cubic meter of water can produce 2.5 kg of grains. It can be
optimized by deliberately allowing crops to sustain a degree of water deficit, if
integrated with improved varieties and good soil and nutrition management (FAO,
2011). Therefore, in the districts of Bundelkhand region, WP can be increased
through the incorporation of some technological changes in farm operations:
genetically improved crop varieties with better tolerance to drought and minimizing
the evapotranspiration losses should be preferred to grow (Amarasinghe et at, 2010).
Improved agronomic and farm management practices, which include the use of new
varieties of seeds of wheat (WH 542 and PBW 343) and recommended doses of
fertilizers and enhancing the role of extension services to farmers for dissemination
of up-to-date knowledge on appropriate sowing dates, and quantities and tinning of
application of inputs, particularly irrigation water can increase the yield and water
productivity of wheat (Hussain et al., 2003).
ii. Rice crop
As mentioned earlier, WP of rice in the state is not satisfactorily high. An
integrated approach of International Rice Research Institute (IRRI), using genetics,
breeding and integrated resource management to increase rice yield and to reduce
water demand for rice production can be applied (Tuong and Bouman, 2003) in low
WP districts of the state, that the water saved at the field level can be used more
effectively to irrigate previously un-irrigated or low-productivity lands (Tuong et al.,
2005). WP of rice in the state can be increased by adopting three possible ways. First,
adopting new rice varieties developed by IRRI, All India Agricultural Research
Institute (IARI), New Delhi and G.B. Pant University of Agriculture and Technology,
Pant Nagar. These hybrid varieties have potentials to reduce crop maturity duration
and increasing the yield to about three-fold in comparison to the traditional varieties.
Improved agronomic practices, such as nutrient management, weed management and
proper land levelling can increase yield of rice significantly without affecting the
losses through evapotranspiration, which may increase water productivity.
Second method is to reduce the unproductive water losses and depletions in
the form of seepage, percolation, evaporation etc. during land preparation and crop
growth period through minimizing the idle periods during by supplying irrigation
water directly to nurseries without having submerged in main fields or using direct
seedling. Instead of keeping the rice field continuously flooded with 5-10 cm. water,
350
the floodwater depth can be decreased; the soil can be kept around saturation.
Saturated Soil Culture (SSC) or Alternate Wetting and Drying (AWD) can be
imposed (Tuong and Bounian, 2003). In-some areas the regime of AWD can even be
doubled in \\P compared with flood irrigation, but with yield reductions up to 30 per
cent.
Third method to increase WP is to make rainfall more effective by using dry-
seeded-rice technology. This technology offers significant opportunity for conserving
irrigation waters by using rain water more effectively. This method can be followed
for land preparation under dry or moist soil conditions, and can be started with the
early monsoon rains. These methods can reduce the e use of irrigation water, and
ultimately WP can be increased by using water in an effective and efficient manner.
iii. Maize crop
Lower WP of maize crop that was noticed in Bundelkhand and northern part
of Awadh plains of the state and the districts belonging to southeastern region. For
maximum production a medium maturity grain crop requires 500 to 800 nun. of
water depending on climatic characteristics. In these districts, water losses during
conveyance and application must be avoided. The effect of limited water on maize
grain yield is considerable and careful control of frequency and depth of irrigation is
required to optimize yields under conditions of water shortage. Maize flourishes on
well-drained soils and waterlogging should be avoided, particularly during the
flowering and yield formation periods because waterlogging during flowering can
also reduce grain yields by 50 per cent or more (PAO, 2011).
iv. Sugarcane crop
In UP, sugarcane is grown by using conventional methods of irrigation that
are inefficient in use of available water. Therefore, it is of utmost importance that
efficient water management practices be adopted for sustained sugarcane production
throughout the crop growth period. The micro-irrigation techniques have a major role
to play in mitigating the water scarcity situation by enhancing the productivity of
water in effective and scientific manner. Importantly with this method, water savings
in sugarcane, water-intensive crop is over 65 per cent per hectare, when compared to
conventional methods of irrigation (Shinde and Jadhav, 2001).
To sum up, the key principles for improving WP in UP at field, farm and
351
basin level in the districts of rain-fed or irrigated are: (i) increase the marketable
yield of the crop for each unit of water transpired by it, (ii) reduce all outflows (e.g.
drainage, seepage and percolation), including evaporative outflows other than the
crop transpiration, and (iii) increase the effective use of rainfall, stored water, and
water of marginal quality.
352
References
1. Agarwal, P.C. (1965). Measurement of Agricultural Efficiency in Bastar District: A Factoral Approach, Proceedings of Summer School in Geography (tfineo) Aligarh Muslim University, pp. 50-59.
2. Amarasinghe, U.A. and Sharma, B.R. (2009). Water Productivity of Foodgrains in India. In: Wager Productivity Improvements in Indian
Agriculture: Potentials, Constraints and Prospects (Eds. M.D. Kumar and U. A. Amarasinghe), IWMI, Colombo, Sri Lanka, pp.13-54.
3. Antarasingbe,U.A., Shah, T. and Malik, R.P.S.(2008). India's Water Futures: Drivers of Change, Scenarios and Issues. In: India's Water Future: Scenarios and Issues (Eds. U.A. Amarasinghe, T. Shah and R.P.S. Malik), IWMI, Colombo, Sri Lanka, pp. 3-24.
4. Aivarsinghe, U.A., Malik, R.P.S. and Sharma, B.R. (2010). Overcoming Growing Water Scarcity: Exploring Potential Improvements in Water Productivity in India, Natural Resources Forum, Vol. 34, No. 3, pp. 188-199.
5. Aykroyd, W.R. and Doughty, J., (1970). Wheat in Human Nutrition, FAO, Rome.
6. Bastiaanssen, W., Abmad, M.D. and Tahir, Z. (2003). Upsetting Water Productivity in Irrigated Agriculture. In: Water Productivity in Agriculture: Limits and Opportunities for Improvement (Eds. J.W. Kijne, R. Barker and D, Molden), IWMI, CABI, UK, pp. 289-300.
7. Bhalla, G.S. (1978). Spatial Patterns of Agricultural Labour Productivity, Yojana, Vol. 22, No. 3, pp. 9-11.
8. Bhalla, G.S. and Tyagi, D.S. (1989). Patterns in Indian Agricultural Development: A District Level Study, Institute of Studies in Industrial Development, Delhi.
9. Bhads, S.S. (1967). A New Measure of Agricultural Efficiency in Uttar Pradesh, India, Economic and Political Weekly, Vol. 43, No. 3, pp. 244-260,
10. Cal, X. and Rosegrant, M.W. (2003). World Water Productivity: Current Situation and Future Options. In: Water Productivity in Agriculture: Limits and Opportunities for Improvement, (Eds. J.W. Kijne, R. Barker, and D. Molden), IWMI, Colombo, Sri Lanka, pp. 163-178.
11. Consultative Committee for International Agricultural Research (CGIAR), Technical Advisory Committee (2001a). Water and the CGIAR, Discussion Paper.
353
12. Dayal, E. (1984). Agricultural Productivity in India: A Spatial Analysis, Annals of the Association ofAmerican Geographers, Vol. 74, No. 1, pp. 98-123.
13. De Wit, C.T. (1958). Transpiration and Crop Yields, Versl. landb onderz., Vol. 64, No. 6, pp. 1-87.
14. Dehghanisanij, H., Oweis, T. and Queresbi, A. S. (2006). Agricultural Water Use and Management in Arid and Semi-arid Areas: Current Situation and Measures for Improvement, Annals of Arid Zone, Vol. 45, No. 3 and 4, pp. 355-378.
15. Dhindwal, R.K. and Kumar, S. (2005). Evaluation of Drip and Surface Irrigation in Sugarcane under Semi-arid Conditions, Journal of Water Management, Vol. 13, No. 1, pp. 21-26.
16. Doorenbos, J. and Kassam, A.H. (1979). Yield Response to Water, Irrigation and Drainage Paper 33, FAO, Rome.
17. Doorenbos, J. and Pruitt, W.O. (1977). Guidelines for Predicting Crop Water Requirements, Irrigation and Drainage Paper 24, FAO, Rome.
1S.Dovring, F. (1967). Productivity of Labour in Agricultural Production, Agricultural Experiment Station Bulletin No. 726, College of Agriculture, Urbana, University of Illinois, Illinois.
19. Enyedi, G.Y. (1964). Geographical Types of Agriculture, Applied Geography in Hungary, Budapest, pp-58-105.
20. FAO (1998). Crop Evapotranspiration, Irrigation and Drainage Paper 56, FAO, Rome.
21. FAO (2002). Crops and Drops, FAO Document, Rome,
22. FAO (2003). World Agriculture: Towards 2015/2030, Broisma, J. (Ed.), Eartivscan Publications, London.
23.FAO (2011). Save and Grow: A Policy Makers Guide to the Sustainable Intensification of Smallholder Crop Production, Food and Agriculture Organization, United Nations, Rome (FAO online catalogue [email protected]/www.fao.orglicatalog/inter-e.htm).
24. Farce, I. and Faci, J.M. (2009). Deficit Irrigation in Maize for Reducing Agricultural Water Use in a Mediterranean Environment, Agricultural Water Management, Vol. 96, No. 3, pp. 383-394.
25. Fulginiti, L. and Perrin, R. (1998). Agricultural Productivity in Developing
354
Countries, Agricultural Economics, Vol. 19, pp. 45-51.
26. Ganguli, B.N. (1938). Trends of Agriculture and Population in the Ganges Valley: A Study in Agricultural Economics, Methuen and co., London.
27. Garg, S.K. (1995). Irrigation Engineering and Hydraulic Structures, Khanna Publishers, New Delhi.
28. 001 (1999). Integrated Water Resource Development: A Plan for Action, Report of the National Commission on Integrated Water Resources Development, Vol. I, Ministry of Water Resources, New Delhi.
29. cloud, J.V. (1989). Water Resources of India and Karnataka: Problems and Prospects, Agricultural Situation in India, Vol. No. 6, pp. 327-327.
30, Hira, G.S. (2009). Water Management in Northern States and the Food Security of India, Journal of Crop Improvement, Vol. 23, No. 2, pp. 136-157.
31. Hirsch, H.G. (1943). Crop Yield Index Numbers, Journal of Farm Economics, Vol. 25, No. 3, pp. 583-598.
32. Honing, J. (1964). Concept of Productivity Measurement in Agriculture on a National Scale, OECD, Documentation in Food and Agriculture, Vol. 57, Paris.
33. Huntington and Valkenburg (1952). Europe, New York.
34. Hussain, I., Sakthivadivel, R. and Amarasinghe, U. (2003). Land and Water Productivity of Wheat in the Western Indo-Gangetic Plain of India and Pakistan: A Comparative Analysis, In: Water Productivity in Agriculture: Limits and Opportunities for Improvement (Eds. J.W. Kijne, R. Barker and D. Molden), CABI, IWMI, Colombo, Sri Lanka, pp. 255-271.
35. Hussain, M. (1970). Patterns of Crop Concentration in Uttar Pradesh, Geographical Review ofIndia, Vol. 32, No. 3, pp. 169-185.
36. Joshi, P.K., Jha, A.K., Wani, S. P., Joslhi, L., Shiyatu, R.L. (2005). Meta Analysis to Assess Impact of Watershed Program and People's Action, Comprehensive Assessment Research Report 8, 1WMI, Colombo, Sri Lanka.
37. Kanwar, J.S. (1972). Coordinated Research in Soil Productivity and Water Management, Fertilizer News, Vol. 17, No. 6, pp.13-26.
38. Karrou, M., Oweis, T., Enein, A.E. and Sherif, M. (2012). Yield and Water Productivity of Maize and Wheat under Deficit and Raised Bed Irrigation Practices in Egypt, African Journal ofAgricultural Research, Vol. 7, No. 11, pp. 1755-1760.
355
39. Kendall, M.G. (1939). The Geographical Distibution of Crop Productivity in England, Journal of the Royal Statistical Society, Vol. 102, No. 1, pp. 21-62.
40. Khusro, A.M. (1965). Measurement of Productivity at Macro and Micro Level, Journal of the Indian Society ofAgricultural Statistics, Vol. 27, No. 2, pp. 278-283.
41. Rijne, I.W., Barker, R and Molden, D. (2003). Water Productivity in Agriculture: Limits and Opportunities for Improvements, CABI International, UK.
42. Lath, S. and Rabman, H. (2011). Crop-Combination and Productivity Regions in Uttar Pradesh-A Correlative Analysis, Asian Profile, Vol. 39, No. 3, pp. 289-303.
43. Lee, P.S. (1999). Irrigated Agriculture-Adding Value through Technology and Management Reform, Agricultural Water Management, Vol. 40, No. 1, pp. 89-93.
44. Loomis, R.A. and Barton, G.T. (1961). Productivity of Agriculture in the United States 1870-1958, Technical Bulletin No. 1238, USDA, Washington, D.C.
45. Mackenzie, W. (1962). The Impact of Technological Change on the Efficiency of Production in Canadian Agriculture, Canadian Journal of Agricultural Economics, Vol. 10, No. 1, pp. 41-53.
46. Mahmood, N. and Ahmad, R.N. (2005). Determination of Water Requirements and Response of Wheat to Irrigation at Different Soil Moisture Depletion Levels, International Journal of Agriculture and Biology, Vol. 7, No. 5, pp. 812-815.
47. Meiburg, C.O. and Brandt, K. (1962). Agricultural Productivity in the United States 1870-1960, Food Research Institute Studies, Vol. 3, No. 2, pp. 63-85.
48. Mishra, U.S., Rathore, T.R. and Tomar V.S. (1995). Water Use Efficiency of Irrigated Wheat in the Tarai Region of India, Irrigation Science, Vol. 16, pp. 75-80.
49. Mishra, P. (1990). Water Management in the Arid Agriculture: A Case Study of District Barmer-Rajasthan, Annals, Vol. 10, No. 1, pp. 29-44.
50. Molden, D. (1997). Accounting for Water Use and Productivity. System-Wide Initiative for Water Management (SWIM) Paper 1, IWMI, Colombo, Sri Lanka.
356
51. Molden, D., Sakthivadivel, R. and Habib, Z. (2001). Basin-Level Use and Productivity of Water: Examples from South Asia, IWMI Research Report 49, IWMI, Colombo, Sri Lanka,
52. Malden, D., Murray-Rust, H., Sakthivadivel, R. and Makin, I. (2003). A Water-productivity Framework for Understanding and Action. In: Water Productivity in Agriculture: Limits and Opportunities for Improvement (Eds. J.W. Kijne, R. Barker and D. Molden), CABI, IWMI, Colombo, Sri Lanka, pp. 1-18.
53. Nagarajan, S. (1998). Perspective on Wheat Demand and Research. In: Wheat Research Needs Beyond 2000, (Eds. S. Nagarajan, G. Singh, and B. S. Tyagi), Directorate of Wheat Research, Kamal, India, pp. 13-28.
54. Olayide, S.O. and Heady, E:O. (1982). Introduction to Agricultural Production Economics, First Edition, Ibadan University Press, Ibadan.
55.Oommen, M.A. (1962). Agricultural Productivity Trends in Kerala, Agricultural Situation in India, Vol. 17, No. 4, pp. 333-336.
56.Otegui, M.E., Andrade, F.H., and Suero, E.E. (1995). Growth Water Use and Kernel Abortion of Maize Subjected to Drought at Silking, Field Crops Research, Vol. 40, No. 2, pp. 87-94.
57. Pereira, A. and Fires, L. (2011). Evapotranspiration and Water Management for Crop Production, In: Evapotranspiration - From Measurements to Agricultural and Environmental Applications (Ed. G. Gerosa), InTech Publisher, Shanghai, China, pp. 443-164 (cdn. IW1echopen.tom1pd1d22694/ln Tech-Evapotranspiration andwatermanagement£or_crop_production.pdf) Accessed on April 12, 2012.
58. Prasad, R. (2002). Textbook of Field Crop Production, Directorate of Information and Publication of Agriculture, ICAR, Krishi Anusandhan Bhavan, Pusa, New Delhi.
59. Rabman, H. and Lath, S. (2012). Comparative Analysis of Irrigation and Cropping Intensity in Uttar Pradesh, India, National Geographical Journal of India, Vol. 58, No. 3, pp. 25-34.
60. Relunan, H. (1976). Mechanization of Farting and its Impact on Food Crop Productivity in Uttar Pradesh, The Geographer, Vol. 22, No. I, pp. 66-80.
61, Rehman, H. and Hussain, M. (2003). Measurement of Agricultural Efficiency in North Bihar Plain, National Geographical Journal of India, Vol. 49, No. 1, pp. 27-32.
357
62. Rockstrom, J., Lannerstad and Falkenmark, M. (2007). Assessing the Water Challenge of a New Green Revolution in Developing Countries, Proceedings of the National Academy of Sciences of the United States of America, Vol. 104, No. 15, pp. 6253-6260.
63. Rosegrant, M.; Cai, X.; and Cline, S. (2002). World Water and Food to 2025: Dealing with Scarcity, IFPRI, Washington, D.C.
64. Rosegrant, M.W. and Hazell, P.B.R. (2000). Transforming the Rural Asian Economy: The Unfinished Revolution, Oxford University Press, Hong Kong.
65. Sapre, S.G. and Deshpande, V.D. (1964). Inter-district Variations in Agricultural Efficiency in Maharashtra State, Indian Journal of Agricultural Economics, Vol. 19, No. 1, pp. 242-252.
66. Saran, R. (1965). Production Function Approach to the Measurement of Productivity in Agriculture, Journal of the Indian Society of Agricultural Statistics, Vol. 27, No. 2, p.268.
67. Shaft, M. (1960). Measurement of Agricultural Efficiency in Uttar Pradesh, Economic Geography, Vol. 36, No. 4, pp. 296-305.
68. Shaft, M. (1965). Approaches to the Measurement of the Agricultural Efficiency, Unpublished, Proceedings of the Summer School in Geography held at Naini Tat, Department of Geography, Aligarh Muslim University, Aligarh.
69. Shafi, M. (1967). Food Production Efficiency and Nutrition in India, The Geographer, Vol. 14, pp. 23-27.
70. Shaft, M. (1969). Can India Support Five Times Her Population? Science Today, No. 3, pp. 21-27.
71. Shafi, M. (1970). Measurement of Food Crop Productivity in India, Presidential Address, Indian Council of Geographers, Indian Science Congress.
72. Shaft, M. (1972). Measurement of Agricultural Productivity of the Great Indian Plains, The Geographer, Vol. 19, No. 1, pp. 4-13.
73. Shafi, M. (1984) Agricultural Productivity and Regional Imbalances, Concept Publishing Company, New Delhi.
74. Sharma, B.R., Rao, K.V. and Vittal, K.P.R. (2008). Converting Rain into Gain: Opportunities for Realizing the Potential of Rain-fed Agriculture in India. In: India's Water Future: Scenarios and Issues (Eds. U.A.
358

Aroarasinghe, T. Shah and RP.S. Malik), IWMI, Colombo, Sri Lanka, pp. 169-180.
75. Sharma, K.S., Sanwa, J. S., and Singh, H. P. (2001). Influence on Boundary Plantation of Poplar (Populus deltoids M.) on Soil-water Use and Water Use Efficiency of Wheat, Agriculture Water Management, Vol. 51, No. 3, pp. 173-185.
76. Sharma, V.P. (2012). Indian Agricultural Development under the New Economic Regime: Policy Perspective and Strategy for the 12 b Five Year Plan, Working Paper No. 2011-11.01, Indian Institute of Management, Ahmadabad.
77. Sharmam D.K., Kumar, A. and Singh, K.N. (1990). Effect of Irrigation Scheduling on Growth, Yield and Evapotranspiration of Wheat in Sodic Soils, Agricultural Water Management, Vol. 18, pp. 267-276.
78. Shinde, P.P. and Jadhav, S.B. (2001). Water Management with Drip Irrigation System for Sugarcane. In: Proceedings of 62"d Annual Convention of the Sugar Technologists'Association, India, pp. A36-A41.
79. Singh, A.K., Choudhary, B.U. and Bouman, B.A.M. (2002). Effect of Rice Establishments Methods on Crop Performance, Water Use, and Mineral Nitrogen. In: Review of Measured Crop Water Productivity Values for Irrigated Wheat, Rice, Cotlon and Maize (Eds. S.J. Zwart and G.M. Bastiaanssen), Agricultural Water Management, Vol. 69, No. 2, pp. 115-133.
80. Singh, K.B., Gajri, P.R. and Arora, V.K. (2001). Modelling the Effects on Soil and Water Management Practices on the Water Balance and Performance of Rice, Agricultural Water Management, Vol. 49, No. 2, pp. 77-95.
81. Singh, R.V. and Chauhan, H.S. (1996). Irrigation Scheduling in Wheat under Shallow Groundwater Table Conditions. In: Proceedings of the International Conference on Evapotranspiration and Irrigation Scheduling ( Eds. C.R. Cramp, E.J.Sadler and R.E.Yodcr). San Antonio Convention Centre, San Antonio, Texas.
82. Singh, V.R. (1979). A Method for Analysing Agricultural Productivity. In: Agriculture and Food Supply in Developing Countries (Ed., J.T. Coppock), Published for the Commission on World Food Problems and Agricultural Productivity of the IGU, Department of Geography, University of Edinburg, pp. 143-51.
83. Sinha, B.N. (1968). Agricultural Efficiency in India, The Geographer, Special Number, Vol.. 15, pp. 101-27.
359

84. Stamp, L.D. (1952). The Measurement of Agricultural Efficiency with Special Reference to India, Silver Jubilee Volume, Indian Geographical Society, pp. 177-78.
85. Stamp, L.D. (1958). The Measurement of Land Resources, The Geographical Review, Vol. 48, No. 1, pp. 110-16.
86. Tekwa, I.J. and Bwade, E.K. (2011). Estimation of Irrigation Water Requirement of Maize (Zea-mays) using Pan Evaporation Method in Maiduguri, Northeastern Nigeria, Agricultural Engineering International: the CIGR Journal, Manuscript No.1552, Vol.13, No.1, pp.1-(http:/Iwivuccigijoumal.org/index.php/EjounraVarliele/viewFilei l552/1387) Accessed on 9 November, 2011.
87. Thomption, R.J. (1926). The Productivity of British and Danish Farming, Journal of the Royal Statistical Society, Vol. 89, No. 2, pp. 217-255.
88. Thornthwaite, C.W. (1994). Report of the Committee on Transpiration and Evapotranspiration, Transactions, American Geophysical Union, Vol. 25, No. 5, pp. 686-693.
89. Tuong, T.P. and Bouman, B.A.M. (2003). Rice Production in Water Scarce Environments. In: Water Productivity in Agriculture: Limits and Opportunities for Improvement (Eds. J.W. Kijne, R. Barker and D. Molden), IWMI, CABI, UK, pp. 53-67.
90. Tuong, T.P., Bouman, B.A.M., and Mortimer, (2005). More Rice, Less Water-Integrated Approaches for Increasing Water Productivity in Irrigated Rice-based Systems in Asia, Plant Production Science, Vol. 8, No. 3, pp. 231-241.
91. Umar, N. and Rehman, H. (2011). Crop Productivity Variations in U.P.: A Regional Analysis, National Geographical Journal of India, Vol. 57, No. 2, pp.55-64.
92. Vaidyanathan, A. and Sivasubramaniyan, K. (2004). Efficiency of Water Use in Agriculture, Economic and Political Weekly, Vol. 39, No. 27, pp. 2989-2996.
93. Yang, W.Y. (1965). Methods of Farm Management Investigations for Improving Farm Productivity, FAO, Rome.
94. Zaman, K. and Rahman, H. (2009). Identification of Productivity Regions in Ganga-Yamuna Doab: A Regional Approach for Agricultural Development, National Geographical Journal of India, Vol. 55, No. 3, pp. 55-64.
360
95. Zobel, S.P. (1950). On the Measurement of Productivity of Labour, Journal of American Statistical Society, Vol. 45, p.218.
96. Zoebl, D. (2006). Is Water Productivity a Useful Concept in Agricultural Water Management? Agricultural Water Management, Vol. 84, No. 3, pp. 265-273.
361

Chapter (III
Impact of Irrigation on
Agricultural Development: A Correlative Analysis

CHAPTER VII IMPACT OF IRRIGATION ON AGRICULTURAL DEVELOPMENT: A CORRELATIVE ANALYSIS
This chapter is an attempt to find out the impact of irrigation on agricultural
development in the districts of Uttar Pradesh. For the agricultural development
analysis, data pertaining to 21 variables for the year 2004-05" were collected, and
grouped into six major development indicators-irrigation, technology, agricultural
land use, agricultural production, human resource and rural infrastructure. Composite
z-score technique was used to examine and determine the levels of agricultural
development in all of the 70 districts of the state. Karl Pearson's correlation
coefficient technique was applied to examine the relationship between variables of
irrigation and agricultural development. If imbalances and variations exist in
provisions of irrigation and agricultural development, some measures have also been
suggested for the development of agriculturally backward districts.
Agriculture occupies a key position in the Indian economy because it
contributes to over-all economic growth by supplying of food, raw materials and
exports. The performance of agriculture in terms of area, production and yield per
hectare of foodgrains and other commercial crops has continued to grow at a steady
rate from the First Five Year Plan and onwards during all the plan periods. This has
been possible due to an accelerated rate of increase in area under HYVs and use of
fertilizers. Apart from provision of infrastructure, other factors are the extension in
the application of new technology and the incentives provided for the procurement of
foodgrains at remunerative prices (Sury et al., 2008). Agricultural sector provides
livelihood to over 58 per cent of the population in the country, though its
contribution to GDP has declined to 14.2 per cent due to high growth achieved in
industries and service sectors (GOI, 2011). Since the beginning of Green Revolution
(1966-67), there has been a considerable change in almost all spheres of agriculture
in the country. In order to meet the growing demand of food for the teeming millions,
it has been attempted to intensify the agriculture on one hand and to bring more and
more areas under cultivation on the other that has led to vertical and horizontal
expansion of agriculture, Cropping patterns have changed and attention of farmers
Due to paucity of data pertaining to consistent years for all the selected variables for computing agricultural development, data for the year 2004-05 was taken for the analysis.
362
has shifted to the cultivation of more remunerative crops. Coarse grained crops have
been replaced by more remunerative crops. Thus, by and large, monetary returns per
hectare yield have increased to a considerable extent (Thakur, 1992).
Irrigation development holds a key to agricultural growth as availability of
irrigation water triggers the use of yield stimulating inputs like HYV of seeds and
chemical fertilizers to encourage farmers for adopting advanced agricultural
techniques and improved agronomic practices. Irrigation helps in diversifying the
cropping pattern in favour of remunerative crops and increasing the cropping
intensity (Dhawan, 1988). Recent studies show that, irrigation has to play a larger
role in achieving higher yields per unit area and ensure national food security (G0I
1999; Bhaduri et al., 2008). Dependency of modem agriculture on groundwater
irrigation has increased many folds. Currently about 60 per cent of the irrigated area
under foodgrains depends on lacklustre efficiency of groundwater due to its
established comparative advantage over canal irrigation (Sivanappan, 1995).
The levels of agricultural development were computed by applying
Composite z-score technique. For the assessment of agricultural development in each
district, six groups of indicators were designated as irrigation development,
agricultural land use development, technological development, agricultural
production development, human resource development and rural infrastructure
development to accommodate 21 independent variables (Table 7.1). The variables
designated to form a set of indicators were in order of; irrigation variables (X t to X5),
agricultural land use variables (X6 to X9), technological variables (Xio to 3(12),
agricultural production variables (X13 to X16), human resource variables (Xn to X18)
and, rural infrastructure variables (X19 to X21).
Composite standard scores computed thus helped in determining the levels of
agricultural development in individual district of the state. Z-score values obtained
for six indicators were further correlated with each other in order to find out the
relationship of these variables with an overall development of agriculture. Karl
Pearson's coefficient of correlation (r) was applied, and finally, t-test was performed
to determine the level of significance between the components. If the `computed
value' is greater than the tabulated value' of 't' at any desired level (0.01 or 1 %
level, and 0.05 or 5 % level), the correlation coefficient was considered as perfect
and significant.
363
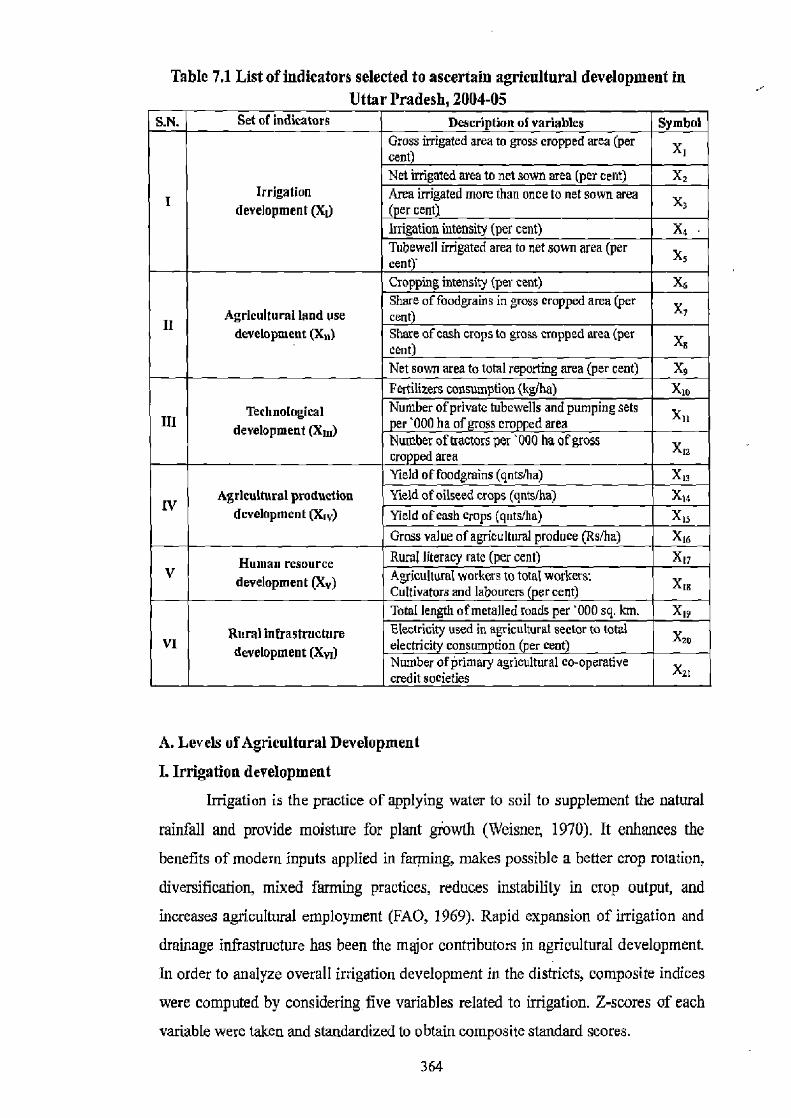
Table 7.1 List of indicators selected to ascertain agricultural development in Uttar Pradesh, 2004-05
S.N. Set of indicators Description of variables Symbol Gross irrigated area to gross cropped area (per X cent) Net irrigated area to net sown area (per cent) X,
Irrigation Area irrigated more than once to net sown area X 3 development (X1) (per cent)
Irrigation intensity (per cent) Xa Tubewell irrigated area to net sown area (per X cent)' Cropping intensity (per cent) X6 Share of foodgrains in gross cropped area (per X
II Agricultural land use cent)
Share of cash crops to gross cropped area (per X develo ment p (XU) cent) Net sown area to total reporting area (per cent) X, Fertilizers consumption (kglba) Xte Number of private tubewells and pumping sets Technological
HI development (XJJ) per'000 ha of gross cropped area Number of tractors per '000 ha of gross Xa cropped area Yield offoodgmins (gntslha) X t3 Yield of oilseed crops (gntsfha) Agricultural production Xty
IV development (X,v) Yield of cash crops (gntsma) Xts Gross value of agricultural produce (Rs/ba) Rural literacy rate (per cent)
Xtb X❑ Human resource
Agricultural workers to total workers: X s V development (Xv) Cultivators and labourers (per cent) Total length of metalled roads per 000 sq. kin. X19
Rnral infrastructure Electricity used in agricultural sector to total X30 VI development (Xvd electricity consumption (per cent)
Number of primary agricultural co-operative Xz credit societies
A. Levels of Agricultural Development
I. Irrigation development
Irrigation is the practice of applying water to soil to supplement the natural
rainfall and provide moisture for plant growth (Weisner, 1970). It enhances the
benefits of modern inputs applied in farming, makes possible a better crop rotation,
diversification, mixed farming practices, reduces instability in crop output, and
increases agricultural employment (FAO, 1969). Rapid expansion of irrigation and
drainage infrastructure has been the major contributors in agricultural development.
In order to analyze overall irrigation development in the districts, composite indices
were computed by considering five variables related to irrigation. Z-scores of each
variable were taken and standardized to obtain composite standard scores.
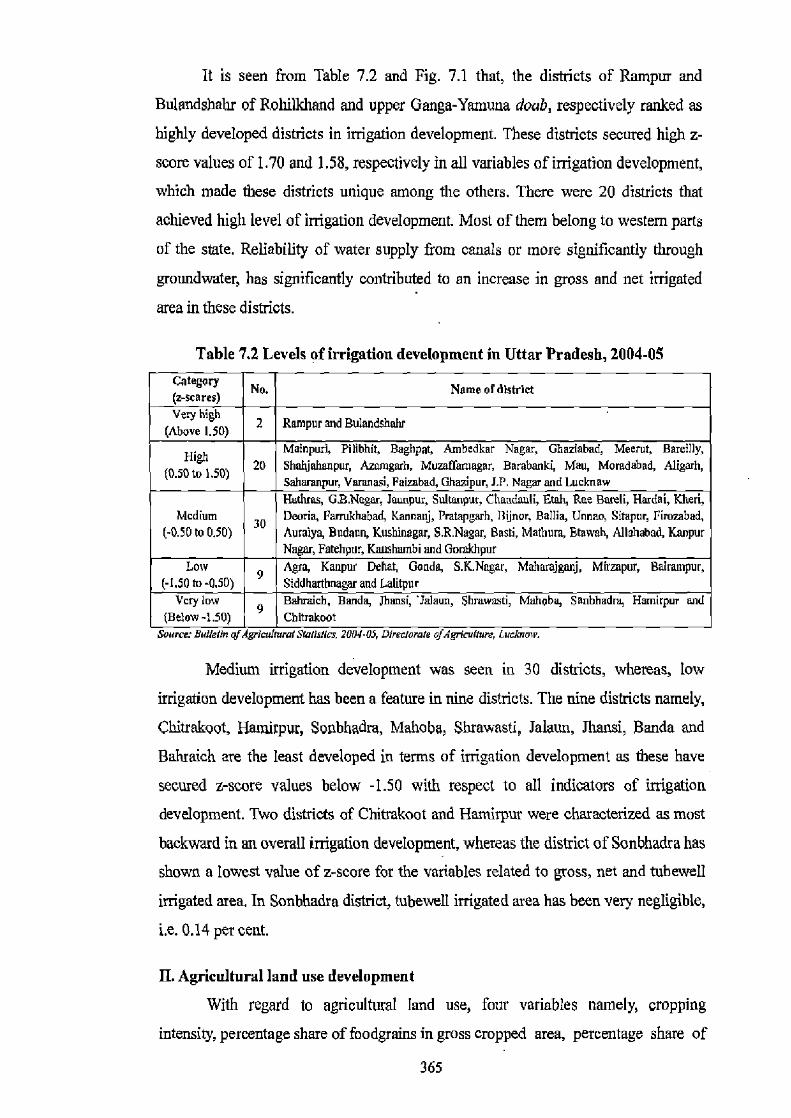
It is seen from Table 7.2 and Fig. 7.1 that, the districts of Rampur and
Bulandsbabr of Rohilkhand and upper Ganga-Yamuna doeb, respectively ranked as
highly developed districts in irrigation development. These districts secured high z-
score values of 1.70 and 1.58, respectively in all variables of irrigation development,
which made these districts unique among the others. There were 20 districts that
achieved high level of irrigation development. Most of them belong to western parts
of the state. Reliability of water supply from canals or more significantly through
groundwater, has significantly contributed to an increase in gross and net irrigated
area in these districts.
Table 7.2 Levels of irrigation development in Uttar Pradesh, 2004-05 Category
No. Name of district (z-scores) very high
2 Rampur and Bulandshahr (Above 1.50)
High Mainpuri, Pilibhit. Baghpat, Ambedkar Nagar, GLaziabad, Meerut, Bareilly,
(0.50101.50) 20 Shahjahaupur, Azamgarh, Muzatfecagsr, Berabanki, Mau, Moradabad, Aligarh, Saharanpur, Varanasi, Fainbad, Ghazipur, J.P. Nagar and Lucknow Hatteras, G B.Nugar, Jaunpur, Sultanpur, Chandauli, Etch, Rae Bnreli, Hardoi, Kheri,
Medium Deoria, Farrukhabad, Kannanj, Pratapgarh, Bijnor, Ballia, Unnao, Sitapur, Firozabad, (-0.50 to 0.50) 30 Auraiya, Budaun, Kushinagar, S.R.Nagar, Basti, Mathura, Etawab, Allahabad, Kanpur
Nagar, Fatehpur, Kaushambi and Gorakhpur Low ~ Agra, Kanpur Dehat, Ganda, S.K.Nagar, Maharajganj, Mvmpur, Balrsmpur,
(-1.50 to -0.50) Siddharthnagar and Latitpur Very low 9 Bahraich, Banda, Jhansi,'7alaun, Shrawasti, Mahoba, Sonbhadra, Hamirpur and
(Below-1.50) Chitrakoot Source: Bulletin pfAgriStural Bcrirles. 2000-05, Directorate afAgncultau, Grckn,w.
Medium irrigation development was seen in 30 districts, whereas, tow
irrigation development has been a feature in nine districts. The nine districts namely,
Chitrakoot, Hamirpur, Sonbhadra, Mahoba, Shrawasti, Jataun, Jhansi, Banda and
Bahraich are the least developed in terms of irrigation development as these have
secured z-score values below -1.50 with respect to all indicators of irrigation
development. Trio districts of Chitrakoot and Hamirpur were characterized as most
backward in an overall irrigation development, whereas the district of Sonbhadra has
shown a lowest value of z-score for the variables related to gross, net and tubewell
irrigated area. In Sonbhadra district, tubewell irrigated area has been very negligible,
i.e. 0.14 per cent.
II. Agricultural land use development
With regard to agricultural land use, four variables namely, cropping
intensity, percentage share of foodgrains in gross cropped area, percentage share of
365
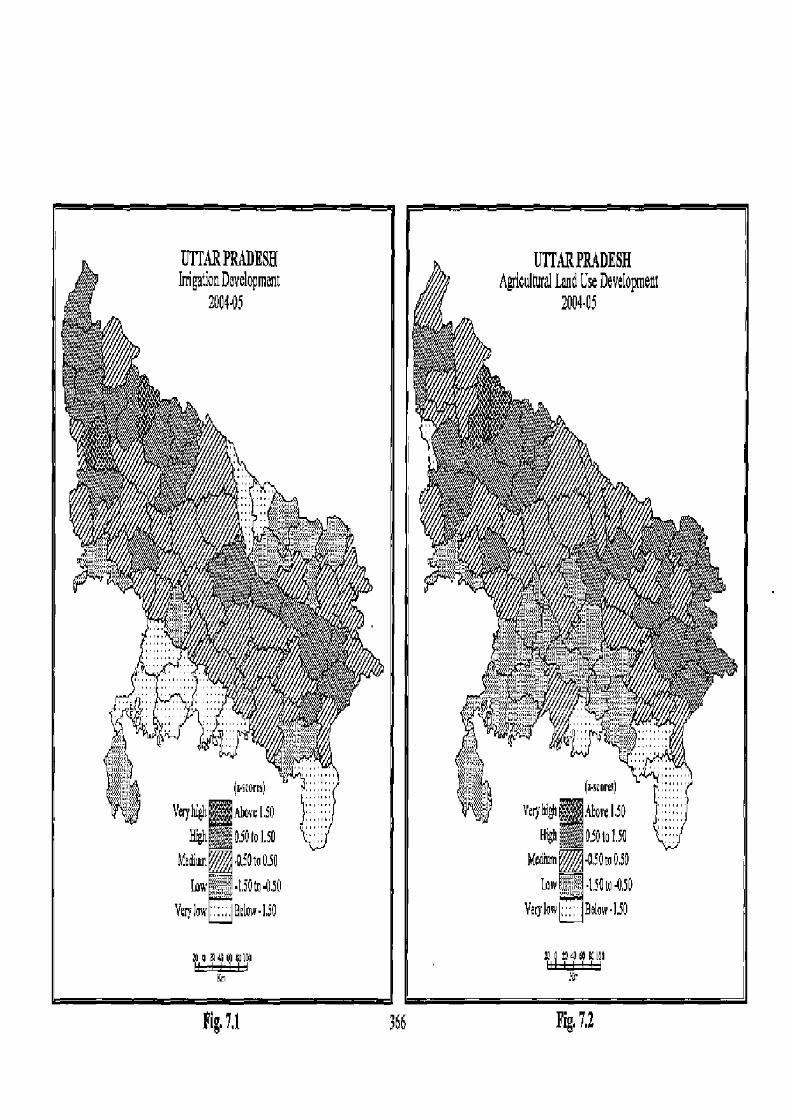
Fig.7,1 366 Fig, 7,2
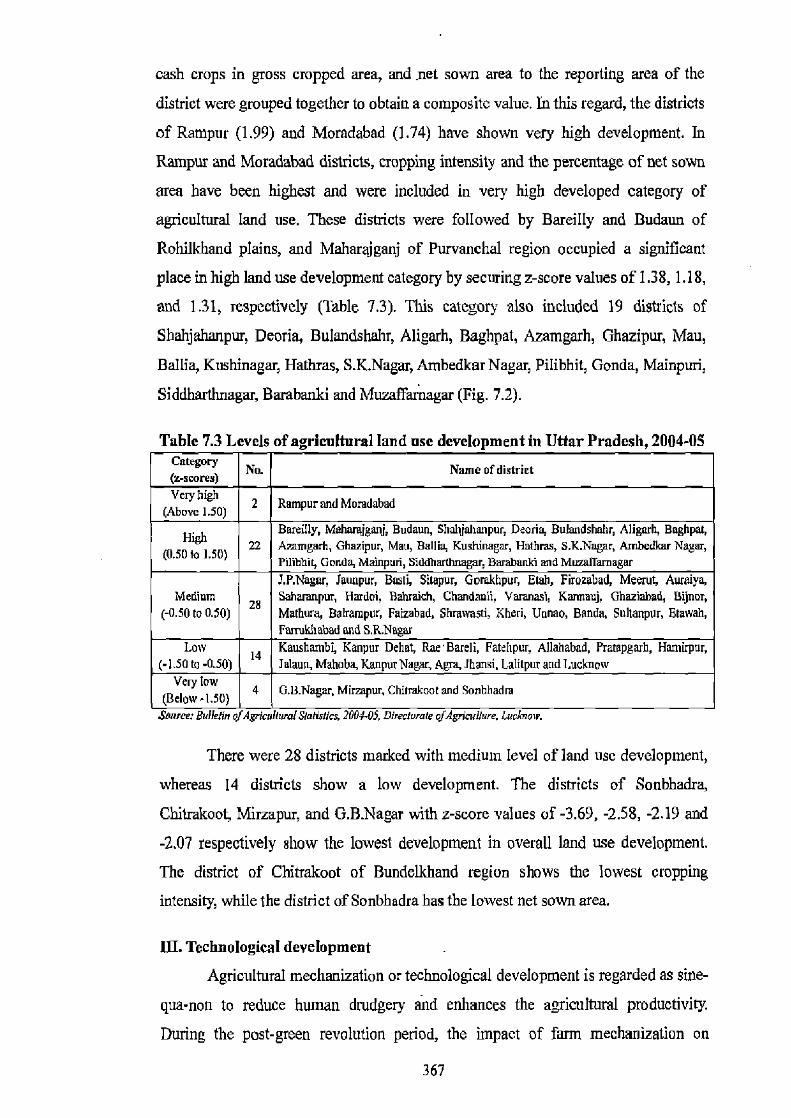
cash crops in gross cropped area, and net sown area to the reporting area of the
district were grouped together to obtain a composite value. In this regard, the districts
of Rampur (1.99) and Moradabad (1.74) have shown very high development. In
Rampur and Moradabad districts, cropping intensity and the percentage of net sown
area have been highest and were included in very high developed category of
agricultural land use. These districts were followed by Bareilly and Budaun of
Rohilkhand plains, and Maharajganj of Purvanchal region occupied a significant
place in high land use development category by securing z-score values of 1.38, 1.18,
and 1.31, respectively (Table 7.3). This category also included 19 districts of
Shahjahanpur, Deoria, Bulandshahr, Aligarh, Baghpat, Azamgarh, Ohazipur, Mau,
Ballia, Kushinagar, Hathras, S.K.Nagar, Ambedkar Nagar, Pilibhit, Gonda, Mainpuri,
Siddharthnagar, Barabanki and Muzaffamagar (Fig. 7.2).
Table 7.3 Levels of agricultural land use development in Uttar Pradesh, 2004-05 Category Na Name of district (z-scores) Very h 1.5 2 Rompur and Moradabad (Above 1.50)
High Bareilly, Mahwajgaaj, Budaun, Shalijahaupuy Deoria, Bulandshalu, Aligarh, Baghpat, (0.50 to 1.50) 22 , Hathras, S.K.Nagar, Abedlmr Nagar, Azamgarh, Ghazipur, Mau, Ballia, KusMnagar m
pdithi4 Gonda, Mainpuri, SiddhaNmagar, Barabanki and Muzalramagar J.P.Nagur, launpur, Bush, Silapur, Gorakhpur, Elah, Firozabad, Meerut, Auraiya,
Medium Saharanpur, Hardoi, Babraich, Chandaull, Varanasi, Kannauj, Ghaziabad, Bijnor, 28 (-0.50 to 0.50)
Mathura, Bairampur, Faizabad, Shrewasti, Kheri, Unnao, Banda, Sullanpur, Elawah, Furrukhabad and S.R.Nagar
Low Kaushambi, Kanpur Dehat, Rae' Bareli, Fatehpm, Allahabad, Pratapgarh, Hamirpur, (-1.50 to -0.50) 14 Jalaun, Mahuba, Kanpur Nagar, Agra, Ihansi, Lalitpur and Lucknow
Very low (Below l-1.50) SO) 4 G.B.Na6ar, Mirzapur, CNlrekoot and Sonbhadra
Source: Bulletin of Agricufhuu( Motetics, 2UU1-U), Direci wale ofAgrieupnre, ducMnmr.
There were 28 districts marked with medium level of land use development,
whereas 14 districts show a low development. The districts of Sonbhadra,
Chitrakoot, Mirzapur, and G.B.Nagar with z-score values of -3.69, -2.58, -2.19 and
-2.07 respectively show the lowest development in overall land use development.
The district of Chitrakoot of Bundelkhand region shows the lowest cropping
intensity, while the district of Sonbhadra has the lowest net sown area.
III. Technological development .
Agricultural mechanization or technological development is regarded as sine-
qua-non to reduce human drudgery and enhances the agricultural productivity.
During the post-green revolution period, the impact of farm mechanization on
367
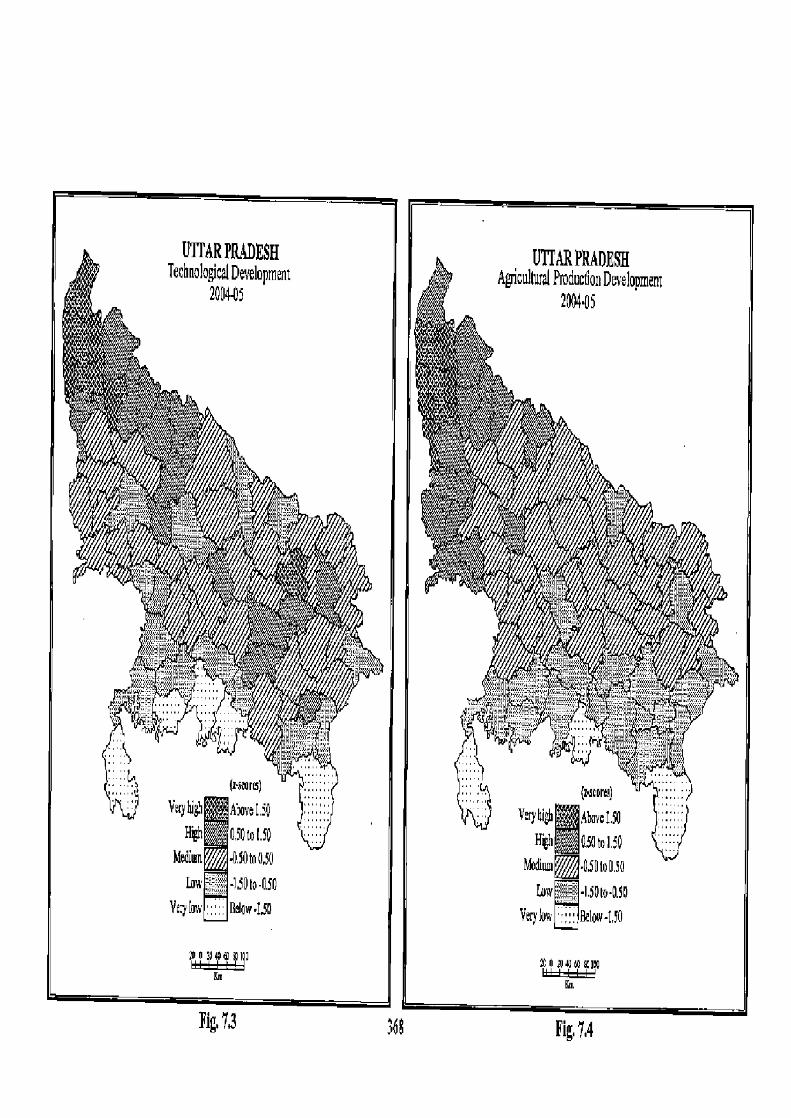
rig, 7.s 366 Fig.7,4
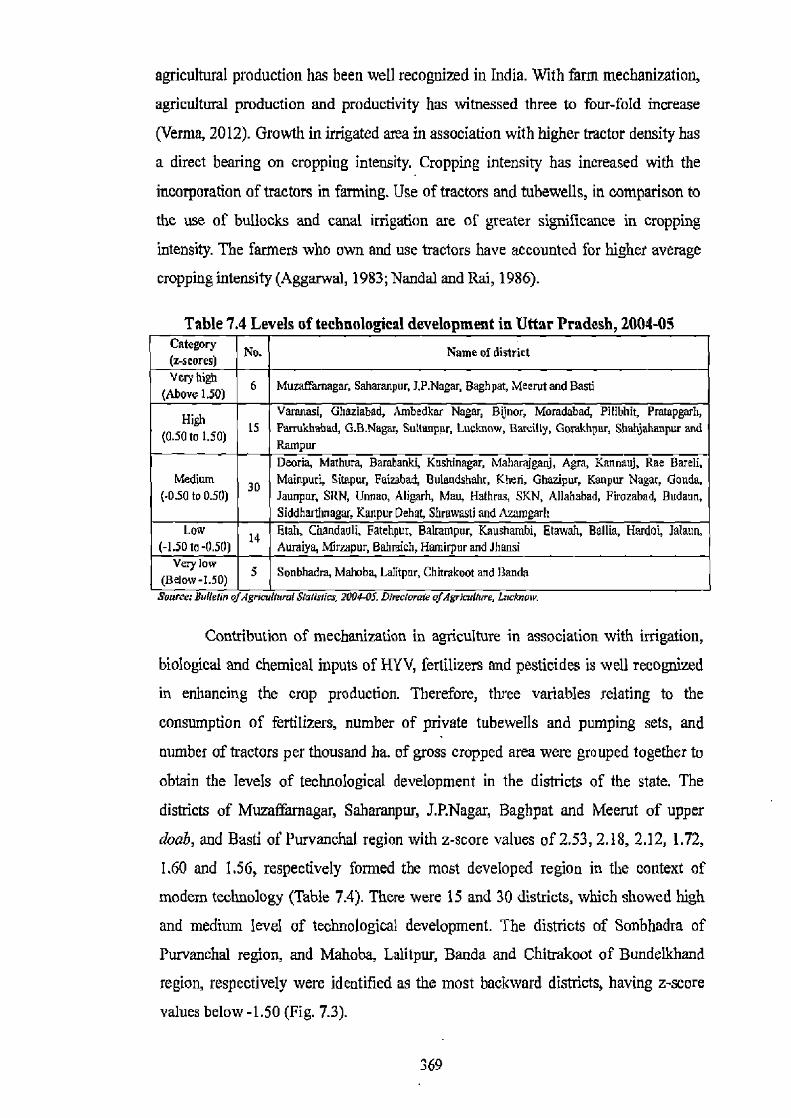
agricultural production has been well recognized in India. With faint mechanization,
agricultural production and productivity has witnessed three to four-fold increase
(Velma, 2012). Growth in irrigated area in association with higher tractor density has
a direct bearing on cropping intensity. Cropping intensity has increased with the
incorporation of tractors in farming. Use of tractors and tubewells, in comparison to
the use of bullocks and canal irrigation are of greater significance in cropping
intensity. The farmers who own and use tractors have accounted for higher average
cropping intensity (Aggarwal, 1983; Nandal and Rai, 1986).
Table 7.4 Levels of technological development in Uttar Pradesh, 2004-05 Category
No. Name of district (z-scores) Very high
(Above 1,50) 6 ffa Muzarnagar, Saharanpur, J.P.Nagar, Baghpat, Meerut and Basti
HIS Varanasi, Ghaziabad, Ambedkar Nagar, Bijnoy Momdabad, Pilibhit, Pmtapgarh,
(O.8O to 1.50) 15 Farrukhabad, G.B,Nagar, Sultenpur, Locknow, Bareilly, Gomkhpur, Shahjahanpur and wpm
Deoria, Mathura, Barahanki, Kushinagar, Maharajganj, Agra, Kannauj, Rae Bareli. Medium 30 Muiapuri, Sitapur, Faizabad, Bulandshahr, Kheri, Ghuzipur, Kanpur Nagar, Gonda,
(.0.50 to 0.50) Jaunpar, SRN, Unnao, Aligarh, Mau, Hathres, SKN, Allahabad, Firozabad, Budaun, SiddhaNinagar, Kanpur Dehat, Shrawasti and Azamgarh
Low 14 Etah, Chandauli, Fatehpur, Bahampur, Kaushambi, Etawah, Bellia, Hardoi, lalann, (-1.50 to -0.50) Aumiye, Mirzapur, Behndch, Hamirpur and Jhansi
Very low (Below-L50) S Sonbhadra, Mahoba, Lalitpur, Chitrakoot and Banda
d'onrec: CWtetm of dgrMUMnor Jra/blru, AW"). L/Melomk' of Agriculture, 6rscdI0u.
Contribution of mechanization in agriculture in association with irrigation,
biological and chemical inputs of HYV, fertilizers and pesticides is well recognized
in enhancing the crop production. Therefore, three variables relating to the
consumption of fertilizers, number of private tubewells and pumping sets, and
number of tractors per thousand ha. of gross cropped area were grouped together to
obtain the levels of technological development in the districts of the state. The
districts of Muzaffamagar, Saharanpur, J.P.Nagar, Baghpat and Meerut of upper
doab, and Basti of Purvanchal region with z-score values of 2.53, 2.18, 2.12, 1.72,
1.60 and 1.56, respectively formed the most developed region in the context of
modem technology (Table 7.4). There were 15 and 30 districts, which showed high
and medium level of technological development. The districts of Sonbhadra of
Purvanchal region, and Mahoba, Lalitpur, Banda and Chitrakoot of Bundelkhand
region, respectively were identified as the most backward districts, having z-score
values below -1.50 (Fig. 7.3).
369
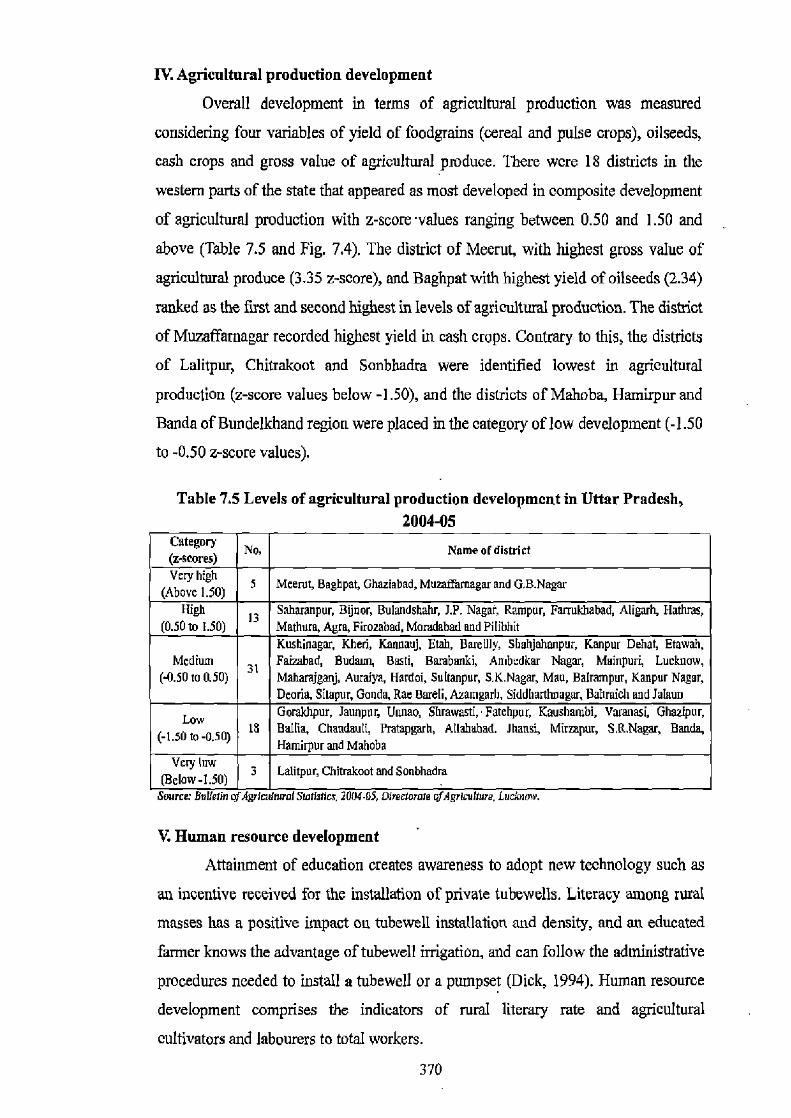
IV. Agricultural production development
Overall development in terms of agricultural production was measured
considering four variables of yield of foodgrains (cereal and pulse crops), oilseeds,
cash crops and gross value of agricultural produce. There were 18 districts in the
western parts of the state that appeared as most developed in composite development
of agricultural production with z-score values ranging between 0.50 and 1.50 and
above (Table 7.5 and Fig. 7.4). The district of Meerut, with highest gross value of agricultural produce (3.35 z-score), and Baghpat with highest yield of oilseeds (2.34)
ranked as the first and second highest in levels of agricultural production. The district
of Muzaffarnagar recorded highest yield in cash crops. Contrary to this, the districts
of Lalitpur, Chitrakoot and Sonbhadra were identified lowest in agricultural
production (z-score values below -1.50), and the districts of Mahoba, Hamirpur and
Banda of Bundelkhand region were placed in the category of low development (-1.50
to -0.50 z-score values).
Table 7.5 Levels of agricultural production development in Uttar Pradesh, 2004-05
Category No. Name of district (z-scores) Very
igh (Above 1.50) 5 Meerut, Baghpat, Ghaziabad, Muzatamagar and GB. .Nagar
High 13 Saharanpur, Bijuor, Bulandshabr, J.P. Nagar, Rampur, Farrukhabad, Aligarh, Hathras, (0.50 to 1.50) Mathurn, Agra, Firozabad, Maradabad and Pilibhit
Kushinagar, Khed, Kannauj, Etah, Bareilly, Shahjahanpur, Kanpur Dehat, Etawah, Medium 31 FaGzbad, Budauo, Basti, Barabanki, Amhedkar Nagar, Mainpuri, Lucknow,
(.0.50 to 0.50) Maharajganj, Auraiya, Hr doi, Sullanpur, S.K.Nagar, Mau, Balrampur, Kanpur Nagar, Deoria, Sitapur, Ganda, Rae Bareli, Azamgorb, Siddhartmagar, Baloaich and Jalaun
Low Gorakhpur, Jaunpur, Unnau, Shrawasti, Fatehpur, Kaushambi, Varanasi, Ghazlpur, (-1.50 to -0.50) la Ballia, Chaudauli, Pratapgarh, Attahabad, Jhansi, Mirzapur, S.R.Nagar, Banda,
Hamirpur and Mahoba Very low
(Below-1.50) 3 Lalitpur, Chitrnkoot and Sonbhadra 6ourct Mason 01A27tr2Irm7at Smnni[S, 2U04-o>, Uvenorate p1 AgTlttmre, u¢kn WV.
V. Human resource development
Attainment of education creates awareness to adopt new technology such as
an incentive received for the installation of private tubewells. Literacy among rural
masses has a positive impact on tubewell installation and density, and an educated
farmer knows the advantage of tubewell irrigation, and can follow the administrative
procedures needed to install a tubewell or a pumpset (Dick, 1994). Human resource
development comprises the indicators of rural literary rate and agricultural
cultivators and labourers to total workers.
370
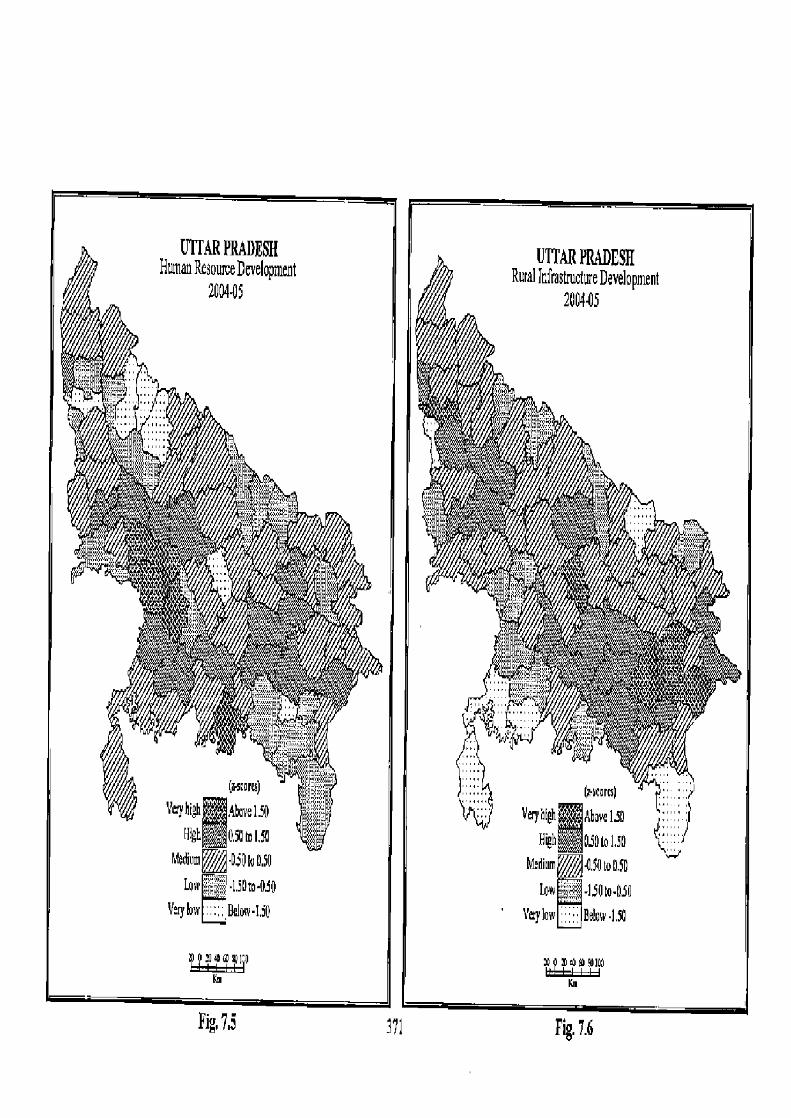
(aRerw)
Veryhi h Above150
High 0.50EeI.50 h1 MM-Oj)luO.SO
Low ' .1.5N.oso
V.ybw Bclow•Li0
Fig, 7.5
LI1TAR PRADESH Homan Resource Development
2U45
UTTAR PRADESH Rural Infrastruett eDevelopment
2004-05
WSWU/1/jYflAYJdWtL f.
wry
aril,:
SW
Vep[ti AtoveISO J1I Huh 0.SOIo LSD \ I
~Haiun~ -0.Qlo050 Low " -I50 w•os0
• Vaylow Be(ec -I 0
x mmmaim
Fig. 7.6
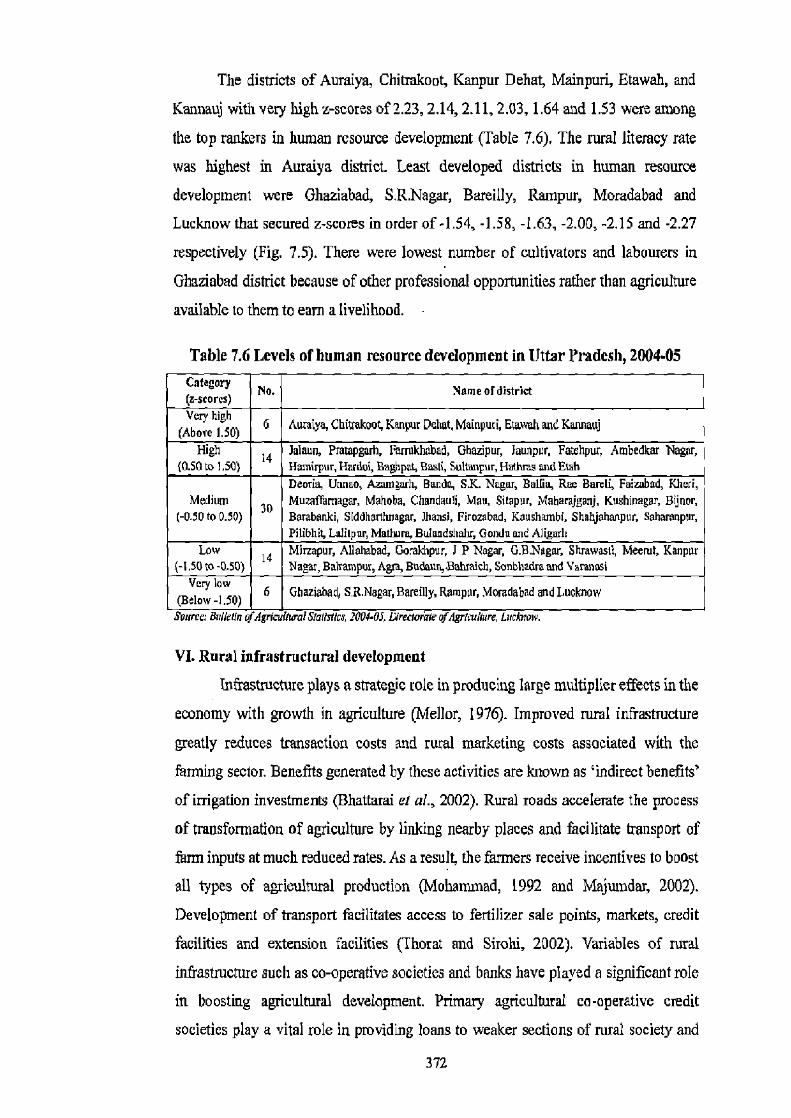
The districts of Auraiya, Chitrakoot, Kanpur Dehat, Mainpuri, Etawah, and
Kannauj with very high z-scores of 2.23, 2.14, 2.11, 2.03, 1.64 and 1.53 were among
the top rankers in human resource development (Table 7.6), The rural literacy rate
was highest in Auraiya district. Least developed districts in human resource
development were Ghaziabad, S.R.Nagar, Bareilly, Rampur, Moradabad and
Lucknow that secured z-scores in order of -1.54, -1.58, -1.63, -2.00, -2.15 and -2.27
respectively (Fig. 7.5). There were lowest number of cultivators and labourers in
Ghaziabad district because of other professional opportunities rather than agriculture
available to them to earn a livelihood.
Table 7.6 Levels of human resource development in Uttar Pradesh, 2004-05 Category
No. Name of district (z-scores) Very
(Above L.5 h10) 6 Aara[ya, Chivakoot, Kanpur Dehet, Mainpuri, Etawah and Kanoauj 5 High 14 Jalaun, Prawpgarh, rwrukhabad, Ghazipur, Jaunper, Faxhpw,, Ambedkar Nagar,
(0.50 to 1.50) Ham(rpur, Hudoi, Baghpat, Basil, Sultanrur, Hsthms and Etah Deorie, Unnao, Azamaarh, Banda, S.IC Nagar, Beira, Rue Barth, Faizabod, Khui,
Medium Mu~affamagar, Mahoba, Chandauli, Mau, Sitapur, Maharajganj, Kuahinagar, Bijnnr, (-0.50 to 0.50) 1U Barabanki, Siddharthnagar, Jhansi, Firozabad, Kaushambi, Shahjahaapur, Siharanpur.
Pilibhit, Lalilpur, Mathure, Bulaadshahr, Gonda and Aligarh Low Ia Mirzapur, Allahabad, Gozkhpur, J P Nagar, G.B.Nagar, Shrawwfl, Meerut, Kanpur
(-ISO to -0.50) Nagar, Balrempur, Agra, Budann,.Bahmich, Sunbhadra and Varanasi
(Below V
50) o low 6 Ghaziabad, 5R.Nagar, Bareilly, Rampur, Moradabad and Lucknow -L
VI. Rural infrastructural development
infrastructure plays a strategic tole in producing large multiplier effects in the
economy with growth in agriculture (Mellor, 1976). Improved rural infrastructure
greatly reduces transaction costs and rural marketing costs associated with the
farming sector. Benefits generated by these activities are known as `indirect benefits'
of irrigation investments (Bhattarai at al., 2002). Rural roads accelerate the process
of transformation of agriculture by linking nearby places and facilitate transport of
farm inputs at much reduced rates. As a result, the farmers receive incentives to boost
all types of agricultural production (Mohannnad, 1992 and Majutndar, 2002).
Development of transport facilitates access to fertilizer sale points, markets, credit
facilities and extension facilities (Thorat and Sirohi, 2002). Variables of rural
infrastructure such as co-operative societies and banks have played a significant role
in boosting agricultural development. Primary agricultural co-operative credit
societies play a vital role in providing loans to weaker sections of rural society and
372
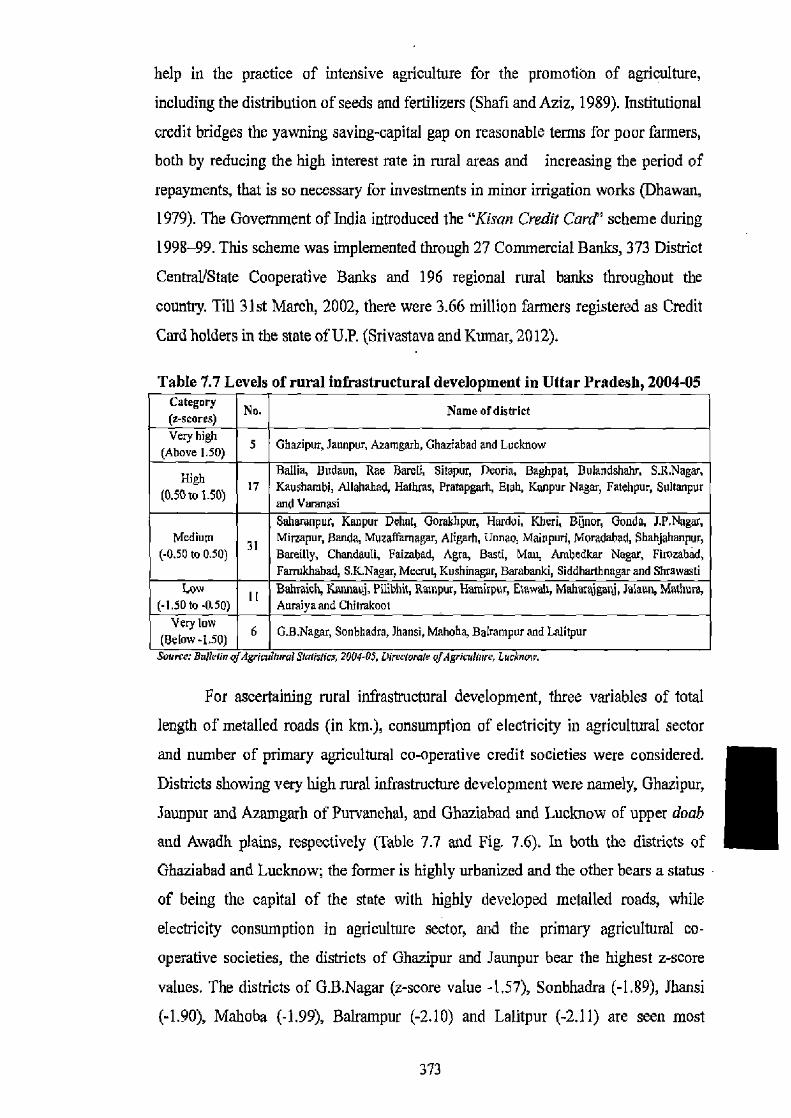
help in the practice of intensive agriculture for the promotion of agriculture,
including the distribution of seeds and fertilizers (Shaft and Aziz, 1989). Institutional
credit bridges the yawning saving-capital gap on reasonable terms for poor farmers,
both by reducing the high interest rate in rural areas and increasing the period of
repayments, that is so necessary for investments in minor irrigation works (Dhawan,
1979). The Government of India introduced the "Kisan Credit Card" scheme during
1998-99. This scheme was implemented through 27 Commercial Banks, 373 District
Central/State Cooperative Banks and 196 regional rural banks throughout the
country. Till 31st March, 2002, there were 3.66 million farmers registered as Credit
Card holders in the state of U.P. (Srivastava and Kumar, 2012).
Table 7.7 Levels of rural infrastructural development in Uttar Pradesh, 2004-05 Category
No. Name of district (z-scores)
Very high 5 Ghazipur, Jaunpur, Azamgarh, Chaziabad and Lucknow
(Above 1.50) High nallia, Dodaun, Rae Bareli, Sitapur, Peoria, Baghpat, Bulandshahr, S.R.Nagar,
(0.50 to 1.50) 17 Kaushambi, Allafrabad, Harbas, Pralzpgarh, Etah, Kanpur Nagar, Fatehpur, Sultanpur
and Varanasi Saharanpur, Kanpur Dehal, Gorakhpur, Hardoi, Kheri, Bijnur, Gonda, J.P.Nagv,
Medium Mirzapur, Banda, Muzafzrnagar, Aligarh, Honour, Maiupuri, Moradabad, Shahjahanpur, (-0.50 to 0.50) 31 Bareilly, Chandguli, Faizabsd, Agra, Basti, Mau, Arnbedkar Nagar, Firoiabad,
Farrukhabsd, S.K.Nagar, Meerut, Kushinagar, Barobanki, Siddharthuagar and Shrawasti Low 11 Bahraich, Katuteuj. Pilibbit, Rampur, Hamirpur, Etowah, Mahmajgmj, Jolson, Mathrn ,
(-1.50 to -0.50) Auraiya and Chllrakoot Veryl0[v
(Below -1,50) 6 G.B.Nagar, Sonb6adra, )hansi, Mahoba, Bairampur and Labtpur
Source: Bulletin of Agrkvilwu(5lati jiR. 2UV4-U, Uir c(omIe yAzrhu(ItNe. Luck+~01v.
For ascertaining rural infrastructural development, three variables of total
length of metalled roads (in km.), consumption of electricity in agricultural sector
and number of primary agricultural co-operative credit societies were considered.
Districts showing very high rural infrastructure development were namely, Ghazipur,
Jaunpur and Azamgarh of Purvanchal, and Ghaziabad and Lucknow of upper doab
and Awadh plains, respectively (Table 7.7 and Fig. 7.6), In both the districts of
Ghaziabad and Lucknow; the former is highly urbanized and the other bears a status
of being the capital of the state with highly developed metalled roads, while
electricity consumption in agriculture sector, and the primary agricultural co-
operative societies, the districts of Ghazipur and Jaunpur bear the highest z-score
values. The districts of G.B.Nagar (z-score value -1.57), Sonbhadra (-1.89), Jhansi
(-1.90), Mahoba (-1.99), Balrampur (-2.10) and Latitpur (-2.11) are seen most
373

backward in rural infrastructure development. The district of G.B.Nagar forming a
part of National Capital Region is highly industrialized and urbanized, hence has
shown a low rural infrastructure development.
VII. Overall agricultural development
As shown in Fig. 7.7, a contiguous region characterized with very high level
of agricultural development with z-score values above 1.50 covered the districts of
Baghpat, (z-score value 1.95), Ghaziabad (1.74), Meerut (1.64) and Muzaffamagar
(1.63). Next in order were 15 districts namely, Rampur, Bulandshahr, Saharanpur,
J.P.Nagar, Moradabad, Pilibhit, Bareilly, Shahjahanpur, Ambedkar Nagar, Bijnor,
Mainpuri, Aligarh, Hathras, Azamgarh and Ghazipur altogether attributed to high
level of agricultural development with z-score values in between 0.50 and 1.50
(Table 7.8).
Table 7.8 Agricultural development in Uttar Pradesh, 2004-05 Category
No. Name of district (z-scores) Very high 4 Baghpat, Ghaziabad, Meerut and Muzaffarnagar (Above 1.50)
tBgb Rampur, Bulandshahr, Saharanpur, I.P. Nagar, Moradabad, Pilibhiy Barcilly,
(0.50 to LSD) 15 Shahjahanpur, Ambedkar Nagar, Bijnor,Mainpuri, Aligarh, Halhras, Azamgarh and Ghazipur Barabanki, Farmkhabad, Deorin, Varanasi, hash, Budaun, Lucknow, Mau, Jaunpur,
Medium G.B.Nagar, Faizabad, Suitanpur, Kushinagar, Etah, Kheri, Sitapur, Firozsbad,
(-0.50 to 0.50) 37 Mathura, Kannauj, Rae Bares, Bahia, Hardol, Pratapgarh, Gorakhpur, Agra, Unnao,
Gonda, Kanpur Dehat, Maharajganj, Chandauli, Kanpur Nagar, Etawah, S.K.Nagar, Aumiya, S.R.Nagar, Allahabad and Kauslrnmbi
Low 7 Fatelipur, Siddharthnagar, Buhampur, Baliraich, Shmwastb Jalaun and Mirzapur (-1.50 to -0.50) Very low 7 Banda, Jhansi, Hamirpur, Lrtilpur, Mahoba, Chitrakoat and Sonbhadra (Below-1.50)
NUn¢e: Bulletin Of AgflcolIGra!JlshS!1cs, LUU4-U, DireciOrole OfAgoeurNR, 4,c1mO1V.
Most of the districts characterized with very high and high level of
agricultural development were confined to western parts of the state. This is because,
all of the western districts are well developed with respect to all the indicators of
agricultural development, such as the inputs of HYV seeds, irrigation and
mechanisation. There were 37 districts that recorded a moderate agricultural
development (with -0.50 to 0.50 z-scare values), whereas low development was
confined to 7 districts of Fatehpur, Siddharthnagar, Balrampur, Bahraich, Shrawasti,
Jalaun and Mirzapur. The districts showing very low agricultural development
(z-score values below -1.50) were Banda, Jhansi, Hamirpur, Lalitpur, Mahoba and
374
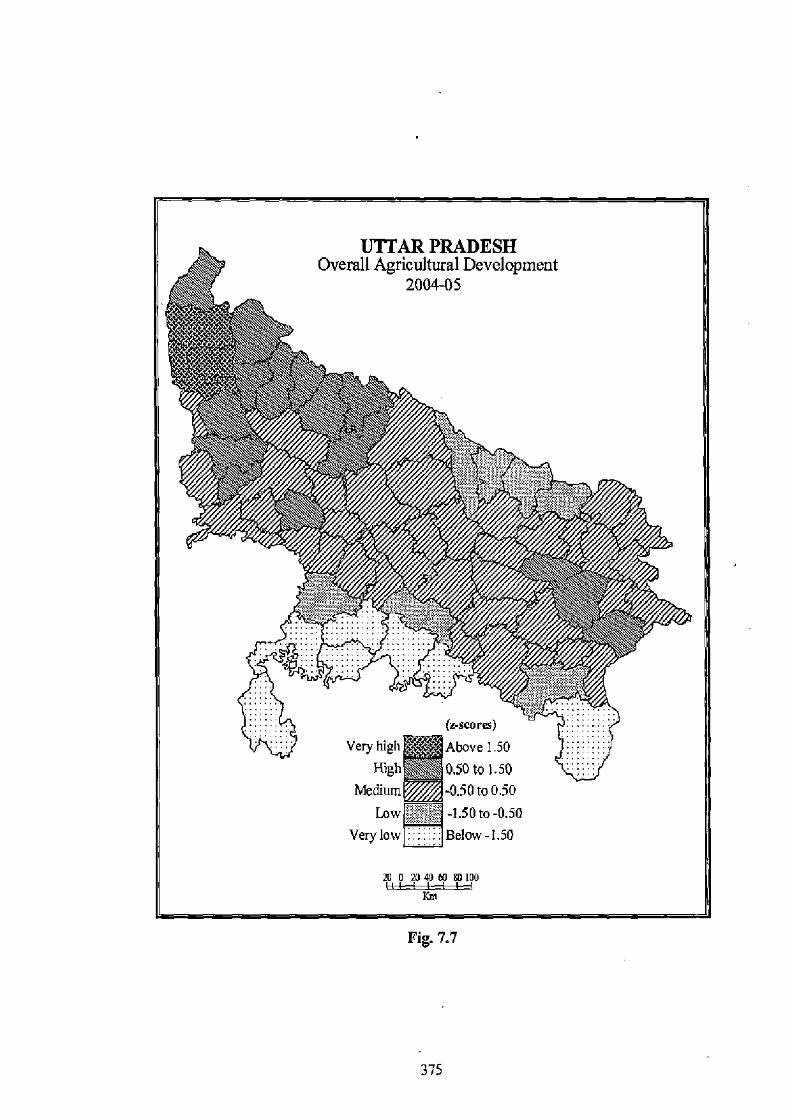
UTTAR PRADESH Overall Agricultural Development
2004-05
Above high
M-0.50toO.50
Above 1 50 High 0.50 to 1 50
Medium Low „e" -1.50 to -0.50
Very low ii Below-1.50
m 0 2040W eo100
ICm
Fig. 7.7
375
Chitrakoot of Bundelkhand and Sonbhadra of Purvanchal regions, respectively.
B. Correlation between Indicators of Irrigation and Agricultural Development
Tables 7.9 and 7.10 show the coefficient of correlation values of major groups
of different categories of development and the correlation coefficient values of
individual indicators of agriculture development, respectively. Evidently, it is seen
that irrigation development bears a strong and positive correlation with correlation
coefficient value of 0.866 at 1 per cent significance level for an overall agricultural
development. Agricultural land use also has a high positive correlation with irrigation
development showing T value of 0.632 at 1 per cent significance level, meaning
thereby that, high irrigation development promotes more cultivable area under
double or multiple cropping, which led to an increase in the intensity of cropping.
The district of Rampur, with very high irrigation development (1.54 z-score value)
has the highest cropping intensity (2.12 i-score).
At the same time, the correlation coefficient of agricultural technology and
agriculture production also show a strong positive correlation with irrigation
development and r values were 0.728 and 0.609, respectively at I per cent
significance level. These indicators have a positive correlation with overall
agricultural development and achieved r values of 0.848 and 0.840 at 1 per cent
significance level. Agricultural production shows low and positive correlation with
rural infrastructure, this might be due to the poor supply of electricity and rural roads
in the state. In a study by Pant (2000), it is reported that villages in the eastern and
western regions of the state had electricity supply for only 6.2 hours and 6.3 hours
per day, respectively. The poor supply of electricity affects the agricultural
productivity because more than 70 per cent of area in the state largely depends on
electric-operated tubewells and pumpsets (Prabha et al., 2009).
Table 7.9 also shows that, there is a positive association between irrigation
development and development of rural infrastructure (0.550 with 1 per cent
significant level), whereas the variables of human resource development showed a
negative correlation with all variables of irrigation, agricultural land use, technology,
agricultural production and rural infrastructure, with r values in order of -0.172,
-0.061, -0.241, -0.146 and -0.046, respectively.
It is shown in Table 7.10 that, among irrigation variables, irrigation intensity
(X4) shows a very high positive correlation, with r values of 0.743 and 0.939,
376
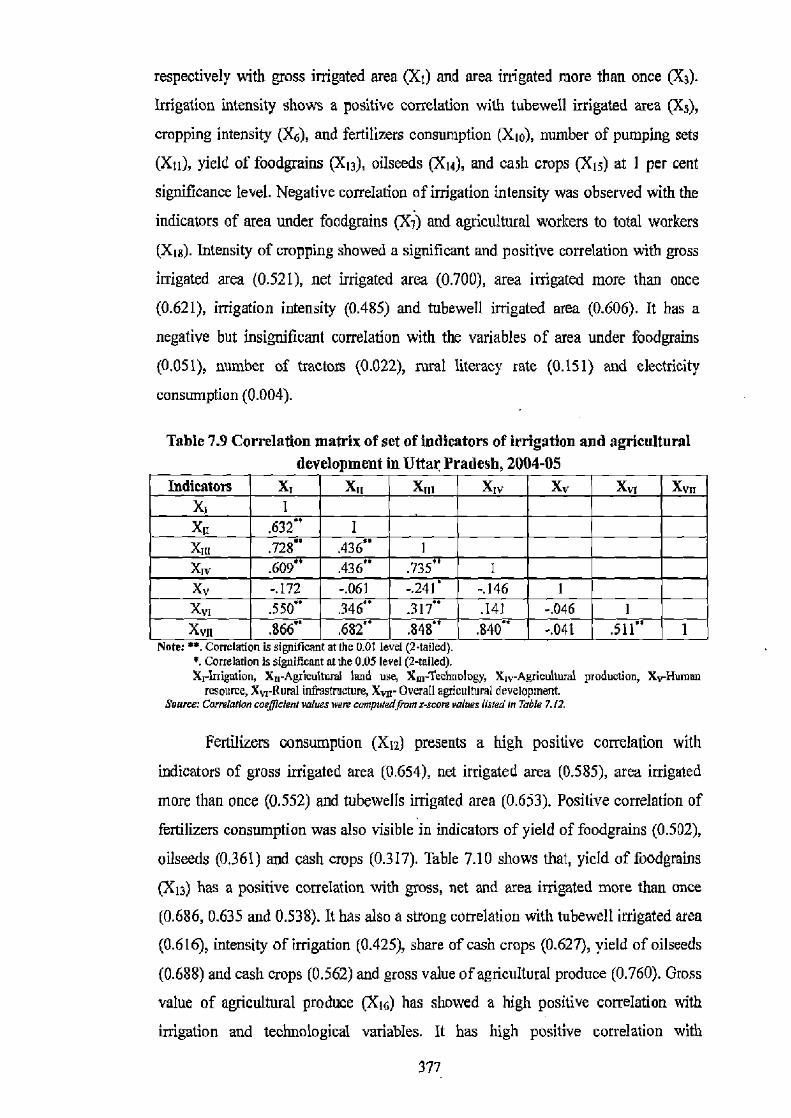
respectively with gross irrigated area (XI) and area irrigated more than once (3(3).
Irrigation intensity shows a positive correlation with tubewell irrigated area
cropping intensity (X6), and fertilizers consumption (X10), number of pumping sets
(Xll), yield of foodgrains (X13), oilseeds (X14), and cash crops (X15) at I per cent
significance level. Negative correlation of irrigation intensity was observed with the
indicators of area under foodgrains (X;) and agricultural workers to total workers
(Xis). Intensity of cropping showed a significant and positive correlation with gross
irrigated area (0.521), net irrigated area (0.700), area irrigated more than once
(0.621), irrigation intensity (0.485) and tubewell irrigated area (0.606). It has a
negative but insignificant correlation with the variables of area under foodgrains
(0.051), number of tractors (0.022), rural literacy rate (0.151) and electricity
consumption (0.004).
Table 7.9 Correlation matrix of set of indicators of irrigation and agricultural development in Uttar Pradesh, 2004-05
Indicators Xt Xt, X111 Xry Xv Xv, Xya
X, I Xa .632" 1 X~o .728" .436 " 1 Xtv .609 .436 .735 I Xv -.172 -.061 -.241" -.146 1 Xvi Xvil
.550"
.866" .346" .682"
.317" .141
.848" .840" -.046 1 -.041 .511" 1
Note: ••. Correlation is significant at the 0.01 level (2-tailed). •. Correlation is significant at the 0.05 level (2-tailed). Xringution, Xu-Agzieuttuml land use, Xm-Tedetology, X1,-Agricultmx1 production, Xv-Hunnan
resource, XvrRuml infrastructure, Xvn- Overall ageultural development Source: Correlation coefficient values wen cnmpwedjrom sscare values listed in Table 7.12.
Fertilizers consumption (Xts) presents a high positive correlation with
indicators of gross irrigated area (0.654), net irrigated area (0.585), area irrigated
more than once (0.552) and tubewells irrigated area (0.653). Positive correlation of
fertilizers consumption was also visible in indicators of yield of foodgrains (0.502),
oilseeds (0.361) and cash crops (0.317). Table 7.10 shows that, yield of foodgrains
(X l3) has a positive correlation with gross, net and area irrigated more than once
(0.686, 0.635 and 0.538). It has also a strong correlation with tubewell irrigated area
(0.616), intensity of irrigation (0.425), share of cash crops (0.627), yield of oilseeds
(0.688) and cash crops (0.562) and gross value of agricultural produce (0.760). Gross
value of agricultural produce (XI6) has showed a high positive correlation with
irrigation and technological variables. It has high positive correlation with
377
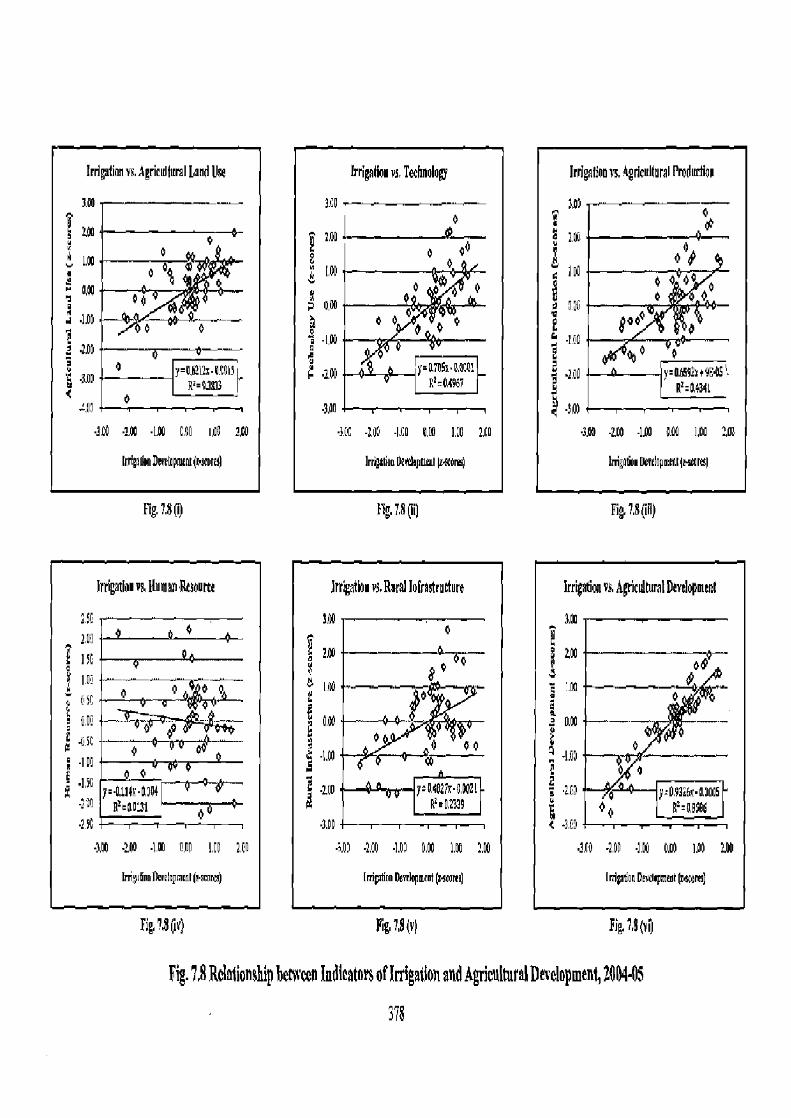
Irrigation vs. Agricultural Land IIse
300
top•
I.00 0 DQ W
~ dAG
3AU ° Ta Ch-O01S~
.J .7A0 LX Call I,0 23
IrrijokDwellp un(Peru)
Irrignnor vs. Technology
r.ao p ° pA 0
w IW
000
a I W Øv
•gym Y=0.90Sa 0IX0: R =d96i
•3i¢ -1,0o -1,C0 Om 1,7C 1.00
Irri k OcmkpmmI IGtturs)
11g.7.8 in 11g. 7.8 (Ii) Fig, 7,8(ill)
Irr'atho vs. Neral Infrastructure
100
Z ppp __°-0.._9 r
° P OP
.100 y-048th 0,00EI
1A0 d.01 •200 •1.0 ex LX 1W
Imp nn newkD unt)rnmm)
Irrigation vs, A8rialdtara1 Development
3.00
200
-LG8
-3 ( 9 I------r----=T=-~ .3Ip .200 •1W 040 140 LORI
lrAPtion 0.M19M t)ap~oFtr)
Fig, 7,8 (it) Pig, 7,9 (v) Fig, 7,8 (vil
Fig. 7.8 Relationship between Indicators of Irrigation and Agricultural Development, 200405
378
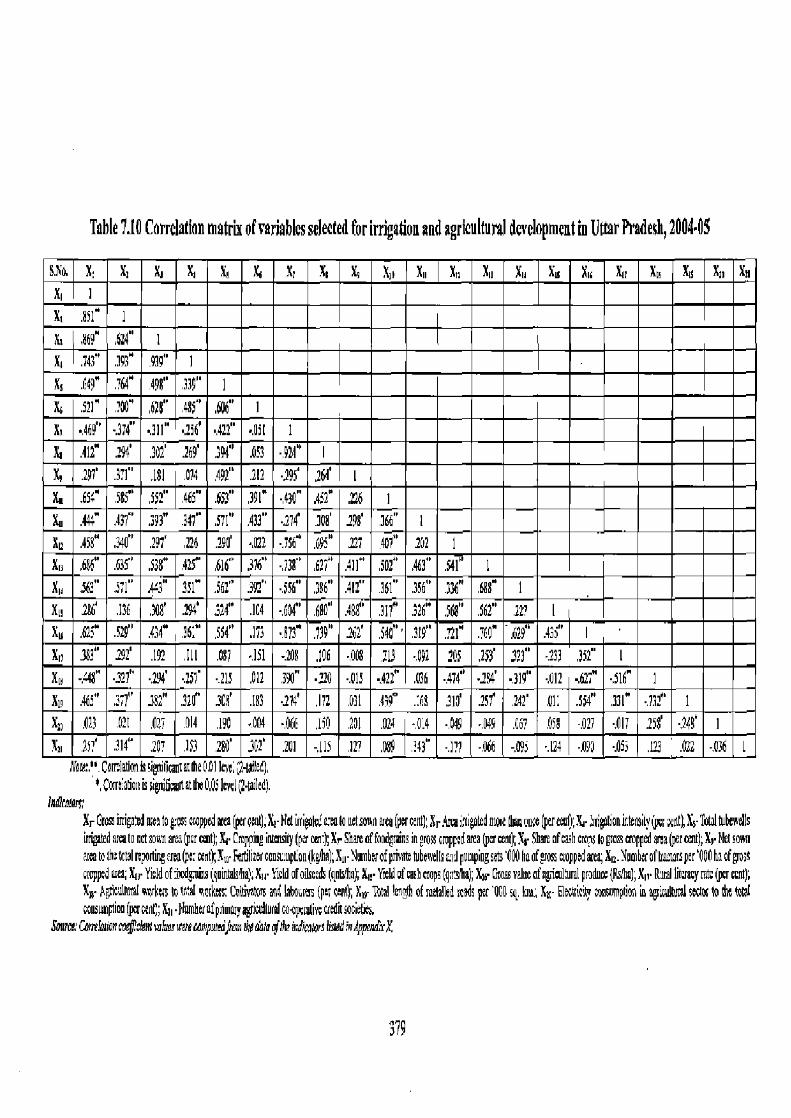
Table 7.10 Correlation matrix of variables selected for irrigation and agricultural development in Uttar Pradesh, 2004.05
S.SA X; XI XI Xl XE XI XI X, XO X,1 XII X11 XIl XI! Xis XIi X11 XIE Xli X10 Xd
XI I
X1 .85I" 1 X, ,869" ,624" 1 X1 .743" .393" 979' 1 X, .649" 764" 498" 339" 1 & .921 '00" b11" 485' 406" 1 X, •469' -.374' •.311" •.256' •.422 •Ail 1 %, .412" .294' .302' .269' X,
394° A53 •.2'I" P. 311" 131 .074 491" .212 •.295' .264' I
X. .65" 5V 552" 465" .653" 391" •43C" A52" 126 Xu .444 .437 .393" .347•• .571" 433" •.274' X08' 198' 1 Xa 458" ,34( .29? 226 390' 1Q2 •.736" .695" 227 1 XI, ,686" .635• .53r J 425" 616 ,37e ,138' ,627" All' .541° 1 X, .562" .571' A=ii' 3Sl 362" .392'' •556" 386" .412°
t36
'' 376" .688 1
XL! 106' .136 .X' .294' 324" .IC4 ,6a" .680" .48g" S6$' ,562" 22?
529" .434" 36: ,534" .173 •B73" .739" .202 " .721" 760" h29° .435" I 192 081 •ISI -.D38 205 .253' 323" •233 .352" I
Xlr -.=48° .321" ,194' .157 .215 .012 3'10" 4" .036 •474" Y
•134' •.319" ,012 ,027" -516" 1
X,y Ad' .i71" 962" .720" JCS' .183 •275 : s Z- ,310 25Y' .242' Al: .554" 971" 11?" 1 Xr .013 011 ,027 414 ,190 .ON -.066 -.0:4 .049 4A49 C6? 058 -.027 -.017 .256 -248' I Xx 2f' 3141 .2117 IS) .280' 362' .291 147" .177 ,066 -.WS -.124 A98 -AS .123 1
S:!'_Corcaatiane ci ifcmtatli 6,01 it '21t), ,Coireoussigiifi tattlwM5i sl(!•piled).
XrGrsaitigandateatopSSClappedago(perW);&-Rdini0a!LEkuetsmrnUr (ryerosnt)XrArmiiifldmpe xat);X,-TOtaIWbSls imputed alto net soxn ares (p¢r amt); Xr• Cropping ilaa (par em:); Xr Share f fondglam in grou empred Brea (per aM); Xr Share of cr9h crops W glass napped arm far mrt); Xr• 6RI sown ata to St t I agoein mro(pe: nt) X r krolimrcoasi içLon(kj);XirN nb rofptivnte tuheadk rrJpungiug sets '000 haofgui a oppadareq Xi . Vumbuaf Vawrs per '00 ha ofgros crappr-0 re;XEr Yield ofihodpins (9aiSalarna);X,1 Yield ofoihee (gnlsnla);Xi- Y k1 of &h naps (9n3lta); Rla Crass yak ofag aIti ral paatlua (Rams); Xn. aid lkmgrate (per aatl); Xi AgieuthS wises ro trod nmkecs Cults ors and IaEoums (pet ant), X,r Total IS of mild reads p r'WO sq. km; X>- Elw k ty roawmption in agi¢uI ON to the S Consumption (rue nl;; I -Nunbuafpnmpqqiadlunl lin uwiitsnci¢1sn.
Som Cam!mionmf..ckmm,fue" wpwmJmm iS dôØ irSrarors kwde Fir ppethX
379

agricultural production variables, viz, yield of foodgrains (0.760), oilseed crops
(0.629) and yield of cash crops (0.435) at 1 per cent significance level. A negative
relationship was observed among the indicators of gross value of agriculture produce
with agricultural workers to total workers, electricity consumption and number of
primary agricultural co-operative societies.
Irrigation, being one of important input to agriculture, becomes an important
component of the rural infrastructure for development (Swain and Das, 1999). From
Tables 7.9 and 7.10, it is clear that, though rural infrastructure variables show a low
positive correlation with indicators of irrigation development. This illustrates that,
there is no direct relationship of infrastructure variables, viz, length of metalled
roads, electricity consumption in agriculture sector to total consumption and number
of primary agricultural co-operative societies, with irrigation and agricultural
development.
Impact assessment of irrigation development on agricultural development
was analyzed with the help of linear regression technique and this relationship is
presented in Figs. 7.8(i) to 7.8(vi). It manifests a linear and positive relationship with
all development variables, viz. agricultural land use, technology, agricultural
production, rural infrastructure, and finally on overall agricultural development with
corresponding RZ values of 0.3833, 0.4967, 0.4341, 0.2339, and 0,8686, respectively,
except the variable human resource use that shows linear but negative trend with
irrigation development (R2=0.0131).
C. Composite Index of Irrigation vis-a-vis Agricultural Development
A composite index of irrigation and agriculture is shown in Table 7.11 and
Fig. 7.9. It is illustrated from the figure that, there were 17 districts, which show a
high level of irrigation development and high level of agricultural development. The
districts of Rampur and Bulandshahr were seen on the top of irrigation and
agricultural development, respectively. Three districts namely, Ambedkar Nagar,
Azamgarh and Ghazipur represented this category belonged to Awadh and
Purvanchal regions of the state, respectively, and the remaining districts belonged to
agriculturally most fertile upper and middle Ganga-Yamuna doab and the
Rohilkhand plains of the state. High level of irrigation and medium level of
agricultural development was visible in five districts namely, Lucknow, Barabanki
and Faizabad of Awadh plains, and Mau and Varanasi districts of Purvanchal region.
380

Fig. 7.9
1ldilluI m
381
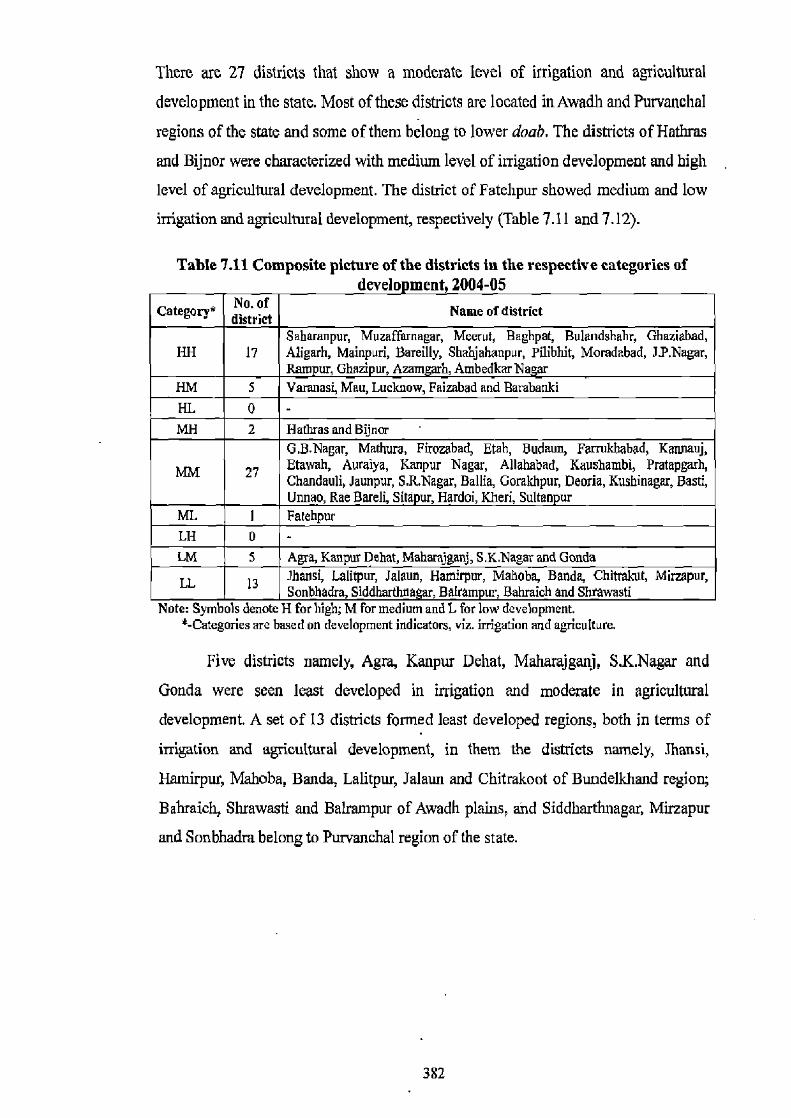
There are 27 districts that show a moderate level of irrigation and agricultural
development in the state. Most of these districts are located in Awadh and Purvanchal
regions of the state and some of them belong to lower doab. The districts of Hathras
and Bijnor were characterized with medium level of irrigation development and high
level of agricultural development. The district of Fatelipur showed medium and low
irrigation and agricultural development, respectively (Table 7.11 and 7.12).
Table 7.11 Composite picture of the districts in the respective categories of development. 2004-05
Category* No. of district Name of district
Saharanpur, MuzafTrnagar, Meerut, Baghpat, Bulandshahr, Ghaziabad, HH 17 Aligarh, Mainpuri, Bareilly, Shabjahanpur, Pilibhit, Moradabad, JP.Nagar,
Rsm ur, Ghazi ur, Azam h, Ambedkar Nagar HM 5 Varanasi, Mau, Lucknow, Faizabad and Barabanki HL 0 MH 2 Hatteras and Bijnor
C.B.Nagar, Mathura, Firozabad, Etah, Budaun, Farmkbabad, Kawauj, MM 27 Etawah, Auraiya, Kanpur Nagar, Allahabad, Kaushambi, Pratapgarh,
Chandauli, Jaunpur, S.R.Nagar, Ballia, Goraidtpu; Deoria, Kushinagar, Bast, Unnao, Rae Barely Sitapur, Hardoi, Kited, Sultan ur
ML I Fatehpur Lit 0 LM 5 Agra, Kanpur Dehat, Maharajganj, S.K.Nagar and Gonda
LL 13 lhansi, Lalitpur, Jalaun, Harnirpur, Mahoba, Banda, Chitrakut, Mirzapur, Sonbhadra, Siddharthna ar, Balram ur, Bahraich and Shrawasti
Note: Symbols denote H for high; M for medium and L for low development. '-Categories are based on development indicators, viz. irrigation and agriculture.
Five districts namely, Agra, Kanpur Dehat, Maharajganj, S.K.Nagar and
Gonda were seen least developed in irrigation and moderate in agricultural
development. A set of 13 districts formed least developed regions, both in terms of
irrigation and agricultural development, in them the districts namely, Jhansi,
Hamirpur, Mahoba, Banda, Lalitpur, Jalaun and Chitrakoot of Bundelkhand region;
Bahraich, Shrawasti and Balrampur of Awadh plains, and Siddharthnagar, Mirzapur
and Sonbhadra belong to Purvanchal region of the state.
382
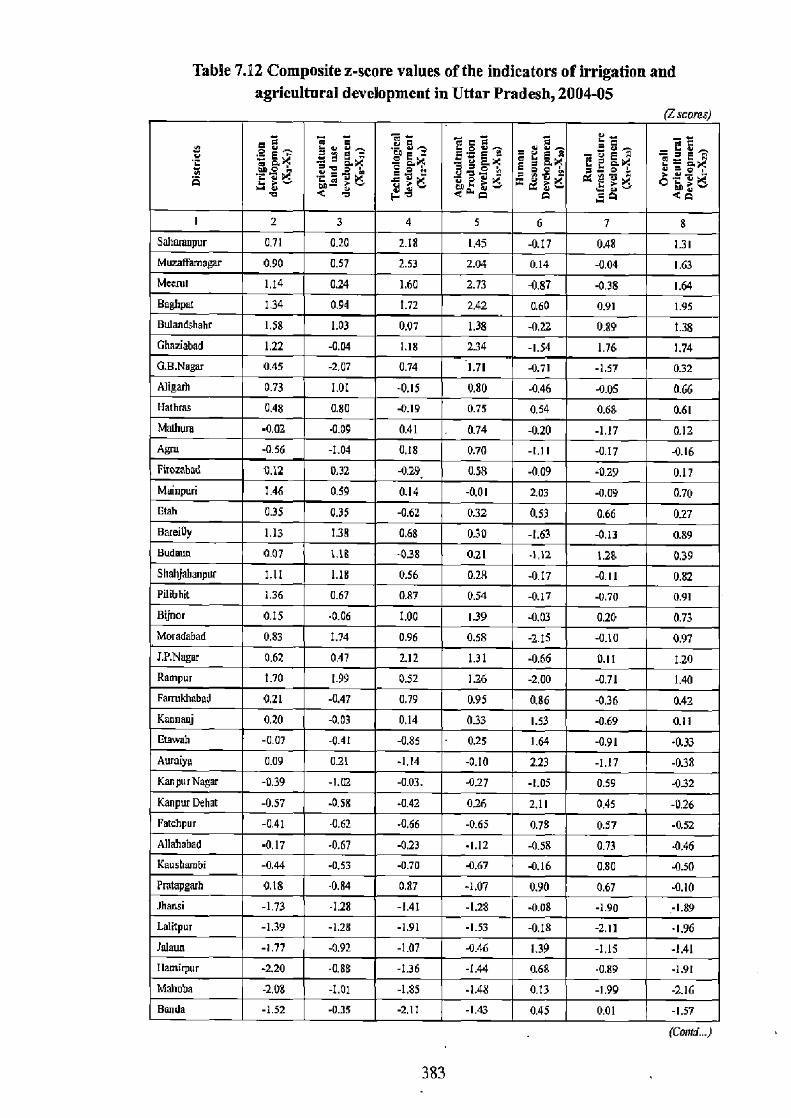
Table 7.12 Composite z-score values of the indicators of irrigation and agricultural development in Uttar Pradesh, 2004-05
(Z scares)
=9 C
9 Ca5 per q9 a~eu"
a
Q.
a
a i 3 a
J ao"
2 3 4 5 6 7 8 Sahoreupur 0.71 0.20 2.18 1,45 -0.17 0.48 1.31 Muzaffamagu 0,90 0.57 2.53 2.04 0.14 -0.04 1.63
1.14 0.24 1,60 2.73 -0.87 -038 1.64 134 0.94 1.72 2.42 0.60 0.91 1.95
r 1,58 1.03 0.07 1.38 -0,22 0.89 1.38
EA]ig
arb
1.22 -0.04 1.18 134 -1.54 1.76 1.74 0.45 -2.07 0.74 1.71 -0.71 -1.57 0.32 0.73 1.01 -0.15 0.80 046 -0.05 0.66 0.48 0.80 -0.19 0.75 0.54 0.68 0.61 -0.02 -0.09 0.41 0.14 -0.20 -1.17 0.12
Agra -0.56 -1.04 0.18 0.70 -1.11 -0.17 -0.16 Fimzabad 9.12 0.32 -0.29 0.58 -0.09 -0.29 0.17 Mmnpuri 7 46 0.59 0.14 -0.01 2.03 -0.09 0.70 Utah 0.35 0.35 -0.62 0.32 0.53 0,66 027 BafrA1ly 1.13 1.38 0.68 0.30 -1.63 -0.13 0.89 Budmm 007 1.18 -038 0.21 -1,12 1.28 0.39 Shahjahanpur 1.11 1.18 056 0.2R -0.17 -0.11 0.82 Pilbhit 1.36 0.67 0.87 0.54 -0.17 -0.70 0.91 Bijnar 0,15 -0.06 1.00 1.39 -0.03 0.20 0.73
1.74 0.96 0.58 -2.15 -0.10 0.97 0.62 047 2.12 1.)1 -0.66 0.11 1.20 1.70 1.99 0.52 1.26 -2.00 -0.71 1.40
Vj0.83
rn 0.21 -0.47 0.79 0.95 0.86 -0.36 0.42 0.20 -0.03 0,14 0.33 1.53 -0.69 0.11 -0.07 -0.41 -0.85 0.25 1,64 -0.91 -0.33 0.09 0.21 -1,14 -0.10 2.23 -1.17 -0.38
grc -0.39 -1.02 -0.03. -0.27 -1.05 0.59 -032 KenpurDehat -0.57 .0.58 -0.42 0.26 2.11 045 -0.26 Fatchpur -0.41 -0.62 -0.66 -0.65 0.73 0.57 -0.52 Allahabad -0.17 -0.67 -0.23 -1.12 -0.58 Kausbambi -0.44 -0.53 -0.70 -0.67 -0.16 0.80
t46
Pmlapgazh 0.18 -0.84 087 -1.07 0.90 0.67 Jhansi -1.73 -1.28 -1.41 -1.28 -0.06 -1.90 -1.89
Lalitpur -1.39 -1.28 -1.91 -1.53 -0.18
0.73
-2.11 -1.96
lelaua -1.77 -0.92 -1.07 -0.46 1.39 -1.15 -1.41 ilamirpur -2.20 -0.86 -1.36 -1.44 0.68 -0.89 -1.91
Mahoba -2,03 -1.01 -1.85 -1.48 0,13 -1,99 -2.16 Bonds -1.52 -0.35 -2,11 -1.43 0.45 0.01 -1.57
(Cwrrd...)
383
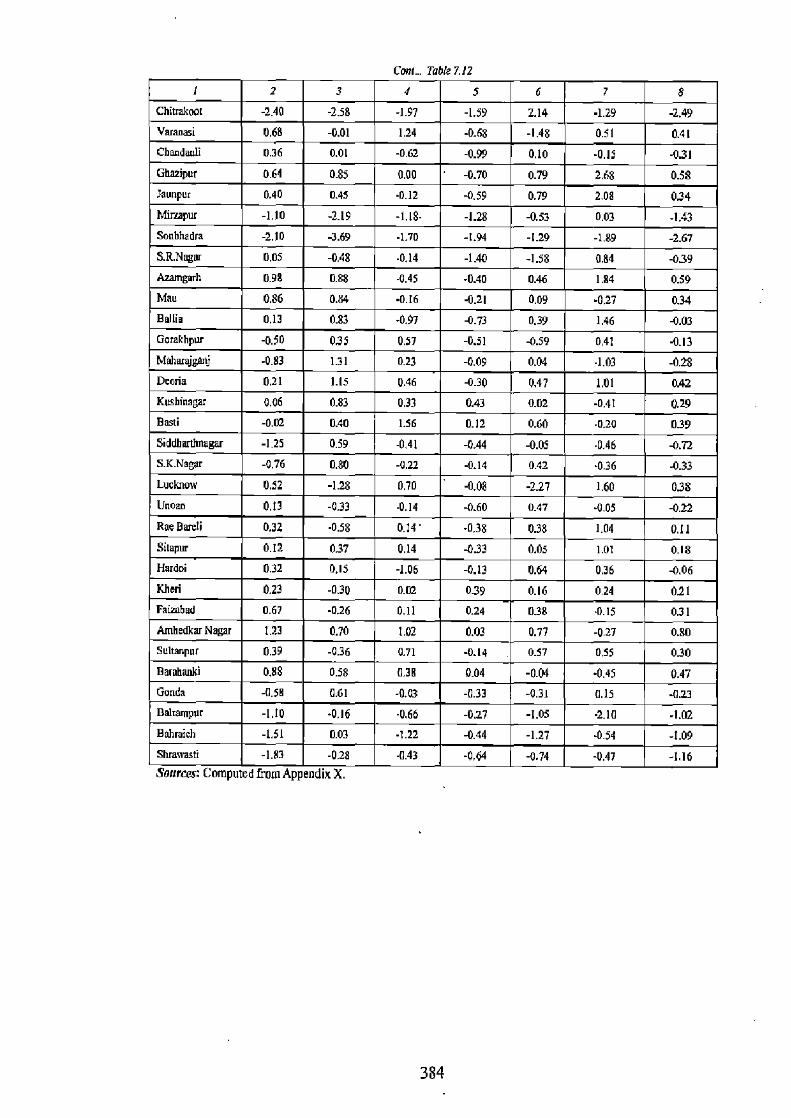
Coal... Table 7.12 1 2 3 4 5 6 7 8
GhitrakuOt -2.40 -2.58 -1.97 -1.59 714 -1.29 -2.49 Varanasi 0.68 -0.01 1.24 -D.68 -1.48 0.51 0.41 Chandauli 0.36 0.01 -062 -0.99 0.10 -0.15 -031 Ghazipur 064 0.85 0.00 -0.70 0.79 2.68 0.58 )aunpur 0.40 0.45 -0.12 -0.59 0.79 2.08 034 Minapur -1.10 -2.19 -1.18. -1.28 -0.53 0.03 -1.43 Sonbhadra -2.10 -3.69 -1.70 -1.94 -1.29 -1.89 -2.67 S.R.Nagar 0.05 -0A8 -0,14 -IAO -1.58 0.84 -039 Aumgarh 0.98 0.88 -0.45 -0.40 0.46 1 A4 0.59 Mau 0.86 0.84 -0.16 -0.21 0.09 -0.27 0.34 BWlia 0.13 6.83 -0,97 -033 0.39 1.46 -0.03 Gorakhpur -0.50 035 0.57 -0.51 -0.59 041 -0.13 MaharajSanj -0.83 1.31 0.23 -0.09 0.04 -1.03 -0.28 Dona 0.21 1.15 0.46 -0.30 0.47 1.01 0.42 Kushinagar 0.06 0.83 0.33 0.43 0.02 -0.41 0.29 Basti -0,02 0.40 1.56 0.12 0.60 -0,20 039 Siddharlhnugar -125 0.59 -041 -0.44 -0.05 -0.46 -0.72 S.K.Nagar -0.76 0.80 -0.22 -0.14 0.42 -0.36 -0.33 Lucknow 052 -1.28 0.70 AA8 -227 1.60 038 Unnao 0.13 -0.33 -0.14 -0.60 0.47 -0.05 -0.22 Rae Barth 0.32 -0.58 0.14 -0.38 038 1.04 0.11 Sitapur 0.12 037 0.14 -033 0.05 1.01 0.18 Hardoi 0,32 0,15 -1.06 -0.13 0.64 036 -0.06 Kheri 0.23 -0.30 0.02 039 0.16 0.24 021 Faimbud 0.67 -0,26 0.I1 0.24 038 -0.15 031 AmbedkarNegar 1.23 0.70 1.02 0.03 0.77 -0.27 0.80 Supanpur 0.39 -0.36 0.71 -0.14 0.57 0.55 030 Banbaniti 0.88 0.58 0.38 0.04 -0.04 -0.45 0.47 Gonda -0.58 0.61 -0.03 -0.33 -0.31 0.15 -023 BaIranwpr -1.10 -0,16 -0.66 -0.27 -1.05 -2.10 -1,02 Bahraich -1.51 0.03 -1.22 -0.44 -1.27 -0.54 -1.09 Shrawasti -1.83 -028 -0.43 -0,64 -0.74 -0.47 -1.16 Sources: Computed from Appendix X.
384

References
1. Aggarwal, B. (1983). Mechanization in Indian Agriculture: An Analytical Study based on Punjab. Allied Publishers, Delhi School of Economics: Monograph in Economics, India, No.6.
2. Bhaduri, A., Amarasinghe, U. and Shah, T. (2008). Groundwater Expansion in Indian Agriculture: Past Trends and Future Opportunities. In: India's Water Future: Scenarios and Issues (Eds. U.A. Amarasinghe, T. Shah and R.P.S. Malik), IWMI, Colombo, Sri Lanka, pp. 181-196.
3. Bhattarai, M., Sakihivadivel, K. and Hussain, I. (2002). Irrigation Impacts on Income Inequality and Poverty Alleviation: Policy Issues and Options for Improved Management of Irrigation Systems, Working Paper 39, IWMI, Colombo, Sri Lanka.
4. Dhawan, B.D. (1979). Trends in Tubewell Irrigation: 1951-78, Economic and Political Weekly, Vol. 14, No. 51/52, pp. A143+154-147+149+151-154.
5. Dhawan, B.D. (1988). Indian Irrigation: An Assessment, Economic and Political Weekly, Vol. 23, No. 19, pp. 965-967, 969-971.
6. Dick, R.M. (1994). Private Tubewell Development and Groundwater Markets in Pakistan: A District-level Analysis, The Pakistan Development Review, Vol, 33, No. 4, pp. 857-869.
7. FAO (1969). Smaller Farmlands Can Yield More: Raising Agricultural Productivity by Technological Change, Rome.
8. Government of India (1999). Integrated Water Resource Development: A Plan for Action, Report of the National Comnussion on Integrated Water Resources Development, Vol. I, Ministry of Water Resources, New Delhi.
9. GOI (2011). Annual Report 2010-2011, Department of Agriculture and Cooperation, Ministry of Agriculture, GOI, New Delhi.
10. Majumdar, R. (2002). Infrastructure and Economic Development: A Regional Analysis, CSRD/SSS, Jawaharlal Nehru University, New Delhi.
11. Mellor, J.W. (1976). The New Economics of Growth: Strategy for India and the Developing World, Cornell University Press, New York, USA.
12. Mohammad, N. (Ed.) (1992). Spatial Dimensions of Agriculture, Concept Publishing Company, New Delhi.
13. Nandal, D.S. and Rai, K.N. (1986). Impact of Farm Mechanization on Farm
385
Productivity and Income in Haryana, Haryana Agricultural University, Hissar.
14. Prabha, Goswami, K. and Chatterjee, B. (2009). Impact of Infrastructure and Technology on Agricultural Productivity in Uttar Pradesh, Agricultural Economics Research Review, Vol. 22, No.1, pp. 61-70.
15. Pant, N. (2000). Productivity and Equity in Irrigation Systems, Uttar Pradesh Development Report, New Royal Book Company, Lucknow.
16. Sivanappan, R.K. (1995). A Proposed Action Programme to Maintain Groundwater Levels and Achieve Sustainable Agriculture in Tamil Nadu, News from the Fields, Groundwater Development and Lift Irrigation, ODI Irrigation Management Network Paper 5, Overseas Development Institute, London, UK.
17. Srivastava, S.K., and Kumar, R. (2012). Irrigation Development and Groundwater Extraction in Uttar Pradesh State: Emerging Issues of Distribution and Sustainability. (http://www.ecoinsee.org/fbconf/Sub%2OTheme%20D/Srivastava.pdt).
18. Shafi, M. and Aziz, A. (Eds.). (1989). Food Systems of the World, Rawat Publications, Jaipur.
19. Sury, M.M., Mathur, V. and Bhasin; N. (2008). India's Five Year Plans: Ito XI (1951-56 to 2007-12), New Century Publications, New Delhi.
20. Swain, M. and Das, D.K. (Eds.) (1999). Emerging Trends and Reforms in Irrigation in India, M.D. Publishers Pvt. Ltd, New Delhi.
21. Thakur, R. (1992). Patterns of Agricultural Growth in Bihar. In: New Dimensions in Agricultural Geography: Dynamics of Agricultural Development (Eds. N, Mohammad), Vol. 7, Concept Publishing Company, New Delhi, pp. 97-126.
22. Thorat, S. and Sirohi, S. (2002). Rural Infrastructure: State of Indian Farmers, A Millennium Study, Ministry of Agriculture, GGI, New Delhi.
23. Verma, S.R. (2012). Impact of Agricultural Mechanization on Production, Productivity, Cropping Intensity Income Generation and Employment of Labour. In: Status of Farm Mechanisation in India - A Document Published by the Department of Agriculture and Cooperation, Ministry of Agriculture (http://agricoop.nic. in/Farm%20Meeh. %2O PDF/contents.htm).
24. Weisner, C.J. (1970). Climate, Irrigation and Agriculture: A Guide to the Practice of Irrigation, Angus and Robertson, Sydney.
386
Chapter VIII
Irrigation as a Component in
Agricultural Development: A Village Level Study
CHAPTER VIII IRRIGATION AS A COMPONENT IN AGRICULTURAL
DEVELOPMENT-. A VILLAGE LEVEL STUDY
Primary survey forms a significant part of any geographical study. It is a
basic procedure to learn more details about the earth as a home for humankind. In
this chapter an attempt has been made to describe in detail the sources of irrigation
and levels of agricultural development in different parts of the state. For this purpose,
primary surveys in nine villages were conducted in the year 2012 from the selected
districts of the state. Information collected through field surveys were organized for
meaningful interpretation, and analysis was performed to achieve the set objectives
of the study.
A total of nine villages were randomly selected from nine districts namely,
Agra, Aligarh, Allahabad, Azamgarh, Barabanki, Bijnor, Hamirpur, Siddharthnagar
and Unnao for conducting primary surveys. Although the criteria to select a
minimum of 2 to 5 per cent sampling from the whole population (total villages of the
state) was not fulfilled in the study, but in order to justify the problem and to bolster
the secondary data, the grass-root level (local level) information was collected. For
taking an in depth study, the purposive stratified random sampling was followed
keeping in mind to cover almost all the agro-climatic regions of the state, and much
more emphasis was laid down to take the samples from developed districts,
moderately developed and least developed districts on the basis of irrigation and
agricultural development. Three villages from each category (high, medium and low)
were randomly selected, and 10 per cent of total households from each village were
taken and surveyed with the help of a well prepared questionnaire (Appendix I).
From three categories, the districts belonging to developed part were namely,
Aligarh, Barabanki and Azamgarh, and from them three villages namely, Kakethal,
A?ohammadpur Bahun and Clusainganj were selected, respectively. The districts of
Bijnor, Unnao and Allahabad represented moderately developed part cover the
villages namely, Darbara, Dostinagar and Tara Gov, and the least developed part
was represented by the villages namely, Ujrai, Asnahara and Kalauli Teer Daria
selected from the districts of Agra, Siddharthnagar and Hamirpur, respectively (Fig.
S.1). Sampled villages were visited by the researcher herself and the natives of the
villages were contacted for questions. Information regarding total number of
387
members in family, agricultural land use, sources of irrigation, type of agricultural
implements used in farming, mode of agricultural operations together with
educational status of the family and occupation of the residents. Some interviews
with irrigation engineers and officials of Irrigation Department were also carried out
to know the sources of irrigation and supply of water through canals different
channels. The survey work was carried out during the rabi season during the period
January to April, 2012. A total of 278 households were surveyed in selected villages
covering an area of 1824.1 ha and a population of 2,495 persons (belonging to
sampled household's population).
A. Selection Criteria of Sampled Villages from the Districts of the State
1. Developed districts: Based on irrigation and agricultural development 1. District: Aligarh
Tahsil: Atrauli Developmental Block: Atrauli Village: Kakethal
2. District: Barabanki Tahsil: Sirauli Developmental Block: Sirauli Gauspur Village: Mohammadpur Bahun
3. District: Azamgarh Tahsil: Sadar Developmental Block: Palhani Village: Husainganj
H. Moderately developed districts: Based on irrigation and agricultural development
1. District: Bijnor Tahsil: Chandpur Developmental Block: Jalilpur Village: Darbara
2. District: Unnao Tahsil: Unnao Sadar Developmental Block: Sikandarpur Sarosi Village: Dostinagar
3. District: Allahabad Tahsil: Handia Developmental Block: Handia Village: Tara Gay
388

Hierarchy of villages selected from the districts of the state
ft (Based on irrigation and agricultural development)
Highly developed 1 developed 1 tdeyeloped
District Il i Aligarh I If Baralaalu III Azamgarh III Bijnor I II Unnao III AllahabadIII Agra III Sidd ebnagar II, Haniitpur
Block Amauli Sirauli Gauspur Palhani 1sNIpur Sams! Sikendarpur
Handia Khandauli Mithvval Sumerpnr
Village g&y pi M17dmu.wiu"rnr 1 8usaui Dardara Darheagar TaraGuv 0~rui Asw ra I ~aloaUTeer
WIN g"~ Dana
Fig. 8.1
389
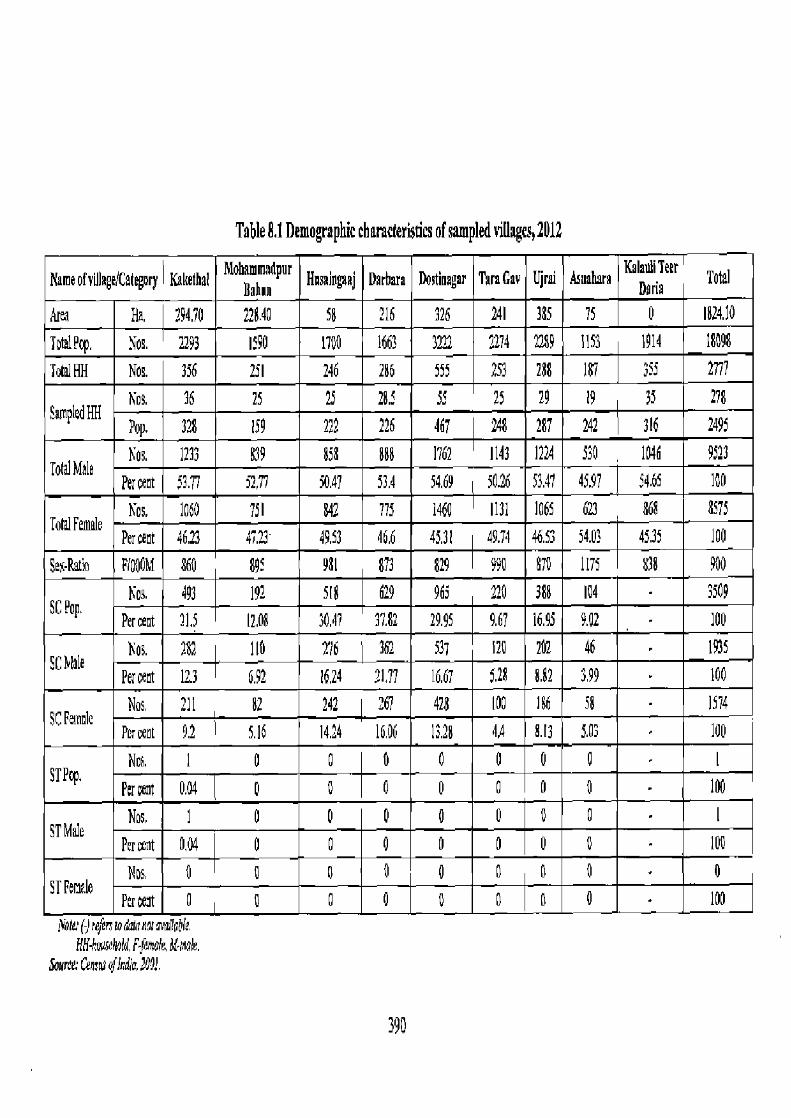
Table 8.1 Demographic characteristics of sampled villages, 2812
Name ofvillagelCalegory Kakethal Mohammadpur
Dahen Nasaingauj Darbara Dostinagar TaraGav Ujrai Asuahara
KaIauliT¢er Total Doria
Area Ha. 294.70 22840 58 216 326 241 335 75 0 1824.10
TotalPop. Nos. 2293 1590 1700 1663 3222 2274 2289 1153 1914 18098
Total Ull Nos. 356 251 246 286 555 253 238 17 355 2777
SampledHH Nos. 36 25 25 2M 55 25 29 19 35 278
Pop. 328 159 222 226 467 248 287 242 I 316 2495
Nos. 1233 639 658 888 1762 1143 1224 530 1046 9523 Total Male
Percent 53.77 52,77 50.47 53.4 54.69 50.26 53.41 45.97 54.65 100
Yes. 1060 751 842 775 1460 1131 1065 623 868 8575 ToI1 Female
Percent 46.23 47.23 49.53 46.6 45.31 49.74 46.53 54.03 4533 100
Sex-Rat F100011 860 895 981 873 829 990 870 1175 S30 900
Nos. 493 192 518 629 963 220 3S8 104 3509 SC Pap.
Percent 21.5 12.08 30.47 37.82 29.95 9.67 16.95 9.02 OD
1co5. 282 116 276 362 517 120 262 46 1935 SC Male
Percent 12.3 6.92 16.24 21,77 16.67 5.28 8.82 399 100
Nos 211 82 242 267 428 100 186 58 1574 SC Penale
Percent 9.2 I 5.16 14.24 1606 1318 4.4 8.13 5.03 100
Nos. 1 0 0 0 0 0 P 0 I 4rPop.
Ptrcenc 0.04 P 0 0 0 0 0 0 IN
Nos, 1 0 0 0 0 0 0 0 1 ST We
PuCelt 0,04 0 0 0 0 0 0 0 lOP
Nos o P 0 0 o a 0 0 srPanzle
Percent 0 0 0 0 0 0 P 0 100 Not' () r44rs ro Ea d n cr mni laNe,
!1U-hwsegoU F female, M(male. Source: Ceoras Oflntha, 209!.
390
III. Least developed districts: Based on irrigation and agricultural development
1. District: Aga Tahsil: Etmadpur Developmental Block: Khandauli Village: Ujrai
2. District: Siddharthnagar Tahsil: Bansi Developmental Block: Mithwal Village: Asnahara
1. District: Hamirpur Tahsil: Hamirpur Developmental Block: Sumerpur Village: Kalauli Teer Dania
B. Demographic Characteristics of Sampled Villages
Demographic characteristics of the sampled villages listed in Table 8.1 are as
follows:
I. Kakethal: This village is situated on left side of Atrauli-Ranrghat road,
nearly 6 km away from Atrauli tahsi! headquarters in Aligarh district, and covers an
area of 294.7 ha. Total population of the village is 2,293 persons, out of which, 53.77
per cent are males and female's population constitutes the rest of 46.23 per cent. Sex-
ratio of the village can be described as 860 females per thousand of males. In
Kakethal, scheduled castes (SCs) constitute 22 per cent in total population. Main
occupation of the people living in the village is agriculture. According to census
2001, there were 356 households (I-IH) in the village. Out of the total population of
2,293 persons, main workers constituted 665 persons, cultivators were 306 persons
and agricultural labourers as 114 persons. For the attainment of education, this
village has two primary schools and one middle school, and for college education,
the students have to cover a distance from 5-10 km from the village.
it Mohammadpur Bahun: This village forms a part of Sirauli Gauspur block
in Barabanki district and is situated at a distance of 26 km from the district
headquarters. The village lies at a distance of 2 km from its nearest town of
Sahadatganj. Village Mohammadpur Bahun covers an area of 228.4 ha, with a
population of 1,590 persons, which dwell in 251 households (Census of India, 2001).
Out of the total population, males constituted 52.77 per cent and rest were females
making a sex-ratio of 895. About 12 per cent of the population in the village is
391

represented by SCs. About 22 ha area of the village is under the forest cover. There
is only one primary school in the village, and a college for degree classes exists at a
distance of more than 10 km from the village. Saidanpur Raj haha (a drain) of Sarda
Sahayak canal passes through the village, the water of which is used to irrigate the
fields during the rainy season.
iii. Husainganj: This village is situated in the vicinity of Azamgarh city
nearly at 10 km from the municipal limits and forms a part of Palhani block of Sadar
tahsil. It covers an area of 58 ha, and the population of the village consists of 1700
persons. Out of total population, 50.47 per cent are males and 49.53 per cent females.
Sex-ratio in Husainganj is 981. According to Census 2001, there were 246
households in the village. Scheduled castes population in the village is high which
makes up 30.47 per cent of the total population. There are three primary schools in
the village and a nearest college is at a distance of 5 km.
iv. Darbara: This village of Bijnor district lies in the Jalilpur block of
Chandpur tahsil with 286 households (Census 2001). It is situated at a distance of 3-4
km from the tahsil headquarters. Darbara village covers an area of 216 ha and
population of the village is 1,663 persons. Out of the total population of the village,
the males constitute 53.4 and females 46.6 per cent. Sex-ratio in the village is 873.
The village population consists of a highest proportion of scheduled castes to the
tune of 37.82 per cent to the total population of the village, and they work as
agriculture labourers. Muslims and dalits (SCs) form the majority in Chandpur town.
Jots and Vaisyas occupy second place. One primary, one middle school, and one
degree college situated along the road serve to fulfil the needs of education.
Agriculture is the main occupation of the people, and sugarcane is the main crop that
is cultivated. A sugar mill is located in Chandpur town which is famous in the entire
area for the production of sugar and gur (jaggery).
v. Dostinagar: This village is situated along the Unnao-Hardoi road at least 5
km away from Unnao city and lies in Sikandarpur Sarosi block of Unnao Sadar
tahsil. This village has a population of 3,222 persons, which is highest in comparison
to other sampled villages. According to Census 2001, there were 555 households in
the village covering an area of 326 ha, which is second largest next to Ujrai village
of Agra district. Population in the village consists of 54.69 per cent males, which is
highest among all the sampled villages. Sex-ratio in the village is 829 females per
thousand of males, which is lowest among all selected villages. Schedule casts
392
population residing in the village is about 30 per cent. School education up to the
primary and middle classes are available in the village and a college is situated
having a distance of 5 to 10 km away from the village.
vi. Tara Gav: This village constitutes a part of Allahabad district, and is
situated at a distance of 5 km from its main town of Handia of the same tahsil. Tara
Gav is situated at a distance of 36.7 km from Allahabad and 208 kin from Lucknow.
This village bears an elongated shape because of its nearness to railway line. Tara
Gav has a dual advantage with respect to transport and education facilities, as there is
one primary school (prathmic vidhalay) and one higher secondary school in the
village, and a National Highway-2 and railway line passes in the vicinity of the
village. Three colleges located nearby the village area namely, Vidhyavati Yadav
Smarak Maharshi Krishna Inter College at Handia; Shivaji Inter College and Smt.
Jagpati Devi Inter College near Allahabad. Out of a total population of 2,274
persons, males constitute 50.26 and females 49.74 per cent, and account for sex-
ratio of 990 females per thousand of males. SCs population is 9.67 per cent. As per
Census 2001, there were 253 households in the village.
vii. Ujrai: Ujrai village is situated along the road and lies in Etmadpur rahsil
of Khandauli block of Agra district. This village covers an area of 385 ha, and is
divided in 3 parts on the basis of castes: Ujrai Parav, U,Jrai Kalan and Ujrai Jaat.
Ujrai Jaat, as the name itself explains, consisting of Jaw population and Ujrai Kalan
belongs to Pandits and Ujrai Parav has OBC and SCs population. Total population
of the village is 2,289 persons which form 288 households (Census 2001), out of
which, 53.47 per cent were males and rest of females securing a sex-ratio of 870
females per thousand of males. One primary and two middle schools are located
along the road to provide education to children of the village. College for degree
classes is available at a distance of more than 10 km from the village. Agra, the
nearest town, is located at a distance of 14 km from the village. )
viii. Asnahara: This village of Siddharthnagar district, with a population of
1,153 persons lies in Mithwal block, and is situated at a distance of about 25 km
from tahsil Bansi. Owing to migratory nature, male population moves to other
districts in search of job opportunities within the state or elsewhere in the country,
and even outside the country. Consequently, the village has the highest number of
females, nearly 54.0 per cent, contributing to a high sex-ratio of 1175 females per
thousand of males in the village. Because of the preponderance of uneconomic
393
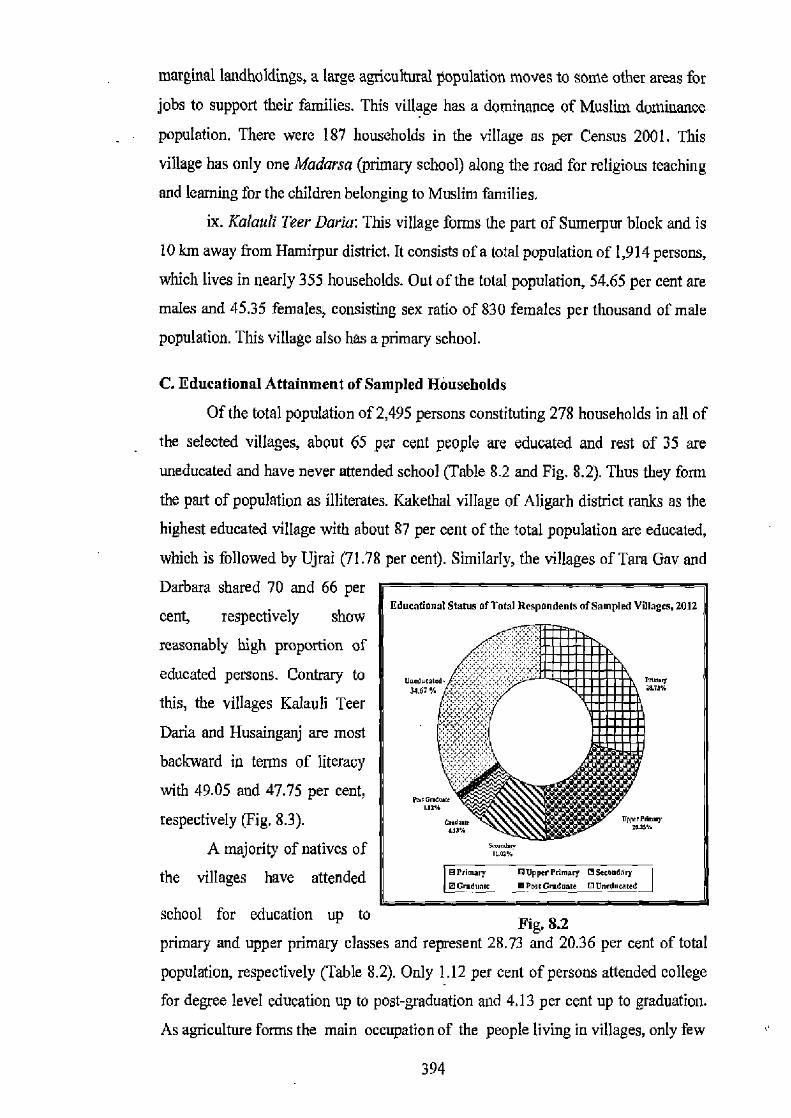
marginal landholdings, a large agricultural population moves to some other areas for
jobs to support their families. This village has a dominance of Muslim dominance
population. There were 187 households in the village as per Census 2001. This
village has only one Madarsa (primary school) along the road for religious teaching and learning for the children belonging to Muslim families.
ix. Kalauli Teer Daria: This village forms the part of Sumerpur block and is
10 km away from Hamirpur district. It consists of a total population of 1,914 persons,
which lives in nearly 355 households. Out of the total population, 54.65 per cent are
males and 45.35 females, consisting sex ratio of 830 females per thousand of male
population. This village also has a primary school.
C. Educational Attainment of Sampled Households
Of the total population of 2,495 persons constituting 278 households in all of
the selected villages, about 65 per cent people are educated and rest of 35 are
uneducated and have never attended school (Table 8.2 and Fig. 8.2). Thus they form
the part of population as illiterates. Kakethal village of Aligarh district ranks as the
highest educated village with about 87 per cent of the total population are educated,
which is followed by Ujrai (71.78 per cent). Similarly, the villages of Tara Gay and
Darbara shared 70 and 66 per
cent, respectively show
reasonably high proportion of
educated persons. Contrary to
this, the villages Kalauli Teer
Dana and Husainganj are most
backward in terms of literacy
with 49.05 and 47.75 per cent,
respectively (Fig. 8.3).
A majority of natives of
the villages have attended
school for education up to Fig. 8.2 primary and upper primary classes and represent 28.73 and 20.36 per cent of total
population, respectively (Table 8.2). Only 1.12 per cent of persons attended college
for degree level education up to post-graduation and 4,13 per cent up to graduation.
As agriculture forms the main occupation of the people living in villages, only few
394

Plate 2 Kachcha houses in Kalauli
Teer Dana village of H.amirpur District
Plate 3 Primary school in Tara Gov village ofAllahabad district
Plate 1 Rocky terrain in
Kalauli Teer Dana village of Hamirpur
district
Plate 4 Poor condition of roads in Kalauli Teer Dada village
of Hamirpur district
395
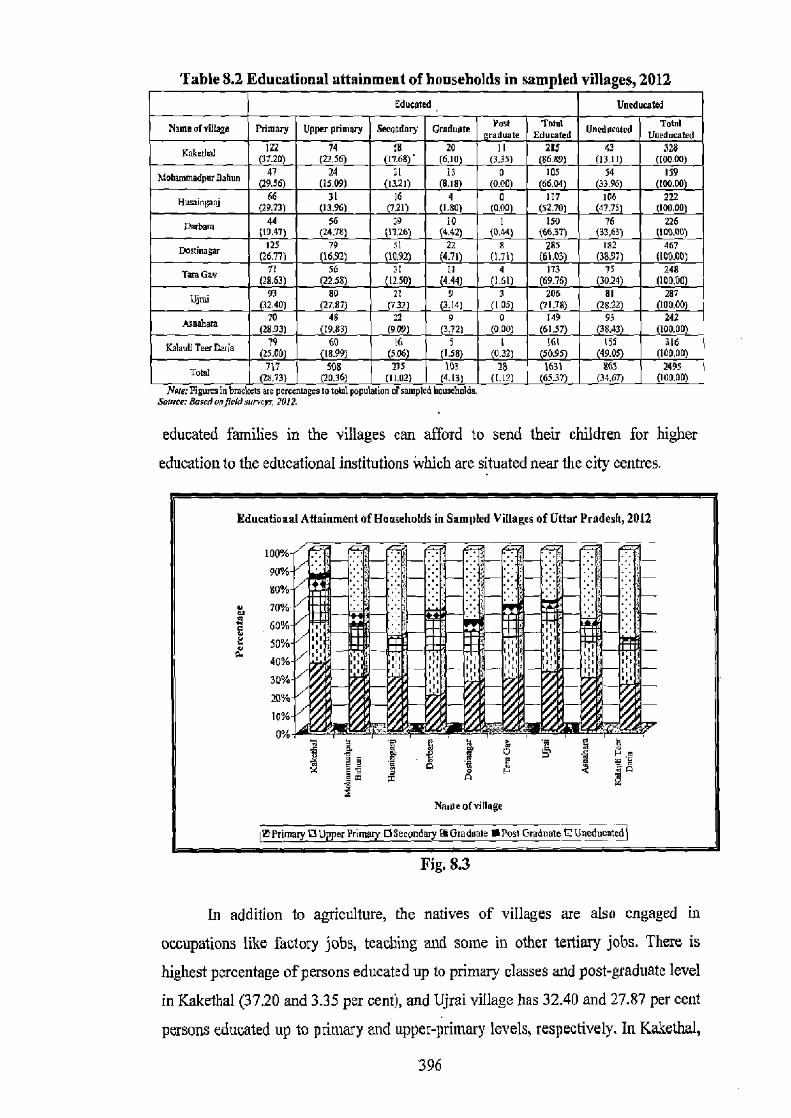
Table 8.2 Educational attainment of households in sampled villages, 2012 eduared
Primary Upper prirnory Saeoodnp Gmduah Post ToM
Unedhvad
Name nfrilkre Ut.luoala Total graduate £doLaIed Unetlocriled
JZA dal 122 74 .8 20 II 285 43 32A
(31.20) (22,56) (19.68)' (6.10) 13
(3.35) (6609) (13.11) (100.00)
Mo6umnadpw Lahon 47 24 it 0 105 54 'Sc 9.36) (1509) 13.21) (8.18) ((0.00) 66.04 33.96 (10000)
Husainpnj 66 31 16 4 0 177 106 222 (29.73) (13,96) (721) (1.80) (0,00) (52(10) (4995) (100.00)
on- 44 56 39 10 1 150 76 226 (19.47) (24.18)
79
(1726) 51
(4.42 22
(044) A
(66.37) 13363) (100.00)
Dastiwgaz 125 285 I82 467
(26.77) (16.92) (10.92) (4.71) (1,71) (61.03) (38.97) (IOOAO)
T.G. 21 56 31 ❑ 4 173 75 248 E9.61 22.5 1250 4.447 161 (69.76) 30.24 (leO,00)
G)- 93 80 21 9 3 206 81 287 (3240) (2447) (732) (3.141 (105) (91.78) (28.T2) (ICOGG)
Asna8am 70 48 9 0 149 93 242
(2893) (19.83) (909) (3.72) (0.00) (61.57) 38A3 (100.00) 60 5 I 161 155 Kalaull Tea Oaria 16 316
25.00 18.9 51 1.58) 0327 50.9 49.0 (100.00)
roml 717 506 215 103 28 1631 865 2495
(28,93) (2016) (11,02) (4.13) (1.12) I (6537)_ (34.67) (100.00) m/¢: FI8wM1E In borrths are ptixeaIag610 total population oliampled hoorholdti.
Source: Bo.srdon.70d aurvoys, 2012.
educated families in the villages can afford to send their children for higher
education to the educational institutions which are situated near the city centres.
ini •
f gpnpu . _.®{
•
i.~.
a
m
I'J'ap~nnflllladf.a r jq■lab
I
Fig. 8.3
In addition to agriculture, the natives of villages are also engaged in
occupations like factory jobs, teaching and some in other tertiary jobs. There is
highest percentage of persons educated up to primary classes and post-graduate level
in Kakethal (37.20 and 3.35 per cent), and Ujrai village has 32.40 and 27.87 per cent
persons educated up to primary and upper-primary levels, respectively. In Kakethal,
396
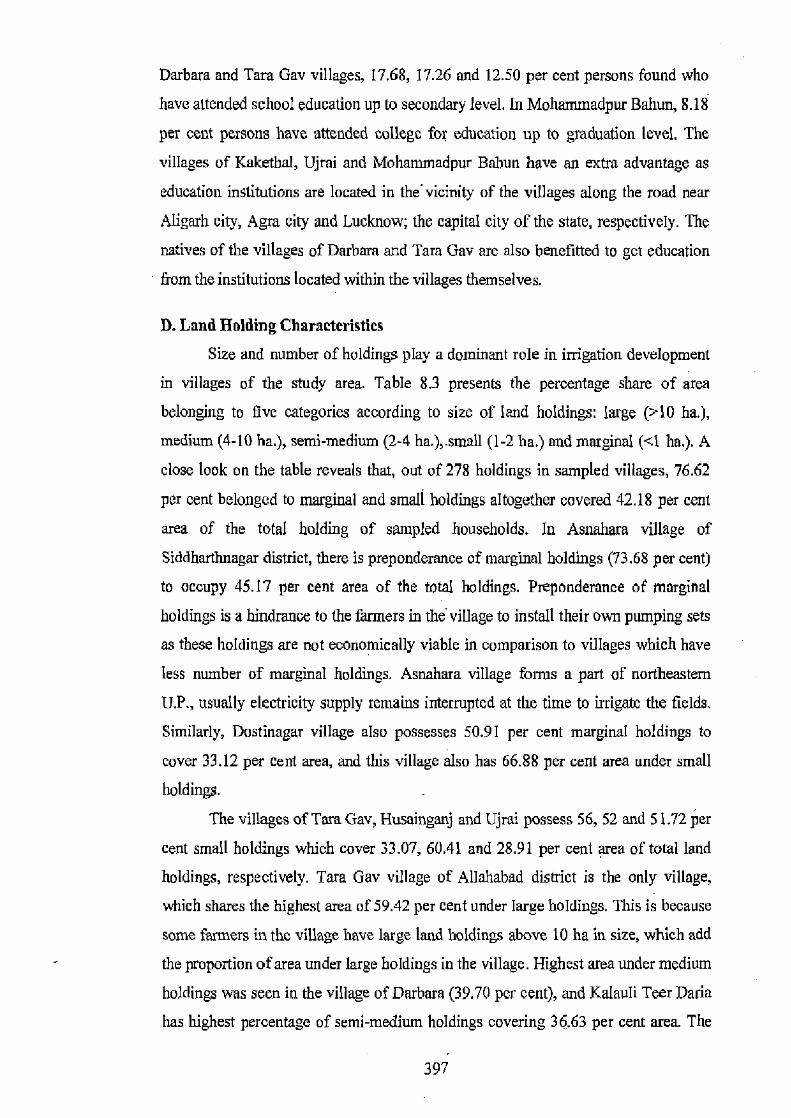
barbara and Tara Gav villages, 17.68, 17.26 and 12.50 per cent persons found who
have attended school education up to secondary level. In Mohammadpur Bahun, 8.18
per cent persons have attended college for education up to graduation level. The
villages of Kakethal, Ujrai and Mohammadpur Babun have an extra advantage as
education institutions are located in the vicinity of the villages along the road near
Aligarh city, Agra city and Lucknow; the capital city of the state, respectively. The
natives of the villages of Darbara and Tara Gov are also benefitted to get education
from the institutions located within the villages themselves.
D. Land Holding Characteristics
Size and number of holdings play a dominant role in irrigation development
in villages of the study area. Table 8.3 presents the percentage share of area
belonging to five categories according to size of land holdings: large (>10 ha.),
medium (4-10 ha.), semi-medium (2-4 ha.),.small (1-2 ha.) and marginal (<I ha.). A
close look on the table reveals that, out of 278 holdings in sampled villages, 76.62
per cent belonged to marginal and small holdings altogether covered 42.18 per cent
area of the total holding of sampled households. In Asnahara village of
Siddharthnagar district, there is preponderance of marginal holdings (73.68 per cent)
to occupy 45.17 per cent area of the total holdings. Preponderance of marginal
holdings is a hindrance to the farmers in the village to install their own pumping sets
as these holdings are not economically viable in comparison to villages which have
less number of marginal holdings. Asnahara village forms a part of northeastern
U.P., usually electricity supply remains interrupted at the time to irrigate the fields.
Similarly, Dostinagar village also possesses 50.91 per cent marginal holdings to
cover 33.12 per cent area, and this village also has 66.88 per cent area under small
holdings.
The villages of Tara Gav, Husainganj and Ujrai possess 56, 52 and 51.72 per
cent small holdings which cover 33.07, 60.41 and 28.91 per cent area of total land
holdings, respectively. Tara Gav village of Allahabad district is the only village,
which shares the highest area of 59.42 per cent under large holdings. This is because
some farmers in the village have large land holdings above 10 ha in size, which add
the proportion of area under large holdings in the village. Highest area under medium
holdings was seen in the village of Darbara (39.70 per cent), and Kalauli Teer Darla
has highest percentage of semi-medium holdings covering 36.63 per cent area. The
397
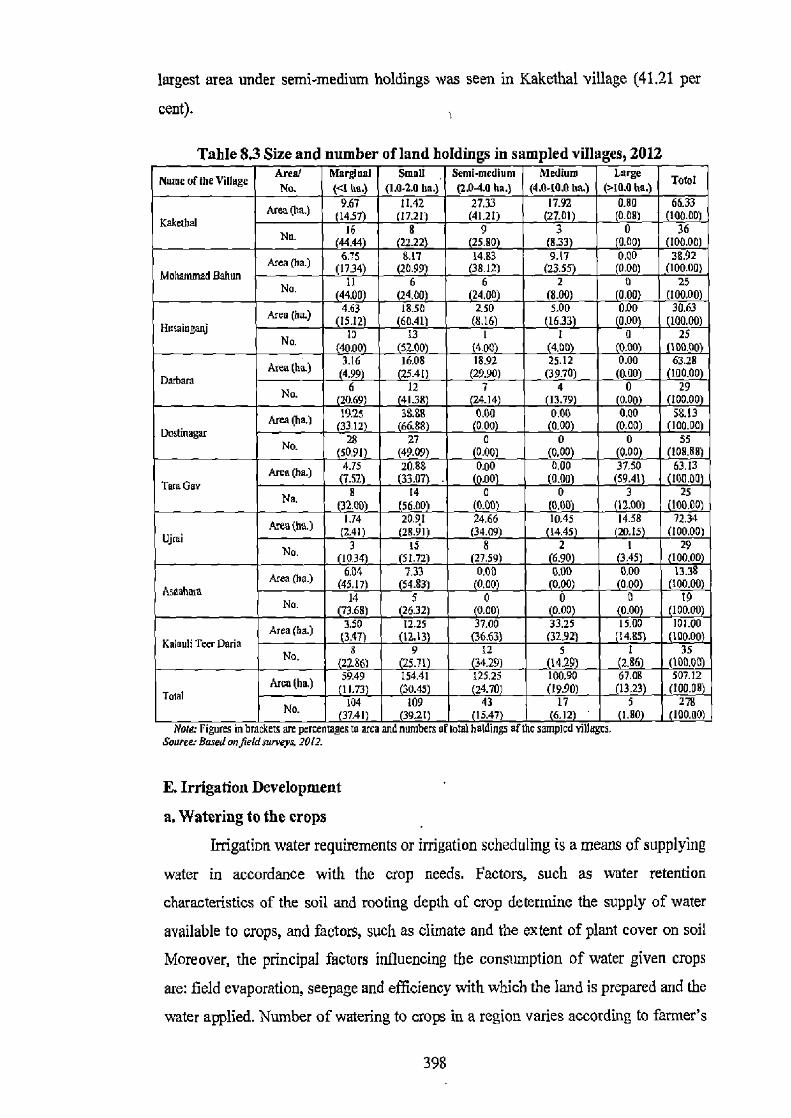
largest area under semi-medium holdings was seen in Kakethal village (41.21 per
cent).
Table 83 Size and number of land holdings in sampled villages, 2012 Name of the Village
Areal Marginal Small Semi-medium Medium Large Total No. ( 4 ha.) (2.04.0 ha.) (1.0.2.0 ha. ) (4A-I0A Is) (>I0.0 ha.)
9.67 11.42 27.33 17.92 0.00 66.33
Kakmhel )
(14.57) (17.21) (41.21) (27.01) 0.00) (1000 16 8 9 3 0 36
No. (44.44) (2222) 25.00 (8.33) 0.00 (100.00)
Area (ha.) 6.75 8.17 14.83 9.17 0.00 38.92 (1724 (20.99 38.12) (23.55) (0.00) (100.00) Mohammad Bahun
11 6 6 2 0 25 No. 44.00 (24.00) (8.00) 0.00 (100.00)
Area (ha.) 4.63 18.50 2.50 5.00 0.00 30.63
Hosm.2uaj
(15.12) 60.41 (8.16) 1633 0.00 (100.00)
I3 13 1 1 0 25 No. 40.00 52.00) t4.00) (4.00 0.00 (iOO.0O)
Atea(ha) 3.16 1608 18.92 25.12 0.00 6128 n ~ 4.99 25.41) (29.90) (39.70) (0.00) 100.00
6 12 7 4 0 29 No. (20.69) 4138 24.14 (13.79) (0.00) (100.00) 19.25 3&S8 0.60 0.00 coo 5&13
Dos Area(ha) (33.12) ((66.88) (0.00) (0.00) ((0.00) (100.00) 2R 27 0 0 0 55
No. 5091 (49.09) 0.0__ PL 100.00
Area(ha) Area(ha) 4.75 20.88 Tern
Gay
0.00 0.00 37.50 63.13 .52) (33.07) 0.00 (0.00) (59.41 100.00
14 0 0 3 25 No. N 2.00 56.00 __JP .DO
24.66 pp) 10.45
(12.00) 10000 1.74 20.91 14.58 72.34 (341) (28.91 (34.09) (14.45) (20.15 (100.00)
uj.i 3 15 8 2 I 29 Na. 10.34 (51.72) (27.59) (6.90) 3.45 (100.00) 6.04 7.33 0.00 0,00 13.38 Area (he.) (45.17) (54.83) (0.00) 0.00 (100.00) Asaahm 14 5 0 0 19
No. 7368 26.32 (0.00) (0.00) 0.00 (100.00)
Area (ha) 3.50 12.25 37.00 15.00 101.00 (3.47) 12.13 (36.63) (14.95) 100.00 Keluuli Tee, Dean 8 9 12 1 35
No. 2286) 5.71 154.41
3429) 2.86 (160,00)
NW(hn) 59.49 125.25 507.12 ILT3 30.45 24.70 1323 (10000) Tmal I04 109 43 5 278
No. (37.41) (3921) (15.4]) ((6.12) (1.80) 100A0 Nate: Figures in brackets are pncentzges to area and numbers OFtotal holdings of Me sampled villages.
Saurec Based onfieldmrvey, 2012.
E. Irrigation Development
a. Watering to the crops
Irrigation water requirements or irrigation scheduling is a means of supplying
water in accordance with the crop needs. Factors, such as water retention
characteristics of the soil and rooting depth of crop determine the supply of water
available to crops, and factors, such as climate and the extent of plant cover on soil
Moreover, the principal factors influencing the consumption of water given crops
are: field evaporation, seepage and efficiency with which the land is prepared and the
water applied. Number of watering to crops in a region varies according to farmer's
Kul
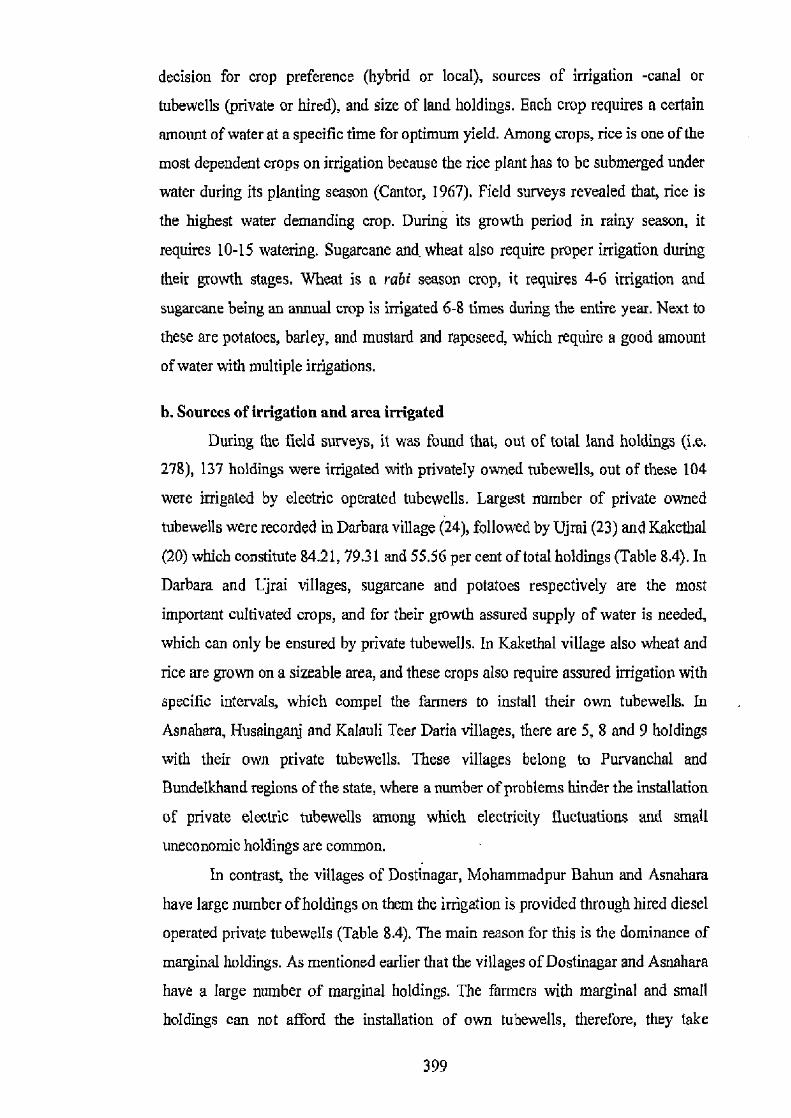
decision for crop preference (hybrid or local), sources of irrigation -canal or
tubewells (private or hired), and size of land holdings. Each crop requires a certain
amount of water at a specific time for optimum yield. Among crops, rice is one of the
most dependent crops on irrigation because the rice plant has to be submerged under
water during its planting season (Cantor, 1967). field surveys revealed that, rice is
the highest water demanding crop. During its growth period in rainy season, it
requires 10-15 watering. Sugarcane and wheat also require proper irrigation during
their growth stages, Wheat is a rabi season crop, it requires 4-6 irrigation and
sugarcane being an annual crop is irrigated 6-8 times during the entire year. Next to
these are potatoes, barley, and mustard and rapeseed, which require a good amount
of water with multiple irrigations.
b. Sources of irrigation and area irrigated
During the field surveys, it was found that, out of total land holdings (i.e. 278), 137 holdings were irrigated with privately owned tubewells, out of these 104
were irrigated by electric operated tubewells. Largest number of private owned
tubewells were recorded in Darbara village (24), followed by Ujrai (23) and Kakethal
(20) which constitute 84.21, 79.31 and 55.56 per cent of total holdings (Table 8.4). In
Darbara and Ljrai villages, sugarcane and potatoes respectively are the most
important cultivated crops, and for their growth assured supply of water is needed,
which can only be ensured by private tubewells. In Kakethal village also wheat and
rice are grown on a sizeable area, and these crops also require assured irrigation with
specific intervals, which compel the farmers to install their own tubewells. In
Asnahara, Husainganj and Kalauli Teer Daria villages, there are 5, 8 and 9 holdings
with their own private tubewells. These villages belong to Purvanchal and Bundelkhand regions of the state, where a number of problems hinder the installation
of private electric tubewells among which electricity fluctuations and small
uneconomic holdings are common.
In contrast, the villages of Dostinagar, Mohammadpur Behan and Asnahara
have large number of holdings on them the irrigation is provided through hired diesel
operated private tubewells (Table 8.4). The main reason for this is the dominance of
marginal holdings. As mentioned earlier that the villages of Dostinagar and Asnahara
have a large number of marginal holdings. The farmers with marginal and small
holdings can not afford the installation of own tubewells, therefore, they take
399
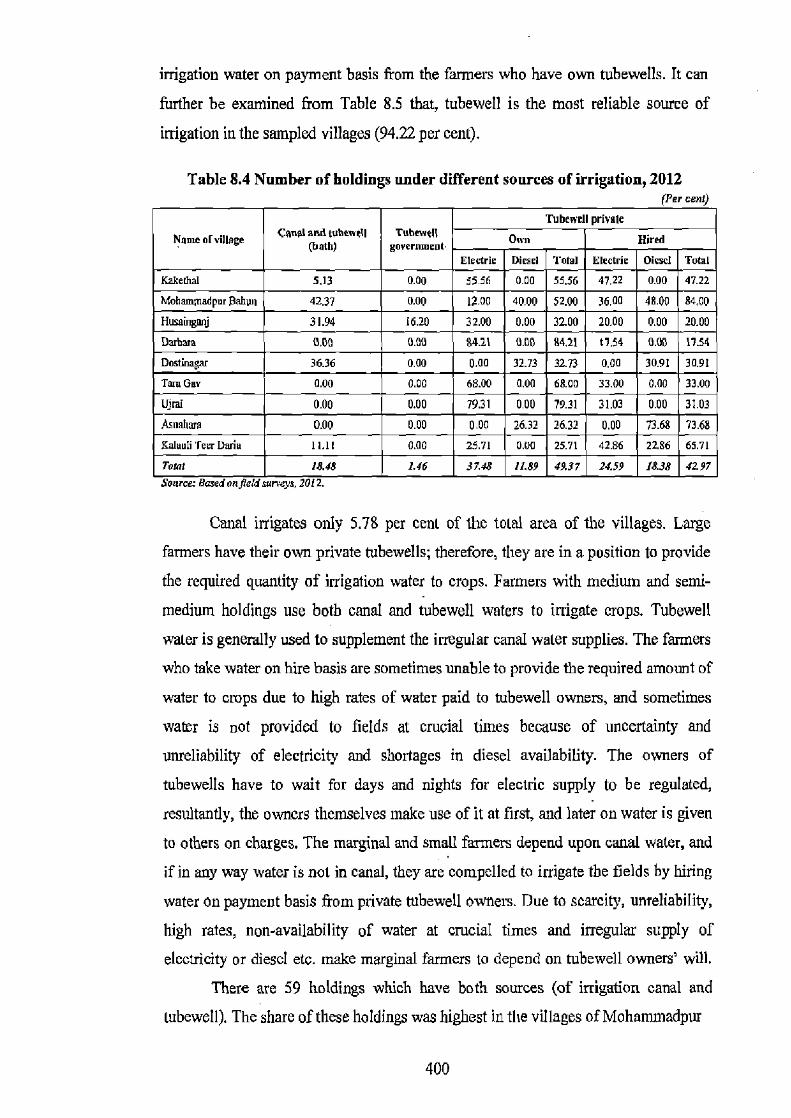
irrigation water on payment basis from the farmers who have own tubewells. It can
further be examined from Table 8.5 that, tubewell is the most reliable source of
irrigation in the sampled villages (94.22 per cent).
Table 8.4 Number of holdings under different sources of irrigation, 2012 (Per cent)
Nnme ofvllinge CM'I and tuhewtI [both)
Tubewea government
Tubewrll private
O,ra Hired
Electric Diesel Total Electric Diesel Total
KkcthaI 5.13 0.00 55.56 0.00 55.56 47.22 0.00 47.22
Moliainrnadpur aahon 42.37 0.00 12.00 40.00 52.00 NO 48.00 84,00
Husaingmj 31.94 16.20 32.00 0.00 32.00 20.00 0.00 20.00
Darbara 0.60 000 94.21 000 84.21 17.54 0.00 17.54
Dostinagu 36.36 0.00 0.00 32.73 32.73 0.00 30.91 30.91
Tani G. 0.00 0.00 68.00 0.00 68.00 33.00 0.00 33.00
Ojrai 0.00 000 79.31 0.00 79.31 31.03 000 31.03
Asnahara 0.00 0.00 0.00 26.32 26.32 0.00 73.68 73.68
Kulnuli Teer Dod. 11.11 0.00 25.71 0.00 25.71 42.86 22.86 65.71
Tani 18.48 1.46 37.48 11.89 49.37 24.59 18.38 4297 aaurce. o,vea anJieie nurt'ya, svL.L
Canal irrigates only 5.78 per cent of the total area of the villages. Large
farmers have their own private tubewells; therefore, they are in a position to provide
the required quantity of irrigation water to crops. Farmers with medium and semi-
medium holdings use both canal and tubewell waters to irrigate crops. Tubewell
water is generally used to supplement the irregular canal water supplies. The farmers
who take water on hire basis are sometimes unable to provide the required amount of
water to crops due to high rates of water paid to tubewell owners, and sometimes
water is not provided to fields at crucial times because of uncertainty and
unreliability of electricity and shortages in diesel availability. The owners of
tubewells have to wait for days and nights for electric supply to be regulated,
resultantly, the owners themselves make use of it at first and later on water is given
to others on charges. The marginal and small farmers depend upon canal water, and
if in any way water is not in canal, they are compelled to irrigate the fields by hiring
water on payment basis from private tubewell owners. Due to scarcity, unreliability,
high rates, non-availability of water at crucial times and irregular supply of
electricity or diesel etc. make marginal farmers to depend on tubewell owners' will.
There are 59 holdings which have both sources (of irrigation canal and
tubewell). The share of these holdings was highest in the villages of Mohammadpur
400
Table 8.5 Area under different sources of irrigation in sampled villages, 2012 (Par rant)
Name olvillage Canal Tubewell government
Tubewell private Total
tubewell
Total irrigated
area own
Electric Diesel
Hired
Electric Diesel
Kaketid 0.60 0.00 83.31 0.00 16.09 0.00 99.40 139.32
Mohainniadpurflshun 6.07 0.00 19.69 .95 18332 93.93 107.31
Husaingznj 14.51 14.07 48.48 .94 0.00 85.49 28.78
Darbara 0.00 0.00 91.23 .77 0.00 100.00 80.72
Dastinugar 29.20 0.00 0.00 .00 23.98 70.80 113.45
Tara Gay 0.00 0.00 91.62. .38
T0.00
0.00 100.00 98.50
Ujrai 0.00 0.00 85.44 .56 0.00 100.00 74.36
Asnahara 0.00 0.00 0.00 .00 51.59 100.00 19.63 Kalauli leer Dana 0.86 0.00 63.52 .03 19.59 99.14 130.20
5.78 0.51 58.22 .30 7141 94.22 79226 Source: Sosed on field surveys, 2014
Bahun and Dostinagar. Canals passing through the villages provide irrigation to
farms only which come under their command area, mainly during the months of
rainy season. Most of the marginal and small farmers of the villages get benefitted
from canal water only during the rainy months. Only 1.46 per cent holdings in these
villages were irrigated by public tubewells, these belong to Husainganj only (Table
8.4).
Survey data account for net irrigated area in the villages to the extent of
710.67 ha. Of the total 9 villages, 2 villages namely, Darbara and Kakethal possess
the highest percentage of net irrigated area to the tune of 93.03 and 87.90 per cent,
respectively. Whereas, the lowest net irrigated area was recorded in the villages of
Ujrai (50.38 per cent) and Asnahara (63.23 per cent). Out of 889.71 ha of gross
cropped area (area sown under crops in three distinct seasons) of sampled villages,
89.04 per cent was irrigated and a remaining of 10.96 was rain-fed. Of the total
irrigated area of 792.26 ha, 746,49 ha (94.22 per cent) was irrigated by tubewells.
Out of 71 per cent of irrigated area by own private tubewells, 58.22 and 12.78 per
cent accounted for electric and diesel operated tubewells. Of the total irrigated area
by hired water, 12.30 and 10.41 per cent area was irrigated by electric and diesel
operated private tubewells, respectively. Only 0.51 per cent of area was irrigated by
government tubewells, and canal waters irrigated 5.78 per cent of area. The highest
irrigated area with 91.62 and 91.23 per cent, respectively by own electric tubewells
was seen in the villages of Tara Gay and Darbara. Similarly, the villages of Ujrai and
Kakethal had 85.44 and 83.31 per cent of area under own electric tubewells.
401

Plate 5
Canal passing through MohanmadpurBohan village of Barahanki
district
Plate 6
Tubewell in Tam Gay village ofA!mhabad
district
Plate 7
Wheat crop grown in Kakethal village ofAligarh
district
Plate 8
Mustard clop grown in Asnahara village of
Siddharthnagar district
402
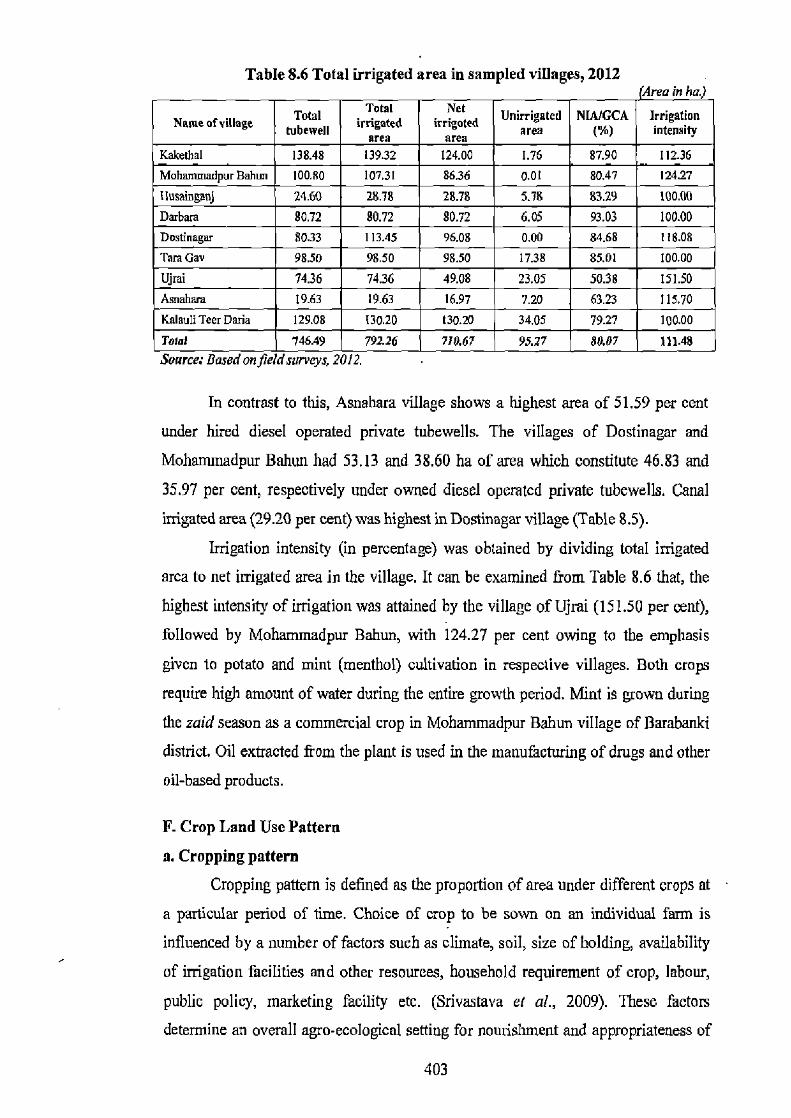
Table 8.6 Total irrigated area in sampled villages, 2012 (Area in ha.)
Name of village Total tubewell
Total irrigated
area
Net irrigated
area Unirrigated
area NIAIGCA
(%) Irrigation intensity
Kakethal 138.48 139.32 124.00 1.76 87.90 112.36 Mohammadpur Bohan 100.80 10731 86.36 0.01 80.47 124.27 llusainganj 24.60 28.75 28.78 5.78 83.29 100.00 Darbara 80.72 80.72 80.72 6.05 93.03 100.00 Dostinagar 80.33 113.45 96.08 0.00 84.68 118.08 Tara Gay 98.50 98.50 98.50 17.38 85.01 100.00 Ujrai 74.36 74.36 49.03 23.05 50.38 151.50 Asnahara 19.63 19.63 16.97 7.20 63.23 115.70 Kalauli Teer Dana 129.08 130.20 130.20 34.05 79.27 100.00 To1o1 746.49 792.26 710.67 95.27 80.07 111.48 Source: Based on field surveys, 2012.
In contrast to this, Asnahara village shows a highest area of 51.59 per cent
under hired diesel operated private tubewells. The villages of Dostinagar and
Mohaminadpur Bahun had 53.13 and 38.60 ha of area which constitute 46.83 and
35.97 per cent, respectively under owned diesel operated private tubewells. Canal
irrigated area (29.20 per cent) was highest in Dostinagar village (Table 8.5).
Irrigation intensity (in percentage) was obtained by dividing total irrigated
area to net irrigated area in the village. It can be examined from Table 8.6 that, the
highest intensity of irrigation was attained by the village of Ujrai (151.50 per cent),
followed by Mohammadpur Bahun, with 124.27 per cent owing to the emphasis
given to potato and mint (menthol) cultivation in respective villages. Both crops
require high amount of water during the entire growth period. Mint is grown during
the zaid season as a commercial crop in Mohammadpur Bahun village of Barabanki
district. Oil extracted from the plant is used in the manufacturing of drugs and other
oil-based products.
F. Crop Land Use Pattern
a. Cropping pattern
Cropping pattern is defined as the proportion of area under different crops at
a particular period of time. Choice of crop to be sown on an individual farm is
influenced by a number of factors such as climate, soil, size of holding, availability
of irrigation facilities and other resources, household requirement of crop, labour,
public policy, marketing facility etc. (Srivastava et al., 2009). These factors
determine an overall agro-ecological setting for nourishment and appropriateness of
403
crop or set of crops for cultivation. Nevertheless, at farmers' level, potential
productivity and monetary benefits act as guiding principles to opt a particular
cropping pattern. Decisions with respect to choice of crops be grown and cropping
systems are also influenced by several other factors related to infrastructure facilities,
socio-economic and technological developments, all operate interactively at micro-
level (Das, 2013).
Area sown under different categories of crops in villages is presented in
Tables 8.7 and 8.8. As shown in table that, gross cropped area in sampled villages
was enumerated as 889.71 he and net cropped area ranged from a lowest value of
26.83 ha in Asnahara to the highest value of 164.27 ha in Kalauli Teer Dana. Cereal
crops in Asnahara, Husainganj and Tara Gav villages are grown on 85.87, 82.20 and
81.12 per cent of total cropped area of the villages, respectively. Cereal and cash
crops are grown on 45.60 and 46.26 per cent area in Darbara, and in Ujrai village,
largest area is devoted to the cultivation of cash crops (77.03 per cent). Total area
under kharif crops was highest in the village of Darbara (68.52 per cent) of Bijnor
district, and area under rabi season crops was highest (82.21 per cent) in Ujrai
village of Agra district, it is because of that the farmers prefer to grow cash crops of
sugarcane and potatoes, respectively (Table 8.9).
Among kharif crops, rice dominates over other crops by covering an area of
about 17 per cent in the villages. This was followed by bajra, jowar and urad crops,
which covered 4.13, 3.68 and 3.34 per cent of area, respectively. Rice acquired the
highest area under cultivation (42.86) in Annahara village, followed by Husainganj
(33.29) and Mohantmadpur Bahun (30.58) and its area was lowest in the village of
Darbara (13.46 per cent). Whereas, Ujrai and Kalauli Teer Daria are situated in the
southwestern and Bundelkhand region of the state, respectively the farmers do not
cultivate rice due to semi-arid conditions and lack of proper irrigation facilities in
these villages.
Bajra is grown in almost all villages, but it shared a highest area in Ujrai
(15.45 per cent), Tara Gay (550 per cent) and Kakethal (4.36 per cent) villages. Area
devoted to the cultivation of jowar crop was highest in Dostinagar (9.37 per cent)
aid Tara Gav (7.98 per cent), whereas urad and maize occupied the highest area.
under cultivation to the extent of 10.09 and 8.03 per cent in Dostinagar and Kakethal
villages, respectively. Darbara is the .only village in which the cultivation of
sugarcane dominates and this crop covers 40.14 ha area (46.26 per cent) to gross
404
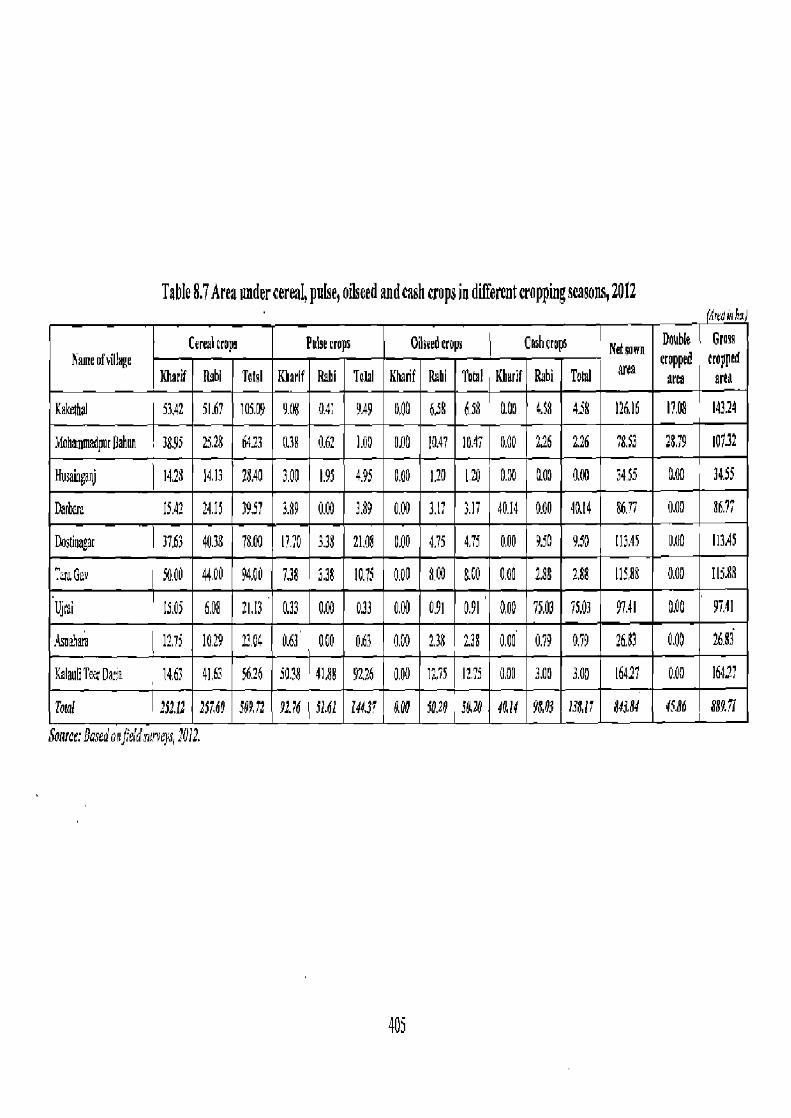
Table 8.7 Area andercereal, pulse, oilseed and cash crops in different cropping seasons, 2012 (Ash)
Name of Nillage C¢realcra Pe rop Oilc¢edcrops Cash crops n~~aa Double Gross
cropped cropped arcs area Ithari( Hshl Total Kiarif Hahi Total Kla f Rabi Total i Kharif Rabi Total fl
Kakejha] 53,42 51.67 105.09 9.08 041 9.49 000 &5 6.58 0A0 4.38 43 12616 I?.00 143.24
Mohønimpvrpahua 38.95 25.28 6423 028 0.62 1.00 hD0 10.47 10.47 0.00 2,26 2,26 78.2 28.79 10732
Husaicgaaj 14.23 1.13 28.40 3.00 1.95 4.95 0.00 120 120 0.30 0.00 0.00 3a S5 0.00 34.55
Darh;r 15.42 24.15 39.57 3.89 0.00 3.89 0.09 3.17 IN 40.14 0.00 10.14 66 77 0.00 86.77
DnsGuagu 37,65 40.33 73A0 I?.7G 3.38 21.48 OAO 4)S 4.75 o.o0 9.50 9.50 113,95 0.00 113.43
"u¢Ga 5000 44,00 4.00 738 3.38 10.75 0.00 8.00 &00 0.00 288 2.86 I1588 0.00 11588
Uj~mi 1S,05 6J 21.13 0.33 0.00 033 1 0,91 0.91 000 75,03 75.03 97.41 0.00 97.41
.AsSa 1235 1029 1104 0.63 ON U3 0.00 2.38 238 OAO 0.79 0.79 26.83 0.00 26.83
KalappTearpS 14.63 4163 5626 3038 41.88 92,26 000 17,75 1279 0.00 3.00 300 16427 0.00 1642?
Taw! 25212 25749 399.22 92.76 52.61 I433? 0.00 50,20 590 410!4 98.03 138.17 843.84 45.86 889.71
Source: Based an fiefdvirueys, 2012.
405
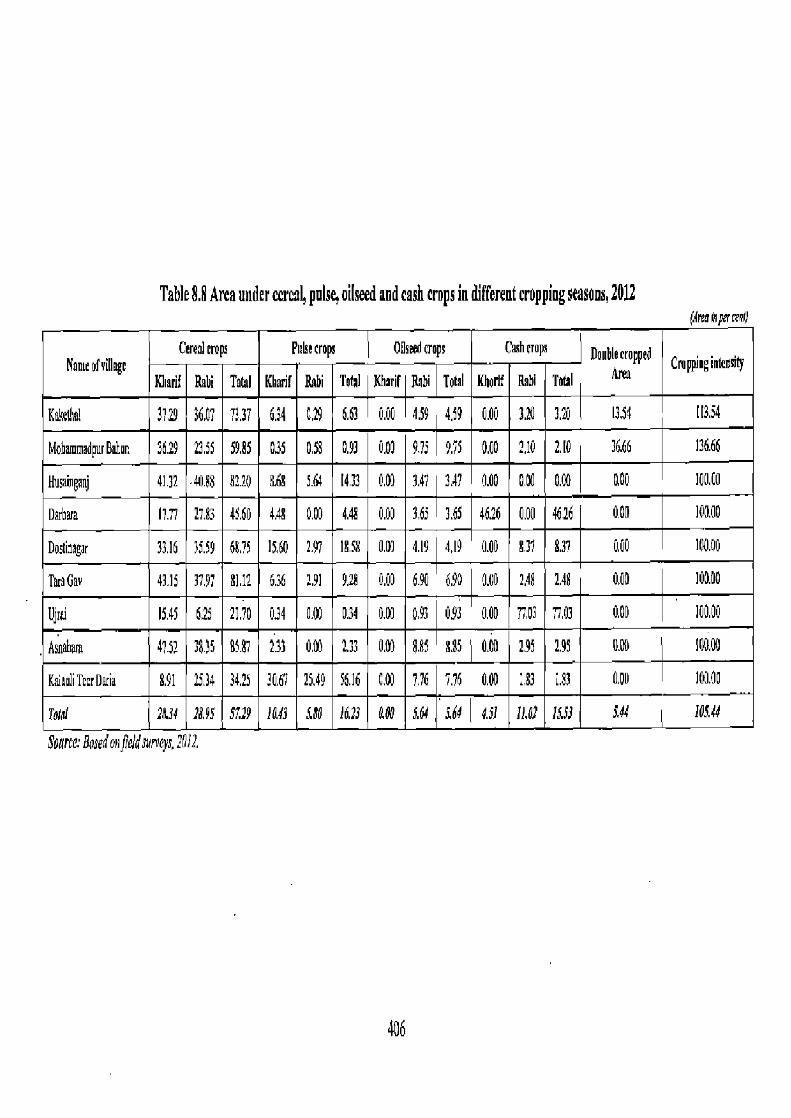
Table 8.8 Area under cercaL pulse, oilseed and cash crops in different cropping seasons, 2012 (Arealnperrrn0
Cereal crops
IBiarit Rabi Total Nome ofvillrge
Pubocrope 011sotiyops Lxshcrops Doublleecropped
Rhprlf Rabi Tohl Groppilginlcnolty
Kharif Rabi Todl ]ihorif Rabi Total
Kit & 3729 36,07 73,37 634 C,29 6.63 0.00 4.59 4,59 0.00 12 IN 1754 113.54
MohammodpurBatun 56.79 2355 59.85 035 058 0.93 0.00 9.73 9.75 0.00 210 2,10 36.66 I3666
!hsinganj 41.32 411j8 82.20 5.64 1473 U,D) 3.47 3A7 0.00 000 0.00 p.00 100,00
Darbara 17.77 27.83 45.60 000 4.48 U.00 3.65 3.65 46.76 0.00 46.26 000 100.00
Doslluagar 3316 35.59 6835
14AS
2.97 1859 0DI 4.19 4,19 0.00 831 8.37 0..00 IOU
TooGav 43.15 3797 81.12 1.91 9.29 U.00 6.90 6.90 0.00 2.48 2,48 0,00 IODAC
Ujr& 15,45 625 21.70 0.00 034 0.00 0,93 093 0.00 7703 7703 0.00 IOOAO
Asnahum 47.52 38.35 0 2.33 0.0) 0.85 8.85 O.MI 2.95 2.95 U.00 100,00
KaiauliT:rCria 8.91 25.34 130~67 49 66.16 C.DO 7% 7.76 0.00 :.63 1.33 ODO 100.00
Told 2834 28,95 O 1623 x00 5,64 164 4x7 11.01 150 5,44 105.44
SOarce. Bwedon ftrld smNeys, 2012
4U6
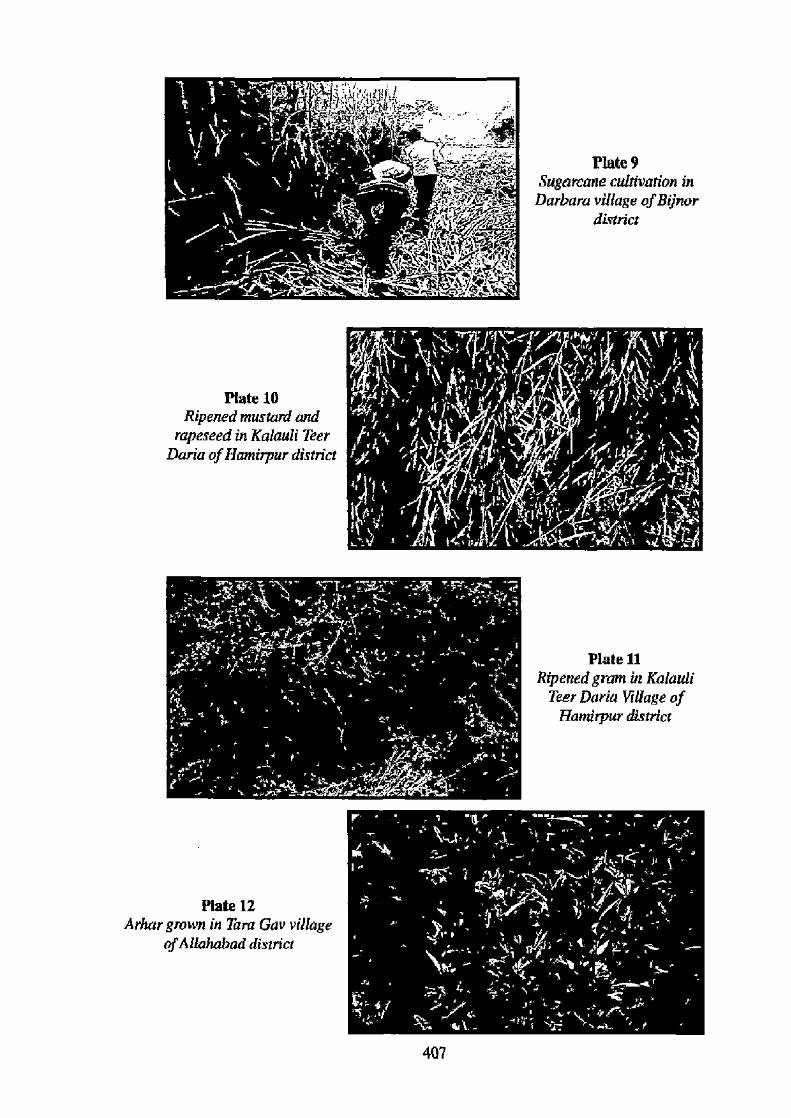
• fts /t
'If.
cropped area (Tables 8.9 and 8.10). This village constitutes a part of sugarcane
growing districts of the tarai belt of the Rohilkhand plains, where irrigation facilities
are good enough, and account for 93.03 per cent of net irrigated area and about 91
per cent of area of the village is under own electric tubewells. In the cultivation of
kharif pulses, Kalauli Teer Darla village ranks first. In Mohammadpur Bahun and
Asnahara villages mustard occupied 9.75 and 8.85 per cent of area, respectively. The
largest area (5.02 per cent) under barley was in the village of Tara Gay. Owing to
least irrigation development, Kalauli Teer Daria again has the highest share of rabi
pulses (about 26 per cent) amongst all villages constituting 56 per cent of area under
pulses to gross cropped area of the village (Table 8.8).
Among crops sown in zaid season, the cultivation of mint acquired 26.82 per
cent of area to the gross cropped area in Mohammadpur Bahun village. `Mentha
arvensis' is a variety of mint, commonly used in household kitchens. It is considered
as a feedstock for an essential oil that contains menthol, a substance used in food,
pharmaceutical and cosmetic industries. A reason for consistent progress in mint
cultivation lies in its demand for domestic consumption and of menthol and mint oils
in other countries including USA, Germany, France, UK, Singapore, Australia and
Japan. Another consideration is that, cultivation of mint is adopted as a bonus crop
when main rabi food crops of wheat, potatoes, gram etc. are harvested. The
accommodation of mint cultivation in traditional farming rotations of crops has
encouraged farmers to improve their remunerations with the mint cultivation as a
bonus crop (Panda, 2005). Recently, India has become the largest producer of
menthol mint oil in the world, overtaking China.
If other things are equal, farmers decide to grow crops that give them the
highest returns per hectare, which is characterized as a function of yield and price
(Carlyle, 2002).This industrial crop is now cultivated on over 0.145 million ha. in the
state of Uttar Pradesh encompassing other states of the Gangetic plains. Major districts
devoting large areas for the cultivation of mint in the state are namely, Budaun,
Bareilly, Shahjahanpur, Pilibhit, Kheri, Barabanki and Ambedkar Nagar. Barabanki
presents itself as an ideal district for the cultivation of mint and accounts for 80 per
cent of mint production in India. Mentha requires enough irrigation water, which is
available in the district of Barabanki. Distillation and marketing of oil are also easy.
Four varieties of mentha arvensis (Himalaya, Kosi, Saksham, and Kushal) are
commonly adopted by the farmers, which have developed by the Central Institute of

Table 8.9 Cropping pattern in sampled villages, 2012 AwInhoA
Kla,tmp
f•'aak ofvike C¢zlt
R J a MU Vg Mr Mt ' A S
TQII
RoWimps
Ttlnl
1.tlJ
Told (R+K+ZI Cvmila Pdus ORvnR calm
011m' 1V By G Pt Ct fluodR P
H2YA6d 3193 4,42 6,25 1150 192 1,00 OY RUI 4,15 00u 6751 4713 447 DO a,33 OAO Us 439 69H '9.06 14324
Mohmrd?A uo 1:81 4.17 uS I;1 p,0a 0,01 U,36 J,OI 0,ID C7E 39]3 i3aB 000 0o8 2,!d OW IO di :'N 3863 7d19 IPLR
17u__gv IISO 23 0,75 1,20 RW a0D 0.00 0.99 169 OOP 1314 I3A6 015 19! 0.76 0.7J 12 040 11.18 OPO 34Ss
110 us 199 all TOO 1.23 CIX~ 914 037 40.14 S94i 24.IS Us 0so aOa OW 917 0.00 2172 9.W 8471
U*4- 25,13 10.67 OSO 075 II45 0,,15 C9 409 310 CJ 51J3 4938 @0 333 0.00 025 410 960 3801 ODD 11315
>Ya n Jo,7S 9,23 5,78 3.63 18K 16b Lf3 OPO 2.6J 0,40 5710 38.19 S91 3,Bd 0'.0 O.a 9C0 2.1a 39,33 9.00 IIS88
Ch 0.00 111 13,03 O,W 0,08 0.08 OJ9 0.04 R00 C00 1:.31 :.84 0.24 15A3 9107 0.00 91.41
Amulwa 1139 6.63 753 0]9 067 GS3 RaE GL6 40G 400 11 98 [a29 0.00 O.W OCJ 0.00 29fi 0.79 1146 9.00 2681
KSi7xtDaia 3 11S 3$S 3,13 1199 9W Ifl( 4a0 1330 00 6901 E3 25 7978 350 UAfi 1275 7.10 99'M 6B0 :6127 fmd 1512 7274 3fi15 7239 VI 1W' !A ➢1 AIJ 79Q 10.34 ?81,01 244M
AAdw SSi.2 W.V/S Rv, LW 1611 1.&1 &7! 4th 9U3 13745 0.561 789.71
.AN6 SIhUirt¢;k R.RiuJ.) rA3air M.Maim U1JMMeMxrm Mra,n Mt44rae6. AevGl,m. P3.Pm flbCmnidrnt MUA#4mrd and!larw P-Pornw. 1raotuod Of
X94 9vc.Baduf¢IJww7, X11.
Table 8,10 Cropping pattern in sampled villages, 2012 (Nmmpr a i)
NBrr nfYlllage IchfacaRpi
Total
R iCmp T01a1
Zaid cr a
Cfruis Pulses rash l: O nu1s Pulses 01RPPEs CL crop;
eBP R J B M U MQ Mr MI A s R' Bf G Ps Gt Manda P
Kaabal 21.82 309 436 ad 784 170 473 096 ;.32 0. 4365 7199 3.09 D.06 Cl) 0.00 459 720 41.16 11.92
MohamnaJprDahl 3058 388 0.33 1.60 000 NO 0.33 000 (LOU O,W 3664 13aS % 0.08 050 OAC 915 :.ID 73.98 26.62
Hasqiqgalj 3729 139 717 7Ai 0.00 O.00 0.08 OM O S.63 0.00 SC 00 40AS C47 S.fi4 000 000 ]47 aU 49.53 0.00
1146U1 2.19 0]0 230 IA6 O,CO 078 0,43 Dsrbma
4626 6@52 SIX 0.00 a00 000 000 3.0 09D 31.48 D~CU
HaAiN~2r 7070 937 044 CA 1G,09 066 0.09 fA0 41 QVO 4877 000 .97 027 5112 000 ?b.S4 796 SSO 3,13 L62 I,J? IAO O.W LT3 9A0 4932 3296 502 248 D.43 OBf 10,11 OAO OAO UO IS.4S .00 0.09 0.09 a09 CA9 (.00 000 13.81 A 023 0.00 0.00 0.00 92.21 D00
Mt 4286 2 3 174 1.09 0.00 213 Q00 0.00 OOC C.fO 49.85 7635 O.OD 0.00 0.00 0.00
t97~
41.99 OG0
XkJTnellana 0.00 0.16 3.20 49; 6.93 SAS 7AI 1.4 87? 0.0D 39$ 23.82 1,52 2336 3,13 Oa0 61St 000
TAI 11,45 5.69 4.13 3.98 134 Lb9 L68 R49 171 AS! lb31 1848 L4B Sa aSS ABJ SI41 5,16 SourwBseediqj^ d&ep¢y4 20f2,
409
Medicinal and Aromatic Plants located at various places in the country (Lucknow,
Bangalore, Hyderabad, Pantnagar and Purara). These varieties are characterized with
improved traits and bear higher content of menthol. The farmers in Barabanki district
have found menthol mint an ideal crop for plugging the gap between the rabi crop
(wheat or potatoes) and kharif crop (rice). Almost 70 per cent of total arable land in
the district is devoted to cultivate this `bonus' cash crop in addition to other food
crops (Kumar or al., 2011). Kalka (HY-77) and MM-I are the two varieties widely
grown in Barabanki where soils are sandy loam and climate is somewhat drier than
that of rarai region, and about 125 and 150 kg oil/ha can be extracted from these
varieties, respectively (Panda, 2005). It was investigated during the survey that in
Barabanki district farmers get on an average about 113 kg of menthol oil/ha from
crop, the cost of which amounts to ! 56,615/ha.
b. Cropping intensity
Irrigation is usually used as a platform for intensification of agriculture
because it offers a point on which inputs concentrate. Uniformity in distribution and
application efficiency in irrigation varies with technology adopted to deliver water,
soil type and slope, and the methods of water management. With 17.08 and 28.79 ha
of area, respectively under double cropping in the villages of Kakethal and
Mohammadpur Bahun are characterized with highest cropping intensity being 113.54
and 136.66 per cent, respectively (Table 8.8). This has been possible due to high
irrigation development in these villages. In both of them cultivation of crops
continues in all seasons, without leaving any land as fallow, In Mohaxnmadpur
Bahun village, menthol is cultivated on a significant area in zaid season when the
harvest of rabi season crops is over, which gives farmers the highest returns.
c. Area, production and yield of crops
There were 18 crops reported occupying an important position in cultivation
in sampled villages. Area, production and yield of major crops have been presented
in Table 8.11, It is clear from the table that, among cereals, wheat is commonly
grown crop in all villages and rice occupies the second place, grown next to wheat.
Wheat is grown over an area of 47.25 ha. in Kakethal village and its production
accounted for a total of 2277 quintals with highest yield of 48.19 qnts/ha. Similarly,
the villages of Husainganj, Dostinagar and Tara Gay also showed high yield of wheat
410

(48 gntslha). The villages namely, Barbara, Asnahara and Ujrai recorded yield of
wheat in order of 42.17, 36.14 and 30.12, respectively. Lowest yield of wheat was
seen in Kalauli Teer Dana and Mohammadpur Bahun (24 qnts/ha).
Rice acquired an area of 32.81, 31.25 and 30.75 ha. in the villages of
Mohammadpur Bahun, Kakethal and Tara Gav, respectively. Highest yield of rice
was seen in Tara Gav to the tune of 100 qnts/ha, it was followed by the villages of
Asnahara (84.34 gntslha), Husainganj (80 gntslha), Kakethal (48.19 qnts/ha) and
Darbara (48.19 qnts/ha). Lowest yield of rice was seen in Mohammadpur Bahun (30
qnts/ha). Next in line has been bajra crop, which is one of the main crops in Ujrai,
Tara Gav and Kakethal villages and grown on 15.05, 6.38 and 6.25 ha. of area, and
respective yields of this crop were 42.17, 24 and 30.12 qnts/ha (Table 8.9).
Jowar is cultivated in Dostinagar and Tara Gav villages on 10.63 and 9.25 ha.
of area, respectively and its yield on an average was 24 qnts/ha. Highest yield of
maize crop to the tune of 18.07 gntslha was obtained by the farmers in the villages of
Kakethal, Kalauli Teer Dada and Tara Gay. Barley cultivation is prominent in Tara
Gov and Kakethal villages with yields of 42.17 qnts/ha. It can be observed from
Table 8.9 that, among pulses, gram acquired highest area of 38.38 ha in Kalauli Teer
Dana. Other villages namely, Dostinagar, Tara Gav and Husainganj acquired 3.38,
2.88 and 1.95 ha., respectively. Among these villages, the highest yield of gram was
recorded in Tara Gav and Husainganj, which has been 24 qnts/ha, Kalauli 'feet Dana
was characterized with lowest yield of 6 qnts/ha.
Urad was cultivated on 11.45 and 11.38 ha. of area in Dostinagar and Kalaull
Teer Daria, respectively. Arhar was grown on 13.50, 5.50, 4.75 and 3.0 ha. of area in
the villages of Kalauli Teer Dana, Dostinagar, Kakethal and Husainganj. Moong and
masoor were sown on 9 and 12.50 ha in Kalauli Teer Dario, with yield of 6 qnts/ha in
both the villages, respectively. Peas crop is also grown on 3.50 ha. area in Kalauli
Teer Darla village. Mustard and rapeseed acquires a place in cultivation in villages of
Kalauli Teer Darla, Mohammadpur 13ahun, Tara Gav, Kakethal, Dostinagar and
Darbara on 12.75, 10.47, 8, 6.58, 4.50, and 3.17 ha. area to the total cropped area,
respectively. Highest proportion of area (9.75 per cent) under cultivation of mustard
and rapeseed was seen in Mohammadpur Bahun. Yield of mustard was highest in
Kakethal (30.12 qnts/ha), followed by Tara Gav (28 qnts/ha), Asnahara (24.10
qnts/ha), Dostinagar (16 qnts/ha), Mohammadpur Bahun (14 qnts/ha), Darbara 12.05
qnts/ha) and Kalauli Teer Darla (6 qnts/ha). Groundnut acquired a
411
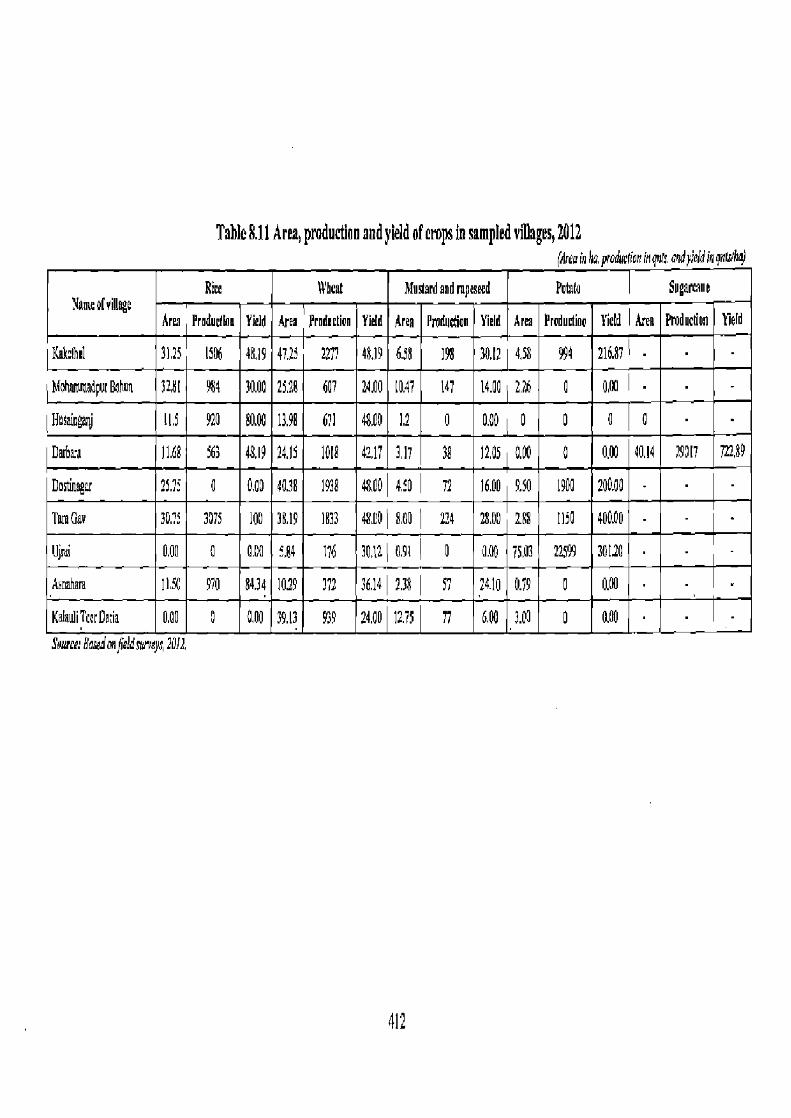
Table 8.11 Area, production and yield of crops in sampled villages, 2012 (Area in haprodudinninq' evdyrefdin gnvehn
Rice Wheat Mustard endrupegeed Patala Sugarcane Vameafvill~¢
Area Proelodma Yield Area Prod.ction Yield Area Produtdon Yield Area Production Yield Area Production field
Cgikahel 31 25 1506
%4
46,19 47.23 2277 48.19 6.58 198 30.12 4,58 994 216.87
Mohaznmadpur6nhun 32,81 10.00 25.28 607 24A0 lO.A7 147 14.00 2.26 0 100 -
baingerj S 910 80.00 1398 671 48.00 1.2 0 0.00 0 0 0 0 •
Dabaa 11.68 563 4519 2413 1D18 42,17 317 38 12,03 0.00 0 0,00 40.14 29011 Il,89
Do64U 2315 0 0.00 40.38 1938 48.01 4.'0 72 16M0 9.50 1900 200.00 -
19reGav 30.75 3075 100 38.19 1633 481018.001 224 28.00 288 1150 400A0 -
ujrni 0,00 0 a00 3,84 11,6 30.121691
36.14 2.38
0
57
0.00
24.10
75.03
0.i9
22599 30110 -
L aha e I13C 970 84,34 1029 372 0 011 •
KataufiTlerje;ia 0.00 0 0.00 39.13 939 24.00 12.75 77 6.00 3.00 0 000 -
Snuree: Benacci,fiaddsveays, 2011,
412

meagre area of only 0.25 ha. in Dostinagar village. Among cash crops, cultivation of
sugarcane is seen only in Darbara village with yield of 722.89 gnts/ha. of the crop.
Highest yield in potatoes was obtained by farmers of Tara Gov (42.17 qnts/ha),
leaving behind the village of Ujrai in which it is grown on about 75 per cent of area.
G. Input Use in Agriculture
a. Farming operations
Generally it is seen that, the supplemental irrigation provides a base for an
increase in cropping intensity. Consequently, the use of inputs in the form of new
seeds, fertilizers, and plant protection chemicals has to be applied for crop
production (Sharma et al., 2008). Farm implements, machinery, and draught animals
(especially if owned by the farmer) can increase substantially on-farm resource-use
efficiency and labour productivity. Several studies have revealed the fact, that tractor
operated farms have provided higher yields of wheat, paddy and sugarcane crops,
and thus produce an increased amount of output per hectare in comparison to non-
tractor/bullock operated farms. Tractor-owned farms invariably use adequate amount
of agricultural inputs and have an efficient control on farming activity in the form of
better seed-bed preparations, timely distribution and placement of seeds and
fertilizers by using seed-turn-fertilizer drills (Singh and Singh, 1972; Pathak el al., 1978; Nandal and Rai, 1987). In another study, Singh and Chancellor (1974) has
highlighted, that tractor operated and tubewell irrigated farms were having
significantly higher yields than the bullock operated farms in case of wheat
cultivation. Tractors are used as multipurpose machinery for different farm
operations.
Table 8.12 shows area cultivated (in percentage) and number of respondents
who are adopting a specific mode of operation, viz, bullock, tractor both, in the
sampled villages.Of the total cultivated area of the villages, in Tara Gay village
farming is carried on 91.80 per cent of area, and nearly 68 per cent of households use
their own tractors for different farming operations. Other than Tara Gay, the farmers
in the villages namely, Darbara, Kakethal and Mohammadpur Bahun also use
tractors for efficient operations on 77.60, 76A4 and 69.22 per cent of area, which
covered 72.41, 55.56 and 56 per cent households, respectively.
In Darbara village sugarcane is the main crop for its successful cultivation
mechanization becomes more important. In the village, the yield of sugarcane has
413
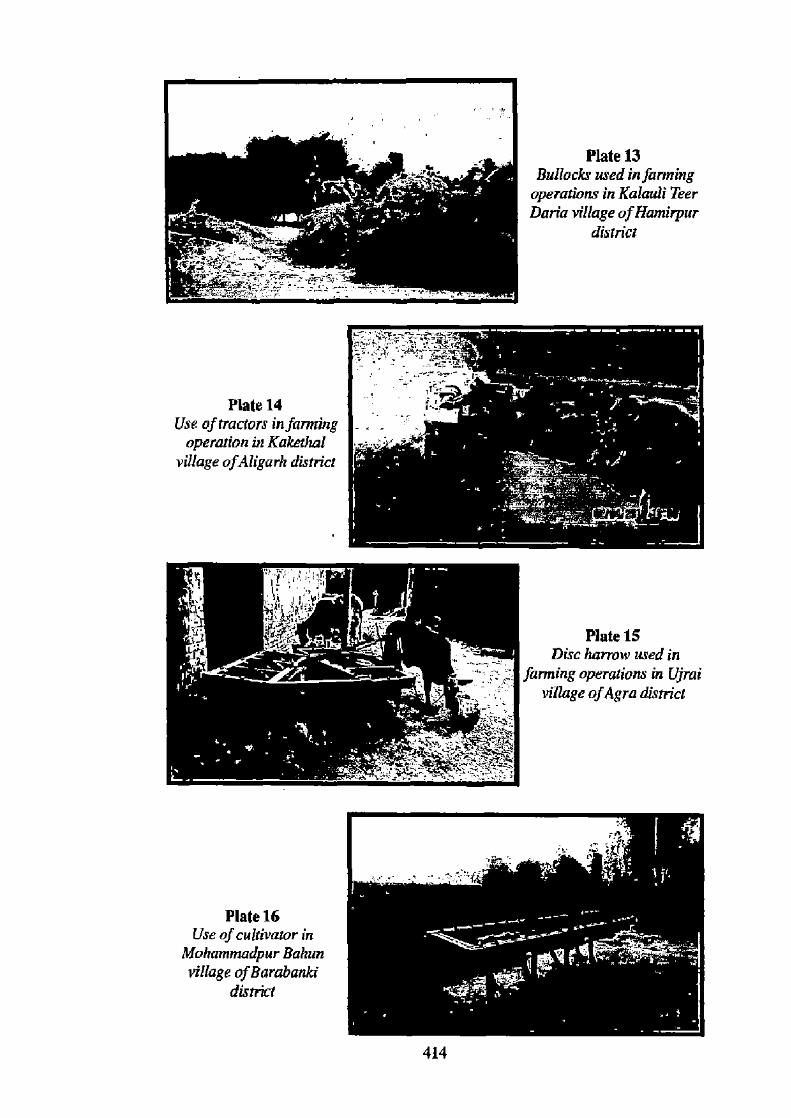
Plate 13 Bullocks used in farming
operations in Kalauli Teer Dacia village of Hamirpur
district
Plate 14 Use of tractors in farming
operation in Kakethal village ofAligarh district
Plate 15 Disc harrow used in
farming operations in Ujrai village ofAgra district
Plate 16 Use of cultivator in
Mohammadpur Bahun village ofBarabanki
district
414
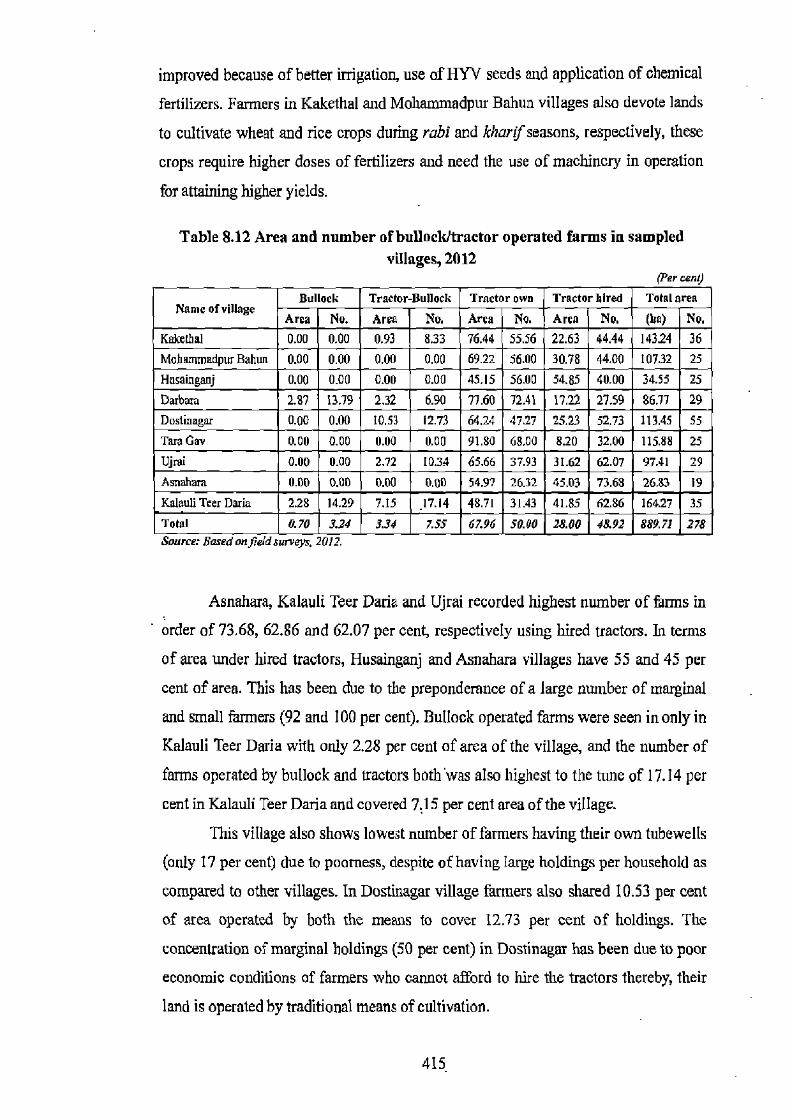
improved because of better irrigation, use of HYV seeds and application of chemical
fertilizers. Farmers in Kakethal and Mohammadpur Bahun villages also devote lands
to cultivate wheat and rice crops during rabi and kharif seasons, respectively, these
crops require higher doses of fertilizers and need the use of machinery in operation
for attaining higher yields.
Table 8.12 Area and number of bullocicltractor operated farms in sampled villages, 2012
(Per cent)
Name of village Bullock Tractor-Bullock Tractor own Tractor hired Total area Arco No. Area ea No. Area No. 0w) No.
Kekelhal 0.00 0.00 0.93 .44 55.56 22.63 44.44 14324 36 MohemmadpurBahun 0.00 0.00 0.00 .22 56.00 30.78 44.00 107.32 25 Husainganj 0.00 0.00 0.00 .15 56.00 54.85 40.00 34.55 25 Darbara 2.87 13.79 2.32
E0.0069.22
.60 72.41 17.22 27.5 886.77 29 Doslinegar 0.00 0.00 10.53 .24 47.27 25.23 52.73 113.45 55 'rara Gay 0.00 0.00 0.00 .80 68,00 8.20 32.00 115.88 25 Ujrui 0.00 0.00 2.72 .66 37.93 31.62 62.07 97.41 29 Asnahara 0.00 0.00 0.00 .97 26.32 45.03 73.68 2633 19 Kalauli Teer Dario 2.28 14.29 7.15 17.14 48.71 31.43 41.85 62.86 164.27 35 Total 0.70 3.24 3.34 7.55 67.96 50.00 28.00 4&92 889.71 278 Source: Based on feeld surveys. 2012.
Asnahara, Kalauli Teer Dada and Ujrai recorded highest number of farms in
order of 73.68, 62.86 and 62.07 per cent, respectively using hired tractors. In terms
of area under hired tractors, Husainganj and Asnahara villages have 55 and 45 per
cent of area. This has been due to the preponderance of a large number of marginal
and small farmers (92 and 100 per cent). Bullock operated farms were seen in only in
Kalauli Teer Darla with only 2.28 per cent of area of the village, and the number of
farms operated by bullock and tractors both' was also highest to the tune of 17.14 per
cent in Kalauli Teer Daria and covered 7.15 per cent area of the village.
This village also shows lowest number of farmers having their own tubewells
(only 17 per cent) due to poorness, despite of having large holdings per household as
compared to other villages. In Dostinagar village farmers also shared 10.53 per cent
of area operated by both the means to cover 12.73 per cent of holdings. The
concentration of marginal holdings (50 per cent) in Dostinagar has been due to poor
economic conditions of farmers who cannot afford to hire the tractors thereby, their
land is operated by traditional means of cultivation.
415
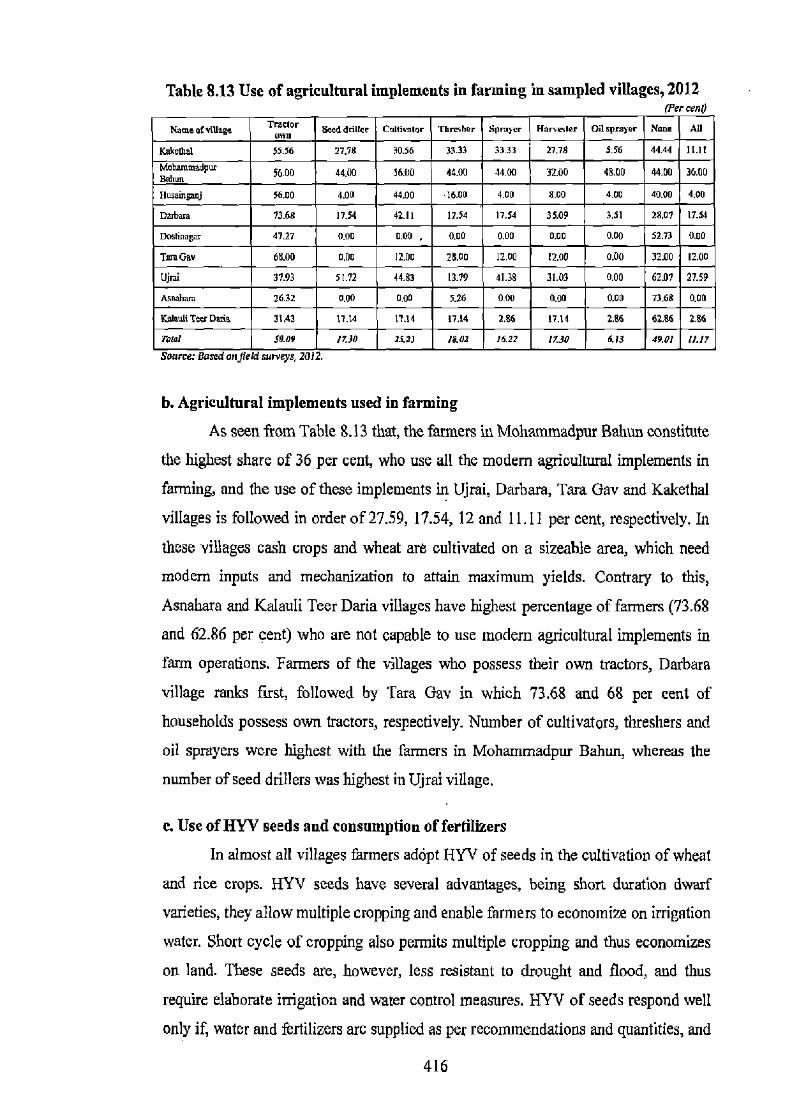
Table 8.13 Use of agricultural implements in farming in sampled villages, 2012 (Per rent)
Namea[Mlage Tractor Seed drUcr CWfivalor Thresher Spr cr Hare,Ier Oil sprayer Nane 6a
RakMal 5556 2],78 30.56 3333 3333 27.78 5.56 44.44 11.11
Mct° w Bahun 56.00 44.00 16,00 4400 4400 32.00 48.00 44.00 36.00
Huzinganj 5600 4.00 44.00 16.00 40D 800 4.00 4000 4.00
Darbara 73.68 1254 42.11 17.54 17.54 35.09 3.51 28.09 17.54
Duslinagar 4121 0.00 000 0,00 000 0.00 000 52.73 000
Tamoav 68.00 0.00 12.00 28.00 12.00 12.00 0.00 32.00 12.00
13jrzi 37.93 5172 44,83 13.99 41.38 31.03 0.00 62.07 27.59
AsvaM1:ua 2632 0.00 0.00 536 000 0.00 0.00 73.68 0.00
Kehuli T. DZria 31.43 ll.t4 1.14 11.14 2.86 17.14 2.86 62.86 2.86
Total 59.09 1230 2123 1802 1622 17.30 G13 4.01 7).17
CWITCG ... Un jiela Surveys, LVIL.
b. Agricultural implements used in farming
As seen from Table 8.13 that, the farmers hi Mohammadpur Bahun constitute
the highest share of 36 per cent, who use all the modem agricultural implements in
farming, and the use of these implements in Ujrai, Darbara, Tara Gav and Kakethal
villages is followed in order of 27.59, 17.54, 12 and 11.11 per cent, respectively. In
these villages cash crops and wheat are cultivated on a sizeable area, which need
modem inputs and mechanization to attain maximum yields. Contrary to this,
Asnahara and Kalauli Teer Dana villages have highest percentage of farmers (73.68
and 62.86 per cent) who are not capable to use modern agricultural implements in
farm operations. Farmers of the villages who possess their own tractors, Darbara
village ranks first, followed by Tara Gav in which 73.68 and 68 per cent of
households possess own tractors, respectively. Number of cultivators, threshers and
oil sprayers were highest with the farmers in Mohammadpur Bahun, whereas the
number of seed drillers was highest in Ujrai village.
c. Use of HYV seeds and consumption of fertilizers
In almost all villages farmers adapt HYV of seeds in the cultivation of wheat
and rice crops. HYV seeds have several advantages, being short duration dwarf
varieties, they allow multiple cropping and enable farmers to economize on irrigation
water. Short cycle of cropping also permits multiple cropping and thus economizes
on land. These seeds are, however, less resistant to drought and flood, and thus
require elaborate irrigation and water control measures. HYV of seeds respond well
only if, water and fertilizers are supplied as per recommendations and quantities, and
416
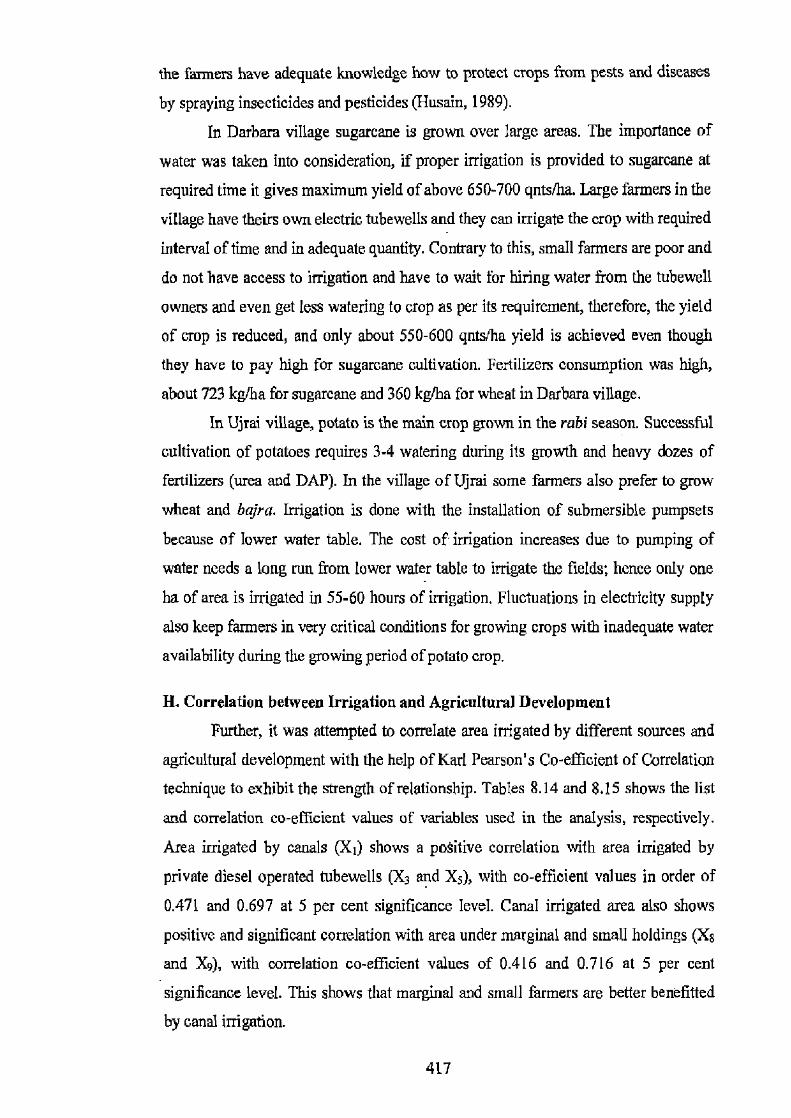
the farmers have adequate knowledge how to protect crops from pests and diseases
by spraying insecticides and pesticides (Husain, 1989).
In Darbara village sugarcane is grown over large areas. The importance of
water was taken into consideration, if proper irrigation is provided to sugarcane at
required time it gives maximum yield of above 650-700 qnts/ha. Large farmers in the
village have theirs own electric tubewells and they can irrigate the crop with required
interval of time and in adequate quantity. Contrary to this, small farmers are poor and
do not have access to irrigation and have to wait for hiring water from the tubewell
owners and even get less watering to crop as per its requirement, tlterefbre, the yield
of crop is reduced, and only about 550-600 gntslha yield is achieved even though
they have to pay high for sugarcane cultivation. Fertilizers consumption was high,
about 723 kg/ha for sugarcane and 360 kg/ha for wheat in Darbara village.
In Ujrai village, potato is the main crop grown in the rabi season. Successful
cultivation of potatoes requires 3-4 watering during its growth and heavy dozes of
fertilizers (urea and DAP). In the village of Ujrai some farmers also prefer to grow
wheat and bajra. Irrigation is done with the installation of submersible pumpsets
because of lower water table. The cost of irrigation increases due to pumping of
water needs a long run from lower water table to irrigate the fields; hence only one
ha of area is irrigated in 55-60 hours of irrigation. Fluctuations in electricity supply
also keep fanners in very critical conditions for growing crops with inadequate water
availability during the growing period of potato crop.
H. Correlation between Irrigation and Agricultural Development
Further, it was attempted to correlate area irrigated by different sources and
agricultural development with the help of Karl Pearson's Co-efficient of Correlation
technique to exhibit the strength of relationship. Tables 8.14 and 8.15 shows the list
and correlation co-efficient values of variables used in the analysis, respectively.
Area irrigated by canals (Xi) shows a positive correlation with area irrigated by
private diesel operated tubewells (X3 and X5), with co-efficient values in order of
0.471 and 0.697 at 5 per cent significance level. Canal irrigated area also shows
positive and significant correlation with area under marginal and small holdings (Xs
and X9), with correlation co-efficient values of 0.416 and 0.716 at 5 per cent
significance level. This shows that marginal and small farmers are better benefitted
by canal irrigation.
417
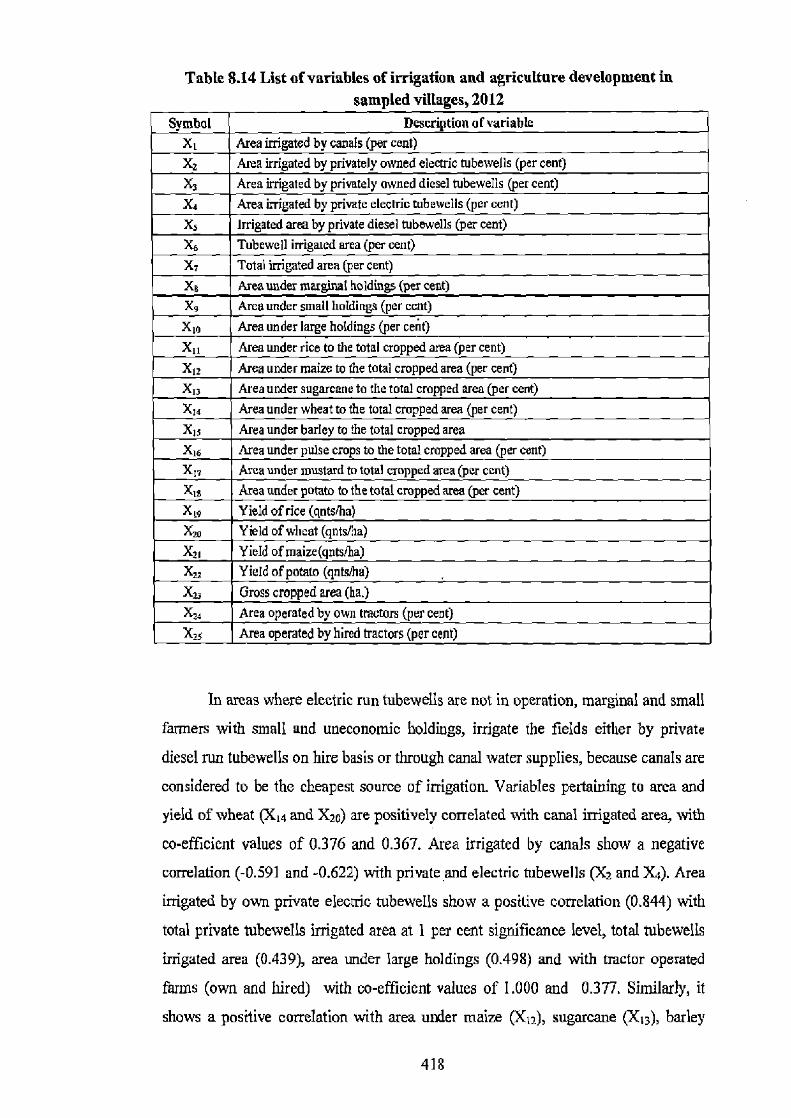
Table 8.14 List of variables of irrigation and agriculture development in sampled villages, 2012
Symbol Description of variable
XL Area irrigated by canals (per cent) Area irrigated by privately owned electric tubewells (per cent) X2
X~ Area irrigated by privately owned diesel tubewells (per cent) X. Area irigated by private electric tubewells (per cent) Xs Irrigated area by private diesel tubewells (per cent) X6 Tubewell irrigated area (per cent) Xr Total irrigated area (per cent) Xa Area under marginal holdings (per cent) Xv Area under small holdings (per cent) Xto Area under large holdings (per cent) X11 Area under rice to the total cropped area (per cent) Xtt Area under maize to the total cropped area (per cent) X13 Area under sugarcane to the total cropped area (per cent) X„ Area under wheat to the total cropped area (per cent) Xis Area under barley to the total cropped area
X,a Area under pulse crops to the total cropped area (per cent) X1v Area under mustard to total cropped area (per cent)
Area under potato to the total cropped area (per cent) Xsa X_ Yield of rice (gntslha) Xp Yield of wheat (gnts/ha) X21 Yield ofmaize(gntsTha) X12 Yield of potato (gnts.+ha) X„ Gross cropped area (ha.) Xz, Area operated by own tractors (per cent)
Area operated by hired tractors (per cent) Xu
In areas where electric run tubewells are not in operation, marginal and small
farmers with small and uneconomic holdings, irrigate the fields either by private
diesel run tubewells on hire basis or through canal water supplies, because canals are
considered to be the cheapest source of irrigation. Variables pertaining to area and
yield of wheat (X14 and X20) are positively correlated with canal irrigated area, with
co-efficient values of 0.376 and 0.367. Area irrigated by canals show a negative
correlation (-0.591 and -0.622) with private and electric tubewells (X2 and X<). Area
irrigated by own private electric tubewells show a positive correlation (0.844) with
total private tubewells irrigated area at 1 per cent significance level, total tubewells
irrigated area (0.439), area under large holdings (0.498) and with tractor operated
farms (own and lured) with co-efficient values of 1.000 and 0.377, Similarly, it
shows a positive correlation with area under maize (X12), sugarcane (X13), barley
418
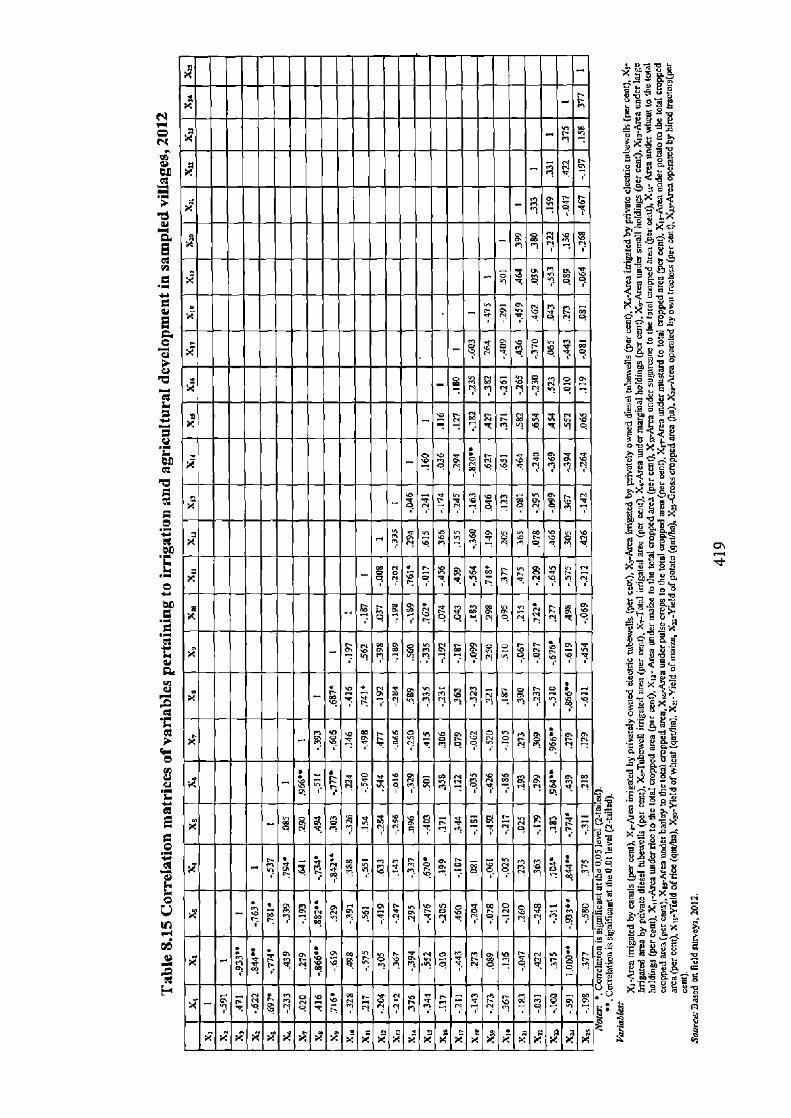
rn
• 1
X $ ry n -
-
%'
- 2 $
k 9 b
k ,
"ry
- - & n
k E N ry
_ R _ S _ CO
K g n
(X20), yield of potato (Xu) and gross cropped area (X23). Diesel operated private
owned tubewells (X3) show a positive correlation with diesel operated tubewells
(0.781 at 5 per cent significance level), area under marginal holdings (0.882 at 1 per
cent significance level), area under small holdings (0.529), area cultivated under rice
and mustard (0,561 and 0.460). Diesel operated tubewells show a negative
correlation with area operated by tractors to the magnitude of -0.844 at I per cent
significance level. Total irrigated area shows a high positive correlation with gross cropped area with co-efficient of correlation value of 0.966 at I per cent significance
level. Gross cropped area (XZ3) is negatively correlated with area under marginal and
small holdings with coefficient values of -0.510 and -0.676 at 5 per cent significance
level.
It is clear from Table 8.15 that, area under owned tractors (X24) indicates a
positive association with irrigated area by private electric tubewells, and the co-
efficient values for this were 1.000 and 0.844 at I per cent significance level, and
negatively correlated with marginal and small holdings (-0.866 and -0.619). Wheat
and rice are two important crops grown in sampled villages. Area under wheat shows
a positive correlation with marginal and small farmers (0.589 and 0.560). Rice
cultivated area is positively correlated with its yield (0.718 at 5 per cent significance
level). It is clear that, in the villages where farmers prefer to grow rice over a large
area, yield is high. Yield of potato is positively correlated with own electric
tubewells and are under large holdings (0.722 at 5 per cent significance level) and
with own tractor operated farms 0.422. Potato cultivation sustains well on adequate
amount of water associated with mechanization to get good returns on large holdings.
Meaning thereby, large farmers cam enough profit from potato cultivation with the
application of irrigation and giving a weightage to the use of farm machinery at the
time when needed in cultivation.
420
References
1. Cantor, L.M. (1967). A World Geography of Irrigation, Oliver and Boyd, London.
2. Carlyle, W.J. (2002). Cropping Patterns in the Canadian Prairies: Thirty Years of Change, The Geographical Journal, Vol. 168, No. 2, pp. 97-115.
3. Census of India (2001). District Census Handbooks of Aligarh, Allahabad, Azamgarh, Barabanki, Bijnor, Hamirpur, Siddharthnagar, Unnao, Village and Town Directory, Primary Census Abstract, Directorate of Census Operations, Uttar Pradesh, Lucknow.
4. Das, P. (2013). Cropping Pattern (Agricultural and Horticultural) in Different Zones, their Average Yields in Comparison to National Average/Critical Gaps/Reasons Identified and Yield Potential, Status ofFarm Mechanisation in India-A Document Published by Department ofAgriculture and Cooperation. Ministry of Agriculture, ICAR, New Delhi, pp. 3347 (http://agricoop.nic.in/Farm%2OMech.%20PDF/05024-02.pdf) Accessed on 5 December, 2013.
5. Husain, M. (1989). Diffusion of High Yielding Varieties of Rice and Wheat in India and Social Tension. In: Food Systems of the World (Eds. M. Shafi and A. Aziz), pp. 53-54, Rawat Publications, Jaipur.
6. Kumar, M.A., Sivacnohnn, M.V.K., and Narayanamoorthy, A. (2011). Irrigation Water Management for Food Security in India: The Forgotten Realities, Institute for Resource Analysis and Policy (TRAP) (http://irapindia.orgllndia-wat-food-challenge-paper2.pdf) Accessed on 24 November, 2011.
7. Nandal, D.S., and Rai, K.N. (1987). Impact of Farm Mechanization on Farm Productivity and Income in Haryana, Haryana Agricultural University (http:/fbooks.google.co.in/bookslabout/Impact_of farm_me_mechanization_ on_farm.html?id=AclaewAACAAJandredir_esc=y) Accessed on 30 December, 2011.
8. Panda, H. (2005). Aromatic Plants Cultivation, Processing and Uses, Asia Pacific Business Press Inc, New Delhi.
9. Pathak, B.S., Panesar, B.S., Singh, C.P. and Verma, S.R. (1978). Effect of Power Sources on Production and Productivity in Ludhiana District-A Survey Report. ISAE North Chapter and ISAE, Panjab Agricultural University, Ludhiana, pp. 34-44.
10, Sharma, BR., Rao, K.V. and Vittal, K.P.R. (2008). Converting Rain into
421
Gain: Opportunities for Realizing the Potential of Rain-fed Agriculture in India. In: India's Water Future: Scenarios and Issues (Eds. U.A. Amarasinghe, T. Shah and R.P,S. Malik), pp. 169-180, IWMI, Colombo, Sri Lanka.
11. Singh, R and Singh, B.B. (1972). Farm Mechanization in Western Uttar Pradesh-Problems of Farm Mechanization Seminar Series IX, Indian Society of Agricultural Economics, Bombay.
12. Srivastava, S.K., Kumar, R. and Singh, R.P. (2009). Extent of Groundwater Extraction and Irrigation Efficiency on Farms under Different Water-market Regimes in Central Uttar Pradesh, Agricultural Economics Research Review, Vol. 22, No. 1, pp. 87-97.
422
CONCLUSION AND SUGGESTIONS
The present research work has enlisted various sources of irrigation and
management of water for agricultural development in the state of Uttar Pradesh.
From the analysis, it can be concluded that, there has been a considerable increase in
gross irrigated area from 17.69 million ha. (67.59 per cent) to 19.24 million ha.
(76.62 per cent) in the state during the periods of 1995-2000 and 2005-10. Central
region of the state recorded the highest positive growth in gross irrigated area,
whereas its growth in western region has been negative. The number of districts
almost doubled, having 85 per cent of gross irrigated area during 1995-2000 to 2005-
10, and most of the growth was confined to Awadh and Purvanchal regions of the
state. It is evident from the study that, net irrigated area was high in almost all the
districts, except some districts of Bundelkhand and northeastern tarai belt of the
state. Net irrigated area has been positive with a growth of 3.88 and 2.33 per cent
during the periods of 1995-2000 to 2000-05 and 2000-05 to 2005-10, respectively.
The Bundelkhand and central regions of the state have also shown a high positive
growth in net irrigated area in the respective periods. Area irrigated more than once
acquired a strong hold, to become almost doubled with a growth of 99.57 per cent
during 1995-2000 to 2000-05. The districts belonging to eastern region of the state
achieved the highest growth in area irrigated more than once, as against the
Bundelkband region which was characterized with negative growth during both the
periods.
While examining the sourcewise growth in irrigated area, it was observed
that, it has been significant in groundwater (tubewell) development in the state
because of inherent weaknesses in maintenance and operational efficiencies of the
surface water (canal) irrigation. Evidently, water conveyance loss in irrigation
through canal is twice that of tubewell irrigation. Among different sources of
irrigation, tubewells play a significant role in enhancing the extent of net irrigated
area. Tubewefls have become the most important source of irrigation as they irrigate
more than 70 per cent of cultivated area in the state. Above 90 per cent of area was
irrigated through tubewells in the districts of Baghpat, Farrukhabad, Bahraich,
Gorakhpur and ShahjahanpuL The districts of Bundelkhand region and Sonbhadra of
Purvanchal show a remarkable progress in tubewell irrigation and achieved a growth
of above 20 per cent during the period of 2000-05 to 2005-10. In spite of the
423
achievements, Bundelkhand still considered to be backward region in respect to
irrigation, as only 40 per cent of its total cropped area receives irrigation.
Area irrigated through canal was very high in the districts of Chandauli,
Sonbhadra and Mirzapur of Purvanchal region, and Jalaun of Bundelkhand region.
The districts belonging to central part and Bundelkhand region of the state registered
a negative growth of -14.98 and -8.32 per cent, respectively in canal irrigated area.
With the exception of Bundelkhand region, there has been a rapid decrease in area
irrigated by government tubewells in all other regions of the state. These tubewells
share a low percentage (about 3 per cent) in net irrigated area in the state. Irrigated
area by other wells recorded a significant growth to the tune of 122.64 and 57.23 per
cent in central and western regions, respectively during the period of 1995-2000 to
2000-05.
Annual growth rates calculated for the last 15 years from 1995-96 to 2009-10
show a positive growth of 0.96 and 0.85 per cenVannum in gross and net irrigated
area, respectively of the state. Highest positive growth was seen in the districts of
Ambedkar Nagar, followed by Kanpur Nagar, Sitapur and Bahraich, whereas lowest
negative growth was recorded by the districts of Sonbhadra, Varanasi, G.B.Nagar and
Etah. The districts possessing high growth rate per annum in area irrigated more than
once mainly belonged to Purvanchal region of the state, including the districts of
Jalaun and Jhansi of Bundelkhand. Area irrigated through canal recorded a negative
growth of -1.57 per cent per annum in the state. Highest positive growth in canal
irrigated area was recorded in the districts of Gonda and Ambedkar Nagar in contrast
to a negative growth achieved by the districts of Varanasi, Rampur, Baghpat, Bareilly
and Basti. Very high growth in tubewell irrigated area was noticed in the districts of
Bundelkhand region namely, Lalitpur, Mahoba and Chitrakoot, and also including
Ambedkar Nagar ofAwadh plains.
As regards the growth in cropwise irrigated area, cash crops and cereals were
highly irrigated crops to the extent of about 94 and 82 per cent of area sown under
these crops, and showed a growth of 1.13 and 1.04 per cent per annum, respectively
during the period of study. The districts representing Awadh and Purvanchal regions
along with Kanpur Nagar of lower doab recorded a high growth per annum in
irrigated area under cereal crops. High percentage of growth in area irrigated under
cash crops was seen in the districts of middle-lower doab and Awadh plains of the
state. For state as a whole, the growth in area irrigated under pulses and oilseeds was
424
in negative order. For pulses, the growth was high in the districts of lower doab and
the Bundelkhand region. The districts of Lalitpur and Bijnor showed the highest
growth in irrigated area under oilseeds. The analysis indicates that, average irrigation
intensity for the whole state was nearly 145 per cent during 2005-10. Western districts
of the state were fortunate to have high irrigation development. Consequently, the
districts of Rohilkhand plains and upper doab region showed very high irrigation
intensity. Very low irrigation intensity was observed in the districts of Bundelkhand
region.
It is evident from the results of the analysis that, the levels of irrigation
development have not been uniform and wide disparities exist in different regions.
The districts of western part were much benefitted during the green revolution phase
and show very high and high levels of irrigation development whereas, all the
districts of Bundelkhand region, and Trans-Ghaghara plain including a detached
district of Sonbhadra lying in southeastern corner of the state showed a contrasting
picture, with low and very low irrigation development need special attention.
It is a fact that, due to increased pressure of population on land, area and
number of marginal land holdings increased during the period of 2000-01 to 2005-06. This has been due to a decrease in area and number of other categories of
holdings. It further shows that, there is a dominance of marginal holdings in eastern
part of the state. Marginal holdings make farm mechanization rather uneconomical,
hence the farmers of the eastern districts are unable to realize the full benefits of
modem farm technology in spite of having fertile agricultural lands and adequate
potentials of underground water resources. Comparatively, farmers of Bundelkhand
region possess enormous area under large holding category possibly due to low
population base and consequently, lesser land division resulting in a high man-land
ratio. But owing to poor quality of land in this region, the cultivation remains
uneconomic.
Use of inputs in agriculture records significant variations in the state.
Fertilizers distribution and consumption have recorded a considerable increase. The
districts of middle doab, Awadh and Purvanchal regions show a significant increase
in consumption of fertilizers, which has been possible due to an increase in irrigated
area. The districts of upper doab and Rohilkhand plains are seen highly mechanized,
having tractor density of above 45 (tractors per thousand hectares of gross cropped
area). Fertilizers consumption and tractor density show a strong positive relationship
425
with irrigated area. In areas where irrigation development has been high, both
fertilizers and tractor use was quite high than that of the districts marked with low
irrigation development.
During the period of 1995-96 to 2009-10, there have been considerable
changes in agricultural land use pattern in the state. Gross and net cropped areas were
high in the districts of Rohilkhand and doab regions, including some districts of
Purvanchal region, these was above 75 per cent of area cropped more than once. The
extent of gross cropped area was lowest in the districts of Sonbhadra, Mirzapur,
Lalitpur and Chitrakoot, because of low irrigation development, and a very small
area brought under multiple-cropping. Area cultivated more than once was high in
the districts of upper-middle doab, Rohilkhand, Barabanki of Awadh plains, and
some districts of Purvanchal region because of high irrigation development.
With regard to cropping patterns, cereals were dominant among all crops
covering about 70 per cent of area to gross cropped area of the state, and the share of
pulses was about 10 per cent, which acquired the largest share in cultivated land,
mainly in the districts of Bundelkhand region. Oilseeds covered the highest area in
cultivation in the districts of Jhansi, Agra, Jalaun and Mathura because of a
considerable area devoted to mustard and rapeseeds, and til in cultivation. Cash crops
covered an area equal to the area under pulse crops. Wheat dominates among cereals
throughout the region, and rice is the second important crop which dominates in the
Trans-Ghaghara region and Purvanchal region. With respect to growth in area,
production and yield, cash crops have shown a positive growth in area at the expense
of negative growth in pulses and oilseeds. Among cereal crops, wheat, rice and bajra
recorded an increase in area, production and yield. Negative growth was observed in
area, production and yield of other cereal crops (maize, jowar and barley). An
impressive increase in area and production of wheat and rice crops have been due to
technological breakthrough in cultivation of these, combined with price support,
market infrastructure and less yield risks. These factors altogether have made rice
and wheat more profitable in comparison to other crops. Among pulses, urad and
masoor showed an increasing trend. Growth in yields of soyabean, ril, mustard and
rapeseed was positive among oilseed crops. Sugarcane dominates in cultivation,
mainly in the districts of upper Ganga-Yamuna doab and Rohilkhand plains showing
positive growth in area and production, but a marginal decrease in yield per annum.
Growth in area, production and yield of potatoes was positive.
426

A complex picture of crop-combinations emerged in the state, ranging from
monoculture/single crop-combination, which dominates over the districts of
Muzaffarnagar, Meerut, Baghpat, Mathura, Bijnor, S.R.Nagar, Gorakhpur, Lucknow
and Unnao to six crop-combination regions in the districts of Kanpur Dehat and
Lalitpur of Awadh and Bundelkhand regions, respectively. Two crop-combinations
were dominant in the districts of Purvanchal region and in some pockets of upper
doab, Awadh and Rohilkhand plains with wheat-rice, rice-wheat and sugatcane-
wheat emerged as common crop components. Three crop-combinations were seen in
middle doab, Rohilkhand and northern districts of Awadh plains. The districts of
Bundelkhand region present more complex combinations (four, five and six
combinations). It can be concluded from the foregoing description that irrigation
development has provided an opportunity to the farmers to adopt crops requiring
much water and highly remunerative, like wheat, rice and cash crops. In addition, it
is revealed from the analysis that, the districts marked with least irrigation
development have more complex crop-combinations.
In general, cropping intensity is high in regions with higher percentage of net
irrigated area and high intensity of irrigation. As illustrated that, the districts
belonging to western parts of the state show significantly higher intensity of
cropping, whereas, the districts of Bundelkhand have a contrasting picture with low
irrigation development, hence low cropping intensity. The study has established a
positive correlation between cropping intensity and irrigated area The regression
analysis has also confirmed that, there is a significant and positive association
between tubewell irrigation and intensity of cropping. High cropping intensity was
confined in the districts marked with high irrigation development, securing a large
area within the category of area irrigated more than once, which depicts a strong
positive relationship with net irrigated area and area irrigated more than once.
Tubewell irrigation has a dominant role in raising the intensity of cropping. It is
considered to be the most reliable source of irrigation and assures farmers to refrain
from the risks associated with the vagaries of monsoon, and encourages them to
cultivate land intensively. In contrast, canal irrigated area shows a low and negative
relationship. A negative correlation was also observed in canal irrigated area, and net
irrigated and area irrigated more than once. Irrigated area by other wells and tanks
presented a value which bears high negative correlation.
427
Crop productivity regions delineated for major groups of crops: cereals,
pulses, oilseeds and cash crops by applying Yang's Crop Yield Index method show
very interesting results. High productivity regions for cereal crops were mainly
confined to western parts of the state and the districts belonging to the Ganga-
Yamuna doab and Rohilkhand plains. Whereas, low productivity regions form the
part of Bundelkhand and Purvanchal region during all the periods of study.
Productivity of pulses was high in the regions of Rohilkhand, middle and lower
doab, and least developed regions in pulses productivity were in the northeastern
comer of the state and Bundelkhand region. Productivity of oilseeds was found high
in the entire Ganga-Yamuna doab. High productivity of cash crops was noticed in
few districts lying in the upper and middle doab. It is important to mention that
Awadh, Purvanchal and Bundelkhand were all demarcated as low productivity
regions in cash crops.
Productivity indices computed for all crops and aggregated for the cereals,
pulses, oilseeds and cash crops present a composite index that show, high
productivity was recorded in the districts lying in the Ganga-Yanmna doab and
Rohilkhand plains of the state. Contrary to this, low productivity regions were
confined to Bundelkhand region. High positive correlation was seen between
irrigation and crop yield indices. Therefore, it is worth mentioning that, productivity
levels are in harmony with the development of irrigation in the state.
Water saving devices in the state are very much poor due to paucity in rural
infrastructure, particularly rural electrification, relative water abundance, shallow
groundwater in most areas, and very small size of operational holdings. Thus, water
productivity (WP) of crops is low. Sugarcane achieved highest WP, and it was lowest
for rice crop. High WP of wheat (above I kg/m3) was seen in the districts belonging
to western parts of the state because•higher yields in wheat were due to low
evapotranspiration losses. On the other hand WP of wheat was lowest in
Bundelkhand and Purvanchal regions. WP of sugarcane is highest (above 3 kgtm3);
even it requires Comparatively more water than other crops. This is mainly because
of higher yields of crop. For rice crop, WP was high in northeastern districts forming
a part of tarai belt. WP of maize was seen high in the districts of the Ganga-Yamuna
doab and Rohilkhand plains. It was confirmed with the analysis of correlation and
regression that, there is a positive correlation between yield and WP of the crops,
whereas, CWU and WP show a negative correlation.
428
From the foregoing analysis, it can be concluded that irrigation plays a
significant role in overall agricultural development of the state. In terms of overall
irrigation and agricultural development, the districts of upper-middle doab and
Rohilkhand plains form the most developed regions. Only few districts belonging to
eastern parts namely, Ambedkar Nagar, Azamgarh and Ghazipur were characterized
as highly developed with respect to irrigation and agriculture development. Contrary
to this, the districts of Bundelkhand region, few districts of northern Awadh plains,
and the districts of Sidd1tarthnagar, Mirzapur and Sonbhadra of Purvanchal region
were characterized as backward on the basis of irrigation and agricultural
development.
It was further observed that, on the basis of other selected indicators of
agricultural development (land use, technology and agricultural production) the
southern districts of the state were placed-at the bottom of the list. Moreover, the
results of correlation and regression analyses confirm that, irrigation development
has a strong positive relationship with agricultural land use, technology, agricultural
production, rural infrastructure and agricultural development.
The result of primary surveys in nine sampled villages revealed that, tubewell
is a major source of irrigation and irrigates large areas (about 94 per cent). In villages
where canal water is available, farmers prefer to irrigate the fields only during rainy
season when water is abundantly available in canal. Most farmers who cultivate
crops by using canal water are marginal holders who can not afford to install
pumpsets or tubewells. They have to rely on water to be obtained on hire basis,
which they get from large farmers owning pumpsets and tubewells. Buying of
pumpsetltubewell water is preferred by the farmers who possess small and
fragmented holdings. Electric operated privately owned tubewells are dominant in
villages of Darbara, Ujrai and Kakethal, where tubewells are considered to be the
most reliable source of taping groundwater. Farmers in Darbara, Kakethal and Ujrai
villages preferred to grow cash crops (sugarcane and potatoes), wheat and rice. The
advantage to the farmers in their native villages is that forming the part of western
U.P, the provisions of irrigation have been developed during the phase of green
revolution. Whereas, in villages of Dostinagar, Mohammadpur Bahun and Asnahara,
where a large number of farms have marginal holdings and form parts of the central
and eastern U.P. Farmers have to face fluctuations in electricity supply, hence diesel
operated tubewells are necessary for irrigation. Net irrigated area is high in Darbara
429
and Kakethal and low in Ujrai and Asnahara villages. Irrigation intensity was high in
Ujrai and Mohammadpur Bahun villages because of the cultivation of cash crops and
mint, respectively, which require adequate amount of water during the cultivation
period. Primary surveys reveal that, the use of inputs (fertilizers, seeds and
machinery) is constrained in canal irrigated and government tubewells irrigated areas
due to the poor efficiency and higher risks associated. Probability of inputs use at
right time and in adequate amount declines with the size of holding, due to the fact
that, both the irrigation efficiency and access to resources is poor in case of marginal
and small farmers. `Most productive agriculture' is found in villages with area
privately irrigated by tubewells and preponderance of large land holdings. Results of
the study show that, tractors operated farms were high in Tam Gay, Darbara,
Kakethal and Mohammadpur Bahun because of having high percentage of tubewell
irrigated area. The villages of Asnahara, Kalauli Teer Daria have the largest number
of hired tractors in use because of the preponderance of either the marginal holdings
or the poor status of farmers. Agricultural operations in Kalauli Teer Daria village are
carried out with the use of bullocks. Numbers of agricultural implements are high in
Mohammadpur Bahun village. Seed drillers were large in numbers in Ujrai village,
and mostly used in potato cultivation. Most marginal and small farmers depend on
canal water for irrigation, and a large number of diesel operated tubewells also
irrigate the land in canal irrigated areas. The extent of gross cropped area is low on
farms with marginal and small holdings. Tractor use intensity was high on private
electric tubewells operated farms. Yield of cash crops has been relatively high in
areas of electric tubewells and on tractor operated farms.
Suggestions
Some suggestions for developing irrigation in least developed areas of the
state for the development of agriculture can be taken into consideration as follows:
Cereal crops (wheat and rice) have created serious imbalances in cropping
pattern which cause regional disparities and instability in production of other crops.
To improve the situation, the components of green revolution strategy have to be re-
examined, These include the evolving of HYV of seeds, pest and drought resistant
varieties of all crops particularly, the coarse grains, millets, pulses and oilseeds;
exploiting the untapped potential (mostly in ill irrigated areas), realizing the full
430
potentials of fertilizers use, development and management of irrigation facilities, and
market expansion. Government's role in supplying the inputs on subsidized basis to
farmers will be appreciable in rain-fed areas, so that the crops can be grown suited to
agro-climatic conditions successfully. It is needed, that in Bundelkhand and
Purvanchal regions, the state government should provide credit to poor farmers on
easy rate of interest, so that they can get the opportunity to purchase the agricultural
inputs: $YV of seeds, fertilizers and farm machinery, needed on farms.
The goverwnent has taken initiatives to step up the production of pulses.
Setting of the Indian Institute of Pulses Research at Kanpur is a step in the right
direction and that acts as a national centre for basic and applied research on pulse
crops. To promote pulses cultivation, enhance productivity and reduce production
cost, post-harvest losses and handling charges of pulse crop production, attention is
urgently required. I-IYVs and short-duration crops suitable to local conditions are
being developed in different parts of the state and popularised. Pulses require being
stored under optimal humidity conditions to prevent them from post-harvest losses.
For improvements in pulse production, innovative techniques, particularly the
mutation breeding techniques, are needed. There is a need to develop early maturing
varieties for multiple cropping. Priority should be given to develop integrated pest
and disease management schedules. Pulses cultivation is generally perceived by
farmers as a risk hence crop insurance schemes should be extended to farmers who
intend to bring their land under pulse crops.
Purchasing of improved varieties of pulses is difficult to many farmers due to
the lack of concerned seed stores. Infestation of pest and diseases and lack of plant
protection measures are other important constraints. One of the most important
constraints to pulses production is lack of proper markets. It has been observed that,
government's procurement policy for pulses has not been as effective as in case of
cereals and other crops. To encourage pulses production, similar mechanisms as for
rice and wheat procurement needed to be evolved. Price and yield risks for pulses
have been much higher than those of rice and wheat, because pulses are more prone
to risk due to crop failure in comparison to rice and wheat.
Importance of pulses in maintaining food security as well as nutritional
security has been felt since very long. Production of pulses definitely needs to be
increased manifold to meet the demand in coming years. Farmers grow pulses on the
marginal lands with minimum inputs. There is enormous potential for pulse
431
cultivation in irrigated areas. Adoption of improved varieties of pulses should be
emphasized, and transfer of technology pertaining to pulses should be strengthened
in farmers' participatory mode with active involvement of multidisciplinary team of
scientists. Creation of Informal Seed Village System is required, wherein farmer to
farmer seed production and distribution chain will ensure easy availability of quality
seeds. Farmers need training to incorporate improved harvesting methods,
standardization and grading, improved packaging and handling of grains for proper
storage, etc. for profitable marketing.
Moisture conservation or rain-water management should receive due
attention as there is a strong contemporaneous relationship between moisture
conservation and crop-centred technologies. Developing drought resistant varieties of
seeds to sustain with low rainfall and to protect themselves from foliar diseases
should be emphasized. In most dryland areas, output surpluses for marketing remain
very low. This in turn results in localisation of demand for a number of commodities
and poor market infrastructure facilities. Weak market infrastructure sometimes leads
to decline in market prices for commodities in post-harvest period for three to four
weeks. Further, the crops grown on dry lands generally spread thinly over large areas
and thus could make intervention of public agencies due to which overhead costs
become very high. For this, the Commission on Agricultural Costs and Prices has
recommended that, state governments should make adequate arrangements for timely
purchasing of crop commodities.
Technological changes to improve water productivity of crops by raising the
yields hold a better promise in the state. In canal command areas, farmers should be
given subsidies to install small pumpsets and the construction of warehouses should
be regulated for crop storage. This would result in a greater control over "water
delivery" and better quality of irrigation to achieve higher water efficiency and WP.
Through "water control" interventions either through micro-irrigation technologies;
water delivery control devices such as the storage, particularly in case of surface
irrigation can help to achieve control over water, and reduce non-beneficial
depletions of applied water and maximizing the consumptive use fractions of applied
water. Improvement in quality of irrigation (adequacy and reliability of applied
water) would significantly impact on crop yield and WE
Improvements in crop productivity by genetically methods can further
contribute much in the realm of possibility. These methods, at the same time, can
432
significantly raise WP of crops, if such improvements are adopted with the aim to
save water. Better water management is needed for the supply of water in canal
irrigated areas in the concerned districts so that the farmers can get water in
accordance with their actual needs. The pricing of water must be regulated according
to the needs and capability of the farmers, and controlling the wasteful use of water.
In dry areas of Bundelkhand region of the state, farmers depend on rainfall for cereal
production. Yield of these crops can be increased by using supplemental irrigation,
which entails harvesting run-off water, storing it in ponds, tanks or small dams, and
applying it during critical crop growth stages. It will allow earlier planting of crops,
while the planting date in rain-fed areas is determined with the onset of monsoon.
Supplemental irrigation allows the farmers to select the date of sawing precisely,
which will help in improving crop productivity.
Irrigated farming, in general is very wasteful as it uses more water, partly due
to farmers' lack of knowledge of water requirement of crops. Recent researches have
led to a drastic revision of these ideas, and it is now generally accepted that irrigation
in an area, at a given time requires the same amount of water almost irrespective of
the crop being grown. Therefore, the farmers should grow crops which give highest
economic returns per unit of area and per unit of time. The most critical stages of a
crop are seedling and flowering. Irrigation should be applied at these critical stages
of growth under limited water supply conditions. As irrigation facilities are extended
to new areas, farmers in those areas have a choice to grow rice in kharif and wheat in rabi season. Farmers need advice on spot and demonstrations pertaining to water
management practices for increasing crop production under limited water supply
conditions. There should also be sincere efforts to provide knowledge for transferring
water management methods and practices to the farmers. When water supply is
limited, the proper water conveyance and land development (levelling, grading etc.)
are important steps to minimize water losses.
Installation of deep tubewells should be financed with subsidy and supply of
chemical fertilizers be regulated by the government at subsidized rates to farmers in
rain-fed districts in Bundelkhand region. In areas where irrigation is provided
through tubewells, there should be least fluctuations in electricity supply to achieve
greater efficiency in irrigation water use. Water Use Efficiency (WUE) is as low as
30-35 per cent in rice crop whereas, average WUE in other crops ranged from 45 to
50 per cent. Hence, it is necessary that, attention should be focused on efficient water
433

management practices for rice cultivation without compromising it yield levels. For
conserving water, the entire areas under sugarcane by tubewell need to be covered
under drip irrigation. Drip irrigation cart bring improvements in output and optimize
the use of fertilizers and other nutrients.
Achievements in rain-fed agriculture are associated with new crops,
supplemental irrigation, deficit irrigation, rainwater harvesting, and precision
irrigation. Dry fanning techniques in low rainfall and water scarcity areas can avert
the ill effects of droughts. Deficit irrigation has been widely investigated as a
valuable strategy for dry regions where water is the limiting factor. Genetically
modified varieties of seeds, if adopted and introduced can sustain on minimum
moisture in water scarcity districts. Subsidy on farm inputs or special package of
farm incentives should be given to poor farmers, for improving irrigation facilities
for the betterment of agriculture.
According to Famine Enquiry Commission (1945), different sources of
irrigation are complimentary and supplementary rather than competitive. The
problem of water supply can not be solved by mere extending application of any
particular method of irrigation but by using all the methods combined. Moreover, for
getting the maximum benefit from irrigation, a region requires firstly, an increase in
number of canals, tubewells and tanks etc. Secondly, the loss of irrigation water
through evaporation and seepage must be reduced based on the techniques suggested.
Thirdly, those techniques should be adopted which involve less investment and can
lift water to a higher level, if required. Lifting of water to a higher level is regulated
either by man power, bullocks or mechanical power, such as oil engine with pump or
electric motor attached with pump. And fourthly, in parts of the country, the methods
of irrigation being used are not much efficient. The selection of a most suitable
irrigation method for each field, carefully applied, can definitely bring
transformation of agriculture by increasing crop yield.
Expansion of area under irrigation can greatly increase agricultural
productivity; much can also be achieved by increasing yields on land already
irrigated. Bringing new land under irrigation is usually both time-consuming and
costly. Increasing yields on land already irrigated contribute to maximize the returns
from costs that have already incurred. Improvements in irrigation efficiency or
supplemental irrigation can double or triple production in many existing irrigated
areas. Better irrigation practices could result in enormous savings.
434
It was found during surveys in the villages that, electric supply has not been
regular. Assured electric supplies in rural areas with affordable cost will not only help
the farmers in reducing the cost of crop production but also the judicious use of
groundwater for irrigation.
The government has incorporated some policies and programmes for the
better management and conservation of water resources in different states and also in
the state of Uttar Pradesh. Some of them are as discussed below:
Methods for enhancing groundwater recharge through rainwater harvesting or
through different soil conservation measures along with training of farmers
pertaining to judicious use and management of available groundwater would help in
sustaining this vital natural resource. Artificial Groundwater Recharge (AGWR) has
the capacity to alleviate the stress in groundwater overexploited areas. A total of 83
projects for the construction of 1488 artificial recharge structures (amounting to T
839.24 million) have been approved in the 11a Five Year Plan (2007-2012) and a
sum of! 646.98 million was released to 20 states by 3l" December 2011. At least
568 recharge structures were completed till December, 2011.
Formation of a group of water users/farmers known as Participatory Irrigation
Management (PIM) is a formal body made for the purpose of managing parts or
whole of an irrigation system. This body is often called Water User's Association
(WUA). PIM implies the involvement of water users in levelling the management of
water including planning design, construction, maintenance and distribution as well
as financing. The primary objective of PIM is typically to achieve better availability
and utilization of water through a participatory process that gives farmers a
significant role in the management decisions of water in their hydraulic units.
As irrigation is one of the six components for development of rural
infrastructure under `Bharat Nirman', the Ministry of Water Resources in
collaboration with State Governments is responsible for creation of additional 10
million hectares of irrigation capacity during four years from 2005-06 to 2008-09.
The target for creation of irrigation potential under Bharat Nirman was proposed to
be met through completion of on-going major and medium irrigation projects,
Extension. Renovation and Modernization (ERM) of major and medium irrigation
projects, surface water minor irrigation projects and ground water minor irrigation
projects. Emphasis has also been laid on repair, renovation and restoration (RRR) of
435
water bodies. The `National Water Mission'12 has been formulated by the Ministry of
Water Resources with the main objective of "conservation of water, minimizing
wastage and ensuring its more equitable distribution both across and within states
through integrated water resources development and management". Five identified
goals of the Mission are: (i) a comprehensife water data base in public domain and
assessment of impact of climate change on water resource; (ii) promotion of citizen
and state action for water conservation, augmentation and preservation; (iii) to focus
attention on vulnerable areas including over-exploited areas; (iv) increasing water
use efficiency by 20 per cent, and (v) promotion of basin level integrated water
resources management in the state of Uttar Pradesh
To sum up, agricultural development relies on a perfect combination of
irrigation and other farming inputs together with physical characteristics of the
component areal unit. There are inter-regional variations in sources of irrigation
water and development that have led to uneven development in agriculture in the
state. Thus, for an overall development of agriculture, efforts should be made in a
sustainable manner. The scope of this research work presented in the form of thesis,
so far exists to locate the backward districts in the state of Uttar Pradesh with
reference to irrigation and agricultural development, and to suggest some remedial
measures for irrigation and agriculture development in these districts.
"National Water Mission was approved by Honorable Prime Minister's Council on August 30, 2010 and by the Union Cabinet on April 6, 2011.
436
BIBLIOGRAPHY
1. Abrol, I.P. and Sangar, S. (2006). Sustaining Indian Agriculture: Conservation Agriculture the Way Forward, Current Science, Vol. 91, No. 8, pp. 1020-1025.
2. Agro-Economic Research Centre (AERC) (2006). Impact of Shallow Tubewell Irrigation on Crop Production in India, Agricultural Situation in India, Vol. 63, No. 1, pp. 47-54.
3. Ahluwalia, M.A. (1978). Rural Poverty and Agricultural Performance in India, The Journal of Development Studies, Vol. 14, No. 3, pp. 298-323.
4. Abmad, R. (1999). Growth of Agriculture in the Last Fifty Years, Agricultural Situation in India, Vol. 46, No. 1, pp. 9-14.
5. Ansari, N. (1968). Economics of Irrigation Rates: A Study in Punjab and Uttar Pradesh, University of Delhi, Agricultural Economics Research Centre, Asia Publication House.
6. Ayars, J.E., Christen, E.W. and Hombuckle, J.W. (2006). Controlled Drainage for Improved Water Management in Arid Regions Irrigated Agriculture, Agricultural Water Management, Vol. 86, Nos. 1-2, pp. 128-139.
7. Azam, S.F. (1998). Irrigation andAgricultural Development, B.R. Publishing Corp., New Delhi.
8. Banerjee, S. (1986). Regional Imbalances in the Agricultural Development in Madhya Pradesh, Northern Book Centre, New Delhi.
9. Barker, R. (1984). Irrigation Development in Asia, Past Trends and Future Directions, Connell University, Ithaca.
10. Bhalla, G.S. and Singh, G. (1997). Recent Development in Indian Agriculture: A State Level Analysis, Economic and Political Weekly, Vol. 32, No. 13, pp. A2-A18.
11. Bhatia, B.M. (1988). Indian Agriculture: A Policy Perspective, Sage Publications, New Delhi.
12. Rhatia, S.S. (1967). Spatial Variations, Changes and Trends in Agricultural Efficiency in Uttar Pradesh, Indian Journal ofAgricultural Economics, Vol. 22, No. 1, pp. 66-80.
13. Birkenholtz, T. (2009). Groundwater Govertmtentality: Hegemony and
437

Technologies of Resistance in Rajasthan's (India) Groundwater Governance, The Geographical Journal, Vol. 175, No. 3, pp. 208-220.
14. Birkenholtz, T. (2009). Irrigated Landscapes, Produced Scarcity, and Adaptive Social Institutions in Rajasthan, India, Annals of the Association of American Geographers, Vol. 99, No. 1, pp. 118-137.
15. Blandford, H.P. (1986). Hot Winds of Northern India, Memoires of the Indian Meteorological Department, Vol. 6, No. 6, pp.162-163.
16. Briscoe, J. and Malik, R.P.S. (2005). India's Water Economy: Bracing for Turbulent Future, World Bank, Agriculture and Rural Development Unit South Asia Region, Oxford.
17. Burman, R.R., Singh, S.K., Singh, L. and Singh, A.K. (2008). Extension Strategies for increasing Pulses Production for Evergreen Revolution, Indian Research Journal of Extension Education, Vol. 8, No. 1, pp. 5-8.
18. Chand, R. (2009). Demand for Foodgrains during Il°i and Towards 2020, Policy Brief 28, National Centre for Agricultural Economics and Policy Research, ICAR, New Delhi.
19. Chand, R., Prasanna, P.A. and Singh, R. (2011), Farm Size and Productivity, The Financial Express (http://www.financiatexpre-ss.com/news/farm-size-and-productivity/820977/0) Accessed on I" February, 2013,
20. Chandra, S., Singh, A.K. and Chauhan S.K. (2000). Indigenous Technology in Water Management for Sustainable Agriculture, Indian Farming, Vol. 49, No. 11, pp. 68-71.
21. Chopra, K., Rao, C.H.H. and Sengupta, R. (Eds.) (2003). Water, Resources, Sustainable Livelihoods and Ecosystem Services, Concept Publishing Company, New Delhi.
22. Collett, J.R. (1980). Agricultural Use of Water, Biological Sciences, Vol. 209, No. 1174, pp. 31-36.
23. Coward, W. E. Jr. (Ed). (1980). Irrigation and Agricultural Development in Asia: Perspectives from the Social Sciences, Cornell University Press, Ithaca.
24. Das, D.K. (2008). Participatory Irrigation Management in India: Policy and Practice, In: Democratisation of Water (Eds. B.K. Thapliyal, S.S.P. Sharma, P.S. Ram and U.H. Kumar), Serials Publication, New Delhi, pp. 264-294.
25. Datta, S.K. Chakrabartl, M. and Pal, S.P. (2008). Studying Gap between Irrigation Potential Created and Utilized in India, Final Report, November 2008, Indian Institute of Management, Ahmadabad.
438
26. Dhawan, B. D. (1980). Underutilisation of Groundwater Resources: A Case Study of East Uttar Pradesh, Economic and Political Weekly, Vol. 15, No. 39, pp. A113-115,A117-122.
27. Dhawan, B.D. (1982). Development of Tubewell Irrigation in India, Agricol Publishing Company, New Delhi.
28. Dhawan, B.D. (1989), Studies in Irrigation and Water Management, Commonwealth Publishers, Delhi,
29. Dhawan, B.D. (1990). Studies in Minor Irrigation: With Special Reference to Groundwater, Commonwealth Publishers, Delhi,
30. Dbawan, B.D. (1993). Indian Water Resource for Development for Irrigation: Issues, Critiques and Reviews, Commonwealth Publishers, Delhi.
31. Dhawan, B.D. (2000). Drip Irrigation: Evaluating Returns, Economic and Political Weekly, Vol. 35, No. 42, pp. A3775-3780.
32. Easter, K.W. (1977). Improving Village Irrigation Systems: An Example from India, Land Economics, Vol. 53, No.1, pp. 56-66.
33. Evenson, R.E. and GoIlin, D. (2003). Assessing the Impact of the Green Revolution, 1960 to 2000, Science, Vol. 300, No. 5620, pp. 758-762.
34. Famine Enquiry Commission: Final Report (1945), Government Press, Madras, p.518.
35. Farre, I. and Faci, J.M. (2006). Comparative Response of Maize (Zea mays L.) and Sorghum (Sorghum bicolour L. Moench) to Deficit Irrigation in a Mediterranean Environment, Agricultural Water Management, Vol. 83, Nos. 1-2,pp. 135-143.
36. Farrel, M.J. (1957). The Measurement of Production Efficiency, Journal of Royal Statistical Society, Vol. 120, No. 3, pp. 253-290.
37. Gautam, H.R. and Sapehia, R.S. (2011). Need to Augment Irrigation Capacity in Agriculture, Kurukshetra, Vol. 59, No. 4, pp. 6-8.
38. Government of India (1972). Report of the Irrigation Commission 1972, Vol. II, Ministry of Irrigation and Power, New Delhi, pp. 387-416.
39. Gray, E., Jackson, T. and Zhao,. S. (2011). Agricultural Productivity: Concepts, Measurement and Factors Driving it: A Perspective from the ABARES Productivity Analyses, Australian Bureau of Agricultural and Resource Economics and Sciences, Rural Industries Research and Development Corporation, Canberra.
439

40. Grigg, D. (1992). World Agriculture: Production and Productivity in the late 1980s. Geography, Vol. 77, No. 2, pp. 97.108.
41. Hall, A.W. (1999). Priorities for Irrigated Agriculture, Agricultural Water Management, Vol. 40, No. 1, pp. 25-29.
42. Hashmi, S.N. I. and Singh, A.L. (1989). Trend of Rice Production in Western Uttar Pradesh, Agricultural Situation in India, Vol. 44, No. 8, pp. 649-52.
43. Hazel!, P.B.R. (2009). The Asian Green Revolution, IFPRI Discussion Paper, IFPRI, Washington, D.C. (http://www.ifpri.org/sit&default/fdes/publications/oc64chO3.pdf) Accessed on 15 July 2012.
44. Hoag, L.P. (1969). The Weaver's Method: An Evaluation, Professional Geographer, Vol. 21, pp. 244-247.
45. Human Development Report (2003), Uttar Pradesh, State Planning Commission, U.Y., Yojana Bhawan, Lucknow.
46. Husain, M. (1982). Crop Combinations in India: A study, Concept Publishing Company, New Delhi.
47. Hussain, M. (1972). Crop Combination Regions of Uttar Pradesh: A Study in Methodology, Geographical Review ofIndia, Vol. 34, No. 2, pp. 143-147.
48. Indian National Committee on Irrigation and Drainage (INCID) (1998). Sprinkler Irrigation in India, New Delhi.
49. Infrastructure Development Finance Company (IDFC) (2011). India Infrastructure Report 2011, Water: Policy and Performance for Sustainable Development, Oxford University Press, New Delhi.
50. Jain, C.K. (1988). Patterns of Agricultural Development in Uttar Pradesh, Sudha Publications, Bangalore.
51. Jodha, N.S. (1973). Prospects for Coarse Cereals: Permanent Constraints of Jowar and Bajra, Economic and Political Weekly, Vol. 8, No. 52, pp. A145-A147+A149-A150.
52. Joshi, P.K. and Agnihotri, A.K. (1984). An Assessment of the Adverse Effects of Canal Irrigation in India, Indian Journal of Agricultural Economics, Vol. 39, No. 3, pp. 528-536.
53. Kar, G. (2001). Improving Rainwater Use Efficiency, Productivity, Cropping Intensity of Rainfed Upland Rice Ecosystem of Orissa through Crop Diversification, Indian Farming, Vol. 51, No. 6, pp. 26-28, 30.
440

54. Kelley, T.G., Jayawant, M. and Rao P.P. (1997). Rainfed Agriculture Typology in India, Economic and Political Weekly, Vol. 32, No. 26, pp. A68-70.
55. Kolay, A.K. (2007). Soil Genesis, Classification Survey and Evaluation, Vol. 2, Atlantic Publishers and Distributors (P) Ltd.
56. Kumar, A. (2001). Indian Agriculture: Issues and Prospects, Sarup and Sons, New Delhi.
57. Kumar, M.D, Amarasinghe, U.A. (Eds.) (2009). Water Productivity Improvements in Indian Agriculture: Potentials, Constraints and Prospects, Strategic Analyses of the National River Linking Project (NRLP) of India: Series 4, IWMI, Colombo, Sri Lanka.
58. Kumar, M.D., Singh, 0. P., Samad,M., Purohit, C. and Didyala, M.S. (2008), Water Productivity of Irrigated Agriculture in India: Potential Areas for Improvement. In: India's Water Future: Scenario k and Issues (Eds. U.A. Amarasinghe, T. Shah, R.P.S. Malik), IWMI, Colombo, Sri Lanka, pp. 227-252.
59. Kumar, M.P. (1989). Crop Economics and Cropping Pattern Changes, Economic and Political Weekly, Vol. 24, No. 51/52, pp. A159-A161, A163-A166.
60. Kumar, S., Suresh, R., Singh, V. and Singh, A.K. (2011). Economic Analysis of Menthol Mint Cultivation in Uttar Pradesh: A Case Study of Barabanki District, Agricultural Economics Research Review, Vol. 24, No. 2, pp. 345-350.
61. Learman, S.H. and Conkling, E.C. (1995). Transport Change and Agricultural Specialization, Annals ofAssociation ofAmerican Geographers, Vol. 65, No. 3, pp. 425-432,
62. Liu, J., Zehnder, A.J.B. and Yang, H. (2009). Global Consumptive Water Use for Crop Production: The importance of Green Water and Virtual Water, Water Resources Research, Vol. 45, W05428, doi: 10.1029/2007 WR006051, 2009.
63. Magen, H. (1995). Fertigation: An Overview of Some Practical Aspects, Fertilizer News, Fertilizer Association of India, New Delhi.
64. Mamoria, C.B. (1984). Agricultural Problems of India, Kitab Mahal, Allahabad.
65. Mamya, D.M. and Sisodia, B.V.S. (1994). Changing Scenario of Wheat and
441

Barley Culture in Eastern Uttar Pradesh, Agricultural Situation in India, Vol. 49, No. 6, pp. 445-450.
66. Mehrotra, C.L. (1972). Soils of Uttar Pradesh: Their Broad Distribution and Management, Fertilizer News, Vol. 17, No. 6, pp. 79-88.
67. Michael, A. M. (2001). Irrigation Theory and Practice, Vikas Publishing House Pvt. Ltd, New Delhi.
68. Mishra, H.S., Rathore, T.R. and Pant R.C. (1990). Effect of Intermittent Irrigation on Ground Water Table Contribution, Irrigation Requirement and Yield of Rice in Mollisols of the Tarai Region, Agriculture Water Management, Vol. 18, pp. 231-241.
69. Mishra, S.P. (1988). Agricultural Productivity and its Spatial Variation in Eastern Uttar Pradesh, The National Geographical Journal of India, Vol. 34, No. 2, pp. 113-125.
70. Misra, B.N. (1984). Impact of Irrigation on Farming in Mirzapur District, Geographical Review ofindia, Vol, 46, No. 4, pp. 24-33.
71. Misra, S. (1968). A Comparative Study of Economics of Minor Sources of Irrigation in Uttar Pradesh: A report, Oxford and I.B.H. Publishing Co., New Delhi.
72. Mitra, A.K. (1984). Managing Irrigation System in Drought Prone Areas, Indian Journal ofAgricultural Economics, Vol. 39, No. 3, pp.491-497.
73. Mohammad, A. (Ed.) (1979). Dynamics of Agricultural Development in India, Concept Publishing Company, New Delhi.
74. Mohammad, N. (Ed.) (1992). New Dimensions in Agricultural Geography: Dynamics of Agricultural Development, Vol. 7. Concept Publishing Company, New Delhi.
75. Molden, D. J. (1997). Accounting for Water Use and Productivity, SWIM Paper 1, System-Wide Initiative for Water Management, IWMI, Colombo, Sri Lanka.
76. Molden, D.J. (2007). Water for Food Water for Life: A Comprehensive Assessment of Water Management in Agriculture, Earthscan, London,
77. More, K.S. and Shinde, D. (1988). Irrigation Potential and Development in Maharashtra, Geographical Review of India, Vol. 48, No. 1, pp. 164-167.
78. Munir, A., Siddiqui, S.H. and Suflyan, A. (1994). Agricultural Modernization in Uttar Pradesh, The Geographer, Vol. 41, No. 1, pp. 13-19.
442
79. Nag, P. (2008). State Atlas of Uttar Pradesh, National Atlas and Thematic Mapping Organization, Department of Science and Technology, Government of India, Kolkata.
80. Narain, P., Sharma, S.D., Rai, S.C. and Bhatia, V.K. (2004). Estimation of Socio-economic Development in Hilly States, Journal of the Indian Society of Agricultural Statistics, Vol. 58, No. 1, pp.126-135.
81. Narayanamoorthy, A, (1997a). Drip Irrigation: A Viable Option for Future Irrigation Development, Productivity, Vol. 38, No. 3, pp. 504-511.
82. Narayanamoorthy, A. (1997b). Beneficial Impact of Drip Irrigation: A Study Based on Western India, Water Resource Journal, No.STJESCAP/SER.0/195, December, pp. 17-25.
83. Narayanamoorthy, A. (1999). Drip Irrigation for Sustainable Agriculture, Productivity, Vol. 39, No. 4, pp. 672-680.
84. Narayanamoorthy, A. (2001a). Irrigation and Rural Poverty Nexus: A Statewise Analysis, Indian Journal ofAgricultural Economics, Vol. 56, No. 1, pp. 40-56.
85. Narayanamoorthy, A. (2003). Averting Water Crisis by Drip Method of Irrigation: A Study of Two Water-Intensive Crops, Indian Journal of Agricultural Economics, Vol. 58, No. 3, pp. 427-437.
86. Narayanamoorthy, A. (2004). Drip Irrigation in India: Can it Solve Water Scarcity?, Water Policy, Vol. 6, No.2 pp. 117-130.
87. Narayanamoorthy, A. (2004a). Impact Assessment of Drip Irrigation in India: The Case of Sugarcane, Development Policy Review, Vol. 22, No. 4, pp. 443-462.
88. Narayanamoorthy, A. (2005). Efficiency of Irrigation: A Case of Drip Irrigation, Occasional Paper: 45, Department of Economic Analysis and Research, National Bank for Agriculture and Rural Development, Mumbai, India.
89. Narayanamoorthy, A. and Destepande, R.S. (1997). Economics of Drip Irrigation: A Comparative Study of Maharashtra and Tamil Nadu, Mimeograph Series No. 47, Agro-Economic Research Centre, Gokhale Institute of Politics and Economics, Pane, India, 100 -11125.
90. Narayanamoorthy, A. and Deshpande, R.S. (1998). Micro-Irrigation for Sustainable Agriculture, The Hindu, Madras, January 8, p. 28.
91. Oweis, T. and Bachum, A. (2001). Reducing Peak Supplemental Irrigation
443
Demand by Extending Sowing Dates, Agricultural Water Management, Vol. 50, No. 2, pp. 109-123.
92. Pal, B.P. (1968). New Planning for Water Management Research, Indian Farming, Vol. 17, No. 10, pp. 9-11.
93. Palanisami, K., Senthilvel, S. and Ramesh, T. (2008). Water Productivity at Different Scales under Canal, Tank and Well Irrigation Systems. In: India's Water Future: Scenarios and Issues, (Eds. U.A. Amarasinghe, T. Shah and R.P.S. Malik), IWMI, Colombo, Sri Lanka, pp. 217-226.
94. Pant, N. (1984). Productivity and Equity in Irrigation Systems, Ashish Publishing House, New Delhi.
95. Pender, J. (2008). Agricultural Technology Choices for Poor Farmers in Less favoured Areas of South and East Asia, International Fund for Agricultural Development (IFAD), Occasional Papers, IPPRI, Washington, D.C.
96. Pike, J.G. (1995). Some Aspects of Irrigation System Management in India, Agricultural Water Management, Vol. 27, No. 2, pp. 95-104.
97. Prasad, R. (2002). Textbook of Field Crop Production, Directorate of Information and Publication of Agriculture, ICAR, Krishi Anusandhan Bhavan, Pusa, New Delhi.
98. Prashar, C.R.K. and Hagan, R.M. (1970). Indian Council of Agricultural Research, ICAR, Technical Bulletin, No. 23, Establishing a Irrigation Programme, ICAR, New Delhi.
99. Punithavathi, J. and Baskaran, R. (2010). Changes in Cropping Pattern, Crop Concentration, Agricultural Efficiency in Papanasam Taluk, Thanjavur District, Tamilnadu, India, Recent Research in Science and Technology, Vol. 2, No. 5, pp. 1-7.
100. Qais, A.N. (1990). Role of Modern Technology in the Transformation of Agriculture in the Lower Ganga-Yainuna Doab. Unpublished Ph.D., Thesis, Department of Geography, Aligarh Muslim University, Aligarh.
101. Rangeley, W. R. (1986). Scientific Advances Most Needed for Progress in Irrigation, Philosophical D•ansactions of the Royal Society of London, Vol. 316, No. 1537, pp. 355-368.
102. Rao C.H.H. (2003). Sustainable Use of Water for Irrigation in Indian Agriculture. In: Water, Resources, Sustainable Livelihoods and Ecosystem
444
Services (Eds. K. Chopra, C.H. Hanumantha Rao and R. Sengupta), Concept Publishing Company, New Delhi, pp. 15-28.
103. Rao, B.K. and Rajput, T.B.S. (2005). Effective Rainfall and its Significance in Crop Water Requirements in Canal Command Areas, Journal of Water Management, Vol. 13, No. 1, pp. 36-42.
104. Rao, C.H.H. (2002). Sustainable Use of Water for Irrigation in Indian Agriculture, Economic and Political Weekly, Vol. 37, No. 18, pp.1742-1745.
105. Rao, D.V. (1987). Rural Development through Irrigation, Ashish Publishing House, New Delhi.
106. Rao, K.L. (1975). India's Water Wealth: Its Assessment, Uses and Projection, Orient Longman, New Delhi.
107. Rawal, V. (2001). Expansion of Irrigation in West Bengal: Mid-1990's, Economic and Political Weekly, Vol. 36, No. 42, pp. 4017-4024.
108. Raza, M. (1989). Irrigation Potential of Groundwater Resources of Uttar Pradesh (India), The Geographer, Vol. 36, No. 1, pp. 24-35.
109. Reddy, N.B. (1992). Economics of Conjunctive Irrigation in Canal Command Area, Anmol Publications, New Delhi.
110. Reddy, P. S. (1997). Different Sources of Irrigation: A Case Study of the Telengana Region, Manak Publications, Delhi.
111. Rehman, H. (2003). Energy Use in Agricultural Productivity, Concept Publishing Company, New Delhi.
112. Rehman, H. and Rehman, A. (2008). Crop Productivity and Productivity Regions in the Rohilkhand Region, The Geographer, Vol. 55, No. 2, pp. 16-25.
113. Rosegrant and Hazell (2000). Rural Asia: Beyond the Green Revolution, Asian Development Bank, Manila, Philippines.
114, Rosegrant, M. W. (1997). Water Resources in the Twenty-first Century; Challenges and Implications for Action, Food, Agriculture and the Environment, Discussion Paper 20, IFPRI, Washington D.C., USA.
115. Roy, B.K. (1967). Crop-Association and Changing Patterns of Crops in Ganga-Ghaghra Doab, East, National Geographical Journal of India, Vol.13, pp. 194-204.
445
116. Roy, B.K. (1990).Water in India with Reference to Agriculture and Population: Some Issues and Patterns-Dynamic Approaches Needed for Development, Geofow'nal, Vol. 20, No.3, pp. 271-284.
117. Roy, S. (1971). Profitability of 1-IYV Paddy Cultivation, Economic and Political Weekly, Vol. 6, No. 26, pp. A75-A78.
118. Ruttan, V.W. (1965). The Economic Demand for Irrigated Acreage: New Methodology and Some Preliminary Projections-1954-1980, Johns Hopkins Press.
119. Rydzewski, J.R. (1990). Irrigation: A Viable Development Strategy, The Geographical Journal, Vol. 156, No. 2, pp. 175-80.
120. Rydzewski, J.R. and Ward, C.F. (Eds.) (1989). Irrigation: Theory and Practice, Pentech Press, London.
121. Saleth, R.M. (1996). Water Institutions in India: Economics, Law and Policy, Commonwealth Publishers, New Delhi.
122. Sankhyikiya Patrika (http://updes.up.nic.in/spatrikaIspatrika.httn).
123. Singh, G. and Chancellor, W. (1974). Relation between Farm Mechanization and Crop Yield for a Farming District in India, Transactions of the American Society of Agricultural and Biological Engineers (ASABE), Vol. 17, No. 5, pp. 808-813.
124. Sawant, S.D. (1986). Irrigation and Water Use. In: Indian Agricultural Development since Independence: A Collection of Essays (Ed. M.L., Dantwala), Oxford and LB.H. Publishing Co, New Delhi, pp. 107-139.
125. Shafi, M. (1992). Changing Role of Agriculture in the Economic Development of India, The Geographer, Vol. 39, No. 1, pp. 1-7.
126. Shah, T. (1993). Groundwater Markets and Irrigation Development: Political Economy and Practical Policy, Oxford University Press, Bombay.
127. Shah, T., Debroy, A., Qureshi, A.S. and Wang J. (2003). Sustaining Asia's Groundwater Boom: An Overview of Issues and Evidence, Natural Resources Forum, Vol. 27, No. 2, pp. 130-141.
128. Shanan, L. (1987). The Impact of Irrigation. in: Land Transformation in Agriculture, (Eds. M.G. Wolmanand Fournier), John Wiley, Chichester.
129. Sharma, K.R (2000). Groundwater Management for Sustainable Agriculture, Indian Farming, Vol. 49, No. I t, pp. 42-46.
446

130. Shivay, Y.S. and Rahat, A. (2011). Creating New Irrigation Potential, Kuruleshetra, Vol. 59, No. 4, pp. 9-13.
131. Siddiqi, M.F. (1990). Agriculture in Bundelkhand (UP): A Study of Post-independence Changes, The Geographer, Vol. 37, No. 1, pp. 50-56.
132. Sigurdson, J. (1977). Water Policies in India and China, Ambio, Vol. 6, No. 1, pp. 70-76.
133. Sinclair, T.R., Tanner, C.B. and Bennett, J.M. (1984). Water-Use Efficiency in Crop Production, BioScience, Vol. 34, No. 1, pp. 36-40.
134. Singh, A. (1990). Punjab Agriculture: Scope of Energy Conservation, Yojna, Vol. 34, No. 18, pp.18-20.
135. Singh, A.L. and Saxena, A.P. (1985). Agricultural Development in Uttar Pradesh, The Geographer, Vol. 32, No. 1, pp. 20-28.
136. Singh, D. and Bajaj, M. (1988). Usar (Sadie) Soils in Uttar Pradesh: A Case Study of Two Villages in Hardoi District, Economic and Political Weekly, Vol. 23, No. 52/53, pp. A181-A187.
137. Singh, J. (1990). Regional Agricultural Disparities in Uttar Pradesh, National Geographical Journal ofIndia, Vol. 36, No. 3, pp. 199-210.
138. Singh, S. (1992). Dynamics of Cropping Pattern in Northern India. In: N. Mohammad (Ed.) Spatial Dimensions of Agriculture, Concept Publishing Company, New Delhi.
139. Singh, S.P., Gangwar, B. and Singh, M.P. (2009). Economics of Farming Systems in Uttar Pradesh, Agricultural Economics Research Review, Vol. 22, No. 1,pp.129-138.
140. Spielman, D.J. and Lerch, R.P. (Eds.) (2009). MillionsFed: Proven Successes in Agricultural Development, International Food Policy Research Institute, Washington, D.C.
141. Srivastava, R.K., Singh, A.K., Kalra, A., Tomar, V.K.S., Bansal, R.P., Patra, D.D., Chand, S., Naqvi, A.A., Sharma, S., Kumar, Sushil (2002). Characteristics of menthol mint Mentha Arvensis Cultivated on Industrial Scale in the Indo-Gangetic plains, Industrial Crops and Products, Vol. 15, No. 3, pp. 189-198.
142. Srivastava, S. and Singh, B.N. ,(2010). Agricultural Productivity and Level of Agricultural Development in Azamgarh District, Uttar Pradesh. National Geographical Journal of India, Vol. 56, No. 3-4, pp. 81-92.
447
143. Srivastava, S.K. and Kumar, R. Irrigation Development and Groundwater Extraction in Uttar Pradesh State:: Emerging Issues of Distribution and Sustainabiltty (http://wwwecoinsee.org/fbconflSub°/`20Theme %20D/Srivastava.pdf) Accessed on 14 April, 2012.
144. Sury, M.M. and Mathur, V. (2010). India: Sixty years of Planned Economic Development 1950 to 2010, New Century Publications, New Delhi.
145. The World Bank (2008). Agriculture for Development, World Development Report 2008, The World Bank, Washington, DC.
146. Thind, H.S. and Buttar, G.S. and Aujla, M.S. (2010). Yield and Water Use Efficiency of Wheat and Cotton under Alternate Furrow and Check-basin Irrigation with Canal and Tubewell Water in Punjab, India. Irrigation Science, Vol. 28, pp. 489-496.
147. Thomas, H.B. (1970, May 29). Ganges Plain: Irrigation Potential, Science, Vol. 168, No. 3935, p. 1042.
148. Tikka, R.N. (1961). Persistence Probability of Cold Spells in Uttar Pradesh. 1GF, Vol. 36, No. 4, pp. 140-51.
149. Tuong, T. P. (1999). Productive Water Use in Rice Production: Opportunities and Limitations, Journal of Crop Production, Vol. 2, No. 2, pp. 241-264.
150. Tuong, T.P. and Bhuiyan, S.I. (1999). Increasing Water-use Efficiency in Rice Production: Farm-level Perspectives, Agricultural Water Management, Vol. 40, No. 1, pp. 117-122.
151. Tyagi, R.C. (1995). Problems and Prospects of Sugar Industry in India, Mittal Publications, New Delhi.
152. Vaidyanathan, A. (1999). Water Resource Management: Institutions and Irrigation Development in India, Oxford University Press, New Delhi.
153. Walker, G.T. (1914). The Table of Relative Humidity, Memoires of the Indian Meteorological Department, Vol. 22, No. 3, pp. 462-463.
154. Wallace, J.S. and Batchelor, C.H. (1997). Managing Water Resources for Crop Production, Philosophical Transactions of the Royal Society of London, Vol. 352, No. 1356, pp. 937-947.
155. Weaver, S.C. (1954). Changing Patterns of Crop Land Use in the Middle West, Economic Geography, Vol. 30, pp. 1-47.
448
156. Weaver, J.C., J.P. and Fenton, B.L. (1956). Livestock Units and Combination Regions in the Middle West, Economic Geography, Vol. 32, pp. 237-259.
157. Wolman, M.G. and Fournier, F.G.A. (1987). Land Transformation in Agriculture, John Wiley and Sons, New York.
158. World Bank (1997). Rural Development: Vision to Action: A Sector Strategy, The World Bank, Washington DC, USA.
159. Yadav, R.N. (1994). Intensity of Cropping in Narnaul Tahsil (Haryana): A Spatio-temporal Analysis, Geographical Review of India, Vol. 56, No. 3, pp. 75-79.
160. Yuling, S. and Lein, H. (2010). Treating Water as Economic Good: Policies and Practices in Irrigation Agriculture in Xinjiang, China, The Geographical Journal, Vol.176, No.2, pp. 124-137.
161. Zhang, H. and Oweis, T. (1999). Water-yield Relations and Optimal Irrigation Scheduling of Wheat in the Mediterranean Region, Agricultural Water Management, Vol. 38, No. 3, pp. 195-211.
449
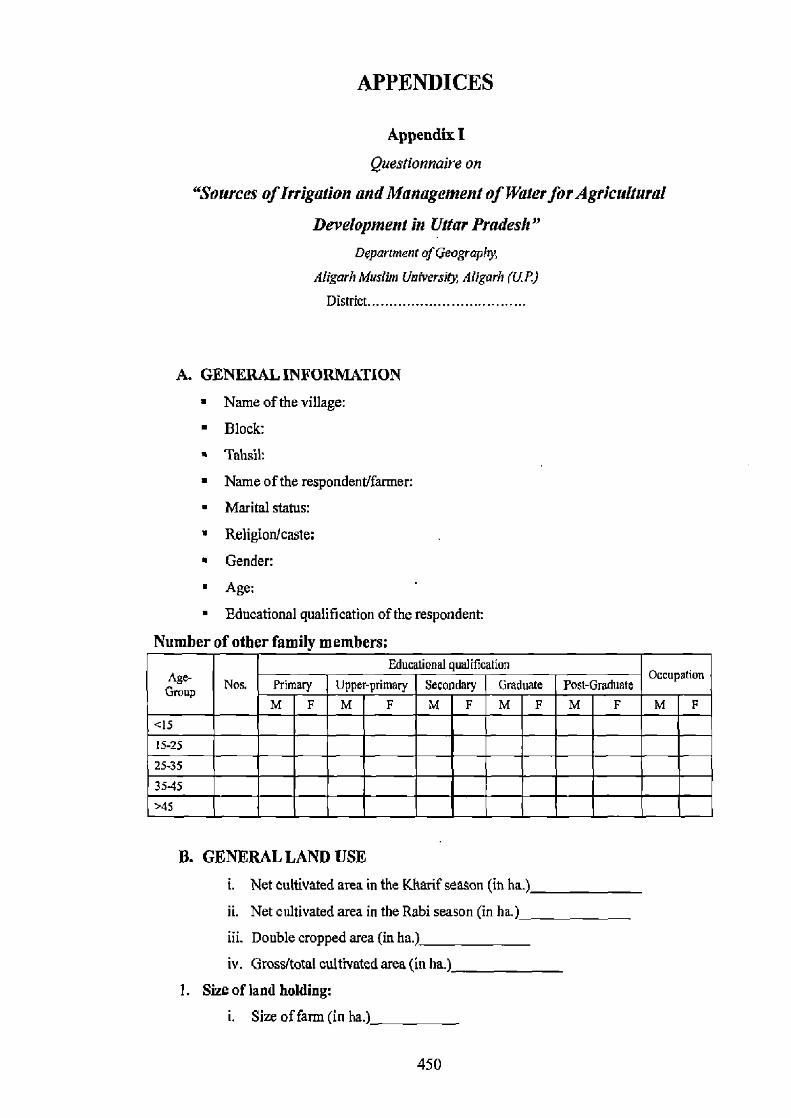
APPENDICES
Appendix I
Questionnaire on
"Sources of Irrigation and Management of Water for Agricultural Development in Uttar Pradesh"
Department of Geography.
Aligarh Muslim Un&ersiN Aligarh (UP.)
District....................................
A. GENERAL INFORMATION
• Name of the village:
• Block: • Tahsil:
• Name of the respondent/fanner:
• Marital status:
• Religionlcaste:
• Gender:
• Age:
• Educational qualification of the respondent:
Number of other family members: Educational qualification
Age Group Nos. Primary Upper-primary Secondary Graduate Post-Graduate
Occupation
M F M F M F M F M F M F <15 15-25 25-35 35-45 >45
B. GENERAL LAND USE
i. Net cultivated area in the Kharif season (in ha.)
ii. Net cultivated area in the Rabi season (in ha.)
iii. Double cropped area (in ha.)
iv. Gross/total cultivated area (in ha.)
1. Size of land holding:
i. Size of farm (in ha.)
450

ii. Owned (a) Irrigated (b) Rain-
iii. Leased (in) (a) Irrigated (b) Rain-fed
2. Family income from:
i. Crop
ii. Livestock
iii. Labour
iv. Others
3. Income from fanning in an agricultural year
4. Type of farming:
i. Tractor-operated ( )
ii. Bullock-operated ( )
iii. Tractor-bullock operated ( )
5. Which of the following helps in increasing yield/ha
i. Ensured canal water supply ( )
ii. Improved water management practices ( )
iii. Better extension services ( )
iv. Good quality seed ( )
v. Timely availability of fertilizers ( )
vi. Availability of credit on easy terms ( )
vii. Availability of modern machinery ( )
viii.Availability of quality pesticides ( )
6. Area under irrigation has increased or decreased:
7. Change in irrigated area: Reasons
i. Shortage of surface water
ii. Poor water quality
iii. Cost of irrigation water
iv. Ban on irrigation
v. Crop did not require irrigation
vi. Fuel or electricity cost
vii. Labour shortage
viii.Other reasons
8. Labour used: Labour Sex Number Age
Farm labour (permanently hired) Farm labour (casual) Farm labour (family member)
451
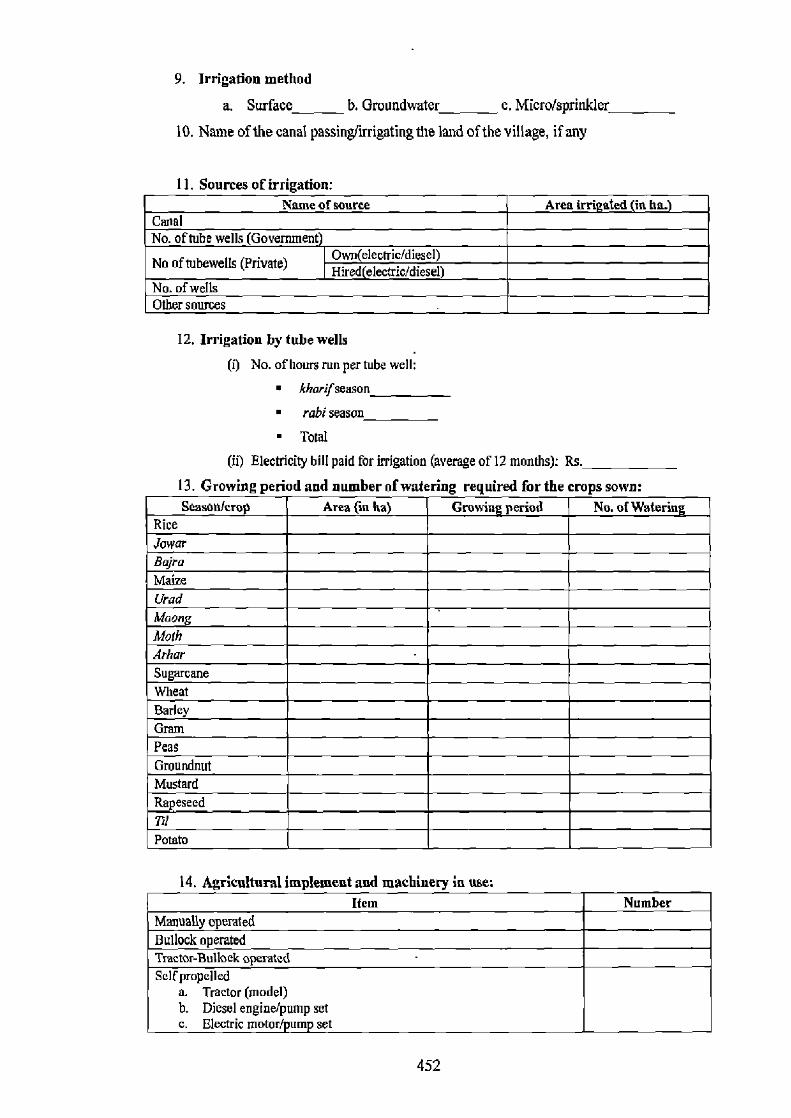
9. Irrigation method
a. Surface b. Groundwater c. Micro/sprinkler
10. Name of the canal passing/irrigating the land of the village, if any
11. Sources of irrigation: Name of source Area irrigated (in ha.)
Canal No. of tube wells (Government)
No oftubewells (Private) Own electric/diesel) Hired(electric/diesel)
No. of wells Other sources
12. Irrigation by tube wells (i) No. of hours run per tube well:
• khmifseason • rabi season • Total
(ii) Electricity bill paid for irrigation (average of 12 months): Its.
13. Growing period and number of watering required for the crops sown: SeasonJerop Area On ha) Crowing period No. of Watering
Rice Jo war Bajra Maize Urad Moong Moth Arhar Sugarcane Wheat Barley Gram Peas Groundnut Mustard Rapeseed 7111 Potato
14. Agricultural implement and machinery in use: Item Number
Manually operated Bullock operated Tr actor-Bullock operated Self propelled
a. Tractor (model) b. Diesel enginelpump set c. Electr ic motor/pump set
452
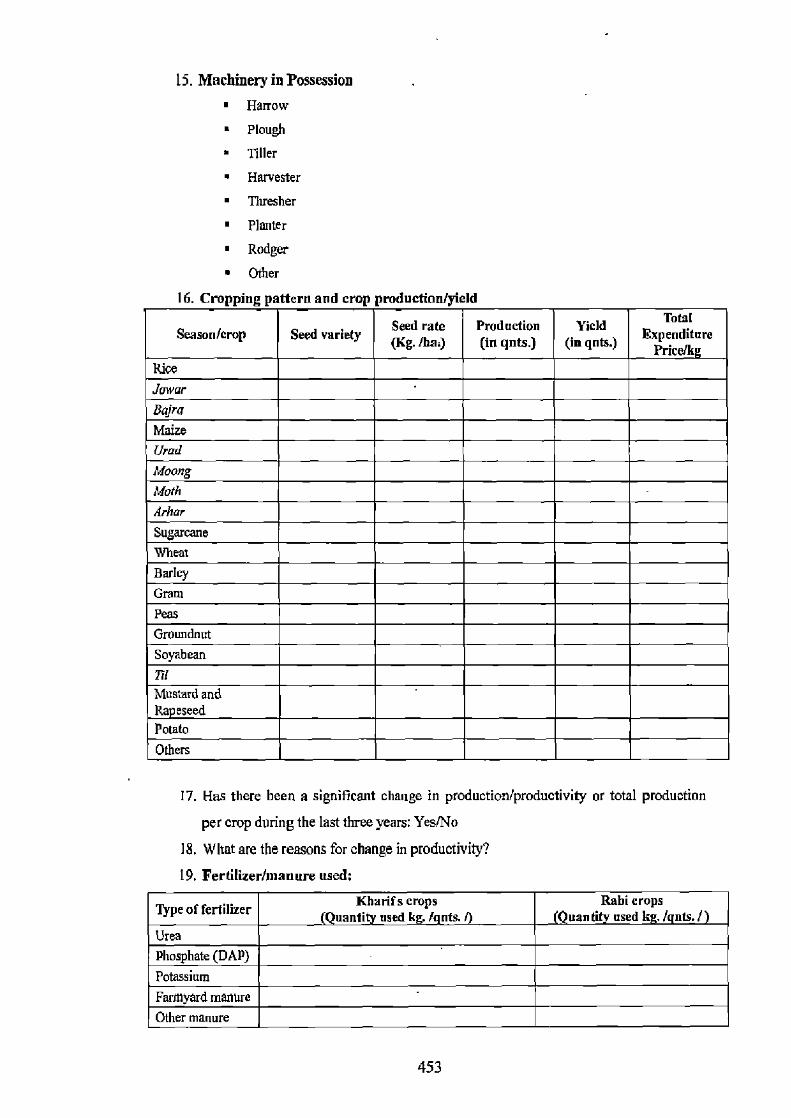
15. Machinery in Possession
• Harrow • Plough • Tiller • Harvester • Thresher
• Planter • Rodger • Other
16. Cropping pattern and crop production/yield
Season/crop Seed variety Seed rate (Kg tea.)
Production (in gnts.)
Yield (in gnts.)
Total Expenditure
Price k Rice Jawar
Uajra Maize Urad Moong Moth Arhor Sugarcane Wheat Barley Gram Peas Groundnut Soyabean 7111 Mustard and Rap eseed Potato Others
17. Has there been a significant change in production/productivity or total production
per crop during the last three years: Yes/No
18. What are the reasons for change in productivity?
19. Fertilizer/manure used:
Type of fertilizer Kharifs crops uantit used k f nts.
Rabi crops (Quauflty used kg. / nis. /
Urea Phosphate (DAP) Potassium Farmyard manure Other manure
453
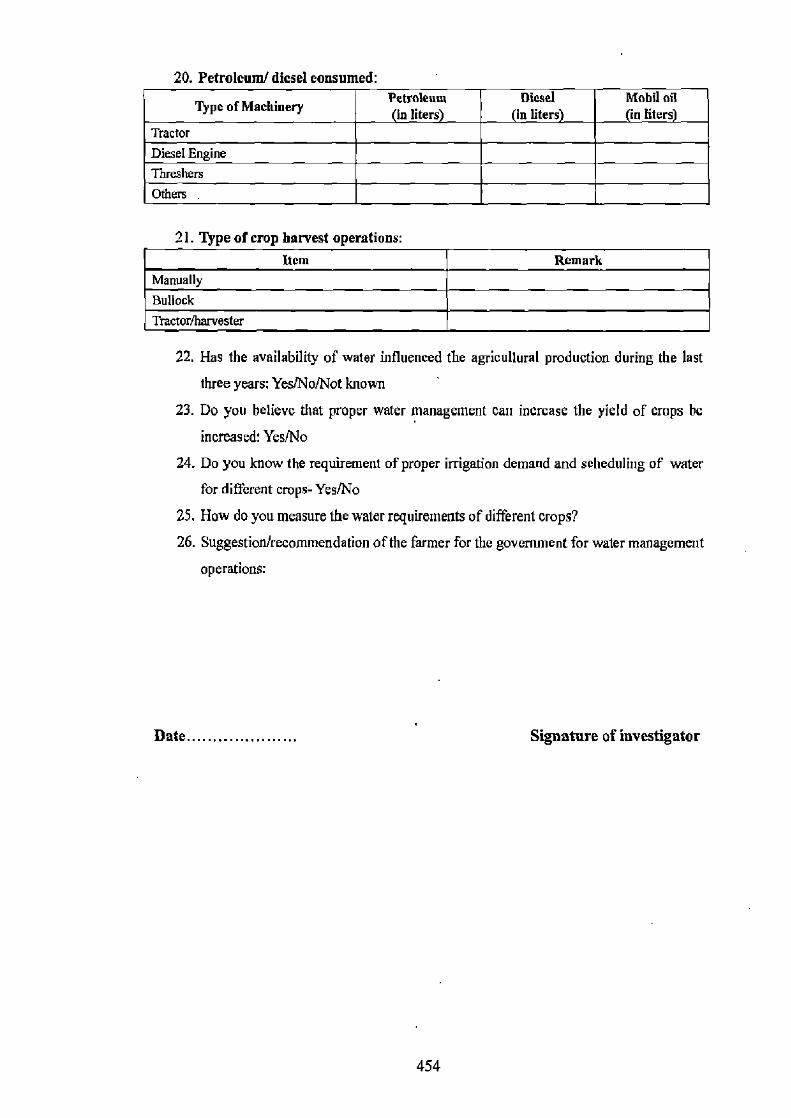
20. Petroleum/ diesel consumed:
Type of Machinery Petroleum in liters
Diesel (in liters)
Mobil oil (in liters)
Tractor Diesel Engine Threshers Others
21. 'type of crop harvest operations Item Remark
Manually Bullock Tractor/harvester
22. Has the availability of water influenced the agricultural production during the last
three years: Yes/No/Not known
23. Do you believe that proper water management can increase the yield of crops be
increased: Yes/No 24. Do you know the requirement of proper irrigation demand and scheduling of water
for different crops- Yes/No
25. How do you measure the water requirements of different crops? 26. Suggestion/recommendation of the farmer for the government for water management
operations:
Date................. Signature of investigator
454
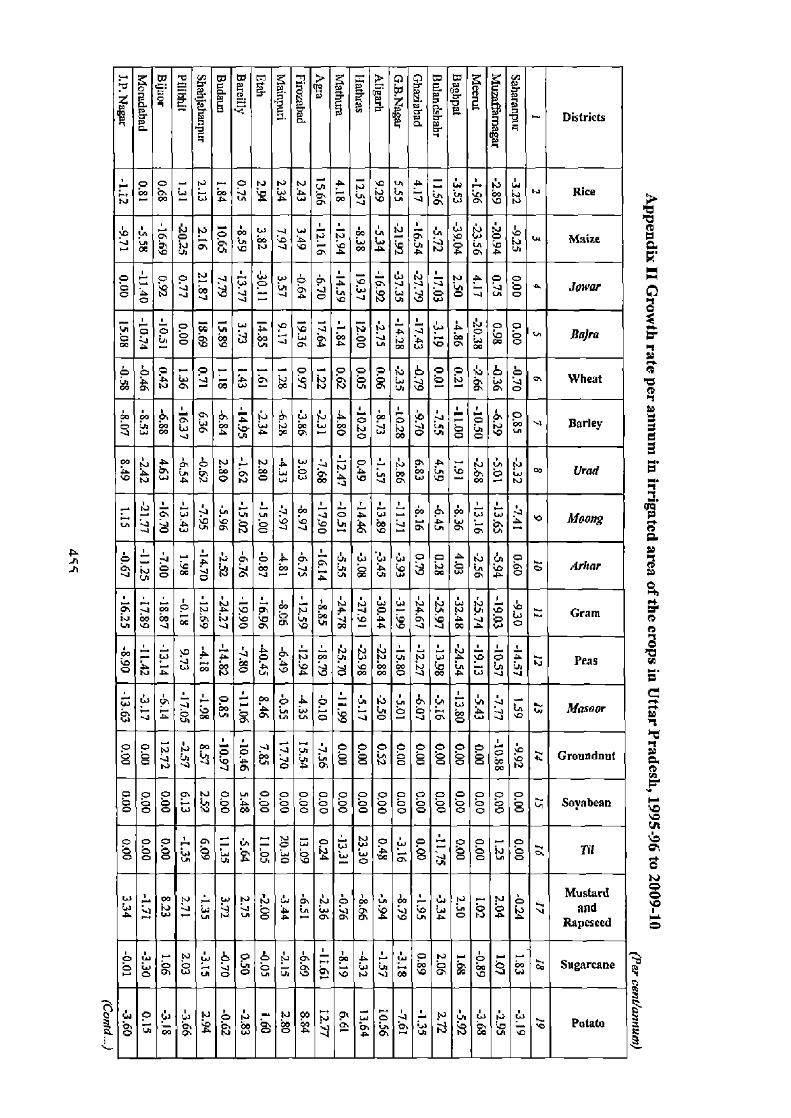
•- 3 m? s m m en W> m Z a cr P m m g 6 3 °° E' Yi'
I m p 6 Districts
=
O N O N . N A N b C A N 4 A +` b q
Rice j J
Maize
O N V tlJ J p~ J J
V O a ✓OWO/ O N V
w
H p p .O W V~ w Y :~ ~➢ J— N N p V w A O O O b W J W P A O N P W O B(IJra W
W P N O~ J W W C W U N ° P Iwn N P O p Wheat T
O W W N
Barley V y A A P O o Nq O 8 8
A P O `) N £a.4P :. Urad
b hi J O W C O U q b P P Q N A 00/Ig
N
O 4I — IJ O, L A O. C U W W O O A ~j ~j, O y ° U 'aJ1 4 Oi U O 4 AHmr La b IJ O
aU A O N 00
j A
J W O N A N .O A J O A CM N N D . Gram N U V J G C 'D J '0 -40 O~ lD J CO A W
' — P P J O P N W Vi W N N N W AC O d Peas
00. N N, W Masoor b
CM CM v O J
O O ~J
PP P P o O O p P O ,o ° c D N
P O O
,p Groundnut SO
P O P T N O (n O O 2 0 0 0 0 0 0 0 0 0 0 0
0 0 o w tt"i o a°e ° o 0 0 0 0 o 0 0 °o o 0 o `Z" Soyabean 0
]It
Mustard N N N a V J a N H o V La
W
A Rapeseed
N O O Sugarcane P O O W O O
Palate 3
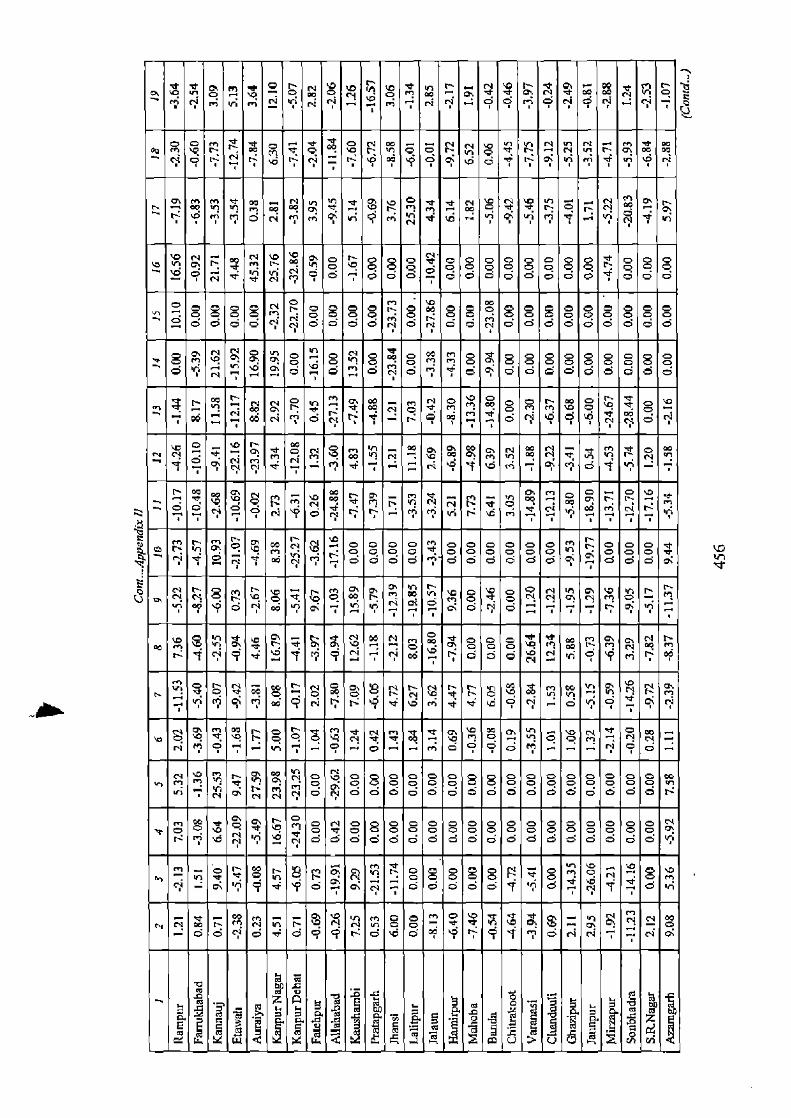
v~
b Y a n V' ' o m vi N - tV ➢ N N C m Cn o o o o a, e a P a ry CI N N O OO CI Q [V CI
M W O N n Cl ` M Q O m h O h vl p m
P Y BOO
en en gait V• N e u O h N ^ 1- m Q O O. O
b N W O O O O 0 O 0 O O O O e O 0 O V h P O b O O O O 0
O 0 O °
O O O 0 O
0 0 O O 0 0 0 O O O O
O 9 oo
O O O n O O O S S O S O O O O O • O O O O O
O
O
O O O O N N O O O O O N O ry C O O ry O OO O O O O O 0 0 0
m W b V
•an p d .N W P O . 4 ^' P < m N O Cl 0 0 m b p p
O b m O Vbl W T r m b ~ b VNl N< vpi N
m D P b
r r l
O OO Eby' O O tl
b O R 0 O m N 0 0 0 O p O O O O O D P O O O Q ^ OO O OO O O O
Q Odd
N C O Q W b O' N y h n IX O C p
c , O M O h S h
O O h0 ^ l~ N h m O N b y O
4 LG O N n C O p O~ !Y
'P" °o to m ^_ a c °o °o °o ° °° °o °o °° °a °o °o ° °°
P N N O O O O O O O O O O d O O N N
' 0 O Cl y O O V O C O O O O O O O O O O O ° O O
h m N ry ~ ~ ry OO O OO OO OO OO OO OO G OO O OO O OO OO OO OO OO '~
Q O VNi O 1~ In lam+ O S O S O O N S Ibl M Y q r p < b p. N OA h Q<'9 G r O~ N -+ O OO C O G Q 1? O i t N Q Z O VI
ry J C O IV OO < G O q [L OO G C yp b 1r Q `r M di (J : N G~
¢ G i p
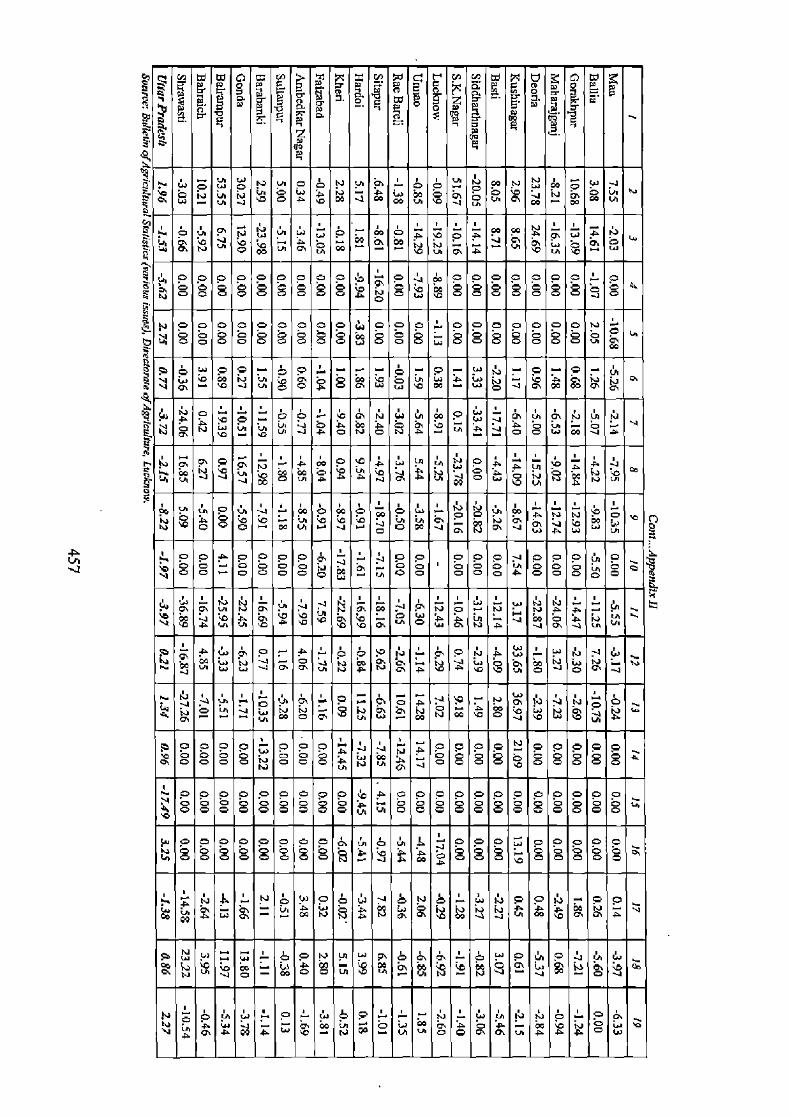
w~ m ~. x N ~+ C r m v, m 9S b '~, ~ m~ E ~
7. ~. ~'
H` ~e 2 Fi X a
AA`
~_ ,7.
Q ° _~ F 0.
2 O F U
6 ed I T n
2
w e
W w N ,n O p Q p W wi W W J O O Np O
i I p
y P P P P P P P O 0 p q O O O p O 0 O 2 a O O O tl
S S O S S
~p
O O .gyp S O S S O S O O
0C
O N O O y NO
N O O O O O O O O O jy O O O '. O O O p O N O O O O O O O S O O S O O O O O
O O M L W O O O W U
Ajp 0 c O O W NN O~p
V - O O W b A J O P 00 O q ~ O
L, O 0 O O r b, N W to O W J 0, in O~ N in N N J .P 4 bLab- N O J p A J
b
P O P N" A CO O~p i0 A W V' In yNj O d J A b J p IJ O •A A U O dp N .~ ~y
M 4 J J J~ O U A d P A H W O W b lIi N la
O O O O U O V O U p eJ ° J A u
O too °° J ° ° a ° °
A
$ a c op W ° o oo ° o °
N N N < a, P a, . O' N A
V b A V~.A U'C 0 b O~ O W d V 4 U
N P N N p P LuA N O Oq G N WO
il~ 4~ r O CI O L V N T N IqI bN
,O G O O O W O O O d y y N y O O O O
g O ° O O ° O O O O O O O O G
p
O N N a C V O
V O O O O O C O O O p~ A O O O O O O O O O O O O
O O O S O
G
S
G
O . O O O
C
O
G
O
C
O S O S M G O N G C O
Sra O O O O O o O O q L G O y~ O O O O O L yp Op
j - N O O & b b W O N r O p ti Wa Jy Np Op
5~ w , _ o O Nq yn a b 6, s- o p in p v
G.O .W p O O O N N ta L L1 p , A W A b— N- N W O O °. T U A O W
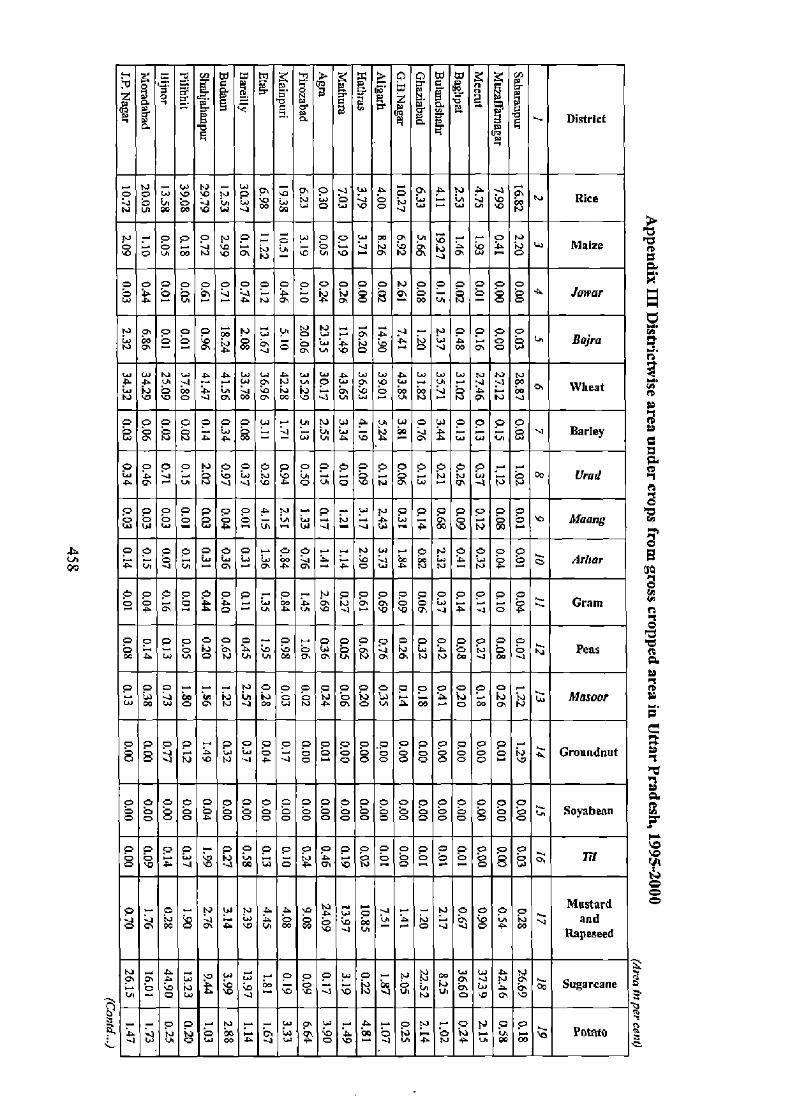
LA LA Qr
p pZ p 7 y 9 C S G y;
District C
tl O 0 N w to J V m Rice N IA GO OJ b W V W O V 0 V
N r O O N O !w O m P H b - O to IJ W Maize
O lA 00 N Q LA .D P N V V to
0 G 0 0
O 0 0 0 0 0 0 O O O O N O O Op O O O
Jawar p - A N Q O A S N- O U N -
GO GO N m O O u a O O W U
BOfrn T A J O b O O J W T
Li W N a La W ui W W W W N N N A A u J P N u O a b U -' N J N Wheat N IJO O O 0
S. N
N ~O N JO N P N -1
O O O O O O W- In N w 4 u W O W 0 0 0 O
O~ Op
N A N W P g G Barley Li N a
O O O O N O O O O O O O O P O O O O O O -' -
tLU Urad A P" LA N J V a p O 'O N P u- g y N N
OG O b Musing S W S o Li A •- ~ .w. W J- ~l W A o b N W
0 0 0 0 0 0 0 O O -' N W- O N O O a O
A A O O 4,1,8, P A N N
PPP o o O- - N 929 O o O O O O o A O
Op
4 b P O° Cram a O b -1 A -1
O O O O O O P O r-. 0 0 0 0 0 0 0 0 0 0 0 C O N U VC a T N C P N OG J 00 j N P265 A W La La LA N
O O O v- v Na O O O O O O O O O O O O O r
y W O P N V N C O NP O NO Yl L N r Al N Mascot 00 Li Ni
O O O O r O O O O O O r
O O O O O O O O O
O O V N C N V P J - O- 0 0 OO O
0 0 0 0 0 O O to q Groundnut 0 " b
O O O O O O O O O O O O O O O O O O O O O
°o °o 0 0 0 0 0 oa o Oo 'oo 'otl o i'„ Soyabean
0 0 0 0— o 0 P P 0 0 0 P 0 o 0 0 o 0 O 0 o 0 0 9
q TII o V a J b V cc w O Y O. b N
0 O 00 w
Mustard J J V J A G O A N P ~p P Z and
liapeseed
N a w o o O O- N N W j yaj N
C q N y
C 00 - COL - N Sugarcane L N V N U O V P V °J
O O N r W
N"- W P w r a r O N r O N O O
Potato a N LA 0
O w y A
P y u P O " N P N P 00 00
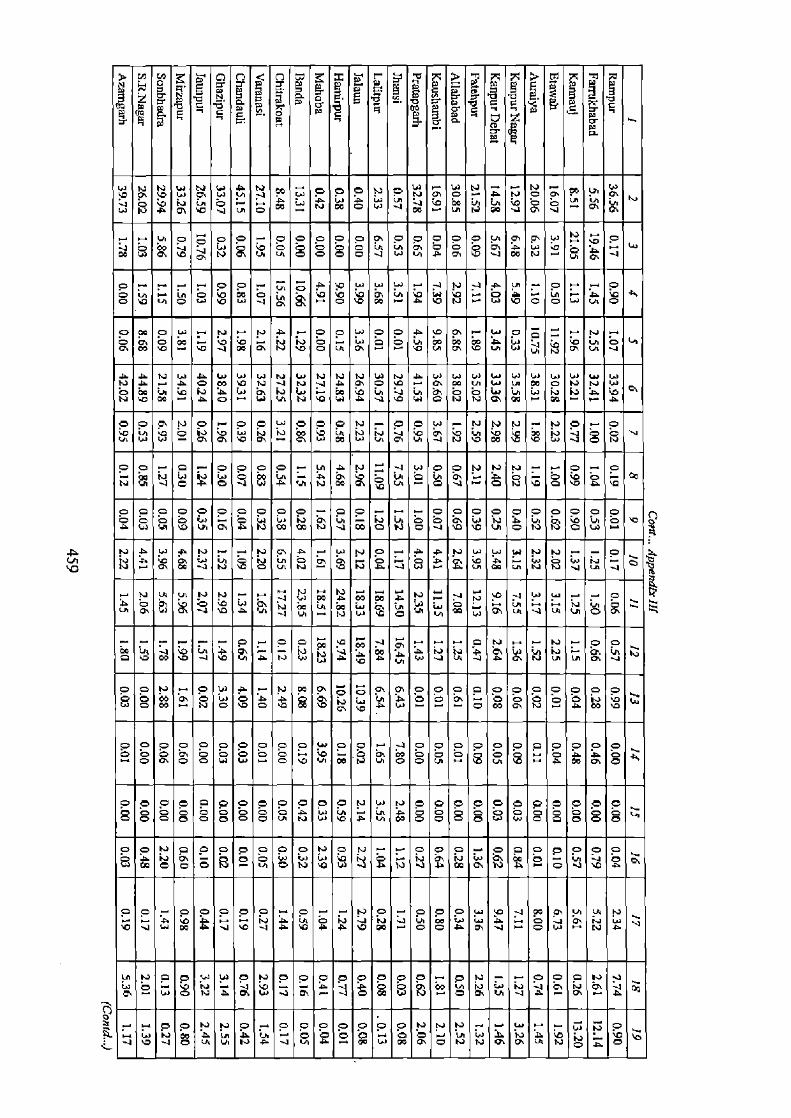
a b
N '.`~'. Z
c S
3I~~
C m b
N ~i E
s~ 3p S_ Z Y. u~ ..dCi h~ e+ 9y S 9 5~ y~C b C. m ~ (~~j .y
Le o\'0 w g w N J. O O O N O N 0' O r a N O rn V` P
0* W q Q\ b a
O Li N O 0 O\ U L
O OS
O O
OS O
O g J WO
UO 0000'
O O W
q P N
W O g J W
O O V LA O O V V w O J b 0 O b q - q d Uib V N —
✓ O W L 'p 0 0 a U U O
T ~ N V q
P N
K) O w O O
O Oy
A 0O q N U K
a d Y a Ww W W N W N N N W'4 A W m N W u w O W W W N a d O b N -1 N J a g O W N N N Y IJ W V J C~ O 'O W W IJ N L 00 .P O U Vi N 'O sa A V V W O N N a - A
O O P N O O O w O O O N O O W N N N N J O O p 00 'p w w p
T 0% V ON C W N P V V J N ~ W b b W~ N
O O O r O O U A J W O N N - O N N V O F O
OG J
OM W N N W
NV N-
OrA O •-a •
NA O N L O b a
o O o pp p p p pp O O O O O O O O o O o O O 0 O G~ - W + IJ Q L - IJ ~N O O Q U) N C v 'C I.a O b a W U ~D Vn 0% N W W N V M O NO - V b 'AC N N O tH
N .Ni
A A .l lJ
C '0 N
N d
~ N N -3
d A N N N N J La
O J
W N m. O 1pA
W V. 4 VG A Vqi J , N . b
p N tLn
J m
N b J W Vi to O a
00 O N W V J b p' U - N NO a U) N L
'4 J CN
U) P LA !
La a -4
O O O O r
q O S
W A 0 r a N a Cc ON
0q W V
, g w OO
O O N$ JW
Op OO PO OO
OO OO a O 'O
O p O
O Q p
O O
O P
P O
W P
O V bU 0
W O N O
J O oO
p U
0 b O
U 0
b 0 0
A 0 >
CE o V
O
P P P O O O O O a V O % P O O O O O S
O UO W O a 2 N 0 0
O W 0
0 O 0 O 1O N —
O O
O LO U
O O N W O N
'C
O b U)
.4 N N- C a
V N 0 IJ V 0 a P
W co 0- T 0 O~ N
0 A- 0 O 0 O 0 N U 0 '0
0 O d q
O o O o O O• o 0 I+ N o O O o w J W P Vi N b J W D] A J b V A b P A V J ~~ O O A 4
. r O W r N A Li
U N O O W W O N O O O O O O O O O N O O O N J
.J~ W V N J O M U U Y N U A O D O O .- O Oa O P 0 t P 0 o 'C K
WN O dN Oo
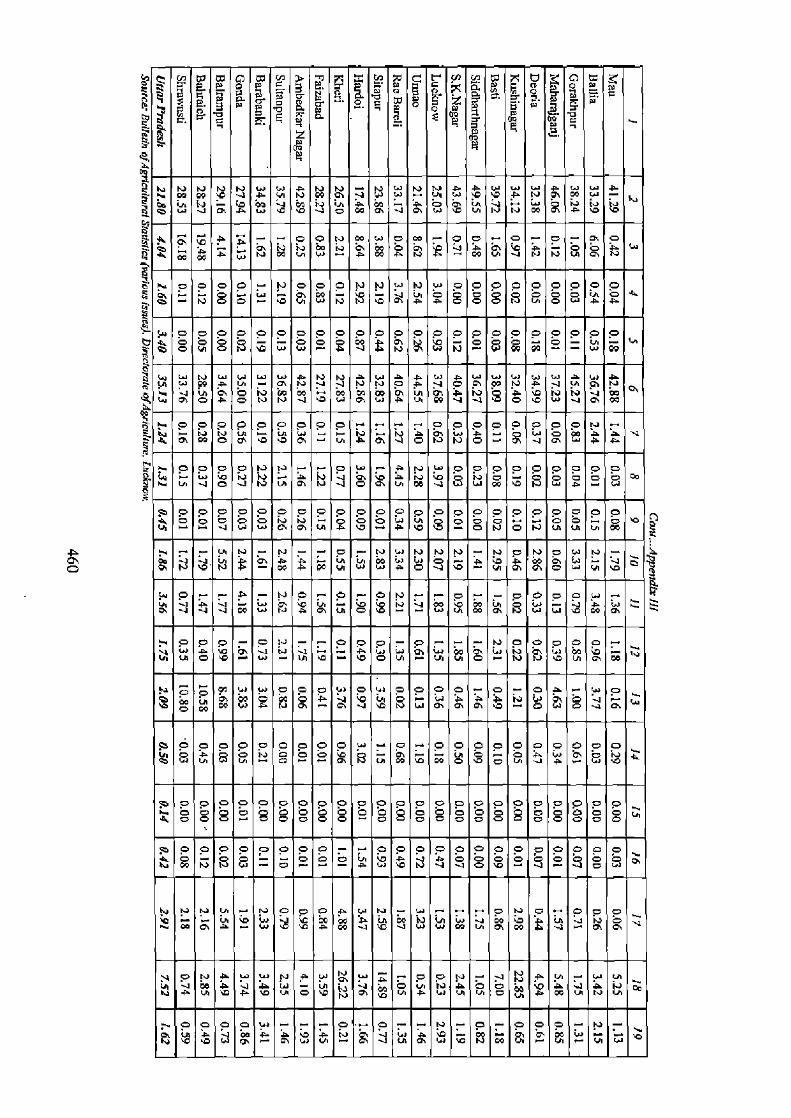
A O
ti N % W N N
'0 N J A
A N Po
N- P J
N W^ W N W A 'p ' A N S O
u W A
O W S U) ' J O% J P tUJ V th N N ' A V b
N g m A -- 00 N O T
O O
- 4' p J O A
.~ LA O -O r - 0'O
A 00 N N LA N
O O Op O-
O-
N qO O W
O N N W
Q
N
A
W
S
Op O
O
Op O
N
O O
O
O
w
O
A
O
A - N O V^ N N N 'G O O Lii
P O C O C O P P C P PP OP P P P P P . . . .
w g N J N N O A Ul O P CJ N A N g N
W P O A O N N J 'G W P W
W T A
vi Vi O~
O) A J
N J 'G O 'O
O W V 0 W
P
0 0
N 0
O
0 0 0
b
0 0
y 0 N
J O
O
u
O pp O
O O P
O O O
w
N
A A V { T 0 '0 a n Y g N - J J
O O N N .3 N
N J P b P Y
O O
W
O O O
O O
O O
U J O .J N P N J O T U Ca J 00 1O * Li P
c o O p 0 p p
w
p w
0 p p 0 p p p p 0 O -
0 p 0 p 0 p p 0 0 b u y g p o S V-o A b V O N O N n U U 0
P J -
J r
J
A-
w N
N?
A
r
T LA
O-
O
O 'p NU) -
r- O
LA W
--
a
p W
O y W W W M 'O J W 'O
N
O
U
O
O
O-
b -
O
J
W-
N LA r
'D
O O AU) O- O
- V
-- pN N
S
0 0 p
b
0 O
ia
O
- ci O N N V W
b
%
W S
O
N
Op O
A
W
CJl
O W
b
Op O O
Q
O-
A a b
O-
N
O
O
d
P
r
O
W
V a W m O Wy W Q r J N W
C O
O A P O P O
O N
O G O O- O O
b W
N
O
P^ p O
O
O
b W
O O
O O
A P 0000 _
5D A n 00 '0 D] O V
O O
O O O- O O O O O
O O O O
O O O
O O o p O
O o O O O o O O
D O O O
o O
A 00 00 00 00 00 00 0 00 OO
0
AAi
p0 0 0p 0p W
0 0 0 O O 0-
O G
O
4Vi
O
V
Oy O
V
O O
O
O
b
O
O Op O
O Op O
O
OO
~' W N N O N ~l J W
N N N
Q
M U D
N w
O O L
O p
A W
W '0 W
0
W N
- w W J
P
N
bp _
J
O
J O
P
O
>
O N 0 LA I) > O OY
U A L
In W Nw N
N A Lii b A b W O V q a p
Cs 0
b
0
b
0
W
0
P A P V A
O N r T O J - N - A V N-
,O .3
O-
W
0q
N-
0 0y
LA
r
S
N
N W
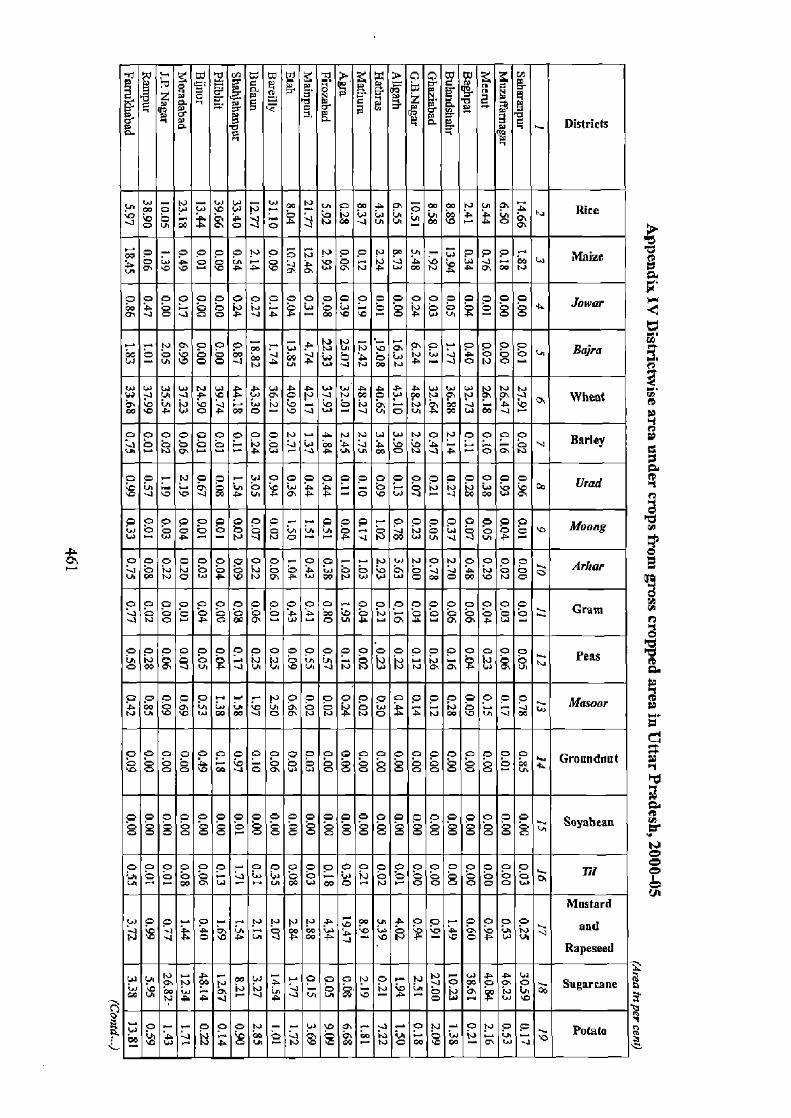
S
° o. . Districts
Rice o O O d
• J N J u U OD F O N J A C1 O
Make ~p
O O O O O O O O C Op O O O O O Op O Op O Op O Op Op JQWCf
C' O J A A 'C b O A W U A O O
L
.p O O O O O BQ//Q W O J m W
t
J O O M O O N A O - O N
W UI
Vi V> ~O } • W P O N V N UI
lb W W N P N Q S J WhCAt A O A P N W - J LA U
q m JW b
q D M O 9 J 0 A W
O O O O O O O O O N A N N W W N O N O O O O RArIE J O O O O . -> J t b N j a- O P O to V Y
O O- N O Op r W O~p O Op Op O O O P O O O ON O O O~p Br-d O -1 V b J m d U A O~ A A .-+ O b W S N J m W W
CC
e p o e o o 0 0 0 —— e o o— o o e o o e p e Moon w o o b o o b o c n b - o J tab W o 0 o c '0 8 U) W A -- N Y N O -? Y N W W LA J J N A-
0 0 0 0 0 0 0p 0 0- O O -- w N O O O O Q Ar, c P N O W A O N P P w W N w y w O W O W D N O
o 0 o 0 p 0 o 0 0 0 0 0— o 0 0 0 0? o 0 0 o Gram bbJ O A O Oi' q O U Y G1 Y ~ a A w
o pp op op o 0 o op 0 o 0p 0 0 0 0 0p 0 0p o Peas
O P
O 0W
O O
O O LA
r'+ ^' N O O O O O O O C o O N
O O O O Masaor P In P O N P O O> A N O -• Jm U)
p O
00O0o O o O 000 o
O O Oo0000O00
O O O O o O Gruunanut C b 00-a 0 UO O O
Go
0 CI O$ g p
0 0p 0p 0 0p 0~p 0 p~p 0p C pp o 0p 0 0p pp 0 0p 0p 0 0p 0 So bean eo O O eo O O- O O Oo O eo 0 O o O O o O O o O °o
0 0 0 0 0 0 .- o o c o 0 o 0 0 o 0 0 o 0 0 p o .7- 0 O 00 a 00 O
O N N O O O O o O o O Ui m
Mustard
.4 O-p -- N
N CC Fp O] V~ O O O
NVi
`
V
QA d M b J O P LA J G P J ' V N AG O P W
W
Rapeseed
W NI
W N m W F ' O O O N O N y O m O a O SL 31E W b 2 p uNi b~ gBr
A
Potato m b W J N A D W O N It
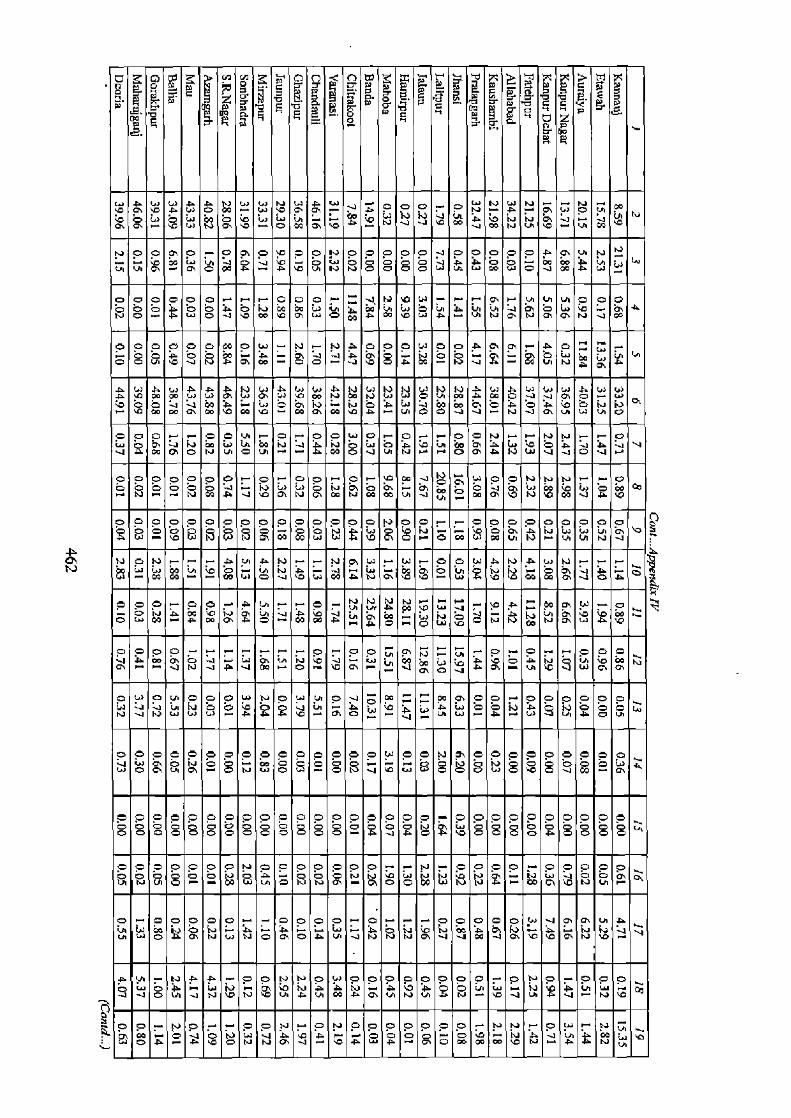
~. C ro7i S 6 9 J G ' ✓' S 'S 9 C ~. F 7
p Fi Ni P'i ~ O S P d Y W
La a b W O - W b a- - y O O O O N- O A W P
IW !J IJ J O' W U 90
lIi N p Q to
N O O P O O S O 'O ? O N O O O O O J O O O O O P u N
P- P O J A N O O O O U) A O O J W A u W W V N N Lt w O
O O O O O O C O O r J N b W r r T r M M N O O O O O p LO O 00
A 'O j y IA W UO P U N
N J NJ N
0O g N
L T A N O A w O J b m w O A m W - N P T J O0
O O O O O O my Op W O O A q - A O So O O O b O N A Q A- 0 0 J A
b N O N Q L N p O A J A- 00 n
A C W W g W q W b W N W N W W O lLn w m O J O v U)
00 w d J O~ J J 41 A O O0 C 00 '0 O P W J W - LA
m ' m - 00 N O O J J- O N
O O N r O w O NJ Oy C v J A m P O N 1A O m tli N - A m O J N N- r O P A N W'4 J O J v
LA O O O N O O •0 'C O
N 4J
N O G
o O H O
V N CO W O W r NJ
r r N W A J m w CO t J 2 mo' 'C Co J A ~p
O O O O O O O O O r r O O O O O O O Op Op Op Op Op Op Op NJp O~y O~p
O °-r Nm
W- W W - - 00 41 O J W M A Q 'G - W A b b m W -3 O 0' A
O O O O O r A - r y w A w ;D w A W LA
A
b -
N
""
P
rn W
w NA mb g A A r So O r
a O N N W p b O W W A W O y O
O O O " N r O O r
a J N J
-
P
-
O b
0°
V 0
O La
A T U NC
u
0 N J ro T P L J w
O W O N O O O W N O w N O J 6 W P O O r O O O O O O
N w N O O A G A b b A -. P YW - y a O O W P r
O O O O O O O O O O O O O O O W O O N NJ O O O O O O O O O
- W
q
O S -
p
W O C J - O N W W
p N
O W
p
'
p
J p a O G V O N J V O O O O CO
O O O O O O O O O O O O O O O O O O- 0 0 0 0 0 0 0 0 0 0
O O O O O O O O O O O O O -
p
O A NpS
O O O O A
p
O
p p
U J J A V O O O
O P O O O O N O C O O O O O r r r O O O O r O O J O O O
O U N Lp O -
NJ 00 w LA O N N - S P N W O N O U) N N A m CS 'p N A -
O O O O O - -. O O O O r O -- O O O O O W J P P LA A ti U W N O N L A 0 NJ O
N IJ M P T '0
G N - W O A 05 N W N O 05 O N J NJ N N Q V J m J Os b b Q b
O W O A - W IJ 'C N A i N r i NJ A O O -' w r N O P- iu r ~y J J O N J N ~G N ~p LA A N W A OS N N U A N b J U A J" N ~p
O O N O O O N O O O O O O O r N N O r N
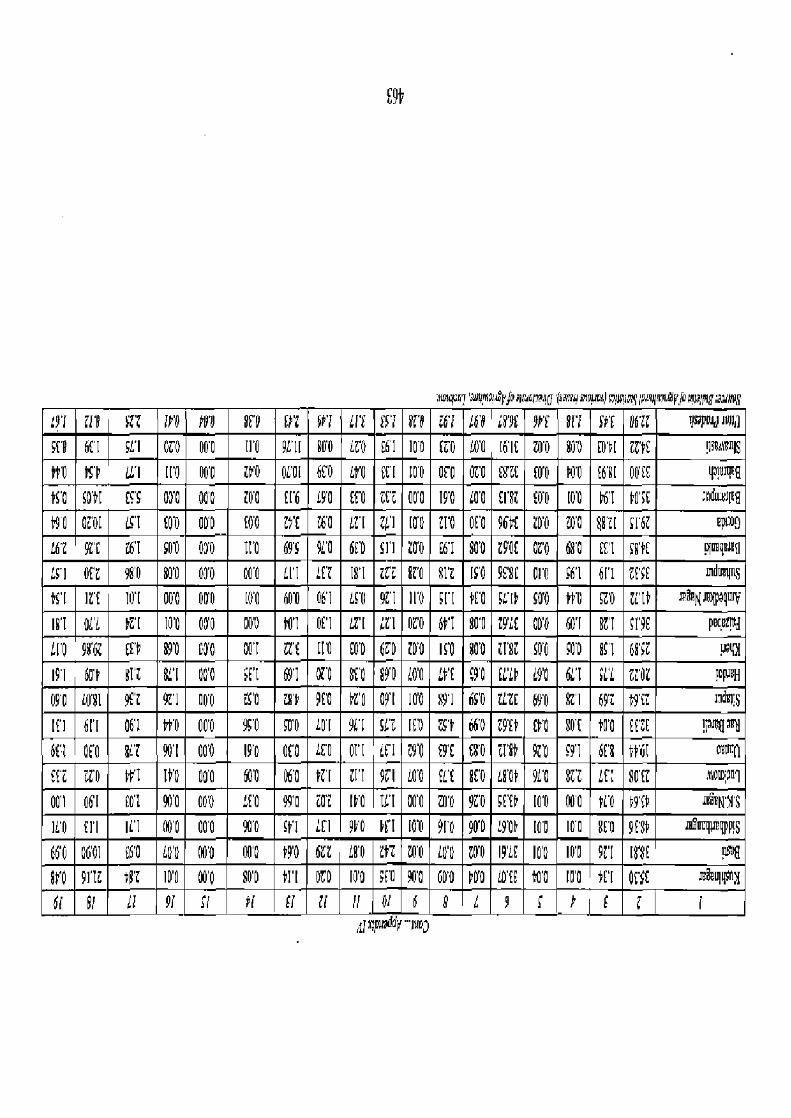
nmq? v(o 'v a asIP' natdyfou~lg'~A aazpog
19'1 ii' Z WO 70'0 in £i'z WI 61'C 151 8C'B i6.1 !6'D l8'9E 96'1 11 S6'£ 06Zi Nmfw4l Jolli
S('0 61! SKI OLD 000 lit 9411 SOT LZD E61 IOU (i0 LOU 16'I( OD 800 [U'1 ZZ'4f 1_s_¢nl8
b4' K6 S'6 Ill III IT b4'0 ova' co6 In 6EI 10'0 CFO ova ESZE co'0 40'0 £6'8I 006£ y~RE
NO SD'4[ fS'S OD'0 00'0 Z00 EI'6 L9'T at Z6'Z DD'o 190 LO'0 CITE (D'0 IOU 66( PC;E nd ld9
19-0 DZD( LZ'I LOU U00 (00 t9'( t t LVI 4'1 IU'D Z!'U 0E1 964E Z0'U Z0'0 E8'a S16Z COM9
L6'Z 9E'C E6'I S0'0 OD'0 I('0 69'S 9L1 6('0 SI'I ZO'0 £6'I 80'0 ME DtU 680 t£'1 Sfl[
LSI Oft 9810 IT 00'0 000 LI'I LE'T 18'1 M E'0 812 IS'0 9£'8E DI'0 S61 611 ZESE mq
tS'I in 101 06D 00'0 !D'0 60'0 061 LS'0 9ZI III) It 4£'0 C'm SO f0 co tCl4 ~______ IlOv
181 OL'd bt'I 100 000 00'D 601 DE'! LV! LZ'I OZ'0 64'1 80'0 MME 00'0 60'I RZI ci9E pa9___d
LID 9862 ED IT PD'0 00'( il'E (I'0 f0'0 00 im'0 co 801 tl'8i coo SO'0 9S'1
191 604 BIt BLI NO iE'l 61 89'0 LOU LIE 3'D IVL4 G9'U 6L'I iCL UUZ OR
090 L081 9Z 9d'I 000 ES0 3'p 9E'D pn 09'I 10'0 89 'I co6 ZLZC 690 BL'1 69! 19 z
IfI GI'I 06'1 W0000 9S'0 SO'D 10'1 9!'I SG'Z IE'0 S'4 06'0 Z9'(4 C4'0 80'f 40'0 EE'lf ! ~tl
611 on Bi't 90'1 000 190 O£'0 LEO 01'1 !E'I of E9'E £S'D iI'8V 9b'0 S9'1 6E1 44of
Li i Zd'0 r 110 050 601J 060 4i'1 E1.1 9ll LO') fL! fl fl NO 8l 'b Li: 80'1i ~~ 1
001 061 EOl 90'0 00'0 LEO 99'0 Z0°t 16'0 ICI 00'U 3'0 9V0 SE'f4 NO 000 4C0 D9'(6 AeN'71'S
IL'0 FI'I IC! 010 UO'0 90'0 WI LCI 9D'0 WI 10'D 910 9UD L9'06 ID0 IDO 8(0 9('8p +~______!S
6GU O6! £61 IT UO'0 ODD on 61 L8'0 Yi? ZD'0 LD'D ED'0 19'LE 100 10'D 9V1 18'8E !~9
84'0 91'I 49'Z 100 010 80'0 41'1 C70 IO'U S('D 90't 600 WD'0 L0'( 4D'0 I01 $CI USTm8ev!4m)f
II 41 9i ,I 7( FI 1f !f 01 6 9 6 9 S b F T f
£96
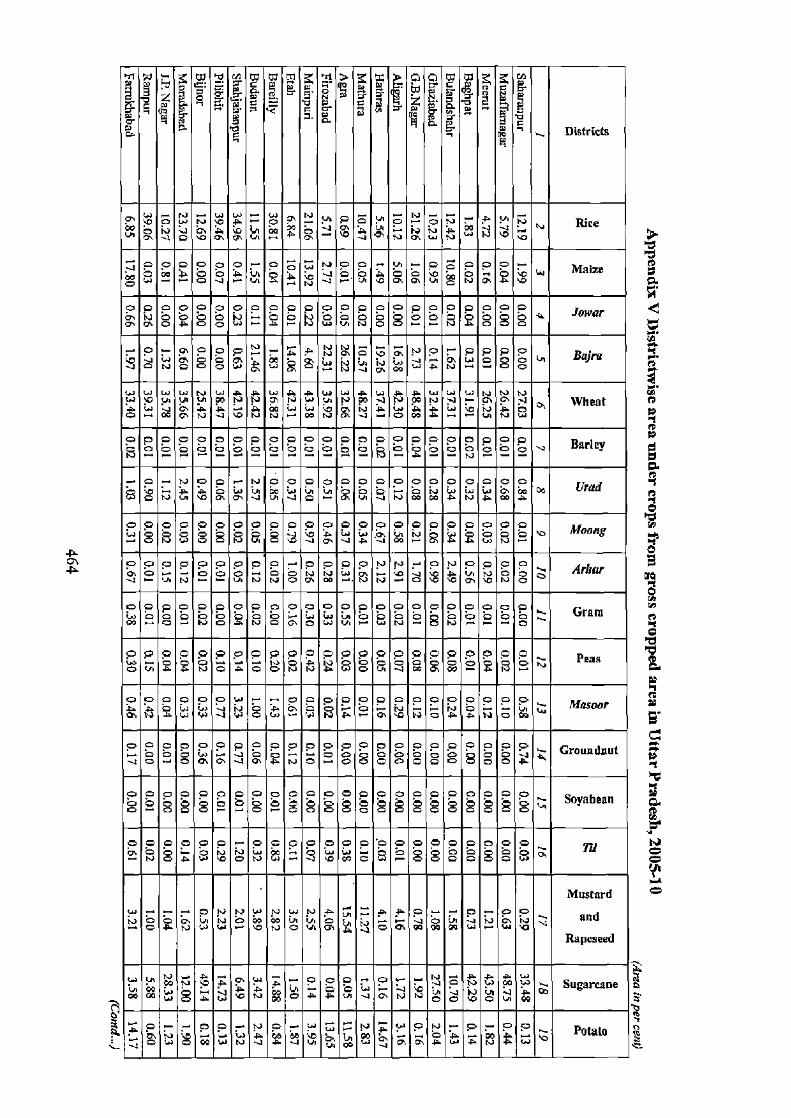
a A
' P ' Districts
Pi
W O W N b La
A r',. O? N O O O O N .- JA N N N Rice m O J rn U W P O y C A A 1" N N W N b O Q P bJ
✓ 0 0 0 0 0 0- O p w N O O- N r O O O oO 'fl • W M - 00 O A O 'p N j O O C O P t m N W b th P A
o 0 0 0 0 0 0 o c o 0 0 0 0 0 0 0 0 0 0 0 0 o Jowar o, O. 0 o 0 w. -t a. oN No 00° o S a oo 00 ° A
P O O BaI~ -J 0 W O P A m G 0 - IJ N W J U W O O U J N O O O W w O w A N - O O
N w La
A A w A A A A w w N N N Vi f~ W V Wheat
O" W y W
C1 P
S N
G y r 'D
p N
W ha
La w QQ
'0 N
0' O.
N y-
A W O
C W
L w 'C N N
d N
O W
0 0 0 o O o 0 0 0 0 0 0 0 0 p 0 o O O o p o Rarle b o 0 o o 0 0 0 o o o a o ti o o o b N o 0 0 Y
N O O N 0 0 0 0 0 0 0 0 0 0 O O O O O UraA OW O L b g P J J O T U m A N w N CM N
O Op Op QO Op O O 0 O O 0 O O O O O O O O Op O O O Maaa 'NJ V 'A J
A 0 W N O b R
--. O N W O \D CO L
O O O O O O O O O H O O O O N N r O N O O O O t OO - coo -'
P -• N A/U
- y b b T b N O O N
N N
0 0 0 0 0 0 0 0 0 0 0 0 0 0 O
0 O
0 O
0 O
0 0 o O
O O
o O
o ,ram O O N O O O N P O w W
O N p
O O O O O O O O O O O O O O O O O O O O O O O paa
- O N A
p A N O A O O N O N
1a A
p W O V J W
p C, W
p - A N
0 0 0 0 o — .. o c o 0 0 0 0 0 0 0 0 0 0 o M¢ Oor Q N A Q W J W O W P O~ N O N O W
0 o c o 0 0 0 0 op a o 0 0 0 0 0 0 0 0 0 0 0 0 Groundnut -1 O O 0 0 0 0 0 0 0 0 0 o A C Q .J o a N O
o c
c o c
0 0 0 0 0 0 2 0 e
0 c
0 0 0 0 0 0 0 0 0 0 e
0 c u So flhean Y eo 00000 o g 'eo 0©000 0000
iii P O g t O b O N
2 W-
p J b W O W-
p O
p O O O
p O O
O W
Mustard
an d N A W W •- S O j O\ W W N `a V w O N O A
Rapeseed
• to A y - .- 0 0 0- o ~- A p a "' Su arcane W m yWj g yy b N O A A e -1 0 N N O O b O H S A
j O - ~-p O O r N O- w N W O N- O p O potato • O N O m W N J F O P WR m P G' A w A N A Li y
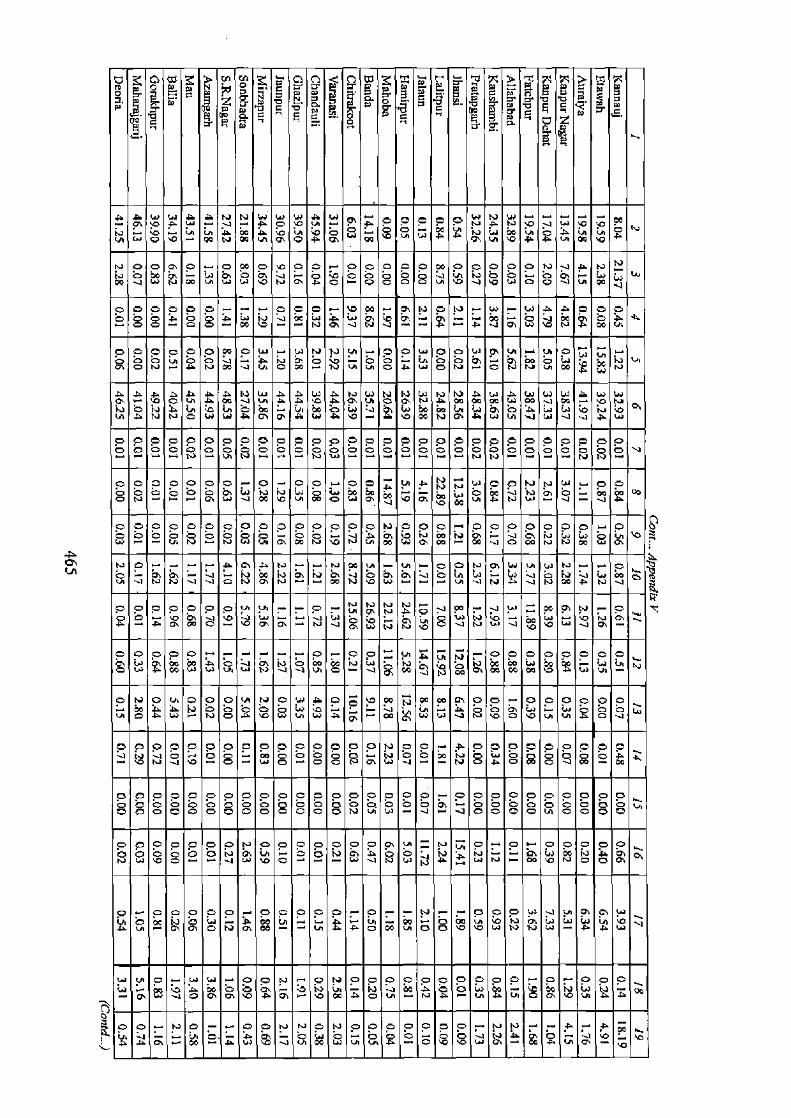
O F'
A rn J- b u j . O O O N A N - A O U A A
b J u ~p ~p U w O b v W N W 4~ O A Q' W T U 'O A A U W b 'P
N O O P O r O O r O O O C O CO O O O O O N J A N N
j b O^ O O -
`Q C 0 0
p Q La
~ V+
op w N 0 W N P O V' J W O J J
0 0 0 0 0 0- -. O C O- V W - N N- r W A O O ~p Oq wq Ay qO
0 0 0 0 0 0 O+ O w u w N N U u O O w p O w g U u U O W U
v p N -a A O La O O w O N N N u W N N % A - O W
A A A u A J Ui d A N N N W N
u A w w
b O A m La a A P u
O P NI 00 m w m y w U D N N O N D N W
to O be J W W W p~ O A. u W b N U G N N O w A C P A W A b- A b 0 N g A w U V W V J A w
o O O N O O N O O O O O O O O O O O V
O O N O O O C N O ha ha
O O O O O O O O- O O O O y A ~j ~j w O O N N W r I 0 O
V U W --
O A N w p
o
O
N
O O O Q g W b
00 O P
C
'O P b La
O O O C O O O O O C O O O O O O O O O r O O O O O O O + O C O N ha O O U) O O O AJ N A q W T W- Q W N N w O g b b N 0
O J N !J J J p ha% N - N Q TO O Q p~
O' J C U J Y J N N A N J N
a - q APO - U Li • - N wJ
-
y P O. J NOb~Nip O-1 b
O O pO O O O q O O U A U NN O O O C O O O O q
O W A W W W W U L N J -
o
U O- V ON W OM W V' A W La - N t N N O`
O N Op In O O O N N O W A O p 'C W La W g O O O O O O O O O W N O
O y W W
La P O O b Y O J A 4- 'C - C N La
O O O O O O O O O O O O O O O N O C A O O O O O O O O O
- N N J • O 0 w 0 0 O
O N N O 0 0
N 0 O O O 00 O A b 0 — 0 P A O J
O O O 2 O O O O O O C O O O O O O O r O 0 O O O 0 0 O O O` o O OO 0 O 0 0 O 0 0 O 0 Q 0 a PO 0 O C 0 O 0 tw O O O O O O O O O O O O O N U UI - J- ] O O O O U O O O O
o O O o O O O N o O O o O o o q to N y. C -+ r O O C O O O O Ob O O O N T In o O N g C O O J a A N N- Go W W N O g p
w
O O_ 0 G 0 0 O -- - O O O W N U q q w OU
4 U- 0N
O' 0p
O' O N P W U~ In Op
A A O GO La O O b U b N N Li W - A A W
O 0 N 0 N 0 0 0 O O 0 O O O-~p C- O O
W J U T A b Oc A N a N a U O b U 4- q O 'C g 1-
O
p p P W A W b O V W W U lOi~ 2 O O b O w C d g A U N b b

G rn W tO O D -. - a P~
o c 0
C.
N w W N W u P W N N N W N Y P W u N W N w J U t O P a N N N w w J w N
1W '- 0l L 0% N LO O. O U J r LA a m L O CO N W P P W O P J 0~ J H ~'
u U A Y d N A J T a P W : c A A d 00
o o O O o- o O Co .- O N r r p O o O - O P
Op O O 2 A W N O
W O O O O O O O O O O O O O O 0 O O O
O O O
o
N O A P Q La P
O O P a
4nn--~
D M D. N N O O m W w O A P W
O O O O P O O O O O O O O O O O O O O O N O O O O O O O 00 0 0 0 O O N O O p J
O O O N N O -J O W W A IWJ O O O O NJ
N A O H N A C O O CO
O w w r
O O 0 O O 0 O 0 0 O O r O O O O O N O O O O O IJ 0 N 0 0 0 'r O O O O O b V - '-' P O P ' CM O b
NJ N T O O N P
0 r 0 r r O 0 O O O 0 r O N O J
N J
N
O G\ J O W
p m O PO - P m N O `G N
N O O 0 O O i+ O O O O O u O 0 O O 0 O N r LO
N m U O NJ P O L1 IJ O
O O to to b r Oa A N N W '0
V O O O O O N r O O O p O O O r O- O
V O N V A W
p
- N 00 p b p y O O P La
O N r A O O O r O
q0%
J N N b
O
- N U W a
N
- tv m O r P
_
W O - LA L
,O p O O p p p O p p p p O O O O O O`
W 0
O~.]
0 N O O O wF J H
p L O L O Q p .q
A N A 00
b ° 0 0 0 0 0 0 0 0 0 0 0 0 0 0 U 0 0 0 0 00 0 0 00 0 0 0 0 0 0 0
p O O O O O O O O O N O O O O O O o c c c o 0 0 o 0% - 10 b oo a 2a N La
N N r U u N O u a A N 00 N r W N P w J J J A
b A
O P 'G O N O%
W J N G 0 10 A-
Ia Y > 6' N b O J p Y1Jj
0 O O r 0 r O r - O O p
Q J W N
p5 q p
' LNW O A O
N
J W
p
Q La A % A CM 0%
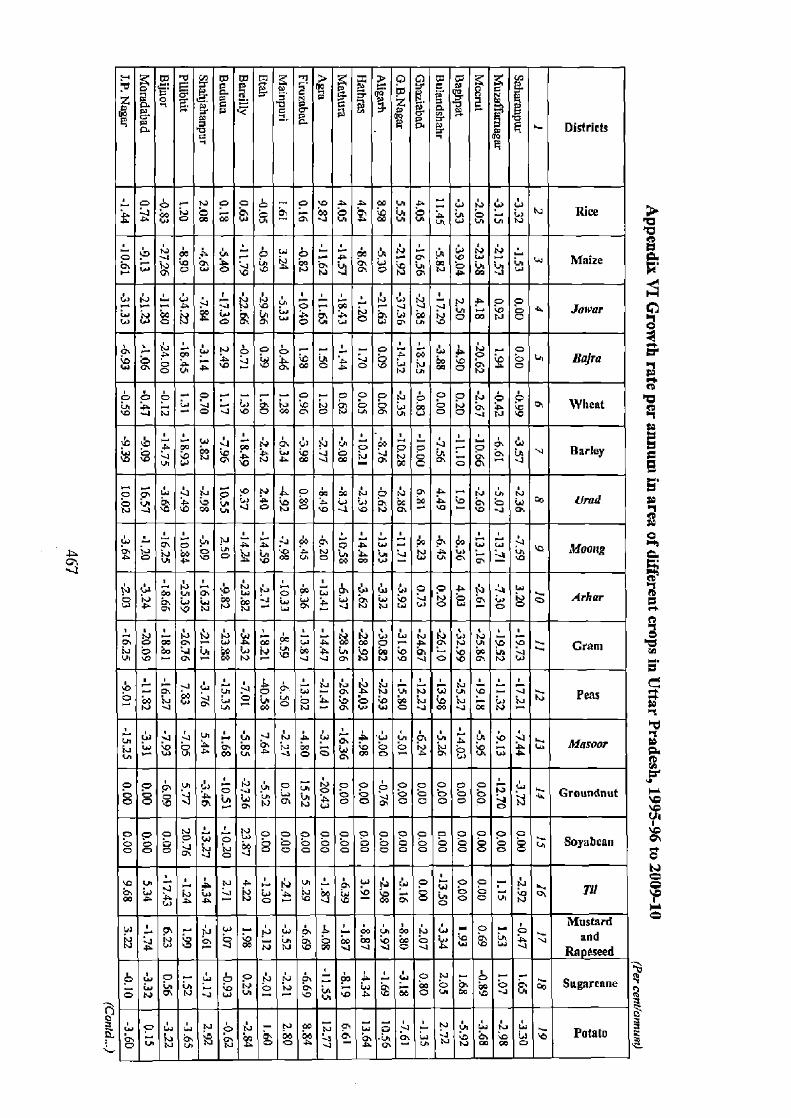
~ 0 q
Q Q ~' P' ,fir » BIStrICtS
N Rice
V N A N CJ C> r lA U b W N a g ? a w Maize
N O O Jowar
O Bafra O P O U A b
Wheat N N +O
b p '~ W J N C~ ti+ N U W V 7 O P W Barley
O O A a~ F Ll 'o W UJI!(I N Nl b O P J N
b
u O b m o jp In N A w J b +NOOII$ y y p
N P U N O ArJr
A WV' Ij Ij A N O ~
O W N P 03 Pc w A c, O- A? cc V O v GYBm
N N V T N N C P b P W W ~p - 00 N -J O
• J. U. 0. W- O. a N In N W u fl - J
PCAS O W W
Ui N N V O0
N- Q W W O J W J N-
W J J u L 1A J N A W A 'J 1%i Q~ IA U~ b V
A W Ma.M%r
r A W U O O P A ua A
O U {~ O w OG y Groundnut
O O ~p J p N P N P N A O O g O O O O O o Ij
o O o p W O o O o o O o O o O O O p p O y N o O O O O O O O O O 0 g 'O g t~i~ Soyab ca n O-
J
J N p N~p 3't N jY IJ J% b u OO W 00 N l
Mustard WN r ON+ rp Ij Wp u N 11 11111 W r O r ti N W V P J J O J W W A ~ A N ~ W J A l
Ra eseed
° o N bs — a O U
a ~ W V Sugarcane
b
w W N â a r N 4J P N W N
W r N b Q lJ b Potato
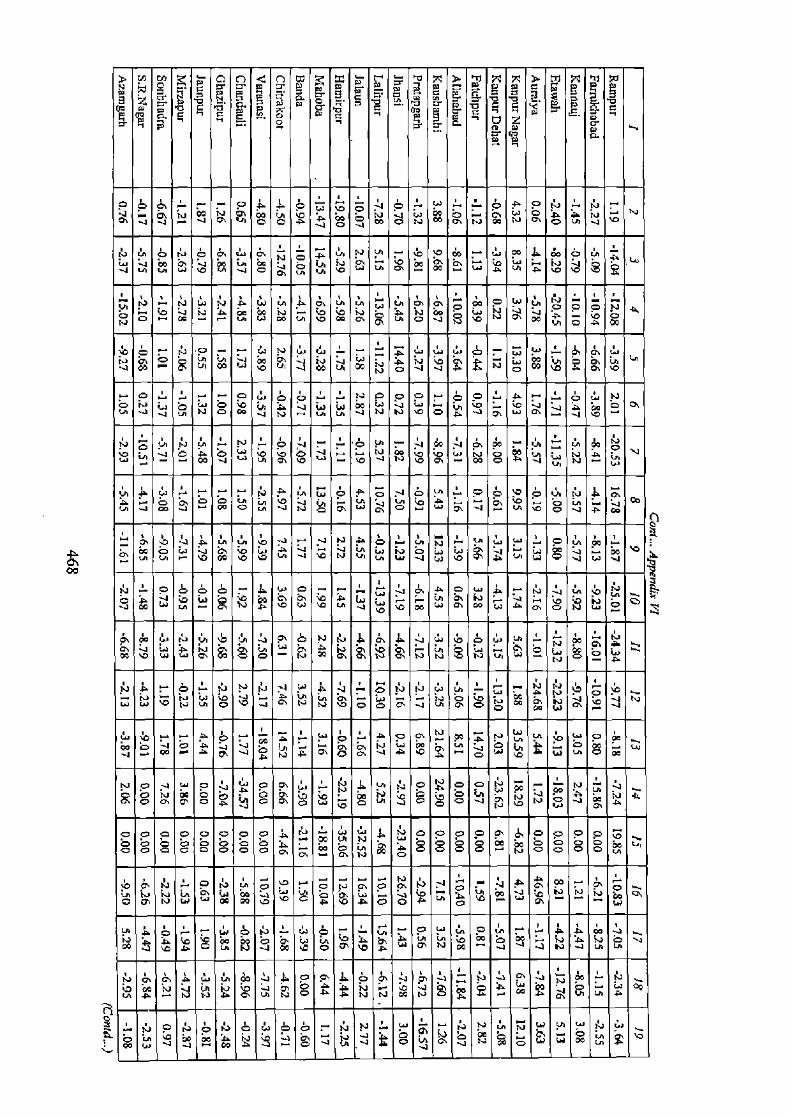
N C O ten, < a x_ r '° x a mR x x a en m r~
~YiG C y C
O b d L r Op~ F. q y O~ N IX T O O A O N G W IX P ~j P P p A j V~ A J W J N YJ
IX t- O a boJ N j bo O. A jJ Jn 'O A
• JIX b P O A H
r N O r La N J aa
O N O O O O A N
H N v O N O b •
VWi N N p~ g J O
O U N& .+ ta 2. O J r •O V' V OJ N O~ W N In &
AW S b - ~ J N b J N -1 D Q 00 0
P 0 O tM LA b U r J LA O P A c J A
U d V A N Y O O
{I~
wU J b N La IA 00' 4 Ia O V b 000 \O Lu J W V 1Y
N O S S bO Ap] W O r W J A O w r N J in S H W ~ N
S T W N N qU U O~ O N NN Aq G~p1 S J 6 4p1 S W U ^ N IX Q~ A\
v IJ ~ N lWli O b H
A P N O U P ~p
OJ1 b y
N O Q~ J O IX~ J
W o r r A p r Z la p r i O P 2
P O A J IX
O O O O O Op O O p k O Op Op O O O O O
S O S S S O g yP O O S N O O O O y P
b P N r O N
J b Y VIXi J ~O O O~ b P W U N b% W~ J U N N u Pn V IX o IJ W
N
u d N J N> P J P O
O N
2 N O N O N S W O Oq .' NN .'N :_ w „ N N in N W U w jJ u- O U W
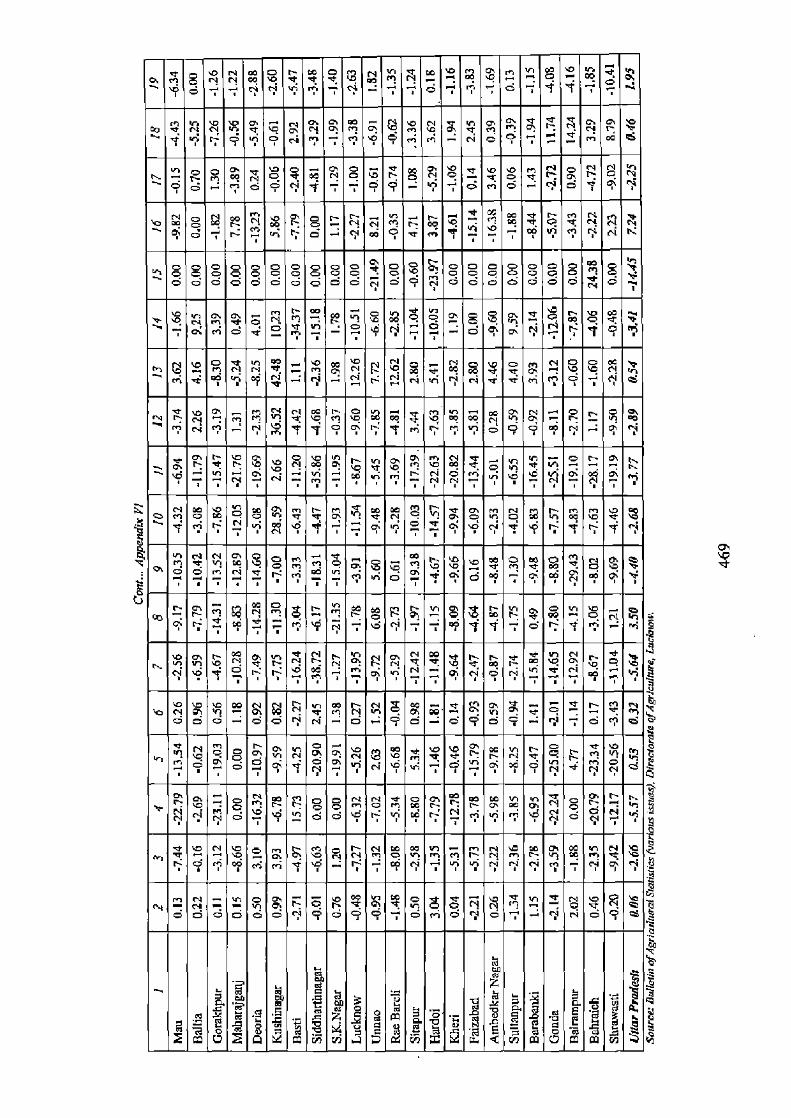
N O r n O N 9 d O 0CC D] O N O Q y o Q P
O 7 t~ 6 p ' I S 7 G
9 Q N '-' O M O n N 0 < T N O
o S o S O o o o 0 o O O O S N O S O O b o r!
O O O O 0' O O 0' O N O O N O OO C 0' G 0' ry O tr j.
m1
V
M< M N pr'• O N N [~ H N Vl N N C Q t~l M O r N OO
P M
ti N b W
en N P
O 0 N 1~ ry N
o99oprl.. 0~ ry
N T p D In M y — O G'
N N N N O N
O en a m V O V ~: N h P O nl V V Co
e r m u o m? q o $ .o M •bo a ms-+ e o e a O
m b a O r h b O n N N N ~: r N Q ? b V N t b
El
NO a
O O o
OO o O ~ N
! b N V Q V N m O vii M en N m 00 0' m b g N M M1
ro

y w m M y > 3 ? z m o 3
°~ - 7 e c Q a 2 Districts
Rice O '0 J A N o O a N bo a b' — r- O y D] c, A p oo
ry~ N N O r-. A'' W ' N N N O O A U J O N W Marie q J V A N V
J O N
U bJ O b m N U 6_' p N QN\ Jowar O1 A A O U P A
W U
a
O P A O N O U Bay- V J VNi V ej A J J WA m O
O O O W N N N N— O .. O N O P O N O O N N — J N bp Wheat S %
O A W g J y to W W b u— ° W J b J O N N PA N N A O A O
O~ N W A a a ~I O O O P a P N O NA N N N
P •N •d •C Y m Urn it I4 b N W W a J~ P
W M00# O N W N 6 O B b U 0 OPi b N P
. N4 G !~ `^ e — ^ W a `^ ° a °` 0' a -I 00 Arlear > a °o w — J A W N y O Ui UI
O o N d m b N W P w A Iii m W O A P P ~o v .. Gram O d mM P W N d O J Ln W P ~ O 0'
• V W V P O. u N ¢ P Q W A O V
b Peas N
b d P O O t, U y
b w ~1 N U fG P - w O W Ma5001 N N p~ O 00 00 A N O W
p p y a O ~' Groundnut O O N Nr ` m P A O O w O O O O
PP O ti N g O O O O O p O p p p O O O O 0 o o $ o °o °o °o 0 0 °o o °o 0 0 °o 0 0 " Soyabean o
Ti!
I I I _ Mustard W O P V A w w k O m m p r U O L1 v and P O N N A N N P d Rapeseed
Sugarcane qt
C 0
3
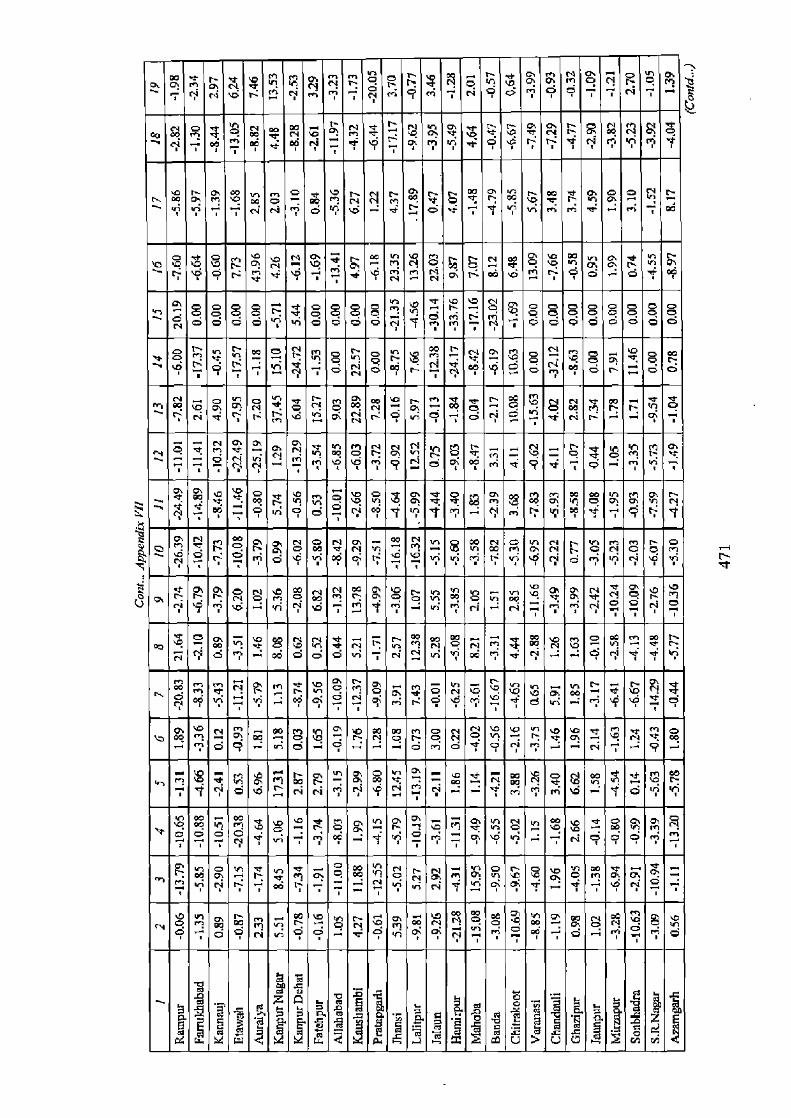
m a N N ry N R R N N O b P Oi m O N r O fqi~ U N IV b
d r
M N O
d N O
o O O OT-re.
' W N 4 d Q b
b O; ry b p. O w n C1 O O O b h P. P n h OM1i
ry O O O O b N O O O O N Y M M r N O O O O P O O O
a O O O > o h h M1 D d O b O P 6
ry' V h n pp N h O O OO v'
N y n (y ry N M O r Nl n O Q NV' O M M n Q O N KI O N p' q ' O i O, G
N
d W p N h t1 b N b g V d W M Wp Q h O T Q Vqi N 1
• 4 ... O vi O p N W g N v ^ t Q IF 1
O C N o h a O m O N 'b - W m m G1 Cl
N O N O O m 1
- N 2 1;
•
9 M OO 'G c t vi 'G N d r N 'C
0 o N d a
N N m "i t
o N lJ m OO W OO OO h N N O d '
Cl' C N S ri
IM'1 V N N VOI o. l O L~ < D' O M1i of b q (Y d N °? ? .-. W T N S M M1 O OO N ~O M OO
W M g W 00 O b" b N O m O N '0 1~ O T O OW V O O O N O
eel b G m m b P OW P d ry o] ry .p vWi do ^ m W
O O O O
d~, M - R N, O q M q Ol BC q O - . ct r - - < < _•b
A ~ w
N

m ar c~ m x d 3 n m g
It Ut
W
QO
•O ' N b° W
i.. W -1
O N
O O b
.- T
O- O N
. O ~1 b O b O O J b j o, N J W b N N
N N_ `. r N O- r W r W W b O b U r U W U
4- O' N- In C' W P A O O p O b N { p ~O
•1.~ W N IJ N W N~ b C P ~ O r N P W 'A N O N a b~ a = O~ O W yi WV N O N w t 00
P O N - N N N p bo N N J P - Q O P b U 4 G~ P N P
w A V. N N b W W N ~W U i b
b J A N b 0 ~D A H G1 j b P U d1 b -
O 'p P. -
A P O b
W O
U CO
W UI P U
d N
A W
O- P W
T O äø Ui
A O O P
O
N W A W u b O A r U r b r ^ & S.
N N W O N q A yi Ø q a A N !P p A ] ~ W N
\ O W O NN
o
4
y
O P
O
O P C
G
O
jJ ~ p
L
O A 0 0 O O O O O O b O O O O O o O O
^. S S S O S O G
p O W N S `O S O O O p O O O O S W
ti N A g A b N ~➢ Oi GG W ~' S Q. ~ N S N N In O U O W Q
•O S N W O W N J N NN - y~ A O O N r N O O O r W N
w W o_ Op b N N W UI L G tJ , w— o a, b oc . ti N LII U N W C J O O O O N Q N U W m W P A -
ml
. O b A O N A" O J O
O O "b A N P r' v w W O 1.
b IJ ~ J p •p b~~ J w N P U b Q U
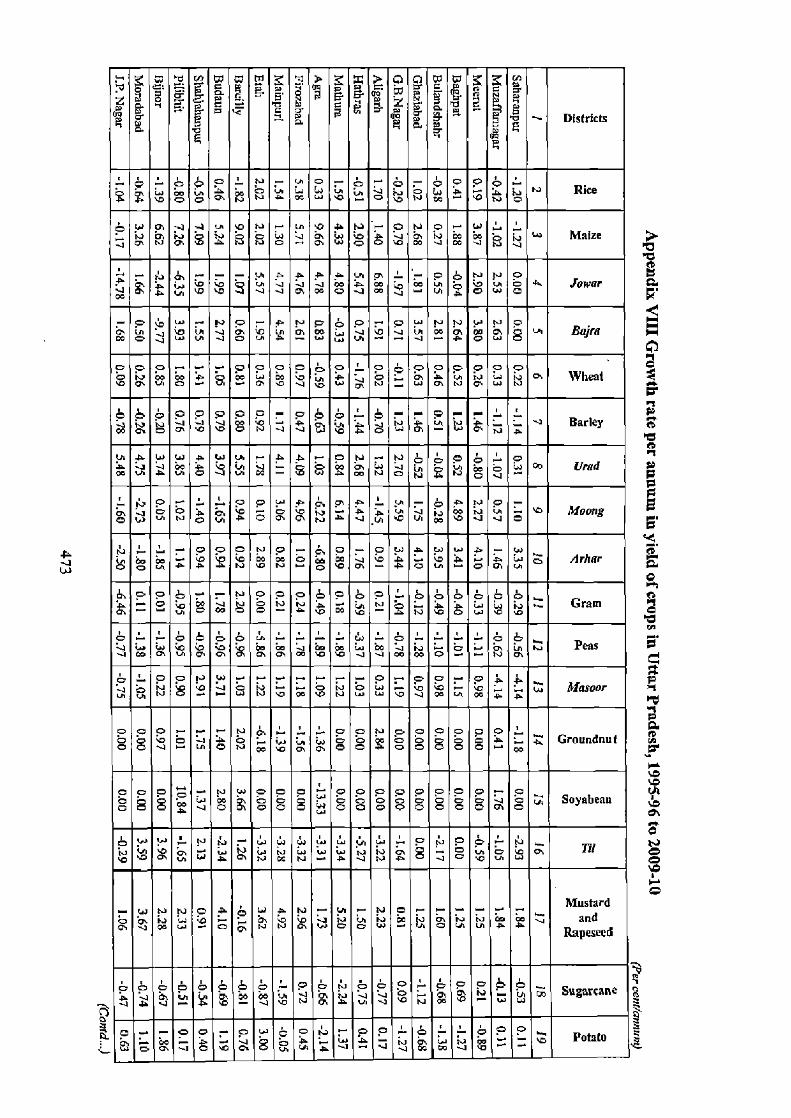
4-W
~i - p - •! 'C . F '~ ei 7 g P ~n y v6 y na+ g Districts
F
Q N J N C N IJ N Rice
W 01 - J U V' N m b y N •-' O N O- W L N P P O L N N O O W O O J g J Po O - "' Maize
-J 05 - O N J
-- -'P A A P lA 00 q- O O N
Iowa, N O
A J G. y O O J J J J Q\ 00 O J D) - u A O w O Po
U b 0' W M P O b J 0 p w J - J_ j W_ g 0 w O Bajra J
p M A O W a g u o q Wheat P P V a P N Ui
by c o 0 p o p- o o b- b- r A r - • A O P b J O b J J b
p O w a W P y j Barley
AO N p p O . O
A co In > °O o J N a . = CW W n m N -J
° N H La N
CO 1/pad J
L , Pr 'r . O O p g A N- 'p A N O ' o O P O• b A A J IJ ~' Mootig
j - O O O y A d b to O J b b A D tth /t r)IQr p o Po A O'c A O O O
° O W O O N A N N N~ Gram q N Po d N b O ua b
O v
O O Peas P O N
O O N W .• r r _ -__ O- O O- O d M1IQsoor
O O P t- r J
r• N pq .. ._. O O N O O O O PP A . Groundnut O O J O O N q W g O O A O O O O O d
O O O G N O O O W O O p O O 09 O- O _
O O J O p
O O O
O O O O O O O O a O SOy412aY O p Os O
W W N {J • • _ O O
VP W L a N- A O O TI
Li
b
W
Si A J N La
_ Mustard W N N O> O •~ A N N r N o ry~ —— q j b N O• W N O Po N O A A and
Rapeseed
o 6 o b b b= o o N b o o O :, o
p~ 0 G~ o N b b
Vi _.
SN garCa114 J A J ' y b J N J J p
•O
PQtato C
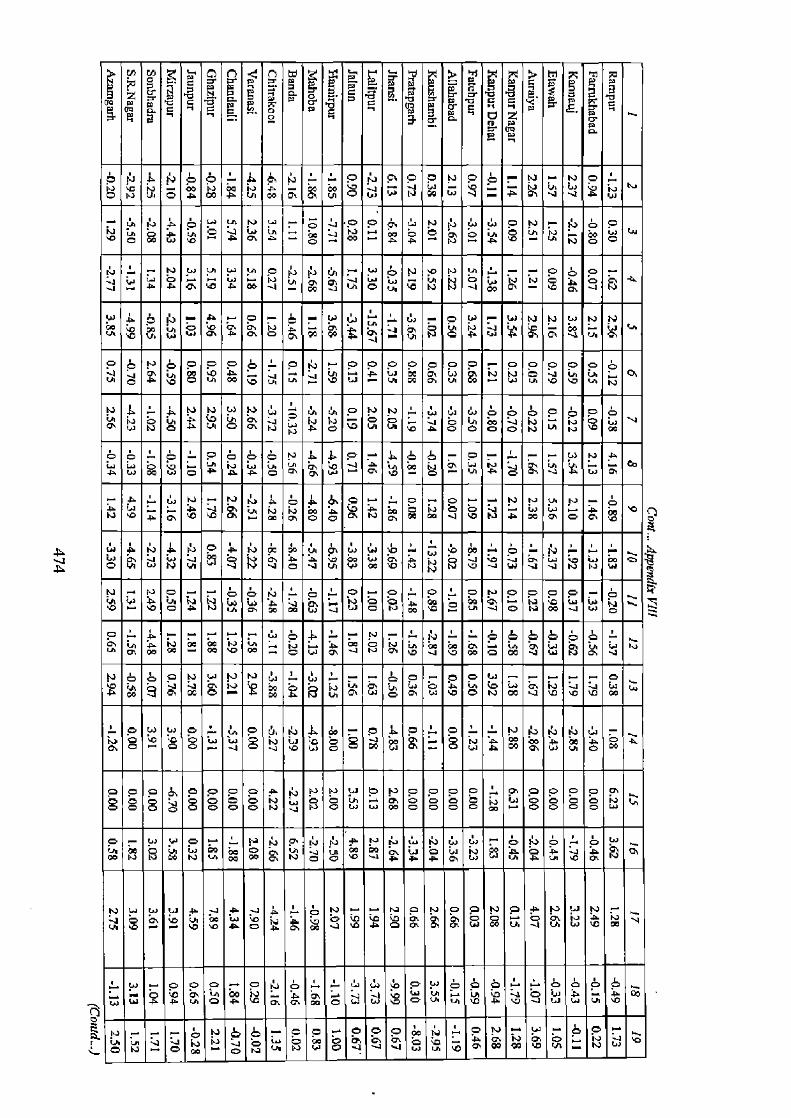
A
A
pym A
y - W
O N Vj A A In O W A A O Co 0% VI W I`/ W J r Gi V J yj
--a NN 0 r M OG p O C'.
J - A 'a A J w P y U U N -4 Q~ N !. O a T W O b N .p N
p N p O o O p - O j - O O O O O o O r o O O o p J VI O V
0 hD a L u F WU CC J~ tJ Q N ~l O JO U t b r N
IJ W
A N p' p b P O O N N
N O~ is w O U '^ O N O b
J p.
`. A W b b A O 'C O O P N R U J N d O q
A U b N O O N UI N N N
Gp INJ
J
a
O J N W
Wq
'G N
o
N JV' W J V N O ~i N W N
N b" O r O . O :, O N O O O O^ O
b N N O O O W N 1
b W U i W c 2 W -J Wl'
O N W (Si
w
- A r r rrr 41 O 2- r N r - N^ 9 b b b O O - P b J V O 00 N 3M J N
NV o o O N W N N w q o O 0 O O W -a
W J C 2 O N A G
N Nip G~ lei o CM W b O N 0 V d 'JO N W t" A oo L
O W W O H O Vi N }+ O b Oq O N N N N w O O O- J b W O W T- A W W J O ~
000 0 0 j3 N W N O O ... q O O T
8 0p
0
0p
O O O N Li J
N O W 'a Q
O O O O N- O O
O O N y 0 0 O
O- W O -' N N P N N N N iu N W W^ O N O L O o
N A A N"" O N O O N O A N N p
O O O O N O W W W O O O O b
O A A PO 0 't A h w b
A A 3M 00
PO VOi W b O N J O g N U N W O J J J_ U b G~ W W N O
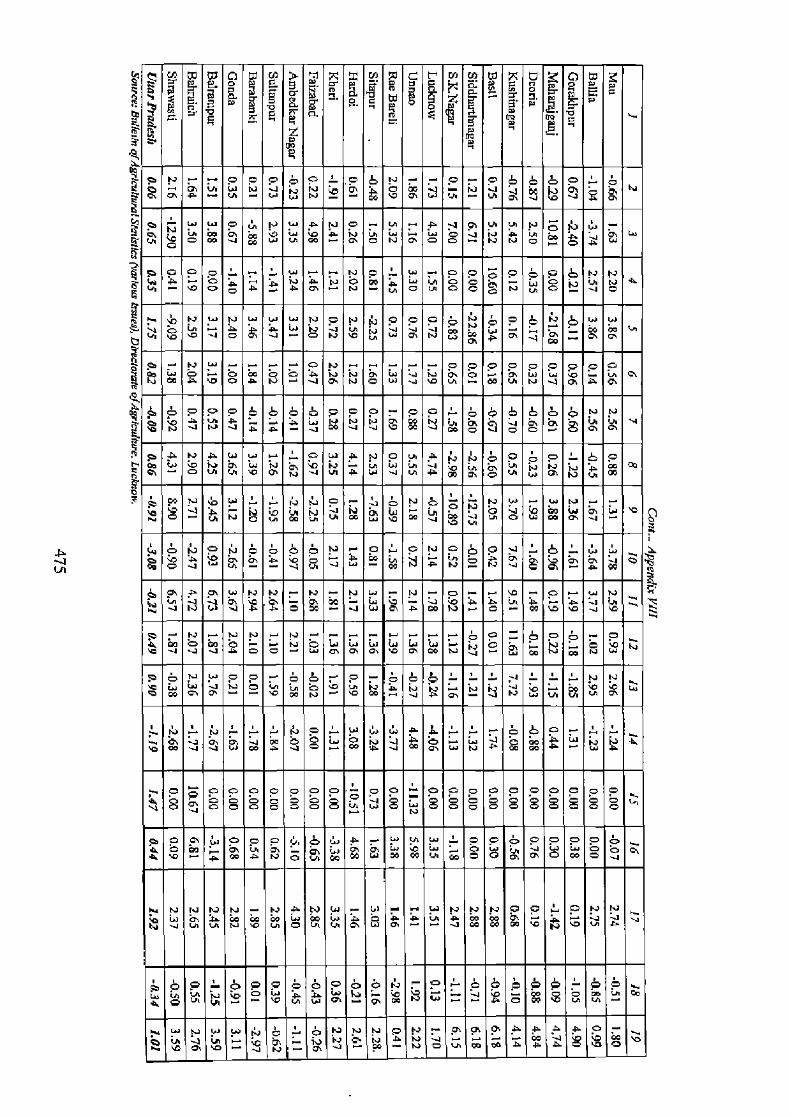
J lA
_ F c Q E o v z m ~ ~
op Q
N- P U
- - o W
0 N o b
w o_ N -
o - b W' N r
S
- La
o- V N
o o N P
b b b
o y
,_. p g N
O ti
b
uw,
~ P O - N N
Np O
W - p P W
O - O O O O C
-
A- A A A N O O W
-
LW,
O
S
O
S
`O
Q
O
LA Li
b O
S
b
N
N
J
N
O
O U - N N b
•0 N O. IN A Pq -
S
00 P N
N
r La m
N
A D O A
p
N
- O
J
N
P N O J ~E
0
u- 0 0
00
0
u
0
N
0
.4
0
q
0
A
0
p. O
0 O~p
o b O A
o N
? J
o A
b r A-
o j 0 0 N M
0 J
0 N J'
- P U
P N
w U
J O -
6&N O P
^~ U
g w S N M b P
-
N
p
J N
A
A
N
W
O La U
M
A
A
N
O
N
P
O O
V
O
W
O-
T j
•
b U
A W
p
y
O'
J
A~1
N
G'
bI
W
J
N
.
N r
O
N
S-
r N
J
W-V
W O.
N
A W
O
N-
`-
O-
b-
W
O
\G
Ui
-
N
b
M O 00 O- N) O to U !u W J O t W
b O N
- O
O 'U N
O 8NP Pr 66rPr6 b O- L J L 1 hi N
0 00 N J La 00
N j
O OO
L
...
W W
A
Ia A A
y
OO
H
L V
A
b O
b ,O p N
4
V
O
O
Q
v
0
O
0
O
0
O
O O O
S
O
O
O O
S
O" O
S
O
S
O
O
p
S
O
S
O
S
O
S
O
S S
O
O
i
o O
a - -
w o W
0 u
0 N O
bQ w W
?- W O Y 00 N oo
o O
o O
6 P
o P
O O E O A
ti N N N N N A N W- w- r w N N N O O u O N N
b o 1- b o a o 0 o b b ^ o b o 0 0- o 0
O ~O T V ~.• ~ N~ g v P N A v N" w 'W D A D O uV' O b
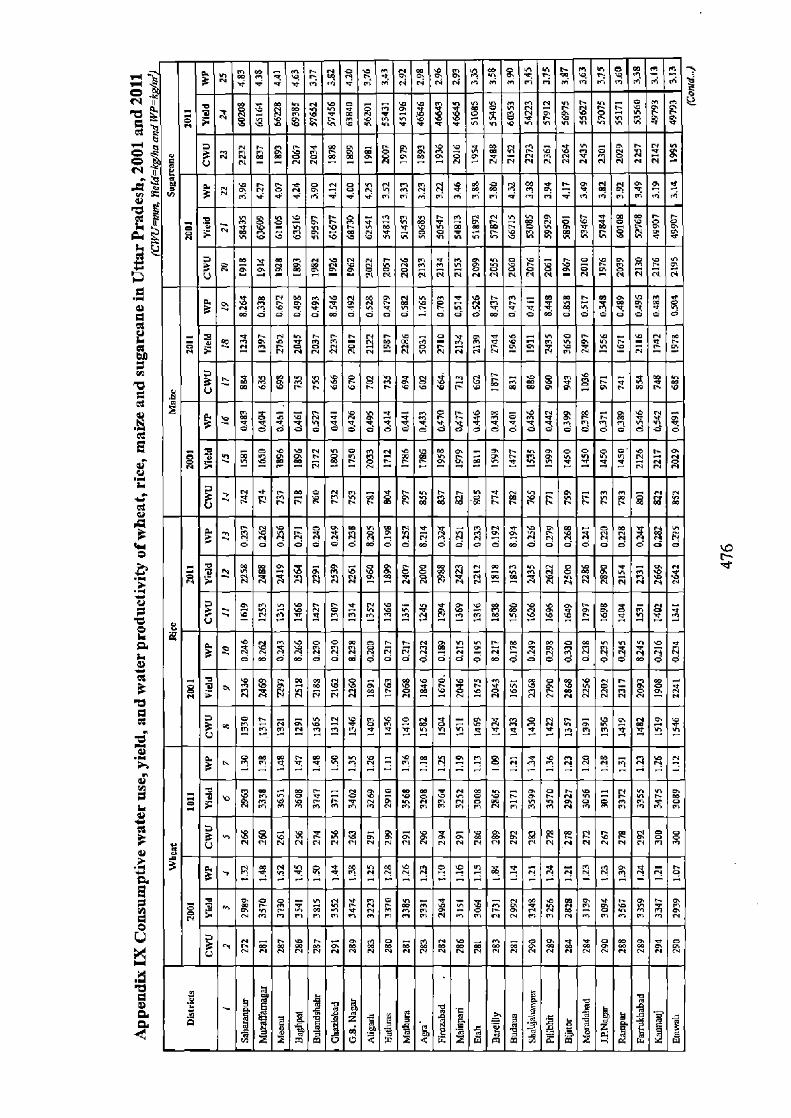
8
ry
G
Cl a m m
r $ 3 $
V m a - S 0 a
fl
$ S 2
u N N N N 0 0 0 N -
Q e e e e o e e e e e o e e e e Q e e e e o a e o e
'O 0 0 0 CC °s s;~a
C =Sn "a
NO'
~ n 0 0 0 o a o 0 0 0 0 0 0 0 0 0 0 o e o o e o o e
- Si
p N 3 A _
r4
a
- t ,t gy m.
(4 0 n
0% 0 -t
- - - 0 N Cl 0% 0 - - - DO Sn - 0% 0 N '0 - N Sn Sn a' —
} b in sn 0 •t 0 '0 '00 0 50 N N Cl Sn N Sn N
U ry ry Cl n r n ry m Cl ry ry n Cl ry ry ry ry ry Cl ry ry Cl ry n m ~
m U
ff
f 3 ' ' o ti a t E¢ ' ' 'm
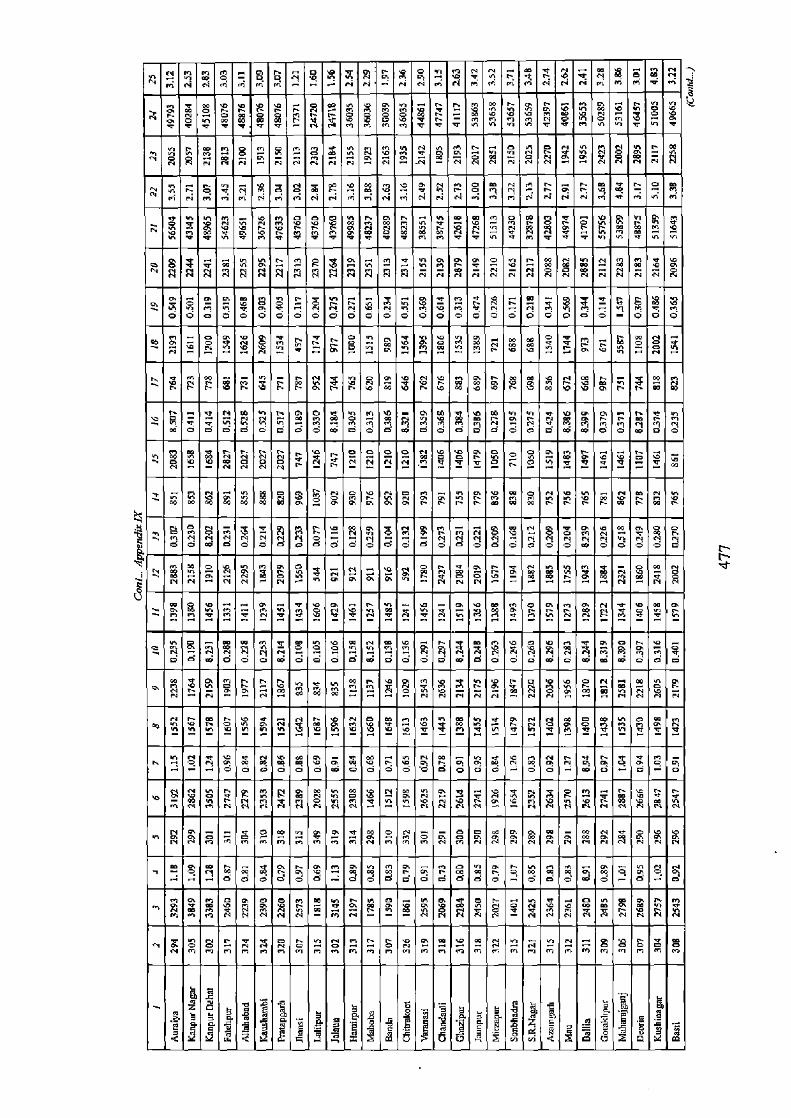
en 7
n - Cl o 0 0 0 0 Cl 0 Cl
en $ o o - - - - _ - v 8 _
- R '.~ o. r R $ o _ _
-, Intitititi n .+ ,y 8 m$ n n$ 3 ry 8 o p '
E a R f N - 0 -
£ 3 £ ffi - 8 C B 17
S _
- S a ffi- S R Cl ti Cl Ci Cl Cl
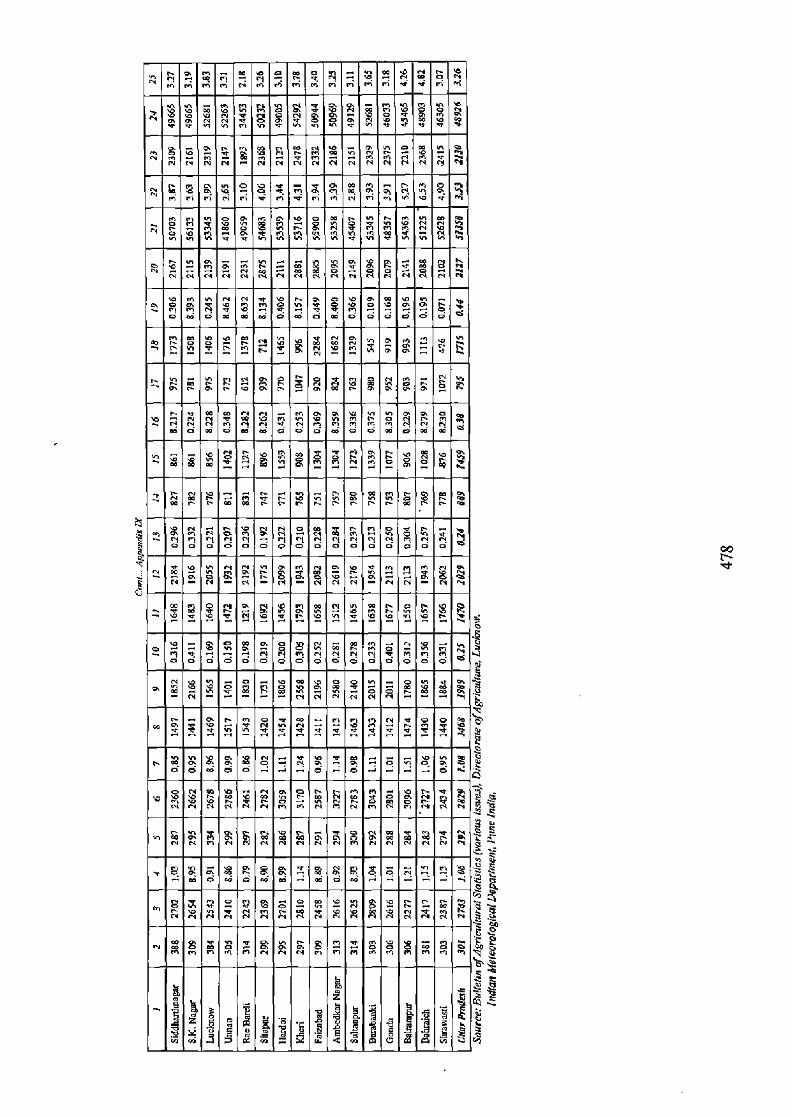
g H —tI
p 00 - N - ° mg-2-
9 ^-sxsti fl
0 0 ! p o Cl
N o o a „ s a g
M1
a o 0 0 0 0 0 0 a
R
-
s _ s s s al N ffi— B e B
i tlg
N00
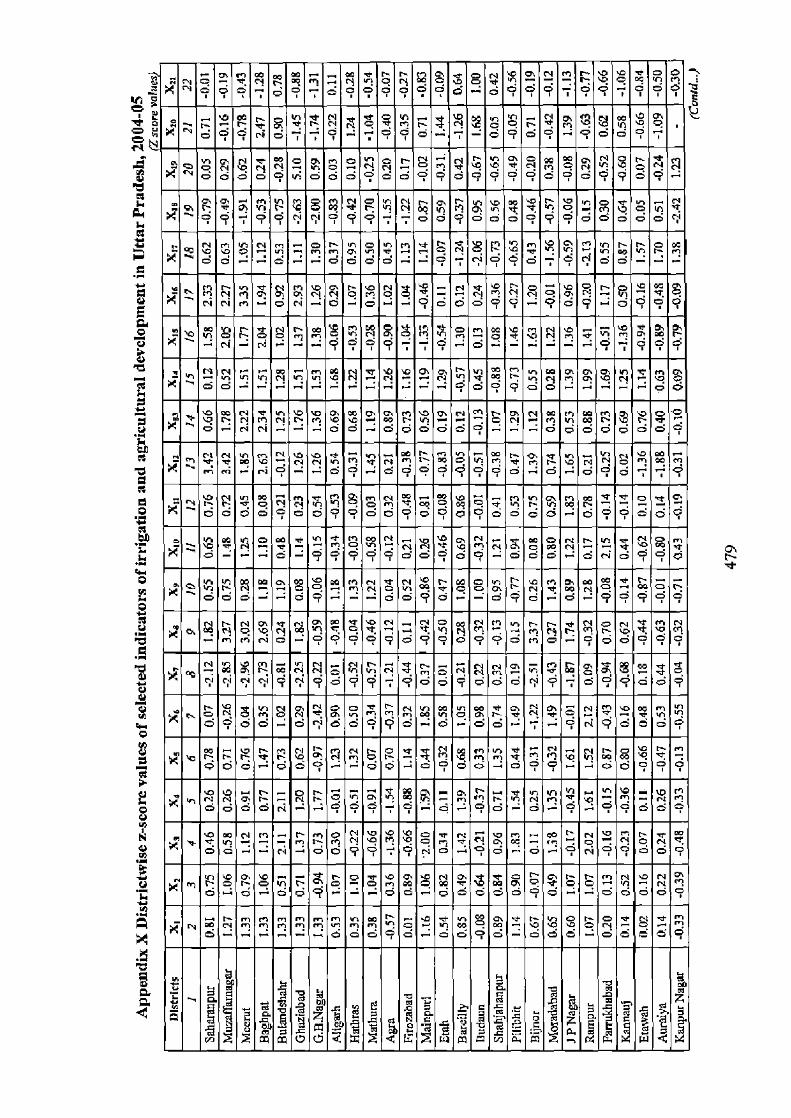
0 q= o q- o 0
O 9 ~O o p k c o c ri o o 0 p o - g o 9
g O P N V O d O N O y N a N O O d N V N N
d N^ m SO D b O S b
K N O O O O O vi O OO O O OO O OO OO O' OO OO O OO O O O OO C OO O_ -
° P Q
YN V1
`~ C.. I- T N
M N P T N H O M O Q M O- O M1 O b Nj S c
` n ^ r .- .- .- n w r e go ~o a m M1 V~ r m M P m a i % N N T vn %O N- N 4 n N '0 N^ O O O OO OO O 0' O OO O O
N C b ~O . 0
n m n mW O N C1 m W m ° T V~ < m b N N n rr~ Q N h m< e.l r b N p
O O D o O a O Q O C O O O O O O o 0 o O~ o o p p Q
SIC
O O n W p Vii r %N W Q~ O ~ m h O vNi W< O O A M1 N< ON N O N
NM N h e O O CM _ Q O ONl M1 O M X Q N O D 0 0 0 0 0 0 0 0 0 0 o p, o- o o d9 o
ci r r ri o o ry q ~i q o g 4~ 4 0 o g o 0 o o~ o g o q
C m h O n 6
M " m cc e tn
b . r N F b U N CCM O n P R 00 M Q M V N F- oo
O O O^ O O 9 O O- 0 O O C o O-- p p 0 0 0
h --
W V „ m m h N - N- ON N m m l~ e ~p ry
r_ M b X P P M M1 N ~O O M< N G~ - u O "i N O N OO NO
- N .+ O O O O O N O - O H O O O O O
N O N O O - O n W W< W P q< O O N ..i nl Vl M1 g G V Yfl 1
- M In m N ... .c a o a K m = w o ° o °ry °. o 0 0 0 0 0 0 - o a c = c 0 0 0
N
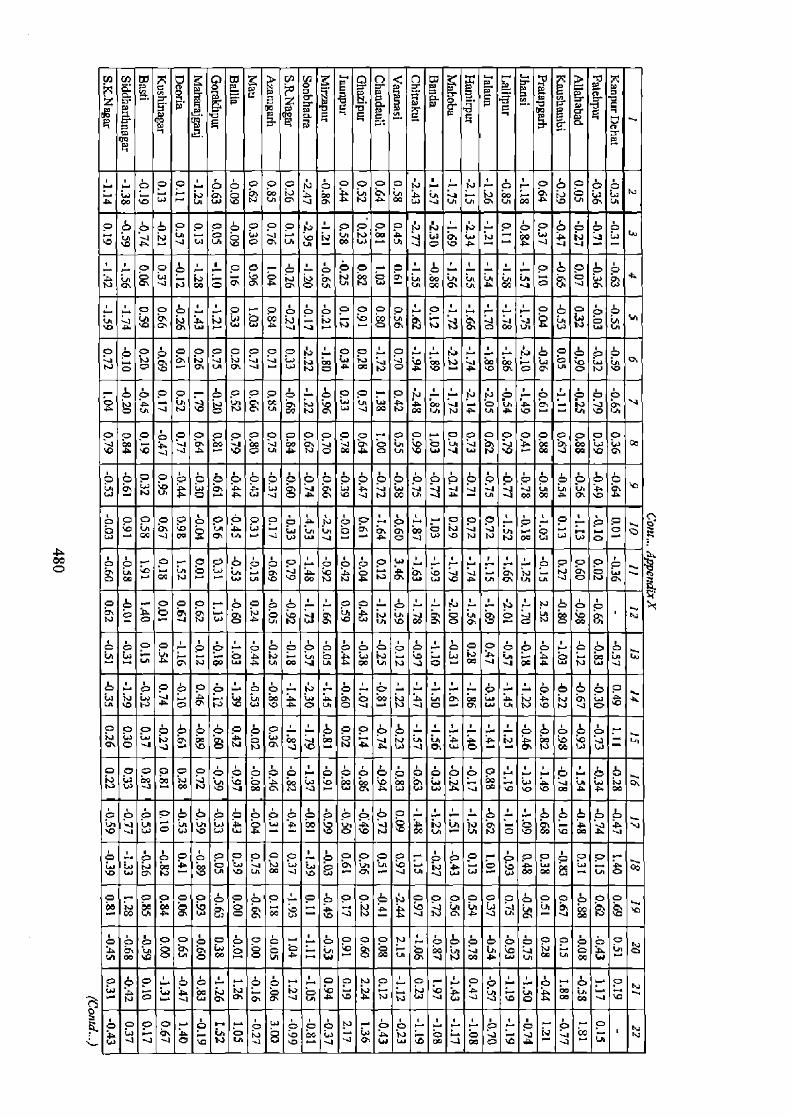
A Ce O
d 0 3 C S m C 7i P 9 C. n S 9
~ 5 ~
r O O O •:.. O O P O O N O y O o o N r^ N ~ O r Oq tS O •O O N
^ U w b N U N J T L N O m W N C Po W A b tO.n Q U A W b
O b O CJ O O O O O O O N O O O O N N N O b4p O O b p O
N T G1 J 9 O• T A P N N N w ~ u W P VV'i A~ O ~ J C~ A N O O J W
•• Y O ' O O O O O O O r O '. •••
b O O O
b T W OW 4 N~ O P
p
N b D T w N J V N N N N P O W N a W N •aJ H
O b O j O O O O O O O - O O . O v r. N b O b O b
N 41 E O O O ^ a O. J O a A b - A mO O. O P fi O N b
bN o P o-y bN o 0q 0 _ b•p o o- o N o 2 bN b b -p A p U J N V p N C1 tin W N w J W N W U N Voi A~~ r V~ ~ VOi v O1 A
O O O O O O O O O O O O O O^ O O O O O O O O O O O
N O N b - O A `O J V A V' O tIi A N A O V W N O Ol W b P
o b? o bp b b b b b bp~ b bq b b b b b oy o b b by b b b o b bq
N P A W J N U J J VJi 00 Y g b A O J O G, C W J CC A
00 J W a U La J O -a Lapi+ t N N N M OW W O-
Sr O PP O O O O W 2-2-1-6299 o W r O u '0 00 :Q N a 0 U -a as
N N A N Q w ~+ V N C
N~ O~ N N W O A V b 4Ai lN/~ ~D O A V~ N O W U~ N N W P OJ O• O
p o Oy~ r O O- p O o b o • O O p p o o O o
- v n L N W A g wN
N J w J n A o V U N V O K A N
b N A p A P
' b w OV
y O OJ N N o N N J O A b
pp Pa b St o b . o_ b pp o b= = b b b b&- ti La N j u O
p
N J O - N R W C• O -
- P
IJ y W W - O Q` A J P
0 0 0 0 0 0 o b o 0 o i- o b o b O b o 6
b b o .. ..• o .~ o b W +1 In O P bo j b W- La C• N La a
`O b b J a A 0
J W O W A W O b N •O o G W L J D b A OOtti . LPito O M
^ O O O a O O O O- b O O O O^ b O-• O O b p O+ Li La
A - U U ~D trJi• A w O W A
w
O P N b '0 L N' ta 00 00 La _ lA
o - o 0 o o _ o b o a b N o 0 0 0 0 0 0 0 o L W
y
N A
0e P W
0~p ap. W O
q
q GE 'y -' J
N N-
y
J'0 C A J U n- • Po N b b A
O O O O O b p p p b '-' b O O O N • b b b O b b O O b O o O N O O A - O U g 00 w 0 {A n V N W A
VJi W ^
O b O v O O r. ^ D •'~ ` ~+ O o p i.. o r r o 'O J.• L. p" b r` o N N b N ua b A a
N O J w a P 0. J A N P N ~j w J W J J b O A w W N b
b O O O ✓ b •- . W O b .') r O O ~ i. ~ ~ O~ O O O N

Coot.. 4p¢ndfx 1 2 3 ! S 6 7 8 9 10 11 12 13 14 6 16 17 18 !9 20 21 12
Lutkaaw MS 0.SS 09 as 043 0.28 423 .058 131 0.16 0.26 06 -0,67 •I!1 197 OA7 •232 4.23 •1.51 •0.21
Unoe UZ 0.61 •021 -0.37 031 0.13 035 464 A36 -033 0.32 06'431 -1.27 -0.06 •0,14 0.61 -0A7 492 1.31
Aae wi, -0,36 0.39 0.43 0,40 413 or Ohl -ass 4,04 433 0..56 19 •0.13 -034 -037 417 OSS 107 0.29 14!
Silapur 0.11 0.20 420 822 0.61 •QIB •0i6 0.72 0.61 0.03 0,71 144a 4S2 •1.29 0,93 -020 IN 0.89 438 0.21 1,76
Hadoi 0.74 O.1 0.0: •0.10 036 QI7 099 431 003 167 439 46 -0S4 0.09 A42 -037 L00 •0.62 442 1.61
hari O.22 D07 .0,04 0.02 0.73 433 •I22 1.76 -0.68 0.06 D.10 47 -038 177 0.19 -0.80 0.96 -091 ON 0.42
Fa'vzbd 0,60 0.62 0.39 0,24 033 -0.11 0.12 006 443 IA •2A5 77 408 0.49 0.01 0,01 0.37 017 0.10 -050 ASkarNagr 1.06 0.81 137 1.14 02891 117 0.58 442 0.08 041 0.98 3 -0.09 403 -0.22 0.42 034 .039 A,03 A.01
SW'~pm 0.50 0.21 a43 0.43 0.11 407 0.47 445 .033 446 2.12 -0.18 i 0.13 4.25 423 410 0..15 0.41 .0.14 40 1.41
Barkarki 49 ' 2$ 1.46 1.38 464 1.73 -OA7 430 0,44 048 O,SS •0.18 MI 412-129 0.06 -0.81 0.77 429-126 0.84
Go_da -0.89 4B5 457 -0.21 019 0.01 020 0,27 049 171 1.15 451 -0.41 463 037 .0.39 -1A5 1.14 -0.72 413 107
Uran:pu 1.75 .2,34 fi„B 0.99 dAS -023 429 0.73 -046 •I,IS 0,12 444 -0.68 4J4 067 -053 •233 1.31 •0.85 A,52 •I.93 3ahraiah B6 I.45 -IA1 •I44 •.32 0.04 0.71 4.41 •0.30 -1.13 -0.35 -123 .0.35 4.68 037 .0.97 -239 1.13 •0. -0,01 0.06 SVrnwafi -2.1d •1,99 -1.47 -Ld9 O7S -0.49 092 •0.65 .22 •103 1.17 •1.16 -0.70 -0,77 048 -1.09 •2,23 LSO A.93 1,31 •IJ2 Sara 4lel1 Agri hunlStaGrlira, &a DIrjcbrafafArpthv, ILiww.
GLOSSARY
And/ti Dust storm or thunder storm.
Bhangar Old alluvium.
Dalils A group of people traditionally regarded as
untouchable.
Desi Refers to people, cultures, and products of a specific
region.
Doab A tract of land lying between two confluent rivers. Gar (jaggery) A traditional uncentrifuged sugar consumed in Asia. Jots A community of traditionally non-elite tillers and
herders in northern India.
Kankar To detrital or residual rolled, often nodular calcium
carbonate formed in soils of semi-arid regions. Khadar Newer alluvium.
Madarsa Any type of educational institution, whether secular or
religious (of any religion).
Panchayat Local self-governments at the village or small town
level in India. Sarpanch is incharge of it.
Pargana A former administrative unit of the Indian
subcontinent, used primarily, but not exclusively,
by the Muslim kingdoms.
Prathmic vidhalay Primary school
Rajbaha A drain
Tahsil An administrative division of some countries of South
Asia.
Tarsi Marshy zone at the foot hill.
Vaisyas One of the four varnas of the Hindu social order.
Warabandi A rotational method for distribution of irrigation water,
with fixed time allocations based on the size of
landholdings of individual water users within a water
course command area.
482
Related Documents