This is the authors’ corrected version of paper published as: Nakaya, T. and Dorling, D (2005) Geographical inequalities of mortality by income in two developed island countries: a cross-national comparison of Britain and Japan. Social Science and Medicine Volume 60, Issue 12, June 2005, Pages 2865-2875. Geographical inequalities of mortality by income in two developed island countries: a cross-national comparison of Britain and Japan Tomoki Nakaya 1 and Danny Dorling 2 1 Department of Geography, Ritsumeikan University 56-1 Tojiin-kita-machi, Kita-ku, Kyoto, 603-8577, Japan 2 Department of Geography, University of Sheffield Winter Street, Sheffield, S10 2TN, UK Abstract In this paper we examine the ecological relations between household income distribution and age-grouped mortality in Britain and Japan. Comparable datasets were prepared in terms of age intervals of mortality, household income intervals and geographical units for years around 1990. Then we conducted series of regression analyses to associate absolute and relative income indices with age and sex-specific standardized mortality ratios (SMRs). The results are as follows: (1) In Britain mortality is lower where inequalities in income are lower, while in Japan there is no obvious relationship. It is, however, apparent that - just as in the case of the USA and Canada - Britain and Japan appear to merge and appear part of greater pattern when considered as series of city regions. Thus an overall global relationship between income inequality and mortality may exist. To assess such global relationship, further studies using cross-national regional datasets covering wide rage of rich nations are desirable. (2) Income–mortality relations are consistent among different age–sex groups in Britain, but there are substantial differences in the relationships as revealed between different demographic groups in Japan. In particular, while absolute income levels are correlated negatively with mortality of working-age men in both countries, mortality of elderly people in Japan is higher where absolute income is higher. This indicates the different historical contexts to the health divides these two different geographical contexts, but further consideration of more historically nuanced understanding of income–mortality relations is required. Introduction There has been considerable debate concerning the relationship between income distribution and health outcomes for many years which escalated following Rodgers’ (1979) seminal paper. The essence of recent debates is summarised by Wilkinson’s (1996) relative income hypothesis which suggests that wider income distribution within population group leads to worse standard of overall population health. This hypothesis has been tested mainly in the US where variety of aggregated and disaggregated datasets are available. In that country, even if controlling for individual income effects on individual health at the micro scale, income distribution variables, such as the Gini coefficient of inequality, are often significantly associated with mortality and self-rated health measures (Kennedy, Kawachi, & Prothrow-Stith, 1996; Kawachi, 2000; Wolfson, Kaplan, Lynch, Ross, Backlund, 1999).

Welcome message from author
This document is posted to help you gain knowledge. Please leave a comment to let me know what you think about it! Share it to your friends and learn new things together.
Transcript
This is the authors’ corrected version of paper published as: Nakaya, T. and Dorling, D (2005) Geographical inequalities of mortality by income in two developed island countries: a cross-national comparison of Britain and Japan. Social Science and Medicine Volume 60, Issue 12, June 2005, Pages 2865-2875.
Geographical inequalities of mortality by income in two developed island countries: a cross-national comparison of Britain and Japan
Tomoki Nakaya1 and Danny Dorling 2
1 Department of Geography, Ritsumeikan University 56-1 Tojiin-kita-machi, Kita-ku, Kyoto, 603-8577, Japan 2 Department of Geography, University of Sheffield Winter Street, Sheffield, S10 2TN, UK Abstract In this paper we examine the ecological relations between household income distribution and age-grouped mortality in Britain and Japan. Comparable datasets were prepared in terms of age intervals of mortality, household income intervals and geographical units for years around 1990. Then we conducted series of regression analyses to associate absolute and relative income indices with age and sex-specific standardized mortality ratios (SMRs). The results are as follows: (1) In Britain mortality is lower where inequalities in income are lower, while in Japan there is no obvious relationship. It is, however, apparent that - just as in the case of the USA and Canada - Britain and Japan appear to merge and appear part of greater pattern when considered as series of city regions. Thus an overall global relationship between income inequality and mortality may exist. To assess such global relationship, further studies using cross-national regional datasets covering wide rage of rich nations are desirable. (2) Income–mortality relations are consistent among different age–sex groups in Britain, but there are substantial differences in the relationships as revealed between different demographic groups in Japan. In particular, while absolute income levels are correlated negatively with mortality of working-age men in both countries, mortality of elderly people in Japan is higher where absolute income is higher. This indicates the different historical contexts to the health divides these two different geographical contexts, but further consideration of more historically nuanced understanding of income–mortality relations is required. Introduction There has been considerable debate concerning the relationship between income distribution and health outcomes for many years which escalated following Rodgers’ (1979) seminal paper. The essence of recent debates is summarised by Wilkinson’s (1996) relative income hypothesis which suggests that wider income distribution within population group leads to worse standard of overall population health. This hypothesis has been tested mainly in the US where variety of aggregated and disaggregated datasets are available. In that country, even if controlling for individual income effects on individual health at the micro scale, income distribution variables, such as the Gini coefficient of inequality, are often significantly associated with mortality and self-rated health measures (Kennedy, Kawachi, & Prothrow-Stith, 1996; Kawachi, 2000; Wolfson, Kaplan, Lynch, Ross, Backlund, 1999).
Such evidence is limited in the rest of the world. In the European context, while a social gradient to health is widely acknowledged (Machkenbach and Bakker, 2002), systematic analysis to assess regional population health outcomes in relation to variations in income distributions is rare, possibly due to data limitations. Moreover, other recent studies (Lynch et al., 2001; Osler et al., 2002; Shibuya, Hashimoto, Yano, 2002; Pearce and Davey Smith, 2003) have presented counter arguments to the relative income hypothesis. Given this, Machkenbach (2002) thus suggested that “the idea that the evidence for correlation between income inequality and the health of the population is slowly dissipating.” However, to date, we are still not sure of how well relative and absolute levels of income can partly explain regional population health collectively under different contexts. Blakely and Woodward (2000) insist that we need to conduct variety of “natural experiments” by using datasets from different countries to test if consistent relationships between income and mortality are observed in different contexts. In this paper we examine ecological relations between household income distributions and age standardised mortality by sex in Britain and Japan to add to this debate. For this study, we prepared comparable datasets in terms of age intervals of mortality, household income intervals and geographical units for years around 1990. Following previous studies (Kennedy et al., 1996; Kawachi and Kennedy, 1997), we calculate series of absolute and relative indices of income in equality to compare with age-specific SMRs for the assessment of the income–mortality relationships. Our research design is similar to that of Ross et al. (2000) who conducted cross-sectional comparative ecological studies of the importance of relative income between the US and Canada. Despite cultural similarity and close interactions between the two countries, the association of mortality with income inequality was only seen in the US where income inequality was much higher than Canada. Since the setting in terms of the difference in income inequality is well matched to our comparison between Britain and Japan, we can say that our design is another ‘‘natural experiment’’ to test the regional relative income hypothesis. Britain and Japan share similar geographic settings among rich nations in their geographic extents and urban systems. Both are dominated by world cities, London and Tokyo. Both countries have provided health services to their population universally (National Health Insurance in Japan and National Health Service in Britain). However, standards of health and its historical–geographical structure differ between the two countries. In Britain, evidence showing strong relationships between material deprivation and mortality has been accumulated over many decades (Shaw, Dorling, Gordon, Davey Smith, 1999). This evidence provided the basis for the social gradient and material wealth theory of health inequality. Deprived areas with worse health status, observed mainly in large cities, have persisted over ears, became especially apparent from late 1970s to early1980s when the nation experienced rapid widening of income differentials under Thatcherism that has yet to be reversed under previous administrations (Shaw et al., 1999). On the other hand, until the early1980s, Japan had experienced drastic economic developments with dramatic socio-economic changes and has simultaneously attained one of the lowest levels of income inequalities and the longest life expectancy seen worldwide. This Japanese experience was taken up as demonstration of the relative income hypothesis (Wilkinson, 1996) and social gradient thesis (Evans Stoddart, 1994). Cockerham et al. (2000), however, insisted that the social gradient explanation of health inequality was not adequate to explain the situation in Japan. They showed that Okinawa, southern peripheral island part of Japan had experienced the worst income levels but had the longest life expectancy in Japan. During the rapid economic growth in 1960s and early1970s in Japan, people living in the major metropolitan areas generally experienced better health conditions than those living in rural areas. After that period, the Japanese health gap has reduced and the major metropolitan areas no longer enjoy the best health standards (Hoshi, 2000). Considering several more facts defying the social gradient thesis, Cockerham et al. (2000) anticipated no regional correlation between income and mortality in Japan. Shibuya et al. (2002) associated absolute/relative income indices of 47 prefectures with self-rated health by using an individual dataset. They certainly found no effect of regional relative income measure on measures of self-rated health when individual attributes including age, sex, marital status and income were controlled for. The geographical consistency between self-rated health and mortality at the prefecture level is however, only weakly associated to life expectancy in Japan at present (Kanda, Ojima, Yanagawa, 2000).
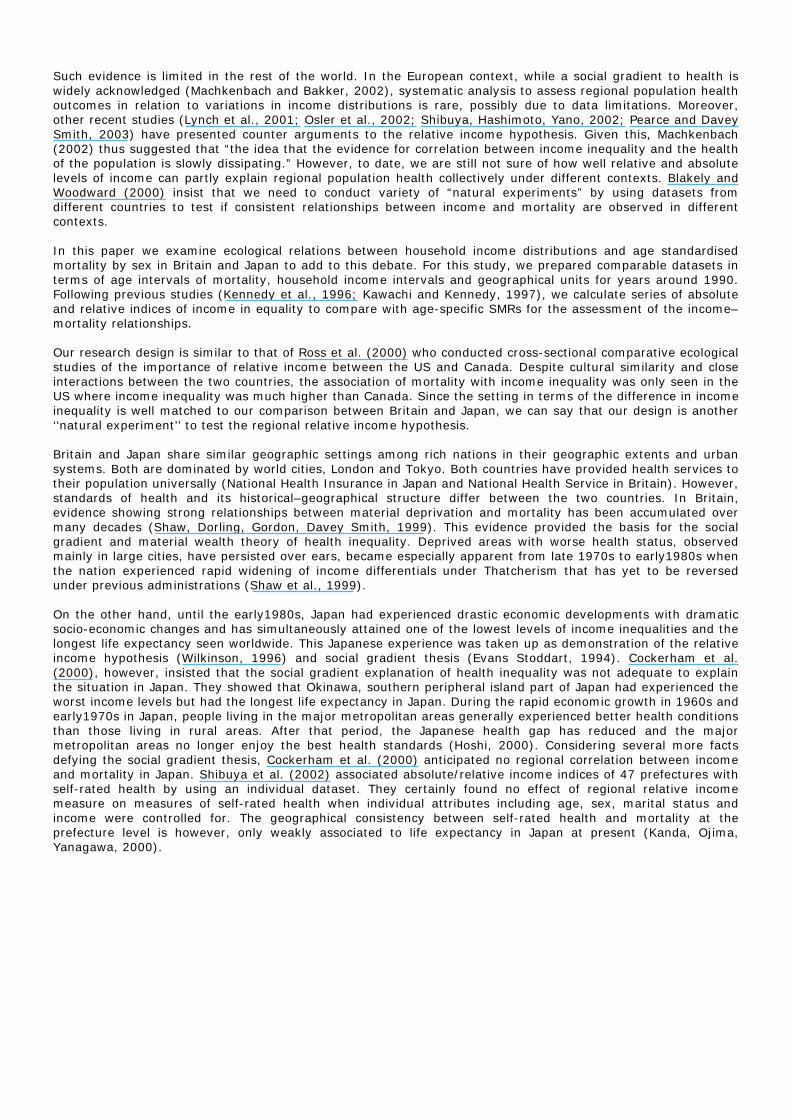
Methods Regional settings Associations between absolute/relative income and mortality around 1990 are examined in 47 Japanese prefectures and 30 British pseudo-NUTS2 regions which are slightly different with formal NUTS2 regionalisation: the two London regions are integrated (to be approximated by aggregations of function cities (which only pose slight problems on the borders of Cheshire). Northern Ireland is excluded because of the lack of consistent statistics. Mean regional population sizes of these areas in Britain and Japan are 1,713,205 and 2,667,803, respectively. Similarly, regional standard deviations of population are 2,261,407 in Britain and 2,469,243 in Japan. Unlike Japanese prefectures as political regions, NUTS2 regions are designed as reporting units for statistics of the European Union. Of all the differing geographies of Britain for which data are available, the amalgamation to NUTS2 regions provides the most comparable set of areas to Japan, both in terms of number of areas being compared and in terms of the relative variations in population size between areas. Both regional systems are also chosen to be large enough to represent city regions in themselves. Mortality data Given concerns about population most recently, counts can be obtained in Britain (corrected under-enumeration) and 1990 in for Japan. Combined with vital statistics of 1990–1992 for Britain and 1990 for Japan, we obtained 5-year intervalled mortality by sex. (SMR) of working age for the two countries were age-specific mortality of Britain as the referent base data. Fig. 1 shows working age SMRs.
Fig. 1. Geographical distributions of working-age SMRs based on quantile classes. (a) Britain and (b) Japan.
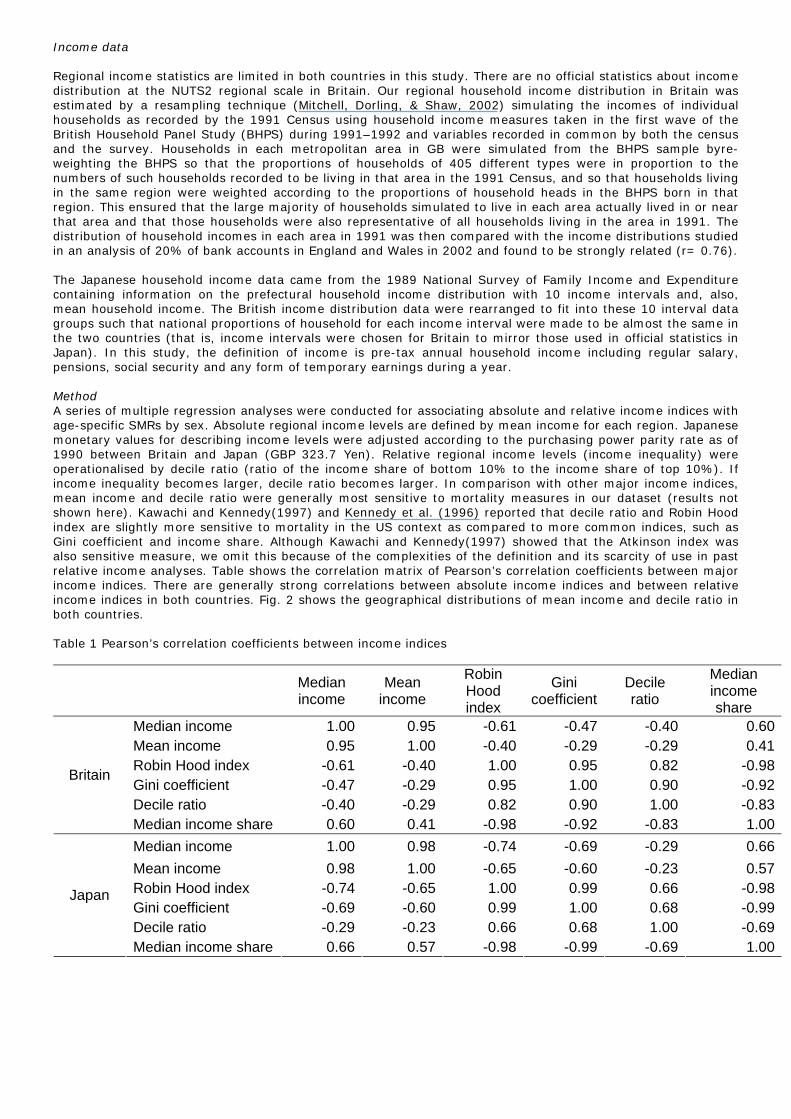
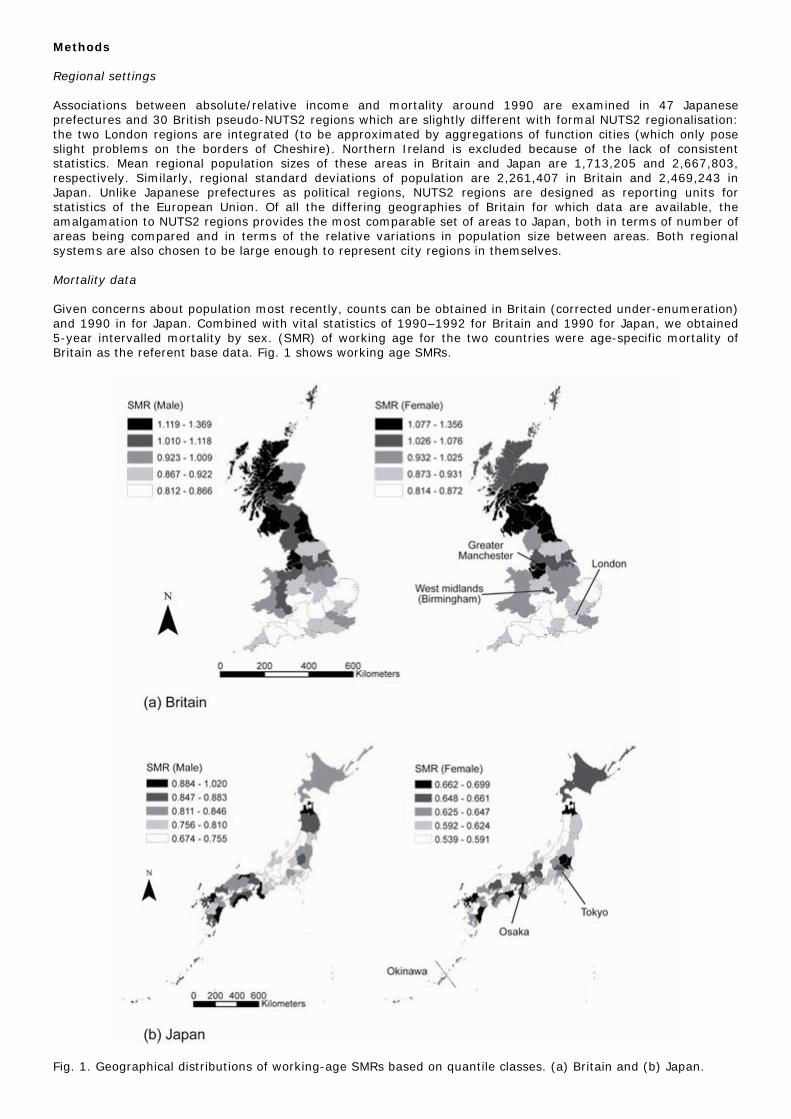
Income data Regional income statistics are limited in both countries in this study. There are no official statistics about income distribution at the NUTS2 regional scale in Britain. Our regional household income distribution in Britain was estimated by a resampling technique (Mitchell, Dorling, & Shaw, 2002) simulating the incomes of individual households as recorded by the 1991 Census using household income measures taken in the first wave of the British Household Panel Study (BHPS) during 1991–1992 and variables recorded in common by both the census and the survey. Households in each metropolitan area in GB were simulated from the BHPS sample byre-weighting the BHPS so that the proportions of households of 405 different types were in proportion to the numbers of such households recorded to be living in that area in the 1991 Census, and so that households living in the same region were weighted according to the proportions of household heads in the BHPS born in that region. This ensured that the large majority of households simulated to live in each area actually lived in or near that area and that those households were also representative of all households living in the area in 1991. The distribution of household incomes in each area in 1991 was then compared with the income distributions studied in an analysis of 20% of bank accounts in England and Wales in 2002 and found to be strongly related (r= 0.76). The Japanese household income data came from the 1989 National Survey of Family Income and Expenditure containing information on the prefectural household income distribution with 10 income intervals and, also, mean household income. The British income distribution data were rearranged to fit into these 10 interval data groups such that national proportions of household for each income interval were made to be almost the same in the two countries (that is, income intervals were chosen for Britain to mirror those used in official statistics in Japan). In this study, the definition of income is pre-tax annual household income including regular salary, pensions, social security and any form of temporary earnings during a year. Method A series of multiple regression analyses were conducted for associating absolute and relative income indices with age-specific SMRs by sex. Absolute regional income levels are defined by mean income for each region. Japanese monetary values for describing income levels were adjusted according to the purchasing power parity rate as of 1990 between Britain and Japan (GBP 323.7 Yen). Relative regional income levels (income inequality) were operationalised by decile ratio (ratio of the income share of bottom 10% to the income share of top 10%). If income inequality becomes larger, decile ratio becomes larger. In comparison with other major income indices, mean income and decile ratio were generally most sensitive to mortality measures in our dataset (results not shown here). Kawachi and Kennedy(1997) and Kennedy et al. (1996) reported that decile ratio and Robin Hood index are slightly more sensitive to mortality in the US context as compared to more common indices, such as Gini coefficient and income share. Although Kawachi and Kennedy(1997) showed that the Atkinson index was also sensitive measure, we omit this because of the complexities of the definition and its scarcity of use in past relative income analyses. Table shows the correlation matrix of Pearson’s correlation coefficients between major income indices. There are generally strong correlations between absolute income indices and between relative income indices in both countries. Fig. 2 shows the geographical distributions of mean income and decile ratio in both countries. Table 1 Pearson’s correlation coefficients between income indices
Median income
Mean income
Robin Hood index
Gini coefficient
Decile ratio
Median income share
Median income 1.00 0.95 -0.61 -0.47 -0.40 0.60 Mean income 0.95 1.00 -0.40 -0.29 -0.29 0.41 Robin Hood index -0.61 -0.40 1.00 0.95 0.82 -0.98 Gini coefficient -0.47 -0.29 0.95 1.00 0.90 -0.92 Decile ratio -0.40 -0.29 0.82 0.90 1.00 -0.83
Britain
Median income share 0.60 0.41 -0.98 -0.92 -0.83 1.00 Median income 1.00 0.98 -0.74 -0.69 -0.29 0.66 Mean income 0.98 1.00 -0.65 -0.60 -0.23 0.57 Robin Hood index -0.74 -0.65 1.00 0.99 0.66 -0.98 Gini coefficient -0.69 -0.60 0.99 1.00 0.68 -0.99 Decile ratio -0.29 -0.23 0.66 0.68 1.00 -0.69
Japan
Median income share 0.66 0.57 -0.98 -0.99 -0.69 1.00
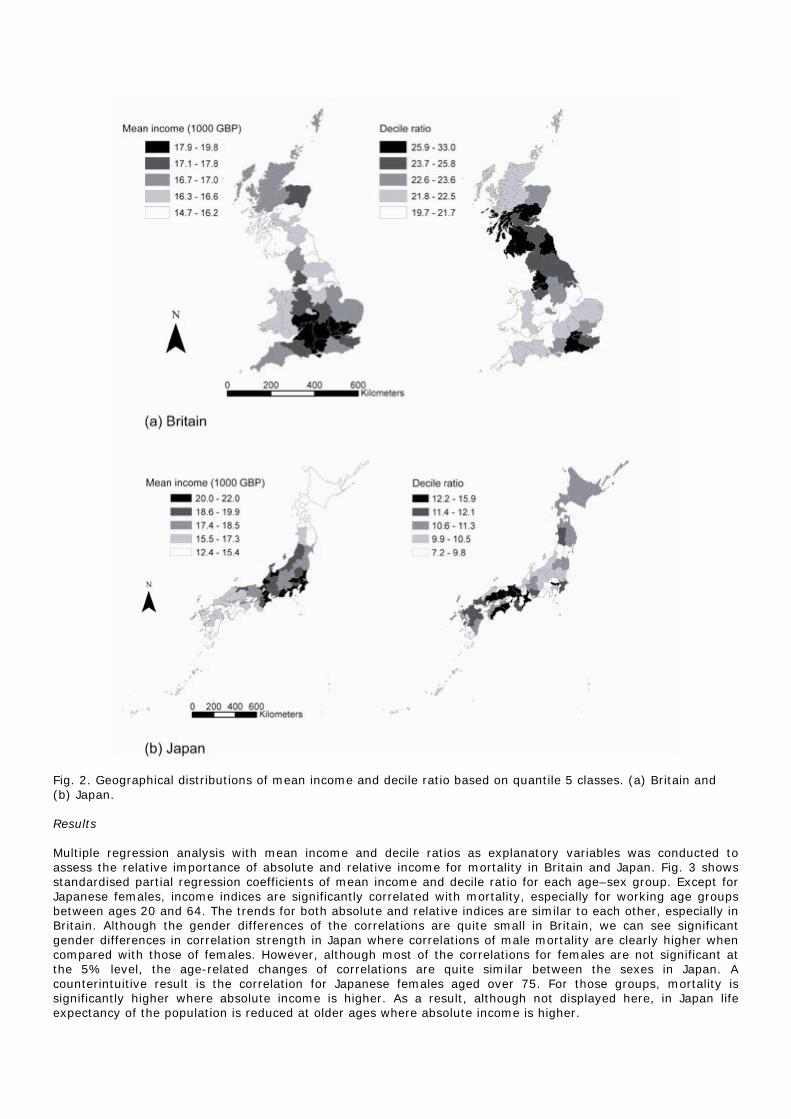
Fig. 2. Geographical distributions of mean income and decile ratio based on quantile 5 classes. (a) Britain and (b) Japan. Results Multiple regression analysis with mean income and decile ratios as explanatory variables was conducted to assess the relative importance of absolute and relative income for mortality in Britain and Japan. Fig. 3 shows standardised partial regression coefficients of mean income and decile ratio for each age–sex group. Except for Japanese females, income indices are significantly correlated with mortality, especially for working age groups between ages 20 and 64. The trends for both absolute and relative indices are similar to each other, especially in Britain. Although the gender differences of the correlations are quite small in Britain, we can see significant gender differences in correlation strength in Japan where correlations of male mortality are clearly higher when compared with those of females. However, although most of the correlations for females are not significant at the 5% level, the age-related changes of correlations are quite similar between the sexes in Japan. A counterintuitive result is the correlation for Japanese females aged over 75. For those groups, mortality is significantly higher where absolute income is higher. As a result, although not displayed here, in Japan life expectancy of the population is reduced at older ages where absolute income is higher.
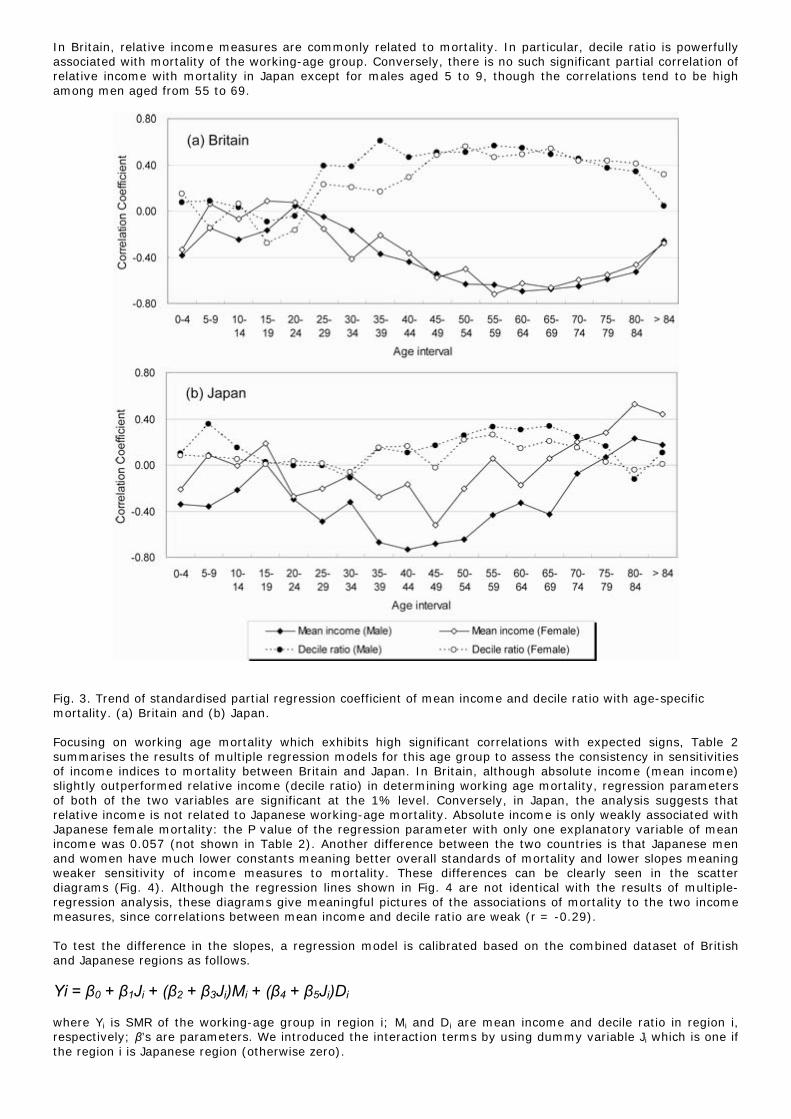
In Britain, relative income measures are commonly related to mortality. In particular, decile ratio is powerfully associated with mortality of the working-age group. Conversely, there is no such significant partial correlation of relative income with mortality in Japan except for males aged 5 to 9, though the correlations tend to be high among men aged from 55 to 69.
Fig. 3. Trend of standardised partial regression coefficient of mean income and decile ratio with age-specific mortality. (a) Britain and (b) Japan. Focusing on working age mortality which exhibits high significant correlations with expected signs, Table 2 summarises the results of multiple regression models for this age group to assess the consistency in sensitivities of income indices to mortality between Britain and Japan. In Britain, although absolute income (mean income) slightly outperformed relative income (decile ratio) in determining working age mortality, regression parameters of both of the two variables are significant at the 1% level. Conversely, in Japan, the analysis suggests that relative income is not related to Japanese working-age mortality. Absolute income is only weakly associated with Japanese female mortality: the P value of the regression parameter with only one explanatory variable of mean income was 0.057 (not shown in Table 2). Another difference between the two countries is that Japanese men and women have much lower constants meaning better overall standards of mortality and lower slopes meaning weaker sensitivity of income measures to mortality. These differences can be clearly seen in the scatter diagrams (Fig. 4). Although the regression lines shown in Fig. 4 are not identical with the results of multiple-regression analysis, these diagrams give meaningful pictures of the associations of mortality to the two income measures, since correlations between mean income and decile ratio are weak (r = -0.29). To test the difference in the slopes, a regression model is calibrated based on the combined dataset of British and Japanese regions as follows. Yi = β0 + β1Ji + (β2 + β3Ji)Mi + (β4 + β5Ji)Di where Yi is SMR of the working-age group in region i; Mi and Di are mean income and decile ratio in region i, respectively; β’s are parameters. We introduced the interaction terms by using dummy variable Ji which is one if the region i is Japanese region (otherwise zero).
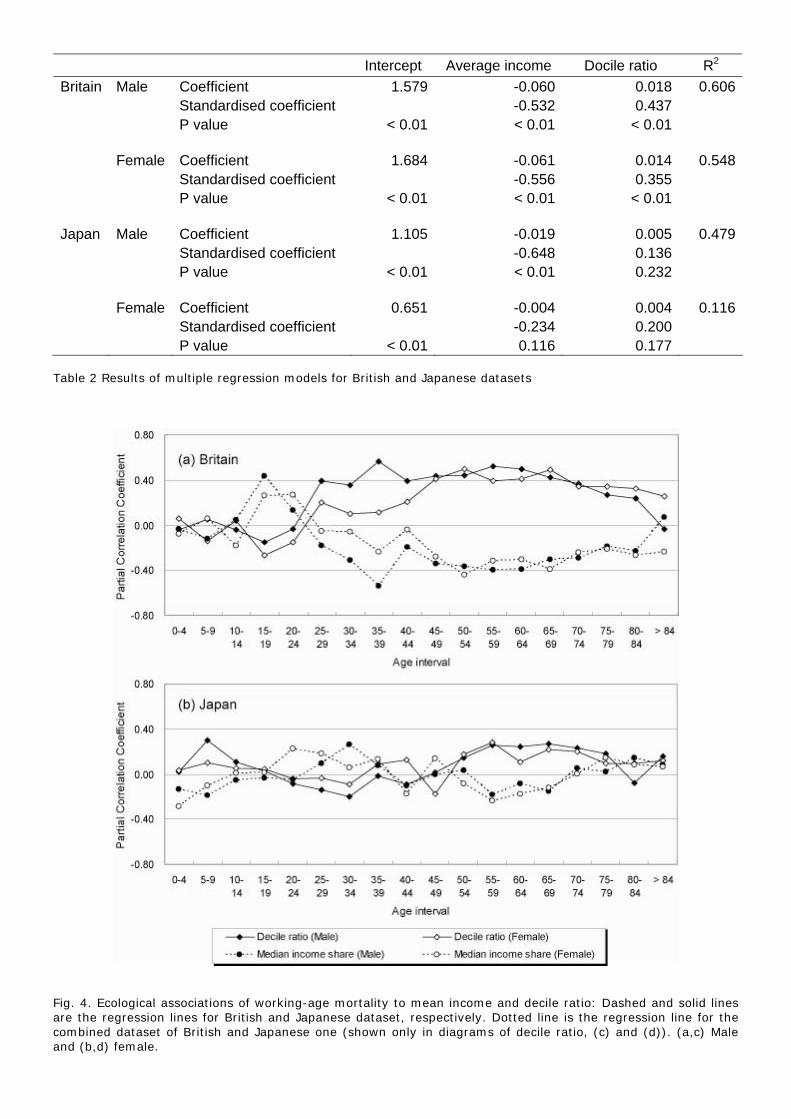
Intercept Average income Docile ratio R2 Britain Male Coefficient 1.579 -0.060 0.018 0.606 Standardised coefficient -0.532 0.437 P value < 0.01 < 0.01 < 0.01 Female Coefficient 1.684 -0.061 0.014 0.548 Standardised coefficient -0.556 0.355 P value < 0.01 < 0.01 < 0.01 Japan Male Coefficient 1.105 -0.019 0.005 0.479 Standardised coefficient -0.648 0.136 P value < 0.01 < 0.01 0.232 Female Coefficient 0.651 -0.004 0.004 0.116 Standardised coefficient -0.234 0.200 P value < 0.01 0.116 0.177
Table 2 Results of multiple regression models for British and Japanese datasets
Fig. 4. Ecological associations of working-age mortality to mean income and decile ratio: Dashed and solid lines are the regression lines for British and Japanese dataset, respectively. Dotted line is the regression line for the combined dataset of British and Japanese one (shown only in diagrams of decile ratio, (c) and (d)). (a,c) Male and (b,d) female.
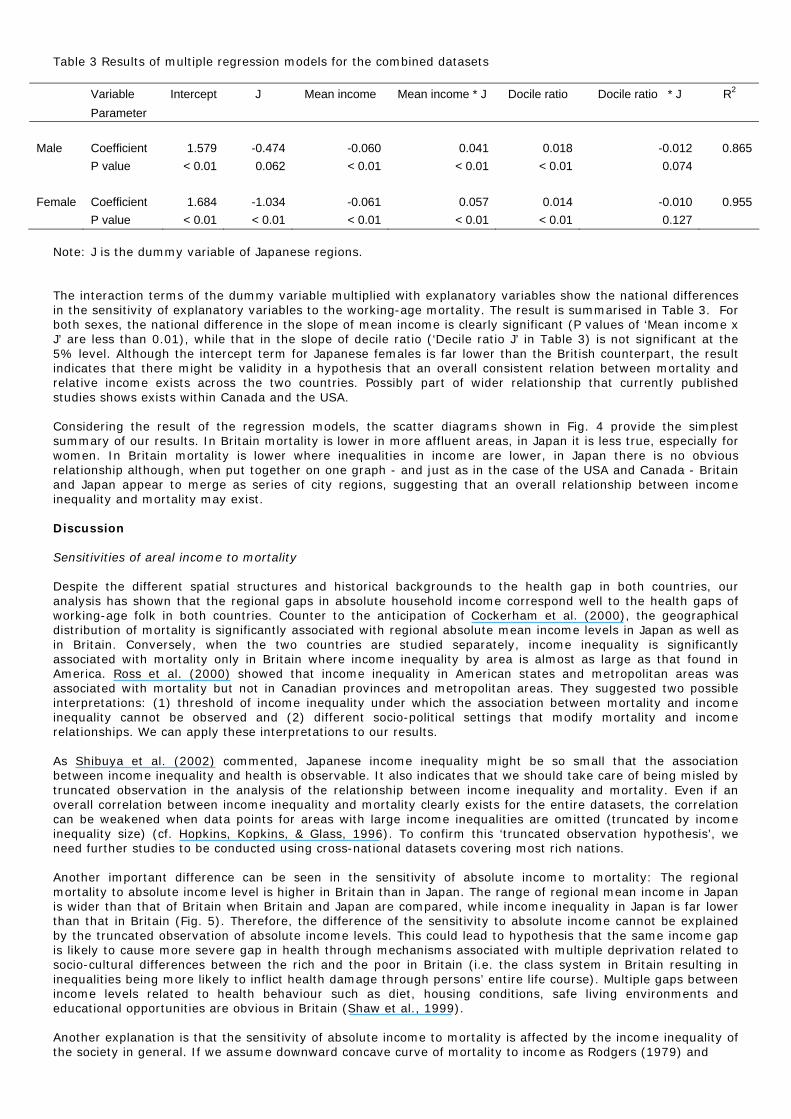
Table 3 Results of multiple regression models for the combined datasets
Variable Intercept J Mean income Mean income * J Docile ratio Docile ratio * J R2 Parameter Male Coefficient 1.579 -0.474 -0.060 0.041 0.018 -0.012 0.865 P value < 0.01 0.062 < 0.01 < 0.01 < 0.01 0.074 Female Coefficient 1.684 -1.034 -0.061 0.057 0.014 -0.010 0.955 P value < 0.01 < 0.01 < 0.01 < 0.01 < 0.01 0.127
Note: J is the dummy variable of Japanese regions. The interaction terms of the dummy variable multiplied with explanatory variables show the national differences in the sensitivity of explanatory variables to the working-age mortality. The result is summarised in Table 3. For both sexes, the national difference in the slope of mean income is clearly significant (P values of ‘Mean income x J’ are less than 0.01), while that in the slope of decile ratio (‘Decile ratio J’ in Table 3) is not significant at the 5% level. Although the intercept term for Japanese females is far lower than the British counterpart, the result indicates that there might be validity in a hypothesis that an overall consistent relation between mortality and relative income exists across the two countries. Possibly part of wider relationship that currently published studies shows exists within Canada and the USA. Considering the result of the regression models, the scatter diagrams shown in Fig. 4 provide the simplest summary of our results. In Britain mortality is lower in more affluent areas, in Japan it is less true, especially for women. In Britain mortality is lower where inequalities in income are lower, in Japan there is no obvious relationship although, when put together on one graph - and just as in the case of the USA and Canada - Britain and Japan appear to merge as series of city regions, suggesting that an overall relationship between income inequality and mortality may exist. Discussion Sensitivities of areal income to mortality Despite the different spatial structures and historical backgrounds to the health gap in both countries, our analysis has shown that the regional gaps in absolute household income correspond well to the health gaps of working-age folk in both countries. Counter to the anticipation of Cockerham et al. (2000), the geographical distribution of mortality is significantly associated with regional absolute mean income levels in Japan as well as in Britain. Conversely, when the two countries are studied separately, income inequality is significantly associated with mortality only in Britain where income inequality by area is almost as large as that found in America. Ross et al. (2000) showed that income inequality in American states and metropolitan areas was associated with mortality but not in Canadian provinces and metropolitan areas. They suggested two possible interpretations: (1) threshold of income inequality under which the association between mortality and income inequality cannot be observed and (2) different socio-political settings that modify mortality and income relationships. We can apply these interpretations to our results. As Shibuya et al. (2002) commented, Japanese income inequality might be so small that the association between income inequality and health is observable. It also indicates that we should take care of being misled by truncated observation in the analysis of the relationship between income inequality and mortality. Even if an overall correlation between income inequality and mortality clearly exists for the entire datasets, the correlation can be weakened when data points for areas with large income inequalities are omitted (truncated by income inequality size) (cf. Hopkins, Kopkins, & Glass, 1996). To confirm this ‘truncated observation hypothesis’, we need further studies to be conducted using cross-national datasets covering most rich nations. Another important difference can be seen in the sensitivity of absolute income to mortality: The regional mortality to absolute income level is higher in Britain than in Japan. The range of regional mean income in Japan is wider than that of Britain when Britain and Japan are compared, while income inequality in Japan is far lower than that in Britain (Fig. 5). Therefore, the difference of the sensitivity to absolute income cannot be explained by the truncated observation of absolute income levels. This could lead to hypothesis that the same income gap is likely to cause more severe gap in health through mechanisms associated with multiple deprivation related to socio-cultural differences between the rich and the poor in Britain (i.e. the class system in Britain resulting in inequalities being more likely to inflict health damage through persons’ entire life course). Multiple gaps between income levels related to health behaviour such as diet, housing conditions, safe living environments and educational opportunities are obvious in Britain (Shaw et al., 1999). Another explanation is that the sensitivity of absolute income to mortality is affected by the income inequality of the society in general. If we assume downward concave curve of mortality to income as Rodgers (1979) and
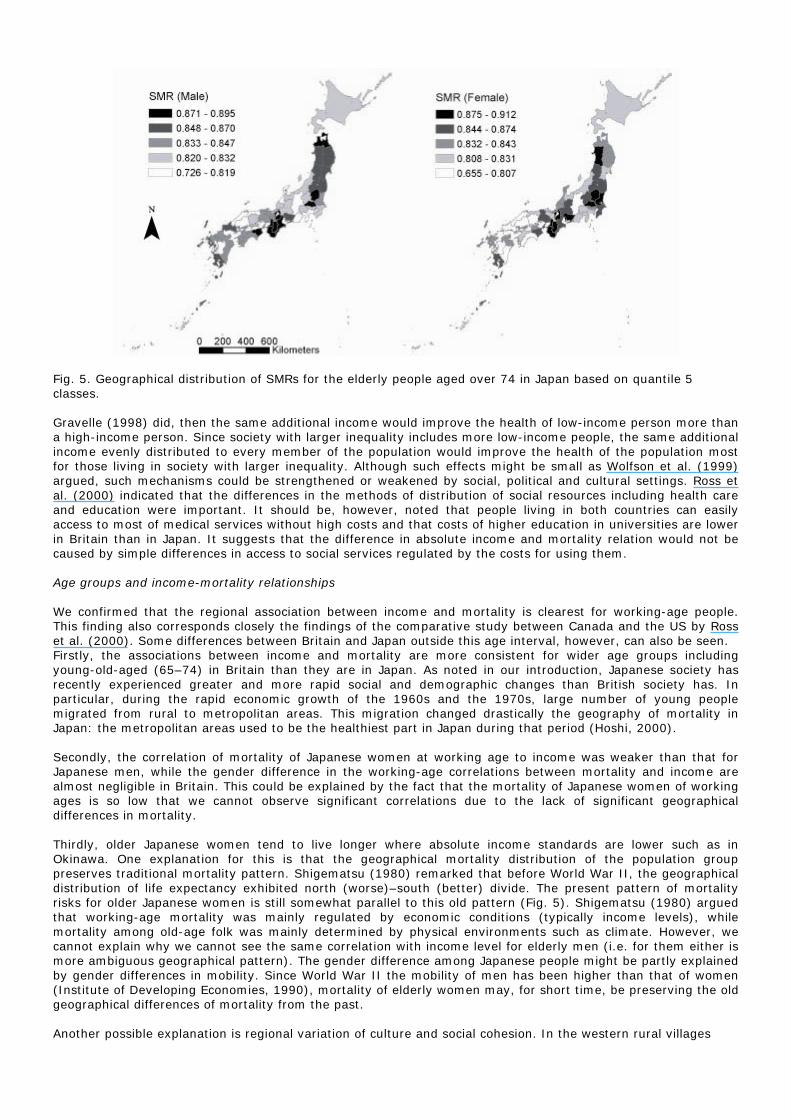
Fig. 5. Geographical distribution of SMRs for the elderly people aged over 74 in Japan based on quantile 5 classes. Gravelle (1998) did, then the same additional income would improve the health of low-income person more than a high-income person. Since society with larger inequality includes more low-income people, the same additional income evenly distributed to every member of the population would improve the health of the population most for those living in society with larger inequality. Although such effects might be small as Wolfson et al. (1999) argued, such mechanisms could be strengthened or weakened by social, political and cultural settings. Ross et al. (2000) indicated that the differences in the methods of distribution of social resources including health care and education were important. It should be, however, noted that people living in both countries can easily access to most of medical services without high costs and that costs of higher education in universities are lower in Britain than in Japan. It suggests that the difference in absolute income and mortality relation would not be caused by simple differences in access to social services regulated by the costs for using them. Age groups and income-mortality relationships We confirmed that the regional association between income and mortality is clearest for working-age people. This finding also corresponds closely the findings of the comparative study between Canada and the US by Ross et al. (2000). Some differences between Britain and Japan outside this age interval, however, can also be seen. Firstly, the associations between income and mortality are more consistent for wider age groups including young-old-aged (65–74) in Britain than they are in Japan. As noted in our introduction, Japanese society has recently experienced greater and more rapid social and demographic changes than British society has. In particular, during the rapid economic growth of the 1960s and the 1970s, large number of young people migrated from rural to metropolitan areas. This migration changed drastically the geography of mortality in Japan: the metropolitan areas used to be the healthiest part in Japan during that period (Hoshi, 2000). Secondly, the correlation of mortality of Japanese women at working age to income was weaker than that for Japanese men, while the gender difference in the working-age correlations between mortality and income are almost negligible in Britain. This could be explained by the fact that the mortality of Japanese women of working ages is so low that we cannot observe significant correlations due to the lack of significant geographical differences in mortality. Thirdly, older Japanese women tend to live longer where absolute income standards are lower such as in Okinawa. One explanation for this is that the geographical mortality distribution of the population group preserves traditional mortality pattern. Shigematsu (1980) remarked that before World War II, the geographical distribution of life expectancy exhibited north (worse)–south (better) divide. The present pattern of mortality risks for older Japanese women is still somewhat parallel to this old pattern (Fig. 5). Shigematsu (1980) argued that working-age mortality was mainly regulated by economic conditions (typically income levels), while mortality among old-age folk was mainly determined by physical environments such as climate. However, we cannot explain why we cannot see the same correlation with income level for elderly men (i.e. for them either is more ambiguous geographical pattern). The gender difference among Japanese people might be partly explained by gender differences in mobility. Since World War II the mobility of men has been higher than that of women (Institute of Developing Economies, 1990), mortality of elderly women may, for short time, be preserving the old geographical differences of mortality from the past. Another possible explanation is regional variation of culture and social cohesion. In the western rural villages
in Japan, the status of brides tends to be high and older people are also likely to live independently (Sugimoto, 1997). Such regional cultural and social systems might have contributed to better health for older women through the promotion of self-esteem and social respect for older women living in the areas. We should, however, take note of recent criticisms about relations between social cohesion/network and health (Pearce & Davey Smith, 2003). Social cohesion/networks might worsen health standards depending on the social contexts. As for counterevidence against the social gradient thesis, Cockerham et al. (2000) stress the extraordinary long life expectancy of the Okinawan by listing many aspects of the mode of living in Okinawa which contrast to that in the Japanese metropolitan areas. Although Okinawa’s uniqueness is still valid for elderly people, we should note that the mortality of working age people living in Okinawa is now below the national average, following the national relation between absolute income and mortality (Fig. 5). Therefore, we should carefully consider this counter evidence by considering cohort effects and changing social environments. It also seems that the Japanese uniqueness should be considered by focusing on not only Okinawa experience but also the age–sex differences in income–mortality relation in Japan. Final remarks The main findings of this study are summarised as follows. Firstly, our cross-national comparisons for Britain and Japan were generally similar to those for Canada and the US. In both “natural experiments” of the relative income hypothesis, relative income measures were associated with working-age mortality only in the countries with high-income inequality, Britain and the US. These results indicate that relative income–mortality relations maybe cross-nationally consistent but can be identified only when we include countries with high-income inequality in our scope. In other words, despite recent arguments against denying income-mortality relations, regional income inequality should be a meaningful indicator of regional health standard in cross-national contexts. To test the hypothesis, we need further studies to be conducted using cross-national regional datasets covering most rich nations. Secondly, although mortality rates for working-age people were lower where absolute income was larger in both countries, we also identified inconsistency of income–mortality relations by age and sex between the two countries. In Japan, especially, elderly women lived longer where absolute income was smaller: The Okinawan mystery, that people living in poorest areas have the best health standards, was valid only for elderly people. For better understanding this inconsistency we need further study about temporal aspects of income–mortality relations with changing social backgrounds. The need for such temporal study is desirable for progressing the testing of the relative income hypothesis. By using regional statistics, Chiang (1999) reported that as the economy has developed the correlation between relative income and health has become stronger in Taiwan. As Chiang (1999) describes Taiwan, Japan is also characterised by the rapid growth of income and improvement in income distribution in comparison with western nations. However, after the 1980s, Japanese income inequality grew to be comparable to those of some European countries such as Germany in terms of the Gini coefficient of disposal income. As stated before, the regional association between income and mortality is clearest for working age people. If we focus on the spatial structure of working age men, we can see an interesting similarity of SMRs and income between Britain and Japan (Figs. 1–2). In both countries the more peripheral areas and the second largest metropolitan areas (Greater Manchester in Britain and Osaka in Japan) have low absolute income, high income inequality and high mortality levels. On the contrary, areas with high absolute income, low income inequality and low mortality levels are seen between the first and second largest metropolitan areas (London–Greater Manchester in Britain and Tokyo–Osaka in Japan). The core regions, London and Tokyo, are characterised by high absolute income, high income inequality and intermediate (relatively low in Japan) mortality. A possible common root of this similarity is globalisation reinforcing world cities and the core–periphery differentiation of capital (Friedmann, 1986). It thus seems that the spatial structure of Japan has also been becoming similar to that of Britain after the rapid economic growth of Japan in 1960s and 1970s with the associated drastic geographical changes of mortality. Will Japanese health in the near future suffer through rising income inequality as has occurred in the US and Britain in the recent past? The answer is not straightforward. Lynch, Due, Muntaner, and Davey-Smith (2000) showed that increasing income inequality and improvement of health were common in many developed countries. However, Otake (2000) demonstrated that the recent growth of income inequality in Japan could be explained by rapid ageing and changes of household formation rather than through the polarisation of income between social classes such as in Britain and the US. In order to proceed with cross-national comparisons of temporal aspects of the relative income hypothesis, further studies are needed for making clear the correspondence of the behaviour of relative income measures with the manifestation of multiple deprivation by considering the factors contributing to what underlie relative income indices. Most importantly we need to incorporate information on the changing social and economic contexts of city regions through the 1960s, 1970s, 1980s and 1990s in these different countries if we are to begin to capture a fuller picture of the forces that lead to people dying earlier in one place as compared to another.
Acknowledgements An earlier draft paper was presented at the 10th International Symposium in Medical Geography, University of Manchester, Manchester, UK, 17 July 2003. Helpful comments from two anonymous referees are gratefully acknowledged. References Blakely, T., & Woodward, A. (2000). Letters: income inequality and mortality in Canada and the United States:
third explanation is plausible. British Medical Journal 321, 1532. Chiang, T-l. (1999). Economic transition and changing relation between income inequality and mortality in
Taiwan: regression analysis. British Medical Journal 319, 1162-5. Cockerham, W.C., Hattori, H., & Yamori, Y. (2000). The social gradient in life expectancy: the contrary case of
Okinawa in Japan. Social Science and Medicine 51, 11-122. Evans, R.G., & Stoddart, G.L. (1994). Producing health, consuming health care. In: Evans, R. Barer, M., &
Marmor, T. (Eds.), Why are some people healthy and others not? The determinants of health of populations. (pp. 27-64). New York: Aldine de Gruyter.
Friedmann, J. (1986). The world city hypothesis. Development and Change 17, 1.69-83. Gravelle, H. (1998). How much of the relation between population mortality and unequal distribution of income
is a statistical artefact? British Medical Journal 316, 382-85. Hopkins, K.D., Kopkins, B.R., & Glass G.V. (1996). Basic statistics for behavioural sciences third edition. Boston:
Allyn and Bacon. Hoshi, T. (Ed.) (2000). Toshi no Kenko-suijyun (Health Levels of Cities). Tokyo: Tokyo Metropolitan University
Press. (in Japanese) Institute of Developing Economies (1990). Migration rates by age group and migration patterns: application of
Rogers' Migration schedule model to Japan, the Republic of Korea and Thailand. Tokyo: Institute of Developing Economies.
Kanda, A., Ojima, T., & Yanagawa, H. (2000). Jikakuteki-kenkokan no kenko-sihyo toshiteno yukosei (Effectivness of self rated health as a health indicator). Journal of Health and Welfare Statistics, 47-5, 33-37. (in Japanese)
Kawachi, I. (2000). Income inequality and health. In: Berkaman, L.F., & Kawachi, I. (Eds.), Social epidemiology (pp. 76-94). Oxford: Oxford University Press.
Kawachi, I., & Kennedy, B.P. (1997). The relationship of income inequality to mortality: does the choice of indicator matter? Social Science and Medicine 45-7, 1121-1127.
Kennedy, B.P, Kawachi, I, & Prothrow-Stith, D. (1996). Income distribution and mortality: cross-sectional ecological study of the Robin Hood index in the United States. British Medical Journal 312, 1004-07.
Lynch, J, Due, P., Muntaner, C., & Davey-Smith, G. (2000). Social capital – is it a good investment strategy for public health? Journal of Epidemiology and Community Health 54, 404-408.
Lynch, J., Davey-Smith, G, Hillemeier, M., Shaw, M., Raghunathan, T., & Kaplan, G. (2001). Income inequality, the psychosocial environment, and health: comparisons of wealthy nations. The Lancet, 358, 194-200.
Machkenbach, J. (2002). Income inequality and population health. British Medical Journal 324, 1-2. Machkenbach, J., & Bakker, M. (Eds.) (2002). Reducing inequalities in health: A European perspective. London:
Routledge. Mitchell, R., Dorling, D., & Shaw, M. (2002). Population production and modelling mortality: an application of
Geographic Information Systems in health inequalities research. Health and Place 8, 15-24. Osler, M., Prescott, E., Gronbaek, M., Christensen, U., Due, P., & Engholm, G. (2002). Income inequality,
individual income, and mortality in Danish adults: analysis of pooled data from two cohort studies. British Medical Journal 324, 13-16.
Otake, F. (2000): 90nendai no syotoku-kakusa (Income inequality during 1990s), The Monthly Journal of the Japan Institute of Labour 480, 2-11. (in Japanese)
Pearce, N., & Davey Smith G. (2003). Is social capital the key to inequalities in health? American Journal of Public Health 93, 1,122-129.
Rodgers, G.B. (1979). Income and inequality as determinants of mortality: an international cross-section analysis. Population Studies 33, 343-51.
Ross, N.A., Wolfson, M.C., Dunn, J.R., Berthelot, J-M.,Kaplan, G.A., & Lynch, J.W. (2000). Relationship between income inequality and mortality in Canada and in the United States: cross sectional assessment using census data and vital statistics. British Medical Journal 319, 989-02.
Shaw, M., Dorling, D., Gordon, D., & Davey Smith, G. (1999). The widening gap: Health inequalities and policy in Britain. Bristol: Policy Press.
Shibuya, K., Hashimoto, H., & Yano, E. (2002). Individual income, income distribution, and self rated health in Japan: cross-sectional analysis of nationally representative sample. British Medical Journal 324, 16-19.
Shigematsu, T. (1980). Wagakunini okeru jyumyou to nenreikaisobetu kenkodo no chiikisa to sono suii (Regional gaps and transitions of life expectancy and age-specific mortality in Japan). Journal of Population Studies (Jinkogaku-kenkyu) 3, 36-44. (in Japanese)
Sugimoto, Y. (1997). An introduction to Japanese society. Cambridge: Cambridge University Press. Wilkinson, R.G. (1996). Unhealthy societies: the affliction of inequality. Routledge: London. Wolfson, M., Kaplan, G., Lynch, J., Ross, N., & Backlund, E. (1999). Relation between income inequality and
mortality: empirical demonstration. British Medical Journal 319, 953-955.
Related Documents