Geographical analyses of wood chip potentials, costs and supply for sustainable energy production in Denmark Dr. Bernd Moeller, Aalborg University Denmark Dr. Per S. Nielsen, Forest Research

Geographical analyses of wood chip potentials, costs and supply for sustainable energy production in Denmark Dr. Bernd Moeller, Aalborg University Denmark.
Dec 13, 2015
Welcome message from author
This document is posted to help you gain knowledge. Please leave a comment to let me know what you think about it! Share it to your friends and learn new things together.
Transcript
Geographical analyses of wood chip potentials,
costs and supply for sustainable energy
production in Denmark
Dr. Bernd Moeller, Aalborg University Denmark
Dr. Per S. Nielsen, Forest Research
Image goes here
Acknowledgement
Bruce Talbot, Hans Skov-Petersen and Niels Heding of the Danish Centre for Forest, Landscape and Planning – KVL
Image goes here
Introduction
Determine the transport costs of wood chips from forest to location of energy plants in Denmark
Spatial relation between supply transportation, and costs
Spatial models with raster GIS
Image goes here
Biomass in the Danish system
Wood covered 3.5% of primary fuel consumption in Denmark 2002
350,000 wet tons/year In 80 energy plants Very little un-used 9 US$/GJ

Image goes here
Biomass from forests
Forests cover 11.3% of land area
20%<5 ha, 50%<50ha Chips are from either summer
dried logs or thinnings with a required moisture content of 40-55% (wet basis)

Image goes here
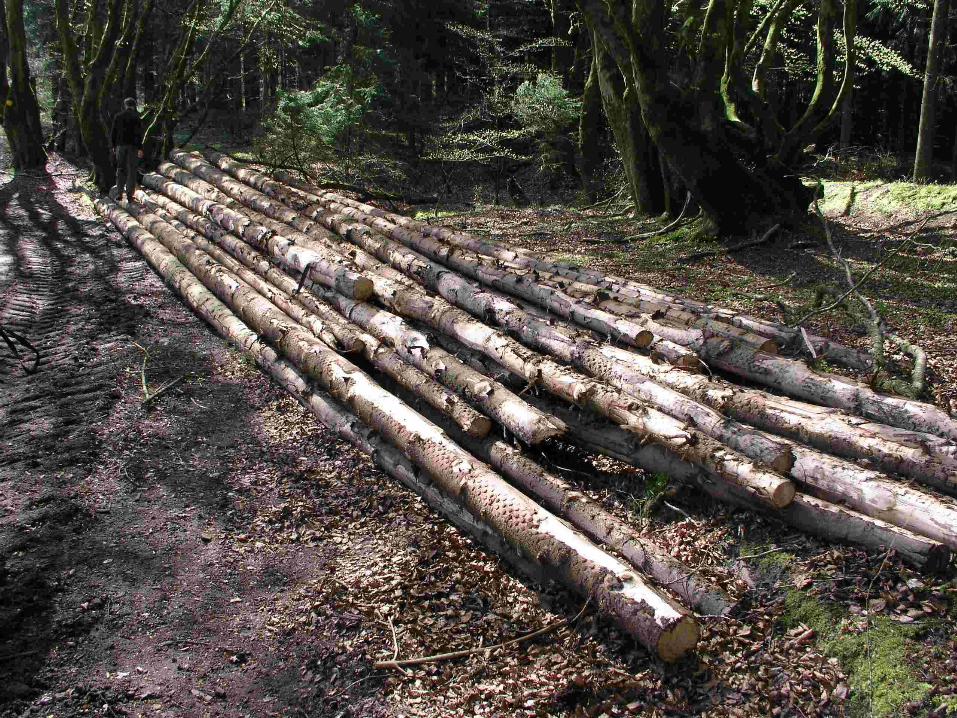
Image goes here
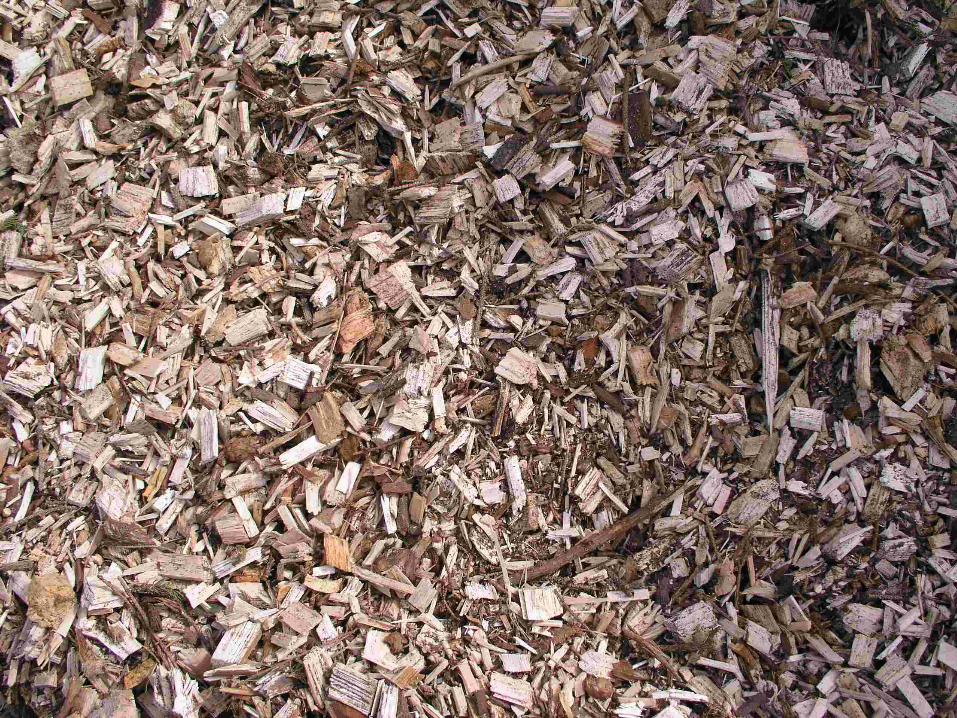
Image goes here
Image goes here
Transportation of wood chips
Bin containers 40m3 maximum load assumed Costs includes in-forest transportation. Costs includes costs independent on
location (loading, chipping etc) Does not include revenue a forest owner
might receive. Which means that the final cost curves does
not reflect the wood chips market price
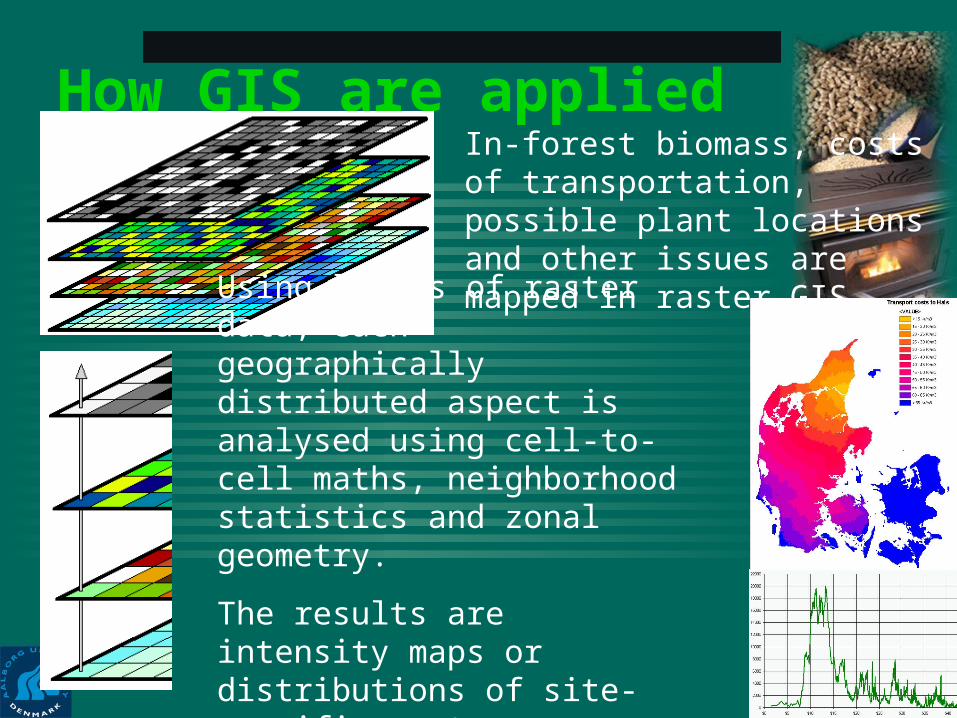
Image goes here
How GIS are appliedIn-forest biomass, costs of transportation, possible plant locations and other issues are mapped in raster-GIS.
Using layers of raster data, each geographically distributed aspect is analysed using cell-to-cell maths, neighborhood statistics and zonal geometry.
The results are intensity maps or distributions of site-specific costs.
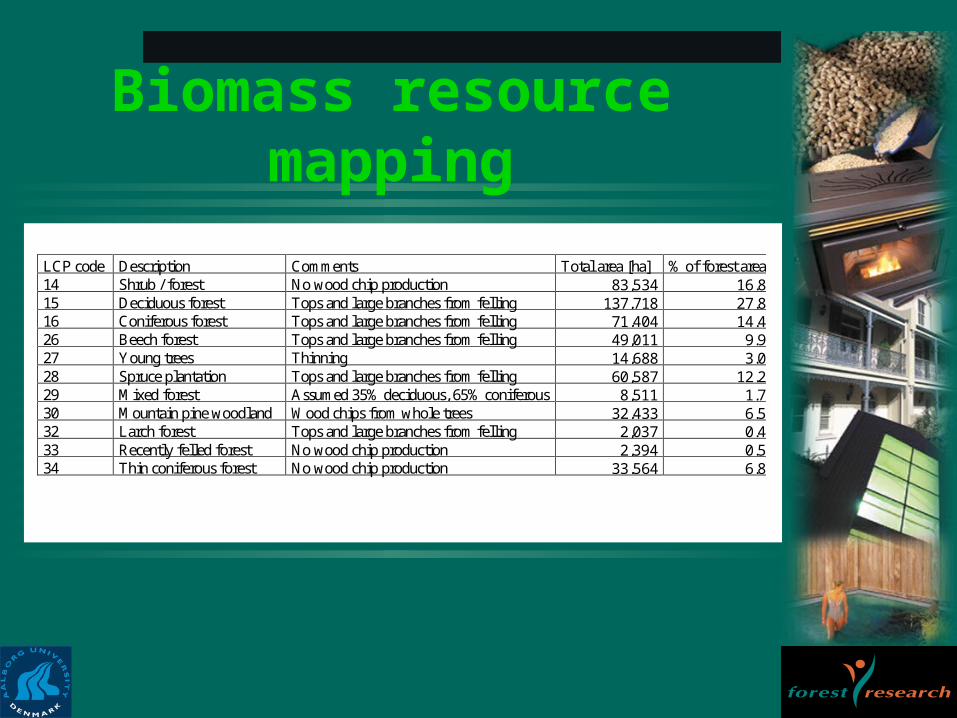
Image goes here
Biomass resource mapping
LCP code Description Comments Total area [ha] % of forest area14 Shrub / forest No wood chip production 83,534 16.815 Deciduous forest Tops and large branches from felling 137,718 27.816 Coniferous forest Tops and large branches from felling 71,404 14.426 Beech forest Tops and large branches from felling 49,011 9.927 Young trees Thinning 14,688 3.028 Spruce plantation Tops and large branches from felling 60,587 12.229 Mixed forest Assumed 35% deciduous, 65% coniferous 8,511 1.730 Mountain pine woodland Wood chips from whole trees 32,433 6.532 Larch forest Tops and large branches from felling 2,037 0.433 Recently felled forest No wood chip production 2,394 0.534 Thin coniferous forest No wood chip production 33,564 6.8
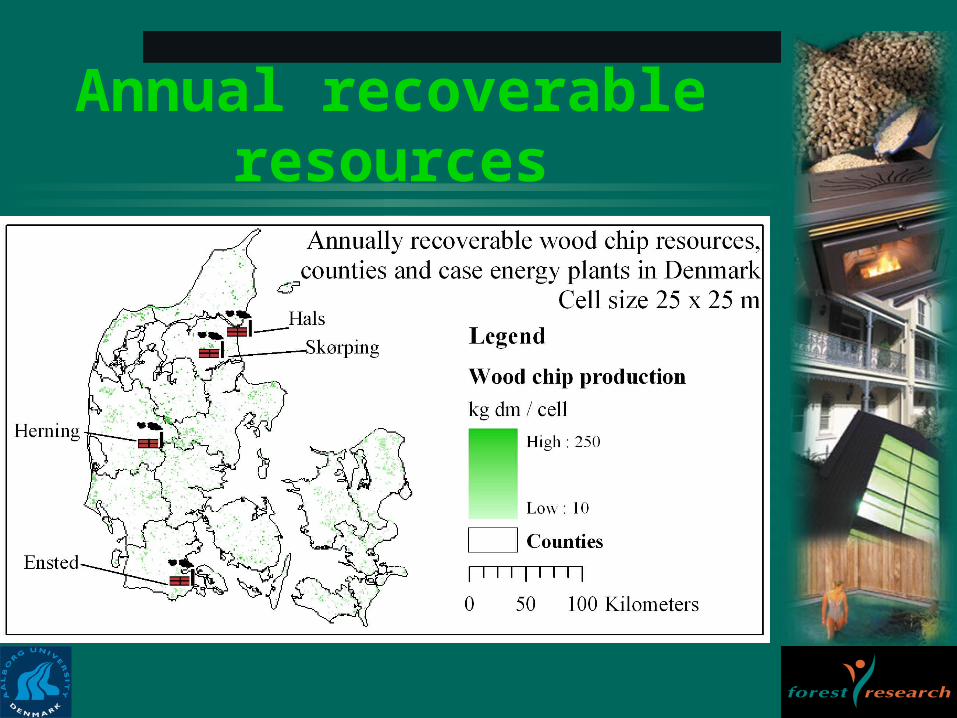
Image goes here
Annual recoverable resources
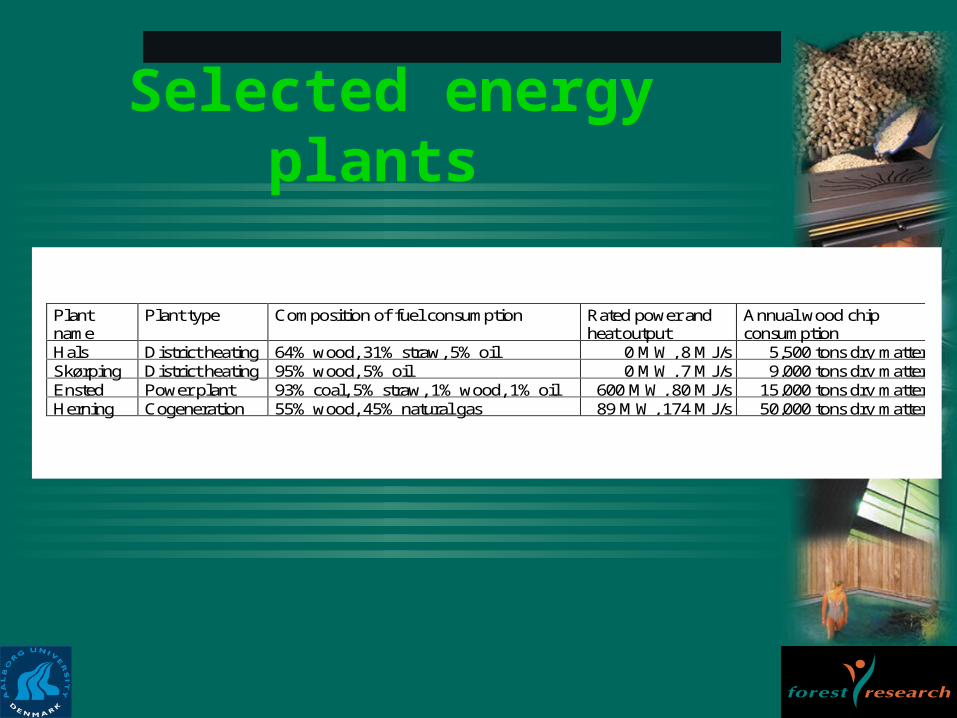
Image goes here
Selected energy plants
Plantname
Plant type Composition of fuel consumption Rated power andheat output
Annual wood chipconsumption
Hals District heating 64% wood, 31% straw, 5% oil 0 MW, 8 MJ/s 5,500 tons dry matterSkørping District heating 95% wood, 5% oil 0 MW, 7 MJ/s 9,000 tons dry matterEnsted Power plant 93% coal, 5% straw, 1% wood, 1% oil 600 MW, 80 MJ/s 15,000 tons dry matterHerning Cogeneration 55% wood, 45% natural gas 89 MW, 174 MJ/s 50,000 tons dry matter
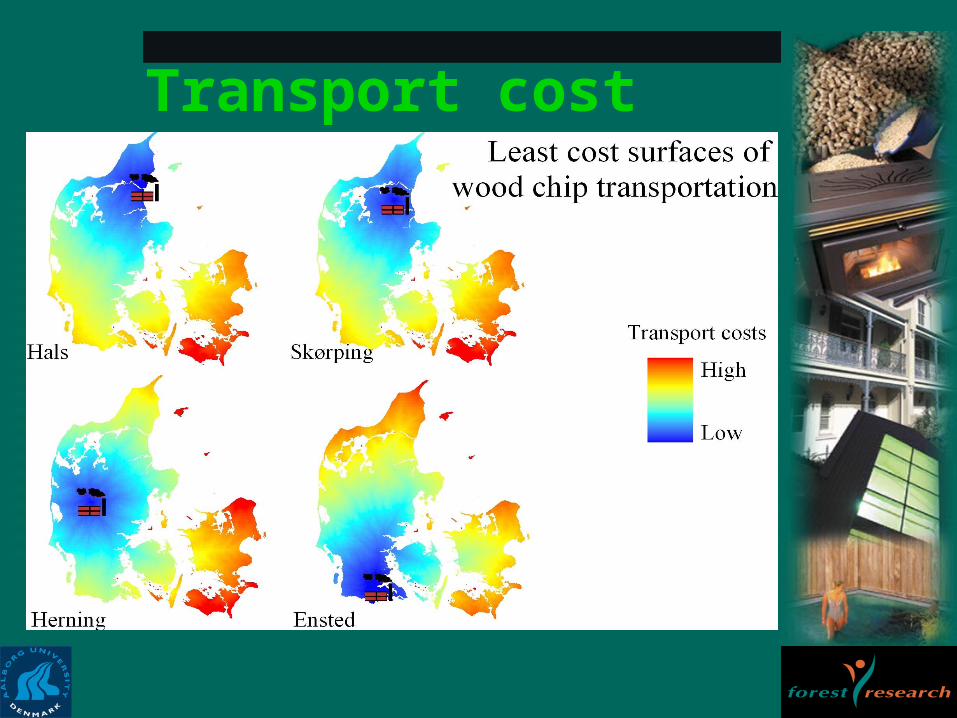
Image goes here
Transport cost modeling
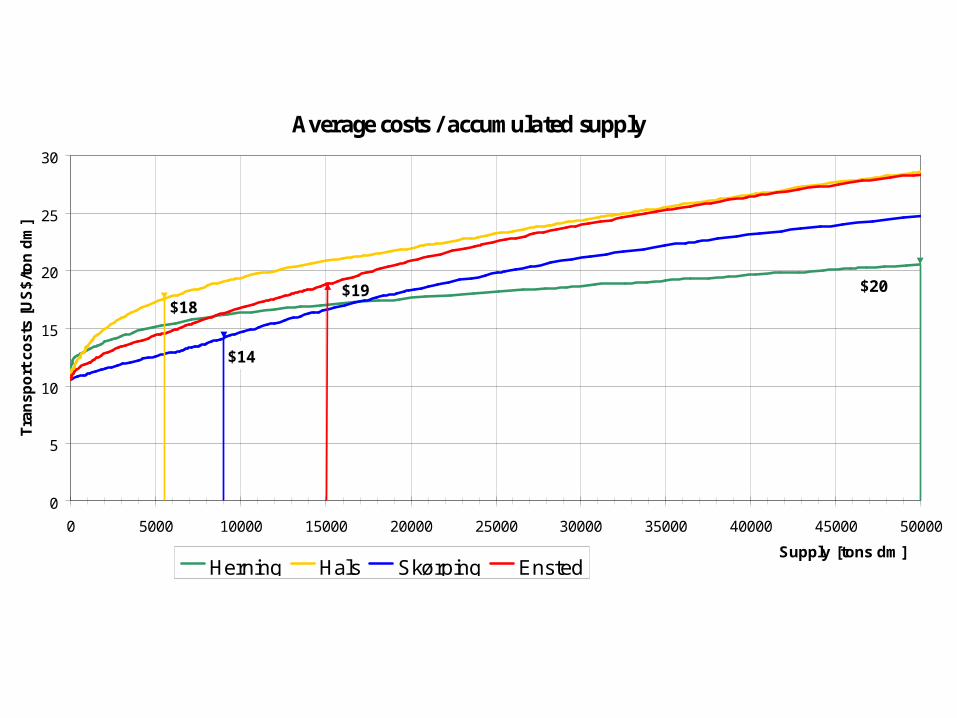
Image goes here
Average costs / accumulated supply
$20$18
$14
$19
0
5
10
15
20
25
30
0 5000 10000 15000 20000 25000 30000 35000 40000 45000 50000
Supply [tons dm]
Tra
nsp
ort
co
sts
[US
$/to
n d
m]
Herning Hals Skørping Ensted
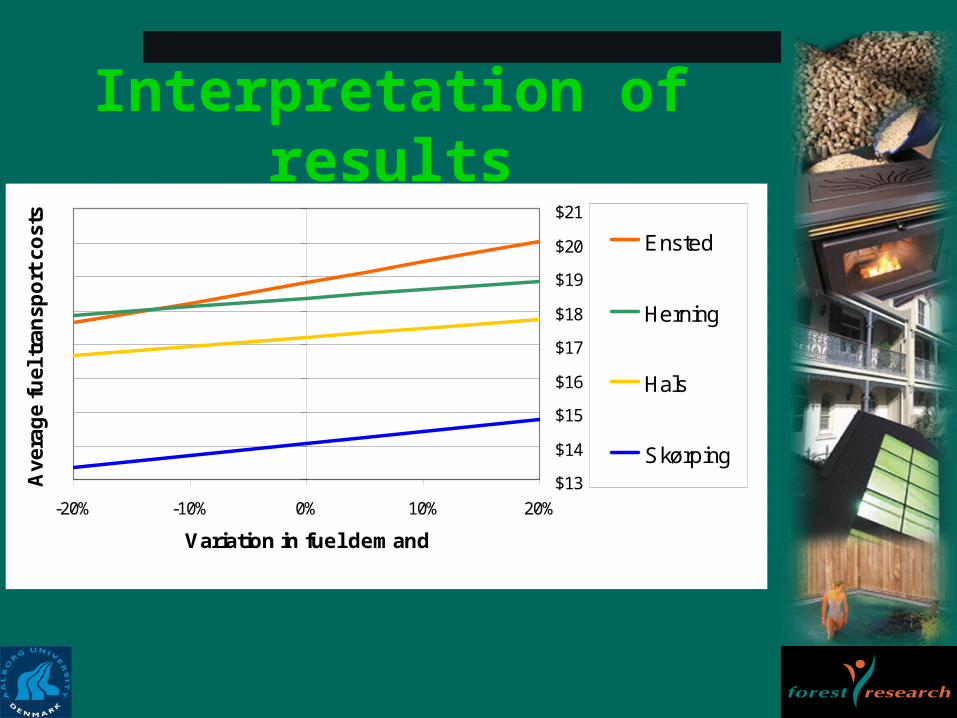
Image goes here
Interpretation of results
$13
$14
$15
$16
$17
$18
$19
$20
$21
-20% -10% 0% 10% 20%
Variation in fuel demand
Av
era
ge
fu
el t
ran
sp
ort
co
sts
Ensted
Herning
Hals
Skørping

Image goes here
Conclusions
Forest owners can assess the value of un-used residues
Hauling companies can use it for improve efficiency
Energy plants can use it to assess resources availability for new investments or upgrades (cogen)
Policy makers can use it to assess environmental and socio-economic aspects of local wood resources
Image goes here
Conclusions (continued)
Although transportation cost is important other issues may be more important for the individual operator
The reality does not always the most optimal solution
Many players with different prices Harvesting intervals of many small
forests - challenge long term fuel supply demand from energy plants.
Related Documents