Geographic Information Systems and decision processes for urban planning: a case study of Rough Set Analysis on the residential areas of the city of Cagliari, Italy Corrado Zoppi, Sabrina Lai Dipartimento di Ingegneria del Territorio Sezione di Urbanistica Università di Cagliari Via Marengo, 3 - 09123 Cagliari, Italy Tel.: ++39 (0)70 6755216, telefax: ++39 (0)70 6755215 e-mail: [email protected]; [email protected] 46 th Congress of the European Regional Science Association Enlargement, Southern Europe and the Mediterranean Volos, August 30 th - September 3 rd , 2006

Welcome message from author
This document is posted to help you gain knowledge. Please leave a comment to let me know what you think about it! Share it to your friends and learn new things together.
Transcript

Geographic Information Systems and decision processes for urban
planning: a case study of Rough Set Analysis
on the residential areas of the city of Cagliari, Italy
Corrado Zoppi, Sabrina LaiDipartimento di Ingegneria del Territorio
Sezione di UrbanisticaUniversità di Cagliari
Via Marengo, 3 - 09123 Cagliari, ItalyTel.: ++39 (0)70 6755216, telefax: ++39 (0)70 6755215
e-mail: [email protected]; [email protected]
46th Congress of the European Regional Science AssociationEnlargement, Southern Europe and the Mediterranean
Volos, August 30th - September 3rd, 2006

2Geographic Information Systems and decision processes for urban planning: a case study of Rough Set Analysis on the residential areas of the city of
Cagliari, Italy
Introduction
Methodology: the Rough Set Analysis
The urban residential areas of Cagliari: a geographic information system based analysis
RSA procedure results: analysis of the spatial configuration of the urban residential areas of Cagliari
Findings and conclusions: implications of the RSA methodology when dealing with complex spatial planning issues
Summary

Section 1
IntroductionSummary

4Geographic Information Systems and decision processes for urban planning: a case study of Rough Set Analysis on the residential areas of the city of
Cagliari, Italy
Aim of this study: to analyze the relationship between the geography of the residential areas of Cagliari anda system of variables based on the integration of different branches of knowledge.
Method: Rough Set Analysis (RSA) and Geographic Information System.Case-study: the city of Cagliari.Results: a set of rules, concerning correlations between subsets of variables and residential areas.
The rules give a picture of how and why the geography of housing areas has developed, and provide sound
basis for discussing, recognizing and addressing the mutual interests and expectations for planning
policies for these areas.

5Geographic Information Systems and decision processes for urban planning: a case study of Rough Set Analysis on the residential areas of the city of
Cagliari, Italy
The spatial configuration of the urban residential areas of Cagliari is considered to be dependent on: • distribution of the resident population across the city; • zoning rules concerning the characteristics of the
residential areas;• urban land-use structure;• layout of the zones on which building is forbidden:
areas around the city cemeteries; wetlands; historic and panoramic sites; coastal areas; natural reserves.
Several variables……no prior on how these variables are connected to each other……RSA is specifically designed to address this kind of problems.The most relevant methodological point of this study is to demonstrate how the RSA procedure can be used to address an important problem of spatial analysis.
RSA and complex issues

6Geographic Information Systems and decision processes for urban planning: a case study of Rough Set Analysis on the residential areas of the city of
Cagliari, Italy
Advantages of RSARSA is not a favorite tool among urban and regional
planners for different reasons:• unavailability of computer programs implementing RSA applied to urban and regional problems;
• lack of a consolidated and structured literature;• absence of any prior in building knowledge.
However,the RSA methodologies make it possible:
• to build a step-by-step explanation of the inferential process;
• to let public officials, politicians, practitioners, scientists, citizens, entrepreneurs and others understand the reasons why decisions are taken;
• to provide sound informational basis for public discussion and negotiation.

7Geographic Information Systems and decision processes for urban planning: a case study of Rough Set Analysis on the residential areas of the city of
Cagliari, Italy
RSA and spatial phenomena The RSA methodologies applied to regional and
urban planning problems imply the use of spatial data, and inference on spatial phenomena.
The variables can be studied and depicted by means of a geographic information system.
The results of the inferential process can be represented through geographic information systems.
The results from the RSA can be integrated into other evaluation methodologies, such as Multicriteria Analysis and Contingent Valuation.

8Geographic Information Systems and decision processes for urban planning: a case study of Rough Set Analysis on the residential areas of the city of
Cagliari, Italy
RSA and planning: some references
1. Bruinsma’s et al.’s (2002): problem of the location of industrial activities in some urban regions of Belgium, Germany, France and Denmark;
2. Cerreta and Salzano (2004): evaluation of alternative planning policies for conservation of urban cultural heritage (RSA is integrated into Institutional Analysis and Community Impact Evaluation);
3. Murgante and Sansone (2005): identification of the boundaries of the urban and suburban areas of the region of Basilicata (Southern Italy).

Section 2
Methodology: the Rough Set Analysis
Summary

10
Geographic Information Systems and decision processes for urban planning: a case study of Rough Set Analysis on the residential areas of the city of
Cagliari, Italy
DefinitionsOBJ = {o1, o2, …, oM} : a set of objects; A = {A1, A2, …, AN; AD} : a set of attributes of these objects;RS: rough sets of these objects subsets of OBJ
characterized by an indiscernibility relation;LA: lower approximation of a RS
the union of the equivalence classes of the elements of OBJ which are contained in RS;
UA: upper approximation of a RS the union of the equivalence classes of the elements of OBJ which have a non-empty intersection with RS;
BR: boundary region of a RS the set of the elements of UA which are not contained in LA;
NR: negative region of a RS the set of elements of OBJ which are contained in equivalence classes whose elements are not contained in UA.
LA
RS
UA
RS
LA BR NR
RS

11
Geographic Information Systems and decision processes for urban planning: a case study of Rough Set Analysis on the residential areas of the city of
Cagliari, Italy
Equivalence classesAn equivalence class is a subset of elements of OBJ for which the following property holds:
o1 R(Aj) o2
where:
- R(Aj) is an equivalence relation; - Aj is the jth element of A; - o1 and o2 are two elements of OBJ.
o1 is equivalent to o2 if they share the same value of the attribute Aj

12
Geographic Information Systems and decision processes for urban planning: a case study of Rough Set Analysis on the residential areas of the city of
Cagliari, Italy
AttributesThe attributes of A are:• either characteristics of the elements of OBJ
condition attributes
• or a classification order of the elements of OBJ
decision attribute

13
Geographic Information Systems and decision processes for urban planning: a case study of Rough Set Analysis on the residential areas of the city of
Cagliari, Italy
ReductsThe RS can be identified by the so-called reducts.
The reduct relative to the kth element of OBJ (REDK) is the minimal combination of condition attributes of A which discerns the kth element from the other elements of OBJ.
If a RS is identified by all the elements of OBJ which have the same value of the decision attribute…
… the decision-relative reduct relative to the kth element of OBJ (DREDK) is the minimal combination of condition attributes of A which discerns the kth element from the other elements of OBJ.
Discernibility between the elements of OBJ is based on the value of the decision attribute

14
Geographic Information Systems and decision processes for urban planning: a case study of Rough Set Analysis on the residential areas of the city of
Cagliari, Italy
Decision rulesConnect the condition attributes and their values to the decision attribute and its values:
DREDK(B) ADor
DREDK(B) AD OR AQ OR AR OR…where AD, AQ, AR are values of the decision attribute.
• the decision-relative reduct relative to the kth element of OBJ, for the values of the attributes of vector B (these attributes are a subset of the condition attributes of A)
• implies• (*) a value of the decision attribute equal to AD, or (**) a value of the decision attribute equal to AD, or a value of the decision attribute equal to AQ, or a value of the decision attribute equal to AR, or a value of the decision attribute equal to …
Case (*): exact decision rule, Case (**): approximate decision rule.
(*)
(**)
DREDK(B)
AD
AD OR AQ OR AR OR…

15
Geographic Information Systems and decision processes for urban planning: a case study of Rough Set Analysis on the residential areas of the city of
Cagliari, Italy
Information matrix - an exampleLet OBJ = {o1, o2, o3, o4, o5, o6} and let A = {A1, A2, A3, AD}, where the elements of OBJ are six applicants for a position of assistant professor at an Italian university; A1, A2, A3, AD are described in the table below:
Attribute Type Value Meaning of the valueA1
articles published in international journals
with refereeing process
c.a.
L <3 articlesM 3 ÷ 6 articles
A >6 articles
A2
university courses with a number of
credits equal to five or more taught by the
applicant
c.a.
K <3 coursesJ 3 ÷ 6 coursesI 7 ÷ 10 courses
H >10 courses
A3
knowledge of the English language
c.a.S very good knowledgeG intermediate levelL pre-intermediate level
AD
dichotomous decision attribute
d.a.W the applicant takes the
positionF the applicant fails
A1 A2 A3 AD
O1 A I S WO2 A H L FO3 L J G FO4 M J G FO5 L K L FO6 M H S W
Information about the job selection process is summarized in a matrix named either
information matrix or
object-attribute matrix

16
Geographic Information Systems and decision processes for urban planning: a case study of Rough Set Analysis on the residential areas of the city of
Cagliari, Italy
Decision-relative discernibility matrix (DRDM)- an exampleThe DRDM:
• derives from the information matrix;
• is the symmetric matrix of the binary comparisons of the elements of OBJ.
O1 O2 O3 O4 O5 O6
O1 - A2,A3 A1,A2,A3 A1,A2,A3 A1,A2,A3 -
O2 A2,A3 - - - - A1,A3
O3 A1,A2,A3 - - - - A1,A2,A3
O4 A1,A2,A3 - - - - A2,A3
O5 A1,A2,A3 - - - - A1,A2,A3
O6 - A1,A3 A1,A2,A3 A2,A3 A1,A2,A3 -
The result of a binary comparison of two elements of OBJ, Oi and Oj, is expressed by the condition attributes whose values are different for Oi and Oj, given Oi and Oj have different values of the decision attribute. If Oi and Oj have the same value of the decision attribute, they are considered indiscernible and the result of their binary comparison is the empty set.
If the result of the binary comparison of Oi and Oj is the empty set, the two elements belong to the same RS.
A1 A2 A3 AD
O1 A I S WO2 A H L FO3 L J G FO4 M J G FO5 L K L FO6 M H S W

17
Geographic Information Systems and decision processes for urban planning: a case study of Rough Set Analysis on the residential areas of the city of
Cagliari, Italy
DRED1={{A2}U{A3}} ∩ {{A1}U{A2}U{A3}} ∩{{A1}U{A2}U{A3}} ∩{{A1}U{A2}U{A3}} =={A2,A3}
DRED1={{A2}U{A3}} ∩ {{A1}U{A2}U{A3}} ∩{{A1}U{A2}U{A3}} ∩{{A1}U{A2}U{A3}} =={A2,A3}
Decision rules - an exampleGiven the DRDM, the DRED1 can be calculated as follows:
O1 O2 O3 O4 O5 O6
O1 - A2,A3 A1,A2,A3 A1,A2,A3 A1,A2,A3 -
O2 A2,A3 - - - - A1,A3
O3 A1,A2,A3 - - - - A1,A2,A3
O4 A1,A2,A3 - - - - A2,A3
O5 A1,A2,A3 - - - - A1,A2,A3
O6 - A1,A3 A1,A2,A3 A2,A3 A1,A2,A3 -
• The element O1 is discernible by the values of the condition attributes
A2 and A3• The element O1 of the RS {O1, O6} has a reduct relative to the decision
attribute A4 equal to the set {I, S}The definition of DRED1 implies the following rule:
DRED1(A2=I, A3=S) AD = WWith the same procedure, the following rule can also be identified:
DRED6(A3=S) AD=W

18
Geographic Information Systems and decision processes for urban planning: a case study of Rough Set Analysis on the residential areas of the city of
Cagliari, Italy
left-hand side support (LHSS) of a decision rule : number of elements of OBJ for which
condition DREDK(B) holds;
right-hand side support (RHSS) of a decision rule:• number of elements of OBJ for which the
decision rule holds (exact rules); • a n-tuple of values (approximate rules);
right-hand side accuracy (RHSA) of a decision rule:
left-hand side coverage (LHSC) of a decision rule:
right-hand side coverage (RHSC) of a decision rule: • RHSS divided by the number of elements of
OBJ for which the decision attribute has the value AD, in case of an exact decision rule;
• RHSS divided by the number of elements of OBJ for which the decision attribute has the values AP OR AQ OR AR OR…, (it is a n-tuple of values).
Descriptive statistics
RHSA =LHSSRHSS
LHSC =no. of elements
of OBJ
RHSS
A1 A2 A3 AD
O1 A I S WO2 A H L FO3 L J G FO4 M J G FO5 L K L FO6 M H S W
DRED6 (A3=S)Rule: A3=S AD=W
LHSS = 2RHSS =2RHSA = 1LHSC = 0,33RHSC = 0,33

19
Geographic Information Systems and decision processes for urban planning: a case study of Rough Set Analysis on the residential areas of the city of
Cagliari, Italy
Descriptive statisticsThe RHSA
• is based on the LHSS and the RHSS• informs on how much a rule is reliable • indicates if and how much we can be confident that the rule holds, provided that the reduct DREDK(B) holds
The LHSC • is based on the RHSS• makes it possible to put in evidence and compare the different shares of the phenomenon represented by the decision attribute that each rule contributes to explain
The RHSC • is based on the RHSS• informs on how much a particular state of the phenomenon, represented by a value of the decision attribute, is explained by a decision rule

20
Geographic Information Systems and decision processes for urban planning: a case study of Rough Set Analysis on the residential areas of the city of
Cagliari, Italy
To sum up…In the RSA methodology, the attributes define the characteristics of a set of objects.
These characteristics refer to states, behaviors, preferences, expectations, needs.
The identification of the relations between the attributes makes it possible to recognize what makes the objects different from each other with reference to the decision attribute, that is
which characteristics are decisive in decision-making processes.

21
Geographic Information Systems and decision processes for urban planning: a case study of Rough Set Analysis on the residential areas of the city of
Cagliari, Italy
Section 3
The urban residential areas
of Cagliari: a geographic information system based analysis
Summary

22
Geographic Information Systems and decision processes for urban planning: a case study of Rough Set Analysis on the residential areas of the city of
Cagliari, Italy
IntroductionWhy GIS?
Geographic information systems are, by far, the most powerful and user-friendly tool which makes it possible:
• to depict the present characteristics of a particular area;
• to analyze and integrate past knowledge;• to develop new knowledge.

23
Geographic Information Systems and decision processes for urban planning: a case study of Rough Set Analysis on the residential areas of the city of
Cagliari, Italy
Methodology – choosing dataAim of the study: ascertaining whether the zoning
rules of the city Masterplan of Cagliari are somehow linked with a system of environmental, demographic and legal variables.
Which data should be used?
The choice may significantly affect the outcomes.
A mere introduction of all the available data implies a great number of the derived rules.
Some prior knowledge of the phenomenon is necessary.

24
Geographic Information Systems and decision processes for urban planning: a case study of Rough Set Analysis on the residential areas of the city of
Cagliari, Italy
Methodology - dataThe following variables are selected:1. resident population in 2001;2. land use, classified according to the European
project Corine Land Cover (4th level);3. areas where building is forbidden, due to
environmental or binding reasons:
• parks and protected natural areas;• Sites of Community Interest;• protection zones;• buffer zones around coastal line (300 meters) and around rivers, canals and streams (150 meters);
• landscape-protection areas;• buildings and areas protected because of cultural or historic reasons;
• the area of the San Michele Landscape Plan;• buffer zones around the cemeteries.

back
The
zones
of the
Maste
rplan
of
Caglia
ri wit
hin th
e stud
y area

26
Geographic Information Systems and decision processes for urban planning: a case study of Rough Set Analysis on the residential areas of the city of
Cagliari, Italy
Residential zonesAccording to the city Masterplan of Cagliari, housing zones are classed into four categories:
• A zone historic center zone• B zone residential completion zone• C zone residential expansion zone• EZ zone enterprise zone
The historic center zone (A zone):• dates from the Middle Ages;• is a single, dense and central area in
the urban fabric;• hosts buildings important for cultural,
artistic and historic reasons;• specific rules apply to this area;• it is a mixed-use zone rather than
a residential zone.
We do not consider this zone as part of the spatial configuration of the residential areas, even though we consider it as an important spatial reference to explain this configuration.

27
Geographic Information Systems and decision processes for urban planning: a case study of Rough Set Analysis on the residential areas of the city of
Cagliari, Italy
The B zones are built-up areas which consist mainly of dense residential blocks. A partially-built area is generally considered to belong to a B zone when:
• its area is smaller than 5000 m2; • more than a 30 % of the volume has already been built.Restrictions on built volume: generally 3 m3/m2 per building lot.
The C zones are • still-not-built or partially-built parts of the city
(less than a 30 % of the volume has already been built)…• … bound to be residential areas. Restrictions on built volume: generally 1,5 m3/m2 per building lot.In order to obtain a building permission, a plan must be approved by the local municipality.
The EZ zones are • still-not-built or partially-built parts of the city …• … where an integration of different functions is required
(residential buildings, public facilities and recreational areas). For each EZ zone, the city Masterplan sets specific rules on:
• the combination of functions;• the amount of area where building is not permitted.
Residential zones

28
Geographic Information Systems and decision processes for urban planning: a case study of Rough Set Analysis on the residential areas of the city of
Cagliari, Italy
Residential zonesResidential blocks have been aggregated, provided that they are parted from each other only by: secondary roads; areas specifically designed for local recreational, cultural, social or sports activities.
How to link the type of a residential area with the relevant information?
analysis of a buffer zone around each housing area; hypothesis: the residential characterization of an area is influenced by:
• its own morphologic, environmental, demographic and legal qualities ;
• those of its surrounding areas.
Which spatial analysis methodology? overlay mapping technique for vector datasets; the new dataset contains new levels of site characteristics.
EZ

29
Geographic Information Systems and decision processes for urban planning: a case study of Rough Set Analysis on the residential areas of the city of
Cagliari, Italy
Spatial intersection - an example
By intersecting the buffer around residential areas and the zones in which building is forbidden, it is immediately possible to determine:
whether a part of the area is affected by this prohibition;
which is the measure of the overlap zone.

30
Geographic Information Systems and decision processes for urban planning: a case study of Rough Set Analysis on the residential areas of the city of
Cagliari, Italy
Spatial intersection - an exampleThe same methodology, consisting of a combination
of buffer creation and overlay mapping, is also used to fill in the fields related to: • land cover; • resident population;• buildings/areas characterized by their cultural/historic importance.
In these cases, some additional hypotheses and procedures are required, either because of data geometry or because of overlaying outcomes.

31
Geographic Information Systems and decision processes for urban planning: a case study of Rough Set Analysis on the residential areas of the city of
Cagliari, Italy
Descriptive attributes of the database The information table associated with geographic features has
the following fields:
• Area Code, which takes three values (B, C, EZ).• Area, which contains the value of the area of a residential zone.
• Area_A (or Area_B, or Area_C, or Area_EZ), which is the area of the A (or B, or C, or EZ) zone which overlaps the buffer around a residential zone.
• Population, which contains the number of residents in a buffer.
• Land-use Code, which is the combination of the prevailing land uses in a buffer.
• Nobuild Area, the area affected by building prohibition inside a buffer.

32
Geographic Information Systems and decision processes for urban planning: a case study of Rough Set Analysis on the residential areas of the city of
Cagliari, Italy
Area Code Area(m2)
Area_A(m2)
Area_B(m2)
Area_C(m2)
Area_EZ(m2)
Population
Land-use code
Land-use area (m2)
Nobuild area (m2)
B 8335 0 0 6969 68474 416 1112 95728 62886B 3621 0 42252 0 327 917 1111-1112 71809 0C 21706 0 73758 9159 0 1501 1111-1112 179780 0B 500416 0 217307 0 0 11223 1111-1112 1140922 368277B 323029 0 149847 22815 77396 6247 1111-1112 691978 242041B 42665 0 57228 4560 28842 1778 1112 210392 0B 437279 0 199216 25579 0 12343 1111-1112 897643 125383B 94822 0 36893 50062 55147 1298 1112-121 323598 0B 43030 11253 2270 0 64840 1486 1111 173140 18891B 329394 0 314867 3791 0 12724 1111 778955 1529C 30404 0 17086 0 30582 170 121 51501 68202C 3971 0 74479 4724 13317 492 1111 110148 0EZ 348331 4766 230140 10970 2166 5904 1111 657172 5063B 114846 0 132787 0 0 4407 1111 354449 28306B 141418 0 132544 20227 0 6414 1111-1112 363691 196B 5263 0 42211 0 10 748 1111-1112 95280 0EZ 121149 0 143275 22916 0 1926 1112 264728 146174EZ 4060 0 58251 0 9806 1014 1112 112776 0B 135148 0 212029 0 0 9011 1111 378611 196B 150587 58828 126518 0 0 8759 1111 462255 99692
Descriptive attributes - an example

33
Geographic Information Systems and decision processes for urban planning: a case study of Rough Set Analysis on the residential areas of the city of
Cagliari, Italy
Area of the A zone contained in the buffer around a residential zone Only in 9 cases out of 56 does the attribute Area_A take a non-zero value.
There are only 9 residential areas closer to the historic center less than 150 meters:• 7 B zones;• 1 C zone;• 1 EZ zone.
The smallest overlap values refer to• the C zone, because of its small
area;• the EZ zone, due to its distance
from the A zone.
Most of the inner part of the urban fabric is classified as B zone.
The inner part of the city is almost completely built. Only few areas are available for new housing.

34
Geographic Information Systems and decision processes for urban planning: a case study of Rough Set Analysis on the residential areas of the city of
Cagliari, Italy
Area of the B zone contained in the buffer around a residential zone In 54 cases out of 56 the attribute Area_B takes non-zero value
Almost every residential zone, regardless of its own type, is very close to at least one B zone.
Only two B zones do not overlap any buffer around a completion zone.
The highest values of this attribute are always connected with B zones and EZ zones …
… because of their dimension and their position.

35
Geographic Information Systems and decision processes for urban planning: a case study of Rough Set Analysis on the residential areas of the city of
Cagliari, Italy
Area of the C zone contained in the buffer around a residential zone In 36 cases out of 56 the attribute Area_C takes non-zero values:
• 22 are B zones;• 9 are C zones; • 5 are EZ zones.
Since the C zones are mostly located in the outer part of the city …
… areas with the highest values of this attribute(B and EZ zones) shape a sort of buffer around the central districts.

36
Geographic Information Systems and decision processes for urban planning: a case study of Rough Set Analysis on the residential areas of the city of
Cagliari, Italy
Land use Out of 56 residential areas,
• 13 are classified as “1111” (dense-residential-settlement land use),
• 18 as “1112” (scattered-residential-settlement land use),
• 17 as “1111-1112” (a mix of dense and scattered-residential-settlement land use),
• 6 as “1112-121” (a mix of scattered-residential-settlement land use, and industrial, commercial and services land uses)
• 2 as “121” (industrial, commercial and services land uses)
A gradual transition in prevailing land uses is shown, when moving from the center to the outer parts of the city, from 1111 to 1111-1112, then to 1112-121.
The apparent absence of commercial and services uses is due to the procedure used in constructing residential areas: areas reserved for local recreational, cultural, social or sports activities are included in residential zones, whereas areas for services and trading with a greater level of importance are excluded.

37
Geographic Information Systems and decision processes for urban planning: a case study of Rough Set Analysis on the residential areas of the city of
Cagliari, Italy
Population• Areas with the highest values
of population, which are always B zones, form a continuous shape that surrounds the city center.
• Outer zones are characterized by lower values.
• However, the same happens with some inner areas.
• Three main reasons justify this spatial distribution:
The dimension of each housing zone; The differences in the amount of built
volume permitted in each type of residential zone; The different types of buildings, particularly with
reference to the number of stories.

38
Geographic Information Systems and decision processes for urban planning: a case study of Rough Set Analysis on the residential areas of the city of
Cagliari, Italy
Building prohibition Spatial distribution of areas where building is not permitted is influenced by many factors.
1. Inner areas: by their proximity to the historical center and by the presence of monuments and important buildings/areas.
2. Eastern and western areas: by their closeness to environmentally-relevant sites (parks, wetlands, coastline).
3. Northern area: by a landscape plan and by the presence of the cemetery.
Different key factors play a role in prohibition on new housing, and they are scattered throughout the study area.

Section 4
Spatial configuration of the residential areas of
CagliariSummary

40
Geographic Information Systems and decision processes for urban planning: a case study of Rough Set Analysis on the residential areas of the city of
Cagliari, Italy
Objects
The elements of OBJ are 56 residential zones of the city of Cagliari.
Each zone: • is identified as
residential by the city Masterplan;
• contains at least one block;
• is bounded by city streets. EZ

41
Geographic Information Systems and decision processes for urban planning: a case study of Rough Set Analysis on the residential areas of the city of
Cagliari, Italy
Attributes: values and meaning
ATTRIBUTE VALUE MEANING
area of the historic center zone AREA_A
YES a part of the historic center zone belongs to the buffer of the residential zone
NO no part of the historic center zone belongs to the buffer of the residential zone
area of the residential completion zone AREA_B
HIGH the area is greater than the 50th percentile (~ 7 hectares)LOW the area is smaller than the 50th percentile (~ 7 hectares)
area of the residential expansion zone AREA_C
HIGH the area is greater than the 50th percentile (~ 1,1 hectares)LOW the area is smaller than the 50th percentile (~ 1,1 hectares)
area of the enterprise zone AREA_EZ
HIGH the area is greater than the 50th percentile (~ 3 hectares)LOW the area is smaller than the 50th percentile (~ 3 hectares)
area of the prevailing land use L_USE
DRS dense-residential-settlement land use prevailsSRS scattered-residential-settlement land use prevailsDRS-SRS a mix of dense and scattered-residential-settlement land uses
prevailsICS industrial-commercial-service land use prevails
resident population POPHIGH the residents are more than the 50th percentile (~ 2.500 people)LOW the residents are less than the 50th percentile (~ 2.500 people)
area where building is forbidden NOBUILD
HIGH the area is greater than the 50th percentile (~ 5 hectares)LOW the area is smaller than the 50th percentile (~ 5 hectares)
class of the residential zone established by the zoning rules of the city
MasterplanAREA_COD
B-HIGH the zone is classified as “residential completion zone” and its area is greater than the 50th percentile (~ 8 hectares)
B-LOW the zone is classified as “residential completion zone” and its area is smaller than the 50th percentile (~ 8 hectares)
C the zone is classified as “residential expansion zoneEZ the zone is classified as “enterprise zone
COND
ITIO
N AT
TRIB
UTES
DECI
SION
AT
TRIB
UTE

42
Geographic Information Systems and decision processes for urban planning: a case study of Rough Set Analysis on the residential areas of the city of
Cagliari, Italy
Analytical description of the values of the attributesATTRIBUTES /
VALUESOCCURRENCES FREQUENCY
(%)ATTRIBUTES /
VALUESOCCURRENCES FREQUENCY
(%)AREA_A L_USEYES 9 16,07 DRS 13 23,21NO 47 83,93 SRS 18 32,14
DRS-SRS 17 30,36AREA_B ICS 8 14,29HIGH 28 50,00LOW 28 50,00 POP
HIGH 28 50,00AREA_C LOW 28 50,00HIGH 18 32,14LOW 38 67,86 NOBUILD
HIGH 18 32,14AREA_EZ LOW 38 67,86HIGH 16 28,57LOW 40 71,43 AREA_COD
B-HIGH 23 41,08B-LOW 13 23,21
C 13 23,21EZ 7 12,50

43
Geographic Information Systems and decision processes for urban planning: a case study of Rough Set Analysis on the residential areas of the city of
Cagliari, Italy
Information matrix In this case study:
The information matrix is 56x8, since : the elements of OBJ are 56, the condition and decision attributes are 8.
All the attributes are alphabetical, so there is not a problem of variable discretization.
There are not missing values in the information matrix, so there is not a problem of completion of the information matrix.
Information is based on alphabetical values. Information is complete.

44
Geographic Information Systems and decision processes for urban planning: a case study of Rough Set Analysis on the residential areas of the city of
Cagliari, Italy
ResultsThe rules are 29. Each rule refers to one or more values of the decision
attribute, according to whether it is exact or approximate.
With reference to the decision attribute, the rules which refer to: • B-HIGH are 13 (11 exact + 2 approximate); • B-LOW are 7 (3 exact + 4 approximate); • C are 8 (5 exact + 3 approximate);• EZ are 7 (3 exact + 4 approximate).
The RHSA of each exact rule equals 1. The sum of the RHSA’s of each approximate rule also
equals 1. This indicates that all the rules are highly reliable.

DECISION RULES LHSS RHSS RHSA LHSC RHSC1 POP(HIGH) AND NOBUILD(HIGH) AREA_COD(B-HIGH) 12 12 1,00 0,21 0,522 AREA_A(NO) AND AREA_C(LOW) AND POP(HIGH) AREA_COD(B-HIGH) 9 9 1,00 0,16 0,393 AREA_A(YES) AND NOBUILD(HIGH) AREA_COD(B-HIGH) 6 6 1,00 0,11 0,264 AREA_B(LOW) AND AREA_C(LOW) AND POP(HIGH) AREA_COD(B-HIGH) 5 5 1,00 0,09 0,225 L_USE(DRS-SRS) AND NOBUILD(HIGH) AREA_COD(B-HIGH) 5 5 1,00 0,09 0,22
6 AREA_EZ(LOW) AND L_USE(SRS) AND POP(HIGH) AND NOBUILD(LOW) AREA_COD(B-HIGH) OR AREA_COD(B-LOW) 3 2, 1 0,67,
0,33 0,05 0,09, 0,08
7 AREA_A(YES) AND L_USE(DRS-SRS) AREA_COD(B-HIGH) 2 2 1,00 0,04 0,09
8 AREA_B(HIGH) AND AREA_C(HIGH) AND L_USE(DRS-SRS) AND NOBUILD(LOW) AREA_COD(B-HIGH) OR AREA_COD(EZ) 2 1, 1 0,50,
0,50 0,04 0,04, 0,14
9 AREA_B(HIGH) AND AREA_EZ(HIGH) AND L_USE(SRS) AREA_COD(B-HIGH) OR AREA_COD(C) 2 1, 1 0,50, 0,50 0,04 0,04,
0,0810 AREA_C(HIGH) AND AREA_EZ(HIGH) AND L_USE(ICS) AREA_COD(B-HIGH) 1 1 1,00 0,02 0,04
11 AREA_B(LOW) AND L_USE(DRS-SRS) AND POP(LOW) AREA_COD(B-LOW) OR AREA_COD(EZ) 3 2, 1 0,67, 0,33 0,05 0,15,
0,1412 AREA_B(LOW) AND AREA_C(HIGH) AND AREA_EZ(LOW) AND L_USE(SRS) AREA_COD(B-LOW) 2 2 1,00 0,04 0,1513 AREA_B(LOW) AND AREA_C(HIGH) AND AREA_EZ(LOW) AND NOBUILD(LOW) AREA_COD(B-LOW) 2 2 1,00 0,04 0,1514 AREA_C(LOW) AND AREA_EZ(HIGH) AND L_USE(SRS) AREA_COD(B-LOW) 2 2 1,00 0,04 0,15
15 AREA_B(LOW) AND AREA_C(LOW) AND AREA_EZ(LOW) AND L_USE(SRS) AND POP(LOW) AREA_COD(B-LOW) OR AREA_COD(C) OR AREA_COD(EZ) 4 1, 2,
10,25, 0,50, 0,25
0,070,08, 0,15, 0,14
16 AREA_A(NO) AND AREA_B(LOW) AND AREA_EZ(LOW) AND L_USE(DRS) AREA_COD(B-LOW) 1 1 1,00 0,02 0,0817 AREA_B(HIGH) AND AREA_C(HIGH) AND L_USE(ICS) AREA_COD(B-LOW) 1 1 1,00 0,02 0,0818 AREA_B(LOW) AND AREA_C(HIGH) AND L_USE(DRS-SRS) AREA_COD(B-LOW) 1 1 1,00 0,02 0,0819 AREA_C(LOW) AND AREA_EZ(HIGH) AND L_USE(ICS) AND POP(LOW) AND NOBUILD(LOW) AREA_COD(B-LOW) 1 1 1,00 0,02 0,08
20 AREA_A(YES) AND POP(LOW) AREA_COD(B-LOW) OR AREA_COD(C) 2 1, 1 1,00 0,04 0,08, 0,08
21 AREA_B(HIGH) AND AREA_C(LOW) AND POP(LOW) AREA_COD(C) 6 6 1,00 0,11 0,4622 AREA_A(NO) AND AREA_EZ(HIGH) AND L_USE(DRS) AREA_COD(C) 1 1 1,00 0,02 0,0823 AREA_B(HIGH) AND AREA_C(LOW) AND L_USE(SRS) AREA_COD(C) 1 1 1,00 0,02 0,0824 AREA_B(LOW) AND AREA_C(LOW) AND AREA_EZ(LOW) AND L_USE(ICS) AREA_COD(C) 1 1 1,00 0,02 0,0825 AREA_EZ(HIGH) AND L_USE(ICS) AND NOBUILD(HIGH) AREA_COD(C) 1 1 1,00 0,02 0,0826 AREA_A(YES) AND AREA_B(HIGH) AND NOBUILD(LOW) AREA_COD(EZ) 1 1 1,00 0,02 0,1427 AREA_B(HIGH) AND AREA_C(HIGH) AND POP(LOW) AREA_COD(EZ) 1 1 1,00 0,02 0,1428 AREA_B(LOW) AND AREA_C(HIGH) AND AREA_EZ(HIGH) AND L_USE(SRS) AREA_COD(EZ) 1 1 1,00 0,02 0,1429 AREA_C(HIGH) AND L_USE(ICS) AND NOBUILD(HIGH) AREA_COD(EZ) 1 1 1,00 0,02 0,14
Rules and their descriptive statistics

46
Geographic Information Systems and decision processes for urban planning: a case study of Rough Set Analysis on the residential areas of the city of
Cagliari, Italy
The most part of occurrences are explained by few rules with respect to a total of 29.
The role each condition attribute plays in generating the decision rules is fundamental to understand the phenomenon represented by the values of the decision attribute.
The decision rules connect the condition attributes with each other in order to identify the value of the decision attribute, that is how the zoning rules of the Masterplan of Cagliari characterize the use of a city residential area.

47
Geographic Information Systems and decision processes for urban planning: a case study of Rough Set Analysis on the residential areas of the city of
Cagliari, Italy
Number and frequency of the explained occurrences of the decision attribute for each condition attribute
with reference to the decision rules Attribute
sValues
ExplainedOccurrences
Frequency(%)
DecisionAttribute “B-HIGH”
Frequency(%)
DecisionAttribute “B-LOW”
Frequency(%)
DecisionAttribute
“C”Frequency
(%)DecisionAttribute
“EZ”Frequency
(%)
AREA_A 22 27,50 17 38,64 2 13,33 2 14,29 1 14,29YES 11 13,75 8 18,18 1 6,67 1 7,14 1 14,29NO 11 13,75 9 20,45 1 6,67 1 7,14 0 0,00
AREA_B 32 40,00 7 15,91 8 53,33 11 78,57 6 85,71HIGH 14 17,50 2 4,55 1 6,67 8 57,14 3 42,86LOW 18 22,50 5 11,36 7 46,67 3 21,43 3 42,86
AREA_C 30 37,50 7 15,91 8 53,33 10 71,43 5 71,43HIGH 12 15,00 2 4,55 6 40,00 0 0,00 4 57,14LOW 18 22,50 5 11,36 2 13,33 10 71,43 1 14,29
AREA_EZ 22 27,50 4 9,09 10 66,67 6 42,86 2 28,57HIGH 9 11,25 2 4,55 3 20,00 3 21,43 1 14,29LOW 13 16,25 2 4,55 7 46,67 3 21,43 1 14,29L_USE 34 42,50 10 22,73 12 80,00 7 50,00 5 71,43DRS 2 2,50 0 0,00 1 6,67 1 7,14 0 0,00SRS 15 18,75 3 6,82 6 40,00 4 28,57 2 28,57
DRS-SRS 11 13,75 6 13,64 3 20,00 0 0,00 2 28,57ICS 6 7,50 1 2,27 2 13,33 2 14,29 1 14,29POP 45 56,25 27 61,36 6 40,00 9 64,29 3 42,86HIGH 28 35,00 27 61,36 1 6,67 0 0,00 0 0,00LOW 17 21,25 0 0,00 5 33,33 9 64,29 3 42,86
NOBUILD 34 42,50 26 59,09 4 26,67 1 7,14 3 42,86HIGH 25 31,25 23 52,27 0 0,00 1 7,14 1 14,29LOW 9 11,25 3 6,82 4 26,67 0 0,00 2 28,57
48
Geographic Information Systems and decision processes for urban planning: a case study of Rough Set Analysis on the residential areas of the city of
Cagliari, Italy
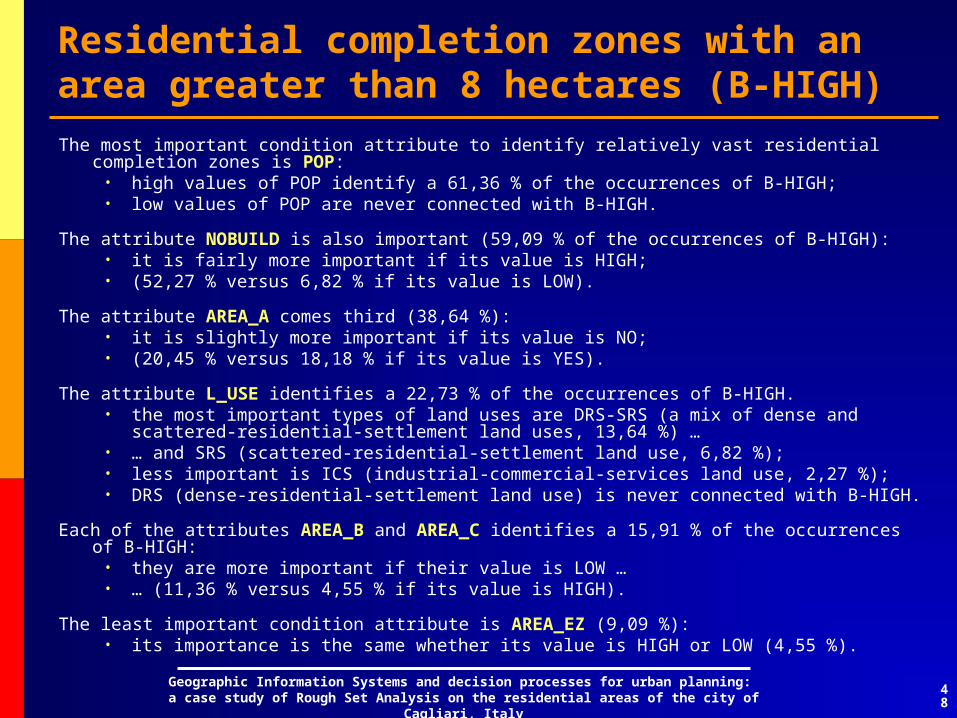
Residential completion zones with an area greater than 8 hectares (B-HIGH) The most important condition attribute to identify relatively vast residential
completion zones is POP:• high values of POP identify a 61,36 % of the occurrences of B-HIGH;• low values of POP are never connected with B-HIGH.
The attribute NOBUILD is also important (59,09 % of the occurrences of B-HIGH): • it is fairly more important if its value is HIGH; • (52,27 % versus 6,82 % if its value is LOW).
The attribute AREA_A comes third (38,64 %): • it is slightly more important if its value is NO; • (20,45 % versus 18,18 % if its value is YES).
The attribute L_USE identifies a 22,73 % of the occurrences of B-HIGH. • the most important types of land uses are DRS-SRS (a mix of dense and
scattered-residential-settlement land uses, 13,64 %) …• … and SRS (scattered-residential-settlement land use, 6,82 %);• less important is ICS (industrial-commercial-services land use, 2,27 %);• DRS (dense-residential-settlement land use) is never connected with B-HIGH.
Each of the attributes AREA_B and AREA_C identifies a 15,91 % of the occurrences of B-HIGH: • they are more important if their value is LOW …• … (11,36 % versus 4,55 % if its value is HIGH).
The least important condition attribute is AREA_EZ (9,09 %): • its importance is the same whether its value is HIGH or LOW (4,55 %).

49
Geographic Information Systems and decision processes for urban planning: a case study of Rough Set Analysis on the residential areas of the city of
Cagliari, Italy
Residential completion zones with an area greater than 8 hectares (B-HIGH)Relatively vast residential completion zones are mostly identified, in a buffer of 150 meters around the completion zone, by:
• the presence of a relatively high resident population (more than 2.500 residents);
• a low presence of residential expansion zones (less than 1,1 hectares),
• a low presence of residential completion zones (less than 7 hectares), • a low presence of enterprise zones (less than 3 hectares); • a non-dense-residential-settlement land use; • the presence of a relatively vast zone where building is forbidden
(more than 5 hectares). The presence and the absence of areas of the historic center zone do not play a definite role with respect to residential completion zones with an area greater than 8 hectares.
The first five decision rules: • POP(HIGH) AND NOBUILD(HIGH) AREA_COD(B-HIGH)• AREA_A(NO) AND AREA_C(LOW) AND POP(HIGH) AREA_COD(B-HIGH)• AREA_A(YES) AND NOBUILD(HIGH) AREA_COD(B-HIGH)• AREA_B(LOW) AND AREA_C(LOW) AND POP(HIGH) AREA_COD(B-HIGH)• L_USE(DRS-SRS) AND NOBUILD(HIGH) AREA_COD(B-HIGH)
are very effective in summarizing the importance of the attributes in identifying the value B-HIGH of the condition attribute.

50
Geographic Information Systems and decision processes for urban planning: a case study of Rough Set Analysis on the residential areas of the city of
Cagliari, Italy
Residential completion zones with an area smaller than eight hectares (B-LOW) The most important condition attribute to identify relatively small residential
completion zones is L_USE (80,00 % of the occurrences of B-LOW): • the most important types of land use are SRS (40,00 %) and DRS-SRS (20,00 %);• less important are ICS (13,33 %) and DRS (6,67 %).
The attribute AREA_EZ is also important (66,67%): • it is fairly more important if its value is LOW • (46,67 % versus 20,00 % if its value is HIGH).
The attributes AREA_B and AREA_C identify a 53,33 %of the occurrences of B-LOW:• AREA_B is fairly more important if its value is LOW (46,67 % versus 6,67 % if
its value is HIGH);• AREA_C is more important if its value is HIGH (40,00 % versus 13,33 % if its
value is LOW).
The attribute POP comes fifth (40%);• it is fairly more important if its value is LOW • (33,33 % versus 6,67 % if its value is HIGH).
The attribute NOBUILD:• low values identify a 26,67 % of the occurrences of B-LOW;• high values are never connected with B-LOW.
The least important condition attribute is AREA_A (13,33 %):• its importance is the same whether its value is YES or NO (6,67 %).

51
Geographic Information Systems and decision processes for urban planning: a case study of Rough Set Analysis on the residential areas of the city of
Cagliari, Italy
Residential completion zones with an area smaller than eight hectares (B-LOW)Relatively small residential completion zones are mostly identified, in a buffer of 150 meters around the completion zone, by:
• a high presence of residential expansion zones (more than 1,1 hectares) • a low presence of enterprise zones (less than 3 hectares); • a non-dense-residential-settlement land use; • a relatively low resident population (less than 2.500 residents); • a low presence of residential completion zones (less than 7 hectares); • the presence of a relatively small zone where building is forbidden
(less than 5 hectares). The presence and the absence of areas of the historic center zone do not play a definite role with respect to residential completion zones with an area smaller than 8 hectares.
The first four decision rules concerning the decision attribute B-LOW• AREA_B(LOW) AND L_USE(DRS-SRS) AND POP(LOW) AREA_COD(B-LOW) OR AREA_COD(EZ)• AREA_B(LOW) AND AREA_C(HIGH) AND AREA_EZ(LOW) AND L_USE(SRS) AREA_COD(B-LOW)• AREA_B(LOW) AND AREA_C(HIGH) AND AREA_EZ(LOW) AND NOBUILD(LOW) AREA_COD(B-LOW)• AREA_C(LOW) AND AREA_EZ(HIGH) AND L_USE(SRS) AREA_COD(B-LOW)
are very effective in summarizing the importance of the attributes in identifying the value B-LOW of the condition attribute. In the fourth rule, the value of AREA_EZ is HIGH, which should not be amazing, since the value LOW of AREA_EZ identifies a significant fraction of the occurrences of B-LOW, even though smaller than that identified by the value HIGH.

52
Geographic Information Systems and decision processes for urban planning: a case study of Rough Set Analysis on the residential areas of the city of
Cagliari, Italy
Residential expansion zones (C)The most important condition attributes to identify residential expansion zones
are AREA_B and AREA_C: • AREA_B identifies a 78,57 % of the occurrences of C: it is fairly more
important if its value is HIGH (57,14 % versus 21,43 % if its value is LOW).
• low values of AREA_C identify a 71,43 % of the occurrences of C; high values of AREA_C are never connected with C.
The attribute POP is also important:• low values of POP identify a 64,29 % of the occurrences of C;• high values of POP are never connected with C.
The attribute L_USE identifies a 50,00 % of the occurrences of C and comes fourth: • the most important types of land use are SRS (28,57 %) • and ICS (14,29 %); less important is DRS (7,14 percent);• DRS-SRS is never connected with C.
The attribute AREA_EZ identifies a 42,86 % of the occurrences of C; • its importance is the same whether its value is HIGH or LOW (21,43 %).
Attributes AREA_A and NOBUILD are the least important.• The attribute AREA_A identifies a 14,29 % of the occurrences of C; its
importance is the same whether its value is YES or NO (7,14 %);• high values of the attribute NOBUILD identify a 7,14 % of the occurrences
of C;• low values of NOBUILD are never connected with C.

53
Geographic Information Systems and decision processes for urban planning: a case study of Rough Set Analysis on the residential areas of the city of
Cagliari, Italy
Residential expansion zones (C)Residential expansion zones are mostly identified, in a buffer of 150
meters around the expansion zone, by: • a low presence of residential expansion zones (more than 1,1
hectares); • a high presence of residential completion zones (more than 7
hectares); • a scattered-residential-settlement land use with industrial-
commercial-service land use; • a relatively low resident population (less than 2.500 residents); • the presence of enterprise zones (whether their area is large or
small, that is greater or smaller than 3 hectares). The presence and the absence of areas of the historic center zone do not
play a definite role with respect to residential expansion zones. The condition attribute NOBUILD (areas where building is forbidden) is very
slightly connected with the value C of the decision attribute, since in only one rule a (high) value of NOBUILD is associated with a C value of the decision attribute.
The rule: AREA_B(HIGH) AND AREA_C(LOW) AND POP(LOW) AREA_COD(C)
is very effective in summarizing the importance of the attributes in identifying the value C of the condition attribute.

54
Geographic Information Systems and decision processes for urban planning: a case study of Rough Set Analysis on the residential areas of the city of
Cagliari, Italy
Enterprise zones (EZ)The most important condition attribute to identify enterprise zones is AREA_B:
• it identifies a 85,71 % of the occurrences of EZ;• its importance is the same whether its value is HIGH or LOW (42,86 %).
The attributes AREA_C and L_USE are also important. • each of them identifies a 71,43 % of the occurrences of EZ;• the attribute AREA_C is more important if its value is HIGH (57,14 %
versus 14,29 % if its value is LOW). • The most important types of land uses are SRS (28,57 %) and DRS-SRS (28,57
%); • less important is ICS (14,29 %);• DRS is never connected with EZ.
Attributes POP and NOBUILD come fourth;• each of them identifies a 42,86 per % cent of the occurrences of EZ;• high values of POP identify a 42,86 % of the occurrences of EZ;• low values of POP are never connected with EZ;• the attribute NOBUILD is more important if its value is LOW (28,57 %
versus 14,29 % if its value is HIGH).The attribute AREA_EZ identifies a 28,57 % of the occurrences of EZ;
• its importance is the same whether its value is HIGH or LOW (14,29 %).The least important condition attribute is AREA_A:
• the YES value of this attribute identifies a 14,29 % of the occurrences of EZ;
• low values of AREA_A are never connected with EZ.

55
Geographic Information Systems and decision processes for urban planning: a case study of Rough Set Analysis on the residential areas of the city of
Cagliari, Italy
Enterprise zones (EZ)Enterprise zones are mostly identified, in a buffer of 150 meters
around the enterprise zone, by: • the presence of residential completion zones (whether their area
is large or small, that is greater or less than 7 hectares); • a high presence of residential expansion zones (more than 1,1
hectares); • the presence of enterprise zones (whether their area is large or
small, that is greater or less than 3 hectares); • a non-dense-residential-settlement land use; • a relatively low resident population (less than 2.500
residents); • the presence of a relatively small zone where building is
forbidden (less than five hectares).
The condition attribute AREA_A (areas of the historic center zone) is very slightly connected with the value EZ of the decision attribute, since in only one rule a (YES) value of AREA_A is associated with a EZ value of the decision attribute.
There is no dominant rule among the seven concerning the decision attribute EZ.

Section 5
Discussion and Conclusions
Summary

57
Geographic Information Systems and decision processes for urban planning: a case study of Rough Set Analysis on the residential areas of the city of
Cagliari, Italy
Analysis of the rules: B ZonesLarge residential completion zones (B-HIGH) are
• mostly surrounded by highly-populated areas and areas where building is forbidden
• close to non-dense-residential land uses, small residential completion and expansion zones
Small residential completion zones (B-LOW) are• close to residential expansion zones, enterprise zones and
other B-LOW’s, low-populated areas and areas with a low presence of building prohibitions
• close to non-dense-residential land uses• part of the most recent urban expansion• relatively less populated and less interested by building
prohibitions
The B-LOW’s are boundary zones for the city residential completion sectors, whereas the B-HIGH’s are located in the
most internal areas of the completion sectors

58
Geographic Information Systems and decision processes for urban planning: a case study of Rough Set Analysis on the residential areas of the city of
Cagliari, Italy
Analysis of the rules: C Zones and EZ Zones
The residential expansion zones (C) are:• close to B-HIGH zones, C zones and EZ zones• characterized by scattered-residential-settlement land uses and a low resident population
• a sort of a buffer between the B zones and the EZ zones
The enterprise zones (EZ) are:• close to B-HIGH zones and C zones • spread over the urban fabric: even though the C zones work as a buffer between B and EZ zones, the spatial configuration of the EZ zones is not uniquely connected to the proximity to EZ zones

59
Geographic Information Systems and decision processes for urban planning: a case study of Rough Set Analysis on the residential areas of the city of
Cagliari, Italy
Analysis of the rules: C Zones and EZ ZonesThe EZ zones, mixed-use (residential and public service)
areas, are used by the zoning rules of the city Masterplan without a preference for their surrounding zones, which might be whichever type of residential area.
As a result, the spatial configuration of the residential areas of Cagliari is generally characterized by a progressive increase: • in resident population• in density of the residential land uses • in areas where building is forbidden, from the outer to the inner city
The completion zones are mostly located in the inner city, the expansion zones in the outer city
The enterprise zones are scattered and used to address the problem of the underendowment of public services for the residents, whether it arises in the inner or in the outer
areas

60
Geographic Information Systems and decision processes for urban planning: a case study of Rough Set Analysis on the residential areas of the city of
Cagliari, Italy
ConclusionsThis study has employed RSA to analyze the spatial configuration of the residential areas of the city of Cagliari.
It demonstrates how a spatial analysis approach based on a GIS can be utilized to figure out the geography of the residential zones within the urban fabric, thereby improving upon the objectivity and accuracy of RSA.
The application of this method allows for an integration of the results of the GIS and RSA approaches, which can be used by the city planners in the development of the policy-making processes concerning city residential areas.

61
Geographic Information Systems and decision processes for urban planning: a case study of Rough Set Analysis on the residential areas of the city of
Cagliari, Italy
By applying the method developed in this paper, planners can better ensure that the policies they advocate are based on a thorough analysis of the spatial configuration of housing areas.The zoning rules for urban planning of the Italian cities are quite similar to each other, since they are based on the same national law enacted by decree.
The results obtained by the GIS-based RSA could be an important reference point to compare the characteristics of the spatial configuration of the residential areas of the Italian cities.
This methodology is easily exportable, and allows for comparisons of different spatial configuration and policies.
The same methodology can be applied to analyze the spatial configuration of the residential areas of other medium-sized European and North-American cities, once a thorough comparison of the zoning rules of their Masterplans is developed.
Conclusions

62
Geographic Information Systems and decision processes for urban planning: a case study of Rough Set Analysis on the residential areas of the city of
Cagliari, Italy
The optimal choice of the attributes to be included in the RSA
includes as many variables as necessary to describe the housing market satisfactorily.
This choice is heavily influenced by available information. In Italy, information quantity and quality are not as high
as in the US, where empirical studies regarding the housing market
have been largely developed.
The analysis implemented here is based on a set of variables representing the best choice given the information available, rather than the optimal choice. These variables should be considered a subset of the optimal variable choice.
Conclusions
Related Documents


