POPULATION AND DEVELOPMENT REVIEW 39(4): 611–634 (DECEMBER 2013) 611 ©2013 The Population Council, Inc. Geographic Divergence in Mortality in the United States ANDREW FENELON LIFE EXPECTANCY at birth in the United States (both sexes combined) rose from 70 years in 1965 to nearly 78 years in 2007. While this is a new mile- stone for low mortality among Americans, the United States lags significant- ly behind countries in Western Europe. Especially after age 50, mortality in the US remains substantially higher than in countries with similar levels of economic development, an unfavorable trend that has emerged in the past few decades (Crimmins, Preston, and Cohen 2010). 1 Despite spending more per capita on health care than any other peer country, the health perfor- mance of the United States is comparatively poor, especially among older adults aged 50 to 80 (Ho and Preston 2010). A recent National Academy of Sciences panel was charged with identifying why US adult mortality is so high relative to its peers (Crimmins, Preston, and Cohen 2010). Although a number of causes were identified, the relatively poor health status of the United States remains a problem that American health policy has not suf- ficiently addressed. Levels of health and mortality are far from homogeneous across subpop- ulations in the United States. The experience of the country as a whole does not necessarily reflect the experience of individual subgroups. Health and mortality vary in a number of dimensions including race/ethnicity, socioeco- nomic status, sex, and geography. Geographic inequalities in adult mortality in the US appear to be greater on average than in Western Europe (Wilmoth, Boe, and Barbieri 2010). Along with varying mortality levels, regions within the US also have vastly different experiences in terms of environmental exposures, disease control, medical treatment and care, and behavioral risk (Geronimus et al. 1996; Hayward, Pienta, and McLaughlin 1997). Since the mid-twentieth century, the sections of the US with particu- larly high mortality have become increasingly concentrated in space and clustered in the South. The standard South US census region includes all

Welcome message from author
This document is posted to help you gain knowledge. Please leave a comment to let me know what you think about it! Share it to your friends and learn new things together.
Transcript

POPULATION AND DEVELOPMENT REVIEW 39(4 ) : 6 1 1 –6 3 4 ( D ECEMBER 2 0 1 3 ) 611
©2013 The Population Council, Inc.
Geographic Divergence in Mortality in the United States
Andrew Fenelon
Life expectancy at birth in the United States (both sexes combined) rose from 70 years in 1965 to nearly 78 years in 2007. While this is a new mile-stone for low mortality among Americans, the United States lags significant-ly behind countries in Western Europe. Especially after age 50, mortality in the US remains substantially higher than in countries with similar levels of economic development, an unfavorable trend that has emerged in the past few decades (Crimmins, Preston, and Cohen 2010).1 Despite spending more per capita on health care than any other peer country, the health perfor-mance of the United States is comparatively poor, especially among older adults aged 50 to 80 (Ho and Preston 2010). A recent National Academy of Sciences panel was charged with identifying why US adult mortality is so high relative to its peers (Crimmins, Preston, and Cohen 2010). Although a number of causes were identified, the relatively poor health status of the United States remains a problem that American health policy has not suf-ficiently addressed.
Levels of health and mortality are far from homogeneous across subpop-ulations in the United States. The experience of the country as a whole does not necessarily reflect the experience of individual subgroups. Health and mortality vary in a number of dimensions including race/ethnicity, socioeco-nomic status, sex, and geography. Geographic inequalities in adult mortality in the US appear to be greater on average than in Western Europe (Wilmoth, Boe, and Barbieri 2010). Along with varying mortality levels, regions within the US also have vastly different experiences in terms of environmental exposures, disease control, medical treatment and care, and behavioral risk (Geronimus et al. 1996; Hayward, Pienta, and McLaughlin 1997).
Since the mid-twentieth century, the sections of the US with particu-larly high mortality have become increasingly concentrated in space and clustered in the South. The standard South US census region includes all

612 G e o G r a p h i c D i v e r G e n c e i n M o r ta l i t y i n t h e U n i t e D S tat e S
states south of the Mason–Dixon line and westward to Texas and Oklahoma. The most disadvantaged region of the South is the so-called Central South, containing Alabama, Kentucky, Mississippi, and Tennessee. This region is distinctive for experiencing a large health and mortality disadvantage as well as relatively high poverty (Fenelon and Preston 2012). The southern disadvantage in resources is a more longstanding pattern; southern states that are more highly dependent on agriculture have been slower to rebound from economic recessions (Slesnick 1993; Tickamyer and Duncan 1990). As a result, poverty and rural isolation have historically had more profound effects on social and economic opportunities in the South among both whites and blacks (Friedman and Lichter 1998). Although regional differences in pov-erty have narrowed, some of the enduring disadvantages of southern states may reflect the institutionalization of black inequality (Karnig and McClain 1985). In contrast to economic inequality, the southern disadvantage related to health and mortality is a more recent occurrence. The current southern mortality disadvantage reflects diverging trends between the southern states and states in the Northeast, West, and Midwest over the second half of the twentieth century (Ezzati et al. 2008). In the early to mid-2000s, adult mortality rates in many southern states were 30–40 percent higher than top performers in other regions, particularly the Pacific Coast, Upper Midwest, and New England. This excess mortality translates into 3–4 fewer expected years of life at age 50 for the states that are worst off.2
This article seeks to explain the considerable geographic realignment in adult mortality that occurred in the US since 1965. Identifying the specific consequences of residing in a particular region for a person’s health and life expectancy is analytically difficult. Instead, the analysis examines the ag-gregate divergence in mortality between the southern states and states with more favorable mortality experience. The article also highlights the contri-bution of cigarette smoking to the increasing disadvantage of the southern states. Using US vital statistics between 1965 and 2004, the article compares observed mortality trends across states to trends in a counterfactual scenario in which the impact of smoking is removed. If smoking is an important contributor, the latter scenario should reveal substantially less divergence in mortality.
Geographic differences in health
The public health and epidemiological literatures contain a multitude of studies demonstrating poorer health and mortality outcomes in the south-ern US, a pattern that is observed with respect to many measures of health and well-being (Devesa et al. 1999; Jemal et al. 2005; Wilmoth, Boe, and Barbieri 2010; Mansfield et al. 1999). The large literature on the “stroke
a n D r e w f e n e l o n 613
belt” indicates the extent to which specific cardiovascular diseases are espe-cially concentrated in this region (Howard 1999; Lanska and Kuller 1995). Although the southern disadvantage characterizes most states in the South census region, the phenomenon is particularly focused in the Central South: Alabama, Kentucky, Mississippi, and Tennessee. Rural counties in these four states are especially disadvantaged (Eberhardt and Pamuk 2004; Ezzati et al. 2008), with many of the economic hardships of the 1970s and 1980s having pronounced effects on rural well-being.
Over the second half of the twentieth century, the increasing concentra-tion of mortality disadvantage in southern states was exceptional. The maps in Figure 1 show the changing alignment of states between the 1960s and the mid-2000s. Although all states have experienced reductions in mortal-ity over this 40-year period, the pace of the decline has been geographically uneven. In 1965, the states with the highest mortality were not particularly concentrated in space; the worst-off states (Rhode Island, Alaska, Delaware, Pennsylvania, and New Hampshire) were spread across geographic regions. By the 2000s, however, the southern disadvantage was both evident and widely acknowledged (National Center for Health Statistics 2001). Gaps in adult mortality between the southern states and better-off states in the Northeast, Midwest, and West have widened considerably. In 1965, for ex-ample, California and Kentucky had very similar expectation of life at age 50, around 20 years for men. While remaining life expectancy for men in California increased steadily over the next four decades, to nearly 30 years in 2004, men in Kentucky experienced only a modest increase, to 26 years in the same year. Kentucky is not alone among southern states in falling behind other regions over the past 40 years; the 13 worst-off states were geographically contiguous in 2004. Among women, reductions in mortality over this period were slower than for men. Women in many southern states experienced stagnating mortality decline in the 1980s and 1990s, and some even suffered increases in mortality (Meara, Richards, and Cutler 2008).
The realization that specific regions of the country are falling further behind is absent in policy discussions of health disparities. Although geo-graphic location is mentioned by the Healthy People 2020 goals as one dimen-sion of health inequality in the US, significantly more attention is paid to differences in health outcomes between rural and urban residents, with less focus on region or state of residence. The large differences in health and mor-tality outcomes across US regions reflect differences in sociodemographic, behavioral, environmental, and institutional factors (Murray et al. 2006). There is evidence that broad cultural shifts in the United States have led to increasingly disparate social and demographic outcomes among regions of the country (Lesthaeghe and Neidert 2006). Although southern states have experienced socioeconomic disadvantage throughout this 40-year period, it

614 G e o G r a p h i c D i v e r G e n c e i n M o r ta l i t y i n t h e U n i t e D S tat e S
is unknown to what extent this affects health performance relative to other regions (Ezzati et al. 2008).
As chronic and degenerative diseases have come to dominate American morbidity and mortality over the past several decades, the potential role of health-related behavior in individual health status has risen (Cutler et al. 2011). It has become increasingly important for individuals to translate a large amount of health-related information into action in order to produce more favorable health outcomes (Cutler and Lleras-Muney 2006; Goldman and Smith 2002; Pampel, Krueger, and Denney 2010). At the individual
FIGURE 1 Age-standardized mortality by state, 1965 and 2004
1965
2004
NOTES: States classified into quintiles. Darker shades represent higher death rates. Death rates are standardized using year 2000 age structure. SOURCE: Author’s calculations from National Center for Health Statistics Multiple Cause-of-Death public-use files 1965 and 2004.
5,192–5,288
4,885–5,191
5,289–5,798
4,731–4,884
4,322–4,730
Age-standardized death rateper 100,000 ages 50+
3,043–3,324
2,870–3,042
3,325–3,799
2,779–2,869
2,551–2,778
Age-standardized death rateper 100,000 ages 50+

a n D r e w f e n e l o n 615
level, a portion of the socioeconomic differences in health is purported to reflect gradients in the availability of information about the risks and ben-efits of various health behaviors (Cutler and Lleras-Muney 2010). Some of the differences in the understanding and application of health information may also reflect differences in the level of trust in science (National Science Board 2012). The process through which individuals make health decisions depends, to some extent, on how they weigh health-related evidence in terms of costs and benefits. It is not clear whether place of residence, in particular, influences behavior or whether place is a marker for underlying determi-nants of behavioral norms and diffusion (Duncan, Jones, and Moon 1993). Social policy interventions aimed at improving health behaviors must rely on motivating individual action to foster behavioral or attitudinal change and improve population health (Cutler 2004). Behaviors such as cigarette smoking pose substantial challenges for public policy.
Cigarette smoking and mortality
Cigarette smoking is the single greatest cause of preventable deaths in many developed countries. Knowledge of the dangers of smoking emerged in the 1950s and became widespread in the 1960s, particularly with the release of the Surgeon General’s report on tobacco (US Surgeon General 1964). At the individual level, tobacco has been linked to mortality from numer-ous causes, including cardiovascular diseases, stroke, many cancers, and chronic respiratory conditions (Doll et al. 2004). The magnitude of excess risk depends jointly on the duration and intensity of cigarette use (Thun et al. 1995). Rates of cigarette smoking in the US increased starting in the first half of the twentieth century (Forey et al. 2002), although there is a notable difference by sex in smoking trends. Men began smoking widely in the early to mid-twentieth century, consuming more cigarettes than women in the 1940s, 1950s, and 1960s. Men’s lung cancer rates rose substantially, peaking in the early 1980s, and declined thereafter (Jemal, Cho, and Tarone 2001). Smoking prevalence among women reached a peak later, with declines much less pronounced than for men. Rates of lung cancer among women reached a peak in the early 2000s (Burns et al. 1997).3
As smoking initiation rates dropped precipitously and smoking cessation rates rose across American cohorts following the 1960s (ibid.), the mortality burden of smoking declined for men and leveled off for women. Although the prevalence of smoking has declined in all states, southern states, particu-larly Kentucky, have maintained high levels of smoking while other states, especially those in the West, have kept smoking prevalence relatively low over the past several decades (CDC 2009). Regional differences in the onset of smoking declines in the United States have produced large geographic

616 G e o G r a p h i c D i v e r G e n c e i n M o r ta l i t y i n t h e U n i t e D S tat e S
disparities in lung cancer (Devesa et al. 1999). This growing gap in smoking behavior likely produced widespread inequalities in health and mortality.
Data and methods
Data
US mortality data for this article come from vital statistics for the period 1965–2004. The National Center for Health Statistics (NCHS) releases mortality micro-data as part of Multiple Cause-of-Death (MCD) public-use files, which contain demographic and geocoded information on all deaths occurring within the US and to US residents. Causes of death are coded according to the International Classification of Disease (ICD), with lung cancer being the principal cause of interest. Data from 1965–67 refer to the 7th revision (ICD7); 1968–70 refer to ICD8; 1970–98 refer to ICD9; and 1999–2004 refer to ICD10. State population data come from US decennial census enumerations and US Census Bureau in-tercensal estimates. State-specific deaths refer to state of residence as opposed to state of occurrence.4 Using this specification, all individuals included in the denominator of the death rate also have the potential to be included in the nu-merator, preserving the logic of a traditional demographic rate.
Geographic units considered
Beginning in 2005, NCHS no longer provides geographic identifiers below the level of Census region in the public-use version of MCD files. For geo-graphic comparisons, mortality experience is examined at two levels of aggregation: 1) states—this includes the 50 states but excludes the District of Columbia, and 2) divisions—the US Census Bureau established nine Census divisions taking into account geographic and cultural regions. Table 1 presents the classification of the 50 states. The division of interest here is the Central South.
Measuring geographic divergence in mortality
The geographic divergence in mortality refers to the changing gap in the age-standardized all-cause death rate between the South and the comparison geographic units. Death rates for ages 50+ standardized to the 2000 US popu-lation age structure are calculated in each year and each geographic unit by sex. Age 50 is chosen as the beginning age because smoking-related mortality occurs almost exclusively in the age group 50 and higher and because recent research indicates that mortality above age 50 is responsible for the major-ity of international differences in life expectancy (Crimmins, Preston, and Cohen 2010). (Mortality at all ages is considered in the Appendix.) Between

a n D r e w f e n e l o n 617
1965 and 2004, the geographic pattern of adult mortality in the US changed considerably. The most notable trend is the increasing gap between the Cen-tral South and states in the Northeast, Upper Midwest, and West. In order to measure the magnitude of this divergence, age-standardized death rates are compared over two 20-year periods: 1965–85 and 1985–2004. Mortality divergence over the period x to x+20 is calculated as
divergenceobs = (ASDRi(t2) – ASDRj(t
2)) – (ASDRi(t
1) – ASDRj(t
1))
where ASDRi(t) is the all-cause age-standardized death rate in state or divi-sion i and year t and ASDRj is the age-standardized death rate in the com-parison state j. The mortality divergence simply represents the change in the difference in the death rate between geographic units over a 20-year period between t
1 and t
2.
Indirect estimation of the impact of smoking
Smoking-attributable mortality is estimated using an indirect method devel-oped by Preston, Glei, and Wilmoth (2010a). The model uses lung cancer as a reliable “indicator” of the population-level impact of smoking, a recognition that is key to indirect methods for estimating smoking-attributable mortality (Preston, Glei, and Wilmoth 2010a; Peto et al. 1992). The model extrapolates smoking’s impact to all-cause mortality using the statistical relationship between mortality from lung cancer and mortality from all other causes of death across geographic units. The original model coefficients were estimated
TABLE 1 Classification of states in nine geographic divisions
Division States included
New England Connecticut, Maine, Massachusetts, New Hampshire, Rhode Island, Vermont
Middle Atlantic New Jersey, New York, Pennsylvania
South Atlantic Delaware, Florida, Georgia, Maryland, North Carolina, South Carolina, Virginia, West Virginia
Central South Alabama, Kentucky, Mississippi, Tennessee
Western South Arkansas, Louisiana, Oklahoma, Texas
Great Lakes Illinois, Indiana, Michigan, Ohio, Wisconsin
Upper Midwest Iowa, Kansas, Minnesota, Missouri, Nebraska, North Dakota, South Dakota
Mountain West Arizona, Colorado, Idaho, Montana, Nevada, New Mexico, Utah, Wyoming
Pacific Alaska, California, Hawaii, Oregon, Washington
NOTES: Division labels used here differ from those used by the Census Bureau. The choice of names was in-tended to represent more familiar terms for these regions.SOURCE: US Census Bureau.

618 G e o G r a p h i c D i v e r G e n c e i n M o r ta l i t y i n t h e U n i t e D S tat e S
across developed countries. Fenelon and Preston (2012) adapted the model to the US context, using the re-estimated coefficients across US states and at-tributing a substantial fraction of regional disparities in mortality to smoking.
An examination of the differential effect of cigarette smoking across states and regions is problematic because reliable survey data on cigarette smoking are largely unavailable for subnational populations before the mid-1980s and the 1990s. As a result, any measurement of smoking’s impact in prior years must be indirect, relying on the observable consequences of smoking rather than the unobserved prevalence of the habit. Lung cancer is a powerful indicator because its etiology is intricately linked to smoking. In the US more than 90 percent of lung cancer deaths among men and more than 80 percent among women result from cigarette smoking (Fenelon and Preston 2012). The benefit of the indirect approach is that lung cancer implic-itly accounts for the cumulative nature of the relationship between cigarette smoking and mortality (Peto et al. 1994; Haldorsen and Grimsrud 1999). Because smoking typically begins in adolescence while the health effects are not observed until middle age, survey-based reports of smoking behavior may not accurately reflect the eventual mortality burden. The indirect approach produces national estimates of smoking-attributable mortality that are very similar to those using survey-based methods without relying on individual-level smoking data or assumptions about the relationship between reported smoking behavior and eventual mortality (Preston, Glei, and Wilmoth 2010a; Malarcher et al. 2000).
Contribution of smoking to the divergence
The contribution of smoking to geographic divergence in mortality is ex-amined using counterfactual scenarios in which mortality attributable to smoking is removed. This allows one to observe how trends in geographic differences in mortality would be expected to change in the absence of the impact of smoking:
contribution = divergenceobs – divergence*
The superscript obs refers to the observed data and the asterisk refers to the same measure in the absence of smoking-related mortality. To the extent that geographic divergences in mortality are attributable to smoking, the differ-ence between the divergence in the observed data and the divergence in the smoking-absent scenario should be larger. The percentage contribution of smoking refers to the size of the contribution relative to the overall magnitude of the mortality divergence. The next section examines geographic divergence across two periods, 1965–85 and 1985–2004, as well as over the entire period.

a n D r e w f e n e l o n 619
Geographic divergence in adult mortality
Adult mortality rates diverged substantially across geographic regions be-tween 1965 and 2004. However, most of the observed divergence reflects relatively slow progress against mortality in many of the southern states. Figure 2 shows trends in the age-standardized death rate (ages 50 and above) for ten states between 1965 and 2004. The graph includes five southern states (Alabama, Kentucky, Louisiana, Mississippi, Tennessee) and five states (Cali-
1965 1970 1975 1980 1985 1990 1995 2000 20050.02
0.03
0.04
0.05
0.06
ASD
R
MississippiAlabamaLouisianaTennesseeKentucky
IowaSouth DakotaConnecticutMinnesotaCalifornia
FIGURE 2 Diverging trends in all-cause mortality by sex at ages 50 and above in five southern states and five other states, 1965–2004
1965 1970 1975 1980 1985 1990 1995 2000 20050.01
0.02
0.03
0.04
ASD
R
AlabamaLouisianaMississippiTennesseeKentucky
IowaCaliforniaMinnesotaConnecticutSouth Dakota
Men
Women
NOTES: Age-standardized all-cause death rates (ASDR) by state standardized to US age structure in 2000. States arelabeled according to their level of mortality in 2004. SOURCE: Same as Figure 1.

620 G e o G r a p h i c D i v e r G e n c e i n M o r ta l i t y i n t h e U n i t e D S tat e S
fornia, Connecticut, Iowa, Minnesota, South Dakota) from other regions that experienced larger declines in mortality over this period. States are labeled according to their level of mortality in 2004. For men, all ten states begin the period with similar mortality experience; the split between the groups occurs early and widens substantially by the end of the period. By 2004, the southern states have mortality rates 30–40 percent higher than rates in the comparison states. Among women, the divergence occurs later, beginning in the 1980s and 1990s, but leads to a sizable difference in the 2000s.
1965 1970 1975 1980 1985 1990 1995 2000 20050.025
0.03
0.035
0.04
0.045
0.05
0.055
AS
DR
Central South
Upper MidwestMiddle AtlanticNew EnglandMountain WestPacific
FIGURE 3 Diverging trends in all-cause mortality by sex at ages 50 and above in the Central South and five other geographic divisions, 1965–2004
1965 1970 1975 1980 1985 1990 1995 2000 20050.01
0.02
0.03
0.04
AS
DR
Men
Women
NOTES: Age-standardized all-cause death rates (ASDR) by geographic division standardized to US age structure in 2000.State-division classifications shown in Table 1.SOURCE: Same as Figure 1.
Central South
Middle AtlanticUpper MidwestNew EnglandMountain WestPacific
a n D r e w f e n e l o n 621
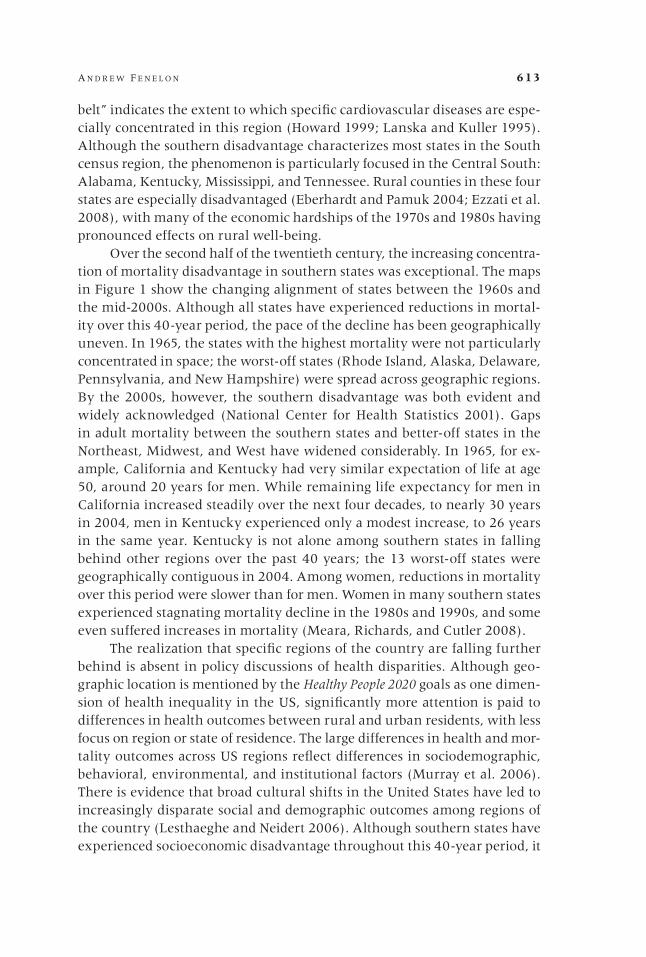
The pattern is similar at the Census division level (see Figure 3). The top line indicates the mortality level for the Central South division, and the other lines refer to New England, Middle Atlantic, Upper Midwest, Mountain West, and Pacific divisions, labeled according to mortality level in 2004. Again among men, all divisions begin the period with similar mortality experience but diverge considerably; the magnitude of the divergence ranges from about 500 to 1,200 deaths per 100,000. New England and Middle Atlantic states exhibit mortality declines that are 75–90 percent larger over this period com-pared to the Central South. One should note the degree of similarity in mor-tality rates among the comparison divisions, especially later in the period,
B
B
B
B
B
BB
B
B
B
B
B
B
B
B
B
B
B
BB
B
B
B
B
B
BB
B
B
B
B B
B
B
B
B
B
B
B
B
B
B
B
B
B
B
B
B
B B
0.025
0.03
0.035
0.04
0.04 0.045 0.05 0.055 0.06
ASD
R 2
000–0
4
ASDR 1965–69
AL
AK
AZ
AR
CACO
CT
DE
FL
GA
HI
ID
IL
IN
IA
KS
KYLA
MEMD
MA
MI
MN
MS
MO
MTNE
NV
NHNJ
NM NY
NC
ND
OH
OK
OR
PA
RI
SC
SD
TN
TX
UT
VT
VA
WA
WV
WI WY
B
B
B
B
B
B
B
B
B
B
B
B
B
B
B B
B B
B
B
B
B
B
B
B
B
B B
BB
B
B
B
B
BB
B
B
B
B
B
B B
B
B
B
B
B
0.018
0.02
0.022
0.024
0.026
0.028
0.025 0.027 0.029 0.031 0.033 0.035 0.037 0.039
ASD
R 2
000–0
4
ASDR 1965–69
AL
AZ
AR
CA
CO
CT
DE
FL
GA
ID
IL
IN
IA
KS
KY LA
ME MD
MA
MI
MN
MS
MO
MT
NE
NV
NH NJ
NM NY
NC
ND
OH
OK
ORPA
RI
SC
SD
TN
TX
UT VT
VA
WA
WV
WI
WY
FIGURE 4 Realignment of US mortality by sex and state, 1965–2004
Men
Women
SOURCE: Same as Figure 1.

622 G e o G r a p h i c D i v e r G e n c e i n M o r ta l i t y i n t h e U n i t e D S tat e S
while the Central South remains a significant outlier. Among women, the divergence does not begin until later in the period. This widening primarily reflects an extended period of stagnation or even mortality increase among women in the Central South.
The increasing inequality between the South and the rest of the United States is clearly shown by comparing mortality in 1965 and 2004. Figure 4 plots the relationship between the age-standardized death rate in 1965 and the same measure in 2004. The x-axis denotes age-standardized (to year 2000) death rates in the period 1965–69; the y-axis denotes the same measure in the period 2000–04. High-mortality states in 1965–69 are on the right side of the scatter. States with high mortality in 2000–04 are at the top of the scatter. For men, ten southern states (shown in the oval) in 1965 show variation in mortality but are not disadvantaged relative to other states. By 2004, a cluster of high mortality is evident in a large inequality between these ten states (visible at the top of the cluster in the oval) and the remaining 40 states. The resulting inequality between the South and the rest of the US is also significant for women.
The role of cigarette smoking
Geographic divergence in smoking-attributable mortality closely tracks corresponding divergence in all-cause mortality. Figure 5 shows trends in the death rate from smoking-attributable causes by Census division. Over this period, the comparison divisions experienced more favorable trends in smoking-attributable mortality than the Central South. The Central South peaks later and at a significantly higher death rate than the other divisions, indicating a greater and more persistent burden of smoking. Men exhibit large divergences in the early part of the period, with larger declines in smoking-attributable mortality in the Northeast, Midwest, and West, as com-pared with the Central South. By 2004, the gap is exceptionally large. Among women, the divergence is less extreme and begins later. Smoking-attributable mortality in the Central South rises continuously over this period, while other divisions reach a peak in the 1990s and stabilize or decline thereafter.
Table 2 quantifies the contribution of smoking to the divergences in Census divisions observed in Figure 3. The contribution is calculated for the divergence between the Central South and each of the other divisions for the periods 1965–85 and 1985–2004. Although these 20-year periods are used for parsimony, considering individual years does not change the substantive results of the analysis. For men, most divisions show larger divergence during the early period, with substantial divergences occurring for New England, the Middle Atlantic, and the Mountain West. Smoking explains at least 50 per-cent of the divergence of each division in the early period, including nearly all of the divergence for the Pacific. It also explains sizable fractions in the

a n D r e w f e n e l o n 623
later period and overall. Smoking makes the largest relative contributions to the divergence of the Western South, Mountain West, and Pacific. For women, the magnitude of divergence and the contribution of smoking are smaller than for men. Smoking is an important factor for several divisions. Overall, it is responsible for 56 percent of the divergence of the Pacific, 47 percent of the divergence of the Upper Midwest, and around 15 percent of the divergence of New England and the Middle Atlantic.
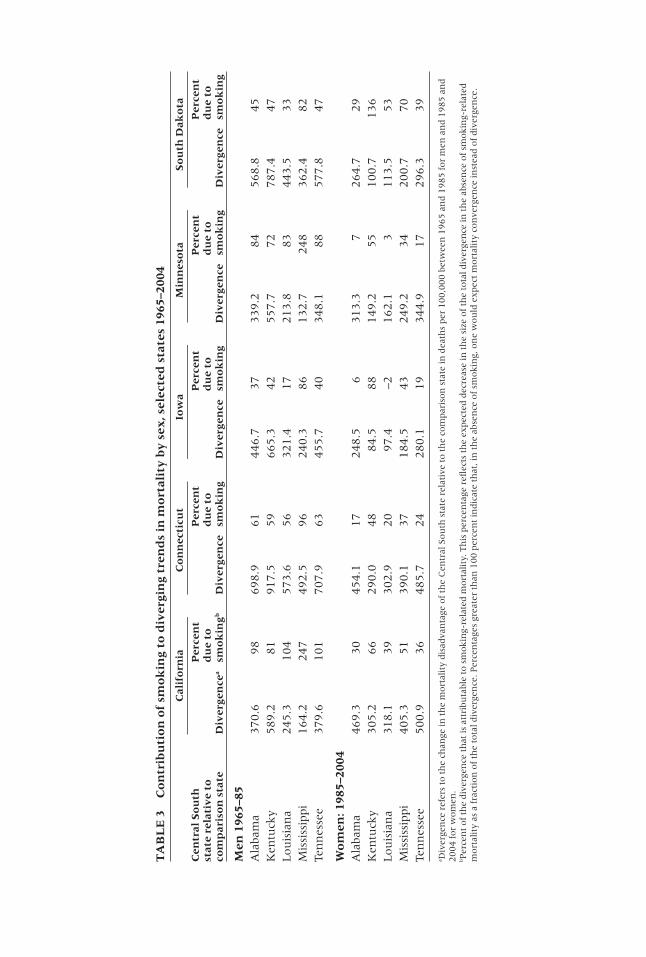
A similar pattern exists at the state level (see Table 3). The comparisons are presented for the five southern states with the highest mortality in 2004 and five comparison states in other divisions. For men, the period considered
1965 1970 1975 1980 1985 1990 1995 2000 20050
50
100
150
200
250
300
350
ASD
R
FIGURE 5 Smoking-attributable mortality trends by sex at ages 50 and above in selected geographic divisions, 1965–2004
1965 1970 1975 1980 1985 1990 1995 2000 20050
20
40
60
80
ASD
R
Men
Women
Central South
NOTES: Age-standardized death rate (ASDR) for smoking-related mortality by geographic division standardized to US age structure in 2000. Death rates are per 100,000. State-division classifications shown in Table 1. Smoking-attributable mortality estimated using indirect method and coefficients from Fenelon and Preston (2012). SOURCE: Same as Figure 1.
Upper MidwestMiddle AtlanticNew EnglandPacificMountain West
Central South
Middle AtlanticPacificNew EnglandMountain WestUpper Midwest

624 G e o G r a p h i c D i v e r G e n c e i n M o r ta l i t y i n t h e U n i t e D S tat e S
is 1965–85, since these years exhibit the largest divergence. Of the southern states, Kentucky shows the largest divergence from the comparison states, particularly Connecticut and South Dakota. Smoking appears to have a noticeably high burden in Kentucky, consistent with that state’s history of sustained heavy smoking (CDC 2009). Relative to Kentucky, smoking explains 81 percent, 59 percent, and 72 percent of the divergence for Cali-fornia, Connecticut, and Minnesota, respectively. For women, the period considered is 1985–2004. Smoking makes a substantial contribution to state-level divergence for women as well, particularly with respect to Kentucky. Relative to that state, it explains 66 percent, 48 percent, and 55 percent of the divergence of California, Connecticut, and Minnesota. The age profile of smoking-attributable mortality has likely changed over the 40-year period, although the contribution of smoking to state and regional divergence in mortality is robust to this change.
TABLE 2 Contribution of smoking to geographic divergence in mortality by sex and geographic division, 1965–2004
1965–85 1985–2004 1965–2004
Percent Percent Percent Central South due to due to Total due to relative to Divergencea smokingb Divergence smoking divergence smoking
MenNew England 741.8 50 466.4 30 1,208.2 42Middle Atlantic 524.3 73 515.6 35 1,039.9 54South Atlantic 397.2 64 206.8 65 603.9 64Western South 115.8 224 64.5 42 180.3 159Great Lakes 466.3 59 303.8 34 770.1 49Upper Midwest 405.6 71 171.2 –11 576.8 46Mountain West 467.7 89 68.5 –33 536.2 73Pacific 386.9 98 333.1 46 720.0 74
WomenNew England 203.9 –2 365.9 23 569.8 14Middle Atlantic 260.6 –2 463.2 26 723.8 16South Atlantic 3.2 –174 198.6 39 201.8 35Western South –241.7 –5 50.7 78 –191.0 –27Great Lakes 149.1 –4 273.9 27 423.0 16Upper Midwest 40.4 106 168.7 33 209.0 47Mountain West –117.4 –53 180.4 47 62.9 234Pacific –148.0 16 385.6 40 237.6 56
aDivergence refers to the change in the mortality disadvantage of the Central South division relative to the comparison di-visions in deaths per 100,000 over the periods in question. A negative divergence implies that the age-standardized death rate in the comparison division converged to that in the Central South.bPercent of the divergence that is attributable to smoking-related mortality. This percentage reflects the expected decrease in the size of the total divergence in the absence of smoking-related mortality as a fraction of the total divergence. Per-centages greater than 100 percent indicate that, in the absence of smoking, one would expect mortality convergence in-stead of divergence. A negative contribution of smoking reflects a convergence in smoking-attributable mortality between the Central South and the comparison division over the period.
TA
BL
E 3
C
on
trib
uti
on
of
smo
kin
g to
div
ergi
ng
tren
ds
in m
ort
alit
y b
y s
ex, s
elec
ted
sta
tes
1965
–200
4
C
alif
orn
ia
Co
nn
ecti
cut
Iow
a M
inn
eso
ta
So
uth
Dak
ota
Cen
tral
So
uth
Per
cen
t
Per
cen
t
Per
cen
t
Per
cen
t
Per
cen
t st
ate
rela
tiv
e to
du
e to
du
e to
du
e to
du
e to
du
e to
co
mp
aris
on
sta
te
Div
erge
nce
a sm
ok
ingb
D
iver
gen
ce
smo
kin
g D
iver
gen
ce
smo
kin
g D
iver
gen
ce
smo
kin
g D
iver
gen
ce
smo
kin
g
Men
196
5–85
Ala
bam
a 370.6
98
698.9
61
446.7
37
339.2
8
4
56
8.8
4
5K
entu
cky
589.2
81
917.5
59
665.3
42
557.7
7
2
78
7.4
4
7Lou
isia
na
245.3
104
573.6
56
321.4
17
213.8
8
3
44
3.5
3
3M
issi
ssip
pi
164.2
247
492.5
96
240.3
86
132.7
2
48
3
62
.4
82
Ten
nes
see
379.6
101
707.9
63
455.7
40
348.1
8
8
57
7.8
4
7
Wo
men
: 198
5–20
04A
laba
ma
469.3
30
454.1
17
248.5
6
313.3
7
2
64
.7
29
Ken
tuck
y 305.2
66
290.0
48
84.5
88
149.2
5
5
10
0.7
1
36
Lou
isia
na
318.1
39
302.9
20
97.4
–2
162.1
3
1
13
.5
53
Mis
siss
ippi
405.3
51
390.1
37
184.5
43
249.2
3
4
20
0.7
7
0Te
nn
esse
e 500.9
36
485.7
24
280.1
19
344.9
1
7
29
6.3
3
9
a Div
erge
nce
ref
ers
to t
he
chan
ge in
th
e m
ort
alit
y dis
adva
nta
ge o
f th
e C
entr
al S
ou
th s
tate
rel
ativ
e to
th
e co
mpar
ison
sta
te in
dea
ths
per
100,0
00 b
etw
een
19
65
an
d 1
98
5 f
or
men
an
d 1
98
5 a
nd
2004 f
or
wom
en.
b Per
cen
t of
the
div
erge
nce
th
at is
att
ribu
tabl
e to
sm
okin
g-re
late
d m
ort
alit
y. T
his
per
cen
tage
refl
ects
th
e ex
pec
ted d
ecre
ase
in t
he
size
of
the
tota
l div
erge
nce
in t
he
abse
nce
of
smo
kin
g-re
late
d
mort
alit
y as
a f
ract
ion
of
the
tota
l div
erge
nce
. Per
cen
tage
s gr
eate
r th
an 1
00 p
erce
nt
indic
ate
that
, in
th
e ab
sen
ce o
f sm
okin
g, o
ne
wou
ld e
xpec
t m
ort
alit
y co
nve
rgen
ce in
stea
d o
f d
iver
gen
ce.

626 G e o G r a p h i c D i v e r G e n c e i n M o r ta l i t y i n t h e U n i t e D S tat e S
Smoking and residual factors
Previous work demonstrated that regional differences in the impact of ciga-rette smoking contribute to disparities in mortality, explaining as much as 50 percent of the current life expectancy disadvantage of the southern states among men (Devesa et al. 1999; Jemal, Cho, and Tarone 2001; Fenelon and Preston 2012). The present study demonstrates that smoking also largely contributed to the emergence of this disadvantage over the last four decades. Among men, smoking explains as much as 75 percent of the divergence between the Central South and other US regions. It is important, however, not to overstate the role of smoking independent of broader cultural, de-mographic, and socioeconomic shifts that took place over this period. One question that arises is whether smoking is an independent contributor to the growing disadvantage of the South or whether smoking is only one (perhaps the most virulent) of many interrelated factors that have altered the deter-minants of health in the southern states compared to states in other regions.
Cigarette smoking may represent one critical piece of a broader cultural, socioeconomic, and behavioral puzzle that has implications for numerous health-related behaviors and outcomes. Obesity may be another piece of this puzzle, given that the impact of widespread obesity has been larger in southern states (Wang and Beydoun 2007). The contribution of obesity will be concentrated in the latter part of the period, since the rise in obesity prevalence began only the 1980s and 1990s (Flegal et al. 2005). Geographic divergence in obesity may thus explain a significant fraction of the growing disadvantage of the South between 1985 and 2004. There is less certainty, however, regarding the mortality impact of obesity than there is with regard to smoking (Mehta and Chang 2009). It is also possible that declines in smok-ing in some places have led to a rising burden of obesity, although this notion is more controversial (Flegal 2007).
Limitations
The limitations of this study largely relate to the methods used to estimate the impact of cigarette smoking. The results are based on an indirect method for calculating mortality attributable to cigarette smoking. The estimates do not reference self-reports of smoking status from representative surveys, and instead refer only to vital statistics. The method rests on the contention that lung cancer is a reliable indicator of cigarette smoking across populations (Preston, Glei, and Wilmoth 2010a). One primary concern in applying indi-rect estimation to subnational populations such as states is the assumption that smoking is responsible for the vast majority of state variation in lung can-
a n D r e w f e n e l o n 627
cer mortality. Factors other than cigarette smoking may lead to geographic variation in lung cancer, biasing estimates of the impact of smoking. Other factors may include pollution, mining, and asbestos inhalation (Samet et al. 2009; Thun et al. 2008). Although direct evidence that smoking is the primary determinant of state differences in lung cancer mortality is difficult to obtain, research on trends indicates that smoking is the main factor lead-ing to change in lung cancer over time and across populations (Rosenbaum, Sterling, and Weinkam 1998; Peto et al. 1992). While other factors may lead to some bias in estimates of the impact of smoking, they are not expected to be large (Preston, Glei, and Wilmoth 2010a). The innovators of the indirect method also demonstrate the validity of smoking-attributable mortality estimates over long periods of time (Preston, Glei, and Wilmoth 2010a). De-spite potential sources of uncertainty, the broad applicability of the indirect method makes it an appropriate choice for populations with little available data on cigarette smoking. Existing estimates of smoking prevalence at the state level, which begin in the 1980s, tend to confirm a higher burden of smoking in the southern states.
An additional consideration is whether the composition of state popu-lations may have some effect on geographic patterns of health and mortal-ity. States differ substantially in their racial composition, and differential mortality of racial groups may obscure geographic analyses. Indeed, racial composition helps to explain some differences between states, but it does not account for the overall geographic pattern of southern disadvantage. The pattern looks much the same when considering only the white popu-lation (Fenelon and Preston 2012). The same appears to be true for the di-vergent trends. The mortality experience of whites in the South has shown a similar divergence from whites in other parts of the United States. The results also appear robust to patterns of internal migration (see Appendix), consistent with previous work at the county level (Ezzati et al. 2008).
Conclusion
There has been an increasing concentration of health and mortality disad-vantage in the American South since the mid-twentieth century. States with the least favorable mortality trajectories during this period were located al-most exclusively in the South, while states in the Northeast, Upper Midwest, and West performed relatively well. The poorest-performing southern states were Alabama, Kentucky, Louisiana, Mississippi, and Tennessee. This pro-cess reflects a wider trend of diverging mortality experience among regions within the US, with gaps between the South and more-advantaged parts of the country growing to more than 30 percent in the mid-2000s. Declines in

628 G e o G r a p h i c D i v e r G e n c e i n M o r ta l i t y i n t h e U n i t e D S tat e S
all-cause mortality between 1965 and 2004 were rather small in southern states; slowdowns occurred first for men and later for women, a trend also observed at the national level (Rostron and Wilmoth 2011). In contrast to the Healthy People 2020 goal of eliminating health and mortality disparities based on geographic location, the past 40 years have seen a substantial widening of geographic disparities in mortality. The results of this study are consistent with similar studies focusing on the county level (Ezzati et al. 2008) and with studies documenting the rising gap between the United States and other developed countries (Crimmins, Preston, and Cohen 2010).
The analysis finds both direct and indirect evidence for the contribution of smoking to this divergence in mortality in the US. First, direct adjustment for smoking-attributable mortality across US states and regions demonstrates that the widening gap in the mortality impact of smoking between the South and other parts of the country was a major determinant of mortality trends over this period. Second, the differential timing of the divergence for men and women provides indirect evidence for the role of smoking. The smoking epidemic occurred earlier for men than for women, and men experienced a greater peak burden of smoking (Pampel 2002). Accordingly, the geographic divergence for men occurred earlier, largely between 1965 and 1985, with a smaller divergence observed between 1985 and 2004. Women exhibit no consistent mortality divergence until the mid-1980s, with the largest diver-gence occurring in the 1990s and early 2000s.
Some of the geographic pattern in the burden of smoking may reflect variation in access to relevant health information between places and over time. Widespread socioeconomic deprivation in the South may be com-pounded by a corresponding deprivation in health-related information and in knowledge of the health risks of cigarette smoking. Although support for this notion is speculative, it can help to explain the largely laissez-faire ap-proach to smoking-related policy intervention in the southern states. While California introduced the first statewide smoking ban in 1995, 27 states have followed with bans that include all enclosed public spaces, and many others have legislation that limits or forbids smoking in workplaces and restaurants (Rodu, Peiper, and Cole 2012). The remaining ten states with no statewide ban on smoking are nearly all located in the South. State taxes on tobacco products also remain low in the Central South states compared to states with more favorable trends in the burden of smoking, especially those in New England (CDC 2011). Indeed, smoking bans and cigarette taxes tend to limit the prevalence of smoking (Chaloupka 1999; Wasserman et al. 1991), and their absence may partially explain persistent smoking in the southern states. These states have been less successful at translating emerging information about health risks into effective policies (Viswanath et al. 2010).

a n D r e w f e n e l o n 629
A final consideration concerns international health comparisons and the shortfall of US life expectancy with respect to other developed countries. During the period considered here, in which the South fell behind much of the rest of the United States, the US as a whole also fell behind much of the rest of the developed world. As the burden of smoking rose throughout the southern states, the United States sank in the international rankings, with smoking identified as a principal factor in the US shortfall (Crimmins, Preston, and Cohen 2010; Preston, Glei, and Wilmoth 2010b). The temporal correspondence between these trends makes two lessons particularly clear. The first is that simple comparisons between the United States and countries in Europe ignore and obscure the wide variation in health and mortality within both the US and Europe (Wilmoth, Boe, and Barbieri 2010). The slowed progress against mortality in the southern United States is not un-like the unfavorable health and mortality experience of Eastern Europe over the past three decades (McKee and Shkolnikov 2001). The second lesson is that the disadvantage of the American South and the disadvantage of the US in the international context may have similar causes. The findings of this analysis support evidence that smoking contributed to the underperformance of the United States (Preston, Glei, and Wilmoth 2010b). The high mortality burden of smoking in the US appears to be at least partially driven by the persistence of smoking in many of the southern states (Fenelon and Preston 2012). Thus, the narrowing of geographic inequalities in health and mor-tality within the United States emerges as an important public policy goal both in itself and as a step toward improving the country’s performance in an international context.
Appendix
Mortality trends at subnational levels of aggregation always have the potential to be affected by patterns of internal migration. Bias in estimates of mortality can occur if health status is correlated with migration (Palloni and Ewbank 2004). Migrants may have better underlying health characteristics, which will improve the observed mortality profile of receiving states and lead to higher observed mortality in sending states, all else being equal (Ezzati et al. 2008). Migration may also lead to inconsis-tencies between the enumerated population and the actual population at risk and may distort the components of the age-specific death rate (Tong 2000). Table A1 presents selected demographic and health characteristics of origin and destination states using decennial census micro-data samples. Characteristics are weighted by the relative in-out migration flows for each state, since census respondents report both current state of residence and state of residence five years earlier. Differences between sending and receiving states are slight, with little consistency across cat-egories, suggesting that a healthy migrant effect cannot explain the observed trends. There is also no significant relationship between net interstate migration rates and

630 G e o G r a p h i c D i v e r G e n c e i n M o r ta l i t y i n t h e U n i t e D S tat e S
mortality level throughout the period under consideration. While interstate migra-tion may have altered the geographic pattern of demographic composition in the United States in the past four decades, it is not responsible for the large shifts in mortality during this period (Ezzati et al. 2008).
The choice to consider mortality above age 50 reflects the role of this age group in international variation in life expectancy. However, divergent trends between states are identical when all ages and all causes of death are considered, indicating that mortality above age 50 is also responsible for the majority of cross-state varia-tion in life expectancy. The patterns are also not driven by state differences in racial composition. Additional results available upon request.
Although cigarette smoking is a primary contributor to regional divergence in mortality, it is unclear whether it should be interpreted as an independent factor or as merely one dimension of a broad health-related puzzle. Additional analyses (not shown) indicate that the geographic pattern of the contribution of smoking to the divergence is strongly correlated with the pattern of the contribution of residual fac-tors. This indicates that broader social processes may in fact be responsible both for trends in cigarette smoking and for trends in other unmeasured factors. Indeed, it
TABLE A1 Differences between origin and destination states of interstate migrants in the US, 1975–2000
1975–80 1985–90 1995–2000
Origina Destinationb Origin Destination Origin Destination
MortalityTotal adult death rate (per 1,000)c 20.3 20.0 18.3 18.2 16.9 16.9Lung cancer death rate (per 1,000) 1.1 1.1 1.3 1.3 1.2 1.2Percent intercensal mortality declined 14.8 14.8 9.0 8.8 6.7 6.0
Demographics (adults over 18)Median age 40.9 40.8 42.5 42.7 44.9 45.0Percent male 47.2 47.4 47.1 47.0 47.6 47.6Percent white 85.8 85.8 85.3 84.7 80.3 80.4Percent black 10.4 10.3 9.3 9.9 10.2 10.7Percent married 62.5 63.2 61.1 61.0 59.0 59.1
Income and occupationMedian income (US$) 6,952 6,889 12,954 13,014 19,471 19,367Duncan’s Socioeconomic Indexe 30.0 29.9 31.7 31.7 32.4 32.3
EducationPercent completing high school 67.8 67.8 77.9 77.7 83.0 82.8Percent with bachelor’s degree 13.9 13.9 16.7 16.7 20.2 19.9
NOTE: Refers to interstate migrants only. Respondents report state of residence currently and state of residence five years ago. International migration is not considered.aDenotes average values for non-movers in sending states, weighted by the total number of migrants sent.bDenotes average values for non-movers in receiving states, weighted by total number of migrants received.cRefers to ages 35 and above in the census year. Age-standardized to US population in 2000.dIn the ten years preceding the focal census year.eA general index of occupational prestige and socioeconomic status ranging from 0–100.SOURCE: US Census Public-Use Microdata 5% Samples 1980, 1990, 2000 (available from IPUMS).
a n D r e w f e n e l o n 631
appears the southern states have shown only limited improvement with respect to both smoking-related and non-smoking-related causes of mortality.
Notes
1 In terms of life expectancy at birth, the US currently ranks 29th in the world (Crim-mins, Preston, and Cohen 2010). In terms of mortality after age 50, the US ranks 15th out of 21 developed countries among men and 17th among women (Preston, Glei, and Wilmoth 2010b).
2 These gaps are similar to the corre-sponding differences between the United States and the top performers among other developed countries; the US trails Japan by 3.2 years of expected life at age 50.
3 At the peak, close to 50 percent of US adult men were current smokers. During the same period, smoking prevalence was closer to 30 percent among adult women. In 1965, Americans consumed roughly 11 cigarettes per day per adult (Forey et al. 2009).
4 This is the preferred procedure used by NCHS in calculating decennial state life tables. The vast majority of deaths occur to individuals in their state of residence.
References
Adler, Nancy E. and Judith Stewart. 2009. “Reducing obesity: Motivating action while not blaming the victim,” Milbank Quarterly 87(1): 49–70.
Burns, David M. et al., 1997. “Cigarette smoking behavior in the United States,” in Changes in Cigarette-Related Disease Risks and Their Implications for Prevention and Control, Smoking and Tobacco Control. Smoking and Tobacco Control Monograph no. 8, NIH publication no. 97-4213. Bethesda, MD.: Cancer Control and Population Sciences, National Cancer Institute, US National Institutes of Health, pp. 13–112.
CDC. 2009. “State-specific smoking-attributable mortality and years of potential life lost—United States, 2000–2004,” (Reprinted from MMWR, vol. 58, pp. 29–33, 2009). Journal of the American Medical Association 301(9): 928–929.
———. 2011. “Smoking and tobacco use; Data and statistics; Tables, charts, and graphs; Trends in state and federal cigarette tax and retail price,” Smoking and Tobacco Use. «http://www.cdc.gov/tobacco/data_statistics/tables/economics/trends/index.htm».
Chaloupka, Frank J. 1999. “Macro-social influences: The effects of prices and tobacco-control policies on the demand for tobacco products,” Nicotine and Tobacco Research 1(Supp. 2): S77–S81.
Crimmins, Eileen, Samuel H. Preston, and Barney Cohen (eds.). 2010. International Differences in Mortality at Older Ages: Dimensions and Sources. Washington, DC: National Academies Press.
Cutler, David, 2004. “Behavioral health interventions: What works and why,” Understanding Racial and Ethnic Differences in Health in Late Life: A Research Agenda. «http://www.econom-ics.harvard.edu/files/faculty/13_interventions_6-02.pdf».
Cutler, David, Fabian Lange, Ellen Meara, Seth Richards-Shubik, and Christopher J. Ruhm. 2011. “Rising educational gradients in mortality: The role of behavioral risk factors,” Journal of Health Economics 30(6): 1174–1187.
Cutler, David and Adriana Lleras-Muney. 2006. Education and Health: Evaluating Theories and Evidence. National Bureau of Economic Research.
———. 2010. “Understanding differences in health behaviors by education,” Journal of Health Economics 29(1): 1–28.
Devesa, Susan S., Dan J. Grauman, William J. Blot, and Joseph F. Fraumeni. 1999. “Cancer surveillance series: Changing geographic patterns of lung cancer mortality in the United States, 1950 through 1994,” Journal of the National Cancer Institute 91(12): 1040–1050.
632 G e o G r a p h i c D i v e r G e n c e i n M o r ta l i t y i n t h e U n i t e D S tat e S
Doll, Richard, Richard Peto, Jillian Boreham, and Isabelle Sutherland. 2004. “Mortality in rela-tion to smoking: 50 years’ observations on male British doctors,” British Medical Journal 328(7455): 1519–1528.
Duncan, Craig, Kelvyn Jones, and Graham Moon. 1993. “Do places matter? A multi-level analysis of regional variations in health-related behaviour in Britain,” Social Science and Medicine 37(6): 725–733.
Eberhardt, Mark S. and Elsie R. Pamuk. 2004. “The importance of place of residence: Ex-amining health in rural and nonrural areas,” American Journal of Public Health 94(10): 1682–1686.
Ezzati, Majid, Ari B. Friedman, Sandeep C. Kulkarni, and Christopher J. L. Murray, 2008. “The reversal of fortunes: Trends in county mortality and cross-county mortality disparities in the United States,” Plos Medicine 5(4): 557–568.
Fenelon, Andrew and Samuel H. Preston. 2012. “Estimating smoking-attributable mortality in the United States,” Demography 49(3): 797–818.
Flegal, Katherine M. 2007. “The effects of changes in smoking prevalence on obesity prevalence in the United States,” American Journal of Public Health 97(8): 1510–1514.
Flegal, Katherine M., Barry I. Graubard, David F. Williamson, and Mitchell H. Gail. 2005. “Ex-cess deaths associated with underweight, overweight, and obesity” Journal of the American Medical Association 293(15): 1861–1867.
Forey, Barbara A., Jan Hamling, Peter Lee, and Nicholas Wald. 2002. International Smoking Statistics: A Collection of Historical Data from 30 Economically Developed Countries. 2nd Edition, London: Oxford University Press.
———. 2009. International Smoking Statistics WEB Edition. «http://www.pnlee.co.uk/ISS3.htm».Friedman, Samantha and Daniel T. Lichter. 1998. “Spatial inequality and poverty among
American children,” Population Research and Policy Review 17(2): 91–109.Geronimus, Arline T., John Bound, Timothy A. Waidmann, Marianne M. Hillemeier, and Pa-
tricia B. Burns. 1996. “Excess mortality among blacks and whites in the United States,” New England Journal of Medicine 335(21): 1552–1558.
Goldman, Dana P. and James P. Smith. 2002. “Can patient self-management help explain the SES health gradient?,” Proceedings of the National Academy of Sciences 99(16): 10929–10934.
Haldorsen, Tor and Tom K. Grimsrud. 1999. “Cohort analysis of cigarette smoking and lung cancer incidence among Norwegian women,” International Journal of Epidemiology 28(6): 1032–1036.
Hayward, Mark D., Amy M. Pienta, and Diane K. McLaughlin. 1997. “Inequality in men’s mortality: The socioeconomic status gradient and geographic context,” Journal of Health and Social Behavior 38(4): 313–330.
Ho, Jessica Y. and Samuel H. Preston. 2010. “US mortality in an international context: Age variations,” Population and Development Review 36(4): 749–773.
Howard, George, 1999. “Why do we have a stroke belt in the southeastern United States? A review of unlikely and uninvestigated potential causes,” The American Journal of the Medi-cal Sciences 317(3): 160–167.
Jemal, Ahmedin, Kenneth C. Chu, and Robert E. Tarone. 2001. “Recent trends in lung cancer mortality in the United States,” Journal of the National Cancer Institute 93(4): 277–283.
Jemal, Ahmedin et al. 2005. “Geographic patterns of prostate cancer mortality and variations in access to medical care in the United States,” Cancer Epidemiology Biomarkers and Preven-tion 14(3): 590–595.
Karnig, Albert K. and Paula D. McClain. 1985. “The new South and Black economic and po-litical development: Changes from 1970 to 1980,” The Western Political Quarterly 38(4): 539–550.
Lanska, Douglas J. and Lewis H. Kuller. 1995. “The geography of stroke mortality in the United States and the concept of a stroke belt,” Stroke 26(7): 1145–1149.
Lesthaeghe, Ron and Lisa Neidert. 2006. “The second demographic transition in the United States: Exception or textbook example?,” Population and Development Review 32(4): 669–698.
a n D r e w f e n e l o n 633
Malarcher, Ann M. et al. 2000. “Methodological issues in estimating smoking-attributable mortality in the United States,” American Journal of Epidemiology 152(6): 573–584.
Mansfield, Christopher J., James L. Wilson, Edward J. Kobrinski, and Jim Mitchell. 1999. “Premature mortality in the United States: The roles of geographic area, socioeconomic status, household type, and availability of medical care,” American Journal of Public Health 89(6): 893–898.
McKee, Martin and Vladimir Shkolnikov. 2001. “Understanding the toll of premature death among men in eastern Europe,” British Medical Journal 323(7320): 1051–1055.
Meara, Ellen, Seth Richards, and David Cutler. 2008. “The gap gets bigger: changes in mortality and life expectancy, by education, 1981–2000,” Health Affairs 27(2): 350–360.
Mehta, Neil K. and Virginia W. Chang. 2009. “Mortality attributable to obesity among middle-aged adults in the United States,” Demography 46(4): 851–872.
Murray, Christopher J.L. et al. 2006. “Eight Americas: investigating mortality disparities across races, counties, and race-counties in the United States,” PLoS Medicine 3(9): 260.
National Center for Health Statistics. 2001. United States Decennial Life Tables, 1999–2001: State Life Tables. Hyattsville, MD: National Center for Health Statistics.
National Science Board. 2012. Science and Engineering Indicators 2012. Arlington, VA: National Science Foundation (NSB 12-01).
Palloni, Alberto and Douglas C. Ewbank, 2004. “Selection processes in the study of racial and ethnic differentials in adult health and mortality,” in Norman B. Anderson, Randy A. Bulatao, and Barney Cohen (eds.), Critical Perspectives on Racial and Ethnic Differences in Health in Late Life. Washington, DC: National Academies Press.
Pampel, Fred C. 2002. “Cigarette use and the narrowing sex differential in mortality,” Popula-tion and Development Review 28(1): 77–104.
Pampel, Fred C., Patrick M. Krueger, and Justin T. Denney. 2010. “Socioeconomic disparities in health behaviors,” Annual Review of Sociology 36: 349–370.
Peto, Richard, Alan D. Lopez, Jillian Boreham, Michael Thun, and Clark Heath, Jr. 1992. “Mortality from smoking in developed countries—Indirect estimation from national vital-statistics,” Lancet 339(8804): 1268–1278.
———. 1994. Mortality from Smoking in Developed Countries 1950–2000, Oxford: Oxford Univer-sity Press.
Preston, Samuel H., Dana A. Glei, and John R. Wilmoth. 2010a. “A new method for estimat-ing smoking-attributable mortality in high-income countries,” International Journal of Epidemiology 39(2): 430–438.
———. 2010b. “Contribution of smoking to international differences in life expectancy,” in Eileen Crimmins, Samuel H. Preston, and Barney Cohen (eds.), International Differences in Mortality at Older Ages: Dimensions and Sources. Washington, DC: National Academy Press.
Rodu, Brad, Ncholas Peiper, and Philip Cole. 2012. “Acute myocardial infarction mortality before and after state-wide smoking bans,” Journal of Community Health 37(2): 468–472.
Rosenbaum, Wilfred L., Theodor D. Sterling, and James J. Weinkam. 1998. “Use of multiple surveys to estimate mortality among never, current, and former smokers: Changes over a 20-year interval,” American Journal of Public Health 88(11): 1664–1668.
Rostron, Brian L. and John R. Wilmoth. 2011. “Estimating the effect of smoking on slowdowns in mortality declines in developed countries,” Demography 48(2): 461–479.
Samet, Jonathan M. et al. 2009. “Lung cancer in never smokers: Clinical epidemiology and environmental risk factors,” Clinical Cancer Research 15(18): 5626–5645.
Slesnick, Daniel T. 1993. “Gaining ground: Poverty in the postwar United States,” Journal of Political Economy 101(1): 1–38.
Thun, Michael J. et al. 1995. “Excess mortality among cigarette smokers—Changes in a 20-year interval,” American Journal of Public Health 85(9): 1223–1230.
———. 2008. “Lung cancer occurrence in never-smokers: An analysis of 13 cohorts and 22 cancer registry studies,” PloS Medicine 5(9): 1357–1371.
Tickamyer, Ann R. and Cynthia M. Duncan. 1990. “Poverty and opportunity structure in rural America,” Annual Review of Sociology 16: 67–86.

634 G e o G r a p h i c D i v e r G e n c e i n M o r ta l i t y i n t h e U n i t e D S tat e S
Tong, Shilu. 2000. “Migration bias in ecologic studies,” European Journal of Epidemiology, 16(4): 365–369.
US Surgeon General. 1964. “Smoking and Health: Report of the Advisory Committee to the Surgeon General of the Public Health Service,” Public Health Service Publication No. 1103.
Viswanath, Kasiomavaiula, Roy S. Herbst, Stephanie R. Land, Scott J. Leischow, and Peter G. Shields. 2010. “Tobacco and cancer: An American Association for Cancer Research policy statement,” Cancer Research 70(9): 3419–3430.
Wang, Youfa and May A. Beydoun. 2007. “The obesity epidemic in the United States—Gender, age, socioeconomic, racial/ethnic, and geographic characteristics: A systematic review and meta-regression analysis,” Epidemiologic Reviews 29(1): 6–28.
Wasserman, Jeffrey, Willard G. Manning, Joseph P. Newhouse, and John D. Winkler. 1991. “The effects of excise taxes and regulations on cigarette smoking,” Journal of Health Eco-nomics 10(1): 43–64.
Wilmoth, John R., Carl Boe, and Magali Barbieri. 2010. “Geographic differences in life expec-tancy at age 50 in the United States compared with other high-income countries,” in Eileen Crimmins, Samuel H. Preston, and Barney Cohen (eds.), International Differences in Mortality at Older Ages: Dimensions and Sources. Washington, DC: National Academies Press, pp. 333–366.
Related Documents