ĢEOGRĀFISKI RAKSTI FOLIA GEOGRAPHICA XVII 2019 APPRECIATING GEOGRAPHY: LOCAL AND GLOBAL SCALE Latvijas Ģeogrāfijas biedrība Societas Geographica Latviensis Rīga ISSN 1407 - 5229

Welcome message from author
This document is posted to help you gain knowledge. Please leave a comment to let me know what you think about it! Share it to your friends and learn new things together.
Transcript
ĢEOGRĀFISKI RAKSTI FOLIA GEOGRAPHICA
XVII 2019
APPRECIATING GEOGRAPHY:
LOCAL AND GLOBAL SCALE
Latvijas Ģeogrāfijas biedrība Societas Geographica Latviensis
Rīga ISSN 1407 - 5229
ĢEOGRĀFISKI RAKSTI
FOLIA GEOGRAPHICA
Latvijas Ģeogrāfijas biedrības zinātnisko rakstu krājums
Research Papers of the Latvian Geographical Society
Latvijas Ģeogrāfijas biedrība nodibināta 1923. gadā. Pirmie seši darbu krājuma sējumi
(I-VI) izdoti laika periodā no 1929. līdz 1938. gadam. Izdevums atjaunots 1999. gadā
(VII sējums).
The Latvian Geographical Society was founded in 1923. The first six volumes (I-VI) of
its research papers were published during 1929 - 1938. Publication was re-established
in 1999 (volume VII).
Redaktore / Editor
Zaiga Krišjāne
Redakcija / Editorial board
Andris Bauls (Latvijas Universitāte, Rīga)
Jusi Sakari Jauhiainens (Jussi Sakari Jauhiainen, Oulu Universitāte, Somija)
Māris Kļaviņš (Latvijas Universitāte, Rīga)
Normunds Stivriņš (Latvijas Universitāte, Rīga)
Daniels Gēlers (Daniel Göler, Bambergas Universitāte, Vācija)
Maija Rozīte (Biznesa augstskola Turība, Rīga)
Donats Burneika (Donatas Burneika, Lietuvas sociālo pētījumu centrs, Lietuva)
Datorsalikums / Layout
Ineta Grīne
Valodas konsultanti / Literary advisors
Edgars Kariks, Marija Kaupere
Rakstu krājums publicēts ar Latvijas Universitātes un Valsts pētījumu
programmas “Latvijas mantojums un nākotnes izaicinājumi valsts
ilgtspējai” projekta “DemoMig” (VPP-IZM-2018/1-0015) atbalstu.
Redakcijas adrese / Editorial office
LU Ģeogrāfijas un Zemes zinātņu fakultāte, Raiņa bulv.19, Rīgā, LV -1586
© Latvijas Ģeogrāfijas biedrība, 2019 / Latvian Geographical Society, 2019
Contents
NATURE RESEARCH
Laimdota Kalniņa, Aija Ceriņa, Valdis Bērziņš
Palaeo-geographic changes in the Sārnate former lagoon area .......................................... 7
Ivars Strautnieks, Elīna Deksne, Laimdota Kalniņa, Aija Ceriņa, Andra Štube
Changes of the palaeo-geographical conditions in the Lake Usma depression
during the end of the Late Glacial and the Holocene ........................................................ 14
Līga Paparde, Laimdota Kalniņa, Aija Ceriņa, Ilze Loze, Ivars Strautnieks, Jānis Dreimanis
Evidence of palaeo-climate changes and their impact on sediment accumulation
conditions in the Lubāns Stone-Age settlement areas ........................................................ 21
Jānis Dreimanis, Laimdota Kalniņa, Līga Paparde, Elīna Deksne
Changes of peat properties in differently affected parts of the Lauga Bog ..................... 29
Māris Kļaviņš, Jānis Šīre, Laura Kļaviņa
Humic substances and the potential of their use in agriculture ........................................ 37
MAN AND ENVIRONMENT
Reinis Bitenieks, Laimdota Kalniņa, Ingrīda Krīgere, Jānis Dreimanis
Characteristics of peat properties from extracted peatlands in the context of
sustainable management ...................................................................................................... 47
Olga Ritenberga
Fitness of air quality measurement equipment for real-time aerobiological
monitoring: case study from Rīga ......................................................................................... 54
Agnese Reķe, Anita Zariņa, Solvita Rūsiņa
Landscape of semi-wild large herbivores in the specially protected nature
territories of Latvia ............................................................................................................... 60
Arta Krūmiņa, Jānis Kotāns, Jānis Puga, Ilze Reinika, Gita Strode
Nature census – the first detailed, scientifically-grounded information about
Latvia’s nature values ........................................................................................................... 69
HUMAN GEOGRAPHY
Juris Paiders
Projected changes in the number of inhabitants of Latvia in the event of the
stabilization of emigration .................................................................................................... 77
Mihails Kozlovs
Emigration and remittances pattern analysis in lagging-behind regions of the
Baltics: case studies for Narva, Daugavpils and Visaginas ............................................... 85
Elīna Apsīte-Beriņa, Ģirts Burgmanis, Zaiga Krišjāne
Exploring labour migration from Latvia: geographies of origin ...................................... 94
Inese Šūpule
Mobility motivations and experiences of highly skilled Latvians abroad ...................... 101
Baiba Švāne
Socio-demographic composition of the geographically immobile urban population ... 109
Jānis Krūmiņš, Māris Bērziņš, Zaiga Krišjāne
Residential patterns of in-migrants in Rīga ...................................................................... 116
DEVELOPMENT OF PLACES AND REGIONS
Toms Skadiņš
Defining the commuting regions of Latvia ....................................................................... 123
Līga Feldmane
Inner city or outskirts: where are residents more satisfied? The case of Jelgava .......... 131
Ineta Grīne, Inese Mieze
The process of suburbanization in Babīte rural municipality after the year 2000 ....... 139
Margarita Kairjaka
Diversity of gentrification in the inner cities of Rīga and Prague – the case of
Āgenskalns and Holešovice ................................................................................................ 145
Jānis Matvejs
Imposed Stalinism: narrating Rīga’s urban space through Soviet films from
1945 to 1953 ......................................................................................................................... 153
TOURISM
Daina Vinklere
Tourism information providers in Latvia: development and challenges ....................... 161
Saturs
DABAS PĒTĪJUMI
Laimdota Kalniņa, Aija Ceriņa, Valdis Bērziņš
Paleoģeogrāfisko apstākļu pārmaiņas Sārnates bijušās lagūnas teritorijā .......................... 7
Ivars Strautnieks, Elīna Deksne, Laimdota Kalniņa, Aija Ceriņa, Andra Štube
Paleoģeogrāfisko apstākļu pārmaiņas Usmas ezera ieplakās leduslaikmeta
beigās un holocēnā ................................................................................................................... 14
Līga Paparde, Laimdota Kalniņa, Aija Ceriņa, Ilze Loze, Ivars Strautnieks, Jānis Dreimanis
Liecības par paleoklimata pārmaiņām un to ietekmi uz nogulumu uzkrāšanās
apstākļiem Lubāna akmens laikmeta apmetņu teritorijās ................................................... 21
Jānis Dreimanis, Laimdota Kalniņa, Līga Paparde, Elīna Deksne
Kūdras īpašību pārmaiņas dažādi ietekmētās Laugas purva daļās .................................... 29
Māris Kļaviņš, Jānis Šīre, Laura Kļaviņa
Humusvielas un to izmantošanas iespējas lauksaimniecībā ................................................. 37
CILVĒKS UN VIDE
Reinis Bitenieks, Laimdota Kalniņa, Ingrīda Krīgere, Jānis Dreimanis
Izstrādāto purvu kūdras īpašību raksturojums ilgtspējīgas
apsaimniekošanas kontekstā ................................................................................................... 47
Olga Ritenberga
Gaisa kvalitātes novērtēšanas aprīkojuma izmantošana reālā laika
aerobioloģiskajā monitoringā: Rīgas piemērs ....................................................................... 54
Agnese Reķe, Anita Zariņa, Solvita Rūsiņa
Lielie pussavvaļas zālēdāji īpaši aizsargājamās dabas teritorijās Latvijā .......................... 60
Arta Krūmiņa, Jānis Kotāns, Jānis Puga, Ilze Reinika, Gita Strode
Dabas skaitīšana – pirmā detalizētā un zinātniski pamatotā informācija par
Latvijas dabas vērtībām .......................................................................................................... 69
CILVĒKA ĢEOGRĀFIJA
Juris Paiders
Latvijas iedzīvotāju skaita prognozējamās pārmaiņas, stabilizējoties starpvalstu
migrācijai .................................................................................................................................. 77
Mihails Kozlovs
Emigrācijas un transfērmaksājumu izpēte Baltijas valstu nomales reģionos: Narvas
(Igaunija), Daugavpils (Latvija) un Visaginas (Lietuva) piemēra analīze
.................................................................................................................................................... 85
Elīna Apsīte-Beriņa, Ģirts Burgmanis, Zaiga Krišjāne
Darba spēka migrācijas izpēte Latvijā: izbraukšanas ģeogrāfija ....................................... 94
Inese Šūpule
Augsti kvalificētu Latvijas emigrantu mobilitātes motivācija un pieredze ārvalstīs ....... 101
Baiba Švāne
Dzīvesvietu nemainījušo pilsētas iedzīvotāju sociāli demogrāfiskais sastāvs ................... 109
Jānis Krūmiņš, Māris Bērziņš, Zaiga Krišjāne
Iekšzemes migrantu apdzīvojuma iezīmes. Rīgas piemērs ................................................. 116
VIETU UN REĢIONU ATTĪSTĪBA
Toms Skadiņš
Latvijas svārstmigrācijas reģionu noteikšana ..................................................................... 123
Līga Feldmane
Iekšpilsēta vai nomales: kur iedzīvotāji ir vairāk apmierināti? Jelgavas piemērs ........... 131
Ineta Grīne, Inese Mieze
Suburbanizācijas procesi Babītes pagastā pēc 2000. gada ................................................. 139
Margarita Kairjaka
Ģentrifikācijas daudzveidība Rīgas un Prāgas iekšpilsētā – Āgenskalna un
Holešovices piemērs ............................................................................................................... 145
Jānis Matvejs
Īstenotais staļinisms: Rīgas atveids padomju perioda filmās no
1945. līdz 1953. gadam ........................................................................................................... 153
TŪRISMS
Daina Vinklere
Tūrisma informācijas sniedzēji Latvijā: attīstība un izaicinājumi ................................... 161
APPRECIATING GEOGRAPHY: LOCAL AND GLOBAL SCALE
7
PALAEO-GEOGRAPHIC CHANGES IN THE SĀRNATE
FORMER LAGOON AREA
Paleoģeogrāfisko apstākļu pārmaiņas Sārnates
bijušās lagūnas teritorijā
Laimdota Kalniņa, Aija Ceriņa, Valdis Bērziņš
University of Latvia, Faculty of Geography and Earth Sciences
Abstract. Due to the lowering of the Littorina Sea level before approximately 5000 years, Sārnate lagoon
was separated from the sea and became a shallow lagoon lake, which gradually terrestrialised and filled in
with peat. The aim of the research project reported in this paper was to characterise the changing palaeo-
geographical conditions in the former Sārnate lagoon area, as recorded by changes in sediment properties,
pollen and plant macro-remain composition. The plant macro-remain and pollen studies indicate intensive
human activity in the area during the latter part of the Holocene climatic optimum and the first part of the
Late Holocene, Subboreal, including a record of Water chestnut (Trapa natans) fruits and pollen in the
gyttja under the grass peat, indicating that water chestnut grew in the lake adjacent to the settlement. The
presence of cereal and weed pollen confirms that agriculture was also being practiced, at least during the
final phase of occupation, in the late 6th and the 5th millennium BP.
Keywords: Littorina, gyttja, peat, pollen, plant macro-remains, water chestnut
Introduction
The Sārnate, former lagoon area, located in the Coastal Lowland belt near the
open Baltic Sea coast of western Latvia (Figure 1) has been influenced by various
geological processes in different developmental stages of the Baltic Sea. Due to the
lowering of the Littorina Sea level approximately before 5000 years, the lagoon was
separated from the sea, turning the former lagoonal area into a lake basin, which
became overgrown and developed into Sārnate Mire (Mūrniece et al. 1999; Kalniņa
et al. 2011). This area is interesting not only in terms of geology and Baltic Sea
development, but also from the perspective of archaeology. Thus, the wetland
settlement site of Sārnate, located within this area, constitutes one of the richest
sources of information concerning human lifeways in the East Baltic during the period
approximately 5900–5000 BP, i.e., corresponding in climatic terms to the early part of
the Late Holocene (Bērziņš 2008).
Silt and silty sand with a small amount of organic matter was deposited in the area
of the present-day Sārnate Mire during the Younger Dryas (12 900 cal. years BP), with
the fall in the level of the Baltic Ice Lake. During the Ancylus Lake stage the area
contained one or more shallow coastal lakes, which were cut off from the open water of
the lake on the western side by a narrow (0.3–0.5 km wide) spit of land (Grinbergs
1957; Veinbergs 1996). Freshwater lime accumulated in some parts of the Sārnate lake,
and thin layers of peaty gyttja were formed on their shores. During the Littorina Sea
transgression, at the beginning of the Holocene climatic optimum, sea water entered the
low-lying area in the environs of Sārnate and other stretches of the coastline with lower
topography, and reached a height above present sea level of 5–6 m. This formed a large,
APPRECIATING GEOGRAPHY: LOCAL AND GLOBAL SCALE
8
shallow lagoon, which was cut off from the sea through the process of long-shore drift.
The water level during the Littorina regression fell and the lagoon rapidly divided into
separate lakes, which became overgrown, and mires were formed (Mūrniece et al.
1999).
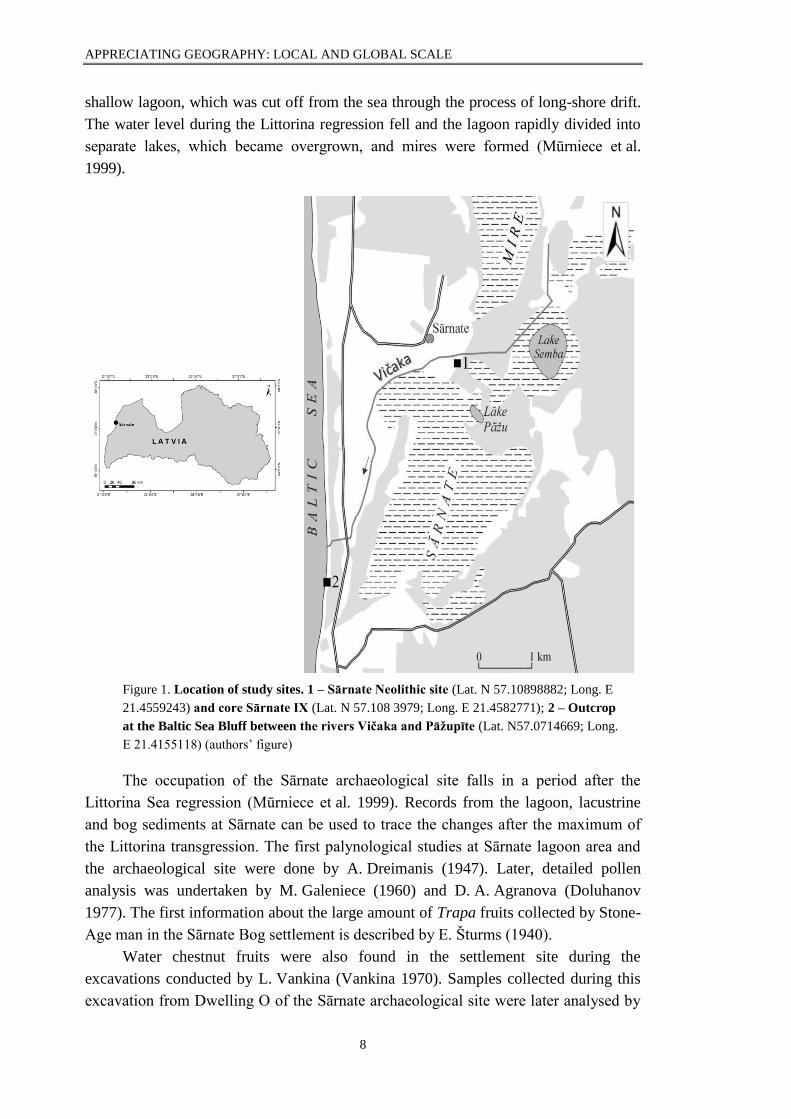
Figure 1. Location of study sites. 1 – Sārnate Neolithic site (Lat. N 57.10898882; Long. E
21.4559243) and core Sārnate IX (Lat. N 57.108 3979; Long. E 21.4582771); 2 – Outcrop
at the Baltic Sea Bluff between the rivers Vičaka and Pāžupīte (Lat. N57.0714669; Long.
E 21.4155118) (authors’ figure)
The occupation of the Sārnate archaeological site falls in a period after the
Littorina Sea regression (Mūrniece et al. 1999). Records from the lagoon, lacustrine
and bog sediments at Sārnate can be used to trace the changes after the maximum of
the Littorina transgression. The first palynological studies at Sārnate lagoon area and
the archaeological site were done by A. Dreimanis (1947). Later, detailed pollen
analysis was undertaken by M. Galeniece (1960) and D. A. Agranova (Doluhanov
1977). The first information about the large amount of Trapa fruits collected by Stone-
Age man in the Sārnate Bog settlement is described by E. Šturms (1940).
Water chestnut fruits were also found in the settlement site during the
excavations conducted by L. Vankina (Vankina 1970). Samples collected during this
excavation from Dwelling O of the Sārnate archaeological site were later analysed by
APPRECIATING GEOGRAPHY: LOCAL AND GLOBAL SCALE
9
complex plant macro-remain analysis (Ceriņa et al. 2013). Plant macro-remains have
been studied in the sediment sequence from the north-western edge of Dwelling O,
where charred plant remains were found in the cultural layer at the top of the
sequence. It was revealed that the dwelling had been established on a lacustrine gyttja
layer with remains of aquatic plants: yellow water-lily Nuphar lutea, water chestnut
Trapa natans and common club-rush Scirpus lacustris (Ceriņa et al. 2013).
The aim of the research reported in this paper is to characterise the changing
palaeo-geographical conditions in the former Sārnate lagoonal area, as recorded by
changes in sediment properties, pollen and plant macro-remain composition.
Data and Methods
The study presented in this paper is based on the results of investigations at three
points in the Sārnate former lagoon area: 1) sediment samples from the core
Sārnate IX (Lat. N 57.1083979; Long. E 21.4582771), taken at the margin of the
present-day Sārnate Mire, immediately south-east of the central part of the
archaeological site ; 2) samples of sand from the hearths of Dwelling K and
Dwelling 11 of the archaeological site (Lat. N 57.10898882; Long. E 21.4559243),
and 3) samples from organic sediment layers formed in the Sārnate lagoonal area
during the Holocene and nowadays revealed at the Baltic Sea bluff between the rivers
Vičaka and Pāžupīte (Lat. N 57.0714669; Long. E 21.4155118) due to coastal
erosion.
Sampling: Sampling has been performed using recommended approaches for
sediment core sampling (Berglund and Ralska-Jasiewiczowa 1986). Coring and
sediment sampling were undertaken using a soft sediment sampler with 50 cm long
camera with diameter 7 cm. The sediment monoliths were placed in a special cartridge
and wrapped in poly-ethylene film to preserve natural moisture, brought to the
laboratory and sliced into 5 cm intervals. The outer margins were systematically
discarded, as these could have been contaminated during sampling.
Plant macro-remain analysis: Plant macro-remains have been extracted and
identified from two bulk (volume 1 l) sediment samples of sand with charcoal
fragments recovered during the excavation conducted by L. Vankina and stored at the
National History Museum of Latvia: 1) a sample from the hearth of Dwelling K
(1949 excavation), belonging to the final phase of occupation, c. 5580–4800 BP; and
2) a sample from the hearth of Dwelling 11 (1959 excavation), with non-diagnostic
archaeological remains, not attributable to a particular phase. The overall site plan,
showing the location of the dwellings, can be viewed in the publication by V. Bērziņš
(2008: 61). In the case of the sediment samples from the outcrop north of the mouth of
the Pāžupīte, the material from the sediment sequence was divided into 10 sub-
samples and used for plant macro-remain analysis. The volume of each sub-sample
was approximately 200 ml. Preliminary processing of the plant macro-fossil samples
was undertaken in the laboratory, using flotation to separate the light fraction (flot),
collected on a 0.25 mm sieve, from the heavy fraction (residue). Recovery and
APPRECIATING GEOGRAPHY: LOCAL AND GLOBAL SCALE
10
determination of the plant remains and other sub-fossil remains was then undertaken.
The samples for plant macro-remain analysis were prepared following standard
techniques (Warner 1990). Plant macro-remains were identified using available
reference material, as well as pictures and descriptions in Velichkevich and
Zastawniak (2006; 2008).
Results
Samples from Dwelling 11 and Dwelling K of the Sārnate archaeological site
A large number of macro-remains, predominantly charred, such as fruits of
Trapa, Corylus, as well as seeds of Nuphar lutea Scirpus lacustris, Chenopodium alba
and Fragaria vesca, have been found in the samples of sands from the archaeological
excavation of the hearths (Dwelling 11 and Dwelling K). The sediment of the hearth
of Dwelling 11 contained fruits of Trapa natans (200 fragments), Corylus avellana nut
fragments (46), one Pinus sylvestris pine cone scale fragment, a fragment of Poacea
(charred grain fragment), Nuphar luteum (charred seed) and Scirpus lacustris
(2 seeds).The sample from the hearth of Dwelling K predominantly contained achenes
of sedges Carex sp. (14) and common club-rush, Scirpus lacustris (19). Seeds of other
plants were present in small numbers: Chenopodium album – three nutlets, a few seeds
of aquatic plants Potamogeton perfoliatus (1) and Nuphar luteum (1), as well as
achenes of Polygonum aviculare, Galeopsis ladanum, Fragaria vesca and Potentilla
anserina. The Potamogeton seed is not charred, while the rush and sedge seeds are
only partly charred. Most of these plants were used for food.
Core Sārnate IX, at Sārnate Neolithic site
Records from the lower part of the sequence show the presence of a Hypnum
peat layer formed on sandy sediments earlier than 9670–9290 BP, when the depression
of the former Sārnate Lagoon was almost dry, with some wet areas providing
favourable conditions for Hypnum moss growth. The peat was covered by calcareous
clay, which accumulated in a basin, evidently during the maximum Littorina Sea
transgression. At a depth of 2.0–2.4 m from the section top calcareous clay with
organic remains was deposited, earlier than 8050–7810 BP, when the water level in
the basin fell somewhat and the clay became richer in plant and faunal remains.
Higher up in Sārnate core IX, at a depth of 2.0–0.85 m, peaty gyttja was laid down.
The water level in the basin gradually decreased and the lagoonal lake was
progressively filled in and covered by wood-grass fen-type peat. Analysis of the
earlier pollen studies data (Kalniņa et al. 2011) reveals their composition from
sediments of core IX and is used for description of vegetation changes in the
surroundings of the Sārnate site starting from the second half of the Early Holocene
Boreal, when a pine forest was distributed on sandy soils in the area (Kalniņa 2018).
Pollen composition at the base of the core, in the depth interval 3.25–3.65 m from top,
represented by the Hypnum peat layer, is characterised by a dominance of birch
Betula, a small amount of pine Pinus pollen and herb pollen, mainly represented by
APPRECIATING GEOGRAPHY: LOCAL AND GLOBAL SCALE
11
Poaceae and Cyperaceae. From this time onwards, until the present day, the Sārnate
area has been characterised by an open landscape. Pollen composition in the
calcareous clay with organic remains and peaty gyttja (8050–7810 BP) reflects the
widest distribution of broad-leaved trees (Ulmus, Tilia, and Quercus), alder and hazel
in the area, characteristic of the Holocene Climatic Optimum (Atlantic climatic
period). The pollen composition in the peaty gyttja at 1.9–1.25 m shows an increase in
Pinus, Picea and Quercus, as well as in aquatic plant pollen (Nymphaceae, Stratiotes
aloides, Menyanthes, Typhaceae). In this interval water chestnut Trapa natans pollen
has been found, its presence also recorded in the depth interval 0.9–0.7 m (5090–
4900 BP), represented by wood–grass peat showing a decrease in broadleaved tree
pollen and an increase in Picea and herb pollen, including pollen of ruderals and
cultivated plants, as well as in the amount of charcoal dust. The uppermost layer of
the core contains pollen of cultivated plants (Hordeum, Triticum, Avena) and
anthropogenic indicators Plantago major/media, Chenopodium album, Polygonum
aviculare, Urtica and Rumex acetosella, dated to 4890–4670 BP and 3950–3770 BP.
Outcrop at the Baltic Sea Bluff
Organic sediment layers formed in the Sārnate area during the Holocene are
nowadays being revealed due to coastal erosion. These sediment sequences can be
studied at the Baltic Sea coastal bluff (Lat. N 57.0714669; Long. E 21.4155118)
located between the River Vičaka to the north and the River Pāžupīte to the south. The
bottom interval of this outcrop is represented by sandy and silty sediment layers,
which are overlain by an organic layer consisting mainly of peat in various stages of
decomposition. The lowest unit, is at 3.2–3.1 m depth from the top, formed 9780–
9630 BP (Saulīte et al. 2007) and consists of well-decomposed sandy wood–grass
peat, containing fragments of wood (with some charred pieces), as well as remains of
grasses and Bryales. The admixture of sand decreases in the peaty gyttja further up in
the section (3.1–2.8 m). This layer is rich in plant remains, including wood remains.
Carex achenes and Menyanthes trifoliata seeds have been found (Figure 2). It is
covered by poorly decomposed Hypnum–sedge peat with pressed structures containing
Carex sp. achenes and Menyanthes trifoliata seeds (depth 2.8–2.7 m), formed 6230–
6190 BP.
The layer of Hypnum–sedge peat is covered by Hypnum–reed peat (2.6–2.7 m),
which is overlain by Hypnum peat with Menyanthes trifoliata seeds at 2.5–2.6 m depth.
Conditions for plant growth changed at the depth 2.3–2.5 m, when grass–sedge peat
with large numbers of Carex sp. achenes, fewer Menyanthes trifoliata seeds and some
Betula nana achenes accumulated. The uppermost layer (depth: 2.3–2.2 m), consisting
of well-decomposed grass peat with Carex sp. nutlets, Cladium mariscus, Menyanthes
trifoliata and Potentilla seeds, as well as Betula nana achenes, is dated to 3610–
3510 BP. The overlying peat layer, at 2.2–2.0 m depth, consists of well-decomposed,
dense peat with branch fragments, many Picea sp. needle fragments, and small
quantities of Betula sect. Albae and Carex nutlets, Potentilla achenes, charred
APPRECIATING GEOGRAPHY: LOCAL AND GLOBAL SCALE
12
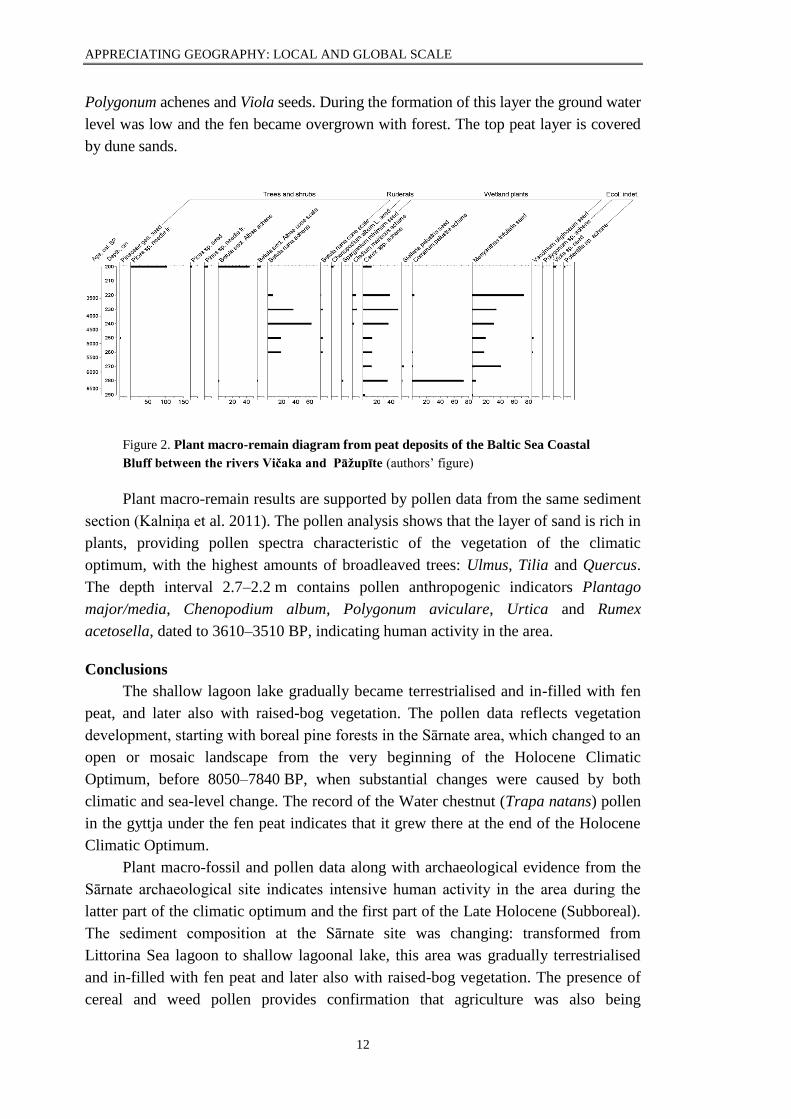
Polygonum achenes and Viola seeds. During the formation of this layer the ground water
level was low and the fen became overgrown with forest. The top peat layer is covered
by dune sands.
Figure 2. Plant macro-remain diagram from peat deposits of the Baltic Sea Coastal
Bluff between the rivers Vičaka and Pāžupīte (authors’ figure)
Plant macro-remain results are supported by pollen data from the same sediment
section (Kalniņa et al. 2011). The pollen analysis shows that the layer of sand is rich in
plants, providing pollen spectra characteristic of the vegetation of the climatic
optimum, with the highest amounts of broadleaved trees: Ulmus, Tilia and Quercus.
The depth interval 2.7–2.2 m contains pollen anthropogenic indicators Plantago
major/media, Chenopodium album, Polygonum aviculare, Urtica and Rumex
acetosella, dated to 3610–3510 BP, indicating human activity in the area.
Conclusions
The shallow lagoon lake gradually became terrestrialised and in-filled with fen
peat, and later also with raised-bog vegetation. The pollen data reflects vegetation
development, starting with boreal pine forests in the Sārnate area, which changed to an
open or mosaic landscape from the very beginning of the Holocene Climatic
Optimum, before 8050–7840 BP, when substantial changes were caused by both
climatic and sea-level change. The record of the Water chestnut (Trapa natans) pollen
in the gyttja under the fen peat indicates that it grew there at the end of the Holocene
Climatic Optimum.
Plant macro-fossil and pollen data along with archaeological evidence from the
Sārnate archaeological site indicates intensive human activity in the area during the
latter part of the climatic optimum and the first part of the Late Holocene (Subboreal).
The sediment composition at the Sārnate site was changing: transformed from
Littorina Sea lagoon to shallow lagoonal lake, this area was gradually terrestrialised
and in-filled with fen peat and later also with raised-bog vegetation. The presence of
cereal and weed pollen provides confirmation that agriculture was also being
APPRECIATING GEOGRAPHY: LOCAL AND GLOBAL SCALE
13
practiced, at least during the final phase of occupation, in the late 6th and the 5th
millennium BP.
Kopsavilkums
Paleoģeogrāfisko apstākļu pārmaiņu rakstura izpēte Sārnates bijušās lagūnas teritorijā ir saistīta
ar šīs teritorijas ģeoloģisko uzbūvi un mūsdienu ģeoloģisko procesu norisi, kā arī ar akmens laikmeta
mītņu izpēti šajā teritorijā. Veikta nogulumu vecuma datēšana, sporu un putekšņu izpēte IX urbumam
Sārnates apmetnes teritorijā, kā arī jūras krasta atsegumā ziemeļos no Pāžupītes ietekas jūrā. Priekšstatu
par nogulumu veidošanos zemā purva apstākļos rada augu makroatlieku pētījumi. Ogļotas ezerrieksta
un citu augu makroatliekas atrastas akmens laikmeta apmetnes “K” mītnes un 11. mītnes pavardu
nogulumu paraugos.
References
Bērziņš, V. (2008). Sārnate: living by a coastal lake during the East Baltic Neolithic. Acta
Universitatis Ouluensis. B Humaniora, 86. http://herkules.oulu.fi/isbn9789514289415/ (23.02.2012).
Ceriņa, A., Kalniņa, L. and Bērziņš, V. (2013). Changes in the level of Lake Sārnate and the
conditions for settlement along its shore during the holocene. In: Kļaviņš, M. and Kalniņa, L. (eds.) Bog
and lake research in Latvia. Riga: The University of Latvia Press, 75-80.
Dolukhanov, V.M. (1977). Holocene history of the Baltic Sea and the ecology of prehistoric
settlement. Baltica, 6, 227-247.
Dreimanis, A. (1947). Pollenanalytische Datierung archaologischer Funde von Sarnate, Lettland,
und die Entwicklungsgeschichte des Sarnate-Moores. Contributions of the Baltic University, 28.
Galeniece, M. (1960). Dažu Kurzemes purvu stratigrāfija un ģenēze. Latvijas PSR veģetācija.
3. sēj. Rīga: LPSR ZA izdevniecība, 21-41.
Grīnbergs, E. (1957). The Late Glacial and Post-Glacial history of the coast of the Latvian SSR, Rīga.
Kalniņa, L. and Ceriņa, A. (2018). Biotas mainība holocēnā. In: Nikodemus, O., Kļaviņš, M.,
Krišjāne, Z. and Zelčs, V. (eds.) Latvija. Zeme, daba, tauta, valsts. Rīga: Latvijas Universitāte, 442-445.
Kalnina, L., Cerina, A. and Berzins, V. (2011). Environment and vegetation changes during
the Neolithic settlement at Sarnate site, Western Latvia. XVIII INQUA Congress Bern, Switzerland.
Sessions & Abstracts.
Mūrniece, S., Kalniņa, L., Bērziņš, V. and Grasis, N. (1999). Environmental Change and
Prehistoric Human Activity in West Kurzeme, Latvia. In: Miller, U., Hackens, T., Lang, V., Raukas, A.
and Hicks, S. (eds.) Environmental and Cultural History of the Baltic Region. Belgium: PACT 57, 35-
70.
Saulīte, A., Kalniņa, L., Stinkulis, Ģ. and Ceriņa, A. (2007). A new data from the outcrop at the
coastal cliff of the Baltic sea near to Sārnate. In: Guobytė, R., Stančikaitė, M. (eds) The Quaternary of
Western Lithuania: from the Pleistocene glaciations to the evolution of the Baltic Sea. Proceedings of
the INQUA Peribaltic Group Field Symposium, Vilnius: Institute of Geology and Geography, 73-74.
Šturms, E. (1940). Sārnates purva mītnes. Senatne un māksla, 1, 41-64.
Vankina, L. (1970). The Bog Settlement of Sārnate. Riga: Zinatne.
Veinbergs, I. (1999). Baltijas jūras leduslaikmeta beiguposma un pēcleduslaikmeta baseinu
Latvijas krasta zonas morfo- un litodinamika (pēc Latvijas piekrastes pētījumu rezultātiem). Latvijas
Universitātes Ģeoloģijas institūts, atskaite.
Velichkevich, F.Y., Zastawniak, E. (2006). Pteridophytes and monocotyledons. In: J.J. Wojcicki
(ed.). Atlas of the Pleistocene vascular plant macrofossils of Central and Eastern Europe. Krakow: W.
Szafer Institute of Botany, Polish Academy of Sciences, 224.
Warner, B.G. (1990). Plant macrofossils. Methods in quaternary ecology. Geoscience Canada, 53-63.
APPRECIATING GEOGRAPHY: LOCAL AND GLOBAL SCALE
14
CHANGES OF THE PALAEO-GEOGRAPHICAL CONDITIONS
IN THE LAKE USMA DEPRESSSION DURING THE END
OF THE LATE GLACIAL AND THE HOLOCENE
Paleoģeogrāfisko apstākļu pārmaiņas Usmas ezera
ieplakās leduslaikmeta beigās un holocēnā
Ivars Strautnieks, Elīna Deksne, Laimdota Kalniņa,
Aija Ceriņa, Andra Štube
University of Latvia, Faculty of Geography and Earth Sciences
Abstract. Lake Usma occupies the lowest part of the Late Glacial glacio-depression at the Kursa Lowland
(NW Latvia), where the Venta-Usma ice-dammed lake and the Baltic Ice Lake sediments have been
accumulated. Geological and geo-morphological investigations have been carried out on the largest Lake
Usma islands - Moricsala and Viskūži Island as well as at Košķēni Bay. Changes in palaeo-geographic
conditions in the Lake Usma depression during the Holocene are evidenced by organogenic sediments
from cores in Moricsala and Viskūži Island and in the lake bottom of Košķēni Bay. The loss on ignition
analysis of these sediments has been carried out with the aim to determine changes of organic, mineral
and carbonate matter proportions and the relative percentage in their composition, which together with
macro-remain analysis data allow to gain better understanding about the character of the palaeo-
geographic conditions during the lake's development,
Keywords: relief, Košķēni Bay, loss on ignition, Moricsala, Viskūži Island
Introduction
Lake Usma, is located in the N-W part of Latvia and occupies the lowest part of
the Late Glacial glacio-depression at the Kursa Lowland, where the Venta-Usma ice-
dammed lake and the Baltic Ice Lake sediments have been accumulated. The lake is
13.5 km long and 6.2 km wide, oriented towards N-E (Figure 1 - a). The shoreline of
the lake, bays and peninsulas is overgrown and paludified. There are four islands in
the lake - Viskūži Island, Moricsala, Lielalksnīte and Mazalksnīte. Viskūži Island is
the largest lake island in Latvia with length 3.1 km and 1.75 km wide. It is a natural
border between the northern and the deepest southern part of Lake Usma. The
peninsula at the eastern shore of the lake, Viskūži Island, and Amjūdze Peninsula
forms a transverse elevation in the middle part of Lake Usma (Figure 1 – a, b).
The genesis of the Lake Usma depression and its surrounding area at the end of
the last glacial and the Holocene has been described in published and unpublished
interpretations in the late 20th century by Quaternary researchers E. Grīnbergs
(Гринбергс 1957), I. Veinbergs (Вейнбергс 1975; 1999). Of particular note, mention
should be made of the investigation carried out by I. Veinbergs and I. Jakubovska
(Veinbergs and Jakubovska 1999), which was based on geological, geo-morphological
and palynological research. In this study it was found that the glaciolimnic clay
rhythm and the thickness of the layers series were conditioned by changes in the
accumulation conditions at the end of the glaciation. Information about the
APPRECIATING GEOGRAPHY: LOCAL AND GLOBAL SCALE
15
morphology of the lake depression and the islands and the fixed levels of terraces
provided by the research data allows us to understand the Venta-Usma ice-dammed
basin and the Baltic Ice Lake levels changes in the area of Lake Usma. Palynological
analysis of organo-genic sediments was carried out for sediment sections from
Moricsala, Ozoliņi valley, and Usma station bog in that study, however there was not
given sufficient attention to the sediment composition. Recent studies include analyses
of organo-genic sediments from Košķēni Bay, Moricsala and Viskūži Island
(Figure 1 - a).
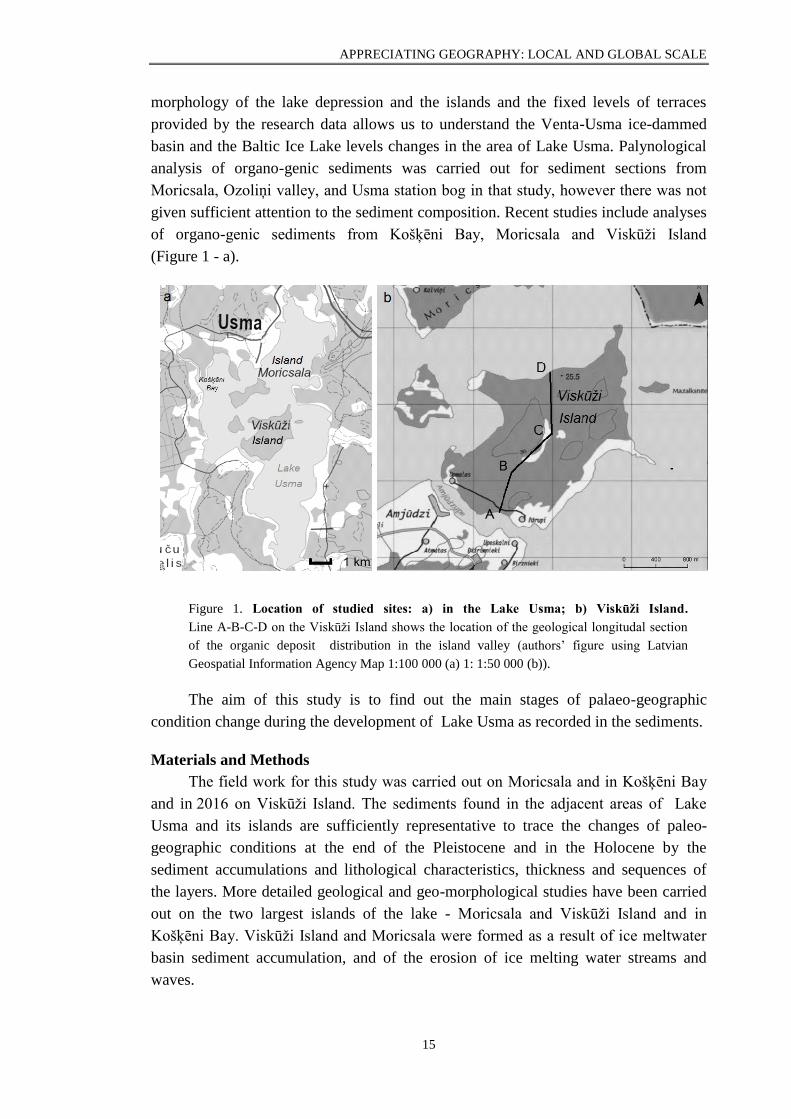
Figure 1. Location of studied sites: a) in the Lake Usma; b) Viskūži Island.
Line A-B-C-D on the Viskūži Island shows the location of the geological longitudal section
of the organic deposit distribution in the island valley (authors’ figure using Latvian
Geospatial Information Agency Map 1:100 000 (a) 1: 1:50 000 (b)).
The aim of this study is to find out the main stages of palaeo-geographic
condition change during the development of Lake Usma as recorded in the sediments.
Materials and Methods
The field work for this study was carried out on Moricsala and in Košķēni Bay
and in 2016 on Viskūži Island. The sediments found in the adjacent areas of Lake
Usma and its islands are sufficiently representative to trace the changes of paleo-
geographic conditions at the end of the Pleistocene and in the Holocene by the
sediment accumulations and lithological characteristics, thickness and sequences of
the layers. More detailed geological and geo-morphological studies have been carried
out on the two largest islands of the lake - Moricsala and Viskūži Island and in
Košķēni Bay. Viskūži Island and Moricsala were formed as a result of ice meltwater
basin sediment accumulation, and of the erosion of ice melting water streams and
waves.
APPRECIATING GEOGRAPHY: LOCAL AND GLOBAL SCALE
16
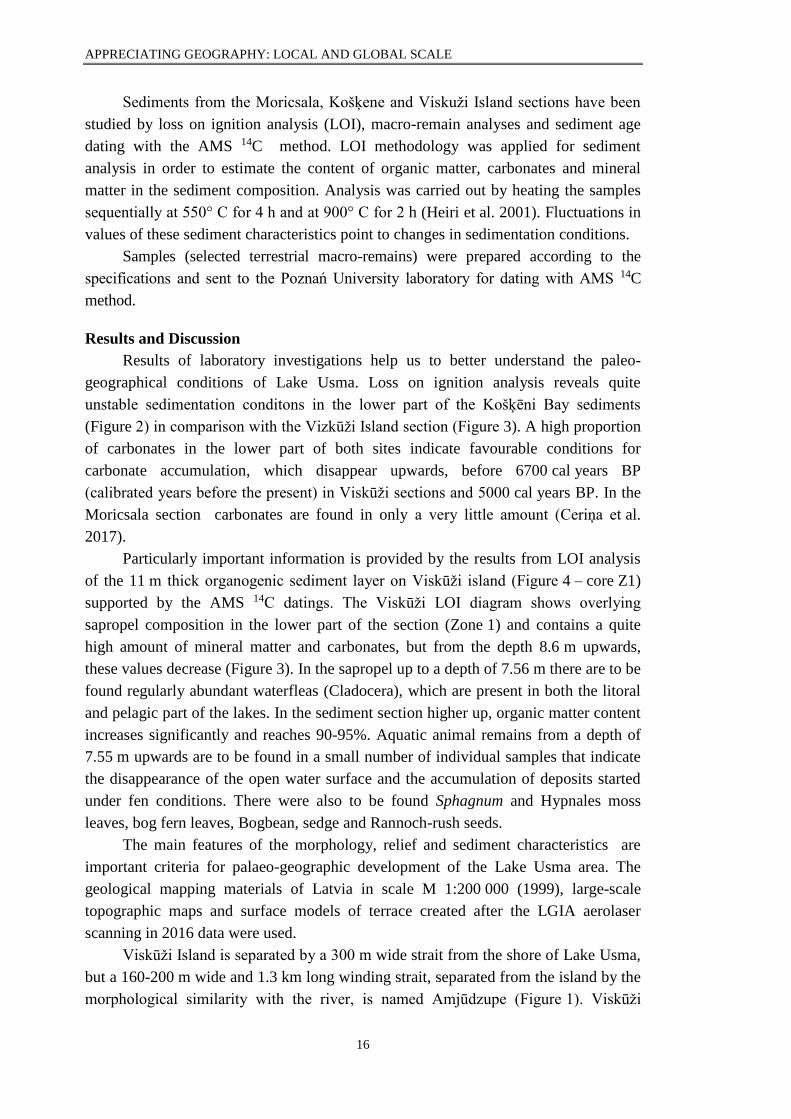
Sediments from the Moricsala, Košķene and Viskuži Island sections have been
studied by loss on ignition analysis (LOI), macro-remain analyses and sediment age
dating with the AMS 14C method. LOI methodology was applied for sediment
analysis in order to estimate the content of organic matter, carbonates and mineral
matter in the sediment composition. Analysis was carried out by heating the samples
sequentially at 550° C for 4 h and at 900° C for 2 h (Heiri et al. 2001). Fluctuations in
values of these sediment characteristics point to changes in sedimentation conditions.
Samples (selected terrestrial macro-remains) were prepared according to the
specifications and sent to the Poznań University laboratory for dating with AMS 14C
method.
Results and Discussion
Results of laboratory investigations help us to better understand the paleo-
geographical conditions of Lake Usma. Loss on ignition analysis reveals quite
unstable sedimentation conditons in the lower part of the Košķēni Bay sediments
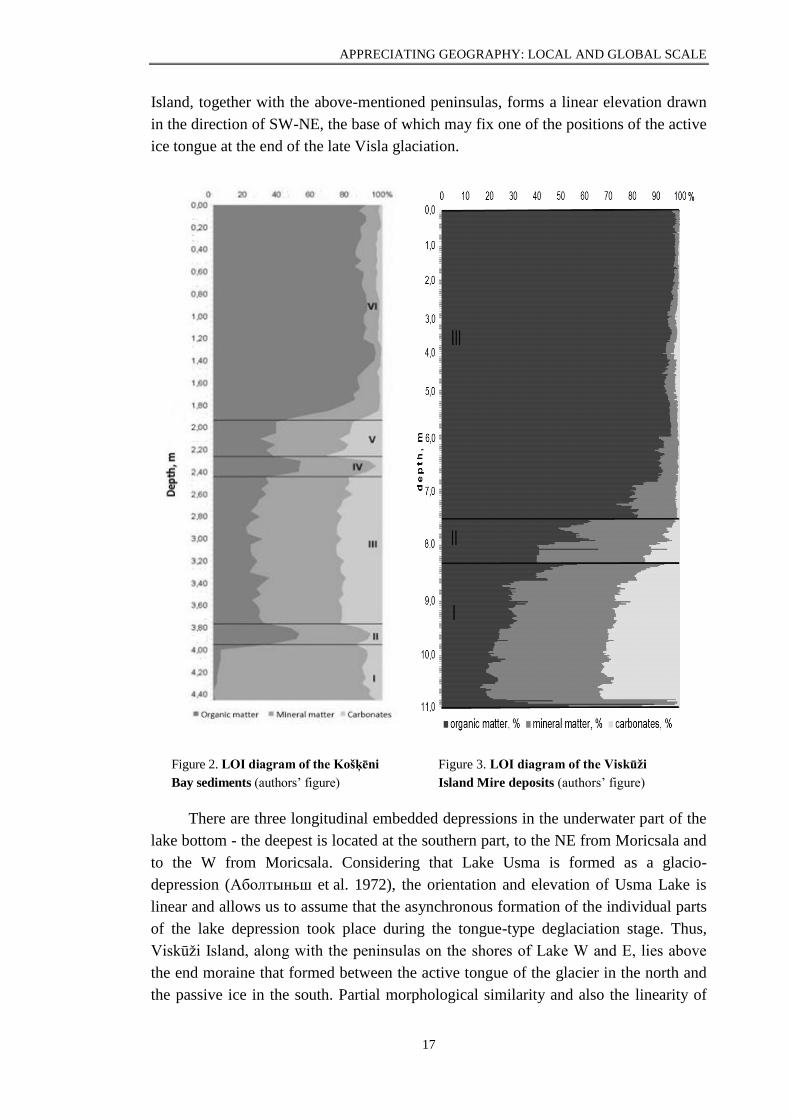
(Figure 2) in comparison with the Vizkūži Island section (Figure 3). A high proportion
of carbonates in the lower part of both sites indicate favourable conditions for
carbonate accumulation, which disappear upwards, before 6700 cal years BP
(calibrated years before the present) in Viskūži sections and 5000 cal years BP. In the
Moricsala section carbonates are found in only a very little amount (Ceriņa et al.
2017).
Particularly important information is provided by the results from LOI analysis
of the 11 m thick organogenic sediment layer on Viskūži island (Figure 4 – core Z1)
supported by the AMS 14C datings. The Viskūži LOI diagram shows overlying
sapropel composition in the lower part of the section (Zone 1) and contains a quite
high amount of mineral matter and carbonates, but from the depth 8.6 m upwards,
these values decrease (Figure 3). In the sapropel up to a depth of 7.56 m there are to be
found regularly abundant waterfleas (Cladocera), which are present in both the litoral
and pelagic part of the lakes. In the sediment section higher up, organic matter content
increases significantly and reaches 90-95%. Aquatic animal remains from a depth of
7.55 m upwards are to be found in a small number of individual samples that indicate
the disappearance of the open water surface and the accumulation of deposits started
under fen conditions. There were also to be found Sphagnum and Hypnales moss
leaves, bog fern leaves, Bogbean, sedge and Rannoch-rush seeds.
The main features of the morphology, relief and sediment characteristics are
important criteria for palaeo-geographic development of the Lake Usma area. The
geological mapping materials of Latvia in scale M 1:200 000 (1999), large-scale
topographic maps and surface models of terrace created after the LGIA aerolaser
scanning in 2016 data were used.
Viskūži Island is separated by a 300 m wide strait from the shore of Lake Usma,
but a 160-200 m wide and 1.3 km long winding strait, separated from the island by the
morphological similarity with the river, is named Amjūdzupe (Figure 1). Viskūži
APPRECIATING GEOGRAPHY: LOCAL AND GLOBAL SCALE
17
Island, together with the above-mentioned peninsulas, forms a linear elevation drawn
in the direction of SW-NE, the base of which may fix one of the positions of the active
ice tongue at the end of the late Visla glaciation.
Figure 2. LOI diagram of the Košķēni
Bay sediments (authors’ figure)
Figure 3. LOI diagram of the Viskūži
Island Mire deposits (authors’ figure)
There are three longitudinal embedded depressions in the underwater part of the
lake bottom - the deepest is located at the southern part, to the NE from Moricsala and
to the W from Moricsala. Considering that Lake Usma is formed as a glacio-
depression (Аболтыньш et al. 1972), the orientation and elevation of Usma Lake is
linear and allows us to assume that the asynchronous formation of the individual parts
of the lake depression took place during the tongue-type deglaciation stage. Thus,
Viskūži Island, along with the peninsulas on the shores of Lake W and E, lies above
the end moraine that formed between the active tongue of the glacier in the north and
the passive ice in the south. Partial morphological similarity and also the linearity of
APPRECIATING GEOGRAPHY: LOCAL AND GLOBAL SCALE
18
the SW-NE are 1.7 km long and 0.2-0.7 km wide and are characteristic for Moricsala.
There are several stages of erosion of the steep coasts on Moricsala and Viskūži
Island. Moricsala is hipsometrically lower, so the height of its steep coasts is not more
than 3-5 m, but for Viskūži Island they reach 6-8 m, vertical, unstable bluff parts.
Mostly, around Moricsala, as well as around Viskūži Island, there are wide shallow
water areas overgrown by reed belts that dampen wave energy (Veinbergs and
Jakubovska 1999).
The two largest islands of the lake have differently articulated surface relief
characteristics, but there are also flat surfaces and terraces at the same height above
the lake level (Veinbergs and Jakubovska 1999), which apparently point to the levels
of stabilization during the lake development. Not only the surface of the terrain but
also the sediments found in the corings and observation sites indicate the conditions
for the formation of the islands. In the 4 boreholes carried out in different places of
Viskūži Island, in the highest part (28-32 m above sea level), there is to be found sand.
Under these the changes of glaciolymnic clay and silt layers were recognized as being
with a seasonal rhythmic character. Similar glaciolimnic sand, silt and clay have also
been found on Moricsala (Veinbergs and Jakubovska 1999). It is only because of the
absolute height difference, that the sediment strata in Viskūži Island is 4 m thicker.
On both islands there are also to be found areas of eolian relief, where dunes and
deflation depressions alternate. The formation of eolian relief was possible at the time
when the water level was falling and the glaciolimic sand did not cover the vegetation.
The prevalence of glaciolimic sediments on both islands of the lake, as well as the
erosion bluffs and terraces, are indicative of their initial formation in the same ice-
melting water basin and can currently be classified as sediment accumulation and
erosion remnants under basin conditions. According to the relief profiles made using
LIDAR 2016 data for Viskūži Island, there are several notable levels of terraces and
flat tops – 30 m, 28 m, 27 m, 23.5-24 m and 22 m above sea level. These levels are
similar also to those on Moricsala, except for the two highest levels. The accumulation
of glaciolimic clays and silt occurred in the Venta-Usma ice-dammed basin, while
sand accumulation occurred in the Gulf of Usma in the Baltic Ice Lake (Гринбергс
1957; Страуме 1979; Veinbergs 1990). As the water level dropped, the surface of the
islands was flattened and partially eroded. At the elevation mark 25 m above sea level.
E. Grīnbergs (1957) and J. Straume (1979) noted that lake Usma separated from the
Baltic ice lake, although later observations do not confirm this (Veinbergs and
Jakubovska 1999). According to J. Straume's (1979) observations, the elevation of the
terrace surface elevation varies from 24 m a.s.l. at the southern part of the lake to
26 m a.s.l. at the northern part, which indicates a different isostatic uplift speed.
Changes in palaeo-geographic conditions in the Lake Usma depression in the
Holocene are evidenced by the character of organogenic sediments, the samples of
which were obtained by coring in mire depressions on Moricsala (Ceriņa et al. 2017),
Viskūži Island (Strautnieks et al. 2017) and from the lake bottom in Košķēni Bay
APPRECIATING GEOGRAPHY: LOCAL AND GLOBAL SCALE
19
(Štube et al. 2018 ). Layers of organogenic sediments at all 3 sites have both common
and distinct features, including layer thickness.
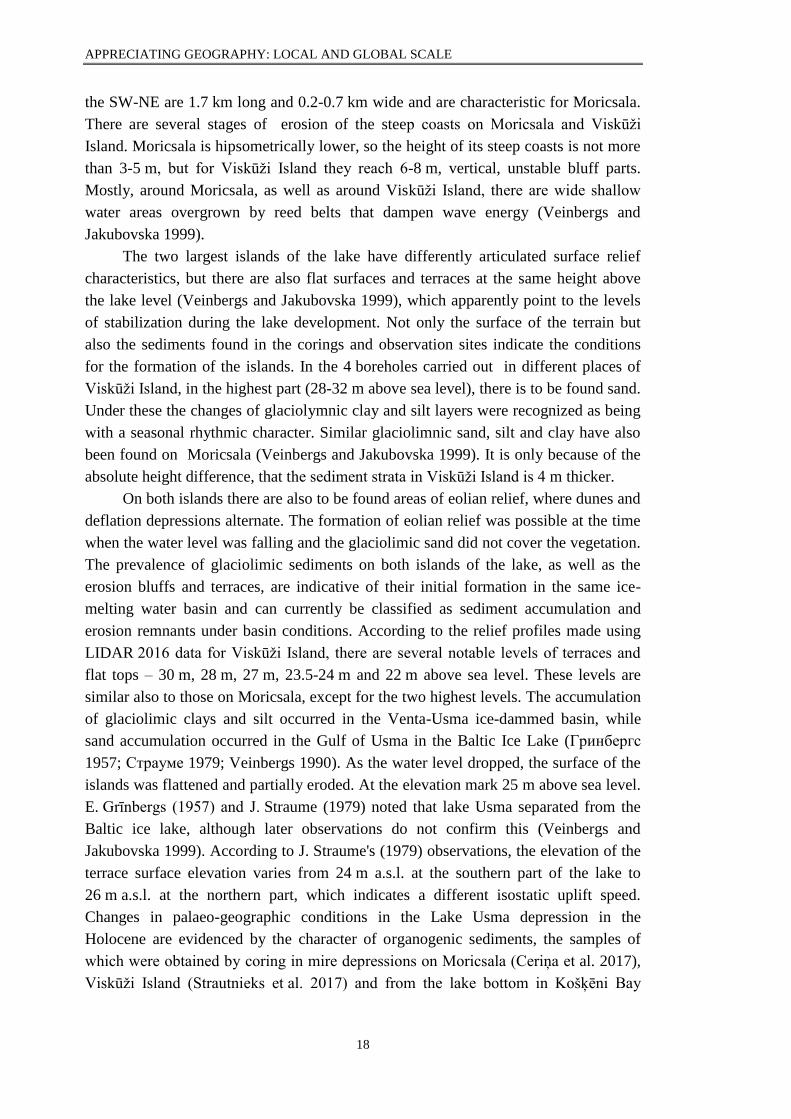
The maximum thickness of the organogenic sediment is to be found on Viskūži
Island, where it reaches 11 m. Organogenic sediments are concentrated in the Viskūži
Island mire, which is developed in the S-folded valley with a length of 2.5 km, a width
of 150-200 m, and relative height of the slopes being 6-8 m. On the slopes of the
downhill, the expressive terraces are clearly visible at certain stages. The elevation of
the surface in the lowering is 22-24 m above sea level, i.e., 1-3 m above the level of
Lake Usma, which means that the partially buried lowering bed is 8 m below the
current lake level. In the Viskūži paludified valley area there were found three
different mire types: fen, transitional and raised bog. In core Z1 there has been
identified an 8 m thick peat layer, which covers 3 m thick sapropel strata (Figure 4 –
core Z1) shown in the longitudinal section of Viskūži Mire (Figure 4). The absolute
age for the peat layer in the valley bottom of deepest core Z1 at the depth 10.93 cm
laying below the sapropel, just above the medium-grained sand, the absolute age AMS 14C is 9080 ± 50 BP was determined. This peat contains only green moss residues, a
small amount of sedge and Bogbean seeds, which are generally characteristic of plant
composition in fens. No residues of aquatic animals have been detected.
Seeds and bark fragments of pines have been found in the peat layer and show
that the island had been covered with pine forests at this time.
Figure 4. Geological longitudinal section of the S-folded valley crossing Viskūži Island
(authors’ figure)
APPRECIATING GEOGRAPHY: LOCAL AND GLOBAL SCALE
20
Investigation data reveals that up to the present day the accumulation of sapropel
and peat has been undisturbed and steadily rapid - around 1.2 m per thousand years.
On Moricsala, the thickness of the organogenic sediment is only 1.2 m, where the age
of the sapropel layer is 9450 ± 50 BP. The thickness of the sediment layer is 10 times
smaller, which is likely to be an explanation for the facially different position where
the accumulation of sapropel was limited by the action of surface waves, which
contributed to erosion of the accumulated material. The rate of accumulation of the
peat layer was reduced by decomposition, as the lake and groundwater levels
decreased. The relatively rapid accumulation of sapropel and peat has taken place in
Košķēni Bay, where the lower 3.3 m of the stratum have accumulated in about
1000 years, between 6500-5500 years BP. The top 70 cm thick layer of peat has
developed over 5500 years, which is most likely due to the decomposition of peat with
improved aeration.
Conclusion
The absolute age of the lower part of organogenic sediment layers in all studied
sites is similar - over 9000 years. However, the thickness of these is different - 10.9 m,
4.0 m and 1.2 m, which can be explained by the facial difference. Changes in
sediment, plant and aquatic remain composition indicate that sediment accumulation
conditions have been changing and they were more different in the Lake Usma basin
during the Holocene than at the end of the Late Glacial.
Kopsavilkums
Usmas ezera ieplaka izveidojusies glaciodepresijā Kursas zemienē, kur uzkrājušies Ventas–
Usmas sprostbaseina un Baltijas ledus ezera nogulumi, kas raksturo paleoģeogrāfiskos apstākļus
pleistocēna beigās un holocēnā. Detalizētāki ģeoloģiskie un ģeomorfoloģiskie pētījumi ir veikti divās
lielākajās Usmas ezera salās – Moricsalā un Viskūžu salā, kā arī Košķēnu līcī. Salas ir gan ledājkušanas
ūdeņu baseinu nogulumu akumulācijas, gan arī šo ūdeņu straumju un baseinu viļņu erozijas rezultāts.
Viskūžu salas erozijas stāvkrasti un salu šķērsojošais erozijas padziļinājums liecina, ka tā ir
ledājkušanas ūdeņu baseina gultnes un straumju erozijas paliksnis. Organogēno nogulumu slāņkopas
apakšējā daļā nogulumiem noteiktais absolūtais vecums ir līdzīgs, tas pārsniedz 9000 gadu. Taču
slāņkopas biezums ir ļoti atšķirīgs – 11 m, 4 m un 1,2 m. Atšķirīgais nogulumu biezums izskaidrojams
ar faciāli atšķirīgo novietojumu. Nogulumu, augu un ūdensdzīvnieku atlieku sastāva pārmaiņas
nogulumos liecina, ka Viskūžu salā ir bijis paleoezers, kurā nogulumu uzkrāšanās apstākļi ir bijuši
mainīgi. Pētījumu rezultāti lokālajās vietās ir salīdzināmi, tomēr ir labi novērojamas faciālās atšķirības,
kas saistītas ar dažādu nogulumu akumulācijas, erozijas vai sadalīšanās ātrumu.
References
Ceriņa, A., Kiziks, K., Kalniņa, L., Nikodemus, O. and Priedniece, E. (2017). Vides un
veģetācijas izmaiņu pazīmes leduslaikmeta beiguposma un holocēna nogulumu griezumā Moricsalas
DR daļā. Ģeogrāfija. Ģeoloģija. Vides zinātne: referātu tēzes. Latvijas Universitātes 75. zinātniskā
konference. Rīga: Latvijas Universitāte, 34-37.
Heiri, O., Lotter, A.F. and Lemcke, G. (2001). Loss on ignition as a method for estimating
organic and carbonate content in sediments: reproducibility and comparability of results. Journal of
Paleolimnology, 25, 101-110.
Priedniece, E., Ceriņa, A., Kalniņa, L., Nikodemus, O., Kiziks, K. and Lamsters, K. (2016).
Holocēna nogulumi Usmas ezera piekrastē pie Košķēniem un Moricsalā. Ģeogrāfija. Ģeoloģija. Vides
APPRECIATING GEOGRAPHY: LOCAL AND GLOBAL SCALE
21
zinātne: referātu tēzes, Latvijas Universitātes 74. zinātniskā konference. Rīga: Latvijas Universitāte, 362–
364.
Strautnieks, I., Kalniņa, L., Žagata, S., Sadovina, V., Kiziks, K., Stibe, R., Paparde, L., Lapiņš,
D. and Freiberga, G. (2017). Viskūžu salas reljefs un ģeoloģiskās uzbūves īpatnības. Ģeogrāfija.
Ģeoloģija. Vides zinātne : referātu tēzes. Latvijas Universitātes 75. zinātniskā konference. Rīga:
Latvijas Universitāte, 175-177.
Štube, A., Kalniņa, L. and Ceriņa, A. (2018). Liecības par paleoģeogrāfiskām izmaiņām Usmas
ezera Z līcī pie Košķēniem. Ģeogrāfija. Ģeoloģija. Vides zinātne : referātu tēzes: Latvijas Universitātes
76. zinātniskā konference. Rīga: Latvijas Universitāte, 108-109.
The Latvian Geospatial Information Agency Map. https://kartes.lgia.gov.lv/karte/ (11.02.2019).
Veinbergs, I. (1999). Baltijas jūras leduslaikmeta beiguposma un pēcleduslaikmeta baseinu
Latvijas krasta zonas morfo- un litodinamika (pēc Latvijas piekrastes pētījumu rezultātiem). Latvijas
Universitātes Ģeoloģijas institūts, atskaite.
Veinbergs I. and Jakubovska I. (1999). Moricsala Island and Usma Lake: development of natural
environment during the Late Glacial time and Holocene (in Latvian). Folia Geographica, 7, 58-72.
Аболтыньш О.П., Вейнбергс И.Г., Стелле В.Я., Эберхард Г.Я. (1972). Основные
комплексы маргинальных образований и отступание ледника на территории Латвийской ССР. В
кн.: Горецкий Г.И., Погуляев Д.И., Шик С. М. (ред.) Краевые образования материковых
оледенений. Москва: Наука, 30-37.
Вейнбергс, И. (1975). Формирование Абавско-Слоценской системы долины талых
ледниковых вод. Вопросы четветичных отложений Латвии, 8. Рига: Зинатне, 82-101.
Гринбергс Э.Ф. (1957). Позднеледниковая и послеледниковая история побережья
Латвийской ССР. Рига, 122.
Страуме Я.А. (1979). Геоморфология. Мисанс Я.П., Брангулис А,П., Даниланс И.Я.,
Куршс В.М. (ред.) Геологическое строение и полезные ископаемые Латвии, Рига: Зинатне, 297-
439.
EVIDENCE OF PALAEO-CLIMATE CHANGES AND THEIR
IMPACT ON SEDIMENT ACCUMULATION CONDITIONS
IN THE LUBĀNS STONE-AGE SETTLEMENT AREAS
Liecības par paleoklimata pārmaiņām un to ietekmi
uz nogulumu uzkrāšanās apstākļiem Lubāna akmens
laikmeta apmetņu teritorijās
Līga Paparde1, Laimdota Kalniņa1, Aija Ceriņa1, Ilze Loze2,
Ivars Strautnieks1, Jānis Dreimanis1 1 University of Latvia, Faculty of Geography and Earth Sciences
2 University of Latvia, Institute of Latvian History
Abstract. Changes in palaeo-climate and palaeo-geographic conditions have influenced palaeo-vegetation
and sediment accumulation conditions during the development of Lake Lubāns. These circumstances have
also affected human life conditions and the distribution of Stone-Age settlement sites. To discover notions
about evidence of sediment accumulation condition changes and reconstruct the palaeo-geographic
APPRECIATING GEOGRAPHY: LOCAL AND GLOBAL SCALE
22
conditions of Lake Lubāns, studies were undertaken in Stone-Age settlement areas and the palaeo-lake’s
overgrown and paludificated territories.
The investigations for this study were based on field work, including sampling, geological coring and
probing, obtaining and documenting samples of sediments, as well as laboratory analysis on aspects such
as loss on ignition, pollen and macroscopic remain analysis. The results have allowed us to make the
conclusion that the most essential of reasons why Stone-Age people changed the sites of their settlements
was due to lake water level fluctuations as well as to overgrowing and paludificating of the lake bays and
shores.
Keywords: Paludification, sediment accumulation, loss on ignition, Stone-Age
Introduction
The research area is located in the East Latvian Lowland, the Lubāns Plain and
the Lubāns Wetland. The lake itself combined with its surrounding territories is
situated in the lowest area of the Lubāns Plain. Notable among the characteristics of
Lake Lubāns is its complicated geological structure, hydrographic network, large
wetland covered areas and rich evidence about Stone-Age settlements. During the late
glacial period Lubāns palaeo-lake was at least three times the size it is today (Grūbe
2006).
Due to the complicated geological development of Lake Lubāns and the Lubāns
Plain, palaeo-geographic conditions around Lake Lubāns in various places are diverse
(Эберхардс 1985). It is essential to mention that Lake Lubāns and its surrounding
territories is a unique place not only in Latvia but also in a global context. Around the
ancient and present day lake shores and many nearby rivers there have been
discovered more than 30 ancient settlement sites. And is is exactly at the Lubāns
Stone-Age settlement sites that there have been found the most bone and horn
sculptures not only in Latvia but also in the eastern Baltic territory (Лозе 1988;
Segliņš et al. 1999). Lake Lubāns is one of the largest of these kind of archaeological
research areas not only in the Baltic states but also in Europe. The overall territory
covers some 100 000 hectares where 24 nationally protected archaeological sites are
located (Loze 1990). For those reasons, further researches into any of this
archaeological site’s environmental changes are significant to obtain a better overall
understanding about the specific territory's geological development and palaeo-
environmental changes during the existence of Stone-Age settlements around the
ancient Lake Lubāns shore.
During the time period 2016 – 2017, studies were undertaken in the N and
NE part of the Lubāns palaeolake – the Iča and Lagaža settlement areas (Paparde et al.
2017). In order to reconstruct sediment accumulation condition changes for the whole
ancient Lubāns territory, it was required also to study the W and S parts of Lake
Lubāns – the Asne and Sūļagols settlement areas. These additional expeditions took
place during 2018 – 2019. Specific settlement sites were chosen because they are
interesting in a palaeo-geographic aspect and also because of the lack of any existing
geological information about them.
APPRECIATING GEOGRAPHY: LOCAL AND GLOBAL SCALE
23
Data and Methods
During the study process different types of data and versatile materials were used,
including sediment samples from field works, the author’s prepared cartographic
materials, performed laboratory analysis and visualised results in conversant diagrams
and charts. In addition to obtaining samples for further investigations so as to reconstruct
palaeo-geographic and sediment accumulation condition changes during field works,
geological coring and probing was also undertaken as was the obtaining and
documenting of sediment monoliths, and transportation of these samples to the
laboratory of Quaternary Environment studies at the University of Latvia. A
combination of different laboratory methods was used to get the best results on aspects
such as loss on ignition, pollen and macroscopic remains analysis. A plausible palaeo-
geographic reconstruction can be made only by comparison and combination of
different laboratory analysis results and data from diverse geological coring sediment
samples.
Loss on ignition analyses of the Quaternary lake sediments provide an
opportunity to investigate changes in the past environment. Curve fluctuations in
diagrams can indicate sediment accumulation condition changes, water level
fluctuations, lake shore overgrowing and paludification processes. With these methods
seven geological cores were analysed: Sūļagols – U1, Iča – U1, Iča – U2, Iča – U3,
Lagaža – U1, Lagaža – U2 and Lagaža – U3 with a total length of 10.6 m of sediment
samples. Each sediment monolith was analysed to within a 1 cm accuracy, meaning
1060 samples in total. Loss on ignition analyses was used to estimate organic, mineral
and carbonate matter in sediments.
Pollen analysis, the study of fossil pollen and spores, is one of the key methods
for reconstruction of past vegetation dynamics and environment changes. The results
of this method can provide an insight into long term changes of various plant species
and also indicate human influence on vegetation, therefore sediments from two cores
were analysed – Iča – U1 (69 samples) and Lagaža – U1 (39 samples). Macroscopic
remain analysis can reveal significant information about palaeo-climate and palaeo-
vegetation as well as give evidence about early human impact on vegetation and the
beginnings of agriculture (Paparde et al. 2017). In total, a macroscopic remain analysis
was done for 63 sediment samples and with 5 cm accuracy. Samples from two
sediment cores were analysed – Iča – U1 (40 samples) and Lagaža – U2 (23 samples).
Results
During the field work in 2016 at Iča and the Lagaža Stone-Age settlement
territories, six sediment cores were made with a total length of 7.6 m - three cores at
each Stone-Age settlement area. Field work for this research took place in the northern
part of Lake Lubāns. All sediment samples and monoliths were taken to use for further
laboratory analyses. As well, from the pit wall of the Iča settlement area 5 extra
sediment samples (each approximately 2.0 – 2.5 litres) were collected to use for
macroscopic remain analysis. During the 2018 research field work that continued in
APPRECIATING GEOGRAPHY: LOCAL AND GLOBAL SCALE
24
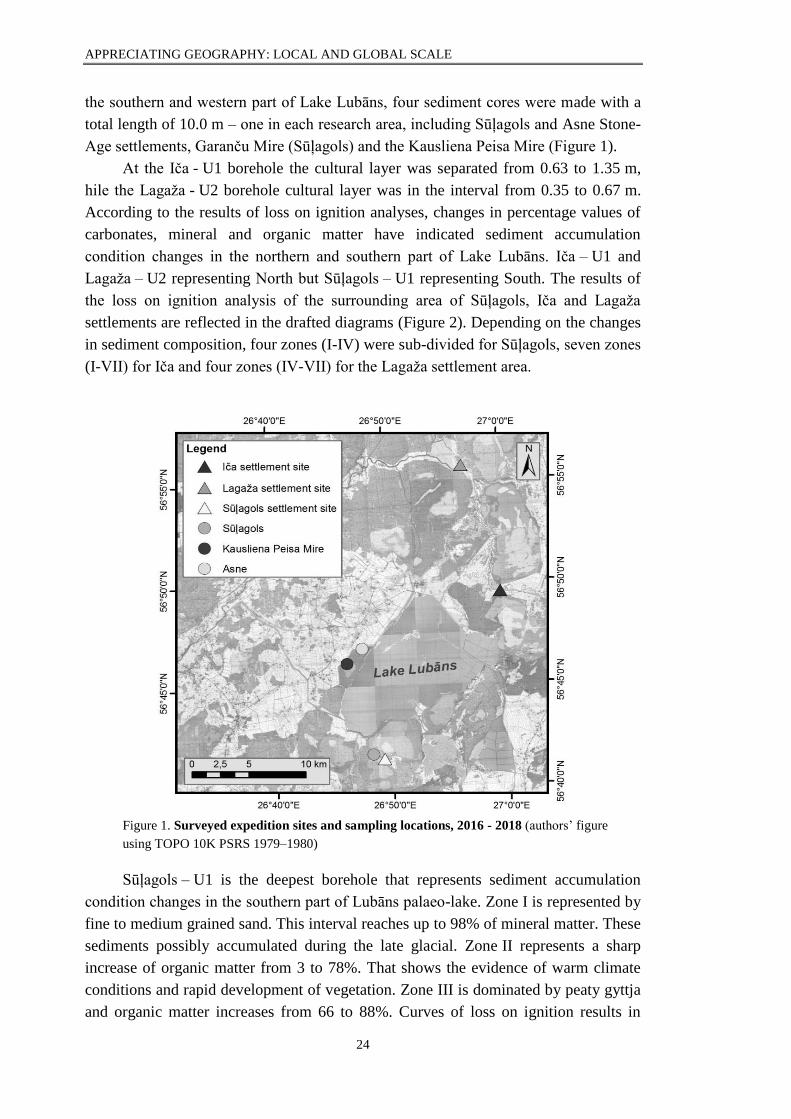
the southern and western part of Lake Lubāns, four sediment cores were made with a
total length of 10.0 m – one in each research area, including Sūļagols and Asne Stone-
Age settlements, Garanču Mire (Sūļagols) and the Kausliena Peisa Mire (Figure 1).
At the Iča - U1 borehole the cultural layer was separated from 0.63 to 1.35 m,
hile the Lagaža - U2 borehole cultural layer was in the interval from 0.35 to 0.67 m.
According to the results of loss on ignition analyses, changes in percentage values of
carbonates, mineral and organic matter have indicated sediment accumulation
condition changes in the northern and southern part of Lake Lubāns. Iča – U1 and
Lagaža – U2 representing North but Sūļagols – U1 representing South. The results of
the loss on ignition analysis of the surrounding area of Sūļagols, Iča and Lagaža
settlements are reflected in the drafted diagrams (Figure 2). Depending on the changes
in sediment composition, four zones (I-IV) were sub-divided for Sūļagols, seven zones
(I-VII) for Iča and four zones (IV-VII) for the Lagaža settlement area.
Figure 1. Surveyed expedition sites and sampling locations, 2016 - 2018 (authors’ figure
using TOPO 10K PSRS 1979–1980)
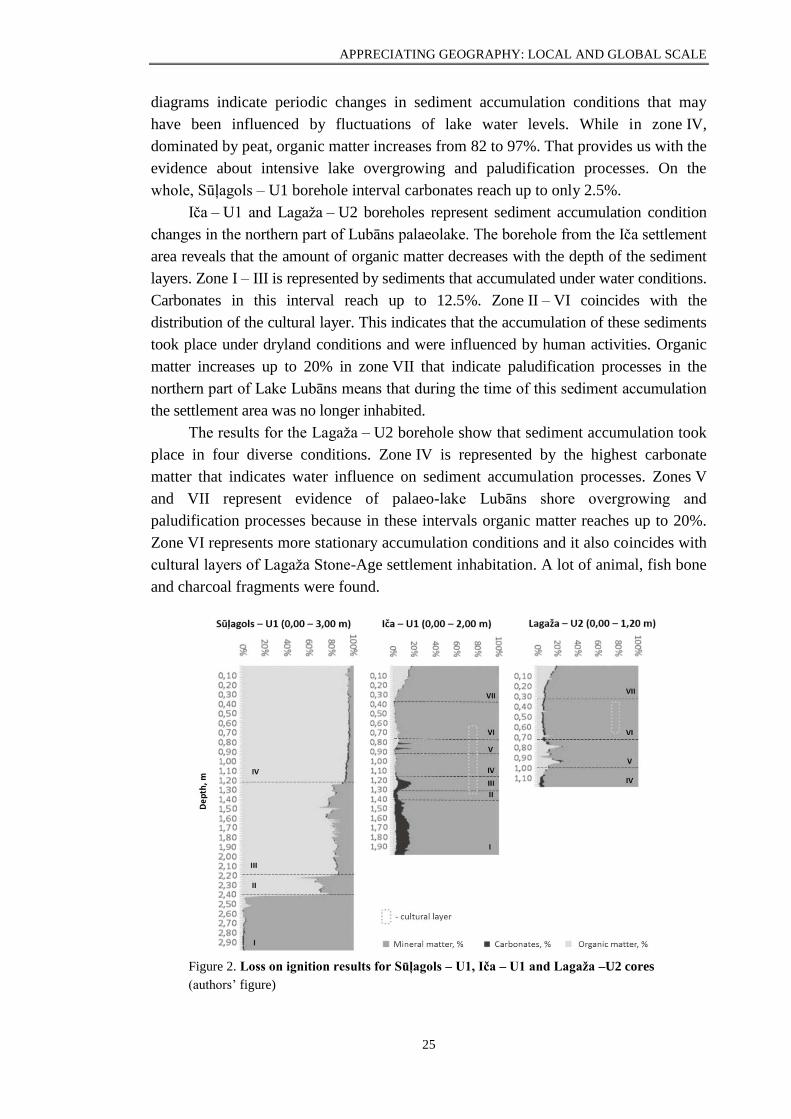
Sūļagols – U1 is the deepest borehole that represents sediment accumulation
condition changes in the southern part of Lubāns palaeo-lake. Zone I is represented by
fine to medium grained sand. This interval reaches up to 98% of mineral matter. These
sediments possibly accumulated during the late glacial. Zone II represents a sharp
increase of organic matter from 3 to 78%. That shows the evidence of warm climate
conditions and rapid development of vegetation. Zone III is dominated by peaty gyttja
and organic matter increases from 66 to 88%. Curves of loss on ignition results in
APPRECIATING GEOGRAPHY: LOCAL AND GLOBAL SCALE
25
diagrams indicate periodic changes in sediment accumulation conditions that may
have been influenced by fluctuations of lake water levels. While in zone IV,
dominated by peat, organic matter increases from 82 to 97%. That provides us with the
evidence about intensive lake overgrowing and paludification processes. On the
whole, Sūļagols – U1 borehole interval carbonates reach up to only 2.5%.
Iča – U1 and Lagaža – U2 boreholes represent sediment accumulation condition
changes in the northern part of Lubāns palaeolake. The borehole from the Iča settlement
area reveals that the amount of organic matter decreases with the depth of the sediment
layers. Zone I – III is represented by sediments that accumulated under water conditions.
Carbonates in this interval reach up to 12.5%. Zone II – VI coincides with the
distribution of the cultural layer. This indicates that the accumulation of these sediments
took place under dryland conditions and were influenced by human activities. Organic
matter increases up to 20% in zone VII that indicate paludification processes in the
northern part of Lake Lubāns means that during the time of this sediment accumulation
the settlement area was no longer inhabited.
The results for the Lagaža – U2 borehole show that sediment accumulation took
place in four diverse conditions. Zone IV is represented by the highest carbonate
matter that indicates water influence on sediment accumulation processes. Zones V
and VII represent evidence of palaeo-lake Lubāns shore overgrowing and
paludification processes because in these intervals organic matter reaches up to 20%.
Zone VI represents more stationary accumulation conditions and it also coincides with
cultural layers of Lagaža Stone-Age settlement inhabitation. A lot of animal, fish bone
and charcoal fragments were found.
Figure 2. Loss on ignition results for Sūļagols – U1, Iča – U1 and Lagaža –U2 cores
(authors’ figure)
APPRECIATING GEOGRAPHY: LOCAL AND GLOBAL SCALE
26
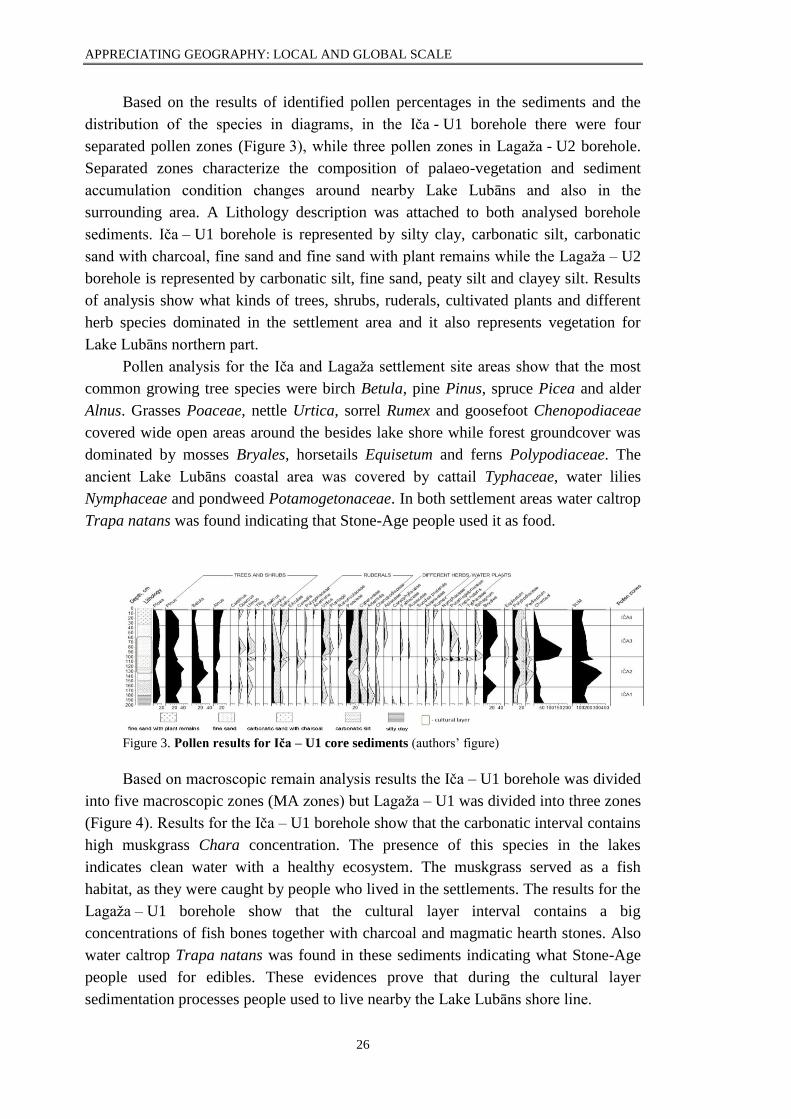
Based on the results of identified pollen percentages in the sediments and the
distribution of the species in diagrams, in the Iča - U1 borehole there were four
separated pollen zones (Figure 3), while three pollen zones in Lagaža - U2 borehole.
Separated zones characterize the composition of palaeo-vegetation and sediment
accumulation condition changes around nearby Lake Lubāns and also in the
surrounding area. A Lithology description was attached to both analysed borehole
sediments. Iča – U1 borehole is represented by silty clay, carbonatic silt, carbonatic
sand with charcoal, fine sand and fine sand with plant remains while the Lagaža – U2
borehole is represented by carbonatic silt, fine sand, peaty silt and clayey silt. Results
of analysis show what kinds of trees, shrubs, ruderals, cultivated plants and different
herb species dominated in the settlement area and it also represents vegetation for
Lake Lubāns northern part.
Pollen analysis for the Iča and Lagaža settlement site areas show that the most
common growing tree species were birch Betula, pine Pinus, spruce Picea and alder
Alnus. Grasses Poaceae, nettle Urtica, sorrel Rumex and goosefoot Chenopodiaceae
covered wide open areas around the besides lake shore while forest groundcover was
dominated by mosses Bryales, horsetails Equisetum and ferns Polypodiaceae. The
ancient Lake Lubāns coastal area was covered by cattail Typhaceae, water lilies
Nymphaceae and pondweed Potamogetonaceae. In both settlement areas water caltrop
Trapa natans was found indicating that Stone-Age people used it as food.
Figure 3. Pollen results for Iča – U1 core sediments (authors’ figure)
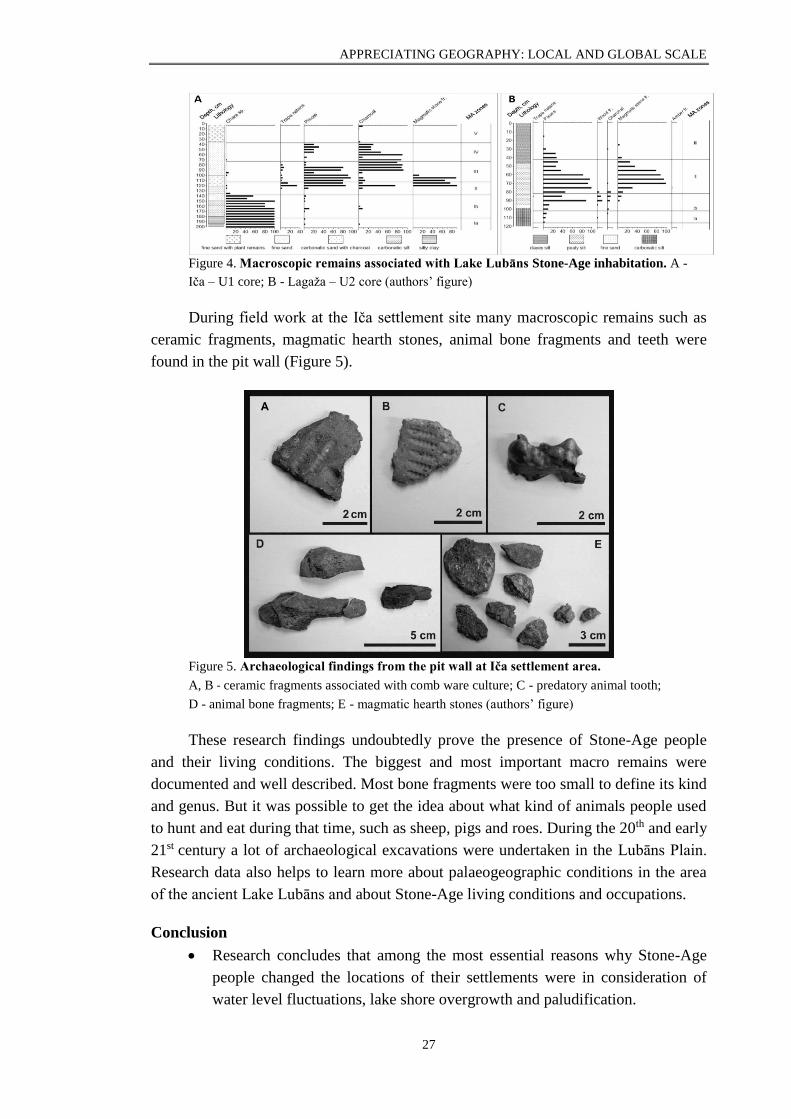
Based on macroscopic remain analysis results the Iča – U1 borehole was divided
into five macroscopic zones (MA zones) but Lagaža – U1 was divided into three zones
(Figure 4). Results for the Iča – U1 borehole show that the carbonatic interval contains
high muskgrass Chara concentration. The presence of this species in the lakes
indicates clean water with a healthy ecosystem. The muskgrass served as a fish
habitat, as they were caught by people who lived in the settlements. The results for the
Lagaža – U1 borehole show that the cultural layer interval contains a big
concentrations of fish bones together with charcoal and magmatic hearth stones. Also
water caltrop Trapa natans was found in these sediments indicating what Stone-Age
people used for edibles. These evidences prove that during the cultural layer
sedimentation processes people used to live nearby the Lake Lubāns shore line.
APPRECIATING GEOGRAPHY: LOCAL AND GLOBAL SCALE
27
Figure 4. Macroscopic remains associated with Lake Lubāns Stone-Age inhabitation. A -
Iča – U1 core; B - Lagaža – U2 core (authors’ figure)
During field work at the Iča settlement site many macroscopic remains such as
ceramic fragments, magmatic hearth stones, animal bone fragments and teeth were
found in the pit wall (Figure 5).
Figure 5. Archaeological findings from the pit wall at Iča settlement area.
A, B - ceramic fragments associated with comb ware culture; C - predatory animal tooth;
D - animal bone fragments; E - magmatic hearth stones (authors’ figure)
These research findings undoubtedly prove the presence of Stone-Age people
and their living conditions. The biggest and most important macro remains were
documented and well described. Most bone fragments were too small to define its kind
and genus. But it was possible to get the idea about what kind of animals people used
to hunt and eat during that time, such as sheep, pigs and roes. During the 20th and early
21st century a lot of archaeological excavations were undertaken in the Lubāns Plain.
Research data also helps to learn more about palaeogeographic conditions in the area
of the ancient Lake Lubāns and about Stone-Age living conditions and occupations.
Conclusion
Research concludes that among the most essential reasons why Stone-Age
people changed the locations of their settlements were in consideration of
water level fluctuations, lake shore overgrowth and paludification.
APPRECIATING GEOGRAPHY: LOCAL AND GLOBAL SCALE
28
During field work at the Iča and Lagaža settlement sites, among the obtained
borehole sediment monoliths and collected pit wall sediment samples there
was found to be a surprisingly large amount of evidence of Stone-Age
habitats.
The results of loss on ignition analysis revealed that in all prospected
sections the amount of organic matter increases in the upper layer was
related to coastal overgrowing intensification processes in the vicinity of
Lake Lubāns.
The highest values of mineral substances in sediment compositions were
found in the lower layers of sections, which have accumulated under water
conditions.
The largest amount of carbonates in sediments is in the lower part of sections
below the cultural layer, which shows that sediments before the creation of
the settlements, including carbonates, have accumulated in the aquatic
environment. The largest amount of carbonates was found in the core
sediment samples of the Iča settlement, which is located closer to the lake
than Lagaža.
During the time of Stone-Age settlements, which occurred in the Neolithic
Age and also durng the early Bronze Age, sediment accumulation took place
in dryland conditions.
According to analysed loss on ignition results and pollen diagrams the
cultural layer sediments from the Iča and Lagaža settlement sites
accumulated in the Holocene Climatic Optimum and Late Holocene.
Research undertaken at the Sūļagols settlement site provides a lot of
information about sediment accumulation processes, such as overgrowing
and paludification. The composition of these sediments is thought to have
been influenced by the rivers Suļka and Malmuta.
Results of loss on ignition and macroscopic remain analysis reflect changes
in sediment accumulation conditions that are closely related to changes in
palaeoclimate.
Kopsavilkums
Pētījuma mēķis ir noskaidrot paleoģeogrāfisko apstākļu pārmaiņas Lubāna ezera ģeoloģiskās
attīstības laikā. Pētījumā iegūtās liecības pierāda, ka viens no galvenajiem faktoriem, kas ietekmēja
nogulumu uzkrāšanās apstākļus, bija paleoklimata pārmaiņas. Lai noskaidrotu Lubāna ezera un tā
apkārtnes veidošanās apstākļus, ezerā mītošo dzīvnieku un augu sugas, kā arī vides apstākļus, kādi ir bijuši
akmens laikmetā, šeit pētījumus ir veikuši ģeologi, ģeomorfologi, hidrologi, arheologi un biologi.
Arheoloģiskajos izrakumos iegūts bagātīgs materiāls, kas sniedz liecības par akmens laikmeta iedzīvotāju
sadzīvi un nodarbošanos. Ir pierādījumi par cilvēku nodarbošanos ar zvejniecību, medniecību un vēlāk arī
lopkopību un zemkopību. Taču vēl nav pietiekami daudz informācijas par ģeoloģiskajiem procesiem un to,
kā klimata pārmaiņu ietekmē mainījušies dabas apstākļi. Šāda veida pētījumi ir ļoti būtiski, lai, izzinot
pagātni, varētu izprast mūsdienu situāciju.
APPRECIATING GEOGRAPHY: LOCAL AND GLOBAL SCALE
29
References
Grūbe, G. (2006). Lubāna ezera attīstības modelēšana: maģistra darbs. Rīga: LU Ģeogrāfijas un
Zemes zinātņu fakultāte, Latvijas Universitāte.
Loze, I. (1990). Arheoloģiskie izrakumi Ičas neolīta apmetnē. Zinātniskās atskaites sesijas
materiāli par arheologu un etnogrāfu 1988. un 1989. gada pētījumu rezultātiem. Rīga: Zvaigzne. 106–
109.
Paparde, L., Kalniņa, L., Ceriņa, A., Loze, I., Kiziks, K. and Purmalis, O. (2017). Ičas un
Lagažas akmens laikmeta apmetņu teritoriju nogulumu raksturojums. Latvijas Universitātes 75.
zinātniskā konference. Ģeogrāfija, Ģeoloģija, Vides zinātne. Referātu tēzes. Rīga: LU Akadēmiskais
apgāds, 64–67.
PSRS MP Ģeodēzijas un kartogrāfijas galvenās pārvaldes topogrāfiskās kartes M 1:10 000;
Topogrāfisko karšu mozaīka M 1:10 000 (1963. g. koord. sistēma, 1976. g. izdevums pēc 1971. g.
rekognoscijas datiem). LU ĢZZF WMS. https://www.geo.lu.lv/kartes/ (03.02.2019)
Segliņš, V., Kalniņa, L. and Lācis, A. (1999). The Lubans Plain, Latvia, as a Reference Area for
Long Term Studies of Human Impact on the Environment. PACT, 57, 105-129.
Лозе, И.А. (1988). Поселения каменного века Лубанской низины. Мезолит, ранний и
средний неолит. Рига: Зинатне. 5-17.
Эберхардс, Г.Я. (1985). Морфогенез долины области последнего материкового оледенения
и современные речные процессы. Автореферат дисертации на соискания ученой степени доктора
географических наук. Москва: МГУ им. М.В. Ломоносова, 52.
CHANGES OF PEAT PROPERTIES IN DIFFERENTLY
AFFECTED PARTS OF THE LAUGA BOG
Kūdras īpašību pārmaiņas dažādi ietekmētās
Laugas purva daļās
Jānis Dreimanis, Laimdota Kalniņa, Līga Paparde, Elīna Deksne
University of Latvia, Faculty of Geography and Earth Sciences
Abstract. At the present time much attention on the identification and investigation of degraded peatland
areas is mainly being undertaken by studies on growing bog plant species, vegetation cover continuity and
character. However, it is also understood that to choose the most effective re-cultivation method it is
necessary to know the properties of the remaining peat layers and local hydrological conditions. The aim
of this study was to discover the characteristics of peat properties and their changes in three differently
affected areas of the Lauga Bog. Field work included geological coring and the collecting of deposit
samples for further laboratory analysis including loss on ignition (LOI) analysis, determination of the peat
density, pH and magnetic susceptibility measurements. The obtained results reveal that peat properties in
the Lauga Bog vary in differently affected areas. In the affected areas (Lauga-1 and Lauga-3) the top layer
of the peat section has a higher natural density and larger proportion of mineral matter. Whereas a natural
bog section is characterised by peat with lower natural density, a higher percentage of organic matter and
lower pH is typical for raised bogs.
Keywords: natural density, LOI analysis, pH, drainage
APPRECIATING GEOGRAPHY: LOCAL AND GLOBAL SCALE
30
Introduction
At the beginning of the 21st century special attention was paid to the
identification and exploration of affected or degraded peatland areas with cut-over
and/or abandoned peat fields. At present, the degree of degradation of the peatlands is
mainly assessed by the presence of the moisture-loving bog plant species and the
character of vegetation cover. However, it has been found that in choosing the most
appropriate re-cultivation method it is necessary to know the properties of the
remaining peat layers and other characteristics of the areas for re-cultivation. It is
considered that impact on the peatland area also affects the properties of the peat,
especially after peat extraction. During the preparation of peatland for peat extraction,
the hydrological regime of the field for peat extraction is altered due to drainage and
removed vegetation. These measures promote peat compaction and increase of natural
density, which also causes an increase in the mineral matter part in peat composition,
especially near ditches (Aleksans 2015; Kalniņa et al. 2017).
Peat formation and accumulation in the bogs is mainly influenced by factors
such as volume of precipitation, temperature, available oxygen required for aerobic
processes, micro-organism colonies, chemical composition of decaying material,
composition of peat-forming plants and other properties (Nomals 1930). In the process
of peat accumulation, the peat forming plants not only decay and accumulate, but also
undergo physical and chemical transformations (Silamiķele 2010). The main
characteristics of peat are characterized by a number of indicators, such as degree of
decomposition, botanical composition, ash content, moisture, as well as natural
density, content and amount of organic matter, minerals and carbonates, pH,
conductivity, magnetic sensitivity, etc.
It is considered that re-naturalization of the cut-over peat fields as restoration of
the bog vegetation is not always useful. Other scenarios of re-cultivation, such as the
planting of berries, forests, sphagnum mosses or other paludicultures, are also
considered for rational use and management of these extracted peat fields depending
on site conditions and economical aspects. For the realisation of re-cultivation
measures, it is important to understand the parameters of the peat properties, the
thickness of the remaining peat layers and the character of the hydrological regime.
For the best way to assess the changes in the peat properties, research should be
undertaken in several differently affected areas, as data comparison and analysis is
required.
This study was based on the Lauga Bog investigations, which in the short term
was located at differently affected areas. The Lauga Bog as a research location was
chosen as it is one of the LIFE REstore project pilot areas, which aim to restore the
hydrological regime, and to provide a sustainable and responsible management for the
re-use of degraded peatlands in Latvia. Detailed multi-disciplinary studies of three
peat sections nearby in the same peatland area have been carried out for the first time,
which justifies the novelty of this study and also determines the need for investigation
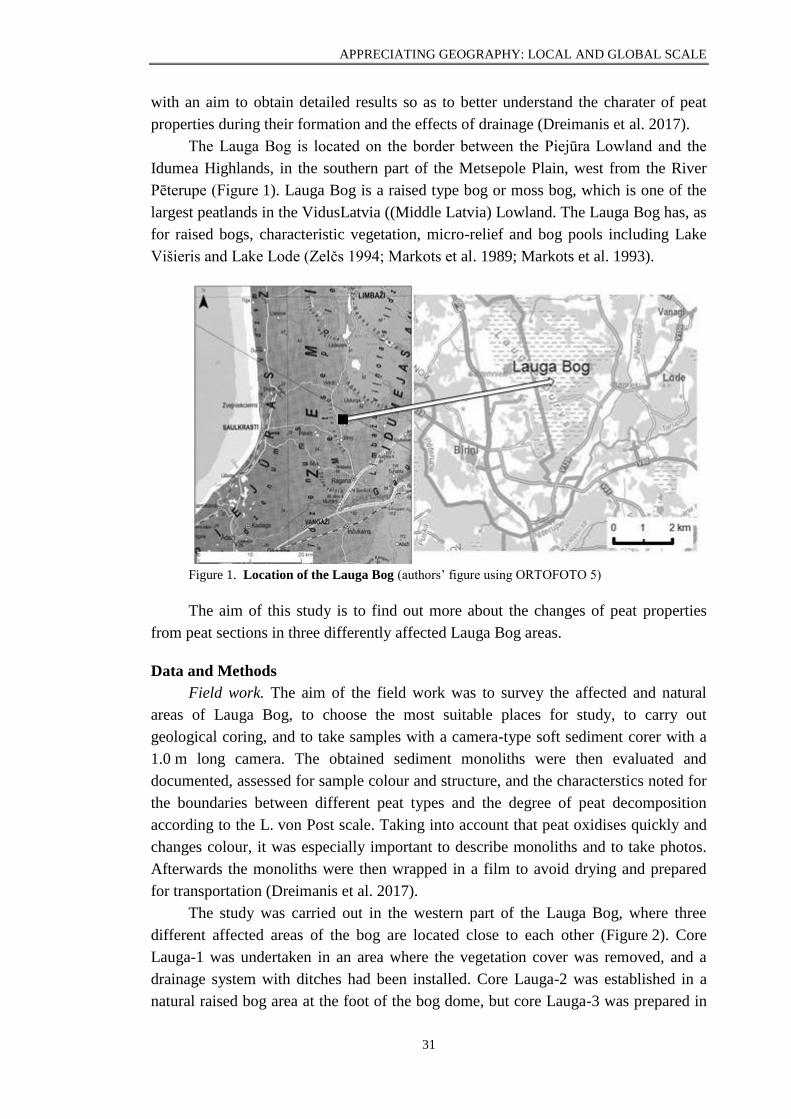
APPRECIATING GEOGRAPHY: LOCAL AND GLOBAL SCALE
31
with an aim to obtain detailed results so as to better understand the charater of peat
properties during their formation and the effects of drainage (Dreimanis et al. 2017).
The Lauga Bog is located on the border between the Piejūra Lowland and the
Idumea Highlands, in the southern part of the Metsepole Plain, west from the River
Pēterupe (Figure 1). Lauga Bog is a raised type bog or moss bog, which is one of the
largest peatlands in the VidusLatvia ((Middle Latvia) Lowland. The Lauga Bog has, as
for raised bogs, characteristic vegetation, micro-relief and bog pools including Lake
Višieris and Lake Lode (Zelčs 1994; Markots et al. 1989; Markots et al. 1993).
Figure 1. Location of the Lauga Bog (authors’ figure using ORTOFOTO 5)
The aim of this study is to find out more about the changes of peat properties
from peat sections in three differently affected Lauga Bog areas.
Data and Methods
Field work. The aim of the field work was to survey the affected and natural
areas of Lauga Bog, to choose the most suitable places for study, to carry out
geological coring, and to take samples with a camera-type soft sediment corer with a
1.0 m long camera. The obtained sediment monoliths were then evaluated and
documented, assessed for sample colour and structure, and the characterstics noted for
the boundaries between different peat types and the degree of peat decomposition
according to the L. von Post scale. Taking into account that peat oxidises quickly and
changes colour, it was especially important to describe monoliths and to take photos.
Afterwards the monoliths were then wrapped in a film to avoid drying and prepared
for transportation (Dreimanis et al. 2017).
The study was carried out in the western part of the Lauga Bog, where three
different affected areas of the bog are located close to each other (Figure 2). Core
Lauga-1 was undertaken in an area where the vegetation cover was removed, and a
drainage system with ditches had been installed. Core Lauga-2 was established in a
natural raised bog area at the foot of the bog dome, but core Lauga-3 was prepared in
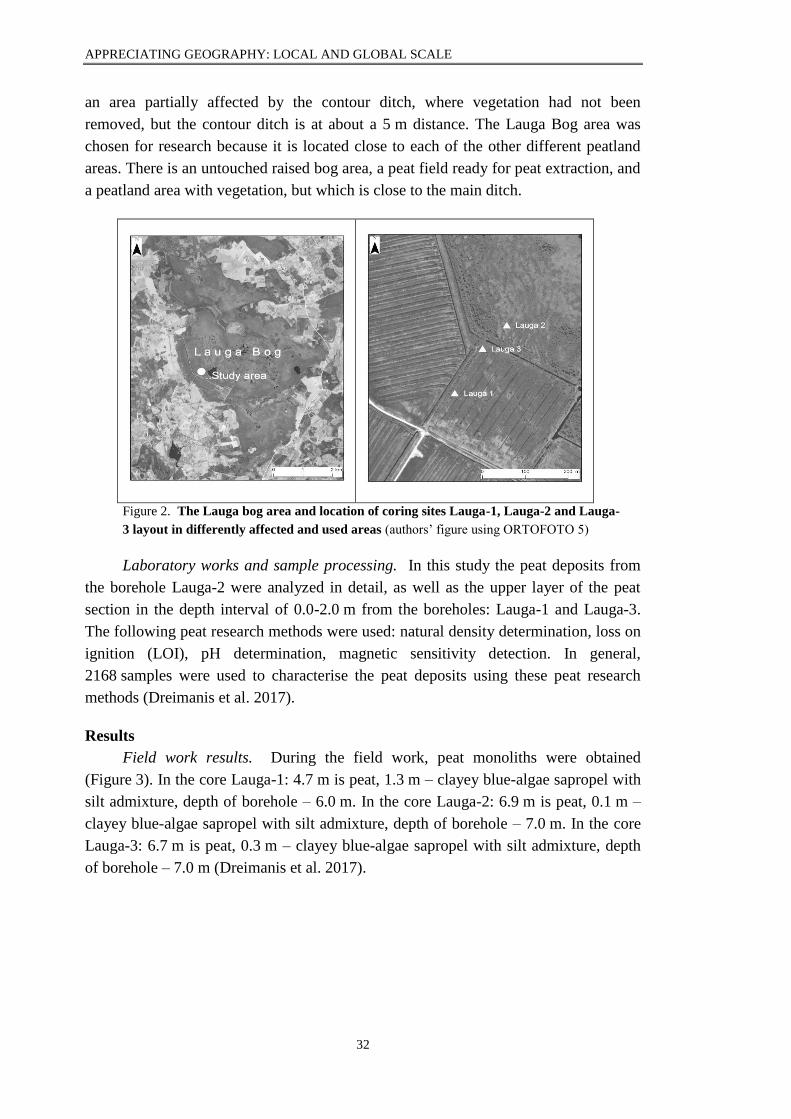
APPRECIATING GEOGRAPHY: LOCAL AND GLOBAL SCALE
32
an area partially affected by the contour ditch, where vegetation had not been
removed, but the contour ditch is at about a 5 m distance. The Lauga Bog area was
chosen for research because it is located close to each of the other different peatland
areas. There is an untouched raised bog area, a peat field ready for peat extraction, and
a peatland area with vegetation, but which is close to the main ditch.
Figure 2. The Lauga bog area and location of coring sites Lauga-1, Lauga-2 and Lauga-
3 layout in differently affected and used areas (authors’ figure using ORTOFOTO 5)
Laboratory works and sample processing. In this study the peat deposits from
the borehole Lauga-2 were analyzed in detail, as well as the upper layer of the peat
section in the depth interval of 0.0-2.0 m from the boreholes: Lauga-1 and Lauga-3.
The following peat research methods were used: natural density determination, loss on
ignition (LOI), pH determination, magnetic sensitivity detection. In general,
2168 samples were used to characterise the peat deposits using these peat research
methods (Dreimanis et al. 2017).
Results
Field work results. During the field work, peat monoliths were obtained
(Figure 3). In the core Lauga-1: 4.7 m is peat, 1.3 m – clayey blue-algae sapropel with
silt admixture, depth of borehole – 6.0 m. In the core Lauga-2: 6.9 m is peat, 0.1 m –
clayey blue-algae sapropel with silt admixture, depth of borehole – 7.0 m. In the core
Lauga-3: 6.7 m is peat, 0.3 m – clayey blue-algae sapropel with silt admixture, depth
of borehole – 7.0 m (Dreimanis et al. 2017).
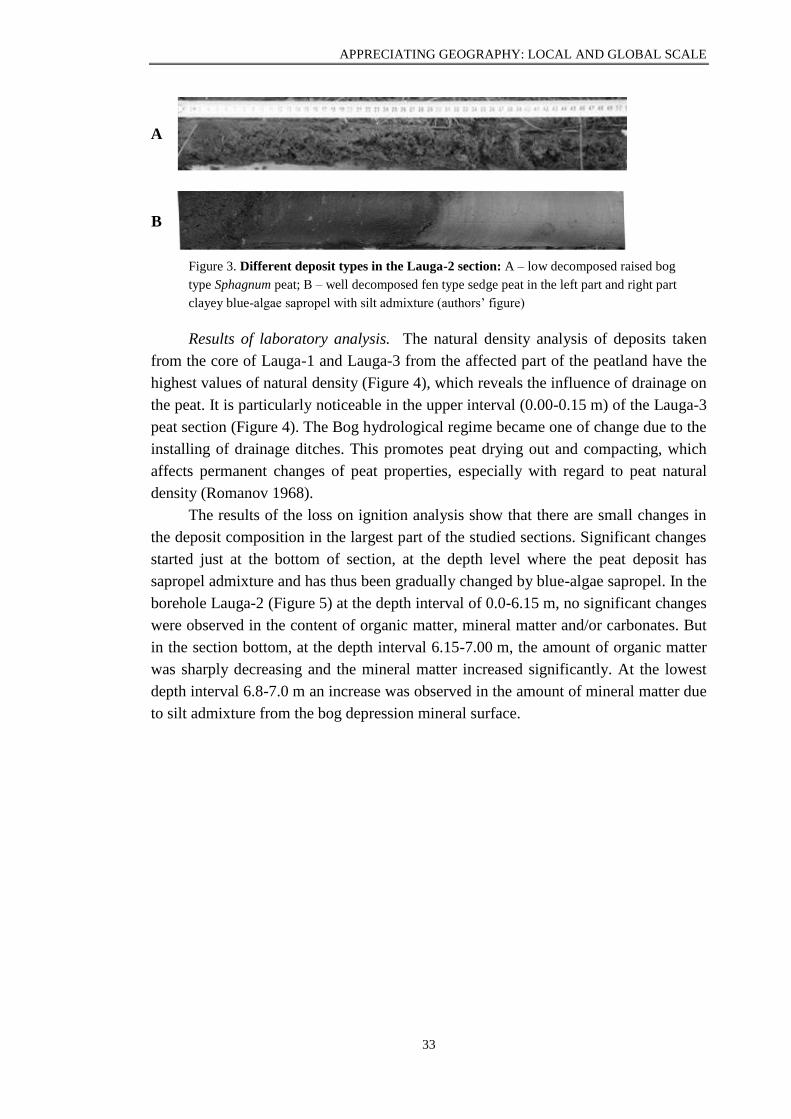
APPRECIATING GEOGRAPHY: LOCAL AND GLOBAL SCALE
33
A
B
Figure 3. Different deposit types in the Lauga-2 section: A – low decomposed raised bog
type Sphagnum peat; B – well decomposed fen type sedge peat in the left part and right part
clayey blue-algae sapropel with silt admixture (authors’ figure)
Results of laboratory analysis. The natural density analysis of deposits taken
from the core of Lauga-1 and Lauga-3 from the affected part of the peatland have the
highest values of natural density (Figure 4), which reveals the influence of drainage on
the peat. It is particularly noticeable in the upper interval (0.00-0.15 m) of the Lauga-3
peat section (Figure 4). The Bog hydrological regime became one of change due to the
installing of drainage ditches. This promotes peat drying out and compacting, which
affects permanent changes of peat properties, especially with regard to peat natural
density (Romanov 1968).
The results of the loss on ignition analysis show that there are small changes in
the deposit composition in the largest part of the studied sections. Significant changes
started just at the bottom of section, at the depth level where the peat deposit has
sapropel admixture and has thus been gradually changed by blue-algae sapropel. In the
borehole Lauga-2 (Figure 5) at the depth interval of 0.0-6.15 m, no significant changes
were observed in the content of organic matter, mineral matter and/or carbonates. But
in the section bottom, at the depth interval 6.15-7.00 m, the amount of organic matter
was sharply decreasing and the mineral matter increased significantly. At the lowest
depth interval 6.8-7.0 m an increase was observed in the amount of mineral matter due
to silt admixture from the bog depression mineral surface.
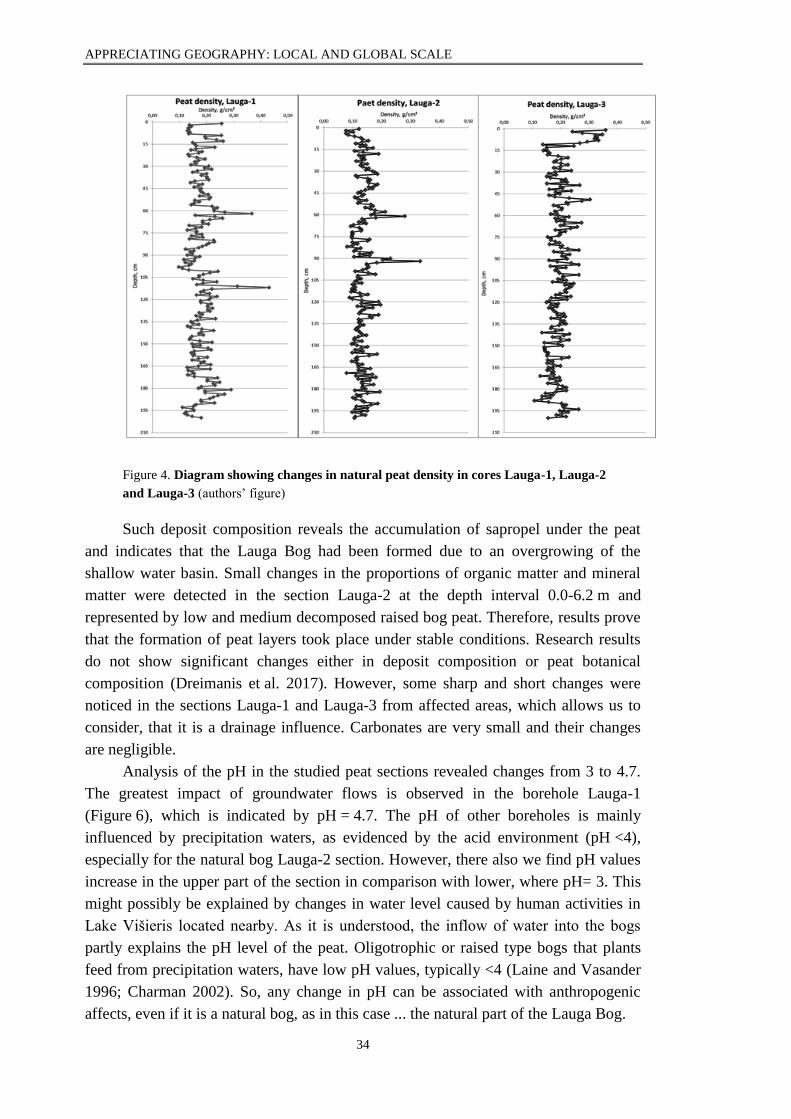
APPRECIATING GEOGRAPHY: LOCAL AND GLOBAL SCALE
34
Figure 4. Diagram showing changes in natural peat density in cores Lauga-1, Lauga-2
and Lauga-3 (authors’ figure)
Such deposit composition reveals the accumulation of sapropel under the peat
and indicates that the Lauga Bog had been formed due to an overgrowing of the
shallow water basin. Small changes in the proportions of organic matter and mineral
matter were detected in the section Lauga-2 at the depth interval 0.0-6.2 m and
represented by low and medium decomposed raised bog peat. Therefore, results prove
that the formation of peat layers took place under stable conditions. Research results
do not show significant changes either in deposit composition or peat botanical
composition (Dreimanis et al. 2017). However, some sharp and short changes were
noticed in the sections Lauga-1 and Lauga-3 from affected areas, which allows us to
consider, that it is a drainage influence. Carbonates are very small and their changes
are negligible.
Analysis of the pH in the studied peat sections revealed changes from 3 to 4.7.
The greatest impact of groundwater flows is observed in the borehole Lauga-1
(Figure 6), which is indicated by pH = 4.7. The pH of other boreholes is mainly
influenced by precipitation waters, as evidenced by the acid environment (pH <4),
especially for the natural bog Lauga-2 section. However, there also we find pH values
increase in the upper part of the section in comparison with lower, where pH= 3. This
might possibly be explained by changes in water level caused by human activities in
Lake Višieris located nearby. As it is understood, the inflow of water into the bogs
partly explains the pH level of the peat. Oligotrophic or raised type bogs that plants
feed from precipitation waters, have low pH values, typically <4 (Laine and Vasander
1996; Charman 2002). So, any change in pH can be associated with anthropogenic
affects, even if it is a natural bog, as in this case ... the natural part of the Lauga Bog.
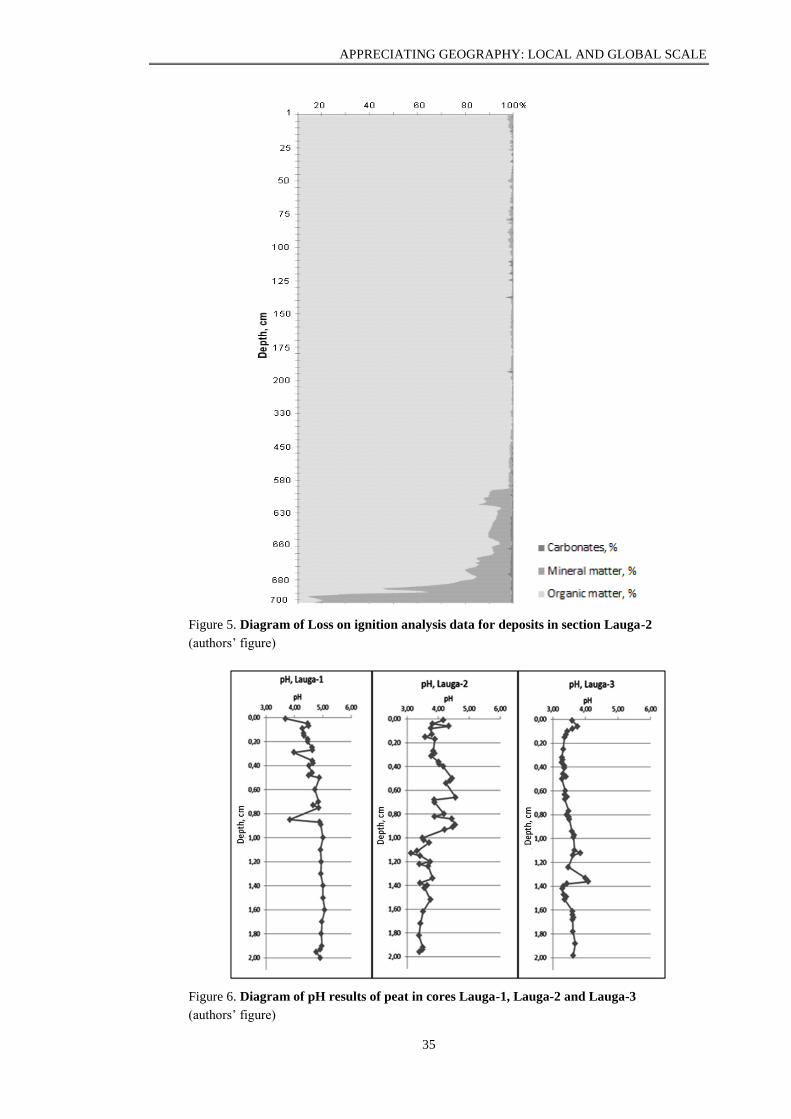
APPRECIATING GEOGRAPHY: LOCAL AND GLOBAL SCALE
35
Figure 5. Diagram of Loss on ignition analysis data for deposits in section Lauga-2
(authors’ figure)
Figure 6. Diagram of pH results of peat in cores Lauga-1, Lauga-2 and Lauga-3
(authors’ figure)
APPRECIATING GEOGRAPHY: LOCAL AND GLOBAL SCALE
36
Negative values for low and high frequency magnetic susceptibility of all
boreholes, mean values and their minimum differences indicate that no magnetically
susceptible minerals have been detected in the boreholes (Dreimanis et al. 2017).
Conclusion
The upper peat layer in the affected part of the bog (Lauga-1, Lauga-3) became
compacted due to drainage and natural density of peat increase and it is higher than in
the natural part of the Lauga Bog (core Lauga-2).
In the affected part of the bog, the core Lauga-1 has two intervals with a rapid
decrease in the amount of organic matter, while the section of the natural part (core
Lauga-2) has no significant changes in the peat composition which indicates deposit
formation under stable conditions.
More pronounced pH changes occur in the natural part of the bog, where pH
values are low in the lower part but tend to increase upwards from the depth interval,
probably also caused by anthropogenic impact. The highest pH values were detected
in the borehole Lauga-1.
In various affected parts of the bog in the range of 0.0-2.0 m, there are negative
magnetic susceptibility values indicating that there are no magnetically susceptible
minerals in the peat.
Changes of properties in peat sections from degraded areas are different and
reveal anthropogenic influence.
Kopsavilkums
Pētījuma mērķis ir noskaidrot, raksturot un salīdzināt kūdras nogulumu īpašības un to pārmaiņas
trīs urbumos, kas atrodas dažādi ietekmētās Laugas purva daļās. Lai noskaidrotu kūdras īpašības un to
pārmaiņas, tika veikti lauka pētījumi, tajā skaitā ģeoloģiskā urbšana un nogulumu paraugu iegūšana, lai
veiktu analīzes laboratorijā. Šīs analīzes ietvēra kūdras blīvuma noteikšanu, karsēšanas zudumu analīzi,
pH, magnētiskā jutīguma analīzi. Iegūtie rezultāti liecina, ka kūdras īpašības Laugas purva dažādi
ietekmētajās teritorijās ir atšķirīgas. Purva ietekmētajās daļās augšējā kūdras slānī ir raksturīgs lielāks
kūdras dabīgais blīvums un minerālvielu daudzums. Savukārt purva neskartajā daļā ir lielāks organisko
vielu daudzums, mazāks dabiskais blīvums, kā arī zemāks pH.
References
Aleksāns, O. (2015). Hidroloģiskie un ģeoloģiskie pētījumi Ziemeļu purvu dabas liegumā.
Pārskats. LIFE13 NAT/LV/000578. Prioritāro mitrāju biotopu aizsardzība un apsaimniekošana Latvijā.
Charman, D. (2002). Peatlands and Environmental Change. England: John Wiley & Sons Ltd.
Dreimanis, J., Kalniņa, L., Krīgere, I. and Paparde, L. (2017). Kūdras īpašību pētījumi dažādi
ietekmētajās Laugas purva teritorijās. In: Kļaviņš, M. (ed.) Rakstu krājums „Kūdra un sapropelis –
ražošanas, zinātnes un vides sinerģija resursu efektīvas izmantošanas kontekstā”. Latvijas Universitāte, 26–
30.
Kalniņa, L., Dreimanis, J., Ozola, I., Bitenieks, R., Dreimanis, I., Krīgere, I. and Nusbaums, J.
(2017). Kūdras īpašību izmaiņas dabas apstākļu un cilvēka darbības ietekmes rezultātā. In: Kļaviņš, M.
(ed.) Rakstu krājums „Kūdra un sapropelis – ražošanas, zinātnes un vides sinerģija resursu efektīvas
izmantošanas kontekstā”. Latvijas Universitāte. 51-54.
Laine, J. and Vasander, H. (1996). Ecology and vegetation gradients of peatlands. In: Vasander,
H. (ed). Peatlands in Finland. Helsinki: Finnish Peatland Society, 10-19.
APPRECIATING GEOGRAPHY: LOCAL AND GLOBAL SCALE
37
ORTOFOTO 5. ĢZZF WMS - LĢIA Latvijas 5. etapa ortofoto karšu mozaīka.
http://kartes.geo.lu.lv (23.01.2017).
Markots, A., Zelča L. and Zelčs, V. (1989). Augsto purvu fenomens. Zinātne un Tehnika, 11.
Markots, A., Zelča, L. and Zelčs, V. (1993). Dinamiskie sūnekļi. Latvijas daba: enciklopēdija.
2. sēj. Rīga: Gandrs, 20-21.
Nomals, P. (1930). Latvijas purvi. In: Putniņš, R. (ed.) Ģeogrāfiski raksti. Rīga: Latvijas
Ģeogrāfijas biedrība, 1-40.
Romanov, V.V. (1968). Hydrophysics of bogs. Kaner, N. (ed.) Jerusalem: Program for scientific
translations Ltd, Jerusalem. 1-299.
Silamiķele, I. (2010). Humifikācijas un ķīmisko elementu akumulācijas raksturs augsto purvu
kūdrā atkarībā no tās sastāva un veidošanās. Promocijas darbs. Rīga: Latvijas Universitāte.
Zelčs, V. (1994). Augstā purva mikroreljefs. Enciklopēdija “Latvijas Daba”, 1.sēj. Rīga.
HUMIC SUBSTANCES AND THE POTENTIAL OF THEIR USE
IN AGRICULTURE
Humusvielas un to izmantošanas iespējas lauksaimniecībā
Māris Kļaviņš, Jānis Šīre, Laura Kļaviņa
University of Latvia, Department of Environmental Science
Abstract. Most important properties of the major soil and peat organic component – humic substances -
have been compared, depending on their origin, including the isolation, basic properties, and recent
concepts about the structure of humic substances. The influence of humic substances on plant growth has
been re-assessed in light of the growing use of humic products in agriculture, and the most prospective
areas for humus application have been evaluated. The properties of humic substances possibly influencing
their impact on plant growth and, in general, their role in the environment have been analysed. Peat humic
substances have substantial potential for use in agriculture.
Keywords: natural organic matter; agriculture; biological activity
Introduction
Humic substances (HS) are the main component of soil and peat organic matter
(SOM), comprising up to 60 - 70% of content, but at the same time humic substances
can be considered as one of the key elements in the bio-geo-chemical turnover of
carbon, possibly being the most abundant of naturally occurring organic macro-
molecules on Earth (2 – 3 ×10¹⁰ t) (Jones and Bryan 1998). As far as HS are able to
interact with inorganic and organic substances, they act as carriers for the many
influencing fluxes of elements in the environment. They also play an important role in
the formation of fossil fuels and mineral deposits (MacCarthy 2001).
Humic substances are a general category of naturally occurring, biogenic,
heterogeneous organic substances that can generally be characterized as being yellow
to black in colour, of high molecular weight, and refractory (Aiken et al. 1985).
They consist of several groups of substances that, depending on their solubility,
can be grouped as: humin which is the fraction of humic substances that is not soluble
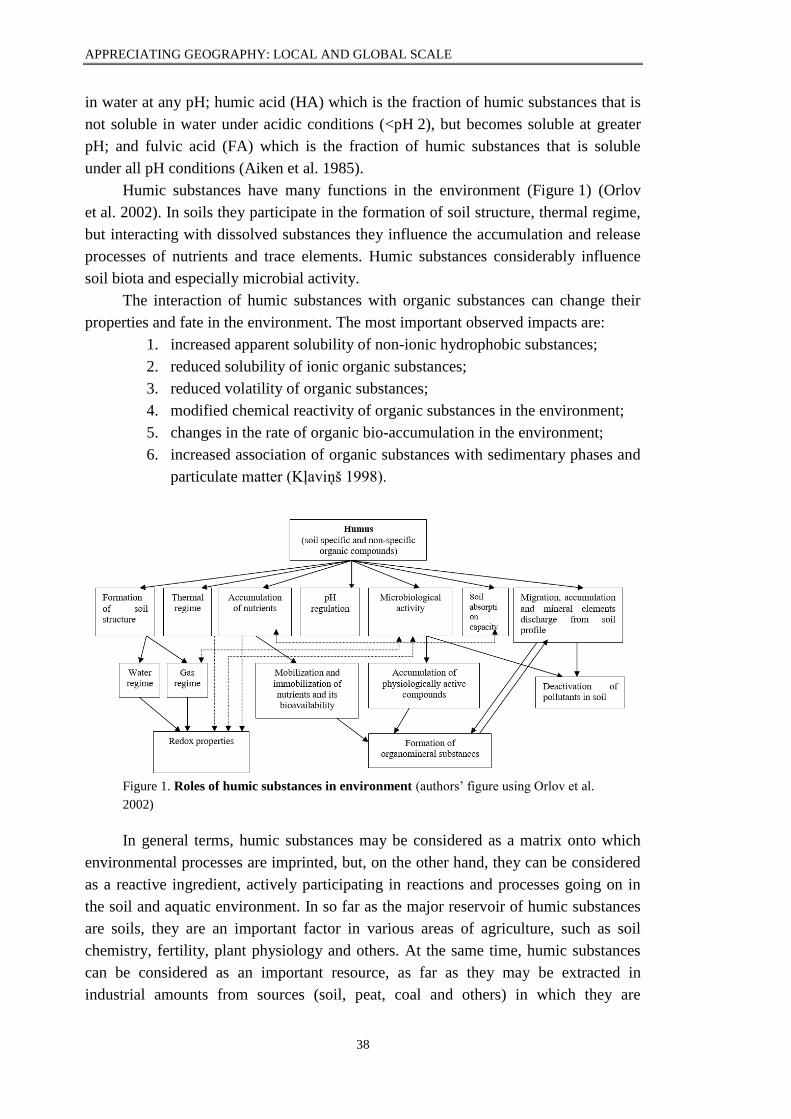
APPRECIATING GEOGRAPHY: LOCAL AND GLOBAL SCALE
38
in water at any pH; humic acid (HA) which is the fraction of humic substances that is
not soluble in water under acidic conditions (<pH 2), but becomes soluble at greater
pH; and fulvic acid (FA) which is the fraction of humic substances that is soluble
under all pH conditions (Aiken et al. 1985).
Humic substances have many functions in the environment (Figure 1) (Orlov
et al. 2002). In soils they participate in the formation of soil structure, thermal regime,
but interacting with dissolved substances they influence the accumulation and release
processes of nutrients and trace elements. Humic substances considerably influence
soil biota and especially microbial activity.
The interaction of humic substances with organic substances can change their
properties and fate in the environment. The most important observed impacts are:
1. increased apparent solubility of non-ionic hydrophobic substances;
2. reduced solubility of ionic organic substances;
3. reduced volatility of organic substances;
4. modified chemical reactivity of organic substances in the environment;
5. changes in the rate of organic bio-accumulation in the environment;
6. increased association of organic substances with sedimentary phases and
particulate matter (Kļaviņš 1998).
Figure 1. Roles of humic substances in environment (authors’ figure using Orlov et al.
2002)
In general terms, humic substances may be considered as a matrix onto which
environmental processes are imprinted, but, on the other hand, they can be considered
as a reactive ingredient, actively participating in reactions and processes going on in
the soil and aquatic environment. In so far as the major reservoir of humic substances
are soils, they are an important factor in various areas of agriculture, such as soil
chemistry, fertility, plant physiology and others. At the same time, humic substances
can be considered as an important resource, as far as they may be extracted in
industrial amounts from sources (soil, peat, coal and others) in which they are
APPRECIATING GEOGRAPHY: LOCAL AND GLOBAL SCALE
39
abundant and consecutively applied to achieve or increase their positive impacts. The
various roles of humic substances in soil environments, and their possible use in
agriculture has been examined in recent reviews (Nardi et al. 2002), but the area of
their use is steadily growing and thus systematization of available knowledge can be
important to develop the most rational ways of application and development of new
roles.
Therefore, this paper aims to re-assess the areas of use of humic substances in
agriculture, analysing the latest knowledge about the structure of humic substances,
their functions in environmental processes, including their physiological effects, the
character of interaction between humic substances and soil ingredients, nutrients, trace
elements and other biologically active substances of importance for agricultural
applications. This knowledge can be important considering recently developed
technologies for humus extraction, many new applications of humic substances and
the growing market of industrially produced humic substances.
Isolation and basic properties of humic substances
Humic substances are generally extracted from soil and peat by treating with
alkaline solutions (Stevenson 1994) while humic and fulvic acids are solubilised, but
the residue contains the humin. After the acidification of the alkaline extract by
addition of a strong acid, humic acid precipitates the remaining organic material in the
solution and is referred to as the fulvic acid (Stevenson 1994). Further purification is
often needed to clean up the HA and to separate the FA from other materials in the
fulvic acid fraction, as well as to reduce the ash contents of the humic and fulvic
extracts, and to fully convert the acid salts to their hydrogen forms. Evidently quite a
lot of chemical degradation occurs during the extraction of HS. Thus, base-extracted
HS is generally a combination of native and altered materials. The extracted HS are
frequently dried by conventional evaporation or by lyophilization. Many other
extraction procedures and variations have been used, some involving various organic
solvents such as dimethylsulfoxide, dimethylformamide, and formic acid (Hayes and
Clapp 2001). It is not surprising that materials extracted from soils or sediments
according to procedures based on the above definitions actually consist of mixtures,
and their properties depend on the specific conditions of extraction. Nevertheless,
there is a remarkable uniformity in the average properties of all HA, FA, and humins
(Schnitzer and Khan 1972). The elemental contents of HA, FA from very different
sources are remarkably consistent (Kļaviņš 1998). Humic acids have been reported to
have an average MW varying from about 800 Da for aquatic materials to greater than
1×10⁶ Da for soil - and peat derived materials (Kļaviņš 1998). Humic substances have
an abundance of oxygen-containing functional groups (carboxyl-, phenolic-, alcoholic-
) which dominate their chemical properties. Humic substances occur in close
association with other organic and inorganic materials in soil and sediments. Aquatic
HS also occur in association with non-humic materials and may exist in colloidal or
larger aggregate forms.
APPRECIATING GEOGRAPHY: LOCAL AND GLOBAL SCALE
40
Interaction between humic substances, nutrients and trace elements
The influence of soil humus on plant growth is much regulated through ion
uptake, and these influences have been studied by Vaughan and Malcom (1985), Chen
and Aviad (1990), Varanini and Pinton (2001). The effects of HS on ion uptake are
more or less selective and variable in respect to their concentration and to the pH of
the medium (Clapp etal. 1998). HS may stimulate NO3-, SO4
-2 and K+ uptake by barley
and oat seedlings (Maggioni et al. 1987). The most significant stimulatory effect has
been found considering NO3- uptake in oat roots.
The complexation of metals by humic substances is of particular interest because
this complexation alters the toxicity and bio-availability of metal ions. The
complexation of metals ions much reduce their toxicity in comparison with the free,
hydrated metal ions (Florence and Batley 1980), however, substantial differences exist
between different metal ions and the modification of metal ion toxicity depends also
on properties of humic matter (Winner 1984). The interaction of humic substances
with metals is important in plant nutrition and availability of metal ions as well as
nutrients to plants in soils is a function of the speciation of the metals in the soil
solutions surrounding the plant roots (Jarvis 1981). Considering the much differing
toxicity and biological availability of different speciation forms it is thus important to
consider not so much the total amount of metals, but rather their extractable forms
(Alvarez et al. 2002). Humic substances exist both in the bound and in the dissolved
phase. In the solid phase humic substances are present as coatings on mineral grains
and possibly, in some instances, as separate particles. The most common type of
interaction of metal ions with humic substances is ion exchange, in which protons on
carboxylic acid groups are replaced by metal ions.
Most of the studies on the interaction of humic substances with anions have been
concerned with the interactions of phosphorus species with humic substances as far as
phosphorus is an essential plant nutrient. In the pH range of most natural waters and
soils the predominant orthophosphate species in solution is H2PO4-. Orthophosphate
reacts with Fe(III) and dissolved humic substances to form high molecular weight
complexes (Francko 1986). At the present time, mechanisms of phosphorus cycling in
the environment have not yet been clearly elucidated; however, it is apparent that
Fe(III)-humic substances-orthophosphate complexes are an important part of this
cycling.
Interaction between humic substances and organic molecules of importance for
agricultural plants
Organic compounds interact with humic substances in a number of different
ways. Non-ionic organic compounds partition into insoluble humic substances in soils,
whereas soluble humic substances solubilize non-ionic organics (Wershaw et al. 1969;
Chiou et al. 1983). Ionic organic compounds can undergo ionic exchange reactions
and charge-transfer complexation. In addition, some evidence exists for oxidative
coupling reactions between xenobiotic organic compounds and humic substances. The
APPRECIATING GEOGRAPHY: LOCAL AND GLOBAL SCALE
41
absorbtion of non-ionic organic compounds by wet soils involves partitioning of the
organic compounds between the soil-water phase and the soil-organic phase. An
analogous process to partitioning into an insoluble organic phase is the solubilization
of hydrophobic organic compounds by dissolved humic substances. It has been found
that humic acid enhances the solubility of DDT, but also of other hydrophobic
pesticides in water (Misra et al. 1996). This increase in solubility is apparently brought
about by the partitioning of the DDT molecules in the hydrophobic interiors of humic
acid micelles. In a number of studies a variety of other hydrophobic organic
compounds have been included as well as other humic substances, and a generally
similar solubilization behaviour has been found (Misra et al. 1996; Shaw et al. 2000;
Loffredo et al. 1999).
A number of different types of ionic interactions have been reported between
humic substances and organic compounds. In the simplest case, the organic compound
exists in solution as cations that can be bound by carboxylate groups of humic
substances. Amino acids and triazine herbicides would bind to humic substances by
this mechanism at low pH values where the nitrogen containing groups would be
protonated, but hydrogen bonding can also take place between humic substances and
basic herbicides such as substituted urea herbicides (Kam and Gregory 2001). The
groups most likely to enter into hydrogen-bonding interactions would be hydroxyl and
carboxylic acid groups on the surfaces of the humic substance membrane-like
aggregates (Kļaviņš 1998).
Impact of humic substances on metabolic processes in plants
The suggestion that HS can have a direct effect on plant metabolism, considers
that these substances are taken up into plant tissues (Vaughan and Malcom 1985). As
far as they have a poly-anionic (acid) nature, HS could simply act as surface-active
molecules (Nardi et al. 1991). By decreasing the pH at the surface of the plasma
membranes of root cells, HS may counteract the alkalinization which occurs when
NO3- is used as an N source (Raven and Smith 1976).
The plasma membranes of plant cells possess several redox activities that can be
related to both plant nutrition and cell wall formation and lignification. In this context,
it has been shown that, in oat roots, HS inhibited NADH oxidation in either the
presence or absence of an artificial electron acceptor (ferricyanide) (Pinton et al.
1995).
There are many reports showing that HS, extracted from a wide range of soils,
were able to enhance respiration of higher plants (Vaughan and Malcom 1985), with
the effects of FA more pronounced than that of HA. These results have been
interpreted in varying ways. At first, humic substances can act as substrates or
respiratory chain catalysts, but they can also stimulate the peroxidase (Muscolo et al.
1993). A second aspect that has been examined concerns photosynthesis. Even in this
case, our information is fragmentary and not very recent. Although indirect, the most
prominent effect of HS application to growing plants was an increase of chlorophyll
APPRECIATING GEOGRAPHY: LOCAL AND GLOBAL SCALE
42
content which, in turn, could affect photosynthesis (Sladky 1959). However, the
increase of chlorophyll alone did not necessarily result in higher yields. HS, applied to
the growth solution, stimulated enzyme activities related to the photosynthetic
sulphate reduction pathway. This positive effect of HS has also been observed on the
main photosynthetic metabolism in maize leaves, where a decrease in starch content
was accompanied by an increase of soluble sugars (Merlo et al. 1991). This change
appeared to be mediated by variations of the activity of the main enzymes involved in
carbohydrate metabolism.
Applications of humic substances in agriculture
Composts originating from animal manures, sewage sludge or paper-mill sludge
have been shown to contain large amounts of humic substances (Garcia et al. 1995;
Maggioni et al. 1987; Valdrighi et al. 1996). Studies of the positive effects of these
humic substances on plant growth, when full requirements for mineral nutrition have
been met, have resulted in consistently positive effects on growth independent of
nutrition (Chen and Aviad 1990). For instance, in controlled experiments, humic
substances increased dry matter yields of corn and oat seedlings; numbers and lengths of
tobacco roots (Mylonas and Mccants 1980); dry weights of shoots, roots, and nodules of
soybean, peanut, and clover plants (Tan and Tantiwiramanond 1983); vegetative growth
of chicory plants (Valdrighi et al. 1996); and induced shoot and root formation in
tropical crops grown in tissue culture (Goenadi and Sudharama 1995). The typical
growth response curves that have been reported to result from treating plants with humic
substances show progressively increased growth with increasing concentrations of
humic substances, but there is usually a decrease in growth at higher concentrations of
the humic materials (Chen and Aviad 1990). Hypotheses accounting for this stimulatory
effect of humic substances at low concentrations are numerous, the most convincing of
which suggests a "direct" action on the plants, which is hormonal in nature, together
with an "indirect" action on the metabolism of soil micro-organisms, the dynamics of
uptake of soil nutrients, and soil physical conditions (Casenave de Sanfilippo et al. 1990;
Chen and Aviad 1990; Muscolo et al. 1993, 1996, 1999). Other mechanisms which have
been suggested to account for promotion of plant growth by humic substances include:
enhanced uptake of metallic ions and increases in cell permeability (Chen and Aviad
1990).
During the last decade, the biological activities of humic substances, particularly
those derived from earthworm faeces, have begun to be investigated. Dell'Agno1a and
Nardi (1987) reported hormone-like or plant-growth regulator effects, of
depolycondensed humic fractions obtained from the faeces of the earthworms
Apporectodea rosea (Eisen) and Apporectodea caliginosa (Sav), on plants. Nardi et al.
(1988) reported that humic materials produced in the faeces of A. rosea and
A. caliginosa exhibited auxin-, gibberellin-, and cytokinin-like activities. Treating
carrot cells with humic substances obtained from the faeces of the earthworm A. rosea
APPRECIATING GEOGRAPHY: LOCAL AND GLOBAL SCALE
43
increased their growth and induced morphological changes similar to those produced
by auxins (Muscolo et al. 1999).
In a recent study (Atiyeh et al. 2002) some effects of humic acids, formed during
the breakdown of organic wastes by earthworms (vermicomposting), on plant growth
were evaluated. The incorporation of vermicompost derived humic acids, into either
type of soilless plant growth media, increased the growth of tomato and cucumber
plants significantly, in terms of plant heights, leaf areas, shoot and root dry weights.
Plant growth increased with growing concentrations of humic acids incorporated into
the medium up to a certain proportion, but this differed according to the plant species,
the source of the vermicompost, and the nature of the container medium. Plant growth
tended to be increased by treatments of the plants with 50-500 mg/kg humic acids, but
often decreased significantly when the concentrations of humic acids derived in the
container medium exceeded 500 – 1000 mg/kg. These growth responses were most
probably due to the hormone-like activity of humic acids from the vermicomposts or
could have been due to plant growth hormones adsorbed onto the humates.
Conclusions
In contrast to the highly specialized and individualized roles of molecules in
biological processes, the functions of HS in the environment do not necessitate the
participation of specific molecules. The functions of HS in the soil environment (such
as pH-buffering, binding of clay particles, serving as a reservoir for various micro-
nutrient metal ions, sequestration and transport of metal ions, retaining moisture, etc.)
are less specific than those in biological systems. In fact, the general functions of HS
in the soil could, in principle, be satisfied by many of the direct, unaltered products of
living cells such as proteins, poly-saccharides, or poly-nucleotides. The molecular
heterogeneity that is characteristic of HS serves a vital role in the ecological system.
Humic substances constitute the only natural organic material that can survive in bulk
and still possess the requisite chemical reactivity to perform the various functions for
sustaining soil quality and promoting plant growth.
It is clear from the above that HS may positively influence higher plant
metabolism. Still, the yet unknown nature of HS prevents us from drawing more
conclusive results concerning the effects of HS on plant growth. We can only consider
that HS appear to influence the metabolism of plant cells at different levels. Their
effects may, therefore, be different and be additive, overlapping, or, in some cases,
mechanistic related. This apparently puzzling situation can be, however, rationalized
by hypothesizing that HS have several targets that can be explained partly by their
chelating capacity and partly by their hormone-like activity. This is not surprising,
considering the complex and differentiated nature of HS. Therefore, more research is
necessary to explain the positive effects of HS on higher plants. In particular these
studies have to be, primarily, focused on the following topics: (1) the availability of
humus in the soil solution and in the rhizosphere; (2) the link between humus activity
APPRECIATING GEOGRAPHY: LOCAL AND GLOBAL SCALE
44
and the presence in the soil solution of active metabolites of various microbes; and
(3) the use of more characterized HS in experiments on plant metabolism.
Acknowledgement
This study was supported by the Latvia Science Council project “Properties and
structure of peat humic substances and possibilities of their modification”
(lzp-2018/1-0009).
Kopsavilkums
Rakstā aplūkotas nozīmīgākās augsnes un kūdras galvenās organiskās sastāvdaļas – humusvielu
īpašības atkarībā no to izdalīšanas apstākļiem, izcelsmes, kā arī to iespējamie struktūras modeļi. Izvērtēts
humusvielu iespējamās darbības modelis uz augiem, kas varētu būt pamatā humusvielu saturošu preparātu
izmantošanai augu augšanas nodrošināšanai un stimulēšanai.
References
Aiken, G.R., McKnight, D.M. and Wershaw, R.L. (1985). Humic substances in soil, sediment,
and water. Geochemistry, Isolation and Characterization. New York: Wiley.
Alvarez, E.A., Mochon, M.C., Sanchez, J.C.J. and Rodriguez, M.T. (1998). Heavy metal
extractable forms in sludge from wastewater treatment plants. Chemosphere, 47, 765-775.
Atiyeh, R.M., Lee, S., Edwards, C.A., Arancon, N.Q. and Metzger, J.D. (2002). The influence of
humic acids derived from earthworm-processed organic wastes on plant growth. Bioresource Technology,
84, 7-14.
Casenave de Sanfilippo, E., Arguello, J.A., Abdala, G., and Orioli, G.A. (1990). Content of Auxin-,
inhibitor- and Gibberellin-like substances in humic acids. Biologia Plantarum, 32, 346-351.
Chen, Y. and Aviad, T. (1990). Effects of humic substances on plant growth. In: MacCarthy, P.,
Clapp, C.E., Malcolm, R.L. and Bloom, P.R. (eds.) Humic Substances in Soil and Crop Sciences:
Selected Readings. Madison, Wisconsin: ASA and SS SA, 161-186.
Chiou, C.T., Porter, P.E., and Schmedding, D.W. (1983). Partition equilibria of nonionic organic
compounds between soil organic matter and water. Environmental Science & Technology, 17, 227-231.
Clapp C.E., Liu R., Cline V.W., Chen Y. and Hayes M.H.B. (1998). Humic substances for
enhancing turfgrass growth. In: Davies, G. and Ghabour, E.A. (eds.) Humic substances: structures,
properties and uses, London: RSC, 227-233.
Dell'Agnola, G. and Nardi, S. (1987). Hormone-like effect and enhanced nitrate uptake induced
by depolycondensed humic fractions obtained from Allobophora rosea and A. caliginosa faeces.
Biology and Fertility of Soils, 4, 115-118.
Francko, D.A. (1986). Epilimnetic phosphorus cycling: influence of humic materials and iron on
co-existing major mechanisms. Canadian Journal of Fisheries and Aquatic Sciences, 43, 302-310.
Florence, T. M. and Batley, G. E. (1980). Chemical speciation in natural waters. Critical
Reviews in Analytical Chemistry, 9, 219-296.
Garcia, C., Ceccanti, B., Masciandaro, G. and Hemandez, T. (1995). Phosphatase and p-
glucosidase activities in humic substances from animal wastes. Bioresource Technology, 53, 79-87.
Goenadi, D.H. and Sudharama, I.M. (1995). Shoot initiation by humic acids of selected tropical
crops grown in tissue culture. Plant Cell Reports, 15, 59-62.
Hayes, M.H.B. and Clapp, C.E. (2001). Humic substances: considerations of compositions,
aspects of structure and environmental influences. Soil Science, 166 (11), 723-737.
Jarvis, S.C. (1981). Copper sorption by soils at low concentrations and relation to uptake by
plants. Journal of Soil Science, 32, 257-269.
Jones, M.N. and Bryan, N.D. (1998). Colloidal properties of humic substances. Advances in
Colloid and Interface Science, 78, 1-48.
APPRECIATING GEOGRAPHY: LOCAL AND GLOBAL SCALE
45
Kam, S.K. and Gregory, J. (2001). The interaction of humic substances with cationic
polyelectrolytes. Water Research, 35 (15), 3557-3566.
Kļaviņš, M. (1998). Aquatic humic substances. Rīga: LU.
Kļaviņš, M., Seržāne, J. and Babre, K. (1999). Catalytic activity of humic substances in
degradation and transformation of xenobiotics: hydrolysis reactions of p-nitrophenylacetate. Latvijas
Ķīmijas Žurnāls, 1, 87-92.
Loffredo, E., D’Orazio, V., Brunetti, G. and Senesi, N. (1999). Adsorption of chlordane onto
humic acids from soils and pig slurry. Organic Geochemistry, 30, 443-451.
MacCarthy, P. (2001). The principles of humic substances. Soil Science, 166 (13), 738-751.
Maggioni, A., Varanini, Z., Nardi, S. and Pinton, R. (1987). Action of soil humic matter on plant
roots: stimulation of ion uptake and effects on (Mg+2 K+) ATPase activity. Science of the Total
Environment, 62, 355-363.
Merlo, L, Ghisi, R., Rascio, N. and Passera, C. (1991). Effects of humic substances on
carbohydrate metabolism of maize leaves. Canadian Journal of Plant Science, 71, 419-425.
Misra, V., Pandey, S.D. and Viswanathan, P.N. (1996). Binding of gamma-
hexachlorocyclohexane with humic acid and chlorophyll in aquatic environment in relation to
ecotoxicity. International Journal of Environmental Analytical Chemistry, 64, 257-264.
Muscolo, A., Bovalo, F., Gionfriddo, F. and Nardi, S. (1999). Earthworm humic matter produces
auxin-like effects on Daucus cardia cell growth and nitrate metabolism. Soil Biology and Biochemistry,
31, 1303-1311.
Muscolo, A., Felici, M., Concheri, G. and Nardi, S. (1993). Effect of earthworm humic
substances on esterase and peroxidase activity during growth of leaf explants of Nicotiani
plumbaginifolia. Biology and Fertility of Soils, 15, 127-131.
Muscolo, A., Panuccio, M.R., Abenavoli, M.R., Concheri, G. and Nardi, S. (1996). Effect of
molecular complexity and acidity of earthworm faeces humic fractions on glutamate dehydrogenase,
glutamine synthetase, and phosphenolpyruvate carboxylase in Daucus cardia IX II cell. Biology and
Fertility of Soils, 22, 83-88.
Mylonas, V.A. and Mccants, C.B. (1980). Effects of humic and fulvic acids on growth of
tobacco. I. Root initiation and elongation. Plant and Soil, 54, 485-490.
Nardi, S., Arnoldi, G. and Dell' Agnola, G. (1988). Release of the hormone-like activities from
Allolobophora rosea and A. caliginosa faeces. Canadian Journal of Soil Sciences, 68, 563-567.
Nardi, S., Concheri, G. and Dell'Agnola, G. (1996). Biological activity of humic substances. In:
Piccolo, A., (ed.) Humic Substances in Terrestrial Ecosystems. Amsterdam: Elsevier, 361-406.
Nardi, S., Concheri, G., Dell'Agnola, G. and Scrimin, P. (1991). Nitrate uptake and ATPase activity
in oat seedlings in the presence of two humic fractions. Soil Biology and Biochemistry, 23, 833-836.
Nardi, S., Pizzeghello, D., Reniero, F., Rascio, N. (2000). Chemical and biochemical properties
of humic substances isolated from forest soils and plant growth. Soil Science Society of America
Journal, 64, 639-645.
Nardi, S., Pizzeghello, D., Muscolo, A. and Vianello A. (2002). Physiologial effects of humic
substances on higher plants. Soil Biology and Biochemistry, 34, 1527-1536.
Orlov, D.S. (1990). Soil humic acids and general humification theory. Moscow: MGU.
Piccolo, A., Nardi, S. and Concheri, G. (1992). Structural characteristics of humus and biological
activity. Soil Biology and Biochemistry, 24, 273-380.
Pinton, R., Cesco, S., Santi, S. and Varanini, Z. (1995). Effect of soil humic substances on
surface redox activity of oat roots. Journal of Plant Nutrition, 18, 2111-2120.
Pizzeghello, D., Nicolini, G. and Nardi, S. (2001). Hormone-like activity of humic substances in
Fagus sylvatica forests. New Phytologist, 151, 647-657.
Raven, J.A. and Smith, F.A. (1976). Nitrogen assimilation and transport in vascular land plants
in relation to intracellular pH regulation. New Phytologist, 76, 415-431.
APPRECIATING GEOGRAPHY: LOCAL AND GLOBAL SCALE
46
Schnitzer, M. and Khan, S.U. (1972). Humic substances in the environment. New York: Marcel
Dekker.
Schulten, H.R. and Schnitzer, M. (1993). A state of the art structural concept for humic
substances. Naturwissenschaften, 80, 29-30.
Senesi, N., Sposito, G. and Martin, J.P. (1986). Copper(II) and iron(III) complexation by soil
humic acids: and IR and ESR study. Science of the Total Environment, 55, 851-362.
Shaw, L.J., Beaton, Y., Glover, L.A., Killham, K., Osborn, D. and Meharg, A.A. (2000).
Bioavailability of 2,4-dichlorphenol associated with soil water-soluble humic material. Environmental
Science & Technology, 34 (22), 4721-4726.
Sladky, Z. (1959). The effect of extracted humus substances on growth of tomato plants.
Biologia Plantarum, 1, 142-150.
Stevenson, F.J. (1991). Organic matter-micronutrient reactions in soil. In: Mortvedt, J.J., Cox,
E.R., Shuman, L.M., Welch, R.M. (eds.) Micronutrients in Agriculture. Madison: Soil Science Society
of America, 145-186.
Stevenson, F.J. (1994). Humus Chemistry: Genesis, Composition, Reactions, Second Edition.
New York: Wiley, 496.
Tan, K.H. and Tantiwiramanond, D. (1983). Effect of humic acids on nodulation and dry matter
production of soybean, peanut, and clover. Soil Science Society of America Journal, 47, 1121-1124.
Tipping, E. (1986). Some aspects of the interactions between particulate oxides and aquatic
humic substances. Marine Chemistry, 18, 161-169.
Tipping, E. (1994). WHAM – a chemical equilibrium model and computer code for waters,
sediments and soils incorporating a discrete site/electrostatic model of ion-binding by humic substances.
Computers & Geosciences, 20 (6), 973-1023.
Valdrighi, M.M., Pera, A., Agnolucci, M., Frassinetti, S., Lunardi, D. and Vallini, G. (1996).
Effects of compost-derived humic acids on vegetable biomass production and microbial growth within a
plant (Cichorium intybus)-soil system: a comparative study. Agriculture, Ecosystems and Environment,
58, 133-144.
Varanini, Z., Pinton, R. (1995) Humic substances and plant nutrition. In: Liittge, U. (ed.)
Progress in Botany 56. Berlin: Springer, 97-117.
Varanini, Z. and Pinton, R. (2001). Direct versus indirect effects of soil humic substances on
plant growth and nutrition. In: Pinton, R., Varanini, Z. and Nannipieri, P. (eds.) The Rizosphere. Basel:
Marcel Dekker, 141-158.
Vaughan, D. and Malcom, R.E. (1985). Influence of humic substances on growth and
physiological processes. In: Vaughan D. and Malcom R.E. (eds.) Soil Organic Matter and Biological
Activity. Dordrechts: Martinus Nijhoff Junk W., 37-76.
Vaughan, D. and Ord, E.G. (1981). Uptake and incorporation of 14C-labelled soil organic matter
by roots of Pisum. sativum L. Journal of Experimental Botany, 32, 679-687.
Visser, S.A. (1987). Effect of humic substances on mitochondrial respiration and oxidative
phosphorylation. The Science of the Total Environment, 62, 347-354.
Wershaw, R.L. (1989). Application of a membrane model to the sorptive interactions of humic
substances. Environmental Health Perspectives, 83, 191-203.
Wershaw, R.L. (1993). Model for humus. Environmental Science & Technology, 27 (5), 814-
817.
Wershaw, R.L., Bulcar, P.J. and Goldberg, M.C. (1969). Interaction of pesticides with natural
organic material. Environmental Science & Technology, 3, 271-273.
Wershaw, R.L. & Pinckney, D.J. (1973). Determination of the association and dissociation of humic
acid fractions by small angle X-ray scattering. Journal of Research of the U.S. Geological Survey, 1, 701-707.
Winner, R.W. (1984). The toxicity and bioaccumu1ation of cadmium and copper as affected by
humic acid. Aquatic Toxicology, 5, 267-274.
APPRECIATING GEOGRAPHY: LOCAL AND GLOBAL SCALE
47
CHARACTERISTICS OF PEAT PROPERTIES FROM
EXTRACTED PEATLANDS IN THE CONTEXT OF
SUSTAINABLE MANAGEMENT
Izstrādāto purvu kūdras īpašību raksturojums
ilgtspējīgas apsaimniekošanas kontekstā
Reinis Bitenieks, Laimdota Kalniņa, Ingrīda Krīgere, Jānis Dreimanis
University of Latvia, Faculty of Geography and Earth Sciences
Abstract. The degradation level and re-cultivation possibilities of extracted peat fields have usually been
evaluated using data from vegetation studies, and partly from hydrological measurements. Very little
attention has been paid to the remaining peat layer properties; however, this is important for the planning
and choice of scenario for re-cultivation. The aim of this study has been to investigate the properties of the
remaining peat section with special attention to the top layer. This research project included the following
laboratory methods: loss – on ignition method, pH, degree of peat decomposition botanical composition
and natural peat density analysis. The results of this study point to those peat properties that are changing
due to extraction processes. The obtained results suggest that peat properties in the studied affected
peatlands vary differently. The top layers of the peat section have a higher natural density and increased
amount of mineral matter. The main changes observed were in the peat natural moisture, pH, mineral
content, degradation rates, and ash content, which in the extracted peat field were associated with
hydrological regime modification.
Keywords: deposit composition, natural density, botanical composition, degree of decomposition, pH
Introduction
Peat is the natural resource of Latvia whose potential for use is important for the
development of the country, but which is not yet fully understood and has not
achieved its full economic potential. It is also necessary to identify which re-
cultivation measures should be promoted as being more efficient, economical and
more bio-diversity friendly with the least possible negative impact on climate change.
When the peatland is being prepared for peat cutting, the vegetation is removed
in the planned extraction area and the hydrological regime is changed by the drainage
system. The part of mineral matter increases in the content of peat, especially at the
top of the section with resultant peat compaction. Upon completion or discontinuation
of peat extraction, the remaining top layer of peat differs by the degree of its natural
density, as well as other peat properties, including the proportion of mineral parts in
the peat composition and the degree of decomposition.
By exploring and studying the degraded peat fields, the focus, so far, has been
on the analysis of peatland vegetation, most often assessing its re-generation potential.
In order to select the most suitable type of re-cultivation, it is necessary to carry out
research and to evaluate the state of each specific peat field and the properties of the
remaining layer of peat (Lācis 2010). Several LIFE projects have been implemented in
Latvia, as a result of which restoration of the hydrological regime of the peatland has
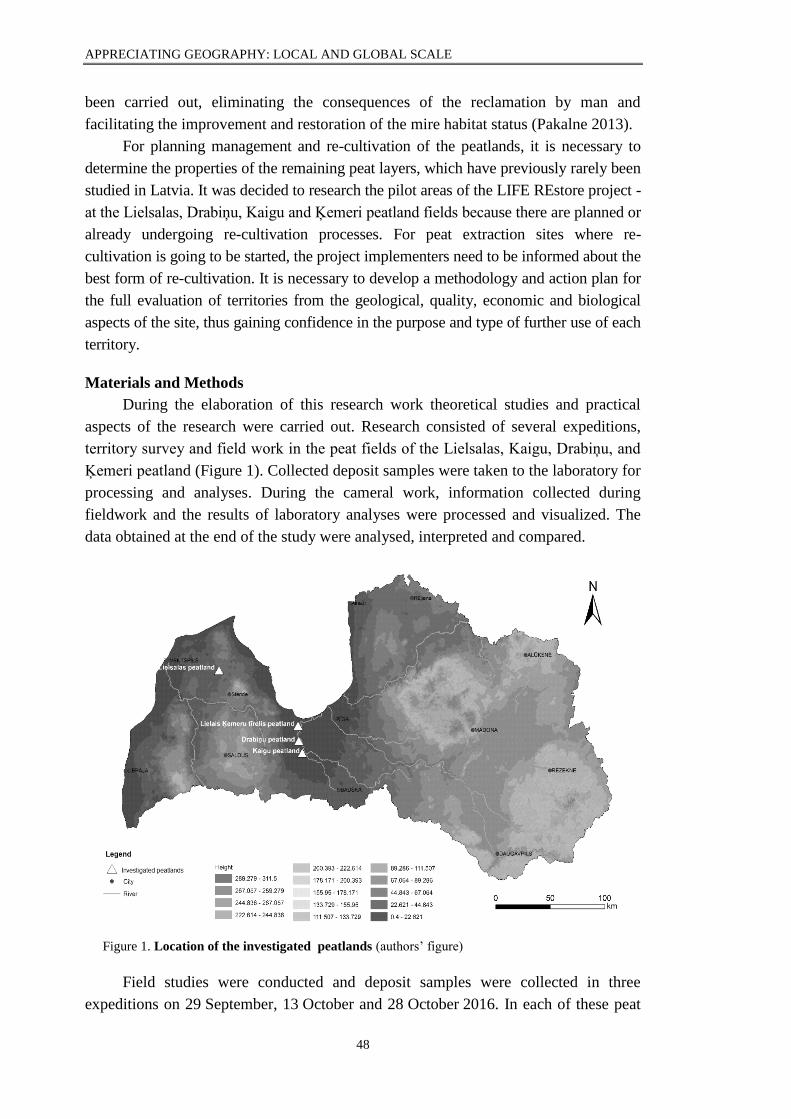
APPRECIATING GEOGRAPHY: LOCAL AND GLOBAL SCALE
48
been carried out, eliminating the consequences of the reclamation by man and
facilitating the improvement and restoration of the mire habitat status (Pakalne 2013).
For planning management and re-cultivation of the peatlands, it is necessary to
determine the properties of the remaining peat layers, which have previously rarely been
studied in Latvia. It was decided to research the pilot areas of the LIFE REstore project -
at the Lielsalas, Drabiņu, Kaigu and Ķemeri peatland fields because there are planned or
already undergoing re-cultivation processes. For peat extraction sites where re-
cultivation is going to be started, the project implementers need to be informed about the
best form of re-cultivation. It is necessary to develop a methodology and action plan for
the full evaluation of territories from the geological, quality, economic and biological
aspects of the site, thus gaining confidence in the purpose and type of further use of each
territory.
Materials and Methods
During the elaboration of this research work theoretical studies and practical
aspects of the research were carried out. Research consisted of several expeditions,
territory survey and field work in the peat fields of the Lielsalas, Kaigu, Drabiņu, and
Ķemeri peatland (Figure 1). Collected deposit samples were taken to the laboratory for
processing and analyses. During the cameral work, information collected during
fieldwork and the results of laboratory analyses were processed and visualized. The
data obtained at the end of the study were analysed, interpreted and compared.
Figure 1. Location of the investigated peatlands (authors’ figure)
Field studies were conducted and deposit samples were collected in three
expeditions on 29 September, 13 October and 28 October 2016. In each of these peat
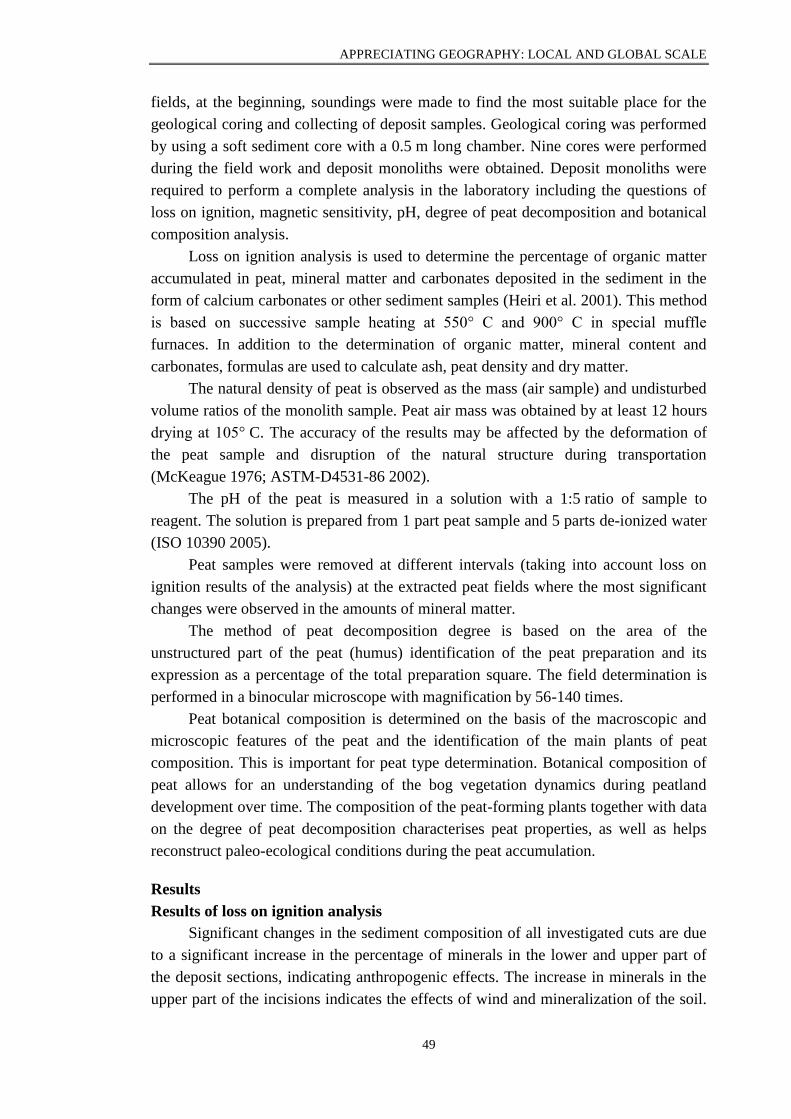
APPRECIATING GEOGRAPHY: LOCAL AND GLOBAL SCALE
49
fields, at the beginning, soundings were made to find the most suitable place for the
geological coring and collecting of deposit samples. Geological coring was performed
by using a soft sediment core with a 0.5 m long chamber. Nine cores were performed
during the field work and deposit monoliths were obtained. Deposit monoliths were
required to perform a complete analysis in the laboratory including the questions of
loss on ignition, magnetic sensitivity, pH, degree of peat decomposition and botanical
composition analysis.
Loss on ignition analysis is used to determine the percentage of organic matter
accumulated in peat, mineral matter and carbonates deposited in the sediment in the
form of calcium carbonates or other sediment samples (Heiri et al. 2001). This method
is based on successive sample heating at 550° C and 900° C in special muffle
furnaces. In addition to the determination of organic matter, mineral content and
carbonates, formulas are used to calculate ash, peat density and dry matter.
The natural density of peat is observed as the mass (air sample) and undisturbed
volume ratios of the monolith sample. Peat air mass was obtained by at least 12 hours
drying at 105° C. The accuracy of the results may be affected by the deformation of
the peat sample and disruption of the natural structure during transportation
(McKeague 1976; ASTM-D4531-86 2002).
The pH of the peat is measured in a solution with a 1:5 ratio of sample to
reagent. The solution is prepared from 1 part peat sample and 5 parts de-ionized water
(ISO 10390 2005).
Peat samples were removed at different intervals (taking into account loss on
ignition results of the analysis) at the extracted peat fields where the most significant
changes were observed in the amounts of mineral matter.
The method of peat decomposition degree is based on the area of the
unstructured part of the peat (humus) identification of the peat preparation and its
expression as a percentage of the total preparation square. The field determination is
performed in a binocular microscope with magnification by 56-140 times.
Peat botanical composition is determined on the basis of the macroscopic and
microscopic features of the peat and the identification of the main plants of peat
composition. This is important for peat type determination. Botanical composition of
peat allows for an understanding of the bog vegetation dynamics during peatland
development over time. The composition of the peat-forming plants together with data
on the degree of peat decomposition characterises peat properties, as well as helps
reconstruct paleo-ecological conditions during the peat accumulation.
Results
Results of loss on ignition analysis
Significant changes in the sediment composition of all investigated cuts are due
to a significant increase in the percentage of minerals in the lower and upper part of
the deposit sections, indicating anthropogenic effects. The increase in minerals in the
upper part of the incisions indicates the effects of wind and mineralization of the soil.
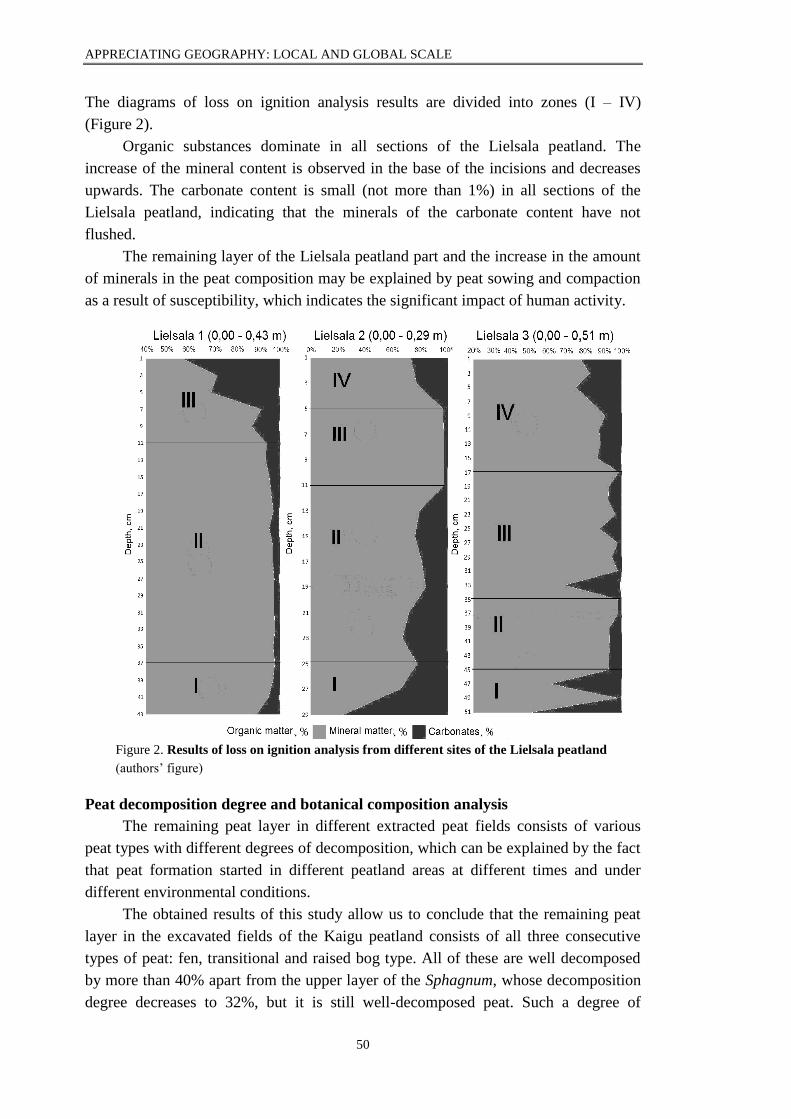
APPRECIATING GEOGRAPHY: LOCAL AND GLOBAL SCALE
50
The diagrams of loss on ignition analysis results are divided into zones (I – IV)
(Figure 2).
Organic substances dominate in all sections of the Lielsala peatland. The
increase of the mineral content is observed in the base of the incisions and decreases
upwards. The carbonate content is small (not more than 1%) in all sections of the
Lielsala peatland, indicating that the minerals of the carbonate content have not
flushed.
The remaining layer of the Lielsala peatland part and the increase in the amount
of minerals in the peat composition may be explained by peat sowing and compaction
as a result of susceptibility, which indicates the significant impact of human activity.
Figure 2. Results of loss on ignition analysis from different sites of the Lielsala peatland
(authors’ figure)
Peat decomposition degree and botanical composition analysis
The remaining peat layer in different extracted peat fields consists of various
peat types with different degrees of decomposition, which can be explained by the fact
that peat formation started in different peatland areas at different times and under
different environmental conditions.
The obtained results of this study allow us to conclude that the remaining peat
layer in the excavated fields of the Kaigu peatland consists of all three consecutive
types of peat: fen, transitional and raised bog type. All of these are well decomposed
by more than 40% apart from the upper layer of the Sphagnum, whose decomposition
degree decreases to 32%, but it is still well-decomposed peat. Such a degree of
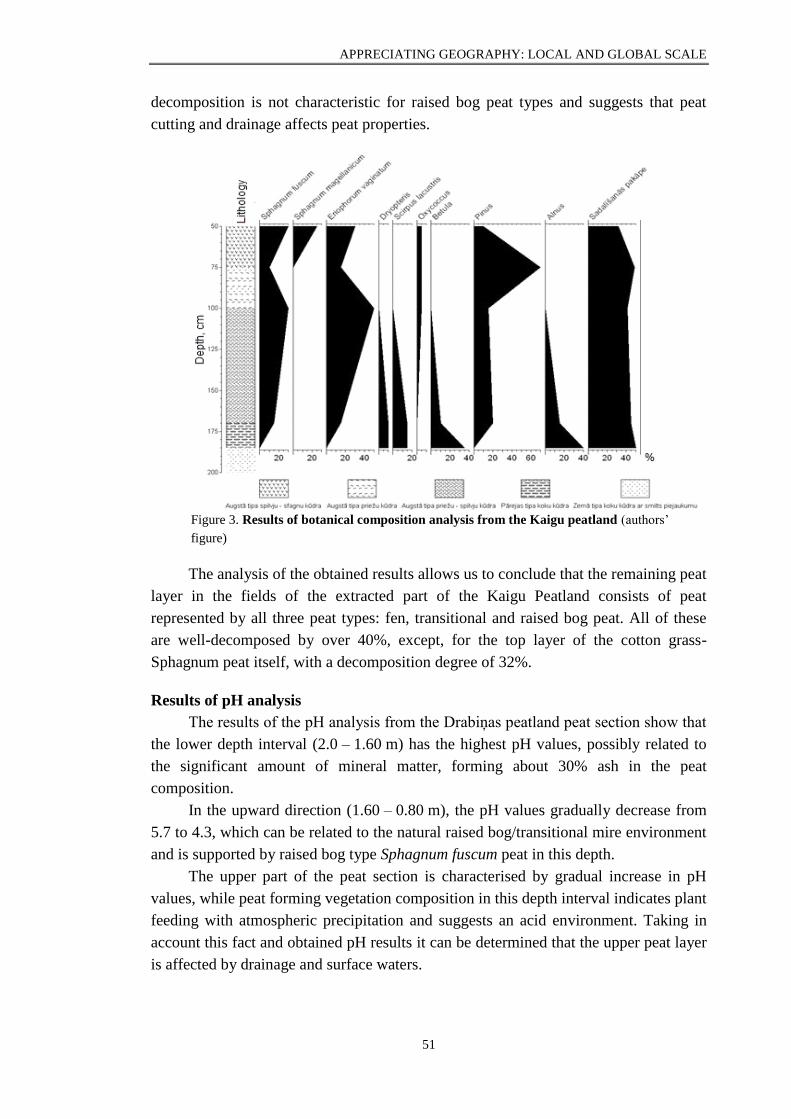
APPRECIATING GEOGRAPHY: LOCAL AND GLOBAL SCALE
51
decomposition is not characteristic for raised bog peat types and suggests that peat
cutting and drainage affects peat properties.
Figure 3. Results of botanical composition analysis from the Kaigu peatland (authors’
figure)
The analysis of the obtained results allows us to conclude that the remaining peat
layer in the fields of the extracted part of the Kaigu Peatland consists of peat
represented by all three peat types: fen, transitional and raised bog peat. All of these
are well-decomposed by over 40%, except, for the top layer of the cotton grass-
Sphagnum peat itself, with a decomposition degree of 32%.
Results of pH analysis
The results of the pH analysis from the Drabiņas peatland peat section show that
the lower depth interval (2.0 – 1.60 m) has the highest pH values, possibly related to
the significant amount of mineral matter, forming about 30% ash in the peat
composition.
In the upward direction (1.60 – 0.80 m), the pH values gradually decrease from
5.7 to 4.3, which can be related to the natural raised bog/transitional mire environment
and is supported by raised bog type Sphagnum fuscum peat in this depth.
The upper part of the peat section is characterised by gradual increase in pH
values, while peat forming vegetation composition in this depth interval indicates plant
feeding with atmospheric precipitation and suggests an acid environment. Taking in
account this fact and obtained pH results it can be determined that the upper peat layer
is affected by drainage and surface waters.
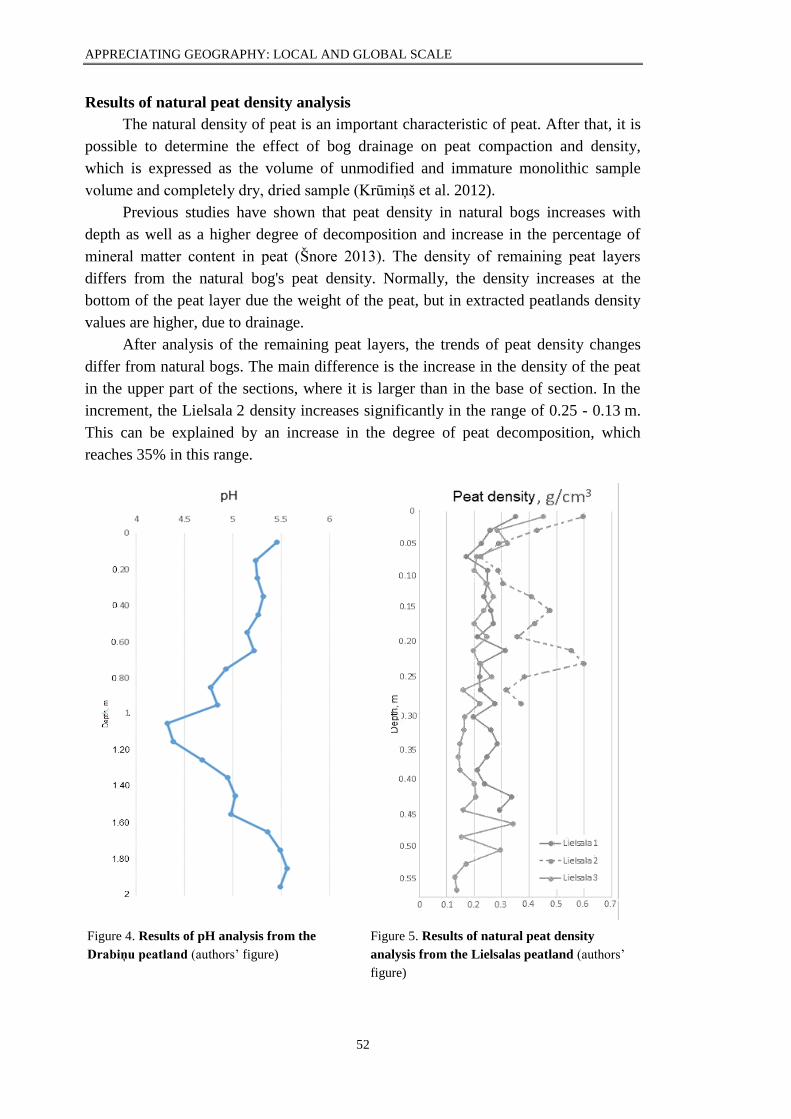
APPRECIATING GEOGRAPHY: LOCAL AND GLOBAL SCALE
52
Results of natural peat density analysis
The natural density of peat is an important characteristic of peat. After that, it is
possible to determine the effect of bog drainage on peat compaction and density,
which is expressed as the volume of unmodified and immature monolithic sample
volume and completely dry, dried sample (Krūmiņš et al. 2012).
Previous studies have shown that peat density in natural bogs increases with
depth as well as a higher degree of decomposition and increase in the percentage of
mineral matter content in peat (Šnore 2013). The density of remaining peat layers
differs from the natural bog's peat density. Normally, the density increases at the
bottom of the peat layer due the weight of the peat, but in extracted peatlands density
values are higher, due to drainage.
After analysis of the remaining peat layers, the trends of peat density changes
differ from natural bogs. The main difference is the increase in the density of the peat
in the upper part of the sections, where it is larger than in the base of section. In the
increment, the Lielsala 2 density increases significantly in the range of 0.25 - 0.13 m.
This can be explained by an increase in the degree of peat decomposition, which
reaches 35% in this range.
Figure 4. Results of pH analysis from the
Drabiņu peatland (authors’ figure)
Figure 5. Results of natural peat density
analysis from the Lielsalas peatland (authors’
figure)
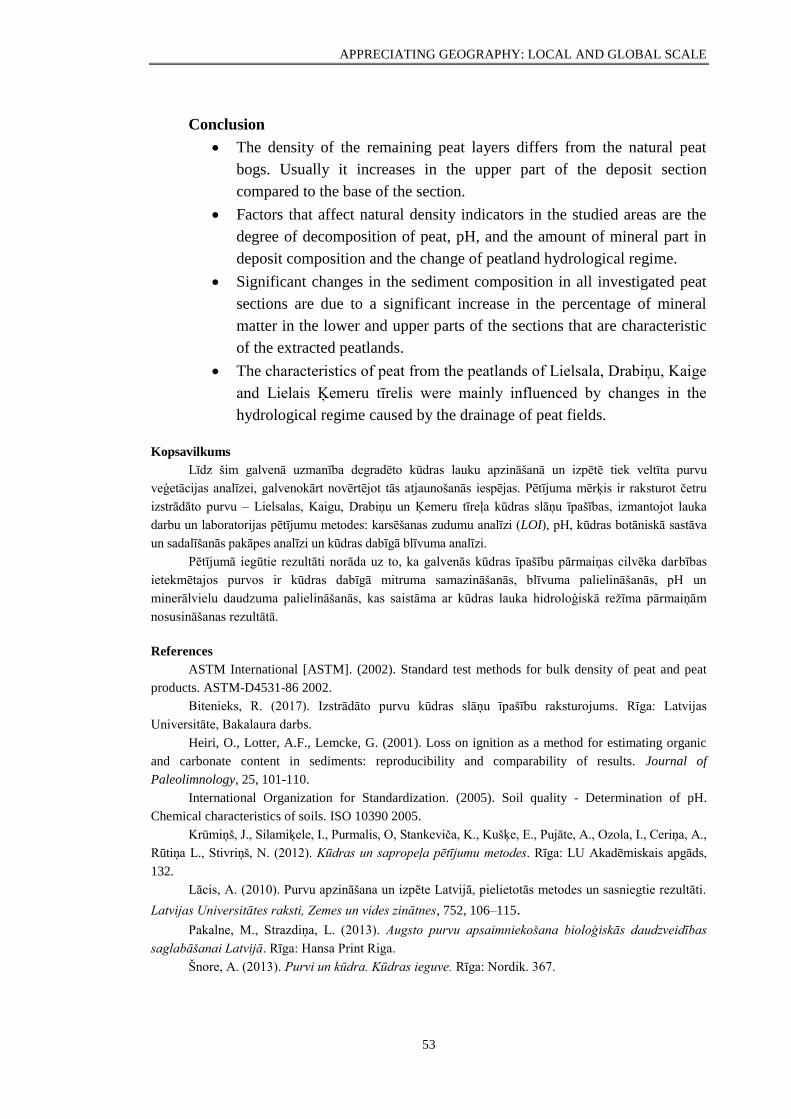
APPRECIATING GEOGRAPHY: LOCAL AND GLOBAL SCALE
53
Conclusion
The density of the remaining peat layers differs from the natural peat
bogs. Usually it increases in the upper part of the deposit section
compared to the base of the section.
Factors that affect natural density indicators in the studied areas are the
degree of decomposition of peat, pH, and the amount of mineral part in
deposit composition and the change of peatland hydrological regime.
Significant changes in the sediment composition in all investigated peat
sections are due to a significant increase in the percentage of mineral
matter in the lower and upper parts of the sections that are characteristic
of the extracted peatlands.
The characteristics of peat from the peatlands of Lielsala, Drabiņu, Kaige
and Lielais Ķemeru tīrelis were mainly influenced by changes in the
hydrological regime caused by the drainage of peat fields.
Kopsavilkums
Līdz šim galvenā uzmanība degradēto kūdras lauku apzināšanā un izpētē tiek veltīta purvu
veģetācijas analīzei, galvenokārt novērtējot tās atjaunošanās iespējas. Pētījuma mērķis ir raksturot četru
izstrādāto purvu – Lielsalas, Kaigu, Drabiņu un Ķemeru tīreļa kūdras slāņu īpašības, izmantojot lauka
darbu un laboratorijas pētījumu metodes: karsēšanas zudumu analīzi (LOI), pH, kūdras botāniskā sastāva
un sadalīšanās pakāpes analīzi un kūdras dabīgā blīvuma analīzi.
Pētījumā iegūtie rezultāti norāda uz to, ka galvenās kūdras īpašību pārmaiņas cilvēka darbības
ietekmētajos purvos ir kūdras dabīgā mitruma samazināšanās, blīvuma palielināšanās, pH un
minerālvielu daudzuma palielināšanās, kas saistāma ar kūdras lauka hidroloģiskā režīma pārmaiņām
nosusināšanas rezultātā.
References
ASTM International [ASTM]. (2002). Standard test methods for bulk density of peat and peat
products. ASTM-D4531-86 2002.
Bitenieks, R. (2017). Izstrādāto purvu kūdras slāņu īpašību raksturojums. Rīga: Latvijas
Universitāte, Bakalaura darbs.
Heiri, O., Lotter, A.F., Lemcke, G. (2001). Loss on ignition as a method for estimating organic
and carbonate content in sediments: reproducibility and comparability of results. Journal of
Paleolimnology, 25, 101-110.
International Organization for Standardization. (2005). Soil quality - Determination of pH.
Chemical characteristics of soils. ISO 10390 2005.
Krūmiņš, J., Silamiķele, I., Purmalis, O, Stankeviča, K., Kušķe, E., Pujāte, A., Ozola, I., Ceriņa, A.,
Rūtiņa L., Stivriņš, N. (2012). Kūdras un sapropeļa pētījumu metodes. Rīga: LU Akadēmiskais apgāds,
132.
Lācis, A. (2010). Purvu apzināšana un izpēte Latvijā, pielietotās metodes un sasniegtie rezultāti.
Latvijas Universitātes raksti, Zemes un vides zinātnes, 752, 106–115.
Pakalne, M., Strazdiņa, L. (2013). Augsto purvu apsaimniekošana bioloģiskās daudzveidības
saglabāšanai Latvijā. Rīga: Hansa Print Riga.
Šnore, A. (2013). Purvi un kūdra. Kūdras ieguve. Rīga: Nordik. 367.
APPRECIATING GEOGRAPHY: LOCAL AND GLOBAL SCALE
54
FITNESS OF AIR QUALITY MEASUREMENT EQUIPMENT
FOR REAL-TIME AEROBIOLOGICAL MONITORING:
CASE STUDY FROM RĪGA
Gaisa kvalitātes novērtēšanas aprīkojuma izmantošana
reālā laika aerobioloģiskajā monitoringā: Rīgas piemērs
Olga Ritenberga
University of Latvia, Faculty of Geography and Earth Sciences
Abstract. There are about 300 aerobiological monitoring stations in Europe, providing regular
observational data on pollen and spore concentration in the air. The data is available with a delay of 1-
2 weeks or even more, which makes direct use for model-based forecasting immensely problematic.
Automatic real-time pollen monitors are too expensive for massive deployment. Therefore, the primary
attention is presently being put either to forecasting models that do not use observations in daily routine or
to alternative ways for near real-time equipment for pollen monitoring. One of the solutions is an
adaptation of existing air quality equipment for the needs of aerobiological monitoring. This study
performs an analysis of the GRIMM monitoring station capability for the afore-mentioned purposes.
Keywords: aerobiology, air quality, alternative aerobiological monitoring, total real-time pollen
counts
Introduction
The importance of aerobiological research follows at least two main lines –
human health issues - through pollen allergy (polinosis) (Newson et al. 2014; Ring
et al. 2012), as well as phenology and agriculture as studies of the timing of
phenological phases and the productivity of plants (Aguilera and Ruiz-Valenzuela
2014; Orlandi et al. 2005). Both lines support the necessity of aerobiological forecasts
of pollen and related processes including the start/end of flowering (Ritenberga et al.
2016), annual pollen productivity of plants (Ritenberga et al. 2018), and the inter-
seasonal fluctuation of pollen depending on meteorological and environmental
conditions. Precise forecasting models require data as fresh as possible because one of
the most accurate air quality forecasts is the persistence forecast - which states that
yesterday’s actual situation is the best forecast for today (Sofiev et al. 2017).
The dense network of manual aerobiological sites (Figure 1) requires a regular,
time-consuming effort on the job as all the samples are counted manually using
microscopes. Automatic real-time pollen monitors, capable of providing necessary
aerobiological data on time, are too expensive for massive deployment. Therefore, the
primary attention currently is put to forecasting models that do not use observations in
daily routine, being only calibrated and evaluated against them in an offline mode.
Automatic pollen monitoring trials from different producers have begun at several
European monitoring stations (Scheifinger et al. 2013), but for the time being, its
accuracy is far behind the manual monitoring accuracy (Crouzy et al. 2016; Šauliene
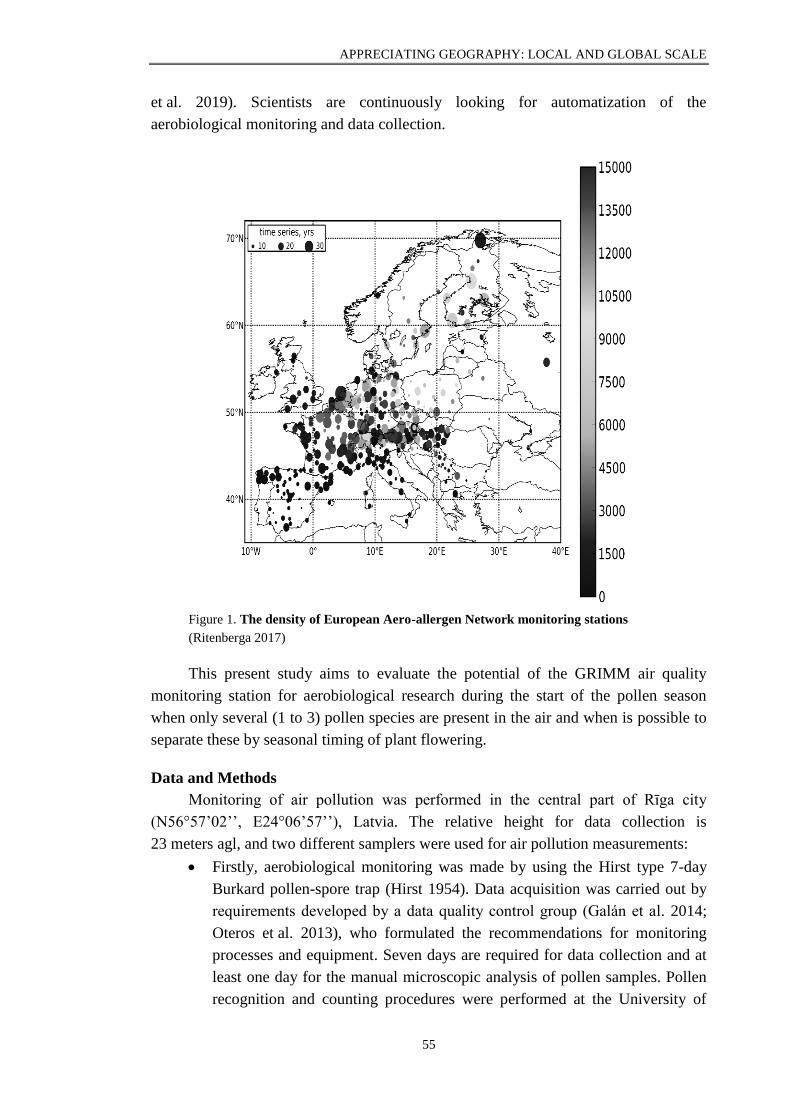
APPRECIATING GEOGRAPHY: LOCAL AND GLOBAL SCALE
55
et al. 2019). Scientists are continuously looking for automatization of the
aerobiological monitoring and data collection.
Figure 1. The density of European Aero-allergen Network monitoring stations
(Ritenberga 2017)
This present study aims to evaluate the potential of the GRIMM air quality
monitoring station for aerobiological research during the start of the pollen season
when only several (1 to 3) pollen species are present in the air and when is possible to
separate these by seasonal timing of plant flowering.
Data and Methods
Monitoring of air pollution was performed in the central part of Rīga city
(N56°57’02’’, E24°06’57’’), Latvia. The relative height for data collection is
23 meters agl, and two different samplers were used for air pollution measurements:
Firstly, aerobiological monitoring was made by using the Hirst type 7-day
Burkard pollen-spore trap (Hirst 1954). Data acquisition was carried out by
requirements developed by a data quality control group (Galán et al. 2014;
Oteros et al. 2013), who formulated the recommendations for monitoring
processes and equipment. Seven days are required for data collection and at
least one day for the manual microscopic analysis of pollen samples. Pollen
recognition and counting procedures were performed at the University of
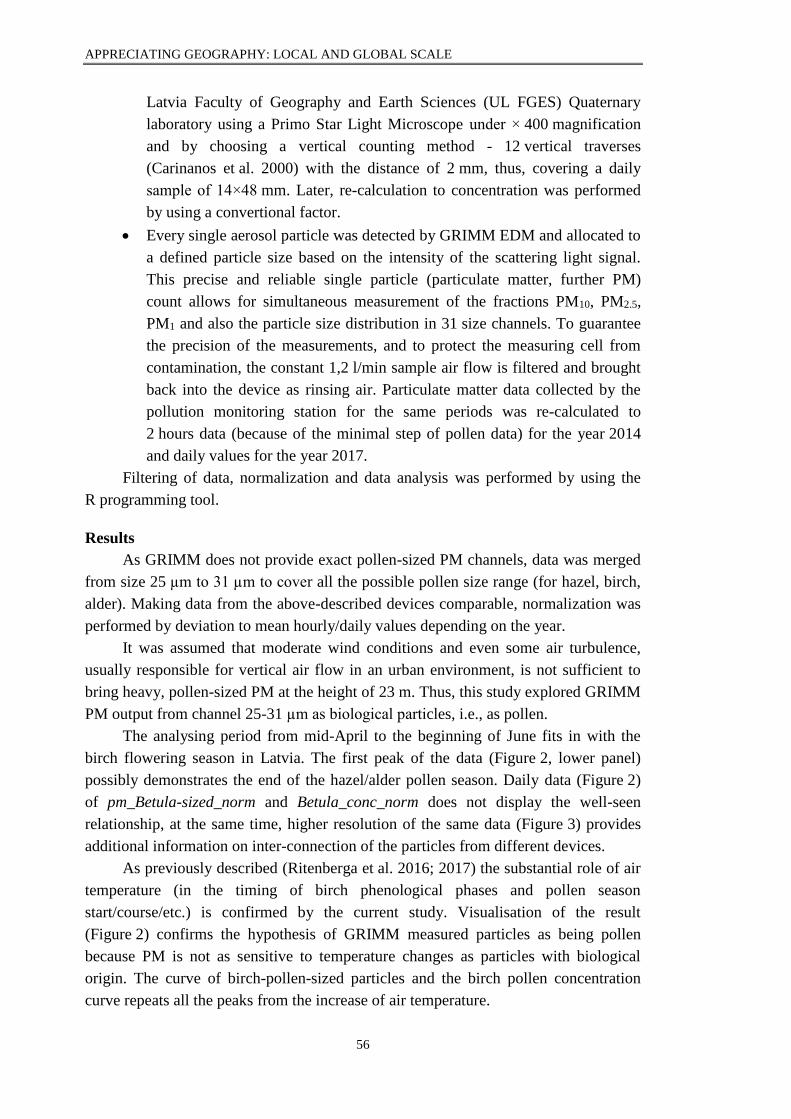
APPRECIATING GEOGRAPHY: LOCAL AND GLOBAL SCALE
56
Latvia Faculty of Geography and Earth Sciences (UL FGES) Quaternary
laboratory using a Primo Star Light Microscope under × 400 magnification
and by choosing a vertical counting method - 12 vertical traverses
(Carinanos et al. 2000) with the distance of 2 mm, thus, covering a daily
sample of 14×48 mm. Later, re-calculation to concentration was performed
by using a convertional factor.
Every single aerosol particle was detected by GRIMM EDM and allocated to
a defined particle size based on the intensity of the scattering light signal.
This precise and reliable single particle (particulate matter, further PM)
count allows for simultaneous measurement of the fractions PM10, PM2.5,
PM1 and also the particle size distribution in 31 size channels. To guarantee
the precision of the measurements, and to protect the measuring cell from
contamination, the constant 1,2 l/min sample air flow is filtered and brought
back into the device as rinsing air. Particulate matter data collected by the
pollution monitoring station for the same periods was re-calculated to
2 hours data (because of the minimal step of pollen data) for the year 2014
and daily values for the year 2017.
Filtering of data, normalization and data analysis was performed by using the
R programming tool.
Results
As GRIMM does not provide exact pollen-sized PM channels, data was merged
from size 25 µm to 31 µm to cover all the possible pollen size range (for hazel, birch,
alder). Making data from the above-described devices comparable, normalization was
performed by deviation to mean hourly/daily values depending on the year.
It was assumed that moderate wind conditions and even some air turbulence,
usually responsible for vertical air flow in an urban environment, is not sufficient to
bring heavy, pollen-sized PM at the height of 23 m. Thus, this study explored GRIMM
PM output from channel 25-31 µm as biological particles, i.e., as pollen.
The analysing period from mid-April to the beginning of June fits in with the
birch flowering season in Latvia. The first peak of the data (Figure 2, lower panel)
possibly demonstrates the end of the hazel/alder pollen season. Daily data (Figure 2)
of pm_Betula-sized_norm and Betula_conc_norm does not display the well-seen
relationship, at the same time, higher resolution of the same data (Figure 3) provides
additional information on inter-connection of the particles from different devices.
As previously described (Ritenberga et al. 2016; 2017) the substantial role of air
temperature (in the timing of birch phenological phases and pollen season
start/course/etc.) is confirmed by the current study. Visualisation of the result
(Figure 2) confirms the hypothesis of GRIMM measured particles as being pollen
because PM is not as sensitive to temperature changes as particles with biological
origin. The curve of birch-pollen-sized particles and the birch pollen concentration
curve repeats all the peaks from the increase of air temperature.
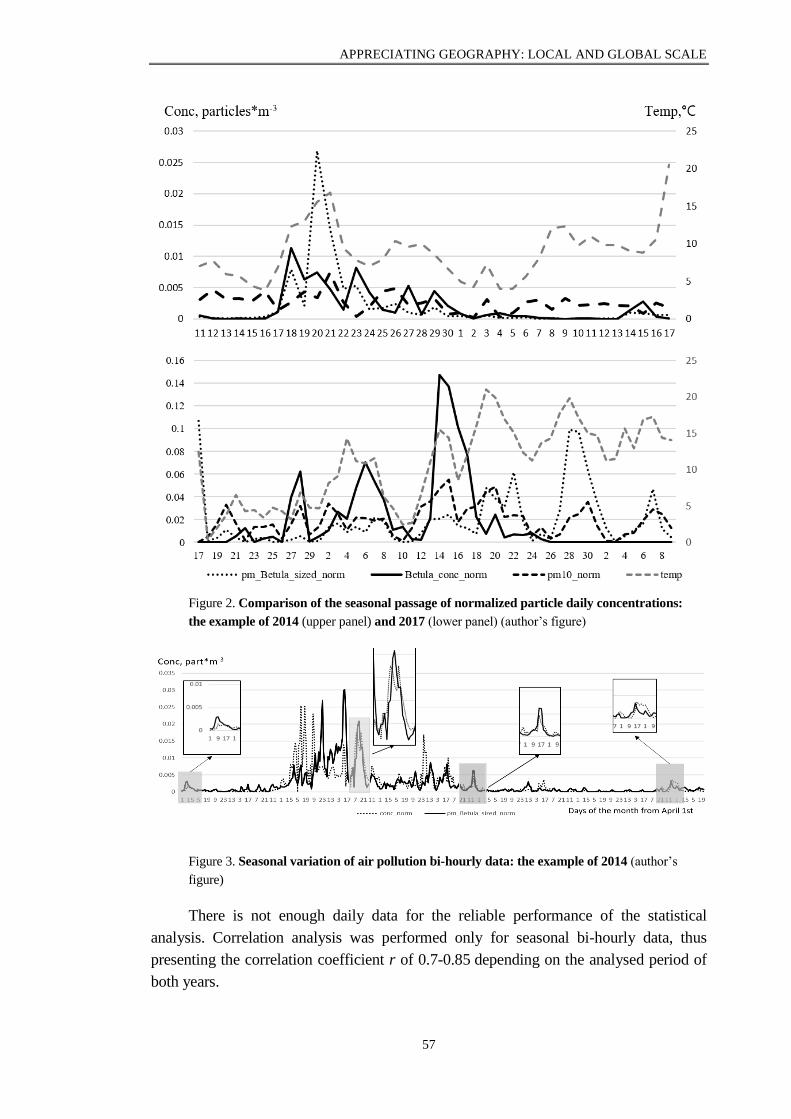
APPRECIATING GEOGRAPHY: LOCAL AND GLOBAL SCALE
57
Figure 2. Comparison of the seasonal passage of normalized particle daily concentrations:
the example of 2014 (upper panel) and 2017 (lower panel) (author’s figure)
Figure 3. Seasonal variation of air pollution bi-hourly data: the example of 2014 (author’s
figure)
There is not enough daily data for the reliable performance of the statistical
analysis. Correlation analysis was performed only for seasonal bi-hourly data, thus
presenting the correlation coefficient r of 0.7-0.85 depending on the analysed period of
both years.
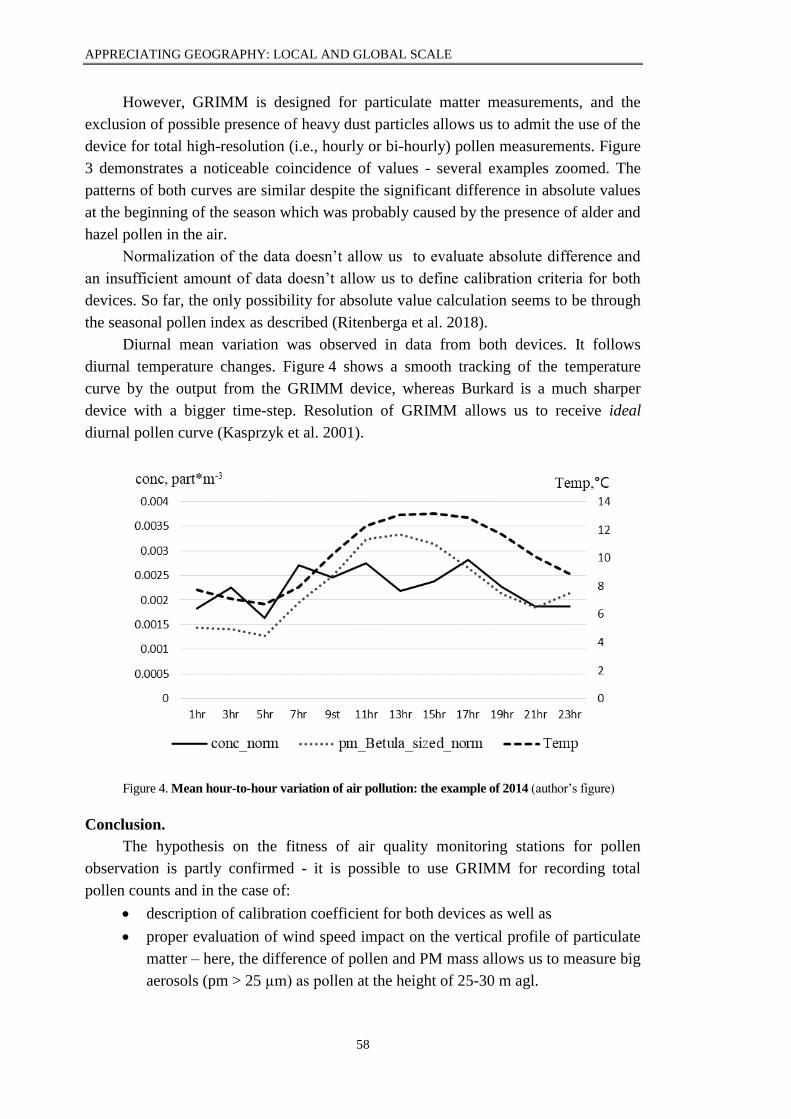
APPRECIATING GEOGRAPHY: LOCAL AND GLOBAL SCALE
58
However, GRIMM is designed for particulate matter measurements, and the
exclusion of possible presence of heavy dust particles allows us to admit the use of the
device for total high-resolution (i.e., hourly or bi-hourly) pollen measurements. Figure
3 demonstrates a noticeable coincidence of values - several examples zoomed. The
patterns of both curves are similar despite the significant difference in absolute values
at the beginning of the season which was probably caused by the presence of alder and
hazel pollen in the air.
Normalization of the data doesn’t allow us to evaluate absolute difference and
an insufficient amount of data doesn’t allow us to define calibration criteria for both
devices. So far, the only possibility for absolute value calculation seems to be through
the seasonal pollen index as described (Ritenberga et al. 2018).
Diurnal mean variation was observed in data from both devices. It follows
diurnal temperature changes. Figure 4 shows a smooth tracking of the temperature
curve by the output from the GRIMM device, whereas Burkard is a much sharper
device with a bigger time-step. Resolution of GRIMM allows us to receive ideal
diurnal pollen curve (Kasprzyk et al. 2001).
Figure 4. Mean hour-to-hour variation of air pollution: the example of 2014 (author’s figure)
Conclusion.
The hypothesis on the fitness of air quality monitoring stations for pollen
observation is partly confirmed - it is possible to use GRIMM for recording total
pollen counts and in the case of:
description of calibration coefficient for both devices as well as
proper evaluation of wind speed impact on the vertical profile of particulate
matter – here, the difference of pollen and PM mass allows us to measure big
aerosols (pm > 25 µm) as pollen at the height of 25-30 m agl.
APPRECIATING GEOGRAPHY: LOCAL AND GLOBAL SCALE
59
Further studies should be performed to clarify the above-mentioned objectives.
The accuracy of GRIMM for pollen monitoring depends on the timing of the
measurements. The long-year mean and seasonal variation of pollen spectra helps us
to better define the proper time for single taxon monitoring, as distinguishing by
pollen type is not possible using the mentioned technique.
Acknowledgement
This study was performed within the scope of the project of EC ERDF and
PostDoc Latvia No 1.1.1.2/VIAA/2/18/283 “Development of Pollen Data Fusion and
Assimilation: Real-time Monitoring and Modelling for Public Health PREMIuM.”
Kopsavilkums
Eiropā ir ap 300 aerobioloģisko monitoringa vietu, kas regulāri veic putekšņu un sporu mērījumus
gaisā. Ņemot vērā izmantoto mērierīču specifikāciju, dati ir pieejami ar 1–2 nedēļu nobīdi, kas ietekmē
putekšņu koncentrācijas prognožu precizitāti. Automātisko reālā laika putekšņu monitoru iegāde un
kalibrācija prasa lielus finanšu ieguldījumus. Kā iespējamo risinājumu var minēt prognostisko modeļu
uzbūvi, kas gandrīz neprasa novērojumu datus, vai esošo mērierīču pielāgošanu putekšņu un sporu reālā
laika mērījumiem. Viens no variantiem ir gaisa kvalitātes mērīšanas aprīkojuma izmantošana
aerobioloģisko mērķu sasniegšanai. Šis pētījums izvērtē GRIMM gaisa kvalitātes monitoringa stacijas datu
izmantošanu, lai mērītu putekšņu koncentrāciju noteiktā laika periodā.
References
Aguilera, F. and Ruiz-Valenzuela, L. (2014). Forecasting olive crop yields based on long-term
aerobiological data series and bioclimatic conditions for the southern Iberian Peninsula. Spanish
Journal of Agricultural Research, 12, 215-224.
Carinanos, P., Emberlin, J., Galan, C. and Dominguez-Vilches, E. (2000). Comparison of two
pollen counting methods of slides from a hirst type volumetric trap. Aerobiologia (Bologna), 16, 339-346.
Crouzy, B., Stella, M., Konzelmann, T., Calpini, B. and Clot, B. (2016). All-optical automatic
pollen identification: Towards an operational system. Atmospheric Environment, 140, 202–212.
Cunha, M. and Ribeiro, H. (2015). Pollen-based predictive modelling of wine production:
Application to an arid region. European Journal of Agronomy, 73, 42-54.
Galán, C., Smith, M., Thibaudon, M., Frenguelli, G., Oteros, J., Gehrig, R., Berger, U., Clot, B.
and Brandao, R. (2014). Pollen monitoring: minimum requirements and reproducibility of analysis.
Aerobiologia (Bologna). 30, 385-395.
Hirst, J.M. (1954). An automatic volumetric spore trap. Annals of Applied Biology, 39, 257-265.
Kasprzyk, I., Harmata, K., Myszkowska, D., Stach, A. and Stepalska, D. (2001). Diurnal
variation of chosen airborne pollen at five sites in Poland. Spore, 327-345.
Newson, R.B., van Ree, R., Forsberg, B., Janson, C., Lötvall, J., Dahlén, S.-E., Toskala, E.M.,
Baelum, J., Brożek, G.M., Kasper, L., Kowalski, M.L., Howarth, P.H., Fokkens, W.J., Bachert, C., Keil,
T., Krämer, U., Bislimovska, J., Gjomarkaj, M., Loureiro, C., Burney, P.G.J. and Jarvis, D. (2014).
Geographical variation in the prevalence of sensitization to common aeroallergens in adults: the GA(2)
LEN survey. Allergy.
Orlandi, F., Romano, B. and Fornaciari, M. (2005). Relationship between pollen emission and
fruit production in olive (Olea europaea L.). Grana, 44, 98-103.
Oteros, J., Galan, C., Alcazar, P. and Dominguez-Vilches, E. (2013). Quality control in bio-
monitoring networks, Spanish Aerobiology Network. Science of the Total Environment, 443, 559-565.
Ring, J., Akdis, C., Behrendt, H., Lauener, R.P., Schäppi, G., Akdis, M., Ammann, W., de
Beaumont, O., Bieber, T., Bienenstock, J., Blaser, K., Bochner, B., Bousquet, J., Crameri, R., Custovic,
A., Czerkinsky, C., Darsow, U., Denburg, J., Drazen, J., de Villiers, E.M., Fire, A., Galli, S., Haahtela, T.,
APPRECIATING GEOGRAPHY: LOCAL AND GLOBAL SCALE
60
zur Hausen, H., Hildemann, S., Holgate, S., Holt, P., Jakob, T., Jung, A., Kemeny, M., Koren, H., Leung,
D., Lockey, R., Marone, G., Mempel, M., Menné, B., Menz, G., Mueller, U., von Mutius, E., Ollert, M.,
O’Mahony, L., Pawankar, R., Renz, H., Platts-Mills, T., Roduit, C., Schmidt-Weber, C., Traidl-Hoffmann,
C., Wahn, U. and Rietschel, E. (2012). Davos declaration: allergy as a global problem. Allergy, 67, 141-
143.
Ritenberga, O. (2017). Forecasting the geospatial and temporal patterns of pollen season in
Europe using statistical and deterministic modelling. Riga: University of Latvia.
https://dspace.lu.lv/dspace/handle/7/37532
Ritenberga, O., Sofiev, M., Kirillova, V., Kalnina, L. and Genikhovich, E. (2016). Statistical
modelling of non-stationary processes of atmospheric pollution from natural sources: Example of birch
pollen. Agricultural and Forest Meteorology, 226-227.
Ritenberga, O., Sofiev, M., Siljamo, P., Saarto, A., Dahl, A., Ekebom, A., Sauliene, I.,
Shalaboda, V., Severova, E., Hoebeke, L., Ramfjord, H. (2018). A statistical model for predicting the
inter-annual variability of birch pollen abundance in Northern and North-Eastern Europe. Science of the
Total Environment, 615.
Šauliene, I., Šukiene, L., Daunys, G., Valiulis, G., Vaitkevičius, L., Matavulj, P., Brad, S., Panic,
M., Sikoparija, B., Clot, B., Crouzy, B., Sofiev, M. (2019). Automatic pollen recognition with the
Rapid-E particle counter: the first-level procedure, expercience and next steps (under review).
Atmospheric Measurement Techniques.
Scheifinger, H., Belmonte, J., Buters, J., Celenk, S., Damialis, A., Dechamp, C., Garcia-Mozo,
H., Gehrig, R., Grewling, L., Halley, J.M., Hogda, K.-A., Jager, S., Karatzas, K., Karlsen, S.-R., Koch,
E., Pauling, A., Peel, R., Sikoparija, B., Smith, M., Galan-Soldevilla, C., Thibaudon, M., Vokou, D. and
de Weger, L. (2013). Monitoring, modelling and forecasting of the pollen season. In: Sofiev, M. and
Bergmann, K.-C. (eds.) Allergenic Pollen. 247.
Sofiev, M., Ritenberga, O., Albertini, R., Arteta, J. and Belmonte, J. (2017). Multi - model
ensemble simulations of olive pollen distribution in Europe in 2014. 1-32.
LANDSCAPE OF SEMI-WILD LARGE HERBIVORES IN THE
SPECIALLY PROTECTED NATURE TERRITORIES OF LATVIA
Lielie pussavvaļas zālēdāji īpaši aizsargājamās
dabas teritorijās Latvijā
Agnese Reķe, Anita Zariņa, Solvita Rūsiņa
University of Latvia, Faculty of Geography and Earth Sciences
Abstract. Semi-wild large herbivores have been present in the Latvian landscape now for just on 20 years.
Nevertheless, the available information about the already implemented introduction projects is scattered
and fragmentary. The aim of this paper is to outline and discuss the landscape of semi-wild animal grazing
projects in the specially protected nature territories (SPNT) throughout Latvia, focusing on the project
implementation contexts, locational factors and current management issues. The results of this study show
that grazing areas of semi-wild herbivores are located mainly in nature parks and nature reserves. The
typical location for the establishment of a grazing site is a former agricultural land area that has been
abandoned by its previous users due to unsuitable conditions for profitable agricultural activity and which
is located close to a natural waterbody. The main goal for all of the analyzed introduction projects was the
restoration and protection of open landscape and grassland habitats. According to the research results, at
APPRECIATING GEOGRAPHY: LOCAL AND GLOBAL SCALE
61
present, the main problem regarding grazing sites of semi-wild large herbivores, is the existing policy
framework. This study raises many questions about the future of semi-wild herbivores in Latvia and these
should be addressed in further in-depth studies.
Keywords: semi-wild large herbivores, grazing animal landscape, introduction, re-wilding, natural
grazing
Introduction
Large herbivores had an important role in shaping the natural landscape of
Europe in the pre-agrarian period. By the allowing of grazing they maintained the
natural grasslands, influenced the species composition in habitats of their surroundings
and by uprooting the smaller trees and de-barking the larger ones, they even changed
the closed forests on a local scale (Vera 2000; Vera et al. 2007; Vermeulen 2015) - a
habitat that, according to traditional succession theories (see Clements 1916), is the
final stage of vegetation succession in lowland Europe. Due to the development of
farming and over-hunting, the number of wild large herbivores in Europe rapidly
decreased – some species were driven out of their surroundings to more remote
territories, other species became extinct. The species that completely vanished from
European nature were wild horses (Equus ferus) or tarpans and wild cattle (Bos
primigenius) or aurochs – the last known auroch died in 1627 in Poland and the last
tarpan in 1887 in Ukraine (Vermeulen 2015).
Around the 1920-30s, scientists created two new herbivore breeds through cross-
breeding of existing primitive cattle and horse breeds. The two new breeds were Heck
cattle and Konik polski horses which resembled the extinct aurochs and tarpans by
appearance and had the capability to survive in the wild. After the creation of these
new herbivore breeds, the idea of introducing them into the wilderness was born
(Lorimer and Driessen 2013; Vermeulen 2015). According to the research of some
well-recognized authors (Vera 2000; Vermeulen 2015), the (re)introduction of large
herbivores in the European landscape is a fundamental part of restoring the natural
balance of eco-systems or ‘re-wilding’ – a term that is largely used to describe the
restoration of natural processes (Jorgensen 2015; Vermeulen 2015). One might ask the
question that, amongst all the other herbivore species that did not become extinct, why
bother with wild cattle and horses? As a matter of fact, it is a widely held view that
each of the indigenous large herbivore species in Europe had its own role in the eco-
system that cannot be overtaken by other species (Vermeulen 2015). The basic idea of
introducing animal species that resemble the extinct herbivores, was to replace the
missing grazing animals in the landscape, so they can participate in the creation of
landscapes once again (Kugler and Broxham 2014; Vermeulen 2015). Probably the
best known introduction project is the Oostvaardersplassen in the Netherlands – at the
beginning of the 1980s, the Dutch scientist Frans Vera commenced an experiment in
the Oostvaardersplassen polder by introducing Heck cattle, Konik polski and other
large herbivores in the territory to ‘re-wild’ the landscape of Oostvaardersplassen.
After Vera’s experiment, the idea of introducing large herbivores gained popularity
APPRECIATING GEOGRAPHY: LOCAL AND GLOBAL SCALE
62
and these introduction projects gradually spread all over Europe (Lorimer and
Driessen 2013).
In Latvia, the first large herbivores were introduced in 1999 at the Nature Park
“Pape” as a part of WWF Latvia’s project that aimed to restore the natural habitats in
the Pape polder – a former agricultural territory (Zariņa et al. 2018). However, even
though just on 20 years have passed since the first introduction project and at the time
the project was controversially received (Schwartz 2005; Schwartz 2006; Zariņa and
Treija 2015), there has still been no in-depth analysis and/or discussions made
available for study. Most of the studies done thus far focus only on particular aspects
of these grazing projects, for example, changes in vegetation of the grazing sites
(Mednis 2008; Gruberts and Štrausa 2011), the attitudes of society (Schwartz 2005;
Zariņa and Treija 2015) or the emergence of post-productivist ideas in the former
agricultural lands of Latvia (Zariņa et al. 2018).
Thus, the aim of this paper is to outline and discuss the landscape of semi-wild
animal grazing projects in the specially protected nature territories (SPNT) of Latvia,
focusing on the various project implementation contexts, locational factors and current
management issues.
We used field observations, interviews, analyses of literature and documents to
understand the geography and time-line of the introduction projects, as well as to
create a database consisting of the accounts of introduced animal species, initial and
current size of animal populations, geographic location, size of grazing areas and
landscape characteristics. Our fieldwork was conducted in 2018, when we visited
altogether 4 grazing areas. We conducted 8 semi-structured interviews with park
managers and experts. The interviews were conducted in 2018 and 2019.
Semi-wild herbivore grazing sites in specially protected nature territories of
Latvia
The grazing areas of semi-wild large herbivores of SPNT are situated in
geographically different locations (Figure 1), all of which were established from 1999
to 2007 (Figure 2), mainly in nature parks and nature reserves. Since 2007 no new
semi-wild grazing areas have been established. According to the conducted interviews,
the main reason for this phenomenon might be the issue of insufficient funding – most
of the grazing sites were established with the financial support of various nature
conservation projects. Since the project conclusion, the main source of funding for
maintenance of the grazing sites consists only of subsidies, which, according to the
interviewed managers of the grazing sites, do not cover all the costs. Another factor is
the lack of grassland territories that are large enough for the establishment of grazing
sites. However, this aspect requires further in-depth study.
All of the cases bear a similar objective – the protection and restoration of
mosaic landscape and grasslands. Another significant trait, common to almost all of
the cases, is their link to the internationally significant bird breeding, nesting and
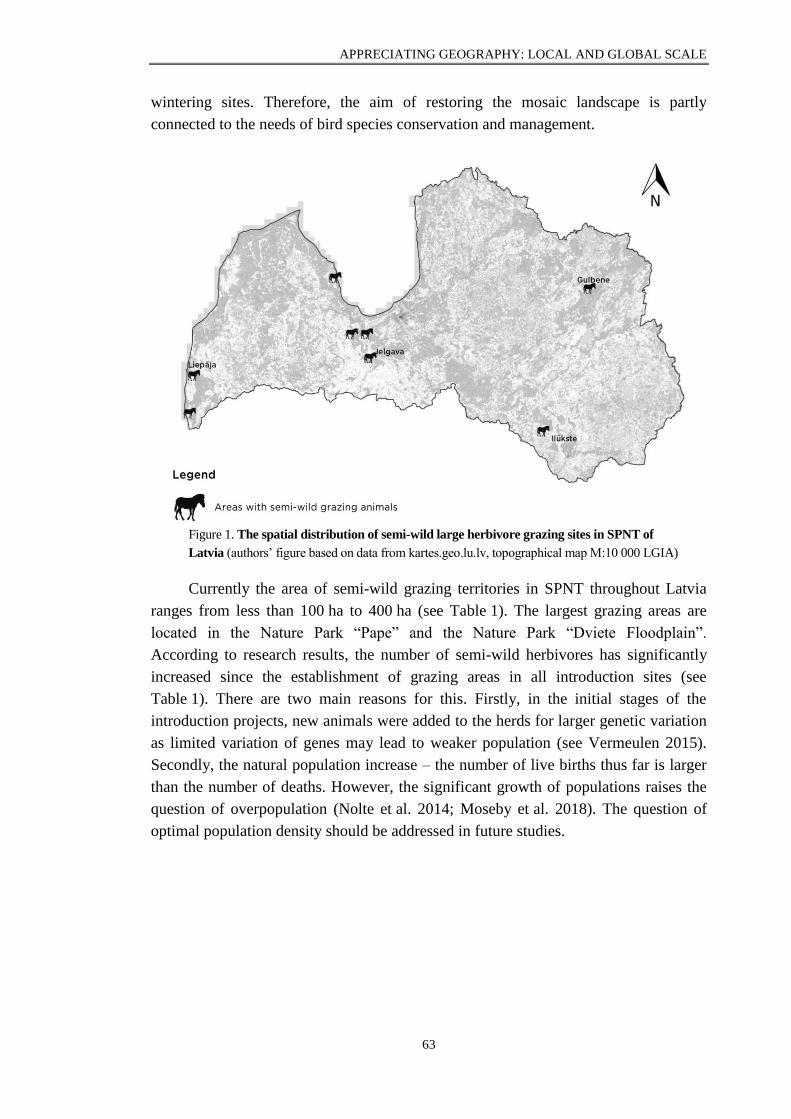
APPRECIATING GEOGRAPHY: LOCAL AND GLOBAL SCALE
63
wintering sites. Therefore, the aim of restoring the mosaic landscape is partly
connected to the needs of bird species conservation and management.
Figure 1. The spatial distribution of semi-wild large herbivore grazing sites in SPNT of
Latvia (authors’ figure based on data from kartes.geo.lu.lv, topographical map M:10 000 LGIA)
Currently the area of semi-wild grazing territories in SPNT throughout Latvia
ranges from less than 100 ha to 400 ha (see Table 1). The largest grazing areas are
located in the Nature Park “Pape” and the Nature Park “Dviete Floodplain”.
According to research results, the number of semi-wild herbivores has significantly
increased since the establishment of grazing areas in all introduction sites (see
Table 1). There are two main reasons for this. Firstly, in the initial stages of the
introduction projects, new animals were added to the herds for larger genetic variation
as limited variation of genes may lead to weaker population (see Vermeulen 2015).
Secondly, the natural population increase – the number of live births thus far is larger
than the number of deaths. However, the significant growth of populations raises the
question of overpopulation (Nolte et al. 2014; Moseby et al. 2018). The question of
optimal population density should be addressed in future studies.
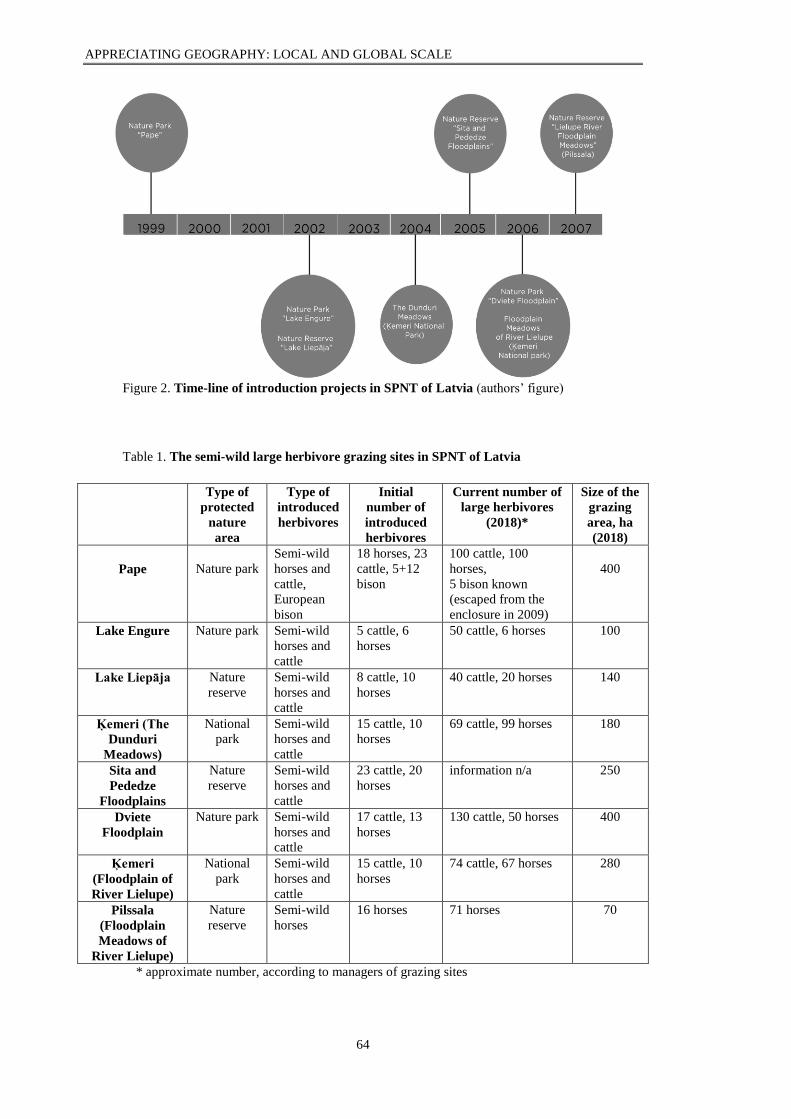
APPRECIATING GEOGRAPHY: LOCAL AND GLOBAL SCALE
64
Figure 2. Time-line of introduction projects in SPNT of Latvia (authors’ figure)
Table 1. The semi-wild large herbivore grazing sites in SPNT of Latvia
Type of
protected
nature
area
Type of
introduced
herbivores
Initial
number of
introduced
herbivores
Current number of
large herbivores
(2018)*
Size of the
grazing
area, ha
(2018)
Pape
Nature park
Semi-wild
horses and
cattle,
European
bison
18 horses, 23
cattle, 5+12
bison
100 cattle, 100
horses,
5 bison known
(escaped from the
enclosure in 2009)
400
Lake Engure Nature park Semi-wild
horses and
cattle
5 cattle, 6
horses
50 cattle, 6 horses 100
Lake Liepāja Nature
reserve
Semi-wild
horses and
cattle
8 cattle, 10
horses
40 cattle, 20 horses 140
Ķemeri (The
Dunduri
Meadows)
National
park
Semi-wild
horses and
cattle
15 cattle, 10
horses
69 cattle, 99 horses 180
Sita and
Pededze
Floodplains
Nature
reserve
Semi-wild
horses and
cattle
23 cattle, 20
horses
information n/a 250
Dviete
Floodplain
Nature park Semi-wild
horses and
cattle
17 cattle, 13
horses
130 cattle, 50 horses 400
Ķemeri
(Floodplain of
River Lielupe)
National
park
Semi-wild
horses and
cattle
15 cattle, 10
horses
74 cattle, 67 horses 280
Pilssala
(Floodplain
Meadows of
River Lielupe)
Nature
reserve
Semi-wild
horses
16 horses 71 horses 70
* approximate number, according to managers of grazing sites
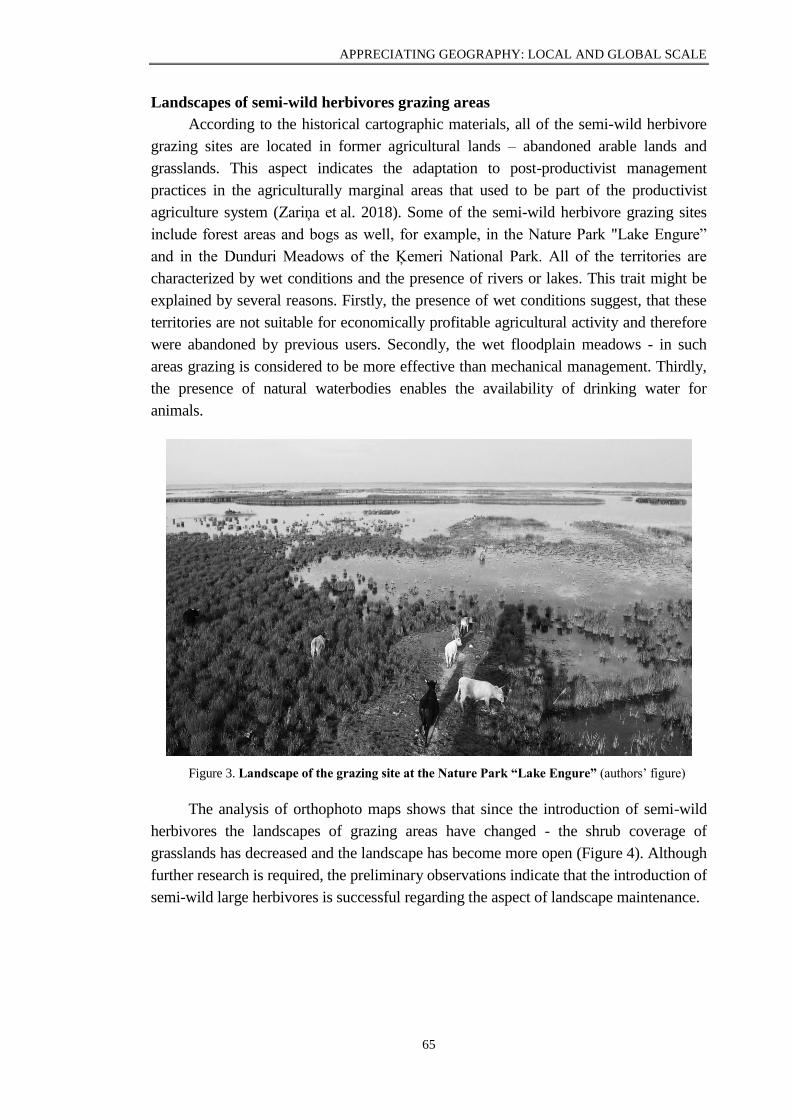
APPRECIATING GEOGRAPHY: LOCAL AND GLOBAL SCALE
65
Landscapes of semi-wild herbivores grazing areas
According to the historical cartographic materials, all of the semi-wild herbivore
grazing sites are located in former agricultural lands – abandoned arable lands and
grasslands. This aspect indicates the adaptation to post-productivist management
practices in the agriculturally marginal areas that used to be part of the productivist
agriculture system (Zariņa et al. 2018). Some of the semi-wild herbivore grazing sites
include forest areas and bogs as well, for example, in the Nature Park "Lake Engure”
and in the Dunduri Meadows of the Ķemeri National Park. All of the territories are
characterized by wet conditions and the presence of rivers or lakes. This trait might be
explained by several reasons. Firstly, the presence of wet conditions suggest, that these
territories are not suitable for economically profitable agricultural activity and therefore
were abandoned by previous users. Secondly, the wet floodplain meadows - in such
areas grazing is considered to be more effective than mechanical management. Thirdly,
the presence of natural waterbodies enables the availability of drinking water for
animals.
Figure 3. Landscape of the grazing site at the Nature Park “Lake Engure” (authors’ figure)
The analysis of orthophoto maps shows that since the introduction of semi-wild
herbivores the landscapes of grazing areas have changed - the shrub coverage of
grasslands has decreased and the landscape has become more open (Figure 4). Although
further research is required, the preliminary observations indicate that the introduction of
semi-wild large herbivores is successful regarding the aspect of landscape maintenance.
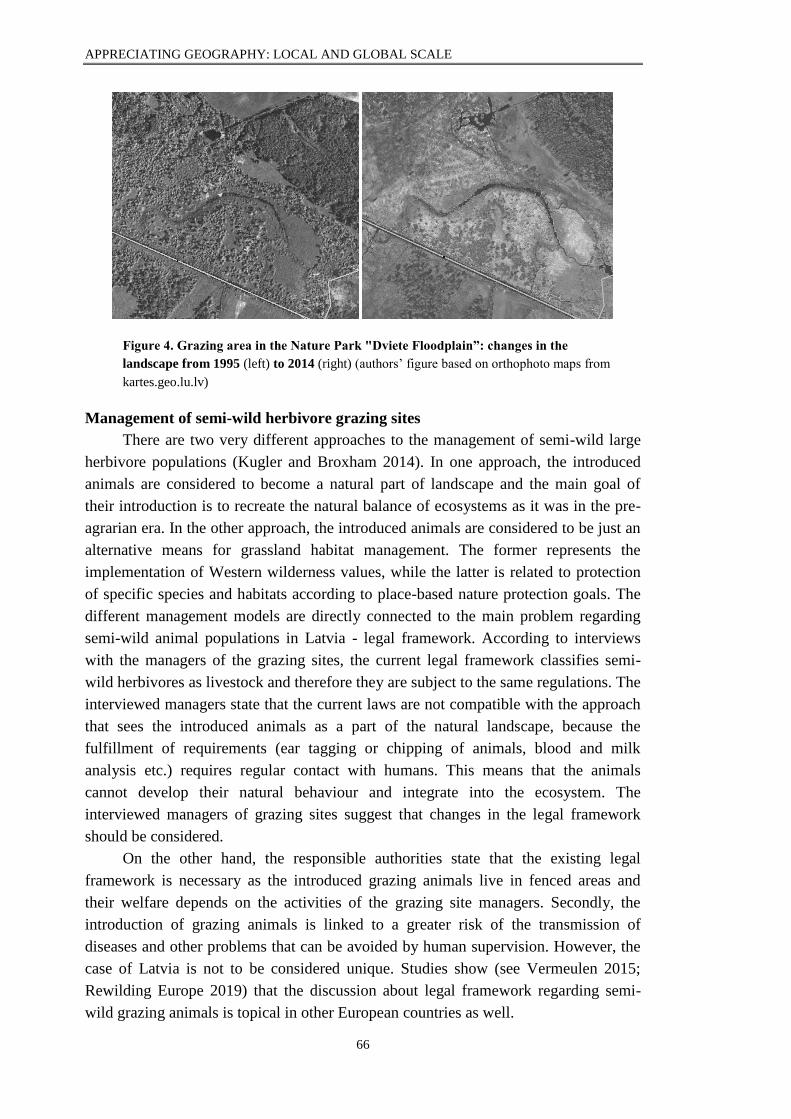
APPRECIATING GEOGRAPHY: LOCAL AND GLOBAL SCALE
66
Figure 4. Grazing area in the Nature Park "Dviete Floodplain”: changes in the
landscape from 1995 (left) to 2014 (right) (authors’ figure based on orthophoto maps from
kartes.geo.lu.lv)
Management of semi-wild herbivore grazing sites
There are two very different approaches to the management of semi-wild large
herbivore populations (Kugler and Broxham 2014). In one approach, the introduced
animals are considered to become a natural part of landscape and the main goal of
their introduction is to recreate the natural balance of ecosystems as it was in the pre-
agrarian era. In the other approach, the introduced animals are considered to be just an
alternative means for grassland habitat management. The former represents the
implementation of Western wilderness values, while the latter is related to protection
of specific species and habitats according to place-based nature protection goals. The
different management models are directly connected to the main problem regarding
semi-wild animal populations in Latvia - legal framework. According to interviews
with the managers of the grazing sites, the current legal framework classifies semi-
wild herbivores as livestock and therefore they are subject to the same regulations. The
interviewed managers state that the current laws are not compatible with the approach
that sees the introduced animals as a part of the natural landscape, because the
fulfillment of requirements (ear tagging or chipping of animals, blood and milk
analysis etc.) requires regular contact with humans. This means that the animals
cannot develop their natural behaviour and integrate into the ecosystem. The
interviewed managers of grazing sites suggest that changes in the legal framework
should be considered.
On the other hand, the responsible authorities state that the existing legal
framework is necessary as the introduced grazing animals live in fenced areas and
their welfare depends on the activities of the grazing site managers. Secondly, the
introduction of grazing animals is linked to a greater risk of the transmission of
diseases and other problems that can be avoided by human supervision. However, the
case of Latvia is not to be considered unique. Studies show (see Vermeulen 2015;
Rewilding Europe 2019) that the discussion about legal framework regarding semi-
wild grazing animals is topical in other European countries as well.
APPRECIATING GEOGRAPHY: LOCAL AND GLOBAL SCALE
67
Conclusion
According to the authors (Vera 2000; Vera et al. 2007; Vermeulen 2015), the
(re)introduction of large herbivores in the European landscape is a fundamental part of
restoring the natural balance of ecosystems. In Latvia the first semi-wild large
herbivores were introduced in 1999 at the Nature Park "Pape”. Since then, pastures of
semi-wild large herbivores have been established in various SPNT, mainly in nature
parks and nature reserves. The most popular herbivore breeds for introduction are Konik
polski horses and Heck cattle, but other similar crossbreeds are present in the grazing
areas as well. All of the grazing sites are located in the former arable lands and
grasslands.
The conducted interviews elucidated legal framework as the main issue
regarding the management of semi-wild grazing animal populations. According to
current laws, semi-wild grazing animals are classified as livestock. The interviewed
managers of grazing sites state that the laws should be modified and legal exceptions
for semi-wild animals should be made in order to fit the actual situation – the semi-
wild animals are not used to regular human presence, therefore meeting the current
legal requirements is almost unattainable.
The results of this study raise a number of questions that should be addressed in
further situational explorations. Firstly, the question of legal framework - the opinion
of different stakeholders should be analyzed, as well as case studies of semi-wild large
herbivore grazing sites should be conducted to evaluate advantages and disadvantages
of different management approaches. Results of such studies would provide crucial
information for possible legal framework improvements. Secondly, the time
dimension of the introduction projects. Results show that no new semi-wild herbivore
grazing areas have been established since 2007. According to the interviews, this
might be linked to insufficient subsidies and the lack of suitable territories for the
establishment of pastures. However, this aspect requires further in-depth study.
Thirdly, the semi-wild herbivore populations themselves - there are still many
unanswered questions regarding optimal population densities and population dynamic.
Finally, landscapes of semi-wild herbivores. In-depth studies about the landscape
changes, society's perception of the new rural landscapes with the presence of large
herbivores and the role of herbivores in Latvia’s landscape should be undertaken.
Kopsavilkums
Latvijā pirmie pussavvaļas lielie zālēdāji tika ieviesti jau 1999. gadā dabas parkā „Pape”, taču
informācija par Latvijā īstenotajiem introdukcijas projektiem joprojām ir nepilnīga. Šis pētījums ir veikts,
lai apkopotu un analizētu informāciju par introducēto pussavvaļas zālēdāju ganībām īpaši aizsargājamās
dabas teritorijās (ĪADT) Latvijā, akcentējot projektu ieviešanas kontekstu, ganību ģeogrāfiskā novietojuma
faktorus un pašreizējās apsaimniekošanas problēmas. Pētījumā analizētas 8 ievērojamākās pussavvaļas
zālēdāju ganības ĪADT. Pētījumā noskaidrots, ka visas analizētās ganības ir ierīkotas vietās, kas pēc
vairākām pazīmēm ir savstarpēji līdzīgas – tās atrodas bijušajās lauksaimniecības zemēs, ko raksturo
ūdeņu (ezera vai upes) klātbūtne, pārmitri apstākļi un retas biotopu vai putnu sugas. Cita iezīme, kas
līdzīga visiem analizētajiem projektiem, bija formulētais introdukcijas mērķis – mozaīkveida ainavas un
APPRECIATING GEOGRAPHY: LOCAL AND GLOBAL SCALE
68
zālāju biotopu uzturēšana. Kopumā iegūtie rezultāti nodrošina būtisku informācijas bāzi turpmākajiem
pētījumiem.
Pētījumā veiktās intervijas parādīja, ka pašlaik galvenā problēma pussavvaļas zālēdāju ganību
uzturēšanā ir spēkā esošie likumi, kas pussavvaļas zālēdājus klasificē kā mājlopus, līdz ar to pakļaujot tos
tādām pašām likumdošanas prasībām. Pēc ganību apsaimiekotāju domām, būtu jāveic likumu grozījumi,
lai tos pielāgotu reālajai situācijai. Interešu konflikts starp atbildīgajām valsts instancēm un ganību
apsaimniekotājiem ir viens no jautājumiem, kam plānots pievērst uzmanību turpmākajos pētījumos. To
rezultāti iezīmēja arī citus pussavvaļas zālēdāju ganību aspektus, kam būtu nepieciešams pievērsties
turpmākajos pētījumos, to skaitā ainavu pārmaiņām ganību teritorijās un introducēto zālēdāju lomai un tās
uztverei Latvijas lauku ainavā.
References
Birks, H.J.B. (2005). Mind the gap: how open were European primeval forests? Trends in
Ecology and Evolution, 20 (4), 154-156.
Clements, F.E. (1916). Plant Succession. An Analysis of the Development of Vegetation.
Washington: Carnegie Institution, 62-67.
Gruberts, D. and Štrausa, B. (2011). A cooperational model of year-round grazing for the
benefits of farmers and floodplain habits: an example from the Dviete Floodplain Nature Park. In:
Reihmanis, J. (ed.) Nordic-Baltic-Belarus solutions in farming for biodiversity. Rīga: Latvian Fund of
Nature, 62-81.
Hobson, K. (2007). Political animals? On animals as subjects in an enlarged political geography.
Political Geography, 26 (3), 250-267.
Jorgensen, D. (2015). Rethinking rewilding. Geoforum, 65, 482-488.
Kugler, W. and Broxham, E. (2014). The ecological value of feral livestock populations in
Europe. Switzerland: SAVE Foundation, 27.
Lorimer, J. and Driessen, C. (2013). Bovine biopolitics and the promise of monsters in the
rewilding of Heck cattle. Geoforum, 48, 249-259.
Mednis, A. (2008). Pļavu biotopu kā putnu dzīves vietas atjaunošana Engures ezera dabas parkā
2003.-2007.gadā. In: Auniņš, A. (red.) Aktuālā savvaļas sugu un biotopu apsaimniekošanas
problemātika Latvijā. Rīga: Latvijas Universitāte, 101-110.
Moseby, K.E., Lollback, G.W. and Lynch, C.E. (2018). Too much of a good thing: successful
reintroduction leads to overpopulation in a threatened mammal. Biological Conservation, 219, 78-88.
Nolte, S., Esselink, P., Smit, C. and Bakker, J.P. (2014). Herbivore species and density affect
vegetation-structure patchiness in salt marshes. Agriculture, Ecosystems & Environment, 185, 41-47.
Pasaules dabas fonds. (2004). Lielo savvaļas zālēdāju dabiskā ganīšanās.
http://assets.wwflv.panda.org/downloads/lielo_savvalas_zaledaju_gramata.pdf (03.01.2019).
Rewilding Europe. (2019). Rewilding Europe to coordinate new LIFE project on grazing
management models. https://rewildingeurope.com/news/rewilding-europe-to-coordinate-new-life-
project-on-grazing-management-models/ (25.01.2019)
Schwartz, K. (2006). Nature and National Identity after Communism. Globalizing the
Ethnoscape. Pittsburgh: University of Pittsburgh Press.
Schwartz, K. (2005). Wild horses in a ‘European wilderness’: imagining sustainable
development in the post-Communist countryside. Cultural Geographies, 12 (3), 292-320.
Vera, F. (2000). Grazing Ecology and Forest History. Wallingford: CABI.
Vera, F., Buissink, F., Weidema, J. (2007). Wilderness in Europe: What really goes on between
the trees and the beasts? Netherlands: Tirion Natuur, 199.
Vermeulen, R. (2015). Natural grazing: Practises in rewilding of cattle and horses. Netherlands:
FREE Nature, 40.
Zariņa, A. and Treija, D. (2015). Becoming bison: the precedent of wilderness in the Latvia
ethnoscape. Landscape Wilderness and the Wild. Conference program and full papers, 254-257.
APPRECIATING GEOGRAPHY: LOCAL AND GLOBAL SCALE
69
Zariņa, A., Vinogradovs, I. and Šķiņķis, P. (2018). Towards (dis)continuity of agricultural
wetlands: Latvia’s polder landscapes after Soviet productivism. Landscape Research, 43 (3), 455-469.
Watt, A.S. (1947). Pattern and process in plant communities. Journal of Ecology, 35 (1/2), 1-22.
NATURE CENSUS - THE FIRST DETAILED,
SCIENTIFICALLY-GROUNDED INFORMATION
ABOUT LATVIA’S NATURE VALUES
Dabas skaitīšana – pirmā detalizētā un zinātniski
pamatotā informācija par Latvijas dabas vērtībām
Arta Krūmiņa, Jānis Kotāns, Jānis Puga, Ilze Reinika, Gita Strode
Nature Conservation Agency of Latvia
Abstract. The purpose of this article is to analyse the importance of major inventories of nature values –
the mapping of habitats of EU importance – in the context of introducing and implementing a nature
conservation policy in compliance with the necessity to integrate the requirements of those EU directives
concerning specially protected nature areas into the governance system of Latvia. This paper examines the
inventory of nature values from different perspectives – the introduction and implementation of policy,
cross-sector co-operation and the integrity of national natural resource databases.
Keywords: nature conservation, implementation of EU directives, sustainable development for natural
values, Latvia
Introduction
Until 2014, only 10% of Latvian territory had been made accessible to the
distribution maps of the protected species and habitats of European Union (further in
the text – EU) importance. The main part of this data consisted of information about
the already mapped special areas of conservation. Moreover, in most cases, this data
was more than 5 years old. Such a situation had resulted during the recession (i.e.,
from 2008 to 2014), when financial resources for the monitoring of data related to
nature were reduced significantly (Ministry of Environmental Protection and Regional
Development 2013). The lack of voluminous and qualitative data influences the
efficiency of nature - and environmental protection; it also has an adverse impact on
Latvia’s ability to maintain EU commitments and its ability to report on general
environmental indicators and their changes in the entire territory of Latvia. Thus far,
information about the habitat distribution of EU importance, and its occurrence in
Latvia, has been based on an extrapolation of monitoring or other data, which does not
reflect the situation at the level of specific areas, but rather provides an insight into the
possible situation in the entire country. As a result of such data extrapolation, the
occurrence of some habitats of EU importance in the country can possibly be assessed
too pessimistically (i.e. without knowing the overall situation in the entire country, or
about stricter limitations that are set for some types of habitats, thus unreasonably
APPRECIATING GEOGRAPHY: LOCAL AND GLOBAL SCALE
70
restricting economic activities) or too optimistically, thus allowing for the possibility
to destroy habitats of EU importance due to economic activities. Considering that
Latvia has undertaken commitments to form and to maintain the network Natura 2000,
the purpose of which is to preserve the set proportion of the habitats of EU
importance, the EU is entitled to bring judicial proceedings against the country and to
enforce sanctions for non-implementation of the EU Nature Directive (European
Commission 2018). Before the establishment of Natura 2000, most of the EU
countries conducted a comprehensive inventory of nature values, including the
mapping of habitats and forming a network of protected nature areas according to the
EU guidelines, yet not all countries had sufficient resources to conduct it properly.
One such project was implemented in Latvia (Ministry of Environmental Protection
and Regional Development 2001; Latvian Fund for Nature 2002), yet it did not include
mapping of habitats for the entire country, therefore, since that time there have been
debates within the sector about the need to organize the mapping of habitats of EU
importance (European Commission 2013) throughout the national territory. From 2017
to 2019, for the first time in the history of Latvia, and following common
methodology, data on habitat distribution of EU importance was collected throughout
the national territory. Such large-scale data collection, done in a relatively short period
of time, is possible thanks to the EU Cohesion fund, which financed 85% of the
project “Pre-conditions for better bio-diversity preservation and ecosystem protection
in Latvia”.
The Importance of Nature Census in Introducing the Nature Conservation Policy
Latvia takes part in global environmental protection and climate processes to
ensure preservation of the planet for future generations. As a full EU member, Latvia
must implement the common EU nature conservation policy, which differs
significantly from the nature conservation practice that had been implemented before
joining the EU. For Example, Specially Protected Nature Territories (further in the
text – SPNT) were established in Latvia for purposes that not always prioritized the
protection and conservation of nature values. For instance, the Law on Specially
Protected Nature Territories (originally adopted in 1993) lays down the categories of
special areas of conservation according to which, e.g., nature reserves are the
territories which represent cultural, historical and nature values of a specific region
and which are suitable for public recreation and education, whilst economic activities
are organized ensuring the conservation of cultural, historical and nature values, i.e.,
the occurrence of nature values and enhancement of their quality is not a priority. Yet
irrespective of the nationally defined SPNT status (i.e. a nature reserve or a protected
landscape area), if the territory is a Natura 2000 site, economic activities must be
planned so as not to deteriorate the status of the existing nature values and to improve
them in future. To ensure a favourable conservation status for species and habitats, the
implementation of EU nature conservation requirements is carried out on the basis of
two European Council directives:
APPRECIATING GEOGRAPHY: LOCAL AND GLOBAL SCALE
71
Directive 92/43/EEC of 21 May 1992 “On the conservation of natural
habitats and of wild fauna and flora” (European Commission 1992);
Directive 2009/147/EC of 30 November 2009 “On the conservation of
wild birds” (European Commission 2009).
In Latvia, requirements of these directives were carried over by the law “On
protection of species and habitats” (2001); the law “On specially protected nature
territories” (1993); the law “On environmental impact assessment” (1998) and the
subordinate regulations of the Cabinet of Ministers and other legislative acts. The
underlying idea of the EU nature conservation policy is the concept of “conservation
in a favourable status of selected habitat types and species of Community interest”
(Veinla 2009), which must ensure the long-term existence and functioning of protected
species and habitats not only within the special areas of conservation (SPNT,
hereinafter the term is used within the meaning of the law “On specially protected
nature territories”), but also outside them. This is a complex task for any country,
because SPNT regulations partially ensure the conservation of nature values within the
conservation areas by setting the restrictions for economic activities. Outside these
areas the status “protected” can be granted to species by limiting or prohibiting their
exploitation, and it is much more complex when it comes to habitats. Therefore, it is
essential that the most important and valuable areas which offer the greatest bio-
diversity are included in the SPNT category. Without having the information about the
mapping of habitats of EU importance and species distribution throughout the country,
we cannot be certain that the existing Natura 2000 network provides species and
habitats of national importance with the required protection status. At national level, it
must be ensured that a set proportion of habitats (including special habitats) from the
total surface area of the country is included in the Natura 2000 network (also known as
the network of special areas of conservation of EU importance) (European
Commission 1997).
The Importance of Nature Census in Implementing the Nature Conservation
Policy
Mapping the habitats of EU importance is crucial not only for the implementation
of EU requirements, but also for Latvia’s municipalities, entrepreneurs and other
economic operators so as to be able to plan and develop their economic activities.
Namely, according to the legislation of Latvia, it is permitted to carry out an envisaged
activity if it does not have an adverse effect on ecological functions and the integrity of a
protected site of EU importance, which is a part of the Natura 2000 network and as long
as it does not contradict with its establishment and conservation purposes (Law 1993).
One of the most important Environmental Impact Assessment (further EIA) objectives is
to predict the impact of a specific activity on a habitat in a specific location and to
compare it with the total habitat area in the country and all Natura 2000 sites.
Conservation of a habitat is considered to be favourable if its natural range and surface
areas are unchanged or are expanding; they have the characteristic structure and
APPRECIATING GEOGRAPHY: LOCAL AND GLOBAL SCALE
72
functions which are necessary for sustainable existence of a habitat; and it is expected
that they will keep existing in the near future. It must be ensured that there are
favourable conditions for the protection of the typical species in these areas. If there is
no available information in the country concerning habitat distribution of EU
importance, then in each EIA such an assessment must be conducted within the specific
area and the comparative information about the country in general is based on
extrapolated data. The EIA initiator must involve the relevant nature experts, both
increasing the expenses and prolonging the obtainment of permission. Moreover, one
can always question the relevance of the assessment in respect to the total surface area
of the national habitats of EU importance. At the same time, it must be pointed out that
after carrying out the EIA procedure, economic operators expressed their reproach,
when the location of their envisaged economic activities was identified as a habitat of
EU importance or a habitat of protected species, and as a result the intended economic
activities were restricted or prohibited. The number of such reproaches would very
likely be much smaller if the information concerning the nature values in the specific
area was made available prior the EIA procedure, and it were possible to take it into
account before planning of activities.
The Importance of Nature Census in Promoting Cross-Sectoral Co-operation
Information about habitats of EU importance and habitats of protected species
must be considered when planning territorial development at local and regional level.
Furthermore, there is a case-law in Latvia which states that when planning territorial
development, both nature conservation and environmental protection and economic
development interests must be balanced out (Constitutional Court 2008). This means
that insufficient information delays the integration of nature conservation requirements
into the development plans of other sectors and prevents balanced and sustainable
development. These problems are also emphasized in the “Guidelines for
Environmental Policy (2014-2020)” (Ministry of Environmental Protection and
Regional Development 2014). Lack of data on habitat distribution is also regarded as
one of limiting factors for natural resource management in “Guidelines for Forestry
and Related Sectors (2015-2020)” (Ministry of Agriculture 2015). In considering the
forestry sector, it is important to emphasize that information about habitat distribution
and its quality is mandatory to be able to reach inter-institutional agreement on
specially protected national forestry areas. Similarly, data collected during the
mapping of habitats of EU importance would allow for an update of the coastal dune
protection zone of the Baltic Sea and to improve the quality of the territorial planning.
Often such nature conservation measures as the establishment of micro-reserves is
used to limit or stop the planned construction on site because during the territorial
planning stage the intended use of the territory was not discussed thoroughly and the
occurrence of nature values on site was not assessed properly.
APPRECIATING GEOGRAPHY: LOCAL AND GLOBAL SCALE
73
The Importance of Nature Census in Improving National Natural Resource
Databases
Besides the collecting of data on habitats of EU importance, the quality of
information in national natural resource databases is also constantly improving. For
instance, as the data of different national authorities and organizations is constantly
being co-ordinated, mistakes and inaccuracies are identified and eliminated. Such data
exchange offers a practically applicable result. For example, there is co-operation
between the Nature Conservation Agency and the Rural Support Service (RSS) which
implements the rural support policy at national level (MK 2015). Data collected during
the mapping of habitats of EU importance and concerning the grasslands of high
nature value is transferred to the RSS to administer the payments for management of
grasslands of high nature value more effectively.
When starting the inventory of nature values, the criteria for surveyed and non-
surveyed areas were set by the Cabinet of Ministers (Ministry of Environmental
Protection and Regional Development 2016). There was established the methodology
for mapping the habitat distribution of EU importance, according to EU directive
92/43/EEC of 21 May 1992 “On the conservation of natural habitats and of wild
fauna and flora” (European Commission 1992) and for their quality and organization
of work (for a full description of the methodology see the reference: Nature
Conservation Agency 2016), which was co-ordinated with the Ministry of Agriculture
and confirmed by the Ministry of Environmental Protection and Regional
Development. To illustrate the diversity of data used, the authors of this article
indicate below the sources of natural resource databases from which to select
information about different types of habitats.
Forestry and Mires. These include areas which must be surveyed by experts
in situ on a mandatory basis, as well as areas where an in situ survey is not
required due to a small probability of discovering any nature values (non-
surveyed areas). The main data sources were the associations of State Forest
Service (SFS), JSC “Latvia’s State Forests”, Nature Conservation Agency
(NCA), Environment State Bureau (ESB), State Environmental Service
(SES), and Latvian Peat Association. To distinguish different types of
forestry habitats, geo-morphological data on distribution of ash trees and
inland dunes was used, tracing the areas that are surveyed on a mandatory
basis from the maps of the Latvian Environment, Geology and Meteorology
Centre (LEGMC). Furthermore, in co-operation with experts, a watershed
between the coastal dunes and inland dunes was set.
Grasslands. Mandatory surveyed and non-surveyed agricultural areas are
selected by using data provided by the Rural Support Service, Nature
Conservation Agency, Latvian Fund for Nature and State Land Service (SLS).
For example, “mandatory surveyed” status was assigned to agricultural areas,
which correspond to the code “type of use of cultivated plants and lands”,
indicated in the RSS database “710 – perennial grasslands”, and grasslands of
APPRECIATING GEOGRAPHY: LOCAL AND GLOBAL SCALE
74
high nature value found in the habitat section of the nature database “Ozols”,
whereas the areas which correspond to other cultivated plants were excluded
from the “surveyed” class.
Freshwaters. No distinction was made between “mandatory surveyed” and
“non-surveyed” areas. All water courses of natural origin were selected for
mapping purposes. Namely, information provided by the LEGMC, SLS and
the land amelioration cadastre was used for these purposes. Topographic
maps provided by the Latvian Geo-Spatial Information Agency were also
used in the process. Artificial water courses and hydro-electric power
stations, as well as other significantly modified water courses (amelioration
systems) were excluded from the mapping process.
Rocks and caves of EU importance. The mapping of these habitats had a
solely informative nature. Before mapping the rocky habitats and caves, the
experts had to carry out the geological and geo-morphological information
analysis of each mapping square, using the terrain maps of the LEGMC,
sediment maps, real material (point) maps of rocky habitats and hydro-
geological maps with indications of springs.
The status of “non-surveyed area” was assigned to the national and local areas of
transportation (including motor roads and railways), communication infrastructures
and their protection zones, as well as the protection zones of amelioration systems
outside the special areas of conservation and micro-reserves, and the geo-spatial data
which was available to the experts. Areas, where EIAs had been conducted or
concluded for the past 3 years, and SPNTs, for which a nature conservation plan has
been developed for the past 3 years, are also included in the “non-surveyed area”
category.
Not all nature databases provide information in the form of geo-spatial data,
moreover, such information is not always correct. Often, information in the database is
not updated for the entire data set, sometimes there are inconsistencies of information
in databases of different national authorities. For example, a specific area can be
defined as a forest in the SFS database, whereas according to RSS this area is managed
as a canola field, and there is completely different information about this area in the
State Unified Computerized Land Register. Sometimes situations occur, where the
plant cover of an ameliorated system is inventoried as a forest, forest plots reaching
the rivers and lakes, parking lots and courtyards. During the Nature Census, there were
many inconsistencies identified between the SLS data (cadastre) and the real situation.
Conclusion
Sustainable management of natural resources is based on decisions which are
made, considering comprehensible and qualitative data analysis. As in any other
sector, there is a necessity for fundamental data inventory when it comes to the
effective management of special areas of conservation and nature values. However,
this process is also accompanied by negative trends, e.g., misleading the public and
APPRECIATING GEOGRAPHY: LOCAL AND GLOBAL SCALE
75
even fraudulent conduct by dishonest individuals or companies in a specific habitat
group. Therefore, the authors of this article emphasize that after the Nature Census, the
volume of publicly-available information about the nature values of Latvia will
increase significantly. This will contribute to ensuring decision-making transparency
and will decrease possible corruption, moreover, it will accelerate the speed of passing
legislative acts and decision-making related to economic activities in special areas of
conservation.
Although, primarily, the mapping of habitats of EU importance is a contribution
to introducing an effective and liable nature conservation policy, the process of Nature
Census raises many issues related to the national governance system and reaching the
aims to introduce sustainable development principles. A good example of that is the
heated debates among representatives of different sectors about the SPNT proportion
in Latvia. The nature conservation sector indicates the factors that prevent the
assignment of adequate favourable conservation status and even destroy the natural
resources of Latvian and of EU importance (Report to European Commission 2012),
whereas the sectors of nature development and management draw attention to the
“abundance” of SPNT, which hinders economic activities (Public Broadcasting of
Latvia 2017). Thus, irrespective of how important the data collected during the Nature
Census is, its use for determining the SPNT will depend on political decision-makers,
who, hopefully, will make their decisions, based on constructive inter-sectoral debates
that are oriented on sustainable development.
Habitats of EU importance are only one of many identified Latvian nature
values. There is a lack of data concerning the distribution of protected species in the
country. Not always shall conservation and management of habitats of EU importance
contribute to the conservation of species. Consequently, after analysing Nature Census
data related to the distribution of specially protected species in the country, there shall
remain many unidentified factors, and Nature Census will not be a solution to all
problems in the nature conservation sector. To make the best use of the Nature Census
results, it would be important to enhance the habitat monitoring programs so as to
provide up-to-date, scientifically grounded data about the entire country. This could be
used later on to ensure a balanced decision-making. Nevertheless, the nature
conservation sector must realize that species and habitat conservation cannot be
planned long-term, while ignoring the interests of the third parties, and the other
sectors must understand that integration of nature conservation principles in the sector
policies and their implementation is cheaper and more efficient than trying to save and
renew something that has already become almost extinct.
Kopsavilkums
Laikā līdz 2014. gadam tikai 10 procentiem no Latvijas valsts teritorijas bija pieejamas Eiropas
Savienības nozīmes aizsargājamo sugu un biotopu izplatības kartes. Apjomīgu un kvalitatīvu datu trūkums
ietekmē dabas un vides aizsardzības efektivitāti, kā arī negatīvi iespaido Latvijas spēju pildīt ES saistības
un iespējas ziņot par vispārīgiem vides indikatoriem un to pārmaiņām Latvijas valstī kopumā. Tāpēc laikā
no 2017. līdz 2019. gadam pirmo reizi Latvijas vēsturē notiek ES nozīmes biotopu izplatības datu ieguve
APPRECIATING GEOGRAPHY: LOCAL AND GLOBAL SCALE
76
pēc vienotas metodikas visā valsts teritorijā jeb Dabas skaitīšana. Raksta mērķis ir analizēt ES nozīmes
biotopu kartēšanas nozīmi dabas aizsardzības politikas ieviešanā un īstenošanā atbilstoši ES direktīvu
prasību integrēšanu Latvijas valsts pārvaldībā pār īpaši aizsargājamām dabas teritorijām. Rakstā apskatīta
dabas vērtību inventarizācija politikas ieviešanas, īstenošanas, starpnozaru sadarbības un valsts nozīmes
dabas datu bāžu integritātes aspektā. Vienlaikus akcentējot, ka Dabas skaitīšana aktualizē arī daudzus
problēmjautājumus valsts pārvaldības sistēmā un valsts mērķu īstenošanā ilgtspējīgas attīstības principu
ieviešanā.
References
Nature Conservation Agency (2016). ES nozīmes biotopu izplatības un kvalitātes apzināšanas un
darbu organizācijas metodika. https://www.daba.gov.lv/upload/File/DOC/BIOTOPI_met_160722.pdf
(14.01.2019)
European Commission (2018). List of legal issues proposed by the European Commission.
http://ec.europa.eu/environment/legal/law/press_en.htm (14.01.2019)
European Commission (2013). The Interpretation Manual of European Union Habitats – EUR28.
http://ec.europa.eu/environment/nature/legislation/habitatsdirective/docs/Int_Manual_EU28.pdf
(14.01.2019)
European Commission (2009). Directive 2009/147/EC of the European Parliament and of the
Council of 30 November 2009 on the conservation of wild birds. https://eur-lex.europa.eu/legal-
content/EN/TXT/?uri=CELEX%3A32009L0147 (14.01.2019)
European Commission (1992). Council Directive 92/43/EEC of 21 May 1992 on the
conservation of natural habitats and of wild fauna and flora. https://eur-lex.europa.eu/legal-
content/EN/TXT/?uri=CELEX%3A31992L0043 (14.01.2019)
European Commission (1997). Criteria for assessing national list of Sites of Community
Importance at biogeographical level. 97 (2/4). https://bd.eionet.europa.eu/activities/Natura_2000/crit
(14.01.2019)
Latvijas dabas fonds (2002). EMERALD projekta pase. http://old.ldf.lv/pub/?doc_id=27878
(14.01.2019)
Law “On the Conservation of Species and Biotopes” (2001). https://likumi.lv/ta/en/en/id/3941-
law-on-the-conservation-of-species-and-biotopes (14.01.2019)
Law “On Specially Protected Nature Territories” (1993). https://likumi.lv/ta/en/en/id/59994-on-
specially-protected-nature-territories (14.01.2019)
Law “On Environmental Impact Assessment” (1998). https://likumi.lv/ta/en/en/id/51522-on-
environmental-impact-assessment (14.01.2019)
MK (2015). Tiešo maksājumu piešķiršanas kārtība lauksaimniekiem. Ministru kabineta
noteikumi Nr. 126. https://likumi.lv/ta/id/273050-tieso-maksajumu-pieskirsanas-kartiba-
lauksaimniekiem (14.01.2019)
Public broadcasting of Latvia (2017). Dabas skaitīšana atsegusi dabas un ekonomisko interešu
sadursmi: https://www.lsm.lv/raksts/zinas/ekonomika/dabas-skaitisana-atsegusi-dabas-un-ekonomisko-
interesu-sadursmi.a251746/ (05.12.2018)
Report to European Commission (2012). General reporting format for the 2007-2012 report.
Reporting under Article 17 of the Habitats Directive (period 2007-2012) Member States Deliveries.
Latvia.
https://bd.eionet.europa.eu/activities/Reporting/Article_17/Reports_2013/Member_State_Deliveries
(14.01.2019)
Constitutional Court (2008). Spriedums Latvijas Republikas vārdā Rīgā 2008. gada 17. janvārī
lietā Nr. 2007-11-03. http://www.satv.tiesa.gov.lv/wp-content/uploads/2016/02/2007-11-
03_Spriedums.pdf (14.01.2019)
Veinla, H. (2009). The influence of European Union Law on the conservation of Estonian
biological diversity -the Ccse of Natura 2000 areas. Juridica International, XVI.
https://www.juridicainternational.eu/public/pdf/ji_2009_1_168.pdf (14.01.2019)
APPRECIATING GEOGRAPHY: LOCAL AND GLOBAL SCALE
77
Ministry of Environmental Protection and Regional Development (2014). Vides politikas
pamatnostādnēs 2014-2020. gadam. http://www.varam.gov.lv/lat/pol/ppd/vide/?doc=17913
(14.01.2019)
Ministry of Environmental Protection and Regional Development (2016). Informatīvais
ziņojums "Par pasākumiem aizsargājamo biotopu izplatības un kvalitātes apzināšanai".
http://tap.mk.gov.lv/lv/mk/tap/?pid=40372506 (14.01.2019)
Ministry of Environmental Protection and Regional Development (2013). Informatīvais
ziņojums par vides monitoringu un jūras zvejas kontroli. http://tap.mk.gov.lv/mk/tap/?pid=40259415
(14.01.2019)
Ministry of Environmental Protection and Regional Development (2001). EMERALD/ Natura
2000 projekta kopsavilkums.
http://www.varam.gov.lv/lat/darbibas_veidi/daba/dabas_aizsardzibas_projekti/?doc=2920 (14.01.2019)
Ministry of Agriculture (2015). Meža un saistīto nozaru pamatnostādnēs 2015.-2020. gadam.
https://www.zm.gov.lv/mezi/statiskas-lapas/meza-un-saistito-nozaru-attistibas-pamatnostadnes-2015-
2020-gadam?id=6501#jump (14.01.2019)
PROJECTED CHANGES IN THE NUMBER OF INHABITANTS
OF LATVIA IN THE EVENT OF THE STABILIZATION
OF EMIGRATION
Latvijas iedzīvotāju skaita prognozējamās pārmaiņas,
stabilizējoties starpvalstu migrācijai
Juris Paiders
University of Latvia, Faculty of Geography and Earth Sciences
Abstract. The decline in population is a significant problem for Latvia, the causes and consequences of
which have been brought to the attention of many researchers. The aim of this study is to perform a
mathematical analysis of the population and the main components of its changes at the national level to
evaluate the use of these indicators in the estimation of population changes. The methods of this research
are based on data regression analysis. The statistical analysis of this work uses the data of the Central
Statistical Bureau of Latvia. The study also utilised Statistical Office of the European Union (Eurostat)
population projections at the national level. The results of this research are based on data regression
analysis. Although linear regression models evaluate changes in the population of Latvia and show very
strong correlation, they must be treated critically.
The population migration balance is not predictable based on historical observations and/or by using
mathematical models. In migration balance forecast models that are based on mathematical statistical
methods, the uncertainty is so great that the practical value of such models is negligible.
Keywords: population of Latvia, regression analysis, population forecasts, natural growth, population
migration balance
Introduction
The decline in population is a significant problem for Latvia, the causes and
consequences of which have been brought to the attention of many researchers. Most
research is devoted to studying the impact of mobility and migration on territorial
APPRECIATING GEOGRAPHY: LOCAL AND GLOBAL SCALE
78
disparities (Krišjāne et al. 2017; Zhitin et al. 2018; Arbidane and Markevica 2016;
Göler et al. 2014; Apsīte et al. 2012; Krišjāne and Bērziņš 2012, etc.). The prediction
of the population is important in planning the availability of labour (Arbidane and
Markevica 2016; Kekla and Senfelde 2016, etc.) as well as other economic and social
activities (Klavenieks and Blumberga 2016; Berloviene and Samusevich 2016 etc.).
The aim of this work is to perform a mathematical analysis of the population and
the main components of its changes at the Latvian national level in order to evaluate
the use of these indicators in the estimation of population changes.
Data and Methods
The statistical analysis for this work uses the data of the Central Statistical
Bureau of Latvia (CSB) last updated on 1 January 2018. In turn, the calculation of the
forecasts in Table 3 includes the more recent population figure on 1 January 2019. The
research process also used Statistical Office of the European Union (Eurostat)
population projections at the national level, as well as development planning
documents by the government and government structures of Latvia.
Methods incorporated in this study are based on data regression analysis. As a
regression co-efficient criterion for rejecting or accepting a zero hypothesis, a rule was
set that the zero value would not be in the confidence interval of a regression co-
efficient with a 95% probability. Unless otherwise stated in this work, a 95%
probability was used to assess the statistical significance.
The strategic goal of Latvian population and population forecasts.
According to the main Latvian strategic planning document Sustainable
Development Strategy of Latvia until 2030 (approved by the Latvian Parliament in
2010) the aim of Latvia is to reach a population level of more than 2.02 million
by 2030 (Sustainable... 2010). The Government of Latvia decided not to change this
goal in 2015 (Latvijas Ilgtspējīgas... 2015), specifying that this goal is moving forward
satisfactorily. This target was considered to be likely to be achieved if the population
will exceed 1.93 million in 2020 (Indikatori… 2015). The exact same goal for 2020
was also included in the National Development Plan of Latvia for 2014-2020
(National Development Plan… 2012). Unfortunately, according to the CSB data, on
January 1, 2019, there were only 1.92 million inhabitants in Latvia. Given the
demographic and migration trends in Latvia, neither the 2020, nor the 2030 target can
be achieved. Such conclusions follow from the Latvian population forecasts published
by the Ministry for the Economy of Latvia (Informatīvais… 2018) and Eurostat
(Table 1).
Forecasts for 2020 and 2030 were not published in the Labor Market Forecasts
by the Ministry for the Economy of Latvia (Informatīvais… 2018). These values were
calculated by the author based on the average size of population changes recorded in
the report (negative 0.6% per annum in 2018-2025 and negative 0.2% in 2026-2035).
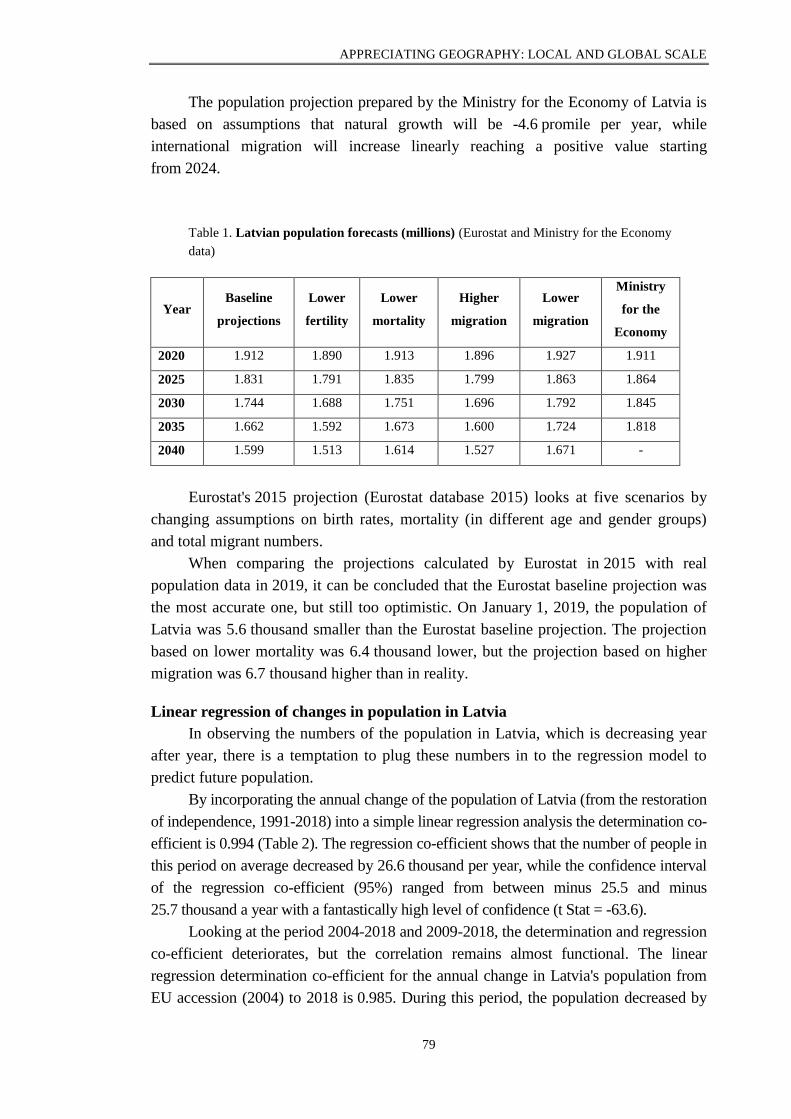
APPRECIATING GEOGRAPHY: LOCAL AND GLOBAL SCALE
79
The population projection prepared by the Ministry for the Economy of Latvia is
based on assumptions that natural growth will be -4.6 promile per year, while
international migration will increase linearly reaching a positive value starting
from 2024.
Table 1. Latvian population forecasts (millions) (Eurostat and Ministry for the Economy
data)
Year Baseline
projections
Lower
fertility
Lower
mortality
Higher
migration
Lower
migration
Ministry
for the
Economy
2020 1.912 1.890 1.913 1.896 1.927 1.911
2025 1.831 1.791 1.835 1.799 1.863 1.864
2030 1.744 1.688 1.751 1.696 1.792 1.845
2035 1.662 1.592 1.673 1.600 1.724 1.818
2040 1.599 1.513 1.614 1.527 1.671 -
Eurostat's 2015 projection (Eurostat database 2015) looks at five scenarios by
changing assumptions on birth rates, mortality (in different age and gender groups)
and total migrant numbers.
When comparing the projections calculated by Eurostat in 2015 with real
population data in 2019, it can be concluded that the Eurostat baseline projection was
the most accurate one, but still too optimistic. On January 1, 2019, the population of
Latvia was 5.6 thousand smaller than the Eurostat baseline projection. The projection
based on lower mortality was 6.4 thousand lower, but the projection based on higher
migration was 6.7 thousand higher than in reality.
Linear regression of changes in population in Latvia
In observing the numbers of the population in Latvia, which is decreasing year
after year, there is a temptation to plug these numbers in to the regression model to
predict future population.
By incorporating the annual change of the population of Latvia (from the restoration
of independence, 1991-2018) into a simple linear regression analysis the determination co-
efficient is 0.994 (Table 2). The regression co-efficient shows that the number of people in
this period on average decreased by 26.6 thousand per year, while the confidence interval
of the regression co-efficient (95%) ranged from between minus 25.5 and minus
25.7 thousand a year with a fantastically high level of confidence (t Stat = -63.6).
Looking at the period 2004-2018 and 2009-2018, the determination and regression
co-efficient deteriorates, but the correlation remains almost functional. The linear
regression determination co-efficient for the annual change in Latvia's population from
EU accession (2004) to 2018 is 0.985. During this period, the population decreased by
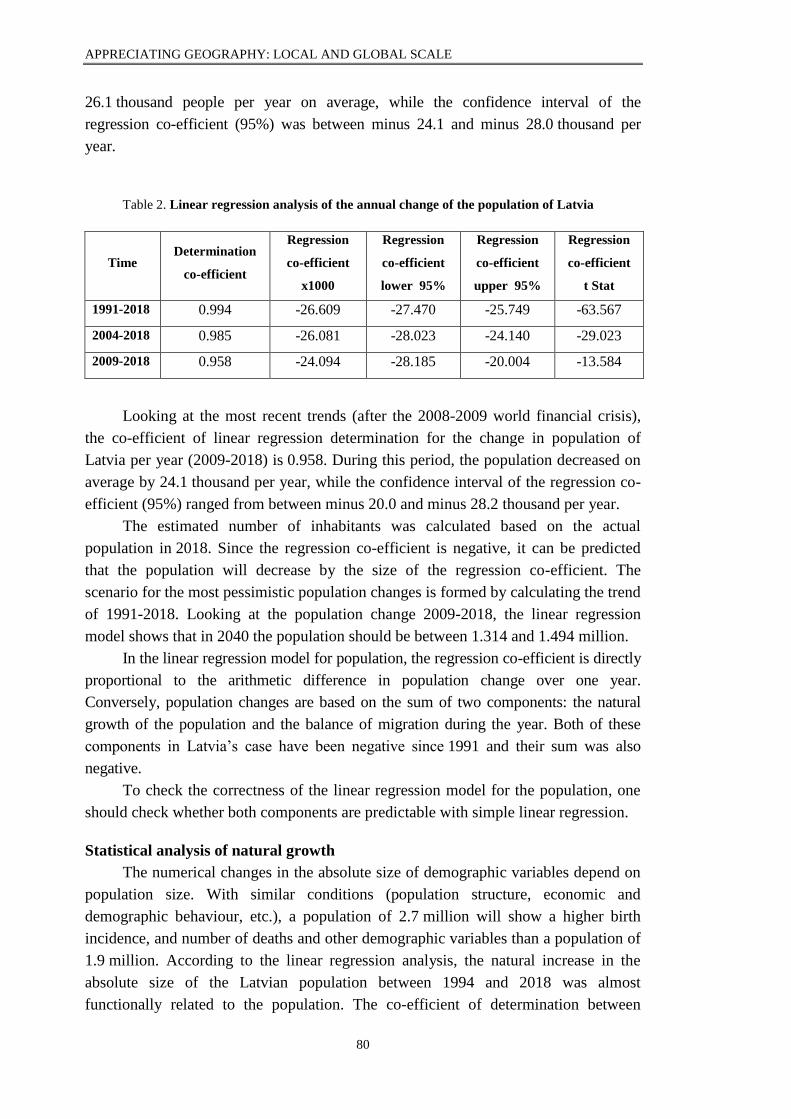
APPRECIATING GEOGRAPHY: LOCAL AND GLOBAL SCALE
80
26.1 thousand people per year on average, while the confidence interval of the
regression co-efficient (95%) was between minus 24.1 and minus 28.0 thousand per
year.
Table 2. Linear regression analysis of the annual change of the population of Latvia
Time Determination
co-efficient
Regression
co-efficient
x1000
Regression
co-efficient
lower 95%
Regression
co-efficient
upper 95%
Regression
co-efficient
t Stat
1991-2018 0.994 -26.609 -27.470 -25.749 -63.567
2004-2018 0.985 -26.081 -28.023 -24.140 -29.023
2009-2018 0.958 -24.094 -28.185 -20.004 -13.584
Looking at the most recent trends (after the 2008-2009 world financial crisis),
the co-efficient of linear regression determination for the change in population of
Latvia per year (2009-2018) is 0.958. During this period, the population decreased on
average by 24.1 thousand per year, while the confidence interval of the regression co-
efficient (95%) ranged from between minus 20.0 and minus 28.2 thousand per year.
The estimated number of inhabitants was calculated based on the actual
population in 2018. Since the regression co-efficient is negative, it can be predicted
that the population will decrease by the size of the regression co-efficient. The
scenario for the most pessimistic population changes is formed by calculating the trend
of 1991-2018. Looking at the population change 2009-2018, the linear regression
model shows that in 2040 the population should be between 1.314 and 1.494 million.
In the linear regression model for population, the regression co-efficient is directly
proportional to the arithmetic difference in population change over one year.
Conversely, population changes are based on the sum of two components: the natural
growth of the population and the balance of migration during the year. Both of these
components in Latvia’s case have been negative since 1991 and their sum was also
negative.
To check the correctness of the linear regression model for the population, one
should check whether both components are predictable with simple linear regression.
Statistical analysis of natural growth
The numerical changes in the absolute size of demographic variables depend on
population size. With similar conditions (population structure, economic and
demographic behaviour, etc.), a population of 2.7 million will show a higher birth
incidence, and number of deaths and other demographic variables than a population of
1.9 million. According to the linear regression analysis, the natural increase in the
absolute size of the Latvian population between 1994 and 2018 was almost
functionally related to the population. The co-efficient of determination between
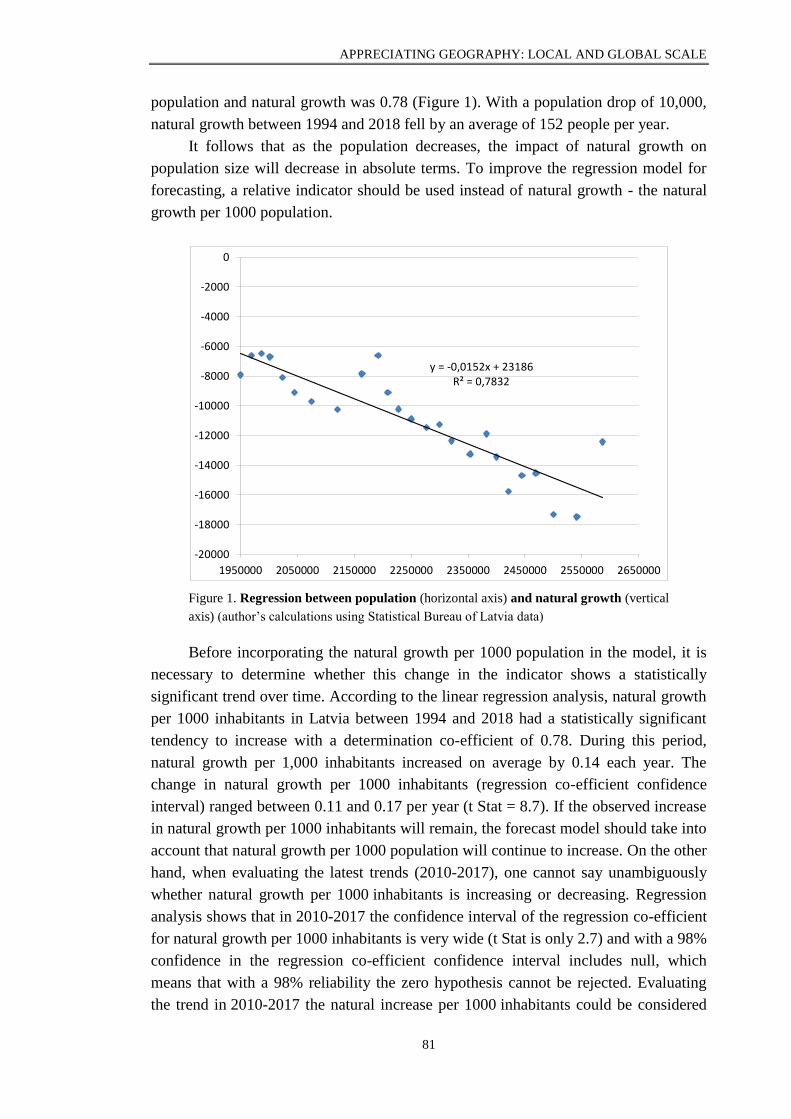
APPRECIATING GEOGRAPHY: LOCAL AND GLOBAL SCALE
81
population and natural growth was 0.78 (Figure 1). With a population drop of 10,000,
natural growth between 1994 and 2018 fell by an average of 152 people per year.
It follows that as the population decreases, the impact of natural growth on
population size will decrease in absolute terms. To improve the regression model for
forecasting, a relative indicator should be used instead of natural growth - the natural
growth per 1000 population.
Figure 1. Regression between population (horizontal axis) and natural growth (vertical
axis) (author’s calculations using Statistical Bureau of Latvia data)
Before incorporating the natural growth per 1000 population in the model, it is
necessary to determine whether this change in the indicator shows a statistically
significant trend over time. According to the linear regression analysis, natural growth
per 1000 inhabitants in Latvia between 1994 and 2018 had a statistically significant
tendency to increase with a determination co-efficient of 0.78. During this period,
natural growth per 1,000 inhabitants increased on average by 0.14 each year. The
change in natural growth per 1000 inhabitants (regression co-efficient confidence
interval) ranged between 0.11 and 0.17 per year (t Stat = 8.7). If the observed increase
in natural growth per 1000 inhabitants will remain, the forecast model should take into
account that natural growth per 1000 population will continue to increase. On the other
hand, when evaluating the latest trends (2010-2017), one cannot say unambiguously
whether natural growth per 1000 inhabitants is increasing or decreasing. Regression
analysis shows that in 2010-2017 the confidence interval of the regression co-efficient
for natural growth per 1000 inhabitants is very wide (t Stat is only 2.7) and with a 98%
confidence in the regression co-efficient confidence interval includes null, which
means that with a 98% reliability the zero hypothesis cannot be rejected. Evaluating
the trend in 2010-2017 the natural increase per 1000 inhabitants could be considered
y = -0,0152x + 23186R² = 0,7832
-20000
-18000
-16000
-14000
-12000
-10000
-8000
-6000
-4000
-2000
0
1950000 2050000 2150000 2250000 2350000 2450000 2550000 2650000
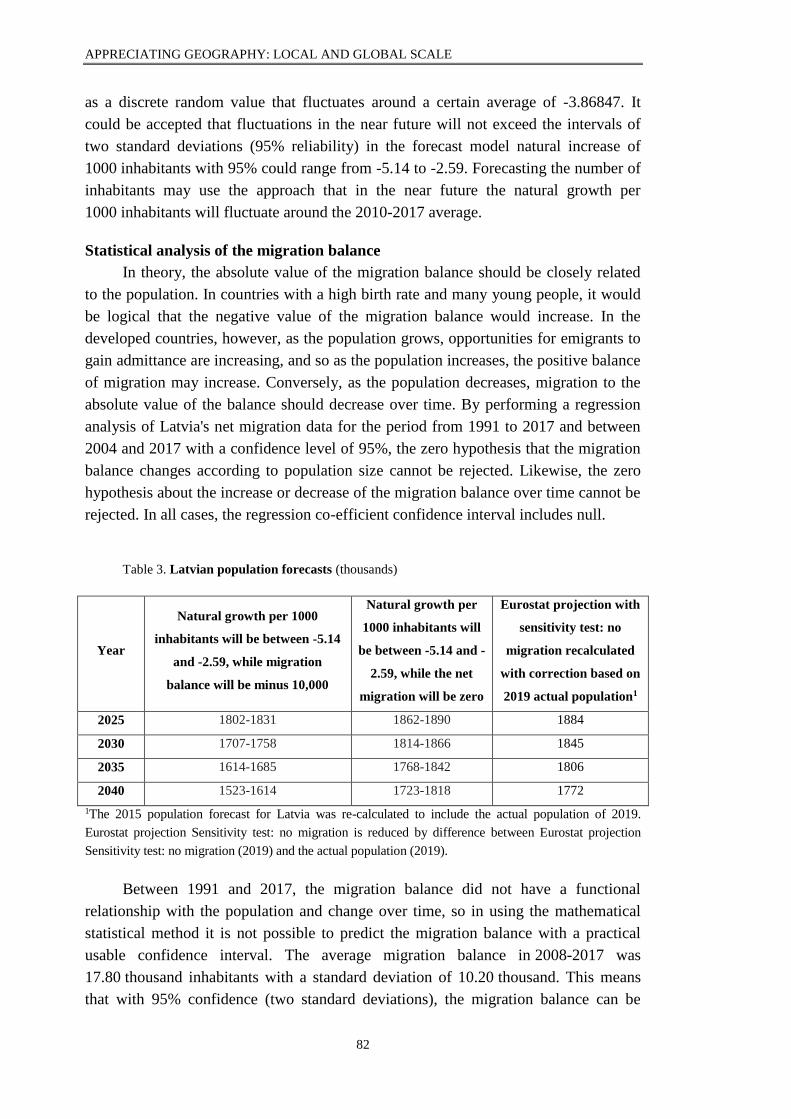
APPRECIATING GEOGRAPHY: LOCAL AND GLOBAL SCALE
82
as a discrete random value that fluctuates around a certain average of -3.86847. It
could be accepted that fluctuations in the near future will not exceed the intervals of
two standard deviations (95% reliability) in the forecast model natural increase of
1000 inhabitants with 95% could range from -5.14 to -2.59. Forecasting the number of
inhabitants may use the approach that in the near future the natural growth per
1000 inhabitants will fluctuate around the 2010-2017 average.
Statistical analysis of the migration balance
In theory, the absolute value of the migration balance should be closely related
to the population. In countries with a high birth rate and many young people, it would
be logical that the negative value of the migration balance would increase. In the
developed countries, however, as the population grows, opportunities for emigrants to
gain admittance are increasing, and so as the population increases, the positive balance
of migration may increase. Conversely, as the population decreases, migration to the
absolute value of the balance should decrease over time. By performing a regression
analysis of Latvia's net migration data for the period from 1991 to 2017 and between
2004 and 2017 with a confidence level of 95%, the zero hypothesis that the migration
balance changes according to population size cannot be rejected. Likewise, the zero
hypothesis about the increase or decrease of the migration balance over time cannot be
rejected. In all cases, the regression co-efficient confidence interval includes null.
Table 3. Latvian population forecasts (thousands)
Year
Natural growth per 1000
inhabitants will be between -5.14
and -2.59, while migration
balance will be minus 10,000
Natural growth per
1000 inhabitants will
be between -5.14 and -
2.59, while the net
migration will be zero
Eurostat projection with
sensitivity test: no
migration recalculated
with correction based on
2019 actual population1
2025 1802-1831 1862-1890 1884
2030 1707-1758 1814-1866 1845
2035 1614-1685 1768-1842 1806
2040 1523-1614 1723-1818 1772
1The 2015 population forecast for Latvia was re-calculated to include the actual population of 2019.
Eurostat projection Sensitivity test: no migration is reduced by difference between Eurostat projection
Sensitivity test: no migration (2019) and the actual population (2019).
Between 1991 and 2017, the migration balance did not have a functional
relationship with the population and change over time, so in using the mathematical
statistical method it is not possible to predict the migration balance with a practical
usable confidence interval. The average migration balance in 2008-2017 was
17.80 thousand inhabitants with a standard deviation of 10.20 thousand. This means
that with 95% confidence (two standard deviations), the migration balance can be
APPRECIATING GEOGRAPHY: LOCAL AND GLOBAL SCALE
83
between the threshold of plus 3.60 thousand and minus 38.2 thousand. Using such
confidence intervals, the confidence interval of the forecasts was so broad that the
practical use of forecasts was questionable.
By dividing population changes into two components, it can be concluded that
population changes due to natural delivery are predictable using mathematical
statistics, but changes in population due to migration balance are not rational to predict
using mathematical statistics methods. Therefore Eurostat, in addition to the five
forecast scenarios, also calculates the potential population change for no migration for
all EU Member States. It is likely that a rational population forecast should be made
by forecasting the change in the migration balance with qualitative research methods.
For instance, by assuming that the natural growth per 1000 inhabitants will remain at
the 2008-2017 average level, we will create two scenarios (Table 3). In the first, let us
assume that from 2019 onwards, the average migration balance will stabilize at the
2015-2017 level (minus 10,000 inhabitants per year), while in the second, we may
assume that from 2019 onwards, the average migration balance will stabilize at zero.
Conclusions
Decreasing population means less internal demand and less labour supply. It
follows that there are presently no signs of a rapid change in Latvia's economic
development. The population of Latvia will continue to decline even if the migration
balance stabilizes at zero.
In turn, Eurostat's calculation based on assumptions about age and gender
differences in mortality for each year is within the confidence interval of the forecast,
based on a simple mathematical analysis of natural growth.
Though linear regression models evaluate changes in the population of Latvia
and show very strong correlation, they must be treated critically.
The population migration balance is not predictable on the basis of historical
observations and by using mathematical models. In migration balance forecast models
that are based on mathematical statistical methods, the uncertainty is so great that the
practical value of such models is negligible.
Kopsavilkums
Šī darba mērķis ir veikt iedzīvotāju skaita un tā pārmaiņu galveno komponentu matemātisko analīzi
nacionālā līmenī, lai apzinātu šo indikatoru izmantošanu iedzīvotāju skaita pārmaiņu novērtējumā. Darba
statistiskajā analīzē ir izmantoti Centrālās Statistikas pārvaldes dati un Eurostat veiktās iedzīvotāju skaita
prognozes. Darba rezultātu pamatā ir datu regresijas analīze. Secinājums darba rezultātā: lai gan lineārās
regresijas modeļi, vērtējot Latvijas iedzīvotāju skaita pārmaiņas, demonstrē ļoti augstus ciešuma
rādītājus, pret tiem ir jāizturas kritiski. Savukārt iedzīvotāju migrācijas saldo nav viennozīmīgi
prognozējams, ņemot vērā tā vēsturiskos novērojumus un izmantojot matemātiskos modeļus.
References
Apsite, E., Krišjāne, Z. and Berzins, M. (2012). Emigration from Latvia under economic crisis
conditions, International Proceedings of Economics Development and Research, 31, 134-138.
Arbidane, I. and Markevica, L. (2016). Impact of labour force migration on Latvia's economy
Scientific Journal of Polonia University, 18 (3), 69-78.
APPRECIATING GEOGRAPHY: LOCAL AND GLOBAL SCALE
84
Berloviene, D. and Samuseviča, A. (2016). Topošo veselības aprūpes speciālistu motivācija vecu
cilvēku sociālās labklājības veicināšanā. Proceedings of the International Scientific Conference. Volume
I, May 27th - 28th, 57-66.
Eurostat database (2015). Population projections 2015 at national level (base year 2015) Population
on 1st January by age, sex and type of projection
http://appsso.eurostat.ec.europa.eu/nui/show.do?dataset=proj_15npms&lang=en (24.01.2019)
Göler, D., Krišjāne, Z. and Bērziņš, M. (2014). International migration in the periods of
transition and crisis: the case of Latvia. Baltic Region, 6 (2), 75-85.
Indikatori 2015. gadā (2015). Latvijas ilgtspējīgas attīstības stratēģija līdz 2030.gadam. Nacionālais
attīstības plāns 2014.-2020.gadam. Uzraudzības ziņojuma pielikums. Pārresoru koordinācijas centrs.
https://www.pkc.gov.lv/sites/default/files/inline-files/MPzinP_07092015_Indikatori_5.pdf (24.01.2019)
Informatīvais ziņojums par darba tirgus vidēja un ilgtermiņa prognozēm (2018). Latvijas
Republikas Ekonomikas ministrija.
https://www.em.gov.lv/files/tautsaimniecibas_attistiba/dsp/EMZino_06072018_full.pdf (24.01.2019)
Kekla, J. and Senfelde, M. (2016). Public finance sustainability in Latvia: assessing long-term
challenges and policy options. Economic Science for Rural Development Conference Proceedings, 43,
274-282.
Klavenieks, K. and Blumberga, D. (2016). Forecast of waste generation dynamics in Latvia.
Energy Procedia, 95, 200-207.
Krisjane, Z., Apsite–Berina E., Berzins M. and Grine I. (2017). Regional topicalities in Latvia:
Mobility and immobility in the countryside. Economic Science for Rural Development Conference
Proceedings, 45, 127-133.
Krisjane, Z. and Berzins, M. (2012). Post-socialist urban trends: New patterns and motivations
for migration in the suburban areas of Riga, Latvia. Urban Studies, 49 (2), 289-306.
Latvijas Ilgtspējīgas attīstības stratēģija līdz 2030. gadam (2015). Latvijas Ilgtspējīgas attīstības
stratēģijas līdz 2030. gadam, Nacionālā attīstības plāna no 2014.–2020. gadam un Laimdotas
Straujumas vadītās valdības deklarācijas par iecerēto darbību īstenošanas uzraudzības ziņojuma,
indikatoru pielikums. https://www.pkc.gov.lv/sites/default/files/inline-
files/MPzin_07092015_Uzraudzibas_zinojums_4.pdf (24.01.2019)
National Development Plan of Latvia for 2014–2020 (2012). Cross-Sectoral Coordination Centre.
https://www.pkc.gov.lv/sites/default/files/inline-files/NDP2020%20English%20Final___1.pdf (24.01.2019)
Sustainable Development Strategy of Latvia until 2030 (2010). Saeima of the Republic of Latvia
https://www.pkc.gov.lv/sites/default/files/inline-files/LIAS_2030_en_0.pdf (24.01.2019)
Zhitin, D.V., Krisjane, Z. and Sechi, G. (2018). The effect of migration on Latvia’s sex And age
composition. Baltiс Region, 10 (1), 107-129.
APPRECIATING GEOGRAPHY: LOCAL AND GLOBAL SCALE
85
EMIGRATION AND REMITTANCES PATTERN ANALYSIS
IN LAGGING-BEHIND REGIONS OF THE BALTICS:
CASE STUDIES FOR NARVA, DAUGAVPILS AND VISAGINAS
Emigrācijas un transfērmaksājumu izpēte Baltijas valstu
nomales reģionos: Narvas (Igaunija), Daugavpils (Latvija) un
Visaginas (Lietuva) piemēru analīze
Mihails Kozlovs
University of Latvia, Faculty of Geography and Earth Sciences
Abstract. In this paper the author is studying the economic effect of emigration in three lagging-behind
Baltic regions over the past decade. During this time span the influence of emigration on the economy is
analyzed in terms of the size of migration flows, taxation system differences and the level of remittances in
the Baltic countries, all of which affect local economies / communities.
An analysis in made of three distinctive lagging-behind regions: Estonian Narva, Latvian Daugavpils and
Lithuanian Visaginas. The overall impact of emigration on the economies of the Baltic countries is
evaluated by a weighting of negative and positive factors.
In order to measure the influence of emigration on the selected Baltic economies – two quantitative
approaches were developed. Each of these scenarios contains different sets of parameters and these
combinations describe the economic impact of migration. Underlying formulae of the undertaken
approaches, with small modifications, may be used for the examination of similar issues in other regions
and countries.
Keywords: economic migration, remittances, taxes, Baltic region, lagging-behind regions, Narva,
Daugavpils, Visaginas
Introduction
Migration nowadays is a new norm for the expression of attitude. People are
leaving one socio-economic environment in order to explore the benefits of another.
Migration derives from a set of fundamental causes: inequalities in development,
employment prospects, incomes and living conditions between and within the countries
(King 2008).
The World Bank’s annual research on migration shows that the quantity of
people changing location is constantly growing (WB 2017). The size of remittances
and money transfer services are following the same trend and developing rapidly.
Latvian emigration studies undertaken by O. Krasnopjorov (2011) and
M. Hazans (2013) prove that emigration from Latvia has had a significant impact on
the economy. M. Hazans reported that emigration could be up to 200 thousand people,
which is more than 10% of the Latvian population. Migration researcher
O. Krasnopjorov analyzed emigration patterns by comparing in-flows and out-flows of
people at Rīga airport and at Latvian harbours. He concluded that the total number of
emigrants could be around 177 thousand people.
Not only Latvia, but the whole Baltic region was hugely influenced by
emigration over the last ten years. Latvians, Lithuanians and Estonians were leaving in
APPRECIATING GEOGRAPHY: LOCAL AND GLOBAL SCALE
86
massive numbers towards the direction of the Western and Northern European
countries. A number of studies show the negative impact of emigration (Krasnopjarov
2011) and fewer researches are taking a balanced approach in analysing not only the
negative side of the emigration, but also the benefits (Hazans 2013).
In this study the author is modelling the economic impact of emigration not only
on the national economies of each of the Baltic countries, but as well on the regions,
which are exposed to emigration to the highest extent. Economically lagging-behind
regions in the Baltics during the past ten years have been experiencing both the
positive and negative impacts of migration.
It is essential to emphasize that in some cases it was impossible to extract
statistical information about all three economically lagging-behind cities - Narva,
Daugavpils and Visaginas. In these cases – information was gathered about the larger
statistical regions – Ida-Viruma, Utena and Daugavpils counties.
Skilled and unskilled migrants have an opposite effect on the expenditure of
government programs such as unemployment compensation and other existing social
benefit (Borjas 1995). But it is important to mention that models in this research are
examining the very basic relationship between migrants and their national economies
and the skills and professional degrees of the emigrants are not taken into
consideration in these basic scenario calculations.
The regional scope of this research is linked with the distinctive economically
lagging-behind regions: Estonian Narva, Latvian Daugavpils and Lithuanian Visaginas.
The objective of this study is (1) to measure the behaviour of emigration in the selected
regions (2) to compare the emigration process and its patterns within the Baltic countries
and (3) to evaluate the overall impact of emigration in economically lagging-behind
regions.
Data and Methods
The main limitation for this study was the unavailability of regional statistics
and the segmentation of national data into the regions. This study is based on
statistical information analysis and on the adjustment of available data on lagging-
behind regions.
While studying emigration and remittances in the economically lagging-behind
regions the author of this study was using different international organisation sources -
World Bank annual reports (2017), The International Organisation for Migration and
information from each of the three Baltic country statistics bureau data bases (2018).
As well, and in order to understand the impact of migration, the author
developed an economic equation, where taxes, number of emmigrants, and remittance
levels are encapsulated. In economic terms, emigration translates into unpaid taxes
from salaries and from the everyday expenditure on goods and services (Borjas 1995).
At the same time, the migrant country-of-origin economy is gaining remittances and
expenditure tax, which is paid from spending the money received from emigrants.
APPRECIATING GEOGRAPHY: LOCAL AND GLOBAL SCALE
87
Two scenarios were developed with a different impact ratio to the emigrant country-
of-origin economies.
In the first model, the smallest impact on emigrant country-of-origin economies
is projected. In this scenario, factors such as average number of emmigrants per year,
minimum wage level and Value Added Tax (VAT) are taken into consideration. VAT
is multiplied with minimum wage in order to see the spending impact of one potential
emigrant on the country-of-origin economy.
The second model is an average impact scenario on migrant country-of-origin
economies. Average number of emmigrants per year, average wage, income tax and
VAT are considered. It projects that all of the emigrants would have been paying taxes
from an average salary and VAT from the expenditure had the emigrants stayed in the
country-of-origin. So, in this model, the average wage is multiplied with VAT and
Income tax in order to evaluate the impact of one potential emigrant on the country-of-
origin economy.
In both models the author is comparing unpaid taxes with the size of existing
remittances. In the first scenario the impact of one migrant is evaluated by VAT from a
minimum wage expenditure. In the second scenario the impact of one migrant is
evaluated by VAT and Income taxes from an average wage expenditure. In both
scenarios the economic effect of emigrations is compared with existing remittances
flow.
Research Results and Discussion
The three Baltic countries – Latvia, Lithuania and Estonia were facing the brutal
reality of EU competition for labour over the past decade. Access to free movement
throughout the EU in combination with economic problems in the Baltic region had a
huge impact on the community. The population of the Baltic region in 2008 accounted
for 6.7 million population. In less than a decade the Baltic region’s population shrank
by approximately 630 thousand people (Figure 1).
However, over the same time period all three Baltic economies gained a
significant amount of remittances, which were sent by migrants to their families and
friends back home. Since 2008, emigrants from the Baltic countries transferred more
than 35 billion EUR to their homes and families (World Bank 2018).
The Baltic GDP has constantly been growing since 2010, but still in 2017 it did
not reach pre-crisis level. Baltic remittances were following the track of the GDP
fluctuations, but during the economic downturn remittances were more likely to grow,
than fall. For example, in 2009 remittances slightly grew, while the economies of the
three Baltic countries continued to shrink (Figure 1).
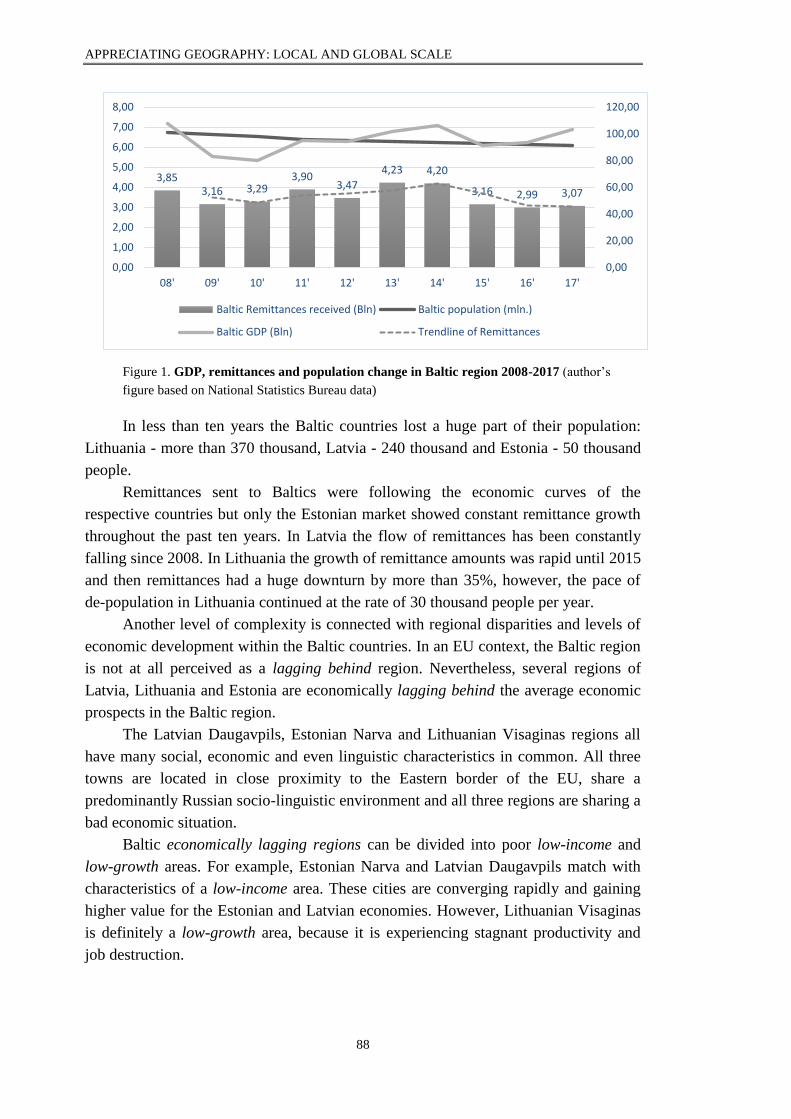
APPRECIATING GEOGRAPHY: LOCAL AND GLOBAL SCALE
88
Figure 1. GDP, remittances and population change in Baltic region 2008-2017 (author’s
figure based on National Statistics Bureau data)
In less than ten years the Baltic countries lost a huge part of their population:
Lithuania - more than 370 thousand, Latvia - 240 thousand and Estonia - 50 thousand
people.
Remittances sent to Baltics were following the economic curves of the
respective countries but only the Estonian market showed constant remittance growth
throughout the past ten years. In Latvia the flow of remittances has been constantly
falling since 2008. In Lithuania the growth of remittance amounts was rapid until 2015
and then remittances had a huge downturn by more than 35%, however, the pace of
de-population in Lithuania continued at the rate of 30 thousand people per year.
Another level of complexity is connected with regional disparities and levels of
economic development within the Baltic countries. In an EU context, the Baltic region
is not at all perceived as a lagging behind region. Nevertheless, several regions of
Latvia, Lithuania and Estonia are economically lagging behind the average economic
prospects in the Baltic region.
The Latvian Daugavpils, Estonian Narva and Lithuanian Visaginas regions all
have many social, economic and even linguistic characteristics in common. All three
towns are located in close proximity to the Eastern border of the EU, share a
predominantly Russian socio-linguistic environment and all three regions are sharing a
bad economic situation.
Baltic economically lagging regions can be divided into poor low-income and
low-growth areas. For example, Estonian Narva and Latvian Daugavpils match with
characteristics of a low-income area. These cities are converging rapidly and gaining
higher value for the Estonian and Latvian economies. However, Lithuanian Visaginas
is definitely a low-growth area, because it is experiencing stagnant productivity and
job destruction.
3,853,16 3,29
3,903,47
4,23 4,20
3,16 2,99 3,07
0,00
20,00
40,00
60,00
80,00
100,00
120,00
0,00
1,00
2,00
3,00
4,00
5,00
6,00
7,00
8,00
08' 09' 10' 11' 12' 13' 14' 15' 16' 17'
Baltic Remittances received (Bln) Baltic population (mln.)
Baltic GDP (Bln) Trendline of Remittances
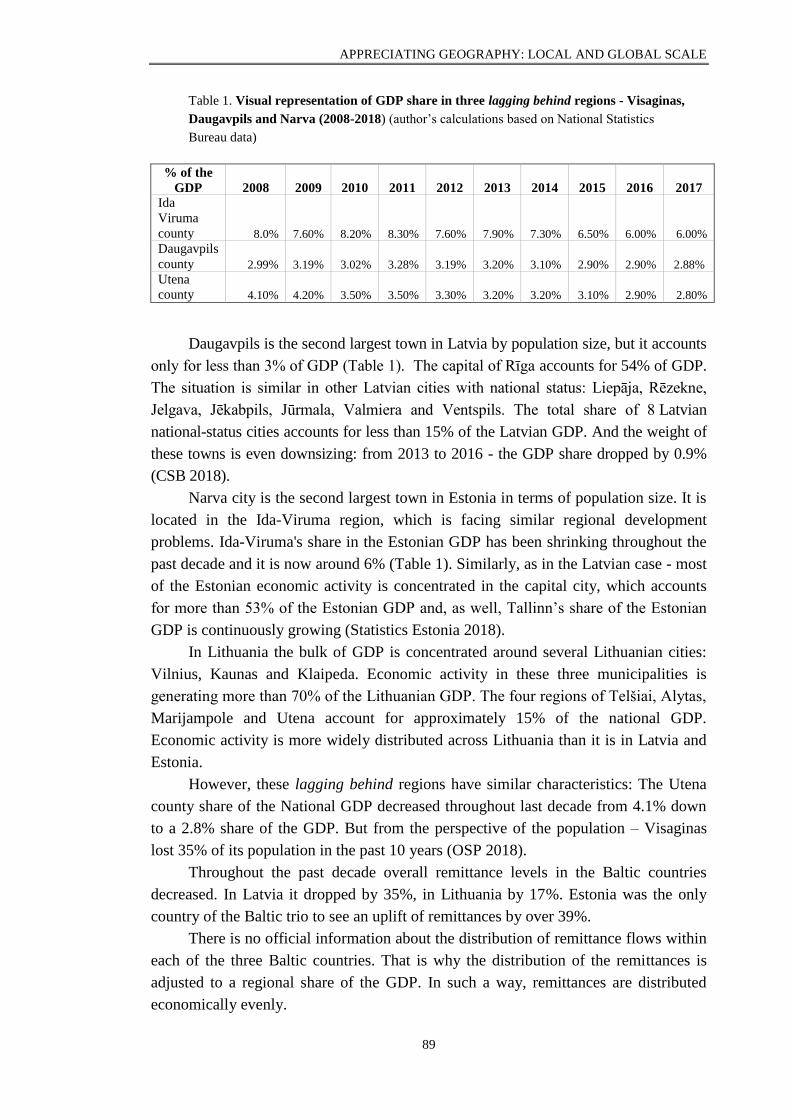
APPRECIATING GEOGRAPHY: LOCAL AND GLOBAL SCALE
89
Table 1. Visual representation of GDP share in three lagging behind regions - Visaginas,
Daugavpils and Narva (2008-2018) (author’s calculations based on National Statistics
Bureau data)
% of the
GDP 2008 2009 2010 2011 2012 2013 2014 2015 2016 2017 Ida
Viruma
county 8.0% 7.60% 8.20% 8.30% 7.60% 7.90% 7.30% 6.50% 6.00% 6.00%
Daugavpils
county 2.99% 3.19% 3.02% 3.28% 3.19% 3.20% 3.10% 2.90% 2.90% 2.88%
Utena
county 4.10% 4.20% 3.50% 3.50% 3.30% 3.20% 3.20% 3.10% 2.90% 2.80%
Daugavpils is the second largest town in Latvia by population size, but it accounts
only for less than 3% of GDP (Table 1). The capital of Rīga accounts for 54% of GDP.
The situation is similar in other Latvian cities with national status: Liepāja, Rēzekne,
Jelgava, Jēkabpils, Jūrmala, Valmiera and Ventspils. The total share of 8 Latvian
national-status cities accounts for less than 15% of the Latvian GDP. And the weight of
these towns is even downsizing: from 2013 to 2016 - the GDP share dropped by 0.9%
(CSB 2018).
Narva city is the second largest town in Estonia in terms of population size. It is
located in the Ida-Viruma region, which is facing similar regional development
problems. Ida-Viruma's share in the Estonian GDP has been shrinking throughout the
past decade and it is now around 6% (Table 1). Similarly, as in the Latvian case - most
of the Estonian economic activity is concentrated in the capital city, which accounts
for more than 53% of the Estonian GDP and, as well, Tallinn’s share of the Estonian
GDP is continuously growing (Statistics Estonia 2018).
In Lithuania the bulk of GDP is concentrated around several Lithuanian cities:
Vilnius, Kaunas and Klaipeda. Economic activity in these three municipalities is
generating more than 70% of the Lithuanian GDP. The four regions of Telšiai, Alytas,
Marijampole and Utena account for approximately 15% of the national GDP.
Economic activity is more widely distributed across Lithuania than it is in Latvia and
Estonia.
However, these lagging behind regions have similar characteristics: The Utena
county share of the National GDP decreased throughout last decade from 4.1% down
to a 2.8% share of the GDP. But from the perspective of the population – Visaginas
lost 35% of its population in the past 10 years (OSP 2018).
Throughout the past decade overall remittance levels in the Baltic countries
decreased. In Latvia it dropped by 35%, in Lithuania by 17%. Estonia was the only
country of the Baltic trio to see an uplift of remittances by over 39%.
There is no official information about the distribution of remittance flows within
each of the three Baltic countries. That is why the distribution of the remittances is
adjusted to a regional share of the GDP. In such a way, remittances are distributed
economically evenly.
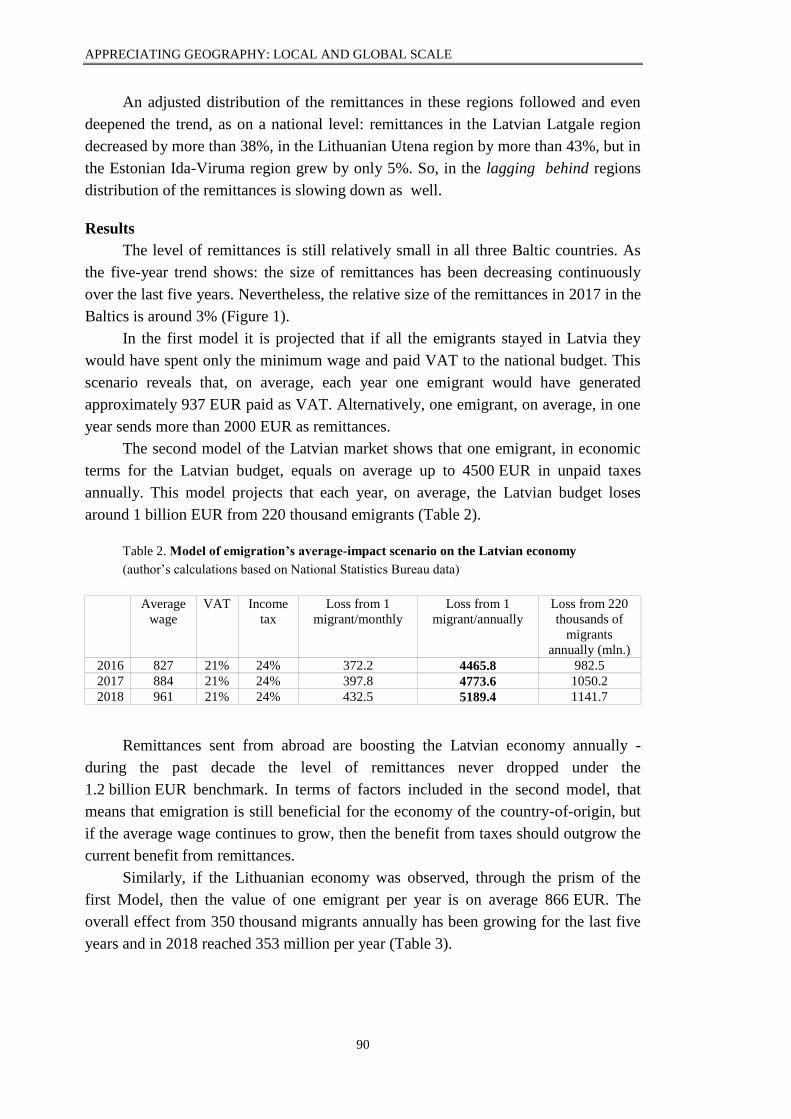
APPRECIATING GEOGRAPHY: LOCAL AND GLOBAL SCALE
90
An adjusted distribution of the remittances in these regions followed and even
deepened the trend, as on a national level: remittances in the Latvian Latgale region
decreased by more than 38%, in the Lithuanian Utena region by more than 43%, but in
the Estonian Ida-Viruma region grew by only 5%. So, in the lagging behind regions
distribution of the remittances is slowing down as well.
Results
The level of remittances is still relatively small in all three Baltic countries. As
the five-year trend shows: the size of remittances has been decreasing continuously
over the last five years. Nevertheless, the relative size of the remittances in 2017 in the
Baltics is around 3% (Figure 1).
In the first model it is projected that if all the emigrants stayed in Latvia they
would have spent only the minimum wage and paid VAT to the national budget. This
scenario reveals that, on average, each year one emigrant would have generated
approximately 937 EUR paid as VAT. Alternatively, one emigrant, on average, in one
year sends more than 2000 EUR as remittances.
The second model of the Latvian market shows that one emigrant, in economic
terms for the Latvian budget, equals on average up to 4500 EUR in unpaid taxes
annually. This model projects that each year, on average, the Latvian budget loses
around 1 billion EUR from 220 thousand emigrants (Table 2).
Table 2. Model of emigration’s average-impact scenario on the Latvian economy
(author’s calculations based on National Statistics Bureau data)
Average
wage
VAT Income
tax
Loss from 1
migrant/monthly
Loss from 1
migrant/annually
Loss from 220
thousands of
migrants
annually (mln.)
2016 827 21% 24% 372.2 4465.8 982.5
2017 884 21% 24% 397.8 4773.6 1050.2
2018 961 21% 24% 432.5 5189.4 1141.7
Remittances sent from abroad are boosting the Latvian economy annually -
during the past decade the level of remittances never dropped under the
1.2 billion EUR benchmark. In terms of factors included in the second model, that
means that emigration is still beneficial for the economy of the country-of-origin, but
if the average wage continues to grow, then the benefit from taxes should outgrow the
current benefit from remittances.
Similarly, if the Lithuanian economy was observed, through the prism of the
first Model, then the value of one emigrant per year is on average 866 EUR. The
overall effect from 350 thousand migrants annually has been growing for the last five
years and in 2018 reached 353 million per year (Table 3).
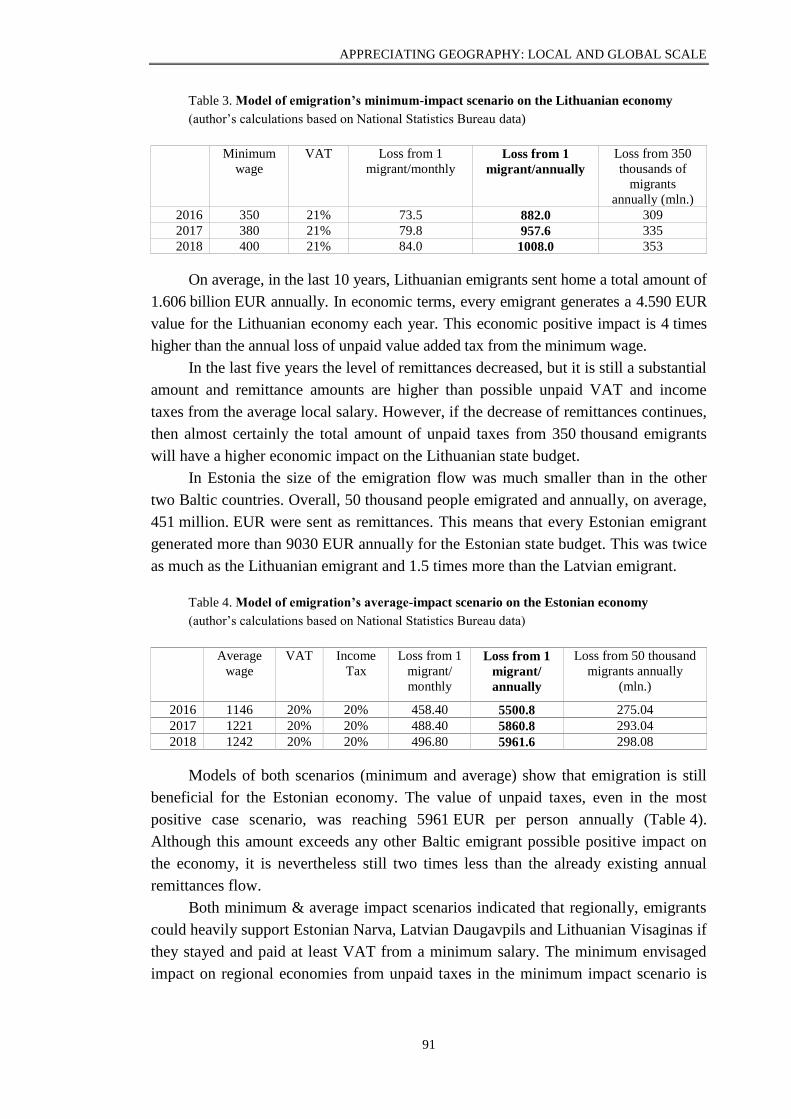
APPRECIATING GEOGRAPHY: LOCAL AND GLOBAL SCALE
91
Table 3. Model of emigration’s minimum-impact scenario on the Lithuanian economy
(author’s calculations based on National Statistics Bureau data)
Minimum
wage
VAT Loss from 1
migrant/monthly Loss from 1
migrant/annually
Loss from 350
thousands of
migrants
annually (mln.)
2016 350 21% 73.5 882.0 309
2017 380 21% 79.8 957.6 335
2018 400 21% 84.0 1008.0 353
On average, in the last 10 years, Lithuanian emigrants sent home a total amount of
1.606 billion EUR annually. In economic terms, every emigrant generates a 4.590 EUR
value for the Lithuanian economy each year. This economic positive impact is 4 times
higher than the annual loss of unpaid value added tax from the minimum wage.
In the last five years the level of remittances decreased, but it is still a substantial
amount and remittance amounts are higher than possible unpaid VAT and income
taxes from the average local salary. However, if the decrease of remittances continues,
then almost certainly the total amount of unpaid taxes from 350 thousand emigrants
will have a higher economic impact on the Lithuanian state budget.
In Estonia the size of the emigration flow was much smaller than in the other
two Baltic countries. Overall, 50 thousand people emigrated and annually, on average,
451 million. EUR were sent as remittances. This means that every Estonian emigrant
generated more than 9030 EUR annually for the Estonian state budget. This was twice
as much as the Lithuanian emigrant and 1.5 times more than the Latvian emigrant.
Table 4. Model of emigration’s average-impact scenario on the Estonian economy
(author’s calculations based on National Statistics Bureau data)
Average
wage
VAT Income
Tax
Loss from 1
migrant/
monthly
Loss from 1
migrant/
annually
Loss from 50 thousand
migrants annually
(mln.)
2016 1146 20% 20% 458.40 5500.8 275.04
2017 1221 20% 20% 488.40 5860.8 293.04
2018 1242 20% 20% 496.80 5961.6 298.08
Models of both scenarios (minimum and average) show that emigration is still
beneficial for the Estonian economy. The value of unpaid taxes, even in the most
positive case scenario, was reaching 5961 EUR per person annually (Table 4).
Although this amount exceeds any other Baltic emigrant possible positive impact on
the economy, it is nevertheless still two times less than the already existing annual
remittances flow.
Both minimum & average impact scenarios indicated that regionally, emigrants
could heavily support Estonian Narva, Latvian Daugavpils and Lithuanian Visaginas if
they stayed and paid at least VAT from a minimum salary. The minimum envisaged
impact on regional economies from unpaid taxes in the minimum impact scenario is
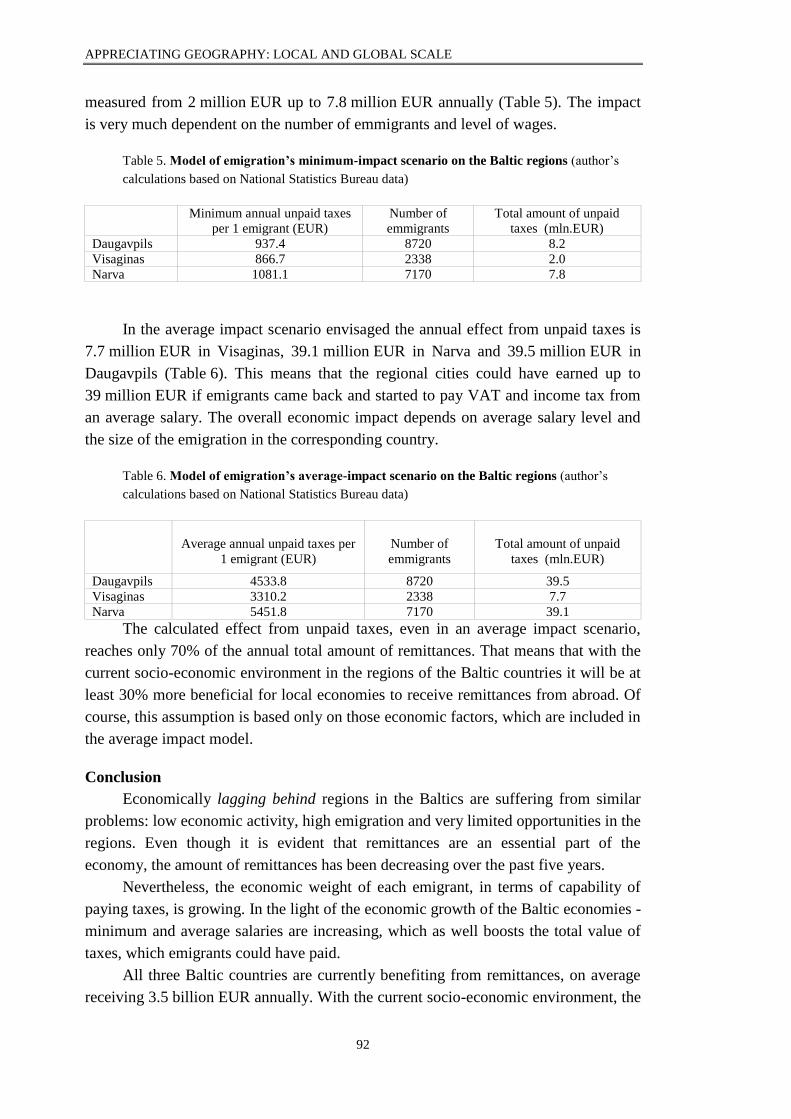
APPRECIATING GEOGRAPHY: LOCAL AND GLOBAL SCALE
92
measured from 2 million EUR up to 7.8 million EUR annually (Table 5). The impact
is very much dependent on the number of emmigrants and level of wages.
Table 5. Model of emigration’s minimum-impact scenario on the Baltic regions (author’s
calculations based on National Statistics Bureau data)
Minimum annual unpaid taxes
per 1 emigrant (EUR)
Number of
emmigrants
Total amount of unpaid
taxes (mln.EUR)
Daugavpils 937.4 8720 8.2
Visaginas 866.7 2338 2.0
Narva 1081.1 7170 7.8
In the average impact scenario envisaged the annual effect from unpaid taxes is
7.7 million EUR in Visaginas, 39.1 million EUR in Narva and 39.5 million EUR in
Daugavpils (Table 6). This means that the regional cities could have earned up to
39 million EUR if emigrants came back and started to pay VAT and income tax from
an average salary. The overall economic impact depends on average salary level and
the size of the emigration in the corresponding country.
Table 6. Model of emigration’s average-impact scenario on the Baltic regions (author’s
calculations based on National Statistics Bureau data)
Average annual unpaid taxes per
1 emigrant (EUR)
Number of
emmigrants
Total amount of unpaid
taxes (mln.EUR)
Daugavpils 4533.8 8720 39.5
Visaginas 3310.2 2338 7.7
Narva 5451.8 7170 39.1
The calculated effect from unpaid taxes, even in an average impact scenario,
reaches only 70% of the annual total amount of remittances. That means that with the
current socio-economic environment in the regions of the Baltic countries it will be at
least 30% more beneficial for local economies to receive remittances from abroad. Of
course, this assumption is based only on those economic factors, which are included in
the average impact model.
Conclusion
Economically lagging behind regions in the Baltics are suffering from similar
problems: low economic activity, high emigration and very limited opportunities in the
regions. Even though it is evident that remittances are an essential part of the
economy, the amount of remittances has been decreasing over the past five years.
Nevertheless, the economic weight of each emigrant, in terms of capability of
paying taxes, is growing. In the light of the economic growth of the Baltic economies -
minimum and average salaries are increasing, which as well boosts the total value of
taxes, which emigrants could have paid.
All three Baltic countries are currently benefiting from remittances, on average
receiving 3.5 billion EUR annually. With the current socio-economic environment, the
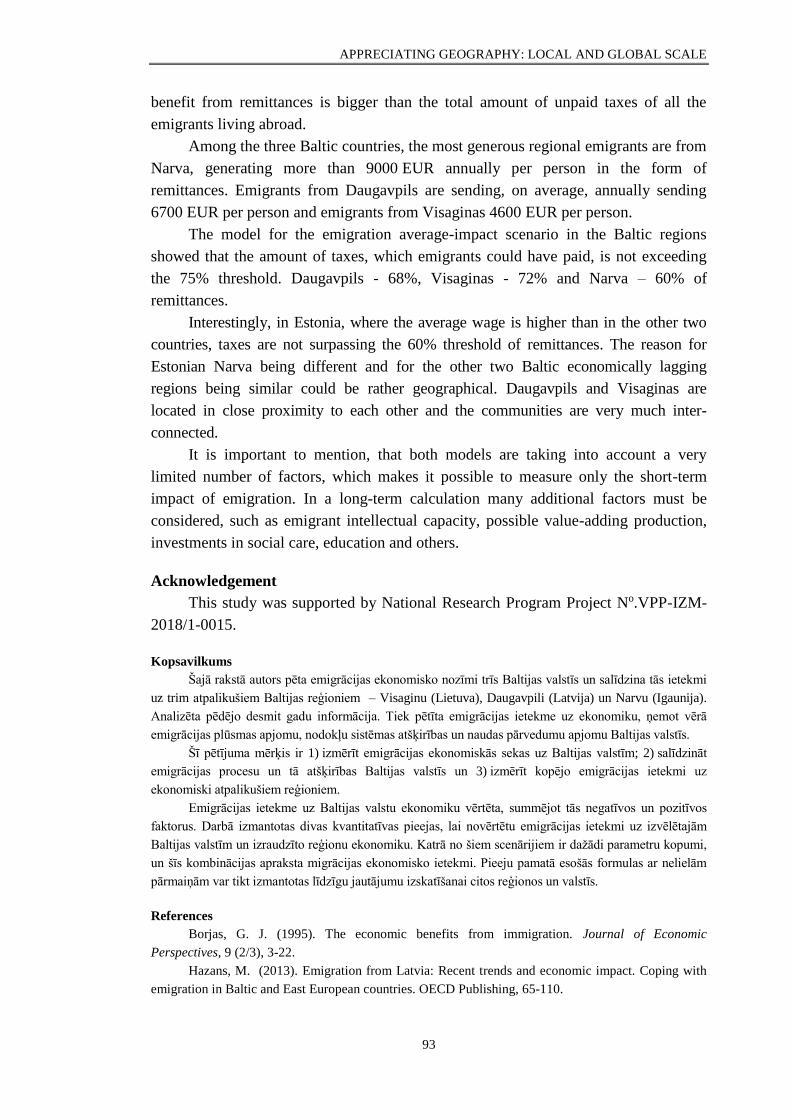
APPRECIATING GEOGRAPHY: LOCAL AND GLOBAL SCALE
93
benefit from remittances is bigger than the total amount of unpaid taxes of all the
emigrants living abroad.
Among the three Baltic countries, the most generous regional emigrants are from
Narva, generating more than 9000 EUR annually per person in the form of
remittances. Emigrants from Daugavpils are sending, on average, annually sending
6700 EUR per person and emigrants from Visaginas 4600 EUR per person.
The model for the emigration average-impact scenario in the Baltic regions
showed that the amount of taxes, which emigrants could have paid, is not exceeding
the 75% threshold. Daugavpils - 68%, Visaginas - 72% and Narva – 60% of
remittances.
Interestingly, in Estonia, where the average wage is higher than in the other two
countries, taxes are not surpassing the 60% threshold of remittances. The reason for
Estonian Narva being different and for the other two Baltic economically lagging
regions being similar could be rather geographical. Daugavpils and Visaginas are
located in close proximity to each other and the communities are very much inter-
connected.
It is important to mention, that both models are taking into account a very
limited number of factors, which makes it possible to measure only the short-term
impact of emigration. In a long-term calculation many additional factors must be
considered, such as emigrant intellectual capacity, possible value-adding production,
investments in social care, education and others.
Acknowledgement
This study was supported by National Research Program Project No.VPP-IZM-
2018/1-0015.
Kopsavilkums
Šajā rakstā autors pēta emigrācijas ekonomisko nozīmi trīs Baltijas valstīs un salīdzina tās ietekmi
uz trim atpalikušiem Baltijas reģioniem – Visaginu (Lietuva), Daugavpili (Latvija) un Narvu (Igaunija).
Analizēta pēdējo desmit gadu informācija. Tiek pētīta emigrācijas ietekme uz ekonomiku, ņemot vērā
emigrācijas plūsmas apjomu, nodokļu sistēmas atšķirības un naudas pārvedumu apjomu Baltijas valstīs.
Šī pētījuma mērķis ir 1) izmērīt emigrācijas ekonomiskās sekas uz Baltijas valstīm; 2) salīdzināt
emigrācijas procesu un tā atšķirības Baltijas valstīs un 3) izmērīt kopējo emigrācijas ietekmi uz
ekonomiski atpalikušiem reģioniem.
Emigrācijas ietekme uz Baltijas valstu ekonomiku vērtēta, summējot tās negatīvos un pozitīvos
faktorus. Darbā izmantotas divas kvantitatīvas pieejas, lai novērtētu emigrācijas ietekmi uz izvēlētajām
Baltijas valstīm un izraudzīto reģionu ekonomiku. Katrā no šiem scenārijiem ir dažādi parametru kopumi,
un šīs kombinācijas apraksta migrācijas ekonomisko ietekmi. Pieeju pamatā esošās formulas ar nelielām
pārmaiņām var tikt izmantotas līdzīgu jautājumu izskatīšanai citos reģionos un valstīs.
References
Borjas, G. J. (1995). The economic benefits from immigration. Journal of Economic
Perspectives, 9 (2/3), 3-22.
Hazans, M. (2013). Emigration from Latvia: Recent trends and economic impact. Coping with
emigration in Baltic and East European countries. OECD Publishing, 65-110.
APPRECIATING GEOGRAPHY: LOCAL AND GLOBAL SCALE
94
King, R., Skeldon R. and Vullnetari, J. (2008). Internal and International Migration: Bridging
the Theoretical Divide. Sussex: Centre for Migration Research, University of Sussex.
Kozlovs, M. (2014). Comparative analysis of economic migration in Serbia and Latvia in period
2008 till 2013. University of Latvia, 1-69.
Krasnopjorov, O. (2011). Cik cilvēku pameta Latviju un cik vēl pametīs? (How many people
emigrated from Latvia and how many are planning to do so?). http://www.makroekonomika.lv/cik-
cilveku-latviju-pameta-un-cik-vel-pametis (19.12.2018).
Migration Policy Centre (2013). The politics of European Union migration governance.
http://cadmus.eui.eu/handle/1814/57305?show=full (21.1.2019)
Ratha, D., Mohapatra, S., Scheja, E. (2011). Impact of migration on economic and social
development: A review of evidence and emerging Issues. World Bank Policy Research Working Paper
No 5558.
European Commission (2017). Competitiveness in low-income and low-growth regions.
https://ec.europa.eu/regional_policy/sources/docgener/studies/pdf/lagging_regions%20report_en.pdf
(14.1.2019)
World Bank (2017). Migration and Remittances Recent developments and outlook.
https://www.worldbank.org/en/topic/labormarkets/brief/migration-and-remittances (21.1.2019)
EXPLORING LABOUR MIGRATION FROM LATVIA:
GEOGRAPHIES OF ORIGIN
Darba spēka migrācijas izpēte Latvijā: izbraukšanas ģeogrāfija
Elīna Apsīte-Beriņa, Ģirts Burgmanis, Zaiga Krišjāne
University of Latvia, Faculty of Geography and Earth Sciences
Abstract. The aim of this study is to explore labour migration geographies in order to reveal peculiar
aspects of emigration spatial distributions between core and peripheral sending regions and destination
country choices. In this study the term core is considered the capital of Latvia, Rīga, and the term
periphery is considered as the remaining statistical regions in Latvia as well as the receiving countries
which are identified as the UK, Ireland, Germany, Norway and Sweden. The study is based on a database
derived from an online survey and analysed through statistical methods.
The findings suggest that the profiles of labour migrants differ sharply in terms of geographic context in
Latvia. Migrants from the core part of the country were more educated, skilled and had worked in the
tertiary sector of the economy prior moving away from Latvia than their counterparts from peripheral
regions. In addition, other findings show that migrants from the core are less likely to be circular migrants,
but more often than not, migrants from the periphery use their own efforts to find a job in the destination
country. In terms of destination country geographies, emigrants from the core more often choose
Germany, Norway and Sweden, but emigrants with lower hierarchy in education and occupation levels
engage more in circular movements by repeatedly going to Ireland and the UK.
This paper was supported by the project 1.1.1.2/VIAA/1/16/184.
Keywords: labour migration, core, periphery, Latvia, youth
Introduction
Sources of human capital as substantial forces in the economic development of
Western countries are often attracted from poorer economies. Migration flows from
APPRECIATING GEOGRAPHY: LOCAL AND GLOBAL SCALE
95
Central and Eastern-European countries are global economic semi-peripheries and are
examples of relations among core and periphery (Torok 2017). Migration from the
European periphery are seen as a factor facilitating peripheralisation (Lulle 2019).
Bartlett and Prica (2013) show evidence of the existence of core regions, peripheral
regions and super-peripheral regions. The Low intensity of peripheral economies that
are overshadowed by core regions enforces factor mobility which includes various
forms of labour mobilities (Bosworth and Venhorst 2018). Analysis of migrants to the
‘escalator region’ in the UK (Fielding 1992) suggest that selectivity of migration relates
to workers occupying lower and higher levels of the labour sector displaying the
complex nature of occupational mobility (Findlay et al. 2009, McCollum et al. 2018).
Spatial disparities and societal changes, in economic development and demographic
characteristics, are intertwined in several ways. Economically weak regions are often
affected by both age and gender selective out-migration, leading to an unbalanced
demographic and to socio-economic structures (Leibert 2016; Wiest 2016) however, in
the case of Latvia, both age and gender are not statistically significant pre-conditions for
out-migration.
The aim of this study is to explore labour migration geographies in order to
reveal peculiar aspects of emigration spatial distributions between core and peripheral
sending regions and destination country choices. In this study an analysis of labour
migration is used to reveal peculiar aspects for different spatial distributions of core
and peripheral regions of a sending country, and which are associated with
peripherality and exclusive dependance on the centres (Skeldon 1997). Furthermore,
we look at the geographies of destination countries. Countries of destination were
previously identified with centrality, accumulation of human resources, and
connectedness (Skeldon 1997).
To study geographical aspects of out-going migration flows we use the
geographical division of Latvia in two distinct regions. Firstly, we assume that core
includes urban areas around Rīga - the economic center of Latvia. Secondly, periphery
is considered as being all other urban and rural regions in Latvia, where economic
activity is less dense (Pierīga, Kurzeme, Zemgale, Latgale and Vidzeme).
The analysis examines quantitative features of labour migrants in Latvia
considering the core-periphery divide. The analysis focuses on following two specific
research questions:
What are the main features of labour emigrants from core and peripheral
parts of Latvia?
How does the core and peripheral divide translate into choice of
destination?
The regional geographies of out-migration in relation to low economic activity
and unemployment leading to peripheralisation tendencies are little researched thus we
seek to attract more attention by exemplifying the case of Latvia.
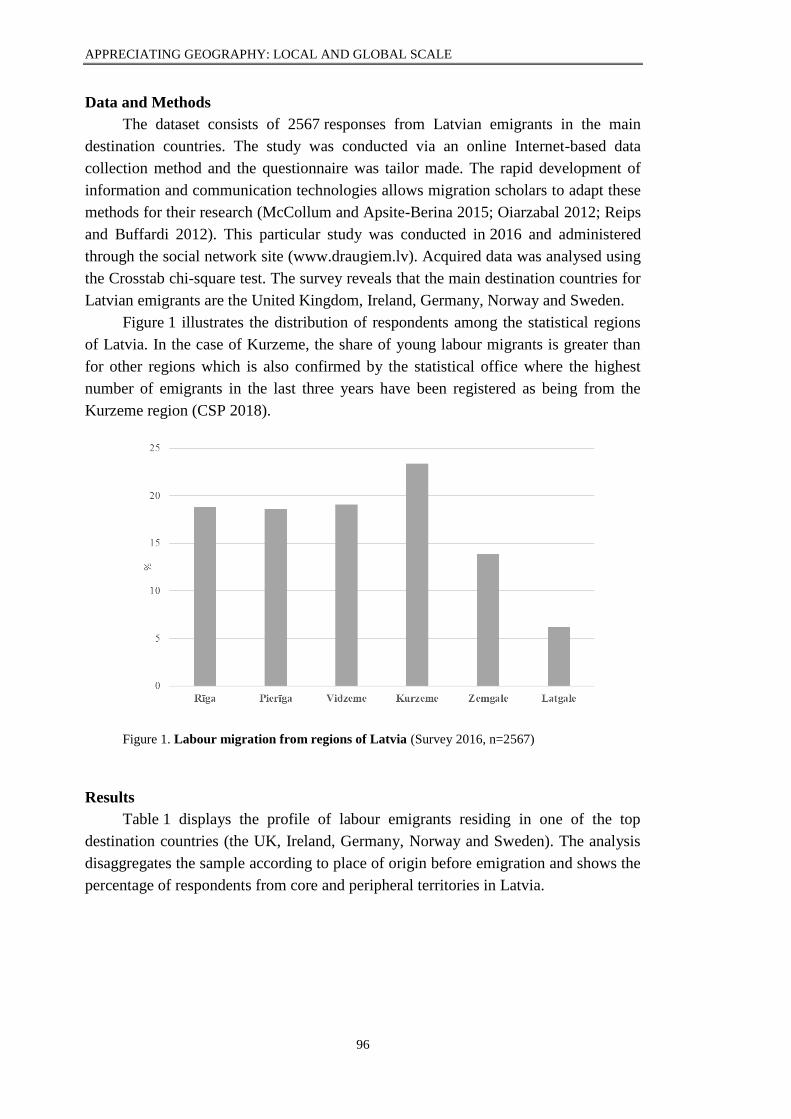
APPRECIATING GEOGRAPHY: LOCAL AND GLOBAL SCALE
96
Data and Methods
The dataset consists of 2567 responses from Latvian emigrants in the main
destination countries. The study was conducted via an online Internet-based data
collection method and the questionnaire was tailor made. The rapid development of
information and communication technologies allows migration scholars to adapt these
methods for their research (McCollum and Apsite-Berina 2015; Oiarzabal 2012; Reips
and Buffardi 2012). This particular study was conducted in 2016 and administered
through the social network site (www.draugiem.lv). Acquired data was analysed using
the Crosstab chi-square test. The survey reveals that the main destination countries for
Latvian emigrants are the United Kingdom, Ireland, Germany, Norway and Sweden.
Figure 1 illustrates the distribution of respondents among the statistical regions
of Latvia. In the case of Kurzeme, the share of young labour migrants is greater than
for other regions which is also confirmed by the statistical office where the highest
number of emigrants in the last three years have been registered as being from the
Kurzeme region (CSP 2018).
Figure 1. Labour migration from regions of Latvia (Survey 2016, n=2567)
Results
Table 1 displays the profile of labour emigrants residing in one of the top
destination countries (the UK, Ireland, Germany, Norway and Sweden). The analysis
disaggregates the sample according to place of origin before emigration and shows the
percentage of respondents from core and peripheral territories in Latvia.
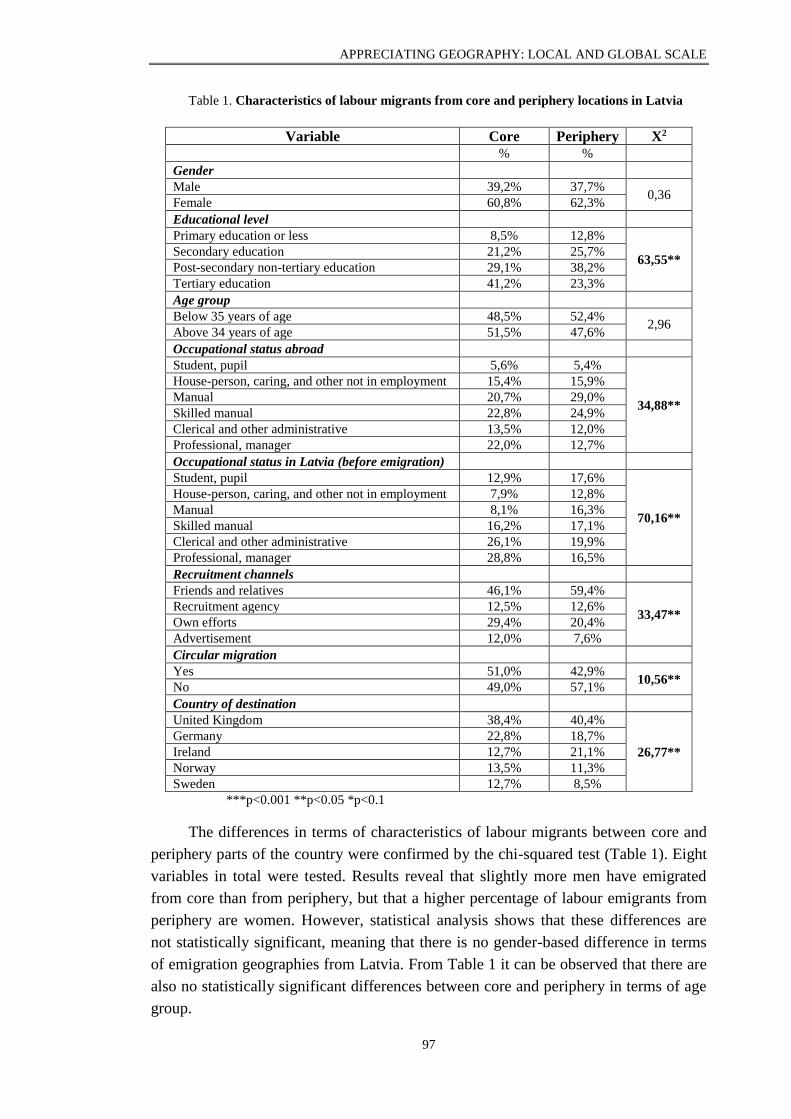
APPRECIATING GEOGRAPHY: LOCAL AND GLOBAL SCALE
97
Table 1. Characteristics of labour migrants from core and periphery locations in Latvia
Variable Core Periphery X2 % %
Gender Male 39,2% 37,7%
0,36 Female 60,8% 62,3%
Educational level Primary education or less 8,5% 12,8%
63,55** Secondary education 21,2% 25,7%
Post-secondary non-tertiary education 29,1% 38,2%
Tertiary education 41,2% 23,3%
Age group Below 35 years of age 48,5% 52,4%
2,96 Above 34 years of age 51,5% 47,6%
Occupational status abroad Student, pupil 5,6% 5,4%
34,88**
House-person, caring, and other not in employment 15,4% 15,9%
Manual 20,7% 29,0%
Skilled manual 22,8% 24,9%
Clerical and other administrative 13,5% 12,0%
Professional, manager 22,0% 12,7%
Occupational status in Latvia (before emigration) Student, pupil 12,9% 17,6%
70,16**
House-person, caring, and other not in employment 7,9% 12,8%
Manual 8,1% 16,3%
Skilled manual 16,2% 17,1%
Clerical and other administrative 26,1% 19,9%
Professional, manager 28,8% 16,5%
Recruitment channels Friends and relatives 46,1% 59,4%
33,47** Recruitment agency 12,5% 12,6%
Own efforts 29,4% 20,4%
Advertisement 12,0% 7,6%
Circular migration Yes 51,0% 42,9%
10,56** No 49,0% 57,1%
Country of destination United Kingdom 38,4% 40,4%
26,77**
Germany 22,8% 18,7%
Ireland 12,7% 21,1%
Norway 13,5% 11,3%
Sweden 12,7% 8,5%
***p<0.001 **p<0.05 *p<0.1
The differences in terms of characteristics of labour migrants between core and
periphery parts of the country were confirmed by the chi-squared test (Table 1). Eight
variables in total were tested. Results reveal that slightly more men have emigrated
from core than from periphery, but that a higher percentage of labour emigrants from
periphery are women. However, statistical analysis shows that these differences are
not statistically significant, meaning that there is no gender-based difference in terms
of emigration geographies from Latvia. From Table 1 it can be observed that there are
also no statistically significant differences between core and periphery in terms of age
group.
APPRECIATING GEOGRAPHY: LOCAL AND GLOBAL SCALE
98
Six of the analysed variables confirmed statistically significant differences
among the studied groups. As it is evident from Table 1. there are differences in terms
of education, occupation before and after emigration, country of destination,
recruitment channels and choice of destination countries.
There are differences in terms of education level. A greater share of the surveyed
labour migrants with tertiary education departed from the core. Meanwhile more
migrants holding an education level lower than tertiary moved from peripheral regions
(76.7%) compared to core (59.8%). These findings suggest that the level of investment
in human capital prior to emigration has been greater among those from the core than
for those residing in peripheral parts of the country.
Furthermore, occupational status also exemplifies core-periphery differences.
More skilled and qualified labour migrants (professionals, managers and
administrative workers) emigrated from the core. At the same time most of the manual
workers departed from peripheral regions of the country. Similar findings are
displayed in occupational status analysis at the destination country. Migrants who
moved away from the core more often found employment consistent with their
previous skills, but migrants from the periphery were more likely to become manual
workers. In the case of migrants from the periphery, the majority - nearly 30% abroad
are employed as manual labourers, however, before emigration they were doing
clerical or other administrative jobs. Peripheral migrants in terms of occupational
status positions experience a double downward shift. In addition, labour migrants from
core parts of the country experience an even sharper downward occupational mobility
experiencing shift between status and place (Schuster 2005). Similar to migrants from
peripheral regions, also migrants from core parts abroad are often employed as manual
workers (23%). But prior to migration, the majority of respondents (27.8%) were
employed as professionals and managers.
Eastern European migrants traditionally rely on the support of informal social
networks and use this as a source of information on employment opportunities.
Analysis reveals statistically significant differences among labour migrants from core
and periphery locations in terms of recruitment channels. The share of migrants who
use friends and relatives as sources of information for employment abroad is (59%)
from periphery and (46%) in the case of core. Another feature is that labour migrants
from core parts of Latvia have relied more on their own efforts to find employment
abroad that can be linked to a higher level of education and more specific requirements
for employment abroad. As it was noted before, migrants from core parts experience
occupational downward mobility to a much lower extent than do labour migrants from
periphery locations.
Interestingly, repeated migration and circular movements are more evident
among labour migrants from the periphery, but first time migrants more often come
from the core. This point exemplifies migration as a strategy to overcome periodic
employment issues in peripheral Latvia. First time emigrants from the core parts of
Latvia emigrate mainly to access higher levels of income.
APPRECIATING GEOGRAPHY: LOCAL AND GLOBAL SCALE
99
Analysis of the geographies of labour migrants from Latvia in the receiving
countries is differentiated among labour migrants from core and periphery. Overall,
the variety of background among migrants from core and peripheral parts of the
country show statistically significant differences in their destination countries. The
largest number of labour migrants from Latvia is going towards the United Kingdom
where labour migrants from periphery slightly exceed their counterparts from the core.
A similar trend is also evident in the case of Ireland where migrants from the
periphery slightly outnumber migrants from central parts. However, labour migrants
from core parts of the country are more evident in cases of the so-called new
destination countries such as Germany, Norway and Sweden.
Conclusions
This analysis allows us to identify distinctive features of labour migrants within the
EU. The geographical scale of this analysis focuses on the distinction between core parts
of Latvia and the peripheral regions. Similarly, the geographic approach is used to
illustrate destination country choices among labour migrants from the core and the
periphery.
The results suggest that there are differences as the majority of analysed aspects
showed statistically significant results among labour migrants from core and
peripheral parts of the country. Among the analysed respondents there was no gender
and age difference when looking at the core-periphery divide contrary to other studies
(Leibert 2016; Wiest 2016). Previous studies have found that younger people emigrate
from peripheral parts which can be related to opportunities and life style migration
(Korpela 2009), but in the case of Latvia some of the age-specific conditions can be
met by migrating to the core part of the country where educational and employment
opportunities are more diverse.
However, there are a number of differences among labour migrants originating
from core and periphery locations in Latvia. Emigrants from the core part of the
country can be characterised, firstly, as having tertiary education; secondly, to be a
qualified worker before emigration (professionals, managers and administrative
workers) and to be more likely to occupy a similar position also in the country of
destination; thirdly, they have found employment abroad more pro-actively, are more
first-time movers and have chosen destination countries such as Germany, Sweden and
Norway. Overall, these are migrants with a high human capital who tend to move to
‘escalator regions’ (Fielding 1992) where higher levels of social mobility (Smith and
Sage 2014) and occupational mobility (Findlay et al. 2009) can be accessed.
Against this backdrop, labour migrants from periphery locations mostly hold a
secondary or vocational education, and before emigration are employed as clerical and
other administrative workers, but once abroad to a higher extent, they concentrate their
efforts in low-skilled manual work sectors thus experiencing a downward occupational
mobility. Labour migrants from the periphery more often are circular migrants and as
APPRECIATING GEOGRAPHY: LOCAL AND GLOBAL SCALE
100
a country of destination they mostly choose Ireland and the UK where the strong
support of friends and relatives is ever present.
More so, it is evident that labour migrants from core and peripheral parts of the
country select different destinations. Reverse patterns can be observed as migrants
from core parts generally hold a higher level of education and are higher in the
occupational hierarchy and, as a destination country choose relatively new destinations
– Germany, Norway and Sweden. By contrast, labour migrants from peripheral parts
having a seconday level of education and manual labour work as a prime choice for
employment abroad, have moved mostly to Ireland and the UK.
In Europe, countries with sparsely populated regions experience a population
decline which is a result of working age people choosing out-migration, mainly due to
the lack of employment and life experience opportunities. De-population in rural parts
of the country is a concern in many countries, thus further studies on the question of
non-migrants, emigrants, return migrants and immigrants are important.
Acknowledgement
This study was supported by ERDF grant 1.1.1.2/VIAA/1/16/184 and National
Research Program Project No.VPP-IZM-2018/1-0015.
Kopsavilkums
Raksta “Darbspēka migrācijas izpēte Latvijā: izbraukšanas ģeogrāfija” mērķis ir izpētīt darbaspēka
migrācijas ģeogrāfiskos aspektus, analizējot emigrācijas īpatnības, kas raksturīgas izbraukšanai no
centrālajiem un perifērajiem Latvijas reģioniem, kā arī emigrantu galamērķa valsts izvēli atkarībā no viņu
iepriekšējās dzīvesvietas. Analīze veikta, ņemot vērā galamērķa valstīs (Lielbritānija, Īrija, Vācija,
Zviedrija un Norvēģija) esošo Latvijas emigrantu tiešsaistes aptaujas datus. Rezultāti parāda, ka darba
migrantu raksturojums krasi atšķiras atkarībā no izcelsmes vietas Latvijā. Migranti, kuri pirms emigrācijas
dzīvojuši valsts ekonomiskajā centrā Rīgā, ir ar augstāku izglītību un nodarbinātības raksturu
salīdzinājumā ar migrantiem no Latvijas perifērajiem reģioniem. Turklāt migrantiem no Rīgas retāk ir
iepriekšēja migrācijas pieredze, un viņi papildus radu un draugu atbalstam darba meklējumos ārvalstīs
biežāk ir proaktīvi. Galamērķa valsts izvēle emigrantiem no centra biežāk ir Vācija, Norvēģija un
Zviedrija, bet emigranti, kuriem ir vidējā izglītība un zemākas prasības darba tirgū, biežāk iesaistās
cirkulārajā migrācijā un atkārtoti dodas uz Īriju vai Lielbritāniju.
References
Bosworth, G. and Venhorst V. (2018). Economic linkages between urban and rural regions–
what’s in it for the rural? Regional Studies, 52 (8), 1075-1085. DOI: 10.1080/00343404.2017.1339868
Centrālā Statistikas pārvalde (2018). Emigranta profils 2014. – 2016.gadā.
Fielding, A. J. (1992). Migration and social mobility: South East England as an escalator region,
Regional Studies, 26 (1), 1-15.
Findlay, A., Mason, C., Houston, D., McCollum, D. and Harrison R. (2009). Escalators,
elevators and travelators: The occupational mobility of migrants to South-East England, Journal of
Ethnic and Migration Studies, 35 (6), 861-879.
Korpela, M. (2009). When a trip to adulthood becomes a lifestyle: western lifestyle migrants in
Varanasi, India. In: Benson, M. and O’Reilly, K. (eds.) Lifestyle Migration: Expectations, Aspirations
and Experiences. Ashgate: Farnham, 15-30.
Leibert, T. (2016). She leaves, he stays? Sex-selective migration in rural East Germany. Journal
of Rural Studies, 43, 267-279.
APPRECIATING GEOGRAPHY: LOCAL AND GLOBAL SCALE
101
Lerch, M. (2016). Internal and international migration across the urban hierarchy in Albania.
Population Research & Policy Review, 35, 851.
Lulle, A. (2019). Balkans and Baltics: On migration as a factor of regional
peripheralization. Journal of Balkan and Near Eastern Studies, 21 (1), 27-
42, DOI: 10.1080/19448953.2018.1532684
McCollum, D., Liu, Y., Findlay, A., Feng, Z. and Nightingale, G. (2018). Determinants of
occupational mobility: the importance of place of work, Regional Studies, 52 (12), 1612-1623.
Rérat, P. (2014). Highly qualified rural youth: why do young graduates return to their home
region? Children's Geographies, 12 (1), 70-86.
Rogaly, B. (2009). Spaces of work and everyday life: Labour geographies and the agency of
unorganised temporary migrant workers. Geography Compass, 3, 1975-1987.
Schuster, L. (2005). The continuing mobility of migrants in Italy: Shifting between places and
statuses. Journal of Ethnic and Migration Studies, 31 (4), 757-774.
Skeldon, R. (1997). Migration and Development: A Global Interpretation. London: Longman.
Smith, P.D. and Sage, J. (2014). The regional migration of young adults in England and Wales
(2002–2008): a ‘conveyor-belt’ of population redistribution?, Children's Geographies, 12 (1), 102-117.
Torok, I. (2017). Migration patterns and core–periphery relations from the Central and Eastern-
European perspective. European Review, 25 (3), 388-405.
Wiest, K. (2016). Migration and everyday discourses: Peripheralisation in rural Saxony-Anhalt
from a gender perspective. Journal of Rural Studies, 43, 280-290.
MOBILITY MOTIVATIONS AND EXPERIENCES
OF HIGHLY SKILLED LATVIANS ABROAD
Augsti kvalificētu Latvijas emigrantu mobilitātes motivācija un
pieredze ārvalstīs
Inese Šūpule
University of Latvia, Institute of Sociology and Philosophy
Abstract. The aim of this paper is to analyse career migration of the highly skilled from Latvia in the
context of post-accession migration since the EU enlargement of 2004. Based on secondary analysis of
survey data, the study addresses three empirical questions: What are the motives of these highly skilled
migrants, both for the initial migratory move and future mobility? What are the structural factors
influencing the decisions of the highly skilled? What kinds of jobs do they actually obtain, and how do
they get those jobs? The theoretical framework of the study is a synthesis of several theories, taking into
account and testing the concept of liquid migration and its applicability to the career migration of the
highly skilled from Latvia. The data analysis demonstrates that the concept of liquid migration does not
characterise most typical migration patterns from Latvia, especially the migration patterns of the highly
skilled in STEM areas. Contrary to the dominant characteristics of liquid migration, the highly skilled
often choose long-term settlement and register abroad as employees.
Keywords: career migration of the highly skilled, liquid migration, post-accession migration
Introduction
Migration patterns and trends among highly qualified specialists have been
investigated in many countries. At the same time, studies on the mobility of highly
APPRECIATING GEOGRAPHY: LOCAL AND GLOBAL SCALE
102
qualified specialists in Latvia are under-represented; also, studies on return migration
are very few in Latvia (Krišjāne et al. 2013; Hazans 2015; Hazans 2018; Kļave and
Šūpule 2015). Recent studies on emigration processes in Latvia show that the
proportion of highly educated people leaving Latvia significantly increased during the
years of the economic crisis of 2009-2011. Different studies show that Latvia is
suffering a serious brain drain effect (Krišjāne et al. 2013: 104). Highly educated
emigrants are over-represented in Science, Mathematics, IT and Medicine (Hazans
2018). Hazans also concludes that so far, return migration is not compensating the
brain drain from Latvia (Hazans 2015), and emigration has contributed to a shortage of
high‐ and medium‐skilled professionals educated in Science, Mathematics, ICT and
Medicine, as well as experienced engineers and technicians (Hazans 2018). In this
context, it is important to analyse the career migration of the highly skilled from
Latvia, their migration motives and intentions, and career development.
When Central and Eastern European countries joined the European Union in 2004,
and some years later, when Western European countries removed the last restrictions for
the free movement of labour, inflow of the highly skilled to Western European countries
increased exponentially (ICF 2018). The individual migration decisions of all migrants,
including the highly skilled, are influenced by a complex interplay of push and pull
factors at macro, meso and micro level (Faist 1997; King et al. 2016). One of the
strategies to enter into the labour market is studying abroad (ICF 2018). Many well-
educated women from Central and Eastern European countries come to Western
European countries due to their romantic relationship. At the same time, they often
continue their studies in the chosen destination country and stay there thanks to their
talents (Matyska 2019). As a core part of skilled migration literature, including the
debates on return migration policies, a discussion on circular migration has emerged
(Kuvik 2012). These discussions have been inspired by the contributions of Chinese and
Indian high-tech workers to the development of their countries-of-origin (Hooper and
Sumption 2016).
The theoretical framework of this study is inspired by the concept of liquid
migration, and the study tests if this concept is useful for the understanding of career
migration among the highly skilled from Latvia. Studies on intra-European migration
indicate that the migration process after 2004 differs from the dominant migration
patterns of the twentieth century (Glorius et al. 2013). Social scientists talk about new
types of migrants, among them being highly qualified workers who seek employment
in the Western knowledge economies (Engbersen and Snel 2013). New trends also
need new theoretical concepts, and one of the new concepts characterizing current
migration processes is the concept of liquid migration. According to Engbersen and
Snel (2013), liquid migration is a typical phenomenon of post-accession migration,
characterising contemporary labour migration patterns from Central and Eastern
Europe to Western Europe, and it has six dominant characteristics: (1) the temporality
of a stay abroad; (2) invisibility (the temporal nature of residence often goes hand in
hand with non-registration and contributes to invisibility); (3) it is predominantly
APPRECIATING GEOGRAPHY: LOCAL AND GLOBAL SCALE
103
labour migration; (4) it is mostly regular migration; most migrants have legal
residential status; (5) it is unpredictable, because labour migrants react and adapt to
altering conditions in the different labour markets; (6) it is more individualistic,
because there is a trend that family ties have become looser and more fragile among
migrants from CEE countries. At the same time, recent studies on labour migration
patterns from Central and Eastern Europe to Western Europe reveal the trend of
transition to longer-term settlement and the diversity of labour migration patterns
(Friberg 2012; Bygnes and Erdal 2017 etc.). The analysis of career migration among
the highly skilled from Latvia aims to determine if the concept of liquid migration is
applicable to the migration patterns of the highly skilled from Latvia. The analysis is
focused on the first and the most important feature of liquid migration: the temporality
of a stay abroad, because other characteristics are very connected to this (invisibility of
migration and adaptiveness to altering conditions), or needs more in-depth analysis of
societal changes. The last aspect refers especially to the question about family ties and
the trend that they have become looser and more fragile among migrants from CEE
countries.
Data and Methods
The data source used for the analysis of career migration of the highly skilled is
an emigrant survey organized within the Project “The emigrant communities of
Latvia: national identity, transnational relations, and diaspora politics”. An online
Internet-based method was used to engage with Latvian migrants, and the survey was
organized from August to October 2014. A total of 14048 Latvian nationals from
118 countries participated in the study.
For the purpose of this particular analysis a sub-sample of labour migrants has
been developed. This sub-sample includes only those who are first-generation
emigrants from Latvia and who were working at the time of the survey. In total, the
sub-sample has reached 7798 respondents, out of which 331 were highly skilled
managers and professionals in STEM areas (Science, Technology, Engineering, and
Mathematics) with a Masters or Doctoral degree.
The approach of data analysis is based on comparison of the highly skilled in
STEM areas (Science, Technology, Engineering, and Mathematics) with other labour
migrants from Latvia. To determine whether there is a significant difference in the
answers of the two groups, Pearson's chi-squared test or Yates's correction for continuity
is used.
Results
Highly skilled Latvian emigrants: main characteristics
As has been found already by other studies (Goldmanis 2015; Hazans 2015), the
educational and professional structure of Latvian migration varies depending on the
destination. According to survey data, highly skilled managers and professionals in
STEM areas with Masters and Doctoral degrees are not concentrating in one particular
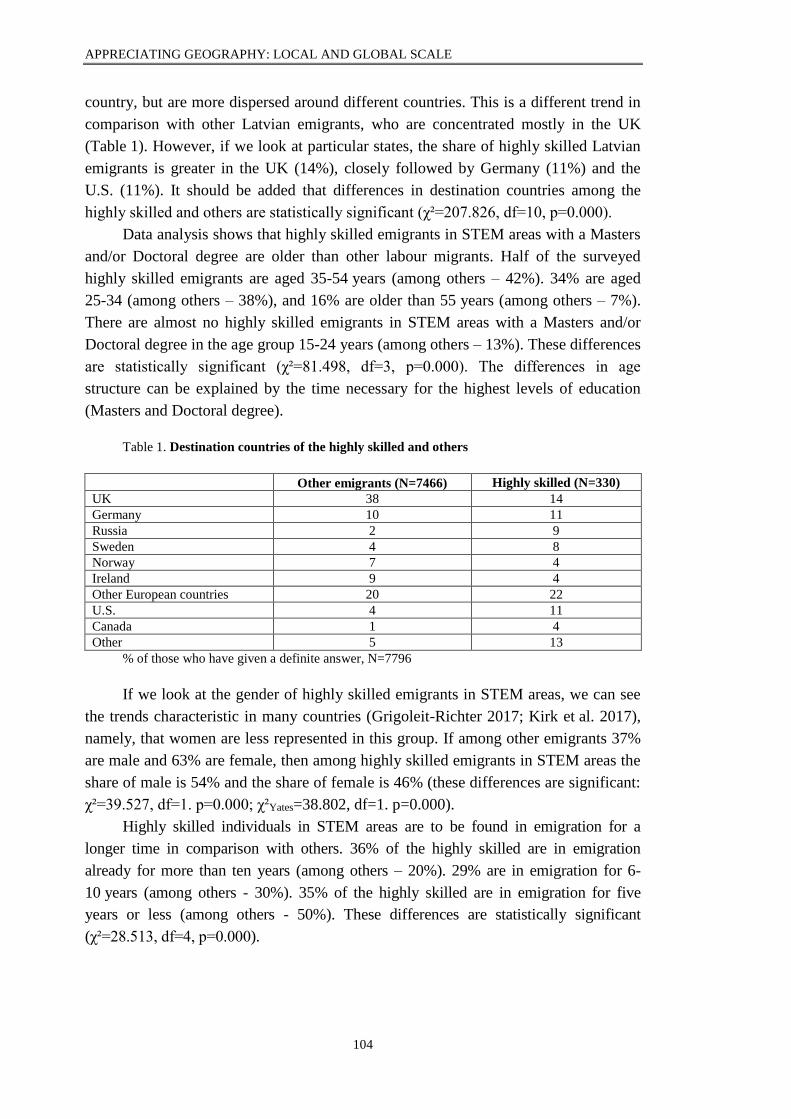
APPRECIATING GEOGRAPHY: LOCAL AND GLOBAL SCALE
104
country, but are more dispersed around different countries. This is a different trend in
comparison with other Latvian emigrants, who are concentrated mostly in the UK
(Table 1). However, if we look at particular states, the share of highly skilled Latvian
emigrants is greater in the UK (14%), closely followed by Germany (11%) and the
U.S. (11%). It should be added that differences in destination countries among the
highly skilled and others are statistically significant (χ²=207.826, df=10, p=0.000).
Data analysis shows that highly skilled emigrants in STEM areas with a Masters
and/or Doctoral degree are older than other labour migrants. Half of the surveyed
highly skilled emigrants are aged 35-54 years (among others – 42%). 34% are aged
25-34 (among others – 38%), and 16% are older than 55 years (among others – 7%).
There are almost no highly skilled emigrants in STEM areas with a Masters and/or
Doctoral degree in the age group 15-24 years (among others – 13%). These differences
are statistically significant (χ²=81.498, df=3, p=0.000). The differences in age
structure can be explained by the time necessary for the highest levels of education
(Masters and Doctoral degree).
Table 1. Destination countries of the highly skilled and others
Other emigrants (N=7466) Highly skilled (N=330)
UK 38 14
Germany 10 11
Russia 2 9
Sweden 4 8
Norway 7 4
Ireland 9 4
Other European countries 20 22
U.S. 4 11
Canada 1 4
Other 5 13
% of those who have given a definite answer, N=7796
If we look at the gender of highly skilled emigrants in STEM areas, we can see
the trends characteristic in many countries (Grigoleit-Richter 2017; Kirk et al. 2017),
namely, that women are less represented in this group. If among other emigrants 37%
are male and 63% are female, then among highly skilled emigrants in STEM areas the
share of male is 54% and the share of female is 46% (these differences are significant:
χ²=39.527, df=1. p=0.000; χ²Yates=38.802, df=1. p=0.000).
Highly skilled individuals in STEM areas are to be found in emigration for a
longer time in comparison with others. 36% of the highly skilled are in emigration
already for more than ten years (among others – 20%). 29% are in emigration for 6-
10 years (among others - 30%). 35% of the highly skilled are in emigration for five
years or less (among others - 50%). These differences are statistically significant
(χ²=28.513, df=4, p=0.000).
APPRECIATING GEOGRAPHY: LOCAL AND GLOBAL SCALE
105
Career experiences of the highly skilled
The questionnaire included two questions on the occupational position of
emigrants abroad: one question was about their occupational position after the first
year in emigration, and the other was about their situation now. The survey results
show that 84% of the highly skilled in STEM areas were employees at the time of the
survey, 9% were businessmen and 7% were self-employed. Conversely, after the first
year in emigration, 21% were students and only 4% were businessmen. This means,
firstly, that during their stay abroad about 5% have managed to develop their own
businesses. Secondly, the survey data confirms the findings of other studies that
universities are powerful recruitment channels for highly skilled migrants (Ackers
2005).
The highly skilled in STEM areas are both in emigration and in their current job
for a longer period of time. Survey data shows that 13% of the highly skilled have
been working in their current organisation for more than 10 years (among others –
4%). 20% of the highly skilled have been working in their current organisation for 6 to
10 years (among others – 16%). 24% of the highly skilled have been working in their
current organisation for 6 to 10 years (among others – 28%). 43% of the highly skilled
and 52% of others have been working in their current organisation for less than three
years (these differences are significant: χ²=59.834, df=3, p=0.000).
It is interesting that, according to the survey results, finding one’s first job in
emigration is very different between highly skilled emigrants and others. The most
popular way of finding a first job among the highly skilled was by applying for a
vacancy in a tender; 46% found their first job in this way (among others this was
mentioned in 20% of cases). For others, the most popular way to find the job was with
the help of friends and relatives. This was mentioned by 17% of the highly skilled and
46% of others (these differences are significant: χ²=106.070, df=4, p=0.000).
97% of the highly skilled in STEM areas have a written contract and are
included in the social security system of the destination country. Among other Latvian
emigrants this share is slightly smaller – 88% have a written contract and are included
in the social security system of the destination country (these differences are
significant: χ²=19.340, df=4, p=0.001).
Motivation for emigration and return intentions
The questionnaire included several questions measuring the motives for
emigration. After the evaluation of 16 possible reasons, respondents were asked to
choose the most important one. The survey results show that the three main arguments
for emigration most often mentioned are: (1) financial problems, difficulties living
with a low level of income (19%); the opportunity to earn a lot better abroad (10%);
the possibilities to develop (to get a good education and/or to build a career) (9%).
Among highly skilled labour migrants from Latvia, the argument for emigration
most often mentioned is the possibility to develop (to get a good education and/or to
build a career - 24%, among others - 8%). Financial problems and difficulties living
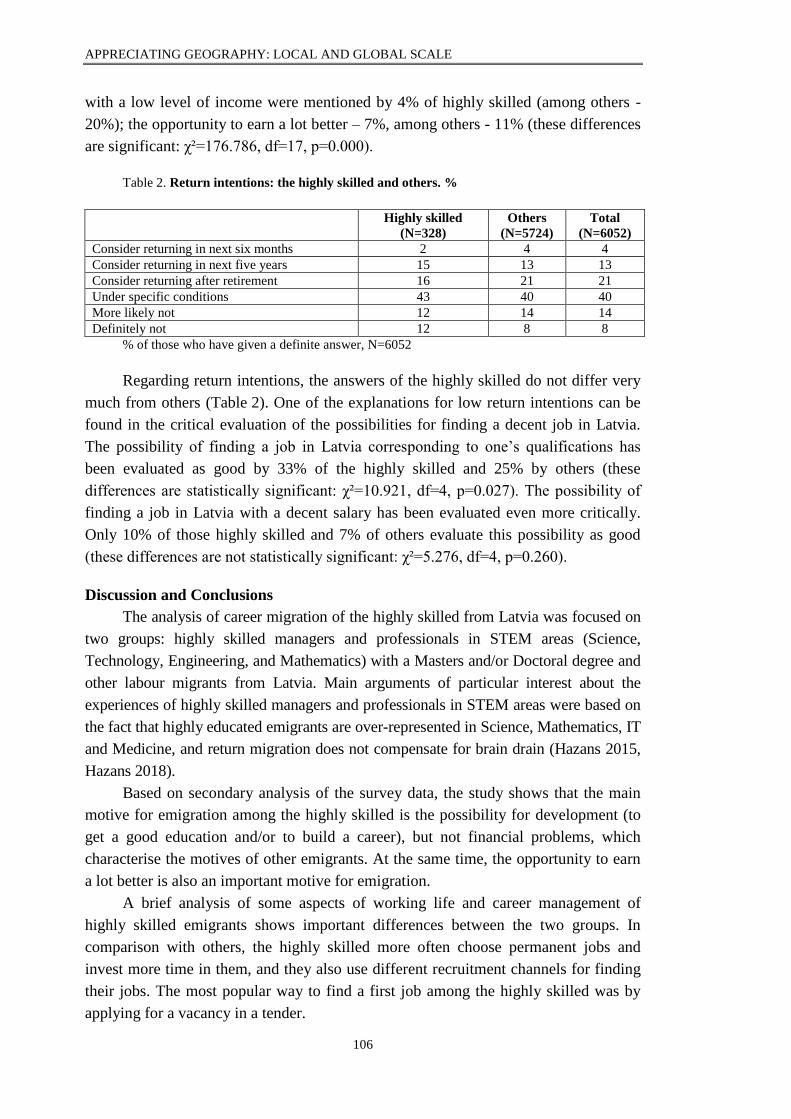
APPRECIATING GEOGRAPHY: LOCAL AND GLOBAL SCALE
106
with a low level of income were mentioned by 4% of highly skilled (among others -
20%); the opportunity to earn a lot better – 7%, among others - 11% (these differences
are significant: χ²=176.786, df=17, p=0.000).
Table 2. Return intentions: the highly skilled and others. %
Highly skilled
(N=328)
Others
(N=5724)
Total
(N=6052)
Consider returning in next six months 2 4 4
Consider returning in next five years 15 13 13
Consider returning after retirement 16 21 21
Under specific conditions 43 40 40
More likely not 12 14 14
Definitely not 12 8 8
% of those who have given a definite answer, N=6052
Regarding return intentions, the answers of the highly skilled do not differ very
much from others (Table 2). One of the explanations for low return intentions can be
found in the critical evaluation of the possibilities for finding a decent job in Latvia.
The possibility of finding a job in Latvia corresponding to one’s qualifications has
been evaluated as good by 33% of the highly skilled and 25% by others (these
differences are statistically significant: χ²=10.921, df=4, p=0.027). The possibility of
finding a job in Latvia with a decent salary has been evaluated even more critically.
Only 10% of those highly skilled and 7% of others evaluate this possibility as good
(these differences are not statistically significant: χ²=5.276, df=4, p=0.260).
Discussion and Conclusions
The analysis of career migration of the highly skilled from Latvia was focused on
two groups: highly skilled managers and professionals in STEM areas (Science,
Technology, Engineering, and Mathematics) with a Masters and/or Doctoral degree and
other labour migrants from Latvia. Main arguments of particular interest about the
experiences of highly skilled managers and professionals in STEM areas were based on
the fact that highly educated emigrants are over-represented in Science, Mathematics, IT
and Medicine, and return migration does not compensate for brain drain (Hazans 2015,
Hazans 2018).
Based on secondary analysis of the survey data, the study shows that the main
motive for emigration among the highly skilled is the possibility for development (to
get a good education and/or to build a career), but not financial problems, which
characterise the motives of other emigrants. At the same time, the opportunity to earn
a lot better is also an important motive for emigration.
A brief analysis of some aspects of working life and career management of
highly skilled emigrants shows important differences between the two groups. In
comparison with others, the highly skilled more often choose permanent jobs and
invest more time in them, and they also use different recruitment channels for finding
their jobs. The most popular way to find a first job among the highly skilled was by
applying for a vacancy in a tender.
APPRECIATING GEOGRAPHY: LOCAL AND GLOBAL SCALE
107
Contrary to many other issues, the return intentions of the highly skilled do not
differ from other emigrants from Latvia. 2% of emigrants currently working are
considering returning in the next six months, 15% are considering returning in the next
five years, and 16% are considering returning after retirement. All in all, a majority of
highly skilled managers and professionals in STEM areas are presently not planning
to return to Latvia and are settled in the particular destination country.
From the data presented above it follows that the concept of liquid migration
does not characterise current migration patterns from Latvia. In particular, highly
skilled managers and professionals in STEM areas do not fit the dominant
characteristics of liquid migration, defined by Engbersen and Snel (2013). Firstly, the
current trend features a long-term settlement practice, not the temporality of a stay
abroad. Secondly, people tend to register abroad as employees and do not stay
invisible to state offices anymore. At the same time, the intra-European migration
regime has some characteristics of liquid migration, namely, because it is mainly
labour-motivated, and it is strongly facilitated by the free movement of workers within
the EU. It can be concluded that the concept of liquid migration is not helpful for the
understanding of career migration of the highly skilled from Latvia, but we can see
that both structural factors and individual motives and lifecycle stages influence
migration decisions on initial moves and return intentions.
The author considers that there is no one unified labour migration pattern
characterising contemporary labour migration patterns from Central and Eastern
Europe to Western Europe, but a diversity of different types and a complex set of
factors underlying these types, which need to be explored in further studies.
Acknowledgement
This study was supported by the European Regional Development Fund,
Activity 1.1.1.2 “Post-doctoral Research Aid” (No 1.1.1.2/VIAA/1/16/012; Project
“Migration of highly qualified specialists: emigration and return migration in Latvia”).
Kopsavilkums
Raksta “Augsti kvalificētu Latvijas emigrantu mobilitātes motivācija un pieredze ārvalstīs” mērķis
ir analizēt augsti kvalificētu Latvijas emigrantu karjeras migrācijas pieredzi un novērtēt, vai tās
raksturošanai ir izmantojams teorētiskajā literatūrā piedāvātais “likvīdās migrācijas” jēdziens. Ņemot vērā
emigrantu aptaujas sekundāro datu analīzi, rakstā tiek aplūkoti šādi jautājumi: migrācijas motivācija, darba
pieredze un atrašana, atgriešanās plāni. Empīriskajā analīzē pamatotie secinājumi kritizē “likvīdās
migrācijas” jēdziena skaidrojuma potenciālu attiecībā uz pēdējos gados vērojamajiem migrācijas
procesiem Latvijā, īpaši attiecībā uz augsti kvalificētiem un izglītotiem speciālistiem STEM jomās
(zinātne, tehnoloģijas, inženierzinātnes un matemātika).
References
Ackers, L. (2005). Moving people and knowledge: Scientific mobility in the European Union.
International Migration, 43 (5), 99-131.
Bygnes, S. and Erdal, M. B. (2017). Liquid migration, grounded lives: Considerations about
future mobility and settlement among Polish and Spanish migrants in Norway. Journal of Ethnic and
Migration Studies, 43 (1), 102-118.
APPRECIATING GEOGRAPHY: LOCAL AND GLOBAL SCALE
108
Engbersen, G. and Snel, E. (2013). Liquid migration. Dynamic and fluid patterns of post-
accession migration flows. In: Glorius, B., Grabowska-Lusińska, I. and Kuvik, A. (eds.) Mobility in
Transition: Migration Patterns after EU Enlargement. Amsterdam: Amsterdam University Press, 21-
40.
Faist, T. (1997). The crucial meso-level. In: Hammar, T., Brochmann, G., Tamas, K., Faist, T.
(eds.) International Migration, Immobility and Development: Multidisciplinary Perspectives. Oxford:
Berg, 187-217.
Friberg, J. H. (2012). The stages of nigration. From going abroad to settling down: Post-accession
Polish migrant workers in Norway. Journal of Ethnic and Migration Studies 38 (10), 1589-1605.
Goldmanis, M. (2015). Statistisko svaru dizains pētījumā “Latvijas emigrantu kopienas”. In:
Mieriņa, I. (ed.) Latvijas emigrantu kopienas: Cerību diaspora. Rīga: Latvijas Universitātes Filozofijas
un socioloģijas institūts, 42-65.
Grigoleit-Richter, G. (2017). Highly skilled and highly mobile? Examining gendered and
ethnicised labour market conditions for migrant women in STEM professions in Germany. Journal of
Ethnic and Migration Studies, 43 (16). 2738-2755.
Hazans, M. (2015). Smadzeņu aizplūde no Latvijas 21. gadsimtā. In: Mieriņa, I. (ed.) Latvijas
emigrantu kopienas: Cerību diaspora. Rīga: Latvijas Universitātes Filozofijas un socioloģijas institūts, 85-
92.
Hazans, M. (2018). An in-depth analysis of the emigration of skilled labour. Latvia. Brussels:
European Centre of Expertise in the field of labour law, employment and labour market policy.
https://ec.europa.eu/social/main.jsp?catId=738&langId=en&pubId=8132&furtherPubs=yes"furtherPubs
=yes (20.01.2019).
Hooper, K. and Sumption, M. (2016). Reaching a “Fair Deal” on Talent: Emigration,
Circulation, and Human Capital in Countries of Origin. Washington, DC: Migration Policy Institute.
ICF (2018). Study on the Movement of Skilled Labour. Luxembourg: Publications Office of the
European Union.
King, R., Lulle, A., Morosanu, L. and Williams, A. (2016). International youth mobility and life
transitions in Europe: Questions, definitions, typologies and theoretical approaches. Working Paper.
Sussex Centre for Migration Research. http://sro.sussex.ac.uk/61441/1/mwp86.pdf. (01.03.2019).
Kirk, K., Bal, E. and Janssen, S. R. (2017). Migrants in liminal time and space: an exploration of
the experiences of highly skilled Indian bachelors in Amsterdam, Journal of Ethnic and Migration
Studies, 43 (16), 2771-2787.
Kļave, E. and Šūpule, I. (2015). Remigrācijas procesa analīze: politika un prakse. In: Mieriņa, I.
(ed.) Latvijas emigrantu kopienas: Cerību diaspora. Rīga: Latvijas Universitātes Filozofijas un
socioloģijas institūts, 194-209.
Krisjane, Z.; Berzins, M. and Apsite, E. (2013). Post-accession migration from the Baltic states.
The case of Latvia. In: Glorius, B., Grabowska-Lusińska, I. and Kuvik, A. (eds.) Mobility in Transition:
Migration Patterns after EU Enlargement. Amsterdam: Amsterdam University Press, 85-111.
Kuvik, A. (2012). Skilled migration in Europe and beyond: Recent developments and theoretical
considerations. In: Martiniello, M. and Rath, J. (eds.) An Introduction to International Migration
Studies: European Perspectives. Amsterdam: Amsterdam University Press, 211-235.
Matyska, A. (2019). How far can talent take you? Polish skilled mobility as self-initiated
expatriation during and after the Cold War. In: Habti, D. and Elo M. (eds.) Global Mobility of Highly
Skilled People. Multidisciplinary Perspectives on Self-initiated Expatriation. Basel: Springer
International Publishing AG, 147-161.
APPRECIATING GEOGRAPHY: LOCAL AND GLOBAL SCALE
109
SOCIO-DEMOGRAPHIC COMPOSITION OF THE
GEOGRAPHICALLY IMMOBILE URBAN POPULATION
Dzīvesvietu nemainījušo pilsētas iedzīvotāju sociāli
demogrāfiskais sastāvs
Baiba Švāne
University of Latvia, Faculty of Geography and Earth Sciences
Abstract. Most of the populace remains geographically immobile according to classical migration
theories. An important consideration that limits change of place of residence is attachment to that place
and its people, as well as some life-shaping circumstances such as job prospects, education, raising
children and the buying of a residential property (Fischer et. al. 2000). More than half of the residents of
Rīga (419146) in 2018 have lived in the same neighbourhood for at least 18 years (CSB 2018). This raises
the question as to whether they also share common socio-economic circumstances. Geographically
immobile residents are the core of the population. Study analyses on the socio-demographic background of
geographically immobile residents of Rīga, who have not changed location since the 1990s, used data
from a 2015 survey (n=867). The residential 'harbours' for long-term residents are Soviet socialist period-
built apartment-block housing neighbourhoods. Having a population of school-age children, people in
retirement and/or on a low income might contribute to some of the reasons for staying at one place for
longer periods of time in suburban Rīga. The socio- demographic characteristics of the geographically
immobile population displays differences among respondents residing in different neighbourhoods.
Among the neighbourhoods with the highest share of geographically immobile respondents, the areas
located on the outskirts of the capital city are less attractive than those more central and with higher
incomes and children.
Keywords: geographical immobility, residential mobility, Rīga.
Introduction
Geographical immobility refers to a difficulty for people to move to different
places of residence (Cambridge University Press 2011). Despite the fact that migration
researchers usually concentrate on moving, most people remain geographically
immobile (non-mobile). An important consideration that limits mobility is attachment to
a place and its people (Fischer et al. 2000). Research studies on geographical immobility
in Sweden show that the longer the period of time lived in the one place, the less the
probability of moving away, because local knowledge and social ties that have
developed over a period of time - insider advantages - might be lost in the event of
changing place of residence (Fischer et al. 2000). On the other hand, at some stages of
life, the decision to move is necessary to adjust for a new situation or circumstances
(Figure 1).
Research studies on geographical immobility are often related to the labour
market (e.g. Fischer et al. 2000; Green and Canny 2003), because an inability to move
for work reasons may be a cause of unemployment. Financial issues may constrain
geographical mobility between regions and countries despite wage differences,
because of the costs of moving, variation in housing prices and in cost of living, all of
which may be determinants of geographical immobility (Greenwood 1997; Fischer
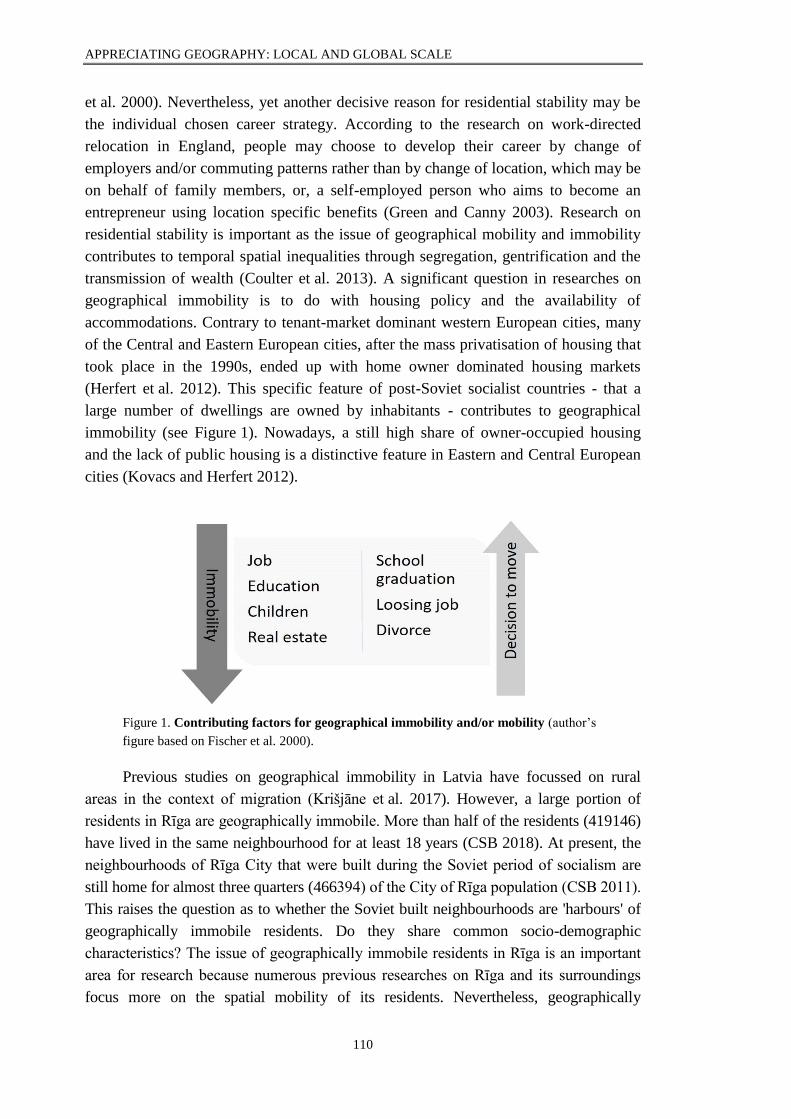
APPRECIATING GEOGRAPHY: LOCAL AND GLOBAL SCALE
110
et al. 2000). Nevertheless, yet another decisive reason for residential stability may be
the individual chosen career strategy. According to the research on work-directed
relocation in England, people may choose to develop their career by change of
employers and/or commuting patterns rather than by change of location, which may be
on behalf of family members, or, a self-employed person who aims to become an
entrepreneur using location specific benefits (Green and Canny 2003). Research on
residential stability is important as the issue of geographical mobility and immobility
contributes to temporal spatial inequalities through segregation, gentrification and the
transmission of wealth (Coulter et al. 2013). A significant question in researches on
geographical immobility is to do with housing policy and the availability of
accommodations. Contrary to tenant-market dominant western European cities, many
of the Central and Eastern European cities, after the mass privatisation of housing that
took place in the 1990s, ended up with home owner dominated housing markets
(Herfert et al. 2012). This specific feature of post-Soviet socialist countries - that a
large number of dwellings are owned by inhabitants - contributes to geographical
immobility (see Figure 1). Nowadays, a still high share of owner-occupied housing
and the lack of public housing is a distinctive feature in Eastern and Central European
cities (Kovacs and Herfert 2012).
Figure 1. Contributing factors for geographical immobility and/or mobility (author’s
figure based on Fischer et al. 2000).
Previous studies on geographical immobility in Latvia have focussed on rural
areas in the context of migration (Krišjāne et al. 2017). However, a large portion of
residents in Rīga are geographically immobile. More than half of the residents (419146)
have lived in the same neighbourhood for at least 18 years (CSB 2018). At present, the
neighbourhoods of Rīga City that were built during the Soviet period of socialism are
still home for almost three quarters (466394) of the City of Rīga population (CSB 2011).
This raises the question as to whether the Soviet built neighbourhoods are 'harbours' of
geographically immobile residents. Do they share common socio-demographic
characteristics? The issue of geographically immobile residents in Rīga is an important
area for research because numerous previous researches on Rīga and its surroundings
focus more on the spatial mobility of its residents. Nevertheless, geographically
APPRECIATING GEOGRAPHY: LOCAL AND GLOBAL SCALE
111
immobile residents represent the core of the population. The aim of this study is to
investigate the socio-demographic background of the geographically immobile residents
of Rīga who have not changed their place of residence since the 1990s.
Data and Methods
The data used in this study was obtained from the 2015 Rīga City Council
survey among 2043 randomly (with quota elements) selected respondents in the age
group 15-75 with face-to-face interviews on their own premises. The aim of the survey
was to investigate levels of satisfaction with services available to residents of Rīga in
addition to, and including, questions about residential satisfaction and the migration
experience. The survey consisted of 84 questions in total. For this research project I
used a sample of 867 residents who have remained in their current place of residence
even since the 1990s. In order to analyse socio-demographic background descriptive
statistics were used. In total, 10 variables were taken into consideration – gender, age
group, language spoken, occupation, income level per person, family status,
neighbourhood of residence, neighbourhood where working/studying, neighbourhood
where spending leisure time, period of housing built and attitude towards Soviet
period built neighbourhoods.
The Population of Rīga
The capital of Latvia is a shrinking city - between the population census of 2000
and that of 2011, Rīga has lost one sixth of its population, because of a trend of
negative natural growth balance across Latvia and negative internal migration (CSB
2000; CSB 2011). Previous researches on the question of geographical mobility in
Rīga indicate that the inner city has lost residents more rapidly than other parts of the
city and thus the share of residents living in neighbourhoods built during the period of
Soviet socialism have grown (Krišjāne and Bērziņš 2014). The population Census
of 2011 reveals that majority of the population 93% (601314) lives in large scale
housing estates (consisting of more than 30 dwellings), but also that a large part - 72%
(466394) lives in Soviet period built residences (CSB 2011). A similar number - 71%
(462721) of residents live in housing that is owned by a member of their household
(CSB 2011). These geographically immobile residents are concentrated in
neighbourhoods where Soviet period built apartment-block housing is dominant e.g.
Vecmīlgrāvis, Imanta, Pļavnieki, Bolderāja, Ziepniekkalns, Purvciems, Ķengarags and
Zolitūde, according to the statistics (from 2000 and also from 2018) on internal
mobility in Rīga (CSB 2018). Furthermore, the highest share of geographically
immobile residents in neighbourhood areas is to be found in the periphery of the
capital (Figure 2).
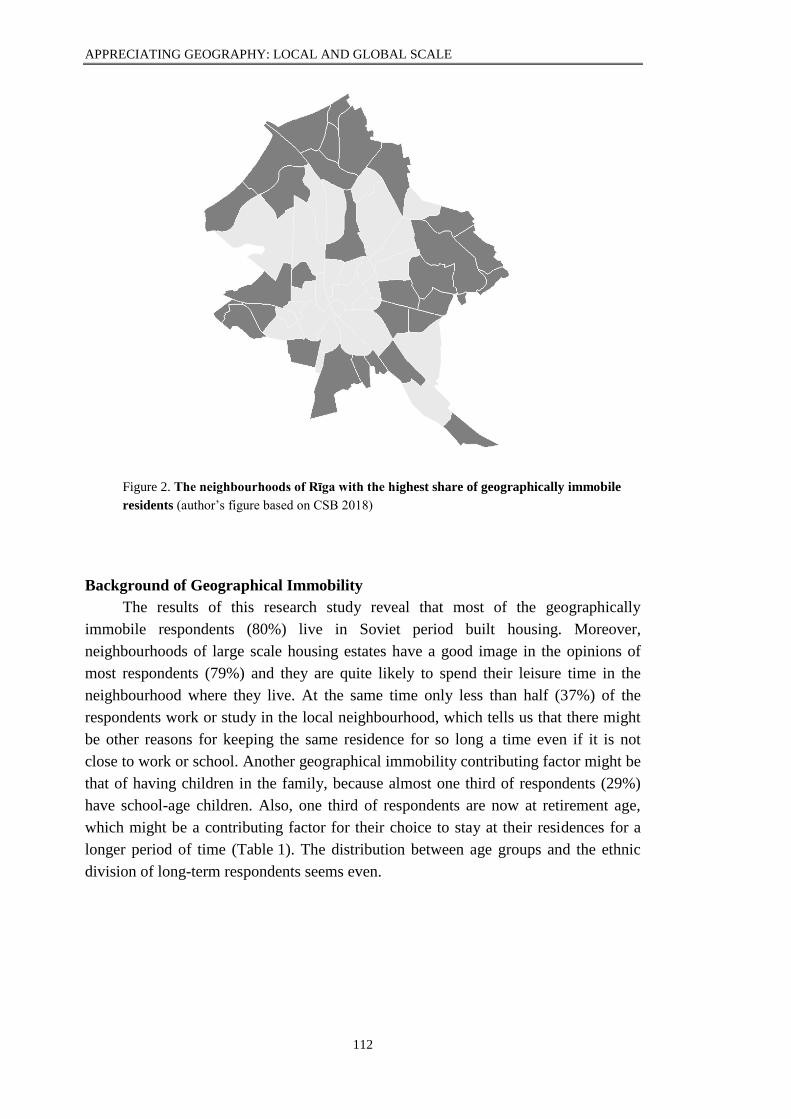
APPRECIATING GEOGRAPHY: LOCAL AND GLOBAL SCALE
112
Figure 2. The neighbourhoods of Rīga with the highest share of geographically immobile
residents (author’s figure based on CSB 2018)
Background of Geographical Immobility
The results of this research study reveal that most of the geographically
immobile respondents (80%) live in Soviet period built housing. Moreover,
neighbourhoods of large scale housing estates have a good image in the opinions of
most respondents (79%) and they are quite likely to spend their leisure time in the
neighbourhood where they live. At the same time only less than half (37%) of the
respondents work or study in the local neighbourhood, which tells us that there might
be other reasons for keeping the same residence for so long a time even if it is not
close to work or school. Another geographical immobility contributing factor might be
that of having children in the family, because almost one third of respondents (29%)
have school-age children. Also, one third of respondents are now at retirement age,
which might be a contributing factor for their choice to stay at their residences for a
longer period of time (Table 1). The distribution between age groups and the ethnic
division of long-term respondents seems even.
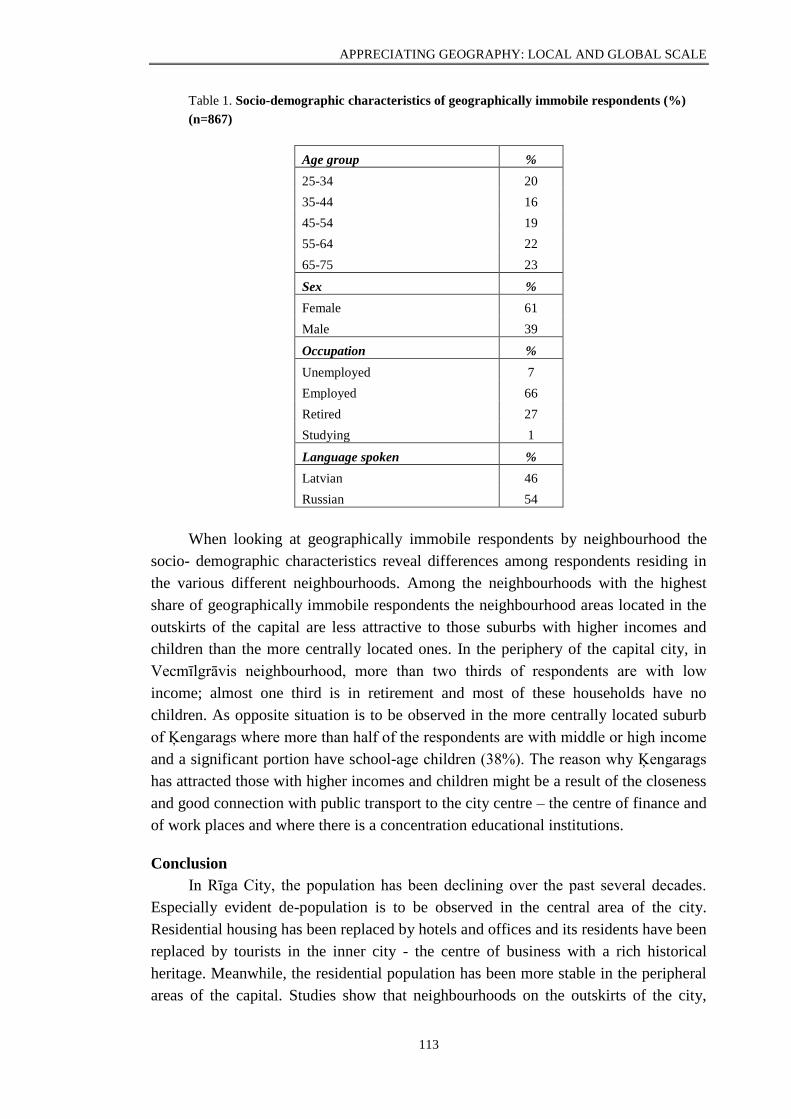
APPRECIATING GEOGRAPHY: LOCAL AND GLOBAL SCALE
113
Table 1. Socio-demographic characteristics of geographically immobile respondents (%)
(n=867)
Age group %
25-34 20
35-44 16
45-54 19
55-64 22
65-75 23
Sex %
Female 61
Male 39
Occupation %
Unemployed 7
Employed 66
Retired 27
Studying 1
Language spoken %
Latvian 46
Russian 54
When looking at geographically immobile respondents by neighbourhood the
socio- demographic characteristics reveal differences among respondents residing in
the various different neighbourhoods. Among the neighbourhoods with the highest
share of geographically immobile respondents the neighbourhood areas located in the
outskirts of the capital are less attractive to those suburbs with higher incomes and
children than the more centrally located ones. In the periphery of the capital city, in
Vecmīlgrāvis neighbourhood, more than two thirds of respondents are with low
income; almost one third is in retirement and most of these households have no
children. As opposite situation is to be observed in the more centrally located suburb
of Ķengarags where more than half of the respondents are with middle or high income
and a significant portion have school-age children (38%). The reason why Ķengarags
has attracted those with higher incomes and children might be a result of the closeness
and good connection with public transport to the city centre – the centre of finance and
of work places and where there is a concentration educational institutions.
Conclusion
In Rīga City, the population has been declining over the past several decades.
Especially evident de-population is to be observed in the central area of the city.
Residential housing has been replaced by hotels and offices and its residents have been
replaced by tourists in the inner city - the centre of business with a rich historical
heritage. Meanwhile, the residential population has been more stable in the peripheral
areas of the capital. Studies show that neighbourhoods on the outskirts of the city,
APPRECIATING GEOGRAPHY: LOCAL AND GLOBAL SCALE
114
which consist of pre-dominantly Soviet socialist period-built apartment-block housing,
are characterized by a high proportion of long-term residents. The specific feature of
the Soviet socialist period-built apartment-block housing is that most actual residing
tenants in the 1990s became home owners after the massive privatisation of previously
state owned dwellings, and it is significant that this has contributed to residential
stability.
The findings of this study suggest that such factors as family status, occupational
status and income level are also important in shaping the distribution of the
geographically immobile population in Rīga by neighbourhoods and not by gender,
ethnicity or age group which is mostly similar in extent within all of the populace.
These findings can further be explained with the fact that having school-age
children or being of retirement status and/or having a lower income level might
contribute to the decision of staying at one place for a longer period of time in certain
neighbourhoods of Rīga. The neighbourhood areas located in the outskirts of the
capital are less attractive than the more central to those with higher incomes and
children.
The findings indicate that the major 'harbours'' for long-term residents are the
Soviet socialist period-built apartment-block housing neighbourhoods (e.g.
Vecmīlgrāvis, Imanta, Pļavnieki, Bolderāja, Ziepniekkalns, Purvciems, Ķengarags and
Zolitūde). These neighbourhoods have a good image in the eyes of geographically
immobile residents and they are more likely to spend their leisure hours in the
neighbourhood where they live. At the same time only less than half of these residents
either work or study in the local neighbourhood, which suggests that residents are
more likely to change commuting patterns rather than the place of residence.
Further studies of the significance of different factors shaping the profile of the
geographically immobile population would be worthwhile. In this case, a more
detailed analysis could also be undertaken on the effect of housing policy and socio-
economic factors.
Acknowledgement
This study was supported by National Research Program Project No.VPP-IZM-
2018/1-0015.
Kopsavilkums
Lielākā daļa cilvēku nekur nepārceļas un uzskatāmi par ģeogrāfiski nemobiliem saskaņā ar
migrācijas teorijām. Nozīmīgs iemesls, kas ierobežo pārcelšanos, ir piesaiste vietai un cilvēkiem un dzīves
notikumi, piemēram, darbs, mācības, bērna piedzimšana un īpašuma iegāde (Fischer et al. 2000). Vairāk
nekā puse Rīgas iedzīvotāju (419146) 2018. gadā dzīvoja tai pašā vietā, kur pirms 18 gadiem (CSB 2018).
Tas rada jautājumu, vai šiem nemobilajiem iedzīvotājiem ir līdzīgs sociālekonomiskais raksturojums?
Nemobilie rīdzinieki ir nozīmīgs pētījuma objekts, jo vairāki iepriekšējie pētījumi par Rīgu un tās
aglomerāciju fokusējās uz iedzīvotāju telpisko mobilitāti. Tomēr nemobilie rīdzinieki veido iedzīvotāju
kodolu. Pētījumā, izmantojot 2015. gada aptaujas anketas datus (n=867), analizēts to Rīgas iedzīvotāju
sociālekonomiskais raksturojums, kuri nav pārcēlušies kopš 1990. gada. Ilgtermiņa iedzīvotāji lielākoties
apdzīvo padomju laikā būvētos mikrorajonus (Vecmīlgrāvi, Imantu, Pļavniekus, Bolderāju, Ziepniekkalnu,
APPRECIATING GEOGRAPHY: LOCAL AND GLOBAL SCALE
115
Purvciemu, Ķengaragu un Zolitūdi). Dažādās apkaimēs dzīvojošo ilgtermiņa iedzīvotāju raksturojums
atšķiras. Vecmīlgrāvja apkaime, kas atrodas Rīgas nomalē, ir mazāk pievilcīga iedzīvotājiem ar
augstākiem ienākumiem un bērniem, nekā tuvāk centram esošais Ķengarags. Nepilngadīgi bērni, mājoklis
īpašumā un zemi ienākumi ir nozīmīgi faktori nemobilitātei Rīgas apkaimē.
References
Cambridge University Press (2011). Cambridge Business English Dictionary. Cambridge:
Cambridge University Press.
Central Statistical Bureau of Latvia (2000). Tautas skaitīšana 2000.
http://data1.csb.gov.lv/pxweb/lv/iedz/iedz__tautassk__demogr__tsk2000/?tablelist=true&rxid=d891949
2-06f0-4d91-86c7-72286caaa641 (15.01.2018)
Central Statistical Bureau of Latvia (2011). Tautas skaitīšana 2011.
http://data1.csb.gov.lv/pxweb/lv/iedz/iedz__tautassk__riga/?rxid=d8919492-06f0-4d91-86c7-
72286caaa641 (29.08.2018)
Central Statistical Bureau of Latvia (2018). Pastāvīgo iedzīvotāju skaita izmaiņu iemesli
statistiskajos reģionos, republikas pilsētās, novados, novadu pilsētās, pagastos un Rīgas apkaimēs
http://data1.csb.gov.lv/pxweb/lv/iedz/iedz__riga/RIG050.px/?rxid=d8919492-06f0-4d91-86c7-
72286caaa641 (29.08.2018)
Coulter, R., van Ham, M. and Findlay, A. (2013). New directions for residential mobility research:
Linking lives through time and space. Discussion paper 7525. Bonn: Institute for the Study of Labour, 25.
Fischer, P.A., Holm, E., Malmberg, G. and Straubhaar, T. (2000). Why do people stay? Insider
advantages and immobility. HWWA Discussion Paper, 112.
Green, A.E. and Canny, A. (2003). Geographical mobility: Family impacts. Bristol, The Policy
Press, 60.
Greenwood, M.J. (1997). Internal migration in developed countries. Handbook of Population
and Family Economics, 12 (1B), 647-720.
Herfert, G., Neugebauer, C.S., Smigiel, C. (2012). Living in Residential Satisfaction? Insights
from Large-Scale Housing Estates in Central and Eastern Europe. Tijdschrift voor economische en
sociale geografie, 104 (1), 57-74.
Kitching, R. (1990). Migration behaviour among the unemployed and low-skilled. In: Johnson,
J.H. and Salt, J. (eds.) Labour migration. London: David Fulton, 172-190.
Kovacs, Z. and Herfert, G. (2012). Development pathways of large housing estates in
postsocialist cities: An international comparison. Housing Studies, 27 (3), 324-342.
Krišjāne, Z. and Bērziņš, M. (2014). Intra-urban residential differentiation in the post-Soviet
city: the case of Riga, Latvia. Hungarian Geographical Bulletin, 63 (3), 235-253.
Krišjāne, Z., Apsīte-Beriņa, E., Bērziņš, M., Grīne, I. (2017). Regional topicalities in Latvia:
mobility and immobility in the countryside. Proceedings of the 2017 International Conference
“Economic Science for Rural Development”, 45, 127-133.
APPRECIATING GEOGRAPHY: LOCAL AND GLOBAL SCALE
116
RESIDENTIAL PATTERNS OF IN-MIGRANTS IN RĪGA
Iekšzemes migrantu apdzīvojuma iezīmes. Rīgas piemērs
Jānis Krūmiņš, Māris Bērziņš, Zaiga Krišjāne
University of Latvia, Faculty of Geography and Earth Sciences
Abstract. Population distribution and internal migration are closely related to each other and are sensitive
to changes that are evoked by various political, economic and social processes. The distribution of
population sub-groups has been mostly studied in post-socialist cities in relation to ethnic and socio-
economic segregation. However, the importance of internal migration has been less investigated. This
paper uses 2000 and 2011 census data and aims to evaluate the residential patterns of in-migrants in the
neighbourhoods of Rīga. Key findings have revealed that levels of in-migrant concentration are higher in
the inner city neighbourhoods, whereas the degree of activity is considerably lower in the city outskirts.
Comparison of 2000 and 2011 patterns show a decrease of in-migration activity for more than half of the
neighbourhoods, with the exception of numerous panel housing estates to the east from the inner city.
Keywords: internal migration, population distribution, Rīga.
Introduction
Political, economic and social transformations since the collapse of state
socialism in Central and Eastern Europe (CEE) have been crucial in the changing
nature of population distribution and settlement patterns. These changes have been
most evident in urban areas of the region, where such development has drawn
scholarly and public attention to the topic of socio-spatial differentiation in post-
socialist cities. Numerous researches have been conducted in relation to urban social
inequalities and have also paid attention to mobility related processes such as
suburbanisation and gentrification, mostly addressing population differentiation
among city neighbourhoods (e.g. Brade et al. 2009; Kovacs and Herfert 2012; Kährik
and Tammaru 2010; Temelová et al. 2011; Gentile et al. 2012). Another body of
literature that is closely related to population distribution has tried to address the issue
of social segregation in the cities of CEE, mostly trying to study either the ethnic or
socio-economic intra-urban geography of the total population (e.g. Gentile and
Tammaru 2006; Marcińczak et al. 2012; Marcińczak et al. 2014; Krišjāne and Bērziņš
2014; Tammaru et al. (eds.) 2015). However, the linkage between internal migration
and population distribution has been less studied.
According to Central Statistical Bureau data for 2018, Rīga, the capital and
largest city of Latvia, housed 637971 residents or approximately one third of the total
national population. It can be considered as the most important urban centre of Latvia,
and holds significant primacy in the country’s political, social and cultural functions.
The population of Rīga is reported to be almost eight times higher than in the 2nd most
populated urban centre – Daugavpils. Although, the importance of Rīga is
unambiguous, the total population of the city has decreased by 16.7% during the
period from 2000 to 2017. Mobility processes can be considered as the main cause for
such changes. Respectively, Rīga has lost 11% of its population at the expense of
APPRECIATING GEOGRAPHY: LOCAL AND GLOBAL SCALE
117
migration, whereas the decline in relation to natural balance has been less significant (-
5.7%). Although, this can partially be explained with increased international migration
outflows (especially from 2008 to 2011), the most specific contributor to steady
population decline in Rīga can be attributed to internal migration and its resulting
process – residential suburbanisation. As a result, Rīga had been losing population in
exchange with its suburban hinterland – Pierīga; whereas, the capital city is gaining
population at the expense of all other statistical regions (Vidzeme, Zemgale, Kurzeme
and Latgale). Such inter-regional relations also reflect on internal migration numbers
that define Rīga as the main hub of internal migration activity. In 2016, 29.6% of all
internal migration flows were related to Rīga.
Therefore, internal migration can be considered as very significant in re-shaping
population distribution in the post-socialist space (e.g. Kontuly and Tammaru 2006;
Krišjāne and Bērziņš 2012; Novotný and Pregi 2015), and this study aims to evaluate
residential patterns of in-migrants in the neighbourhoods of Rīga by examining 2000
and 2011 Population Census rounds. Location quotient (LQ) is used as a descriptive
measure to assess the concentration of internal migrants within the neighbourhoods of
Rīga.
Data and Methods
The data used in this study was drawn from the 2000 and 2011 population
census rounds provided by the Central Statistical Bureau and focussed solely on Rīga
city. The data on internal migrants to Rīga was thus derived. The available dataset is
the most reliable source of information for the population composition in Latvia.
However, the census data categorises persons as migrants only for a limited timespan.
Thus, according to the census data collection specifics, a person was considered an
internal migrant to Rīga if the following criteria applied:
In 2000, on answering the question about their place of residence one year
before the Census had been taken (as of 31 March 1999), residents had
chosen the “Other” option, and later indicated any other municipality of
residence except Rīga.
In 2011, on answering the question about whether the person lived in the same
place of residence one year before the Census had been taken (as of 1 March
2010), the resident had replied negatively (No – meaning that not only the
dwelling had been changed, but also the municipality), and in the next question
had indicated their previous municipality of residence (not Rīga).
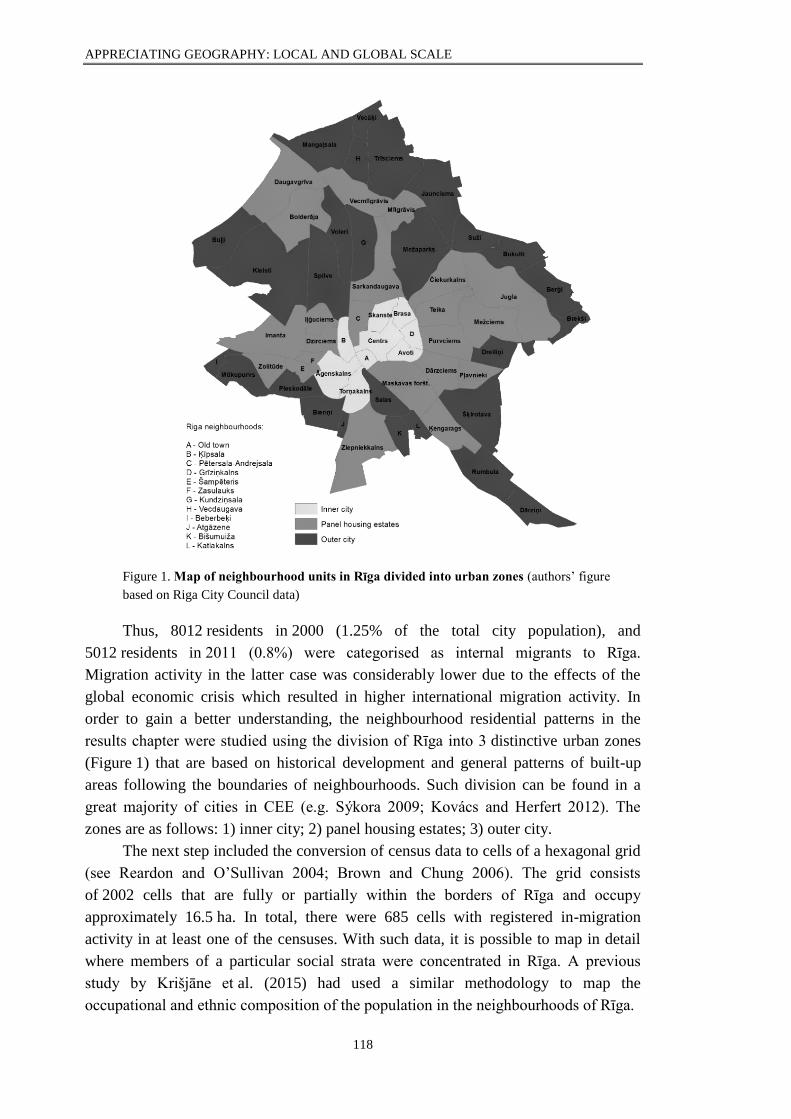
APPRECIATING GEOGRAPHY: LOCAL AND GLOBAL SCALE
118
Figure 1. Map of neighbourhood units in Rīga divided into urban zones (authors’ figure
based on Riga City Council data)
Thus, 8012 residents in 2000 (1.25% of the total city population), and
5012 residents in 2011 (0.8%) were categorised as internal migrants to Rīga.
Migration activity in the latter case was considerably lower due to the effects of the
global economic crisis which resulted in higher international migration activity. In
order to gain a better understanding, the neighbourhood residential patterns in the
results chapter were studied using the division of Rīga into 3 distinctive urban zones
(Figure 1) that are based on historical development and general patterns of built-up
areas following the boundaries of neighbourhoods. Such division can be found in a
great majority of cities in CEE (e.g. Sýkora 2009; Kovács and Herfert 2012). The
zones are as follows: 1) inner city; 2) panel housing estates; 3) outer city.
The next step included the conversion of census data to cells of a hexagonal grid
(see Reardon and O’Sullivan 2004; Brown and Chung 2006). The grid consists
of 2002 cells that are fully or partially within the borders of Rīga and occupy
approximately 16.5 ha. In total, there were 685 cells with registered in-migration
activity in at least one of the censuses. With such data, it is possible to map in detail
where members of a particular social strata were concentrated in Rīga. A previous
study by Krišjāne et al. (2015) had used a similar methodology to map the
occupational and ethnic composition of the population in the neighbourhoods of Rīga.
APPRECIATING GEOGRAPHY: LOCAL AND GLOBAL SCALE
119
The in-migrant spatial data was analysed using the Geo-Segregation
Analyzer 1.2, and calculated as location quotients (LQ). This analytical statistic
measure was used to illustrate spatial patterns of concentration (see Brown and Chung
2006). In this case, it shows the representation of in-migrants within a spatial unit in
comparison to the city average (3.5). Therefore, 3 gradation categories were chosen
for visual representation:
LQ < 1.5 – to highlight spatial units with rather low in-migrant
representation;
1.5 < LQ < 3.5 – to emphasize spatial units with neutral in-migrant
representation similar to the city average;
LQ > 3.5 – to distinguish spatial units with high in-migrant representation
above the city average rate.
Results
The intra-urban geography of internal migrant groupings has similar patterns
with higher representation in the neighbourhoods closer to the city centre for both
2000 and 2011 (Figure 2). Respectively, neighbourhoods such as Centrs, Brasa,
Grīziņkalns and Avoti are located in the inner city where the proportion of rental
dwellings is usually higher. Another cause for such an in-migration pattern in the
central part could be explained with a typically younger population composition.
Census data shows that 11 neighbourhoods had a positive or neutral average age of
population in 2011 in comparison to 2000. Three of the four afore-mentioned inner
city neighbourhoods were among these, whereas one (Grīziņkalns) has a slightly
negative difference. In addition, inner city neighbourhoods are very attractive for
residents previously or currently involved in student migration. Thus, even though
these neighbourhoods are attractive to in-migrants; they also witness higher out-
migration by way of both residential mobility and out-migration to Pierīga.
High, and on some occasions, above average concentrations of in-migrants are
characteristic to neighbourhoods with a considerable share of high-rise standardised
and pre-fabricated panel housing estates such as those at Purvciems, Teika, Imanta,
Iļģuciems, Vecmīlgrāvis, Jugla, Ķengarags and Sarkandaugava. Even though, these
neighbourhoods can be characterised as being with above average in-migration
activity, there has been neither increase or decrease of in-migrant representation in
certain spatial units in 2011. High concentrations (>3.5) can be explained with the
status of panel housing estates in the housing market. In this case, the dwellings in
these neighbourhoods are more affordable and thus more in demand by in-migrants.
Meanwhile, the changing pattern of panel housing estates can also be interpreted as a
result of the global economic crisis that affected the conditions of the housing market.
Nevertheless, panel housing neighbourhoods still maintained their status quo during
the 2000s as an economically attractive destination for potential in-migrants. Such
attractiveness can be linked with the fact that Soviet-era standardised apartment
buildings, which are highly evident in the afore-mentioned neighbourhoods, house a
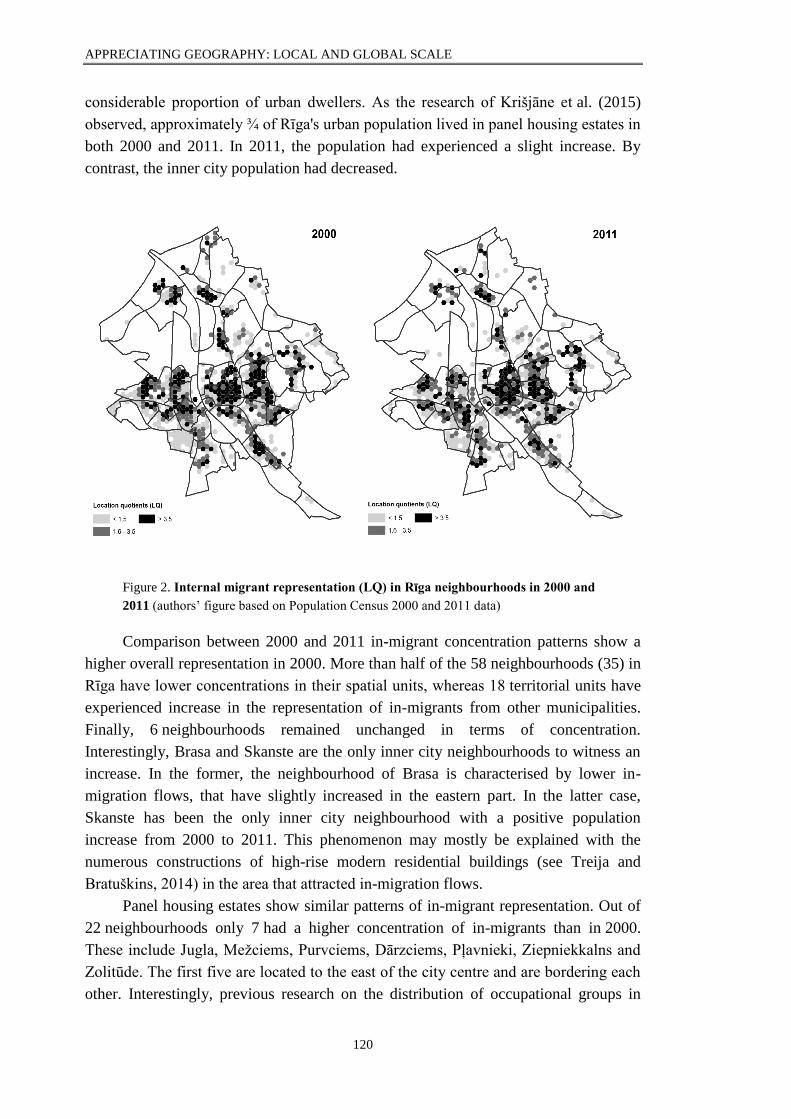
APPRECIATING GEOGRAPHY: LOCAL AND GLOBAL SCALE
120
considerable proportion of urban dwellers. As the research of Krišjāne et al. (2015)
observed, approximately ¾ of Rīga's urban population lived in panel housing estates in
both 2000 and 2011. In 2011, the population had experienced a slight increase. By
contrast, the inner city population had decreased.
Figure 2. Internal migrant representation (LQ) in Rīga neighbourhoods in 2000 and
2011 (authors’ figure based on Population Census 2000 and 2011 data)
Comparison between 2000 and 2011 in-migrant concentration patterns show a
higher overall representation in 2000. More than half of the 58 neighbourhoods (35) in
Rīga have lower concentrations in their spatial units, whereas 18 territorial units have
experienced increase in the representation of in-migrants from other municipalities.
Finally, 6 neighbourhoods remained unchanged in terms of concentration.
Interestingly, Brasa and Skanste are the only inner city neighbourhoods to witness an
increase. In the former, the neighbourhood of Brasa is characterised by lower in-
migration flows, that have slightly increased in the eastern part. In the latter case,
Skanste has been the only inner city neighbourhood with a positive population
increase from 2000 to 2011. This phenomenon may mostly be explained with the
numerous constructions of high-rise modern residential buildings (see Treija and
Bratuškins, 2014) in the area that attracted in-migration flows.
Panel housing estates show similar patterns of in-migrant representation. Out of
22 neighbourhoods only 7 had a higher concentration of in-migrants than in 2000.
These include Jugla, Mežciems, Purvciems, Dārzciems, Pļavnieki, Ziepniekkalns and
Zolitūde. The first five are located to the east of the city centre and are bordering each
other. Interestingly, previous research on the distribution of occupational groups in
APPRECIATING GEOGRAPHY: LOCAL AND GLOBAL SCALE
121
Rīga (Krišjāne et al. 2015) found that there has been an increase in concentration of
the highest socio-economic group and the area of higher representation of this socio-
economic subgroup has extended eastwards. Therefore, both cases could be linked to
the attractiveness of these neighbourhoods in the housing market and the presence of
the economic crisis.
Outer city neighbourhoods have a lower population density, and thus have
considerably lower in-migration flows than do the other two urban zones. Nonetheless,
in terms of migrant concentration, eight neighbourhoods have witnessed increase.
Those include Bieriņi, Dārziņi and Dreiliņi – the areas with housing and residential
patterns similar to municipalities within the suburban ring outside of the Rīga city
borders.
Conclusion
In this paper it has become evident how residential patterns of in-migrants have
evolved and transformed through analysis of the 2000 and 2011 Census data. Results
have shown that the intra-urban geography of internal migrants had similar patterns
with higher representation in the neighbourhoods closer to the city centre for both
years. This could well be explained by the fact that the proportion of rental dwellings
in these areas is usually higher. However, even though the inner city is attractive to in-
migrants; it also witnesses higher out-migration.
High and above average concentrations of in-migrants are characteristic to panel
housing estates. High concentrations can be explained by the affordability of dwellings
in high-rise residential buildings that are located in these areas, and are thus more in
demand by in-migrants. Meanwhile, the changing pattern (increase or decrease
in 2011) of panel housing estates can be interpreted as a result of the global economic
crisis that affected the conditions of the housing market.
Comparison between 2000 and 2011 in-migrant concentration patterns showed
higher overall representation in 2000. Thirty five neighbourhoods had lower
concentrations in their spatial units, whereas 18 territorial units experienced an
increase in representation of in-migrants from other municipalities. The migrant
concentration has most notably increased eastwards from the city centre and can be
linked to the development of the housing market during the time of the economic
crisis.
The authors of this study plan to expand this research and incorporate the
analysis of 2016 and 2017. Such an addition would allow for the evaluation of post-
2011 development of residential patterns in Rīga, and the extent and importance of
internal migration as a driving force in evoking changes in population distribution.
The question of Residential Mobility would be a decent addition to the focus of this
research. In such a case, it would be possible to assess whether short distance moves
within post-socialist city borders are more or less impactful than internal migration.
APPRECIATING GEOGRAPHY: LOCAL AND GLOBAL SCALE
122
Acknowledgement
This study was supported by National Research Program Project No.VPP-IZM-
2018/1-0015.
Kopsavilkums
Iekšzemes migrācijai ir noteicoša nozīme iedzīvotāju izvietojuma attīstības veicināšanā. Migrācijas
plūsmu raksturs var atšķirties un attīstīties dažādu politisku, ekonomisku un sociālu procesu ietekmē.
Dažādu iedzīvotāju sastāva grupu izvietojuma īpatnības ir plaši pētītas postsociālistisko pilsētu kontekstā
saistībā ar etnisko vai socioekonomisko segregāciju. Tomēr izvietojuma saikne pilsētās ar iekšzemes
migrāciju tikusi mazāk pētīta. Šis pētījums vizualizē migrantu izvietojuma telpiskās atšķirības, parādot to
telpisko koncentrāciju vai izkliedi starp Rīgas mikrorajoniem. Lai to panāktu, izmantoti 2000. un
2011. gada Tautas skaitīšanas dati, kas tika ģeoreferencēti un vizualizēti sešstūra šūnu režģa veidā. Katrā
Rīgas mikrorajonā no citām pašvaldībām gada laikā iebraukušie iedzīvotāji tika attiecināti pret kopējo
iebraucēju plūsmu visā pilsētā, izmantojot novietojuma koeficientu (LQ). Pētījuma galvenie rezultāti
norāda uz paaugstinātu migrantu koncentrāciju pilsētas centrālajā daļā, kamēr perifērajā daļā migrācijas
aktivitāte bijusi krietni zemāka. Novērtējot izvietojuma attīstības iezīmes starp 2000. un 2011. gadu,
redzams iekšzemes migrantu koncentrācijas samazinājums lielākajā daļā pilsētas, kas lielā mērā saistāms
ar globālo ekonomisko krīzi un mājokļu tirgus īpatnībām. Izņēmums gan ir vairāki daudzstāvu dzīvojamo
apbūvju rajoni, kas atrodas austrumu virzienā no pilsētas centrālās daļas, kur migrantu koncentrācija pat
palielinājusies.
References
Brade, I., Herfert, G. and Wiest, K. (2009). Recent trends and future prospects of socio-spatial
differentiation in urban regions of Central and Eastern Europe: A lull before the storm? Cities, 26 (5), 233-
244.
Brown, L.A. and Chung, S.Y. (2006). Spatial segregation, segregation indices and the
geographical perspective. Population, Space and Place, 12 (2), 125-143.
Gentile, M. and Tammaru, T. (2006). Housing and ethnicity in the post-soviet city: Ust’-
Kamenogorsk, Kazakhstan. Urban Studies, 43 (10), 1757-1778.
Gentile, M., Tammaru, T. and van Kempen, R. (2012). Heteropolitanization: Social and spatial
change in Central and East European Cities. Cities, 29 (5), 291-299.
Kährik, A. and Tammaru, T. (2010). Soviet prefabricated panel housing estates: Areas of
continued social mix or decline? The case of Tallinn. Housing Studies, 25 (2), 201-219.
Kontuly, T. and Tammaru, T. (2006). Population Subgroups Responsible for New Urbanization
and Suburbanization in Estonia. European Urban and Regional Studies, 13 (4), 319-336.
Kovács, Z. and Herfert, G. (2012). Development pathways of large housing estates in
postsocialist cities: An international comparison. Housing Studies, 27 (3), 324-342.
Krišjāne, Z. and Bērziņš, M. (2012). Post-socialist urban trends: New patterns and motivations
for migration in the suburban areas of Rīga, Latvia. Urban Studies, 49 (2), pp. 289–306.
Krišjāne, Z. and Bērziņš, M. (2014). Intra-urban residential differentiation in the post-Soviet
city: the case of Riga, Latvia. Hungarian Geographical Bulletin, 63 (3), 235-253.
Krišjāne, Z., Bērziņš, M. and Kratoviš, K. (2015). Occupation and ethnicity: Patterns of
residential segregation in Riga two decades after socialism. In: Tammaru, T., Marcinczak, S., Van Ham,
M. and Musterd, S. (eds.) Socio-economic Segregation in European Capital Cities: East Meets West.
UK: Taylor and Francis Inc., 287-312.
Marcińczak, S., Musterd, S. and Stępniak, M. (2012). Where the grass is greener: Social
segregation in three major Polish cities at the beginning of the 21st century. European Urban and
Regional Studies, 19 (4), 383-403.
Marcińczak, S., Tammaru, T., Novák, J., Gentile, M., Kovács, Z., Temelová, J., Valatka, V.,
Kährik, A., and Szabó, B. (2015). Patterns of socioeconomic segregation in the capital cities of fast-
APPRECIATING GEOGRAPHY: LOCAL AND GLOBAL SCALE
123
track reforming postsocialist countries. Annals of the Association of American Geographers, 105 (1),
183-202.
Novotný, L. and Pregi, L. (2015). Changes in ethnic structure of population in the light of recent
trends of migration and natural reproduction. Geographica Pannonica, 19 (4), 194-211.
Reardon, S.F. and O’Sullivan, D. (2004). Measures of spatial segregation. Sociological
Methodology, 34 (1), 121-162.
Sýkora, L. (2009). New socio-spatial formations: Places of residential segregation and separation
in Czechia. Tijdschrift voor Economische en Sociale Geografie, 100 (4), 417-435.
Tammaru, T., Marcińczak, S., Van Ham, M. and Musterd, S. (eds.) (2015). Socio-economic
Segregation in European Capital Cities: East Meets West. UK: Taylor and Francis Inc.
Temelová, J., Novák, J., Ouředníček, M. and Puldová, P. (2011). Housing estates in the Czech
Republic after socialism: Various trajectories and inner differentiation. Urban Studies, 48 (9), 1811-
1834.
Treija, S. and Bratuškins, U. (2014). Rīgas lielmēroga dzīvojamo rajonu identitāte un attīstība.
In: Rozenvalds, J. and Zobena, A. (eds.) Daudzveidīgās un mainīgās Latvijas identitātes, Rīga: LU
Akadēmiskais Apgāds, 347-361.
DEFINING THE COMMUTING REGIONS OF LATVIA
Latvijas svārstmigrācijas reģionu noteikšana
Toms Skadiņš
University of Latvia, Faculty of Geography and Earth Sciences
Abstract. In this research paper the geography of travel to work is analysed based on origin–destination
commuting flows between municipalities. The aim of this study is to define work-related commuting
regions of Latvia using the most recent data derived from the 2011 Population Census. The analysis
demonstrates potential insights to be gained in defining regional patterns in the structure of work-related
commuting flows using census data. The findings identify 17 commuting regions in Latvia and highlight
the importance of Rīga in the context of the Latvian labour market. Two types of commuting regions were
identified – mono-centric regions attracting large numbers of commuters in the main employment centre
and poly-centric regions with more diversified travel-to-work flows.
Keywords: travel-to-work patterns, commuting behaviour, regions, census.
Introduction
In the last few decades, the processes of mobility (population movement) have
had a tendency to become more diverse and more voluminous. Travel-to-work flows
between municipalities represent a significant part of human mobility. Studies on the
peculiarities of work-related commuting in post-socialist countries have mostly
focused on the largest cities and their urban regions or agglomerations (Ahas et al.
2010; Novak and Sykora 2007; Novotny 2016). Country-wide or regional commuting
patterns have been studied considerably less frequently (e.g. Klapka et al. 2013; Kraft
et al. 2014; Marcinczak and Bartosiewicz 2018). The Statistical Bureau of Estonia has
defined labour migration regions based on 2011 Census data (Statistics Estonia 2014).
ESPON functional urban regions research has paid attention to all regional types
APPRECIATING GEOGRAPHY: LOCAL AND GLOBAL SCALE
124
(ESPON 2005). However, researchers, including Ludek Sykora and Ondrej Mulicek
(2009), argue that their approach ends up providing imprecise information about
agglomerations which is contrary to the results of all previous research.
In Latvia, the research has also largely focused in past on various facets of
commuters in the Rīga agglomeration (Krišjāne and Bērziņš 2009; Krišjāne et al. 2012).
The borders of the Rīga agglomeration have been re-defined four times (first occasion
in 1996) since the fall of socialism in 1991 (Bauls et al. 1999; RDPAD 2004; RDPAD
2012; RDPAD 2017). One notable exception is the research on “Latvian Population
Mobility in the Transitional Period” (Bauls and Krišjāne 2000), where labour
commuting flows to the largest cities were analysed for the years 1991 and 1999.
However, nearly two decades have passed since these studies, and there is still a lack of
sufficient knowledge concerning commuting patterns outside the Rīga agglomeration.
Other largest cities and non-metropolitan regions house approximately 45% of the
Latvian population and that is an important part of the national labour market (RDPAD
2017).
The aim of this study is to define the work-related commuting regions of Latvia
using the most recent data derived from the 2011 Population Census.
Data and Methods
The commuting of employed persons between the administrative territories
(municipalities) is the dataset that was used for this paper. Data was generated by
processing the information on residence and workplace addresses (their so-called mis-
match) from the 2011 Population Census. Only municipalities between which
commuting flows are at least 10 people were included in this dataset.
In-bound and out-bound commuting flows among municipalities, as well as
turnover, was analysed not just to define the commuting regions, but also to
characterize the general patterns. Data on total population was used to explain some of
the results, namely the differences between regions. The following steps were utilised
to define the commuting regions of Latvia:
First, the main employment centres were identified (based on in-bound
commuting flows);
Next, it was determined whether (and how) municipalities are connected to
the main employment centres;
Based on the connections, it was identified whether these centres have a
significant number of (voluminous) connections, so that a region can be
defined;
Those municipalities which did not have a pronounced connection with any
centre were further analysed to determine their connections and, conversely,
whether a municipality is the main centre, one of the centres or simply a part
of a region. For this purpose, both out-commuters and in-commuters were
analysed. Since most municipalities outside of the Rīga commuting
hinterland had a small number of (significant) connections with other
APPRECIATING GEOGRAPHY: LOCAL AND GLOBAL SCALE
125
municipalities, only the most voluminous were considered. No commuter
thresholds were defined for creation of regions, due to significant differences
between the various municipalities;
Two types of regions were identified: mono-centric and poly-centric. The
former had either a main employment centre or municipalities that
encompass the largest regional cities as their core. Whilst poly-centric
regions had more diversified travel-to-work flows among several
municipalities;
In some isolated cases a municipality was included into the particular region
despite not having a significant connection with the employment centre. The
reason for inclusion was that it had a significant link with other
municipalities belonging to that region.
The commuting hinterland of the capital city was defined differently. For a
municipality to be a part of Pierīga region, the number commuters to and from Rīga
had to be above the average (national level), which is heavily impacted by numbers in
the municipalities near Rīga, meaning that members of this region have the highest
numbers in country; 1007 and 191 respectively and with a strong connection to other
municipalities of the hinterland. For municipalities to be included in the Lielrīga
region, such characteristics had to be met - a below average number of commuters in
at least one of the two instances (to or from Rīga) and/or a prevalent connection with
other Lielrīga region municipalities. The reason for this type of criteria is that for most
municipalities the number one out-bound connection is with Rīga. Both regions were
classified as poly-centric, since commuting within these regions was more pronounced
than for any other region (especially for Pierīga).
Region names were derived from the Statistical regions of Latvia - a level of
territorial aggregation, which (to an extent) shows the four historical / cultural regions
of Latvia. There are some exceptions, meaning there are municipalities that belong to
different regions.
Results
Based on the number of commuters between municipalities, derived from
the 2011 Population Census, a total of 17 labour commuting regions were identified,
with 11 of them being mono-centric. They are shown in Table 1.
The capital city of Rīga, due to its being the main employment centre of Latvia,
is not a part of any region, rather it is a region by itself. In every municipality (119)
there are at least 10 people who work in Rīga, whereas at least 10 people from Rīga
travel to work in 83 municipalities. Rīga is the main destination of commuters from
81 municipalities. A total of 119970 people commute to Rīga, while 15825 people
commute from the capital. This region is the only one where in-bound commuters
outnumber their counterparts.
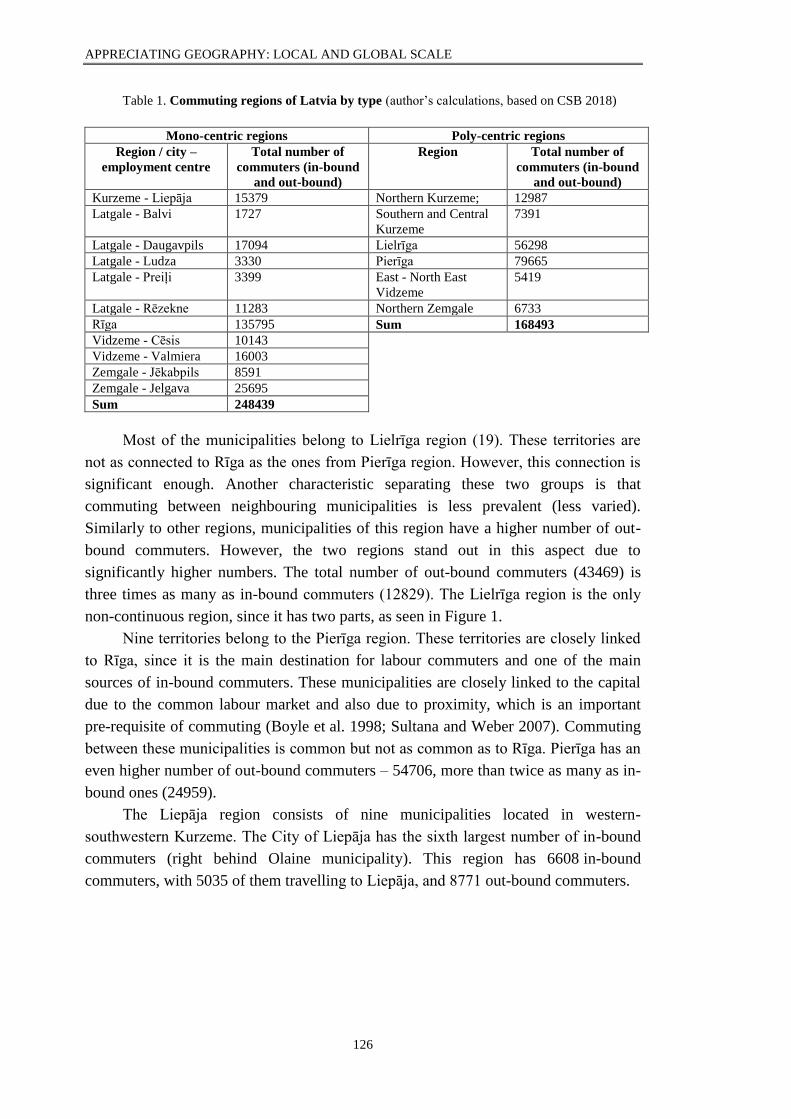
APPRECIATING GEOGRAPHY: LOCAL AND GLOBAL SCALE
126
Table 1. Commuting regions of Latvia by type (author’s calculations, based on CSB 2018)
Mono-centric regions Poly-centric regions
Region / city –
employment centre
Total number of
commuters (in-bound
and out-bound)
Region Total number of
commuters (in-bound
and out-bound)
Kurzeme - Liepāja 15379 Northern Kurzeme; 12987
Latgale - Balvi 1727 Southern and Central
Kurzeme
7391
Latgale - Daugavpils 17094 Lielrīga 56298
Latgale - Ludza 3330 Pierīga 79665
Latgale - Preiļi 3399 East - North East
Vidzeme
5419
Latgale - Rēzekne 11283 Northern Zemgale 6733
Rīga 135795 Sum 168493
Vidzeme - Cēsis 10143
Vidzeme - Valmiera 16003
Zemgale - Jēkabpils 8591
Zemgale - Jelgava 25695
Sum 248439
Most of the municipalities belong to Lielrīga region (19). These territories are
not as connected to Rīga as the ones from Pierīga region. However, this connection is
significant enough. Another characteristic separating these two groups is that
commuting between neighbouring municipalities is less prevalent (less varied).
Similarly to other regions, municipalities of this region have a higher number of out-
bound commuters. However, the two regions stand out in this aspect due to
significantly higher numbers. The total number of out-bound commuters (43469) is
three times as many as in-bound commuters (12829). The Lielrīga region is the only
non-continuous region, since it has two parts, as seen in Figure 1.
Nine territories belong to the Pierīga region. These territories are closely linked
to Rīga, since it is the main destination for labour commuters and one of the main
sources of in-bound commuters. These municipalities are closely linked to the capital
due to the common labour market and also due to proximity, which is an important
pre-requisite of commuting (Boyle et al. 1998; Sultana and Weber 2007). Commuting
between these municipalities is common but not as common as to Rīga. Pierīga has an
even higher number of out-bound commuters – 54706, more than twice as many as in-
bound ones (24959).
The Liepāja region consists of nine municipalities located in western-
southwestern Kurzeme. The City of Liepāja has the sixth largest number of in-bound
commuters (right behind Olaine municipality). This region has 6608 in-bound
commuters, with 5035 of them travelling to Liepāja, and 8771 out-bound commuters.
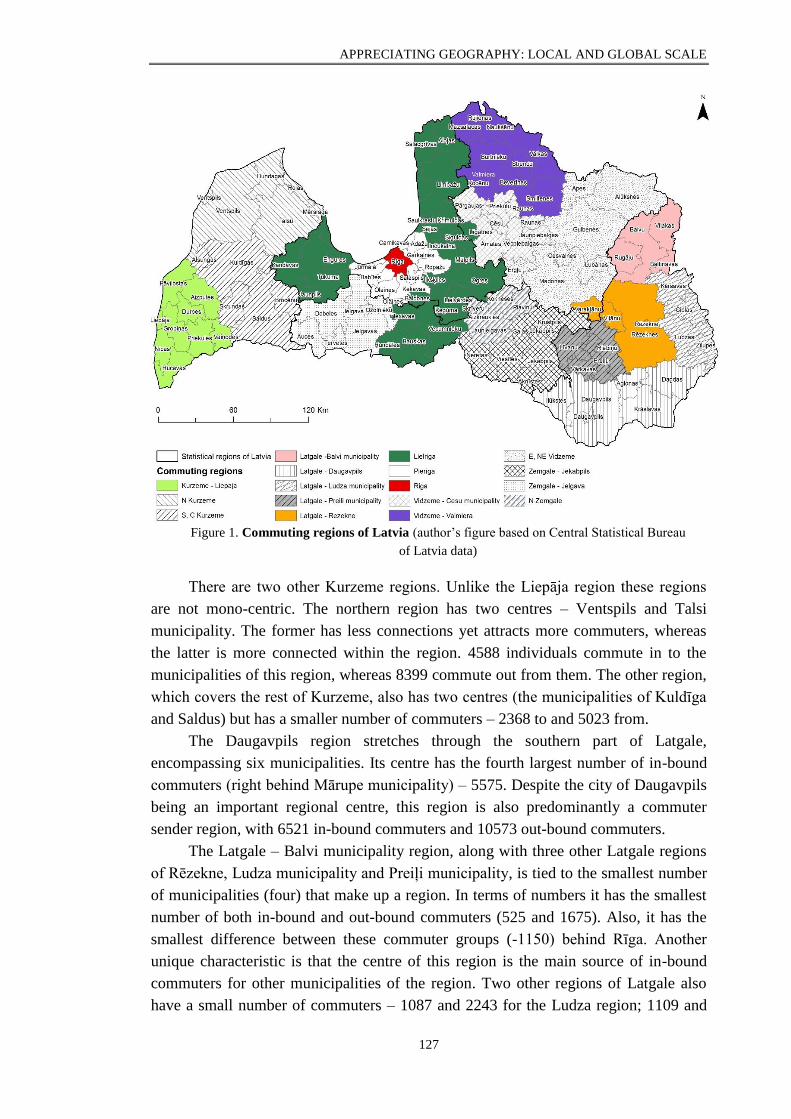
APPRECIATING GEOGRAPHY: LOCAL AND GLOBAL SCALE
127
Figure 1. Commuting regions of Latvia (author’s figure based on Central Statistical Bureau
of Latvia data)
There are two other Kurzeme regions. Unlike the Liepāja region these regions
are not mono-centric. The northern region has two centres – Ventspils and Talsi
municipality. The former has less connections yet attracts more commuters, whereas
the latter is more connected within the region. 4588 individuals commute in to the
municipalities of this region, whereas 8399 commute out from them. The other region,
which covers the rest of Kurzeme, also has two centres (the municipalities of Kuldīga
and Saldus) but has a smaller number of commuters – 2368 to and 5023 from.
The Daugavpils region stretches through the southern part of Latgale,
encompassing six municipalities. Its centre has the fourth largest number of in-bound
commuters (right behind Mārupe municipality) – 5575. Despite the city of Daugavpils
being an important regional centre, this region is also predominantly a commuter
sender region, with 6521 in-bound commuters and 10573 out-bound commuters.
The Latgale – Balvi municipality region, along with three other Latgale regions
of Rēzekne, Ludza municipality and Preiļi municipality, is tied to the smallest number
of municipalities (four) that make up a region. In terms of numbers it has the smallest
number of both in-bound and out-bound commuters (525 and 1675). Also, it has the
smallest difference between these commuter groups (-1150) behind Rīga. Another
unique characteristic is that the centre of this region is the main source of in-bound
commuters for other municipalities of the region. Two other regions of Latgale also
have a small number of commuters – 1087 and 2243 for the Ludza region; 1109 and
APPRECIATING GEOGRAPHY: LOCAL AND GLOBAL SCALE
128
2290 for the Preiļi region. Rēzekne has the smallest number of connections, with three,
because Varaklāņi municipality is more connected to neighbouring Viļāni.
Nevertheless, commuter numbers are much higher than for all other Latgale regions,
except Daugavpils. 4874 people commute to the municipalities of this region, whereas
there are a total of 6409 in-bound commuters.
The third largest region (10 municipalities), is Vidzeme – Valmiera region. Most
municipalities in this group have a strong link with Valmiera, but commuting within
the region is quite pronounced, which is why, despite having a lesser connection to the
centre, Naukšēni municipality was included in this region. The total number of in-
bound commuters (6913) is higher than, for instance, that of the Daugavpils and
Liepāja regions. The number of out-bound commuters is 9090.
Another mono-centric region in Vidzeme is the Cēsis municipality region. It
encompasses a total of seven municipalities. Commuting is not as pronounced as for
the Valmiera region. The municipalities of this region have 4136 in-bound commuters
and 6007 out-bound.
Seven municipalities make up the Eastern, Northeastern Vidzeme region.
Madona municipality is the main centre, while Alūksne is also a significant sender and
receiver of commuters. 5043 people commute from the municipalities of this region
but there are only 1690 in-bound commuters.
The Zemgale - Jelgava region, consisting of seven municipalities, is an
interesting case. The city of Jelgava does have a major connection with Rīga
(6363 commuters to Rīga and 523 from Rīga; both above average values); however it
is also an important regional centre. As a matter of fact, Jelgava has the second largest
number of in-bound commuters (6309). For this reason, the city is the centre of the
Zemgale - Jelgava region and not a part of the Pierīga or Lielrīga region. In total, the
municipalities of this region have 8349 in-bound commuters (mostly to Jelgava) and
17346 out-bound commuters, making it the most active region after Rīga, Pierīga and
Lielrīga. The Auce and Tērvete municipalities are included in this region, while being
more closely linked to Dobele municipality, which in turn has a link with Jelgava.
Northern Zemgale is a poly-centric region (centres - Aizkraukle and Jaunjelgava
municipalities), whereas Zemgale – Jēkabpils, as the name suggests, is mono-centric.
That is not the only difference - The northern region has a much smaller number of in-
bound commuters (1192 compared to 3282). The difference between out-bound
commuters is not as significant, with the Jēkabpils region having a total of 5309 and
Northern having 4227 commuters.
Conclusions
The results of this study clearly highlight the importance of Rīga in the national
labour market in terms or work-related commuting. The number of people travelling to
work in the capital city far exceeds the number of commuters travelling to the other
largest employment centres.
APPRECIATING GEOGRAPHY: LOCAL AND GLOBAL SCALE
129
The Pierīga and Lielrīga regions reflect the commuting range of Rīga, which is
especially evident by the structure of out-bound flows from Rīga. These flows are
significantly higher in areas near the capital, due to development and expansion of
businesses (also known as commercial suburbanisation) in recent years. In-bound
flows play a lesser role, since for most municipalities the number one out-bound
connection is with Rīga. Nevertheless, the flows tend to be higher in the vicinity of
Rīga. This could be explained by the large numbers of people who have moved from
Rīga to the suburbs, while retaining their jobs in the capital (residential
suburbanisation).
Results also indicate that the other largest employment centres – cities, except
Jūrmala and Ventspils, form mono-centric regions with numerous significant
connections. Jūrmala is an integral part of the Pierīga region, where out-bound
commuting is more prominent. Meanwhile, the city of Ventspils only has a major
connection with Ventspils municipality, which could be explained by the fact that
other municipalities of Northern Kurzeme are located far from this city.
In general, mono-centric regions attract large numbers of commuters while poly-
centric regions have more diversified travel-to-work flows with several employment
centres.
This study paves the way for future research. Available data allows for in-depth
analysis to be conducted. This dataset allows to calculate numerous variables and to
explore, as well as analyse, regional differences.
Acknowledgement
This study was supported by National Research Program Project No.VPP-IZM-
2018/1-0015.
Kopsavilkums
Šajā pētījumā analizēta ceļa uz darbu ģeogrāfija, ņemot vērā svārstmigrantu plūsmu starp
pašvaldībām. Šī pētījuma mērķis ir noteikt svārstmigrācijas reģionus, izmantojot jaunākos datus, kas iegūti
2011. gada Tautas skaitīšanā. Analīze parāda potenciālos ieskatus, kurus var iegūt, definējot ar darbu
saistītu pārvietošanās plūsmu struktūru reģionālos modeļus, izmantojot Tautas skaitīšanas datus. Rezultāti
parāda, ka Latvijā ir 17 svārstmigrācijas reģioni, un uzsver Rīgas nozīmi valsts darba tirgū. Tika
identificēti divi reģionu veidi – monocentriski, kas piesaista lielu skaitu svārstmigrantu galvenajā
nodarbinātības centrā, un policentriski ar daudzveidīgākām pārvietošanās plūsmām.
References
Ahas, R., Aasa, A., Slim, S. and Tiru, M. (2010). Daily rhythms of suburban commuters’
movements in the Tallinn metropolitan area: case study with mobile positioning data. Transportation
Research. 18C, 45-54.
Bauls, A. and Krišjāne, Z. (2000). Latvian population mobility in the transition period. Folia
Geographica. 10, 24-35.
Bauls, A., Melbārde, Z. and Šķinķis, P. (1999). Rīgas aglomerācijas robežu noteikšana
nepilnīgas informācijas apstākļos. Ģeogrāfiski Raksti. Folia Geographica. 8, 86-94.
Boyle, P., Halfacree, K. and Robinson, V. (1998). Exploring Contemporary Migration. Essex:
Longman.
APPRECIATING GEOGRAPHY: LOCAL AND GLOBAL SCALE
130
CSB (2018). LR Centrālās statistikas pārvaldes datu bāze - Nodarbināto iedzīvotāju svārstmigrācija
starp administratīvajām teritorijām. https://data.gov.lv/dati/dataset/svarstmigracija (26.12.2018)
CSB (2018). LR Centrālās statistikas pārvalde - CSP datu bāzes.
https://www.csb.gov.lv/lv/statistika/db (26.12.2018)
ESPON. (2005). Potentials for polycentric development in Europe. ESPON 1.1.1. project report.
Kraft, S., Halas, M. and Vancura, M. (2014). The delimitation of urban hinterlands based on
transport flows: A case study of regional capitals in the Czech Republic. Moravian Geographical
Reports. 22 (1), 24-32.
Klapka, P., Halas, M., Tonev, P. and Bednar, M. (2013). Functional regions of the Czech
Republic: comparison of simpler and more advanced methods of regional taxonomy. Acta Universitatis
Palackianae Olomucensis–Geographica. 44 (1), 45-57.
Krišjāne, Z. and Bērziņš, M. (2009). Commuting and the deconcentration of the post-socialist
urban population: the case of the Rīga agglomeration. Folia Geographica. 14, 56–74.
Krišjāne, Z., Bērziņš, M., Ivlevs A. and Bauls, A. (2012). Who are the typical commuters in the
postsocialist metropolis? The case of Riga, Latvia. Cities. 29 (5), 334-340.
Marcinczak, S. and Bartosiewicz, B. (2018). Commuting patterns and urban form: Evidence
from Poland. Journal of Transport Geography. 70, 31-39.
Novak, J. and Sykora, L. (2007). A city in motion: Time-space activity and mobility patterns of
suburban inhabitants and the structuration of the spatial organization of Prague metropolitan area.
Geografiska Annaler. 89B (2), 147-167.
Novotny, L. (2016). Urban development and migration processes in the urban region of Bratislava
from the post-socialist transformation until the global economic crisis. Urban Geography. 37 (7), 1009-
1029.
Rīgas Domes Pilsētas attīstības departaments (2004). Rīgas aglomerācijas robežu precizēšana.
SIA CTB.
Rīgas Domes Pilsētas attīstības departaments, LU Cilvēka ģeogrāfijas katedra. (2012). Rīgas
aglomerācijas robežu precizēšana
http://www.sus.lv/sites/default/files/media/faili/2012_rigas_aglomeracijas_robezu_precizesana.pdf
(26.12.2018)
Rīgas domes Pilsētas attīstības departaments, LU Cilvēka ģeogrāfijas katedra. (2017). Rīgas
aglomerācijas robežu precizēšana http://www.sus.lv/sites/default/files/rigas_aglomeracija_2017.pdf
(26.12.2018)
Statistics Estonia. (2014). Eesti piirkondlik areng. Regional Development in Estonia
https://www.stat.ee/publication-2014_regional-development-in-estonia-2014 (26.01.2019)
Sultana, S. and Weber, J. (2007). Journey-to-work patterns in the age of sprawl: Evidence from
two midsize southern metropolitan areas. The Professional Geographer. 59 (2), 193-208.
Sykora, L. and Mulicek, O. (2009). The micro-regional nature of functional urban areas (FUAs):
lessons from the analysis of Czech urban and regional system. Urban Research and Practice. 2 (3), 287-
307.
APPRECIATING GEOGRAPHY: LOCAL AND GLOBAL SCALE
131
INNER CITY OR OUTSKIRTS: WHERE ARE RESIDENTS MORE
SATISFIED? THE CASE OF JELGAVA
Iekšpilsēta vai nomales: kur iedzīvotāji ir vairāk apmierināti?
Jelgavas piemērs
Līga Feldmane
University of Latvia, Faculty of Geography and Earth Sciences
Abstract. Residential satisfaction is an important issue in any urban development policy. In order to
ascertain the level of residential satisfaction in Jelgava in 2018 a population survey was conducted, in
which 961 residents were questioned. Since the urban environment of Jelgava is not homogeneous,
respondents were grouped according to the place of residence in two parts of the city - the inner city and
the outer city. The results revealed that the overall satisfaction with life in Jelgava is relatively high, but
this indicator is not influenced by the respondent's place of residence in the urban area. There were no
statistically significant differences between respondent satisfaction in the inner city and/or the outskirts
with life in general, household financial situation, educational facilities, air quality, noise level, cleanliness
and/or job opportunities. By contrast the location of residence in one or another urban zone affects
satisfaction with public transport, health-care services, sports facilities, cultural facilities, the state of the
streets and buildings, public places, green areas and the availability of retail shops - respondents living in
the inner city are more satisfied with all of these factors compared with those living on the city outskirts.
Keywords: residential satisfaction, urban zones, second-tier city, Jelgava
Introduction
The number of satisfaction studies in different fields of science since the middle
of the 20th century has grown rapidly, as identifying the level of satisfaction can help
to improve services, products and policies. The expressed interest of geographers in
satisfaction research is related to spatial expressions of satisfaction and thus residential
satisfaction is most often studied. It is a complex concept influenced by various
environmental and socio-demographic variables (Lu 1999). According to Amerigo and
Aragones (1997) residential satisfaction is defined as the positive emotional state an
individual feels towards his or her living environment and which will influence his or
her behaviour to maintain or increase the link with that environment. It is often
associated with the migration intentions of residents (Frijters et al. 2011) and
especially within neighbourhoods in the same city (Nowok et al. 2018). Previous
research has proved the relationship: the less satisfied a person is with residence, the
greater is his desire to move (Fang 2006; Nowok et al. 2018).
Residential satisfaction may be studied from different viewpoints and factors that
influence it, and one of these is the spatial factor. Previous studies have revealed that
place of residence in the urban morphological structure affects residential satisfaction
(Dekker et al. 2011). There are studies which reveal that suburbanites tend to be more
satisfied than centrality residents (Speare 1974), residents of semi-central areas are more
satisfied than others (Gentile 2015; Kovacs and Douglas 2004). At the same time there
are research studies that did not find an impact as a result of location. For example,
APPRECIATING GEOGRAPHY: LOCAL AND GLOBAL SCALE
132
Gentile (2005) points out that residential satisfaction varies more significantly according
to housing types rather than according to a neighbourhood’s distance from the city
center.
Residential satisfaction in the context of Central-Eastern Europe has been
studied in the Czech Republic (Temelova et al. 2012; Hanák et al. 2015; Špačková
et al. 2016); Estonia (Kährik et al. 2011); Poland (Gorczyca and Grabinski 2017). In
the academic field residential satisfaction in Latvia has been little studied. Parsova and
Sidelska (2017) have studied household opinion regarding their accommodations and
criteria that influence this in the cities and rural areas of Latvia. Krūmiņš, Bērziņš and
Sechi (2018) have investigated how both mobility and static factors affect the
assessment of young individuals with regard to the question of residential satisfaction
in Rīga. Overall residential satisfaction has also been studied in Jelgava (Feldmane
2018), but residential satisfaction in the different urban zones within medium sized
cities of Latvia has not yet been researched. As a consequence of this situation the
research question for this study is to investigate how location of residence in the inner
city or outskirts affects residential satisfaction in the case of Jelgava.
Data and Methods
In 2018 a survey of the residents of Jelgava (hereinafter - The Survey) was
carried out in order to ascertain the level of satisfaction with the place of residence,
and 961 persons in total were interviewed. Respondents were asked to assess their
satisfaction with life in Jelgava and the factors affecting this according to the Likert 5-
point scale, where "1” is "very dissatisfied” and "5” – "very satisfied”. The factors
affecting residential satisfaction in Jelgava were as follows: overall life satisfaction,
satisfaction with the household financial situation, public transport, health-care
services, sports facilities, cultural facilities, the state of the streets and buildings,
public spaces, green spaces, availability of retail shops, educational facilities, the
quality of the air, noise levels, cleanliness, safety and job opportunities.
Within the framework of the study, the city of Jelgava was divided into two
urban areas – the inner city and the outer city (Figure 1). The inner city is located in
the central part of the city, it is historically the oldest part of Jelgava, dominated by
apartment complexes built during the years of Soviet socialism. The inner city is also
an area where business and trading activities dominate. By contrast, the outer city is
the territory outside the city center. It is not homogeneous, and it contains both
housing estates built during the Soviet socialist era, as well as private houses. The
growth of private houses built in recent years is vividly evident in this urban zone.
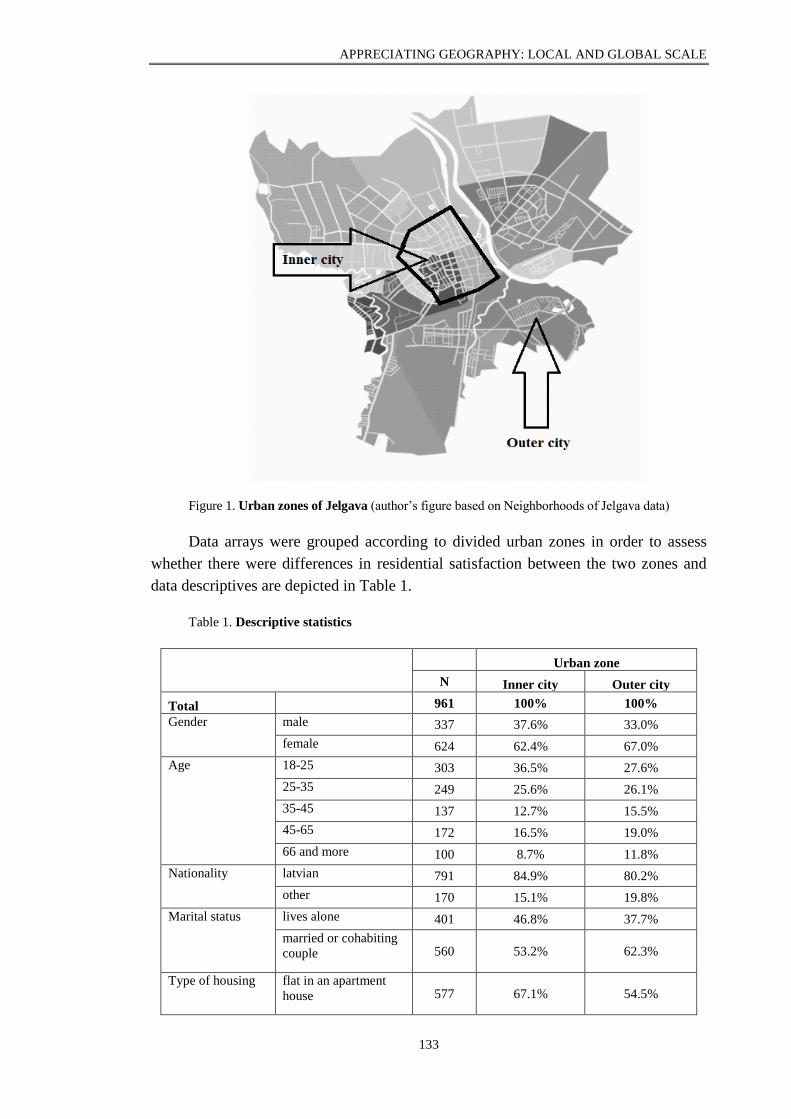
APPRECIATING GEOGRAPHY: LOCAL AND GLOBAL SCALE
133
Figure 1. Urban zones of Jelgava (author’s figure based on Neighborhoods of Jelgava data)
Data arrays were grouped according to divided urban zones in order to assess
whether there were differences in residential satisfaction between the two zones and
data descriptives are depicted in Table 1.
Table 1. Descriptive statistics
Urban zone
N Inner city Outer city
Total 961 100% 100%
Gender male 337 37.6% 33.0%
female 624 62.4% 67.0%
Age 18-25 303 36.5% 27.6%
25-35 249 25.6% 26.1%
35-45 137 12.7% 15.5%
45-65 172 16.5% 19.0%
66 and more 100 8.7% 11.8%
Nationality latvian 791 84.9% 80.2%
other 170 15.1% 19.8%
Marital status lives alone 401 46.8% 37.7%
married or cohabiting
couple 560 53.2% 62.3%
Type of housing flat in an apartment
house 577 67.1% 54.5%
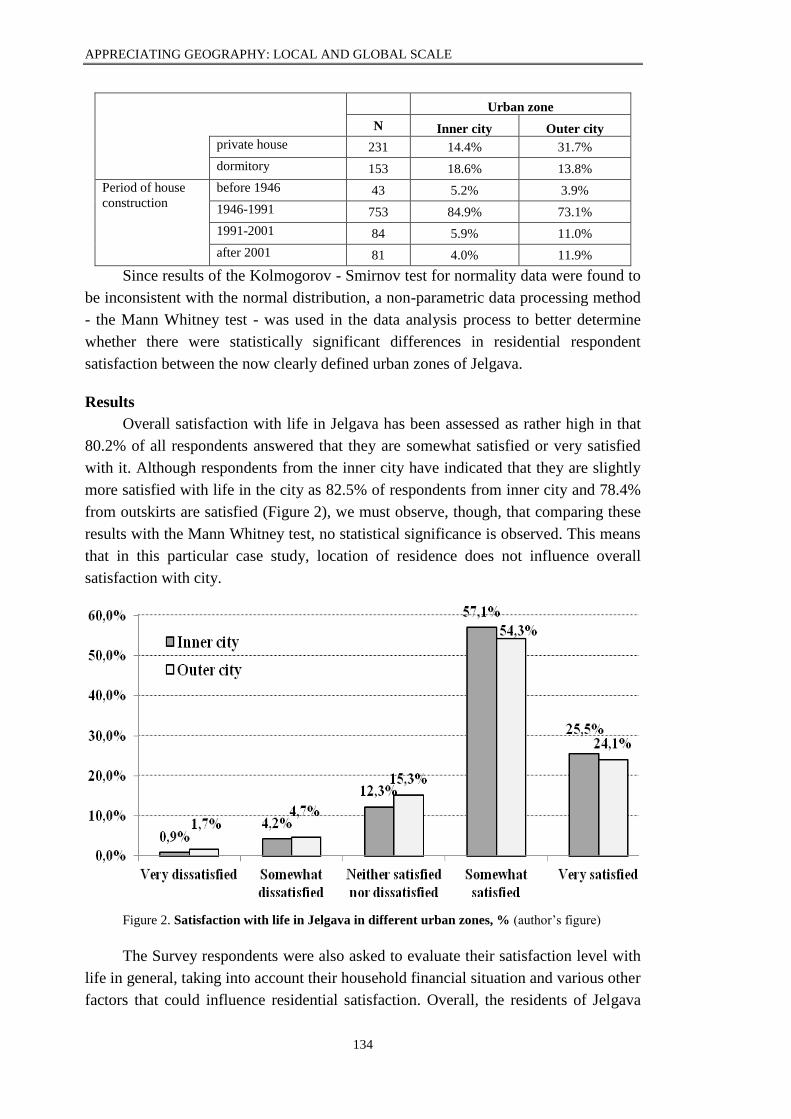
APPRECIATING GEOGRAPHY: LOCAL AND GLOBAL SCALE
134
Urban zone
N Inner city Outer city
private house 231 14.4% 31.7%
dormitory 153 18.6% 13.8%
Period of house
construction
before 1946 43 5.2% 3.9%
1946-1991 753 84.9% 73.1%
1991-2001 84 5.9% 11.0%
after 2001 81 4.0% 11.9%
Since results of the Kolmogorov - Smirnov test for normality data were found to
be inconsistent with the normal distribution, a non-parametric data processing method
- the Mann Whitney test - was used in the data analysis process to better determine
whether there were statistically significant differences in residential respondent
satisfaction between the now clearly defined urban zones of Jelgava.
Results
Overall satisfaction with life in Jelgava has been assessed as rather high in that
80.2% of all respondents answered that they are somewhat satisfied or very satisfied
with it. Although respondents from the inner city have indicated that they are slightly
more satisfied with life in the city as 82.5% of respondents from inner city and 78.4%
from outskirts are satisfied (Figure 2), we must observe, though, that comparing these
results with the Mann Whitney test, no statistical significance is observed. This means
that in this particular case study, location of residence does not influence overall
satisfaction with city.
Figure 2. Satisfaction with life in Jelgava in different urban zones, % (author’s figure)
The Survey respondents were also asked to evaluate their satisfaction level with
life in general, taking into account their household financial situation and various other
factors that could influence residential satisfaction. Overall, the residents of Jelgava
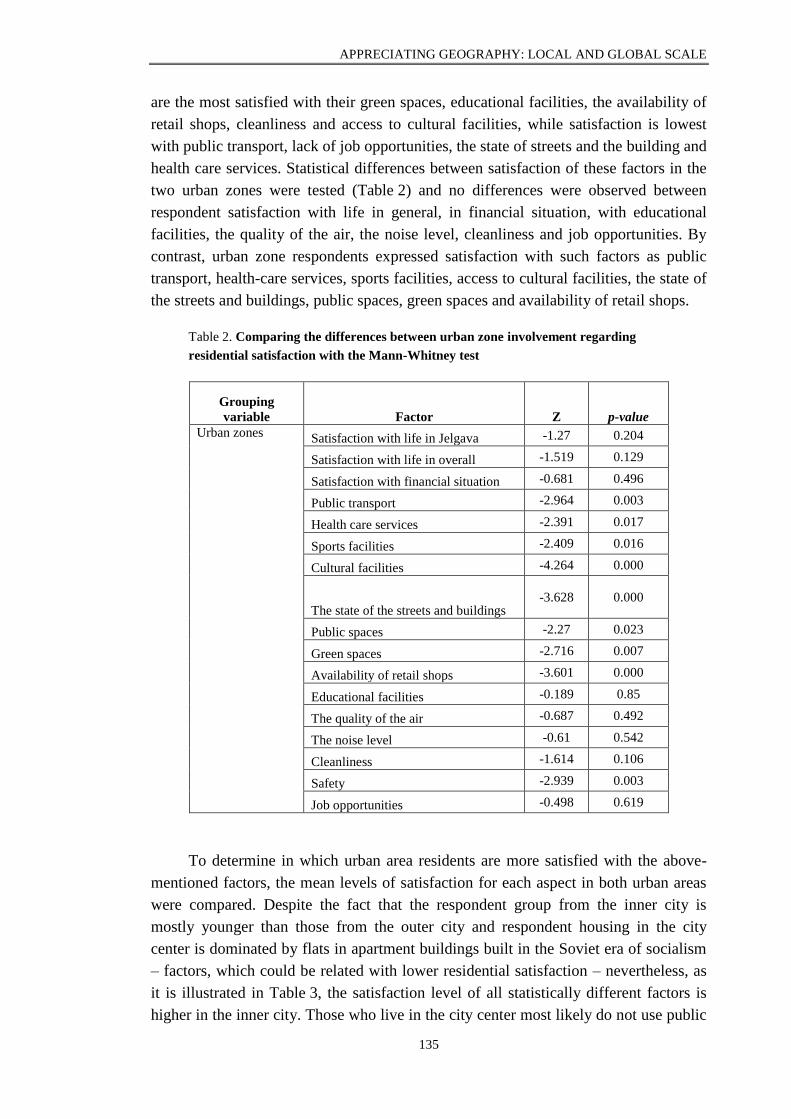
APPRECIATING GEOGRAPHY: LOCAL AND GLOBAL SCALE
135
are the most satisfied with their green spaces, educational facilities, the availability of
retail shops, cleanliness and access to cultural facilities, while satisfaction is lowest
with public transport, lack of job opportunities, the state of streets and the building and
health care services. Statistical differences between satisfaction of these factors in the
two urban zones were tested (Table 2) and no differences were observed between
respondent satisfaction with life in general, in financial situation, with educational
facilities, the quality of the air, the noise level, cleanliness and job opportunities. By
contrast, urban zone respondents expressed satisfaction with such factors as public
transport, health-care services, sports facilities, access to cultural facilities, the state of
the streets and buildings, public spaces, green spaces and availability of retail shops.
Table 2. Comparing the differences between urban zone involvement regarding
residential satisfaction with the Mann-Whitney test
Grouping
variable Factor Z p-value
Urban zones Satisfaction with life in Jelgava -1.27 0.204
Satisfaction with life in overall -1.519 0.129
Satisfaction with financial situation -0.681 0.496
Public transport -2.964 0.003
Health care services -2.391 0.017
Sports facilities -2.409 0.016
Cultural facilities -4.264 0.000
The state of the streets and buildings -3.628 0.000
Public spaces -2.27 0.023
Green spaces -2.716 0.007
Availability of retail shops -3.601 0.000
Educational facilities -0.189 0.85
The quality of the air -0.687 0.492
The noise level -0.61 0.542
Cleanliness -1.614 0.106
Safety -2.939 0.003
Job opportunities -0.498 0.619
To determine in which urban area residents are more satisfied with the above-
mentioned factors, the mean levels of satisfaction for each aspect in both urban areas
were compared. Despite the fact that the respondent group from the inner city is
mostly younger than those from the outer city and respondent housing in the city
center is dominated by flats in apartment buildings built in the Soviet era of socialism
– factors, which could be related with lower residential satisfaction – nevertheless, as
it is illustrated in Table 3, the satisfaction level of all statistically different factors is
higher in the inner city. Those who live in the city center most likely do not use public
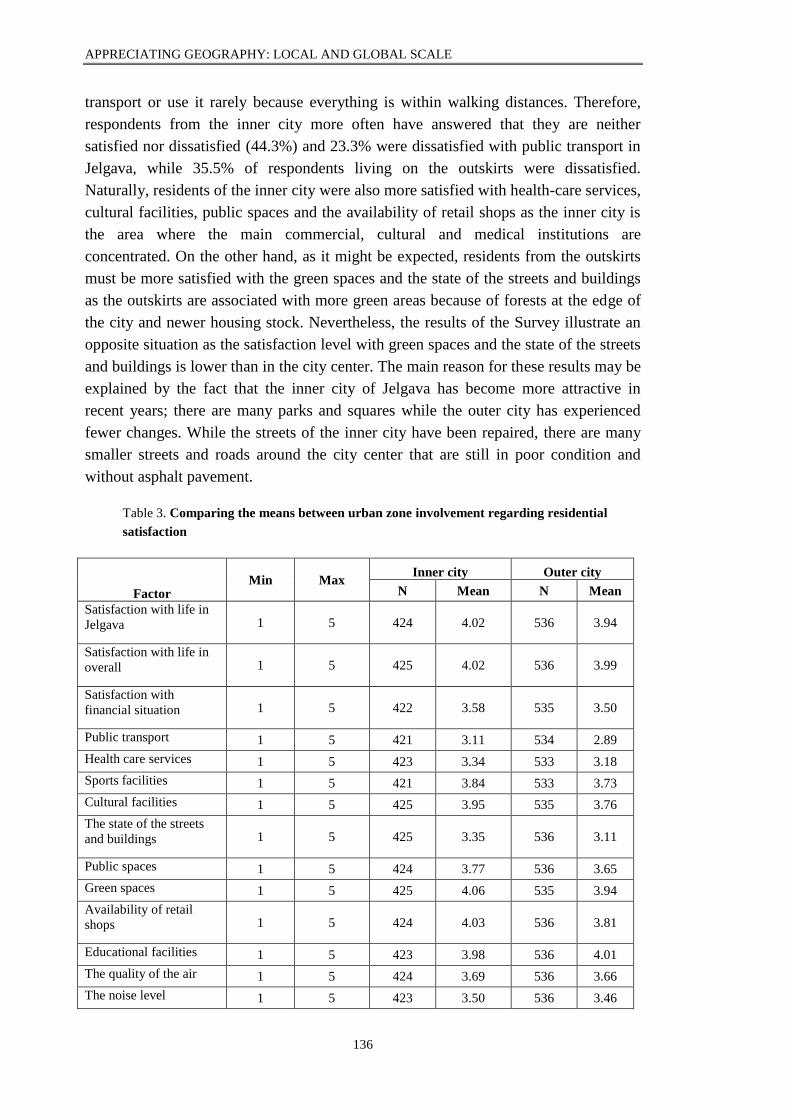
APPRECIATING GEOGRAPHY: LOCAL AND GLOBAL SCALE
136
transport or use it rarely because everything is within walking distances. Therefore,
respondents from the inner city more often have answered that they are neither
satisfied nor dissatisfied (44.3%) and 23.3% were dissatisfied with public transport in
Jelgava, while 35.5% of respondents living on the outskirts were dissatisfied.
Naturally, residents of the inner city were also more satisfied with health-care services,
cultural facilities, public spaces and the availability of retail shops as the inner city is
the area where the main commercial, cultural and medical institutions are
concentrated. On the other hand, as it might be expected, residents from the outskirts
must be more satisfied with the green spaces and the state of the streets and buildings
as the outskirts are associated with more green areas because of forests at the edge of
the city and newer housing stock. Nevertheless, the results of the Survey illustrate an
opposite situation as the satisfaction level with green spaces and the state of the streets
and buildings is lower than in the city center. The main reason for these results may be
explained by the fact that the inner city of Jelgava has become more attractive in
recent years; there are many parks and squares while the outer city has experienced
fewer changes. While the streets of the inner city have been repaired, there are many
smaller streets and roads around the city center that are still in poor condition and
without asphalt pavement.
Table 3. Comparing the means between urban zone involvement regarding residential
satisfaction
Factor Min Max
Inner city Outer city
N Mean N Mean
Satisfaction with life in
Jelgava 1 5 424 4.02 536 3.94
Satisfaction with life in
overall 1 5 425 4.02 536 3.99
Satisfaction with
financial situation 1 5 422 3.58 535 3.50
Public transport 1 5 421 3.11 534 2.89
Health care services 1 5 423 3.34 533 3.18
Sports facilities 1 5 421 3.84 533 3.73
Cultural facilities 1 5 425 3.95 535 3.76
The state of the streets
and buildings 1 5 425 3.35 536 3.11
Public spaces 1 5 424 3.77 536 3.65
Green spaces 1 5 425 4.06 535 3.94
Availability of retail
shops 1 5 424 4.03 536 3.81
Educational facilities 1 5 423 3.98 536 4.01
The quality of the air 1 5 424 3.69 536 3.66
The noise level 1 5 423 3.50 536 3.46
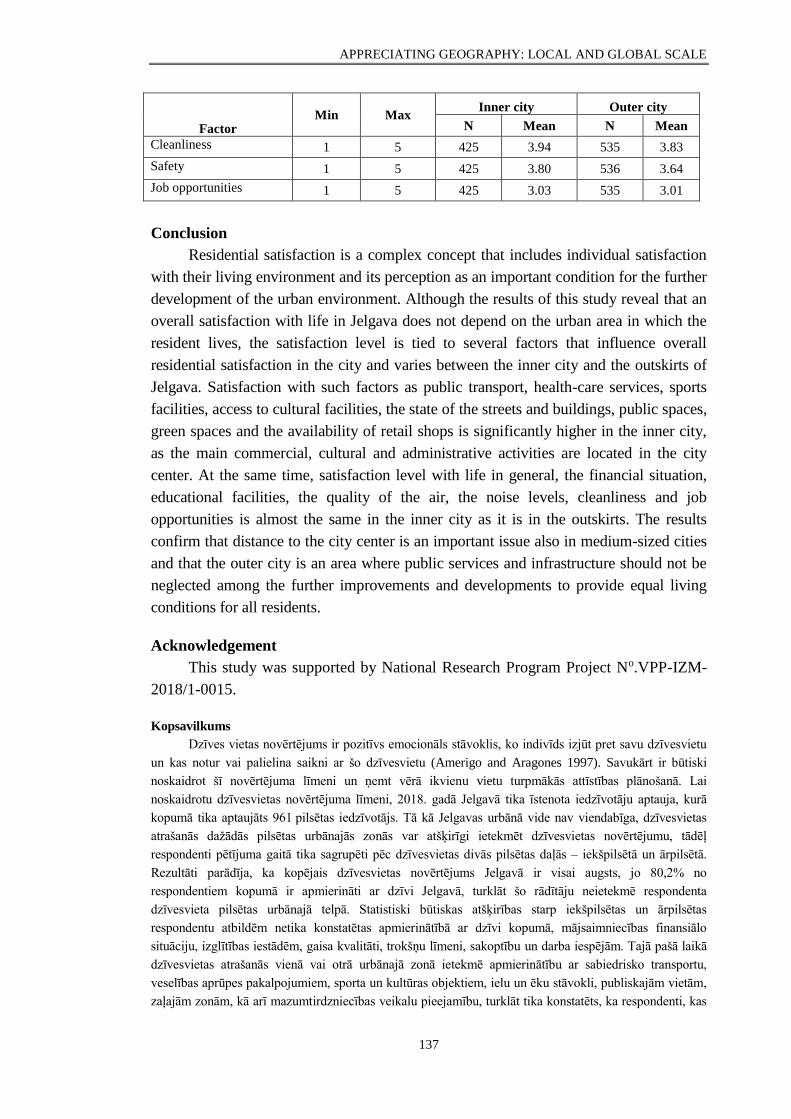
APPRECIATING GEOGRAPHY: LOCAL AND GLOBAL SCALE
137
Factor Min Max
Inner city Outer city
N Mean N Mean
Cleanliness 1 5 425 3.94 535 3.83
Safety 1 5 425 3.80 536 3.64
Job opportunities 1 5 425 3.03 535 3.01
Conclusion
Residential satisfaction is a complex concept that includes individual satisfaction
with their living environment and its perception as an important condition for the further
development of the urban environment. Although the results of this study reveal that an
overall satisfaction with life in Jelgava does not depend on the urban area in which the
resident lives, the satisfaction level is tied to several factors that influence overall
residential satisfaction in the city and varies between the inner city and the outskirts of
Jelgava. Satisfaction with such factors as public transport, health-care services, sports
facilities, access to cultural facilities, the state of the streets and buildings, public spaces,
green spaces and the availability of retail shops is significantly higher in the inner city,
as the main commercial, cultural and administrative activities are located in the city
center. At the same time, satisfaction level with life in general, the financial situation,
educational facilities, the quality of the air, the noise levels, cleanliness and job
opportunities is almost the same in the inner city as it is in the outskirts. The results
confirm that distance to the city center is an important issue also in medium-sized cities
and that the outer city is an area where public services and infrastructure should not be
neglected among the further improvements and developments to provide equal living
conditions for all residents.
Acknowledgement
This study was supported by National Research Program Project No.VPP-IZM-
2018/1-0015.
Kopsavilkums
Dzīves vietas novērtējums ir pozitīvs emocionāls stāvoklis, ko indivīds izjūt pret savu dzīvesvietu
un kas notur vai palielina saikni ar šo dzīvesvietu (Amerigo and Aragones 1997). Savukārt ir būtiski
noskaidrot šī novērtējuma līmeni un ņemt vērā ikvienu vietu turpmākās attīstības plānošanā. Lai
noskaidrotu dzīvesvietas novērtējuma līmeni, 2018. gadā Jelgavā tika īstenota iedzīvotāju aptauja, kurā
kopumā tika aptaujāts 961 pilsētas iedzīvotājs. Tā kā Jelgavas urbānā vide nav viendabīga, dzīvesvietas
atrašanās dažādās pilsētas urbānajās zonās var atšķirīgi ietekmēt dzīvesvietas novērtējumu, tādēļ
respondenti pētījuma gaitā tika sagrupēti pēc dzīvesvietas divās pilsētas daļās – iekšpilsētā un ārpilsētā.
Rezultāti parādīja, ka kopējais dzīvesvietas novērtējums Jelgavā ir visai augsts, jo 80,2% no
respondentiem kopumā ir apmierināti ar dzīvi Jelgavā, turklāt šo rādītāju neietekmē respondenta
dzīvesvieta pilsētas urbānajā telpā. Statistiski būtiskas atšķirības starp iekšpilsētas un ārpilsētas
respondentu atbildēm netika konstatētas apmierinātībā ar dzīvi kopumā, mājsaimniecības finansiālo
situāciju, izglītības iestādēm, gaisa kvalitāti, trokšņu līmeni, sakoptību un darba iespējām. Tajā pašā laikā
dzīvesvietas atrašanās vienā vai otrā urbānajā zonā ietekmē apmierinātību ar sabiedrisko transportu,
veselības aprūpes pakalpojumiem, sporta un kultūras objektiem, ielu un ēku stāvokli, publiskajām vietām,
zaļajām zonām, kā arī mazumtirdzniecības veikalu pieejamību, turklāt tika konstatēts, ka respondenti, kas
APPRECIATING GEOGRAPHY: LOCAL AND GLOBAL SCALE
138
dzīvo iekšpilsētā, visus šos faktorus vērtē augstāk nekā iedzīvotāji, kuru dzīves vieta atrodas ārpus pilsētas
centra.
References
Amerigo, M. and Aragones, J. (1997). A theoretical and methodological approach to the study of
residential satisfaction. Journal of Environmental Psychology, 17. 47-57.
Dekker, K., de Vos, S., Musterd, S. and van Kempen, R. (2011). Residential satisfaction in
housing estates in European cities: A multi-level research approach, Housing Studies, 26 (4), 479-499.
Feldmane, L. (2018). Life quality assessment in the city of Jelgava. Proceedings of Conference
Economic Science for Rural Development: Integrated and Sustainable Regional Development,
Marketing and Sustainable Consumption, 48, 85-92.
Gentile, M. (2005). Urban residential preferences and satisfaction in the former Soviet Union:
Results from a survey in Ust’-Kamenogorsk, Kazakhstan. Urban Geography, 26 (4), 296-327.
Gentile, M. (2015). The “Soviet” factor: exploring perceived housing inequalities in a midsized
city in the Donbas, Ukraine. Urban Geography, 36 (5), 696-720.
Gorczyca, K. and Grabinski, T. (2017). Ageing in place: residential satisfaction in Polish
housing-estate communities. Ageing & Society, 38 (12), 1-25.
Kährik, A., Leetmaa, K. and Tammaru, T. (2011). Residential decision-making and satisfaction
among new suburbanites in the Tallinn urban region, Estonia. Cities, 29 (1), 49-58.
Kovacs, Z. and Douglas, M. (2004). Hungary: From socialist ideology to market reality. In:
Turkington, R., van Kempen, R. and Wassenber, F. (eds.) Highrise Housing in Europe: Current Trends
and Future Prospects. Housing and Urban Policy Studies. Delft: University Press, 231-248.
Krūmiņš, J., Sechi, G. and Bērziņš, M. (2018). Residential satisfaction and mobility behaviour
among the young: insights from the post-Soviet city of Riga. BELGEO Thematic Issue: Mobility and
the international migration of young people: new models, new behaviours:
https://journals.openedition.org/belgeo/28347
Neighborhoods of Jelgava (Jelgavas apkaimes). (2019). http://jelgavas-ielas.lv/apkaimes/
(01.02.2019).
Špačková P., Dvořáková N. and Tobrmanová, M. (2016). Residential satisfaction and intention
to move: the case of Prague’s new suburbanites’, Geografiska Annaler: Series B, Human Geography,
98 (4), 331–348.
Speare, A. (1974). Residential satisfaction as an intervening Variable in residential mobility.
Demography, 11 (2), 173-188.
Parsova V. and Sidelska A. (2017). Sustainability of dwellings in the context of their residents’
opinion. Proceedings of Conference "Engineering for Rural Development”, 994-999.
Fang, Y. (2006). Residential satisfaction, moving intention and moving behaviours: a study of
re-developed neighbourhoods in inner-city Beijing. Housing Studies, 21 (5), 671-694.
Nowok, B., Findlay, A. and McCollum, D. (2018). Linking residential relocation desires and
behaviour with life domain satisfaction. Urban Studies, 55 (4), 870-890.
Frijters, P., Johnston, D.W. and Shields, M.A. (2011). Life satisfaction dynamics with quarterly
life event data. Scandinavian Journal of Economics, 113 (1), 190-211.
Temelova J. and Dvorakova N. (2012). Residential satisfaction of elderly in the city center: The
case of revitalizing neighbourhoods in Prague. Cities, 29 (5), 310-317.
APPRECIATING GEOGRAPHY: LOCAL AND GLOBAL SCALE
139
THE PROCESS OF SUBURBANISATION IN BABĪTE
RURAL MUNICIPALITY AFTER THE YEAR 2000
Suburbanizācijas procesi Babītes pagastā pēc 2000. gada
Ineta Grīne and Inese Mieze
University of Latvia, Faculty of Geography and Earth Sciences
Abstract. Since the year 2000 the population in rural territories surrounding Rīga has grown mainly at
the expense of migration. These territories have been intensively built up over the past 20 years. As
result - many new single-family-house villages have appeared in landscape areas or within the borders
of already existing villages. One of the rural municipalities experiencing intensive suburbanisation in its
territory after the year 2000 is Babīte parish (a rural municipality), where the population has increased
considerably and building of new dwelling houses is rapidly growing, forming new residential districts
and new villages. The goal of the present study is to characterise changes in housing in Babīte parish
(rural municipality) since 2000 under the influence of suburbanisation. The analysis of the present
situation proves that Babīte parish has become an attractive place of residence in suburban Rīga with
developing housing and a growing population.
Keywords: suburbanisation, Rīga area, Babīte parish, villages.
Introduction
Since the year 2000 in Latvia, many new single-family-house villages have
appeared in the outskirts of large cities, close to highways, in landscape areas or within
the borders of already existing villages (Grīne and Strautnieks 2012; Grīne and
Strautnieks 2018). A typical example is to be found in the rural territories surrounding
Rīga, the capital of Latvia. These territories have been intensively built up over the past
20 years. This can be explained not only by the favourable geographical situation,
closeness to the main highways and good traffic links from these areas to the capital, but
also by good access to public services and a visually attractive landscape. Since 2000 the
population in the rural territories surrounding Rīga has grown mainly at the expense of
migration – people have moved to the suburban rural territories to live but still work and
access public services in town, thus favouring the growth of outskirt migration. Another
type of suburbanisation observed in the area is when people (and also companies) move
to suburbs where blocks of flats are being built. After the year 2000 the intensity of
suburbanisation and migration to the suburban Rīga area has been regulated by housing
construction, the housing market and the outreach of jobs (Bērziņš 2011).
One of the rural municipalities experiencing intensive suburbanisation in its
territory since 2000 is Babīte parish (rural municipality; pagasts), where the
population has increased considerably, and the building of new dwelling houses is
rapidly growing, forming new residential districts and new villages.
The aim of the present study is to characterise changes in housing at Babīte
parish (rural municipality) after the year 2000 under the influence of suburbanisation.
APPRECIATING GEOGRAPHY: LOCAL AND GLOBAL SCALE
140
Data and Methods
The principal sources of the present research are:
published statistical data by the Central Statistical Bureau of Latvia (CSB)
about the number and age structure of the population in Babīte parish (rural
municipality) and its villages in 2000, 2011, 2016-2018;
analysis of the cartographical material – orthophotographs of 2013 and 2015,
a topographic map (scale 1:10 0000) by the Map browser of the University
of Latvia (data source - Geospatial Information Agency of Latvia (LGIA));
planning documents of the Babīte county - Development Programme of
Babīte county for 2014-2020, Sustainable Development Strategy of Babīte
county until 2030 and Spatial Planning of Babīte Parish of Riga district from
2008 till 2020;
public opinion poll results of 2018 (203 respondents), field survey results
of 2017-2018. A population survey was undertaken to find out what kind of
income levels the residents had gone to live in the Babīte parish and their
connection with Rīga. The survey included questions about type of housing
and year of construction, about residence (reasons for choosing a place to
live, satisfaction with the place of residence, future plans for living), as well
as questions about workplace, age, income, use of transport by respondents,
goals and frequency of visits to Rīga.
Principal Results and Discussion
Babīte parish with an area of 165.3 sq. km. is situated in the central part of
Latvia, bordering with Rīga and the Town of Jūrmala. According to statistical data
provided by the Central Statistical Bureau of Latvia (CSB), in 2018 Babīte parish was
inhabited by 8977 people, which is approx. 87% of the population of the Babīte county
(novads), the density of population being 54.3 people per sq.km. The most part of the
territory of Babīte parish is covered by agricultural land and forests, a lake and bogs.
The housing of Babīte parish is formed by historically established villages and a
network of detached homesteads, as well as new detached houses and villages built
during the previous 10 – 15 years. At present, Babīte parish comprises 17 villages
mainly located not far from the principal highways and the Rīga city border. In some
cases the merging of villages has been hindered by natural or artificial obstacles, for
instance highway A5 between Piņķi and Beberi villages and highway A9 between
Dzilnuciems and Skārduciems. In other cases the villages have merged together, so
that it is difficult to spot the border between the villages, as is the case with Piņķi and
Sēbruciems or Spilve and Mežāre. The expansion of villages takes place at the
expense of agricultural lands. Some new villages have formed closed areas.
Present day housing in the villages reflects the building types of the 1990s, as
well as the manner of the first decade of the 21st century. We can see detached single
family houses, terraced houses and blocks of flats (Mieze 2018). Up to the year 1999
Babīte, Piņķi and Spilve villages were intensively built over. Since 2000 intensive
APPRECIATING GEOGRAPHY: LOCAL AND GLOBAL SCALE
141
construction of new dwellings has been carried out in such villages as Lapsas,
Sēbruciems, Vīkuļi, Dzilnuciems, Priežciems, Mežāre, Spilve (its new part) and Piņķi
(Saliena). The financial crisis affected the intensity of construction works – the most
active house building took place until 2008.
Today, new buildings cluster not only around the former residential centres and
highways, but also a good way of the highways, as well as next to or even in the
forests. Expansion of housing can be seen in such villages as Mežāres, Spilve,
Brīvkalni, Sēbruciems, Vīkuļi, Priežciems, Lapsas and Piņķi. According to data
(Babītes novada attīstības… 2012) in the year 2012 the largest villages by territories
occupied were Piņķi (659 ha), Spilve (444 ha) and Trenči (378 ha). However, analysis
of the cartographical material shows that in 2018 also Mežāres, with a territory of
379 ha belongs to the largest villages. By density of population today the largest
villages are Babīte, Piņķi and Priežciems (Babītes novada attīstības… 2012). With the
expansion of housing territories, also the population continues to grow in the villages
and in the municipality at large (Figure 1).
After 2000 the population in Babīte parish continued growing. During the period
between 2000 and 2018 it has grown by 38.5% (approx. 3 500 people) or, on average,
by 200 people a year.
Between 2000 and 2018 the population has grown in all age groups (except in
the age group between 15 and 24), and especially in the age group up to 6. It is worthy
of note that in 2018, in every age group (except age groups between 15 to 24 and 55 to
64), the number of people exceeded 1000. Thus, in 2018, 16% of the population of
Babīte parish were of the age group between 35 and 44 and 14% of the age group were
between 45 and 54. From 25% to 34% is a comparatively large percentage of
economically active population.
According to data of the CSB, the population in Babīte parish has grown mainly
on account of migration. Between 2000 and 2018 some 48% of people
(2674 individuals) have not changed their place of residence, 1744 have left the area
(including emigrants to the EU) and 3817 individuals have newly arrived. The fact that
twice as many people have arrived in the rural municipality than have left it has
remained constant also between the years 2011 and 2018.
The data of the CSB reveals that in the period between 2000 and 2018 Babīte
residents have migrated mainly to Rīga, Rīga suburbs (the Mārupe and Ķekava
counties) and the Town of Jūrmala. A similar tendency appears in immigration –
people have arrived in Babīte parish mainly from Rīga, the Town of Jūrmala, and the
counties of Jelgava and Mārupe.
This is also confirmed by the survey data. The data from a public opinion poll
shows that people arriving in Babīte parish are mainly townspeople from Rīga and
Jūrmala. They have moved over mostly due to family reasons (approx. 36%), purchase
of housing (approx. 31%) as well as in search of a more attractive environment
(approx. 20%). Many of them had previously lived in multi-story apartment houses.
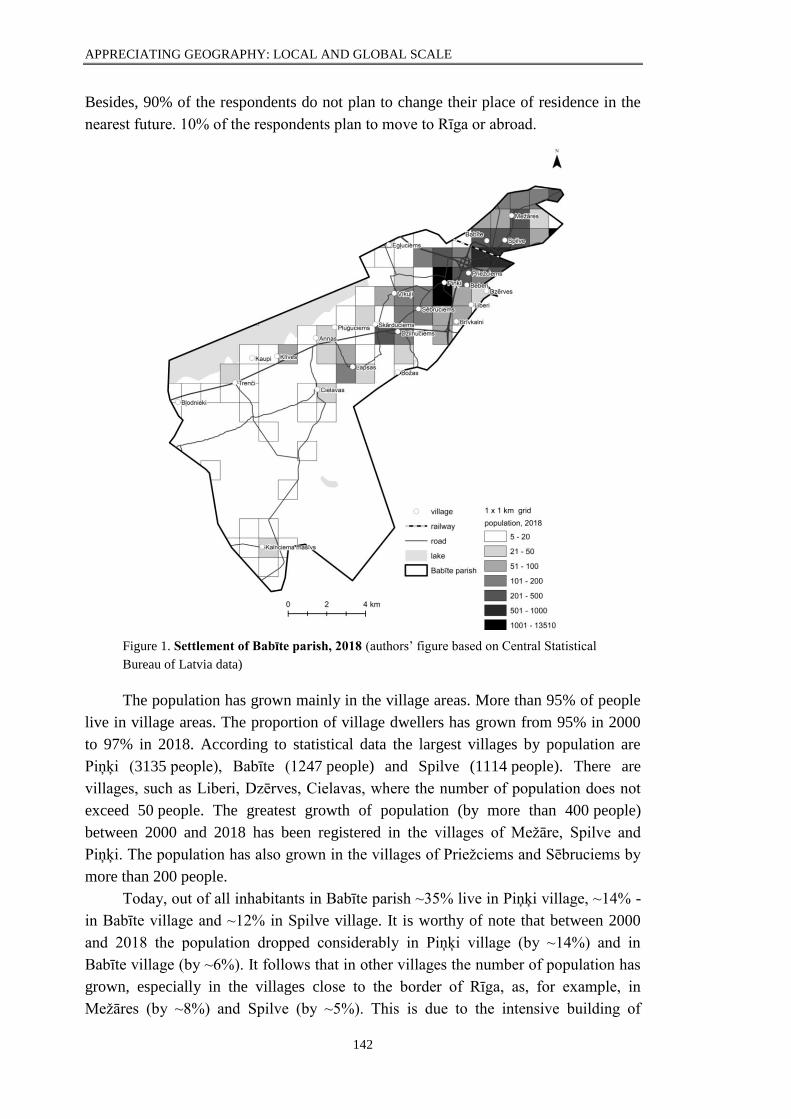
APPRECIATING GEOGRAPHY: LOCAL AND GLOBAL SCALE
142
Besides, 90% of the respondents do not plan to change their place of residence in the
nearest future. 10% of the respondents plan to move to Rīga or abroad.
Figure 1. Settlement of Babīte parish, 2018 (authors’ figure based on Central Statistical
Bureau of Latvia data)
The population has grown mainly in the village areas. More than 95% of people
live in village areas. The proportion of village dwellers has grown from 95% in 2000
to 97% in 2018. According to statistical data the largest villages by population are
Piņķi (3135 people), Babīte (1247 people) and Spilve (1114 people). There are
villages, such as Liberi, Dzērves, Cielavas, where the number of population does not
exceed 50 people. The greatest growth of population (by more than 400 people)
between 2000 and 2018 has been registered in the villages of Mežāre, Spilve and
Piņķi. The population has also grown in the villages of Priežciems and Sēbruciems by
more than 200 people.
Today, out of all inhabitants in Babīte parish ~35% live in Piņķi village, ~14% -
in Babīte village and ~12% in Spilve village. It is worthy of note that between 2000
and 2018 the population dropped considerably in Piņķi village (by ~14%) and in
Babīte village (by ~6%). It follows that in other villages the number of population has
grown, especially in the villages close to the border of Rīga, as, for example, in
Mežāres (by ~8%) and Spilve (by ~5%). This is due to the intensive building of
APPRECIATING GEOGRAPHY: LOCAL AND GLOBAL SCALE
143
detached single-family houses. Already by 2008 it was noted in the documents of
spatial planning that Spilve and Mežāre villages are turning into the so-called Rīga
“dormitory areas”, where people have moved their residences while keeping their jobs
in Rīga. The new inhabitants are more linked with Rīga than with the village owing to
closeness of the city and good traffic (Rīgas rajona Babītes … 2007/2008). Resident
polls also pointed out that choosing Babīte parish as a place of residence - buying a
home or building a home - paid attention to the quality of the building, the
infrastructure, the availability of schools and kindergartens, the availability of public
transport, and the availability of utilities for land (Mieze 2018).
A public opinion poll showed that 95% of the respondents liked living in the
parish. Such an assessment is related to good road infrastructure, good landscapes,
accessibility of public transport, sense of security and proximity to Rīga. Some 85%
of the respondents liked the tidy dwelling, 80% - its environment and 84% - the
neighbours. The respondents who were only partly satisfied or dissatisfied with the
environment and dwelling mostly lived in blocks of flats.
The most densely populated area of Babīte parish is its Northern and North
Eastern part. It is the territory surrounding the centre of the parish, the Rīga border
area and the area at the crossing of highways A5 and A10. According to statistical data
it is the Eastern territories of Babīte parish, especially the area around the Piņķi,
Beberi, Babīte, Mežāres and Spilve villages, which have become densely populated
between 2000 and 2018 (Figure 1). This can be explained by the process of
suburbanisation and development of villages owing to their favourable geographical
position, road infrastructure and comparatively good public transport. Most of the
respondents either working or studying in Rīga (78%) commute between the villages
and Rīga. The commuters go to Rīga mostly on working days. They usually travel by
their own cars (71%) and sometimes also by public transport (26%). The data from the
public opinion poll shows that travelling to Rīga by public transport usually takes from
20 to 40 minutes, sometimes even up to 60 minutes. Travelling from villages close to
the Rīga border to Rīga centre by one’s own car takes up to 20-40 minutes, sometimes
up to 50-60 minutes (as it is from the village of Lapsas). If the job location is either in
Mārupe, Ķekava or Jūrmala the respondents mostly commute by their own cars. As
the field survey data shows, there is an increasing migration to work and back (Mieze
2018).
As the answers to the public opinion poll showed, the respondents mostly go to
Rīga not only because of jobs or studies, but also for shopping, entertainments and
medical services. As to access to public services in the parish, the respondent evaluation
varied – 36% of respondents were satisfied, 38% - were partly satisfied, but 26% -
unsatisfied. Rеsроndеnts also stressed that the lack of services in the rural municipality
can be easily replaced with the amenities within Rīga. Therefore, as the answers of the
public opinion poll showed, the respondents go to Rīga for shopping a few times in the
week.
APPRECIATING GEOGRAPHY: LOCAL AND GLOBAL SCALE
144
The respondents who work at the municipality travel to work either by bicycle
(50%) or by public transport (38%). As to the quality of public transport services in
Babīte parish, 58% of the respondents are satisfied, 24% are partly satisfied but 18%
are dissatisfied. From the group of the respondents who travel to work by public
transport 57% are satisfied with bus services, but from those who travel to work by
their own cars ~52% find public transport services sufficient.
Most of the respondents who travel to Rīga either because of jobs or studies find
their income higher than those working at the municipality. ~82% of the respondents
working in Rīga earn above the average salary (i.e. 700 EUR), while only 38% of the
respondents working at the municipality earn more than the average salary. The data
of the opinion poll also testifies that ~53% of the respondents are dissatisfied with job
opportunities being offered in Babīte parish, while 27% are only partly satisfied.
Taking into account the public opinion poll, briefly: the characteristics of the
respondents from Babīte parish - a short distance to the center of Rīga, the
infrastructure development, convenience, good ecological conditions, the availability
of forest areas, homogeneous social environment and appropriate property prices
(Mieze 2018).
Conclusion
The analysis of the present situation leads to the conclusion that Babīte parish
has become an attractive living space in the Pierīga area - changes in the population
are taking place, the number of inhabitants in the parish continues to increase. In
Babīte parish there is a characteristic suburbanisation process - the construction of new
houses near the Rīga city border, close to the main roads A5, A10, A9, Lake Babīte
and forest areas. The construction of new houses is changing the landscape - new
individual houses are appearing in the old villages, new villages are being formed. The
construction is also related to the return of agricultural land in building territories. In
Latvia, there is a tendency for residents to choose their place of residence on the
outskirts of the city, as the main reasons are family, housing, work and nature. Babīte
parish is one of those in which the number of inhabitants in the parish increases mostly
at the expense of in-migration from the capital city. The proximity of Rīga, the road
network and transport options make it easy to reach the city, thus ensuring the
possibility of working and providing various services, on the other hand - providing
better quality of life and environment - dwelling, nature, calm, recreation.
Babīte county spatial planning documents worked out 5 years ago envisaged
further development of Babīte parish by promoting a balanced development of
housing, density of population, transport, business, access to public services and
attractive environment. The document also envisaged further growth of the population.
Thus, Babīte parish of 2020 has been planned as a place of residence with properly
organised infrastructure suitable for families, but after 2030 – as a fashionable place of
residence in Suburban Rīga (Babītes novada ilgtspējīgas … 2015).
APPRECIATING GEOGRAPHY: LOCAL AND GLOBAL SCALE
145
Kopsavilkums
Iedzīvotāju skaits lauku teritorijās ap Rīgu kopš 2000. gada palielinās galvenokārt migrācijas
procesu rezultātā. Intensīva apbūve ir notikusi lauku teritorijās ap Rīgas pilsētu, kas saistās ne tikai ar
izdevīgo ģeogrāfisko stāvokli, galveno autoceļu tuvumu, labo satiksmi, bet arī ar pakalpojumu pieejamību
un sasniedzamību un ainaviski pievilcīgo dzīves telpu. Rezultātā veidojas jauni privātmāju ciemi, kā arī
notiek jauno ciemu daļēja saplūšana ar vēsturiskajiem. Viens no pagastiem, kur kopš 2000. gada ir
notikušas ievērojamas pārmaiņas apdzīvojumā – palielinājies iedzīvotāju skaits, notikusi strauja apbūve,
ceļot jaunas dzīvojamās mājas, veidojot jaunus māju rajonus, jaunus ciemus, ir Babītes pagasts. Šīs
pārmaiņas apdzīvojumā norāda uz intensīvu suburbanizācijas procesu šajā teritorijā. Pētījuma mērķis –
raksturot pārmaiņas apdzīvojumā suburbanizācijas procesu ietekmē Babītes pagastā pēc 2000. gada.
References
Babītes novada attīstības programma 2014.-2020.gadam. Pašreizējās situācijas raksturojums un
analīze (2012). http://www.babite.lv/wp-content/uploads/2015/06/I_dala.pdf
Babītes novada ilgtspējīgas attīstības stratēģija līdz 2030. gadam. Stratēģiskā daļa un telpiskās
attīstības perspektīvas (2015). http://www.babite.lv/wp-
content/uploads/2015/07/IAS_Strategiska_dala_apstiprinats.pdf
Bērziņš, M. (2011). Iekšzemes migrācijas reģionālās dimensijas Latvijā. Latvijas Zinātņu
Akadēmijas Vēstis, 65 (3/4), 34-54.
Grīne, I. and Strautnieks, I. (2012). Amatciems: example of the creation of a new kind of rural
landscape and settlement pattern in Latvia. Latvijas Zinātņu Akadēmijas Vēstis, 66 (3), 156-171.
Grīne, I. and Strautnieks, I. (2018). Apdzīvojuma un ainavas pārmaiņas Amatas ciemā pēc 2000.
gada. Ģeogrāfiski raksti. Ģeogrāfija kopīgai nākotnei Latvijas simtgadē. 54-61.
Mieze, I. (2018). Pierīga kā dzīvesvietas izvēle: Babītes pagasta piemērs. Bakalaura darbs. Rīga:
Latvijas Universitāte.
Rīgas rajona Babītes pagasta teritorijas plānojums 2008–2020 (2007/2008) I sējums.
Paskaidrojuma raksts.
http://www.metrum.lv/data/files/teritoriju_attistibas_planosana/Babite/Teksta_dala__gala._red.2008.pdf
(28.01.2019.)
DIVERSITY OF GENTRIFICATION IN THE INNER CITIES OF
RĪGA AND PRAGUE – THE CASE OF ĀGENSKALNS AND
HOLEŠOVICE
Ģentrifikācijas daudzveidība Rīgas un Prāgas iekšpilsētā –
Āgenskalna un Hološovices piemērs
Margarita Kairjaka
University of Latvia, Faculty of Geography and Earth Sciences
Abstract. This paper analyses gentrification from two perspectives - cultural consumption and changes in
population composition as observed in two inner-city neighbourhoods that are gentrifying, Āgenskalns in
Rīga and Holešovice in Prague. Both quantitative and qualitative methods were employed - such as field
study and observation, Census data analysis, interview, analysis of reviews on internet platforms, as well
as the mapping of results. The study revealed that both neighbourhoods experienced an influx of young
and educated residents. It was also concluded that both neighbourhoods experienced major changes in the
APPRECIATING GEOGRAPHY: LOCAL AND GLOBAL SCALE
146
cultural scene over the past years, turning from being once neglected to now very hip areas. The study also
showed that Holešovice is more popular among foreigners than Āgenskalns. The findings suggest that the
location of newly opened places in both neighbourhoods follows concentrated patterns.
Keywords: gentrification, cultural consumption, population composition, inner cities, neighbourhood
trajectories
Introduction
The process of gentrification has been studied globally for the past several
decades, with the research originally starting in the global West. With the changing of
global development patterns, the definition of the term has slightly changed over the
years, as well. Contemporary gentrification studies include social, economic, ethnic,
and cultural aspects. With the currently booming culture of hip and aesthetic
youngsters, it is important to observe the changes of the cultural scene particularly in
gentrifying neighbourhoods. Globally, neighbourhoods that have a special, alternative
atmosphere, for example – the artistic Montmartre in Paris, or the home of the
carnival, Notting Hill in London - are often linked to gentrification processes.
Gentrification, however, is not the same everywhere and a lot depends on the pre-
conditions of urban development.
While most gentrification studies in the post-socialist space emphasize the
importance of the real estate market, social exclusion in the inner city (Kovacs 2009;
Kovacs et al. 2013), urban renewal in terms of new built gentrification by either state-
funded or private investment (Sykora 2005), and the rent gap phenomena (Holm et. al.
2015), it is also claimed that gentrification is a process of migration and, therefore,
studies on population composition changes are important. The newcomers, or
gentrifiers, are often described as being young (under 40), often couples without
children or single-person household owners, middle-class or having higher income
than previous residents of the specific neighbourhood (Gorczynska 2017).
In former Socialist countries, some examples of gentrification, in terms of cultural
consumption, might be the famous ruin bars of Budapest (Smith et. al. 2018) or Užupis
– the self-proclaimed artist republic in the capital of Lithuania. However, the academic
research of cultural aspects of gentrification is rather limited. The example from Vilnius
shows that the pioneer gentrifiers were the artists, yet they were later followed by
middle and upper-class residents (Standl and Krupickaite 2004), while the example from
Warsaw shows that since the 1990s, the relationship between the cultural and the
economic capital of specific residential groups has evolved (Gorczynska 2017).
This paper looks at gentrification from two different perspectives: cultural
consumption and population composition. The neighbourhoods studied are
Āgenskalns in Rīga, the capital of Latvia, and Holešovice in Prague, the capital of the
Czech Republic (Czechia). Cultural consumption, in this context, is meant to be the
consumption that is related to cultural and lifestyle activities, such as art galleries,
designer cafes etc. In simple words, these are the modern hipster venues. The aim of
this study is to research the cultural consumption and changes in the population
composition in the neighbourhoods observed. The main tasks are to identify the
APPRECIATING GEOGRAPHY: LOCAL AND GLOBAL SCALE
147
places, associated with the hipster culture and to map their geographic locations to
identify the gentrifiers of both neighbourhoods.
Data and Methods
A Field Study was undertaken with the aim of observing and identifying examples
of gentrified places, in terms of cultural consumption, in the neighbourhoods of
Holešovice in Prague and Āgenskalns in Rīga. The field study took place in both
neighbourhoods in late 2018 and January 2019. During the field study, the main focus
was on artistic venues such as art galleries, markets, venues that are hosting
contemporary art events, coffee roasteries, and, frankly speaking, venues that are often
labelled as hipster places.
Interviews: During the research process, a semi-structured interview with the
councillor for social policy of Prague 7, Ing. Jakob Hurrle, was conducted. The main
questions of the interview were about the overall transformation of Holešovice in the
past and the present, about cultural consumption and its patterns in Holešovice, and
about future scenarios for the development of Holešovice as a gentrified
neighbourhood.
Analysis of Tripadvisor, Foursquare, Facebook and Google reviews. After
identifying gentrifying places in both Holešovice and Āgenskalns, an analysis of
reviews of selected venues was made in order to understand who the main visitors are
and what are the most common keywords they use to describe the specific place.
Using this method, it must be noted that not all reviews written in the English
language are written by residents of English speaking countries, therefore the
nationality of visitors cannot always be defined.
Census data analysis: During the research process, the results of the Population
Census of both countries were analysed. In the case of Czechia, the Population Census
data from 2001 and 2011 was used. In the case of Latvia, data from 2000 and 2011
was used to compare the population composition of Āgenskalns and Holešovice and to
observe the differences between the years.
Mapping of the gentrified places, which were identified during the field study.
Software used: ArcGis 10.2.2.
The neighbourhoods studied
Āgenskalns, a neighbourhood in the inner city of Rīga, is located on the left side
of the river Daugava. Originally, the area served as a vacation housing neighbourhood
for German resident-citizens, which later turned into a neighbourhood populated mostly
by artisans or simple workers, such as fishers, cabmen, anchor-men, wine barrel carriers
etc. Mainly built in the 19th century, Āgenskalns can be described by its rather chaotic
street network. Until WWI, the neighbourhood developed without a specific plan.
Nowadays it is a gentrifying neighbourhood, with a gradual change in population
composition, signs of a new-build gentrification, studentification and new cultural,
lifestyle venues.
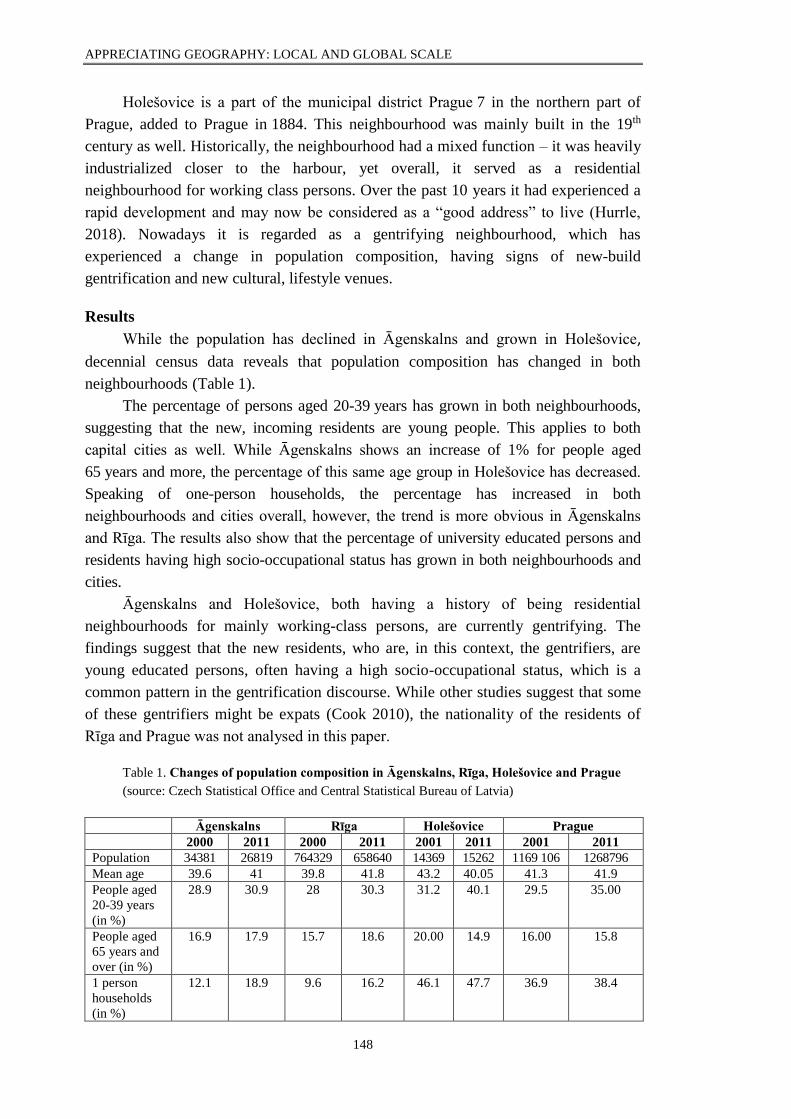
APPRECIATING GEOGRAPHY: LOCAL AND GLOBAL SCALE
148
Holešovice is a part of the municipal district Prague 7 in the northern part of
Prague, added to Prague in 1884. This neighbourhood was mainly built in the 19th
century as well. Historically, the neighbourhood had a mixed function – it was heavily
industrialized closer to the harbour, yet overall, it served as a residential
neighbourhood for working class persons. Over the past 10 years it had experienced a
rapid development and may now be considered as a “good address” to live (Hurrle,
2018). Nowadays it is regarded as a gentrifying neighbourhood, which has
experienced a change in population composition, having signs of new-build
gentrification and new cultural, lifestyle venues.
Results
While the population has declined in Āgenskalns and grown in Holešovice,
decennial census data reveals that population composition has changed in both
neighbourhoods (Table 1).
The percentage of persons aged 20-39 years has grown in both neighbourhoods,
suggesting that the new, incoming residents are young people. This applies to both
capital cities as well. While Āgenskalns shows an increase of 1% for people aged
65 years and more, the percentage of this same age group in Holešovice has decreased.
Speaking of one-person households, the percentage has increased in both
neighbourhoods and cities overall, however, the trend is more obvious in Āgenskalns
and Rīga. The results also show that the percentage of university educated persons and
residents having high socio-occupational status has grown in both neighbourhoods and
cities.
Āgenskalns and Holešovice, both having a history of being residential
neighbourhoods for mainly working-class persons, are currently gentrifying. The
findings suggest that the new residents, who are, in this context, the gentrifiers, are
young educated persons, often having a high socio-occupational status, which is a
common pattern in the gentrification discourse. While other studies suggest that some
of these gentrifiers might be expats (Cook 2010), the nationality of the residents of
Rīga and Prague was not analysed in this paper.
Table 1. Changes of population composition in Āgenskalns, Rīga, Holešovice and Prague
(source: Czech Statistical Office and Central Statistical Bureau of Latvia)
Āgenskalns Rīga Holešovice Prague
2000 2011 2000 2011 2001 2011 2001 2011
Population 34381 26819 764329 658640 14369 15262 1169 106 1268796
Mean age 39.6 41 39.8 41.8 43.2 40.05 41.3 41.9
People aged
20-39 years
(in %)
28.9 30.9 28 30.3 31.2 40.1 29.5 35.00
People aged
65 years and
over (in %)
16.9 17.9 15.7 18.6 20.00 14.9 16.00 15.8
1 person
households
(in %)
12.1 18.9 9.6 16.2 46.1 47.7 36.9 38.4
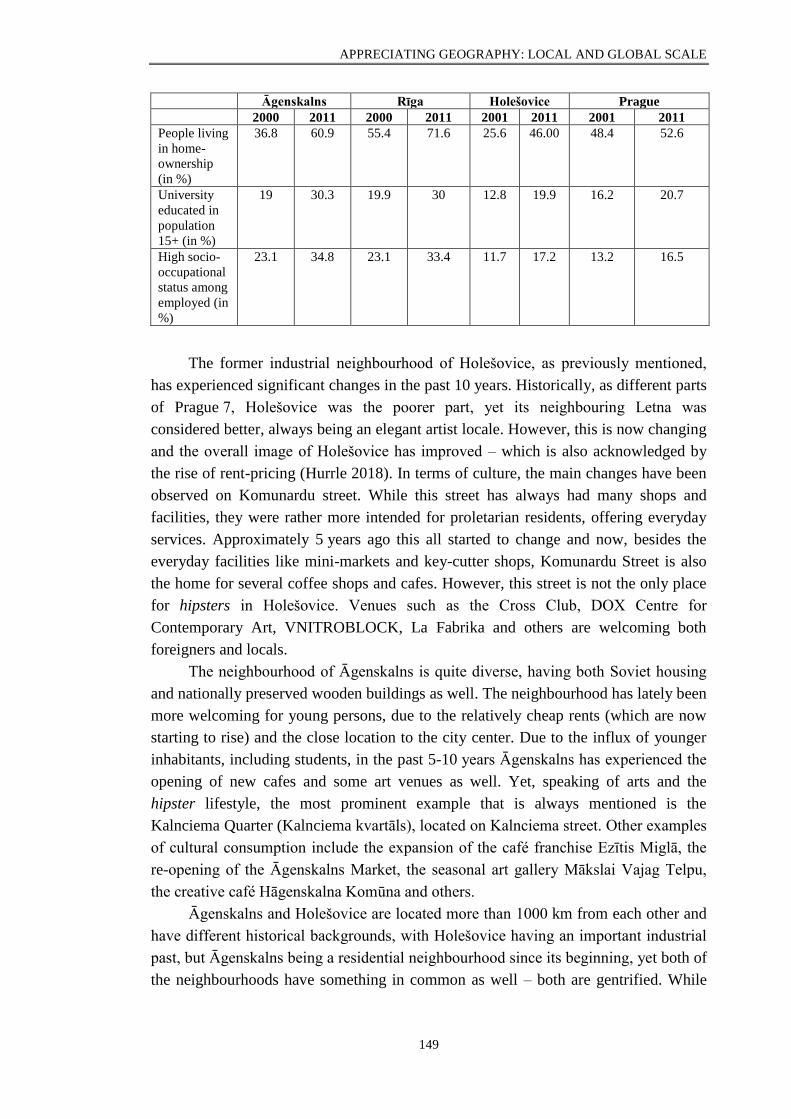
APPRECIATING GEOGRAPHY: LOCAL AND GLOBAL SCALE
149
Āgenskalns Rīga Holešovice Prague
2000 2011 2000 2011 2001 2011 2001 2011
People living
in home-
ownership
(in %)
36.8 60.9 55.4 71.6 25.6 46.00 48.4 52.6
University
educated in
population
15+ (in %)
19 30.3 19.9 30 12.8 19.9 16.2 20.7
High socio-
occupational
status among
employed (in
%)
23.1 34.8 23.1 33.4 11.7 17.2 13.2 16.5
The former industrial neighbourhood of Holešovice, as previously mentioned,
has experienced significant changes in the past 10 years. Historically, as different parts
of Prague 7, Holešovice was the poorer part, yet its neighbouring Letna was
considered better, always being an elegant artist locale. However, this is now changing
and the overall image of Holešovice has improved – which is also acknowledged by
the rise of rent-pricing (Hurrle 2018). In terms of culture, the main changes have been
observed on Komunardu street. While this street has always had many shops and
facilities, they were rather more intended for proletarian residents, offering everyday
services. Approximately 5 years ago this all started to change and now, besides the
everyday facilities like mini-markets and key-cutter shops, Komunardu Street is also
the home for several coffee shops and cafes. However, this street is not the only place
for hipsters in Holešovice. Venues such as the Cross Club, DOX Centre for
Contemporary Art, VNITROBLOCK, La Fabrika and others are welcoming both
foreigners and locals.
The neighbourhood of Āgenskalns is quite diverse, having both Soviet housing
and nationally preserved wooden buildings as well. The neighbourhood has lately been
more welcoming for young persons, due to the relatively cheap rents (which are now
starting to rise) and the close location to the city center. Due to the influx of younger
inhabitants, including students, in the past 5-10 years Āgenskalns has experienced the
opening of new cafes and some art venues as well. Yet, speaking of arts and the
hipster lifestyle, the most prominent example that is always mentioned is the
Kalnciema Quarter (Kalnciema kvartāls), located on Kalnciema street. Other examples
of cultural consumption include the expansion of the café franchise Ezītis Miglā, the
re-opening of the Āgenskalns Market, the seasonal art gallery Mākslai Vajag Telpu,
the creative café Hāgenskalna Komūna and others.
Āgenskalns and Holešovice are located more than 1000 km from each other and
have different historical backgrounds, with Holešovice having an important industrial
past, but Āgenskalns being a residential neighbourhood since its beginning, yet both of
the neighbourhoods have something in common as well – both are gentrified. While
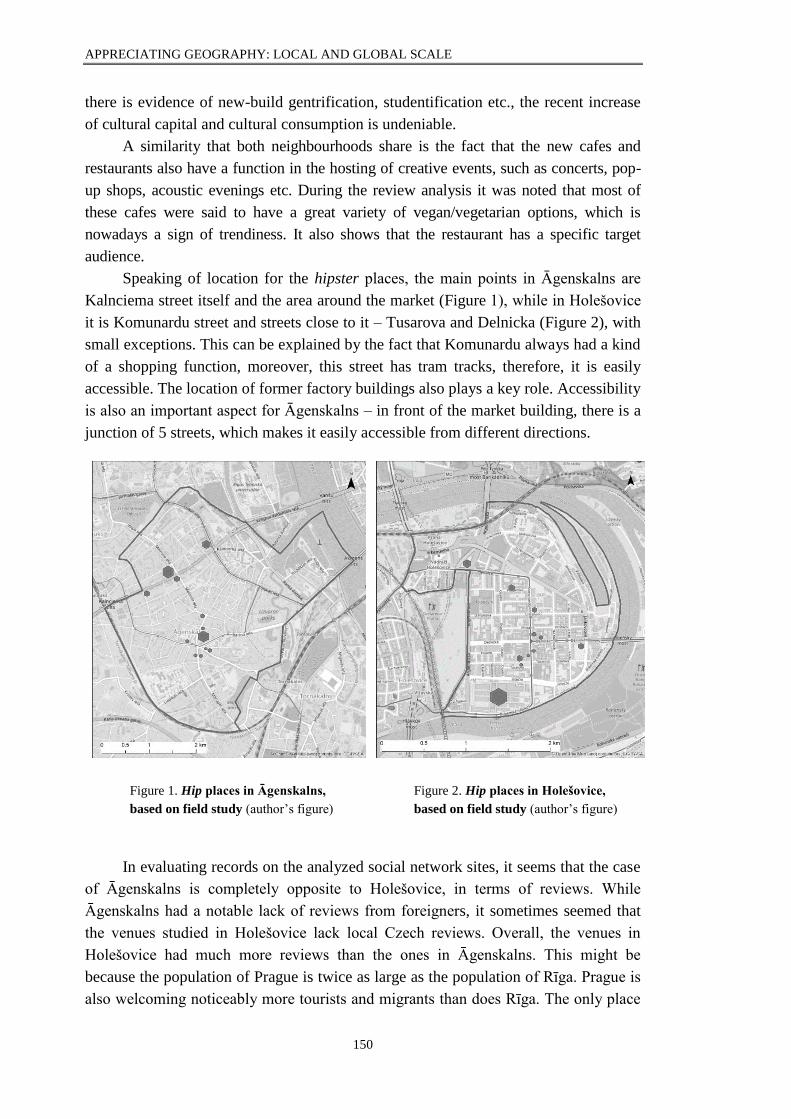
APPRECIATING GEOGRAPHY: LOCAL AND GLOBAL SCALE
150
there is evidence of new-build gentrification, studentification etc., the recent increase
of cultural capital and cultural consumption is undeniable.
A similarity that both neighbourhoods share is the fact that the new cafes and
restaurants also have a function in the hosting of creative events, such as concerts, pop-
up shops, acoustic evenings etc. During the review analysis it was noted that most of
these cafes were said to have a great variety of vegan/vegetarian options, which is
nowadays a sign of trendiness. It also shows that the restaurant has a specific target
audience.
Speaking of location for the hipster places, the main points in Āgenskalns are
Kalnciema street itself and the area around the market (Figure 1), while in Holešovice
it is Komunardu street and streets close to it – Tusarova and Delnicka (Figure 2), with
small exceptions. This can be explained by the fact that Komunardu always had a kind
of a shopping function, moreover, this street has tram tracks, therefore, it is easily
accessible. The location of former factory buildings also plays a key role. Accessibility
is also an important aspect for Āgenskalns – in front of the market building, there is a
junction of 5 streets, which makes it easily accessible from different directions.
Figure 1. Hip places in Āgenskalns,
based on field study (author’s figure)
Figure 2. Hip places in Holešovice,
based on field study (author’s figure)
In evaluating records on the analyzed social network sites, it seems that the case
of Āgenskalns is completely opposite to Holešovice, in terms of reviews. While
Āgenskalns had a notable lack of reviews from foreigners, it sometimes seemed that
the venues studied in Holešovice lack local Czech reviews. Overall, the venues in
Holešovice had much more reviews than the ones in Āgenskalns. This might be
because the population of Prague is twice as large as the population of Rīga. Prague is
also welcoming noticeably more tourists and migrants than does Rīga. The only place
APPRECIATING GEOGRAPHY: LOCAL AND GLOBAL SCALE
151
that had a significant amount of foreigner reviews was the Kalnciema Quarter –
perhaps since it is the most famous venue of this kind. In both cases, visitors of the
venues studied were mainly young persons.
Conclusion
While gentrification might be a common discourse topic in Western countries,
the studies in CEE countries mainly started only after the collapse of the Socialist
regimes. It is usually seen from the perspective of real estate, privatization, the
restitution policies of the 1990s, and changes in the socio-economic composition of
the residents of a specific neighbourhood, yet less attention has been paid to cultural
changes that have also come along.
Āgenskalns and Holešovice – both being classified as former working-class
neighbourhoods (Holešovice has an industrial past, too) are currently experiencing
changes, both in the compositional make-up of their residents and in cultural life. The
findings suggest that the new residents, who are, in this context, the gentrifiers, are
young, educated persons, often having a high socio-occupational status, which is a
common pattern in the gentrification discourse. With the fast development of both
neighbourhoods in recent years, new cultural facilities such as art galleries or concert
venues have been opening alongside alternative cafés and co-working spaces. Most
cafes of this kind also serve as concert venues. The venues in Holešovice are attracting
visitors from all over the world, however, the findings suggest that only one place in
Āgenskalns keeps up with the foreign visitors, while the rest is famous only among
locals. Since the venues in Holešovice are popular among visitors, this also shows that
gentrification is linked to touristification – the increase of tourists can contribute to the
process of gentrification (Lees et. al. 2007). Geographically speaking, the main changes
in Holešovice have been noticed on Komunardu street (and some streets crossing it), yet
in Āgenskalns the leading spot is Kalnciema street, together with the area around the
Āgenskalns market.
Since both neighbourhoods studied are currently experiencing an influx of new,
mainly young residents, changes in the cultural scene and rising rent prices, the future
development scenario remains rather unclear. The rent pricing must be controlled in
order to stay affordable for middle-class residents, and the offer and demand for
hipster places must be in balance. In addition, for a better understanding of the cultural
consumption patterns in both Āgenskalns and Holešovice, there is need for further
detailed investigation. An in-depth research, focused specifically on consumption
patterns, would allow us to predict the possible future of the currently booming hipster
cultural scene in Āgenskalns and Holešovice.
Acknowledgement
This study was supported by National Research Program Project No.VPP-IZM-
2018/1-0015.
APPRECIATING GEOGRAPHY: LOCAL AND GLOBAL SCALE
152
Kopsavilkums
Pētījuma mērķis ir analizēt ģentrifikāciju divās iekšpilsētas apkaimēs – Āgenskalnā (Rīgā) un
Holešovicē (Prāgā) – divos aspektos – kultūrkapitāla patēriņš un iedzīvotāju sastāva pārmaiņas. Pētījumā
izmantotas gan kvalitatīvās, gan kvantitatīvās metodes, piemēram, apkaimju apsekojums, tautas
skaitīšanas rezultātu analīze, intervija, interneta platformu atsauksmju analīze un rezultātu kartēšana.
Rezultāti parāda, ka abās apkaimēs ir palielinājies jaunu un izglītotu iedzīvotāju īpatsvars. Tāpat tika
secināts, ka gan Āgenskalnā, gan arī Holešovicē pēdējo gadu laikā ir notikušas ievērojamas pārmaiņas
kultūras dzīvē, kā rezultātā kādreiz novārtā pamestās apkaimes ir kļuvušas par pievilcīgām vietām.
Rezultāti parāda, ka Holešovice, atšķirībā no Āgenskalna, ir arī ārzemnieku iecienīta un ka jaunatvērto
moderno iestāžu atrašanās vietas abās apkaimēs nav izvēlētas nejauši.
References
Cook, A. (2010). The expatriate real estate complex: Creative destruction and the production of
luxury in post-socialist Prague. International Journal of Urban and Regional Research, 34 (3), 611-628.
Gorczynska, M. (2017). Gentrifiers in the post-socialist city? A critical reflection on the
dynamics of middle- and upper-class professional groups in Warsaw. Environment and Planning, A, 49
(5), 1099-1121.
Holm, A., Marcinczak, S. and Ogrodowczyk, A. (2015). New-build gentrification in the post-
socialist city: Lodz and Leipzig two decades after socialism. Geografie, 120 (2), 164-187.
Hurrle, J. (2018). Interview. Prague. 06.12.2018.
Kovacs, Z. (2009). Social and economic transformations of historical neighbourhoods in
Budapest. Tijdschrift voor Economische en Sociale Geografie, 100 (4), 399-416.
Kovacs, Z., Wiessner, R. and Zischner, R. (2013). Urban renewal in the inner city of Budapest:
Gentrification from a post-socialist perspective. Urban Studies, 50 (1), 22-38.
Lees, L., Slater, T. and Wyly, E. (2007). Gentrification. New York: Routledge, 339.
Smith, M.K., Egedy, T., Csizmady, A., Jancsik, A., Olt, G. and Michalkó, G. (2018). Non-
planning and tourism consumption in Budapest’s inner city. Tourism Geographies, 20 (3), 524-548.
Standl, H. and Krupickaite, D. (2004). Gentrification in Vilnius (Lithuania). The example of
Užupis. Europa Regional, 12 (1), 42-51.
Sykora, L. (2005). Gentrification in post-communist cities. In: Atkinson, R. and Bridge, G. (eds)
Gentrification in a Global Context: The New Urban Colonialism. London: Routledge, 72-89.
APPRECIATING GEOGRAPHY: LOCAL AND GLOBAL SCALE
153
IMPOSED STALINISM: NARRATING RĪGA’S URBAN SPACE
THROUGH SOVIET FILMS FROM 1945 TO 1953
Īstenotais staļinisms: Rīgas atveids padomju perioda filmās
no 1945. līdz 1953. gadam
Jānis Matvejs
University of Latvia, Faculty of Geography and Earth Sciences
Abstract. Cinema is essentially a geographic art, a way of “writing the world”. By bringing a geographic
perspective to examining how cinema evokes a location, we gain a better understanding of the way we
socially construct place/location in our geographical imaginations. Studies of films can inform us about
new historio-graphical perspectives on space, architecture and urban imagery, and thus advance new
critical insights into the geo-historical formation of urban modernity.
The focus of this study is to describe the portrayal of Rīga’s urban space under Stalin’s regime. The mixed
method approach is used to interpret the representation of Stalin’s Soviet occupied Rīga. This exposes
different elements and processes about the formation of Soviet Rīga’s cinematic landscape. Spatial
analysis of Stalin’s Rīga not only displays which sites were transformed in cinematic places but also acts
as an archaeological tool that explores hidden residential settings during the Soviet period.
This study sheds light on innovative methods in historical analyses of geographical thought and practice,
where films have been considered as geographic practice for visual language with a goal to evoke viewer
experiences of inhabiting Soviet urban space. This paper acknowledges both development and spatial
organization of urban space in Stalin’s Rīga, and that politically restricted space uncovers gaps and
contradictions in the official Soviet history by creating an alternative history of Soviet Rīga.
Keywords: cinema, Soviet Rīga, representation, apartment, visual methodology
Introduction
Landscape as text is the dominant metaphor in film geography because it
provides a means by which to explore the intersection between the narration of films
and geography (Lukinbeal 2005). In studying cinematic landscape, acknowledgment
of cultural values and historical background of the geographical location is important,
and allows us to understand and interpret a place of residence (Kennedy and Lukinbeal
1997). The interest of Geographers in film arose simultaneously from two streams of
thought: humanism and socio-cultural studies (Kennedy and Lukinbeal 1997). The
central property that has been reviewed in geographical studies of cinema, is the
transformation of the location’s look/appearance (Lukinbeal 2012), which allows the
viewer to suspend belief and accept that a narrative is taking place in a particular
locale.
The era of Stalin was a time of profound change for the people of the Soviet
Union. Cities were transformed into new urban conglomerations that bore the mark of
socialist planning and Soviet ideological theories of urban living. Industries were
created and new towns established where none had existed before. The Stalin era Rīga
experienced economic and political transformations through the deconstruction of
specific urban structures, such as churches. There was also some reconstruction and
APPRECIATING GEOGRAPHY: LOCAL AND GLOBAL SCALE
154
remodelling of the historical buildings that were in the best repair. Some new
monuments and enormous expansion of factories appeared, that changed Rīga from
being city of merchants into a city of workers. New transport lines and bus routes
reached out to these new industrial areas.
In a study of Soviet history and design, historian Susan Reid found that the
reflection of domestic life has hardly been the dominant angle from which to study the
Soviet Union (Reid 2009). Neglect of human comfort, shortage of living space and re-
design of urban structures were some of the questions/issues that were hidden from the
official ideology but coded into films. Thus, this study investigates how living spaces
were depicted in the films of the Stalin era and interprets the discourse on residential
areas of Rīga. A cinematic analysis of Latvian documentary and fiction movies
unfolds the spatial realities of Soviet Rīga where the city is transformed not only
through new construction unities, but also by celebratory events and everyday people.
Data and methods
To better understand the subject, an advanced research approach was developed
that exposes various processes about the formation of Soviet Rīga’s cinematic landscape
under Stalin’s regime. The research consists of a qualitative visual approach that offers
an effective and critical way of describing city-space, as well as of quantitative analysis
that allows us to examine the similarities and disparities of urban landscape. Spatial
analysis of Soviet Rīga displays which sites were transformed in cinematic places and
acts as an archaeological tool that explores hidden urban settings during the Soviet
period.
276 films from 1945 through 1953 were randomly selected for this study. The data
about films was collected using the database of the National Film Centre of Latvia.
Content analysis of films was accomplished in which each film was divided into 5-
minute intervals (Hazan 1997). Grouping video materials allowed for the possibility to
review represented urban structures in more detail. Secondly, each sequence was
described by reference to eight indicators, based on previous research about Stalin’s
housing (Reid 2006; Reid 2009): geographical location, social description, furnishing,
appliances, representation of public or semi-public space, mise-en-scène, actor’s
monologue or dialogue, and filming techniques used.
The analysis of cinematic content of two genres – fiction (2 films) and
documentary (274 films) – consisted of a comparison of films with actual urban
processes and development of housing. The films were divided into twelve categories
depending on their geographical and functional structure, including natural objects,
residential areas, street-level, industries, engineering constructions, recreational areas,
cultural and religious structures, transportation system and others. In total, 601 spatial
points were identified and mapped into the film analysis.
The mapping and analyses of the filmed sites reveals a stratigraphy of texts
written across residential living spaces in Stalin’s Rīga. Collected quantitative data
was stored in a spatial database (QGIS software) to employ methods of geographical
APPRECIATING GEOGRAPHY: LOCAL AND GLOBAL SCALE
155
information systems on analysing and visualization of data. Various methods of
geographical information systems, including cartographical approach, data frequency
applying approach and spatial auto-correlation, were used to acquire more precise and
data-based results.
Results
Stalin brought an end to the state-sanctioned debate among modernists on the
future of the socialist city. Accordingly, ongoing series of Five-Year Plans accelerated
urbanization and industrialization throughout Soviet-occupied Latvia. City-planning was
considered as an essential alternative to chaotic capitalist development, with the
potential to meet the needs of the urban population. Consequently, a comprehensive
master plan was released in 1945, with a focus on post-war reconstruction, housing,
military complexes, industry, transportation, and public green space (Bunkše 1979;
Hurina 2015).
Another symbol of Soviet power under Stalin’s regime was the naming and
renaming of streets and institutions on behalf of major politicians or events (Ļeņina
street, Komunāru square and others) (Grava 1993). The plasticity, verticality,
symmetry and hierarchy of forms and functions of architecture were accomplished
during the Stalin government years (Varga-Harris 2008), however the time-frame
during which an attempt to implement Stalinist stylistics in architecture in Latvia took
place was just too short. In many cases, it was either organically synthesised with local
features, or introduced as a foreign body (Rudovska 2012).
Housing for residents remained insufficient, as elites were given apartments in the
city (Gentile and Sjöberg 2006). Basic human needs were neglected in favour of
industrial development and an image of grandiosity and the unwanted/less desirable
social classes were excluded through urban design (Bodenschatz 2014; Gentile and
Sjöberg 2010; Varga-Harris 2015). The highest social status residents stayed in the city
centre, while workers lived on the outskirts of the city. Also, new residential
developments tended to follow a kvartal model, in which buildings were bound by a city
block with shops at street level and shared interior courtyards (French 1995; Reid 2006;
Richardson 2010). However, the massive construction of residential housing was not
possible, and housing revealed high building costs with outdated design solutions,
limitation of construction management and inadequate technical equipment (Grava
1993; Hurina 2015).
The purpose of socialist realism was to limit cinematic representation to a specific
and highly regulated faction of creative expression that promoted Soviet ideals.
Cinematic representation of landscape during the Stalin period was limited by rigid
censorship. More attention was paid to the spoken text in films. Consequently, certain
ideas were easier to put to the public through images, dialogue and cinematic narrative
(Mazierska 2014). Throughout the period of Stalin’s regime, cinematic representation of
both urban and rural areas is passive and distracted from the main cinematic character.
Films do not reveal genuine urban space, but cities are portrayed rather from above or at
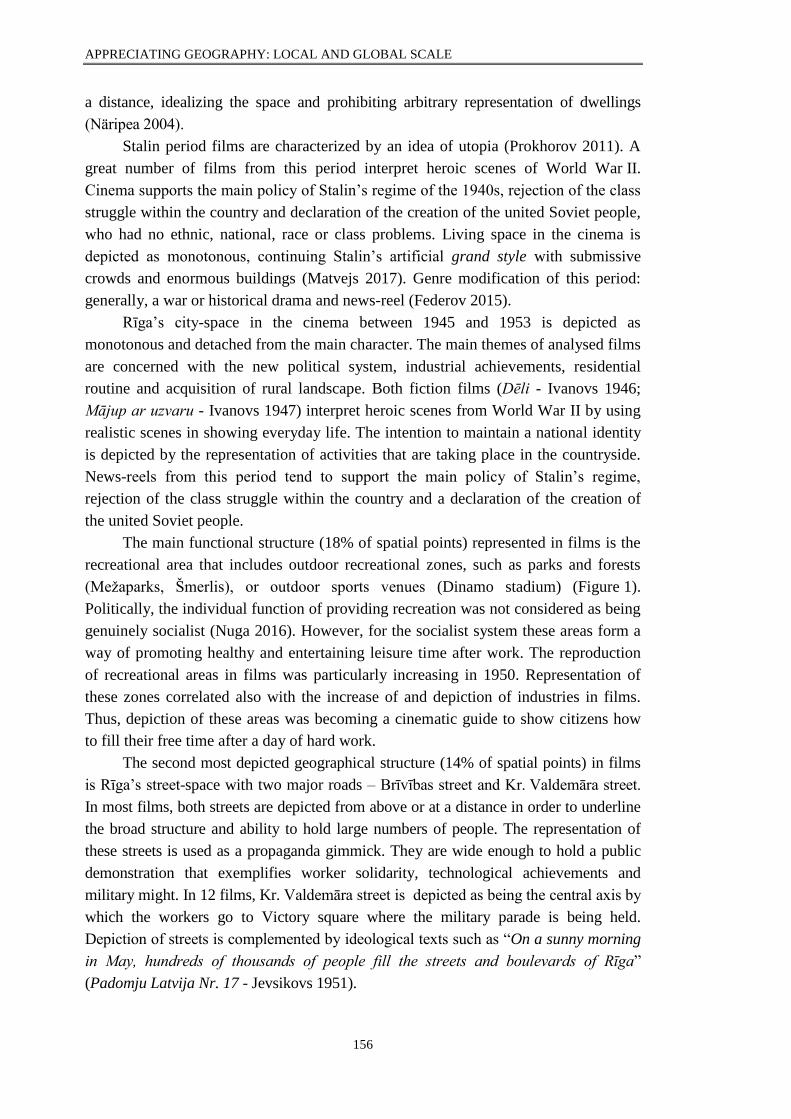
APPRECIATING GEOGRAPHY: LOCAL AND GLOBAL SCALE
156
a distance, idealizing the space and prohibiting arbitrary representation of dwellings
(Näripea 2004).
Stalin period films are characterized by an idea of utopia (Prokhorov 2011). A
great number of films from this period interpret heroic scenes of World War II.
Cinema supports the main policy of Stalin’s regime of the 1940s, rejection of the class
struggle within the country and declaration of the creation of the united Soviet people,
who had no ethnic, national, race or class problems. Living space in the cinema is
depicted as monotonous, continuing Stalin’s artificial grand style with submissive
crowds and enormous buildings (Matvejs 2017). Genre modification of this period:
generally, a war or historical drama and news-reel (Federov 2015).
Rīga’s city-space in the cinema between 1945 and 1953 is depicted as
monotonous and detached from the main character. The main themes of analysed films
are concerned with the new political system, industrial achievements, residential
routine and acquisition of rural landscape. Both fiction films (Dēli - Ivanovs 1946;
Mājup ar uzvaru - Ivanovs 1947) interpret heroic scenes from World War II by using
realistic scenes in showing everyday life. The intention to maintain a national identity
is depicted by the representation of activities that are taking place in the countryside.
News-reels from this period tend to support the main policy of Stalin’s regime,
rejection of the class struggle within the country and a declaration of the creation of
the united Soviet people.
The main functional structure (18% of spatial points) represented in films is the
recreational area that includes outdoor recreational zones, such as parks and forests
(Mežaparks, Šmerlis), or outdoor sports venues (Dinamo stadium) (Figure 1).
Politically, the individual function of providing recreation was not considered as being
genuinely socialist (Nuga 2016). However, for the socialist system these areas form a
way of promoting healthy and entertaining leisure time after work. The reproduction
of recreational areas in films was particularly increasing in 1950. Representation of
these zones correlated also with the increase of and depiction of industries in films.
Thus, depiction of these areas was becoming a cinematic guide to show citizens how
to fill their free time after a day of hard work.
The second most depicted geographical structure (14% of spatial points) in films
is Rīga’s street-space with two major roads – Brīvības street and Kr. Valdemāra street.
In most films, both streets are depicted from above or at a distance in order to underline
the broad structure and ability to hold large numbers of people. The representation of
these streets is used as a propaganda gimmick. They are wide enough to hold a public
demonstration that exemplifies worker solidarity, technological achievements and
military might. In 12 films, Kr. Valdemāra street is depicted as being the central axis by
which the workers go to Victory square where the military parade is being held.
Depiction of streets is complemented by ideological texts such as “On a sunny morning
in May, hundreds of thousands of people fill the streets and boulevards of Rīga”
(Padomju Latvija Nr. 17 - Jevsikovs 1951).
APPRECIATING GEOGRAPHY: LOCAL AND GLOBAL SCALE
157
Figure 1. Represented geographic locations in films between 1945 and 1954 (author’s
figure)
Another important spatially functional group that is portrayed in films is the
growing industrial sector (14% of spatial points), including VEF, RER, the textile
factory in the Jugla area and other factories. Initially film-makers represented
construction sites (Rīga Shipyard) and light industry (the Chocolate Factory “Laima” or
Jaunciems Paper Mill), but starting with 1948 the depiction of machinery, consumer
electronics and textile industry had increased. Cinematic scenes with industrial zones are
complemented by an ideological text about achievements of the workmen: “The “Red
October” factory team already completed its annual plan in October this year”
(Padomju Latvija Nr. 47 - Goldberga 1946). Factories in films were being glorified by
focusing cinematic attention on the new technologies and methods used in various
industries.
The growth of industries also contributed to the representation of residential
structures. Between 1946 and 1953 seventeen films portrayed the construction of four
to five-story residential apartment buildings. Each film emphasized the necessity of
apartment allocation for industrial workers. In news-reels apartment scenes are
characterized by spoken text that highlights anniversaries and the accomplishments of
Five-year plans. For example, in Padomju Latvija Nr. 16 (Čardiņina 1948) the
building process is being idealized: “the first 56 apartments will be ready on the day of
The Anniversary of the Great October Socialist Revolution”.
Other major geographical and functional structures depicted in films include:
administrative buildings (7% of spatial points), public squares (7% of spatial points),
culture facilities (7% of spatial points), historical objects (6% of spatial points),
panoramic views of the city (6% of spatial points), educational institutions (6% of
spatial points) and economic zones (6% of spatial points), such as the harbour or the
APPRECIATING GEOGRAPHY: LOCAL AND GLOBAL SCALE
158
Central market. Rīga’s cinematic representation under Stalin’s regime does not seek to
reveal public service facilities (hospitals, fire brigades, police) or religious institutions.
Since 1952, more foreign-states appear in films: Kolkhoz in Azerbaijan, Opening of
the Volga-Don canal, whaling in the Bering Sea and other scenes.
Conclusion
This study set out to determine the manner and practices of representing the city
space of Rīga under Stalin’s regime. The study has revealed that between 1945 and
1953 the representation of Rīga is central with major geographical structures being the
Old Town and parts of the city between Elizabetes and Tallinas streets. Outside the
central part of the city, in most cases the films depict industrial and recreational areas.
This idea exemplifies that socialist realism depicted reality of imagination: focusing
on industrial areas in combination with recreational zones. Another visual aspect of
Stalin’s urban symbolism represented in films is the use of large public squares
(Uzvaras laukums and Esplanāde), where it was possible to gather people and hold
parades. However, various substantial public service facilities were ignored in official
representation due to the limited resources and shortcomings in these structures.
The analysis of films has shown that negativity was not permitted in urban
representation under Stalin’s regime. Instead, sentiment about flawless living
standards was created, by presenting common images. Cinematic representation of
city-space in Stalin’s period is characterized by an artificial utopia. For instance,
representation of Stalinist-era apartments with mono-functional and spatially discreet
rooms, focusing on the family dining table or stolovaia at the centre that expressed a
petit-bourgeois layout (Padomju Latvija Nr. 41 - Šuļatins 1952). The landscape is
static and detached from the hero becoming as a pictorial background. The films also
emphasise that from 1945 there was a strong tendency to talk about preliminary
industrialization plans and to gradually prepare for mass production.
The most obvious finding to emerge from this research is that city-space is
frequently depicted in films, thus becoming an integral part of visually represented
space during Stalin’s regime. Public squares, an overview of the city, street-space, vast
recreational areas and newly built industrial zones are at the centre of urban
representation. However, living space is not cinematic and portrayal of both the Soviet
apartments and residential housing is limited. Also, other geographical and functional
structures are mostly abandoned, such as public services or neglected space. It
confirms the tendency of Soviet cinema to refuse the representation of imperfect
space.
Kopsavilkums
Par telpas vizuālo reprezentāciju tiek uzskatīts attēls, kurā ir ietverts ierobežots vēstījuma kopums,
savukārt filmas nav nejaušs attēlu atveids, bet gan pārdomāts pilsētvidē pastāvošo sociālo, ekonomisko un
politisko procesu raksturojums. Kultūras ģeogrāfija tiecas pilsētas attēlus un tajā notiekošos procesus
raksturot kā daļu no kultūras ainavas. Pilsētvides reprezentācija filmās ir viena no nozīmīgākajām
pieejamajām kultūras ģeogrāfijā, sniedzot pētniekiem iespēju skaidrot pilsētu ar paņēmieniem, kādus
nepiedāvā tradicionālās dabas un sociālās zinātnes.
APPRECIATING GEOGRAPHY: LOCAL AND GLOBAL SCALE
159
Raksta mērķis ir izzināt Rīgas dzīvojamo telpu diskursu Staļina laika kinematogrāfijā laika periodā
no 1945. līdz 1953. gadam. Atsevišķas, ar nodomu izvēlētas, kinematogrāfiskās metodes tiek lietotas
padomju filmās, dzīvojamo platību atklājot kā politiski pārvaldītu telpu ar skaidri raksturotām telpiskām
funkcijām un iedzīvotāju kategorijām, kurām šo telpu ir atļauts apdzīvot. Pētījums ietver 276 dokumentālo
un spēlfilmu analīzi. Rīgā uzņemto filmu saraksts pētījuma veikšanai tika iegūts, izmantojot Nacionālā
Kino centra datu bāzi.
Lai novērtētu padomju kinematogrāfisko materiālu, tika izmantota A. R. Hazana filmu pētījuma
metode, katru filmu sadalot piecu minūšu intervālos. Katrs no apskatītajiem filmas intervāliem tika
raksturots pēc astoņiem iepriekš noteiktiem indikatoriem: atveidotā objekta atrašanās vietas, cilvēku
skaita, iekštelpas iekārtojuma, publiskās un semi-publiskās telpas atveida, mise-en-scène, runātā teksta un
filmēšanas tehnikas. Šis pētījums izskaidro paņēmienu kopumu, kādā dzīvojamā telpa tika atveidota
Staļina laika kino. Pētījumā apskatītās filmas tika iedalītas 12 kategorijās pēc to ģeogrāfiskās un
funkcionālās struktūras, nošķirot dabas objektus, atpūtas vietas, inženierbūves, dzīvojamos rajonus un citas
struktūras. Kopā 601 telpiskais punkts tika identificēts un izmantots pētījuma kartogrāfiskā materiāla
izveidē.
No 20. gadsimta 40. gadu vidus līdz 50. gadu vidum galvenās filmās atveidotās telpiskās struktūras
ir Vecrīga un Rīgas centrs. Ārpus pilsētas centra tiek atveidotas industriālās būves un rekreācijas zonas,
tādējādi veidojot utopisku pilsētas telpas atveidu: nevainojamu un visiem pieejamu publisko telpu līdzās ar
platībā strauji augošajiem Rīgas industriālajiem rajoniem.
Pretstatā publiskajai telpai, privātās telpas atveids Staļina laika filmās ir ierobežots. Šī perioda
spēlfilmās tiek atveidotas lauku un Rīgas centra dzīvojamās telpas, atklājot kara radītās sekas un veidojot
atsauci uz starpkaru perioda greznajām iekštelpām, turpretim dokumentālās filmas atklāj mono-
funkcionālu interjeru, uzmanību vēršot uz ģimenes ēdamgaldu viesistabā (stolovaja). Pētījums atklāj, ka
Staļina laika pilsētas telpa kinematogrāfijā tiek atveidota bieži, tādējādi kļūstot par nozīmīgu filmās
atveidotā stāstījuma struktūru. Lai gan Staļina laika filmas lielā mērā atveido Rīgas centrālo daļu un ārpus
tās esošos publiskos laukumus, atpūtas un industriālās zonas, tomēr dzīvojamā telpa nav kinematogrāfiskā
atveida centrālā vienība, padomju dzīvoklis atveidots tikai 11 pētītajās filmās.
References.
Bodenschatz, H. (2014). Urban design for Mussolini, Stalin, Salazar, Hitler and Franco (1922–
1945). Planning Perspectives, 29 (3), 381-392.
Bunkše, E.V. (1979). The role of a human environment in Soviet urban planning. Geographical
Review, 69 (4), 379-394.
Čardina, M. (1948). Padomju Latvija Nr. 16 [fiction movie].
http://www.redzidzirdilatviju.lv/lv/search/movie/160566?filter=date_from:1948;date_to:1948 (1.01.2019).
Fedorov, A. (2015). The mass and individual terror in the mirror of the Soviet and Russian
cinema (the feature films of the sound period) and media literacy education. European Research. 101
(12), 778-771.
French, R.A. (1995). Plans, pragmatism and people: the legacy of Soviet planning for today's
cities. London: UCL Press, 62-152.
Gentile, M. and Sjöberg, Ö. (2006). Intra-urban landscapes of priority: the Soviet legacy.
Europe-Asia Studies. 58 (5), 701-729.
Gentile, M. and Sjöberg, Ö. (2010). Space of priority: The geography of Soviet housing
construction in Daugavpils, Latvia. Annals of the Association of American Geographers, 100 (1), 112-136.
Goldberga, Ņ. (1946). Padomju Latvija Nr. 47 [fiction movie].
http://www.redzidzirdilatviju.lv/lv/search/movie/160458?filter=date_from:1946;date_to:1946 (4.01.2019).
Grava, S. (2007). The urban heritage of the Soviet regime: the case of Riga Latvia. Journal of the
American Planning Association, 59 (1), 9-22.
Hazan, A.R., Lipton, H.L. and Glantz, S.A. (1994). Popular films do not reflect current tobacco
use. American Journal of Public Health, 84, 998-1000.
APPRECIATING GEOGRAPHY: LOCAL AND GLOBAL SCALE
160
Hurina, A. (2015). Representations of Urban Spaces and Their Transformations in Soviet
Cinema of the 1920s and 1960s. Durham: Durham University.
Ivanovs, A. (1946). Dēli [fiction movie]. https://www.youtube.com/watch?v=nxiulDXTtmc
(12.12.2018).
Ivanovs, A. (1946). Mājup ar uzvaru [fiction movie].
https://www.youtube.com/watch?v=wU5mjLMKxDo (5.01.2019).
Jevsikovs, A. (1951). Padomju Latvija Nr. 17 [fiction movie].
http://www.redzidzirdilatviju.lv/lv/search/movie/161199?filter=date_from:1951;date_to:1951 (8.01.2019).
Kennedy, C. and Lukinbeal, C. (1997). Towards a holistic approach to geographic research on
film. Progress in Human Geography, 21 (1), 33-50.
Lukinbeal, C. (2005). Cinematic landscapes. Journal of Cultural Geography, 23 (1), 3-22.
Lukinbeal, C. (2012). "On location” filming in San Diego county from 1985-2005: How a
cinematic landscape is formed through incorporative tasks and represented through mapped
inscriptions. Annals of the Association of American Geographers. 102 (1), 171-190.
Matvejs, J. (2017). Visual representation of urban environment: Microraioni of Riga in Soviet
cinematography. Architecture and Urban Planning, 13, 54-60.
Mazierska, E. (2014). Squeezing space, releasing space: spatial research in the study of Eastern
European cinema. In: Bahun, S., Haynes, J. (eds.) Cinema, State Socialism and Society in the Soviet
Union and Eastern Europe, 1917-1989: Re-visions. New York: Routledge.
Naripea, E. (2004). Medieval socialist realism: Representations of Tallinn Old Town in Soviet
Estonian feature films, 1969–1972. Spec. issue of Place and Location: Studies in Environmental
Aesthetics and Semiotics IV, 121-144.
Nuga, M. (2016). Soviet-era summerhouses. On homes and planning in post-socialist suburbia.
Tartu: Tartu University Press.
Prokhorov, A. (2001). Springtime for Soviet Cinema. Re/Viewing the 1960s. Pittsburgh: Russian
Film Symposium.
Reid, S. (2006). Khrushchev modern: Agency and modernization in the Soviet home. Cahiers
Du Monde Russe. 47 (1), 227-258.
Reid, S. (2009). Communist comfort: Socialist modernism and the making of cosy homes in the
Khrushchev era. Gender & History. 21 (3), 465-498.
Richardson, W. H. (2010). Planning a model Soviet city: Transforming Vladivostok under Stalin
and Brezhnev. Urban Transformation: Controversies, Contrasts and Challenges. Paper of 14th IPHS
Conference.
Rudovska, M. (2012). Expired monuments: Case studies on Soviet-era architecture through the
kaleidoscope of postcolonialism. Kunstiteaduslikke Uurimusi, 32 (3/4), 77-80.
Šulatins, H. (1952). Padomju Latvija Nr. 41 [fiction movie].
http://www.redzidzirdilatviju.lv/lv/search/movie/161446?filter=date_from:1952;date_to:1952 (1.01.2019)
Varga-Harris, C. (2008). Homemaking and the aesthetic and moral perimeters of the Soviet
home during the Khrushchev era. Journal of Social History, 41 (3), 561-589.
Varga-Harris, C. (2015). Stories of House and Home: Soviet Apartment Life During the
Khruschev Years. New York: Cornell University Press.
APPRECIATING GEOGRAPHY: LOCAL AND GLOBAL SCALE
161
TOURISM INFORMATION PROVIDERS IN LATVIA:
DEVELOPMENT AND CHALLENGES
Tūrisma informācijas sniedzēji Latvijā: attīstība un
izaicinājumi
Daina Vinklere
Turība University, Faculty of International Tourism
Abstract. The tourism information system uniting tourism information providers is one of the important
players within the tourism industry both for destination development and for tourists. Since the first
tourism information providers in Latvia started operations in 1994 it has been important to evaluate the
development of this sector of the overall tourism industry. Therefore, the objective of this study is to
analyse the achievements and challenges in the development of tourism information providers as part of
the tourism information system in Latvia after 1991. For the purposes of reaching the objective of this
paper, analysis and interviews with experienced managers of tourism information centres were used as the
main research methods. The paper reveals that significant progress has been achieved in this area and
tourism information providers have become important players for tourism development in Latvia at all
levels – municipal, regional and national.
Keywords: tourism development, tourism information, tourism information centres, tourism
information providers
Introduction
Significant changes in all areas of development have taken place in Latvia
since 1991. However, the tourism information system is among those which was built
completely from scratch. After the initial activities in the area of tourism information
in Rucava, then part of the Liepāja region, it was only in 1994 that permanent tourism
information centres were established in four municipalities of Latvia – the cities of
Salacgrīva, Tukums, Jūrmala and Limbaži. Taking into account the sufficient duration
of their operation: 25 years, it is essential to summarise and assess the results of the
development and operation of the tourism information system, since they are of
interest to all parties involved - tourism information providers, state institutions and
entrepreneurs engaged in the tourism industry.
According to the explanation by Dimitrios Buhalis, tourism information centres
(TICs) provide information and reservations for destinations and tourism companies.
Operated by local, regional or national organisations, they aim to facilitate the visits of
consumers and to assist organisations in implementing their policies, by increasing
tourist length of stay and expenditure (Jafary 2000).
In Latvia, the forms and the key operational conditions for tourism information
providers are governed by the Tourism Law. The current edition of the Tourism Law
defines three categories of tourism information providers - a tourism information
centre, a tourism information point and a tourism information stand (Tourism Law
1998).
APPRECIATING GEOGRAPHY: LOCAL AND GLOBAL SCALE
162
The Tourism Law also establishes the functions of the government and
municipalities on the issues of tourism information providers. Municipalities shall:
determine the prospects of tourism; provide measures for the provision of
comprehensive and precise information in Latvia and foreign countries on tourism
opportunities; participate in the development and financing of tourism information
centres, points and stands (Tourism Law 1998).
Since the guaranteeing of operations of tourism information providers lies within
the scope of municipal responsibilities, municipalities are those, which establish the
legal status, operational conditions and specific functions of any particular tourism
information provider. The specific situation in Latvia requires that the functions of
tourism information centres in the country are significantly broader than elsewhere.
The main directions for the activities of most TICs include collection, summarising
and systematisation of information, providing of information to tourists, the
organisation and conducting of marketing of a territory, organising of co-operation
with entrepreneurs and promotion of the tourism business, co-operation with local
authorities and their experts for the purposes of developing local tourism, addressing
the issues of professionalism and education (Lattūrinfo 2014). Therefore, tourism
information centres in their respective municipalities largely work also as destination
management organisations (DMOs). One of the definitions provided by Inskeep
in 1991 says that the DMO assumes the destination’s central management functions,
namely, strategic planning and destination development as well as product
development and marketing (Pechlaner and Fuchs 2002).
The respective areas, particularly with regard to the operational specifics of
tourism information providers have not been analysed often in a scientific research
context. However, some authors have addressed, for instance, the topic of the role and
responsibility of destination management organisations and tourism information
providers in promoting tourism information in the online environment (Assenova et al.
2018) and the issues related to the financing of tourism information services in Poland
and Hungary (Mayer and Pawlicz 2010). A few publications in the media and
individual professional publications on related problems of TIPs (Smuškova 2017)
have been devoted to this issue in Latvia. Several studies have also been conducted as
part of the graduation papers of students at higher education institutions. The objective
of this study is to assess the most significant aspects of the activities of tourism
information providers over the course of 25 years. The research questions include:
1) What have been the main challenges for the operation of tourism information
providers? 2) What are the main success stories and their contribution to the tourism
industry of Latvia and to regional development from the perspective of the veteran
managers of the tourism information centres?
Data and Methods
The existing study has been implemented in 2019 and aims to sum up and
analyse the development of the tourism information system in Latvia since 1991.
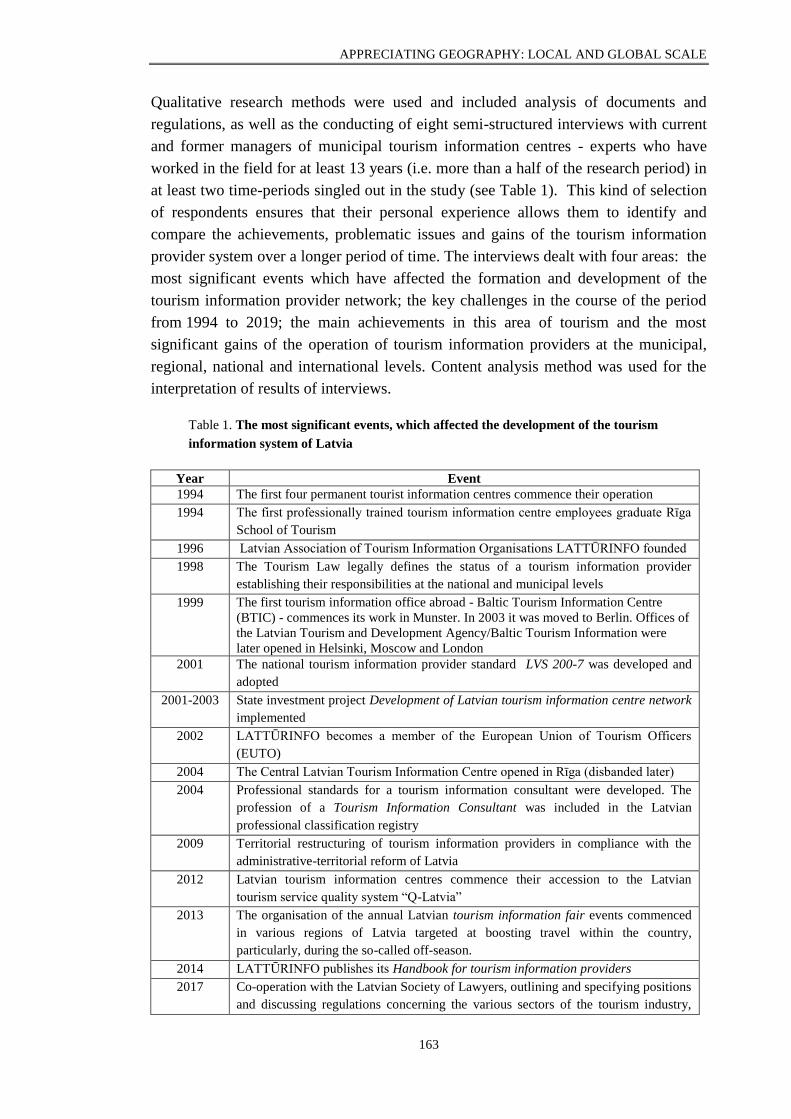
APPRECIATING GEOGRAPHY: LOCAL AND GLOBAL SCALE
163
Qualitative research methods were used and included analysis of documents and
regulations, as well as the conducting of eight semi-structured interviews with current
and former managers of municipal tourism information centres - experts who have
worked in the field for at least 13 years (i.e. more than a half of the research period) in
at least two time-periods singled out in the study (see Table 1). This kind of selection
of respondents ensures that their personal experience allows them to identify and
compare the achievements, problematic issues and gains of the tourism information
provider system over a longer period of time. The interviews dealt with four areas: the
most significant events which have affected the formation and development of the
tourism information provider network; the key challenges in the course of the period
from 1994 to 2019; the main achievements in this area of tourism and the most
significant gains of the operation of tourism information providers at the municipal,
regional, national and international levels. Content analysis method was used for the
interpretation of results of interviews.
Table 1. The most significant events, which affected the development of the tourism
information system of Latvia
Year Event
1994 The first four permanent tourist information centres commence their operation
1994 The first professionally trained tourism information centre employees graduate Rīga
School of Tourism
1996 Latvian Association of Tourism Information Organisations LATTŪRINFO founded
1998 The Tourism Law legally defines the status of a tourism information provider
establishing their responsibilities at the national and municipal levels
1999 The first tourism information office abroad - Baltic Tourism Information Centre
(BTIC) - commences its work in Munster. In 2003 it was moved to Berlin. Offices of
the Latvian Tourism and Development Agency/Baltic Tourism Information were
later opened in Helsinki, Moscow and London
2001 The national tourism information provider standard LVS 200-7 was developed and
adopted
2001-2003 State investment project Development of Latvian tourism information centre network
implemented
2002 LATTŪRINFO becomes a member of the European Union of Tourism Officers
(EUTO)
2004 The Central Latvian Tourism Information Centre opened in Rīga (disbanded later)
2004 Professional standards for a tourism information consultant were developed. The
profession of a Tourism Information Consultant was included in the Latvian
professional classification registry
2009 Territorial restructuring of tourism information providers in compliance with the
administrative-territorial reform of Latvia
2012 Latvian tourism information centres commence their accession to the Latvian
tourism service quality system “Q-Latvia”
2013 The organisation of the annual Latvian tourism information fair events commenced
in various regions of Latvia targeted at boosting travel within the country,
particularly, during the so-called off-season.
2014 LATTŪRINFO publishes its Handbook for tourism information providers
2017 Co-operation with the Latvian Society of Lawyers, outlining and specifying positions
and discussing regulations concerning the various sectors of the tourism industry,
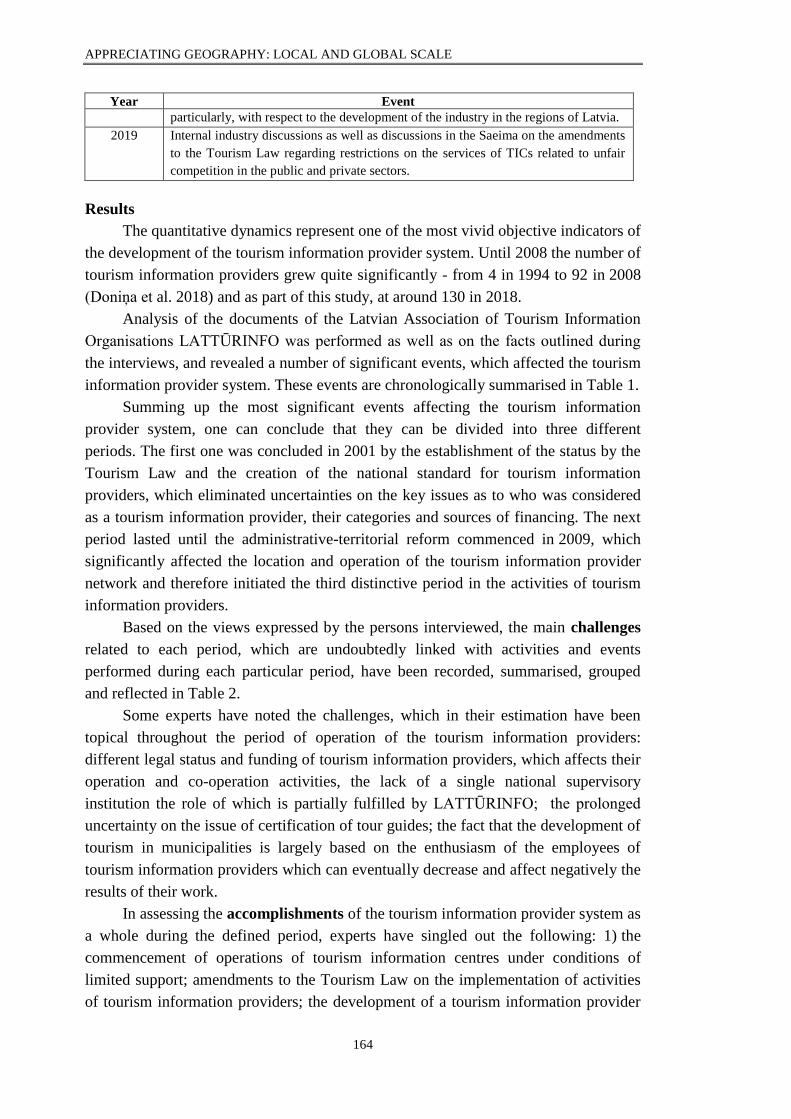
APPRECIATING GEOGRAPHY: LOCAL AND GLOBAL SCALE
164
Year Event
particularly, with respect to the development of the industry in the regions of Latvia.
2019 Internal industry discussions as well as discussions in the Saeima on the amendments
to the Tourism Law regarding restrictions on the services of TICs related to unfair
competition in the public and private sectors.
Results
The quantitative dynamics represent one of the most vivid objective indicators of
the development of the tourism information provider system. Until 2008 the number of
tourism information providers grew quite significantly - from 4 in 1994 to 92 in 2008
(Doniņa et al. 2018) and as part of this study, at around 130 in 2018.
Analysis of the documents of the Latvian Association of Tourism Information
Organisations LATTŪRINFO was performed as well as on the facts outlined during
the interviews, and revealed a number of significant events, which affected the tourism
information provider system. These events are chronologically summarised in Table 1.
Summing up the most significant events affecting the tourism information
provider system, one can conclude that they can be divided into three different
periods. The first one was concluded in 2001 by the establishment of the status by the
Tourism Law and the creation of the national standard for tourism information
providers, which eliminated uncertainties on the key issues as to who was considered
as a tourism information provider, their categories and sources of financing. The next
period lasted until the administrative-territorial reform commenced in 2009, which
significantly affected the location and operation of the tourism information provider
network and therefore initiated the third distinctive period in the activities of tourism
information providers.
Based on the views expressed by the persons interviewed, the main challenges
related to each period, which are undoubtedly linked with activities and events
performed during each particular period, have been recorded, summarised, grouped
and reflected in Table 2.
Some experts have noted the challenges, which in their estimation have been
topical throughout the period of operation of the tourism information providers:
different legal status and funding of tourism information providers, which affects their
operation and co-operation activities, the lack of a single national supervisory
institution the role of which is partially fulfilled by LATTŪRINFO; the prolonged
uncertainty on the issue of certification of tour guides; the fact that the development of
tourism in municipalities is largely based on the enthusiasm of the employees of
tourism information providers which can eventually decrease and affect negatively the
results of their work.
In assessing the accomplishments of the tourism information provider system as
a whole during the defined period, experts have singled out the following: 1) the
commencement of operations of tourism information centres under conditions of
limited support; amendments to the Tourism Law on the implementation of activities
of tourism information providers; the development of a tourism information provider
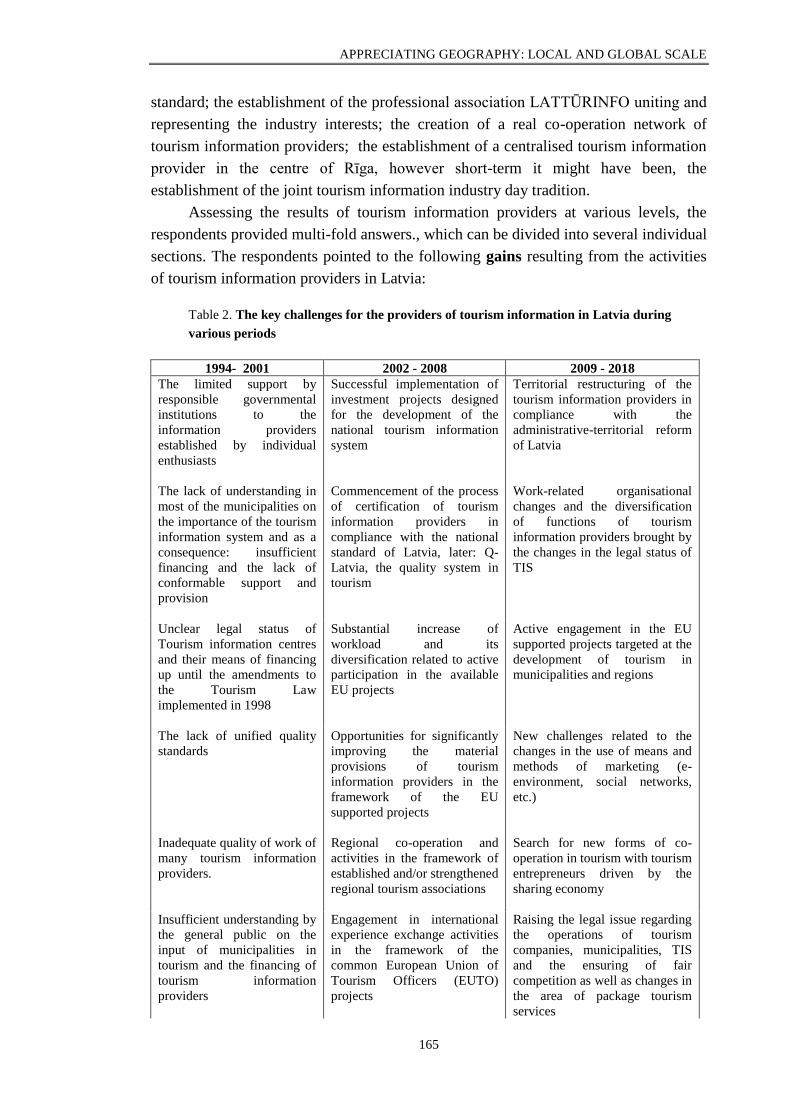
APPRECIATING GEOGRAPHY: LOCAL AND GLOBAL SCALE
165
standard; the establishment of the professional association LATTŪRINFO uniting and
representing the industry interests; the creation of a real co-operation network of
tourism information providers; the establishment of a centralised tourism information
provider in the centre of Rīga, however short-term it might have been, the
establishment of the joint tourism information industry day tradition.
Assessing the results of tourism information providers at various levels, the
respondents provided multi-fold answers., which can be divided into several individual
sections. The respondents pointed to the following gains resulting from the activities
of tourism information providers in Latvia:
Table 2. The key challenges for the providers of tourism information in Latvia during
various periods
1994- 2001 2002 - 2008 2009 - 2018
The limited support by
responsible governmental
institutions to the
information providers
established by individual
enthusiasts
Successful implementation of
investment projects designed
for the development of the
national tourism information
system
Territorial restructuring of the
tourism information providers in
compliance with the
administrative-territorial reform
of Latvia
The lack of understanding in
most of the municipalities on
the importance of the tourism
information system and as a
consequence: insufficient
financing and the lack of
conformable support and
provision
Commencement of the process
of certification of tourism
information providers in
compliance with the national
standard of Latvia, later: Q-
Latvia, the quality system in
tourism
Work-related organisational
changes and the diversification
of functions of tourism
information providers brought by
the changes in the legal status of
TIS
Unclear legal status of
Tourism information centres
and their means of financing
up until the amendments to
the Tourism Law
implemented in 1998
Substantial increase of
workload and its
diversification related to active
participation in the available
EU projects
Active engagement in the EU
supported projects targeted at the
development of tourism in
municipalities and regions
The lack of unified quality
standards
Opportunities for significantly
improving the material
provisions of tourism
information providers in the
framework of the EU
supported projects
New challenges related to the
changes in the use of means and
methods of marketing (e-
environment, social networks,
etc.)
Inadequate quality of work of
many tourism information
providers.
Regional co-operation and
activities in the framework of
established and/or strengthened
regional tourism associations
Search for new forms of co-
operation in tourism with tourism
entrepreneurs driven by the
sharing economy
Insufficient understanding by
the general public on the
input of municipalities in
tourism and the financing of
tourism information
providers
Engagement in international
experience exchange activities
in the framework of the
common European Union of
Tourism Officers (EUTO)
projects
Raising the legal issue regarding
the operations of tourism
companies, municipalities, TIS
and the ensuring of fair
competition as well as changes in
the area of package tourism
services
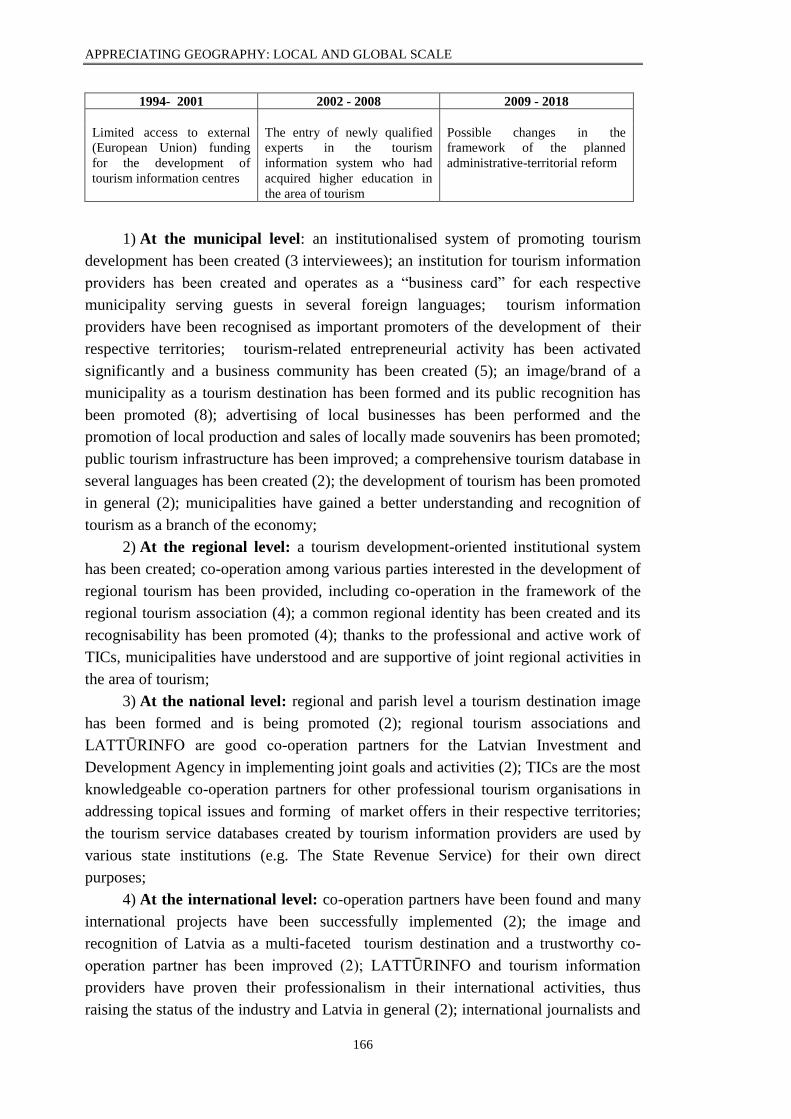
APPRECIATING GEOGRAPHY: LOCAL AND GLOBAL SCALE
166
1994- 2001 2002 - 2008 2009 - 2018
Limited access to external
(European Union) funding
for the development of
tourism information centres
The entry of newly qualified
experts in the tourism
information system who had
acquired higher education in
the area of tourism
Possible changes in the
framework of the planned
administrative-territorial reform
1) At the municipal level: an institutionalised system of promoting tourism
development has been created (3 interviewees); an institution for tourism information
providers has been created and operates as a “business card” for each respective
municipality serving guests in several foreign languages; tourism information
providers have been recognised as important promoters of the development of their
respective territories; tourism-related entrepreneurial activity has been activated
significantly and a business community has been created (5); an image/brand of a
municipality as a tourism destination has been formed and its public recognition has
been promoted (8); advertising of local businesses has been performed and the
promotion of local production and sales of locally made souvenirs has been promoted;
public tourism infrastructure has been improved; a comprehensive tourism database in
several languages has been created (2); the development of tourism has been promoted
in general (2); municipalities have gained a better understanding and recognition of
tourism as a branch of the economy;
2) At the regional level: a tourism development-oriented institutional system
has been created; co-operation among various parties interested in the development of
regional tourism has been provided, including co-operation in the framework of the
regional tourism association (4); a common regional identity has been created and its
recognisability has been promoted (4); thanks to the professional and active work of
TICs, municipalities have understood and are supportive of joint regional activities in
the area of tourism;
3) At the national level: regional and parish level a tourism destination image
has been formed and is being promoted (2); regional tourism associations and
LATTŪRINFO are good co-operation partners for the Latvian Investment and
Development Agency in implementing joint goals and activities (2); TICs are the most
knowledgeable co-operation partners for other professional tourism organisations in
addressing topical issues and forming of market offers in their respective territories;
the tourism service databases created by tourism information providers are used by
various state institutions (e.g. The State Revenue Service) for their own direct
purposes;
4) At the international level: co-operation partners have been found and many
international projects have been successfully implemented (2); the image and
recognition of Latvia as a multi-faceted tourism destination and a trustworthy co-
operation partner has been improved (2); LATTŪRINFO and tourism information
providers have proven their professionalism in their international activities, thus
raising the status of the industry and Latvia in general (2); international journalists and
APPRECIATING GEOGRAPHY: LOCAL AND GLOBAL SCALE
167
bloggers consider tourism information centres as a quality source of information and
co-operation partners; the activities of TICs have on many occasions ensured the
attraction of specific project-based co-operation partners for several local companies.
Conclusion
The study results lead to a number of conclusions, which are listed below.
After 1991 the tourism information system and the network of tourism
information providers in Latvia was formed completely from scratch and, as the result
of 25 years of operation and thanks to the support by municipalities, has become a
crucial player for the development of tourism in various regions of Latvia. The support
of state institutions has not been particularly intense. However, the development of the
system was substantially boosted by providing an orderly regulatory basis (the status
of tourism information providers, sources of financing, quality standards) as well as by
the implementation of the state investment project for the development of the TIC
network in Latvia. The availability of the European Union funding for the promotion
of tourism and the development of the digital environment substantially affected the
workload and functions of tourism information providers. According to the most
experienced Latvian heads of tourism information centres, the operation of the tourism
information system has provided significant input in the development of tourism and
the respective territories at all levels: municipal, regional, national and international.
Assessing the results of the study in the context of future developments, it should
be stressed that they reflect the development of the system as stated in various
documents and the subjective opinions of long-term managers of tourism information
centres. In future, they should be supplemented with specific indicators as well as the
assessments of persons who joined the system at a later stage and also by the opinions of
other parties: municipalities, state institutions, regional and professional tourism
associations.
Kopsavilkums
Tūrisma informācijas sniedzēju tīkls Latvijā 25 darbības gados ir attīstījies gan kvantitatīvi, gan
kvalitatīvi, saņemot pašvaldību un valsts atbalstu, kā arī lielā mērā baudot tajos strādājošo darbinieku
ieinteresētību. Ilglaicīgi stādājošo Tūrisma informācijas centru vadītāju vērtējumā Tūrisma informācijas
sniedzēji ir devuši būtisku ieguldījumu ne tikai tūrisma attīstībā, bet arī kopējā teritoriju attīstības un
atpazīstamības veicināšanā pašvaldību, reģionu, nacionālajā un arī starptautiskajā līmenī.
References
Assenova, M., Marinov V. and Petrov, E. (2018). Destination management systems in Bulgaria:
the current situation and challenges. Annual of Sofia University “St. Kliment Ohridski”, Faculty of
Geology and geography, Book 2-Geography, 111, 1-32.
Cabinet of Ministers of the Republic of Latvia (1998). Tourism Law. Riga, Latvia: Saeima of
the Republic of Latvia.
Doniņa, A., Rozīte, M. and Vinklere, D. (2018). Latvia. In: Hospitality and Tourism in
Transitioning Central and Eastern Europe. A Comparative Analysis. Vodenska, M. (ed.) Cambridge
Scholars Publishing, 241.
Jafary, J. (2000). Encyclopaedia of Tourism. Routledge, 307.
Latturinfo (2014). Rokasgrāmata tūrisma informācijas sniedzējiem, 19.

APPRECIATING GEOGRAPHY: LOCAL AND GLOBAL SCALE
168
Mayer, P., Pawlicz A. (2010). Financing tourist information service. Comparative study of West
Pomerania province, Poland and lake Balaton, Hungary. Zeszyty Naukowe uniwersytetu Szczecinskiego.
Ekonomiczne problem turystyki, 14 (592), 89-99.
Pechlaner, H., Volgger, M. and Herntrei, M. (2012). Destination management organizations as
an interface between destination governance and corporate governance. An International Journal of
Tourism and Hospitality Research, 23 (2), 151-168.
Smuškova, I. (2017). Tūrisms un likumi. Cik viegli un ērti strādāt jeb – vai likumdošana palīdz
lauku tūrismam. Jurista vārds, 34 (988), 15-17.
APPRECIATING GEOGRAPHY: LOCAL AND GLOBAL SCALE
169
Latvijas Ģeogrāfijas biedrības rakstu krājuma
Ģeogrāfiski Raksti / Folia Geographica
NORĀDES AUTORIEM
Ģeogrāfiski Raksti / Folia Geographica publicē
oriģinālus rakstus vispārīgās un lietišķās ģeogrāfijas
jomā. Gaidīti ir pētījumi, jaunas ievirzes, idejas un
vispārinājumi, kā arī darbi par pētniecības, izglītības
un ikdienas ģeogrāfijas integrācijas problēmām Latvijā
un citviet pasaulē. Visus saņemtos manuskriptus
izskata redaktors un divi neatkarīgi recenzenti.
Manuskripti iesniedzami elektroniskā formā un
izdrukā. Teksts rakstāms ar 1 ½ intervālu Times New
Roman parasta lieluma (12) burtiem uz A4 formāta
lapām, atstājot 2.5 cm platas piemales. Raksta
lappusēm jābūt numurētām.
Raksta apjoms no 6 līdz 8 lapaspusēm. Rakstam
jāpievieno anotācija (līdz 200 vārdiem) un
kopsavilkums angļu valodā (līdz 200 vārdiem), un
atslēgas vārdi (līdz 5).
Manuskripta ieteicamā struktūra: (1) virsraksts (īss,
precīzs un labi saprotams), (2) autora(u) vārds(i) un
uzvārds(i), darba vieta, pasta adrese, kā arī e-pasta
adrese (3), anotācija (līdz 200 vārdiem) un atslēgvārdi
(līdz 5), (4) pamatteksts (parasti – ievads, materiāls un
metodes, rezultāti, to interpretācija un secinājumi,
atzinības apliecinājumi), (5) atsauces (literatūras
saraksts), (6) kopsavilkums angļu valodā. Drīkst
iesniegt tikai tos manuskriptus, kas nav publicēti citā
izdevumā.
Tekstā atsauces uz literatūras avotiem jānorāda
šādi: (Gregory 2000; Rutkis (ed.) 1967; Rediscovering
Geography Committee 1997). Literatūras sarakstā
raksta beigās visi tekstā minētie darbi jāsakārto
alfabētiskā secībā. Žurnālu un atsevišķu grāmatu
nosaukumi jāraksta slīprakstā. Ja izmantots interneta
resurss, jābūt norādei uz tīmekļa vietnes adresi (minot
datumu, kad tas aplūkots).
Piemēri:
INSTRUCTIONS FOR CONTRIBUTORS
Ģeogrāfiski Raksti / Folia Geographica publishes
original papers contributing to general and applied
geography. Research reports, new trends, ideas and
generalizations as well as efforts to integration of
research, education and everyday geography in
Latvia’s and the world context are expected
contributions. All manuscripts are reviewed by the
editor and two external reviewers.
Manuscripts must be submitted in an electronic
format together with a printout. The text should be
typed with standard-size letters (12 points) on paper of
A4 format, with 1 ½ spacing and margins at least 2.5
cm.
Recommended length is from 6 to 8 pages. The
manuscript should include: (1) title (as short as
possible, precise and well understandable), (2)
author(s) name(s), institution, postal and e-mail
addresses, (3) abstract (up to 200 words) and
keywords, (4) main text (in a conventional research
paper – introduction, materials and methods, results,
discussion and conclusions, acknowledgements), (5)
references, (6) summary (up to 200 words in English),
The submission of a manuscript does imply that
this paper has not been published elsewhere.
The pages should be numbered throughout,
including tables and legends to figures. References to
published materials, when cited in the text, must be
written as follows: (Gregory 2000; Rutkis (ed.) 1967;
Rediscovering Geography Committee 1997). In the list
at the end of the manuscript they should be arranged in
alphabetical order. Names of journals and separate
books should be written in italics. In case web page
use, the address should be noted in the reference list
(by specifying the date when it was accessed).
Examples:
Dansereau, P. (1966). Ecological impact and human ecology. Darling, F.F. and Milton, J.P. (eds.) Future
environment of North America. New York: Natural History Press Garden City, 425-462.
Gregory, K. (2000). The changing nature of physical geography. London: Arnold.
Latvijas zeme, daba, tauta, I-III, (1936-1937). Rīga: Valters un Rapa.
Lewis, M.W. (2000). Global ignorance. The Geographical Review, 90 (40), 603-628.
Rediscovering Geography Committee (1997). Rediscovering geography. New relevance for science and
society. Washington DC: National Academy Press.
Rutkis, J. (ed.) (1967). Latvia: country and people. Stockholm: Latvian National Foundation.
Centrālā statistikas pārvalde. Galvenie statistikas rādītāji 2015.gadā:
http://www.csb.gov.lv/sites/default/files/publikacijas/2015/nr_03_Latvija_2015_galvenie_statistikas_raditaj
i_15_00.pdf (18.01.2016)
Manuskripti jānosūta Latvijas Ģeogrāfijas Biedrībai [email protected] Manuscripts to be sent to Latvian Geographical Society [email protected]
Related Documents