Top Banner
Geog 3A:Ocean and Atmosphere Mid-term Review TA: Rui Zhu Winter 2015
55

Geog 3A:Ocean and Atmosphere Mid-term Reviezhu/TA_slides/Winter 2015_GEOG3A/2015Winter... · Geog 3A:Ocean and Atmosphere ... (Chapter 6 slides) ... (Ch6 slides or Ch6 p.102-103 Figure

Jun 08, 2018

Download

Documents

nguyentruc
Welcome message from author
This document is posted to help you gain knowledge. Please leave a comment to let me know what you think about it! Share it to your friends and learn new things together.
Transcript
Page 1: Geog 3A:Ocean and Atmosphere Mid-term Reviezhu/TA_slides/Winter 2015_GEOG3A/2015Winter... · Geog 3A:Ocean and Atmosphere ... (Chapter 6 slides) ... (Ch6 slides or Ch6 p.102-103 Figure

Geog 3A:Ocean and Atmosphere

Mid-term Review TA: Rui Zhu Winter 2015

Page 2: Geog 3A:Ocean and Atmosphere Mid-term Reviezhu/TA_slides/Winter 2015_GEOG3A/2015Winter... · Geog 3A:Ocean and Atmosphere ... (Chapter 6 slides) ... (Ch6 slides or Ch6 p.102-103 Figure

1. Ionic bonding is a. relevant to the sodium chloride molecule b. relevant to the water molecule c. a. and b. d. none of the above

Rui Zhu Winter 2015

Page 3: Geog 3A:Ocean and Atmosphere Mid-term Reviezhu/TA_slides/Winter 2015_GEOG3A/2015Winter... · Geog 3A:Ocean and Atmosphere ... (Chapter 6 slides) ... (Ch6 slides or Ch6 p.102-103 Figure

Topic: chemical bonding (Ch6, p.95) Key: Ionic bonding and hydrogen bonding sodium chloride moleculeà Ionic bonding water moleculeàhydrogen bonding Answer: a

Rui Zhu Winter 2015

Page 4: Geog 3A:Ocean and Atmosphere Mid-term Reviezhu/TA_slides/Winter 2015_GEOG3A/2015Winter... · Geog 3A:Ocean and Atmosphere ... (Chapter 6 slides) ... (Ch6 slides or Ch6 p.102-103 Figure

Rui Zhu Winter 2015

2. Of the following, which form of energy propagates over the greatest distances in the ocean? a. sound energy b. infrared energy c. visible energy

Page 5: Geog 3A:Ocean and Atmosphere Mid-term Reviezhu/TA_slides/Winter 2015_GEOG3A/2015Winter... · Geog 3A:Ocean and Atmosphere ... (Chapter 6 slides) ... (Ch6 slides or Ch6 p.102-103 Figure

Topic: Electromagnetic energy (Ch7 p128-130 Figure 7-28, 7-29) ) Key: •  “Water strongly absorbs red and infrared light. Blue light is absorbed

the least, the ocean appears blue”. •  So, long wavelength is better to be absorbed by water. Thus

shortwave travel longer distance in the ocean. •  Sound energy travel the longest distance due to the

discompressibility of water.

Answer: a Rui Zhu Winter 2015

Page 6: Geog 3A:Ocean and Atmosphere Mid-term Reviezhu/TA_slides/Winter 2015_GEOG3A/2015Winter... · Geog 3A:Ocean and Atmosphere ... (Chapter 6 slides) ... (Ch6 slides or Ch6 p.102-103 Figure

3. Three examples of greenhouse gases are: a. carbon dioxide, methane, oxygen b. methane, water vapor, DMS

(dimethylsulfide) c. methane, nitrogen, oxygen d. carbon dioxide, helium, DMS

(dimethylsulfide) e. helium, DMS (dimethylsulfide),

chlorofluorocarbons Rui Zhu Winter 2015

Page 7: Geog 3A:Ocean and Atmosphere Mid-term Reviezhu/TA_slides/Winter 2015_GEOG3A/2015Winter... · Geog 3A:Ocean and Atmosphere ... (Chapter 6 slides) ... (Ch6 slides or Ch6 p.102-103 Figure

Topic: Greenhouse gases: (slides Ch7) Key: Answer: b

Rui Zhu Winter 2015

Page 8: Geog 3A:Ocean and Atmosphere Mid-term Reviezhu/TA_slides/Winter 2015_GEOG3A/2015Winter... · Geog 3A:Ocean and Atmosphere ... (Chapter 6 slides) ... (Ch6 slides or Ch6 p.102-103 Figure

4. Which of the following is a red tide phytoplankton?

a. diatom b. dinoflagellate c. coccolithophore d. all of the above e. none of the above

Rui Zhu Winter 2015

Page 9: Geog 3A:Ocean and Atmosphere Mid-term Reviezhu/TA_slides/Winter 2015_GEOG3A/2015Winter... · Geog 3A:Ocean and Atmosphere ... (Chapter 6 slides) ... (Ch6 slides or Ch6 p.102-103 Figure

Topic: phytoplankton (Chapter 7 slides) Key: Diatom (green) Dinoflagellate (red) Coccolithophore (blue) Answer: b

Rui Zhu Winter 2015

Page 10: Geog 3A:Ocean and Atmosphere Mid-term Reviezhu/TA_slides/Winter 2015_GEOG3A/2015Winter... · Geog 3A:Ocean and Atmosphere ... (Chapter 6 slides) ... (Ch6 slides or Ch6 p.102-103 Figure

5. Methane and carbon dioxide gases in the atmosphere:

a. trap visible radiation emitted by the earth b. trap radiation in the visible portion of

the electromagnetic spectrum emitted by the sun

c. have not varied with the Milankovitch cycles

d. all of the above e. none of the above

Rui Zhu Winter 2015

Page 11: Geog 3A:Ocean and Atmosphere Mid-term Reviezhu/TA_slides/Winter 2015_GEOG3A/2015Winter... · Geog 3A:Ocean and Atmosphere ... (Chapter 6 slides) ... (Ch6 slides or Ch6 p.102-103 Figure

Topic: Greenhouse gasses (Ch7 and lab 2) Key: Radiation (infrared longwave) stopped (trapped) at the atmosphere, absorbed, and heat up the earth. Answer: e

Rui Zhu Winter 2015

Page 12: Geog 3A:Ocean and Atmosphere Mid-term Reviezhu/TA_slides/Winter 2015_GEOG3A/2015Winter... · Geog 3A:Ocean and Atmosphere ... (Chapter 6 slides) ... (Ch6 slides or Ch6 p.102-103 Figure

6. Seawater density increases with both: a. increasing salinity and increasing

temperature b. decreasing pressure and decreasing

temperature c. increasing salinity and decreasing pressure d. decreasing salinity and increasing

temperature e. none of the above

Rui Zhu Winter 2015

Page 13: Geog 3A:Ocean and Atmosphere Mid-term Reviezhu/TA_slides/Winter 2015_GEOG3A/2015Winter... · Geog 3A:Ocean and Atmosphere ... (Chapter 6 slides) ... (Ch6 slides or Ch6 p.102-103 Figure

Topic: Density formula (Chapter 7 slides) Key: Answer: e

Page 14: Geog 3A:Ocean and Atmosphere Mid-term Reviezhu/TA_slides/Winter 2015_GEOG3A/2015Winter... · Geog 3A:Ocean and Atmosphere ... (Chapter 6 slides) ... (Ch6 slides or Ch6 p.102-103 Figure

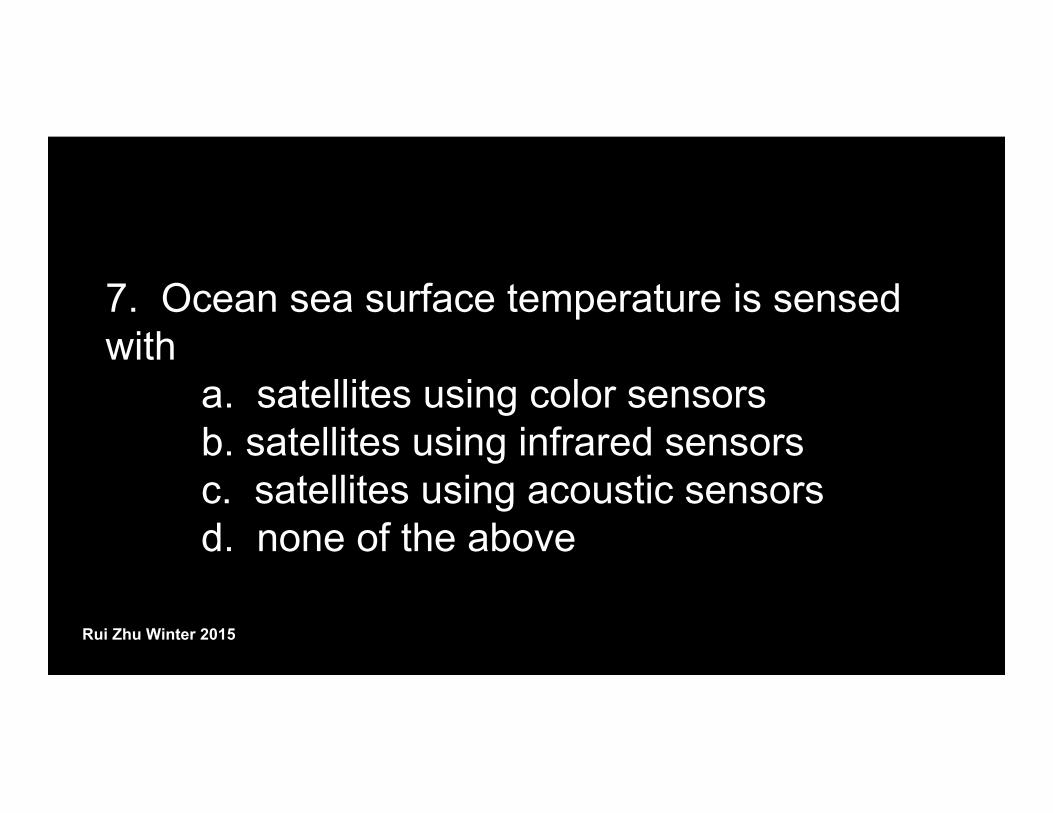
7. Ocean sea surface temperature is sensed with

a. satellites using color sensors b. satellites using infrared sensors c. satellites using acoustic sensors d. none of the above

Rui Zhu Winter 2015

Page 15: Geog 3A:Ocean and Atmosphere Mid-term Reviezhu/TA_slides/Winter 2015_GEOG3A/2015Winter... · Geog 3A:Ocean and Atmosphere ... (Chapter 6 slides) ... (Ch6 slides or Ch6 p.102-103 Figure

Topic: Satellite sensors: Key: •  Color sensors: ocean chlorophyll or concentration of

phytoplankton (Chapter 6 slides) •  Infrared sensors: temperature (Chapter 7 slides) •  Acoustic sensors: Deep Ocean (sound travel further in

ocean) Answer: b

Rui Zhu Winter 2015

Page 16: Geog 3A:Ocean and Atmosphere Mid-term Reviezhu/TA_slides/Winter 2015_GEOG3A/2015Winter... · Geog 3A:Ocean and Atmosphere ... (Chapter 6 slides) ... (Ch6 slides or Ch6 p.102-103 Figure

8. Argo floats a. measure temperature b. move up and down in the ocean c. use Archimedes Principle d. all of the above e. none of the above

Rui Zhu Winter 2015

Page 17: Geog 3A:Ocean and Atmosphere Mid-term Reviezhu/TA_slides/Winter 2015_GEOG3A/2015Winter... · Geog 3A:Ocean and Atmosphere ... (Chapter 6 slides) ... (Ch6 slides or Ch6 p.102-103 Figure

Topic: Argo floats (Chapter 7 slides) Key: CTD; Concept of Buoyancy Answer: d

Rui Zhu Winter 2015

Page 18: Geog 3A:Ocean and Atmosphere Mid-term Reviezhu/TA_slides/Winter 2015_GEOG3A/2015Winter... · Geog 3A:Ocean and Atmosphere ... (Chapter 6 slides) ... (Ch6 slides or Ch6 p.102-103 Figure

Rui Zhu Winter 2015

Page 19: Geog 3A:Ocean and Atmosphere Mid-term Reviezhu/TA_slides/Winter 2015_GEOG3A/2015Winter... · Geog 3A:Ocean and Atmosphere ... (Chapter 6 slides) ... (Ch6 slides or Ch6 p.102-103 Figure

9. Compute the salinity of a sample of water collected in the open ocean with a chlorinity value of 20 ppt. The answer is

a. 34 ppt b. 35 ppt c. 36 ppt d. 37 ppt e. 38 ppt

Rui Zhu Winter 2015

Page 20: Geog 3A:Ocean and Atmosphere Mid-term Reviezhu/TA_slides/Winter 2015_GEOG3A/2015Winter... · Geog 3A:Ocean and Atmosphere ... (Chapter 6 slides) ... (Ch6 slides or Ch6 p.102-103 Figure

Topic: Dittmar’ Principle (Chapter 6 slides) Key: s=1.8*cl Answer: c

Rui Zhu Winter 2015

Page 21: Geog 3A:Ocean and Atmosphere Mid-term Reviezhu/TA_slides/Winter 2015_GEOG3A/2015Winter... · Geog 3A:Ocean and Atmosphere ... (Chapter 6 slides) ... (Ch6 slides or Ch6 p.102-103 Figure

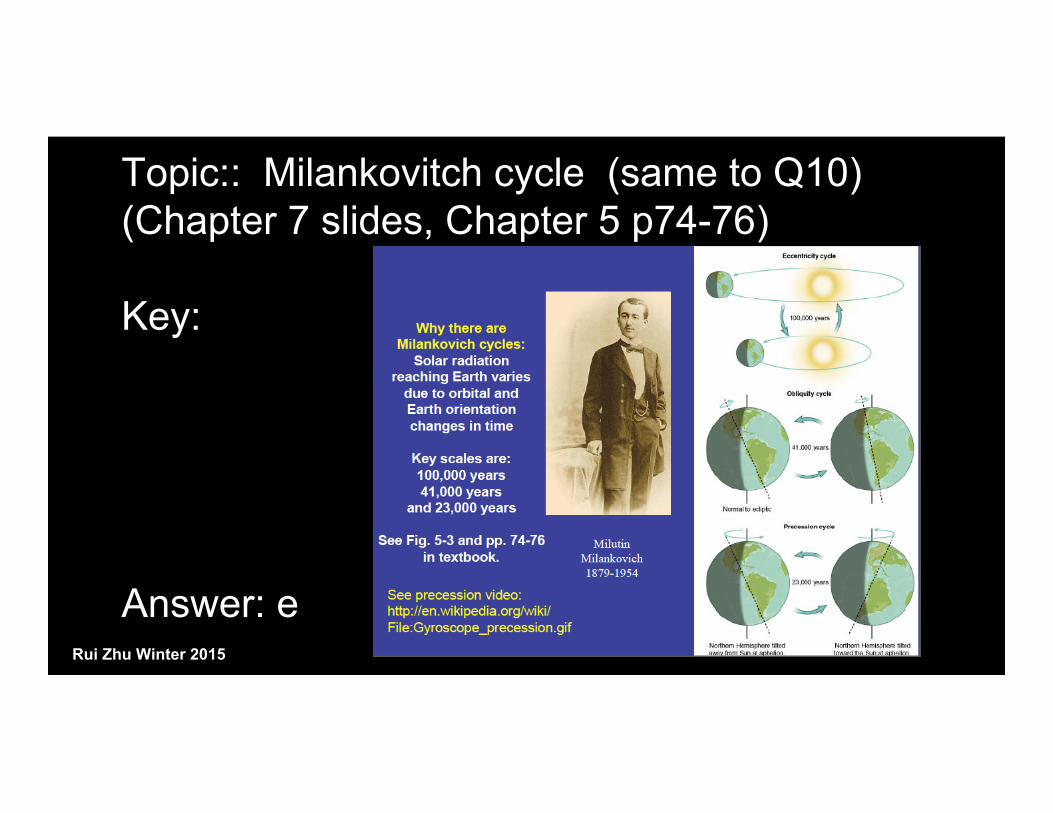
10. The Milankovitch cycles are caused by variations in a. the eccentricity of the earth’s orbit around the sun b. the precession of the earth’s axis of rotation c. the tilt of the earth’s axis of rotation d. all of the above e. none of the above Rui Zhu Winter 2015

Page 22: Geog 3A:Ocean and Atmosphere Mid-term Reviezhu/TA_slides/Winter 2015_GEOG3A/2015Winter... · Geog 3A:Ocean and Atmosphere ... (Chapter 6 slides) ... (Ch6 slides or Ch6 p.102-103 Figure

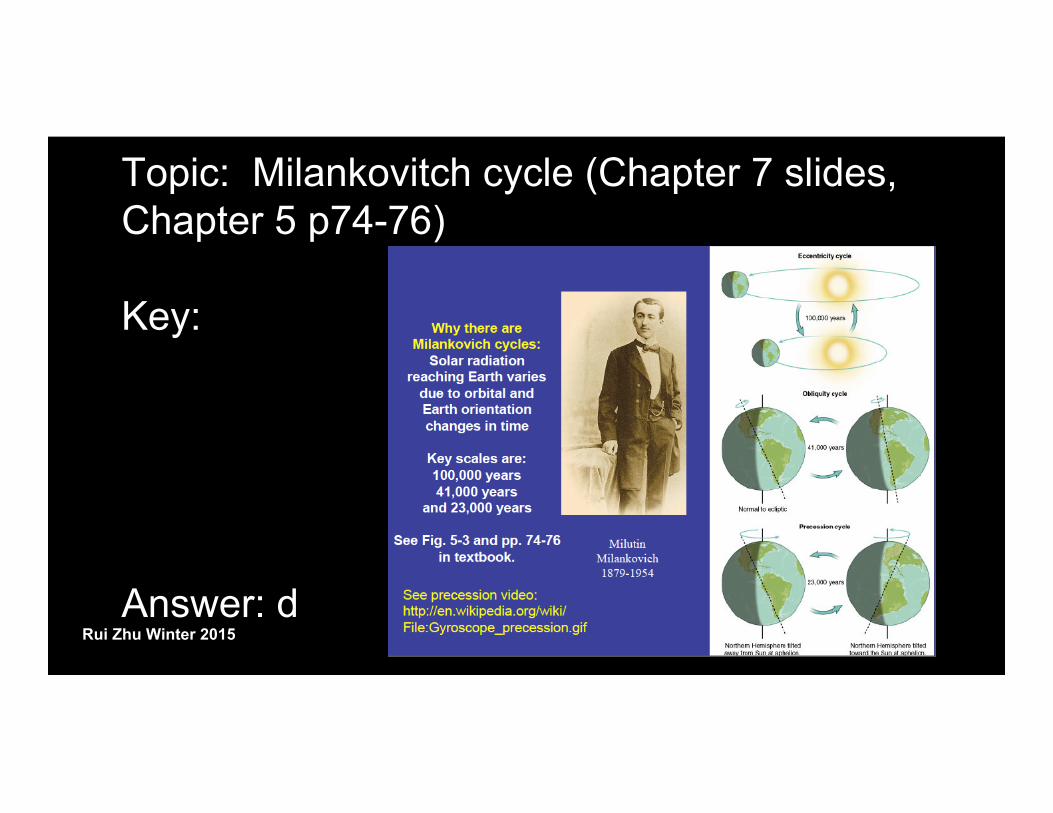
Topic: Milankovitch cycle (Chapter 7 slides, Chapter 5 p74-76) Key: Answer: d

Rui Zhu Winter 2015

Page 23: Geog 3A:Ocean and Atmosphere Mid-term Reviezhu/TA_slides/Winter 2015_GEOG3A/2015Winter... · Geog 3A:Ocean and Atmosphere ... (Chapter 6 slides) ... (Ch6 slides or Ch6 p.102-103 Figure

11. The Keeling curve a. proves that atmospheric carbon

dioxide concentrations have never been greater than at present over the entire history of the earth

b. shows generally increasing concentrations of atmospheric carbon dioxide over approximately the past 50 years.

c. does not display seasonal variability d. none of the above

Page 24: Geog 3A:Ocean and Atmosphere Mid-term Reviezhu/TA_slides/Winter 2015_GEOG3A/2015Winter... · Geog 3A:Ocean and Atmosphere ... (Chapter 6 slides) ... (Ch6 slides or Ch6 p.102-103 Figure

Topic: Keeling curve (Ch6 slides or Ch6 p.102-103 Figure 6-18) Key: Answer: b

Rui Zhu Winter 2015

Page 25: Geog 3A:Ocean and Atmosphere Mid-term Reviezhu/TA_slides/Winter 2015_GEOG3A/2015Winter... · Geog 3A:Ocean and Atmosphere ... (Chapter 6 slides) ... (Ch6 slides or Ch6 p.102-103 Figure

12. One volcano’s active lava flow appears yellow whereas another appears red. Which has the hotter lava? a. red lava volcano b. yellow lava volcano c. both would have the same temperature

Rui Zhu Winter 2015

Page 26: Geog 3A:Ocean and Atmosphere Mid-term Reviezhu/TA_slides/Winter 2015_GEOG3A/2015Winter... · Geog 3A:Ocean and Atmosphere ... (Chapter 6 slides) ... (Ch6 slides or Ch6 p.102-103 Figure

Topic: Wien's Law (Ch7 p.126-127, Ch7 slides; lab2) Key: Answer: b

λ = 2890 /T

Rui Zhu Winter 2015

Page 27: Geog 3A:Ocean and Atmosphere Mid-term Reviezhu/TA_slides/Winter 2015_GEOG3A/2015Winter... · Geog 3A:Ocean and Atmosphere ... (Chapter 6 slides) ... (Ch6 slides or Ch6 p.102-103 Figure

13. Which of the following is true? a. Tree rings from mid-latitudes and deep ice cores from polar regions can be used to study climate change. b. The molecule with the greatest concentration in the atmosphere is oxygen. c. The albedo of polar regions is decreasing at the present time. d. a. and b. e. a. and c.

Page 28: Geog 3A:Ocean and Atmosphere Mid-term Reviezhu/TA_slides/Winter 2015_GEOG3A/2015Winter... · Geog 3A:Ocean and Atmosphere ... (Chapter 6 slides) ... (Ch6 slides or Ch6 p.102-103 Figure

Topic: A comprehensive question (property of atmosphere and albedo) Key: (a). common knowledge not covered in the lecture. (b). 78.1% N2 (nitrogen) (Chapter 8 Figure 8.1 ) (c). global warming, ice melting, but ice has a high albedo value. So the albedo of polar region is decreasing Answer: e

Page 29: Geog 3A:Ocean and Atmosphere Mid-term Reviezhu/TA_slides/Winter 2015_GEOG3A/2015Winter... · Geog 3A:Ocean and Atmosphere ... (Chapter 6 slides) ... (Ch6 slides or Ch6 p.102-103 Figure

14. Milutin Milankovitch’s climate theory a. helps to explain why the earth experiences periodic glacial and interglacial climatic conditions b. was developed while he was in prison c. argues that earth’s exposure to solar radiation is affected by astronomical and earth orientation factors d. a. and c. only e. a., b. and c.

Page 30: Geog 3A:Ocean and Atmosphere Mid-term Reviezhu/TA_slides/Winter 2015_GEOG3A/2015Winter... · Geog 3A:Ocean and Atmosphere ... (Chapter 6 slides) ... (Ch6 slides or Ch6 p.102-103 Figure

Topic:: Milankovitch cycle (same to Q10) (Chapter 7 slides, Chapter 5 p74-76) Key: Answer: e

Rui Zhu Winter 2015

Page 31: Geog 3A:Ocean and Atmosphere Mid-term Reviezhu/TA_slides/Winter 2015_GEOG3A/2015Winter... · Geog 3A:Ocean and Atmosphere ... (Chapter 6 slides) ... (Ch6 slides or Ch6 p.102-103 Figure

15. If the Mir Russian-Finnish submersible descended to 2000 m. Approximately what pressure did it have to withstand?

a. 20 atmospheres b. 200 atmospheres c. 20,000 atmospheres d. 200,000 atmospheres e. none of the above

Page 32: Geog 3A:Ocean and Atmosphere Mid-term Reviezhu/TA_slides/Winter 2015_GEOG3A/2015Winter... · Geog 3A:Ocean and Atmosphere ... (Chapter 6 slides) ... (Ch6 slides or Ch6 p.102-103 Figure

Topic: Pressure in ocean (Chapter 7 slide) Key: 10 meters =1 atmosphere Answer: b

Rui Zhu Winter 2015

Page 33: Geog 3A:Ocean and Atmosphere Mid-term Reviezhu/TA_slides/Winter 2015_GEOG3A/2015Winter... · Geog 3A:Ocean and Atmosphere ... (Chapter 6 slides) ... (Ch6 slides or Ch6 p.102-103 Figure

16. Which is a requirement for hurricane formation in the northern hemisphere? a. sea surface temperatures of about 80 deg F b. a disturbance with counterclockwise rotation c. minimal shear winds at the tropopause d. all of the above

Rui Zhu Winter 2015

Page 34: Geog 3A:Ocean and Atmosphere Mid-term Reviezhu/TA_slides/Winter 2015_GEOG3A/2015Winter... · Geog 3A:Ocean and Atmosphere ... (Chapter 6 slides) ... (Ch6 slides or Ch6 p.102-103 Figure

Topic: Formation of hurricane (Chapter 8 slides, Chapter 8 p.154) Key: Answer: d

Rui Zhu Winter 2015

Page 35: Geog 3A:Ocean and Atmosphere Mid-term Reviezhu/TA_slides/Winter 2015_GEOG3A/2015Winter... · Geog 3A:Ocean and Atmosphere ... (Chapter 6 slides) ... (Ch6 slides or Ch6 p.102-103 Figure

17. Which of the following is a major (macro) nutrient for phytoplankton a. nitrate b. aluminum c. chromium d. tritium e. helium

Rui Zhu Winter 2015

Page 36: Geog 3A:Ocean and Atmosphere Mid-term Reviezhu/TA_slides/Winter 2015_GEOG3A/2015Winter... · Geog 3A:Ocean and Atmosphere ... (Chapter 6 slides) ... (Ch6 slides or Ch6 p.102-103 Figure

Topic: Nutrient for phytoplankton (Chapter 6 p.99 and Chapter 6 slides) Key: Macronutrients: •  Nitrate •  Phosphate Micronutrients: •  Silicate •  Iron Answer: a

Page 37: Geog 3A:Ocean and Atmosphere Mid-term Reviezhu/TA_slides/Winter 2015_GEOG3A/2015Winter... · Geog 3A:Ocean and Atmosphere ... (Chapter 6 slides) ... (Ch6 slides or Ch6 p.102-103 Figure

18. The atmospheric circulation around southern hemisphere low pressure center is: a. counterclockwise b. clockwise c. both a and b are correct d. neither a nor b are correct

Rui Zhu Winter 2015

Page 38: Geog 3A:Ocean and Atmosphere Mid-term Reviezhu/TA_slides/Winter 2015_GEOG3A/2015Winter... · Geog 3A:Ocean and Atmosphere ... (Chapter 6 slides) ... (Ch6 slides or Ch6 p.102-103 Figure

Topic: Atmosphere circulation (Coriolis effect) (Chapter 8 p.148 and Chapter 8 slides) Key: Answer: b

Rui Zhu Winter 2015

Page 39: Geog 3A:Ocean and Atmosphere Mid-term Reviezhu/TA_slides/Winter 2015_GEOG3A/2015Winter... · Geog 3A:Ocean and Atmosphere ... (Chapter 6 slides) ... (Ch6 slides or Ch6 p.102-103 Figure

19. In the wake of a hurricane, you may observe: a. a wake bloom of phytoplankton b. a cool temperature wake c. a warm temperature wake d. a. and b. e. none of the above

Rui Zhu Winter 2015

Page 40: Geog 3A:Ocean and Atmosphere Mid-term Reviezhu/TA_slides/Winter 2015_GEOG3A/2015Winter... · Geog 3A:Ocean and Atmosphere ... (Chapter 6 slides) ... (Ch6 slides or Ch6 p.102-103 Figure

Topic: The effect of hurricane Key: •  phytoplankton (nutrient to the surface); •  temperature (the formation of hurricane

needs heat; cold water to the surface); •  high current speed Answer: d

Rui Zhu Winter 2015

Page 41: Geog 3A:Ocean and Atmosphere Mid-term Reviezhu/TA_slides/Winter 2015_GEOG3A/2015Winter... · Geog 3A:Ocean and Atmosphere ... (Chapter 6 slides) ... (Ch6 slides or Ch6 p.102-103 Figure
Page 42: Geog 3A:Ocean and Atmosphere Mid-term Reviezhu/TA_slides/Winter 2015_GEOG3A/2015Winter... · Geog 3A:Ocean and Atmosphere ... (Chapter 6 slides) ... (Ch6 slides or Ch6 p.102-103 Figure

20. The polar jet stream: a. can reach speeds of 200 mile per hour b. often lies between cold air north of it and warm air south of it c. moves north and south as a very long wave d. all of the above e.  none of the above Note: we changed the sentence in b, originally, it was “often lies between warm air north of it and cold air south of it”, which is wrong!

Page 43: Geog 3A:Ocean and Atmosphere Mid-term Reviezhu/TA_slides/Winter 2015_GEOG3A/2015Winter... · Geog 3A:Ocean and Atmosphere ... (Chapter 6 slides) ... (Ch6 slides or Ch6 p.102-103 Figure

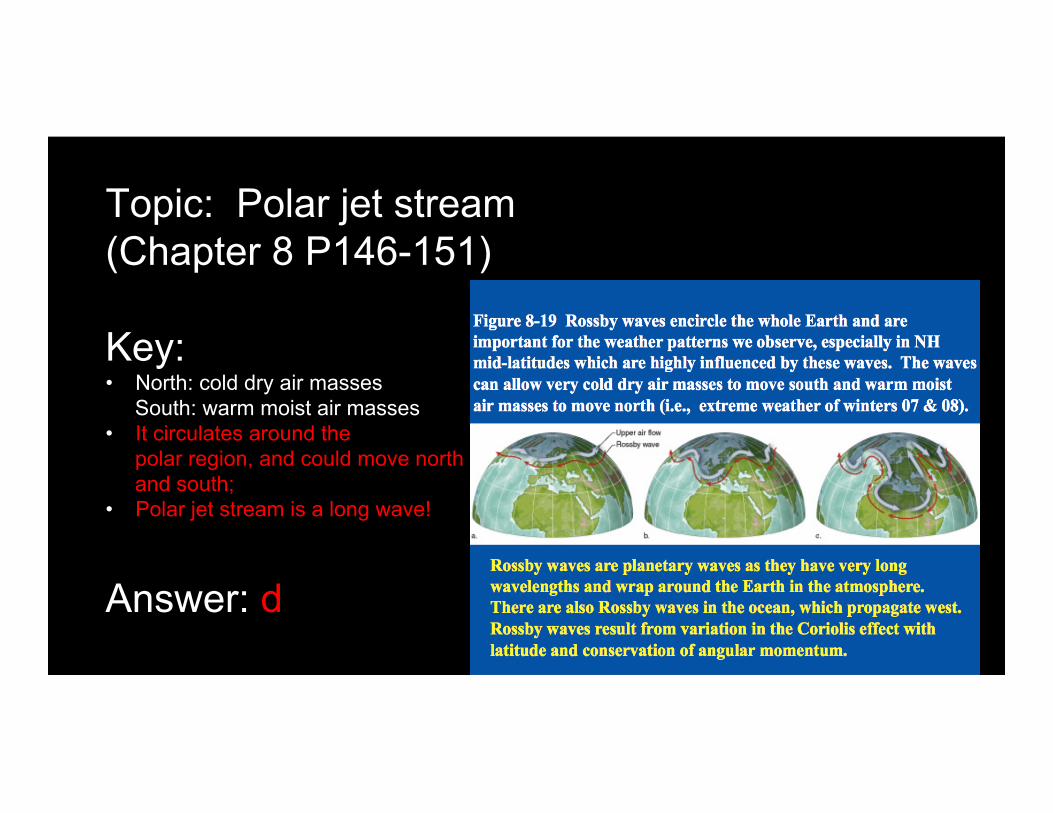
Topic: Polar jet stream (Chapter 8 P146-151) Key: •  North: cold dry air masses South: warm moist air masses •  It circulates around the polar region, and could move north and south; •  Polar jet stream is a long wave!

Answer: d

Page 44: Geog 3A:Ocean and Atmosphere Mid-term Reviezhu/TA_slides/Winter 2015_GEOG3A/2015Winter... · Geog 3A:Ocean and Atmosphere ... (Chapter 6 slides) ... (Ch6 slides or Ch6 p.102-103 Figure

21. Which of the following statements about the Challenger expedition is true? a. It used the first deep submersible to view life in the deep see. b. It was led by Captain James Cook. c. It used lead lines to measure ocean depths. d. All of the above e. None of the above Rui Zhu Winter 2015

Page 45: Geog 3A:Ocean and Atmosphere Mid-term Reviezhu/TA_slides/Winter 2015_GEOG3A/2015Winter... · Geog 3A:Ocean and Atmosphere ... (Chapter 6 slides) ... (Ch6 slides or Ch6 p.102-103 Figure

Topic: Early oceanography (Chapter 6 slides) Key: (a). There is no submersible at that time (Ships) (b). Captain Cook: 18th century; HMS Challenger: 19th (c). in the slides

Answer: c

Rui Zhu Winter 2015

Page 46: Geog 3A:Ocean and Atmosphere Mid-term Reviezhu/TA_slides/Winter 2015_GEOG3A/2015Winter... · Geog 3A:Ocean and Atmosphere ... (Chapter 6 slides) ... (Ch6 slides or Ch6 p.102-103 Figure

22. Sea level rise can be caused by: a. ice melt on land b. thermal expansion c. melting sea ice d. a. and b. e. a. and c.

Rui Zhu Winter 2015

Page 47: Geog 3A:Ocean and Atmosphere Mid-term Reviezhu/TA_slides/Winter 2015_GEOG3A/2015Winter... · Geog 3A:Ocean and Atmosphere ... (Chapter 6 slides) ... (Ch6 slides or Ch6 p.102-103 Figure

Topic: Sea level rise Key: •  Ice melt on land à more water to the sea; •  thermal expansionà volume increase, then

level increase •  Melting sea ice will not increase the mass of

sea water thus no increase of the sea level. Answer: d

Page 48: Geog 3A:Ocean and Atmosphere Mid-term Reviezhu/TA_slides/Winter 2015_GEOG3A/2015Winter... · Geog 3A:Ocean and Atmosphere ... (Chapter 6 slides) ... (Ch6 slides or Ch6 p.102-103 Figure

23. Ocean acidification is likely being primarily caused by a.  increasing ocean temperature b.  increasing phytoplankton concentrations c.  increasing input of carbon dioxide at the sea

surface d.  all of the above e.  none of the above

Page 49: Geog 3A:Ocean and Atmosphere Mid-term Reviezhu/TA_slides/Winter 2015_GEOG3A/2015Winter... · Geog 3A:Ocean and Atmosphere ... (Chapter 6 slides) ... (Ch6 slides or Ch6 p.102-103 Figure

Topic: Ocean acidification (Chapter 6 p.102, Figure 6-16) Key: (a). Temperature è density (b). phytoplankton concentrationà absorb carbon dioxide (c). Carbon dioxide reacts with water to form carbonic acid, which increase the ocean’s acidification.

Answer: c Rui Zhu Winter 2015

Page 50: Geog 3A:Ocean and Atmosphere Mid-term Reviezhu/TA_slides/Winter 2015_GEOG3A/2015Winter... · Geog 3A:Ocean and Atmosphere ... (Chapter 6 slides) ... (Ch6 slides or Ch6 p.102-103 Figure

24. Which of the following is true? a.  Water is about 800 times more dense than

air b.  Air is compressible c.  Seawater in the open ocean does not obey

Dittmar’s Principle d.  a. and b. e.  b. and c. Rui Zhu Winter 2015

Page 51: Geog 3A:Ocean and Atmosphere Mid-term Reviezhu/TA_slides/Winter 2015_GEOG3A/2015Winter... · Geog 3A:Ocean and Atmosphere ... (Chapter 6 slides) ... (Ch6 slides or Ch6 p.102-103 Figure

Topic: Property of water and air. Key: Chapter 8 Figure 8.1 Answer: d

Rui Zhu Winter 2015

Page 52: Geog 3A:Ocean and Atmosphere Mid-term Reviezhu/TA_slides/Winter 2015_GEOG3A/2015Winter... · Geog 3A:Ocean and Atmosphere ... (Chapter 6 slides) ... (Ch6 slides or Ch6 p.102-103 Figure

25. Sea level is lower during : a.  interglacial periods than during glacial

periods b.  glacial periods than during interglacial

periods c.  Both d.  neither Rui Zhu Winter 2015

Page 53: Geog 3A:Ocean and Atmosphere Mid-term Reviezhu/TA_slides/Winter 2015_GEOG3A/2015Winter... · Geog 3A:Ocean and Atmosphere ... (Chapter 6 slides) ... (Ch6 slides or Ch6 p.102-103 Figure

Topic: Sea level: Key: Is lower during glacial periods because water are frozen, which decreased the sea level. Answer: b

Rui Zhu Winter 2015

Page 54: Geog 3A:Ocean and Atmosphere Mid-term Reviezhu/TA_slides/Winter 2015_GEOG3A/2015Winter... · Geog 3A:Ocean and Atmosphere ... (Chapter 6 slides) ... (Ch6 slides or Ch6 p.102-103 Figure

What’s next (week 6): Lab 3. Ocean Circulation Please print your own lab manuals! Read your lab manual before class! Due of lab 2: next week! One hard copy per group; submit it at the beginning of class

Rui Zhu Winter 2015

Page 55: Geog 3A:Ocean and Atmosphere Mid-term Reviezhu/TA_slides/Winter 2015_GEOG3A/2015Winter... · Geog 3A:Ocean and Atmosphere ... (Chapter 6 slides) ... (Ch6 slides or Ch6 p.102-103 Figure

Good Luck!