Geodesign as a strategic collaborative asset within the academic institution Brian Orland, College of Environment + Design, University of Georgia

Welcome message from author
This document is posted to help you gain knowledge. Please leave a comment to let me know what you think about it! Share it to your friends and learn new things together.
Transcript

Geodesign as a strategic collaborative asset within the academic institution
Brian Orland, College of Environment + Design, University of Georgia

Realization • Most academic
disciplines have embraced geospatial thinking
• Most administrative branches of the university use geospatial tools
• Few of them customarily talk to each other, even fewer work together

Geodesign – rehearse, evaluate, adjust • To rehearse change
–Explore what the future will be like
–Try out different ideas, examine different points of viewew
• To evaluate possible outcomes –Measure performance (biophysical and social outcomes)
–Compare alternate policies or plans, anticipate impacts
• To adjust methods and goals –Choose a path forward and accommodate impacts
–Monitor future performance
Geodesign in rehearsal and appraisal

Faced with a new teaching assignment… • “Professor of Geodesign”…better teach it then...
• “Applied Landscape Ecology” –lecture + hands-on laboratory
–no teaching assistant, uneven tech support
• 45 undergraduate landscape architecture students—65 this coming August –no prior GIS experience
–ingrained belief that ecology does not include humans

Decide that this is an “opportunity” • My goal is to develop students’ ability to use
ideas and data from a range of disciplines
• Focus on human ecology –comfort, walkability, access to food, environmental
justice, access to nature, health and well-being
• Use resources and tools created by others, reliable and needing no data preparation
• “Evidence-based” design, at a variety of scales

Evidence-based design at multiple scales • Char-lanta: SE Regional megalopolis
ESRI/Clark Labs 2011-2050 projections: Building America’s Green Infrastructure: http://www.esri.com/about-esri/greeninfrastructure
Atlanta
Charlotte
Atlanta
Charlotte

Ecological design in the Hwy 316 corridor • ESRI/Clark Labs projections, 2011-2050
• Interactive viewer via ESRI
Gwinnett County
Atlanta
Athens Gwinnett County
Atlanta
Athens
http://www.esri.com/about-esri/greeninfrastructure

Final project • Assess the contribution
of community gardens to human well-being, local and regional green infrastructure
• Design green networks offering improvements in human-oriented ecosystem services.
• Provide fresh produce.
• Beautify neighborhoods.
• Bring neighbors together.
• Reduce crime.
• Provide recreation.
• Clean air and water.
• Promote biodiversity.
• Disease control.

Apply the Geodesign Framework • How should the study area
be described? • How does the study area
operate? • Is the area currently
working well? • How might the area be
altered? • What differences might the
changes cause? • How should the area be
changed? Steinitz, 2013. A Framework for Geodesign

How should the study area be described? Neighborhood profile
• 96.7% hip and trendy • 52% likely to be single • Safe from crime • REM recording studios
https://earth.google.com/, http://www.realtor.com https://www.neighborhoodscout.com
Crime statistics
Demogr-aphics
Cultural landmarks
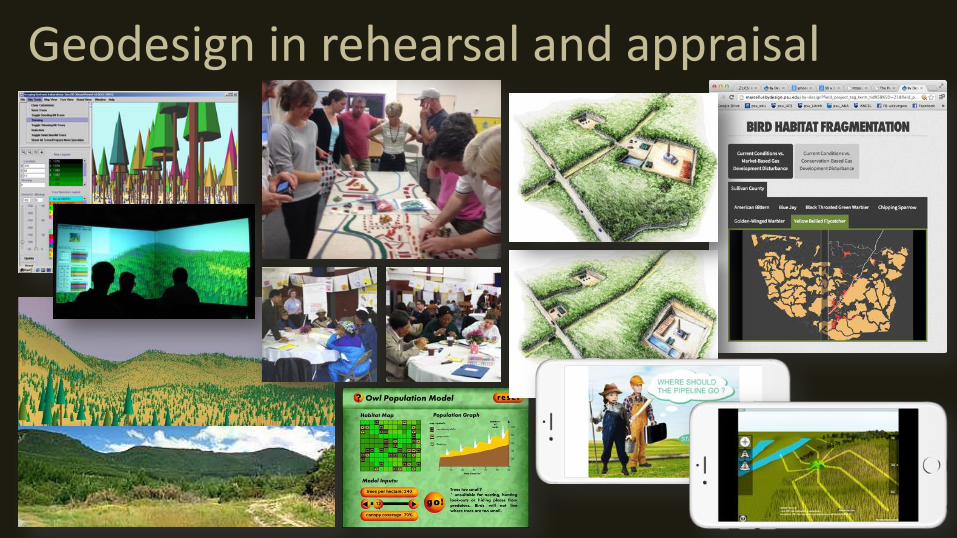
How does the study area operate? • Access to fresh food
• Connections to regional conservation networks
http://doc.arcgis.com/en/geoplanner/, https://www.ers.usda.gov/data-products/food-access-research-atlas/
Food deserts
Walk times
Conservation priorities

Is the area currently working well? • iTree assesses monetary
benefits for stormwater energy, air quality, CO2
• Walkscore assesses walkability to neighborhood assets
https://design.itreetools.org/, https://www.walkscore.com/
Walkscore
Ecosystem services

priority to % minority
priority to % poverty
priority to pop. density
How might the area be altered? • ESRI GeoPlanner
connects neighborhood-scale and regional design
• iTree Landscape weigh environmental justice issues in design
http://doc.arcgis.com/en/geoplanner/, https://landscape.itreetools.org/
Weighted overlay
Compare alternatives

What differences will the changes cause? • The Nature Conservancy
–National and global atlas hosted via ArcGIS Online
• ESRI Green Infrastructure –Asset assessments
http://maps.tnc.org/globalmaps.html, http://www.esri.com/about-esri/greeninfrastructure
Regional green networks
Habitat assessment

What differences will the changes cause? • EPA EJSCREEN (Env. Justice)
–Respiratory, hazardous waste
• CDC Social Vulnerability –Disability, language, access
to transportation, socio-economic
https://www.epa.gov/ejscreen, http://svi.cdc.gov/Index.html
Exposure to hazards
Social vulnerability

How should the area be changed? • A participatory Delphi
process using Google Docs allows anonymous, real-time interactive consensus-building
http://www.rand.org/topics/delphi-method.html
Local priorities
Regional priorities
Global priorities

Communicating the outcomes ESRI Story Maps tools
–“Map Journal”
–“Swipe”
–“SpyGlass”
https://storymaps.arcgis.com/

Realization • Most academic
disciplines have embraced geospatial thinking
• Most administrative branches of the university use geospatial tools
• Few of them customarily talk to each other, even fewer work together

Lightbulb! If my goals are:
• An “Ecology of Mind” (Gregory Bateson, 1972)
• Defensible decision-making
• Preparing students to apply knowledge in the work place
• To be broadly relevant to the university
Then:
• Geodesign needs to be central to the operation of the university
• For those without expert skills in design or GIS
So:
• GEOD 1XXX: What should the future be like?


Steps in the assignment—I • Identify global, regional and local priorities via a
Google Docs implemented Delphi process • Use Google Earth, social media and other web
resources to create a introductory, context-setting portrait of the immediate area
• Use ESRI GeoPlanner to identify 5, 10, 15 and 20-minute walk-time ”service areas” and assess their walkability
• Use USDA Forest Service i-Tree Design to derive ecosystem service contributions of CG trees

Steps in the assignment—II • Use i-Tree Canopy to estimate ecosystem service
performance of entire 20-minute service area
• Use ESRI GeoPlanner Green Infrastructure Weighted Overlay to design habitat connectivity
• Use i-Tree Landscape, EPA EJSCREEN and CDC Social Vulnerability Index web resources, show how network contributes, or not, to EJ
• Use ESRI Story Maps to report your findings
Related Documents