1 GeoDAR: Georeferenced global dam and reservoir dataset for bridging attributes and geolocations Jida Wang 1 , Blake A. Walter 1 , Fangfang Yao 2 , Chunqiao Song 3 , Meng Ding 1 , Abu S. Maroof 1 , Jingying Zhu 3 , Chenyu Fan 3 , Aote Xin 1 , Jordan M. McAlister 4 , Safat Sikder 1 , Yongwei Sheng 5 , George H. Allen 6 , Jean-François Crétaux 7 , and Yoshihide Wada 8 5 1 Department of Geography and Geospatial Sciences, Kansas State University, Manhattan, Kansas, USA 2 Cooperative Institute for Research in Environmental Sciences (CIRES), University of Colorado Boulder, Boulder, Colorado 3 Nanjing Institute of Geography and Limnology, Chinese Academy of Sciences, Nanjing, China 4 Department of Geography, Oklahoma State University, Stillwater, Oklahoma, USA 5 Department of Geography, University of California, Los Angeles (UCLA), Los Angeles, California, USA 10 6 Department of Geography, Texas A&M University, College Station, Texas, USA 7 Laboratoire d'Études en Géophysique et Océanographie Spatiales (LEGOS), Centre National d'Études Spatiales (CNES), Toulouse, France 8 International Institute for Applied Systems Analysis (IIASA), Laxenburg, Austria Correspondence to: Jida Wang ([email protected]) 15 Abstract. Dams and reservoirs are among the most widespread human-made infrastructure on Earth. Despite their societal and environmental significance, spatial inventories of dams and reservoirs, even for the large ones, are insufficient. A dilemma of the existing georeferenced dam datasets is the polarized focus on either dam quantity and spatial coverage (e.g., GOODD) or detailed attributes for a limited dam quantity or region (e.g., GRanD and national inventories). One of the most comprehensive datasets, the World Register of Dams (WRD) maintained by the International Commission on Large Dams 20 (ICOLD), documents nearly 60,000 dams with an extensive suite of attributes. Unfortunately, WRD records are not georeferenced, limiting the benefits of their attributes for spatially explicit applications. To bridge the gap between attribute accessibility and spatial explicitness, we introduce the Georeferenced global Dam And Reservoir (GeoDAR) dataset, created by utilizing online geocoding API and multi-source inventories. We release GeoDAR in two successive versions (v1.0 and v1.1) at https://doi.org/10.6084/m9.figshare.13670527. GeoDAR v1.0 holds 21,051 dam points georeferenced from WRD, 25 whereas v1.1 consists of a) 23,680 dam points after a careful harmonization between GeoDAR v1.0 and GRanD and b) 20,214 reservoir polygons retrieved from high-resolution water masks. Due to geocoding challenges, GeoDAR spatially resolved 40% of the records in WRD which, however, comprise over 90% of the total reservoir area, catchment area, and reservoir storage capacity. GeoDAR does not release the proprietary WRD attributes, but upon individual user requests we can assist in associating GeoDAR spatial features with the WRD attribute information that users have acquired from ICOLD. 30 With a dam quantity triple that of GRanD, GeoDAR significantly enhances the spatial details of smaller but more widespread dams and reservoirs, and complements other existing global dam inventories. Along with its extended attribute accessibility, GeoDAR is expected to benefit a broad range of applications in hydrologic modelling, water resource management, ecosystem health, and energy planning. https://doi.org/10.5194/essd-2021-58 Open Access Earth System Science Data Discussions Preprint. Discussion started: 24 March 2021 c Author(s) 2021. CC BY 4.0 License.

Welcome message from author
This document is posted to help you gain knowledge. Please leave a comment to let me know what you think about it! Share it to your friends and learn new things together.
Transcript
1
GeoDAR: Georeferenced global dam and reservoir dataset for
bridging attributes and geolocations
Jida Wang1, Blake A. Walter1, Fangfang Yao2, Chunqiao Song3, Meng Ding1, Abu S. Maroof1, Jingying
Zhu3, Chenyu Fan3, Aote Xin1, Jordan M. McAlister4, Safat Sikder1, Yongwei Sheng5, George H.
Allen6, Jean-François Crétaux7, and Yoshihide Wada8 5
1Department of Geography and Geospatial Sciences, Kansas State University, Manhattan, Kansas, USA 2Cooperative Institute for Research in Environmental Sciences (CIRES), University of Colorado Boulder, Boulder, Colorado 3Nanjing Institute of Geography and Limnology, Chinese Academy of Sciences, Nanjing, China 4Department of Geography, Oklahoma State University, Stillwater, Oklahoma, USA 5Department of Geography, University of California, Los Angeles (UCLA), Los Angeles, California, USA 10 6Department of Geography, Texas A&M University, College Station, Texas, USA 7Laboratoire d'Études en Géophysique et Océanographie Spatiales (LEGOS), Centre National d'Études Spatiales (CNES),
Toulouse, France 8International Institute for Applied Systems Analysis (IIASA), Laxenburg, Austria
Correspondence to: Jida Wang ([email protected]) 15
Abstract. Dams and reservoirs are among the most widespread human-made infrastructure on Earth. Despite their societal
and environmental significance, spatial inventories of dams and reservoirs, even for the large ones, are insufficient. A
dilemma of the existing georeferenced dam datasets is the polarized focus on either dam quantity and spatial coverage (e.g.,
GOODD) or detailed attributes for a limited dam quantity or region (e.g., GRanD and national inventories). One of the most
comprehensive datasets, the World Register of Dams (WRD) maintained by the International Commission on Large Dams 20
(ICOLD), documents nearly 60,000 dams with an extensive suite of attributes. Unfortunately, WRD records are not
georeferenced, limiting the benefits of their attributes for spatially explicit applications. To bridge the gap between attribute
accessibility and spatial explicitness, we introduce the Georeferenced global Dam And Reservoir (GeoDAR) dataset, created
by utilizing online geocoding API and multi-source inventories. We release GeoDAR in two successive versions (v1.0 and
v1.1) at https://doi.org/10.6084/m9.figshare.13670527. GeoDAR v1.0 holds 21,051 dam points georeferenced from WRD, 25
whereas v1.1 consists of a) 23,680 dam points after a careful harmonization between GeoDAR v1.0 and GRanD and b)
20,214 reservoir polygons retrieved from high-resolution water masks. Due to geocoding challenges, GeoDAR spatially
resolved 40% of the records in WRD which, however, comprise over 90% of the total reservoir area, catchment area, and
reservoir storage capacity. GeoDAR does not release the proprietary WRD attributes, but upon individual user requests we
can assist in associating GeoDAR spatial features with the WRD attribute information that users have acquired from ICOLD. 30
With a dam quantity triple that of GRanD, GeoDAR significantly enhances the spatial details of smaller but more
widespread dams and reservoirs, and complements other existing global dam inventories. Along with its extended attribute
accessibility, GeoDAR is expected to benefit a broad range of applications in hydrologic modelling, water resource
management, ecosystem health, and energy planning.
https://doi.org/10.5194/essd-2021-58
Ope
n A
cces
s Earth System
Science
DataD
iscussio
ns
Preprint. Discussion started: 24 March 2021c© Author(s) 2021. CC BY 4.0 License.
2
1 Introduction 35
Since around the 1950s, the world has seen an unprecedented boom in large dam construction as a response to the ever-
growing human demands for water and energy (Chao et al., 2008; Wada et al., 2017). Today, dams and their impounded
reservoirs are ubiquitous across many global basins, providing multiple services that range from hydropower and flood
control to water supply and navigation (Belletti et al., 2020; Biemans et al., 2011; Boulange et al., 2021; Doll et al., 2009;
Grill et al., 2019). These benefits were, however, often gained at the costs of fragmenting river systems, submerging arable 40
lands, displacing population, and disturbing climate regimes (Carpenter et al., 2011; Cretaux et al., 2015; Degu et al., 2011;
Grill et al., 2019; Latrubesse et al., 2017; Nilsson and Berggren, 2000; Tilt et al., 2009; Vorosmarty et al., 2003; Wang et al.,
2017).
Despite such environmental and societal significance, our spatial inventory of global dams and reservoirs, even for the large
ones (such as those with a surface area >1 km2), has been insufficient. We still lack a thorough and authoritative dataset that 45
documents both geographic coordinates (latitude and longitude) and standard attributes (e.g., purpose, reservoir storage
capacity, and hydropower capacity) of the existing large dams. One of the most comprehensive datasets, the World Register
of Dams (WRD), is regularly updated by the International Commission on Large Dams (ICOLD; https://www.icold-
cigb.org), a non-governmental organization dedicated to the global sharing of professional dam/reservoir information. The
recent version of ICOLD WRD documents nearly 60,000 “large” dams, defined as those with a wall higher than 15 m or 50
between 5 to 15 m but with a reservoir storage greater than 3 million m3 (mcm). These WRD records are considered to be
“complete” to the extent of contributions from willing nations and water authorities (Wada et al., 2017).
While ICOLD WRD provides more than 40 attributes, the dam locations are, unfortunately, either not georeferenced or
inaccessible. Despite the availability of many essential attributes, missing geographic coordinates has severely limited the
applications of WRD, including for hydrological modelling and hydropower planning (Yassin et al., 2019) which require the 55
dam records to be spatially explicit. This dilemma may be partially resolved by using georeferenced regional registers such
as the United States National Inventory of Dams (US NID; https://nid.sec.usace.army.mil) and from the Canadian Dam
Association (https://www.cda.ca). Nevertheless, such regional registers are not always publicly available, especially in
developing nations where dam construction is still booming (Zarfl et al., 2015).
Other global dam and reservoir datasets that are georeferenced, however, often lack essential attributes. An example is the 60
recently published GlObal geOreferenced Database of Dams (GOODD V1) (Mulligan et al., 2020), which contains 38,667
dam points digitized from Google Earth imagery and their associated catchments delineated from digital elevation models
(DEMs). Despite this dam quantity, GOODD provides no other attribute information. Another inventory, the Global River
Obstruction Database (GROD) (Kornei, 2020; Whittemore et al., 2020), located more than 35,000 flow obstructions along
rivers wider than 30 m as mapped in the Global River Width from Landsat (GRWL) database (Allen and Pavelsky, 2018). 65
https://doi.org/10.5194/essd-2021-58
Ope
n A
cces
s Earth System
Science
DataD
iscussio
ns
Preprint. Discussion started: 24 March 2021c© Author(s) 2021. CC BY 4.0 License.
3
The current attributes are limited to obstruction types such as locks, weirs, and multiple types of dams. In addition, GROD is
tailored for the forthcoming Surface Water and Ocean Topography (SWOT) satellite mission which is designed to observe
river reaches wider than 50–100 m (Biancamaria et al., 2016). While these rivers are sufficiently captured by GRWL, the
obstruction infrastructure identified along the river mask in GRWL excludes many large dams on rivers narrower than 30 m.
In the US, for instance, there are at least 5170 NID-registered dams higher than 15 m (i.e., large dams according to ICOLD 70
criteria), but less than 8% of these dams intersect with GRWL (i.e., located on rivers wider than 30 m).
Among the few global dam/reservoir datasets that provide both georeferenced locations and essential attributes, are the
United Nations Food and Agricultural Organization (FAO) AQUASTAT (Li et al., 2011) and the Global Reservoir and Dam
database (GRanD) (Lehner et al., 2011). GRanD was constructed by harmonizing AQUASTAT and a wide range of regional
gazetteers and inventories. Its latest version, v1.3, contains 7320 dams as well as their reservoir boundaries and 75
approximately 50 attributes, with a cumulative storage capacity of 6881 km3. Since its publication, GRanD has been applied
extensively by a variety of studies, although its focus is on the world’s largest dams (e.g., >0.1 km3) and its quantity (7320
dams) is only a fraction of the 59,000 dams documented in WRD. A spatially resolved inclusion of additional large dams,
such as those in compliance with the ICOLD definition, has been increasingly desired by the hydrology community and
encouraged by growing collaborations from multiple disciplines such as biogeochemistry, ecology, energy planning, and 80
infrastructure managements (Belletti et al., 2020; Boulange et al., 2021; Grill et al., 2019; Lin et al., 2019; Wada et al.,
2017).
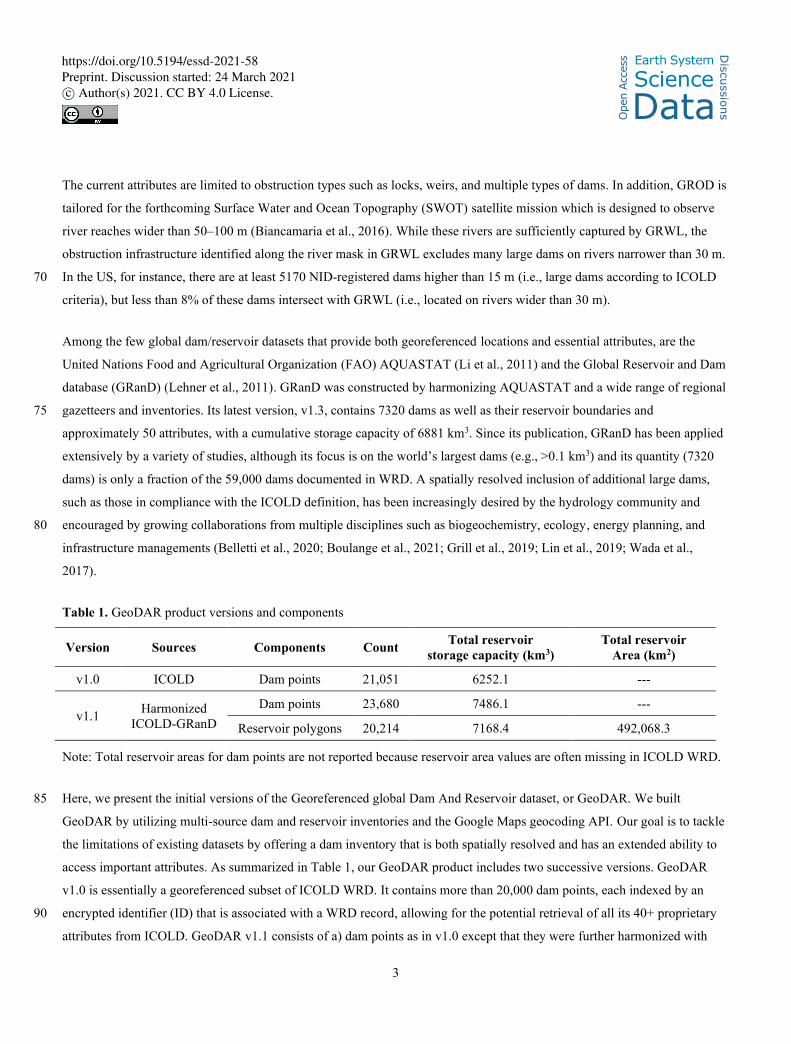
Table 1. GeoDAR product versions and components
Version Sources Components Count Total reservoir
storage capacity (km3)
Total reservoir
Area (km2)
v1.0 ICOLD Dam points 21,051 6252.1 ---
v1.1 Harmonized
ICOLD-GRanD
Dam points 23,680 7486.1 ---
Reservoir polygons 20,214 7168.4 492,068.3
Note: Total reservoir areas for dam points are not reported because reservoir area values are often missing in ICOLD WRD.
Here, we present the initial versions of the Georeferenced global Dam And Reservoir dataset, or GeoDAR. We built 85
GeoDAR by utilizing multi-source dam and reservoir inventories and the Google Maps geocoding API. Our goal is to tackle
the limitations of existing datasets by offering a dam inventory that is both spatially resolved and has an extended ability to
access important attributes. As summarized in Table 1, our GeoDAR product includes two successive versions. GeoDAR
v1.0 is essentially a georeferenced subset of ICOLD WRD. It contains more than 20,000 dam points, each indexed by an
encrypted identifier (ID) that is associated with a WRD record, allowing for the potential retrieval of all its 40+ proprietary 90
attributes from ICOLD. GeoDAR v1.1 consists of a) dam points as in v1.0 except that they were further harmonized with
https://doi.org/10.5194/essd-2021-58
Ope
n A
cces
s Earth System
Science
DataD
iscussio
ns
Preprint. Discussion started: 24 March 2021c© Author(s) 2021. CC BY 4.0 License.
4
GRanD for an improved inclusion of the largest dams, and b) reservoir boundaries for most of the dam points. For
proprietary reasons, neither version releases any WRD attributes, but upon individual request we may decrypt the ICOLD
“international code” of each GeoDAR feature, through which the user can match attributes from the WRD website
(https://www.icold-cigb.org/GB/world_register/world_register_of_dams.asp) (see Section 3.3 and Section 4 for details). Due 95
to geocoding challenges, GeoDAR v1.0 spatially resolved about 40% of the individual dams in WRD. However, these
georeferenced locations were quality controlled, and after the supplementation by GRanD, v1.1 captures a total storage
capacity of 7486 km3, a magnitude comparable to the full storage capacity of ICOLD WRD.
2 Methods
2.1 Georeferencing rationale 100
We aim to georeference (i.e., acquire the latitude and longitude of) each dam listed in ICOLD WRD, by using the nominal
location (i.e., descriptive information) available in the WRD attributes. Examples of the attributes that are important for
georeferencing include the names of the dam and reservoir, the administrative divisions the dam is affiliated with, and the
name of the impounded river. Using such attribute information, spatial coordinates of a dam may be either a) queried from
an existing register or inventory where dam records were already georeferenced and verified, or b) estimated through a 105
geocoding service that can convert descriptive addresses to numeric spatial coordinates. Our preference was the former when
possible for the reason of optimizing the georeferencing accuracy.
2.2 Method overview
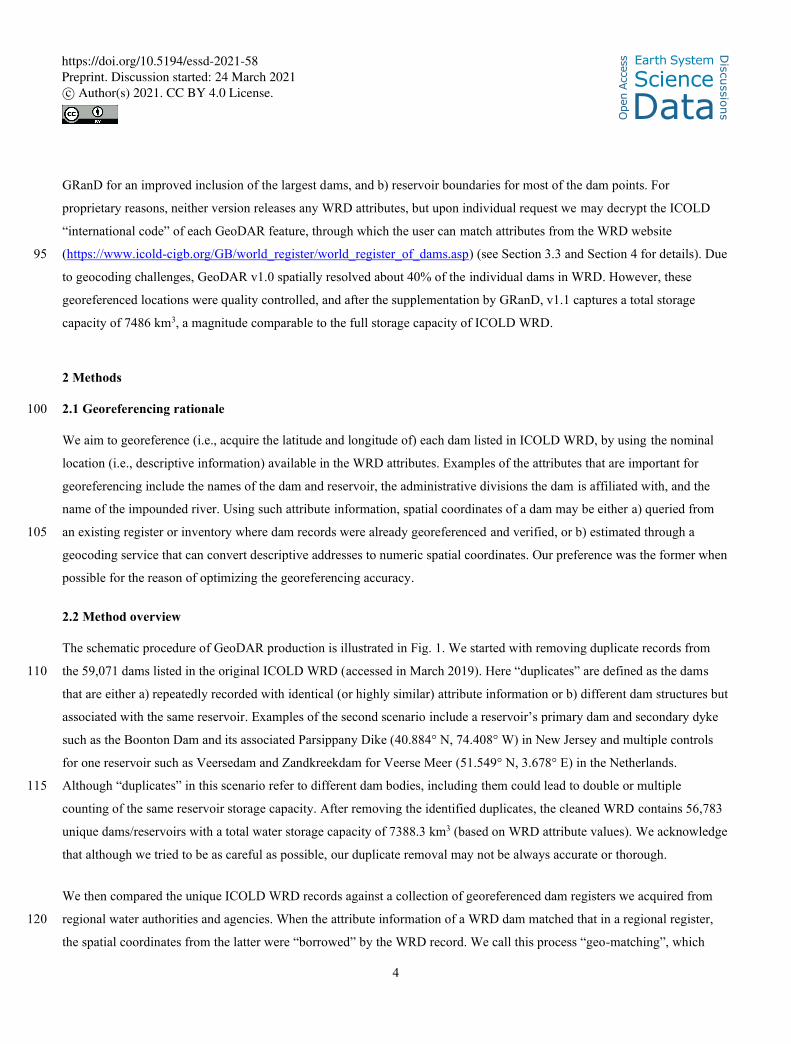
The schematic procedure of GeoDAR production is illustrated in Fig. 1. We started with removing duplicate records from
the 59,071 dams listed in the original ICOLD WRD (accessed in March 2019). Here “duplicates” are defined as the dams 110
that are either a) repeatedly recorded with identical (or highly similar) attribute information or b) different dam structures but
associated with the same reservoir. Examples of the second scenario include a reservoir’s primary dam and secondary dyke
such as the Boonton Dam and its associated Parsippany Dike (40.884° N, 74.408° W) in New Jersey and multiple controls
for one reservoir such as Veersedam and Zandkreekdam for Veerse Meer (51.549° N, 3.678° E) in the Netherlands.
Although “duplicates” in this scenario refer to different dam bodies, including them could lead to double or multiple 115
counting of the same reservoir storage capacity. After removing the identified duplicates, the cleaned WRD contains 56,783
unique dams/reservoirs with a total water storage capacity of 7388.3 km3 (based on WRD attribute values). We acknowledge
that although we tried to be as careful as possible, our duplicate removal may not be always accurate or thorough.
We then compared the unique ICOLD WRD records against a collection of georeferenced dam registers we acquired from
regional water authorities and agencies. When the attribute information of a WRD dam matched that in a regional register, 120
the spatial coordinates from the latter were “borrowed” by the WRD record. We call this process “geo-matching”, which
https://doi.org/10.5194/essd-2021-58
Ope
n A
cces
s Earth System
Science
DataD
iscussio
ns
Preprint. Discussion started: 24 March 2021c© Author(s) 2021. CC BY 4.0 License.
5
resulted in the georeferencing of 11,859 WRD dams. For the remaining dams in WRD, we implemented the alternative
geocoding approach (see rationale in Section 2.1) by inputting the available ICOLD attribute information to the Google
Maps geocoding API (http://developers.google.com/maps). The geocoding process successfully retrieved the spatial
coordinates of another 9149 WRD dams. The combined output from both geo-matching and geocoding were next collated 125
with the spatial coordinates and reservoir storage capacities of 124 WRD dams larger than 10 km3 as documented in Wada et
al. (2017). These processes resulted in GeoDAR v1.0, a total of 21,051 georeferenced WRD dam points with an
accumulative storage capacity of 6252 km3 (accounting for more than 80% of that in ICOLD WRD). The Venn diagram in
Fig. 2a provides an overview of the logical relations among the georeferencing sources and methods for GeoDAR v1.0.
130
Figure 1. Schematic flowchart of GeoDAR production. Text in roman indicates applied or produced datasets, and text in
italics indicates methods or procedures.
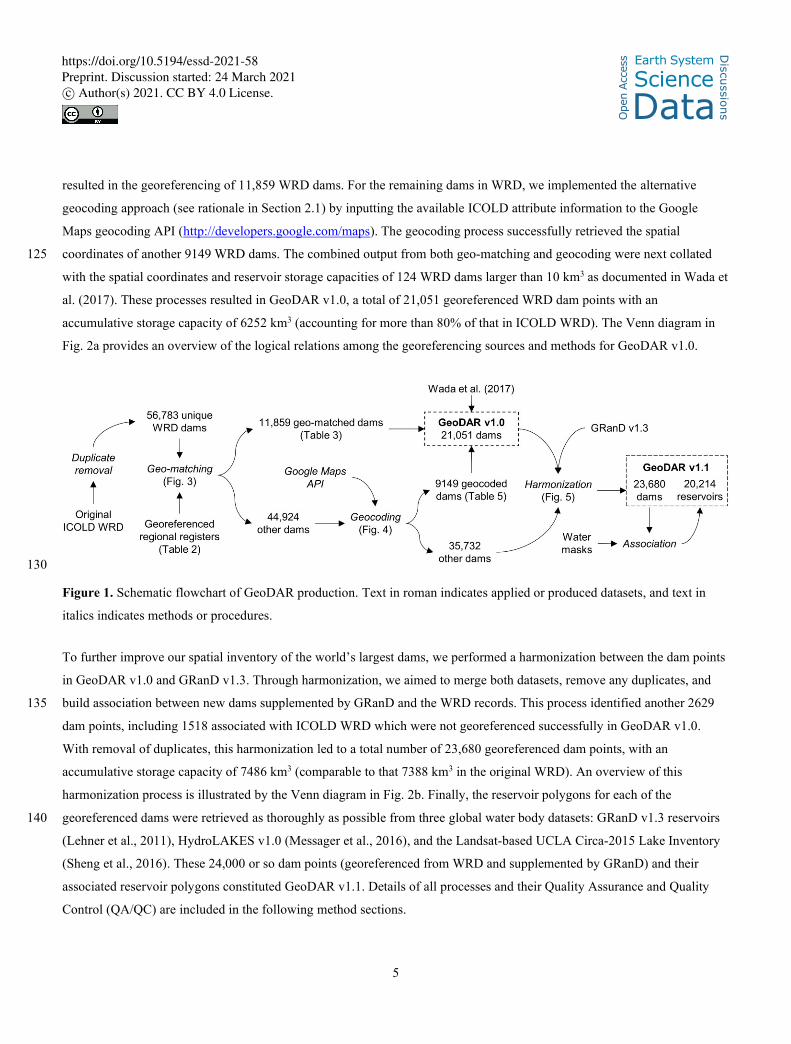
To further improve our spatial inventory of the world’s largest dams, we performed a harmonization between the dam points
in GeoDAR v1.0 and GRanD v1.3. Through harmonization, we aimed to merge both datasets, remove any duplicates, and
build association between new dams supplemented by GRanD and the WRD records. This process identified another 2629 135
dam points, including 1518 associated with ICOLD WRD which were not georeferenced successfully in GeoDAR v1.0.
With removal of duplicates, this harmonization led to a total number of 23,680 georeferenced dam points, with an
accumulative storage capacity of 7486 km3 (comparable to that 7388 km3 in the original WRD). An overview of this
harmonization process is illustrated by the Venn diagram in Fig. 2b. Finally, the reservoir polygons for each of the
georeferenced dams were retrieved as thoroughly as possible from three global water body datasets: GRanD v1.3 reservoirs 140
(Lehner et al., 2011), HydroLAKES v1.0 (Messager et al., 2016), and the Landsat-based UCLA Circa-2015 Lake Inventory
(Sheng et al., 2016). These 24,000 or so dam points (georeferenced from WRD and supplemented by GRanD) and their
associated reservoir polygons constituted GeoDAR v1.1. Details of all processes and their Quality Assurance and Quality
Control (QA/QC) are included in the following method sections.
https://doi.org/10.5194/essd-2021-58
Ope
n A
cces
s Earth System
Science
DataD
iscussio
ns
Preprint. Discussion started: 24 March 2021c© Author(s) 2021. CC BY 4.0 License.
6
145
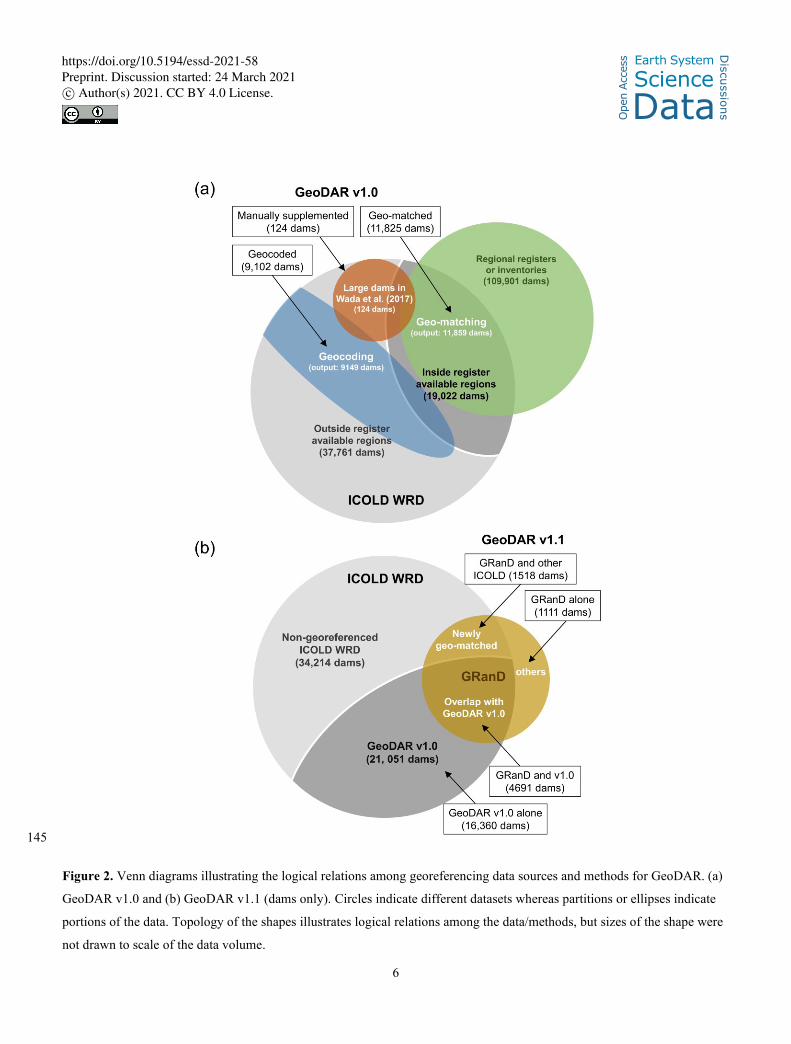
Figure 2. Venn diagrams illustrating the logical relations among georeferencing data sources and methods for GeoDAR. (a)
GeoDAR v1.0 and (b) GeoDAR v1.1 (dams only). Circles indicate different datasets whereas partitions or ellipses indicate
portions of the data. Topology of the shapes illustrates logical relations among the data/methods, but sizes of the shape were
not drawn to scale of the data volume.
https://doi.org/10.5194/essd-2021-58
Ope
n A
cces
s Earth System
Science
DataD
iscussio
ns
Preprint. Discussion started: 24 March 2021c© Author(s) 2021. CC BY 4.0 License.
7
2.3 Geo-matching regional registers 150
The ICOLD WRD was a joint contribution from more than 100 member nations, some of which also release detailed and
publicly accessible dam registers that have been georeferenced. These regional/local registers, with reliable spatial
coordinates already provided for each dam, were our preferred sources for georeferencing WRD. Since this type of register is
not available for most countries, we searched multiple water authority and project websites, and collected seven
georeferenced regional registers or inventories that are open access. Their names, sources, and numbers of documented dams 155
are summarized in Table 2.
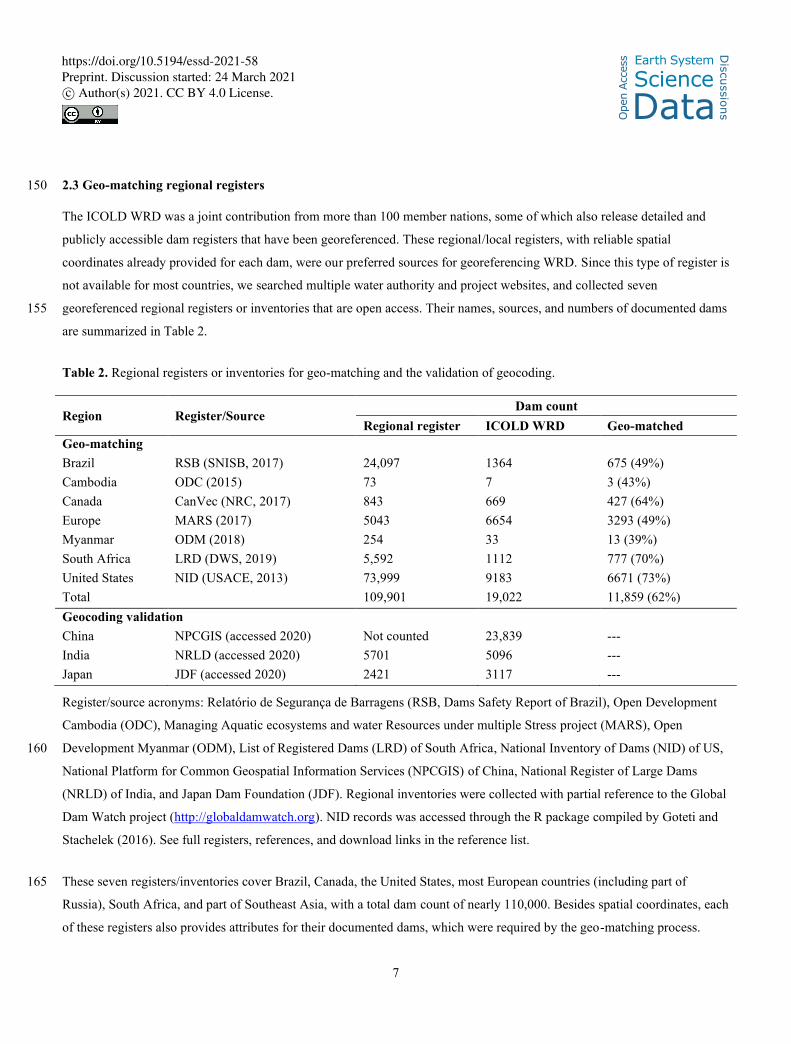
Table 2. Regional registers or inventories for geo-matching and the validation of geocoding.
Region Register/Source Dam count
Regional register ICOLD WRD Geo-matched
Geo-matching
Brazil RSB (SNISB, 2017) 24,097 1364 675 (49%)
Cambodia ODC (2015) 73 7 3 (43%)
Canada CanVec (NRC, 2017) 843 669 427 (64%)
Europe MARS (2017) 5043 6654 3293 (49%)
Myanmar ODM (2018) 254 33 13 (39%)
South Africa LRD (DWS, 2019) 5,592 1112 777 (70%)
United States NID (USACE, 2013) 73,999 9183 6671 (73%)
Total 109,901 19,022 11,859 (62%)
Geocoding validation
China NPCGIS (accessed 2020) Not counted 23,839 ---
India NRLD (accessed 2020) 5701 5096 ---
Japan JDF (accessed 2020) 2421 3117 ---
Register/source acronyms: Relatório de Segurança de Barragens (RSB, Dams Safety Report of Brazil), Open Development
Cambodia (ODC), Managing Aquatic ecosystems and water Resources under multiple Stress project (MARS), Open
Development Myanmar (ODM), List of Registered Dams (LRD) of South Africa, National Inventory of Dams (NID) of US, 160
National Platform for Common Geospatial Information Services (NPCGIS) of China, National Register of Large Dams
(NRLD) of India, and Japan Dam Foundation (JDF). Regional inventories were collected with partial reference to the Global
Dam Watch project (http://globaldamwatch.org). NID records was accessed through the R package compiled by Goteti and
Stachelek (2016). See full registers, references, and download links in the reference list.
These seven registers/inventories cover Brazil, Canada, the United States, most European countries (including part of 165
Russia), South Africa, and part of Southeast Asia, with a total dam count of nearly 110,000. Besides spatial coordinates, each
of these registers also provides attributes for their documented dams, which were required by the geo-matching process.
https://doi.org/10.5194/essd-2021-58
Ope
n A
cces
s Earth System
Science
DataD
iscussio
ns
Preprint. Discussion started: 24 March 2021c© Author(s) 2021. CC BY 4.0 License.
8
While other dam inventories could be available, our geo-matching effort for GeoDAR v1.0 was focused on these collected
ones. However, we referred to additional registers from China, India, and Japan (Table 2) for the validation of our WRD
geocoding (see Validation). For these additional regional registers, it was either difficult to bulk-download the dam records, 170
or we were legally restricted from releasing their dam coordinates, as was the case for China, and therefore, we only used
these registers for the purpose of validation.
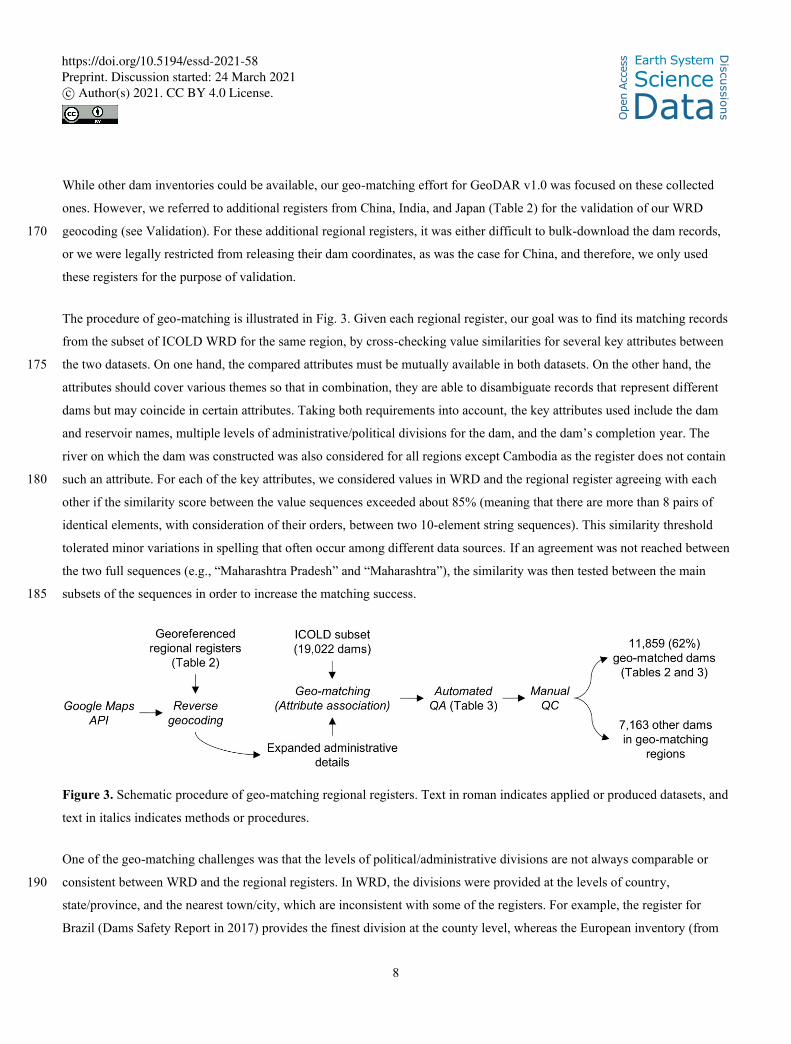
The procedure of geo-matching is illustrated in Fig. 3. Given each regional register, our goal was to find its matching records
from the subset of ICOLD WRD for the same region, by cross-checking value similarities for several key attributes between
the two datasets. On one hand, the compared attributes must be mutually available in both datasets. On the other hand, the 175
attributes should cover various themes so that in combination, they are able to disambiguate records that represent different
dams but may coincide in certain attributes. Taking both requirements into account, the key attributes used include the dam
and reservoir names, multiple levels of administrative/political divisions for the dam, and the dam’s completion year. The
river on which the dam was constructed was also considered for all regions except Cambodia as the register does not contain
such an attribute. For each of the key attributes, we considered values in WRD and the regional register agreeing with each 180
other if the similarity score between the value sequences exceeded about 85% (meaning that there are more than 8 pairs of
identical elements, with consideration of their orders, between two 10-element string sequences). This similarity threshold
tolerated minor variations in spelling that often occur among different data sources. If an agreement was not reached between
the two full sequences (e.g., “Maharashtra Pradesh” and “Maharashtra”), the similarity was then tested between the main
subsets of the sequences in order to increase the matching success. 185
Figure 3. Schematic procedure of geo-matching regional registers. Text in roman indicates applied or produced datasets, and
text in italics indicates methods or procedures.
One of the geo-matching challenges was that the levels of political/administrative divisions are not always comparable or
consistent between WRD and the regional registers. In WRD, the divisions were provided at the levels of country, 190
state/province, and the nearest town/city, which are inconsistent with some of the registers. For example, the register for
Brazil (Dams Safety Report in 2017) provides the finest division at the county level, whereas the European inventory (from
https://doi.org/10.5194/essd-2021-58
Ope
n A
cces
s Earth System
Science
DataD
iscussio
ns
Preprint. Discussion started: 24 March 2021c© Author(s) 2021. CC BY 4.0 License.
9
the MARS (Managing Aquatic ecosystems and water Resources under multiple Stress) project) documents no divisions
below the national level. To improve the feasibility in division comparison, we performed a “reverse geocoding” for each
georeferenced regional register using the Google Maps geocoding API. Opposite to a regular (or the so-called “forward”) 195
geocoding process, this reverse geocoding converts the documented spatial coordinates of each dam, to a parsed address with
an array of divisions at consecutive administrative levels. These multi-level divisions and subdivisions were appended to the
original regional registers (Fig. 3), thus enabling a more flexible and complete comparison with the WRD attributes and thus
an increased success rate of geo-matching.
We considered a WRD record matched with a regional record if their agreements on the key attributes warranted a 200
reasonable confidence that the two are the same dam. In principle, a high confidence would require a unanimous agreement
on all key attributes. However, this ideal scenario was often unnecessary and sometimes impossible. One of the reasons is
that the key attributes do not always have valid values. In WRD, for instance, the values of “nearest town” for nearly all
(>99%) US dams are null. While this attribute is valid for most other dams, the nearest town/city in WRD is not necessarily
the division that administrates or contains the dam as is the case in the township in some regional registers. Another reason is 205
that our collected multi-source datasets were not collated by a universal standard. As a result, inherent discrepancies of the
attribute definitions and/or values may exist among the datasets. One example is the dam’s “completion year”, which could
be ambiguous between the year when the dam construction was concluded and the year when the dam operation was
initiated or commissioned. These two definitions do not necessarily lead to the same year. To address such inconsistencies,
we defined a baseline scenario that required any pair of matched WRD and regional records to agree on the following: 210
• Dam or reservoir name,
• Country, state/province if values are valid, and
• At a minimum, (a) either completion year or river if the town/city values disagree or are invalid, or (b) town/city
when completion years and rivers do not both disagree.
In compliance with this baseline, we further ranked our geo-matched WRD records according to their specific scenarios of 215
attribute agreements to three general QA levels (M1, M2, and M3 as explained in Table 3). As the QA level increases (from
M3 to M1), agreements on the key attributes improved from the baseline to the ideal scenario (i.e., a unanimous agreement).
Users may refer to the provided QA levels as an indicator of the general reliability of each geo-matched location.
Following the automated geo-matching process, we performed a manual QC to verify whether the attribute values in the
matched WRD records in fact agreed with those in the source regional registers. It is worth noting that our geo-matching 220
purpose was to acquire the spatial coordinates of any matched WRD record from the regional register, rather than collating
or correcting any existing attribute values. In other words, some of the WRD and regional records may actually refer to the
same dams but were not matched successfully due to major discrepancies between their attribute values. This led to a
conservative success rates in our automated geo-matching. In addition, our manual QC identified that about 3% of the geo-
https://doi.org/10.5194/essd-2021-58
Ope
n A
cces
s Earth System
Science
DataD
iscussio
ns
Preprint. Discussion started: 24 March 2021c© Author(s) 2021. CC BY 4.0 License.
10
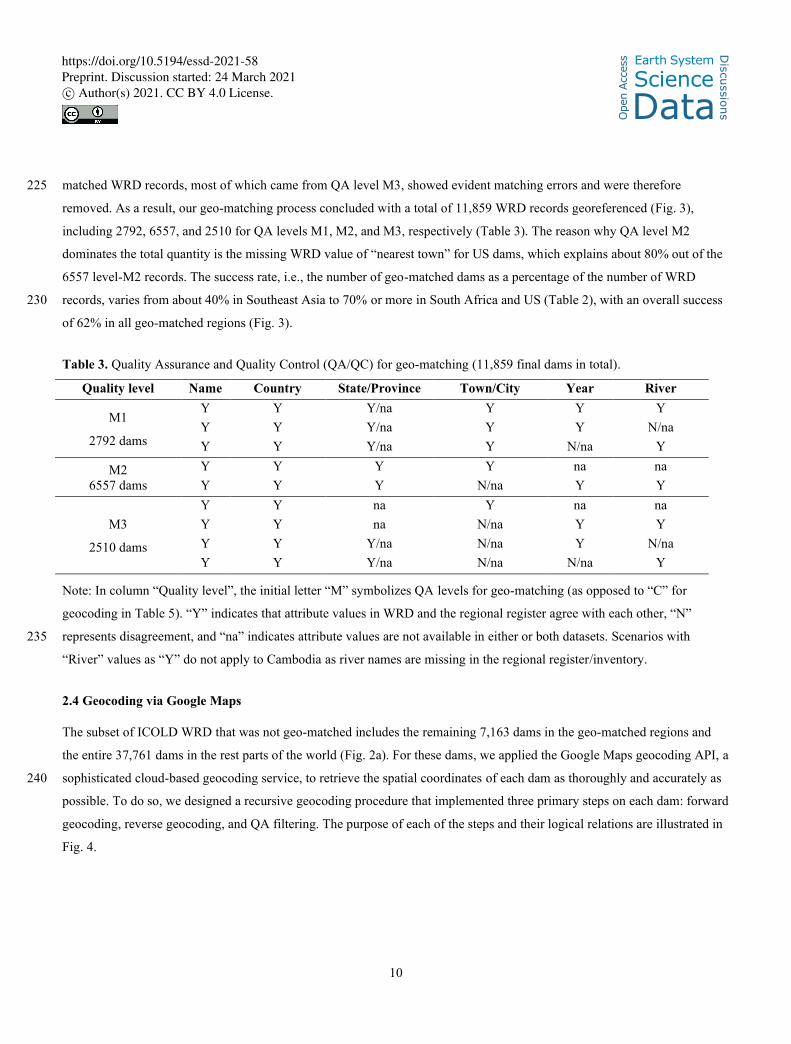
matched WRD records, most of which came from QA level M3, showed evident matching errors and were therefore 225
removed. As a result, our geo-matching process concluded with a total of 11,859 WRD records georeferenced (Fig. 3),
including 2792, 6557, and 2510 for QA levels M1, M2, and M3, respectively (Table 3). The reason why QA level M2
dominates the total quantity is the missing WRD value of “nearest town” for US dams, which explains about 80% out of the
6557 level-M2 records. The success rate, i.e., the number of geo-matched dams as a percentage of the number of WRD
records, varies from about 40% in Southeast Asia to 70% or more in South Africa and US (Table 2), with an overall success 230
of 62% in all geo-matched regions (Fig. 3).
Table 3. Quality Assurance and Quality Control (QA/QC) for geo-matching (11,859 final dams in total).
Quality level Name Country State/Province Town/City Year River
M1
2792 dams
Y Y Y/na Y Y Y
Y Y Y/na Y Y N/na
Y Y Y/na Y N/na Y
M2
6557 dams
Y Y Y Y na na
Y Y Y N/na Y Y
M3
2510 dams
Y Y na Y na na
Y Y na N/na Y Y
Y Y Y/na N/na Y N/na
Y Y Y/na N/na N/na Y
Note: In column “Quality level”, the initial letter “M” symbolizes QA levels for geo-matching (as opposed to “C” for
geocoding in Table 5). “Y” indicates that attribute values in WRD and the regional register agree with each other, “N”
represents disagreement, and “na” indicates attribute values are not available in either or both datasets. Scenarios with 235
“River” values as “Y” do not apply to Cambodia as river names are missing in the regional register/inventory.
2.4 Geocoding via Google Maps
The subset of ICOLD WRD that was not geo-matched includes the remaining 7,163 dams in the geo-matched regions and
the entire 37,761 dams in the rest parts of the world (Fig. 2a). For these dams, we applied the Google Maps geocoding API, a
sophisticated cloud-based geocoding service, to retrieve the spatial coordinates of each dam as thoroughly and accurately as 240
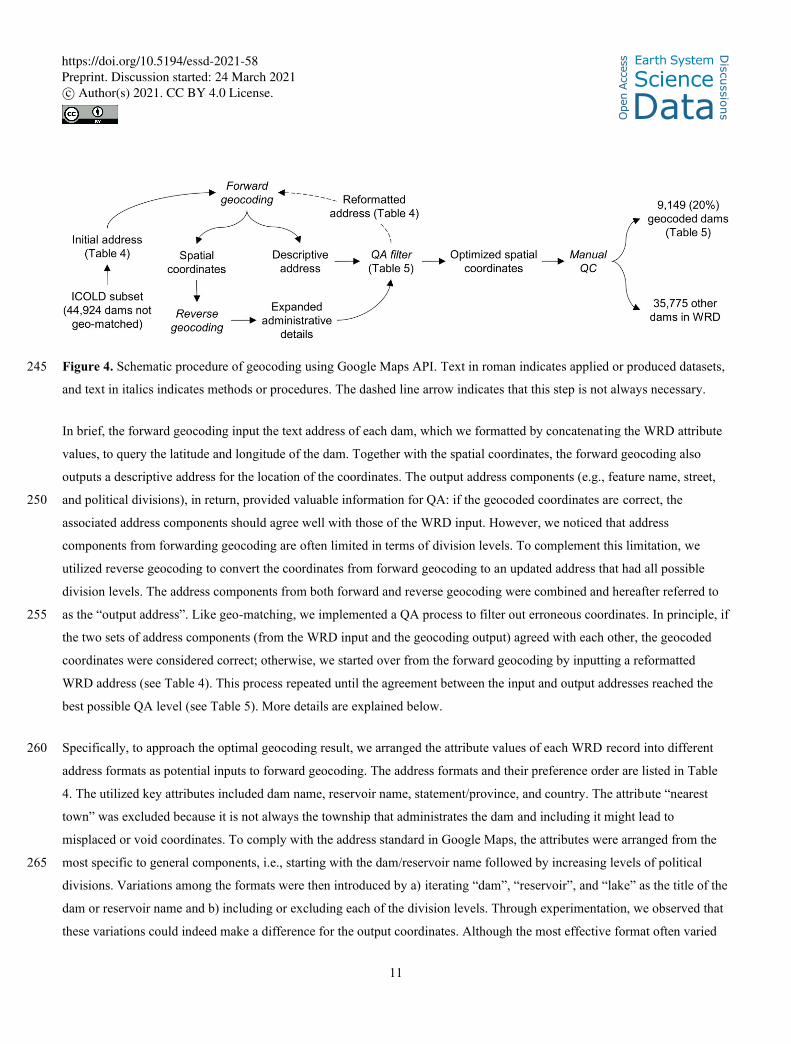
possible. To do so, we designed a recursive geocoding procedure that implemented three primary steps on each dam: forward
geocoding, reverse geocoding, and QA filtering. The purpose of each of the steps and their logical relations are illustrated in
Fig. 4.
https://doi.org/10.5194/essd-2021-58
Ope
n A
cces
s Earth System
Science
DataD
iscussio
ns
Preprint. Discussion started: 24 March 2021c© Author(s) 2021. CC BY 4.0 License.
11
Figure 4. Schematic procedure of geocoding using Google Maps API. Text in roman indicates applied or produced datasets, 245
and text in italics indicates methods or procedures. The dashed line arrow indicates that this step is not always necessary.
In brief, the forward geocoding input the text address of each dam, which we formatted by concatenating the WRD attribute
values, to query the latitude and longitude of the dam. Together with the spatial coordinates, the forward geocoding also
outputs a descriptive address for the location of the coordinates. The output address components (e.g., feature name, street,
and political divisions), in return, provided valuable information for QA: if the geocoded coordinates are correct, the 250
associated address components should agree well with those of the WRD input. However, we noticed that address
components from forwarding geocoding are often limited in terms of division levels. To complement this limitation, we
utilized reverse geocoding to convert the coordinates from forward geocoding to an updated address that had all possible
division levels. The address components from both forward and reverse geocoding were combined and hereafter referred to
as the “output address”. Like geo-matching, we implemented a QA process to filter out erroneous coordinates. In principle, if 255
the two sets of address components (from the WRD input and the geocoding output) agreed with each other, the geocoded
coordinates were considered correct; otherwise, we started over from the forward geocoding by inputting a reformatted
WRD address (see Table 4). This process repeated until the agreement between the input and output addresses reached the
best possible QA level (see Table 5). More details are explained below.
Specifically, to approach the optimal geocoding result, we arranged the attribute values of each WRD record into different 260
address formats as potential inputs to forward geocoding. The address formats and their preference order are listed in Table
4. The utilized key attributes included dam name, reservoir name, statement/province, and country. The attribute “nearest
town” was excluded because it is not always the township that administrates the dam and including it might lead to
misplaced or void coordinates. To comply with the address standard in Google Maps, the attributes were arranged from the
most specific to general components, i.e., starting with the dam/reservoir name followed by increasing levels of political 265
divisions. Variations among the formats were then introduced by a) iterating “dam”, “reservoir”, and “lake” as the title of the
dam or reservoir name and b) including or excluding each of the division levels. Through experimentation, we observed that
these variations could indeed make a difference for the output coordinates. Although the most effective format often varied
https://doi.org/10.5194/essd-2021-58
Ope
n A
cces
s Earth System
Science
DataD
iscussio
ns
Preprint. Discussion started: 24 March 2021c© Author(s) 2021. CC BY 4.0 License.
12
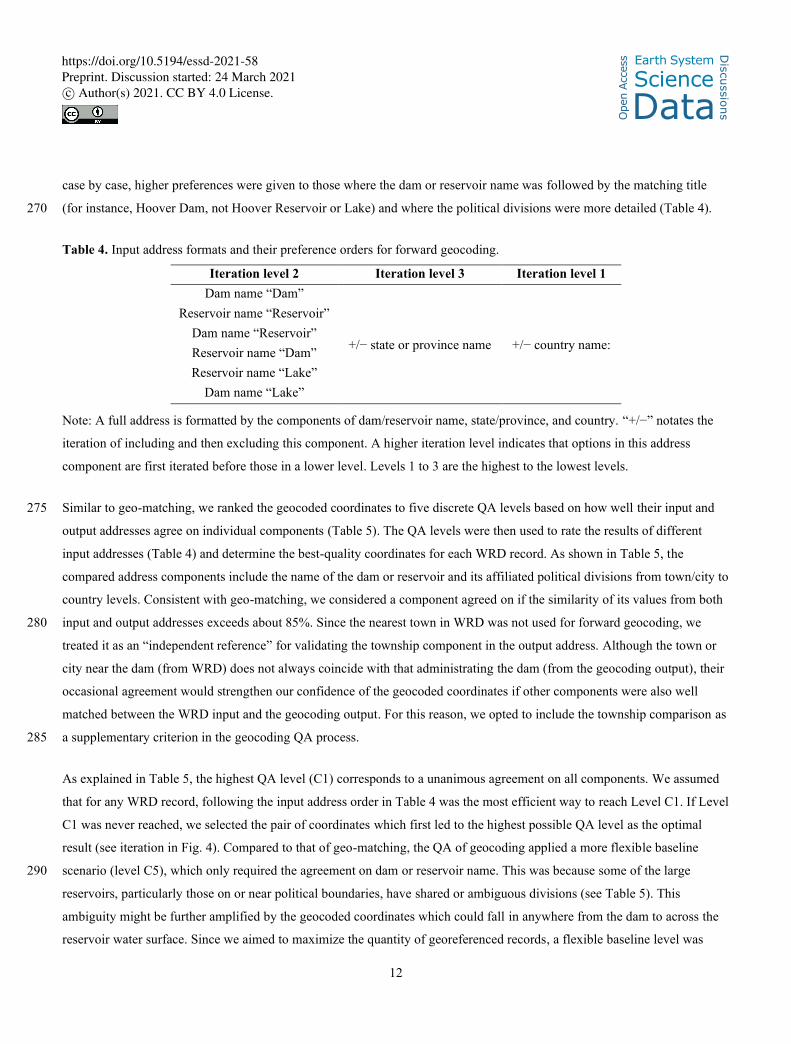
case by case, higher preferences were given to those where the dam or reservoir name was followed by the matching title
(for instance, Hoover Dam, not Hoover Reservoir or Lake) and where the political divisions were more detailed (Table 4). 270
Table 4. Input address formats and their preference orders for forward geocoding.
Iteration level 2 Iteration level 3 Iteration level 1
Dam name “Dam”
+/− state or province name +/− country name:
Reservoir name “Reservoir”
Dam name “Reservoir”
Reservoir name “Dam”
Reservoir name “Lake”
Dam name “Lake”
Note: A full address is formatted by the components of dam/reservoir name, state/province, and country. “+/−” notates the
iteration of including and then excluding this component. A higher iteration level indicates that options in this address
component are first iterated before those in a lower level. Levels 1 to 3 are the highest to the lowest levels.
Similar to geo-matching, we ranked the geocoded coordinates to five discrete QA levels based on how well their input and 275
output addresses agree on individual components (Table 5). The QA levels were then used to rate the results of different
input addresses (Table 4) and determine the best-quality coordinates for each WRD record. As shown in Table 5, the
compared address components include the name of the dam or reservoir and its affiliated political divisions from town/city to
country levels. Consistent with geo-matching, we considered a component agreed on if the similarity of its values from both
input and output addresses exceeds about 85%. Since the nearest town in WRD was not used for forward geocoding, we 280
treated it as an “independent reference” for validating the township component in the output address. Although the town or
city near the dam (from WRD) does not always coincide with that administrating the dam (from the geocoding output), their
occasional agreement would strengthen our confidence of the geocoded coordinates if other components were also well
matched between the WRD input and the geocoding output. For this reason, we opted to include the township comparison as
a supplementary criterion in the geocoding QA process. 285
As explained in Table 5, the highest QA level (C1) corresponds to a unanimous agreement on all components. We assumed
that for any WRD record, following the input address order in Table 4 was the most efficient way to reach Level C1. If Level
C1 was never reached, we selected the pair of coordinates which first led to the highest possible QA level as the optimal
result (see iteration in Fig. 4). Compared to that of geo-matching, the QA of geocoding applied a more flexible baseline
scenario (level C5), which only required the agreement on dam or reservoir name. This was because some of the large 290
reservoirs, particularly those on or near political boundaries, have shared or ambiguous divisions (see Table 5). This
ambiguity might be further amplified by the geocoded coordinates which could fall in anywhere from the dam to across the
reservoir water surface. Since we aimed to maximize the quantity of georeferenced records, a flexible baseline level was
https://doi.org/10.5194/essd-2021-58
Ope
n A
cces
s Earth System
Science
DataD
iscussio
ns
Preprint. Discussion started: 24 March 2021c© Author(s) 2021. CC BY 4.0 License.
13
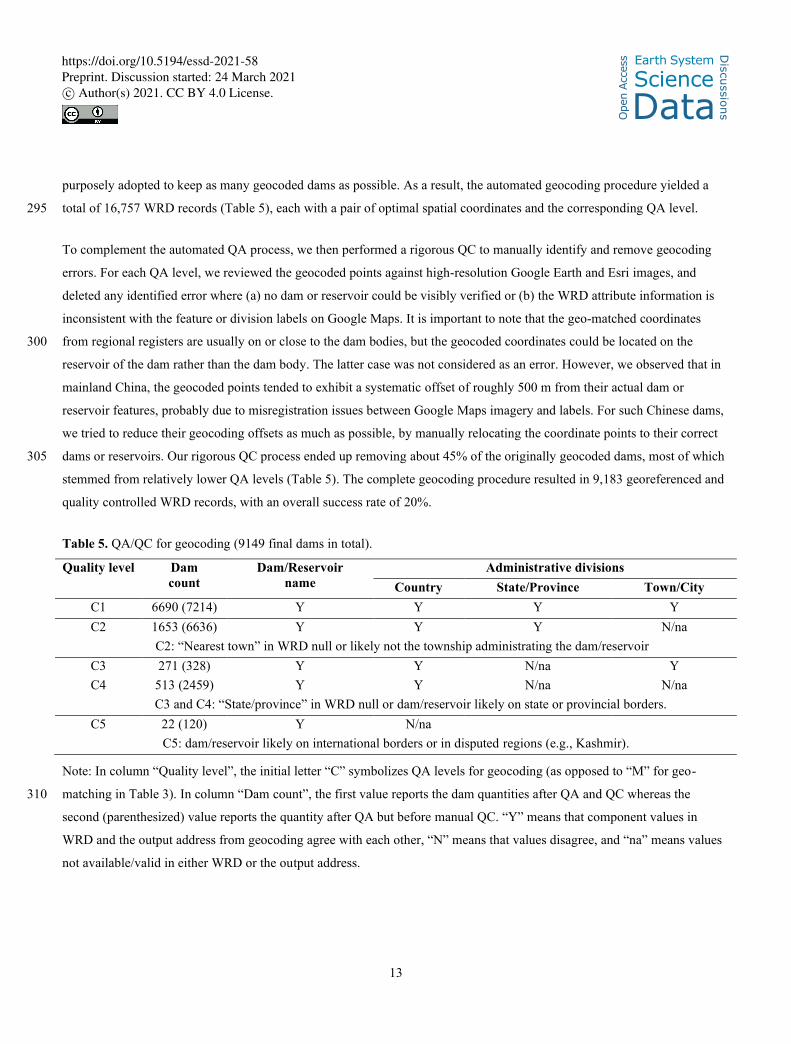
purposely adopted to keep as many geocoded dams as possible. As a result, the automated geocoding procedure yielded a
total of 16,757 WRD records (Table 5), each with a pair of optimal spatial coordinates and the corresponding QA level. 295
To complement the automated QA process, we then performed a rigorous QC to manually identify and remove geocoding
errors. For each QA level, we reviewed the geocoded points against high-resolution Google Earth and Esri images, and
deleted any identified error where (a) no dam or reservoir could be visibly verified or (b) the WRD attribute information is
inconsistent with the feature or division labels on Google Maps. It is important to note that the geo-matched coordinates
from regional registers are usually on or close to the dam bodies, but the geocoded coordinates could be located on the 300
reservoir of the dam rather than the dam body. The latter case was not considered as an error. However, we observed that in
mainland China, the geocoded points tended to exhibit a systematic offset of roughly 500 m from their actual dam or
reservoir features, probably due to misregistration issues between Google Maps imagery and labels. For such Chinese dams,
we tried to reduce their geocoding offsets as much as possible, by manually relocating the coordinate points to their correct
dams or reservoirs. Our rigorous QC process ended up removing about 45% of the originally geocoded dams, most of which 305
stemmed from relatively lower QA levels (Table 5). The complete geocoding procedure resulted in 9,183 georeferenced and
quality controlled WRD records, with an overall success rate of 20%.
Table 5. QA/QC for geocoding (9149 final dams in total).
Quality level Dam
count
Dam/Reservoir
name
Administrative divisions
Country State/Province Town/City
C1 6690 (7214) Y Y Y Y
C2 1653 (6636) Y Y Y N/na
C2: “Nearest town” in WRD null or likely not the township administrating the dam/reservoir
C3 271 (328) Y Y N/na Y
C4 513 (2459) Y Y N/na N/na
C3 and C4: “State/province” in WRD null or dam/reservoir likely on state or provincial borders.
C5 22 (120) Y N/na
C5: dam/reservoir likely on international borders or in disputed regions (e.g., Kashmir).
Note: In column “Quality level”, the initial letter “C” symbolizes QA levels for geocoding (as opposed to “M” for geo-
matching in Table 3). In column “Dam count”, the first value reports the dam quantities after QA and QC whereas the 310
second (parenthesized) value reports the quantity after QA but before manual QC. “Y” means that component values in
WRD and the output address from geocoding agree with each other, “N” means that values disagree, and “na” means values
not available/valid in either WRD or the output address.
https://doi.org/10.5194/essd-2021-58
Ope
n A
cces
s Earth System
Science
DataD
iscussio
ns
Preprint. Discussion started: 24 March 2021c© Author(s) 2021. CC BY 4.0 License.
14
2.5 Supplementation with other global inventories
The outputs from both geo-matching and geocoding, a total of 21,008 georeferenced ICOLD WRD records (Fig. 2a), was 315
further supplemented or harmonized by two global dam/reservoir inventories to improve our inclusion of the world’s largest
dams. We considered this process necessary for two reasons. First, our georeferencing process, particularly geocoding via
Google Maps API, did not warrant an exhaustive inclusion of the largest dams. This is particularly evident for regions where
the address and label information in Google Maps is either lacking or difficult to pass the automated QA due to language
ambiguity or naming discrepancies. Second, through cross-referencing we noted that the attribute values of reservoir storage 320
capacity provided in ICOLD WRD are occasionally erroneous, e.g., by a factor of 1000 probably caused by unit confusion in
WRD compilation. As part of the supplementation/harmonization process, we therefore collated the ICOLD reservoir storage
capacities with those in the two global inventories below and corrected any evident errors in ICOLD.
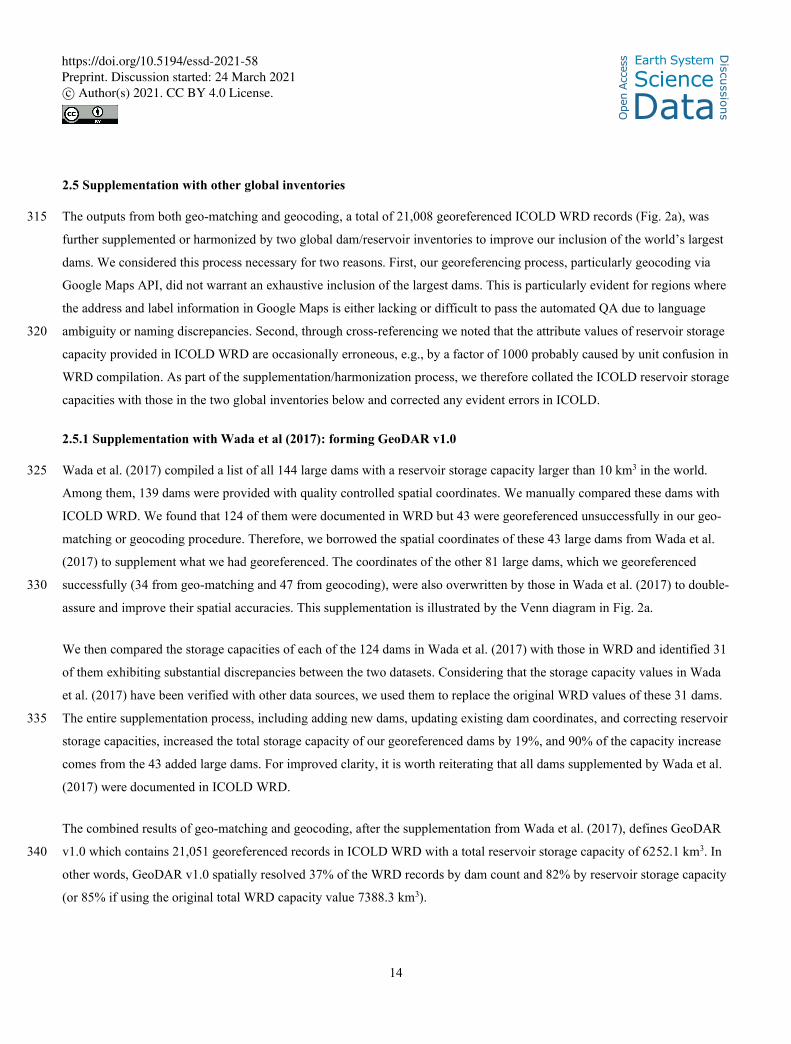
2.5.1 Supplementation with Wada et al (2017): forming GeoDAR v1.0
Wada et al. (2017) compiled a list of all 144 large dams with a reservoir storage capacity larger than 10 km3 in the world. 325
Among them, 139 dams were provided with quality controlled spatial coordinates. We manually compared these dams with
ICOLD WRD. We found that 124 of them were documented in WRD but 43 were georeferenced unsuccessfully in our geo-
matching or geocoding procedure. Therefore, we borrowed the spatial coordinates of these 43 large dams from Wada et al.
(2017) to supplement what we had georeferenced. The coordinates of the other 81 large dams, which we georeferenced
successfully (34 from geo-matching and 47 from geocoding), were also overwritten by those in Wada et al. (2017) to double-330
assure and improve their spatial accuracies. This supplementation is illustrated by the Venn diagram in Fig. 2a.
We then compared the storage capacities of each of the 124 dams in Wada et al. (2017) with those in WRD and identified 31
of them exhibiting substantial discrepancies between the two datasets. Considering that the storage capacity values in Wada
et al. (2017) have been verified with other data sources, we used them to replace the original WRD values of these 31 dams.
The entire supplementation process, including adding new dams, updating existing dam coordinates, and correcting reservoir 335
storage capacities, increased the total storage capacity of our georeferenced dams by 19%, and 90% of the capacity increase
comes from the 43 added large dams. For improved clarity, it is worth reiterating that all dams supplemented by Wada et al.
(2017) were documented in ICOLD WRD.
The combined results of geo-matching and geocoding, after the supplementation from Wada et al. (2017), defines GeoDAR
v1.0 which contains 21,051 georeferenced records in ICOLD WRD with a total reservoir storage capacity of 6252.1 km3. In 340
other words, GeoDAR v1.0 spatially resolved 37% of the WRD records by dam count and 82% by reservoir storage capacity
(or 85% if using the original total WRD capacity value 7388.3 km3).
https://doi.org/10.5194/essd-2021-58
Ope
n A
cces
s Earth System
Science
DataD
iscussio
ns
Preprint. Discussion started: 24 March 2021c© Author(s) 2021. CC BY 4.0 License.
15
2.5.2 Harmonization with GRanD: forming GeoDAR v1.1
While GeoDAR v1.0 largely exceeds GRanD in dam count, a visual comparison of their spatial distributions revealed that
the latter is often complementary to (instead of completely duplicated by) the former in many regions of the world. This 345
motivated us to perform a systematic harmonization between the two datasets. The merged version, which we entitled
GeoDAR v1.1, combines the merits of GRanD in accurately documenting the world’s largest dams and GeoDAR v1.0 in
providing unprecedented spatial details of smaller but more widespread dams (see Disclaimer section for citation courtesy).
Compared with other global inventories such as GOODD which only emphasized spatial locations, GeoDAR v1.1 also
enables the access to many critical attributes of each of the georeferenced dams through the ICOLD WRD website (see 350
Section 3 for more comparisons).
We assumed that GRanD, by having collated multiple data sources, is superior to GeoDAR v1.0 in the accuracies of both
spatial locations and attribute values (particularly reservoir storage capacity) of the world’s largest dams. Following this
assumption, the harmonizing process (Fig. 5) aimed to achieve four major objectives:
• Improving spatial coordinates of the dam points in GeoDAR v1.0, 355
• Adding WRD dams that are not georeferenced in GeoDAR v1.0 but are included by GRanD,
• Correcting storage capacity errors in the georeferenced WRD, and
• Absorbing the remaining GRanD dams that are not documented in WRD.
Detailed processing for each of the objectives is given below.
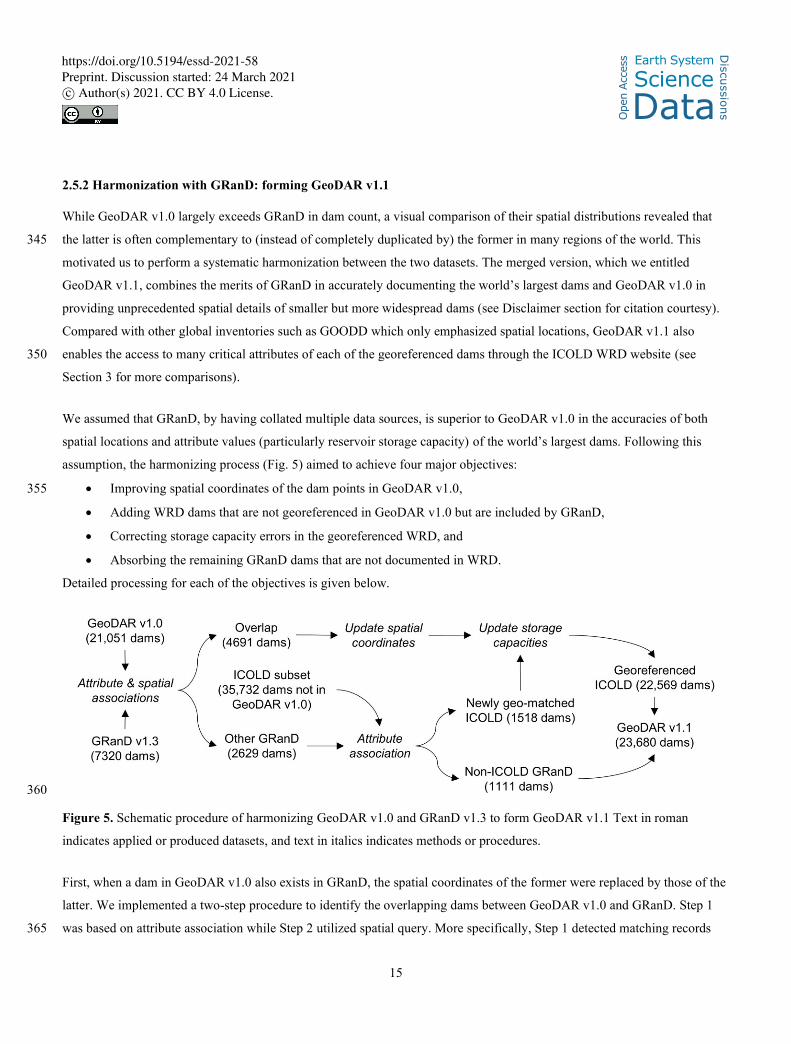
360
Figure 5. Schematic procedure of harmonizing GeoDAR v1.0 and GRanD v1.3 to form GeoDAR v1.1 Text in roman
indicates applied or produced datasets, and text in italics indicates methods or procedures.
First, when a dam in GeoDAR v1.0 also exists in GRanD, the spatial coordinates of the former were replaced by those of the
latter. We implemented a two-step procedure to identify the overlapping dams between GeoDAR v1.0 and GRanD. Step 1
was based on attribute association while Step 2 utilized spatial query. More specifically, Step 1 detected matching records 365
https://doi.org/10.5194/essd-2021-58
Ope
n A
cces
s Earth System
Science
DataD
iscussio
ns
Preprint. Discussion started: 24 March 2021c© Author(s) 2021. CC BY 4.0 License.
16
between ICOLD WRD and GRanD by assessing agreements on several attributes, including dam/reservoir names,
administrative divisions, impounded rivers, and completion years. This step was essentially the same as the “geo-matching”
process that was used to link WRD records to regional registers for GeoDAR v1.0 (Section 2.3). The association results,
after a meticulous manual QC, identified 4258 dams in GRanD that were georeferenced in GeoDAR v1.0. For the remaining
3062 dams in GRanD, Step 2 utilized their reservoir polygons to spatially intersect with the dam points in GeoDAR v1.0. A 370
distance tolerance of 500 m was applied in the spatial intersection to account for occasional geographic offsets in GeoDAR
v1.0 (such as in mainland China; see Section 2.4). As part of the QC, the attribute values of each intersecting pair (one from
GRanD and the other from WRD) were manually compared to determine whether they are indeed the same dam. This step
identified another 433 overlapping dams between the two datasets. In total, we found that GeoDAR v1.0 overlaps 4691 out
of the 7320 dams in GRanD, and their spatial coordinates were updated to be consistent with those in GRanD. 375
Second, for the remaining 2629 dams in GRanD that do not overlap GeoDAR v1.0, we assumed that at least part of them
could be matched to the WRD records that were not georeferenced in GeoDAR v1.0. Therefore, we performed another round
of attribute association between the remaining subsets of GRanD and WRD, with a purpose of including as many WRD
records as possible by fully exploiting what is already available in GRanD. After QC, this process identified another 1518
WRD dams that are included in GRanD. These additional WRD dams, with a total storage capacity of 671 km3, were then 380
added to our inventory using the spatial coordinates provided in GRanD. As a result of the first two objectives, GeoDAR
v1.1 georeferenced 22,569 (40%) out of the 56,783 dams in ICOLD WRD, including 6209 that overlap GRanD.
Third, to reduce the impact of possible attribute errors in ICOLD WRD, we next merged the values of reservoir storage
capacity from both WRD and GRanD to a single updated attribute, where the original values in WRD or Wada et al. (2017)
were overwritten by those of the overlapping dams in GRanD. This correction led to a minor decrease of 30 km3 (less than 385
1%) in the total reservoir storage capacity. Eventually, the remaining 1111 dams in GRanD, which were not found in ICOLD
WRD, were appended to the 22,569 georeferenced WRD dams so that our final inventory absorbed the entire dataset of
GRanD. It is worth noting that similar to geo-matching (Section 2.3), our attribute association here could be conservative,
meaning that some of the dams appended from GRanD might be documented in the remaining WRD (the subset not
georeferenced successfully). 390
The harmonized dataset, GeoDAR v1.1, contains a total of 23,680 georeferenced dam points, including 16,360 from WRD
alone, 6209 shared between WRD and GRanD, and the other 1111 from GRanD alone (Fig. 2b). Although this number of
dams is still about 42% of that of WRD, the total reservoir storage capacity in GeoDAR v1.1 reaches 7486 km3, which
matches the scale of the original WRD (7388 km3). In comparison, the remaining 34,214 WRD dams not included by
GeoDAR v1.1 own a total reservoir storage capacity of 716 km3 (or less than 10%), indicating that we have thus far 395
georeferenced some of the most capacious and influential dams in ICOLD WRD.
https://doi.org/10.5194/essd-2021-58
Ope
n A
cces
s Earth System
Science
DataD
iscussio
ns
Preprint. Discussion started: 24 March 2021c© Author(s) 2021. CC BY 4.0 License.
17
2.6 Retrieving reservoir boundaries
In addition to the 23,680 georeferenced dam points, GeoDAR v1.1 also includes their associated reservoir boundaries which
we retrieved as thoroughly as possible from three global water body datasets: GRanD reservoirs (Lehner et al., 2011),
HydroLAKES v1.0 (Messager et al., 2016), and UCLA Circa-2015 Lake Inventory (Sheng et al., 2016). These three water 400
body datasets exhibit an increasing spatial resolution: from 7000+ polygons in GRanD reservoirs provided exclusively for
GRanD’s dam points, to millions of water body polygons, including both natural lakes and reservoirs, in the other two
datasets. While HydroLAKES documents 1.4 million water bodies larger than 0.1 km2 (10 ha), the Landsat-based UCLA
Circa-2015 Lake Inventory further reduced the minimum size to only 0.004 km2 (0.4 ha), resulting in another 7.7 million
water bodies on the global continental surface. Accordingly, we implemented a hierarchical procedure, where the three water 405
body datasets were applied in ascending order of spatial resolution to retrieve the reservoir boundaries with an overall
decreasing size.
Specifically, GRanD v1.3 provides 7250 reservoir polygons for the 7320 collected dam points. The remaining 70 dams
without reservoir polygons are either river barrages and thus have no proper reservoirs, or infrastructures that were too recent
to have filled impoundments. Other rarer cases also include dams that were abandoned or to be constructed (Lehner et al., 410
2011). These 7250 reservoir polygons were assigned to their associated dam points in GeoDAR v1.1 through GRanD IDs.
Reservoirs of the remaining 16,360 dam points in GeoDAR v1.1, which were georeferenced from ICOLD alone, were next
retrieved from HydroLAKES when possible. To avoid duplicates in the reservoirs retrieved from different data sources, we
only used the subset of HydroLAKES that is spatially independent from (i.e., not intersecting with) GRanD reservoirs.
Different from reservoir assignment using GRanD, there was no common attribute ID to pair HydroLAKES polygons with 415
the remaining dam points, so their reservoir retrieval relied completely on spatial association. One major challenge in dam-
reservoir spatial association was the ambiguity caused by the offsets between our georeferenced dam points and their actual
reservoir polygons (see Section 2.4).
To tackle this ambiguity, we designed a procedure that consists of three rounds of iteration to progressively optimize
reservoir-dam association. This procedure was based on two assumptions, both conditional on a reasonable spatial tolerance. 420
We started with 500 m to be consistent with the georeferencing offset (e.g., observed in China). The first assumption was
that larger reservoirs are more likely to be documented than smaller ones, in both ICOLD WRD and Google Maps.
Therefore, the first round of iteration assigned each of the dams to the largest water body within the tolerance. This
assignment might, however, lead to a situation where multiple dams were assigned to the same reservoir. To untangle this
situation, the remaining iterations assumed Tobler’s First Law of Geography (Tobler, 1970): “everything is related to 425
everything else, but near things are more related than distant things” (p.236). Accordingly, for any water body mistakenly
associated with multiple dams, the second round of iteration reassigned the water body to its closest dam, and the other
dam(s) within the tolerance, as a result, was/were left unpaired. To reduce the number of such “orphan” dams, a final, third
https://doi.org/10.5194/essd-2021-58
Ope
n A
cces
s Earth System
Science
DataD
iscussio
ns
Preprint. Discussion started: 24 March 2021c© Author(s) 2021. CC BY 4.0 License.
18
round of iteration assigned the remaining unpaired dams to the next closest water body that was within the spatial tolerance
and had not been previously associated with any dams. If this led to multiple dams associated with one reservoir again, only 430
the dam with the closest proximity to the reservoir was kept. Through experimentation, we opted to implement this three-
iteration procedure twice, first using a conservative 500-m tolerance to maximize the accuracy for most associations, and
then a 1-km tolerance to further minimize the number of orphan dams.
This multi-iteration procedure retrieved 6902 reservoir polygons from HydroLAKES. For the remaining 9458 dam points
left unpaired, we applied the same association procedure to continue retrieving their reservoirs from the high-resolution 435
UCLA Circa-2015 Lake Inventory. Similarly, only the subset that does not intersect with the 6902 HydroLAKES polygons
was considered, in order to avoid duplicates in the retrieved reservoirs from different datasets. The use of UCLA Circa-2015
Lake Inventory retrieved another 6062 reservoirs. Combining the results from all three water body datasets, 20,214 (85%)
out of the 23,680 georeferenced dams were paired with their reservoir polygons. To this end, both of the dam points and their
associated reservoir polygons were considered as the final product components in GeoDAR v1.1. 440
3 Results and discussions
3.1 Product components
Following method descriptions, here we present the product components of the two current versions for GeoDAR (v1.0 and
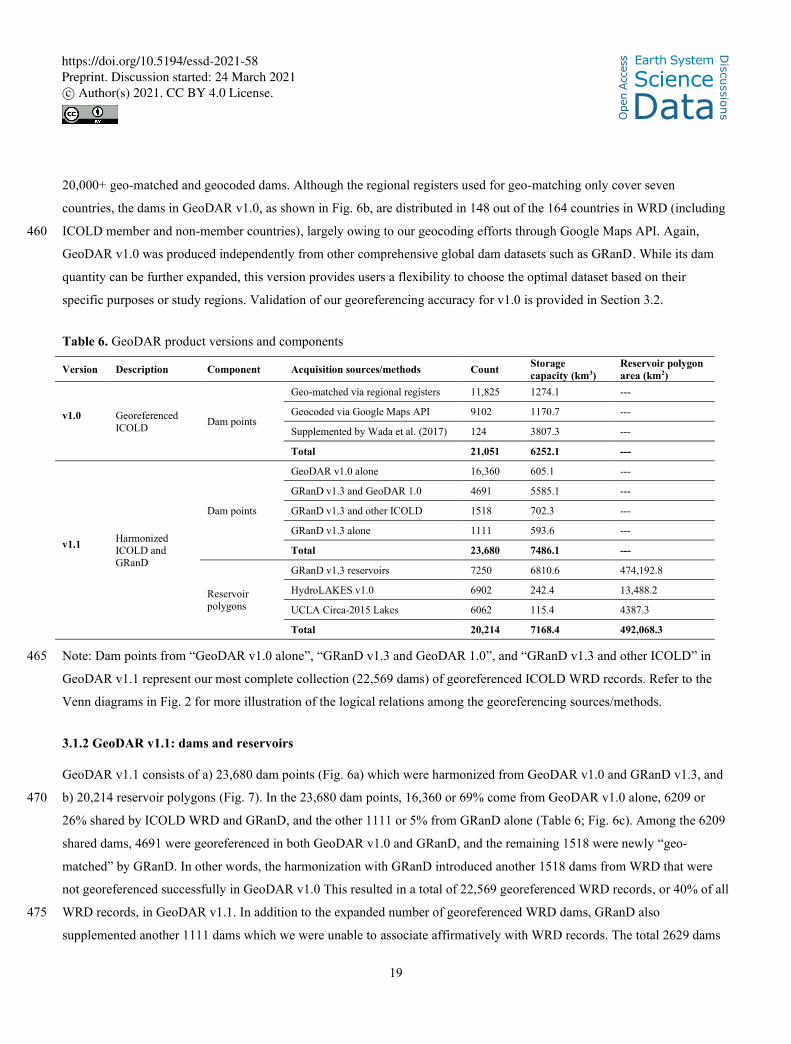
v1.1). Although previously summarized in Table 1, the two GeoDAR versions and their component statistics are further
explained in Table 6, and spatial distributions of the dam points and reservoir polygons are visualized in Figs. 6 and 7. 445
3.1.1 GeoDAR v1.0: dams
GeoDAR v1.0 is a collection of 21,051 dam points georeferenced exclusively for ICOLD WRD (Fig. 6a). In other words,
each dam point corresponds to the location of a unique WRD record, and the dam latitude and longitude coordinates were
acquired independently from GRanD. Among the 21,051 dam points, 11,825 or 56% were retrieved from geo-matching
regional dam registers, 9102 or 43% from Google Maps geocoding API, and the remaining 124 largest dams from the spatial 450
inventory in Wada et al. (2017) (Fig. 6b). For improved accuracies, the WRD storage capacities of these 124 large reservoirs
were replaced by the values in Wada et al. (2017) (see Section 2.5.1), and unless stated otherwise, our following statistics on
storage capacities were calculated after this replacement.
The total reservoir storage capacity of all the 21,051 dams is 6252.1 km3, meaning that GeoDAR v1.0 georeferenced 37% of
the 56,786 WRD records but included 82% of their cumulative reservoir storage capacity (7639 km3). The total storage 455
capacity of the 124 largest dams from Wada et al. (2017), despite being limited in number, reaches 3807 km3 or 61% of the
cumulative storage capacity in GeoDAR v1.0, and the other ~40% capacity was split almost equally between the remaining
https://doi.org/10.5194/essd-2021-58
Ope
n A
cces
s Earth System
Science
DataD
iscussio
ns
Preprint. Discussion started: 24 March 2021c© Author(s) 2021. CC BY 4.0 License.
19
20,000+ geo-matched and geocoded dams. Although the regional registers used for geo-matching only cover seven
countries, the dams in GeoDAR v1.0, as shown in Fig. 6b, are distributed in 148 out of the 164 countries in WRD (including
ICOLD member and non-member countries), largely owing to our geocoding efforts through Google Maps API. Again, 460
GeoDAR v1.0 was produced independently from other comprehensive global dam datasets such as GRanD. While its dam
quantity can be further expanded, this version provides users a flexibility to choose the optimal dataset based on their
specific purposes or study regions. Validation of our georeferencing accuracy for v1.0 is provided in Section 3.2.
Table 6. GeoDAR product versions and components
Version Description Component Acquisition sources/methods Count Storage
capacity (km3)
Reservoir polygon
area (km2)
v1.0
Georeferenced
ICOLD Dam points
Geo-matched via regional registers 11,825 1274.1 ---
Geocoded via Google Maps API 9102 1170.7 ---
Supplemented by Wada et al. (2017) 124 3807.3 ---
Total 21,051 6252.1 ---
v1.1
Harmonized ICOLD and
GRanD
Dam points
GeoDAR v1.0 alone 16,360 605.1 ---
GRanD v1.3 and GeoDAR 1.0 4691 5585.1 ---
GRanD v1.3 and other ICOLD 1518 702.3 ---
GRanD v1.3 alone 1111 593.6 ---
Total 23,680 7486.1 ---
Reservoir
polygons
GRanD v1.3 reservoirs 7250 6810.6 474,192.8
HydroLAKES v1.0 6902 242.4 13,488.2
UCLA Circa-2015 Lakes 6062 115.4 4387.3
Total 20,214 7168.4 492,068.3
Note: Dam points from “GeoDAR v1.0 alone”, “GRanD v1.3 and GeoDAR 1.0”, and “GRanD v1.3 and other ICOLD” in 465
GeoDAR v1.1 represent our most complete collection (22,569 dams) of georeferenced ICOLD WRD records. Refer to the
Venn diagrams in Fig. 2 for more illustration of the logical relations among the georeferencing sources/methods.
3.1.2 GeoDAR v1.1: dams and reservoirs
GeoDAR v1.1 consists of a) 23,680 dam points (Fig. 6a) which were harmonized from GeoDAR v1.0 and GRanD v1.3, and
b) 20,214 reservoir polygons (Fig. 7). In the 23,680 dam points, 16,360 or 69% come from GeoDAR v1.0 alone, 6209 or 470
26% shared by ICOLD WRD and GRanD, and the other 1111 or 5% from GRanD alone (Table 6; Fig. 6c). Among the 6209
shared dams, 4691 were georeferenced in both GeoDAR v1.0 and GRanD, and the remaining 1518 were newly “geo-
matched” by GRanD. In other words, the harmonization with GRanD introduced another 1518 dams from WRD that were
not georeferenced successfully in GeoDAR v1.0 This resulted in a total of 22,569 georeferenced WRD records, or 40% of all
WRD records, in GeoDAR v1.1. In addition to the expanded number of georeferenced WRD dams, GRanD also 475
supplemented another 1111 dams which we were unable to associate affirmatively with WRD records. The total 2629 dams
https://doi.org/10.5194/essd-2021-58
Ope
n A
cces
s Earth System
Science
DataD
iscussio
ns
Preprint. Discussion started: 24 March 2021c© Author(s) 2021. CC BY 4.0 License.
20
added by GRanD, shown as “GRanD v1.3 & other ICOLD” and “GRanD v1.3 only” in Fig. 6c, are distributed worldwide
and complement the results of v1.0 particularly in regions such as Africa and Central Asia, where geocoding using Google
Maps was challenging. After this ICOLD-GRanD harmonization, the spatial coverage of the dam points in GeoDAR v1.1
increased to 154 out of the 164 countries in WRD. 480
As described in Section 2.5.2, we substituted the reservoir storage capacities in GRanD for the original capacity values of
their overlapping WRD dams. As a result, the total reservoir storage capacity in GeoDAR v1.1 reaches 7486.1 km3, which
matches the cumulative capacity in the entire ICOLD WRD (see Section 3.4 for more comparisons with ICOLD). As
reported in Table 6, 75% (5585 km3) of the total storage capacity in GeoDAR v1.1 is explained by the 4691 relatively large
dams georeferenced in both GeoDAR v1.0 and GRanD. The 16,360 smaller dams from GeoDAR v1.0 alone contribute only 485
8% (605 km3) of the total storage capacity, which is comparable to the subset from GRanD alone (594 km3) or both GRanD
and other ICOLD WRD (702 km3). These capacity contributions suggest that compared to GRanD, the major improvement
of GeoDAR lies on the increased number of relatively small dams, rather than the increase in total storage capacity of the
dams (see Section 3.5 for more comparisons with GRanD).
https://doi.org/10.5194/essd-2021-58
Ope
n A
cces
s Earth System
Science
DataD
iscussio
ns
Preprint. Discussion started: 24 March 2021c© Author(s) 2021. CC BY 4.0 License.
21
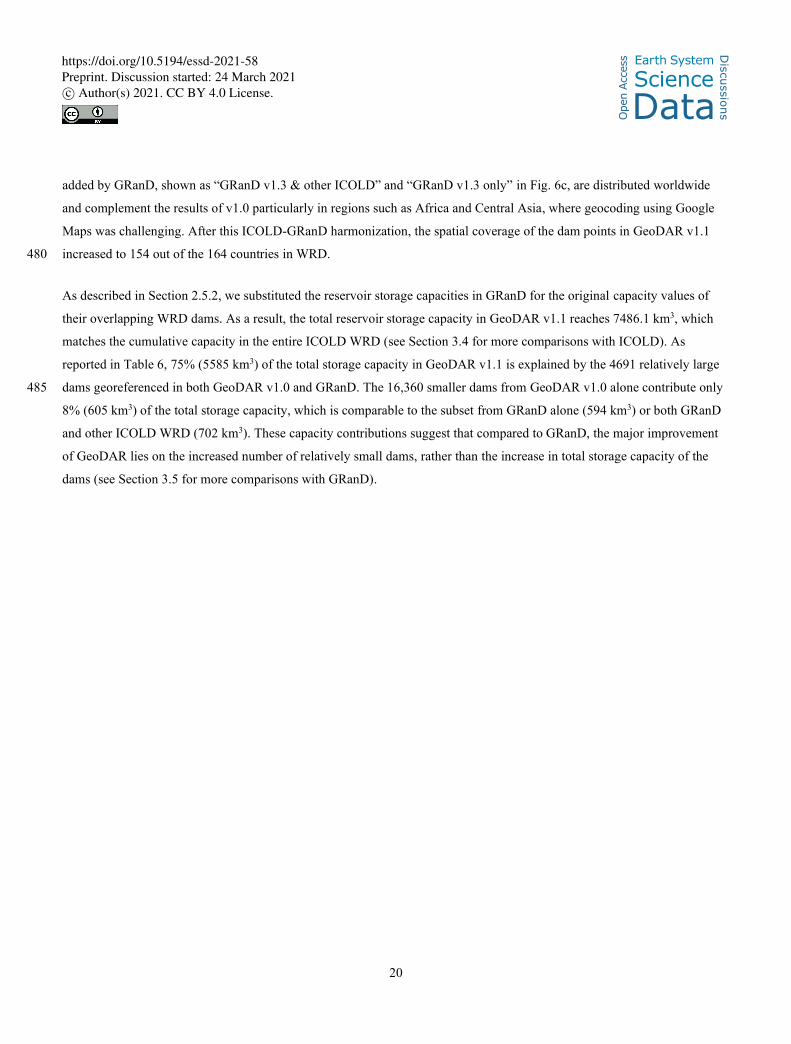
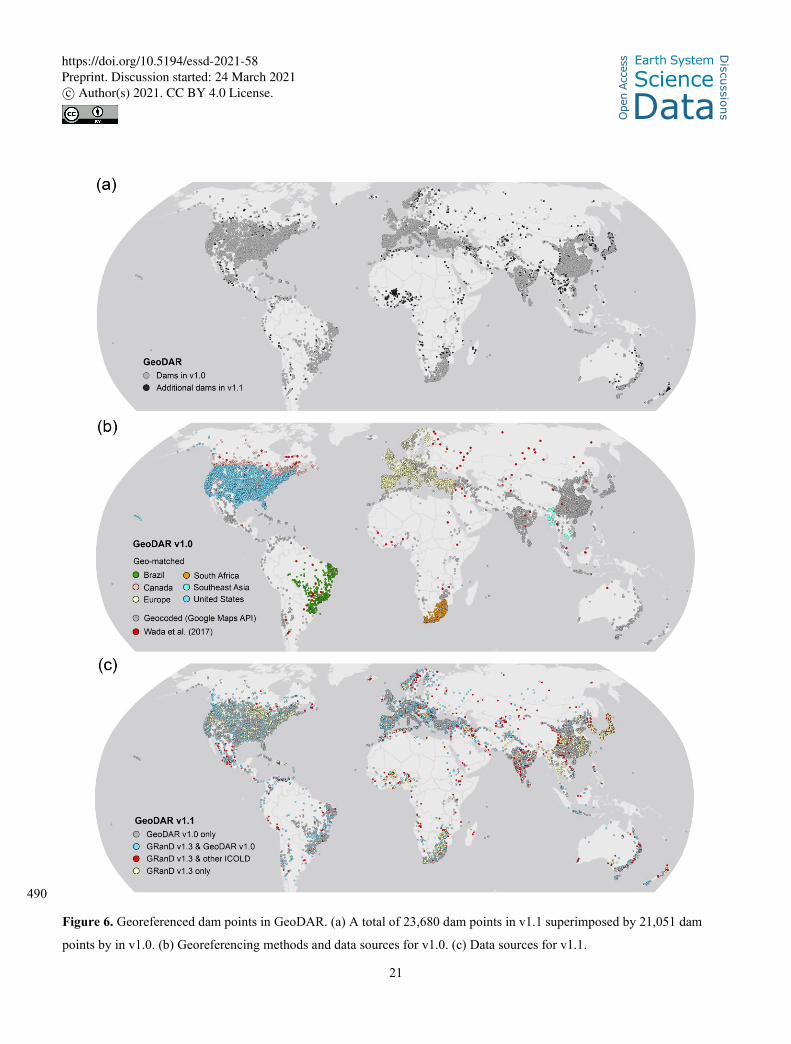
490
Figure 6. Georeferenced dam points in GeoDAR. (a) A total of 23,680 dam points in v1.1 superimposed by 21,051 dam
points by in v1.0. (b) Georeferencing methods and data sources for v1.0. (c) Data sources for v1.1.
https://doi.org/10.5194/essd-2021-58
Ope
n A
cces
s Earth System
Science
DataD
iscussio
ns
Preprint. Discussion started: 24 March 2021c© Author(s) 2021. CC BY 4.0 License.
22
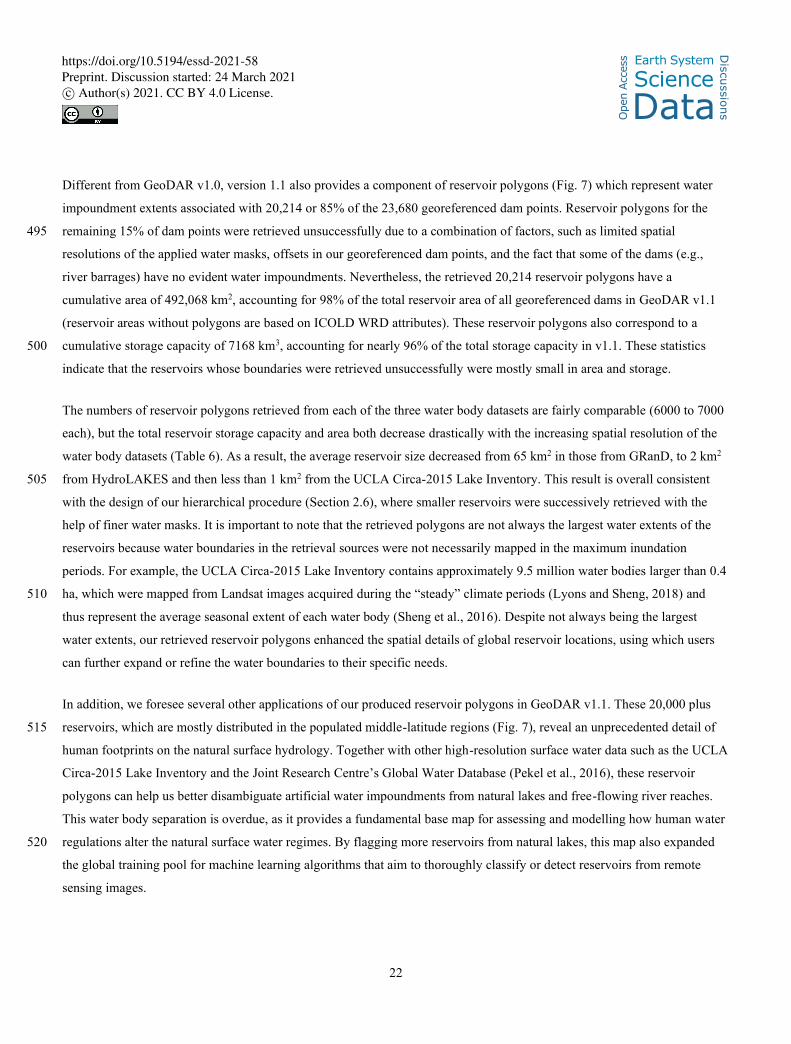
Different from GeoDAR v1.0, version 1.1 also provides a component of reservoir polygons (Fig. 7) which represent water
impoundment extents associated with 20,214 or 85% of the 23,680 georeferenced dam points. Reservoir polygons for the
remaining 15% of dam points were retrieved unsuccessfully due to a combination of factors, such as limited spatial 495
resolutions of the applied water masks, offsets in our georeferenced dam points, and the fact that some of the dams (e.g.,
river barrages) have no evident water impoundments. Nevertheless, the retrieved 20,214 reservoir polygons have a
cumulative area of 492,068 km2, accounting for 98% of the total reservoir area of all georeferenced dams in GeoDAR v1.1
(reservoir areas without polygons are based on ICOLD WRD attributes). These reservoir polygons also correspond to a
cumulative storage capacity of 7168 km3, accounting for nearly 96% of the total storage capacity in v1.1. These statistics 500
indicate that the reservoirs whose boundaries were retrieved unsuccessfully were mostly small in area and storage.
The numbers of reservoir polygons retrieved from each of the three water body datasets are fairly comparable (6000 to 7000
each), but the total reservoir storage capacity and area both decrease drastically with the increasing spatial resolution of the
water body datasets (Table 6). As a result, the average reservoir size decreased from 65 km2 in those from GRanD, to 2 km2
from HydroLAKES and then less than 1 km2 from the UCLA Circa-2015 Lake Inventory. This result is overall consistent 505
with the design of our hierarchical procedure (Section 2.6), where smaller reservoirs were successively retrieved with the
help of finer water masks. It is important to note that the retrieved polygons are not always the largest water extents of the
reservoirs because water boundaries in the retrieval sources were not necessarily mapped in the maximum inundation
periods. For example, the UCLA Circa-2015 Lake Inventory contains approximately 9.5 million water bodies larger than 0.4
ha, which were mapped from Landsat images acquired during the “steady” climate periods (Lyons and Sheng, 2018) and 510
thus represent the average seasonal extent of each water body (Sheng et al., 2016). Despite not always being the largest
water extents, our retrieved reservoir polygons enhanced the spatial details of global reservoir locations, using which users
can further expand or refine the water boundaries to their specific needs.
In addition, we foresee several other applications of our produced reservoir polygons in GeoDAR v1.1. These 20,000 plus
reservoirs, which are mostly distributed in the populated middle-latitude regions (Fig. 7), reveal an unprecedented detail of 515
human footprints on the natural surface hydrology. Together with other high-resolution surface water data such as the UCLA
Circa-2015 Lake Inventory and the Joint Research Centre’s Global Water Database (Pekel et al., 2016), these reservoir
polygons can help us better disambiguate artificial water impoundments from natural lakes and free-flowing river reaches.
This water body separation is overdue, as it provides a fundamental base map for assessing and modelling how human water
regulations alter the natural surface water regimes. By flagging more reservoirs from natural lakes, this map also expanded 520
the global training pool for machine learning algorithms that aim to thoroughly classify or detect reservoirs from remote
sensing images.
https://doi.org/10.5194/essd-2021-58
Ope
n A
cces
s Earth System
Science
DataD
iscussio
ns
Preprint. Discussion started: 24 March 2021c© Author(s) 2021. CC BY 4.0 License.
23
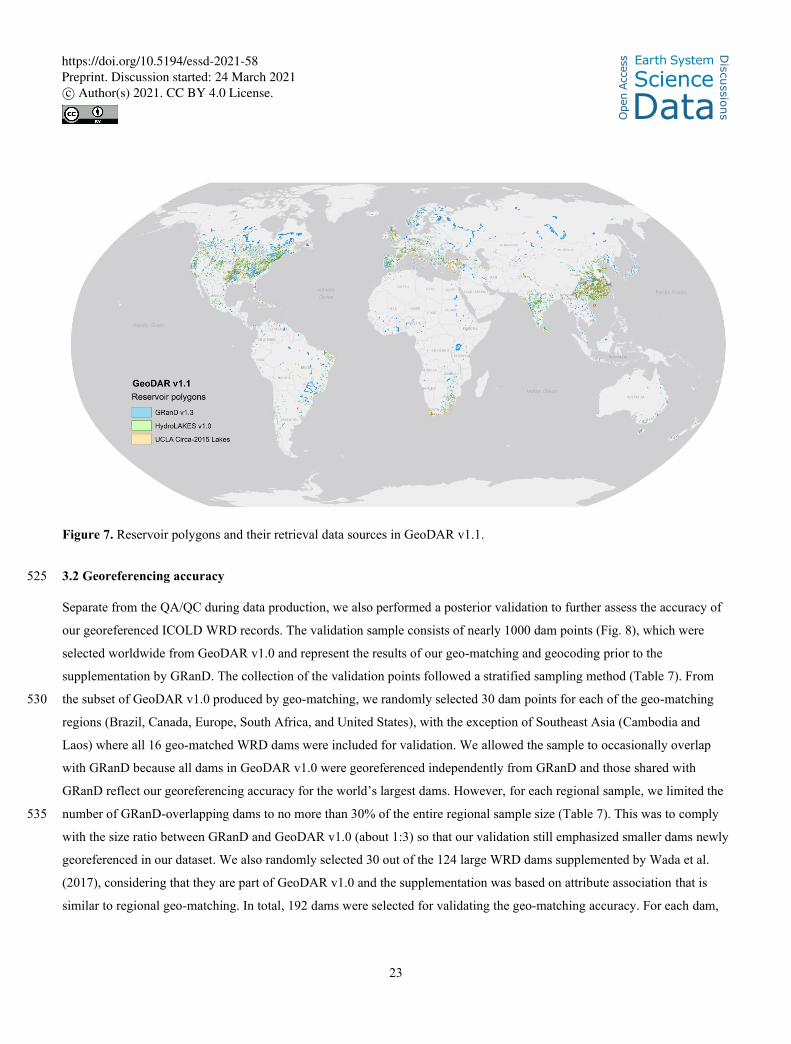
Figure 7. Reservoir polygons and their retrieval data sources in GeoDAR v1.1.
3.2 Georeferencing accuracy 525
Separate from the QA/QC during data production, we also performed a posterior validation to further assess the accuracy of
our georeferenced ICOLD WRD records. The validation sample consists of nearly 1000 dam points (Fig. 8), which were
selected worldwide from GeoDAR v1.0 and represent the results of our geo-matching and geocoding prior to the
supplementation by GRanD. The collection of the validation points followed a stratified sampling method (Table 7). From
the subset of GeoDAR v1.0 produced by geo-matching, we randomly selected 30 dam points for each of the geo-matching 530
regions (Brazil, Canada, Europe, South Africa, and United States), with the exception of Southeast Asia (Cambodia and
Laos) where all 16 geo-matched WRD dams were included for validation. We allowed the sample to occasionally overlap
with GRanD because all dams in GeoDAR v1.0 were georeferenced independently from GRanD and those shared with
GRanD reflect our georeferencing accuracy for the world’s largest dams. However, for each regional sample, we limited the
number of GRanD-overlapping dams to no more than 30% of the entire regional sample size (Table 7). This was to comply 535
with the size ratio between GRanD and GeoDAR v1.0 (about 1:3) so that our validation still emphasized smaller dams newly
georeferenced in our dataset. We also randomly selected 30 out of the 124 large WRD dams supplemented by Wada et al.
(2017), considering that they are part of GeoDAR v1.0 and the supplementation was based on attribute association that is
similar to regional geo-matching. In total, 192 dams were selected for validating the geo-matching accuracy. For each dam,
https://doi.org/10.5194/essd-2021-58
Ope
n A
cces
s Earth System
Science
DataD
iscussio
ns
Preprint. Discussion started: 24 March 2021c© Author(s) 2021. CC BY 4.0 License.
24
we manually checked whether its spatial coordinates in GeoDAR v1.0 are consistent with those documented in the geo-540
matching source (see source references in Table 2).
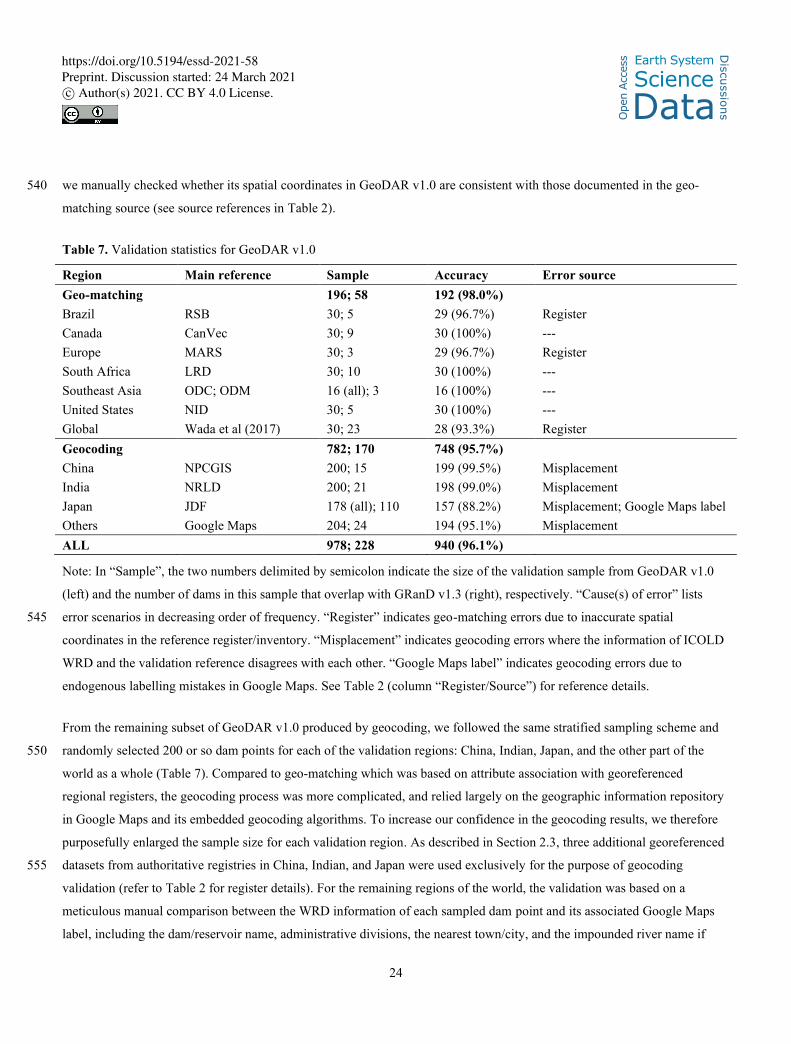
Table 7. Validation statistics for GeoDAR v1.0
Region Main reference Sample Accuracy Error source
Geo-matching 196; 58 192 (98.0%)
Brazil RSB 30; 5 29 (96.7%) Register
Canada CanVec 30; 9 30 (100%) ---
Europe MARS 30; 3 29 (96.7%) Register
South Africa LRD 30; 10 30 (100%) ---
Southeast Asia ODC; ODM 16 (all); 3 16 (100%) ---
United States NID 30; 5 30 (100%) ---
Global Wada et al (2017) 30; 23 28 (93.3%) Register
Geocoding 782; 170 748 (95.7%)
China NPCGIS 200; 15 199 (99.5%) Misplacement
India NRLD 200; 21 198 (99.0%) Misplacement
Japan JDF 178 (all); 110 157 (88.2%) Misplacement; Google Maps label
Others Google Maps 204; 24 194 (95.1%) Misplacement
ALL 978; 228 940 (96.1%)
Note: In “Sample”, the two numbers delimited by semicolon indicate the size of the validation sample from GeoDAR v1.0
(left) and the number of dams in this sample that overlap with GRanD v1.3 (right), respectively. “Cause(s) of error” lists
error scenarios in decreasing order of frequency. “Register” indicates geo-matching errors due to inaccurate spatial 545
coordinates in the reference register/inventory. “Misplacement” indicates geocoding errors where the information of ICOLD
WRD and the validation reference disagrees with each other. “Google Maps label” indicates geocoding errors due to
endogenous labelling mistakes in Google Maps. See Table 2 (column “Register/Source”) for reference details.
From the remaining subset of GeoDAR v1.0 produced by geocoding, we followed the same stratified sampling scheme and
randomly selected 200 or so dam points for each of the validation regions: China, Indian, Japan, and the other part of the 550
world as a whole (Table 7). Compared to geo-matching which was based on attribute association with georeferenced
regional registers, the geocoding process was more complicated, and relied largely on the geographic information repository
in Google Maps and its embedded geocoding algorithms. To increase our confidence in the geocoding results, we therefore
purposefully enlarged the sample size for each validation region. As described in Section 2.3, three additional georeferenced
datasets from authoritative registries in China, Indian, and Japan were used exclusively for the purpose of geocoding 555
validation (refer to Table 2 for register details). For the remaining regions of the world, the validation was based on a
meticulous manual comparison between the WRD information of each sampled dam point and its associated Google Maps
label, including the dam/reservoir name, administrative divisions, the nearest town/city, and the impounded river name if
https://doi.org/10.5194/essd-2021-58
Ope
n A
cces
s Earth System
Science
DataD
iscussio
ns
Preprint. Discussion started: 24 March 2021c© Author(s) 2021. CC BY 4.0 License.
25
possible. When necessary, we also referred to other auxiliary information including open-source gazetteers and other
literature. The auxiliary validation sources were provided in the attribute table of GeoDAR v1.0 (see data attributes in 560
Section 3.3). In total, we collected 782 dam points for validating the accuracy of geocoding, including all 178 Japanese dams
in GeoDAR v1.0 (before GRanD supplementation). The distribution of all sampled validation dams is shown in Fig. 8.
As reported in Table 7, our geo-matching accuracy ranges from 93% to 100% among different regions, with an overall
accuracy of 98%. Causes of the identified geo-matching errors (see the last column in Table 7) were not necessarily mistakes
in our attribute association between ICOLD WRD and the georeferenced registers, but sometimes inaccurate spatial 565
coordinates provided by the georeferenced registers themselves. An example is Skutvik Dam/Reservoir (completion year
1991) in Norway (Fig. 8), where coordinates are documented to be 68.025° N and 15.345° E in MARS. However, inspected
from high-resolution Google Maps imagery, no dam or reservoir, operational or abandoned, could be conclusively verified at
or near this coordinate point, except for three surrounding lakes that are all over 2 km away and labelled with other names
(Vanbassenget, Lanstøvatnet, and Stenslandsvatnet). We believed that the documented coordinates for this dam are probably 570
inaccurate.
The accuracy of our geocoded sample ranges from 88% in Japan to about 99% in China and India, with an overall accuracy
of 96%. As shown in Table 7, most of the errors were related to the misplacement of the dam/reservoir to another feature,
typically a free-flowing river reach, which shares the name and administrative divisions with the dam/reservoir. One
example is Nambiar Dam near the city of Tirunelveli in the state of Tamil Nadu, southern India (Fig. 8). The correct 575
coordinates, according to INRLD, are 8.374° N and 77.738° E where the Google Maps labelled “Nambi Dam” instead of
Nambiar Dam. Probably because of this spelling inconsistency, our geocoded coordinates were misplaced on a reach of the
Nambi(y)ar River (8.435° N, 77.569° E, labelled as “Nambiyar”) about 20 km upstream from the dam. Although our
recursive geocoding procedure (Section 2.4) embedded an automated filter that examines the type of the feature at each
returned point (see released scripts through Code availability), this filter was designed to only eliminate the coordinates 580
where feature types are clearly disparate from a dam or reservoir (such as commercial and residential buildings). Our
experiments showed that dams/reservoirs and free-flowing river reaches could both be categorized as “establishment” of
“natural feature” and a feature type that is more specific to dams/reservoirs was hardly seen. Thus, to avoid over-filtering, we
allowed a certain ambiguity in the geocoded feature types, and then relied on manual QC to correct or remove mistaken
coordinates as thoroughly as possible. The misplacement of dams to their upstream/downstream river reaches is a major 585
cause of the relatively low geocoding accuracy in Japan. Through experimentations, we noticed that Google Maps labelling
for some of the Japanese dams that are homonymous to their impounded rivers, is either lacking or highly adapted to the
Japanese language. The latter further challenged our geocoding accuracy using English-based ICOLD information. For one
of the errors in Japan, we verified from the JDF register that Google Maps mislabelled Myojin Dam in Horoshima Prefecture
(34.587° N, 132.505° E) as “Nabara Dam” whose correct location is 3 km downstream (34.563° N, 132.517° E; Fig. 8). As a 590
https://doi.org/10.5194/essd-2021-58
Ope
n A
cces
s Earth System
Science
DataD
iscussio
ns
Preprint. Discussion started: 24 March 2021c© Author(s) 2021. CC BY 4.0 License.
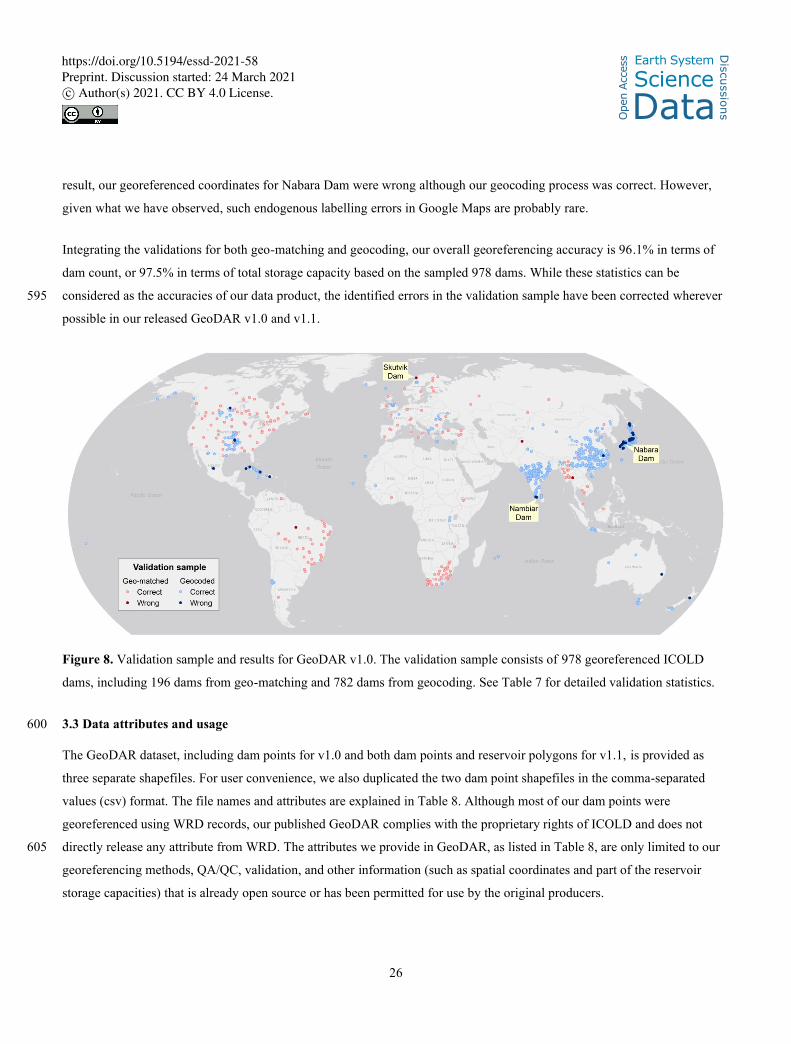
26
result, our georeferenced coordinates for Nabara Dam were wrong although our geocoding process was correct. However,
given what we have observed, such endogenous labelling errors in Google Maps are probably rare.
Integrating the validations for both geo-matching and geocoding, our overall georeferencing accuracy is 96.1% in terms of
dam count, or 97.5% in terms of total storage capacity based on the sampled 978 dams. While these statistics can be
considered as the accuracies of our data product, the identified errors in the validation sample have been corrected wherever 595
possible in our released GeoDAR v1.0 and v1.1.
Figure 8. Validation sample and results for GeoDAR v1.0. The validation sample consists of 978 georeferenced ICOLD
dams, including 196 dams from geo-matching and 782 dams from geocoding. See Table 7 for detailed validation statistics.
3.3 Data attributes and usage 600
The GeoDAR dataset, including dam points for v1.0 and both dam points and reservoir polygons for v1.1, is provided as
three separate shapefiles. For user convenience, we also duplicated the two dam point shapefiles in the comma-separated
values (csv) format. The file names and attributes are explained in Table 8. Although most of our dam points were
georeferenced using WRD records, our published GeoDAR complies with the proprietary rights of ICOLD and does not
directly release any attribute from WRD. The attributes we provide in GeoDAR, as listed in Table 8, are only limited to our 605
georeferencing methods, QA/QC, validation, and other information (such as spatial coordinates and part of the reservoir
storage capacities) that is already open source or has been permitted for use by the original producers.
https://doi.org/10.5194/essd-2021-58
Ope
n A
cces
s Earth System
Science
DataD
iscussio
ns
Preprint. Discussion started: 24 March 2021c© Author(s) 2021. CC BY 4.0 License.
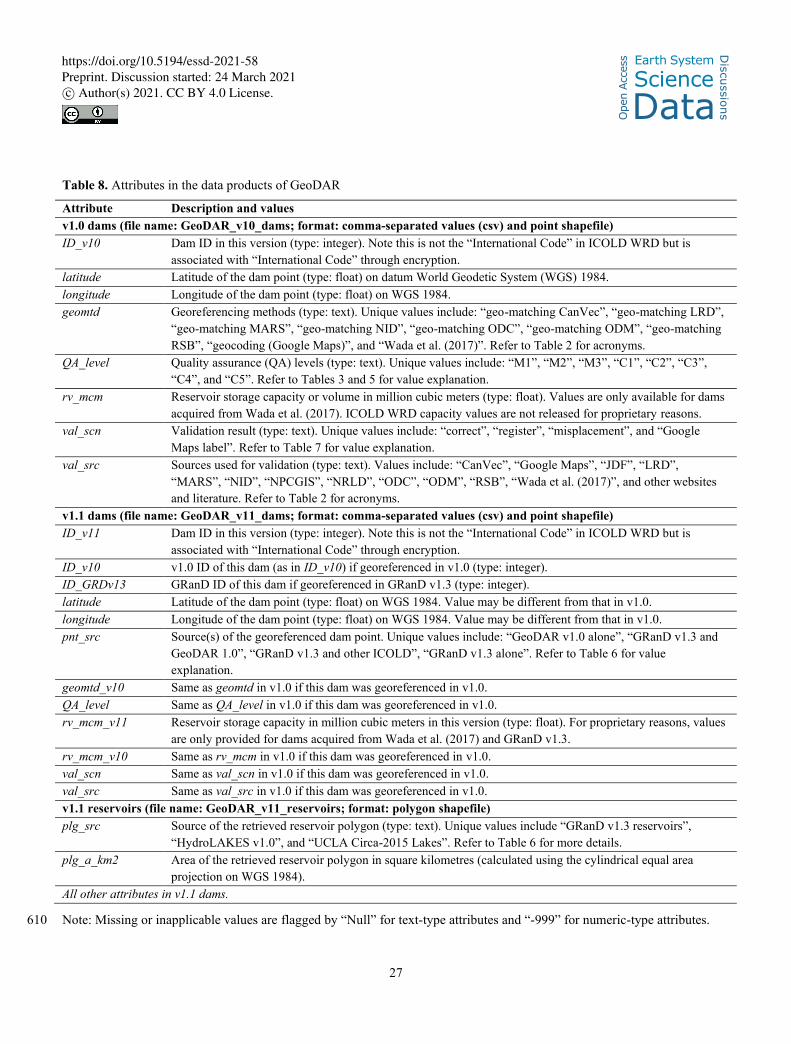
27
Table 8. Attributes in the data products of GeoDAR
Attribute Description and values
v1.0 dams (file name: GeoDAR_v10_dams; format: comma-separated values (csv) and point shapefile)
ID_v10 Dam ID in this version (type: integer). Note this is not the “International Code” in ICOLD WRD but is
associated with “International Code” through encryption.
latitude Latitude of the dam point (type: float) on datum World Geodetic System (WGS) 1984.
longitude Longitude of the dam point (type: float) on WGS 1984.
geomtd Georeferencing methods (type: text). Unique values include: “geo-matching CanVec”, “geo-matching LRD”,
“geo-matching MARS”, “geo-matching NID”, “geo-matching ODC”, “geo-matching ODM”, “geo-matching
RSB”, “geocoding (Google Maps)”, and “Wada et al. (2017)”. Refer to Table 2 for acronyms.
QA_level Quality assurance (QA) levels (type: text). Unique values include: “M1”, “M2”, “M3”, “C1”, “C2”, “C3”,
“C4”, and “C5”. Refer to Tables 3 and 5 for value explanation.
rv_mcm Reservoir storage capacity or volume in million cubic meters (type: float). Values are only available for dams
acquired from Wada et al. (2017). ICOLD WRD capacity values are not released for proprietary reasons.
val_scn Validation result (type: text). Unique values include: “correct”, “register”, “misplacement”, and “Google
Maps label”. Refer to Table 7 for value explanation.
val_src Sources used for validation (type: text). Values include: “CanVec”, “Google Maps”, “JDF”, “LRD”,
“MARS”, “NID”, “NPCGIS”, “NRLD”, “ODC”, “ODM”, “RSB”, “Wada et al. (2017)”, and other websites
and literature. Refer to Table 2 for acronyms.
v1.1 dams (file name: GeoDAR_v11_dams; format: comma-separated values (csv) and point shapefile)
ID_v11 Dam ID in this version (type: integer). Note this is not the “International Code” in ICOLD WRD but is
associated with “International Code” through encryption.
ID_v10 v1.0 ID of this dam (as in ID_v10) if georeferenced in v1.0 (type: integer).
ID_GRDv13 GRanD ID of this dam if georeferenced in GRanD v1.3 (type: integer).
latitude Latitude of the dam point (type: float) on WGS 1984. Value may be different from that in v1.0.
longitude Longitude of the dam point (type: float) on WGS 1984. Value may be different from that in v1.0.
pnt_src Source(s) of the georeferenced dam point. Unique values include: “GeoDAR v1.0 alone”, “GRanD v1.3 and
GeoDAR 1.0”, “GRanD v1.3 and other ICOLD”, “GRanD v1.3 alone”. Refer to Table 6 for value
explanation.
geomtd_v10 Same as geomtd in v1.0 if this dam was georeferenced in v1.0.
QA_level Same as QA_level in v1.0 if this dam was georeferenced in v1.0.
rv_mcm_v11 Reservoir storage capacity in million cubic meters in this version (type: float). For proprietary reasons, values
are only provided for dams acquired from Wada et al. (2017) and GRanD v1.3.
rv_mcm_v10 Same as rv_mcm in v1.0 if this dam was georeferenced in v1.0.
val_scn Same as val_scn in v1.0 if this dam was georeferenced in v1.0.
val_src Same as val_src in v1.0 if this dam was georeferenced in v1.0.
v1.1 reservoirs (file name: GeoDAR_v11_reservoirs; format: polygon shapefile)
plg_src Source of the retrieved reservoir polygon (type: text). Unique values include “GRanD v1.3 reservoirs”,
“HydroLAKES v1.0”, and “UCLA Circa-2015 Lakes”. Refer to Table 6 for more details.
plg_a_km2 Area of the retrieved reservoir polygon in square kilometres (calculated using the cylindrical equal area
projection on WGS 1984).
All other attributes in v1.1 dams.
Note: Missing or inapplicable values are flagged by “Null” for text-type attributes and “-999” for numeric-type attributes. 610
https://doi.org/10.5194/essd-2021-58
Ope
n A
cces
s Earth System
Science
DataD
iscussio
ns
Preprint. Discussion started: 24 March 2021c© Author(s) 2021. CC BY 4.0 License.
28
Although WRD attributes are not directly available in GeoDAR, we suggest two possible ways for users to acquire at least
some of the essential attributes. Upon the user’s reasonable request, we can decrypt GeoDAR IDs (Table 8) to ICOLD’s
International Codes, and using the International Codes, the user can link each of the dams/reservoirs in GeoDAR to the
entire 40 or so proprietary attributes in WRD. However, this is based on the premise that the user needs to acquire the WRD
attribute data from ICOLD, and that the user agrees to not release the decryption key or the WRD attributes to the public. 615
Alternatively, since we imposed no usage restrictions on our spatial features (geometric dam points and reservoir polygons),
users are free to integrate them with other datasets and tools, such as remote sensing observations and modelling, to acquire
the needed attributes, particularly those not yet documented in ICOLD WRD. Acquisition methods have been exemplified
for at least the following attributes: reservoir hypsometry and bathymetry (Li et al., 2020; Yigzaw et al., 2018), surface
evaporation loss (Mady et al., 2020; Zhan et al., 2019; Zhao and Gao, 2019a), operation rules (Shin et al., 2019; Yassin et al., 620
2019), completion years (Zhang et al., 2019), storage capacities (Liu et al., 2020), and the changes in water area (Pekel et al.,
2016; Yao et al., 2019; Zhao and Gao, 2019b), level (Cretaux et al., 2011; Schwatke et al., 2015), and storage or volume
(Busker et al., 2019; Cretaux et al., 2016; Gao et al., 2012; Zhang et al., 2014).
3.4 Comparisons with other global dam and reservoir datasets
To better understand the improvements and potential applications of GeoDAR, we compare it with three major global dam 625
and reservoir datasets: the complete ICOLD WRD, GRanD (v1.3), and GOODD (V1). To recap the pros and cons of each
dataset, ICOLD WRD documents over 56,000 unique dam records with a broad suite of attributes, but the provided dam
records are not georeferenced. GOODD depicts the spatial details of more than 38,000 dam points and their catchments but
does not include any other attribute. GRanD is georeferenced and provides multiple essential attributes, but the records are
limited to 7320 large dams. Accordingly, our comparison first emphasized the aspects of dam quantity, reservoir area, and if 630
applicable, the spatial pattern and distribution of the dams. These aspects are directly acquirable from the spatial features
(i.e., dam points and reservoir polygons) in GeoDAR. Considering that each GeoDAR feature is explicitly linked to a WRD
or GRanD record which contains detailed attributes, our comparison also includes two important attributes, i.e., reservoir
storage capacity and catchment area, to help inform the extended capability of GeoDAR once the attributes are acquired.
3.4.1 Comparisons with ICOLD WRD 635
Since georeferencing ICOLD WRD was one of our primary motivations for this work, we view the most important
improvement of GeoDAR is the fact that it is spatially resolved. Despite our efforts to integrate multi-source registers and
the Google Maps geocoding API, georeferencing WRD, particularly smaller dams in poorly documented regions, has proven
to be challenging. This challenge was reflected by the proportion of WRD that was spatially resolved in GeoDAR. As
compared in Table 9, GeoDAR v1.0 included 37% of the 56,783 records in the entire WRD. Although limited in number, 640
these georeferenced records compromised a balance between geocoding thoroughness and quality (see Sections 2.3 and 2.4),
https://doi.org/10.5194/essd-2021-58
Ope
n A
cces
s Earth System
Science
DataD
iscussio
ns
Preprint. Discussion started: 24 March 2021c© Author(s) 2021. CC BY 4.0 License.
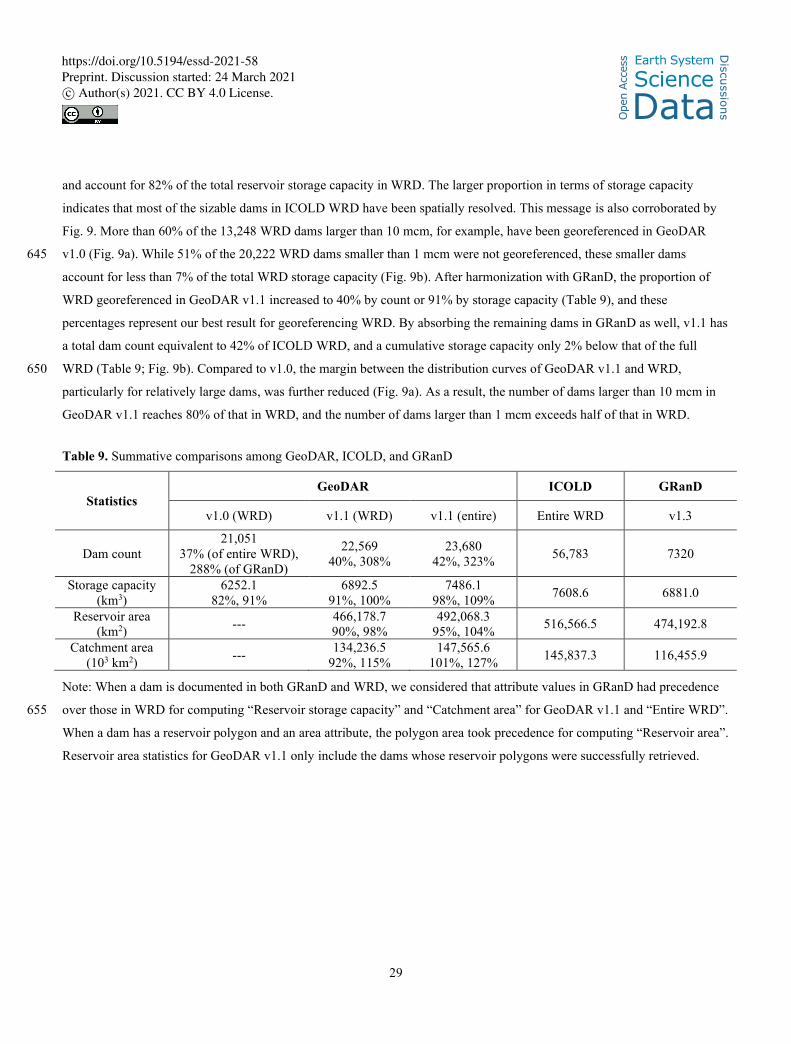
29
and account for 82% of the total reservoir storage capacity in WRD. The larger proportion in terms of storage capacity
indicates that most of the sizable dams in ICOLD WRD have been spatially resolved. This message is also corroborated by
Fig. 9. More than 60% of the 13,248 WRD dams larger than 10 mcm, for example, have been georeferenced in GeoDAR
v1.0 (Fig. 9a). While 51% of the 20,222 WRD dams smaller than 1 mcm were not georeferenced, these smaller dams 645
account for less than 7% of the total WRD storage capacity (Fig. 9b). After harmonization with GRanD, the proportion of
WRD georeferenced in GeoDAR v1.1 increased to 40% by count or 91% by storage capacity (Table 9), and these
percentages represent our best result for georeferencing WRD. By absorbing the remaining dams in GRanD as well, v1.1 has
a total dam count equivalent to 42% of ICOLD WRD, and a cumulative storage capacity only 2% below that of the full
WRD (Table 9; Fig. 9b). Compared to v1.0, the margin between the distribution curves of GeoDAR v1.1 and WRD, 650
particularly for relatively large dams, was further reduced (Fig. 9a). As a result, the number of dams larger than 10 mcm in
GeoDAR v1.1 reaches 80% of that in WRD, and the number of dams larger than 1 mcm exceeds half of that in WRD.
Table 9. Summative comparisons among GeoDAR, ICOLD, and GRanD
Statistics GeoDAR ICOLD GRanD
v1.0 (WRD) v1.1 (WRD) v1.1 (entire) Entire WRD v1.3
Dam count
21,051
37% (of entire WRD),
288% (of GRanD)
22,569
40%, 308%
23,680
42%, 323% 56,783 7320
Storage capacity
(km3)
6252.1
82%, 91%
6892.5
91%, 100%
7486.1
98%, 109% 7608.6 6881.0
Reservoir area
(km2) ---
466,178.7
90%, 98%
492,068.3
95%, 104% 516,566.5 474,192.8
Catchment area
(103 km2) ---
134,236.5
92%, 115%
147,565.6
101%, 127% 145,837.3 116,455.9
Note: When a dam is documented in both GRanD and WRD, we considered that attribute values in GRanD had precedence
over those in WRD for computing “Reservoir storage capacity” and “Catchment area” for GeoDAR v1.1 and “Entire WRD”. 655
When a dam has a reservoir polygon and an area attribute, the polygon area took precedence for computing “Reservoir area”.
Reservoir area statistics for GeoDAR v1.1 only include the dams whose reservoir polygons were successfully retrieved.
https://doi.org/10.5194/essd-2021-58
Ope
n A
cces
s Earth System
Science
DataD
iscussio
ns
Preprint. Discussion started: 24 March 2021c© Author(s) 2021. CC BY 4.0 License.
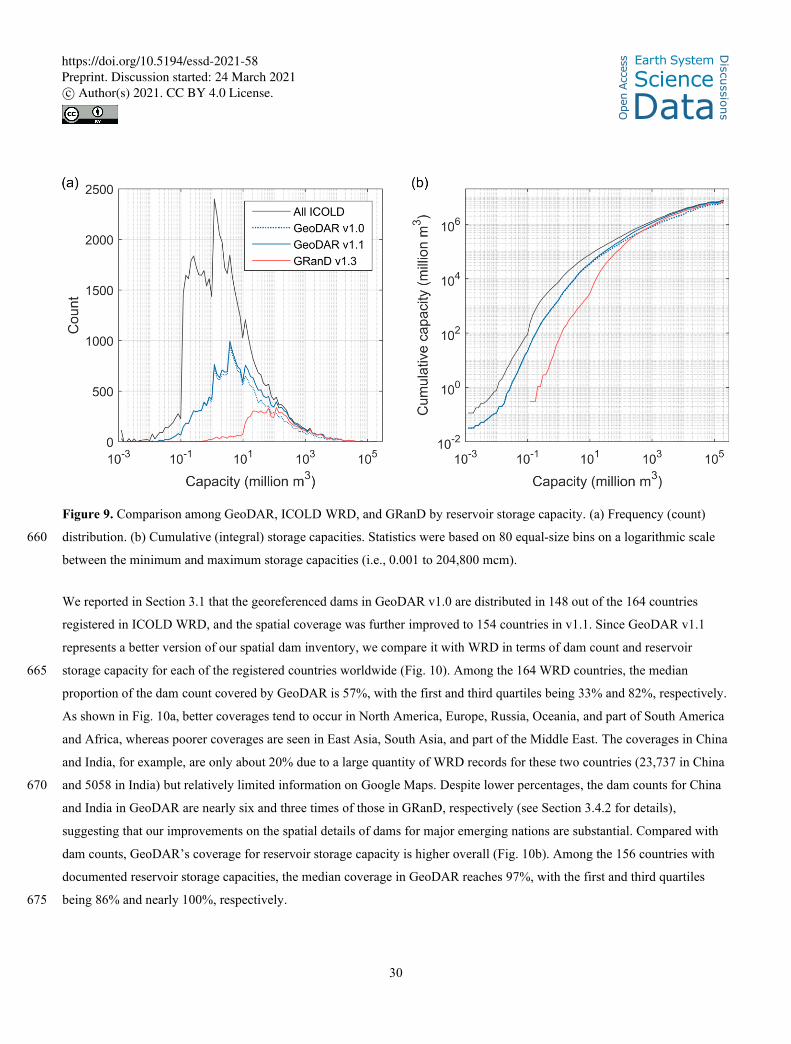
30
Figure 9. Comparison among GeoDAR, ICOLD WRD, and GRanD by reservoir storage capacity. (a) Frequency (count)
distribution. (b) Cumulative (integral) storage capacities. Statistics were based on 80 equal-size bins on a logarithmic scale 660
between the minimum and maximum storage capacities (i.e., 0.001 to 204,800 mcm).
We reported in Section 3.1 that the georeferenced dams in GeoDAR v1.0 are distributed in 148 out of the 164 countries
registered in ICOLD WRD, and the spatial coverage was further improved to 154 countries in v1.1. Since GeoDAR v1.1
represents a better version of our spatial dam inventory, we compare it with WRD in terms of dam count and reservoir
storage capacity for each of the registered countries worldwide (Fig. 10). Among the 164 WRD countries, the median 665
proportion of the dam count covered by GeoDAR is 57%, with the first and third quartiles being 33% and 82%, respectively.
As shown in Fig. 10a, better coverages tend to occur in North America, Europe, Russia, Oceania, and part of South America
and Africa, whereas poorer coverages are seen in East Asia, South Asia, and part of the Middle East. The coverages in China
and India, for example, are only about 20% due to a large quantity of WRD records for these two countries (23,737 in China
and 5058 in India) but relatively limited information on Google Maps. Despite lower percentages, the dam counts for China 670
and India in GeoDAR are nearly six and three times of those in GRanD, respectively (see Section 3.4.2 for details),
suggesting that our improvements on the spatial details of dams for major emerging nations are substantial. Compared with
dam counts, GeoDAR’s coverage for reservoir storage capacity is higher overall (Fig. 10b). Among the 156 countries with
documented reservoir storage capacities, the median coverage in GeoDAR reaches 97%, with the first and third quartiles
being 86% and nearly 100%, respectively. 675
https://doi.org/10.5194/essd-2021-58
Ope
n A
cces
s Earth System
Science
DataD
iscussio
ns
Preprint. Discussion started: 24 March 2021c© Author(s) 2021. CC BY 4.0 License.
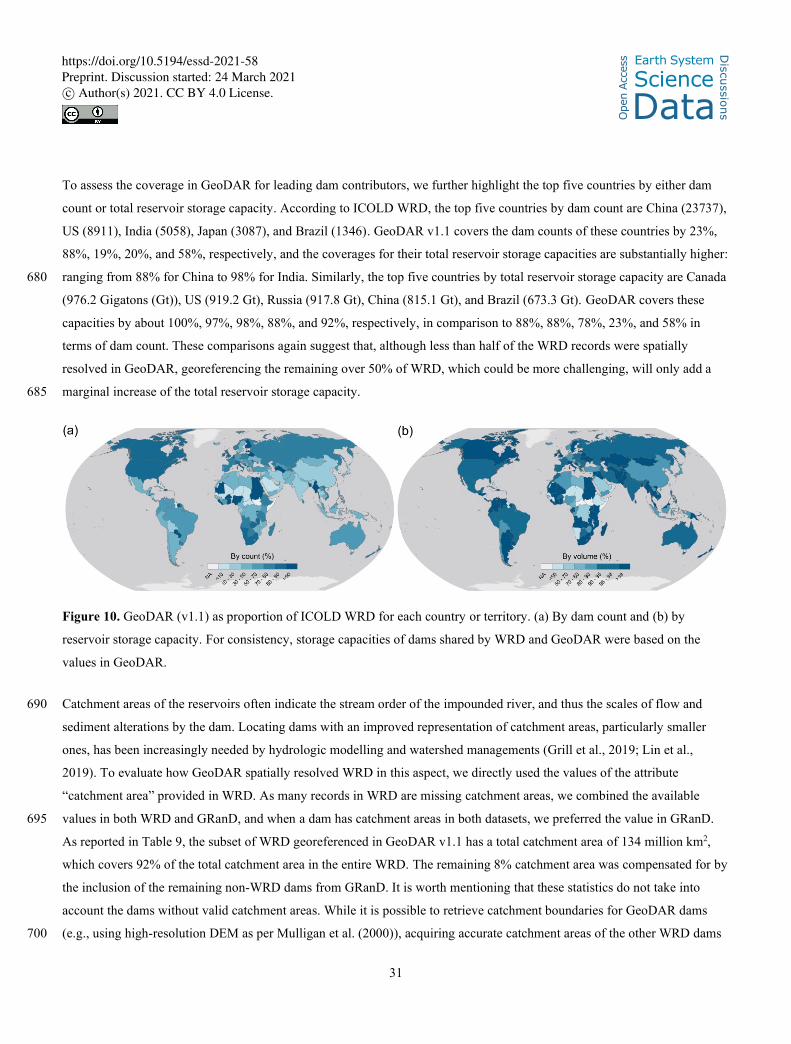
31
To assess the coverage in GeoDAR for leading dam contributors, we further highlight the top five countries by either dam
count or total reservoir storage capacity. According to ICOLD WRD, the top five countries by dam count are China (23737),
US (8911), India (5058), Japan (3087), and Brazil (1346). GeoDAR v1.1 covers the dam counts of these countries by 23%,
88%, 19%, 20%, and 58%, respectively, and the coverages for their total reservoir storage capacities are substantially higher:
ranging from 88% for China to 98% for India. Similarly, the top five countries by total reservoir storage capacity are Canada 680
(976.2 Gigatons (Gt)), US (919.2 Gt), Russia (917.8 Gt), China (815.1 Gt), and Brazil (673.3 Gt). GeoDAR covers these
capacities by about 100%, 97%, 98%, 88%, and 92%, respectively, in comparison to 88%, 88%, 78%, 23%, and 58% in
terms of dam count. These comparisons again suggest that, although less than half of the WRD records were spatially
resolved in GeoDAR, georeferencing the remaining over 50% of WRD, which could be more challenging, will only add a
marginal increase of the total reservoir storage capacity. 685
Figure 10. GeoDAR (v1.1) as proportion of ICOLD WRD for each country or territory. (a) By dam count and (b) by
reservoir storage capacity. For consistency, storage capacities of dams shared by WRD and GeoDAR were based on the
values in GeoDAR.
Catchment areas of the reservoirs often indicate the stream order of the impounded river, and thus the scales of flow and 690
sediment alterations by the dam. Locating dams with an improved representation of catchment areas, particularly smaller
ones, has been increasingly needed by hydrologic modelling and watershed managements (Grill et al., 2019; Lin et al.,
2019). To evaluate how GeoDAR spatially resolved WRD in this aspect, we directly used the values of the attribute
“catchment area” provided in WRD. As many records in WRD are missing catchment areas, we combined the available
values in both WRD and GRanD, and when a dam has catchment areas in both datasets, we preferred the value in GRanD. 695
As reported in Table 9, the subset of WRD georeferenced in GeoDAR v1.1 has a total catchment area of 134 million km2,
which covers 92% of the total catchment area in the entire WRD. The remaining 8% catchment area was compensated for by
the inclusion of the remaining non-WRD dams from GRanD. It is worth mentioning that these statistics do not take into
account the dams without valid catchment areas. While it is possible to retrieve catchment boundaries for GeoDAR dams
(e.g., using high-resolution DEM as per Mulligan et al. (2000)), acquiring accurate catchment areas of the other WRD dams 700
https://doi.org/10.5194/essd-2021-58
Ope
n A
cces
s Earth System
Science
DataD
iscussio
ns
Preprint. Discussion started: 24 March 2021c© Author(s) 2021. CC BY 4.0 License.
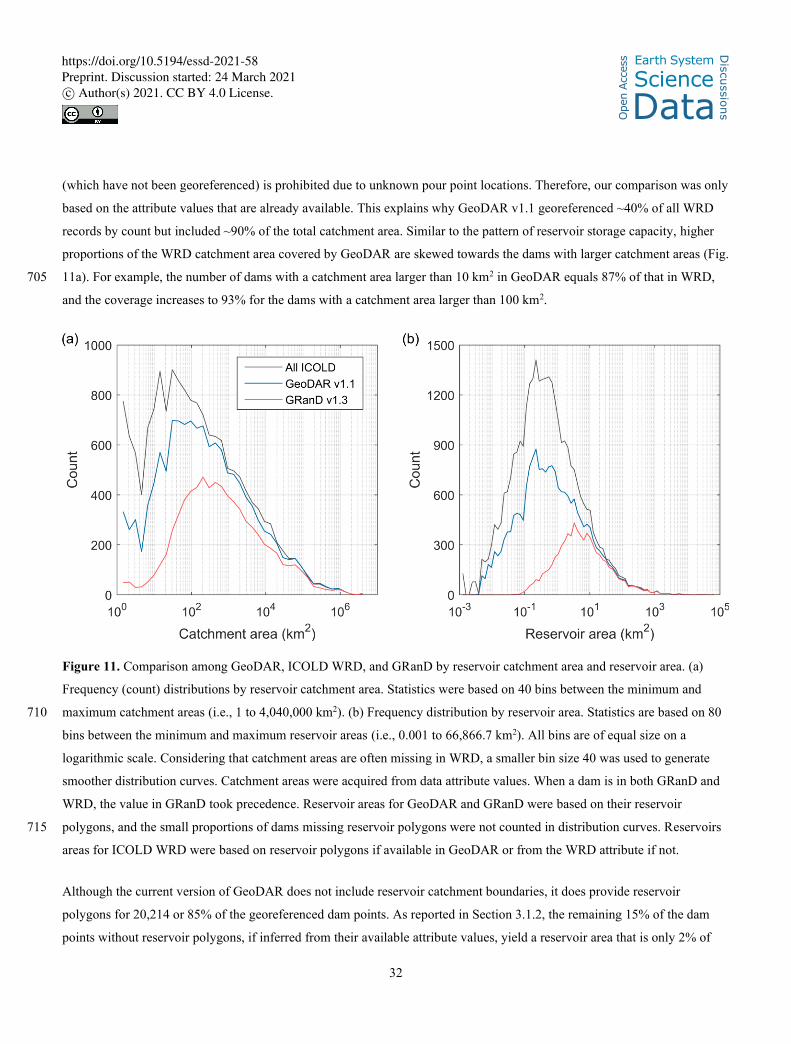
32
(which have not been georeferenced) is prohibited due to unknown pour point locations. Therefore, our comparison was only
based on the attribute values that are already available. This explains why GeoDAR v1.1 georeferenced ~40% of all WRD
records by count but included ~90% of the total catchment area. Similar to the pattern of reservoir storage capacity, higher
proportions of the WRD catchment area covered by GeoDAR are skewed towards the dams with larger catchment areas (Fig.
11a). For example, the number of dams with a catchment area larger than 10 km2 in GeoDAR equals 87% of that in WRD, 705
and the coverage increases to 93% for the dams with a catchment area larger than 100 km2.
Figure 11. Comparison among GeoDAR, ICOLD WRD, and GRanD by reservoir catchment area and reservoir area. (a)
Frequency (count) distributions by reservoir catchment area. Statistics were based on 40 bins between the minimum and
maximum catchment areas (i.e., 1 to 4,040,000 km2). (b) Frequency distribution by reservoir area. Statistics are based on 80 710
bins between the minimum and maximum reservoir areas (i.e., 0.001 to 66,866.7 km2). All bins are of equal size on a
logarithmic scale. Considering that catchment areas are often missing in WRD, a smaller bin size 40 was used to generate
smoother distribution curves. Catchment areas were acquired from data attribute values. When a dam is in both GRanD and
WRD, the value in GRanD took precedence. Reservoir areas for GeoDAR and GRanD were based on their reservoir
polygons, and the small proportions of dams missing reservoir polygons were not counted in distribution curves. Reservoirs 715
areas for ICOLD WRD were based on reservoir polygons if available in GeoDAR or from the WRD attribute if not.
Although the current version of GeoDAR does not include reservoir catchment boundaries, it does provide reservoir
polygons for 20,214 or 85% of the georeferenced dam points. As reported in Section 3.1.2, the remaining 15% of the dam
points without reservoir polygons, if inferred from their available attribute values, yield a reservoir area that is only 2% of
https://doi.org/10.5194/essd-2021-58
Ope
n A
cces
s Earth System
Science
DataD
iscussio
ns
Preprint. Discussion started: 24 March 2021c© Author(s) 2021. CC BY 4.0 License.
33
the total reservoir area of all GeoDAR dams. For this reason, we focus on the retrieved reservoir polygons for comparing 720
how GeoDAR v1.1 represents the reservoir areas in the entire ICOLD WRD. Among the 20,214 polygons, 19,122 (95%) are
associated with the georeferenced WRD dams. These retrieved WRD reservoirs have a total area of 466 thousand km2,
accounting for 90% of the cumulative reservoir area in WRD (Table 9). After supplementation of the other 1092 polygons
from GRanD, the total reservoir area reached 492 thousand km2, equivalent to 95% of the cumulative reservoir area in WRD.
Like other attributes, the values of reservoir area are not always available in all WRD records, so our reported coverage 725
percentages are theoretically overestimated. However, if a WRD record is missing its area attribute value but has a retrieved
reservoir polygon, we used the area of the reservoir polygon as the de facto reservoir area in calculating WRD statistics, and
the other WRD records still missing reservoir areas probably contribute a miniscule fraction of the aggregated area.
Therefore, we consider our comparison to be overall reasonable. Keeping this limitation in mind, we showed in the
distribution curves (Fig. 11b) that the number of GeoDAR reservoir polygons accounts for 64% of all WRD records that 730
have reservoir area values (either documented or de facto), and consistent with the distributions of other attributes, higher
coverages for reservoir area tend to occur for larger reservoirs. For example, GeoDAR retrieved 7828 reservoirs larger than 1
km2, which account for 76% of those in WRD. The coverage increases to 88% for reservoirs larger than 10 km2 although the
reservoir polygon number decreases to 2522.
3.4.2 Improved spatial details over GRanD 735
Enhancing the spatial detail of existing global inventories of dams and reservoirs, such as GRanD, is another motivation of
producing GeoDAR. While GRanD emphasized all dams and reservoirs larger than 100 mcm (or 0.1 km3), GeoDAR aimed
to georeference all records in WRD which, by definitions, have a minimum storage capacity of 3 mcm or smaller if the dam
is higher than 15 m (see Section 1). This reduced storage threshold entailed a substantial increase of the dam quantity in
GeoDAR. As compared in Table 9, GeoDAR v1.0, which was generated independently from GRanD, already exceeds the 740
dam quantity of GRanD (7320) by 188%, and accounts for more than 90% of the total reservoir storage capacity in GRanD
(6881 Gt). The harmonization with GRanD further expanded GeoDAR by another 2629 dam points including 1518 newly
georeferenced from WRD. As a result, the WRD portion of GeoDAR v1.1 (with 22,569 dams) matches the full storage
capacity of GRanD but is triple GRanD’s dam count. This comparison suggests that the improvement of GeDAR is mainly
manifested as the increased dam locations or spatial details, rather than reservoir storage capacity. With the inclusion of the 745
remaining 1111 large dams from GRanD, the number of dams in GeoDAR v1.1 (23,680) reaches 323% of that in GRanD,
with a total reservoir storage capacity (7486 Gt) also exceeding 9% of that in GRanD.
https://doi.org/10.5194/essd-2021-58
Ope
n A
cces
s Earth System
Science
DataD
iscussio
ns
Preprint. Discussion started: 24 March 2021c© Author(s) 2021. CC BY 4.0 License.
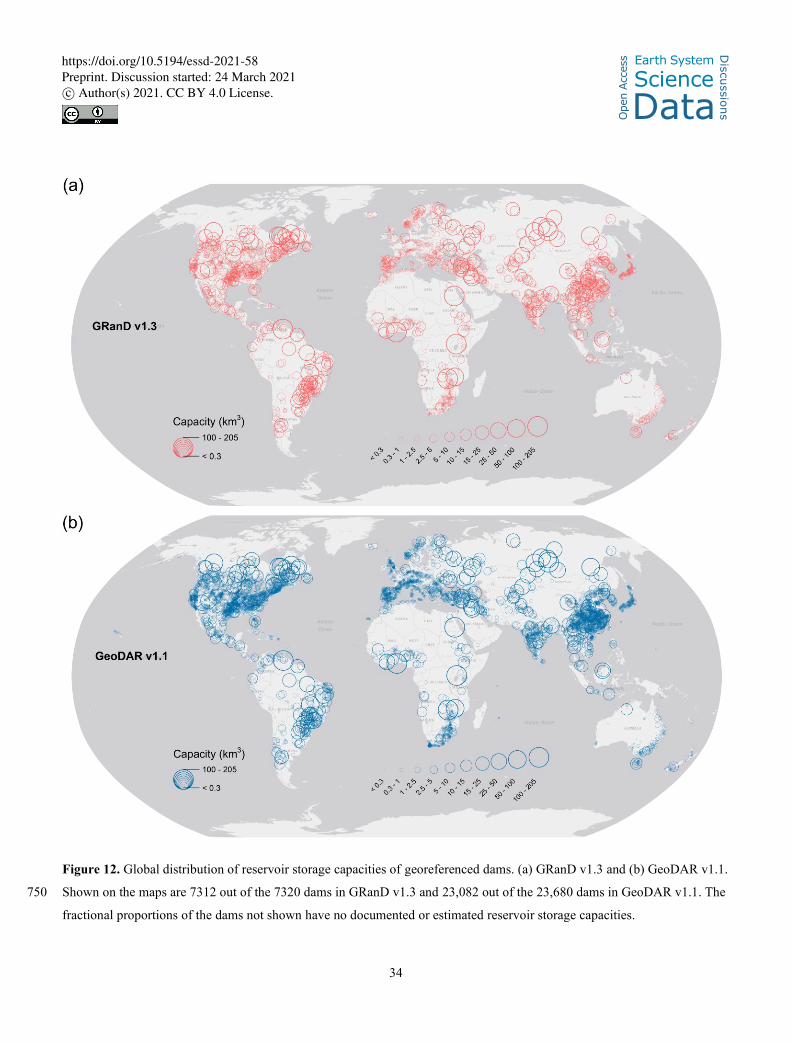
34
Figure 12. Global distribution of reservoir storage capacities of georeferenced dams. (a) GRanD v1.3 and (b) GeoDAR v1.1.
Shown on the maps are 7312 out of the 7320 dams in GRanD v1.3 and 23,082 out of the 23,680 dams in GeoDAR v1.1. The 750
fractional proportions of the dams not shown have no documented or estimated reservoir storage capacities.
https://doi.org/10.5194/essd-2021-58
Ope
n A
cces
s Earth System
Science
DataD
iscussio
ns
Preprint. Discussion started: 24 March 2021c© Author(s) 2021. CC BY 4.0 License.
35
The improved spatial detail in GeoDAR is also revealed by the distribution of individual reservoir storage capacities
worldwide (Fig. 12). Since GeoDAR v1.1 has absorbed GRanD v1.3, the global patterns for capacious reservoirs are overall
similar between the two datasets. What is noticeably different are the proliferated spatial densities of thousands of smaller
reservoirs, particularly those beyond the main focus of GRanD (such as smaller than 100 mcm). The substantial increase of 755
smaller dams and reservoirs is corroborated by the distribution curves in Fig. 9a, where the mode storage capacity (i.e., the
capacity corresponding to the peak frequency) shifted from about 100 mcm in GRanD to about 3–5 mcm in GeoDAR (both
v1.0 and v1.1). The area between the distribution curves is largely explained by the addition of ~15,300 dams smaller than
100 mcm in GeoDAR v1.1 (Fig. 9a), which correspond to a total storage increase of 75Gt or 58% (Fig. 9b). These smaller
dams (<100 mcm) comprise 84% of GeoDAR v1.1 in number, in comparison to only 54% of GRanD. 760
As visualized in Fig. 12, increases of reservoir population and density are seen across the continents such as North America,
Europe, East and South Asia, the Middle East, southern Africa, and South America. Some of the hotspots, not surprisingly,
also concur with the most economically active and energy-demanding regions, such as China, Europe, India, and the US
where details are further enlarged in Fig. 13. It is important to note that the added reservoirs in GeoDAR still comply with
ICOLD’s definition of “large dams”. Although their aggregated storage is limited, these relatively small reservoirs are 765
geographically widespread, meaning that they are locally significant for filling service gaps between more sporadic larger
dams. Examples include hundreds of smaller dams and reservoirs that provide irrigation from southern Europe (Fig. 13b) to
north-western and central India (Fig. 13c), hydropower and water usage in central and southern China (Fig. 13a), and flood
controls across the Mississippi River Basin and southern Texas in the US (Fig. 13d). The sheer number of these added
smaller dams and reservoirs accentuate the benefits of an improved knowledge of their spatial locations, such as what 770
GeoDAR offers, for strategizing water and energy managements and assessing fragmentation of the river ecosystems
(Belletti et al., 2020; Grill et al., 2019).
https://doi.org/10.5194/essd-2021-58
Ope
n A
cces
s Earth System
Science
DataD
iscussio
ns
Preprint. Discussion started: 24 March 2021c© Author(s) 2021. CC BY 4.0 License.
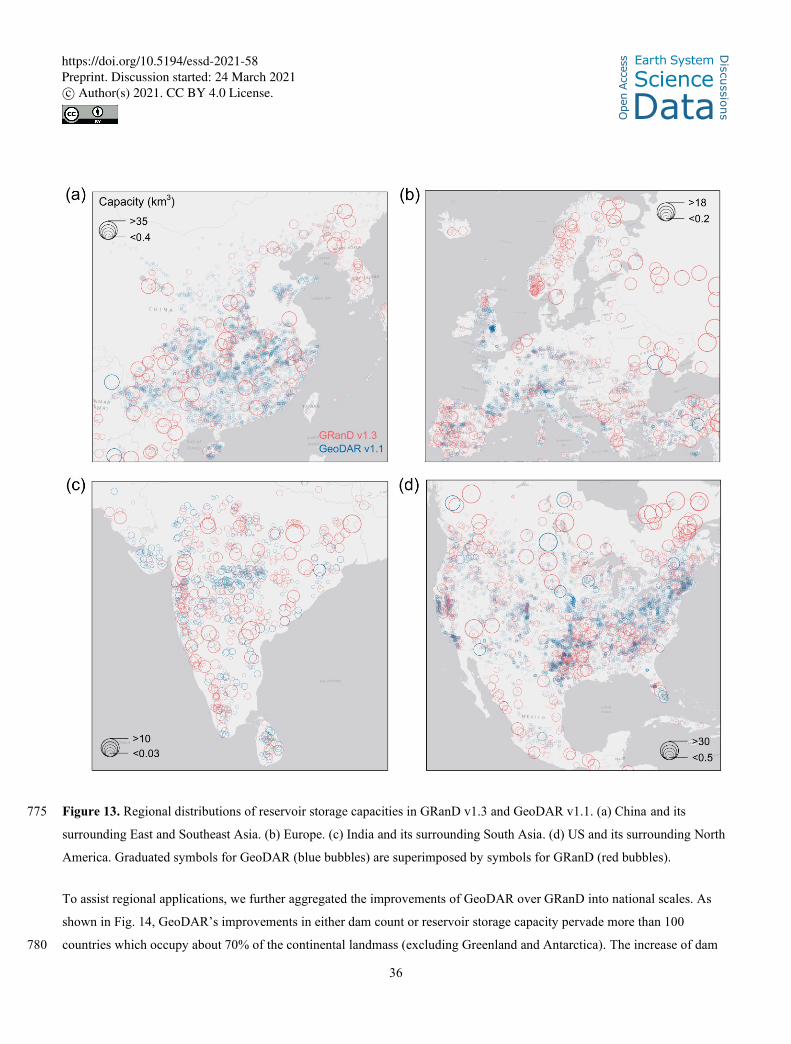
36
Figure 13. Regional distributions of reservoir storage capacities in GRanD v1.3 and GeoDAR v1.1. (a) China and its 775
surrounding East and Southeast Asia. (b) Europe. (c) India and its surrounding South Asia. (d) US and its surrounding North
America. Graduated symbols for GeoDAR (blue bubbles) are superimposed by symbols for GRanD (red bubbles).
To assist regional applications, we further aggregated the improvements of GeoDAR over GRanD into national scales. As
shown in Fig. 14, GeoDAR’s improvements in either dam count or reservoir storage capacity pervade more than 100
countries which occupy about 70% of the continental landmass (excluding Greenland and Antarctica). The increase of dam 780
https://doi.org/10.5194/essd-2021-58
Ope
n A
cces
s Earth System
Science
DataD
iscussio
ns
Preprint. Discussion started: 24 March 2021c© Author(s) 2021. CC BY 4.0 License.
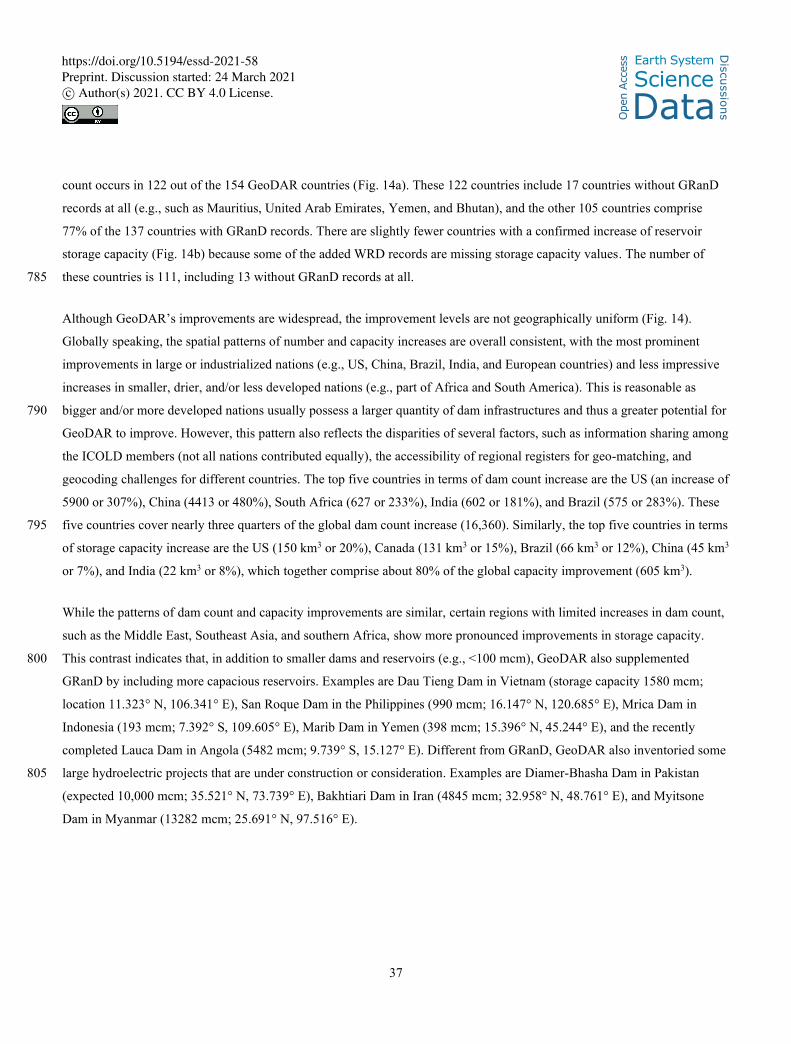
37
count occurs in 122 out of the 154 GeoDAR countries (Fig. 14a). These 122 countries include 17 countries without GRanD
records at all (e.g., such as Mauritius, United Arab Emirates, Yemen, and Bhutan), and the other 105 countries comprise
77% of the 137 countries with GRanD records. There are slightly fewer countries with a confirmed increase of reservoir
storage capacity (Fig. 14b) because some of the added WRD records are missing storage capacity values. The number of
these countries is 111, including 13 without GRanD records at all. 785
Although GeoDAR’s improvements are widespread, the improvement levels are not geographically uniform (Fig. 14).
Globally speaking, the spatial patterns of number and capacity increases are overall consistent, with the most prominent
improvements in large or industrialized nations (e.g., US, China, Brazil, India, and European countries) and less impressive
increases in smaller, drier, and/or less developed nations (e.g., part of Africa and South America). This is reasonable as
bigger and/or more developed nations usually possess a larger quantity of dam infrastructures and thus a greater potential for 790
GeoDAR to improve. However, this pattern also reflects the disparities of several factors, such as information sharing among
the ICOLD members (not all nations contributed equally), the accessibility of regional registers for geo-matching, and
geocoding challenges for different countries. The top five countries in terms of dam count increase are the US (an increase of
5900 or 307%), China (4413 or 480%), South Africa (627 or 233%), India (602 or 181%), and Brazil (575 or 283%). These
five countries cover nearly three quarters of the global dam count increase (16,360). Similarly, the top five countries in terms 795
of storage capacity increase are the US (150 km3 or 20%), Canada (131 km3 or 15%), Brazil (66 km3 or 12%), China (45 km3
or 7%), and India (22 km3 or 8%), which together comprise about 80% of the global capacity improvement (605 km3).
While the patterns of dam count and capacity improvements are similar, certain regions with limited increases in dam count,
such as the Middle East, Southeast Asia, and southern Africa, show more pronounced improvements in storage capacity.
This contrast indicates that, in addition to smaller dams and reservoirs (e.g., <100 mcm), GeoDAR also supplemented 800
GRanD by including more capacious reservoirs. Examples are Dau Tieng Dam in Vietnam (storage capacity 1580 mcm;
location 11.323° N, 106.341° E), San Roque Dam in the Philippines (990 mcm; 16.147° N, 120.685° E), Mrica Dam in
Indonesia (193 mcm; 7.392° S, 109.605° E), Marib Dam in Yemen (398 mcm; 15.396° N, 45.244° E), and the recently
completed Lauca Dam in Angola (5482 mcm; 9.739° S, 15.127° E). Different from GRanD, GeoDAR also inventoried some
large hydroelectric projects that are under construction or consideration. Examples are Diamer-Bhasha Dam in Pakistan 805
(expected 10,000 mcm; 35.521° N, 73.739° E), Bakhtiari Dam in Iran (4845 mcm; 32.958° N, 48.761° E), and Myitsone
Dam in Myanmar (13282 mcm; 25.691° N, 97.516° E).
https://doi.org/10.5194/essd-2021-58
Ope
n A
cces
s Earth System
Science
DataD
iscussio
ns
Preprint. Discussion started: 24 March 2021c© Author(s) 2021. CC BY 4.0 License.
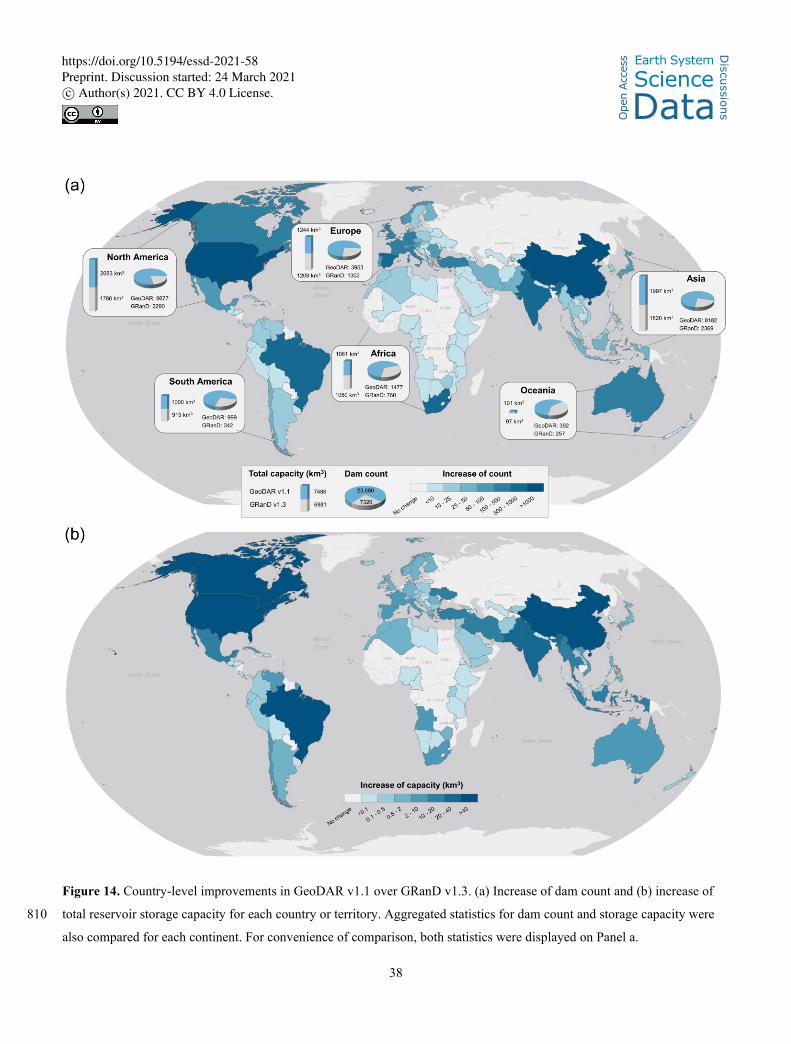
38
Figure 14. Country-level improvements in GeoDAR v1.1 over GRanD v1.3. (a) Increase of dam count and (b) increase of
total reservoir storage capacity for each country or territory. Aggregated statistics for dam count and storage capacity were 810
also compared for each continent. For convenience of comparison, both statistics were displayed on Panel a.
https://doi.org/10.5194/essd-2021-58
Ope
n A
cces
s Earth System
Science
DataD
iscussio
ns
Preprint. Discussion started: 24 March 2021c© Author(s) 2021. CC BY 4.0 License.
39
By further aggregating national statistics to each continent (Fig. 14a), the result echoes that GeoDAR’s major improvement
lies on the quantity or spatial details of the dams, rather than their total reservoir storage capacity. However, this should not
overshadow the fact that improvements of both dam count and storage capacity do exist in all continents. As summarized in
Fig. 14a, the continental improvement ascends from 135 more dams with a 4 km3 total capacity in Oceania, to a scale of 815
5000–6000 more dams with a 200–300 km3 capacity in North America or Asia. Unfortunately, because the total storage
capacity is disproportionally dominated by the largest reservoirs and GRanD has already included most of them, the added
storage capacity by GeoDAR relative to what has existed in GRanD appears limited and descends from 10–17% in North
America and Asia, 9% in South America, to only 1–4 % in the other continents. By contrast, GeoDAR’s dam quantity ranges
from being almost double that of GRanD in Oceania and South America, to being triple to quadruple in the other continents. 820
A derivative benefit of the increased dam quantity is a more complete representation of the reservoir catchment areas, which
is critical to improving discharge estimates. As revealed by the distribution curves in Fig. 11a, GeoDAR improved GRanD in
the inclusion of reservoir catchment areas from two aspects. First, the exceedance of the number of reservoir catchments is
almost unanimous on all area levels. This corresponds to a total increase of the regulated catchment area by 31,110 km2 or
27% (Table 9). Second, the increase of reservoir catchments is skewed towards smaller catchments, signifying a more 825
realistic inventory of human water regulations in the basins of lower stream orders or closer to stream headwaters. As shown
in the distribution curves (Fig. 11a), the average increasing rate is augmented from about 28% for catchments larger than
1000 km2, 75% for catchments between 10 and 1000 km2, to more than 500% for those smaller than 10 km2. The mode of
catchment areas decreases from about 200–400 km2 in GRanD to 30–100 km2 in GeoDAR, with the latter much closer to the
mode of the entire ICOLD WRD (15–50 km2). As a result, the number of dams with a catchment size smaller than 25 km2, 830
for example, which is the channelization threshold for the high-resolution MERIT Basins hydrography dataset (Lin et al.,
2019; Yamazaki et al., 2017)), is 2938 or 23% in GeoDAR in comparison to only 571 or 8% in GRanD. These small-
catchment dams, once integrated into river networks, may substantially improve the performance of routing models.
Consistent with our comparison with ICOLD WRD (Section 3.4.1), these statistics are only based on the records with valid
catchment areas. Considering that missing values more likely occur to dams with smaller catchments, our reported 835
improvement could be theoretically conservative.
The increased dam count in GeoDAR also enabled the retrieval of another 12,894 reservoir polygons from the high-
resolution HydroLAKES dataset and the finer UCLA Circa-2015 Lake Inventory (Fig. 7). These added reservoir polygons
are mostly small, with a median size of 0.2 km2 in comparison to 4.3 km3 in GRanD. They aggregate to a total area of 17,876
km2, a scale comparable to 30 Lake Meads. Although this area increase may appear substantial, it only expanded the global 840
reservoir area in GRanD by a marginal proportion of 4%. Similar to the pattern of storage capacities, reservoir areas follow a
quasi-Pareto distribution, meaning that smaller reservoirs tend to dominate the population (or number) whereas larger
reservoirs dominate the area and storage. This explains why the increase of relative area is small, but the increase of absolute
https://doi.org/10.5194/essd-2021-58
Ope
n A
cces
s Earth System
Science
DataD
iscussio
ns
Preprint. Discussion started: 24 March 2021c© Author(s) 2021. CC BY 4.0 License.
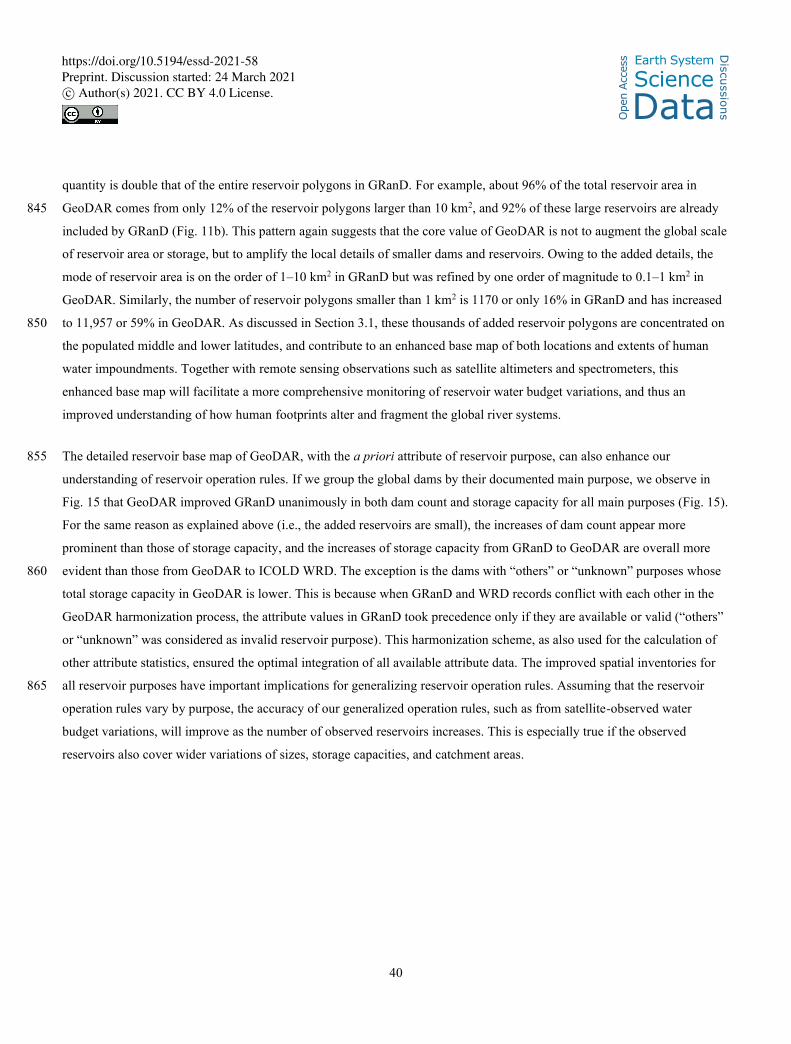
40
quantity is double that of the entire reservoir polygons in GRanD. For example, about 96% of the total reservoir area in
GeoDAR comes from only 12% of the reservoir polygons larger than 10 km2, and 92% of these large reservoirs are already 845
included by GRanD (Fig. 11b). This pattern again suggests that the core value of GeoDAR is not to augment the global scale
of reservoir area or storage, but to amplify the local details of smaller dams and reservoirs. Owing to the added details, the
mode of reservoir area is on the order of 1–10 km2 in GRanD but was refined by one order of magnitude to 0.1–1 km2 in
GeoDAR. Similarly, the number of reservoir polygons smaller than 1 km2 is 1170 or only 16% in GRanD and has increased
to 11,957 or 59% in GeoDAR. As discussed in Section 3.1, these thousands of added reservoir polygons are concentrated on 850
the populated middle and lower latitudes, and contribute to an enhanced base map of both locations and extents of human
water impoundments. Together with remote sensing observations such as satellite altimeters and spectrometers, this
enhanced base map will facilitate a more comprehensive monitoring of reservoir water budget variations, and thus an
improved understanding of how human footprints alter and fragment the global river systems.
The detailed reservoir base map of GeoDAR, with the a priori attribute of reservoir purpose, can also enhance our 855
understanding of reservoir operation rules. If we group the global dams by their documented main purpose, we observe in
Fig. 15 that GeoDAR improved GRanD unanimously in both dam count and storage capacity for all main purposes (Fig. 15).
For the same reason as explained above (i.e., the added reservoirs are small), the increases of dam count appear more
prominent than those of storage capacity, and the increases of storage capacity from GRanD to GeoDAR are overall more
evident than those from GeoDAR to ICOLD WRD. The exception is the dams with “others” or “unknown” purposes whose 860
total storage capacity in GeoDAR is lower. This is because when GRanD and WRD records conflict with each other in the
GeoDAR harmonization process, the attribute values in GRanD took precedence only if they are available or valid (“others”
or “unknown” was considered as invalid reservoir purpose). This harmonization scheme, as also used for the calculation of
other attribute statistics, ensured the optimal integration of all available attribute data. The improved spatial inventories for
all reservoir purposes have important implications for generalizing reservoir operation rules. Assuming that the reservoir 865
operation rules vary by purpose, the accuracy of our generalized operation rules, such as from satellite-observed water
budget variations, will improve as the number of observed reservoirs increases. This is especially true if the observed
reservoirs also cover wider variations of sizes, storage capacities, and catchment areas.
https://doi.org/10.5194/essd-2021-58
Ope
n A
cces
s Earth System
Science
DataD
iscussio
ns
Preprint. Discussion started: 24 March 2021c© Author(s) 2021. CC BY 4.0 License.
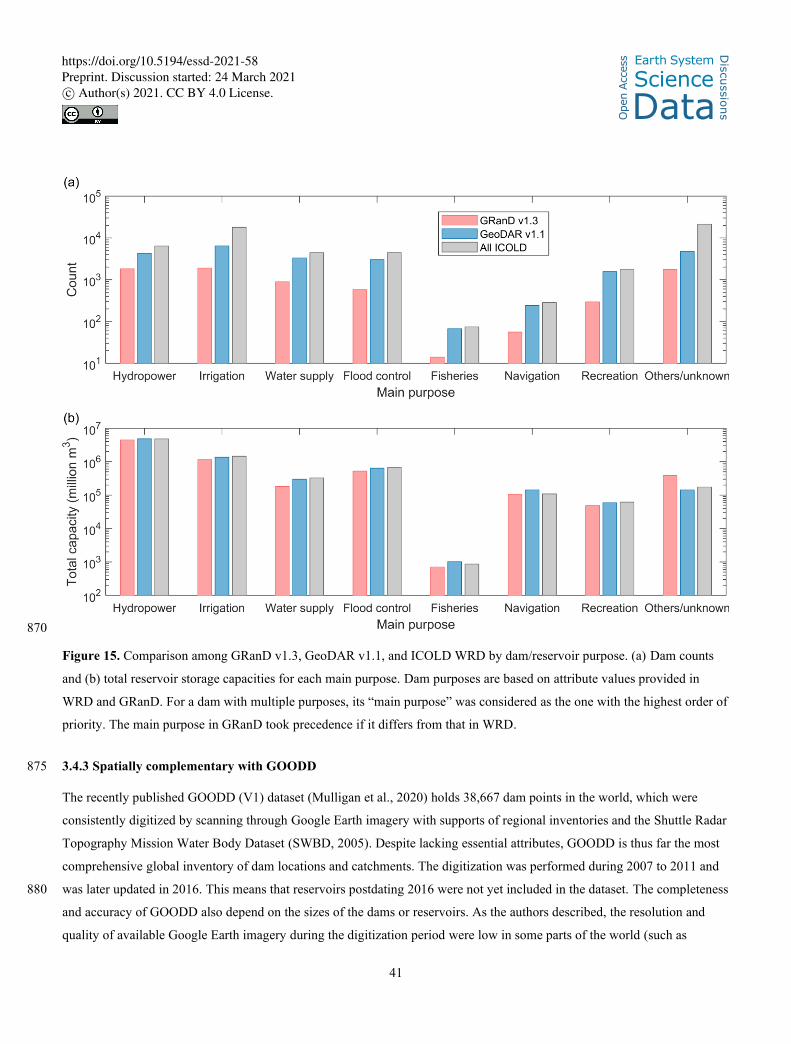
41
870
Figure 15. Comparison among GRanD v1.3, GeoDAR v1.1, and ICOLD WRD by dam/reservoir purpose. (a) Dam counts
and (b) total reservoir storage capacities for each main purpose. Dam purposes are based on attribute values provided in
WRD and GRanD. For a dam with multiple purposes, its “main purpose” was considered as the one with the highest order of
priority. The main purpose in GRanD took precedence if it differs from that in WRD.
3.4.3 Spatially complementary with GOODD 875
The recently published GOODD (V1) dataset (Mulligan et al., 2020) holds 38,667 dam points in the world, which were
consistently digitized by scanning through Google Earth imagery with supports of regional inventories and the Shuttle Radar
Topography Mission Water Body Dataset (SWBD, 2005). Despite lacking essential attributes, GOODD is thus far the most
comprehensive global inventory of dam locations and catchments. The digitization was performed during 2007 to 2011 and
was later updated in 2016. This means that reservoirs postdating 2016 were not yet included in the dataset. The completeness 880
and accuracy of GOODD also depend on the sizes of the dams or reservoirs. As the authors described, the resolution and
quality of available Google Earth imagery during the digitization period were low in some parts of the world (such as
https://doi.org/10.5194/essd-2021-58
Ope
n A
cces
s Earth System
Science
DataD
iscussio
ns
Preprint. Discussion started: 24 March 2021c© Author(s) 2021. CC BY 4.0 License.
42
China), and an experiment in the US showed that detectable dams and reservoirs from low resolution imagery (e.g., Landsat
Geocover 2000) may require the reservoir length greater than 500 m and the dam width greater than 150 m. These minimum
size criteria do not necessarily overlap with those of ICOLD WRD which instead emphasize the reservoir storage capacity 885
and dam height (see Section 1).
Because of the digitizing limitations and criterion difference, the dam points in GeoDAR are spatially complementary to,
rather than completely duplicated by, those in GOODD across many regions. Figure 16 identified four examples in Cerrado
Brazil, northern China, southwestern France, and northern Pakistan, where a large proportion of the GeoDAR dams were not
digitized by GOODD. Some of the dams that only appear in GeoDAR also comply with the minimum size criteria of 890
GOODD, and examples are those enlarged in the right panels except the Duber Khwar Dam in Pakistan (35.119° N, 72.927°
E; Fig. 16j) which was completed more recently in 2014. Since the area of the Duber Khwar Reservoir (about 0.05 km2) is
smaller than the resolution of HydroLAKES (0.1 km2) and the dam completion year overlaps with the image acquisition
period of the UCLA Circa-2015 Lake Inventory (from May 2013 to August 2015 (Sheng et al., 2016)), GeoDAR
georeferenced the dam point but did not successfully retrieve the reservoir polygon. 895
To approximate how GeoDAR and GOODD complement each other globally, we intersected both dam datasets with the 30-
m-resolution UCLA Circa-2015 Lake Inventory. We noticed that some of the points in GOODD, particularly in regions like
China, India, and Brazil, exhibit substantial geographic offsets from the dams or reservoirs observed in the Google Earth
imagery. Through a pilot experiment, we applied a 1-km tolerance when intersecting the UCLA lake inventory with
GOODD, and kept a 500-m tolerance as used in Section 2.6 for intersecting the lake inventory with GeoDAR. The result 900
shows that among the 57,000 or so water bodies that intersect either datasets, 82% intersect with GOODD and the other 18%
with GeoDAR alone. These statistics imply that GeoDAR may have an ability to expand the number of dams in GOODD by
about 21% (i.e., 18% divided by 82%). It is important to note that since we applied a larger tolerance for GOODD, this
estimated expansion by GeoDAR is likely conservative (considering that the number of GOODD-intersecting reservoirs may
be overestimated). If a 500-m tolerance is used for both intersections, the expansion by GeoDAR will increase to 42%. In 905
addition to the expanded spatial coverage, GeoDAR indexed each georeferenced dam point to a WRD and/or GRanD record
and thus enabled access to multiple attributes, whereas GOODD carries no attribute information except the delineated
reservoir catchments. These regional and global comparisons suggest that, even just with the geometric dam points,
GeoDAR is not a simple replication of GOODD, but instead complements GOODD for an improved spatial coverage of
global dams. 910
https://doi.org/10.5194/essd-2021-58
Ope
n A
cces
s Earth System
Science
DataD
iscussio
ns
Preprint. Discussion started: 24 March 2021c© Author(s) 2021. CC BY 4.0 License.
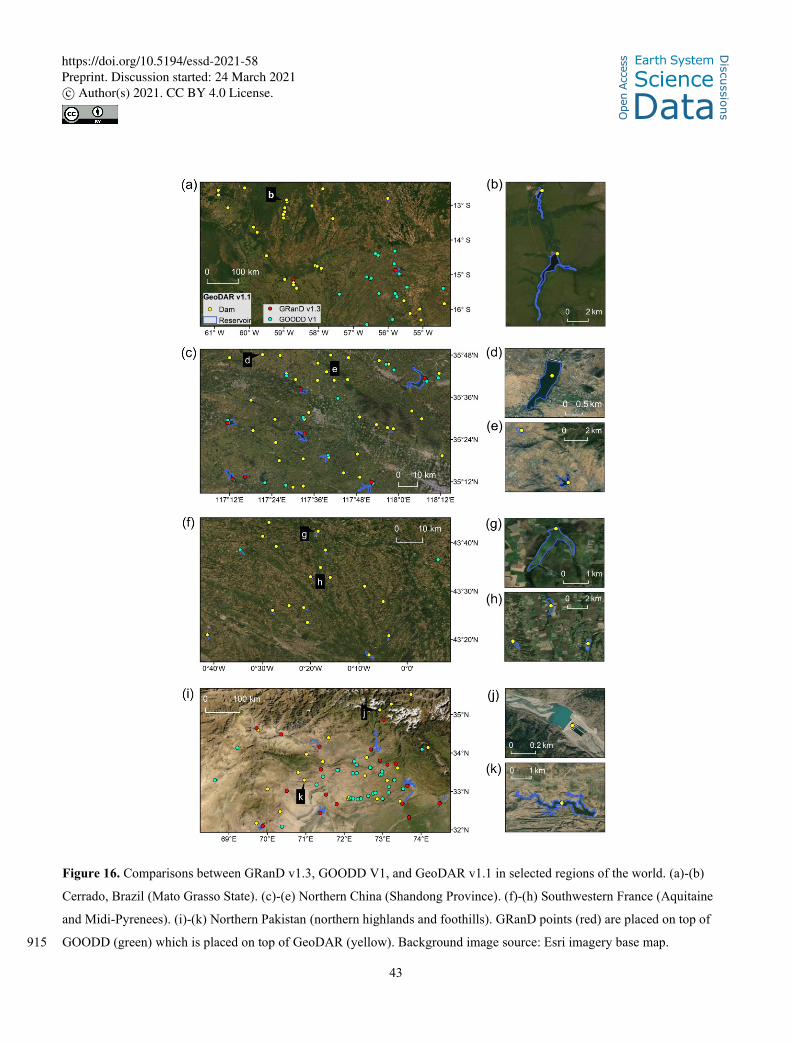
43
Figure 16. Comparisons between GRanD v1.3, GOODD V1, and GeoDAR v1.1 in selected regions of the world. (a)-(b)
Cerrado, Brazil (Mato Grasso State). (c)-(e) Northern China (Shandong Province). (f)-(h) Southwestern France (Aquitaine
and Midi-Pyrenees). (i)-(k) Northern Pakistan (northern highlands and foothills). GRanD points (red) are placed on top of
GOODD (green) which is placed on top of GeoDAR (yellow). Background image source: Esri imagery base map. 915
https://doi.org/10.5194/essd-2021-58
Ope
n A
cces
s Earth System
Science
DataD
iscussio
ns
Preprint. Discussion started: 24 March 2021c© Author(s) 2021. CC BY 4.0 License.

44
4 Data Availability
GeoDAR v1.0 (dam points) and v1.1 (both dam points and reservoir polygons) are available for download from the figshare
repository https://doi.org/10.6084/m9.figshare.13670527. The dam points are stored in both csv and shapefile formats, and
the reservoir polygons are provided in shapefile. Their attributes and values are described in Table 8 as well as in the
repository website. The data usage information is described in Section 3.3. Other citation courtesy and disclaimer 920
information are given in the Disclaimer section and the repository website. All released datasets and information are
available under the Creative Commons Attribution 4.0 International (CC-BY 4.0) license
(https://creativecommons.org/licenses/by/4.0). Users who would like to link GeoDAR records to the proprietary WRD
attributes they have purchased in advance from ICOLD should contact the corresponding author.
5 Conclusions and Outlooks 925
We have produced a comprehensive and spatially resolved dam and reservoir dataset, GeoDAR, which complementarily
improved the existing global inventories of large dams. We demonstrated that the production of GeoDAR is not a direct
compilation or collation of existing dam datasets. Instead, it involved a first-known effort to georeference ICOLD WRD.
This was jointly enabled by geo-matching (or table-associating) multi-source regional registers and geocoding descriptive
attributes through the Google Maps API. This georeferencing effort resulted in GeoDAR v1.0 which contains 21,051 930
spatially resolved dam points, each associated with a WRD record, with an overall accuracy of 96%. Each of the
georeferenced records was also labelled with a QA score, providing users a reference to the qualities of individual dam
locations. Our georeferencing process and accuracy validation, as we have elaborated in substantive detail, have important
methodological values for future expansions of spatial dam inventories using similar approaches, such as Geo-Wiki and
OpenStreetMap. 935
To further ensure the optimal inclusion of the world’s largest dams, we harmonized the georeferenced WRD (or GeoDAR
v1.0) carefully with GRanD v1.3. Using the harmonized dam points as spatial identifiers, most of their reservoir boundaries
were then retrieved from high-resolution water body datasets. This ICOLD-GRanD harmonization and the subsequent
reservoir retrieval resulted in GeoDAR v1.1, our end product, which holds 23,680 dam points (including 22,569 linked to
WRD) and 20,214 reservoir polygons. This product spatially resolved 40% of the entire ICOLD WRD by dam count and 940
more than 90% by reservoir storage capacity. Since most of the world’s largest reservoirs (e.g., >0.1 km3) are already
included in GRanD, GeoDAR adds limited improvements (by 4–27%) to the total reservoir area, storage capacity, and
catchment area. However, by including many smaller dams particularly in lower and middle latitudes, GeoDAR is triple the
size of GRanD in terms of dam and reservoir quantity. For this reason, one of the major improvements of GeoDAR is its
unparalleled ability to capture relatively small dams, or in other words, to enhance the spatial detail of global dam and 945
reservoir distributions.
https://doi.org/10.5194/essd-2021-58
Ope
n A
cces
s Earth System
Science
DataD
iscussio
ns
Preprint. Discussion started: 24 March 2021c© Author(s) 2021. CC BY 4.0 License.

45
Besides an enhanced spatial detail, another unique value of GeoDAR is its capability of bridging the locations of dams to a
broad suite of attributes that are essential to scientific applications. A standing dilemma of existing global dam datasets is the
divergence between the focus on dam quantity or spatial detail and the provision of detailed attributes for a limited dam
quantity. This dilemma was partially ameliorated by GeoDAR because its georeferenced dams and reservoirs were explicitly 950
indexed to WRD and/or GRanD records where many attributes are available. Since the original ICOLD WRD is not
georeferenced, our perception was that the task of georeferencing WRD to enable a spatially explicit application of the
attribute information, even at regional scales, often fell on individual users. To avoid the duplication of efforts and to
facilitate scientific applications, we performed this comprehensive georeferencing on the entirety of ICOLD WRD as
thoroughly as possible, and hereby released the resultant dam coordinates and reservoir polygons to the public as part of 955
GeoDAR. We would like to reiterate the disclaimer that GeoDAR does not directly contain, and neither do we intend to
release, the original WRD attribute data which are proprietary to ICOLD. In other words, the association between GeoDAR
IDs and WRD IDs exist but were purposefully encrypted. However, if individual users need GeoDAR records to be linked to
the WRD attributes that they already purchased from ICOLD, we can be contacted and, we may provide this information on
a case-by-case basis, given that the users agree not to release the decryption key or the proprietary WRD attributes. 960
We envision that GeoDAR, with its enhanced spatial detail and extended accessibility to essential attributes, will benefit a
wide spectrum of disciplines and applications. It is worth noting that although most dams in GeoDAR are smaller than those
in GRanD or AQUASTAT, they are still compliant with ICOLD’s size criteria which exclude countless tiny on-farm
reservoirs and water storage tanks. Nevertheless, we have suggested from regional examples that GeoDAR partially
complements some of the most extensive global dam inventories such as GOODD, despite GOODD owning a larger number 965
of dams. In this sense, even just with the 24,000 or so geometric dam points, GeoDAR contributes yet another fundamental
extension to global water infrastructure databases. If these dam points are rectified to high-resolution hydrographic networks
(such as MERIT Hydro (Lin et al., 2021; Yamazaki et al., 2019)), GeoDAR, together with other existing dam and barrier
datasets, can help refine our understanding of how human water infrastructure fragmented global rivers and their ecosystems
(Belletti et al., 2020; Grill et al., 2019; Kornei, 2020), especially with a more exhaustive inclusion of smaller and/or 970
headwater catchments.
Alongside the detailed dam points, GeoDAR’s reservoir boundaries provide thus far the most comprehensive global base
maps for assessing reservoir dynamics and the impacts of human water regulation. In combination with the expanding
constellation of satellite sensors (e.g., ICESat-2, Sentinel-6, and the forthcoming SWOT), this high-resolution base map will,
for instance, enable a more complete and accurate monitoring of water storage variation and surface evaporation in global 975
reservoirs (Biancamaria et al., 2016; Chen et al., 2021; Cretaux et al., 2016; Zhao and Gao, 2019a). Tracking the
spatiotemporal balance between reservoir water storage and evaporative loss will help strategize regional water
managements under a warming climate (Cretaux et al., 2015). Since our knowledge and understanding improves as
https://doi.org/10.5194/essd-2021-58
Ope
n A
cces
s Earth System
Science
DataD
iscussio
ns
Preprint. Discussion started: 24 March 2021c© Author(s) 2021. CC BY 4.0 License.
46
observations increase, the observed water storage dynamics for an increased quantity of reservoirs will inevitably entail a
more realistic generalization of the reservoir operation rules. This is particularly true if the attribute information such as 980
reservoir purpose and storage capacity are also utilized. Considering that small but widespread reservoirs have a strong
cumulative impact on discharge (Habets et al., 2018; Lin et al., 2019), the improved operation rules and the fine details of
reservoir storage changes will benefit discharge estimations from hydrological models. From another perspective,
GeoDAR’s reservoir polygons can also help refine surface water typology, either by directly using them to mask artificial
impoundments from natural lakes, or by expanding the training pool to enhance machine learning algorithms so that 985
additional reservoirs can be detected (Fang et al., 2019). A refined water typology map will, in turn, assist other analysis
tools in improving our assessments of how human footprints alter surface hydrology and its related biodiversity and
ecosystem health.
6 Code availability
Python scripts for geo-matching, geocoding, and reservoir assignment are publicly available at https://github.com/jida-990
wang/georeferencing-ICOLD-dams-and-reservoirs. We request users who adapt or use the scripts to cite Wang et al. (2021).
7 Author contribution
JW: Conceptualization, Data curation, Formal analysis, Funding acquisition, Investigation, Methodology, Programming,
Project administration, Quality assurance, Quality control, Supervision, Validation, Visualization, Writing – original draft
preparation, and Writing – review and editing. BAW: Data curation, Formal Analysis, Investigation, Methodology, 995
Programming, Visualization, Writing – original draft preparation, and Writing – review and revision. FY: Data curation,
Methodology, Quality control, Writing – review and revision. CQ: Methodology, Quality control, Supervision, Validation,
Writing – review and revision. MD: Quality control, Validation, Writing – review and revision. MASM: Quality control,
Validation, Writing – review and revision. JZ: Quality control and Validation. CF: Quality control and Validation. AX:
Quality control and Validation. JMM: Validation and Writing – review and revision. MSS: Methodology, Quality control, 1000
and Writing – review and revision; YS: Data curation, Methodology, and Writing – review and editing; GHA: Methodology
and Writing – review and editing; JFC: Data curation, Supervision, and Writing – review and editing; YW: Methodology,
Supervision, and Writing – review and editing.
8 Competing interests
The authors declare no conflict of interest. 1005
https://doi.org/10.5194/essd-2021-58
Ope
n A
cces
s Earth System
Science
DataD
iscussio
ns
Preprint. Discussion started: 24 March 2021c© Author(s) 2021. CC BY 4.0 License.
47
9 Disclaimer
GeoDAR v1.0 and v1.1 contain knowledge derived from ICOLD WRD (https://www.icold-
cigb.org/GB/world_register/acknowledgements_wrd.asp) but release no original values of the proprietary WRD attributes.
The production and dissemination of GeoDAR (spatial features) abide by ICOLD’s legal policies (https://www.icold-
cigb.org/GB/legal.asp) and were approved by the Central Office of ICOLD. GeoDAR v1.0 represents an initial effort of 1010
georeferencing WRD at a global scale, and the resultant dam distribution may be geographically skewed and thus may not
reflect the distribution of all WRD records. The authors are not responsible for any consequence arising from this limitation.
GeoDAR v1.1 absorbed the spatial features (i.e., dam point coordinates and reservoir polygons) in GRanD v1.3. To
acknowledge the originality of GRanD, we request that a user cites the reference of GRanD (Lehner et al., 2011) under the
following two conditions: a) if a user uses the complete collection or a subset of GeoDAR v1.1 that contains spatial features 1015
from both GeoDAR v1.0 and GRanD, the user should cite this paper (Wang et al., 2021) and Lehner et al. (2011)
concurrently; b) if a user uses a subset of GeoDAR v1.1 that only includes spatial features from GRanD and meanwhile the
user does not use the WRD attribute data associated with the GRanD features, the user should only cite Lehner et al. (2011).
The source of each spatial feature in GeoDAR v1.1 has been specified in the attribute “pnt_src” for dam points and the
attribute “plg_src” for reservoir polygons (see Table 8). For any questions about data citation, users are recommended to 1020
contact the corresponding author JW. Authors of this paper claim no responsibility or liability for any consequences related
to the use, citation, or dissemination of GeoDAR.
10 Acknowledgements
The work was in part supported by Kansas State University faculty start-up fund to JW and NASA Surface Water and Ocean
Topography (SWOT) Grant (#80NSSC20K1143) to JW. The authors would like to acknowledge ICOLD for providing WRD 1025
and the Central Office of ICOLD for informing data dissemination policies and for allowing us to release the position
information of WRD we georeferenced. The authors are also grateful to Bernhard Lehner at McGill University for his
constructive suggestions and comments on data curation, usage, and dissemination. We also acknowledge Google Maps
Platform (https://cloud.google.com/maps-platform) for providing the geocoding API.
11 References 1030
Allen, G. H. and Pavelsky, T. M.: Global extent of rivers and streams, Science, 361, 585-587,
https://doi.org/10.1126/science.aat0636, 2018.
Belletti, B., Leaniz, C. G. d., Jones, J., Bizzi, S., Börger, L., Segura, G., Castelletti, A., Bund, W. v. d., Aarestrup, K., Barry,
J., Belka, K., Berkhuysen, A., Birnie-Gauvin, K., Bussettini, M., Carolli, M., Consuegra, S., Dopico, E., Feierfeil, T.,
Fernández, S., Garrido, P. F., Garcia-Vazquez, E., Garrido, S., Giannico, G., Gough, P., Jepsen, N., Jones, P. E., Kemp, 1035
https://doi.org/10.5194/essd-2021-58
Ope
n A
cces
s Earth System
Science
DataD
iscussio
ns
Preprint. Discussion started: 24 March 2021c© Author(s) 2021. CC BY 4.0 License.
48
P., Kerr, J., King, J., Łapińska, M., Lázaro, G., Lucas, M. C., Marcello, L., Martin, P., McGinnity, P., O’Hanley, J.,
Amo, R. O. d., Parasiewicz, P., Pusch, M., Rincon, G., Rodriguez, C., Royte, J., Schneider, C. T., Tummers, J. S.,
Vallesi, S., Vowles, A., Verspoor, E., Wanningen, H., Wantzen, K. M., Wildman, L., and Zalewski, M.: More than one
million barriers fragment Europe's rivers, Nature, 588, 436-441, https://doi.org/10.1038/s41586-020-3005-2, 2020.
Biancamaria, S., Lettenmaier, D. P., and Pavelsky, T. M.: The SWOT mission and its capabilities for land hydrology, Surv. 1040
Geophys., 37, 307-337, https://doi.org/10.1007/s10712-015-9346-y, 2016.
Biemans, H., Haddeland, I., Kabat, P., Ludwig, F., Hutjes, R. W. A., Heinke, J., von Bloh, W., and Gerten, D.: Impact of
reservoirs on river discharge and irrigation water supply during the 20th century, Water Resour. Res., 47, W03509,
https://doi.org/10.1029/2009WR008929, 2011.
Boulange, J., Hanasaki, N., Yamazaki, D., and Pokhrel, Y.: Role of dams in reducing global flood exposure under climate 1045
change, Nat. Commun., 12, 417, https://doi.org/10.1038/s41467-020-20704-0, 2021.
Busker, T., de Roo, A., Gelati, E., Schwatke, C., Adamovic, M., Bisselink, B., Pekel, J. F., and Cottam, A.: A global lake
and reservoir volume analysis using a surface water dataset and satellite altimetry, Hydrol. Earth Syst. Sci., 23, 669-690,
https://doi.org/10.5194/hess-23-669-2019, 2019.
Carpenter, S. R., Stanley, E. H., and Vander Zanden, M. J.: State of the world's freshwater ecosystems: physical, chemical, 1050
and biological changes, Annu. Rev. Environ. Resour., 36, 75-99, https://doi.org/10.1146/annurev-environ-021810-
094524, 2011.
Chao, B. F., Wu, Y. H., and Li, Y. S.: Impact of artificial reservoir water impoundment on global sea level, Science, 320,
212-214, https://doi.org/10.1126/science.1154580, 2008.
Chen, T., Song, C., Ke, L., Wang, J., Liu, K., and Wu, Q.: Estimating seasonal water budgets in global lakes by using multi-1055
source remote sensing measurements, Journal of Hydrology, 593, 125781,
https://doi.org/10.1016/j.jhydrol.2020.125781, 2021.
Cretaux, J. F., Abarca-del-Rio, R., Berge-Nguyen, M., Arsen, A., Drolon, V., Clos, G., and Maisongrande, P.: Lake volume
monitoring from space, Surv. Geophys., 37, 269-305, https://doi.org/10.1007/s10712-016-9362-6, 2016.
Cretaux, J. F., Biancamaria, S., Arsen, A., Berge-Nguyen, M., and Becker, M.: Global surveys of reservoirs and lakes from 1060
satellites and regional application to the Syrdarya river basin, Environ. Res. Lett., 10, 015002,
http://dx.doi.org/10.1088/1748-9326/10/1/015002, 2015.
Cretaux, J. F., Jelinski, W., Calmant, S., Kouraev, A., Vuglinski, V., Berge-Nguyen, M., Gennero, M. C., Nino, F., Del Rio,
R. A., Cazenave, A., and Maisongrande, P.: SOLS: A lake database to monitor in the near real time water level and
storage variations from remote sensing data, Adv. Space. Res., 47, 1497-1507, https://doi.org/10.1016/j.asr.2011.01.004, 1065
2011.
Dams in Japan, Japan Dam Foundation (JDF): http://damnet.or.jp/Dambinran/binran/TopIndex_en.html, last access:
September 2020.
https://doi.org/10.5194/essd-2021-58
Ope
n A
cces
s Earth System
Science
DataD
iscussio
ns
Preprint. Discussion started: 24 March 2021c© Author(s) 2021. CC BY 4.0 License.
49
Degu, A. M., Hossain, F., Niyogi, D., Pielke, R., Shepherd, J. M., Voisin, N., and Chronis, T.: The influence of large dams
on surrounding climate and precipitation patterns, Geophys. Res. Lett., 38, L04405, 1070
https://doi.org/10.1029/2010GL046482, 2011.
Department of Water and Sanitation (DWS) of South Africa: List of Registered Dams (LRD) [data set],
http://www.dwaf.gov.za/DSO/Publications.aspx, 2019.
Doll, P., Fiedler, K., and Zhang, J.: Global-scale analysis of river flow alterations due to water withdrawals and reservoirs,
Hydrol. Earth Syst. Sci., 13, 2413-2432, https://doi.org/10.5194/hess-13-2413-2009, 2009. 1075
Fang, W., Wang, C., Chen, X., Wan, W., Li, H., Zhu, S., Fang, Y., Liu, B., and Hong, Y.: Recognizing global reservoirs
from Landsat 8 images: a deep learning approach, IEEE J. Sel. Top. Appl. Earth. Obs. Remote Sens., 12, 3701-3701,
https://doi.org/10.1109/JSTARS.2019.2929601, 2019.
Gao, H., Birkett, C., and Lettenmaier, D. P.: Global monitoring of large reservoir storage from satellite remote sensing,
Water Resour. Res., 48, W09504, https://doi.org/10.1029/2012WR012063, 2012. 1080
Grill, G., Lehner, B., Thieme, M., Geenen, B., Tickner, D., Antonelli, F., Babu, S., Borrelli, P., Cheng, L., Crochetiere, H.,
Macedo, H. E., Filgueiras, R., Goichot, M., Higgins, J., Hogan, Z., Lip, B., McClain, M. E., Meng, J., Mulligan, M.,
Nilsson, C., Olden, J. D., Opperman, J. J., Petry, P., Liermann, C. R., Saenz, L., Salinas-Rodriguez, S., Schelle, P.,
Schmitt, R. J. P., Snider, J., Tan, F., Tockner, K., Valdujo, P. H., van Soesbergen, A., and Zarfl, C.: Mapping the world's
free-flowing rivers, Nature, 569, 215-221, https://doi.org/10.1038/s41586-019-1111-9, 2019. 1085
Goteti, G. and Stachelek J.: Dams in the United States from the National Inventory of Dams, R package version 0.2 [data
set], https://www.rdocumentation.org/packages/dams/versions/0.2, 2016.
Habets, F., Molenat, J., Carluer, N., Douez, O., and Leenhardt, D.: The cumulative impacts of small reservoirs on hydrology:
a review, Sci. Total Environ., 643, 850-867, https://doi.org/10.1016/j.scitotenv.2018.06.188, 2018.
Kornei, K.: Europe’s rivers are the most obstructed on Earth, Eos, 101, https://doi.org/10.1029/2020EO139204, 2020. 1090
Latrubesse, E. M., Arima, E. Y., Dunne, T., Park, E., Baker, V. R., d'Horta, F. M., Wight, C., Wittmann, F., Zuanon, J.,
Baker, P. A., Ribas, C. C., Norgaard, R. B., Filizola, N., Ansar, A., Flyvbjerg, B., and Stevaux, J. C.: Damming the
rivers of the Amazon basin, Nature, 546, 363-369, https://doi.org/10.1038/nature22333, 2017.
Lehner, B., Liermann, C. R., Revenga, C., Vorosmarty, C., Fekete, B., Crouzet, P., Doll, P., Endejan, M., Frenken, K.,
Magome, J., Nilsson, C., Robertson, J. C., Rodel, R., Sindorf, N., and Wisser, D.: High-resolution mapping of the 1095
world's reservoirs and dams for sustainable river-flow management, Front. Ecol. Environ., 9, 494-502,
https://doi.org/10.1890/100125, 2011.
Li, B., Yan, Q., and Zhang, L.: Flood monitoring and analysis over the middle reaches of Yangtze River basin using MODIS
time-series imagery, in: 2011 IEEE International Geoscience and Remote Sensing Symposium, Vancouver, British
Columbia, Canada, 24-29 July 2011, 807-810, https://doi.org/10.1109/IGARSS.2011.6049253, 2011. 1100
Li, Y., Gao, H., Zhao, G., and Tseng, K. H.: A high-resolution bathymetry dataset for global reservoirs using multi-source
satellite imagery and altimetry, Remote Sens. Environ., 244, 111831, https://doi.org/10.1016/j.rse.2020.111831, 2020.
https://doi.org/10.5194/essd-2021-58
Ope
n A
cces
s Earth System
Science
DataD
iscussio
ns
Preprint. Discussion started: 24 March 2021c© Author(s) 2021. CC BY 4.0 License.
50
Lin, P., Pan, M., Wood, E. F., Yamazaki, D., and Allen, G. H.: A new vector-based global river network dataset accounting
for variable drainage density, Sci. Data, 8, 28, https://doi.org/10.1038/s41597-021-00819-9, 2021.
Lin, P., Pan, M., Beck, H. E., Yang, Y., Yamazaki, D., Frasson, R., David, C. H., Durand, M., Pavelsky, T. M., Allen, G. H., 1105
Gleason, C. J., and Wood, E. F.: Global reconstruction of naturalized river flows at 2.94 million reaches, Water Resour.
Res., 55, 6499-6516, https://doi.org/10.1029/2019WR025287, 2019.
Liu, K., Song, C., Wang, J., Ke, L., Zhu, Y., Zhu, J., Ma, R., and Luo, Z.: Remote sensing‐based modeling of the bathymetry
and water storage for channel‐type reservoirs worldwide, Water Resour. Res., 56, e2020WR027147,
https://doi.org/10.1029/2020WR027147, 2020. 1110
Lyons, E. A. and Sheng, Y.: LakeTime: Automated seasonal scene selection for global lake mapping using Landsat ETM+
and OLI, Remote Sensing, 10, 54, https://doi.org/10.3390/rs10010054, 2018.
Mady, B., Lehmann, P., Gorelick, S. M., and Or, D.: Distribution of small seasonal reservoirs in semi-arid regions and
associated evaporative losses, Environ. Res Commun., 2, 061002, https://doi.org/10.1088/2515-7620/ab92af, 2020.
Managing Aquatic ecosystems and water Resources under multiple Stress project (MARS): MARS GeoDatabase 1115
(MARSgeoDB) version 2 [data set], http://www.mars-project.eu/index.php/databases.html, 2017.
Map World (Tianditu), National Platform for Common Geospatial Information Services (NPCGIS):
https://map.tianditu.gov.cn, last access: September 2020.
Messager, M. L., Lehner, B., Grill, G., Nedeva, I., and Schmitt, O.: Estimating the volume and age of water stored in global
lakes using a geo-statistical approach, Nat. Commun., 7, 13603, https://doi.org/10.1038/ncomms13603, 2016. 1120
Mulligan, M., van Soesbergen, A., and Saenz, L.: GOODD, a global dataset of more than 38,000 georeferenced dams, Sci.
Data, 7, 31, https://doi.org/10.1038/s41597-020-0362-5, 2020.
National Register of Large Dams (NRLD), Central Water Commission (CWC) of India: http://cwc.gov.in/national-register-
large-dams, last access: September, 2020.
Natural Resources Canada (NRC): CanVec 1M Man-Made Features - Dam version 1.0 [data set], 1125
http://geogratis.gc.ca/api/en/nrcan-rncan/ess-sst/0c78d7fe-100b-5937-b74e-7590a03a6244.html, 2017.
Nilsson, C. and Berggren, K.: Alterations of riparian ecosystems caused by river regulation, Bioscience, 50, 783-792,
https://doi.org/10.1641/0006-3568(2000)050[0783:AORECB]2.0.CO;2, 2000.
Open Development Cambodia (ODC): Hydropower dams 1993-2014 [data set],
https://data.opendevelopmentmekong.net/en/dataset/hydropower-2009-2014, 2015. 1130
Open Development Myanmar (ODM): Myanmar Dams [data set],
https://data.opendevelopmentmekong.net/en/dataset/myanmar-dams, 2018.
Pekel, J. F., Cottam, A., Gorelick, N., and Belward, A. S.: High-resolution mapping of global surface water and its long-term
changes, Nature, 540, 418-422, https://doi.org/10.1038/nature20584, 2016.
https://doi.org/10.5194/essd-2021-58
Ope
n A
cces
s Earth System
Science
DataD
iscussio
ns
Preprint. Discussion started: 24 March 2021c© Author(s) 2021. CC BY 4.0 License.
51
Schwatke, C., Dettmering, D., Bosch, W., and Seitz, F.: DAHITI - an innovative approach for estimating water level time 1135
series over inland waters using multi-mission satellite altimetry, Hydrol. Earth Syst. Sci., 19, 4345-4364,
https://doi.org/10.5194/hess-19-4345-2015, 2015.
Sheng, Y., Song, C., Wang, J., Lyons, E. A., Knox, B. R., Cox, J. S., and Gao, F.: Representative lake water extent mapping
at continental scales using multi-temporal Landsat-8 imagery, Remote Sens. Environ., 185, 129-141,
https://doi.org/10.1016/j.rse.2015.12.041, 2016. 1140
Shin, S., Pokhrel, Y., and Miguez-Macho, G.: High-resolution modeling of reservoir release and storage dynamics at the
continental scale, Water Resour. Res., 55, 787-810, https://doi.org/10.1029/2018WR023025, 2019.
Shuttle Radar Topography Mission Water Body Data set (SWBD): http://www2.jpl.nasa.gov/srtm, last access 2014.
Sistema Nacional de Informações sobre Segurança de Barragens (SNISB, Brazilian National Dam Safety Information
System): Relatório de Segurança de Barragens 2017 (Dams Safety Report 2017) [data set], 1145
http://www.snisb.gov.br/portal/snisb/relatorio-anual-de-seguranca-de-barragem/2017, 2017.
Tilt, B., Braun, Y., and He, D.: Social impacts of large dam projects: A comparison of international case studies and
implications for best practice, Journal of Environmental Management, 90, S249-S257, 2009.
Tobler, W. R.: Computer Movie Simulating Urban Growth in Detroit Region, Econ. Geogr., 46, 234-240,
https://doi.org/10.2307/143141, 1970. 1150
United States Army Coprs of Engineers (USACE): National Inventory of Dams (NID) [data set], https://nid.usace.army.mil,
2013.
Vorosmarty, C. J., Meybeck, M., Fekete, B., Sharma, K., Green, P., and Syvitski, J. P. M.: Anthropogenic sediment
retention: major global impact from registered river impoundments, Glob. Planet Change, 39, 169-190,
https://doi.org/10.1016/S0921-8181(03)00023-7, 2003. 1155
Wada, Y., Reager, J. T., Chao, B. F., Wang, J., Lo, M. H., Song, C., Li, Y. W., and Gardner, A. S.: Recent changes in land
water storage and its contribution to sea level variations, Surv. Geophys., 38, 131-152, https://doi.org/10.1007/s10712-
016-9399-6, 2017.
Wang, J., Sheng, Y., and Wada, Y.: Little impact of the Three Gorges Dam on recent decadal lake decline across China's
Yangtze Plain, Water Resour. Res., 53, 3854-3877, https://doi.org/10.1002/2016WR019817, 2017. 1160
Wang, J., Walter, B.A., Yao, F., Song, C., Ding, M., Maroof, M.A.S., Zhu, J., Fan, C., Xin, A., McAlister, J.M., Sikder,
M.S., Sheng, Y., Allen, G.H., Crétaux, J.-F., and Wada, Y., 2021. GeoDAR: Georeferenced global dam and reservoir
dataset for bridging attributes and geolocations. Earth System Science Data, in review.
Whittemore, A., Ross, M. R. V., Dolan, W., Langhorst, T., Yang, X., Pawar, S., Jorissen, M., Lawton, E., Januchowski‐
Hartley, S., and Pavelsky, T.: A participatory science approach to expanding instream infrastructure inventories, Earth's 1165
Future, 8, e2020EF001558, https://doi.org/10.1029/2020EF001558, 2020.
https://doi.org/10.5194/essd-2021-58
Ope
n A
cces
s Earth System
Science
DataD
iscussio
ns
Preprint. Discussion started: 24 March 2021c© Author(s) 2021. CC BY 4.0 License.
52
Yamazaki, D., Ikeshima, D., Sosa, J., Bates, P. D., Allen, G. H., and Pavelsky, T. M.: MERIT Hydro: A high-resolution
global hydrography map based on latest topography dataset, Water Resour. Res., 55, 5053-5073,
https://doi.org/10.1029/2019WR024873, 2019.
Yamazaki, D., Ikeshima, D., Tawatari, R., Yamaguchi, T., O'Loughlin, F., Neal, J. C., Sampson, C. C., Kanae, S., and Bates, 1170
P. D.: A high-accuracy map of global terrain elevations, Geophys. Res. Lett., 44, 5844-5853,
https://doi.org/10.1002/2017GL072874, 2017.
Yao, F., Wang, J., Wang, C., and Cretaux, J. F.: Constructing long-term high-frequency time series of global lake and
reservoir areas using Landsat imagery, Remote Sens. Environ., 232, 111210, https://doi.org/10.1016/j.rse.2019.111210,
2019. 1175
Yassin, F., Razavi, S., Elshamy, M., Davison, B., Sapriza-Azuri, G., and Wheater, H.: Representation and improved
parameterization of reservoir operation in hydrological and land-surface models, Hydrol. Earth Syst. Sci., 23, 3735-
3764, https://doi.org/10.5194/hess-23-3735-2019, 2019.
Yigzaw, W., Li, H. Y., Demissie, Y., Hejazi, M. I., Leung, L. R., Voisin, N., and Payn, R.: A new global storage-area-depth
data set for modeling reservoirs in land surface and earth system models, Water Resour. Res., 54, 10372-10386, 1180
https://doi.org/10.1029/2017WR022040, 2018.
Zarfl, C., Lumsdon, A. E., Berlekamp, J., Tydecks, L., and Tockner, K.: A global boom in hydropower dam construction,
Aquat. Sci., 77, 161–170, https://doi.org/10.1007/s00027-014-0377-0, 2015.
Zhan, S., Song, C., Wang, J., Sheng, Y., and Quan, J.: A global assessment of terrestrial evapotranspiration increase due to
surface water area change, Earth's Future, 7, 266-282, https://doi.org/10.1029/2018EF001066, 2019. 1185
Zhang, S., Gao, H., and Naz, B. S.: Monitoring reservoir storage in South Asia from multisatellite remote sensing, Water
Resour. Res., 50, 8927-8943, https://doi.org/10.1002/2014WR015829, 2014.
Zhang, W., Pan, H., Song, C., Ke, L., Wang, J., Ma, R., Deng, X., Liu, K., Zhu, J., and Wu, Q. H.: Identifying emerging
reservoirs along regulated rivers using multi-source remote sensing observations, Remote Sens-Basel, 11, 25,
https://doi.org/10.3390/rs11010025, 2019. 1190
Zhao, G. and Gao, H.: Estimating reservoir evaporation losses for the United States: Fusing remote sensing and modeling
approaches, Remote Sens. Environ., 226, 109-124, https://doi.org/10.1016/j.rse.2019.03.015, 2019a.
Zhao, G. and Gao, H.: Towards global hydrological drought monitoring using remotely sensed reservoir surface area,
Geophys. Res. Lett., 46, 13027-13035, https://doi.org/10.1029/2019GL085345, 2019b.
1195
https://doi.org/10.5194/essd-2021-58
Ope
n A
cces
s Earth System
Science
DataD
iscussio
ns
Preprint. Discussion started: 24 March 2021c© Author(s) 2021. CC BY 4.0 License.
Related Documents