Geochemistry of Tungsten and Arsenic in Aquifer Systems: A Comparative Study of Groundwaters from West Bengal, India, and Nevada, USA T. Jade Mohajerin & Andrew W. Neal & Katherine Telfeyan & Sankar M. Sasihharan & Sophie Ford & Ningfang Yang & Darren A. Chevis & Deborah A. Grimm & Saugata Datta & Christopher D. White & Karen H. Johannesson Received: 19 June 2013 /Accepted: 22 October 2013 /Published online: 29 November 2013 # Springer Science+Business Media Dordrecht 2013 Abstract Tungsten (W) concentrations were measured along with arsenic (As) in groundwaters from the Murshidabad district of West Bengal, India. Tungsten concentrations range from 0.8 to ~8 nmol kg -1 (0.15– 1.5 μg kg -1 ) in the circumneutral pH (average pH~7.3) Murshidabad groundwaters, and attain concentrations as high as 14 nmol kg -1 (2.5 μg kg -1 ) in local ponds (n =2). Total dissolved As concentrations (As T ) range from 0.013 to 53.9 μmol kg -1 (<1 to 4,032 μg kg -1 ), and As(III) predominates in Murshidabad groundwaters accounting for 70 %, on average, of As in solution. Tungsten concentrations in Murshidabad groundwaters are low compared to alkaline groundwaters (pH>8) from the Carson Desert in Western Nevada, USA, where W concentrations are reported to reach as high as 4,036 nmol kg -1 (742 μg kg -1 ). Although W is positively correlated with As in groundwaters from the Carson Desert, it is not correlated with As T or As(III) in Murshidabad groundwaters, but does exhibit a weak relationship with As(V) in these groundwaters. Surface complexation modeling indicates that pH related adsorption/desorption can explain the geochemical be- havior of W in Murshidabad groundwaters. However, the model does not predict the high As concentrations observed in Murshidabad groundwaters. The high As and low W concentrations measured in Murshidabad groundwaters indicate that either As and W originate from different sources or are mobilized by different biogeochemical processes within the Murshidabad aqui- fers. Mobilization of As in Murshidabad groundwaters is presumed to reflect reductive dissolution of Fe(III) oxides/oxyhydroxides and release of sorbed and/or coprecipitated As to the groundwaters. Multivariate sta- tistical analysis of groundwater composition data indicate that W is associated with Mn and Cl - , which may point to a Mn oxide/oxyhydroxide, clay mineral, and/or apatite source for W in the Murshidabad sediments. Keywords Tungsten . Arsenic . Groundwater . West Bengal . India . Nevada 1 Introduction Recently recognized childhood leukemia clusters within the western USA (e.g., Fallon, NV) have been Water Air Soil Pollut (2014) 225:1792 DOI 10.1007/s11270-013-1792-x T. J. Mohajerin : K. Telfeyan : N. Yang : D. A. Chevis : K. H. Johannesson (*) Department of Earth and Environmental Sciences, Tulane University, New Orleans, LA 70118-5698, USA e-mail: [email protected] A. W. Neal : S. M. Sasihharan : S. Ford : S. Datta Department of Geology, Kansas State University, Manhattan, KS 66506-3201, USA D. A. Grimm Coordinated Instrumentation Facility, Tulane University, New Orleans, LA 70118, USA C. D. White Department of Petroleum Engineering, Louisiana State University, Baton Rouge, LA 70803, USA

Welcome message from author
This document is posted to help you gain knowledge. Please leave a comment to let me know what you think about it! Share it to your friends and learn new things together.
Transcript

Geochemistry of Tungsten and Arsenic in Aquifer Systems:A Comparative Study of Groundwaters from West Bengal,India, and Nevada, USA
T. Jade Mohajerin & Andrew W. Neal & Katherine Telfeyan &
Sankar M. Sasihharan & Sophie Ford & Ningfang Yang &
Darren A. Chevis & Deborah A. Grimm & Saugata Datta &
Christopher D. White & Karen H. Johannesson
Received: 19 June 2013 /Accepted: 22 October 2013 /Published online: 29 November 2013# Springer Science+Business Media Dordrecht 2013
Abstract Tungsten (W) concentrations were measuredalong with arsenic (As) in groundwaters from theMurshidabad district of West Bengal, India. Tungstenconcentrations range from 0.8 to ~8 nmol kg-1 (0.15–1.5 μg kg-1) in the circumneutral pH (average pH~7.3)Murshidabad groundwaters, and attain concentrations ashigh as 14 nmol kg-1 (2.5 μg kg-1) in local ponds (n=2).Total dissolved As concentrations (AsT) range from0.013 to 53.9 μmol kg-1 (<1 to 4,032 μg kg-1), andAs(III) predominates in Murshidabad groundwatersaccounting for 70 %, on average, of As in solution.Tungsten concentrations in Murshidabad groundwatersare low compared to alkaline groundwaters (pH>8)from the Carson Desert inWestern Nevada, USA, whereW concentrations are reported to reach as high as
4,036 nmol kg-1 (742μg kg-1). AlthoughW is positivelycorrelated with As in groundwaters from the CarsonDesert, it is not correlated with AsT or As(III) inMurshidabad groundwaters, but does exhibit a weakrelationship with As(V) in these groundwaters. Surfacecomplexation modeling indicates that pH relatedadsorption/desorption can explain the geochemical be-havior of W in Murshidabad groundwaters. However,the model does not predict the high As concentrationsobserved in Murshidabad groundwaters. The high Asand low W concentrations measured in Murshidabadgroundwaters indicate that either As and W originatefrom different sources or are mobilized by differentbiogeochemical processes within theMurshidabad aqui-fers. Mobilization of As in Murshidabad groundwatersis presumed to reflect reductive dissolution of Fe(III)oxides/oxyhydroxides and release of sorbed and/orcoprecipitated As to the groundwaters. Multivariate sta-tistical analysis of groundwater composition data indicatethat W is associated with Mn and Cl-, which may point toa Mn oxide/oxyhydroxide, clay mineral, and/or apatitesource for W in the Murshidabad sediments.
Keywords Tungsten . Arsenic . Groundwater .WestBengal . India . Nevada
1 Introduction
Recently recognized childhood leukemia clusters withinthe western USA (e.g., Fallon, NV) have been
Water Air Soil Pollut (2014) 225:1792DOI 10.1007/s11270-013-1792-x
T. J. Mohajerin :K. Telfeyan :N. Yang :D. A. Chevis :K. H. Johannesson (*)Department of Earth and Environmental Sciences, TulaneUniversity, New Orleans, LA 70118-5698, USAe-mail: [email protected]
A. W. Neal : S. M. Sasihharan : S. Ford : S. DattaDepartment of Geology, Kansas State University, Manhattan,KS 66506-3201, USA
D. A. GrimmCoordinated Instrumentation Facility, Tulane University, NewOrleans, LA 70118, USA
C. D. WhiteDepartment of Petroleum Engineering, Louisiana StateUniversity, Baton Rouge, LA 70803, USA
tentatively linked to local tungsten (W)-bearing oredeposits, active or inactive W mineral-smelting opera-tions, and/or active hard-metal processing plants (Seileret al. 2005; Koutsospyros et al. 2006; Sheppard et al.2006; Sheppard et al. 2007; Bednar et al. 2007; 2008).An independent investigation by the United States Cen-ters for Disease Control and Prevention, discovered viaurine analysis that residents of Fallon, NV, exhibitedelevated levels of W (Seiler et al. 2005; Koutsospyroset al. 2006). Although it is difficult to unequivocallyascribe these childhood leukemia clusters to environ-mental exposure of local populations to elevated Wconcentrations (e.g., Seiler 2012; Francis et al. 2012),a number of investigations have demonstrated that Wcan be toxic and may be carcinogenic (Peão et al. 1993;Marquet et al. 1996; ATSDR 2005; Kalinich et al. 2005;U.S. EPA 2008; Kelly et al. 2013). Furthermore, inha-lation of W dust in the hard metal manufacturing indus-try has been linked to hard metal pneumoconiosis andpulmonary fibrosis (Edel et al. 1990; Sprince et al. 1994;Sahle et al. 1996). Consequently, the U. S. GeologicalSurvey conducted a survey of W in groundwaters fromthe vicinity of Fallon, NV, and found W concentrationsthat ranged from 1.47 to 4,036 nmol kg-1 (Seiler et al.2005), confirming an earlier investigation that alsoreported high W (i.e., up to 1,029 nmol kg-1) in surfaceand groundwaters of the region (Johannesson et al. 2000).Natural terrestrial waters known to exhibit elevated Wconcentrations include geothermal springs, alkaline salinelakes, groundwaters associated withWoremineralization,and alkaline N-rich fissure-vein thermal waters (Kletzinand Adams 1996; Seiler et al. 2005; Arnórsson andÓskarsson 2007), most of which, if not all, are found inwestern Nevada.
Tungsten occurs as themonomeric tungstate oxyanion,WO4
2-, in circumneutral to alkaline pH natural waters, buttends to form polytungstate species at low pH and highWconcentrations (Baes and Mesmer 1976; Cruywagen andvan der Merwe 1987; Koutsospyros et al. 2006; Strigul2010; Clausen et al. 2011). Consequently, in many naturalwaters, W exhibits similar geochemical behavior to otheroxyanion-forming trace elements like molybdenum (Mo)and arsenic (As), such that it is strongly sorbed toFe(III)/Mn(IV) oxides/oxyhydroxides and other mineralsurfaces in oxic waters of low to circumneutral pH, anddesorbs from these mineral surface sites at higher pH(Johannesson et al. 1997; 2000; 2013; Gustafsson 2003;Seiler et al. 2005; Arnórsson and Óskarsson 2007; Bednaret al. 2007, 2008, 2009; Johannesson and Tang 2009;
Kashiwabara et al. 2013). For example, Seiler et al.(2005) presented evidence that desorption of W fromFe/Mn oxide/oxyhydroxide minerals plays an importantrole in groundwaters from the Carson Desert region ofnorthwestern Nevada as groundwaters with high W con-centrations (i.e., W > 272 nmol kg-1) all exhibit pH>8.These researchers also demonstrated correlations betweendissolvedWand orthophosphate (PO4
3-) andAs (i.e.,R2=0.85, p<0.05; and R2=0.63, p<0.05, respectively), whichmay indicate that application of fertilizer to irrigated fieldsin the region could either be a source or act to facilitatemobilization (e.g., by competitive desorption) of W to thegroundwaters (Seiler et al. 2005). The correlation betweenW and As led Seiler et al. (2005) to conclude that theseoxyanion-forming trace elements either have the samesource or their dissolved concentrations are controlledby the same processes in Carson Desert groundwaters.Furthermore, they hypothesized that other groundwatersystems exhibiting high As concentrations may also haveelevated W concentrations. Here, we directly test thishypothesis for groundwaters from the Murshidabaddistrict of West Bengal, India, and compare thesegroundwaters with those from the Carson Desert. Pre-viously, we demonstrated that groundwaters from theMurshidabad district have among the highest As con-centrations reported for the entire Bengal Basin[i.e., up to 61.7 μmol kg-1 (4,622 μg kg-1); Dattaet al. 2011]. We employ statistical methods toevaluate the relationships between W and As inMurshidabad groundwaters, and surface complexationmodeling to assess the role of pH-related desorption incontrolling W and As concentrations in Murshidabadgroundwaters.
2 Site Description
The study area is located in Murshidabad (population~5.8 million; area: 5,324 km2), which is one of 18districts in the State of West Bengal, India, and is partof the vast alluvial plain created by the Ganges–Brahmaputra–Meghna (GBM) river system. The Gangesenters West Bengal in the Malda district and flows southinto the Murshidabad district where it turns and flowssoutheastward into Bangladesh (Fig. 1). Just south of thenorthern border of Murshidabad, the Ganges splits toform the river Bhagirathi, a distributary of the Ganges.The Bhagirathi meanders south through the study area,through the city of Kolkata (approximately 200 km from
1792, Page 2 of 19 Water Air Soil Pollut (2014) 225:1792

the study site, where it is known as the Hooghly river),and finally into the Bay of Bengal.
The field area is relatively flat and was formed bysedimentary sequences deposited in older river valleysincised during Pleistocene low-stand(s) of sea level(e.g., McArthur et al. 2008; Mukherjee et al. 2009a).Numerous rivers and smaller streams, along withhuman-constructed canals and associated ponds, dissectthe region. East of the Bhagirathi river, in the activefloodplain, is a series of paleo-oxbow lakes, where themain villages are built on top of natural or artificiallevees to protect them from monsoonal flooding duringthe summer months (June–October), which is when themajority of the >1,500 mm of annual rainfall occurs.
Within Murshidabad are 26 blocks (smaller adminis-trative units) of which six were chosen for study in thiscontribution (Fig. 1; Table 1). Each of the sampling siteswas chosen based either on previous work conducted bySur (2006), where areas of elevated (and low) As con-centrations in groundwater were identified, or by com-munication with members of the local population whowere knowledgeable of specific areas with high-Asgroundwaters. The Nabagram (Binodpur: 24°11.850′N88°13.569′E) and Kandi (Hizole: 23°58.585′N 88°6.815′E) blocks are located west of the river Bhagirathi in theolder Pleistocene river terraces, whereas the Beldanga(Makrampur: 23°56.355′N 88°16.156′E), Hariharpara(Koshalpur, Bahariparamore: 24°3.658′N 88°21.544′E),
Fig. 1 Map showing location of the study area in theMurshidabad district of West Bengal, India. Inset maps show alocation of West Bengal in India, b general location of theMurshidabad district within West Bengal, and c our study siteswithin Murshidabad. Orange circles show the approximate loca-tions of where we collected water samples within the six blocks inMurshidabad, namely the Nabagram and Kandi blocks west of the
river Bhagirathi, and the Beldanga, Hariharpara, Jalangi, andNaoda blocks east of the river Bhagirathi. Map is after Dattaet al. (2011), and for references to specific sites the reader isreferred to this paper. The reader is directed to the on-lineversion of this paper for reference to colors for all the figurespresented here
Water Air Soil Pollut (2014) 225:1792 Page 3 of 19, 1792

Jalangi (Baramasia: 24°12.656′N 88°41.385′E), andNaoda (Rejlapara, Raipur: 23°54.093′N 88°28.068′E)blocks are situated east of the river Bhagirathi in theyounger, Holocene floodplains, paleo-interfluves, andpaleo-channels (Datta et al. 2011).
Murshidabad is severely affected by elevated ground-water As concentrations, predominantly occurring east ofthe river Bhagirathi in reduced gray Holocene sediments,whereas areas west of the river Bhagirathi mainly pro-duce low As groundwaters from oxidized, orange-brownPleistocene sediments (Mukherjee et al. 2009b; Neal2010; Datta et al. 2011). High concentrations of dissolvedAs occur in localized hotspots where As concentrationsexceed the World Health Organization standard of133 nmol kg-1 (i.e., 10 μg kg-1) and reach concentrationsin excess of 53 μmol kg-1 (>4,000 μg kg-1; this study andDatta et al. 2011). Attempts to link groundwaterarsenic concentrations within Holocene aquifers to themineralogy have not been successful (e.g., Métral et al.2008; Neal 2010).
3 Materials and Methods
3.1 Sample Collection and Field Analysis
All sample bottles [high-density polyethylene (HDPE)],field containers [low-density polyethylene (LDPE)],Teflon® tubing, and lab-ware were rigorously cleanedusing trace element clean procedures before transport tothe field sampling sites (Johannesson et al. 2004).Furthermore, during sample bottle-cleaning laboratorypersonnel wore similarly cleaned polyethylene gloves.After sample bottles were cleaned and bagged, theywere placed within clean plastic ice chests for transportto and from the field collection sites.
Water samples for W and As analysis were collectedfrom tube wells (TW), an irrigation well (IRW), and twoponds (PW) in the Murshidabad district during June2009 and January 2012 (Fig. 1; Table 1). A number ofother important geochemical parameters including pH,temperature, alkalinity, dissolved oxygen, and Eh werealso analyzed in the field, or in the laboratory (i.e., majorsolutes) on separate aliquots. In order to ensure thatgroundwater samples collected from each of the tubewells and irrigation well were representative of ground-waters from the aquifer and not the individual well bore,all of the wells were purged for at least 30 mins or until
pH, temperature, and conductivity stabilized beforesamples were collected.
Groundwater samples for determination of W andAs species were collected using trace element cleanprocedures that followed the “clean hands, dirtyhands” protocol (i.e., Fitzgerald 1999) to minimizepotential contamination. More specifically, ground-water samples were first collected into collapsible“trace cleaned” LDPE) cubitainers® (Hedwin, MD)from each of the wells and then immediately filteredthrough 0.45 μm Gelman Sciences in-line ground-water filter capsules (polyether sulfone membrane),by pumping the groundwater sample from thecubitainers® through pre-cleaned Teflon® tubingconnected to the in-line filter capsule, and subse-quently into 500 ml opaque, amber HDPE samplebottles. Pond water samples were similarly collectedand filtered. The amber sample bottles, which wereused in order to prevent photocatalyzed oxidation ofAs(III) (e.g., McCleskey et al. 2004), were firstrinsed three times with the filtered water sample inorder to “condition” the bottle before filling thebottle with the filtered water sample (Haque andJohannesson 2006; Haque et al. 2008; Datta et al.2011). The sample was then immediately acidifiedto pH<2 with ultrapure HNO3 (Seastar Chemical,Baseline) to preserve the total dissolved W and Asconcentrations and prevent precipitation of Fe/Mnoxides/oxyhydroxides within the collected samples(Clausen et al. 2010; Datta et al. 2011). A separate~60 mL aliquot of non-acidified, filtered groundwa-ter (or pond water) was subsequently acidified to pH~4 with ultra-pure HNO3 (Seastar Chemical, Base-line), and passed through an anion exchange column(i.e., Bio-Rad Poly-Prep 0.8×4 cm chromatographycolumns) packed with Bio-Rad AG® 1×8, 50–100mesh, anion exchange resin converted to the acetateform (see Wilkie and Hering 1998). At pH 4, As(V) isretained on the anion-exchange resin owing to the neg-ative charge of the predominant anionic species,H2AsO4
-, whereas As(III), which occurs as the neutralspecies H3AsO3
0 at this pH, passes through the column.The eluted fractions containing As(III) were also col-lected in pre-cleaned, amber HDPE bottles, and thenacidified to pH<2 with ultrapure HNO3. Sample ali-quots for W, total As, and As(III) were subsequentlyplaced within pre-cleaned polyethylene bags, and theninto clean plastic ice chests for cold (i.e., ~4 °C) storageand transport back to the laboratory for analysis.
1792, Page 4 of 19 Water Air Soil Pollut (2014) 225:1792
3.2 Analytical Techniques
Major cations and anions were quantified inMurshidabadwaters using ion chromatography at Kansas State Univer-sity. Dissolved Fe and Mn concentrations were measuredusing standard UV/Vis spectrophotometric techniques(e.g., Haque et al. 2008; Johannesson and Neumann2013). Groundwater samples were analyzed for W andAs concentrations within 2 weeks of sample collection(Clausen et al. 2010) using a high-resolution (magneticsector) inductively coupled plasma mass spectrometry
(HR-ICP-MS; Thermo Fisher Element 2) at Tulane Uni-versity. In the case of As, the high-resolution mode of theHR-ICP-MS allows 75As to be distinguished from possi-ble ArCl+ interferences. TwoWisotopes (182Wand 183W)were monitored during the analysis because neither hasany direct isobaric interferences (Johannesson et al. 2013).The principal molecular (polyatomic) interferences thatcan occur during analysis of these W isotopes in the ICP-MS involve oxides of Er (i.e., 166Er16O+ on 182W and167Er16O+ on 183W). However, because Er concentrationsin these groundwaters are low (e.g., 4–55 pmol kg-1; Datta
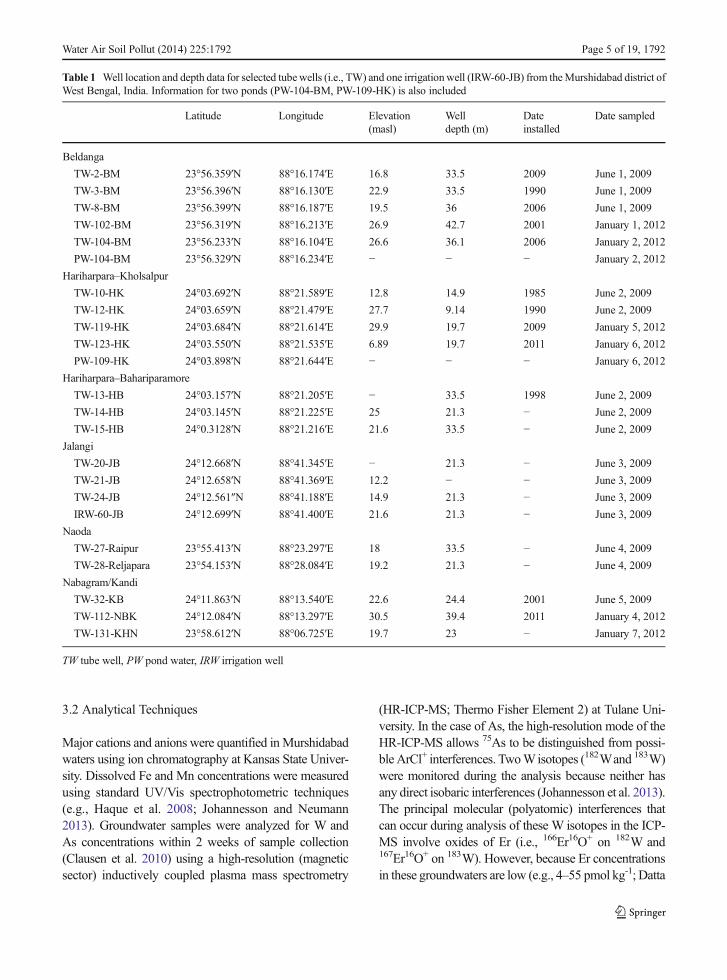
Table 1 Well location and depth data for selected tubewells (i.e., TW) and one irrigationwell (IRW-60-JB) from theMurshidabad district ofWest Bengal, India. Information for two ponds (PW-104-BM, PW-109-HK) is also included
Latitude Longitude Elevation(masl)
Welldepth (m)
Dateinstalled
Date sampled
Beldanga
TW-2-BM 23°56.359′N 88°16.174′E 16.8 33.5 2009 June 1, 2009
TW-3-BM 23°56.396′N 88°16.130′E 22.9 33.5 1990 June 1, 2009
TW-8-BM 23°56.399′N 88°16.187′E 19.5 36 2006 June 1, 2009
TW-102-BM 23°56.319′N 88°16.213′E 26.9 42.7 2001 January 1, 2012
TW-104-BM 23°56.233′N 88°16.104′E 26.6 36.1 2006 January 2, 2012
PW-104-BM 23°56.329′N 88°16.234′E − − − January 2, 2012
Hariharpara–Kholsalpur
TW-10-HK 24°03.692′N 88°21.589′E 12.8 14.9 1985 June 2, 2009
TW-12-HK 24°03.659′N 88°21.479′E 27.7 9.14 1990 June 2, 2009
TW-119-HK 24°03.684′N 88°21.614′E 29.9 19.7 2009 January 5, 2012
TW-123-HK 24°03.550′N 88°21.535′E 6.89 19.7 2011 January 6, 2012
PW-109-HK 24°03.898′N 88°21.644′E − − − January 6, 2012
Hariharpara–Bahariparamore
TW-13-HB 24°03.157′N 88°21.205′E − 33.5 1998 June 2, 2009
TW-14-HB 24°03.145′N 88°21.225′E 25 21.3 − June 2, 2009
TW-15-HB 24°0.3128′N 88°21.216′E 21.6 33.5 − June 2, 2009
Jalangi
TW-20-JB 24°12.668′N 88°41.345′E − 21.3 − June 3, 2009
TW-21-JB 24°12.658′N 88°41.369′E 12.2 − − June 3, 2009
TW-24-JB 24°12.561″N 88°41.188′E 14.9 21.3 − June 3, 2009
IRW-60-JB 24°12.699′N 88°41.400′E 21.6 21.3 − June 3, 2009
Naoda
TW-27-Raipur 23°55.413′N 88°23.297′E 18 33.5 − June 4, 2009
TW-28-Reljapara 23°54.153′N 88°28.084′E 19.2 21.3 − June 4, 2009
Nabagram/Kandi
TW-32-KB 24°11.863′N 88°13.540′E 22.6 24.4 2001 June 5, 2009
TW-112-NBK 24°12.084′N 88°13.297′E 30.5 39.4 2011 January 4, 2012
TW-131-KHN 23°58.612′N 88°06.725′E 19.7 23 − January 7, 2012
TW tube well, PW pond water, IRW irrigation well
Water Air Soil Pollut (2014) 225:1792 Page 5 of 19, 1792

and Johannesson, unpublished), and ErO+/Er+ formationwithin the plasma was <0.3 %, polyatomic interferenceson W by Er oxides were generally negligible. Moreimportantly, the mass discrimination capability of theHR-ICP-MS allows for the clear delineation andseparation of the W peaks from those of the polyatomicErO+ peaks.
The HR-ICP-MS instrument was calibrated usingaqueous standard solutions of the same acid concentra-tions as in the samples, prepared from stock solutions bysubsequent dilution in the range of 0.01–100 μg kg-1 foreach element (for details see Datta et al. 2011;Johannesson et al. 2013). The stock Wand As solutionswere prepared from both Perkin Elmer Pure Plusstandards and NIST traceable High Purity Standards(Charleston, SC). In addition, all standards and samplesolutions were spiked with indium as an internal stan-dard to correct for instrument drift. The NIST StandardReference Material (SRM) “Trace Elements in Water”No. 1643b and the National Research Council Canada(Ottawa, Ontario, Canada) SRM for trace elements inriver water (SRLS-3) were included in our analyses asadditional quality control checks.
3.3 Statistical Methods
We employed a two-pronged statistical approach toevaluate the relationship between W, As, and othergeochemical parameters measured in Murshidabadgroundwaters. First, to test the hypothesis that ground-waters with high As concentrations also exhibit high Wconcentrations, we applied regression (i.e., correlation)analysis using the reduced major axis approach (e.g.,Davis 1986, and see below). Second, to evaluate possiblerelationships between W and As species and the majorand minor solute compositions of Murshidabad ground-waters, we used correspondence analysis (Greenacre1984). As with many multivariate statistical methods,correspondence analysis employs eigendecompositionanalysis of an original N×Mdatamatrix (i.e., N representsthe rows [individual samples] and M are the columns[chemical attributes] of the matrix) to construct plots ofthe decomposed data in low-dimensional vector space(Carr 1990, 1995, 2002). Chemical attributes and/orindividual samples that plot separately in the low-dimensional vector space are not related or correlatedwith other attributes of individual samples, whereasthose that plot close to each other are related or corre-lated to each other (Oleson and Carr 1990; Carr 1995;
Johannesson et al. 1996). Correspondence analysis pro-vides simultaneous R- and Q-mode analysis of the datamatrix and is centered on the chi-squared distance be-tween the data in the original N×M matrix (Carr 1995,2002). Here, we are particularly interested in examiningrelationships between W and the other geochemicalparameters measured in Murshidabad groundwaters(Tables 2 and 3), and consequently only present theresults of the R-mode analysis. To account for missingdata in Tables 2 and 3 (i.e., for K+, Fe, Mn, and As), weemployed the approach of Farnham et al. (2002), wherebythe missing data are replaced in the N×M matrix by one-half the detection limit value. The detection limits for K+,Fe, Mn, and As, determined as 3σ the analytical blanks,are 1.28 μmol kg-1, 0.16 μmol kg-1, 0.13 μmol kg-1, and0.14 nmol kg-1, respectively. Correspondence analysis ofthe Murshidabad data set was achieved using a VisualBasic version of the original FORTRAN-77 computerprogram, CORSPOND (Carr 1990, 2002).
3.4 Surface Complexation Model
The generalized two-layer surface complexation model(Dzombak and Morel 1990) was employed to studyW(VI), As(III), As(V), and PO4
3- adsorption/desorptionin groundwater systems of Murshidabad and the CarsonDesert. The surface complexation model parameters arepresented in Table 4. We assumed that amorphous hy-drous ferric oxide (HFO) is the chief solid-phase mate-rial controlling W and As adsorption/desorption withinthe Murshidabad and Carson Desert aquifer sediments.Surface complexation reactions for PO4
3- and As(V) arethose given in Dzombak and Morel (1990), whereas weemployed the surface complexation constants and reac-tions describing As(III) adsorption presented by Dixitand Hering (2003). The intrinsic surface complexationconstants describing WO4
2- adsorption onto HFO wereobtained by refitting the batch adsorption data fromGustafsson (2003) using FITEQL 4.0 (Herbelin andWestall 1999) and the surface complexation reactionsgiven in Table 4 (see Johannesson et al. 2013). Surfacecomplexation reactions for phosphate were included inour model simulations because the PO4
3- oxyanion cancompete withWO4
2- and As(V) for mineral surface sites(Manning and Goldberg 1996; Gao and Mucci 2003;Gustafsson 2003; Gustafsson and Bhattacharya 2007).Infinite dilution dissociation constants for tungstic acid,H2WO4
0, used in the fitting exercise are from Smith andMartell (2004).
1792, Page 6 of 19 Water Air Soil Pollut (2014) 225:1792
Surface complexation of WO42-, PO4
3-, and the Asspecies was modeled using the React program of theGeochemist’s Workbench® (release 8.0; Bethke 2008;Bethke and Yeakel 2010) to compute adsorption edgesfor these oxyanions in “average” Murshidabad andCarson Desert groundwaters. Specifically, simple elec-trolyte solutions composed of Na+ and Cl- with ionicstrengths equivalent to the mean ionic strength ofMurshidabad and Carson Desert groundwaters (i.e.,13.9 and 36.6 mmol kg-1, respectively) were employed
in the model calculations. The mean ionic strength forMurshidabad groundwaters was computed with the ma-jor solute data presented in Table 2. To estimate themean ionic strength of Carson Desert groundwaters,we used the major solute data for the Dodge Ranchgroundwater samples presented in Welch and Lico(1998). Adsorption edges for WO4
2-, As(III), As(V),and PO4
3- in Murshidabad and Carson Desert ground-waters were computed using the mean concentration ofeach oxyanion in these groundwaters. In the case of
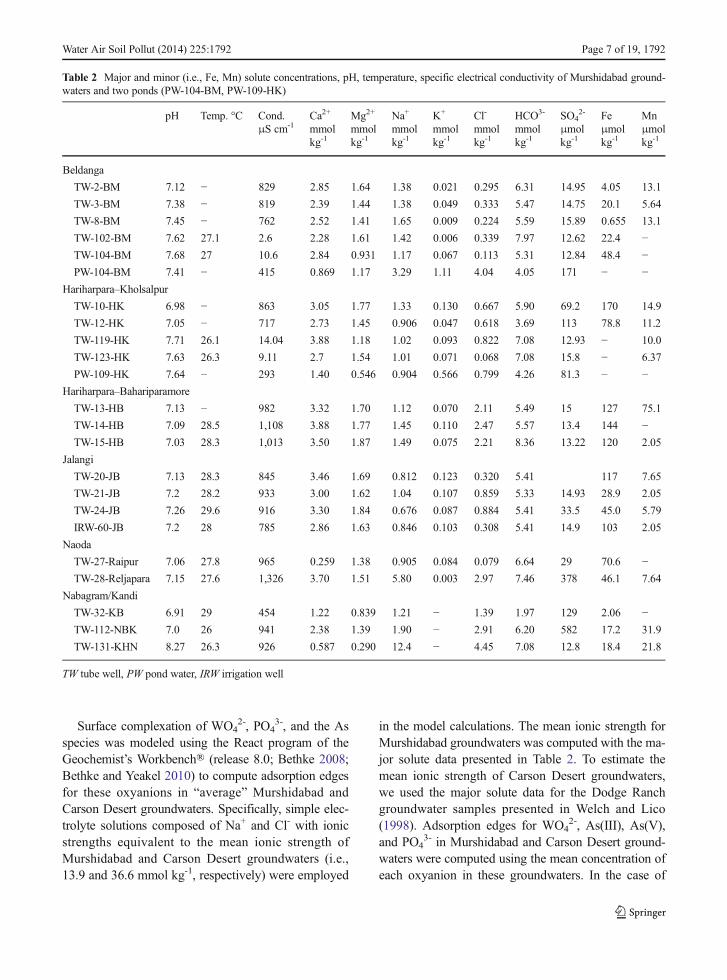
Table 2 Major and minor (i.e., Fe, Mn) solute concentrations, pH, temperature, specific electrical conductivity of Murshidabad ground-waters and two ponds (PW-104-BM, PW-109-HK)
pH Temp. °C Cond.μS cm-1
Ca2+
mmolkg-1
Mg2+
mmolkg-1
Na+
mmolkg-1
K+
mmolkg-1
Cl-
mmolkg-1
HCO3-
mmolkg-1
SO42-
μmolkg-1
Feμmolkg-1
Mnμmolkg-1
Beldanga
TW-2-BM 7.12 − 829 2.85 1.64 1.38 0.021 0.295 6.31 14.95 4.05 13.1
TW-3-BM 7.38 − 819 2.39 1.44 1.38 0.049 0.333 5.47 14.75 20.1 5.64
TW-8-BM 7.45 − 762 2.52 1.41 1.65 0.009 0.224 5.59 15.89 0.655 13.1
TW-102-BM 7.62 27.1 2.6 2.28 1.61 1.42 0.006 0.339 7.97 12.62 22.4 −TW-104-BM 7.68 27 10.6 2.84 0.931 1.17 0.067 0.113 5.31 12.84 48.4 −PW-104-BM 7.41 − 415 0.869 1.17 3.29 1.11 4.04 4.05 171 − −
Hariharpara–Kholsalpur
TW-10-HK 6.98 − 863 3.05 1.77 1.33 0.130 0.667 5.90 69.2 170 14.9
TW-12-HK 7.05 − 717 2.73 1.45 0.906 0.047 0.618 3.69 113 78.8 11.2
TW-119-HK 7.71 26.1 14.04 3.88 1.18 1.02 0.093 0.822 7.08 12.93 − 10.0
TW-123-HK 7.63 26.3 9.11 2.7 1.54 1.01 0.071 0.068 7.08 15.8 − 6.37
PW-109-HK 7.64 − 293 1.40 0.546 0.904 0.566 0.799 4.26 81.3 − −Hariharpara–Bahariparamore
TW-13-HB 7.13 − 982 3.32 1.70 1.12 0.070 2.11 5.49 15 127 75.1
TW-14-HB 7.09 28.5 1,108 3.88 1.77 1.45 0.110 2.47 5.57 13.4 144 −TW-15-HB 7.03 28.3 1,013 3.50 1.87 1.49 0.075 2.21 8.36 13.22 120 2.05
Jalangi
TW-20-JB 7.13 28.3 845 3.46 1.69 0.812 0.123 0.320 5.41 117 7.65
TW-21-JB 7.2 28.2 933 3.00 1.62 1.04 0.107 0.859 5.33 14.93 28.9 2.05
TW-24-JB 7.26 29.6 916 3.30 1.84 0.676 0.087 0.884 5.41 33.5 45.0 5.79
IRW-60-JB 7.2 28 785 2.86 1.63 0.846 0.103 0.308 5.41 14.9 103 2.05
Naoda
TW-27-Raipur 7.06 27.8 965 0.259 1.38 0.905 0.084 0.079 6.64 29 70.6 −TW-28-Reljapara 7.15 27.6 1,326 3.70 1.51 5.80 0.003 2.97 7.46 378 46.1 7.64
Nabagram/Kandi
TW-32-KB 6.91 29 454 1.22 0.839 1.21 − 1.39 1.97 129 2.06 −TW-112-NBK 7.0 26 941 2.38 1.39 1.90 − 2.91 6.20 582 17.2 31.9
TW-131-KHN 8.27 26.3 926 0.587 0.290 12.4 − 4.45 7.08 12.8 18.4 21.8
TW tube well, PW pond water, IRW irrigation well
Water Air Soil Pollut (2014) 225:1792 Page 7 of 19, 1792

Murshidabad groundwaters, the mean WO42-, As(III),
and As(V) concentration (i.e., 3.45 nmol kg-1,5.95 μmol kg-1, and 1.16 μmol kg-1, respectively) werecalculated using the data in Table 3. Because we havenot measured PO4
3- concentrations in Murshidabadgroundwaters, we used the mean PO4
3- concentrationof 8.7 μmol kg-1 reported by Mukherjee et al. (2009c)for 73 groundwater sample analyses from West Bengalin our simulations. Mean concentrations for WO4
2-,PO4
3-, and total dissolved As in Carson Desert ground-waters (i.e., 406 nmol kg-1, 6.3 μmol kg-1, and2.58 μmol kg-1, respectively) were calculated from con-centration estimates extracted by digitizing (i.e., Tummers2006) Figs. 9 and 12 of Seiler et al. (2005). Finally,
average As(V) and As(III) concentrations in CarsonDesert groundwaters were estimated assuming the rela-tive distribution of these As species determined ingroundwaters from the Dodge Ranch site, whereAs(V) accounts for ~83 %, on average, of As in solution(Welch and Lico 1998).
The content of HFO in Murshidabad aquifer sedi-ments was estimated by extracting aliquots of aquifersediments collected from the Beldanga block east of theriver Bhagirathi with hydroxylamine hydrochloride(Neal 2010). The mean extracted Fe concentration(i.e., 619 μg Fe g-1 sediment) was used along with theaquifer porosity (~30 %), the average density of sedimentmineral grains (~2.6 g cm-3), and the gram-formula
Table 3 Arsenic speciesconcentrations (nmol kg-1) andtungsten concentrations(pmol kg-1) in groundwatersand surface waters (PW-104-BM, PW-109-HK) fromMurshidabad, West Bengal,India
ND not detected
*As(V)=AsTotal–As(III)
AsTotal(nmol kg-1)
As(III)(nmol kg-1)
As(V)*(nmol kg-1)
W (pmol kg-1)
Beldanga
TW-2-BM 53,867±608 52,938±939 929±1118 1,822
TW-3-BM 4,992±29.7 4142±98 850±102 5,929±37.4
TW-8-BM 37.5±0.36 20.5±1.6 17±1.64 821±11.6
TW-102-BM 3,069±653 2,646±64.8 423±656 2,037±337
TW-104-BM 18,619±105 14,799±300 3,820±317 3,024±16.3
PW-104-BM 179±10.9 22.4±4.1 156±11.7 14,355±87
Hariharpara–Kholsalpur
TW-10-HK 4,572±16.4 4,000±22.3 573±27.7 4,774±39.5
TW-12-HK 6,350±35.5 5,863±25.4 486±43.7 2,020±22.7
TW-119-HK 4,582±77.8 2,501±265 2,080±276 1,135±152
TW-123-HK 7,022±374 4,760±499 2,262±624 1,057
PW-109-HK 251±5.05 ND 251±5.05 13,023±517
Hariharpara–Bahariparamore
TW-13-HB 3,333±10.9 2,630±30 703±31.9 5,641±33.9
TW-14-HB 3,754±40.9 2,052±12.9 1,702±42.9 5,958±25.2
TW-15-HB 4,999±41.1 3,134±35.3 1,865±54.2 5,105±52.8
Jalangi
TW-20-JB 2,581±29.1 1,534±13.3 1,047±32 3,642±31
TW-21-JB 7,792±70.2 5,399±14.2 2,393±71.6 4,960±30.2
TW-24-JB 1,423±12.8 1,137±8.12 287±15.1 2,009±36.4
IRW-60-JB 7,731±84.7 4,232±24.9 3,499±88.2 3,691±12.5
Naoda
TW-27-Raipur 236±2.91 127±0.71 109±2.99 4,255±36.4
TW-28-Reljapara 6,777±9.29 6,605±122 172±122 987±9.17
Nabagram/Kandi
TW-32-KB 12.6±0.44 4.52±0.47 8.06±0.64 4,156
TW-112-NBK 871±876 435±324 436±934 8,340±1061
TW-131-KHN 592±13.3 ND 592±13.3 1,163±5.44
1792, Page 8 of 19 Water Air Soil Pollut (2014) 225:1792

weight of HFO (89 g mol-1) to calculate the amount offree HFO (i.e., 3.76 g l-1) in the Murshidabad aquifersediments following the approach of Welch and Lico(1998). Using the same approach the mean extracted Fecontent of sediment from the Carson Desert (i.e.,1,514.5 μg g-1; Table 4 of Welch and Lico 1998) resultsin an estimate of 9.2 g l-1 for HFO in these sediments.
4 Results and Discussion
4.1 Groundwater Compositions
Murshidabad groundwaters are dilute, circumneutralwaters with pH ranging from 6.91 to 8.27, andexhibiting a mean pH (±σ)=7.29±0.33 (Table 2). Tung-sten and As concentrations measured in groundwatersand two ponds from the Murshidabad district are report-ed in Table 3. Tungsten concentrations in Murshidabadgroundwaters are relatively low ranging from 821 to8,340 pmol kg-1 with a mean (±σ) of 3,454±2,091 pmolkg-1 (Table 3). In contrast, the As concentrations of thesegroundwaters are typically elevated. For example, total
dissolved arsenic concentrations (AsT) range from~0.038 up to 53,867 μmol kg-1 (Table 3). Previously,we reported an As concentration of 61,700 μmol kg-1
for a groundwater sample from a tublewell in theBeldanga block that has since been sealed to preventfurther use (Datta et al. 2011). We have consistentlyobserved the highest AsT concentrations in groundwa-ters from the Beldanga site, followed by groundwatersfrom wells within the Jalangi and Hariharpara blocks(Table 3). For example, the mean AsT (±σ) for theBeldanga, Jalangi, Hariharpara–Kholsalpur, andHariharpara–Bahariparamore sites are 16,771±22,270,4,882±3,359, 5,632±1,248, and 4,029±867 nmol kg-1,respectively. These sites are all located to the east of theriver Bhagirathi (Fig. 1), and within reduced Holocenefloodplain, paleochannel, and paleo-interfluve deposits(Neal 2010; Datta et al. 2011). By comparison, ground-waters from the Nabagram and Kandi blocks to the westof the river Bhagirathi have substantially lower AsTconcentrations that range from 12.6 to 871 nmol kg-1
(Table 3). Again, groundwaters from west of the riverBhagirathi come from oxidized sands of the Pleistoceneriver terrace deposits (Neal 2010; Datta et al. 2011).
Table 4 Surface complexationmodel for phosphate [P(V)],arsenite [As(III)], arsenate[As(V)], and tungstate [W(VI)]onto hydrous ferric oxide (HFO)
aDzombak and Morel (1990)bDixit and Hering (2003)cJohannesson et al. (2013)
Mineral Surface area m2 g-1 Weak sites(mol/mol mineral)
Strong sites(mol/mol mineral)
HFOa 600 0.2 0.005
Surface acidity reactions Acidity constants
HFOa (strong and weak sites)
≡FeOH0+H+↔≡FeOH2+ log Ka1=7.92
≡FeOH0↔≡FeO-+H+ log Ka2=−8.93Surface complexation reactions Surface complexation constants
Phosphatea
≡FeOH0+PO43-+3H+↔≡FeH2PO4
o+H2O log K1int=31.29
≡FeOH0+PO43-+2H+↔≡FeHPO4
-+H2O log K2int=25.39
≡FeOH0+PO43-+H+↔≡FePO4
2-+H2O log K3int=17.72
Arsenitea,b
≡FeOH0+H3AsO30↔≡FeH2AsO3
0+H2O log K1int=4.02
≡FeOH0+HAsO32-+H+↔≡FeHAsO3
-+H2O log K2int=18.46
Arsenatea
≡FeOH0+AsO43-+3H+↔≡FeH2AsO4
0+H2O log K1int=29.31
≡FeOH0+AsO43-+2H+↔≡FeHAsO2
-+H2O log K2int=23.51
≡FeOH0+AsO43-↔≡FeOHAsO4
3- log K4int=10.58
Tungstatec
≡FeOH0+H++WO42-↔≡FeWO4
-+H2O log K2int=10.28
≡FeOH0+WO42-↔≡FeOHWO4
2- log K3int=2.1
Water Air Soil Pollut (2014) 225:1792 Page 9 of 19, 1792

Arsenite concentrations range from 4.52 to52,938 nmol kg-1, and As(V) concentrations range be-tween 8 and 3,820 nmol kg-1 in Murshidabad ground-waters (Table 3). With the exception of groundwatercollected from one tube well in the Kandi block (i.e.,TW-32-KB), As(III) predominates in Murshidabadgroundwaters, accounting for on average (±σ) 70±17.8 % of the total As in solution (Datta et al. 2011;Table 3).
The two perennial ponds sampled in January 2012,one each from the Beldanga and Hariharpara blocks
(Fig. 1), have substantially lower AsT concentrationsthan themajority of sampled groundwaters. Specifically,the AsT concentration of water in the Beldanga andHariharpara ponds are 179 and 251 nmol kg-1, respective-ly, and in both cases As(V) is the predominant As species(Table 3). In contrast, the ponds have substantially higherW concentrations than the local groundwaters. Forexample, the W concentrations of the Beldgana andHariharpara ponds are 14,355 and 13,023 pmol kg-1,respectively. Consequently, the pond waters exhibit Wconcentrations that are, on average, close to a factor offour higher than the average groundwater W concentra-tion, whereas themean AsTconcentration ofMurshidabadgroundwaters is more than 30-fold greater than the aver-age AsT of these ponds. The sources and/or processesresponsible for the elevatedWin these ponds are currentlyunder investigation.
4.2 Statistical Analysis
Seiler et al. (2005) reported that Wand As are positivelycorrelated in Carson Desert groundwaters (Fig. 2),which led them to suggest that W and As either sharedsimilar sources within the aquifer sediments of the Car-son Desert, or that the same biogeochemical processescontrolled their mobilization and transport in thesegroundwaters. As a consequence, they hypothesizedthat it is reasonable to expect other groundwater systemswith high As concentrations to also exhibit elevated Wconcentrations. This notion is supported by groundwa-ters from the Oasis Valley in southern Nevada where Wand As are also positively correlated (Fig. 3), althoughW concentrations are not especially high (Johannessonand Tang 2009). Hence, a principal objective of thiscontribution was to evaluate the applicability of thishypothesis to other groundwaters with elevated As con-centrations, and in particular, groundwaters from theMurshidabad district of West Bengal, India, which ex-hibit some of the highest dissolved As concentrationswithin the Bengal Basin (Datta et al. 2011).
Inspection of the Murshidabad groundwater data re-veals lower W and higher As concentrations, on average,compared toCarsonDesert groundwaters (compare Figs. 2and 4). For example, W concentrations range up to4,036 nmol kg-1 in Carson Desert groundwaters comparedto only 8.34 nmol kg-1 in Murshidabad groundwaters.Furthermore, the highest As concentrations reported forgroundwaters from the Carson Desert is ~27 μmol kg-1 ascompared to 61.7μmol kg-1 inMurshidabad groundwaters
Carson Desert, Nevada
W (nmol kg-1)
100 101 102 103 104
As
(nm
ol k
g-1)
101
102
103
104
105
Basalt AquiferIntermediate AquiferShallow AquiferThermal Water
= 0.42
Fig. 2 Arsenic and W concentrations for groundwaters from theCarson Desert of western Nevada, USA. Data are from Seiler et al.(2005). The median trends and confidence intervals are computedusing a bootstrap with 2000 replicates. The correlation coefficient(ρ=0.42) is positive and significant at the 95 % confidence level
Oasis Valley, Nevada
W (nmol kg-1)
100 101 102
As
(nm
ol k
g-1)
101
102
103
= 0.76
Fig. 3 Arsenic and W concentrations for groundwaters from theOasis Valley of southern Nevada, USA. The median trends andconfidence intervals are computed using a bootstrap with 2000replicates. The correlation coefficient (ρ=0.76) is positive andsignificant at the 95 % confidence level. Data are from Johannessonand Tang (2009)
1792, Page 10 of 19 Water Air Soil Pollut (2014) 225:1792

(Seiler et al. 2005; Datta et al. 2011). These observationsindicate that W and As are not coupled in Murshidabadgroundwaters as they appear to be in the CarsonDesert andOasis Valley groundwaters.
To quantitatively test the hypothesis we employedregression analysis to the W and As concentration datafor the Carson Desert (Seiler et al. 2005), Oasis Valley(Johannesson and Tang 2009), and those presented inthis contribution for Murshidabad, West Bengal, India(Figs. 2, 3 and 4). For brevity, these data are referred toas the Carson, Oasis, andMurshidabad data sets, respec-tively, in Table 5. Regression analysis of these data setspresents several challenges because confidence intervalsfor correlation coefficients are more difficult to constructcompared with regression coefficients such as slopes–they cover the range [−1,1] rather than the infinite range
covered by some other statistics. This complexity haslong been recognized: Fisher (1915, 1921) formulatedthe z-transform to partly address this issue. Althoughthis is adequate for large samples that are truly normal,the approach may fail in other cases (e.g., Kowalski1972). Therefore, it is generally preferred to make the(univariate) distributions approximately normal usingan appropriate transform (e.g., Box and Cox 1964),and to then derive confidence intervals using a bootstrap(Anderson 2003).
These principles guided the analysis presented below,all of which use a cross-platform, open-source statisticspackage (R Development Core Team 2012). First, ap-proximate power transforms were computed using theBox-Cox procedure so that the data were approximatelynormal (Box and Cox 1964; Venables and Ripley 2002).For all data sets, the log transform was indicated asacceptable at 90 % confidence, and the Anderson-Darling test of normality was higher for the log-transformed data (Anderson and Darling 1954; Gross2012). Nonetheless, not all data sets are clearly normal(Table 5); in particular the W concentration data fromthe Carson Desert groundwater data set (Seiler et al.2005) and the AsT and As(III) concentrations from ourMurshidabad data set do not appear to be approximatelynormal. Thus, confidence intervals should be computedusing bootstraps rather than simpler approaches(DiCiccio and Efron 1996).
Bootstrap confidence intervals for correlation(reduced major axis fits) were constructed using 2,000replicates and the bias-corrected accelerated (BCa)method (Table 5, Figs. 2, 3, and 4; DiCiccio and Efron1996; Canty and Ripley 2012). The Carson Desert andOasis Valley data set have statistically significant posi-tive correlations between W and As (ρ=0.42 and 0.76,respectively; confidence intervals in Table 5, Figs. 2 and3). Like the groundwaters from the Carson Desert, thegroundwaters of Oasis Valley in southern Nevada aregenerally oxic and of high pH (White and Chuma 1987;Thomas et al. 2002; Johannesson and Tang 2009). Incontrast, for theMurshidabad groundwaters, neither AsTnor As(III) appears to be correlated with W at the 95 %confidence level (Table 5, Fig. 4).
The statistical results quantitatively demonstrate thatgroundwater As concentrations cannot be used as aproxy to predict W concentrations in all groundwatersystems. Hence, the positive relationship between Wand As concentrations reported for both in the oxic,and high pH groundwaters from the Carson Desert and
Murshidabad, West Bengal
W (nmol kg-1)10-1 100 101 102
As T
(n
mo
l kg-1
)
101
102
103
104
105
W (nmol kg-1)10-1 100 101 102
As(
III)
(nm
ol k
g-1)
101
102
103
104
105
(a)
(b)
= -0.18
= -0.21
Fig. 4 Arsenic and W concentrations for groundwaters from theMurshidabad district, West Bengal, India. Panel a shows thetotal dissolved As concentration (AsT) as a function of Wconcentrations, whereas panel b plots As(III) vs. W. TheMurshidabad data have no significant correlation (and themeans at Murshidabad are negative)
Water Air Soil Pollut (2014) 225:1792 Page 11 of 19, 1792

Oasis Valley groundwater systems do not necessarilyapply to other aquifers, especially systems wheregroundwaters are predominantly reducing and of neutralpH, as is the case in Murshidabad, West Bengal. Morespecifically, the correlation analysis of W and As inMurshidabad groundwaters indicates that either thesources of these trace elements differ in the aquifersystem, or the processes responsible for their mobiliza-tion into the groundwaters are not the same. Indeed, it isprobable that the mineral sources and biogeochemicalprocesses that influence Wand As mobilization in oxic,alkaline groundwaters such as those from the CarsonDesert and Oasis Valley (e.g., Seiler et al. 2005;Johannesson and Tang 2009) differ from those thatcharacterize the anoxic, neutral pH groundwaters ofMurshidabad (Datta et al. 2011). Consequently, pos-sible mineral sources of W and As to Murshidabadgroundwaters are evaluated below using multivariatestatistics, whereas the biogeochemical role thatadsorption/desorption reactions play in mobilizingW and As in Murshidabad groundwaters is investi-gated in the following section. Again we note thatadsorption/desorption has previously been demonstrat-ed to strongly influence W mobilization in the highpH, oxic groundwaters of the Carson Desert (Seileret al. 2005), whereas sulfide mineral oxidation, pH-related desorption, and volcanic glass dissolution allappear to play important roles in Wand As mobilizationin the Oasis Valley groundwater system (Johannessonand Tang 2009).
To gain insights into possible sources and processesresponsible for the differential behavior of W and As inMurshidabad groundwaters, we employ correspondenceanalysis to evaluate relationships between the concen-trations of W, As, and other geochemical parametersmeasured in these groundwaters (Tables 2 and 3).Correspondence analysis can help discern relationshipsbetween groundwater samples and their chemical attri-butes, and may provide insights into sources and/orprocesses responsible for the geochemical behavior of Wand As in Murshidabad groundwaters (e.g., Johannessonet al. 1996). Specifically, multivariate techniques areuseful for reducing complex data sets containing manyindividual samples and chemical attributes, includingdata sets with missing values, such as the geochemicaldata presented here for Murshidabad groundwaters(e.g., Oleson and Carr 1990; Farnham et al. 2002).Fig. 5 presents two-dimensional plots of the first threefactors computed via correspondence analysis for thecombined groundwater data in Tables 3 and 4. Factor 1accounts for ~74 % of the variation of the original dataset, factor 2 describes 20 % of the variation, and factor 3explains ~3 % of the variation. Together, the first threefactors account for more than 96 % of the variation inthe original data set. It is important to note that the twoponds sampled, PW-104-BM and PW-109-HK, werenot included in the correspondence analysis becausewe are interested here in evaluating relationshipsbetween W, As, and other geochemical parameters inthe local groundwaters.
Table 5 Summary statistics for W-As relationships at various localities
Case Element orspecies
Numberof data
Meansa Normalp value
Correlation coefficient
Meanc 95 % Lower 95 % Upper
Carson W 94 77.6 0.014 0.42 0.33 0.55As(T) 871 0.765
Oasis W 10 6.58 0.25 0.76 0.44 0.91As(T) 132 0.36
Murshidabad W 23 3.21 0.359 −0.18 −0.55 0.43As(T) 1,900 0.01
As(III) 21 1,380 0.001 −0.21 −0.59 0.39
Statistics are for a 2000 sample bootstrap analysis. The data do not appear to be normal. Bootstrap confidence intervals indicate significantpositive correlations between W and As at Carson and Oasis, and no significant correlation at MurshidabadaAll statistics use the logarithm base 10 of the species concentration in nmol kg-1 , except means are not in logarithmsb For the normal p value columns, plain text indicates the species concentration distribution may be normal. Italics indicate that theconcentration distribution is probably not normal. Bold indicates the concentration distribution cannot be accepted as normal.c Bold indicates that the 95 % confidence interval includes zero and thus is not significant statistically
1792, Page 12 of 19 Water Air Soil Pollut (2014) 225:1792

Arsenic is not strongly associated with any of theanalyzed dissolved constituents measured inMurshidabadgroundwaters as both AsTand As(III) plot separately fromthe other chemical attributes on Fig. 5. Tungsten, however,plots relatively close toMn, Cl-, pH, and HCO3
- on Fig. 5,suggesting that the dissolved W concentrations are relatedto these parameters in Murshidabad groundwaters. Oneinterpretation of these results is that W concentrations inthe Murshidabad groundwaters may, in part, be controlledby reductive dissolution of Mn(VI) oxides/oxyhydroxidesin the local aquifer sediments and subsequent release ofsorbed and/or co-precipitated W (e.g., Kashiwabara et al.2013). Alternatively, or in combination with Mn reduc-tion, pH, and alkalinity, as HCO3
-, may also influence Wmobilization in Murshidabad aquifers. Here, the associa-tion betweenW, pH, andHCO3
- is broadly consistent withprevious studies demonstrating that desorption from min-eral surfaces owing to pH increases can play a crucial role
in W mobilization in groundwater systems as well aslakes (Miyauchi et al. 1998; Johannesson et al. 2000,2013; Harita et al. 2005; Seiler et al. 2005; Johannessonand Tang 2009). The association of W with Cl- inMurshidabad groundwaters suggests a possible relation-ship between Cl salts and/or minerals like biotite, mus-covite, or apatite, which may contain Cl- andWO4
2- thatcould be mobilized by anion-exchange reactions (e.g.,Leybourne et al. 2008). We note that these three min-erals are all relatively common in the aquifer sedimentsfrom east of the river Bhagirathi (Neal 2010).
Although visual inspection of the correspondenceanalysis results (Fig. 5) provides a qualitative assess-ment, the results can be more quantitatively evaluatedby examining the factor scores (Oleson and Carr 1990).The factor scores for the first three factors for the R-mode analysis of the chemical attributes measured inMurshidabad groundwaters are presented in Table 6.These factors represent the axes on which the factorscores (i.e., the coordinates) of the various chemicalattributes are plotted in Fig. 5. Following the approachof Oleson and Carr (1990), the factors are employed tocompute Euclidean distances between the various chem-ical attributes plotted in Fig. 5. The Euclidean distanceapproach enables a more quantitative understanding ofthe “closeness”, and hence, similarity, which is depictedgraphically between the chemical attributes on Fig. 5(J. R. Carr, personal communication 1995). Because thefactor scores are treated as position coordinates in factor
Factor 1 (73.6%)
-3.0 -2.5 -2.0 -1.5 -1.0 -0.5 0.0 0.5
Fac
tor
2 (2
0.07
%)
-4
-3
-2
-1
0
1
2
Factor 1 (73.6%)
-3.0 -2.5 -2.0 -1.5 -1.0 -0.5 0.0 0.5
Fac
tor
3 (2
.78%
)
-0.6
-0.4
-0.2
0.0
0.2
0.4
0.6
0.8
1.0
SO42-
Cl-
Na+
W
Mn
SPC
pHHCO3
-
Mg2+Ca2+
Fe K+
As(III)
AsT
Fe
K+
AsT
As(III)
Na+
SO42-
Cl-
SPCpH
Mn
W
Mg2+
HCO3-
Ca2+
(a)
(b)
Fig. 5 Correspondence analysis plots of the data (Tables 2 and 3).Panel a is a plot of Factor 1 vs. Factor 2, and panel b shows Factor1 vs. Factor 3
Table 6 First three factor scores for chemical attributes ofMurshidabad groundwaters
Factor 1 Factor 2 Factor 3
pH −1.54 0.283 −0.0357SPC −1.81 0.44 −0.0777Fe −0.899 0.673 0.778
Mn −1.76 −0.0367 0.113
Ca −0.965 0.146 0.234
Mg −1.25 0.256 0.112
Na −2.32 0.96 −0.397K −0.715 0.737 0.733
Cl −2.2 −0.184 0.175
HCO3 −1.34 0.403 0.0973
SO4 −2.82 −3.17 0.114
AsT 0.0986 0.0093 0.0748
As(III) 0.167 −0.0347 −0.0899W −1.68 −0.424 0.407
Water Air Soil Pollut (2014) 225:1792 Page 13 of 19, 1792

space in Fig. 5, the Euclidean distances are readilycomputed using the equations given in Olesonand Carr (1990). Table 7 presents the computedEuclidean distances, based on the first three factors(i.e., Table 6). The smaller the Euclidean distance be-tween chemical attributes, the more similar, and hencecorrelated, they are with each other (J. R. Carr, personalcommunication 1995).
The Euclidean distances for AsT and As(III) and theother chemical attributes measured in Murshidabadgroundwaters are relatively large, again indicating thatAs is not closely associated with any of these otherchemical attributes (Table 7). The calculated Euclideandistances betweenWand the As species are also relativelylarge indicating no clear relationship exists between theseoxyanion-forming trace elements inMurshidabad ground-waters. These observations also support the regressionanalysis presented above (Table 5). Calculation ofEuclidean distances demonstrates that W is mostclosely associated with Mn, followed by Cl-, andthen pH in Murshidabad groundwaters (Table 7).The Euclidean distances support our qualitative assess-ment based on Fig. 5, and further underscore the relativelyclose relationship betweenW, Mn, and Cl- concentrationsin Murshidabad groundwaters. Again, we interpret theseresults as indicating a similar mineral source or sources forthese three elements in Murshidabad groundwaters.Minerals that may contain Mn, Cl, and W could includeMn oxides/oxyhydroxides, muscovite/biotite, apatite,
and/or amphiboles. As mentioned above, micas and apa-tite are relatively common minerals within the aquifersediments of Murshidabad (Neal 2010). Geochemicalmodeling indicates that Murshidabad groundwaters aregenerally saturated to slightly oversaturated with respectto rhodochrosite [mean (±σ) SIrhodochrosite=0.15±0.56],and substantially undersaturated with respect to amor-phous Mn(OH)2 [mean (±σ) SIMn(OH)
2(am)=−6.2±0.56].
Consequently, future work should address Mnoxides/oxyhydroxides and/or other Cl- and/or Mn-bearing minerals (e.g., muscovite, biotite, apatite, rhodo-chrosite) as potential sources of W to Murshidabadgroundwaters.
4.3 Adsorption/Desorption Controls
Although a number of geochemical processes have beenadvanced to explain the range of W concentrations inCarson Desert groundwaters, the positive relationshipbetweenWand pH as reported by Seiler and co-workers(i.e., R2=0.35, p<0.05) suggests that pH controlledadsorption/desorption reactions play an important rolein the development of high W concentrations in thesegroundwaters. Indeed, Seiler et al. (2005) employedsurface complexation modeling to demonstrate theeffects of increasing groundwater pH onWmobilizationin the Carson Desert aquifers.
Application of the surface complexation model pre-sented in Table 4 to Murshidabad and Carson Desert
Table 7 Distances between chemical attributes of Murshidabad groundwaters calculated with the first three factor scores
pH SPC Fe Mn Ca Mg Na K Cl HCO3 SO4 AsT As(III) W
pH 0.00
SPC 0.32 0.00
Fe 1.11 1.27 0.00
Mn 0.42 0.52 1.30 0.00
Ca 0.65 0.95 0.76 0.82 0.00
Mg 0.33 0.62 0.86 0.59 0.33 0.00
Na 1.09 0.80 1.87 1.25 1.70 1.38 0.00
K 1.22 1.39 0.20 1.44 0.81 0.95 1.98 0.00
Cl 0.84 0.78 1.67 0.47 1.28 1.05 1.28 1.83 0.00
HCO3 0.27 0.50 0.85 0.61 0.47 0.17 1.23 0.95 1.04 0.00
SO4 3.69 3.75 4.35 3.31 3.80 3.77 4.16 4.48 3.05 3.87 0.00
AsT 1.66 1.96 1.39 1.86 1.08 2.37 2.64 1.27 2.31 1.49 4.32 0.00
As(III) 1.74 2.03 1.55 1.94 1.19 1.46 2.68 1.43 2.39 1.58 4.34 0.18 0.00
W 0.85 1.00 1.40 0.49 0.93 0.86 1.72 1.54 0.62 0.95 2.99 1.86 1.95 0.00
1792, Page 14 of 19 Water Air Soil Pollut (2014) 225:1792

groundwaters demonstrates that surface complexationreactions can indeed explain the geochemical behaviorof W in both groundwater systems. For example, thesurface complexation model predicts that WO4
2- isstrongly adsorbed to Fe(III) oxides/oxyhydroxides inMurshidabad groundwaters. Specifically, the model pre-dicts that only between 7 % and 21 % (average ~14 %)of surface bound WO4
2- in the Murshidabad aquifersystems can be mobilized to the groundwaters owingto pH-related desorption in these circumneutral pHgroundwaters (Fig. 6). In other words, WO4
2- remainsstrongly bound to Fe(III) oxide/oxyhydroxide surfacesites in the neutral pH groundwaters systems ofMurshidabad, which buffers the WO4
2- concentrations
at relatively low levels. In contrast, the model predictsthat between 26 % and 36 % (average ~32 %) of thesurface bound W can be mobilized by the high pHCarson Desert groundwaters. Therefore, the surfacecomplexation model explains the higher W concentra-tions of the Carson Desert groundwaters compared tothose of Murshidabad, supporting the conclusions ofSeiler et al. (2005) who argued that the high W concen-trations in Carson Desert groundwaters reflect pH-related desorption. Again, Carson Desert groundwaterswith W concentrations exceeding 272 nmol kg-1 allexhibit pH≥8 (Seiler et al. 2005).
The surface complexation model also indicates thatAs(V) is relatively mobile in the Carson Desert ground-water flow system, predicting mobilization of between11 % and 17% of surface bound As(V) to these ground-waters. Again, we note that speciation analysis of As ingroundwaters from the Carson Desert region indicatethat As(V) predominates, accounting for between 61and >97 % [mean (±σ)=82.8±13.7 %] of As in solution(Welch and Lico 1998). Therefore, both the high Wandhigh As(V) concentrations that characterize ground-waters from the Carson Desert are consistent withdesorption from mineral surface sites in these oxicand alkaline (pH≥8) groundwaters (Fig. 6b).
The surface complexation model does not predictmobilization of As(III) in Murshidabad groundwaters(Fig. 6) despite the very high As(III) concentrationsmeasured in many groundwaters from the Murshidabaddistrict (Table 3; Datta et al. 2011). We interpret theresults of the surface complexation modeling and thehigh As(III) concentrations of Murshidabad groundwa-ters as indicating that other processes besides pH-relateddesorption are important in mobilizing As(III) to thesegroundwaters. For example, it is generally agreed thatreductive dissolution of Fe(III) oxides/oxyhydroxides,mediated by microbes, and the subsequent release ofsorbed and/or coprecipitated As to groundwaters is thechief mechanism responsible for As mobilization togroundwaters of the Bengal Basin of India and Bangla-desh (Nickson et al. 2000; Harvey et al. 2002; Islamet al. 2004; Zheng et al. 2004; Ravenscroft et al. 2009).Although correspondence analysis does not support aclose association between As and Fe in Murshidabadgroundwaters (Fig. 5; Table 7), others have demonstratedthat As and Fe concentrations are commonly decoupledin groundwaters from the Bengal Basin (e.g., van Geenet al. 2004). Hence, another possible mechanism thatcould explain the elevated As(III) concentrations and
(a) Murshidabad
pH6 7 8 9
Fra
ctio
n A
dso
rbed
0.0
0.2
0.4
0.6
0.8
1.0
(b) Carson Desert
pH
6 7 8 9
Fra
ctio
n A
dso
rbed
0.0
0.2
0.4
0.6
0.8
1.0
WO42-
As(V)As(III)PO4
3-
WO42-
As(III)
As(V)
As(III)
As(V)
WO42-
PO43-
PO43-
0.0139 M NaCl3.76 g/L HFO
0.03655 M NaCl9.2 g/L HFO
Fig. 6 Surface complexation model predicted sorption edges forW, As(V), As(III), and PO4
3- for “average” a Murshidabadgroundwater and b Carson Desert groundwater (see text fordetails). The vertical dashed lines represent the mean (thick,shorter-spaced dashed lines) ± standard deviation (thinner,longer-spaced dashed lines) for pHmeasured inMurshidabad (thisstudy) and Carson Desert (Seiler et al. 2005) groundwaters. ThepH data for the Carson Desert groundwaters were obtained bydigitizing (i.e., Tummers 2006) Fig. 12 of Seiler et al. (2005)
Water Air Soil Pollut (2014) 225:1792 Page 15 of 19, 1792

poor correlations between As and Fe that characterizeMurshidabad groundwaters is enzymatic reduction ofsurface sorbed As(V) and subsequent release of As(III)to the groundwaters (e.g., Oremland and Stolz 2005).Because As(III) will chiefly occur as H3AsO3
0 in thecircumneutral pH groundwaters of Murshidabad, As(III)mobilized from the aquifer sediments by either of thesemicrobially mediated processes may not be readily re-adsorbed tomineral surface sites.We note that the surfacecomplexation model does not explicitly account foreither of these hypothesized microbial processes.
5 Conclusions
Tungsten and As concentrations in groundwaters fromthe Murshidabad district of West Bengal, India, arepresented and compared with those of groundwatersfrom the Carson Desert of western Nevada, USA. Here,we specifically tested the hypothesis that groundwatersexhibiting elevated As concentrations will also havehigh W concentrations. Although groundwaters fromthe Murshidabad district have among the highest Asconcentrations reported for the entire Bengal Basin, Wconcentrations in the groundwaters are relatively low. Incontrast, Carson Desert groundwaters exhibit elevatedWand As concentrations. Surface complexation model-ing can explain the differences in W concentrationsbetweenMurshidabad and Carson Desert groundwaters,as the model predicts that ≥96 % of all W is sorbed ontoFe(III) oxides/oxyhydroxides in the circumneutral pHgroundwaters of Murshidabad, whereas substantial pro-portions of W can be mobilized by pH-related desorp-tion in the alkaline (pH>8) groundwaters of the CarsonDesert. The surface complexation model also correctlypredicts mobilization of As(V) in groundwaters of theCarson Desert, where As chiefly occurs in solution asAs(V). However, the model does a poor job at predictingAs(III) mobilization in Murshidabad groundwaters,indicating that other processes besides pH-induceddesorption, such as reductive dissolution of Fe/Mnoxides/oxyhydroxides and subsequent release of sorbedand/or coprecipitated As, likely account for the elevatedAs concentrations of these groundwaters. Consequently,the statistical analysis and surface complexation model-ing presented here indicate that As can be a relativelygood proxy for predicting high dissolved W concentra-tions in groundwaters from oxic, high pH groundwaterflow systems such as those that commonly characterize
arid regions. In these systems, both W and As chieflyoccur are relatively stable oxyanions (i.e., WO4
2- andHAsVO4
2-, respectively) that are not strongly adsorbedto mineral surfaces at high pH. In contrast, in anoxic,neutral pH groundwaters such as those of Murshidabad,West Bengal, India, groundwater W concentrations aredecoupled from As owing to the much stronger adsorp-tion of WO4
2- to mineral surface sites compared to theuncharged, H3As
IIIO30 species, which is the predominant
form of As in these groundwaters.Finally, multivariate statistical analysis indicates
that W is closely associated with Mn and Cl- inMurshidabad groundwater, suggesting that thedissolution/weathering of Mn oxides/oxyhydroxides,clay minerals, mica (muscovite or biotite), and/or apatitemay contribute W to these groundwaters. Future studiesshould investigate the possible mineral reservoirs of W inaquifer sediments of Murshidabad to better constrain itslocal geochemical cycle.
Acknowledgments This work was supported by NSF awardsEAR-1014946 to Johannesson and EAR-1014971 to Datta. Wethank the editor J. T. Trevors and the anonymous reviewers whosecomments greatly improved this manuscript.
References
Anderson, T.W. (2003). An introduction to multivariate statisticalanalysis (3rd ed.). Wiley Series in Probability and Statistics.Wiley–Interscience.
Anderson, T. W., & Darling, D. A. (1954). A test ofgoodness of fit. Journal of the American StatisticalAssociation, 49, 765–769.
Arnórsson, S., & Óskarsson, N. (2007). Molybdenum and tung-sten in volcanic rocks and in surface and <100 °C groundwaters in Iceland. Geochimica et Cosmochimica Acta, 71,284–304.
ATSDR–Agency for Toxic Substances and Disease Registry.(2005). Toxicological Profile for Tungsten. http://www.atsdr.cdc.gov/toxprofiles/tp186.pdf. Accessed 3 December2009.
Baes, C. F., Jr., &Mesmer, R. E. (1976). The hydrolysis of cations.New York: Wiley.
Bednar, A. J., Mirecki, J. E., Inouye, L. S., Winfield, L. E., Larson,S. L., & Ringelberg, D. B. (2007). The determination oftungsten, molybdenum, and phosphorus oxyanions by highperformance liquid chromatography inductively coupledplasma mass spectrometry. Talanta, 72, 1828–1832.
Bednar, A. J., Jones, W. T., Boyd, R. E., Ringelberg, D. C., &Larson, S. L. (2008). Geochemical parameters influencingtungsten mobility in soils. Journal of Environmental Quality,37, 229–233.
1792, Page 16 of 19 Water Air Soil Pollut (2014) 225:1792

Bednar, A. J., Boyde, R. E., Jones,W. T., McGrath, C. J., Johnson,D. R., Chappell, M. A., et al. (2009). Investigation of tung-sten mobility in soil using column tests. Chemosphere, 75,1049–1056.
Bethke, C. M. (2008). Geochemical and biogeochemical reactionmodeling (p. 543). Cambridge, UK: Cambridge UniversityPress.
Bethke, C. M., & Yeakel, S. (2010). Geochemist’s Workbench®Release 8.0: Reaction modeling guide (p. 84). Urbana:University of Illinois.
Box, G. E. P., & Cox, D. R. (1964). An analysis of transformations.Journal of the Royal Statistical Society, Series B: StatisticalMethodology, 26(2), 211–252.
Canty, A., Ripley, B. (2012). Boot: Bootstrap R (S–Plus) func-tions, R package version 1.3–4.
Carr, J. R. (1990). CORSPOND: a portable FORTRAN-77 programfor correspondence analysis. Computers and Geosciences, 16,289–307.
Carr, J. R. (1995). Numerical analysis for the geological sciences.Englewood Cliffs, NJ: Prentice-Hall. 592 pp.
Carr, J. R. (2002). Data visualization in the geosciences. UpperSaddle River: Prentice-Hall. 267 pp.
Clausen, J. L., Ketterer, M. E., Bednar, A. J., & Koening, M. R.(2010). Challenges and successes in using inductivelycoupled plasma mass spectrometry for measurements oftungsten in environmental water and soil samples.International Journal of Environmental Analytical Chemistry,90, 773–783.
Clausen, J. L., Bostick, B. C., Bednar, A., Sun, J., Landis, J. D.(2011). Tungsten speciation in firing range soils (82 pp.).U.S. Army Corps of Engineers, Engineering Research andDevelopment Center Report TR-11-1.
Cruywagen, J. J., & van der Merwe, I. F. J. (1987). Tungsten(VI)equilibria: A potentiometric and calorimetric investigation.Journal of the Chemical Society, Dalton Transactions, 7,1701–1705.
Datta, S., Neal, A. W., Mohajerin, T. J., Ocheltree, T., Rosenheim,B. E., White, C. D., et al. (2011). Perennial ponds are not animportant source of water or dissolved organic matter togroundwaters with high arsenic concentrations in WestBengal, India. Geophysical Research Letters, 38, L20404.doi:10.1029/2011GL049301.
Davis, J. C. (1986). Statistics and data analysis in geology (2nded.). New York: Wiley. 646 pp.
Development Core Team, R. (2012). R: A language andenvironment for statistical computing. Vienna: R Foundationfor Statistical Computing. 3-900051-07-0.
DiCiccio, T. J., & Efron, B. (1996). Bootstrap confidence intervals.Statistical Science, 11(3), 189–228.
Dixit, S., & Hering, J. G. (2003). Comparison of arsenic(V) andarsenic(III) sorption onto iron oxide minerals: Implicationsfor arsenic mobility. Environmental Science & Technology,37, 4182–4189.
Dzombak, D., & Morel, F. M. M. (1990). Surface complexationmodeling: Hydrous ferric oxide. New York: Wiley. 393 pp.
Edel, J., Sabbioni, E., Pietra, R., Rossi, A., Torre, M., Rizzato, G.,et al. (1990). Trace metal lung disease: In vitro interaction ofhard metals with human lung and plasma components.Science of the Total Environment, 95, 107–117.
Farnham, I. M., Singh, A. K., Stetzenbach, K. J., & Johannesson,K. H. (2002). Treatment of nondetects in multivariate
analysis of groundwater geochemistry data. Chemometricsand Intelligent Laboratory Systems, 60, 265–281.
Fisher, R. A. (1915). Frequency distribution of the values of thecorrelation coefficient in samples from an indefinitely largepopulation. Biometrika, 10, 507–521.
Fisher, R. A. (1921). On the “probable error” of a coefficient ofcorrelation deduced from a small sample. Metron, 1, 3–32.
Fitzgerald, W. F. (1999). Clean hands, dirty hands: Clair Pattersonand the aquatic biogeochemistry of mercury. In C. I.Davidson (Ed.), Clean hands: Clair Patterson Crusadeagainst environmental lead contamination (pp. 119–137).Commack: Nova Science Publishers.
Francis, S. S., Selvin, S., Yang,W., Buffler, P. A., &Wiemels, J. L.(2012). Unusual space-time patterning of the Fallon, Nevadaleukemia cluster: Evidence of an infectious etiology.Chemico-Biological Interactions, 196, 102–109.
Gao, Y., & Mucci, A. (2003). Individual and competitive adsorp-tion of phosphate and arsenate on goethite in artificial sea-water. Chemical Geology, 199, 91–109.
Greenacre, M. J. (1984). Theory and application of correspon-dence analysis. London: Academic. 364 pp.
Gross, J. (2012). nortest: Tests for normality. R package version1.0-1.
Gustafsson, J. P. (2003). Modelling molybdate and tungstate ad-sorption to ferrihydrite. Chemical Geology, 200, 105–115.
Gustafsson, J. P., & Bhattacharya, P. (2007). Geochemical model-ling of arsenic adsorption onto oxide surfaces. In P.Bhattacharya, A. B. Mukherjee, J. Bundschuh, R.Zevenhoven, & R. H. Loeppert (Eds.), Arsenic in soil andgroundwater environment: biogeochemical interactions,health effects and remediation. Trace metals and other con-taminants in the environment (Vol. 9, pp. 159–206).Amsterdam: Elsevier.
Haque, S., & Johannesson, K. H. (2006). Arsenic concentra-tions and speciation along a groundwater flow path: TheCarrizo sand aquifer, Texas, USA. Chemical Geology,228, 57–71.
Haque, S., Ji, J., & Johannesson, K. H. (2008). Evaluating mobi-lization and transport of arsenic in sediments of Aquia aqui-fer, Maryland, USA. Journal of Contaminant Hydrology, 99,68–84.
Harita, Y., Hori, T., & Sugiyama, M. (2005). Release of traceoxyanions from littoral sediments and suspended particlesinduced by pH increase in the epilimnion of lakes.Limnology and Oceanography, 50, 636–645.
Harvey, C. F., Swartz, C. H., Baduzzaman, A. B. M., Keon-Blute,N., Yu, W., Ali, M. A., et al. (2002). Arsenic mobility andgroundwater extraction in Bangladesh. Science, 298, 1602–1606.
Herbelin, A. L., & Westall, J. C. (1999). FITEQL 4.0: A computerprogram for determination of chemical equilibrium constantsfrom experimental data (Department of Chemistry Report99–01). Corvallis: Oregon State University.
Islam, F. S., Gault, A. G., Boothman, C., Polya, D. A., Charnock,J. M., Chatterjee, D., et al. (2004). Role of metal-reducingbacteria in arsenic release from Bengal delta sediments.Nature, 430, 68–71.
Johannesson, K. H., & Neumann, K. (2013). Geochemical cyclingof mercury in a deep, confined aquifer: Insights from biogeo-chemical reactive transport modeling. Geochimica etCosmochimica Acta, 106, 25–43.
Water Air Soil Pollut (2014) 225:1792 Page 17 of 19, 1792

Johannesson, K. H., & Tang, J. (2009). Conservative behavior ofarsenic and other oxyanion-forming trace elements in an oxicgroundwater flow system. Journal of Hydrology, 378, 13–28.
Johannesson, K. H., Stetzenbach, K. J., Kreamer, D. K., & Hodge,V. F. (1996). Multivariate statistical analysis of arsenic andselenium in groundwaters from south–central Nevada andDeath Valley, California. Journal of Hydrology, 178, 181–204.
Johannesson, K. H., Lyons, W. B., Huey, S., Doyle, G. A.,Swanson, E. E., & Hackett, E. (1997). Oxyanion concentra-tions in eastern Sierra Nevada rivers: 2. Arsenic and phos-phate. Aquatic Geochemistry, 3, 61–97.
Johannesson, K. H., Lyons, W. B., Graham, E. Y., &Welch, K. A.(2000). Oxyanion concentrations in eastern Sierra Nevadarivers: 3. Boron, molybdenum, vanadium, and tungsten.Aquatic Geochemistry, 6, 19–46.
Johannesson, K. H., Tang, J., Daniels, J. M., Bounds, W. J., &Burdige, D. J. (2004). Rare earth element concentrations andspeciation in organic-rich blackwaters of the Great DismalSwamp, Virginia, USA. Chemical Geology, 209, 271–294.
Johannesson, K. H., Dave, H. B., Mohajerin, T. J., & Datta, S.(2013). Controls on tungsten concentrations in groundwaterflow systems: The role of adsorption, aquifer sediment Fe(III)oxide/oxyhydroxide content, and thiotungstate formation.Chemical Geology, 351, 76–94.
Kalinich, J. F., Emond, C. A., Dalton, T. K., Mog, S. R., Coleman,G. D., Kordell, J. E., et al. (2005). Embedded weapons-gradetungsteon alloy shrapnel rapidly induces metastatic high-grade rhabdomyosarcomas in F344 rats. EnvironmentalHealth Perspectives, 113, 729–734.
Kashiwabara, T., Takahashi, Y., Marcus, M. A., Uruga, T., Tanida,H., Terada, Y., et al. (2013). Tungsten species in naturalferromanganese oxides related to its different behavior frommolybdenum in oxic ocean. Geochimica et CosmochimicaActa, 106, 364–378.
Kelly, A. D. E., Lemaire, M., Young, Y. K., Eustache, J. H.,Guilbert, C., Molina, M. F., et al. (2013). In vivo tungstenexposure alters B-cell development and increases DNA dam-age in murine bone marrow. Toxicological Sciences, 131,434–446.
Kletzin, A., & Adams, M. W. W. (1996). Tungsten in biologicalsystems. FEMS Microbiology Ecology, 18, 5–63.
Koutsospyros, A., Braida, W., Christodoulatos, C., Dermatas, D.,& Strigul, N. (2006). A review of tungsten: Frrom environ-mental obscurity to scrutiny. Journal of HazardousMaterials, 136, 1–19.
Kowalski, C. J. (1972). On the effects of non-normality on thedistribution of the sample product–moment correlation coef-ficient. Journal of the Royal Statistical Society: Series C:Applied Statistics, 21, 1–12.
Leybourne, M. I., Peter, J. M., Johannesson, K. H., & Boyle, D. R.(2008). The Lake St. Martin bolide has a big impact ongroundwater fluoride concentrations. Geology, 36, 115–118.
Manning, B. A., & Goldberg, S. (1996). Modeling arsenate com-petitive adsorption on kaolinite, montmorillonite, and illite.Clays and Clay Minerals, 44, 609–623.
Marquet, P., François, B., Vignon, P., & Lachâtre, G. (1996). Asoldier who had seizures after drinking quarter of a litre ofwine. Lancet, 348, 1070.
McArthur, J. M., Ravenscroft, P., Banerjee, D. M., Milsom, J.,Hudson-Edwards, K. A., Sengupta, S., et al. (2008). How
paleosols influence groundwater flow and arsenic pollution:A model from the Bengal Basin and its worldwide implica-tions. Water Resources Research, 44, W11411. doi:10.1029/2007/WR006552.
McCleskey, R. B., Nordstrom, D. K., & Maest, A. S. (2004).Preservation of water samples for arsenic(III/V) determina-tions: An evaluation of the literature and new analyticalresults. Applied Geochemistry, 19, 995–1009.
Métral, J., Charlet, L., Bureau, S., Basu Mallik, S., Charkraborty,S., Ahmed, K.M., et al. (2008). Comparison of dissolved andparticulate arsenic distributions in shallow aquifers ofChakdaha, India, and Araihazar, Bangladesh. GeochemicalTransactions, 9, 1. doi:10.1186/1467-4866-9-1.
Miyauchi, T., Iwashita, M., & Shimamura, T. (1998). Behaviors oftrace elements in Tsukui Reservoir inferred from ICP-MSanalysis. Journal of Environmental Chemistry, 8, 12–21.
Mukherjee, A., Fryar, A. E., & Thomas, W. A. (2009a). Geologic,geomorphic and hydrologic framework and evolution of theBengal basin, India and Bangladesh. Journal of Asian EarthSciences, 34, 227–244.
Mukherjee, A., Fryar, A. E., & O’Shea, B. M. (2009b). Majoroccurrences of elevated arsenic in groundwater and othernatural waters. In K. Henke (Ed.), Arsenic: Environmentalchemistry, health threats and waste treatment (pp. 303–350).Chichester: Wiley.
Mukherjee, A., Bhattacharya, P., Shi, F., Fryar, A. E., Mukherjee,A. B., Xie, Z. M., et al. (2009c). Chemical evolution in thehigh arsenic groundwater of the Huhhot basin (InnerMongolia, PR China) and its difference from the westernBengal basin (India). Applied Geochemistry, 24, 1835–1851.
Neal, A. W. (2010). Hydrogeochemical and mineralogical evalu-ation of groundwater arsenic contamination in MurshidabadDistrict, West Bengal, India (M.S. thesis, 128 pp.).Manhattan, KS: Kansas State Univ.
Nickson, R. T., McArthur, J. M., Ravenscroft, P., Burgess, W. G.,& Ahmed, K. M. (2000). Mechanism of arsenic release togroundwater, Bangladesh and West Bengal. AppliedGeochemistry, 15, 403–413.
Oleson, S. G., & Carr, J. R. (1990). Correspondence analysis ofwater quality data: implications for fauna deaths at StillwaterLakes, Nevada. Mathematics Geology, 22, 665–698.
Oremland, R. S., & Stolz, J. F. (2005). Arsenic, microbes andcontaminated aquifers. Trends in Microbiology, 13, 45–49.
Peão, M. N. D., Águas, A. P., Sá, C. M., & Grande, N. R. (1993).Inflammatory response of the lung to tungsten particles:an experimental study in mice submitted to intratrachealinstillation of a calcium tungstate powder. Lung, 171,187–201.
Ravenscroft, P., Brammer, H., Richards, K. (2009). Arsenic pol-lution: A global synthesis (588 pp).
Sahle, W., Krantz, S., Christensson, B., & Laszlo, I. (1996).Preliminary data on hard metal workers exposure totungsten oxide fibres. Science of the Total Environment,191, 153–167.
Seiler, R. L. (2012). Physical setting and natural sources of expo-sure to carcinogenic trace elements and radionuclides inLahontan Valley, Nevada. Chemico-Biological Interactions,196, 79–86.
Seiler, R. L., Stollenwerk, K. G., & Garbarino, J. R. (2005).Factors controlling tungsten concentrations in ground water,Carson Desert, Nevada. Applied Geochemistry, 20, 423–441.
1792, Page 18 of 19 Water Air Soil Pollut (2014) 225:1792
Sheppard, P. R., Ridenour, G., Speakman, R. J., & Witten, M. L.(2006). Elevated tungsten and cobalt in airborne particulatesin Fallon, Nevada: Possible implications for the childhoodleukemia cluster. Applied Geochemistry, 21, 152–165.
Sheppard, P. R., Speakman, R. J., Ridenour, G., & Witten, M. L.(2007). Temporal variability of tungsten and cobalt in Fallon,Nevada. Environmental Health Perspectives, 115, 715–719.
Smith, R. M., Martell, A. E. (2004). NIST critically selectedstability constants of metal complexes database. NISTStandard References Database 46, Version 8.0.
Sprince, N. L., Oliver, L. C., Chamberlain, R. I., Eisen, E. A., &Greene, R. E. (1994). Etiology and pathogenesis of hardmetal disease. Science of the Total Environment, 150, 55.
Strigul, N. (2010). Does speciationmatter for tungsten ecotoxicology?Ecotoxicology and Environmental Safety, 73, 1099–1113.
Sur, P. (2006). Mineralogical and geochemical investigations ofsediments and waters from river Ganges with specialapplication to arsenic contamination of groundwaters in theaquifers of Murshidabad district, West Bengal (Masters thesis,pp. 103). University of Calcutta.
Thomas, J. M., Benedict, F. C., Jr., Rose, T. P., Hershey, R. L.,Paces, J. B., Peterman, Z. E., et al. (2002). Geochemical andisotopic interpretations of groundwater flow in the OasisValley flow system. Southern Nevada: Desert ResearchInstitute. Publication No. 40190.
Tummers, B. (2006). DataThief III. http://datathief.org. Accessed7 February 2013.
U.S. EPA. (2008). Emerging contaminant–tungsten. Fact Sheet.EPA 505-F-07-005.
van Geen, A., Rose, J., Thoral, S., Garnier, J. M., Zheng, Y., &Bottero, J. Y. (2004). Decoupling of As and Fe release toBangladesh groundwater under reducing conditions: Part II.Evidence from sediment incubations. Geochimica etCosmochimica Acta, 68, 3475–3486.
Venables,W. N., & Ripley, B. D. (2002).Modern applied statisticswith S (4th ed.). New York: Springer. 0-387-95457-0.
Welch, A. H., & Lico, M. S. (1998). Factors controlling As and Uin shallow ground water, southern Carson Desert, Nevada.Applied Geochemistry, 13, 521–539.
White, A. F., & Chuma, N. J. (1987). Carbon and isotopic massbalance models of Oasis Valley–Fortymile Canyon ground-water basin, southern Nevada. Water Resources Research,23, 571–582.
Wilkie, J. A., & Hering, J. G. (1998). Rapid oxidation of geother-mal arsenic(III) in streamwaters of the eastern Sierra Nevada.Environmental Science & Technology, 32, 657–662.
Zheng, Y., Stute, M., van Geen, A., Gavrieli, I., Dhar, R.,Simpson, H. J., et al. (2004). Redox control of arsenicmobilization inBangladesh groundwater.AppliedGeochemistry,19, 201–214.
Water Air Soil Pollut (2014) 225:1792 Page 19 of 19, 1792
Related Documents