Geochemistry and Water Quality Volume III: Seepage and Water Quality for Recliamed Tailings Containment Area – Lupin Operation Presentation to; The Nunavut Water Board April 11, 2006 Presented by; Ron Nicholson, PhD. Ecometrix Incorporated

Welcome message from author
This document is posted to help you gain knowledge. Please leave a comment to let me know what you think about it! Share it to your friends and learn new things together.
Transcript

Geochemistry and Water QualityVolume III: Seepage and Water Quality for Recliamed
Tailings Containment Area – Lupin Operation
Presentation to;The Nunavut Water Board
April 11, 2006
Presented by;Ron Nicholson, PhD.
Ecometrix Incorporated

Objectives
• Verify that the Closure Plan is based on sound geochemical principals
• Verify that downstream water quality is protected for ongoing permafrost conditions
• Assess water quality for future conditions if thawing of permafrost occurs
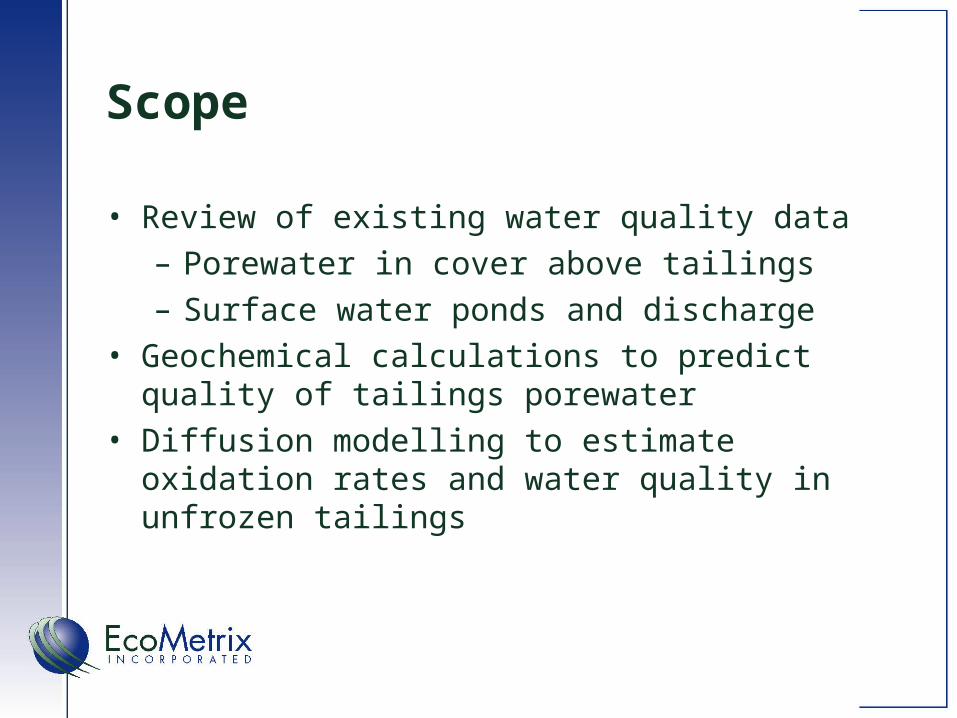
Scope
• Review of existing water quality data– Porewater in cover above tailings– Surface water ponds and discharge
• Geochemical calculations to predict quality of tailings porewater
• Diffusion modelling to estimate oxidation rates and water quality in unfrozen tailings

Lupin Tailings Containment Area
LEGEND Outside lakes Covered cells
Lakes after closureFormer lakes
CELL 1CELL 3
CELL 5
CELL 2
CELL N
POND 2
POND 1
END LAK E
CELL 4
DAM 2 N
SmallLake ‘p’
LEGEND Outside lakes Covered cells
Lakes after closureFormer lakes
CELL 1CELL 3
CELL 5
CELL 2
CELL N
POND 2
POND 1
END LAK E
CELL 4
DAM 2 N
SmallLake ‘p’

Locations of Shallow Pipes to Collect Porewater in Cover above Tailings
Cell 1WC-
WC- 4
WC-
WC-
WC- 5
WC-
WC-
WC- 6WC- 3
Cell 1ACell 2

Selection of Constituents of Potential Concern (COPC)
Maximum Average Concentration
Maximum Concentration of any
Grab Sample
pH --- 4.6 6.5 - 9.5 6.5 - 9.5 6.5-9.0Alkalinity mg CaCO3/L 15 --- --- ---
Conductivity uS/cm 1145 --- --- --- Indicator ParameterHardness mg CaCO3/L 606 --- --- ---
Antimony mg/L 0.0004 --- --- ---Arsenic mg/L 0.9 0.5 1.00 0.005 COPC
Cadmium mg/L 0.003 --- --- 0.000017 3,4 COPCCobalt mg/L 1 --- --- ---Copper mg/L 0.2 0.15 0.30 0.002-0.004 3 COPCCyanide mg/L 0.02 0.80 1.60 0.005
Lead mg/L 0.02 0.10 0.20 0.001-0.007 3 COPCMercury mg/L <0.0001 --- --- 0.00001
Molybdenum mg/L <0.001 --- --- 0.073Nickel mg/L 1.6 0.20 0.40 0.025-0.15 3 COPC
Sulphate mg/L 660 --- --- --- Indicator ParameterUranium mg/L 0.004 --- --- ---
Zinc mg/L 0.5 0.40 0.80 0.03 COPC
CCME Guidelines2 Comments
Discharge Criteria1
ParameterAverage
Concentration in Cell 1 Cover Pipes (2005)
Notes:1 - Discharge Limits for Current Water Board License2 - Guidelines for the Protection of Aquatic Life - Fresh Water3 - Hardness Based Limits - Upper Limits for >180 mg CaCO 3/L4 - Interim Guideline

Porewater: Trends in pH
3.0
3.5
4.0
4.5
5.0
5.5
6.0
6.5
Jan-02 Jan-03 Jan-04 Jan-05 Jan-06
pH
WC1-2 WC1-4 WC1-5 WC1-6 WC1-7 WC1-8

Porewater: Trends in Arsenic
0.0001
0.001
0.01
0.1
1
10
100
Jan-02 Jan-03 Jan-04 Jan-05 Jan-06
Ars
en
ic (
mg
/L)
WC1-2 WC1-2a WC1-4 WC1-5 WC1-6 WC1-7 WC1-8

Porewater: Trends in Nickel
0.0001
0.001
0.01
0.1
1
10
Jan-02 Jan-03 Jan-04 Jan-05 Jan-06
Nic
ke
l (m
g/L
)
WC1-2 WC1-2a WC1-4 WC1-5 WC1-6 WC1-7 WC1-8
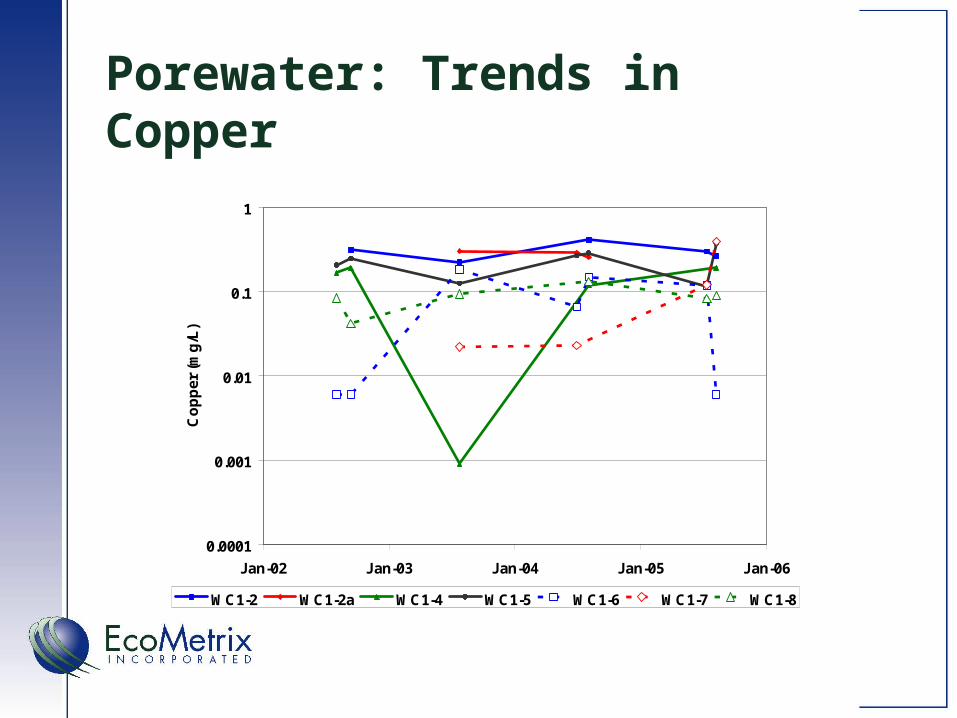
Porewater: Trends in Copper
0.0001
0.001
0.01
0.1
1
Jan-02 Jan-03 Jan-04 Jan-05 Jan-06
Co
pp
er
(mg
/L)
WC1-2 WC1-2a WC1-4 WC1-5 WC1-6 WC1-7 WC1-8

Surface Water Sampling Locations
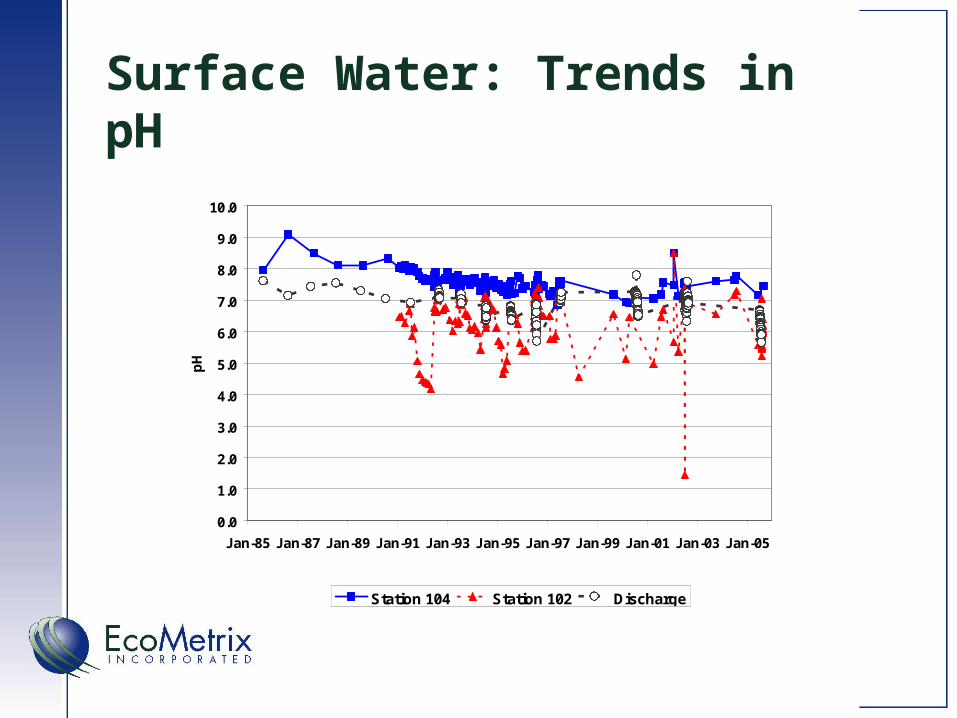
Surface Water: Trends in pH
0.0
1.0
2.0
3.0
4.0
5.0
6.0
7.0
8.0
9.0
10.0
Jan-85 Jan-87 Jan-89 Jan-91 Jan-93 Jan-95 Jan-97 Jan-99 Jan-01 Jan-03 Jan-05
pH
Station 104 Station 102 Discharge
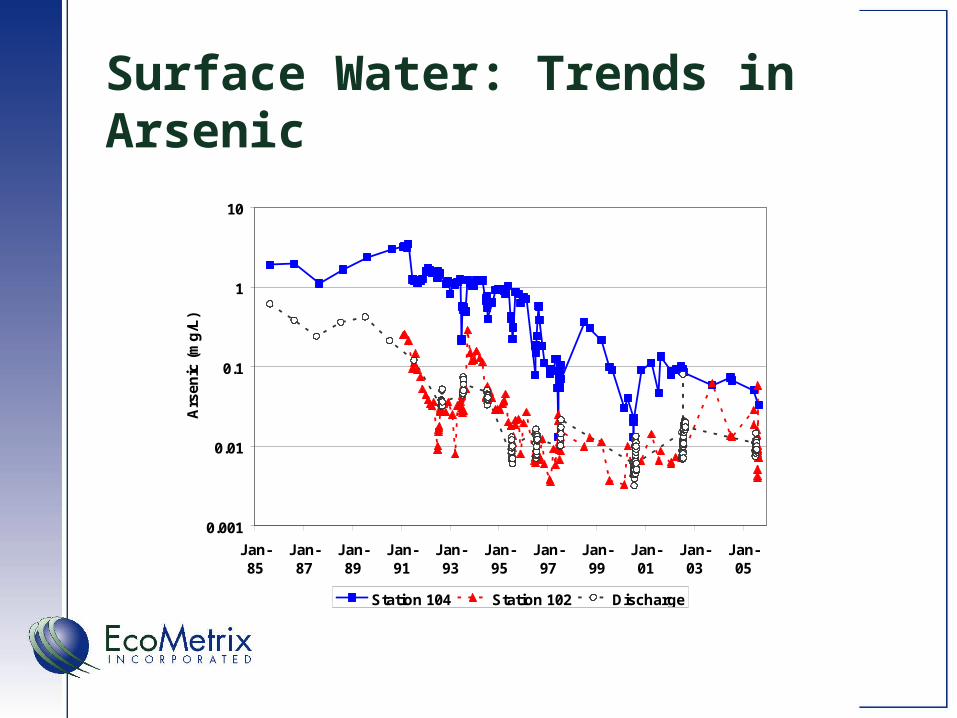
Surface Water: Trends in Arsenic
0.001
0.01
0.1
1
10
Jan-85
Jan-87
Jan-89
Jan-91
Jan-93
Jan-95
Jan-97
Jan-99
Jan-01
Jan-03
Jan-05
Ars
enic
(m
g/L
)
Station 104 Station 102 Discharge

Surface Water: Trends in Nickel
0.001
0.01
0.1
1
Jan-85
Jan-87
Jan-89
Jan-91
Jan-93
Jan-95
Jan-97
Jan-99
Jan-01
Jan-03
Jan-05
Nic
kel
(m
g/L
)
Station 104 Station 102 Discharge

Surface Water: Trends in Copper
0.001
0.01
0.1
1
10
Jan-85
Jan-87
Jan-89
Jan-91
Jan-93
Jan-95
Jan-97
Jan-99
Jan-01
Jan-03
Jan-05
Co
pp
er
(mg
/L)
Station 104 Station 102 Discharge

Comparisons BetweenPorewater and Surface Water Quality
Average from 1997 to 2005
Cyanide Arsenic Cadmium Copper Nickel ZincCover WQ 1 1 1 1 1 1Cell pond 0.25 0.09 0.18 0.16 0.09 0.27Pond 1 20.7 1.00 0.11 0.68 0.05 0.25Pond 2 1.90 0.06 0.12 0.12 0.06 0.57
Discharge 1.71 0.04 1.49 0.05 0.06 1.69
2005 Values
Cyanide Arsenic Cadmium Copper Nickel ZincCover WQ 1 1 1 1 1 1Cell pond 0.25 0.06 0.18 0.16 0.09 0.26Pond 1 17.0 0.05 0.04 0.25 0.05 0.40Pond 2 1.99 0.01 0.05 0.07 0.06 0.51
Dischage 2.39 0.01 0.04 0.09 0.06 0.51

Sulphate/Metal Ratios and Scaling Factors in Oxidation Column Test
pHSulphate
(mg/L)Arsenic (mg/L)
Cadmium (mg/L)
Copper (mg/L)
Zinc (mg/L)
Lead (mg/L)
Nickel (mg/L)
3.08 11375 2.300 0.020 0.100 1.700 0.400 0.1003.36 4509 0.800 0.010 0.200 1.000 0.100 0.1003.22 2389 0.200 0.010 1.700 1.600 0.100 0.1003.20 2029 0.100 0.010 1.400 0.800 0.100 0.1003.85 2786 0.040 0.002 0.060 0.260 0.040 0.0103.87 1855 0.090 0.002 0.060 0.220 0.020 0.0050.52 1722 0.190 0.003 0.130 0.240 0.050 0.0243.47 1714 0.210 0.002 0.140 0.290 0.020 0.0053.45 1714 0.020 0.002 0.100 0.190 0.020 0.0053.47 1670 0.020 0.003 0.130 0.190 0.020 0.0053.39 1720 0.140 0.002 0.190 0.100 0.020 0.0053.25 1770 0.100 0.002 0.260 0.110 0.020 0.005
Average 3.18 2938 0.351 0.006 0.373 0.558 0.076 0.039
Scaling Factor Based on Sulphate
1 8.08E-05 1.92E-06 1.72E-04 1.92E-04 2.17E-05 1.31E-05
Column 1 Data from Klohn-Leonoff (1993)
Individual Data

Sulphate/Metal Ratios and Scaling Factors in Porewater Above Tailings
pHSulphate
(mg/L)Arsenic (mg/L)
Cadmium (mg/L)
Copper (mg/L)
Zinc (mg/L)
Lead (mg/L)
Nickel (mg/L)
4.74 846 1.290 0.004 0.150 0.950 0.040 2.4805.98 989 0.877 0.003 0.221 0.645 0.034 2.0903.36 702 2.120 0.003 0.300 0.783 0.054 1.5504.17 1470 0.173 0.005 0.116 0.694 0.006 3.5805.28 270 4.360 0.001 0.118 0.156 0.108 0.0934.55 145 1.340 0.002 0.120 0.264 0.034 0.5664.44 375 1.320 0.002 0.083 0.402 0.029 1.170
4.88 931 1.070 0.005 0.186 1.110 0.025 2.9306.96 1010 1.110 0.002 0.146 0.607 0.033 1.8103.34 681 3.390 0.003 0.263 0.884 0.054 1.7804.85 654 0.046 0.003 0.192 0.511 0.006 1.6704.13 1760 0.047 0.007 0.372 0.777 0.003 3.920
Average 4.72 819 1.429 0.003 0.189 0.649 0.036 1.970
Scaling Factor Based on Sulphate
1 3.48E-03 4.82E-06 3.02E-04 9.29E-04 8.56E-05 2.45E-03
Individual Data
2005 Chemistry from Tailings Pipes
July 2005
August 2005
Individual Data

Predicted Porewater Concentrations Below the Water Table for Lab and Porewater Scaling Factors
Using Scaling Factor from Tailings Oxidation Column Test
Data (Klohn-Leonoff, 1993)
Using Scaling Factor from 2005 Tailings Pipe Chemistry
Sulphate (mg/L) 16 1 16 1
Arsenic (mg/L) 0.001 0.06Cadmium (mg/L) 0.00003 0.00008Copper (mg/L) 0.003 0.005
Zinc (mg/L) 0.003 0.015Lead (mg/L) 0.0003 0.001
Nickel (mg/L) 0.0002 0.039
Parameter
FeS2 + 15/4 O2 2SO42- + Fe(OH)3 + 4H+

Post Permafrost – Some Tailings May Partially Desaturate Near the Dams
Oxidizing Tailings DamUnoxidized Tailings
Infiltration
Oxygen
Water
Infiltration
FeS2 + O2 ==> Fe2+ / SO42- / H+
Evaporation
Years to Decades
Years
Esker Cover Runoff

Diffusion Coefficient as a Function of Saturation of Pore Spaces by Water in Tailings
1.E-11
1.E-10
1.E-09
1.E-08
1.E-07
1.E-06
1.E-05
0 10 20 30 40 50 60 70 80 90 100
Saturation (%)
Eff
ec
tiv
e D
iffu
sio
n C
oe
ffic
ien
t (m
2/s
ec
)
Deff=(0.3*Da*(1-S)^3.3+0.3*S*Dw/H)
Data from Reardon and Moddle

Predicted Sulphate Concentrations in Porewater for a Range of Saturation Values
Diffusion Only Diffusion and Infiltration
100 804 3 19
98 14,676 49 65
94 101,755 340 356
90 300,712 1006 1022
Tailings SaturationOxygen Flux
(mg/m2/a)
Sulphate Concentration in Porewater (mg/L)

Dilution Factors for Porewater Seepage into Basin Discharge for the Seepage Cases Assessed
Model Case 1Estimated Seepage Volume 1
(m3)Dilution Factor 2
Case 1 89,700 0.076Case 2 17,940 0.015Case 3 76,245 0.065Case 4 77,740 0.066Case 5 11,960 0.010Case 6 71,760 0.061
Notes:1 - Refer to Volume 1 (Holubec, 2006)2 - Based on Total Annual Flow of 1.175x10⁶ m3/a

Predicted Concentrations in Basin Discharge for Min and Max DilutionsUsing the Porewater Scaling Factors
Min Max Min Max Min Max Min Max Min Max Min Max Min Max
100 0.2 1.4 0.0007 0.005 0.000001 0.00001 0.00006 0.0004 0.00002 0.0001 0.0005 0.003 0.0002 0.001
98 0.7 5 0.002 0.017 0.000003 0.00002 0.0002 0.002 0.00006 0.0004 0.002 0.012 0.0006 0.005
94 4 27 0.013 0.095 0.00002 0.0001 0.001 0.008 0.0003 0.002 0.009 0.067 0.003 0.025
90 10 78 0.036 0.272 0.00005 0.0004 0.003 0.024 0.0009 0.007 0.025 0.191 0.010 0.072
Water Saturation
(%)
Nickel1 (mg/L) Zinc1 (mg/L)Sulphate (mg/L) Arsenic1 (mg/L) Copper1 (mg/L) Lead1 (mg/L)Cadmium1 (mg/L)
Notes:1 - Metal Concentrations Estimated with Scale Factor from 2005 Monitoring Data from Cell 1 Pipes (see Table 2.2)2 - Min and Max based on predicted seepage volumes from unsaturated tailings

Predicted Concentrations in Basin Discharge for Min and Max DilutionsUsing the Column Test Scaling Factors
Min Max Min Max Min Max Min Max Min Max Min Max Min Max
100 0.2 1.4 0.00002 0.0001 0.0000004 0.000003 0.00003 0.0002 0.000004 0.00003 0.000002 0.00002 0.000036 0.0003
98 0.7 5.0 0.00005 0.0004 0.000001 0.00001 0.0001 0.0009 0.00001 0.0001 0.000009 0.00006 0.0001 0.0010
94 3.6 27.2 0.0003 0.002 0.00001 0.00005 0.0006 0.005 0.00008 0.0006 0.00005 0.0004 0.0007 0.005
90 10.4 78.0 0.0008 0.006 0.00002 0.00015 0.002 0.013 0.0002 0.002 0.0001 0.001 0.0020 0.015
Water Saturation
(%)
Nickel1 (mg/L) Zinc1 (mg/L)Sulphate (mg/L) Arsenic1 (mg/L) Copper1 (mg/L) Lead1 (mg/L)Cadmium1 (mg/L)
Notes:1 - Metal Concentrations Estimated with Scale Factor from the Tailings Column Test Results (see Table 2.2)2 - Min and Max based on predicted seepage volumes from unsaturated tailings

Conclusions
• Lupin tailings are potentially acid generating if exposed to atmosphere for prolonged periods
• Quality of existing porewater in the esker cover above the tailings has been influenced by historic oxidation before cover construction
• Development of a shallow water table in the esker cover is protective of downstream water quality for ongoing permafrost conditions
Conclusions
• If permafrost thaws, the Lupin Tailings will retain high degrees of moisture below the cover and will only partially desaturate near the dams
• The high saturation will limit the diffusion of oxygen and oxidation rates in the desaturated tailings
• Predicted concentrations of COPCs in the basin discharge are near or below guideline values when reasonable scale-up factors for sulphate to metal ratios are applied
• Estimated concentrations for low dilutions and higher scale-up factors are less than current criteria in the basin discharge
• Overall, the closure plan is considered to be protective of downstream water quality
Related Documents