Geochemical tools for the stratigraphic correlation of floodplain deposits of the Morava River in Strážnické Pomoraví, Czech Republic from the last millennium Tomáš Grygar a, ⁎, Ivo Světlík b , Lenka Lisá c , Leona Koptíková c , Aleš Bajer d , David S. Wray e , Vojtěch Ettler f , Martin Mihaljevič f , Tereza Nováková f , Magdaléna Koubová g , Jan Novák h , Zdeněk Máčka i , Mirek Smetana i a Institute of Inorganic Chemistry ASCR, v.v.i., 250 68 Řež, Czech Republic b Nuclear Physics Institute ASCR, v.v.i, 250 68 Řež, Czech Republic c Institute of Geology ASCR, v.v.i., Rozvojová 269, 165 00 Prague, Czech Republic d Mendel University of Agriculture and Forestry, Zemědělská 3, 613 00 Brno, Czech Republic e The University of Greenwich at Medway, Chatham Maritime, Kent, ME4 4 TB, UK f Charles University, Faculty of Science, Albertov 6, 128 43 Prague, Czech Republic g Czech Geological Survey, Klárov 3, 118 21 Prague, Czech Republic h University of South Bohemia, Faculty of Science, Department of Botany, Branišovská 31, 370 05 České Budějovice, Czech Republic i Masaryk University, Faculty of Science, Department of Geography, Kotlářská 2, 611 37 Brno, Czech Republic abstract article info Article history: Received 16 July 2009 Received in revised form 14 September 2009 Accepted 14 September 2009 Keywords: Fluvial archives Environmental change Chemostratigraphy Proxy analyses The floodplain of the Morava River in Strážnické Pomoraví, south-east Moravia, Czech Republic contains a very valuable record of regional environmental change, which goes back to several thousand years. Its interpretation has been limited by poor stratigraphic correlation and dating of the sediments. We present a geochemical solution to this challenge. We studied 8 outcrops of floodplain deposits from 4 localities along a 6 km long part of the current meander belt of the Morava River in Strážnické Pomoraví using geochemical proxy analyses, magnetic susceptibility measurements, 14 C dating of wood remnants, and sediment micromorphology. The proxy methods are based on elemental analysis (EDXRF) and analysis of the cation exchange capacity of clay minerals; granulometric analyses provided the basis for lithological and facies assignment of the sediments. Our geochemical and mineralogical interpretations have further been tested by microstratigraphically studying the optical properties of the fine fraction. Horizons older than about 3 centuries were 14 C dated using wood remnants and the age of deposits from the last century was determined on the base of several proxies reflecting their industrial contamination by heavy metals and magnetic particles. The mean depositional rate over the period from about 1000 to about 1900 AD ranged from 0.2 to 0.6 mm y −1 , depending on the sedimentary facies. The coeval lithological change in the majority of the studied sections indicated a change of the meander belt structure at between ~1200 AD and ~ 1600 AD probably as a consequence of changes of channel structure. The alluvial deposition in the 20th century was strongly affected by the river regulation. © 2009 Elsevier B.V. All rights reserved. 1. Introduction Floodplain deposits are invaluable archives of Holocene fluvial activity (e.g., Macklin et al., 2006; Macklin and Lewin, 2008). The sediments may also contain information about regional environmen- tal changes in countries which have undergone substantial change of land use and industrial development (e.g., Swennen and Van der Sluys, 2002; Lang et al., 2003; Vannière et al., 2003; de Moor et al., 2008). Both the quality and quantity of river-transported solid material can reflect the history of agriculture, anthropogenic adjust- ments to changing the river dynamics, evidence of chemical pollution, and other aspects of land–human interactions. However, floodplain development is a very dynamic and complex process that requires great care to be taken in the interpretation of overbank deposit sequences (Lewin and Macklin, 2003; Macklin and Lewin, 2008). In many European countries there is lack of continuous environmental sedimentary records such as natural lakes covering the historical and prehistoric periods and documentary archives older than five hundred years are very scattered. The understanding of how to interpret river dynamics has improved in recent years, enabling the production of estimates of river activity extending back several millennia (Macklin et al., 2005, 2006; Starkel et al., 2006; Thorndycraft and Benito, 2006; Hoffmann et al., 2008) allowing workers to identify large, regional, continental, or perhaps global environmental changes in fluvial activity in the multi-millennial time scale. On shorter time- and spatial scales, some local (regional, episodic) changes in the flood- plains of rivers with smaller watersheds and alluvial plains have been Catena 80 (2010) 106–121 ⁎ Corresponding author. E-mail address: [email protected] (T. Grygar). 0341-8162/$ – see front matter © 2009 Elsevier B.V. All rights reserved. doi:10.1016/j.catena.2009.09.005 Contents lists available at ScienceDirect Catena journal homepage: www.elsevier.com/locate/catena

Welcome message from author
This document is posted to help you gain knowledge. Please leave a comment to let me know what you think about it! Share it to your friends and learn new things together.
Transcript

Catena 80 (2010) 106–121
Contents lists available at ScienceDirect
Catena
j ourna l homepage: www.e lsev ie r.com/ locate /catena
Geochemical tools for the stratigraphic correlation of floodplain deposits of theMorava River in Strážnické Pomoraví, Czech Republic from the last millennium
Tomáš Grygar a,⁎, Ivo Světlík b, Lenka Lisá c, Leona Koptíková c, Aleš Bajer d, David S. Wray e, Vojtěch Ettler f,Martin Mihaljevič f, Tereza Nováková f, Magdaléna Koubová g, Jan Novák h, Zdeněk Máčka i, Mirek Smetana i
a Institute of Inorganic Chemistry ASCR, v.v.i., 250 68 Řež, Czech Republicb Nuclear Physics Institute ASCR, v.v.i, 250 68 Řež, Czech Republicc Institute of Geology ASCR, v.v.i., Rozvojová 269, 165 00 Prague, Czech Republicd Mendel University of Agriculture and Forestry, Zemědělská 3, 613 00 Brno, Czech Republice The University of Greenwich at Medway, Chatham Maritime, Kent, ME4 4 TB, UKf Charles University, Faculty of Science, Albertov 6, 128 43 Prague, Czech Republicg Czech Geological Survey, Klárov 3, 118 21 Prague, Czech Republich University of South Bohemia, Faculty of Science, Department of Botany, Branišovská 31, 370 05 České Budějovice, Czech Republici Masaryk University, Faculty of Science, Department of Geography, Kotlářská 2, 611 37 Brno, Czech Republic
⁎ Corresponding author.E-mail address: [email protected] (T. Grygar).
0341-8162/$ – see front matter © 2009 Elsevier B.V. Adoi:10.1016/j.catena.2009.09.005
a b s t r a c t
a r t i c l e i n f oArticle history:Received 16 July 2009Received in revised form 14 September 2009Accepted 14 September 2009
Keywords:Fluvial archivesEnvironmental changeChemostratigraphyProxy analyses
The floodplain of the Morava River in Strážnické Pomoraví, south-east Moravia, Czech Republic contains avery valuable record of regional environmental change, which goes back to several thousand years. Itsinterpretation has been limited by poor stratigraphic correlation and dating of the sediments. We present ageochemical solution to this challenge. We studied 8 outcrops of floodplain deposits from 4 localities along a6 km long part of the current meander belt of the Morava River in Strážnické Pomoraví using geochemicalproxy analyses, magnetic susceptibility measurements, 14C dating of wood remnants, and sedimentmicromorphology. The proxy methods are based on elemental analysis (EDXRF) and analysis of the cationexchange capacity of clay minerals; granulometric analyses provided the basis for lithological and faciesassignment of the sediments. Our geochemical and mineralogical interpretations have further been tested bymicrostratigraphically studying the optical properties of the fine fraction. Horizons older than about 3 centurieswere 14C datedusingwood remnants and the age of deposits from the last centurywas determined on the base ofseveral proxies reflecting their industrial contamination by heavy metals and magnetic particles. The meandepositional rate over the period from about 1000 to about 1900 AD ranged from 0.2 to 0.6 mm y−1, dependingon the sedimentary facies. The coeval lithological change in the majority of the studied sections indicated achange of themeander belt structure at between ~1200 AD and ~1600 AD probably as a consequence of changesof channel structure. The alluvial deposition in the 20th century was strongly affected by the river regulation.
ll rights reserved.
© 2009 Elsevier B.V. All rights reserved.
1. Introduction
Floodplain deposits are invaluable archives of Holocene fluvialactivity (e.g., Macklin et al., 2006; Macklin and Lewin, 2008). Thesediments may also contain information about regional environmen-tal changes in countries which have undergone substantial change ofland use and industrial development (e.g., Swennen and Van derSluys, 2002; Lang et al., 2003; Vannière et al., 2003; de Moor et al.,2008). Both the quality and quantity of river-transported solidmaterial can reflect the history of agriculture, anthropogenic adjust-ments to changing the river dynamics, evidence of chemical pollution,and other aspects of land–human interactions. However, floodplain
development is a very dynamic and complex process that requiresgreat care to be taken in the interpretation of overbank depositsequences (Lewin and Macklin, 2003; Macklin and Lewin, 2008). Inmany European countries there is lack of continuous environmentalsedimentary records such as natural lakes covering the historical andprehistoric periods and documentary archives older than five hundredyears are very scattered. The understanding of how to interpret riverdynamics has improved in recent years, enabling the production ofestimates of river activity extending back several millennia (Macklinet al., 2005, 2006; Starkel et al., 2006; Thorndycraft and Benito, 2006;Hoffmann et al., 2008) allowing workers to identify large, regional,continental, or perhaps global environmental changes in fluvialactivity in the multi-millennial time scale. On shorter time- andspatial scales, some local (regional, episodic) changes in the flood-plains of rivers with smaller watersheds and alluvial plains have been

107T. Grygar et al. / Catena 80 (2010) 106–121
successfully linked to well documented anthropogenic activities(Lang and Nolte, 1999; Swennen and Van der Sluys, 2002; Vannièreet al., 2003; de Moor et al., 2008; Notebaert et al., 2009). Largerwatersheds has some retention capacity for transport of the materialseroded due to the land use via colluvia and smaller tributaries to thetrunk river floodplains that was discussed by Lang et al. (2003),Rommens et al. (2006), Kalicki et al. (2008), and Hoffmann et al.(2009).
The majority of large, naturally meandering rivers in the CzechRepublic have been straightened and/or channelized and theirfloodplains narrowed by flood barriers. Several parts of the MoravaRiver, one of the most important rivers in the Czech Republic fromboth geographical and historical points of view, have apparently beenless affected, one such area is Strážnické Pomoraví (Kadlec et al.,2009). The floodplain in that area has been covered by several metresof fine grained deposits since the end of the Last Glacial Maximum(Havlíček, 1991, pp. 319–341; Havlíček and Smolíková, 1994; Kadlecet al., 2009). The rapid aggradation of the Morava River in the lastmillennium was assumed by several previous researchers to beconnected to changes in land use (e.g., Prudič, 1978). Similarly thedramatic increase in loam deposits on floodplains, where mostly oronly peat deposits were formed during theMiddle Holocene, has beenreported for many European rivers, where catchments were mostlydeforested and changed to arable fields (e.g., de Moor et al., 2008;Notebaert et al., 2009; Hoffmann et al., 2009). We have recentlystarted re-examining the floodplain deposits of the lower course ofthe Morava River and found that its character in a part of StrážnickéPomoraví underwent substantial changes during the last millennium(Kadlec et al., 2009).
The aim of this work is to establish a set of quantitative geochemicallaboratorymethodswhichwould allow routine analysis of sediments ata sufficient sampling density to facilitate their correlation, and deliverinterpretations in conventional lithological and sedimentological terms.These tools should enable floodplain scale correlations, which offer thebest approach to the description of the fluvial architecture asdemonstrated in numerous successful case studies (Lang and Nolte,1999; deMoor et al., 2008; Notebaert et al., 2009).We employed cationexchange capacity obtained by [Cu(trien)]2+ complex (Meier and Kahr,1999; Grygar et al., 2005, 2009), X-ray fluorescence element analysisand magnetic susceptibility measurements. To interpret these proxyresults, we cross-correlated them with outputs of conventional, moredemanding methods such as particle size analysis, micromorphologicalstudy of processes within the fine grain matrix of the studied material,and ICP elemental analysis performed on samples from selectedsections. The interpretation of the results is also based on 14C dating ofwood fragments. The sedimentological analysis, dating, and correlationare used to estimate the mean depositional rate (aggradation pluslateral accretion) over the last millennium.
2. Methods and material studied
2.1. Studied area
Strážnické Pomoraví is one of the last meandering reaches of theMorava River, which is not channelized, however, it is not free ofsignificant modern human impact. The river upstream from Stráž-nické Pomoraví was straightened, the cross section modified, and theriver banks stabilized. These alterations caused a downstreamresponse leading to changes in channel hydraulics and morphology.The Morava River channel has gradually become more deeply incisedinto the alluvial sediments, the banks have become destabilized andthe channel has widened. The changes in the course of the riverchannel are apparent from Fig. 1. Additionally, in the 1930's flooddefences were constructed along the Morava River and its tributaries,limiting the area available for overbank flooding to about 20% of theoriginal floodplain (Fig. 1). Historical maps show an anabranching
channel pattern within the area while currently a single channel isactive. Parallel channels in the vicinity of Strážnice and Petrov aredepicted in several maps from 17th to 19th centuries. The formerchannel pattern is evident from the map of Moravia compiled in 1665(Blaeu, 1665) and themaps of the 1st AustrianMilitary Survey of 1764–1768 and 1780–1783. Side channels called Morawka (Morávka) andWeschka Arm (Véšky) are also recorded on the map from the 2ndAustrianMilitary Survey (1841). During the 20th century, Morávka andVéškywere both channelized and used aswaterway (the Bat'a Channel)and to drain local streams (including the Velička, Véšky, and Radějovkacreeks). Other very substantial artificial modifications to the rivermorphology in the study area were the construction of flood defencesand channel straightening and consequent abandonment of meanderloops in two places within the study area during the 1930's (Fig. 1).
The map of the 2nd Austrian Military Survey (1841) indicates thatthe floodplain was dominated bymeadows and forests during the firsthalf of the 19th century. Currently the floodplain is mostly forestedand a smaller area covered by arable land. The current forests aremostly composed of alder (Alnus glutinosa), willows (Salix sp.), ashtree (Fraxinus excelsior), and oak (Quercus robur), but introduced (notdomestic) planted species are common in the current river banks,such as poplars (P. canadensis, cross-breed P. canadensis×P. nigra),maple Acer negundo=Negundo aceroides, ash tree F. angustifolia, andwalnut Juglans nigra.
Our observation after several years of fieldwork is that the lateralmovement of the concave banks of meanders in the largest meandersis up to 0.5 to 1 m per year. This is derived from the rate at whichprevious sampling sites have been removed by lateral erosion.
2.2. Sampling and sample pretreatment
Floodplain sediments were sampled from sections in naturaloutcrops of the Morava River banks during the seasonal minimumflows. In many places the rate of lateral erosion in the meander loops isabout 1 mper year and so after each large seasonal flood relatively freshdeposits are exposed. The outer 0.5 to 1 m of sediment was removedbefore sampling. Sediments frommoredistal parts of river channelwereretrieved by Auger corers with a diameter of 2 or 3 cm (Ejikelkamp, theNetherlands). Sediments were sampled as cubes with 3 cm edge at 5 or10 cm intervals, i.e. in a discontinuousmanner. Sampleswere left to dryin an ambient atmosphere. Very gently crushed material was used forthe size distribution analysis, clay mineral identification and magneticsusceptibility measurement. Powders obtained by manual grinding inan agate mortar were subjected to geochemical analyses. Micromor-phological samples were taken from macroscopically identified litho-logical layers using small Kubiena boxes.
2.3. Clay mineral identification
Samples for identification of clay mineral composition (clayfraction, <2 μm) were obtained by a conventional sedimentationmethod (Tanner and Jackson, 1948). Oriented specimens for XRDwere prepared by pipette method. Approximately 2 ml of suspensionwas dropped by pipette on the glass slide and air dried. The orientedspecimens were analysed air-dried and after overnight saturationwith ethylene glycol vapour at 60 °C. Then a part of the suspensionwas removed and left to evaporate at 40–50 °C and subjected to CECanalysis (discussed below). The clay fraction was analyzed by X-raydiffraction using a Philips X'Pert system (PANalytical, the Nether-lands) with CuKα1 radiation. Clay mineral identification wasperformed using the NEWMOD code (Reynolds, 1985). Relativechanges in illite–smectite concentration within the clay fractionwere estimated by determining the relative areas of the basaldiffraction lines in oriented specimens, estimated by their deconvolu-tion to pseudo-Voigt components using the Peak Fitting Module inOrigin7.0 (OriginLab, Northampton, MA, USA).

108 T. Grygar et al. / Catena 80 (2010) 106–121

Table 1List of studied sections.
Locality Sections Former land use(land cover)
Number of14C dates
Other analyses
Bridge toBzenec
M215 19th century: forest 1 MS, ICP/MS1950's: orchardSince 1960's: forest
M7 19th century: forest 3 (takenfrom Kadlecet al., 2009)
1950's: orchardSince 1960's: forest
M127 19th century: forest no MS, particle sizefractionation,micromorphology
1950's: arable landSince 1980's: forest
MeadowbelowSandDepot
M134 19th century to 1960's:forest
no
1980's: arable land1990's: shrubs
M249 19th century to 1960's:forest
no MS, ICP/MS
1980's: arable land1990's: shrubs
Old Piles M110 19th and 20th century:alterations betweenmeadow and arable land(3 changes of land cover)
4 MS, ICP/MS,particle sizedistributionfunction
Jasenová M107 19th century: forest 1 MS1950's: arable landSince 1980's: forest
M108 19th century: forest 11950's: arable landSince 1980's: forest
Only 14C date points from the last millennium relevant to this study are listed. CEC andEDXRF analyses were performed for all sections; other performed analyses are listed inthe last column.
109T. Grygar et al. / Catena 80 (2010) 106–121
2.4. Micromorphology of sediments
Samples were taken into small Kubiena boxes, slowly dried,impregnated by a polymer resin, proceeded into thin sections andthen studied according to Bullock and Murphy (1983). A record wasmade of the microfabric types, structural and porosity features,natural inclusions, anthropogenic inclusions and pedofeatures (Mac-phail and Cruise, 2001, pp. 241–267).
2.5. Quantitative analysis of expandable clay minerals (CEC)
The cation exchange capacity (CEC) was determined using aprocedure proposed by Meier and Kahr (1999) for pure clay mineralspecimens and recently tested for sediments and soils (Grygar et al.,2009). [Cu(trien)]2+ solution was obtained from CuSO4·5H2O (Penta,Czech Republic) and trien, triethylenetetramine (1,4,7,10-tetraazade-kane, Sigma-Aldrich), to the final concentration 0.01 M with apotentiometric control of the constant ligand-to-metal ratio (Grygaret al., 2009). A fine dry powder (100–500 mg) was placed in a 50 mlbeaker,wetted and then suspendedby stirring in5 mLof distilledwater;then 5 mL 0.01 M Cu-trien solution was added, and the suspensionstirred for a further 5 min using a magnetic stirrer. The suspension wasthen filtered into a 50 mL flask and the solid washed with severalaliquots of distilled water, and the final volume of the filtrate made to50 mL. The solutions were analyzed by AAS (Cu and Mg) and AES (Caand Na). The sample weight for analysis was adjusted depending on itsactual CEC to consume about 50% of [Cu(trien)]2+ using the routinedescribed by Grygar et al. (2009).
Fig. 1. The development of the channel network of the Morava River in Strážnické PomoraAustrian Military Survey, 1876; Topographical Map of the Czechoslovak Army, 1953–1955; Tand flood defence system. The current area of the city of Strážnice is plot in all maps.
2.6. Magnetic susceptibility (MS)
MS of samples from 5 sections was measured using KappabridgeKLY-2 (Agico Brno) operatingwithmagnetic field intensity of 300 A/mand frequency of 920 Hz. Raw data were recalculated to mass-specificMS expressed in m3/kg, the mass of each sample was 20 to 50 g.
2.7. Particle size fractionation
Particle size fractionation was performed using sedimentationmethod ISO 11277:1998.
2.8. Particle size distribution function (PSDF)
Particle size distribution was established using a MalvernMastersizer 2000. Samples of air dried and roughly crushed sedimentswere gently disaggregated and dispersed in de-ionized water. Organicmatter was removed by addition of hydrogen peroxide accompaniedby gentle warming at 40 °C until effervescence stopped. Thesupernatant was removed after centrifugation and the sample rinsedwith two changes of deionised water. Samples were then re-homogenised in a minimum of water using a whirlymixer and thensub-sampled for particle size analysis. Two sub-samples were takenfrom each sample and analysed sequentially, the graphs presented arethe mean of the two measurements.
2.9. ICP/MS including Pb isotopic analysis
The sediments were mineralized (dry ashed) in a Linn (Germany)programmable furnace at final temperature 450 °C. The residues weresubsequently dampened with deionized water, dissolved in HF andHClO4 and evaporated (twice), then the residue was dissolved indiluted nitric acid and the solutions transferred to volumetric flasks.The metal contents were determined using inductively coupledplasma mass spectrometry (ICP/MS, X Series 2, ThermoScientific).The Pb isotopic composition (ratios 206Pb/207Pb and 208Pb/206Pb) wasmeasured by diluting the solutions to a concentration of <20 μg/L,and a correction for mass bias was performed using SRM 981(Common Lead, NIST, USA). The detailed instrument parameters aregiven elsewhere (Ettler et al., 2004). Mean r.s.d. of the 206Pb/207Pb and208Pb/206Pb ratio analyses was 0.2%.
2.10. X-ray fluorescence analysis (EDXRF)
The analysis was performed with a PANalytical MiniPal4.0spectrometer with Peltier-cooled silicon drift energy dispersivedetector. The ground samples were analyzed after pouring intomeasuring cells with a mylar foil bottom. Al and Si were analyzedunder He flow, the ratio of their raw signals was used for correlations.The signals of Al, Cu, Pb, Ti, and Zn were calibrated using the resultsderived from the analysis of a series of sediments by ICP/MS.
2.11. Xylotomy analysis
Identification of the woods remains was carried out using anepiscopic microscope. Fragments were broken manually to exposetransverse, tangential–longitudinal and radial–longitudinal sections.Taxonomic determinations were made using published works onwood anatomy (Jacquiot et al., 1973; Schweingruber, 1990).
ví according to historical and current maps (2nd Austrian Military Survey, 1841; 3rdopographical maps of the Czech Republic, 2006–2007) and the actual channel network

Fig. 2.Map of theMorava River catchment (map at top) with the Strážnické Pomoraví area (black rectangle) with the position of studied sections. Legend: 1 current and 2 abandonedchannels within the maximal area of the floodplain (altitude below ~165 m.a.s.l.), 3 eolian sand body, 4 Late and Middle Pleistocene alluvial fans, 5 towns, 6 positions and labels ofstudied sections.
110 T. Grygar et al. / Catena 80 (2010) 106–121
2.12. 14C dating
Large fragments of wood (trunks, branches) were processedaccording to the routine procedure entailing Acid/Alkali/Acid pretreat-ment, combustion and benzene synthesis (Gupta and Polach 1985). Theresultingbenzenewasmeasuredbya low-background liquid scintillationspectrometer (Quantulus 1220). For calibration, the InternationalStandard Certified Reference Material for Contemporary C-14, OxalicAcid NIST SRM 4990C was used (Schneider 1995). For a backgroundcorrection, commercially available benzene (Sigma-Aldrich, cat. No.154628-1 L, benzene, 99+%,A.C.S., spectrophotometric grade)wasused.The resulting conventional radiocarbon age and its uncertainty wereconverted to an interval of calibrated age utilizing IntCal04 calibrationcurve for terrestrial samples (Curie, 1995; Reimer et al., 2004).
Dating of small charcoal chips was performed by AMS in PoznańRadiocarbonLaboratory (Poland) and calibratedusing theOxCal program.
3. Results
3.1. Lithological, facial and micromorphological description of studiedsections
The list of sections included in this study together with methodsused to their analyses is shown in Table 1 and their positions aredepicted in Fig. 2. Floodplain deposits in the study area aremoderately
to poorly sorted mixtures of components from fine clay to coarse sand(Figs. 3 and 4). The coarse to fine ratio (C/F) strongly varies accordingto the chosen coarse limit. Generally, when the lower coarse limit istaken as 100 μm, the C/F ratio varies between 1:5 and 3:1.Sedimentary facies were defined using terminology developed byCojan and Renard (1999, pp. 322–333), Bridge (2003, pp. 260–295),and Houben (2007) on the basis of field observations, sedimentolog-ical, pedological and micromorphological evaluation, and laboratoryanalyses. The list of facies (Table 2) was obtained by comparison ofseveral sections and an “iterative” evaluation of laboratory analysesusing individual approach recommended by Houben (2007) to eachstudied reach.
From the sequences observed in outcrops (concave banks ofmeanders) during minimal river flows and material retrieved by theAuger corer farther from the river channel, we focused on fineoverbank deposits consisting mostly of clay, silt, and minor fine sandfractions. We avoided horizons containing mostly sandy materialthrough most of their thickness, i.e., we did not systematically studythe infill of abandoned channels and deposits on former point bars.The fine-grained overbank sedimentary sequences, up to a thicknessof 5 m, lay mostly on early Holocene peat layers (Kadlec et al., 2009)or on channel or point bar deposits older than about several thousandyears (e.g., in M127 section, Fig. 3).
The lithological development of the fine overbank deposits instudied area is typical for meandering rivers (Bridge, 2003). The facies

Fig. 3. Characteristics of section M127 with particle size distribution. A: results of particle size fractionation. B: section description, 1 dark brown A horizon (ploughed), 2 light brownsoil with coarse polyedric structure, 3 light grey layer with about 1 mm black nodules and about 1 cm rusty stains, 4 grey gleyed layer with up to 0.5 cm rusty stains, 5 grey sand layerwith massive grey silty lenses and fossil wood fragments. C: 14C dates of three wood fragments. D: CEC values. E: particle size distribution functions in selected depths.
111T. Grygar et al. / Catena 80 (2010) 106–121
assignment is supported by the size distribution analyses of sectionsM127 (Fig. 3) and M110 (Fig. 4). The sedimentary sequence observedin section M127 commences with the fining-upward sandy fill of anabandoned channel or point bar. These coarse sand deposits areoverlain by massive sands intercalated with silty layers. The centralpart of section M127 as well as many other studied sedimentarysequences, is 1–3 m thick and consists mostly of silty–clayey materialwith <20% fine sand and <10%medium and coarse sand, we considerthis to reflect distal or proximal floodplain deposition (the furtherdiscrimination is given below). This sedimentary unit always displayssigns of gleying with rhizoconcretions and centimetre-sized Fe oxidestains, mostly along desiccation cracks, and it usually has a coarseangular structure. Macromorphologically these stains are Fe,Mn-oxide segregations and hypocoatings. Along these segregations andchannels with hypocoatings, depletion features are visible represent-ing the fact that solutions rich in Fe and Mn were transported quiteshort distances, i.e. on millimetre scale. No dusty or clayey voidcoatings were observed. Material in this horizon usually has a massiveto channel microstructure and a C/F ratio, with the threshold set at50 μm, varying from 1:1 to 1:2. The upper 1.4 m thick layer of theM127 section has a coarser grain size, dominated by coarse silt andfine sand and with the sum of medium and fine sand totalling about40%. A C/F ratio of 3:1, with the threshold limit of 200 μm, representsmore sandy and unsorted material, but this horizon also containsmaterial with a C/F ratio of 1:1 using a threshold of 50 μm. Samplesdominated by coarse-silt to fine-sand fractions can be assigned to thetransition from proximal floodplain to levee deposits. Material of thishorizon is micromorphologically characterised by the presence ofincreased bioturbation by roots, redeposited soil fabric fragments, thepresence of Fe,Mn-oxides' as well as depletion features. Importantly,there is no visible clay redeposition and segregation as a channelcoating. The uppermost parts of sedimentary sequences commonlycontain 10–30 cm thick layers covering the buried A horizons perhaps
related to agricultural activities. Typical features are bioturbation, thepresence of decomposed organic matter, fragments of roots, charcoal,redeposited Fe,Mn-oxide nodules and soil fabric fragments.
The finest grained deposits are assigned to the distal floodplain(backswamp) facies. These are best documented in the central part ofsection M110. The particle size distribution function of the finestdeposits in this section displays the highest proportion of clay-sizedmaterial (Fig. 4).
Wood fragments suitable to 14C dating comprised parts of trunksor branches of ash tree or oak. Tree roots were excluded from dating.The wood fragments most commonly occur in the top of clayey layers,in the fining upward abandoned channel deposits, and ratherexceptionally in the distal floodplain facies. Charcoal samples aremostly found in deposits with a prevailing fine fraction. The moreporous, silty proximal floodplain and sandy levee deposits are usuallyvery poor in fossil wood fragments and charcoal, probably because ofoxidative degradation or removal by floods, this substantially hinderstheir dating and correlation and became a motivation for ourchemostratigraphic correlation approach. While 14C dating of thelower parts of the overbank fines can be used to achieve correlation,proxies of industrial anthropogenic pollution were used in their upperparts.
3.2. Geochemical proxy analyses and magnetic susceptibility
Several analytical methods were used to aid interpretation of thelarge sample series and to increase the number of correlatable sections.To interpret and validate the so obtained proxies, we compared themwith the results ofwell establishedquantitativemethods andperformeda regression analysis, which is summarized in Table 3. The mostsignificant correlation is that between CEC and % clay fraction.Correlation of the EDXRF signal of Al/Si and EDXRF signal of Rb withthe percentage of the clay fraction are also highly significant.

Fig. 4. Characteristics of sectionM110. A: section description, 1 brown silty sediment with sandy layers and inclusions, 2 brown silty or clayey gleyedmaterial with sand inclusions attop and rhizoconcretions and their pseudomorphs at bottom, 3 mostly anoxic, plastic, unsorted grey sediment with substantial sand component. B: the position of wood fragmentswith their age obtained by 14C dating. C: CEC log of the section. D: particle.
112 T. Grygar et al. / Catena 80 (2010) 106–121
Preparation and analysis by ICP/MS of a selection of samples enabled theproduction of calibration lines for lead, titanium and zinc using theEDXRF. We used EDXRF for the majority of measurements because itoffers the advantage (over ICP-MS) of a simple, rapid drying andgrinding pre-treatment.
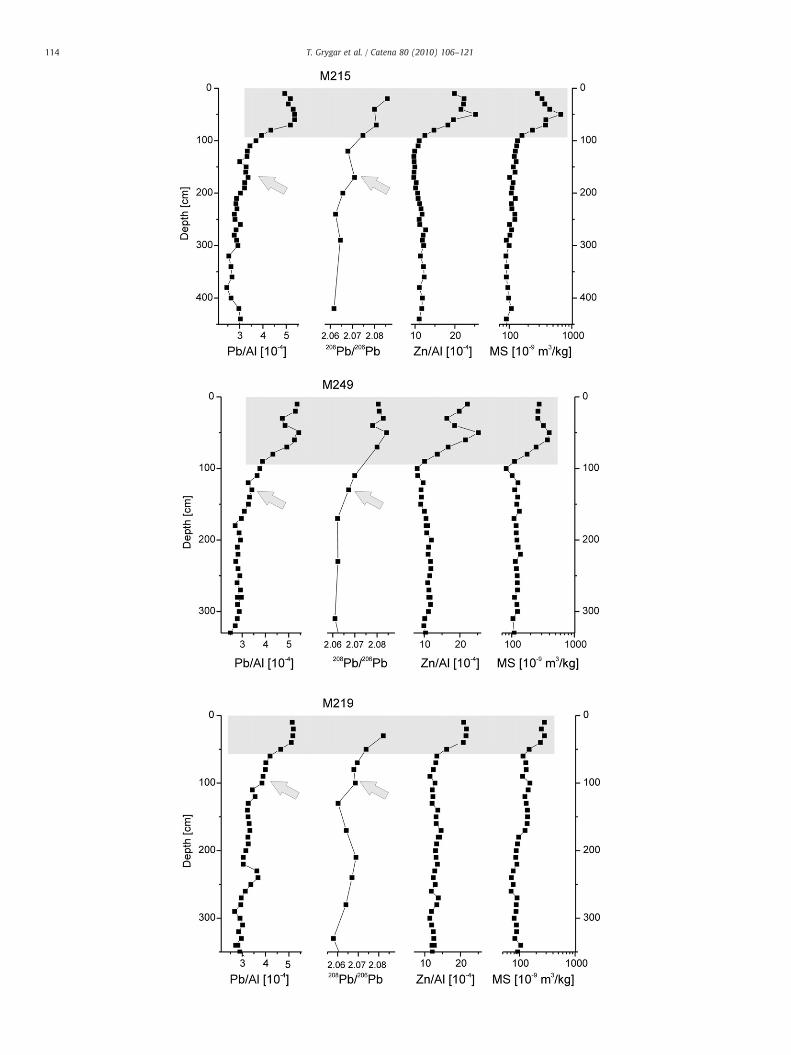
The depth of industrially polluted deposits is readily identifiedfrom the depth profiles of aluminium-normalised Pb and Znconcentrations, Pb isotopic analysis, and magnetic susceptibility(MS) measurements, as can be seen for 3 sections in Fig. 5. Cudepth profiles (not shown) are very similar to those of Pb and Zn.Heavy metal concentrations were normalized to Al, because it isconsidered an immobile lithogenic element which is not expected tobe anthropogenically affected (Al was also used for the normalization ,e.g., by Desenfant et al., 2004; Ettler et al., 2006; and Pasternack and
Table 2Facies description used in this work and “adjusted” for the deposits of the actual studied si
Facies Spatial position Lithology
Channel sands Bottom parts of profiles, occasionallywithin proximal floodplain deposits
Coarse sand, sometime
Deposits of pointbars
Usually on channel sands Sand layers, silt layers
Distal floodplainsediments
Upward fining of underlying channelsands or point bar deposits
Comparable percentageclay and silt fractions
Proximal floodplainsediments
Upward coarsening of underlyingdistal floodplain deposits
Silt fraction larger thanminor fine sand
Levee deposits Topmost layers in outcrops of thecurrent banks
Mainly silt and fine san
CEC values in mmol [Cu(trien)2+] given as mean values for the given facies.
Brown, 2006). The Pb isotopic composition is a very useful tracer ofmodern industrial pollution (e.g., Novák et al., 2003; Ettler et al.,2004), because common lithogenic Pb in central Europe has a lowerabundance of the lighter Pb isotopes, particularly 206Pb than Pb fromcoal burning and leaded gasoline. Komárek et al. (2008) gave typical206Pb/207Pb values about 1.19–1.22 for Central European natural Pb,1.18–1.20 for Pb from coal combustion, and 1.12–1.16 for Europeanleaded gasoline. In M215, M219, and M249, 206Pb/207Pb ratios ofcontaminated sediments were 0.189 (σ=0.002), 1.191 (σ=0.001),and 0.188 (σ=0.002), respectively, while the underlying unpollutedsediment in these three sections had mean 206Pb/207Pb values 1.200(σ=0.003). Although the change is not dramatic, it is statisticallysignificant. 206Pb/207Pb and 208Pb/206Pb ratios are linearly dependentin the studied sediments.
te.
Structure CEC
s with fine gravel Non-laminated, sometimes with gravel layers <0.02
Usually laminated (cm to dm scale) <0.05
s of Non-laminated, coarse prismatic soil structures >0.12
clay fraction, Non-laminated, occasional layers or inclusionsof fine sand (mm or cm scale), coarse polyedricsoil structure
0.08–0.12
d fractions Usually alterations of silt and thin sand layers,fine polyedric soil structure
0.04–0.07

Table 3Correlations used to interpret and calibrate geochemical proxies.
Proxy (method) Correlation/calibration analysis Sections used to correlation Regression coefficient r(number of experimental points)
Proxy interpretation
CEC (Cu[trien]2+) Percentage of fraction below 2 μm M127 0.9318 Clay fraction percentage(46)
Al/Si ratio of signals (EDXRF) Percentage of fraction below 2 μm M127 0.8575 Clay fraction percentage(46)
Rb signal (EDXRF) Percentage of fraction below 2 μm M127 0.8319 Clay fraction percentage(46)
Ti signal (EDXRF) Percentage of fraction 2–50 μm M127 0.8071 Silt fraction percentage(43)
Al signal (EDXRF) Al content (ICP/MS) M215, M249 0.8647 Al percentage(87)
Ti signal (EDXRF) Ti content by ICP/MS M215, M110, M249 0.8941 Ti percentage(144)
Zn signal (EDXRF) Zn content (ICP/MS) M215, M110, M249 0.9297 Zn percentage(144)
Cu signal (EDXRF) Cu content (ICP/MS) M215, M110, M249 0.7485 Cu percentage(143)
Pb signal (EDXRF) Pb content (ICP/MS) M215, M249 0.8166 Pb percentage(87)
113T. Grygar et al. / Catena 80 (2010) 106–121
There is also a minor increase in Pb concentration and a change inthe Pb isotopic composition in the Morava River floodplain depositspreceding the major “step” at the top of this minor, and presumablyearlier variation is indicated by grey arrows in Fig. 5. It could be causedby a downward movement of Pb ions (Hudson-Edwards et al., 1998;Fernandez et al., 2008) or indicate minor Pb contamination precedingthe significant (industrial) increase.
3.3. Proxies based on cation exchange capacity
Cation exchange capacity (CEC) of expandable clay minerals in thesediments was determined by [Cu(trien)]2+method (Meier and Kahr,1999), which has recently been successfully tested and used in theanalysis of the floodplain deposits (Kadlec et al., 2009; Grygar et al.,2009). To interpret the CEC value of the samples in conventionalsedimentological terms, we performed detailed mineralogical andgranulometric analyses of selected sediment samples. We separatedthe clay fractions in 11 samples from the M127 section and subjectedthem to conventional XRD phase identification and CEC determina-tion, producing a specific CEC of the clay fraction (Table 4). XRD of theclay fraction showed that disordered (R0) mixed-layer illite–smectite(with about 50% expandable layers) is the major component, whileillite and kaolinite are present at smaller concentrations (Table 4).Depth changes in the % basal diffraction of illite–smectite and CEC ofthe clay are negligible, showing that the mineralogical composition ofthe clay fraction is independent of the depth (or age of the sediments).This evaluation is in agreement with the observation that CEC can beused to determine the percentage of clay present using linearregression (Table 3). The regression line of that dependence (withstatistically insignificant constant) is:
%clay fraction ð< 2μmÞ = 0:6628⋅CEC; r2 = 0:86
where CEC is the consumption of [Cu(trien)]2+ in mmol/g.Another parameter derived from determination of the cation
exchange capacity is the Mg/Ca ratio of the exchangeable/solublefraction. We have already described a very specific Mg/Ca depthprofile common in the floodplain deposits in Strážnické Pomoraví(Kadlec et al. 2009, Grygar et al. 2009). Similar depth profiles wereobtained in the sections described in this paper (Figs. 6 and 7). Weevaluated the correlation of the Mg/Ca ratio with CEC (clay fractioncontent) and the sample depth, comparing the upper 350 cm of8 sections. Mg/Ca ratio was statistically weakly dependent on CEC(r=0.4702, 349 points) but it was statistically significantly depen-
dent on the sample depth (r=0.7945, 349 points). The Mg/Ca ratio ishence not primarily derived from sediment lithology, but it issomehow related to the “history” of the sediments.
The general trend found in sedimentary sections is that the Mg/Caratio decreases from values around ~0.2 at depths of about 250–350 cmto 0.10–0.15 at the uppermost 50–100 cm, as shown, for example, inFigs. 6 and 7. In agreement with our previous reports (Kadlec et al.,2009; Grygar et al., 2009) we consider the Mg/Ca ratio in theexchangeable/soluble fraction to be very efficient in inter-correlationof the individual sections of floodplain deposits (Fig. 7, panel B).
To exclude some spatial bias in the Mg/Ca ratio of floodplaindeposits, we analyzed sediments along a 180 m long transect (M234;Fig. 2) which covers the top layers of a point bar, covered by sparsewillows and herbs, through shrubs dominated by Acer negundo andSalix sp., to the edge of a Fraxinus sp. forest at the level of floodplain(total height difference of about 4 m). We found that the Mg/Ca ratioin the top soil layers (Fig. 6) is not dependent on the distance of thesite from the channel, because all Mg/Ca values in the top layer of theM234 transect were in the interval 0.09 to 0.15, i.e. within the samerange as the top sediments collected from river banks. Additionally, asimilar depth trend in the Mg/Ca ratio as in the sections was alsofound in cores drilled several hundred metres away from the riverchannel, i.e., outside the range of levee deposits (as demonstrated bycore M129 in Fig. 6).
The mean Mg/Ca ratio of water derived from the Morava River (3samples) is 0.25; this is similar to Mg/Ca ratio of ~0.2, typical forsamples in sections of river banks at greater depths. It is also possiblethat the higher Mg/Ca ratios found in the older (deeper) sedimentsare due to their slow cation exchange with groundwater derived fromthe Morava River. If this was the case, the Mg/Ca increase with depthwould indicate longer residence of the deeper material in thefloodplain.
3.4. Facies description using geochemical proxies
As shown in Table 3, CEC, Rb abundance and the ratio of Al/Sisignals from the EDXRF are useful proxies for the abundance of clayfraction material in the sediments. The Si signal of EDXRF is bestcorrelated with the coarse sand fraction (0.25–2 mm), i.e. coarsequartz grains. Variation in the grain size distributionwithin all studiedsections can hence be tracked by the results of geochemical analyseswith a high sampling density.
Depth changes in CEC can be used as a sensitive indicator of sandintercalations, which cause sharp minima in CEC/depth profiles (see
114 T. Grygar et al. / Catena 80 (2010) 106–121

Table 4Percentage and characteristics of clay fraction of floodplain deposits from sectionM127.
Depth[cm]
Sedimentaryfacies
% clay fraction(<2 μm) a
% basal diffractionof illite–smectite b
CECc
[meq/100 g]
10 Proximal floodplain/levee sediments
13 83 0.205
30 Proximal floodplain/levee sediments
14 81 0.212
70 Proximal floodplain/levee sediments
16 90 0.214
110 Sandy intercalation 13 90 0.219150 Distal/proximal
floodplain sediments31 93 0.212
190 Distal/proximalfloodplain sediments
30 92 0.232
230 Distal/proximalfloodplain sediments
32 94 0.251
270 Distal floodplainsediments
31 95 0.263
330 Distal floodplainsediments
29 95 0.250
360 Abandoned channelsediments
20 95 0.251
440 Abandoned channelsediments
15 94 0.202
a Obtained by size fractionation according to ISO 11277:1998.b Analysis of clay fraction separated according to Tanner and Jackson (1948), the area
of basal diffraction of illite–smectite (diffraction maximum d between 13.6 and 14.7 Å)to sum of the areas of basal diffractions of illite–smectites plus micas plus kaolinite.
c CEC in mmol [Cu(trien)]2+ obtained with the clay fraction (<2 μm) separatedaccording to Tanner and Jackson (1948).
115T. Grygar et al. / Catena 80 (2010) 106–121
also in Kadlec et al., 2009), but CEC also visualizes stepwiselithological changes development (gradation) within the units offine overbank floodplain deposits. CEC maxima within units inter-preted as distal or proximal floodplain deposits correspond tomaximaof clay (<5 μm) and fine silt (<20 μm) fractions, while simpleincreases in the coarseness of the silt fraction in upward coarseningsequences of distal to proximal floodplain deposits is identified by adecrease in CEC values (Figs. 3 and 4).
A combination of the lithological description and appearance ofthe sediments with their CEC makes it possible to propose a faciesassignment (Table 2). Sediments with a high proportion of clay gradematerial, considered to be distal floodplain sediments (e.g., in themiddle of the section M110), have CEC values higher than about0.13 mmol [Cu(trien)]2+/g, and in some exceptional cases the CEC ofthe finest sediments is up to 0.16 mmol [Cu(trien)]2+/g. Thesediments with approximately equal proportions of clay and fine siltfractions, and minor percentage of fine sand, are considered to beproximal floodplain sediments, and have CEC values in the rangeabout 0.08–0.12 mmol [Cu(trien)]2+/g. Sediments with CEC values<0.07 always have a significant or even a dominant proportion ofcoarse silt and/or sand and are considered to be proximal floodplainsediments intercalated with some levee deposits. Levee deposits, thecoarsest uppermost sediments, have a CEC of about 0.05 mmol [Cu(trien)]2+/g. This sediment sorting, dependent on the distance of thepoint of deposition from the channel, is typical for floodplains, wherethe finest particles are deposited over the entire flooded area, whilecoarser fraction is preferentially settled out closer to the channel(Bridge, 2003). The above described interpretation of the CEC valuesin the terms of facies is only valid for this particular site in the MoravaRiver floodplain, for which it was “calibrated” by the conventionalmethods discussed above.
Fig. 5. Proxies of industrial pollution in three studied sections. Pb/Al and Zn/Al ratios and Pb issusceptibility. Grey rectangles indicate industrially polluted top sediments. Grey arrows poinmajor change of these parameters.
3.5. Lateral stability of the sections
In some localities (such as Bridge to Bzenec) the lateral stability offacies is good at a hundred-metre scale (Fig. 7), while in others (e.g., suchas Old Piles) a fewmetres deep and about 10 mwide palaeochannels arefound in the outcrops in close proximity to continuous outcrops ofoverbank fines. The lateral continuity of outcrops is important to ensurethat the chosen sections are representative prior to extendingchemostratigraphic correlation and 14C dating to other sections. Thesections shown in Fig. 7 are a few hundredmetres apart; sectionM219 isthe furthest upstream, M7 is 200 m downstream of M219 and M127~400 m downstream of M219 (Fig. 2).
The chemostratigraphic correlation lines for the Bridge to Bzeneclocation are identified by grey areas in Fig. 7. The topmost layers of thesectionM127 are thinner, as would be expected from correlation lines1, 2, and 3, which correspond to industrially polluted layers, theMg/Caratio change, and upward coarsening, respectively. The variablethickness of the industrially polluted layer is probably due to differentland use (land cover) in these sections (Table 1). The silt fractionminimum (line 5, clay fraction maximum, distal floodplain sedimen-tation) within section M127 is at a correspondingly shallower depth.The thickness of proximal to distal floodplain deposits (sedimentsbetween lines 3 and4) is similar in all three sections, implying a similardepositional rate for this unit. The facies development at depthsgreater than that indicated by line 4 is very different; either thedevelopment within the three sections was different due to a differentchannel position before the Middle Ages, or there is a depositionalhiatus in the bottom part of at least two of the three studied sections.The poorer correlation of older deposits is a common consequence ofthe aggradation dynamics of a meandering river.
3.6. Correlation of sections along the studied meander belt
The lithological development recorded in the eight studiedsections can be approximately correlated in their central andupper parts, covering in 3–4 m the last 500–1200 years. Thiscorrelation is based on the genetic relationship between the studiedsections, which seem to belong to a single meander belt. Thelocation of all studied sections along a single river channel is alsoapparent from the available maps as discussed above. The timing ofthe beginning of the coarsening upwards fillings of the abandonedchannels (at the base of the sequences of overbank fines) cannot becorrelated, because available data are scattered from about 5 to 2 kyBP. The correlation of sedimentation in the sections studied is shownin Fig. 8. Five sections from three localities are displayed, in each ofthem at least one 14C date of wood fragments or charcoals wasdetermined, which, together with the date point, of approximately1900 AD derived from the start of the industrially polluted layer —
produced five age-depth models.There are three periods indicated in the sections by grey areas,
where some major changes of depositional facies occurred. Thesechanges in individual sections do not always display the same pattern,but they are notably coincident. The start of gradual upward coarseningat ~1200 AD in sections M215, M7, M110, and M107 could indicate thebeginning of the gradual approach of the river channel towards thesesites. The sediments deposited at ~1600 AD are unusually coarse in thestudied sections, and these sediments only briefly fined upward insections M107 and M110. The final coarsening after 1900 AD isprobably due to a combination of the floodplain narrowing due to theconstruction of flood defences and also an artefact of the substantialaccumulation of levee deposits in the studied sections.
otopic composition obtained by ICP/MS. MS (the right panels) is mass-specific magnetict to possible increase in Pb concentration and changed isotopic composition before the

Fig. 6. Mg/Ca in the transect M234 (superficial sampling from the point bar level to the floodplain level) and core M129 (about 200 m far from the river channel). Bar plots show Mg/Ca dependence on the sampling depth.
116T.G
rygaret
al./Catena
80(2010)
106–121

Fig. 7. Lateral stability of three sections in the locality “Bridge to Bzenec” using several chemostratigraphic and lithologic markers. A: the depth of industrially polluted sediments (Pb/Al ratio by EDXRF). B: the inflex point of Mg/Ca ratio in exchangeable/soluble fraction. C: CEC values with selected 14C dates of wood fragments and charcoals. D: Ti/Al minimum, aproxy of silt minimum content (finest sediments of distal floodplain).
117T. Grygar et al. / Catena 80 (2010) 106–121

Fig. 8. The depth profiles of CEC in the sections with age models. Three synchronous lithological changes are indicated by grey areas.
118 T. Grygar et al. / Catena 80 (2010) 106–121
4. Discussion
4.1. Use of proxy analyses to facilitate sediment descriptionand correlation
In the studied floodplain deposits we found that CEC values can beused as a proxy for the percentage of clay fraction, which in turn canbe used in the assignment of sediment facies. Micromorphologicalstudy confirmed that clay horizons or more clayey areas were due toprimary sedimentation and that clay redeposition caused by pedoge-netic processes is only microscopic (at millimetre scale). If the use ofCEC logs is combinedwith visual sediment examination, it can be usedas a substitute for more demanding size fractionation or analysis andallows rapid comparison of data from numerous sections. EDXRF andCEC needs only sample homogenization and grinding, the formermethod is non-destructive and the latter has sample consumption ofup to 0.5 g; each analysis takes several minutes of laboratory work iflarge sample numbers are routinely processed. The efficiency and lowsample consumption are very useful features in checking the lateralstability of the sediments in the studied sites by enabling high densitysampling of more sections. Subjective visual evaluation of sedimentlithology in the field is seriously hindered by the highly variabledegree of gleying, variable development of soil structure, andmediumto poor sorting of the overbank fines. The quantitative output of theproxy methods offers a possibility to objectively identify gradationwithin each sediment subunit (facies).
As shown by the depth profiles in the majority of the studiedsections, the Mg/Ca ratio of the exchangeable/soluble fraction has anadditional control be it the age of the material deposition, or the timeperiod over which the sediment was subjected to local pedogenesis inthe floodplain, or equilibration with groundwater. Our current
Table 5Interpolated dates of bottom of Pb polluted layer in selected sections.
Section Age model(number of 14Cdating points)
Locality Depth of Pbpolluted layer[cm]
Interpolateddate
S1 3 (taken fromKadlec et al., 2009)
Bridge toBzenec
30 1910
M110 3 Old Piles 40 1890M108 1 Jasenová 30 1940
knowledge is insufficient to discriminate between these hypotheses,but this fact is not essential for correlation purposes. In the sectionswith a reliable age model, the inflex of the Mg/Ca gradient is centredbetween 50 cm and 150 cm depth, or in 18th century AD (the letterassignment has a much better consistency). Interpretation of thisgradient will be the subject of our further study.
4.2. Chemostratigraphy based on industrial pollution
We had expected individual heavy metals and magnetic particles todisplay different depth profiles because of their use in differentanthropogenic applications (such as corrosion inhibitors, pigments).However, on examination, the individual proxies of the industrialpollution are strongly correlated, i.e. the sharp changes of MS and Znconcentration occurred at practically the same depths in a given section(Fig. 5). The significant increase in Pb concentration and the majorchange in its isotopic composition also coincide with an increase in MSand Zn levels. This co-variance is in agreementwith the results obtainedin several previous European studies: in a small watershed of the ArcRiver in southern France, polluted by fly ash, linked contamination bymagnetic particles, Pb and Zn was found by Desenfant et al. (2004).Likewise, a correlation between Cu, Zn, and MS results in riverbedsediments was reported in the Vltava River (Moldau River) in thewestern part of Czech Republic by Knab et al. (2006).
The estimated age of the industrially polluted deposits in thestudied area (grey areas in Fig. 5) can be based on the interpolation of14C dates, an assumption of a recent deposition of the topmostsediments, and relatively a stable mean depositional rate at the mea-sured section. The last assumption causes the exclusion of sectionswith thick sandy intercalations in proximal floodplain deposits and/orthick levee deposits on their top. Measured sections meeting thecriteria for the interpolation are summarized in Table 5. The mean ofthe three listed interpolated dates for the lower boundary of thepolluted layer is 1910 AD.
Anthropogenic pollution of the topmost floodplain deposits in thestudy area is probably related to coal combustion and perhaps otherindustrial processes in the Morava River watershed and, as such, thescheme is generally valid for the Czech Republic (Novák et al., 2003).The recording of elevated concentrations of heavy metals related tothe industrial pollution is commonly noted in study of sedimentarchives (e.g., Swennen and Van der Sluys, 2002; Novák et al., 2003;Ettler et al., 2004; 2006; Pasternack and Brown, 2006). The reliable

Table 6Mean depositional rates of fine overbank deposits in the studied area.
14C age BP Calendar age Depositional rate [cm·y−1](time interval)
Sediment character
M107, 90 cm 1900 0.26 (1140–1900) Mostly clayey, distal floodplainM 107, 280 cm 8062 901±81 1012 – 1268 (94)M107-280, Poz-29491 815±30 1169 – 1269 (95)
M108, 35 cm 1900 0.55 (1535–1900) Mostly silty, proximal floodplainM 108, 210-260 cm, 8063 389±80 1408 – 1661 (95)
M110, 40 cm 1900 0.42 (1570–1900) Upward coarsening, silty, proximalfloodplain deposits to leveeM110, 178 cm, 8057 273±81 1446 – 1696 (70),
1725 – 1814 (17),1917 – 1952 (6)
220 cm, 8066 205±80 1515 – 1598 (11%),1617 – 1953 (84%)DATUM NOT USED
250 cm, 8065 672±82 1213 – 1426 (95) 0.20 (720–1320) Clayey, distal floodplain sediments370 cm, 8064 1343±83 556 – 884 (95%)
M215, 90 cm 1900 0.24 (1126–1900) Upward coarsening from silty to sandyM215-290, Poz-29494 900±30 1040–1211 (95)
M7 taken from Kadlecet al., 2009
0.36 (1123–1900) Upward coarsening silty, proximalfloodplain to levee
The depositional rate of the deposits from the last century was not evaluated because of a highly variable proportion of levee deposits in the top of the sections.
119T. Grygar et al. / Catena 80 (2010) 106–121
identification of the depth profiles of the pollutants may be limited bythe weathering of the original contaminant particles and themobilization of their ions (Hudson-Edwards et al., 1998). Thischemical mobilization may be very important in the case of metalsulphide contaminations from historical mining, which considerablydecreases pH during their oxidative weathering, and consequentlyhighly mobile free ions are formed (Hudson-Edwards et al., 1998).This is probably not the case in the study area where there are nonearby sources of pollution due to historical or current mining ormetal smelting and the pollution probably originates from moreremote, global sources. Swennen and Van der Sluys (2002) are ratheroptimistic with respect to the post-depositional stability of industrialpolluted fluvial deposits. The outcrops in Strážnické Pomoraví do notbear signs of systematic translocations of soil particles (illimeriza-tion), however, special attention must be paid to the levee depositsand sandy intercalations wherever they are present in the top layersand where metal contamination is observed. The downward particletransport through permeable, coarse sediments in sandy or gravellyriver alluvia was observed, e.g., by Cieszewski et al. (2008). Ploughingand bioturbation are also responsible for some downward transport ofthe atmospherically derived contaminants (Fernandez et al., 2008).The effects blurring the actual lower boundary of the industrialpollution in the measured sections could be responsible for about adecimetre-scale inaccuracy, which is not a significant problem in thestudied sections where the depth of industrially polluted layersranges from 0.3 to 1 m. In spite of all these uncertainties, the lack ofreliable dating techniques for the last 100 y makes the industrialpollution an invaluable chemostratigraphic tool for the studiedsections.
The pollution of the Morava River watershed by the fallout of flyash from coal combustion is one possible explanation for the almoststep-like growth of heavy metals' and magnetic particles' concentra-tions observed in sections at the depth of 30 to 100 cm in river banks(Fig. 5). The increase of the magnetic susceptibility signal haspreviously been attributed to the redeposition of less weathered soilmaterial from intensified agricultural activities since the 1950's(Kadlec et al., 2009). The coincidence of its growth with the growthof heavy metal concentration and Pb isotopic composition can alsoimply another explanation, such as the contamination of thesediments by fly ash from coal combustion. Such an association ofmagnetic carriers and heavy metals was experimentally demonstrat-
ed in case studies in the Czech Republic by Kapička et al. (1999) andFrance (Desenfant et al., 2004).
The sharp changes in Pb concentration and isotopic compositionobserved in the Morava River floodplain sequences closely resemblethe observation in sediments of Lake Constance in Switzerland wherethese signatures started to change around 1900 AD, a pattern that wasagain attributed to the coal combustion (Kober et al., 1999). Similarlyin the Czech Republic, coal combustion was the most importantsource of atmospheric lead; the first steep growth of coal mining,associated with modern industrialization of Czech lands started at~1900 and a second growth peak of coal mining followed in the 1950's(Novák et al., 2003). Previously we assigned the change in Pb isotopicsignature in the floodplain deposits in Strážnické Pomoraví exclu-sively to the introduction of leaded gasoline (Kadlec et al., 2009). It is,however, not easy to distinguish the influences of leaded gasoline andcoal combustion only from Pb isotopic signatures (Komárek et al.,2008).
4.3. The depositional rates in current floodplain in Strážnické Pomoraví
The depositional rate (aggradation plus lateral accretion) is a veryimportant factor describing the floodplain when an anthropogenicinfluence is suspected to affect the behaviour of a river or floodplain.In many recent studies, a reported increase of aggradation rates infloodplains has been assigned to an intensification of land use,especially deforestation and ploughing. Such a straightforwardrelationship seems justified for small watersheds, especially wherecolluviation and enhanced direct localized erosion can be relevant(e.g., de Moor et al., 2008), but it may be oversimplified in thefloodplains of rivers with a large watershed, where the transport ofthe material from soil erosion to the floodplains of the trunk rivers isdelayed in temporal sinks in the higher order valleys (e.g., Lang et al.,2003; Kalicki et al., 2008).
Calculation of themean depositional rate in Strážnické Pomoraví ishindered by two facts. Firstly, the deposition rate of the topmostsediments in the studied area was probably affected by past changesin land use, flood defence building in Strážnické Pomoraví, andchannelization of the river upstream during the 20th century.Evaluation of the depositional rate during the last century wouldrequire a much more detailed study than is the scope of this paper.The second limitation is the lack of the recent dating points caused by

120 T. Grygar et al. / Catena 80 (2010) 106–121
the equivocality of the radiocarbon calibration curve between 1620and 1955 AD. The latter problem is partly solved by using the proxiesof the industrial pollution, which indicate the sediments depositedafter ~1900 AD.
The mean depositional rates in Table 6 were calculated by linearregression using the age of 1900 AD of the bottom of the industriallypolluted sediments and 14C date points from the deeper parts of thesections. A facies control on themean depositional rate is quite clear: thelowest deposition rates (0.2 to 0.3 cm y−1) are typical for distalfloodplain sediments (middle, mostly clay (lower part of section M110,mean CEC 0.12 mmol [Cu(trien)]2+/g) or upward coarsening clayeysediments grading from distal to proximal floodplain deposits (centralparts of sections M7, M107, and M215). The sedimentation rates insection M108 and the upper part of section M110, both with muchcoarser sediments of proximalfloodplain to leveedeposits (CEC~0.09 m-mol [Cu(trien)]2+/g) was 0.55 and 0.42 cm y−1, respectively. Thisdependence shouldbe taken intoaccountwhenmeanaggradation rate offloodplains is to be evaluated from large sets of depth-age profiles.
In our previous study (Kadlec et al., 2009) we found a pronouncedchange in the nature of the sediment, centred on the 16th century,where a shift from more clayey deposits, assigned here to distalfloodplain sediments, tomore silty deposits, assigned here to proximalfloodplain deposits occurred. The current results (Figs. 3, 4, and 8)confirm that substantial lithological (facial) changes occurred in thatperiod in the floodplain part under investigation. The current agemodel nowpermits the identification of three simultaneous changes indepositional conditions in four sections from three localities (Fig. 8):one at ~1200 AD, another at ~1600 AD, and the last at ~1900 AD.
The sediment coarsening at ~1600 AD in sections M7 and M110indicated in Fig. 8 is within the uncertainty of the sediment datingcoincident with the sediment coarsening during the 16th century, asreported previously (Kadlec et al., 2009), where onemore locality wasalso included (downstream from sections M107 and M108). For atleast the last two centuries all these sections belonged to the sameriver branch (meander belt). The simultaneous coarsening of thesediments in several sections from that branch allows proposing ahypothesis that the proportion of water flowing through this branchwas enhanced in ~1600 AD at the expense of the branchwhich passedthrough the vicinity of Strážnice and Petrov (Figs. 1 and 2). This is themost straightforward interpretation reflecting the knowledge on thedynamics of floodplain of meandering and aggrading rivers (Bridge,2003). To discriminate between such a facies change and an assumedgeneral change in the nature of the sediments, as assumed previously(Kadlec et al., 2009), further analyses will be needed to focus onsections and cores from other areas of the Morava River floodplain,including localities downstream from the current sites and alsosections and cores from parts of the river floodplain currentlyseparated from the active river branch by flood defences. This paperpresents and verifies tools and approaches suitable for such studies.
5. Conclusions
Geochemical proxies are very useful tools for the study ofsedimentary sequences comprised of aggrading meandering riversdue to their ease of generation. The proxy methods were “calibrated”using conventional analytical methods that allowed their interpreta-tion in lithological terms and permit the facies assignment to thesediments. The chemostratigraphic correlation of floodplain horizonswith a heavy metal contamination helps to overcome two problemswhen describing sediment sequences from the last century: firstly byproviding a date point of the onset of massive industrial pollution(~1900 AD) into the interval of equivocality of the radiocarboncalibration curve, and secondly by permitting identification of the toplayers most affected by river regulations and land use changes in the20th century. The results of the study produced estimates of meandepositional rates in Strážnické Pomoraví between ~1000 and
~1900 AD in several localities; the actual sedimentation rates dependon the actual depositional facies.
Acknowledgments
The work would never have been performed without theenthusiastic and inspiring work of Jaroslav Kadlec (GeologicalInstitute ASCR, Prague, Czech Republic). We also thank to Libor Petr(Charles University, Prague, Czech Republic) and Anna Píšková(Institute of Inorganic Chemistry ASCR, Řež, Czech Republic) fortheir help in the field trips. Jana Dörflová, Petr Vorm, and ZuzanaHájková (all three from the Institute of Inorganic Chemistry ASCR, Řež,Czech Republic) substantially contributed by processing and labora-tory analyses (CEC and EDXRF) of many hundred samples. The workwas funded by project IAAX00130801 (Grant Agency of the Academyof Sciences of Czech Republic) and the EDXRF analyses by the projectAV0Z4032918.
References
2nd Austrian Military Survey, 1841. Map sheets no. m137 O 12 IV, m138b O 12 V(Mähren), scale 1:28 800, Austrian State Archive/Military Archive, Vienna; digitalprocessing: © Laboratory of Geoinformatics, University of J.E. Purkyně, Ústí nadLabem, © Agency for nature conservation and landscape protection of the CzechRepublic, The Silva Tarouca Research Institute for Landscape and OrnamentalGardening, Branch Brno.
3rd Austrian Military Survey, 1876. Map sheet no. 4458/2, scale 1:25 000, Mapcollection of the Charles University, Praha; digital processing: © The Silva TaroucaResearch Institute for Landscape and Ornamental Gardening, Branch Brno.
Blaeu, J., 1665. The Atlas Maior (Atlas Novus), page 125, available on line at TheRegional Archives of Leiden, the Netherlands, http://www.atlasblaeu.com/.
Bridge, J.S., 2003. Rivers and floodplains. Forms, Processes, and Sedimentary Record.Blackwell Publishing.
Bullock, P.,Murphy, C.P. (Eds.), 1983. Soilmicromorphology. Berkhamsted ABAcademic.Cieszewski, D., Czajka, A., Błażej, S., 2008. Rapid migration of heavy metals and 137Cs in
alluvial sediments, Upper Odra River valley, Poland. Environ. Geol. 1577–1586.Cojan, I., Renard, M., 1999. Sedimentology. A.A. Balkema Publishers Lisse/Abingdon/
Exton (PA)/Tokyo.Curie, L.A., 1995. Nomenclature in evaluation of analytical methods including detection
and quantification capabilities. (IUPAC Recommendation 1995). Pure Appl. Chem.67, 1699–1723.
de Moor, J.J.W., Kasse, C., van Balen, R., Vandenberghe, J., Wallinga, J., 2008. Human andclimate impact on catchment development during the Holocene – Geul River, theNetherlands. Geomorphology 98, 316–339.
Desenfant, F., Petrovský, E., Rochette, P., 2004. Magnetic signature of industrialpollution of stream sediments and correlation with heavy metals: Case study fromSouth France. Water Air Soil Pollut. 152, 297–312.
Ettler, V.,Mihaljevič, M., Komárek,M., 2004. ICP-MSmeasurement of lead isotopic ratios insoils heavily contaminated by lead smelting: tracing the sources of pollution. Anal.Bioanal. Chem. 378, 311–317.
Ettler, V., Mihaljevič, M., Šebek, O., Molek, M., Grygar, T., Zeman, J., 2006. Geochemical andPb isotopic evidence for sources and dispersal of metal contamination in streamsediments from themining and smelting district of Příbram, Czech Republic. Environ.Pollut. 142, 409–417.
Fernandez, C., Monna, F., Labanowski, J., Loubet, M., van Oort, F., 2008. Anthropogeniclead distribution in soils under arable land and permanent grassland estimated byPb isotopic compositions. Environ. Pollut. 156, 1083–1091.
Grygar, T., Bezdička, P., Hradil, D., Hrušková,M., Novotná, K., Kadlec, J., Pruner, P., Oberhänsli,H., 2005. Characterization of expandable clay minerals in Lake Baikal sediments bythermal dehydration and cation exchange. Clays Clay Miner. 53, 389–400.
Grygar, T., Kadlec, J., Žigová, A., Mihaljevič, M., Nekutová, T., Lojka, R., Světlík, I., 2009.Chemostratigraphic correlation of sediments containing expandable clay mineralsbased on ion exchangewith Cu(II) triethylenetetramine. Clays ClayMiner. 57, 168–182.
Gupta, S.K., Polach, H.A., 1985. Radiocarbon dating practises at ANU. ANU, Canberra,Australia.
Havlíček, P., 1991. The Morava River Basin during the last 15000 years. In: Starkel, L.,Gregory, K.J., Thornes, J.B. (Eds.), Temperate Palaeohydrology: Fluvial Processes inthe Temperate Zone During the Last 15, 000 Years. John Wiley & Sons, Chichester,West Sussex, UK.
Havlíček, P., Smolíková, L., 1994. Evolution of south Moravian flood plains. Věst. Čes.Geol. Úst. 69, 23–40 (in Czech).
Hoffmann, T., Lang, A., Dikau, R., 2008. Holocene river activity: analysing 14C-datedfluvial and colluvial sediments from Germany. Quat. Sci. Rev. 27, 2031–2040.
Hoffmann, T., Erkens, G., Gerlach, R., Klostermann, J., Lang, A., 2009. Trends and controlsof Holocene floodplain sedimentation in the Rhine catchment. Catena 77, 96–106.
Houben, P., 2007. Geomorphological facies reconstruction of Late Quaternary alluvia bythe application of fluvial architecture concepts. Geomorphology 86, 94–114.
Hudson-Edwards, K.A., Macklin, M.G., Curtis, C.D., Vaughan, D.J., 1998. Chemical remobili-zation of contaminant metals within floodplains sediments in an incising river system:implications for dating and chemostratigraphy. Earth Surf. Process. Landf. 23, 671–684.

121T. Grygar et al. / Catena 80 (2010) 106–121
ISO 11277:1998. Soil quality — Determination of particle size distribution in mineralsoil material — Method by sieving and sedimentation.
Jacquiot, C., Trenard, Y., Dirol, D., 1973. Atlas d'anatomie des bois des Angiospermes.Centre Technique du Bois, Paris.
Kadlec, J., Grygar, T., Světlík, I., Ettler, V., Mihaljevič, M., Diehl, J.F., Beske-Diehl, S.,Svitavská-Svobodová, H., 2009. Morava River floodplain development during thelast millennium, Strážnické Pomoraví, Czech Republic. Holocene 19, 499–509.
Kalicki, T., Sauchyk, S., Calderoni, G., Simakova, G., 2008. Climatic versus human impacton the Holocene sedimentation in river valleys of different order: examples fromthe upper Dnieper basin, Belarus. Quat. Int. 189, 91–105.
Kapička, A., Petrovský, E., Ustjak, S., Macháčková, K., 1999. Proxy mapping of fly-ashpollution of soils around a coal-burning power plant: a case study in the CzechRepublic. J. Geochem. Explor. 66, 291–297.
Knab, M., Hoffmann, V., Petrovský, E., Kapička, A., Jordanova, N., Appel, E., 2006.Surveying the anthropogenic impact of the Moldau river sediments and nearbysoils using magnetic susceptibility. Environ. Geol. 49, 527–535.
Kober, B., Wessels, M., Bollhöfer, A., Mangini, A., 1999. Pb isotopes in sediments of LakeConstance, Central Europe constrain the heavy metal pathways and the pollutionhistoryof the catchment, the lake and the regional atmosphere.Geochim. Cosmochim.Acta 63, 1293–1303.
Komárek, M., Ettler, V., Chrastný, V., Mihaljevič, M., 2008. Lead isotopes in environmentalsciences: a review. Environ. Int. 34, 562–577.
Lang, A., Nolte, S., 1999. The chronology of Holocene alluvial sediments from theWetterau, Germany, provided by optical and 14C dating. Holocene 9, 207–214.
Lang, A., Bork, H.R., Mackel, R., Preston, N., Wunderlich, E., Dikau, R., 2003. Changes insediment flux and storage within a fluvial system: some examples from the Rhine.Hydrol. Process. 17, 3321–3334.
Lewin, J., Macklin, M.G., 2003. Preservation potential for Late Quaternary river alluvium.J. Quat. Sci. 18, 107–120.
Macklin, M.G., Lewin, J., 2008. Alluvial responses to the changing Earth system. EarthSurf. Process. Landf. 33, 1374–1395.
Macklin, M.G., Johnstone, E., Lewin, J., 2005. Pervasive and long-term forcing of Holoceneriver instability and flooding in Great Britain by centennial-scale climate change.Holocene 15, 937–943.
Macklin, M.G., Benito, G., Gregory, K.J., Johnstone, E., Lewin, J., Michczyńska, D.J., Soja, R.,Starke l, L., Thorndycraft, V.R., 2006. Past hydrological events reflected in theHolocenefluvial record of Europe. Catena 66, 145–154.
Macphail, R.I., Cruise, J., 2001. The soilmicromorphologist as teamplayer: amultianalyticalapproach to the study of European microstratigraphy. In: Goldberg, P., Holliday, V.T.,Ferring, C.R. (Eds.), Earth Sciences and Archaeology. Kluver Academic.
Meier, L.P., Kahr, P., 1999. Determination of the cation exchange capacity (CEC) of clayminerals using the complexes of copper(II) ion with triethylenetetranine andtetraethylenepentamine. Clays Clay Miner. 47, 386–388.
Notebaert, B., Verstraeten, G., Rommens, T., Vanmontfort, B., Govers, G., Poesen, J., 2009.Establishing a Holocene sediment budget for the river Dijle. Catena 77, 150–163.
Novák, M., Emmanuel, S., Vile, M.A., Erel, Y., Véron, A., Pačes, T., Wieder, R.K., Vaněček,M., Štěpánová, M., Břízová, E., Hovorka, J., 2003. Origin of lead in eight CentralEuropean peat bogs determined from isotope ratios, strengths, and operation timesof regional pollution sources. Environ. Sci. Technol. 37, 437–445.
Pasternack, G.B., Brown, K.J., 2006. Natural and anthropogenic geochemical signatures offloodplain and deltaic sedimentary strata, Sacramento-San Joaquin Delta, California,USA. Environ. Pollut. 141, 295–309.
Prudič, Z., 1978. The Strážnice floodplain forest in the second half of the 1st millenniumA.D. Lesnictví 24, 1019–1036 (in Czech).
Reimer, P.J., Baillie,M.G.L., Bard, E., Bayliss, A., Beck, J.W., Bertrand, C.J.H., Blackwell, P.G., Buck,C.E., Burr, G.S., Cutler, K.B., Damon, P.E., Edwards, R.L., Fairbanks, R.G., Friedrich, M.,Guilderson, T.P.,Hogg,A.G.,Hughen,K.A., Kromer, B.,McCormac,G.,Manning, S., Ramsey,C.B., Reimer, R.W., Remmele, S., Southon, J.R., Stuiver,M., Talamo, S., Taylor, F.W., van derPlicht, J., Weyhenmeyer, C.E., 2004. IntCal04 terrestrial radiocarbon age calibra-tion, 0–26 cal kyr BP. Radiocarbon 46, 1029–1058.
Reynolds Jr., R. C., 1985. NEWMOD©, a computer program for the calculation of one-dimensional diffraction patterns of mixed-layered clays — R. C. Reynolds, Jr., 8 BrookDr., Hanover, New Hampshire 03755.
Rommens, T., Verstraeten, G., Bogman, P., Peeters, I., Poesen, J., Govers, G., VanRompaey, A.,Lang, A., 2006. Holocene alluvial sediment storage in a small river catchment in theloess area of central Belgium. Geomorphology 77, 187–201.
Schweingruber, F.H., 1990. Anatomie europäischer Hölzer: Ein Atlas zur Bestimmungeuropäischer Baum-. Strauch- und Zwergstrauchhölzer, Haupt, Bern, Stuttgart.
Starkel, L., Soja, R., Michczynska, D.J., 2006. Past hydrological events reflected in Holocenehistory of Polish rivers. Catena 66, 24–33.
Swennen, R., Van der Sluys, J., 2002. Anthropogenic impact on sediment compositionand geochemistry in vertical overbank profiles of river alluvium from Belgium andLuxembourg. J. Geochem. Explor. 75, 93–105.
Tanner, C.B., Jackson, M.L., 1948. Nomographs of sedimentation times for soil particlesunder gravity or centrifugal acceleration. Soil Sci. Soc. Am. Proc. 12, 60–65.
Thorndycraft, V.R., Benito, G., 2006. The Holocene fluvial chronology of Spain: evidencefrom a newly compiled radiocarbon database. Quat. Sci. Rev. 25, 223–234.
TopographicalMapsof theCzechRepublic, 2006–2007.Digital versionZABAGED,Mapsheetsno. 34–22-15, 34-22-19, 34-22-20, scale 1 : 10 000, © Czech Geodetic and CadastralInstitute.
Topographical Maps of the Czechoslovak Army, 1953–1955. Map sheets no. m33119ab,m33119ad, m33119ba, m33119bc, scale 1:25 000, Military Schools, Brno; digitalprocessing: © The Silva Tarouca Research Institute for Landscape and OrnamentalGardening, Branch Brno.
Vannière, B., Bossuet, G.,Walter-Simonnet, A.-V.,Gauthier, E., Barral, P., Petit, C., Buatier,M.,Daubigney, A., 2003. Land use change, soil erosion and alluvial dynamic in the lowerDoubs Valley over the 1st millenium AD (Neublans, Jura, France). J. Archaeol. Sci. 30,1283–1299.
Related Documents