Journal to be submitted to: chemical geology Geochemical modelling of a Zn-Pb skarns: Constraints from LA-ICP-MS Analysis Of Fluid Inclusions Martina Bertelli 1,2 *, Timothy Baker 1,2 , James S. Cleverley 1,2 , Thomas Ulrich 3 1. Economic Geology Research Unit School of Earth Sciences James Cook University Townsville, Q4811, Australia 2. Predictive Mineral Discovery Cooperative Research Centre 3. Department of Earth & Marine Sciences Australian National University Canberra, ACT 0200, Australia *Corresponding Author: email [email protected]

Welcome message from author
This document is posted to help you gain knowledge. Please leave a comment to let me know what you think about it! Share it to your friends and learn new things together.
Transcript
Journal to be submitted to: chemical geology
Geochemical modelling of a Zn-Pb skarns: Constraints from
LA-ICP-MS Analysis Of Fluid Inclusions
Martina Bertelli1,2*, Timothy Baker1,2, James S. Cleverley1,2, Thomas Ulrich3
1. Economic Geology Research Unit School of Earth Sciences James Cook University Townsville, Q4811, Australia
2. Predictive Mineral Discovery Cooperative Research Centre
3. Department of Earth & Marine Sciences Australian National University Canberra, ACT 0200, Australia
*Corresponding Author: email [email protected]
1
Abstract
The Bismark deposit (northern Chihuahua, Mexico) is one of several base metal-rich high-
temperature, carbonate-replacement deposits hosted in northern Mexico. Previous studies (Baker
and Lang, 2003; Baker et al., 2004) have suggested a range of possible ore-forming processes
including cooling and fluid-rock reaction, all involving a fluid that contains comparable
concentrations of Zn and Pb based on PIXE analysis. However, new laser ablation data revealed
overall lower concentrations of Pb in the ore fluid (average value ~336ppm) than previously
indicated by PIXE analysis (average value ~713ppm). The new laser ablation data provided the
basis for chemical modelling of ore deposition of the Bismark deposit. The processes tested in this
study include: 1) cooling; 2) fluid-rock reaction at constant temperature; 3) temperature decrease
and simultaneous fluid-rock interaction. Modeling results show that the gangue and ore minerals
observed at Bismark are best reproduced by the fluid-rock interaction and simultaneous cooling.
Results from our simulations strongly indicate that ore deposition was mainly driven by a pH
increase due to the neutralization of the acidic ore fluid (pH = 3.9) as the result of the reaction with
the limestone. Modelling results also suggest that the deposit likely formed under cooling
conditions, but do not support the hypothesis of a temperature decrease as the principal ore-forming
process.
Keywords: fluid inclusions; LA ICP MS analysis; geochemical modelling; Zn/Pb ratios.

2
1. Introduction
Ore deposition in hydrothermal systems is the result of a complex interplay between several
geochemical processes. Geochemical modelling can be used to explore the chemical effects of a
wide range of processes and can aid the determination of the most likely mechanism responsible for
ore formation. Any geochemical modelling exercise must be approached from an initial conceptual
model which is based on well constrained field observations, data collection and a number of
geological and geochemical assumptions. The validity of the model is strictly dependent on the
quality and quantity of the data and on the consistency of assumptions on which the model is based.
In chemical models of geological systems one of the key areas of uncertainty is the chemical
composition of the fluids that interacted with the rocks. Fluid inclusions are a sample of the fluids
trapped during fluid-rock reactions, but techniques to determine their detailed chemical composition,
such as Proton Induced X-ray Emission (PIXE;(Ryan et al., 1991; Heinrich et al., 1992; Ryan et al.,
1993; Ryan et al., 2001) and Laser Ablation Inductively Coupled Plasma Mass Spectrometry (LA
ICP MS; (Gunther et al., 1998; Ulrich et al., 1999; Heinrich et al., 2003), have only recently been
developed. Prior to these developments geochemical modelling studies of fluid-rock interaction in
geological systems have relied upon assumption that the model fluid composition is controlled by
equilibrium with a model rock prior to entering the system (Sverjensky, 1987; Changsheng Lu et al.,
1992; Komninou and Sverjensky, 1995; Komninou and Sverjensky, 1996). The latest progress of
microanalytical techniques now allows in situ determination of the composition of fluid inclusions.
The data from fluid inclusion analysis can now be employed to help constrain the chemical system
for input into geochemical models (e.g. (Heinrich et al., 2004). In this study we present results of
numerical simulations of ore-forming processes at the Bismark Zn deposit using new LA ICP MS
analysis of fluid inclusions to constrain the composition of the model ore-forming fluid. The

3
Bismark deposit is a Zn-rich skarn deposit located in the northern Chihuahua district, Mexico, and
the paragenesis of the alteration and the fluid evolution history of this deposit have been described
in detail by the previous studies of Baker and Lang (2003; 2004) and Baker et al. (2004). The well
constrained geology together with the fluid inclusion data make this an ideal case study for
geochemical modelling of an ore-forming system. Although these aspects are well constrined it is
not clear which key processes led to ore precipitation. Furthermore, PIXE analysis of fluid
inclusions indicate a comparable Pb and Zn concentration in the ore fluid but the ore reserves
contain 8% Zn and only 0.5% Pb. In this study we present new results from LA ICP MS analysis of
ore stage fluid inclusions and compare them with the existing PIXE data (Baker et al., 2004). The
fluid chemical data is then used as input to geochemical simulations of the potential ore forming
processes using the Geochemists Workbench (Bethke, 2002) with a new extended T-P
thermodynamic dataset (Cleverley and Bastrakov, 2005) to help understand the behavior of Zn and
Pb in the Bismark system.
2. Background Geology & Summary of Previous Studies
The Bismark deposit is a zn-rich skarn located in the northern Chihuahua district, Mexico (Figure
1). The deposit contains Zn (8%), Pb (0.5%), Cu (0.2%) and Ag (50g/t) (Haptonstall, 1994; Baker
and Lang, 2003). Rocks in the Bismark area comprise a sequence of massive to thickly-bedded
Cretaceous limestones interbedded with thin layers of quartzite and shales, and intruded by a suite of
Tertiary igneous rocks (~ 42 Ma K–Ar age on biotite, unpublished internal data of Minera Bismark
S.A.) that include the Bismark stock and several dikes and sills (Figure 1). Emplacement of the
Bismark stock was controlled by the Bismark and the Diana faults, WNW-oriented faults that border

4
the stock on the south and on the north respectively (Baker and Lang, 2003). The intrusion is
dominated by a biotite-rich quartz monzonite porphyry and a finer-grained equivalent with lesser
biotite (Baker and Lang, 2003).
The main ore bodies occur at the contact between the Bismark stock and the carbonate host rock
along the Bismark fault. Mineralization is predominantly found as replacement of garnet-pyroxene
exoskarn and limestone, in both the footwall and the hanging wall of the Bismark fault while
intrusion-hosted mineralization is rare. The paragenesis of the alteration and mineralization at the
Bismark deposit is summarized in Figure 2. Alteration of the intrusion consists of three stages that
comprise early pervasive potassic (K feldspar, biotite) alteration, later fracture-controlled kaolinite
alteration and a final stage of sericite-sulphide alteration. Alteration of the limestone has been
subdivided in two main stages: a main essentially barren prograde exoskarn that consists primarily
of green-garnet of andradite-grossular composition and with quartz, calcite, fluorite, K-feldspar,
pyroxene, vesuvianite and trace apatite; the final stages of the prograde skarn include the
precipitation of pyrite, pyrrhotite, chalcopyrite and sphalerite. The later ore stage is composed
predominantly of sphalerite, galena, pyrrhotite, pyrite, and chalcopyrite, with gangue calcite, lesser
quartz, fluorite and chlorite.
Baker and Lang (2003) have recognized several populations of fluid inclusions at the Bismark
deposit characterized by different temperatures and compositions (Table 1). The earliest fluid
inclusion types comprise high-temperature (400 to 600°C) halite-bearing brine (32 to 62 wt% NaCl
equivalent) coexisting with vapour inclusions (>80% vol. vapour) found within early fluorite and
predating the main ore stage. A later population of inclusions that display critical to near critical
behaviour and have salinity estimates ranging between 8.4 and 10.9 wt% NaCl equivalent and
homogenization temperatures between 351 to 438°C. These inclusions were found in quartz veins
5
associated with the mineralization and are interpreted to be samples of the ore-forming fluid (Baker
et al., 2004). Finally a population of syn- to post-ore liquid-rich fluid inclusions have salinity values
that range between 5.1 to 11.8 wt% NaCl equivalent and homogenization temperatures between 104
to 336°C. PIXE analysis on selected fluid inclusions from each population revealed that both early
and ore stage fluid carried a significant amount of base metals and showed that at higher
temperature Zn and Pb were preferentially concentrated in the brine whereas Cu partitioned in the
coexisting vapour phase (Baker et al., 2004). PIXE analysis of ore stage fluid inclusions also
highlighted an apparent difference between the contents of Zn and Pb in the fluid and the ore grade
of the deposit. The analyses measured comparable concentrations of Zn and Pb, though the deposit
is very Zn-rich (8%) relative to Pb (0.5%). This inconsistency can be explained invoking a different
behaviour of Zn and Pb in response to changes in the physical-chemical conditions, which led to Zn
precipitation as sphalerite while Pb remained mostly soluble. However, Pb was often below the limit
of detection for PIXE and data are regarded as the maximum concentrations of Pb in the fluid. New
LA ICP MS analysis carried out in this study allow for lower detection limits compared to PIXE,
enabling us to reduce the uncertainty related to the Pb data (Table 2). Baker and Lang (2003) and
Baker et al. (2004) inferred a common magmatic origin for both early and later fluids and
interpreted their diversities as the result of the evolution of a magmatic fluid that underwent high
temperature phase separation of immiscible brine and vapour, followed by the formation of later
lower-temperature, lower-salinity ore forming fluid that formed in response to changes in
temperature and pressure conditions. Similar models have been proposed for the formation of
porphyry copper deposits (Shinohara et al., 1997) and more recently also for skarns (Meinert et al.,
2003). However, the process responsible for ore deposition is still unclear. Baker and Lang (2003)
and Baker et al. (2004) proposed the following potential ore deposition mechanisms: decrease of

6
temperature, decrease of pressure and reaction of the ore-forming fluid with the host rock. The
purpose of this paper is therefore to address ore deposition processes using geochemical modelling
and new ore stage fluid inclusion data to constrain the initial composition of the fluid used in the
simulations. Pressure (200 bars) and initial temperature (350°C) for the modelling were determined
by microthermometric studies of the ore stage fluid inclusions.
3. LA ICP MS analysis of fluid inclusions
The chemistry of ore-stage fluid inclusions from the Bismark deposit was determined by LA ICP
MS analysis undertaken at the facilities of Research School of Earth Sciences of the Australian
National University. The instrumentation employed combines a 193nm excimer laser (Lambda
Physik, Germany) to open the inclusion and volatilize its content, and an Agilent 7500s ICPMS
which analyzes the ablated material (Gunther et al., 1998; Heinrich et al., 2003). The technique
provides multi-element analysis and quantitative measurement of element ratios. The value of Na
determined from microthermometry (3.7 wt%, average composition of ore stage fluid inclusions at
Bismarck; (Baker and Lang, 2003)) was used as internal standard to convert the element ratios to
absolute concentrations (Gunther et al., 1998; Heinrich et al., 2003). Analytical precision using Na
as an internal standard is typically within 20% (Gunther et al., 1998; Heinrich et al., 2003).
Detection limits are highly variable and must be determined for each element in each inclusion
because it is a function of the mass of the element, the size and shape of the inclusion and the
number of elements measured from a single inclusion (Heinrich et al., 2003). Standard detection
limits for fluid inclusions of 25µm are in the µg range (Heinrich et al., 2003). Uncertainties are
7
primarily linked to imperfect sampling of inclusions, particularly of inclusions containing daughter
crystals (Heinrich et al., 2003).
A total of 11 fluid inclusions were analysed, all from the same sample of syn-ore quartz vein. Here
we present results only for the elements that we used in our modelling simulations: K, Ca, F, Mg,
Mn, Zn, Cu, Pb, and Ag (Table 3, Figure 3). The data reveal high concentrations of K and Ca
ranging from about 23000 to approximately 160000ppm and from around 7000 to about 56000ppm
respectively. Magnesium content in the fluid varies from approximately 400ppm to around 10000
ppm. The fluid carries a considerable concentration of metals: Fe, Zn, Cu, Pb and Ag. Iron and Zn
are particularly enriched in the fluid, displaying average concentrations higher than 1000ppm;
specifically Fe content in the fluid varies from about 1000ppm to approximately 25000ppm, while
Zn displays concentrations ranging from around 600ppm to about 8000ppm. Copper, Pb and Ag
concentrations are generally lower than 1000, ranging from 356 to 2551 for Cu, from 129 to
839ppm for Pb and from 1.41 to 34.74ppm for Ag. Manganese concentrations range from 120 to
535ppm.
4. Comparison of LA ICP MS and PIXE data
In this section we compare results obtained from PIXE (Baker et al., 2004) and laser ablation
analysis of ore stage fluid inclusions. The discussion is restricted to elements measured with both
techniques. The range of values and average values for each element from each dataset are plotted in
Figure 3. The comparison of the two datasets shows that absolute element concentrations measured
by PIXE analysis are lower than those obtained from laser ablation, for all the elements except lead.
The highest difference (one order of magnitude) in concentrations detected by the two techniques is
8
displayed by Fe and Zn, the lowest by Mn. Lead is the only element for which average PIXE values
are higher than laser ablation data. The difference in the measured absolute element concentrations
may depend on several factors, namely the different sensitivity and calibration method of the two
techniques, as well as geometry related factors such as size, mass, depth, matrix of the inclusions
that differentially affect the results of the two methodologies (Ryan et al., 1991; Heinrich et al.,
1992; Heinrich et al., 2003). PIXE detection limits and uncertainties are related to the depth,
thickness and internal structure of the inclusions as well as beam profile (Ryan et al., 1991; Heinrich
et al., 1992). Depth in particular is a critical aspect for PIXE analysis affecting the determination of
light element concentrations due to absorption of low-energy X-rays (K lines for Z < 21 and L lines
for Z < 50) which are very depth-sensitive, producing for example error of more than 50 percent in
Cl concentrations for depth uncertainty of ±1.5µm (Heinrich et al., 1992). However, high-energy X-
rays (K lines Z > 25 and L lines Z > 60) are less sensitive to depth. Uncertainties in the thickness of
the inclusion create uncertainties in the estimation of the volume of the inclusions and this in turn
produces an approximate proportional error in the element concentrations (Ryan et al., 1991).
Heterogeneities of the inclusion, such as the presence of vapour and/or daughter phases represent
additional sources of error in the element concentrations due to variations in X-ray absorption and
variations in beam intensity for different crystal position within the inclusion (Ryan et al., 1991;
Heinrich et al., 1992). By comparison LA ICP MS do not suffer depth-related problems as much as
PIXE and while detection limits depend on the inclusion geometry, the size and shape of inclusions
are not as crucial as in PIXE analysis; however, imperfect ablation of inclusions, especially of those
containing daughter phases, and wrong assumptions about the internal standard may be sources of
error (Heinrich et al., 2003). Typical detection limits are lower than PIXE with most heavy elements
(above mass ~100) in a multi-element menu (20–40 isotopes) ~1 µg/g for a ~25-µm inclusion
9
(Heinrich et al., 2003). In our case, the two techniques measured very different concentrations of Pb,
Zn and Fe. The inconsistency for Pb is due to the high detection limits for PIXE analysis and the
real Pb content in the fluid is likely considerably lower. Explanation for the differences in Zn and Fe
is less straightforward, since both techniques normally provide good measurements for Zn and Fe.
However, it is important to observe that the highest concentrations of Zn and Fe from LA ICP MS
seems to be related to small inclusions for which the signal was not very clear and therefore Zn and
Fe might have been overestimated.
The main purpose of comparing the data was to select a reliable single analysis to apply to the
modelling of ore-forming processes for the Bismark deposit. Problems related to specific
instrumental procedures of the two techniques can be overcome by considering the comparison
between element ratios of the two dataset as this reduces the errors derived from the absolute
quantification process in each technique. The analysis of the interelement ratios reveals different
degree of correspondence between the PIXE and LA ICP MS datasets dependent on the elements
selected for the plots (Figure 4). The consistency between the two set of data is particularly good
when plotting ratios involving any of K, Ca and Cu against each other or against Zn/Fe (Figure5A),
and is good but slightly lower when plotting ratios that include Zn or Fe and any of K, Ca, and Cu
(e.g. Fe/Ca, Zn/Cu, Zn/Ca) or that involve Mn with K, Ca and Cu against any other ratio considered
previously (e.g. K/Ca, Zn/Fe) as shown in Figure 5B. The consistency between the two set of data is
lower than in the previous cases when plotting ratios involving Mn with either Zn or Fe against any
other ratios (Figure 5C and 5D). Plots in Figure 5C and 5D show, in fact, a restrict area of
overlapping between the two set of data. The lowest degree of consistency between the two dataset
is obtained when Pb is compared to Zn and/or Fe, the elements for which results from the two
techniques display the greatest difference. The Zn/Pb-Fe/Zn plot (Figure 5E) clearly shows two
10
distinct population of data, with Pb/Zn and Fe/Pb ratios from laser ablation (average values 22.6 and
32.7 respectively) significantly higher than the same ratios determined from PIXE (average values
0.59 and 0.74 respectively). Finally, we consider the relationship between element ratios for
elements of major interest for the deposit Zn, Pb and Cu. In Figure 5F Zn/Pb ratios are plotted
against the Pb/Cu ratios calculated from the two dataset. The graph also displays the Zn/Pb and
Pb/Cu ratios calculated from the average deposit grade. The Zn/Pb ratios obtained from the two
dataset greatly differ: calculated Zn/Pb ratios display average values around 0.5 for PIXE and about
12 for laser ablation; and this latter is more consistent with the Zn/Pb ratios of the deposit (16). On
overall all the observations suggest that the concentration of Pb in the fluid must have been lower
than PIXE data indicated, confirming the inconsistency of these data.
For the modelling experiment we thus decide to use the new laser ablation data. In particular,
inclusion 53 was chosen to constrain the initial fluid composition. This specific inclusion was
selected primarily because was proved by the analysis of the data as one of the best inclusions, and
secondarily for its relative high Zn/Pb ratio.
5. Geochemical modelling
5.1. Overview of the method
Thermodynamic calculations were carried out using the program React included in The
Geochemists Workbench (GWB) software package (Bethke, 1996; Bethke, 2002). React can model
equilibrium states and chemical reactions of systems involving an aqueous phase, minerals and
gases. We used React to determine the initial composition of the fluid for our simulations and to run
simulations of ore-forming processes. The thermodynamic dataset used was specifically created for
11
this study case to fit the T-P conditions (350°C, 200bars) at which the deposit is thought to have
formed. These are higher than the T-P working conditions of GWB default datafiles (temperatures
up to 300°C and pressures along the curve of water). The new data file comprises thermodynamic
data of minerals, gases and aqueous species of interest selected from UNITHERM, a utility database
included in HCh software package (Shvarov and Bastrakov, 1999). The data file was adapted to the
GWB environment using utilities developed by Cleverley and Bastrakov (Cleverley and Bastrakov,
2005).
5.2. Fluid composition
The ore fluid composition used in our simulations was reconstructed partly utilizing the laser
ablation data of the low salinity inclusions at Bismark and partly from phase equilibria relationships.
We assumed that the fluid was in equilibrium with the late pre-ore mineral assemblage consisting of
quartz, pyrite, fluorite, pyrrhotite, chalcopyrite and minor sphalerite. The fluid was not set in
equibrilium with calcite, which is one of the major components of the ore stage, in the assumption
that fluid had not reacted enough with the rock to be in equilibrium with calcite. Here we summarize
the steps we followed to define the fluid composition:
1. Element concentrations of Ca, K, Fe, Zn, Pb, Mg, Mn, and Ag were taken from the laser ablation
data. As above mentioned, fluid inclusion 53 was chosen to represent the fluid because of the
good correlation displayed with PIXE data. The concentration of Fe was set to a slightly higher
value (4500ppm) than the one of the inclusion (3269ppm) to allow the coexistence of pyrrhotite
and pyrite which occur together in the deposit mineral assemblage. The concentration of and Pb
Ag were also increased with the respect of the inclusion content from 221 and 1.41; The original
values were in fact low (Ag in particular was below detection limit for inclusion 53) compared
12
to other inclusions and therefore new concentrations were set close to the average values
displayed by the best inclusions in the set.
2. Pyrite, quartz, fluorite, chalcopyrite and K-feldspar were used to constrain the amount of total
sulphur, SiO2(aq), F, Cu and Al respectively. Copper was constrained by setting chalcopyrite in
the initial system in order to increase the amount of total sulphur and allow the simultaneous
equilibrium of pyrite, chalcopyrite and pyrrhotite.
3. Temperature (350°C), pressure (200bar), Na (37000ppm) and Cl (50000)contents were defined
by microthermometric studies (Baker and Lang, 2003).
4. CO2 was set equal to 0.01 molality unit, based on previous studies on a similar geological
system (Changsheng Lu et al., 1992), because no data on CO2 content was available from
Bismark.
5. Oxygen fugacity was set at a value of 10-31.3, determined by the equilibrium of pyrrhotite and
pyrite.
6. The pH value was set at 4, following previous studies on similar systems (Changsheng Lu et al.,
1992)
The fluid obtained after calculating the overall equilibrium of the system was saturated with the
respect to quartz, pyrite, sphalerite, pyrite, pyrrhotite, chalcopyrite, and muscovite (Table 2). The
concentration of major elements largely reflects the element concentrations set initially to constrain
the system; Zn concentration in the final fluid (2000ppm) is slightly less than in the fluid inclusion
(2501ppm). Copper concentration in the final fluid (36ppm) is one order of magnitude less than in
the fluid inclusion (564ppm). However, the previous value was obtained, as previously mentioned,
by setting chalcopyrite for Cu in the initial system and not the inclusion content. On the other hand,
13
attempts of setting copper concentrations in the initial system lead invariably to low copper
concentrations in the final fluid, suggesting that Cu has probably low solubility in such fluid
conditions. The final oxidation state (fO2=10 -31.019) and pH (3.9) of the fluid does not vary
significantly from the input data (fO2=10 -31.3 and pH=4). Data relative to the distribution of aqueous
species for Zn, Pb, Cu and Fe show that these elements are transported mainly as chloride
complexes.
5.3. Process modelling
The fluid obtained has been used to test ore depositional processes including: 1) temperature
decrease; 2) reaction with the host rock; 3) cooling and simultaneous fluid-rock interaction. The first
model tested is an example of polythermal path model that in our case consists of a temperature
decrease from 350°C to 100°C at a constant rate through a series of steps; at the end of each step the
program calculates the new equilibrium state of the system. The second model tested the reaction of
the ore fluid with the host rock. It is an example of titration model in which a fixed amount of rock
is progressively added to the initial system and, as in the previous model. This type of model is
useful to identify the series of reactions taking place when a rock reacts with fluid of a given
composition, as well as recognize the type of alteration produced by the reactions. For our
simulation of fluid-rock interaction we employed 100g of rock reacting with 1.3 kg of fluid. The
composition of the rock has been reconstructed in order to be representative of the real composition
of the host rock at Bismark and consists of 90% calcite, 5 % quartz, 3% kaolinite and 2%
clinochlore. The final process tested represents a combination of the previous two, i.e. fluid-rock
interaction and simultaneous cooling.
14
6. Results
6.1. Temperature decrease
The predicted mineral assemblage from the cooling simulation includes three main stages (Figure
5A): at higher temperature the system comprises quartz, pyrite, minor muscovite and fluorite,
followed by a pyrite-quartz stage and finally at lower temperature the mineral assemblages include
sphalerite, pyrite and quartz with minor chalcopyrite. Changes in the fluid composition comprise a
decrease in the concentrations of SiO2 (aq), H2S (aq), Cu, Zn, Fe due to the precipitation of quartz,
chalcopyrite, sphalerite, pyrite and acanthite (not shown in Figure 5A due to the very low amount
precipitated; Figure 5B). The oxygen fugacity of the system and the pH rapidly decrease from log -
31 to log -61 and from 3.9 to 1.1 respectively due to the lack of any mineral to buffer the system
(Figure 5C).
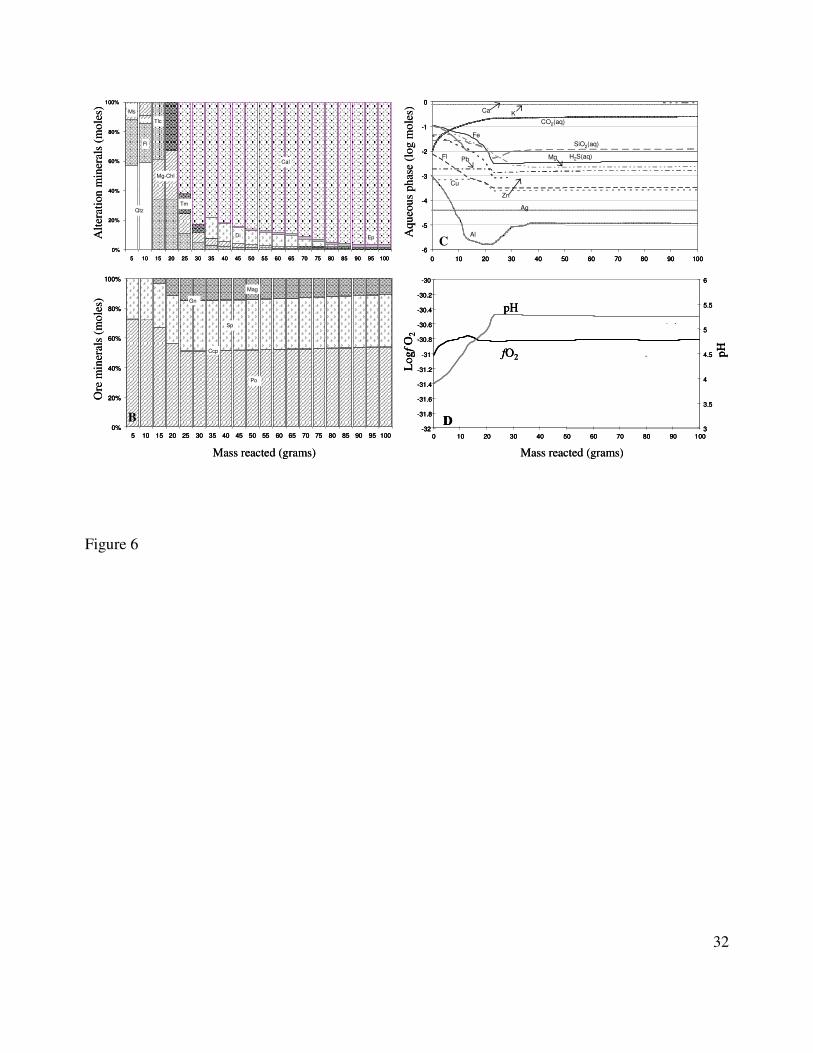
6.2. Host rock reaction
The fluid-rock interaction at constant temperature (350°C) initially precipitates pyrrhotite,
sphalerite, quartz, muscovite and fluorite (Figures 7A and 7B). As new rock is added to the fluid,
quartz and muscovite are rapidly consumed and the initial stage is replaced by the simultaneous
precipitation of a sequence of skarn minerals and sulfides (Figures 7A and 7B). Skarn minerals
predicted include Mg-chlorite, talc, tremolite, diopside, epidote, and calcite. Development of skarn
alteration is synchronous with the precipitation of ore minerals: pyrrhotite and sphalerite precipitate
initially and further progressing of the reaction yields a rapid increase of their amounts together with
the precipitation of magnetite, galena and chalcopyrite (chalcopyrite is among the minerals that
precipitate initially but is then dissolved in the fluid when less than 10 grams of rock has reacted and
then it precipitates again along with the other ore minerals; Figure 6B). The sulfide precipitation is
15
driven by an increase in the pH due to the reaction between the acidic fluid (pH = 3.9) and the
carbonate rock (Figure 6D). The neutralization reaction consumes hydrogen forcing the pH to rise
and consequently reducing the stability of Cl-complexes, leading to sulfide precipitation. The pH
stops to rise when calcite equilibrates with the fluid. Thus, we can consider the reaction completed
when calcite precipitates for 23 grams of rock reacted. The subsequent reaction produces few
changes that consist mainly of variations in the abundances of minerals. However, epidote is also
precipitated and continuing reactions convert tremolite to diopside and diopside back to tremolite
(Figure 6B). The mineral assemblage when calcite first appears consists of pyrrhotite (45%),
sphalerite (29.6%), magnetite (13%), tremolite (3.3%), clinochlore (2.9%), calcite (2.8%), fluorite
(2.7%), galena (0.4%) and chalcopyrite (0.3%). Changes in the fluid composition reflect the
evolution of the mineral assemblages during the reaction (Figure 6C). The concentrations of Fe, Mg,
Al, Zn, Cu, Fl, H2S(aq), and SiO2(aq) significantly decrease (more than one order of magnitude) in the
interval 0-23 grams of rock reacted due to the precipitation of ore and alteration minerals. The fluid
is depleted by lesser amounts in Cu and Pb with concentrations decreasing less than one order of
magnitude due to the precipitation of chalcopyrite and galena respectively (Figure 6C). In this
interval the concentration of CO2(aq) rapidly increases from 0.01 to 0.2 moles as shown in Figure 6C
as a result of calcite consumption to neutralize the fluid. After calcite equilibrates with the fluid
there are no major further changes in the fluid composition, except an increase of aluminum, due to
the dissolution of talc and the decrease of chlorite content, and a drop in the magnesium
concentration caused by the precipitation of diopside (Figures 7B and 7C).
16
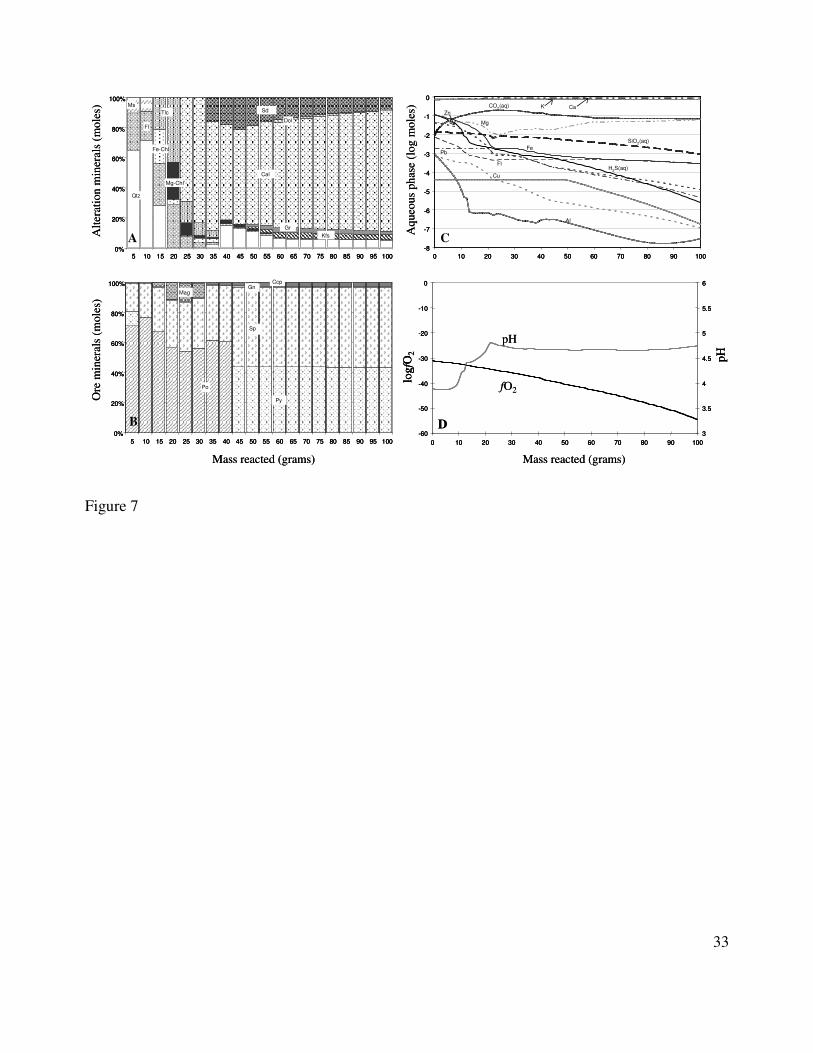
6.3. Host rock reaction and cooling
The results of a fluid-host rock reaction with cooling are shown in Figures 8A-D. For high wall/rock
ratio the resulting mineral assemblage consists mainly of pyrrhotite and sphalerite with pyrite,
quartz and lesser muscovite and fluorite (Figures 8A and 8B). As in the case of a fluid reacting with
the host rock, the initial mineral assemblage is replaced at lower w/r ratio and lower temperature by
a series of skarn minerals and sulfides. Skarn minerals include talc, chlorite, and calcite (Figure 7A).
Sulfide minerals at this stage comprise abundant pyrrhotite, sphalerite, magnetite and lesser galena
and chalcopyrite (Figure 7B). Pyrite present in the initial stage is replaced by pyrrhotite (Figure 7B).
The precipitation of sulfide is again controlled by the increase in pH due to the neutralization of the
acidic fluid (Figure 7D). The pH stops increasing when calcite precipitates for 22 grams of rock
reacted. At this stage the mineral assemblage consists of pyrrhotite (48.9%), sphalerite (28.9%),
magnetite (11.6%), clinochlore (2.7%), fluorite (2.6%), tremolite (1.8%), talc (1.3%), calcite (1.1%)
and chalcopyrite (0.5%). The fluid at this stage is depleted by more than one order of magnitude in
Fe, Al, Zn, Cu, Fl and H2S(aq) and to a lesser extent in Pb, Mg and SiO2(aq) (Figure 7C). By further
adding rock mass to the fluid and lowering the temperature the reaction precipitates carbonates
(siderite and dolomite), K-feldspar, quartz and graphite that leaves the fluid depleted in CO2 (aq),
SiO2(aq), Fe and K (Figures 8A and 8C). These phases are typical of the retrograde alteration that
accompanies ore precipitation in skarns. Ore minerals in this late stage include abundant pyrite and
sphalerite and lesser galena, chalcopyrite and lesser acanthite. Pyrrhotite is no longer stable at lower
temperature and is replaced by pyrite.
17
7. Comparison of modelling results with the Bismark ore stage minerals
assemblage
7.1. Temperature decrease
Our simulation correctly predicts part of the assemblage observed at the Bismark deposit (Figure
5A). In fact, all the phases produced by the cooling of the fluid are present in the ore stage
assemblage at Bismark. However, the model does not produce pyrrhotite, galena and skarn minerals;
the latter is as expected, since there is no carbonate rock available.
7.2. Host rock reaction
Our simulation reproduces with good approximation both ore and gangue minerals present at the
Bismark deposit (Figures 7A and 7B). In terms of ore minerals, the simulation correctly predicts
pyrrhotite, sphalerite, galena and chalcopyrite, whereas magnetite is not observed at the Bismark
deposit. Relative abundances are also consistent to those observed at Bismark with sphalerite more
abundant than galena, however, the model fails to produce pyrite and silver. The alteration minerals
produced show a reasonably good correspondence with the skarn assemblage at Bismark; the only
difference is the presence of tremolite instead of actinolite, but this is probably due to the inability of
GWB to model solid solutions (Bethke, 1996; Bethke, 2002). On the other hand the model predicts
minerals not present at Bismark, such as epidote and talc. A complete skarn sequence comprises
early anhydrous skarn followed by the precipitation of hydrous calc-silicates and sulfide. Our model
only predicts the formation of a hydrous skarn with anhydrous skarn represented by a small amount
pyroxene. The explanation is most likely the relatively low temperature (350°C) used in the

18
calculation, because prograde skarn assemblages usually form at temperatures ranging from 650 to
400°C (Einaudi, 1981).
7.3. Host rock reaction and cooling
Simulation of fluid-rock reaction and simultaneous cooling presents a good prediction of ore and
gangue minerals (Figures 8A and 8B). All the ore phases observed at the Bismark deposit are
predicted by the model and their relative abundances are consistent with those of the deposit.
Alteration minerals can be subdivided into two different stages; 1) at high temperature and high w/r
ratio the alteration assemblage is very similar to those produced for the simple reaction with the host
rock (chlorite, talc, fluorite, tremolite and calcite); 2) at lower temperature and lower w/r ratio these
minerals are replaced (excluding calcite) by retrograde alteration phases siderite, dolomite, quartz,
K-feldspar and graphite. Talc, graphite and K-feldspar are not observed at Bismark, whereas calcite,
siderite and dolomite carbonates are present in the final phase of the ore stage.
8. Discussion
The results of the modelling indicate that a temperature decrease can produce part of the minerals
assemblage observed at the Bismark deposit (Figure 5A). However, the calculations fail to predict
important phases, such as galena and pyrrhotite. All these observations suggest that cooling alone
was not responsible for skarn alteration and sulfide deposition, but was likely a contributing factor
in the formation of the Bismark deposit. Simulation of fluid-rock interaction shows that this process
is an effective ore depositional mechanism, producing all the ore mineral observed at Bismark with
the exception of pyrite and silver (Figures 7A and 7B). Sulfide precipitated during the first phases of

19
the reaction in the interval 0-23 grams of rock reacted with the fluid. In this interval the pH
increased from 3.9 to 5.3, while the other parameters that may cause ore precipitation are constant
(e.g. temperature, pressure and oxidation state; Figure 6D). When calcite equilibrates with the fluid
the pH stops increasing resulting in the cessation of the precipitation of sulfide. The abundance of
sulfide does not significantly vary as the reaction continues. These observations suggest that the
primary control on ore deposition was the pH increase due to the reaction between the fluid and the
dominantly carbonate host rock. This is confirmed in the result of the last process tested. Simulation
of fluid-rock reaction and simultaneous cooling presents a good prediction of the real system
reproducing all the ore phases observed at the Bismark deposit and offers the best matches between
modelling results and real system (Figures 8A and 8B). As in the previous process sulfide
precipitated during the first phases of the reaction in the interval 0-22g of rock reacted with the
fluid. At this stage the temperature is still high (342°C), while pH values increase from 3.9 to 4.9,
providing further evidence that the primary control on ore deposition was the reaction with the
carbonate host rock (Figure 7D). Further progressing of the reaction leads to the precipitation of
pyrite which replaced pyrrhotite (Figure 7B). The pyrite-pyrrhotite transition is primarily controlled
by the oxidation state of the system, with pyrite stable in more oxidized conditions. The temperature
decrease causes the system to become more oxidized leading to the instability of pyrrhotite (Figure
7D). This observation indicates that the temperature decrease was a key factor in controlling the
precipitation of pyrrhotite first and its later transition to pyrite.
20
9. Conclusions
Our simulations allow us to draw some important conclusions on the genesis of the Bismark deposit
and some considerations on the behavior of zinc and lead for this specific deposit and skarn deposits
in general.
1. The modelling results indicate that ore deposition was the result of fluid neutralization
caused by the reaction with the limestone host rock. This hypothesis is supported by the
precipitation of sulfide in correspondence of the sudden increase of the pH in the first steps
of the fluid-rock reaction. A temperature variation is likely to have contributed to ore
deposition, particularly to precipitation of pyrite, though simple fluid cooling was not the
main mechanism that led to the formation of the Bismark deposit.
2. Our trials, together with the analysis of the laser ablation data of ore stage fluid inclusions,
also demonstrate that the amount of Zn and Pb precipitating from the ore fluid are dependent
on the initial concentrations of Zn and Pb of the fluid.
3. Results from the modelling, in particular the close reproduction of ore stage minerals of the
Bismark deposit, support the application of fluid inclusions data to constrain geochemical
modelling simulations as a valuable method to investigate geochemical processes.
Acknowledgement
Work reported here was conducted as part of the predictive mineral discovery Cooperative Research
Centre and this paper is published with the permission of the CEO, pmd*CRC.
21
10. References
Baker, T. and Lang, J.R., 2003. Reconciling fluid inclusion types, fluid processes, and fluid sources
in skarns: an example from the Bismark Deposit, Mexico. Mineralium Deposita, 38: 474-
495.
Baker, T., van Achterberg, E., Ryan, C.G. and Lang, J.R., 2004. Composition and evolution of ore
fluids in a magmatic-hydrothermal skarn deposit. Geology (Boulder), 32(2): 117-120.
Bethke, C., 1996. Geochemical reaction modeling. Oxford University Press, New York, xvii, 397
pp.
Bethke, C.M., 2002. The Geochemist’s Workbench:A User’s Guide to Rxn, Act2, Tact, React, and
Gtplot. University of Illinois, USA.
Changsheng Lu, Reed, M.H. and Misra, K.C., 1992. Zinc-lead skarn mineralization at Tin Creek,
Alaska: Fluid inclusions and skarn-forming reactions*1. Geochimica et Cosmochimica Acta,
56(1): 109-119.
Cleverley, J.S. and Bastrakov, E.N., 2005. K2GWB: Utility for generating thermodynamic data files
for The Geochemist's Workbench(R) at 0-1000 [deg]C and 1-5000 bar from UT2K and the
UNITHERM database. Computers & Geosciences, 31(6): 756-767.
Einaudi, M., Meinert, L.D. and Newberry, R.J., 1981. Skarn deposits. Society of Economic
Geologists, Economic Geology Seventy-Fifth Anniversary Volume: 317-391.
Gunther, D., Audetat, A., Frischknecht, r. and Heinrich, C.A., 1998. Quantitative analysis of major,
minor and trace elements in fluid inclusionsusing laser-ablation inductively-coupled-plasma
mass-spectrometry. Journal of Analytical Atomic Spectometry, 13(4): 263-270.
Haptonstall, J.C., 1994. Bismark; Mexico's new major zinc mine. Mining Engineering, 46(4): 295-
302.

22
Heinrich, C.A., Driesner, T., Stefansson, A. and Seward, T.M., 2004. Magmatic vapor contraction
and the transport of gold from the porphyry environment to epithermal ore deposits.
Geology, 32(9): 761-764.
Heinrich, C.A. et al., 2003. Quantitative multi-element analysis of minerals, fluid and melt
inclusions by laser-ablation inductively-coupled-plasma mass-spectrometry. Geochimica et
Cosmochimica Acta, 67(18): 3473-3497.
Heinrich, C.A., Ryan, C.G., Mernagh, T.P. and Eadington, P.J., 1992. Segregation of ore metals
between magmatic brine and vapor; a fluid inclusion study using PIXE microanalysis.
Economic Geology and the Bulletin of the Society of Economic Geologists, 87(6): 1566-
1583.
Komninou, A. and Sverjensky, D.A., 1995. Hydrothermal alteration and the chemistry of ore-
forming fluids in an unconformity-type uranium deposit. Geochimica et Cosmochimica
Acta, 59(13): 2709-2723.
Komninou, A. and Sverjensky, D.A., 1996. Geochemical modeling of the formation of an
unconformity-type uranium deposit. Economic Geology and the Bulletin of the Society of
Economic Geologists, 91(3): 590-606.
Meinert, L.D., Hedenquist, J.W., Satoh, H. and Matsuhisa, Y., 2003. Formation of anhydrous and
hydrous skarn in Cu-Au ore deposits by magmatic fluids. Economic Geology and the
Bulletin of the Society of Economic Geologists, 98(1): 147-156.
Ryan, C.G. et al., 1991. Quantitative PIXE microanalysis of fluid inclusions based on a layered yield
model. Nuclear Instruments and Methods in Physics Research Section B: Beam Interactions
with Materials and Atoms, 54(1-3): 292-297.
23
Ryan, C.G., Heinrich, C.A. and Mernagh, T.P., 1993. PIXE microanalysis of fluid inclusions and its
application to study of ore metal segregation between magmatic brine and vapor. Nuclear
Instruments and Methods in Physics Research, v. B77,: p. 463–471.
Ryan, C.G., Jamieson, D.N., Griffin, W.L., Cripps, G. and Szymanski, R., 2001. The new CSIRO-
GEMOC nuclear microprobe: First results, performance and recent applications. Nuclear
Instruments and Methods in Physics Research, v. B181: p. 12–19.
Shinohara, H. et al. (Editors), 1997. Constraints on magma degassing beneath the Far Southeast
porphyry Cu-Au deposit, Philippines. Clarendon Press, Oxford, United Kingdom, 1741-1752
pp.
Shvarov, Y.V. and Bastrakov, E.N., 1999. HCh: a software package for geochemical equilibrium
modelling (User’s guide). Australian Geological Survey Organisation. Record 1999/25.
Sverjensky, D.A., 1987. The role of migrating oil field brines in the formation of sediment-hosted
Cu-rich deposits. Economic Geology and the Bulletin of the Society of Economic
Geologists, 82(5): 1130-1141.
Ulrich, T., Guenther, D. and Heinrich, C.A., 1999. Gold concentrations of magmatic brines and the
metal budget of porphyry copper deposits. Nature (London), 399(6737): 676-679.
Captions to Figures
1. Location map and geology of the Bismark deposits, Chihuahua. Modified from Baker & Lang
(2003)
24
2. Diagram showing the paragenesis of alteration within the limestone at the Bismark deposit.
Modified from Baker & Lang (2003)
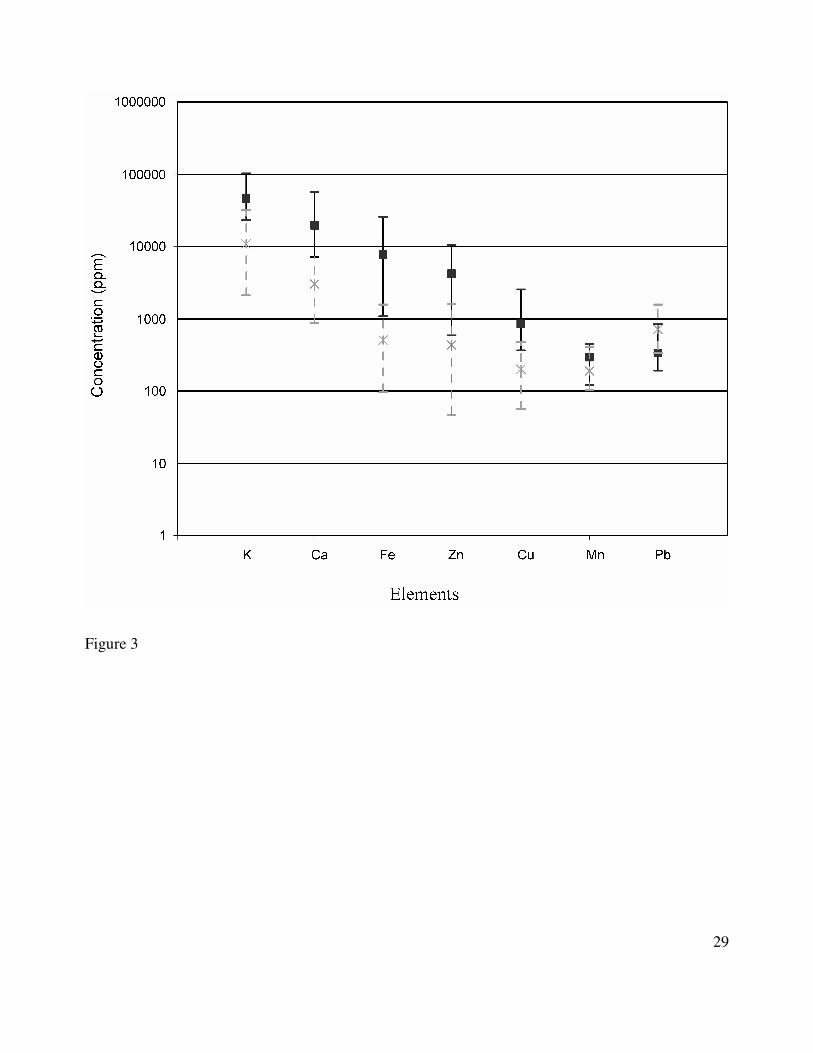
3. Fluid composition as determined by LA ICP MS. Bars represents average, maximum and
minimum concentrations of each element in the ore fluid.
4. Element concentrations determined by La ICP MS (represented in black) and PIXE (represented
in grey). Bars represent the range of concentrations of each element in the fluid; squares and
crosses indicate the average concentrations of each element determined by LA ICP MS and
PIXE respectively.
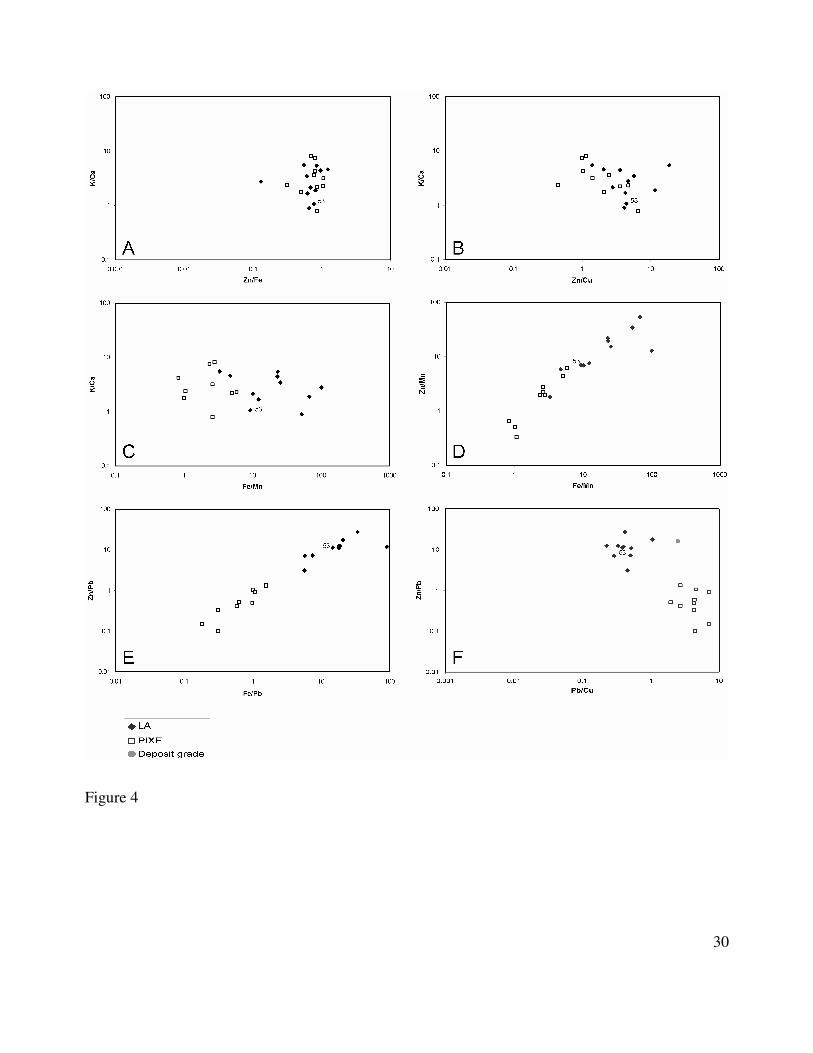
5. Biplot illustrating the Zn/Pb-Pb-Cu ratios of the ore stage fluid inclusions calculated from LA
ICP MS and PIXE data. The chart also plots the Zn/Pb-Pb/Cu ratios calculated from the average
grade of the deposit.
6. Mineral assemblages, composition of the aqueous phase and gases resulting from cooling the ore
fluid from 350°C to 100°C. (A) Alteration and ore mineral assemblages; (B) Total element
concentrations; (C) pH and oxygen fugacity. Mineral abbreviation after Kretz (1983):
chalcopyrite (ccp), fluorite (fl), muscovite (ms), quartz (qtz), pyrite (py), sphalerite (sp).
7. Results of reaction of the ore fluid (1.3kg) with host rock (100g) at constant temperature (350°C)
in terms of (A) alteration minerals, (B) ore minerals (C) composition of the aqueous phase, (D)
pH and oxygen fugacity. Mineral abbreviation after Kretz (1983): calcite (cal), chalcopyrite
25
(ccp), diopside (di), epidote (ep), fluorite (fl),galena (gn), magnesium-chlorite (mg-chl),
magnetite (mag), muscovite (ms), quartz (qtz), pyrrhotite (po), sphalerite (sp), talc (tlc),
tremolite (tr).
8. Results of ore fluid- host rock interaction (1.3kg-100g) and cooling of the system from 350°C to
100°C. A) alteration minerals, (B) ore minerals (C) composition of the aqueous phase, (D) pH
and oxygen fugacity. Mineral abbreviation after Kretz (1983): calcite (cal), chalcopyrite (ccp),
dolomite (dol), ferroan-chlorite (fe-chl), fluorite (fl),galena (gn), graphite (gr), kfeldspars (kfs),
magnesium-chlorite (mg-chl), magnetite (mag), muscovite (ms), quartz (qtz), pyrite (py),
pyrrhotite (po), sphalerite (sp), siderite (sd), talc (tlc).
Captions to Tables
1. Summary of fluid inclusions characteristics of the Bismark deposit. Modified from Baker et
Lang (2003)
26
2. PIXE analysis of ore stage low-salinity fluid inclusions from the Bismark deposit. Numbers
printed in italic refer to values that are below the detection limits.
3. LA ICP MS analysis of ore stage low-salinity fluid inclusions from the Bismark deposit.
Numbers printed in italic refer to values that are below the detection limits.
4. Input data used to constrain the initial fluid composition and composition of the fluid used for
simulation of ore-forming processes.

27
Figure 1

28
Figure 2
29
Figure 3
30
Figure 4

31
Temperature (°C)
-70
-60
-50
-40
-30
-20
-10
0
350 325 300 275 250 225 200 175 150 125 100
Log
fO2
0
0.5
1
1.5
2
2.5
3
3.5
4
4.5
pH
C
Aqu
eous
pha
se (l
og m
oles
)M
iner
als
(mol
es)
A
Qtz
Fl
Ms
Py
Ccp
Sp
0%
20%
40%
60%
80%
100%
350 300 250 200 150 100
A
B
Ag
Al
Cu
Fl
Fe
Mg
Pb
H2S(aq)
SiO2(aq)Zn
Ca K
-6
-5
-4
-3
-2
-1
0
350 325 300 275 250 225 200 175 150 125 100
B
Temperature (°C)
-70
-60
-50
-40
-30
-20
-10
0
350 325 300 275 250 225 200 175 150 125 100
Log
fO2
0
0.5
1
1.5
2
2.5
3
3.5
4
4.5
pH
Temperature (°C)
-70
-60
-50
-40
-30
-20
-10
0
350 325 300 275 250 225 200 175 150 125 100
Log
fO2
0
0.5
1
1.5
2
2.5
3
3.5
4
4.5
pH
C
Aqu
eous
pha
se (l
og m
oles
)M
iner
als
(mol
es)
A
Qtz
Fl
Ms
Py
Ccp
Sp
0%
20%
40%
60%
80%
100%
350 300 250 200 150 100
A
Min
eral
s (m
oles
)
A
Qtz
Fl
Ms
Py
Ccp
Sp
0%
20%
40%
60%
80%
100%
350 300 250 200 150 100
AA
Qtz
Fl
Ms
Py
Ccp
Sp
0%
20%
40%
60%
80%
100%
350 300 250 200 150 100
A
B
Ag
Al
Cu
Fl
Fe
Mg
Pb
H2S(aq)
SiO2(aq)Zn
Ca K
-6
-5
-4
-3
-2
-1
0
350 325 300 275 250 225 200 175 150 125 100
BB
Ag
Al
Cu
Fl
Fe
Mg
Pb
H2S(aq)
SiO2(aq)Zn
Ca K
-6
-5
-4
-3
-2
-1
0
350 325 300 275 250 225 200 175 150 125 100
B
Figure 5
32
Mass reacted (grams)
Ag
Al
CO2(aq)
Cu
Fl
Fe
MgPb H2S(aq)
SiO2(aq)
Zn
Ca K
-6
-5
-4
-3
-2
-1
0
0 10 20 30 40 50 60 70 80 90 100
Po
Ccp
Sp
Gn
Mag
0%
20%
40%
60%
80%
100%
5 10 15 20 25 30 35 40 45 50 55 60 65 70 75 80 85 90 95 100
B
CAlte
ratio
n m
iner
als
(mol
es)
Ore
min
eral
s (m
oles
)
Aqu
eous
pha
se (l
og m
oles
)
Mass reacted (grams)
D-32
-31.8
-31.6
-31.4
-31.2
-31
-30.8
-30.6
-30.4
-30.2
-30
0 10 20 30 40 50 60 70 80 90 100
Log
fO2
3
3.5
4
4.5
5
5.5
6
pH
pH
fO2
A
Qtz
Fl
Ms
Mg-Chl
Tlc
Tm
Di Ep
Cal
0%
20%
40%
60%
80%
100%
5 10 15 20 25 30 35 40 45 50 55 60 65 70 75 80 85 90 95 100
Mass reacted (grams)
Ag
Al
CO2(aq)
Cu
Fl
Fe
MgPb H2S(aq)
SiO2(aq)
Zn
Ca K
-6
-5
-4
-3
-2
-1
0
0 10 20 30 40 50 60 70 80 90 100
Ag
Al
CO2(aq)
Cu
Fl
Fe
MgPb H2S(aq)
SiO2(aq)
Zn
Ca K
-6
-5
-4
-3
-2
-1
0
0 10 20 30 40 50 60 70 80 90 100
Po
Ccp
Sp
Gn
Mag
0%
20%
40%
60%
80%
100%
5 10 15 20 25 30 35 40 45 50 55 60 65 70 75 80 85 90 95 100
B
Po
Ccp
Sp
Gn
Mag
0%
20%
40%
60%
80%
100%
5 10 15 20 25 30 35 40 45 50 55 60 65 70 75 80 85 90 95 100
B
CAlte
ratio
n m
iner
als
(mol
es)
Ore
min
eral
s (m
oles
)
Aqu
eous
pha
se (l
og m
oles
)
Mass reacted (grams)
D-32
-31.8
-31.6
-31.4
-31.2
-31
-30.8
-30.6
-30.4
-30.2
-30
0 10 20 30 40 50 60 70 80 90 100
Log
fO2
3
3.5
4
4.5
5
5.5
6
pH
pH
fO2
D-32
-31.8
-31.6
-31.4
-31.2
-31
-30.8
-30.6
-30.4
-30.2
-30
0 10 20 30 40 50 60 70 80 90 100
Log
fO2
3
3.5
4
4.5
5
5.5
6
pH
pH
fO2
A
Qtz
Fl
Ms
Mg-Chl
Tlc
Tm
Di Ep
Cal
0%
20%
40%
60%
80%
100%
5 10 15 20 25 30 35 40 45 50 55 60 65 70 75 80 85 90 95 100
A
Qtz
Fl
Ms
Qtz
Fl
Ms
Mg-Chl
Tlc
Tm
Di Ep
Cal
0%
20%
40%
60%
80%
100%
5 10 15 20 25 30 35 40 45 50 55 60 65 70 75 80 85 90 95 100
Figure 6
33
Alte
ratio
n m
iner
als
(mol
es)
Ore
min
eral
s (m
oles
)
Aqu
eous
pha
se (l
og m
oles
)
Qtz
Fl
Ms
Mg-Chl
Fe-Chl
Tlc
KfsGr
Cal
Dol
Sd
0%
20%
40%
60%
80%
100%
5 10 15 20 25 30 35 40 45 50 55 60 65 70 75 80 85 90 95 100
A
Po
Py
Sp
Ccp
MagGn
0%
20%
40%
60%
80%
100%
5 10 15 20 25 30 35 40 45 50 55 60 65 70 75 80 85 90 95 100
B
H2S(aq)
SiO2(aq)
CO2(aq)
Al
Cu
Fl
Fe
Mg
Pb
ZnCaK
-8
-7
-6
-5
-4
-3
-2
-1
0
0 10 20 30 40 50 60 70 80 90 100
C
D-60
-50
-40
-30
-20
-10
0
0 10 20 30 40 50 60 70 80 90 100
logf
O2
3
3.5
4
4.5
5
5.5
6
pH
Mass reacted (grams)Mass reacted (grams)
pH
fO2
Alte
ratio
n m
iner
als
(mol
es)
Ore
min
eral
s (m
oles
)
Aqu
eous
pha
se (l
og m
oles
)
Qtz
Fl
Ms
Mg-Chl
Fe-Chl
Tlc
KfsGr
Cal
Dol
Sd
0%
20%
40%
60%
80%
100%
5 10 15 20 25 30 35 40 45 50 55 60 65 70 75 80 85 90 95 100
A
Qtz
Fl
Ms
Mg-Chl
Fe-Chl
Tlc
KfsGr
Cal
Dol
Sd
0%
20%
40%
60%
80%
100%
5 10 15 20 25 30 35 40 45 50 55 60 65 70 75 80 85 90 95 100
A
Po
Py
Sp
Ccp
MagGn
0%
20%
40%
60%
80%
100%
5 10 15 20 25 30 35 40 45 50 55 60 65 70 75 80 85 90 95 100
Po
Py
Sp
Ccp
MagGn
0%
20%
40%
60%
80%
100%
5 10 15 20 25 30 35 40 45 50 55 60 65 70 75 80 85 90 95 100
B
H2S(aq)
SiO2(aq)
CO2(aq)
Al
Cu
Fl
Fe
Mg
Pb
ZnCaK
-8
-7
-6
-5
-4
-3
-2
-1
0
0 10 20 30 40 50 60 70 80 90 100
C
H2S(aq)
SiO2(aq)
CO2(aq)
Al
Cu
Fl
Fe
Mg
Pb
ZnCaK
-8
-7
-6
-5
-4
-3
-2
-1
0
0 10 20 30 40 50 60 70 80 90 100
C
D-60
-50
-40
-30
-20
-10
0
0 10 20 30 40 50 60 70 80 90 100
logf
O2
3
3.5
4
4.5
5
5.5
6
pH
-60
-50
-40
-30
-20
-10
0
0 10 20 30 40 50 60 70 80 90 100
logf
O2
3
3.5
4
4.5
5
5.5
6
pH
Mass reacted (grams)Mass reacted (grams)
pH
fO2
Figure 7
Related Documents