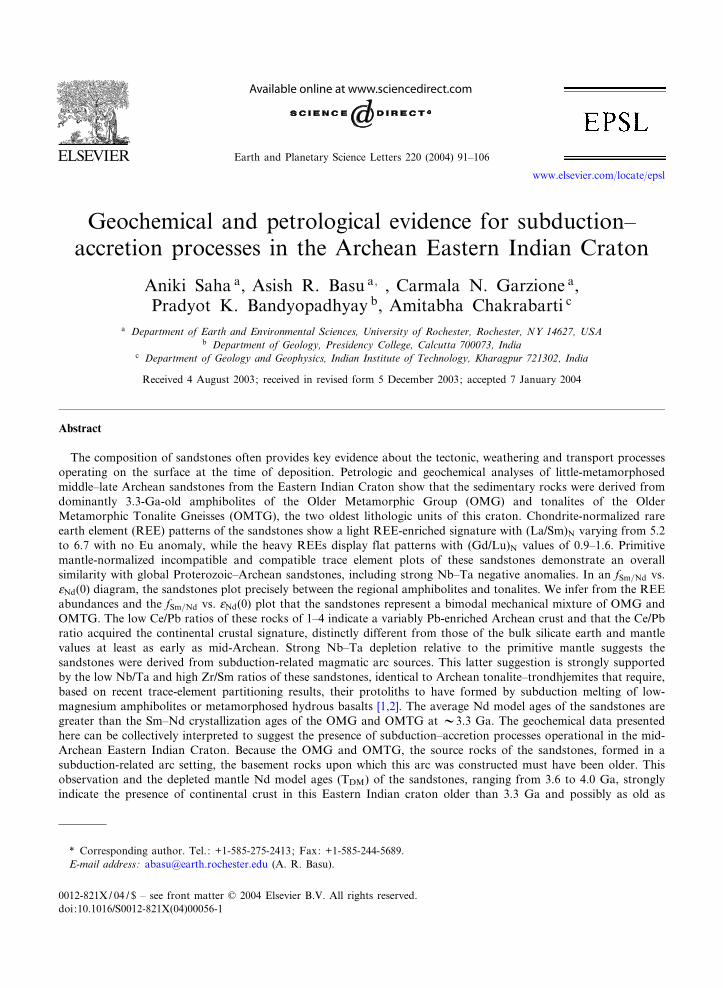
Geochemical and petrological evidence for subduction^ accretion processes in the Archean Eastern Indian Craton Aniki Saha a , Asish R. Basu a; , Carmala N. Garzione a , Pradyot K. Bandyopadhyay b , Amitabha Chakrabarti c a Department of Earth and Environmental Sciences, University of Rochester, Rochester, NY 14627, USA b Department of Geology, Presidency College, Calcutta 700073, India c Department of Geology and Geophysics, Indian Institute of Technology, Kharagpur 721302, India Received 4 August 2003; received in revised form 5 December 2003; accepted 7 January 2004 Abstract The composition of sandstones often provides key evidence about the tectonic, weathering and transport processes operating on the surface at the time of deposition. Petrologic and geochemical analyses of little-metamorphosed middle^late Archean sandstones from the Eastern Indian Craton show that the sedimentary rocks were derived from dominantly 3.3-Ga-old amphibolites of the Older Metamorphic Group (OMG) and tonalites of the Older Metamorphic Tonalite Gneisses (OMTG), the two oldest lithologic units of this craton. Chondrite-normalized rare earth element (REE) patterns of the sandstones show a light REE-enriched signature with (La/Sm) N varying from 5.2 to 6.7 with no Eu anomaly, while the heavy REEs display flat patterns with (Gd/Lu) N values of 0.9^1.6. Primitive mantle-normalized incompatible and compatible trace element plots of these sandstones demonstrate an overall similarity with global Proterozoic^Archean sandstones, including strong Nb^Ta negative anomalies. In an f Sm=Nd vs. O Nd (0) diagram, the sandstones plot precisely between the regional amphibolites and tonalites. We infer from the REE abundances and the f Sm=Nd vs. O Nd (0) plot that the sandstones represent a bimodal mechanical mixture of OMG and OMTG. The low Ce/Pb ratios of these rocks of 1^4 indicate a variably Pb-enriched Archean crust and that the Ce/Pb ratio acquired the continental crustal signature, distinctly different from those of the bulk silicate earth and mantle values at least as early as mid-Archean. Strong Nb^Ta depletion relative to the primitive mantle suggests the sandstones were derived from subduction-related magmatic arc sources. This latter suggestion is strongly supported by the low Nb/Ta and high Zr/Sm ratios of these sandstones, identical to Archean tonalite^trondhjemites that require, based on recent trace-element partitioning results, their protoliths to have formed by subduction melting of low- magnesium amphibolites or metamorphosed hydrous basalts [1,2]. The average Nd model ages of the sandstones are greater than the Sm^Nd crystallization ages of the OMG and OMTG at V3.3 Ga. The geochemical data presented here can be collectively interpreted to suggest the presence of subduction^accretion processes operational in the mid- Archean Eastern Indian Craton. Because the OMG and OMTG, the source rocks of the sandstones, formed in a subduction-related arc setting, the basement rocks upon which this arc was constructed must have been older. This observation and the depleted mantle Nd model ages (T DM ) of the sandstones, ranging from 3.6 to 4.0 Ga, strongly indicate the presence of continental crust in this Eastern Indian craton older than 3.3 Ga and possibly as old as 0012-821X / 04 / $ ^ see front matter ȣ 2004 Elsevier B.V. All rights reserved. doi :10.1016/S0012-821X(04)00056-1 * Corresponding author. Tel.: +1-585-275-2413; Fax: +1-585-244-5689. E-mail address: [email protected] (A. R. Basu). Earth and Planetary Science Letters 220 (2004) 91^106 R Available online at www.sciencedirect.com www.elsevier.com/locate/epsl

Welcome message from author
This document is posted to help you gain knowledge. Please leave a comment to let me know what you think about it! Share it to your friends and learn new things together.
Transcript
Geochemical and petrological evidence for subduction^accretion processes in the Archean Eastern Indian Craton
Aniki Saha a, Asish R. Basu a;�, Carmala N. Garzione a,Pradyot K. Bandyopadhyay b, Amitabha Chakrabarti c
a Department of Earth and Environmental Sciences, University of Rochester, Rochester, NY 14627, USAb Department of Geology, Presidency College, Calcutta 700073, India
c Department of Geology and Geophysics, Indian Institute of Technology, Kharagpur 721302, India
Received 4 August 2003; received in revised form 5 December 2003; accepted 7 January 2004
Abstract
The composition of sandstones often provides key evidence about the tectonic, weathering and transport processesoperating on the surface at the time of deposition. Petrologic and geochemical analyses of little-metamorphosedmiddle^late Archean sandstones from the Eastern Indian Craton show that the sedimentary rocks were derived fromdominantly 3.3-Ga-old amphibolites of the Older Metamorphic Group (OMG) and tonalites of the OlderMetamorphic Tonalite Gneisses (OMTG), the two oldest lithologic units of this craton. Chondrite-normalized rareearth element (REE) patterns of the sandstones show a light REE-enriched signature with (La/Sm)N varying from 5.2to 6.7 with no Eu anomaly, while the heavy REEs display flat patterns with (Gd/Lu)N values of 0.9^1.6. Primitivemantle-normalized incompatible and compatible trace element plots of these sandstones demonstrate an overallsimilarity with global Proterozoic^Archean sandstones, including strong Nb^Ta negative anomalies. In an fSm=Nd vs.ONd(0) diagram, the sandstones plot precisely between the regional amphibolites and tonalites. We infer from the REEabundances and the fSm=Nd vs. ONd(0) plot that the sandstones represent a bimodal mechanical mixture of OMG andOMTG. The low Ce/Pb ratios of these rocks of 1^4 indicate a variably Pb-enriched Archean crust and that the Ce/Pbratio acquired the continental crustal signature, distinctly different from those of the bulk silicate earth and mantlevalues at least as early as mid-Archean. Strong Nb^Ta depletion relative to the primitive mantle suggests thesandstones were derived from subduction-related magmatic arc sources. This latter suggestion is strongly supportedby the low Nb/Ta and high Zr/Sm ratios of these sandstones, identical to Archean tonalite^trondhjemites that require,based on recent trace-element partitioning results, their protoliths to have formed by subduction melting of low-magnesium amphibolites or metamorphosed hydrous basalts [1,2]. The average Nd model ages of the sandstones aregreater than the Sm^Nd crystallization ages of the OMG and OMTG at V3.3 Ga. The geochemical data presentedhere can be collectively interpreted to suggest the presence of subduction^accretion processes operational in the mid-Archean Eastern Indian Craton. Because the OMG and OMTG, the source rocks of the sandstones, formed in asubduction-related arc setting, the basement rocks upon which this arc was constructed must have been older. Thisobservation and the depleted mantle Nd model ages (TDM) of the sandstones, ranging from 3.6 to 4.0 Ga, stronglyindicate the presence of continental crust in this Eastern Indian craton older than 3.3 Ga and possibly as old as
0012-821X / 04 / $ ^ see front matter D 2004 Elsevier B.V. All rights reserved.doi:10.1016/S0012-821X(04)00056-1
* Corresponding author. Tel. : +1-585-275-2413; Fax: +1-585-244-5689.E-mail address: [email protected] (A. R. Basu).
EPSL 7005 11-3-04
Earth and Planetary Science Letters 220 (2004) 91^106
R
Available online at www.sciencedirect.com
www.elsevier.com/locate/epsl
4.0 Ga.D 2004 Elsevier B.V. All rights reserved.
Keywords: Archean sediments; subduction; trace element geochemistry; Nd isotopes; Eastern Indian Craton
1. Introduction
Terrigenous clastic sediments provide impor-tant information on their provenance and tectonicsetting, as well as on paleoclimate and paleowea-thering during sediment deposition. This informa-tion can be extracted by examination of the lithol-ogy, chemical and isotopic composition, anddetrital mineralogy of the sediments [3]. Archeantectonic and sedimentary processes are recordedin contemporaneous sediments from Archeansource terranes. The limited occurrence of rem-nants of Archean crustal fragments and sedimen-tary rocks has made it di⁄cult to evaluate therelationship between the composition of Archeansedimentary rocks, their sources and tectonic set-tings [4,5]. In addition, most Archean cratons arehigh-grade metamorphic terranes, making inter-pretations di⁄cult for petrologic and geochemicaldata gathered on these rocks.Several authors have considered the trace-ele-
ment geochemistry of Archean siliciclastic rocksto di¡er from those of post-Archean rocks [6],particularly in terms of the former’s more variableRare Earth Element (REE) patterns, lower totalREE content and by their general lack of euro-pium anomalies. Such di¡erences, if true, mighthave implications for the mode of origin of theEarth’s early crust, or they might re£ect an age-dependent preservation bias. Geochemical studyof Archean sedimentary rocks, which re£ects thenature of their sources, thus can help in constrain-ing the composition of the upper crust during theArchean and the tectonic setting in which the Ar-chean crust was formed. REEs in conjunction withNd isotopes are shown to be useful for character-izing provenance [7,8]. REEs are generally trans-ported unfractionated by ¢ne-grained siliciclasticsediments and hence re£ect the average REE com-position of their sources [9]. A temporal dimensioncan also be added to the sedimentary provenancestudy by the Nd isotopic model ages, providing
extraction ages of the sediment’s parent protolithsfrom a depleted mantle source (TDM) [10].The present study represents a comprehensive
investigation of the provenance of a relativelyfresh succession of Archean sandstones from theEastern Indian Craton, one of the world’s rare,well-preserved and least metamorphosed Archeanterranes [11^13]. These sedimentary rocks are par-ticularly interesting because of their antiquity (atleast 2.8 Ga in age), lower grade of metamor-phism (low greenschist facies) and lack of pene-trative deformation. Our sedimentological andpetrographic examinations, combined with highprecision trace element and Nd-isotopic analysesfor model ages, enabled us to draw several infer-ences concerning: (1) the sources of these Arche-an sediments; (2) trace element characterizationand the nature of the s 3.0-Ga-old continentalcrust of this craton; (3) the provenance age ofthe protoliths of the sandstones; and (4) themode of origin of the igneous sources of the sand-stones, the amphibolites (metabasalts) and tona-lite suite of rocks of this craton by ancient sub-duction.
2. Geologic settings and samples for this study
The Eastern Indian Craton (Fig. 1) is boundedby the arcuate Copper Belt thrust in the northand the Sukinda thrust to the south, neither ofwhose ages are well constrained. The mid-Prote-rozoic Eastern Ghat Granulite belt is in the south-west and the relatively high-grade metamorphicSatpura Orogenic belt of middle Proterozoic ageis situated to the northwest of the craton. TheSinghbhum Granite batholithic complex of3292P 51 Ma age [14,15] occupies the major por-tion of this craton. Remnants of ancient rocksthat include the Older Metamorphic Group(OMG), which consists of meta-igneous andmeta-sedimentary rocks of amphibolite facies
EPSL 7005 11-3-04
A. Saha et al. / Earth and Planetary Science Letters 220 (2004) 91^10692
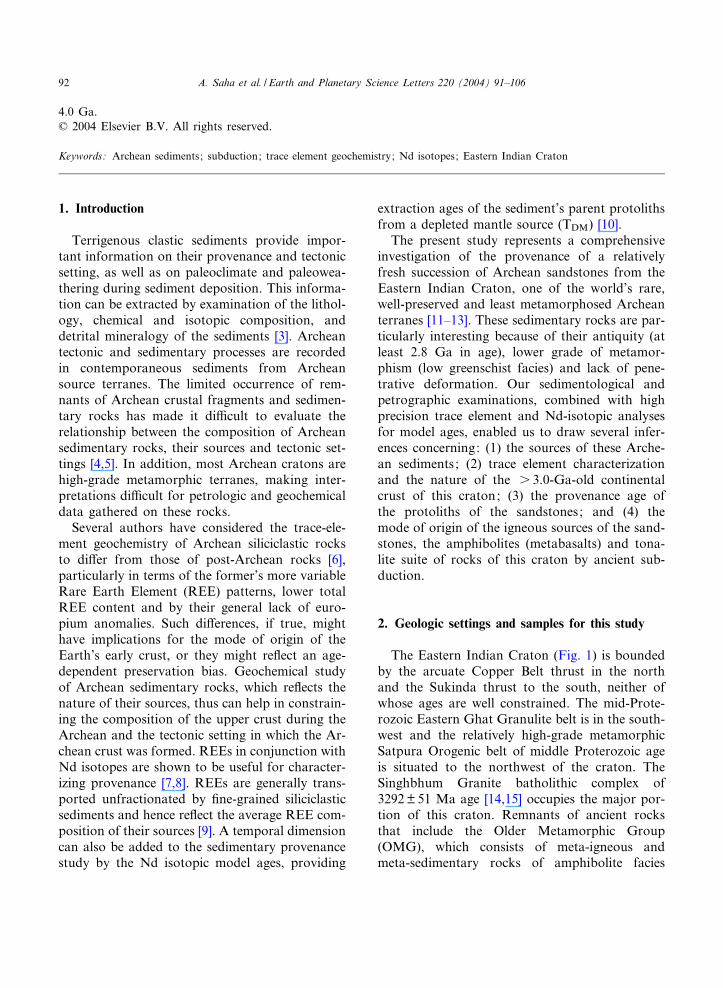
[16], and the Older Metamorphic TonaliteGneisses (OMTG) are found within the batho-lithic complex. These enclaves range in size froma few square meters to several hundred squarekilometers (Fig. 1). The OMTG intrude theOMG amphibolites, indicating that the latterform the oldest rock unit in the area. The pres-ence of enclaves of the OMG^OMTG assemblagethroughout the batholithic complex indicates thatthese units were of extensive nature. This bath-olith itself is overlain on all sides by the IronOre Group. At places, the Iron Ore Group is in-truded by the youngest phases of batholithic in-trusions, although details of age relationships be-tween the Iron Ore Group and the SinghbhumGranite are yet to be established. The Iron OreGroup has been intruded by the Bonai Granite inthe west (Fig. 1). Remnants of quartzite from theIron Ore Group and metabasic rocks are pre-
served within the Bonai Granite (Pb^Pb age of3163P 126 Ma [17]), which is thought to be coevalwith the Singhbhum Granite.A 200-m-thick succession of dominantly sand-
to-pebble-size siliciclastic rocks is preserved ontop of the Iron Ore Group and the Bonai Granitein the northwestern part of the craton (Fig. 1).The lower part of this succession consists of alter-nating matrix-supported conglomerate and feld-spathic quartzite, overlain by dominantly coarseto ¢ne-grained feldspathic arenite. The most com-mon sedimentary structure in this succession islarge-scale trough cross-beds. Other sedimentarystructures include scour-and-¢ll structures andsymmetrical and asymmetrical ripple cross-strati-¢cations. Field and stratigraphic relations of thisunit are described in an earlier study [18]. Thepreliminary sedimentologic study suggests thatthe sandstones were deposited in a marginal ma-rine depositional setting and the paleo£ow direc-tion was towards the northwest [18].The above sedimentary rocks have been in-
cluded within the Birtola Formation of the Dar-jing Group [19]. Rocks overlying the Birtola For-mation have been intruded by the TamperkolaGranite with an age of 2809P 12 Ma fromU^Pb dating of zircons [20]. Thus the age of de-position of these sandstones can be constrainedbetween the age of intrusion of the Bonai Granite(V3.16 Ga) and that of the Tamperkola pluton(V2.8 Ga).Fourteen sandstone samples were collected for
this study from the Birtola Formation of theDarjing Group from the area shown by thecrossed-box in Fig. 1. Of the fourteen samplesthat were analyzed for a thorough petrographicand modal analysis, nine were selected for traceelement and isotopic study. These nine samplesrepresent a 200-m-thick contiguous sedimentarysuccession of the Birtola Formation.
3. Petrology of the Archean sandstones and theirsource rocks
3.1. Lithology of the source area
The Eastern Indian Craton is a mosaic of sev-
Fig. 1. Geological map of the Eastern Indian Craton in theSinghbhum^Orissa region of the Indian continent (see inset)modi¢ed after [13] and [17]. The current study area is to thenorth of the Bonai Granite. The sandstones of this study arefrom the Darjing Group, west of the Singhbhum Granite.Samples analyzed are from a sedimentary succession shownby the crossed box. Abbreviations: OMG, Older Metamor-phic Group; OMTG, Older Metamorphic Tonalite Gneisses.The ages of the relevant rocks are: Tamperkola Granite,V2.8 Ga; Bonai Granite, V3.2 Ga; Singhbhum GraniteComplex, V3.1 Ga; OMTG, V3.3 Ga; OMG, V3.3 Ga.See text for geologic^lithologic details.
EPSL 7005 11-3-04
A. Saha et al. / Earth and Planetary Science Letters 220 (2004) 91^106 93
eral geological units (Fig. 1). The OMG, the old-est unit in this area, is similar in lithology to otherancient Archean terranes of the world by the ab-sence of ultrama¢c or komatiitic lavas [12], a sit-uation which is duplicated in the Slave and NorthChina cratons [21]. The OMG consists of domi-nantly pelitic schists with several thick bands ofpara-amphibolites, along with quartzite, quartz^sericite schist and quartz^magnetite^cummington-ite schist. These metasediments are extensively in-truded by sill-like ma¢c intrusives, now metamor-phosed to ortho-amphibolites and rare talc^tremolite and anthophyllite schists. Subhedraltourmaline grains and elongate-elliptical zirconare common accessories in these pelitic schists[12,22]. The tonalites of the OMTG, which in-trude the OMG, consist mainly of plagioclaseand quartz with biotite and occasional hornblende[11,13,15]. The Singhbhum Granite, varying frombasic granodiorite through adamellite to acid po-tassic granite, comprises plagioclase, quartz, or-thoclase, and chloritized hornblende and mica.The Bonai Granite crops out (Fig. 1) west ofthe Singhbhum Granite and is thought to be acontinuation of the Singhbhum Granite.The Iron Ore Group is to be found in the
northwest of the craton (Fig. 1) resting uncon-formably on a sequence of volcanic rocks. Bandedchert and jasper along with quartzite dominatepart of the Iron Ore Group sequence, while shaleand banded hematite quartzite with hematiteore dominate the other part of the sequence.Ferruginous clastic metasedimentary rocks includ-ing phyllite, tu¡ and chlorite^actinolite schistsare also signi¢cant members of the Iron OreGroup.
3.2. Petrology of the sandstones
Modal analysis of the sandstones of the BirtolaFormation was determined to characterize sourcerock composition and to facilitate the interpreta-tion of the trace element and isotopic data. Stan-dard petrographic thin-sections of fourteen sam-ples were used for point counting. Counts variedfrom 400^500 data points depending on the grainsize of the sandstones. The Gazzi^Dickinsonpoint-counting method [23] was used to make
possible comparisons with tectonic provenancemodels [24].The parameters for the modal point-count anal-
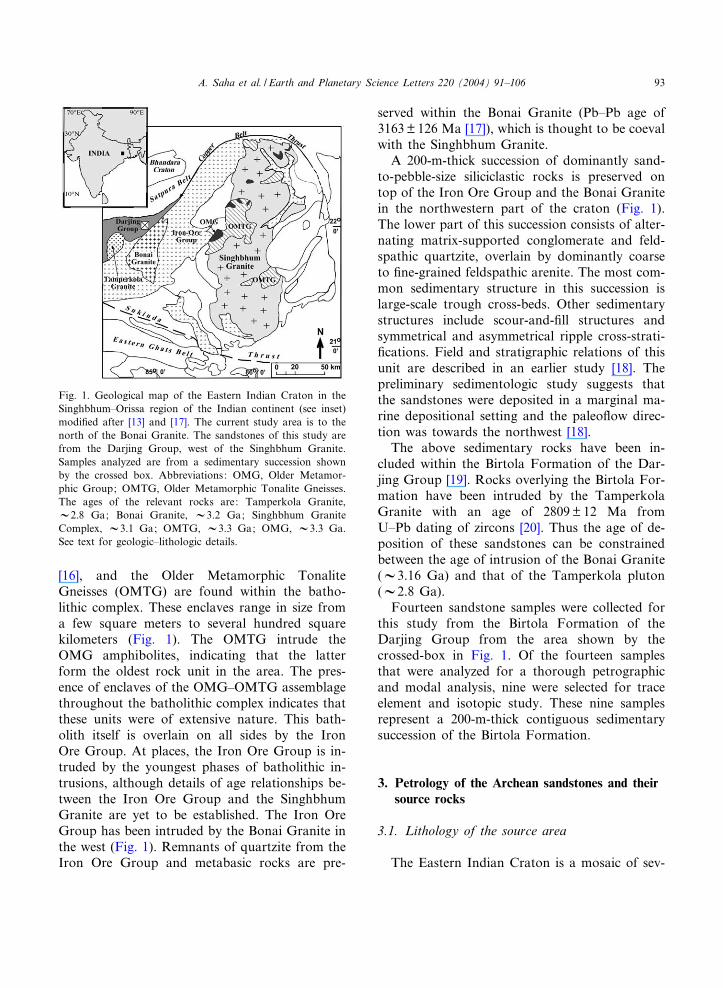
ysis are given in Table 1 along with the recalcu-lated data. Because a major conclusion of thisstudy, based on trace elements and Nd isotopes,is supported by the petrography of the sand-stones, the di¡erent constituents of the sandstonesare described below.(1) Monocrystalline quartz (Qm). Monocrystal-
line quartz, with undulose extinction, constitutesan average of V87% of the samples. Ubiquitousmarginal granulation and recrystallization causeddi⁄culty in assessing the original roundness ofthe quartz grains, but chloritic material border-ing some quartz grains preserves the originally
Table 1Results of point-counting of 14 thin-sections of sandstonesamples. 400^500 points were counted per sample
QFL data QmFLt data
Sample Q F L Qm F Lt
23/96 81.0 18.3 0.7 80.7 18.3 1.024/96 90.3 9.3 0.3 88.7 9.3 2.025/96 83.3 14.7 2.0 80.3 14.7 5.027/96 93.6 6.4 0.0 87.9 6.4 5.728/96 98.3 1.3 0.3 83.7 1.3 15.030/96 93.0 5.3 1.7 88.7 5.3 6.031/96 89.3 7.7 3.0 87.0 7.7 5.333/96 90.7 6.7 2.7 87.0 6.7 6.3P1/96 87.3 11.3 1.3 85.7 11.3 3.0P3/96 82.8 16.2 1.0 80.3 16.0 3.7P4/96 87.0 12.3 0.7 86.3 12.3 1.3P6/96 79.7 19.7 0.7 78.0 19.7 2.3PRM 88.3 11.0 0.7 85.0 11.0 4.0R/96 80.3 19.0 0.7 78.0 19.0 3.0Average 87.5 11.4 1.1 84.1 11.4 4.5Std. Dev. 5.6 5.6 0.9 3.9 5.6 3.5
The data are shown recalculated with respect to the endmembers of the ternary plots. Key: Qm=MonocrystallineQuartz; Qp=Polycrystalline Quartz; C=Chert; F=TotalFeldspar Grains; P=Plagioclase feldspars; K=Potash-feld-spar; L=Lithics. For QFL data: Q=Total quartzose grains( =Qm+Qp+C); F=Total Feldspar Grains ( = P+K); L=To-tal Lithic Grains ( =L). QFL%Q=100Q/(Q+F+L); QFL%F=100F/(Q+F+L); QFL%L=100L/(Q+F+L). For QmFLt data:Qm=Monocrystalline Quartz ( =Qm); F=Total FeldsparGrains ( =P+K); Lt =Total Lithic Grains including polycrys-talline quartz(=Qp+C+L) QmFLt%Qm =100Qm/(Qm+F+Lt);QmFLt%F=100F/(Qm+F+Lt); QmFLt%Lt= 100Lt/(Qm+F+Lt).
EPSL 7005 11-3-04
A. Saha et al. / Earth and Planetary Science Letters 220 (2004) 91^10694
rounded to sub-rounded nature of the grains. Theprobable sources of the quartz grains were theOMTG and possibly the Singhbhum Granite[25].(2) Polycrystalline quartz (Qp). Polycrystalline
quartz fragments make up an average of V2.5%of the samples counted. These grains show poly-gonized, crenulated and sutured boundaries. Mi-crocrystalline quartz grains and metachert (C)(usually 6 2%) occur as rounded clasts. Potentialsources of these polycrystalline grains are the sil-tites and cherts of the Iron Ore Group as well asOMG source terrane.(3) Feldspar (F). An average of 10% of the
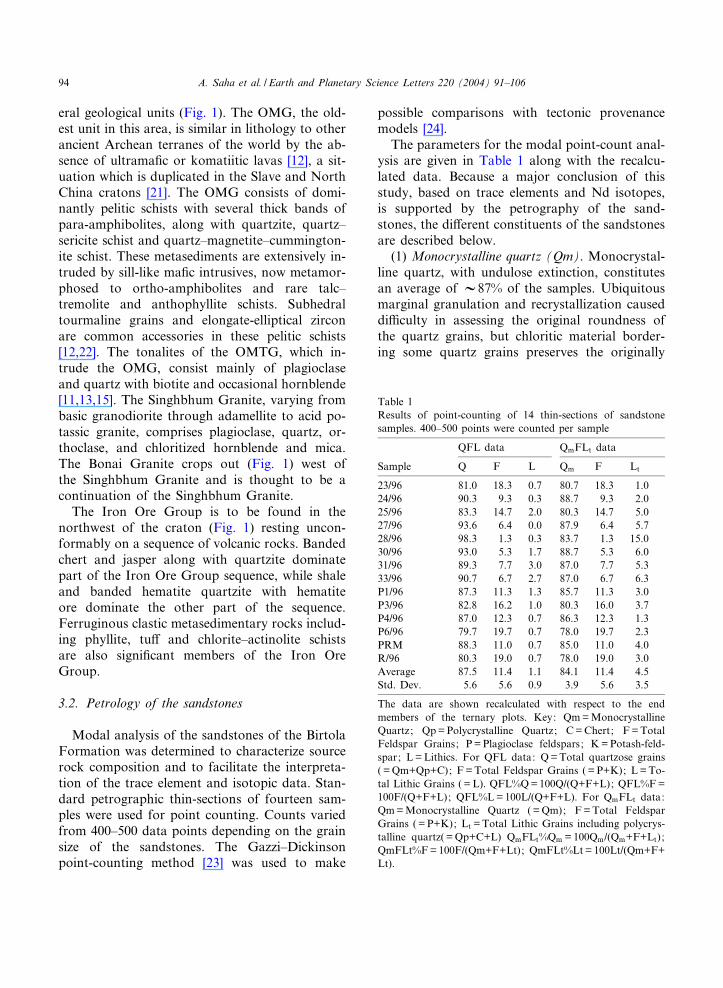
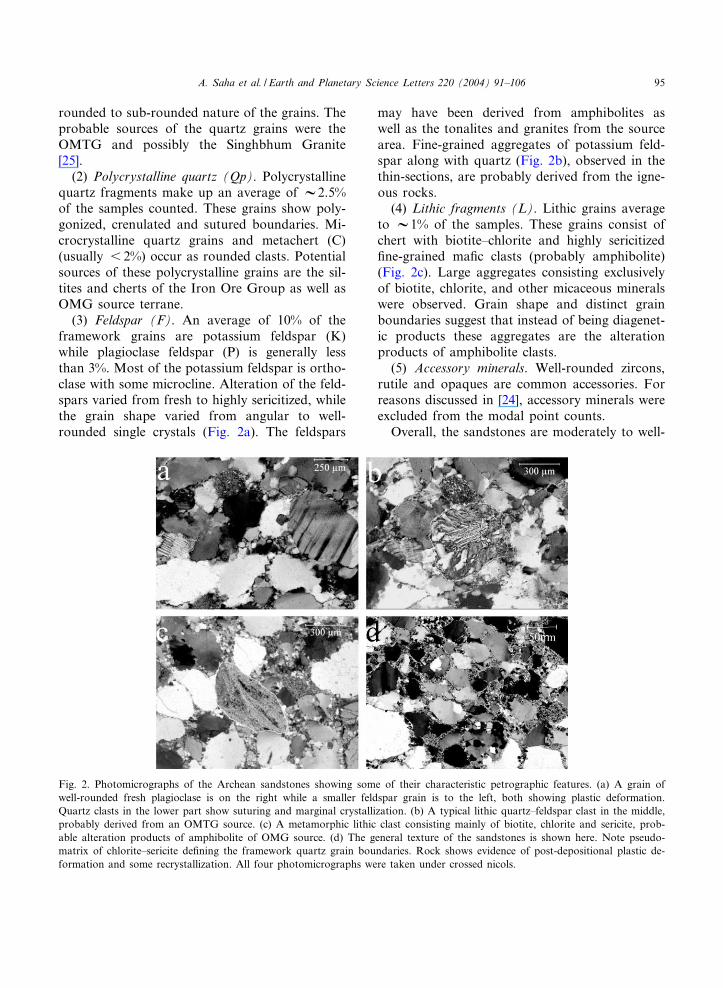
framework grains are potassium feldspar (K)while plagioclase feldspar (P) is generally lessthan 3%. Most of the potassium feldspar is ortho-clase with some microcline. Alteration of the feld-spars varied from fresh to highly sericitized, whilethe grain shape varied from angular to well-rounded single crystals (Fig. 2a). The feldspars
may have been derived from amphibolites aswell as the tonalites and granites from the sourcearea. Fine-grained aggregates of potassium feld-spar along with quartz (Fig. 2b), observed in thethin-sections, are probably derived from the igne-ous rocks.(4) Lithic fragments (L). Lithic grains average
to V1% of the samples. These grains consist ofchert with biotite^chlorite and highly sericitized¢ne-grained ma¢c clasts (probably amphibolite)(Fig. 2c). Large aggregates consisting exclusivelyof biotite, chlorite, and other micaceous mineralswere observed. Grain shape and distinct grainboundaries suggest that instead of being diagenet-ic products these aggregates are the alterationproducts of amphibolite clasts.(5) Accessory minerals. Well-rounded zircons,
rutile and opaques are common accessories. Forreasons discussed in [24], accessory minerals wereexcluded from the modal point counts.Overall, the sandstones are moderately to well-
Fig. 2. Photomicrographs of the Archean sandstones showing some of their characteristic petrographic features. (a) A grain ofwell-rounded fresh plagioclase is on the right while a smaller feldspar grain is to the left, both showing plastic deformation.Quartz clasts in the lower part show suturing and marginal crystallization. (b) A typical lithic quartz^feldspar clast in the middle,probably derived from an OMTG source. (c) A metamorphic lithic clast consisting mainly of biotite, chlorite and sericite, prob-able alteration products of amphibolite of OMG source. (d) The general texture of the sandstones is shown here. Note pseudo-matrix of chlorite^sericite de¢ning the framework quartz grain boundaries. Rock shows evidence of post-depositional plastic de-formation and some recrystallization. All four photomicrographs were taken under crossed nicols.
EPSL 7005 11-3-04
A. Saha et al. / Earth and Planetary Science Letters 220 (2004) 91^106 95
sorted with sub-angular to well-rounded grains.The cement in the sandstones is dominantlyquartzose. Most of the ‘pseudomatrix’ (1^25%),which consists of sericite and chlorite, formedfrom in situ alteration of clay minerals and lithicgrains. The matrix is not post depositional, as itexceeds the maximum volume of reported in¢l-trated material of 3^9% [26] and occludes porespace instead of forming grain coatings [27](Fig. 2d).Dissolution and decomposition of lithic grains
during and after the diagenesis of sandstones canincrease the amount of matrix [28^30]. This isparticularly important for ancient sedimentaryrocks that have undergone advanced diagenesis.In the sandstones of this study there is variableamount of pseudomatrix, all showing chloritegrade of metamorphism. The sandstones also ex-hibit pressure solutions (Fig. 2d). Assuming thatthe entire matrix was derived from lithic clasts,recalculating the matrix into lithic grains in thepoint counting would increase the modal amountof the lithics (2^15%) [29]. The e¡ect of this re-calculation is discussed below.
3.3. Modal sand composition
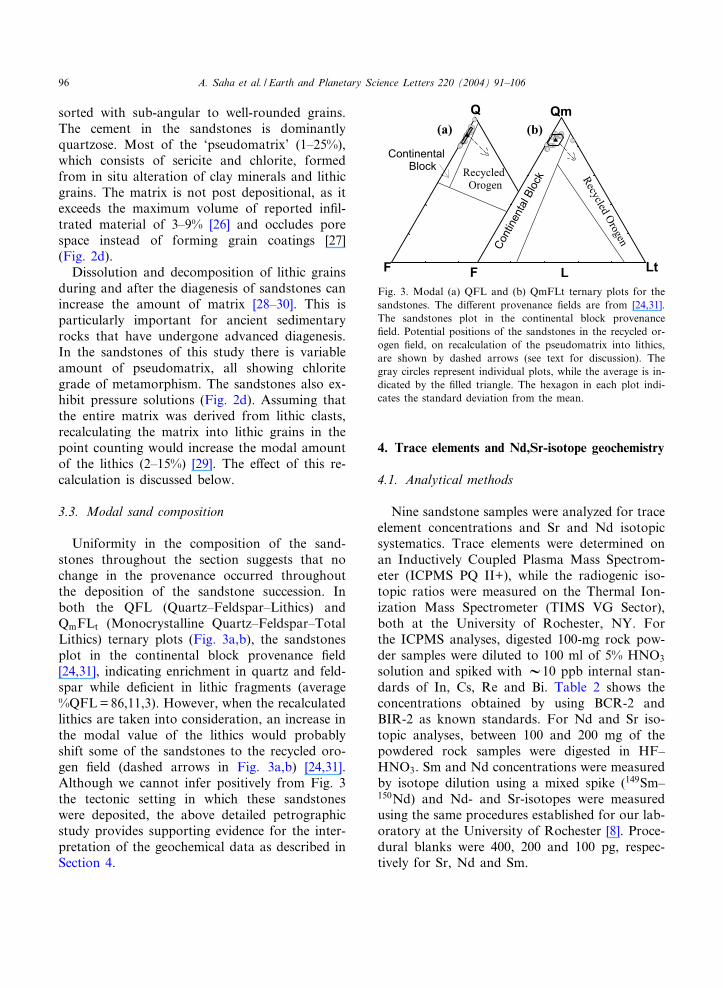
Uniformity in the composition of the sand-stones throughout the section suggests that nochange in the provenance occurred throughoutthe deposition of the sandstone succession. Inboth the QFL (Quartz^Feldspar^Lithics) andQmFLt (Monocrystalline Quartz^Feldspar^TotalLithics) ternary plots (Fig. 3a,b), the sandstonesplot in the continental block provenance ¢eld[24,31], indicating enrichment in quartz and feld-spar while de¢cient in lithic fragments (average%QFL=86,11,3). However, when the recalculatedlithics are taken into consideration, an increase inthe modal value of the lithics would probablyshift some of the sandstones to the recycled oro-gen ¢eld (dashed arrows in Fig. 3a,b) [24,31].Although we cannot infer positively from Fig. 3the tectonic setting in which these sandstoneswere deposited, the above detailed petrographicstudy provides supporting evidence for the inter-pretation of the geochemical data as described inSection 4.
4. Trace elements and Nd,Sr-isotope geochemistry
4.1. Analytical methods
Nine sandstone samples were analyzed for traceelement concentrations and Sr and Nd isotopicsystematics. Trace elements were determined onan Inductively Coupled Plasma Mass Spectrom-eter (ICPMS PQ II+), while the radiogenic iso-topic ratios were measured on the Thermal Ion-ization Mass Spectrometer (TIMS VG Sector),both at the University of Rochester, NY. Forthe ICPMS analyses, digested 100-mg rock pow-der samples were diluted to 100 ml of 5% HNO3solution and spiked with V10 ppb internal stan-dards of In, Cs, Re and Bi. Table 2 shows theconcentrations obtained by using BCR-2 andBIR-2 as known standards. For Nd and Sr iso-topic analyses, between 100 and 200 mg of thepowdered rock samples were digested in HF^HNO3. Sm and Nd concentrations were measuredby isotope dilution using a mixed spike (149Sm^150Nd) and Nd- and Sr-isotopes were measuredusing the same procedures established for our lab-oratory at the University of Rochester [8]. Proce-dural blanks were 400, 200 and 100 pg, respec-tively for Sr, Nd and Sm.
Fig. 3. Modal (a) QFL and (b) QmFLt ternary plots for thesandstones. The di¡erent provenance ¢elds are from [24,31].The sandstones plot in the continental block provenance¢eld. Potential positions of the sandstones in the recycled or-ogen ¢eld, on recalculation of the pseudomatrix into lithics,are shown by dashed arrows (see text for discussion). Thegray circles represent individual plots, while the average is in-dicated by the ¢lled triangle. The hexagon in each plot indi-cates the standard deviation from the mean.
EPSL 7005 11-3-04
A. Saha et al. / Earth and Planetary Science Letters 220 (2004) 91^10696
4.2. Trace element geochemistry
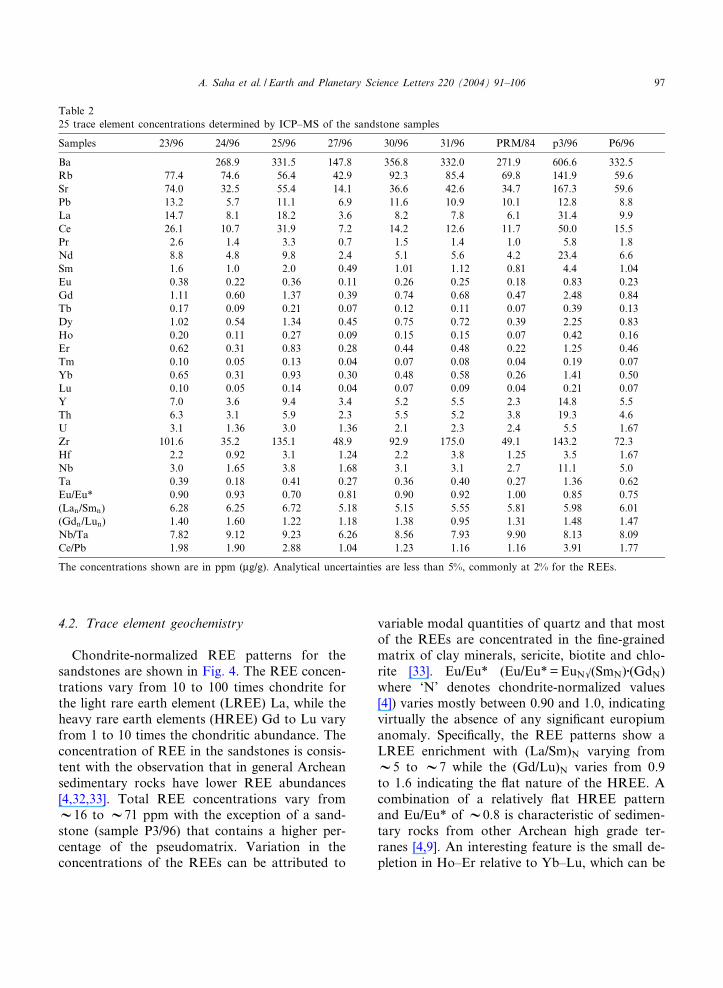
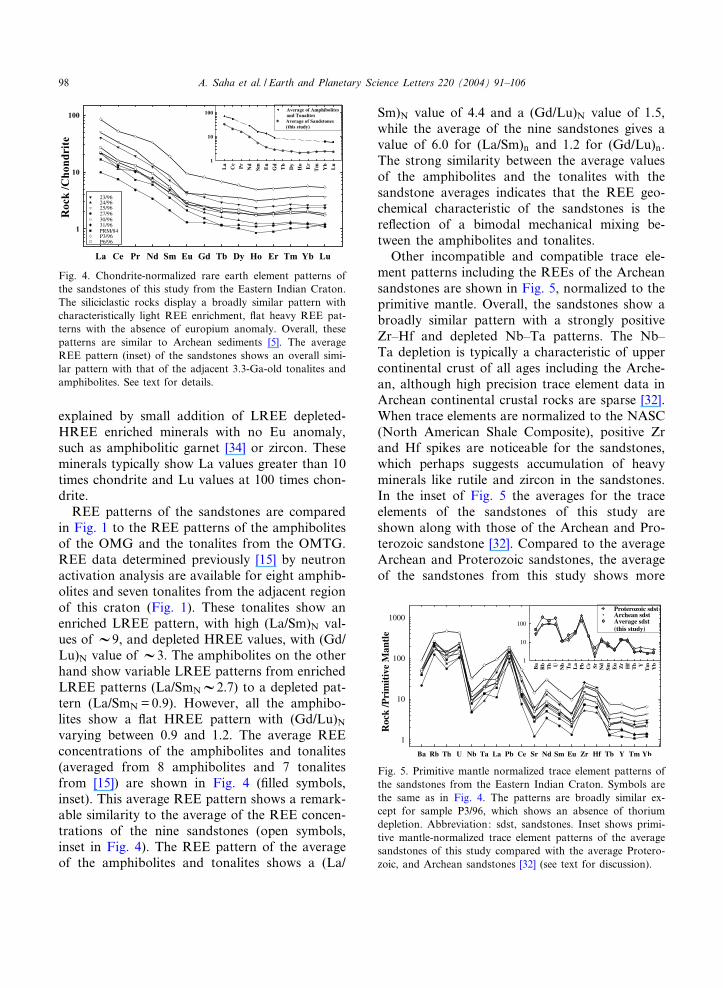
Chondrite-normalized REE patterns for thesandstones are shown in Fig. 4. The REE concen-trations vary from 10 to 100 times chondrite forthe light rare earth element (LREE) La, while theheavy rare earth elements (HREE) Gd to Lu varyfrom 1 to 10 times the chondritic abundance. Theconcentration of REE in the sandstones is consis-tent with the observation that in general Archeansedimentary rocks have lower REE abundances[4,32,33]. Total REE concentrations vary fromV16 to V71 ppm with the exception of a sand-stone (sample P3/96) that contains a higher per-centage of the pseudomatrix. Variation in theconcentrations of the REEs can be attributed to
variable modal quantities of quartz and that mostof the REEs are concentrated in the ¢ne-grainedmatrix of clay minerals, sericite, biotite and chlo-rite [33]. Eu/Eu* (Eu/Eu*=EuNk(SmN)W(GdN)where ‘N’ denotes chondrite-normalized values[4]) varies mostly between 0.90 and 1.0, indicatingvirtually the absence of any signi¢cant europiumanomaly. Speci¢cally, the REE patterns show aLREE enrichment with (La/Sm)N varying fromV5 to V7 while the (Gd/Lu)N varies from 0.9to 1.6 indicating the £at nature of the HREE. Acombination of a relatively £at HREE patternand Eu/Eu* of V0.8 is characteristic of sedimen-tary rocks from other Archean high grade ter-ranes [4,9]. An interesting feature is the small de-pletion in Ho^Er relative to Yb^Lu, which can be
Table 225 trace element concentrations determined by ICP^MS of the sandstone samples
Samples 23/96 24/96 25/96 27/96 30/96 31/96 PRM/84 p3/96 P6/96
Ba 268.9 331.5 147.8 356.8 332.0 271.9 606.6 332.5Rb 77.4 74.6 56.4 42.9 92.3 85.4 69.8 141.9 59.6Sr 74.0 32.5 55.4 14.1 36.6 42.6 34.7 167.3 59.6Pb 13.2 5.7 11.1 6.9 11.6 10.9 10.1 12.8 8.8La 14.7 8.1 18.2 3.6 8.2 7.8 6.1 31.4 9.9Ce 26.1 10.7 31.9 7.2 14.2 12.6 11.7 50.0 15.5Pr 2.6 1.4 3.3 0.7 1.5 1.4 1.0 5.8 1.8Nd 8.8 4.8 9.8 2.4 5.1 5.6 4.2 23.4 6.6Sm 1.6 1.0 2.0 0.49 1.01 1.12 0.81 4.4 1.04Eu 0.38 0.22 0.36 0.11 0.26 0.25 0.18 0.83 0.23Gd 1.11 0.60 1.37 0.39 0.74 0.68 0.47 2.48 0.84Tb 0.17 0.09 0.21 0.07 0.12 0.11 0.07 0.39 0.13Dy 1.02 0.54 1.34 0.45 0.75 0.72 0.39 2.25 0.83Ho 0.20 0.11 0.27 0.09 0.15 0.15 0.07 0.42 0.16Er 0.62 0.31 0.83 0.28 0.44 0.48 0.22 1.25 0.46Tm 0.10 0.05 0.13 0.04 0.07 0.08 0.04 0.19 0.07Yb 0.65 0.31 0.93 0.30 0.48 0.58 0.26 1.41 0.50Lu 0.10 0.05 0.14 0.04 0.07 0.09 0.04 0.21 0.07Y 7.0 3.6 9.4 3.4 5.2 5.5 2.3 14.8 5.5Th 6.3 3.1 5.9 2.3 5.5 5.2 3.8 19.3 4.6U 3.1 1.36 3.0 1.36 2.1 2.3 2.4 5.5 1.67Zr 101.6 35.2 135.1 48.9 92.9 175.0 49.1 143.2 72.3Hf 2.2 0.92 3.1 1.24 2.2 3.8 1.25 3.5 1.67Nb 3.0 1.65 3.8 1.68 3.1 3.1 2.7 11.1 5.0Ta 0.39 0.18 0.41 0.27 0.36 0.40 0.27 1.36 0.62Eu/Eu* 0.90 0.93 0.70 0.81 0.90 0.92 1.00 0.85 0.75(Lan/Smn) 6.28 6.25 6.72 5.18 5.15 5.55 5.81 5.98 6.01(Gdn/Lun) 1.40 1.60 1.22 1.18 1.38 0.95 1.31 1.48 1.47Nb/Ta 7.82 9.12 9.23 6.26 8.56 7.93 9.90 8.13 8.09Ce/Pb 1.98 1.90 2.88 1.04 1.23 1.16 1.16 3.91 1.77
The concentrations shown are in ppm (Wg/g). Analytical uncertainties are less than 5%, commonly at 2% for the REEs.
EPSL 7005 11-3-04
A. Saha et al. / Earth and Planetary Science Letters 220 (2004) 91^106 97
explained by small addition of LREE depleted-HREE enriched minerals with no Eu anomaly,such as amphibolitic garnet [34] or zircon. Theseminerals typically show La values greater than 10times chondrite and Lu values at 100 times chon-drite.REE patterns of the sandstones are compared
in Fig. 1 to the REE patterns of the amphibolitesof the OMG and the tonalites from the OMTG.REE data determined previously [15] by neutronactivation analysis are available for eight amphib-olites and seven tonalites from the adjacent regionof this craton (Fig. 1). These tonalites show anenriched LREE pattern, with high (La/Sm)N val-ues ofV9, and depleted HREE values, with (Gd/Lu)N value ofV3. The amphibolites on the otherhand show variable LREE patterns from enrichedLREE patterns (La/SmNV2.7) to a depleted pat-tern (La/SmN =0.9). However, all the amphibo-lites show a £at HREE pattern with (Gd/Lu)Nvarying between 0.9 and 1.2. The average REEconcentrations of the amphibolites and tonalites(averaged from 8 amphibolites and 7 tonalitesfrom [15]) are shown in Fig. 4 (¢lled symbols,inset). This average REE pattern shows a remark-able similarity to the average of the REE concen-trations of the nine sandstones (open symbols,inset in Fig. 4). The REE pattern of the averageof the amphibolites and tonalites shows a (La/
Sm)N value of 4.4 and a (Gd/Lu)N value of 1.5,while the average of the nine sandstones gives avalue of 6.0 for (La/Sm)n and 1.2 for (Gd/Lu)n.The strong similarity between the average valuesof the amphibolites and the tonalites with thesandstone averages indicates that the REE geo-chemical characteristic of the sandstones is there£ection of a bimodal mechanical mixing be-tween the amphibolites and tonalites.Other incompatible and compatible trace ele-
ment patterns including the REEs of the Archeansandstones are shown in Fig. 5, normalized to theprimitive mantle. Overall, the sandstones show abroadly similar pattern with a strongly positiveZr^Hf and depleted Nb^Ta patterns. The Nb^Ta depletion is typically a characteristic of uppercontinental crust of all ages including the Arche-an, although high precision trace element data inArchean continental crustal rocks are sparse [32].When trace elements are normalized to the NASC(North American Shale Composite), positive Zrand Hf spikes are noticeable for the sandstones,which perhaps suggests accumulation of heavyminerals like rutile and zircon in the sandstones.In the inset of Fig. 5 the averages for the traceelements of the sandstones of this study areshown along with those of the Archean and Pro-terozoic sandstone [32]. Compared to the averageArchean and Proterozoic sandstones, the averageof the sandstones from this study shows more
Fig. 4. Chondrite-normalized rare earth element patterns ofthe sandstones of this study from the Eastern Indian Craton.The siliciclastic rocks display a broadly similar pattern withcharacteristically light REE enrichment, £at heavy REE pat-terns with the absence of europium anomaly. Overall, thesepatterns are similar to Archean sediments [5]. The averageREE pattern (inset) of the sandstones shows an overall simi-lar pattern with that of the adjacent 3.3-Ga-old tonalites andamphibolites. See text for details.
Fig. 5. Primitive mantle normalized trace element patterns ofthe sandstones from the Eastern Indian Craton. Symbols arethe same as in Fig. 4. The patterns are broadly similar ex-cept for sample P3/96, which shows an absence of thoriumdepletion. Abbreviation: sdst, sandstones. Inset shows primi-tive mantle-normalized trace element patterns of the averagesandstones of this study compared with the average Protero-zoic, and Archean sandstones [32] (see text for discussion).
EPSL 7005 11-3-04
A. Saha et al. / Earth and Planetary Science Letters 220 (2004) 91^10698
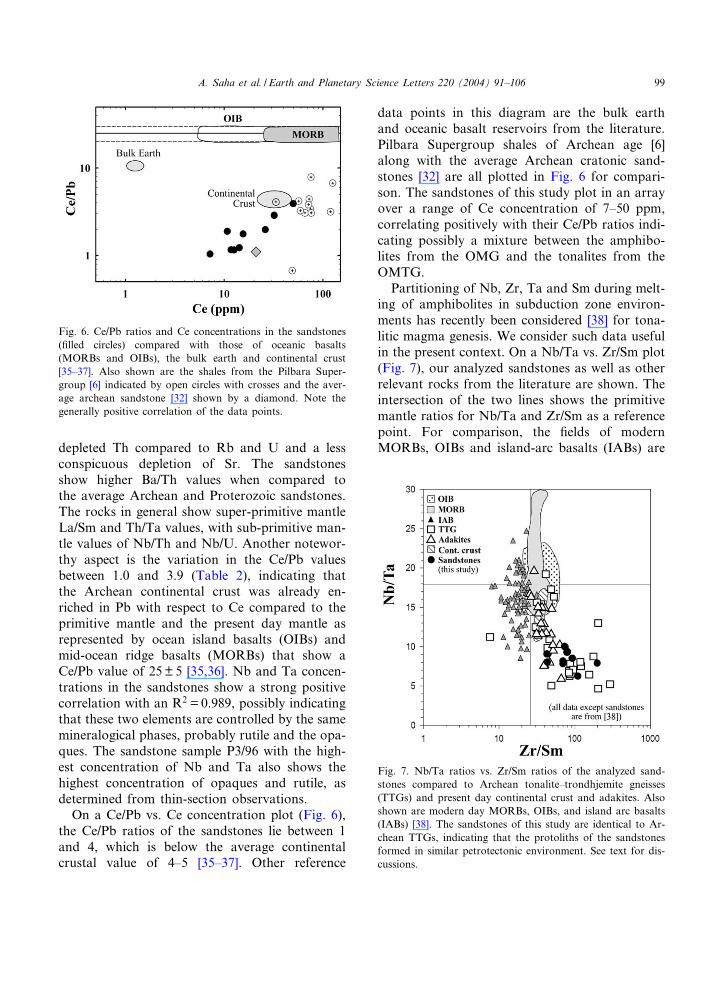
depleted Th compared to Rb and U and a lessconspicuous depletion of Sr. The sandstonesshow higher Ba/Th values when compared tothe average Archean and Proterozoic sandstones.The rocks in general show super-primitive mantleLa/Sm and Th/Ta values, with sub-primitive man-tle values of Nb/Th and Nb/U. Another notewor-thy aspect is the variation in the Ce/Pb valuesbetween 1.0 and 3.9 (Table 2), indicating thatthe Archean continental crust was already en-riched in Pb with respect to Ce compared to theprimitive mantle and the present day mantle asrepresented by ocean island basalts (OIBs) andmid-ocean ridge basalts (MORBs) that show aCe/Pb value of 25P 5 [35,36]. Nb and Ta concen-trations in the sandstones show a strong positivecorrelation with an R2 = 0.989, possibly indicatingthat these two elements are controlled by the samemineralogical phases, probably rutile and the opa-ques. The sandstone sample P3/96 with the high-est concentration of Nb and Ta also shows thehighest concentration of opaques and rutile, asdetermined from thin-section observations.On a Ce/Pb vs. Ce concentration plot (Fig. 6),
the Ce/Pb ratios of the sandstones lie between 1and 4, which is below the average continentalcrustal value of 4^5 [35^37]. Other reference
data points in this diagram are the bulk earthand oceanic basalt reservoirs from the literature.Pilbara Supergroup shales of Archean age [6]along with the average Archean cratonic sand-stones [32] are all plotted in Fig. 6 for compari-son. The sandstones of this study plot in an arrayover a range of Ce concentration of 7^50 ppm,correlating positively with their Ce/Pb ratios indi-cating possibly a mixture between the amphibo-lites from the OMG and the tonalites from theOMTG.Partitioning of Nb, Zr, Ta and Sm during melt-
ing of amphibolites in subduction zone environ-ments has recently been considered [38] for tona-litic magma genesis. We consider such data usefulin the present context. On a Nb/Ta vs. Zr/Sm plot(Fig. 7), our analyzed sandstones as well as otherrelevant rocks from the literature are shown. Theintersection of the two lines shows the primitivemantle ratios for Nb/Ta and Zr/Sm as a referencepoint. For comparison, the ¢elds of modernMORBs, OIBs and island-arc basalts (IABs) are
Fig. 6. Ce/Pb ratios and Ce concentrations in the sandstones(¢lled circles) compared with those of oceanic basalts(MORBs and OIBs), the bulk earth and continental crust[35^37]. Also shown are the shales from the Pilbara Super-group [6] indicated by open circles with crosses and the aver-age archean sandstone [32] shown by a diamond. Note thegenerally positive correlation of the data points.
Fig. 7. Nb/Ta ratios vs. Zr/Sm ratios of the analyzed sand-stones compared to Archean tonalite^trondhjemite gneisses(TTGs) and present day continental crust and adakites. Alsoshown are modern day MORBs, OIBs, and island arc basalts(IABs) [38]. The sandstones of this study are identical to Ar-chean TTGs, indicating that the protoliths of the sandstonesformed in similar petrotectonic environment. See text for dis-cussions.
EPSL 7005 11-3-04
A. Saha et al. / Earth and Planetary Science Letters 220 (2004) 91^106 99
shown from the literature [38]. The early conti-nental crust represented by trondhjemite^tona-lite^granodiorite gneisses (TTG) as well as mod-ern adakites and continental crust lie in the lowerright quadrant having sub-primitive mantle Nb/Ta ratios and super-primitive mantle Zr/Sm ratios[38]. The sandstones fall in the lower right quad-rant, remarkably identical to the Archean TTGhaving lower Nb/Ta and higher Zr/Sm values.
4.3. Nd and Sr isotopes
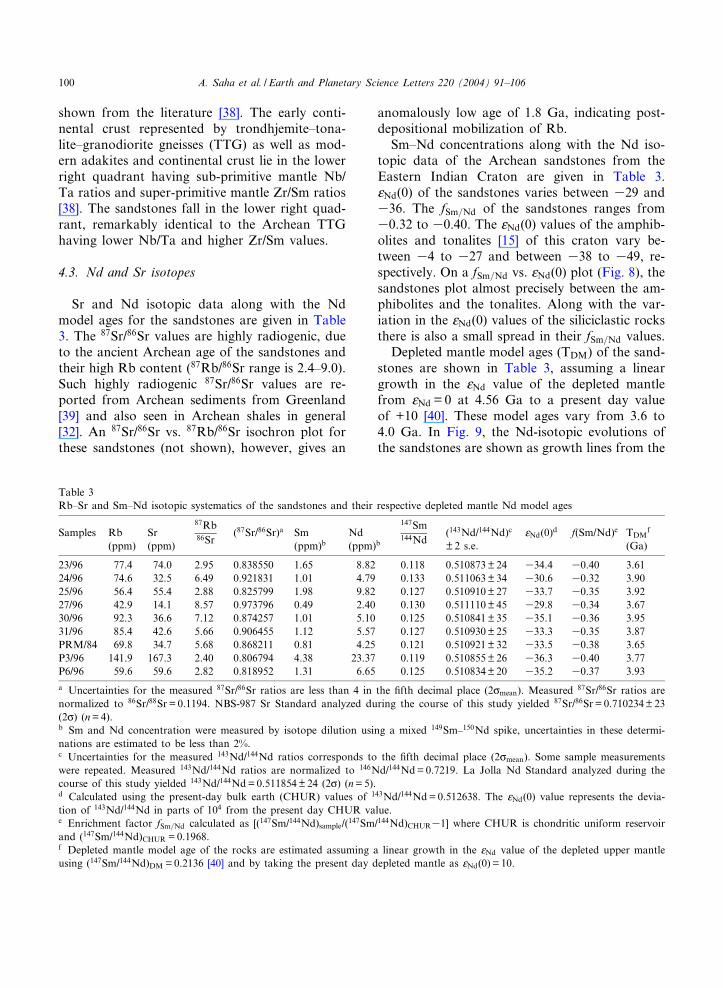
Sr and Nd isotopic data along with the Ndmodel ages for the sandstones are given in Table3. The 87Sr/86Sr values are highly radiogenic, dueto the ancient Archean age of the sandstones andtheir high Rb content (87Rb/86Sr range is 2.4^9.0).Such highly radiogenic 87Sr/86Sr values are re-ported from Archean sediments from Greenland[39] and also seen in Archean shales in general[32]. An 87Sr/86Sr vs. 87Rb/86Sr isochron plot forthese sandstones (not shown), however, gives an
anomalously low age of 1.8 Ga, indicating post-depositional mobilization of Rb.Sm^Nd concentrations along with the Nd iso-
topic data of the Archean sandstones from theEastern Indian Craton are given in Table 3.ONd(0) of the sandstones varies between 329 and336. The fSm=Nd of the sandstones ranges from30.32 to 30.40. The ONd(0) values of the amphib-olites and tonalites [15] of this craton vary be-tween 34 to 327 and between 338 to 349, re-spectively. On a fSm=Nd vs. ONd(0) plot (Fig. 8), thesandstones plot almost precisely between the am-phibolites and the tonalites. Along with the var-iation in the ONd(0) values of the siliciclastic rocksthere is also a small spread in their fSm=Nd values.Depleted mantle model ages (TDM) of the sand-
stones are shown in Table 3, assuming a lineargrowth in the ONd value of the depleted mantlefrom ONd = 0 at 4.56 Ga to a present day valueof +10 [40]. These model ages vary from 3.6 to4.0 Ga. In Fig. 9, the Nd-isotopic evolutions ofthe sandstones are shown as growth lines from the
Table 3Rb^Sr and Sm^Nd isotopic systematics of the sandstones and their respective depleted mantle Nd model ages
Samples Rb(ppm)
Sr(ppm)
87Rb86Sr
(87Sr/86Sr)a Sm(ppm)b
Nd(ppm)b
147Sm144Nd
(143Nd/144Nd)c
P 2 s.e.ONd(0)d f(Sm/Nd)e TDMf
(Ga)
23/96 77.4 74.0 2.95 0.838550 1.65 8.82 0.118 0.510873P 24 334.4 30.40 3.6124/96 74.6 32.5 6.49 0.921831 1.01 4.79 0.133 0.511063P 34 330.6 30.32 3.9025/96 56.4 55.4 2.88 0.825799 1.98 9.82 0.127 0.510910P 27 333.7 30.35 3.9227/96 42.9 14.1 8.57 0.973796 0.49 2.40 0.130 0.511110P 45 329.8 30.34 3.6730/96 92.3 36.6 7.12 0.874257 1.01 5.10 0.125 0.510841P 35 335.1 30.36 3.9531/96 85.4 42.6 5.66 0.906455 1.12 5.57 0.127 0.510930P 25 333.3 30.35 3.87PRM/84 69.8 34.7 5.68 0.868211 0.81 4.25 0.121 0.510921P 32 333.5 30.38 3.65P3/96 141.9 167.3 2.40 0.806794 4.38 23.37 0.119 0.510855P 26 336.3 30.40 3.77P6/96 59.6 59.6 2.82 0.818952 1.31 6.65 0.125 0.510834P 20 335.2 30.37 3.93a Uncertainties for the measured 87Sr/86Sr ratios are less than 4 in the ¢fth decimal place (2cmean). Measured 87Sr/86Sr ratios arenormalized to 86Sr/88Sr= 0.1194. NBS-987 Sr Standard analyzed during the course of this study yielded 87Sr/86Sr= 0.710234P 23(2c) (n=4).b Sm and Nd concentration were measured by isotope dilution using a mixed 149Sm^150Nd spike, uncertainties in these determi-nations are estimated to be less than 2%.c Uncertainties for the measured 143Nd/144Nd ratios corresponds to the ¢fth decimal place (2cmean). Some sample measurementswere repeated. Measured 143Nd/144Nd ratios are normalized to 146Nd/144Nd= 0.7219. La Jolla Nd Standard analyzed during thecourse of this study yielded 143Nd/144Nd=0.511854P 24 (2c) (n=5).d Calculated using the present-day bulk earth (CHUR) values of 143Nd/144Nd=0.512638. The ONd(0) value represents the devia-tion of 143Nd/144Nd in parts of 104 from the present day CHUR value.e Enrichment factor fSm=Nd calculated as [(147Sm/144Nd)sample/(147Sm/144Nd)CHUR31] where CHUR is chondritic uniform reservoirand (147Sm/144Nd)CHUR = 0.1968.f Depleted mantle model age of the rocks are estimated assuming a linear growth in the ONd value of the depleted upper mantleusing (147Sm/144Nd)DM =0.2136 [40] and by taking the present day depleted mantle as ONd(0) = 10.
EPSL 7005 11-3-04
A. Saha et al. / Earth and Planetary Science Letters 220 (2004) 91^106100
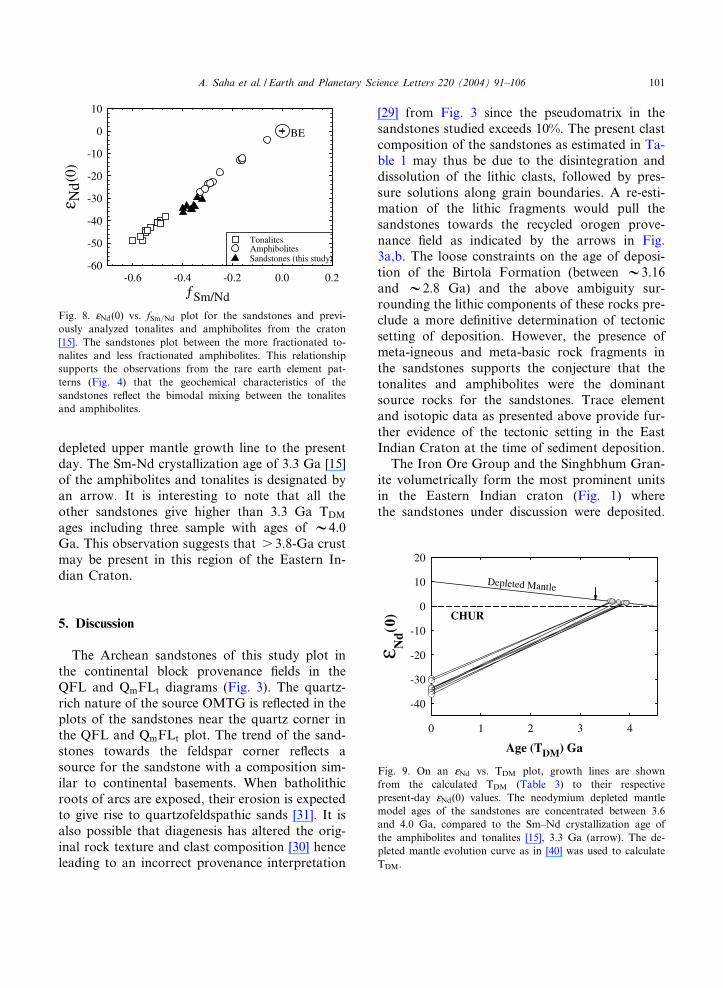
depleted upper mantle growth line to the presentday. The Sm-Nd crystallization age of 3.3 Ga [15]of the amphibolites and tonalites is designated byan arrow. It is interesting to note that all theother sandstones give higher than 3.3 Ga TDMages including three sample with ages of V4.0Ga. This observation suggests that s 3.8-Ga crustmay be present in this region of the Eastern In-dian Craton.
5. Discussion
The Archean sandstones of this study plot inthe continental block provenance ¢elds in theQFL and QmFLt diagrams (Fig. 3). The quartz-rich nature of the source OMTG is re£ected in theplots of the sandstones near the quartz corner inthe QFL and QmFLt plot. The trend of the sand-stones towards the feldspar corner re£ects asource for the sandstone with a composition sim-ilar to continental basements. When batholithicroots of arcs are exposed, their erosion is expectedto give rise to quartzofeldspathic sands [31]. It isalso possible that diagenesis has altered the orig-inal rock texture and clast composition [30] henceleading to an incorrect provenance interpretation
[29] from Fig. 3 since the pseudomatrix in thesandstones studied exceeds 10%. The present clastcomposition of the sandstones as estimated in Ta-ble 1 may thus be due to the disintegration anddissolution of the lithic clasts, followed by pres-sure solutions along grain boundaries. A re-esti-mation of the lithic fragments would pull thesandstones towards the recycled orogen prove-nance ¢eld as indicated by the arrows in Fig.3a,b. The loose constraints on the age of deposi-tion of the Birtola Formation (between V3.16and V2.8 Ga) and the above ambiguity sur-rounding the lithic components of these rocks pre-clude a more de¢nitive determination of tectonicsetting of deposition. However, the presence ofmeta-igneous and meta-basic rock fragments inthe sandstones supports the conjecture that thetonalites and amphibolites were the dominantsource rocks for the sandstones. Trace elementand isotopic data as presented above provide fur-ther evidence of the tectonic setting in the EastIndian Craton at the time of sediment deposition.The Iron Ore Group and the Singhbhum Gran-
ite volumetrically form the most prominent unitsin the Eastern Indian craton (Fig. 1) wherethe sandstones under discussion were deposited.
Fig. 8. ONd(0) vs. fSm=Nd plot for the sandstones and previ-ously analyzed tonalites and amphibolites from the craton[15]. The sandstones plot between the more fractionated to-nalites and less fractionated amphibolites. This relationshipsupports the observations from the rare earth element pat-terns (Fig. 4) that the geochemical characteristics of thesandstones re£ect the bimodal mixing between the tonalitesand amphibolites.
Fig. 9. On an ONd vs. TDM plot, growth lines are shownfrom the calculated TDM (Table 3) to their respectivepresent-day ONd(0) values. The neodymium depleted mantlemodel ages of the sandstones are concentrated between 3.6and 4.0 Ga, compared to the Sm^Nd crystallization age ofthe amphibolites and tonalites [15], 3.3 Ga (arrow). The de-pleted mantle evolution curve as in [40] was used to calculateTDM.
EPSL 7005 11-3-04
A. Saha et al. / Earth and Planetary Science Letters 220 (2004) 91^106 101
Banded Iron Formation (BIF) and associatedmetavolcanic and metasedimentary rocks consti-tute the Iron Ore Group. Trace element concen-trations of representative samples of BIF, quartz-ite and iron ores from this region are reported in[41]. Normalized REE patterns of quartzite andbanded quartz magnetite show pronounced nega-tive Eu anomalies while the BIF and iron oresshow negative Ce anomalies. Metavolcanic rocksof the Iron Ore Group also show a strong nega-tive Eu anomaly (our unpublished data). Volcanicrocks from the Iron Ore Group are known todisplay two types of REE patterns [42] : a £atpattern with a positive Eu anomaly, and anotherwith LREE enrichment and a strong negative Euanomaly. The Singhbhum Granite batholith, con-sisting of three phases of intrusion, displays in itsthird phase, constituting the major part of thepluton, a LREE enriched pattern with a strongnegative Eu anomaly [13,16,17]. The Bonai Gran-ite (Fig. 1), above which the sandstones were de-posited, has an REE pattern similar to this thirdphase [17].The REE patterns of the sandstones show an
enriched LREE and a relatively £at HREE pat-tern with no Eu anomaly. If the granitoids or theIron Ore Group rocks of the craton contributedsigni¢cantly as a major source of the sandstones,an Eu anomaly would certainly be discernible inthese sandstones. Ce anomalies are also absentfrom the sandstones. Thus from the REE distri-bution patterns alone, we infer that the granitoidsand the Iron Ore Group of the craton were notpossible contributors to the sandstones of thisstudy. This inference is also supported by thesandstone petrography, which shows a low abun-dance of metasedimentary lithic clasts, ruling outsedimentary members of the Iron Ore Group.The REE patterns of the sandstones, amphib-
olites and tonalites reported here are similar tothose demonstrated by turbidites from Archeangreenstone belts [9,43]. The average of the tonaliteand amphibolite REE patterns shows a strongsimilarity with the average sandstone. The di¡er-ence between the average of REE concentrationsof the tonalites and amphibolites, and the sand-stones is probably due to the dilution e¡ect ofquartz in the sandstones. The presence of poly-
crystalline quartz (V1^5%) indicates that theIron Ore Group metacherts and metaquartzites(Fig. 1) may have provided minor contributionsto the sandstones, without a¡ecting the REE pat-terns.Sandstones are more likely to be a¡ected by
mineral sorting [9] than ¢ne-grained sedimentaryrocks like shales. This would be re£ected in theREE patterns of the sandstones. Sandstones ana-lyzed for this study di¡er in grain size from coarseto very ¢ne-grained. However, all the sandstonesshow similar REE patterns, indicating that theheavy mineral sorting, if present, a¡ected all thesamples in a similar manner, regardless of theirgrain-size.Comparisons of the primitive mantle-normal-
ized incompatible and compatible trace elementpatterns of the sandstones with that of the aver-age Archean and Proterozoic sandstones show abroad similarity in their patterns. The higher Ba/Th values in the sandstones from this study, alongwith their less conspicuous Sr depletion, com-pared to the average Archean and Proterozoicsandstones [32] could be due to the presence ofmore modal feldspars in these sandstones, as ob-served petrographically (Fig. 2a).The fSm=Nd vs. the ONd(0) plot of Fig. 8 clearly
shows that the sandstones fall between the am-phibolite and tonalite data [15]. Because theserocks have undergone little metamorphism, themobility of the REEs [44] of the sandstones wasprobably negligible. Thus Sm^Nd isotope system-atics data are consistent with the interpretationthat the sandstones are a result of bimodal mixingbetween the tonalites and the amphibolites. Thisobservation supports the inference that the REEand other immobile element characteristics of thesandstones re£ect the geochemical signatures oftheir protoliths, the amphibolites and tonalites,providing information on the tectonic setting forthe formation of these source rocks.Ce/Pb vs. the Ce concentration data (Fig. 6)
show that the Archean shales from the Pilbara(3.4^2.7 Ga) craton [6] as well as the sandstonesof this study do not fall within the ¢eld ofpresent-day continental crust [35^37]. The factthat present-day continental crust has a Ce/Pbvalue of around 4 compared to some demonstra-
EPSL 7005 11-3-04
A. Saha et al. / Earth and Planetary Science Letters 220 (2004) 91^106102
bly lower value in the Archean, such as in thesandstones of this study (Fig. 6), is noteworthy.This observation should provide constraints forrecent discussions regarding the preferential par-titioning of Pb, apparently by a continuing geo-logical process, from mantle into the continentalcrust via some non-magmatic transfer of mantlePb into the subduction zone magmas [35].Incompatible trace element patterns of the
sandstones (Fig. 5) show a distinct Nb, and inmost samples, also a Ta depletion with respectto Ba and La when normalized to the primitivemantle. Such a Nb^Ta depletion is characteristicof present-day island arc magmas and is also evi-dent in many sandstones of Archean and Prote-rozoic ages [32]. As already demonstrated in thisstudy, the geochemical properties of the sand-stones from the Eastern Indian Craton representthe geochemical signatures of their speci¢c sourcerocks, the amphibolites and tonalites. Thereforethe Nb^Ta depletion was also present in these3.3-Ga-old amphibolites and tonalites. Such aNb and Ta depletion in the amphibolites and to-nalites can thus be attributed to their formation ina subduction setting, similar to other Archeanterranes that are believed to have formed by sub-duction accretion [1,5,21]. The super-primitivemantle La/Sm, Zr/Sm and Th/Ta ratios coupledwith the sub-primitive mantle Nb/Th, Nb/Ta andNb/U ratios of the sandstone^protoliths (Figs. 5and 7) indicate slab-induced melting [1,2]. Thusthe sandstone sources of tonalites and amphibo-lites formed in a subduction related tectonic set-ting. A similar mode of origin has also been sug-gested for some Archean granite^greenstones ofthe Superior Province [45] using the same geo-chemical analogy of the REE and high ¢eldstrength elements. Depleted mantle model agesof the sandstones indicate ages greater than theage of the OMG and OMTG at V3.3 Ga. Ndmodel ages of V4.0 Ga may imply that not onlywere the tonalites and amphibolites the source ofthe sandstones, there may also exist an older con-tinental component in this part of the Indian Cra-ton. The zircons from the OMG have indicated207Pb/206Pb ages of V3.5^3.6 Ga [22,46].In the Nb/Ta vs. Zr/Sm plot (Fig. 7) the sand-
stones plot in the lower right quadrant with low
Nb/Ta and high Zr/Sm ratios, implying that theprotoliths of the sandstones had similar trace ele-ment ratio signatures as in the Archean tonalite^trondhjemite gneiss [38]. Based on trace elementpartitioning results, partial melting of low-magne-sium amphibolite or hydrous basalts in eclogitefacies are viable mechanisms for the low Nb/Taand high Zr/Sm ratios seen in the early continen-tal crust [2,38]. Such melting of amphibolites ormeta-basalts is likely to take place during subduc-tion. It is signi¢cant that the protoliths of thesandstones of this study show similar Nb/Taand Zr/Sm ratios as in Archean tonalite^trondh-jemite gneisses (Fig. 7). This analogy gives strongsupport to our assertion that the sandstone pro-toliths of the amphibolites (metabasalts) and thetonalites were formed by subduction zone mag-matism at 3.3 Ga in the eastern Indian Craton.The geochemical data presented above point to
the formation of the amphibolites and tonalites ina subduction environment, which were exhumedwhen the Singhbhum Granite was being emplacedat depth. The arc signature expected on the QFLand QmFLt diagrams is not apparent in Fig. 3,perhaps due to the dissolution of the lithic clastsin the sandstones [29,30] or the deeper dissectionof arc assemblages exposing batholithic roots thatmay give rise to quartzofeldspathic sands [31].Preponderance of the monocrystalline quartz inthe sandstones has them plot in the continentalblock ¢eld with dominantly meta-igneous rocksas their protoliths.Our geochemical data of the sandstones has
established the OMG (amphibolites) and OMTG(tonalites) as the dominant sources of the sedi-ment. We do not see trace elemental signaturescharacteristic of the Iron Ore group or theSinghbhum granite, although these lithologiesare east of the Darjing Group (Fig. 1). This ob-servation suggests that during the deposition ofthe Birtola Formation, the Singhbhum Granitebatholithic complex did not have the aerial expo-sure that it does today. Intrusion of the Singh-bhum Granite into the amphibolites and tonalites,the roots of the subduction arc, would cause theirexhumation, and subsequent erosion and deposi-tion in an adjacent trough. This petro-tectonicreconstruction would viably produce the geo-
EPSL 7005 11-3-04
A. Saha et al. / Earth and Planetary Science Letters 220 (2004) 91^106 103
chemical signature that we see in the sandstonestoday.
6. Conclusions
(1) The trace element and isotope geochemistry,and petrography of the sandstones of the BirtolaFormation and their source rocks suggest that thesandstones were derived from amphibolites andtonalites, two of the oldest known lithologic unitsin the Eastern Indian Craton.(2) The characteristic Nb^Ta depletion in the
sandstones, considered here not as a result ofheavy mineral sorting, is inferred to be presentin the protoliths of the amphibolites and tonalites.This inference implies that the OMG and OMTGrocks formed in a subduction zone magmatic arcsetting. Arc magmatism and accompanying meta-morphism formed the tonalites and amphibolitesin their roots, which were later exhumed, eroded,and deposited as the sandstone of the Birtola For-mation.(3) Lower Nb/Ta and higher Zr/Sm ratios of
these sandstones indicate subduction zone meltingof low-magnesium amphibolites or metamor-phosed hydrous basalts to form the protoliths ofthese sandstones as described above. This conclu-sion is ¢rmly based on recent trace element parti-tioning results, and indicates the existence of asubduction^accretion complex at ca. 3.3 Ga inthe East India Craton.(4) Ce/Pb ratios in the Archean sandstones are
variable and lower than the present-day averagecontinental crustal value of 4, and thus show thatthe Archean continental crust was already en-riched in Pb having a much lower Ce/Pb ratiothan present day mantle.(5) Sm^Nd model ages of the sandstones with
respect to the depleted mantle (TDM) range fromV3.6 to 4.0 Ga, clustering around higher than the3.3-Ga-old crystallization ages of the tonalitesand amphibolites. These higher model ages, asold as V4.0 Ga, suggest the presence of an oldercrustal component in the craton. This older com-ponent is probably present in the basement of the3.3-Ga-old amphibolites and tonalites forming theroots of this subduction-related arc complex.
Acknowledgements
We are grateful to Dr. G. Wortman for techni-cal help with the trace element analysis. Discus-sions with Dr. A. Basu of Indiana University werehelpful for provenance analysis. We would like tothank Drs. T. Kusky and F. Kalsbeek for review-ing an early version of this paper. Drs. P.G. De-Celles, S.B. Jacobsen and T. Kusky are alsothanked for their thorough and constructive re-views of this manuscript. This research was par-tially supported by NSF grants (A.R.B.) and aDST grant (Government of India ^ P.K.B. andA.C.).[SK]
References
[1] S.F. Foley, S. Buhre, D.E. Jacob, Evolution of the Ar-chaean crust by delamination and shallow subduction,Nature 421 (2003) 249^252.
[2] R.P. Rapp, N. Shimizu, M.D. Norman, Growth of earlycontinental crust by partial melting of eclogite, Nature425 (2003) 605^609.
[3] S.M. McLennan, S. Hemming, D.K. McDaniel, G.N.Hanson, Geochemical approaches to sedimentation, prov-enance, and tectonics, Geol. Soc. Am. Spec. Pap. 284(1993) 21^40.
[4] S.R. Taylor, S.M. McLennan, The Continental Crust: ItsComposition and Evolution, Blackwell, London, 1985,312 pp.
[5] M.G. Green, P.J. Sylvester, R. Buick, Growth and Recy-cling of early Archean continental crust: Geochemicalevidence from the Coonterunah and WarrawoonaGroups, Pilbara Craton, Australia, Tectonophysics 322(2000) 69^88.
[6] S.M. McLennan, S.R. Taylor, K.A. Eriksson, Geochem-istry of the Archean Shales from the Pilbara Supergroup,Western Australia, Geochim. Cosmochim. Acta 47 (1983)1211^1222.
[7] B.K. Nelson, D.J. DePaolo, Comparison of isotopic andpetrographic provenance indicators in sediments fromTertiary continental basins of New Mexico, J. Sediment.Petrol. 58 (1988) 348^357.
[8] A.R. Basu, M. Sharma, P.G. DeCelles, Nd, Sr-isotopicprovenance and trace element geochemistry of Amazo-nian foreland basin £uvial sands, Bolivia and Peru; im-plications for ensialic Andean Orogeny, Earth Planet. Sci.Lett. 100 (1990) 1^17.
[9] S.R. McLennan, Rare earth element in sedimentaryrocks: In£uences of provenance and sedimentary process-es, in: B.R. Lipin, G.A. McKay (Eds.), Geochemistry andMineralogy of Rare Earth Elements, Reviews in Mineral-ogy, Min. Soc. Am., 1989, pp. 169^200.
EPSL 7005 11-3-04
A. Saha et al. / Earth and Planetary Science Letters 220 (2004) 91^106104
[10] M.T. McCulloch, G.J. Wasserburg, Sm^Nd and Rb^Srchronology of continental crust formation, Science 200(1978) 1003^1011.
[11] A.R. Basu, S.L. Ray, A.K. Saha, S.N. Sarkar, EasternIndian 3800-million-year-old crust and early mantle di¡er-entiation, Science 212 (1981) 1502^1506.
[12] D. Mukhopadhyay, Precambrian of the Eastern IndianShield ^ Perspective of the Problems, in: D. Mukhopad-hyay (Ed.), Precambrian of the Eastern Indian Shield,Geological Society of India, Memoir 8, Bangalore, 1988,pp. 1^12.
[13] A.K. Saha, S.L. Ray, S.N. Sarkar, Early history of theEarth: Evidence from the Eastern Indian Shield, in: D.Mukhopadhyay (Ed.), Precambrian from the Eastern In-dian Shield, Geological Society of India, Memoir 8, Ban-galore, 1988, pp. 13^38.
[14] S. Moorbath, P.N. Taylor, N.W. Jones, Dating the oldestterrestrial rocks.... facts and ¢ction, Chem. Geol. 57(1986) 63^86.
[15] M. Sharma, A.R. Basu, S.L. Ray, Sm^Nd isotopic andgeochemical study of the Archean tonalite^amphiboliteassociation from the eastern Indian Craton, Cont. Min.Pet. 117 (1994) 45^55.
[16] A.K. Saha, S.L. Ray, The structural and geochemicalevolution of the Singhbhum granite Batholithic Complex,India, Tectonophysics 105 (1984) 163^176.
[17] S. Sengupta, D.K. Paul, J.R. deLaeter, N.J. McNaughten,P.K. Bandopadhyay, J.B. deSmeth, Mid-Archean evolu-tion of the eastern Indian craton: Geochemical and iso-topic evidence from Bonai pluton, Precamb. Res. 49(1991) 23^37.
[18] A. Chakrabarti, P.K. Bandyopadhyay, A.K. Chakrabarti,Rounded fresh feldspar in the Late Archaean nearshoredeposits around Patasahi, Orissa: Glacial activity?, Ind. J.Earth Sci. 25 (2001) 94^107.
[19] N.K. Mahalik, Geology of rocks lying between GangpurGroup and Iron Ore Group of the Horse Shoe Syncline inNorth Orissa, Ind. J. Earth Sci. 14 (1987) 73^83.
[20] P.K. Bandyopadhyaya, A.K. Chakrabarti, M.P. DeoMur-ari, S. Misra, 2.8 Ga old granite^acid volcanics associa-tion from western margin of the Singhbhum^Orissa Cra-ton, eastern India, Gond. Res. 4 (2001) 465^475.
[21] T.M. Kusky, A. Polat, Growth of the Granite^Green-stone Terranes at convergent margins and stabilizationof Archean terranes, Tectonophysics 305 (1999) 43^73.
[22] A.R. Basu, M. Sharma, W.R. Premo, U^Pb age of anolder metamorphic group mica schist; earliest terrain ofthe eastern Indian Craton, Recent Res. Geol. Geophys.Precamb. 16 (1996) 93^102.
[23] R.V. Ingersoll, T.F. Fullard, R.L. Ford, J.P. Grimm, J.D.Pickle, S.W. Sares, The e¡ect of grain size on detritalmodes; a test of the Gazzi^Dickinson point-countingmethod, J. Sediment. Petrol. 54 (1984) 103^116.
[24] W.R. Dickinson, C.A. Suczek, Plate tectonics and sand-stone compositions, AAPG Bull. 63 (1979) 2164^2182.
[25] A. Basu, S.W. Young, L.J. Suttner, W.C. James, G.Mack, Re-evaluation of the use of undulatory extinction
and polycrystallinity in detrital quartz for provenance in-terpretation, J. Sediment. Petrol. 45 (1975) 873^882.
[26] M.A.S. Moraes, L.F. de Ros, Depositional, in¢ltrated andauthigenic clays in £uvial sandstones of the Jurassic SergiFormation, Reconcavo Basin, northeastern Brazil, in:D.W. Houseknecht, E.D. Pittman (Eds.), Proc. 27th An-nual Meeting of the Clay Minerals Society, Symposiumon Origin, Diagenesis, and Petrophysics of Clay Mineralsin Sandstone, 1992, 47, pp. 197^208.
[27] K.S. Matlack, D.W. Houseknecht, K.R. Applin, Em-placement of clay into sand by in¢ltration, J. Sediment.Petrol. 59 (1989) 77^87.
[28] W.R. Dickinson, Interpreting detrital modes of gray-wackes and arkose, J. Sediment. Petrol. 40 (1970) 695^707.
[29] R. Cox, D.R. Lowe, Quanti¢cation of the e¡ects of sec-ondary matrix on the analysis of sandstone composition,and a petrographic^chemical technique for retrieving orig-inal framework grain modes of altered sandstones,J. Sediment. Res. 66 (1996) 548^558.
[30] R. Cox, E.D. Gutmann, P.G. Hines, Diagenetic origin forquartz-pebble conglomerates, Geology 30 (2002) 323^326.
[31] W.R. Dickinson, Interpreting provenance relations fromdetrital modes of sandstones, In: G.G. Zu¡a (Ed.), Prov-enance of Arenites, Reidel, Dordrecht^Boston, 1985, pp.333^361.
[32] K.C. Condie, Chemical composition and evolution of theupper continental crust: Contrasting results from surfacesamples and shales, Chem. Geol. 104 (1993) 1^37.
[33] S.R. Taylor, S.M. McLennan, The geochemical evolutionof the continental crust, Rev. Geophys. 33 (1995) 241^265.
[34] F. Bea, Residence of REE, Y, Th and U in granites andcrustal protoliths; Implications for the chemistry crustalmelts, J. Petrol. 37 (1996) 521^552.
[35] D.M. Miller, S.L. Goldstein, C.H. Langmuir, Cerium/Lead and lead isotope ratios in arc magmas and the en-richment of lead in the continents, Nature 368 (1994) 514^520.
[36] A.W. Hofmann, K.P. Jochum, M. Seufert, W.M. White,Nb and Pb in oceanic basalts: New constraints on mantleevolution, Earth Planet. Sci. Lett. 79 (1986) 33^45.
[37] C. Chauvel, S.L. Goldstein, A.W. Hofmann, Hydrationand dehydration of oceanic crust controls Pb evolution inthe mantle, Chem. Geol. 126 (1995) 65^75.
[38] S. Foley, M. Tiepolo, R. Vannucci, Growth of early con-tinental crust controlled by melting of amphibolite in sub-duction zones, Nature 417 (2002) 837^840.
[39] F. Kalsbeek, Use of Rb^Sr isotope data to constrain thetime of deposition of Precambrian metasediments: Anexample from Hamborgerland, West Greenland, Rep.Geol. Surv. Greenland 159 (1993) 95^100.
[40] S.J. Goldstein, S.B. Jacobsen, Nd and Sr isotopic system-atics of river water suspended material; implications forcrustal evolution, Earth Planet. Sci. Lett. 87 (1988) 249^265.
[41] T. Majumder, J.E. Whitley, K.L. Chakraborty, Rare-
EPSL 7005 11-3-04
A. Saha et al. / Earth and Planetary Science Letters 220 (2004) 91^106 105

earth elements in the Indian Banded Iron Formation,Chem. Geol. 45 (1984) 203^211.
[42] S. Sengupta, S.K. Acharyya, J.B. DeSmeth, Geochemistryof Archaean volcanic rocks from the Iron Ore Super-group, Singhbhum, Eastern India, Proc. Indian Acad.Sci. (Earth Planet. Sci.) 106 (1997) 327^342.
[43] S.M. McLennan, S.R. Taylor, Sedimentary rocks andcrustal evolution; tectonic setting and secular trends,J. Geol. 99 (1991) 1^21.
[44] D.K. McDaniel, S.R. Hemming, S.M. McLennan, G.N.Hanson, Resetting of neodymium isotopes and redistribu-tion of REEs during sedimentary processes: The Early
Proterozoic Chelmsford Formation, Sudbury Basin, On-tario, Canada, Geochim. Cosmochim. Acta 58 (1994)931^941.
[45] A. Polat, R. Kerrich, Archean greenstone belt magmatismand the continental growth-mantle evolution connection;constraints from Th^U^Nb^LREE systematics of the 2.7Ga Wawa Subprovince, Superior Province, Canada,Earth Planet. Sci. Lett. 175 (2001) 41^54.
[46] S. Mishra, M.P. Deomurari, M. Wiedenbeck, J.N. Gos-wami, S. Ray, A.K. Saha, 206Pb/207Pb zircon ages and theevolution of the Singhbhum Craton, eastern India, an ionmicroprobe study, Precamb. Res. 93 (1999) 139^151.
EPSL 7005 11-3-04
A. Saha et al. / Earth and Planetary Science Letters 220 (2004) 91^106106
Related Documents