GEOCHEMICAL AND PALYNOLOGICAL SIGNALS FOR PALAEOENVIRONMENTAL CHANGE IN SOUTH WEST ENGLAND by STEVEN WEST A thesis submitted to the University of Plymouth in partial fulfilment for the degree of DOCTOR OF PHILOSOPHY Department of Geographical Sciences Faculty of Science July 1997. ni

Welcome message from author
This document is posted to help you gain knowledge. Please leave a comment to let me know what you think about it! Share it to your friends and learn new things together.
Transcript

GEOCHEMICAL AND PALYNOLOGICAL SIGNALS FOR PALAEOENVIRONMENTAL CHANGE IN SOUTH WEST ENGLAND
by
STEVEN WEST
A thesis submitted to the University of Plymouth in partial fulfilment for the degree of
DOCTOR OF PHILOSOPHY
Department of Geographical Sciences Faculty of Science
July 1997.
ni

90 0342204 X
Item No.
Date
ClassNd. ContlNe,
L
ik^m ov pu
9oo342204/X:
H NOV mi
if^Aavii^vicgS LIBRARY STORE
U J € &
Steven West
GEOCHEMICAL AND PALYNOLOGICAL SIGNALS FOR PALAEOENVIRONMENTAL CHANGE IN SOUTH WEST ENGLAND.
ABSTRACT
This thesis evaluates the utility of a geochemical technique for the investigation of paiaeoenvironmental change in south west England. The method, EDMA (Energy Dispersive X-ray Micro Analysis), is a rapid, non-destructive analysis tool, capable of detecting a large range of geochemical elements.
This research examines the most appropriate method of sample preparation for organic soils and peats, and investigates the reliability of results gained from EDMA with respect to conventional bulk geochemical techniques. A detailed study focused on a range of different sedimentary sites in south west England where a variety of palaeoenvironmental changes were thought to occur. Pollen analysis was undertaken on the same sedimentary material, and provided complementary information on the nature and scale of vegetation change through time. Sediments from a coastal valley mire near North Sands, Salcombe, revealed information relating to the processes of sea-level change in this part of south Devon and the subsequent autogenic processes as the sediment accumulated through time. A range of sites were located on the granitic upland of Dartmoor. A raised bog, Tor Royal, provided data relating to the changing nature of the central upland landscape from late Mesolithic times to the present day. Two soligenous sites. Upper Merrivale and Piles Copse, sought to investigate the activities of postulated anthropogenic activity at a much smaller spatial scale, with particular interest placed upon the evidence for deforestation activity and the utilisation of the local mineral resources. The last site, Crift Down, a lowland spring fed valley mire utilised geochemical and palynological fluxes within the peat to investigate processes and activities associated with archaeological evidence for Medieval tinworking in this area of Cornwall.
The results from the EDMA investigations, and comparable studies using other geochemical methods including EMMA, AAS and flame photometry, suggest the technique to have greatest applicability as a first stage tool in the analysis of general activities of past environmental change. The technique was found to yield reliable results for the major elements (Si, Al, S, Fe, Ca, K, Na and Mg), but is generally incapable of providing useful data on heavy metal elements.
The data from south west England suggest the method to reflect activity at a range of different scales, and as part of a structured programme of analysis may contribute information to allow a more holistic environmental reconstruction to be made.
IV

List of contents
Page Chapter 1.
1.0 1.1 1.2
1.2.1 1.2.2 1.2.3 1.2.4 1.2.5
1.3 1.4 1.5
1.5.1 1.5.2 1.5.3 1.5.4 1.5.5
1.6 1.6.1
1.7 1.8
Chapter 2. 2.0 2.1
2.1.1 2.1.2 2.1.3
2.2 2.2.1 2.2.2 2.2.3 2.2.4 2.2.5
2.3 2.3.1 2.3.2 2.3.3
2.4 2.4.1 2.4.2 2.4.3
2.5
Chapter 3. 3.0 3.1
3.1.1 3.1.2 3.1.3
3.2 3.2.1 3.2.2
Introduction Introduction Research aims EDMA: a technique for palaeoenvironmental reconstruction History and development Uses The physics of the system Correction procedures Accuracy Alternatives to EDMA Uses of EDMA in palaeoenvironmental reconstruction Interpretation of individual elements for EDMA Major elements Nutrient elements Mobile elements Trace/heavy metal elements Summary Interpretation of multi element spectra Behavioural trends Philosophical basis for interpretation Summary
Methodology Introduction South west England and Dartmoor Geological history Palaeoenvironments of south west England Archaeology of the south west Field sites North Sands, near Salcombe, south Devon Tor Royal, central Dartmoor Upper Merrivale, River Walkham, west Dartmoor Piles Copse, River Erme, south Dartmoor Crift Down, near Lanlivery, Cornwall Data collection and analysis Field sampling strategy Laboratory sampling strategy and analytical techniques Radiocarbon dating procedures Data analysis Profile zonation Standard error bars Multi-variate statistical methods Summary
Experimental procedures Introduction Investigation of EDMA sample preparation methods Discussion of the preparation techniques Results Discussion Comparison of EDMA and bulk chemical analysis Results Discussion
1 1 2 2 3 3 9 12 14 17 18 19 26 27 29 35 36 36 38 41
42 42 42 44 51 58 60 60 61 61 62 62 62 63 65 66 66 67 67 68
69 69 72 74 83 84 84 90

3.3 Conclusions 91
Chapter 4. North Sands pilot study 4.0 Introduction 92 4.1 North Sands and the Salcombe area 92
4.1.1 Geology and Geomorphology 92 4.1.2 Land use and modem vegetation groups 95
4.2 Sampling regime 96 4.3 Palaeoenvironmental reconstruction of the North Sands area 96 4.4 Stratigraphical description of the North Sands sediment 96 4.5 EDMA geochemical study 99
4.5.1 Multi-variate analysis of the geochemical results 100 4.5.2 Interpretation of the geochemical signals for North Sands 106
4.6 Pollen analysis of the North Sands sediment 109 4.6.1 Multi-variate analysis of the North Sands pollen data 109 4.6.2 Interpretation of the pollen evidence 109
4.7 Discussion of the palaeoenvironmental development of the North 115 Sands area
4.8 Discussion 118 4.9 Conclusions 119
Chapter 5. Palaeoenvironmental investigations at Tor Royal, central Dartmoor 5.0 Introduction 120 5.1 Site location, morphology and age 120 5.2 Sampling regime 124 5.3 Palaeoenvironmental reconstruction of the Tor Royal sediment 127
5.3.1 Stratigraphical description 127 5.3.2 EDMA investigation 127 5.3.3 Multi-variate analysis of the Tor Royal EDMA data 128 5.3.4 Interpretation of the geochemical signals from Tor Royal 128 5.4.5 Pollen analysis of the Tor Royal sediment 137 5.4.6 Multi-variate analysis of the Tor Royal pollen data 137 5.4.7 Interpretation of the Tor Royal pollen data 143
5.5 Discussion of the palaeoenvironmental development of the Tor Royal 148 area
5.6 Discussion 150
Chapter 6. Upper Merrivale, western Dartmoor 6.0 Introduction 152 6.1 Site location, morphology and modem vegetation communities 152 6.2 Archaeology of the Upper Walkham catchment 155 6.3 Sampling regime 156 6.4 Palaeoenvironmental reconstruction of Upper Merrivale, western 156
Dartmoor 6.4.1 Stratigraphic description of the sediment 158 6.4.2 Radiocarbon dating procedures and results 158 6.4.3 EDMA investigation 159 6.4.4 Multi-variate analysis of the Upper Merrivale EDMA data 165 6.4.5 Interpretation of the geochemical signals from Upper Merrivale 165 6.4.6 Pollen analysis of the sediments from Upper Merrivale 168 6.4.7 Multi-variate analysis of the Upper Merrivale pollen data 168 6.4.8 Interpretation of the Upper Merrivale pollen data 174
6.5 Discussion of the palaeoenvironmental development of the Upper 179 Merrivale area
6.6 Discussion 183
VI

Chapter 7. Piles Copse: investigation of an 'ancient' woodland and its environment
7.0 Introduction 184 7.1 The status of the relict high level oak woodlands in the British Isles 187 7.2 Sampling regime 188 7.3 Radiocarbon dating of the Piles Copse profiles 188 7.4 Palaeoenvironmental reconstruction of the Piles Copse area 189
7.4.1 Stratigraphical description 189 7.4.2 EDMA investigation of the Piles Copse sediment 192 7.4.3 Multi-variate analysis of the Piles Copse EDMA data 192 7.4.4 Interpretation of the geochemical signals from Piles Copse 203 7.4.5 Pollen analysis of the Piles Copse sediment 208 7.4.6 Multi-variate analysis of the Piles Copse pollen data 208 7.4.7 Interpretation of the Piles Copse pollen data 217
7.5 Discussion of the palaeoenvironmental development of the Piles Copse 221 area
Chapter 8. Investigation of a lowland Cornish site: Crift Down 8.0 Introduction 225 8.1 Site location and morphology 225 8.2 Sampling regime 228 8.3 Radiocarbon dating 228 8.4 Palaeoenvironmental reconstruction of the Crift Down sediment 229
8.4.1 Stratigraphical description 229 8.4.2 EDMA investigation of the Crift Down sediment 231 8.4.3 Multi-variate analysis of the Crift Down EDMA data 231 8.4.4 Interpretation of the geochemical signals from Crift Down 237 8.4.5 Pollen analysis of the Crift Down sediment 240 8.4.6 Multi-variate analysis of the Crift Down pollen data 240 8.4.7 Interpretation of the Crift Down pollen data 246
8.5 Discussion of the palaeoenvironmental development of the Crift Down 250 area
Chapter 9. EDMA: evaluation of the technique 9.0 Introduction 254 9.1 EDMA in practice 254 9.2 The accuracy of EDMA: comparative analyses using EMMA 262
Chapter 10. Conclusions and recommendations 10.0 Introduction 270 10.1 Conclusions 270 10.2 Recommendations 271
List of References 272
vu

List of Figures, Tables and Plates
Figure Page 1.1 The probe forming system of EDMA 4 1.2 Interactions occurring upon electron bombardment of a sample 5 1.3 Arrangement of K, L and M shells, with associated X-ray families 8 1.4 Detector system 9 1.5 Results gained from analysing a suspected diatom frustrule from a 11
depth of 8.10m in the North Sands sedimentary sequence 1.6 Origin of the sedimentary geochemical record 20 1.7 Behavioural trends in geochemical data 39
2.1 Simplified geological map of south west England 43 2.2 Palaeoenvironmental and archaeological sites of south west England 46 2.3 Field sites in south west England 59
3.1a Replicability between different analysis areas for the same sample 76 (Na, K)
3.1b Replicability between different analysis areas for the same sample 77 (Mg, Ca)
3.1c Replicability between different analysis areas for the same sample (Fe, 78 Mn)
3.Id Replicability between different analysis areas for the same sample (Pb, 79 Cu)
3. le Replicability between different analysis areas for the same sample (As, 80 Sn)
3.2 Sample analysis areas 82 3.3 Comparison between bulk analyses and EDMA for Na, K and Mg 85 3.4 Comparison between bulk analyses and EDMA for Ca, Fe and Mn 86 3.5 Comparison between bulk analyses and EDMA for Cu, Pb, As and Sn 87 3.6 Transformed data plots used in the Wilcoxon analysis 88
4.1 North Sands and Salcombe 93 4.2 The geology around Salcombe 94 4.3 Stratigraphy of the North Sands sediment 98
4.4a EDMA results from North Sands sediment 101 4.4b EDMA results from North Sands sediment 102
4.5 DCA element plot of EDMA data from analysis of North Sands 104 sediment
4.6 DCA sample plot of EDMA data from analysis of North Sands 105 sediment
4.7 North Sands percentage pollen diagram 110 4.8 DCA species plot of pollen data from analysis of North Sands 112
sediment 4.9 DCA sample plot of pollen data from analysis of North Sands 113
sediment 4.10 Schematic development of North Sands sedimentary system 117
5.1 Lx)cation of Tor Royal mire 121 5.2 Morphology of Tor Royal ombrotrophic mire 122 5.3 Age-depth profile of Tor Royal sediment 123 5.4 Stratigraphy of the Tor Royal sediment 126
5.5a EDMA results from Tor Royal sediment 129 5.5b EDMA results from Tor Royal sediment 130
5.6 DCA element plot of EDMA data from analysis of Tor Royal 132 sediment
viii

5.7 DCA sample plot of EDMA data from analysis of Tor Royal sediment 133 5.8 Tor Royal percentage pollen diagram 138-
139 5.9 DCA species plot of pollen data from analysis of Tor Royal sediment 141
5.10 DCA sample plot of pollen data from analysis of Tor Royal sediment 142
6.1 location of Upper Merrivale sampling location 153 6.2 Stratigraphy of the Upper Merrivale sediment 157
6.3a EDMA results from Upper Merrivale, western Dartmoor 160 6.3b EDMA results from Upper Merrivale, western Dartmoor 161
6.4 DCA element plot of EDMA data from Upper Merrivale, western 163 Dartmoor
6.5 DCA sample plot of EDMA data from Upper Merrivale, western 164 Dartmoor
6.6 Upper Merrvale percentage pollen diagram 169-170
6.7 DCA species plot of pollen data from analysis of Upper Merrivale 172 sediment
6.8 DCA sample plot of pollen data from analysis of Upper Merrivale 173 sediment
6.9 Schematic development of the Upper Merrivale area from late 181 Mesolithic to modem times
7.1 Location of Piles Copse, southern Dartmoor 185 7.2 Stratigraphy of the Piles Copse sediment - PCI 190 7.3 Stratigraphy of the Piles Copse sediment - PC2 191
7.4a EDMA results from analysis of Piles Copse core 1 (PCI) 193 7.4b EDMA results from analysis of Piles Copse core 1 (PCI) 194
7.5 DCA element plot of EDMA data from analysis of Piles Copse core 1 196 (PCI)
7.6 DCA sample plot of EDMA data from analysis of Piles Copse core 1 197 (PCI)
7.7a EDMA results from analysis of Piles Copse core 2 (PC2) 198 7.7b EDMA results from analysis of Piles Copse core 2 (PC2) 199
7.8 DCA element plot of EDMA data from analysis of Piles Copse core 2 201 (PC2)
7.9 DCA sample plot of EDMA data from analysis of Piles Copse core 2 202 (PC2)
7.10 Piles Copse core 1 (PCI) percentage pollen diagram 209 7.11 Piles Copse core 2 (PC2) percentage pollen diagram 213 7.12 DCA species plot of pollen data from analysis of Piles Copse core 1 211
(PCI) sediment 7.13 DCA sample plot of pollen data from analysis of Piles Copse core 1 212
(PCI) sediment 7.14 DCA species plot of pollen data from analysis of Piles Copse core 2 215
(PC2) sediment 7.15 DCA sample plot of pollen data from analysis of Piles Copse core 2 216
(PC2) sediment
8.1 Location of Crift Down sampling site 227 8.2 Stratigraphy of the Crift Down sediment 230
8.3a EDMA results from Crift Down sediment 232 8.3b EDMA results from Crift Down sediment 233
8.4 DCA element plot of EDMA data from analysis of Crift Down 235 8.5 DCA sample plot of EDMA data from analysis of Crift Down 236
IX
8.6 Crift Down percentage pollen diagram 241 -242
8.7 DCA species plot of pollen data from analysis of Crift Down sediment 244 8.8 DCA sample plot of pollen data from analysis of Crift Down sediment 245
9.1 A conceptual model of the record of deforestation activity as recorded 259 in peatland sediments by geochemical and palynological indicators
9.2 Comparative analysis of Fe and Mn using EDMA and EMMA 264 9.3 Comparative analysis of Pb, As and Cu using EDMA and EMMA 265 9.4 Comparison of Fe and Mn determinations using EDMA and EMMA 266
data 9.5 Comparison of Pb, As and Cu determinations using EDMA and 267
EMMA data
Table 1.1 The different factors which affect accuracy and precision of EDMA 13
results 1.2 Comparison of EDMA, XRF and bulk chemical operations 15 1.3 Summary of interpretational possibilities using geochemical data 37
2.1 Human activity in the uplands of south west England during the 47 Holocene
3.1 EDMA experimental preparation techniques 71 3.2 EDMA operating conditions 72 3.3 Visual assessment of sample-analyser system interactions 75 3.4 Test statistic matrix from Wilcoxon analysis of four preparation 81
techniques with respect to standard chemical procedures 3.5 Wilcoxon test statistic values for comparison between EDMA data 89
and that obtained using standard chemical procedures
4.1 Description of North Sands chemizones 103 4.2 Description of North Sands local pollen assemblage zones 111 4.3 Summary of the palaeoenvironmental development of North Sands 116
5.1 Radiocarbon dating results 124 5.2 EDMA results from analysis of Tor Royal sediment 131 5.3 Pollen analysis results from Tor Royal 140 5.4 Summary of the palaeoenvironmental development of Tor Royal 149
6.1 Radiocarbon dates from Upper Merrivale 158 6.2 Description of chemizones from Upper Merrivale 162 6.3 Description of local pollen assemblage zones from Upper Merrivale 171 6.4 Summary of the palaeoenvironmental conditions at Upper Merrivale 180
7.1 Radiocarbon dates from Piles Copse 188 7.2 EDMA results from analysis of PCI 195 7.3 EDMA results from analysis of PC2 200 7.4 Description of Piles Copse core 1 (PCI) local pollen assemblage zones 210 7.5 Description of Piles Copse core 2 (PC2) local pollen assemblage zones 214 7.6 Summary of the development of the area around Piles Copse 222
8.1 Radiocarbon dating results from Crift Down 229 8.2 Description of the chemizones from EDMA of the Crift Down 234
sediment
8.3 Description of LPAZ from pollen analysis of Crift Down sediment 243 8.4 Summary of the palaeoenvironmental conditions of Crift Down 251
9.1 Summary of the interpretative possibilities of EDMA data 257 9.2 Summary of heavy metal element ranges from Tor Royal and Crift 268
Down
Plate 4.1 North Sands beach viewed from the cliffs above the beach 97
5.1 Tor Royal ombrotrophic mire, central Dartmoor 125 5.2 The margins of the mire 125
6.1 The Upper Merrivale catchment 154
6.2 The Upper Merrivale blowing and stamping mill 154
7.1 Piles Copse 186
8.1 The Crift Down area 226 8.2 The Crift Down sampling site 226
XI
Acknowledgements
I firstly wish to acknowledge the Department of Geographical Sciences, University of Plymouth for the internal grant from HEFCE funds which made this study possible. Great thanks are due to the project supervisors, Dr. Dan Charman and Dr. John Grattan, for their encouragement, comment and friendship. Thanks also to the technical staff of the University of Plymouth for their time and knowledgeable guidance, including Dr. Roy Moate, Brian Lakey and Jane Green of the EM unit; Alexandra Fraser of the Department of Environmental Science for carrying out the AAS work on the North Sands sediment; Ann Kelly, Kevin Solman, Pat Bloomfield and Richard Hartley of the Department of Geographical Sciences for considerable assistance throughout the fieldwork and laboratory components of this project. I owe a considerable debt of gratitude to my trusty band of field slaves: Dr. Ben Gearey, Richard Armitage, Carl Ishemo particularly after a broken scaphoid bone meant I merely 'supervised' the coring of Piles Copse.
I owe thanks to the Dartmoor National Park Authority, the Duchy of Cornwall, English Nature and South West Water for guidance with field sampling and permitting access to a number of the fieldsites, and Dr. Chris Caseldine of the Department of Geography, University of Exeter, and Dr. Tom Greeves for valuable comments. Thanks are due to NERC for the provision of three radiocarbon dates from Tor Royal in conjunction with another project. Thanks also to the landowners of the various sites, including Mrs. Mary Alford (Upper Merrivale), and Mr. Roger Howell (Piles Copse). Further thanks are extended to English Nature for permission to core in the environmentally sensitive locations at Tor Royal and Piles Copse, South West Water and Stephen Reed of Exeter Archaeological Field Unit for providing the North Sands sediment. Thanks to Dr. Gerry McDonnell of the Department of Archaeological Science, University of Bradford for detailed information on Crift Down, who with Mr. Eric Higgs and Phil Burton proved invaluable in the coring of this location. Thanks also to the Department of Geographical Sciences and Dr. Bill Shotyk of the Geological Institute, University of Berne for providing funds to enable me to present selected aspects of this research at an international workshop on peat bog archives of heavy metal deposition. Thanks are also due to Dr. Andrij Cheburkin of the Institute of Geological Sciences, Ukrainian Academy of Sciences, Kiev for providing the EMMA data.
Finally, I wish to thank the many people who have attempted to keep me sane (!) throughout the duration of this research project: the weekend combat drinking crew, Ben, Martin, Hoggy, Andy Collins, Mel, Andy Clegg, Teresa, Kim, Ollie, Grum, Piers and more recently. Ginger Jon, Gobber, Andy E., Karen, Mel G., Matt and Niall (aka the Fish Twins) and the lads from sunny Weston-super-Mare, Keith, Steve, Mike and my brother, Dave. I love you all.
xn

AUTHOR'S DECLARATION
At no time during the registration for the degree of Doctor of Philosophy has the author been registered for any other University award.
This study was financed with the aid of a studentship from the Higher Education Funding Council for England, through the Department of Geographical Sciences, University of Plymouth.
Publications:
Published: West S., Charman D.J. and Grattan J.P. 1996. Palaeoenvironmental investigations at Tor Royal, central Dartmoor. In: Charman D.J., Newnham R.M. and Croot D.G. (eds.). The Quaternary of Devon and East Cornwall: Field Guide. Quaternary Research Association, London: 62-80.
In press: West S., Charman D.J., Grattan J.P. and Cheburkin A.K. Heavy metals in Holocene peats from south west England: detecting mining impacts and atmospheric pollution. Water, Air and Soil Pollution.
Presentations and Conferences Attended:
April 1995. 'Geochemical and palynological signals for palaeoenvironmental change'. Postgraduate Palaeoecology Conference. Department of Geographical Sciences, University of Plymouth.
November 1995. 'Palaeoenvironments on Dartmoor'. Discussion meeting: Evolution of Dartmoor habitats. Dartmoor National Park Research Group, Newton Abbot.
April 1996. 'Palaeoenvironments on Dartmoor: Merrivale and Tor Royal'. Postgraduate Paiaeoecology Conference. Department of Zoology, University of Cambridge.
April 1996. 'Palaeoenvironmental investigations at Tor Royal, central Dartmoor'. Quaternary Research Association. Annual field meeting, Devon and East Cornwall.
October 1996. 'Detection of prehistoric and historic smelting activity in south west England using EDMA'. Workshop on peat bog archives of atmospheric metal deposition. Geologicd Institute, University of Beme.
Signed
Date ....^?)..l!.P..b.^.
xiu
Chapter 1
Introduction
1.0 Introduction
This chapter begins with a discussion of the primary research aims. The history and development of
Energy Dispersive X-Ray Micro Analysis (EDMA) as a research tool is discussed. A section is
presented detailing the processes of X-ray production, detection and correction procedures. A short
discussion presents the recent literature illustrating the uses of EDMA as a palaeoenvironmental
tool. The final part considers the interpretational possibilities that may be gained from geochemical
studies of peatland systems based on a review of published literature on the subject.
1.1 Research aims
The primary aim of this research project is to explore and develop a new technique for the
reconstruction and interpretation of palaeoenvironmental change in south west England. The
technique, EDMA, has been shown by preliminary studies (Grattan, 1994; Grattan et ai, 1996) to
have the capability of identifying a range of elements simultaneously (Goldstein et ai, 1981; Lawes,
1987) from a variety of different sedimentary contexts. Grattan (1994) first applied EDMA to the
analysis of Holocene palaeoenvironmental conditions in northern Scotland. However, he largely
adopted the methodologies of Pyatt et al. (1991) and Pyatt and Lacy (1988) with respect to sample
preparation and did not compare results with other techniques and did not critically evaluate the
reliability of the data for different elements This research project thus seeks to:
(i) investigate the capability of EDMA to produce meaningful geochemical results with respect
to other geochemical methods,
(ii) evaluate the most appropriate sample preparation method for the sediments under
investigation,
(iii) contribute to the palaeoenvironmental database for south west England through a series of
case studies.
The research will apply EDMA, pollen and carbon analysis to a range of palaeoenvironmental
situations representing different levels and types of past environmental change in south west
England. Palynological investigations will be used both as a standard technique with which to
compare results, and to provide complementary information on the detail and nature of the
1

environmental changes occurring.
A number of sites have been identified which will test the efficiency of the technique to provide
meaningful palaeoenvironmental data from different sediment body types e.g. raised, valley and
soligenous mire (section 2.2). These sites should also provide detailed information on natural
environmental development (soil evolution, vegetation succession) and human induced changes
arising from deforestation, cultivation and cultural changes in prehistory, the Medieval period and
more recent times. Particular emphasis will be placed upon the detection of prehistoric and Medieval
tinning activity in south west England and the associated effect this has upon peatland ecosystems.
EDMA together with pollen analysis will therefore extend our knowledge of environmental
development of south west England from early Holocene times.
1.2 EDMA: a technique for palaeoenvironmental reconstruction
This section presents a brief outline to EDMA. It deals with the history of the technique from the
early discoveries of the 1920s to the wide ranging uses of the modem scientific community. A short
section describes the hardware of the system including the probe forming system, the X-ray detecting
equipment and the correction procedures applied iteratively during the final processing stages.
7.2.7 History and Development
The first decades of the 20th century saw real developments in the field of X-Ray analysis. Moseley
first established the relationship between wavelength and atomic number, using a crystal diffraction
spectrometer to gain enhanced resolution of spectra (Reed, 1993). Moseley's law states that the
height of the output pulse is proportional to the energy of the X-ray quantum. The energy of the X-
ray is inversely related to the wavelength.
With the development of the Scanning Electron Microscope (SEM), more finely focused electron
beams were a possibility. Castaing's research (1951, quoted in Cescas et ai, 1968), was primarily
concerned with developing microprobe analysis and laid the theoretical and practical foundations of
quantitative analysis. A major recent development was the implementation of silicon lithium, Si(Li),
drifted detectors (see page 5). The utilisation of Multi-Channel Analyser (MCA) technology allowed
energy spectrum analysis over a range of X-ray energies (Cescas et ai, 1968).
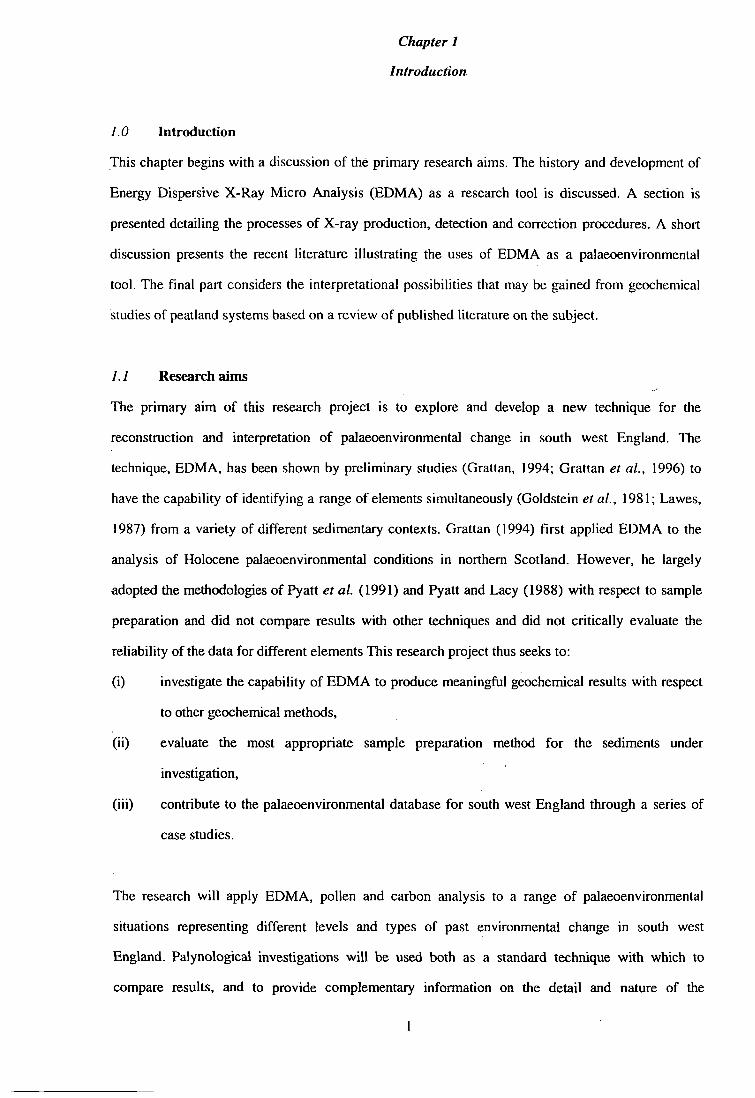
1.2.2 Uses
There has been a huge increase in the use of EDMA since the 1960s in such widely based disciplines
as dentistry (Gerard et al., 1990; Wiesmann et ai, 1993); forensic science (Andrasko and Petterson,
1991; Burnett, 1991; Degaetano et al., 1992; Thornton, 1994); materials science and engineering
(Fritsch and Keimel, 1991; Buarzaiga and Thorpe, 1994; Chow and Fung, 1994); and the natural
sciences: soil studies (Smart, 1973; Scott and Collinson, 1978; Tovey and Wong, 1978; Smart and
Tovey, 1981); geology and mineralogy (Kiel and Fredriksson, 1964; Straszheim et al., 1988;
Kwiecinska et al., 1992). This project seeks to develop the technique in the analysis and
interpretation of Holocene sediment in a range of different locations in south west England.
1.2.3 The physics of the system
Principles
The probe forming system (Fig. 1.1) consists of a sealed column held under a constant high vacuum
to prevent beam scattering (> 10"* Torr). A tungsten filament at the top of the column is heated to
2700K. Electrons are produced by thermionic emission and accelerated away from the filament by
the application of a high negative potential between the filament and the anode (accelerating voltage,
Eo). The beam is shaped electrostatically by a Wehnelt cylinder (cathode), to a diameter ranging
from ca. 10-50|Xm (Lawes, 1987). The overall performance of the microprobe is related to beam
diameter, which is controlled by condensers to produce a narrow diameter beam. For a more detailed
description of the principles see Hren et al. (1979), Goldstein et al. (1981), Russ (1984) and Reed
(1993).
Quantitative analysis requires a normal incident electron beam to be focused on the surface of the
sample. However, there are a number of factors which need correction: chromatic aberration due to
drifts in the accelerating voltage; spherical aberrations caused by off axis electrons being of stronger
energy than those closer to the beam axis; and, astigmatism created by imperfections in the lens
polepieces, which may be corrected with relative ease using the stigmator mechanism.
The sample stage is composed of an earthed plate, with a sample holder. The stage is capable of
shifts in the X, Y and Z axes, as well as tilt relative to the detector (normally set at 45° - Yakowitz
and Heinrich, 1968), and rotation through 360°.

ELECTRON MICROPROBE
ELECTRON GUN
ELECTRON OPTICS COLUMN
HIGH VACUUM CHAMBER
i<f^^^^
"-LIQUID ~-:NITROGEN-RESERVOIR
SAMPLE
ANALYSER
X'-RAY / | l \ SPECTRUM \
ksm I
^
SEMI-CONDUCTOR DETECTOR
Figure 1.1 The probe forming system of EDMA. (Gill, 1986)
ELECTRON BEAM
S A M P L E
RADIATION''
CHARGED PARTICLES
rBREMSSTRAHLUNG
CHARACTERISVC 'RADIAWN
ELECTRON BEAM INTERACTION WITH SAMPLE <
BACKSCATTER ELECTRONS
SECONDARY ELECTRONS
AU6ER ELECTRONS
REDIFFUSED ELECTRONS
CHEMICAL REACTIONS
PHYSICAL REACTIONS
EMISSON SPECTRA
1. X-RADIATION 2. U.V.RADIAT10N 3. OPTICAL RADIATION 4. INFRARED RADIATION
ABSORPVON SPECTRA
1. X-RAYS 2. aECTRONS
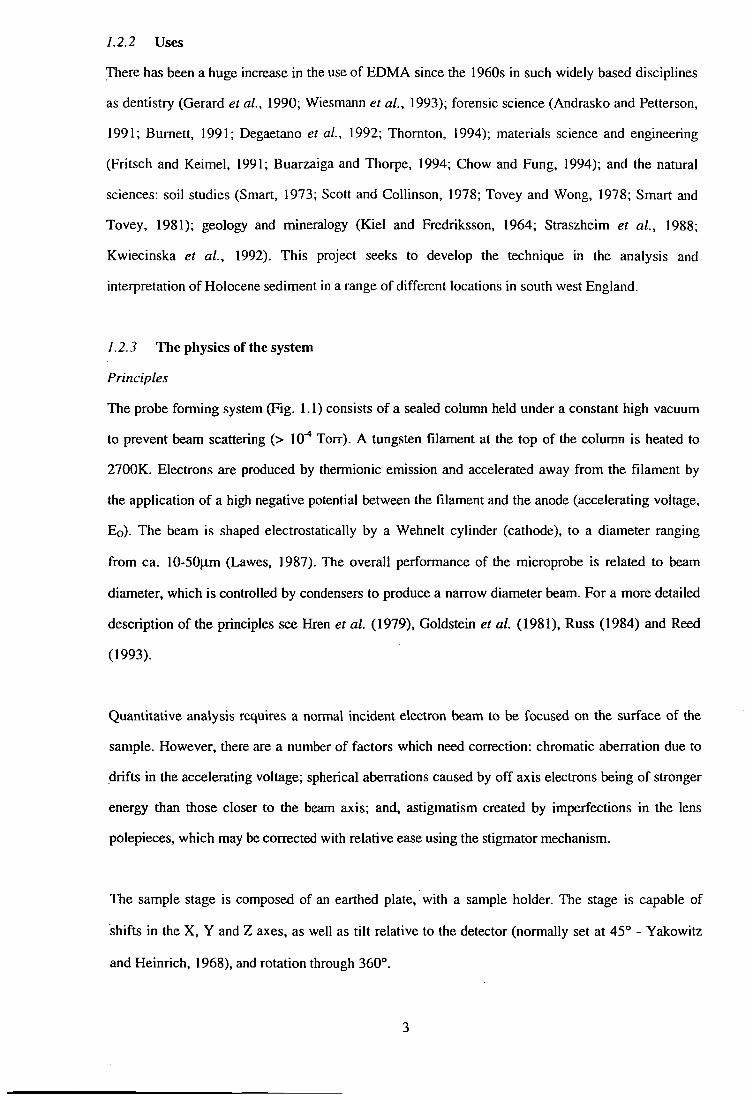
Figure 1.2 Interactions occurring upon electron bombardment of a sample. Principle interactions utilised in the analysis of sediment samples by EDMA are shown in italics.
(Modified from Cescas et ai, 1968)

Sample interactions
The high energy incident electron beam travels through the probe column, and is focused on the
surface of the sample. Upon impact a number of interactions occur (Fig. 1.2) resulting in the
production of:
(i) Unscattered electrons - very high energy electrons which pass straight through the specimen
with no interaction (of no use to the analysis).
(ii) Elastically scattered electrons - produced when the electrons in the beam pass very close to
the nucleus, thus deflecting the beam (with an energy loss of <1 eV). The angle of deflection
is dependant upon the energy of the incident electron. Backscattered electron images contain
information relating to the average elemental composition of the sample, since scattering is a
function of atomic structure.
(iii) Secondary electron emission - the incident beam may knock loosely bound electrons from
the sample. If these are released within lOnm of the surface they will escape as low energy
secondary electrons. These are useful for topographical mapping of samples (Lawes, 1987).
(iv) Auger electrons - have limited use in SEM imaging; see Russ (1984: p.6).
(v) X-Rays.
The latter is of prime importance in EDMA, and will be discussed in the following sections.
A brief discussion of atomic structure is required at this point. All matter is composed of atoms,
these atoms are in turn composed of smaller particles: protons and neutrons, forming the nucleus of
the atom, with electrons orbiting the nucleus in an arrangement of shells. In X-ray analysis these
shells are designated K, L, M etc. arranged in order of increasing distance from the nucleus. The
electrons in the inner shell (K) are most tightly bound and consequently require the most energy to
displace them (Fig. 1.3).
The incident electron beam may interact with an atom in the sample, causing one of the shell
electrons to be ejected leaving the atom in an ionised state. The atom will seek to attain ground state
as quickly as possible by drawing an electron from an outer shell to fill the vacancy. The movement
from an outer shell to an inner shell will create a displacement of energy equal to the difference in
energy between the shells involved in the transition (Jenkins et al., 1981). This energy is released as
a photon of electromagnetic energy: an X-Ray.

There are essentially two forms of X-ray: (i) characteristic; and (ii) continuum or Bremsstrahlung
('braking' radiation). The former is of prime importance since it contains information which relates
specifically to the elemental composition of the sample. Each electron shell in the sample has a
distinct energy, which varies with the atomic number for each component in the sample. When an
electron transition occurs the amount of energy released will be unique for each element; by counting
the X-rays produced at each energy level an indication of the elemental composition of the sample
may be gained. X-rays are grouped together into families which denote where they originated, and
consequently their energy level. K families are the most abundant i.e. those electrons which fill
vacancies in the K shell of the atom, they are labelled Ka, KB etc. A Ka electron will have come
from the next shell out from the nucleus (the L shell), while KB electrons will have originated in the
M shell. Similar families exist for the L and M shells labelled a, B, T etc. (Fig. 1.3).
The X-ray continuum may be described as the background signal upon which characteristic X-rays
are superimposed. It is created when the incident electron beam is slowed as it passes close to the
nucleus of an atom in the sample. Some of the electron's energy is given up and produces X-rays; the
formation of which is a function of atomic number. More X-rays are produced by lighter elements,
resulting in a greater proportion of total X-rays at the lower end of the energy spectrum.
An important point relevant to the production of X-rays is the concept of critical excitation potentials
(Ec). This relates to the energy required to displace a bound electron from its inner shell position,
creating ionisation of the atom and X-ray production. Typically, EQ should be 1.5 to 2 times as large
as the Ec of the elements under investigation (Wittry, 1958; Goldstein e a/., 1981;Reed, 1993).
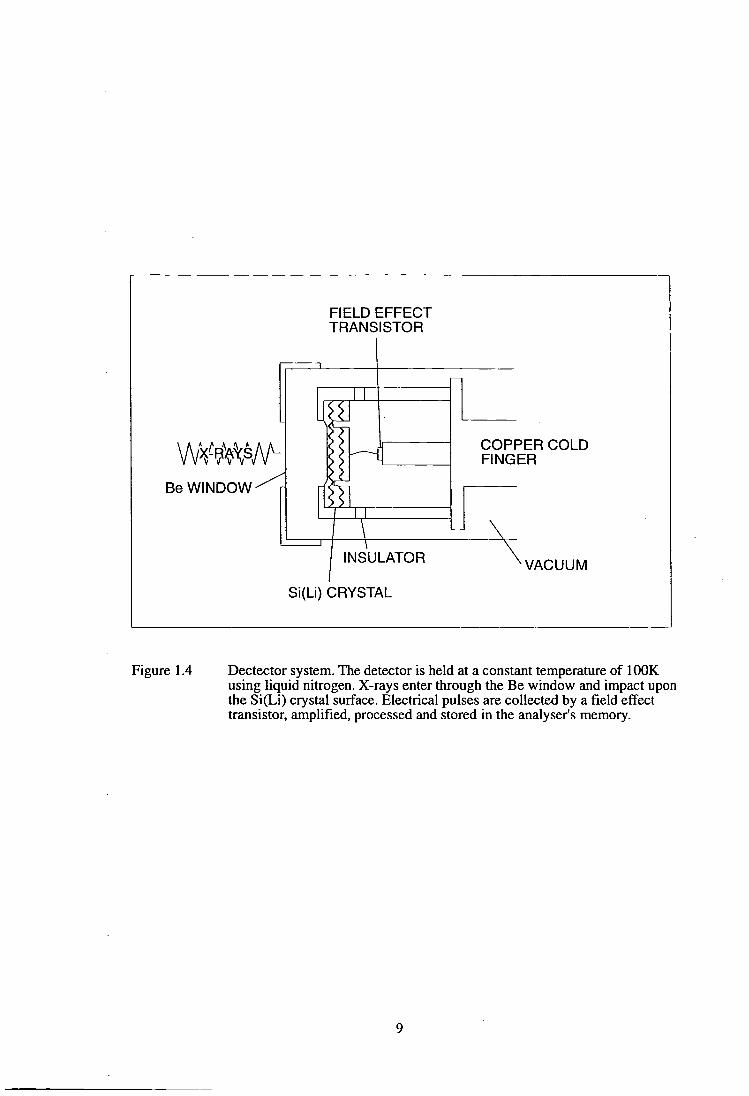
Detector system
The detector system is composed of a number of different elements (Fig. 1.4). The detector is
mounted on a cold-stage which is housed inside a liquid nitrogen dewar (-190°C). This prevents
redistribution of the Li within the Si, and helps reduce noise. The detector itself is constructed from
Si which is doped with small quantities of Li, and is often described as 'Si(Li) drifted'. Ultra thin
gold contacts are evaporated on to each end of the crystal (Lawes, 1987; Statham, 1980). X-rays
emitted from the sample travel in all directions in the vacuum chamber, some will be directed
towards the detector. Those with sufficient energy will penetrate the Be window (ca. 8pm), impact
upon the Si(Li) surface and cause a charge to be liberated which is directly proportional to the
7

Figure 1.3 Arrangement of K, L and M shells, with associated X-ray families.
FIELD EFFECT TRANSISTOR
Be WINDOW-^^
COPPER COLD FINGER
INSULATOR
Si(Li) CRYSTAL
•VACUUM
Figure 1.4 Dectector system. The detector is held at a constant temperature of lOOK using liquid nitrogen. X-rays enter through the Be window and impact upon the Si(Li) crystal surface. Electrical pulses are collected by a field effect transistor, amplified, processed and stored in the analyser's memory.

incident photon energy. This charge is collected by applying a high voltage (500-lOOOV) between the
contacts. The electron charge from each X-ray is passed to a field effect transistor (FET), which
produces a small electrical pulse. This signal is amplified and undergoes a number of processing
operations before being passed to the MCA, where it is stored. The MCA records the intensity of
each pulse alongside its energy level. After a predetermined time has elapsed, the live-time, an X-ray
energy spectrum is produced by plotting the number of X-rays counted at each given energy level
(Erasmus, 1978; Statham, 1980; Goldstein etal., 1981; Reed, 1993 - chapter 11), Fig. 1.5.
There are a number of small problems inherent to the use of this type of detector. Any surface which
is 'visible' to the detector is a potential source of spurious radiation. The detector has a dead time
caused by the fact that the processing time is greater than the conversion time of the MCA, therefore
the system is ineffective for a length of time while each pulse is collected and passed through the
processing system.
1.2.4 Correction procedures
Castaing recognised a number of complications in the application of electron microprobe technology
to analytical procedures (Cescas et al., 1968). In the conversion of X-ray intensity to mass
concentration there is a difficulty since intensities measured by the detector are not the true
intensities generated within the sample. A number of correction procedures must be applied to gain
true intensities.
Initial corrections for dead time, drift and contamination, and background should be carried out prior
to analysis. Matrix correction procedures are then applied to adjust for: (i) differences in atomic
number (Z) since the generation of X-rays varies with the elemental composition of the sample - this
correction procedure deals with the penetration and scattering of electrons as they ionise. The effect
if uncorrected would lead to a reduced apparent concentration of heavier elements and increased
concentration of light elements; (ii) changes in absorption characteristics with different elements in
the sample (A), since absorption of X-rays in a sample is controlled by their depth distribution and
the absorption coefficients of each element present in the sample. Only X-rays that leave the sample
are useful to the analysis. As the X-rays pass through the sample they will be absorbed exponentially
with distance travelled; and (iii) differences with respect to the fluorescence of atomic nuclei within
the sample (F). This is due to the fact that absorption of X-rays in a sample by one element will
10

Counts (xlO)
4-
2-
1
Si
8 10
Range (keV)
Figure 1.5 Results gained from analysing a suspected diatom frustrule from a depth of 8.10m in the North Sands sedimentary sequence.
11

result in the excitation of another. Thus, a proportion of the measured intensity from a given element
will be increased by this secondary excitation. The extent to which the X-ray intensity is increased is
a function of the other elements present in the sample matrix. This effect is greatest when the energy
of the fluorescing radiation falls below the absorption edge of a corresponding analytical line. These
factors will have different relative impacts on samples of different composition and structure.
The ZAF corrections are applied iteratively until results are statistically acceptable. The user must
carry out regular calibration of the microprobe using a stub of known composition, (e.g. Co), to limit
problems caused by detector drift and contamination. This procedure ensures optimal analysis
conditions are maintained throughout the analyses.
1.2.5 Accuracy
Cescas et al. (1968) state that care must be taken to ensure that the precision of collection is greater
than the errors in the correction procedures employed. During analysis care must be taken to use the
same operating conditions for all samples analysed (EQ, tilt angle, probe current).
Generally the detection limits, defined as the concentration of element required to produce an
intensity three times as large as the standard deviation of the background, will vary for the sample
under investigation (matrix structure, composition). Published figures range from 0.1 to 0.01%
weight fraction (Erasmus, 1978). Statham (1980) suggests for Z between 11 and 30 (Na to Zn) the
detection limit is 0.1%wt with greater than 3xl0' counts, although the low end of the energy
spectrum will exhibit higher detection limits due to greater absorption of electrons within the sample.
When analysing bulk samples with a total analysed volume between 10-50jim^, detection of small
elemental amounts will be difficult (Erasmus, 1978).
C.A. Anderson (1967) suggests that the quality of analysis depends upon the degree of spatial
resolution, the sensitivity of detection and the precision of measurement (Table 1.1). Goldstein et al.
(1981) state that, although the technique of EDMA may be precise and accurate, the characteristics
of some materials may limit the accuracy to ±10% relative to the true value, due to variable surface
geometry and roughness. There may also be inaccuracies introduced during the analysis by radiation
damage to the sample i.e. loss of mass (Hall and Gupta, 1974), production of CO2, H2, NO2,
contamination resulting in the deposition of hydrocarbons (Erasmus, 1978).
12

Precision: Measurements tlmt relate to scatter of dispersion among test results without assumption of any prior information
1.
2.
Statistics of X-ray counting
a.
b.
c.
d.
Signal from unknown
Signal from reference standard
Background measurements
Calibration measurements
Other sources of scatter
a.
b.
c.
Stability of electronics
Sample positioning (reproducibility of 'focus')
Sample preparation (surface roughness or irregularities)
Accuracy: Measurements that relate to differences between average test results and true results when the latter is known or assumed
1.
2.
Error in relative intensity
a.
b.
c.
Sample preparation
Background metisurements
Counting system errors (dead time error, peak shift)
Error in calibration
a.
b.
Empirical method: accuracy of equations; uncertainty in true composition
Computational methods: accuracy of equations; uncertainty in physical properties
(absorption coefficients; X-ray yields; etc.)
Table 1.1 The different factors which affect accuracy and precision of EDMA results (From Cescas et ai, 1968).
13

1.3 Alternatives to EDMA
There are a number of different geochemical techniques available for the investigation of
palaeoenvironmental signals in peatlands. This research sought to investigate EDMA in the analysis
and interpretation of these signals. However, a number of problems are associated with the technique
and the way in which it produces data, which are the focus for discussion later. The major problem
associated with EDMA data is that the system yields elemental data which are expressed as a
proportion of all of the elements under investigation. This has been noted by some workers (Grattan,
1994; Pyatt et ai, 1995) as a potential limitation, and means direct comparison between the results
from EDMA and other more conventional bulk chemical methods is not possible (Erasmus, 1978).
However, the technique has illustrated the potential to reveal much information based on general
elemental trends. Indeed, Pennington et al. (1972) state the overall trends in conventional
concentration data yield the greatest amount of palaeoenvironmental information.
A number of closely related techniques have been developed and fall under the broad heading of X-Ray
spectrometric techniques. All share the following stages: (i) excitation of characteristic radiation from the
specimen by bombardment with high energy photons, electrons, protons; (ii) detection and integration of
the characteristic photons to give a measure of emission line intensity; and (iii) the conversion of the
characteristic emission line intensity to elemental concentration by use of a calibration procedure (Jenkins
etai, 1981). Three of these are briefly introduced below and compared in Table 1.2.
Wavelength Dispersive Spectrometry (WDS)
As the name suggests, the principle lies in analysing the wavelength of X-rays emitted following
bombardment by an electron beam. X-rays produced in the sample are focused on to a diffraction
crystal in which the atoms are aligned in a very orderly arrangement. The beam is reflected at a
specific angle by the crystal and the X-rays are detected using a gas flow proportional detector. A
problem with the method is that each crystal is only operational over a specific wavelength range.
Thus, for full element analysis a number of crystals must be used. This means that analysis for a
range of elements, as is required for this research, may be time consuming. Descriptions of the
technique may be found in Lawes (1987) and Reed (1993 - chapter 11).
X-Ray fluorescence
This technique relies upon the production of characteristic X-rays as an excitation source radiation
14

Analysis time
Analytical performance
Quality control
Range of elements
Data format
EDMA and EDS XRF
Simultaneously processes X-rays of all energies
Detector can be placed close to the sample. therefore captures most X-rays
No moving parts that require alignment, but requires calibration every 4 samples
Detects Z> 11 with Be window; Z>5 without
Produces data as %s of analysed volume. EDS XRF = ppm
WDSXRF
Need to scan using a range of crystals through different angles to get full range coverage (time-consuming)
Geometrical restrictions due to X-ray diffraction. size of detector means 80 -95% of the X-rays are lost during diffraction. Good spectral resolution - peak separation
Need to frequently change crystals, much re-calibration required
Detects Z>4
Produces data as %s of analysed volume and in ppm
Bulk chemistry
Generally time consuming. full analysis may take a week or more
Variable efficiency with which elements liberated into solution from different types of sediment
Much equipment required. frequent quality control checks necessary
Costly, therefore means frequently that only a small range of elements are analysed
Presents concentration data in ppm
Table 1.2 Comparison of EDMA, XRF and bulk chemical operations
15

which is obtained directly from fluorescence of the anode in an X-ray tube. Electrons are emitted
from a heated cathode, accelerated and focused to strike the anode. Upon impact most of the power
is lost as heat, with only a small amount of energy resulting in the emission of X-rays. It is these X-
rays which interact with the atoms of the sample and produce further characteristic X-rays which
relate specifically to the elemental composition of the specimen (Jenkins, 1974; Williams, 1987).
Common anode materials include chromium, rhodium, tungsten and molybdenum (Jenkins et ai,
1981) amongst a number of other suitable elements. This technique developed largely as a
wavelength dispersive method (WDS), but energy dispersive (EDS) forms are common with a
greater flexibility offered by the superior energy resolution capabilities of the solid state detector,
and the simultaneous, as opposed to sequential, collection and processing procedures speeding
analysis times considerably (Williams, 1987).
A new development of this technology is the introduction of EMMA (Energy dispersive Multi
element Miniprobe Analyser). This is variation on the energy dispersive XRF technique which
utilises monochromatic X-ray radiation as an excitation source, and is thus capable of reliable trace
element analysis for a limited range of elements (Cheburkin and Shotyk, 1996).
Bulk chemical operation
Previous palaeoenvironmental investigations have used bulk chemical procedures to obtain the
required geochemical data (e.g. Mackereth 1965, 1966; M0msjo, 1968; Pennington et ai, 1972;
Mannion, 1978, 1979; Livett et ai, 1979; Van Geel et ai, 1989; Bennett et al., 1992; Shotyk,
1996a; Shotyk et al., 1996). This involves subjecting each sample to a time consuming and
frequendy hazardous operation, involving chemical digestion and subsequent analysis using a suite
of different pieces of analytical equipment including atomic absorption spectrophotometers (AAS),
flame photometers, and inductively coupled plasma mass spectrophotometers (ICP-MS).
Descriptions of these techniques are outside the context of this thesis, but further details may be
obtained elsewhere (Date and Gray, 1989; Jarvis et al., 1992; Ure, 1995).
Bengtsson and Enell (1986) state that chemical operations are frequently dependant upon the
material analysed. A common problem is that the results obtained from different methods may be
unreliable and not directly comparable. The results should be treated with a degree of caution.
Although they produce concentrations of elements (ppm) the overall question of efficiency of the
16
extractant method used to liberate each element into solution must be addressed, as must the
accuracy of the analytical technique. Bengtsson and Enell (1986) propose a standard reference
technique for use in palaeoenvironmental work. This technique was adopted for comparative analysis
of the North Sands sediment, the results of which will be discussed in Chapters 3 and 4.
1.4 Uses of EDMA in palaeoenvironmental reconstruction
The use of EDMA in palaeoenvironmentai reconstruction is in its infancy. The primary application
of the technique is to gain geochemical data relating to palaeoenvironmental conditions to aid
interpretation of specific processes. However, the greatest information is obtained when the method
is used in association with other data, such as pollen and diatoms, with a secure chronology provided
by radiocarbon dates.
Pyatt et al. (1991) first used the technique in a palaeoenvironmental context applying it to the
analysis of the remains of a 2000 year old bog body from Lindow Moss. The technique was utilised
to illustrate the mobility of elements between the body and the encompassing peat mass. It provided a
useful indication of the relative mobility of the elements under investigation and served "to illustrate
all the important geochemical trends...." (Pyatt et al. 1991: 155). The technique was put to a similar
use by Bartsiokas and Day (1993), who used it on fossil bone samples from Java. They adopted a
new method for sample preparation and used peak-to-background ratios (Erasmus, 1978; Statham
and Pawley, 1978; Small et al., 1979; Statham, 1979) as the basis for analysis, concluding that
EDMA is an accurate technique for studying the elemental composition of various materials.
However, these workers did not use the technique for direct palaeoenvironmental reconstruction, and
it was not until the work of Grattan (1994) and Grattan et al. (1996) that the procedure was first
adopted in an investigation of Holocene environmental development. He applied EDMA to both lake
and terrestrial sediments in northern Scotland to investigate environmental development and
anthropogenic impacts from deforestation and pollution episodes. Grattan found the technique to
produce comparable results to those obtained using other bulk geochemical techniques from similar
sedimentary environments in the locality (e.g. Bennett et al., 1992). Pyatt et al. (1995) used EDMA
in association with diatom analysis to examine soil changes, erosion and acidification episodes as the
result of climate change, catchment vegetation succession and anthropogenic disturbance as recorded
in sediments obtained from Loch Hellisdale, northern Scotland. Charman et al. (1995) similarly
investigated sediments from northern Scotland, using pollen analysis and EDMA to examine the
17

environmental effect of three separate tephra deposition episodes.
7.5 Interpretation of individual elements for EDMA
Bengtsson and Enell (1986) state that a body of sediment may be regarded as a mirror of past
conditions in ecosystems and in the surrounding land. Systematic analysis of the sediment may
elucidate environmental processes operating both externally (allogenically), including such factors as
climate change, anthropogenic activity, and internally (autogenically), including those processes
which govern the development and accumulation of the sediment, microbial activity, mobilisation
and precipitation of certain elements and changes in the redox state of the system (Jones and Bowser,
1978). Autogenic compounds may include biochemically precipitated carbonate minerals,
amorphous and cryptocrystalline Fe and Mn, oxyhydroxides, sulphides, phosphates etc. (Engstrom
and Wright, 1984).
The quality of any inferences drawn from the geochemical data collected will be as accurate as: (i)
the reliability of the analytical procedure, and (ii) the way in which the data are interpreted to
produce the environmental reconstruction model. The former of these will be addressed elsewhere
with respect to EDMA (Chapter 3). A discussion of the latter follows.
There have been many palaeolimnological studies which use geochemistry as the primary data
source. The investigations of the British Lake District and Scotland are the most notable (see, for
example, Mackereth, 1965, 1966; Pennington et al. 1972; Pennington, 1981; Bennett et ai, 1990;
Edwards and Rowntree, 1980; Grattan, 1994). Mackereth (1965) largely initiated chemical
investigations of lake sediments, suggesting that the composition of the sedimented material is
indicative of the stability/instability of the land surface from which it was derived. His analyses of
the Lake District sediments led him to a number of conclusions:
"One may then regard the sedimentary sequence of a lake deposit as a series of samples of soils eroded from the drainage basin and deposited chronologically in the lake bed." (Mackereth, 1966: 168).
There have been many palaeoenvironmental investigations using the geochemical signals held within
a body of peat as a prirnary information source (Livett et. al., 1979; Glooschenko, 1986; Van Geel
et al., 1989; Grattan, 1994; Shotyk et al., 1996). There appears to be a great deal of potential in
such investigations (Livett, 1988) since the sediment is a store of both allogenic and autogenic
18

materials, and as such may provide an insight to the processes operational during different
accumulation phases of the peat system, and those processes which influence the sediment unit
externally. Grattan (1994: 246) states ".... EDMA to mire, as opposed to lake sediments, allows the
reconstruction of general environmental trends and specific episodes of environmental disturbance".
The chemistry of a peat body relates to the composition of the original plant material, the supply of
solutes and particulates (from both atmospheric and groundwater sources), the extent and nature of
biological activity and the environmental conditions (pH, Eh, temperature) during and after peat
formation (Clymo, 1983; Naucke et al., 1993). Inferences drawn from geochemical data will have to
take account of the relative importance of a large number of dynamic, inter-related factors (Fig. 1.6).
Kemp et al. (1976) suggests the following classification for the majority of elements analysed in
palaeoenvironmental studies, although many of these elements may be considered components of
more than one group:
Major elements: Na, K, Mg, Si, Al
Carbonate elements: Ca, Mg, inorganic C (carbonate)
Nutrient elements: organic C, N, P
Mobile elements: Fe, Mn, S
Trace/heavy metal elements: Cu, Pb, Zn, Sn, V
This classification will form the background to the analysis of elements in this study, with data
generally presented in the above groups to aid interpretation and provide consistency.
1.5.1 Major elements
Sodium (Na)
Sodium is a highly soluble, alkali metal. It is present in all outer spheres of the Earth, and has an
abundance of approximately 25000 ppm (Day, 1963; Wedepohl, 1995). In the main modes of
occurrence sodium may be found in a limited number of complex aluminohalide minerals; in a very
large group of complex silicate minerals, typically associated with igneous rocks; and, in a variety of
soluble salts. In igneous rocks it may be appear as orthoclase, albite and anorthite (Day, 1963).
When associated with mineral matter in peatland sediments it is indicative of the relative importance
of leaching and erosion. If there is a high proportion of the element in the mineral fraction it provides
19

A U T O G E N I C
Microbial decay
Vegetation characteristics
Mobilisation / precipitation
P H \ T •
< ^ , C.E.C.
. _ . / Tenrtperature
^M ^ \ \ other elements
r O N Hurnfication ^ * ^
Catchment geology .'33'
' • - <
POST DEPOSITIONAL DIAGENESIS Aerobism : Anaerobism
Humification-< >• S reduction
Leaching / Bio-accumulation
f Hydrology, Eh. pH, [Temperature. C.E.C., othei V elements....
ALLOGENIC
ANTHROPOGENIC NATURAL
Land disturbance
Mineral extraction & processing
Climate change
Pedogenesis
Vegetation succession
TIME
PALAEOENVIRONMENTAL RECORD
Figure 1.6 Origin of the sedimentary geochemical record
20

evidence for soil erosion. Conversely, when there is a low proportion of the metal associated with
mineral material, it suggests that soil maturation and leaching processes are occurring under more
stable environmental conditions (Mackereth, 1965; 1966; Pennington et al., 1972; Guppy and
Happey-Wood, 1978; Mannion, 1979; Edwards and Rowntree, 1980; Pennington, 1981; Engstrom
and Wright, 1984; Gill, 1989; Bennett et al., 1990; Grattan, 1994). Na has a low affinity for
organic substances and forms weak organic complexes, and thus may be rapidly lost from peatland
systems (Shotyk, 1988). Damman (1978) studied a number of elements, finding Na to be the element
most rapidly and completely removed from the peat. Clymo et al. (1990) comment that generally less
than 1% was retained in cores from Scottish rainwater-dependent peatlands. Na maybe associated
with salt water influence upon a coastal catchment, especially when it exhibits a relationship to K
(Bengtsson and Enell, 1986). The concentration of dissolved Na in soil may be related to the amount
of rain, the rate of evaporation, the drainage regime, which is in turn controlled by climate,
topography and the texture of the soil (Goldschmidt, 1954). Na normally forms a higher proportion
of total ionic content of oligotrophic/ombrotrophic waters, due to its relative abundance in rainwater
(Green and Pearson, 1977).
Potassium (K)
Potassium has a strong affinity for O and the halogens, and occurs primarily with these elements in
nature. There are a large number of K containing minerals, including biotite, feldspar and
hornblende, in which K forms a major component, together with a large number in which the element
occurs as a more conservative constituent. In igneous rocks the element reaches between 3-4%, with
an average crustal abundance of 133 ppm (Wedepohl, 1978). The weathering of K-feldspar, which is
a function of pH, and the concentration of Si and Al in solution, releases much K into the soil
solution. This is either used in the formation of K minerals, absorbed by clay particles or removed by
fluid migration. In the mineral phase it may be used as an indicator of mechanical erosion of
basement materials, and often follows the same distributional pattern as Na. It is important in mire
ecosystems as a plant nutrient (Naucke et al., 1993), where it is generally in a mobile form and may
be readily leached (Athi, 1984). According to Goldschmidt (1954), the geochemistry of K ions in
soils is dominated by the equilibrium of cation absorption and exchange between soil solution and
various clay minerals. Shotyk (1988) notes strong bio-accumulation of K in surface peats, but below
the acrotelm layer of the mire the element may be readily leached since it exhibits a low humic/fulvic
acid complexing capability. Aulio (1980) studied 13 separate Sphagnum species for a range of
21
different elements and discovered the greatest element in concentration was K, confirming the strong
bio-accumulation for K of moss species. Generally K forms a greater component than Na in
sedimentary sequences (Mackereth, 1966).
Magnesium (Mg)
This alkaline earth element is an abundant element in nature, accounting for 2.2% of the continental
crust. There are numerous minerals which contain this element, of which forsterite is the pure
orthosilicate form, and olivine the more general form in rock (Day, 1963). It may reflect the process
of weathering, soil formation and sedimentation (Goldschmidt, 1954). It is an indispensable element
to plant life, being an essential constituent of chlorophyll (Gill, 1989; Goldschmidt, 1954). Mg is a
very soluble element and forms divalent cations in aqueous solutions (Sikora £ind Keeney, 1983). It
is similar to Na, K and Ca in that the adsorption of the element by decomposing organic matter is not
particularly strong, and forms unstable organic complexes which are readily leached from the peat,
especially if the pH of the circulating water is low. However, Damman (1978), studying
ombrotrophic peat bogs found this element accumulated to the greatest extent with respect to the
peat mass as a whole.
Mg^* is the second most abundant cation in sea-water (Gill, 1989) and may reflect salt-water
influence upon a catchment (Bengtsson and Enell, 1986).
Calcium (Ca)
Calcium, occurs in the upper crust at about 3.5% by weight forming a large number of minerals,
some of which are major constituents of rocks. In most minerals and other inorganic materials Ca
forms bonds with the strongly electronegative elements O and Fl. It occurs in minerals primarily as
silicates, carbonates, phosphates, sulphates and borates, with the most common Ca bearing forms
including plagioclase feldspar, pryoxene and amphibole. Its abundance in granitic rocks is around
0.72-1.33% wt CaO. The concentration of dissolved Ca in natural waters is controlled by the level of
dissolved carbonate, phosphate and sulphate species (Wedepohl, 1978). The mineral form in
sedimentary systems frequently shows a similarity to K, Mg and Na possibly indicating periods of
mechanical erosion, however, it is more easily removed in solution than these. Hence, it may only be
representative of mechanical erosion during extreme environmental events. The highest
concentrationof the element in the sediment of the Lake District was immediately after deglaciation
22
(Mackereth, 1965, 1966). Mannion (1979) states that low levels of Ca may suggest leaching
processes are active.
High H ion concentration favours the mobility and therefore the removal of Ca via leaching
processes (Goldschmidt, 1954; Shotyk, 1988). This element has a strong affinity with organic
ligands (humic and fulvic acids) and as such a body of sediment may contain much Ca not
associated with allogenesis (Engstrom and Wright, 1984). Ca * is the main cation in the exchange
complex, and thus effectively controls pH (McRae, 1988). Zailer and Wilk (1907) used the Ca/Mg
ratio to distinguish between ombrotrophic and minerotrophic mires, a low value indicating a bog and
a high value indicating fen conditions. Witting (1947) suggests the boundary between bog and fen
occurs at around 1 mg 1' Ca.
Silicon (Si)
Silicon is one of the most abundant crustal elements, and is a major constituent of most common
rock forming minerals: silicates and alumino-silicates. The most common silicates are quartz,
feldspar and mica, these frequently forming a significant component of detrita! material. The
abundance of silica in igneous rocks of the crust range from 35 to 85%, with granites accounting for
72.1% on average (Wedepohl, 1978, 1995). It most commonly occurs in the oxidised state as SiOj.
The element is often derived in large proportions from erosion of exposed soils (Goldschmidt, 1954;
Shotyk, 1988; Pyatt et al., 1992). Quartz in sediments may represent the inclusion of wind-blown
dust, for example under peri-glacial conditions (Goldschmidt, 1954; Cowgill and Hutchinson, 1970).
Davis et al. (1984) suggest silica and £issociated minerals may originate in peat by a number of
different mechanisms: allogenic detrital contributions in the form of insoluble quartz and other
silicates and eilumino-silicates; autogenic formation during sedimentation; soluble biogenic silica
from plants; post-depositional and diagenetic alteration of existing minerals. Silica may occur as
associations with alumino-silicate minerals (Cowgill and Hutchinson, 1970), or in the form of
opaline silica skeletons of plants and animals (phytoliths, diatoms frustules, radiolaria, chrysophyte
cysts, sponge spicules). The limiting factors for the latter are usually N and P (Goldschmidt, 1954;
Engstrom and Wright, 1984; Grattan, 1994).
It is useful in palaeoenvironmental interpretations to separate the allogenic/autogenic fractions of
Si02 (Feustel and Byers, 1930 - quoted in Shotyk, 1988; Chapman, 1964; Engstrom and Wright,
23
1984), and commonly values in the region of 8% soluble, 30% insoluble are found in peatland
systems (Shotyk, 1988). Davis et al. (1984) state that separation is possible by inference from
compositional, textural and geochemical evidence including crystal morphology, the presence of
other mineral inclusions and the composition of the mineral itself. M0msjo (1968) suggests that high
levels of Si02 with Ca and Fe indicate the influence of mineral soil water during the formation of
carr peat. He also proposes that increased levels of Si02 with Fe and Al in the uppermost sediments
may relate to the deposition of airborne mineral particles.
Aluminium (Al)
This element is the dominant metal in the earth's crust. It occurs as cryolite, chiolite, elpasolite and
weberite in granitic rocks, but is a component of a wide variety of different compounds, including
kaolinite, a major clay mineral, with orthoclase and albite dominant forms in igneous rocks. Typical
abundances for the element in the crust approach 80,000 ppm, or 7.96% (Day, 1963; Wedepohl,
1995). A common weathering effect of aluminous minerals following dissolution is that the cations
are leached out, with the Al and Si undergoing hydrolysis and subsequent recombination to yield
aluminium silicate clay minerals of some form (Day, 1993). It is primarily viewed as an element
indicative of erosional intensity and soil leaching, with minimal post depositional diagenesis, since its
chemistry is not affected by redox conditions or sulphide concentrations (Engstrom and Wright,
1984; Clymo et al., 1990). According to Bache (1986), the solubility of the cation is dependant on
pH, rising rapidly below pH 5. However, Muscutt et al. (1993) illustrated the concentration of
organically complexed Al species to show a strong correlation with dissolved organic carbon (DOC),
concluding that acidity was not the major control of Al in the streamwater of the Plynlimon
catchment. In the presence of organic matter Al will move into solution, where it is leached from the
upper surface humic layers and precipitated further down the profile. Bache (1986) states the cation
exchange system of acid soils provides a large reserve of ionic Al, which can be brought into
solution when soluble salts percolate through soils. Thus Al may be commonly utilised as an
indicator of acidification, in association with other elements (Bengtsson and Enell, 1986).
Weathered granite may be almost completely devoid of Na and Ca, with partial leaching of K, Mg,
Fe'*, while Al remains immobile, resulting in very aluminous sediments (Gill, 1989), for example the
china clay deposits of Lee Moor, Devon and similar examples throughout Cornwall.
24
Both Si02 and Al may be complexed with other sedimentary components: Si02 as an anionic ligand
of hydrated Fe and Mn oxides; with Al chelated with high molecular weight humic materials
(Engstrom and Wright, 1984).
Carbon (C)
Carbon is essential for every form of life. Its abundance in naturally occurring rocks of the crust is
around 2000 ppm (Wedepohl, 1995). It is a most ubiquitous element, and is encountered in a great
variety of forms and locations: as a free element it is found in the iithosphere; CO^ is present in the
biosphere, the atmosphere, the hydrosphere and the lithosphere (Day, 1963). The most important
ionic forms of C in nature are the carbonate and bicarbonate ions, in which state vast quantities of C
are immobilised in the upper part of the lithosphere. Numerous carbonate minerals exists, many of
which are associated with metals e.g. Na, Ca, Sr, Ba, Zn, Mg, Cd, Pb, Fe, Mn and Co (Day, 1963).
According to Gill (1989), sedimentary rocks have on average 0.2-2% organic matter, the highest
amount is found in shales. He states that inorganic C occurs largely as carbonate, mainly biogenic in
origin. The solubility of inorganic C is governed by the pH of the circulating water and the presence
of H2CO3 acid (Gill, 1989). Increased production of CO2 from decaying organic matter will lead to a
higher concentration of H2CO3 and thus more carbonate is dissolved.
The net difference between primary production and the total decomposition and leaching determines
the C balance of a peatland system (Silvola et al., 1996). Natural soils exhibit a net gain of organic
substances of generally acidoid character (e.g. humus), which can form compounds with Fe and
other metals (Goldschmidt, 1954). Pennington et al. (1972) comment that in a description of Late-
glacial sedimentary profiles it is often more informative to use carbon content than any other variable
to distinguish minerogenic material. Mackereth (1965) states that similarities in the element between
two very different lakes shows that the controlling factors are regional, confirming the importance of
C as a sedimentary variable (Steinberg et al. 1991). Kuhry and Vitt (1996) have used fossil C/N
ratios as a measure of peat decomposition over a 9000 year period.
DOC generally includes both simple organic compounds, such as carbohydrates and short chain
acids, as well as more complex humic and fulvic complexes (Heyes and Moore, 1992). Peatland
investigations have confirmed that the deeper peats are generally more resistant to decay processes,
with the bulk of CO2 production confined to the acrotelm layer only (Hogg et al., 1992). If there is a
25
net loss of CO2 to the atmosphere or by transformation to another product, this may influence the pH
regime of the system, with a subsequent effect on the availability of certain mineral nutrients in
waterlogged soils (Sikora and Keeney, 1983).
1.5.2 Nutrient elements
Phosphorus (P)
The most abundant phosphate mineral in the crust is apatite, which is frequently associated with
silicate rocks. The only stable oxidation state of phosphorus within the lithosphere is the P ^ state of
the phosphate ion [P04]^. The abundance of P 0 in common igneous rocks is between 0 and 2%,
and in granites between 0.01 to 0.28% (Wedepohl, 1978). The weathering behaviour of the element
depends largely upon the kind of P minerals present, and the relative solubilities of these compounds
in the weathering solutions. Generally, in acidic environments apatites are remarkably soluble. The
concentration of P may thus be regarded as a fiinction of the following variables: (i) the rate of
supply; (ii) the efficiency of precipitating mechanisms; (iii) the rate of sediment accumulation; and
(iv) the rate of loss of P from recently sedimented material (Mackereth, 1966).
The sedimentation of P may be initiated by a number of factors: (i) carried in solution with Fe and
Mn (under anaerobis); and (ii) precipitated into organic material. The first is important both to the
precipitation, as well as the retention of the element in the sediment (Mackereth, 1966). Shotyk
(1988) states the geochemistry of P in mire waters is most likely related to the concentration of
DOC, Fe and the pH, with the capacity of peat to uptake P essentially a function of mineral content
(Naucke et al., 1993). Organic P is expected to dominate in peatland systems, therefore the
availability of inorganic forms is largely a function of the net mineralisation of organic P and the
chemistry of inorganic P in the organic matrix (Sikora and Keeney, 1983). The sedimentary signal of
P is often mixed and difficult to interpret since there are many diifferent processes which control the
availability of the element. Sedimentation of autogenic P may be through the biological uptake of
dissolved inorganic P, with subsequent deposition as particulate organic P (Engstrom and Wright,
1984). In lake, and possibly terrestrial sediments, there may be considerable migration and
accumulation of P in surficial layers. The total P content of these layers may bear no relation to the
P content of the sedimentary material and may complicate determinations of historical P loading for
a particular area (Carignan and Flett, 1981).
26
1.5.3 Mobile elements
Iron (Fe)
Iron is an abundant element in the lithosphere. It has a high abundance in the earth with a crustai
value of 5% (Day, 1963; Wedepohl, 1995). In the crust it occurs in combination with O and freely
enters into silicate minerals. Its forms are abundant, widespread and numerous, and include free
metallic iron, primary oxide and sulphide minerals and primary silicate minerals, the last of which
are extremely numerous, particularly in igneous rocks (Day, 1963). It is an essential element for
living organisms. Its presence is strongly affected by the redox potential of the sedimentary
environment. Iron is mobilised in anaerobic conditions and precipitated under oxidation
(Goldschmidt, 1954; Mackereth, 1966; Jones and Bowser, 1978; Engstrom and Wright, 1984;
Naucke et ai, 1993). Oxide coatings on sediments (primarily Fe) are ubiquitous in oxygenated
environments.
Jones and Bowser (1978) suggest that Fe can be transported in many ways: (i) in a dissolved form as
humic/fulvic acid complexes; (ii) in particulate form as inorganic oxides, and oxide coatings on
mineral matter from the mechanical erosion of the surrounding soils; or (iii) sedimented by
particulate organic matter formed autogenically within the sediment. Soil humic materials play an
important role in the mobilisation of Fe since they readily form strong soluble complexes (Jones and
Bowser, 1978; Engstrom and Wright, 1984). Mackereth (1965, 1966) and Pennington et al. (1972)
have used the Fe:Mn ratio to reconstruct palaeo-redox conditions, a low value being indicative of
reducing conditions and a high ratio suggesting the erosion of mineral soils under oxidising
conditions. Since the precipitation of the Fe is essentially controlled by the ionic composition of the
circulating water, the redox conditions, pH and microbial activity, there may be changes in the long
term concentration of the element as the influence of these variables vary with time. A number of
workers (Chapman, 1964; Green and Pearson, 1977; Mannion, 1979) suggest that high levels of Fe
are indicative of groundwater influence.
Manganese (Mn)
The crustai abundance of this element is eighth in the order of abundance as far as the metals are
concerned and is estimated to be 716 ppm (Wedepohl, 1995). It has a number of oxidation states,
but is essentially cationic, with states of 2, 3 and 4. It is present in a wide variety of minerals,
particularly silicates, where it occurs as a trace or minor element (Day, 1963). It has a geochemistry
27

similar to that of Fe, with low solubility conditions in aerobic environments and enhanced
mobilisation under anaerobic conditions. Anderson and Hawkes (1958) state that ferromagnesian
minerals and feldspars decompose fairly rapidly yielding clay minerals and secondary oxides.
Goldschmidt (1954) states that Eh and pH are important variables governing the solubility and
precipitation of both Mn and Fe. Acidic, anaerobic conditions result in mobilisation, while alkaline,
aerobic conditions lead to precipitation. The weathering of crustal rocks is one of the most
significant sources of Mn (Jeffries and Snyder, 1981; Engstrom and Wright, 1984). It is an
indispensable trace element for organic life and is also an important catalyst in the oxidation of
organic matter. Pakarinen and Tolonen (1976) report that the retention of Mn by mosses is rather
weak.
Sulphur (S)
Sulphur is a primary constituent of three major mineral groups: sulphides, sulphosalts and sulphates,
between them forming many minerals. The S content of rock forming silicates is generally less than
100 ppm, however it has been noted as having an abundance of c.330 ppm in granitic rocks
(Wedepohl, 1978). Its presence in oxygenated environments is largely controlled by biological
processes. The behaviour of the element in the weathering process relates to three main processes: (i)
the participation in Eh processes, many of which may influence or be influenced by pH; (ii) the
formation of volatile compounds with some light elements, especially H and O; and (iii) its role in a
great variety of biochemical processes. In the pore waters of reducing sediments various authigenic
metal sulphides will form, the most common of which is FeS (pyrite).
Total sulphur is made up of organically bound S and a wide range of plant available and unavailable
inorganic forms (Brown, 1982). Reduced S is an essential element for living creatures (Goldschmidt,
1954; Brown, 1985; Gill, 1989). The source of S may be a combination of the following: (i)
mechanical weathering of catchment soils - the S is produced through the microbial reduction of
sulphate in terrestrial soils; (ii) the bedrock, this is largely dependant on catchment geology, and; (iii)
in more recent sediments from the smelting activities of the 19th century (Pyatt, 1974). Rudd et al.
(1986) conclude that the most significant product of sulphate reduction is organic S. Brown (1985)
states that 90% of the S (total) in valley mire peats is associated with organic matter, and this was
confirmed by the analyses of Casagrande et al. (1980) and Novak and Wieder (1992) in different
peat forming environments. Thus sulphate reduction is the major source of S to peatland sediments.
28

Organic S in peatland systems is commonly found in a C bonded form, including proteins, amino-
acids and polypeptides, these are bound to humic acids and colloidal mineral material (Brown,
1982). Inorganic S is less abundant than organic S in sediments, the major form being sulphate in
well drained soils. As already introduced, under anaerobic conditions H2S may be produced by
bacterial sulphate reduction or by decomposing organic matter. Conversely, when O enters a
previously anaerobic environment the sulphides may be chemically and microbiologically oxidised to
elemental S, which is then subject to attack by micro-organisms, with the eventual conversion to
sulphate (Brown, 1982). However, Casagrande et al. (1977) state that the water content of the soil
has much to do with the specific forms of S present.
High levels of S may be detected in more recent sediments as a result of the increased liberation of
SO2 into the atmosphere as a result of fossil fuel burning (Cowgill and Hutchinson, 1970; Gill,
1989), this may increase the acidity of the soil system (Goldschmidt, 1954). A greater concentration
of S may also be encountered in sediments close to the sea.
J.5.4 Trace/heavy metal elements
These elements are generally the least abundant elements in the rocks of the earth's crust, and occur
in concentrations of less than 1%, frequently below 0.01% or 100 ppm (AUoway, 1995; Wedepohl,
1995).
These elements may be considered as having three roles in the atmosphere, lithosphere and
hydrosphere: (i) as nutrients, (ii) as toxic pollutants, and (iii) as indicators of transfer mechanisms
(Pierson et al., 1973). It is therefore necessary to determine the background concentrations of these
elements to examine the contribution each makes in a particular ecosystem (Fortescue, 1992;
Rasmussen, 1996). There is a large amount of literature which proposes that increased levels of a
number of trace elements may be attributable to anthropogenic activities (Goodman and Roberts,
1971; Aston et al., 1973; Lee and Tallis, 1973; Pierson et ai, 1973; Livett et al., 1979; Van Geel et
al., 1989; Christensen and Chien, 1981; Rippey et al., 1982; Glooschenko and Benedetti, 1983;
Glooschenko, 1986; Markert and Thorton, 1990; Stewart and Fergusson, 1994; Hong et al., 1994
Renberg et a/., 1994; Hong et al., 1996; Shotyk, 1996b). The use of peat profiles for historical
monitoring of pollution episodes is a complex process, with some elements proving to be more useful
than others (Livett, 1988; Glooschenko, 1986; Stewcirt and Fergusson, 1994).
29

Livett et al. (1979) analysed a number of blanket peat profiles for their concentrations of Pb, Zn and
Cu, with the underlying assumption that a number of heavy metals will remain virtually immobile
once incorporated into the peat. They suggested that a time sequence of deposition may be preserved
in the peat profile and dated by pollen analysis. This assumption has subsequently been questioned
and there are a number of more complex processes operating which determine the mobility and
retention of heavy metal elements in peat (Livett, 1988).
Bog vegetation has long been considered an effective trap of metals both from dry and wet
depositional vectors. In particular, species of Sphagnum moss have been used to analyse recent
aerial pollution and its effects on bog vegetation (Goodman and Roberts, 1971; Glooschenko and
Benedetti, 1983; Ruhling and Tyler, 1984). The ability oi Sphagnum species to trap metals is related
to a number of factors including the biomass density of its stem, growth rate, leaf structure and its
high cation exchange capacity. The last of these factors is attributable to the presence of polyuronic
acids in the cell walls (Glooschenko, 1986). Livett (1988) comments that heavy metal-peat
associations are initially determined by the surface upon which the metals are deposited. The
principal site of accumulation in plants is the cell wall and intracellular membranes. Since many
peatlands generally have an abundance of Sphagnum species which are incorporated in to the
developing peat matrix as time progresses, it is likely that any extraneous input of heavy metals will
be incorporated in to the peat bound to the surficial organic material. Ruhling and Tyler (1970)
examined the woodland moss Hylocomium splendens and found that its capacity for sorption and
retention of heavy metals was in the order Cu>Pb>Ni>Co>Mn, Zn.
There are a number of inter-related processes operational in peat which will determine whether a
given element will remain bound to the organic matter upon which it was initially deposited, or
mobilised to a different location in the profile: (i) the state of decomposition; (ii) the presence of
other elements; (iii) Eh; (iv) temperature; (v) the nature of the hydrological regime, especially the
position of the water table; (vi) the activity of micro-organism populations; and (vii) pH. Livett
(1988) states the last is the most important independent factor to influence heavy metal binding by
humic material.
The degree of decomposition has three major effects in peatland environments: (i) loss of organic
matter through leaching; (ii) loss of physical structure; and (iii) a change in the chemical state of the
30
peat (Clymo, 1983). As the peat becomes more humified, the concentration of humic substances
increases. These are the major reactive constituents of the sediment and are significant metal binding
agents. The association between heavy metal and humic acids is dominated by the cation exchange
and chelation process (Livett, 1988).
The pH of the circulating water and peat soil is a particularly important variable in peatlands. The
pH will affect the availability of exchange sites, the rates of decay through microbial activity, the
availability of plant nutrients and the mobility of Fe, Mn and Al which themselves are important in
complexing and chelating processes. Eh will similarly affect the mobility of certain trace elements
and is primarily governed by fluctuations in the position of the water table, pH of the circulating
water, temperature, the presence of sulphides and O concentration (Clymo, 1983).
The nature of the hydrological regime is of prime consequence in these environments. A peat body
fed by groundwater circulation will differ significantly from an ombrotrophic system fed solely by
atmospheric inputs. The former mire system will typically be enriched by lithospheric elements
gained directly from the surrounding catchment. It will have a higher pH, perhaps approaching
neutrality, a more diverse surface flora, greater mobility of nutrient elements, especially in the
acrotelm, higher concentrations of major ions since more exchange sites are available for the bases
from the groundwater, and generally a more rapid rate of accumulation. The ombrotrophic system
will exhibit a much lower pH due to the low availability of Ca and Mg ions (Sikora and Keeney,
1983). The system will experience a lower rate of decay since microbial activity will be restricted, a
greater concentration of complexing organic substances produced as a by-product of decomposition,
with a smaller contribution from the surface vegetation which may release polyphenolic acids, and a
larger concentration of metallic compounds. Durand et al. (1994) illustrated that metal leaching will
be higher for acidified systems. Glooschenko (1986) showed metals to be mobile in peat profiles with
the water table location and fluctuation being a major influence on metal behaviour.
The presence of other elements is of significant importance. For example, a net decrease of CO2 may
exert a major influence upon pH and availability of certain mineral nutrients in the soil (Sikora and
Keeney, 1983). They also suggest that Fe and Mn may affect the Eh and pH status of the circulating
waters, changing the solubility of certain elements. The formation of sulphides produced primarily
from the reduction of sulphates under anaerobic conditions (Brown, 1985; Rudd et al., 1986), may
31
be responsible for the decreased mobility of certain heavy metal elements such as Zn, Cd, Cu
(Hermann and Neumann-Mahlkau, 1985).
It is evident that the accumulating peat matrix is an extremely complex system. Stewart and
Fergusson (1994) conclude that the physicochemical processes in peat bogs are not well enough
understood to make a definite statement of the origin of certain trace elements, although Markert and
Thorton (1990), in their analysis of a number of elements from an English peat bog soil suggested
that the vertical transport of heavy metals through such processes as leaching to groundwater was
negligible due to the high affinity of the elements for organic matter. They encountered no migration
of substances between basal and higher layers. A brief discussion of the geochemistry of the heavy
metal elements analysed in this research will now be presented.
Copper (Cu)
Copper is a chalcophile element (it has a strong affinity for S). The average crustal for this element
is around 25 ppm (Day, 1963; Wedepohl, 1995), with a much lower occurrence in acidic, granitic
rocks. It does not contribute significantly to rock-forming silicate minerals, and occurs in rocks
largely in the form of sulphides. The presence of sulphate ions and organic matter may lead to the
microbial formation of H2S, and thus to the precipitation of metal sulphides (Goldschmidt, 1954). It
is a necessary element for plant and animal life (Baker and Senft, 1995).
The mobility of Cu in peat profiles has been considered in some detail by Tanskanen (1976), who
concludes that Cu generally decreases in concentration as the peat becomes more humified, and
increases with pH and depth. Merrington and Alloway (1994) conclude that aerial deposition of the
metal is the dominant mode of transport from two metalliferous mine sites in the UK The
anthropogenic flux of Cu is said to be important with respect to natural levels, thus the composition
of peats associated with the impact of human activity may contain elevated levels of Cu
superimposed on background concentrations (Rippey et ai, 1982). Cu is said to have an 'AIF of
1363%. It is one of the elements generally considered to be immobile under anaerobic conditions due
' AIF - Atmospheric Interference Factor (.see Lantzy and Mackenzie, 1979)
AIF = total anthropogenic emission.s x 100 total natural emis.sions
A value of 100% means natural = anthropogenic sources e.g. AIF of 1300% indicates anthropogenic sources are 13 times as large a-s the natural flux.
32

most likely to a combination of sulphate reduction and the formation of metal/organic complexes
G ivett et ai, 1979; Swanson and Johnson, 1980; Hermann and Neumjinn-Mahlkau, 1985; Shotyk,
1988; Stewart and Fergusson, 1994). Copper has been identified as an indicator of industrial activity
(combustion of fossil fuels) increasing in sediments dated from the 19th century (Goodman and
Roberts, 1971; Tyler, 1972; Rippey etai, 1982).
Lead(Pb)
Lead is relatively common element in the earth's crust with a general abundance of around 15 ppm
(Henderson, 1982; Wedepohl, 1995). It is particularly associated with sulphide bodies, and occurs
most commonly in the form of galena (PbS). It is neither an essential nor a beneficial element for
plants and animals. It is suggested that soil is a sink for anthropogenic Pb with several well identified
sources, including mining and smelting activities, manures and contamination from vehicle exhausts
(Davies, 1995; Shotyk et al., 1996). There is little evidence to suggest that Pb is readily lost from
soil profiles by leaching processes, indeed it seems that most heavy metals, including Pb, remain in
an insoluble, stable form, with the organic soil fraction largely responsible for the immobilisation of
the metal (Davies, 1995). Tanskanen (1976) analysed 103 peat profiles from central Lapland and
suggested the concentration of this metal increases as pH decreases. In addition Pb is more abundant
in less humified peat and exhibits a noticeable surface enrichment possibly due to recent aerial
pollution.
However, Pb is considered by some workers to be more mobile in peat profiles than Cu. It may be
retained in well drained peat but mobilised and removed in the permanently anaerobic zone below the
water table (Damman, 1978), especially where acidity is high and C.E.C. is low (Pakarinen and
Tolonen, 1976). Stewart and Fergusson (1994) propose a different hypothesis: in a reducing
environment of high organic content with low pH and low Eh, it is likely that Pb(II) would be
immobiUsed by insoluble compounds (e.g. PbS). However, following analysis they found Pb to be
mobilised in anaerobic peat, thus suggesting that either there was insufficient sulphide to form PbS,
or other elements were more important. Their analyses suggest that Pb displays a relationship with
Mn, and consequently may be associated with Fe(ni)-Mn(rV) compounds and thus liberated in
anaerobic peat. McKenzie (1980) similarly found a relationship between the adsorption of Pb and
the oxides of Fe and Mn. He suggests that adsorption by Mn was 40 times greater than by Fe oxides.
Glooschenko (1986) and Clymo (1983) noticed a peak at mean water-table level, which effectively
33
demonstrated the differential mobility of the element under different Eh states.
Pb may be associated with modem aerial pollution from urban/industrial areas such as fossil fuel
combustion and pollution from vehicle exhaust, and both modem and prehistoric smelting activities
(Tyler, 1972; Pierson et ai, 1973; Davies and White, 1981; Rippey et ai, 1982; Pacyna, 1987;
Nriagu and Pacyna, 1988; Puchelt et ai, 1993; Hong et ai, 1994; Renberg et ai, 1994; Maskall et
al., 1995). It has an AIF value of 34,583% (Lantzy and Mackenzie, 1979).
Pollution studies which utilise bog vegetation as indictors of atmospheric pollution (Goodman and
Roberts, 1971; Glooschenko, 1986) have noted a regional pattern in the deposition of this metal.
Livett et al. (1979) noticed a roughly proportional relationship between logg population and the
surface concentrations of Pb, Cu and Zn. However, the form of Pb compounds released will affect
dispersal and inclusion processes. During the earlier smelting operations, the lead released to the
atmosphere would have been of a much coarser particulate form, which would have had a lower
atmospheric residence time than the aerosol Pb from more recent industrial/urban activities
(Grousset et al., 1994). Similarly, much contamination may be caused by wind-blown material from
mine waste heaps, especially where the waste is composed of fine material (Davies and White, 1981;
Nriagu and Pacyna, 1988; Davies and Ballinger, 1990; Merrington and Alloway, 1994).
Tin (Sn)
There are 10 stable isotopes of this element, greater than for any other element in nature. It is a
relatively rare metal with an average crustal abundance of 3 ppm (Day, 1963; Henderson, 1982).
The most important natural compound in which it occurs is cassiterite (SnOi), which is found largely
in pneumatolytic and hydrothermal veins associated with siliceous igneous rocks, usually granite
(Edwards et al., 1995). Goldschmidt (1954) notes cassiterite to be particularly resistant to
weathering and mechanical attrition. However, Sn also occurs in many sulphide ores, stannite
(CuFeSnS4) being the most noteworthy. The occurrence of Sn in peatland systems will be largely
from local bedrock sources (Beeson et al., 1977), whether naturally or anthropogenically derived.
This metal is among one of the first used in antiquity, with the Cu-Sn alloy, bronze, discovered
around 2500 BC (Edwards et al., 1995).
"A great number of tin deposits were known even in ancient times in the south-western and central parts of Europe, such as in Cornwall, , all connected with granites of Carboniferous age", Goldschmidt (1954: 392).
34

In south west England tin is located in and around the granitic aureole of the Cornubian intruded
zones. It has a background concentration of 3-4ppm in the pelitic rocks of these areas (Beer and
Ball, 1986), which compares well with the data of Wedepohl (1995), and those workers mentioned
above. Sn is known to have a high affinity for organic fractions, and to be concentrated in humus-
rich and organic-rich sediments (Edwards et ai, 1995). It is reported to have an AIF of 821 %.
Arsenic (As)
This element is found predominantly in sulphide ore bodies, of which the most common arsenical
mineral is arsenopyrite (FeAsS), but over 200 As-containing minerals have been identified (O'Neill,
1995). In soils the natural levels are dependent upon the nature of the bedrock, with an average
concentration of between 1-15 ppm in igneous rocks (Day, 1963; O'Neill, 1995; Wedepohl, 1995).
Arsenic may be produced following the combustion of fossil fuels (in particular coal), and as a by
product of the smelting of tin (Harris, 1992) and copper (Lux, 1993; O'Neill, 1995). The majority of
As-rich compounds are concentrated in flue dust and soot (Li and Thornton, 1993), with a much
smaller component volatilised and transported in the gaseous phase. There is little information
relating to its mobility in organic soils, but Christensen and Chien (1981) suggest that As may be
incorporated into ferromanganese nodules. Hermann and Neumann-Mahlkau (1985) indicate a
mobility comparable with Fe. There is limited evidence to propose As is enriched in humic
substances (Himer et al., 1990). Arsenic has an AIF of 2786% (Lantzy and Mackenzie, 1979).
1.5.5 Summary
Peatlands are inherently complex systems with a great number of inter-linked mechanisms operating
both as the sediment accumulates and diagenetically afterwards. Hydrology plays a major role in
controlling the development of the peat, and consequently may be considered the primary factor
governing autogenic processes. There are a number of external influences which may have a
significant impact on the peatland ecosystem, each of which operate at different scales. At the
macro-scale climate change is the most obvious, but anthropogenic activity also falls into this
category. The micro-scale factors include erosion through land disturbance caused by agriculture,
deforestation and peat cutting, eutrophication and associated processes.
The systems under investigation are dynamic as the acrotelm is constantly moving upwards as the
peat develops. A number of elements may already have been removed before the peat becomes
35
permanently anoxic (Livett, 1988), thus any description of the chemical changes in a peat profile,
must take account of this fact (Glooschenko, 1986).
The above discussion of elements addresses two major issues: (i) to evaluate the usefulness of each
to contribute to the overall palaeoenvironmental reconstruction, and (ii) to provide evidence of the
relative mobility of different elements at different stages of sediment accumulation, and from
different sedimentary environments. Table 1.3 summarises the use of each element in
palaeoenvironmental reconstructions.
/. 6 Interpretation of multi-element spectra
One of the key advantages of EDMA as an analytical technique is the capability to provide rapid
simultaneous multi-element analysis, with no sample destruction. The large amount of data produced
necessitates careful investigation of results, since most elements have a variety of different sources.
A single element interpreted on its own will not yield a great deal of information and only when a
relationship is shown between a number of elements will the interpretation be meaningful. For
example, Mg may relate to mechanical weathering of catchment materials, the breakdown of
chlorophyll, or give an indication of rainfall intensity (Grattan, 1994). By examining the elements
that increase or decrease with Mg an indication of the most likely source may be given. When
associated with K it may indicate mechanical erosion, when associated with Na and CI it may relate
to increased rainfall and if it is comparable to P or S it could indicate a source related to the
breakdown of chlorophyll.
If the relationship between several elements is maintained over a length of the core their controlling
variables may be stable. Differentiation between different sections of the core may also be possible
where ratios are maintained, identifying chemizones of distinct composition. Each chemizone can
then be regarded as a litho-facies which represents a specific sedimentary environment (Mannion,
1979; Grattan, 1994).
1.6.1 Behavioural trends
Butzer (1982) considered equilibrium concepts of environmental processes which may be utilised in
the analysis of EDMA geochemical data. He used a number of terms which require definitions at this
stage. Feedback is a change introduced by one variable which is transmitted through the system back
36

Geochemical
Group
Major
Nutrient
Mobile
Traces
Element
Na
K
Mg
Ca
Si
Al
C
N
P
Fe
Mn
S
Cu
Pb
Sn
As
Main indicator value
Allogenic
Weathering
Weathering
Weathering
Autogenic
Absence - leaching
Bio-accumulation in upper levels, absence - leaching
Absence - leaching
Biogenic activity - breakdown of chlorophyll
Weathering, presence of CaCOs
Weathering of exposed soils
Absence - leaching, humic / fiilvic acids
Biogenic activity
Biogenic activity - phytoliths / diatoms / sponge spicules
Weathering
Inorganic - CaC03
Inorganic clastic minerals
Lithospheric materials
Lithospheric materials
Lithospheric materials, dependent upon geology
Anthropogenic distuibance (pollution)
Anthropogenic distuitiance (pollution)
Anthropogenic disturbance, Sn02 exploitation
Anthropogenic disturbance, SnOz exploitation
Acidification, mobilised below pH5
Organic = humus accumulation
Biological processes
Biogenic activity
Aerobic conditions
Aerobic conditions
Formation of sulphides (anaerobis)
Formation of sulphides
Anaerobic precipitation if associated with Fe / Mn compounds
Others
With K = marine influence
Marine influence, clay minerals
With Na, K = marine influence
Control pH, C.E.C.
With Fe, Mn = anaerobic conditions
Acidity, groundwater influence
Acidity
Smelting activities
Anaerobic catotelm conditions
Table 1.3 Summary of interpretational possibilities using geochemical data
37
to the original variable. Negative feedback acts to dampen the effect of the changed variable to
maintain stable/dynamic equilibrium, while positive feedback reinforces the effect of externally
induced change. Natural systems typically have negative feedback characteristics, exhibiting systems
which oscillate around a steady state. This is maintained through a self-regulatory mechanism known
as dynamic homeostasis. However, this may be complicated by two factors: (i) secondary responses,
in which change continues after the mediating factor has been reversed, for example, water will
continue to flow from a hose pipe even after the tap has been switched off, and (ii) thresholds, above
which a system is forced to a new dynamic equilibrium. Butzer (1982) discusses a number of
different equilibrium states which may be of use in the interpretation of change from EDMA data
which will be briefly discussed below (Fig. 1.7):
(i) Static equilibrium represents a stable system which is constant through time. There is no
external force which disturbs equilibrium,
(ii) Stable equilibrium is the state in which an initial perturbation from the norm recovers to
static conditions after a relaxation period, the variation around the mean may be an integral
part of the system,
(iii) Unstable equilibrium involves a change from an old to a new stable state with an
accompanying relaxation time. The new level is achieved in the absence of any threshold,
(iv) Metastable conditions with a threshold separating different equilibrium levels may represent
extemal forcing. The threshold could be changing climatic or hydrological conditions,
(iv) Steady state conditions represent oscillations around a mean value with no net change in
stable conditions. It is not possible to assume signific£int environmental change,
(v) Dynamic equilibrium is essentially steady state conditions which exhibit a long-term trend,
each deviation from the mean may not be significant but the long term trend is.
(vi) Dynamic metastable equilibrium conditions are characterised by long-term trends separated
by a threshold to a new dynamic equilibrium level. The establishment of a new level may relate to a
significant environmental change.
By considering a group of elements shown to exhibit a degree of correspondence, the above may help
in the overall interpretation of palaeoenvironmental change as reflected in the geochemical record.
y. 7 Philosophical basis for interpretation
Palaeoecology seeks to initially find the results and then try to reconstruct the courses and conditions
38
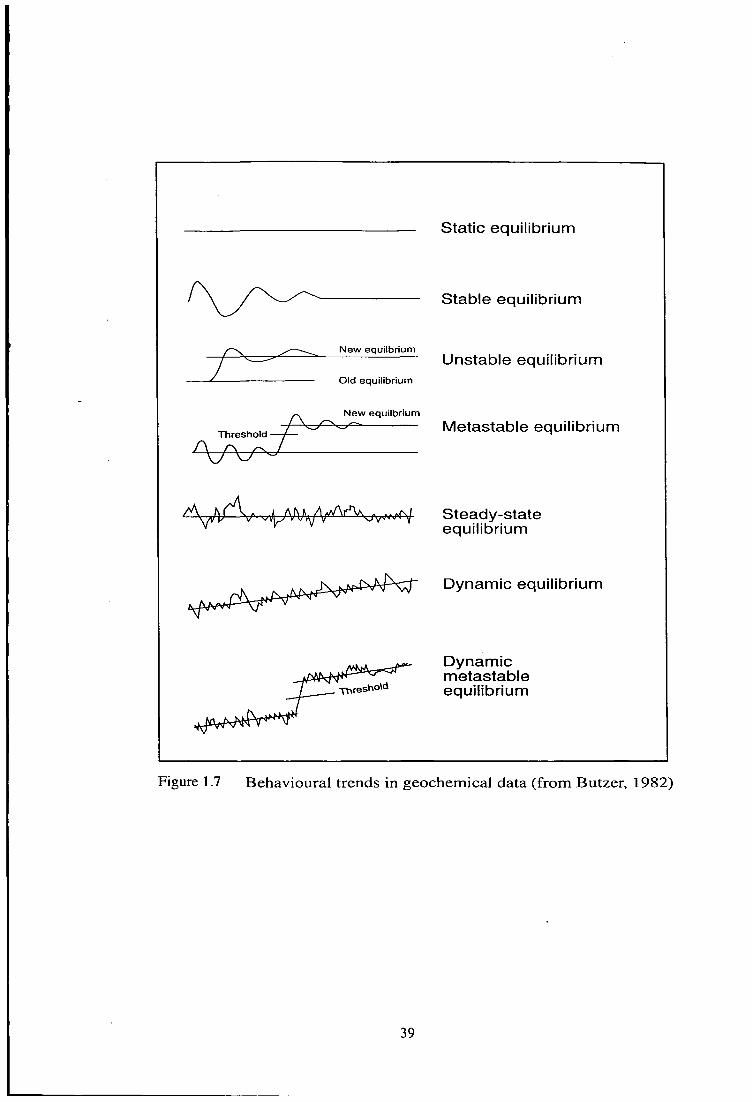
New equilbrium
Old equilibrium
New equilbrium
Static equilibrium
Stable equilibrium
Unstable equilibrium
Metastable equilibrium
' V ^ V I T W K / V ^ ' ^ ' J ' V - ^ ^ ^ N s t e ady - s t a t e ^ equilibrium
ThresI ho\d
Dynamic equilibrium
Dynamic metastable equilibrium
Figure 1.7 Behavioural trends in geochemical data (from Butzer, 1982)
39

of change which led to them (Rymer, 1978). Its ideological framework is firmly rooted in the
Baconian inductive route to scientific enquiry: collection of facts, their ordering, inductive
generalisations and preferably theory formulation (Edwards, 1983a; Haines-Young and Fetch,
1986). Interpretation of most palaeoecological data is fraught with difficulties, since it is impossible
to replicate the conditions of formation to rigidly test if the theories produced are correct.
Popper (1972) states the value of any statement depends ultimately upon its falsifiability. Science is
conjecture and refutation. Thus knowledge grows through the elimination of error. The interpretation
of palaeoecological data should therefore be consistent with all available facts (statements) and as
direct and simple as possible. The principle of uniformitarianism follows logically, in which a
continuing uniformity of existing processes is regarded as providing the key to understanding the
history of the earth (Gregory, 1989), or to quote Hutton's aphorism: "the present is the key to the
past".
Rymer (1978) suggests that methodological uniformitarianism serves as a means of organising our
knowledge of the past by serving as an a priori method, limiting interpretations that can be used to
explain a given set of data, as such it assumes that the world is regular, lawful and intelligible. A key
aspect of the principle lies in the fact that analogy is the main interpretative tool and relies heavily on
processes of pattern recognition, with the myriad of statistical techniques which have been developed
to aid this process, such as cluster analysis techniques to produce pollen zones that reflect modem
communities. A basic question of analogy is how similar must two sets of data be in order to be
similar? There is another problem in that every context is unique, no analogy is exact, therefore no
argument from analogy is certain (Bell and Walker, 1992). Many former plant communities have
different distributions, both geographically and ecologically, to their extant analogues.
There are often a number of possible explanations which can not be distinguished by using the
available evidence. Chamberlain (1965) proposed the construction of multiple working hypotheses in
these situations, in which weaker theories may be rejected as they are tested critically against each
other. Bell and Walker (1992) state the main aim of using multiple hypotheses is to achieve an
explanation that is more 'nearly' correct than would have been the case if only a single hypothesis
were considered. An example may be cited using an increase in total Si content of a sediment body.
This may be associated with (i) an inwash of mineral soil material from the surrounding catchment;
40

(ii) an increase in biogenic Si, either phytoliths from the catchment vegetation or from in situ
diatoms. Only upon further investigation does the explanation become more accurate. Birks and
Birks (1980) regard multiple working hypotheses as one of the fundamental philosophical principles
of palaeoecology.
Palaeoecologists do not, in general, set out to predict, but to explain. However, the experiments
carried out by palaeoecologists do not themselves provide explanation (Rymer, 1978). It is the
interpretations that are the key issues and by applying uniformitarianist principles as a conceptual
framework the explanations will become more intelligible.
This project will use multiple working hypotheses as a major interpretative tool, since no single
statement will ever adequately represent the spectrum of possibilities produced using proxy
reconstruction methods.
1.8 Summary
This chapter has introduced EDMA as a palaeoenvironmental tool. Discussion was presented of the
development and use of technique in a wide range of applications, illustrating its potential in
palaeoenvironmental studies. A large section detailing the interpretation possibilities from
geochemical studies was presented, along with the philosophical basis of palaeoenvironmental work
of this kind. This leads to the next chapter in which the methodological aspects of the project will be
addressed, including a discussion of sites and reasons for their selection.
41
Chapter 2
Methodology
2.0 Introduction
This chapter presents the methodological aspects of the research. The fieldsites are presented
following an introduction to the palaeoenvironmental conditions and archaeology of south west
England. Data collection and analysis strategies are introduced, including field and laboratory
sampling regimes, and radiocarbon dating procedures.
2. / South west England and Dartmoor
2.1.1 Geological History
Few geological time periods are unrepresented in the south west peninsula (Fig. 2.1). This is the
major reason for its diverse topography ranging from the rugged, dissected rocks of the granitic
uplands, to the 'soft* landscapes of the Permian, Mesozoic and Cenozoic eras and the wide, gently
sloping coastal peneplains formed during Pliocene times (Durrance and Laming, 1982). The oldest
rocks of the south west are small exotic masses of Ordovician quartzite and Silurian limestone lying
in Devonian beds at Meneage and Nare Head (Edmonds et al., 1975). The largest portion of the land
surface is composed of Devonian and Carboniferous rocks, which in places are up to 9km thick
(Anderson and Owen, 1980).
The uplands of Dartmoor and Bodmin Moor are the most extensive exposures of the granitic
bathoUth intruded into the sedimentary country rock of Devon and Cornwall during the
Carboniferous period following a major period of faulting, folding, metamorphism and granitic
intrusion ca. 280 million years ago. The entire area associated with this movement has a tendency for
metallic mineral occurrence due to the numerous episodes of faulting and intrusion with subsequent
mineral crystallisation. Metallic minerals are distributed in a series of concentric belts around the
main aureole centres. The minerals are related both laterally and vertically to the hydrothermal
gradients which existed at the time of intrusion between the magma and the much cooler surface
rocks. Minerals associated with high temperature crystallisation such as cassiterite, wolfram and
tourmaline occur closest to the granite, with more cooler, distant zones forming suitable
environments for crystallisation of copper, lead, zinc and iron mineralisations (Edmonds et al.,
1975).
42

Tortiory • day, sand, gmwl, Dgnts
Crataceous - chalk. Upper GresRsand and Gout
Jurassic Lias • day wfth Emastona
PiNiiibn - Rsd Malta, bcaoctos and oonQtomarataa
OartionJfIMP) f i - ctiaiaa, Bmastona and sandstona
Dawanian - slataw, aandstona, Iknestone & diarta
tntruslva lonaoitf todcs - Granka / Oolaita
KUomotiBS
300
I
Figure 2.1 Simplified geological map of south west England. Modified from Edmonds et al (1975)
43

The Quaternary has had a mariced effect upon the present day appearance of the environment in the
south west. There is currently much discussion as to the maximum extent of glaciation during the
Quaternary, with much interest directed upon the sediments around Fremington, north Devon (Croot
et al., 1996) and till-like material near St. Martins in the Isles of Scilly (Scourse, 1986, 1991).
However, general consensus appears to suggest that the limit of glaciation fell along the north Devon
coast during the penultimate cold stage, the Wolstonian (Jones and Keen, 1993; Lowe and Walker,
1997), and that the uplands of the south west were subject, during these cold, glacial episodes to
intense periglacial activity (Todd, 1987).
There is widespread evidence for periglacial action in the south west at the coasts and further inland.
Abundant soUfluction 'head' deposits may be traced throughout the region, characterised by angular
comminuted material embedded in a fine matrix. This sedimentary unit is frequently observed at the
coasts where it commonly overlies much earlier erosion platforms (Mottershead, 1971; Harris,
1987). Other features of this periglacial era include the upland granite tors with their soUflucted
scree slopes ('clitter'). It is suggested that the tors were exposed during periglacial activity of
Wolstonian age (Stephens, 1980), with the majority of clitter fields formed during the Devensian,
primarily as a result of intense freeze-thaw activity (Kidson, 1971), resulting in partial destruction of
the exposed tors. It was during these periods that the extensive alluvial tin deposits were formed in
the upland river valleys. The cassiterite (Sn02) bearing granite was comminuted under periglacial
freeze-thaw action, transported downslope by solifluction processes and deposited in the valleys of
many upland river systems. Chemical weathering of the granite releases three main minerals. Biotite,
is readily oxidised, feldspars, which are broken down forming clay minerals. Quartz, along with
some clay minerals, remains in situ forming a gravel-like deposit known locally as growan
(Brunsden and Gerrard, 1977). This material is most likely to have been derived from one of the cold
phases of the Pleistocene (Bnmsden, 1964), and is encoimtered in many valleys of this area.
2.1.2 Palaeoenviromnents of south west England
A large number of investigations have been conducted into the vegetation and soil history of south
west England. These studies have concentrated largely upon the nature, scale and direction of change
in the upland zone due to the concentration of suitable sedimentary sites for palaeoenvironmental
research. TTiere is obviously a bias in our understanding of environmental change for the south west
due to the lack of suitable lowland sites (Caseldine, 1983), although analysis of sediments associated
44
with archaeological features help piece together the history of these areas (e.g. Cam Euny (Christie,
1978), Colliford Reservoir (Griffith et al., 1984) and Zennor, west Penwith (Herring et al., 1993)).
There are fundamental problems concemed with upland studies related to the lack of deep basins and
the abundance of shallow blanket peat deposits with inherently poor temporal resolution, which
frequently cover only short periods of time. The lack of radiocarbon dated pollen profiles hampers
both inter-site correlation and the interpretation of the timing of significant events in the pollen
record. Further problems are created by the destruction of the environmental archive through human
activity during prehistoric and historic time e.g. peat cutting, drainage and mineral extraction
operations (Caseldine and Maguire, 1981). Although there are problems with the nature of the
evidence much valuable work has been conducted and will briefly be presented in the following
paragraphs to place the site discussions in context. Discussion of the environmental history of south
west England may be divided into two zones: the mooriand areas, and the lowlands and coastal
fringe (Fig. 2.2).
The moorland zone (Table 2.1)
ITie earliest palaeoecological evidence from organic sediments was found at Hawks Tor and Parsons
Park on Bodmin Moor (ConoUy et at., 1950; Brown, 1977; Caseldine, 1980). At both sites the Late-
glacial vegetation was characterised by open grassland with a rich herbaceous flora. Ameliorating
climatic conditions during the Late-glacial Interstadial are reflected at Hawks Tor by the
development of Juniperus scrub and intense solifluction activity after ca. 12(K)0 BP (ca. 10000 BC).
Between ca. 11500 and 11000 BP these sites record the spread of scattered Betula trees probably in
the lower valleys, forming small pockets of carr woodland. Sediments dating to the period of the
Loch Lomond Stadial suggest an environment returning to periglacial conditions, in which woody
components of the flora diminish and are replaced by grasses and sedges. TTie initiation of these
colder conditions has been dated to 10884±210 BP (Q-1016) at Hawks Tor (Brown, 1977).
TTie earliest sediments encountered so far on Dartmoor date from the Loch Lomond Stadial ca.
1ICXK)-10000 BP, and are found at Blacklane Brook, near to the head of the River Erme (Simmons,
1962, 1964b; Simmons et al., 1983), and at Black Ridge Brook (Caseldine and Maguire, 1986;
Caseldine et al., 1987). Both sites indicate the general absence of woodland in the area and the
dominance of open ground plant communities, with a wide range of taxa indicative of arctic
45

Key:
Land >300m OD
Land >550m OD
Area of National Park
Sites referred to in text
Harlyn Bay
TAUNTON
Penwith Peninsula
Cam Brea
Gwithian
Hembury
B , O D M I N 'CgJ qOR
• Trevisker _ . . . . • • ? < *'TorbrvaFi Val
Haldon Hill
EXETER
Castlewich
Helman Tor* .Unlivery Eu(^OUT^r%HL-* '
CriftDown* • ~ ^ ^ *\*
/MbrbryaBi Valley Kents Cavern
Crift Down' „ . ,. Hayle C >Barcelona-Fartn
• TRURO ^ ; hian ^ Z/T-^
Cam Euny Marazion Marsh yt/ \ • ^ ^ " V ^ r a a S a n ^
StB<Wan'P'«"^"=9^ Liza'r^ LooePool /l?eninsu!a
Gunweilloe
A
Bantham ^siapton Ley
-S^M ' t " ^ ^ / Start Bay Thur^estone••'^^^/ - i BoltTair / ^ > ^ a l l s a n d
Soar Mill Cove OTM Head
Kilometres 80 200
I
StannonDown oozmary ^ % Pool
CollifordTT S ^r-N Reservoir _ • „ ^ \ j v J
Parsons Park " ^^
o ^rlockBay
„'* . • V > « » ' ^ •HaWk-^mbe-,^ Panj«imbe> , ^ - v+HeiS-O* ^T"
% . ^ ^ C h a > n s < H ^ ^ 5 ^ ;
•Spinster's Rock' ^ S
Kes'TorV-5(5fag,ort"' (p \
[Cbrfihbddh.Ball 9 I. .,9 , ^ ^
CuckootBall
Figure 2.2 Palaeoenvironmental and archaeological sites of south west England discussed in the text.
46

Time
Present-AD 1600
AD 1000-1600
AD 400-1000
0-AD400
500BC-0
2000 -500 BC
3000-2000 BC
8000-3000 BC
Cultural period
Modem
Medieval
DaikAges
Romano-Biitisb
Iron Age
Bronze Age
Late
Mid
Eariy
Neolithic
Mesohtliic
Activity
Pastoralism, tin extraction, peat cutting, deforestation.
Tin streaming, peat cutting, limited arable cultivation, pastoralism. Settlement on lower fringes of the moor.
Low scale pastoral activities.
Umited use of moorland resources.
Movement of people from moors to lowlands. Possible grazing activity - transhumance.
Settlement pressure in uplands. Start of movement to lower areas.
Increased deforestation, cultivation, construction of large settletnents and complex ritual monuments. Reaves.
Deforestation, increasing setdement activity on the moots. IiKieased cultivation activity.
First fiiimers, small scale clearance. Minor incursion into forest, variable and often regenerating.
Small scale activity in forest - very limited evidmce.
Evidence
Open moorland, extensive industrial disturbance in uplands. Evidence for mining of tin resources (C19th).
Extensive tin streaming remains throughout uplands of south west Medieval long houses and associated features.
No evidence for settlement on the moor at Aistime.
No archaeological evidence for human activity.
Lack of settlement evidence for all upland areas in south west Evidence in lowlands include hillfort and pallisaded structures.
Trevisker style pottery. Metrivale ritual landscape: stone rows, circles.
Diversity of s^ement types: single hut; hut villages; poimds.
Round baiTows, single inhumations.
'Beaker' period -pottery.
Use of fire - charcoal in peat profiles. Chambeied tombs and mclosed hilltop settlements. Flint scatters and Cornish stone circles.
Flint scatters typically fovouting spring head sites and caves.
Vegetation
Calluna, Erica and Poaceae dominated moorland. Pteridium invasion.
Open moorland dominates, with limited stands of Corylus, Betula and Quercus.
Largely open areas dominated by grasses and ericaceous species.
Pockets of woodland in un&vourable locations
Regrowth of blanket bogs under deteriorating climatic conditions.
Major episode of deforestation resulting in large open patches, low regeneration rates, initiation of pedogenesis.
Mosaic of woodland patches, moorland, grassland. Intense grazing activity
First significant incursion to upland woodlands. Expansion of ruderal species and arable weeds.
Ulnua decline. High forest diversity. Appearance of cultural indicators e.g. Plantago lanceokaa.
Qosing woodland cover. Maximum height of tree-line attained duiing this period.
Table 2.1 Human activity in the uplands of south west England during the Holocene.
47

conditions. Ameliorating climatic conditions on Dartmoor after ca. 10000 BP were marked by a
reduction in herbaceous species and an increasing shrubby woodland component. It appears that the
development of a woodland cover was delayed following the onset of Holocene conditions in relation
to other upland areas of the British Isles. Numerous studies suggest thermophilous taxa such as
Betula and Corylus spread rapidly through the country following deglaciation, occurring widely by
ca. 9500 BP (Huntley and Birks, 1983; Huntley, 1993), but on the upland moors of the south west
ericaceous heathland species were still present until 9000 BP. Caseldine and Maguire (1986: 262)
accept that exposure may be a factor, as proposed by Brown (1977) for Bodmin Moor, but conclude:
"a combination of coarse-textured parent material, exposure and possibly the winter temperature regime could lie behind the persistence of open ground after the end of the [Loch Lomond] Stadial".
Betula-Corylus woodland eventually spread onto these upland areas by ca. 8000 BP. ITie
environment after this time was composed of a subtle range of ecosystems with Quercus and
Corylus rapidly forming the major components of the woodlands. After ca. 7000 BP Alnus invaded
suitable sites, although it must be noted that the timing of invasion was not a synchronous event for
Dartmoor (Chris Caseldine, pers. comm.), with a range of dates for different areas of the moor, as
experienced for a number of other areas in the British Isles (e.g. Chambers and Price, 1985). A
common precursor to invasion of Alnus in many areas was site disturbance (Bush and Hall, 1987;
Chambers and Elliott, 1989). Tlie woodlands of the south west at this time were composed of the
three species mentioned with smaller quantities of Betula, Pinus with some Fraxinus, Ulmus and
Tilia (Simmons, 1962; Caseldine and Maguire, 1981; Huntley and Birks, 1983; Maguire and
Caseldine, 1985). TTie forest would have contained natural clearings with associated heliophytes, as
suggested by Beckett (1981) for areas on Shaugh Moor in the lower southern area of Dartmoor. The
moorland summits would have supported a community composed largely of ericaceous species with
grasses, sedges, Rumex species and members of the Asteraceae family (Maguire and Caseldine,
1985).
The soils of this time would have been characterised by base rich brown earths in which nutrient
cycles and soil micro and macro fauna were active supporting a diverse woodland cover (Findlay et
al, 1984). Following the first evidence for forest disturbance and the use of fire (Simmons, 1962,
1964a,b; Hatton, 1991; Caseldine and Hatton, 1993), in association with changing climatic
conditions around 7000 BP, a number of different soil types evolved. At high altitudes and slopes
48

thin blanket peats (<lm) developed. These soils had a slowly permeable A horizon resulting in peaty
gley soils, with restricted development of peaty gley podzols (Staines, 1974). This period marked the
development of many of the valley bogs on Dartmoor due to a multiplicity of triggering factors,
including increased precipitation rates, deforestation of slopes increasing water yields, and increased
build up of acidic humic material (Clayden and Manley, 1964; Maguire, 1983). Clearance of the
forest cover would have resulted in the subsequent development of acid grassland and accompanying
acidification of brown earth soils, with low tree regeneration rates as experienced at Pinswell
(Hatton, 1991; Caseldine and Hatton, 1993). It seems likely that these processes were under way by
Neolithic times in the uplands of the south west. The fragmentary evidence from the lowland areas
suggests the soils were still relatively nutrient rich and supported a dense woodland cover. The major
differentiation of soil types occurred after the Neolithic Ulmus decline of ca. 5000 BP, with peaty
gleyed soils of the Hexworthy group becoming dominant on gentle slopes. These formed the
dominant moorland soil which characteristically contained a thin iron pan at ca. 15cm, overlain by
an acidic loam unit, over which a thin peat layer developed.
In the following millennia the uplands of the south west saw much disturbance which began during
late MesoUthic and Neolithic times, and culminated in the active settiement and utilisation of
moorland resources during the mid and late Bronze Age periods. A somewhat different picture
emerges for Exmoor since TTie Chains and Hoar Tor areas remained wooded until Neolithic times
(Merryfield and Moore, 1974) witii high Quercus pollen values before 4170±75 BP (UB-821). ITie
lack of palaeoenvironmental studies from this upland hampers discussion of general vegetational
trends, which forms a major gap in the palaeoenvironmental database for south west England
(Straker and Crabti^e, 1995), although the work of Francis and Slater (1990, 1992) on Hoar and
Godsend Moor has extended the knowledge of environmental development from mid-Holocene times
in this small area of Exmoor.
Significant incursions of the high level woodlands were made during the Bronze Age resulting in
large scale conversion of these areas to acidic grass and heathland (Beckett, 1981; Hatton, 1991;
Caseldine and Hatton, 1993), with only marginal woodlands in unfavourable situations (e.g.
Barkham, 1978). Reduction of the woodland cover was accompanied by evidence for a shift in the
nature of moorland utilisation, with organised pastoral activities associated with the construction of
large scale boimdaries (reaves) on Dartmoor around 3600 BP (Fleming, 1988). Evidence for cereal
49

cultivation associated with a number of setflement sites has been detected, particularly around the
lower fringes of the moor on Shaugh Moor (Beckett, 1981) and Holne Moor (Maguire et al., 1983).
Similar events have been observed from this period on Bodmin Moor (Gearey, 1996; Gearey and
Charman 1996).
The vegetation of the uplands was largely in its modem form by the start of historic times.
Discussion of the changes in the context of the results from some of the sites in this study further
elucidates activities throughout this period, a time for which the palaeoenvironmental record from the
peninsula is fragmentary (Caseldine and Hatton, 1996).
The lowlands and coastal areas
This zone of land is by far the most extensive in south west England, and accounts for approximately
60% of the total land cover. Little is generally known of the palaeoenvironmental conditions of this
area. Studies of sea level change have been conducted on a number of coastal peat deposits and
submerged forests in the coastal fringe (Hawkins, 1971a,b; Kidson and Heyworth, 1973) with
emphasis placed upon '*C determinations of inter-tidal organic sediments from such sites as Start
Bay and Hallsand in south Devon, and Penzance and Praa Sands in Cornwall (Heyworth and
Kidson, 1982). Indeed coastal work has often provided the focus of interest in the lowland zone.
Sand dimes are particularly important since they frequently seal former land surfaces and contain
archaeological sequences interstratified with blown sand e.g. Gwithian (Megaw, 1976) and Harlyn
Bay (Whimster, 1977) in Comwall, Bantham in south Devon (Silvester, 1981) and Westward Ho!
on the east Devon coast (Rogers, 1946; Balaam et al., 1987).
Another focus for palaeoenvironmental research in the coastal zone is provided in enibayment
environments. These features fiequently developed during the mid-Holocene period under the
influence of a relative sea-level rise in a sediment rich environment (Healy, 1996a). Records from
such areas have produced important information about the changing coastline of the south west and
the increasing influence of anthropogenic inputs to these systems. Published work on such sites
includes Church Cove, Gunwalloe (French, 1996), Ponsandane (James, 1990), Marazion Marsh and
Hayle Copperhouse (Healy, 1996b) and Looe Pool (O'Sullivan et al., 1982), in Comwall, while in
other regions of the south west similar sites are found at Slapton Ley (Crabtree and Round, 1967;
O'SuUivan, 1994, 1996) and Porlock Bay (Canti et al., 1996; Jennings and Orford, 1996).
50
The palaeoenvironmental evidence from sites inland is often associated with the excavation of
archaeological structures. Thus the driving force for reconstruction work in these areas is somewhat
different from the stimuU for reconstruction of past environmental conditions in the uplands. Work in
the lowlands has largely sought to place the local archaeology in its immediate geographical and
temporal palaeoenvironmental context. This stems largely from the fact that suitable deposits were
generally considered not to be present in the lowlands, and reconstruction has usually concentrated
on soil pollen and micro-morphological analyses of sediments associated with 'rescue-
archaeological' excavations, e.g. CoUiford Reservoir (Caseldine and Maltby, 1980; Maltby and
Caseldine, 1982; Griffith et al., 1984), and field systems of the Penwith Peninsula at Zennor
(Herring ef a/., 1993).
Tlie nature of evidence from the lowlands of south west England has produced a somewhat
fragmentary picture of Holocene environmental change. TTie sites, although relatively numerous, lend
little to the overall reconstruction. Clearly the absence of long sedimentary sequences is a problem in
these areas, but with careful fieldwork and a degree of luck suitable deposits can be identified and
provide essential data on the nature and scale of palaeoenvironmental conditions (Burton and
Charman, in press).
2.1.3 Archaeology of the south west
Wainwright and Smith (1979: 132) state "the 500 square kilometres of Dartmoor contain what is
probably the most impressive surviving prehistoric landscape to be found in Britain". Tlie
importance of the archaeological remains of the uplands of the south west is evident, although the
legacy of human settlement began long before the start of the Holocene. ITie earliest evidence for
human occupation of the area dates to the Lower Palaeolithic period, a time when Britain formed
part of a large peninsula of the European land-mass (Todd, 1987). Sediments from Kent's Cavern,
Torbay, contain a range of fauna including Ursus deningeri (bear) and artefacts relating to
Acheulian industries (Todd, 1987; Proctor, 1996). Other sediments in the caves contain evidence for
Middle and Upper Palaeolithic activity, as do caves from the nearby Torbryan Valley (Roberts,
1996). Sporadic finds in Cornwall relate to activity from this period, e.g. a small ovate chert
handaxe from the Lizard, and an Acheulian handaxe from St. Buryan (Berridge and Roberts, 1986).
Similar finds of Lower Palaeolithic Acheulian type implements have also been made in Porlock Bay
and Doniford, north Devon (Grinsell, 1970).
51
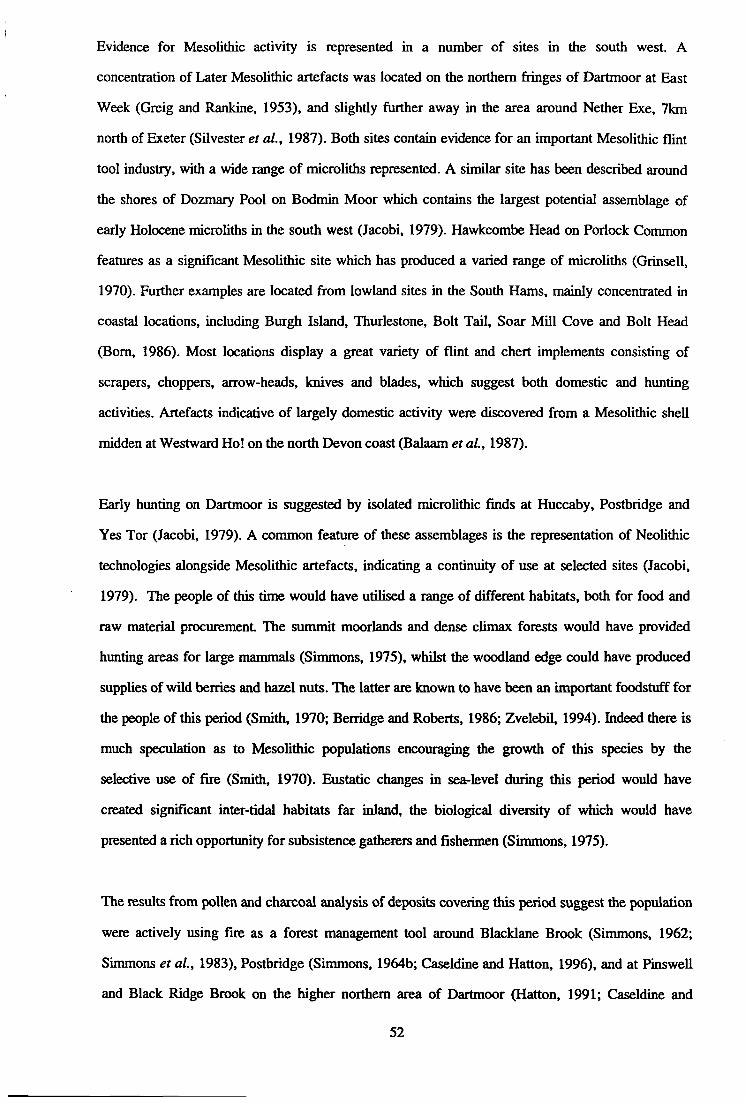
Evidence for Mesolithic activity is represented in a number of sites in the south west. A
concentration of Later Mesolithic artefacts was located on the northern fringes of Dartmoor at East
Week (Greig and Rankine, 1953), and slightly further away in the area around Nether Exe, 7km
north of Exeter (Silvester et ai, 1987). Both sites contain evidence for an important Mesolithic flint
tool industry, with a wide range of microliths represented. A similar site has been described around
the shores of Dozmary Pool on Bodmin Moor which contains the largest potential assemblage of
early Holocene microliths in the south west (Jacobi, 1979). Hawkcombe Head on Porlock Common
features as a signiflcant MesoUthic site which has produced a varied range of microliths (Grinsell,
1970). Further examples are located from lowland sites in the South Hams, mainly concentrated in
coastal locations, including Burgh Island, Thurlestone, Bolt Tail, Soar Mill Cove and Bolt Head
(Bom, 1986). Most locations display a great variety of flint and chert implements consisting of
scrapers, choppers, arrow-heads, knives and blades, which suggest both domestic and hunting
activities. Artefacts indicative of largely domestic activity were discovered from a MesoUthic shell
midden at Westward Ho! on the north Devon coast (Balaam et al., 1987).
Early hunting on Dartmoor is suggested by isolated microUthic finds at Huccaby, Postbridge and
Yes Tor (Jacobi, 1979). A common feature of these assemblages is the representation of Neolithic
technologies alongside Mesolithic artefacts, indicating a continuity of use at selected sites (Jacobi,
1979). "Die people of this time would have utilised a range of different habitats, both for food and
raw material procurement 'Hie summit moorlands and dense climax forests would have provided
hunting areas for large mammals (Simmons, 1975), whilst the woodland edge could have produced
supplies of wild berries and hazel nuts. The latter are known to have been an important foodstuff for
the people of this period (Smith, 1970; Berridge and Roberts, 1986; Zvelebil, 1994). Indeed there is
much speculation as to Mesolithic populations encouraging the growth of this species by the
selective use of fire (Smith, 1970). Eustatic changes in sea-level during this period would have
created significant inter-tidal habitats far inland, the biological diversity of which would have
presented a rich opportunity for subsistence gatherers and fishermen (Simmons, 1975).
The results from pollen and charcoal analysis of deposits covering this period suggest the population
were actively using fire as a forest management tool around Blacklane Brook (Simmons, 1962;
Simmons et al., 1983), Postbridge (Simmons, 1964b; Caseldine and Hatton, 1996), and at Pinswell
and Black Ridge Brook on the higher northern area of Dartmoor (Hatton, 1991; Caseldine and
52

Hatton, 1993). However, there is as yet no evidence for activity on other parts of the moor
throughout the MesoUthic, including Blacka Brook (Beckett, 1981). The available evidence therefore
suggests that the effect was only local and that regeneration of woodland generally followed
clearance episodes, although a more significant effect may have occurred at forest edge ecotones in
which the environment was considerably finer balanced (Smith, 1970).
Although there is a general lack of archaeological and palaeoenvironmental information about the
hunter-gatherers who Uved in the south west during the Mesolithic (Caseldine, 1980; Berridge and
Roberts, 1986), the available evidence suggests valleys, particularly around the margins of spring
heads, formed the major focus of exploitation, with transitory setdement in the immediate locality,
e.g. East Week (Greig and Rankine, 1953) and Hawkcombe Head (Grinsell, 1970).
The division between the Mesolithic and Neolithic periods is classically cited in palaeoecological
literature, as the period marked by the Ulmus decline. This horizon may be traced throughout north
western European poUen diagrams, and is present, but difficult to detect around 5000 BP in south
west England (Huntiey and Birks, 1983; Birks, 1989). Almost concurrent with this decline in the
pollen record is the appearance of a number of ruderal species, specifically attributed to
anthropogenic disturbance activities (Behre, 1981). This suggests the population was engaged in
woodland resource management and modification to allow agricultural practices to proceed, often
with resultant soil degradation episodes and retrogressive forest succession (Iversen, 1964).
Another feature used to define Neolithic cultures is the introduction of pottery in the archaeological
record. A number of distinctive forms developed and are useful in ascribing trade and
communication routes based on typological differentiation of forms. A significant industry was
present in Cornwall which displayed mainly examples of gabbroic ware, later taken as the major
ceramic form of the south west. This was uninspiringly termed the 'South-western style', and was
present at many sites including the important centre at Cam Brea which supplied ceramic materials
for sites up to 27km distant between ca. 3(X)0 and 2700 BC (Mercer, 1986). TTiese sites included the
important enclosed settiement at Helman Tor, near Lanlivery, Cornwall.
TTiere are relatively few firmly dated Neolithic sites in south west England, but on the basis of
structure and ceramic typology a number of settiements are attributed to this period including Cam
53
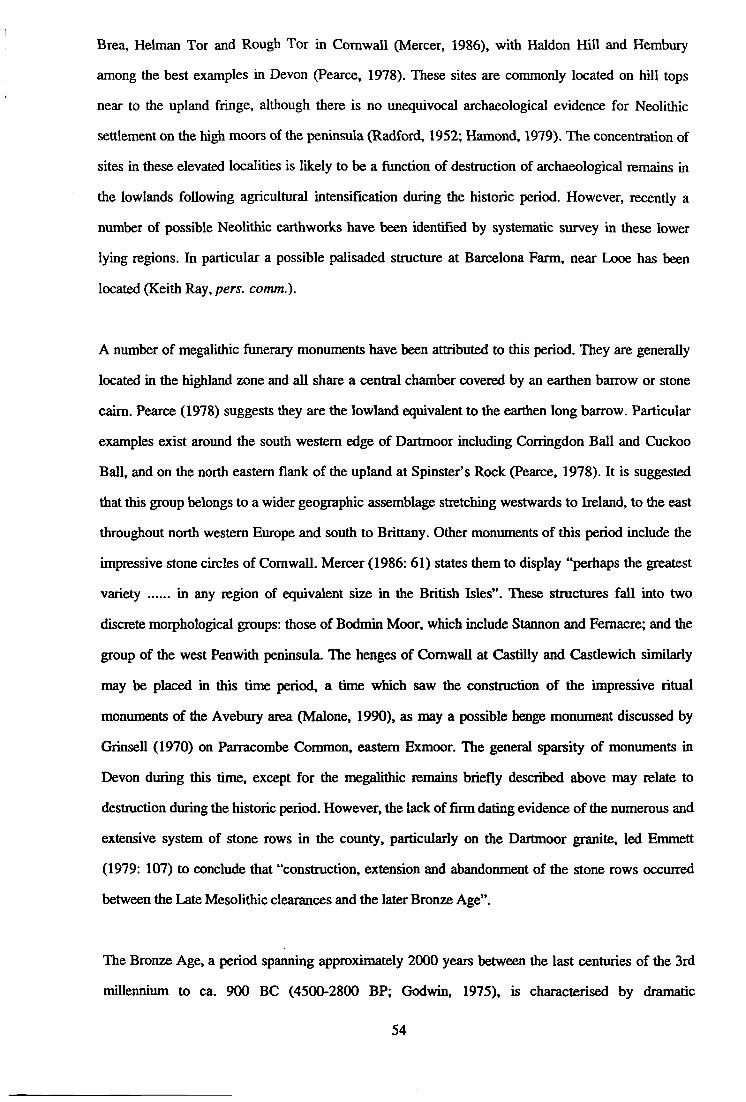
Brea, Helman Tor and Rough Tor in Cornwall (Mercer, 1986), with Haldon Hill and Hembury
among the best examples in Devon (Pearce, 1978). TTiese sites are commonly located on hill tops
near to the upland fringe, although there is no unequivocal archaeological evidence for Neolithic
settlement on the high moors of the peninsula (Radford, 1952; Hamond, 1979). The concentration of
sites in these elevated localities is likely to be a fimction of destruction of archaeological remains in
the lowlands following agricultural intensification during the historic period. However, recently a
number of possible Neolithic earthworks have been identified by systematic survey in these lower
lying regions. In particular a possible palisaded structure at Barcelona Farm, near Looe has been
located (Keith Ray, pers. comm.).
A number of megaUthic funerary monuments have been attributed to this period. TTiey are generally
located in the highland zone and all share a central chamber covered by an earthen barrow or stone
cairn. Pearce (1978) suggests they are the lowland equivalent to the earthen long barrow. Particular
examples exist around the south western edge of Dartmoor including Corringdon Ball and Cuckoo
Ball, and on the north eastern flank of the upland at Spinster's Rock (Pearce, 1978). It is suggested
that this group belongs to a wider geographic assemblage stretching westwards to Ireland, to the east
throughout north western Europe and south to Brittany. Other monuments of this period include the
impressive stone circles of Cornwall. Mercer (1986: 61) states them to display "perhaps the greatest
variety in any region of equivalent size in the British Isles". These structures fall into two
discrete morphological groups: those of Bodmin Moor, which include Stannon and Femacre; and ttie
group of the west Penwith peninsula. The henges of Cornwall at Castilly and Castlewich similarly
may be placed in this time period, a time which saw the construction of the impressive ritual
monuments of the Avebury area (Malone, 1990), as may a possible hoige monument discussed by
Grinsell (1970) on Parracombe Common, eastern Exmoor. Tlie general sparsity of monuments in
Devon during this time, except for the megalithic remains briefly described above may relate to
destmction during the historic period. However, the lack of firm dating evidence of the numerous and
extensive system of stone rows in the county, particularly on the Dartmoor granite, led Emmett
(1979: 107) to conclude that "construction, extension and abandonment of the stone rows occurred
between the Late Mesolithic clearances and the later Bronze Age".
Tlie Bronze Age, a period spanning approximately 2000 years between the last centuries of the 3rd
millennium to ca. 900 BC (4500-2800 BP; Godwin, 1975), is characterised by dramatic
54
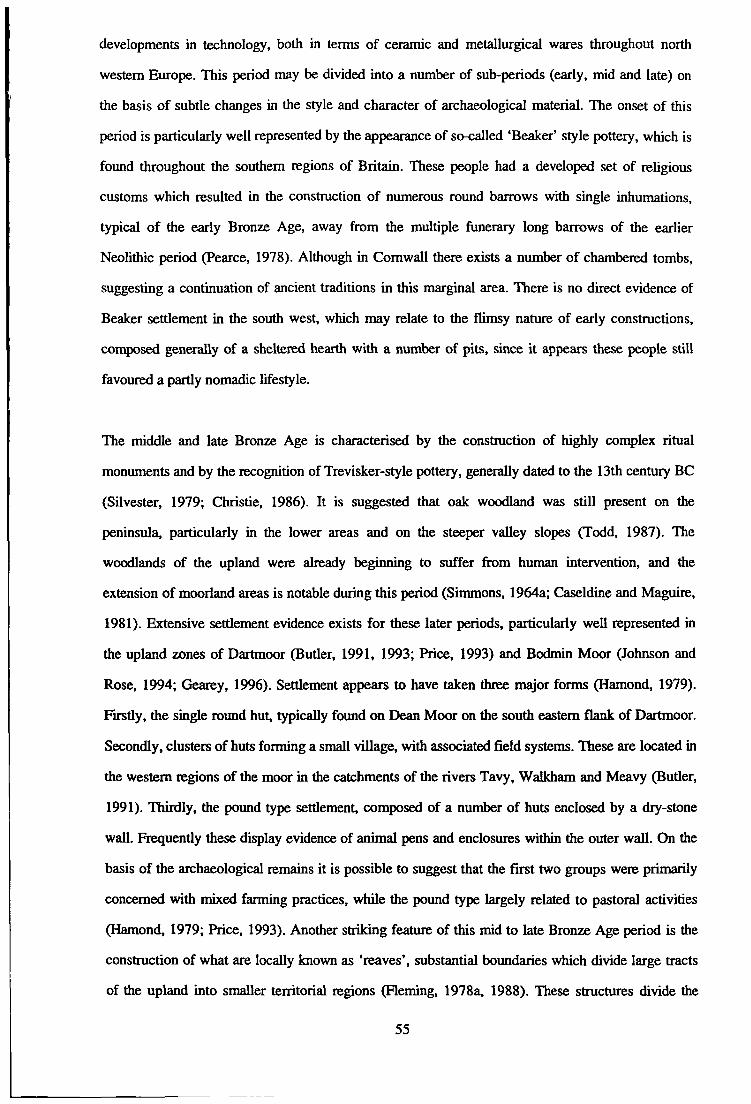
developments in technology, both in terms of ceramic and metallurgical wares throughout north
western Europe. This period may be divided into a number of sub-periods (early, mid and late) on
the basis of subtle changes in the style and character of archaeological material. The onset of this
period is particularly well represented by the appearance of so-called 'Beaker' style pottery, which is
found throughout the southern regions of Britain. TTiese people had a developed set of religious
customs which resulted in the construction of numerous round barrows with single inhumations,
typical of the early Bronze Age, away from the multiple fiinerary long barrows of the earlier
Neolithic period (Pearce, 1978). Although in Comwall there exists a number of chambered tombs,
suggesting a continuation of ancient traditions in this marginal area. TTiere is no direct evidence of
Beaker settlement in the south west, which may relate to the flimsy nature of early constructions,
composed generally of a sheltered hearth with a number of pits, since it appears these people still
favoured a partly nomadic lifestyle.
TTie middle and late Bronze Age is characterised by the construction of highly complex ritual
monuments and by the recognition of Trevisker-style pottery, generally dated to the 13th century BC
(Silvester, 1979; Christie, 1986). It is suggested that oak woodland was still present on the
peninsula, particularly in the lower areas and on the steeper valley slopes (Todd, 1987). The
woodlands of the upland were already beginning to suffer from human intervention, and the
extension of moorland areas is notable during this period (Simmons, 1964a; Caseldine and Maguire,
1981). Extensive settlement evidence exists for these later periods, particularly well represented in
the upland zones of Dartmoor (Butler, 1991, 1993; Price, 1993) and Bodmin Moor (Johnson and
Rose, 1994; Gearey, 1996). Settlement appears to have taken three major forms (Hamond, 1979).
Firstly, the single round hut, typically found on Dean Moor on the south eastern flank of Dartmoor.
Secondly, clusters of huts forming a small village, with associated field systems. These are located in
the western regions of the moor in the catchments of the rivers Tavy, Walkham and Meavy (Butler,
1991). TTiirdly, the pound type settlement, composed of a number of huts enclosed by a dry-stone
wall. Frequently these display evidence of animal pens and enclosures within the outer wall. On the
basis of the archaeological remains it is possible to suggest that the first two groups were primarily
concemed with mixed farming practices, while the pound type largely related to pastoral activities
(Hamond, 1979; Price, 1993). Another striking feature of this mid to late Bronze Age period is the
construction of what are locally known as 'reaves', substantial boundaries which divide large tracts
of the upland into smaller territorial regions (Heming, 1978a, 1988). TTiese structures divide the
55

major river valleys in to discrete landscape units. Tlie lower areas are characterised by parallel reave
systems probably used for crop production, with the upper zones divided into territorial grazing
areas, each with access to the highest areas of common land. It is suggested that the construction of
these structures dates to 1700-1600 BC and is a result of increasing pressure on upland resources
(Fleming, 1979).
The most noticeable features of the upland landscape are the impressive ritual monuments which
exist in both Cornwall (Christie, 1986; Johnson and Rose, 1994) and Devon, particularly on the
Dartmoor upland (Brailsford, 1938; Emmett, 1979). These are too numerous to describe in detail,
but generally include extensive stone alignments and rows, stone circles, cists and caims. On the
basis of typology they appear to date to the early to mid Bronze Age (Radford, 1952; Silvester,
1979; Fleming, 1988). This was a period of increased upland setdement which resulted in reduced
woodland resources and the conversion of extensive areas to acidic grassland (Caseldine and Hatton,
1993). However, it is extremely difficult to place a firm date for the construction of these monuments
since few have been thoroughly excavated, and almost none are associated with radiocarbon dates.
A significant feature of the Bronze Age was the advent of new metallurgical technologies. Price
(1993) comments on the frequent relationship between habitation sites and the evidence for alluvial
tinworking. Numerous examples exist in which archaeological artefacts have been located alongside
evidence for prehistoric metal working. At Trevisker, Cornwall, cassiterite pebbles were located with
evidence for on-site bronze working (ApSimon and Greenfield, 1972; Shell, 1978; Christie, 1986).
Another site was discovered during excavation of a 17th century tin processing plant in the upper
reaches of the River Walkham catchment (Gerrard and Greeves, 1992, 1993; Greeves, 1994). Here
an amount of tin slag was found associated with prehistoric flints (Greeves and Newman, 1996). The
major question is whether this evidence for early bronze working utilised the supplies of local
cassiterite bearing river gravels as a source of tin (Charles, 1975). Recent work has suggested
Ireland to have been an unlikely source for the tin (Budd et al, 1992; Budd et al., 1994), although
northern France and central Europe had viable supplies at this time (Pearce, 1979). Support for the
theory that the mineral deposits of south west &igland provided the tin for this early metal woridng
is presented by Todd (1987), who describes Bronze Age objects found in alluvial cassiterite deposits.
Clearly this question is one which deserves a great deal more attention in the future.
56

ITie transition to Iron Age times is marked by a postulated climatic downturn around 2700 BP
(Godwin, 1975; Kilian et al., 1995). It appears that the uplands at this time were largely abandoned
due to a number of different factors including the increasingly harsh environment, the spread of
blanket bog and heathland, and the depleted natural resources. The population shifted to the lower
fringes of the moors and the lowland zone. A settlement at Kes Tor, Dartmoor is almost the only
example of Iron Age activity on the moor. Certainly after ca. 2300 BP there is no evidence for
settlement in the Dartmoor area (Barber, 1977), and little evidence for Iron Age communities on
Exmoor (Grinsell, 1970). Throughout the lowland at this time spread a people typified by a different
style of ceramic ware, with curvilinear decoration, best known for its occurrence at the lake villages
of Glastonbury and Meare in Somerset (Storer, 1985).
The change to Iron Age times is again maiked by a different type of settlement in south west
England. Morphologically similar to the enclosed settlements of the Bronze Age in the uplands, they
were now characterised by 'rounds', which are said to have been the settlements of landowning
kindred groups, while more elaborate multiple enclosure hillforts were occupied by the upper social
stratum of chiefs (Quinnell, 1986). Excavation of Iron Age structures at Cam Euny, Cornwall, have
revealed that the site was surroimded by open land used largely for arable cultivation, although this
was initially cleared to provide pastoral land for grazing animals (Christie, 1978).
Little is known of the activities of the Roman legions in the south west, indeed it is possible they
would have utilised the natural metal resources of the peninsula, but may have met considerable
resistance from the Celtic people of the Dumnonii (Todd, 1987). By this time the uplands of the
south west would be largely open with only isolated wooded areas.
During the Dark Ages there is no evidence for settlement from the uplands of the south west,
however the more recent pollen analytical work suggests the possibility that these areas were utilised
as a pastoral resource (Gearey, 1996).
Settlement activity on the upland moors occvirs during the Medieval period, although there is no
archaeological evidence to suggest Medieval habitation prior to AD 1200 (Allan, 1996; Henderson
and Weddell, 1996). TTie settlement would have been associated with grazing activity, possibly
seasonally, with small areas devoted to cereal production (Austin and Walker, 1985; Gearey and
57

Charman, 1996) characterised by ridge and furrow techniques (Austin et al., 1980; Fleming, 1996).
The Medieval long house settlements characterise the main type of habitation (Beresford, 1979;
Preston-Jones and Rose, 1986). This period saw the major episode of tinning activity in the uplands
of the south west (Gerrard, 1996). Documentary evidence exists for workings at Whiteworks near
Princetown which began operations in AD 1150. The scale of activity was largely governed by the
price and subsequent demand for tin (Greeves, 1985). This period was therefore a very volatile
period for settlement on the uplands, with an exodus occurring from Dartmoor during the mid 14th
century AD.
A significant development in the tin industry came with the introduction of blowing houses and mills
in the early 14th century. This allowed a more efficient smelt, resulting in the production of a much
purer end product (Harris, 1992). Numerous examples are found on the uplands of the south west,
particularly Dartmoor and Exmoor, the only requirement being a location close to a supply of
flowing water. The development of these tinners' mills, was accompanied by the implementation of a
netwo± of leats capable of drawing water for tinwoiking activities. A further insight to the
significance of Dartmoor's mineral wealth resulted in the appointment of Tavistock, Ashburton and
Chagford as stannary towns in 1305.
After the high level activity of the Medieval period and early sixteenth century much quieter times
followed during which tin mining took a role of lesser importance. TTie last major period of activity
occurred during the 19th century. The Industrial Revolution encouraged prospectors to once again
probe the moorland resources, now concentrating primarily on shaft mining, e.g. Whiteworks, Vitifer
and Hexworthy Mines. However, this was never as economically productive as the exploitation of
the alluvial tin deposits due to the problems caused by flooding, and the need for more thorough
separation of tin from associated gangue minerals (Harris, 1992).
2.2 Field sites (see Fig 2.3)
The study sites for this investigation were carefully selected to address specific research issues
concerning the Holocene of south west England. A unifying theme throughout the work was the
assessment of EDMA in providing interpretable data, and the effectiveness of the technique in a
range of sedimentary systems. Particular importance was placed upon the detection of signals
indicating mineral extraction processes, deforestation episodes and acidification of catchment soils.
58
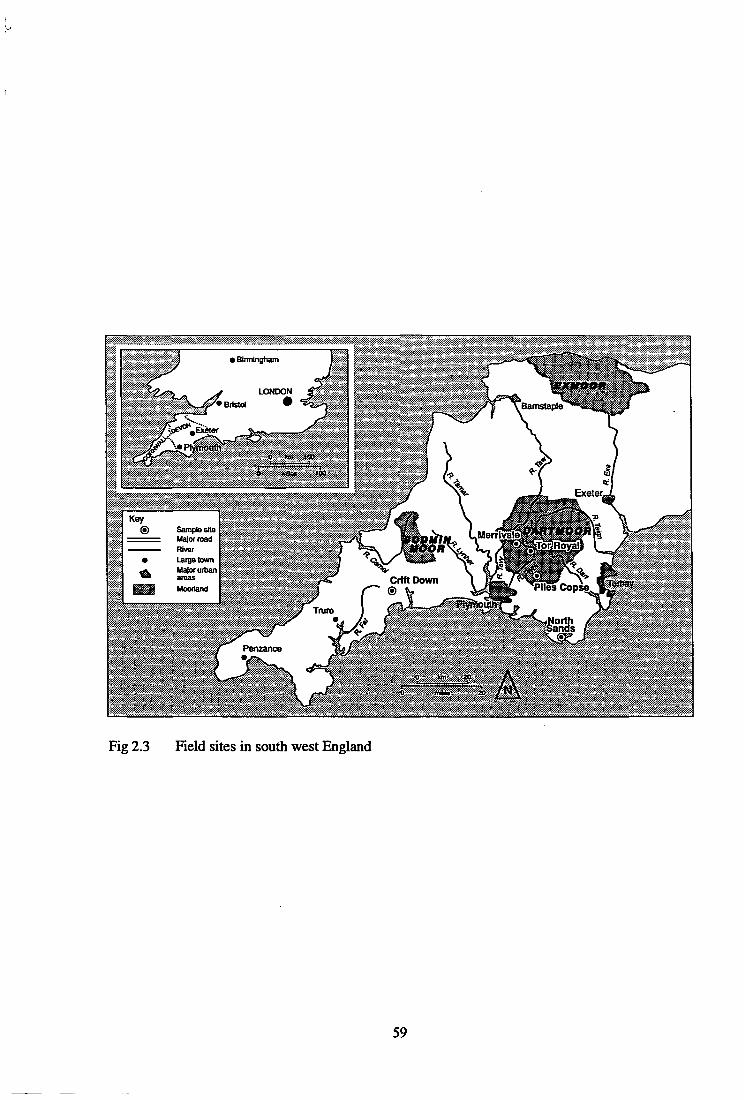
Fig 2.3 Field sites in south west England
59

2.2.1 North Sands, near Salcombe, south Devon (SX 730383)
The site is an infilled valley which has developed behind a bar feature. Borehole data from South
West Water suggest the presence of unconsolidated sediments to a depth of ca. 16m. Sediments at
this site have been accumulating from the mid-Holocene and are characterised by silty clays overlaid
by ca. 8m of organic material.
The sediments from North Sands extend our knowledge of Holocene palaeoenvironments for this
part of the coast. It was hoped the site would elucidate the geochemical signals associated with a
marine to freshwater transition. Once terrestrialised the embayed area accumulates palaeoecological
information relating to the immediate hinterland, and was hoped to provide cultural indications of the
activities of the communities in the valley.
Further analysis of the sediments was carried out as a pilot study to test the general comparability of
the EDMA technique to standard geochemical methods used in palaeoenvironmental reconstructions
(Bengtsson and Enell, 1986).
2.2.2 Tor Royal, central Dartmoor (SX 602728)
Preliminary depth probing of Tor Royal revealed deposits in excess of 6m and suggested this site
could provide an opportunity to investigate a long, high resolution Holocene sequence of
palaeoenvironmental conditions from a central location on Dartmoor. It is possibly the last remaining
raised mire on Dartmoor and contains the most extensive depth of sediment known from the upland.
Thus it has the potential to solve some of the common problems of palaeoenvironmental research on
Dartmoor (Caseldine, 1983; Caseldine and Hatton, 1996), which include poor temporal resolution
and a lack of continuity in the record, particularly during Bronze Age and post Iron Age times.
Ombrotrophic sediments contain a regional signal of palaeoenvironmental change (Jacobson and
Bradshaw, 1981) as they depend entirely on atmospheric supply of water and nutrients. This means
that the sediments should contain inputs from aerial pollution, as well as a small contribution of
locally derived wind-blown material. It was hoped the sediments would contain a record of pollution
episodes from such activities as tin processing and other industrial activities. In addition, particular
importance was placed upon the investigation of diminishing moorland resources through the Bronze
Age and into the Iron Age, a period when it is largely assumed, due to the absence of archaeological
60

evidence, the uplands of Dartmoor where abandoned
2.2.3 Upper Merrivale, River Walkham, west Dartmoor (SX 552766)
This site is a small flush fed mire in the upper reaches of the River Walkham catchment. TTie
soligenous nature of the peatland system means the sediment contains material from a variety of
sources, including mineral and organic material from the surrounding rocks and soils, and autogenic
material from the developing peatland system. In contrast to Tor Royal the principal geochemical
input is from immediate catchment sources rather than regional atmospheric sources. This case study
thus sought to examine the potential use of EDMA in another sedimentary context.
The site is located close to an excavation of a 17th century tin blowing and stamping mill (Gerrard
and Greeves, 1992, 1993; Greeves, 1994) which contains fragmentary archaeological evidence for
earlier working at the site (Greeves and Newman, 1996). It was hoped the signals associated with
this activity and would be recorded in the sediments and thus provide firm evidence for early human
activity in the area and a valuable insight into the timing of activity and subsequent environmental
disturbance.
2.2.4 Piles Copse, River Erme, south Dartmoor (SX 645623)
This site is in a similar situation to the site at Merrivale, in the upper reaches of an upland river
catchment, surrounded by a concentration of industrial archaeology connected to the Medieval and
post-Medieval period (Harris, 1992; Butler, 1993).
In addition the site lies very close to a proposed remnant of the mid-Holocene woodlands, one of the
pockets of high level oak woods to have survived along with Black Tor Copse and Wistman's Wood.
A further focus was therefore to investigate the antiquity of the woodland in comparison with work
conducted in the area over 10 years ago (Roberts, 1983; Roberts and Gilbertson, 1994) which
suggested periods of deforestation at unspecified times in the past.
Multiple cores were also used to address the problem of differential retention of geochemical signals
in different sedimentary environments within a similar palaeoenvironmental context since one core
(PCI) was obtained from a small flush fed hollow, while the other (PC2) was taken from an area of
blanket bog.
61
2.2.5 Crift Down, near Lanlivery, Cornwall (SX 067596)
The site is a lowland mire and in a different environmental setting to the sites introduced so far. It is
remote from the intrusive granitic rocks, but still in the metamorphic aureole associated with this
activity.
A significant feature of the local landscape is the concentration of industrial archaeology indicative
of mineral extraction and processing. A nearby Medieval smelting site is currently the focus of
excavation (McDonnell, 1993; 1994). It was hoped that the signals associated with activity at this
site would be reflected in the geochemistry of the sediments, with the palynological data providing
data relating to the nature and scale of utilisation of local woodland resources and farming activities
during these periods of known activity.
2.3 Data collection and analysis
This short section will briefly introduce the initial sampling strategies adopted for the fieldsites. A
section will describe field sampling procedures followed by strategies for both pollen and
geochemical analyses. Brief discussion will be made of radiocarbon dating procedures before a short
review of the use of multi-variate statistical techniques is presented.
2.3.1 Field sampling strategy
In the selection of sites for this project the primary criterion was that a variety of sedimentary
sequences were obtained, which reflected different levels of both natural and human induced
environmental change. All sites were carefiilly selected to ensure a range of different sedimentary
types was included, and that a range of different palaeoenviroimiental signals would be detected.
Where possible sites were depth probed in two perpendicular transects using Russian auger rods, and
surveyed to ensure the deepest body of sediment was recovered. Surveying provided spatial control
allowing subsequent re-sampling if this was necessary.
Identification of wholly representative areas is of the utmost importance in the selection of sites for
palaeoenvironmental investigations. Jacobson and Bradshaw (1981) working primarily with sites for
palaeovegetational studies suggest the selection of the investigation area essentially determines the
62

level of detail that can be resolved. In peatland ecosystems there are a number of important variables
to be considered which affect the resolution of the data: (i) basin characteristics; (ii) sedimentation
dynamics; and (iii) characteristics of the local environment. All of these were considered in the
selection of suitable field sites.
AJl field sampling was undertaken using a standard Russian auger, with a chamber diameter of 5cm,
and a length of 50cm. Samples were extruded from altemate boreholes to minimise contamination of
consecutive samples (Lowe and Walker, 1997), into cut lengths of drain-pipe, wrapped in
hydrocarbon free clingfilm and aluminium foil. The samples were then stored in a fridge at 4°C prior
to sub-sampling in the laboratory.
2.3.2 Laboratory sampling strategy and analytical techniques
Initially all the cores were subsampled for pollen and geochemical analysis at coarse regular
intervals of between 5 and 10cm, depending on the depth of the profile. Samples were taken for
carbon analysis and ashing at the same intervals. Samples for pollen analysis were prepared using
standard procedures outlined in Moore et al. (1991). Samples of 1cm' were submitted to NaOH
digestion to break up the sample matrix and dissolve humic materials, treated with HCl (where
appropriate) to dissolve CaCOs, and HF (where necessary) to remove Si02 from the sample, and
finally subjected to acetolysis to remove cellulose. Once extracted, samples were stained using
safranine and mounted in silicon oil. Spore tablets (Lycopodium spp.) of known concentration were
added to the samples to allow pollen and spore concentration to be calculated (Stockmarr, 1971).
Pollen nomenclature follows Bennett et al. (1994), while plant names follow Stace (1991). To enable
a statistically viable pollen sum to be calculated a minimum of 300 pollen grains (Total Land Pollen
- TLP) were counted for all samples (Rull, 1987).
Hie presence of microscopic charcoal fragments in pollen slides provides a record of past fire history
for an area (Patterson et al., 1987). Tlie charcoal content of all samples prepared for pollen analysis
was therefore assessed using a simple count scheme which involved counting fragments passing a
graticule at the same time as pollen counting was undertaken. Charcoal concentration was calculated
using the maricer spore method utilised for the calculation of pollen concentrations (Robinson, 1984).
This very simple approach was chosen due to the time constraints of the project as a whole. Further
work would develop the interpretation made of these results by trying to quantify more accurately the
63

changing levels of this material (Clark, 1982). There are potential problems created when counting
microscopic charcoal fragments which have been subjected to the same chemical procedures required
for the preparation of pollen slides (Clark, 1984), but the results produced provide a first
approximation to the levels of charcoal in the sediments, and compare well with other documented
charcoal profiles from contemporary sites from the Dartmoor upland
Samples for EDMA were air-dried for ca. 72 hours, then ground using an agate pestle and mortar
which was cleaned thoroughly between samples, and mounted as described in section 3.1.3.
Carbon analysis was undertaken separately from the EDMA operation since sample preparation for
the latter required the coating of material with a fine layer of carbon to improve analytical efficiency.
Samples were prepared for analysis by a Shimadzu TOC 5000 Total Organic Carbon Analyser
equipped with a SSM-5000A solid sample module. Tlie samples were initially dried at room
temperature for ca. 72 hours prior to grinding and sieving through a 63nm sieve. Samples were then
placed in an oven at 110°C for two hours to remove interstitial moisture. Material was weigjied
carefully (±0.0(X)lg), placed in a 1cm' sample holder, covered with ceramic fibres and placed into
the sample carrier. Each sample was fired at 900°C. TTie data were produced as percentages of total
weight analysed. An experimental error was calculated by analysing the same material four times;
this resulted in a maximum error of ±1.25%. These errors may occur for two principal reasons: (i)
the small amount of material analysed (< 150 mg) and the heterogeneous nature of peat, and (ii)
instrumental errors producing a background level of interference. However, this method seems to
give a more reUable indication of the organic content of sediment than loss-on-ignition techniques
(Kevin Solman, pers. comnu).
Ashing of peat in a muffle fiimace at 900°C for 8 hours provided a first approximation to the
amount of mineral matter in the profile (Aaby, 1986). Results were expressed as a percentage of the
initial dry weight. Caution must be taken when interpreting ashed peat values in terms of the varying
proportion of mineral matter, particularly in the upper sediments since bio-elements (Ca, Mg, Si etc.)
may contribute significantly to the ash fraction, thus inflating the actual mineral content of the peat
(Bill Shotyk, pers. comnu). "Die results obtained are interpretable in a number of different ways.
However, generally low values (<5-10%) are particularly indicative of ombrotrophic peat sediments
(Sillanpaa, 1972). Peat is technically defined as material containing no more than 25% by weight
64

mineral matter (Andrejko et al., 1983). Material exceeding this value may be defined as organic
sediment and is typified by soligenous/flushed soils which contain much mineral material from
weathering of local soils and rocks.
2.3.3 Radiocarbon dating procedures
Radiocarbon dating was used to date significant events in the palaeoenvironmental history of all
profiles. Levels were chosen on the basis of both significant palj^ological and geochemical signals.
Both standard radiometric and AMS (Accelerator Mass Spectrometry) analyses were used. The
decision between the application of each technique was made on the basis of the amount of sediment
available and the apparent temporal resolution of the profile, using changes in the arboreal pollen
spectra and total pollen concentration curves as indications of sediment accumulation rate.
Both techniques are described in detail by Aitken (1990), Bell and Walker (1992) and Lowe and
Walker (1997). Standard radiometric techniques generally require lOOg of wet organic sediment.
Pre-treatment included acidifying (hot HCl) the material to remove carbonates and washing with
alkali (NaOH) to eliminate organic acids. AMS techniques require much less sediment (ca. lOOmg
wet organic material) and only the fine sediment fraction was dated to avoid contamination due to
root penetration from the upper levels.
All samples were taken according to the guidelines of Pilcher (1991). Measured "C ages are
normalised with respect to the level of isotopic fractionation to the base of "C/^Kl = -25%o for
standard radiometric dates, and for calculated values when using AMS techniques, which are
generally in the range '^C/ '^ = -20 to -32%o (Stuiver and Polach, 1977). This operation provides a
'conventional' '*C age which may be calibrated to calendar years. Calibration is undertaken to
reduce the distortion of chronologies and interpretation due to the variations between calendar and
radiocarbon ages, which is created primarily as a result of the variable flux of "*C production
through time (Bartlein et ai, 1995). TTie CALIB 3.0 program of the Quaternary Isotope Laboratory,
University of Washington was used for the calibration procedures (Stuiver and Reimer, 1993) for all
dates reported in this research. In the site descriptions all radiocarbon dates are quoted as calibrated
two sigma calendrical dates BCVAD with respect to AD 1950. Tlie following sections detail the
selection and different dating techniques applied to each study site.
65
North Sands
Only one sample was submitted from this site fmra a wood fragment at the bottom of the profile
(12.50m below groimd surface). The sample was submitted to the NERC Radiocarbon Laboratory
for AMS analysis.
Tor Royal
Samples for standard radiometric analysis were taken from the Tor Royal site due to the abundance
of sediment, with a high temporal resolution resulting in a 10cm slice of sediment spanning only ca.
100 years. Six evenly spaced samples were dated. The upper three samples were sent to the NERC
Radiocarbon Laboratory, whilst the lower three samples were submitted to Beta Analytic Inc. The
evenly spaced samples and the apparently even sediment accumulation rate allow the construction of
a reliable age-depth profile.
Merrivale, Piles Copse and Crift Down
Samples from these sites were submitted to Beta Analytic Inc. for AMS dating due to the low
amount of sediment available and the apparent lower temporal resolution of these profiles. Single
centimetre slices were taken (ca. 1.5g wet sediment) from the cores, with only the fine fraction
utilised for dating procedures to reduce the possibilities of sample contamination from root
penetration. Two samples were taken from both the Merrivale and the Crift Down profiles, with one
sample taken from each profile from the Piles Copse material.
2.4 Data analysis
2.4.1 Profile zonation
Each profile presented has been divided into zones which display internally homogenous
characteristics with respect to the other samples analysed (LPAZ - Local Pollen Assemblage Zone,
and Chemizones). Each zone may be regarded as conforming to a particular set of environmental
parameters. Each chemizone may be considered as a litho-facies representing a distinct sedimentary
environment (Mannion, 1979; Grattan, 1994).
A range of different techniques were utilised for the zoning operations included within the ZONE
program written by Steve Juggins, based upon the FORTRAN programs ZONATION, BARRIER
and CONISS (Gordon and Birks, 1972; Bkks and Gordon, 1985; Grimm, 1987). Tlie final position
66

of the boundaries was determined using a combination of statistical analysis and operator
experience.
2.4.2 Standard error bars
EDMA was based upon a number of separate analysis areas for each sample. The result expressed
was therefore the average value for each element from the different analyses conducted (eight for
each sample). Since a number of separate analysis areas are selected for a single sample and the
mean used as a measure of the elemental composition of the sample, it was considered necessary to
calculate standard errors of the mean (Shaw and Wheeler, 1994) as an indication of the homogeneity
of the sample's composition. Since peat is a complex sediment composed of a variety of different
materials, analysis of a number of sub-areas on a single carbon stub mounted specimen may produce
unreUable results if only the mean composition of the sample is considered, since one analysis area
may concentrate on a component of the sediment that is not generally representative of the sample as
a whole. The use of standard error bars will thus act as an interpretation aid, pointing to samples in
which one or more analyses have focused upon unrepresentative analysis areas.
2.4.3 Multi-variate statistical methods
These techniques have long been used in the fields of ecology as an aid to the description of plant
communities at varying scales (Kent and Coker, 1992). The overall aims of using such procedures is
to reveal environmental gradients operational within the data. Each individual in the analysis is
positioned with respect to the level of similarity between other components in the data set. When
grouping of individuals is evident each individual in each group is more similar to the other
individuals in that group than to any other individual in any other group.
TTie application of these techniques by the palaeoecological community is still relatively rare. TTiere
is a supposition that the extra work rarely results in additional knowledge. However, due to the large
volume of data produced in a study of this nature it was decided to use detrended correspondence
analysis (DCA - Ter Braak, 1987) since this technique may be viewed as the "preferred method for
analysing highly heterogeneous sets of samples in palaeoecology" (Prentice, 1986: 783). For a
review of the development of these techniques, and their potential uses in palaeoenvironmental work
see Prentice (1980, 1986), and Hicks and Birks (1996).
67

2.5 Summary
This chapter presented the methodological aspects of the research, from a presentation of the
archaeological and palaeoenvironmental conditions of south west England, which sought primarily to
place each fieldsite in context, to a discussion of sampling and data analysis/presentation techniques.
The next chapter describes in detail the major part of the methodological experimental work carried
out during this project. This focuses upon the examination of different preparation techniques and
the comparison of EDMA with respect to standard geocheraical methods.
68
Chapter 3
Experimental procedures
3.0 Introduction
This chapter describes the experimental investigations undertaken to address the following questions:
(i) what is the most appropriate sample preparation technique for EDMA of organic soils and
clay?
(ii) How do the results gained from EDMA compare to those produced using other geochemical
methods?
3.1 Investigation of EDMA sample preparation methods
Tliere have been only a few attempts to investigate the most reliable method of sample preparation
for EDMA. Although the analytical technique has been applied in a range of different situations
(Pyatt and Lacy, 1988; Grattan, 1994; Pyatt et al., 1995), the experimental preparation of sediments
has largely remained unexamined. TTiese studies all involved the mounting of ground sediment
samples directiy onto a SEM carbon stub, secured using graphite cement. It was considered
appropriate to develop and examine other methods of sample preparation, including the one
described above, as the first component of the experimental development of this technique.
Sample preparation for EDMA is a necessary operation for any X-ray technique. It is required
specifically to:
(i) reduce the build up of charge on the specimen surface. This reduces the possibility of sample
damage, since the h i ^ beam currents used can lead to rapid loss of organic material (Hall
and Gupta, 1974), and possibly even elemental losses,
(ii) Remove moisture from the sample. This will improve analyser efficiency and reduce high
vacuum pump down times considerably, subsequently reducing degassing effects (Goldstein
et al., 1981). Sediments, such as peat, with a high moisture content present the greatest
difficulties to the preparation procedure (Tovey and Wong, 1978).
(iii) Homogenise the sample. Due to the heterogeneous nature of the sediments under
investigation the potential effects of bias will be reduced by sample homogenisation.
A good preparation will therefore aid matrix correction procedures (ZAF-4), and improve
69

quantitative accuracy. It is generally considered that polished flat surfaces should be used to obtain
fully quantitative results (Erasmus, 1978; Goldstein et al., 1981) as used in mineralogical einalysis of
rock samples (Kiel and Fredriksson, 1964; Straszheim et al., 1988; Kwiecinska et al., 1992).
However, given the friable nature of the sediment to be analysed, it is extremely difficult to obtain
these conditions. A number of different methods were therefore investigated based on two general
procedures, which sought to address the points outlined above:
(i) mounting the sample directly onto an SEM carbon stub, as described in Pyatt and Lacy
(1988), Grattan (1994) and Pyatt et al. (1995), (referred to as methods A to C here),
(ii) embedding the specimen in resin and grinding flat. This was performed to obtain a level
analysis surface (methods D and E).
Samples were taken at the following position from the North Sands core (see Chapter 4): 1.30, 3.30,
5.40, 7.50, 9.30, 11.40ra, numbered 1 to 6 respectively. This ensured a range of different
sedimentary units were investigated, firom highly organic sediments to silty clays. It was decided to
analyse each sample for: Na, K, Mg, Ca, Mn, Fe, Cu, As, Sn and Pb using samples prepared
according to the procedures described in Table 3.1. "Hiese ten elements were chosen since they
represent a range of different groups of chemical elements i.e. major, mobile and heavy metal
elements. Ideally the full range of elements would have been investigated, including Si, Al, S and P,
but this was not feasible at this early stage in the project.
Table 3.1 describes the specific operations of each method (A - E). In addition to the five preparation
methods, standard bulk chemical extracts were made from material at the same depths, for the same
elements to act as a comparison of the geochemistry of the samples, following the methods outlined
in Bengtsson and Enell (1986). A combination of Atomic Absorption Spectrometry (Ca, Mg, Fe,
Mn, Pb, Cu, As, Sn) and Flame Photometry (Na, K) wae used. TTie bulk chemical data (ppm) were
standardised to 100% so that they were directly comparable to the results from EDMA (the totals
from which were >95%), and analysed using the Wilcoxon test for paired samples (Hammond and
McCuUagh, 1978; Matthews, 1981). This is a non-parametric test were the null hypothesis states
that the two sets of data come from identical, equivalent populations (Hammond and McCullagh,
1978). The test considers not only the direction of the differences between pairs, but also the relative
magnitude of these differences, givmg more weight to a pair which shows a large difference between
profiles than to a pair which shows a small difference (Siegel and Castellan, 1988). The main use of
70

All samples were air dried for 72 hours, then ground to a fine powder (ca. 63|im) using an agate pestle and mortar which was cleaned thoroughly with distilled water between samples.
PROCEDURE 1 Coat a carbon stub of 13mm diameter with graphite dag onto which the sample is peppered.
Method Preparation as described in Pyatt and Lacy (1988), Pyatt et al. (1992) and Grattan (1994). The mounted sample was sprayed with Duron anti static solution.
B Samples were placed in a low vacuum desiccator for 24 hours to remove interstitial moisture from the specimen, then sprayed with Duron.
Hie sample was coated with a layer of carbon in a vacuum evaporation unit, coating thickness is sufficient when a piece of filter paper placed on the stage turns a light chocolate brown colour.
PROCEDURE! The samples were embedded in qxjxy resin (Spurr low viscosity), as suggested in Goldstein et al. (1981) and Erasmus (1978). TTie surface of the resin was ground down using silicon carbide paper until the sample was exposed. Using a frosted glass plate and silicon carbide slurries (600 grade for 25nm, followed by 302 grade for 1 l^m), each stub was ground down until a smooth, even, flat surface was attained (specimen micro-topography was examined using a low powCTed binocular microscope). Resin blanks were prepared, which were subjected to each stage of the preparation procedure to check for contamination from the resin (CI and S are possibilities), and the addition of extraneous material from the grinding pastes.
Method D The samples were placed in a low vacuum desiccator to remove air bubbles from the resin and interstitial moisture from the specimen matrix. The samples were then transferred to a low temperature oven (50°C for 24 hours) to allow the resin to polymoise. Ground, as described above, any contaminants were removed in an ultrasonic bath (de-ionised water, no detergent). The stubs were then placed in a vacuum desiccator unit for ca. 24 hours to remove moisture, and finally sprayed with Duron. The sides of the analysis surface, and the vertical edge of the stub were coated with graphite dag to ensure good electrical conductance between sample and holder.
As D, but the stub was coated with C in an evaporation unit after the ultrasonic cleaning operation.
Table 3.1 EDMA experimental preparation techniques
71

this technique is to assess the amount to which the profile features (peaks and troughs) produced by
each preparation method are coincident with those of the bulk procedures, and therefore indicate the
accuracy of the EDMA.
Standard errors of the mean were calculated for each sample to address the question of replicability
between different analysis areas for the same sample for each preparation technique (Fig. 3.2a-e).
All EDMA analyses were conducted with the microprobe operating conditions set as outlined in
Table 3.2 below.
Live time
Dead time
Magnification Accelerating voltage
Analyser
Analysis
100 seconds
<25% at ca. 2500 counts per second
x500
20keV
Link Analytical electron microscopy data management system (eXL), with an energy dispersive microprobe attached to a Joel 6100 SEM
Each sample was analysed 8-10 times (randomly selected areas), the results were averaged and expressed as mean ±2 standard errors
Table 3.2 EDMA operating conditions
3.1.1 Discussion of the preparation techniques
All samples were initially air-dried, then ground to a fine powder as described in Table 3.1. The
division between the two sets of preparation procedures relates to the specific method of sample
mounting. Methods A to C were based upon the peppering techniques adopted by Pyatt et at. (1995)
and Grattan (1994) for previous palaeoenvironmental studies. Methods D and E were based upon the
resin embedded methods, commonly utilised for analysis of biological specimens (Erasmus, 1978).
"Die use of Duron, a poljmiine derived anti-static agent, may reduce specimen charging effects
(Goldstein et al. 1981), and was consequendy utilised in the development of methods A, B and D.
An investigation undertaken by Pease and Bailey (1975) states that thin polymer films (1.2-20nm)
are readily transparent and relatively stable under an incident electron beam. A S.Onm coating of
polymer has a number of advantages over other coating techniques: no special equipment is required
for the coating operation; irregular surfaces may be coated; the method is cheap and rapid; the coat
does not hinder light microscopical examination; and the film, having a low backscattering
72

coefficient results in the production of fewer secondary electrons.
The problems associated with interstitial water in the sample were addressed by placing the samples
(methods B, C, D and E) in a vacuum desiccator unit prior to analysis to reduce sample degassing
and high vacuum pump down times.
Methods C and E involved a layer of carbon evaporated on to the surface of the sample under a
working vacuum of 10"* Torr. This is an effective way to coat the sample to provide good electrical
conductance, reducing charge accumulation on the specimen surface and the problems of thermal
damage, sample movement and image distortion. Goldstein et al. (1981) suggest that organic
samples may be fixed more firmly by applying a thin coating of carbon. This has the advantage of
preventing loss of materials during analysis.
Embedding the specimens in resin was seen as an alternative to the methods described in procedure
one since the variable surface geometry of samples may create problems for analysis. The surface
should therefore be as flat as possible, which will aid the determination of concentrations of elements
present in the sample. Erasmus (1978) states that embedding samples in resin will simplify the
manipulation and sectioning of the specimen, but care must be taken when selecting embedding
materials since some may contain high levels of elements that interfere with those of the analysis, e.g.
Araldite is said to contain CI and S (Davies and Erasmus, 1973). For this investigation Spurr low
viscosity epoxy resin was considered suitable, and resin blanks were prepared to check for the
presence of possible contaminants. Ideally a completely flat surface should be attained to maximise
analyser efficiency, and would involve repeated polishing to less than l^m with high quality
diamond pastes, with ultrasonic cleaning between each polish (Kane, 1973; Hunt and Hill, 1993). It
proved impractical to polish to this level due to the ftiable nature of the matrix under investigation. It
was considered sufficient to grind the surface down to ca. 1 lum, and utilise the fact that high take
off angles may be used to reduce the effects of local surface inclinations, produced by the
grinding/sectioning procedure (Yakowitz and Heinrich (1969) suggest >45°). Preparation method E
was undertaken since it was hoped to share the benefits of a flat analysis surface, with those of using
carbon as a coating material.
Each method contained ten randomly selected analysis areas for each sample. A number of analysis
73
areas were analysed three times to assess reproducibility on the same analysis area.
In the following discussion a number of different physical criteria were assessed visually and used as
an indication of the suitabiUty of each method. These included an assessment of charging, i.e. how
much of the incident electron beam was absorbed by the various parts of the sample. In extreme
situations it results in the sample effectively becoming an 'electron mirror' (Roy Moate, pers.
comm.), seriously effecting the production of characteristic X-rays and consequently reducing
analytical efficiency. Sample movement is another criteria which essentially relates to how
effectively the sample is fixed to the carbon stub, which is likely to vary for the different techniques.
Contamination is shown as a build up of material in the focused area of the microprobe during
recaUbration of the instrument and is most likely to be a function of contamination of the vacuum
creating this transient residue on the cobalt calibration stub.
3.1.2 Results
Method D failed since a residue formed on the analysis surface of the sample. This is probably due
to interaction between the Duron and the epoxy resin. In a discussion of the results obtained fi-om the
remaining preparation techniques, a number of issues are important:
(i) the sample-analysis system interaction
(ii) the level of replicability within an individual analysis area
(iii) the absolute differences between the different techniques with respect to standard bulk
geochemical operations
(iv) the replicability between analysis areas for the same sample.
Sample-analysis system interactions
One of the aims of a preparation technique is to minimise sample charging, movement and
contamination since these may lead to spurious data and a reduction in analyser efficiency. Hie
assessment of these criteria was subjective since it would have been impossible to quantify the
interaction, each preparation method was described using a low-medium-high scale. Three of the
methods (A, B, C) investigated did not seem to reduce these problems. However, method E was more
successfiil (Table 3.3) and resulted in lower levels of charging and sample movement. There is no
indication of how significantly these effects reduce the sensitivity of the machine, but it is obvious
that their effects should be minimised wherever possible.
74
Method
A
B
C
D
E
Charging
High
High
Medium
Movement
Medium
High
High
Contamination (build-up)
High
High
High
M e t h o d f a i l e d
Low Low Low
Table 3.3 Visual assessment of sample - analyser system interactions
Replicability within an individual sample area
One of the key issues with the development of any new technique is reliability of the analytical
method. TTie use of identical operating conditions and frequent re-calibration of the analyser goes
some way to ensuring constancy, but it is largely unknown how replicable EDMA analyses are. It
was decided to answer this question by simply analysing a given area at x500 magnification for 100
seconds live time, then repeating this procedure three times. Itie results for all methods are in the
region of ±0.05% for the base and trace elements, and up to ±0.75% for the more abundant elements,
such as Fe. This suggests that the results from analysis of individual areas for any one preparation
technique are highly replicable, and there is no need for the replication of single analysis areas.
However, this says nothing about the reliability and accuracy of each preparation technique.
Absolute differences between the different techniques
Since all EDMA analyses were conducted under the same operating conditions (Table 3.2) any
variation between different preparation techniques with respect to bulk chemical results gives a
reflection of the overall efficiency of the individual preparation technique. Wilcoxon test coefficients
(Table 3.4) were calculated for techniques A, B, C and E in comparison to bulk results and illustrate
the lower level of similarity between method E and standard chemical procedures, illustrated on Rg.
3.1a-e. This was probably due to the use of epoxy resin introducing elements which interfered with
the analysis (Erasmus, 1978). The grinding procedures similarly added small quantities of Al and Si
obscuring the chemical signatures of the samples. Methods A, B and C demonstrate a statistically
significant level of similarity with standard chemical procedures for Na, K, Ca, Mg, Fe. TTiere is
inevitably a degree of inconsistency in the relationship due to the different ways in which the
methods produce the data (Erasmus, 1978).
75
Rq)licability betweai different analysis areas for the same sample
s e
5 0
5 6
Figure 3.1a Na cm left, K on ri^t. Vertical axis indicates the percoitage of the elemait in the analysed volume of the sample. X-axis displays the sample number, vertical bars show ±2 standard errors of the mean. All data are standardised to 100%.
76

R^Ucability between differait analysis areas for the same sample
3 «
Figure 3.1b Mg on left, Ca on right. Vertical axis indicates the percaitage of the elemart in the analysed volume of the sample. X-axis displays the san:q)le mmiber, vertical bars show ±2 standard errors of the mean. All data are standardised to 100%.
77
Rq)licability betweoi differoit analysis areas for the same sample
3 4 5 6
3 4 5 6
I
q w ^ ^ ^ *
2 3 5 6
3 4 5 6
•
v-^
0.1a
01s
0.U
012
0-1
o-oe
0.06
0.0«
002
J 4 5 »
Figure 3.1c Fe on left, Mn on r i ^ . Vertical axis indicates the percaitage of the el^nait in the analysed volume of die sanq)le. X-axis displays the sample number, vertical bars show ±2 standard errors of the mean. All data are standardised to 100%.
78

Replicability betweai differait analysis areas for the same sample
/ ——4——5 B
2 3 4 5 6
D M
0.W
oos
o.oa
002
0.03
0.01
001
ao7
OOB
0.05
0.0«
003
002
0.01
Figure 3. Id Pb cm left, Cu cm right. Vertical axis indicates the percentage of the elranait in the analysed volume of the sample. X-axis displays the sample number, vertical bars show ±2 standard errors of the mean. All data are standardised to 100%.
79
R^licability betweai differait analysis areas for the same sanqjle
Figure 3. le As on left, Sn on right Vertical axis indicates the percentage of the element in the analysed volume of Ae sample. X-axis displays Ae saasph number, vertical bars show ±2 standard errors of tiie mean. All data are standardised to 100%.
80

This point is illustrated by the general variations in the heavy metal elements. These elements exhibit
the lowest concentrations and are therefore the hardest to detect (Fig. 3.Id and e).
A
B
C
E
Elements
Na
15
14
11
8
K
20
20
21
21
Ca
21
21
21
21
Mg
21
21
21
21
Fe
16
16
15
14
Mn
0
0
0
0
Cu
0
0
0
0
Pb
21
21
21
21
As
10
17
12
15
Sn
12
17
16
17
Table 3.4 WUcoxon test statistic matrix for comparison between the geochemical data obtained from EDMA and standard analytical procedures for the different preparation methods investigated. It is possible to accept Ho (no difference) at the 95% significance level if the tabulated value is greater than 0 (Matthews, 1981).
Statistically significant levels of consistency were exhibited in the analysis of the Na, K, Ca, Mg, Fe,
Pb, As and Sn for preparations A, B and C with respect to bulk chemical procedures, with the plots
of K, Ca and Fe for all of the preparation techniques illustrating similar results (Fig. 3.1a, b, c). The
lack of similarity for Mn and Cu may be due to a nimaber of factors including the detection
capabilities and efficiency of the each analytical instnunent. The trace elements were in low
concentration (Cu range: 0.05-0.9ppm; Pb: 0.1-0.25ppm; As: 0-3.3ppm; Sn: 0-0.5ppm),
approaching the detection limits of the AAS technique. This may partly explain the low levels of
similarity between the data produced by the two techniques. A similar explanation for the rejection of
Ho for Mn may be suggested since this element is in concentrations of <5ppm. The extraction method
used for the bulk procedures may have been incapable of releasing some elements to solution,
reducing the level of similarity between EDMA and the bulk chemical methods. Further analysis is
required to resolve this matter.
Replicability between different analysis areas for the same sample
This part of the investigation sought to identify the level of replicability between different analysis
areas for the same sample. The selection of small analysis areas is a potentially hazardous operation
due to the heterogeneous nature of peat. Investigations were therefore carried out for each analysis
area of a sample to see if the results gained were representative of the sample as a whole (Fig. 3.2).
The most consistently low standard errors for all elements were displayed by
81

^ S O N o .
Figure 3.2 Schematic representation of sample analysis areas for EDMA. Eight areas are analysed, the mean of these is taken as the representative geochemical signal of the sample.
82
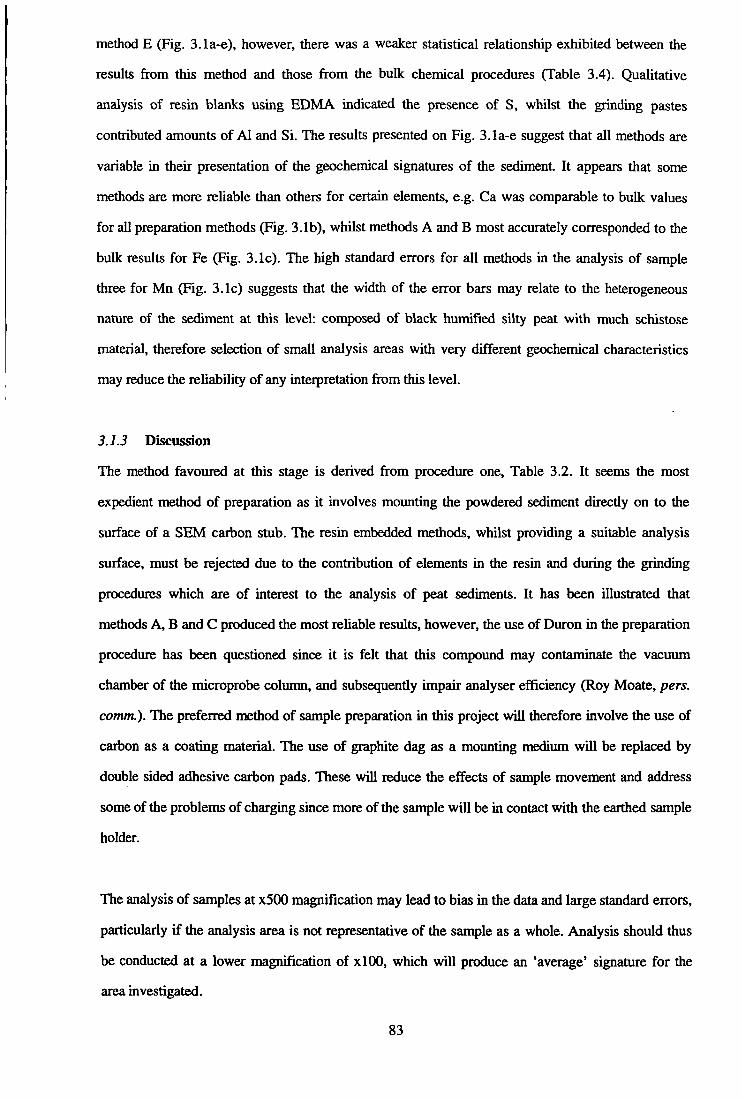
method E (Fig. 3.1a-e), however, there was a weaker statistical relationship exhibited between the
results from this method and those from the bulk chemical procedures (Table 3.4). Qualitative
analysis of resin blanks using EDMA indicated the presence of S, whilst the grinding pastes
contributed amounts of Al and Si. The results presented on Fig. 3.1a-e suggest that all methods are
variable in their presentation of the geochemical signatures of the sediment It appears that some
methods are more reUable than others for certain elements, e.g. Ca was comparable to bulk values
for all preparation methods (Fig. 3.1b), whilst methods A and B most accurately corresponded to the
bulk results for Fe (Fig. 3.1c). The high standard errors for all methods in the analysis of sample
three for Mn (Fig. 3.1c) suggests that the width of the error bars may relate to the heterogeneous
nature of the sediment at this level: composed of black humified silty peat with much schistose
material, therefore selection of small analysis areas with very different geochemical characteristics
may reduce the reliability of any interpretation from this level.
3.1.3 Discussion
The method favoured at this stage is derived from procedure one. Table 3.2. It seems the most
expedient method of preparation as it involves mounting the powdered sediment directly on to the
surface of a SEM carbon stub. The resin embedded methods, whilst providing a suitable analysis
surface, must be rejected due to the contribution of elements in the resin and during the grinding
procedures which are of interest to the analysis of peat sediments. It has been illustrated that
methods A, B and C produced the most reliable results, however, the use of Duron in the preparation
procedure has been questioned since it is felt that this compound may contaminate the vacuum
chamber of the microprobe column, and subsequently impair analyser efficiency (Roy Moate, pers.
comnu). TTie preferred method of sample preparation in this project will therefore involve the use of
carbon as a coating material. Tlie use of graphite dag as a mounting medium will be replaced by
double sided adhesive carbon pads. TTiese will reduce the effects of sample movement and address
some of the problems of charging since more of the sample will be in contact with the earthed sample
holder.
The analysis of samples at x500 magnification may lead to bias in the data and large standard errors,
particularly if the analysis area is not representative of the sanqjle as a whole. Analysis should thus
be conducted at a lower magnification of x 100, which will produce an 'average' signature for the
area investigated.
83
There appears to be no need for replication of individual analysis areas for samples, since there was
no significant variation between consecutive analyses. However, the use of no less than eight
analysis areas per sample produces statistically viable results. This will allow the interpretation of
highly heterogeneous samples and aid interpretation.
3.2 Comparison of EDMA and bulk chemical methods
The overall objectives of this section are as follows:
(i) to assess whether EDMA provides data which are comparable with other geochemical
methods. Although exact values cannot be easily compared, the overall trends in the data
should be similar.
(ii) to examine if the EDMA technique provides reliable data. Many workers (Gulson and
Loveiing, 1968; Erasmus, 1978; Goldstein et al., 1981) state that flat analysis surfaces are
a pre-requisite for accurate quantitative analysis. However, semi-quantitative results have
been obtained from the analysis of 'rough' surfaces of sediment samples (see for example
Pyatt and Lacy, 1988; Pyatt et al., 1991; Pyatt et al., 1992: Grattan, 1994; Charman et al.,
1995; Pyatt et al., 1995). This pilot smdy seeks to examine whether the results produced are
meaningful for palaeoenvironmental reconstruction work.
TTiirty nine samples were prepared for EDMA using the revised preparation procedures, and for bulk
chemical analysis as described above in section 3.1. The data from both methods are presented as
raw elemental plots and as standardised data (Figs. 3.3, 3.4 and 3.5). Hie data are also presented as
transformed plots, in which each elemental profile is manipulated to have a mean of zero (Fig. 3.6).
This enabled direct comparison of profile features using the Wilcoxon test for paired samples, and
provided a statistical index of similarity (Table 3.5).
3.2.1 Results
As already stated ten elements were selected for comparison:
Base elements: Na, K, Mg
Carbonate elements: Ca
Mobile elements: Fe, Mn
Heavy metal elements: Cu, Pb, Sn etc.
84

Na
a Z
- 2 Q UJ
2 4 6 8 10 12
Depth (m)
• 4
3 $ Q LU
K
o 30 Q LU
2 4 6 8 10 12
Depth (m)
li 4
2 4 6 8 10 12
Depth (m)
Q LU
2 4 6 8 10 12
Depth (m)
2 4 6 8 10 12
Depth (m)
Figure 3.3 Comparison between bulk analyses (solid line - ppm) and EDMA (% with 2 s.e.) for Na, K and Mg. The right hand diagram illustrates the expression of both data sets as percentages (sum 100%).
85

Ca
Q LU
- 10 o
2 4 6 8 10 12
Depth (m)
J£ 3 n ^ m U
60
50
40
30
20
10
/ » / 1
,', i l l (' \'-t ' •* A 1 * * ' ' ' ' ' 1 1 ; \ .'• j l • ' ' ' ' I I I V ' * J 1 l l
H ;" p.A
*\ V
j V J I 1 \
• v i j ^ "'"r"\,\i ;-\
50
40
• 30 o LU
20 S
10
4 6 8 10 12
Depth (m)
Fe Fe
4 6 8
Depth (m)
80
70
60
50
40
30
20 6 8
Depth (m)
10 12
• 80
60
40
20
< Q
Mn Mn
0.4 < 2-Q UJ
4 6 8 10 12
Depth (m)
Figure 3.4 Comparison between bulk analyses (solid line - ppm) and EDMA (% with 2 s.e.) for Ca, Fe and Mn. The right hand diagram illustrates the expression of both data sets as percentages (sum 1(X)%).
86
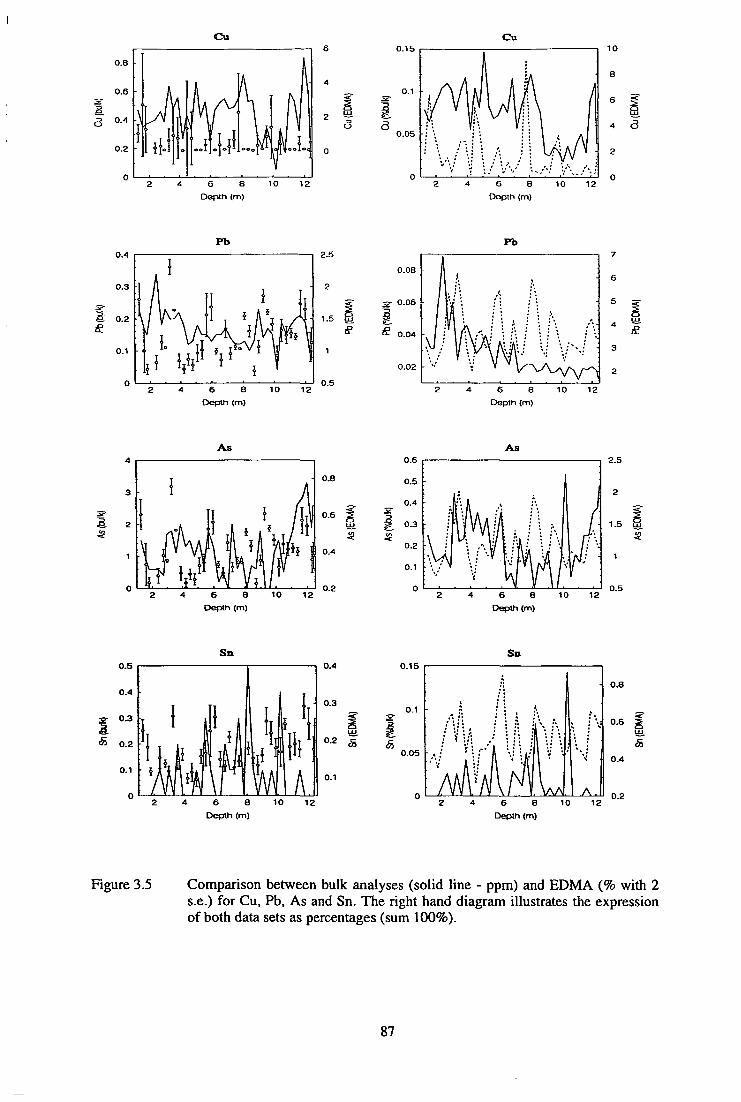
Cu Cu
S 5
0.05
/\ r i\ n
2
\k
'i 4
/
I -'' V'' 6
'i^
••' i„-8
Depth (m)
^
10 12
10
8
6
4
2
0
1 3
Pb Pb 2.5
0.08
g- 0.06
I £ 0.04 •
0.02
1
H '• m 1 '11 A
- 1 ; 1 A /•. V / V \ V • ••••• V
2 4
J
•1 A • ; J •' ;
• ; ; ' ; ; ' ;
\jiMl • 6 8
Depth (m)
.\ ; '. ; •
; '. ; ,
10
•
/., ; ',
/ •
12
/ 6
5
4
3
2
&
A s
0.6
0.2
Sn Sn 0.5 0.4 0.15
I 0.05 •
0.6
0.4 &
Figure 3.5 Comparison between bulk analyses (solid line - ppm) and EDMA (% with 2 s.e.) for Cu, Pb, As and Sn. The right hand diagram illustrates the expression of both data sets as percentages (sum 100%).
87
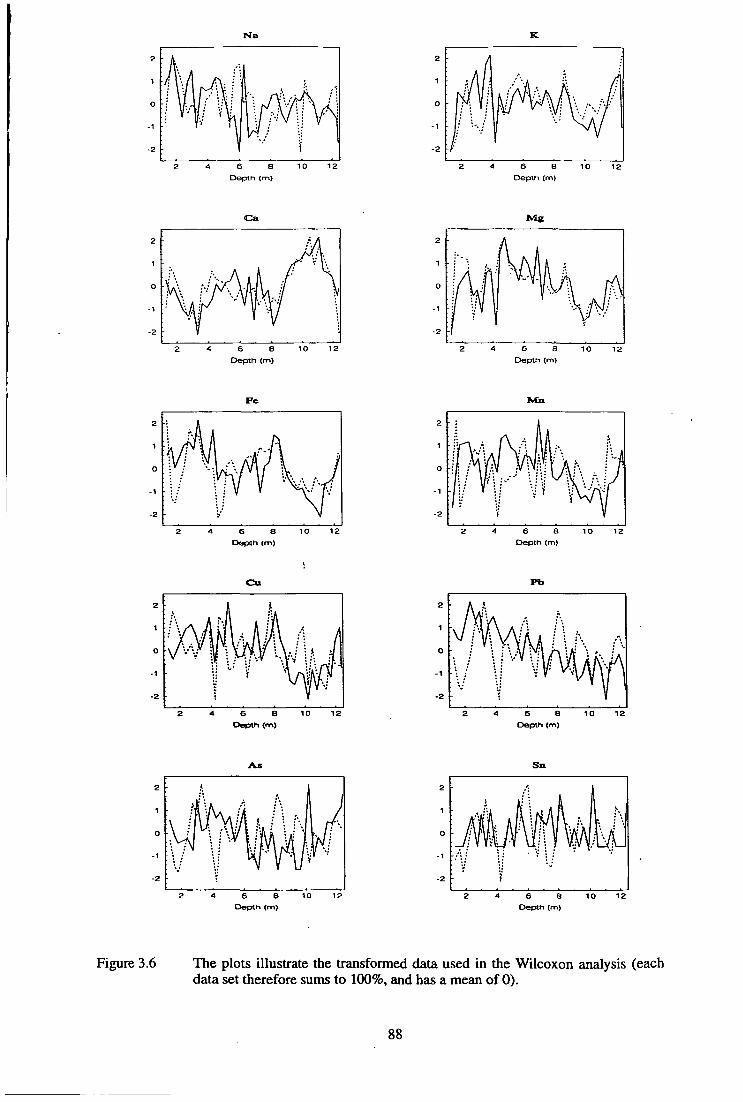
M g
•MM
2
1
0
1
-2
k /^ \ /
• 2
••- -.I ,
V A
'.-/'\
K'lxf "
6 8 Deprtti (m)
I'. . f
^V''
1 0
N
1 2
2
1
0
• 1
- 2
;
-
Vc": . / \
(
\M-^\ V *
Vi f.
v'
:' "-4
r\i
2 4 6 8 10 12 Depth (m)
2
1
O
-1
- 2
• \ / \ ,f\ i
V "V H
y I
C u
•*. Il : / • • • • ' '
V
J.
'•
/ A
\V"V •;•. ; M
VA|\jf..j
P b
2 4 6 8 10 12 Deptn (m)
2
1
0
-1
- 2
I
jJJ
'. .'
V
'A •'• ^ 1 \ j'A ji
\i\" \f
•••• 1 r /
•\ / V
6 8 10 12 Dep th (m)
Figure 3.6 The plots illustrate the transformed data used in the Wilcoxon analysis (each data set therefore sums to 100%, and has a mean of 0).
88
Na
328
K
315
Ca
316
Mg
308
Fe
299
Mn
351
Cu
373
Pb
349
As
385
Sn
367
Table 3.5 Wilcoxon test statistic values for comparison between EDMA data and that obtained using standard chemical procedures. Both data sets have been standardised to 100% and transformed so that the means of each set equal zero to allow direct analysis of coincident profile features. It is possible to accept Ho (no difference) at the >95% significance level if the tabulated value exceeds 249 (Matthews, 1981).
Base and carbonate elements
Analysis of Na suggests a good deal of similarity between the two methods (Fig. 3.3, 3.6), confirmed
by a statistically significant result from the Wilcoxon test (Table 3.5). Both techniques generally
demonstrate higher amounts in the uppermost sediments, with the overall trends reasonably well
repUcated for each method.
Both Mg and K form a greater proportion of the sample than Na. The reasonably consistent standard
errors for these elements suggests reUable analyses. The level of similarity between features of the
profiles for K is good, with peaks detected by both methods at 4, 5.75, 9 and 12m. However the
basal sample proved problematic since higher levels of K were detected by EDMA than bulk
chemical methods. This may be attributable to the inefficiency of the chemical extraction used
(HNO3, HCl) where perhaps the extraction method could not liberate the tightly bound K from these
predominantly phyllosilicate sediments derived from the local mica schist rocks. Standard error
deviations for Mg increase up through the profile possibly indicating changing fluxes of Mg to the
sedimentary system through time, particularly in the uppermost sediments, as shown by increased
standard errors above 5m. However, the level of similarity between the methods is statistically
significant.
Calcium was selected to represent the carbonate elements in this pilot study since it was likely to be
a major component of the basal material. All plots indicate a good deal of similarity between
adjacent profile features. Elevated levels in the basal 3m of the sediment are detected, with a close
correspondence between other features in the remainder of the section (Fig. 3.6).
Mobile elements
Fe displays comparable trends with respect to the EDMA and bulk chemical techniques (Fig. 3.4,
89
3.6). Iron displays low, consistent standard errors suggesting high reproducibility of the EDMA
technique, and detects the major profile features produced by the bulk analysis, resulting in a
significant Wilcoxon test statistic. Mn, a much smaller component of the sediment, displays a
fluctuating profile for both techniques. A number of samples exhibit large standard errors effectively
obscuring the remainder of the EDMA data. Discrepancies between the results gained ft'om the two
methods for this element occur at a number of levels in the profile (2, 5 and 6.6m). This possibly
questions the validity of the EDMA data for Mn from this site, although it could equally stem from a
problem with the standard chemical procedure, since the element is in low concentration (<5ppm). A
problem may stem from the variable extraction efficiency of the digestion method used.
Heavy metal elements
These elements are the most difficult to detect in a sample since, by definition, they are usually the
smallest components of the sediment body (Bengtsson and Enell, 1986; Alloway, 1995). Problems of
detection will influence any geochemical study, with difficulties created by variable extraction
efficiency compoimded in the analysis of these elements using standard chemical procedures since
these elements are bound with varying efficiency in different sedimentary situations.
It appears Sn was present close to the detection limits of AAS making direct comparison of profiles
difficult. There are common features to the profiles for As, Sn and Pb from the EDMA results. Tliey
all exhibit similar standard errors through the profile, and share peaks and troughs at the same
levels, albeit of different relative magnitudes. The plots for the heavy metal elements, both
standardised percentage (Fig. 3.5) and transformed (Fig. 3.6) display the least convincing levels of
similarity between the two analytical methods. This questions the utility of the signals fi-om these
elements since they are present in very low concentrations, perhaps below the lowest limit of
detection (LLD) of the EDMA techniques. This problem will be addressed in the analysis of the
other sites.
3.2.2 Discussion
Most of the data produced from EDMA of the sediment was comparable to that produced from the
bulk chemical procedures. However, there were discrepancies between these two methods. The
variable success with which the chemical extraction released the elements to solution from the
different sedimentary units may have caused problems, for example, below 12m K may have been
90
bound too tightly for the extractant (HNO3, HCl) to release it, while it was readily detected by the
EDMA technique.
It is possible that too much emphasis may have been placed upon the accuracy of the standard
chemical procedure, since a number of elements seemed to have been present in the sediment at or
below the detection limits of the analytical devices used. This will obviously make direct comparison
between the two methods problematic, but for the major, carbonate and mobile elements there does
appear to have been a good deal of similarity, both graphically and statistically.
3.3 Conclusions
Energy Dispersive X-ray Micro Analysis has produced results that are generally comparable with
the bulk chemical operations. Although a limited number of elements have been examined, the trends
produced may be used to make palaeoenvironmental reconstructions on the same basis that has been
established for standard bulk chemical analyses (Bengtsson and Enell, 1986). Tliese results suggest
EDMA to be most reUable for the more abundant elements present in the sediment, but suggests
caution must be exercised in the interpretation of the elements present in lower concentrations i.e. the
heavy metal elements and Mn.
TTie technique produced consistent data within each sample as shown by the small range of values
from the standard error calculations for the majority of samples. It seems therefore that EDMA of
'rough' surfaces prepared according to the method described in section 3.1.2 produces reliable data
from which environmental processes may be deduced. This will now be discussed with respect to a
range of different sedimentary systems located in south west England, beginning with the
investigation of a coastal mire with a variety of different sedimentary materials.
91
Chapter 4
North Sands pilot study
4.0 Introduction
This chapter describes results obtained from EDMA using the new preparation methods and
procedures outlined in chapter three. EDMA and pollen analysis of the sediment from a coastal mire
at North Sands, south Devon, revealed a detailed picture of palaeoenvironmental development for
this area of the Kingsbridge Estuary. The first section introduces the physical and historical
character of the area, followed by the discussion of the analytical results and palaeoenvironmental
reconstmction.
4.1 North Sands and the Salcombe area (Fig. 4.1)
The sampling site (SX 730382) lies in the lower reaches of the North Sands combe, at a height of
2.61m above OD, approximately 100 metres from MHW. TTie site was of particular importance
since it had the potential to test the efficiency of EDMA using a range of different sediments,
hopefully revealing information relating to marine/freshwater phases, aquatic/terrestrial phases and
autogenic processes, in addition to the disturbance activities associated with anthropogenic activity.
The site will fiirther reveal important palaeoenvironmental information about this lowland coastal
environment, a zone for which there is generally very little known in the south west.
4.1.1 G^logy and Cieomorphology
The rocks of this area of south Devon are part of the Start Point Complex (Fig. 4.2). Ussher (1904)
divided the rocks of this complex into two distinct groups: (i) the Green Schists - green homblende
and chlorite schists; and (ii) the Grey Schists - grey pelitic schists. Both groups are derived from
altered Devonian rocks, with possible remnants of the Lower Palaeozoic land mass that have been
brought into contact with the Lower Devonian rocks by faulting (Edmonds et al., 1975). The Green
Schist group are composed primarily of altered basic lavas or sills, with the distinction between the
two sub-groups made with respect to the dominant mineral within each grade (Durrance and Laming,
1982). The Grey Schists are formed from slate, siltstone and sandstone, have a simple mineralogy of
quartz and muscovite with numerous accessory minerals, and are more susceptible to weathering
(Bom, 1986). The North Sands study site lies within an area classified by Ussher as alluvial
sediments, bounded to the north and south by homblendic and chloritic schists.
92
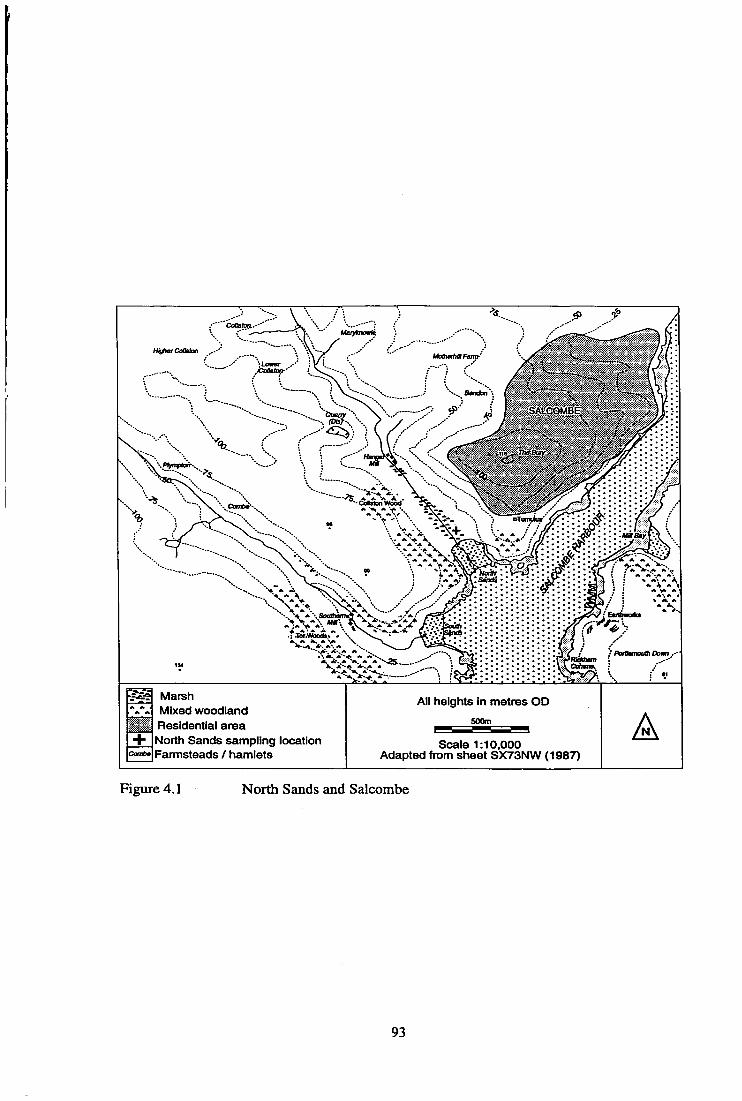
Marsh Mixed woodland Residential area North Sands sampling location Farmsteads / hamlets
All heights In metres OD SOOm
Scale 1:10,000 Adapted from sheet SX73NW (1987)
Figure 4.1 North Sands and Salcombe
93
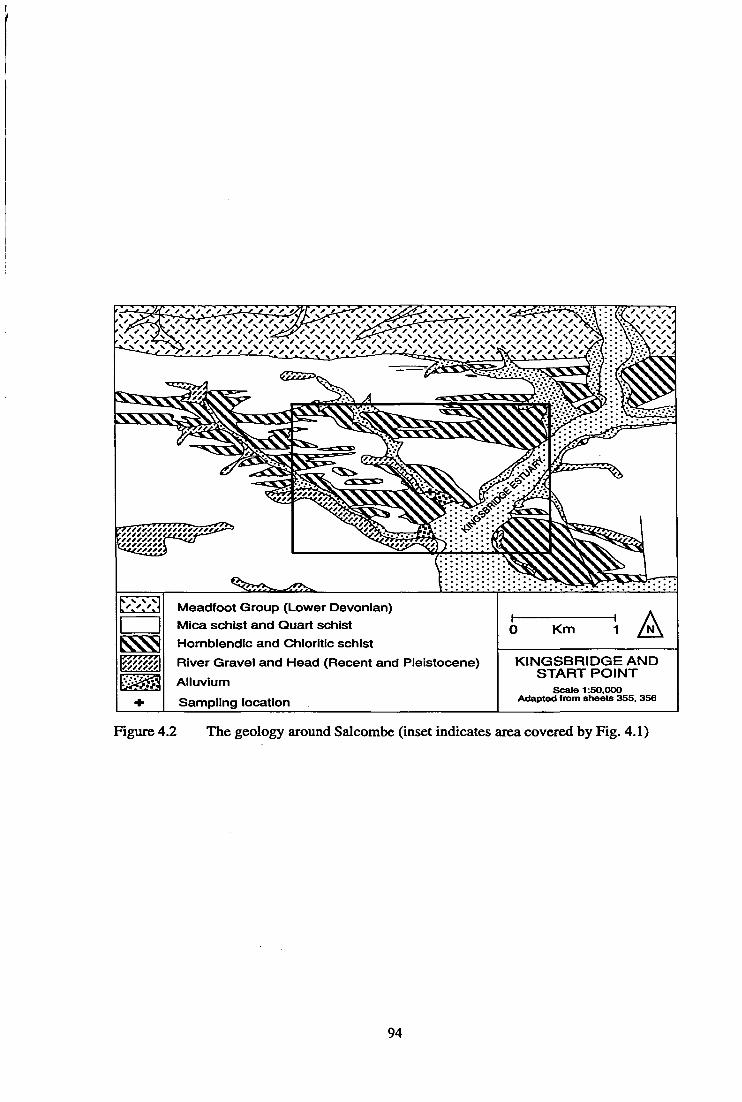
S. N. S \ ^ ^ f ,
• * ^ *
^ \/fff/f/\
Meadfoot Group (Lower Devonian)
Mica sctiist and Quart scliist
IHomblendic and Chloritic schist
River Gravel and Head (Recent and Pleistocene)
Alluvium
Sampling location
Km 1 A KINGSBRIDGE AND
START POINT Scale 1:50,000
Adaptod from sheets 355, 356
Figure 4.2 The geology around Salcombe (inset indicates area covered by Fig. 4.1)
94
The coastal plateau of this part of south Devon consists of a number of wide step-like terraces, the
highest at around 240m OD on the fiinges of Dartmoor, with the lowest at 60m in the area around
Berry Head (Millward and Robinson, 1971). Each terrace was formed when the sea was at a higher
level than at present. A number of rivers have subsequently cut down into these erosion surfaces
during periods of lower sea-level forming the characteristic rias or flooded valleys of south west
England, which were inundated by the rapidly rising sea level around 7000 years BP (Hawkins,
1971a).
Many of these rias have been choked with sediment since ca. 7000 BP (5000 BC), with much
material being deposited off shore, contributing to existing barriers and sand banks. Hails (1975)
identifies a number of submerged features in Start Bay, Devon, which include a buried cliff line at a
depth of 42m, and a number of relict barriers. He suggests that a barrier-estuarine-lagoon complex
has migrated steadily shorewards during the past 8000 years in Start Bay. The presence of these off
shore barrier features is confirmed elsewhere in south west England by Clarke (1969) and Healy
(1996a). James (1990) comments that sand banks are a common off-shore feature in coastal sites,
and may have obstructed the rising sea-level permitting the development of lagoonal features. There
are numerous accounts of a large sand bank at the entrance to the Kingsbridge Estuary (Robinson,
1977; Adey, undated). The presence of a submerged forest is hinted at in a text entitled 'Kingsbridge
and it Surroundings' (Anonymous, 1874: 169), which describes a wood which is:
'.... believed to have been overwhelmed by the waves in times remote, and the stumps of a number of large trees, discernible some years ago, strengthen the supposition; some of these may yet be seen at the ebb of spring tides'.
This may be contemporary with a band of peat at 14.70m (-12.90m OD), located during trial
boreholes associated with the South West Water installation (Stephen Reed, pers. comm.).
Investigation of these deeper sediments is currently the focus of a micropaleontological study to
examine sea-level change in this part of south west England (Roland Gehrels, perj. comm.).
4.1.2 Land use and modem vegetation groups
The land use has remained in largely the same state since Anglo-Saxon times. TTie size of the fields
has increased, but they are still used for pasture, although the number of farms growing arable crops
has declined. The area of woodland has most likely remained the same since these times, although the
woods of Saxon times have been felled, probably to supply the ship building industries of the 18th
95
and 19th centuries, subsequently replaced by mixed woodlands and plantations, e.g. CoUaton Wood
and Tor Woods.
"Die North Sands study site is dominated by wooded valley sides of Salix spp., Quercus spp.,
Aesculus hippocastanum, Fagus sylvatica, and Alnus glutinosa, with patches of Corylus avellana
scrub. Hedera helix and Ilex aquifolium form a major component of the wooded areas, with
Pteridium aquilinum prevalent on the more open slopes. Trees extend down to the damp marsh area
in the combe bottom. "Die wedand flora is dominated by Phragmities australis with a variety of
different Rumex and Carex species and members of the Poaceae, Cyperaceae and Apiaceae families.
4.2 Sampling regime
Field sampling was carried out by Stephen Reed (Exeter Archaeological Field Unit) using a 7cm
diameter piston corer to a depth of 12.50m. Samples were taken in conjunction with the construction
of a foul water discharge facility in the immediate area by South West Water Pic. (Plate 4.1).
Laboratory sampling was undertaken following detailed stratigraphical description of the sediment
(Troels-Smith, 1955), see section 4.4. Samples were taken at an interval of 30 cm due to the depth of
sediment (39 samples in total). Pollen samples were taken at the same levels as those for geochemical
analysis. Pollen analysis was undertaken by Mrs. Mary Jack in connection with a pollen analytical
study of coastal sediments at the Open University.
4.3 Palaeoenvironmental reconstruction of the North Sands area
Description will initially be made of the stratigraphy of the sediment, followed by a discussion of the
geochemical and then pollen analysis results. Multi-variate statistical techniques were used, as
presented in section 2.4, to examine the direction of change and grouping of samples with similar
geochemical and palynological characteristics through time. This is the first investigation of the
EDMA technique using the improved operating and preparation procedures, therefore carefiil
discussion will be made of the efficacy of the technique to produce meaningfiil palaeoenvironment
information.
4.4 Stratigraphical description of the North Sands sediment (Fig 4.3)
The uppermost 1.20m of sediment is missing, as is the material between 1.94 and 2.31m. It was not
96
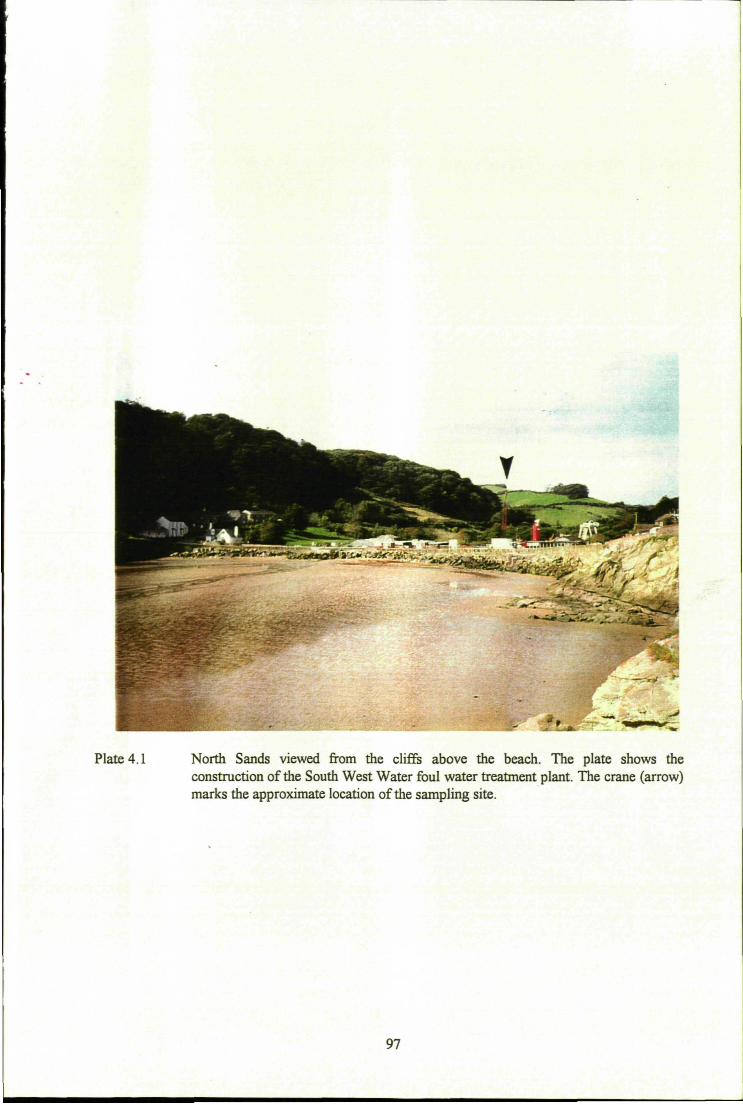
:^
Plate 4.1 North Sands viewed from the cliffs above the beach. The plate shows the construction of the South West Water foul water treatment plant. The crane (arrow) marks the approximate location of the sampling site.
97

2.61 mOD
As above. Some schistose pebbles at 240cin.
Fine, silty peat with no macrofossils. mgj rirr? elaj.1 humo.4 Sh2 Ga2
Qimpressed woody peat. mf.2 rirr/ elas.1 luimo.11X3 Shi
Black, silty peaL ldg.4 tier? tltu.1 kumo.4 Sh3 Gal
Black, humified silty peat with occasional wood fiagments.Schist derived mica
fiagments evident idg.4 Bcc2 dai.1 huniaJ-4 Sh3 Dll Ga*
Silty mud/humified peaL Incieasing mica ftagmentswidi wood remains. ——
•dg.4 rirr?ttsa.1 kptiB3-4UaCalSilDIt
Black silty peal with occasional wood fragments. iut.4ai^diii.l liwK>J-4(!a2SU Ul
Grey silty peat wit shell fragments becoming sandy to base.
mt.2 titci elaxjOAfl Gal laL(mJL)l
Not retrieved
— V — V — V — V — V — V — V — V — V — V — V — V — V — V
Not retrieved — \i — \i—^—
S 3
^ ^ ^ ^ ^ ^ ^
Highly decomposed black peat with monocot. roots, wood fibres and occasional Phragmites rhizomes iug.4BaJilai2kiaioJSIi2JUTll
Highly decomposed peat Few recognisable remains. nig J ria.2 elax.1 humo.4 Sh4Dh*
, Silty black peat with very fine sand. ' mgJ-3 ricc2 elai.0 himo.4 Si2 Gal Gil
Silty peat with occasional wood fragments. iiigJiiccJelaj.lhmKi.45h2Ga2Dlt
•Wood peat iu;.2 rioc7 elai2 htanal Sh2Dl3Shl
-Wood. mg.l noci eUuJ httmo.0 IH4
10
L-L-L-L 'L •L -L -L 'L L - L L - L - L L-L-L-L
Grey silty clay becoming coarser to base. ta%2 accl dasMAgS Gal
11
L - L ' L ' L - L • L ' L ' L - L -
12 Coarse gravelly sand in grey silt matrix
with occasional organics. • " " irifj ncci tUaS) Gi2 Gt(miiL)l Gal Sh*
' ' ' ' r L - L ' L ' L ' L • L ' L ' L ' L -L -L 'L -L 'L •L -L ' L -L L 'L 'L-L-L l
Black silty humified peat No mica fragments. Wood remains at 623-62San. mgJ-4 riocJ dat.1 hmoJ ld2 Gal Shi
Black, humified silty peat with occasional wood fiagments. Mica fragments evideoL Fine monocot fragments from 770cm. 101.4 Bcc2 elax.1 hiiiiio3-4Sk3Dll Go* Dh*
Organic silt/clay witti decreasing oganic content to silt/clay below. tdgj aocJ dasJ hamo.4 Ga2 Shi Ihl
Grey sand with shell fiagments. aigj sbcJ elaiJ>Gi3 ua<maB.)l
, Grey silty sand with shell fragments. mt2ticclelauOGt2GallaL(molLtl
Giey silty clay. Occasional shell fragments and organic inclusions. Corylus melUina shell at 1223cm with gnaw marks of Apodemus syhaticus. aigjaocl elauOAgJ Gal Sh*
12.50m (-9.89 m OD)
6705+165 BP
Figure 4.3 Stratigraphy of the North Sands sediment
98

possible to sample these levels due to the semi-liquid state of this material. The sediments
immediately overlying bedrock were not recovered in this study due to Umitations of the coring
equipment used, however, engineers borehole investigations, associated with the installation of the
marine discharge, indicate bedrock (grey/green medium grained, narrowly cleaved, highly fractured,
slightly weathered schist) occurred at a depth of 16.00m. The engineering test pit was terminated at
16.30m. Immediately above this level (15.25m to 16.00m) the sediments were composed of grey
sands with fine to coarse sub-rounded to sub-angular gravels. This in turn was overlain by a peat
band between 14.70-15.00m. The next unit was composed of olive green/grey clayey silts, with
abundant shell fragments and occasional peat inclusions. Above this unit the sediments are
essentially of the same nature of those at the base of the core extracted for this analysis. A calibrated
radiocarbon date of 5930-5290 BC was obtained by AMS analysis of a wood fragment taken from a
depth of 12.50m (conventional '*C age: 6705±165 BP, lab code AA-14699).
Tlie basal sediment of the North Sands core is composed primarily of coarse gravels in a silt matrix,
with occasional organic inclusions. Above this is a grey silty clay unit with small shell fragments. A
nutshell of Corylus avellana was foimd at 12.23m with gnaw marks of Apodemus sylvaticus (Wood
mouse). Overlying this unit the sediment becomes sandier (ca. 11.00m), with frequent shell
fragments. The peat/clay interface is a gradual transition encountered at 9.00m. The sediments above
this junction are characterised by sUty, well humifred peat, with altemating micaceous units. A wood
layer is encountered at 4.16m, which is in turn overlain by black silty peat, and wood peat. Towards
the top of the profile the peat becomes more humified, with few recognisable macrofossil remains,
llie unit at 2.31m is a highly decomposed peat, but has schistose pebbles at its base. Hie uppermost
unit recovered is a h i ^ y decorrqx)sed peat with frequent monocotyledonous remains, including
rhizomes of Phragmities australis. The top of the core was at a height of 2.61m above OD.
4.5 EDMA geochemical study
For this initial analysis of sediment using EDMA a relatively wide range of elements were analysed
i.e. those detailed in section 1.5, in addition to Zn, V and CI. It was hoped to use these additional
elements to: (i) corroborate any indication of sea-level change (CI) provided by other elements such
as Na, K and Ca; (ii) utiUse ^ as an additional indicator of anthropogenic activity (Tanskanen,
1976; Stewart and Fergusson, 1994); and finally (iii) investigate Vanadium, which is primarily
associated with magmatic rocks in the upper Uthosphere (Goldschmidt, 1954), although is present in
99

a range of different minerals (Day, 1963). This element may therefore be linked to the weathering of
these rocks, and the burning of fossil fuels (Hopkins et al., 1977).
The geochemical results are presented as element profiles (Fig. 4.4a,b) divided into six distinct
chemizones using the techniques outlined in section 2.4.1, and are described in Table 4.1.
Initial examination of the geochemical data suggest that a number of elements lend very little to the
overall interpretation of the site.:
(i) Mn, CI and Zn all appear to be present in negUgible amounts. This is either a problem of
detection capabilities of the EDMA technique, or related to the fact that the elements simply
were not present in the sediment,
(ii) Cu, V and P suffer from similar problems to those outlined above. All elements display a
number of peaks, which are associated with high standard errors, and as such are of
questionable utility. This does question the general utility of EDMA for analysis of these
types of sediments since V is generally quite abundant with a crustal average of lOOppm
(Wedepohl, 1995).
(iii) Hie heavy metal elements. As, Sn and Pb, exhibit very similar profiles and are probably
meaningless due to this.
These points will be addressed through the interpretation and discussion sections of the chapter, but
emphasis will be placed upon the more meaningful signals produced by the following elements: Na,
K, Ca, Mg, Fe, S, Al and Si.
4.5.1 Mulfi-variate analysis of geochemical results
Tlie use of these techniques was briefly introduced in 2.4.3. Their application m this study will be
used to investigate relationships both between samples and elements through the North Sands
sedimentary profile.
DCA of the data produced two plots, the element plot (Fig. 4.5) and the sample plot (Fig. 4.6). The
analysis of elements revealed some interesting results. However, only the elements which provide
meaningfiil profiles are presented. It is more informative to examine the position of the elements on
the plot with respect to environmental gradients. It seems likely that axis one indicates the
100

101
Depth (metres below ground surface) Calendar years (2 Sigma)
3
s n c
3 3 o §•
I
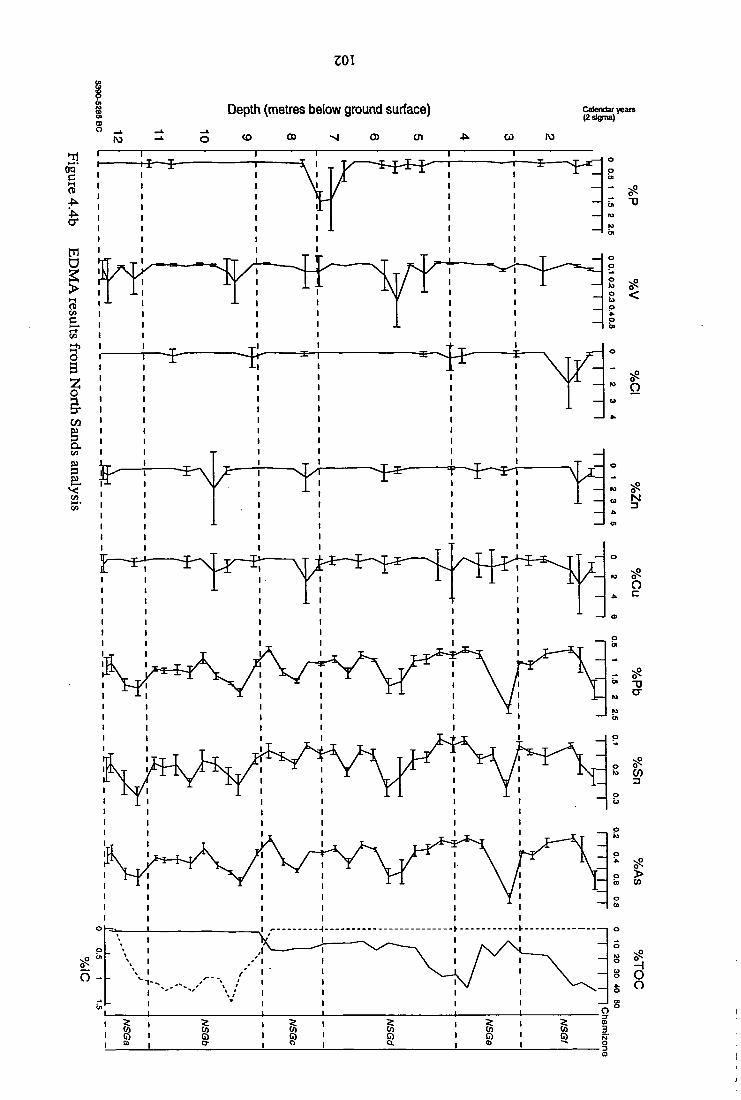
ZOI
Depth (metres below ground surface) Calendar years (2 Sigma)
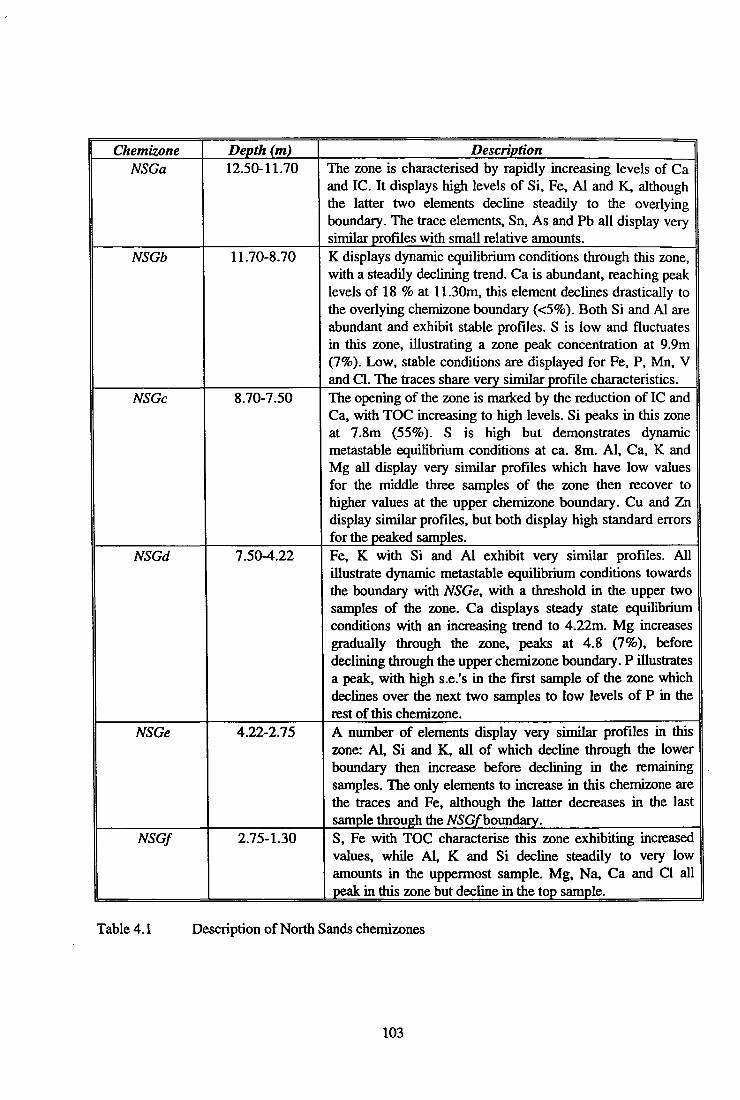
Chemizone NSGa
NSGb
NSGc
NSGd
NSGe
NSGf
Depth (m) 12.50-11.70
11.70-8.70
8.70-7.50
7.50-4.22
4.22-2.75
2.75-1.30
Description The zone is characterised by rapidly increasing levels of Ca and IC. It displays high levels of Si, Fe, Al and K, although the latter two elements decline steadily to the overlying boundary. The trace elements, Sn, As and Pb all display very similar profiles with small relative amounts. K displays dynamic equilibrium conditions through this zone, with a steadily declining trend. Ca is abundant, reaching peak levels of 18 % at 11.30m, this element declines drastically to the overlying chemizone boundary (<5%). Both Si and Al are abundant and exhibit stable profiles. S is low and fluctuates in this zone, illustrating a zone peak concentration at 9.9m (7%). Low, stable conditions are displayed for Fe, P, Mn, V and CI. TTie traces share very similar profile characteristics. Tlie opening of the zone is maiked by the reduction of IC and Ca, with TOC increasing to high levels. Si peaks in this zone at 7.8m (55%). S is high but demonstrates dynamic metastable equilibrium conditions at ca. 8m. Al, Ca, K and Mg all display very similar profiles which have low values for the middle three samples of the zone then recover to higher values at the upper chemizone boundary. Cu and S i display similar profiles, but both display high standard errors for the peaked samples. Fe, K with Si and Al exhibit very similar profiles. All illustrate dynamic metastable equiUbrium conditions towards the boundary with NSGe, with a threshold in the upper two samples of the zone. Ca displays steady state equilibrium conditions with an increasing trend to 4.22m. Mg increases gradually through the zone, peaks at 4.8 (7%), before declining through the upper cheraizone boundary. P illustrates a peak, with high s.e.'s in the first sample of the zone which declines over the next two samples to low levels of P in the rest of this chemizone. A number of elements display very similar profiles in this zone: Al, Si and K, all of which decline through the lower boundary then increase before declining in the remaining samples. TTie only elements to increase in this chemizone are the traces and Fe, although the latter decreases in the last sample through the NSGf boundary. S, Fe with TOC characterise this zone exhibiting increased values, while Al, K and Si decline steadily to very low amounts in the uppermost sample. Mg, Na, Ca and CI all peak in this zone but decline in the top sample.
Table 4.1 Description of North Sands chemizones
103
-1.5
• S
• TOC
in c\i +
CM CO
x <
• Fe
• Mg
• Na
in
• Ca
• A I
Cumulative percentage varieuice explained by two axes = 59.9%
.Si
Axis 1
+2.5
• K
Figure 4.5 DCA element plot of EDMA data from analysis of North Sands sediment
104

' " " • ^ ^
N d +
CJ / N to 1 , N
_ 5 > "^^^ 2 \ 1 \
_ , ^ ' 10.B - t l . , , , ' ( 1.6 s > ^ Tj-IOS ,
1 ^. ^ -. ' 9 + 4 - 94 , , ^ ^ - 2.75 8.1 s \ + + " ' V 4.22 ^ - , " + + 73 >• ^ /
^ 1-8 + 1 ' ••' 6.6 6 ' ' 131 ^
^ - . - ' 1 6J + + I L f , ; ^ \ * « 5, + + ^ ^ ; . r \ + + 8- 5.7/ ' ' \ + 4 . 8 2.4 + / * . ' " ' AxiSi
- . - ' , - ^ / ~ " ^ - ^ +1.5
Cumulative percentage variance explained by two axes = 59.5%
Figure 4.6 DCA sample plot of EDMA data from analysis of North Sands sediment
105
organic/mineral continuum, with clastic elements generally present on the right of the plot and those
elements usually related to organic material on the left. Axis two is a Uttle more ambiguous, but
possibly indicates an acidity gradient. The higher base status elements are generally present at the
bottom, with those associated with lower pH values occurring towards the top.
The analysis of samples produced a number of groupings, labeled one to four on Fig. 4.6. Group one
includes the basal two samples, the second group consists of a number of samples between ca. 9 and
12m. The last two groups include rather mixed samples, but may be divided on the basis of the
uppermost samples (group four) and the bulk of the organic sediment samples (group three). The
groups relate most clearly to the stratigraphic changes in the sediment, although it must be
remembered that the position of samples is determined by the geochemical data, therefore the groups
must relate to the element ordination on Fig. 4.5.
A number of questions become apparent after the treatment of these techniques, which will be
addressed in subsequent sections of the discussion, and with reference to the results from the pollen
analysis:
(i) What is the nature of the marine influence and its associated geochemical signals within the
sediment?
(ii) Can the oxidation versus reduction regime of the system be reconstructed?
(iii) What is the nature of the geochemical difference between the organic and the minerogenic
sediments?
4.5.2 InterpFetation of the geochemical signals fi-om Nortfa Sands
The basal sediments: terrestrial versus marine activity
Tlie basal sediment are characterised by alumino-silicate material due to the elevated levels of Al and
K. The declining levels of K, with low Na, and increasing values for Ca and IC suggest the
increasing influence of marine conditions (Spears, 1973). Si exhibits stable conditions in the basal
zone, suggesting a constant input to the system. The form of this Si was confirmed by SEM
examination to be quartz sand grains, with no visible input of biogenic siliceous material. However,
the input of material with a terrestrial origin is confirmed by the identification of a wood fragment at
12.50m which produced a radiocarbon date of 5930-5290 BC, although it must be stressed that the
values for TOC are very low and the incidence of wood fragments in this unit is very occasional in
106

what must be considered a largely non-organic sediment. This phase relates to group one on Fig. 4.6.
The radiocarbon date and the geochemical evidence from these basal sediments agrees well with the
assumption made earlier for rising sea-levels in this part of the south west around 7000 BP.
High levels of Ca, IC and shell fragments (Fig. 4.3) in NSGb confirm the presence of carbonate
material with a likely marine origin between ca. 9.00 and 11.00m. This evidence suggest the
continued influence of marine conditions as the sea continues to rise during the mid-Holocene period.
Si and S both exhibit dynamic equilibrium conditions in NSGb, which may relate to the steady
increase in biological productivity of the immediate environment; diatoms were located at 9.40 and
11.10m. However, the presence of these two elements may indicate the destabilisation of catchment
soils (Shotyk, 1988; Pyatt et al., 1992), and the possible inclusion of wind blown sand from coastal
banks (Cowgjll and Hutchinson, 1970).
The cessation of marine influences
The reduced influence of marine conditions is noted at the boundary between NSGb and NSGc as
indicated by the declining values for Ca, K (Spears, 1973) and IC. These samples therefore illustrate
the diminishing marine influence with an associated increase in terrestrial processes. The
geochemistry of the sediment is dominated by terrestrial processes with an increase of TOC from
8.70m, and the transition from clay to organic silt/clays with an increasing organic content and the
development of peat sediments at 8.5m. This transition most likely dates to the attainment of sea-
levels similar to today's for this part of the coast, dated in other locations to around 5500 BP
(Kidson and Heyworth, 1973; Healy, 1996b).
The initiation of organic sedimentation
The rapid rise in organic carbon and the accumulation of black silty peat at 8.50m indicates the first
stages of terrestrialisation of the North Sands sedimentary system (NSGc). The geochemical signals
of this period are dominated by Si, confirmed to be quartzitic mineral particles following SEM
examination of the sediment, most likely wind blown sand from the nearby beach. TTie peak of P at
7.5m could relate to a nutrient inwash following destabilisation of the surrounding soils, transported
as Fe/Mn co-precipitated compounds, since P is noted as having a low solubility under oxidising
conditions (Mackereth, 1966). The destabilisation hypothesis is supported by the increased presence
of Fe at 7.50m and the increased number of clastic elements at this level: K, Al with slighdy lower
107
levels of organic carbon and S, suggesting disturbance to the accumulating organic system.
The attainment of geochemical stability
After ca. 6.75m most of the major elements exhibit dynamic metastable equilibrium, indicating more
stable conditions in which the input of chemical compounds to the sediment is constant {NSGd). The
increase in organic carbon between 6.75 and 4.80m illustrates the developing status of the organic
sediment body. Static profiles for Al, K, Fe and Si corroborate this stability. However, it is
suggested that the increasing profiles for Al and Si is linked to the gradual input of alumino-silicate
material derived from the local catchment rocks.
The uppermost sediments
The presence of a marine inundation phase is possibly suggested by an increase for Ca, Mg and Na
around 4.5m. However, no mineral material with a marine origin was deposited on the accumulating
mire surface, with Si still linked to the presence of alumino-silicate minerals of a terrestrial origin.
TTie identification of a wood layer at 4.16m and the diminished base status of the system in NSGe
suggests a change in the local conditions. The evidence indicates a modification to the local
hydrological and geochemical status of the system, initially creating anaerobic conditions in which
sulphides could form. These conditions were short-lived and the system appears to have been
systematically acidified as illustrated by the declining amounts of Ca and Mg.
The upper 2.5ra of sediment are the most problematic to interpret due to the behaviour of a number
of geochemical indicators. TTie increase for Fe from 1.6m suggests the presence of oxidised
conditions, although the accumulation of S at this level may relate to the process of sulphate
reduction since Rudd et al. (1986) state this to be the major source of S to the sediment Peaks for
Ca and Mg may relate to the erosion of schistose catchment materials following disturbance, and the
low presence of other bases would suggest the material introduced to the sediment body was
previously subjected to leaching processes, following earlier de-stabilisation phases. However, the
continued increase for TOC suggest minimal disturbance to the autogenic processes controlling peat
accumulation.
108

4.6 Pollen analysis of the North Sands sediments
The results are presented as a pollen diagram (Fig. 4.7) and described in Table 4.2. The DCA plots
firom analysis of the pollen data are presented as a species plot (Fig. 4.8) and a sample plot (Fig.
4.9).
4.6.1 Multi-vaiiate analysis of the North Sands pollen data
The position of taxa on Fig. 4.8 suggest axis one differentiates between relatively undisturbed
wood/scrub land and species indicative of more open habitats. It is not clear fi-om the ordination
plots the nature of factors differentiated with axis two on Fig. 4.8, or the axes of the sample plot
(Fig. 4.9), since no pattern is clearly discernible.
TTie basal samples fall into a group (I), characterised by the species of group (X, indicative of
deciduous woodland composed of Ulmus and Hedera with an epiphytic flora dominated by
Polypodium. Pinus belongs to this group, but would have been present either only very locally, or at
some distance from the North Sands site. Group n relates most likely to p on Fig. 4.8, with declining
values of dryland arboreal taxa and the increasing dominance of Alnus. The next group (HI) includes
samples between 6.30 and 3.50m and is associated with group x. a disturbed ecosystem in which
damp species become more abundant (NSP4) including Cyperaceae and species represented by
Pteropsida, with possible indicators of local vegetation disturbance i.e. Plantago lanceolata, Rumex
and Brassicaceae species. The last sample group (V) is associated with the fen communities, Typha
latifolia and Sparganium emersum-type (group e), although lacks the Alnus component of previous
zones.
4.6.2 Interpretation of the pollen evidence
TTie lowermost sample suggests a habitat dominated locally by Alnus, although this immediately
declines to low values. Indeed it seems likely that this species was present on the sampling site given
the high pollen values (ca. 70%). The dryland tree taxa present on the upper slopes at this time were
composed of Quercus, Ulmus and Corylus avellana, although Myrica gale could equally have
formed part of the local wetland flora since these two species are inherently difficult to differentiate
palynologically (Godwin, 1975; Edwards, 1981). The local presence of salt marsh is suggested by
the identification of poUen grains of the Chenopodiaceae, a large family with distinct affinities for
bare ground, often by the sea (Fitter et al., 1985; Rieley and Page, 1990). Additional palynological
109
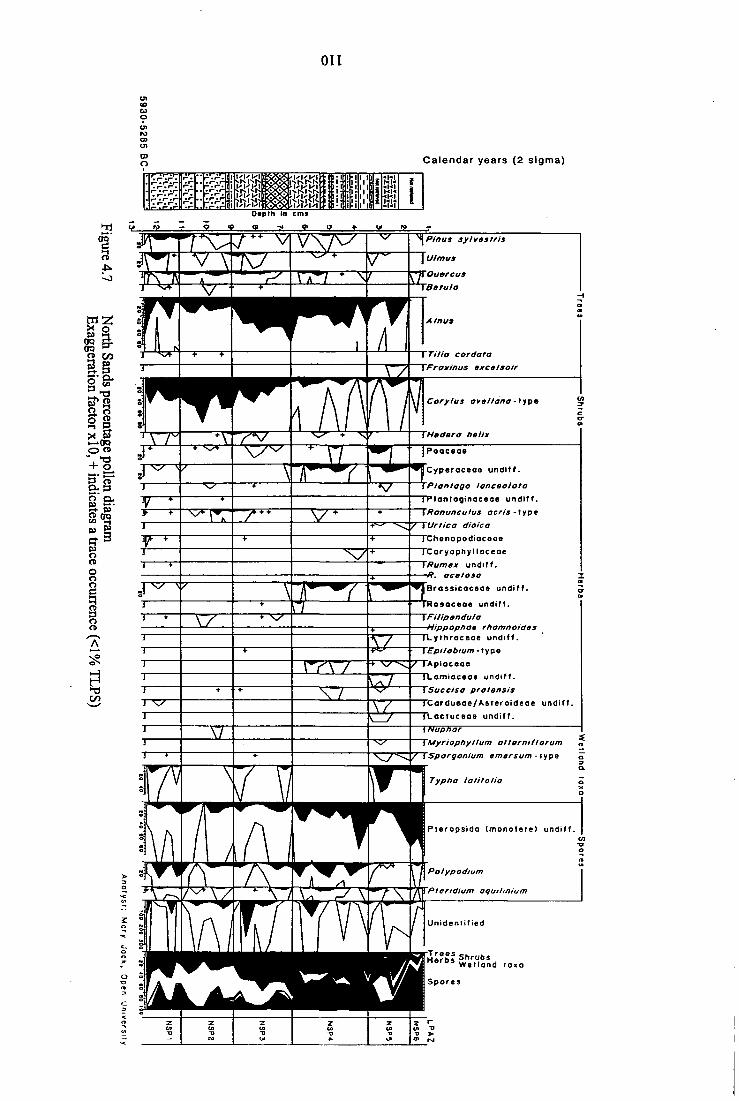
oil
Calendar years (2 sIgma)
a
X o 03 3 .
OQ B
2 00
I—'OQ
o <* 2-
S*. ^ o' ca. C9
o o o o o c
o o
H
i l l 0*pth In cms
^Pinus sylvastris
Ju/mus
TBetu/o
AInui
TTi/ia eordata
TFra»inus »xe»lsolr
Corylus avelfana-i^^B
THadera he lit
Poaceoe
Cyperaceae und i f f .
\PlQnfago lanceolato
TPlan log inaceae undi f f .
TRanunculus acris -lype
•?"=' " ^ 1 / t Urtica dioica
rChenopodiaceoe
r c a r y o p h y l l a c e a e
Tffumex undl t f .
•ft. acetoso Brossicoceoe undi f f .
^ TRosQcooe undif f .
TPitipendu/a
•Hippophoo rhamnoides
TLythroceoe u n d i f l .
TEpilobium - t y p e
+ V ^ ^ L ^ lAp iocsos
rLamtocece undif f .
TSuccisa protensis
'Carduede /Asrero ideae undif f .
TLoctuceae undi f f . I Nupnar
TMyriophyllum aitgrniflorum
TSporgonium amersum-X^^K
Typha latifotio
Pteropsido (mono le te ) undif f .
Polypodium
Pteridium aquilinium
Unident i f ied
H a f h l Shrubs " * ' " * Wel lond taxo
Spores
2 tn TJ
-'
Z CA T3 N
2 i n
tx
Z b ) • D
»-
2 W
u>
2 tft T7
m
r
> rsi

LPAZ NSPl
NSP2
NSP3
NSP4
NSP5
NSP6
Depth (cm) 12.5-11.1
11.1-9.0
9.0-6.6
6.6-3.5
3.5-1.8
1.8-1.3
Description Alnus, Corylus, Quercus, Typha latifoUa This zone is characterised by high, but fluctuating levels of ari)oreal pollen dominated by Alnus, with smaller components of Pinus, Ulmus £Uid Quercus. Corylus features more consistently, at around 35%. Herbaceous pollen, is sparse and is composed of Poaceae, with smaller amounts of Cyperaceae, Chenopodiaceae and members of the Cardueae/Asteroidae tribe. Spores are well represented and are dominated by Polypodium. Typha latifoUa dominates the wetland taxa. Corylus, Alnus, Quercus, Urtica Corylus attains peak values in this zone approaching 80% at 10m. Alnus appears more consistently at around 20%, with a more diverse herbaceous flora composed of Urtica, Plantago lanceolata, Filipendula and Succisa pratensis. Spores feature prominently in the zone. Alnus, Corylus, Quercus, Typha latifoUa Increasing values of Alnus and declining Corylus characterise this pollen zone. Both Ulmus and Quercus disappear in the upper levels of the zone. Hedera features at the onset of this zone. Urtica dominates the herbaceous flora, but disappears to trace levels at 8m. Spores are low, but consistently represented at ca. 10%. Typha latifolia marks both the onset and close of NSP3. Alnus, Corylus, Cyperaceae, Brassicaceae, Apiaceae, Pteropsida Alnus features consistently with an average value of 30%, but displays a significant deviation at 4m (<10%). Corylus is low, and stable at ca. 10%, but declines steadily OVCT the zone. Herbaceous pollen is dominated by Cyperaceae, Brassicaceae and Apiaceae, with smaller contributions from Poaceae, Ranunculus acris and Succisa pratensis. Fluctuating values for Polypodium and Pteridium contribute to a spore count dominated by undifferentiated monolete spores. Alnus, Typha latifolia, Poaceae, Cyperaceae, Brassicaceae, Pteropsida TTie zone is dominated by high, fluctuating levels of Pteropsida and Alnus. Herbaceous pollen features significantly in this zone and is characterised by Cyperaceae, Poaceae, Brassicaceae, with smaller components of Urtica, Rumex, Epilobium-type, Apiaceae, Lamiaceae and members of the Asteraceae family. Typha latifolia reaches peak values in this zone of 40% at 3m. Pteropsida, Typha latifoUa, Cyperaceae, Brassicaeae, Corylus TTie spectra of this zone are dominated exclusively by the peak values of undifferentiated monolete spores. Arboreal pollen is sparse with only a trace presence of Quercus and Pinus. Herbaceous pollen is dominated by Cyperaceae and Brassicaeae, with a small contribution from Urtica and Apiaceae in the base of NSP6.
Table 4.2 Description of North Sands local pollen assemblage zones (LPAZ)
111

o ei +
Cardueae/Asteroideae undiff. •
^pa/gan/umeme/sunHype ^ |l p Typha laSfvlia + ( '*fe
\ / * Myriophyllurn altamiflonjm + — \
Lythraceae undiff. • , ' ' ~" ^ ^ ^
Vitica dioica • . 1 I . I \
Lactuceae undifl. ^ 1 •Poao^
• Trees ', 5 ^ • Herbs v , * Shrubs \ Biassicaceae uixfiff. / • Spores \ • / + Wetland taxa v x
"V. - ^
" tM ^ Ulmus • B . ^ o Rosaceae • ' Pinus "
, Hedera >
I a 1 \ /
^ ^ PolyptxBim ' " ^ , Betula •
' Pteropsii i;;KMete) undiff. , - ^ ' • ' ^ "™="*« a°<s-«yP^ " ^ • " ^PteridiumaguiUun, / , CorylusaveBsna v^ •Ksoiata »Succtsapratansis / m Quenxis \
• CaiyophyDaceae / \ - X / ' Rlipendula • 1
« RumsxundSff. / R
Cypeiaqeae / Axis 1 ^ • 1 1 1 ,t 1 1 1 1 ^ 1
- ^ / +4.5 litobtunHype | ^
ae ^ ^ ^
N. ^ ^ "^
# Apiaceae , ^ , • Chenopodiaceae
Plantago undiff. •
Cumulative percentage variance explained by two axes = 39.5%
Figure 4.8 DCA species plot of pollen data from analysis of North Sands sediment (Species shown all have occurences >1% TLPS in >5 samples).
112

O P«M cvi +
^ -Jf
' 3.00 -V
m
Si
/ ^ ~ " • " ^
, 12.00 1 ^
_ 1 N. N,
1 \
1 ^ ^ 1 + 11.10
— — — — — ^ ^ ' ' " - ^ \ 11.70+
/ V ^ - > 900 + ' . + 3.90 ^ ' - ^ V
1 1.30 + ^ 1 / \ ^
, ' ^ 9.90+ •*• +9 .40
' ~ ~ ~ ~ ~ ^ ' , , « - 1 ' ' + ; ^ x + 12.30 ,1.50 - ~. ' I l l ' ^ . + 10.50
+ 2.7S - - . ^ / ^ ^ + / _ _ _ - _ - _ - _ - _ + _ ' IV " ' ' ' ' ^
1 11 6.90 ^5Q+ 1
1 ««'+ / ' \ II •'«'+ / ' I ' ^ y^
4.8^ + + / 5.80 V y + 12.50
1 1 \ .' V «•«? - ' 1 r » ^ 1 y ^ .^ _ X ~
Cumulative percentage variance explained by two axes = 39.5%
\ \ \ \
\ \
10.20+' / /
/ /
y
Axis 1 1
+3.5
Figure 4.9 DCA sample plot of pollen data from analysis of North Sands sediment
113
evidence for salt marsh communities is lacking, possibly due to the low pollen production and the
largely entomophilous dispersal strategies of these plants. Eutrophic freshwater or brackish
conditions are suggested by the appearance of Typha latifolia at 12.4m, a species favouring shallow
open water, with a pH of greater than 5 (Grime et al., 1988), which may have been growing on the
margins of the Alnus woodland. However, this species declines rather rapidly through the remaining
samples in NSPl and is not present in the next pollen zone. This is interpreted as a reduction in
freshwater conditions, with an associated increasing marine influence since neither Typha latifolia
nor Alnus will tolerate saline conditions. By 12.00m the local Alnus dominated woodland has
retracted considerably, most likely up the combe away from the sampling site and the advancing sea.
This effectively allows a greater proportion of the extra-local pollen component (Jacobson and
Bradshaw, 1981) on to the surface of the accumulating sediment. The surrounding envirormient at
this time is dominated by Corylus avellana on the drier slopes, with a consistent fern component
probably present in an understory-type habitat.
The next stage of development (10.00m) is marked by a sharp reduction of Corylus pollen which
seems likely to be the result of either a diminished flowering efficiency or deforestation of this
species. It is possible that management of Corylus may have been occurring since the species may be
considered a valuable resource (Zvelebil, 1994).
The opening of NSP3 reveals an increase in Alnus pollen values and a reappearance of Typha
latifolia, again suggesting less saline conditions in the immediate locality. ITie sustained presence of
Alnus which increases through NSP3 suggests a re-advancement and closing of this damp woodland
habitat on to the sampling site. Again it seems possible that the dense woodland could have
effectively filtered extra-local and regional pollen components (Tauber, 1965). This would explain
the diminished amount of Corylus avellana pollen reaching the sampling site. However, increased
indications for disturbance in the environment are found in the next pollen zone (NSP4). Low levels
of Corylus in association with an increased herbaceous flora, composed of sedges, grasses, and
members of the Apiaceae family, which include species such as Crithmum maritimwn, Oenanthe
lachenalii, Apium graveolens and Peucedanum officinale, suggests a more open enviroimient. TTie
species mentioned are all frequently encountered in wet places and marshes, particularly by the sea
(Stace, 1991). This zone also contains members of the Brassicaceae family, a large group of plants
which are present in a number of different habitat types, including coastal areas e.g. Crambe
114

maritima, Matthiola incana, M. sinuata and Cochlearia anglica.
The opening of NSP5 is marked by the reappearance of Typha latifolia suggesting a reversion to the
damper eutrophic conditions experienced in the basal zone. It is accompanied by an expansion of
Cyperaceae pollen and a significant increase of fem spores. This evidence indicates a reversion to
swamp conditions on the sampling site, in a local habitat characterised by a more open species rich
herbaceous flora with a declining Alnus woodland cover similar to the present day situation at North
Sands.
4.7 Discussion of the palaeoenvironmental development of the North Sands area
The basal sediments from North Sands have accumulated under eutrophic conditions characterised
by local Alnus fen woodland with Typha latifolia forming a sub-dominant component of the flora
(Fig. 4.10, Table 4.3). This hypothesis is corroborated with reference to the geochemical evidence,
which displays elevated levels of K. However, this environment seems short-Uved and is replaced by
conditions indicating increased marine activity, in which K and Al decline and are replaced by high
levels of Ca, IC with much shell material. Alnus pollen declines sharply, most probably in response
to the rising sea-level. This suggests a movement of the fen woodland northwards away from the
sampling location. Further evidence for elevated sea-levels is provided by the decline of Typha
latifolia at 11.00m. TTie persistence of high amounts of Si through NSGb is most likely due to wind
blown material from the beach. Continued marine influence is interpreted from the sediments
between 9.00 and 11.00m due to the sustained levels of Ca, IC and the identification of shell
fragments throughout this stratigraphic unit. The pollen spectra of NSP2 is dominated largely by
dryland arboreal taxa suggesting the relatively open nature of the accumulating sediment system at
this time.
It has been suggested in other parts of the coast that a number of sedimentary systems have
developed immediately behind morpho-sedimentary structures (Healy, 1995, 1996a,b; French, 1996)
which developed during the mid-Holocene. This was a time of significant sea-level change (Hawkins,
1971a; Kidson and Heyworth, 1973; Heyworth and Kidson, 1982) and much movement of sediment
rich features in this part of the south Devon coast (Clarke, 1969; Hails, 1975). It is likely that the
transition from marine to terrestrial sedimentation, which occurs around 9.00m, is due to such a
feature moving onshore with the rising sea-level which effectively cut off the lower reaches
115

Time Modem
3500 BC
5000 BC
Geochemistry Fe with Ca and Mg, much TOC
Increased Ca, Mg, Na
Stable Al, K, Fe, Si
Increase Fe, K, Al, lower TOC and S
Declining Ca, K, increasing TOC
Increasing Ca, IC, much Si
Terrestrial conditions (A1.K)
Vegetation Sparse AP. Cyperaceae and Brassicaceae dominate spectra
Alnus, much NAP
Increasing Alnus, declining Corylus, Typha latifolia
Corylus avellana. Alnus increasing NAP
Alnus, mixed dryland arboreal species. Typha latifolia
Environment Damp eutrophic conditions
Possible deforestation linked erosion episode
Deforestation. Lower Alnus and Corylus
Closed damp woodland conditions
Cessation of marine conditions. Organic sedimentation initiates. Alnus moves back onto site
Increasing marine influence. movement of Alnus up combe
Eutrophic fen woodland
Table 4.3 Summary of the palaeoenvironmental development of North Sands, south Devon
116
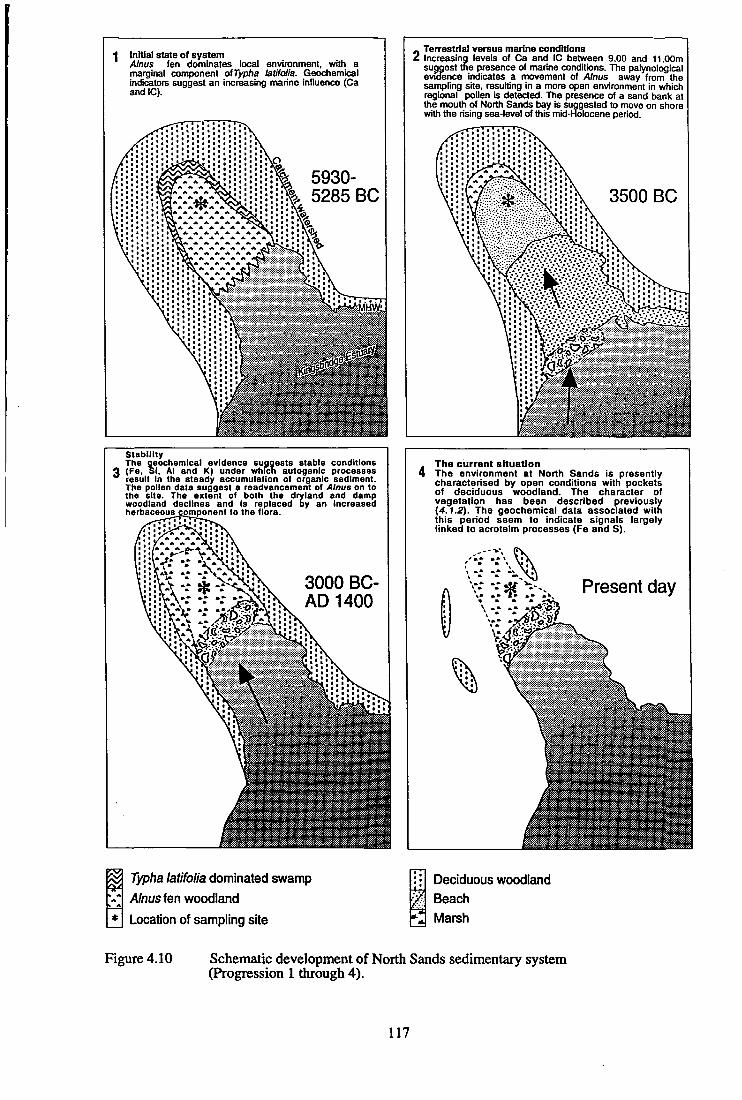
Initial state of system AInus fen dominates local environment, witti a marginal component ofTypha latifolia. Geochemical indicators suggest an increasing marine influence (Ca and IC).
5930-5285 BC
stability The geochemtcal evidence suggests stable conditions (Fe, Si. Al and K) under which autogenic processes result In the steady accumulation of organic sediment. The pollen data suggest a readvancement of AInus on to the site. The extent of both the dryland and damp woodland declines and is replaced by an Increased herbaceouscomponent to the flora.
3000 BC-AD 1400
I Terrestrial versus marine conditions > Increasing levels of Ca and IC between 9.00 and 11.00m supgest tne presence of marine conditions. The palynological evidence indicates a movement of AInus away from the sampling site, resulting in a more open environment in which regional pollen is detected. The presence of a sand bank at the mouth of North Sands bay is suggested to move on shore with the rising sea-level of this mid-Holocene period.
The current situation The environment at North Sands is presently characterised by open conditions with pockets of deciduous woodland. The character of vegetation has been described previously {4.1.2). The geochemical data associated with this period seem to indicate signals largely linked to acrotelm processes (Fe and S).
Present day
I V Typha latifolia dominated swamp
AInus ien woodland
Location of sampling site
Deciduous woodland Beach Marsh
Figure 4.10 Schematic development of North Sands sedimentary system (Progression 1 through 4).
117
of the combe to marine influences. The event results in a reduction in the indicators of marine
conditions, Ca, IC and the shell fragments, and an increase in TOC. A date of ca. 3500 BC (5500
BP) may be suggested for this incident due to similar events along the coast of south west England
(Kidson and Heyworth, 1973; Healy, 1995). The steady decline of a number of elements for this
phase of activity is interpreted as a gradual advancement of the sand bar and subsequent closing of
the lower reach of the combe to marine influences (Fig. 4.10).
The next stage of development is characterised by a development of Alnus woodland in the
immediate vicinity of the sampling site. This effectively filters out most of the extra-local pollen as
the woodland closes. The stability of the system during this phase is reflected by the static nature of
a number of elements, and the continued accumulation of TOC in NSGd. The palynological data
suggest more open conditions with a decrease in both the extent of Corylus avellana and Alnus with
a subsequent expansion of herbaceous taxa indicative of open, damp, disturbed habitats.
The wood layer at 4.16m resembled that of Alnus although poor preservation made it difficult to
make a definite identification, again corroborating the fact that fen woodland existed in the
immediate locality of the sampling site. The geochemical conditions associated with this wood layer
indicate locally anaerobic conditions in which sulphides could form, however this stage appears to be
rather short lived.
The uppermost sediments suggest a return to damp eutrophic conditions on the sampling site given
the high values for Typha latifolia (ca. 40% at 3.1m), with an increased presence of sedges (Fig.
4.7). Hie geochemical signals associated with this phase are rather difficult to interpret in terms of
palaeoenvironmental processes and most likely relate to modem acrotelm processes.
4.8 Discussion
The results from EDMA and pollen analysis of the sediments from North Sands were generally
complementary. Both techniques indicated the presence of eutrophic conditions in the basal samples
as illustrated by group one on Fig. 4.6. TTie geochemical data illustrates the nature of the marine
sediments between 9.00 and ll.(X)m (Group two. Fig. 4.6). Tlie return to eutrophic freshwater
conditions at 9.00m is shown by the decrease of Ca and IC, increasing TOC with S and the
identification of Typha latifolia pollen. Hie stability phase illustrated by the geochemistry relates to
118

the development ofAlnus woodland on the site (Group three. Fig. 4.6).
With respect to the questions posed at the outset regarding the utility of the geochemical signals to
provide information on a number of different environmental activities and processes, it seemed likely
that the geochemistry of Si and Al were linked strongly to the presence of alumino-silicate minerals,
particularly after 9.00m. Fe seemed to be of some use in determining the redox regime of the system
particularly in the upper levels of the profile, with S seemingly relating to the production of sulphides
in the anaerobic zone experienced around 4.2m, associated with the closed Alnus woodland at this
time. Ca proved useful in the examination of the marine activity, especially in the lower 3.5m of the
profile, its activity in the organic sediments apparentiy linked to the presence of clastic material from
the surrounding catchment slopes, as does K and to some extent Mg.
However, a number of elements produced no meaningful data in this analysis: the heavy metal
elements, together with P, V, CI, and Zn. The problem with these elements remains to be investigated
in the other sites, but Zn, CI and V will be excluded fi-om fiirther analysis due to the limited potential
use of these elements in the other upland sites. TTie problem with this suite of elements may be of an
analytical nature, associated with the detection capabilities of the EDMA technique.
4.9 Conclusions
EDMA of the North Sands sediment produced significant information about the nature of the
palaeoenvironments in this area of the Kingsbridge Estuary. The focus of study will now move to the
investigation of a number of sites on the Dartmoor upland, and will address a range of different
research questions, using material from different types of sedimentary environment to fully
investigate the usefulness of the EDMA technique.
119

Chapter 5
Palaeoenvironmental investigations at Tor Royal, centi-al Dartmoor
5.0 Introduction
This chapter presents the results from analyses conducted at the highest of the Dartmoor sites (Fig
5.1). It will follow on from the work undertaken at North Sands further testing the utility of EDMA
in a very different environmental and sedimentary context.
Tor Royal provides a significant opportunity to explore anthropogenic activity from late Mesolithic
times on Dartmoor. Analysis is of particular significance since post-fron Age records of
environmental change are under represented in palaeoenvironmental data collected from Dartmoor
since the early work of Simmons (1962, 1964a,b). The bulk of the existing pollen diagrams from the
upland are also hampered by a number of problems including destruction/truncation by draining,
peat cutting and mineral extraction processes (Caseldine and Maguire, 1986).
The ombrotrophic nature of the upper sediments provides an excellent opportunity to examine the
regional patterns of change occurring in the central Dartmoor area, both in terms of the vegetation
change and the flux of heavy metals and mineral material transported aerially and deposited direcdy
on to the site.
5.1 Site location, morphology and age
Tor Royjd (SX 602728) Ues approximately 1.3km south east of Princetown at a height of ca. 390ra
(Fig. 5.1). Tlie vegetation is typical of an ombrotrophic mire, with ericaceous shrubs, Tricophorum
cespitosus, Eriophorum spp. and Sphagnum mosses. An unusual feature of the vegetation is the
abundant Rhyncospora alba. The surface and subsurface morphology of the bog was constructed by
probing in two separate transects across the surface, each levelled to OD (Fig. 5.2). This revealed
the bog to consist of a single sediment body lying in a smooth valley trending north-south (Plate 5.1).
The surface of the bog is domed, with the apex of the dome offset to the north east. It is therefore an
eccentric raised mire (Heathwaite et al., 1993). The southern area of the bog appears to lobe and end
quite abruptly, with a more gradual thinning of peat experienced to the northern edge. A number of
drainage chaimels have been cut across the surface, all of which seem to drain westwards in to a
larger chaimel. The origin of the ditches and channel is unknown at present, but it is suspected they
120

Whiteworks disused tin mine
Barrator plantation (continues south & west)
jlSB--
_.- Crane HiH Blacklane «i Brook
Plantation J^-'-- Bog A kilometres Heights in metres
Figure 5.1 Location of Tor Royal mire
121
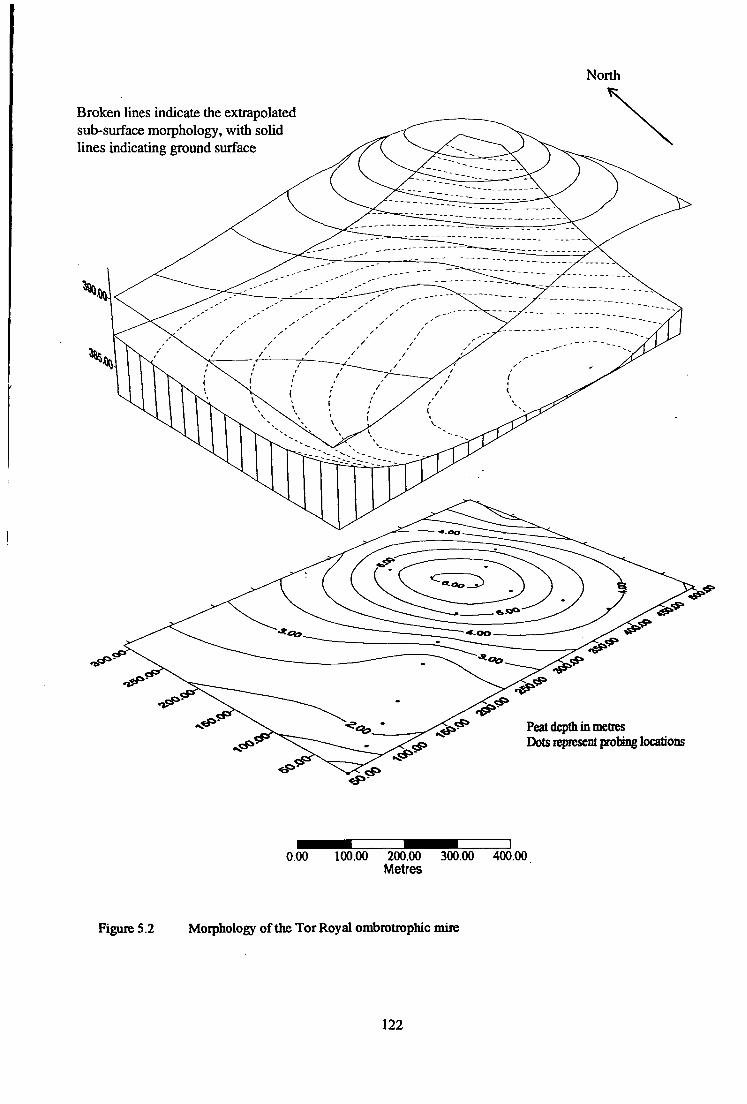
North
Broken lines indicate the extrapolated sub-surface morphology, with solid lines indicating ground surface
Peat dqjfii in metres Dots iqsTesent polang locations
0.00 100.00 200.00 300.00 400.00 Metres
Figure 5.2 Moipbology of the Tor Royal ombrotiophic mire
122
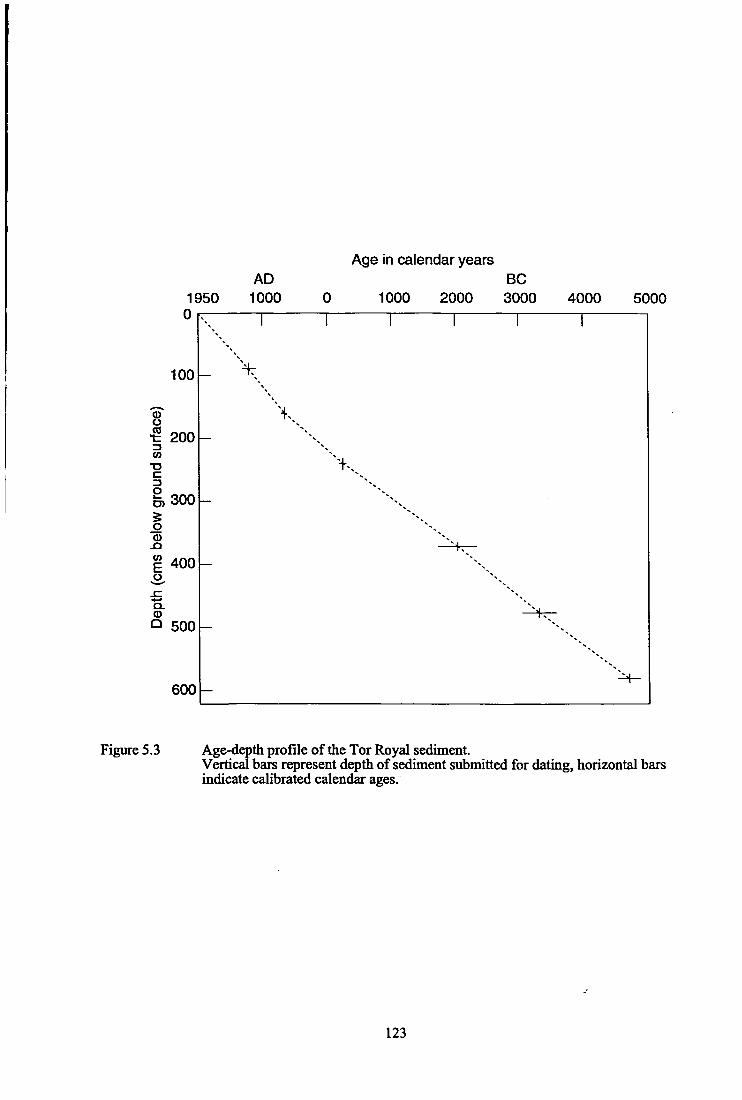
Age in calendar years AD 1000
BC 1000 2000 3000 4000 5000
Q.
<=> 5 0 0
Figure 5.3 Age-depth profile of the Tor Royal sediment. Vertical bars represent depth of sediment submitted for dating, horizontal bars indicate calibrated calendar ages.~
123

were used to aid peat cutting operations as a number of cutters hollows can be found around the
margins of the site (Plate 5.2). However, there are no signs of physical disturbance beyond the
extreme margins of the western portion of the mire and the pollen and stratigraphical records do not
contain noticeable hiatuses.
Radiocarbon dating suggests the system to have initiated around 5000 BC and to have accumulated
at an average rate of ca. 0.09cmyr'' (Table 5.1). This site therefore has the potential to provide a
high temporal resolution palaeoenvironmental history for central Dartmoor.
Depth (cm)
80-100
150-170
230-250
366-380
471-485
574-859
Lab-code
SRR-5715
SRR-5716
SRR-5717
Beta-93822
Beta-93823
Beta-93824
'"Cage
840±45
1460±45
2240±45
3700±90
4650±90
5890±70
Calibrated age (BP)
900-670
1410-1290
2345-2130
4340-3730
5590-5050
6880-6530
Calendar age (refAD 1950)
AD 1050-1285
AD 540-660
395-180 BC
2390-1780 BC
3640-3100 BC
4930-4580 BC
Accumulation rate
0.124
0.09
0.074
0.082
0.075
Table 5.1 Radiocarbon dating results for Tor Royal
5.2 Sampling regime
Samples were collected from the deepest point of the mire (6.23m). Six samples were taken for
radiocarbon dating from the profile (Table 5.1, Fig. 5.3). Each monolith was described in the field
using Troels-Smith (1955) classification, and subsequently re-examined in the laboratory to confirm
initial identifications (Rg. 5.4). A total of 48 samples were prepared for EDMA, pollen. Total
Organic Carbon (TOC) analyses and ashing at 900°C to give an indication of the mineral content of
the sediment (Aaby, 1986). Samples were taken at 5cm intervals for the top 35cm, with the aim of
detecting the exotic pollen of the coniferous plantations located around the fringes to the site (Plate
5.2), at Beardown Hill (ca. 3.5km to the north) and from the extensive tracts of woodland around
Burrator Reservoir (ca. 5km to the south west). Documentjuy evidence suggests these plantations are
no older than 200 years (Simmons, 1962; Staines, 1974). The remaining samples were taken at
15cm intervals throughout the profile.
124
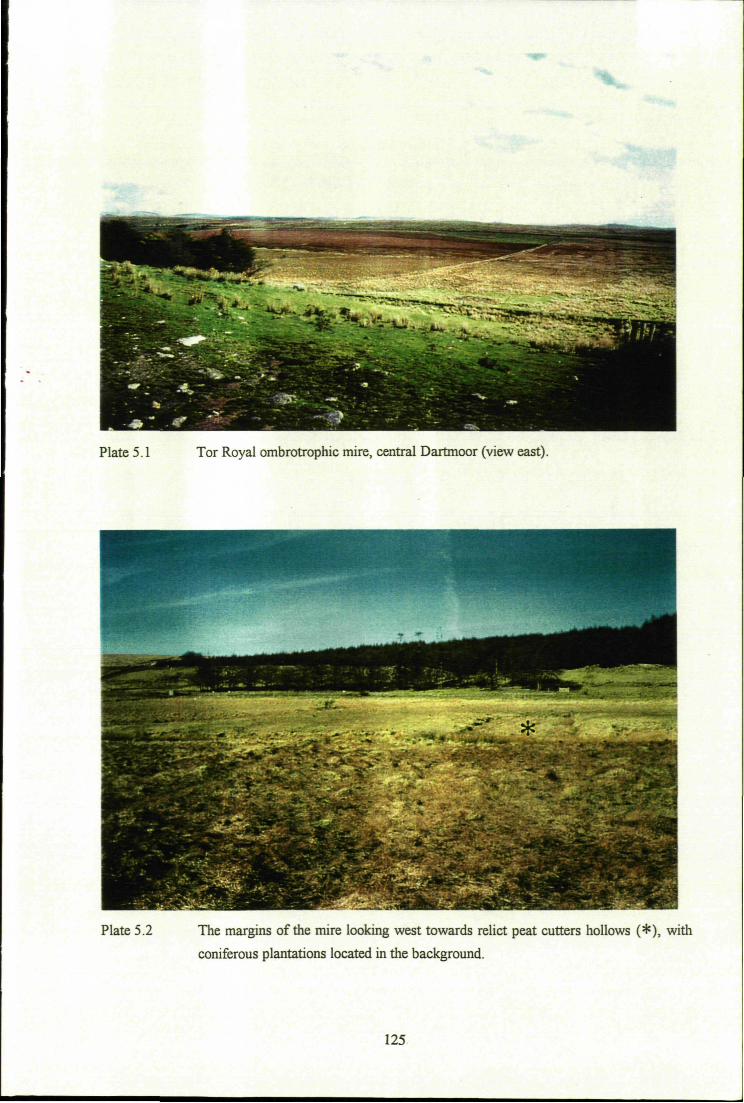
Plate 5,1 Tor Royal ombrotrophic mire, central Dartmoor (view east).
^^|H|H^^^^^^Hm^^^^^^^^^^|H^PI^iPVH^^^^^^
^^^^^^^^^^^^^^^^^^^^^^^^^^^^^^^^^^^^^^K^
Ej^^^HBMBIB^Si^^^^^^^^^^^
Plate 5.2 The margins of the mire looking west towards relict peat cutters hollows (*), with
coniferous plantations located in the background.
12S.
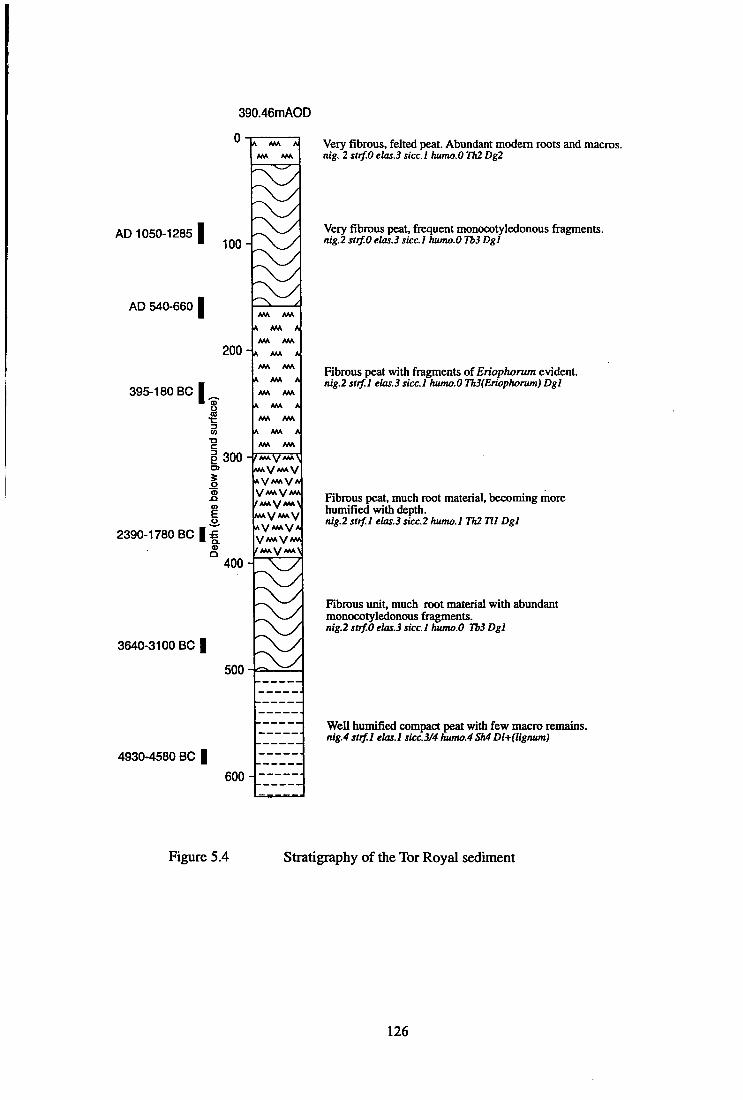
390.46mAOD
AD 1050-1285
AD 540-660
100-
395-180 BC I
a t
1300 i 2 m
E o 2390-1780 BC I S
• a. a. O
400
KMVAMV
^ 3 7
3640-3100 BC |
4930-4580 BC |
600-
Very fibrous, felted peat. Abundant modem roots and macros. nig. 2 strf.O elas.3 sicc.l humo.O Th2 Dg2
Very fibrous peat, firequent monocotyledonous fragments. nig.2 strf.O elas.3 sicc.l humo.O Tb3 Dgl
Rbrous peat with fragments of Eriophorum evident. nig.2 strf.l elas.3 sicc.l humo.O Th3(Eriophonim) Dgl
Inbrous peat, much root material, becoming more humified witii depth. nig.2 strf.l elas.3 sicc.2 humo.l Th2 Til Dgl
Fibrous unit, much root material with abundant monocotyledonous fragments. nig.2 strf.O elas.3 sicc.l humo.O Tb3 Dgl
Well humified compact peat with few macro remains. nig.4 strf.l elas.l sicc.3/4 humo.4 Sh4 Dl+(lignum)
Figure 5.4 Stratigraphy of the Tor Royal sediment
126

5.3 Palaeoenvironmental reconstruction of the Tor Royal sediment
Discussion will initially be made of the stratigraphy of the sediment followed by a reflection of the
geochemical and pollen results. Multi-variate techniques were used, as presented in 2.4, and are
shown to be of some use in the interpretation of geochemical and palynological signals from the
previous site (see 4.5.1 and 4.6.1).
5.3.1 Stratigraphical description
The basal sediments are characterised by a well humified compact peat containing few wood
fragments (Fig. 5.4). This sediment developed somewhere around 5000 BC. The stratigraphy varies
very little through the profile, and is composed generally of felted/fibrous material differing only in
respect to the degree of humification. TTie unit between 290 and 313cm exhibits an increase in fine
root material with the over lying imits displaying much better preserved macrofossil remains.
Fragments of Eriophorum are evident in the unit above 170cm, with an increasing frequency of
monocotyledonous material. The upper unit (0-lOcm) is characterised by modem roots and
Cyperaceae fragments. TTie division between minerotrophic and ombrotrophic status is not apparent
from the stratigraphy of the profile.
5.3.2 EDMA investigation
Geochemical investigation of the sediment offered the opportunity to examine the potential of the
sediment body to reveal patterns of atmospheric deposition of materials once the system had gained
ombrotrophic status, as well as the autogenic signals associated with the accumulation and
development of this type of system. EDMA results are presented as element profiles (Fig. 5.5a,b)
divided into six distinct chemizones (Table 5.2).
Initial indications suggest the profiles of P, K, Mn, Sn, As and Pb (except for the upper samples) to
be of limited use for the investigation of palaeoenvironmental processes from Tor Royal, since these
elements either display inter-correlated profile features (heavy metals and Mn) or profiles with
isolated peaks which are associated with wide standard error bars (P and K). Discussion will
therefore focus upon the information provided by the major elements. Si, Al, the mobile elements, Fe,
S and the bases Na, Ca and Mg.
127

5.3.3 Multi-variate analysis of the Tor Royal EDMA data
DCA of the Tor Royal geochemical data produced an element plot (Fig. 5.6) and a sample plot (Fig.
5.7). Axis two on Fig 5.6 seems to relate to the balance between mineral matter and organic
material, with the former including an association between elements such as Al, K, Si and %ash, and
the latter displaying a relationship between TOC, S and Ca. Axis one is more difficult to explain but
may represent the pH regime of the system through time with elements associated with high base
conditions located to the right of the plot.
Analysis of the samples produced a somewhat circular pattern in which the samples from the basal
zone and the upper most samples share geochemical signals (Fig. 5.7). Group two includes samples
between 500 and 575cm, and as such relates to the phases of declining Fe and lower levels of
mineral material. Group three seems to continue the trend of the previous group in which a number
of elements attain low, stable profiles (TRGc). TTie division between groups three and four identifies
a major change in the elemental profiles from Tor Royal, the final disappearance of Fe, possibly
indicating the position of the minerotrophic/ombrotrophic boundary. Group five identifies the
uppermost group of samples which display highly fluctuating profiles, possibly as a result of modem
acrotelm processes.
The primary use of the DCA technique is to aid evaluation of the different stages in the development
of this peatland system, particularly focusing on:
(i) TTie initial status of the system, and how it differs from the overlying sediments.
(ii) Hie nature of the minerotrophic/ombrotrophic boundary.
(iii) Whether the upper sediments contain a greater proportion of anthropogenic signals.
5.3.4 Interpretation of the geochemical signals from Tor Royal
Analysis of the sediment has made it possible to interpret the signals in terms of a number of specific
processes operational both within the developing peatland and extemally in the surroimding
catchment. These will be addressed in the following sections. It is noteworthy to comment on the ash
curve at this point. TTie ash contents of the peats exhibit a ' C shaped profile which is characteristic
of bog profiles (Sillanpaa, 1972) due to the incorporation of basal mineral material as the bog plants
become established, and the more recent contribution of aiibome dust particles. At the top and
bottom ash values approach 10%, between 50 and 550cm however, the ash contents are generally
128

631
Depth (cms below ground surface) 8
O) O) g N> O o ro o o O o
O O
CO o o to o o
8 _i 9
OS
Calendar yeais (2 Sigma)

o
(euiGjs z) sjesX SB^usjeo
S O w O ^ ^ a <
8 s s o <
o o CM
o
A n
O O CO
o o o o in
o o CM ? O CM
^
(eoe|jns punojS /AO|eq suio) mdeQ
130

Chemizone
TRGa
TRGb
TRGc
TRGd
TRGe
TRGf
Depth (cm)
622-605
605-462
462-357
357-72
72-22
22-0
Description
This zone is characterised by high, but falling levels of Si and Al, which seem to relate to the high levels of mineral material in the basal samples (ca. 6% at 622cm), Na is suggested to be linked to this material and shows a similar profile. Fe, S and TOC increase in this zone, while the trace elements, Sn, As, Cu and Pb display little variation.
Dynamic equilibrium conditions are exhibited by Fe in this zone which falls from 35% at 560cm to <20% at 462cm.. Al, Si and the mineral fraction continue to decline, all attaining very low values by 560cm. S continues to increase through this zone, with TOC displaying stable equiUbrium conditions. P, K, Ca display trace occurrences, while the trace elements display intercorrelated profiles. Mg increases towards the boundary with the overlying zone.
This zone is marked by the decline of Fe, which disappears at 357cm. Mg peaks at 440cm reaching ca. 8%. "Die continued increase of S is noted, but dynamic equiUbrium conditions exhibiting a declining trend are displayed for TOC. The trace elements. As, Sn and Pb, display interrelation, with Cu fluctuating somewhat stochastically. P, K and Ca are consistently low.
TTie significant feature of this zone is the increase in Ca which is sustained throughout the chemizone. Mg, Cu, S and Si display stable equilibrium conditions, while Al peaks at 290cm (ca. 10%), and Na displays elevated values between 140 and 300cm (1-4%). TOC continues to display declining dynamic equiUbrium conditions. P and K display random peaks.
Si, Al, Na and mineral matter display an increased presence in this zone. Mg, Ca decline over the same profile depths. Peaks for Fe and K mark the onset of the zone. TOC and S both decline over this zone. "Die trace elements. As, Pb and Sn display very similar profile characteristics.
In this zone many of the elements display stochastic behaviour, probably due to acrotelm processes. TTie levels of mineral matter continue to increase which corresponds to a sharp decline in the values for TOC.
Table 5.2 EDMA results from analysis of Tor Royal sediment
131
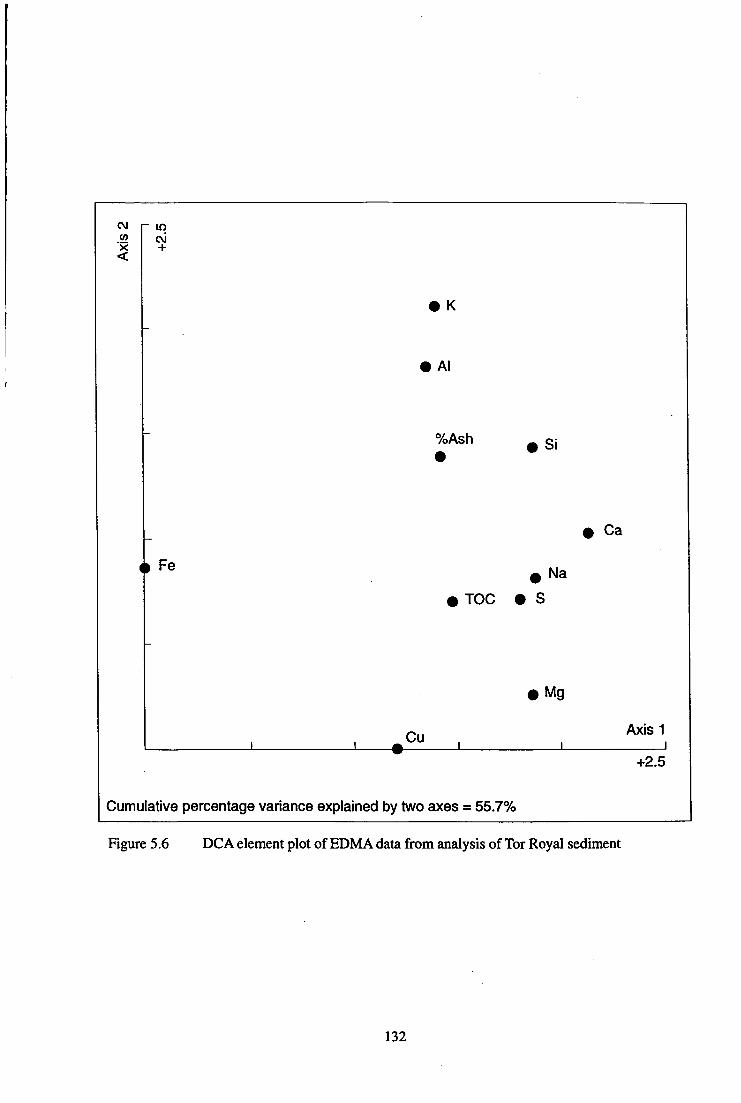
Figure 5.6 DCA element plot of EDMA data from analysis of Tor Royal sediment
132

CM
, 590 >
I +560 545
+ +515
in
+
622 ^
+ 620,
sooi " ' J=^
^ N
+ 15\
j290
\+' 10
35 .
/
/ ' 320 .2^5 110 '
+^+ + 305 80 ,1251
, ,365 + " . . + .155 *
j230
J \ L •335 'Axis1 J 1. I
530 ,
'+.,
^ ^«5 , \ 3
^ ^ "'350 .' '
380*
^ ^ "^440 , '
Cumulative percentage variance explained by two axes = 55.7%
Figure 5.7 DCA sample plot of EDMA data from analysis of Tor Royal sediment
133
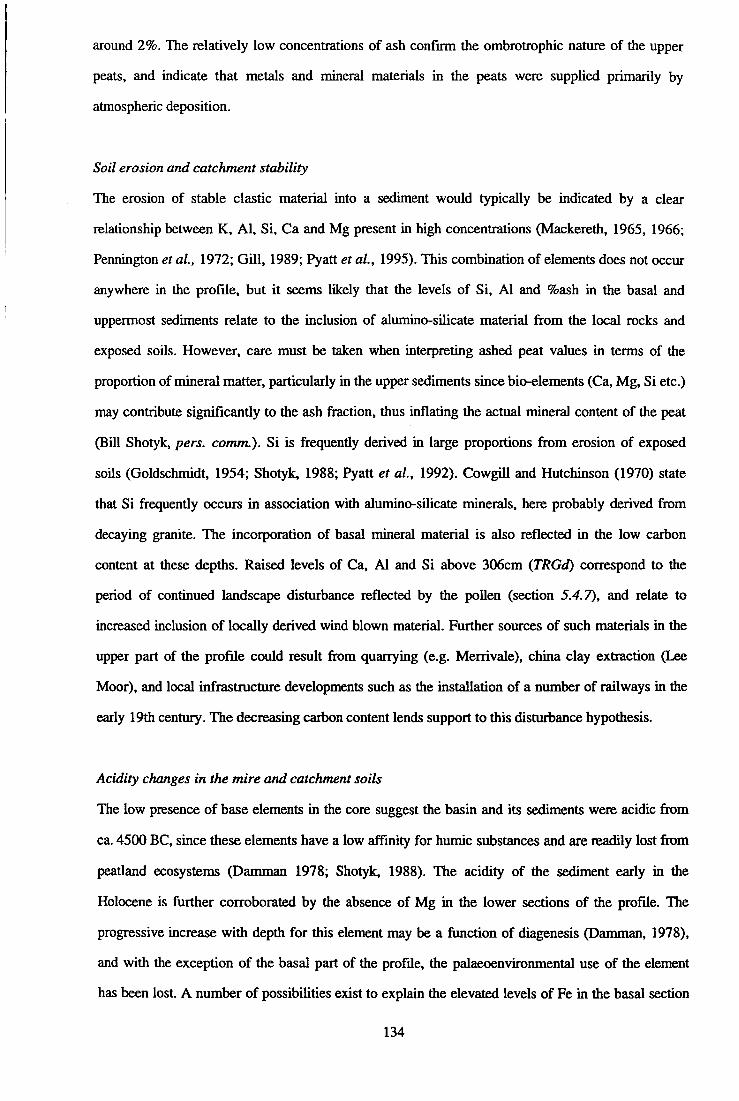
around 2%. The relatively low concentrations of ash confirm the ombrotrophic nature of the upper
peats, and indicate that metals and mineral materials in the peats were supplied primarily by
atmospheric deposition.
Soil erosion and catchment stability
TTie erosion of stable clastic material into a sediment would typically be indicated by a clear
relationship between K, Al, Si, Ca and Mg present in high concentrations (Mackereth, 1965, 1966;
Pennington et al., 1972; Gill, 1989; Pyatt et al., 1995). This combination of elements does not occur
anywhere in the profile, but it seems likely that the levels of Si, Al and %ash in the basal and
uppermost sediments relate to the inclusion of alumino-silicate material from the local rocks and
exposed soils. However, care must be taken when interpreting ashed peat values in terms of the
proportion of mineral matter, particularly in the upper sediments since bio-elements (Ca, Mg, Si etc.)
may contribute significantly to the ash fraction, thus inflating the actual mineral content of the peat
(Bill Shotyk, pers. comm.). Si is firequently derived in large proportions from erosion of exposed
soils (Goldschmidt, 1954; Shotyk, 1988; Pyatt et al., 1992). Cowgill and Hutchinson (1970) state
that Si frequently occurs in association with alumino-silicate minerals, here probably derived ftom
decaying granite. The incorporation of basal mineral material is also reflected in the low carbon
content at these depths. Raised levels of Ca, Al and Si above 306cm (TRGd) correspond to the
period of continued landscape disturbance reflected by the pollen (section 5.4.7), and relate to
increased inclusion of locally derived wind blown material. Further sources of such materials in the
upper part of the profile could result from quarrying (e.g. Merrivale), china clay extraction (Lee
Moor), and local infrastructure developments such as the installation of a number of railways in the
early 19th century. The decreasing carbon content lends support to this disturbance hypothesis.
Acidity changes in the mire and catchment soils
The low presence of base elements in the core suggest the basin and its sediments were acidic from
ca. 4500 BC, since these elements have a low affinity for humic substances and are readily lost from
peatland ecosystems (Daimnan 1978; Shotyk, 1988). The acidity of the sediment early in the
Holocene is fiirther corroborated by the absence of Mg in the lower sections of the profile. The
progressive increase with depth for this element may be a function of diagenesis (Damman, 1978),
and with the exception of the basal part of the profile, the palaeoenvironmental use of the element
has been lost. A number of possibilities exist to explain the elevated levels of Fe in the basal section
134
of the core. Firstly, the signal may indicate the fossil Fe signature of the sediment. The declining
profile between 450 and 550cm would therefore serve to indicate the increasingly anaerobic
sedimentary environment. However, since it seems that the sediment was becoming acidic and
anaerobic as suggested by the absence of base elements, increased formation of sulphides and the
changing nature of the flora at this time, any Fe present then would have most likely been mobilised
and lost from the system in the drainage waters since it is generally mobiUsed under anaerobic
conditions (Goldschmidt, 1954; Mackereth, 1966; Naucke et ai, 1993). A second possibility relates
to the modem drainage of soil water fi-om the westem side of Royal Hill (Fig. 5.1). This water would
move down hill as groundwater throughflow and into the margins of the peat mass where it then
moves laterally through the sediment. The presence of this element may therefore relate to the
influence of modem groundwater in the basal sections of the peat body, which agrees well with the
results of a number of other workers (Chapman, 1964; Green and Pearson, 1977; Mannion, 1979).
This effect is only limited to the basal two metres of sediment, with the upper four metres supplied
solely by atmospheric precipitation. The third possibility includes the mobilisation of Fe fi-om the
upper levels following anaerobic surficial conditions (possibly seasonal waterlogging), to deeper
levels where the element is sedimented with particulate organic matter. It seems highly likely that the
last two hypotheses are the most likely in this environment and thus suggest the limited utility of this
element in providing palaeoenvironmental information.
Industrial activity
A potentially useful application of EDMA is to detect periods of industrial activity, in this locality
dominated by tinworking and the post extraction stamping and smelting processes. It would also be
expected that evidence of the Industrial Revolution would be recovered and could be used as an
additional source of dating. TTie profiles for Sn, As and Pb all have similar patterns throughout the
profile. This may record anthropogenic exploitation of metal resources on Dartmoor, but may be a
fiinction of the expression of the data as percentages. As the amounts of these elements are low by
comparison with other elements, they may be strongly affected by changes in the total elemental
composition, reducing the use of these elements significantly. A further problem may be due to the
detection capabilities of the EDMA technique, especially given the low concentrations of these
elements in this type of system. This will be discussed with respect to the results obtained from
analysis of other sites, and with comparison to other analytical techniques in Chapter 9.
135
The interpretation of the Cu profile is less problematic. Cu is one of the elements that is generally
considered to be immobile under anaerobic conditions, due most likely to a combination of sulphate
reduction and the formation of metal and organic complexes (Livett et ai, 1979; Hermann and
Neumann-Mahlkau, 1985; Shotyk, 1988; Stewart and Fergusson, 1994). It does not display the
inter-correlation of the other trace metals and displays relatively high values (up to 30%). Therefore,
it seems possible that the Cu profile relates to the conditions of accumulation at any given position.
However, there is no suggestion of raised values at the depths where anthropogenic inputs of the
metal would be likely, during the Industrial Revolution and modem times (Hong et al, 1996).
Increased values are present before 2000 BC, a time for which anthropogenic inputs are very
unlikely. This suggests the profile may result either from post depositional diagenetic effects or is
dominated by autogenic processes, with minimal extemal influences.
Mire development processes
Natural soils exhibit a net gain of organic substances of generally acid character (e.g. humus), which
can form compounds with Fe and other metals (Goldschmidt, 1954). The C profile from Tor Royal
increases from 623 to 560cm (4400-5500 BC), which is indicative of the developing peat system
with organic material contributing the bulk of TOC. However, from this point up through the profile
it exhibits a gradual decrease, which perhaps suggests the increasing influence of wind and
precipitation home mineral matter. Brown (1985) states that 90% of the total S in valley mire peats
is associated -with organic matter. Thus, the S signal obtained from the bog is dominated by
processes operational within the sediment body. TTie increase in S through the profile to 80cm (AD
1200) relates to the development of the peat system, and the accumulation of sulphide rich organic
matter through time. Declining values in the upper sediments are associated with aerobic conditions
in the acrotelm. Acrotelm activity also affects Fe, and elevated levels in the upper most sediments are
a result of precipitation under aerobic conditions. Fluctuating P values may also be linked to aerobic
activity, although levels are very low and probably below reliable detection limits (see below). The
geochemistry suggests the acrotelm-catotelm boundary is at 15-20cm depth (TRGf). This is
consistent with measured water table depths on the site (Woodland, 1996).
Other elements
There are a group of elements which do not fluctuate throughout the profile in any meaningfiil way
and do not appear to yield usefid palaeoenvironmental information. P and K remain at extremely low
136

values apart from in the acrotelm. K has probably been leached from the peat since it will have been
present in a mobile form (Athi, 1984). While P is often used as an indicator of past anthropogenic
activity in soil from archaeological contexts, the Tor Royal record does not reflect such activity.
Phosphorus is a difficult element to interpret since there are many different processes which control
its availability. "Die sedimentation of P may be initiated by a number of factors: (i) carried into
solution with Fe and Mn under anaerobis; and (ii) precipitated into organic material. TTie first being
important both to the precipitation, as well as the retention of the element in the sediment body
(Mackereth, 1966). Shotyk (1988) states the geochemistry of P in mire waters is most likely related
to the concentration of dissolved organic C, Fe and the pH, with the capacity of peat to uptake P
essentially being a function of mineral content (Naucke et al, 1993). Sedimentation of autogenic P
may be through the biological uptake of dissolved inorganic P, with subsequent deposition as
particulate organic P (Engstrom and Wright, 1984). It seems possible that the higher levels of P in
the basal section of the profile may relate to the inclusion of the element from basal mineral material,
although the wide errors bars for the element reduce the confidence of this suggestion.
Although Mn has a similar geochemistry to Fe, low levels throughout the profile are probably due to
enhanced mobility under anaerobic conditions, resulting in post-depositional leaching.
5.4.5 Pollen analysis of the Tor Royal sediment
Palynological investigation of Tor Royal has the potential to provide a significant contribution to the
general understanding of the vegetation history of central Dartmoor for the period extending from
late Neolithic to modem times, with high resolution information available for the latter phases of the
archaeological period which are generally poorly covered by existing pollen profiles.
llie results are presented as a pollen diagram (Fig. 5.8) and described in Table S.3. Hie data are
shown as percentages of Total Land Pollen and Spores (TLPS) minus Sphagnum. Tlie DCA plots
fix)m the data analysis are presented as follows: the species plot (Fig. 5.9) and the sample plot (Fig.
5.10).
5.4.6 Multi-variate analysis of the Tor Royal pollen data
DCA plots of the pollen data reveal three groups: a, P and %. TTie first relates to woodland
conditions in the basal levels of the profile and is composed of Pinus, Betula, Ulmus, Quercus and
137
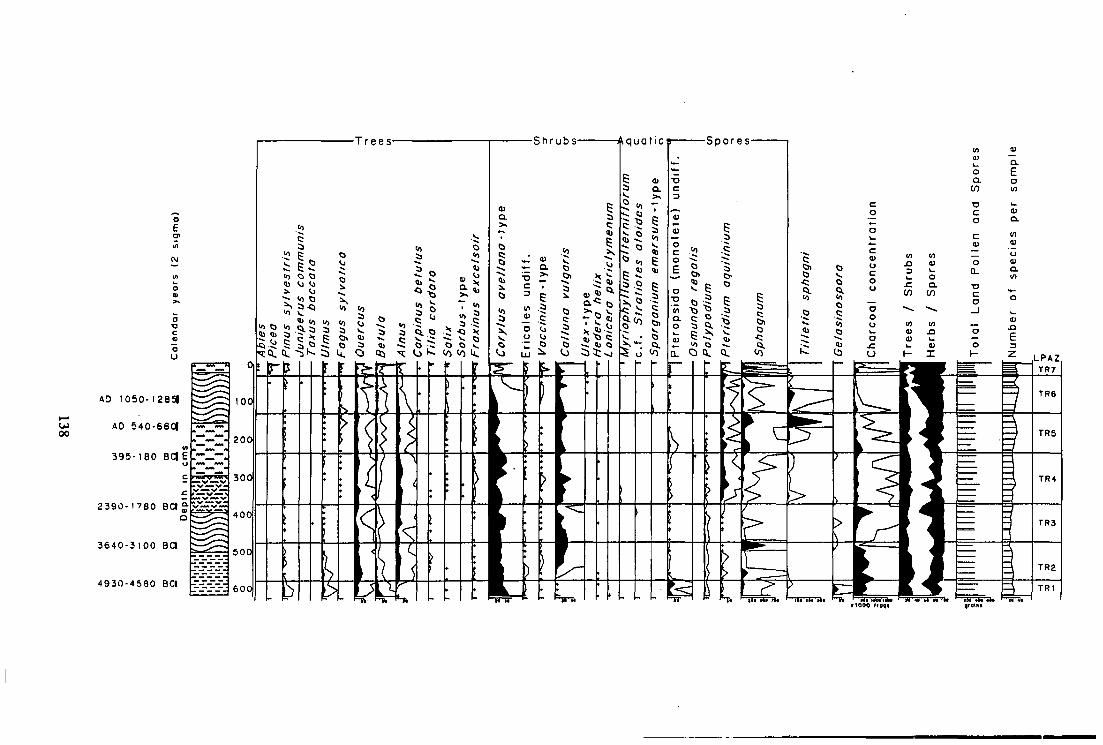
- T r e e s - -Shrubs- -Aquot ic f Spores-
w n 3 u. x: CO
^ 10 0}
« k-
h-
(O 0)
\_ o a. V)
^^
k . 0) X
o Q.
m •o c o
c (U
o a.
c a _l
o *-o 1-
Q.
t: o V)
L .
0) Q.
in 0) (J
<u a.
o
e D Z
u> 00
AO l050-i28S|
AO 540-6601
395-180 BCie o c
2390-1780 e a j o
3640-3100 Ba
4930-4580 BCI
vAuvur^
k-r.«'_—.S
<< Oi
100
200
300
400
500
600

6£T
u> CD
Tl
a bo
W H X p
n P»
o •-t
p
O T 3 P f »
R? o (0 ( 1
O
X o
+ R-
ra O
K TO CB
o o B
(X O-o (O
n
i - t (S
o o O o o c n fO 3 o cs
P •« fo 3
H r ha
01
o U S , Oeoth in cms
Calendar years (2 sigmo)
^
i > I I I
( M M
' > » ' ' o o - 2 2_
Wi J_ _i_ j _ _i-
T
TC^
1 "
^ z •J-J^-
T —
CO <o
3)
AAU/^-S^^.^*
Pooceae
* ^*Aj~i Pooceae > 4 0 microns
C y p e r o c e a e undi f f .
• p t a n l a q i n o c e a e undi t t .
' ^ 7 -J '•' t Z'. major/media undi f f .
1—FT—
**• i — I T -
TTTT
r ? — i ^ *
••'T"^ » ^ Ranunculus acris - type
^ "TT B r a s s i c o c e a e
" T Urtica dioica
"^ChenopodioceQe
s— C a r y o p h y l l o c e a e
• Polygonum
* * * i i 4 5 ^ >-*^f*-^ Rumex und i f f .
rTTwrrr FT—racF! »»-r/p acelOSO
—nr-
1 — i - ^ -
Planlago lanceolota
•w R. acetosella
"J Hypericum per foratum -X^^z
Tf Drosera intermedia
— Lysimachia vulgaris -x^pe
— Anagallis tenella-%^p^
— Saxifraga stelloris -xype
— S. hirsuta - t ype
— 5. oppostifoiia-X'jpe
* ~ r R o s a c e a e und i f f .
rwr Filipendula
"^ Potentilla-\^pi
^^ Lotus
t— Polygala
^ T Ap iaceae
1- Solanum dulcamara
— L a m i a c e a e undi f f .
— Melampryum
' ^^Rub iaceoe
"T Succisa pratensis
T Scabiosa columbaria
— C o r d u e a e / A s t e r o i d e a e undi f f .
— Cirsium - t y p e
r^TTLoctuceae undi f f .
-Solidago virgaurea-lype
T Artemisia -type
Tr-- 3»i- Achillea - t y p e

LPAZ
TRl
TR2
TR3
TR4
TR5
TR6
TR7
Depth (cm)
622-580
580-477
477-373
373-237
237-132
132-32
32-0
Description
Corylus, Betula, Quercus, Ulmus, Poaceae, PotentUla The zone is dominated by Corylus, which declines steadily from 45% at 623cm to 30% at the upper zone boundary. Arboreal pollen is well represented. Betula declines sharply in this zone. Poaceae increases dramatically, with a wide range of herbaceous species present The ferns, Pteridium and Polypodium are present. Significant amounts of charcoal are present in this zone.
Corylus, Quercus, Ulmus, Alnus, Calluna, Poaceae, Cyperaceae Corylus continues to dominate the spectra, with an increasing Quercus component. Alnus appears for the first time, attaining a stable profile of ca. 10%. Calluna vulgaris increases significantly, whilst Poaceae remains a significant element of the spectra. Cyperaceae features consistently, increasing only in the upper sample of the LPAZ. A lower diversity of herbaceous taxa is noted in this zone. The boundary between TRl and TR3 is marked by a dramatic peak in Sphagnum. High levels of charcoal are present.
Corylus, Quercus, Alnus, Calluna, Cyperaceae Cyperaceae rises to high levels peaking with 55% TLP at 390cm. The arboreal taxa fluctuate very little. Calluna vulgaris declines through the zone. Poaceae is present in low amounts (5%). High levels of charcoal are found towards the upper LPAZ boundary.
Corylus, Alnus, Quercus, CaUuna, Poaceae, Cyperaceae, Plantago lanceolata, Pteridium aquUinum Corylus dominates the spectra. Fagus sylvatica and Sorbus appear for the first time. Calluna fluctuates widely, peaking at ca. 320cm. P. lanceolata first appears and is associated with an expanding herbaceous component. Poaceae increases marginally, while Cyperaceae declines before increasing through the upper boundary. Cereal type pollen grains are first identified at 280cm. Pteridium aquilinum is consistent Stable levels of charcoal are experienced.
Corylus, Alnus, Quercus, CaUuna, Poaceae, Cyperaceae, P. lanceolata Corylus declines, with the arboreal taxa remaining consistently represented in low amounts. Callurux remains a significant component of the spectra, although the increased presence of Poaceae and Cyperaceae is noted. P. lanceolata, Rumex acetosa, Potentilla and members of the Asteraceae all attain levels >1% in this zone. Cereal type pollen grains are present in two samples (<1%). Sphagnum peaks twice in the zone. Charcoal is low and declining.
Corylus, Quercus, CaHuiui, Poaceae, Cyperaceae, P. lanceolata The significant feature of the zone is the sustained declines for Corylus and Alnus. Poaceae and Cyperaceae expand. An increased herbaceous component is dominated by P. lanceolata. Cereal type grains increase in the upper samples of TR6. Pteridium aquilinum is the only Pteridophyte represented (5-10%).
Poaceae, Cyperaceae, P. lanceolata, Calluna TTie spectra are dominated by Poaceae and Cyperaceae, with a diverse herbaceous flora. Hie arboreal taxa are present in low amounts. Alnus and Corylus almost disappear. Exotic coniferous pollen is present in the uppermost samples. Cereal type pollen is present in low amounts. Sphagnum peaks twice in this zone.
Table 5.3 Pollen analysis results from Tor Royal
140
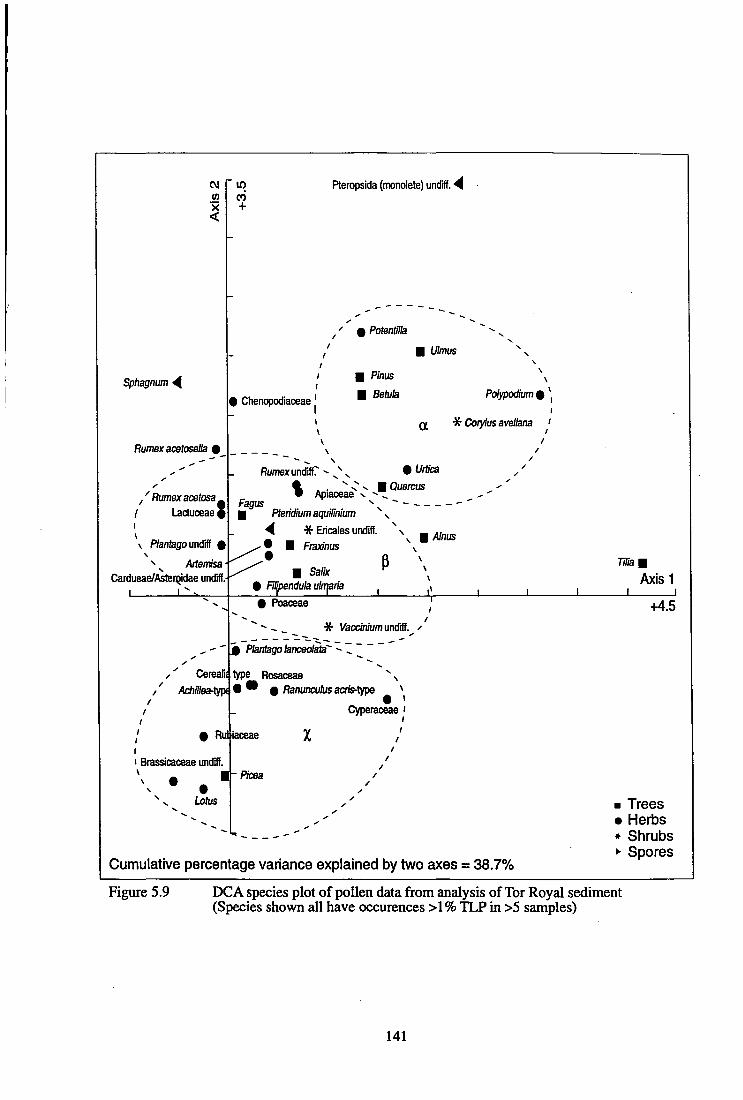
CM (0
Sphagnum ^
RumexacetoseUa #
/ /Rumexacetosa
Lactuceae t \ PlantagouivM %
^^ Memisa Cardueae/AsteiiQidae undHf.-
in CO
+
Reropsida (monolete) undiff. A
^' %Potentilla
Ulmus
9 Chenopodiaceae'
Pinus
Betuia Pofypodium 0 *|
I Q ^ Coiylus avellana '
%umca
% . . ^ C" V H Quercus Apiaceae
flumex undiftr ^ ^^ ^
Fagus N
Pteridium aquilinium ^ ^
A * Ericales undiff. • • Fraxinus •
• Salix • Filjpendula ubriarii.
Alnus
P \ Tilia I
Axis1
# Poaceae
" - * Vaccinium undifl. "^ — ••
• Plantagolancedata^ -Z.
y' CereaBi type Rosaceae ^ ^ AchSleshX^
9 Ruiiaceae %
I Brassicaceae undffi.
• Lotus
• • 9 flanuncuftKacns-type ^
Cyperaceae '
- Pioea
+4.5
Cumulative percentage variance explained by two axes = 38.7%
Figure 5.9 DCA species plot of pollen data from analysis of Tor Royal sediment (Species shown all have cxicurences >1% TLP in >5 samples)
• Trees • Herbs * Shrubs • Spores
141
CM tn "x <
in cvj
+
.622 > + / /
/ /
/ .620 ' + /
^ • /
1 yZO
s. .+10
+
^
485
u\
- -. _
" - ^ " ^
, 2 1 5
^.155
140
/ /.590 /
; ( /
560;^ \ +^05 / ^ +575-\
,230 /
245 ^260 + 290 / 200+275 + + - ^
/ + + 425 ^ ; + ' ' ° 305 ^^+530+4-215 \
500 ^ ^ 1 .95 110 J25 +500 4 f
^ +320 4- ^365 * ^=^2° .440 \
; + ; 2 = "^^Ov 80 " +380 ; \ IV ^ ^ t +455 / \ 15L .35 .0 N - - ^ / IS 35 . " \ ^ - ^
I \ + "^50 _ \ ^-^^ > Ax is1
" - ^ _ - ' ' ' ~~'' +2.5 Cumulative percentage variance explained by two axes = 38.7%
Figure 5.10 DC A sample plot of pollen data from analysis of Tor Royal sediment
142
Corylus. The transition to slightly more open conditions is indicated by the assemblage of species
present in group p in which Calluna, Alnus and Poaceae together with a number of herbaceous taxa
all become better represented. The last group (x) contains species belonging to the upper levels in
which a range of anthropogenic indicators are particularly well represented, including Plantago
lanceolata. Cereal type grains and pollen of the coniferous plantation species (e.g. Picea).
The sample plot (Fig. 5.10) indicated a similar situation as the species plot. The basal zone was
identifiable (Group I, 575 to 622cm). There appears to be a division between groups n and ED,
which share samples between 560 and 100cm, but display definite clustering patterns possibly
indicating different pathways to the final situation in which the indicators of human activity are
prevalent.
5.4.7 Interpretation of the Tor Royal pollen data
The early to mid Holocene
TTie basal zone (JRl) is characterised by high values for Corylus, Quercus, Betula, Ulmus and
Pinus, with a diverse herbaceous flora composed of open ground indicators including Potentilla,
Succisa and Rumex species, with Urtica and Hypericum perforatum-type. This zone indicates open
Corylus, Betula and Quercus scrub conditions. The onset of TRl probably dates to around 5000 BC
(7000 BP) extrapolating from the "C date at 574-589cm (Table 5.1). The zone appears similar to
the pollen zone BLB4-BLB5 of nearby Blacklane Brook (Simmons et al., 1983) where the transition
to Quercus dominated woodland is dated somewhat earlier to 7760±140 BP.
High levels of charcoal were experienced in the basal samples, which have a late Mesolithic date.
This is significant since it appears that small scale disturbance was occurring at this time in other
parts of the moor (Pinswell and Black Ridge Brook, Caseldine and Hatton, 1993). The site at
Pinswell suggests enhanced levels of burning between 7700-6300 BP (ca. 5700-4300 BC) which led
to the transformation of Corylus dominated woodland into blanket peat, with an intermediate acid
grassland phase. The charcoal levels at Tor Royal suggest that burning was a widespread activity at
this time and extended to these lower altitudes.
The opening of TR2 is marked by the rational limit (after Smith and Pilcher, 1973) of Alnus which is
dated to ca. 7000 BP elsewhere (Simmons et al., 1983; Bush and Hall, 1987; Birks, 1989).
143

However, radiocarbon evidence suggest the increase of this species around Tor Royal to have
occurred somewhat later, dated to 6880-6530 BP (4930-4580 BC, Table 5.1). The generally low
levels and late migration of this species into upland areas of the south west has been discussed by
Chambers and Price (1985). Early dates are not limited to lower lying areas elsewhere and late dates
from Dartmoor and Bodmin Moor are probably a realistic representation of the regional signal
(Chris Caseldine, pers. comm.). Tlie suggestion that Mesolithic activity may have facilitated the
local establishment of this species (Chambers and Price, 1985; Chambers and Elliott, 1989) is
supported by the circumstantial evidence at Tor Royal. However, the relatively low Alnus values
suggest it was only growing in restricted areas, perhaps around the margin of the developing mire.
ITie base of TR2 indicates a denser woodland cover, composed of Quercus, Betula and Alnus with
Ulmus and Fraxinus likely to have been components at a lower altitude, or on the higher nutrient
status soils of the slopes surrounding the mire. Tilia appears for the first time in this zone, although
its low representation in the spectra may be due a combination of factors. It is likely to have formed
a more active component in woodlands at a lower altitude, and the fluctuating size of the pollen
catchment area may affect its relative abundance (Waller, 1994). In this zone Corylus is out
competed by Quercus, aided possibly by Mesolithic activity.
Heathland develops for the first time during this zone, forming a major component of the vegetation
at the expense of the deciduous forest cover, but also relates to a contraction in the area of grassland.
Calluna vulgaris would most likely be restricted to the better drained areas such as the summits,
slopes and forest openings, although it may have grown on the developing blanket bog initiated at
about this time (Staines, 1974). The precise dating of blanket bog development of an area such as
Dartmoor is not considered possible due to the varying effects of anthropogenic disturbance, and the
wide differences in local topography (Maguire, 1983; Moore, 1993). Many of the features noted in
other areas of the British Isles which are precursors to blanket peat initiation, including declining
arboreal pollen, the use of fire and increasing acidity (Moore, 1988) are present in the Tor Royal
pollen and geochemical sequences. The TR1/TR2 boundary is taken as the period when blanket peat
first began development on the slopes around the bog, with a date of 4930-4580 BC.
TR3 sees a marginal recovery of Corylus, but Ulmus and Quercus continue to decline. Jacobi et al.
(1976) working in the southem Pennines state that contemporaneous with the decline of Corylus, an
increase in charcoal concentration is related to a permanent suppression of the closed tree cover, and
144

possibly hastened the onset of soil deterioration and blanket peat formation. Increased disturbance is
indicated towards the TR4 boundary by an elevated charcoal concentration, a decline for Quercus
and Corylus, and an expansion of herbaceous taxa indicative of open communities, e.g. Rumex
species, Plantago lanceolata and Ranunculus acris-type. Increasing sedge pollen with a concurrent
decrease in Calluna is probably a local on-site vegetation change, since the latter is generally insect
pollinated and thus interpreted as being of local origin (Evans and Moore, 1985).
Post-elm decline changes
The Holocene Ulmus decline in the Tor Royal sequence seems to occur at 5(X)cm close to the
TR2/TR3 boundary, placing the event at around ca. 3600 BC (5600 BP), and thus indicates the
position of the Mesolithic-NeoUthic transition. Tlie small increase for Poaceae at this time was
similarly noted by Smith and WilUs (1962) at Fallohogy, Ireland. There the reduction of Ulmus and
the expansion of grasses were interpreted as an indication of early pastoral activity, which seems
likely at Tor Royal given the advent of different exploitation strategies associated with the Neolithic
period (Smith et al., 1981). The reduction of Ulmus is followed ca. 1000 years later by the first
significant levels of Plantago lanceolata, both features apparent in other Dartmoor pollen diagrams
(Taw Head and Postbridge, Simmons, 1962; Blacklane Brook, Simmons et al., 1983; Blacka Brook,
Beckett, 1981).
Hie expansion of Cyperaceae from 5(X)cm may result from increased surface wetness associated
with the initiation of blanket bog development, or relate to local on-site change. TR4 marks the
empirical limit of Fraxinus and the reasonably consistent representation of Fagus. Tlie occurrence of
the former species at around 4500 BP is consistent with other work (Birks, 1989) but Fagus is not
usually recorded until much later (1-2000 BP, Huntley and Birks, 1983; Birks, 1989; Bennett, 1989;
Huntley et al., 1989). Tlie earliest south westem record is ca. 4500 BP from a Neolithic wooden
trackway at Blakeway Farm, Somerset (Godwin, 1975) and the Tor Royal data support the idea that
it was present further west sporadically fix)m much earlier than is generally recognised. Comparison
to other Dartmoor sites for this period is possible. At Lee Moor (275m OD) the Neolithic period is
characterised by local Alnus growth, localised scrubby woodland, and a small amount of grassland
with a herb flora suggesting a largely pastoral economy. TTie absence of heathland development is
noted at this site. Blacka Brook (BBS) is similar to Tor Royal in that heathland is present, with
human activity indicated by the presence of various ruderal species. Minor clearance by NeoUthic
145

people is indicated in the profiles from Taw Head and Postbridge (Simmons, 1962, 1964b).
The British Bronze Age generally begins around 2000 BC (Godwin, 1975). This coincides with the
first significant expansion of ruderal species around Tor Royal at 380cm, dated to between 2390 and
1780 BC (Table 2.1). The expansion of Plantago lanceolata and the sustained increase for the
grasses indicate the continued importance of the area for pastoral activities. It is interesting since this
is the period when the major clearance of the uplands began, but the pollen spectra from Tor Royal,
although indicating continued deforestation, do not suggest more intensive activity. This may be
attributable to an increased pollen source area at this time. The fact that Alnus is steady through the
zone, and there is only a single deviation in the Cyperaceae curve suggests minimal disturbance to
the local vegetation communities. The very gradual decrease of arboreal species, and replacement by
grassland interspersed with Corylus scrub, with Fraxinus colonising the lower open patches
indicates an imperceptible removal of woodland cover. Further evidence for the presence of open
groimd is confirmed by increases in Pteridium, Potentilla and Rumex species. TTie zone appears
contemporaneous with nearby Blacklane Brook (BLB6) in which shrubs invade the more exposed
areas following deforestation, accompanied by an increased weed flora component It is significant
that Pteridium aquilinum first becomes a component of the vegetation following the early Bronze
Age clearances around Tor Royal, suggesting larger tracts of open land.
Tlie archaeological evidence for this time confirms the suggestion that the moor was primarily
utilised for pastoral activities, llie mid to late Bronze Age saw an intensification in the utilisation of
moorland resources culminating in the construction of extensive boundary structures, the 'reaves',
around 1300 BC (Fleming 1978a,b, 1979,1988; Maguire etai, 1983).
"Die appearance of cereal type pollen at 275cm is most likely derived from local late Bronze Age
arable cultivation. Beckett (1981) states that although the level of farming at this time would have
been on a minor scale, the available pollen evidence suggests as much cultivation has taken place
during this time as at any time since, including the Medieval period. TTie low pollen productivity and
dispersal capabilities of the majority of arable crops, in association with the basic harvesting
techniques used may result in an under-representation of these species in the pollen record (Vuorela,
1973; Hall, 1988).
146

Given the radiocarbon dates it is difficult to identify the Iron Age in the Tor Royal profile with any
degree of confidence. It is however suggested that the period relates to a position in the core between
ca. 220-250cm. The resolution of the pollen record for this period hampers the level of
interpretation, but it seems possible to reject the classically adopted archaeological hypothesis for
wholescale upland landscape abandonment during this period (cf. Young and Simmonds, 1995). It
appears that the extent of grassland dominated areas expands, although there is no palynological
evidence for arable activity during this period. Obviously the lack of evidence may result from a
number of factors including those outlined above, and do not make it possible to refute the
proposition of Iron Age arable activity on Dartmoor at this time. Tlie increased abundance of
Sphagnum spores relates possibly to the deterioration of climatic conditions (Godwin, 1975; Kilian
et al., 1995) fiiequently cited as to have caused the exodus of the moorland population (Pearce,
1978). However, recent archaeological theory has suggested the upland would have become a
'marginal farming resource' (Quinnell, 1996) during the Iron Age and later periods. This is certainly
apparent from the palaeoenviroimiental data obtained from Tor Royal and a number of other
locations in south west England (Rough Tor on Bodmin Moor, Gearey, 1996; Gearey and Charman,
1996) covering this time frame.
Historic landscape changes
Tht Medieval period saw an increasing human population on the moor, resulting in habitation and
increased arable production. Numerous examples of Medieval settlements exist on Dartmoor
(Beresford, 1979; Austin et al., 1980; Austin and Walker, 1985), although there is no evidence to
suggest these sites were established before AD 1200 (Allan, 1996; Henderson and Weddell, 1996).
TTie increased levels of cereal pollen above 80cm (ca. AD 1100) corroborate this suggestion, and is
likely to be linked to the widespread traces of cultivation on the upland, including characteristic field
patterns with associated cultivation ridges (Fleming, 1996). The upper zones indicate a further
development of grassland communities and a significant expansion of herbaceous taxa. Arboreal
pollen is still declining with the indicators of open habitats expanding. It is significant to see Corylus
decline dramatically, possibly relating to further selective clearance. TTie decline in charcoal
concentration during this period suggests the minor use of fire, probably relating to small scale
domestic activities.
77? 7 reflects the establishment of the modem moorland landscape with a mix of open heath and
grassland dominated by Callwui, members of the Poaceae and Cyperaceae families, and small
147
pockets of deciduous woodland on the fringes of the moor. TTie presence of Picea, Abies and Pinus
at ca. 20cm with an extrapolated date of ca. AD 1800, relates to the establishment of coniferous
plantations in the Princetown area (Simmons, 1962) and areas surrounding the site itself (Plate 5.2).
Some contraction in the area of Calluna dominated heathland has occurred during this time,
probably as a result of recent over-grazing or uncontrolled burning activities, as suggested by the
marginally elevated levels of charcoal at 20cm. Hie retraction of Calluna dominated areas is a
common feature of British upland heaths (Stevenson and TTiompson, 1993). Their investigations
reveal heather cover to have declined in ca. 90% of the sites studied over the last 200 years,
attributing its demise to a range of factors including those suggested above in addition to
afforestation, atmospheric pollution and climate change.
5.5 Discussion of the palaeoenvironmental development of the Tor Royal area
The geochemistry of the basal sediments suggest physical disturbance in the catchment of the mire
due to increased levels of mineral matter and those elements associated with clastic material (Table
5.4). However, this material may result from biotuibation of the basal sediment incorporating fine
particulate matter as sedimentation begins. The pollen record reflects open Betula-Corylus-Quercus
woodland, with an open habitat hert^aceous flora. Acidification of the mire and the catchment soils
after ca. 4600 BC is reflected by the sediment geochemistry and the development of heathland and
blanket bog. Deforestation is gradual throughout the Holocene, although there is a period of
transition to more intensively managed open habitats following the Ulmus decline. Fraxinus and
Fagus are both present in the woodland vegetation from the mid Holocene period.
On the basis of the geochemical data it seems possible to suggest the transition between
minerotrophic and ombrotrophic conditions occurred around 1500 BC (ca. 350cm), in an
environment experiencing increased disturbance by the Bronze Age population. Low levels of base
elements in zones TRGa-c suggests the system was becoming progressively more acidic. This may
have resulted from the increased ground cover of Calluna and associated increases in leached
organic substances (e.g. polyuronic acid). Gradual increases in the ash and Si content of the
sediment from 320cm suggest the increasing influence of wind-blown material produced as a result
of increasing catchment disturbance activity. TTiis may explain the elevated amounts of Ca and Na in
chemizones TRGd-f. However, these elements may also relate to autogenic processes given their
strong affinity for organic Ugands (Engstrom and Wright, 1984). TTie modem influence of
148

Time Cultural period
Geochemistry Vegetation Environment
AD 1950
AD 1000
1000 BC
2000 BC
3000 BC
4000 BC
Modem Significant increase in clastic elements and ash.
Grassland dominated moorland
5000 BC
Medieval
Dark Ages
Romano-British
Iron Age
Plantation species present.
Cereal pollen
Bronze Age
Neolithic
Declining TOC - disturbance
Increased mineral material: Si, Al, Na,Ca
OMBRO
MINERO
Reduced arboreal pollen
Increasing TOC, reduced aeration, lower Fe,pH
Cereal pollen & weeds
Increasing evidence for grassland communities
P. lanceolata, Pteridium
Ulmus decline
Mesolithic Mineral matter, high Si, Al
Marginal grazing resource
Continued utilisation of moorland resources
More open environment, much activity on moor.
Increasing anthropogenic activity pastoralism
Closing woodland
Open Betula-Corylus
Evidence for forest clearance • charcoal
Blanket bog initiates in area
Evidence for forest disturbance
Table 5.4 Summary of the palaeoenvironmental development of Tor Royal, central Dartmoor
149
groundwater seems confined to the basal two metres of sediment.
No absolute geochemical evidence exists for the exploitation of the moorland mineral resources from
Bronze Age times. Given the nature and resolution of the sediments from Tor Royal it was expected
to gain a history of atmospheric metal pollution similar in content to those gained from other
depositional environments (Livett, 1988; Van Geel et al, 1989; Hong et ai, 1994, 1996; Shotyk,
1996a). The specific problems of trace metal detection using EDMA will be discussed in more
detail, with reference to the results from the other site investigations and supplementary geochemical
data in Chapter 9.
Final woodland decline resulted principally in the removal of Corylus, just prior to the expansion in
cereal growth which reflects the Medieval period. Recent coniferous plantations date the upper
sediments to around 1800 AD, but the geochemistry is too strongly affected by the active surface
layer to be reliable.
5.6 Discussion
The nature of the data from EDMA and pollen analysis of these sediments is fiindamentally
different, particularly for the ombrotrophic sediments. Each dataset reveals information on a
particular aspect of the palaeoenvironmental conditions. TTie geochemical signals, while affected by
conditions external to the accumulating mire, are largely dependant upon autogenic processes
associated with the accumulation of organic material through time, llie pollen data reveal the
changing nature of the vegetation at local, extra-local and regional scales (Jacobson and Bradshaw,
1981).
The increasing flux of mineral matter to the system detected after the attainment of ombrotrophic
status provides an indication for increasing disturbance caused by human activity, which continues
to present times. This material seems to be composed of alumino-silicate mineral associations given
the correspondence between Si, Al and the ash profile. The analysis did not reveal the expected
history of heavy metal deposition. This may be a factor of the low concentration of these elements in
the peat matrix, and the detection capabilities of the EDMA technique. TTie inter-correlated nature of
these profiles (with Mn) may point to their questionable utility as was noted previously in Chapter 4.
Further analyses from the other sites may clarify this feature.
150
Once again a number of elements proved of Uttle use in the investigation of palaeoenvironmental
processes possibly due to the same problems outlined above for the heavy metals. Potassium only
displayed useful information in the uppermost sediments, as a result of bio-accumulation processes
within the acrotelm (Aulio, 1980), but was absent from the underlying sediments. Shotyk (1988)
notes this element to exhibit a low humic/fulvic acid complexing capability and as such is readily
leached from acidic peatland systems. P also produced information that was difficult to interpret in
terms of palaeoenvironmental processes, due to the large standard errors associated with detected
peaks. "Die fluxes of P in the uppermost sediments relates most likely to the changing conditions in
the acrotelm layer of the system.
It seems in this instance that palynological investigation of the sediments from this site yield far more
useful information with respect to the palaeoenvironmental history of the area, gievn the apparent
limitation of the EDMA technique. TTie next chapter presents further analyses from the granitic
upland of Dartmoor. The site is in a very different environmental context and as such was hoped to
reveal new information about the effectiveness of EDMA to elucidate palaeoenvironmental processes
and activity at a smaller spatial scale.
151

Chapter 6
Upper Merrivale, western Dartmoor.
6.0 Introduction
This chapter presents the results gained from geochemical and palynological analysis of a small
soUgenous mire in the upper reaches of the River Walkham catchment, western Dartmoor (Fig. 6.1).
The justification for selecting this site is oudined below:
(i) the sediments have accumulated in a different environmental situation to any of those
presented so far and reveal information about the utility of EDMA in this type of
sedimentary environment. Using these data the different processes affecting the retention and
mobility of elements may be detected.
(ii) The enclosed local topography (Plate 6.1) results in a pollen source area dominated by local
and extra-local components (Jacobson and Bradshaw, 1981). This is useful since it will
provide information at a local scale, detailing vegetation dynamics which relate to landuse
change in the immediate locality.
(iii) TTie site is located adjacent to a 17th century tin blowing and stamping mill (Plate 6.2)
which has been the focus of recent archaeological excavation by the Dartmoor Tin-working
Research Group (Gerrard and Greeves, 1992, 1993; Greeves 1994; Greeves and Newman,
1996). It therefore provides the opportunity to examine the evidence for this activity in the
sedimentary record.
(iv) The site lies in one of the best preserved prehistoric landscapes of mainland Britain (Butler,
1991), with the impressive stone rows of Merrivale ca. Tkra to the south, and extensive
evidence for Bronze Age hut circle settlement and prehistoric land boundaries. "Die site
therefore provides an opportunity to investigate the activities associated with the numerous
phases of human exploitation in this part of the Dartmoor landscape.
The site provides detail on a different scale to that obtained previously from Tor Royal,
concentrating more specifically on the evidence for human modification of this part of the Walkham
catchment.
6.1 Site location, morphology and modem vegetation communities
Upper Merrivale (SX 552766) is located 4.5km north west of Princetown at a height of ca. 340m.
152

1 kilometre Calm
Hut circle settlements
;§ Old tin workings
River / leat
Sampling location
50-, Contour (metres)
Spot height
Boundary work
'reaves'
Figure 6.1 Location of Upper Merrivale sampling location
153
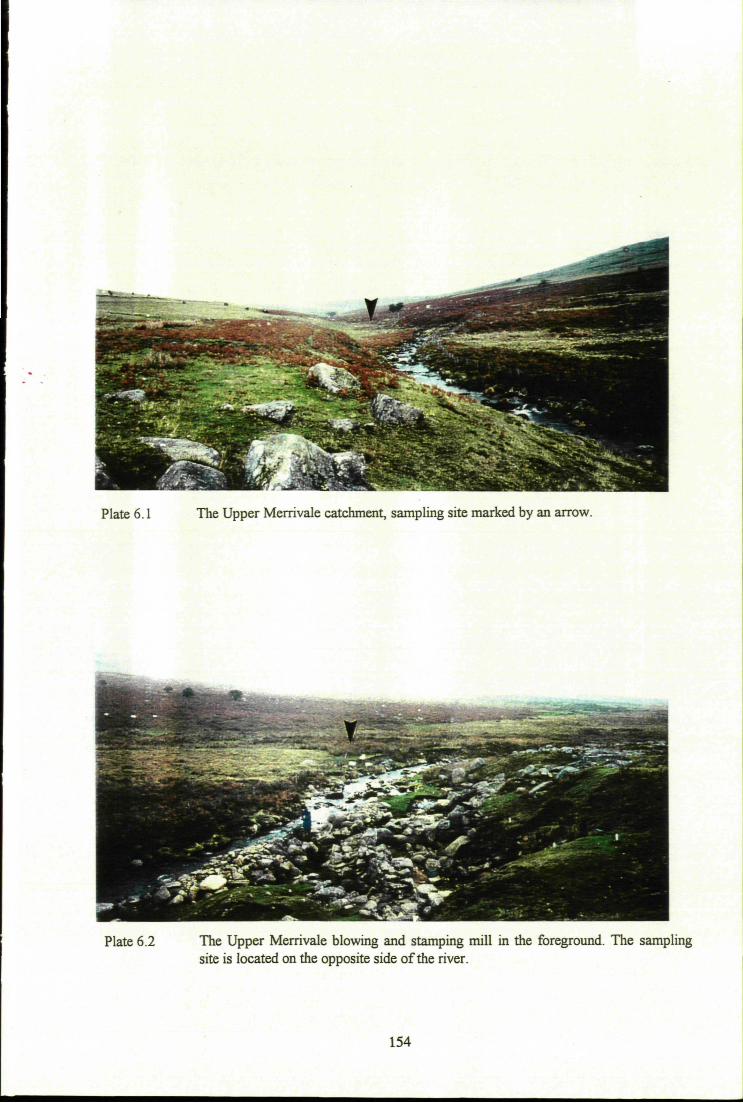
Plate 6.1 The Upper Merrivale catchment, sampling site marked by an arrow.
Plate 6.2 The Upper Merrivale blowing and stamping mill in the foreground. The sampling site is located on the opposite side of the river.
154

The sampling site is located in a valley between the slopes of Great Mis Tor to the east and Roos
Tor to the west (Fig. 6.1, Plate 6.1). The vegetation of the surrounding slopes is characterised by
grassland communities composed largely of Agrostis tenuis, Festuca ovina, Galium saxatile, Luzula
campestris and Pteridium aquilinum (Ward et ai, 1972), although the sampling site itself is
dominated by Juncus spp., Molinia caerulea. Sphagnum spp. with isolated occurrences of Calluna
vulgaris. Erica tetralix and Hydrocotyle vulgaris.
The site extends for ca. 75m along the eastem bank of the River Walkham and is fed directiy from
springs draining the slopes of Great Mis Tor. This site was chosen since it was the largest of a
number of similar systems, but was closest to the evidence for historic tin processing activity. Depth
probing of the mire confirmed the deepest section to be 141cm.
6.2 Archaeology of the Upper Walkham catchment
The earhest evidence for a human presence in the area are the stone rows at Merrivale, although
these structures remain undated. The only dating evidence is the fact they apparently lack association
with later beaker graves and cists in the same region (Todd, 1987). Emmett (1979: 107) concludes:
"At present the only conclusion to be drawn is that the construction, extension and abandonment of the stone rows occurred between the late MesoUthic clearances and the later Bronze Age."
Much discussion has been directed towards the evidence for setdement and palaeoeconomy in the
area, which dates generally from the mid to late Bronze Age. It appears the different structural styles
of settlement may be attributed chronologically to different time periods. Walled pounds indicate the
early Bronze Age incursion of pastoralists into previously unoccupied regions. Hie mid Bronze Age
experiences an expansion of setdement during which the pounds are replaced by large open villages
with increasing indications of arable activities. Late Bronze Age times are characterised by a
reduction in setdement size and a general movement of permanent setdements to the moorland fringe
(Hamond, 1979; Price, 1993), with possible re-use of earlier pounds as seasonal or short term
dwellings associated with transhumance practices (Radford, 1952). Evidence for all of these
structural styles are seen in the area immediately surroimding the sampling site on Langstone Moor,
around Great Mis Tor and at Merrivale Bridge East (BuUer, 1991). Particularly well preserved
features relating to Bronze Age pastoral and arable activity are the earthen bank features known as
reaves. These once formed substantial banks dividing areas of the moor into discrete territorial units.
155
The reaves separate the moor into two main landscape categories. Large parallel systems demarcate
enclosed land with some indication of arable activity, with a higher altitude zone of unenclosed
grazing land between the watershed reaves (Fleming, 1979, 1988). The reaves are generally viewed
as a response to increased pressure on land resources during the late Bronze Age, around 1700 BC
(Fleming, 1988).
Evidence for Iron Age activity on Dartmoor is sparse, with only a very few examples of settlements
confined largely to the upland fringe. However, a postulated Iron Age enclosure exists at White Tor,
to the north of the sampling site (Fig. 6.1), although its contemporaneity with the other forts of the
period is questioned by the different construction styles. However, this may be due to its
geographical location with an abundance of readily available stone for building purposes (Brailsford,
1938).
An archaeological hiatus exists for the next ca. 1000 years during which time no direct evidence for
setdement can be seen in the area. Shillapark Farm is perhaps the earliest settlement of the historic
period in the area, which displays a classic curvilinear comditch, and has buildings orientated
downslope - a characteristic displayed by virtually all Medieval longhouses. "Die later remains in the
catchment are dominated by tin working features dating from perhaps the mid 12th to the second half
of the 19th centuries (Greeves and Newman, 1996). The tin blowing and stamping mill adjacent to
the site was operational during the 16th and 17th centuries (Greeves, 1994).
6.3 Sampling regime
Samples were collected using a standard Russian auger (SOcm x 5cm). Two samples were taken for
radiocarbon dating (Table 6.1). Each monoUth extracted was described in the field using Troels-
Smith (1955) classification and subsequently re-examined in the laboratory to confirm initial
descriptions (Fig. 6.2). A total of 28 samples were taken from the profile at 5cm intervals and
prepared for EDMA, pollen. Total Organic Carbon analyses and ashing at 900°C (Aaby, 1986;
Shotyk. 1996b).
6.4 Palaeoenviromnental reconstruction of Upper Merrivale, western Dartmoor
Discussion will initially be directed towards the stratigraphy of the sediment followed by the results
fi-om both geochemical and palynological investigations. Multi-variate techniques were applied to
156
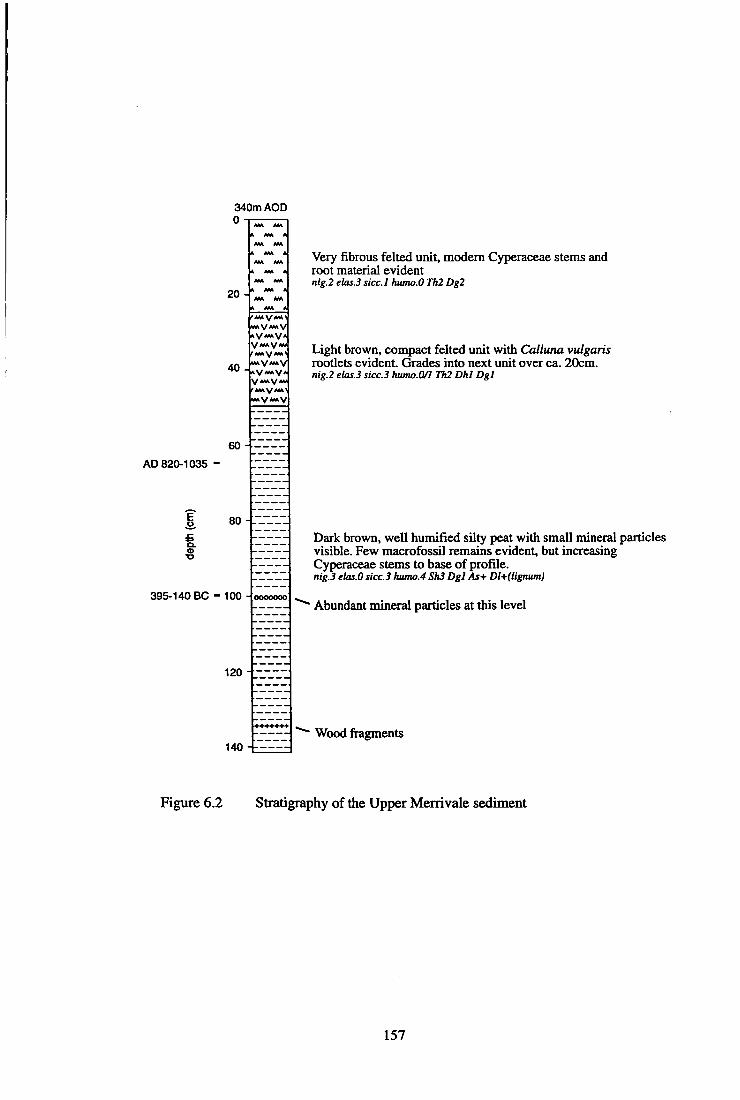
AD 820-1035
E
£ Q . <D
340m AOD 0
20
fc MM A
A M A
4 0 -
• M V M V
WkV^MV
V«»V
8 0 -
395-140 BC - 100 - ooooooo
6 0 -
120
Very fibrous felted unit, modem Cyperaceae stems and root material evident nig.2 elas.3 sice. I humo.O Th2 Dg2
Light brown, compact felted unit with Calluna vulgaris rootlets evident Grades into next unit over ca. 20cm. nig.2 elas.3 sicc.3 humo.0/1 Th2 Dhl Dgl
140
Dark brown, well humified silty peat with small mineral particles visible. Few macrofossil remains evident, but increasing Cyperaceae stems to base of profile. nig.3 elas.O sicc.3 humo.4 Sh3 Dgl As* Dl+(lignum)
Abundant mineral particles at this level
Wood fragments
Figure 6.2 Stratigraphy of the Upper Merrivale sediment
157
both sets of data, the results from which will be discussed shortly.
6.4.1 Stratigraphic description of the sediment
The basal sediment is composed of a well humified greasy unit with very occasional macrofossil
remains, but with increasing Cyperaceae stems to the base. The overlying unit is composed of well
humified material with an homogenous structure and no identifiable macrofossil remains. This
grades into a unit (50-100cm) composed of homogenous material, with fragments of charcoal and
small mineral particles, which appear more abundant in the next section of the profile. The upper
sediments display little variation except for a transition to a more felted structure and the increasing
presence of rootlet material, possibly of Calluna vulgaris. The most significant aspect of the
sediment stratigraphically is the presence of a considerable concentration of mineral particles at
100cm.
6.4.2 Radiocarbon dating procedures and results
As already stated two samples were taken from the profile and submitted to Beta Analytic for AMS
analysis. The table below gives details of the results obtained:
Depth (cm)
65-66
100-101
Lab-code
Beta-97050
Beta-93819
^"^Cage 1090±60
2230±60
Calibrated age (BP)
1130-920
2345-2090
Calendar age (refAD 1950)
AD 820-1035
395-140 BC
Table 6.1 Radiocarbon dates from Upper Merrivale
TTie data suggest the rate of sediment accumulation between 65 and 100cm was 0.021 Icmyr". It IS
not possible to extrapolate with any degree of certainty beyond this. However, given the increasing
levels of Alnus pollen at 125cm a date of 4930-4580 BC is suggested by comparison with the Tor
Royal profile (Table 5.1). This suggests an accumulation rate of 0.0056cmyr'^ between 100 and
125cm, and obviously creates considerable problems in interpretation of Neolithic and Bronze Age
activity in the area since the very slow accuurnulation rate and/or very compressed nature of the
sediment for these periods has reduced the temporal resolution of the sediment; a period when much
activity is inferred from the archaeological evidence. Assuming the exotic coniferous pollen detected
158

in the uppermost sediments (Abies, Picea and Pinus) is due to plantations of the last two centuries an
accumulation rate of ca. 0.06cmyr" is feasible for the upper sediments.
In a sedimentary situation such as the one at Upper Merrivale in which there is much field evidence
for the influence of human activities fi-om an early date the presence of a hiatus in the depositional
record is always a possibility. It is possible that the profile may have been truncated in late Neolithic
times although more radiocarbon dating evidence from these levels is required to investigate this
further.
6.4.3 EDMA investigation
Initially it was hoped that geochemical analysis of the sediments fi-om Upper Merrivale would reveal
a record of local mineral exploitation associated with the tin streaming and processing activities in
the area. TTie possibility also existed for the identification of prehistoric tinning signals, suggested to
have occurred in the immediate vicinity (Greeves and Newman, 1996). Tlie investigation was also
aimed at elucidating wider scale palaeoenvironmental processes, such as the geochemical
consequences of local deforestation and the subsequent degradation of catchment materials through
the initiation of retrogressive pedogenic processes.
EDMA geochemical results are presented as elemental profiles (Fig. 6.3a/b) divided into six distinct
chemizones (section 2.4.1). l l ie chemizones are described in Table 6.2. Initial observations question
the utility of a number of elemental profiles. TTie heavy metal elements (As, Pb and Sn) along with
Mg and Mn all display very low values throughout the core. TTiey also behave in a very similar
fashion, a feature observed for the other sites so far discussed. This close relationship between
profile features may point to the fact that these elements are of no use, and the profile characteristics
are therefore a result of fluctuations in the other, more abundant elements. However, the peak
exhibited by Sn, As, Pb at 100cm may suggest caution is required before discounting the use of these
elements. Na and Ca display generally stable profiles, with only one peak each. Their general
absence may be a function of the sedimentary system, relating to increased levels of acidity which
favours mobility and removal of these elements through leaching processes (Goldschmidt, 1954;
Shotyk, 1988).
159
091
Depth (cms below ground surface) no
o O
O
O O
8 Calendar years (2 Sigma)
00 O o o o
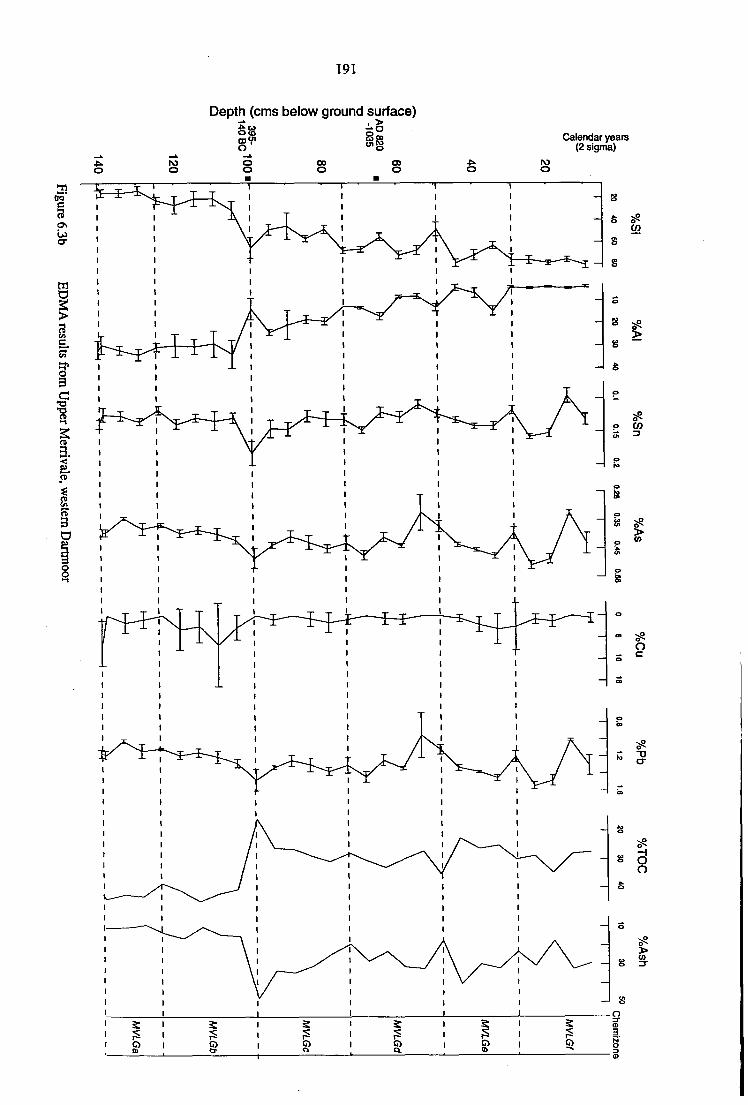
191
Depth (cms below ground surface) TJ • >
Calendar years (2 Sigma)
Chemizone
MVLGa
MVLGb
MVLGc
MVLGd
MVLGe
MVLGf
Depth (cm)
141-125
125-100
100-75
75-45
45-30
30-10
Description
Si and Al dominate the zone. Steady state equilibrium is displayed for a number of elements: the trace metals Pb, Sn, As with Fe, Mn, Na, K and Mg. P peaks at the MVLGa/b boundary, whilst S falls consistently. Ca exhibits a peak at 130cm of ca. 5%. TOC is high and stable at 35%. Mineral content of the sediments in MVLGa is around 10%.
Sn, As and Pb all display gradual increases through the zone with a peak value for these traces found at 100cm. A similar profile is presented for Fe, K and Si. S, Al and TOC fall through the zone and exhibit dynamic equiUbrium conditions at 100cm. Na and Ca are steady.
Increasing levels of Si and TOC are accompanied by declining profiles for Al, K and mineral material. Fe also declines following a peak at 95cm (2%). TTie trace elements appear intercorrelated and stable, except for Sn which declines from the peak experienced at the MVLGb/c boundary. S behaves erratically, but displays a profile similar to TOC.
Hie zone is dominated by Si, which at the upper boundary reaches ca. 80%. Al declines steadily through this zone. Na, K, Ca and Fe appear only in trace quantities. S and Cu are low and stable The trace elements display intercorrelated profiles with Mg and Mn..
Ca, K, Na, Fe all display very low amounts of <1%. P and Al display similar profiles in this zone. The peak of these elements at 35cm is associated with a reduced Si content of the sediment, and declining levels of mineral material. TTie trace metals display very similar profile features.
Si dominates the elemental spectra of this uppermost zone, peaking with a surficial value of 80%. Al, Cu, S, Fe, Na, K and Ca are present only in small amounts. Hie trace elements are intercorrelated and fluctuate widely in this zone.
Table 6.2 Description of chemizones from Upper Merrivale
162
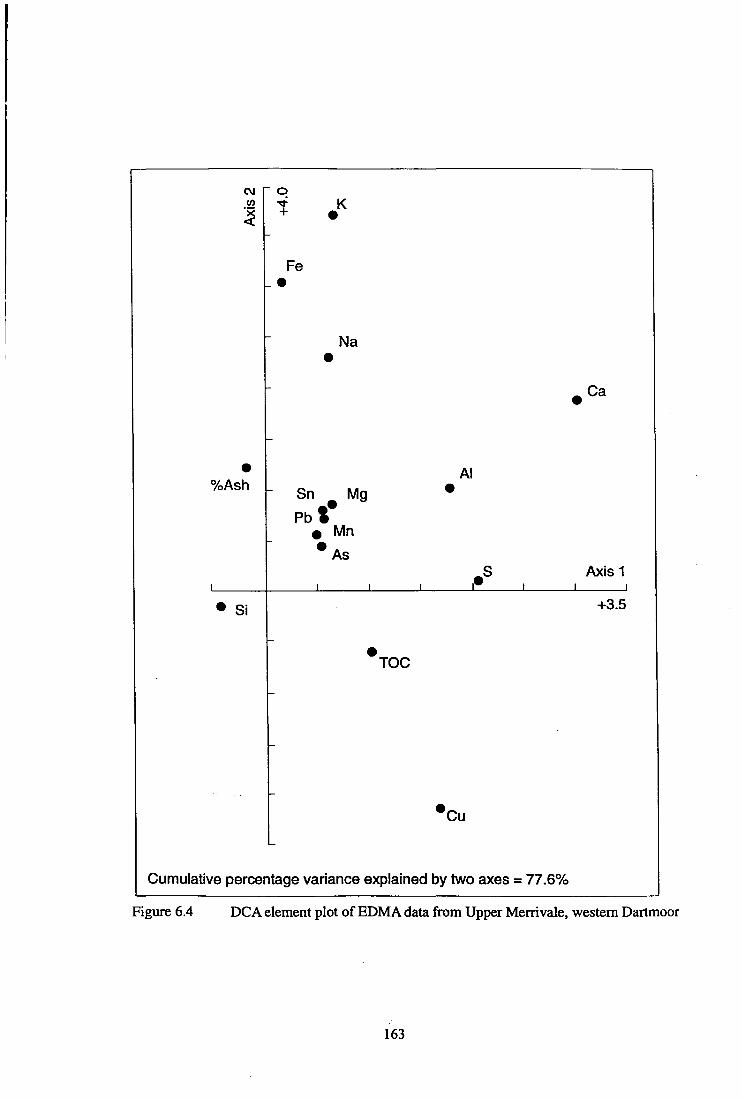
CVJ (A
? .K
Fe
Na
Ca
• %Ash
1
• Si
Sn Mg • • P b l
9 Mn
• A S
1 1
• TOC
• Al
Axis 1 1 1
+3.5
'Cu
Cumulative percentage variance explained by two axes = 77.6%
Figure 6.4 DCA element plot of EDMA data from Upper Merrivale, western Dartmoor
163

CM CO
/ 1
1 1 1 1 1 1 1 1 1
1 1 \
V
1 ^
O) O
_ +
- .100
2
+10 ^'°
4*30
-..
\ .90 \
1
1 85 ,
+ 80 ,
/ 1 • "
/ +105+ r +130 -^
' "^2° 140 110 . + ^ 1 3 5
+ +115 + 141 . ' "-.>_ + - ' ' Axis 1
- - - , 1
+2.0
Cumulative percentage variance explained by two axes = 77.6%
Figure 6.5 DCA sample plot of EDMA data from Upper Merrivale, western Dartmoor
164

6.4.4 Multi-variate analysis of the Upper Merrivale EDMA data
The DCA plots of the geochemical data are shown in Figs. 6.4 and 6.5. Investigation suggests a
relationship between %ash and the Si content of the sediment, as such this indicates that axis one
represents the division between mineral matter and organic material, since S is located some distance
from these clastic components. The position of Ca may therefore suggest its geochemistry in this
situation is largely controlled by autogenic processes. It also seems likely that the presence of Al is
not primarily govemed by the levels of alumino-silicate material, as such it may be related to the
presence of humic material, since Engstrom and Wright (1984) comment that Al can be chelated
with high molecular weight humic materials. Axis two seems to indicate the pH regime of the
system. A clustering of elements towards the upper limit of the axis, composed of Na, K and Fe,
suggests these elements to be associated with a higher base status, as opposed to TOC and Cu which
in this case are associated with acidic, anaerobic processes. The sample plot (Fig. 6.5) is clearly
divisible into two distinct groups, which relate solely to the pre- and post-100cm event. The specific
nature of this event wUl be discussed in the following sections.
6.4.5 Interpretation of the geochemical signals from Upper Merrivale
The initial status of the system
The indicators of physical erosion (Na, K, Mg, %ash) are all low and stable. TTie basal zone seems
to suggest stability in the catchment. However, evidence to suggest increasing disturbance to MVLGb
is presented by the falling S and TOC profiles. This may be significant since both are important
elements associated with the metabolism of all living organisms (Goldschmidt, 1954). The peak of P
at 125cm may be associated with inorganic clastic minerals or result fix)m increased precipitation of
the element with organic matter (Engstrom and Wright, 1984). Tlie former is unlikely since there is
limited evidence for the inclusion of clastic minerals into the sediment at this time. The single peak of
Ca at 130cm may relate to mechanical erosion of catchment material, but the element is more easily
removed in solution from mineral material than K, Mg and Na, which are absent at this level. Ca has
a strong affinity for organic ligands, as such the signal at 130cm may relate to autogenic processes
within the sedimentary body (Engstrom and Wright, 1984). Tlie absence of Fe in MVLGa potentially
suggests acidic, anaerobic conditions.
The geochemistry of Cu here may be linked to the fonnation of sulphides in the anaerobic zone since
the presence of sulphate ions and organic matter can lead to the microbial formation of H2S, and
165

thus to the precipitation of metal sulphides (Goldschmidt, 1954). The presence and behaviour of Cu
in MVLGa seems most likely controlled by a combination of sulphate reduction and the formation of
metal/organic complexes (Livett et al., 1979; Hermann and Neumann-Mahlkau, 1985; Shotyk,
1988; Stewart and Fergusson, 1994).
Increasing catchment disturbance
TTie signals associated with MVLGb present more clearly an episode of environmental disturbance
into which quartzitic grains were introduced to the sedimentary system at 100cm. This explains the
peak in Si, K and %ash. Elevated values for the heavy metals at this level suggest possibly that the
mineral material was enriched in these elements. The disturbance may therefore have been connected
with prehistoric mineral extraction procedures; although the radiocarbon evidence produced a date of
395-140 BC (Table 6.1), a period generally considered to indicate the demise of Bronze Age
traditions and the onset of Iron Age times. It must be stated that the link between the geochemical
evidence and the archaeological hypothesis of prehistoric tinning activity in the area is tentative. As
has already been stated the utility of EDMA for heavy metal analysis from this type of sedimentary
environment seems questionable. Further investigation is required in a range of different
environmental situations with comparison made to the results from a comparable geochemical
technique.
"Die gradual increase for Si and K suggests intensifying activity from MVLGa, possibly caused by
increasing landscape disturbance, which may have taken the form of mineral extraction or
deforestation activities. TTie sharp decline for S and TOC at 100cm confirm intensive disturbance to
the peat accumulating system at this time. TTie decrease in TOC may relate to the erosion of the peat
body itself, and general degradation in catchment and mire materials. Increasing Fe from 105cm may
suggest the system was becoming less acidic and experiencing increased periods of aeration, possibly
even drying out since Fe is considered ubiquitous in oxygenated environments (Goldschmidt, 1954;
Mackereth, 1966; Jones and Bowser, 1978; Engstrom and Wright, 1984; Naucke et al., 1993).
However, the increased Fe content of the sediments at this level may not result from a change in the
internal status of the mire, but from the increased transportation and deposition of inorganic oxides
and oxide coatings on mineral material. "Die elevated levels of mineral material (%ash) at 100cm
exceed the generally accepted values for fen peat reported by Naucke (1980), suggesting the bulk of
this material was deposited as suspended matter carried locally by the river or in the spring waters.
166

This increased nmoff may have been the result of increased woodland clearance on the surrounding
slopes, or a possible climatic change.
The system appears to recover following the disturbance of MVLGb. However, it seems likely that it
never attained its pre-disturbance status: S, TOC and Al exhibit dynamic metastable equilibrium at
lOOcm suggesting a major environmental change (Butzer, 1982; Grattan, 1994). The heavy metal
elements decline marginally fix»m 100cm then attain static equilibrium for the rest of the zone. Both
K and Mg fall through MVLGc suggesting a declining input of base rich material and/or enhanced
leaching under increasingly acidic catchment conditions. This is confirmed by the declining levels of
Fe from 95cm upwards, which is mobilised under acidic, anaerobic conditions. Si fluctuates through
the zone, exhibiting an overall increase and does not display a relationship to the Al profile, which
suggests a possible link with organic material, as opposed to an association with alumino-silicate
material (Muscutt et al., 1993). The presence of diatoms at 95cm was confirmed by SEM
investigation, thus the Si and ash signals contain both biogenic and allogenic components. The
elevated levels of P in MVLGc may relate to the presence of diatoms in the sedimentary system since
this element is considered one of the controlling variables for the organisms (Goldschmidt, 1954;
Engstrom and Wright, 1984; Grattan, 1994).
Post disturbance conditions
Increased acidity is suggested from MVLGc since a number of elements exhibit a very low presence
in this zone (Ca, Mg, K, Na and Fe). However, the signals associated with MVLGd indicate general
stability with an absence of elemental peaks. Many of the elements display declining trends through
this and the remaining zones, including S, P, Al, Mg, K and the heavy metal elements, indicating a
continued degradation of catchment materials, possibly initiated by the earlier disturbance phase.
Tlie presence of diatoms was again noted at 70cm and possibly explains the high levels of Si in
MVLGd. The Si and Al elemental curves display inverse profiles, as such it is unlikely they relate to
the presence of alumino-silicate material, however it may be the case that the Al has experienced
post-depositional leaching partially obscuring the palaeoenvironmental signal for the element.
Signals eissociated with the intense tinning activity inferred from the concentration of industrial
archaeology in the area appear to be absent. Given the accumulation rates discussed above (section
6.4.2) sediments at a depth of 20cm date from the 16th/17th century. This is the period when the tin
167
mills in this area were operating at capacity (Greeves and Newman, 1996). The minor peak for Sn,
As and Pb may be attributable to such activity but caution must be used in the interpretation of these
signals as stated earlier.
Modem signals
This upper zone is complex to interpret due to the combination of active chemical, biological and
physical mire processes and the signals of recent environmental change. The acrotelm/catotelm
boundary seems to be located at 20cm due to the bio-accumulation of K above this level in the active
acrotelm layer, and the possible concentration of heavy metals accumulated at this boundary. Si and
Al display steady state equilibrium which suggests constant supply of these elements to the sediment.
6.4.6 Pollen analysis of the sediments from Upper Merrivale
The nature of the peatland system and its topographic setting suggest that taphonomic processes will
result in pollen spectra dominated by load and extra-local components (Jacobson and Bradshaw,
1981; Prentice, 1985), with a potentially large amount of pollen entering the system as components
of run-off (Chen, 1988). TTie effects of human activity therefore form the focus of palynological
investigation here. "Die results are presented as a pollen diagram (Fig. 6.6) and described in Table
6.3. TTie data are presented as percentages of Total Land Pollen (TIP). TTie DCA plots from
analysis of the pollen are presented as Figs. 6.7 and 6.8.
6.4.7 Multi-variate analysis of the Upper Merrivale pollen data
DCA of the pollen data indicate a number of discrete species groupings (Fig. 6.7). The first (group
a) is indicative of a woodland habitat, conqxised of Quercus, Betula. Alnus and Salix with epiphytic
species, including Polypodium and other components of Pteropsida imdiff. This group is present in
the basal levels of the core and points to the initial status of the local vegetation. The next group (p)
includes species typical of disturbed habitats {Plantago lanceolata, Rumex undiff. and Pteridium
aquilinum) possibly indicating the vegetation response to the activity identified geochemically and
stratigraphically at 100cm. The change in the nature of the local vegetation suggests the activity to
have been local but relatively intensive. Group x contains those species associated with acidic
grassland communities, as identified for other areas of Dartmoor (Hatton, 1991; Caseldine and
Hatton, 1993) and includes such taxa as Potentilla, Lotus, Succisa pratensis and members of the
Asteraceae family. This group indicates the post disturbance condition of the local area. TTie final
168
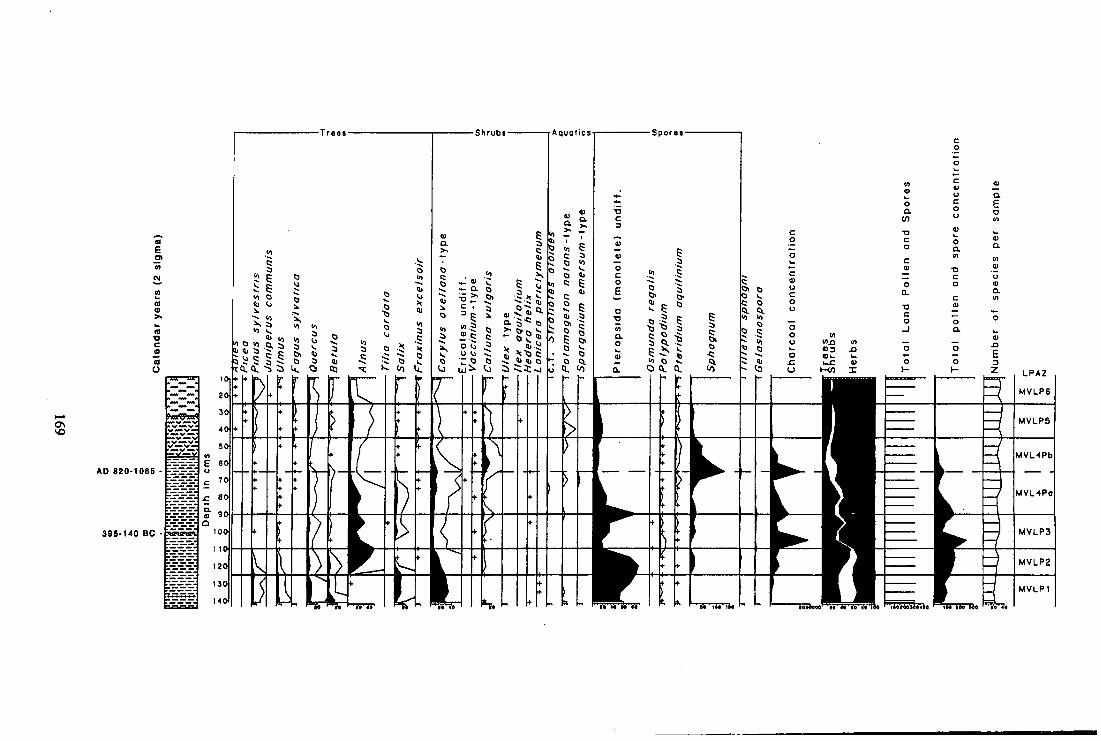
- T r e e s - -Shrubs- Aqualics Spores-
0^
AD 820-1065
395-140 BC
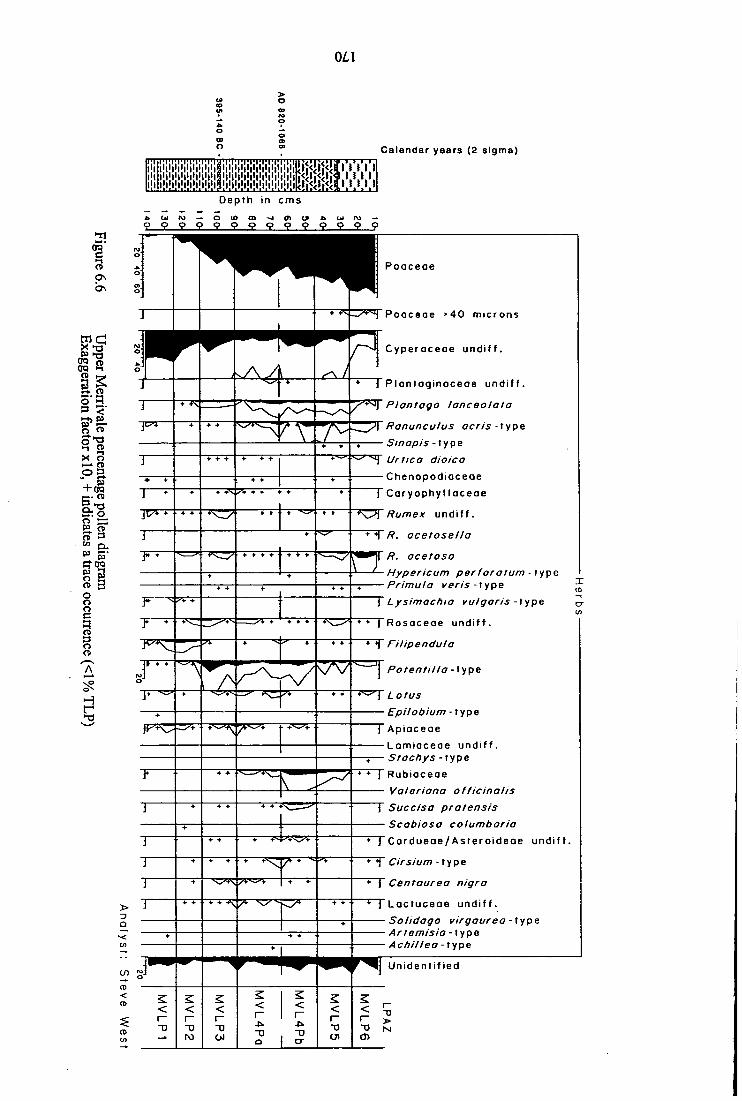
0L\
>
Calendar years (2 sigma)
O
ON
22 « (re "-I
o'3 p :<•
o « 1-1 2 X o
°a J - ^
5« Sto
« a.
o 3 o o o c n 3 o a
/—\
H t-'
< > > I I I ! I l l
i i i i i i i i i
- i i i i
i i i i i
!!!!!
77 m Depth in cms
J k O l M — O l D O D ^ O l O ^ O i r O '
Poaceoe
• ••4--^*~TPoaceae >40 microns
Cyperaceae undiff.
T" Planloginoceoe undiff.
Plantago lancaolata
^Ranunculus acris -\ype
Sinapis - type
•'- 'f '^"^ Urtica dioica
Chenopodiaceae
TCaryophyl laceae
* \^1 Rum ex undiff.
'•'• + i /?. acetosella
R. acetosa
Hypericum perforaium-x^p^ Primula veris -type
Lysimachia vulgaris -\ype
' • * J Rosaceoe undiff.
X
+ - Filipendula
Potentilla -type
Epilobium -type
T Apiaceae
Lamiaceae undiff. Stachys -type
+ • J Rubiaceae
Valeriana officinalis
r Succisa pratensis
Scabiosa columbaria
* J Cordueae/Asteroideoe undiff.
+ •) Cirsium -type
*• ) Centaurea nigra
'•'• + \ Loctuceae undiff.
Solidago virgaurea-type Artemisia -\ypa Achillea -type
Ij Unidentified
Zone
MVLPl
MVLP2
MVLP3
MVLAPa/b
MVLP5
MVLP6
Depth (cm)
140-125
125-110
110-90
90-45
45-25
25-10
Characteristic pollen types
Coryhis avellana-type, Cyperaceae, Pteropsida Increasing ferns through this zone (50-80%). Arboreal pollen (AP) is consistently represented, decreasing sUghtly to MVLPl. Salix increases through the zone, while Corylus avellana-typt falls gradually. Herbaceous pollen is abimdant (ca. 40% TLP) and is dominated by the sedges, with contributions from Ranunculus acm-type, Rumex spp., Filipendula, Potentilla-type, Lotus and members of the Apiaceae family.
Alnus, Corylus avellana-type, Poaceae, Cyperaceae, Sphagnum, Pteropsida AP increases to 50% TLP, the major component of which is Alnus. The other trees decrease gradually to MVLP3. Calluna and Poaceae reach their empirical limit at 125cm. Cyperaceae pollen decreases to MVLP3. Herbaceous taxa still form a major component, with Plantago lanceolata appearing for the first time at 120cm.
Poaceae, Cyperaceae, Alnus, Pteropsida Declining AP. Ferns increase dramatically through the zone. Sphagnum rises steadily. Herbaceous pollen is dominated by Poaceae and Cyperaceae, the latter declining steadily through the zone, with increasing contributions from open grassland and disturbed environment indicators.
Poaceae, Cyperaceae, A/nus, Corylus avellana-typc. Sphagnum AP falls steadily through this zone, with Quercus and Betula falling to trace amounts at 60cm. Fagus appears for the first time at 75cm. Tlie shrubs are consistently represented in the zone, with Calluna exhibiting a maximum occurrence at 60cm. Poaceae increases through the zone, with Cyperaceae steadily present. Herbaceous taxa are generally well represented in this zone.
Poaceae, Cyperaceae, A/n«s, Corylus avellana-type, Calluna Poaceae increases steadily through the zone, while the arboreal species remain generally constant. Herbaceous taxa are composed largely of acidic grassland indicators.
Poaceae, Rumex species, Cyperaceae, Pteropsida For the large part all of the components of the pollen spectra are constant. TTie only arboreal species to decrease is Alnus (10 to 5%). TTiere is a consistent presence of Fraxinus in this zone (3%). Herbaceous components are dominated by the grasses, but the Rumex species increase to a peak in this zone. The indicators of acid grassland are also prevalent here. Cereal type pollen grains increase. Species attributable to the plantation of exotic coniferous woodlands are located in the upper sediments.
Table 6.3 Description of local pollen assemblage zones from Upper Merrivale
171

CM (0
Sucxdsa pratensis/ Cardueae/Asteroldae undiffCji Callurja vulgaris
Caryophyllac^ae •
Rubiace^^ i Lotus
• Potentilla
Pteridium aquliniuiA^ Cyperaceae
Plantago lanceolaf£(m ^ Ranunculus acns-type' •
Poaceae'
O CO
+ 'Sphagnum
• Lactuceae'
N /
I Aplaceae
' • Corylus I avellana *• Reropsida (monolete) undlff.
' // • Salix • ffumex undlff. Tilipendula
p --^' *• Pol^xxiium ^^^ ' • Betula
/mAlnus "• 1 Quercus ^ "
I " - . • , ! _ • - - " I Axis 1
Fagus • ^ Fmxinusu •'Jrtica
V Rumex acetosa •
• Rosaceae
Pinus
Ulmust +2.5
• Cerealia type
Cumulative percentage variance explained by two axes = 57.7%
• Trees • Herbs * Shrubs • Spores
Figure 6.7 DCA species plot of pollen data from analysis of Upper Merrivale sediment (Species shown all have occurences >l% TLP in >5 samples)
172
CM
'x <
in cvi
/ +6^^
+ 60 \
///
\-f^' 55
50
\ + ° .85
100 s + \ \
95 \ + I
45 ' y +*" ( I+7C 105 / / I
/ IV I > ^^+ ^80 ( 40 I ^ •*• '
v3a + I ^ ,110 / - ^35
• /
/ /
10
1-0^=
'^Z /
/
^.90 .120
115 \
,141 + , ^ ^130 '
135 / - ^ ,
^ ++ \ / ^ . 1 4 0
Axis 1
+2.5
Cumulative percentage variance explained by two axes = 57,7%
Figure 6.8 DCA sample plot of poUen data from analysis of Upper Merrivale sediment
173
group (6) relates to the modem pollen spectra of the area, with components derived from a wider
catchment area {Fagus sylvatica and Fraxinus excelsior).
The DCA plot of pollen sample scores (Fig. 6.8) revealed a clear pattem of groups each significantly
different to produce five distinct assemblages. Group I includes the basal samples from 141 to
115cm, therefore relating to group a (Fig. 6.7). The next set includes samples covering the major
signals associated with the disturbance event at 100cm (100 to 75cm). Groups in and IV include
samples from post disturbance levels and thus relate to group x of Fig- 6.7. The final sample
assemblage outlines the uppermost samples, and indicates the modem vegetation communities as
illustrated by group 5 on the species plot (Fig. 6.7).
6.4.8 Interpretation of the Upper Merrivale pollen data
The initial stage: ca. 6000-5000 BC
The basal sediments indicate a Corylus, Quercus, Betula and Ulmus dominated woodland, in which
ferns are abundant, suggesting open patches in the woodland cover. High values for Corylus at this
time (>30% TLP) suggest it to have been present very close to the sampling site. It is likely that the
river area would have been dominated by Salix species and members of the Cyperaceae family, with
Betula possibly forming a component of this carr community. The ferns may also have shared this
damp area, as would Lysimachia vulgaris-type and Filipendula with fen species of the
Chenopodiaceae and Caryophyllaceae famiUes. This site was more sheltered than some of the other
contemporaneous Dartmoor sites (Blacklane Brook, Simmons, 1962, 1964; Simmons et al., 1983;
Black Ridge Brook, Caseldine and Maguire, 1986), and has fewer heathland components, higher
AP/NAP ratios (40%) and a higher representation of species usually confined to the lower slopes e.g.
Ulmus, Hedera helix and Lonicera periclymenum. The basal samples seem likely to date to the late
Mesolithic/early Neolithic period, although fiuther radiocarbon dating evidence is required to
substantiate this.
The herbaceous pollen indicate the presence of open disturbed conditions, with such species as
Rumex, Epilobium and Urtica dioica. The absence of grass and Calluna vulgaris pollen suggests
this zone predates the inception of blanket peat for this part of the Walkham catchment. It seems
likely that the high levels of Corylus compared to Quercus suggests the presence of hazel scrub, with
174

oak as a secondary species, although the differential pollen productivity of the two species may be a
factor (Anderson, 1970). ITie absence of ericaceous species at this time may be explained partly by
the dominance and increased shading produced by the dense Corylus avellana scrub, although the
pollen dispersal capabilities of Calluna vulgaris suggests this absence may be explained by plants at
some distance from the sampling site (Evans and Moore, 1985).
A changing landscape: the inception o/Alnus woodland and grassland communities - ca. 5000 BC
Hie most striking feature of MVLP2 is the sudden, rapid rise of Alnus, usually taken as a well
defined regional chronozone dated to ca. 7(X)0 BP (Simmons et al, 1983; Chambers and Price,
1985; Birks, 1989). TTie greater representation of this species here in comparison to Tor Royal
(Chapter 5) suggests it was actively growing as the dominant fen carr species having outcompeted
Salix. It appears to have formed a closed canopy woodland which outshades the sedges, ferns and
other mire components.
This zone displays the first indications of anthropogenic disturbance in the Walkham catchment.
Many of the arboreal species are declining, while the pollen spectra indicates an opening of the
previous woodland phase. Poaceae first becomes a component at this level as does Calluna vulgaris
and Potentilla-type, with other herbaceous taxa indicative of more open conditions: Plantago
lanceolata. Ranunculus acris-type and Rumex species. This suggests the onset of blanket bog
development on the surrounding slopes. It is possible, given the evidence described above, to suggest
that the local environment at this time became considerably wetter, indeed Sphagnum species first
appear at 125cm. The triggering mechanism for the inception of blanket peat therefore seems to have
been a change in local hydtological conditions (Staines, 1974; Maguire, 1983), possibly following a
subtle climatic change or deforestation (cf. Chambers and Price, 1985) resulting in a greater amount
of run-off (Moore, 1988,1993).
The decline in AP and Corylus avellana with an increase in charcoal concoitration points to increasing
human activity in the area, althou^ thoe is no archaeologjical evidoKe to support this hypothesis in the
immediate area at this time. The limited dating evidaice suggests this activity could well have beoi
contarporary with crtho- Mesolithic/Neolithic activity on the moOT, e.g. Tor Royal (Chapta: 5), at Pinswell
(Caseldine and Hatton, 1993, 1996), and at Post Bridge and Taw Marsh (Simmons, 1962). All of tiiese
sites share common features at this time including suppression of the woodland cava, expanding levels of
175
habaceous taxa and increased levels of microscopic charcoal. Zveld)il (1994) commoits that the
incidaice of clearing and burning phases at this time wae too high to be sinply explained by acts of
nature alone. He suggests that delibwate forest clearance and the maint^iance of more opea landscapes
WCTe part of a promotional strategy to increase the productivity of nut and fruit trees and shrubs, wetland
plants and possibly evoi native grasses. This notion suggests that increases for Corylus woe possibly the
result of human intoraition (Smith 1970; Simmons, 1993).
Salix was outcompeted by the invasion of Alnus in MVLP2, most likely due to the effective
reproductive strategies of the former which are greatiy enhanced by the presence of flowing water
(McVean, 1953). Chambers and Elliott (1989: 548) comment that "disturbance may be
regarded as a prerequisite for the expansion of alder at many sites". Given the time frame this seems
a distinct possibility. Continued suppression of the local woodlands is noted in this zone with the
reduction of a number of arboreal species after ca. 5000 BC. The herbaceous taxa indicate more
open conditions, with an expansion of blanket bog which may relate to the increasing use of fire.
Supposing there was a connection it may follow the model of environmental change proposed by
Caseldine and Hatton (1993) for the Pinswell site, and by Jacobi et al. (1976) for sites in the
Pennines.
Given the temporal resolution of the mid profile sediments it is not possible to clearly identify the
position of the Ulmus decline with any certainty more than to say it seems to be located around
110cm, thus dating these levels to ca. 3000 BC. TTie very compressed nature of these sediments
obscures the palaeoenvironmental information relating to the Neolithic and Bronze Age utilisation of
the moorland. There is abundant archaeological evidence in the vicinity for the activities of the
Bronze Age population including various types of hut circle settiement, reaves and possibly some of
the ritual monuments to the south. Evidence from other parts of the upland suggest increased
clearance and habitat disturbance during this period. At Holne Moor (Maguire et al., 1983) and
Shaugh Moor (Beckett, 1981; Smith et al, 1981) after ca. 1200 BC increased levels of
anthropogenic activity in the local area are inferred from the changing pollen spectra, and by the
construction of a number of reave structures in these areas. "Die general character of the vegetation
in these areas was probably comparable to that of Upper Merrivale at this time, dominated by Alnus
with Quercus, Betula and Corylus avellana with a herbaceous flora composed of mderal plants
including Plantago lanceolata, Rumex species and Ranunculus acm-type. However, both of these
176

sites include indicators of arable activity which are absent from Merrivale, possibly suggesting the
higher altitude sites were not as favourable during these times for cereal production, although the
pollen dispersal capabilities of cereal crops may be a factor (Vuorela, 1973; Hall, 1988) . Tlie
sporadic occurrence of blanket bog indicators across the moor at this time suggests that local
topography and hydrological regimes dominated the triggering and development of these systems {cf.
Maguire, 1983).
Increasing deforestation activity: post 500 BC
MVLP3 is characterised mainly by falling Alnus values which seem to relate to selective clearance of
the species from the carr woodland. TTie opening of the previously dense woodland allows secondary
colonisation of Salix and Betula species to occur. Similarly the fems and sedges respond rapidly to
the more open conditions. Expansion of blanket bog is also experienced.
Grasses increase through the zone, as do the indicators of open grassland communities: Potentilla-
type, Lotus, Centaurea nigra and members of the Lactuceae tribe. Similarly disturbed ground
indicators are significant in this zone, P. lanceolata, Urtica dioica, Rumex species and Hypericum
perforatwn-type. A peak of charcoal at 105cm seems to have had a significant effect on the area
around the sampling site, leading possibly to an acceleration in the rate and extent of blanket bog
development and recession of the forest cover, with a subsequent expansion of herbaceous species. A
short-Uved recovery of Alnus occurs at 95cm (ca. AD 200), but its continued decline seems to relate
to a second phase of burning activity, with a fiirther expansion of fem species, and an expansion of
blanket bog.
Many of the trees expand slightly following the disturbance of MVLP3. Quercus, Betula and
Corylus avellana increase, most likely forming woodland patches on the hillslopes. Alnus and Salix
are present and form a secondary woodland carr in the damper area surrounding the River Walkham.
Hie area of grassland expands through MVLP4a, with open/disturbed herbaceous pollen indicators
represented. TTiese levels indicate the continued utilisation of catchment resources through the Iron
Age and Roman period into the Dark Ages. General features of the period include the continued
expansion of acidic grassland dominated communities, and the persistence of Alnus and Corylus
avelUma albeit at reduced amounts.
177
The early Medieval period {MVLP4b) experiences further clearance in an environment that seems to
be increasingly stressed. This activity is associated with a major increase in charcoal concentration
at 65cm, and the almost complete removal of arboreal species, dated to AD 820-1035 (Table 6.1).
Clearance is accompanied by an expansion of Filipendula, Potentilla, Lotus, members of the
Rubiaceae family, Succisa pratensis and Cirsium species, all of which relate to damp acidic
grassland communities (Rieley and Page, 1990; Hatton, 1991). It is likely that this clearance activity
is linked to the mineral extraction processes operating in this area of the moor from as early as the
9th century AD (Greeves and Newman, 1996), since Alnus is well documented as a possible source
of charcoal (McVean, 1953) for die early tinners (Simmons, 1962; Brown, 1977; Beckett, 1981;
Caseldine and Maguire, 1981).
The clearance is tentatively related to a possible deterioration of climatic conditions and subsequent
increase in blanket bog development, as reflected by the peaks for Sphagnum, Calluna and
Cyperaceae at the MVLP4a/b boundary. It is possible that this expansion of blanket bog may relate
to the increased levels of anthropogenic disturbance in the area, but also to a mid-first millennium
AD cUmatic downturn (Blackford and Chambers, 1991). However, the validity of the climatic
deterioration at this time remains largely unsubstantiated (Ballantyne, 1991) since the English
temperature curve before AD 1100 is rather uncertain. However, recent investigations have
suggested some indication of increased surface wetness of ombrotrophic mires from northern
England aroimd 1000 years ago (Barber et al, 1994).
Following this period a number of arboreal species appear in the pollen spectra, including Pinus
sylvestris, Ulmus, Fagus sylvatica, Quercus, Betula, Alnus, Salix, Fraxinus and Corylus avellana,
although it seems likely these would have formed a very patchy woodland. The largest proportion of
this area consisted of acid grassland with associated herbaceous species characterised by Potentilla,
Rubiaceae (probably Galium saxatile), Succisa pratensis, Plantago lanceolata and members of the
Cyperaceae family (e.g. Carex and Eriophorum species).
The modem moorland: AD 1400 to present times
The upper two pollen zones characterise the late Medieval and more recent times indicating general
stability in the area. However, grassland continues to increase in the area. The appearance of cereal
type pollen grains in the upper sediments (45cm), dated to ca. AD 1400, relate to Medieval
178
agricultural practices, and characterise the most intensive tinning activity in the area, as indicated by
the concentration of industrial archaeological remains of this period. TTie presence of these grains
confirms arable practices were being carried out on the moor at this time, but it is likely that activity
was on a small scale, possibly resulting from activities at Shillapark Farm. The open moorland of
this time was utilised as common grazing land for sheep, with smaller amounts of cattle. A decline in
Calluna at the onset of MVLP6 may relate to more intensive use of the moorland in the form of
overgrazing, burning and afforestation around AD 1500 (Stevenson and Tliompson, 1993). Again,
the presence of cereal type pollen indicates arable agriculture for the period after AD 1500. TTie
presence of Picea, Abies and Pinus sylvestris date the upper lOcms to around AD 1700 since the
first coniferous plantations were generally established after this date (Ratcliffe, 1984). Dartmoor at
this time was undergoing a change with respect to its land use. Enhanced technology had improved
the extractive efficiency of the tin ore smelting process meaning previously worked areas could be re
worked to extract the small amounts of tin which were previously considered unproductive. The
moor saw the development of stone quarries, such as the nearby Merrivale and Fogintor quarries,
which would have provided materials for the implementation of infrastructure developments.
6.5 Discussion of the palaeoenvironmental development of the Upper Merrivale area
The basal sediments characterise a local fen carr community composed predominantly of Salix
species, with surrounding hill slopes dominated by Corylus-Quercus scrub woodland (Fig. 6.9,
Table 6.4). Open conditions are indicated by the presence of a number of taxa, including ferns,
Rumex species and Urtica dioica. Although it is seems these openings may be natural components of
the woodland, since the indicators of physical erosion are low, with the other geochemical signals
suggesting stable conditions. The initiation of blanket bog development occurs at 125 cm (late
Mesolithic) as indicated by the increased abundance of Calluna vulgaris, Poaceae and Potentilla-
type pollen, in association with an increased presence of Alnus and charcoal fragments. This
evidence corroborates the suggestion presented by Moore (1988, 1993), but it is still not possible to
unequivocally state the dominant triggering mechanism for inception. However, in this location it
seems that the activities of the human population have been more than instrumental in the initiation
of pedogenic processes, inevitably resulting in large scale landscape degradation with subsequent
development of blanket peaL Continued deforestation is noted through the prehistoric period and into
the Roman and Dark Age periods. This substantiates further the claims made at Tor Royal that the
moorland resources were being actively utUised throughout these periods, despite scant
179
Time
Modem
AD 1700
AD 1200
AD 820-1065
395-140 BC
3000 R P J\AJ\J Lt\^
6000 BC
Cultural period
Medieval
Dark Ages
Romano-Bridsh
Iron Age
Bronze Age
Neolithic
Mesolithic
Geochemistry
Acrotelm processes (bio-accumulation of K)
Acidic sedimentary environment
Increasingly acidic conditions Goss of Fe, Al and bases)
Tfif*!*** cf*H I P V P I C OT S I
K, %ash
Autogenic processes
Stable elemental profiles (Na, K, Mg)
Vegetation
Coniferous plantations
Cereal pollen
LowAP
Acidic grassland communities dominate
Falling Alnus, increasing Poaceae
Inception of blanket bog FalUng AP, expanding NAP
Alnus rise
Corylus, Quercus, Betula, Salix plus ferns
Environment
Much grazing activity
Tlnworking
Area characterised by rough grazing pasture
Significant local disturbance activity
Gradual deforestation
Anthropogenic disturbance (charcoal)
Mixed woodland with open patches
Table 6.4 Summary of the palaeoenvironmental conditions at Upper Menivale
180
Late Mesolithic/Neolithic
Great Mis Tor
Local area dominated by damp woodland adjacent to the nver, with hillslope characterised by Corylus and Quercus. Increasing disturt)anc8 results in a pollen spectra composed increasingly of grasses and mderal species. Blanket bog initiates around the same time.
River Walkham
Acidic, einaerobic sedimentary environment (low Fe and bases,
formation of sulphides).
Salix dominates until the invasion of AInus at 5000 BC
Iron Age (400 BC)
Increased presence of Si, clastic elements and %ash
A significant deforestation episode results in the recession of woodland concfitions in the area and an expansion of grassland and bleinket bog communities. Patchy hazel scrub is present on the hillslopes of this period, with alder still dominating the damp area around the River Walkham.
Dark Ages - Medieval - Present day
Acidic conditions (low bases)
Open environment charactersied by acidic grassland and blanket bog communities. Very infrequent tree species.
Figure 6.9 Schematic development of the Upper Merrivale area from late Mesolithic to modem times
181

archaeological evidence for setdement of these uplands areas. The indicators of physical disturbance
increase and peak between 395-140 BC (100cm). Increases for Si, K and the mineral content (%ash)
of the sediments in association with decreases for TOC and S indicate significant disturbance to the
system in which mineral particles were deposited direcfly onto the mire surface. This episode is
similarly reflected in the palynological data, and includes an increase in charcoal concentration, a
reduced amount of arboreal species, particularly Corylus avellana, and an expansion of acidic
grassland and blanket bog communities (Fig. 6.9). The nature of this evidence suggests a relatively
large scale clearance of the local area using fire. This possibly relates to the final clearances of the
late Bronze Age period, which opened the landscape sufficiently to allow increased run-off, with the
transportation of mineral particles via water and wind home vectors.
The post disturbance scene is one of stability, although the changed nature of the enviroiunent is
reflected in the sediments of this period. Increased acidity is inferred from the low presence of a
number of base elements and the expansion of blanket bog species. The period between AD 200-900
experiences a minor expansion of arboreal species and Corylus avellana, suggesting a recolonisation
of small patches of woodland in the area. This also confirms the reduced levels of anthropogenic
activity in the area (Quinnell, 1996). However, after ca. AD 1000 increased activity is again
experienced. Declining levels of Alnus, and the other arboreal species in association with elevated
levels of charcoal suggest active management of these local resources. This period indicates the start
of tinworking in the River Walkham catchment, which continues for the next seven centuries. It is
possible to suggest that the decreasing levels of Alnus in association with the elevated charcoal
concentrations are directly attributable to the activities of the Medieval tinners, since this species has
long been known to be suitable for the production of charcoal (McVean, 1953), an essential
component in the early tin smelting process. However, the geochemical signals reveal no defimte
eAddence for such activity. It was hoped the analysis would reveal elevated Sn contents at these
levels, but given the problems outlined previously this may not be possible.
At ca. AD 1250 the first indications for arable crop production are obtained, possibly relating to
activities around the nearby Shillapaik Farm and the numerous stamping mills. "Die uppermost
sediments indicate reduced levels of Calluna, as was observed at Tor Royal, and reflect the result of
more recent mis-management of the moor in the form of overgrazing and uncontrolled burning. TTie
presence of coniferous pollen above 25cm suggests a date of AD 1700 and indicates a more regional
182
pollen component produced from the plantations.
6.6 Discussion
Analysis of the sediments from Upper Merrivale has yielded much information about human
interaction with the local landscape from late MesoUthic times. Tlie geochemical data has provided
important information to substantiate the palynological hypotheses presented, and identified a
significant landscape disturbance episode dated to 395-140 BC in which deforestation appears to
have resulted in the increased erosion of local catchment materials and an extension in acidic
grassland and blanket bog communities. The more subtle changes to the catchment revealed by
pollen analysis of the early historic and Medieval sediments are not replicated in the geochemical
dataset, suggesting the geochemical signals to be dominated by autogenic processes during this
period with a minimal input of allogenic material.
TTie limited use of a number of elements using EDMA was again illustrated. TTie heavy metals (Sn,
As and Pb) were intercorrelated and thus of Utde use to the overall palaeoenvironmental
interpretation, although elevated levels were detected in sediments from 100cm. Similarly the use of
Mn and Mg is limited by the same problems. Again it is not clear whether these problems are
inherently connected with the detection capabiUties of the technique. Discussion of the remaining
sites will hopefully Anther elucidate this factor.
183

Chapter 7
Piles Copse: investigation of an 'ancient' woodland and its environment
7.0 Introduction
This chapter presents the results from analyses conducted at Piles Copse on the River Erme,
southern Dartmoor (Fig. 7.1). The site was chosen for the following reasons:
(i) the sampling sites Ue in a similar situation to Upper Merrivale. TTiere is much evidence for
human activity in the area with a concentration of industrial archaeological remains
associated with more recent tin working. The possibility existed to compare the
palaeoenvironmental signals obtained from this site with those from Upper Merrivale, with
emphasis placed upon the detection of prehistoric and historic tin working activities.
(ii) Tlie site lies close to a suggested 'relict' woodland. A multi-core approach was adopted here
to elucidate the antiquity of this ancient woodland and examine the geochemical signals for
deforestation and other catchment activities.
(iii) The sampling of two cores from different sedimentary contexts but within 100m of one
another provided the opportunity to examine whether regional palaeoenvironmental changes
were detectable using different types of sedimentary material.
The first core (PCI) was extracted from a small spring fed hollow approximately three metres in
diameter immediately adjacent to the northem tip of the woodland (Fig. 7.1; Plate 7.1). It was hoped
this site would contain a significant local pollen component (Jacobson and Bradshaw, 1981;
Prentice, 1985) and have a similar pollen catchment to that of a study conducted fourteen years
previously (Roberts, 1983; Roberts and Gilbertson, 1994). PCI most likely contained the greater
proportion of its external mineral material fix)m the River Erme, and as suspended material carried in
overland flow from the adjacent slopes of Sharp Tor, immediately above Piles Comer. The second
profile (PC2) was taken ca. 100m to the north of PCI firom an area of blanket peat on the gentle
slopes above the River Erme (Plate 7.1), and as such provides a regional pollen signal since the site
is situated in a more open location. The use of a multi-core approach allows the separation of
different poUen components at varying spatial scales (Bradshaw, 1991; Edwards, 1991, 1983b),
which is potentially useful m the investigation of the antiquity of the local Quercus woodland.
184
Track
Cairn
Hut circle settlements
Metres 500
PCI
River/leat
Sampling location
....-5a....-
• 415
Boundary stones
Contour (metres)
Spot height
Figure 7.1 Location of Piles Copse, southern Dartmoor CR83 illustrates the position of the coring site used in Roberts (1983)
185

Plate 7.1 Piles Copse. Sampling sites PCI and PC2 are marked with arrows. The view is to the south west.
186

7.1 The status of the relict high level oak woodlands in the British Isles
There has been much discussion as to the origin and antiquity of the relict high level woodlands of
the British Isles (Yapp, 1953; Archibald, 1966; Proctor et al., 1980; Rackham, 1986). These are
suggested to be direct descendants of the mid-Holocene climatic climax woods, and would have
experienced their maximum coverage of the British Isles around 4000 BC. The forests of these times
were composed of Quercus, Betula, Ulmus, and Corylus with both a rich herbaceous and epiphytic
flora. Activities of an increasing human population, climatic change and other factors saw the
reduction of the majority of these woods, with only a few small pockets surviving in generally
inhospitable areas confined mainly to the uplands of the British Isles. These existing remnants are
characteristically small scale woods on steep river valley slopes. The trees frequendy display a
stunted growth form, an uneven age structure (Simmons, 1965) with a diverse and rich epiphytic
flora (Harris, 1921; Tansley, 1939; Turner and Watt, 1939).
Three such woodlands exist on the Dartmoor upland: Wistman's Wood, 3km north of Two Bridges
(Harris, 1921; Anderson, 1953), Black Tor Copse on the West Okement river (Barkham, 1978), and
Piles Copse (Roberts, 1983; Roberts and Gilbertson, 1994). The last is of particular interest and will
be described briefly below.
Piles Copse is composed almost exclusively of Quercus robur (Harris, 1975). TTie slopes
surrounding the woodland are largely open and dominated by Pteridium aquilinium with abundant
Vaccinium myrtillus, Galium species and members of the Cyperaceae family. However, small
pockets of shrubby woodland exist and are composed largely of Sorbus aucuparia and Salix species,
with Crataegus monogyna and Sambucus nigra.
Roberts (1983), however, questions the antiquity of this woodland, basing her conclusions on the
even aged structure of the wood, an undated decline in Quercus pollen percentages and
concentrations and the inferred activity of the 17th century during which time much wood was
known to have been cut to produce charcoal for smelting practices. Others have also questioned the
origin of the woodland (Christy and Worth, 1922: 325):
"I feel certain, although I can produce no proof, that Piles Wood has been felled, in part at least. It is situate where the trees could be removed-not easily it is true! and probably it has been resorted to for timber and firewood, but this must have been very many years ago."
187
This investigation therefore seeks to extend the results of Roberts and further elucidate the origin
of the modem woodland that exists today at Piles Copse.
7.2 Sampling regime
The area surrounding the woodland was probed to find suitable deposits for analysis. Two sites were
selected as presented earlier. Samples were taken at 5cm intervals from each of the profiles. A fmer
interval was adopted in the upper section of the PCI profile, between a depth of 15 and 30cm since
in these samples the levels of arboreal poUen were subsequently foimd to be low, and therefore
possibly related to a deforestation episode. Two samples were taken for AMS radiocarbon dating of
the sediment, one fi-om each profile at the levels where the arboreal pollen curve started to decline.
73 Radiocarbon dating of the Piles Copse proJSles
Core
PCI
PC2
Depth, (cm)
28-29
50-51
Lab'Code
Beta-93820
Beta-93821
''Cage
540±50
240±60
Calibrated age (BP)
640-500
440-0
Calendar age (ref AD 1950)
AD 1310-1450
AD 1510-1950
Table 7.1 Radiocarbon dates from Piles Copse
Calculation of accumulation rates using one date for each profiles is not possible, and normally a
minimum of two, preferably three dates, are required. However, assuming the upper samples are
modem the rate of accumulation between the dates and the top of the profile may be calculated. The
upper 29cm of the PCI profile therefore displays an accumulation rate of 0.056cmyr"'. Assuming the
sediment accumulated at a reasonably constant rate up to 29cm, this gives the basal sample an
extrapolated date of AD 300. This assumption is weak since it seems likely that the rate of
accumulation has changed substantially, as reflected by the varying total pollen and spore
concentration curve (Fig. 7.10).
Similar calculations using the data from PC2 are compUcated by the wide age range of the date,
although the mid-point of the calendar age may be used (AD 1730). It seems possible that the
sediment developed at a more rapid rate than that of PCI, although more radiocarbon dates are
required to confirm this suggestion.
188

7.4 Palaeoenvironmental recoiistruction of the Piles Copse area
Discussion will be made of the profile stratigraphy followed by presentation of the geochemical
results for each site, then the results from pollen analysis of each profile. Multi-variate techniques
were used as presented in section 2.4, the results from which will be discussed in the relevant
section.
7.4.1 Stratigraphical description
Piles Copse core 1 - PCI
The basal sedimaits are charactoised by minCTOgraiic raaSiXsc with vay few organic inclusions (Fig. 7.2).
The matoial is most likely daived from weathCTed granite carried and deposited by the rivCT during times
of flood. Thae is a sharp transition at 74cm to a sandy organic dqxjsit with infrequoit, but idoitifiable
organic rranains. These mainly consist of decayed habaceous rootle with grass and sedge stems. The
matsial ova-lying this unit becomes increasingly OTganic. Sedimaits b^weoi 52 and 60cm are
charactoised by a dark brown greasy dqx)sit in \ ^ c h small mineral particles are visible, but vegetative
remains arc largely absoit. The unit b^weoi 30 and 52cm is much the same as that of preceding levels but
contains largo* minaal particles up to 5mm in diam^a, with more abundant macrofossil ronains.
A significant change in sedimoit type is oicountoed bdweoi 27 and 29cm, wiiich divides the uppo* and
lowCT sedimaits. This unit is charactoised by a laya of Sphagnum macrofossil ronains into which the
roots from the overlying unit poietrates. The matoial takes on a felted, h^oog^eous naturc with an
absoice of minoal matoial. The ronaining sedtmoits arc essoitially of this type, becoming ligjita in
colour and felted in structurc. The uppomost unit is charactoised by felted peat with abundant
macrofossil ronains, including Sphagnum mosses and woody fi-agmoits and roots.
Piles Copse core 2 - PC2
The lack of mineral matta is noted in the base of the profile (Fig. 7.3). The basal sedimaits arc con5>osed
of brown felted organic matoial with abundant macrofossils, including Calluna vulgaris rootle and
stons. The main division of the sedimoit into stratigraphic units is possible only with rrfCTOice to subtle
changes in the nature of the sedimoit and the predominant macrofossil elemoits. The unit betweoi 48 and
74cm is conqxjsed predominantly of Sphagnum remains, but is similar to the basal unit in both colour and
structure. The sedimoit brtweoi 18 ami 48cm is more humified than the preceding material and is
considoably darfca, but still displays abundant macrofossil coit^iraits donnnated by vegrtative rootle.
189

285m AOD
20-
AD 1310-1450
1^40
Q. (D •a
60
80
L'L, •L 'U L-L • L -L-L • L * L«L
L-ll » I
I
Light brown felted peat with abundant macrofossil remains. nig.2 elas.3 sicc.2 humo.I Tb2 Til Dgl
Light brown felted unit with abundant roodets. nig.2 elas.2/3 sicc.2 humo.2 Tb(Sphagni)3 Dhl Dg+
Dark brown greasy unit, well humified with mineral fragments visible. nig.3 elas.l sicc.3 humo.3 Thl Dgl Ld2 Ga+
Very sandy deposit with few organic remains. nig.2 elas.O sicc.3 humo.3 Ga2 Gs2 Th+ Ld+
Figure 7.2 Stratigraphy of Piles Copse sediment - core 1 (PCI)
190

290m AOD
20
40-E
AD 1350-1955 £ -o •D
60
80
^::^
-
Light brown felted peat dominated by Sphagnum macrofossils. nig.l elas.4 sicc.O humo.O n(Sphagni)3 Til Th+ Dh-¥
Dark brown humified peat with abundant macrofossil remains. nig.3 elas.2 sicc.2 humo.3 Tbl 7X2 Thl Dh+
Light brown felted peat dominated by Sphagnum remains, abundant monocot remains. mg.2 elas.Osicc.l humo.l Tb3 Til Dh+ Dg+
Dark brown felted peat Abundant macrofossils including Calluna vulgaris remains. nig.3/4 elas.2 sicc.l humo.l Tbl Til D12 Dg+ Ld+
Figure 7.3 Stratigraphy of Piles Copse sediment - core 2 (PC2)
191

The boundary of the uppamost unit is marked by a sharp transition. The sedimoits of these levels are
once again dominated by well presorved Sphagnum rranains, modon macrofossils and root matmal
7.4.2 EDMA investigation offfaePQes Copse sediment
Geochemical investigation of the two profiles from the Piles Copse area sou^t to address a number of
diffCTOit questions:
(i) the degree to which the signals ftora diffarait sedimaitary systons located close tog^o- WCTC
comparable;
(ii) wh^CT both profiles drtect the signals associated with the postulated rdna^l extraction and
processing opoations in the Rivo- &rae catchmrait, and;
(iii) the nature and scale of otho- anthropog^c activities in the surrounding area, including
deforestation ami possible afforestation practices.
The results from each profile will be presaited individually. The results from PCI are presoited as
elonaital profiles (Rg. 7.4a,b) divided into four distinct chamzones vMch are described in Table 7.2.
Multi-variate analysis of the geochonical data was undotakoi and is presaited in Figs. 7.5 and 7.6. The
results from analysis of PC2 are similarly presaited as elranaital profiles (Rg. 7.7a,b), described in Table
7.3, with results from DCA in Rgs. 7.8 and 7.9.
Initial obso^ations of tte results from both cores sugg^ the profiles of Mn and the heavy m^al elon^ts,
Sn, As and Pb, to be of limited use v/ben addressing the palaeoaivironmoital processes opoational in the
Piles Copse area OVCT the last 1500 years, althougji both Sn (PCI) and th (PC2) display elevated amounts
in the basal material from each care, sug^sting EDMA may be capable of d^ecting these elanoits vAiea
they contribute significantly to the o v o ^ geoch^nical signature of the sanq>le. Howeva*. discussion will
be focused upon the majcH-d»n»its, Si, Al, the mobile el^noitsFe, S andP, and the bases Na, K,Caand
Mg, since these seon to presoit the most reliable signals.
7.4.3 Multi-variate analysis of the PQes Copse EDMA data
Piles Copse core 1 - PCI
The elanaits on Rg. 7.5 sean to charactoise a gradiait of increasing minCTal matto- towards the ri^t
hand side of axis caie, with d»nents more usually associated with organic matoial (TOC, P) present on
the otho- eoA of the gradiaiL Axis two is mrae difficult to ocplain, but may relate to the pH status of the
192
£61
Depth (cms below ground level)
CO
o o 4^ O
i o
Calendar years (2 Sigma)
iv> o
161
Depth (cms below ground level)
03 O
at o o
> • i ^ - k
en 03 o
CeUendar years (2 Sigma)
o
SI C • - I
- J
tT)
a
en C
g
o
O o
o

Chemizone PClGa
PClGb
PClGc
PClGd
Depth (cm) 90-50
50-29
29-15
15-0
Description A number of elements exhibit steady state equilibrium conditions in this zone: Al, P, S, Si, Na, K and Ca. The TOC curve increases gradually up through the zone from <5% at 90cm to c.25% at the boundary, while the %ash curve falls gradually over the same samples. Fe and Mg display fluctuating profiles but display generally declining trends through the zone. Increases for S, P and TOC characterise this zone. %Ash falls through this zone from 55% at 50cm to 30% at 30cm. High levels of Si and Al are present. Complex geochemical conditions are indicated in this zone by the erratic nature of the elemental profiles. Dynamic equilibrium conditions are demonstrated with a long-term declining trend for K, Fe, Al and Si. An increasing trend is exhibited for TOC and S. %Ash declines through PClGc to low levels at the upper zone boundary. TTie spiked nature of a number of profiles (Na, Ca, Cu and P) make interpretation difficult. This zone indicates sediment containing high levels of TOC, a declining amount of Al, with fluctuations for a number of elements. The base elements, Na, K and Ca, experience increased amounts in this zone. Fe, Mg and Mn are present in very low amounts.
Table 7.2 EDMA results from analysis of PCI
195

CSJ
+
Axis 1 I L
TOC^ " •P
CO Al
Ca<
• Si
j _
As «Mn IPb
«Sn
• K
Na
+2.5
»%Ash . • F e MQ
Cu
Cumulative percentage variance explained by two axes = 90.8%
Figure 7.5 DCA element plot of EDMA data from analysis of Piles Copse core 1 (PCI)
196

CO
o +
/ /
/
\
"CM CO
' +28 ^
+17 22 \
16 > .23 \
424 1
-19 ^^ + ' ' ; + 5
/ ^ 0 " L^^-F ^ '
• •
1 29 ^ T Of)
1
^ M 55 60 85 75%
1
Axls1 1
+2.0
Cumulative percentage variance explained by two axes = 90.8%
Figure 7.6 DCA sample plot of EDMA data from analysis of Piles Copse core 1 (PCl)
197
861
Depth (cms below ground level)
Calendar years (2 Sigma)
661
Depth (cms below ground level)
Calendar years (2 Sigma)
a
B to
w O i-h
<r n o C/l n o o >-i o K)
O to
Chemizone PClGa
PC2Gb
PC2Gc
Depth (cm) 83-60
60-20
20-0
Description TOC exhibits high stable equilibrium conditions with values of ca. 45%. A number of elements exhibit declining trends throiigh the zone: Mg, Ca, Fe, S with only Si, Al, P and %Ash exhibiting increasing profiles. The zone is dominated by Si and Al, the former of which increases through the profile with %Ash from 50cm to peaks at 20cm. Al remains static until the last three samples of the zone over which it declines. Fe increases from 50cm, with Mg disappearing at 45cm. S, Ca and TOC decline steadily over the zone. This zone is dominated by Si which again shows a close association to %Ash. A number of elements increase through this zone: Fe, Ca, K, Cu and Al. The trace elements display inter-cortelated profiles in this and all preceding zones.
Table 7.3 EDMA results from analysis of PC2
200

• Pb (2.0,5.0)
o +
>Cu
As Al
V •TOC
• P • S
Axis 1
+3.0
Ca
Cumulative percentage variance explained by two axes = 64.8% y r (2.0,-8.0)
Figure 7.8 DCA element plot of EDMA data from analysis of Piles Copse core 2 (PC2)
201

CM m
1 in
o +
-20 ^^^ +15 - 4 - ^ ^ + ' '
+ 0 +25 ^ ^ ^ + 30 ^ ^ ^
+ 4 o \ v ^ + 6 0 \
_
+ 65
1 1 1 r 1 1
Cumulative percentage variance explained by two axes = 64.8%
+ 70 +75
' \ + 45
+ 55
+ 50
80 „ , Axis 1
+0.9
Figure 7.9 DCA sample plot of EDMA data from analysis of Piles Copse core 2 (PC2)
202

developing system.
There are two clear associations on the sample plot (Fig. 7.6). Group one includes san^les b^werai 29
and 90cm and group two which includes all the remaining samples. It seems that the postulated
disturbance activity which initiates at 29cm forms the basis for the boundary, with the geochonical signals
above this level displaying significantly diffCTOit charactaistics to those below.
Piles Copse core 2 - PC2
Again it seems feasible to explain axis one in tams of the mina^-organic mataial continuum, with those
elements usually associated with clastic matto" presoit towards the left of the plot. Axis two presents a
confiising picture, which cannot sin5)ly be explained in toms of clearly disconible aivironmaital
gradioits. It thoefore pa°haps relates to a combination of factors.
Multi-variate analysis of the san^les from PC2 produced a plot in which the sanqjles woe arranged
gHiCTally fi:om right to left, suggesting long torn geochranical trends are more inqwrtant than single events,
as confirmed by the increasing tr^ds for Si, Fe, K and %ash, with a sustained decrease for Ca, S, Mg and
TOC. Axis one on Fig. 7.9 thCTefore SCTves as a time scale with oldest sanqjles on the r i^ t of the plot.
7.4.4 Interpretation of the geoch^nical signak firom PQes Copse
Piles Copse core 1 - PCI
The basal samples - initial status of the system
The indicators of physical erosion, Na and K, together with Si and Al are stable. This combination
of elements most likely relates to the composition of the mineral material dominating the basal
section of the core. Ash values, taken as a first approximation of the concentration of mineral matter
(Aaby, 1986; Shotyk, 1996b), reach values up to 90% in PClGa confirming the minerogenic nature
of the sediment at this time. It seems likely that this material was deposited directiy by the River
Erme during times of flood. The alumino-silicate associations and base element signatures of this
sediment are derived from the locally weathered granite (Brunsden and Genrard, 1977). The stable
elemental profiles relate to the constant input of this material into the sedimentary system. The
presence of P, TOC and S suggests the steadily increasing status of the organic matter from 90cm.
The Fe signal possibly suggests the sedimentary system was under oxidised conditions in the basal
203
section of the core, but the widely fluctuating nature of this profile in this basal zone may relate to
pulses of mineral material, since the element may have been transported to the sedimentary system in
particulate form as inorganic oxides, or oxide coatings on mineral material (Jones and Bowser,
1978). It seems that this activity may have subsequently led to anaerobic conditions as the peat
system develops. This progression to more anoxic, waterlogged conditions are confirmed by the
increasing S content since this element likely relates to the formation of H2S and metal complexes
under reducing conditions (Gill, 1989). It appears that these conditions are experienced to modem
times due to the absence of Fe, particularly in the upper levels confirming a predominantly anaerobic
sedimentary environment, in which sulphide production becomes increasingly important.
The elevated base status of the system in PClGa may have been maintained by the introduction of
semi-weathered granitic mineral material, as suggested earlier. This material has an elevated Sn
content which serves to illustrate no more than the local rocks are enriched in this element.
The next zxme (PC 1Gb) seems to indicate an environment becoming increasingly anoxic. Lower Fe
values and increasing S suggests the sedimentary environment is dominated by anaerobic, acidic
conditions (Goldschmidt, 1954; Mackereth, 1965, 1966; Engstrom and Wright, 1984; Naucke et al.,
1993).
A peak for K and %ash in association with a reduced TOC content at 45cm may relate to the
introduction of mineral material. However, K is then seen to decline quite rapidly, possibly indicating
a short lived physical disturbance phase. Increases for TOC, P and S after this episode relate to the
continued development of the peadand system, in which Na, Ca, Mg and Mn are mobilised as the
peat becomes increasingly anaerobic and acidic. The gradual decline of ash in PCla and b relates to
the increased input of mineral matter as the sediment accumulates beyond the level of the river
influence, except in times of high flow.
An environmental change
TTie boundary between PC 1Gb and c is marked by a dramatic change in a number of elemental
profiles (Fig. 7.4a/b). This change occurs as a boundary threshold between earlier lower values and
later higher ones for Al, S, P and TOC, with a decline to levels for K, Si and %ash. TTie nature of
204

this change seems to relate to a decline in the introduction of clastic elements, and an increase in
organic sedimentation as confirmed by the presence of those elements characteristic of autogenic
peatland processes. The boundary between these two chemizones marks the suggested onset of
deforestation in the locaUty detected in the pollen record (section 7.4.6). These sediments do not
exactly agree with this hypothesis since increased deforestation activity may result in an increased
introduction of mineral material. This suggests the possible deforestation episode was not occurring
immediately upslope from PCI. It appears that the sediments of PClGc become more acidic since Fe
and K are lost and S increases. The association between S and Cu relates possibly to the formation
of copper sulphides in the now anaerobic sedimentary environment. The increased acidity of this
zone may relate to a number of separate inter-related factors including increased run-off generation
through reduced woodland cover in the locality, with the subsequent effect of lowering pH which
increased the mobilisation of K, Fe and Al (Williams et al., 1984, 1986; Muscutt et al., 1993). A
change in the local vegetation may also trigger certain changes in the peatland system, e.g. Calluna
vulgaris is capable of producing locally increased environmental acidity through the liberation of
polyuronic acids (Grime et al., 1988; Rieley and Page, 1990). These suggestions will be discussed
with reference to the pollen data.
TTie upper sediments of PCI (PClGd) are dominated by complex bio-chemical processes operational
within the acrotelm of the system. These include bio-accumulation of K in the surficial sediment
(Shotyk, 1988), and the peak of Cu and S, due most likely to the formation of sulphides at the Eh
boimdary. Absence of Fe in the upper sediments is explained by the likely anoxic surficial
sedimentary environment, confirmed by permanently waterlogged conditions.
Piles Copse core 2 - PC2
TTie indicators of physical erosion, Na, K, Mg, Ca, and Si are present in small amounts in the basal
2»ne {PC2Ga). However, some may relate to autogenic processes. For example, Ca has a strong
affinity with organic Ugands (humic and fiilvic acids), as such a body of sediment may contain much
Ca not associated with allogenesis (Engstrom and Wright, 1984). This element may thus have
limited use as a palaeoenvironmental erosion indicator. Similarly the gradual decline for Mg may
relate to post-depositional mobilisation of the element, since it is has a weak adsorption potential to
decomposing organic matter, and thus forms unstable organic complexes which are readily leached
from the peatland system, especially if the pH of the circulating water is low (Shotyk, 1988). The
205

Mg signal may simply illustrate the system was becoming progressively acidified during this phase
of accumulation. The low levels of %ash in the basal zone suggest minimal input of clastic materials
at this time.
A high S content of the peat most likely relates to the presence of sulphides in the anaerobic zone.
The relationship to TOC therefore indicates the status of organic matter in the sedimentary system. It
seems probable that the peatland environment is anoxic by the time represented by the upper
sediments of this zone, due to the absence of Fe which is readily mobilised under anaerobic and low
pH conditions (Goldschmidt, 1954). Hie lack of correspondence between tiie Si and Al profiles
suggests that neither element relates primarily to the presence of alumino-silicate mineral
associations, other processes being more important, in which the availability of organic C influences
the presence of Al.
TTie heavy metal elements appear difficult to interpret. As and Sn display very similar profiles in this
zone, which may be a result of the procedures inherent to the EDMA technique. However, elevated
levels of Pb are detected in the basal zone, confirming the material at this time to be relatively
enriched in this element. Again this strengthens previous suggestions of the general inefficiency of
EDMA for the analysis of trace and heavy metal elements from most peatland systems.
TTie next zone {PClGb) exhibits indications for oxidised conditions in the sediment body (e.g. Fe),
with a possible rise in pH, which may explain the slight increase in Al to 30cm. Similarly K
demonstrates increased values from 40cm indicating a possible rise in pH levels. Further
corroboration for this suggestion is provided by the increased Fe content of sediment above 50cm. A
number of elements which may be linked to organic matter and associated biological processes are
shown to decline: S, TOC and Ca indicating a degradation of catchment materials through time.
TOC in particular illustrates a long term declining trend which may relate to the natural sequence of
progression for such a sedimentary system, given the changing nature of activity in the local
environment
In the upper sections of PCGh (ca. 30cm) the system displays continued indications for disturbed,
oxidised conditions: increased Fe with declines for Mg and Ca possibly relating to increased pore-
water acidity. TTie primary indicator for increasing disturbance is the increased ash content of the
206
sediment, which is comparable to the Si profile, indicating the material to be derived fi-om local
catchment rocks. TTie introduction of this mineral matter may relate to increased catchment
disturbance resulting from deforestation or mineral extraction and processing operations. "Die
specific nature of the disturbance may become apparent in the discussion of the pollen analysis data.
TTie oxygenated nature of the sediments provide suitable conditions for a set of complex bio
chemical processes to become operational, in which aerobic microbial activity will increasingly play
a role, resulting in the increased humification of sediment between 18 and 48cm (Fig. 7.3).
The system is shown to exhibit increasingly oxidised conditions into PClGc. Fe increases, while S
and TOC fall, possibly a function of microbial decomposition under oxygenated conditions. The
zone is marked by increases for the indicators of erosion, Ca, Na and K which would relate to small
scale/low intensity activity since there is littie effect on the long term trend for TOC. The uppermost
sediments display processes operational within the acrotelm. Similar conditions are noted as existed
in PClGd including bio-accumulation of K, precipitation of organo-metal complexes and sulphides
at the acrotelm-catotelm boundary at ca. 5cm.
Summary of the geochemical history of the Piles Copse area
The basal levels of both cores indicate the presoice of min^al matto-, and the increasing status of the
organic sedimaiL PCI initially displays oxidised conditions, vka\sX. PC2 indicates a more anaerobic
situation in the basal levels of the profile which may similarly be noitral givai the levds of Ca betweoi 65
and 83cnL At PCI the next phase of sedimoit accumulation is dominated by increasingly anao-obic
ccmditions in w^ch sulphides may have formed. PC2 howevo- indicates increasingly oxidised conditions,
with a gradually increasing base status and/cH* the introduction of vranetdl matmal devated in Ca, Na and
K in the uppomost sedimoits. A minor o'osicHi q)isode is infored fixam tte signals of PCI at 45cm in
which %ash and K contait is elevated, matched by a reduction in TOC. From this level upwards the
sedim^t seons to cUsplay the indications of beconmig increasingly anaoobic and acidic, althou^ HOSK
are no furtha* increases for the indicators of extonal oivironmoital disturbatKe.
It scans that con^arison of the individual elonoits is osaH^y nsH possible b^wesi profiles. A numbo* of
factors may explain this including diffoing rates of accumulation, varying san:q)le selection strate^es and
intorvals, variations within the peat accumulating syston throu^ time, and the ^xisxel soisitivity of each
syston with respect to ret«ition and mobility of diffCTOit elonoits. Both sites failed to produce convincing
207

geochemical evidaice for the exploitation of local mineral resources, wtoch may relate as much to
problans of the analytical technique as to the rrtoition/mobility of these el^n^ts in peatland sediiiKnts,
although elevated levels of Sn and Pb woe d^ected in the basal sections of each core. PCI displayed
increasingly acidic conditions from the levd of postulated deforestation activity, but did not exhibit the
expected increased levels of mino^ matter, sugg^ting the activity occurred some distance from the coring
location. No such activity was detected in the sedimmts from PC2.
7.4.5 PoDen analysis of the POes Copse sedinKnt
The palynological investigation of the sedimmts was aimed at investigating the antiquity and status of
Piles Copse, an area of suggested relict ancioit woodland on the uppo- reaches of the Rivo- &ine. TTie site
would also provide indications for the disturbance created by tinning and associated activities in the area,
and as such act as a conq>arison to the Upp^ Merrivale site.
Initial obso^atiohs of the data from both profiles s u g ^ t some drforestation activity to have occurred in
the locality in the more lecoit sedim^ts, primarily focused upon the Quercus woodland. Discussion will
be directed to the iiiq>lications of this activity as well as the goteral pattern of veg^ation change in the
catchmait as a whole. The results are presorted as pCTCOitage pollai diagrams (Figs. 7.10 and 7.11) and
described in Tables 7.4 and 7.5. The data are shown as pax:aitages of Tcrtal Land Polloi (TLP). The
DCA plots from the data analysis are presetted as follows: core one species plot, Rg. 7.12; san[q)le plot.
Fig. 7.13; core two species pic* 7.14; san5)leplot. Fig. 7.15, and are described below.
7.4.6 Multi-variate analysis of (be Piles Copse pollai data
Piles Copse core 1 - PCI
Investigation of the species data using DCA techniques reveal a nunobo- of discrete assonbla^. The first
group (a) relates to species indicative of the local Quercus dominated woodland in >\iiich various fern taxa
are rq)resaited. This may indicate the presoit day status of the v ^ ^ t i o n of Piles Copse (Harris, 1975;
Robots, 1983). Group P includes a large numbo- of species donrinated by scrub and darap woodland
con^noits including Corylus avellana, Calluna vulgaris wiAiAImts. Cyperaceae and Filipendula. This
group may bdong to the pre-deforestation activity poiod. Assoriilage X includes species primarily
associated with disturbed habitats, and seons likdy to rdate directly to the deforestation activity
b^weenl5 and 30cm. The last group (5) include taxa associated with dan^ habitats, iiKluding Sphagnum
and Salix species. These plants SCTve to indicate the general status of the wrtland flora in the area.
208
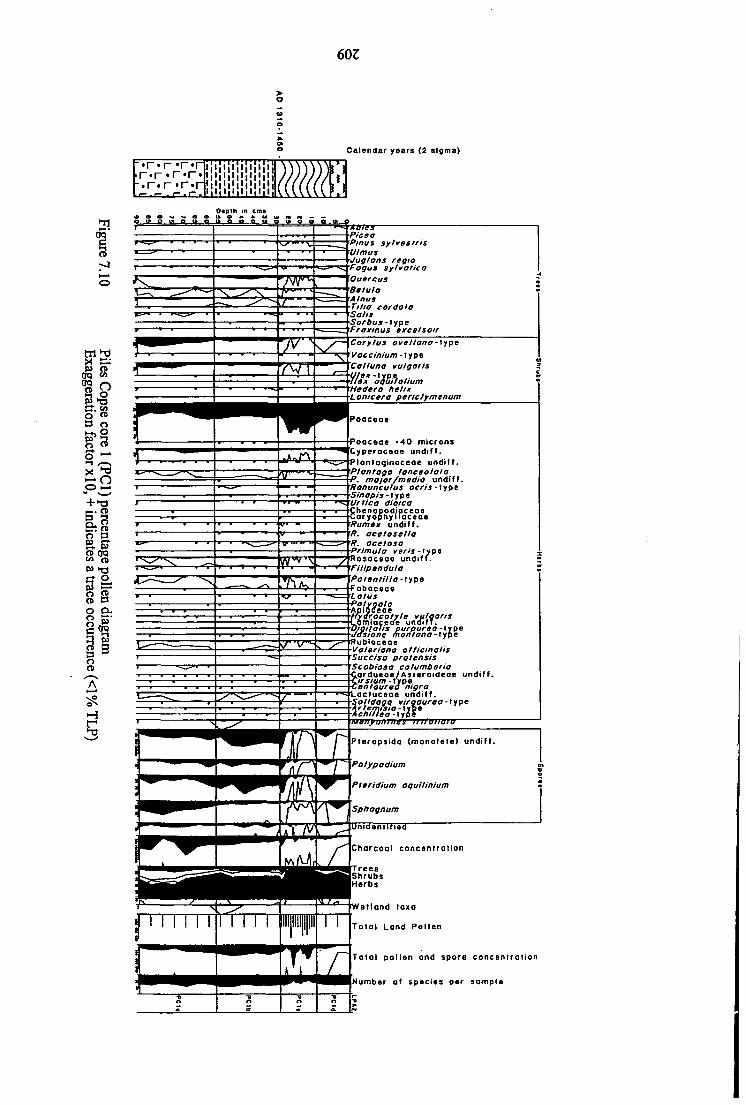
6or
Calendar years (2 slgma)
1
o - r
W T J X p rra n •-I
c : o CO
n o ^ • o
cr. o o
o o l - l
X
o •*
CO
n o o <u •—*
•TJ
r-) N . ^ '
+>a R-o. o p
fB a B
« Oq CO P
pr p o o O O o
1-1 o s o o
n >a o n a a.
^ ^
'TIS
r . r « r « r . r « r 'T^r I I
• • I I I I I I I I I I I I a
Otpth m cm* o t t o t a o a o t f o a o q Q q o
^ I rm ^ ^ ^zn:
77-
• — ' >~s Fogi
AOies •Pic a a 'P/nus sylvesrris Ulmus •Juglons regto " us sylvotico Outrcus Belulo A Inus Tiho cordota Sail* •Sordus-lype Fraxinus axcelsoir
Corylus ovettano-typt Vaeclnium-xifit Colluno vulgaris
Hiax aquitolium 'Hedera helix •L onictro periclymenum
T — • * — • — I ^%—*•
WX^^.^
» • s
NA'ja
E H.
7"v^:-7^
7^
— ^ • •
Pooceoe
Pooceae ' 4 0 microns 'Cyperaceae undif f . P lan loginaceae undi l f . ^Ptantago lanceolaia •P. major/madio undif f . Ranunculus acris-type •Sinopis-typt 'Urtica dioica Chenopodipceofl Caryopnyiraceoe Rumax undif f . rff. acetosella R. aceiosa •Primula veris-type nosoceoe undi f t . rFilipandulo Poranlillo-type •f aboceoe Lotus •Po/voolo •Apiaeeae , •ffyarocotyle vulgaris -Lgmioc^de u n o i f l . •Digitalis purpurea-type •Jasione montono-type l^ubiQceae
Valeriana a fficinalis 'Succisa protensis 'Scabiosa columbaria CQrdueoe/Asferoideoe undi f f . •Cir Slum-\ype •Centaurea nigra
v ^ L a c t u c e o e undi f f . •Solidogo virgaurea-type •Arferntsio-type •Achillea-type uenyanines iriroliuiu
Pteropsida (monolete) undi f t .
Polypodium
Pteridium aquilinium
Sphagnum
unidentif ied
Charcoal concentrat ion
fees hrubs
Herbs
W e t l a n d toxa
T o t a l Lond Pol len
T o t a l pol len and spore concentrot ion
.Number of species per sample
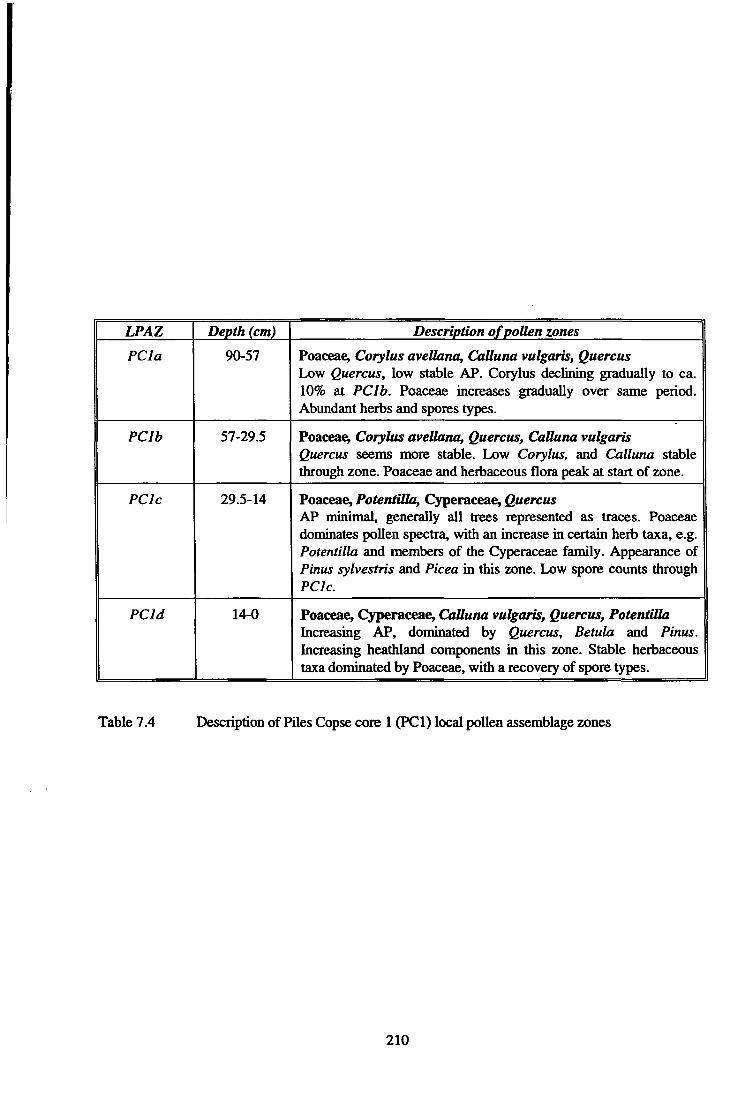
LPAZ
PCla
PClb
PClc
PCld
Depth (cm)
90-57
57-29.5
29.5-14
14-0
Description of pollen zones
Poaceae, Corylus avellana, Calluna vulgaris, Quercus Low Quercus, low stable AP. Corylus declining gradually to ca. 10% at PClb. Poaceae increases gradually over same period. Abundant herbs and spores types.
Poaceae, Corylus aveUana, Quercus, Calluna vulgaris Quercus seems more stable. Lx)w Corylus, and Calluna stable through zone. Poaceae and herbaceous flora peak at start of zone.
Poaceae, Potentilla, Cyperaceae, Quercus AP minimal, generally all trees represented as traces. Poaceae dominates pollen spectra, with an increase in certain herb taxa, e.g. Potentilla and members of the Cyperaceae family. Appearance of Pinus sylvestris and Picea in this zone. Low spore counts through PClc.
Poaceae, Cyperaceae, Calluna vulgaris, Quercus, Potentilla Increasing AP, dominated by Quercus, Betula and Pinus. Increasing heathland components in this zone. Stable herbaceous taxa dominated by Poaceae, with a recovery of spore types.
Table 7.4 Description of Piles Copse core 1 (PCI) local pollen assemblage zones
210

CVJ V)
, Poaceae
l O
CO
+ Scabiosa columbaria
' m Ulmus I / I / , Sphagnum /
Salix
* Corylus avBllana
' AInus glutinosa
P/antego undiff. • Calluna vulgaris
Pinus _ Cyperaceae undiff. • • - sylvestns' Fraxinus excelsoir • Lactuceae undiff.
Vacdnium * undiff. -
Betula
V Rubiaceae undiff. • Filipendula P
•Rosaceae • Cerea/fa-type -Rumex acetosa% ~ " -- ^
Lotus piantago - - ^ i lanceolata " ^x"* . Cardueae/Asteroidae undiff.,-
Rumexundlfh "" - -fijfl^ 4 - - ' ' I L
. 0 Urtica _L J
Potentilla
m Fagus sylvatica _ .
+2.5
Quetcus I Pteridium aquilinlum ^
^ Fteropslda (monolete) undiff. ^
*• Polypodium
a .Rumexacetosella
• Trees • Herbs • Shrubs • Spores
Cumulative percentage variance explained by two axes = 64.6%
Figure 7.12 DCA species plot of pollen data from analysis of Piles Copse core 1 (PCI) sediment (Species shown all have occurences >1% TLP in >5 samples)
211

CM r o (0
5
/ /18 \
V
>
1 —
- + - ' - -, ' + 90 80 ^ ^
+ + 8 5 \ 1 + ™ +75 ;
' ' " " " + ~ ' " ~ ^ ^ ^ . ^ ^ +65 '
- 1 7 +25 " 22 +21 1
+ 26 / /// / , ' " - ~ - ^
+ 23 + 2 7 . - ' / + « ' " - ,
- ^ ^ - - - - " " ; +^ // \ _ 30
v10+ +35 +50 \
40++45 \ V )
29/ 1 1 ^ . 1 . 1
-
Cumulative percentage variance explained by two axes = 64.6%
Axis 1 1
+2.0
Figure 7.13 DC A sample plot of pollen data from analysis of Piles Copse core 1 (PCI) sediment
212
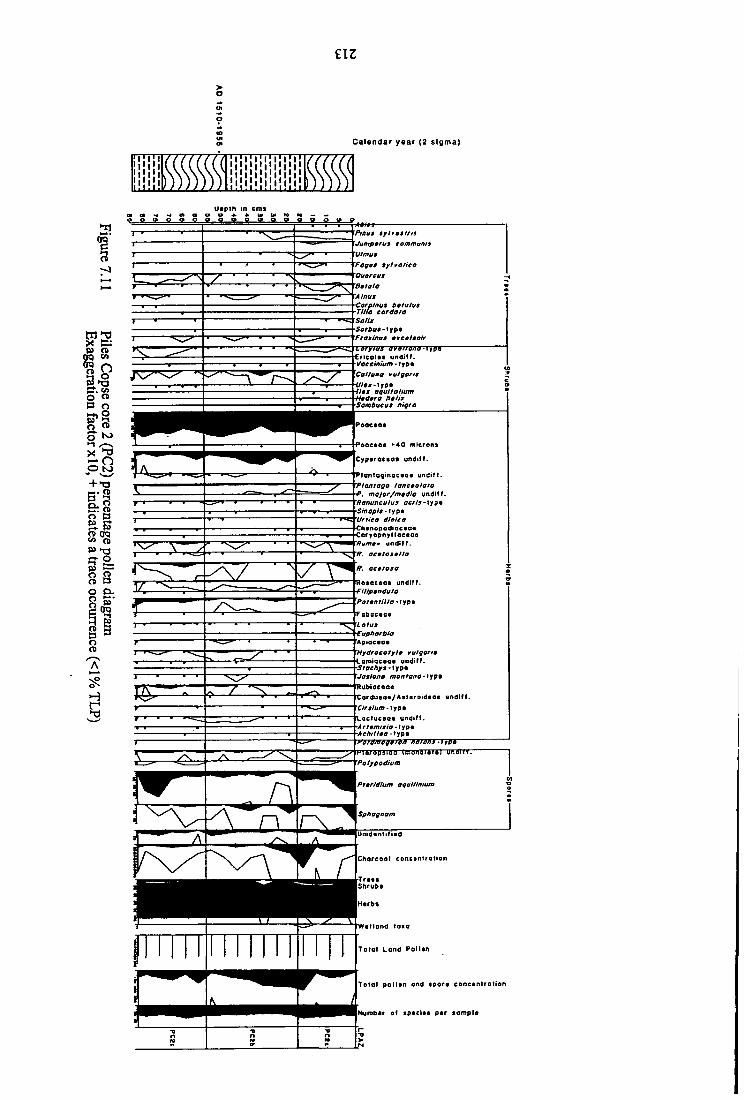
£\Z
I I
Calendar year (2 sIgma)
uaptn in ems I I > * * W I
9 » q tf q
Piaas syi*estf/s
'Juoipmrui commums
'Ulmos
'Fogut aytvaHco
'OuorctiS
•Botalo
'A/nus •Corpinut 60/u/us TUfa ear da to Salix
'Frauituis BMctlsotr
'(MO-type €r lcolas undiff. Veceinivm-yfpt
Coiloao vulgaris
•(//ajr-type •II9X oquiiotium •H9d0ra h9li* •Sombucyt nigra
Pooeaoa • 4 0 microns
Cyparocaoa undift,
PlontogtROcaoa undiff. 'Ftantago /atte»olata •P. mojor/madia undiff. 'Ranunculus oerls-iyp* •Sfnapis-XTfpt
"^^^Vrtieo dioieo •Chanopodioeaoa •Coryophyllacaae 'Kumtm undiff.
aettoialla
nosacaoa undiff. •FilipmDdulo
'Potaalillo-^yp*
'Apiacaoa
'Mydrocotylm vulgaris •Lamiocaaa undiff. •5 /aeA/4- typa 'Jasiona monfana-^yp*
Rubiocaae
"Cordueoa/AsieroldiQe undiff.
Clrsium-typm
Voctucaoa undiff.
Hi/aitii^tran itaisfii-ii^t
onaiftTSJ unaiff.
Pttrldw/n aguilinium
Chorcool concantration
Toroi Land Pollan
Totol pol lan ond apora concantration
jNunibar of spaclaa par sompla

LPAZ
PC2a
PC2b
PC2c
Depth (cm)
83-57
57-22
22-0
Description of pollen zone
Poaceae, C}^eraceae, Potentilla-type, Pteridium aquilinum, Quercus AP <5%, stable and dominated by Quercus. Spectra characterised by Poaceae (>50%) and Cyperaceae. Herbaceous taxa include Plantago lanceolata, Rumex species, Potentilla-type and members of the Rubiaceae family. Pteridophyte species are dominated by Pteridium aquilinium.
Poaceae, Cyperaceae, Potentilla-type, Calluna vulgaris AP largely disappears. Pinus increases from 35cm. Calluna vulgaris increases to a peak at 35cm (15%). Herbaceous taxa are again dominated by Poaceae and Cyperaceae, the latter experiencing a peak at 35cm. Other species include Potentilla-typc, Rumex, Hydrocotyle vulgaris and members of the Rubiaceae family.
Poaceae, Cyperaceae, Pteridium aquilinum, Quercus AP increases gradually through zone, dominated by Quercus, Betula and Pinus sylvestris. Herbaceous species are characterised by Poaceae which declines gradually through the zone and Cyperaceae which fluctuates through the upper samples. Potentilla is replaced in the uppermost samples by Rumex, Lotus and members of the Rubiaceeie family. Pteridium aquilinium becomes a significant component of the vegetation towards the top of the profile.
Table 7.5 Description of Piles Copse core 2 (PC2) local pollen assemblage zones
214

CVI,
; • Ru/nexundiff,
\ X • Betula \ \
\
CO " - ^
+ • Corytus avellana4ype ^ ^
Quercus ^ - • • AInus \ * Pteridium aquillnum i
g • Jaslone montana i Fagus sylvatlca '
1
e
^ , ^ ^ _ - - ' ' ' A Pteropsida (monolete) undiff. \
, ' ' « Lotus "
Y / 1 Rumexaa 1 Sphagnum • \ *
• P/nus sylvestris 1 " *~ 1 ' ,
• Cereal type
^Apiaceae Plantago lanceolala <|) / Chenopodiaceae
"v , Poacsaea* • RuWacea* Pote/7ff«a-type / ' Cardueae/ « \ \ • Asteroidae undiff.
^ X ^ Lacbjceae undiff. ^ tosella, ^ ^ ^ m Hydmcotyle vulgaris^ ^ "
' • Ranunculus acrisAype
, ' Axis 1 1 1 1 1 1 1 1 1
• Ulmus '^^•^ • Rosaceae
• Cyperaceae
« CaBuna vulgaris • Trees • Herbs • Shmbs
Cumulative percentage variance explained by two axes = 48.0% *• Spores
Figure 7.14 DCA species plot of pollen data from analysis of Piles Copse core 2 (PC2) sediment (Species shown all have occurences >1% TLP in >5 samples)
215

x <
in
- 0
+75 + 80
+ 15
+65
+ 5 .10 +' 20
\ + 45 50
+ 70 I
+ 83 /
+ 60 + 30
\ 25 ^40 "v
35 ' Axis 1
+1.5
Cumulative percentage variance explained by two axes = 48.0%
Figure 7.15 DC A sample plot of pollen data from analysis of Piles Copse core 2 (PC2) sediment
216
The sanqjie plot produced three clearly distinguishable groupings. Group I includes sanples between 65
and 90cm and illustrates the initial state of the v^^t ion. This group relates to groups a and P of Fig.
7.12 and seems to indicate Corylus and Poaceae dominated habitats. The second san^jle assemblage is
group n which includes saii5)les between 30 and 60cnL These sanples are indicative of the more stable
conditions which immediately predate the next group. The last group (JS) include those sanples firom
30cm to the surface, and include the levels in which the infored deforestation activity is found.
Piles Copse core 2 - PC2
The species data from PC2 (Fig. 7.14) do not form as clearly defined groups as the data from PCI.
However, group e includes those species associated with the woodland in the locality, with Quercus,
Corylus, Alnus, Betula, Fagus and Fraxinus rq)resaited. Group (|) includes those species charactoistic of
more disturbed, acicUc grassland habitats, possibly indicating the status of the local grassland communities
throu^out the time of sedimait accumulation. The last assemblage group (y) includes species more
typically associated with darap acidic habitats. It is int^'esting to note that no group clearly idoitifres the
deforestation activity noted in the discussion of PCI. The sairple plot (Fig. 7.15) produced two groups: IV
and V. It does not seon possible to clearly idaitify the causative factors for association since group IV
included the majority of sanples, and group V with the remaindCT, possibly relating to outliers in the data
s ^
7.4.7 Interpretation of llie POes Copse poDen data
Piles Copse core 1 - PCI
The initial status of the vegetation
The. basal zone reflects a grassland dominated environment with local patches of heath vegetation
and Corylus scrub. Quercus, Betula and Alnus were present in the sparse woodlands of the area.
Tlie gradual decline in Corylus does not appear to have been a function of increased shading, since
the AP/NAP ratios indicate largely open conditions. This suggests selective clearance of the shrub.
The heathland is conqxjsed of Calluna vulgaris, with only a sparse occurraice of Vaccinium-type pollai
(including such species as Erica and Vaccinium), and hobacecAis taxa including Potentilla, Scabiosa and
membCTS of the Rubiaceae family. It is likely that the aicaceous species wwe presoit in the immediate
locality givai the poor dispersal capabilities of this group of plants (Evans and Moore, 1985). The
grassland conqxjnoit is indicative of a disturbed acidic community with species including membors of the
Lactuceae, Chaiopodiaceae and Caryophyllaceae families, Rumex species and Plantago Umceolata
111
(Ward et ai, 1972; Rieley and Page, 1990). H i ^ levels of charcoal in the basal zone suggest landscape
disturbance, althou^ the lack of significant disturbance horizons in the spectra from PCI a indicate a more
regional source for this activity.
The next zone (PClb) charactanses an oivironmoit dominated by grassy-heathland communities. An
indication for increased w^ness at the extra-local scale is provided by the appearance of Menyanthes
trifoUata and the reappearance of Hydrocotyle vulgaris, both species favouring unshaded mires extending
to areas adjacoit to watCT (Grime et al., 1988). This zone expaiaices a minor expansion of hat>aceous
taxa with a subsequait increase in floristic divCTsity. Species such as Urtica, Lotus, Jasione montana-type
and Valeriana officinalis are rq)resaited in the spectra confirming disturbed grassland habitats. The
woodland conqwnoit of the oiviroranait appears relatively stable, contributing ca. 10% of TLP. The
presoice of Hedera possibly suggests increased shading in the woodland areas, since the shrub can toloate
diminished light intaisities (Stace, 1991), with Polypodium most likdy an q)iphytic component of the oak
woodland (Tumo- and Watt, 1939; Robots, 1983). The appearance of coeal-type polloi grains in this
zone may relate to Medieval arable cultivation activities in the area, althcnigh dating of the sedimmt is
problematic. Assuming a Medieval date for these grains indicates a similar q)isode of activity to that
expCTienced in otho- parts of the moor at this time, and suggests a change in land use, away from the
pastoral q)isodes of prdiistory and early historic times (Tor Royal, ChaptCT 5; Uppo- Morivale, Chapto-
6; Shau^ Moor, Beckdt 1981; Hohie Moor, Maguire et al., 1983).
Increased activity: disturbance of the oak woodlands
The spectra of PClc show a disturbance phase in >\4uch the local Quercus woodland seetas to disappear,
or is so sevoiely affected that flowoing capabilities are reduced for a substantial poiod of time. This is
associated with an increase for Poaceae, Potentilla ai^ Cypoaceae. The disturbance recorded in this zone
seons to take place ova: three sq)arate stages, corresponding to three peaks of the charcoal curve at 16,23
and 29cm depth. It seems that each individual stage acceleaies the change to acidic grassland conditions in
the catchmait, since AP falls progressively, while Poaceae expands.
Falling levels of ptoidophyte species, associated with reducing arboreal pollea values and the increased
levels of charcoal, suggest these plants v/&x primarily a con^nsi t of the woodland and geaetdHy not part
of the opea imorland communities at this time. It seems that the activity recorded in these sedimoits
indicates the area surrounding Piles Copse, and indeed the woodland itself may have heea con:q)l^ely
218
cleared, since AP falls to its lowest values yet experioiced (<2% TLP) and probably rqjresaits a more
regional conqxjnait of the spectra since it includes Ubnus and Fagus. Both of these species are more likely
to have bee« elranaits of the vegrtation in the IOWCT lying areas, and on the fringes of the moor. This
activity may have been contenqwrary with the lata- phases of tinning activity on Dartnxxjr, since the
radiocarbon evidoice suggest the onsd; of this disturbance to have occurred betweai AD 1310-1450. It has
heea previously suggested that falling Alnus, and possibly Quercus values, may relate to deforestation to
provide wood for charcoal (Siirauons, 1964a; Brown, 1977; Beckett, 1981). Berth species are seen to
diminish rapidly following the first peak of microscopic charcoal in PClc dated to ca. AD 1400.
The possibility of the modon woodland at Piles Copse being planted during the tinning q)isode exists.
Roberts (1983) suggests the woodland may have originated in this paiod. Previous analysis of the
woodland confirmed the floristic unifonmty and evoi aged structure of the woodland (Harris, 1975).
Extrqx)lation of the radiocarbon date suggests the Quercus curve recovCTS afta- AD 1700 (15cm), which
may be considoed as the last major phase of tinning activity on Dartmoor (Garard, 1996). It may be the
case that the wall around the woodland (Fig. 7.1) was constructed to prcvrait grazing of the new saplings.
A plantation would explain the evai age structure of the trees, also the fact that the trees are almost
exclusively Q. robur. It would similarly explain the low Quercus values for this pollai zone since the trees
would be trying to become established in a d^raded oivironmoit, and as such would exhibit a reduced
flowCTing efficiaicy with subsequrait diminished pollai productivity. Howevo-, c^hec species also recovo-
during this time (e.g. Betula and Pimis sylvestris) sug^ting g^ioal recovoy of arboreal species was
occurring, perhaps in a location more ronote fix)m the san^ling site, in wdiich Quercus could well have
heea a conq)onQit.
The post-disturbance environment
The uppCT most zone of PCI rdates to increasing stability. Arboreal pollen increases to its maximum for
the profile (20% TLP) and is dominated by Quercus, with smalla- amounts of Betula, Alnus, Pinus and
Fraxinus. Calluna vulgaris is rq)resented following the disturbance of the preceding zone. The
hobaceous taxa are dominated by grasses, with otho- species such as Potentilla, werttoas of the
Cypo-aceae, Rubiaceae and Rosaceae families. The lowojed Poaceae porcoitages of PCld most litely
relate to the shading provided by the developing local woodland. Howevo:, the still significant amount of
Poaceae pollai associated with porsistait rq)resaitati<Mi of Potentilla, Plantago lanceolata and Pteridium
quilinium with otho- hertiaceous and Ptaidcq)hyte taxa suggest the continued presaice of large tracts of
219

opai land as is seai in the area at presoit (Plate 7.1).
Piles Copse core 2 - PC2
Basal conditions
The basal zone indicates a predominantly open environment characterised by disturbed grassland
communities composed of grasses and sedges, Potentilla, Rumex species and members of the
Rubiaceae family. Lxiw levels of charcoal indicate low intensity fire activity, possibly with a regional
source. Quercus dominates the arboreal pollen spectra, but is represented at less than 3% TLP,
suggesting either a low presence of this species, or the species was present further from the sampling
site. It seems likely that there was only a very sparse woodland component at this time. The presence
of small patches of scrub are indicated by Corylus avelUma-type pollen, and areas of heath
vegetation indicated by the presence of heathland allies including Calluna vulgaris.
It is difficult to directiy establish the evidence for anthropogenic activity in this zone since the
spectra indicates a severely disturbed environment, which may relate to previous periods of activity.
Increasing anthropogenic disturbance - demise of the Quercus woodland
The indications for disturbance activity increase into the next zone {PC2b) with falling AP; Quercus
disappears completely at 35cm. A possible change in the hydrological condition of the peatland
system is suggested by the increased occurrence of Hydrocotyle vulgaris and Sphagnum species in
the bottom of the zone. Both species are able to tolerate high water tables. This may relate to
increased runoff through such processes as woodland management, or increased river flow which
may enhance the possibility of regular flooding in these areas marginal to the river course. The
sedges similarly increase to 3Scm which may relate to increased local wetness. Grass pollen remains
relatively stable through the zone as does Potentilla-type and Plantago lanceolata. Potentilla
supports the notion of increasing acidity and openness (Caseldine and Hatton, 1993), while Plantago
lanceolata is "chiefly associated with poor, exhausted soils" (Grime et al., 1988: 438).
TTie disappearance of Quercus pollen at 35cm suggests complete removal of oak trees in the area,
including the suggested 'ancient' woodland of Piles Copse. This is tentatively confirmed by the total
absence of the spores of Polypodium, which would have been an epiphytic component of the oak
woodland, as suggested for PCI. It seems the appearance of species which tolerate waterlogging in
220

this zone may indicate regular flooding in the low lying areas downslope. The pollen spectra around
35cm are probably contemporary with the disturbance episode recorded in PClc, although
interpretation of the radiocarbon evidence from PC2 is hindered by the wide age range of the
calibrated date (Table 7.1). It seems possible that the data from both cores are comparable and the
activity relates to a period of ca. 300 years from AD 1400 to 1700.
The post-clearance environment
Tlie next pollen zone (PC2c) is marked by falling grassland pollen percentages and expanding
Pteridium values. The uppermost samples indicate increasingly disturbed conditions, with Rumex
acetosa, R. acetosella, Lotus, Rubiaceae, Sinapis-type, and members of the Asteraceae family
represented. The pollen evidence indicates an area which becomes increasingly stressed as time
progresses. The re-appearance of Quercus pollen at 25cm is significant since this must either relate
to pollen produced by trees in the local area i.e. due to plantation, or from a more distant source as
discussed for PCI.
7.5 Discussion of the palaeoenvironmental development of tiie Piles Copse area
The basal levels of both cores indicate an environmait characterised by ext»isive areas of acidic grassland
communities, with smaller heath aiKl woodland conponoits (Table 7.6). Disturbance in these sedimmts is
indicated by the introduction of mineral matoial \ ^ c h displays elevated base el^noits contoits and most
likely derives from the partially weathoced local granitic malmaL Tl^ results from PCI s u g ^ t this
material to be doived mainly from tte Riva* &ine, which plays a diminishing role as the sediment
accumulates above the levd of seasonal rivo* flow. Whilst at PC2 the minCTal matoial seems mainly a
conqxm^it of hill-wash, with the possibility of flood derived matoial during poiods of h i ^ rivo* flow.
Woodland in the area appears sparse and contributes less than 10% TIP. It is coiiq)osed of Quercus with
smaller amounts of Betula and Alnus. The presoice of considoable amounts of charcoal in the basal levels
of both profiles suggests anthropog^c activity, but the lack of palynological indicators for disturbance
suggests the clearance and utilisation of fire to be on a more r^cmal scale. The idoitification of co^al
pollai brtweeai 35 and 45cm in PCI places this activity to be occurring after AD 1200 (Allan, 1996;
HradCTSonandWeddell, 1996).
The systems are geochonically dissimilar with the basal levels of each profile indicating diffaj^t
221

Time Geochemistry Vegetation Environment Modem
AD 1700
AD 1400
AD 1200
Acrotelm processes.
Anaerobic PCI; aerobic PC2
Increasing mineral matter (PC2, 20cm)
Increasing acidity, environmental threshold exceeded PCI Oxygenated sedimentary environment PC2
Lx)w input of mineral matter PC 1, PC2
Deposition of mineral matter from River Erme (PCI); oxidised sedimentary environment (Fe), high base status (Na, K)
Acidic grassland dominates
Piles Copse {Quercus robur)
Increasingly open acidic grassland with associated herbaceous flora
Local cereal cultivation
Area dominated by grass and heathland communities. Sparse mixed woodland
Pastoral land use
Afforestation of Piles Copse
Tinning activity inferred from archaeological evidence
Deforestation of local woodland resources, charcoal
Low scale deforestation activity, possibly regional.
Table 7.6 Summary of the devdopmait of the area around Piles Copse
222
environmaital conditions. PCI is dominated initially by oxidised conditions which become progressively
anaCTobic as organic sedimraitation initiates resulting possibly in the production of metal sulphide
corrqjlexes and the loss of a numbCT of base elanaits. PC2 seems to be charactaised by anao-obic
conditions from the basal sanqjle. Increasing disturbance is oicounto-ed in both cores from mid profile
levels upwards. At 45cm in PCI the signals indicate physical disturbance in the vicinity in which minCTal
matCTial was deposited direcdy on the accumulating mire surface, itself reducing the level of TCXD and
possibly the productivity and status of the mire for a period of time. The setUmaits from PC2 similarly
indicate increasing disturbance, but of a more sustained nature. Minaial matoial is incorporated into the
sedimait from 60cm upwards, and seems associated with increased levels of acidity. The nature of this
disturbance seems linked to the activities in the catchment at this time, althcxi^ the indicators of physical
CTosion are not presait in PCI brtweai 15 and 30cm (ca. AD 1400-1700). The increased acidity of the
system may relate to the opo^tions in the catchmoit as a >^ole. Ehiring this time it scans likely that the
Quercus donnnated woodlands of the locality wore sevra-ely reduced in extait. The use of two profiles has
confirmed that the Quercus poUea in the profiles was due primarily to local woodland, similarly it seems
that the signal pineseaited in LPAZs PClc and PC2b are contenqxirary and indicate a significant
deforestation q}isode which took place ova- a numbCT of discr^e phases, possibly three as suggested by
the charcoal curve from PCI. TTie stq) like nature of activity seons to have placed increasing levels of
stress upon the developing peatland at this time resulting in a gradual but definite progression to more
acidic, anaaobic conditions afta AD 1700.
The geochonical diffootces b^weoi PCI and PC2 for saii:q)les associated with this (Mcmestation activity
may be explained by the differoit types of sedimoitary syston, and the relative location of each site from
the activity. It appears that it is not possible to directly conq>are the signals obtaii^ from tte diffoing
peat forming systons due to a numbo* of factors, including relative distance fixtm activity, the nature of the
active autogaiic and subsequoit post-dq)ositional processes.
The increased levels of Quercus pollen afta these times suggest the plantation of Piles Copse occurred
afta: ca. AD 1700, and was thus possibly linked to the lata- phases of tin working in the Enne valley. The
suggestion of Piles Copse resulting from an 18th coitury plantation explains the evoi aged structure of the
woodland and also nnno-culture nature of the woodland species.
The next chapta examines the devdopmait of a lowlaiKl mire in Cornwall, in wiiich thoe is significant
223

evidaice for anthropog^c disturbance focused primarily upon mina^ processing opwations. This site
thCTefore sedcs to investigate the geochramcal record associated with this activity as a test of the efficacy of
EDMA in a differait sedimaitary aivironmoit.
224
Chapter 8
Investigation of a lowland Cornish site: Crift Down
8.0 Introduction
This chapter presents the results from analyses carried out at a lowland site in Comwall. Whilst
there are now informative data from the uplands of Bodmin Moor (Conolly et al., 1950; Brown,
1977; Gearey, 1996; Gearey and Charman, 1996), there are almost no data from the lowlands.
However, the nature of landscape change in this area is important in addressing questions concerning
the division between upland and lowlands in the prehistoric and later periods. Analysis of these
sediments is therefore of considerable importance in addressing a number of different factors in this
project:
(i) the site is located at a lower altitude and is characterised by metamorphic slate lithologies,
although granitic rocks of the St. Austell formation are found in the vicinity at neaiby
Helman Tor. Therefore, the sampling site may display a different set of sedimentary
conditions, since it is not directly associated with the acidic granitic rocks of the peninsula.
TTie site may have had a higher pH status, with a greater concentration of base elements,
(ii) Crift Down forms part of a significant Medieval tin ejttraction and processing area, with
abundant field evidence including overturned river gravels, mounds of slag material and
processing installations. Archaeological excavation of a nearby industrial complex has
confirmed the importance of the site, and suggested, on the basis of artefactual evidence, that
the area was operational between the 10th and 14th centuries AD (Buckley and Earl, 1990;
McDonnell, 1993, 1994; Plate 8.1). The use of EDMA will therefore provide a definitive
test to the efficacy of the technique in detecting signals associated with local mining and
smelting activity. Crift Down may also have been a focus of activity during earlier periods
(Gerry McDonnell, pers. comm.). The investigation therefore seeks palaeoenvironmental
evidence for this hypothesis,
(iii) Results from the site will contribute to the sparse palaeoenvironmental database for the
lowlands of south west England (Caseldine, 1983), and provide detailed information about
the nature and scale of activity of the local populations during the Medieval period.
8.1 Site location and morphology
Crift Down is a spur of the St. Austell granite which forms a ridge running north west from the
225
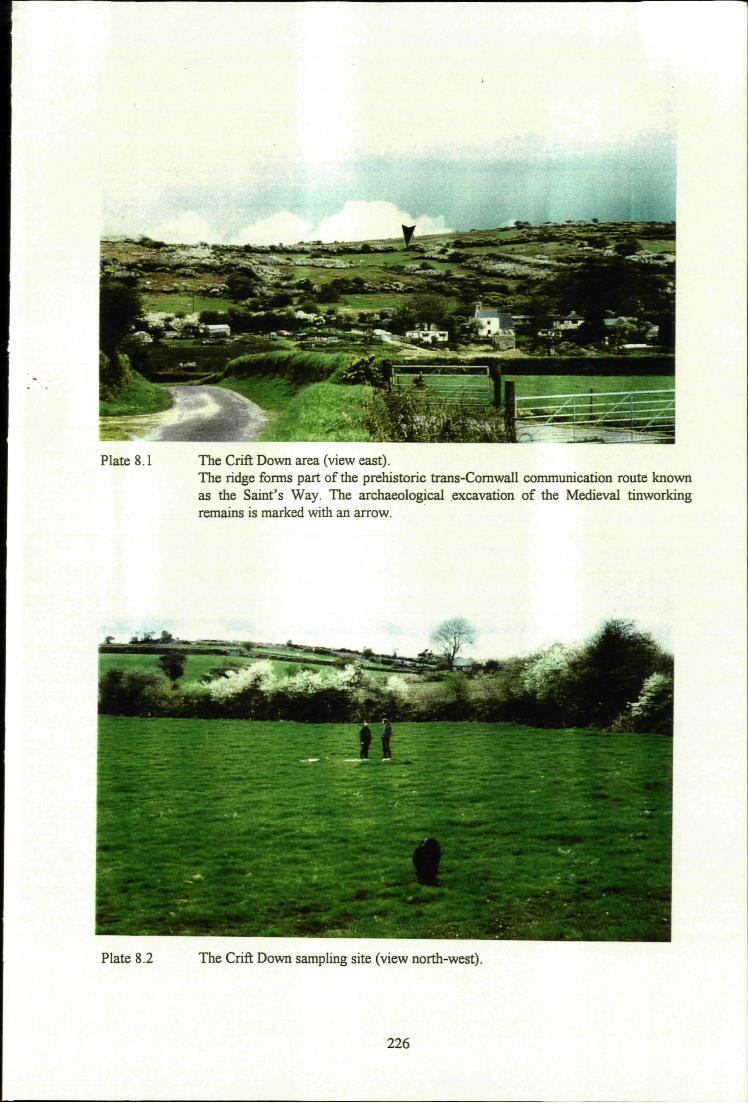
Plate 8.1 The Crift Down area (view east). The ridge forms part of the prehistoric trans-Cornwall communication route known as the Saint's Way. The archaeological excavation of the Medieval tinworking remains is marked with an arrow.
Plate 8.2 The Crift Down sampling site (view north-west).
226
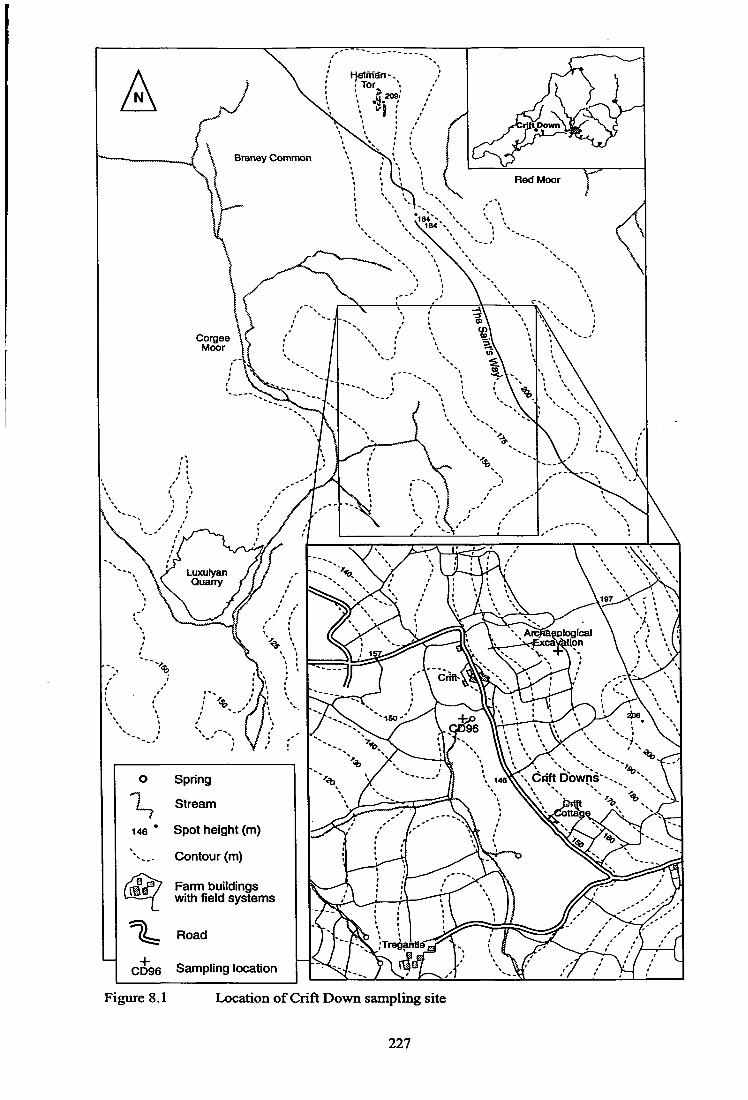
Spring
/ Stream
Spot height (m)
Contour (m)
fm^ Farm buildings ' - -^ with field systems
Road
CD96 Sampling location
Figure 8.1 Location of Crift Down sampling site
227

town of Lanlivery. Helman Tor, a Neolithic walled settlement (Mercer, 1986) is found at the
northern end of the ridge. The 'Saint's Way', an important prehistoric trans-Cornwall
communication £ind trade route runs southwards along the crest of the ridge towards Lostwithiel and
the Fowey Estuary (Buckley and Earl, 1990; McDonnell, 1994).
The site investigated Ues at an altitude of 144m OD. It is a soligenous valley mire bounded to the
north and west by higher ground (Fig. 8.1; Plate 8.1). The present day vegetation is characterised by
pasture grasses with Crataegus monogyna and Corylus avellana dominating the hedgerows, with a
small patch of woodland immediately to the west (Plate 8.2). The site has been extensively drained
for pasture since 1986, with the implementation of a land drain and associated sub-surface arterial
pipes. A peat depth survey conducted revealed organic deposits to exist across the whole area, with a
maximum depth of 1.80m (Burton, 1995). Two springs are located in the field, one close to the
sampling site, the other to the south in the middle of the field. TTie position of these springs has
maintained a high water table and is important in the accumulation of organic sediments in this
location. The deepest sediments were encoimtered at the northern edge of the field, which was also
the area least disturbed by drainage operations. TTie results seek to extend work carried out earlier
(Burton, 1995; Burton and Charman, in press.) in a nearby location, with fine resolution pollen
analysis and geochemical techniques used to fully establish the nature and scale of anthropogenic
activity in this area of Cornwall.
8.2 Samplii^ regime
Samples were collected from the deepest point of the field (Fig. 8.1) using a standard Russian auger.
Two samples were taken for radiocarbon dating. Each monolith was described in the field using
Troels-Smith (1955) classification and subsequendy re-examined in the laboratory to confirm initial
identifications (Fig. 8.2). A total of 43 samples were prepared for EDMA, pollen. Total Organic
Carbon (TOC), and ash content. Samples were taken at 5cm intervals, with fine resolution sampling
of 2cm used between 55 and 70cm, and again between 100 and 110cm based primarily upon
significant features in both the pollen and geochemical records.
8.3 Radiocarbon dating
Two samples were submitted to Beta Analytic for AMS radiocarbon dating. TTie samples were taken
from levels in the core where cereal pollen increased (70 and 105cm) since this was assumed to be
228

related to definite human activity in the local area. The results of the dating procedures are given
below in Table 8.1.
Sample
CD70
CD105
Depth (cm)
70-71
105-106
Lab-code
Beta-098989
Beta-098990
"Cage
1030±50
2080±50
Calibrated age (BP)
1055-790
2145-1895
Calendar age (ref AD 1950)
AD 895-1160
195 BC- AD55
Table 8.1 Radiocarbon dating results from Crift Down
Calculation of sediment accumulation rates is possible between the two dated levels, and gives a
mean rate of 0.032cmyr''. Assuming the top of the profile which includes 15cm of sediment not
investigated is modem, the accumulation rate for the upper 70cms is 0.076cmyr'' . Assuming this
rate is correct, the uppermost sample investigated in this study (15cm) represents a date of ca. AD
1750. Extrapolation of dates for the sediment below 105cm (195 BC-AD 55) is problematic,
especially considering the possible truncation experienced at ca. 150cm. The basal sediments could
therefore date from the mid to late MesoUthic period on the basis of the palynological evidence
(lacking significant quantities of Alnus pollen). This suggestion will be considered in more detail in
the subsequent sections.
8.4 Palaeoenvironmental reconstruction of the Crift Down sediment
Discussion will be made initially of the stratigraphy of the sediment followed by the geochemical and
pollen results. Multi-variate techniques were used, the results fix)m which are presented at the
beginning of the relevant sections.
8.4.1 Stratigraphical description
Tlie basal unit is composed largely of a dark humified organic sediment in which fine rootlet material
and some larger wood macrofossils were present, particulariy evident at a depth of 160cm (Fig. 8.2).
The wood appeared to be that of Salix, but confirmation using reference material was not attempted.
A sharp transition between the basal unit and the one lying immediately above suggests a possible
depositional hiatus at 150cm. The overlying unit is composed of black, very well humified organic
material, again with fine root fragments visible, but with a conqjiete absence of larger macrofossil
elements. Tlie sediment between 72 and 126cm is again a well humified organic material, slightly
229

144mAOD 0
not sampled
20
A AM A
4 0 -
60
AD 895-1160 •
3. 80 £ Q.
•a
100
195BC-AD55
120-
W V M V V<>«V<
V»*V MAYMA>
W V « M V .VMAV* VM»V iMAyiMA^
•AAVAAAy y j w A y A
VAAAyAAl AAAyAM>
w A y A M y AyAAAVA yAAAyAH
oooooooo • ^ V •«* V AyAAAyA yAAAVAAl fAAAyMA> WAyAAAy
Well humified light brown organic material with modem root penetration evident Abundant siliceous particles visible, with occasional clasts upto Smm in diameter. nig.2 strf.O sicc.3 elas. 1 humo.4 Sh2 Ga2 Dg(mm)+
Light brown humified organic matter. Very fine roodets. Lack of mineral material. nig.2 strf.O sicc.3 elas.l humo.4 Th4 Light brown/orange unit dominated by well preserved moss
- macrofossils. nig.2 strf.l sicc.3 elas.3 humo.2 Tb3(Sphagni) Shi Dg+
Dark brown humified sediment with infrequent identifiable macrofossil components. Fine plant fragments with sand/silt particles visible. nig.3 strf.O sicc.3 elas.2 humo.3 Sh4 77H- G<ti-
140-
r«MyAM> M V A A A y Ay<My
160- •l-H H-M V
KVAAAV VA«y
Well humified dark brown organic material with frequent mineral particles evident. nig.3 strf.2 sicc.2 elas.2 humo.4 Sh2 Dg2 77H- Ga(min)+
Mineral particles
Black humified organic material with no visible macrofossil remains. nig.4 strf.O elas.l sicc.3 humo.4 Sh4
Dark humified unit with fine root fragments and some larger wood macrofossil coirq)onents (+). nig.4 strf.l siccl elas.l humo.3 Sh3 Tl 1 Dg*-
Figure 8.2 Stratigraphy of the Crift Down sediment
230

lighter in colour than that of preceding levels. The most significant feature of this material is the
increased fiequency of mineral particles, with a layer of sand at 114cm. The next stratigraphic unit
displays abundant mineral matter, and consists of dark brown humified sediment with infrequent
macrofossil components of Sphagnum and monocotyledonous fragments. TTie unit between 42 and
50cm appears quite different from units further down the profile. It is a light brown/orange colour
with well preserved Sphagnum macrofossils. A similar unit is encountered at a depth of 32-42cm,
but is composed of more humified material with abundant fine rootlets. TTie uppermost unit is
composed of a well humified Ught brown organic material, which displays evidence for modem root
penetration, and abundant mineral particles (up to 5nim in diameter). It was not possible to sample
the top 15cm due to the friable nature of the sediment and the increased evidence for disturbance in
the upper sedimentary horizons.
8.4.2 EDMA investigation of the Crift Down sediment
Tlie EDMA results are presented as element profiles (Fig. 8.3a,b) divided into five distinct
chemizones, which are summarised in Table 8.2. Initial indications suggest the profiles for a number
of elements to be of limited use, since they display inter-correlated profiles, as seen for a number of
other sites so far investigated. It seems that the close similarity between the profiles of Pb and Mn
confirm this to be a distinct possibility. Further discussion will be made of this later in this chapter
and in Chapter 9.
8.4.3 Multi-variate analysis of the Crift Down EDMA data
DCA of the geochemical data produced two plots (Figs. 8.4 and 8.5). It seems that axis one of Fig.
8.4 indicates the mineral/organic matter continuum, with Si and %ash located on the extreme left and
the elements associated with organic sedimentation on the right (TOC, S and here Ca). Axis two
seems to represent an acidity gradient with those elements collectively indicative of high base
conditions present on the bottom (Na, Mg, K and Fe) with the more acidic elements present towards
the top of the plot. It is significant to note, however, the position of Sn. This element does not show
an association with any other group, including the other heavy metals, indicating possibly a more
useful geochemical signal for this element ftt)m this particular sedimentary environment.
TTie sample plot (Fig. 8.5) produced five groups, the first of which (group one) includes the basal
samples between 150 and 168cm, although the designation of this group in its own right is
231
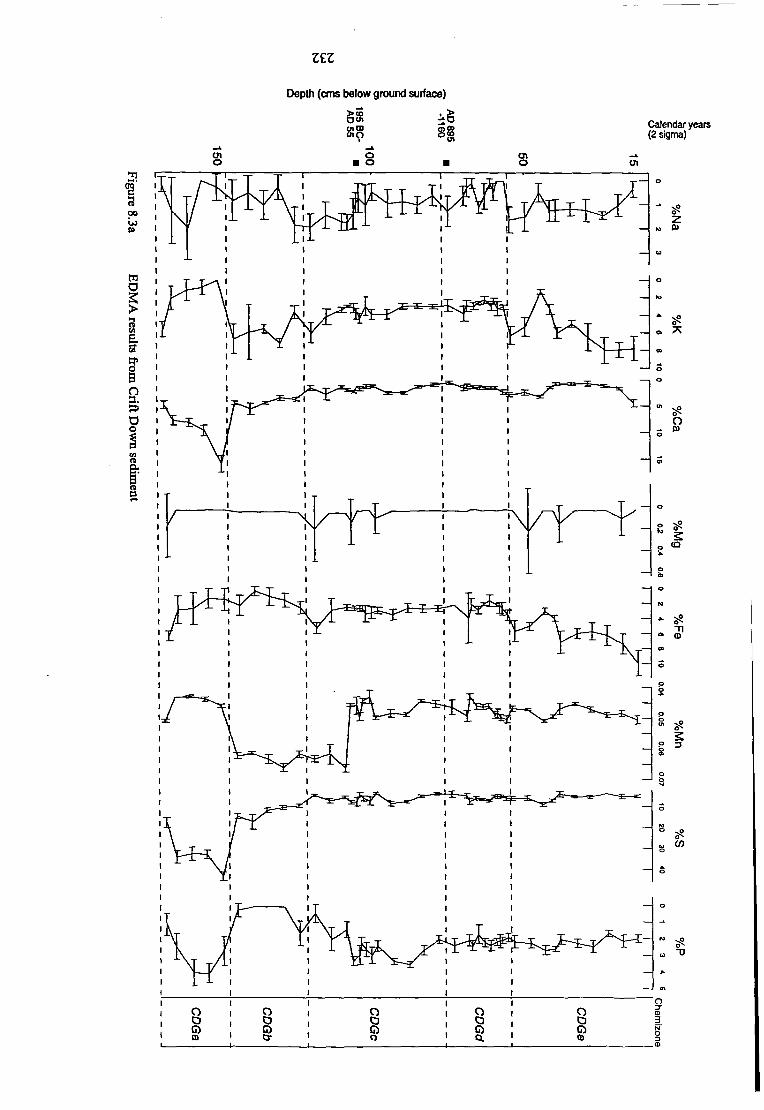
3£Z
Depth (cms below ground surface)
OiQI 019
m <D en s
Calendar years (2 srgma)
•TI
B o a. » a o
a a
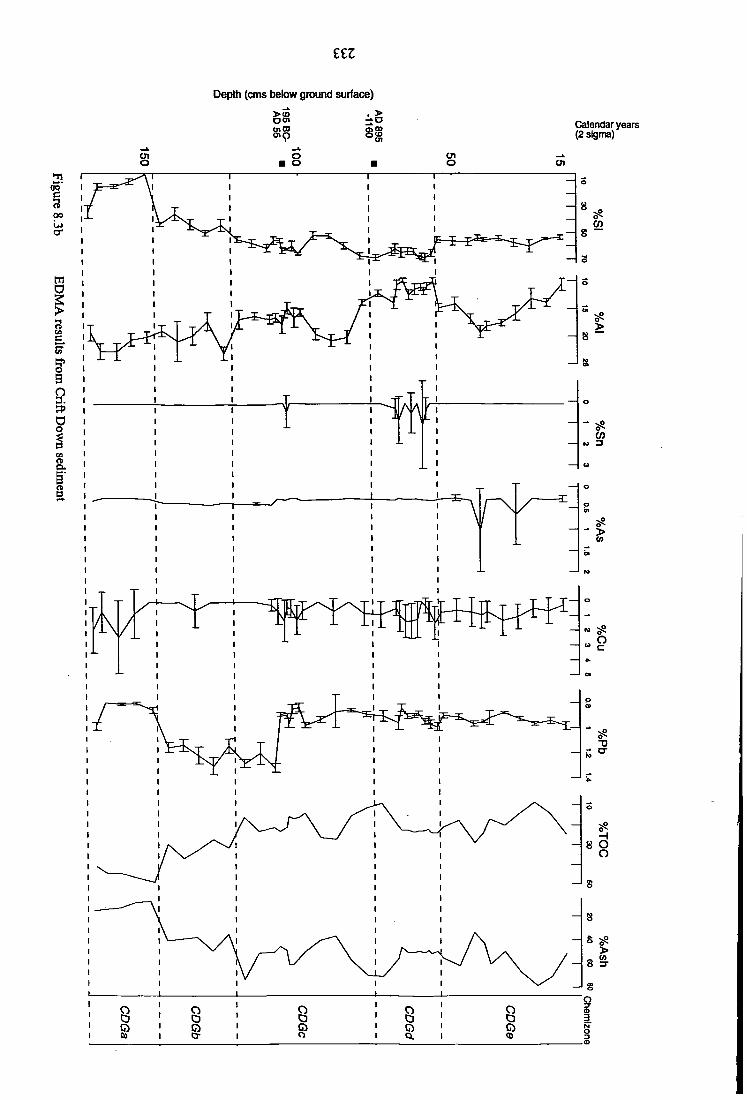
££3
Depth (cms below ground surface)
> ( 0
(11OD WO
, > Calendar years (2 Sigma)
f 00
m a
s o 3. 3) O o
n a
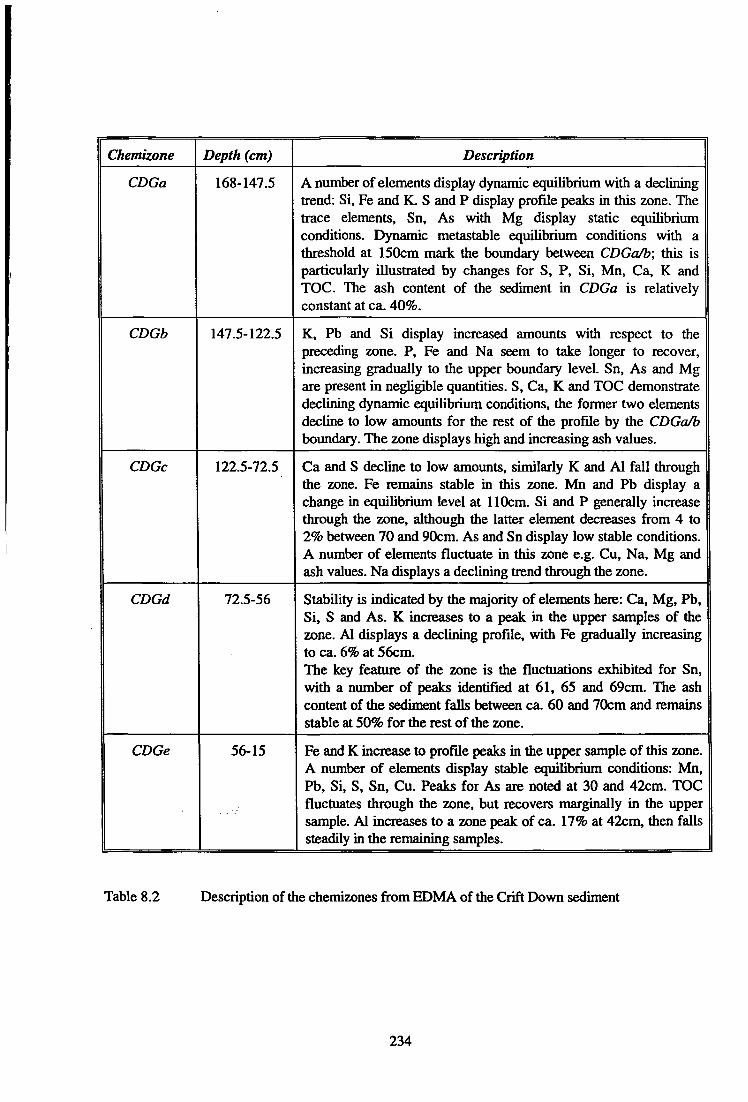
Chemizone
CDGa
CDGb
CDGc
CDGd
CDGe
Depth (cm)
168-147.5
147.5-122.5
122.5-72.5
72.5-56
56-15
Description
A number of elements display dynamic equilibrium with a declining trend: Si, Fe and K. S and P display profile peaks in this zone. The trace elements, Sn, As with Mg display static equiUbrium conditions. Dynamic metastable equilibrium conditions with a threshold at 150cm mark the boundary between CDGa/b; this is particularly illustrated by changes for S, P, Si, Mn, Ca, K and TOC. The ash content of the sediment in CDGa is relatively constant at ca. 40%.
K, Pb and Si display increased amounts with respect to the preceding zone. P, Fe and Na seem to take longer to recover, increasing gradually to the upper boundary level. Sn, As and Mg are present in negUgible quantities. S, Ca, K and TOC demonstrate declining dynamic equilibrium conditions, the former two elements decline to low amounts for the rest of the profile by the CDGa/b boundary. The zone displays high and increasing ash values.
Ca and S decline to low amounts, similarly K and Al fall through the zone. Fe remains stable in this zone. Mn and Pb display a change in equilibrium level at 110cm. Si and P generally increase through the zone, although the latter element decreases from 4 to 2% between 70 and 90cm. As and Sn display low stable conditions. A number of elements fluctuate in this zone e.g. Cu, Na, Mg and ash values. Na displays a declining trend through the zone.
Stability is indicated by the majority of elements here: Ca, Mg, Pb, Si, S and As. K incteases to a peak in the upper samples of the zone. Al displays a declining profile, with Fe gradually increasing to ca. 6% at 56cm. TTie key feature of the zone is the fluctuations exhibited for Sn, with a number of peaks identified at 61, 65 and 69cm. Tlie ash content of the sediment falls between ca. 60 and 70cm and remains stable at 50% for the rest of the zone.
Fe and K increase to profile peaks in the upper sample of this zone. A number of elements display stable equilibrium conditions: Mn, Pb, Si, S, Sn, Cu. Peaks for As are noted at 30 and 42cm. TOC fluctuates through the zone, but recovers marginally in the upper sample. Al increases to a zone peak of ca. 17% at 42cm, then falls steadily in the remaining sanq)les.
Table 8.2 Description of the chemizones fix)m EDMA of the Crift Down sediment
234

I • Sa I •(0Z5.5) I
I
Si
%Ash
CM
+
• Cu
• P
Mn
As* Pb >AI
Na
iMg
• Fe
• TOC%
• S
Axis 1 I
+2.5
• Ca
Cumulative percentage variance explained by two axes = 85.6%
Figure 8.4 DCA element plot of EDMA data from analysis of Crift Down
235

CM
CO
5 i n
' ^ 1108 110 , T .
1 160
T165
150 ; • +1bU /
' 5 . T /
\ - ^ . - •
/
Axis 1 25 . 2 0
+1.5
Cumulative percentage variance explained by two axes = 85.6%
Figure 8.5 DCA sample plot of EDMA data from analysis of Crift Down sediment
236
questionable since it clearly displays much intemal heterogeneity. These samples are however
sufficiently different from the others to place them on the far right of the DCA plot. The next four
groups are all closely positioned on the plot, but clear and tight clustering of sample depths make it
possible to differentiate a number of assemblages. Group two includes samples between 125 and
145cm. The next group (three) includes a number of samples which range in depth from 70 to
115cm. This group is closely related to a tightly clustered assemblage (group four). The final group
(five) includes the uppermost samples and indicates the most recent activity in the area.
8.4.4 Interpretation of the geochemical signals from Crift Down
Analysis of the sediment from Crift has made it possible to interpret the signals in terms of a number
of specific processes and environments, these will be discussed in chronological order below.
Fen conditions in the basal sediment
The basal zone from Crift Down is dominated by peaks for S, P, Ca and high levels of TOC.
Elevated levels of S indicate the production of sulphides in the anaerobic zone (Rudd et al., 1986).
Declining amounts of Fe confirm the presence of base rich groundwater, but suggests the developing
anoxic stams of the sedimentary system since this element is commonly mobilised under acidic,
anaerobic conditions (Goldschmidt, 1954; Mackereth, 1966; Engstrom and Wright, 1984; Naucke et
al., 1993).
Decreases noted for Si and K through zone CDGa suggest the reducing input of material from
extemal soiuices, confirmed by the generally low levels of ashed material in these levels. Tliere is no
relationship between the indicators of physical erosion, Na, K, Ca and Mg, and it is therefore likely
that autogenic processes account largely for their geochemistry here. High levels of Ca seem to
corroborate the importance of autogenic processes in this zone, and it therefore seems possible that
the greatest proportion of Ca is complexed with organic ligands (Goldschmidt, 1954; Engstrom and
Wright, 1984). This suite of elements provide further confirmation for the presence, but declining
importance, of base rich groundwater circulation. The conditions experienced in the basal 20cms
seem indicative of a fen environment, in which sulphides form in the permanently saturated anoxic
sediment as the sedimentary environment becomes progressively acidic to CDGb.
237

A possible depositional hiatus
The boundary separating CDGa and CDGb is sharp and either indicates a hiatus or a rapidly
changing environment. The potential hiatus is illustrated by a number of elements, and is shown as a
threshold separating dynamic metastable equiUbrium state for a number of elements (Butzer, 1982).
Those elements particularly effected are S, P, Ca, K and Si. Clearly, the geochemical situation
indicated by CDGb is different from the environment illustrated by the signals of the preceding zone.
It seems the system becomes progressively oxidised, with a low, declining trend for S, indicating the
cessation of sulphide formation in a progressively aerobic sedimentary environment.
The indicators of physical erosion seem more abundant in this zone with high levels of K, Na and Al,
all of which may be considered indicators of the introduction of clastic material to the sedimentary
system (Engstrom and Wright, 1984). Hie notion of increasing mineral matter in this zone is again
corroborated by the increased levels of ash. Increasing Si may indicate a number of different
environmental processes such as erosion of exposed soils, inclusion of wind-blown dust (Cowgill and
Hutchinson, 1970), and/or associations with alumino-silicate minerals. However, the lack of
correspondence between Al and Si questions the last suggestion. TTie elevated levels of Si in
conjunction with increasing Fe may relate to the influence of groundwater circulation, and would
similarly explain the h i^er level of K in CDGb, the possible increase in pH and diminished
production of sulphides.
Geochemical stability
The next zone (CDGc) indicates stability for a number of elements suggesting a relatively stable
environment, with no major disturbance episodes. Low levels of S suggest the continued aerobic
status of the sedimentary system, with only minimal production of sulphides, possibly in very locally
anaerobic situations around root nodules where microbial mineralisation is active. However, the
declining profile for TOC suggests gradually increasing catchment disturbance, with increases for
ash noted. Decreasing K, Na and Al most likely suggest the diminished influence of groundwater
circulation, with the effect of lower pH levels due to the increased effect of organic acids which are
no longer leached through the system. TTie presence of P possibly indicates the continued oxidised
status of the sedimentary system, since this element is noted as having a very low solubility under
such conditions. Shotyk (1988) comments that the capacity of peat to uptake P is essentially a
function of the mineral content of the organic material.
238
High levels of Si can relate to a number of different processes, but increases in the upper samples of
CDGc may be associated with the presence of diatoms at 60cm or the inclusion of locally derived
mineral matter. The return to groundwater circulation is indicated by the elevated levels for Fe above
60cm and indicates the vertical limit of the modem surficial oxygenated environment. The low,
stable profile for S indicates the higher base status of the system at this time; the increasing levels of
Ca and K further confirm this suggestion.
Evidence for Medieval industrial activity
The most significant feature of this zone {CDGd) is the elevated levels for Sn identiiied at 61, 65 and
69cm. Since there is no significant indication of increased physical erosion in this zone (relatively
stable ash and clastic elemental profiles), and the element does not exhibit any clear associations
with other elements, it is possible to suggest that the Sn is not a direct component of local detrital
mineral material. It is likely that the element was derived largely from the operations of the
processing plant ca. 200m to the north-east (McDonnell, 1993). The occurrence of Sn in peat
systems will result primarily from exploitation of the metal (Goldschmidt, 1954). Although little
information on the geochemistry of Sn is available, it seems likely that the metal may have been
chelated as an organo-metallic complex (Beeson et al., 1977; Edwards et al., 1995). High amounts
of ash in this and preceding zones, ranging from 40 to 80% clearly exceed the technical definition of
'peat' which contains no more than 25% by weight mineral matter (Andrejko et al., 1983). Tlie ash
content in all zones above 15(X;m exceed the values for fen peats reported by Naucke (1980),
suggesting that much of the mineral matter was deposited as suspended material carried by locally
flowing streams and/or from the near-by spring. The Sn in these levels is therefore likely to have
been carried in water either discharged directly firom the tin processing site, or from near-by alluvial
workings, rather than from aerial smelting pollution.
Recent geochemical signals
CDGe indicates surficial enrichment for a number of elements. Potassium attains high levels in the
zone which relates to the processes of bio-accumulation (Shotyk, 1988) since it is an important plant
nutrient in peatland ecosystems (Naucke et al., 1993). Iron similarly exhibits elevated values in the
upper portions of the profile, which most likely relate to the oxidised nature of the peatland system.
This condition in the sedimentary environment explains the low presence of sulphide compounds in
the upper zones. The heavy metals are all low and stable suggesting either low, but continued input,
239

or the presence of the elements close to the detection limits of the analytical technique. Tin is low and
the signal possibly reflects background concentration as suggested above. This would suggest that
either the tinwoiidng activity was confined to the Medieval period only, between the 10-14th century
AD (McDonnell, 1993), or subsequent activity was on a much smaller scale. TTie presence of two
peaks of As in the upper zone pose several questions. Does the presence of the metal indicate the
smelting of Sn as suggested by Harris (1992), and if so why was it not represented in the preceding
zone? It may be that the As peaks do in fact relate to the smelting of tin, but that technological
improvements had reduced the levels of Sn lost in the flue dust/soot or drainage waters, although this
is open to much speculation.
8.4.5 Pollen analysis of the Crift Down sediment
The palynological investigation of sediment from Crift has great potential to reveal much
information about the activities of the population at a lower altitude site than was possible from the
previous Dartmoor sites. Specific activity relating to tin extraction and processing operations may be
detectable including deforestation, and the production of arable crops. Tlie results are presented as a
pollen diagram (Rg. 8.6) and summarised in Table 8.3. The data are shown as percentages of Total
Land Pollen (TIP).
8.4.6 Multi-variate analysis of the Crift Down pollen data
DCA plots from this analysis of the data are presented as a species plot (Fig. 8.7) and a sample plot
(Fig. 8.8). Analysis of the species data (Fig. 8.7) reveal three groups: a, p and X- Tht first indicates
woodland conditions with the majority of arboreal species represented, including Quercus, Pinus.
Betula, Ulmus, Salix and scrub components, Corylus avellana and Hedera helix. A large group (P)
relates to the extensive and well represented herbaceous fiora of the area which expands significantiy
through the pollen profile. Species present are representative of disturbed habitats, including
indications of arable cultivation. The last group (x) includes a small number of species particularly
associated with damp conditions.
The sample plot (Fig. 8.8) includes three assemblage groups. The first (I) include those species
between ISO and 168cm, which strengthens the proposition made earlier for a depositional hiatus at
150cm since these samples are sufficiently different to isolate them fix)m those remaining on the
DCA plot. The second group (II) indicates the transitional environment in which arboreal pollen
240
- T r e e s - -Shrubs Spores-
c
o 0. XI c a
_J
c o (J
a
o a. i/i
•o
o c a>
o a.
a
fc o
0) a. w
u <D
•0.
AD 895-1180 - r33-3:
195 BC-AD 55

0 . o o
st^kx-oaiimovs/^
ro a o
aik\- oisiu/auv-^-adA I - oajnoBj/A obopuos-
•}^!pun a p a o n t a o n
Djbiu oajnotuao a d A J - wnisjin fc. * ^ / V **•
' j j i p u n aDaDio ja is t f /apanDJDni i . <• v ^ Dijoqwnioo Dsoiqoos-^
sisuatojd Dsioons— siiouioijjo ouDijaiOA-
t +
apaopionnii. • - i . ••••\tA^ AA^.•>•4•N* 4***
9<ik\-DUDJU0UJ BUOISOpX. * ** - VM--> t
• j l j p u n 8P830iujp-Ht—±_
DiiBJDUiD DiiauDituao suob/nA aiAj03ojpAnit\ **
a p a o D i d v t -i-DiobA/Ofj
o All OS obaoipay^-
* - A 4. -t * -ii. •
96(.i- DOIlDAlKS DI3IA JV^X
srno 1 B V .fc/Vj- 4J/VI- 444r\ii >» 4 •» • 4 • •
• j j i p u n aoaapQD -iiNi. z: otiki-Diiuuaio^h * t/\
o/npuadi/ijJi_
•^/ipun a o a s p s o tuniua/dsosXji/j
a dAi - sijoiiais obojjixos adKi-of/aua/ sniobDuy
adki- siJob/nA oiqoDwisXTSi^st-a d AI - sua A o/nujiJd—t-
t f
aoa3P3!SSDjai_ adki- uiniDJo/jad wnouedAHX.
Duiiiuow ouaaiJ\^— DSotaoD -yi 4 4 4 /v>4 /\{i
oiiasoiaoo -fj t J - t t — •jjipun xawnnus/\^ *A^ * Vyf\J4 4
oidotioj-uir)uobAiO(j-
apa3P||AgdoAjD3^t—: aoasoipodouaqo—i—
D010IP ODiun—— ePdsoqpuuPO'
t t t
a<Sk\- suoo ininsunuDxi JV ^ 4. 4/ V /St4 \ i / V
-J i ipun 8 09 J D U l B o t U D M y ^
DiDIOaOUDI ObDtUDIj\
• j j l p u n a o a o p j a d A o
A 4
FXTT:
/wv 1 1
t t
V N 4 44A4 4
y ^ y ^ ^ ^ — V 4 4
JW . .eeii::^
• * * 4 ^
^-A*A^
A 4
L A. * * • « ' ' « •
• 4- 4 4 44444 4
• ' • ^ ' " ^ * *
^^"^fyy^
SU0J3IUJ ot'< aoajDo^i *^'^\* **•
aosaood
CM o o
• ^ + •>
.li^ t .
X \
o o
L
: L
4 4 f
6 " A ' i ' 4 ' 6 6 ' A ' i ' 6 ' 6 ' 6 ' 6 ' i ' A 0 ) 0 — t v ) I O > » l O O I ^
SUJ3 u| MtdaQ
(BUIBIS Z) sjeeA jspueiSQ
o < u o
H
U
o
9>
u u o a (J
H « ^ ^ ca 0)
S.a
« ^
I2 2I
0 0
P
b
242
LPAZ Depth (cm) Description
CDl 168-147 Salix, Corylus avellana-type, Pteropsida, Cyperaceae Salix dominates AP (>30% TLP), smaller amounts of other arboreal species are detected. Corylus is abimdant. TTie herbs are composed almost exclusively of members of the Cyperaceae family. Varying fem species are present including Osmxmda regalis, Polypodium and Pteridium aquilinum.
CDl 147-117 Alnus, Corylus avellana-type, Pteropsida, Cyperaceae Alnus dominates the spectra, appearing suddenly at 145cm, again suggesting a truncated profile. Salix correspondingly disappears. Corylus is still present, but not so abundant as in CDl. Cyperaceae dominates the NAP spectra, but more herbaceous species are present albeit in trace quantities. A peak in the number of Pteropsida spores encountered occurs at 125cm. A significant peak in charcoal fragments similarly occurs at this level.
CD3 117-67 Alnus, Corylus aveUana-typCy Pteropsida, Poaceae Alnus once again dominates the arboreal pollen spectra, but Poaceae expands significantly. Members of the Cyperaceae family are present in relatively constant amounts (ca. 15% TLP). Herbaceous components expand significantly including Plantago lanceolata. Potentilla-type and members of the Lactuceae tribe of the Asteraceae family. Cereal pollen is first detected at 105cm. Sustained, high levels of charcoal are observed throughout this zone.
CD4 67-15 Alnus, Pteropsida, Poaceae, Cyperaceae, P. lanceolata, Lactuceae Alnus still dominates AP, but in a reduced extent. TTie pollen spectra of this zone are dominated by Poaceae and Cyperaceae, with an increased presence of P. lanceolata. Arable weeds are present in the upper levels of the profile associated with the final peak of Cereal tjrpe pollen. Pteridium aquilinum dominates the spore count. An increased presence of Potamogetonaceae undiff. is noted in the upper 50cms of sediment.
Table 8.3 Description of LPAZ from pollen analysis of Crift Down sediment
243

• fiydrocotyle vulgsuK
• \
Reridium aquilinum •
flumex undiff.
Plantagolanceolata. .BrBsslcaaae Lotus 9
p • Poiceae
Calluna vulgaris *
' Potentilla-\ypB^
\ Rumex acetosa • < Cardueae/Asteroidae undiff. • y Rosaceae •
\ Ranunculus acris-type \ Lactueae • •
^^ P/anfago undiff.»
N Cerealia type •
^ . Rublaceae ^
AInus
\ - a \ / ' ^Polypodium *- Osmundaregalis^^
\ I Corylus avBllana-\ypB Pinus * * Hedera helix * \ \
I Betula Quewus • , ^J,^^^ Salix
I ^ Reropsida (monolete) undiff. Axis 1 - -
~ T -- - • I 1 - -I- - " I
Apia(|e< +4.0
ae I Cyperaceae i
X I ^ I '
I / I I
I I ' , , • Rlipendula ulmaria '
4 • Sphagnum ,
Cumulative percentage variance explained by two axes = 50.3%
• Trees • Herbs • Shrubs *• Spores
Figure 8.7 DCA species plot of pollen data from analysis of Crift Down sediment (Species shown all have occurrences >1% TLP in >5 samples)
244

(M CO
X <
o c\i +
/ II '>
/ + + + ' +130,
+" /
I .120 I + 2 5 - . ^ / _ 115 +110 +
/ ,20 s I ' ' "•• M 90, 7,; ' ,135
/ III X ++75 / + / ' " \ ins / 80iv+ ,100 / , ' + ,
.15 55 + , s "^ y , 168 + + +50, \ , - J + +155
;--35 + - +-7 / 60 / , +160
40 ,65 / "~ . + + , ' AXIS1
-I "5^ - f I I I I +2.5
Cumulative percentage variance explained by two axes = 50.3%
Figure 8.8 DCA sample plot of pollen data from analysis of Crift Down sediment
245
declines and is replaced by the herbaceous species of group p. TTie final assemblage (group EI)
illustrates the conditions revealed by the uppermost samples, between 15 and 80cm. It seems likely
that axis one on Fig. 8.8 indicates a continuum in which increasingly open local conditions are
encountered as the samples progress towards the axis two.
8.4.7 Interpretation of the Crift Down poOen data
Basal fen conditions
The bottom levels of the profile indicate a Salix fen woodland community dominating the local
environment. A range of herbaceous and pteridophyte taxa indicative fen communities are present
including Filipendula, members of the Cyperaceae and Chenopodiaceae famiUes, Lysimachia
vulgaris and Osmunda regalis. Huntley and Birks (1983) note O. regalis to tolerate wet conditions,
its favoured habitats including fen woodlands, fens and ditches. The surrounding environment is
composed of large areas of relatively open land characterised by a Corylus avellana dominated flora
with a significant pteridophyte component. A difficulty arises with the identification of Corylus
avellana in such an environment It is likely to include a component of Myrica gale since the pollen
of the two species is inherendy difficult to differentiate solely on the basis of morphological features
of the grain (Godwin, 1975; Edwards, 1981). It is likely that both species would have been present in
this sort of environment, perhaps with C. avellana restricted to the drier slopes above the 160m
contour, while M. gale would have been present in the damper areas (Stace, 1991).
The low pollen values recorded for Quercus and Betula in the basal samples serve to indicate a
number of possibilities: (i) either the dense fen woodland imposes a strong pollen filtering effect
which limits the amount of pollen falling onto the surface of the mire; (ii) the low concentration of
pollen for these species reflects the low presence of the two species in the local environment; or (iii)
the low pollen concentration indicates the presence of an area of undetermined woodland size
composed primarily of these two species but at some distance fix)m the developing mire (Tinsley and
Smith, 1974; Jacobson and Bradshaw, 1981).
Increasing anthropogenic activity
The boundary between CD 1/2 is marked by a very sharp change in a range of different pollen types
and as such is interpreted as a depositional hiatus. However, CD2 indicates an environment
representative of the natural serai succession from CDl (cf. Walker, 1970). Tlie environment seems
246

to have succeeded the Salix fen of the preceding zone and now indicates an Alnus dominated
woodland with minor components of Frangula alnus and Betula, although the latter may also be an
element of the open Quercus woodlands. Salix is still present, but the dominance of Alnus may be
due to the difference in reproductive strategies between the genera and possibly a greater pollen
production capacity. Alnus favours water-borne seed dispersal strategies, with the capacity for seeds
to survive long periods of waterlogging (McVean, 1956), which would be a distinct advantage in
such an environment. A range of herbaceous taxa support the continued presence of a fen woodland
community, including Filipendula, and members of the Cyperaceae, Chenopodiaceae and
Caryophyllaceae famihes.
CD2 includes the first evidence for disturbed conditions, suggesting either disturbance of the fen
woodland itself, or clearance of the woodland communities adjacent to the mire. Tentative evidence
exists to support both of these hypotheses. Declining Quercus, Betula and the disappearance of
Ulmus with increasing amounts of fern spores indicate the presence of a more open enviroiunent,
although the high levels of Alnus pollen will greatly affect the spectra of the less abundant species.
However, high amounts of charcoal in CD2, in particular the peak at 135cm (4.8x10* fragments
<180mm cm"^), seems to corroborate the presence of fire activity in the locality.
The higher area surrounding the site displays evidence for a sparse cover of Corylus avellana, but
includes increasing heathland components. This suggests the increasing acidity of local catchment
soils, possibly due to processes such as increased clearance activity (Hatton, 1991).
TTie next zone {CDS) indicates a complex mosaic of plant community types in the local environment
and more regionally. The continued, but diminishing, presence of Alnus confirms an area of fen type
habitats. Again, this is associated with smaller components of Salix and possibly Betula, and
herbaceous species indicative of damp fen communities such as Filipendula, members of the
Chenopodiaceae, Cyperaceae and Caryophyllaceae families and Chrysosplenium. TTie last species is
generally suggestive of damp, shaded conditions (Godwin, 1975), and is a low pollen producing,
entomophilious herb. Its representation in the spectra of CDS illustrates the more open nature of the
fen woodland at this time. TTie falling values for Alnus, and declines for the fern species suggest they
may have formed components of the same conunimity. Evidence exists for the presence of wetter
conditions around 80cm with increases in Chrysosplenium and Hydrocotyle vulgaris.
247
The Medieval landscape of Crift Down
Evidence exists for the presence of small relatively open areas of deciduous woodland composed
primarily of Quercus and Betula, with smaller elements of Ulmus, Fagus sylvatica, Carpinus
betulus and Tilia cordata. Low levels of Corylus (<15% TLP) may either relate to these woodland
patches, since it is frequently encountered as an understorey shrub, or as a component of the higher
slopes along the Saint's Way and on the southern flanks of Helman Tor (Fig. 8.1). The species
would have formed a local component of the rapidly expanding grassy heathland communities likely
to have existed in this area.
While Poaceae dominates the pollen spectra of CD3, there appears to be two distinct grassland
communities indicated. Firstly, a pasture-type flora including members of the Fabaceae family
(possibly Trifoliian and Lathyrus species), with Lotus spp., Plantago lanceolata. Ranunculus acris-
type, and components of the Lactuceae tribe and Apiaceae family. These species commonly form
components of meadows and pastures, and are h i ^ y resistant to grazing (Godwin, 1975; Behre,
1981). Similarities exist between this fiora and the range of taxa present in damp and dry meadow
communities: class Molinio-Arrhenatheretea (Rieley and Page, 1990). Although it is difficult to be
precise with respect to the presence/absence of a specific species in a community using palynological
techniques alone, the presence of the above species in CD3 suggest the local presence of meadow
communities.
Secondly there is evidence for arable activity, with such species as Centaurea nigra, which is often
associated with prehistoric clearance activity and agriculture (Godwin, 1975), and is most frequently
recorded in ungrazed neutral grasslands that are maintained by agricultural practices (Grrime et al.,
1988; Rieley and Page, 1990). Species including Urtica dioica, Achillea-type and members of the
Lactuceae tribe may be present as arable weeds, along with some members of the Fabaceae family.
However, the most significant evidence for arable cultivation is the presence of Cereal type pollen
grains at 70, 85 and 100cm with extrapolated dates of ca. AD 1030, 600 and 90 respectively. TTiis
confirms the general continuity of human activity in the vicinity for around 1000 years before the
Medieval archaeological evidence associated with tinworking at Crift. Over this period of time the
environment has become progressively more open with a significant expansion in the floristic
diversity of the herbaceous species represented, and increased evidence for the use of fire as a tool
(Fig. 8.6).
248

Continued Medieval activity: a mosaic of habitat types
TTie final zone of the Crift Down profile (CD4) suggests a predominantly open grassland dominated
environment. The Alnus fen woodland is shown to diminish in extent, indicating the more open
nature of the area. The lower levels of Alnus in the zone may relate to use of this tree for charcoal
production (Chambers and Price, 1985) for the smelting of tin at the nearby industrial complex
located ca. 200m north east of the sampUng site (McDonnell, 1993, 1994). Small areas of woodland
may exist, composed of Quercus and Betula. Further clearance of Corylus avellana on the higher,
drier areas is noted, accompanied by an expansion of heathland areas and the arrival of Ulex species.
This is a major component of the modem day flora around the lower slopes of Helman Tor.
However, it is difficult to suggest the abundance of this entomophilous shrub on the presence of
pollen data since little woik has been conducted on its flowering and dispersal capabilities
(Anderson, 1967, 1974). It is also possible that Ilex may have formed a component of this scrub
environment, but it may also have formed an elen^nt of the increasingly open fen woodland
communities.
The continued presence of grassland dominated areas including both the pasture and arable elements
of CD3 are noted. However, the increased presence of cereal pollen grains is significant since these
grains are generally under-represented in records derived from peatland areas (Behre, 1981). Indeed
clumps of this pollen type were encountered at 65cm suggesting the very local presence (Moore et
al., 1991) of cereal cultivation and/or processing operations (Hall, 1988). Tlie arable weed flora
becomes more developed than that represented previously in CD3, including such species as
Fallopia (most likely F. convolvulus - see Bennett et al., 1994), which is a reliable indicator of
arable activity (Behre, 1981), and Polygonum (P. aviculare) common in similar habitats (Godwin,
1975). Artemisia-type includes a few species (e.g. A. vulgaris. A. campestris) associated with
anthropogenic disturbance, in particular arable cultivation (Huntley and Birks, 1983). Behre (1981)
suggests Rumex acetosella is more a component of arable fields than simply a result of clearance
activity. This is significant since the species first becomes evident in the pollen spectra of CD4.
Similarly Jasione montarui-type firequently appears with weeds typical of arable cultivation
(Godwin, 1975), and associated fallow periods (Behre, 1981).
It seems likely therefore that by CD4 the area around Crift Down was virtually open except for small
pockets of deciduous woodland, possibly at some distance, with a diminishing Alnus fen woodland,
and a small localised scrub component on the higher areas. "ITie expansion of arable cultivation is
249
illustrated by the increased presence of cereal pollen grains, and a more diverse arable weed flora.
The uppermost sample has an extrapolated radiocarbon age of ca. AD 1750. This date suggests the
continuity of arable activity and indeed the presence of human populations in the area from pre-
Medieval times. The increased evidence for a more developed arable flora serves to indicate the
possible use of the sampling site for crop production.
8.5 Discussion of the palaeoenvironmental development of the Crift Down area (Table 8.4)
The basal levels of the profile indicate a high nutrient status closed canopy willow fen environment.
Geochemical data suggest the sedimentary system was oxidised but was becoming progressively
anoxic, allowing the formation of sulphides. ITie initially high nutrient status of the system is
indicated both by the con^onents of the flora (e.g. Osmunda regalis), and the geochemistry of the
sediments, with high levels of Fe and base elements suggesting the circulation of base rich
groundwater. However, the reduction of Fe towards CDGb serves to reinforce the increasingly
anaerobic status of the system and the lowering pH. TTie low levels of charcoal in this zone illustrate
the general absence of anthropogenic disturbance in the area at this time. It seems likely that these
sediments date firom the late MesoUthic period due to the general absence of Alnus, a species usually
present in lowland sites by 5000 BC. A depositional hiatus was identified both stratigraphically, and
using pollen and geochemical analysis. Changes in a number of taxa, particularly Alnus and Salix,
and elements, namely S, P. Ca, K, Si and TOC, were instructive in confirming the presence of a
truncation at 150cm.
Tlie duration of this hiatus is extremely difficult to establish without further radiocarbon evidence.
However, the pollen data indicate the continued presence of fen communities at the site but a change
in the dominant species firom Salix to Alnus. This change is characteristic of the natural sequence of
serai succession in this type of wetland environment (Walker, 1970). Clearly the geochemical
conditions associated with this phase of fen woodland are quite different firom that of the preceding
zone. The system seems to become progressively oxidised with increasing amounts of Fe, an element
ubiquitous in oxygenated environments, and lower levels of S. The indicators of physical erosion are
better represented in this zone, which agrees with the results of the pollen analysis indicating
increased disturbance of both the fen woodland and the surrounding tree cover. Tlie nature of the
clearance is difficult to ascertain firom the available evidence, but increased concentrations of
250
Depth (cm)
15
70
85
100
105
150
Date
ca.AD 1250
Medieval AD 895-1165
AD 600
Romano-British AD 90
195 BC-AD55
Late MesoUthic (post 5000 BC)
Geochemistry
Aerobic sedimentary environment (Fe), increased base status (K,Ca).
Increased levels of Sn detected.
Stable profiles for a number of elements: K, Na and Al.
Aerobic sedimentary environment.
Increasing indications for physical disturbance of the area.
Aerobic sedimentary environment.
High base status, with groundwater circulation.
Vegetation
Sparse woodland. developed arable flora.
Low AP, high charcoal values.
Lower levels of AP, spectra dominated by Poaceae.
High levels of Alnus and fen species.
Alnus dominates spectra, much Poaceae.
Alnus dominated local fen woodland, increasing Poaceae.
Salix dominated local closed fen woodland.
Environment
Open grassland dominated environment.
Industrial activity. Active deforestation of local woodland resources. Opening environmental conditions. Increased evidence for arable cultivation and pastoral activities.
Declining local woodland. increasing evidence of arable activities.
Arable activity. Increasing charcoal concentiation, declining arboreal pollen suggest disturbance to the local woods.
Clearance activity.
Opening environment. expanding grassland areas.
Hiatus.
Locally dominant fen woodland. surrounded by mixed deciduous woods.
Table 8.4 Smmnary of the palaeoenviroimiental conditions of Crift Down
251

charcoal suggest the active use of fire. The increased base status of the system at this time is
indicated, and possibly relates to increased circulation of groundwater, or increased levels of runoff
from the local slopes. Clearance activity is generally associated with increased throughfall, itself
contributing to a greater overland flow component and thus an enhanced catchment erosion yield,
and increased leaching of solutes from the surrounding slopes. Tlie eroded material would have been
transported downslope and a proportion of it may have been deposited onto the mire surface causing
a temporary amelioration in base status. Continued clearance is postulated, since arboreal pollen is
shown to fall progressively, with an associated increase for grassland communities. However, lower
levels of detrital clastic material are indicated by the reduced levels of K and Al. Continued oxidation
is illustrated by the sediments of CDGc, with a lower pH which may relate to the increased presence
of heathland species on the slopes around the mire.
Hie key feature of the geochemical profile from Crift Down is the Sn peaks between 56 and 72cm.
Although the geochemistry of the element in peatland systems is litde known, it seems fair to suggest
that the activity is linked with the processing of tin at the site upslope. Archaeological excavation has
suggested a Medieval date for the activity, probably between the 10th and the 14th centuries AD
(Buckley and Earl, 1990; McDonnell, 1994). This date fits well with the arable activity indicated by
the pollen data, itself most likely attributable to the strip field system of the later Medieval period
(Preston-Jones and Rose, 1986).
The sedimentary system at this time seems to be experiencing a h i^er base status, possibly relating
to an increasing component of eutrophic water from the nearby spring. Increases for Fe may be
considered indicative of increased groundwater influence (Chapman, 1964; Green and Pearson,
1977; Mannion, 1979). TTie presence of Hydrocotyle vulgaris similarly indicates the proximity of
eutrophic water (Godwin, 1975; Stace, 1991). "ITie upper zones of the profile indicate expansion of
grassland communities, with a developing arable and pastoral component The presence of scrub and
heathland is confirmed on the upper slopes. The geochemical signals are dominated by the complex
physical, biological and chemical processes operational io the acrotelm of the system, but do
however seem to indicate oxidised conditions.
TTie next chapter will discuss the general applicability and reliability of EDMA in
palaeoenvironmental studies with reference to the results so far presented. Critical analysis of the
252

infomiation obtained from EDMA for the heavy metal elements will be made with reference to the
investigation of selected sediments from Tor Royal and Crift Down using a complementary
geochemical technique.
253

Chapter 9
EDMA: evaluation of the technique
9.0 Introduction
This research sought to examine the usefulness of EDMA in the analysis and interpretation of
palaeoenvironmental change in south west England. The technique was initially considered attractive
for this type of study due to the speed and non-destructive nature of the analysis, and the use of only
small amounts of sediment. The project thus aimed to evaluate the efficacy and accuracy of the
technique to provide interpretable data from a number of different sediment types, each with material
derived from a variety of sources, and reflecting processes operational at a range of spatial and
temporal scales.
The main thrust of the research was therefore to examine the potential utility of EDMA as a standard
palaeoenvironmental research tool by applying the technique to a range of 'real' palaeoenvironmental
situations. This required the comparison of results obtained from EDMA to those gained from
standard geochemical methods to establish the reliability of the method, as described in Chapter 3,
and the application of EDMA at a number of different sites in south west England (Chapters 4, 5, 6,
7 and 8).
Results from this research provide a unique opportunity to investigate palaeoenvironmental
conditions of the peninsula using a more holistic approach based mainly upon geochemical and
palynological data. The pollen evidence is an extremely valuable source of data providing
information on the impacts occurring and the timing of various events. Geochemical data reveals
information relating to the different accumulation phases of the peatland systems and the associated
autogenic signals, but has the greatest potential in palaeoenvironmental studies to provide
information relating to processes external to the peatland such as disturbance created by
deforestation episodes and mineral processing activities.
9. / EDMA in practice
The results from North Sands (Chapter 4), provided an insight to the processes of sea-level change in
the Kingsbridge Estuary. The basal sediments are characterised by terrestrial Typha swamp
conditions, there is then increasing evidence for marine conditions between 9 and 11m associated
254
with the deposition of significant amounts of mineral material. Increasing signals for autogenic
activity (S, TOC) are present above 9m. In the upper portions of the profile Si and Al are
predominantly linked to alumino-silicate material from erosion of the local catchment materials.
Results from sites on Dartmoor reveal much information relating to palaeoenvironmental conditions
operational at different temporal and spatial scales on this upland area. Analysis of the material from
Tor Royal (Chapter 5) suggest the basal sediments accumulated around 5500 BC in an environment
characterised by relatively intensive landscape disturbance, illustrated by the concentration of
alumino-silicate mineral matter below 550cm. EDMA results suggest the system to have been
acidified from the mid-Holocene onwards with the geochemistry of the upper levels dominated by
processes operational within the sediment body itself. The uppermost levels display indications of
acrotelm activity with bio-accumulation and precipitation of a number of elements, in addition to
increased levels of presumably wind-blown mineral material. Analysis of the other Dartmoor sites
provides information of a much more local nature, due mainly to the topography of the surrounding
catchment areas. Merrivale (Chapter 6) has basal sediments characterised by increasing catchment
disturbance, culminating in a significant episode at the Iron Age/Romano-British transition which
seems linked to local deforestation activity. The results from a multiple core study of the area around
Piles Copse (Chapter 7) suggest that correlation between geochemical signals from different
sedimentary systems is problematic since autogenic processes seem far more important in controlling
and explaining the majority of elements investigated. The Dartmoor sediments do not reliably present
the signals linked with mineral extraction and processing activities, for which much archaeological
evidence exists throughout the upland area. Discussion of this problem will be made in section 9.2
below. Clearly, the utility of EDMA for analysis of heavy metals from peatland sediments must be
questioned.
The results from Crift Down (Chapter 8) provide a valuable insight into the development of this
area. Archaeological evidence in the vicinity suggests the site to have been an important tinworking
centre during the Medieval and possibly earlier periods. Geochemical analysis identified the levels to
which this activity relates and these were confirmed by AMS radiocarbon dating. Increases for Sn in
these levels suggest EDMA is possibly capable of detecting higher levels of heavy metal pollution in
certain situations.
255

EDMA has allowed investigation of general episodes of environmental change. The most significant
information is obtained when the assemblage of elements detected is considered, with the
interpretation of individual elements generally of limited utility. With this in mind the following
discussion summarises the results from the geochemical analysis of the sites with respect to a
number of different environmental processes, operating at different scales (allogenic, autogenic and
post-depositionai), although it must be stated that the processes may not always have been mutually
exclusive. Table 9.1 introduces the interpretation possibilities based upon the experience of analysis
of the sites from south west England. It must be noted that individual elements may be interpreted
differently depending on their trends, abundance and the other elements with which they occur.
A potential problem inherent to EDMA and the way in which it produces data occurs when an
element is in low concentration in the sediment, typically the base and heavy metal elements,
particularly when more abundant elements dominate the samples (often Si, Al, Fe and S). The
representation of elemental data as percentages (of the total values for all elements chosen) can
create problems since the more abundant elements may effectively reduce the values for less
abundant components, the apparent fluxes of these minor elements simply relating to changes in the
more abundant elements. This is one of the possible explanations for the unreliable data obtained for
the heavy metal elements in this study and will be discussed more fully below.
Allogenic group
This group of elements are the most significant in palaeoenvironmental research since it is usually
changes external to the sedimentary system that are of most interest. These elements are linked to
processes operating at a range of different spatial scales, but are always associated with the
introduction of material to the system from an external source. EDMA results indicated that elevated
levels of Si and Al when associated with %ash relate usually to the introduction of alumino-silicate
materials to the sedimentary system. However, in certain situations Al seems to have been hnked to
humic/fulvic materials (e.g. Merrivale and possibly Piles Copse and Crift Down) which may be
connected to the levels of DOC (Muscutt et al., 1993). However, an assemblage including Si, Al,
Ca, K, Na and Mg is similarly linked to an erosion episode in which material is transported to the
sedimentary system, as was seen in the basal samples from Tor Royal and in the upper chemizone,
TRGf, and from the sediments at North Sands (NSGb and NSGf), but may indicate the erosion of soil
material as opposed to granitic basement fragments.
256

Element
Si
Al
Na K
Mg
Ca
Fe
Heavy metals
(Sn)
(Cu)
S
Interpretation based on EDMA data Allogenic
When associated with Al and %ash = mineral material
When associated with Si and %ash = mineral material
When a relationship exists between Si and Al it suggests they relate to the level of alumino-silicate present in the sample
When associated with %ash = mineral matter When a relationship exists between Na, K, Mg, Ca, Si and Al this elemental assemblage suggests the presence of soil material
Climate change if related to Na and evidence for increased accumulation of sediment. Marine influence Erosion: transportation as oxides/oxide coatings on mineral material; soil material
Local mineral extraction processing activities, since EDMA is not capable of detecting 'natural/background' presence of elements
Autogenic Bio-genic Si: diatoms, phytoliths
When associated with S and TOC = humic/fulvic material
Possibly linked to the circulation of groundwater, particularly when linked to Fe
Humic/fulvic material
Redox status of sedimentary system: aerobic
Formation of sulphides under anaerobic conditions Redox status of sedimentary system: anaerobic, especially when associated with TOC
Other
Absence suggests low pH, especially where indications suggest low base elements and high S
Absence of Na, K, Ca and Mg indicates active leaching processes
Table 9.1 Summary of the interpretative possibilities of EDMA data
257

A particularly significant anthropogenic activity linked with the clastic elements mentioned above is
deforestation. An holistic approach to reconstructing palaeoenvironmental change is of considerable
utility since it often places these allogenic signals in their wider geographical and temporal context.
Figure 9.1 presents a model of environmental processes resulting from catchment deforestation and
is discussed with reference to the results from three of the fieldsites which display signals linked to
this activity. At Merrivale deforestation of the catchment between 395-140 BC is indicated by
reduced levels of arboreal pollen, and increases for Poaceae and non-arboreal pollen. The
introduction of mineral matter to the sediment system and the associated increased environmental
acidity agrees well with the hypothesised model presented. However, at Piles Copse deforestation
activity is recorded palynologically in the sediments from both PCI and PC2, but there is no
evidence for the resultant erosion of catchment mineral material, although at PCI there is a
progression to more acidic, anaerobic sedimentary conditions following the disturbance. These data
suggest the scale of activity may have been sufficiently remote from the sedimentary system,
explaining the absence of increased mineral matter. However, the more open nature of the catchment
may have resulted in higher levels of runoff with an increased incidence of anoxic sedimentary
conditions, particularly in the lower lying areas adjacent to the river channel. At Crift Down it is
difficult to link the geochemical and palynological data with respect to deforestation activity since
the former is dominated by high concentrations of mineral material throughout the profile. A
tentative link does however exist. As the environment becomes more open so the level of mineral
matter increases, although this may result solely from increasing industrial activities in the vicinity.
The results from these fieldsites make it possible to suggest that geochemical data provide
information of the nature of deforestation that has occurred. It seems that three different possibilities
may arise following the detection of falling arboreal pollen values in the sedimentary record. The
first relates to the loss of forest cover with no or little disturbance to the soil cover (e.g. Piles Copse);
the second suggests loss of forest with erosion of soil material (e.g. Merrivale), and the third relates
to the loss of forest with significant disturbance, including the erosion of basement material (e.g.
Crift Down).
One of the more significant potential applications of geochemical studies of peatlands is the detection
of heavy metal pollution from past anthropogenic activity (e.g. Livett et al., 1979; Livett, 1988; Van
Geel et al., 1989; Stewart and Fergusson, 1994; Shotyk, 1996a,b). Increased levels of heavy metals
have been detected globally from ice core repositories dating back to the fourth millennia BC
258

Deforestation - reduced arboreal pollen - change in the pollen spectra - Increase in ruderal species
I So/7 disturbance and destabilisation
Erosion of catchiment material - increased levels of mineral matter (%ash) - elevated Si, Al and other clastic elements,
particularly on or near to granitic areas Increased runoff
Increased waterlogging downslope - enhanced leaching of poorly bound base elements
(Na, K, Ca and Mg) - production of sulphides (S, Cu)
I Increased environmental acidity - pH thresholds rapidly exceeded due to poorly buffered soils
(reduced Al and base elements) - enhanced production of sulphides (S, TOC and possibly Cu) - sustained change in the pollen record, usually resulting in abundant representation of Poaceae species
PALAEOENVIRONMENTAL RECORD
Figure 9.1 A conceptual model of the record of deforestation activity as recorded in peatland sediments by geochemical and palynological indicators. Bold type indicates major processes with plain type suggesting main indications in the palaeoenvironmentai record. These depend largely upon the location, magnitude of impact and the nature of the sedimentary system.
259

(Boutron, 1995) with dramatic increases for heavy metals, particularly Pb, attributable to the
activities of the Roman era and later periods. This activity culminated in the widespread pollution of
the global atmosphere which peaked during the 1970s (Grousset et al., 1994) due to the use of
anthropogenic lead emitted from smelters and automobile exhausts (Martin et al., 1979; Hong et al.,
1994; Renberg et al., 1994; Shotyk et al., 1996). It was expected to obtain similar results from
analysis of the peatland sediments from south west England, as had previously been obtained from
analysis of sites from widely differing geographical locations, detailing this increased heavy metal
signature through time. It was also hoped, given the nature of the sediments chosen for analysis with
associated archaeological remains indicative of intense tinworking activities, that the signals for
prehistoric and Medieval exploitation would be recorded in the sediments. Neither of these have been
generally possible using EDMA, again questionning its utility for the investigation of heavy metal
pollution episodes from peatland sediments. Further discussion is made in section 9.2 and the results
of some additional analyses are presented.
A further aspect of the environmental history of these sites relates to the possible evidence for
climate change. Tor Royal is site most likely to contain signals relating to this process since the
upper sediments are isolated from local soil water influences and are thus highly sensitive to changes
in precipitation regime. A possible perturbation is recorded around the onset of Iron Age times in
which increased levels of Sphagnum spores are linked with minor increases for Na and Ca, possibly
derived from a change in regional atmospheric circulation.
Autogenic group (Table 9.1)
Sometimes the most dominant signals obtained from analysis of these sediments relate to processes
operational within the sediment body as it accumulates through time. S is generally linked to TOC
and as such relates to the production of sulphides in the anaerobic zone. Brown (1985) comments
that 90% of the total S in valley mire peats is associated with organic matter and in a number of the
areas investigated (Piles Copse and Crift Down) it seems likely that sulphides figure prominendy in
the geochemistry of the sediments.
Reconstruction of the palaeo-redox regime hjis been attempted for some time (Mackereth, 1966;
Mannion, 1978). Indications from the sites investigated for this research suggest that the
anaerobic/aerobic regime can sometimes be detected with respect to the presence of S and TOC
indicating reducing conditions, with Fe suggesting precipitation of compounds under predominantly
260
aerobic conditions (Tor Royal and Crift Down). The geochemical results also offer additional
information with respect to the status and nature of sediment accumulation. At Tor Royal the basal
sediments are characterised by groundwater circulation regimes with the transition to wholly
ombrotrophic status reached at around 350 cm. Again, the different nature of sediment in the basal
sediments from Crift Down is apparent with reference to the geochemical data. The basal Salix fen
becomes progressively anaerobic with high levels of S, TOC and P, however the sediment
immediately overlying this material {Alnus fen peat) displays signals characteristic of aerobic
conditions.
The last group of signals belonging to the autogenic group are those associated with acrotelm
processes, many of which were present in the sediments from the fieldsites investigated. The bio-
accumulation of K was particularly noticeable and relates to the uptake of this nutrient in the modem
living plant material (Shotyk, 1988; Alloway, 1995). Again the precipitation of Fe and Mn was
sometimes noted in these upper layers of the sediment due to the aerobic status of the sedimentary
environment at this time.
Post-depositional diagenetic effects
These are the most difficult processes to establish without compiling detailed geochemical
inventories of modem inputs and outputs to the system. Much literature exists to suggest that base
elements are most readily lost from peatland systems (Tanskanen, 1976; Damman, 1978; Shotyk,
1988), particularly where pore-water acidity is high due to the poor cation exchange capacity of
these elements (Chapter 1). This seems to have been the case with Ca, K, Na and Mg, particularly
where other geochemical assemblages suggest lower pH values to exist. The usefulness of these
elements for palaeoenvironmental interpretations is limited, however it must also be stated that these
elements are frequently eissociated with clastic materials, again stressing the importance to consider
the assemblage of elements where diagenetic effects are suspected.
9.2 The accuracy of EDMA: comparative analyses using EMMA
It has already been stated that the EDMA results for the heavy metal elements are of questionable
utility due to the detection limits of the analytical system and the influence of other elements. Further
analyses were conducted using another geochemical technique to specifically address the accuracy of
261
EDMA for heavy metal analysis, and extend the analyses discussed in Chapter 3 for Fe and Mn.
Towards the end of the research the opportunity arose to carry out comparative analyses of sediment
from Tor Royal and Crift Down using an Energy-dispersive Miniprobe Multielement Analyser -
EMMA, (Cheburkin and Shotyk, 1996) as introduced briefly in section 7.5. This technique has been
developed recently to provide multielement analysis of peat sediments for a range of elements, and is
based upon an energy dispersive X-ray fluorescence instrument. The instrument benefits from the
advantage of using considerably smaller samples than for conventional XRF analyses, with a larger
beam size and a rotating sample stage included to reduce the problems of sample heterogeneity. The
lowest limit of detection (LLD) for heavy metals (e.g. Pb, LLD=0.33pg/g) are approximately one
order of magnitude lower than for standard XRF procedures. The advantages of EMMA in
comparison to standard geochemical methods include the following: (i) no sample dissolution is
required; (ii) several elements can be determined simultaneously, and; (iii) the EMMA technique is
not generally subject to matrix interference.
Sub-samples of the original material analysed using EDMA were taken from 20 levels from the Tor
Royal profile, with 22 samples taken from the Crift Down sediment. EMMA was capable of analysis
of a limited range of elements, which for the Tor Royal sediment included Fe, Mn, Ni, Cu, Zn, Ga,
As, Se, Br, Rb, Sr, Pb and U, with the Crift Down analyses providing analytical data for the same
elements with the exception of Ni and U, but with Y as an addition. The most significant use of this
additional geochemical data is in the investigation of the accuracy and reliability of heavy metal
determinations using EDMA, a question which occurred for every field site so far investigated with
the exception of Sn from Medieval sediments (60-70 cm) at Crift Down, and the basal material from
Piles Copse (PCI), with Pb detected in the lower samples from PC2. Unfortunately, EMMA was
incapable of providing quantitative Sn concentrations (Andrij Cheburkin, pers. comm.), although
further analyses of the Crift Down sediment using fusion TCP analysis with a detection limit of 1
ppm is a possibility (Eric Hoffman - ACTLABS, pers. comm.). The analytical error of EMMA
results is ±15% for elemental concentrations lower than 20 ppm, and ±10% for all other
concentrations.
The EMMA data thus has the possibility of providing comparative information on the EDMA
results, but also provides a first approximation of detection limits for heavy metal elements using
EDMA in sediments. The raw data are presented as elemental profiles (Figures 9.2 and 9.3), as well
262
as transformed data (Figures 9.4 and 9.5). The transformation was the same as carried out in
Chapter 3, with the EMMA data standardised to 100% then transformed so that the mean values of
each data set were the same, in this case zero. This allowed the direct comparison of profile features
obtained by each of the analytical methods.
Iron and Manganese
The data are presented graphically on Fig. 9.2 and Fig 9.4 suggest a good deal of similarity between
results obtained from EDMA and EMMA for Fe, examining both raw and transformed data sets.
Raw data profiles exhibit very similar characteristics. Elevated concentrations in the basal section of
the Tor Royal sediment decline over 2m but increase again towards the surface, with a very close
correspondence exhibited for the transformed data, with generally small differences between the two
plots. Similar characteristics are illustrated by both techniques for the Crift Down material with
fluctuations in the lower metre of sediment and steadily increasing values from 60 cm to the surface.
These data strengthen the reliability of Fe determinations using EDMA (c/ Chapter 3). However, Fe
is usually considered a major component of peatland geochemical budgets, and given the way in
which the EDMA technique produces data (as elemental percentages of analysed volume for the
range of elements investigated, in this case fourteen), a major component will obviously be better
represented than a more minor constituent. This is illustrated with reference to the Mn profile for
both sites (Figs. 9.2 and 9.4). The concentration of Mn in the sediments from Tor Royal ranges from
10-112 ppm, and 16-162 ppm for Crift Down using the EMMA method. The percentage profiles
produced by EDMA do not clearly replicate the concentration profile using EMMA, thus questioning
the utility of EDMA for analysis of Mn. Similarly, the transformed data vary considerably with
much deviation between the plots from each technique suggesting little correspondence between
profile characteristics for the data. TTie transformed Mn plot from Tor Royal suggests a reasonable
level of similarity, most likely due to the generally featureless nature of the EMMA Mn curve and
the fact that both profiles display increasing elemental values above 100 cm. However, the
transformed plot of Mn from Crift Down (Fig. 9.4) displays little relationship between the two
profiles, and as such questions the validity of the Mn profile from this sediment. Manganese would
be expected to behave in a comparable way to Fe in these environments, since it shares similar
geochemical characteristics (Goldschmidt, 1954). This appears to be the case for the results from
EMMA but not from EDMA (Fig. 9.2). These results are in general agreement with the data
produced by AAS of the North Sands sediment (section 3.2, Figs. 3.4 and 3.6), in which there was
263
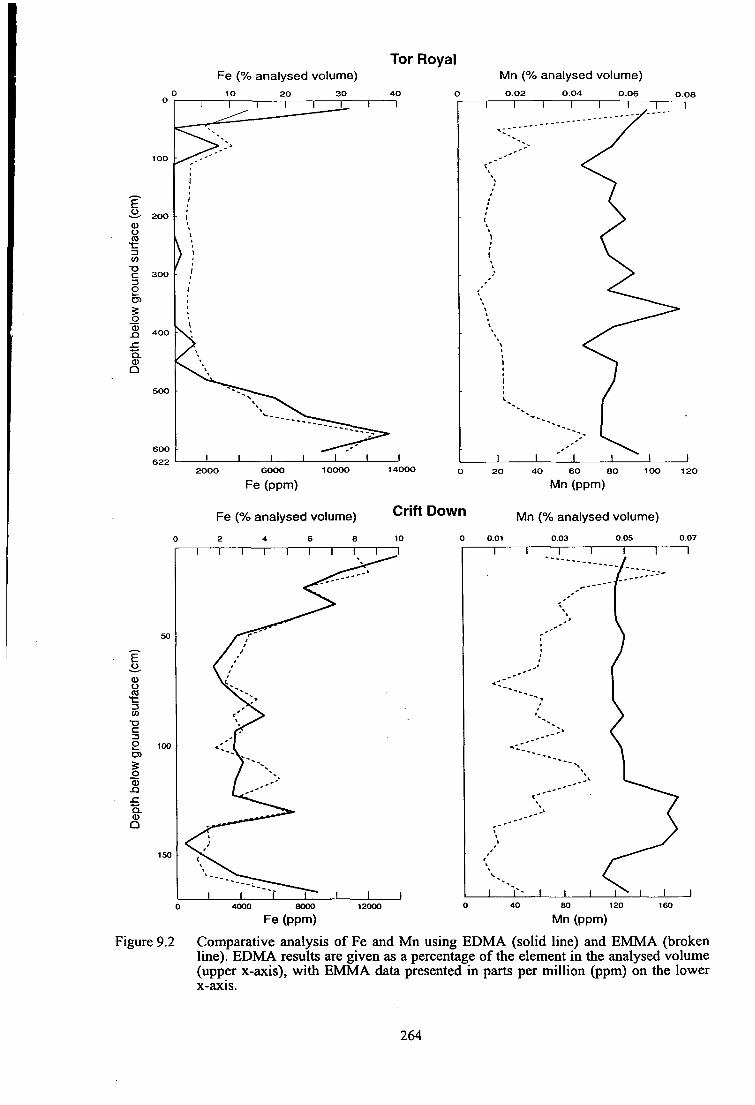
Tor Royal Fe (% analysed volume) Mn (% analysed volume)
0.02 0.04 0.06
E S- 200 03 O CO
t l CO
C 3 0 0 :3 o i _ en
Q.
Q
600 622
Fe (ppm)
Fe (% analysed volume) Crift Down
Mn (ppm)
Mn (% analysed volume)
Fe (ppm) Mn (ppm)
Figure 9.2 Comparative analysis of Fe and Mn using EDMA (solid line) and EMMA (broken line). EDMA results are given as a percentage of the element in the analysed volume (upper X-axis), with EMMA data presented in parts per million (ppm) on the lower X-axis.
264

Tor Royal
Pb (% analysed volume) 0 0.2 0.6 1.0 1.4 1.8
E
0 ) 200
o CO
X )
§ 300
o D5
I Q.
Q
600
622
As (% analysed volume) 0 0.2 0.4 0.6
Cu (% analysed volume) 0 5 10 15 20 25
_j I l_
100 200 300 400 0 5 10 15 20 25 30
Pb (ppm) As (ppm) 5 0 100 150 200 250
Cu (ppm)
Pb (% analysed volume)
F o fl)
() m t - i (/}
•D c-Zi o C3)
5 o a>
J D
SI
o. a> Q
c
50
100
150
0.2 0.6
< '> .'
r'
!
\ \ * *
, ' ' i
1 f
»
. ,
f
1
1.0
/ . . - ' r
1.4
20 40 60 80
Pb (ppm)
Crift Down
As (% analysed volume)
0 0.2 0.4 0.6
Cu (% analysed volume)
0 0.5 1.0 1.5 2 .0 2.5
8 12 16 20 100 200 300 400
As (ppm) Cu (ppm)
Figure 9.3 Comparative analysis of Pb, As and Cu using EDMA (solid line) and EMMA (broken line). EDMA results are given as a percentage of the element in the analysed volume (upper X-axis), with EMMA data presented in parts per million (ppm) on the lower X-axis.
265
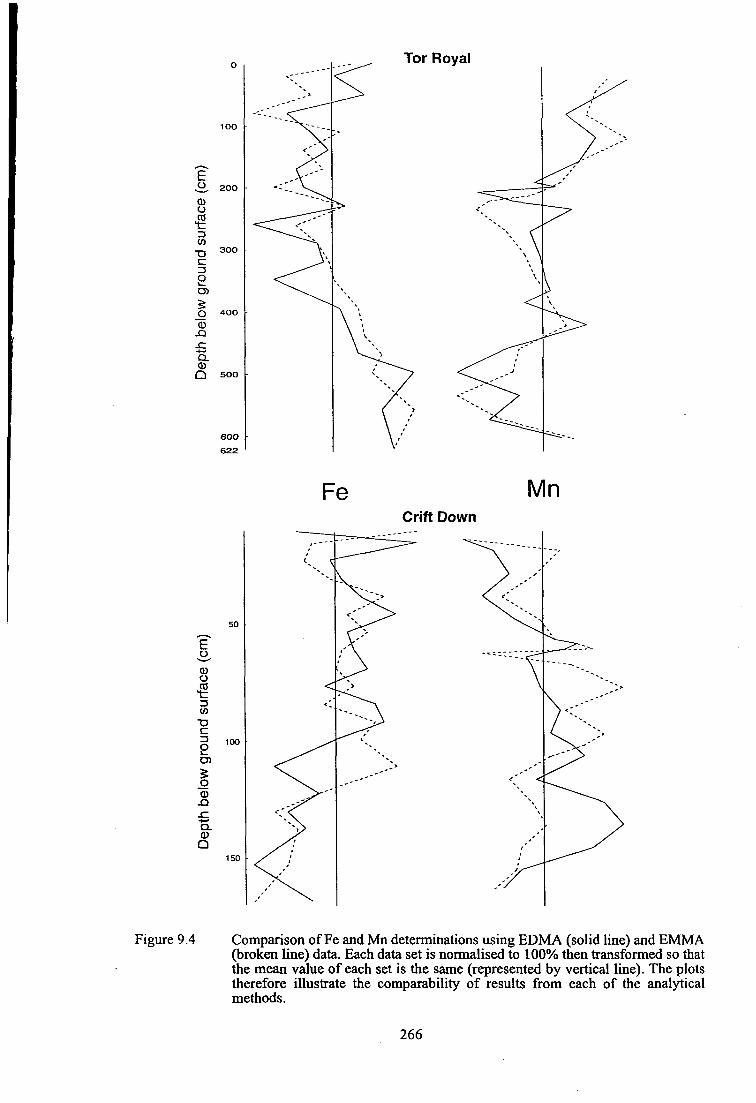
E ^
o o 05 t 3 CO T3 C 13 O . D)
5 o 0) XJ ^ Q. O Q
20O
300
400
500
600 622
Tor Royal
Fe Mn Crift Down
50
E
0)
o 3 «
C
2
J3
100
Figure 9.4 Comparison of Fe and Mn determinations using EDMA (solid line) and EMMA (broken line) data. Each data set is normalised to 100% then transformed so that the mean value of each set is the same (represented by vertical line). The plots therefore illustrate the comparability of results from each of the analytical methods.
266
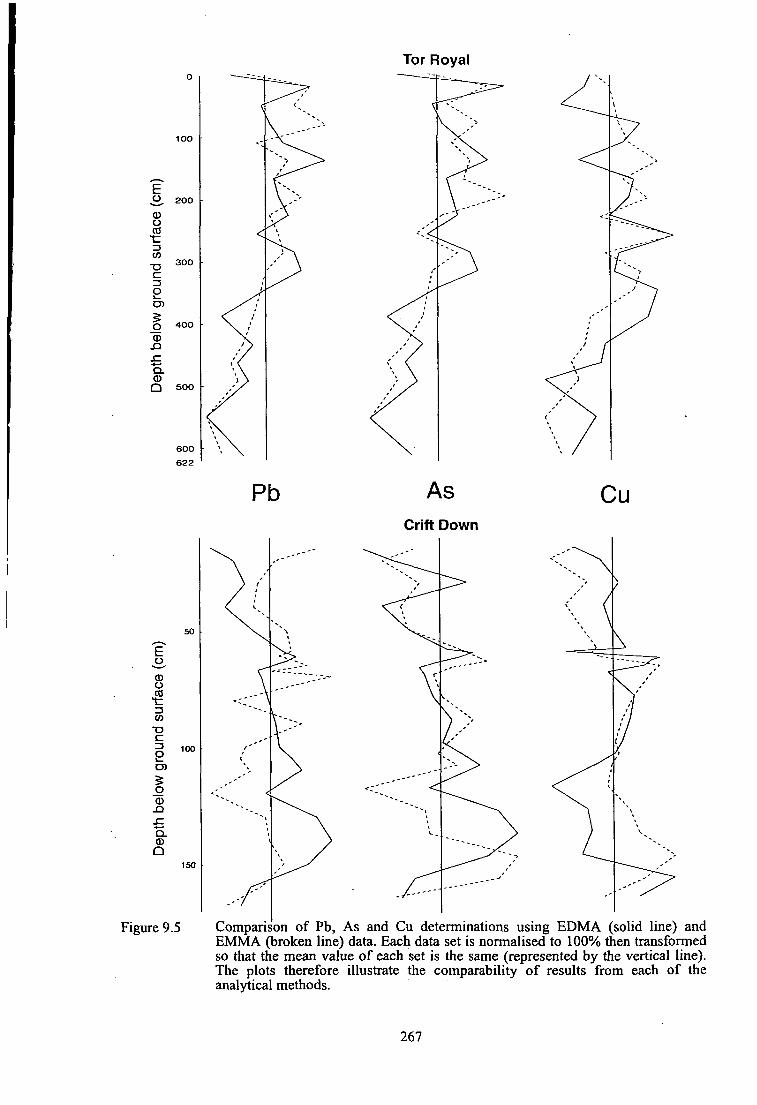
Tor Royal
E ^ 200 0} O CO
w
c 13 o i— O)
O 400
X3
Q. 0) Q 500
600 622
Pb Cu
E
O CO t 13 CO
c O
Q.
Q
Figure 9.5
^
*
• • • • (
\ \ \,
^ ^ i
K
.-
\ /
s. ,
A
n
\^
,-'
Comparison of Pb, As and Cu determinations using EDMA (solid line) and EMMA (broken line) data. Each data set is normalised to 100% then transformed so that the mean value of each set is the same (represented by the vertical line). The plots therefore illustrate the comparability of results from each of the analytical methods.
267
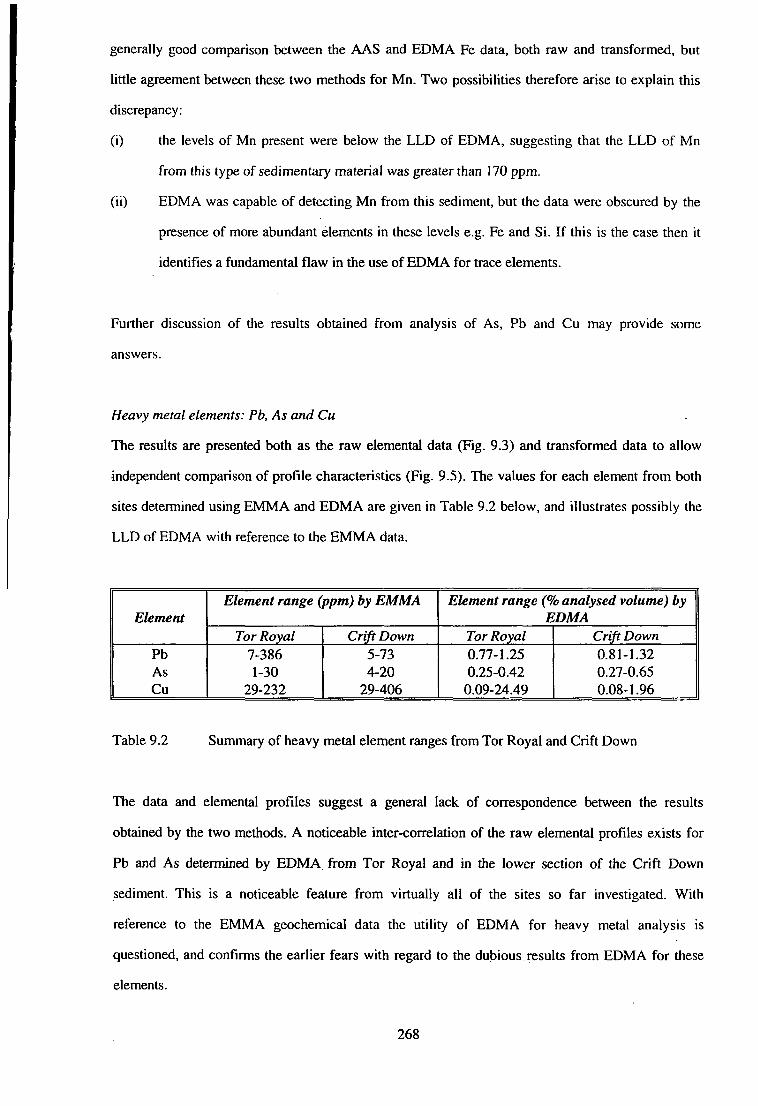
generally good comparison between the AAS and EDMA Fe data, both raw and transformed, but
little agreement between these two methods for Mn. Two possibilities therefore arise to explain this
discrepancy:
(i) the levels of Mn present were below the LLD of EDMA, suggesting that the LLD of Mn
from this type of sedimentary material was greater than 170 ppm.
(ii) EDMA was capable of detecting Mn from this sediment, but the data were obscured by the
presence of more abundant elements in these levels e.g. Fe and Si. If this is the case then it
identifies a fundamental flaw in the use of EDMA for trace elements.
Further discussion of the results obtained from analysis of As, Pb and Cu may provide some
answers.
Heavy metal elements: Pb, As and Cu
The results are presented both as the raw elemental data (Fig. 9.3) and transformed data to allow
independent comparison of profile characteristics (Fig. 9.5). The values for each element from both
sites determined using EMMA and EDMA are given in Table 9.2 below, and illustrates possibly the
LLD of EDMA with reference to the EMMA data.
Element
Pb As Cu
Element range (ppm) by EMMA
Tor Royal 7-386 1-30
29-232
Crift Down 5-73 4-20
29-406
Element range (% analysed volume) by EDMA
Tor Royal 0.77-1.25 0.25-0.42
0.09-24.49
Crift Down 0.81-1.32 0.27-0.65 0.08-1.96
Table 9.2 Summary of heavy metal element ranges from Tor Royal and Crift Down
The data and elemental profiles suggest a general lack of correspondence between the results
obtained by the two methods. A noticeable inter-correlation of the raw elemental profiles exists for
Pb and As determined by EDMA from Tor Royal and in the lower section of the Crift Down
sediment. This is a noticeable feature from virtually all of the sites so far investigated. With
reference to the EMMA geochemical data the utility of EDMA for heavy metal analysis is
questioned, and confirms the earlier fears with regard to the dubious results from EDMA for these
elements.
268

The general lack of similarity for the heavy metal elements detected from Crift Down is illustrated
with reference to both Fig. 9.3 and the transformed data, Fig. 9.5. The lack of correspondence
between the EDMA and EMMA data for Pb, As and Cu is attributable to the problems of detection
and masking seemingly inherent to the EDMA technique when dealing with these less abundant
elements.
Another significant point to question the validity of heavy metal determinations using EDMA is the
fact that the results are not interpretable in a meaningful manner, whilst those from EMMA reflect
increasing anthropogenic activity and atmospheric metal deposition in these areas (\Vest et al., in
press) as stated earlier in the section.
The LLD for Pb and Cu by EDMA appear to be in the order of >400 ppm, which throws
considerable question over the sensitivity of the technique to provide meaningful data relating to the
changing concentrations of heavy metal elements from peatland sediments. The LLD for As appears
lower (possibly >50 ppm). However, some useful information was obtained from EDMA of the Crift
Down sediments which provided confirmatory evidence for Medieval tinworking in the locality. This
suggests that the technique may provide interpretable information relating to heavy metal pollution in
certain circumstances, however it is often the more subtle fluxes of these elements which is of
interest to both the palaeoenvironmental scientist and environmental chemist alike.
269
Chapter 10
Conclusions and recommendations
10.0 Introduction
This chapter briefly provides a critical analysis of EDMA for use in palaeoenvironmental research
based on the experiences of this project, with a brief section suggesting recommendations for the
future of the technique in this sort of work.
10.1 Conclusions
The main findings of this research project may be summarised as follows:
1. EDMA has limited potential in the analysis of palaeoenvironmental investigations from
peatland environments, due to a number of analytical problems identified previously which
include detection limits and overall accuracy.
2. The results from EDMA may be used as a first approximation to the geochemical singatures
of the sediment, but where specific elements are of interest more sophisticated techniques
must be applied, particularly in the investigation of the less abundant trace and heavy metal
elements.
3. Analyses of major elements (Si, Al, Fe) were the most reliable and compared well with
results from comparative techniques. The association between these elements and mineral
matter (ash%) indicated the major patterns of landscape degradation processes and
instability, and were frequently associated with reduced levels of arboreal pollen.
4. Palynological investigation of the sediments was particularly fruitful and indicated the
changing character of landscape at a variety of scales.
- Analysis at Tor Royal served to illustrate in some detail the effects of prehistoric
and historic activity upon central Dartmoor, the latter of which is particularly
under-represented on the upland area.
- Investigation at Merrivale suggests an intense but localised disturbance activity
around the onset of Iron Age times, during which time the levels of trees in the
catchment decline while grass pollen values expanded rapidly.
- Similar results were obtained from analysis of two cores from Piles Copse. The
results from site detected more recent deforestation activity (probably of 17th
century AD date), confirming the suggestion of Roberts (1983) and others that the
area known today as Piles Copse was planted around two hundred years ago.
270
- The results from pollen analysis at Crift Down confirm archaeological hypotheses
for settled agricultural activity during Medieval times. It seems this activity
intensified during the 14th and 15th centuries AD, and subsequently relates to a well
developed arable and pastoral flora on the site.
10.2 Recommendations
Routine geochemical investigation of peatlands as part of a study of palaeoenvironmental conditions
has much to offer in terms of the different environmental processes which were active both within the
catchment as a whole, and within the accumulating sedimentary system. However, EDMA as a tool
is generally incapable of revealing useful geochemical information due to various inherent analytical
problems. This research suggests therefore that geochemical analysis of peatland sediments should
be subordinate to palynology, and in particular EDMA should be used with great caution as a first
stage investigative technique. However, the investigation of specific aspects in the geochemical
history of a peatland site may be repaid by the application of other techniques, eg. AAS, XRF, ICP-
MS based techniques, INAA, EMMA etc. These techniques have not been widely utilised in
palaeoenvironmental studies, most have previously been concerned with the characterisation of metal
pollution in modem day soils and plants (Johnson and Johnson, 1976; Jahnke et al., 1981; Hiraoka,
1994; Wilson et al., 1995; Dong, 1996; Goldstein et al., 1996; Pyle et al., 1996; Zbiral, 1996).
There is limited evidence to suggest they are effective in the analysis of heavy metal elements from
peatland sediments (Bengtsson and Enell, 1986). The use of some of these techniques also offers the
possibility of isotopic analysis (ICP-MS) which may be specifically used to investigate the
provenance of metals in peatland sediments (Shotyk et al., 1996).
Further work on different preparation techniques for EDMA, possibly involving finer grinding and
pressing of material into discs may be fruitful and would possibly improve the quantitative accuracy
of the technique, since it seems the analysis of 'bulk' samples hampered analytical operations.
However, the additional work, and the effort required would be better employed in the analysis of the
utility of other more sophisticated procedures for the characterisation of geochemical signals for
palaeoenvironmental change.
271
List of References
Aaby B. 1986. Palaeoecological studies of mires. In: Berglund B.E. (ed.). Handbook of Holocene Palaeoecology and Palaeohydrology, John Wiley & Sons Ltd., London: 145-164.
Adey W.M.T. undated. All about Kingsbrldge and Salcombe.
Aitken M.J. 1990. Science-Based Dating in Archaeology. Longmans Archaeological Series, London.
Allan J. 1996. Medieval pottery and the dating of deserted settlements on Dartmoor. Proceedings of the Devon Archaeological Society 52: 141-147.
Alloway B.J. 1995. The origins of heavy metals in soils. In: AUoway B. J. (ed.) Heavy metals in soils, Blackie Academic & Professional, London: 38-57.
Anderson C.A. 1967. The Quality of X-Ray Microanalysis in the Ultrasoft X-Ray Region. British Journal of Applied Physics 18: 1033-1043.
Anderson D.H. and Hawkes H.E. 1958. Relative mobility of the common elements in weathering of some schist and granite areas. Geochimica et Cosmochimica Acta 14: 204-210.
Anderson J.G.C. and Owen T.R. 1980. The Structure of the British Isles. Pergamon, Oxford.
Anderson M.L. 1953. The ecological status of Wistman's Wood, Devonshire. Transactions of the Botanical Society of Edinburgh 36: 195-206.
Anderson S.T. 1967. Tree-pollen rain in a mixed deciduous forest in south Jutland (Denmark). Review of Palaeobotany and Palynology 3: 267-275.
Anderson S.T. 1970. The relative pollen productivity and pollen representation of North European trees, and correction factors for tree spectra. Dansmark Geologiske Undersogelse 96: 1-99.
Anderson S.T. 1974. Wind conditions and pollen deposition in a mixed deciduous forest. II. Seasonal and annual pollen deposition 1967-1972. Grana 14: 64-11.
Andrasko J. and Petterson S. 1991. A simple method for collection of gunshot residues from clothing. Journal of Forensic Science 31: 321-330.
Andrejko M.J., Fiene F. and Cohen A.D. 1983. Comparison of ashing techniques for the determination of the inorganic content of peats. In: Jarrett P.M. (ed.). Testing of peats and organic soils. American Society for Testing and Materials, special publication no. 820.
Anonymous 1874. Kingsbridge and its surroundings, G. P. Friend, Plymouth.
ApSimon A.M. and Greenfield E. 1972. The excavation of Bronze Age and Iron Age settlements at Trevisker, St. Eval, Cornwall. Proceedings of the Prehistoric Society 38: 302-381.
Archibald J.F. 1966. Wistman's Wood: a forest nature reserve. Journal of the Devon Trust for Nature Conservation 11: 423-428.
Aston S.R., Bruty D., Chester R. and Padgham R.C. 1973. Mercury in Lake Sediments: a Possible Indicator of Technological Growth. Nature 241: 450-451.
Athi E. 1984. Fertiliser induced leaching of phosphorus and potassium from peatlands drained for forestry. Proceedings of the 7th International Peat Congress 3: 153-163.
272
Aulio K. 1980. Nutrient accumulation in Sphagnum mosses. I. A multivariate summarisation of the mineral element composition of 13 species from an ombrotrophic bog. Annals Botanica Fennicia 17: 307-314.
Austin D. and Walker M.J.C. 1985. A new landscape context for Hound Tor, Devon. Medieval Archaeology 29: 147-152.
Austin D., Daggett R.H. and Walker M.J.C. 1980. Farms and fields in Okehampton Park, Devon: the problems of studying medieval landscape. Landscape History 2: 39-58.
Bache B.W. 1986. Aluminium mobilisation in soils and waters. Journal of the Geological Society 143:699-706.
Baker D.E. and Senft J.P. 1995. Copper. In: Alloway B. J. (ed.) Heavy metals in soils, Blackie Academic & Professional, London: 179-205.
Balaam N.D., Bell M.G., David A.E.U., Levitan B., Macphail R.I., Robinson M. and Scaife R.G. 1987. Prehistoric and Romano-British sites at Westward Ho!, Devon. Archaeological and palaeo-environmental surveys 1983 and 1984. In: Balaam N.D., Levitan B. and Straker V. (eds.) Studies in palaeoeconomy and environment in south west England, BAR British series 181: 163-264.
Ballantyne C.K. 1991. Late Holocene erosion in upland Britain: climatic deterioration or human influence? The Holocene 1: 81-85.
Barber J. 1977. Early Men. In: Gill C. (ed.), Dartmoor: a new study, David & Charles, Newton Abbot: 55-75.
Barber K.E., Chambers F.M., Maddy D., Stoneman R. and Brew J.S. 1994. A sensitive high-resolution record of late Holocene climatic change from a raised bog in northern England. The Holocene 4: 198-205.
Bsirkham J.P. 1978. Penunculate oak woodland in a severe environment: Black Tor Copse, Dartmoor. Journal of Ecology 66: 707-740.
Bartlein P.J., Edwards M.E., Shafer S.L. and Barker E.D. 1995. Calibration of Radiocarbon ages and the interpretation of palaeoenvironmental records. Quaternary Research 44: 417-424.
Bartsiokas A. and Day M.H. 1993. Electron probe energy dispersive X-ray microanalysis (EDXA) in the investigation of fossil bone: the case of Java man. Proceedings of the Royal Society of London B252: 115-123.
Beckett S.C. 1981. The Shaugh Moor project: third report. IV. Pollen analysis of the peat deposits. Proceedings of the Prehistoric Society 47: 245-273.
Beer K.E. and Ball T.K. 1986. Tin and tungsten in pelitic rocks from S.W. England and their behaviour in contact zones of granites and in mineralised areas. Proceedings of the Ussher Society 6: 330-337.
Beeson K.C., Griffitts W.R. and Milne D.B. 1977. Tin. In: Geochemistry and the Environment, Volume II: The relation of other selected trace elements to health and disease. National Academy of Sciences, Washington: 88-92.
Behre K.E. 1981. The interpretation of anthropogenic indicators in pollen diagrams. Pollen et Spores 23: 225-245.
Bell M. and Walker M.J.C. 1992. Late Quaterrmry Environmental Change: Physical and Human
273
Perspectives. Longman Scientific and Technical, Essex, England.
Bengtsson L. and Enell M. 1986. Chemical Analysis. In: Berglund B.E. (ed.), Handbook of Holocene Palaeoecology and Palaeohydrology, John Wiley & Sons Ltd., Chichester: 423-451.
Bennett K.D., Fossitt J.A., Sharp M.J. and Switsur V.R. 1990. Holocene vegetational and environmental history at Loch Long, South Uist, Western Isles, Scotland. New Phytologist 114: 281-298.
Bennett K.D., Boreham S., Sharp M.J. and Switsur V.R. 1992. Holocene history of environment, vegetation and human settlement on Catta Ness, Lunanasting, Scotland. Journal of Ecology 80: 241-273.
Bennett K.D., Whittington G. and Edwards K.J. 1994. Recent plant nomenclature changes and pollen morphology in the British Isles. Quaternary Newsletter 73: 1-6.
Bennett K.D. 1989. A provisional map of forest types for the British Isles 5000 years ago. Journal of Quaternary Science A: 141-144.
Beresford G. 1979. Three deserted Medieval settlements on Dartmoor: a report on the late E. Marie Minter's excavations. Medieval Archaeology 23: 98-158.
Berridge P. and Roberts A. 1986. The Mesolithic in Cornwall. Cornish Archaeology 25: 7-34.
Birks H.J.B. 1989. Holocene isochrone maps and patterns of tree-spreading in the British Isles. Journal of Bio geography 16: 503-540.
Birks H.J.B. and Birks H.H. 1980. Quaternary Palaeoecology. Edward Arnold, London.
Birks H.J.B. and Gordon A.D. 1985. Numerical methods in Quaternary pollen analysis. Academic Press, London.
Blackford J.J. and Chambers P.M. 1991. Proxy records of climate from blanket mires: evidence for a Dark Age (1400 BP) climatic deterioration in the British Isles. The Holocene 1: 63-67.
Bom A. 1986. A History of Kingsbridge and Salcombe. Phillimore & Co., Ltd., Chichester, Sussex.
Boutron C.F. 1995. Historical reconstruction of the earth's past atmospheric environment from Greenland and Antarctic snow and ice cores. Environmental Reviews 3: 1-28.
Bradshaw R. 1991. Spatial scale in the pollen record. In: Harris D.R. and Thomas K.D., (eds.) Modelling Ecological Change, Institute of Archaeology, University College London: 41-52.
Brailsford J.W. 1938. Bronze Age stone monuments of Dartmoor. Antiquity 12: 444-463.
Brown A.P. 1977. Late-Devensian and Flandrian vegetational history of Bodmin Moor, Cornwall. Philosophical Transactions of the Royal Society of London B276: 251-320.
Brown K.A. 1982. Sulphur in the environment: a review. Environmental Pollution B3: 47-80.
Brown K.A. 1985. Sulphur distribution and metabolism in waterlogged peat. Soil Biology and Biochemistry 17: 39-45.
Brunsden D. 1964. The origin of decomposed granite on Dartmoor. In: Simmons I.G. {ed.)Dartmoor Essays, Devonshire Association for the Advancement of Science, Literature and Art, Devonshire Press, Torquay: 97-116.
274
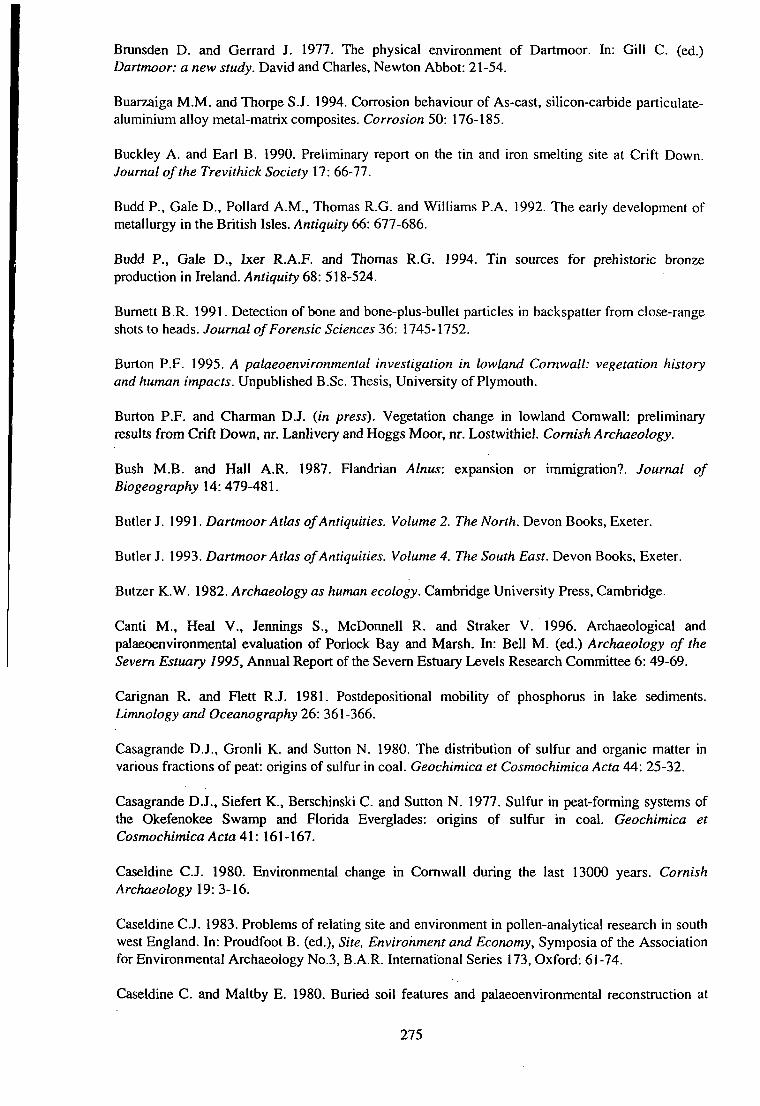
Bmnsden D. and Gerrard J. 1977. The physical environment of Dartmoor. In: Gill C. (ed.) Dartmoor: a new study. David and Charles, Newton Abbot: 21-54.
Buarzaiga M.M. and Thorpe S.J. 1994. Corrosion behaviour of As-cast, silicon-carbide particulate-aluminium alloy metal-matrix composites. Corrosion 50: 176-185.
Buckley A. and Earl B. 1990. Preliminary report on the tin and iron smelting site at Crift Down. Journal of the Trevithick Society 17: 66-11.
Budd P., Gale D., Pollard A.M., Thomas R.G. and Williams P.A. 1992. The early development of metallurgy in the British Isles. Antiquity 66: 677-686.
Budd P., Gale D., Ixer R.A.F. and Thomas R.G. 1994. Tin sources for prehistoric bronze production in Ireland. Antiquity 68: 518-524.
Bumett B.R. 1991. Detection of bone and bone-plus-bullet particles in backspatter from close-range shots to heads. Journal of Forensic Sciences 36: 1745-1752.
Burton P.P. 1995. A palaeoenvironmental investigation in lowland Cornwall: vegetation history and human impacts. Unpublished B.Sc. Thesis, University of Plymouth.
Burton P.P. and Charman D.J. {in press). Vegetation change in lowland Cornwall: preliminary results from Crift Down, nr. Lanlivery and Hoggs Moor, nr. Lostwithiel. Cornish Archaeology.
Bush M.B. and Hall A.R. 1987. Flandrian Alnus: expansion or immigration?. Journal of Biogeography 14: 479-481.
Butler J. \99\. Dartmoor Atlas of Antiquities. Volume 2. 7/?g Worr/i. Devon Books, Exeter.
Butler J. 1993. Dartmoor Atlas of Antiquities. Volume 4. The South East. Devon Books, Exeter.
Butzer K.W. 1982. Archaeology as human ecology. Cambridge University Press, Cambridge.
Canti M., Heal V., Jennings S., McDonnell R. and Straker V. 1996. Archaeological and palaeoenvironmental evaluation of Porlock Bay and Marsh. In: Bell M. (ed.) Archaeology of the Severn Estuary 1995, Annual Report of the Severn Estuary Levels Research Committee 6: 49-69.
Carign£ui R. and Flett R.J. 1981. Postdepositional mobility of phosphorus in lake sediments. Limnology and Oceanography 26: 361-366.
Casagrande D.J., Gronli K. and Sutton N. 1980. The distribution of sulfur and organic matter in various fractions of peat: origins of sulfur in coal. Geochimica et Cosmochimica Acta 44: 25-32.
Casagrande D.J., Siefert K., Berschinski C. and Sutton N. 1977. Sulfur in peat-forming systems of the Okefenokee Swamp and Florida Everglades: origins pf sulfur in coal. Geochimica et Cosmochimica Acta A\: 161-167.
Caseldine C.J. 1980. Environmental change in Cornwall during the last 13000 years. Cornish Archaeology 19: 3-16.
Caseldine C.J. 1983. Problems of relating site and environment in pollen-analytical research in south west England. In: Proudfoot B. (ed.). Site, Environment and Economy, Symposia of the Association for Environmental Archaeology No.3, B.A.R. International Series 173, Oxford: 61-74.
Caseldine C. and Maltby E. 1980. Buried soil features and palaeoenvironmental reconstruction at
275
Colliford, Bodmin Moor. In: Sims P. (ed.) West Cornwall field meeting. Quaternary Research Association: 9-11.
Caseldine C.J. and Maguire D.J. 1981. A review of the prehistoric and historic environment on Dartmoor. Proceedings of the Devon Archaeological Society 39: 1-16.
Caseldine C.J. and Maguire D.J. 1986. Lateglacial / early Flandrain vegetation change of northern Dartmoor, south-west England. Journal of Biogeography 13: 255-264.
Caseldine C.J. and Hatton J. 1993. The development of high moorland on Dartmoor: fire and the influence of Mesolithic activity on vegetation change. In: Chambers P.M. (ed.) Climate Change and Human Impact on the Landscape, Chapman and Hall, London: 119-131.
Caseldine C.J. and Hatton J. 1996. Vegetation history of Dartmoor: Holocene development and impact of human activity. In: Charman D.J., Newnham R.M. and Croot D.G. (eds.) The Quaternary of Devon and East Cornwall: Field Guide. Quatemary Research Association, London: 48-61.
Caseldine C.J., Maguire D.J. and Butler S.B. 1987. The vegetation of Dartmoor during the Loch Lomond Stadial. Transactions of the Devonshire Association 119: 123-134.
Cescas M.P., Edward H.T. and Lawrence J.G. 1968. The electron microprobe X-ray analyser and its use in soil investigations. Advances in Agronomy 20: 153-198.
Chamberlain T.C. 1965. The method of multiple working hypotheses. Science 148: 745-759.
Chambers P.M. and Elliott L. 1989. Spread and expansion of Alnus Mill, in the British Isles: timing, agencies and possible vectors. Journal of Biogeography 16: 541-550.
Chambers P.M. and Price S.M. 1985. Palaeoecology of Alnus (Alder): early Post-Glacial rise in a valley mire, north-west Wales. New Phytologist 101: 333-344.
Chapman S.B. 1964. The ecology of Coom Rigg Moss, Northumberland, II. The chemistry of peat profiles and the development of the bog system. Journal of Ecology 52: 315-321.
Charles J.A. 1975. Where is the tin? Antiquity 49: 19-24.
Charman D.J., Grattan J.P., West S. and Kelly A. 1995. Environmental change and tephra: the Strath of Kildonan, Northern Scotland. Journal of Archaeological Science 22: 799-809.
Cheburkin A.K. and Shotyk W. 1996. An energy-dispersive miniprobe multielement analyser (EMMA) for direct analysis of Pb and other trace elements in peats. Fresenius Journal of Analytical Chemistry 354: 688-691.
Chen Y. 1988. Pollen source and distribution in a forest hollow in Sylvania, Michigan, U.S.A. Pollen et Spores 30: 95-110.
Chow J.C.L. and Fung P.C.W. 1994. Energy-dispersive X-ray spectroscopic analysis in a microscopic area of a grain in YBCO ceramic superconductor. Journal of Materials Science Letters 13: 586-588.
Christensen E.R. and Chien N-K. 1981. Fluxes of Arsenic, Lead, Zinc and Cadmium to Green Bay and Lake Michigan Sediments. Environmental Science and Technology 15: 553-558.
Christie P.M. 1986. Cornwall in the Bronze Age. Cornish Archaeology 25: 81-110.
Christie P.M.L. 1978. The excavation of an Iron Age souterrain and settlement at Cam Euny,
276

Sancreed, Cornwall. Proceedings of the Prehistoric Society 44: 309-433.
Christy M. and Worth R.H. 1922. The ancient dwarfed oak woods of Dartmoor. Report and Transactions of the Devonshire Association 54: 291-342.
Clark R.L. 1982. Point count estimation of charcoal in pollen preparations and thin sections of sediments. Pollen et Spores 24: 532-535.
Clark R.L. 1984. Effects on charcoal of pollen preparation procedures. Pollen et Spores 26: 559-576.
Clarke R.H. 1969. Quaternary sediments off south-east X^e,\on. Quarterly Journal of the Geological Society of London 125: 277-318.
Clayden B. and Manley J.R. 1964. The soils of the Dartmoor granite. In: Simmons I. G. (ed.) Dartmoor Essays, Devonshire Association for the Advancement of Science, Literature and Art, Devonshire Press, Torquay: 117-140.
Clymo R.S. 1983. Peat. In: Gore A.J.P. (ed.) Mires: Swamp, Bog, Fen and Moor, Elsevier Scientific Publishing Company, Amsterdam: 159-224.
Clymo R.S., Oldfield P., Appleby P.G., Pearson G.W., Ratnesar P. and Richardson N. 1990. The record of atmospheric deposition on a rainwater-dependent peatland. Philosophical Transactions of the Royal Society of London B327: 331-338.
Conolly A.P., Godwin H., Megaw E.M. and Ross R. 1950. Studies in the Post-Glacial history of British Vegetation. XI. Late-Glacial deposits in Cornwall. Philosophical Transactions of the Royal Society of London 234 (B615): 397-469.
Cowgill U.M. and Hutchinson G.E. 1970. Chemistry and Mineralogy of the Sediments and their source materials. Transactions of the American Philosophical Society 60: 37-101.
Crabtree K. and Round F.E. 1967. Analysis of a core from Slapton Ley. New Phytologist 66: 255-270.
Croot D., Gilbert A., Griffiths J. and Van der Meer J. 1996. Fremington clay series. In: Charman D.J., Newnham R.M. and Croot D.G. (eds.) The Quaternary of Devon and East Cornwall: Field Guide. Quaternary Research Association, London: 14-34.
Damman A.W.H. 1978. Distribution and movement of elements in ombrotrophic peat bogs. Oikos 30: 480-495.
Date A.R. and Gray A.L. 1989. Applications of Iruiuctively Coupled Plasma Mass Spectrometry. Blackie Academic & Professional, London.
Davies B.E. 1995. Lead. In: AUoway B.J. (ed.) Heavy metals in soils, Blackie Academic & Professional, London: 206-223.
Davies B.E. and Ballinger R.C. 1990. Heavy metal in soils in north Somerset, England, with special reference to contamination from base metal mining in the Mendips. Environmental Geochemistry and Health 12: 291-300.
Davies B.E. and White H.M. 1981. Environmental pollution by wind blown lead mine waste: a case study in Wales, UK. The Science of the Total Environment 20: 57-74.
Davies T.W. and Erasmus D.A. 1973. Cryo-ultramicrotomy and X-ray micro-analysis in the
277

transmission electron microscope. Science Tools 20: 9-13.
Davis A., Russell S.J., Rimmer S.M. and Yeakel J.D. 1984. Some genetic implications of silica and aluminosilicates in peat and coal. IntemationalJournal of Coal Geology 3: 293-314.
Day F.H. 1963. The Chemical Elements in Nature. George G. Harrap & Co. Ltd., London.
Degaetano D., Siegel J.A. and Klomparens K.L. 1992. A comparison of 3 techniques for sampling and analysis of gunshot residue by scanning electron-microscopy energy dispersive X-ray analysis (SEM-EDX). Journal of Forensic Sciences 37: 281-300.
Dong D.M. 1996. Investigation of the discrimination between aluminium held within vegetation and that contributed by soil contamination using ICP-AES and EPMA. Microchemical Journal 53: 337-348.
Durand P., Neal C , Jeffery H.A., Ryland G.P. and Neal M. 1994. Major, minor and trace element budgets in the Plynlimon afforested catchments (Wales): general trends, and effects of felling and climate variations. yoMma/o/Z/y^ro/og)' 157: 139-156.
Durrance E.M. and Laming D.J.C. (eds.) 1982. The Geology of Devon. University of Exeter, Exeter.
Edmonds E.A., McKeown M.C. and Williams M. 1975. South-West England. Natural Environment Research Council, British Geological Survey, London.
Edwards K.J. 1981. The separation of Corylus and Myrica pollen in modem and fossil samples. Pollen et Spores 23: 205-218.
Edwards K.J. 1983a. Quaternary palynology: consideration of a discipline. Progress in Physical Geography 1: 113-125.
Edwards K.J. 1983b. Quaternary palynology: multiple profile studies and pollen variability. Progress in Physical Geography 7: 587-609.
Edwards K.J. 1991. Spatial scale and palynology: a commentary on Bradshaw. In: Harris D. R. and Thomas K. D. (eds.) Modelling Ecological Change, Institute of Archaeology, University College London: 53-59.
Edwards K.J. and Rowntree K.M. 1980. Radiocarbon and palaeoenvironmental evidence for changing rates of erosion at a Flandrian stage site in Scotland. In: Cullingford R. A., Davidson D. A. and Lewin (eds.), Timescales in Geomorphology, John Wiley & Sons Ltd., Chichester: 207-223.
Edwards R., Lepp N.W. and Jones K.C. 1995. Other less abundant elements of potential environmental significance. In: Alloway B.J. (ed.) Heavy metals in soils, Blackie Academic & Professional, London: 306-352.
Einarsson T. 1986. Tephrochronology. In: Berglund B.E. (ed.). Handbook of Holocene Palaeoecology and Palaeohydrology, John Wiley & Sons Ltd., Chichester: 329-342.
Emmett D.D. 1979. Stone rows: the traditional view reconsidered. In: Maxfield V.A. (ed.). Prehistoric Dartmoor in its context, Devon Archaeological Society: 94-114.
Engstrom D.R. and Wright H.E. 1984. Chemical stratigraphy of lake sediments as a record of environmental change. In: Haworth E.Y. and Lund J.W.G. (eds.) Lake Sediments and Environmental History Leicester University Press Leicester: 11-67.
278

Erasmus D.A. (ed.) 1978. Electron Probe Microanalysis in Biology. Chapman and Hall, London.
Evans A.T. and Moore P.D. 1985. Surface pollen studies of Calluna vulgaris (L.) Hull and their relevance to the interpretation of bog and moorland pollen diagrams. Circaea 3: 173-178.
Feustel LC. and Byers H.G. 1930. The physical and chemical characteristics of certain American peat profiles. U.S.D.A. Technical Bulletin No. 214.
Findlay D.C., Colbome G.J.N., Gope D.W., Harrod T.R., Hogan D.V. and Staines S.J. 1984. Soils and their use in south west England. Soil Survey of England and Wales, Bulletin No. 14, Harpenden.
Fitter R., Fitter A. and Blamey M. 1985. The wild flowers of Britain and northern Europe. Harper Collins, London.
Fleming A. 1978a. The prehistoric landscape of Dartmoor. Part I: South Dartmoor. Proceedings of the Prehistoric Society 44: 97-123.
Heming A. 1978b. Dartmoor reaves: a nineteenth-century fiasco. Antiquity 52: 16-20.
Fleming A. 1979. The Dartmoor Reaves: boundary patterns and behaviour patterns in the second millennium BG. In: Maxfield V.A. (ed.), Prehistoric Dartmoor in its context, Devon Archaeological Society: 115-131.
Fleming A. 1988. The Dartmoor Reaves - Investigating prehistoric land divisions. B.T. Batsford Ltd., London.
Fleming A. 1996. Medieval and Post-Medieval Cultivation on Dartmoor: a Landscape Archaeologist's View. Proceedings of the Devon Archaeological Society 52: 101-117.
Fortescue J.A.G. 1992. Landscape geochemistry: retrospect and prospect - 1990. Applied Geochemistry 7: 1-53.
Francis P.D. and Slater D.S. 1990. A record of vegetational and land use change from upland peat deposits on Exmoor. Part 2: Hoar Moor. Proceedings of the Somerset Archaeological and Natural History Society 134: 1-25.
Frjincis P.D. and Slater D.S. 1992. A record of vegetational and land use change from upland peat deposits on Exmoor. Part 3: Godsend Moors. Proceedings of the Somerset Archaeological and Natural History Society 136: 9-28.
French G.N. 1996. Preliminary results of the pollen analysis of sediments from Church Cove, Gunwalloe. In: Healy M.G. (ed.), Late Quaternary coastal change in west Cornwall, UK. IGCP Project 367, Environmental Research Centre, University of Durham, Durham: 20-27.
Fritsch G. and Keimel J. 1991. Determination of static structure factors of metallic glasses by Energy-Dispersive X-Ray scattering. Materials Science and Engineering A - Structural Materials Properties, Microstructures and Processing 134: 888-892.
Gearey B.R. 1996. Human-Environment Relations on Bodmin Moor During the Holocene. Unpublished Ph.D. thesis. University of Plymouth.
Gearey B.R. and Charman D.J. 1996. Rough Tor, Bodmin Moor: Testing some archaeological hypotheses with landscape scale palynology. In: Charman D.J., Newnham R.M. and Croot D.G. (eds.) The Quaternary of Devon and East Cornwall: Field Guide. Quaternary Research Association, London: 101-119.
279
Gerard D., Cooper E., Gotcher J., Perrott D. and Chase D. 1990. STEM-EDX studies of titanium aluminium-alloy implants in canines. Journal of Dental Research 69: 128.
Gerrard S. 1996. The Dartmoor Tin Industry: an Archaeological Perspective. Proceedings of the Devon Archaeological Society 52: 173-198.
Gerrard S. and Greeves T.A.P. 1992. Excavation of Upper Merrivale Tin Blowing and Stamping Mill. Interim Report No. 2.
Gerrard S. and Greeves T.A.P. 1993. Excavation of Upper Merrivale Tin Blowing and Stamping Mill. Interim Report No. 3.
Gill R. 1989. Chemical Fundamentals of Geology. Chapman and Hall, London.
Glooschenko W.A. 1986. Monitoring the atmospheric deposition of metals by use of bog vegetation and peat profiles. In: Nriagu J.O. (ed.) Toxic Metals in the Atmosphere, Wiley - Interscience, New York: 507-533.
Glooschenko W.A. and Benedetti A.D. 1983. Atmospheric deposition of iron from mining activities in Northern Ontario. The Science of the Total Environment 32: 73-79.
Godwin H. 1975. The History of the British Flora, Cambridge University Press, Cambridge.
Goldschmidt V.M. 1954. Geochemistry, Oxford University Press, London.
Goldstein J.I., Newbury D.E., Echlin P., Joy D. C , Fiori C. and Lifshin E. 1981. Scanning Electron Microscopy and X-Ray Microanalysis. Plenum Press, New York.
Goldstein S.J., Slemmons A.K. and Canavan H.E. 1996. Energy dispersive X-ray fluorescence methods for environmental characterisation of soils. Environmental Science and Technology 30: 2318-2321.
Goodman T.G. and Roberts T.M. 1971. Plants and Soils as Indicators of Metals in the Air. Nature 231:287-292.
Gordon A.D. and Birks H.J.B. 1972. Numerical methods in Quaternary palaeoecology. I. Zonation of pollen diagrams. New Phytologist 1 \: 961-979.
Grattan J.P. 1994. The impact of Icelarulic volcanic eruptions upon the ancient settlement and environment of northern Britain. Unpublished Ph.D. thesis. University of Sheffield.
Grattan J., Gilbertson D. and Pyatt F.B. 1996. Geochemical investigations of environmental change in the Outer Hebrides. In: Gilbertson D., Kent M. and Grattan J. (eds.). The Outer Hebrides, The last 14000 years, Sheffield Environmental and Archaeological Campaign in the Hebrides 2: 27-43.
Green B.H. and Pearson M.C. 1977. The ecology of Wybunbury Moss, Cheshire. II. Post-Glacial history and the formation of the Cheshire Mere and the mire landscape. Journal of Ecology 65: 793-814.
Greeves T.A.P. 1985. The Dartmoor Tin Industry. Devon Archaeology No.3: 31-40.
Greeves T.A.P. 1994. Stamping and smelting at Upper Merrivale tin mill: preliminary results 1991-1993. Bulletin of the Peak District Mines Historical Society 12: 76-80.
Greeves T.A.P. and Newman P. 1996. Tin-working and Land-Use in the Walkham Valley: a
Preliminary Analysis. Proceedings of the Devon Archaeological Society 52: 199-219.
280
Gregory K.J. 1989. The Nature of Physical Geography. Edward Arnold, London.
Greig O. and Rankine W.F. 1953. A Stone Age settlement system near East Week, Dartmoor: Mesolithic and Post-Mesolithic industries. Proceedings of the Devon Archaeological Exploration Society 5: 8-26.
Griffith P.M., Maltby E., Caseldine C.J., Allan J.P., Drewett P. and Ellison A.B. 1984. Archaeological investigations at CoUiford Reservoir, Bodmin Moor, 1977-78. Cornish Archaeology 23:47-140.
Grime J.P., Hodgson J.G. and Hunt R. 1988. Comparative Plant Ecology: A functional approach to common British species. Unwin Hyman, London.
Grimm E.G. 1987. CONISS: A FORTRAN 77 program for stratigraphically constrained cluster analysis by the method of incremental sum of squares. Computers and Geosciences 13: 13-15.
Grinsell L.V. 1970. The Archaeology ofExmoor. David and Charles, Newton Abbot.
Grousset F.E., Quetel C.R., Thomas B., Buat-Menard P., Donard O.F.X. and Bucher A. 1994. Transient Pb isotopic signatures in the westem European atmosphere. Environmental Science and Technology 22,: 1605-1608.
Gulson B.L. and Lovering J.F. 1968. Rock analysis using the electron probe. Geochimica et Cosmochimica Acta 32: 119-122.
Guppy S.F. and Happey-Wood CM. 1978. Chemistry of sediments from two linked lakes in North Wales. Freshwater Biology 8: 401-413.
Hails J.R. 1975. Some aspects of the Quaternary history of Start Bay, Devon. Field Studies 4: 207-222.
Haines-Young R. and Petch J. 1986. Physical geography: its nature and methods. Paul Chapman Publishing Ltd., London.
Hall T.A. and Gupta B.L. 1974. Beam-induced loss of organic mass under electron microprobe conditions. Journal of Microscopy 100: 177-188.
Hall V.A. 1988. The role of harvesting techniques in the dispersal of pollen grains of Cerealia. Pollen et Spores 30: 265-270.
Hammond R and McCullagh P.S. 1978. Quantitative techniques in Geography. Clarendon Press, Oxford.
Hamond F.W. 1979. Settlement, economy and environment on prehistoric Dartmoor. Proceedings of the Devonshire Archaeological Society 37: 145-175.
Harris C. 1987. Solifluction and related deposits in England and Wales. In: Boardman J. (ed.) Periglacial processes and landforms in Britain and Ireland. Cambridge University Press, Cambridge: 209-224.
Harris G.T. 1921. Ecological notes on Wistman's Wood and Black Tor Copse, Dartmoor. Report and Transactions of the Devonshire Association 53: 232-245.
Harris H. 1992. The Industrial Archaeology of Dartmoor. Phillip Harris, Exeter.
Harris J.P. 1975. Piles Copse. Unpublished B.Sc. thesis. University of East Anglia.
281
Hatton J. 1991. Environmental change on northern Dartmoor during the Mesolithic period. Unpublished M.Phil, thesis. University of Exeter.
Hawkins A.B. 1971a. Sea level changes around South-West England. Colston Papers 23: 67-87.
Hawkins A.B. 1971b. The late Weichselian and Flandrain Transgression of south west Britain. Quaternaria 14: 115-130.
Healy M.G. 1995. The lithostratigraphy and biostratigraphy of a Holocene coastal sediment sequence in Marazion Marsh, west Cornwall, U.K. with reference to relative sea-level movements. Marine Geology 124: 237-252.
Healy M.G. 1996a. Late Quaternary coastal change in west Cornwall, UK. In: Healy M.G. (ed.). Late Quaternary coastal change in west Cornwall, UK. IGCP Project 367, Environmental Research Centre, University of Durham, Durham: 1-10.
Healy M.G. 1996b. Holocene coastal evolution at Marazion Marsh and Hayle Copperhouse, west Cornwall. In: Healy M.G. (ed.). Late Quaternary coastal change in west Cornwall, UK. IGCP Project 367, Environmental Research Centre, University of Durham, Durham: 46-59.
Heathwaite A.L., Gottlich Kh., Burmeister E.G., Kaule G. and Grospietsch Th. 1993. Mires: Definitions and Form. In: Heathwaite A.L. and Gottlich Kh. (eds.) Mires: Processes, Exploitation and Conservation, John Wiley & Sons, Chichester: 1-75.
Henderson C.G. and Weddell P.J. 1996. Medieval settlements on Dartmoor and in west Devon: the evidence from excavations. Proceedings of the Devon Archaeological Society 52: 119-140.
Henderson P. 1982. Inorganic Geochemistry. Pergamon Press, Oxford.
Hermann R. and Neumann-Mahlkau P. 1985. The mobility of Zinc, Cadmium, Copper, Lead, Iron and Arsenic in ground water as a function of redox potential and pH. The Science of the Total Environment 43: 1-12.
Herring P., Crabtree K., Straker V. and West S. 1993. Examining a Romano-British boundary at Foage, Zennor. Cornish Archaeology 32: 17-28,
Heyes A. and Moore T.R. 1992. The influence of dissolved organic carbon and anaerobic conditions on mineral weathering. Soil Science 154: 226-236.
Heyworth A. and Kidson C. 1982. Sea-level changes in southwest England and Wales. Proceedings of the Geologist's Association 93: 91-111.
Hicks S. and Birks H.J.B. 1996. Numerical analysis of modem and fossil pollen spectra as a tool for elucidating the nature of fine-scale human activities in boreal areas. Vegetation History and Archaeobotany 5: 257-272.
Hiraoka Y. 1994. A possible approach to soil discrimination using X-ray fluorescence analysis. Journal of Forensic Sciences 39: 1381-1392.
Himer A.V., Kritsotakis K. and Tobschall H.J. 1990. Metal-organic associations in sediments - I. Comparison of unpolluted recent and ancient sediments and sediments affected by anthropogenic pollution. Applied Geochemistry 5: 491-505.
Hogg E.H., Lieffers V.J. and Wein R.W. 1992. Potential carbon losses from peat profiles: effects of temperature, drought cycles, and fire. Ecological Applications 2: 298-306.
282

Hong S., Candelone J-P., Patterson C.C. and Boutron C.F. 1994. Greenland Ice Evidence of Hemispheric Lead Pollution Two Millennia Ago by Greek and Roman Civilizations. Science 265: 1841-1843.
Hong S., Candelone J-P., Patterson C.C. and Boutron C.F. 1996. History of ancient copper smelting pollution during Roman and Medieval times recorded in Greenland Ice. Science 111: 246-248.
Hopkins L., Cannon H.L., Miesch A.T., Welch R.M. and Nielson F.H. 1977. Vanadium. In: Geochemistry and the Environment, Volume II: The relation of other selected trace elements to health and disease. National Academy of Sciences, Washington: 93-107.
Hren J.J., Goldstein J.I. and Joy D.C. (eds.) 1979. Introduction to Analytical Electron Microscopy. Plenum Press, New York.
Hunt J.B. and Hill P.G. 1993. Tephra geochemistry: a discussion of some persistent analytical problems. The Holocene 3: 271-278.
Huntley B. 1993. Rapid early-Holocene migration and high abundance of hazel {Corylus avellana L.): alternative hypotheses. In: Chambers F.M. (ed.) Climate change and Human impact on the landscape. Chapman and Hall, London: 205-215.
Huntley B. and Birks H.J.B. 1983. An Atlas of Past and Present Pollen Maps for Europe: 0-13,000 Years Ago. Cambridge University Press, Cambridge.
Huntley B., Bartlein P.J. and Prentice I.C. 1989. Climatic control of the distribution and abundance of beech {Fagus L.) in Europe and North America. Journal of Biogeography 16: 551-560.
Iversen J. 1964. Retrogressive vegetational succession in the Post-Glacial. Journal of Ecology 52 (suppl.): 59-70.
Jacobi R.M. 1979. Early Flandrian hunters in the south-west. In: Maxfield V.A.. (ed.). Prehistoric Dartmoor in its context, Devon Archaeological Society: 48-93.
Jacobi R.M., Tallis J.H. and Mellars P.A. 1976. The southern Pennine Mesolithic and the ecological record. Journal of Archaeological Science 3: 307-320.
Jacobson G.L. and Bradshaw R.H.W. 1981. The Selection of Sites for Palaeovegetational Studies. Quaternary Research 16: 80-96.
Jahnke A., Shimmen T., Koyama-Ito H. and Yamazaki T. 1981. PIXE trace element analysis of aquatic plants as indicators of heavy metal pollution. Chemosphere 10: 303-312.
James H.C.L. 1990. Post-glacial site at Ponsandane, near Penzance. Proceedings of the Ussher Society 7: 299-300.
Jarvis K.E., Gray A.L. and Houk R.S. 1992. Handbook of Inductively Coupled Plasma Mass Spectrometry. Chapman and Hall, New York.
Jeffries D.S. and Snyder W.R. 1981. Atmospheric deposition of heavy metals in Central Ontario. Water, Air and Soil Pollution 15: 127-152.
Jenkins R. 1974. An introduction to X-ray spectrometry. Heyden & Son Ltd., London.
Jenkins R., Gould R.W. and Gedcke D. 1981. Quantitative X-Ray Spectrometry. Marcel Dekker, Inc., New York.
283
Jennings S. and Orford J. 1996. The impact of Mid-Holocene Deceleration of Relative Sea-Level Rise on the Porlock (Somerset) Coastal System. In: Healy M.G. (ed.) Late Quaternary coastal change in west Cornwall, UK. IGCP project 367. Environmental Research Centre, University of Durham, Durham: 28-33.
Johnson J.A.E. and Johnson T.B. 1976. Analytical applications of particle induced X-ray emission. Nuclear Instruments and Methods 137: 473-516.
Johnson N. and Rose P. 1994. The Bodmin Moor Survey. English Heritage, London.
Jones B.F. and Bowser C.J. 1978. The Mineralogy and Related Chemistry of Lake Sediments. In: Lerman A. (ed.) Lakes: Chemistry, Geology, Physics, Springer-Verlag, New York: 179-235.
Jones R.L. and Keen D.H. 1993. Pleistocene Environments of the British Isles. Chapman and Hall, London.
Kane W.T. 1973. Applications of the electron microprobe in ceramics and glass technology. In: Anderson C.A. (ed.) Microprobe Analysis, John Wiley & Sons, New York: 241-70.
Kemp A.L.W., Thomas R.L., Dell C.I. and Jaquet J.M. 1976. Cultural impact on the geochemistry of sediments in Lake Erie. Journal of the Fisheries Research Board of Canada, (special issue) 33: 440-462.
Kent M. and Coker P. 1992. Vegetation Description and Analysis: A Practical Approach. Belhaven Press, London.
Kidson C. 1971. The Quaternary History of the Coasts of South West England, with special reference to the Bristol Channel. In: Gregory K.J. and Ravenhill W.L.D. (eds.) Exeter Essays in Geography. University of Exeter, Exeter: 1-22.
Kidson C. and Heyworth A. 1973. The Flandrian Sea-Level Rise in the Bristol Channel. Proceedings of the Ussher Society 2: 565-584.
Kiel K. and Frediksson K. 1964. The iron, magnesium, and calcium distribution in co-existing olivines and rhombic pyroxenes of chrondrites. Journal of Geophysical Research 69: 3487-3515.
Kilian M.R., Van Der Plicht J. and Van Geel B. 1995. Dating raised bogs: new aspects of AMS '"C wiggle matching, a reservoir effect and climatic change. Quaternary Science Reviews 14: 959-966.
Krauskopf K.B. 1957. Separation of manganese from iron in sedimentary processes. Geochimica et Cosmochimica Acta. 12: 61-84.
Kuhry P. and Vitt D.H. 1996. Fossil carbon/nitrogen ratios as a measure of peat decomposition. Ecology 11:111-215.
Kwiecinska B.K., Hamburg G. and Vleeskens J.M. 1992. Formation temperatures of natural coke in the Lower Silesian coal basin, Poland - evidence from pyrite and clays by SEM-EDX. International Journal of Coal Geology 21: 217-235.
Lantzy R.J. and Mackenzie F.T. 1979. Atmospheric trace metals: global cycles and assessment of man's impact. Geochimica et Cosmochimica Acta 43: 511-525.
Lawes G. 1987. Scanning Electron Microscopy and X-Ray Microanalysis. John Wiley & Sons, Chichester.
Lee J.A. and Tallis J.H. 1973. Regional and Historical Aspects of Lead Pollution in Britain. Nature
284
245: 216-218.
Li X. and Thornton I. 1993. Multi-element contamination of soils and plants in old mining areas, U.K. Applied Geochemistry (suppl.) 2: 51-56.
Livett E.A. 1988. Geochemical monitoring of atmospheric heavy metal pollution: theory and applications. Advances in Ecological Research 18: 65-177.
Livett E.A., Lee J.A. and Tallis J.H. 1979. Lead, Zinc and Copper analyses of British blanket peats. Journal of Ecology 67: 865-891.
Lowe J.J. and Walker M.J.C. 1997. Reconstructing Quaternary Environments. Longman Group Ltd., London.
Lux W. 1993. Long-term heavy metal and As pollution of soils, Hamburg, Germany. Applied Geochemistry (suppl.) 2: 135-143.
Mackereth F.J.H. 1965. Chemical investigation of lake sediments and their interpretation. Proceedings of the Royal Society ofLorulon B161: 295-309.
Mackereth F.J.H. 1966. Some chemical observations on Post-Glacial lake sediments. Philosophical Transactions of the Royal Society of London ^25Q: 165-214.
Maguire D.J. 1983. The inception and growth of blanket peat: a study of northern Dartmoor. Unpublished Ph.D. Thesis, University of Bristol.
Maguire D.J. and Caseldine C.J. 1985. The former distribution of forest and moorland on northern Dartmoor. Area 17: 193-203.
Maguire D.J., Ralph N. and Fleming A. 1983. Early land use on Dartmoor - palaeobotanical and pedological investigations on Holne Moor. In: Jones M. (ed.). Integrating the subsistence economy. Symposia of the Association for Environmental Archaeology No.4, BAR International Series 181: 57-106.
Malone C. 1990. The prehistoric monuments ofAvebury. English Heritage, London.
Maltby E. and Caseldine C.J. 1982. Prehistoric soil and vegetation development on Bodmin Moor, southwestern England. Nature 297: 397-400.
Mannion A.M. 1978. Chemical analysis of the basal sediments from Linton Loch, south-east Scotland. Chemosphere 3: 291-296.
Mannion A.M. 1979. Chemical analyses of a peat profile from Threepwood Moss, south east Scotland. Chemosphere 4: 223-242.
Markert B. and Thornton 1. 1990. Multi-element analysis of an English peat bog soil. Water, Air and Soil Pollution 43: 113-123.
Martin M.H., Coughtrey, P.J. and Ward P. 1979. Historical aspects of heavy metal pollution in the Gordano Valley. Proceedings of the Bristol Naturalists Society 31: 91-97.
Maskall J., Whitehead K. and Thompson I. 1995. Heavy metal migration in soils and rocks at historical smelting sites. Environmental Geochemistry and Health 17: 127-138.
Matthews J.A. 1981. Quantitative and statistical approaches to Geography: a practical manual. Pergamon Press, Oxford.
285
McDonnell G. 1993. The Crift Farm Tin Project. First interim report. Journal of the Trevithick Society 20: 48-50.
McDonnell G. 1994. The Crift Farm Project. Interim report No. 2.
McKenzie R.M. 1980. The adsorption of lead and other heavy metals on oxides of manganese and iron. Australian Journal of Soil Science 18: 61-73.
McRae S.G. 1988. Practical Pedology: studying soils in the field. John Wiley & Sons, Chichester.
McVean D.N. 1953. Biological flora of the British Isles. Alnus Mill. Jourrml of Ecology 41: 447-466.
McVean D.N. 1956. Ecology of Alnus glutinosa (L.) Gaertn. VI. Post-Glacial history. Journal of Ecology 44: 33]-333.
Megaw J.V.S. 1976. Gwithian, Cornwall: some notes on the evidence for Neolithic and Bronze Age settlement. In: Burgess C. and Miket R. (eds.) Settlement and economy in the third and second millennium BC. British Archaeological Reports, Oxford: 51-68.
Mercer R. 1986. The Neolithic in Cornwall. Cornish Archaeology 25: 35-80.
Merrington G. and AUoway B.J. 1994. The transfer and fate of Cd, Cu, Pb and Zn from two historic metalliferous mine sites in the U.K. Applied Geochemistry 9: 677-687.
Merryfield D.L. and Moore P.D. 1974. Prehistoric human activity and blanket peat initiation on Exmoor. Nature 250: 439-441.
Millward R. and Robinson A. 1971. The South-West Peninsula. Macmillan and Co. Ltd., London.
Moore P.D. 1988. The Development of Moorlands and Upland Mires. In: Jones M. (ed.) Archaeology and the Flora of the British Isles, Oxford University Committee for Archaeology: 116-122.
Moore P.D. 1993. The origin of blanket mire, revisited. In: Chambers F.M. (ed.) Climate Change and Human Impact on the Landscape, Chapman Hall, London: 217-224.
Moore P.D., Webb J.A. and CoUinson M.E. 1991. Pollen Analysis. Blackwell Scientific Publications, London.
M0msjo T. 1968. Stratigraphical and Chemical Studies on Two Peatlands in Scania, South Sweden. Botaniska Notiser 121: 343-360.
Mottershead D.N. 1971. Coastal head deposits between Start Point and Hope Cove, Devon. Field Studies 3: 433-453.
Muscutt A.D., Reynolds B. and Wheater H.S. 1993. Sources and controls of aluminium in storm runoff from a headwater catchment in Mid-Wales. Journal of Hydrology 142: 403-425.
Naucke W. 1980. Chemie von Moor und Torf. In: Gottlieb K. (ed.) Moor und Torfkunde. E. Schweizerbart'sche Verlagbuchhandlung, Stuttgart: 173-195.
Naucke W., Heathwaite A.L., Eggelsmann R. and Schuch M. 1993. Mire Chemistry. In: Heathwaite A.L. and Gottlich Kh. (eds.) Mires: Processes, Exploitation and Conservation, John Wiley & Sons, Chichester: 263-309.
286

Newnham R.M. and Lowe D.J. 1991. Holocene vegetation and volcanic activity, Auckland Isthmus, New Zealand. Journal of Quaternary Science 6: 177-194.
Novak M. and Wieder R.K. 1992. Inorganic and organic sulfur profiles in nine Sphagnum peat bogs in the United States and Czechoslovakia. Water, Air and Soil Pollution 65: 353-369.
Nriagu J.O. and Pacyna J.M. 1988. Quantitative assessment of worldwide contamination of air, water and soils by trace metals. Nature 333: 134-139.
O'Neill P. 1995. Arsenic. In: Alloway B.J. (ed.) Heavy metals in soils, Blackie Academic & Professional, London: 105-121.
O'SuUivan P.E. 1994. The natural history of Slapton Ley Nature Reserve XXi: The palaeolimnology of the uppermost sediments of the Lower Ley, with interpretations based on ^'°Pb dating and the historical record. Field Studies 8: 405-449.
O'Sullivan P.E. 1996. Slapton Ley: catchment history and sedimentation processes. In: Charman D.J., Newnham R.M. and Croot D.G. (eds.) The Quaternary of Devon and East Cornwall: Field Guide, Quaternary Research Association, London: 120-146.
O'Sullivan P.E., Coard M.A. and Pickering D.A. 1982. The use of laminated lake sediments in the estimation and calibration of erosion rates. In: Walling D.E. (ed.) Recent developments in the Explaruition and Prediction of Erosion arui Sediment Yield, Proceedings of the Exeter Symposium, L\HS Publ. 137: 385-396.
Pacyna J.M. 1987. Atmospheric Emissions of Arsenic, Cadmium, Lead and Mercury from High Temperature Processes in Power Generation and Industry. In: Hutchinson T.C. and Meema K.M., (eds.). Lead, Mercury, Cadmium arui Arsenic in the Environment, SCOPE, John Wiley & Sons: 69-87.
Pakarinen P. and Tolonen K. 1976. Regional Survey of Heavy Metals in Peat Mosses (^Sphagnum). Ambio 5: 3S-41.
Patterson W.A., Edwards K.J. and Maguire D.J. 1987. Microscopic charcoal as a fossil indicator of fire. Quaternary Science Reviews 6: 3-23.
Pearce S. 1978. Devon in prehistory. Exeter City Museums, Exeter.
Pearce S. 1979. The Distribution and Production of Bronze Age Metal work. In: Maxfield V.A. (ed.) Prehistoric Dartmoor in its context, Devon Archaeological Society: 136-145.
Pease R.W. and Bailey J.F. 1975. Thin polymer films as non-charging surfaces for scanning electron microscopy. Journal of Microscopy 104: 281-285.
Pennington W. 1981. Records of a lake's life in time: the sediments. Hydrobiologia 79: 197-219.
Pennington W., Haworth E.Y., Bonny A.P. and Lishman J.P. 1972. Lake Sediments in Northern Scotland. Philosophical Transactions of the Royal Society of London B (264): 191-294.
Pierson D.H., Cawse P.A., Salmon L. and Cambray R.S. 1973. Trace elements in the Atmospheric Environment. Nature 241: 252-256.
Pilcher J. 1991. Radiocarbon dating. In: Smart P.L. and Frances P.D. (eds.). Quaternary Dating Methods - a user's guide. Technical Guide No.4, Quaternary Research Association, London: 16-36.
Popper K. 1972. The logic of scientific discovery. Hutchinson, London.
287

Prentice I.C. 1980. Multi dimensional scaling as a research tool in Quaternary palynology: a review of theory and methods. Review of Palaeobotany and Palynology 31: 71-104.
Prentice I.C. 1985. Pollen representation, source area, and basin size: toward a unified theory of pollen analysis. Quaternary Research 23: 76-86.
Prentice I.C. 1986. Multivariate methods for data analysis. In: Berglund B. E. (ed.). Handbook of Holocene Palaeoecology and Palaeohydrology, John Wiley & Sons Ltd., Chichester: 115-191.
Preston-Jones A. and Rose P. 1986. Medieval Cornwall. Cornish Archaeology 25: 135-185.
Price D.G. 1993. Dartmoor: the pattern of prehistoric settlement sites. The Geographical Journal 153: 261-280.
Proctor C. 1996. Kent's Cavern. In: Charman D.J., Newnham R.M. and Croot D.G. (eds.) The Quaternary of Devon and East Cornwall: Field Guide. Quaternary Research Association, London: 163-167.
Proctor M.C.F., Spooner G.M. and Spooner M.F. 1980. Changes in Wistman's Wood, Dartmoor -photographic and other evidence. Report of the Devonshire Association for the Advancement of Science 112: 43-79.
Puchelt H., Kramar U., Gumming G.L., Krstic D., Noltner T., Schottle M. and Schweikle V. 1993. Anthropogenic Pb contamination of soils, south west Germany. Applied Geochemistry (suppl.) 2: 71-73.
Pyatt F.B. 1974. Plant sulphur content as an indication of air pollution from nineteenth century smelting operations. Proceedings of the Second International Conference on Bioindicators of Landscape Deterioration, Most, Czech Republic 2: 89-102.
Pyatt F.B. and Lacy D. 1988. An appraisal of atmospheric pollution by aluminium fiimes emanating from smelter works in Western Norway. Environment International 14: 407-416.
Pyatt F.B., Beaumont E.H., Buckland P.C, Lacy D. and Storey D.M. 1991. An examination of the mobilisation of elements from the skin and bone of the bog body Lindow 11 and a comparison with Lindow III. Environmental Geochemistry and Health 13: 153-159.
Pyatt F.B., Grattan J.P., Lacy D., Gilbertson D.D., Brayshay B.A. and Wadsworth W.D. 1995. Exploratory studies of loch-sediment chemistry Jind soil history from a 10,000+ year old core from Loch Hellisdale, South Uist, Outer Hebrides. Scottish Geographical Magazine 111: 106-112.
Pyatt F.B., Lacy D., Beattie R.C. and Pyatt A.J. 1992. Element content of Thalli of Xanthoria parietina obtained from three different types of substrata. Environment and Ecology 10: 682-692.
Pyle S.M., Nocerino J.M., Deming S.N., Palasota J.A., Palasota J.M., Miller E.L., Hillman D.C., Kuharic C.A., Cole W.H., Fitzpatrick P.M., Watson M.A. and Nichols K.D. 1996. Comparison of AAS, ICP-AES, PSA and XRF in determining lead and cadmium in soil. Environmental Science and Technology 30: 204-213.
Quinnell H. 1986. Cornwall during the Iron Age and Roman period. Cornish Archaeology 25: 111-134.
Quinnell H. 1996. Becoming Marginal? Dartmoor in Later Prehistory. Proceedings of the Devon Archaeological Society 52: 75-83.
Rackham O. 1986. The History of the Countryside. J. M. Dent, London.
288
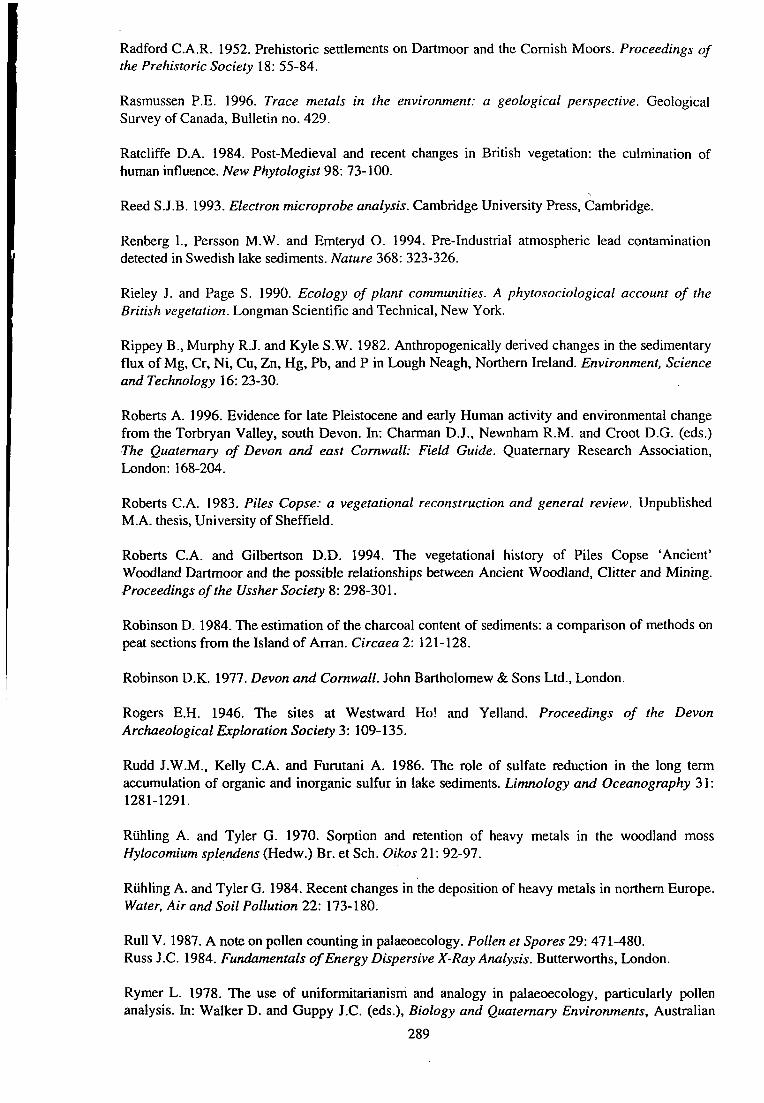
Radford C.A.R. 1952. Prehistoric settlements on Dartmoor and the Cornish Moors. Proceedings of the Prehistoric Society 18: 55-84.
Rasmussen P.E. 1996. Trace metals in the environment: a geological perspective. Geological Survey of Canada, Bulletin no. 429.
Ratcliffe D.A. 1984. Post-Medieval and recent changes in British vegetation: the culmination of human influence. New Phytologist 98: 73-100.
Reed S.J.B. 1993. Electron microprobe analysis. Cambridge University Press, Cambridge.
Renberg 1., Persson M.W. and Emteryd O. 1994. Pre-Industrial atmospheric lead contamination detected in Swedish lake sediments. Nature 368: 323-326.
Rieley J. and Page S. 1990. Ecology of plant communities. A phytosociological account of the British vegetation. Longman Scientific and Technical, New York.
Rippey B., Murphy R.J. and Kyle S.W. 1982. Anthropogenically derived changes in the sedimentary flux of Mg, Cr, Ni, Cu, Zn, Hg, Pb, and P in Lough Neagh, Northern Ireland. Environment, Science arui Technology 16: 23-30.
Roberts A. 1996. Evidence for late Pleistocene and early Human activity and environmental change from the Torbryan Valley, south Devon. In: Charman D.J., Newnham R.M. and Croot D.G. (eds.) The Quaternary of Devon and east Cornwall: Field Guide. Quaternary Research Association, London: 168-204.
Roberts C.A. 1983. Piles Copse: a vegetational reconstruction and general review. Unpublished M.A. thesis. University of Sheffield.
Roberts C.A. and Gilbertson D.D. 1994. The vegetational history of Piles Copse 'Ancient' Woodland Dartmoor and the possible relationships between Ancient Woodland, Glitter and Mining. Proceedings of the Ussher Society 8: 298-301.
Robinson D. 1984. The estimation of the charcoal content of sediments: a comparison of methods on peat sections from the Island of Arran. Circaea 2: 121-128.
Robinson D.K. 1977. Devon and Cornwall. John Bartholomew & Sons Ltd., London.
Rogers E.H. 1946. The sites at Westward Ho! and Yelland. Proceedings of the Devon Archaeological Exploration Society 3: 109-135.
Rudd J.W.M., Kelly C.A. and Furutani A. 1986. The role of sulfate reduction in the long term accumulation of organic and inorganic sulfur in lake sediments. Limnology and Oceanography 31: 1281-1291.
Riihling A. and Tyler G. 1970. Sorption and retention of heavy metals in the woodland moss Hylocomium splendens (Hedw.) Br. et Sch. Oikos 21: 92-97.
Ruhling A. and Tyler G. 1984. Recent changes in the deposition of heavy metals in northern Europe. Water, Air and Soil Pollution 22: 173-180.
RuU V. 1987. A note on pollen counting in palaeoecology. Pollen et Spores 29: 471-480. Russ J.C. 1984. Fundamentals of Energy Dispersive X-Ray Analysis. Butterworths, London.
Rymer L. 1978. The use of uniformitarianism and analogy in palaeoecology, particularly pollen
analysis. In: Walker D. and Guppy J.C. (eds.). Biology and Quaternary Environments, Australian
289

Academy of Science: 245-257.
Scott A.C. and Collinson M.E. 1978. Organic sedimentary particles: results from Scanning Electron Microscope studies of fragmentary plant material. In; Whalley W.B. (ed.), Scanning Electron Microscopy in the study of sediments, a symposium, Geo Abstracts Ltd., Norwich: 137-167.
Scourse J.D. 1986. 77ie Isles ofScilly Field Guide. Quaternary Research Association, London.
Scourse J.D. 1991. Late Pleistocene stratigraphy and palaeobotany of the Isles of Scilly. Transactions of the Royal Society B334: 405-448.
Shaw G. and Wheeler D. 1994. Statistical Techniques in Geographical Analysis. Wiley, London.
Shell C.A. 1978. The early exploitation of tin deposits in south west England. Ryan M. (ed.). The origins of metallurgy in Atlantic Europe, Proceedings of the fifth Atlantic colloquium, Dublin: 251-263.
Shotyk W. 1988. Review of the Inorganic Geochemistry of Peats and Peatland Waters. Earth-Science Reviews 25: 95-176.
Shotyk W. 1996a. Natural and anthropogenic enrichments of As, Cu, Pb, Sb and Zn in ombrotrophic versus minerotrophic peat bog profiles. Jura Mountains, Switzerland. Water, Air and Soil Pollution 90: 375-405.
Shotyk W. 1996b. Peat bog archives of atmospheric metal deposition: geochemical evaluation of peat profiles, natural variations in metal concentrations and metal enrichment factors. Environmental Reviews 4: 149-183.
Shotyk W., Cheburkin A.K., Appleby P.G., Fankhauser A. and Kramers J.D. 1996. Two thousand years of atmospheric arsenic, antimony and lead deposition recorded in an ombrotrophic peat bog profile. Jura Mountains, Switzerland. Earth and Planetary Science Letters 145: E1-E7.
Siegel S. and Castellan N.J. 1988. Nonparametric statistics for the behavioural sciences. McGraw-Hill Book Company, London.
Sikora L.J. and Keeney D.R. 1983. Further aspects of soil chemistry under anaerobic conditions. In: Gore A.J.P. (ed.) Mires: Swamp, Bog, Fen and Moor, Elsevier Scientific Publishing Company, Amsterdam: 225-256.
Sillanpaa M. 1972. Distribution of trace elements in peat profiles. Proceedings of the 4th International Peat Congress 5: 185-191.
Silvester R.J. 1979. The relationship of first millennium settlement to the upland areas of the south west. Proceedings of the Devon Archaeological Society 37: 176-190.
Silvester R.J. 1981. An excavation on the post-roman site at Bantham, S. Devon. Proceedings of the Devon Archaeological Society 39: 89-118.
Silvester R.J., Berridge P.J. and Uglow J. 1987. A fieldwalking exercise on Mesolithic and Neolithic site at Nether Exe. Proceedings of the Devon Archaeological Society 45: 1-21.
Silvola J., Aim J., Ahlholm U., Nykanen H. and Martikainen P.J. 1996. CO2 fluxes from peat in boreal mires under varying temperature and moisture conditions. Journal of Ecology 84: 219-228.
Simmons I.G. 1962. The development of the vegetation of Dartmoor. Unpublished Ph.D. thesis, University of London.
290
Simmons I.G. 1964a. An ecological history of Dartmoor. In: Simmons I.G. (ed.), Dartmoor Essays, The Devonshire Association for the Advancement of Science, Literature and Art: 191-217.
Simmons I.G. 1964b. Pollen diagrams from Dartmoor. New Phytologist 63: 165-180.
Simmons I.G. 1965. The Dartmoor Oak Copses: observations and speculations. Field Studies 2: 225-235.
Simmons I.G. 1975. Towards an ecology of Mesolithic Man in the uplands of Great Britain. Journal of Archaeological Science 2: 1-15.
Simmons I.G. 1993. Vegetation change during the Mesolithic in the British Isles: some amplifications. In: Chambers P.M. (ed.) Climate Change and Human Impact on the Environment, Chapman Hall, London: 109-118.
Simmons I.G., Rand J.I. and Crabtree K. 1983. A further pollen analytical study of the Blacklane peat section on Dartmoor, England. New Phytologist 94: 655-667.
Small J.A., Heinrich K.F.J., Newbury D.E. and Myklebust R.L. 1979. Progress in the development of the peak-to-background method for the quantitative analysis of single particles with the electron probe. Scanning Electron Microscopy 2: 807-816.
Smart P. 1973. Electron microscope methods in soil micromorphology. In: Rutherford G.K. (ed.). Proceedings of 4th Soil Microscopy Conference, Limestone Press, Ontario: 190-206.
Smart P. and Tovey N.K. 1981. Electron Microscopy of Soils and Sediments: examples. Clarendon Press, Oxford.
Smith A.G. 1970. The influence of Mesolithic and Neolithic Man on British Vegetation: a discussion. In: Walker D. and West R.G., (eds.). Studies in the vegetational history of the British Isles, Cambridge University Press, Cambridge: 81-96.
Smith A.G. and Pilcher J.R. 1973. Radiocarbon dating and vegetational history of the British Isles. New Phytologist 72: 903-914.
Smith A.G. and Willis E.H. 1962. Radiocarbon dating of the Fallohogy landnam phase. Ulster Journal of Archaeology 25: 16-24.
Smith K., Coppen J., Wainwright G.J. and Beckett S. 1981. The Shaugh Moor project: third report -Settlement and environmental investigations. Proceedings of the Prehistoric Society 47: 205-273.
Spears D.A. 1973. Relationship between exchangeable cations and palaeosalinity. Geochimica et Cosmochimica Acta 37: 77-85.
Stace C. 1991. New Flora of the British Isles. Cambridge University Press, Cambridge.
Staines S. 1974. Environmental Change on Dartmoor. Proceedings of the Devon Archaeological Society 31: 21-47.
Statham P.J. 1979. Measurement and Use of Peak-to-Background Ratios in X-Ray Analysis. Mikrochimica Acta 8 (supp.): 229-242.
Statham P.J. 1980. X-ray microanalysis with Si(Li) detectors. Journal of Microscopy 123: 1-23.
Statham P.J. and Pawley J.B. 1978. A new method for particle X-ray micro-analysis based on peak to background measurements. Scanning Electron Microscopy 1: 469-478.
291

Steinberg E.W., Saumweber S. and Kern J. 1991. Palaeolimnological trends in total organic carbon indicate natural and anthropogenic sources of acidity in Grosser Arbersee, Germany. The Science of the Total Environment 107: 83-90.
Stephens N. 1980. Introduction. In: Sims P. (ed.) Field Handbook, West Cornwall Meeting. Quaternary Research Association, Plymouth: 1-7.
Stevenson A.C. and Thompson D.B.A. 1993. Long-term changes in the extent of heather moorland in upland Britain and Ireland: palaeoecological evidence for the importance of grazing. The Holocene 3: 70-76.
Stewart C. and Fergusson I.E. 1994. The use of peat in the historical monitoring of trace metals in the atmosphere. Environmental Pollution 86: 243-249.
Stockmarr J. 1971. Tablets with spores used in absolute pollen analysis. Pollen et Spores 13, 4: 615-621.
Storer B. 1985. The Natural History of the Somerset Levels. Dovecote Press, Dorset.
Straker V. and Crabtree K. 1995. Palaeoenvironmental studies on Exmoor: past research and future potential. In: Binding H. (ed.) The Changing Face of Exmoor, Exmoor Books: 43-51.
Straszheim W.E., Yousling J.G., Younkin K.A. and Markuszewski R. 1988. Mineralogical characterisation of lower rank coals by SEM-based automated image-analysis and Energy-Dispersive X-Ray Spectrometry. Fuel 61: 1042-1047.
Stuiver M. and Polach H.A. 1977. Discussion reporting of '"C data. Radiocarbon 19: 355-363.
Stuiver M. and Reimer P.J. 1993. Extended '"C database and revised CALIB 3.0 radiocarbon calibration program. Radiocarbon 35: 215-230.
Swanson K.A. and Johnson A.H. 1980. Trace metal budgets for a forested watershed in the New Jersey Pine Barrens. Water Resources Research 16: 373-376.
Tanskanen H. 1976. Factors affecting the metal contents in peat profiles. Journal of Geochemical Exploration 5: 412-414.
Tansley A.G. 1939. The British Islands and their Vegetation. Cambridge University Press, Cambridge.
Tauber H. 1965. Differential pollen dispersal and the interpretation of pollen diagrams. Dansmark Geologiske Undersogelse 89: 1-69.
Ter Braak C.J.F. 1987. CANOCO - a FORTRAN program for canonical community ordination by [partial] [detrended] [canonical] correlation analysis, principal components analysis and redundancy analysis (version 2.1). Microcomputer Power, Ithaca, New York, USA.
Thornton J.I. 1994. The chemistry of death by gunshot. Analytica Chimica Acta 288: 71-81.
Tinsley H.M. and Smith R.T. 1974. Surface pollen studies across a woodland heath transition and their application to the interpretation of pollen diagrams. New Phytologist 73: 547-565.
Todd M. 1987. The South West to AD 1000. Longman, London.
Tolonen K. 1986. Rhizopod analysis. In: Berglund B.E. (ed.) Handbook of Holocene Palaeoecology and Palaeohydrology, John Wiley, Chichester: 645-666.
292
Tovey N.K. and Wong K.Y. 1978. Preparation, selection and interpretation problems in scanning electron microscope studies of sediments. In: Whalley W.B., (ed.). Scanning electron microscopy in the study of sediments, a symposium, Geo Abstracts Ltd., Norwich: 181-199.
Troels-Smith J. 1955. Karaakterisering af lose jordater. Dansmarks Geologiske Undersogelse IV 3: 39-73.
Turner J.S. and Watt A.S. 1939. The oakwoods {Quercetum sessiliflora) of Killarney, Ireland. Journal of Ecology 11: 202-233.
Tyler G. 1972. Heavy Metals Pollute Nature, May Reduce Productivity. Ambio 1: 52-59.
Ure A.M. 1995. Methods of analysis for heavy metals in soils. In: Alloway B.J. (ed.) Heavy metals in soils, Blackie Academic & Professional, London: 58-102.
Ussher W.A.E. 1904. The geology of the country around Kingsbridge and Salcombe. Memoirs of the Geological Survey of Great Britain.
Van Geel B., Bregman R., Van Der Molen P.C, Dupont L.M., Van Driel-Murray C. 1989. Holocene raised bog deposits in the Netherlands as geochemical archives of prehistoric aerosols. Acta Botanica Neerl. 38: 467-476.
Vuorela I. 1973. Relative pollen rain around cultivated fields. Acta Botanica Fennica 102: 1-27.
Wainwright G.J. and Smith K. 1979. The South Dartmoor Project 1976-1979. In: Maxfield V.A. (ed.). Prehistoric Dartmoor in its context, Devon Archaeological Society: 132-135.
Walker D. 1970. Direction and rate in some British Post-Glacial hydroseres. In: Walker, D. and West R.G., (eds.). Studies in the vegetational history of the British Isles, Cambridge University Press: 117-139.
Waller M. 1994. Paludification and pollen representation: the influence of wetland size on Tilia representation in pollen diagrams. The Holocene 4: 430-434.
Ward S.D., Jones A.D. and Manton M. 1972. The vegetation of Dartmoor. Field Studies 4: 505-533.
Warner B.G. 1990. Testate amoebae. In: Warner B.G. (ed.) Methods in Quaternary Ecology, Geoscience Canada, Reprint Series No.5: 65-74.
Wedepohl K.H. (ed.) 1978. Handbook of Geochemistry. Vol 11-2, Springer-Verlag, Beriin.
Wedepohl K.H. 1995. The composition of the continental crust. Geochimica et Cosmochimica Acta 7: 1217-1232.
West S., Charman D.J., Grattan J.P. and Cheburkin A.K. (in press) Heavy metals in Holocene peats from south west England: detecting mining impacts and atmospheric pollution. Water, Air and Soil Pollution.
Whimster R. 1977. Harlyn Bay Reconsidered. Cornish Archaeology 16: 61-88.
Wiesmann H-P., Plate U., Hohling H-J., Barckhaus R.H. and Zierold K. 1993. Analysis of early hard tissue formation in dentine by energy dispersive X-ray microanalysis and energy-filtering transmission electron microscopy. Scanning Microscopy 7: 711-718.
Williams A.G., Teman J.L. and Kent M. 1984. Hydrological characteristics of a Dartmoor hillslope.
293

In: Walling D. and Burt T. (eds.). Catchment experiments in Fluvial Geomorphology, GeoBooks, Norwich: 379-398.
Williams A.G., Teman J.L. jmd Kent M. 1986. Some observations on the chemical weathering of the Dartmoor granite. Earth Surface Processes and Landforms 11: 557-574.
Williams K.L. 1987. An introduction to X-ray spectrometry: X-ray fluorescence and electron microprobe analysis. Allen & Unwin, London.
Wilson P., Cooke M., Cawley J., Giles L. and West M. 1995. Comparison of the determination of copper, nickel and zinc in contaminated soils by X-ray fluorescence spectrometry and inductively-coupled plasma spectrometry. X-Ray Spectrometry 24 (3): 103-108.
Witting M. 1947. Katjonsbestamnigar i myrvatten. Botaniska NotiserA: 287-304.
Wittry D.B. 1958. Resolution of electron probe microanalysers. Journal of Applied Physics 29: 1543-1548.
Woodland W.A. 1996. Holocene palaeohydrology from testate amoebae analysis: developing a model for British peatlaruls. Unpublished Ph.D. thesis. University of Plymouth.
Yakowitz H. and Heinrich K.F.J. 1968. Quantitative Electron Probe Microanalysis: Absorption Correction Uncertainty. Mikrochimica Acta 5: 182-200.
Yapp W.B. 1953. The high-level woodlands of the English Lake District. North Western Naturalist 1:190-207.
Young R. and Simmonds T. 1995. Marginality and the nature of later prehistoric upland settlement in the north of England. Landscape History 7: 5-16.
Zailer V. and Wilk L. 1907. Uber deb Einflus der Pflanzenkonstituenten auf die physikalischen und chemischen Eigenschaften des Torfes, B. Die chemischen Eigenschaften der Torfarten. Z. Moorkultur Torfverwertung 5:197-260.
Zbiral J. 1996. Determination of potentially dangerous elements in soil extracts by atomic-emission spectrophotometry ICP - correction of interferences. Communications in Soil Science and Plant Analysis 21: 1527-1536.
Zvelebil M. 1994. Plant Use in the Mesolithic and its Role in the Transition to Farming. Proceedings of the Prehistoric Society 60: 35-74.
294
Related Documents