- 1 - LINCOLN PARK TREE HEALTH STUDY Lincoln Park Tree Group Kim Frye Mandy Nyerges Elizabeth Baer Carla Podrasky Andy Metz Amy Wagenblast GEO 242 March 20, 2007

GEO242_Win0607_LPTree_final_report
Aug 17, 2015
Welcome message from author
This document is posted to help you gain knowledge. Please leave a comment to let me know what you think about it! Share it to your friends and learn new things together.
Transcript

- 1 -
LINCOLN PARK TREE HEALTH STUDY
Lincoln Park Tree Group
Kim Frye Mandy Nyerges Elizabeth Baer Carla Podrasky Andy Metz
Amy Wagenblast
GEO 242
March 20, 2007

2
TABLE OF CONTENTS 1. Introduction……………………………………………………………………….4 2. Needs Assessment
2.1 Background……………………………………………………………...5 2.1.1 Literature Review………………………………………………6
2.2 Project Goals…………………………………………………………….9 2.3 Objectives……………………………………………………………….10 2.4 Information Categories Utilized………………………………………... 10 2.5 Information Structures/Products………………………………………... 11
3. System Requirements
3.1 Introduction……………………………………………………………...12 3.2 Data Requirements as a Conceptual Database Design…………………….12
3.2.1 Matrix of need to know questions cross-referenced with entity classes …………………………………..12
3.2.2 Entity Relationship Modeling…………………………………13 3.2.3 Entity Relationship Diagram ……............................................15
3.3 Software Requirements 3.3.1 Matrix of need to know questions cross-referenced with
Software Functions………………………………………….16 3.3.2 Potential Software Systems …………………………………..16
3.7 Institutional Requirements……………………………………………....19 4. Data Acquisition
4.1 Introduction………………………………………………………………20 4.2 Data Dictionary……………………………………………………..........20 4.4 Data Source Steps………………………………………………………..21 4.5 Fitness For Use…………………………………………..........................22 4.6 Data Acquisition Constraints…………………………………………….23
5. Data Analysis
5.1 Introduction………………………………………………………………25 5.2 Analysis Plan………………………………………………………….....26
6. Results
6.1 Introduction………………………………………………………….......32 6.2 Findings………………………………………………………………..... 32
7. Summary, Conclusions, and Recommendations………………………………....41 8. Technical Appendices
Appendix A: Contact People ………………………………………………44 Appendix B…………………………………………………………………44
References………………………………………………………………………......45

3
Project Summary
In this study, tree health in the Lincoln Park neighborhood of Chicago, Illinois was
explored in relation to land use type. Roughly 200 trees were evaluated using ArcGIS and
statistical analysis to determine whether or not land use has a significant effect on tree
health. The project was first initiated by the environmental science department at De Paul
University. The final analysis indicated a correlation between tree health and land use

- 4 -
1. Introduction
This project is a continuation of the Lincoln Park Tree Study that began in the DePaul
Environmental Sciences department under the supervision of Professor Liam Henegan. The
main purpose of the study was to determine the correlation between land use affects and
tree health. The database we used was created by students of DePaul. Our goal was to
improve the quality of that data, produce maps, and graphs which would examine the
relationship between trees and land use. The original survey covered an 80 block area of
Lincoln Park. In this study the global positioning coordinates for 800 trees were taken
using the Garmin eTrex Legend cX GPS receiver. Unfortunately out of those 800 trees only
294 of the surveyed points were usable, this was the result of human error.
Each group member has their own reasons for choosing this project. I believe some of
the reasons we have in common are: we are city-dwelling tree huggers who care about our
environment, we like to breath, and trees are quite useful in that realm when it comes to the
carbon cycle. Trees remove ton s of pollutants from our air every year. And as a
geographer I know I chose this because of location. This is a study being done in our own
backyard! In regards to the complexities of our modern day society, and the environmental
challenges our planet faces, trees are part of the future saving grace.
What we did in this study was to take a section in the northwest corner of the 80 block
area of the original Lincoln Park Survey. We used a Garmin to get the waypoints for the
trees and attched the database to the waypoint table. The using the U.S. Census tracts we,
palced these points on the map. Unfortunately, we did not meet our goal because of err.

5
This error can be reconciled and the data created via “gpsing” trees will still be able to be
used in the future.
In this project we were our own clients. This study will be expanded and overtime will
be completed in the future. People who are involved in the study of urban trees are
arborists, city planners, hydrologists, and other environmentalists.
2. Needs Assessment
2.1 Background The mission of the Tree project is to determine what effects the land use (residential
and non-residential) has on tree health in the Lincoln Park neighborhood community.
Urban forestry in Chicago, IL has received increasing attention as a major component in
city policy and environmental management. Ecological research has placed Chicago’s
urban forest in an economical context that recognized the role of urban trees in air
pollutants removal, carbon sequestering, savings in annual heating and cooling costs, and
reduced neighborhood wind speeds (McPherson, E. G., et al., 1997). Much of the estimated
value of the urban trees depends on tree maturation, which in turn depends on tree health.
Exploring patterns of urban tree health could inform forest management policy and
ultimately better inform urban foresters in order to decrease tree death and city costs of tree
replacement.
Stakeholders from this research include the community members living within the
Lincoln Park neighborhood, members of the scientific and geographic community at De
Paul University as well as city and regional organizations such as the City of Chicago,
United States Department of Forestry, and the Chicago area Environmental Protection Area.

6
The community of Lincoln Park would receive substantial benefit from this
research by being aware of the land use effects on local tree health in addition to possible
personal health effects. Also, the resultant data may be able to show ways to improve tree
conditions as well as preventative measures to ensure tree health for existing or future tree
species in the area. The Environmental Sciences department at DePaul University has
initiated on-going research to survey the urban forest within the parkways of the Lincoln
Park neighborhood. Tree species, diameter at breast height, and qualitative health condition
(good, fair, poor, dead) have been identified and recorded and is currently mapped as
separate shapefiles each containing only a portion of the available data.
Our proposed project aims to increase the quality and value of the data, create
intelligent maps that coordinate all available data, and use the new data visualizations to
perform geostatistical analyses to identify potential relationships between tree health
variables (qualitative measurement “Condition” and quantitative measurement “DBH” or
Diameter at Breast Height) and basic types of land use (residential and non-residential).
Currently, there is a great deal of data available that requires substantial improvement
through the capabilities of a GIS system such as clear, precise mapping through GPS
technology, more detailed information considering tree health and attributes and analyzing
varying tree health in certain regions along with statistical information of the area.
2.1.1 Literature Review
Whereas the importance of urban forests has been identified in the context of
environmental, economical (McPherson, E. G., et al., 1997; Akbari, et al., 1992), and social
sciences (Sullivan and Kuo, 1996), municipal budgets for tree maintenance have declined
(TreeLink, 2007). Current tree maintenance methods are dominated by dead tree removal

7
and replacement during which replacement tree species are chosen for environmental stress
resistance. The choice of suitable tree species is severely limited due to stressors such as
severe weather (Sissini, et al., 1995), disease, pestilence, pollutants, and soil compaction
(McPherson, et al., 1994). Both the aesthetic and ecological roles of urban forests will
require management that is grounded in an ecosystem-based approach that target the
variables having the most influence on tree and forest health through research that
identifies indirect effects of human activity (Dwyer, et al., 2002). An ecosystem-based
management could prevent tree loss, lower urban forestry budget needs due to decreased
demand for tree replacement, and further increase ecosystem quality to broaden the range
of suitable tree species and increasing urban forest biodiversity.
Ecosystem tolerance and resilience to environmental stressors has been shown to
increase when soil quality increases (Seybold, et al., 1999). Soil quality, defined as soil
function, includes decreases soil compaction in order to improve nutrient cycling, microbial
populations, and water infiltration (Karlen, et al., 2003). Soil compaction largely results
from soil management practices that do not prioritize soil quality sustainability and such
management methods directly result from the type of land use occurring on a given soils
(Karlen, et al., 2003). In an urban forest, land use is diverse and can contain several types
of use within a small area (Dwyer et al, 2002). The Lincoln Park neighborhood in Chicago,
Illinois is an example of an urban forest that must be managed on a continuous gradient of
land use type including residential, commercial, recreational, industrial parks.
Current literature identifies technology as a critical component of future urban
forest management policies in order to efficiently manage ecosystem and city development
change and in order to more easily transfer knowledge from the researcher to the land

8
manager. Specifically addressed are needs for initial forest inventory and the identification
of “forces for change in the urban forest and their influence on the extent, use, and
management of urban forest resources” (Dwyer, et al., 2002). Our project intends to use
ArcGIS to clearly display previous inventory work of Lincoln Park’s urban forest.
Currently the existing urban forest data consists of individual trees spatially identified by
the local spatial reference system of Chicago postal addresses on which each tree is located
or near. Due to the outmoded nature of locally based references systems (Chrisman, 2002)
and the inaccuracies present in the current data, we will initiate work that spatially locates
each tree on a universal reference system that is geodetic and based on GPS outputs gained
from our own re-surveying of Lincoln Park trees. We will also combine representations of
tree GPS locations with existing tree attribute data including individual tree health
condition and tree diameter at breast height (DBH). Once visually represented, we intend to
use the geospatial applications in ArcGIS to assess the probability of land use as a key
factor driving urban forest health within Lincoln. Previous use of GIS in urban forest
research has identified a spatial pattern of urban forest closely related to general land use
zonings in Munich, Germany (Pauleit & Duhme, 2000). Our project hopes to further the
application of GIS to the local urban forest by not only visually identifying spatial forest
patterns correlating with land use, but also exploring the potential causal relationship
between land use and urban forest health.
Points of contact for this project include the group members who are Kim Frye,
Mandy Nyerges, Liz Baer, Amy Wagenblast, Carla Podrasky and Andy Metz, as well as
Liam Heneghan who is a DePaul University Environmental Science faculty member and
oversees DePaul’s Urban Forestry program research. Meetings to discuss progress,

9
problems or issues that arise and to perform the necessary tasks to complete the database
will be scheduled to coincide with deadlines to coincide with the groups schedule and
progress.
Deadlines will be as follows:
Needs Assessment January 30, 2007
System Requirements February 13, 2007
Data Acquisition February 20, 2007
Data Analysis February 27, 2007
Presentation March 20, 2007
Final Report March 20, 2007
Each of the components listed above will enable the group to be able to follow a strict
working schedule to ensure the greatest accuracy and work integrity goes into the final
product. Progress will be communicated primarily through group meetings and e-mail as
the project continues. Although group meetings are essential to creating the ideal and best
working final project, the group dynamic requires communication via e-mail. Points of
contact have been established within the group if any immediate or urgent questions or
issues should arise.
2.2 Project Goal Trees are vital to the health of an urban environment, its residents, and the aesthetic of a
neighborhood. They remove carbon dioxide from the air and can make a city a beautiful
place to live. However, cities can pose hazards for tree health if the effects of an urban
environment on the growth and survival of trees are not researched and available to urban
planners. Our group will examine the topic of tree health in three different urban settings:
residential, commercial, recreational, and industrial. These four urban land uses offer
different environmental conditions for trees to live. Our project will use the data obtained

10
by DePaul students and faculty. This data contains a survey of all the trees within an 80-
block area of Lincoln Park, Chicago. The surveys show the size (DBH), tree species, tree
health at the time of the survey, and the location of the tree by Chicago address (see
Appendix B). For the purpose of our study, we will be using the tree health and location
data to determine the, if any, correlation between tree health and the location of the tree.
The information obtained from this study will be helpful to urban planners and to the
residents of Chicago and other cities. Our environment is also a stakeholder in this group,
including animals and air quality.
2.3 Objectives: -To decide how many trees to include in our study, so that we have enough time to
complete the study, but still have a sufficient amount of trees to constitute a useful sample
size.
-To decide from where within the 80 block area of Lincoln Park, Chicago to focus the
study.
-To transfer the address location of each tree in the study into specific GPS coordinates.
-To determine if different urban land uses (residential/non-residential) have an adverse
effect on tree health, and consequently, to determine to what extent it does.
2.4 Information category In order to meet the needs of the Lincoln Park Urban Forestry Tree Health Group we will
identify the following attributes of the trees: species, diameter at breast height (DBH), tree
health (measured as a gradient), and their exact and relative location. The four categories of
land use will be defined as residential and non-residential. The data will be input in our

11
database and mapped to identify spatial patterns of how or if tree health (DBH and
Condition) is affected by land use. The study will include a small defined area of the
original one which included 3,911 trees of 32 varying species.
2.5 Information Structure The information structures that we wish to create from our information products (DBH,
tree species, location, and tree health) will be the following:
- GIS map including information from the original database and GPS
- Spatial analyses of trees with updated and precise GPS identified locations
Along with the visual representations of our data, text definitions will be made of DBH,
gradients of the tree health, and land use classification. We will also be concluding our
initial hypothesis on the relationship between tree health and land use.

12
3. Systems Requirements
3.1. Introduction: The Systems Requirement sections contains information on entity relationships, data
requirements, brief overview of qualified systems that were considered for the project,
relationship modeling, brief description of the layers used in our project, systems function
matrix, and institutional requirements.
3.2. Data Requirements as a Conceptual Database Design 3.2.1 Matrix of need to know questions cross-referenced with entity classes:
Need to Know Questions
Feasible amount of trees for final product given project constraints? (t)
Placement of study area within the 80 block area of original data? (b)
Do different urban settings (land use) have an effect on tree health? (l)
Entity Classes LP trees Census Blocks, LP
blocks Land use
13
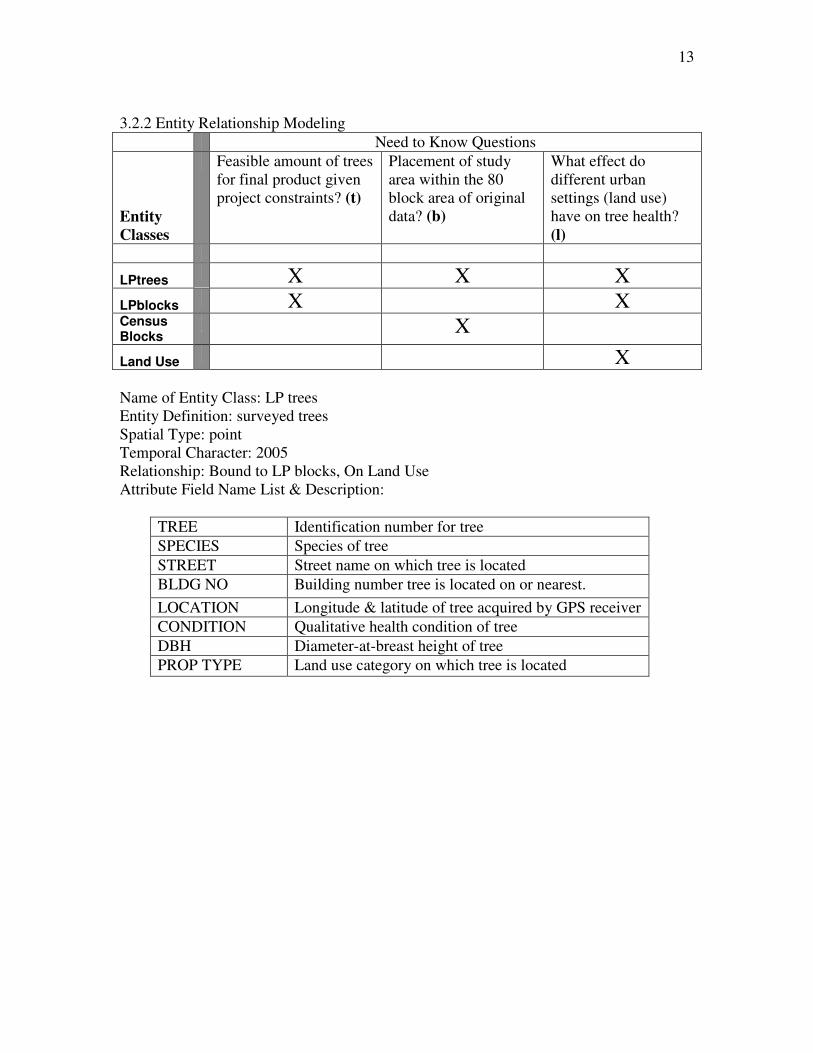
3.2.2 Entity Relationship Modeling
Need to Know Questions
Entity
Classes
Feasible amount of trees for final product given project constraints? (t)
Placement of study area within the 80 block area of original data? (b)
What effect do different urban settings (land use) have on tree health? (l)
LPtrees X X X
LPblocks X X
Census Blocks
X
Land Use X
Name of Entity Class: LP trees Entity Definition: surveyed trees Spatial Type: point Temporal Character: 2005 Relationship: Bound to LP blocks, On Land Use Attribute Field Name List & Description:
TREE Identification number for tree
SPECIES Species of tree
STREET Street name on which tree is located
BLDG NO Building number tree is located on or nearest.
LOCATION Longitude & latitude of tree acquired by GPS receiver
CONDITION Qualitative health condition of tree
DBH Diameter-at-breast height of tree
PROP TYPE Land use category on which tree is located

14
Name of Entity (Object) Class: Census Blocks Entity Definition: US Census Bureau digital database for Cook County Spatial Type: vector Temporal Character: 2006 Relationship: Shares Land Use Attribute Field Name & Description List1:
BG17_D00 US Bureau of the Census 2000 Illinois Block Group number.
STATE FIPS State Numeric Code
COUNTY FIPS County Code
TRACT Census 2000 Tract Code
BLKGROUP Name of Block Group file
NAME County Name
LSAD The legal/statistical area description
LSAD_TRANS The legal/statistical area description translation
Name of Entity (Object) Class: LP blocks Entity Definition: Lincoln Park division by city block Spatial Type: polygon Temporal Character: 2005 Relationship: Within Census Blocks Attribute Field Name & Description List:
BLOCK ID Identification number for block
1 Please note: The first four fields - Area, Perimeter, xxnn_d00_, xxnn_d00_I (where ""xx"" is Tr for Tract, Bg for Block Group, etc., and "nn" is the 2-digit state FIPS code) - are produced as a by-product of the cartographic boundary file creation process, and have no meaning for public data users, therefore, these fields have been ignored or deleted . U.S Census Bureau. February 13, 2007. Cartographic Boundary Files. <http://www.census.gov/geo/www/cob/shape_info.html >Last revised April 19,2005.

15
3.2.3 Entity Relationship Diagram
16
3.3 Software Requirements
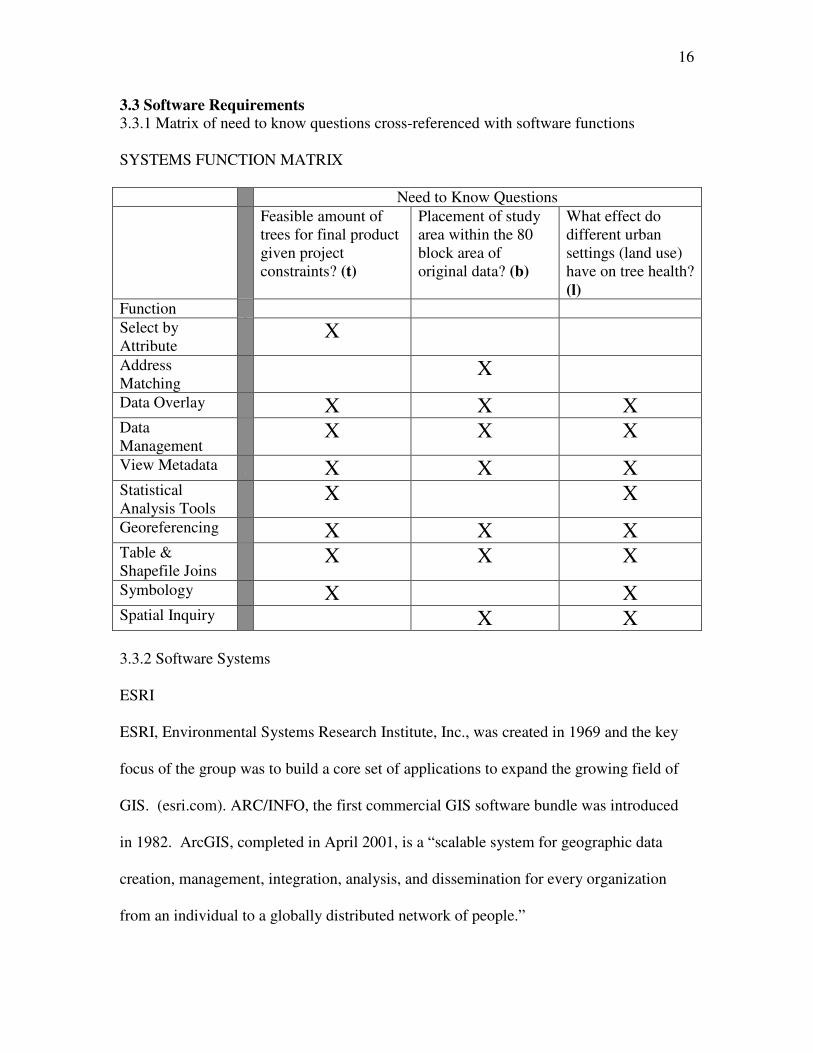
3.3.1 Matrix of need to know questions cross-referenced with software functions
SYSTEMS FUNCTION MATRIX
Need to Know Questions
Feasible amount of trees for final product given project constraints? (t)
Placement of study area within the 80 block area of original data? (b)
What effect do different urban settings (land use) have on tree health? (l)
Function
Select by Attribute
X
Address Matching
X
Data Overlay X X X Data Management
X X X
View Metadata X X X Statistical Analysis Tools
X X
Georeferencing X X X Table & Shapefile Joins
X X X
Symbology X X Spatial Inquiry X X 3.3.2 Software Systems ESRI
ESRI, Environmental Systems Research Institute, Inc., was created in 1969 and the key
focus of the group was to build a core set of applications to expand the growing field of
GIS. (esri.com). ARC/INFO, the first commercial GIS software bundle was introduced
in 1982. ArcGIS, completed in April 2001, is a “scalable system for geographic data
creation, management, integration, analysis, and dissemination for every organization
from an individual to a globally distributed network of people.”

17
The ArcGIS desktop is the central application for all map-based tasks including
cartography, map analysis, and editing. Included is ArcMap, ArcCatalog, and
ArcToolbox (which is embedded in ArcMap and ArcCatalog). ArcMap is a
comprehensive map-authoring application offering two types of views (geographic data
view and layout view) where layers are symbolized, analyzed, and compiled into GIS
datasets and other map elements such as scale bars, legends, north arrows, and reference
maps are added. ArcCatalog is a shared ArcGIS application that allows you to organize
and access all GIS information such as maps, globes, datasets, models, metadata, and
services. ArcToolbox is a user interface in ArcGIS used for accessing, organizing, and
managing a collection of geoprocessing tools, models, and scripts.
Despite the cost for an edition of the ESRI ArcGIS application running at about $1500.00,
there will be no additional cost because De Paul University offers students access to the
program at no additional charge.
MapViewer 6
Produced by Golden Software, Inc., MapViewer is an affordable mapping and spatial
analysis tool that allows you to produce publication-quality thematic maps. MapViewer
creates thematic maps by linking worksheet data to areas or points on the map.
MapViewer offers many types of mapping possibilites such as: base, contour, vector,
non-contiguous cartograms, pin, hatch, density, gradient, dorling cartograms, symbol,

18
territory, pie, bar, line, prism and flow maps. MapViewer can also import boundary
information from several formats including BIP, TIF, georeferenced maps and ESRI
shape files.
The price for MapViewer is an initial payment of $249.00 and each installment of system
upgrades runs about $79.00.
CRIMESTAT
A free program distributed in class to run spatial analyses. Program was developed by
Ned Levine & Associates and is Windows-based and capable of interfacing with
ArcGIS.2
CEDRA:
CEDRA AVland, AVwater, AVsand, and AVparcel are produced in 1895 by CERDA
Corporation which is located in Rochester, New York. The program works with ESRI
and ArcGIS to meet the needs of the client and community. At an affordable price
CERDA software provides a quick way for hard copy maps along with attribute data to
be converted to a digital format through scanning and digitizing. Below is a list of just a
few functions that the software provides:
CEDRA AVland - surveying, COGO, contouring, traverse adjustments, stakeout, road
design, profiling, cross-sections, earthwork, tax mapping, site modeling applications
2 http://www.icpsr.umich.edu/CRIMESTAT/about.html

19
CEDRA AVwater - establish the materials inventory of a water distribution network,
introduce supply and demand loads, perform analyses, display pertinent results in graphic
and/or tabular format
CEDRA AVsand - create the spatial geometric model of a storm water, wastewater or
combined system, impose storm water and/or wastewater loads, and apply custom
peaking factors to average daily contributions
CEDRA AVparcel - provide tax (cadastral) mapping, parcel maintenance and general
Polygon Editing, includes all the functions of AVcad
The CEDRA Corporation provides its clients, at up to 40% below competitive rates.
3.4 Institutional Requirements
Our project will use the data obtained by DePaul students and faculty through the
Environmental Science Department’s Urban Forestry research program.
DePaul University
• Liam Heneghan, Professor Environmental Sciences, Co-Director of DePaul University
Institute for Nature and Culture – provided end-use needs and access to past data.
Data Providers
• Students through DePaul University’s Urban Forestry Tree Survey project
• Illinois Natural Resources Geospatial Data Clearinghouse

20
• U.S. Census Bureau On-Line
4. Data Acquisition
4.1 Introduction
In the Lincoln Park Tree Survey project, four data sets (Lincoln Park Trees, Census
Blocks, Lincoln Park Blocks, and Land Use) have been used in our data acquisition, and
were provided for by the DePaul University Department of Environmental Sciences and
from the US Census. The original data was inaccurate or insufficient in some areas (tree
species, exact addresses), and we have used our own group members to acquire specific
GPS coordinates of trees in the Lincoln Park area. More specific Land Use data would
have been welcome for this project. That, as well as a general lack of time, was the
greatest constraint in our data acquisitioning.
4.2 Data Dictionary
Data Set Name: Lincoln Park Trees
File Name: LP trees
Description: Data on surveyed trees in the Lincoln Park area containing information of tree identification number, species, street name and building number on which each tree is located, location with latitude/longitude values, condition of tree, diameter-at-breast height, and land use category on which tree is located.
Spatial Type: point
Source of the Data: De Paul University Department of Environmental Sciences, Professor Liam Heneghan.
Data Set Name: Census Blocks

21
File Name: Census Blocks
Description: Census data obtained from US Census Bureau digital database for
Cook County including information of FIPS State and County Codes, Census 2000 Tract Code, legal and statistical area description and translation and County Name’s.
Spatial Type: Vector Source of the Data: US Census Bureau Data Set Name: Lincoln Park Blocks
Filename: LP Blocks
Description: Identification information for the Lincoln Park division by city block.
Spatial Type: polygon
Source of the Data: De Paul University Department of Environmental Sciences, Professor Liam Henegan.
4.3 Data Source Steps
The majority of the data for this project and the original Lincoln Park Trees database
were compiled via a field survey conducted by the DePaul University’s Environmental
Science department. The survey recorded attributes of trees within the parkways of the
Lincoln Park neighborhood provided the data for the LP trees file that we are utilizing
and enhancing in this project. The recorded data contains information on individual tree
species, tree location (building number and street name), qualitative health condition of
each tree, diameter-at breast-height measurement, and property type (commercial,
residential, industrial or recreational). There are numerous errors in the original database,
including non-unique tree identifiers and inaccurately identified building numbers. One

22
significant improvement in this project is the transfer of the original data to Global
Positioning System (GPS) coordinates of trees in our study area using a Garmin eTrex
Legend cX GPS receiver. We have also enhanced the original tree data by giving each
tree a unique identifier. To date we have spent 6 hours surveying the coordinates of 639
trees located within 15 of the initial 80 block area of the Lincoln Park study.
The Census Block data is from the Bureau of the United States Census Tiger/Line files.
These are digitized vector files from the Census Bureau’s Cook County area. Federal
information processing standards (FIPS) state and county codes are standardized
alphanumeric codes originated by the National Institute of Standards and Technology.
These are used to guarantee uniformity in the identification of geographic entities (such
as state and county) in all government agencies.
The Lincoln Park Blocks contain polygons that identify the LP Blocks file. These files
are also from the first survey by the DePaul Environmental Sciences department. The
block numbering system was set up by the students and faculty who were involved in the
original survey.
The Land Use data was defined by the current project group and are based on the
dominant land use on each block (commercial, residential, industrial or recreational),
determined by individual property types recorded in the original survey.
4.4 Fitness For Use

23
The data sets used for the purposes of the project are fairly appropriate and accurate. The
Lincoln Park Trees data was taken by a group of students using the same measurement
systems and processes. However, human error is a factor; therefore the original data
collected is not completely accurate. For the accuracy of this project, these trees were
rerecorded with longitude and latitude coordinates to digitize the addresses given to each
tree location. The spatial type of this data is appropriate because we are using points to
represent absolute entities.
The Census Blocks data is credible because it come from the US Census Bureau database,
which is reliable as a source. The vector spatial type incorporates our point data with the
Lincoln Park Trees.
The Lincoln Park Blocks and Land Use data sets are both from our DePaul University
Department of Environmental Science client, Liam Heneghan, and are both in polygon
spatial type. This is reliable data due to our source’s expertise and experience with the
subject and data collection.
The accuracy is what we and our client had hoped for, but like all data sets there are some
limitations. Situational circumstances could have altered the collection of longitude and
latitude coordinates, and human error is possible.
4.5. Data Acquisition Constraints

24
Additional non-essential data that may have been useful for this project would have been
to elaborate more on the types of land use. Each land use category could have been
elaborated on even more to create a better understanding of the usage. For example,
under the land use category recreation, sub-categories could have been created to provide
more detail such as: is the recreational site a playground, baseball field, a park, etc… This
data would provide us with even more understanding of land usage. The land use data for
this project was all pre-collected information and would have ideally been completely
checked over for accuracy, but due to the considerable size of the data that was not
possible at this time. Time did allow us to check the exact location (longitude and
latitude) vs. having only a street address of each tree by using GPS.
A constraint that we faced was a shortage of time; if we had more it would have allowed
us to create more maps and visual aids. With more time we could have included more
detail to our data as described above. It is important to note that data acquisition
constraints did not change the outcome and goal of our project. Our goal, to determine
the correlation between tree health and land use, is still met. However, without these
constraints the project would be more detailed.
25
5. DATA ANALYSIS
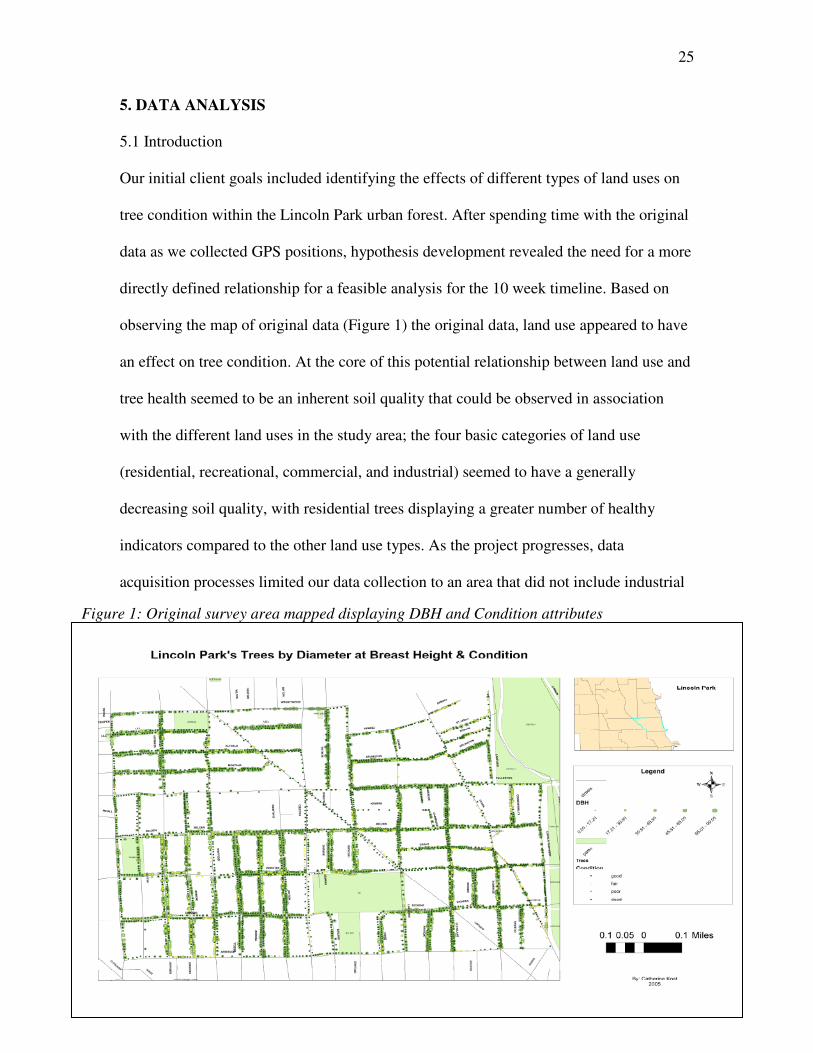
5.1 Introduction Our initial client goals included identifying the effects of different types of land uses on
tree condition within the Lincoln Park urban forest. After spending time with the original
data as we collected GPS positions, hypothesis development revealed the need for a more
directly defined relationship for a feasible analysis for the 10 week timeline. Based on
observing the map of original data (Figure 1) the original data, land use appeared to have
an effect on tree condition. At the core of this potential relationship between land use and
tree health seemed to be an inherent soil quality that could be observed in association
with the different land uses in the study area; the four basic categories of land use
(residential, recreational, commercial, and industrial) seemed to have a generally
decreasing soil quality, with residential trees displaying a greater number of healthy
indicators compared to the other land use types. As the project progresses, data
acquisition processes limited our data collection to an area that did not include industrial
Figure 1: Original survey area mapped displaying DBH and Condition attributes

26
land use, so that category was eliminated form the initially designed land use categories.
Once most of the data acquisition phase was completed, observations were made that the
data points on residential land use outnumbered both recreationally and commercially
located data points. Therefore our analysis was redesigned to specifically question if
there were spatial differences between DBH values and tree condition values and to
explore the question of potential difference between tree health (DBH and Condition) on
residential and non-residential (= recreational + commercial) land uses.
5.2 Analysis Plan
What is a feasible amount of trees for final product given project constraints?
The originally surveyed data was recorded in the postal code relative georeference system
and will be transformed into the Universal Transverse Mercator (UTM) projected
coordinate system. Acquired tree coordinates will employ Global Positioning System
(GPS) technology through the use of Garmin eTrex Legend cX GPS receivers, which
record tree location as waypoints. To date we have spent 9.5 hours surveying the
coordinates of 800 trees located within 20 of the initial 80 block area of the Lincoln Park
study.
Figure 2: Field survey using GPS to locate geodetic tree coordinates
Tree Location (Relative georeference)
LPTrees.dbf
Tree coordinates
(Absolute georeference)
Coordinate Transformation

27
Where is the placement of our study area within the 80 block area of original data?
Figure 3 shows the process of data acquisition of exact and absolute tree coordinates from
the original tree locations based on postal address. The Garmin eTrex Legend receiver
waypoints are downloaded through a USB connection that requires previous download of
DNR Garmin Extension for ArcView3 and the eTrex Legend cx USB driver4. Waypoints
are saved from the garmin application as a shapefile (ArcView), dbf database files
(ArcView), and xls worksheets (Excel). The shapefile layer will be joined to the LPtrees
layer that contains the tree attribute database based on the Waypoint assigned
identification number that serves as the feature key IDENT in the garmin database and
IDENTCODE in the LPtrees database. Joined layer is renamed LPTrees_GPSandLU to
represent that the attribute table now contains both the updated absolute positions of trees
and all of the original LPtrees data, including land use type.
3 http://www.dnr.state.mn.us/mis/gis/tools/arcview/extensions/DNRGarmin/DNRGarmin.html 4 http://www.garmin.com/support/collection.jsp?product=010-00440-00
Figure 3: Process diagram for transforming waypoints into shapefiles
Waypoints Download to DNR Garmin
GPStrees (shapefile) S ave to
shapefile GPS Trees (database)
Minnesota DNR
Garmin /ArcMap
Download to desktop

28
Figure 4: Process diagram for table join of LPTrees database to GPStrees shapefile in
order to combine original data attributes with updated GPS coordinates for trees.
LPtrees (database)
GPSTrees
(shapefile)
LPTrees_GPSandLU (shapefile)
Join based on attribute

29
Do different urban settings (land use) have an effect on tree health?
All layers were set to the NAD 1983 datum and projected in UTM zone 16N. The street
layer representing the roads within Lincoln Park were downloaded from the 2000 US
Census Tiger data, and even after projecting the streets layer there was some spatial
discrepancy between this layer and the roads as they appear in aerial photos of the same
area downloaded from the Illinois Natural Resources Geospatial Clearinghouse5. This
spatial inconsistency appeared to affect the representation of the GPS tree data points,
with some roads being displaced slightly for an entire polyline length.
5 http://www.isgs.uiuc.edu/nsdihome/
Figure5: IL Natural Resources Geospaial Data Clearinghouse Ortho photos
compared to US census 2000 tiger street file. An example of the spatial anomalies
present between files is emphasized.

30
In order to adjust the census street layer, rubbersheeting spatial adjustment was
performed by using the aerial photos of Lincoln Park to create a point shapefile with the
center of each intersection as a data point. The intersections of the census streets file were
then rubbersheeted to align more precisely with the aerial photo (see Figure 6).
Spatial autocorrelation was tested using Moran’s I statistic to assess whether the
attributes of DBH and Condition follow clustered or dispersed spatial patterns. General G
was then calculated to determine whether hot-spots existed consisting of either low
values or high values for DBH and Condition. Condition was coded into an ordinal scale
ranking 4-1 for Good, Fair, Poor, and Dead values respectively; no dead values remained
in our data after normalization processes so the value scale resulted as Good = 4, Fair = 3,
Poor = 2. A Nearest Neighbor Index (NNI) was generated to evaluate the mean distances
between same values of Condition; the data for condition was mapped by selecting for
Figure 6: Digitized corrections of intersections within Lincoln Park
31
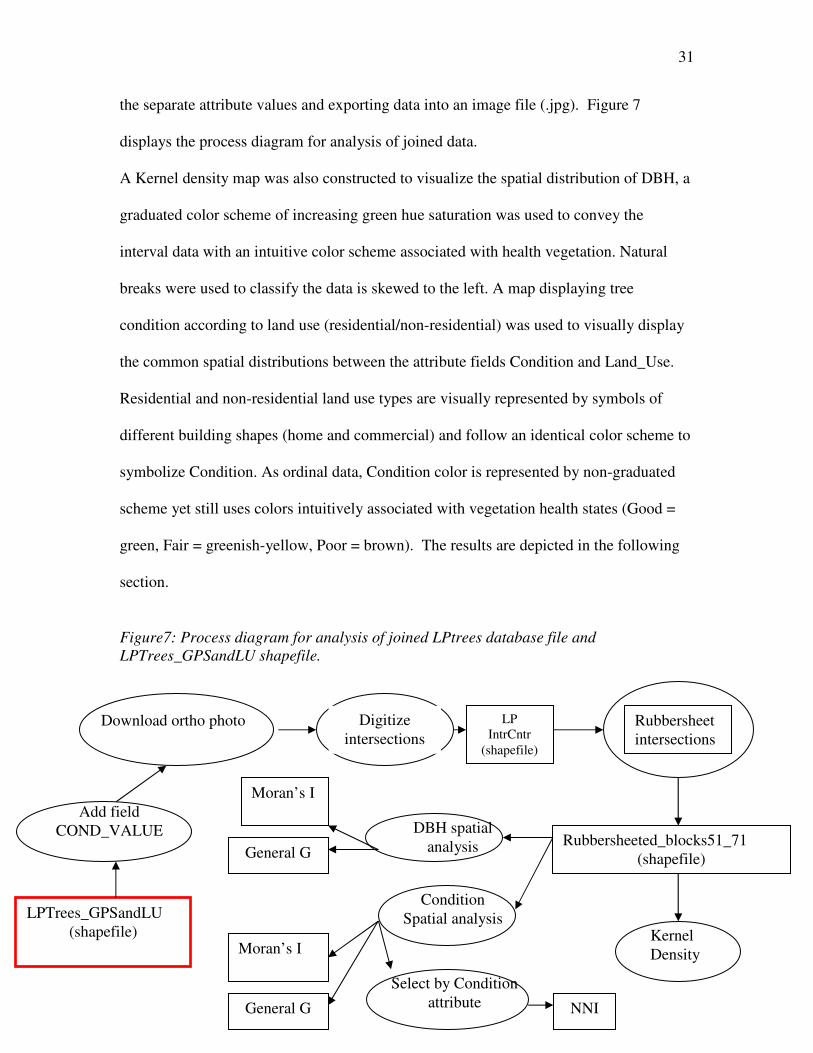
the separate attribute values and exporting data into an image file (.jpg). Figure 7
displays the process diagram for analysis of joined data.
A Kernel density map was also constructed to visualize the spatial distribution of DBH, a
graduated color scheme of increasing green hue saturation was used to convey the
interval data with an intuitive color scheme associated with health vegetation. Natural
breaks were used to classify the data is skewed to the left. A map displaying tree
condition according to land use (residential/non-residential) was used to visually display
the common spatial distributions between the attribute fields Condition and Land_Use.
Residential and non-residential land use types are visually represented by symbols of
different building shapes (home and commercial) and follow an identical color scheme to
symbolize Condition. As ordinal data, Condition color is represented by non-graduated
scheme yet still uses colors intuitively associated with vegetation health states (Good =
green, Fair = greenish-yellow, Poor = brown). The results are depicted in the following
section.
Figure7: Process diagram for analysis of joined LPtrees database file and
LPTrees_GPSandLU shapefile.
Add field COND_VALUE
LP IntrCntr
(shapefile)
Rubbersheeted_blocks51_71 (shapefile) General G
Digitize
intersections
DBH spatial
analysis
Condition
Spatial analysis
Download ortho photo Rubbersheet intersections
Moran’s I
Moran’s I
General G NNI
LPTrees_GPSandLU (shapefile) Kernel
Density
Select by Condition
attribute

32
6. RESULTS 6.1 INTRODUCTION The results of our exploratory analysis of Lincoln Park’s urban forest tree health are
divided by need-to-know questions listed in section five of this report. Our overall results
support the idea that land use can contribute to tree health in Lincoln Park. For instance,
we have found that both DBH and condition display clustering, however DBH reveals
more significant finding compared to condition values and therefore may serve as a better
health indicator for suture statistical analysis. Our results are explained in further detail in
the following sub-section.
6.2 FINDINGS What is a feasible amount of trees for final product given project constraints?
Our projects results indicate that several factors act as limitations on the amount of data
points that could be used for analysis and final products resulted in 277 tree data points
included from the original 3, 912 trees surveyed (7.1 %) (Figure 8). Data acquisition and
normalization restricted the number of trees we were able to include in the study because
of the time consumption each project stage required. Our 10 week study occurred during
the winter season, and additionally Chicago happened to experience unseasonably record
low temperatures and increased snowfall. Consequently, due the field basis of the data
acquisition process the Chicago winter weather will expectedly present a disproportionate
number of limiting factors in terms of both the time required for collecting GPS
waypoints (waiting for clear days with reasonable temperature) and the frequency of
signal reception errors (temperature and cloudiness induced errors).

33
Where is the placement of our study area within the 80 block area of original data? As shown in Figure ? the study covered a northwestern subsection of the originally
surveyed area. Blocks are contained between the streets Wrightwood, Lincoln, Halstead,
Belden, and Racine and include a large portion of DePaul University property and blocks
directly to the north of the campus.
Do different urban settings (land use) have an effect on tree health?
Descriptive statistics were generated to summarize the data. Frequency distributions are
shown in Figure 9 and show that overall tree DBH follows a normal curve with a slight
skew to left or towards the lower end of the DBH range. When distributed separately
according to residential and non-residential land uses, the residential tree DBH’s display
a much more normal distribution compared to the non-residential trees, although a slight
Figure 8: The study coverage of the original survey area. Blocks 51-71 are represented with the GPS tree
data points and are displayed as a northwestern subsection of the original area included in the original
tree survey.
ÞÞ
Þ
Þ
ÞÞ
ÞÞ
ÞÞÞ
ÞÞÞ
Þ ÞÞÞÞÞÞÞ ÞÞÞÞÞÞÞÞÞÞÞ
ÞÞ
ÞÞÞÞÞÞÞÞÞÞÞÞ
Þ
Þ
ÞÞÞÞÞÞÞÞ
ÞÞÞÞÞÞ
ÞÞÞÞÞÞÞ
ÞÞÞÞÞ
Þ
Þ
Þ
ÞÞÞ
Þ
ÞÞ
Þ
ÞÞÞÞÞÞÞÞÞ
Þ
ÞÞÞ
Þ
Þ
Þ
ÞÞÞÞÞÞÞÞ
ÞÞ
ÞÞÞÞÞÞÞ
ÞÞÞÞÞÞÞ
ÞÞ
Þ
Þ
ÞÞ
ÞÞÞÞÞÞÞÞÞ
Þ
ÞÞÞ
ÞÞ
ÞÞÞ
ÞÞ
ÞÞÞÞ
ÞÞÞ
ÞÞÞÞÞÞÞÞÞÞ
Þ ÞÞÞÞÞÞÞÞÞÞ
ÞÞÞÞÞÞÞÞÞ
ÞÞÞ
ÞÞÞ
ÞÞÞ
ÞÞÞÞÞÞÞÞÞÞÞÞÞÞÞ
ÞÞ
ÞÞÞÞÞÞÞÞÞÞÞÞÞÞ
ÞÞ
ÞÞÞÞÞÞÞ ÞÞÞ ÞÞÞ ÞÞÞÞÞÞÞÞÞÞÞÞÞÞ
Þ
ÞÞÞÞ
ÞÞÞ
ÞÞÞÞÞÞÞÞ
Þ
ÞÞÞÞÞÞÞÞÞÞÞÞÞ
ÞÞÞÞÞÞÞÞ
ÞÞÞÞ
ÞÞ
Þ
ÞÞÞÞÞÞÞÞÞÞÞÞÞÞÞÞ
ÞÞÞÞÞÞ
ÞÞÞÞÞÞÞ
ÞÞÞÞÞÞÞÞÞÞÞ
ÞÞ
ÞÞÞÞÞÞÞÞÞÞÞÞÞÞÞ
ÞÞÞÞÞ
Þ
Þ
Þ
ÞÞÞ ÞÞ
ÞÞÞÞÞÞÞÞÞ
Þ
ÞÞ
ÞÞÞÞ
ÞÞÞÞÞÞÞÞ
ÞÞÞÞÞ
ÞÞÞÞÞÞ
ÞÞÞÞÞÞÞÞÞ
ÞÞ ÞÞÞÞ
ÞÞÞÞÞÞ
ÞÞÞÞÞÞÞÞÞ
Þ
ÞÞÞÞÞÞÞÞÞÞÞÞÞÞ
Þ
ÞÞÞÞÞÞÞÞÞ
ÞÞÞÞÞÞÞÞ ÞÞÞÞÞÞÞÞÞÞÞ
ÞÞÞÞÞÞÞÞÞ
ÞÞÞÞÞÞÞÞÞÞÞÞÞÞÞÞÞÞÞÞÞ
ÞÞÞÞÞ ÞÞÞÞÞÞÞÞ
ÞÞÞÞÞÞÞÞÞ
ÞÞ
ÞÞÞÞÞÞÞÞÞÞ
Þ
ÞÞÞÞ
ÞÞ
ÞÞÞÞÞÞÞÞÞÞÞÞÞÞÞÞÞÞÞÞÞÞÞÞÞÞÞÞÞÞÞÞÞÞÞÞÞÞÞÞÞÞÞÞÞÞÞ
ÞÞÞÞÞÞÞÞÞÞÞÞÞÞÞÞÞÞ
ÞÞÞÞ
ÞÞÞ
ÞÞÞÞÞÞÞÞÞÞÞÞ
ÞÞÞÞÞ
ÞÞÞÞ
ÞÞÞÞÞÞÞÞÞÞÞÞÞ
ÞÞ
ÞÞÞÞÞÞÞÞÞÞÞ
ÞÞÞÞÞÞÞÞÞÞÞ
ÞÞÞÞÞÞÞ ÞÞÞÞÞÞ
ÞÞÞÞÞÞÞÞÞÞÞÞÞÞÞÞ
ÞÞ
ÞÞÞ
Þ
ÞÞ
Þ
ÞÞ
ÞÞÞÞÞÞÞÞÞ
ÞÞÞÞÞÞÞÞÞÞÞÞÞÞÞÞ
ÞÞÞÞÞÞÞÞÞÞÞÞÞ
ÞÞÞÞ
ÞÞÞÞÞ
ÞÞÞÞÞÞ
ÞÞÞÞ
ÞÞÞÞÞÞÞÞÞÞÞÞÞ
Þ
ÞÞÞÞÞÞÞÞÞÞÞÞÞÞÞÞÞÞÞÞÞÞÞ
ÞÞÞÞ
ÞÞÞÞÞÞÞÞÞ
ÞÞÞ
ÞÞÞ
ÞÞÞÞÞÞÞÞÞÞÞÞÞÞÞÞÞÞÞÞÞ
ÞÞÞÞÞÞÞÞÞÞÞÞÞÞÞÞÞÞÞÞÞÞÞÞÞÞÞÞ
ÞÞÞÞÞÞÞÞÞÞÞÞÞÞÞÞÞ
ÞÞÞÞÞ
ÞÞÞÞÞÞÞÞÞÞÞÞÞÞÞÞÞÞÞÞÞÞÞÞÞÞÞÞÞÞÞ
ÞÞÞÞÞÞÞÞÞÞÞÞÞÞÞÞÞÞÞÞÞÞÞÞÞÞ
Þ
ÞÞÞÞÞÞÞÞÞÞÞ
ÞÞÞÞÞÞÞÞÞÞ
ÞÞÞÞÞÞÞÞÞÞÞÞÞ
ÞÞÞÞÞÞÞÞÞ
ÞÞÞÞÞÞÞÞÞÞÞÞÞÞÞÞÞÞÞ
ÞÞÞÞÞÞÞÞÞ
ÞÞÞÞÞÞÞÞÞ
ÞÞÞÞÞÞÞÞÞ
Þ
ÞÞÞÞ
ÞÞÞÞÞÞÞÞÞ
ÞÞÞÞÞÞÞÞÞÞ
ÞÞÞÞÞÞÞÞÞÞÞÞÞÞÞÞÞÞÞÞÞÞÞÞÞÞÞÞÞÞÞÞ
ÞÞÞÞÞÞÞÞÞÞÞÞÞÞÞÞÞÞÞÞÞÞÞÞÞÞÞÞÞÞÞÞÞÞÞÞÞÞÞÞÞÞÞÞÞÞÞÞÞÞÞÞÞÞÞÞÞÞ
ÞÞÞÞÞÞÞÞÞÞÞÞÞÞÞÞÞÞÞÞÞÞÞÞÞÞÞÞÞÞÞÞÞÞÞÞÞÞÞÞÞÞÞÞÞÞÞÞÞÞÞÞÞÞÞÞÞ
Þ
ÞÞÞ
ÞÞÞ
Þ
ÞÞÞÞÞÞ
ÞÞÞÞÞÞÞÞÞÞÞÞÞÞÞÞÞÞÞÞÞ
Þ
ÞÞÞÞÞÞÞÞÞÞÞÞ
ÞÞÞ
ÞÞ
ÞÞÞ ÞÞÞÞ
Þ ÞÞÞÞÞÞÞÞ ÞÞÞÞÞÞÞÞÞ
ÞÞÞÞÞÞÞÞÞÞ
ÞÞÞÞÞÞÞÞÞÞÞÞ
ÞÞÞÞÞÞÞÞÞ
ÞÞÞÞÞÞÞÞÞÞÞÞÞÞ
ÞÞÞÞÞÞ ÞÞÞÞ
ÞÞÞÞ ÞÞÞÞÞ
ÞÞÞÞÞÞÞÞÞÞÞÞÞÞÞÞÞÞÞÞÞÞÞÞÞÞÞÞÞÞÞÞ
ÞÞÞ
ÞÞÞÞ
ÞÞÞ
ÞÞÞÞÞÞÞÞÞÞÞÞÞ
ÞÞÞÞÞÞÞÞÞÞÞÞÞÞÞÞÞÞÞÞÞÞÞÞÞÞÞÞÞÞÞÞ ÞÞÞ ÞÞÞÞÞÞÞÞÞ
ÞÞÞÞ ÞÞÞÞÞÞÞÞÞÞÞÞÞÞÞÞÞÞÞÞ
ÞÞÞÞÞÞÞÞÞ ÞÞÞ ÞÞÞÞÞÞÞÞÞÞÞÞÞÞÞÞÞÞÞÞÞÞÞÞ ÞÞÞÞÞÞÞÞÞÞÞÞÞÞÞÞ Þ ÞÞÞÞÞÞÞÞÞÞÞ
ÞÞÞÞÞÞÞÞÞÞ
ÞÞÞÞÞ ÞÞÞÞÞÞÞÞÞ ÞÞÞÞÞÞÞÞÞÞÞÞÞÞÞÞÞÞÞÞÞÞÞÞÞÞÞ
ÞÞÞÞÞÞÞÞÞÞ ÞÞÞÞÞÞÞÞÞÞ
Þ Þ ÞÞÞÞÞÞ
ÞÞÞÞÞÞÞÞÞÞÞÞÞ
ÞÞÞÞÞÞÞÞÞÞÞÞÞ ÞÞÞÞ ÞÞÞÞÞÞ ÞÞÞÞÞÞ ÞÞÞÞÞÞÞ
Þ ÞÞÞÞÞÞÞÞÞÞÞÞÞÞÞÞÞÞ
Þ
ÞÞÞÞÞÞÞÞ
ÞÞÞÞÞÞÞÞÞÞ ÞÞÞÞÞÞÞÞÞÞÞÞÞÞÞÞÞÞÞÞÞÞ
ÞÞÞÞÞÞÞÞÞÞÞÞÞÞÞÞÞ
ÞÞ Þ
ÞÞ
ÞÞÞÞÞÞÞÞ
Þ ÞÞÞ ÞÞÞ
ÞÞÞÞÞÞÞÞÞ
ÞÞÞÞÞÞÞÞÞÞÞÞÞÞÞÞÞÞÞÞÞÞÞ
ÞÞÞÞÞÞ
ÞÞÞÞÞÞÞÞ
ÞÞÞÞÞÞÞÞ ÞÞÞÞÞÞÞÞÞÞ
ÞÞ
Þ
ÞÞÞÞÞÞÞÞÞÞ
ÞÞÞÞÞÞ
Þ ÞÞÞÞÞÞ
ÞÞ
ÞÞÞ
ÞÞÞÞÞÞÞÞ
ÞÞÞ
Þ
ÞÞ
ÞÞÞÞÞÞÞ ÞÞ
ÞÞÞÞÞÞÞÞÞÞÞÞÞÞÞÞÞÞÞÞÞÞÞÞÞÞ
ÞÞÞÞÞÞÞÞÞÞÞÞÞÞÞÞÞÞÞÞÞÞÞÞÞÞÞÞÞÞÞÞÞÞÞÞÞÞÞÞÞÞÞÞÞÞÞÞÞÞÞÞÞÞ
ÞÞÞÞÞ
Þ ÞÞÞÞ ÞÞÞÞÞÞÞÞÞÞÞ
ÞÞÞÞ
Þ
ÞÞÞÞÞÞÞÞÞÞÞÞÞÞÞÞÞÞÞÞÞÞÞÞÞÞÞÞÞ
ÞÞÞÞÞÞÞÞÞÞÞ
ÞÞÞÞ
ÞÞÞÞ
ÞÞÞ
ÞÞÞÞÞÞÞÞÞ
ÞÞÞÞÞÞÞÞÞÞ
ÞÞ
ÞÞÞÞ
ÞÞÞÞÞÞÞÞÞÞÞÞ
ÞÞÞÞÞÞÞÞÞÞÞÞÞÞÞÞÞÞÞÞÞÞÞÞÞÞÞ
ÞÞÞÞÞÞÞÞÞÞÞÞÞÞÞÞÞÞÞÞÞÞÞÞÞÞÞÞÞÞÞÞÞÞÞÞÞÞÞÞÞÞÞÞÞÞÞÞÞÞÞÞÞÞÞÞÞÞÞÞÞÞÞÞÞÞÞÞ
ÞÞÞÞÞÞÞ
ÞÞ
Þ
Þ
Þ
ÞÞ
ÞÞÞÞÞÞÞÞÞÞÞÞÞÞ
ÞÞÞÞ
Þ
ÞÞÞ
ÞÞÞÞÞ
ÞÞ
ÞÞÞÞÞÞÞÞÞÞÞÞ
ÞÞÞÞÞÞÞÞÞÞÞÞÞÞÞÞÞÞÞÞÞÞÞÞÞÞÞÞÞÞÞÞÞÞÞÞÞÞÞÞÞÞÞÞÞÞÞ
ÞÞÞÞÞÞÞÞÞ
ÞÞÞÞÞÞÞÞÞ
ÞÞÞÞÞÞÞÞÞ
ÞÞ
Þ
ÞÞ
Þ
ÞÞÞÞ
ÞÞÞÞÞÞ
ÞÞÞÞÞÞÞÞÞÞÞ
ÞÞÞÞÞÞÞÞÞÞÞÞÞÞÞÞÞÞÞÞÞÞÞÞÞÞÞÞÞÞÞÞÞÞÞÞ
ÞÞÞÞ
ÞÞÞÞÞÞÞ ÞÞÞÞÞÞÞÞÞÞ ÞÞÞÞÞÞÞÞÞÞÞÞÞÞÞÞÞÞÞÞÞÞÞÞÞÞÞÞÞÞÞÞÞÞÞÞÞÞÞÞÞÞÞÞÞÞÞÞ
ÞÞÞÞÞ
ÞÞ
ÞÞÞÞÞÞÞÞÞÞÞÞÞÞÞÞÞÞÞÞÞÞÞÞÞÞÞÞ
Þ ÞÞÞÞÞÞÞÞÞÞÞÞÞ ÞÞÞÞ Þ
ÞÞÞÞÞÞÞÞÞ
Þ ÞÞÞÞÞÞ ÞÞ ÞÞÞÞÞÞÞÞÞÞÞÞÞÞ
ÞÞÞÞÞÞÞÞÞ
ÞÞÞÞÞÞÞÞÞÞÞÞÞÞÞÞÞÞ
ÞÞÞÞÞÞÞÞÞÞ ÞÞÞÞÞÞÞ
ÞÞÞÞÞÞÞÞÞÞÞÞ ÞÞÞÞÞÞÞÞÞÞÞÞÞ ÞÞÞÞÞÞ
ÞÞÞÞÞÞÞÞÞ
ÞÞÞÞÞÞÞÞÞÞÞÞÞÞÞÞÞÞÞÞÞ
ÞÞÞÞÞÞÞÞÞÞ
ÞÞÞÞÞÞÞÞÞÞ ÞÞÞÞÞÞÞÞ ÞÞÞ ÞÞÞ
ÞÞÞÞÞ
ÞÞÞ Þ ÞÞÞÞÞÞÞÞÞÞÞÞÞ ÞÞÞÞÞÞÞÞÞÞÞÞÞÞÞÞÞ
ÞÞÞÞÞÞÞÞ ÞÞÞÞÞÞÞ
ÞÞÞÞÞÞÞÞÞÞÞÞÞÞÞÞÞÞÞÞÞÞÞÞÞÞÞÞ Þ Þ
ÞÞÞÞÞÞÞÞ
ÞÞÞÞÞÞÞÞÞÞÞÞÞÞÞÞÞÞ
ÞÞÞÞÞÞÞÞÞÞÞÞÞÞÞÞÞÞÞÞÞÞÞ
ÞÞÞÞÞÞÞÞ
Þ Þ ÞÞ
ÞÞ
ÞÞÞÞÞÞÞÞÞÞÞÞÞÞ
Þ
ÞÞÞÞÞÞÞÞÞÞÞÞÞÞÞÞÞÞÞÞÞÞÞÞÞÞÞÞÞÞÞÞÞÞÞÞÞÞÞ
ÞÞÞÞÞÞ
ÞÞÞÞ
ÞÞÞÞÞÞÞÞÞÞÞÞÞÞÞÞÞÞÞÞÞÞ
ÞÞÞÞÞ
ÞÞÞÞÞÞÞÞÞ
Þ
ÞÞÞÞÞ
ÞÞÞÞ
ÞÞÞÞÞÞ
Þ
ÞÞÞÞÞÞÞÞÞÞÞÞ ÞÞÞÞÞÞÞÞÞÞÞÞÞÞÞÞÞÞ
ÞÞÞÞÞÞÞÞÞÞÞÞÞÞÞÞÞÞÞÞÞ
ÞÞÞÞÞ
ÞÞÞÞÞÞÞÞÞ
ÞÞÞÞÞÞÞÞÞÞÞÞÞÞÞÞÞ
ÞÞÞÞÞ
ÞÞÞÞÞÞÞÞÞ
ÞÞ
ÞÞÞÞÞÞÞÞÞÞÞÞÞÞÞÞÞÞÞÞÞÞ ÞÞÞ
ÞÞÞ
ÞÞÞÞÞÞ
ÞÞÞÞÞÞÞÞÞÞ
ÞÞ Þ
ÞÞÞÞÞÞÞÞÞÞÞÞÞÞÞÞÞÞÞÞÞÞÞ
ÞÞÞÞÞÞÞÞÞÞÞÞÞÞÞÞÞÞÞÞÞÞÞ
ÞÞ
ÞÞÞÞÞ
Þ
ÞÞÞÞÞÞÞÞÞÞÞÞÞÞÞÞÞ
Þ
ÞÞÞÞÞÞÞÞÞÞÞÞ ÞÞÞÞÞ
ÞÞÞÞÞÞÞÞ
ÞÞÞ
ÞÞ
ÞÞÞÞÞÞÞÞÞÞÞÞÞÞÞÞÞ
ÞÞÞ
ÞÞÞÞÞÞÞÞÞÞÞÞÞÞÞÞÞÞÞÞÞÞÞÞÞÞ
ÞÞÞÞÞÞÞÞ
ÞÞÞÞÞÞÞÞ ÞÞÞÞÞ
ÞÞÞÞÞÞÞÞÞÞÞÞÞÞÞÞÞ ÞÞÞÞÞ
ÞÞÞÞÞÞÞÞÞÞÞÞÞÞÞÞÞÞ
ÞÞ
ÞÞÞÞÞÞÞ
ÞÞÞÞÞÞÞÞÞÞÞÞÞÞÞÞ
Þ
ÞÞÞÞÞÞÞÞÞÞÞÞÞÞÞÞÞÞÞÞÞÞÞÞÞÞ
ÞÞÞÞÞÞÞÞÞÞÞÞÞÞÞ
ÞÞÞÞÞÞÞÞÞÞÞÞÞÞÞÞÞÞÞÞÞÞÞÞÞÞÞÞÞÞÞÞÞÞÞ
ÞÞÞÞÞÞÞÞÞÞ
ÞÞÞÞÞÞÞÞÞÞÞÞÞÞÞÞÞÞÞÞ
ÞÞÞÞÞÞÞ
ÞÞÞÞÞÞÞÞÞÞÞÞÞÞ
ÞÞÞÞÞÞÞÞÞÞÞÞÞÞÞÞÞÞÞÞÞÞÞ
ÞÞÞÞÞÞ
ÞÞÞÞÞÞÞÞÞÞÞÞÞÞÞÞÞÞÞÞÞÞÞÞÞÞÞ
ÞÞÞÞÞÞ
Þ
ÞÞÞÞÞÞÞÞÞÞÞÞÞÞÞÞÞÞÞÞÞÞÞÞÞ ÞÞÞÞ
ÞÞÞÞÞÞÞÞÞÞÞÞÞÞÞÞÞÞÞÞÞÞ
ÞÞ
ÞÞÞÞÞÞÞÞÞÞÞÞÞÞÞÞÞÞÞÞ
ÞÞÞÞÞÞÞÞÞÞÞÞ
ÞÞÞÞÞÞÞÞÞÞ
ÞÞÞÞÞÞÞÞ
ÞÞ
ÞÞÞÞÞÞÞÞÞÞÞÞÞÞÞÞÞÞÞÞÞ
ÞÞÞÞÞÞÞÞÞÞÞÞÞÞÞÞÞÞÞÞÞ
ÞÞÞÞÞÞÞÞÞÞÞÞÞ
ÞÞÞÞÞ
ÞÞÞÞ
ÞÞÞÞÞ
ÞÞÞÞÞÞÞÞÞÞÞÞÞÞÞÞÞÞÞÞ
ÞÞÞÞÞ
ÞÞÞÞÞÞÞ
ÞÞÞÞÞÞÞÞÞÞÞÞÞÞÞÞÞÞÞÞ
ÞÞÞÞÞÞÞ
ÞÞÞÞÞÞÞÞÞÞÞÞ
ÞÞÞ
ÞÞÞÞÞÞÞÞÞ
ÞÞÞÞÞÞÞÞÞÞÞÞÞÞÞÞÞÞÞÞÞÞÞÞÞÞÞÞ
ÞÞÞ
ÞÞÞÞÞÞÞÞÞÞ
ÞÞÞÞÞÞÞÞÞÞÞÞ
ÞÞ
ÞÞÞÞÞÞÞÞÞÞÞÞÞÞÞÞÞÞ
ÞÞÞÞÞÞÞ
ÞÞÞÞÞÞÞÞÞÞÞÞÞÞÞÞÞÞÞÞÞÞÞÞÞÞÞÞ
Þ
ÞÞÞÞÞÞÞÞÞÞÞÞÞÞÞÞÞÞÞ
ÞÞÞÞÞÞÞÞÞÞÞÞÞ
ÞÞÞÞÞÞÞÞ������������������������������������������������������������
������������������
���������������������������������������������
������������������
������������������������������������������������������
���������������������������������������������������
������������������������������������������������
���������������������
������������������������������������������������ ���������
������������������������������
���������������������������������������������������������������������������������������������������������������������������������������
���������
���������������������������������������������
������������
������������������ ������
������������������������������������
���
���������
������������ ���������������������������������������������������������
��������������� ��������� ������������
������������������������
������
������
���������������Lincoln
Cla
rk
Webster
Fullerton
Armitage
Belden
Ra
cin
e
Ha
lste
d
Sh
effie
ld
Altgeld
Dickens
Se
min
ary
Clif
ton
Bis
se
l l
Lill
Da
yt o
n
Wrightwood
Orc
ha
rd
Cle
ve
lan
d
Montana
Fr e
mo
nt
Ke
nm
ore G
en
eva
Sto
ckto
n
Ma
gn
olia
Grant
Sed
gw
ick
Bu
rlin
g
Ho
we
Larr
ab
ee
La
ke
vie
w
Arlington
Deming
Moh
aw
k
Lin
co
ln P
ark
West
Clybourn
Maud
Roslyn
Ogden
St James
Orl
ea
ns
Hu
dso
n
Draper
Ch
ildre
ns
Edw
ard
Cam
brid
ge
Belden
Bu
rlin
g
Dickens
LillLill
Bu
rlin
g
Or c
ha
r d
Arlington
Hu
dso
n
Lincoln Park Urban Forest:Study Coverage of Original Survey
Legend
��� LPtrees_GPSandLU
Þ LPtrees
LPstreets_Rubbersheet_51_71shp

34
skew towards the left still remains. The non-residential distribution is less normal and
almost seems to be binomial, with a two peaks between the 12-18 in. and 24-30 in. ranges.
F re q u e n c y D is tr ib u tio n (D B H )
0
5
1 0
1 5
2 0
2 5
3 0
3 5
4 0
4 5
5 0
012
.324
.636
.949
.261
.573
.886
.1
More
D B H (in c h e s)
freq
uen
cy
F re q u e n c y
F re q . D is t. (D B H N O N -R E S )
0
5
10
15
20
25
30
0
6.155555
556
12.31111111
18.46666667
24.62222
222
30.77777778
36.93333333
43.08888889
49.24444444
More
DBH (in ch e s)
freq
uen
cy
F requenc y
Figure 9: Frequency distributions for DBH
F r e q . D is t . (D B H -R E S )
0
5
1 0
1 5
2 0
2 5
3 0
3 5
0 7 1 4 2 1 2 8 3 5 4 2 4 9 5 6 6 3 7 0 7 7 8 4 9 1 M o re
D B H ( i n c h e s)
freq
uen
cy
F re q u e n c y

35
The mean of all DBH measurements is 30.94 in., the mean for just residential DBH is
34.26 in., and the non-residential mean is 22.92. The mode for Condition (nominal
variable) was calculated at Good.
The calculated Moran’s I and z-score for tree condition value both reported a
value larger than zero indicating clustering. The reported p-value for the Moran’s I value
is 0.01 or a 99% chance that our results are significant and not due to chance.
Additionally, the calculated General G statistic reported an observed value that is slightly
smaller than the expected value and thus indicates that the low condition values are the
clustered. The z-score for the General G of condition values is less than zero and is less
than -1.96 and therefore reports a lower than 95% chance that our results are not due to
chance. Due to this low z-score, the finding of clustered low condition values is not
significant.
Figure 10: The reported calculated values for Moran’s I and General G statistics on
condition values
MORAN’S I and GENERAL G for condition value MORAN'S I - CONDITION VALUE
Moran's "I" .......................: 0.029545
Spatially random (expected) "I" ...: -0.003636
Standard deviation of "I" ..... ...: 0.013283
Normality significance (Z) ........: 2.498005
p-value (one tail) ................: 0.01
p-value (two tail) ................: 0.05
Randomization significance (Z) ....: 2.646529
p-value (one tail) ................: 0.01
p-value (two tail) ................: 0.01
GENERAL G - COND_VALUE
Observed General G = 0.0063014087213754599
Expected General G = 0.0063027252792625587
General G Variance = 5.9583548521252496e-010
Z Score = -0.053935756814426208 Standard Deviations

36
The calculated Moran’s I and z-score for tree DBH both reported a value larger than zero
indicating clustering with a reported p-value that is much smaller than 0.05, indicating
that the clustering is significant. Additionally, the calculated General G statistic reported
an observed value that is slightly larger than the expected value and thus indicates that
the high DBH values are the clustered values. The z-score for the General G of DBH is
positive (again indicating clustering of high values) and is larger than 1.96 and therefore
reports a higher than 95% chance that our results are not due to chance and are significant.
A Kernel dot density map was also generated, and displayed in Figure 11, to
visualize the spatial distribution of the DBH variable. The highest DBH values appear to
be located most densely the more north the trees are of the streets that border the DePaul
University campus. Sheffield appears to be an exception to this trend and reveals mostly
middle to low values. Density of the highest values also occurs west of Lincoln Avenue
and the polygon defined by Lincoln, Belden, and Sheffield, which is where DePaul’s
Figure 11: The reported calculated values for Moran’s I and General G statistics on
DBH
MORAN’S I and GENERAL G for DBH MORAN's I:
Moran's "I" .......................: 0.058661
Spatially random (expected) "I" ...: -0.003623
Standard deviation of "I" ..... ...: 0.013251
Normality significance (Z) ........: 4.700456
p-value (one tail) ................: 0.0001
p-value (two tail) ................: 0.0001
Randomization significance (Z) ....: 4.704160
p-value (one tail) ................: 0.0001
p-value (two tail) ................: 0.0001
General G: Observed General G = 0.0065642653679874405
Expected General G = 0.0063027252792625587
General G Variance = 1.6578555368307931e-008
Z Score = 2.0312572326183784 Standard Deviations

37
campus, Children’s Hospital, and the majority of commercial buildings are located. The
density trend presented here supports the notion that residential versus non-residential
land uses may be a driving factor determining tree health. Figure 13 shows tree condition
mapped by residential vs. non-residential land use.
Figure 12: Kernel Density Map Kernel density map (weighted by DBH values)

38
A Nearest Neighbor Index statistic was calculated separately for each represented value
for the field CONDITION in order to see if expected mean distance between same value
neighbors was larger or smaller than the observed mean distance. Figure 14 shows the
trees by selection of the CONDITION attribute ratings “GOOD,” “FAIR,” and “POOR.”
All values for each NNI test are listed in Figure 15. The Nearest neighbor observed mean
distances calculated for GOOD and FAIR trees are lower than the expected mean
distances and indicate that these points are both clustered (NNI < 1). The z-scores show
that this clustering has less than a 1% chance that results are due to chance. The two trees
Figure 13: Tree Condition displayed according to land use

39
with POOR condition values reported a dispersed NNI (> 1), with an observed mean
distance that is much greater than the expected mean distance and a z-score that reports
significance at less than 1% chance that results are due to chance.
Figure 14: Maps showing trees selected by condition attribute.

40
Figure 15: Reported values for NNI calculated separately on the
different condition values found within the study area.
GOOD Nearest Neighbor Observed Mean Distance = 11.666334 Expected Mean Distance = 22.425661
Nearest Neighbor Ratio = 0.520223
Z Score = -14.307834 Standard
FAIR Nearest Neighbor Observed Mean Distance = 32.887828
Expected Mean Distance = 46.333877
Nearest Neighbor Ratio = 0.709801
Z Score = -3.140522 Standard Deviations
POOR Nearest Neighbor Observed Mean Distance = 631.825925
Expected Mean Distance = 61.481705
Nearest Neighbor Ratio = 10.276649
Z Score = 25.097879 Standard Deviations

41
7. SUMMARY, CONCLUSIONS AND RECOMMENDATIONS
7.1 Summary
277 trees were sampled for the final incarnation of our exploratory analysis of Lincoln
Park’s urban forest tree health, which took place over the course of the ten week term.
Health assessment in residential and non-residential areas ranged from good to fair to
poor, with the vast majority of the trees sampled categorized as being of either good or
fair health.
Once the GPS data of each tree sample was joined to the original database, both
Moran’s I and General G statistics revealed that clustering of tree health values in the
Lincoln Park area had occurred beyond the likelihood of chance, which led to the
conclusion that residential urban land use has an significantly beneficial impact on tree
health. As compared to non-residential land uses.
7.2 Conclusions
The overarching conclusion that can be made from our exploratory analysis of Lincoln
Park’s urban forest tree health is that there is support for a correlation between urban
land use on tree health. Through the collection of a sufficient, if not ideal, amount of data
points (277 trees), we have been able to conclude that residential land use often yields
different results in tree health that non-residential land use.
Practical conclusions can also be drawn that hindered our ability to gather and
interpret field data. As evidenced in the initial readings of data points, the reliability of
the GPS locaters was compromised by the cold and inclement weather this winter, and by

42
the existence of tall buildings on certain streets in Lincoln Park (i.e. Lincoln Avenue).
This made the data points on the some of the early maps blatantly inaccurate, as trees
were implied as existing on top of building, in the middle of the street and in parking lots,
when they did not in reality.
Since it was winter when the GPS data was gathered, it was difficult to verify tree
health data taken from warmer seasons, as it was near impossible to determine the health
of trees in winter. Discrepancies between data collection also occurred in tree species,
and in the case of one street, in tree size and location.
7.3 Recommendations
Because our exploratory analysis of Lincoln Park’s urban forest tree health project faced
numerous constraints, most of which were related to or a result of a very limited amount
of time, if this were to be undertaken again, more time should be expected for completion.
Winter in Chicago is not an ideal season for fieldwork and data collection of this
nature, so it is recommended that a project like this one be undertaken in a different
season in which the weather is more hospitable.
The data collected for this project was taken by multiple groups, which led to
inaccuracies that could likely have been fixed if the entirety of the data was collected by
one group. Mistakes made in tree species categorization also leads to the
recommendation that at least one or more members of the group be experts at identifying
tree species – even in the winter season when one of the most useful identification tools is
missing (leaves).

43
Though the project would have to expand beyond Lincoln Park to collect this data,
an assessment of tree health in greater variations of urban land use (such as industrial)
may yield more conclusive results.

44
8. Technical Appendices
Appendix A
Liam Heneghan, De Paul University Department of Environmental Sciences, Faculty Advisor
Appendix B: Sample data sheet from original field tree survey
Block Number: 51 Surveyed by: J.I, J.S Date: 2005.07.28
Tree No Species Condt Street
Bld. No.
Type of Property DBH Height Age
1 Red Maple Good Lill 1110 Church 28.3
2 N.M Good Lill 1110 Church 28.7
3 Choke Cherry Good Lill 1112 Residential 8
4 Pine Good Lill 1114 Residential n/a
5 N.M Good Lill 1116 Residential 43.4
6 Ash Fair Lill 1124 Residential 51.4
7 Ash Good Lill 1126 Residential 35.8
8 Ash Fair Lill 1128 Residential 43.5
9 Ash Fair Lill 1132 Residential 35.9
10 Linden Good Lill 1134 Residential 16.8
11 Catalpa Good Lill 1134 Residential 16.1
12 H.L Good Lill 1136 Residential 44.3
13 Linden Good Lill 1138 Residential 30.9
14 Plum Good Lill 1142 Residential 11.3
15 S.M Good Lill 1146 Residential 47.5
16 N.M Fair Lill 1150 Residential 26.7
17 Cottonwood Good Lill 1150 Residential 77.2
18 Ash Good Lill 1156 Residential 11.6
19 Ash Good Lill 1156 Residential 15.2
1 Red Maple Good Racine
n/a Residential 12.2
2 Birch Good Racine
n/a Residential 24
3 Ash Good Racine 2543 Residential 20
4 Ash Good Racine 2543 Residential 16.2
5 Ash Good Racine 2545 Residential 18.6
6 Birch Good Racine
n/a Residential 12.8
7 Birch Good Racine
n/a Residential 6.7
8 Elm Good Racine
n/a Residential 62.7

45
References
Akbari H, Davis S, Dorsano S, Huang J, Winnett S (eds.). Cooling Our Communities: A
Guidebook on Tree Planting and Light-Colored Surfacing. U.S. Environmental Protection Agency, Office of Policy Analysis, Climate Change Division. Lawrence Berkeley National Laboratory Report No. LBL-31587, 1992. Chrisman, Nicholas. Exploring Geographic Information Systems. New York: John Wiley & Sons. 2002. Dwyer, J., D. Nowak, and G. Watson. 2002. Future Direction for Urban Forestry
Research in the United States. Journal of Arboriculture 28(5): 231-236. Karlen, D., S. Andrews, B. Weinhold, and J. Doran. 2003. Soil quality: Humankind’s
foundation for survival. Journal of Soil and Water Conservation 58(4):171-179. McPherson, E. G., D. Nowak, R. Rowntree, eds. 1994. Chicago’s Urban Forest
Ecosystem: Results of Chicago Urban Forest Climate Project, general technical report NE-186USDA Forest Service Northeastern Forest Experiment Station, Radnor, PA. McPherson, E. G., D. Nowak, G. Heisler, S. Grimmond, C. Souch, R. Grant, and R. Rowntree. 1997. Quantifying urban forest structure, function, and value: the Chicago
Urban Forest Climate Project. Urban Ecosystems 1(1): March. Pauleit, S. and F. Duhme. 2000. GIS Assessment of Munich’s Urban Forest Structure for
Urban Planning. Journal of Arboriculture 26(3): 133-141. Seybold, C., J. Herrick, and J. Brejda. 1999. Soil Resilience: A Fundamental Component
of Soil Quality. Soil Science 164(4): 224-234. Sissini, S.M., W.C. Zipperer, and A.G. Pleninger. 1995. Impacts from a major ice storm:
street tree damage in Rochester, New York. Journal of Arboriculture 21: 156-167. TreeLink. Urban Forestry Coordinators News Proposal: 2007 President's Budget and
SUFC. 2007. TreeLink. January 25, 2007 <http://www.treelink.org/ufcnews/#3>. Sullivan, W.C. and F. E. Kuo. 1996. Do Trees Strengthen Urban Communities, Reduce
Domestic Violence?, Forestry Report R8-FR 56. USDA Forest Service, Northeastern Area State and Private Forest, Urban Forestry Center for the Midwestern States, Evanston, IL.