©2011 Genworth Financial, Inc. All rights reserved. Genworth Australia - Mortgage Insurance September 26, 2011

Welcome message from author
This document is posted to help you gain knowledge. Please leave a comment to let me know what you think about it! Share it to your friends and learn new things together.
Transcript
©2011 Genworth Financial, Inc. All rights reserved.
Genworth Australia - Mortgage InsuranceSeptember 26, 2011

Forward-Looking StatementsThis presentation contains certain “forward-looking statements” within the meaning of the United States Private Securities Litigation Reform Act of 1995. Forward-looking statements may be identified by words such as “expects,” “intends,” “anticipates,” “plans,” “believes,” “seeks,” “estimates,” “will” or words of similar meaning and include, but are not limited to, statements regarding the outlook for Genworth Financial, Inc.’s (Genworth) future business and financial performance. Forward-looking statements are based on management’s current expectations and assumptions, which are subject to inherent uncertainties, risks and changes in circumstances that are difficult to predict. Actual outcomes and results may differ materially due to global political, economic, business, competitive, market, regulatory and other factors and risks, including those discussed in the Appendix, as well as in the risk factors section of Genworth’s Annual Report on Form 10-K, filed with the United States Securities and Exchange Commission (SEC) on February 25, 2011. Genworth undertakes no obligation to publicly update any forward-looking statement, whether as a result of new information, future developments or otherwise.
Use Of Non-GAAP & Select Operating Performance MeasuresAll financial data as of June 30, 2011 unless otherwise noted. For additional information, please see Genworth’s second quarter of 2011 earnings release and financial supplement posted at genworth.com.
For important information regarding the use of non-GAAP measures and select operating performance measures, see the Appendix.
Unless otherwise noted, all references in this presentation to operating income (loss) should be read as operating income (loss) available to Genworth’s common stockholders. All references in this presentation to return on equity (ROE) should be read as operating ROE on a 20 percent levered basis unless otherwise noted.
Genworth Australia Mortgage Overview September 2011 2

AgendaKey Objectives
Company Overview
Economy/Market Update
Commercial Overview
Risk Management
Financial Model
Capital/Investments
Summary
Appendix
3Genworth Australia Mortgage Overview September 2011
Key ObjectivesAustralia Market Is Significantly Different From U.S.
Active Regulatory Oversight … Banks & Insurers
MI1 Business Embedded In Market … Helps Consumers & Banks Accelerate Homeownership
Regional Performance Differences … Housing Market Digesting Current Home Price Levels
Strong Profitability, Returns & Capital Generation
4Genworth Australia Mortgage Overview September 2011
1Mortgage Insurance

Company Overview
Entered Australian Market In 1997… Acquired Government Entity (HLIC1)
Leading Mortgage Insurance Provider
Strong Customer Relationships
High Quality Mortgage Portfolio
Stand-Alone Capabilities
Delivered Strong Profitability & Returns
89
156
205
106
2004 2007 2010 1H11
($MM)
// //
Strong Double Digit Return On Equity
5Genworth Australia Mortgage Overview September 2011
1Housing Loans Insurance Corporation 2U.S. GAAP Reported Net Operating Income
Operating Income2

Significant Differences From U.S.Engaged Regulator Overseeing Banks & Insurance CompaniesSolid Economic Fundamentals … Outlook Remains PositiveSignificant High Loan-To-Value OriginationsHouse Prices Supported By Market FundamentalsMI Product Embedded In Market
Capital ReliefRisk TransferUnderwriting Discipline
Mortgage Originations Concentrated In 4 Major Banks … Centralized Underwriting
6Genworth Australia Mortgage Overview September 2011
Attractive Market

Economy/Market Update
7Genworth Australia Mortgage Overview September 2011

Economy/Market -- Key MessagesDiversified Economy… Global Commodity Demand Recent Driver Of Growth
Strong Public Finances Gives Government Stimulus Flexibility
Near Full Employment With Solid National Outlook … Expect Regional Weakness To Improve
Housing Overvaluation Concerns Easing With Low Home Appreciation & Strong Underlying Fundamentals
Variable Rate Mortgage Market … Strong & Effective Central Bank Macro Policy Tools
8Genworth Australia Mortgage Overview September 2011

Economy -- GDPObservationsGDP Growth
Key GDP DriversFinancial Services 10% Manufacturing 9%
Mining 9% Construction 7%
Trade 9% Housing Services 7%
(2.0)%
(1.0)%
0.0 %
1.0 %
2.0 %
3.0 %
4.0 %
5.0 %
’00 ’10’02 ’04 ’06 ’08Annual % Change
Quarterly % Change
’11E
9Genworth Australia Mortgage Overview September 2011
Sources: Australia Bureau Of Statistics (ABS), International Monetary Fund & Management Estimate
Strong Public Finances (Debt ~20% Of GDP)Ability To Stimulate Economy
Well Regulated/Capitalized Financial Institutions Diversified Economy
Mining Industry Recent Catalyst For Growth Contraction In 1Q11 Driven By Queensland Flooding Expect Ongoing Solid Economic Growth
Economy -- Commodities
10
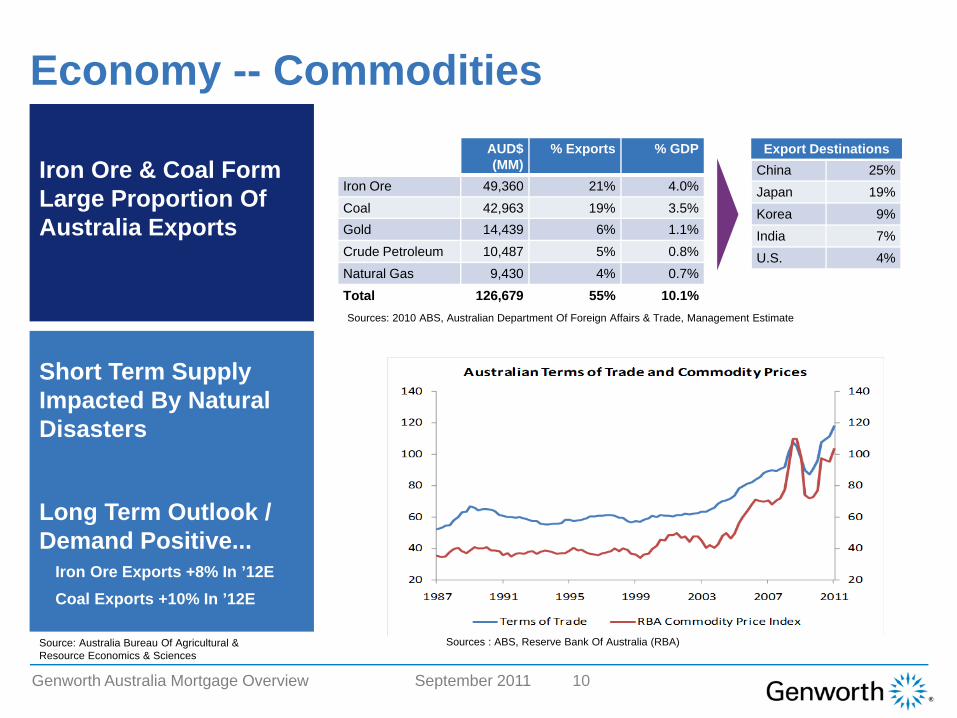
Iron Ore & Coal Form Large Proportion Of Australia Exports
Long Term Outlook / Demand Positive...
Iron Ore Exports +8% In ’12ECoal Exports +10% In ’12E
Short Term Supply Impacted By Natural Disasters
AUD$ (MM)
% Exports % GDP
Iron Ore 49,360 21% 4.0%Coal 42,963 19% 3.5%Gold 14,439 6% 1.1%Crude Petroleum 10,487 5% 0.8%Natural Gas 9,430 4% 0.7%Total 126,679 55% 10.1%
China 25%Japan 19%Korea 9%India 7%U.S. 4%
Export Destinations
Genworth Australia Mortgage Overview September 2011
Sources : ABS, Reserve Bank Of Australia (RBA)
Sources: 2010 ABS, Australian Department Of Foreign Affairs & Trade, Management Estimate
Source: Australia Bureau Of Agricultural & Resource Economics & Sciences
Economy -- Rate Environment
5.0%
6.0%
7.0%
8.0%
9.0%
10.0%
11.0%
’00 ’02 ’04 ’06 ’08 ’10
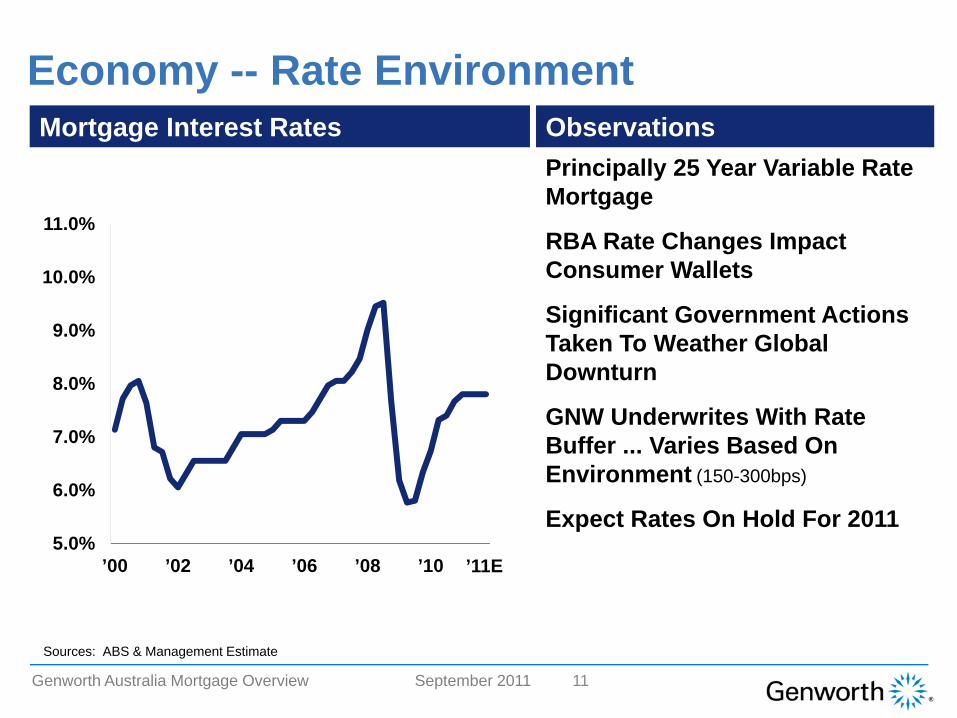
Mortgage Interest Rates ObservationsPrincipally 25 Year Variable Rate Mortgage
RBA Rate Changes Impact Consumer Wallets
Significant Government Actions Taken To Weather Global Downturn
GNW Underwrites With Rate Buffer ... Varies Based On Environment (150-300bps)
Expect Rates On Hold For 2011
’11E
11Genworth Australia Mortgage Overview September 2011
Sources: ABS & Management Estimate

Economy -- Unemployment Trends
Solid Economic Performance Drives Low Unemployment
Full Employment …~5% Or Less
Some Regional Pressure In Queensland
Labor Shortage Continues + Solid Economic Conditions
Expect Ongoing Strong Employment
Wage Growth ~4%
ObservationsUnemployment Rate
12Genworth Australia Mortgage Overview September 2011
Sources: ABS & Management Estimate
3.0%
4.0%
5.0%
6.0%
7.0%
8.0%
9.0%
’00 ’02 ’04 ’06 ’08 ’10 ’11E
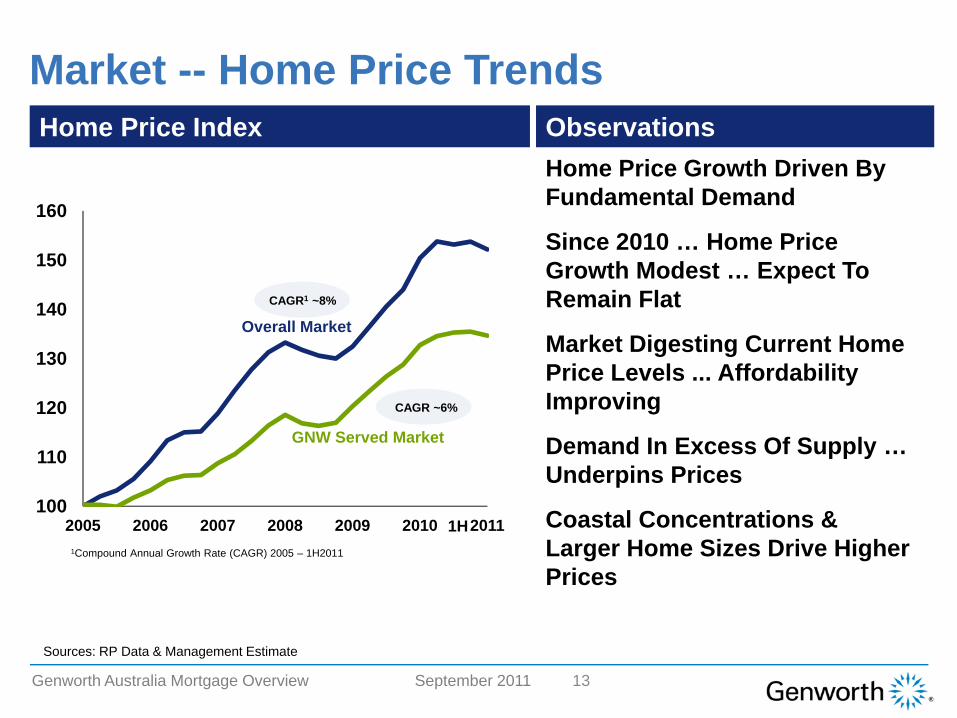
Market -- Home Price Trends
Home Price Growth Driven By Fundamental Demand
Since 2010 … Home Price Growth Modest … Expect To Remain Flat
Market Digesting Current Home Price Levels ... Affordability Improving
Demand In Excess Of Supply … Underpins Prices
Coastal Concentrations & Larger Home Sizes Drive Higher Prices
ObservationsHome Price Index
13
100
110
120
130
140
150
160
2005 2006 2007 2008 2009 2010 2011
GNW Served Market
Overall Market
1H
Genworth Australia Mortgage Overview September 2011
Sources: RP Data & Management Estimate
CAGR1 ~8%
CAGR ~6%
1Compound Annual Growth Rate (CAGR) 2005 – 1H2011
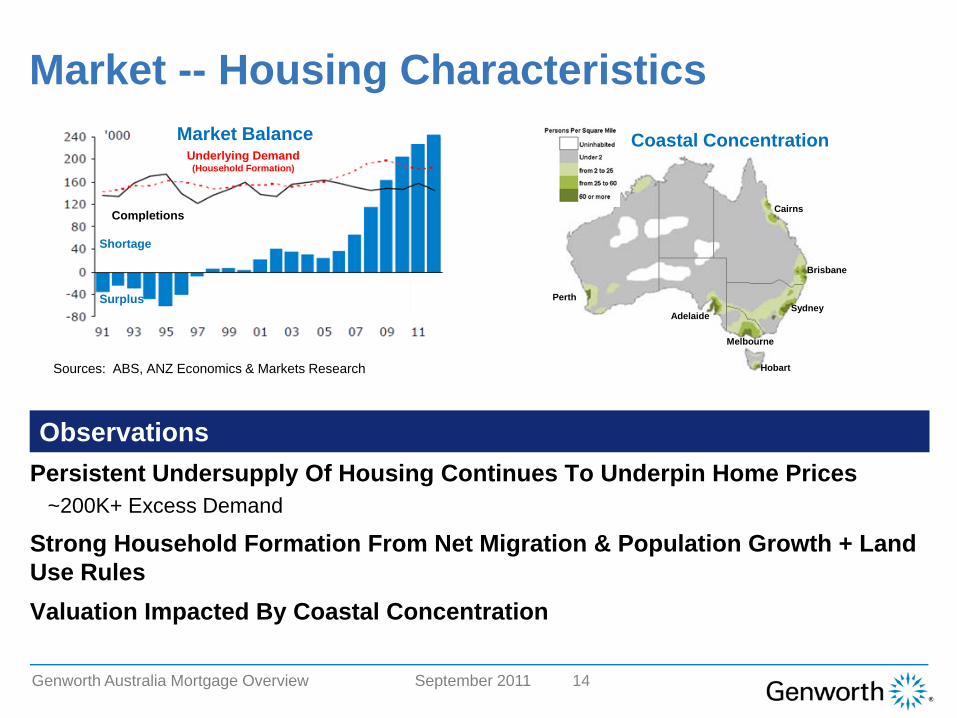
Underlying Demand(Household Formation)
Completions
Shortage
Surplus
Market Balance
Market -- Housing Characteristics
14
Observations
Perth
Adelaide
Melbourne
Sydney
Hobart
Brisbane
Cairns
Coastal Concentration
Genworth Australia Mortgage Overview September 2011
Sources: ABS, ANZ Economics & Markets Research
Persistent Undersupply Of Housing Continues To Underpin Home Prices~200K+ Excess Demand
Strong Household Formation From Net Migration & Population Growth + Land Use RulesValuation Impacted By Coastal Concentration

15Genworth Australia Mortgage Overview September 2011
1Loans In Arrears 90+ Days. For Australia, Only Includes Loans On Banks Balance Sheets. 2Sources: RBA & Management Estimate, Canadian Bankers Association, & U.S. Mortgage Bankers Association.
U.S.2 3.7%
Can2 0.5%
1994 1998 2002 2006
5%
0%
1%
2%
3%
4%
6%
2010Aus2 0.5%
Mortgage Delinquency Rate1Market Characteristics Limited Reliance On Capital Markets
(Majority Of Loans Held On Balance Sheet)
Low Levels Of Risky Products
Active Regulatory Oversight
Strong Underwriting & Credit Culture
Residential Mortgage Interest Not Tax Deductible
Housing Demand Exceeds Supply
Borrower Recourse
Differentiated Markets
16
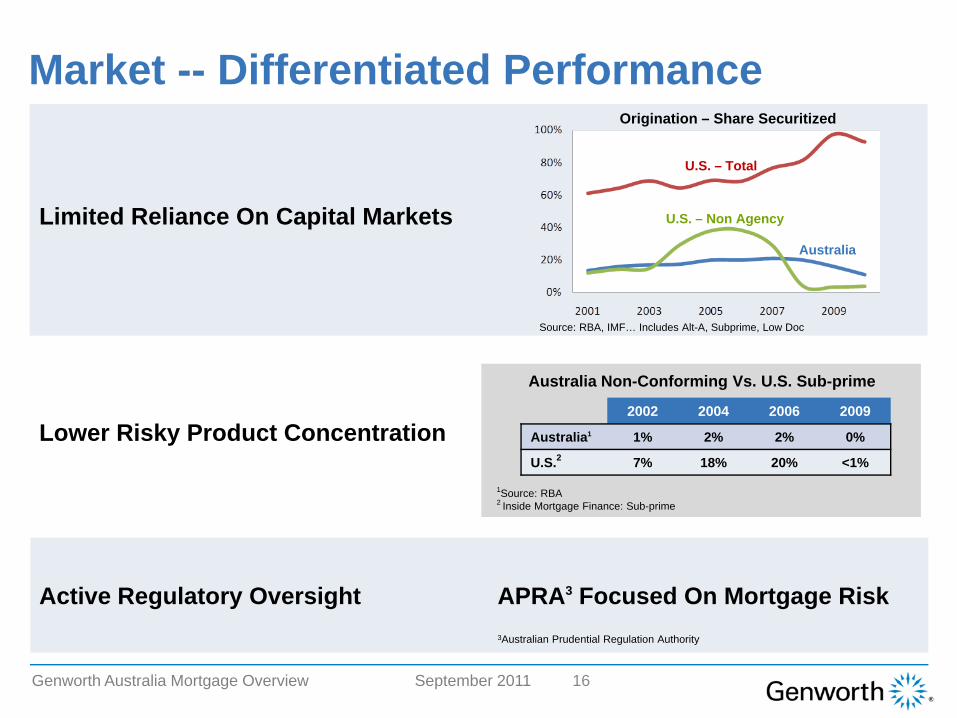
Market -- Differentiated Performance
APRA3 Focused On Mortgage RiskActive Regulatory Oversight
Lower Risky Product Concentration
1Source: RBA2 Inside Mortgage Finance: Sub-prime
Australia Non-Conforming Vs. U.S. Sub-prime
Limited Reliance On Capital MarketsAustralia
U.S. – Non Agency
U.S. – Total
Origination – Share Securitized
Genworth Australia Mortgage Overview September 2011
3Australian Prudential Regulation Authority
Source: RBA, IMF… Includes Alt-A, Subprime, Low Doc
2002 2004 2006 2009
Australia1 1% 2% 2% 0%
U.S.2 7% 18% 20% <1%

Home PriceApp
Price
Supply Vs.Demand
Price
Afford
Market -- Housing Bubble Screen
National Queensland
Home Price Appreciation
Price To Income
Price To Rent
Affordability
Supply Vs. Demand
At Higher Level Since ’03 Driven By Strong Demand & Lower Rates
Recent Improvement As Home Appreciation Slowed & Incomes Grew
2.0
3.0
4.0
5.0
1996 1998 2000 2002 2004 2006 2008 2010
Historical Average
+1 Standard Deviation
+2 Standard Deviation
National Median Price To Income Multiple
Moderate Deviation From Historical Avg. (1 Std Dev)Significant Deviation From Historical Avg. (2 Std Dev)
Within Trigger (< 1 Std Dev)
Fundamental Price Indicators (1Q11)
17Genworth Australia Mortgage Overview September 2011

Commercial Overview
18Genworth Australia Mortgage Overview September 2011

40%
69%
34%
18%26%
13%
Commercial – Distribution
2007
Large Banks Dominate MarketRegionals/Non-Banks … Funding ChallengedDedicated GNW Servicing Teams ... Build Long Term PartnershipsDifferentiated Distributor Needs …
Value Added ServicesFunding AccessAbility To Compete
ObservationsDistribution Segments1
1Company Estimate 2High Loan-To-Value
Genworth Australia Mortgage Overview September 2011 19
Regionals / Non Banks
Other Banks
Large Banks
2010//
HLTV2 Originations

Commercial -- Value Chain Integration
Significant Progress In Value Chain Penetration
Focus Shifting From Helping Drive Volume To Improving Quality
Leveraging Risk/Loss Mitigation Expertise
Improved Customer Experience … Enhances Partnerships
Processing(Order MI) Underwriting Portfolio
ManagementLeadGeneration
ClaimsManagement
ResearchJoint MarketingGov’t LobbyingConsumer Tools
Seamless ProcessesTechnology Links
Credit ScoresFraud Detection
Performance BenchmarkingMarket Updates
Global Best Practice SharingOnsite Hardship & Claims Personnel
Embed In Mortgage Origination & Management Process
20Genworth Australia Mortgage Overview September 2011

Commercial -- MI Value Proposition
21
1Residential Mortgage-Backed Securities
Genworth Australia Mortgage Overview September 2011
Capital Relief For LendersSpecific Capital Benefits For Insured Loans
Credit EnhancementLower Cost Of Funds On RMBS1 Structures
Risk ManagementReduces Volatility Of Earnings By Transferring Mortgage Risk
Improves Loan QualityFraud DetectionUnderwriting StandardsCredit ScoringSecond Set Of Eyes
Fosters Product Innovation & Encourages HomeownershipGlobal Best Practice Sharing

Risk Management
22Genworth Australia Mortgage Overview September 2011

Key Focus Areas
Ensure Quality Of New Business & Avoid Risk Concentrations
EnablersSet Guidelines & PricingEstablish Risk Appetite & Risk Limits
ProductLTVRegion (Higher Risk Areas)
Underwriting AuditsLender AssessmentsMortgage Scoring, Fraud Tools
In Force ManagementNew Business Origination Loss Mitigation
Risk Management Approach
Monitor Performance… Take Remedial Actions
Monthly Portfolio Monitoring
Assess Emerging Risks –Housing Bubble Concerns
Portfolio Stress Testing
Modify Credit Policy Based On Analysis
Actively Mitigate Risk & Reduce Exposure
Partner With Lenders On Workouts & Asset Management
Actively Manage Claims Costs
Reduce Exposure Through Reinsurance
23Genworth Australia Mortgage Overview September 2011

Australia Portfolio Actions
Implemented Price Increases Of ~40%Enhanced Underwriting & Mortgage Scoring ModelsAdjusted Interest Rate Buffer To EnvironmentModified “High Risk” Areas Based On Environment
Queensland Coastal Area
Maintained & Strengthened ’08/’09 Policy Changes
Financial Crisis ActionsTightened Product Guidelines
Eliminated >95% LTV Lending & Certain ProductsRestricted Products >90% LTVStrengthened Self Employed Income DocumentationIncreased Investment Property Equity RequirementsTightened Appraisal RoutinesRestrictive Credit Policy For Underperforming Lenders
Enhanced Fraud Tools & Housing Bubble Analytics
24Genworth Australia Mortgage Overview September 2011

Original LTV1
(Flow Avg 81%)Effective LTV1
(Flow Avg 67%)
Genworth Australia Mortgage Overview September 2011
14.4
Portfolio Composition
$103.7B
2009
2008
2007
2006
2005 &Prior
Bulk
1Book Year Risk In Force Based Upon Production. Effective LTV Initially Estimated Based On Accumulated Regional HPA. 2Source: Rfi Research, RBA
Risk In Force By Vintage
6/30/11
Comments
20102011
86%
83%
81%
79%
~75%
~54%
82%84%
79%
74%
69%
60%
~50%
~46%
83%84%
25
Lower LTVs At Origination
Significant Embedded HPA In Portfolio
Excludes Loan Reduction From Principal Payments …. ~50%2 Of Borrowers Prepay Mortgage
2009/2010 Books Seasoning As Expected
2007/2008 Books -- Queensland Region Pressured

Book Year PerformanceDrivers/ObservationsBook Year Delinquency Development
Months Of Seasoning
26Genworth Australia Mortgage Overview September 2011
As Of 6/30/11
2009/2010 Vintages Seasoning As Expected
Tighter Underwriting GuidelinesIncreased Rate Buffers
2007/2008 Vintages Above Expected Levels
Small Business/Self Employed Impacted By Retail Spending DeclineSignificant Levels Of Embedded Home Price Appreciation
Delinquency Rate as of 6/30/11Book Year 2009: 0.71%Book Year 2008: 1.35%Book Year 2007: 1.16%
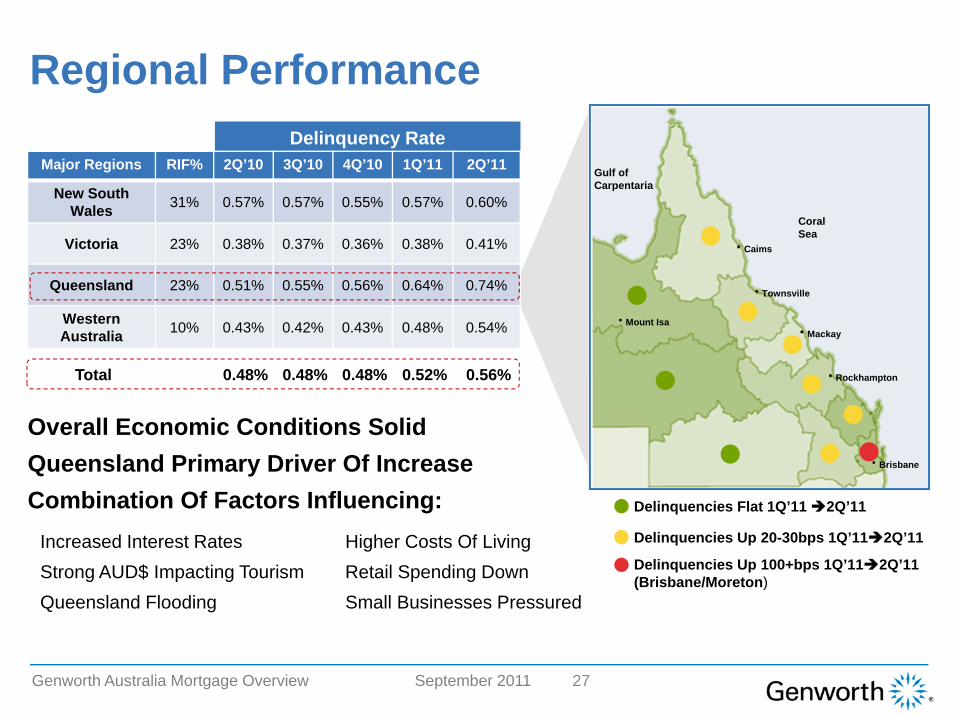
Regional PerformanceDelinquency Rate
Major Regions RIF% 2Q’10 3Q’10 4Q’10 1Q’11 2Q’11
New South Wales 31% 0.57% 0.57% 0.55% 0.57% 0.60%
Victoria 23% 0.38% 0.37% 0.36% 0.38% 0.41%
Queensland 23% 0.51% 0.55% 0.56% 0.64% 0.74%
Western Australia 10% 0.43% 0.42% 0.43% 0.48% 0.54%
Total 0.48% 0.48% 0.48% 0.52% 0.56%
Overall Economic Conditions SolidQueensland Primary Driver Of IncreaseCombination Of Factors Influencing:
Increased Interest Rates Higher Costs Of LivingStrong AUD$ Impacting Tourism Retail Spending DownQueensland Flooding Small Businesses Pressured
Coral Sea
Gulf ofCarpentaria
27Genworth Australia Mortgage Overview September 2011
Delinquencies Flat 1Q’11 2Q’11
Delinquencies Up 20-30bps 1Q’11 2Q’11
Delinquencies Up 100+bps 1Q’11 2Q’11(Brisbane/Moreton)
Mount Isa
Caims
Townsville
Mackay
Rockhampton
Brisbane

Original LTV1
(Flow Avg 83%)Effective LTV1
(Flow Avg 73%)
Queensland – Risk In Force
$23.2B
2009
2008
2007
2006
2005 &Prior
Bulk
1Book Year Risk In Force Based Upon Production. Effective LTV Initially Estimated Based On Accumulated Regional HPA.
Portfolio Composition
6/30/11
20102011
Observations
28
88%
84%
83%
82%
~78%
~53%
84%85%
87%
84%
77%
64%
~51%
~48%
89%85%
Genworth Australia Mortgage Overview September 2011
Region Clearly Impacted By FloodingStrong Australian Dollar Pressuring Local Industries:
TourismExportersAgriculture
Small Business/Self Employed Impact More Pronounced

Australia Loss TrendsAnnual Loss Ratio Quarterly Loss Ratio
$7.5MM Flood Reserve Established In 1Q’11 ... 8pt Impact On Loss Ratio
Queensland Impacted By Number Of Factors ... Driving 2Q’11 Loss Ratio Higher
Project Second Half Loss Ratio In High 40’s/Low 50’s
3847 44
50
40
(%)
2007 2008 2009
(%)
2010
38 3745 48
High 40%-Low 50%
3Q10 4Q10 1Q11 2Q112006 2H11E
29Genworth Australia Mortgage Overview September 2011

Risk Management – Loss Mitigation
90+ Days Arrears(Reported to GNW) Claim
Genworth Works With Customers Across Life Of Delinquencies
0–90 Days Arrears Mortgage In Possession
WorkoutsProvide Assistance To Borrowers Impacted Over Short Term
Principally Loan Modifications
Process Is A Win For All Parties ... Consumer, Lender, Genworth
30Genworth Australia Mortgage Overview September 2011
Asset Management
Accelerate Action On Late Stage Delinquencies … Protect Borrower Equity
Encourage Borrowers To Sell Property Prior To Foreclosure … Protects Property Value
Streamline Process For Properties In Foreclosure
Recoveries After Claim Payment … Pursue Borrower Recovery
Financial Model
31Genworth Australia Mortgage Overview September 2011

Australia -- Strong Financial Track Record
89 106137 156
185148
205
106
2004 2005 2006 2007 2008 2009 2010 1H11
32
Operating Income1
Invested For Growth Self Funded Growth
Generating Excess Capital
Drove Lender Penetration, Invested In Long-Term Relationships
Co-Developed Products With Lender-PartnersFocused Risk Management
Strong Performance Through Global Financial Crisis
Diversified Capital StructureInitiated Parent Company Dividends
1U.S. GAAP Reported Net Operating Income 2ABS, GDP: Change Over Prior Year, 3Home Price Appreciation Year Over Year Based On RP Data Index 4RBA Posted Mortgage Rates
Genworth Australia Mortgage Overview September 2011
Positioned For Strong Mid-High Teen Returns
GDP2 3.8% 3.1% 2.6% 4.6% 2.6% 1.4% 2.7% 1.2%Unemployment2 5.4% 5.0% 4.8% 4.4% 4.3% 5.6% 5.2% 5.0%HPA3 6.5% 3.4% 4.6% 7.1% 3.7% 7.0% 7.1% -Mortgage Rates4 7.1% 7.3% 7.6% 8.2% 8.9% 6.0% 7.3% 7.8%
($MM)
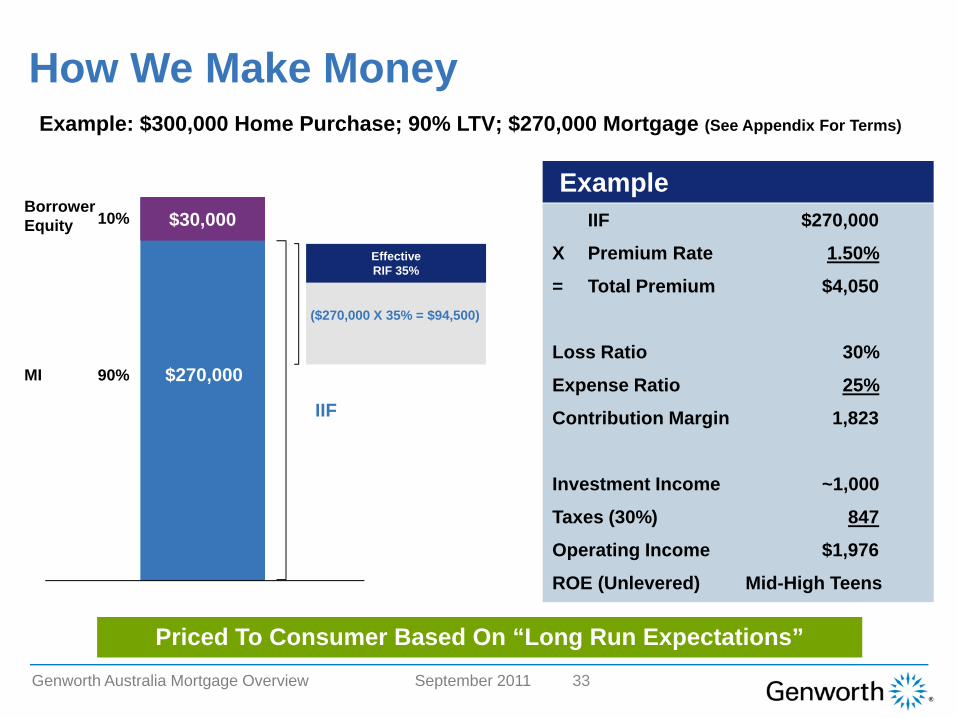
How We Make Money
$30,000Borrower Equity
Example: $300,000 Home Purchase; 90% LTV; $270,000 Mortgage (See Appendix For Terms)
10%
90%MI
IIF
IIF $270,000
X Premium Rate 1.50%
= Total Premium $4,050
Loss Ratio 30%
Expense Ratio 25%
Contribution Margin 1,823
Investment Income ~1,000
Taxes (30%) 847
Operating Income $1,976
ROE (Unlevered) Mid-High Teens
($270,000 X 35% = $94,500)
Example
$270,000
Priced To Consumer Based On “Long Run Expectations”
Effective RIF 35%
33Genworth Australia Mortgage Overview September 2011

How Single Premium MI Products Work
Significant Revenue Pipeline To Be Earned Over 10 Years
Losses
Premiums
Premiums And Losses Are Matched
34Genworth Australia Mortgage Overview September 2011
100% Premium Collected At Loan OriginationUnearned Premium Reserve Established On Balance Sheet
$1.1B Future Revenue Pipeline As Of 6/30/11
Recognized As Earned Premium Principally Over ~10 YearsActuarially Developed Earnings CurveMatches Expected Loss Development PatternReviewed Quarterly By Independent Actuary
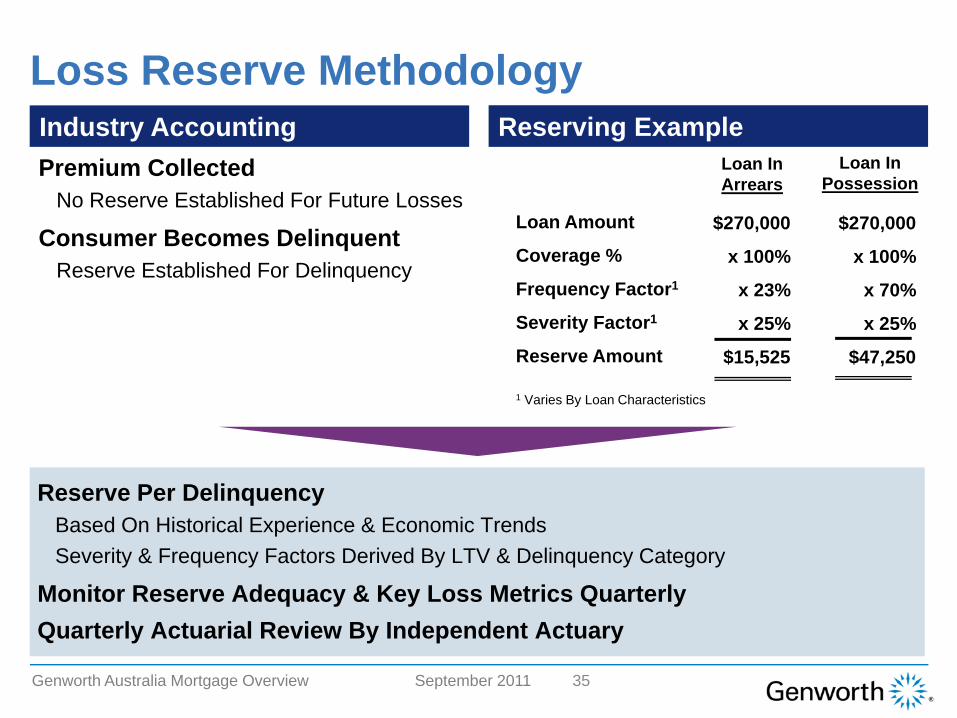
Loss Reserve Methodology
Loan Amount
Coverage %
Frequency Factor1
Severity Factor1
Reserve Amount
$270,000
x 100%
x 23%
x 25%
$15,525
$270,000
x 100%
x 70%
x 25%
$47,250
Loan InArrears
Loan In Possession
1 Varies By Loan Characteristics
35Genworth Australia Mortgage Overview September 2011
Reserving ExampleIndustry AccountingPremium Collected
No Reserve Established For Future Losses
Consumer Becomes DelinquentReserve Established For Delinquency
Reserve Per DelinquencyBased On Historical Experience & Economic TrendsSeverity & Frequency Factors Derived By LTV & Delinquency Category
Monitor Reserve Adequacy & Key Loss Metrics QuarterlyQuarterly Actuarial Review By Independent Actuary

Capital / Investments
36Genworth Australia Mortgage Overview September 2011

Regulatory Capital Requirement
2 95% LVR, Standard Loan, 5% Annual Cancellation Rate
Illustrative Example ($10B NIW)2Background
Probable Maximum Loss
($MM)
1 6-10 11+32 4 5
200
39
181
129 122
6
190
Loan Age (Years)
1 Loan-To-Value Ratio
37
Minimum Capital Requirement Established By APRA Stress Factors Applied To Portfolio To Determine Probably Maximum Loss (Largest Component Of Capital Requirement)
Probability Of Default (PD)Loss Given Default (LGD)Varies By LVR1 & Age Of Loan
Models A Significant Stress Event … Characterized By APRA As 1/250 year Event As Large Blocks Season Past Year 3 … Significant Declines In Capital Required
Genworth Australia Mortgage Overview September 2011

’10 ’11E
CapitalGenerating Capital For Redeployment
Regulatory Requirement
Genworth Available
ExcessCapital*
38
* Excess Does Not Reflect Planned Dividends
Planning Horizon
Maintain Capital To Support Regulatory/Ratings RequirementEnhanced Financial Flexibility
External ReinsuranceTier II Debt Issuance
Strong Capital Generation From In Force Blocks
Large Blocks Of ’08/’09 MaturingSmall ’10/’11 BlocksStrong Profitability
Source Of Parent Company DividendsSignificant Capital Management Levers For Further Capital Optimization
Genworth Australia Mortgage Overview September 2011

Maturity
Investments
Rating Source
US$3.1B Highly Rated Portfolio With Conservative Mix
Liquid Portfolio With Modified Duration ~2.6 Years, Portfolio Yield ~5.4%
AUD$ Denominated Investments -- No Currency Risk
26%
33%
24%
15%2%
0 - 1 Year 1 - 3 Years 3 - 5 Years5 - 10 Years + 10 Years
64%
15%
6%1%
14%
AAA AA A BBB Cash
4%
32%
14%
37%
13%
Commonwealth CorporateGovt Guaranteed Corps Semi GovtAUD Cash
39Genworth Australia Mortgage Overview September 2011
As Of 6/30/11
Summary
40Genworth Australia Mortgage Overview September 2011
Australia Market Is Significantly Different From U.S. Economic/Housing Market Fundamentals Support Home Price Levels … Do Not Expect Significant Price Correction Active Regulatory Oversight With Focus On Quality Originations Strong Balance Sheet
$3.1B High Grade Fixed Income Portfolio$1.1B Unearned Premium$2.1B Equity
Solid Business Performance Through Range Of Economic Conditions

Appendix
41Genworth Australia Mortgage Overview September 2011

Key Terms
New Insurance Written (NIW)
Original Principal Balance Of Mortgages Insured In A Given Period (e.g. One Year)
When We Say … It Represents …
Loan-To-Value (LTV) Loan Amount Divided By Property Value At Origination
Net Written Premiums (NWP)
Premiums Collected On Insured Loans In A Given Period
Insurance In Force (IIF)
Original Principal Balance Of All Mortgage LoansCurrently Insured
Unearned Premium Reserve (UPR) Premiums Received But Not Yet Amortized Into Earnings
Effective Risk In Force (RIF)
IIF x Expected Maximum Severity Of A Single Book (35%) Based On Historical Loss Experience
Loss Ratio Incurred Losses Divided By Net Earned Premiums
42Genworth Australia Mortgage Overview September 2011
Use Of Non-GAAP MeasuresThis presentation includes the non-GAAP1 financial measure entitled “net operating income (loss).” The chief operating decision maker evaluates segment performance and allocates resources on the basis of net operating income (loss). The company defines net operating income (loss) as income (loss) from continuing operations excluding net income attributable to noncontrolling interests, after-tax net investment gains (losses) and other adjustments and infrequent or unusual non-operating items. The company excludes net investment gains (losses) and infrequent or unusual non-operating items because the company does not consider them to be related to operating performance of the company’s segments and Corporate and Other activities. A significant component of net investment gains (losses) is the result of impairments, the size and timing of which can vary significantly depending on market credit cycles. In addition, the size and timing of other investment gains (losses) are often subject to the company’s discretion and are influenced by market opportunities, as well as asset-liability matching considerations. Infrequent or unusual non-operating items are also excluded from net operating income (loss) if, in the company’s opinion, they are not indicative of overall operating trends. While some of these items may be significant components of net income (loss) available to Genworth Financial, Inc.’s common stockholders in accordance with GAAP, the company believes that net operating income (loss), and measures that are derived from or incorporate net operating income (loss), are appropriate measures that are useful to investors because they identify the income (loss) attributable to the ongoing operations of the business. However, net operating income (loss) is not a substitute for net income (loss) available to Genworth Financial, Inc.’s common stockholders determined in accordance with GAAP. In addition, the company’s definition of net operating income (loss) may differ from the definitions used by other companies. Due to the unpredictable nature of the items excluded from the company's definition of net operating income (loss), the company is unable to reconcile its outlook for net operating income (loss) to net income (loss) available to Genworth Financial, Inc.’s common stockholders presented in accordance with GAAP.
1U.S. Generally Accepted Accounting Principles
43Genworth Australia Mortgage Overview September 2011
44Genworth Australia Mortgage Overview September 2011
This presentation contains selected operating performance measures including "insurance in force" or "risk in force" which are commonly used in the insurance industries as measures of operating performance.
Management regularly monitors and reports insurance in force and risk in force. Insurance in force for the international mortgage insurance business is a measure of the aggregate face value of outstanding insurance policies as of the respective reporting date. For the risk in force in the international mortgage insurance business, we have computed an “effective” risk in force amount, which recognizes that the loss on any particular loan will be reduced by the net proceeds received upon sale of the property. Effective risk in force has been calculated by applying to insurance in force a factor of 35% that represents the highest expected average per-claim payment for any one underwriting year over the life of the company’s businesses in Australia and New Zealand. The company considers insurance in force and risk in force to be a measure of the company’s operating performance because they represent a measure of the size of the business at a specific date which will generate revenues and profits in a future period, rather than a measure of the company’s revenues or profitability during that period.
These operating measures enable the company to compare its operating performance across periods without regard to revenues or profitability related to policies or contracts sold in prior periods or from investments or other services.
Definition of Select Operating Performance Measures

45Genworth Australia Mortgage Overview September 2011
This presentation contains certain “forward-looking statements” within the meaning of the Private Securities Litigation Reform Act of 1995. Forward-looking statements may be identified by words such as “expects,” “intends,” “anticipates,” “plans,” “believes,” “seeks,” “estimates,” “will” or words of similar meaning and include, but are not limited to, statements regarding the outlook for the company’s future business and financial performance. Forward-looking statements are based on management’s current expectations and assumptions, which are subject to inherent uncertainties, risks and changes in circumstances that are difficult to predict. Actual outcomes and results may differ materially due to global political, economic, business, competitive, market, regulatory and other factors and risks, including the following:Risks relating to the company’s businesses, including downturns and volatility in global economies and equity and credit markets, downgrades in the company’s financial strength or credit ratings, interest rate fluctuations and levels, adverse capital and credit market conditions, the valuation of fixed maturity, equity and trading securities, defaults, downgrade or other events impacting the value of the company’s fixed maturity securities portfolio, defaults on the company’s commercial mortgage loans or the mortgage loans underlying the company’s investments in commercial mortgage-backed securities and volatility in performance, goodwill impairments, default by counterparties, an adverse change in risk-based capital and other regulatory requirements, insufficiency of reserves, legal constraints on dividend distributions by subsidiaries, competition, availability, affordability and adequacy of reinsurance, loss of key distribution partners, regulatory restrictions on the company’s operations and changes in applicable laws and regulations, legal or regulatory investigations or actions, the failure or any compromise of the security of the company’s computer systems, the occurrence of natural or man-made disasters or a pandemic, the effect of the enactment of the Dodd-Frank Wall Street Reform and Consumer Protection Act, changes in the accounting standards issued by the Financial Accounting Standards Board or other standard-setting bodies and impairment of or valuation allowance against the company’s deferred tax assets; Risks relating to the International segment, including political and economic instability or changes in government policies, foreign exchange rate fluctuations, unexpected changes in unemployment rates, unexpected increases in mortgage insurance default rates or severity of defaults, the significant portion of high loan-to-value insured international mortgage loans which generally result in more and larger claims than lower loan-to-value ratios, competition with government-owned and government-sponsored enterprises offering mortgage insurance and changes in regulations; Other risks, including the possibility that in certain circumstances the company will be obligated to make payments to General Electric Company (GE) under the tax matters agreement with GE even if the company’s corresponding tax savings are never realized and payments could be accelerated in the event of certain changes in control and provisions of the certificate of incorporation and bylaws and the tax matters agreement with GE may discourage takeover attempts and business combinations that stockholders might consider in their best interests; andRisks relating to the company’s common stock, including the suspension of dividends and stock price fluctuation.
The company undertakes no obligation to publicly update any forward-looking statement, whether as a result of new information, future developments or otherwise.
Cautionary Note Regarding Forward-Looking Statements
Related Documents