GENOTYPIC AND PHENOTYPIC DIVERSITY IN CHICKPEA (Cicer arietinum L.) REFERENCE SET THESIS SUBMITTED TO OSMANIA UNIVERSITY FOR THE AWARD OF DOCTOR OF PHILOSOPHY IN GENETICS LALITHA NANUMASA DEPARTMENT OF GENETICS OSMANIA UNIVERSITY, HYDERABAD 2012

Welcome message from author
This document is posted to help you gain knowledge. Please leave a comment to let me know what you think about it! Share it to your friends and learn new things together.
Transcript

GENOTYPIC AND PHENOTYPIC DIVERSITY IN
CHICKPEA (Cicer arietinum L.) REFERENCE SET
THESIS SUBMITTED TO
OSMANIA UNIVERSITY FOR THE AWARD OF
DOCTOR OF PHILOSOPHY
IN GENETICS
LALITHA NANUMASA
DEPARTMENT OF GENETICS
OSMANIA UNIVERSITY, HYDERABAD
2012

CERTIFICATE
This is to certify that Ms. Lalitha Nanumasa has carried out the research work
embodied in the present thesis entitled ―Genotypic and Phenotypic Diversity in
Chickpea (Cicer arietinum L.) Reference set‖ for the degree of Doctor of
Philosophy under the joint-supervision of Dr. H.D. Upadhyaya, Assistant Research
Program Director-grain Legumes and Principal Scientist and Head Gene Bank,
International Crops Research Institute for the Semi- Arid Tropics (ICRISAT),
Patancheru and Prof. P .B. Kavi Kishor, Department of Genetics, Osmania University,
Hyderabad.
This is an original work carried out at ICRISAT and is satisfactory for the award of
Doctor of Philosophy. Any part of this work has not been submitted for the award of
any degree or diploma of any other University or Institute.
Dr. H.D. Upadhyaya
Supervisor
Prof. P. B. Kavikishor
Co-Supervisor

DECLARATION
I hereby declare that the research work presented in this thesis entitled ―Genotypic
and Phenotypic Diversity in Chickpea (Cicer arietinum L.) Reference set‖, has
been carried out under the supervision of Dr. H.D. Upadhyaya at International Crops
Research Institute for the Semi-Arid Tropics (ICRISAT), Patancheru and co-
supervision of Prof. P .B. Kavi Kishor, Department of Genetics, Osmania University,
Hyderabad.
This is the original and no part of the thesis has been submitted earlier for the award
of any degree or diploma of any University.
Date: 19.12.2012 (Lalitha Nanumasa)
Place: Hyderabad

ACKNOWLEDGEMENTS
This dissertation would not have been possible without the guidance and the help of
several individuals who in one way or other contributed and extended their valuable
assistance in the preparation and completion of this study.
First and foremost, I am sincerely obliged and indebted to my supervisor Dr. Hari Deo
Upadhyaya, Assistant Research Program Director-grain Legumes and Principal Scientist
and Head Gene Bank, International Crops Research Institute for the Semi Arid Tropics
(ICRJSAT), Patancheru, Andhra Pradesh, India, for his peer supervision, constructive
comments, enthusiastic discussions, endless support, encouragement and able
direction throughout my research project. It was indeed a rare privilege for me to
work under his able guidance. I also thank him from bottom of my heart for the
critical evaluation and emending suggestions in the preparation of scientific papers
for journals and in achieving the final form of dissertation.
I wish to record my profound gratitude and sincere thanks to the personification of
generosity and kindness to my co-supervisor Prof. P B Kavi Kishor, Department of
Genetics, Osmania University for his expedient advice, ever-encouraging suggestions,
timely help, invaluable support, kind concern and consideration regarding my
academic requirements during this tenure of research work.
I take this opportunity to thank Dr. C. L. L. Gowda (Director-Grain Legumes, ICRISAT),
ingenous suggestions, vivid support and valuable guidance, sustained encouragement
throughout my research work. With respect, regards and immense pleasure, I wish to
acknowledge and express sincere thanks from my heart to several scientists including
Dr. Rajeev Varshney (Director- Center of Excellence for genomics, ICRISAT), for the
valuable suggestions during the molecular data generation and analysis; Dr. Vincent
Vadez (Acting-Research Program Director-Dry lands Cereals and Principal Scientist, Plant
Physiology, ICRISAT), Dr. J. Kashiwagi (Crop Science Lab, Hokkaido University, Japan),
Dr. L. Krishnamurthy (Scientist, Plant Physiology Lab, Grain Legumes, ICRISAT), for
support during generation of phenotypic data for root traits; Dr. H. C. Sharma (Principal
Scientist-Entomology, ICRISAT), Dr. Mukesh Dhillon ( Senior Scientist, Department of
Entomology, IARI, New Delhi) for help and support during the entomology experiment. Dr.
Kanwar Sahrawat (Adjunct Scientist, GT3, ICRISAT), Dr. S. P. Wani (Principal Scientist-
Watersheds and Regional Theme Coordinator GT3: Water, Soil and Agro-biodiversity
Management, ICRISAT) for help during generation of protein data; Dr P. M. Salimath
(Director of Research), UAS, Dharwad for his valuable suggestions and constant
encouragement during my stay in Dharwad.
With immense pleasure, I express my cordial thanks to especially Mr. Sube Singh, Mr.
DVSSR Sastry, Mr. B. Ashok Kumar, Mr.M.Thimma Reddy, Mr.Venkat, and Mrs. Vineela. Words are less to express my gratitude to Mr. Sahadevan, Mr. Yusuf, Mr .Tirupathi
Reddy, Mrs. Prameela; Plant Physiology staff members, Mr. Shankariah, Mr. Jangaiah, Mr.
Laxmi Narayana, Mr. Prabhakar Reddy, Mr. Balwanth Reddy, for teaching me the field
work and GSL staff Mrs. Seetha Kannan, Mr. Eshwar, Mr. Soma Raju, Mr. Gafoor, Mr.
Malla Reddy for teaching me the lab work at the beginning of the research work at
IC'RJSAT and Mrs. Basama, Mrs. Nalini and Mr. Praveen at UAS, Dharwad for their kind
help, which enabled me to accomplish my doctoral research with ease.

I shall be failing in my duty if I do not express my cordial thanks to all my friends Dr.
Ramu, Dr. Spurthi, Dr.Bharathi, Dr. Seetharam, Dr.Vetriventhan, Dr.Jalaja, Rajesh, Pavan,
Tamil Selvi for their support during my happiness and hard times . I also thank Head,
Chairman- Board of Studies, Dean and staff at Department of Genetics and the Dean
Office of Osmania University, Hyderabad for their kind help and co-operation.
I also thank the Bioinformatics and Biometrics unit for the assistance given at the
time of need. Assistance rendered by the members of Central Support Lab, Dr.
Rosanna Mula, Coordinator (LSU), staff of LSU, Mr. Prasad, Mr. Damodar and library staff,
Mr. Gowtham for their excellent assistance during my research work at ICRISAT.
I feel blessed to have my parents who are the Almighty’s most treasured gift to me. I
feel scanty of words to magnitude the boundless love and tireless sacrifice and
affection showed on me by my parents, Late Mr. Yellaiah and Mrs. Sharada and
affection of my sister Saritha and brother Rajesh that I could attain academic heights
to accomplish my doctoral degree. And I express my deepest adoration to them for
teaching me the etiquettes of life.
I avail this opportunity to thank my husband Mr. Suresh and my daughter Baby
Utpreksha in my life, who were the constant inspiration for me to carry out the
research and gave emotional support whenever I had difficult times. I feel indebted to
my parent’s in-laws for their constant support and encouragement throughout the
tenure of research work.
I convey my whole hearted thanks to many of my well wishers and other friends
requesting their forgiveness for not mentioning them here by name.
Date: 19.12.2012 (LALITHA NANUMASA)
Place: Hyderabad

CONTENTS
Chapter
No. Title Page
No.
I INTRODUCTION
II REVIEW OF LITERATURE
III MATERIALS AND METHODS
IV RESULTS
V DISCUSSION
VI SUMMARY
VII LITERATURE
VIII APPENDICES

ABBREVIATIONS
AFLP Amplified Fragment Length Polymorphism
AMOVA Analysis of Molecular Variance
BLUPs Best Linear Unbiased Predictors
bp base pair
cm Centimeter
CTAB Cetyl Trimethyl Ammonium Bromide
DNA Deoxyribo Nucleic Acid
dNTP deoxy Nucleotide Tri-Phosphate
EDTA Ethylene Diamine Tetra Acetic acid
EST-SSR Expressed Sequence Tag-SSR
g Gram
GCV genotypic coefficient of variation
GD genetic distance
H' Shannon and Weaver diversity index
h b Heritability in the broad sense
HCL hydrochloric acid
Kg ha"1 Kilogram per hectare
LD linkage disequilibrium
M Molar
MCMC Markov Chain Monte Carlo
mg milligram
MgCL- Magnesium chloride
ml millilitre
mm milli metre
mM millimolar
MTAs Marker Trait Associations
NaCl Sodium chloride
ng nanogram
PCA Principal Component Analyses
PCoA Principle Coordinate Analysis
PCR Polymerase Chain Reaction
PCs Principal Components

PCV Phenotypic Coefficient of Variation
PIC Polymorphic Information Content
QTL Quantitative Trait Loci
RAPD Randomly Amplified Polymorphic DNA
REML Residual Maximum Likelihood
RFLP Restriction Fragment Length Polymorphism
RNA Ribonucleic acid
RNase Ribonuclease
Rpm revolutions per minute
SE Standard Error
SNP Single-Nucleotide Polymorphism
Ap Phenotypic standard deviation
SSR Simple sequence repeats
TASSEL Trait Analysis by association, Evolution and
Linkage
TBE Tris Borate EDTA
TE Tris EDTA
UPGMA Unweighed Pair Group Method based on Arithmatic
Average
UV Ultraviolet
V volt
% per cent
°C degree Celsius

LIST OF TABLES
Table
No
Title Page
No
1 Major Genebanks holding Chickpea germplasm
2 Core and mini core collections developed for ICRISAT mandate crops
3 Genomic resources available for Chickpea
4 Some Genetic Diversity studies in Chickpea
5 Geographic distribution of Chickpea germplasm with different seed types
from different countries
6 List of 300 accessions present in Chickpea reference set with five control
cultivars used in this study along with seed type and origin
7 Geographic distribution of Chickpea reference set accessions with different
seed types from different countries
8 Meteorological details of five environments were chickpea reference set was
evaluated
9 List of qualitative characters studied in chickpea reference set
10 List of quantitative characters studied in chickpea reference set
11 Details of 91 Chickpea SSR markers used to genotype Chickpea reference
set, chromosome location, repeat motif, forward and reverse primer
sequences
12 Frequency distribution of accessions for various qualitative traits in different
seed types and geographical regions in the Chickpea reference set
13 Variance due to genotypes (σ
2g) and genotype x environment interaction
(σ2ge), and residual, (σ
2e) in different environments for the quantitative traits
in the chickpea reference set
14 Mean (± Standard error) and range values for quantitative traits in different
environments and pooled over environments in the chickpea reference set
15 Means and variance for quantitative traits in different geographical regions of
chickpea reference evaluated in different environments and overall in pooled
analysis

16 Heritability, genotypic (GCV) and phenotypic coefficient of variance (PCV)
in the chickpea reference set evaluated in different environments and overall
in pooled analysis
17 Phenotypic correlation coefficients between 17 quantitative traits in chickpea
reference set evaluated during 2006-2007 postrainy season (E1), at ICRISAT,
Patancheru, India.
18 Phenotypic correlation coefficients between 17 quantitative traits in chickpea
reference set evaluated during 2007-2008 postrainy season (E2), at ICRISAT,
Patancheru, India.
19 Phenotypic correlation coefficients between 17 quantitative traits in chickpea
reference set evaluated during 2008-2009 postrainy season (E3), at ICRISAT,
Patancheru, India.
20 Phenotypic correlation coefficients between 17 quantitative traits in chickpea
reference set evaluated during 2008-2009 postrainy season (E4), at UAS,
Dharwad India.
21 Phenotypic correlation coefficients between 17 quantitative traits in chickpea
reference set evaluated during 2008-2009 spring season (E5), at ICRISAT,
Patancheru, India.
22 Phenotypic correlation coefficients between 17 quantitative traits in chickpea
reference set in pooled analysis.
23 Meaningful correlation (r>0.500) for quantitative traits in the chickpea
reference set evaluated in five environments and in pooled analysis
24 Shannon-weaver diversity (H') for qualitative and quantitative traits in
chickpea reference set evaluated during E1 (2006-07), E2 (2007-08), E3
(2008-09) post-rainy season at ICRISAT Centre, E4 (2008-09) post-rainy
season at UAS, Dharwad, E5 (2008-09) spring at ICRISAT, Patancheru and
pooled analysis
25 Shannon-weaver diversity (H') observed for qualitative traits in different seed
types and geographical regions in the chickpea reference set.
26 Shannon-weaver diversity (H') in different seed types observed for
quantitative traits in chickpea reference set evaluated during E1 (2006-07) , E2
(2007-08) , E3 (2008-09) post-rainy season at ICRISAT Centre , E4 (2008-
09) post-rainy season at UAS, Dharwad, E5 (2008-09) spring at ICRISAT
Patancheru and in overall pooled analysis

27 Shannon-weaver diversity (H') based on geographical origin observed for
quantitative traits in chickpea reference set evaluated during E1 (2006-07) , E2
(2007-08) , E3 (2008-09) post-rainy season at ICRISAT Centre, E4 (2008-09)
post-rainy season at UAS, Dharwad, E5 (2008-09) spring at ICRISAT,
Patancheru and in overall pooled analysis.
28 Percentage of variation (%) and vector loading explained by first ten Principle
component (PCs) estimated for 17 quantitative traits in chickpea reference set
evaluated during 2006-07 (E1) post-rainy season at ICRISAT Centre,
Patancheru, India
29 Percentage of variation (%) and vector loading explained by first ten Principle
component (PCs) estimated for 17 quantitative traits in chickpea reference set
evaluated during 2007-08 (E2) post rainy, at ICRISAT Centre, Patancheru,
India
30 Percentage of variation (%) and vector loading explained by first ten Principle
component (PCs) estimated for 17 quantitative traits in chickpea reference set
evaluated during 2008-09 (E3) post rainy, at ICRISAT Centre, Patancheru,
India
31 Percentage of variation (%) and vector loading explained by first ten Principle
component (PCs) estimated for 17 quantitative traits in chickpea reference set
evaluated during 2008-09 (E4) post rainy, at UAS, Dharwad, India
32 Percentage of variation (%) and vector loading explained by first ten Principle
component (PCs) estimated for 17 quantitative traits in chickpea reference set
evaluated during 2008-09 (E5) spring, at ICRISAT Centre, Patancheru, India
33 Percentage of variation (%) and vector loading explained by first ten Principle
component (PCs) estimated for 17 quantitative traits in chickpea reference set
in overall pooled analysis.
34 Phenotypic diversity index in chickpea reference set evaluated in different
environments at ICRISAT, Patancheru and UAS, Dharwad, India.
35 Mean (± Standard error), variance component and heritability in Chickpea
Reference set evaluated during (E3) 2008-09 post-rainy, (E5) spring season
for SPAD Chlorophyll Meter Readings (SCMR) related traits
36 Expression of drought tolerance related traits in chickpea reference set
evaluated in cylinders during (E2) 2007-08, (E3) 2008-09 post-rainy season at
ICRISAT Patancheru, India

37 Expression of drought tolerance related traits in chickpea reference set
evaluated in cylinders in overall pooled analysis
38 Phenotypic correlation coefficients between drought tolerance related traits in
chickpea reference set during, E2 (2007-08) post rainy season at ICRISAT,
Patancheru, India.
39 Phenotypic correlation coefficients between drought tolerance related traits in
chickpea reference set during E3 (2008-09) post rainy season at ICRISAT,
Patancheru, India
40 Phenotypic correlation coefficients between drought tolerance related traits in
chickpea reference set in pooled analysis.
41 Expression of resistance to H.armigera using detached leaf assay during
flowering stage in Chickpea Reference set evaluated during (E2) 2007-08,
(E3) 2008-09 post-rainy season at ICRISAT Patancheru, India.
42 Expression of resistance to H.armigera using detached leaf assay during
flowering stage in Chickpea Reference set evaluated during (E2) 2007-08,
(E3) 2008-09 post-rainy season at ICRISAT, Patancheru, India.
43 List of trait specific germplasm in the chickpea reference set
44 Allelic richness, major allele frequency, gene diversity, heterozygosity,
polymorphic information content (PIC), allele range, rare, common and most
frequent alleles of 91 SSR loci in the chickpea reference set (300 accessions)
45 Allelic richness, major allele frequency, gene diversity, heterozygosity,
polymorphic information content (PIC), allele range, rare, common and most
frequent alleles of 91 SSR loci of biological races in the chickpea reference
set (300 accessions)
46 Range and average gene diversity of both biological status and geographical
regions in the chickpea reference set
47 Details of the accessions present in four clusters identified by unweighted
neighbor joining tree based on 91 SSR markers in the chickpea reference set
48 Range and average gene diversity of both biological status and geographical
regions in the chickpea reference collection
49 Average logarithm of the probability of data likelihoods (LnP(D)) in the
chickpea reference set

50 Overall proportion of membership of the sample in each of the 13
subpopulations in the chickpea reference set
51 Summary statistics in chickpea reference set accessions based subpopulations
detected by STRUCTURE analysis using 91 SSR markers
52 AMOVA_Subpop-Pairwise Population Fst Values in the chickpea reference set
53 AMOVA_Subpop-Pairwise Population Matrix of Nei Genetic Distance
54 Analysis of molecular variance (AMOVA) based on 13 subpopulations (SP1 to
SP13) identified by software STRUCTURE in the chickpea reference set
55 Principal Coordinates Analysis (PCoA) of chickpea reference set accessions
using 91 SSR markers based on estimates of Nei (1973) distance
56 Marker trait associations (MTAs) detected for qualitative traits in the
Chickpea reference set
57 Marker trait associations (MTAs) detected for different traits in the Chickpea
reference set in five environments and in overall pooled analysis
58 List of highly significant (P<=0.001) marker trait associations detected in
2005-06 (E1) post rainy season at ICRISAT, Patancheru, India
59 List of highly significant (P<=0.001) marker trait associations detected in
2006-07 (E2) post rainy season at ICRISAT, Patancheru, India
60 List of highly significant (P<=0.001) marker trait associations detected in
2008-09 (E3) post rainy season at ICRISAT, Patancheru, India
61 List of highly significant (P<=0.001) marker trait associations detected in
2008-09 (E4) post rainy season at UAS, Dharwad, India
62 List of highly significant (P<=0.001) marker trait associations detected in
2008-09 (E5) spring at ICRISAT, Patancheru, India
63 List of highly significant (P<=0.001) marker trait associations detected in
overall pooled analysis data
64 List of markers associated more than one trait evaluated in the chickpea
reference set

LIST OF FIGURES
Fig.
No
Title Page
No.
1 Geographical distribution of 300 chickpea reference set accessions
2 Number of accessions in each seed types of the chickpea reference set
3 Heritability, genotypic (GCV) and phenotypic coefficient of variance
(PCV) in the chickpea reference set for 17 quantitative traits based on
pooled BLUPs of five environments
4a Frequency distribution of accessions for various qualitative traits in the chickpea
reference set : Frequency distribution of the chickpea reference set accessions
for Growth Habit
4b Frequency distribution of the chickpea reference set accessions for Plant
pigmentation
4c Frequency distribution of the chickpea reference set accessions for Flower color
4d Frequency distribution of the chickpea reference set accessions for Seed color
4e Frequency distribution of the chickpea reference set accessions for Seed shape
4f Frequency distribution of the chickpea reference set accessions for Seed dots
4g Frequency distribution of the chickpea reference set accessions for Seed surface
5a Scatter plot of first two principal components (PCs) of the chickpea reference
set accessions using pooled BLUPs of five environments for yield contributing
traits: Days to 50% flowering (DF) vs. plot yield (YKGH)
5b Days to maturity (DM) vs. Plot yield (YKGH)
5c 100 seed weight vs. Plot yield (YKGH)
6 Ward‘s clustering of the chickpea reference set accessions for geographic
origins based on scores of first three PCs
7 Dendrogram based on 7 qualitative traits of the chickpea reference set
accessions based on different seed types (Desi, Kabuli, Pea Shaped and Wild)
8 Distribution of number of alleles per locus among 91 SSR markers used for
genotyping the chickpea reference set
9a Unweighted neighbor-joining tree based on the simple matching dissimilarity
matrix of 91 SSR markers genotyped across the chickpea reference set
9b Factorial analysis based on the simple matching dissimilarity matrix of 91 SSR
markers genotyped across the chickpea reference set
10 Rate of change in Ln P(D) between successive K (K averaged over the five run)
in the chickpea reference set accessions
11a Population structure of the chickpea reference set based on 91 SSR markers

(k=13) revealed by STRUCTURE analysis (Bar plot in single lines)
11b Population structure of the chickpea reference set based on 91 SSR markers
(k=13) revealed by STRUCTURE analysis (Bar plot in multiple lines)
12 Principal coordinates analysis (PCoA) of the chickpea reference set accessions
using 91 SSR markers based on Nei (1973) distance estimates.

LIST OF PLATES
Plate.
No
Title Page
No.
1 Field Evaluation of the Chickpea Reference set at ICRISAT, Patancheru,
India
2 Field Evaluation of the Chickpea Reference set at UAS, Dharwad,
India
3 Diversity in Chickpea Germplasm at ICRISAT, Patancheru, India
4 Diversity for Foliage Color in Chickpea Reference set
5 Diversity for Leaf and Stem Type and Shape in Chickpea Reference set
6 Diversity for Flower Shape and Color in Chickpea Reference set
7 Diversity for Pod Shape and Color in Chickpea Reference set
8 Diversity for Pod Number in Chickpea Reference set
9 Diversity for Seed Shape and Color in Chickpea Reference set
10 PCR products tested for amplification on 1.2 per cent agarose gel in Chickpea
Reference set
11 Allele sizing of the data obtained from ABI 3730xl genetic analyzer using
Genotyper software version 4.0 (Applied Biosystems, USA) in Chickpea
Reference set
12 Pod borer screening of the chickpea reference set accessions- Detached leaf
bioassay
13 Phenotyping of the chickpea reference set for drought tolerance using PVC
cylinder technique
14 Chickpea reference set accessions showing diversity in root lengths

LIST OF APPENDIX
S.No Title Page No.
1 Scores of 7 qualitative traits for 300 accessions in chickpea reference set
2 Mean performance of 300 accessions in chickpea reference set accessions
for 17 quantitative traits based on overall pooled analysis

ABSTRACT
Chickpea reference set consisting of 300 accessions was evaluated at five
environments for 7 qualitative and 17 quantitative traits to study the phenotypic
diversity and to identify trait specific accessions for grain quality traits, resistance to
pod borer, for traits related to drought tolerance and also molecularly profiled using
91 SSR markers to study molecular genetic diversity, population structure and to
identify SSR markers associated with the agronomic, quality, pod borer and drought
tolerance related traits.
In REML analysis variance due to genotypes (σ2g) and genotype x environment
(σ2ge) were significant for all the traits except tertiary branches and pods per plant for
quantitative traits. On the basis of phenotypic dissimilarity between pair of
accessions, ten pairs of most diverse accessions were identified for use in crop
improvement program for developing high yielding cultivars with a broad genetic
base and for the development of mapping populations. On the basis of pooled BLUPs
(Best Linear Unbiased Predictors) of five environments, we have identified trait
specific accessions for economically important traits such as yield, pod borer
resistant, accessions with high protein content, anthocyanin content, drought tolerance
traits and its traits contributing to yield (10 accessions for each trait). These
accessions could be used in recombination breeding to develop cultivars with
desirable combination of traits.
The SSR markers detected a total of 2411 alleles with an average of 26.45 alleles per
locus. Of these, 2299 alleles were detected in cultivated types and 433 alleles in wild
types, of which 1980 were unique in cultivated, 114 in wild accessions. In cultivated
chickpea, desi accessions contained the largest number of unique alleles (864)
followed by kabuli (836) and pea type (52) which were specific to a particular
accession and useful for germplasm identification. The genetic diversity of chickpea
in this study was correlated well with actual classification of chickpea and showed
greater genetic distance among three seed types. Large molecular variation observed
in reference set, could be utilized effectively for selection of diverse parents for
breeding cultivars and development of mapping populations.
The STRUCTURE analysis provided the evidence for the presence of thirteen

subpopulations. A general linear model was implemented to identify the SSR markers
associated with the qualitative, quantitative and grain quality traits, resistance to pod
borer and for traits related to drought tolerance in chickpea reference set based on
population structure (Q matrix) and relatedness relationship. 64 (P≤0.001) significant
MTAs were detected involving 49 SSR markers in E1, with maximum phenotypic
diversity of 43.4% for anthocyanin content. 86 significant MTAs were detected
involving 46 SSR markers in E2 with maximum phenotypic diversity of 42% for
tertiary branches whereas in E3, 76 significant MTAs with 50 SSR markers and
maximum phenotypic diversity of 42.9% for leaf area, in E4 74 significant MTAs
with 52 SSR markers and maximum phenotypic diversity of 45.4% for apical
secondary branches and in E5 56 significant MTAs with 44 SSR markers and
maximum phenotypic diversity of 34.8% for plant width.
In pooled analysis, the number of significant MTAs (P≤0.001) were 27 for qualitative
traits with 21 markers, 76 (P≤0.001) for quantitative trait, two for SCMR, one for
protein content, two for pod borer resistance traits and 21 for drought related traits.
The major MTAs with <20% phenotypic variation across all the environments were 7
for qualitative, 39 for quantitative, 1 for SPAD and 8 for drought tolerance related
traits, as the major associations in chickpea reference set.
Hence, these most significant MTAs were believed to be associated with co-
localized/pleiotropic QTLs. In summary, the co-localization of specific
genes/QTLs/markers could be a better way to understand the molecular basis of
drought tolerance or of traits related to drought response and pod borer resistance
traits. The presence of several co-localized/pleiotropic QTLs verified the complex
quantitative nature of drought tolerance, pod borer resistance in chickpea and allowed
the identification of some important genomic regions for traits related to high yield,
high protein content, drought tolerance and resistance to pod borer. The results from
this research also demonstrated the use of reference set as association mapping panel
to determine marker-trait associations in chickpea for traits that could lead to effective
utilization of ex-situ conserved genetic resources.

Introduction

1. INTRODUCTION
Chickpea (Cicer arietinum L.) commonly known as Bengal gram or garbanzo bean, is
one of the oldest (earlier than 9500 BC) and widely cultivated pulse crops in over 50
countries of the world. It is a highly self-pollinating (Auckland and van der Maesen
1980) annual grain legume, ranking second among edible pulses in global markets
(Yadav et al., 2007). Chickpea is widely cultivated in the Mediterranean, North
Africa, the Middle East, and the Indian subcontinent. It is a member of the family
Leguminosae, sub-family Papilionoideae and tribe Vicieae. Chickpea most probably
originated in Southeastern Turkey adjoining Syria (Ladizinsky, 1975) and
subsequently spread to India and Europe (Singh and Auckland, 1975). Wild annual
Cicer originated mainly in the Mediterranean regions having a wide ecogeographic
range, differing in habitat, topographic and climatic conditions (Abbo et al., 2003;
Berger et al., 2003). Chickpea is generally grown across a wide temperature regime
ranging from <5 °C in sub-tropics to >30 °C in the arid tropics (Sinha, 1977).
Optimum growing conditions include 21-29 °C day and 18-26 °C night temperatures
with an annual rainfall of 600-1000 mm (Duke, 1981; Smithson et al., 1985;
Muehlbauer et al., 1988).
The world area under chickpea is about 11.98 Mha, with a total production of 10.89
Mt, and an average productivity of 0.91 t ha-1
(FAO, 2010). Important chickpea
producing countries are India (0.91 t ha-1
in 8.21 Mha), Pakistan (0.55 t ha-1
in 1.06
Mha), Turkey (1.20 t ha-1
in 0.44 Mha), Myanmar (1.5 t ha-1
in 0.27 Mha) and China
(2.83 t ha-1
in 0.003 Mha). Large variations in chickpea yield, from 0.36 t ha-1
in
Kenya to 2.83 t ha-1
in China are reported. Chickpea productivity records in the last
four decades revealed interesting trend: productivity consistently increased in India
and Mexico, declined in Turkey, Pakistan, and Iran.
Chickpea is the important grain legume grown for protein-rich seeds for human
consumption, restore and maintain the soil fertility by nitrogen fixing capability, and
fit very well in various cropping patterns. Over 90% of the chickpea is produced and
consumed in Asia (FAO, 2010). Chickpea seeds contain protein, fibre, calcium,
potassium, phosphorus, iron, zinc and magnesium along with appreciable quantities of
selenium, sodium and copper, which make it one of the nutritionally best composed
edible dry legumes, for human consumption (Esha, 2010). Chickpea seeds contain
23% protein, 64% carbohydrates, 47% starch, 5% fat, 6% crude fiber, 6% soluble

sugar and 3% ash (FAO, 2010). Chickpea like other beans is a good source of
cholesterol lowering fiber (Pittaway et al., 2006). In addition to lowering cholesterol,
the high fiber content prevents blood sugar levels from rising, making chickpea a
good choice for individuals with diabetes, insulin resistance or hypoglycemia
(McIntosh and Miller, 2001). The crop also enhances environmental sustainability due
to its nitrogen fixation ability and rotational benefit, all of which facilitate higher
cropping intensification (Miller et al., 2002). Hair like structures on the stems, leaves
and pods secrete acids that provide the first line defense against pests, reducing the
need for chemical sprays (Yadav et al., 2007).
Genetic diversity studies in a crop are important in management of genetic resources,
identification of duplicate accessions in the germplasm collection and use of genetic
resources in applied breeding programs. A large number of chickpea germplasm
accessions (more than 98,000) are conserved in several genebanks (Gowda et al.,
2011). Some of important genebanks that conserve large germplasm collection of
chickpea are International Crop Research Institute for Semi Arid Tropics (ICRISAT)
in India, International Center for Agricultural Research in Dry Areas (ICARDA) in
Syria, Vavilov institute in Russia, the USDA-ARS Regional Plant Introduction
Station at Pullman in the U.S and NBPGR, New Delhi, India. The genebanks at
ICRISAT and ICARDA, the two CGIAR centers have global responsibility for
chickpea germplasm. ICRISAT maintains the largest collection of 20,267 accessions
from 60 countries which include 18,392 landraces, 98 advanced cultivars, 1293
breeding lines, 288 accessions of wild Cicer species and 196 accessions with no
information on biological status.
Plant breeders have successfully improved the yield potential of most crops, which
has resulted in higher production in last four decades, but further progress is not
impressive. One of the main reasons for such a situation is the use of limited genetic
diversity by the plant breeders who tend to use their working collection of highly
adapted material (Evans, 1983; Upadhyaya et al., 2006b; 2011a) or advanced
breeding lines as parents and only a small proportion of the available germplasm has
been used in national and international breeding programs. In India, which has a
strong chickpea breeding program, 41% of the 126 cultivars released in the past four
decades have Pb 7 (desi type) in their pedigree followed by IP 58, F 8, S 26 (all desi)
and Rabat (kabuli, 34 g 100 seed -1
) (Kumar et al., 2004). In the breeding program at

ICRISAT, less than 1% of germplasm has been used in developing more than 3700
breeding lines during 1978-2008 (Upadhyaya et al., 2006b, 2009a). Of the 92
germplasm lines used, only 19 were kabuli types, 6 of which had large seed size
(>40g 100 seed -1
). L 550, a small seeded (20 g 100 seed -1
) kabuli cultivar was
frequently used (983 times) in the breeding program. One of the main reasons for low
use of germplasm in breeding programs is the lack of information on traits of
economic importance which show high genotype x environment interaction, and
require multilocational replicated evaluation to identify parents. Thus, the large
variability in the germplasm instead of prompting more use has created a situation of
not knowing where to begin (Upadhyaya et al., 2005). The importance of diverse
germplasm to generate new variability and to enhance the genetic yield potential and
to stabilize it against various biotic and abiotic stresses has been well established
(Singh, 1987; Upadhyaya et al., 2009a).
Various methods have been used to assess the genetic diversity in crops, such as
analyzing the range of morphological, agronomical and ecogeographical traits and
molecular tools, each with its own associated advantages and disadvantages (Gepts,
1995). Most plant traits are quantitative and are influenced by environment and
display high genotype-environment interaction. Phenotypic data therefore cannot
correctly reflect the genetic diversity among the germplasm accession. If genotypic
values can be predicted based on phenotypic data, then genetic distance based on
genotypic values among accessions can be measured more accurately (Hu et al.,
2000). Understanding the distribution of genetic diversity among individuals,
populations and genepools is crucial for efficient management of germplasm
collections and its use in crop improvement. Diversity analysis is routinely carried out
using sequencing of selected gene(s) or molecular marker technologies. Molecular
marker technologies are becoming increasingly important tools for genetic and
genomics studies, breeding and diversity research. The major advantage of molecular
and a biochemical marker is their genotypic nature which can reflect direct changes at
DNA sequence level.
Several DNA-based molecular markers are available for genetic diversity analysis for
most of the crops. The smaller core collection accessions have been characterized
initially using DNA markers such as random amplified fragment DNA (RAPD) in
common bean (Phaseolus vulgaris L.) (Skroch et al., 1998), potato (Solanum

tuberosum L.) (Ghislain et al., 1999) and isoenzyme markers in Wild barley
(Hordeum vulgare sp. spontaneum) (Liu et al., 2002). The AFLP markers have been
used for studying the variation in core subsets of oats (Fu et al., 2005). However, the
SSR markers are now the markers of choice in most areas of molecular genetics as
they are highly polymorphic even between closely related lines, require low amount
of DNA, can be easily automated for high throughput screening, can be exchanged
between laboratories and are highly transferable between populations. Microsatellite
(SSR) markers were utilized in apple (Malus spp.) (Hokanson et al., 1998), common
beans (Phaseolus vulgaris L.) (Blair et al., 2009) core collections and US peanut mini
core collection (Kottapalli et al., 2007) to reveal genetic diversity.
Molecular markers linked to major quantitative trait loci (QTLs) can greatly facilitate
breeding for complex traits through marker assisted selection (MAS) in segregating
generations. Linkage analysis and association mapping are two most commonly used
tools for dissecting complex traits and identifying major QTLs causing variation in
the traits of interest. Association mapping does not require a bi-parental cross derived
mapping population which is time consuming and expensive to develop. A
manageable diverse natural population is sufficient to carryout association mapping
and has become a promising approach for the dissection of complex traits in plants
(Wilson et al., 2004; Breseghello and Sorrells, 2006). Association mapping, also
known as linkage disequilibrium (LD) mapping, has emerged as a tool to resolve
complex trait variation down to the sequence level by exploiting historical and
evolutionary recombination events at the population level (Nordbourg and Tavare,
2002; Risch and Merikangas, 1996). Association mapping identifies QTLs by
examining the marker-trait associations that can be attributed to the strength of LD
between markers and functional polymorphism across a set of diverse germplasm.
Since its introduction to plants (Thornsberry et al., 2001), association mapping has
gained popularity in genetic research because of advances in high throughput genomic
technologies, interests in identifying novel and superior alleles, and improvements in
statistical methods. Information about the extent and genomic distribution of LD
within the population under consideration is of fundamental requirement for
association mapping (Stich et al., 2005).
The development of gene-based markers based on information derived from a model
plant is a key component. Upadhyaya et al., (2006), developed a global composite

collection of 3,000 accessions which included 1956 core collection (Upadhyaya et al.,
2001) accessions representing ICRISAT collection, 709 cultivated accessions
representing unique accession from ICARDA, 39 advanced breeding lines and
released cultivars, 35 distinct morphological variants, 20 wild species accessions and
241 accessions carrying specific traits such as tolerance/resistance to biotic, abiotic
stresses and important agronomic characters. Using the genetic structure, diversity
and allelic richness in composite collection, a genotype- based reference set of 300
accessions was developed for diverse applications in chickpea genomics and breeding
(Upadhyaya et al., 2008b). Further assessment of genetic diversity and dissection of
population structure, based on morpho-agronomic characters alone might be biased
because distinct morpho-types can result from few mutations and share a common
genetic background. Therefore present investigation was carried out with following
objectives:
1. To assess the phenotypic diversity in chickpea reference set for
morphological, agronomic, and grain quality traits, resistance to pod borer and
for traits related to drought tolerance.
2. To quantify the level of genetic diversity and determine population structure
of chickpea reference set using SSR markers.
3. To identify allelic variation associated with beneficial traits using association
mapping in the reference set of chickpea.
4. To identify most diverse accessions with beneficial traits for use in mapping
and improvement of chickpea.

Review of Literature

2. REVIEW OF LITERATURE
Chickpea (Cicer arietinum L.) is one of the oldest (earlier than 9500 BC) and widely
cultivated pulse crops in over 50 countries of the world. Chickpea is a member of the
West Asian Leolithic crop assemblage, associated with the origin of agriculture in the
Fertile Crescent, some 10,000 years ago (Lev-Yadun et al., 2000; Zohary and Hopf,
2000). South west Asia and the Mediterranean region are the two primary centres of
origin, and Ethiopia the secondary centre of diversity (Vavilov, 1926; 1950). It most
probably originated in Southeastern Turkey adjoining Syria. . The cultivated species,
C. arietinum is found only under cultivation and cannot colonize successfully without
human intervention. Three wild annual Cicer species, C. bijugum, C. echinospermum
and C. reticulatum, closely related to cultivated chickpea, cohabit in this area and
occur in weedy habitats, these three wild Cicer species, eight more wild Cicer species
occur naturally in Turkey, out of 43 known today in the Cicer genus (Van der
Maesen, 1987).
On the basis of Harlan and de Wet‘s (1971) definition, and results obtained from
crossability, biochemical or molecular diversity, and karyotypic studies, a revised
model of the wild annual Cicer gene pools has been proposed (Croser et al., 2003).
The primary gene pool of Cicer consists of Cicer arietinum and only one wild
species, the wild annual progenitor C. reticulatum. The secondary gene pool thus
consists of C. echinospermum only. C. bijugum, C. pinnatifidum and C. judaicum,
which have been reported to give hybrids readily when crossed with the cultivated
species (Verma et al., 1990; Singh et al., 1994; Singh et al., 1999a, b; Croser et al.,
2003). Ahmad et al. (2005) have proposed that the above three species should be
placed in the tertiary gene pool of chickpea, along with the remaining annual species
C. chorassanicum, C. yamashitae and C. cuneatum. Thus until proven these perennial
Cicer spp should be appropriately placed in the tertiary gene pool along with the six
other annual wild species.
Chickpea is known by several names, such as Garbanzo bean, Indian pea, Ceci bean,
Bengal gram, chana, kadale kaalu, sanagalu, shimbra, kadala. It has been an integral
part of agriculture since long time because of its nitrogen fixing ability in the field and
diversified uses as food and feed along with its importance in crop diversification. It
is a good source of energy, protein, minerals, vitamins, fibre and also contains
potentially health-promoting phytochemicals. The nutritional quality of seeds can

vary depending on the environment, climate, soil nutrient status, soil biology,
agronomic practices and stress factors (biotic and abiotic). Amino acid composition is
well balanced; with limited sulphur containing amino acids (methionine and cysteine),
and high lysine. Due to high protein content, it is used as a protein rich animal feed
and the vegetative biomass is used as a fodder.
2.1.1 Importance of genetic diversity
Diverse gene pools are the foundation for effective crop improvement programmes.
The genetic diversity in plant breeding is of paramount importance in developing high
yielding cultivars having resistance to biotic and abiotic stresses and with a broad
genetic base. The recognition of such diversity, its nature and magnitude are crucial to
any breeding program. The genetic variation in crop plants has been narrowed during
domestication due to continuous selection pressure for particular traits like high yield
or disease resistance. It is therefore important to study the genetic composition of the
germplasm and existing cultivars for comparison with their ancestors and related
species, to find new and useful genes, and provide information about the phylogenetic
relationship and molecular markers are now being widely used to classify the
germplasm, to establish genetic linkages between markers and traits of agronomic and
economic interest.
2.1.2 Germplasm collection and its uses
Genetic diversity in crop plants is continuously being lost in farmer‘s field and in
nature. In this context, genebanks assume paramount importance as reservoirs of
biodiversity and source of alleles that can be easily retrieved for genetic enhancement
of crop plants. Increasingly, efforts are being made to collect threatened landraces,
obsolete cultivars, genetic stocks and wild relatives of cultivated species (Ortiz et al.,
2004). All these materials are important for crop improvement because breeding gains
rely largely on access to the genetic variation in the respective gene pool.
International germplasm collections play a very important role in securing genetic
diversity and promoting its use. This has resulted in assemblage of large collections in
national and international genebanks. Some of major genebanks holding chickpea
germplasm are presented in Table1.

Table: 1 Major Genebanks holding chickpea germplasm (more than 1000
accessions)
Country Institute Total
Australia Australian Temperate Field Crops Collection (ATFCC), Horsham
Victoria
8655
Ethiopia Institute of Biodiversity Conservation (IBC), Addis Ababa 1173
Hungary Institute for Agrobotany, Tápiószele 1170
India Indian Agricultural Research Institute (IARI), New Delhi 2000
International Crop Research Institute for the Semi-Arid Tropics
(ICRISAT), Patancheru
20267
National Bureau of Plant Genetic Resources (NBPGR), New Delhi 16881
Iran College of Agriculture, Tehran University, Karaj 1200
National Plant Gene Bank of Iran, Seed and Plant Improvement
Institute (NPGBI-SPII), Karaj
5700
Mexico Estación de Iguala, Instituto Nacional de Investigaciones Agrícolas
(IA-Iguala ), Iguala
1600
Pakistan Plant Genetic Resources Institute (PGRP), Islamabad 2146
Russian
Federation
N.I. Vavilov All-Russian Scientific Research Institute of Plant
Industry (VIR), St. Petersburg
2091
Syria International Centre for Agricultural Research in Dry Areas
(ICARDA), Aleppo
13818
Turkey Plant Genetic Resources Department, Aegean Agricultural
Research Institute (AARI), Izmir
2075
Ukraine Institute of Plant Production n.a. V.Y. Yurjev of UAAS, Kharkiv 1021
USA Western Regional Plant Introduction Station, USDA-ARS, Pullman 6789
Uzbekistan Uzbek Research Institute of Plant Industry (UzRIPI), Botanica 1055
Total 93977
The present status of germplasm collections held at ICRISAT genebank are 1,19,739
accessions as on 15.10.2012 from 144 countries which include 1,17,032 cultivated
and 2,707 wild species of ICRISAT mandate crops and six small millets. The
collection includes 37,949 accessions of sorghum, 22,211 accessions of pearl millet,
20,267 accessions of chickpea, 13,632 accessions of pigeonpea, 15,445 accessions of
groundnut and 10,235 accessions of small millets (Upadhyaya et al., 2010a). Gradual
loss of variability from cultivated species and their wild forms and wild relatives is
due to the advent of advanced breeding lines and replacement of genetically variable
landraces by the improved, genetically uniform cultivars. A large number of
germplasm lines are distributed by the genebank for use in crop improvement
programs. ICRISAT genebank distributed more than 7, 00,000 samples of accessions
to scientists in India and 143 other countries. Of the germplasm supplied by the
genebank, a very small proportion has been used in crop improvement programs. For
example, at ICRISAT, between 1986 and 2008, a total of 10,331 advanced groundnut

breeding lines (ICGV #) were developed from thousands of crosses involving 1,270
unique parents, out of these only 171 were germplasm lines, which includes 10 wild,
out of 15,445 accessions (Upadhyaya et al., 2010a). This is mainly due to lack of
reliable information on large collections particularly for traits of economic importance
which show high genotype x environment interaction and require multilocational
replicated evaluation to identify parents for use by breeders (Upadhyaya et al.,
2010a).
In crops such as, wheat (Dalrymple, 1986); spring barley (Vellve, 1992); groundnut
(Jiang and Duan, 1998, Upadhyaya et al., 2005); chickpea and pigeonpea (Shiv
Kumar et al., 2004, Upadhyaya et al., 2006c, Upadhyaya et al., 2007b); only a small
proportion of germplasm has been used in breeding programs. For effective utilization
of existing genetic resources in research, it is necessary to characterize the germplasm
for identification of trait-specific sources for crop improvement. This requires a small
sample of germplasm lines, which represent the entire diversity present in the crop
species, multi-environmental evaluation data of these subsets, would greatly
encourage the breeders to utilize more germplasm lines in to their breeding program.
Thus, the concept of core collection was proposed.
2.1.3 Core collection
Frankel (1984) proposed the ‗core collection‘ concept, which would ‗represent with
a minimum of repetitiveness, the genetic diversity of a crop species and its
relatives‘. A core collection is a subset, consisting of ~10% of total accessions,
which between them capture most of the available diversity in the entire collection
(Brown, 1989a). Core collections are cost-effective means of identifying accessions
with desirable agronomic traits as well new sources of disease and pest resistance or
abiotic stress tolerance.
Ever since the concept of core collection was developed, a number of core collections
have already been established for many crop species including perennial glycine
(Brown et al., 1987); perennial medicago species (Diwan et al., 1994; Basigulp et al.,
1995); common bean (Tohme et al., 1995); okra (Mahajan et al., 1996); quinoa (Ortiz
et al., 1998); alfalfa (Skinner et al., 1999); sweet potato (Huaman et al., 1999);
safflower (Diwedi et al., 2005). Core collections developed for ICRISAT mandate
crops are listed in Table 2.

Upadhyaya et al., (2001a) developed a chickpea core collection of 1956 accessions
that consisted of 1465 desi, 433 kabuli, and 58 intermediate types representing
more than 85% variation of the entire collection based on geographical origin of
accessions and 13 quantitative traits. This core collection was subjected to multi-
environmental evaluation to identify diverse germplasm with beneficial traits.
2.1.4 Minicore collection
The germplasm collections held by most International Agricultural Research Centers
(IARCs) genebanks are very large in size. For example the IRRI genebank holds more
than 108,000 rice accessions; hence the size of core collection (~10%) will be about
11000 accessions, which again restricts its proper evaluation and use by breeders. To
overcome this, Upadhyaya and Ortiz (2001) postulated the minicore concept. A
minicore is core of core (10% of core or 1% of entire collection) representing the
species diversity. Upadhyaya and Ortiz (2001) developed minicore collection of
chickpea consisting of 211 accessions (Table 2). This strategy was followed by
scientists in different countries such USA (Holbrook and Dong, 2005), Japan (Ebana
et al., 2008), and it has been recognized worldwide as an ―International Public Good‖
(IPG). The reduced size of minicore collections has provided ample opportunities to
the breeders for their efficient and economic multi-environment evaluation, which has
lead to the identification of several new sources of variation for different traits for
utilization in crop improvement programs. Minicore collections developed for
ICRISAT mandate crops are listed in Table 2.
Table 2: Core and mini core collections developed for ICRISAT mandate crops
Crop Accessions Traits
Collection
developed
Accessions in
subset Reference
Chickpea
3350 Core 505 Hannan et al., 1994
16,991 13 Core 1,956 Upadhyaya et al.,2001
1956 22 Minicore 211
Upadhyaya and Ortiz,
2001
Groundnut
7,432 Core collection 831 Holbrook et al.,1993
15 Asian core 504 Upadhyaya et al.,2001b
14,310 14 Core 1,704 Upadhyaya et al.,2003
Valencia core 77 Dwivedi et al.,2008
1704 31 Minicore 184 Upadhyaya et al.,2002
Pigeonpea
12,153 14 Core 1,290 Reddy et al.,2005
1,290 33 Minicore 146 Upadhyaya et al.,2006c
Sorghum
33,100 7 Core 3,475
Prasada Rao and
Ramanatha Rao, 1995
22,473 20 Core 2,247 Grenier et al.,2001
40,000 Core 3,011 Dahlberg et al.,2004

Crop Accessions Traits
Collection
developed
Accessions in
subset Reference
2,247 21 Minicore 242 Upadhyaya et al.,2009b
Pearl
millet
16,063 11 Core 1,600 Bhattacharjee et al.,2007
20,766 12 Core (Augmented ) 2,094 Upadhyaya et al.,2009a
2,094 18 Minicore 238 Upadhyaya et al.,2010c
Finger
millet
5,940 14 Core 622 Upadhyaya et al.,2006b
Minicore 80 Upadhyaya et al.,2010b
Foxtail
millet 1,474 23 Core 155 Upadhyaya et al.,2008a
2.2 Genetics of Qualitative and Quantitative traits.
Most of the economically important characters in chickpea including yield are
complex and polygenically controlled. The expression of these traits is likely to be
affected to a greater extent by environmental factors and genotype x environment
interactions. A thorough understanding of genetic diversity for yield and its attributes,
extent of genetic variation and its heritability would help in developing strong crop
improvement programmes. Investigations on yield and its components made on
genetic variability, heritability, genetic advance, character association, direct and
indirect effects of component traits on grain yield and genetic diversity has been very
useful in plant improvement programmes.
A brief review available on above aspects in chickpea is presented in this section,
under the following sub-headings.
2.2.1 Studies on range of variation and variability parameters (Mean, Range,
heritability and genetic advance)
2.2.2 Correlation studies
2.2.3 Genetic divergence
2.2.1 Variability Studies
Phenotypic variability expressed by a group of genotypes in any species can be
partitioned into genotypic and phenotypic components. The heritable genotypic part
of the total variability and its magnitude influence the selection strategies to be
adopted by the breeder.

2.2.1.1 Qualitative traits
Chickpea germplasm has abundant genetic variation for all traits.
Plant characters often are referred to as simple morphological or complex agronomic
characters, depending on ease of classification, the number of genes that control them
and the importance of the environment in their expression. Qualitative characters have
phenotypes that can be divided into discrete classes.
Genetics of many qualitative traits have been reported by several investigators.
a. Plant pigmentation
Plant pigmentation is an important morphological descriptor, characterized by
presence or absence of anthocyanin pigment. It imparts purplish colour to different
parts of the plant and was found that low anthocyanin content is dominant over high
anthocyanin and light green colour (Rao et al., 1980). Pundir et al., (1985) reported
that 67.1% accessions of the ICRISAT germplasm collection are low in anthocyanin,
32.4% had no anthocyanin and the remaining 0.5% had high anthocyanin content and
also revealed that ICC 5325 has yellow-green foliage which is a rare occurrence.
Sandhu et al., (1993) reported a chickpea line ICC 6071 having anthocyanin
pigmentation on all parts of the plant and pigmentation being stable throughout the
crop growth period (germination to maturity). ICC 5763 had anthocyanin
pigmentation on the parts of the plant exposed to sunlight, the unexposed parts being
green (Mathur, 1998). Upadhyaya et al., (2001) evaluated chickpea core collection at
ICRISAT and reported that 652 accessions had no anthocyanin (33.40%), 1254 were
with low anthocyanin (64.24%), and 50 were with high anthocyanin pigmentation
(2.56%).
b. Flower colour
Flower colour is one of the most important diagnostic characters in chickpea and is
widely used as morphological marker in genetic studies and breeding work. Pundir et
al., (1985) at ICRISAT recognized three main flower colours in chickpea, pink
(71.0%), white (18.9%), light pink (9.4%), and a small proportion of dark pink, blue
and light blue. Gill and Cubero (1993) enumerated the dominance of purple flower
over white flower and reported that geographically, the pink flower colour dominates
in the Indian subcontinent and the white flower colour in the Mediterranean and
Andean regions, and Mexico. Pink and white as well as light pink flower colours

occur together in West Asia, Afghanistan and Ethiopia. Pink flower colour, which is
characteristic of desi type, was the most predominant, represented by 1329 of 1956
core subset accessions (67.94%), followed by white flower (24.59%), which is
characteristic of kabuli type (481 accessions) and light pink (6.03%, 118 accessions).
White flower with pink streaks was found in two accessions (0.10%) at ICRISAT
(Upadhyaya et al., 2001). Arshad et al., (2008) reported blue flower color in a disease
resistant, high yielding chickpea variety ―Thal 2006‖. Chaturvedi et al., (2009)
reported that 11 genotypes with white flower, two with purple flower, one with blue
flower and rest 74 with pink flowers among 88 chickpea genotypes collected from
various parts of India.
c. Growth habit
Growth habit is associated with early seedling establishment and maturity,
contributing to higher yield under adverse conditions like drought (Gupta, 1985;
Singh et al., 1997; Sabaghpour et al., 2003). The growth habit of Cicer varies from
prostrate to erect. Roberts (1986) and Roberts and Osei-Bonsu, (1988) presented
evidence that erect growth habit was dominant to prostrate habit and also reported that
prostrate type of growth habit may reduce seed yields. Semi-erect (80.73%) was the
most predominant growth habit (1579 accessions) followed by semi-spreading
(17.54%, 343 accessions), whereas prostrate growth habit was observed in only one
accession (0.05%) in chickpea core collection evaluated at ICRISAT (Upadhyaya et
al., 2001). One genotype exhibited prostrate growth habit whereas 24 were erect and
other 63 with semi-erect habitat from 88 chickpea genotypes collected from various
parts of the country (Chaturvedi et al., 2009).
d. Seed shape and Seed type
Seed shape and type are of interest to the breeders attempting to satisfy diverse
marketing criteria. There are three different seed shapes angular, owl and pea shaped
and three type‘s desi, kabuli and intermediate in chickpea (Upadhyaya et al., 2002)
seed types. Desi and kabuli chickpea differ in nutrition as crude fibre (Jambunathan
and Singh 1980 and Singh et al., 1984), acid detergent fibre and neutral detergent
fibre (Singh and van Rheenen 1994). The protein and oil (Muhammad et al., 2007)
were similar in these two groups (Jambunathan and Singh 1980). Breeders have found
it convenient to classify chickpea into two main types, namely desi (characterized by
small size, angular shape, and coloured seed with high percentage of fibre) and kabuli

(characterized by large size, ram‘s head shape and beige coloured seeds with a low
percentage of fibre). A third type, designated the intermediate, is characterized by
medium to small size, pea shape and cream coloured seeds. The desi type accounts for
about 85% of the world production, the remainder being kabuli. Hawtin and Singh
(1980) reported that there is a fairly clear distinction between the two types, which is
generally based upon seed shape and colour but also takes account of geographical
origin. Such round seeded types are generally designed ―intermediate‖ or ―pea‖ type
by breeders. Pundir et al., (1985) reported that 78.3% of ICRISAT germplasm
accounted angular shape, 15.46% were owl and 6.25% were pea shaped seeds. Desi
types account for about 85% of world production and the remainder being kabuli
(Singh et al., 1985). Desi seed type was found to be dominant over kabuli, while pea
type was dominant to both desi and kabuli types (Knights, 1980). It is commonly
accepted that kabuli (macrosperma) chickpea originated from desi (microsperma)
(Salimath et al., 1984). Upadhyaya et al., (2001) evaluated chickpea core collection
(1956 accessions) and reported that angular seed shape (74.90%), which is
characteristic of desi types, was most frequent (1465 accessions) followed by the owl
shape (22.14%) of kabuli type (433 accessions) and pea shape (2.97%) of the
intermediate type (58 accessions). In chickpea minicore collection (211 accessions),
159 entries were desi (75.4%), 44 were kabuli (20.9%), and 8 were intermediate
(3.8%) types, which corresponded very well with the number of desi (12,779,
75.5%), kabuli (3,528, 20.8%) and intermediate (621, 3.7%) types in the entire
collection of ICRISAT genebank (Upadhyaya et al., 2001).
e. Seed surface
Seed surface can have an overriding importance in determining market classes of
chickpea and in acceptance of improved cultivars. Three types of seed surface are
classified in chickpea, viz rough, smooth and tuberculated (Pundir et al., 1988). About
79.39% accessions of world germplasm collection of chickpea had rough seed
surface, 18.65% were smooth and 1.96% were tuberculated (Pundir et al., 1985). In a
core collection evaluated at ICRISAT, 1437 accessions were rough (73.47%), while
473 are smooth (22.34%) and 46 were tuberculated (2.35%) (Upadhyaya et al., 2001).

f. Seed colour
The utilization of seed of chickpea largely depends on its seed coat colour. Seed
colour is important with regard to consumer preference, which varies from region to
region. The variation for seed colour in chickpea is enormous. Seed coat colour is
known to change during seed development and ageing. Balasubramanian (1950a,
1950b) described thirteen seed colour classes ranging from yellow to dark brown.
Several factors are involved, which interact with each other, and some have
pleiotropic effects (Smithson et al. 1985). Of the 24 seed colours reported in the
chickpea core collection by Upadhyaya et al., (2001), yellow brown (61.06%) was the
most commonly represented (690 accessions) followed by beige (38.85%, 439
accessions). Orange was seen in only one accession (0.09%).
g. Seed dots
Dots on the seed testa, is a morphological trait which is characterised by the presence
or absence of small black dots on the seed surface. Minute black dots were present
(66.82%) on the seed testa of 1307 accessions and in the remaining 649 the black dots
were absent (33.18%) in chickpea core collection evaluated at ICRISAT (Upadhyaya
et al., 2001).
2.2.1.2 Quantitative Traits
In general most agronomic characters display a continuous distribution of phenotypes.
The variability is associated with the segregation of multiple minor genes or
polygenes, which have small individual effects and are influenced markedly by the
environment. Studies on quantitative variation in chickpea depicted that economic
traits such as plant height, pod number, number of branches, seed weight and yield are
quantitatively inherited. A thorough trait wise understanding of its genetic nature,
heritability and relationship with other characters is necessary for choosing
appropriate breeding and selection method in the crop improvement.
For the purpose of summarization, the traits studied were grouped into three broad
categories based on the life cycle of the chickpea plant (Gowda et al., 2011):
Vegetative traits: plant height, plant width, basal primary branches, apical primary
branches, basal secondary branches, apical secondary branches and tertiary branches;
Reproductive traits: days to 50 percent flowering, flowering duration, days to
maturity;

Yield and yield component traits: pods per plant, seeds per pod, 100-seed weight,
grain yield and productivity per day.
a. Vegetative traits:
(i) Plant height and width
Farmers, particularly in the Mediterranean region, desire mechanization of cultural
operations in chickpea cultivation. One reason for lack of satisfactory mechanization
is low plant height. Tall plants are often mentioned as ideal in chickpea for improving
the yield potential (Bahl et al., 1984; Singh et al., 1980). Plant height is receiving
attention as several workers (Bhardwaj and Singh, 1980, Kumar et al., 1981, Singh et
al., 1990, Misra, 1991, Sandhu et al., 1991, Dasgupta et al., 1992, Panchbhai et al.,
1992, Chavan et al., 1994, Bhatia et al., 1993, Rao et al., 1994, Naseem et al., 1995,
Singh et al., 1995, Mathur and Mathur 1996, Kumar et al., 2001, Somyasharma and
Singh, 2001, Burli et al., 2004) opined that taller stature is necessary for mechanical
harvesting and improving yield. Geneticists in the Indian subcontinent and in the
Mediterranean region have been devoting some of their resources in breeding plants
with taller stature. Arora, (1991), Patil, (1996) and Arora and Jeena, (2000) reported a
moderate variability in chickpea genotypes whereas low variability was reported by
Singh and Rao, (1991), Pushpa et al., 1993 and Mishra et al., 1994, Subhash et al.,
(2001) studied variability in 33 chickpea genotypes grown in five environments and
confirmed large variability for plant height. Chaturvedi et al., (2009) reported a wide
range of variation among 88 genotypes for plant height (31.5cm to 84.5 cm) with an
overall mean of 59.7 cm and reported, 48 genotypes having plant height above the
overall mean.
Plant width is an average spread of plant and is an important trait in evaluation of
chickpea germplasm. Upadhyaya et al., (2001) evaluated chickpea core collection and
reported that means of desi, kabuli, and intermediate types were significantly different
from each other for plant width and kabuli types have greater plant width than desi
and intermediate types. Bhat and Singh, (1980), Mishra et al., (1988) and Chavan et
al., (1994) reported that plant width increases yield as it is related with branching
pattern and number of pods per plant.
Variable estimates of heritability (h2b) have been reported for plant height and plant
width. While Samal and Jagdev, (1989), Sharma et al., (1990), Singh and Rao,

(1991), Mishra, (1991), Chavan et al., (1994), Mishra et al., 1994, Rao et al., 1994,
Patil, (1996), Mathur and Mathur, (1996), Dubey and Srivastav, (2007) and Gowda et
al., (2011) reported high h2b, Rastogi and Singh, (1977); Setty et al., (1977), Sharma
et al., 1989, Sandhu et al., (1991) and Panchbhai et al., (1992), Arora and Jeena,
(2000) and Dubey and Srivastav, (2007) reported moderate and Samal and Jagdev,
(1989), Salimath and Patil, (1990), Mishra, (1991), Chavan et al., (1994) and Mishra
et al., (1988) reported low estimates of h2b for plant height and width.
Similarly, variable genetic advance have been reported for plant height and plant
width. It was reported to be low by Sandhu et al., (1991) and Panchbhavi et al.,
(1992) for plant height and Mishra et al., (1988) for plant width, moderate by Sharma
et al., (1990), Chavan et al., (1994), Geletu et al., (1995), Kumar et al., (2000), Dubey
and Srivastav, (2007) and high by Mandal and Bahl, (1983), Dumbre et al., (1984),
Agarwal, (1986), Rao et al., (1994) , Patil, (1996) and Dubey and Srivastav, (2007)
for plant height and plant width.
(ii) Branches
The chickpea plant is a short bush with several major and minor branches. Branching
affects growth habit, and strongly influences the number and position of reproductive
structures that ultimately determine yield. Pundir et al., (1988) reported five groups of
branching patterns namely, basal primary branches, apical primary branches, basal
secondary branches, apical secondary branches and tertiary branches. Several workers
have reported the importance of number of primary branches. Rang, (1980), Kumar et
al., (1981), Singh et al., (1982), Mandal and Bahl, (1983), Rao et al., (1984),
Malhotra and Singh, (1989), Singh et al., (1990), Dasgupta et al., (1990), Sandhu et
al., (1991), Singh et al., (1993), Singh and Rao, (1991), Chavan et al., (1994), Ghirase
and Deshmukh, (2000) and Shaukatali et al., (2002) whereas Mishra et al., (1988),
Sharma et al., (1989), Malhotra and Singh, (1989), Arora et al., (1991), Singh and
Rao, (1991), Sandhu et al., (1991), Maynez et al., (1993), Jahagirdar et al., (1994),
Rao et al., (1994) and Patil, (1996) reported the importance of number of secondary
branches and Arora, (1991), Rao et al., (1994), Patil, (1996) reported the importance
of number of tertiary branches and reported that large are number of branches are
important from the yield point of view. Subhash et al., (2001) studied variability in 33
chickpea genotypes grown in five environments and confirmed large variability for
number of primary and secondary branches per plant. Upadhyaya et al., (2001)
evaluated chickpea core collection and reported that the variances between chickpea
types were homogeneous for number of apical secondary branches, basal secondary
branches and tertiary branches. Bhavani et al., (2009) studied role of genetic
variability in 27 chickpea accessions and reported wide variations in number of
primary branches.
Variable estimates of heritability (h2b) have been reported for number of branches per
plant. While Sharma et al., (1990), Mishra et al., (1991), Chavan et al., (1994), Jha et
al., (1997), Subhaschandra et al., (2001), Gowda et al., (2011) reported high h2b,
moderate by Patil, (1996), while Singh and Rao, (1991), Rao et al., (1994) and Rana
et al., (1995) reported low estimates of h2b for number of primary branches per plant.
Yadav et al., (1989), Singh and Rao, (1991), Jahagirdar et al., (1994), Patil, (1996)
and Chauhan and Singh, (2000) reported high h2b, moderate by Patil, (1996), while
Rao et al., (1994) reported low estimates of h2b for number of secondary branches per
plant Singh and Rao, (1991), Jahagirdar et al., (1994), Patil, (1996) and Chauhan and
Singh, (2000) reported high h2b, moderate by Patil, (1996), while Rao et al., (1994)
reported low estimates of h2b for number of tertiary branches per plant.
Similarly, variable genetic advance have been reported for number of primary and
secondary branches per plant. It was reported to be low by Sharma and Maloo,
(1988), Sandhu et al., (1991) and Arora and Jeena, (2000), moderate by Kumar et al.,
(2001 ) while high by Sharma et al., (1990) Mishra et al., (1991), Chavan et al.,
(1994), Rao et al., (1994), Patil, (1996) and Subhaschandra et al., (2001) for
number of primary branches. It was reported to be high by Sharma et al., (1989),
Jahagirdar et al., (1994), Patil, (1996) and Chauhan and Singh, (2000) for number of
secondary branches. It was reported to be high by Jahagirdar et al., (1994), Patil,
(1996) and Chauhan and Singh, (2000) and moderate by Chauhan and Singh, (2000)
for number of tertiary branches.
b. Reproductive traits:
(i) Days to 50 percent flowering and maturity
Time of flowering is the major component of crop environmental adaptation,
particularly when the growing season is restricted by climatic factors such as drought
and high temperatures (Subba Rao et al., 1995). Early flowering will help in
minimizing the losses due to biotic (pod borer) and abiotic (terminal moisture and

heat) stresses and in enhancing the per day productivity. So there is a need to develop
early maturing chickpea varieties with large biomass (Chaturvedi and Ali, 2004).
Early flowering, mediated by photoperiod insensitivity was suggested as a means to
increase chickpea adaptability (Sandhu and Hodges, 1971) but, no genetic studies
have been reported until recent years (Kumar and van Rheenen, 2000; Or et al.,
1999). In semi-arid habitats, the time of flowering is of great adaptive value for both
wild and cultivated plants (Or et al., 1999), as early flowering helps the crop to
mature before the onset of biotic and abiotic stresses (Subba Rao et al., 1995, Van
Rheenen et al., 1997).
In chickpea, the duration of flowering is a major yield determinant (Kumar and Abbo,
2001), phenology of the crop has an immense influence on productivity and stability.
Murfet and Reid, (1985) have reported that flowering genes influence maturity and
crop yield through their effects on the onset of reproductive phase, number of
branches, and number of flowers per node. The flowering time of chickpea genotypes
varies with latitude and temperature variations. In the trails conducted by ICRISAT
on 25 genotypes at three locations: Patancheru (18oN), Gwalior (26
oN) and Hisar
(29oN), the range for flowering time did not overlap (80-102 days in Hisar, 71-78 in
Gwalior and 40-61 days in Patancheru) and the mean number of days to 50 percent
flowering was 51, 76 and 96 for three locations, respectively. Pundir et al., (1988),
evaluated the world chickpea germplasm maintained at ICRISAT and listed 43
accessions that flowered in less than 39 days at Patancheru. Kumar and Abbo, (2001)
evaluated ICCV 96029 and control Pant G 114 for their flowering time at Patancheru
and Hisar. The number of days taken to flower by ICCV 96029 was 29 and 43 at
Patancheru and Hisar respectively. This might indicate that mutations for early
flowering genes also survived in sub tropical environments. Upadhyaya et al., (2001)
evaluated chickpea core collection (1956 accessions) for identification of diverse
germplasm lines for use in crop improvement and reported twelve early maturing
genotypes and also reported that means of desi, kabuli, and intermediate types were
significantly different from each other for days to maturity and kabuli types matured
later than desi and intermediate types. Kumar and Abbo, (2001) described the effect
of flowering time on chickpea adaptation, seed weight, seed yield and stability under
semi-arid Near–East and Indian sub continental environments. Subhash et al., (2001)
studied variability in 33 chickpea genotypes grown in five environments and
confirmed large variability for days to 50 percent flowering and days to maturity.

Sandhu et al., (2002) evaluated three genotypes (super early ICCV 96029, early ICCV
2 and late flowering control PBG 1) on three different sowing dates, and reported that
ICCV 96029 flowered in 28-35 days followed by, ICCV 2 in 31- 40 days, while PBG
1 took twice the number of days to flower than ICCV 96029 and ICCV 2 in all three
sowing dates. Kumar and Johansen, (2002) reported that the super early genotype
ICCV 96029 took 43 days to flower and matured in 128 days at Hisar in early
November sown crop. Upadhyaya et al., (2007) identified six most early maturing
genotypes by evaluating twenty eight early maturing genotypes selected from core
and entire collection of ICRISAT genebank. Chaturvedi et al., (2009) evaluated 88
chickpea lines and reported that days to 50 percent flowering varied from 36 to 103
days with an overall mean of 87 days and confirmed that 44 lines flowered earlier
than the control cultivar (96 days). Similarly days to maturity varied from 116 days to
137 days with an overall mean of 130 days and 37 lines took less number of days to
mature than the overall mean. Agarwal, (1985), Shaukatali et al., (2002) and Dubey
and Srivastav, (2007) reported high variability for days to 50% flowering whereas
Dasgupta et al., (1992) Rao et al., (1994) and Rao and Kumar et al., (2000) reported
moderate variability for days to 50% flowering.
Variable estimates of heritability (h2b) have been reported for days to 50 percent
flowering and maturity. While Chandra, (1968); Joshi, (1972); Agarwal, (1985),
Samal and Jagdev, (1989); Sharma et al., (1990); Misra, (1991); Singh and Rao,
(1991); Panchbhavi et al., (1992); Chavan et al., (1994); Jahagirdar et al., (1994);
Mathur and Mathur, (1996), Arora and Jeena, (2000), Burli et al., (2004); Dubey and
Srivastav, (2007), Upadhyaya et al., (2007) and Gowda et al., (2011) reported high
h2b for days to flowering and maturity.
Similarly, variable genetic advance have been reported for days to flowering. It was
reported to be low by Sharma et al., (1990), Misra, (1991) and Rao et al., (1994) and
moderate by Arora, (1991), Arora and Jeena, (2000), while high by Agarwal, (1985),
Jahagirdar et al., (1994) Burli et al., (2004) and Dubey and Srivastav, (2007), for days
to flowering and Mishra et al., (1994) for days to maturity.

c. Yield and yield component traits:
The major yield components of chickpea are pod number per plant, seed number per
pod and 100-seed weight.
(i) Pods per plant and Seeds per pod
In chickpea the number of pods per plant and seeds per pod are directly correlated
with seed yield (Zafar and Khan, 1968, Gupta et al., 1974, Katiyar, 1975, Bhat and
Singh, 1980, Bhardwaj and Singh, 1980, Kumar et al., 1981, Deshmukh and Bhapkar,
1982a, Singh et al., 1982, Singh and Paroda, 1986, Mishra et al., 1988, Fillipetti,
1990, Arora, 1991, Sandhu et al., 1991, Dasgupta et al., 1992, Bhatia et al., 1993,
Chavan et al., 1994, Jahagirdar et al., 1994, Mishra et al., 1994, Rao et al., 1994,
Patil, 1996, Jha et al., 1997, Kumar, 2001, Upadhyaya et al., 2002, Burli et al., 2004
and Dubey and Srivastav, 2007 ). Normally single flowers are borne on pedicels
suspended by single peduncles in the axils of the leaves, at the rate of one pedicel
(one flower) per peduncle which contributes to more stable yield (Smithson et al.
1985). Sheldrake et al., (1978) obtained 613% higher yield in double podded plants
compared to single podded plants. Singh and van Rheenen, (1994) suggested double
poddedness can contribute positively to higher productivity in chickpea. Upadhyaya
et al., (2001) evaluated chickpea core collection and reported that means of desi,
kabuli, and intermediate types were significantly different from each other for pods
per plant and kabuli types have the lowest average number of pods than desi and
intermediate types. Bhavani et al., (2009) studied role of genetic variability in 27
chickpea accessions for 12 quantitative traits and reported a wide variation in number
of seeds per pod and pods per plant. Chaturvedi et al., (2009) reported varied number
of pods per plant from 19 to 64 in six genotypes with overall mean of 37 pods.
Twenty genotypes exhibited higher number of pods per plant than the best control
cultivar (45). The mean number of seeds per pod varied from 0.9 to 2.2 with overall
mean of 1.4 seeds and 4 genotypes had more number of seeds per pod than the overall
mean.
Estimates of heritability (h2b) for number of pods per plant varied from high (Joshi,
1972, Mishra et al., 1988; Samal and Jagdev, 1989, Mishra, 1991; Kumar et al., 1991;
Singh and Rao, 1991, Dasgupta et al., 1992; Chavan et al., 1994, Jahagirdar et al.,
1994; Mishra et al., 1994; Mehndi et al., 1994, Rao et al., 1994; Mathur and Mathur,
1996, Patil, 1996, Arunkumar et al., 1998; Kumar, 2001, Narayana and Reddy, 2002,

Sial et al., 2003; Dubey and Srivastava, 2007 and Gowda et al., 2011) to low (Sandhu
et al., 1991; Mishra et al., 1994; Rao et al., 1994, Rana et al., 1995 and Arora and
Jeena, 2000). While moderate heritability for seeds per plant was reported by Pandey
et al., 1989 and low heritability was reported by Pundir et al., (1991) and Panchbhavi
et al., (1992). Low to moderately high heritability was reported by Rao et al., 1994,
Iqbal et al, 1994 and Arora and Jeena, 2000 low estimates of h2b for pods per plant as
reported by Sandhu et al., (1991); Mishra et al., (1994); Rao et al., (1994) and Rana et
al., (1995). For seeds per pod also varying estimates of h2b have been reported. Low
to moderately high h2b estimates were reported by Iqbal et al., (1994), moderate h
2b
estimates were reported by Pandey et al., (1989), low estimates were reported by
Pundir et al., (1991) and Panchbhavi et al., (1992);
The expected genetic gain was reported to be low (Agarwal, 1985, Panchbhavi et al.,
1992) for number of seeds per plant and pods per plant, high for pods per plant by
Jivani and Yadavendra, (1988); Mishra et al., (1991), Kumar et al., (1991), Chavan et
al., (1994), Jahagirdar et al., (1994), Mishra et al., (1994), Rao et al., (1994), Patil,
(1996), Arunkumar et al., (1998), Kumar, (2001) and Dubey and Srivastav, (2007).
(ii) Seed weight and size
Seed size (as measured by 100-seed weight) is not only the most important yield
component (Singh and Paroda, 1986), but also an important criterion for consumer
preference (Deshmukh and Bhapkar, 1982a, Mandal and Bahl, 1983, Agarwal, 1985,
Salimath and Bahl, 1985, Singh, 1987, Malik et al., 1988, Fillipetti, 1990, Salimath
and Patil, 1990, Sharma et al., 1990, Singh et al., 1990, Bhatia et al., 1993, Maynez
et al., 1994, Bhoyta et al.,1994, Rao et al., 1994, Patil, 1996, Shaukatali et al., 2002
). Tomar et al., (1982) reported that small-seeded cultivars were phenotypically more
stable than large-seeded cultivars. Small-seeded cultivars are a major hurdle in the
large-scale introduction of winter sowing of chickpea (Malhotra et al., 1997).
Therefore improvement in seed size is an important goal in chickpea breeding
programmes. Yadav and Sharma, (1999) evaluated 108 kabuli chickpea accessions to
study various seed quality characteristics under irrigated conditions and they observed
high variation in 100-seed weight. Upadhyaya et al., (2001) evaluated chickpea core
collection and reported that means of desi, kabuli, and intermediate types were
significantly different from each other for 100-seed weight and kabuli types have the
highest 100-seed weight than desi and intermediate types. Bhavani et al., (2009)

studied role of genetic variability in 27 chickpea accessions for 12 quantitative traits
and reported a wide variation in 100- seed weight. Chaturvedi et al., (2009) reported
that the 100-seed weight ranged from 10.2g to 36.6g with the overall mean of 19.2g.
Twenty six genotypes were at par with overall mean, whereas 24 genotypes showed
larger 100-seed weight than the large seeded control cultivar.
Varying estimates of heritability (h2b) have been reported for 100-seed weight. While
Mandal and Bahl, (1983); Agarwal, (1985); Salimath and Bahl, (1985); Salimath and
Patil, (1985); Samal and Jagdev, (1989); Sharma et al., (1990); Kumar et al., (1991);
Mishra et al., (1991); Sandhu et al., (1991); Singh and Rao, (1991); Dasgupta et al.,
(1992); Chavan et al., (1994); Jahagirdar et al., (1994); Rao et al., (1994); Patil,
(1996); Tripathi, (1998); Subhaschandra et al., (2001); Saleem et al., (2002); Toker,
(2004); Burli et al., (2004); Dubey and Srivastav, (2007) and Gowda et al., (2011)
reported high h2b for 100-seed weight; whereas Sandha and Chandra (1969), Joshi,
(1972), Rastogi and Singh, (1977), Sandhu et al., (1991) and Singh et al., (1992)
observed moderate heritability for 100-seed weight.
Similarly, variable genetic advance have been reported for 100-seed weight. It was
reported to be low (Agarwal,1985; Mishra et al., 1991; Sandhu et al., 1991; Arshad et
al., 2003, 2004) and moderate (Agarwal,1985; Mishra et al., 1991) to high (Mandal
and Bahl, (1983); Agarwal, (1985); Sharma et al., (1990); Kumar et al., (1991);
Jahagirdar et al., (1994); Rao et al., (1994); Patil, (1996); Mathur and Mathur, 1996;
Tripathi, (1998); Nimbalkar, 2000; Burli et al., (2004) and Dubey and Srivastav,
(2007)).
(iii) Grain yield and productivity
Grain yield of chickpea is a quantitative character which is influenced by many
genetic factors as well as environmental factors (Muehlbauer and Singh, 1987). Grain
yield per plant is the major determinant of plot yield (Deshmukh and Bhapkar, (1982),
Islam et al., (1984), Malik et al., (1988), Mishra et al., (1988), Reddy and Rao,
(1988), Fillipetti, (1990), Patil, (1996), Arora, (1991), Sandhu et al., (1991), Singh
and Rao, (1991), Dasgupta et al., (1992), Bhatia et al., (1993), Maynez et al., (1993),
Jirali et al., (1994), Rao et al., (1994), Srivastav and Jain, (1994), Wanjari et al.,
(1996), Rao and Kumar, (2000), Kumar, (2001), Burli et al., (2004) and Dubey and
Srivastav, (2007). Although direct selection for grain yield could be misleading,
indirect selection via yield related characters with high heritability might be more

effective (Toker, 1998). Raju et al., (1978) reported high genetic variability,
heritability, genetic advance and trait correlations with respect to yield and its
components in chickpea. Pundir et al., (1991) evaluated twenty-five short and
medium duration chickpea germplasm accessions of diverse geographic origin and
reported wide variation for physio-morphic and yield traits. Bakhsh et al., (1998)
reported a consistent and positive association of biological yield per plant, pods per
plant, harvest index and secondary branches per plant with grain yield. Ali et al.,
(1999) reported that yield was accounted by the plant height, number of secondary
branches and pods per plant, under normal field conditions. The findings are
consistent with the results obtained by Ghafoor et al., (1990) and Khattak et al.,
(1995, 1997, and 1999) in mungbean. Upadhyaya et al., (2001) evaluated chickpea
core collection and reported that means of desi, kabuli, and intermediate types were
significantly different from each other for plot yield and kabuli types have the lowest
plot yield than desi and intermediate types. Saleem et al., (2002) observed high co-
efficient of variability for grain yield and other yield parameters in chickpea. Raval
and Dobariya, (2003) estimated genetic variability and interrelationships among
thirteen yield components in chickpea. Arshad et al., (2004) reported high range of
yield per plant for twenty-four varieties of chickpea. Ali et al., (2002), Kaur et al.,
(2004), Qureshi et al., (2004), Sharma et al., (2005), Singh, (2007) and Sidramappa et
al., (2008) reported that parameters with high genetic variability could be focused for
genetic improvement in chickpea. Renukadevi and Subbalakshmi, (2006) reported the
positive direct effect of number of branches, pods per plant and 100-seed weight on
yield per plant in chickpea genotypes. Bhavani et al., (2009) studied genetic
variability in 27 chickpea accessions on 12 quantitative traits and reported a wide
range of variation in plot yield. Chaturvedi et al., (2009) evaluated 88 chickpea lines
collected from various parts of the country and reported that the mean yield per plant
ranged from 3.4g to 14.4g with overall mean of 8.7g.
Variable estimates of h2b for yield have been reported. Some workers have reported
low h2b (Salimath and Patil, 1990, Sharma et al., 1990, Panchbhai et al., 1992, Rao et
al., 1994 and Wanjari et al., 1996), whereas others have reported moderate h2b
estimates (Mandal and Bahl, 1980, Wanjari et al., 1996 and Arora and Jeena, 2000),
and still others reported high estimates for seed yield (Patil and Phandnis, 1977,
Mishra et al., 1988, Sandhu et al., 1991, Singh and Rao,1991, Singh et al., 1993,
Chavan et al., 1994, Jahagirdar et al., 1994, Mehndi et al., 1994, Mishra et al., 1994,

Mathur and Mathur, 1996, Patil, 1996, Arunkumar et al., 1998, Sandhu et al., 1999,
Nimbalkar, 2000, Kumar, 2000, Singh et al., 2003, Dubey and Srivastav, 2007 and
Gowda et al., 2011). While h2b for seed yield varied from low, moderate and high
(Mehndi et al., 1994, Arshad et al., 2003, 2004, Upadhyaya et al., 2007). Low to
moderately h2b high estimates reported by Iqbal et al., (1994).
Variable estimates of h2b for yield per plant have been reported. Samal and Jagdev,
(1989); Jahagirdar et al., (1994); Singh and Rao, (1991); Chavan et al., (1994);
Gowda et al, (2011) reported high h2b. While low, moderate to high estimates where
reported by Iqbal et al., (1994).
Similarly, variable genetic advance have been reported for seed yield and yield per
plant. It was reported to be high by Mishra et al., (1988), Chavan et al., (1994),
Dasgupta et al., (1994), Jahagirdar et al., (1994), Rao et al., (1994), Patil, (1996),
Arunkumar et al., (1998), Jeena and Arora, (2000a, b), Subhash et al., (2001) and
Dubey and Srivastav, (2007), while moderate by Mandal and Bahl, 1980, Mishra et
al., 1991 and Arora and Jeena, 2000 and low by Wanjari et al., 1996. Low for seed
yield per plant by Sharma et al., (1990), Misra, (1991) and Panchbhai et al., (1992),
Gowda et al, (2011) and for seed yield by Chavan et al., 1994, Rao et al., (1994),
Misra et al., (1994) and Mathur and Mathur, (1996), Patil et al., (1996), Gowda et al,
(2011).
2.2.2 Correlation among traits
The correlation analysis helps to determine the nature and degree of relationship
between any two measurable characters. Correlation among traits may result from
pleiotropy or physiological associations among characters, which often indicate useful
selection indices for two or more traits. Study of correlations is important to know the
relationship between traits and co-adapted gene complexes. It also provides
information on correlated response.
Yield is the end product of many complex component characters, which singly or
jointly influence the yield. Yield does not possess genes for per se as such. Therefore,
selection of a genotype based on yield alone is likely to be ineffective. The efficiency
of selection for yield mainly depends on the direction and magnitude of association
between yield and its components (Breese, 1989). The studies on association of
various yield components with grain yield in chickpea are reviewed here under:-

Characters Association References
Days to 50 percent flowering Positive Paliwal et al., 1987;
Mishra, 1991;
Choudary et al., 1992;
Chavan et al., 1994;
Vijayalakshmi et al., 2000;
Upadhyaya et al., 2001;
Saleem et al., 2002;
Negative Khorgade, 1988;
Narayana and Reddy, 2002;
Sial et al., 2003 ;
Plant height Positive Khan and choudary, 1975;
Mandal, 1977;
Sharma et al., 1989;
Yadav, 1990;
Mishra,1991;
Choudary et al., 1992;
Roshanlal et al., 1993;
Bhambota et al., 1994;
Naseem et al., 1995;
Rao, 1998;
Tripathi, 1998;
Yucel et al., 2006;
Negative Govil, 1980;
Salimath and Patil, 1990 ;
Number of primary branches
per plant
Positive Katiyar et al., 1977;
Jatasra et al., 1978;
Mishra et al., 1988;
Sandhu et al., 1988;
Sharma and Maloo.1988 ;
Sandhu and Mandal, 1989;
Uddin et al., 1990;
Chavan et al., 1994;
Sarvaliya and Goyal, 1994a,1994b;
Geletu et al., 1995;
Singh et al., 1995;
Rana et al., 1995;
Patil, 1996;
Rao, 1998;
Tripathi, 1998;
Bakhsh et al., 1998,
Vijayalakshmi et al., 2000;
Upadhyaya et al., 2001;
Saleem et al., 2002;
Arshad et al., 2002;
Narayana and Reddy, 2002;
Raval and Dobariya, 2003 ;
Sial et al., 2003;
Arshad et al., 2004 ;
Hassan et al., 2005;
Yucel et al., 2006;
Babar et al., 2008;
Malik et al., 2010;
Negative Singh et al., 1989;
Patil, 1996;
Number of secondary
branches per plant
Positive Upadhyaya et al., 2001;
Saleem et al., 2002,
Arshad et al., 2002;
Narayana and Reddy, 2002;
Raval and Dobariya, 2003 ;

Sial et al., 2003;
Arshad et al., 2004 ;
Hassan et al., 2005;
Yucel et al., 2006;
Babar et al., 2008;
Malik et al., 2010;
Negative Sandhu and Singh,1970;
Number of tertiary branches
per plant
Positive Uddin et al., 1990;
Chavan et al., 1994;
Upadhyaya et al., 2001;
Saleem et al., 2002,
Yucel et al., 2006;
Babar et al., 2008;
Malik et al., 2010;
Negative Patil,1996;
Pods per plant Positive Dasgupta et al., 1992;
Bhatia et al., 1993;
Roshanlal et al., 1993;
Bhoyta et al., 1994;
Bhambopta et al., 1994;
Rao et al., 1998;
Berger and Turner, 2000;
Vijayalaxmi et al., 2000;
Guler et al., 2001;
Narayana and Reddy, 2002;
Negative Fillipetti,1990;
Kharat et al., 1991;
Dasgupta et al., 1992;
Singh et al., 1995;
Berger and Turner, 2000;
100-Seed weight Positive Benjamini, 1981;
Singh, 1982;
Tomar et al., 1982;
Salimath and Bhal,1986;
Malik et al., 1988;
Sandhu and Mandal, 1989;
Sandhu et al., 1989;
Mishra et al., 1994;
Jirali et al., 1994;
Srivastava et al.,. 1994;
Naseem et al., 1995;
Vijayalaxmi et al., 2000;
Sial et al., 2003;
Arshad et al., 2004;
Hassan et al., 2005;
Babar et al., 2008;
Negative Khan and choudary, 1975;
Singh et al., 1976;
Narayana and Macefield, 1976;
Rostagi and Singh,1977;
Fillipetti,1990;
Roashanlal et al., 1993;
Chand et al., 1995;
Reviews on inter-relationship between traits other than grain yield are presented
below

Traits Associated traits Direction Author
Days to 50 percent
flowering
Flowering duration, days to
maturity
Positive Upadhyaya et al., 2001;
Flowering duration, number of
primary and secondary
branches, pods per plant.
Negative Upadhyaya et al., 2007;
100-seed weight
Seeds per pod Negative Khorgade et al., 1995;
Plant height Negative Mathur and Mathur, 1996;
Protein content Negative Pundir et al., 1991;
Number of branches Pods per plant Positive Upadhyaya et al., 2007;
Flower colour Seed shape Positive Upadhyaya et al., 2001;
Days to maturity Apical secondary branches Positive Upadhyaya et al., 2007;
Seeds per pod 100-seed weight Negative Pundir et al., 1991;
Pods per plant 100-seed weight Negative Upadhyaya et al., 2007;
Jivani and Yadavendra (1988) reported that number of branches per plant, pods per
plant and seed weight should be given importance in direct selection for increased
yield owing to their greater direct effects on yield. Sharma and Maloo (1988) showed
that pod per plant was the character to have greatest influence on seed yield followed
by number of primary branches. Days to maturity, pods per plant, 100 seed weight,
and conventional harvest index had positive direct effects on yield per plant (Uddin et
al., 1990).Bhambota (1994) observed that pods per plant and plant height had
considerable positive direct effect on seed yield. Number of branches had a negative
direct effect on yield but a positive indirect effect via pods per plant. Chavan et al.
(1994) concluded that branches per plant, pods per plant should be used as selection
criteria for yield improvement. Sarvaliya and Goyal (1994a) found that number of
pods per plant and 100-seed weight had high direct effect on seed yield.
Bhattacharya et al. (1995) concluded that days to 50 percent flowering influence seed
yield greatly under moisture stress condition. Arora and Jeena (1999) in a study of
path analysis in 43 genotypes indicated that plant height; pods per plant were
important characters for seed yield. Khedar and Maloo (1999) in a study of path
analysis in 40 genetically diverse chickpea genotypes reported that pods per plant had
the highest direct effect on seed yield, followed by seeds per pod, 100-seed weight
and number of primary branches per plant.
Rao and Kumar (2000) found that days to 50 percent flowering and duration of
reproductive phase had positive direct effect on yield, while plant height, days to
maturity and 100-seed weight had negative direct effect. Netrapal Singh (2001) in a
study of path analysis in 34 genotypes reveled that biological yield had highest direct

effect on yield followed by number of pods, days to maturity. While 100-seed weight,
number of primary branches and days to 50 percent flowering have negative direct
effect.
Mishra et al. (2002) reported that the number of pods per plant had the highest
positive direct effect on seed yield. Narayana and Reddy (2002) conducted path
analysis in 31 chickpea genotypes and they reported high direct effects of number of
pods per plant, 100-seed weight, number of seeds per pod and harvest index on seed
yield. Pratap et al. (2002) carried out path analysis in 57 chickpea genotypes and they
observed positive direct effect on grain yield by biological yield, number of pods
plant and harvest index.
The study of relationships among quantitative traits is important for assessing
the feasibility of joint selection of two or more traits and hence for evaluating the
effect of selection for secondary traits on genetic gain for the primary trait
under consideration. A positive genetic correlation between two desirable traits
makes the job of the plant breeder easy for improving both traits
simultaneously. Even the lack of correlation is useful for the joint improvement of the
two traits. On the other hand, a negative correlation between two desirable traits
impedes a significant improvement in both traits.
2.2.3 Diversity studies
Study of genetic diversity is the process by which variation among individuals or
groups of individuals or populations is analyzed by a specific method or a
combination of methods. Analysis of genetic relationships in crop species is an
important component of crop improvement program, since it provides information
about genetic diversity of the crop species which is a basic tool for crop improvement.
Analysis of genetic diversity in germplasm collections can facilitate reliable
classification of accessions and identification of subsets of core accessions with
possible utility for specific breeding purpose (Mohammadi and Prasanna, 2003).
2.2.3.1 Importance of Diversity Studies
Diversity is the foundation in which selection is practiced. Diversity studies in a crop
are important for various aspects such as management of genetic resources,
identification of duplicate accessions in the germplasm and in applied breeding
programs. Various data have been used to analyze the genetic diversity in crops,

including morphological, agronomical and ecogeographical traits. Most economic
traits of the crop varieties are quantitative traits that are affected by the crop
environment and also by genotype-environment interaction. Traditionally phenotypic
traits (Nozzolillo 1985; De Leonardis et al. 1996; Robertson et al., 1997; Hassan
2000; Javedi and Yamaguchi 2004), hybridization success (Ladizinsky and Alder
1976; Pundir and VanderMaesen 1983; Pundir and Mengesha 1995; Badami et al.,
1997) analysis of chromosome pairing in hybrids (Ladizinsky and Alder 1976;
Ahmad 1988), and the study of chromosomes structure (Ohri and Pal 1991; Tayyar et
al., 1994; Ahmad 2000) have been widely used methods for analysis of genomic
relationships and the construction of phylogenies among Cicer species. Over the past
15 years, electrophoretic data based on seed storage protein (Ladizinsky and Alder
1975a; Vairinhos and Murray 1983; Ahmad and Slinkard 1992) and isozymes (Kazan
and Muehlbauer 1991; Ahmad and Slinkard 1992; Labdi et al., 1996; Tayyar and
Waines 1996; Gargav and Gaur 2001) have also been applied to systematic studies in
Cicer.
2.2.3.2 Phenotypic diversity studies
Genetic improvement mainly depends upon the amount of genetic variability present
in the population. Information on the nature and degree of genetic divergence would
help the plant breeder in choosing the right parents for breeding programme. In
respect of quantitative characters, a breeder is primarily interested in genetic diversity,
because it decides response to selection. Several methods of divergence analysis
based on quantitative traits have been proposed to suit various objectives, of which
Mahalanobis‘s generalized distance is by and large widely used by plant breeders.
The utility of the Mahalanobis‘s D2 analysis to detect divergence in a group of
genotypes and to identify genotypes that can effectively be used in crossing
programme has been stressed repeatedly (Anilkumar et al., 1993).
Malik et al., (2010) studied twenty chickpea genotypes for various yield parameters
and reported clustering based on Euclidean dissimilarity which placed all genotypes
in three clusters at 50% linkage distance. Cluster I, II and III possessed 8, 5 and 7
genotypes, respectively.
Farshadfar and Farshadfar, (2008) conducted a study to determine the genetic
variability among 360 chickpea lines and reported that 63% variance was explained
by five PCs and the genotypes could be classified into four clusters.
Upadhyaya et al., (2007) identified the diverse germplasm lines for agronomic traits
in the chickpea core collection at ICRISAT by conducting hierarchical cluster
analysis, where the first five principal components accounted for 80.5% variation. The
39 selected accessions and two control cultivars (Annigeri and L 550) were grouped
into three clusters. Cluster I represented early maturing large-seeded kabuli types,
cluster II early and late maturing desi types and cluster 3 late maturing intermediate
and kabuli types. The newly identified lines were diverse than the control cultivar and
could be used in crop improvement.
Vural et al., (2007) performed cluster analysis based on principal components (PCs)
on eleven varieties grown in Turkey which were separated into two main clusters and
three subclusters.
Upadhyaya, (2003) performed principal component analysis on the world chickpea
germplasm collection held at ICRISAT, using 13 quantitative traits. The clustering of
germplasm accessions based on the first three PC scores delineated two regional
clusters consisting Africa, South Asia, and Southeast Asia (all desi types) in the first
cluster and the Americas, Europe, West Asia, Mediterranean region and East Asia (all
kabuli types) in the second cluster.
Upadhyaya et al., (2007) identified new early-maturing germplasm lines using the
core collection approach. The average phenotypic diversity values across traits was
higher for plot yield, apical primary branches and number of pods per plant
Prakash, (2006) conducted divergence analysis in 81 kabuli chickpea accessions
under irrigated conditions and observed wide variations in plot yield, 100 seed weight
and seeds per pod.
Upadhyaya, (2003) determined diversity in different regions of world for seven
qualitative traits and 13 quantitative traits in the world collection of chickpea
germplasm (16,820 accessions). The Shannon-Weaver diversity index (H`) was
variable in different regions, seed colour among qualitative traits and days to 50%
flowering among quantitative traits showed the highest pooled diversity index.

Islam et al., (1984) evaluated 140 chickpea varieties to study phenotypic diversity
based on 7 quantitative traits during postrainy season and observed maximum
diversity in number of pods and plot yield followed by minimum diversity in days to
50 percent flowering and days to maturity.
Dwevedi and Gaibriyal, (2009) reported the magnitude of genetic divergence among
25 genotypes of chickpea, using Mahalanobis‗s D2 statistics, which were grouped
into six clusters and also identified diverse parents which can be utilized in crop
improvement programs.
Durga et al., 2005 assessed the genetic diversity based on seven characters in 132
chickpea genotypes and grouped them into 9 clusters. Cluster I was the largest,
comprising of 20 genotypes, followed by clusters V and VII with 16 and 15
genotypes, respectively. Maximum inter cluster distance was noticed between clusters
I and VIII (511.4) and suggested that crossing the genotypes between clusters I and
VIII may lead to maximum diversity in the segregating populations and development
of high yielding cultivars.
Raval and Dobariya, (2004) studied genetic divergence among 52 chickpea genotypes
and grouped them into 15 clusters. No parallelism was observed between geographic
distribution and genetic diversity.
Jeena and Arora, (2002) evaluated thirty six genetically diverse genotypes of chickpea
for 16 quantitative attributes following Tocher‘s method as described by Rao (1952)
based on Mahalanobis‘s D2statistics. Twenty eight genotypes were grouped in cluster
I, two genotypes each in cluster II and III and one genotype each in clusters IV, V, VI
and VII.
Narendra Singh, (2002) carried out multivariate analysis in 300 kabuli chickpea
accessions using D2 statistic and grouped them into 10 non overlapping clusters with
like genotypes within clusters for different attributes and also reported no association
between clustering pattern and eco-geographical distribution of the genotype.
Sivakumar and Muthiah, 2001 carried out genetic divergence analysis with 126
chickpea cultivars and were grouped into seven clusters. The highest divergence was
observed between clusters IV and VII while the lowest was between clusters IV and
V. The intra cluster divergence varied from 0 to 2.99.
Darshanlal et al., (2001) estimated genetic divergence among 33 genotypes of

chickpea using D2 statistic based on yield related traits, which were grouped into 5
clusters. The grouping pattern did not show any relationship between genetic
divergence and geographic diversity.
Jethava et al., (2000) estimated genetic divergence using Mahalanobis‘s D2 statistic
among 70 chickpea genotypes with different ecogeographical region, which were
grouped into 16 clusters indicating that the geographical distribution and genetic
diversity were not related. Seed yield per plant, number of pods per plant and 100-
seed weight contributed maximum to genetic diversity.
Harisatyanarayana and Reddy, (2000) estimated the genetic divergence among the 31
genotypes of chickpea based on ten characters and were grouped into seven clusters
based on the mean performance, genetic divergence and clustering pattern.
Chand, (1999) studied 49 genotypes for magnitude of genetic diversity using D2
analysis by considering seven quantitative characters like days to flowering, days to
maturity, plant height, branches per plant, pods per plant, 100 seed weight and seed
yield per plant. Forty nine genotypes were grouped into eight clusters.
Pooranchand and Chand, (1999) studied genetic divergence among 49 genotypes of
chickpea using D2
analysis for seven quantitative traits, which were grouped into eight
clusters.
Bhattacharya and Ganguly, (1998) carried out genetic diversity analysis in twenty six
genotypes of chickpea under normal and late seeding conditions. Genotypes grown
under normal seeding were grouped into ten clusters and under late seed condition
into seven clusters and geographical origin of genotypes did not show any definite
relationship with genetic diversity.
Narendra Kumar, (1997) reported grouping of sixty entries of chickpea into five
clusters based on seven characters using Mahalanobis D2 statistics and the grouping of
entries in different clusters was not related to their geographic origin.
Samal and Jagdev, (1996) estimated genetic divergence among 32 cultivars of
chickpea using Mahalanobis‘s D2 statistics for seven yield related characters and were
grouped into six clusters
Dangaria et al., (1994) studied 32 genotypes of chickpea for genetic divergence for
nodulation characters like nodule number, nodule weight and nodule size. Thirty two

genotypes were grouped into 5 clusters with inter-cluster distance ranging from 7.93
(between I and III) to 17.53 (between IV and V).
Sarvaliya and Goyal, (1994b) estimated genetic divergence among 76 genotypes of
chickpea, which were mostly of Indian origin. There were significant differences
among the genotypes for 10 agronomic characters studied and were grouped into 10
clusters. There was no relationship between geographical distribution and genetic
diversity.
Anilkumar et al., (1993) estimated genetic divergence in a collection of 52 true
breeding advanced generation lines and two check varieties of chickpea on the basis
of photosynthetic and yield related traits including nodulation parameters to identify
physiologically efficient types. These genotypes fell in nine and Cluster V had the
highest number of genotypes.
Lokender Kumar and Arora, (1992) used D² statistics to group 40 genotypes of
chickpea collected from various geographical regions into 10 clusters based on 18
characters and reported that there was no definite relationship between genetic
diversity and geographical distribution.
Khan et al., (1991) classified 132 chickpea lines into eight groups on the basis of
physiological and morphological traits using multivariate analysis and reported weak
correspondence between D² analysis and canonical variate analysis.
Sandhu and Gumber, (1991) studied 59 strains of chickpea for magnitude of genetic
diversity using Mahalanobis‘s D2 analysis considering eight yield contributing
characters. They were grouped into 14 clusters. They recommended crossing between
genotypes of divergent clusters namely ICC 11321 and L 550 (cluster VI) with ICC
11316 (Cluster XI) for improving productivity.
Mishra et al., (1988) studied the genetic variability as estimated by D2 and metro
glyph analysis using 12 yield components in 177 genotypes, which were grouped into
13 clusters
Salimath et al., (1985) subjected eighty genotypes comprising of kabuli and desi types
from India and nine other countries to divergence analysis by using Mahalanobis‘s D2
statistic, a clear demarcation between kabuli and desi cultivars based on yield and
nine yield components.

Adhikari and Pandey, (1983) conducted a study involving 36 varieties from ten
chickpea growing states of India and concluded that kabuli and desi types tended to
occupy separate clusters. The study which considered seed yield and 16 yield related
traits formed 9 clusters, with all the kabuli types.
Katiyar, (1978) grouped thirty cultivars into 7 clusters on the basis of flowering time,
leaf weight, number of pods per plant and seed weight per plant. Maximum diversity
was contributed by pod number per plant.
Upadhyaya et al., (2006) assembled a global composite collection of 3,000 accessions
from entire collection of chickpea germplasm preserved in ICRISAT and ICARDA
which included trait donor parent lines, landraces, elite germplasm lines, cultivars and
wild Cicer species representing a wide spectrum of genetic diversity.
Upadhyaya et al., (2002) developed a core subset of 1956 accessions (10% of the
entire collection) from the entire collection at ICRISAT, which contained 1465 desi,
433 kabuli and 58 intermediate types of accessions. The evaluation of the core subset
revealed that kabuli accessions in general had broad plant width, matured late, and
had low pod number; high seed weight and low yield.
Upadhyaya and Ortiz, (2001) postulated the ―mini core‖ concept (10% of the core
collection or 1% of entire collection) representing entire species diversity and mini
core accessions have been selected and used as a gateway for germplasm utilization.
2.3 Drought related traits
Drought is economically the most important abiotic constraint to crop production in
the world (Araus et al., 2002; Boyer, 1982). Chickpea frequently suffers from drought
stress towards the end of the growing season in rain-fed conditions. Ninety percent of
the world‘s chickpea is produced in areas relying upon conserved, receding soil
moisture. Therefore, crop productivity is largely dependent on efficient utilization of
available soil moisture (Kumar and Van Rheenen, 2000). In both Mediterranean and
sub-tropical climates, seed filling in chickpea is subjected to terminal drought, which
limits seed yield (Turner et al., 2001).
In chickpea, the focus of drought resistance research is on the ability to sustain greater
biomass production and crop yield under seasonally increasing water deficit, rather
than the physiological aptitude for plant survival under extreme drought shock (Serraj
and Sinclair, 2002). This has led to the focus on escape and avoidance strategies such

as early maturity (Kumar and Abbo, 2001) and large root systems (Saxena et al.,
1995; Singh et al., 1995; Kashiwagi et al., 2006).
2.3.1 Root system in chickpea
Roots have a major role in dehydration avoidance as deep root system is able to
obtain moisture from the deeper soil layers even when the upper soil layer becomes
dry. Sponchiado et al., (1980) and Pandey et al., (1984) hypothesized that the ability
of a plant to change its root distribution in the soil and it is an important mechanism
for drought avoidance. Benjamin and Nielsen (2006) reported that greater root surface
area to weight ratio in chickpea as compared to field pea and soybean which indicates
either a finer root system or roots with lower specific density. Sponchiado et al.
(1980) reported the ability of common bean to change root distribution to avoid
drought stress that varied by cultivar. A large root system leads to a fall in harvest
index because there is much less assimilate available for grain growth. Hence a more
efficient root system is to be preferred.
Studies in various crops have shown the importance of a deep root system for
extracting moisture under terminal drought stress (Ludlow and Muchow, 1990;
Saxena and Johansen, 1990; Turner et al., 2001). Field studies in legumes (Saxena
and Johansen, 1990; Turner et al., 2001) showed that both dense root systems
extracting more of the water in upper soil layers and longer root systems extracting
soil moisture from deeper soil layers are important for maintaining yield under
terminal drought stress. A higher ratio of deep root weight to shoot weight was also
found to maintain higher plant water potentials and have a positive effect on yield
under stress (Mambani and Lal, 1983). Ludlow and Muchow (1990) recommended
traits that are suited for intermittent stress conditions in modern agriculture and also
three top priorities in order to match plant phenology to water supply, osmotic
adjustment, and rooting depth. Roots at the deeper soil layer contributed more to root
length or surface area than to root weight (Follett et al., 1974). Deep root systems in
sorghum demonstrated increased yield under drought conditions (Jordan et al., 1983;
Sinclair, 1994). A high ratio of root weight to shoot weight also maintained higher
plant water potential and had a positive effect on yield under drought stress conditions
(Mambani and Lal, 1983).
Farshadfar et al. (2001) observed highly significant differences among 21 chickpea
lines for stress tolerance index (STI), stress susceptibility index (SSI), tolerance index

(TOI) and mean productivity (MP) and correlated between these indices, out of these
MP and STI are the most suitable criteria for screening under rainfed environments.
Deshmukh and Kushwa (2002) studied simple traits like relative water content
(RWC) and membrane injury index (MII) for screening 20 genotypes for drought
tolerance and found that RWC and MII of a genotype measured during early phase
provide an indication of its relative MII during reproductive stage and these genotypes
can be used to screen large number of populations for drought tolerance.
Krishnamurthy et al., (2003) identified ICC 4958 as a drought avoidant variety with
most prolific root system and Kashiwagi et al., (2005) identified ICC 8261 with high
root to total plant ratio and deepest root system as most promising by evaluating
chickpea mini-core collection (211 accessions) for drought avoidance root traits.
Deshmukh et al. (2004) suggested that the genotypes with high DTE, Least DSI and
minimum reduction in yield due to stress indicated drought tolerance under field
condition.
Kashiwagi et al. (2006) found substantial variation in root length density among 12
diverse kabuli and desi chickpea genotypes at different soil moisture levels and
reported that the proportion of the roots at the lower depth was also important in water
absorption from deeper soil layers.
Kashiwagi et al., (2007) reported that fifteen out of fifty kabuli accessions had more
than 50g of 100-seed weight, and Root Length Density (RLD) as large as that of ICC
4958 (0.252 cm cm-3
).
Toker et al., (2007) reported that all 68 accessions were significantly superior to
annual wild and cultivated chickpeas including the best drought tolerant chickpea
cultivar, ICC 4958.
Kashiwagi et al., (2008) evaluated sixteen diverse chickpea germplasm accessions
based on transpiration in chickpea and reported a significant positive correlation
between relatively cool canopy area and seed yield under rainfed conditions.
2.4 Pod borer resistance related traits
Chickpea is a major pulse crop, rich in protein and is susceptible to a number of insect
pests, which attacks on roots, foliage and pods. Gram Pod borer (Helicoverpa
armigera Hübner) constitutes a worldwide pest of great economic importance on this

crop. It is a highly polyphagus pest, feeding on a wide range of food, oil and fiber
crops. This pest is the major constraint in chickpea production causing severe losses
upto 100% inspite of several rounds of insecticidal applications (Singh & Yadav,
2006). In chickpea, it feeds on buds, flowers and young pods of the growing crop, the
crop often fails to recover and yield is extremely poor. The pest status of this species
has increased steadily over the last 50 years due to agro-ecosystem diversification by
the introduction of winter host crops such as chickpea (Knights et al., 1980; Passlow,
1986). The noctuid H. armigera Hübner and H. punctigera Wallengren are among the
most damaging pests of field crops (Fitt, 1989; Zalucki et al., 1994). Commercial
chickpea crops are important sources of habitat for Helicoverpa species (White et al.,
1995). Sequeira et al., (2001) reported chickpea attractive to oviposition of
Helicoverpa moths from 14 days after planting and throughout the growth period. Of
all Helicoverpa species larvae recorded from the entire samples and crop
combinations, 98.3% were found on chickpea.
Direct pollution due to agricultural activities is mainly related to increased use of
chemical inputs such as fertilizers and pesticides. But the use of pesticides has lead to
the development of pesticide resistant strains in insects, accumulation of pesticide
residues in the agricultural commodities, and poisoned food, water, air and soil
(Lateef, 1985; Forrester et al., 1993). Moderate levels of resistance in C 235 and L
550 were reported among the eight genotypes evaluated in the laboratory for feeding
preference by the fifth instar H. armigera larvae (Olla and Saini, 1999). Using three
parameters, the number of larvae, number of pods and percentage pod damage, Singh
and Yadav, (1999a, b), screened 70 desi chickpea genotypes under normal sown and
late sown conditions and reported that the genotypes were more tolerant and as good
as common cultivars in late sown conditions. Gumber et al., (2000) reported that the
pod borer damage was positively correlated to the total number of pods and pod
length by screening 62 chickpea germplasm accessions and six approved cultivars.
Bhatt and Patel (2001) evaluated 11 cultivars and reported the cultivars with highest
larval population showed significantly higher pod damage. Sharma et al., (2005c)
standardized a cage technique to screen chickpeas for resistance to H. armigera and
reported that leaf feeding by the larvae and larval weights was lower on ICC 506 than
on ICCC 37 at the flowering stage, across growth stages and infestation levels. Sanap
and Jamadagni (2005) screened twenty-five promising chickpea genotypes under
pesticide-free field conditions at Mahatma Phule Krishi Vidyapeeth, Rahuri, and

Maharashtra with resistant check, ICC 506EB and reported the genotypes with fairly
good resistance/ tolerance against pod borer. Harminder et al., (2005) reported large
pod damage among all the entries; insect infestation was very high in 64 susceptible
genotypes. While forty five genotypes were moderately resistant by evaluating among
184 genotypes scored to find donor for pod borer and wilt resistance, together. Singh
and Yadav (2006) reported that spreading types were more susceptible to Helicoverpa
damage than erect types and kabuli types compared to desi types, by evaluating 1600
desi and 1400 kabuli for yield losses arising from pod borer infestation under rainfed
conditions. Narayanamma et al., (2007) reported that the genotypes showed
antixenosis, antibiosis, and tolerance mechanism of resistance to H. armigera by
evaluating a set of diverse chickpea genotypes and their F1 hybrids. Patil et al., (2007)
screened screening twenty-five promising chickpea under pesticide-free field
conditions with resistant check, ICC 506EB. Sarwar et al., (2009) reported the least
sensitive and least productive genotypes by checking the response of 10 chickpea
lines to gram pod borer H. armigera at the farm conditions.
2.5 Quality traits
2.5.1 Flavonoids
Flavonoids, a diverse group of low molecular weight secondary metabolites found
throughout the plant kingdom, play a key role in a variety of developmental programs,
biochemical processes, and environmental responses (Bruce et al., 2000) and are
widely distributed group of plant phenolics, with more than 9000 compounds
described (Martens and Mithofer, 2005). Accumulation of some flavanoid compounds
in plant tissues can be observed as pigmentation of different organs (Winkel-Shirley
2002).
Anthocyanins, isoflavoids (isoflavones, pterocarpans), flavones (in aerial parts),
flavondiols and tannins have been detected in chickpea seeds (Harborne, 1994; Bravo,
1998). The flavone 3, 7, 4‘-trihydroxyflavanone was named ‗garbanzol‘ after its
discovery in chickpea (Kuhnau, 1976).
2.5.1.1 Anthocyanins
Anthocyanins are water-soluble plant pigments often responsible for the orange to red
(sometimes blue, violet or magenta) colour of flowers, fruits and seed of higher
plants. Anthocyanins are the glycosides of anthocyanidins (e.g. pelargonidin,
malvidin, cyanidin) and play an important role in pollinator attraction and seed

dispersal. Relatively little work has been done on anthocyanins as a dietary
component (Kong et al., 2003), on the health-promoting benefits of anthocyanins
outlining their antioxidant, anti-inflammatory, anti-oedema, anti-ulcer and anti-
tumour activities. Hence, anthocyanins may play a role in the prevention of coronary
heart disease, inflammatory diseases and some cancers.
2.5.2 Protein
Chickpea is an important source of protein for millions of people in developing
countries. In addition to having high protein content, it is used as a protein rich animal
feed and the vegetative biomass is used as fodder. The crude protein content of
chickpea seed varies from 17-24% which extremes from 12.4-31.5%, and is
commonly 2-3 times higher than cereal grains. Chickpea has been specifically used to
treat protein malnutrition and kwashiorkor in children (Krishna Murti, 1975). Factors
that cause variation in chickpea seed protein content include genotypes growing
environment, field conditions and agronomic practices. These also affect the
nutritional quality of protein (Singh et al., 1974; Kumar et al., 1983; Singh et al.,
1983).
Chickpea seed also contains an appreciable amount of nonprotein nitrogen (NPN) and
total seed nitrogen (Singh and Jambunathan 1981). A large variation in NPN would
overestimate the true protein content of the sample and would consequently affect the
estimated protein intake in diet.
2.6 Molecular diversity
Traditionally, genetic variation is inferred by morphological/phenotypic variation or
the growth response of the organism. Classical methods of establishing genetic
diversity and /or relatedness among groups of plants relied upon phenotypic
(observable) traits. However, these had two disadvantages: First, the quantitative traits
are greatly influenced by environmental and genotype x environment interaction, and
secondly the levels of polymorphism (allelic variation) that could be looked at are
limited. These limitations were significantly overcome by deployment of
environment–neutral biochemical makers (Isozymes) and protein electrophoresis and
molecular markers that focus directly on the variation controlled by genes or on the
genetic material (DNA itself). The higher resolution of molecular markers makes
them a valuable tool for finger printing, protection of breeders rights, facilitating
appropriate choice of parents for breeding programmes, analyzing quantitative traits,

detection of Quantitative Trait Loci (QTL), gene mapping, marker assisted selection,
gene transfer, understanding evolutionary pathways and for the assessments of genetic
diversity.
The range of molecular markers that can be used on most plant germplasm is quite
extensive (Mohan et al., 1997; Gupta and Varshney, 2000). Techniques vary from
identifying the polymorphism in the actual DNA sequence to the use of DNA
hybridization methods used to identify RFLPs (Restriction Fragment Length
Polymorphisms) or the use of PCR based (Polymerase Chain Reaction) technology to
find polymorphism using RAPD (Random Amplified Polymorphic DNA), SSR
(Simple Sequence Repeat) or combination techniques like AFLP (Amplified
Fragment Length polymorphism). The different methods differ in their cost, ease of
application, type of data generated (whether it provides dominant or co-dominant
markers) the degree of polymorphism they reveal, the way they resolve genetic
difference, and their utilization for taxonomic studies (Karp et al., 1997).
The applications of different techniques for genetic diversity analysis have been well
reviewed (Malyshev and Karte, 1997; Newbury and Ford-Lloyd, 1997: Westman and
Kresovich, 1997; Karp et al., 1998). Some applications of diversity analysis using
molecular marker tools includes, identifying areas of higher genetic diversity
(Hamrich and Godt, 1990), determining collection priorities and sampling strategies
(Schoen and Brown, 1991), guiding the designation of in-situ or on-farm conservation
strategies (Bonierbale et al., 1997), monitoring genetic erosion (Robert et al., 1991) or
vulnerability (Adams and Demeke, 1993), to guide the management of ex-situ
collection, maximizing the genetic diversity in core collection, comparing
agronomically useful regions of the genomes of different crops (Paterson et al., 1995),
monitoring the movement of genetic resources, assisting in taxonomic evolution,
enhancing understanding of relationships between crop gene pools (Gepts, 1995),
achieving accurate identification of germplasm at the species/ subspecies levels
(Wang and Tanksley, 1989; Virk et al., 1995; Martin et al., 1997; Zhu,1998), and
identifying duplicates with in collections particularly in gene banks (Virk et al.,
1995).
There are various types of DNA markers available to evaluate DNA polymorphism in
sample genomes. Selection of a correct marker system depends upon the type of study
to be undertaken and whether that marker system would fulfill at least a few of the

mentioned characteristics such as easy availability, highly polymorphic nature,
Mendelian inheritance, frequent occurrence in genome, selective neutral behavior,
easy and fast assay, high reproducibility, free of epistasis and pleiotropy etc, (Weising
et al., 1995). The invention of PCR, which is a very versatile and extremely sensitive
technique, uses a thermostable DNA polymerase (Saiki et al., 1988) has changed the
total scenario of molecular biology and has also brought about a multitude of new
possibilities in molecular marker research.
2.6.1 Microsatellite markers:
SSR markers are considered the markers of choice for plant genetics and breeding
applications (Gupta and Varshney, 2000). In case of chickpea, only few hundred SSR
markers were available (Table 3). It is also important to note that majority of these
markers were developed from targeted SSRs for assaying variation in particular repeat
motifs. Hence in order to increase the molecular marker repertoire and to develop
genome wide SSR markers, ICRISAT in collaboration with University of Frankfurt,
Germany, developed 311 SSR markers from SSR-enriched libraries (Nayak et al.,
2010) and 1344 SSR markers from BAC-end sequence mining approaches in
collaboration with University of California, Davis, USA (Table 3). As EST sequences
from various tissues and developmental stages of chickpea have also been reported
(Boominathan et al., 2004; Romo et al., 2004; Buhariwalla et al., 2005; Coram and
Pang, 2005; Varshney et al., 2009b, Choudhary et al., 2009), a few hundred SSR
markers have been developed from ESTs (Buhariwalla et al., 2005, Varshney et al.,
2009b, Choudhary et al., 2009). As a result of above mentioned efforts, at present
>2000 SSR markers representing the entire chickpea genome are available.
2.6.2 Diversity Array Technology (DArT) markers
DArT are one of the new generation markers. DArT provides high quality markers
that can be used for diversity analyses and to construct medium-density genetic
linkage maps. The high number of DArT markers generated in a single assay not only
provides a precise estimate of genetic relationships among genotypes, but also their
even distribution over the genome offers real advantages for a range of molecular
breeding and genomics application. DArT was first developed in rice (Jaccoud et al.,
2001). Subsequently, it was developed for different crops and used in linkage map
construction and diversity analysis. The important plant species for which DArT has
been developed include rice (Xie et al., 2006), barley (Wenzel et al., 2004, 2006),

Arabidopsis (Witenberg et al., 2005), eucalyptus (Lezar et al., 2004), wheat (Semagn
et al., 2006; Akbari et al., 2006), cassava (Xia et al., 2005), sorghum (Mace et al.,
2008), in collaboration with DArT Pty Ltd, Australia extended DArT arrays with
15,360 features for chickpea have been developed at ICRISAT (Varshney et al.,
2010a).
Table 3: Genomic resources available for chickpea
Marker type Number of
markers
References
Genomic SSR 28 Hüettel et al., 1999
174 Winter et al., 1999
10 Sethy et al., 2003
233 Lichtenzveig et al., 2005
13 Choudhary et al., 2006
85 Sethy et al., 2006a, b
63 Qadir et al., 2007
311 Nayak et al., 2010
1344 ICRISAT and UC-Davis, USA
EST-derived SSR 60 Choudhary et al., 2009
77 Varshney et al., 2009b
106 Buhariwalla et al., 2005
CAPS 12 Rajesh et al., 2008
5 Varshney et al., 2007
DArT 15,360 DArT Pty Ltd, Australia and ICRISAT
SNP Ca. 9,000 identified and
768 on Golden Gate assay
ICRISAT, UC-Davis, USA and NCGR,
USA
*UC-Davis - University of California, Davis, USA
NCGR - National Center for Genome Resources, New Mexico, USA
ICRISAT - International Crop Research Institute for Semi-Arid Tropics, Hyderabad, India
2.6.3 Transcript sequences and SNP markers
Molecular marker technologies, however, are currently undergoing a transition from
largely serial technologies based on separating DNA fragments according to their size
(SSR, AFLP), to highly parallel, hybridization-based technologies that can
simultaneously assay hundreds to tens of thousands of variations especially in genes.
This transition has already taken place in several major crop species like rice (Nasu et
al., 2009), maize (Yan et al., 2009), soybean (Wu et al., 2010), and common bean
(Hyten et al., 2010). In case of chickpea, only few hundred ESTs and some reports on
identification of SNPs were available until recently. Recent years have witnessed
significant progress in development of comprehensive resource of transcripts by using
Sanger sequencing as well as ‗next generation sequencing‘ (NGS) technologies
(Varshney et al., 2009c) that are being deployed for understanding genome dynamics
as well as development of SNP markers.

Sanger sequencing of a number of cDNA libraries constructed from drought- and
salinity-challenged tissues has provided about 20,000 ESTs (expressed sequence tags)
in chickpea (Varshney et al., 2009b). Combined analysis of Sanger ESTs together
with 454/FLX transcript reads provided 103,215 tentative unique sequences (TUSs) in
chickpea. Selected set of SNPs are being used to develop large-scale SNP genotyping
platform in chickpea that will augment recently developed GoldenGate assay
platforms for 768 SNPs by University of California-Davis, USA, National Centre for
Genome Resources (NCGR), USA and ICRISAT.
2.6.4 Assessment of Allelic Diversity in Germplasm Collections
Crop breeders are reluctant to select parental lines from thousands of available
germplasm lines without knowing their performance especially for quantitative traits
which are highly environment sensitive. Selecting a few lines from these vast pools of
germplasm is like searching for a needle in a hay stack. Obviously it is more
appropriate and attractive to have a small sample of a few hundred germplasm lines,
based on critical evaluation, representing the entire diversity of the species. Genomic
tools such as molecular markers developed may be useful to select such a
representative set of diversity that can be useful in breeding programme (Glaszmann
et al., 2010).
2.6.5 Genetic diversity studies in Chickpea
Almost all kinds of molecular markers have been used for analysis of genetic
diversity in chickpea germplasm. Majority of these studies however employed
RAPD and AFLP markers. Although a limited number of genotypes were used for
diversity analyses in majority of these studies, the main outcome of these studies
was availability of a low level of genetic diversity in cultivated germplasm as
compared to wild species. Some of these studies have been mentioned in Table: 4
below.
Some diversity studies have also provided a general consensus about the members of
the first crossability group which contains C. arietinum along with C. reticulatum
(Ahmad, 1999; Iruela et al., 2002; Rajesh et al., 2002; Sudupak et al., 2002, 2004;
Javedi and Yamaguchi, 2004; Nguyen et al., 2004), suggested to be the annual
progenitor of chickpea (Ladizinsky and Adler, 1976) and C. echinospermum,
suggested to have played a significant role in the evolution of cultivated chickpea
(Tayyar and Waines, 1996). The second crossability group contained C. bijugum, C.

judaicum and C. pinnatifidum (Ahmad, 1999; Sudupak et al., 2002, 2004; Sudupak,
2004; Nguyen et al., 2004). The last three species, C. yamashitae, C. chorassanicum
and C. cuneatum, were either not included in many studies or were differentially
positioned with respect to the cultivated germplasm.
Table 4: Some genetic diversity studies in chickpea
Marker Material Outcome Reference
RAPD
75 RAPD 9 annual Cicer species
(1 cultivated, 8 wild)
A total of 115 reproducibly scorable
RAPD markers were generated, all
except 1 polymorphic were utilized to
deduce genetic relationships among
the annual Cicer species. In addition
to, species-diagnostic amplification
four distinct clusters were observed.
Ahmad, 1999
7 RAPD primers 43 wild and cultivated
accession representing
ten species of Cicer
The dendrogram contained two main
clusters, one of which comprised
accessions of the four perennial
species together with the accessions
of the three annual species and the
other cluster included the remaining
three annual species
Sudupak et al.,
2002
42 RAPD
primers
19 wild Cicer accessions
representing seven
annual Cicer spp.
(C. echinospermum, C.
reticulatum,
C. pinnatifidum, C.
judacium,
C. cuneatum, C.
yamashitae,
C. arietinum)
Diversity analysis provided three
groups. The Group I included the
cultivated species C. arietinum, C.
reticulatum and
C. echinospermum. Within this group,
C. reticulatum accessions were
clustered closest to the C. arietinum,
C. yamashitae. The Group II was
separated from the other clusters.
Group III (the annual tertiary group)
included C. judaicum, C.
pinnatifidum and C. cuneatum.
Talebi et al.,
2009
16 RAPD 30 genotypes No significant differences were
observed between the mean
percentage of the presence of RAPD
markers between commercial
cultivars and landraces.
Ahmad et al.,
2010
ISSR
15 ISSR markers 6 annual and 7 perennial
wild species (C.
acanthophyllum, C.
pungens,
C. nuristanicum, C.
anatolicum,
C. microphyllum, C.
oxyodon)
The clustering pattern was in
agreement with the data based on
crossability, seed storage protein,
isozyme, allozyme and RAPD marker
analysis. 39% molecular variance
was observed among annual and
perennial groups. The results also
suggested the monophyletic origin of
wild annual chickpea.
Rajesh et al.,
2003

Marker Material Outcome Reference
10 ISSR primers 12 chickpea genotypes
(released cultivars and
breeding lines)
In addition to the diversity analysis,
one unique band was produced by the
GGAGA primer in the BCP-15
genotype. This band may be linked to
temperature tolerance phenotype.
Bhagyawant
and
Srivastava,
2008
AFLP
AFLP(EcoRI and
MseI) 306
positions
47 accessions
representing four
perennial and six annual
species
AFLP-based grouping of species
revealed two clusters, Cluster I,
includes three perennial species and
C. anatolicum, while Cluster II
consists of two subclusters, one
including one perennial, along with
three annuals from the second
crossability group and the other one
comprising three annuals from the
first crossability group
Sudupak et al.,
2004
214 AFLP
marker loci
95 accessions that
represented 17 species of
Cicer
Three main species groups were
identified; Group I included the
cultivated species C. arietinum, C.
reticulatum and C. echinospermum.
Group II consists of C. bijugum, C.
judaicum and C. pinnatifidum. While
Group III contained all nine perennial
species assessed and two annual
species
Nguyen et al.,
2004
455AFLP 146 wild annual Cicer
accessions (including
two accessions of
perennial C. anatolicum
and six cultivars of
chickpea)
Maximum genetic diversity of C.
reticulatum, C. echinospermum, C.
bijugum and C. pinnatifidum was
found in southeastern Turkey, while
Palestine was identified as the centre
of maximum genetic variation for C.
judaicum.
Shan et al.,
2005
8 AFLP primer
pairs
28 chickpea accessions
from diverse origin
Greatest genetic diversity was found
among accessions from Afghanistan,
Iran and Lebanon.
Talebi et al.,
2008b
SSR
12 SSRs 78 genotypes (72
landraces, 4 cultivars, 2
wild species-
C. reticulatum and C.
echinospermum)
All the 76 accessions of cultivated
chickpea could be readily
distinguished with these markers. A
significant positive correlation
between the average number of
repeats (size of the locus) and the
amount of variation was observed.
Udupa et al.,
1999
90 SSRs 40 accessions (39
annual, 1 perennial)
The degree of conservation of the
primer sites varied between species
depending on their known
phylogenetic relationship to chickpea,
ranging from 92.2% in C.
reticulatum, chickpea‘s closest
relative and potential ancestor, down
to 50% for C. cuneatum
Choumane et
al., 2000

Marker Material Outcome Reference
11 SSRs 29 accessions Efficient marker transferability (97%)
of the C. reticulatum STMS markers
across other species of the genus was
observed as compared to
microsatellite markers from the
cultivated species. Phylogenetic
analysis clearly distinguished all the
accessions
Sethy et al.,
2006a
74 STMS 10 accessions (9
cultivated, 1 wild
C. reticulatum)
The high levels of intra-specific
genetic polymorphism in chickpea
were clearly evident from
dendrogram analysis. Sequence
analysis of these amplicons suggested
random point mutations followed by
the subsequent expansion by
replication slippage.
Sethy et al.,
2006b
48 SSRs 3000 accessions of
composite collections
This was the most comprehensive
genetic diversity studies in chickpea.
In total, 1683 alleles were detected in
2915 accessions, of which, 935 were
considered rare, 720 common and 28
most frequent. A number of group-
specific alleles were detected: 104 in
Kabuli, 297 in desi, and 69 in wild
Cicer; This is an ideal set of
germplasm for allele mining,
association genetics, mapping and
cloning gene(s), and in applied
breeding for the development of
environments.
Upadhyaya et
al., 2008
10 EST-SSRs 58 accessions Crossability-group-specific sequence
variations were observed among
Cicer species that were
phylogenetically informative. The
neighbor joining dendrogram clearly
separated the chickpea cultivars from
the wild Cicer and validated the
proximity of
C. judaicum
Choudhary et
al., 2009
10 SSRs 47 chickpea (C.
arietinum) accessions
including 21 induced
mutation lines, 17 hybrid
lines, 5 local cultigens,
and 4 non-nodulating
lines
UPGMA and ME (minimum
evolution) trees classified the
accessions into 6 groups and all but 6
accessions could be clearly separated.
Grouping was mostly the same in the
two phylogenetic trees, but the
branching order differed greatly.
Recent introgression among the
parental lines is suggested for this
reason.
Khan et al.,
2010
Miscellaneous
12 RAPD, 8
ISSR
75 accessions belonging
to 17 species of Cicer
The dendrogram showed the
variability between species was
related to both growth habit and
geographical origin
Iruela et al.,
2002

Marker Material Outcome Reference
17 random
genomic and five
heterologous
probes in 65
probe-enzyme
combinations
Five desi and five kabuli
type chickpea cultivars
No polymorphism in chickpea
varieties was detected with four
RAPD markers studied. However,
some degree of polymorphism
between C. arietinum and its wild
relative C. reticulatum was detected.
Udupa et al.,
2003
Microsatellite
derived-RFLP
30 accessions Greatest genetic diversity was
observed in Pakistan, Iraq,
Afghanistan, south-east Russia,
Turkey and Lebanon. Lower genetic
diversity was found in Iran, India,
Syria, Jordan and Palestine
Serret et al.,
2006
60 RAPD and 10
ISSR primers
19 chickpea cultivars
and five accessions of its
wild progenitor
C. reticulatum
Ladizinsky
The ISSR analysis clearly indicated
that only six polymorphic markers are
reliable for estimation of genetic
diversity, while nearly 30 RAPD
primers are required for the same.
Rao et al.,
2007
33 RAPD and 9
morphological
traits
36 genotypes Correlation between the genetic
distances was obtained with RAPD
and morphological traits, indicating
that there is a strong multi-locus
association between molecular and
morphological traits in these
cultivars.
Talebi et al.,
2008a
15 AFLP and 18
STMS primer
pairs
21 cultivars of C.
arietinum
The genetic similarity between
cultivars varied from 0.30 to 0.85 for
AFLP and 0.22 to 0.83 for STMS
markers. Association of varietal type
and flower colour was observed as
cultivars E 100Ymu and Nabin (both
Desi type and pink flower) clustered
together in the dendrogram.
Singh et al.,
2008
2.7 Population structure and Association mapping
Chickpea is a cool season grain legume with high nutritive value. It belongs to the
family Fabaceae and is a self-pollinated diploid (2n=2x=16) with a relatively small
genome of 750 Mbp (Arumuganathan and Earle, 1991). One of the major goals of
plant breeders is to develop genotypes with high yield potential and the ability to
maintain the yield across environments. With the development of molecular
markers, breeders have a complimentary tool to traditional selection and markers
linked to variation in a trait of interest which could be used to assist the breeding
programs. Availability of DNA marker based maps for the genomes of many crops
facilitated mapping of QTLs of interest and marker-assisted selection (Winter and
Kahl, 1995). QTL mapping analysis has provided an effective approach for locating
and subsequently manipulating the QTLs associated with different quantitative traits
in plants (Rachid et al., 2004). However, a DNA marker map of sufficient density
for use in QTL mapping of important traits is still lacking in chickpea but however,

Nayak et al., (2010) developed a first SSR based high density intra specific genetic
map (ICC 4958 x ICC 1882 ) with 255 marker loci.
Linkage analysis and association mapping are the two most commonly used tools for
dissecting complex traits (Zhu et al., 2008). Linkage analysis in plants typically
localizes QTLs in 10 to 20 cM intervals because of the limited number of
recombination events that occur during the construction of mapping populations and
evaluating a large number of lines (Doerge, 2002; Holland, 2007). Alternatively,
association mapping has emerged as a tool to resolve complex trait variation down to
the sequence level by exploiting historical and evolutionary recombination events at
the population level (Nordborg and Tavare, 2002; Risch and Merikangas, 1996).
Choice of population for association mapping and appropriate marker density are
crucial decisions for accuracy of association mapping. Different methods and
software tools have been developed to correct the results for population structure
usually by dividing the germplasm collections into subgroups or adjusting the
probability of the null hypothesis (Rafalski, 2010). Presence of population structure
within an association mapping population can be an obstacle to the application of
association mapping as it often generates spurious genotype-phenotype associations
(Yu and Buckler, 2006; Zhu et al., 2008). To account for population structure in
association analysis, two major statistical methods, genome control (Devlin and
Roeder, 1999; Zheng et al., 2005) and structure association (SA) (Pritchard et al.,
2000a, b) were applied in early studies, both of which used random markers spaced
throughout the genome, but incorporated them into statistical analysis in different
approaches (Yang et al., 2010). Yu and Buckler, 2006 developed a general linear
model (GLM) and a mixed linear model (MLM) approaches to perform association
analysis. The MLM approach, accounting for both population structure (Q) and
relative kinship (K), can be performed with the TASSEL software package (Bradbury
et al. 2007), which is most common method of association analysis in plants and has
been successfully applied in rice (Agrama et al., 2007; Wen et al., 2009; Borba et al.,
2010), wheat (Breseghello and Sorrells, 2006; Neumann et al., 2011), sorghum
(Murrary et al., 2009), Arabidopsis (Zhao et al., 2007) and potato (Malosetti et al.,
2007). However, until now, the reports of QTLs for chickpea are limited except the
QTLs governing grain yield and other agronomic traits would increase our
understanding of the genetic control of the characters and to use them effectively in
breeding programs. Some of the agronomic and yield influencing traits like double-

flower (Yadav et al., 1978; Rao et al., 1980; Pawar and Patil, 1983; Singh and van
Rheenen, 1994; Kumar et al., 2000), flowering time (Or et al., 1999), chilling
tolerance during flowering (Clarke and Siddique, 2003), flowers per axis (Srinivasan
et al., 2006), double-podding and other morphological characters (Rubio et al., 1999,
2004; Cho et al., 2002; Rajesh et al., 2002; Lichtenzveig et al., 2006) and nutritional
traits like β-carotene and lutein content (Abbo et al., 2005) have been extensively
studied in chickpea. A QTL flanked by marker TAA170 and TR55 on LG4A
identified for root length (Chandra et al., 2003). Or et al. (1999) suggested a major
photoperiod response gene (Ppd) affecting time to flowering. Cho et al. (2002)
identified a single QTL for days to 50% flowering on LG3 with a LOD score of 3.03.
Lichtenzveig et al. (2006) identified two QTLs on LG1 and LG2 linked to time to first
flower. Cho et al. (2002) also identified a QTL for seed weight on LG4 accounting for
52% of the total phenotypic variation. Nayak et al. (2010) reported a total of 8 QTLs
for root traits with phenotypic variation 4-54%. These reports generated information
on QTLs for important traits which can be used for stress breeding in chickpea. Until
now, association mapping using the existing natural variation present in the
germplasm for the detection of QTL was not been reported in chickpea and QTL
reported by the earlier studies and linkage mapping based on mapping population
using the RFLP probes were used to identify QTL. Hence, there is a need for the
identification and development of more SSR markers and QTLs in chickpea for
various agronomic traits which contribute to yield and its improvement.

Material and Methods

3. MATERIALS AND METHODS
A large number of chickpea germplasm accessions (more than 98,000) are conserved
in several genebanks in the world (Gowda et al., 2011). ICRISAT maintains the
largest collection of 20,267 accessions of 60 countries. Geographic distribution of
chickpea germplasm at ICRISAT are given in Table 5. The germplasm at ICRISAT
includes 18,392 land races, 98 advanced cultivars, 1293 breeding lines and 288
accessions of wild species. Inspite of vast germplasm accessions available in different
genebanks, there has been very limited use of these accessions in crop improvement
programs (Upadhyaya et al., 2006). To enhance use of germplasm in crop
improvement a core collection of 1956 accessions (Upadhyaya et al., 2001) was
developed representing the variability of the entire collection. However, size of core
collection was also not conveinient for multilocational replicated evaluation. To
achieve this Upadhyaya and Ortiz, (2001) proposed the ‗minicore‘ concept and
developed chickpea minicore consisting 211 accessions (1% of entire, 10% of core
collection), representing entire species diversity and used as a gateway for germplasm
utilization. Upadhyaya et al (2006), developed a global composite collection of 3,000
accessions representing a wide spectrum of genetic diversity captured from entire
collection of chickpea germplasm preserved in ICRISAT and ICARDA, beside other
important genetic stocks and cultivars. Furthermore, based on the 48 SSR markers
allelic diversity data, on global composite collection of chickpea, a ‗reference set‘ of
most diverse 300 accessions was selected (Upadhyaya et al., 2008) to facilitate
identification of diverse germplasm with beneficial traits for enhancing the genetic
potential of chickpea globally and broaden the genetic base of cultivars.
3.1. PHENOTYPIC DIVERSITY
3.1.1 Genetic materials
Chickpea reference set (Upadhyaya et al., 2008) of 300 accessions consisting of 194
desi accessions, 88 kabuli accessions, 11 pea or intermediate type and 7 Wild
accessions was used for this research (Figure 2). Geographically, the reference set
includes accessions from South and East Asia (105 accessions), West Asia (93),
Mediterranean region (56), Africa (21), North America (6), the Russian Federation
(6), South America (4), Europe (3), and accessions with no information on biological
status (6). The country of origin, passport and characterization data of reference set
are given in the Table 6. Graphical representation of geographic distribution of

chickpea reference set accessions is represented in the Figure1 and listed in Table 7.
3.1.2 Evaluation of chickpea reference set for agronomic traits
The reference set was evaluated for agronomic traits in four post-rainy or winter
rainfed environments Viz., 2006/2007 (E1), 2007/2008 (E2) and 2008/2009 (E3) at
ICRISAT (altitude: 545m above the mean sea level, latitude: 17º27‘N, longitude:
78º28‘ E), Patancheru, Andhra Pradesh (Plate 1); 2008/2009 (E4) at UAS (University
of Agricultural Sciences), Dharwad (Plate 2) and one late sown (E5), spring irrigated
environment during 2008/09 at ICRISAT; along with 5 control cultivars (Annigeri, G
130, ICCV 10, KAK 2, and L 550) as common for all environments. Agro-climatic
details of all five seasons are given in Table 8. Annigeri (ICC 4918) is an early
maturing desi cultivar, cultivated in large areas of peninsular India (Ali and Kumar,
2003). ICCV 10 (Bharti) is an early-maturing, semi-erect desi cultivar, resistant to
Fusarium wilt and dry root rot (Ali and Kumar, 2003). G 130 is a medium tall, erect
and late-maturing desi cultivar suitable for irrigated and adequate rainfall areas of
Punjab region of India (Singh, 1987). L 550 is a semi-errect, medium tall, small-
seeded bushy kabuli cultivar released for all chickpea growing regions in India. It is
tolerant to root knot nematode but susceptible to wilt and blight (Dua et al., 2001).
KAK 2 is a semi-errect type, bushy, medium tall, large seeded kabuli cultivar,
resistant to Fusarium wilt (Zope et al., 2002).
The experiment was carried out on vertisol (Kasireddypally series- Isohyperthermic
Type Pellustert) in a solarized field (Swaify et al., 1985) at ICRISAT farm in high
input management of 100 kg ha-1
diammonia phosphate as basal dose and full
protection against weeds, insect pests and diseases. Experiment was planted in an
alpha Design in all four normal sown winter (E1, E2, E3 and E4) environments (date
of sowing 3rd
week of October) with two replications and in an augmented design in
late sown spring environment (date of sowing 3rd
week of January). Planting was
done in each plot on ridges with a row length of 3m and spacing of 60 cm between
rows and 10 cm between plants, at a uniform depth. A post-sowing irrigation was
given to support germination in all environments. In normal sown environment, two
irrigations of 5 cms each were given at 49 days after sowing (DAS) (pre-flowering),
and at 78 DAS (pod filling stage). In late sown spring irrigated environment, four
irrigations at 23 DAS (vegetative stage), 40 DAS (flowering stage), 55 and 67 DAS
(pod development) were given as per the crop requirement. Five pesticide sprays, two

during the vegetative stage, one at flowering stage and two at the pod-filling stage
were given to protect the crop from the pod borer, Helicoverpa armigera (Hübner).
3.1.2.1 Observations recorded
Observations were recorded on seven qualitative (Table 9) and 17 quantitative (Table
10) traits following the IBPGR, ICRISAT and ICARDA (1993) descriptors for
chickpea. The data on all qualitative traits (growth habit, plant pigmentation, flower
color, seed color, seed shape, seed dots and seed texture) were recorded on plot basis.
Out of 17 quantitative traits, observations on days to 50 percent flowering, flowering
duration, days to grain filling, days to maturity, 100-seed weight, plot yield and per
day productivity (kg ha-1
day-1
) were recorded on plot basis. The data on remaining 10
quantitative traits viz., plant height, plant width, basal primary branches, apical
primary branches, basal secondary branches, apical secondary branches, tertiary
branches, seeds per pod, pods per plant, yield per plant, were recorded on five
randomly selected representative plants in a plot. Average values of these five plants
were computed and mean values were used for statistical analysis. Yield of five plants
was added to plant yield.
3.1.3 Evaluation of Chickpea reference set for drought tolerance related traits
3.1.3.1 Soil Plant Analysis Development (SPAD) Chlorophyll Meter Readings
(SCMR) in Chickpea reference set
The chickpea reference set along with five controls cultivars (Annigeri, G 130, ICCV
10, KAK 2, and L 550) was evaluated for SCMR, a trait related to drought tolerance,
in a precision vertisol field (fine montmorillonitic isohyperthermic typic pallustert) at
ICRISAT, during the 2008/09 post rainy (E3) and 2008/09 spring (E5) seasons. The
experiment was carried out in an Alpha Design in 2008/09 post rainy in two
replications and in the 2008/09 spring season in an augmented design with repeated
control cultivars.
The SCMR measurement were taken at 62 DAS by using SPAD-502 meter (Minolta
Konica Co.Ltd., Japan) on the third leaf from top on main branch of the five
representative plants, as the third leaf was considered as representative of the plant
canopy for SCMR measurement (Kashiwagi et al., 2006). The adaxial side of the
leaves was placed towards the emitting window of the chlorophyll meter and major
veins of the leaf are avoided.
Specific Leaf area: After SPAD measurement, leaves were detached from the plants

and collected immediately and kept in cool (~0oC) condition, then the number of
leaflets of five leaves from five representative plants were counted. The leaflets were
seperated from the rachis and then spread on the screen to avoid overlapping. The leaf
area of all the leaflets was measured by an automatic ‗LI-COR area meter‘.
Subsequently, these leaflets were oven dried at 70C for 48 hrs to estimate leaf dry
weight with the help of a precision balance (in grams).
3.1.3.2 Drought tolerance related root traits-Cylinder culture System
Two hundred ninety three test entries (other than wild species ) along with 6 (ICC
4958, Annigeri, G 130, ICCV 10, KAK 2, and L 550) control cultivars were planted
in cylinder culture system under a rain out shelter during the 2007/08 (E2) and
2008/09 (E3) seasons at ICRISAT. ICC 4958, (a desi, drought-resistant, short
duration, high yielding (under terminal drought) with 30% more root weight than the
standard cultivar Annigeri (Saxena, 1987, Krishnamurthy et al., 2003) was used as a
control for root traits related with drought tolerance.
3.1.3.2.1 Cylinder culture System
The chickpea accessions were evaluated in 18 cm diameter, 120 cm tall PVC
cylinders (Kashiwagi et al., 2005) under rain out shelter in an alpha design with 3
replications and each plot consists of 38 blocks in both the trials. Each block consists
of eight PVC cylinders (rows). Plot size ranged from 1.0m width (4 rows) and 2.0m
length (flat seeded bed). Plants were 15 cm apart within rows and 20cm between
rows. The cylinders where placed in 1.2m deep cement pits with a spacing of 0.05 m-2
cylinder-1
to avoid incidence of direct solar radiation on the cylinders. The cylinders
(except the top 15 cm) were filled with an equi-mixture (w/w) of vertisol and sand,
mixed with di-ammonium phosphate. The soil water content of the mixture was
equilibrated to 70% field capacity to create the conditions similar to those in the field
at sowing time, where the soil and sand was used to decrease the soil bulk density and
facilitate root growth and extraction. The top of the cylinder was filled with the same
dried soil-sand mixture. Four seeds of each genotype were sown in the cylinder. The
cylinders were irrigated with 150ml of water three times on alternate days (equivalent
water for the top 15 cm soil to reach 100% field capacity) until seedlings uniformly
emerged, and then no more irrigations was applied to the cylinders. Immediately after
sowing, all cylinders were supplied with a rhizobial inoculum (Mesorhizobium ciceri,

strain IC 59) as a water suspension. The plants were thinned to 3 plants per cylinder at
7 days after sowing (DAS). Plants were harvested at 35 DAS in both the seasons.
3.1.3.2.2 Observations recorded
At 35 DAS, the shoots were harvested, and the cylinders were placed horizontally and
the sand-soil mixture was removed gently with the help of running water. When
approximately three-quarters of the filled soil-sand mixture were washed away, the
cylinder was erected gently on a sieve so that the entire root system could be easily
slipped down. After washing the root and the soil particles, the roots are stretched to
measure their length as an estimate of root depth (RDp). The root system was then
sliced into portions of 30 cm (0-30cm, 30-60cm, 60-90cm, 90-120cm), to measure the
root length (RL) at each of the 30 cm depth of the root system, using an image
analysis system (WinRhizo, Regent Instruments INC., Canada). Root length density
(RLD) in each 30cm layer was obtained by dividing root length by volume of a 30cm
section of the cylinder. The root dry weight (RDW) and shoot dry weight (SDW)
were recorded after drying the roots and shoots in a hot air oven at 80oC for 72 hours.
Total plant dry weight (TDW) is sum of root and shoot dry weights. Root to total
plant dry weight ratio (RDW/TDW %) was calculated as an indicator for biomass
allocation to roots on dry weight basis. In addition, the indicator for the effectiveness
of roots in shoot production was calculated by shoot to root length density ratio since
root length density is the relevant trait associated with water and nutrition uptake than
root dry weight (Krishnamurthy et al., 1996; Kashiwagi et al., 2005).
3.1.4 Evaluation of reference set for pod borer resistance
Three hundred diverse reference set accessions along with 7 control cultivars
(Annigeri, G 130, KAK 2, ICC 506EB-resistant, ICC 3137-susceptible, ICCV 10-
moderately resistant, and L 550-susceptible) were planted in Randomized Complete
Block Design (RCBD) during the 2007/08 (E2), 2008/09 (E3) post rainy seasons at
ICRISAT.
3.1.4.1 Insect Culture
Larvae of Helicoverpa armigera used in bioassays were obtained from a laboratory
culture maintained at ICRISAT. Larvae were reared on chickpea based artificial diet
(Armes et al., 1992) at 27ºC. Field collected larvae of H. armigera were reared in the
laboratory on the natural host for one generation before being introgressed or

transferred into the laboratory culture to avoid contamination with the nuclear
polyhedrosis virus, bacteria, or fungi. The H. armigera neonates were reared in
groups of 200-250 in 200 ml plastic cups (having 2 to 3 mm layer of artificial diet on
the bottom and sides) for five days.
3.1.4.2 Detached leaf assay
The unsprayed plants grown in field were bioassayed during vegetative stage under
controlled conditions in the laboratory (27 ±2ºC, 65 to 75% RH and a 12 hour
photoperiod) by using detached leaf assay (Sharma et al., 2005). Plastic cups of 4.5 x
11.5 cm diameter were used for detached leaf assay. The 10 ml of agar-agar (3%) was
boiled and poured into plastic cups, kept in a slanting manner. The solidified agar-
agar served as a substratum for holding a chickpea terminal branch with 3 to 4 fully
expanded leaves and a terminal bud in a slanting manner. Care was taken to see that
the chickpea branches did not touch the inner walls of the cup. Ten neonate H.
armigera larvae were released on the chickpea leaves in each cup, and then covered
with a lid immediately. This system kept the chickpea terminals in turgid condition
for one week. The experiment was terminated when more than 80 percent of the leaf
area was consumed in the susceptible control or generally 5 to 6 days after releasing
the larvae on the leaves.
3.1.4.3 Observations recorded
Detached leaf bioassay was conducted with unsprayed plants at vegetative stage. The
data was recorded on leaf damage score, larval survival and mean larval weight. Leaf
feeding by H. armigera larvae was evaluated visually by 1 to 9 scale (1= <10%, 2= 11
to 20%, 3 = 21 to 30%, 4 = 31 to 40%, 5 = 41to 50%, 6= 51 to 60% 7= 61to 70%, 8=
71 to 80 and 9= >80% leaf area damaged). The number of larvae survived after the
feeding period was recorded, and the larvae were then placed in 25ml plastic cups
individually and the weights were recorded, 4 hours after weaving them from the
food. The data were expressed as percentage of larval survival and mean weight of the
larvae in each treatment (genotype).
3.1.5 Evaluation of chickpea reference set for Quality traits
3.1.5.1 Estimation of Anthocyanins
The seed samples of 300 accessions of reference set along with 5 control cultivars
were evaluated in 2006/2007 (E1), to estimate anthocyanins at ICRISAT, Patancheru.

The method of estimation of both methanol extract anthocyanins and acidified
methanol extract anthocyanins is given below.
Principle:
The anthocyanins are determined by ionizing the middle ring of flavonoids by acid,
yielding a pink color. The intensity of pink color is directly proportional to the
concentration of flavon-4-ols.
Chickpea seed samples were treated with methanol and the phenolic compounds are
then adsorbed in polyvinyl pyrrolidone (PVP) layers. The PVP is subsequently
cleaned and treated with acid to ionize the flavanoid ring, if any. The results in all
cases are expressed as A 550 g-1
on moisture free basis.
Reagents:
1. Methanol
2. Methanol-HCL 1%: Mix 1 ml conc. HCL in methanol and make up the
solution to 100 ml with methanol.
3. Butanol
4. Hydrochloric acid
5. Acetic acid
6. 0.1 N acetic acid: Dilute 5.71 ml glacial acetic acid to water and make up the
solution to 1 L
7. Water-saturated butanol: Take 300 ml butanol in a 500 ml separating funnel
and add 150 ml water. Shake vigorously and let it stand for overnight. Remove
the top layer and mix in a bottle with HCl in ratio 70:30.
8. Mix water saturated butanol, methanol and N/10 acetic acid in ratio 70:15:15.
Use this reagent for sample blank.
Procedure
Flavon-4-ols: Anthocyanidines
1. 200 mg of defatted sample is weighed into screw cap test tube.
2. 5 ml methanol is added to the sample.
3. The tubes are placed on a Staurt tube rotator (TR-2) and mixed for about 1 h.
4. After centrifugation the supernatant is collected in a vial, steps 2 to 4 are
repeated using the residue and all the extracts in the above vial are pooled.
This is referred to as methanol extract.

5. To the residue 5 ml methanol-HCL (Reagent 2) is added and steps 3 and 4 are
repeated.
6. The residue is re-extracted with additional 5 ml of methanol-HCL again and
then pooled, which is further used for the estimation. This is referred to as
acidic methanol extract.
7. 0.5 ml of sample extract is taken (both methanol and acidic methanol extracts
can be analyzed separately) and 7 ml of water-saturated butanol is added.
8. Using the mixture of water saturated butanol, methanol and N/10 acetic acid in
ratio 70:15:15, a blank is prepared and then the tubes are placed on a test tube
rotator for about 1 h.
9. The absorbance of the sample and blank at 550 nm is recorded by using
Spectrophotometer.
3.1.5.1.1 Calculation:
Results are reported as methanol extract anthocyanins and acidified methanol extract
anthocyanins, A550g-1
by reading the absorbance of samples at 550 nm using
Spectrophotometer.
3.1.5.2 Estimation of Protein
The seed samples of 300 accessions of reference set along with 5 control cultivars ,
evaluated in the post rainy 2006/2007 (E1), 2007/2008 (E2), 2008/2009 (E3) post
rainy and 2008/09 (E5) spring seasons were analyzed for protein. Protein content was
estimated by the micro Kjeldahl digestion and distillation method for determining
nitrogen (N) content, which is multiplied by 6.25 for obtaining the protein percent.
Reagents:
Tri acid mixture of nitric acid, sulfuric acid and perchloric acid (9:2:1v/v)
Procedure
The seed samples were finely ground (< 60 mesh for seed samples) using cyclone mill
then oven dried at 60C for 48 h before analysis.
1. Ground and dried seed samples of 0.5 g were transferred to 125 ml conical
flasks.
2. Twelve ml of tri-acid mixture of nitric acid, sulfuric acid and perchloric acid
(9:2:1(v/v)) were added to the flasks.
3. The flour samples were digested in a room temperature for 3 h followed by
digestion for 2 to 3 hours on a hot plate, until the digest was clear or colorless.

4. The flasks were allowed to cool and contents were diluted to an appropriate
volume.
5. The digests were used for estimation of N using Atomic Absorption
Spectrophotometry (AAS).
3.1.5.2.1 Calculation:
Protein percent was calculated by multiplying 6.25 to the estimated N .
3.1.6 STATISTICAL ANALYSIS
Data for each environment was analysed separately considering genotypes as random
using residual (or restricted) maximum likelihood (REML; Patterson and Thompson,
1971) in GenStat 12 (available at http://www.vsni.co.uk; verified 29 Sept, 2010).
Pooled analysis for all environments was performed using REML Meta analysis
(DetSimonian and Liard, 1986; Hardy and Thompson, 1996; Whitehead, 2002).
Genotype were considered random and season as fixed. Variance components due to
genotypes (σ 2
g), genotype environment (σ 2
ge), error component ( σ 2
e), and their
standard errors were estimated. Significance of differences among seasons was tested
using Wald (1943) statistics. Best linear unbiased predictors (BLUPs) (Schonfeld and
Werner, 1986) were determined for all quantitative traits.
The correlation coefficients among all traits were estimated for each
environment separately as well as on the basis of combined BLUP values obtained
from pooled analysis.
For each character, PCV and GCV were computed from variance components based
on the methods given by Burton (1952).
PCV = 100var
meanGrand
iancePhenotypic
GCV = 100var
meandGran
ianceGenotypic
The broad-sense heritability (h2
b) was estimated for each environment separately and
for over all the environments. Heritability in the broad sense (h2b) was calculated
according to Lush (1940).
2
g
(h2
b) = 100
2
p

where
σ2p=phenotypic variance
σ2g=genotypic variance.
Stability analysis based on Eberhart and Russell‘s (1966) model was performed to
identify stable genotypes. A phenotypic distance matrix was created by calculating the
differences between each pair of entries for each characteristic. The diversity index
was calculated by averaging all the differences in the phenotypic values for each trait
divided by respective range (Johns et al., 1997). The diversity index (H‘) of Shannon
and Weaver (1949) was calculated and used as a measure of phenotypic diversity of
each trait. The index was estimated for each character over all entries in three types.
Principal component analysis (PCA) was performed for dimensional reduction and to
know the importance of different traits in explaining multivariate polymorphism.
Cluster analysis was done following the minimum variance method of Ward (1963) to
group together similar genotypes based on principal component (PC) scores. Mean
and variances of clusters were tested for significance following the Newman-Keuls
procedure (Newman, 1939; Keuls, 1952) and Levene (1960) test, respectively.
3.2 MOLECULAR DIVERSITY
The chickpea reference set was planted in the 3rd week of October 2007 in glass
house at ICRISAT and DNA was extracted from a single representative plant in each
accession. A set of 100 SSR markers located across eight chromosomes of chickpea
were selected based on the chickpea linkage map reported by Winter et al., (2000).
3.2.1 Genomic DNA isolation
DNA was extracted from the single seedling of each 300 accessions along with five
checks by using a high-throughput mini- DNA extraction method (Mace et al., 2003)
as described below:
Reagents required
1. 3% CTAB (Cetyl Trimethyl Ammonium Bromide) buffer having 10mM Tris,
1.4M NaCl, 20mM EDTA and 3% CTAB. The pH was adjusted to 8.0 using
HCl. Just before use, mercaptoethanol (0.17%) was added.
2. Chloroform-isoamyl alcohol mixture (24:1) stored in the dark at room
temperature
3. Ice-cold isopropanol

4. RNase-A (10 mg/ml) dissolved in solution containing 10mM Tris (pH 7.5) and
15mM NaCl stored at –20°C; working stocks were stored at 4°C.
5. Phenol-chloroform-iso-amyl alcohol mixture (25:24:1)
6. 3 M sodium acetate (pH 5.2)
7. Ethanol (absolute and 70)
8. T1E0.1 buffer (10mM Tris and 1mM EDTA)
9. T10E1 buffer (0.5M Tris and 0.05M EDTA)
High-throughput mini- DNA extraction
(i) Sample preparation
1. Steel balls (4-mm in diameter and 3 numbers per extraction tube) (Spex
CertiPrep, USA), pre-chilled at –20ºC for about 30 minutes, were put into the
12 8-well extraction tubes with strip caps (Marsh Biomarket, USA), which
were kept on ice.
2. The CTAB buffer was pre-heated in 65°C water bath before start of DNA
extraction.
3. Leaf samples (Final weight of 20-30mg) were cut into pieces (1mm in length).
These cut leaves were transferred to the extraction tubes, which were fitted
into a 96-tube box.
(ii) Grinding and extraction
4. A volume of 450µl of pre-heated CTAB buffer was added to each extraction
tube containing a leaf sample.
5. Leaf tissues were disrupted to release DNA into the buffer solution using a
Sigma GenoGrinder™
(Spex CertiPrep, USA) at 500 strokes/minute for 5
minutes.
6. Grinding of leaf tissues was repeated until the color of the buffer solution
became pale green and the leaf tissue were sufficiently macerated.
7. After grinding, the tube box was fixed in a locking device and incubated at
65ºC in a water bath for 20 minutes with occasional shaking.
(iii) Solvent extraction
8. A volume of 450µl of chloroform-isoamyl alcohol mixture (24:1) was added
to each tube and the samples were centrifuged at 6200 rpm for 10 minutes
(Sigma centrifuge model 4K15C with Qiagen rotor model NR09100: 2 1120
g SW).

9. After centrifugation the aqueous layer (approximately 300 µl) was transferred
to a fresh strip tube (Marsh Biomarket).
(iv) Initial DNA precipitation
10. To the tube containing aqueous layer, 0.7 volumes (approximately 210µl) of
cold isopropanol (kept at –20ºC) was added. The solutions were carefully
mixed and the tubes were kept at –20ºC for 10 minutes.
11. The samples were centrifuged at 6200rpm for 15 minutes.
12. The supernatant was decanted under a fume-hood and pellets were allowed to
air dry (minimum 20 minutes).
(v) RNase-A treatment
13. In order to remove co-isolated RNA, 200µl of low salt TE buffer (T1E0.1) and
3µl of RNase-A (stock 10mg/µl) were added to each tube containing dry
pellet and mixed properly.
14. The solution was incubated at 37ºC for 30 minutes.
(vi) Solvent extraction
15. After incubation, 200µl of phenol-chloroform-isoamyl alcohol mixture
(25:24:1) was added to each tube, carefully mixed and centrifuged at
5000 rpm for 10 minutes.
16. The aqueous layer was transferred to fresh tubes and chloroform-
isoamylalcohol (24:1) mixture was added to each tube, carefully mixed and
centrifuged at 5000rpm for 10 minutes. The aqueous layer was transferred to
fresh tubes.
(vii) DNA precipitation
17. To the tubes containing aqueous layer, 15µl (approximately 1/10th
volume) of
3M sodium acetate (pH 5.2) and 300µl (2 volume) of absolute ethanol (kept at
–20ºC) were added and the tubes were subsequently placed in a freezer (–
20ºC) for 5 minutes.
18. Following incubation, the box containing tubes was centrifuged at 6200 rpm
for 15 minutes.
(viii) Ethanol wash
19. After centrifugation, supernatant was carefully decanted from each tube
having ensured that the pellets remained inside the tubes and 200µl of 70 per

cent ethanol was added to the tubes followed by centrifugation at 5000 rpm for
5 minutes.
(ix) Final re-suspension
20. Pellets were obtained by carefully decanting the supernatant from each tube
and then allowed to air dry for one hour.
21. Completely dried pellets were re-suspended in 100µl of T10E1 buffer and
incubated overnight at room temperature to allow the pellets to dissolve
completely.
22. Dissolved DNA samples were stored in 4ºC.
3.2.2 DNA quantification and quality check
The quality and quantity of DNA were checked by agarose gel electrophoresis as
described below
Reagents required were:
1. Agarose
2. 1X TBE buffer
For 10X TBE buffer, 109g of Tris and 55g of boric acid were dissolved one by
one in 800 ml distilled water; then 40ml of 0.5M EDTA (pH 8.0) was added.
The volume was made up to 1 liter with distilled water and sterilized by
autoclaving. This was stored at 4°C. To prepare working solution (1X), the
stock solution was diluted 10 times
3. Ethidium bromide (10 mg/ml)
A quantity of 100 mg ethidium bromide was dissolved in 10 ml of distilled
water. The vessel containing this solution was wrapped in aluminium foil and
stored at 4°C
4. Orange loading dye
0.5 M EDTA (pH 8.0) 10ml
5 M NaCl 1ml
Glycerol 50ml
Distilled water 39ml
Orange dye powder (Orange G, Gurr Certistain®) was added till the color
became sufficiently dark

Procedure
A quantity of 0.8g of agarose was added to 100ml of 1X TBE buffer and the slurry
was heated using microwave oven until the agarose was completely dissolved. After
cooling the solution to about 60C, 5µl of ethidium bromide solution was added and
the resulting mixture was poured into the gel-casting tray for solidification. Before the
gel solidified, an acrylic comb of desired well number was placed on the agarose
solution to form wells for loading samples. Each well was loaded with 5µl of sample
aliquot having 3µl distilled water, 1µl Orange dye and 1µl of DNA sample. The DNA
samples of known concentration (lambda DNA of 50ng/µl, 100ng/µl and 200ng/µl)
were also loaded on to the gel to estimate the DNA concentration of the experimental
samples. The gel was run at 70V for 20 minutes. After completing the electrophoresis
run, DNA on the gel was visualized under UV light and photographed. If the DNA
was observed as a clear and intact band, the quality was considered good, whereas a
smear of DNA indicated poor quality. The band intensity was compared with lambda
DNA to know the approximate quantity of DNA.
3.2.3 Optimization of SSR primers
One hundred and twenty SSR markers (Winter et al, 1999, Huettel et al, 1999) were
initially optimised on two diverse accessions, Annigeri (ICC 4918), an early maturing
desi (Ali and Kumar, 2003), and ICCV 2 (Sweta), early maturing, small seeded kabuli
cultivar (Kumar et al., 1985) by using modified Taguchi method (Cobb and Clarkson,
1994). One hundred SSR primer pairs which produced polymorphic alleles among
two diverse accessions were chosen to genotype the entire reference set.
3.2.4 SSR genotyping
91 SSR markers out of one hundred polymorphic markers were selected for
genotyping 305 (300 reference set accessions along with 5 check cultivars)
accessions, which were mapped on 8 chromosomes of chickpea (Winter et al, 2000)
based on high polymorphism and amplification rate.
3.2.5 Amplification of SSR markers
PCR reactions were conducted in 96-well and 384-well micro-titer plates in a
GeneAmp PCR system 9700 (Applied Biosystems, USA) thermocycler. Each PCR
reaction was performed in 5 l volume in 384-well PCR plates.
Component Stock Concentration Volume

DNA 5 ng/µl 1.0 µl
Primers 10 pm/ µl 0.5 µl
MgCl2 25 mM 1.0 µl
dNTPs 2 mM 0.25 µl
Buffer 10X 0.5 µl
Enzyme 0.3 U/µl 0.2 µl
(AmpliTaq Gold ®, Applied Biosystems, USA)
Water 1.55 µl
Total 5.0 µl
PCR reactions were carried out in GeneAmp®, PCR System 9700 thermal cycler
(Applied Biosystems, USA) with a touchdown (65-60) program using the following
cyclic conditions:
Step 1: Denaturation at 94oC for 15 min
Step 2: Denaturation at 94oC for 15 sec
Step 3: Annealing at 60 oC for 20 sec
(1 oC decrease in temperature per cycle)
Step 4: Extension at 72 oC for 30 sec
Step 5: Go to Step 2 for 10 times
Step 6: Denaturation at 94oC for 10 sec
Step 7: Annealing at 54 oC for 20 sec
Step 8: Extension at 72 oC for 30 sec
Step 9: Go to Step 6 for 40 times
Step 10: Extension at 72 oC for 20 min.
Step 11: Store at 4 oC
The amplified products were tested on 1.2% agarose gel(Plate 1).
3.2.6 Capillary electrophoresis
i. Sample preparation
After confirming the PCR amplification on 1.2 per cent agarose gel, the PCR products
were size-separated by capillary electrophoresis using an ABI Prism 3730 DNA
analyzer (Applied Biosystems Inc.). A set of 30 PCR multiplex sets were constructed
based on the estimated allele size and the type of forward primer label of the markers.
Each set consisted of four SSR markers with different labels and allele size. For post

PCR multiplexing, 1µl PCR product of each of 6-FAM, VIC, NED and PET-labeled
products were pooled (according to above mentioned criteria) and mixed with 7 µl of
Hi-Di formamide (Applied Biosystems, USA), 0.2 µl of the LIZ-500 size standard
(Applied Biosystems, USA) and 2.8 µl of distilled water. The pooled PCR amplicons
were denatured 5 minutes at 95°C and cooled immediately on ice.
ii. SSR fragment analysis
Raw data produced from ABI 3730xl Genetic Analyser was analysed using GeneScan
3.1 software (Applied Biosystems) to size the peak patterns in relation to the internal
size standard GeneScan 500™
LIZ® . GeneScan
® analysis software automatically
calculates the size of the unknown DNA sample fragments by generating a calibration
sizing curve based upon the migration times of the known fragments in the standard.
The unknown fragments are mapped onto the curve and the sample data is converted
from migration times to fragment size. Genotyper 3.7 (Applied Biosystems) was used
for allele calling. The peaks were displayed with base pair and height (amplitude)
values in a chromatogram and the allelic data were exported in to Excel spread sheet
for further analysis (Plate 2).
3.2.7 Molecular data analysis
The fragment sizes for all markers were used for analysis using PowerMarker version
3.25 (Liu and Muse, 2005) (http://www.powermarker.net), including the polymorphic
information content (PIC), allelic richness as determined by total number of the
detected alleles and number of alleles per locus, gene diversity and occurrence of
unique, rare, common, and most frequent alleles, and heterozygosity (%).
Polymorphic Information Content (PIC)
The polymorphic information content (PIC) was estimated as below (Botstein et al.
1980).
Gene diversity
Gene diversity often referred to as expected heterozygosity, is defined as the
probability that two randomly chosen alleles from the population are different. An
unbiased estimator of gene diversity at the lth
locus is

Heterozygosity
Heterozygosity is the proportion of heterozygous individuals in the population. At a
single locus it is estimated as
Allele and genotype frequencies
The sample allele frequencies are calculated as , with the variance
estimated as
Where
Unique, rare and common alleles
Unique alleles are those that are present in one accession or in one group of
accessions but absent in other accessions or group of accessions. Rare alleles are those
whose frequency is ≤ 1 per cent in the investigated materials. Common alleles are
those occurring between 1-20 per cent in the investigated materials while those
occurring >20 per cent was classified as most frequent alleles.
Dissimilarity matrix and construction of dendrogram
Genetic dissimilarities among chickpea accessions present in reference set were
calculated and dendrogram was constructed using un-weighted pair group method
with arithmetic mean (UPGMA) as implemented in DARwin 5.0.156 programme
(http://darwin.cirad.fr/darwin).
Principle Coordinate analysis

The Principal Co-ordinate analysis (PCoA) was carried out with dissimilarity matrix
using DARwin5 version 5.0.156 programme (http://darwin.cirad.fr/darwin).
3.2.8 Population structure analysis
In order to infer the population structure of the reference set of chickpea without
considering the pre-existing classification or geographical information, the analysis
were performed using the software package STRUCTURE 2.3.2. The program
STRUCTURE implements a model based clustering method for inferring population
structure using genotype data consisting of unlinked markers to identify K clusters to
which the program then assigns each individual genotype. The method was introduced
by Pritchard et al. (2000a) and extended by Falush et al. (2003, 2007). To determine
most appropriate K value, burn-in Markov Chain Monte Carlo (MCMC) replication
was set to 10,000 and data were collected over 100,000 MCMC replications in each
run. Five independent runs were performed setting the number of population (K) from
2 to 20 using a model allowing for no admixture and correlated allele frequencies.
The basis of this kind of clustering method is the allocation of individual genotypes to
K clusters in such a way that Hardy-Weinberg equilibrium and linkage equilibrium
are valid within clusters, whereas these kinds of equilibrium are absent between
clusters. The K value was determined by LnP(D) in STRUCTURE output and an ad
hoc statistic ΔK based on the rate of change in LnP(D) between successive K (Evanno
et al., 2005). Once K value had been determined, burn-in period of 1, 00,000 and 2,
00,000 replications were used. The clustering matrices (Q) of closely related clusters/
subdivisions using Bayesian approach, is obtained which is used in association
mapping .
3.2.9 Association mapping
Association of SSR marker genotypes with trait of interest was tested using the
general linear model (GLM) based on chosen Q-matrix derived from STRUCTURE
suggested by Yu et al., (2006) was implemented using Q-matrix and the kinship-
Matrix, which was also calculated considering all mapped markers. The kinship-
Matrix is generated by using the software program TASSEL 2.1
(http://www.maizegenetics.net/), by converting the distance matrix calculated from
TASSEL‘s Cladogram function to a similarity matrix. This method simultaneously
takes into account multiple levels of both gross level population structure (Q) and

finer scale relative kinship (K). The statistical model can be described in Henderson‘s
notations (Henderson, 1975) as follows:
Where y is the vector of observations; ß is an unknown vector containing fixed effects
including genetic marker and population structure (Q); u is an unknown vector of
random additive genetic effects from multiple background QTL for individuals or
lines; X and Z are the know design matrices; and e is the unobserved vector of
random residuals. Each of the marker allele is fit as a separate class were
heterozygotes fits as additional marker class. The resulting marker effect is not
decomposed into additive and dominance effects but simply tested for overall
significance. The u and e vectors are assumed to be normally distributed with null
mean and variance of
as the unknown additive genetic variance and K as the
kinship matrix.
The population structure matrix (Q) was constructed by running Structure at K=13.
The Q-Matrix and kinship-matrix were also calculated using TASSEL considering all
mapped markers. The EMMA method (Kang et al., 2008) was chosen and the MLM
parameters were left at the default setting from TASSEL. The EM method uses an
expectation-maximization algorithm to derive a restricted maximum likelihood
(REML) estimate of the variance components. Each trait was represented by its mean
of the two replications and five environments were separately analyzed and compared
with results obtained from pooled mean of five environments. The SSR markers
associated with trait of interest were identified based on P value of marker, which
determines whether a QTL is associated with the marker. The R2 %(marker)
indicating the fraction of the total variance explained by the marker. Only significant
(P≤0.001) SSR markers alone were selected.
3.2.10 Analysis of Molecular Variance
Analysis of Molecular Variace (AMOVA) is to partition molecular variance among
the sub populations (STRUCTURE) and clusters (DARwin 5.0.156), using the

software GENALEX 6.41 (Peakall and Smouse, 2006)
(http://www.anu.edu.au/BoZo/GenAIEx/). SSR marker data of the entire population
including five checks were subdivided into thirteen subpopulations obtained from
software STRUCTURE at K=13 and four clusters identified by UPGMA using
DARwin 5.0.156.

Table 5: Geographic distribution of Chickpea germplasm with different seed types from different
countries
S.No Country Total Desi Kabuli Pea Wild Not Recorded
1 Afghanistan 734 217 366 120 23 8
2 Albania 2 - 1 - - 1
3 Algeria 40 7 32 - - 1
4 Armenia 3 - 3 - - -
5 Australia 5 3 2 - - -
6 Azerbaijain 9 - 9 - - -
7 Bangladesh 170 170 - - - -
8 Brazil 1 1 - - - -
9 Bulgaria 19 2 14 3 - -
10 Chile 179 2 174 1 - 2
11 China 29 3 26 - - -
12 Colombia 1 - 1 - - -
13 Cyprus 60 24 35 1 - -
14 Czechoslovakia (Former) 9 - 7 2 - -
15 Ecuador 1 - 1 - -
16 Egypt 60 10 28 21 - 1
17 Ethiopia 960 870 43 35 8 4
18 France 16 2 12 1 - 1
19 Georgia 2 - 2 - - -
20 Germany 14 11 1 - - 2
21 Greece 31 12 14 2 - 3
22 Hungary 10 4 5 - - 1
23 ICARDA 20 - 18 2 - -
24 India 7972 7276 344 282 23 47
25 Iran 5294 3585 1576 89 - 44
26 Iraq 46 6 36 - 1 3
27 Israel 79 21 36 5 15 2
28 Italy 66 12 50 3 - 1
29 Jordan 72 8 58 - 3 3
30 Kenya 1 - 1 - - -
31 Kyrgyzstan 4 - 4 - - -
32 Lebanon 41 1 24 - 15 1
33 Libyan Arab Jamahiriya 2 - 2 - - -
34 Malawi 81 78 3 - - -
35 Mexico 457 316 131 8 - 2
36 Moldova 4 - 2 2 - -
37 Morocco 304 99 186 14 1 4
38 Myanmar 132 123 9 - - -
39 Nepal 84 79 2 2 - 1

S.No Country Total Desi Kabuli Pea Wild Not Recorded
40 Nigeria 3 3 - - - -
41 Pakistan 721 462 200 13 37 9
42 Palestine 1 - 1 - - -
43 Peru 4 - 3 - - 1
44 Portugal 99 2 96 1 - -
45 Romania 11 5 4 - - 2
46 Russia & CISs 153 56 68 27 1 1
47 Spain 197 21 154 2 1 19
48 Sri Lanka 4 4 - - - -
49 Sudan 17 3 9 3 - 2
50 Syria 446 57 335 4 44 6
51 Tajikistan 13 6 5 - - 2
52 Tanzania 97 95 2 - - -
53 Tunisia 72 - 69 - - 3
54 Turkey 972 171 620 18 113 50
55 Uganda 1 1 - - - -
56 Ukraine 14 4 8 2 - -
57 Unknown 262 146 71 8 23 14
58 USA 126 36 82 1 - 7
59 Uzbekistan 15 1 8 5 - 1
60 Yugoslavia (Former) 25 5 17 - - 3
Total 20267 14020 5010 677 308 252

Table 6: List of 300 accessions present in Chickpea reference set and five control cultivars, with
seed type, origin, and region
S.n
o Reference
Land
type Source country Region species
1 ICC10018 Desi India South & East Asia Cicer arietinum
2 ICC10341 Pea Turkey Mediterranean Cicer arietinum
3 ICC10393 Desi India South & East Asia Cicer arietinum
4 ICC10399 Desi India South & East Asia Cicer arietinum
5 ICC10466 Kabuli India South & East Asia Cicer arietinum
6 ICC1052 Desi Pakistan South & East Asia Cicer arietinum
7 ICC10673 Desi Turkey Mediterranean Cicer arietinum
8 ICC10685 Desi Turkey Mediterranean Cicer arietinum
9 ICC10755 Kabuli Turkey Mediterranean Cicer arietinum
10 ICC1083 Desi Iran West Asia Cicer arietinum
11 ICC10885 Kabuli Ethiopia Africa Cicer arietinum
12 ICC10939 Desi India South & East Asia Cicer arietinum
13 ICC10945 Desi India South & East Asia Cicer arietinum
14 ICC1098 Desi Iran West Asia Cicer arietinum
15 ICC11121 Desi India South & East Asia Cicer arietinum
16 ICC11198 Desi India South & East Asia Cicer arietinum
17 ICC11279 Desi Pakistan South & East Asia Cicer arietinum
18 ICC11284 Desi Russian Federation Russian Federation Cicer arietinum
19 ICC11303 Kabuli Chile South America Cicer arietinum
20 ICC11378 Desi India South & East Asia Cicer arietinum
21 ICC11498 Desi India South & East Asia Cicer arietinum
22 ICC11584 Desi India South & East Asia Cicer arietinum
23 ICC1161 Desi Pakistan South & East Asia Cicer arietinum
24 ICC11627 Desi India South & East Asia Cicer arietinum
25 ICC1164 Desi Nigeria Africa Cicer arietinum
26 ICC11664 Desi India South & East Asia Cicer arietinum
27 ICC11764 Kabuli Chile South America Cicer arietinum
28 ICC1180 Desi India South & East Asia Cicer arietinum
29 ICC11819 Kabuli Chile South America Cicer arietinum
30 ICC11879 Kabuli Turkey Mediterranean Cicer arietinum
31 ICC11903 Desi Germany Europe Cicer arietinum
32 ICC1194 Desi India South & East Asia Cicer arietinum
33 ICC11944 Desi Nepal South & East Asia Cicer arietinum
34 ICC12028 Desi Mexico North America Cicer arietinum
35 ICC12037 Kabuli Mexico North America Cicer arietinum
36 ICC1205 Desi India South & East Asia Cicer arietinum
37 ICC12155 Desi Bangladesh South & East Asia Cicer arietinum
38 ICC12299 Desi Nepal South & East Asia Cicer arietinum
39 ICC1230 Desi India South & East Asia Cicer arietinum
40 ICC12307 Desi Myanmar South & East Asia Cicer arietinum
41 ICC12321 Desi Unknown Unknown Cicer arietinum
42 ICC12324 Kabuli Unknown Unknown Cicer arietinum
43 ICC12328 Kabuli Cyprus Mediterranean Cicer arietinum
44 ICC12379 Desi Iran West Asia Cicer arietinum
45 ICC12492 Kabuli ICRISAT South & East Asia Cicer arietinum
46 ICC12537 Desi Ethiopia Africa Cicer arietinum
47 ICC12654 Desi Ethiopia Africa Cicer arietinum
48 ICC12726 Desi Ethiopia Africa Cicer arietinum

S.n
o Reference
Land
type Source country Region species
49 ICC12824 Desi Ethiopia Africa Cicer arietinum
50 ICC12851 Desi Ethiopia Africa Cicer arietinum
51 ICC12866 Desi Ethiopia Africa Cicer arietinum
52 ICC12916 Desi India South & East Asia Cicer arietinum
53 ICC12928 Desi India South & East Asia Cicer arietinum
54 ICC12947 Desi India South & East Asia Cicer arietinum
55 ICC13077 Kabuli India South & East Asia Cicer arietinum
56 ICC13124 Desi India South & East Asia Cicer arietinum
57 ICC13187 Kabuli Iran West Asia Cicer arietinum
58 ICC13219 Desi Iran West Asia Cicer arietinum
59 ICC13283 Kabuli Iran West Asia Cicer arietinum
60 ICC13357 Kabuli Iran West Asia Cicer arietinum
61 ICC13441 Kabuli Iran West Asia Cicer arietinum
62 ICC13461 Kabuli Iran West Asia Cicer arietinum
63 ICC13523 Kabuli Iran West Asia Cicer arietinum
64 ICC13524 Desi Iran West Asia Cicer arietinum
65 ICC1356 Desi India South & East Asia Cicer arietinum
66 ICC13599 Desi Iran West Asia Cicer arietinum
67 ICC13628 Kabuli Unknown Unknown Cicer arietinum
68 ICC13719 Kabuli Iran West Asia Cicer arietinum
69 ICC13764 Kabuli Iran West Asia Cicer arietinum
70 ICC13816 Kabuli Russian Federation Russian Federation Cicer arietinum
71 ICC13863 Desi Ethiopia Africa Cicer arietinum
72 ICC13892 Desi Ethiopia Africa Cicer arietinum
73 ICC1392 Desi India South & East Asia Cicer arietinum
74 ICC1397 Desi India South & East Asia Cicer arietinum
75 ICC1398 Desi India South & East Asia Cicer arietinum
76 ICC14051 Desi Ethiopia Africa Cicer arietinum
77 ICC14077 Desi Ethiopia Africa Cicer arietinum
78 ICC14098 Desi Ethiopia Africa Cicer arietinum
79 ICC14199 Kabuli Mexico North America Cicer arietinum
80 ICC1422 Desi India South & East Asia Cicer arietinum
81 ICC1431 Desi India South & East Asia Cicer arietinum
82 ICC14402 Desi ICRISAT South & East Asia Cicer arietinum
83 ICC14446 Kabuli Italy Mediterranean Cicer arietinum
84 ICC14595 Desi India South & East Asia Cicer arietinum
85 ICC14669 Desi India South & East Asia Cicer arietinum
86 ICC14778 Desi India South & East Asia Cicer arietinum
87 ICC14799 Desi India South & East Asia Cicer arietinum
88 ICC14815 Desi India South & East Asia Cicer arietinum
89 ICC14831 Desi India South & East Asia Cicer arietinum
90 ICC1510 Desi India South & East Asia Cicer arietinum
91 ICC15248 Desi Iran West Asia Cicer arietinum
92 ICC15264 Kabuli Iran West Asia Cicer arietinum
93 ICC15294 Desi Iran West Asia Cicer arietinum
94 ICC15333 Kabuli Iran West Asia Cicer arietinum
95 ICC15406 Kabuli Morocco Mediterranean Cicer arietinum
96 ICC15435 Kabuli Morocco Mediterranean Cicer arietinum
97 ICC15510 Desi Morocco Mediterranean Cicer arietinum
98 ICC15518 Kabuli Morocco Mediterranean Cicer arietinum

S.n
o Reference
Land
type Source country Region species
99 ICC15567 Desi India South & East Asia Cicer arietinum
100 ICC15606 Desi India South & East Asia Cicer arietinum
101 ICC15610 Desi India South & East Asia Cicer arietinum
102 ICC15612 Desi Tanzania Africa Cicer arietinum
103 ICC15614 Desi Tanzania Africa Cicer arietinum
104 ICC15618 Desi India South & East Asia Cicer arietinum
105 ICC15697 Kabuli
Syrian Arab
Republic Mediterranean Cicer arietinum
106 ICC15762 Desi
Syrian Arab
Republic Mediterranean Cicer arietinum
107 ICC15785 Desi
Syrian Arab
Republic Mediterranean Cicer arietinum
108 ICC15802 Kabuli
Syrian Arab
Republic Mediterranean Cicer arietinum
109 ICC15868 Desi India South & East Asia Cicer arietinum
110 ICC15888 Pea India South & East Asia Cicer arietinum
111 ICC16207 Desi Myanmar South & East Asia Cicer arietinum
112 ICC16261 Desi Malawi Africa Cicer arietinum
113 ICC16269 Desi Malawi Africa Cicer arietinum
114 ICC16374 Desi Malawi Africa Cicer arietinum
115 ICC16487 Desi Pakistan South & East Asia Cicer arietinum
116 ICC16524 Desi Pakistan South & East Asia Cicer arietinum
117 ICC16654 Kabuli China South & East Asia Cicer arietinum
118 ICC16796 Kabuli Portugal Europe Cicer arietinum
119 ICC16903 Desi India South & East Asia Cicer arietinum
120 ICC16915 Desi India South & East Asia Cicer arietinum
121 ICC1710 Desi India South & East Asia Cicer arietinum
122 ICC1715 Desi India South & East Asia Cicer arietinum
123 ICC1882 Desi India South & East Asia Cicer arietinum
124 ICC1915 Desi India South & East Asia Cicer arietinum
125 ICC1923 Desi India South & East Asia Cicer arietinum
126 ICC2065 Desi India South & East Asia Cicer arietinum
127 ICC2072 Desi India South & East Asia Cicer arietinum
128 ICC2210 Desi Algeria Mediterranean Cicer arietinum
129 ICC2242 Desi India South & East Asia Cicer arietinum
130 ICC2263 Desi Iran West Asia Cicer arietinum
131 ICC2277 Kabuli Iran West Asia Cicer arietinum
132 ICC2482 Kabuli Iran West Asia Cicer arietinum
133 ICC2507 Desi Iran West Asia Cicer arietinum
134 ICC2580 Desi Iran West Asia Cicer arietinum
135 ICC2593 Kabuli Iran West Asia Cicer arietinum
136 ICC2629 Desi Iran West Asia Cicer arietinum
137 ICC2679 Desi Iran West Asia Cicer arietinum
138 ICC2720 Desi Iran West Asia Cicer arietinum
139 ICC2737 Desi Iran West Asia Cicer arietinum
140 ICC283 Desi India South & East Asia Cicer arietinum
141 ICC2884 Desi Iran West Asia Cicer arietinum
142 ICC2919 Desi Iran West Asia Cicer arietinum
143 ICC2969 Desi Iran West Asia Cicer arietinum
144 ICC2990 Desi Iran West Asia Cicer arietinum
145 ICC3218 Desi Iran West Asia Cicer arietinum

S.n
o Reference
Land
type Source country Region species
146 ICC3230 Desi Iran West Asia Cicer arietinum
147 ICC3239 Desi Iran West Asia Cicer arietinum
148 ICC3325 Desi Cyprus Mediterranean Cicer arietinum
149 ICC3362 Desi Iran West Asia Cicer arietinum
150 ICC3391 Desi Iran West Asia Cicer arietinum
151 ICC3410 Kabuli Iran West Asia Cicer arietinum
152 ICC3421 Kabuli Israel Mediterranean Cicer arietinum
153 ICC3512 Desi Iran West Asia Cicer arietinum
154 ICC3582 Desi Iran West Asia Cicer arietinum
155 ICC3631 Desi Iran West Asia Cicer arietinum
156 ICC3761 Desi Iran West Asia Cicer arietinum
157 ICC3776 Desi Iran West Asia Cicer arietinum
158 ICC3892 Desi Iran West Asia Cicer arietinum
159 ICC3946 Desi Iran West Asia Cicer arietinum
160 ICC4093 Desi Iran West Asia Cicer arietinum
161 ICC4182 Desi Iran West Asia Cicer arietinum
162 ICC4363 Desi Iran West Asia Cicer arietinum
163 ICC440 Desi India South & East Asia Cicer arietinum
164 ICC4418 Desi Iran West Asia Cicer arietinum
165 ICC4463 Desi Iran West Asia Cicer arietinum
166 ICC4495 Desi Turkey Mediterranean Cicer arietinum
167 ICC4533 Desi India South & East Asia Cicer arietinum
168 ICC456 Desi India South & East Asia Cicer arietinum
169 ICC4567 Desi India South & East Asia Cicer arietinum
170 ICC4593 Desi India South & East Asia Cicer arietinum
171 ICC4639 Desi India South & East Asia Cicer arietinum
172 ICC4657 Desi India South & East Asia Cicer arietinum
173 ICC4814 Desi Iran West Asia Cicer arietinum
174 ICC4841 Kabuli Morocco Mediterranean Cicer arietinum
175 ICC4853 Kabuli Unknown Unknown Cicer arietinum
176 ICC4872 Pea India South & East Asia Cicer arietinum
177 ICC4918 Desi India South & East Asia Cicer arietinum
178 ICC4991 Desi India South & East Asia Cicer arietinum
179 ICC506 Desi India South & East Asia Cicer arietinum
180 ICC5135 Desi India South & East Asia Cicer arietinum
181 ICC5221 Desi India South & East Asia Cicer arietinum
182 ICC5337 Kabuli India South & East Asia Cicer arietinum
183 ICC5383 Desi India South & East Asia Cicer arietinum
184 ICC5434 Desi India South & East Asia Cicer arietinum
185 ICC5504 Desi Mexico North America Cicer arietinum
186 ICC5613 Desi India South & East Asia Cicer arietinum
187 ICC5639 Desi India South & East Asia Cicer arietinum
188 ICC5845 Desi India South & East Asia Cicer arietinum
189 ICC5878 Desi India South & East Asia Cicer arietinum
190 ICC5879 Pea India South & East Asia Cicer arietinum
191 ICC6263 Kabuli Russian Federation Russian Federation Cicer arietinum
192 ICC6279 Desi India South & East Asia Cicer arietinum
193 ICC6293 Desi Italy Mediterranean Cicer arietinum
194 ICC6294 Desi Iran West Asia Cicer arietinum
195 ICC6306 Desi Russian Federation Russian Federation Cicer arietinum

S.n
o Reference
Land
type Source country Region species
196 ICC637 Desi India South & East Asia Cicer arietinum
197 ICC6537 Desi Iran West Asia Cicer arietinum
198 ICC6571 Desi Iran West Asia Cicer arietinum
199 ICC6579 Desi Iran West Asia Cicer arietinum
200 ICC67 Desi India South & East Asia Cicer arietinum
201 ICC6802 Desi Iran West Asia Cicer arietinum
202 ICC6811 Desi Iran West Asia Cicer arietinum
203 ICC6816 Desi Iran West Asia Cicer arietinum
204 ICC6874 Desi Iran West Asia Cicer arietinum
205 ICC6875 Desi Iran West Asia Cicer arietinum
206 ICC6877 Desi Iran West Asia Cicer arietinum
207 ICC7052 Desi Iran West Asia Cicer arietinum
208 ICC708 Desi India South & East Asia Cicer arietinum
209 ICC7150 Desi Turkey Mediterranean Cicer arietinum
210 ICC7184 Desi Turkey Mediterranean Cicer arietinum
211 ICC7255 Kabuli India South & East Asia Cicer arietinum
212 ICC7272 Kabuli Algeria Mediterranean Cicer arietinum
213 ICC7305 Desi Afghanistan West Asia Cicer arietinum
214 ICC7308 Kabuli Peru South America Cicer arietinum
215 ICC7315 Kabuli Iran West Asia Cicer arietinum
216 ICC7323 Pea Russian Federation Russian Federation Cicer arietinum
217 ICC7326 Desi Unknown Unknown Cicer arietinum
218 ICC7413 Pea India South & East Asia Cicer arietinum
219 ICC7441 Desi India South & East Asia Cicer arietinum
220 ICC7554 Desi Iran West Asia Cicer arietinum
221 ICC7571 Kabuli Israel Mediterranean Cicer arietinum
222 ICC762 Desi India South & East Asia Cicer arietinum
223 ICC7668 Kabuli Russian Federation Russian Federation Cicer arietinum
224 ICC7819 Desi Iran West Asia Cicer arietinum
225 ICC7867 Desi Iran West Asia Cicer arietinum
226 ICC791 Desi India South & East Asia Cicer arietinum
227 ICC8058 Kabuli Iran West Asia Cicer arietinum
228 ICC8151 Kabuli
United States of
America North America Cicer arietinum
229 ICC8195 Desi Pakistan South & East Asia Cicer arietinum
230 ICC8200 Desi Iran West Asia Cicer arietinum
231 ICC8261 Kabuli Turkey Mediterranean Cicer arietinum
232 ICC8318 Desi India South & East Asia Cicer arietinum
233 ICC8350 Pea India South & East Asia Cicer arietinum
234 ICC8384 Desi India South & East Asia Cicer arietinum
235 ICC8515 Desi Greece Mediterranean Cicer arietinum
236 ICC8521 Desi Italy Mediterranean Cicer arietinum
237 ICC8522 Desi Italy Mediterranean Cicer arietinum
238 ICC8607 Desi Ethiopia Africa Cicer arietinum
239 ICC8621 Desi Ethiopia Africa Cicer arietinum
240 ICC867 Desi India South & East Asia Cicer arietinum
241 ICC8718 Desi Afghanistan West Asia Cicer arietinum
242 ICC8740 Kabuli Afghanistan West Asia Cicer arietinum
243 ICC8752 Kabuli Afghanistan West Asia Cicer arietinum
244 ICC8855 Kabuli Afghanistan West Asia Cicer arietinum
245 ICC8950 Desi India South & East Asia Cicer arietinum

S.n
o Reference
Land
type Source country Region species
246 ICC9002 Desi Iran West Asia Cicer arietinum
247 ICC9137 Kabuli Iran West Asia Cicer arietinum
248 ICC9402 Kabuli Iran West Asia Cicer arietinum
249 ICC9418 Kabuli Iran West Asia Cicer arietinum
250 ICC9434 Kabuli Iran West Asia Cicer arietinum
251 ICC95 Desi India South & East Asia Cicer arietinum
252 ICC9586 Desi India South & East Asia Cicer arietinum
253 ICC9590 Desi Egypt Mediterranean Cicer arietinum
254 ICC9636 Desi Afghanistan West Asia Cicer arietinum
255 ICC9643 Desi Afghanistan West Asia Cicer arietinum
256 ICC9702 Desi Afghanistan West Asia Cicer arietinum
257 ICC9712 Desi Afghanistan West Asia Cicer arietinum
258 ICC9755 Desi Afghanistan West Asia Cicer arietinum
259 ICC9848 Pea Afghanistan West Asia Cicer arietinum
260 ICC9862 Pea Afghanistan West Asia Cicer arietinum
261 ICC9872 Kabuli Afghanistan West Asia Cicer arietinum
262 ICC9895 Pea Afghanistan West Asia Cicer arietinum
263 ICC9942 Desi India South & East Asia Cicer arietinum
264 ICCV95311 kabuli ICRISAT South & East Asia Cicer arietinum
265 IG10309 Kabuli
Syrian Arab
Republic Mediterranean Cicer arietinum
266 IG10419 Kabuli
Syrian Arab
Republic Mediterranean Cicer arietinum
267 IG10500 Kabuli
Syrian Arab
Republic Mediterranean Cicer arietinum
268 IG10569 Kabuli
Syrian Arab
Republic Mediterranean Cicer arietinum
269 IG10701 Kabuli
Syrian Arab
Republic Mediterranean Cicer arietinum
270 IG11045 Kabuli
Syrian Arab
Republic Mediterranean Cicer arietinum
271 IG5909 Kabuli Iraq West Asia Cicer arietinum
272 IG5949 kabuli Unknown Unknown Cicer arietinum
273 IG6044 kabuli Sudan Africa Cicer arietinum
274 IG6047 kabuli Afghanistan West Asia Cicer arietinum
275 IG6055 kabuli Iran West Asia Cicer arietinum
276 IG6067 kabuli Turkey Mediterranean Cicer arietinum
277 IG6154 kabuli Iran West Asia Cicer arietinum
278 IG6343 Kabuli Turkey Mediterranean Cicer arietinum
279 IG6905 Kabuli Morocco Mediterranean Cicer arietinum
280 IG69438 Kabuli Cyprus Mediterranean Cicer arietinum
281 IG69761 Kabuli Uzbekistan West Asia Cicer arietinum
282 IG69974 Wild Turkey Mediterranean
Cicer
echinospermum
283 IG70826 Kabuli Greece Mediterranean Cicer arietinum
284 IG7087 kabuli
United States of
America North America Cicer arietinum
285 IG71005 kabuli France Mediterranean Cicer arietinum
286 IG71055 Kabuli
Syrian Arab
Republic Mediterranean Cicer arietinum
287 IG7148 Kabuli Algeria Mediterranean Cicer arietinum
288 IG72070 Kabuli Turkey Mediterranean Cicer arietinum

S.n
o Reference
Land
type Source country Region species
289 IG72109 Kabuli Turkey Mediterranean Cicer arietinum
290 IG7296 kabuli Afghanistan West Asia Cicer arietinum
291 IG72970 Wild Turkey Mediterranean Cicer reticulatum
292 IG73064 Wild Turkey Mediterranean
Cicer
echinospermum
293 IG73074 Wild Turkey Mediterranean
Cicer
echinospermum
294 IG73082 Wild Turkey Mediterranean Cicer reticulatum
295 IG73083 Wild Turkey Mediterranean Cicer reticulatum
296 IG73086 Wild Turkey Mediterranean Cicer reticulatum
297 IG73305 Kabuli France Mediterranean Cicer arietinum
298 IG73458 Kabuli
Syrian Arab
Republic Mediterranean Cicer arietinum
299 IG74036 Pea
Moldova, Republic
of Europe Cicer arietinum
300 IG74052 Kabuli Italy Mediterranean Cicer arietinum
Control cultivars
301
Annigeri
Desi India South & East Asia
Cicer
arietinum
302
G130
Desi India South & East Asia
Cicer
arietinum
303
ICCV10
Desi India South & East Asia
Cicer
arietinum
304
KAK2
Kabuli India South & East Asia
Cicer
arietinum
305
L550
Kabuli India South & East Asia
Cicer
arietinum

Table 7: Country of origin and seed type of Chickpea reference set accessions
S.No Country Total Desi kabuli Pea Wild
1 Afghanistan 16 7 6 3 -
2 Algeria 3 1 2 - -
3 Bangladesh 1 1 - - -
4 Chile 3 - 3 - -
5 China 1 - 1 - -
6 Cyprus 3 1 2 - -
7 Egypt 1 1 - - -
8 Ethiopia 14 13 1 - -
9 France 2 - 2 - -
10 Germany 1 1 - - -
11 Greece 2 1 1 - -
12 India 93 82 6 5 -
13 Iran 75 53 22 - -
14 Iraq 1 - 1 - -
15 Israel 2 - 2 - -
16 Italy 5 3 2 - -
17 Malawi 3 3 - - -
18 Mexico 4 2 2 - -
19 Moldova, Republic of 1 - - 1 -
20 Morocco 6 1 5 - -
21 Myanmar 2 2 - - -
22 Nepal 2 2 - - -
23 Nigeria 1 1 - - -
24 Pakistan 6 6 - - -
25 Peru 1 - 1 - -
26 Portugal 1 - 1 - -
27 Russian Federation 6 2 3 1 -
28 Sudan 1 - 1 - -
29 Syrian Arab Republic 12 2 10 - -
30 Tanzania 2 2 - - -
31 Turkey 20 5 7 1 7
32 United States of America 2 - 2 - -
33 Unknown 6 2 4 - -
34 Uzbekistan 1 - 1 - -
35 Total 300 194 88 11 7
Table 8: Meteorological details of environments in which chickpea reference set was evaluated
during 2006-2007 ,2007-08 postrainy, 2008-09 postrainy and winter seasons at
ICRISAT, Patancheru, India
Planting
Season
No. of
Entries
No. of
Irrigations
Rain
fall
(mm)
Evaporation
(mm)
Max
temperature
(oC)
Min temperature
(oC)
No. of bright
sunshine hours
Total Min Max Mean Min Max Mean Min Max Mean Min Max Mean
Normal
sown
300 + 5
checks 3 26.6 1.4 6.7 4.18 24 34 29.9 10.2 21.2 14.2 3.7 10.6 8.65
Late sown
300 + 5
checks 5 33.6 3.4 13.7 8.16 29 42 36.1 11.6 27.3 19.5 5.3 10.9 9.13
Note: Design: Alpha Design, No. of replication=2, spacing (cm) =60x10, plot size (m2) =3 and
fertilizer applied is 16 N; 46 P2O5 (kg ha-1)

Table 9: List of qualitative characters studied
S.No Plant trait Criteria Classes
1 Growth Habit Angle of primary branches, at mid-
pod filling stage
Erect (0-15o from vertical)
Semi-erect (16-25o)
Semi-spreading (26-60o)
Spreading (61-80o)
Prostrate (flat on ground)
2 Plant pigmentation Anthocyanin content in the plant No-anthocyanin
Low-anthocyanin
High-anthocyanin
3 Flower color Color of standard petals of fully
opened flowers
Blue
Light blue
Light pink
Pink
Dark pink
White-pink
White and striped
4 Seed color Observed on mature seeds Black
Brown
Light brown
Dark brown
Reddish brown
Greyish brown
Salmon brown
Grey
Brown beige
Beige
Yellow
Light yellow
Yellow brown
Orange yellow
Orange
Yellow beige
Ivory white
Green
Light green
Variegated
Black-brown mosaic
5 Seed dots Minute black dots on seed coat Absence
Presence
6 Seed shape Angular, ram's head,
Owl's head
Pea shaped
Desi cultivars
Kabuli cultivars
Intermediate types
7 Testa texture Seed texture Rough
Smooth
Tuberculated

Table 10: List of quantitative characters studied
S.No
Quantitative trait
Description
1
Days to 50% flowering
(Days)
Number of days from sowing to the day on which 50%
plants started flowering.
2 Flower duration (Days) Number of days from date of 50% flowering to the day when
50% of the plants stopped flowering.
3 Days to maturity (Days) Number of days from date of sowing to the day when 90% of
pods matured.
4 Days to grain filling (Days) Number of days from date of 50% flowering to the day when
90% of pods were matured.
5 Plant height (cm) Height of the plant from ground level to the top of the plant
(cm)
6 Plant width (cm) It is the average spread of five representative plants of each
accession, recorded in centimeter.
7 Basal primary branches
(number)
Number of branches produced on the
main stem, starting from the base to the middle of the plant.
8 Apical primary branches
(number)
The number of branches produced on upper half to of the
main stem
9 Basal secondary branches
(number)
The number of branches produced from the nodes or buds of
basal primary branches
10 Apical secondary branches
(number)
The number of branches produced from the nodes or buds of
apical primary branches
11 Tertiary branches (number) The number of branches produced from the buds of
secondary branches
12 Pods per plant (number) Average number of fully formed pods per plant from five
representative plants.
13 Seed per pod (number) Average of all pods on five representative plants
14 Yield per plant (g) Average grain yield of five representative plants in gms.
15 100 seed weight (g) Weight of 100 randomly selected well developed seeds after
sun drying.
16 Plot yield (kg ha-1) Total seed weight of all the plants in the plot is expressed as
seed yield in kg per hectare.
17 Per day Productivity (kg
ha-1)
Yield per day computed by dividing total plot yield with no
of days to maturity

Table 11: Details of chickpea SSR markers used to genotype chickpea reference set, chromosome
location, repeat motif, forward and reverse primer sequences
Marker
Name
Chromo
some
location Repeat Motifs Forward Primer Reverse Primer
CaSTMS2 6 (TAT)25
ATTTTACTTTACTACTTTTTT
CCTTTC
AATAAATGGA
GTGTAAATTTCATGTA
CaSTMS4 3
(AT)6(GT)42A
T(GT)5CT(GT)
10
AATATATGAATTGGTTCAGA
CATC
AAACAAATAATAGA
AAATTATGCTCC
CaSTMS5 3 (GA)19
TACAAACTTTTAAGTTCATA
AGTTTGA
AACTTCTCGA
ATTAGTAAATTAAGTTG
CaSTMS6 9 (TC)14
TCTATCTTCCATTATTTCTTG
TTAAGT
TAATTTACATTCTGA
CTACTTAATCCA
CaSTMS7 5 (GA)12 GAGGATTCGGATTCAGAT AAAATCTTGGA AGTGA TTGA G
CaSTMS9 NR (TC)6A(TC)13
CTTCTATATACATAGTCCTA
CCTACAC ACCTCATAAAGCTGTTAAAG
CaSTMS10 3 (AG)32
ATAACAAAAAGATATCTCAT
CGACTA
AACAATATACAATAAATAACCA
AGT
CaSTMS12 11 (AT)10
GTATTTGTTACTGCATATAC
TTAATTA
TATTTACTAGGTAAATCCTATTT
ATTG
CaSTMS13 1 (GAA)9
TATGTTAAAAGAGAAAGAA
GAAGTGAT
TTTTATTAGTTGTCGA
AATGTATATCA
CaSTMS20 5 (CAA)7 CTTNTCGTCATCATCGTTTTG CACCCTACTTTTTTCCACCAC
CaSTMS21 1
(CT)9ATCT(CT
TT)2(CT)4
CTACAGTCTTTTGTTCTTCTA
GCTT
ATATTTTTTAAGA
GGCTTTTGGTAG
CaSTMS23 3 (GT)12
GATGAAGATAAAAGCATAA
TTAAGG
TTTCTTCTTCTATGA
TACACACACT
CaSTMS25 15 (CT)19
TACACTACTGCTATTGATAT
GTGGT GA CAATGCCTTTTTCCTT
GA 6 NR (GA)23 ATTTTTCTCCGGTGTTGCAC AAACGA CAGA GA GTGGCGA T
GA 13 3 (CT)16(CA)11 GGGCTCATTTACAGGTTACA
TCAAAGA TAATATAAAAGGA
TGA A
GA 20 2 (CT)23 TATGCACCACACCTCGTACC TGA CGGA ATTCGTGA TGTGT
GA 22 NR (CT)10
ATGAGTATCAAGCCAACCTG
A GTCCCAACAATTTCTTACATGC
GA 26 13 (CT)28 GATGCTCAAGACATCTGCCA
TCATACTCAACAAATTCATTTCC
C
GA 34 6 (CT)11 CCTTTGCATGTATGTGGCAT
CCGTTTATAAAGGA TGTAZGA
GA C
GA 137 NR (GA)9AA(GA)5 GGGGGAAGATATGTTGGGTT GA TCCAACGGGA ACAAAGA C
GAA 39 13 (GAA)10
GCATTGCGAACAAGTGTTAG
AT
TTCCTTGA AGA TGA TGA GA
AATACA
GAA 40 1 (CTT)9 TTGACGCAGAGAACTCTCAA ATTGGTGTGA TGGGTGGA TT
GAA 43 NR (CTT)10
TGATCGGAGAGAGAGGAGG
A CGTTGA TCCACTGCGA TAGT
GAA 58 NR (GAA)8 CATGATGCAACATCTCACCA TGA TTATGCTGTTTTGGGGG
TA2 4
(TAA)16TGA(T
AA)19
AAATGGAAGAAGAATAAAA
ACGAAAC
TTCCATTCTTTATTATCCATATCA
CTACA
TA5 5 (TTA)29
ATCATTTCAATTTCCTCAAC
TATGAAT
TCGTTAACACGTAATTTCAAGTA
AAGA T
TA8 1
(TAA)44 AAAATTTGCACCCACAAAAT
ATG CTGA AAATTATGGCAGGGA AAC
TA14
6
(TAA)22ATGA
(TAA)4T(A)3T
GAT(AAT)5AT
T(A)3TGATAA
TAAAT(GAT)4
(TAA)5
TGACTTGCTATTTAGGGAAC
A
TGGCTAAAGA CAATTAAAGTT
TA20
1
(TAA)30T(A)5
TAAT(A)5(TA
A)7TGA(TAA)
20
ATTTTCTTTATCCGCTGCAA
AT
TTAAATACTGCCTTCGA TCCGT

Marker
Name
Chromo
some
location Repeat Motifs Forward Primer Reverse Primer
TA21 7 (TAA)51
GTACCTCGAAGATGTAGCCG
ATA
TTTTCCATTTAGA GTAGGA
TCTTCTTG
TA22 6 (ATT)40 TCTCCAACCCTTTAGATTGA TCGTGTTTACTGA ATGTGGA
TA25 8 (TAA)45
AGTTTAATTGGCTGGTTCTA
AGATAAC
AGGA TGA
TCTTTAATAAATCAGA ATGA
TA27 2 (TAA)21
GATAAAATCATTATTGGGTG
TCCTTT
TTCAAATAATCTTTCATCAGTCA
AATG
TA28 7
(TAA)37CAA(T
AA)30
TAATTGATCATACTCTCACT
ATCTGCC
TGGGA ATGA ATATATTTTTGA
AGTAAA
TA53 2 (TTA)57
GGAGAAAATGGTAGTTTAA
AGAGTACTAA
AAAAATATGA AGA
CTAACTTTGCATTTA
TA64
3
(TAA)39 ATATATCGTAACTCATTAAT
CATCCGC
AAATTGTTGTCATCAAATGGA
AAATA
TA71
5
(AAT)32 CGATTTAACACAAAACACA
A
CCTATCCATTGTCATCTCGT
TA72 4 (ATT)36
GAAAGATTTAAAAGATTTTC
CACGTTA
TTAGA AGCATATTGTTGGGA
TAAGA GT
TA78 7 (TTA)30 CGGTAAATAAGTTTCCCTCC CATCGTGA ATATTGA AGGGT
TA80
6
(TTA)23 CGAATTTTTACATCCGTAAT
G
AATCAATCCATTTTGCATTC
TA96 2
(AT)3(TTA)30(
AT)3
TGTTTTGGAGAAGAGTGATT
C TGTGCATGCAAATTCTTACT
TA103
2
(ATT)31 TGAAATATCTAATGTTGCAA
TTAGGAC
TATGGA TCACATCAAAGA
AATAAAAT
TA106 6 (TAA)26 CGGATGGACTCAACTTTATC TGTCTGCATGTTGA TCTGTT
TA108 3
(TTA)15ACTA(
TTA)3ATACT
A(TTA)31
AAACCATTATCGAGTTGGAT
ATAAAGA
TTTCTAAGTGTTCTTTTCTTAGA
GTGTGA
TA110 2 (TTA)22
ACACTATAGGTATAGGCATT
TAGGCAA
TTCTTTATAAATATCAGA CCGGA
AAGA
TA113
1
(TAA)26 TCTGCAAAAACTATTACGTT
AATACCA
TTGTGTGTAATGGA TTGA
GTATCTCTT
TA117
7
(ATT)52 GAAAATCCCAAATTTTTCTT
CTTCT
AACCTTATTTAAGA ATATGA GA
AACACA
TA120
6
(TTA)5CTA(TT
A)23
TTTAGAGACTATTTAGGATT
GTCGT
GTTCCATTTTTCTTTCTTTCTTTA
T
TA125 3 (TAA)33
TTGAAATTGAACTGTAACAG
AACATAAA
TAGA TAGGTGA TCACAAGA
AGA GA ATG
TA130 4 (TAA)19 TCTTTCTTTGCTTCCAATGT GTAAATCCCACGA GA AATCAA
TA132
4
(TAA)28 CGAATAACTGAGAAAAAGA
AATTAG
TTCTAAAACTTCCTTCTACCATT
AG
TA135 3 (TAA)17 TGGTTGGAAATTGATGTTTT GTGGTGTGA GCATAATTCAA
TA140 7
(TAA)5TT(A)3(
TAA)18
TTTTGGCATGTTGTAGTAAT
CATATTT
TGA AATGA AAAAGA AAAGGA
AAAAGTA
TA142 3 (TTA)15
TGTTAACATTCCCTAATATC
AATAACTT
TTCCACAATGTTGTATGTTTTGT
AAG
TA144 8 (TAA)27
TATTTTAATCCGGTGAATAT
TACCTTT
GTGGA
GTCACTATCAACAATCATACAT
TA159
8
(TAA)11(CAA)3
1(TAA)22
GCTTCTATATATTCAAACTG
AGCA
AGTGGTTTTTGTATATCAGA
TTTGT
TA176
6
(TAA)40(GAA)
9
ATTTGGCTTAAACCCTCTTC TTTATGCTTCCTCTTCTTCG
TA180 7 (TAA)30 CATCGTGAATATTGAAGGGT CGGTAAATAAGTTTCCCTCC
TA196 15 (TAA)19
TCTTTTTAAATTTCATTATGA
AAATACAAATTATA
CCTCGGGA GA
GGTAAATGTAATTTC
TA200
2
(TTA)37 TTTCTCCTCTACTATTATGAT
CACCAG
TTGA GA GGGTTAGA
ACTCATTATGTTT
TA203 1 (TAA)43 ATAAAGGTTTGATCCCCATT TGTGCATTCAGA TACATGCT
TAA57 4 (TTA)43
ATCAAAGAAAGAAACACTT
GTTCA TGGTTGGA TACAAAAGA CTGGA
TAA58 7 (AAT)41 CATTGCTTAAGAACCAAAAT CAATTTTACATCGA CGTGTGC

Marker
Name
Chromo
some
location Repeat Motifs Forward Primer Reverse Primer
GG
TAA59 7 (AAT)38
GCAGGAAAGACTCCAGCAA
C TGGA TTAATCGTTTTGCTCATC
TAA169 NR (TAA)28
CTCAACTTTTCATCTCTTCCA
CTACTC
CTATATTACTTCCAATTTTACCCT
TCG
TAA194 3 (TTA)22
AACGGTTATCTATAATTAAT
TGTGCAAG
AATCTTGTCAACCGCATTAATAA
TTT
TAASH 5 (TAA)40
GGTAGACGCAAAAGAGTGG
G GCCACATTGA CCAGGA ATG
TR 1 6 (TAA)31 CGTATGATTTTGCCGTCTAT ACCTCAAGTTCTCCGA AAGT
TR 2
3
(TTA)36 sGGCTTAGAGTTCAAAGAGA
GAA
sAACCAAGA TTGGA AGTTGTG
TR 7 6 (TTA)25 GCATTATTCACCATTTGGAT TGTGA TAATTTTCTAAGTGTTTT
TR 19 2 (TAA)27
TCAGTATCACGTGTAATTCG
T CATGA ACATCAAGTTCTCCA
TR 20 4 (TAA)18 ACCTGCTTGTTTAGCACAAT CCGCATAGCAATTTATCTTC
TR 24
3
(TTA)29 AACAACTTCCTCTTATTTTCC
A
CAGTAAAAATCAGCCCAAAC
TR 26 3 (ATA)15 TCATCGCAGATGATGTAGAA TTGA ACCTCAAGTTCTCTGG
TR 29
5
(TAA)8TAGTA
ATAG(TAA)32
GCCCACTGAAAAATAAAAA
G
ATTTGA ACCTCAAGTTCTCG
TR31 3
(TAA)20T(A)5(
TAA)9
CTTAATCGCACATTTACTCT
AAAATCA
ATCCATTAAAACACGGTTACCTA
TAAT
TR 40 6 (TAA)44
AAGTGAAATATGTCATCCTT
ATTACTAACT
AGGA
AACTGTGTTTCGTCTTTTTATT
TR 43 1 (TAA)24
AGGACGAAACTATTCAAGG
TAAGTAGA
AATTGA GA TGGTATTAAATGGA
TAACG
TR 56 3 (TAA)21
TTGATTCTCTCACGTGTAAT
TC ATTTTGA TTACCGTTGTGGT
TR 59 5
(TA)3(TAA)17
T(TAA)4
AAAAGGAACCTCAAGTGAC
A GA AAATGA GGGA GTGA GA TG
TS 5 3 (TTA)35
GTTGAATAGTACTTTCCCAC
TTGAGTC
TGA GA
CTAAAAATCATATATTCCCCC
TS 24 6
(TAA)3TAC(T
AA)48
GTAGAAAGAAAACTGACAT
GGTTGAG
GCCTAACCCAATAATACCTTCTT
TT
TS 35 5
(TAA)9T(A)3(T
AA)13
GGTCAACATGCATAAGTAAT
AGCAATA
ACTTTCGCGA
TTCAGCTAAAATA
TS 43 5 (ATT)33
AAGTTTGGTCATAACACACA
TTCAATA
TAAATTCACAAACTCAATTTATT
GGC
TS 45 8
(TAA)8(A)3(TA
A)18
TGACACAAAATTGTCTCTTG
T TGTTCTTAACGTAACTAACCTAA
TS 46 7
(TAA)46(CAA)
2(TAA)3
GTTGATATTTTTGTGTGTGC
GTAG
TAATTACTTGCAAAAATAAATGG
A CAC
TS 53 5 (TTA)65
GATCNTTCCAAAAGTTCATT
TNTATAAT
TTAAAGA ACTGA TACATTCCGA
TTATTT
TS 54 4
(TAA)3TAG(T
AA)32(CAA)6
TACAAGTTAAAAATGAATA
AATATTAATA
GA AATTTAGA GA
GTCAAGCTTTAC
TS 62
7
(TAA)33 ATTATTTTGCTTATTGGGTTC
TT
TGCAAGTATAATTTTGTTTACCC
TS 72 11 (ATT)39
CAAACAATCACTAAAAGTAT
TTGCTCT
AAAAATTGA TGGA
CAAGTGTTATTATG
TS 83 13
COMPOUND
OF(TTA),(TAA
)
AAAAATCAGAGCCAACCAA
AAA
AAGTAGGA GGCTAAATTATGGA
AAAGT

Results

4. RESULTS
The Chickpea reference set developed at ICRISAT was evaluated under field
conditions and also molecularly profiled using polymorphic SSR markers. The results
of the investigation are reported under following topics.
5. Phenotypic diversity in chickpea reference set for qualitative,
quantitative, grain quality traits, resistance to pod borer and for traits
related to drought tolerance
6. Genetic diversity and population structure using SSR markers
7. Identification of allelic variation associated with beneficial traits using
association mapping in the reference set of chickpea
8. Identification of most diverse accessions with beneficial traits for use in
mapping and improvement of chickpea
PHENOTYPIC DIVERSITY BASED ON QUALITATIVE AND
QUANTITATIVE TRAITS
4.1 QUALITATIVE TRAITS
4.1.1 Frequency distribution of qualitative traits
The frequency distributions of different phenotypic classes of the 7 qualitative traits
revealed a large variation for each trait. The results of each trait are presented below.
4.1.1.1 Growth habit
Based on the angle of primary branches to main stem at the mid pod-filling stage
accessions were grouped into five types viz., erect (0-15o from vertical), semi-erect
(16-25o), semi-spreading (26-60
o), spreading (61-80
o), and prostrate (>80
o flat on
ground). A larger number of accessions were semi-erect type (62.3%), followed by
semi-spreading (33.4%). Spreading and erect types were in equal frequency (2.0%
each) (Table: 12). The prostrate type of growth habit was rarely (0.3%) observed.
Most of the desi accessions, were semi-erect (60.8%), semi spreading (38.1%), erect
(0.5%) and spreading (0.5%), whereas in kabuli type most of the accessions were
semi-erect (72.7%), semi spreading (19.3%), erect (4.5%) and spreading (3.4%). In
pea type, semi-erect and semi spreading were in equal frequency (45.5% each) and
9.0% were erect type. Prostrate and spreading types were not observed in pea type.
Only semi-spreading (57.1%) and spreading (42.9%) types were observed in wild
accessions. Semi-erect was the most predominant growth habit among the accessions

included in the reference set.
Region wise, West Asia region had more number of semi-erect (71 accessions,
76.3%), followed by South and East Asia (47 accessions, 44.8%) and Mediterranean
region (35 accessions, 62.5%). Semi-spreading type was more frequent in South and
East Asia (57 accessions, 54.3%) and West Asia (21accessions, 22.6%). (Table 12
and Figure 4a).
4.1.1.2 Plant pigmentation
Out of the three types of plant colours, viz., no-anthocyanin, low-anthocyanin and
high-anthocyanin (IBPGR, ICRISAT & ICARDA 1993), low-anthocyanin was
dominant in the entire reference set and desi types, no-anthocyanin was prominent in
kabuli types. In chickpea reference set on the whole, 53.3% accessions had low-
anthocyanin, 44.7% with no-anthocyanin and only 2% showed high-anthocyanin.
Among desi low-anthocyanin was observed in 78.9%, no-anthocyanin in 18.5% and
high-anthocyanin in 2.6% accessions. No-anthocyanin is the characteristic feature of
kabuli type of chickpea, while no-anthocyanin (81.8%), high and low-anthocyanin
(9.1% each) was observed among pea type. Wild accessions showed low and no-
anthocyanin type of plant pigmentation. (Table 12, Figure 4 b and Plate 3, 4, 5).
The frequency of low-anthocyanin pigmentation was predominant in accessions from
South and East Asia region (90 accessions, 85.7%) and no-anthocyanin pigmentation
was predominant in accessions from West Asia (54 accessions, 58.1%) and
Mediterranean (40 accessions, 71.4%) regions.
4.1.1.3 Flower colour
Pink (57.0%), white (31.7%), light pink (10.0%), very light pink (1.0%), white with
pink stripes (0.3%) were different flower colours observed in the reference set. Desi
types were classified into pink (83.5%), light pink (12.9%), very light pink (1.5%),
white (1.5%) and white with pink stripes (0.5%). In pea type, white (45.4%) colour
was predominant followed by light pink (36.4%) and pink (18.2%) and in kabuli types
only white (98.9%) and light pink (1.1%) coloured flowers were observed. Only pink
colour flowers were observed in wild accessions.
Region wise, South and East Asia were dominated with more number of accessions
with pink colour flower (93 accessions, 88.6%) followed by West Asia (39

accessions, 41.9%) whereas Mediterranean region was dominated by accessions with
white (34 accessions, 60.7%) flower colour. (Table 12, Figure 4 c and Plate 6).
4.1.1.4 Seed colour
Seventeen seed colours were observed in the reference set. Yellow brown (36.0%)
was most predominant followed by beige (30.0%), black (7.7%), brown beige (7.3%),
dark brown (4.7%), light brown (3.3%), light yellow (3.0%), yellow (1.7%) and
greyish brown and yellow beige (1.0% each). Brown and green (0.7% each), reddish
brown, salmon brown, light green, orange, light orange (0.3% each) were also
observed. (Table 12, Figure 4 d and Plate 9).
Most desi types had yellow brown colour (55.2%), followed by black (11.9%), brown
beige (10.8%), dark brown (5.7%), light brown (5.2%), light yellow (4.1%), yellow
(1.7%), yellow beige (1.5%), light orange and green (1% each), and beige and light
green (0.5% each), whereas kabuli accessions were characterised by beige coloured
(98.9%) seed coat; however a single kabuli accession possessed Salmon brown
(1.1%) seed coat in the entire reference set. Pea type is represented with all rare
coloured seed coats such as beige and salmon brown (18.2% each), brown, brown
beige, light orange, light yellow, orange, reddish brown, and yellow brown (9.1%
each). Wild accessions were both greyish brown and dark brown (42.9% each) and
brown (14.3%).
Beige seed colour which is characteristic feature of kabuli type dominated in
accessions from Mediterranean (34 accessions, 60.7%) region followed by West Asia
(30 accessions, 32.3%). Brown beige was the prominent seed colour in accessions
from West Asia (17 accessions, 18.3%). Yellow brown (71 accessions, 67.6%) which
is characteristic feature of desi type dominated in South and East Asia accessions
followed by West Asia (19 accessions, 20.4%) and Africa (12 accessions, 57.1%). All
the wild accessions were from Mediterranean region.
Desi type was not represented in accessions from Europe and South America. Pea
types were from the Mediterranean, Europe, Russian Federation and South and East
Asia regions. Rare seed colors such as, Salmon brown were from West Asia while
orange, reddish brown, and light green were from South and East Asia. Green seed
colour was represented in accessions from both West and South and East Asia
regions.
4.1.1.5 Seed shape
Angular or ram‘s head seed shape (67.0%), which is the characteristic of desi type,
dominated reference set followed by owl‘s head shape (29.3%) and Intermediate or
pea shaped (3.7%). Angular seed shape dominated in the South and East Asian
collections (93 accessions, 88.6%), followed by West Asia (60 accessions, 64.5%),
whereas Mediterranean region represented maximum number of Owl‘s head shaped
seeds (33 accessions, 58.9%) followed by West Asia (30 accessions, 32.3%). Three
West Asian accessions were of pea type. All the wild accessions had angular seed
shape. (Table 12, Figure 4 e and Plate 9).
4.1.1.6 Seed dots
Minute black dots were present on the seed testa of most desi (71.6%) accessions
while some (28.4%) accessions had no dots on seeds (Table 12 and Figure 4 f) and in
kabuli types dots were totally absent, whereas in pea type (90.9%) seeds were with
black dots and (1.1%) were without dots. In wild accessions, 57.1% were with dots
and the remaining, 42.9% accessions were without minute black dots. Overall in the
entire reference set, accessions with minute black dots (52%) were slightly more than
the accessions without (48%) black dots.
4.1.1.7 Seed surface
Rough (66.0%), smooth (30.0%) and tuberculated (4.0%) are the three types of seed
testa classes recorded in the reference set. Among desi type, most accessions (97.4%)
were of rough type and only few (2.6%) were tuberculated while in kabuli type
(95.5%) had smooth and (4.5%) had rough seed surface. In pea types, about 55% were
smooth and 45% were with rough seed surface. All wild accessions were tuberculated.
(Table 12 and Figure 4 g). Among the qualitative traits, highest polymorphism was
observed for seed colour followed by seed surface.
4.2 QUANTITATIVE TRAITS
The data on 17 quantitative traits of individual environment and the pooled were
analyzed for the entire set of chickpea reference set separately to estimate variance
components due to genotype and genotype x environments interactions, to compare
mean and variance, estimate phenotypic diversity, Shannon-Weaver diversity-index
and perform principle component analysis. The results of various analyses are
presented below.

Traits variability in different environments
For the purpose of summarization of results and discussion, the traits studied were
grouped into three broad categories based on the life cycle of the chickpea plant
(Gowda et al., 2011).
Vegetative traits: plant height, plant width, basal primary branches, apical primary
branches, basal secondary branches, apical secondary branches and tertiary branches;
Reproductive traits: days to 50 percent flowering, flowering duration, days to
maturity;
Yield and yield component traits: pods per plant, seeds per pod, 100-seed weight,
grain yield and per day productivity.
4.2.1 VARIANCE COMPONENTS
REML analysis for individual environments indicated that genotypic variances were
significant for all traits, except pod per plant (PPP) in E1, basal secondary branches
(BSB) and tertiary branches (TB) in E2 and seed per pod (SDPD) and yield per plant
(YPP) in E5, indicating the presence of high variability among accessions for all of
the traits (Table 13). In pooled analysis, variance due to genotype and genotypes x
environment (G x E) interactions were significant for all the traits except TB and PPP,
indicating differential response of the genotypes to different environments. Wald‘s
statistics was highly significant for all the traits indicating that all the environments
were different and appropriate to differentiate accessions.
4.2.2 MEAN AND RANGE
Mean and range are simple and important measures of variability (Singh, 1983).
Variability among the accessions for different traits was assessed by comparing the
values of means and range for each trait, between environments. Mean and range
were calculated for each character in individual environment separately as well as the
pooled over five environments. Mean values of each environment were tested using
the Newman-Keuls procedure to compare the mean values all five environments. The
estimates of mean and range are presented below.
4.2.2.1 Vegetative traits

4.2.2.1.1 Plant height (PLHT, cm)
Plant height is the important trait related to seed yield and fodder yield. Wide
variation for plant height was observed among the accessions in reference set. The
mean plant height was higher in E3 (44.9 ± 1.11 cm), E2 (44.5 ± 2.17 cm), E1 (44.4±
2.39 cm), and E4 (43.5± 1.00cm) than E5 (37.7± 1.64) (Table 14). However a wide
range for plant height was observed among the accessions in all environments; in E1
(21.3- 86.4 cm), in E2 (18.3- 92.5 cm), E3 (17.7- 97.5 cm), E4 (17.6- 88.6 cm), E5
(16.8- 83.4 cm) and overall pooled (26.3- 92.4 cm) (Table 14). The accessions were
grouped based on plant height as dwarf or short (<45 cm), medium (45-60 cm) and
tall (>60 cm) (http://agricoop.nic.in/SeedTestguide/Chickpea.htm). Using this
criterion and based on the mean height over five environments eight accessions were
considered as tall, sixty accessions were medium tall while 232 accessions were
dwarf. The accessions ICC 19011, ICC 19034, ICC 19164, ICC18724, ICC 8740, ICC
20260, ICC 19100 and ICC 8752 were tall; accessions ICC 20265, ICC 19122, ICC
19147, ICC 18983, ICC 8521 and ICC 8200 were of medium height, whereas
accessions ICC 12321, ICC 12379, ICC 13469, ICC 7554, and ICC 12851 were short
in all the environments. ICC 5434 (17cm) is the only accession with very short stature
in chickpea reference set. The wild accessions were medium in height and attained a
height of (29-33 cm) in almost all the environments.
4.2.2.1.2 Plant width (PLWD, cm)
Plant width, the average spread of plant and is an important descriptor for chickpea.
The mean plant width was similar (65-66cm) in E1, E2, E3 and E4 environments, but
more than E5 (50.4 ± 1.32) (Table 14). A wide range for plant width was observed
among the accessions in different environments. It was 34.8-76.6 cm in E4, 11.91-
59.3 cm in E5 and 45.2-69.4 cm when pooled while the range was similar for E1, E2
and E3 (50.1-73.7) cm (Table 14). The accessions ICC 8515, ICC7308, ICC8521,
ICC13357, and ICC16796 had significantly high plant width (68-70cm) in all the
environments.
4.2.2.1.3 Basal primary branches (BPB, number)
The mean number of basal primary branches was high in E2 (3.1±0.2), than E1 and
E4 (2.9±0.05) than in E3 (2.8±0.62) and E5 (2.6±0.20) (Table 14) with an overall
mean of 2.9 ± 0.10. The range differed in all environments (2.2 -3.7 in E1, 2.2- 4.5 in

E2, 1.2 -4.4 in E3, 1.2-5.0 in E4 and 0.5-3.7 in E5) (Table 14). Nine accessions (ICC
12492, ICC 11284, ICC 12299, ICC 4657, ICC 10018, ICC 11198, ICC 7255, ICC
10466, and ICC 11284) produced consistently high number of BPB (3-4) than the
control cultivars Annigeri and G 130 (<3 branches) in four (E1, E2, E3, E4)
environments and overall the environments, whereas in E5 the accessions ICC 10018,
ICC 1180, ICC 7255, ICC 3239, and ICC 11378 had high (3.4-3.7) BPB than the
control cultivar G 130 (< 3.1 branches).
4.2.2.1.4 Apical primary branches (APB, number)
The mean number of apical primary branches was higher in E3 (2.9 ± 0.95), compared
to other environments (2.4-2.6) (Table 14), with an overall the mean of 2.6 ± 0.11.
The range was wider in E3 (1.1-7.1), than in other four environments (0.1-5.4) (Table
14). Only one accession ICC 9942 had consistently high (5) APB than the highest
control cultivar L550 (< 4 branches) in all the environments and overall across five
environments
4.2.2.1.5 Basal secondary branches (BSB, number)
The mean number of basal secondary branches was similar in all environments (2.9-
3.4), with a mean of 3.2 ± 0.12 (Table 14). However, the range was wider in E4 (1.1-
8.4) followed by E5 (0.3-6.3), E1 (1.1-6.5), E3 (0.3-5.7), E2 (1.2-6.0) and overall
environments (1.3-5.7) (Tabl.e 14). Three accessions (ICC 10755, ICC 7308, and ICC
2067) had high (6) BSB in E1, E2 and ICC 11198 in E4 environments, than the
control cultivar ICCV 10 (< 5 branches).
4.1.2.2.1.6 Apical secondary branches (ASB, number)
The mean number of apical secondary branches was between 4.1-4.4 in all
environments (Table 14), with an overall mean of 4.4 ± 0.21. The range was wide in
E3 (3.1 -14.7), followed by E4 (3.3-13.0), E2 (1.2-11.3), E1 (2.7-10.6) and E5 (0.47-
9.7) (Table 14). Two accessions each in E3 (ICC 16524, ICC 867) (14.7-11.3), and in
E4 (ICC 867, ICC 4991) (11) and one accession ICC 16524 (11) in E1 and overall
environments, had high ASB than the control cultivar L550 (< 8 branches).
4.2.2.1.7 Tertiary branches (TB, number)
The mean number of tertiary branches was higher in E2 (1.8 ± 0.95) than in other
environments (1.3-1.5) (Table 14), with an overall mean of 1.5 ± 0.21. The range was

wide in E2 (1.6-6.9), followed by E1 (1.0-4.2), E4 (0.3-5.4), E3 (0.0-3.2), and E5
(0.3-4.2) (Table 14). Two accessions, ICC 5135, ICC 7308, in E1, E2 and overall
environments, one accession, ICC 13719 in E4 and E5 produced high (4) number of
TB than the control cultivar Annigeri (< 3 branches).
4.2.2.2 Reproductive traits
4.2.2.2.1 Days to 50 percent flowering (DF, days)
Days to 50 percent flowering is an important trait for adaptation. Early flowering is a
desirable trait in chickpea, particularly in short crop season environment such as in
central and southern India. The mean (59.4) days to 50 percent flowering was similar
in E1, E2 and E3 environments. However, overall in the five environments, crop took
57.5 ± 0.72 days for 50% flowering (Table 14). The widest range for days to 50
percent flowering was observed in E4 (34.2-94.7), followed by E5 (35.1-86.5), E2
(37.8-91.6), E1 (40.0-85.3) and E3 (39.2-78.9days) (Table 14).
Some accessions were early flowering than the earliest flowering control cultivar in
each environment, ICC 8318 (40 days) in E1 (earliest control KAK2, 42± 1.72 days),
ICC8318 and ICC14595 (38 to 39days) in E2 (KAK2, 43± 1.56 days), ICC 8318,
ICC 14595 and ICC 16374 (39 to 42 days) in E3 (KAK2, 44± 1.71 days) , ICC 14595,
ICC 8318, ICC 15618, ICC 16374 and ICC 10393 (35 to 39 days) in E5 (KAK2, 41±
2.15 days) were identified as promising early flowering accessions whereas in E4
none of the accessions flowered earlier than the control cultivars. ICC 8318 and ICC
14595 were early flowering in all environments. These accessions could provide
useful genes for earliness in crop improvement programme for early maturity.
4.2.2.2.2 Flowering duration (FD, days)
The mean flowering duration was similar (27.5 days) in all environments and in the
pooled analysis (Table 14). The widest range for flowering duration was observed in
E4 (18.1-36.9) and E2 (18.3-34.1 days) followed by E5 (20.6-34.2 days), E1 (21.1-
35.1 days) and E3 (19.7-32.6 days) (Table 14).
The accessions with shortest flowering duration were ICC 8195, ICC 8521, ICC
12028, ICC 2629, ICC 3421, ICC 5331, ICC 11121, ICC 11198 and ICC 6875 (21 to
23 days) in E1 (shortest control L550, 26 ± 1.21 days), ICC 11121, ICC11198 and
ICC11819 (18 days) in E2 (L550, 25 ± 1.55 days); ICC 8195, ICC 11121, ICC11198
and ICC11819 (20 to 21 days) in E3 (shortest control Annigeri, 21 ± 0.1 days); ICC

11121, ICC11198, ICC 8195, ICC6875, ICC 18699 (18 to 20 days) in E4 (shortest
control Annigeri recorded 21 ± 0.098 days), ICC11819, ICC 11121, ICC11198 and
ICC 8195, (21 days) in E5 (Annigeri 22 ± 0.07 days). Accessions ICC 11121,
ICC11198, ICC 8195, ICC 11819 (19-21 days) showed shortest flowering duration in
all the five environments.
The accessions with largest flowering duration were, ICC 20174, ICC 20193, ICC
7308, ICC 8752 , ICC 9643, ICC 18983 and ICC 20183 (34 to 31 days) in E1 (longest
control cultivar KAK2, 35± 1.21 days), ICC 20183, ICC 20190, ICC 20192, ICC
18983, ICC 20174 and ICC 10393 (32 to 30 days) in E2 (longest control cultivar
KAK 2, 34 ± 1.55 days); ICC20193, ICC 1923, ICC 20183, ICC 16374 and ICC
20190 (32 to 31 days) in E3 (longest cultivar control G 130, 31 ± 0.1 days); ICC
10935, ICC 20174, ICC 20193, ICC 1923, ICC 20183 and ICC 20190 (37 to 32 days)
in E4 (longest control cultivar Annigeri recorded 31 ± 0.098 days), ICC 20174, ICC
20193, ICC 1923 and ICC 20183, (32 days) in E5 (longest control cultivar ICCV10
34 ± 0.07 days). Accessions ICC 20193, ICC 20183, ICC 20174, ICC 20190 and ICC
1923 (33-31 days) showed longest flowering duration in all the five environments.
4.2.2.2.3 Days to grain filling (DGF, days)
Days to grain filling influences crop duration and is an important trait for adaptation.
The mean days to grain filling were nearly same (53.9-55.5 days) in all environments
and overall the environments. (Table 14). However, a wide range for days to grain
filling was observed all the environments, E5 (30.4-68.9 days), E4 (33.5-71.6 days),
E2 (39.0-76.6 days) followed by E3 (40.3-69.8 days) and E1 (43.3- 68.5 days) (Table
14).
The control cultivar, L550 showed the shortest DGF in three environments (50 days in
E1, E2 and 48 days in E3) while in E4 Annigeri (41± 0.83 days) and in E5, G130
(50±2.67 days) showed shortest DGF. A few accessions such as ICC 12299, ICC
19164, ICC11121, ICC2679, ICC11584, ICC 11819, ICC 19147, ICC 2720, ICC
11944, and ICC 5837 had shorter DGF (38-46 days) than L550 in E1, E2, E3. In E4,
ICC 10685, ICC 20174, ICC 8521, ICC 13524, ICC 15435 had shorter DGF (34-40
days) than control Annigeri (41± 0.83 days), while in E5, ICC 14402, ICC 10685,
ICC 506, ICC 1205, ICC 4991, ICC 18847, and ICC 13524 had shorter DGF (30-40
days), compared to the control G130 (50±2.67 days).

4.2.2.2.4 Days to maturity (DM, days)
Overall, the genotypes exhibited the same pattern for days to maturity as that for days
to 50% flowering. The genotypes flowered and matured early under late sowing
conditions than under the irrigated conditions. The mean days to maturity was 113.2 ±
1.66 days with a range of 103.6 -126.3 days in E1, 115.2 ± 1.59 days with range of
102.1 -138.2 days in E2, 114.6 ± 1.42 days with a range of 102.4-134.8 days in E3,
109.2 ±0.83 with a range of 75.6 -129.6 in E4 whereas in E5 mean days to maturity
was 109.5 ± 1.66 days which ranged from 72.5-129.5 and however, the combined
analysis revealed a mean of 112.5 ± 0.59 with a range of 99.2-130.6 days (Table 14).
The promising early maturing accessions compared to the earliest maturing control
cultivar (KAK2, 104 days), were ICC 11121(103 days) in E1. ICC11121, ICC 13219,
ICC 16903, ICC 8318, ICC 15606, ICC 15697, ICC 1398, ICC 14595, ICC14669
(102-106 days) in E2 (earliest control KAK2, 106 days), ICC11121, ICC 13219, ICC
16903, ICC 8318, ICC 15606, ICC 15697, ICC 10685, ICC 11944, ICC1557 (102-
106 days) in E3 (earliest control Annigeri, 108 days), ICC 14402, ICC 10685, ICC
506, ICC 1205, ICC 4991, ICC 12028 (73-93 days) in E5 (earliest control Annigeri,
102 days), ICC 11121, ICC10685, ICC1205, ICC13219, ICC 16903, ICC 11198, ICC
15618, ICC 15606, ICC 15567, ICC 506, ICC 8318, ICC 14402 were the early
maturing accessions, overall in all environments .
4.2.2.3 Yield and yield component traits
4.2.2.3.1 Pods per plant (PPP, number)
The mean number of pods per plant was 57.4 ± 9.19 with range of 30.8-96.5 in E1,
62.7 ± 7.01 (range: 46.2-86.9) in E2, 58.47 ± 3.97 (range: 36.5 -115.5) in E3, 45.2±
3.03 (range: 27.3-68.6) in E4, and 32.2 ± 2.60 (range: 19.6-48.6) in E5. However, the
combined analysis revealed a mean of 52.7 ± 2.1 with range of 27.2-89.3 (Table 14
and Plate 7, 8).
The normal sown environments (E1, E2, and E3) were conducive for more pods than
late sown spring environments. ICC 10018 (96), ICC 10399 (89), ICC 1882 (85), ICC
1510 (82) in E1; ICC 2629 (87), ICC5221 (82), ICC18839 (80), ICC10379 (79),
ICC4093 (79) in E2; (ICC2629 (115), ICC6571 (93), ICC4567 (90), ICC5383 (90),
ICC10399 (89) in E3; ICC2629 (69), ICC5221 (67), ICC10018 and ICC10399 (66)
each, ICC 4991 (64) in E4 and E5, ICC1510 (49), ICC2629 (49), ICC 506 (46), ICC

5221 (46), ICC 1093 9(45) were the top five accessions in each environment with
more number of pods per plant. (ICC2629 (89), ICC5221 (78), ICC10399 (77),
ICC10018 (76), ICC4593 (69) accessions produced more number of pods per plant, in
all environments compared to the control Annigeri (61).
4.2.2.3.2 Seeds per pod (SDPD, number)
The mean number of seeds per pod was higher in E5 (1.3± 0.12), E2 (1.3 ± 0.09), E1
(1.3 ± 0.07), and E3 (1.2±0.11), than E4 (1.1±0.02) (Table 14), with an overall range
of (1.0-2.0). On an average, accessions ICC 4093, ICC 12866, ICC 2864, ICC 3631,
ICC 4533) in E1, (ICC 12866, ICC 4657, ICC 6802, ICC 2884, ICC 3631 in E2 and
ICC 11378, ICC 11198, ICC 762, ICC 13219, ICC 2507 had 2.0 seeds per pod in all
environments. Only one accession (ICC 16207) had two seeds per pod in E5 and all
the five control cultivars had only 1 seed per pod in the all environments.
4.2.2.3.3 Yield per plant (YPP, g)
The mean yield per plant was more in the E2 (15.5±2.23g), E1 (11.1±1.40g), E3
(11.3±1.64g), than E5 (8.4± 1.44g) and E4 (8.0± 0.38g). ICC 13077 (27g) produced
higher yield than control Annigeri (22 g) in E1, while in E2 ICC 13077 (30g), ICC
20267 (21g), ICC 8350 (20g), ICC 1180 (19g), ICC 18679 (19g) produced more yield
per plant than Annigeri (18g). ICC 13077 (30g), ICC 18828 (25g) in E3 were high
yielding accessions than Annigeri (22g) while in E4, ICC 13077 (29g) produced
higher yield than the high yielding control cultivar ICCV 10 (25g) (Table 14).
None of the chickpea reference set accessions showed significantly more yield per
plant in E5 than control cultivar L 550 (17g). ICC 13077 (30 g) produced overall
higher yield than the high yielding control cultivar Annigeri (22 g) in pooled analysis.
4.2.2.3.4 100-seed weight (SDWT, g)
The trait 100-seed weight was more stable across environments E1, E2, E3 and E4
(normal sown) and reduced significantly in E5 (late sown) as indicated by the
environment means: E1 (23.6±1.32), E2 (22.6±0.71), E3 (22.4±0.74), and E4 (21.7±
0.41) (normal sown) and E5 (19.3± 1.16) (late sown)). However, a wide range was
observed among accessions for this trait in all the environments (13.4-51.5g in E1,
12.7- 55g in E2, 14.7-53.0g in E3, 13.6-51.9g in E4 and 11.0-39.6g in E5 (Table 14).
ICC 20266, ICC 19165, ICC 11303, ICC 15518 and ICC 11764 (37-49 g) are the top

five large seeded accessions across E1, E2, E3, and E4 environments. ICC 11303,
ICC 15518, ICC 19165, ICC 8151, ICC 11764 (32-40g) in E5 had significantly higher
100-seed weight than large-seeded control cultivar KAK 2 (31g) (Table 14).
4.2.2.3.5 Plot yield (PY, kg ha-1
)
The overall mean grain yield was about 1675 kg ha-1
, (mean of all five environments).
The environment wise mean yields were 1934.4±134.81 kg ha-1
in E1, 2088.6±206.71
kg ha-1
in E2, 1808.1±115.20 kg ha-1
in E3, 1433.1±122.54 kg ha-1
in E4 and
821±105.64 kg ha-1
E5 (Table 14). However, a wide range was observed among the
accessions for this trait in all the five environments, 365.7 - 3161.4 kg ha-1
in E1,
566.9 - 3275.4 kg ha-1
in E2, 657.2 - 4269.9 kg ha-1
in E3, 296.4-1678.3 kg ha-1
in E4
and 283.5 t- 1892 kg ha-1
in E5. Five accessions, ICC 11498, ICC 15510, ICC 8318,
ICC 4567, and ICC 10393 that produced > 2300 kg ha-1
in all the environments, were
considered as high yielding accessions. ICC 14446, ICC 12321 and ICC 11279
yielded <1000 kg ha-1
in all the environments and were considered as poor yielding.
4.2.2.3.6 per day productivity (PROD, kg ha-1
day-1
)
The overall mean per day productivity was about 14.9 kg ha-1
day-1
(mean of all five
environments). However while the mean per day productivity among environments
varied from: 17.2 kg ha-1
day-1
in E1, 18.3 kg ha-1
day-1
in E2, 15.9 kg ha-1
day-1
in
E3, 13.2 in E4 and 7.6 kg ha-1
day-1
E5 (Table 14). A wide range was observed among
accessions for this trait in all the five environments : 3.3 - 29.8 kg ha-1
day-1
in E1, 4.6
- 27.9 kg ha-1
day-1
in E2, 5.7 - 36 kg ha-1
day-1
in E3, 2.54 - 16.5 kg ha-1
day-1
in E4
and 2.5- 18.3 kg ha-1
day-1
in E5 (Table 14). Accessions ICC 11498, ICC 15510, ICC
8318, ICC 4567, and ICC 10393 produced > 20 kg ha-1
day-1
in all environments, and
they were considered as highly productive accessions. Three accessions, ICC 14446,
ICC 12321 and ICC 11279 yielded <8 kg ha-1
day-1
in all the environments and were
considered to be least productive.
4.2.3 Mean performances of the accessions according to their geographical
regions
According to Newman- Keuls test, region wise means were not significantly different
for most of the traits except for days to 50% flowering and days to maturity (Africa),
plant height (Europe), tertiary branches (South America), 100-seed weight (South
America), pods per plant and yield per plant (Africa, South America and South and

East Asia), and plot yield (Africa and South East Asia) in E1, E2, E3, E4, E5 and
when pooled (Table 15). The accessions from Africa flowered earlier (50-54 days),
and matured earlier (110-112 days), whereas accessions from Europe flowered late
(64-69 days) with short grain filling duration (49-53 days) across environments. The
regional mean value for traits such as flowering duration, basal primary branches,
apical primary branches, basal secondary branches, apical secondary branches, seed
per pod were similar across environments. The European accessions had higher mean
plant height (46-53 cm) across environments. Higher mean 100-seed weight across
environments was in the accessions from South America (32-37 gm). The South East
Asian accessions had higher mean yield (2352, 2076, 1933 and 1759 kg ha-1
) in E1,
E2, E3, E4 and overall environments respectively.
The variance of the accessions from different regions were homogeneous for all traits
except for days to 50% flowering, flowering duration, days to grain filling, days to
maturity and seeds per pod in E1, pods per plant and yield per plant in E2, plant
height in E3 and plot yield and per productivity in combined analysis (P = 0.001)
according to Levene‘s test (Table 15).
4.2.4 VARIABILITY STUDIES
The estimates of phenotypic coefficient of variation (PCV), genotypic coefficient of
variation (GCV) and heritability are furnished in Table 16 and Figure 3. In general,
for all the traits, PCV the was slightly higher (0.1-4%) than the GCV. The values were
grouped into high (> 20%), medium (10 – 20%) and low (< 10%) based on
Sivasubramanian and Madhavamenon, (1973). In pooled analysis PCV was high for
tertiary branches (32.42 %), yield per plant (25.24 %), 100-seed weight (24.59 %),
productivity (22.19 %), and plot yield (20.60 %). Medium PCV was observed for
apical primary branches (18.66%), apical secondary branches (18.31%), basal
secondary branches (16.86%), pods per plant (16.67%), plant height (16.43 %), seeds
per pod (14.52%), basal primary branches (13.24%) and days to flowering (10.90%).
Low PCV was observed for days to grain filling (8.46%), flowering duration (5.70%),
plant width (4.77%) and days to maturity (3.94%).
The GCV% was highest for tertiary branches (28.55 %), 100-seed weight (24.25 %),
yield per plant (22.87 %) and productivity (21.25%). Medium PCV was observed for
plot yield (19.6 %), apical secondary branches (16.91%), plant height (16.53 %), pods
per plant (16.49%), apical primary branches (15.89%), basal secondary branches

(14.63%), seeds per pod (11.46%), basal primary branches (11.31%) and days to
flowering (10.79%). Low PCV was observed for by days to grain filling (8.02%),
Flowering duration (5.14%), plant width (4.51%) and days to maturity (3.72%).
In the present study, all the traits exhibited narrow difference between PCV and GCV
indicating the low effect of environment and greater role of genetic factors on the
expression of the traits.
The estimates of broad sense heritability (h2b) in the chickpea reference set were high
(> 70 %) for all traits except PPP and YPP in E2 and seeds per pod on E3 and E5
(Table: 16). For pooled data the h2b was more than 85% for PLHT, PLWD, DF, DGF,
DM, ASB, PPP, SDWT, YKGH and PROD. The pooled estimates were (62% – 85%)
for BPB, APB, BSB, TB, SDPD and YPP. High heritability was observed for more
traits in individual as well as overall five environments indicating the reliability of the
estimates for variation between entries and selection of material for these traits.
4.2.5 CORRELATION COFFICIENTS
The correlation coefficients help to understand the degree, nature and extent of
association that existed between the different traits in different environments.
Phenotypic correlation coefficients were calculated for the chickpea reference set to
understand the nature of associations between 17 quantitative traits in all the five
environments separately and overall in the five environments. In total, 61 correlations
were significant in E1 (Table 17), 55 in E2 (Table 18), 57 in E3 (Table 19), 48 in E4
(Table 20), 50 in E5 (Table 21), and 50 in overall five environments (Table 22).
4.2.5.1 Days to 50 percent flowering
Days to 50 percent flowering was significantly and positively correlated with days to
maturity (0.597 in E1, 0.694 in E2, 0.620 in E3, 0.599 in E4, 0.525 in E5 and 0.671 in
overall), plant width (0.316 in E1, 0.304 in E2, 0.263 in E3, 0.218 in E4, and 0.256 in
overall), plant height (0.233 in E1, 0.304 in E2, 0.181 in E3, 0.185 in E4, 0.219 in E5
and 0.240 in overall) and basal primary branches ( 0.128 in E1, 0.131 in E3, 0.152 in
E5 and 0.161 in overall), whereas DF was significantly negatively correlated with
flowering duration (-0.345 in E1,-0.121 in E2, -0.211 in E3, -0.159 in E5 and -0.227
in overall), days to grain filling (-0.630 in E1, -0.657 in E2, -0.711 in E3, -0.614 in
E4, -0.487 in E5 and -0.716 in overall), apical primary branches (-0.164 in E1, -0.144
in E2, -0.151 in E4, -0.187 in E5 and -0.190 in overall), seeds per pod (- 0.138 in E2),
pods per plant (-0.214 in E1, -0.276 in E2, -0.229 in E3, -0.246 in E4 and -0.300 in

overall), yield per plant (-0.158 in E1, -0.173 in E2,-0.220 in E3, -0.135 in E4 and -
0.188 in overall), plot yield ( -0.360 in E1, -0.345 in E2, -0.360 in E3, -0.326 in E4, -
0.293 in E5 and -0.462 in overall) and per day productivity (-0.423 in E1and E2,-
0.433 in E3, -0.428 in E4, -0.364 in E5 and -0.537 in overall) (Tables 17 to 22).
4.2.5.2 Flowering duration
Flowering duration was significantly and positively correlated with days to grain
filling (0.422 in E1, 0.325 in E2, 0.311 in E3, 0.210 in E4, 0.192 in E5 and 0.379 in
overall), days to maturity (0.194 in E2, 0.208 in E4), 100-seed weight (0.139 in E1),
apical primary branches (0.169 in E4), basal secondary branches (0.137 in E1, 0.136
in E4), tertiary branches (0.127 in E3, 0.180 in E4) and yield per plant (0.284 in E4),
whereas significantly negatively correlated with per day productivity (-0.226 in E2
and-0.126 in overall) , plot yield (-0.209 in E2, -0.121 in overall) , basal primary
branches (-0.119 in E4), plant height (-0.145 in E4), apical secondary branches (-
0.131 in E2), and seeds per pod (-0.132 in E3) (Tables 17 to 22).
4.2.5.3 Plant height
Plant height was significantly and positively correlated with plant width (0.357 in
E1,0.216 in E2, 0.311 in E3, 0.271 in E4, 0.234 in E5 and 0.297 in overall), days to
maturity (0.231 in E1, 0.267 in E2, 0.207 in E3, 0.194 in E4, 0.192 in E5 and 0.273
when pooled) and 100-seed weight (0.435 in E1, 0.239 in E2, 0.269 in E3, 0.267 in
E5, 0.306 when pooled), whereas significantly negatively correlated with seeds per
pod (-0.210 in E1, -0.230 in E2 , -0.162 in E3, -0.238 in E5 and -0.201 when pooled),
pods per plant (-0.131 in E1, -0.321 in E2, -0.148 in E3 and -0.212 when pooled) plot
yield ( -0.216 in E2 and -0.149 when pooled) per day productivity (-0.152 in E1, -
0.246 in E2 and -0.189 when pooled), basal secondary branches (-0.124 in E4), yield
per plant (-0.158 in E1) and days to grain filling ( -0.125 in E2) (Tables 17 to 22).
4.2.5.4 Plant width
Plant width was significantly and positively correlated with days to maturity (0.336 in
E1, 0.248 in E2, 0.244 in E3, 0.291 in E4 and 0.282 in overall) and 100-seed weight
(0.200 in E1, 0.227 in E2, 0.236 in E3, 0.219 in E4, 0.145 in E5 and 0.250 in overall),
whereas significantly negatively correlated with pods per plant (-0.155 in E1 and -
0.143 in overall), yield per plant (-0.173 in E1) and tertiary branches (-0.155 in E3)
(Tables 17 to 22).

4.2.5.5 Days to grain filling
Days to grain filling was significantly and positively correlated with plot yield (0.238
in E1, 0.134 in E2, 0.213 in E3, 0.213 in E4 and 0.267 in overall), per day
productivity (0.203 in E1, 0.190 in E3, 0.130 in E4 and 0.241 in overall), yield per
plant (0.197 in E3 and 0.125 in overall) and days to maturity (0.162 in E1, 0.264 in
E4, 0.483 in E5), pods per plant (0.124 in E4), whereas it was significantly and
negatively correlated with basal primary branches (-0.136 in E1, -0.125 in E3 and -
0.128 in overall) and tertiary branches (-0.141 in E4). In E2 and E5, days to grain
filling was not significantly and negatively correlated with any of the character
(Tables 17 to 22).
4.2.5.6 Days to maturity
Days to maturity was significantly and positively correlated with 100-seed weight in
all the five environments separately and over all in the five environments (0.200 in
E1, 0.170 in E2, 0.188 in E3, 0.148 in E4, 0.169 in E5 and 0.216 in overall), basal
secondary branches in E5 (0.142), whereas significantly negatively correlated with
apical primary branches (-0.199 in E1, -0.138 in E2 and -0.183 when pooled), seeds
per pod (-0.134 in E1, -0.148 in E2, -0.123 in E3 and -0.199 when pooled), pods per
plant (-0.307 in E1, -0.319 in E2, -0.279 in E3, -0.178 in E4 and -0.335 when pooled),
plot yield (-0.358 in E1, -0.407 in E2, -0.305 in E3, -0.191 in E4, -0.194 in E5 and -
0.429 when pooled), per day productivity (-0.476 in E1, -0.524 in E2,-0.429 in E3, -
0.400 in E4, -0.383 in E5 and -0.560 when pooled), yield per plant (-0.201 in E1, -
0.148 in E2, -0.135 in E4) and apical secondary branches (-0.128 in E2) (Tables 17 to
22).
4.2.5.7 Basal primary branches
Basal primary branches were significantly and positively correlated with basal
secondary branches (0.219 in E3, 0.343 in E4, and 0.133 in overall), apical secondary
branches (0.119 in E1, 0.204 in E4) and tertiary branches (0.155 in E4) whereas
significantly negatively correlated with 100-seed weight (-0.130 in E1, -0.144 in E3, -
0.122 in E4), yield per plant (-0.137 in E3) and per day productivity (-0.144 in
overall). Basal primary branches were not significantly correlated either positively or
negatively with any of the character in E2 and E5 (Tables 17 to 22).
4.2.5.8 Apical primary branches
Apical primary branches was significantly positively correlated with basal secondary

branches (0.143 in E5), apical secondary branches (0.151 in E1, 0.335 in E3, 0.359 in
E5 and 0.283 in overall), seeds per pod (0.129 in E1, 0.147 in E2 and 0.182 in
overall), pods per plant (0.169 in E1, 0.139 in E3, 0.187 in E4, 0.222 in E5 and 0.249
in overall), yield per plant (0.161 in E1, 0.210 in E3, 0.271 in E5 and 0.180 in
overall), plot yield (0.139 in E1, 0.191 in E3, 0.614 in E4, 0.206 in E5 and 0.232 in
overall), per day productivity (0.154 in E1, 0.197 in E3, 0.160 in E4, 0.205 in E5 and
0.240 in overall) and basal primary branches ( 0.165 in overall) whereas significantly
negatively correlated with 100-seed weight (-0.140 in E5). Apical primary branches
were not significantly negatively correlated with any of the character in E1, E2, E3,
E4 and in overall (Tables 17 to 22).
4.2.5.9 Basal secondary branches
Basal secondary branches was significantly positively correlated with tertiary
branches (0.316 in E1, 0.276 in E2, 0.217 in E3, 0.174 in E4, 0.338 in E5 and 0.215 in
overall), apical secondary branches (0.281 in E1, 0.161 in E2, 0.274 in E4, 0.355 in
E5 and 0.228 in overall), yield per plant (0.176 in E2, 0.179 in E3, 0.200 in E4 and
0.221 in overall) and pods per plant (0.135 in E1, 0.129 in E4 and 0.121 in overall),
plot yield (0.153 in E5) and per day productivity (0.172 in E5), whereas significantly
negatively correlated with 100-seed weight (-0.140 in E5). Basal secondary branches
were not significantly negatively correlated with any of the character in E1, E2, E3,
E4 and in overall five environments (Tables 17 to 22).
4.2.5.10 Apical secondary branches
Apical secondary branches was positively correlated with tertiary branches (0.154 in
E1, 0.158 in E2, 0.151 in E3, 0.260 in E4, 0.206 in E5 and 0.250 in overall), pods per
plant (0.190 in E1, 0.121 in E2, 0.125 in E3, 0.236 in E4, 0.176 in E5 and 0.217 in
overall), yield per plant (0.182 in E1, 0.136 in E3, 0.134 in E4, 0.232 in E5 and 0.166
in overall), plot yield (0.177 in E2 , 0.127 in E3 and 0.180 in overall) and per day
productivity (0.179 in E2, 0.134 in E3 and 0.178 in overall) and negatively correlated
with 100-seed weight ( -0.131 in E1, -0.161 in E5 and -0.125 in overall. Apical
secondary branches were not significantly negatively correlated with any of the
character in E2, E3, E4 and in overall five environments (Tables 17 to 22).
4.2.5.11 Tertiary Branches
Tertiary branches were not significantly correlated either positively or negatively with
any of the character in E1, E2, and E4 and negatively in E3 and in overall. Number of

tertiary branches was positively correlated with yield per plant (0.131 in E3, 0.314 in
E5 and 0.258 in overall) whereas it was significantly and negatively correlated with
seeds per pod (-0.130 in E5) (Tables 17 to 22).
4.2.5.12 Seeds per pod
Seeds per pod was significantly and positively correlated with pod per plant (0.157 in
E1, 0.317 in E2, 0.206 in E3 and 0.279 in overall), plot yield (0.210 in E3 and 0.122
in overall), pods per plant (0.139 in E5) and per day productivity (0.215 in E2) and
negatively correlated with 100-seed weight (-0.459 in E1 and E2, -0.376 in E3, -0.196
in E4, -0.316 in E5 and -0.508 in overall), yield per plant (-0.216 in E5) (Tables 17 to
22).
4.2.5.13 Pods per plant
Pods per plant was significantly positively correlated with three traits viz., yield per
plant (0.335 in E1, 0.383 in E2, 0.322 in E3, 0.124 in E4, 0.210 in E5 and 0.277 in
overall), plot yield (0.331 in E1, 0.488 in E2, 0.324 in E3, 0.203 in E4 and 0.448 in
overall) and per day productivity (0.354 in E1, 0.500 in E2, 0.344 in E3, 0.227 in E4
and 0.466 in overall) and negatively correlated only with 100-seed weight in all
environments and when pooled (-0.312 in E1, -0.486 in E2, -0.301 in E3, -0.334 in
E4, -0.300 in E5 and -0.448 in overall) (Tables 17 to 22).
4.2.5.14 Yield per plant
Yield per plant was significantly positively correlated with two traits in all
environments and in overall five environments viz., plot yield (0.159 in E1, 0.269 in
E2, 0.169 in E3 and 0.164 in overall) , per day productivity (0.181 in E1, 0.269 in E2,
0.177in E3 and 0.181 in overall) and 100- seed weight (0.136 in E3) and negatively
correlated with only 100-seed weight (-0.161 in E1) and Yield per plant were not
significantly correlated either positively or negatively with any of the character in E4
and E5, and none of the traits were significantly negatively correlated with yield per
plant in E2 , E3 and in overall five environments (Tables 17 to 22).
4.2.5.15 100-seed weight
100-seed weight was negatively correlated with only one trait, per day productivity (-
0.135 in E2) and was not significantly correlated either positively or negatively in E1,
E3, E4, E5 and in combined analysis and but was positively in E2 (Tables 17 to 22).
4.2.5.16 Plot yield

Plot yield was correlated positively only with per day productivity in all environments
and when pooled (0.990 in E1, E2, E3, 0.974 in E4, 0.978 in E5 and 0.987 when
pooled) (Tables 17 to 22).
4.2.5.17 Pairs of characters showing meaningful correlation
The numbers of significant correlations were large (316 out of 816 correlations) in the
present study and some of them may not be biologically meaningful. Skinner et al,
(1999) suggested that only those correlations, which are greater than 0.707 or less
than –0.707 are biologically meaningful, so that 50 % of the variation in one trait is
predicted by the other trait (Snedecor and Cochran, 1980). However with 298 degrees
of freedom, the character pairs showing correlation greater than 0.700 or lesser than –
0.700 were found biologically meaningful and 2 pairs of characters showed
meaningful correlations. The correlations for 1 pair of the characters were positive in
all environments and in overall in all environments; plot yield and per day
productivity in E1, E2, E3 (0.990), E4 (0.974), E5 (0.978) and in overall. Correlations
for 1 pair of the characters were negative in E3 and in overall ; viz., days to 50 percent
flowering and days to grain filling in E3 (-0.711), and in overall (-0.716); showed
significantly higher and biologically meaningful correlation (Table 23).
However the pairs of traits, viz., days to 50 percent flowering and days to maturity in
E1 (0.597), E2 (0.694), E3 (0.620), E4 (0.599), E5 (0.525) and in overall (0.671);
pods per plant and per day productivity in E2 (0.500) showed high correlation, and
correlations for 1 pair of the characters were negative, days to 50 percent flowering
and days to grain filling (-0.614 ) in E4 (r = 0.50 or more) (Table 23).
4.2.6 DIVERSITY ANALYSIS
4.2.6.1 Shannon Weaver Diversity Indices
The Shannon-Weaver diversity (H’) indices were calculated to compare values among
17 quantitative traits in each environment separately and also over all the
environments. The index is used as a measure of allelic richness and evenness; a low
H` indicates an extremely unbalanced frequency class for an individual trait and lack
of genetic diversity.
Out of twenty four morphological and agronomic traits studied, dots on seed coat
showed lowest H` (0.300) in all environments followed by seed shape (0.325), seed
surface (0.332), plant color (0.335), growth habit (0.362) and flower color (0.424),
however, seed color showed high H` (0.807). Among the quantitative traits, tertiary

branches showed lowest H` in E1 (0.244), and E2 (0.0797), flowering duration in E3
(0.429) and in E4 (0.312) and seeds per pod in E5 (0.219) environments followed by
apical primary branches in E1 (0.468), flowering duration in E2 (0.456) and in E4
(0.305), apical secondary branches in E3 (0.440), yield per plant in E5 (0.413)
environments. The traits such as, days to 50 percent flowering in E1(0.631), grain
yield in E2 (0.634), days to maturity in E3 (0.631), per day productivity in E4 (0.621)
and apical primary branches in E5 (0.623) environments showed highest H` followed
by days to grain filling (0.620), flowering duration (0.602), yield per plant (0.600),
apical secondary branches (0.578) in E1, grain yield (0.634), basal primary branches
(0.628), per day productivity (0.626), basal secondary branches (0.617) in E2, days to
maturity (0.631), plant width (0.613) and tertiary branches (0.582) in E3, pod per
plant (0.617) in E4 and apical primary branches (0.623), seeds per pod (0.619), days
to 50 percent flowering (0.612), 100-seed weight (0.584) and plant height (0.559) in
E5.
The combined analysis revealed low H` for tertiary branches (0.244) and high H` for
pods per plant (0.624). Among the environments, E1 (0.577 ± 0.018) revealed high H`
for the quantitative traits followed by E3 (0.552 ± 0.015), E2 (0.551 ± 0.032), E5
(0.543 ± 0.022) and E4 (0.543 ± 0.019) (Table 24).
4.2.6.1.2 Phenotypic diversity of chickpea reference set according to their
biological and geographical origin
4.2.6.1.2.1 Qualitative traits
A high H` was observed for the pea (0.932), followed by desi (0.688) and wild
(0.436) accessions for seed color and kabuli accessions for growth habit (0.351) in all
environments (Table 25).
Region wise, the accessions from West Asia (0.790), Africa (0.620) , South East Asia
(0.594) and Mediterranean (0.590) showed high H` for seed color, and European
accessions for growth habit (0.477), North American accessions for flower and seed
color (0.378) and accessions from Russian Federation for seed color (0.540),, whereas
accessions from Africa had high H` for growth habit and seed dots (0.137); South
East Asia for plant color (0.194), Mediterranean for seed shape (0.252), West Asia for
seed shape (0.267) for seed shape had low H` for all traits except growth habit (Table
25).

4.2.6.1.2.2 Quantitative traits
The cultivated type accessions had more diversity than wild type accessions. Among
cultivated, desi accessions showed higher diversity (0.574 ± 0.02 in E1, 0.560 ±0.03
in E2, 0.552 ±0.02 in E3, 0.524 ± 0.03 in E4, 0.529 ± 0.02 in E5 and 0.565 ± 0.02 in
overall). Accessions of wild type (0.362 ± 0.02 in E1, 0.347 ± 0.03 in E2, 0.393 ±
0.02 in E3, 349 ± 0.03 in E4, 349 ± 0.02 in E5 and 0.385± 0.02 in overall) showed
low H` (Table: 26). The traits such days to 50 percent flowering (0.636 in E1),
flowering duration (0.527 in E1), plant height (0.602 in E5), plant width (0.620 in
E3), days to grain filling (0.629 when combined), days to maturity (0.630 in E2),
basal primary branches (0.608 when combined), apical primary branches (0.602 in
E1), basal secondary branches (0.597 in E2), tertiary branches (0.582 in E3), seeds per
pod (0.581 in E1), pods per plant ( 0.632 in E4), yield per plant (0.605 when
combined), 100-seed weight (0.624 in E4), plot yield ( 0.619 in E2) and per day
productivity (0.6255 in E1) in desi accessions, flowering duration (0.562 in E3),
basal primary branches ( 0.628 in E1) and plot yield ( 0.628 when combined) in
kabuli accessions and apical secondary branches (0.562 in E1) in the pea accessions
had more H`.
Region wise, the accessions from West Asia (0.624 ± 0.02 in E1, 0.639± 0.03 in E4,
0.634 ± 0.02 in E5 and 0.638 ± 0.02 in pooled analysis), and South East Asia (0.639 ±
0.03 in E2 and 0.653 ± 0.02 in E3) recorded high H`, whereas Russian Federation in
E1, South East Asia in E2, West Asia in E5 , North America accessions in E3, E4, and
in overall showed low H` (0.196 ± 0.02 in all environments and overall) (Table: 27).
The traits such as, days to 50% flowering (0.638 when combined), flowering duration
(0.624 in E1), plant width (0.630 in E2), apical secondary branches ( 0.637 in E2),
basal primary branches (0.610 in E2), 100-seed weight (0.606 in E5) and yield per
plant (0.626 when combined) in the accessions of West Asia, plant height (0.563 in
E4), pods per plant (0.635 in E2) in the accessions of Africa, days to maturity (0.639
in E2), tertiary branches (0.582 in E5), seeds per pod (0.610 in E1), plot yield (0.633
in E2) and per day productivity (0.639 in E2) in the accessions of South East Asia ,
days to grain filling and apical primary branches (0.620 and 0.630 when combined) in
the accessions of Mediterranean region had high H` in different environments (Table
27).
4.2.6.2 Principal components analysis
Principal component analysis on the mean values of the entire set provides a reduced
dimension to the model that could indicate measured differences among the
accessions.
4.2.6.2.1 PCA based on environments
The results revealed that in all the five environments and also in the pooled analysis,
a large proportion of the total variation was explained by the first seven Principal
Components (PCs) in discriminating the entire set of chickpea reference set. The first
seven PCs explained 70.41% variation in E1, 69.65% in E2, 69.78% in E3, 66.60% in
E4 and 69.79% in E5 (Tables 28, 29, 30, 31, 32). In pooled analysis 71.80% variation
was accounted by first seven PCs (Table 33).
The PC1 separated the accessions based on per day productivity, plot yield, days to
50% flowering and days to maturity in all five environments and when pooled, along
with pods per plant in E2. PC2 separated the accessions based on days to grain filling
and flowering duration in E1, E2, E4 and pooled whereas in E5 based on yield per
plant, apical and basal secondary branches and tertiary branches. The PC3 separated
the accessions based on flowering duration and plot yield in E1, 100-seed weight and
seeds per pod in E2, days to grain filling and flowering duration in E3, apical
secondary branches and tertiary branches in E4, days to grain filling and 100-seed
weight in E5 and tertiary branches and apical secondary branches when pooled. PC4
separated the accessions based on apical and basal secondary branches in E1, basal
secondary branches and tertiary branches in E2, apical primary branches and apical
secondary in E3, flowering duration and days to grain filling in E4 and in combined
analysis, and plant height, days to grain filling and plant width in E5. The PC5
separated the accessions based on days to maturity in E1, yield per plant in E2, basal
secondary branches in E3, 100-seed weight in E4, basal primary branches in E5 and
seeds per pod when pooled. Similarly PC6 separated the accessions based on apical
primary branches in E1, E2, seeds per pod in E3, E5 and basal primary branches in
E4 and when pooled. PC7 separated the accessions based on basal primary branches
in E1, E2, E3 and E4, plant width in E5 and apical primary branches when pooled.
Scatter plot of first two principal components (PCs) of Chickpea reference set
accessions using pooled BLUPs of five environments for yield contributing traits is
represented in Figure 5a (Days to 50% flowering (DF) vs. plot yield (YKGH), Figure

5b Days to maturity (DM) vs. Plot yield (YKGH), Figure 5c 100 seed weight vs. Plot
yield (YKGH)
4.2.6.3 Phenotypic diversity index
Phenotypic diversity index (Johns et al., 1997) was created by calculating differences
between each pair of accessions for each of the 7 qualitative and 17 quantitative traits
by averaging all the differences in the phenotypic values for each traits divided by
their respective range. Phenotypic diversity differed in different environments. The
mean phenotypic diversity index was 0.184 in all environments indicating high
variability in the reference set accessions (Table 34). In E1 minimum phenotypic
diversity index of 0.002 was observed between ICC 3362 (West Asia) and ICC 1230
(South and East Asia) revealing that these accessions were almost similar. The
maximum diversity index was 0.444 between ICCV92311 (South and East Asia) and
ICC 11198 (South and East Asia). The cross between these two accessions may result
in useful variation. Minimum phenotypic diversity index of 0.002 was observed
between ICC 13764 (West Asia) and ICC 12037 (North America) in E2 and ICC
13187 (West Asia) and ICC 12324 (Unknown biological status) in E3 and maximum
diversity index was 0.425 between ICC 20266 (Unknown biological status) and ICC
4991 (South and East Asia) in E2 and between Annigeri (South and East Asia) and
ICC 16796 (Europe) in E3. In E4 the mean phenotypic diversity was recorded as
0.188, the minimum diversity (0.001) was observed between ICC 9002 (West Asia)
and ICC 2065 (South and East Asia) and the maximum diversity (0.430) was
observed between Annigeri (South and East Asia) and ICC 16796 (Europe). In E5 the
mean phenotypic diversity was recorded as 0.182, the minimum diversity (0.001) was
observed between ICC 2065 (South and East Asia) and ICC 12947 (South and East
Asia) and the maximum diversity (0.445) was observed between Annigeri (South and
East Asia) and ICC 18983 (Mediterranean region). When pooled the mean phenotypic
diversity index was 0.184. The maximum diversity (0.425) was observed between
ICC 13764 (West Asia) and ICC 12037 (North America). The minimum diversity was
0.001 observed in ICCV92311 (South and East Asia) and ICC 11198 (South and East
Asia).
4.2.6.4 Clustering
The hierarchical cluster analysis (Ward, 1963) based on Euclidean distance was
conducted using the scores of first three PCs on the pooled data capturing 85%

variation based on geographical origin of reference set accessions.
Grouping of reference set accessions resulted into a dendrogram with four clusters.
Accessions from Africa and South East Asia were grouped in to Cluster I, South
America origin in Cluster II. Europe and Russian Federation in Cluster III and
whereas Mediterranean, unknown, North America and West Africa were grouped
together in Cluster IV (Figure 6). Dendrogram of chickpea reference set based on 7
qualitative traits and 17 quantitative traits are represented in Figure 7 and Figure 8
respectively.
EVALUATION OF CHICKPEA REFERENCE SET ACCESSIONS FOR
DROUGHT RESISTANT TRAITS
4.3 IDENTIFICATION OF ACCESSIONS WITH HIGH SPAD
CHLOROPHYLL METER READINGS (SCMR)
The chickpea reference set along with five check cultivars (Annigeri, ICCV 10, KAK
2, L 550, G130) were used to estimate the variation of SPAD Chlorophyll Meter
Readings (SCMR) in 2008/2009 post rainy season, normal sown (E3) and 2008/09
spring season, late sown, (E5) at high temperatures at ICRISAT, Patancheru, Andhra
Pradesh.
4.3.1 Soil Plant Analysis Development (SPAD) Chlorophyll Meter Readings
(SCMR)
The mean SCMR reading was 58.21, 62.00, and 60.06 in normal (E3), late sown (E5)
environments and for pooled data respectively. The accessions ICC 506 (61.86), ICC
637 (61.61), ICC 11121 (61.13), ICC 7305 (61.02) and ICC 12928 (60.99) had high
SCMR when compared with the control cultivar G130 (57.23 ± 1.19) in normal sown
conditions. ICC 19095 (71.57), ICC 1510 (67.16), ICC 6874 (66.99), ICC 15567
(66.89) and ICC 2277 (66.68) were better when compared with the control ICCV 10
(58.86 ± 0.60) under late sown environment, whereas in pooled analysis, ICC 19095
(62.78), ICC 6874 (62.45), ICC 506 (62.41), ICC 15618 (62.24) and ICC 12321
(62.10) recorded high SCMR than the control cultivar KAK2 (58.03 ± 1.01) (Table
35).

4.4 IDENTIFICATION OF ACCESSIONS RESISTANT TO DROUGHT
TOLERANCE
The 293 cultivated diverse accessions of reference set (excluding wild accessions
from 300 accessions of chickpea reference set) along with 6 control cultivars (ICC
4958, Annigeri, ICCV 10, G 130, L 550, KAK 2,) were evaluated for drought related
root traits during two consecutive post rainy seasons (2007-08 (E2), 2008-09 (E3)) at
ICRISAT, Patancheru (Tables 36-37 and Plate 13-14).
4.4.1 VARIANCE COMPONENTS
The REML analysis of data for individual environment revealed significant genotypic
variance for all traits in two (E2, E3) environments and in pooled analysis (Tables 36-
37).
4.4.2 RANGE AND MEAN PERFORMANCE
Mean and range are simple and important measures of variability (Singh, 1983).
Variability among the accessions for different traits was assessed by comparing the
values of means and range for each trait between environments. Mean and range were
calculated for each character in individual environment separately as well as pooled
mean of two environments were tested using the Newman-Keuls procedure to
compare the mean values within environments. The estimates of mean and range are
presented below.
4.4.2.1 Shoot dry weight (g)
At 35 DAS the genotypes, ICC 15518 (3.18gm), ICC 18679 (2.94gm), ICC 15406
(2.86gm), ICC 20263 (2.83gm) and ICC 9137 (2.79gm) recorded high shoot dry
weight when compared to deep rooted and drought resistant control cultivar ICC 4958
(2.23 ± 0.30) in E2, whereas in E3 the genotypes ICC 15406 (2.68 gm), ICC 15518
(2.56 gm), ICC 14446 (2.49 gm), ICC 11303 (2.48 gm) and ICC 18912 (2.45 gm)
recorded high shoot dry weight as compared to control ICC 4958 (2.27 ± 0.24) in E3.
In pooled analysis ICC 15518 (2.87 gm), ICC 15406 (2.77gm), ICC 18679 (2.57gm),
ICC 20263 (2.56gm) and ICC 11903 (2.50gm) recorded high shoot dry weight as
compared to control ICC 4958 (2.16 ± 0.200). The genotypes ICC 15518, ICC 15406
recorded high shoot dry weight as compared to ICC 4958 both in E2 and E3 and also
in pooled analysis (Table: 36-37).
Shoot dry weight was significantly positively correlated with the traits RDW, RDp,

TDW, RL, RLD , RSA, RV, S/RLD and significantly negatively correlated with
R/T% in both E2 and E3 environments and also when pooled (Tables 38-40).
4.4.2.2 Root dry weight (g)
ICC 10885 (0.96gm), ICC 12379 (0.92gm), ICC 20267 (0.90gm), ICC 12492
(0.88gm) and ICC 9862 (0.87gm) recorded high root dry weight than the control
cultivar ICC 4958 (0.80 ± 0.11) in E2, whereas in E3 the genotypes ICC 12492 (1.01
gm), ICC 10885 (0.99 gm), ICC 11819 (0.95 gm), ICC 11903 (0.93 gm) and ICC
13187 (0.93 gm) out yielded ICC 4958 (0.76 ± 0.10). In pooled analysis ICC 10885
(0.97 gm), ICC 12492 (0.95 gm), ICC 13187 (0.87gm), ICC 18858 (0.85gm) and ICC
20267 (0.84 gm) recorded high root dry weight than ICC 4958 (0.72 ± 0.086). The
genotypes ICC 10885 and ICC 12492 recorded high root dry weight as compared to
deep rooted and drought resistant control cultivar ICC 4958 in E2, E3 and also in
pooled analysis (Table: 36-37).
Root dry weight was significantly positively correlated with all the traits RDW, RDp,
R/T%, TDW, RL, RLD , RSA, RV, S/RLD in both E2 and E3 environments and also
when pooled (Tables 38-40).
4.4.2.3 Total plant dry weight (g)
The genotypes ICC 15518 (3.99gm), ICC 20267 (3.67gm), ICC 9137 (3.63gm), ICC
15406 (3.62gm) and ICC 18679 (3.61gm) recorded high total plant dry weight as
compared to deep rooted and drought resistant control cultivar ICC 4958 (3.03 ±
0.356) in E2, whereas in E3 the genotypes ICC 15406 (3.51 gm), ICC 10885 (3.39
gm), ICC 15518 (3.33 gm), ICC 18912 (3.27 gm) and ICC 11903 (3.26 gm) recorded
high total plant dry weight as compared to control cultivar ICC 4958 (0.76 ± 0.10). In
pooled analysis ICC 15518 (3.66 gm), ICC 15406 (3.56 gm), ICC 10885 (3.31gm),
ICC 18679 and ICC 20263 (3.30gm) recorded high total plant dry weight as compared
to ICC 4958 (2.88 ± 0.249) (Tables 36-37).
Total dry weight was significantly positively correlated with all the traits RDW, RDp,
TDW, RL, RLD , RSA, RV, S/RLD in both E2 and E3 environments and also when
pooled, and significantly negatively correlated with R/T% in E2 and pooled (Table:
38-40).
4.4.2.4 Root Depth (cm)
In the E2, genotypes ICC 8740 (136.7cm), ICC 12028 (130cm), ICC 11378, ICC
11498, ICC 15510 and ICC 5845 (128.3cm) recorded high root depth as compared to

control cultivar ICC 4958 (110 ± 10.69), whereas in E3 the genotypes ICC 7819
(133.3 cm), ICC 15610 ICC 2679 and ICC 637 (130cm) and ICC 2242 (128.7cm)
recorded high root depth as compared to control cultivar ICC 4958 (0.76 ± 0.10). In
pooled analysis ICC 8740 (131.7cm), ICC 11498 (123.5 cm), ICC 18983 (122.6 cm),
ICC 15518 and ICC 7819 (122.5 cm) recorded high root depth as compared to control
cultivar ICC 4958 (114.16 ± 7.64) (Tables 36-37).
Root depth was significantly positively correlated with the traits (RDW, RDp, R/T%,
TDW, RL, RSA, and RV) except S/RLD in E2 and RLD in E3. In combined analysis,
root depth was significantly positively correlated with all traits (RDW, RDp, R/T%,
TDW, RL, RLD, RSA, RV, S/RLD) and significantly negatively correlated with
R/T% in E3 (Tables 38-40).
4.4.2.5 Root to total plant dry weight ratio (%)
Root to total plant dry weight ratio(R/T %) is an indicator for biomass allocation to
roots on dry weight basis. The genotypes ICC 12492 (34.42%), ICC 9942 (32.47%),
ICC 2629 (32.30%), ICC 9434 (31.00%) and ICC 8195 (30.64%) recorded high root
to total plant dry weight ratio as compared to ICC 4958 (26.48± 3.51) in E2, whereas
in E3 the genotypes ICC 12492 (43.17%, ICC 15610 (35.27%), ICC 11198 (35.23%),
ICC 8384 (34.98%) and ICC 12928 (34.44%) recorded high root to total plant dry
weight ratio as compared to deep rooted and drought resistant control cultivar ICC
4958 (24.96± 3.19). In pooled analysis ICC 12492 (38.95%), ICC 12928 (32.65%),
ICC 11198 (32.56%), ICC 2629 (31.55%) and ICC 18858 (31.22%) recorded root to
total plant dry weight ratio as compared to ICC 4958 (24.28± 2.64) (Tables 36-37).
Root to total plant dry weight ratio(R/T %) was significantly positively correlated
RDW, RDp in E2, RDW, RDp, RL, RSA, RV in E3 and when pooled R/T % was
significantly negatively correlated with SDW, TDW, S/RLD in E2 and SDW, S/RLD
in E3 (Tables 38-40).
4.4.2.6 Root Length (cm)
The genotypes ICC 18828 (6949 cm), ICC 10885 (6848 cm), ICC 15518 (6668 cm),
ICC 15785 (6533 cm) and ICC 15510 (6496 cm) recorded high root length as
compared to ICC 4958 (5865± 1002.4) in E2, whereas in E3 the genotypes ICC 18679
(6804 cm), ICC 10885 (6769 cm), ICC 7819 (6760cm), ICC 3410 (6701 cm) and ICC
20263 (6656 cm) recorded high root length as compared to deep rooted and drought
resistant control cultivar ICC 4958 (5433± 956.10). In combined analysis ICC 10885

(6818.25 cm), ICC 20267 (6496.14 cm), ICC 3410 (3458.22 cm), ICC 18828
(6377.00cm) and ICC 15518 (6267.60cm) genotypes recorded high root length as
compared to ICC 4958 (5549± 751.2) (Tables 36-37).
Root length was significantly positively correlated with all traits in E3, E2 except
R/T%, S/RLD and R/T% when pooled (Tables 38-40).
4.4.2.7 Root Length Density (cmcm-3)
Root length density is associated with water and nutrition uptake. At 35 DAS in E2
the genotypes ICC 8261 (0.397), ICC 5331 (0.268), ICC 6306 (0.262), ICC 20267
(0.258) and ICC 18912 (0.254) recorded high root length density as compared to
control ICC 4958 (0.253± 0.029), whereas in E3 the genotypes ICC 8261 (0.422),
ICC 15333 (0.285), ICC 20259 (0.281), ICC 15435 (0.278) and ICC 15406 (0.274)
recorded high root length density as compared to control ICC 4958 (0.254± 0.036). In
combined analysis ICC 8261 (0.410), ICC 5337 (0.267), ICC 6306 and ICC 18912
(0.263), ICC 20267 (0.255) genotypes recorded high root length density as compared
to control ICC 4958 (0.253± 0.0265) (Table: 36-37).
Root length density was significantly negatively correlated with S/RLD in E2, E3 and
when pooled and positively correlated with all traits in E2, except RDp in E3 and
R/T% when pooled (Tables 38-40).
4.4.2.8 Shoot to Root Length Density ratio (%)
The effectiveness of roots in shoot production was calculated by shoot to root length
density ratio. The genotypes ICC 7315 (18.13), ICC 13124 (16.46), ICC 15435
(15.59), ICC 1180 (15.35) and ICC 19011 (15.25) recorded high shoot to root length
density as compared to control ICC 4958 (8.82± 2.234) in E2, whereas in E3 the
genotypes ICC 4814 (15.49), ICC 16374 (14.89), ICC 3631 (12.56), ICC 10685
(12.27) and ICC 8718 ( 11.96) recorded high shoot to root length density as compared
to control ICC 4958 (8.94± 1.98). In pooled analysis ICC 3631 (14.66), ICC 4814
(14.18), ICC 7315 (14.09), ICC 13124 (14.04) and ICC 15697 (13.79) genotypes
recorded high root length density as compared to control ICC 4958 (8.57± 1.52)
(Tables 36-37).
Shoot to root length density ratio was significantly positively correlated with SDW,
RDW and TDW in E2, SDW, RDW, RDp, TDW and RL in E3 and when pooled.
Shoot to root length density ratio is significantly negatively correlated with R/T% and
RLD in E2, E3 and when pooled (Tables 38-40).

EVALUATION OF CHICKPEA REFERENCE SET FOR POD BORERE
RESISTANCE TRAITS
4.5 IDENTIFICATION OF ACCESSIONS RESISTANT TO POD BORER
Three hundred diverse reference set accessions along with 7 control cultivars
(Annigeri, G 130, KAK 2, ICC 506EB-resistant, ICC 3137-susceptible, ICCV 10-
moderately resistant, L 550-susceptible) were planted in Randomized Complete Block
Design (RCBD) during two consecutive post rainy seasons (2007-08 (E2), 2008-09
(E3)) at ICRISAT, Patancheru (Plate 12).
4.5.1 Leaf Damage score
At vegetative stage in post rainy environments (E2 and E3), the interaction effects
were significant for leaf damage in two seasons and in pooled analysis (Tables 41-
42). The genotypes ICC 16903 (1.62), ICC 14595 and ICC 20174 (1.92), ICC 15518
(2.08) and ICC 8261 (2.09) showed low leaf damage rating when compared to the
resistant control cultivar ICC 506 (2.56) in E2, whereas in E3 the genotypes ICC
20174 (1.28), ICC 14595 (1.29), ICC 16903 (1.55), ICC 15518 (1.91) and ICC 15612
(2.18) had low leaf damage rating as compared to the resistant control cultivar ICC
506 (2.48) in E3 whereas in pooled analysis ICC 20174 (1.39), ICC 16903 (1.42),
ICC 14595 (1.45), ICC 15518 (1.94) and ICC 8522 (2.28) recorded low leaf damage
rating as compared to the resistant control cultivar ICC 506 (2.61) (Tables 41-42).
4.5.2 Larval survival (%)
The interaction effects were significant for larval survival in two seasons and in
pooled analysis. Larval survival (%) was lowest in genotypes ICC 3892 (35.99%),
ICC 9862 (42.21%), ICC 20192 (43.58%), ICC 7305 (45.02%), ICC 18828 (47.37%)
and ICC 7148 (49.8%) when compared to the resistant control cultivar ICC 506
(54.74) in E2. The genotypes ICC 12537 (39.6%), ICC 9590 (39.83%), ICC 7819
(43.01%), ICC 2482 (46.05%) and ICC 14595 (48.71) recorded low larval survival
rating as compared to the resistant control cultivar ICC 506 (53.47) in E3 whereas in
pooled analysis ICC 7819 (48.83%), ICC 12537 (49.83%), ICC 16903 (50.30%), ICC
15435 (51.65%) and ICC 13764 (52.90%) recorded low larval survival (%) when
compared to the resistant control ICC 506 (56.76%) (Tables 41-42).
4.5.3 Larval weights
Significant interactions effects were observed for larval weights in two seasons.

Larval weights was lowest in genotypes ICC 1161 (13.2mg), ICC 7305 (13.5mg), ICC
6293 (15.5mg), ICC 8058 (16.3mg), ICC 16915 (16.5) when compared to the resistant
control cultivar ICC 506 with (20.2mg) larval weight in E2. The genotypes ICC
20174 (21.2mg), ICC 16903 (23.4 mg), ICC 6877 (24.9mg) recorded low larval
weights as compared to the resistant control cultivar ICC 506 (26.2 mg) in E3, when
pooled ICC 20174 (21.1mg), ICC 16903 (25.3mg), ICC 6293 (29.2mg) were with
lower larval weights when compared to the resistant control ICC 506 recorded (31.0
mg).
The genotypes ICC 20174, ICC 16903, ICC 14595 recorded lowest leaf damage,
larval survival and lower larval weights in two environments as well as in pooled
analysis (Tables 41-42).
EVALUATION OF CHICKPEA REFERENCE SET FOR GRAIN QUALITY
TRAITS
4.6 IDENTIFICATION OF ACCESSIONS WITH HIGH PROTEIN
The chickpea reference set along with five check cultivars (Annigeri, ICCV 10, KAK
2, L 550, G130) were used to estimate protein content by Atomic Spectra Photometric
Meter (ASPM) in four seasons 2006/2007 (E1), 2007/2008 (E2), 2008/2009 (E3) post
rainy normal sown conditions, 2008/2009 (E5) winter seasons, late sown conditions at
ICRISAT, Patancheru, Andhra Pradesh. The mean protein content was 21.07% in E2,
20.47% in E1, 19.45% in E3 and 21.79% in E5. The accessions with high protein
content were ICC 12654 (25.82%), ICC 11903 (25.56%), ICC 9418 (25.30%), ICC
19226 (25.23%), and ICC 16654 (25.1), compared to 23.03% of the best control
cultivar L 550 in E1. ICC 2737 (25.45%), ICC 12155 (25.14%), ICC 19165 (24.96%),
ICC 1161 (24.41%) and ICC 3421 (24.37%), compared to 22.76% of control cultivar
L550 in E2. ICC 2737 and ICC 3421 (23.92% each), ICC 3218 (22.97%), ICC 20261
(22.93%) and ICC 19165 (22.77%), compared to 19.15% of the control cultivar
KAK2 in E3. The accessions ICC 1161 (26.83%), ICC 9418 (26.64%), ICC 13719
(26.22%), ICC 3218 (25.8%) and ICC 6294 (25.28%), compared to 23.37% of the
control cultivar L550 in E5. ICC 3421 (24.72%), ICC 3218 (24.67%), ICC 1161
(24.28%), ICC 19165 (24.08%) and ICC 20261 (23.93%), compared to 22% of the
control cultivar ICCV 10 in pooled analysis. Protein content was found to be highest
in (E5) late sown conditions compared to (E1, E2, E3) normal sown conditions. Most

of the kabuli from Mediterranean and desi from West Asia and South and East Asia
had high protein content compared to other regions.
4.7 IDENTIFICATION OF ACCESSIONS WITH HIGH ANTHOCYANIN
CONTENT
The chickpea reference set along with five check cultivars (Annigeri, ICCV 10, KAK
2, L 550, G130) were used to estimate anthocyanin content by using High
Performance Liquid Chromatography (HPLC) at ICRISAT, Patancheru, Andhra
Pradesh. The mean anthocyanin content was 1.55 for anthocyanins extracted with
acidified methanol and 0.38 for anthocyanins extracted with methanol. The accessions
ICC 10939 (3.89 A550g-1
), ICC 4533 (3.20 A550g-1
), ICC 5639 (3.08 A550g-1
), ICC
7272 (2.60 A550g-1
) and ICC 8058 (1.84 A550g-1
) recorded higher anthocyanin
content extracted with methanol than the control cultivar L550 recorded highest
anthocyanin content (1.26 ± 0.14). The accessions ICC 3892 (5.25 A550g-1
), ICC
11498 (4.48 A550g-1
), ICC 7052 (4.08 A550g-1
), ICC 13524 (3.90 A550g-1
) and ICC
16796 (3.64 A550g-1
) recorded higher anthocyanin content extracted with acidified
methanol than the control cultivar G 130 (2.68 ± 0.41).
The accessions with low acidified methanol anthocyanin content were, ICC 1446,
ICC 16374, ICC 2884, ICC 6875 and ICC 7554 (0.25 A550g-1
). Most of the desi
accessions from South and East Asia showed high anthocyanin content extracted with
methanol and acidified methanol. West Asian accessions showed high anthocyanin
content in desi accessions when compared to other regions.
4.8 IDENTIFICATION OF TRAIT SPECIFIC GERMPLASM
By evaluating the chickpea reference set over five environments 2006/07, 2007/08,
2008/09 post-rainy, 2008/09 winter at ICRISAT and 2008/09 post- rainy at UAS,
Dharwad, identified a few accessions performed repeatedly better than the best
control cultivar for the particular trait(s) in all environments. The number of
accessions identified specific for traits, were 2 accessions for early flowering, 11
accessions for early maturing, 17 for more seeds per pod, 35 for more pods per plant,
one with more yield per plant, 19 with high 100-seed weight, 119 for high plot yield,
89 for per day productivity, 20 heat tolerant, 13 with high root depth, 42 with high
shoot dry weight, 40 with high root dry weight, 11 with high root to total plant dry
weight ratio (R-T%), 33 accessions with high root length, 6 accessions for root length

density, twenty five with minimum damage rate to pod borer, 17 with lowest larval
survival%, 3 accessions with minimum unit larval weights, 38 with high protein and
40 accessions with high anthocyanin content (Table 43). Extensive evaluation of these
accessions in different locations may be useful to reconfirm their genetic worth and
use in crop improvement.
4.9 MOLECULAR DIVERSITY IN CHICKPEA REFERENCE SET
In the present study, genotypic diversity and population structure of chickpea
reference set was dissected by using 91 polymorphic SSR markers allelic data. The
experiment was carried out in different steps and the results are briefly described
under the following sub titles,
1. Protocol optimization and marker selection
2. Genotyping and quality index of markers
3. Molecular diversity and population structure of chickpea reference set
4. Identification of allelic variation associated with beneficial traits using
association mapping in the reference set of chickpea
4.9.1 Protocol optimization and marker selection
A total of 120 SSR markers mapped on 12 chickpea linkage groups (Winter et al.,
2000) were used for screening and PCR protocol optimization. So to get the basic idea
of allele range, markers productivity and efficiency by genotyping in the chickpea
reference set, these markers were optimized initially by Modified Taguchi method
(Cobb and Clarkson, 1994). The optimization of PCR protocol was carried out with
two most diverse chickpea accessions (Annigeri and ICCV2) identified from
ICRISAT genebank (Plate 10).
Among the 120 markers, 100 markers produced strong and easily scorable
polymorphic bands in two genotypes. The PCR products for these markers were
analyzed through ABI 3130xl Gene Analyzer which produced first hand on
information about the range of the alleles present in the two genotypes. Alleles close
in size could be distinguished using different fluorescent dye labels. Equimolar primer
concentrations in multiplex PCRs showed uneven amplification in some markers.
Similar levels of amplification of each marker was obtained by decreasing the
quantity of primer for the strongly amplified fragments, increasing the amount of
primers for the poorly amplified fragments and adjusting the concentration of the
remaining PCR reagents accordingly. To increase the efficiency of the genotyping,

markers with different labels and allelic range were grouped as a set of multiplex and
33 post PCR multiplex were made. From these 100 markers, based on high
polymorphism and amplification rate, 91 SSR markers were selected and 26 multiplex
were made to increase the efficiency of genotyping of entire reference set. Raw allelic
data was binned through AlleloBin (Indury and Cardon, 1997) to get perfect allele
calls based on the repeat length of the marker (Plate 11).
4.9.2 Molecular diversity of Chickpea reference set
4.9.2.1 Allelic richness and diversity in reference set
The ninety one SSR markers detected a total of 2411 alleles in 300 reference set
accessions. The number of alleles per locus ranged from 3 (CaSTMS20) to 61 (TS5),
with an average of 26.45 alleles per locus (Table 44). The polymorphic information
content (PIC) values ranged from 0.021 (CaSTMS20) to 0.969 (TA176), with an
average of 0.809. Most of the markers had high PIC (< 4), whereas markers TAA57
(0.166), CaSTMS13 (0.291), TA108 (0.361) and CaSTMS23 (0.392) showed low
polymorphism. Gene diversity is defined as the probability that two randomly chosen
alleles from the population are different. It varied from 0.021 (CaSTMS20) to 0.969
(TA176) with an average of 0.825 in the reference set. Distribution of number of
alleles per locus among 91 SSR markers used for genotyping chickpea reference set id
represented in Figure 8.
Significant and positive relationships was observed between allele size range and the
amount of variation at SSR loci (as measured by alleles per locus and gene diversity)
which indicate that SSR loci with large allele range (resulting from large number of
SSR units) show greater variation, and agree with the idea that replication slippage
plays an important role in the generation of new alleles at SSR loci.
4.9.2.2 Heterozygosity in germplasm accessions
Chickpea is a self pollinated crop. Moreover, in this study, a single plant from each
accession was harvested and parts of the seeds obtained from such plants were sown
in field to raise seedlings for DNA extraction. Extreme care was taken to avoid
inadvertent seed mixtures. In spite of this, a wide range of heterozygosity (%) was
detected in the investigated materials, from 0.00 % to 2.87 %, with an average of 0.15
%. Most of the SSR loci detected no heterozygosity, while the markers TS45, TA64,
TA28 detected >1% while TS62, TA53, TA72, detected >2%, TA113, TA71, TA117
detected <2% heterozygosity. A large collection of landraces was involved in this
study and it is possible that these accessions still possess some residual heterozygosity
at least at some SSR loci reported. A landrace is defined as an autochthonous
(primitive) variety with a high capacity to tolerate biotic and abiotic stresses, resulting
in high yield stability and an intermediate yield level under a low input agricultural
system (Zeven, 1998) (Table 45).
4.9.2.3 Biological and geographical diversity in the chickpea reference set
Biologically, the 300 (2411 alleles) accessions were grouped into cultivated (1978
alleles) and wild types (433 alleles) and among cultivated accessions, desi (2009
alleles), kabuli (1572 alleles) and pea (544 alleles) types. Geographically, West Asia
(1578 alleles) showed maximum alleles followed by South and East Asia (1489
alleles), Mediterranean (1401 alleles), Africa (755 alleles), Russian Federation (333
alleles), North America (286 alleles), South America (239 alleles), Europe (179
alleles) and accessions with unknown biological status (316 alleles). Though
cultivated accessions showed similar mean gene diversity, the desi accessions as a
group were genetically more diverse (high range of gene diversity, 0.000 - 0.97) than
other cultivated such as kabuli and pea types (Tables 46) Interestingly, accessions
from West Asia (0.00 – 0.96), South and East Asia (0.00 – 0.96), Mediterranean (0.11
– 0.96) and Africa (0.00 – 0.92) were genetically more diverse (high range in mean
gene diversity) than other regions.
This study detected many rare, common, and frequent alleles within each group. A
total of 2299 alleles were detected in cultivated types and 433 alleles in wild types of
chickpea reference set, of which 1980 were unique in cultivated, 114 in wild
accessions and 319 alleles were common among wild and cultivated. In the cultivated
group, desi accessions contained the largest number of unique alleles (864) followed
by kabuli (836) and pea type (52).
The PIC values ranged from 0.00 to 0.97 in desi, 0.00 to 0.95 in kabuli and 0.00 to
0.89 with an average of 0.73 in pea type, 0.80 in desi and 0.79 in kabuli. Gene
diversity averaged 0.82, ranging from 0.00 to 0.97 in desi, whereas in kabuli
accessions, it varied from 0.00 to 0.96 with an average of 0.81. In pea type, the gene
diversity ranged from 0.00 to 0.89 with an average 0.73. Desi types exhibited
maximum mean gene diversity and PIC than kabuli and pea types.
The mean PIC was higher in the accessions from West Asia and Mediterranean
regions (0.800) followed by South and East Asia (0.770) and Africa (0.734), whereas

low PIC was observed in the accessions from Europe (0.329). The other regions, with
mean PIC value were Russian Federation (0.582), unknown origin (0.542), North
America (0.502) and South America (0.464) (Table 46).
4.9.2.5 Rare alleles in the reference set
Alleles were considered as rare alleles, when the frequency is less than 1% in the
population. These rare alleles may possess genes responsible for specific traits like
pest and disease resistance and tolerance to drought. In the reference set 2424 rare
alleles were observed from 91 SSR markers. It ranged from 2.0 to 90.0. The markers
TS5 (90 alleles), TR1 (82 alleles), TR43 (76 alleles), TR7 (74 alleles) showed high
number of rare alleles, whereas markers GAA43, TAA57 (each 2 rare alleles) showed
low number of rare alleles. The rare allele loci, number of rare alleles, observed
frequency of each rare allele of reference set were presented in the Table 46
4.9.3 Unweighted neighbor-joining tree
Neighbour-joining tree based on simple matching dissimilarity matrix between 297
accessions of the chickpea reference set was broadly clustered accessions into four
clusters namely CI to CIV respectively. CI contained 89 accessions of which 64 were
desi type, which is dominant in this cluster whereas 24 were kabuli, one accession
was pea type. CII consisted of 30 accessions, desi type dominated with 20 accessions
along with 9 kabuli and one pea type accession. CIII represented by 87 accessions
dominated with 76 desi type of accessions followed by 9 kabuli and two pea type
accession. CIV consisted of 91 accessions dominated by 46 kabuli accessions along
with 34 desi, 7 pea and 4 wild accessions. The results from the neighbor-joining
phylogenetic tree corresponded well with the classification based on three biological
statuses of chickpea. CI, CII, CIII dominated with desi type of accessions whereas
CIV dominated with kabuli accessions. (Table 47, Figure 9a, 9b).
4.9.3.1 Allelic richness and genetic diversity
The ninety one SSR markers detected a total of 1601 alleles in CI, 1006 in CII, 1547
in CIII and 1715 in CIV. The number of alleles ranged from 1-40 in CI, 1-19 in CII,
1-43 in CIII and 2-37 in CIV with an average of 17.6, 11.1, 17.0 and 18.8 in CI to
CIV respectively. The polymorphic information content was 0.961 in CI, 0.929 in CII,
0.960 in CIII and 0.957 in CIV. Gene diversity was 0.962 in CI, 0.933 in CII, 0.962 in
CIII and 0.959 in CIV. Heterozygosity was maximum in CII (0.071) compared to CI
(0.023), CIII (0.047) and CIV (0.049). The allelic composition revealed the

predominance of common allele (10559 in CI, 3432 in CII, 10145 in CIII and 10937
in CIV) as compared to most frequent alleles (3789, 1456, 3915 and 3628 in CI to
CIV respectively). Rare alleles were not seen only in CII whereas in CI (2), CIII (1),
CIV (7) alleles were seen (Table 47).
4.9.3.2 Geographical diversity
Majority of the accessions in the reference set were from Asia and Africa. Clustering
did not follow the country of origin clearly. But in some clusters accessions from
some particular origin were predominant (Table 48)
Cluster I had accessions predominantly from South Asia accessions (43 accessions)
followed by West Asia (14 accessions), Africa (13 accessions) and Mediterranean
region (7 accessions). The limited number of accessions from North America (3
accessions), South America (3 accessions), Russian Federation (2 accessions), Europe
(1 accession), and unknown origin (3 accessions) were spreaded through out the
clusters.
Cluster II was dominated by accessions from South Asian (12 accessions) followed by
Mediterranean region (7 accessions), Africa (5 accessions), West Asia (14 accessions)
and Europe (1 accession).
Cluster III had predominantly accessions from West Asia (43 accessions), followed
by South Asian accessions (34 accessions), Mediterranean region (6 accessions),
Russian Federation (2 accessions), North America and accessions with unknown
origin (1 accession each). Accessions from Africa, South America, and Europe were
not represented in cluster III.
Cluster IV had predominantly accessions from West Asia and Mediterranean region
(32 accessions each), followed by South Asian accessions (16 accessions), Africa (3
accessions), Russian Federation, North America and accessions with unknown origin
(2 accessions each), South America, and Europe (I accession each) were represented
in cluster III.
4.9.3.3 Factorial analysis
The factorial analysis based on biological status, has been given in Figure 4. It
illustrates the high divergence among genotypes of the reference set based on
biological status. The desi type accessions clustered together (quadrant I and II) and
wild were in another cluster (quadrant III and IV), kabuli accessions were clustered in
quadrant III and IV. Accessions with Pea seed type were distributed in overall the

four quadrants.
4.9.4 Population Structure analysis
STRUCTURE analysis can help to identify the presence of population structure and
also distinct genetic population, assigning the individuals to populations and identify
migrants and admixed individuals. Analysis of population structure using 91 SSR
markers provided evidence for the presence of significant population structure in the
chickpea reference set. The k value was determined by LnP(D) in STRUCTURE
output and an ad hoc statistic Δk based on the rate of change in LnP(D) between
successive k. The final subpopulation were determined based on rate of change in
LnP(D) between successive k, stability of grouping pattern across five run and
germplasm information about the material under study (Figure10 and Table 49).
Based on this information, k=13 chosen as the optimal grouping and burn-in period of
1,00,000 and 2,00,000 replications was selected to assign the posterior membership
coefficient (Q) to each accessions. A graphical bar plot was than generated with the
posterior membership coefficient were presented in Figure 6. Biological race and
geographic origin information was used to assist with the clustering. The clustering
matrices (Q) of closely related clusters/ subdivisions using Bayesian approach, was
obtained from STRUCTURE and used in association mapping
Table 49 Average logarithm of the probability of data likelihoods (LnP(D)) of
chickpea reference set
K Average Ln P(D) K Average Ln P(D)
10 -103288 15 -104828
11 -101982 16 -101299
12 -100232 17 -97693.2
13 -99532.7 18 -96499.3
14 -101130 19 99513.1
Table 50 Overall proportion of membership of the sample in each of the 13
subpopulations
Inferred subpopulations
SP1 SP2 SP3 SP4 SP5 SP6 SP7
0.145 0.082 0.074 0.061 0.070 0.094 0.042
SP8 SP9 SP10 SP11 SP12 SP13
0.154 0.046 0.064 0.042 0.041 0.083
In the present study, population structure was dissected for 300 accessions by using
91SSR markers allelic data by using the software program STRUCTURE. The

reference set was grouped in to thirteen subpopulations (Figures 12a, 12b). Thus, the
thirteen subpopulations as inferred from the STRUCTURE analysis denoted as SP1
(Red), SP2 (Green), SP3 (Dark Blue), SP4 (Yellow), SP5 (Pink), SP6 (Sea blue), SP7
(Brown), SP8 (Maroonish brown), SP9 (Light brown), SP10 (Dark sea blue), SP11
(blue), SP12 (Light green), SP13 (Grey) respectively and SP refers to subpopulation.
Overall proportion of membership of the sample in each of the four subpopulations is
0.145, 0.082, 0.074, 0.061, 0.070, 0.094, 0.042, 0.154, 0.046, 0.064, 0.042, 0.041 and
0.083 respectively (Table 50).
The subpopulation 1 contained with 48 accessions, of which kabuli dominated with
28 accessions followed by desi with 17 accessions, pea with 2 accessions and one
accession was wild. Geographically, Mediterranean region - 15 accessions, West
Asia- 7, Africa -5, South East Asia, Russian Federation and unknown origin - 3 each,
North America and Europe by 1 each were represented in this subpopulation.
Subpopulation 2 contained 25 accessions, of which desi dominated with 24 accessions
and kabuli by 1 accession. Geographically, South East Asian region - 15 accessions,
West Asia - 6, Mediterranean region - 3 and Africa only one accession were
represented in this subpopulation.
Subpopulation 3 represented with 24 accessions, of which desi dominated with 17
accessions followed by kabuli with 6 accessions and pea with one accession.
Geographically, South East Asia – 12 accessions, West Asia-6, Mediterranean region
-3, Africa, South America and unknown accessions – 1 each were represented in this
subpopulation.
Subpopulation 4 contained only 14 desi accessions. Geographically, South East Asia
– 8 accessions, West Asia-4, Mediterranean region and Africa- 1 each were
represented in this subpopulation.
Subpopulation 5 contained only 15 desi accessions. Geographically - South East Asia
– 12 accessions and West Asia-3 were represented in this subpopulation.
Subpopulation 6 contained with 28 accessions of which kabuli dominated with 23
accessions followed by desi with 5accessions. Geographically - Mediterranean region
– 9 accessions, West Asia-6, Africa, South East Asia and North America- 3 each,
South America – 2, Europe and unknown origin– 1 each were represented in this
subpopulation.
Subpopulation 7 contained 13 accessions, of which desi dominated with 9 accessions
followed by 4 Wild accessions. Geographically - Mediterranean region – 7

accessions, West Asia-6 accessions. Maximum numbers of wild accessions are
represented in subpopulation 7.
Subpopulation 8 contained highest number of 56 accessions, of which desi dominated
with 33 accessions followed by kabuli with 17 accessions, pea with 5 accessions and
one accession was wild. Geographically- South and East Asia-23 accessions,
Mediterranean region- 13, West Asia -9, Africa-9, South America and Russian
Federation – 1 each were represented in this subpopulation.
Subpopulation 9 contained 12 accessions, of which desi dominated with 10 accessions
followed by kabuli and pea with one accession each. Geographically- West Asia – 11
accessions and North America – 1 accession were represented in this subpopulation.
Subpopulation 10 with 15 accessions, of which kabuli dominated with 7 accessions
followed by desi with 5 accessions, pea 2 with accessions and one accession was wild.
Geographically–Mediterranean region – 3 accessions, West Asia-7, South East Asia-
2, Russian Federation, North America and unknown origin – 1 each were represented
in this subpopulation.
Subpopulation 11 contained only 9 desi accessions. Geographically- South and East
Asia-8 accessions and West Asia -1 accession were represented in this subpopulation.
Subpopulation 12 contained only 12 desi accessions. Geographically- West Asia -10
accession, South and East Asia and Mediterranean region- 1 accession each were
represented in this subpopulation.
Subpopulation 13 contained 29 accessions, of which desi dominated with 24
accessions followed by kabuli with 5 accessions. Geographically - South and East
Asia-18 accessions, West Asia -7, Africa, Europe, Mediterranean region and Russian
Federation-1 accession each were represented in this subpopulation.
4.9.4.1 Genetic diversity of subpopulations
The reference set was grouped in to thirteen subpopulations with 91SSR markers
allelic data by using the software program STRUCTURE. The 91 SSR markers
detected a total of 1199 alleles in SP1, 720 in SP2, 778 in SP3, 483 in SP4, 527 in
SP5, 803 in SP6, 749 in SP7, 1301 in SP8, 544 in SP9, 574 in SP10, 348 in SP11, 428
in SP12 and 759 in Sp13. Highest number of alleles was detected by SP8 with a mean
of 11.4, which ranged from (0 to 26). Lowest number of alleles was detected by SP11
with a mean of 3.1, which ranged from (0-7). PIC values ranged from 0.00 to 0.946
in SP1, 0-0.930 in SP2, 0-0.922 in SP3 and 0-0.891 in SP4 , 0-0.877 in SP5, 0-0.945

in SP6, 0-0.902 in , 0-0.947 in SP8, 0-0.863 in SP9, 0-0.890 in SP10, 0-0.819 in
SP11, 0-0.863 in SP12 and 0-0.947 in SP13, with an average 0.727, 0.649, 0.667,
0.535, 0.538, 0.653, 0.737, 0.715, 0.612, 0.693, 0.527, 0.517 and 0.690 in SP1 to
SP13 respectively. Maximum mean PIC value was detected in SP8 and minimum in
SP11 when compared with other sub-populations. Maximum mean gene diversity
value was detected in SP7 (0.765) and minimum in SP4 (0.560) when compared with
other sub-populations. The average number of alleles per locus and PIC were higher
in SP8 compared to other sub-populations. Rare alleles are detected only in SP1 (32)
and SP8 (2). Accessions from SP8 consist of 2 rare, 7087 common and 3881 most
frequent alleles when compared with other sub-populations (Table 51). Graphical
representation of allelic pattern across the population is represented in Figure 6.
4.9.4.2 Genetic relationship among the population
Pairwise comparison on the basis of the values of Fst could be interpreted as
standardized population distance between two populations. The pairwise Fst value in
this study ranged from 0.102 between SP7 and SP7 to 0.362 between SP11 and SP5
with an average pairwise Fst of 0.206. The pairwise Fst was highest between SP11 and
SP5 (0.362) followed by between SP11 and SP9 (0.349) (Table 51). The genetic
distance data agreed with the Fst estimate with the mean genetic distance was 0.702.
SP2 showed the lowest genetic distance with SP1 (0.172) and SP8 showed the lowest
genetic distance with SP5 (0.267) whereas SP11 showed the greatest genetic distance
with SP5 (1.391) followed by SP5 with SP4 (1.291) (Table 52-53 and Figure 12)
4.9.5 Analysis of molecular genetic variance between and within the
subpopulations
The distribution of molecular genetic variation among and within the thirteen
subpopulations of accessions was estimated by analysis of molecular variance,
AMOVA (Table 54). AMOVA revealed that 20 per cent of the total variance was
among the subpopulations, while 80 per cent was among individuals within the
subpopulations. The same trend was observed when the AMOVA estimated based on
three types of chickpea in reference set.
Table 54 Analysis of molecular variance (AMOVA) based on 13 subpopulations
(SP1 to SP13) identified by software STRUCTURE
Source Df SS MS Est. Var. %
Among Pops 12 8995.045 749.587 28.322 20%
Within Pops 287 33259.412 115.886 115.886 80%

Total 299 42254.457 144.208 100%
4.9.6 Principal coordinates analysis (PCoA)
In this study, principal coordinate analysis and Unweighted neighbor-joining
phylogenetic analysis was conducted to further assess the population subdivisions
identified using STRUCTURE. The first three PCs explained 81.71 per cent of
variation of which PC1 explained 36.48 per variation and PC2 explained 33.38 per
cent of the SSR variation among the 300 accessions of chickpea reference set
including five control cultivars. Plotting the first two PCs and colour coding
genotypes based separated the chickpea reference set accessions into four clusters
which was identified by STRUCTURE analysis (Table 55).
4.10 ASSOCIATION ANALYSIS
4.10.1 Association of markers in reference set with phenotypic traits
A general linear model (GLM) was implemented by using TASSEL 2.1 as suggested
by Yu et al. (2006) to conduct the association analysis and to identify the SSR
markers associated with the qualitative, quantitative and grain quality traits, resistance
to pod borer and for traits related to drought tolerance in chickpea reference set based
on population structure (Q matrix) and relatedness relationship. Each trait was
represented by its mean of the two replications. Association analysis was carried for
over five environments and over all the five environments. MTAs detected in pooled
data were considered as reference, and were compared with the MTAs detected from
individual environments. The results of association analysis using simple linear
regression markers, and their association with traits, linkage group and position, F-
value and probability and percentage of phenotypic variance explained by each MTA
(R2
,%) and details of MTAs detected by pooling the five environments is presented
below:
4.10.1.1 Association of markers with Qualitative traits
Number of significant marker trait associations (MTAs) were 27 ( P≤0.001) for
qualitative traits involving 21 markers (Table 56), out of which 17 SSR markers were
associated with one trait and 4 SSR markers were associated with more than one trait.
Of which major MTAs (>20% phenotypic variation) detected were five (two for
growth habit and three for seed surface). Maximum numbers of MTAs (5) were
detected on chromosome number 6. Seed surface showed detected maximum number

of MTAs (12) whereas minimum number of MTAs was detected for dots on seed coat
(1). No significant MTAs were detected for growth habit and seed color. Both
Maximum and minimum phenotypic variation was observed for seed surface (22.71)
and (6.4), respectively.
Five MTAs were detected for seed shape and were distributed on chromosome
1(TR20), 3(TR24), 5(TS35) and 6(TA22). One unmapped (CaSTMS9) MTA were
detected for seed shape. Five MTAs were detected for flower color that were
distributed on chromosome 4(TA2), 6(TA22) and 7(TA180, TA21, TS62). Four
MTAs were detected for plant color and were distributed on chromosome 1(TA113),
4(TA2, TR20), and 8(TA159). Only one MTA was detected for dots on seed coat on
chromosome 6(TA106).Twelve MTAs were detected for seed surface on chromosome
1(CaSTMS13, TA113), 2(TA96, TA27), 3(TA135), 4(TR20), 5(CaSTMS20,
CaSTMS7), 6(TR40, TA22), and 13(GAA39). One unmapped (GAA58) MTAs was
also detected for seed surface.
Overall the SSR markers, TA22 (Seed shape, flower color and seed surface) and
TR20 (Seed shape, seed surface and plant color) detected three MTAs each, whereas
TA113 (Plant color and seed surface) and TA2 (flower color and plant color) detected
two MTAs each.
Of all the 27 significant MTAs (P≤0.001) detected in pooled analysis for 7 the
qualitative traits, five were major MTAs (>20% phenotypic variation), of these two
MTAs were detected for Growth habit (TS 35-23.6% and TA159-21.2%) and three
MTAs were Seed surface (TR 40-22.7%, TR43-21.6%, TA176-20.2%).
4.10.1.2 Association of markers with Quantitative traits
64 significant (P≤0.001) MTAs were detected involving 49 SSR markers in E1, with
maximum phenotypic diversity of 43.4% for anthocyanin content. 86 significant
MTAs were detected involving 46 SSR markers in E2 and maximum phenotypic
diversity of 42% for tertiary branches whereas in E3, 76 significant MTAs with 50
SSR markers and maximum phenotypic diversity of 42.9% for leaf area, in E4 74
significant MTAs with 52 SSR markers and maximum phenotypic diversity of 45.4%
for apical secondary branches and in E5 56 significant MTAs with 44 SSR markers
and maximum phenotypic diversity of 34.8% for plant width. Marker trait
associations (MTAs) (P<=0.05, P<=0.01 & P<=0.001) detected for different
Quantitative traits in the chickpea reference set in five environments and in pooled

analysis are represented in Table 57. Number of significant MTAs detected in
individual environments from E1 to E5 is represented in Tables 58-62.
In pooled analysis, number of significant MTAs were 76 (P≤0.001) for quantitative
traits (Table 63), of which major MTAs (>20% phenotypic variation) detected were
39. Flowering duration detected highest maximum number of MTAs (14) and
maximum number of major MTAs (7), whereas apical primary branches and seeds per
pod (1) detected minimum number of MTAs. Maximum phenotypic variation was
observed for tertiary branches (37.4%) and minimum was observed for per day
productivity (4.13%).
Traits variability in different environments
For the purpose of summarization of results and discussion, the traits studied were
grouped into three broad categories based on the life cycle of the chickpea plant
(Gowda et al., 2011).
Vegetative traits: plant height, plant width, basal primary branches, apical primary
branches, basal secondary branches, apical secondary branches and tertiary branches;
Reproductive traits: days to 50 percent flowering, flowering duration, days to
maturity;
Yield and yield component traits: pods per plant, seeds per pod, 100-seed weight,
grain yield and per day productivity.
4.10.1.2.1 Vegetative traits
Number of MTAs in pooled analysis has been presented:
Plant height
Eight MTAs were detected for plant height and were distributed on chromosomes
1(TR43), 4(TA132), 5(TS43), 6(GA9), 7(TS46, TA28), 8(TA25) and 13 (GAA39).
Plant width
Five MTAs were detected for plant width that were distributed on chromosomes
1(CaSTMS21), 7(TA180, TA78) and 15 (CaSTMS25). One unmapped (GA22) MTA
s was detected for plant width.
Apical primary branches
Single MTA on chromosome 6(TS24) was detected for apical primary branches.

Basal secondary branches
Two MTAs were detected for basal secondary branches on chromosome 1 (CaSTMS
13) and 6(TS24).
Apical secondary branches
Four MTAs were detected for apical secondary branches on chromosome 1 (GAA40),
2(TA53) and 6 (TS24, CaSTMS2).
Tertiary branches
Nine MTAs were detected for tertiary branches on chromosomes 1 (TR43,
CaSTMS21), 3(TS5, TAA194), 6(TR1, CaSTMS2), 7(TS46, TA78) and
11(CaSTMS12). Phenotypic variation was observed to be highest (34.28%) for this
trait than any other quantitative traits using the marker TA78.
4.10.1.2.2 Reproductive traits
Days to 50 percent flowering
Eight MTAs were detected for days to 50% flowering on chromosomes 2 (TAA58,
TA27), 3(TA64, TA125), 4 (TS54, TA130) and 5(CaSTMS7, TR29)
Flowering duration
Fourteen MTAs were detected for flowering duration on chromosomes 2 (TA110,
TA27), 4 (TS54, TA72, TA132), 5(CaSTMS20, TA5, TS35, CaSTMS7), 6(TR40),
8(TA159), 13(TS83) and 15(CaSTMS25). One unmapped (GAA43) MTA was also
detected for flowering duration using GLM.Flowering duration detected highest
number of MTAs than all other quantitative traits in chickpea reference set when
pooled.
Days to maturity
Two MTAs were detected for days to maturity on chromosomes 4 (TA130) and
5(CaSTMS7).
4.10.1.2.3 Yield and yield component traits
Pods per plant
Four MTAs were detected for pods per plant on chromosomes 3(CaSTMS5),
4(TAA57), 6(TA106), and 7(TAA58).
Seeds per pod
One MTA on chromosome 2 (TA27) was detected for seeds per pod.

Yield per plant
Five MTAs were detected for yield per plant that were distributed on chromosomes 2
(TA96), 3(TA142) and 7(TS46, TA117). One unmapped (CaSTMS9) MTA was
detected using GLM for yield per plant.
100-seed weight
Five MTAs were detected for 100-seed weight on chromosomes 1 (CaSTMS21),
3(TR56) and 6(TS24, TA22, TA106).
Plot yield
Four MTAs were detected for plot yield on chromosomes 3(TA108) and 5(CaSTMS7,
CaSTMS20, TS35).
Per day productivity
Four MTAs were detected for plot yield on chromosomes 3(TA108) and 5(CaSTMS7,
CaSTMS20, TS35).
Of all the 76 significant MTAs (P≤0.001) detected in pooled analysis for 17
quantitative traits, 39 were major MTAs (>20% phenotypic variation), of these two
major MTAs were detected for Days to 50 percent flowering and apical secondary
branches, seven for flowering duration and tertiary branches, six each for plant height,
three for plant width, one each for apical primary branches, basal secondary branches
and plot yield, three for 100-seed weight and four for yield per plant. Maximum
phenotypic variation was observed for tertiary branches (37.4%). TS24 detected
maximum of 4 MTAs among the 17 quantitative traits.
4.10.1.3 Association of markers with SPAD Chlorophyll Meter Readings
(SCMR)
In pooled analysis, only one significant MTAs were detected (P≤0.001) for SCMR
(Table 63), distributed on chromosome 7 (TAA 59) and one more for SLA and is
distributed on chromosome 13 (TS83) and phenotypic variation was observed to be
16.95 and 18.32 % respectively for both traits using GLM
4.10.1.4 Association of markers with quality traits
4.10.1.4.1 Association of markers with protein related traits
In pooled analysis, only one MTA was detected for protein content (P≤0.001) on
chromosome 13(GA26) and phenotypic variation was observed to be 11.04% using
GLM (Table 63).

4.10.1.5 Association of markers with pod borer resistance traits
In pooled analysis, two significant MTAs were detected (P≤0.001) with only one trait
(Damage rating %) related to Helicoverpa resistance at P≤0.001. No MTAs were
detected for Leaf damage score and larval survival percentage. Two MTAs were
distributed on chromosomes, 3(CaSTMS23) and 4(TA132), and phenotypic variation
was 7.09% and 19.63 % respectively for these two markers.
4.10.1.6 Association of markers with drought related traits
In pooled analysis, numbers of significant MTAs detected were 21 (P≤0.001) (Table
63), for drought tolerance related root traits and maximum numbers of MTAs (7) were
detected for shoot dry weight and total dry weight. Minimum numbers of MTAs were
detected for root surface area and root volume (1 each). Maximum phenotypic
variation was expected by MTAs for root length density (30%) with TAA59 on
chromosome 7 and minimum was for total plant dry weight ratio (7.9%) with
CaSTMS 9.
Number of MTAs in pooled analysis has been presented:
Root Traits Association
Shoot dry weight
Seven MTAs were detected for shoot dry weight on chromosomes 1 (TA113),
3(CaSTMS5), 5(TA20, TaaSH) and 6(TA22). One unmapped (CaSTMS9) MTAs was
detected for the trait shoot dry weight using GLM.
Root dry weight
Three MTAs were detected for root dry weight on chromosomes 1 (TA20),
3(CaSTMS5) and 6(TA22).
Total plant dry weight
Seven MTAs were detected for total plant dry weight on chromosomes 1 (TA113,
3(CaSTMS5), 5(TA20, TaaSH), 6(TA22) and 13(GA26) One unmapped (CaSTMS9)
MTA was detected for the trait total plant dry weight.
Root Length Density
Two MTAs each were detected for root length density on chromosomes 4(TA130)
and 7(TAA59). Maximum phenotypic variation was observed for root length density
(30%) with the marker TAA59.

Root surface area and Root volume
Only MTA was detected for both root surface area and root volume on chromosomes
3(CaSTMS5) and chromosome 6(TA22) respectively.
Of all the 21 significant MTAs (P≤0.001) detected in pooled analysis for the10
drought tolerance related root traits 8 were major MTAs (>20% phenotypic variation),
of these one each was detected for shoot dry weight and root volume and two major
MTAs each were detected for root dry weight, total dry weight and root length
density. Maximum phenotypic variation was observed for root length density (30%)
with the marker TAA59. TA25 and TA22 detected maximum of 3 major MTAs each
among the 8 major significant root traits.
4.10.1.7 Association of markers with more than one trait in reference set with
quantitative, quality (anthocyanin and protein traits), pod borer resistant and
drought related root traits:
In pooled analysis, a total of 27 markers were found to be associated with more than
one trait among quantitative, quality, pod borer resistant and drought related root traits
and maximum of the these were detected on chromosome number 1 and 5 (5 each)
(Table 64). 5 traits each were found to be associated with the 3 markers CaSTMS 5
(pods per plant, shoot dry weight, root dry weight, total dry weight and root surface
area), CaSTMS 7 (productivity per day, days to 50 percent flowering, flowering
duration, days to maturity and plot yield) and TA22 (100-seed weight, shoot dry
weight, root dry weight, total dry weight and root volume).
Two markers, TA20 (Leaf area, shoot dry weight, root dry weight and total dry
weight) and TS24 (apical primary branches, basal secondary branches, apical
secondary branches and 100-seed weight) were found to be associated with 4 traits
each
Eleven markers, CaSTMS21 (Tertiary branches, 100-seed weight and plant width),
TA27 and TS54 (days to 50 percent flowering, flowering duration and seed per pod),
TA108 (plot yield, flowering duration and per day productivity), TA132, TS35 and
CaSTMS20 (flowering duration, plant height and damage rate%), TA130 (days to
50% flowering, days to maturity and root length density), TS46 (plant height, tertiary
branches and yield per plant), GA26 (protein %, shoot dry weight and total dry

weight) and CaSTMS 9 (yield per plant, shoot dry weight and total dry weight) were
found to be associated with 3 traits each.
Eleven markers, TA113, TaaSH (shoot dry weight and total dry weight), TA8 (Leaf
Dry weight and leaf area), TR43 (plant height and tertiary branches), TA106 (pods
per plant and 100-seed weight), CaSTMS2 (apical secondary and tertiary branches),
TAA59 (Root length density and SPAD), TAA58 (pods per plant and days to 50
percent flowering), TA78 (plant width and tertiary branches), TS83 (flowering
duration and Specific leaf area) and CaSTMS25 (plant width and flowering duration)
were found to be associated with 2 traits each.
Hence, these most significant MTAs were believed to be associated with co-
localized/pleiotropic QTLs. The co-localization of specific genes/QTLs/markers could
be a better way to understand the molecular basis of drought tolerance or of traits
related to drought response and pod borer resistance traits. The presence of several co-
localized/pleiotropic QTLs verified the complex quantitative nature of drought
tolerance, pod borer resistance in chickpea and allowed the identification of some
important genomic regions for traits related to high yield, good protein percent,
drought tolerance and resistance to pod borer. The markers associated with more than
one trait may be efficiently utilized in improvement of more than one trait
simultaneously through marker assisted selection (MAS).

Tables

Table 12: Frequency distribution of accessions for various qualitative traits in different seed types and geographical regions in the Chickpea
reference set
Trait Entire
Types Geographical regions
Desi Kabuli Pea Wild
Afric
a
Euro
pe
Mediter
ranean
North
America
Russian
Federation
South &
East Asia
South
America
Unkn
own
West
Asia
Growth Habit
Erect 6 (2.0%) 1(0.5%) 4(4.5%) 1(9.0%) - - 1 3 - 1 - - - 1
Prostrate 1 (0.3%) 1(0.5%) - - - - - - - - 1 - - -
Semi-erect 187 (62.3%) 118(60.8%) 64(72.7%) 5(45.5%) - 13 2 35 5 5 47 4 5 71
Semi-Spreading 100 (33.4%) 74(38.1) 17(19.3%) 5(45.5%) 4(57.1%) 8 - 12 1 - 57 - 1 21
Spreading 6 (2.0%) - 3(3.4%) - 3(42.9%) - - 6 - - - - - -
Plant pigmentation
High-
anthocyanin 6(2.0%) 5(2.6%) - 1(9.1%) - 3 - - - - 2 - - 1
Low-anthocyanin 160 (53.3%) 153(78.9%) - 1(9.1%) 6(85.7%) 13 - 16 1 1 90 - 1 38
No-anthocyanin 134 (44.7%) 36(18.5%) 88(100.0%) 9(81.8%) 1(14.3%) 5 3 40 5 5 13 4 5 54
Flower color
Light pink 30 (10.0%) 25(12.9%) 1(1.1%) 4(36.4%) - - 1 1 1 - 1 - 1 25
Pink 171 (57.0%) 162(83.5%) - 2(18.2%) 7(100.0%) 17 - 19 1 1 93 - 1 39
Very light pink 3 (1.0%) 3(1.5%) - - - 1 - 1 - - 1 - - -
White 95 (31.7%) 3(1.5%) 87(98.9%) 5(45.5%) 3 2 34 4 5 10 4 4 29
White with pink
strips 1(0.3%) 1(0.5%) - - - - - 1 - - - - - -
Seed color
Beige 90 (30.0%) 1(0.5%) 87(98.9%) 2(18.2%) - 2 2 34 4 3 7 4 4 30
Black 23 (7.7%) 23(11.9%) - - - 2 - 2 - 1 4 - - 14
Brown 2 (0.7%) - - 1(9.1%) 1(14.3%) - - 1 - - 1 - - -
brown beige 22 (7.3%) 21(10.8%) - 1(9.1%) - - 1 3 1 - - - - 17
Dark brown 14 (4.7%) 11(5.7%) - - 3(42.9%) - - 6 - - 6 - - 2
Green 2 (0.7%) 2(1.0%) - - - - - - - - 1 - - 1
Greyish brown 3 (1.0%) - - - 3(42.9%) - - 3 - - - - - -
Light brown 10 (3.3%) 10(5.2%) - - - 1 - - - - 7 - - 2
Light green 1 (0.3%) 1(0.5%) - - - - - - - - 1 - - -

Trait Entire
Types Geographical regions
Desi Kabuli Pea Wild
Afric
a
Euro
pe
Mediter
ranean
North
America
Russian
Federation
South &
East Asia
South
America
Unkn
own
West
Asia
Light orange 3 (1.0%) 2(1.0%) - 1(9.1%) - 1 - - - - 1 - - 1
Light yellow 9 (3%) 8(4.1%) - 1(9.1%) - 1 - - 1 1 2 - 1 3
Orange 1 (0.3%) - - 1(9.1%) - - - - - - 1 - - -
Reddish brown 1 (0.3%) - - 1(9.1%) - - - - - - 1 - - -
Salmon brown 3 (1.0%) - 1(1.1%) 2(18.2%) - - - - - - - - - 3
Yellow 5 (1.7%) 5(2.6%) - - - 2 - - - 1 2 - - -
Yellow beige 3 (1.0%) 3(1.5%) - - - - - 1 - - - - 1 1
Yellow brown 108 (36%) 107(55.2%) - 1(9.1%) - 12 -- 6 - - 71 - - 19
Seed shape
Angular 201 (67.0%) 194(100.0%) - - 7(100.0%) 19 1 22 2 2 93 - 2 60
Owl's Shape 88 (29.3%) - 88(100.0%) - - 2 1 33 4 3 7 4 4 30
pea 11 (3.7%) - - 11(100.0%) - - 1 1 - 1 5 - 3
Seed dots
Absent 156 (52.0%) 55(28.4%) 88(100.0%) 10(90.9%) 3(42.9%) 6 2 41 5 6 21 4 4 67
Present 144 (48.0%) 139(71.6%) - 1(9.1%) 4(57.1%) 15 1 15 1 - 84 - 2 26
Seed Surface
Rough 198 (66.0%) 189(97.4%) 4(4.5%) 5(45.5%) - 19 1 16 2 2 94 1 2 61
Smooth 90 (30.0%) - 84(95.5%) 6(54.5%) - 2 2 33 4 4 7 3 4 31
Tuberculated 12 (4.0%) 5(2.6%) - - 7(100.0%) - - 7 - - 4 - - 1
Numbers in parenthesis indicate percentage of accessions in each group

Table 13: Variance due to genotypes (σ2g) and genotype x environment interaction (σ
2ge), and residual, (σ
2e) in different environments for the
quantitative traits in the chickpea reference set
Trait
E1 E2 E3 E4 E5 Pooled Pooled
σ 2g SE σ
2g SE σ
2g SE σ
2g SE σ
2g SE σ
2g SE σ
2g x e SE
DF 30.89** 3.12 42.42** 3.66 38.24** 3.37 44.55** 3.64 40.78** 3.95 38.04** 3.17 0.81** 0.26
FD 5.80** 1.08 1.79** 0.17 0.65* 0.28 3.11** 0.27 1.81** 0.31 2.04** 0.20 0.98** 0.10
PLHT 46.48** 5.15 44.86** 4.09 64.33** 5.32 50.39** 4.12 46.94** 4.10 51.12** 4.26 1.71** 0.31
PLWD 7.366** 0.80 10.26** 0.99 8.169** 0.70 14.11** 1.25 19.07** 1.77 7.29** 0.69 3.22** 0.24
DGF 16.92** 2.91 20.60** 1.83 21.83** 2.06 30.02** 2.50 35.73** 4.25 18.34** 1.68 5.13** 0.48
DM 14.69** 2.40 22.34** 2.06 20.75** 1.77 29.29** 2.42 42.57** 3.77 17.06** 1.59 6.87** 0.48
BPB 0.09** 0.04 0.23** 0.02 0.31** 0.03 0.36** 0.03 0.25** 0.03 0.11** 0.01 0.12** 0.01
APB 0.28** 0.04 0.43** 0.04 0.64** 0.05 0.42** 0.03 0.38** 0.04 0.17** 0.02 0.27** 0.01
BSB 0.49** 0.05 0.54 0.00 0.47** 0.04 0.63** 0.05 0.51** 0.05 0.21** 0.02 0.28** 0.02
ASB 1.74** 0.18 1.06** 0.09 1.17** 0.10 1.06** 0.10 0.72** 0.06 0.54** 0.05 0.31** 0.02
TB 0.43** 0.05 1.00 1.13 0.28** 0.02 0.48** 0.04 0.21** 0.03 0.32** 0.12 0.08 0.26
SDPD 0.01* 0.00 0.06** 0.01 0.03** 0.00 0.10** 0.01 0.02 0.01 0.02** 0.00 0.01** 0.00
PPP 45.70 39.30 97.21** 17.90 113.17** 10.64 57.89** 5.66 38.25** 4.28 82.57** 8.08 3.43 4.27
YPP 9.93** 0.94 6.78** 2.57 13.43** 1.38 12.22** 1.00 1.89 1.97 6.57** 0.82 2.16** 0.83
SDWT 36.71** 3.23 37.14** 3.06 31.55** 2.60 29.34** 2.39 19.61** 1.75 28.01** 2.36 3.59** 0.21
YKGH 164440** 17239 227535** 22821 210055** 17998 37818** 12353 73552** 7738 95440** 10009 68916** 5452
PROD 14.44** 1.50 20.28** 1.98 17.57** 1.50 4.5** 1.13 6.74** 0.71 8.98** 0.91 5.481** 0.43
# - trait significant in all environments and pooled
E1= 2006-07, E2=2007-08, E3=2008-09 post rainy, E5=2008-09 spring seasons at ICRISAT centre, Patancheru, E4=2008-09 post rainy seasons at UAS, Dharwad
DF = days to 50% flowering, FD = flowering duration, PLHT = plant height, PLWD = plant width, DGF=Days to Grain Filling, DM = days to maturity, BPB = basal primary
branches, APB = apical primary branches, BSB = basal secondary branches, ASB = apical secondary branches, TB = tertiary branches, SDPD = seed per pod, PPP = pods per
plant, YPP = yield per plant, SDWT = 100-seed weight, YKGH = plot yield, PROD = per day productivity.

Table: 14: Mean (± Standard error) and range values for quantitative traits in different environments and pooled over environments in the chickpea
reference set
Mean ( ± S.E) Range
Trait E1 E2 E3 E4 E5 Pooled E1 E2 E3 E4 E5 Pooled
DF 59.2±1.7 59.6±1.6 59.2±1.7 54.4±0.6 54.9±2.2 57.5±0.7 40.0-85.3 37.8-91.6 39.2-78.9 34.2-94.7 35.1-86.5 36.5-89.3
FD 27.2±1.2 27.6±0.5 27.4±0.8 27.5±0.4 27.8±0.8 27.6±0.5 21.1-35.1 18.3-34.1 19.7-32.6 18.1-36.9 20.6-34.2 19.3-32.9
PLHT 44.4±2.4 44.5±1.7 44.9±1.1 43.5±1.0 37.7±1.6 43.6±0.8 21.3-86.4 18.3-92.5 17.7-97.5 17.6-88.6 16.8-83.4 26.3-92.4
PLWD 65.6±0.9 65.4±1.2 65.7±0.7 64.9±1.1 50.4±1.3 63.4±0.6 52.8-72.1 50.1-73.4 53.3-73.7 34.8-76.6 11.9-59.3 45.2-69.4
DGF 53.9±2.0 55.6±0.7 55.4±1.5 54.7±0.8 54.6±2.7 55.0±1.0 43.4-68.3 37.9-77.9 39.6-70.5 33.5-71.6 30.4-68.9 41.2-70.4
DM 113.2±1.8 115.2±1.3 114.6±1.2 109.2±0.8 109.5±1.7 112.5±0.6 103.6-126.3 102.1-138.2 102.4-134.8 75.6-129.6 72.5-129.5 99.2-130.6
BPB 2.9±0.2 3.1±0.2 2.8±0.1 2.9±0.1 2.6±0.2 2.9±0.1 2.2-3.7 2.2-4.5 1.2-4.4 1.2-5.0 0.5-3.7 2.1-3.9
APB 2.4±0.2 2.5±0.1 2.9±0.1 2.6±0.1 2.5±0.3 2.6±0.1 0.7-4.3 0.1-4.9 1.1-7.1 0.4-5.4 0.4-4.7 1.4-4.9
BSB 3.2±0.3 3.4±0.2 3.0±0.2 3.2±0.1 2.9±0.2 3.2±0.1 1.1-6.5 1.2-6.0 0.3-5.7 1.1-8.7 0.3-6.3 1.3-5.7
ASB 4.2±0.4 4.4±0.2 4.4±0.3 4.4±0.4 4.1±0.2 4.4±0.2 2.7-10.6 1.2-11.3 3.1-14.7 3.3-13.0 0.4-9.7 2.9-10.1
TB 1.5±0.3 1.8±1.0 1.4±0.1 1.5±0.2 1.3±0.2 1.5±0.2 1.0-4.2 1.6-6.9 0.0-3.2 0.3-5.4 0.3-4.2 1.1-12.3
SDPD 1.26±0.07 1.27±0.09 1.23±0.11 1.14±0.02 1.29±0.12 1.20±0.07 1.1-1.6 1.0-2.0 1.1-1.7 1.0-2.0 1-1.5 1.0-1.6
PPP 57.4±9.2 62.7±7.0 58.5±4.0 45.2±3.0 32.2±2.6 52.7±2.1 30.8-96.5 46.2-86.9 36.5-115.5 27.3-68.6 19.6-48.6 27.2-89.3
YPP 11.1±1.4 15.5±2.2 11.3±1.6 8.0±0.4 8.4±1.4 11.2±0.1 6.1-26.8 13.4-25.1 5.5-30.2 1.2-29 6.9-16.7 5.9-29.9
SDWT 23.6±1.3 22.6±0.7 22.4±0.7 21.7±0.4 19.3±1.2 22.0±0.4 13.4-51.5 12.7-55 14.7-53.0 13.6-51.9 11.0-39.6 13.5-49.4
YKGH 1934.1±134.8 2088.6±206.7 1808.1±115.2 1433.1±12 821.7±105.6 1675.0±57.0 365.7-3161.1 566.9-3215.4 657.2-4269.9 296.4-1678.3 283.5-1892.1 771-3176
PROD 17.2±1.3 18.3±1.8 15.9±1.0 13.2±1.4 7.6±1.0 14.9±0.5 3.3-29.8 4.6-27.9 5.6-36.0 11.1-16.5 2.5-16.5 6.8-27.2
E1= 2006-07, E2=2007-08, E3=2008-09 post rainy, E5=2008-09 spring seasons at ICRISAT centre, Patancheru, E4=2008-09 post rainy seasons at UAS, Dharwad
DF = days to 50% flowering, FD = flowering duration, PLHT = plant height, PLWD = plant width, DGF=Days to Grain Filling, DM = days to maturity, BPB = basal primary branches, APB = apical
primary branches, BSB = basal secondary branches, ASB = apical secondary branches, TB = tertiary branches, SDPD = seed per pod, PPP = pods per plant, YPP = yield per plant, SDWT = 100-seed
weight, YKGH = plot yield, PROD = per day productivity.
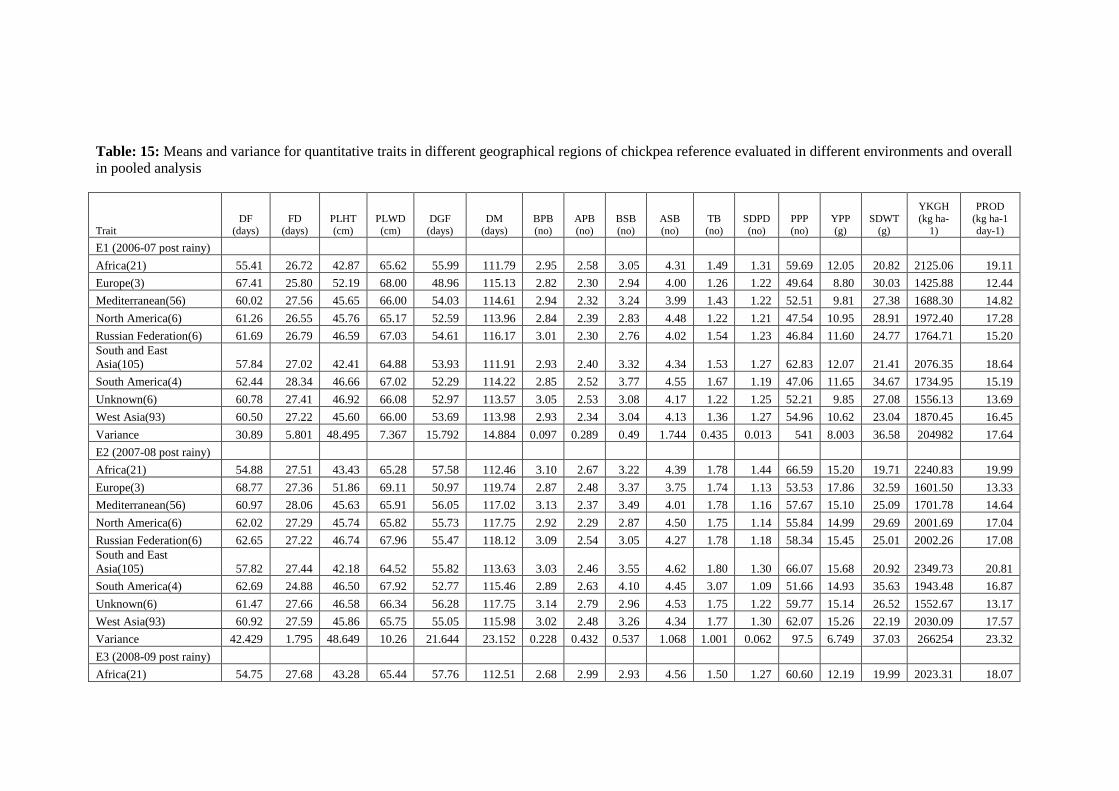
Table: 15: Means and variance for quantitative traits in different geographical regions of chickpea reference evaluated in different environments and overall
in pooled analysis
Trait DF
(days) FD
(days) PLHT (cm)
PLWD (cm)
DGF (days)
DM (days)
BPB (no)
APB (no)
BSB (no)
ASB (no)
TB (no)
SDPD (no)
PPP (no)
YPP (g)
SDWT (g)
YKGH
(kg ha-1)
PROD
(kg ha-1 day-1)
E1 (2006-07 post rainy)
Africa(21) 55.41 26.72 42.87 65.62 55.99 111.79 2.95 2.58 3.05 4.31 1.49 1.31 59.69 12.05 20.82 2125.06 19.11
Europe(3) 67.41 25.80 52.19 68.00 48.96 115.13 2.82 2.30 2.94 4.00 1.26 1.22 49.64 8.80 30.03 1425.88 12.44
Mediterranean(56) 60.02 27.56 45.65 66.00 54.03 114.61 2.94 2.32 3.24 3.99 1.43 1.22 52.51 9.81 27.38 1688.30 14.82
North America(6) 61.26 26.55 45.76 65.17 52.59 113.96 2.84 2.39 2.83 4.48 1.22 1.21 47.54 10.95 28.91 1972.40 17.28
Russian Federation(6) 61.69 26.79 46.59 67.03 54.61 116.17 3.01 2.30 2.76 4.02 1.54 1.23 46.84 11.60 24.77 1764.71 15.20
South and East
Asia(105) 57.84 27.02 42.41 64.88 53.93 111.91 2.93 2.40 3.32 4.34 1.53 1.27 62.83 12.07 21.41 2076.35 18.64
South America(4) 62.44 28.34 46.66 67.02 52.29 114.22 2.85 2.52 3.77 4.55 1.67 1.19 47.06 11.65 34.67 1734.95 15.19
Unknown(6) 60.78 27.41 46.92 66.08 52.97 113.57 3.05 2.53 3.08 4.17 1.22 1.25 52.21 9.85 27.08 1556.13 13.69
West Asia(93) 60.50 27.22 45.60 66.00 53.69 113.98 2.93 2.34 3.04 4.13 1.36 1.27 54.96 10.62 23.04 1870.45 16.45
Variance 30.89 5.801 48.495 7.367 15.792 14.884 0.097 0.289 0.49 1.744 0.435 0.013 541 8.003 36.58 204982 17.64
E2 (2007-08 post rainy)
Africa(21) 54.88 27.51 43.43 65.28 57.58 112.46 3.10 2.67 3.22 4.39 1.78 1.44 66.59 15.20 19.71 2240.83 19.99
Europe(3) 68.77 27.36 51.86 69.11 50.97 119.74 2.87 2.48 3.37 3.75 1.74 1.13 53.53 17.86 32.59 1601.50 13.33
Mediterranean(56) 60.97 28.06 45.63 65.91 56.05 117.02 3.13 2.37 3.49 4.01 1.78 1.16 57.67 15.10 25.09 1701.78 14.64
North America(6) 62.02 27.29 45.74 65.82 55.73 117.75 2.92 2.29 2.87 4.50 1.75 1.14 55.84 14.99 29.69 2001.69 17.04
Russian Federation(6) 62.65 27.22 46.74 67.96 55.47 118.12 3.09 2.54 3.05 4.27 1.78 1.18 58.34 15.45 25.01 2002.26 17.08
South and East
Asia(105) 57.82 27.44 42.18 64.52 55.82 113.63 3.03 2.46 3.55 4.62 1.80 1.30 66.07 15.68 20.92 2349.73 20.81
South America(4) 62.69 24.88 46.50 67.92 52.77 115.46 2.89 2.63 4.10 4.45 3.07 1.09 51.66 14.93 35.63 1943.48 16.87
Unknown(6) 61.47 27.66 46.58 66.34 56.28 117.75 3.14 2.79 2.96 4.53 1.75 1.22 59.77 15.14 26.52 1552.67 13.17
West Asia(93) 60.92 27.59 45.86 65.75 55.05 115.98 3.02 2.48 3.26 4.34 1.77 1.30 62.07 15.26 22.19 2030.09 17.57
Variance 42.429 1.795 48.649 10.26 21.644 23.152 0.228 0.432 0.537 1.068 1.001 0.062 97.5 6.749 37.03 266254 23.32
E3 (2008-09 post rainy)
Africa(21) 54.75 27.68 43.28 65.44 57.76 112.51 2.68 2.99 2.93 4.56 1.50 1.27 60.60 12.19 19.99 2023.31 18.07

Trait
DF
(days)
FD
(days)
PLHT
(cm)
PLWD
(cm)
DGF
(days)
DM
(days)
BPB
(no)
APB
(no)
BSB
(no)
ASB
(no)
TB
(no)
SDPD
(no)
PPP
(no)
YPP
(g)
SDWT
(g)
YKGH
(kg ha-
1)
PROD
(kg ha-1
day-1)
Europe(3) 61.32 26.17 52.60 70.43 59.53 120.85 2.42 2.26 2.79 4.38 1.01 1.18 45.72 11.06 28.87 1430.77 11.91
Mediterranean(56) 60.44 27.82 46.49 65.92 56.26 116.70 2.73 2.83 3.01 4.04 1.43 1.17 50.72 11.10 24.67 1634.23 14.14
North America(6) 62.02 27.21 46.27 65.73 54.23 116.25 2.70 2.82 2.73 4.68 1.34 1.17 49.86 10.13 28.54 1927.01 16.58
Russian Federation(6) 62.02 27.34 47.31 67.85 55.74 117.76 2.59 3.02 2.70 3.99 1.51 1.22 51.11 12.56 23.34 1478.25 12.62
South and East Asia(105) 57.57 27.25 42.37 64.98 55.41 112.99 2.78 3.02 2.99 4.66 1.41 1.24 63.54 12.32 20.93 1935.33 17.20
South America(4) 62.02 25.42 47.48 67.17 53.44 115.46 2.18 2.95 2.44 4.18 1.66 1.14 48.73 11.98 37.17 1527.56 13.19
Unknown(6) 60.78 27.54 46.99 66.77 56.58 117.36 2.73 2.64 2.74 3.94 1.29 1.22 57.83 10.00 27.00 1683.09 14.34
West Asia(93) 60.68 27.33 46.48 66.19 54.89 115.58 2.85 2.76 2.97 4.25 1.33 1.23 57.38 10.35 21.71 1730.94 15.02
Variance 38.243 2.648 66.521 8.17 23.116 20.838 0.318 0.639 0.474 1.167 0.28 0.03 117 13.27 31.55 224707 18.73
E4(2008-09 UAS post rainy)
Africa(21) 49.94 27.61 42.02 64.61 57.67 107.66 2.88 2.66 3.03 4.29 1.31 1.29 45.33 7.66 19.17 1447.49 13.46
Europe(3) 66.07 26.08 51.51 68.16 51.27 117.18 2.62 2.65 2.82 4.14 2.29 1.33 37.80 7.19 28.09 1435.54 12.95
Mediterranean(56) 56.02 27.97 44.43 65.77 53.74 109.82 2.98 2.46 3.29 4.25 1.54 1.08 42.19 7.36 23.89 1299.77 11.97
North America(6) 56.40 27.50 44.70 65.03 53.37 109.74 3.21 2.62 2.70 4.46 1.38 1.19 36.07 7.68 28.11 1431.66 13.16
Russian Federation(6) 57.48 27.66 46.22 66.96 56.20 113.66 2.90 2.67 2.84 3.93 1.43 1.27 40.69 10.20 23.99 1412.79 12.74
South and East Asia(105) 52.53 27.29 41.58 63.85 54.91 107.46 2.89 2.67 3.33 4.57 1.55 1.15 48.56 8.87 20.15 1441.54 13.38
South America(4) 58.59 26.68 44.48 66.90 54.91 113.41 3.42 1.95 3.60 5.22 1.74 1.00 37.08 11.61 35.72 1442.10 13.17
Unknown(6) 55.57 27.58 45.31 66.20 56.23 111.78 3.33 2.42 3.20 4.45 1.41 1.33 46.07 9.10 26.00 1420.43 12.92
West Asia(93) 55.80 27.52 44.85 65.37 54.45 110.25 2.94 2.55 3.09 4.32 1.41 1.10 44.42 6.97 21.05 1426.55 13.06
Variance 0.606 0.421 1.00 1.112 0.831 0.746 0.053 0.074 0.078 0.444 0.15 0.02 3.04 0.388 0.416 122.547 1.43
E5 (2008-09 spring)
Africa(21) 50.09 27.86 36.23 50.48 57.22 107.52 2.57 2.68 2.84 4.23 1.26 1.30 32.27 8.26 17.46 877.85 8.18
Europe(3) 63.84 26.91 45.80 52.98 52.58 116.52 2.38 2.44 2.84 4.32 1.05 1.23 25.56 8.20 23.61 938.97 8.19
Mediterranean(56) 56.59 28.10 39.29 51.24 54.13 110.75 2.59 2.34 2.95 3.88 1.31 1.26 29.52 8.30 20.20 750.62 6.87
North America(6) 56.47 27.82 38.52 52.37 52.92 109.19 2.68 2.51 2.81 4.22 1.08 1.30 28.22 8.26 24.48 923.15 8.48
Russian Federation(6) 57.78 27.74 40.06 51.04 55.85 114.02 2.61 2.39 2.58 3.95 1.50 1.30 30.57 8.77 21.43 698.84 6.21
South and East Asia(105) 52.96 27.76 35.90 49.94 54.61 107.46 2.59 2.67 2.90 4.26 1.29 1.30 34.93 8.67 18.34 858.74 8.07
South America(4) 57.92 25.74 39.74 53.63 53.26 111.14 2.27 2.17 2.36 3.53 1.33 1.25 27.26 9.00 31.81 676.48 6.06

Trait
DF
(days)
FD
(days)
PLHT
(cm)
PLWD
(cm)
DGF
(days)
DM
(days)
BPB
(no)
APB
(no)
BSB
(no)
ASB
(no)
TB
(no)
SDPD
(no)
PPP
(no)
YPP
(g)
SDWT
(g)
YKGH
(kg ha-
1)
PROD
(kg ha-1
day-1)
Unknown(6) 55.75 27.88 39.53 50.91 56.09 112.15 2.79 2.54 2.84 4.00 1.10 1.24 29.02 8.53 19.52 829.80 7.40
West Asia(93) 56.44 27.75 38.65 50.15 54.33 110.80 2.63 2.39 2.82 3.99 1.26 1.29 31.62 8.12 19.23 811.47 7.36
Variance 2.159 0.772 1.645 1.325 2.672 1.669 0.206 0.248 0.224 0.215 0.211 0.118 2.61 1.443 1.165 105.64 1.004
Pooled
Africa(21) 52.72 27.58 41.47 62.25 57.41 110.27 2.85 2.73 3.01 4.35 1.45 1.33 53.42 10.76 19.37 1780.57 16.13
Europe(3) 65.84 26.43 51.20 66.02 52.58 118.20 2.61 2.42 2.95 4.10 1.42 1.19 38.74 11.90 28.88 1329.00 11.23
Mediterranean(56) 58.91 28.01 44.71 62.99 54.54 113.80 2.89 2.46 3.21 4.02 1.47 1.17 44.94 10.17 24.31 1410.02 12.42
North America(6) 59.84 27.32 44.35 62.80 53.77 113.50 2.86 2.52 2.77 4.47 1.31 1.20 40.56 9.90 28.14 1640.83 14.37
Russian Federation(6) 60.45 27.43 45.76 64.35 55.73 116.13 2.86 2.58 2.77 4.01 1.51 1.23 43.63 11.84 23.77 1448.83 12.47
South and East Asia(105) 55.67 27.41 40.73 61.57 54.96 110.63 2.85 2.65 3.22 4.50 1.54 1.26 55.73 11.57 20.32 1759.72 15.89
South America(4) 60.90 26.03 45.02 64.63 53.23 114.03 2.71 2.44 3.26 4.43 4.35 1.12 38.33 11.74 35.39 1470.75 12.83
Unknown(6) 58.97 27.69 45.16 63.34 55.74 114.63 3.04 2.59 2.95 4.22 1.30 1.23 48.17 10.29 25.38 1361.67 11.83
West Asia(93) 58.94 27.53 44.44 62.73 54.47 113.37 2.88 2.50 3.03 4.21 1.40 1.24 49.46 9.87 21.43 1550.90 13.65
Variance 0.7236 0.521 0.7672 0.6449 1.103 0.7684 0.092 0.104 0.097 0.1798 0.177 0.072 2.01 1.0 0.443 67.4 0.612
Numbers in parenthesis indicates number of accessions in each region Variance homogeneity was tested by Levene‘s test.
E1= 2006-07, E2=2007-08, E3=2008-09 post rainy, E5=2008-09 spring seasons at ICRISAT centre, Patancheru, E4=2008-09 post rainy seasons at UAS, Dharwad
DF = days to 50% flowering, FD = flowering duration, PLHT = plant height, PLWD = plant width, DGF=Days to Grain Filling, DM = days to maturity, BPB = basal primary branches, APB = apical primary branches,
BSB = basal secondary branches, ASB = apical secondary branches, TB = tertiary branches, SDPD = seed per pod, PPP = pods per plant, YPP = yield per plant, SDWT = 100-seed weight, YKGH = plot yield, PROD =
per day productivity.

Table: 16 Heritability, genotypic (GCV) and phenotypic coefficient of variance (PCV) in the chickpea reference set evaluated in different
environments and overall in pooled analysis
Heritability GCV% PCV%
Trait E1 E2 E3 E4 E5 Pooled Pooled
DF 94.8 94.2 92.3 99.1 93.9 98.0 10.79 10.90
FD 84.7 87.6 78.2 94.3 80.1 81.1 5.13 5.70
PLHT 93.7 93.8 98.1 99.0 97.0 98.4 16.31 16.43
PLWD 93.5 85.3 94.3 91.2 95.0 89.4 4.51 4.76
DGF 85.4 97.3 90.8 97.7 88.4 90.5 8.02 8.42
DM 87.2 92.6 93.5 98.1 96.5 89.8 3.70 3.90
BPB 69.0 80.6 98.7 99.2 90.8 72.9 11.31 13.24
APB 88.7 95.9 98.5 98.7 90.9 72.5 15.89 18.66
BSB 93.0 91.0 90.8 99.0 94.7 75.2 14.63 16.86
ASB 94.8 95.2 93.5 81.4 96.6 85.2 16.91 18.31
TB 92.0 96.5 98.4 95.3 88.1 77.6 28.55 32.42
SDPD 78.3 86.7 63.2 99.5 53.5 62.2 11.46 14.52
PPP 91.2 49.5 86.5 84.2 90.4 95.8 16.32 16.67
YPP 85.5 56.9 79.7 98.7 70.4 83.8 23.11 25.24
SDWT 97.4 98.6 98.6 99.4 96.2 97.6 24.30 24.59
YKGH 95.2 83.9 94.0 86.4 91.9 89.8 17.79 18.76
PROD 95.3 85.5 94.4 84.7 92.0 91.3 19.52 20.42
E1= 2006-07, E2=2007-08, E3=2008-09 post rainy, E5=2008-09 spring seasons at ICRISAT centre, Patancheru, E4=2008-09 post rainy seasons at UAS, Dharwad
DF = days to 50% flowering, FD = flowering duration, PLHT = plant height, PLWD = plant width, DGF=Days to Grain Filling, DM = days to maturity, BPB = basal primary
branches, APB = apical primary branches, BSB = basal secondary branches, ASB = apical secondary branches, TB = tertiary branches, SDPD = seed per pod, PPP = pods per
plant, YPP = yield per plant, SDWT = 100-seed weight,
YKGH = plot yield, PROD = per day productivity.
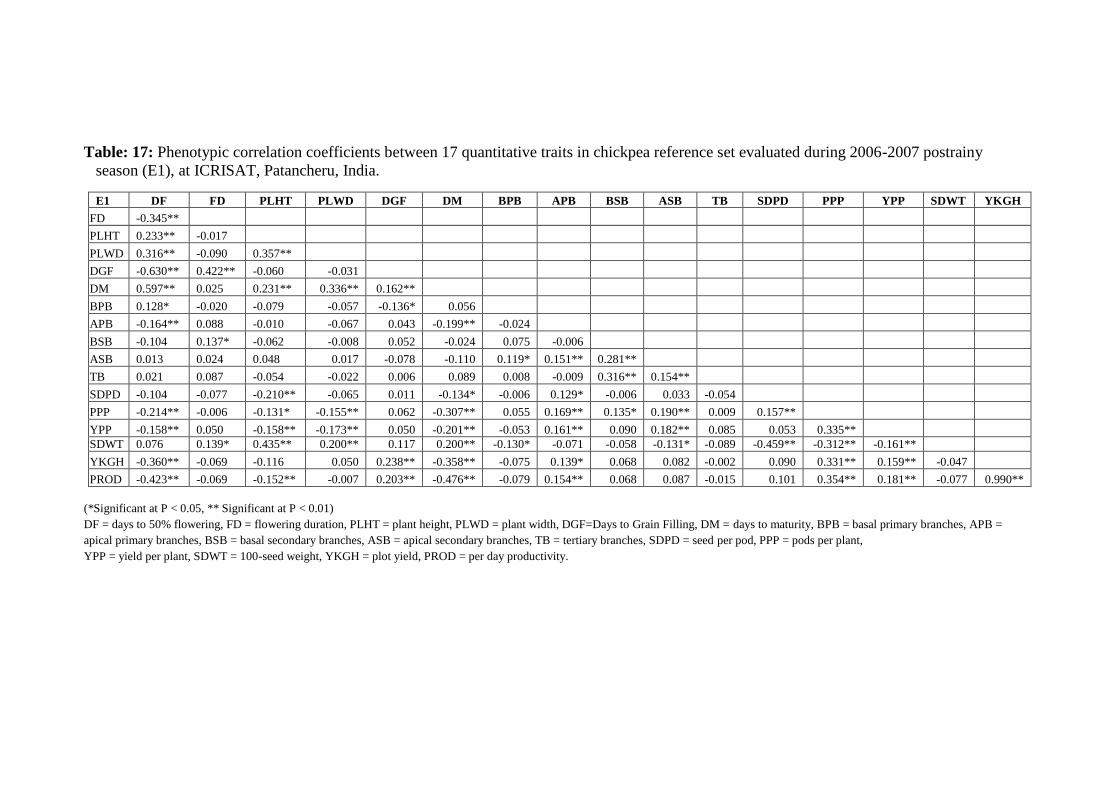
Table: 17: Phenotypic correlation coefficients between 17 quantitative traits in chickpea reference set evaluated during 2006-2007 postrainy
season (E1), at ICRISAT, Patancheru, India.
E1 DF FD PLHT PLWD DGF DM BPB APB BSB ASB TB SDPD PPP YPP SDWT YKGH
FD -0.345**
PLHT 0.233** -0.017
PLWD 0.316** -0.090 0.357**
DGF -0.630** 0.422** -0.060 -0.031
DM 0.597** 0.025 0.231** 0.336** 0.162**
BPB 0.128* -0.020 -0.079 -0.057 -0.136* 0.056
APB -0.164** 0.088 -0.010 -0.067 0.043 -0.199** -0.024
BSB -0.104 0.137* -0.062 -0.008 0.052 -0.024 0.075 -0.006
ASB 0.013 0.024 0.048 0.017 -0.078 -0.110 0.119* 0.151** 0.281**
TB 0.021 0.087 -0.054 -0.022 0.006 0.089 0.008 -0.009 0.316** 0.154**
SDPD -0.104 -0.077 -0.210** -0.065 0.011 -0.134* -0.006 0.129* -0.006 0.033 -0.054
PPP -0.214** -0.006 -0.131* -0.155** 0.062 -0.307** 0.055 0.169** 0.135* 0.190** 0.009 0.157**
YPP -0.158** 0.050 -0.158** -0.173** 0.050 -0.201** -0.053 0.161** 0.090 0.182** 0.085 0.053 0.335**
SDWT 0.076 0.139* 0.435** 0.200** 0.117 0.200** -0.130* -0.071 -0.058 -0.131* -0.089 -0.459** -0.312** -0.161**
YKGH -0.360** -0.069 -0.116 0.050 0.238** -0.358** -0.075 0.139* 0.068 0.082 -0.002 0.090 0.331** 0.159** -0.047
PROD -0.423** -0.069 -0.152** -0.007 0.203** -0.476** -0.079 0.154** 0.068 0.087 -0.015 0.101 0.354** 0.181** -0.077 0.990**
(*Significant at P < 0.05, ** Significant at P < 0.01)
DF = days to 50% flowering, FD = flowering duration, PLHT = plant height, PLWD = plant width, DGF=Days to Grain Filling, DM = days to maturity, BPB = basal primary branches, APB =
apical primary branches, BSB = basal secondary branches, ASB = apical secondary branches, TB = tertiary branches, SDPD = seed per pod, PPP = pods per plant,
YPP = yield per plant, SDWT = 100-seed weight, YKGH = plot yield, PROD = per day productivity.

Table: 18: Phenotypic correlation coefficients between 17 quantitative traits in chickpea reference set evaluated during 2007-2008 postrainy
season (E2), at ICRISAT, Patancheru, India.
E2 DF FD PLHT PLWD DGF DM BPB APB BSB ASB TB SDPD PPP YPP SDWT YKGH
FD -0.121*
PLHT 0.304** -0.047
PLWD 0.260** -0.036 0.216**
DGF -0.657** 0.325** -0.125* -0.070
DM 0.694** 0.194** 0.267** 0.248** 0.062
BPB 0.107 -0.081 -0.058 -0.035 -0.071 0.076
APB -0.144* 0.069 0.092 -0.016 0.067 -0.138* -0.015
BSB -0.019 0.029 -0.065 -0.024 0.019 -0.010 0.038 -0.040
ASB -0.058 -0.131* -0.052 -0.082 -0.040 -0.128* 0.020 0.107 0.161**
TB -0.051 -0.057 0.027 0.048 0.045 -0.020 0.013 0.102 0.276** 0.158**
SDPD -0.138* -0.072 -0.230** -0.083 0.049 -0.148* -0.004 0.147* -0.018 0.052 -0.027
PPP -0.276** 0.017 -0.321** -0.100 0.075 -0.319** 0.025 0.062 0.083 0.121* -0.011 0.317**
YPP -0.173** 0.098 -0.074 0.066 0.099 -0.148* -0.035 -0.022 0.176** 0.048 0.077 -0.040 0.383**
SDWT 0.115 -0.010 0.239** 0.227** 0.044 0.170** -0.024 -0.046 -0.055 -0.110 0.010 -0.423** -0.486** 0.082
YKGH -0.345** -0.209** -0.216** 0.003 0.134* -0.407** -0.039 0.056 0.071 0.177** 0.008 0.210** 0.488** 0.269** -0.117
PROD -0.423** -0.226** -0.246** -0.041 0.116 -0.524** -0.048 0.068 0.070 0.179** 0.009 0.215** 0.500** 0.269** -0.135* 0.990**
(*Significant at P < 0.05, ** Significant at P < 0.01)
DF = days to 50% flowering, FD = flowering duration, PLHT = plant height, PLWD = plant width, DGF=Days to Grain Filling, DM = days to maturity, BPB = basal primary
branches, APB = apical primary branches, BSB = basal secondary branches, ASB = apical secondary branches, TB = tertiary branches, SDPD = seed per pod,
PPP = pods per plant, YPP = yield per plant, SDWT = 100-seed weight, YKGH = plot yield, PROD = per day productivity.

Table: 19: Phenotypic correlation coefficients between 17 quantitative traits in chickpea reference set evaluated during 2008-2009 postrainy
season (E3), at ICRISAT, Patancheru, India.
E3 DF FD PLHT PLWD DGF DM BPB APB BSB ASB TB SDPD PPP YPP SDWT YKGH
FD -0.211**
PLHT 0.181** -0.078
PLWD 0.263** -0.062 0.390**
DGF -0.711** 0.311** -0.004 -0.091
DM 0.620** 0.078 0.207** 0.244** 0.097
BPB 0.131* -0.012 -0.089 -0.065 -0.125* 0.060
APB -0.047 0.048 0.067 -0.028 -0.022 -0.103 0.059
BSB -0.016 0.097 -0.087 -0.051 0.010 0.012 0.219** -0.079
ASB -0.084 0.051 0.069 -0.042 0.013 -0.118* 0.065 0.335** -0.053
TB -0.056 0.137* -0.013 -0.158** 0.064 0.012 0.079 0.061 0.224** 0.143*
SDPD -0.063 -0.132* -0.162** -0.068 -0.033 -0.123* 0.095 0.070 0.048 0.076 -0.055
PPP -0.229** -0.020 -0.148* -0.104 0.052 -0.279** 0.046 0.139* 0.051 0.125* -0.026 0.206**
YPP -0.220** 0.115 0.002 0.027 0.197** -0.094 -0.137* 0.210** 0.179** 0.136* 0.129* 0.021 0.322**
SDWT 0.083 -0.010 0.269** 0.236** 0.082 0.188** -0.144* -0.013 -0.101 -0.084 -0.018 -0.376** -0.301** 0.136*
YKGH -0.360** -0.021 -0.004 0.102 0.213** -0.305** -0.084 0.191** 0.001 0.127* -0.042 0.019 0.324** 0.169** 0.069
PROD -0.433** -0.028 -0.039 0.065 0.190** -0.429** -0.090 0.197** -0.004 0.134* -0.044 0.033 0.344** 0.177** 0.038 0.990**
(*Significant at P < 0.05, ** Significant at P < 0.01)
DF = days to 50% flowering, FD = flowering duration, PLHT = plant height, PLWD = plant width, DGF=Days to Grain Filling,
DM = days to maturity, BPB = basal primary branches, APB = apical primary branches, BSB = basal secondary branches, ASB = apical secondary branches,
TB = tertiary branches, SDPD = seed per pod, PPP = pods per plant, YPP = yield per plant, SDWT = 100-seed weight, YKGH = plot yield, PROD = per day productivity.

Table: 20: Phenotypic correlation coefficients between 17 quantitative traits in chickpea reference set evaluated during 2008-2009 postrainy
season (E4), at UAS, Dharwad India.
E4 DF FD PLHT PLWD DGF DM BPB APB BSB ASB TB SDPD PPP YPP SDWT YKGH
FD -0.013
PLHT 0.185** -0.145*
PLWD 0.218** 0.084 0.271**
DGF -0.614** 0.210** -0.027 0.026
DM 0.599** 0.208** 0.194** 0.291** 0.264**
BPB 0.06 -0.119* -0.07 -0.026 -0.021 0.05
APB -0.151** 0.052 0.008 -0.085 0.141* -0.044 0.038
BSB -0.099 0.039 -0.124* -0.074 0.015 -0.105 0.051 0.06
ASB -0.036 -0.041 0.047 0.039 0.004 -0.042 0.026 0.103 0.274**
TB 0.069 -0.112 0.028 -0.06 -0.141* -0.054 0.059 -0.03 0.174** 0.260**
SDPD 0.01 -0.091 -0.03 -0.018 -0.116 -0.106 0.082 0.072 -0.03 -0.021 0.004
PPP -0.246** -0.033 -0.031 -0.085 0.124* **-0.178 -0.055 0.187** 0.129* 0.236** 0.057 0.049
YPP -0.135* -0.075 -0.078 -0.006 0.028 *-0.135 0.04 0.097 0.200** 0.134* 0.113 0.101 0.124*
SDWT 0.033 -0.044 0.267** 0.219** 0.109 **0.148 -0.022 -0.06 -0.03 -0.048 0.022 -0.196** -0.334** 0.084
YKGH -0.326** -0.028 -0.062 0.035 0.213** **-0.191 -0.078 0.164** 0.153** 0.087 -0.02 0.027 0.203** 0.046 0.053
PROD -0.428** -0.071 -0.102 -0.036 0.130* **-0.400 -0.078 0.160** 0.172** 0.087 0.001 0.05 0.227** 0.081 0.009 0.974**
(*Significant at P < 0.05, ** Significant at P < 0.01)
DF = days to 50% flowering, FD = flowering duration, PLHT = plant height, PLWD = plant width, DGF=Days to Grain Filling, DM = days to maturity, BPB = basal
primary branches, APB = apical primary branches, BSB = basal secondary branches, ASB = apical secondary branches, TB = tertiary branches, SDPD = seed per pod,
PPP = pods per plant, YPP = yield per plant, SDWT = 100-seed weight, YKGH = plot yield, PROD = per day productivity.

Table: 21: Phenotypic correlation coefficients between 17 quantitative traits in chickpea reference set evaluated during 2008-2009 spring season
(E5), at ICRISAT, Patancheru, India.
E5 DF FD PLHT PLWD DGF DM BPB APB BSB ASB TB SDPD PPP YPP SDWT YKGH
FD -0.159**
PLHT 0.219** -0.034
PLWD 0.077 -0.008 0.234**
DGF -0.487** 0.192** -0.022 -0.054
DM 0.525** 0.022 0.191** 0.041 0.483**
BPB 0.152** -0.058 -0.09 -0.076 -0.037 0.114
APB -0.187** 0.169** -0.097 -0.068 0.1 -0.109 0.046
BSB 0.046 0.136** -0.081 -0.035 0.113 0.142** 0.343** 0.143*
ASB 0.054 0.007 0.051 -0.02 -0.092 -0.043 0.204** 0.359** 0.355**
TB 0.051 0.18** 0.016 0.031 0.011 0.045 0.155** 0.102 0.338** 0.206**
SDPD -0.058 -0.097 -0.238** -0.059 -0.019 -0.074 0.021 0.108 0.076 0.03 -0.130*
PPP -0.072 0.063 -0.048 -0.091 -0.002 -0.082 -0.051 0.222** -0 0.176** 0.034 0.139*
YPP -0.03 0.284** 0.128* 0.029 0.072 0.001 -0.012 0.271** 0.117 0.232** 0.314** -0.216** 0.210**
SDWT 0.056 -0.081 0.217 0.145* 0.116 0.169** -0.122** -0.140* -0.140* -0.161** -0.09 -0.316** -0.300** 0.032
YKGH -0.293** -0.007 -0.051** -0.034 0.102 -0.194** -0.078 0.206** 0.024 0.05 -0.1 0.063 0.08 -0.034 0.038
PROD -0.364** -0.003 -0.085 -0.037 -0.02 -0.383** -0.1 0.205** -0.02 0.05 -0.11 0.067 0.08 -0.032 0.008 0.978**
(*Significant at P < 0.05, ** Significant at P < 0.01)
DF = days to 50% flowering, FD = flowering duration, PLHT = plant height, PLWD = plant width, DGF=Days to Grain Filling, DM = days to maturity, BPB = basal
primary branches, APB = apical primary branches, BSB = basal secondary branches, ASB = apical secondary branches, TB = tertiary branches, SDPD = seed per pod,
PPP = pods per plant, YPP = yield per plant, SDWT = 100-seed weight, YKGH = plot yield, PROD = per day productivity.

Table: 22: Phenotypic correlation coefficients between 17 quantitative traits in chickpea reference set in pooled analysis.
Pooled DF FD PLHT PLWD DGF DM BPB APB BSB ASB TB SDPD PPP YPP SDWT YKGH
FD -0.159**
PLHT 0.219** -0.034
PLWD 0.077 -0.008 0.234**
DGF -0.487** 0.192** -0.022 -0.054
DM 0.525** 0.022 0.191** 0.041 0.483**
BPB 0.152** -0.058 -0.09 -0.076 -0.037 0.114
APB -0.187** 0.169** -0.097 -0.068 0.1 -0.109 0.046
BSB 0.046 0.136** -0.081 -0.035 0.113 0.142* 0.343** 0.143*
ASB 0.054 0.007 0.051 -0.02 -0.092 -0.043 0.204** 0.359** 0.355**
TB 0.051 0.180** 0.016 0.031 0.011 0.045 0.155** 0.102 0.338** 0.206**
SDPD -0.058 -0.097 -0.238** -0.059 -0.019 -0.074 0.021 0.108 0.076 0.03 -0.130**
PPP -0.072 0.063 -0.048 -0.091 -0.002 -0.082 -0.051 0.222** -0 0.176** 0.034 0.139*
YPP -0.03 0.284** 0.128** 0.029 0.072 0.001 -0.012 0.271** 0.117 0.232** 0.314** -0.216** 0.21**
SDWT 0.056 -0.081 0.217** 0.145* 0.116 0.169** -0.122* -0.140* -0.140* -0.161** -0.09 -0.316** -0.300** 0.032
YKGH -0.293** -0.007 -0.051 -0.034 0.102 -0.194** -0.078 0.206** 0.024 0.05 -0.1 0.063 0.08 -0.034 0.038
PROD -0.364** -0.003 -0.085 -0.037 -0.02 -0.383** -0.1 0.205** -0.02 0.05 -0.11 0.067 0.08 -0.032 0.008 0.978**
(*Significant at P < 0.05, ** Significant at P < 0.01)
DF = days to 50% flowering, FD = flowering duration, PLHT = plant height, PLWD = plant width, DGF=Days to Grain Filling, DM = days to maturity,
BPB = basal primary branches, APB = apical primary branches, BSB = basal secondary branches, ASB = apical secondary branches, TB = tertiary branches,
SDPD = seed per pod, PPP = pods per plant, YPP = yield per plant, SDWT = 100-seed weight, YKGH = plot yield, PROD = per day productivity.

Table: 23: Meaningful correlation (r> 0.500) for quantitative traits in the chickpea reference
set evaluated in five environments and in pooled analysis
Pair of traits Environment
Correlation
coefficient
Plot yield and per day productivity (2006-07) E1 0.99
(2007-08) E2 0.99
(2008-09) E3 0.99
(2008-09) E4 0.974
(2008-09) E5 0.978
Pooled 0.978
Days to 50% flowering and days to grain filling (2008-09) E3 -0.711
pooled -0.716
Traits showed high correlation (r=0.05 or more)
days to 50% flowering and days to maturity (2006-07) E1 0.597
(2007-08) E2 0.694
(2008-09) E3 0.62
(2008-09) E4 0.599
(2008-09) E5 0.525
pooled 0.671
pods per plant and per day productivity (2007-08) E2 0.5
Days to 50% flowering and days to grain filling (2008-09) E4 -0.614

Table: 24: Shannon-weaver diversity (H') for qualitative and quantitative traits in chickpea
reference set evaluated during E1 (2006-07), E2 (2007-08), E3 (2008-09) post-rainy season at
ICRISAT Centre, E4 (2008-09) post-rainy season at UAS, Dharwad, E5 (2008-09) spring at
ICRISAT, Patancheru and pooled analysis
Qualitative
traits H'
Seed Shape 0.325
Flower color 0.424
Plant color 0.335
Seed color 0.807
Growth habit 0.362
Dots on seed
coat 0.301
Seed surface 0.332
Mean±S.E 0.412±0.067
Quantitative
traits E1 E2 E3 E4 E5 Pooled
DF 0.631 0.602 0.607 0.598 0.612 0.598
FD 0.602 0.456 0.429 0.305 0.312 0.515
PLHT 0.545 0.532 0.539 0.546 0.559 0.539
PLWD 0.577 0.598 0.613 0.566 0.477 0.600
DGF 0.620 0.613 0.600 0.614 0.554 0.610
DM 0.626 0.619 0.631 0.595 0.558 0.612
BPB 0.614 0.628 0.564 0.607 0.512 0.600
APB 0.468 0.608 0.514 0.564 0.623 0.596
BSB 0.580 0.617 0.531 0.518 0.553 0.566
ASB 0.578 0.572 0.440 0.419 0.524 0.518
TB 0.327 0.080 0.582 0.386 0.547 0.244
SDPD 0.617 0.460 0.467 0.219 0.619 0.543
PPP 0.614 0.612 0.582 0.617 0.599 0.624
YPP 0.600 0.545 0.573 0.543 0.413 0.556
100-SDWT 0.579 0.560 0.535 0.550 0.584 0.558
YKGH 0.613 0.634 0.580 0.620 0.591 0.621
PROD 0.618 0.626 0.597 0.621 0.593 0.614
Mean±S.E 0.577±0.018 0.551±0.032 0.552±0.015 0.523±0.029 0.543±0.019 0.560±0.022
E1= 2006-07, E2=2007-08, E3=2008-09 post rainy, E5=2008-09 spring seasons at ICRISAT centre, Patancheru,
E4=2008-09 post rainy seasons at UAS, Dharwad
DF = days to 50% flowering, FD = flowering duration, PLHT = plant height, PLWD = plant width, DGF=Days to
Grain Filling, DM = days to maturity, BPB = basal primary branches, APB = apical primary branches, BSB =
basal secondary branches, ASB = apical secondary branches, TB = tertiary branches, SDPD = seed per PPP = pods
per plant, YPP = yield per plant, SDWT = 100-seed weight, YKGH = plot yield, PROD = per day productivity.

Table: 25: Shannon-weaver diversity (H') observed for qualitative traits in different seed
types and geographical regions in the chickpea reference set.
Trait/Types/Origin
Growth
Habit
Plant
pigmentation
Flower
color
Seed
color
Seed
Shape
Seed
surface
Seed
dots
Seed Types
Desi 0.314 0.256 0.245 0.688 0.000 0.051 0.257
Kabuli 0.351 0.000 0.027 0.027 0.000 0.079 0.000
Pea 0.406 0.261 0.450 0.932 0.000 0.299 0.132
Wild 0.297 0.178 0.000 0.436 0.000 0.000 0.297
Mean 0.342 0.174 0.180 0.521 0.000 0.107 0.172
Geographical origin
Africa 0.136 0.258 0.398 0.619 0.288 0.259 0.136
Europe 0.477 0.276 0.000 0.276 0.276 0.276 0.276
Mediterranean 0.326 0.384 0.259 0.589 0.443 0.252 0.403
North America 0.276 0.376 0.195 0.376 0.195 0.195 0.276
Russian Federation 0.439 0.195 0.195 0.539 0.195 0.000 0.276
South & East Asia 0.201 0.193 0.211 0.594 0.319 0.222 0.189
South America 0.000 0.000 0.000 0.000 0.000 0.000 0.244
Unknown 0.276 0.376 0.195 0.376 0.195 0.276 0.276
West Asia 0.329 0.469 0.317 0.789 0.256 0.257 0.300
Mean 0.274 0.281 0.197 0.462 0.241 0.193 0.264

Table: 26: Shannon-weaver diversity (H') in different seed types observed for quantitative traits in chickpea reference set evaluated during E1 (2006-07) , E2
(2007-08) , E3 (2008-09) post-rainy season at ICRISAT Centre , E4 (2008-09) post-rainy season at UAS, Dharwad, E5 (2008-09) spring at ICRISAT
Patancheru and in overall pooled analysis
Seed type Season DF FD PLHT PLWD DGF DM BPB APB BSB ASB TB SDPD PPP YPP SDWT YKGH PROD Mean
Desi E1 0.637 0.527 0.548 0.605 0.597 0.614 0.585 0.602 0.521 0.520 0.386 0.581 0.620 0.591 0.593 0.603 0.626 0.574
E2 0.597 0.352 0.572 0.611 0.624 0.630 0.602 0.601 0.597 0.556 0.232 0.519 0.621 0.587 0.597 0.619 0.606 0.560
E3 0.597 0.375 0.535 0.620 0.598 0.630 0.569 0.483 0.533 0.428 0.582 0.508 0.567 0.603 0.591 0.570 0.593 0.552
E4 0.604 0.266 0.564 0.577 0.598 0.603 0.606 0.539 0.533 0.417 0.375 0.247 0.632 0.542 0.600 0.601 0.609 0.524
E5 0.624 0.380 0.602 0.499 0.545 0.534 0.563 0.521 0.488 0.560 0.339 0.545 0.620 0.395 0.624 0.574 0.587 0.529
Pooled 0.613 0.450 0.558 0.602 0.629 0.610 0.608 0.542 0.580 0.459 0.354 0.545 0.611 0.605 0.608 0.610 0.616 0.565
kabuli E1 0.602 0.551 0.533 0.563 0.610 0.594 0.628 0.478 0.514 0.561 0.395 0.470 0.602 0.516 0.581 0.610 0.621 0.554
E2 0.605 0.280 0.478 0.602 0.565 0.539 0.611 0.541 0.548 0.535 0.053 0.421 0.579 0.512 0.571 0.623 0.606 0.510
E3 0.614 0.562 0.462 0.595 0.590 0.579 0.603 0.513 0.588 0.464 0.367 0.403 0.618 0.501 0.560 0.582 0.597 0.541
E4 0.576 0.322 0.543 0.451 0.585 0.597 0.543 0.541 0.539 0.413 0.437 0.145 0.617 0.511 0.557 0.597 0.605 0.505
E5 0.579 0.367 0.416 0.436 0.465 0.527 0.496 0.467 0.525 0.486 0.265 0.575 0.599 0.423 0.589 0.604 0.601 0.495
Pooled 0.598 0.509 0.495 0.583 0.604 0.599 0.603 0.574 0.593 0.423 0.079 0.386 0.593 0.492 0.586 0.628 0.618 0.527
pea E1 0.406 0.449 0.330 0.539 0.539 0.473 0.549 0.450 0.505 0.562 0.450 0.261 0.473 0.449 0.330 0.583 0.562 0.465
E2 0.487 0.398 0.374 0.583 0.330 0.539 0.487 0.299 0.562 0.539 0.330 0.261 0.549 0.330 0.398 0.539 0.394 0.435
E3 0.450 0.505 0.398 0.432 0.539 0.549 0.449 0.539 0.487 0.449 0.398 0.374 0.549 0.330 0.398 0.549 0.549 0.467
E4 0.487 0.449 0.374 0.583 0.508 0.539 0.374 0.450 0.432 0.487 0.132 0.132 0.549 0.505 0.261 0.505 0.505 0.428
E5 0.505 0.406 0.374 0.385 0.394 0.539 0.330 0.505 0.285 0.398 0.330 0.508 0.539 0.505 0.539 0.505 0.505 0.444
Pooled 0.562 0.398 0.330 0.394 0.394 0.539 0.508 0.539 0.539 0.539 0.255 0.385 0.562 0.330 0.330 0.583 0.539 0.454
wild E1 0.346 0.469 0.469 0.436 999 0.415 0.555 999 0.415 0.415 0.469 0.178 0.469 0.260 0.346 0.501 0.415 0.362
E2 0.346 0.415 0.346 0.346 0.501 0.346 0.178 0.178 0.178 0.555 0.469 0.415 0.436 0.260 0.415 0.346 0.178 0.347
E3 0.178 0.555 0.469 0.436 0.555 0.436 0.469 999 0.415 0.415 0.469 0.178 0.415 0.469 0.346 0.436 0.436 0.393
E4 0.178 0.415 0.469 0.346 0.415 0.346 0.469 999 0.415 0.415 0.469 0.178 0.436 0.346 0.346 0.346 0.346 0.349
E5 0.346 0.415 0.469 0.436 0.469 0.415 0.469 999 0.415 0.415 0.415 999 0.469 0.346 0.415 0.260 0.346 0.359
Pooled 0.178 0.346 0.501 0.415 0.555 0.346 0.415 0.178 0.415 0.555 0.469 0.346 0.469 0.415 0.346 0.346 0.260 0.385
DF = days to 50% flowering, FD = flowering duration, PLHT = plant height, PLWD = plant width, DGF=Days to Grain Filling, DM = days to maturity, BPB = basal primary branches, APB =
apical primary branches, BSB = basal secondary branches, ASB = apical secondary branches, TB = tertiary branches, SDPD = seed per pod, PPP = pods per plant, YPP = yield per plant, SDWT
= 100-seed weight, YKGH = plot yield, PROD = per day productivity

Table: 27: Shannon-weaver diversity (H') based on geographical origin observed for quantitative traits in chickpea reference set evaluated during E1 (2006-07) , E2 (2007-08) , E3 (2008-09)
post-rainy season at ICRISAT Centre, E4 (2008-09) post-rainy season at UAS, Dharwad, E5 (2008-09) spring at ICRISAT, Patancheru and in overall pooled analysis.
Region Season DF FD PLHT PLWD DGF DM BPB APB BSB ASB TB SDPD PPP YPP SDWT YKGH PROD
Africa
E1 0.494 0.489 0.553 0.556 0.437 0.534 0.567 0.424 0.565 0.527 0.375 0.561 0.549 0.507 0.455 0.553 0.548
E2 0.616 0.258 0.496 0.530 0.495 0.465 0.537 0.424 0.549 0.629 0.424 0.534 0.635 0.523 0.337 0.583 0.541
E3 0.600 0.466 0.501 0.600 0.502 0.474 0.473 0.486 0.392 0.455 0.415 0.564 0.530 0.561 0.218 0.542 0.617
E4 0.604 0.218 0.563 0.530 0.437 0.564 0.501 0.337 0.486 0.543 0.415 0.260 0.564 0.582 0.246 0.567 0.527
E5 0.526 0.392 0.535 0.525 0.433 0.561 0.301 0.427 0.476 0.507 0.212 0.496 0.517 0.582 0.336 0.561 0.536
Pooled 0.633 0.495 0.534 0.517 0.437 0.520 0.525 0.486 0.565 0.564 0.337 0.561 0.536 0.560 0.316 0.588 0.561
Europe
E1 0.276 0.276 0.276 0.276 0.276 0.276 0.276 0.276 0.276 0.276 0.276 0.276 0.276 0.276 0.276 0.276 0.276
E2 0.276 0.276 0.276 0.276 0.276 0.276 0.276 0.276 0.276 0.276 0.276 0.276 0.276 0.276 0.276 0.276 0.276
E3 0.276 0.276 0.276 0.276 0.276 0.276 0.276 0.276 0.276 0.276 999 0.276 0.276 0.276 0.276 0.276 0.276
E4 0.276 0.276 0.276 0.276 0.276 0.276 0.276 0.276 0.276 0.276 0.276 0.276 0.276 0.276 0.276 0.276 0.276
E5 0.276 0.276 0.276 0.276 0.276 0.276 0.276 0.276 0.276 0.276 0.276 0.276 0.276 0.276 0.276 0.276 0.276
Pooled 0.276 0.276 0.276 0.276 0.276 0.276 0.276 0.276 0.276 0.276 0.276 0.276 0.276 0.276 0.276 0.276 0.276
Mediterranean
E1 0.577 0.563 0.481 0.593 0.513 0.577 0.565 0.538 0.487 0.579 0.402 0.425 0.589 0.593 0.570 0.569 0.550
E2 0.522 0.535 0.465 0.597 0.548 0.513 0.589 0.613 0.561 0.576 0.526 0.397 0.585 0.566 0.539 0.569 0.563
E3 0.556 0.494 0.486 0.599 0.620 0.562 0.534 0.542 0.623 0.611 0.403 0.443 0.620 0.500 0.521 0.522 0.513
E4 0.496 0.404 0.523 0.605 0.567 0.550 0.560 0.555 0.555 0.540 0.446 0.280 0.583 0.575 0.529 0.578 0.565
E5 0.546 0.499 0.503 0.591 0.585 0.490 0.524 0.502 0.567 0.509 0.304 0.506 0.584 0.561 0.564 0.545 0.582
Pooled 0.543 0.535 0.493 0.609 0.618 0.605 0.594 0.630 0.568 0.585 0.404 0.449 0.586 0.580 0.546 0.555 0.565
North America
E1 0.439 0.196 0.377 0.439 0.477 0.276 0.377 0.276 0.439 0.439 0.377 0.377 0.439 0.276 0.439 0.377 0.439
E2 0.439 0.377 0.196 0.540 0.439 0.196 0.439 0.196 0.477 0.439 0.377 0.439 0.439 0.301 0.439 0.439 0.439
E3 0.439 0.439 0.196 0.439 0.377 0.439 0.439 0.439 0.439 0.439 0.276 0.439 0.540 0.439 0.439 0.439 0.439
E4 0.477 0.477 0.439 0.439 0.196 0.196 0.477 0.377 0.196 0.439 0.196 0.196 0.439 0.477 0.439 0.477 0.439
E5 0.377 0.439 0.377 0.439 0.196 0.196 0.439 0.377 0.439 0.439 0.196 0.377 0.439 0.477 0.276 0.477 0.439
Pooled 0.439 0.439 0.377 0.439 0.377 0.196 0.439 0.196 0.439 0.377 0.196 0.439 0.439 0.477 0.439 0.439 0.439
Russian Federation
E1 0.196 0.439 0.439 0.439 0.439 0.377 0.377 0.196 0.439 0.477 0.439 0.276 0.377 0.196 0.196 0.276 0.276
E2 0.439 0.276 0.439 0.439 0.439 0.439 0.439 0.377 0.439 0.439 0.377 0.276 0.439 0.276 0.439 0.439 0.439
E3 0.439 0.377 0.439 0.439 0.477 0.439 0.439 0.439 0.439 0.196 0.439 0.377 0.439 0.377 0.439 0.439 0.301
E4 0.439 0.276 0.439 0.439 0.439 0.276 0.477 0.377 0.276 0.477 0.196 0.377 0.439 0.196 0.439 0.377 0.377
E5 0.377 0.196 0.439 0.377 0.439 0.439 0.301 0.377 0.301 0.439 0.439 0.477 0.439 0.196 0.439 0.439 0.439
Pooled 0.439 0.477 0.439 0.439 0.477 0.439 0.439 0.196 0.477 0.439 0.377 0.439 0.439 0.196 0.439 0.477 0.477
South & East Asia E1 0.563 0.591 0.468 0.516 0.597 0.614 0.590 0.528 0.562 0.429 0.382 0.613 0.617 0.557 0.574 0.604 0.597

Region Season DF FD PLHT PLWD DGF DM BPB APB BSB ASB TB SDPD PPP YPP SDWT YKGH PROD
E2 0.589 0.395 0.535 0.558 0.612 0.638 0.595 0.550 0.634 0.461 0.192 0.533 0.610 0.554 0.551 0.633 0.639
E3 0.579 0.505 0.484 0.593 0.602 0.616 0.605 0.492 0.653 0.365 0.569 0.508 0.590 0.543 0.539 0.580 0.578
E4 0.605 0.453 0.556 0.575 0.572 0.580 0.603 0.592 0.502 0.319 0.527 0.261 0.629 0.512 0.515 0.575 0.600
E5 0.610 0.434 0.541 0.615 0.552 0.561 0.552 0.529 0.451 0.462 0.582 0.597 0.623 0.255 0.586 0.569 0.582
Pooled 0.586 0.484 0.505 0.540 0.611 0.611 0.575 0.561 0.583 0.459 0.316 0.576 0.606 0.500 0.522 0.586 0.619
South America
E1 0.452 0.244 0.244 0.452 0.452 0.244 0.452 0.244 0.244 0.244 0.452 0.244 0.452 0.452 0.452 0.452 0.452
E2 0.452 0.244 0.452 0.452 0.452 0.452 0.301 0.244 0.244 0.244 0.244 0.452 0.244 0.244 0.452 0.244 0.244
E3 0.452 0.452 0.244 0.244 0.452 0.452 0.244 0.452 0.452 0.452 0.301 0.244 0.452 0.452 0.452 0.452 0.244
E4 0.452 0.301 0.452 0.452 0.452 0.452 0.452 0.452 0.452 0.452 0.452 999 0.244 0.244 0.452 0.244 0.244
E5 0.452 0.452 0.244 0.452 0.452 0.452 0.452 0.244 0.452 0.452 0.244 0.452 0.244 0.244 0.452 0.452 0.452
Pooled 0.452 0.452 0.244 0.452 0.452 0.452 0.244 0.452 0.452 0.452 0.244 0.244 0.244 0.244 0.452 0.452 0.452
West Asia
E1 0.621 0.624 0.477 0.592 0.616 0.611 0.578 0.521 0.520 0.534 0.407 0.488 0.581 0.558 0.539 0.625 0.586
E2 0.599 0.518 0.494 0.630 0.591 0.603 0.610 0.415 0.597 0.637 0.419 0.483 0.615 0.580 0.480 0.628 0.602
E3 0.626 0.506 0.411 0.605 0.600 0.636 0.494 0.474 0.583 0.561 0.381 0.472 0.471 0.602 0.517 0.589 0.593
E4 0.615 0.224 0.503 0.476 0.611 0.639 0.527 0.563 0.581 0.615 0.421 0.172 0.572 0.574 0.586 0.593 0.602
E5 0.635 0.339 0.447 0.370 0.574 0.578 0.544 0.508 0.438 0.607 0.271 0.527 0.578 0.600 0.606 0.565 0.534
Pooled 0.638 0.480 0.456 0.530 0.613 0.628 0.586 0.592 0.571 0.595 0.467 0.506 0.542 0.626 0.519 0.590 0.594
Unknown
E1 0.377 0.196 0.439 0.439 0.377 0.377 0.276 0.377 0.439 0.540 0.377 0.377 0.477 0.439 0.196 0.439 0.439
E2 0.377 0.377 0.439 0.439 0.377 0.377 0.439 0.439 0.439 0.377 0.439 0.196 0.439 0.377 0.196 0.439 0.439
E3 0.196 0.439 0.477 0.439 0.377 0.439 0.439 0.301 0.276 0.439 0.439 0.377 0.439 0.439 0.196 0.439 0.439
E4 0.377 0.439 0.196 0.477 0.377 0.477 0.276 0.377 0.439 0.377 0.377 0.276 0.439 0.196 0.196 0.276 0.276
E5 0.439 0.439 0.196 0.439 0.377 0.377 0.196 0.377 0.196 0.377 0.196 0.196 0.439 0.196 0.439 0.439 0.439
Pooled 0.196 0.196 0.439 0.439 0.377 0.439 0.377 0.377 0.439 0.439 0.439 0.196 0.439 0.377 0.196 0.439 0.439
DF = days to 50% flowering, FD = flowering duration, PLHT = plant height, PLWD = plant width, DGF=Days to Grain Filling, DM = days to maturity, BPB = basal primary branches, APB =
apical primary branches, BSB = basal secondary branches, ASB = apical secondary branches, TB = tertiary branches, SDPD = seed per pod, PPP = pods per plant, YPP = yield per plant,
SDWT = 100-seed weight, YKGH = plot yield, PROD = per day productivity

Table: 28: Percentage of variation (%) and vector loading explained by first ten Principle component (PCs) estimated for 17 quantitative traits in chickpea
reference set evaluated during 2006-07 (E1) post-rainy season at ICRISAT Centre, Patancheru, India
Percentage of variation
explained (%)
Principle components
1 2 3 4 5 6 7 8 9 10
20.35 11.81 10 9.32 6.83 6.41 5.73 5.24 4.79 3.84
Latent vectors 3.46 2.01 1.70 1.58 1.16 1.09 0.98 0.89 0.81 0.65
DF -0.389 0.294 0.214 0.186 0.037 0.058 -0.076 -0.165 0.116 0.034
FD 0.068 -0.325 -0.475 0.011 -0.050 0.141 0.200 -0.040 -0.069 0.012
PLHT -0.229 -0.244 0.206 0.280 -0.247 0.238 0.095 0.053 -0.197 -0.370
PLWD -0.194 -0.164 0.316 0.293 0.310 0.299 0.040 -0.017 -0.068 0.054
DGF 0.173 -0.469 -0.283 -0.068 0.303 0.183 0.057 -0.201 0.023 0.084
DM -0.369 -0.081 -0.117 0.145 0.370 0.220 -0.050 -0.338 0.183 0.079
BPB -0.032 0.245 -0.101 0.121 0.091 -0.251 0.772 -0.256 0.252 -0.035
APB 0.174 0.019 -0.016 0.080 -0.367 0.521 0.157 0.258 0.569 -0.086
BSB 0.100 0.044 -0.276 0.461 0.169 -0.178 -0.033 0.252 -0.316 -0.250
ASB 0.109 0.177 -0.090 0.489 -0.178 0.139 0.175 0.134 -0.290 0.592
TB 0.025 0.077 -0.288 0.398 0.190 -0.168 -0.369 0.207 0.476 -0.183
SDPD 0.164 0.275 0.010 -0.202 0.362 0.497 0.038 0.217 -0.172 -0.040
PPP 0.312 0.158 0.043 0.148 -0.078 0.128 0.043 -0.432 -0.200 -0.567
YPP 0.228 0.115 -0.108 0.149 -0.287 0.131 -0.379 -0.567 0.026 0.228
SDWT -0.204 -0.469 0.099 0.121 -0.293 -0.155 0.035 0.002 0.025 0.017
YKGH 0.382 -0.186 0.387 0.164 0.208 -0.108 0.030 -0.037 0.149 0.092
PROD 0.412 -0.162 0.377 0.129 0.148 -0.140 0.030 0.007 0.117 0.077
DF = days to 50% flowering, FD = flowering duration, PLHT = plant height, PLWD = plant width, DGF=Days to Grain Filling, DM = days to
maturity, BPB = basal primary branches, APB = apical primary branches, BSB = basal secondary branches, ASB = apical secondary branches,
TB = tertiary branches, SDPD = seed per pod, PPP = pods per plant, YPP = yield per plant, SDWT = 100-seed weight, YKGH = plot yield,
PROD = per day productivity

Table: 29: Percentage of variation (%) and vector loading explained by first ten Principle component (PCs) estimated for 17 quantitative traits in chickpea
reference set evaluated during 2007-08 (E2) post rainy, at ICRISAT Centre, Patancheru, India.
Percentage of variation
explained (%)
Principle components
1 2 3 4 5 6 7 8 9 10
21.68 10.34 9.44 8.18 7.49 6.78 5.74 5.54 4.92 4.17
Latent vectors 3.69 1.76 1.60 1.39 1.27 1.15 0.98 0.94 0.84 0.70
DF -0.362 0.430 -0.124 0.060 0.233 0.053 -0.020 0.032 0.117 0.069
FD -0.057 -0.507 -0.004 0.182 0.351 0.072 -0.083 -0.132 0.209 -0.015
PLHT -0.247 0.114 0.269 -0.034 -0.058 0.368 -0.086 -0.140 0.068 0.503
PLWD -0.135 0.191 0.336 -0.062 0.326 0.278 0.259 0.271 -0.142 -0.388
DGF 0.142 -0.575 0.178 0.052 0.039 0.020 0.347 0.227 0.132 0.077
DM -0.366 -0.009 -0.033 0.155 0.342 0.072 0.270 0.239 0.267 0.134
BPB -0.029 0.141 -0.154 0.143 0.003 -0.270 0.730 -0.531 -0.050 0.017
APB 0.081 -0.083 0.024 0.131 -0.232 0.696 0.105 -0.372 -0.040 0.086
BSB 0.064 0.076 0.149 0.586 0.039 -0.258 -0.092 0.148 -0.084 0.503
ASB 0.130 0.203 0.033 0.342 -0.293 0.068 -0.033 0.030 0.753 -0.339
TB 0.027 0.058 0.213 0.551 -0.230 0.062 0.061 0.185 -0.435 -0.258
SDPD 0.217 0.054 -0.389 0.045 0.134 0.347 0.143 0.247 -0.177 0.026
PPP 0.366 0.091 -0.126 0.100 0.390 0.047 -0.068 -0.140 0.026 -0.067
YPP 0.138 0.050 0.354 0.140 0.444 -0.029 -0.278 -0.434 -0.065 -0.175
SDWT -0.214 -0.056 0.522 -0.195 -0.160 -0.135 0.123 -0.078 0.017 -0.086
YKGH 0.410 0.212 0.240 -0.167 0.086 0.009 0.183 0.138 0.137 0.217
PROD 0.436 0.198 0.225 -0.180 0.028 -0.009 0.129 0.097 0.086 0.188
DF = days to 50% flowering, FD = flowering duration, PLHT = plant height, PLWD = plant width, DGF = Days to Grain Filling, DM = days to maturity, BPB = basal
primary branches, APB = apical primary branches, BSB = basal secondary branches, TB = tertiary branches, SDPD = seed per pod, PPP = pods per plant, YPP = yield per
plant, SDWT = 100-seed weight, YKGH = plot yield,
PROD = per day productivity

Table: 30: Percentage of variation (%) and vector loading explained by first ten Principle component (PCs) estimated for 17 quantitative traits in
chickpea reference set evaluated during 2008-09 (E3) post rainy, at ICRISAT Centre, Patancheru, India
Percentage of variation
explained (%)
Principle components
1 2 3 4 5 6 7 8 9 10
19.01 12.09 10.28 8.93 7.13 6.4 5.94 5.1 4.53 4.33
Latent vectors 3.23 2.06 1.75 1.52 1.21 1.09 1.01 0.87 0.77 0.74
DF -0.434 0.003 0.315 0.207 0.110 0.001 -0.067 0.227 -0.239 0.178
FD 0.075 0.029 -0.461 0.161 -0.059 -0.101 0.281 0.405 -0.407 -0.313
PLHT -0.130 0.405 0.114 0.194 -0.055 -0.112 0.098 -0.448 0.067 -0.367
PLWD -0.124 0.397 0.235 0.084 0.227 -0.296 0.166 -0.105 -0.134 -0.251
DGF 0.242 0.166 -0.493 -0.086 -0.044 -0.269 0.305 -0.173 0.201 0.213
DM -0.354 0.160 -0.130 0.200 0.115 -0.293 0.244 0.154 -0.126 0.494
BPB -0.057 -0.268 0.080 0.269 0.269 0.217 0.497 0.139 0.502 -0.086
APB 0.162 0.051 0.181 0.430 -0.379 0.027 0.058 0.259 0.204 0.154
BSB 0.033 -0.172 -0.170 0.288 0.624 0.048 -0.081 -0.123 0.074 -0.185
ASB 0.149 -0.014 0.116 0.442 -0.428 0.080 0.144 -0.150 -0.065 -0.141
TB 0.042 -0.081 -0.250 0.415 0.067 0.359 -0.169 -0.417 -0.363 0.281
SDPD 0.101 -0.333 0.219 0.010 -0.009 -0.464 0.140 -0.364 0.048 0.315
PPP 0.309 -0.160 0.188 0.102 0.123 -0.325 -0.169 0.224 -0.093 -0.123
YPP 0.221 0.122 -0.122 0.338 0.101 -0.348 -0.531 0.143 0.221 0.016
SDWT -0.096 0.493 -0.111 0.019 0.039 0.221 -0.191 0.104 0.384 0.194
YKGH 0.416 0.261 0.228 -0.041 0.231 0.149 0.185 0.067 -0.182 0.218
PROD 0.445 0.225 0.232 -0.069 0.202 0.181 0.141 0.048 -0.154 0.138
DF = days to 50% flowering, FD = flowering duration, PLHT = plant height, PLWD = plant width, DGF=Days to Grain Filling, DM = days to maturity, BPB = basal primary
branches, APB = apical primary branches, BSB = basal secondary branches, ASB = apical secondary branches, TB = tertiary branches, SDPD = seed per pod, PPP = pods per
plant, YPP = yield per plant, SDWT = 100-seed weight, YKGH = plot yield, PROD = per day productivity

Table: 31: Percentage of variation (%) and vector loading explained by first ten Principle component (PCs) estimated for 17 quantitative traits in
chickpea reference set evaluated during 2008-09 (E4) post rainy, at UAS, Dharwad, India
Percentage of variation
explained (%)
Principle components
1 2 3 4 5 6 7 8 9 10
17.6 10.81 9.48 8.48 7.2 6.69 6.34 5.68 5.15 4.66
Latent vectors 2.99 1.84 1.61 1.44 1.22 1.14 1.08 0.97 0.88 0.79
DF -0.436 -0.148 0.227 -0.051 0.293 -0.198 0.236 0.011 0.185 -0.112
FD -0.035 0.257 -0.220 0.399 0.092 -0.324 0.247 -0.253 0.103 0.219
PLHT -0.164 0.196 0.370 -0.149 0.179 0.227 -0.439 0.058 0.052 0.023
PLWD -0.158 0.312 0.330 -0.029 0.251 0.029 0.099 -0.237 -0.348 -0.165
DGF 0.184 0.472 -0.150 0.367 -0.136 0.261 -0.085 0.119 -0.251 0.192
DM -0.348 0.296 0.121 0.315 0.216 0.019 0.202 0.130 -0.030 0.065
BPB -0.040 -0.169 0.055 0.082 -0.102 0.445 0.480 0.543 -0.196 -0.178
APB 0.181 0.041 0.019 0.224 0.271 0.349 0.002 0.078 0.774 0.023
BSB 0.188 -0.142 0.271 0.302 -0.192 -0.234 0.264 -0.070 0.053 -0.219
ASB 0.132 -0.154 0.417 0.347 0.067 -0.110 -0.161 0.104 -0.097 0.005
TB 0.027 -0.275 0.385 0.122 -0.184 -0.140 -0.075 0.153 -0.028 0.665
SDPD 0.053 -0.240 -0.045 -0.133 0.375 0.392 0.249 -0.343 -0.196 0.476
PPP 0.278 -0.131 0.029 0.265 0.371 0.015 -0.347 0.035 -0.201 -0.255
YPP 0.146 -0.133 0.227 0.159 -0.248 0.328 0.109 -0.602 0.018 -0.226
SDWT -0.104 0.359 0.324 -0.183 -0.436 0.139 0.026 -0.078 0.194 0.070
YKGH 0.424 0.258 0.189 -0.247 0.196 -0.157 0.255 0.113 0.011 0.034
PROD 0.472 0.168 0.151 -0.301 0.136 -0.154 0.202 0.073 0.019 0.014
DF = days to 50% flowering, FD = flowering duration, PLHT = plant height, PLWD = plant width, DGF=Days to Grain Filling, DM = days to maturity,
BPB = basal primary branches, APB = apical primary branches, BSB = basal secondary branches, ASB = apical secondary branches,
TB = tertiary branches, SDPD = seed per pod, PPP = pods per plant, YPP = yield per plant, SDWT = 100-seed weight, YKGH = plot yield,
PROD = per day productivity

Table: 32: Percentage of variation (%) and vector loading explained by first ten Principle component (PCs) estimated for 17 quantitative traits in
chickpea reference set evaluated during 2008-09 (E5) spring, at ICRISAT Centre, Patancheru, India
Percentage of variation
explained (%)
Principle components
1 2 3 4 5 6 7 8 9 10
15.88 13.76 10.55 8.75 8.14 6.95 5.76 5.06 4.52 4.11
Latent vectors 2.70 2.34 1.79 1.49 1.38 1.18 0.98 0.86 0.77 0.70
DF -0.394 0.122 -0.229 0.312 0.133 0.181 0.274 0.314 0.282 0.031
FD 0.092 0.198 0.326 -0.133 -0.276 -0.199 -0.045 0.439 0.486 -0.287
PLHT -0.197 -0.026 0.219 0.453 -0.053 0.253 -0.050 -0.006 -0.199 -0.032
PLWD -0.111 -0.058 0.115 0.353 -0.067 0.070 -0.750 0.115 -0.080 -0.303
DGF 0.055 0.059 0.526 -0.445 0.190 0.243 -0.132 -0.108 -0.204 0.018
DM -0.341 0.181 0.284 -0.125 0.319 0.416 0.140 0.212 0.081 0.049
BPB -0.053 0.287 -0.170 -0.027 0.427 -0.219 0.050 -0.126 -0.124 -0.631
APB 0.303 0.271 0.078 0.068 -0.082 0.190 0.039 -0.360 0.408 -0.117
BSB 0.051 0.418 0.030 -0.001 0.371 -0.190 -0.145 0.105 -0.064 0.103
ASB 0.145 0.394 -0.111 0.275 0.083 0.114 -0.034 -0.378 0.044 0.097
TB -0.019 0.375 0.132 0.132 -0.049 -0.389 -0.036 0.199 -0.320 0.445
SDPD 0.163 0.142 -0.328 -0.146 0.044 0.424 -0.390 0.076 0.175 0.300
PPP 0.195 0.180 -0.080 0.000 -0.328 0.387 0.290 0.162 -0.502 -0.306
YPP 0.068 0.316 0.283 0.219 -0.344 -0.006 0.146 -0.081 0.029 0.069
SDWT -0.169 -0.232 0.372 0.230 0.141 -0.070 0.126 -0.383 0.125 0.052
YKGH 0.455 -0.176 0.141 0.235 0.340 0.086 0.112 0.261 0.007 0.031
PROD 0.492 -0.205 0.074 0.257 0.249 -0.007 0.089 0.215 0.008 0.012
DF = days to 50% flowering, FD = flowering duration, PLHT = plant height, PLWD = plant width, DGF=Days to Grain Filling, DM = days to maturity,
BPB = basal primary branches, APB = apical primary branches, BSB = basal secondary branches, ASB = apical secondary branches,
TB = tertiary branches, SDPD = seed per pod, PPP = pods per plant, YPP = yield per plant, SDWT = 100-seed weight, YKGH = plot yield,
PROD = per day productivity

Table: 33: Percentage of variation (%) and vector loading explained by first ten Principle component (PCs) estimated for 17 quantitative traits in
chickpea reference set in overall pooled analysis.
Percentage of variation
explained (%)
Principle components
1 2 3 4 5 6 7 8 9 10
22.58 11.92 10.08 9.53 6.45 5.76 5.48 4.68 4.57 4.10
Latent vectors 3.84 2.03 1.71 1.62 1.10 0.98 0.93 0.80 0.78 0.70
DF -0.391 -0.246 0.165 0.261 0.046 0.100 0.069 -0.120 -0.246 0.034
FD 0.026 0.238 0.138 -0.525 0.277 0.074 0.023 -0.064 -0.265 -0.006
PLHT -0.191 0.237 0.163 0.288 0.290 -0.066 -0.294 -0.007 0.299 0.197
PLWD -0.138 0.224 0.119 0.361 0.328 0.302 0.386 0.144 0.026 -0.222
DGF 0.198 0.416 -0.045 -0.371 0.149 0.248 -0.031 0.199 0.235 0.164
DM -0.360 0.076 0.193 -0.066 0.215 0.392 0.079 0.039 -0.113 0.208
BPB -0.063 -0.293 0.088 -0.097 -0.336 0.577 -0.213 -0.037 0.515 0.092
APB 0.207 -0.004 0.293 0.032 0.339 -0.051 -0.497 -0.339 0.055 -0.389
BSB 0.115 -0.064 0.428 -0.131 -0.292 0.315 -0.049 0.067 -0.398 -0.342
ASB 0.148 -0.100 0.439 0.158 0.030 -0.137 -0.341 0.292 -0.131 0.393
TB 0.041 0.049 0.482 -0.044 -0.166 -0.317 0.289 0.482 0.268 -0.085
SDPD 0.172 -0.397 -0.016 -0.021 0.408 0.053 0.166 0.107 0.326 -0.348
PPP 0.339 -0.185 0.076 0.057 0.182 0.103 0.201 -0.234 -0.085 0.500
YPP 0.169 0.135 0.378 0.008 -0.160 -0.098 0.413 -0.608 0.220 0.083
SDWT -0.168 0.497 0.014 0.185 -0.294 0.011 -0.137 -0.161 0.101 -0.154
YKGH 0.396 0.151 -0.093 0.334 -0.042 0.260 0.008 0.111 -0.120 0.000
PROD 0.424 0.126 -0.117 0.312 -0.080 0.173 0.000 0.089 -0.097 -0.037
DF = days to 50% flowering, FD = flowering duration, PLHT = plant height, PLWD = plant width, DGF=Days to Grain Filling, DM = days to maturity,
BPB = basal primary branches, APB = apical primary branches, BSB = basal secondary branches, ASB = apical secondary branches,
TB = tertiary branches, SDPD = seed per pod, PPP = pods per plant, YPP = yield per plant, SDWT = 100-seed weight, YKGH = plot yield,
PROD = per day productivity
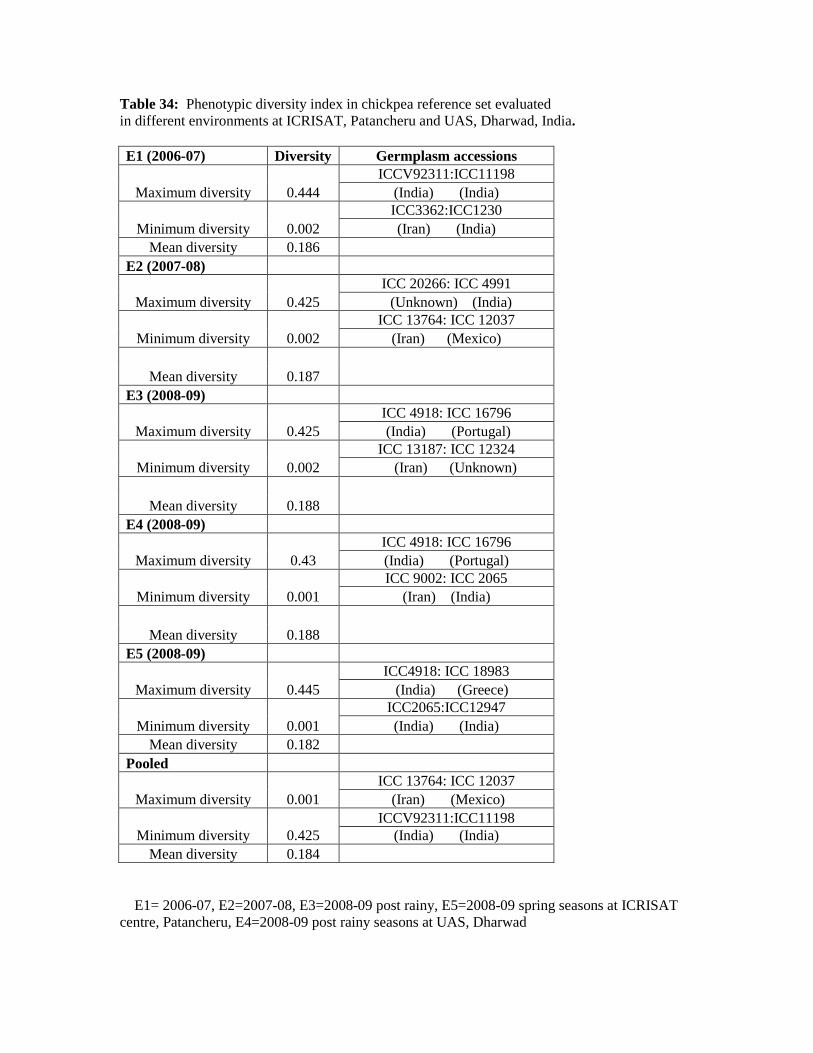
Table 34: Phenotypic diversity index in chickpea reference set evaluated
in different environments at ICRISAT, Patancheru and UAS, Dharwad, India.
E1 (2006-07) Diversity Germplasm accessions
Maximum diversity 0.444
ICCV92311:ICC11198
(India) (India)
Minimum diversity 0.002
ICC3362:ICC1230
(Iran) (India)
Mean diversity 0.186
E2 (2007-08)
Maximum diversity 0.425
ICC 20266: ICC 4991
(Unknown) (India)
Minimum diversity 0.002
ICC 13764: ICC 12037
(Iran) (Mexico)
Mean diversity 0.187
E3 (2008-09)
Maximum diversity 0.425
ICC 4918: ICC 16796
(India) (Portugal)
Minimum diversity 0.002
ICC 13187: ICC 12324
(Iran) (Unknown)
Mean diversity 0.188
E4 (2008-09)
Maximum diversity 0.43
ICC 4918: ICC 16796
(India) (Portugal)
Minimum diversity 0.001
ICC 9002: ICC 2065
(Iran) (India)
Mean diversity 0.188
E5 (2008-09)
Maximum diversity 0.445
ICC4918: ICC 18983
(India) (Greece)
Minimum diversity 0.001
ICC2065:ICC12947
(India) (India)
Mean diversity 0.182
Pooled
Maximum diversity 0.001
ICC 13764: ICC 12037
(Iran) (Mexico)
Minimum diversity 0.425
ICCV92311:ICC11198
(India) (India)
Mean diversity 0.184
E1= 2006-07, E2=2007-08, E3=2008-09 post rainy, E5=2008-09 spring seasons at ICRISAT
centre, Patancheru, E4=2008-09 post rainy seasons at UAS, Dharwad

Table: 35: Mean (± Standard error), variance component and heritability in Chickpea Reference set evaluated during (E3) 2008-09 post-rainy,
(E5) spring season for SPAD Chlorophyll Meter Readings (SCMR) related traits
Trait
E3 E5 Pooled E3 E5 Pooled E3 E5 Pooled Pooled
Mean ( ± S.E) Mean ( ± S.E) Mean ( ± S.E) h2 h
2
h2 σ
2g SE σ
2g SE σ
2g SE σ2g x e SE
SPAD 58.21±1.18 62±0.59 60.1±1.01 77.4 98.4 60.6 **3.30 0.51 **12.24 1.03 0 0.473 **3.94 0.72
Leaf Area 23.07±1.35 8.08±2.57 15.6±1.38 99.0 45.3 45.9 **74.94 6.23 9.44 5.15 **16.08 3.306 **35.22 3.20
Dry Weight 0.15±0.01 0.1±0.01 0.12±0.01 97.1 77.7 36.8 **0.001 0.00 **0.001 0.00 **0.00 0.00 **0.001 0.00
SPAD = Soil Plant Analysis Development.
E3=2008-09 post rainy, E5=2008-09 spring seasons at ICRISAT centre, Patancheru.

Table: 36: Expression of drought tolerance related traits in chickpea reference set
evaluated in cylinders during (E2) 2007-08, (E3) 2008-09 post-rainy season at
ICRISAT Patancheru, India
Trait Trial
mean
Range of predicted
means σ 2g S.E Heritability
Minimum Maximum
Shoot Dry Weight (g)
E2 1.89 1.34 2.77 0.097** 0.0119 68.6
E3 1.65 1.1 2.41 0.0815** 0.0092 73.7
Root Dry Weight (g)
E2 0.6 0.47 0.79 0.007** 0.0011 52.2
E3 0.58 0.39 0.89 0.013** 0.0015 70.2
Root Depth (cm)
E2 107.81 99.37 117.13 27.3** 7.7 32.3
E3 107.57 98.52 116.02 26.6** 7.4 32.8
Root –Total dry weight (%)
E2 24.4 22.09 27.81 2.89** 0.83 32
E3 25.97 20.88 35.05 5.91** 0.95 53.7
Total Dry wt Ratio
E2 2.5 1.85 3.53 0.146** 0.0176 69.9
E3 2.23 1.45 3.19 0.145** 0.0162 75.3
Root Length (cm)
E2 4776.79 4008.26 5523.25 262986** 69483 34.4
E3 4671.71 4024.55 5350.81 213585** 61299 31.8
Root Length Density (cm cm-3)
E2 0.18 0.14 0.21 0.0003** 0.00006 42.7
E3 0.21 0.18 0.23 0.0003** 0.00009 31.6
Root Surface Area (cm2)
E2 748.73 565.63 930.35 9360** 2072 40.4
E3 802.96 629.57 1003.9 11971** 2292 46
Root Volume (cm3)
E2 9.32 6.76 13.75 2.69** 0.54 43.9
E3 11.7 8.55 15.85 3.91** 0.74 46.6 E2=2007-08, E3=2008-09 post rainy seasons at ICRISAT centre, Patancheru.

Table: 37 Expression of drought tolerance related traits in chickpea reference set
evaluated in cylinders in overall pooled analysis
Trait
Mean
Range
σ 2
g
σ 2
p
h2 Minimum Maximum PCV GCV
SDW 1.77 1.073 2.869 48.085 45.649 0.653 0.725 90.12
RDW 0.592 0.3353 0.9739 50.146 46.221 0.075 0.088 84.96
RDp 107.69 83.8 131.7 19.686 17.23 344.3 449.45 76.6
R_T_% 25.194 16.98 38.95 29.529 26.294 43.87 55.32 79.29
TDW% 2.362 1.45 3.662 45.577 43.314 1.047 1.158 90.32
RL 4724.2 2846 6818 41.722 36.024 2896000 3884666 74.55
RLD 0.192 0.1345 0.4098 40.157 36.002 0.005 0.006 80.38
RSA 775.84 466 1149.3 47.695 42.308 107734 136915.5 78.69
RV 10.51 5.44 19.41 60.659 54.251 32.51 40.643 79.99
SDW=Shoot Dry Weight, RDW=Root Dry Weight (RDW), RDp=Root Depth, R_T_%=Root to Total Plant Dry
Weight ratio, TDW%=Total Plant Dry Weight, RL=Root Length, RLD=Root Length Density, RSA=Root surface
area, RV=Root Volume.
Table: 38: Phenotypic correlation coefficients between drought tolerance related traits
in chickpea reference set during, E2 (2007-08) post rainy season at ICRISAT,
Patancheru, India.
Trait SDW RDW RDp R_T_% TDW% RL RLD RSA RV
SDW
RDW 0.658**
RDp 0.300** 0.482**
R_T_% -0.456** 0.343** 0.196**
TDW% 0.983** 0.785** 0.363** -0.291**
RL 0.536** 0.618** 0.739** 0.056 0.591**
RLD 0.607** 0.606** 0.253** -0.046 0.647** 0.513**
RSA 0.588** 0.822** 0.525** 0.220** 0.684** 0.711** 0.711**
RV 0.476** 0.774** 0.434** 0.292** 0.580** 0.550** 0.598** 0.924**
Significant level indicated with asterisks as follows: *P<0.005, **P<0.01.
SDW=Shoot Dry Weight, RDW=Root Dry Weight (RDW), RDp=Root Depth, Root to Total Plant Dry Weight ratio
(R/T %), TDW=Total Plant Dry Weight, RL=Root Length, RLD=Root Length Density, RSA=Root surface area,
RV=Root Volume, and Shoot to Root Length Density ratio (S/RLD).

Table: 39: Phenotypic correlation coefficients between drought tolerance related traits in
chickpea reference set during E3 (2008-09) post rainy season at ICRISAT, Patancheru,
India
Trait SDW RDW RDp R_T_% TDW% RL RLD RSA RV
SDW
RDW 0.706**
RDp 0.263** 0.408**
R_T_% -0.201** 0.535** 0.238**
TDW% 0.975** 0.845** 0.326** 0.015
RL 0.529** 0.608** 0.688** 0.196** 0.589**
RLD 0.602** 0.576** 0.089 0.087 0.634** 0.387**
RSA 0.653** 0.811** 0.464** 0.345** 0.746** 0.615** 0.734**
RV 0.592** 0.798** 0.399** 0.393** 0.695** 0.499** 0.624** 0.943**
Significant level indicated with asterisks as follows: *P<0.005, **P<0.01.
SDW=Shoot Dry Weight, RDW=Root Dry Weight (RDW), RDp=Root Depth, Root to Total Plant Dry
Weight ratio (R/T %), TDW=Total Plant Dry Weight, RL=Root Length, RLD=Root Length Density,
RSA=Root surface area, RV=Root Volume, and Shoot to Root Length Density ratio (S/RLD).
Table: 40: Phenotypic correlation coefficients between drought tolerance related traits in
chickpea reference set in pooled analysis.
Trait SDW RDW RDp R_T_% TDW% RL RLD RSA RV
SDW
RDW 0.721**
RDp 0.311** 0.456**
R_T_% -0.335** 0.392** 0.206**
TDW% 0.983** 0.837** 0.367** -0.160**
RL 0.623** 0.666** 0.656** 0.075 0.670**
RLD 0.667** 0.620** 0.230** -0.038 0.693** 0.564**
RSA 0.689** 0.853** 0.551** 0.241** 0.773** 0.757** 0.722**
RV 0.608** 0.834** 0.482** 0.317** 0.703** 0.609** 0.612** 0.943**
Significant level indicated with asterisks as follows: *P<0.005, **P<0.01.
SDW=Shoot Dry Weight, RDW=Root Dry Weight (RDW), RDp=Root Depth, Root to Total Plant Dry
Weight ratio (R/T %), TDW=Total Plant Dry Weight, RL=Root Length, RLD=Root Length Density,
RSA=Root surface area, RV=Root Volume, and Shoot to Root Length Density ratio (S/RLD).
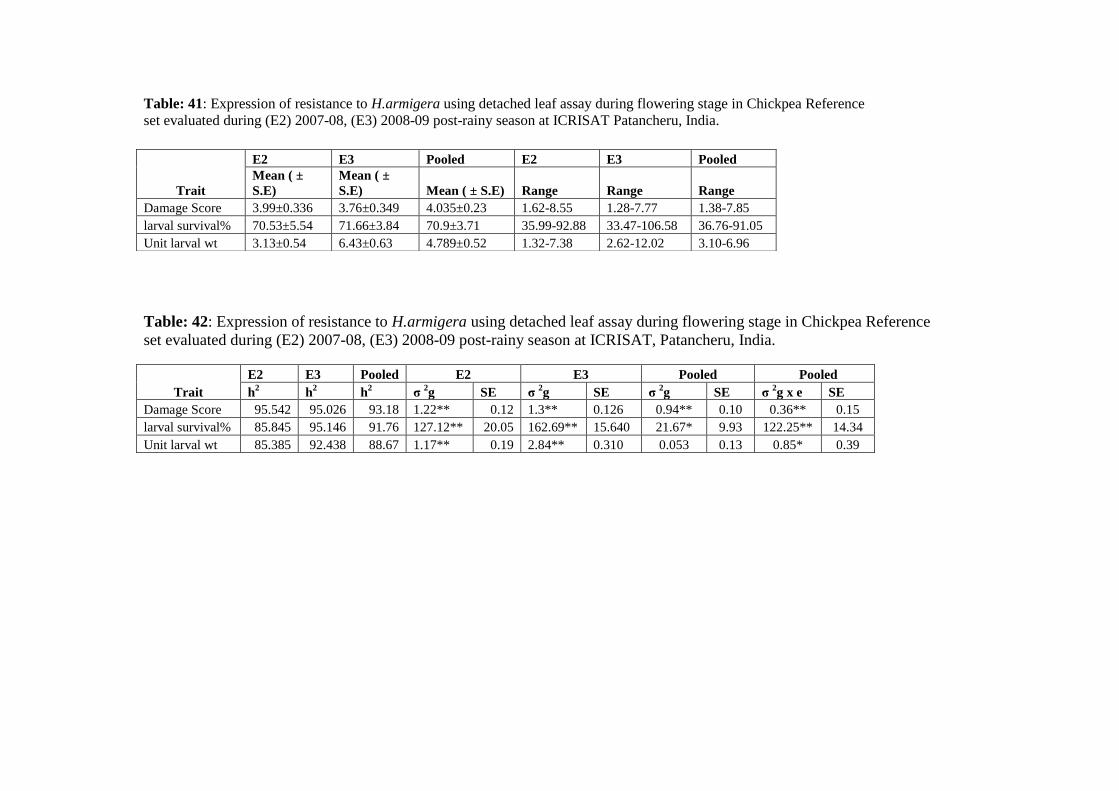
Table: 41: Expression of resistance to H.armigera using detached leaf assay during flowering stage in Chickpea Reference
set evaluated during (E2) 2007-08, (E3) 2008-09 post-rainy season at ICRISAT Patancheru, India.
Table: 42: Expression of resistance to H.armigera using detached leaf assay during flowering stage in Chickpea Reference
set evaluated during (E2) 2007-08, (E3) 2008-09 post-rainy season at ICRISAT, Patancheru, India.
Trait
E2 E3 Pooled E2 E3 Pooled Pooled
h2 h
2 h
2 σ
2g SE σ
2g SE σ
2g SE σ
2g x e SE
Damage Score 95.542 95.026 93.18 1.22** 0.12 1.3** 0.126 0.94** 0.10 0.36** 0.15
larval survival% 85.845 95.146 91.76 127.12** 20.05 162.69** 15.640 21.67* 9.93 122.25** 14.34
Unit larval wt 85.385 92.438 88.67 1.17** 0.19 2.84** 0.310 0.053 0.13 0.85* 0.39
Trait
E2 E3 Pooled E2 E3 Pooled
Mean ( ±
S.E)
Mean ( ±
S.E) Mean ( ± S.E) Range Range Range
Damage Score 3.99±0.336 3.76±0.349 4.035±0.23 1.62-8.55 1.28-7.77 1.38-7.85
larval survival% 70.53±5.54 71.66±3.84 70.9±3.71 35.99-92.88 33.47-106.58 36.76-91.05
Unit larval wt 3.13±0.54 6.43±0.63 4.789±0.52 1.32-7.38 2.62-12.02 3.10-6.96
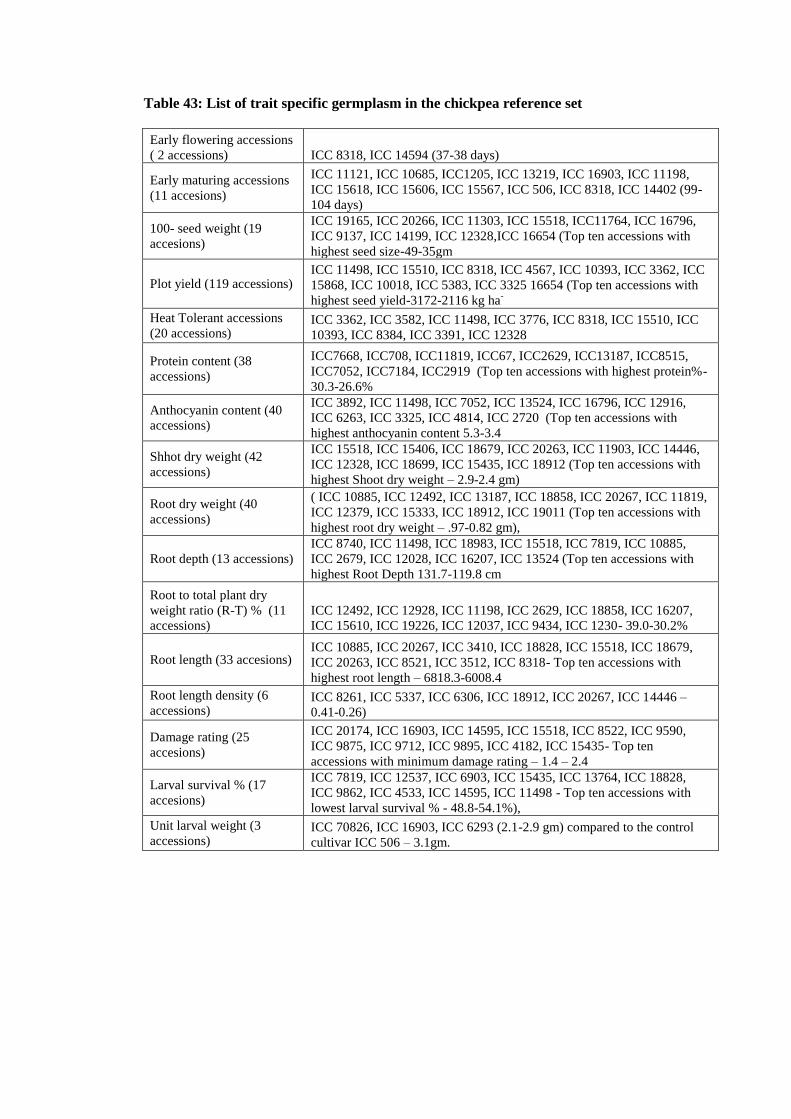
Table 43: List of trait specific germplasm in the chickpea reference set
Early flowering accessions
( 2 accessions) ICC 8318, ICC 14594 (37-38 days)
Early maturing accessions
(11 accesions)
ICC 11121, ICC 10685, ICC1205, ICC 13219, ICC 16903, ICC 11198,
ICC 15618, ICC 15606, ICC 15567, ICC 506, ICC 8318, ICC 14402 (99-
104 days)
100- seed weight (19
accesions)
ICC 19165, ICC 20266, ICC 11303, ICC 15518, ICC11764, ICC 16796,
ICC 9137, ICC 14199, ICC 12328,ICC 16654 (Top ten accessions with
highest seed size-49-35gm
Plot yield (119 accessions) ICC 11498, ICC 15510, ICC 8318, ICC 4567, ICC 10393, ICC 3362, ICC
15868, ICC 10018, ICC 5383, ICC 3325 16654 (Top ten accessions with
highest seed yield-3172-2116 kg ha-
Heat Tolerant accessions
(20 accessions) ICC 3362, ICC 3582, ICC 11498, ICC 3776, ICC 8318, ICC 15510, ICC
10393, ICC 8384, ICC 3391, ICC 12328
Protein content (38
accessions)
ICC7668, ICC708, ICC11819, ICC67, ICC2629, ICC13187, ICC8515,
ICC7052, ICC7184, ICC2919 (Top ten accessions with highest protein%-
30.3-26.6%
Anthocyanin content (40
accessions)
ICC 3892, ICC 11498, ICC 7052, ICC 13524, ICC 16796, ICC 12916,
ICC 6263, ICC 3325, ICC 4814, ICC 2720 (Top ten accessions with
highest anthocyanin content 5.3-3.4
Shhot dry weight (42
accessions)
ICC 15518, ICC 15406, ICC 18679, ICC 20263, ICC 11903, ICC 14446,
ICC 12328, ICC 18699, ICC 15435, ICC 18912 (Top ten accessions with
highest Shoot dry weight – 2.9-2.4 gm)
Root dry weight (40
accessions)
( ICC 10885, ICC 12492, ICC 13187, ICC 18858, ICC 20267, ICC 11819,
ICC 12379, ICC 15333, ICC 18912, ICC 19011 (Top ten accessions with
highest root dry weight – .97-0.82 gm),
Root depth (13 accessions)
ICC 8740, ICC 11498, ICC 18983, ICC 15518, ICC 7819, ICC 10885,
ICC 2679, ICC 12028, ICC 16207, ICC 13524 (Top ten accessions with
highest Root Depth 131.7-119.8 cm
Root to total plant dry
weight ratio (R-T) % (11
accessions)
ICC 12492, ICC 12928, ICC 11198, ICC 2629, ICC 18858, ICC 16207,
ICC 15610, ICC 19226, ICC 12037, ICC 9434, ICC 1230- 39.0-30.2%
Root length (33 accesions) ICC 10885, ICC 20267, ICC 3410, ICC 18828, ICC 15518, ICC 18679,
ICC 20263, ICC 8521, ICC 3512, ICC 8318- Top ten accessions with
highest root length – 6818.3-6008.4
Root length density (6
accessions) ICC 8261, ICC 5337, ICC 6306, ICC 18912, ICC 20267, ICC 14446 –
0.41-0.26)
Damage rating (25
accesions)
ICC 20174, ICC 16903, ICC 14595, ICC 15518, ICC 8522, ICC 9590,
ICC 9875, ICC 9712, ICC 9895, ICC 4182, ICC 15435- Top ten
accessions with minimum damage rating – 1.4 – 2.4
Larval survival % (17
accesions)
ICC 7819, ICC 12537, ICC 6903, ICC 15435, ICC 13764, ICC 18828,
ICC 9862, ICC 4533, ICC 14595, ICC 11498 - Top ten accessions with
lowest larval survival % - 48.8-54.1%),
Unit larval weight (3
accessions) ICC 70826, ICC 16903, ICC 6293 (2.1-2.9 gm) compared to the control
cultivar ICC 506 – 3.1gm.

Table 44: Allelic richness, major allele frequency, gene diversity, heterozygosity,
polymorphic information content (PIC), allele range, rare, common and most frequent
alleles of 91 SSR loci in the chickpea reference set (300 accessions)
Marker Allele
No
Major.Allele.
Frquency
Gene
Diversity
Hetero
zygosity PIC
Allele
range
Rare
alleles
Common
alleles
Frequent
alleles
CaSTMS2 26 0.121 0.936 0.00 0.932 210-326 18 562 0
CaSTMS4 19 0.239 0.873 0.00 0.861 209-275 14 380 124
CaSTMS5 13 0.491 0.699 0.00 0.668 202-242 12 214 218
CaSTMS6 10 0.594 0.538 0.00 0.460 200-232 16 18 404
CaSTMS7 8 0.727 0.443 0.00 0.413 150-177 10 142 404
CaSTMS9 11 0.538 0.597 0.00 0.531 100-138 14 40 362
CaSTMS12 7 0.496 0.564 0.00 0.469 140-152 12 24 476
CaSTMS13 8 0.816 0.318 0.00 0.296 100-156 10 88 434
CaSTMS20 3 0.990 0.021 0.00 0.021 144-153 6 0 570
CaSTMS21 12 0.434 0.724 0.00 0.686 162-207 16 198 380
CaSTMS23 6 0.632 0.484 0.00 0.390 101-151 6 8 518
CaSTMS25 17 0.429 0.732 0.00 0.698 101-186 22 170 372
GA9 13 0.580 0.610 0.00 0.574 177-218 16 230 340
GA13 5 0.577 0.508 0.00 0.402 109-127 6 8 558
GA20 27 0.122 0.927 0.00 0.922 143-213 22 554 0
GA22 31 0.261 0.823 0.00 0.801 110-361 48 198 268
GA26 17 0.211 0.855 0.00 0.838 180-236 12 280 210
GA34 41 0.149 0.918 0.00 0.912 116-363 64 446 0
GA137 18 0.335 0.817 0.00 0.799 117-482 12 216 298
GAA39 15 0.600 0.576 0.00 0.529 209-255 22 60 448
GAA40 9 0.445 0.705 0.00 0.660 199-244 12 150 328
GAA43 4 0.659 0.477 0.00 0.401 100-109 2 24 520
GAA58 9 0.482 0.620 0.00 0.551 219-249 6 58 392
TA2 22 0.121 0.929 0.00 0.924 119-189 14 480 0
TA5 26 0.112 0.920 0.00 0.915 158-440 28 544 0
TA8 24 0.143 0.919 0.00 0.914 131-252 12 448 0
TA14 29 0.139 0.920 0.00 0.915 210-348 18 574 0
TA20 43 0.159 0.949 0.00 0.947 119-347 42 500 0
TA21 34 0.103 0.942 0.00 0.939 276-422 40 540 0
TA22 43 0.071 0.965 0.00 0.963 314-312 28 566 0
TA25 42 0.093 0.952 0.00 0.950 190-373 38 524 0
TA27 28 0.310 0.848 0.00 0.836 177-334 32 360 176
TA28 52 0.089 0.960 0.41 0.958 110-433 67 425 0
TA53 32 0.140 0.936 1.65 0.933 169-269 32 454 0
TA59 18 0.169 0.906 0.00 0.899 216-268 12 426 0
TA64 38 0.084 0.951 0.40 0.949 119-462 35 465 0

Marker Allele
No
Major.Allele.
Frquency
Gene
Diversity
Hetero
zygosity PIC
Allele
range
Rare
alleles
Common
alleles
Frequent
alleles
TA71 34 0.093 0.946 2.71 0.944 121-275 15 575 0
TA72 30 0.168 0.899 1.71 0.891 150-263 34 550 0
TA78 34 0.148 0.924 0.00 0.920 151-259 30 566 0
TA80 29 0.168 0.920 0.00 0.915 125-268 20 576 0
TA96 32 0.149 0.932 0.00 0.929 175-429 24 498 0
TA103 24 0.157 0.902 0.00 0.894 144-202 26 484 0
TA106 41 0.177 0.933 0.00 0.929 131-480 40 502 0
TA108 8 0.788 0.365 0.00 0.349 101-156 12 98 410
TA110 21 0.088 0.941 0.00 0.938 185-244 8 490 0
TA113 18 0.220 0.886 2.41 0.876 112-240 15 439 128
TA117 32 0.116 0.939 2.87 0.936 116-366 32 526 0
TA120 19 0.189 0.876 0.00 0.863 123-126 22 550 0
TA125 29 0.131 0.922 0.00 0.917 168-256 40 404 0
TA130 26 0.272 0.876 0.00 0.867 147-476 32 390 158
TA132 39 0.215 0.908 0.00 0.902 104-484 50 358 112
TA135 34 0.224 0.898 0.00 0.891 107-481 42 422 134
TA140 27 0.208 0.879 0.00 0.868 102-192 38 274 218
TA142 39 0.181 0.918 0.00 0.913 103-263 58 484 0
TA144 22 0.122 0.926 0.00 0.921 198-290 10 530 0
TA159 45 0.077 0.958 0.00 0.956 100-494 56 486 0
TA176 56 0.088 0.969 0.00 0.969 150-356 40 554 0
TA180 27 0.151 0.922 0.00 0.917 153-373 18 526 0
TA196 20 0.192 0.876 0.00 0.864 175-230 22 436 0
TA200 29 0.115 0.933 0.00 0.929 139-343 20 556 0
TA203 39 0.054 0.964 0.00 0.963 108-294 28 560 0
TAA57 4 0.902 0.180 0.00 0.169 128-352 2 48 458
TAA58 39 0.071 0.960 0.00 0.958 206-335 26 454 0
TAA59 28 0.517 0.716 0.00 0.706 145-410 32 228 278
TAA169 20 0.211 0.880 0.00 0.868 152-398 18 378 106
TAA194 21 0.344 0.835 0.00 0.822 116-278 16 324 178
TaaSH 26 0.118 0.932 0.00 0.928 366-463 8 570 0
TR1 52 0.097 0.939 0.00 0.936 107-492 82 516 0
TR2 32 0.081 0.954 0.00 0.952 103-289 18 522 0
TR7 44 0.137 0.917 0.00 0.911 109-465 74 380 0
TR19 34 0.082 0.956 0.00 0.954 106-484 24 466 0
TR20 12 0.221 0.853 0.00 0.836 149-196 8 416 120
TR24 32 0.196 0.919 0.00 0.914 111-242 28 502 0
TR26 11 0.690 0.458 0.00 0.395 129-456 18 10 494

Marker Allele
No
Major.Allele.
Frquency
Gene
Diversity
Hetero
zygosity PIC
Allele
range
Rare
alleles
Common
alleles
Frequent
alleles
TR29 30 0.152 0.927 0.00 0.923 142-395 28 498 0
TR31 35 0.173 0.906 0.00 0.899 117-426 50 550 0
TR40 27 0.123 0.918 0.00 0.912 190-285 24 546 0
TR43 60 0.083 0.966 0.00 0.965 140-495 76 524 0
TR56 17 0.280 0.832 0.00 0.813 227-381 12 224 242
TR59 15 0.260 0.863 0.00 0.850 102-203 6 376 134
TS5 61 0.178 0.944 0.00 0.943 100-425 90 336 0
TS24 31 0.414 0.787 0.00 0.772 100-363 54 212 188
TS35 46 0.076 0.962 0.00 0.961 200-262 50 452 0
TS43 38 0.306 0.885 0.00 0.881 171-290 28 344 164
TS45 31 0.169 0.925 0.36 0.920 140-393 16 540 0
TS46 29 0.100 0.946 0.00 0.944 157-270 28 392 0
TS53 9 0.310 0.738 0.00 0.691 155-400 8 62 466
TS54 35 0.144 0.936 0.00 0.933 149-422 34 506 0
TS62 30 0.095 0.953 1.24 0.951 175-272 12 472 0
TS72 22 0.152 0.919 0.00 0.913 213-304 14 474 0
TS83 26 0.184 0.884 0.00 0.873 113-383 32 500 0
Mean 26 0.264 0.825 0.15 0.809 26.6 374 129.5
Min 3 0.054 0.021 0.00 0.021 2 0 0
Max 61 0.990 0.969 2.87 0.969 90 576 570

Table 45: Allelic richness, major allele frequency, gene diversity, heterozygosity, polymorphic
information content (PIC), allele range, rare, common and most frequent alleles of 91 SSR loci of
biological races in the chickpea reference set (300 accessions)
S.No Marker
Desi Kabuli Pea
Allele
no
Gene
Diversity
Hetero
zygosity PIC
Allele
no
Gene
Diversity
Hetero
zygosity PIC
Allele
no
Gene
Diversity
Hetero
zygosity PIC
1 CaSTMS2 26 0.94 0.00 0.93 17 0.91 0.00 0.90 9 0.88 0.00 0.86
2 CaSTMS4 16 0.83 0.00 0.82 13 0.85 0.00 0.84 8 0.86 0.00 0.84
3 CaSTMS5 8 0.69 0.00 0.66 10 0.64 0.00 0.61 3 0.57 0.00 0.49
4 CaSTMS6 5 0.51 0.00 0.42 5 0.51 0.00 0.46 2 0.48 0.00 0.36
5 CaSTMS7 5 0.44 0.00 0.40 4 0.37 0.00 0.35 3 0.53 0.00 0.47
6 CaSTMS9 7 0.55 0.00 0.46 7 0.58 0.00 0.54 5 0.77 0.00 0.73
7 CaSTMS12 5 0.54 0.00 0.44 5 0.59 0.00 0.51 2 0.48 0.00 0.36
8 CaSTMS13 5 0.33 0.00 0.30 3 0.27 0.00 0.25 1 0.00 0.00 0.00
9 CaSTMS20 1 0.00 0.00 0.00 1 0.00 0.00 0.00 1 0.00 0.00 0.00
10 CaSTMS21 10 0.68 0.00 0.64 7 0.78 0.00 0.74 4 0.55 0.00 0.50
11 CaSTMS23 3 0.47 0.00 0.37 4 0.50 0.00 0.40 2 0.35 0.00 0.29
12 CaSTMS25 11 0.69 0.00 0.65 10 0.75 0.00 0.72 4 0.70 0.00 0.65
13 GA9 10 0.59 0.00 0.55 9 0.63 0.00 0.59 3 0.56 0.00 0.48
14 GA13 3 0.50 0.00 0.38 5 0.53 0.00 0.43 2 0.42 0.00 0.33
15 GA20 23 0.91 0.00 0.90 21 0.93 0.00 0.93 7 0.81 0.00 0.79
16 GA22 24 0.84 0.00 0.82 13 0.73 0.00 0.69 5 0.72 0.00 0.68
17 GA26 13 0.83 0.00 0.81 12 0.85 0.00 0.83 6 0.79 0.00 0.76
18 GA34 35 0.91 0.00 0.91 20 0.90 0.00 0.89 8 0.86 0.00 0.84
19 GA137 17 0.82 0.00 0.80 15 0.81 0.00 0.78 4 0.66 0.00 0.61
20 GAA39 11 0.59 0.00 0.54 6 0.45 0.00 0.41 3 0.57 0.00 0.49
21 GAA40 8 0.71 0.00 0.66 5 0.56 0.00 0.51 3 0.59 0.00 0.53
22 GAA43 3 0.49 0.00 0.42 3 0.41 0.00 0.34 2 0.49 0.00 0.37
23 GAA58 7 0.59 0.00 0.51 4 0.61 0.00 0.55 3 0.43 0.00 0.39
24 TA2 20 0.92 0.00 0.91 15 0.90 0.00 0.89 8 0.86 0.00 0.84
25 TA5 21 0.92 0.00 0.91 18 0.91 0.00 0.90 5 0.69 0.00 0.65
26 TA8 21 0.91 0.00 0.91 20 0.92 0.00 0.91 6 0.78 0.00 0.75
27 TA14 24 0.92 0.00 0.91 19 0.89 0.00 0.89 7 0.84 0.00 0.82
28 TA20 37 0.95 0.00 0.95 30 0.94 0.00 0.93 9 0.88 0.00 0.87
29 TA21 26 0.93 0.00 0.93 28 0.95 0.00 0.94 8 0.86 0.00 0.84
30 TA22 40 0.96 0.00 0.96 24 0.92 0.00 0.91 9 0.88 0.00 0.86
31 TA25 35 0.95 0.00 0.94 29 0.95 0.00 0.95 9 0.88 0.00 0.86
32 TA27 23 0.84 0.00 0.83 19 0.85 0.00 0.84 7 0.81 0.00 0.79
33 TA28 38 0.96 0.01 0.96 33 0.95 0.00 0.95 8 0.86 0.00 0.85
34 TA53 28 0.93 0.01 0.93 22 0.93 0.03 0.92 9 0.86 0.00 0.85
35 TA59 16 0.89 0.00 0.88 14 0.88 0.00 0.87 6 0.81 0.00 0.79
36 TA64 34 0.95 0.01 0.95 21 0.92 0.00 0.92 9 0.88 0.00 0.86
37 TA71 32 0.94 0.03 0.94 22 0.92 0.02 0.92 9 0.88 0.10 0.86
38 TA72 27 0.90 0.02 0.89 18 0.88 0.00 0.87 7 0.82 0.00 0.80
39 TA78 26 0.90 0.00 0.89 24 0.94 0.00 0.94 9 0.88 0.00 0.86
40 TA80 25 0.93 0.00 0.92 17 0.89 0.00 0.88 6 0.76 0.00 0.73
41 TA96 26 0.91 0.00 0.90 22 0.92 0.00 0.92 7 0.84 0.00 0.82
42 TA103 21 0.90 0.00 0.89 16 0.89 0.00 0.88 7 0.84 0.00 0.82
43 TA106 34 0.93 0.00 0.92 24 0.91 0.00 0.90 7 0.84 0.00 0.82
44 TA108 8 0.41 0.00 0.39 4 0.17 0.00 0.17 3 0.59 0.00 0.50
45 TA110 20 0.94 0.00 0.94 19 0.93 0.00 0.92 7 0.84 0.00 0.82
46 TA113 15 0.87 0.01 0.86 13 0.87 0.04 0.85 7 0.81 0.00 0.79
47 TA117 26 0.93 0.02 0.93 26 0.94 0.03 0.94 8 0.86 0.09 0.84
48 TA120 18 0.89 0.00 0.88 13 0.83 0.00 0.81 6 0.76 0.00 0.73
49 TA125 22 0.91 0.00 0.91 20 0.92 0.00 0.92 5 0.73 0.00 0.70
50 TA130 21 0.86 0.00 0.85 16 0.87 0.00 0.86 5 0.74 0.00 0.70
51 TA132 28 0.86 0.00 0.85 30 0.95 0.00 0.94 9 0.88 0.00 0.86

S.No Marker
Desi Kabuli Pea
Allele
no
Gene
Diversity
Hetero
zygosity PIC
Allele
no
Gene
Diversity
Hetero
zygosity PIC
Allele
no
Gene
Diversity
Hetero
zygosity PIC
52 TA135 27 0.89 0.00 0.88 19 0.89 0.00 0.88 6 0.79 0.00 0.76
53 TA140 23 0.88 0.00 0.87 15 0.86 0.00 0.84 6 0.81 0.00 0.79
54 TA142 30 0.90 0.00 0.90 26 0.92 0.00 0.91 4 0.73 0.00 0.68
55 TA144 20 0.93 0.00 0.92 16 0.86 0.00 0.85 8 0.84 0.00 0.82
56 TA159 36 0.94 0.00 0.94 32 0.94 0.00 0.93 9 0.88 0.00 0.87
57 TA176 53 0.97 0.00 0.97 29 0.95 0.00 0.94 9 0.86 0.00 0.85
58 TA180 24 0.90 0.00 0.90 22 0.93 0.00 0.92 7 0.82 0.00 0.80
59 TA196 17 0.88 0.00 0.86 14 0.84 0.00 0.82 5 0.74 0.00 0.70
60 TA200 28 0.93 0.00 0.93 19 0.91 0.00 0.90 8 0.84 0.00 0.83
61 TA203 37 0.96 0.00 0.96 29 0.95 0.00 0.94 8 0.86 0.00 0.84
62 TAA57 4 0.19 0.00 0.18 2 0.16 0.00 0.14 2 0.17 0.00 0.15
63 TAA58 27 0.95 0.00 0.95 32 0.95 0.00 0.95 8 0.86 0.00 0.84
64 TAA59 24 0.72 0.00 0.71 18 0.73 0.00 0.71 2 0.35 0.00 0.29
65 TAA169 17 0.87 0.00 0.86 14 0.83 0.00 0.82 6 0.80 0.00 0.77
66 TAA194 17 0.83 0.00 0.81 19 0.83 0.00 0.82 5 0.78 0.00 0.74
67 TaaSH 24 0.92 0.00 0.92 21 0.93 0.00 0.93 7 0.83 0.00 0.80
68 TR1 34 0.93 0.00 0.93 31 0.94 0.00 0.94 8 0.86 0.00 0.84
69 TR2 32 0.95 0.00 0.95 24 0.94 0.00 0.94 10 0.89 0.00 0.88
70 TR7 31 0.90 0.00 0.89 23 0.92 0.00 0.92 7 0.84 0.00 0.82
71 TR19 32 0.95 0.00 0.95 21 0.93 0.00 0.93 5 0.78 0.00 0.74
72 TR20 11 0.82 0.00 0.80 9 0.82 0.00 0.80 5 0.74 0.00 0.70
73 TR24 27 0.89 0.00 0.89 19 0.93 0.00 0.92 6 0.79 0.00 0.76
74 TR26 7 0.45 0.00 0.38 5 0.39 0.00 0.35 3 0.58 0.00 0.49
75 TR29 27 0.92 0.00 0.91 20 0.90 0.00 0.90 7 0.82 0.00 0.80
76 TR31 28 0.90 0.00 0.89 17 0.88 0.00 0.87 9 0.88 0.00 0.86
77 TR40 21 0.90 0.00 0.89 19 0.90 0.00 0.89 7 0.84 0.00 0.82
78 TR43 51 0.96 0.00 0.96 33 0.92 0.00 0.92 10 0.89 0.00 0.88
79 TR56 13 0.77 0.00 0.74 13 0.88 0.00 0.87 5 0.74 0.00 0.70
80 TR59 14 0.85 0.00 0.84 12 0.86 0.00 0.84 6 0.78 0.00 0.75
81 TS5 48 0.92 0.00 0.92 35 0.96 0.00 0.95 8 0.88 0.00 0.86
82 TS24 27 0.78 0.00 0.77 12 0.75 0.00 0.72 5 0.79 0.00 0.76
83 TS35 36 0.96 0.00 0.96 27 0.95 0.00 0.94 8 0.84 0.00 0.82
84 TS43 32 0.86 0.00 0.86 23 0.92 0.00 0.92 4 0.66 0.00 0.61
85 TS45 27 0.92 0.01 0.92 23 0.91 0.00 0.91 5 0.71 0.00 0.66
86 TS46 26 0.94 0.00 0.93 22 0.94 0.00 0.93 8 0.86 0.00 0.85
87 TS53 8 0.73 0.00 0.68 6 0.75 0.00 0.70 3 0.62 0.00 0.55
88 TS54 32 0.94 0.00 0.94 22 0.91 0.00 0.90 6 0.79 0.00 0.76
89 TS62 27 0.95 0.01 0.94 25 0.94 0.01 0.94 4 0.67 0.00 0.61
90 TS72 20 0.89 0.00 0.89 16 0.92 0.00 0.91 7 0.82 0.00 0.80
91 TS83 22 0.86 0.00 0.85 13 0.86 0.00 0.85 6 0.79 0.00 0.76
Mean 22 0.82 0.00 0.80 17 0.81 0.00 0.79 6 0.73 0.00 0.70
Min 1 0 0 0 1 0 0 0 1 0 0 0
Max 53 0.97 0.03 0.97 35 0.96 0.04 0.95 10 0.89 0.1 0.88

Table 46: Range and average gene diversity of both biological status and geographical regions in
the chickpea reference set
Category #
Accessions
Allele information Gene diversity PIC value Heterozygosity
# Alleles Range Avg Range Avg Range Avg Range Avg
Ref-211+89 300 2411 3-61 26 0.021-0.969 0.825 0.021-0.969 0.809 0.00-2.87 0.15
Biological status
Desi chickpea 194 2009 1-53 22 0-0.97 0.820 0-0.97 0.80 0-0.03 0.00
Kabuli chickpea 88 1572 1-35 17 0-0.96 0.810 0-0.95 0.79 0-0.04 0.00
Pea-shaped
chickpea 11 544 1-10 6 0-0.89 0.73 0-0.89 0.73 0-0.01 0.00
Wild species 7 433 1-8 5 0-0.86 0.73 0-0.84 0.69 0-0.33 0.01
Geographical regions
South East Asia 110 1489 1-36 16 0-0.96 0.79 0-0.22 0 0-0.96 0.770
West Asia 93 1578 1-37 17 0-0.96 0.820 0-0.06 0.001 0-0.96 0.800
Mediterranean 56 1401 2-30 15 0.11-0.96 0.817 0.107-0.96 0.800 0-0.10 0.006
Africa 21 755 1-15 8 0-0.92 0.760 0-0.13 0.010 0-0.91 0.730
North America 6 286 0-6 3 0-0.83 0.560 0-0.50 0.005 0-0.81 0.502
Russian Federation 6 333 0-6 4 0-0.83 0.640 0-0.25 0.030 0-0.81 0.590
South America 4 239 1-4 3 0-0.75 0.540 0-0 0.000 0-0.70 0.460
Europe 3 179 0-4 2 0-0.72 0.410 0-0.33 0.000 0-0.067 0.340
Unknown 6 316 1-6 3 0-0.83 0.590 0-0.25 0.000 0-0.81 0.540

Table 47: Details of the accessions present in four clusters identified by
unweighted neighbor joining tree based on 91 SSR markers in the chickpea
reference set
Cluster I : Total 89 accessions + 2 control cultivars
64 desi accessions 24 kabuli accessions 1 pea type
+ 2 controls
ICC 4918
ICC 4948
Cluster II : Total 30 accessions
20 desi accessions 9 kabuli accessions 1 pea type
Cluster III : Total 87 accessions
76 desi accessions 9 kabuli accessions 2 pea type
Cluster IV : Total 91 accessions + 3 control cultivars
34 desi accessions 46 kabuli accessions 7 pea type
+ 1 control + 2 controls
ICC 15996 ICCV 92311,ICC 4973

Table 48: Range and average Gene diversity of both biological status and
geographical regions in the chickpea reference collection
Category Cluster-I Cluster-II Cluster-III Cluster-IV
Total number of alleles 1601 1006 1547 1715
Allele range 1-40 1-19 1-43 2-37
Average number of alleles 17.6 11.1 17 18.8
PIC 0.961 0.929 0.96 0.957
Gene Diversity 0.962 0.933 0.962 0.959
Heterozygosity 0.023 0.071 0.047 0.049
Rare alleles 2 0 1 7
Common alleles 10559 3432 10145 10937
Frequent alleles 3789 1456 3915 3628
Biological Status
Desi 64 20 76 34
Kabuli 24 9 9 46
Pea 1 1 2 7
Wild 0 0 0 4
Geographical origin
Africa 13 5 0 3
Europe 1 1 0 1
Mediterranean 7 8 6 32
North America 3 0 1 2
Russian Federation 2 0 2 2
South East Asia 43 12 34 16
South America 3 0 0 1
Unknown 3 0 1 2
West Asia 14 4 43 32

Table 51: Summary statistics of the chickpea reference set accessions based on
subpopulations detected by STRUCTURE analysis using 91 SSR markers
Mean Range
Pop
ulati
ons
Total
no of
alleles
Samp
le
Size
Allel
eNo
Gene
Diversi
ty
Heteroz
ygosity PIC
Allele
range
Gene
Dversity
Heterozy
gosity PIC
Rare
alleles
commo
n
alleles
Freque
nt
alleles.
1 1199 48 11 0.739 0.0023 0.727 0-25 0-0.948 0-0.667 0-0.946 32 5816 2824
2 720 25 6 0.668 0.0059 0.649 1-18 0-0.934 0-0.080 0-0.930 0 2183 2297
3 778 24 7 0.685 0.0011 0.667 0-16 0-0.926 0-0.041 0-0.922 0 2122 1556
4 483 14 4 0.560 0.0006 0.535 0-10 0-0.900 0-0.071 0-0.891 0 783 1151
5 527 15 5 0.564 0.0006 0.538 0-11 0-0.888 0-0.066 0-0.877 0 960 1926
6 803 28 7 0.670 0.0035 0.653 0-21 0-0.947 0-0.071 0-0.945 0 2311 1717
7 749 13 7 0.765 0.0027 0.737 1-11 0-0.909 0-0.091 0-0.902 0 1393 871
8 1301 56 11 0.731 0.0006 0.715 0-26 0-0.950 0-0.018 0-0.947 2 7087 3881
9 544 12 5 0.650 0.0013 0.612 1-9 0-0.876 0-0.000 0-0.863 0 865 1241
10 574 15 5 0.714 0.0018 0.693 0-12 0-0.898 0-0.071 0-0.890 0 1160 1130
11 348 9 3 0.561 0.0058 0.527 0-7 0-0.840 0-0.000 0-0.819 0 324 1340
12 428 12 4 0.567 0.0067 0.517 1-9 0-0.876 0-0.083 0-0.863 0 552 1462
13 759 29 7 0.707 0.0017 0.690 0-21 0-0.949 0-0.087 0-0.947 0 2177 1961

Table 52: AMOVA_Subpop-Pairwise Population Fst Values in the chickpea reference set
SP SP1 SP2 SP3 SP4 SP5 SP6 SP7 SP8 SP9 SP10 SP11 SP12 SP13
SP1 0.000
SP2 0.157 0.000
SP3 0.229 0.244 0.000
SP4 0.239 0.255 0.253 0.000
SP5 0.292 0.317 0.284 0.326 0.000
SP6 0.237 0.265 0.220 0.253 0.313 0.000
SP7 0.162 0.185 0.165 0.197 0.161 0.186 0.000
SP8 0.225 0.248 0.215 0.241 0.116 0.235 0.102 0.000
SP9 0.198 0.224 0.195 0.211 0.184 0.202 0.102 0.114 0.000
SP10 0.271 0.298 0.264 0.279 0.334 0.254 0.216 0.259 0.235 0.000
SP11 0.205 0.214 0.292 0.319 0.362 0.313 0.219 0.286 0.268 0.349 0.000
SP12 0.200 0.227 0.229 0.255 0.243 0.245 0.124 0.172 0.158 0.269 0.274 0.000
SP13 0.280 0.292 0.257 0.271 0.337 0.253 0.226 0.268 0.243 0.271 0.346 0.290 0.000
SP- Subpopulations
Table 53: AMOVA_Subpop-Pairwise Population Matrix of Nei Genetic Distance in the chickpea reference set
SP SP1 SP2 SP3 SP4 SP5 SP6 SP7 SP8 SP9 SP10 SP11 SP12 SP13
SP1 0.000
SP2 0.172 0.000
SP3 0.772 0.743 0.000
SP4 0.679 0.643 0.710 0.000
SP5 1.282 1.218 1.192 1.291 0.000
SP6 0.703 0.799 0.529 0.552 1.298 0.000
SP7 0.809 0.864 0.863 0.961 0.761 0.886 0.000
SP8 1.069 1.063 1.016 0.995 0.267 1.020 0.552 0.000
SP9 0.861 0.937 0.831 0.803 0.767 0.760 0.690 0.501 0.000
SP10 0.721 0.806 0.630 0.518 1.188 0.404 0.916 0.949 0.761 0.000
SP11 0.373 0.311 0.928 0.863 1.391 0.952 1.001 1.244 1.130 1.003 0.000
SP12 0.694 0.751 0.920 0.942 1.017 0.933 0.728 0.807 0.786 0.834 0.956 0.000
SP13 0.721 0.665 0.527 0.439 1.081 0.392 0.940 0.935 0.764 0.297 0.872 0.957 0.000
SP- Subpopulations

Table 55: Principal Coordinates Analysis (PCoA) in the chickpea reference set accessions using 91 SSR
markers based on estimates of Nei (1973) distance
Axis PC1 PC2 PC3 ICC18912 0.191 1.331 0.088
% Variation 36.48 33.38 11.85 ICC5434 -0.236 -0.32 -0.32
Cumulative % 36.48 69.86 81.71 ICC4918 -0.349 -0.34 -0.35
Eigen values 188.6 66.97 40.7 ICC14595 -0.151 0.017 -0.42
ICC8522 1.055 -0.09 0.382 ICC5878 -0.554 -0.7 1.041
ICC13283 1.118 -0.19 -0.19 ICC1083 -0.173 -0.33 -0.39
ICC8058 1.069 -0.28 -0.03 ICC5613 -0.308 -0.35 -0.44
ICC12537 1.139 -0.13 0.079 ICC8318 -0.456 -0.67 1.186
ICC8261 1.197 -0.09 0.207 ICC9702 -0.438 -0.2 1.483
ICC19100 1.127 -0.15 -0.02 ICC9590 -0.15 0.062 -0.29
ICC10755 1.043 -0.05 -0.09 ICC6279 -0.227 -0.22 -0.43
ICC13764 0.967 -0.19 -0.02 ICC16374 1.165 -0.24 0.178
ICC20262 1.079 -0.02 0.064 ICC6802 -0.435 -0.19 -0.39
ICC13441 1.201 -0.12 0.055 ICC6811 -0.325 -0.27 1.351
ICC19011 1.28 -0.17 -0.01 ICC14669 -0.324 -0.23 -0.46
ICC7668 1.088 -0.09 0.1 ICC5845 -0.925 -0.07 -0.47
ICC14199 1.131 -0.05 -0.1 ICC11498 -0.902 -0.23 -0.24
ICC7326 1.106 -0.16 0.068 ICC2720 -0.961 -0.05 -0.5
ICC6294 1.016 -0.1 -0.15 ICC791 -1.119 -0.08 -0.42
ICC8607 0.7 -0.19 0.42 ICC6579 -1.125 -0.18 -0.18
ICC15762 0.949 0.028 0.312 ICC5639 -0.98 0.038 -0.25
ICC7571 1.128 -0.16 -0.12 ICC12928 -0.967 -0.09 -0.43
ICC8515 1.214 -0.17 -0.04 ICC440 -0.836 -0.03 -0.33
ICC7305 1.025 -0.2 -0.15 ICC9586 -1.001 -0.08 -0.02
ICC14098 1.171 -0.17 0.078 ICC6571 -0.966 -0.09 -0.18
ICC18858 1.091 -0.05 -0.09 ICC1715 -1.023 -0.06 -0.15
ICC15510 1.184 -0.13 -0.03 ICC16524 -1.055 -0.07 -0.19
ICC2737 1.043 -0.08 0.114 ICC1161 -0.987 -0.14 -0.33
ICC8855 1.001 -0.03 -0.11 ICC11627 -0.986 -0.06 -0.33
ICC19164 1.075 -0.34 -0.08 ICC4567 -1.042 -0.07 -0.08
ICC20259 1.161 -0.24 -0.09 ICC7255 -0.288 -0.32 -0.19
ICC9402 1.153 -0.19 0.05 ICC18720 -0.315 -0.36 -0.36
ICC12866 1.134 -0.1 0.032 ICC13719 -0.316 -0.16 -0.4
ICC12321 1.042 -0.17 -0.08 ICC12324 -0.405 -0.27 -0.16
ICC15802 0.893 -0.12 -0.14 ICC18828 -0.098 -0.03 -0.31
ICC2679 1.1 -0.22 0.044 ICC12328 -0.333 -0.19 -0.29
ICC9643 1.042 -0.09 0.14 ICC11819 -0.392 -0.5 1.013
ICC20261 1.053 -0.19 -0.1 ICC16654 -0.308 -0.19 1.517
ICC7323 1.044 -0.29 -0.16 ICC4841 -0.102 -0.24 -0.31
ICC4853 1.101 -0.15 -0.01 ICC8151 -0.122 -0.02 -0.5
ICC12492 0.984 -0.27 0.146 ICC7308 -0.341 -0.24 -0.24
ICC3421 1.288 -0.19 -0.11 ICC11879 -0.074 -0.28 -0.11
ICC13077 1.004 0.025 0.184 ICC15248 -0.366 -0.4 0.292
ICC19226 1.072 -0.28 -0.12 ICC12037 -0.344 -0.08 -0.39
ICC3410 0.998 -0.31 -0.01 ICC19034 -0.317 -0.24 -0.24
ICC20265 1.077 -0.12 -0.04 ICC20264 -0.413 -0.41 1.021
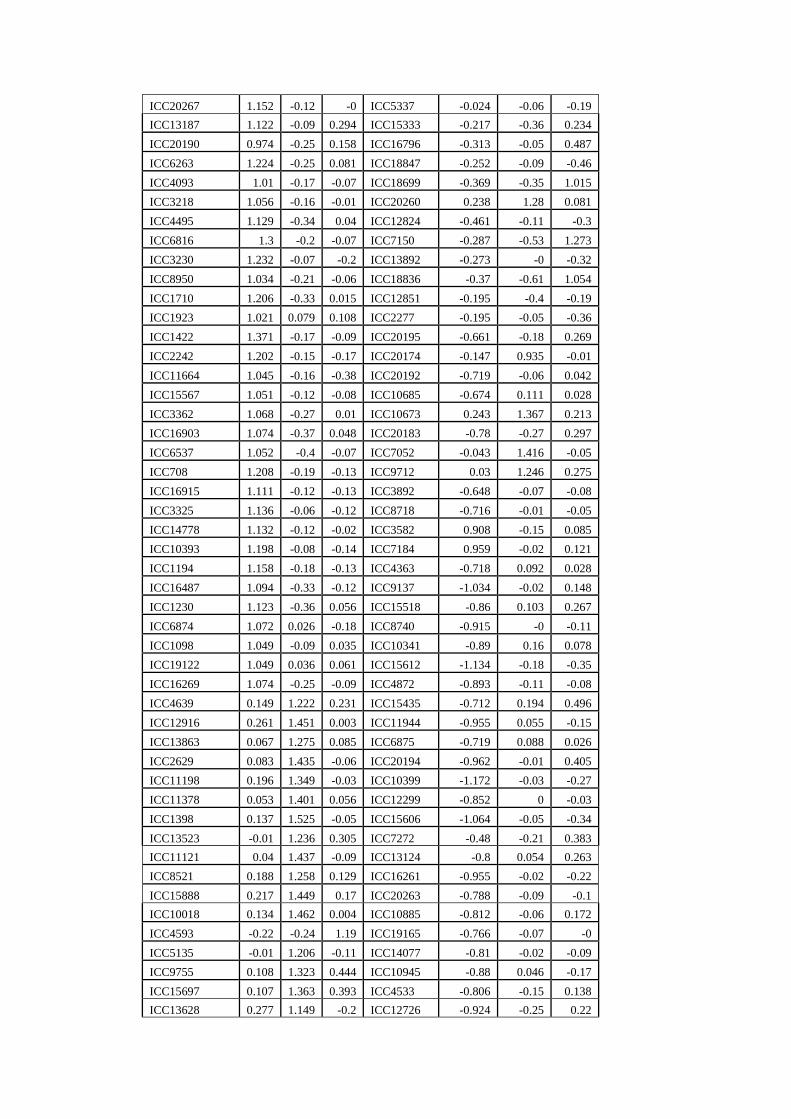
ICC20267 1.152 -0.12 -0 ICC5337 -0.024 -0.06 -0.19
ICC13187 1.122 -0.09 0.294 ICC15333 -0.217 -0.36 0.234
ICC20190 0.974 -0.25 0.158 ICC16796 -0.313 -0.05 0.487
ICC6263 1.224 -0.25 0.081 ICC18847 -0.252 -0.09 -0.46
ICC4093 1.01 -0.17 -0.07 ICC18699 -0.369 -0.35 1.015
ICC3218 1.056 -0.16 -0.01 ICC20260 0.238 1.28 0.081
ICC4495 1.129 -0.34 0.04 ICC12824 -0.461 -0.11 -0.3
ICC6816 1.3 -0.2 -0.07 ICC7150 -0.287 -0.53 1.273
ICC3230 1.232 -0.07 -0.2 ICC13892 -0.273 -0 -0.32
ICC8950 1.034 -0.21 -0.06 ICC18836 -0.37 -0.61 1.054
ICC1710 1.206 -0.33 0.015 ICC12851 -0.195 -0.4 -0.19
ICC1923 1.021 0.079 0.108 ICC2277 -0.195 -0.05 -0.36
ICC1422 1.371 -0.17 -0.09 ICC20195 -0.661 -0.18 0.269
ICC2242 1.202 -0.15 -0.17 ICC20174 -0.147 0.935 -0.01
ICC11664 1.045 -0.16 -0.38 ICC20192 -0.719 -0.06 0.042
ICC15567 1.051 -0.12 -0.08 ICC10685 -0.674 0.111 0.028
ICC3362 1.068 -0.27 0.01 ICC10673 0.243 1.367 0.213
ICC16903 1.074 -0.37 0.048 ICC20183 -0.78 -0.27 0.297
ICC6537 1.052 -0.4 -0.07 ICC7052 -0.043 1.416 -0.05
ICC708 1.208 -0.19 -0.13 ICC9712 0.03 1.246 0.275
ICC16915 1.111 -0.12 -0.13 ICC3892 -0.648 -0.07 -0.08
ICC3325 1.136 -0.06 -0.12 ICC8718 -0.716 -0.01 -0.05
ICC14778 1.132 -0.12 -0.02 ICC3582 0.908 -0.15 0.085
ICC10393 1.198 -0.08 -0.14 ICC7184 0.959 -0.02 0.121
ICC1194 1.158 -0.18 -0.13 ICC4363 -0.718 0.092 0.028
ICC16487 1.094 -0.33 -0.12 ICC9137 -1.034 -0.02 0.148
ICC1230 1.123 -0.36 0.056 ICC15518 -0.86 0.103 0.267
ICC6874 1.072 0.026 -0.18 ICC8740 -0.915 -0 -0.11
ICC1098 1.049 -0.09 0.035 ICC10341 -0.89 0.16 0.078
ICC19122 1.049 0.036 0.061 ICC15612 -1.134 -0.18 -0.35
ICC16269 1.074 -0.25 -0.09 ICC4872 -0.893 -0.11 -0.08
ICC4639 0.149 1.222 0.231 ICC15435 -0.712 0.194 0.496
ICC12916 0.261 1.451 0.003 ICC11944 -0.955 0.055 -0.15
ICC13863 0.067 1.275 0.085 ICC6875 -0.719 0.088 0.026
ICC2629 0.083 1.435 -0.06 ICC20194 -0.962 -0.01 0.405
ICC11198 0.196 1.349 -0.03 ICC10399 -1.172 -0.03 -0.27
ICC11378 0.053 1.401 0.056 ICC12299 -0.852 0 -0.03
ICC1398 0.137 1.525 -0.05 ICC15606 -1.064 -0.05 -0.34
ICC13523 -0.01 1.236 0.305 ICC7272 -0.48 -0.21 0.383
ICC11121 0.04 1.437 -0.09 ICC13124 -0.8 0.054 0.263
ICC8521 0.188 1.258 0.129 ICC16261 -0.955 -0.02 -0.22
ICC15888 0.217 1.449 0.17 ICC20263 -0.788 -0.09 -0.1
ICC10018 0.134 1.462 0.004 ICC10885 -0.812 -0.06 0.172
ICC4593 -0.22 -0.24 1.19 ICC19165 -0.766 -0.07 -0
ICC5135 -0.01 1.206 -0.11 ICC14077 -0.81 -0.02 -0.09
ICC9755 0.108 1.323 0.444 ICC10945 -0.88 0.046 -0.17
ICC15697 0.107 1.363 0.393 ICC4533 -0.806 -0.15 0.138
ICC13628 0.277 1.149 -0.2 ICC12726 -0.924 -0.25 0.22

ICC14831 0.21 1.194 -0.07 ICC6306 -0.711 -0.03 -0.1
ICC15294 0.13 1.316 0.294 ICC18839 -0.747 -0.02 0.207
ICC2072 0.102 1.319 -0.13 ICC10939 -0.686 0.035 -0.02
ICC11764 0.053 1.29 -0.02 ICC5879 -0.866 -0.04 0.413
ICC2593 0.178 1.293 0.105 ICC7413 -0.939 -0.07 -0.01
ICC9636 0.203 1.444 0.264 ICC8200 -0.811 0.096 0.018
ICC8621 -0.92 -0.16 -0.14 ICC18983 -0.213 -0.08 -0.43
ICC4657 -0.96 0.02 -0.14 ICC11284 -0.376 -0.48 -0.08
ICC14051 -0.76 -0.06 0.123 ICC3391 -0.22 -0.3 -0.27
ICC15406 -0.96 -0.08 0.102 ICC1392 -0.209 -0.1 -0.34
ICC15614 -0.9 0.084 -0.06 ICC1397 1.138 -0.03 -0.23
ICC4991 -0.9 -0.12 -0.2 ICC12947 1.176 0.029 -0.22
ICC11303 -0.76 0.055 -0.02 ICC1431 1.177 -0.11 0.074
ICC9942 -0.93 0.011 -0.2 ICC1510 1.114 -0.26 -0.15
ICC506 -0.74 -0.06 -0.1 ICC5383 1.098 -0.11 -0.04
ICC13219 -1.05 -0.07 -0.16 ICC283 1.09 -0.2 -0.13
ICC19095 -0.99 -0.13 0.059 ICC2580 1.195 -0.23 0.017
ICC15785 -0.87 -0.17 -0.02 ICC456 1.022 -0.07 -0.14
ICC11279 -0.98 0.01 -0.17 ICC1356 1.009 -0.2 -0.17
ICC9872 -0.95 -0.11 -0.03 ICC3631 0.973 -0.13 0.048
ICC7441 -0.87 0.117 -0.17 ICC2507 1.128 -0.24 0.073
ICC14815 -1.02 -0.08 -0 ICC3776 1.06 -0.23 0.054
ICC12379 -0.92 -0.05 -0.03 ICC4814 1.122 -0.2 -0.04
ICC867 -1.01 -0.21 -0.05 ICC4182 -0.309 0.05 0.452
ICC12155 -0.8 -0.09 -0.04 ICC4463 1.003 -0.14 0.004
ICC8350 -1.06 -0.05 -0.12 ICC3761 -0.815 0.104 0.268
ICC14446 -0.93 -0.1 0.215 ICC1052 -0.265 -0.07 -0.47
ICC8195 -0.88 -0.13 -0.12 ICC13524 0.111 1.27 0.199
ICC18884 -0.98 -0.04 0.048 ICC2884 -0.933 -0.06 -0.06
ICC1205 -0.98 -0.03 -0.28 ICC6293 -0.832 0.007 0.206
ICC9418 -0.83 -0.02 -0.12 ICC4418 -0.246 -0.1 -0.3
ICC18724 -0.94 -0.02 -0.22 ICC1180 -0.336 -0.46 -0.3
ICC12654 -0.84 -0.02 -0.13 ICC2065 -0.392 -0.42 -0.47
ICC2990 -0.63 -0.01 0.253 ICC8384 -0.102 0.019 -0.46
ICC6877 -1.04 -0.14 0.012 ICC67 -0.282 -0.08 -0.57
ICC9848 -0.94 0.078 0.134 ICC95 -0.358 -0.59 0.925
ICC7867 -0.78 -0.06 0.611 ICC13816 -0.312 -0.22 -0.49
ICC7554 -0.85 0.046 -0.1 ICC2263 -0.203 -0.2 -0.43
ICC7819 0.054 1.411 0.34 ICC3946 -0.397 -0.21 0.907
ICC12028 0.074 1.303 0.203 ICC637 -0.321 -0.27 -0.48
ICC2919 -0.35 -0.17 -0.12 ICC1164 -0.319 -0.3 -0.25
ICC13357 -0.83 -0.13 0.062 ICC1882 -0.328 -0.2 -0.25
ICC3239 -0.24 -0.25 -0.14 ICC5221 -0.198 -0.3 -0.29
ICC3512 -0.3 -0.08 -0.31 ICC15264 -0.313 0.079 -0.51
ICC13599 1.127 -0.1 0.139 ICC18679 -0.344 -0.4 -0.4
ICC9895 -0.45 -0.57 1.074 ICC15868 -0.339 -0.28 -0.53
ICC20193 -0.21 0.035 -0.11 ICC762 -0.416 -0.2 -0.13
ICC13461 -0.24 -0.41 -0.35 ICC11584 -0.382 -0.45 -0.22

ICC9434 -0.12 -0.25 -0.33 ICC14799 -0.217 -0.15 -0.57
ICC2482 -0.4 -0.29 0.166 ICC15610 -0.105 -0.03 -0.4
ICC19147 -0.28 -0.48 0.553 ICC9002 -0.288 -0.31 -0.59
ICC9862 -0.24 -0.32 -0.26 ICC2210 -0.428 -0.19 -0.4
ICC8752 -0.24 -0.06 -0.24 ICC16207 -0.282 -0.15 1.078
ICC20266 -0.38 -0.29 0.598 ICC12307 -0.389 -0.37 1.393
ICC5504 -0.35 -0.46 0.105 ICC2969 -0.229 -0.42 -0.45
ICC1915 -0.14 -0.25 -0.14 ICC15618 -0.353 -0.29 -0.4
ICC10466 -0.23 -0.32 0.842 ICC14402 -0.261 0.125 -0.57
ICC7315 -0.08 -0.25 -0.34 ICC11903 -0.244 -0.46 1.084

Table 56: Marker trait associations (MTAs) detected for different qualitative traits in the Chickpea
reference set
Trait Locus Chr_pos F_Marker p-perm_Marker p-adj_Marker Rsq_Marker
Seed Shape CaSTMS9 NN 4.2958 9.99E-04 9.99E-04 0.0963
TR20 1 4.1727 9.99E-04 9.99E-04 0.1015
TA22 6 2.2348 0.005 9.99E-04 0.1862
TA180 7 2.161 0.007 0.038 0.1208
TR24 3 2.4717 0.007 9.99E-04 0.156
TR40 6 2.0625 0.014 0.1049 0.1163
TS35 5 1.9204 0.014 9.99E-04 0.1768
TS45 8 1.8641 0.016 0.2098 0.1249
GAA40 1 2.8805 0.021 0.1339 0.0562
TR31 3 1.9896 0.021 0.0689 0.139
TAA169 NN 1.9899 0.034 0.4895 0.0855
TR26 3 2.2594 0.04 0.6913 0.0545
TA8 1 1.8121 0.042 0.7393 0.0935
Flower color TA21 7 2.2003 0.003 9.99E-04 0.1557
TS62 7 2.1283 0.003 9.99E-04 0.1478
CaSTMS9 NN 2.9198 0.004 0.023 0.0711
GAA58 NN 2.8298 0.004 0.0689 0.0573
TA2 4 2.3332 0.004 9.99E-04 0.1107
TA22 6 1.969 0.004 9.99E-04 0.1758
TR24 3 2.0424 0.004 0.024 0.1392
TA180 7 2.2434 0.005 9.99E-04 0.1289
CaSTMS5 3 2.1461 0.014 0.5045 0.0631
TR20 4 2.0499 0.025 0.8052 0.056
TA159 8 1.6127 0.027 0.6583 0.1542
TA103 2 1.6831 0.034 0.9201 0.0909
TA106 6 1.5965 0.034 0.7892 0.1402
TR7 6 1.5612 0.034 0.8232 0.1504
GA20 2 1.668 0.038 0.9091 0.1008
TR31 3 1.5498 0.044 0.971 0.1176
TS46 7 1.5593 0.046 0.99 0.1018
TS43 5 1.4864 0.048 0.996 0.1262
Plant color TA2 4 2.6652 9.99E-04 9.99E-04 0.1065
TR20 4 4.1693 9.99E-04 9.99E-04 0.0905
TA159 8 2.1148 0.004 9.99E-04 0.1627
TA113 1 2.4382 0.006 9.99E-04 0.103
TA180 7 2.1228 0.007 0.039 0.1062
GAA58 NN 3.1655 0.012 0.045 0.0546
TR24 3 1.8287 0.017 0.2727 0.1097
TA200 2 1.9488 0.018 0.1748 0.1056
TA22 6 1.7799 0.023 0.1958 0.1403
CaSTMS4 3 2.0267 0.025 0.4196 0.0738
TR43 1 1.6972 0.028 0.2138 0.1793
TR59 5 2.0244 0.038 0.7473 0.059
TA14 6 1.692 0.04 0.8322 0.0939
TA28 7 1.583 0.05 0.7183 0.1525
Seed color CaSTMS21 1 2.4354 0.004 0.1179 0.0523
TA180 7 2.0176 0.005 0.0579 0.0944

Trait Locus Chr_pos F_Marker p-perm_Marker p-adj_Marker Rsq_Marker
CaSTMS5 3 2.3383 0.009 0.1888 0.0544
TA106 6 1.8253 0.014 0.1518 0.1243
TR20 4 2.3149 0.017 0.3586 0.05
TA200 2 1.7615 0.023 0.5654 0.0901
TA130 4 1.6973 0.041 0.8881 0.0788
GAA58 NN 2.0544 0.043 0.975 0.034
TA159 8 1.545 0.049 0.9221 0.1191
Growth
habit TS35 5 1.807 0.006 0.0699 0.2356
TaaSH 5 1.8065 0.011 0.3916 0.1402
CaSTMS20 5 4.7386 0.012 0.1289 0.0438
TR40 6 2.0829 0.013 0.049 0.1634
TA203 1 1.6119 0.032 0.7502 0.1858
GAA43 NN 2.9434 0.034 0.8352 0.0367
CaSTMS25 15 2.0065 0.035 0.6364 0.1031
TA120 6 1.8079 0.035 0.8831 0.1044
TS43 5 1.6812 0.035 0.6004 0.1876
TA159 8 1.6563 0.037 0.5774 0.212
GA26 13 1.8615 0.042 0.8971 0.0964
TA2 4 1.6954 0.045 0.972 0.1134
TA8 1 1.6224 0.047 0.989 0.1185
TA27 2 1.7943 0.047 0.6693 0.1493
TAA194 3 1.6454 0.047 0.994 0.1057
TR2 3 1.5516 0.049 0.99 0.1498
Dots on
seedcoat CaSTMS21 1 2.6347 0.003 0.031 0.0592
TA106 6 2.0049 0.004 9.99E-04 0.1406
CaSTMS5 3 2.5415 0.005 0.0569 0.0617
TA130 4 1.9768 0.005 0.1159 0.0944
TA8 1 2.1707 0.006 0.035 0.0948
TA180 7 2.1346 0.006 0.034 0.1041
TAA169 NN 2.0851 0.007 0.1459 0.0775
TS35 5 1.8285 0.008 0.0799 0.1484
TA120 6 2.0908 0.012 0.2118 0.0741
CaSTMS9 NN 2.2263 0.013 0.5025 0.0468
GAA58 NN 2.4217 0.013 0.4406 0.0417
TA108 3 2.4599 0.013 0.5105 0.0378
TR20 4 2.2106 0.014 0.4715 0.0505
TA159 8 1.7564 0.017 0.2178 0.1384
TR24 3 1.802 0.02 0.3756 0.1058
TS53 5 2.2545 0.021 0.7552 0.039
TA203 1 1.6821 0.023 0.5225 0.12
TAA59 7 1.6931 0.023 0.7622 0.0888
TA22 6 1.6067 0.032 0.6983 0.1266
TA71 5 1.5994 0.037 0.8182 0.118
CaSTMS4 3 1.6917 0.044 0.989 0.0614
TA64 3 1.6044 0.046 0.8711 0.1128
Seed surface CaSTMS13 1 7.567 9.99E-04 9.99E-04 0.1243
CaSTMS20 5 9.5593 9.99E-04 9.99E-04 0.064
GAA58 NN 4.8945 9.99E-04 9.99E-04 0.0954
TR40 6 4.6543 9.99E-04 9.99E-04 0.2271
CaSTMS7 5 5.5069 0.002 9.99E-04 0.0951
TA96 2 2.5801 0.002 9.99E-04 0.1705

Trait Locus Chr_pos F_Marker p-perm_Marker p-adj_Marker Rsq_Marker
TA135 3 2.8 0.002 9.99E-04 0.1906
TR20 4 3.3294 0.002 9.99E-04 0.0885
GAA39 13 3.0198 0.004 9.99E-04 0.0996
TA27 2 2.3971 0.004 9.99E-04 0.1435
TA22 6 1.974 0.005 9.99E-04 0.18
TA113 1 2.3731 0.006 9.99E-04 0.1195
CaSTMS4 4 2.2634 0.011 0.0839 0.0964
TS54 NN 1.9732 0.012 0.046 0.15
CaSTMS23 3 3.5979 0.013 0.049 0.0498
TR43 1 1.7331 0.015 0.1129 0.2159
TS35 5 1.8284 0.016 0.1149 0.1804
TS83 13 2.0295 0.017 0.1179 0.1173
CaSTMS9 NN 2.5288 0.018 0.2328 0.0639
GA26 13 2.2089 0.018 0.2298 0.0852
TS46 7 1.8131 0.021 0.4306 0.1181
TA176 6 1.6824 0.022 0.2507 0.202
CaSTMS6 9 2.8833 0.024 0.0779 0.0658
TA144 8 1.9597 0.029 0.4356 0.0976
CaSTMS25 15 1.9596 0.034 0.6803 0.0766
TaaSH 5 1.8051 0.035 0.6424 0.1063
TA14 6 1.7455 0.038 0.6853 0.1144
TA21 7 1.6895 0.04 0.6953 0.1291
TA180 7 1.6917 0.044 0.8871 0.1042
TA130 4 1.839 0.045 0.6194 0.108
TA64 3 1.5759 0.05 0.9401 0.1352

Table 57: Marker trait associations (MTAs) (P<=0.05, P<=0.01& P<=0.001) detected for different
Quantitative traits in the chickpea reference set in five environments and in overall pooled analysis
Traits Locus E1 E2 E3 E4 E5 Total pooled
Days to 50%
flowering
CaSTMS7 *** *** * *** *** 5 ***
GAA39 *** * *** *** 4
TA27 *** *** *** *** 4 ***
TA64 *** *** * *** *** 5 ***
TA125 *** *** * *** *** 5 ***
TA130 *** *** * *** *** 5 ***
TA135 *** ** *** *** 4 ***
TAA58 *** *** *** *** 4 ***
TR26 *** * * 3 *
TR29 *** *** *** *** *** 5 ***
TS45 *** ** *** *** 4 **
TS54 *** *** *** *** 4 ***
GA20 * ** 2
GA34 * ** *** 3 *
TA144 * * *** * 4 *
TaaSH * ** * * 4 *
TR20 * * ** * * 5 *
TR40 * 1
TS43 * ** 2
CaSTMS2 * * * 3 *
CaSTMS20 * 1
TA72 * 1 *
GA26 *** * 2
TA59 ** * 2
TAA194 *** 1
TA78 * 1
TA106 *** 1
TA159 ** 1
CaSTMS13 ** ** 3
TA80 * 1
TOTAL 19 19 12 20 19 90 17
Flowering
Duration
CaSTMS20 ** *** * ** * 5 ***
TAA194 *** 1
TS54 *** ** ** * 4 ***
CaSTMS6 * 1
CaSTMS13 * 1
GAA58 * 1 *
TAA57 * 1
TR31 * 1
CaSTMS5 *** 1
CaSTMS7 *** *** 2 ***
CaSTMS25 *** *** *** 3 ***
TA5 *** *** *** *** 4 ***
TA20 *** *** 2
TA27 *** *** *** *** 4 ***
TA72 *** *** ** 3 ***
TA110 *** *** *** *** 3 ***
TA132 *** *** 2 ***
TA159 *** *** *** 3 ***

Traits Locus E1 E2 E3 E4 E5 Total pooled
TAA59 *** *** 2
TR1 *** ** 2
TR43 *** 1
TS35 *** * 2 ***
TS83 *** 1 ***
CaSTMS4 *** *** ** 3 *
GA20 * 1
GAA43 ** ** *** 3 ***
TA103 ** *** 2
TR40 *** *** * 3 ***
TA125 *** 1
TR29 ***
TR59 * 1
TOTAL 3 21 13 15 14 64 16
Plant height
GA9 *** *** *** *** *** 5 ***
GAA39 *** *** *** *** *** 5 ***
TA25 *** *** *** *** *** 5 ***
TA28 *** *** *** *** *** 5 ***
TS43 *** *** *** *** *** 5 ***
TS46 *** *** *** *** *** 5 ***
CaSTMS21 * *** * 3 *
CaSTMS25 * * * * 4
GAA43 * * * 3
TA5 * * *** *** 4
TA78 * 1
TA180 * 1
TA132 *** *** * * 4 ***
TR43 *** *** *** *** 4 ***
GA20 * 1
CaSTMS13 * 1
CaSTMS20 * 1
TOTAL 10 11 12 14 10 57 9
Plant width
CaSTMS25 *** *** *** 3 ***
GAA40 ** 1
TA180 *** *** *** 3 ***
TAA169 ** * 2
TR43 ** *** 2
TS35 ** ** * 3 *
TS83 ** ** 2
CaSTMS6 * 1
CaSTMS9 * 1
CaSTMS21 * *** *** *** 4 ***
GAA39 * *** * * 4
GAA58 * *** 2
TA25 * ** 2
TA78 * * *** *** 4 ***
TA132 *** 1
TA28 * 1
TA110 * 1
TS46 * 1
CaSTMS4 *** *** 2 *

Traits Locus E1 E2 E3 E4 E5 Total pooled
GA22 *** *** 2 ***
TA142 *** * 2
TS53 *** * 2
TA130 * 1
TR40 * * 2
TA176 * 1
TA22 *
TOTAL 14 8 9 12 7 50 8
Days tograin
filling
CaSTMS4 ** 1 *
TS54 *** * 2
TA120 * 1
TA180 ** 1
TAA59 * * 2
CaSTMS13 * 1
TR20 * 1
TS83 * ** 2 *
TAA169 * 1
TAA194 * * 2
TA21 ** 1
TA64 ** 1 *
TA132 ** 1 *
TOTAL 3 3 3 6 2 17 4
Days to
maturity
CaSTMS7 ** *** ** 3 ***
TA22 ** 1
TA27 * * 2 *
TA130 * *** * 3 ***
TA159 * 1
TA180 * *** *** 3
TAA194 *** * 2
TaaSH *** 1
TA64 * *** 2 *
TS24 * 1
TAA58 *** * 2
TR40 ** 1
TS45 ** 1 *
CaSTMS20 * 1
CaSTMS21 * 1
GAA39 * 1
TA25 * *** 2 **
GAA58 * 1
TA21 *** 1
TA71 *** 1
GAA40 * 1
TA103 * 1
TOTAL 6 5 12 6 4 33 6
Apical
primary
branches
TS24 *** ** *** ** 4 ***
GAA40 *** 1
TAA194 * ** 2
TaaSH * 1
TA22 * 1
TR29 ** 1

Traits Locus E1 E2 E3 E4 E5 Total pooled
TOTAL 1 1 3 2 3 10 1
Basal
primary
branches
TA106 * * 2
TA110 * 1 *
CaSTMS2 ** 1
TAA169 ** 1
TAA194 * 1
TOTAL 2 0 0 0 4 6 1
Basal
secondary
branches
GA26 *** *** 2
TA22 *** 1
TAA194 *** *** * *** 4
TS24 *** 1 ***
CaSTMS12 * ** * 3
CaSTMS21 * * 2
TA110 * 1
TAA169 * 1
TR29 * 1
CaSTMS7 * 1
TA27 * 1
CaSTMS20 *** 1 **
TAA58 *** 1
CaSTMS13 *** 1 ***
CaSTMS2 * 1
GAA40 * 1
TA159 * 1
TOTAL 9 7 2 1 5 24 3
Apical
secondary
branches
GA34 *** *** 2
TA20 *** 1
TA103 *** *** *** 3 *
TS24 *** *** *** 3 ***
GAA40 *** *** 2 ***
TA53 *** *** *** 3 ***
TS83 *** 1
TS5 * *** 2
TA25 *** 1 *
TA106 *** 1
TA108 *** 1
TA176 *** 1
TaaSH *** 1
TAA169 ** 1
TAA194 ** 1
TR29 *** 1
CaSTMS2 *** ***
TOTAL 4 6 5 8 3 26 6
Tertiary
branches
CaSTMS2 *** *** *** 3 ***
GA22 *** 1
GAA39 *** *** 2
TA140 *** 1
TR19 *** 1
CaSTMS12 * *** *** 3 ***
CaSTMS23 * *** 2

Traits Locus E1 E2 E3 E4 E5 Total pooled
GA26 * 1
GAA43 * * 2
TAA57 * 1
TS35 * *** 2
TAA58 * * *** 4
TAA59 *** 1
TA159 *** 1
TA117 *** 1
GAA40 *** 1
TA103 *** 1
GA20 * 1
CaSTMS13 *** 1
TAA57 * 1
TaaSH *** ** 2
TA5 * *** 2
TA113 * *** 2
TA27 * 1
TS43 * 1
CaSTMS21 *** 1 ***
TA78 *** 1 ***
TAA194 *** 1 ***
TR1 *** *** 2 ***
TR43 *** 1 ***
TS5 *** 1 ***
TS46 *** 1 ***
TA25 *** ** 2
CaSTMS6 * *** 1
GA9 ** 1
CaSTMS9 * 1
CaSTMS25 * 1
TA130 * 1
TA144 * 1
TR7 * 1
TOTAL 12 11 4 9 20 56 9
Seeds per
pod
GA34 *** 1 *
TA130 ** *** 2 **
CaSTMS25 * 1
GAA58 * 1
TA22 * ** 2
TA200 *** 1 **
TR56 ** 1
TA27 * * ** 3 ***
TA28 * 1 **
TS54 * *** 2 **
TA96 ** 1
CaSTMS13 * 1
CaSTMS4 *** 1 **
CaSTMS2 * 1 **
TS5 * 1
TA8 **
TA144 *
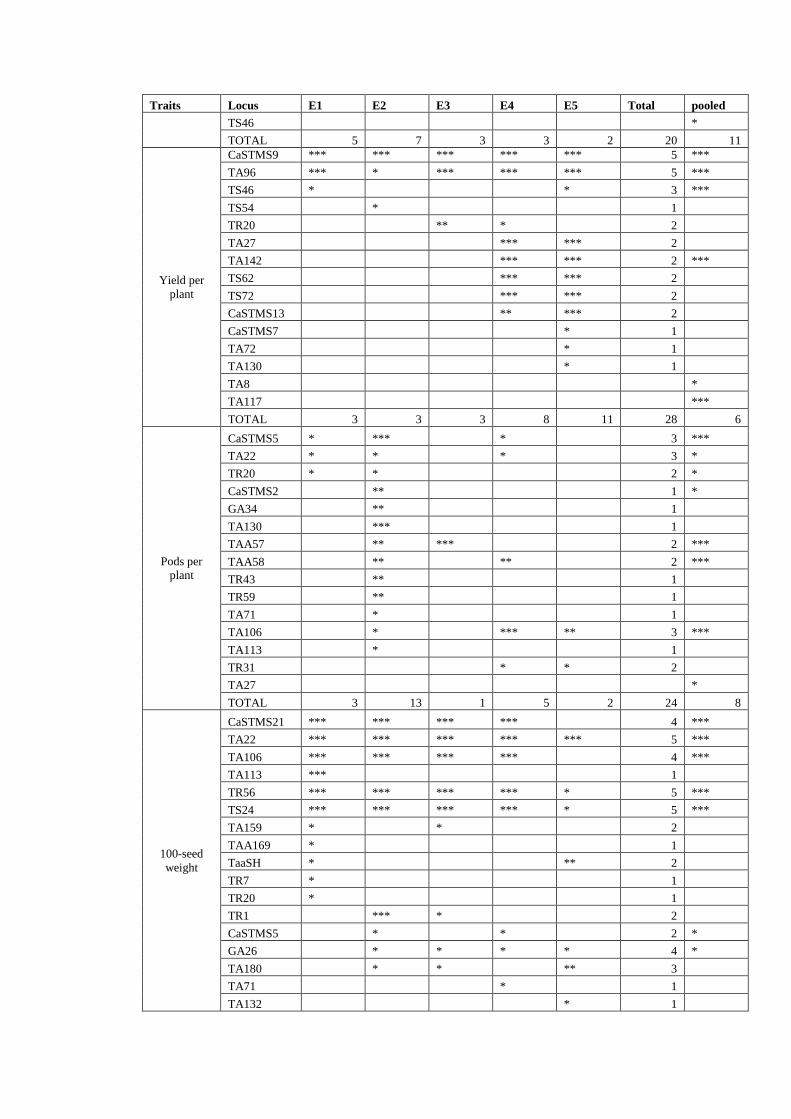
Traits Locus E1 E2 E3 E4 E5 Total pooled
TS46 *
TOTAL 5 7 3 3 2 20 11
Yield per
plant
CaSTMS9 *** *** *** *** *** 5 ***
TA96 *** * *** *** *** 5 ***
TS46 * * 3 ***
TS54 * 1
TR20 ** * 2
TA27 *** *** 2
TA142 *** *** 2 ***
TS62 *** *** 2
TS72 *** *** 2
CaSTMS13 ** *** 2
CaSTMS7 * 1
TA72 * 1
TA130 * 1
TA8 *
TA117 ***
TOTAL 3 3 3 8 11 28 6
Pods per
plant
CaSTMS5 * *** * 3 ***
TA22 * * * 3 *
TR20 * * 2 *
CaSTMS2 ** 1 *
GA34 ** 1
TA130 *** 1
TAA57 ** *** 2 ***
TAA58 ** ** 2 ***
TR43 ** 1
TR59 ** 1
TA71 * 1
TA106 * *** ** 3 ***
TA113 * 1
TR31 * * 2
TA27 *
TOTAL 3 13 1 5 2 24 8
100-seed
weight
CaSTMS21 *** *** *** *** 4 ***
TA22 *** *** *** *** *** 5 ***
TA106 *** *** *** *** 4 ***
TA113 *** 1
TR56 *** *** *** *** * 5 ***
TS24 *** *** *** *** * 5 ***
TA159 * * 2
TAA169 * 1
TaaSH * ** 2
TR7 * 1
TR20 * 1
TR1 *** * 2
CaSTMS5 * * 2 *
GA26 * * * * 4 *
TA180 * * ** 3
TA71 * 1
TA132 * 1

Traits Locus E1 E2 E3 E4 E5 Total pooled
TOTAL 11 9 9 8 7 44 7
Plot yield
CaSTMS6 *** 1
CaSTMS7 ** 1 ***
CaSTMS20 *** 1 ***
TA78 *** * 2 *
TA135 *** 1 **
TS35 *** *** 2 ***
GAA39 * * 2 *
TA72 * 1 *
TA176 * 1
TS24 * 1
TS83 * 1
CaSTMS21 *** 1
TR1 ** 1
CaSTMS2 * 1
GAA43 * 1
TA113 * * 2
TAA58 * 1
GAA58 *** * 2 *
TA108 *** *** 2 ***
TA159 *** 1
TA21 * 1
TAA59 * 1 *
TA14 *
TR40 *
TOTAL 11 9 4 2 2 28 12
per day
productivity
CaSTMS20 ** ***
TA78 *** ** **
TA135 *** *
TA176 **
TS35 ** ** ***
CaSTMS6 *
CaSTMS7 * ***
TA72 * *
TS24 * *
CaSTMS2 **
CaSTMS21 **
TR1 *
TA22 *
TAA58 *
TAA59 *
GAA58 ** *
TA108 *** ** ***
TA159 ***
TA21 ***
TR40 *
TA14 *
TOTAL 9 8 4 2 0 23 10
Significant level indicated with asterisks as follows: *P<0.005, **P<0.01, ***P<0.001

Table 58: List of highly significant (P<=0.001) marker trait associations
(MTAs) detected in 2005-06 (E1) post rainy season at ICRISAT, Patancheru,
India.
Trait Locus
Chromosome
position P F_Marker R2%
Days to 50% flowering
CaSTMS7 5 0.000999 5.5705 11.28
GAA39 13 0.000999 2.8919 11.26
TA27 2 0.000999 2.4838 17.33
TA64 3 0.000999 2.5368 22.85
TA125 3 0.000999 2.1991 16.23
TA130 4 0.000999 2.7108 17.41
TA135 3 0.000999 2.1619 18.43
TAA58 2 0.000999 2.5195 23.23
TR26 3 0.000999 3.1193 9.06
TR29 5 0.000999 2.7847 20.08
TS45 8 0.000999 2.1166 17.19
TS54 4 0.000999 2.0665 18.26
Flowering Duration TAA194 5 0.000999 2.542 15.53
TS54 4 0.000999 2.0726 20.76
Plant Height
GA9 6 0.000999 4.5322 14.77
GAA39 13 0.000999 4.6086 16.91
TA25 8 0.000999 2.276 23.42
TA28 7 0.000999 2.6793 31.05
TS43 5 0.000999 3.0621 26.57
TS46 7 0.000999 3.1852 21.99
Plant width CaSTMS25 15 0.000999 2.8059 14.25
TA180 7 0.000999 2.4544 19.27
Days to grain filling TS54 4 0.000999 2.1633 20.91
Apical primary Branches TS24 6 0.000999 2.3559 21.65
Basal secondary branches
GA26 13 0.000999 2.8009 14.48
TA22 6 0.000999 1.9956 25.13
TAA194 5 0.000999 2.9492 18.24
TS24 6 0.000999 2.1707 20.1
Apical secondary
branches
GA34 6 0.000999 2.219 25.01
TA20 1 0.000999 2.0784 24.83
TA103 2 0.000999 3.3865 21.86
TS24 6 0.000999 6.8883 42.09
Tertiary branches
CaSTMS2 6 0.000999 2.2628 17.87
GA22 NN 0.000999 2.6529 23.62
GAA39 13 0.000999 4.4647 19.19
TA140 7 0.000999 2.9091 22.54
TR19 2 0.000999 2.797 26.53
Seeds per pod GA34 6 0.000999 1.9997 19.37
Yield per plant CaSTMS9 NN 0.000999 6.425 18.89
TA96 2 0.000999 3.6976 29.36

Trait Locus
Chromosome
position P F_Marker R2%
100-seed weight
CaSTMS21 1 0.000999 3.8005 10.26
TA22 6 0.000999 3.4628 27.32
TA106 6 0.000999 2.0635 18.06
TA113 1 0.000999 2.4453 12.67
TR56 3 0.000999 2.5848 10.1
TS24 6 0.000999 2.9035 18.76
Plot yield
CaSTMS6 9 0.000999 3.1643 8.28
CaSTMS20 5 0.000999 5.6496 4.55
TA78 7 0.000999 2.4441 19.95
TA135 3 0.000999 2.1628 18.18
TS35 5 0.000999 1.994 22.25
per day productivity TA78 7 0.000999 2.4849 19.67
TA135 3 0.000999 2.0659 17.07
Antho-Methanol
CaSTMS23 3 0.000999 4.8383 9.24
GA34 6 0.000999 4.6345 42.96
TA53 2 0.000999 3.7207 32.14
TA117 7 0.000999 2.0689 25.3
TA120 6 0.000999 3.0983 17.77
TR19 2 0.000999 2.2202 22.67
TS5 3 0.000999 2.9183 43.44
TS24 6 0.000999 2.2105 20.83
TS62 7 0.000999 2.3317 22.94
Antho-acidifiedmethanol CaSTMS4 3 0.000999 2.8013 14.95
protein content TS53 5 0.000999 4.5679 11.37

Table 59: List of highly significant (P<=0.001) marker trait associations
(MTAs) detected in 2006-07 (E2) post rainy season at ICRISAT, Patancheru,
India.
Trait Locus
Chromosome
position P F_Marker R2%
Days to 50% flowering
CaSTMS7 5 0.000999 5.1422 10.39
GA26 13 0.000999 2.6108 11.41
TA27 2 0.000999 2.3101 16.15
TA64 3 0.000999 2.257 20.7
TA125 3 0.000999 2.4039 17.19
TA130 4 0.000999 2.6667 16.96
TAA58 2 0.000999 2.0054 19.38
TAA194 5 0.000999 2.6096 13.81
TaaSH 5 0.000999 2.5084 16.16
TR29 5 0.000999 2.5601 18.59
TS54 4 0.000999 2.2525 19.26
Flowering Duration
CaSTMS5 3 0.000999 2.8692 10.88
CaSTMS7 5 0.000999 5.2171 11.81
CaSTMS20 5 0.000999 8.0603 7.12
CaSTMS25 15 0.000999 6.4995 26.35
TA5 5 0.000999 4.2982 27.21
TA20 1 0.000999 3.4779 34.48
TA27 2 0.000999 3.8349 26.6
TA72 4 0.000999 2.8298 24.4
TA110 2 0.000999 6.6825 31.33
TA132 4 0.000999 3.9968 35.02
TA159 8 0.000999 2.8017 30.54
TAA59 7 0.000999 3.2373 23.53
TR1 6 0.000999 2.814 34.82
TR43 1 0.000999 2.16 32.54
TS35 5 0.000999 2.2449 27.23
TS83 13 0.000999 2.3638 17.3
Plant Height
GA9 6 0.000999 4.9232 16.21
GAA39 13 0.000999 4.2401 16.22
TA25 8 0.000999 2.6943 27.04
TA28 7 0.000999 2.3053 28.91
TA132 4 0.000999 2.051 20.88
TR43 1 0.000999 1.8639 27.86
TS43 5 0.000999 2.7659 25.41
TS46 7 0.000999 3.3545 23.44
Plant width
CaSTMS21 1 0.000999 3.8324 13.62
GAA39 13 0.000999 3.8626 16.69
TA132 4 0.000999 2.2238 24.63
TR43 1 0.000999 2.4216 36.61
Days to Maturity
TA180 7 0.000999 2.4989 17.04
TAA194 3 0.000999 3.2457 16.87
TaaSH 5 0.000999 2.4763 16.37

Trait Locus
Chromosome
position P F_Marker R2%
Basal secondary branches
CaSTMS20 5 0.000999 5.7683 5.44
GA26 13 0.000999 3.6181 17.55
TAA58 2 0.000999 2.3032 25.15
TAA194 5 0.000999 2.5602 15.91
Apical secondary branches
GAA40 1 0.000999 3.6095 9.7
TA53 2 0.000999 2.1213 20.02
TA103 2 0.000999 2.4517 16.94
TS24 6 0.000999 2.7928 23.42
TS83 13 0.000999 2.2809 17.16
Tertiary branches
CaSTMS2 6 0.000999 3.1193 22.7
CaSTMS12 11 0.000999 592.7988 39.47
CaSTMS21 1 0.000999 10.3337 29.75
TA78 7 0.000999 5.9005 32.32
TAA194 3 0.000999 3.4905 20.69
TR1 6 0.000999 77.6798 30.25
TR43 1 0.000999 69.2155 30.46
TS5 3 0.000999 69.5562 30.67
TS46 7 0.000999 4.0152 29.77
Seeds per pod TA130 4 0.000999 2.5061 15.74
TA200 2 0.000999 2.3083 16.23
Pods per plant CaSTMS5 3 0.000999 2.8585 9.72
TA130 4 0.000999 2.5072 16.27
Yield per plant CaSTMS9 NN 0.000999 4.1946 13.92
100-seed weight
CaSTMS21 1 0.000999 3.1812 9.16
TA22 6 0.000999 3.7471 29.87
TA106 6 0.000999 2.5993 22.26
TR1 6 0.000999 1.864 21.94
TR56 3 0.000999 3.9934 15.1
TS24 6 0.000999 3.54 22.54
Plot yield
CaSTMS21 1 0.000999 2.9326 8.06
TS35 5 0.000999 2.0137 19.71
Shoot Dry weight
CaSTMS5 3 0.000999 3.5863 11.01
GA26 13 0.000999 3.3624 12.73
TaaSH 5 0.000999 2.3699 15.01
TR40 6 0.000999 2.3496 14.37
Root Dry weight TA22 6 0.000999 2.015 21.62
Total dry weight Ratio
CaSTMS5 3 0.000999 3.4495 10.64
GA26 13 0.000999 3.3179 12.57
TA22 6 0.000999 2.0444 21.07
TaaSH 5 0.000999 2.4168 15.23
Root length Density TA130 4 0.000999 4.126 24.66
TAA59 7 0.000999 3.6877 26.57
Shoot to Root length
Density CaSTMS25 15 0.000999 3.5275 13.94
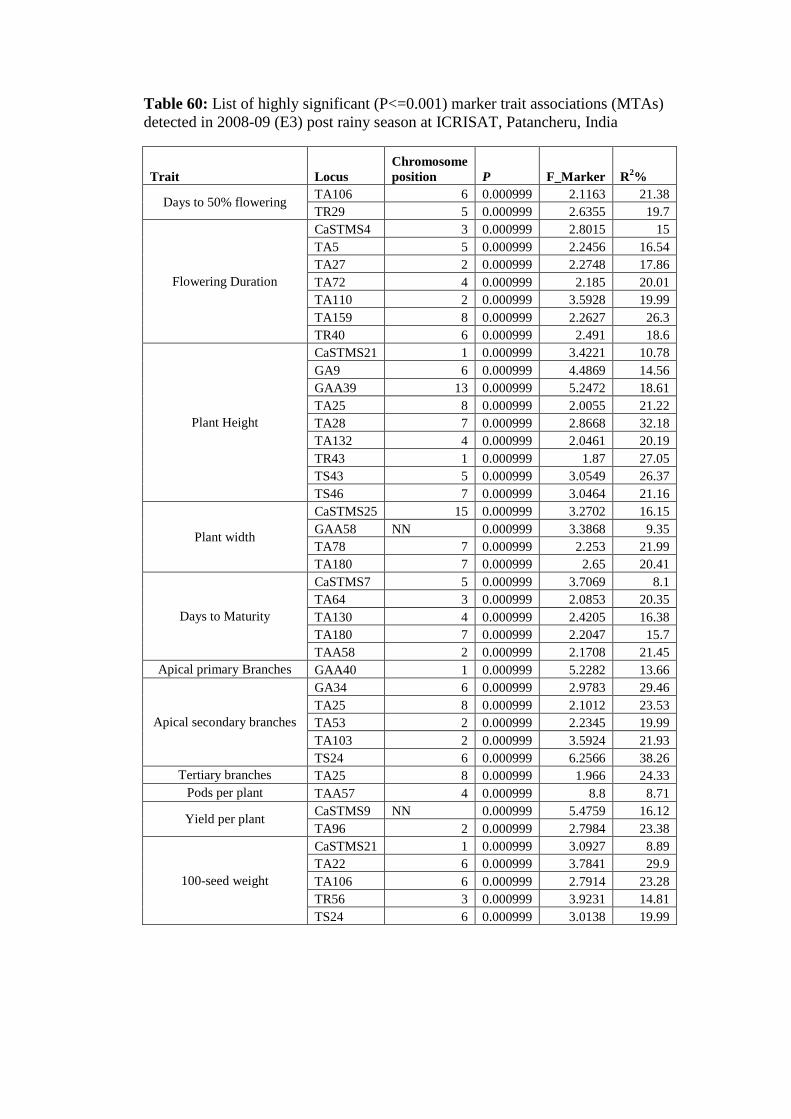
Table 60: List of highly significant (P<=0.001) marker trait associations (MTAs)
detected in 2008-09 (E3) post rainy season at ICRISAT, Patancheru, India
Trait Locus
Chromosome
position P F_Marker R2%
Days to 50% flowering TA106 6 0.000999 2.1163 21.38
TR29 5 0.000999 2.6355 19.7
Flowering Duration
CaSTMS4 3 0.000999 2.8015 15
TA5 5 0.000999 2.2456 16.54
TA27 2 0.000999 2.2748 17.86
TA72 4 0.000999 2.185 20.01
TA110 2 0.000999 3.5928 19.99
TA159 8 0.000999 2.2627 26.3
TR40 6 0.000999 2.491 18.6
Plant Height
CaSTMS21 1 0.000999 3.4221 10.78
GA9 6 0.000999 4.4869 14.56
GAA39 13 0.000999 5.2472 18.61
TA25 8 0.000999 2.0055 21.22
TA28 7 0.000999 2.8668 32.18
TA132 4 0.000999 2.0461 20.19
TR43 1 0.000999 1.87 27.05
TS43 5 0.000999 3.0549 26.37
TS46 7 0.000999 3.0464 21.16
Plant width
CaSTMS25 15 0.000999 3.2702 16.15
GAA58 NN 0.000999 3.3868 9.35
TA78 7 0.000999 2.253 21.99
TA180 7 0.000999 2.65 20.41
Days to Maturity
CaSTMS7 5 0.000999 3.7069 8.1
TA64 3 0.000999 2.0853 20.35
TA130 4 0.000999 2.4205 16.38
TA180 7 0.000999 2.2047 15.7
TAA58 2 0.000999 2.1708 21.45
Apical primary Branches GAA40 1 0.000999 5.2282 13.66
Apical secondary branches
GA34 6 0.000999 2.9783 29.46
TA25 8 0.000999 2.1012 23.53
TA53 2 0.000999 2.2345 19.99
TA103 2 0.000999 3.5924 21.93
TS24 6 0.000999 6.2566 38.26
Tertiary branches TA25 8 0.000999 1.966 24.33
Pods per plant TAA57 4 0.000999 8.8 8.71
Yield per plant CaSTMS9 NN 0.000999 5.4759 16.12
TA96 2 0.000999 2.7984 23.38
100-seed weight
CaSTMS21 1 0.000999 3.0927 8.89
TA22 6 0.000999 3.7841 29.9
TA106 6 0.000999 2.7914 23.28
TR56 3 0.000999 3.9231 14.81
TS24 6 0.000999 3.0138 19.99

Trait Locus
Chromosome
position P F_Marker R2%
Plot yield
GAA58 NN 0.000999 3.3682 8.41
TA108 3 0.000999 4.5874 9.94
TA159 8 0.000999 1.9589 22.4
per day productivity TA108 3 0.000999 4.0082 8.56
TA159 8 0.000999 2.0238 22.28
Damage rating CaSTMS23 3 0.000999 4.7236 8.09
Larval survival (%) TA125 3 0.000999 2.4485 19.65
Shoot Dry weight
CaSTMS5 3 0.000999 4.3973 12.33
CaSTMS9 NN 0.000999 3.6979 8.2
TA20 5 0.000999 2.6213 21.51
TA113 1 0.000999 2.5173 12.16
Root Dry weight CaSTMS5 3 0.000999 3.4384 10.58
TA20 1 0.000999 2.4314 23.79
Total dry weight Ratio
CaSTMS5 3 0.000999 4.7316 13.08
CaSTMS9 NN 0.000999 3.5982 7.99
TA20 5 0.000999 2.5428 23.16
TA113 1 0.000999 2.6266 12.58
TaaSH 5 0.000999 2.3259 13.9
Root length Density TAA59 7 0.000999 3.1209 21.76
Root surface area CaSTMS5 3 0.000999 3.3737 10.86
TA20 1 0.000999 1.9751 21.38
Root Volume TA180 7 0.000999 2.0249 15.2
Shoot to Root length
Density
TS43 5 0.000999 2.0112 21.11
TS53 5 0.000999 3.221 8.71
TS83 13 0.000999 2.3776 16.41
LeafArea TA8 1 0.000999 3.0612 19.93
TA20 1 0.000999 2.3606 26.82
Leaf DryWeight TA8 1 0.000999 2.2668 15.72
Specific Leaf Area
CaSTMS21 1 0.000999 3.1062 11.39
GA22 NN 0.000999 2.1034 19.37
TA8 1 0.000999 2.4506 17.44
TA71 5 0.000999 3.2815 33.09
TR43 1 0.000999 3.1595 42.89
TS83 13 0.000999 2.8661 21.19

Table 61: List of highly significant (P<=0.001) marker trait associations (MTAs)
detected in 2008-09 (E4) post rainy season at UAS, Dharwad, India
Trait Locus
Chromosome
position P F_Marker R2%
Days to 50% flowering
CaSTMS7 5 0.000999 6.4118 12.76
GA34 6 0.000999 2.0349 20.8
GAA39 13 0.000999 3.2104 12.36
TA27 2 0.000999 2.4797 17.36
TA64 3 0.000999 2.4007 22.02
TA125 3 0.000999 2.4547 17.76
TA130 4 0.000999 2.9527 18.67
TA135 3 0.000999 2.3439 19.67
TA144 8 0.000999 2.4735 13.99
TAA58 2 0.000999 2.7125 24.56
TR29 5 0.000999 2.4956 18.53
TS45 8 0.000999 2.1186 17.25
TS54 4 0.000999 2.647 22.08
Flowering Duration
CaSTMS4 3 0.000999 2.4878 13.44
CaSTMS7 5 0.000999 3.7057 8.61
CaSTMS25 15 0.000999 2.7807 13.35
TA5 5 0.000999 3.1901 21.6
TA27 2 0.000999 2.7877 20.75
TA103 2 0.000999 2.4198 16.21
TA110 2 0.000999 4.6485 24.05
TA125 3 0.000999 2.3257 18.57
TR29 5 0.000999 2.1977 18.29
TR40 6 0.000999 2.3141 17.36
Plant Height
GA9 6 0.000999 4.5284 14.9
GAA39 13 0.000999 5.2405 18.89
TA5 5 0.000999 2.3497 15.98
TA25 8 0.000999 2.2892 23.74
TA28 7 0.000999 2.9117 33
TR43 1 0.000999 1.8998 27.77
TS43 5 0.000999 3.1667 27.44
TS46 7 0.000999 3.2535 22.56
Plant width
CaSTMS4 3 0.000999 3.7499 20.32
CaSTMS21 1 0.000999 11.6658 32.62
CaSTMS25 15 0.000999 2.8474 14.71
GA22 NN 0.000999 4.8097 35.59
TA78 7 0.000999 2.2899 22.77
TA142 3 0.000999 2.1009 24.03
TA180 7 0.000999 2.8377 22.02
TS53 2 0.000999 3.937 10.94
Days to Maturity TA21 7 0.000999 1.8998 21.54
TA71 5 0.000999 2.0764 22.02
Apical primary Branches TS24 6 0.000999 2.4505 22.12

Trait Locus
Chromosome
position P F_Marker R2%
Basal secondary branches CaSTMS13 1 0.000999 3.5664 8.84
Apical secondary
branches
CaSTMS2 6 0.000999 4.6254 29.87
GAA40 1 0.000999 9.6394 22.52
TA53 2 0.000999 3.3392 28.65
TA106 6 0.000999 1.9906 23.09
TA108 3 0.000999 5.0383 11.96
TA176 6 0.000999 3.8051 45.41
TaaSH 5 0.000999 3.5502 24.74
TS5 3 0.000999 1.9307 32.45
Tertiary branches
CaSTMS2 6 0.000999 2.2239 17.93
GAA40 1 0.000999 4.8423 13.39
TA5 5 0.000999 3.3003 24.45
TA103 2 0.000999 2.292 17.1
TA159 8 0.000999 2.0606 26.85
TaaSH 5 0.000999 2.4156 19.17
TS35 5 0.000999 2.0139 27.44
Seeds per pod CaSTMS4 3 0.000999 2.5748 15.01
TS54 NN 0.000999 2.1513 22.37
Pods per plant TA106 6 0.000999 2.0317 20.97
Yield per plant
CaSTMS9 NN 0.000999 6.1243 18.85
TA27 2 0.000999 2.3271 19.32
TA96 2 0.000999 2.8181 25.1
TA142 3 0.000999 2.2633 25.23
TS62 7 0.000999 2.178 21.2
TS72 4 0.000999 2.3898 15.91
100-seed weight
CaSTMS21 1 0.000999 2.9984 8.65
TA22 6 0.000999 3.2459 27.19
TA106 6 0.000999 2.5688 21.96
TR56 3 0.000999 3.435 13.29
TS24 6 0.000999 3.114 20.46
Plot yield TA108 3 0.000999 4.1362 9.38
per day productivity TA21 7 0.000999 2.1776 19.38
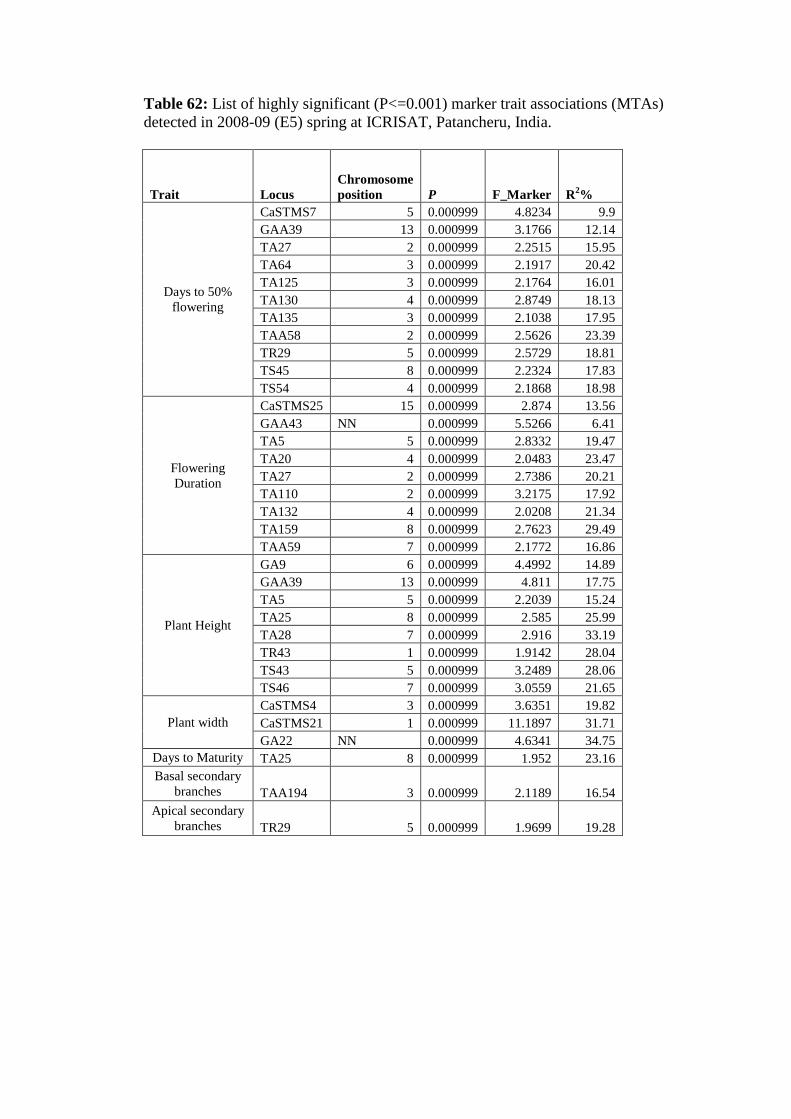
Table 62: List of highly significant (P<=0.001) marker trait associations (MTAs)
detected in 2008-09 (E5) spring at ICRISAT, Patancheru, India.
Trait Locus
Chromosome
position P F_Marker R2%
Days to 50%
flowering
CaSTMS7 5 0.000999 4.8234 9.9
GAA39 13 0.000999 3.1766 12.14
TA27 2 0.000999 2.2515 15.95
TA64 3 0.000999 2.1917 20.42
TA125 3 0.000999 2.1764 16.01
TA130 4 0.000999 2.8749 18.13
TA135 3 0.000999 2.1038 17.95
TAA58 2 0.000999 2.5626 23.39
TR29 5 0.000999 2.5729 18.81
TS45 8 0.000999 2.2324 17.83
TS54 4 0.000999 2.1868 18.98
Flowering
Duration
CaSTMS25 15 0.000999 2.874 13.56
GAA43 NN 0.000999 5.5266 6.41
TA5 5 0.000999 2.8332 19.47
TA20 4 0.000999 2.0483 23.47
TA27 2 0.000999 2.7386 20.21
TA110 2 0.000999 3.2175 17.92
TA132 4 0.000999 2.0208 21.34
TA159 8 0.000999 2.7623 29.49
TAA59 7 0.000999 2.1772 16.86
Plant Height
GA9 6 0.000999 4.4992 14.89
GAA39 13 0.000999 4.811 17.75
TA5 5 0.000999 2.2039 15.24
TA25 8 0.000999 2.585 25.99
TA28 7 0.000999 2.916 33.19
TR43 1 0.000999 1.9142 28.04
TS43 5 0.000999 3.2489 28.06
TS46 7 0.000999 3.0559 21.65
Plant width
CaSTMS4 3 0.000999 3.6351 19.82
CaSTMS21 1 0.000999 11.1897 31.71
GA22 NN 0.000999 4.6341 34.75
Days to Maturity TA25 8 0.000999 1.952 23.16
Basal secondary
branches TAA194 3 0.000999 2.1189 16.54
Apical secondary
branches TR29 5 0.000999 1.9699 19.28

Trait Locus
Chromosome
position P F_Marker R2%
Tertiary branches
CaSTMS6 9 0.000999 3.5545 10.92
CaSTMS12 11 0.000999 4.747 10.19
CaSTMS13 1 0.000999 4.7676 11.55
CaSTMS23 3 0.000999 6.1821 11.2
GAA39 13 0.000999 3.1316 14.14
TA113 1 0.000999 2.369 16.43
TA117 7 0.000999 2.5047 28.28
TAA58 7 0.000999 3.0961 31.44
TAA59 7 0.000999 2.3893 19.72
TR1 6 0.000999 2.4302 33.58
Yield per plant
CaSTMS9 NN 0.000999 5.5588 17.44
CaSTMS13 1 0.000999 4.5098 11.02
TA27 2 0.000999 2.7379 21.97
TA96 2 0.000999 3.0412 26.56
TA142 3 0.000999 2.3116 25.64
TS62 7 0.000999 2.0991 20.61
TS72 4 0.000999 2.5714 16.92
100-seed weight TA22 6 0.000999 2.5127 23.25
LeafArea TA2 4 0.000999 2.3969 14.63
TaaSH 5 0.000999 2.2976 16.42
Leaf DryWeight TA2 4 0.000999 2.4506 15.24
TA130 4 0.000999 2.6076 18.59

Table 63: List of highly significant (P<=0.001) marker trait associations detected in overall
pooled analysis data
Trait Locus
Chromosome
position F_marker P R2%
Days to 50%
flowering
CaSTMS7 5 5.0414 0.001 10.25
TA27 2 2.2398 0.001 15.83
TA64 3 2.2874 0.001 21
TA125 3 2.2706 0.001 16.51
TA130 4 2.7726 0.001 17.57
TAA58 2 2.2898 0.001 21.49
TR29 5 2.567 0.001 18.72
TS54 4 2.265 0.001 19.43
Flowering
Duration
CaSTMS7 5 4.244 0.001 9.45
CaSTMS20 5 8.9955 0.001 7.55
CaSTMS25 15 3.5169 0.001 15.78
GAA43 NN 5.436 0.001 6.21
TA5 5 3.6799 0.001 23.34
TA27 2 3.3 0.001 22.88
TA72 4 2.3486 0.001 20.35
TA110 2 4.8325 0.001 24.03
TA132 4 2.32 0.001 23.27
TA159 8 2.0468 0.001 23.54
TR40 6 2.6472 0.001 18.77
TS35 5 2.0449 0.001 24.44
TS54 4 2.0657 0.001 19.41
TS83 13 2.2877 0.001 16.16
Plant Height
GA9 6 4.7028 0.001 15.23
GAA39 13 4.9861 0.001 18.01
TA25 8 2.3812 0.001 24.2
TA28 7 2.8087 0.001 31.99
TA132 4 1.9958 0.001 19.95
TR43 1 1.9434 0.001 27.94
TS43 5 3.1599 0.001 27.16
TS46 7 3.3905 0.001 23.04
Plant width
CaSTMS21 1 5.8748 0.001 19.51
CaSTMS25 15 2.5384 0.001 13.18
GA22 NN 2.4388 0.001 21.8
TA78 7 2.158 0.001 21.5
TA180 7 2.7401 0.001 21.19
Days to Maturity CaSTMS7 5 3.6833 0.001 7.93
TA130 4 2.3862 0.001 15.93
Apical primary
Branches TS24 6 2.9775 0.001 25.6
Basal secondary
branches
CaSTMS13 1 3.4067 0.001 8.4
TS24 6 2.3527 0.001 20.93

Trait Locus
Chromosome
position F_marker P R2%
Apical secondary
branches
CaSTMS2 6 2.4223 0.001 17.55
GAA40 1 3.4935 0.001 9.17
TA53 2 2.2521 0.001 20.43
TS24 6 2.9171 0.001 23.56
Tertiary branches
CaSTMS2 6 2.4342 0.001 18.53
CaSTMS12 11 132.9631 0.001 32.81
CaSTMS21 1 7.1839 0.001 22.65
TA78 7 4.2099 0.001 34.28
TAA194 3 2.643 0.001 16.39
TR1 6 18.8468 0.001 36.4
TR43 1 17.1985 0.001 37.34
TS5 3 16.4998 0.001 37.35
TS46 7 2.9863 0.001 23.85
Seeds per pod TA27 2 2.1944 0.001 15.2
Pods per plant
CaSTMS5 3 2.7992 0.001 8.9
TA106 6 2.1163 0.001 19.38
TAA57 4 5.4025 0.001 5.39
TAA58 7 1.9948 0.001 18.13
Yield per plant
CaSTMS9 NN 10.2197 0.001 27.22
TA96 2 3.9831 0.001 31.35
TA117 7 2.27 0.001 25.83
TA142 3 2.3795 0.001 25.62
TS46 7 2.3887 0.001 19.92
100-seed weight
CaSTMS21 1 3.2055 0.001 8.94
TA22 6 3.783 0.001 29.11
TA106 6 2.37 0.001 20.19
TR56 3 3.5908 0.001 13.42
TS24 6 3.1591 0.001 20.14
Plot yield
CaSTMS7 5 3.8166 0.001 7.33
CaSTMS20 5 5.9664 0.001 4.41
TA108 3 4.1875 0.001 7.96
TS35 5 2.0798 0.001 21.11
per day
productivity
CaSTMS7 5 3.7768 0.001 7.08
CaSTMS20 5 5.7128 0.001 4.13
TA108 3 3.437 0.001 6.5
TS35 5 1.928 0.001 19.5
protein content GA26 13 2.1067 0.008 11.04
Damage rating CaSTMS23 3 4.2451 0.001 7.09
TA132 4 1.9017 0.003 19.63
Leaf DryWeight TA8 1 2.4949 0.001 16.32
LeafArea TA8 1 2.7677 0.001 17.73
TA20 1 1.9768 0.001 22.72
Specific Leaf Area TS83 13 2.2482 0.001 16.95
SCMR TAA59 7 2.1029 0.005 18.32

Trait Locus
Chromosome
position F_marker P R2%
Shoot Dry weight
CaSTMS5 3 4.613 0.001 12.8
CaSTMS9 NN 3.8527 0.001 8.49
GA26 13 3.3841 0.001 12.02
TA20 5 2.0967 0.001 20.2
TA22 6 1.9585 0.001 19.21
TA113 1 2.5203 0.001 12.15
TaaSH 5 2.5669 0.001 15.04
Root Dry weight
CaSTMS5 3 3.1695 0.001 9.71
TA20 1 2.1367 0.001 21.39
TA22 6 2.1294 0.001 21.33
Total dry weight
Ratio
CaSTMS5 3 4.7487 0.001 13.1
CaSTMS9 NN 3.5495 0.001 7.88
GA26 13 3.0547 0.001 11.02
TA20 1 2.2564 0.001 21.27
TA22 6 2.1079 0.001 20.25
TA113 1 2.6058 0.001 12.48
TaaSH 5 2.6486 0.001 15.4
Root length
Density
TA130 4 3.4588 0.001 20.21
TAA59 7 4.7943 0.001 30.0
Root surface area CaSTMS5 3 3.0982 0.001 10.13
Root Volume TA22 6 2.0859 0.001 21.52

Table 64: List of markers associated with more than one trait evaluated in the
chickpea reference set
S.No Marker
Chromosome
position Traits
1 TA113 1 SDW, TDW
2 CaSTMS21 1 TB, 100sdwt, PLWD
3 TA8 1 LDW,Leaf area
4 TA20 1 Leaf area, SDW,RDW,TDW
5 TR43 1 PLHT, TB
6 TA27 2 DF,FD,SDPD
7 CaSTMS5 3 PPP, SDW, RDW,TDW,RSA
8 TA108 3 PY, FD,Prod
9 TA132 4 FD,PLHT,Damage Rate%
10 TS54 4 DF,FD,SDPD
11 TA130 4 DF,DM,RLD
12 TA20 5 SDW, RDW, TDW, Leaf area
13 TAAsH 5 SDW, TDW
14 CaSTMS7 5 prod,DF,FD,DM,PY
15 CaSTMS20 5 PY,Prod, FD
16 TS35 5 FD,PY,Prod
17 TA106 6 PPP, 100-sdwt
18 TA22 6 100-sdwt, SDW,RDW,TDW,RV
19 TS24 6 APB,BSB,ASB,100-sdwt
20 CaSTMS2 6 ASB,TB
21 TAA59 7 RLD, SPAD
22 TAA58 7 PPP, DF
23 TS46 7 PLHT, TB, YPP
24 TA78 7 PLWD,TB
25 GA26 13 Protein content, SDW,TDW
26 TS83 13 FD,SLA
27 CaSTMS25 15 PLWD,FD
28 CaSTMS9 NN YPP, SDW,TWD
DF = days to 50% flowering, FD = flowering duration, PLHT = plant height, PLWD = plant width,
DGF=Days to Grain Filling, DM = days to maturity, BPB = basal primary branches, APB = apical
primary branches, BSB = basal secondary branches, ASB = apical secondary branches, TB =
tertiary branches, SDPD = seed per pod, PPP = pods per plant, YPP = yield per plant, SDWT =
100-seed weight, YKGH = plot yield, PROD = per day productivity. SPAD = Soil Plant Analysis
Development. SDW=Shoot Dry Weight, RDW=Root Dry Weight (RDW), RDp=Root Depth,
TDW=Total Plant Dry Weight, RL=Root Length, RLD=Root Length Density, RSA=Root surface
area and RV=Root Volume.


Discussion

5. DISCUSSION
A large number of chickpea germplasm accessions (more than 98,000) are
conserved in several genebanks in the world (Gowda et al., 2011). ICRISAT
maintains the largest collection of 20,267 accessions of 60 countries which
include 18392 land races, 98 advanced cultivars, 1293 breeding lines, 288 wild
species and 196 accessions with no information on biological status. Inspite of
vast germplasm accessions available in different genebanks, there has been very
limited use of these accessions in crop improvement programs (Upadhyaya et al.,
2006). To enhance use of germplasm in crop improvement, a core collection of
1956 accessions (Upadhyaya et al., 2001) was developed representing the
variability of the entire collection. However, size of core collection was also not
convenient for multilocational replicated evaluation. To achieve this Upadhyaya
and Ortiz, (2001) proposed the ‗minicore‘ concept and developed chickpea
minicore consisting 211 accessions (1% of entire, 10% of core collection)
representing entire species diversity and used as a gateway for germplasm
utilization.
Global composite collection of Chickpea
Upadhyaya et al., (2006) developed a global chickpea composite collection
consisting of 3000 accessions. The chickpea composite collection included the
1956 accessions of the ICRISAT core collection (Upadhyaya et al., 2001), 709
cultivated accessions representing unique accessions at ICARDA, 39 advanced
breeding lines and released cultivars, 35 distinct morphological variants, 20 wild
species (C. echinospermum and C. reticulatum) accessions and 241 accessions
carrying specific traits such as tolerance/resistance to biotic and abiotic stress,
important agronomic characters (early maturity, multi-seeded pods, double
podded, large-seed size, high seed protein, nodulation and responsiveness to high-
input conditions). This global composite collection is composed of 80% landraces,
9% advanced breeding lines, 2% cultivars, 1% wild species and 8% for which
precise status is unknown. Geographically, 39% of the composite collection
originated from South and South-East Asia, 25% from West Asia, 22% from the
Mediterranean and 5% each from Africa and the Americas.

Development of reference set of Chickpea
A genotype based 300 accessions reference set was developed from composite
collection (Upadhyaya et al., 2006) using data on 48 SSR markers, for diverse
applications in chickpea genomics and breeding (Upadhyaya et al., 2008).
The objectives of this study was to determine phenotypic diversity using 17
quantitative traits, seven qualitative traits and grain quality traits, resistance to pod
borer and for traits related to drought tolerance; genotypic diversity using 91 SSR,
to identify allelic variation associated with beneficial traits using association
mapping and to identify genetically diverse trait-specific germplasm lines for use
in breeding programme to develop cultivars with a broad genetic base.
Diversity in chickpea reference set
A wide spectrum of diversity has been captured in the reference set, which
consisted of 194 desi, 88 kabuli, 11 pea or intermediate type accessions and 7 wild
accessions. Of these 267 were landraces, 13 advanced lines and cultivars, 7 wild
Cicer accessions, and 13 accessions with unknown biological status.
Geographically, the reference set included accessions from South and East Asia
(105), West Asia (93), Mediterranean region (56), Africa (21), North America (6),
Russian Federation (6), South America (4), Europe (3), and unknown origin (6).
PHENOTYPIC DIVERSITY BASED ON QUALITATIVE AND
QUANTITATIVE TRAITS
5.1. QUALITATIVE TRAITS
5.1.1. Frequency distribution
Qualitative traits are useful in characterization of accessions, as they show high
heritability and stable expression. Out of the seven qualitative traits studied,
maximum diversity was observed for seed color indicating importance of this trait
in assessing phenotypic diversity. This is not surprising as the classification of
chickpea types itself is based on seed color, shape and size. The frequency
distributions of different phenotypic classes of the qualitative traits revealed a
large variation for each trait. In chickpea reference set, the traits like low
anthocyanin plant pigmentation (53.3%), pink flower colour (57.0%), semi-erect
growth habit (62.3%), yellow brown seed color (36.0%), angular or ram‘s head
seed shape (67.0%) with minute black dots (52.0%) and rough seed surface

(66.0%) were the most predominant characters.
Most of the qualitative traits are related with type of chickpea, desi or kabuli or
intermediate. As desi types dominated entire reference set, the traits that are
characteristics of desi type were predominant in the reference set. Among the
qualitative traits relatively high polymorphism was observed for seed colour
followed by seed surface indicating relatively greater importance of these two
traits in phenotypic diversity assessment.
Semi-erect growth habit was most prevalent among accessions across three seed
types (Upadhyaya et al., 2001, Chaturvedi et al., 2009), whereas plant
pigmentation, flower colour, seed color, seed shape, minute black seed dots and
seed surface differed within three seed types. Pink flower color (83.5%) among
desi accessions, white flower color (98.9%) in kabuli, both white (45.4%) and
light pink (36.4%) in pea type were the most prevalent characters among three
seed types. Pink flower color in desi, white flower in kabuli is the characteristics
of chickpea seed types, reported by Pundir et al., (1985), Upadhyaya et al.,
(2001), Chaturvedi et al., (2009).
In the entire reference set low-anthocyanin was dominant over no and high
anthocyanin (Rao et al., 1980, Pundir et al., 1985, Upadhyaya et al., 2001). Most
of the desi accessions (78.9%) were with low anthocyanin plant pigmentation,
whereas kabuli types were with no-anthocyanin, and no-anthocyanin (81.8%) and
low-anthocyanin (9.1%) was observed among pea type. Only 2% of the accessions
were with high-anthocyanin pigmentation in the entire reference set. Desi
accessions (55.2%) predominated with yellow brown and kabuli with beige
(98.9%) seed color. Angular or ram‘s head seed shape (67.0%), which is the
characteristic of desi type, dominated reference set followed by owl‘s head shape
(29.3%) and intermediate or pea shaped (3.7%) (Pundir et al., 1985, Upadhyaya et
al., 2001, Upadhyaya and Ortiz, 2001).
Minute black dots were present on the seed testa of most desi (71.6%) accessions
while (28.4%) accessions had no dots on seeds and totally absent in kabuli type
whereas in pea type (90.9%) seeds were with dots and (1.1%) were without dots.
Among desi type accessions (97.4%) were of rough type and (2.6%) are
tuberculated while in kabuli type (95.5%) had smooth and (4.5%) had rough seed
surface. In pea types (54.5%) were smooth and (45.5%) were with rough seed
surface (Pundir et al., 1985 and 1988 Upadhyaya et al., 2001).

Region wise, South and East Asia region accessions dominated with low-
anthocyanin pigmentation (90 accessions, 85.7%), pink flower colour (93
accessions, 88.6%), yellow brown (71 accessions, 67.6%) seeds along with
angular seed shape (93 accessions, 88.6%). Further in West Asian accessions,
semi-erect (71 accessions, 76.3%), and no-anthocyanin (54 accessions, 58.1%)
features were more common compared to other groups. This suggests the presence
of greater variability in Asian material compared to other groups as they are the
most preferred types in cultivation indicating the greater role of human selection
in this region compared to other regions. Mediterranean region was dominated by
accessions with beige seed color, white (34 accessions, 60.7%) flower colour
since most of the kabuli and wild accessions originated from this region compared
to other regions. The wide variability for these qualitative traits were reported
earlier in chickpea with 16,820 accessions at ICRISAT (Upadhyaya et al., 2003),
1956 accessions of core collection (Upadhyaya et al, 2001), 211 accessions of
mini core collection (Upadhyaya and Ortiz, 2001) and 88 accessions (Chaturvedi
et al., 2009).
5.2. QUANTITATIVE CHARACTERS
The data on 17 quantitative traits of individual five environments and pooled
(meta) were analyzed for the entire reference set to estimate variance components
due to genotypes (σ 2
g) and genotype x environment interactions (σ 2
ge), means
and variances, phenotypic diversity and Shannon-Weaver diversity index (H‘) and
PCA. The results of various analyses are discussed below.
5.2.1. Variance components
The statistical procedure REML (Restricted Maximum Likelihood) allows
estimating the variance components in a situation of high unbalancing data.
Variances of 17 quantitative traits were calculated in individual environments
separately and pooled over five environments. The five environments differed
significantly as revealed by Wald‘s statistics; indicating that choice of the
environments was appropriate in expressing the variability of reference set.
Estimates of variance components due to genotypes were significant for most of
the quantitative traits except for days to 50% flowering, flowering duration, days
to grain filling, days to maturity and seeds per pod in E1, pods per plant and yield
per plant in E2, plant height in E3 and plot yield and productivity in pooled

analysis indicating that the reference set had sufficient genetic variation for most
of the traits. In the pooled analysis, estimates of variance components due to σ 2
g
and σ 2
ge were estimated and tested against their respective standard errors and
they were significant for all the traits except plot yield indicating the genotypes
had variation and their performance differed in different environments. Significant
variance in most of the traits in individual and pooled analysis showed that the
genotypes in the reference set are diverse and had sufficient scope for selection
and utilization in crop improvement programme.
Variance due to genotypes has been reported significant in earlier studies for the
qualitative traits such as days to 50 percent flowering (Upadhyaya and Ortiz,
2001, Upadhyaya et al, 2001, 2003, Gowda et al., 2011), flowering duration
(Gowda et al., 2011), days to maturity (Upadhyaya et al, 2001, Gowda et al.,
2011), days to grain filling (Gowda et al., 2011), plant height and width
(Upadhyaya et al. 2003, Gowda et al., 2011), apical primary branches, basal
primary branches, apical secondary branches, basal secondary branches
(Upadhyaya and Ortiz, 2001, Upadhyaya et al, 2001, 2003, Gowda et al., 2011),
tertiary branches (Upadhyaya and Ortiz, 2001, Upadhyaya et al, 2001), 100-seed
weight (Upadhyaya et al, 2001, 2003, Chaturvedi et al., 2009, Gowda et al.,
2011), seeds per pod (Upadhyaya et al. 2003), pods per plant (Chaturvedi et al.,
2009, Gowda et al., 2011), grain yield (Upadhyaya et al, 2001, Gowda et al.,
2011), whereas non-significant for seeds per pod (Chaturvedi et al., 2009), yield
(Abdel et al., 2005) and significant genotype x environment was observed for all
traits except basal primary branches, basal secondary branches and pods per plant
(Gowda et al., 2011).
5.2.2 Variability Studies
Genetic variability studies provide basic information regarding the genetic
properties of the population based on which breeding methods are formulated for
improvement of the crop. These studies are also helpful to know about the nature
and extent of variability that can be attributed to different causes, sensitive nature
of the crop to environmental influences, heritability of the characters and genetic
advance that can be realized in practical breeding. Progress in any crop
improvement program depends mainly on the variability existing for the
quantitative traits of the base population. Hence, to have a comprehensive idea, it

is necessary to have an analytical assessment of yield components and other
important agronomic traits.
5.2.2.1 Mean performance of the reference set accessions for quantitative
traits in different environments
Substantial environmental variation was observed, indicating adequacy of these
environments in differentiating the genotypes. The traits, days to 50 percent
flowering, flowering duration, days to grain filling, 100- seed weight, plant width
and number of branches did not differ significantly between five environments.
However, plant height, days to maturity, pods per plant, seeds per pod, yield per
plant, per day productivity and grain yield differed significantly between the
environments. Mean productivity per day (18.3 kg ha-1
day-1
), plot yield
(2088.6±206.71 kg ha-1
), yield per plant (15.5±2.23g), pods per plant (62.7 ±
7.01), days to maturity (115.2±1.59 days) and basal primary branches (3.1±0.2)
were maximum in E2 when compared to E1, E3, E4 and E5. Apical primary
branches (2.9±0.95) and plant height (44.9±1.11cm) in E3, and 100-seed weight
(23.6±1.32g) in E1 showed the maximum mean performance.
The differential response of reference set accessions for different environments
was due to the different growing conditions in all five environments. In E1, E2,
E3 reference set was grown in irrigated conditions during post rainy seasons
2006/07, 2007/08, 2008/09 at ICRISAT, E4 during post rainy irrigated
environment 2008/09 at UAS, Dharwad and E5 during spring irrigated
environment 2008/09 at ICRISAT. A review of weather data in different seasons
revealed no appreciable difference among environments for sunshine hours,
minimum and maximum temperatures, and total pan evaporation during cropping
period. The major difference observed during E2 from other environments was the
quantity of rainfall received during the cropping season which leads to increased
plant height, plant width, number of branches and grain yield while reducing
number of days to maturity.
The ten accessions ICCs 8318,14595,16374,9590,15518,15618,4918,6279,4533
and 1083 consistently flowered early (<50 days) in all environments indicating
that these accessions could be source of genes for early flowering in breeding of
early maturing cultivars. The incorporation of earliness will also ensure in
avoiding the more exposure against major biotic and abiotic genotypes

(Chaturvedi et al., 2009). Early flowering accessions were reported in chickpea
(Upadhyaya et al., 2007), groundnut (Upadhyaya et al., 2006), pearl millet
(Bhattacharjee, 2007) and finger millet (Geetha Rani, 2005).
The ICC 5434 (17 cm) is the only accession with very short stature in reference
set, five accessions (ICCs 12321, 12379, 13469, 7554 and 12851) were short (<
45 cm) while eight accessions (ICCs 19011, 19034, 19164, 18724, 8740, 20260,
19100, 8752) were tall (> 60 cm) in all the five environments. Plant height with
erect growth habit can play an very important role as it will provide more chances
of sunlight to penetrate the lower most part of the plant which will ultimately help
in reducing the high humidity in crop canopy during reproductive phase. This will
ensure in retaining more number of pods at lower part of the plant also which can
be helpful in relation to biomass accumulation (Chaturvedi et al., 2009).
Multilocational evaluation of these taller accessions could be used to find their
suitability for release as cultivar or use in breeding programme.
The mean number of basal primary branches was high in E2 (3.1±0.2), apical
primary branches in E3 (2.9 ± 0.95) and tertiary branches in E2 (1.8 ± 0.95) than
in other environments, whereas number of basal secondary branches was similar
in all environments with a mean of 3.2 ± 0.12, apical secondary branches with an
overall mean of 4.4 ± 0.21,. The accessions with extreme number of branches
could be used as parents for crossing to improve this particular trait. In general,
traits appreciably affected by environmental factors were mostly vegetative, while
reproductive components were least affected. Similar reports of differential
response of vegetative traits in different seasons were reported in chickpea
(Upadhyaya et al., 2001, Gowda et al., 2011).
Means and range of the reference set studied in the present study were similar to
the composite collection (Upadhyaya et al., 2006) of chickpea indicating that
reference set represented the diversity of composite collection.
The similar range for quantitative traits has been reported earlier in chickpea
germplasm characterization with varying number of accessions (25 accessions,
Pundir et al., (1991);132 accessions, Khan et al., (1991); 40 accessions, Lokender
Kumar and Arora, (1992); 60 accessions, Narendra Kumar, (1997); 108
accessions, Yadav and Sharma, (1999); 33 accessions, Subhash et al., (2001);
1956 accessions, Upadhyaya et al., (2001); 211 accessions, Upadhyaya and Ortiz,
(2001); 16820 accessions, Upadhyaya et al., (2003); 81 accessions, Prakash,

(2006); 24 accessions, 3000 accessions, Upadhyaya et al., (2006); 360 accessions,
Farshadfar and Farshadfar, (2008), 27 accessions, Bhavani et al., (2009); 88
accessions, Chaturvedi et al., (2009); 25 accessions, Dwivedi and Gaibriyal,
(2009); 25 accessions, Malik et al., (2010) and 65 accessions, Gowda et al.,
(2011).
5.2.2.2 Mean performances of the accessions according to their geographical
regions
The seven morphological descriptors showed differences among geographical
regions in their distribution and range of variation. None of the morphological
descriptors was monomorphic and most showed at least two relatively frequent
phenotypic classes. Plant colour showed a pattern typical to the regions in which
different chickpea types are grown. No-anthocyanin which is characteristic of
kabuli chickpeas was less frequent in the Southeast Asia, and Africa, where desi
chickpeas having low- or high-anthocyanin accessions are cultivated. Similarly, in
Mediterranean region and Europe, the no-anthocyanin accessions are cultivated.
The pattern for flower colour, seed colour, seed shape, and seed surface across
different regions was similar to plant colour. Thus kabuli characteristics such as
white flower, owl‘s head seed shape, a smooth seed surface, and beige seeds were
more frequent in the Mediterranean region and Europe. Accessions with pink
flowers, brown or yellow-brown seeds, angular seed shape, and rough seed
surface, were abundant in Southeast Asia, and Africa. Erect, prostrate and
spreading growth habits had a very low frequency across all the regions except
East Asia. Semi-erect and semi spreading growth habits were evenly distributed in
South Asia, whereas in the rest of the regions, except Southeast Asia, semi-erect
accessions were predominant. Southeast Asia and West Asia showed 100% range
for the seven morphological descriptors, and the Mediterranean region showed
100% range variation for all morphological descriptors except for plant colour.
According to Newman- Keuls test, region wise means were not significantly
different for most of the traits except for days to 50 percent flowering and days to
maturity (Africa), plant height (Europe), tertiary branches (South America), 100-
seed weight (South America), pods per plant and yield per plant (Africa, South
America and South and East Asia), and plot yield (Africa and South East Asia) in
five environments and when pooled. The quantitative traits showed a large range

for different traits in different regions. The accessions from Africa flowered
earlier (50-54 days), and matured earlier (110-112 days), whereas accessions from
Europe flowered late (64-69 days) with short grain filling duration (49-53 days)
across environments. The regional mean value for traits such as flowering
duration, basal primary branches, apical primary branches, basal secondary
branches, apical secondary branches, seed per pod were similar across
environments. The European accessions had higher mean plant height (46-53 cm)
across environments. Higher mean 100-seed weight across environments was in
the accessions from South America (32-37 g) indicating the relative importance of
seed size in this regions. The South East Asian accessions had higher mean yield
overall in all environments. In Europe, the Mediterranean region, and Americas,
large-seeded kabuli cultivars are preferred whereas in Southeast Asia and Africa
mostly small-seeded desi cultivars are grown. The similar findings have been
reported in chickpea by Upadhyaya et al., (2001, 2003, and 2006), Upadhyaya and
Ortiz, (2001).
5.2.2.3 Phenotypic and genotypic coefficient of variation, (PCV and GCV)
The values for phenotypic coefficient of variation (PCV) were found higher than
genotypic coefficient of variation (GCV) for all the traits in all environments
indicating the influence of environment upon these traits (Subhash et al., 2001) or
very low influence of environment in the expression of these traits (Sidramappa et
al., 2008). In the present study, the traits tertiary branches, yield per plant, 100-
seed weight, productivity, and plot yield showed high estimates of PCV and GCV.
Singh et al., 1992, Jahagirdar et al., 1994, Rao et al., 1994, Subhash et al., 2001,
Upadhyaya et al., 2001, Upadhyaya and Ortiz, 2001, Saleem et al., 2002, Arshad
et al., 2003 and 2004, Khan et al., 2006, Upadhyaya et al., 2007, Chaturvedi et al.,
2009, Malik et al., 2010 reported higher estimates of PCV and GCV for most of
these traits.
Narrow difference between PCV and GCV was observed in all environments and
when pooled indicating greater role of genetic factors on the expression of these
traits. Rest of the characters showed moderate to low variability. Moderate PCV
and GCV were observed for apical primary branches, apical secondary branches,
basal secondary branches, pods per plant, plant height, seeds per pod, basal
primary branches and days to flowering. Low PCV and GCV were observed for
days to grain filling, flowering duration, plant width and days to maturity. Raju et
al., 1978, Agrawal, 1985, Samal and Jagdev, 1989, Singh and Rao, 1991, Chavan
et al., 1994, Upadhyaya et al., 2001, Upadhyaya and Ortiz, 2001, Upadhyaya et
al., 2007, Ali et al., 2008, Patil et al., 2008 reported moderate to low estimates of
PCV and GCV for most of these traits.
5.2.2.4 Heritability and genetic gain
The simple measures of variability like mean, variance and coefficient of variation
reveals the extent of variability but not the heritable proportion of the total
variation. To have the knowledge of the heritable proportion of variability, it is
necessary to estimate the heritability. Heritability is a quantitative measure and
also provides information about the correspondence between genotypic variance
and phenotypic variance, i.e., the ratio of variance due to hereditary differences
(σ2g) to the total phenotypic variance (σ
2p) (Singh, 1977), expressed as percent.
The knowledge of heritability helps the plant breeder in predicting the behavior of
characters in succeeding generations and to difference the effectiveness of
selections.
In the present study, the broad-sense heritability was high (>80%) for most of the
traits except for pods per plant and yield per plant in E2 and seeds per pod in E3
and E5, plant height, plant width, days to 50 percent flowering, days to grain
filling, days to maturity, apical secondary branches, pods per plant, 100-seed
weight, grain yield and per day productivity for pooled data indicating the
reliability of the selection for these traits in this material. Populations which are
genetically more uniform are expected to show lower heritability than the
genetically variable population. Also, more variable environmental condition
reduces the estimates of heritability, whereas more uniform environmental
condition increases the magnitude of heritability (Dabholkar, 1999). Hence, high
heritability of the traits under study may be due to highly variable and genetically
diverse germplasm and more uniform environmental condition in all five
environments.
Since heritability is also influenced by environment, the information on
heritability alone may not help in pin-pointing characters for effective selection.
Heritability gives the information on the magnitude of inheritance of quantitative
traits, while genetic advance will be helpful in formulating suitable selection
procedures. Therefore estimates of heritability and genetic advance would give
better idea about possible gains of selection (Chavan et al., 1994). The grain yield
and its components like days to 50 % flowering, days to maturity, days to grain
filling, seeds per pod, pods per plant, yield per plant, 100-seed weight and per day
productivity exhibited high genetic advance as per cent of mean coupled with high
estimates of broad sense heritability indicating that, the variation is attributable to
genetic factors and selection may be effective for improvement of these traits.
The high estimates of heritability coupled with high genetic advance as per cent of
mean in chickpea have been reported earlier for days to 50 percent flowering and
days to maturity (Chandra, 1968; Joshi, 1972; Samal and Jagdev, 1989; Sharma et
al., 1990; Misra, 1991; Singh and Rao, 1991; Panchbhavi et al., 1992; Chavan et
al., 1994; Mathur and Mathur, 1996 and Upadhyaya et al., 2007, Gowda et al.,
2011), plant height and plant width (Samal and Jagdev, 1989, Sharma et al., 1990,
Singh and Rao, 1991, Misra 1991, Chavan et al., 1994 and Mathur and Mathur,
1996) Gowda et al., 2011), number of branches (Sharma et al., 1990 and Jha et
al., 1997, Gowda et al., 2011), pods per plant (Joshi, 1972, Mishra et al., 1988;
Samal and Jagdev, 1989, Mishra, 1991; Singh and Rao, 1991, Chavan et al., 1994,
Mehndi et al., 1994, Mathur and Mathur, 1996, Narayana and Reddy, 2002, Sial et
al., 2003 and Gowda et al., 2011), seeds per pod (Iqbal et al., 1994), 100-seed
weight (Samal and Jagdev, 1989) Singh and Rao, 1991; Chavan et al, 1994;
Jahagirdar et al, 1994; Tripathi, 1998; Kumar et al, 1999; Saleem et al, 2002;
Toker, 2004, Gowda et al., 2011), yield per plant (Samal and Jagdev 1989;
Jahagirdar et al, 1994; Singh and Rao 1991; Chavan et al, 1994; Gowda et al,
2011) and grain yield (Mehndi et al., 1994, Kumar and Krishna, 1998, Arshad et
al., 2003, 2004, Upadhyaya et al., 2007).
5.2.3 Correlations
Phenotypic correlation coefficients were estimated to know the association among
traits which could be used as guidelines while making selections to exploit
correlated response in the breeding programme. Understanding the interaction of
traits among themselves and with the environment is of great use in plant
breeding. Correlation studies provide information on the nature and extent of
association between quantitative traits and it would be possible to bring out
genetic up-gradation by selecting for easily measurable trait. Hence, an attempt

was made to study the association prevailing among 17 quantitative traits in
chickpea reference set.
Grain yield is a complex character and jointly determined by a number of yield
related traits. An insight into the association between grain yield and other traits
helps to improve the efficiency of selection. In general, the correlation between
yield and other characters as well as among the component characters will vary
with the genotype handled by the breeder. In the present investigation, the
phenotypic correlations between pairs of characters have been studied to identify
the component traits that are closely related to grain yield in chickpea reference
set. In the present study, correlations were calculated in each environment
separately and also based on the pooled data.
A total of, 61 correlations were significant in E1, 55 in E2, 57 in E3, 48 in E4 , 50
in E5, and 50 in overall five environments at P<0.05. Among the 15 independent
characters on grain yield, days to grain filling had positive correlation with grain
yield in all environments except E5, apical primary branches in all environments
except E2, basal secondary branches in E5, apical secondary branches in E2, E3
and pooled, seeds per pod in E3 and pooled, pods per plant in all environments
except E5 and yield per plant exhibited significant positive correlation with grain
yield in all environments except E4 and E5. However, magnitude of relationship
was different in different environments indicating the strong association between
the traits without any environmental influence.
It would be inferred that, selection for high yield would be effective through
selection for these characters. Besides these characters showed high heritability
coupled with high genetic advance as per cent mean, hence selection would be
effective. Positive correlation of days to 50 per cent flowering (Vijayalakshmi et
al., 2000, Upadhyaya et al., 2001, Saleem et al., 2002 ), plant height (Tripathi,
1998, Yucel et al., 2006), 100-seed weight (Benjamini, 1981, Singh, 1982, Tomar
et al., 1982, Arshad et al., 2002, Saleem, 2002, Narayana and Reddy, 2002,
Dobariya, 2003, Sial et al., 2003, Arshad et al., 2004, Hassan et al., 2005),
number of branches (Ozdemir, 1996), pods per plant and seeds per pod (Mishra et
al., 1988, Sandhu et al., 1988, Sharma and Maloo,1988, Sandhu and Mandal,
1989, Tagore and Singh, 1990, Uddin et al., 1990, Chavan et al., 1994, Sarvalia
and Goyal, 1994, Tripathi, 1998, Bakhsh et al., 1998, Vijayalakshmi et al., 2000,
Upadhyaya et al., 2001, Saleem et al., 2002b, Arshad et al., 2002, Narayana and

Reddy, 2002, Bhaduoria et al., 2003, Dobariya, 2003, Sial et al., 2003, Arshad et
al., 2004, Hassan et al., 2005, Yucel et al., 2006, Babar et al., 2008 , Malik et al.,
2010 ) and per day productivity (Upadhyaya et al., 2007) with grain yield were
reported in chickpea. Days to 50 percent flowering, flowering duration, plant
height and days to maturity showed significant negative correlation with grain
yield.
From the above results it is seen that most of the traits were associated with grain
yield and inter correlated among themselves. It indicates that the selection in any
one of these yield attributing traits will lead to increase in other traits, thereby
finally boosting the grain yield. Hence, primary selection of these traits may be
given importance to obtain genotypes with increased plot yield. In addition, the
significant associations between these component traits suggest the possibility of
simultaneous improvement of these traits by selection.
In the present study, only those correlations which are greater than 0.500 or
smaller than -0.500 were considered as meaningful as at least 25 per cent of the
variation in one trait is predicted by the other (Upadhyaya et al., 2010c). The
correlations for one pair of the characters were positive in all the five
environments and overall, plot yield and per day productivity in E1, E2, E3
(0.990), E4 (0.974), E5 (0.978) and in overall. Correlations for a pair of the
characters were negative in E3 and in overall ; viz., days to 50 percent flowering
and days to grain filling in E3 (-0.711), and in overall (-0.716); showed
significantly higher and biologically meaningful correlation. However the pairs of
traits, viz., days to 50 percent flowering and days to maturity in E1 (0.597), E2
(0.694), E3 (0.620), E4 (0.599), E5 (0.525) and in overall (0.671); pods per plant
and per day productivity in E2 (0.500) showed high correlation, and correlations
for one pair of the characters were negative, days to 50 percent flowering and
days to grain filling (-0.614 ) in E4 (r = 0.50 or more). Days to 50 percent
flowering was significantly and positively correlated with days to maturity, plant
width, plant height and basal primary branches indicates the simultaneous
improvement of other traits through the selection in positive direction for days to
50 percent flowering. Upadhyaya et al., (2001) reported the positive correlation of
days to 50 percent flowering with flowering duration and days to maturity.
Therefore, it can be inferred that selection should be in positive side for days to 50
percent flowering, days to maturity, days to grain filling, number of branches,

seeds per pod, pods per plant and yield per plant and negative side for plant height
and width which will in turn automatically increases the grain yield in chickpea
and is also, useful in evaluation of large germplasm set which is an easily
measurable trait, with high correlation.
5.3 DIVERSITY ANALYSIS
5.3.1. Shannon Weaver Diversity Indices
The Shannon-Weaver diversity index (H`) was calculated for different traits in
each environment separately and also pooled data over environments. The index is
used as a measure of allelic richness and evenness; a low H` indicates an
extremely unbalanced frequency class and lack of genetic diversity.
Out of seven qualitative traits studied, dots on seed coat showed low mean H` in
all environments indicating relatively unevenness distribution of alleles and low
allelic richness for this trait, followed by seed shape, seed surface, plant color,
growth habit and flower color. Seed color showed high mean H`, indicating
relative high diversity for this trait. Among the quantitative traits studied tertiary
branches, flowering duration and seeds per pod showed low mean H` in all
environments followed by apical primary branches, flowering duration, apical
secondary branches and yield per plant in all environments. The traits such as,
days to 50 percent flowering, grain yield, days to maturity, per day productivity
and apical primary branches in all environments showed highest H` indicating
evenness and richness, followed by days to grain filling, flowering duration, yield
per plant, apical secondary branches, grain yield, basal primary branches, per day
productivity, basal secondary branches, days to maturity, plant width and tertiary
branches, pod per plant and apical primary branches, seeds per pod, days to
flowering), 100-seed weight and plant height. Similar results have been reported
by Upadhyaya et al., 2001 in core collection (1956 accessions), Upadhyaya and
Ortiz, 2001 in mini core collection (211 accessions), Upadhyaya, (2003) in world
collection of chickpea germplasm (16,820 accessions) in different regions for
seven qualitative traits and 13 quantitative trait, whereas Islam et al., (1984)
reported maximum diversity in number of pods and plot yield followed by
minimum diversity in days to 50% flowering and days to maturity. The mean and
range of H` for all the traits in the present study, is comparable with the H` of
composite collection of chickpea (Upadhyaya et al., 2006a) indicating that the

reference set represents the entire diversity of composite collection.
5.3.2. Phenotypic diversity matrix
Phenotypic diversity index (Johns et al., 1997) was created by estimating
differences between each pair of accessions for each of the 7 qualitative and 17
quantitative traits by averaging all the differences in the phenotypic values for
each traits divided by their respective range. The entire chickpea reference set
evaluated at five different environments, exhibited similar minimum diversity,
ranging from 0.001 to 0.002 in all environments.
The maximum diversity index was observed between ICCV92311 (Southeast
Asia) and ICC 11198 (Southeast Asia) in E1, between ICC 20266 (Unknown
biological status) and ICC 4991 (Southeast Asia) in E2, between ICC 4918
(Southeast Asia) and ICC 16796 (Europe) in E3 and E4, between ICC 4918
(Southeast Asia) and ICC 18983 (Mediterranean) in E5 and between ICC 13764
(West Asia) and ICC 12037 (North America) when pooled. Based on the diversity
index, ten most diverse accessions were identified in each environment and pooled
data of five environments. Most of the pair of accessions which expressed most
diversity in pooled data was also recorded in individual environment as well.
Hence, ICCV92311 (Southeast Asia) and ICC 11198 (Southeast Asia), ICC
20266 (Unknown biological status) and ICC 4991 (Southeast Asia), ICC 4918
(Southeast Asia) and ICC 16796 (Europe), ICC 4918 (Southeast Asia) and ICC
18983 (Mediterranean), ICC 13764 (West Asia) and ICC 12037 (North America),
ICC 15996 (Southeast Asia) and ICC 19011 (Mediterranean), ICCV 92311
(Southeast Asia) and ICC 16524 (Southeast Asia), ICCV92311 (Southeast Asia)
and ICC 11279 (Southeast Asia), ICCV92311 (Southeast Asia) and ICC 5135
(Southeast Asia), ICC4918 (Southeast Asia) and ICC 14446 (Mediterranean) were
the ten most diverse pairs of accessions identified based on five environments
performance and further exploitation of these widely diverse accessions would
help in the development of mapping population to identify QTLs and use in
breeding programs to study the segregating generation and selection of superior
lines. The results observed in this study are in agreement with earlier reports based
on geographical origin (Upadhyaya, 2003) in world collection of chickpea
germplasm (16,820 accessions) in different regions.
5.3.3. Principal component analysis
Principal Component Analysis (PCA) was used to provide a reduced dimension
model that would indicate measured differences among groups.
In the present study, in all the five environments and also in the pooled analysis, a
large proportion of the total variation was explained by the first seven Principal
Components (PCs) and all together explained that, per day productivity, plot yield,
days to 50% flowering and days to maturity were most important traits that made
contribution in explaining variation in the first seven PCs. It indicated the
importance of these traits which contributed more towards divergence in chickpea
reference set. These results observed in this study are in agreement with earlier
reports based on geographical origin (Upadhyaya, 2003) in world collection of
chickpea germplasm (16,820 accessions) in different regions.
5.3.4. Clustering
The hierarchical cluster analysis (Ward, 1963) based on Euclidean distance was
conducted using the scores of first three PCs on the pooled data of reference set
accessions.
Grouping of reference set accessions resulted into a dendrogram with four
clusters. Accessions from Africa and South East Asia were grouped in to Cluster
I, South America in Cluster II. Europe and Russian Federation in Cluster III and
whereas Mediterranean, unknown, North America and West Africa was grouped
together in Cluster IV.
This clustering is not surprising considering the trade of chickpea from the
Mediterranean region to the countries in West Asia, and between Europe and
Americas, and the preference for light coloured large-seeded cultivars. These links
facilitate a flow of particular chickpea types between regions. The accessions from
all the member regions of Cluster I were predominantly of desi type with low 100-
seed weight whereas most members of Cluster II, III and IV were predominantly
of kabuli type with high 100-seed weight The accessions in Cluster I had
predominantly low-anthocyanin plants, pink flowers, angular shaped brown or
yellow brown seeds with rough seed surface and dots on the seed testa, whereas in
Cluster II, III and IV accessions were predominantly non-anthocyanin plants,
beige coloured seeds, with smooth seed surface and without dots on seed testa.
Both clusters differed significantly for all the 17 agronomic traits. Accessions in

Cluster II, III and IV took more days to 50 percent flowering and maturity had
taller plants and more tertiary branches, and higher 100-seed weight than the
accessions in Cluster I. Accessions in Cluster I had wider plants, more basal
primary branches, apical primary branches, basal secondary branches, apical
secondary branches, pods per plant, seeds per pod and higher plot yield than in
Cluster II, III and IV. This clustering observed in this study is in agreement with
earlier reports based on geographical origin (Upadhyaya, 2003) in world
collection of chickpea germplasm (16,820 accessions) in different regions.
IDENTIFICATION OF TRAIT SPECIFIC SOURCES
In any crop, improvement of yield and other traits like quality, biotic and abiotic
stresses can be achieved by identifying different gene/trait specific sources. The
use of genetic resources in the breeding programs have been mainly as sources of
resistance to pests and diseases (Knauft and Gorbet, 1989), or as sources of male
sterility, short stature or any such character with simple inheritance. Well known
examples are semi-dwarf rice and wheat genotypes which contributed much to the
success of green revolution. There have been fewer efforts for identifying
germplasm lines for increasing yield potential than for pest resistance and
nutritional quality (Halward and Wynne, 1991), because such traits are highly
environment interactive and require multi-environment testing to accurately
characterize them (Upadhyaya et al., 2010a). Thus identification of promising
resources for the environment sensitive quantitative characters is a difficult task.
However, with the use of core (Upadhyaya et al., 2001) and mini core collections
of chickpea (Upadhyaya and Ortiz, 2001), sources for high grain yield
(Upadhyaya et al., 2007a), tolerance to drought (Kashiwagi et al., 2005) and
disease resistance (Pande et al., 2006) have been identified. Evaluation of mini
core led to the identification of 39 chickpea accessions for a combination of
agronomic traits such as early maturity, seed size and grain yield (Upadhyaya et
al., 2007a). Similarly, new sources for tolerance to drought (Upadhyaya, 2005)
and low temperature at germination (Upadhyaya et al 2009a), and for early-
maturity (Upadhyaya et al., 2006a), were identified in the groundnut core and
mini core collections. Upadhyaya et al. (2005) identified 15 fastigiata, 20 vulgaris,
and 25 hypogaea type groundnut accessions for pod yield and its components
upon multi-location evaluation of groundnut core collection for Asia region.

Upadhyaya et al. (2010d) evaluated finger millet core collection for grain
nutrients and identified accessions rich in Fe, Zn, Ca and protein. Hence, multi-
environmental evaluation / characterization of chickpea reference set and
identification of trait specific sources for different yield contributing traits will
provides new sources for future breeding program in chickpea.
In the present study, chickpea reference set was evaluated in five different
environments which showed a wide range of variability for yield and its
component traits within and between environments for identification of new trait
specific sources. Out of 300 accessions present in chickpea reference set, 2 for
early flowering, 17 for more seeds per pod, 35 for more pods per plant, one with
more yield per plant, 19 with high 100-seed weight, 119 for high plot yield, 89 for
per day productivity, 20 heat tolerant, 13 with high root depth, 42 with high shoot
dry weight, 40 with high root dry weight, 11 with high root to total plant dry
weight ratio (R/T%), 33 accessions with high root length, 6 accessions for root
length density, twenty five with minimum damage rate to pod borer, 17 with
lowest larval survival%, 3 accessions with minimum unit larval weights, 38 with
high protein and 40 accessions with high anthocyanin content, were identified as
trait specific for important traits.
The genetically diverse trait-specific accessions identified in the present study can
be used in breeding program to develop high yielding adapted cultivars with a
broad genetic base. Extensive evaluation of these accessions in different locations
may be useful to assess the stability for identifying the stable trait specific
accessions.
5.5. MOLECULAR DIVERSITY
Understanding the distribution of genetic diversity among individuals, populations
and gene pools is crucial for the efficient management of germplasm collections
and breeding programs. Diversity analysis is routinely carried out using
sequencing of selected gene(s) or by molecular markers. Molecular markers are
increasingly important tools for genetic and genomic studies, breeding and
biodiversity research. In any genome, the number of morphological and
biochemical markers are limited when compared to DNA markers which are
ubiquitous and numerous. However, several DNA-based molecular markers are
available for genetic diversity analysis for most of all the crops. An extensive

characterization of plant genetic resources provides an opportunity for structural
dissection to mine the allelic variation, and identify diverse accessions for crop
improvement (Upadhyaya et al., 2010a). The DNA-based markers are promising
and effective tools for measuring genetic diversity in plants germplasm and
elucidating their evolutionary relationships (Pervaiz et al., 2009).
Germplasm characterization based on molecular markers has gained importance
due to the speed and quality of data generated. A comprehensive study of the
molecular genetic variation present in diploid germplasm would be useful for
determining whether morphologically based taxonomic classifications reflect
patterns of genomic differentiation. It would also provide information on the
population structure, allelic richness, and diversity parameters of diploid
germplasm to help breeders use genetic resources for cultivar development more
effectively (Şakiroglu et al., 2010). Almost all kinds of molecular markers have
been used for analysis of genetic diversity in chickpea germplasm. Majority of
these studies however employed RAPD and AFLP markers, but now SSRs are
preferred.
Amongst the DNA markers, the microsatellites (also known as simple sequence
repeats (SSRs)) markers are now the markers of choice in most areas of molecular
genetics as they are highly polymorphic even between closely related lines,
require low amount of DNA, can be easily automated for high throughput
screening, can be exchanged between laboratories and are highly transferable
between populations. The SSR markers are co-dominant markers and good for the
studies of population genetics and mapping. Microsatellite (SSR) markers were
utilized to reveal genetic diversity in apple (Malus spp.) (Hokanson et al., 1998),
common beans (Phaseolus vulgaris L.) (Blair et al., 2009) core collections, US
peanut mini core collection (Kottapalli et al., 2007) and USDA rice minicore
subset (Agrama et al., 2009). Hence in order to increase the molecular marker
repertoire and to develop genome wide SSR markers, ICRISAT in collaboration
with University of Frankfurt, Germany, developed 311 SSR markers from SSR-
enriched libraries (Nayak et al., 2010) and 1344 SSR markers from BAC-end
sequence mining approaches in collaboration with University of California, Davis,
USA. As EST sequences from various tissues and developmental stages of
chickpea have also been reported (Boominathan et al., 2004; Romo et al., 2004;
Buhariwalla et al., 2005; Coram and Pang, 2005; Varshney et al., 2009b,

Choudhary et al., 2009), a few hundred SSR markers have been developed from
ESTs (Buhariwalla et al., 2005, Varshney et al., 2009b, Choudhary et al., 2009).
As a result of above mentioned efforts, at present >2000 SSR markers
representing the entire chickpea genome are available. Genetic diversity in
chickpea using microsatellite (SSR) markers are reported by Udupa et al., (1999),
Choumane et al., (2000), Sethy et al., (2006a) and (2006b), Upadhyaya et al.,
(2008), Choudhary et al., (2009), Khan et al., (2010).
5.5.1 Molecular diversity of chickpea reference set
Out of 100 SSR markers in this study, 91 markers mapped on 12 chickpea linkage
groups of Winter et al., (2000) produced clear, scorable and polymorphic marker
profile.
5.5.1.1 Allelic richness and genetic diversity in chickpea reference set
A set of 91 highly informative SSR markers detected a total of 2,411 alleles in 300
reference set accessions. However, the number alleles per locus detected in this
study was earlier reported, e.g., 7.6 (Wang et al., 2009) and 4.79 (Shehzad et al.,
2009) in sorghum, 8.23 in maize (Yang et al., 2010) and 8.2 (Agrama et al.,
2007), 15.8 (Agrama and Eizenga, 2008) and 12.4 (Borba et al., 2010) in rice.
Higher average number of alleles per locus was reported in some crops like 16.7
in barley (Malyshera-Otta et al., 2006), 35 in chickpea (Upadhyaya et al., 2008b),
whereas (Huettel et al., 1999, Choudhary et al., 2006, Sethy et al., 2006a, b)
reported 2 to 6 alleles per marker in chickpea. The difference in SSR allelic
richness can be explained by several factors like diversity range of the germplasm,
number of accessions used, number of SSR loci and SSR repeat type (Yang et al.,
2010). A higher number of lines in the samples leads to a more diverse range of
germplasm by sampling, and a larger number of loci (and in particular, the use of
dinucleotide repeat SSRs rather than tri- or higher) will leads to a higher number
of alleles and higher genetic diversity (Gupta and Varshney, 2000, Yang et al.,
2010). In fact, the earlier studies in chickpea also revealed the abundance of
TAA/TTA (tri-nucleotide) and TA/GA (di-nucleotide) SSR motifs and the
extensive polymorphism was found with markers containing these repeat motifs
(Huettel et al., 1999, Udupa et al., 1999, Leichtenzveig et al., 2005). Similar
studies in other legumes (Medicago, soybean, Lotus) showed the abundance of tri-
nucleotide (TTC) and di-nucleotide (GA) repeats (Jayashree et al., 2006).

Moreover, the higher number of alleles, gene diversity, and PIC in chickpea
reference set is due to more number of tri-nucleotide and di-nucleotide repeat
motif markers used in the evaluation.
In the reference set, a total of 2424 rare alleles were observed from 91 SSR
markers. It ranged from 2.0 to 90.0. The markers TS5 (90 alleles), TR1 (82
alleles), TR43 (76 alleles), TR7 (74 alleles) showed high number of rare alleles,
whereas markers GAA43, TAA57 (each 2 rare alleles) showed low number of rare
alleles. Common alleles ranged from 0-576 with a mean of 374. TA80 (576)
showed high number of common alleles. Frequent alleles ranged from 0-570 with
a mean of 129.5. CaSTMS 20 (570) showed highest number of frequent alleles
from 91 SSR markers. 1980 unique alleles were detected among cultivated
accessions whereas, 114 in wild accessions and 319 alleles were common among
wild and cultivated. In the cultivated group, desi accessions contained the largest
number of unique alleles (864) followed by kabuli (836) and pea type (52).
However, variable and inconsistent relationship between repeat unit length and
SSR polymorphism has been reported in several self pollinated crops (Sorghum,
Folkerstma et al., 2005). Information available on the alleles present in different
germplasm lines will be very useful for developing the mapping populations for
genome analysis as well as applied breeding programmes.
5.5.1.2 Polymorphic information content (PIC).
The relative informativeness of each marker can be evaluated on the basis of its
polymorphic information content (PIC) value. The average PIC value in this study
was 0.81, this was higher than that reported in sweet sorghum (0.54, Wang et al.,
2009) and rice (0.42, Jin et al., 2010), but lower than that reported in chickpea
(0.85, Upadhyaya et al., 2008b). Out of 91 markers, 80 markers were highly
polymorphic with PIC values more than 0.50. The PIC values ranged from 0.00 to
0.97 in desi, 0.00 to 0.95 in kabuli and 0.00 to 0.89 with an average of 0.73 in pea
type, 0.80 in desi and 0.79 in kabuli.
Similar estimates of PIC values were observed in case of earlier microsatellite
studies in chickpea (Geleta et al., 2006, Taran et al., 2007). Gupta et al. (2003)
reported increased PIC with greater number of markers. They obtained PIC of
0.469 with 65 SSRs markers compared to 0.210 with 20 SSRs on 52 wheat
genotypes. Most of the self pollinated crops such as sorghum (Folkertsma et al.,

2005), barley (Turuspekoy et al., 2001) and wheat (Stepien et al., 2003) produced
the optimum PIC range of 0.600 to 0.700. This result indicated that PIC values
depend not only on the number of alleles but also the gene diversity (Smith et al.,
2000). Normally inbreeding species, the level of polymorphism is expected to be
generally lower than in out crossing species (Miller and Tanksley, 1990).
Although, the number of SSR marker in this study was limited, high
polymorphism was revealed indicating wide diversity among accessions. The high
diversity obtained with SSRs is consistent with their known characteristics, such
as more variability, and higher resolution and higher expected heterozygosity than
the RFLPs, RAPDs or AFLPs (Pejei et al., 1989; Powell et al., 1996; Taramino
and Tingey, 1996). The high levels of polymorphism associated with SSRs are
expected because of the unique mechanism responsible for generating SSR allelic
diversity by replication slippage (Tautz and Renz, 1984; Tautz et al., 1986) rather
than by simple mutations, insertions or deletions.
5.5.1.3 Gene diversity
Gene diversity is defined as the probability that two randomly chosen alleles from
the population are different. It varied from 0.02 to 0.97, with an average of 0.83.
83 out of 91 SSRs were detected high gene diversity > 0.50 and only 8 SSR
markers were <0.50. Gene diversity averaged 0.82, ranging from 0.00 to 0.97 in
desi, whereas in kabuli accessions, it varied from 0.00 to 0.96 with an average of
0.81. In pea type, the gene diversity ranged from 0.00 to 0.89 with an average
0.73. Desi types exhibited maximum mean gene diversity and PIC than kabuli
and pea types. Random genomic DNA markers (RFLP and RAPD) may assay
polymorphism located in the non-coding regions of the genome that are poorly
conserved among species, whereas functional markers such as EST/SSR would
assay polymorphism that is associated with the coding regions of the genome and
detect ―true gene diversity‖ available inside or adjacent to the genes (Maestri et
al., 2002, Thiel et al., 2003). High polymorphism, allele number and gene
diversity indicated a wide diversity among accessions present in the chickpea
reference set.
5.5.1.4 Heterozygosity
Single allele per locus in each genotype was observed in most of the accessions.
These observations are as expected as the SSR markers are locus-specific and

generally amplify one locus (Gupta and Varshney, 2000). In the present study, a
wide range of heterozygosity (%) was detected from 0.00% to 2.87%, with an
average of 0.151%. Out of 91 markers, 82 SSR markers detected no
heterozygosity indicating that a large collection of landraces was involved in this
study and it is possible that these accessions still possess some residual
heterozygosity at least at some SSR loci reported (Upadhyaya et al., 2008). A
landrace is defined as an autochthonous (primitive) variety with a high capacity to
tolerate biotic and abiotic stresses, resulting in high yield stability and an
intermediate yield level under a low input agricultural system (Zeven, 1998). The
heterozygosity observed at some of the loci could also be due to high mutational
rate and mutational bias at SSR loci (Udupa and Baum, 2001). The loci with large
number of repeat units (SSR units) tend to show high mutational rate. As a result,
any mutations in any one of the alleles may create a heterozygous condition.
Many of the loci which displayed heterozygous status have a large number of SSR
units. Therefore, SSR markers from other crop/related species exhibited more
heterozygosity as compared to SSRs from chickpea.
5.5.2 Unweighted neighbor-joining tree
Neighbour-joining tree based on simple matching dissimilarity matrix between
300 accessions of the chickpea reference set along with five checks highlighted
broadly four clusters namely CI to CIV, respectively. The CI, CII and CII were
dominated by desi accessions, CIV predominated with kabuli accessions. The
results from the neighbor-joining phylogenetic tree corresponded well with the
classification based on three seed types of chickpea.
5.5.3 Pearson Correlations
The correlations coefficients among number of repeat unit, number of alleles per
locus, major allele frequency, gene diversity and PIC for 91 SSR markers were
estimated. Number of repeat unit were highly significant and positively correlated
with number of alleles per locus, gene diversity and PIC, whereas negative and
significantly correlated with major allele frequency. Number of alleles per locus
was highly significant and positively correlated with gene diversity and PIC, and
significantly negatively correlated with major allele frequency. Significant
positive correlation between allele per locus and gene diversity was reported in
chickpea with 48 SSR markers (Upadhyaya et al., 2008b) and positive correlation

between PIC and number of allele, PIC and repeat unit, number of alleles per
locus and repeat unit was reported earlier studies by Jia et al. (2009). Highly
significant negative correlation of major allele frequency was recorded with gene
diversity and PIC. Gene diversity was highly significant and positively correlated
with PIC. It could be inferred that the increase in major allele frequency leads to
decreases in number of alleles per locus, gene diversity and PIC.
5.6 POPULATION STRUCTURE AND ASSOCIATION MAPPING
Chickpea is a cool season grain legume with high nutritive value. It belongs to the
family Fabaceae and is a self-pollinated diploid crop (2n=2x=16) with a relatively
small genome of 750 Mbp (Arumuganathan and Earle, 1991). One of the major
goals of plant breeders is to develop genotypes with high yield potential and the
ability to maintain the yield across environments. With the development of
molecular markers, breeders have a complimentary tool to traditional selection
and markers linked to variation in a trait of interest which could be used to assist
the breeding programs. Availability of DNA marker based maps for the genomes
of many crops facilitated mapping of QTLs of interest and marker-assisted
selection (Winter and Kahl, 1995). QTL mapping analysis has provided an
effective approach for locating and subsequently manipulating the QTLs
associated with different quantitative traits in plants (Rachid et al., 2004).
However, a DNA marker map of sufficient density for use in QTL mapping of
important traits is still lacking in chickpea but however, Nayak et al., (2010)
developed a first SSR based high density intra specific genetic map (ICC 4958 x
ICC 1882 ) with 255 marker loci.
The phenotypic variation of many complex traits of agriculturally or evolutionary
importance is influenced by multiple quantitative trait loci (QTLs), their
interaction, the environment and the interaction between QTL and environment.
Linkage analysis and association mapping are the two most commonly used tools
for dissecting complex traits (Zhu et al., 2008). Linkage analysis in plants
typically localizes QTLs in 10 to 20 cM intervals because of the limited number of
recombination events that occur during the construction of mapping populations
and evaluating a large number of lines (Doerge, 2002; Holland, 2007).
Alternatively, association mapping has emerged as a tool to resolve complex trait
variation down to the sequence level by exploiting historical and evolutionary

recombination events at the population level (Nordborg and Tavare, 2002; Risch
and Merikangas, 1996). Choice of population for association mapping and
appropriate marker density are crucial decisions for accuracy of association
mapping. One of the sources of false positives in association mapping is
population structure, which is a division of the population into distinct subgroups
related by kinship. Different methods and software tools have been developed to
correct the results for population structure usually by dividing the germplasm
collections into subgroups or adjusting the probability of the null hypothesis
(Rafalski, 2010). Presence of population structure within an association mapping
population can be an obstacle to the application of association mapping as it often
generates spurious genotype-phenotype associations (Yu and Buckler, 2006; Zhu
et al., 2008). To account for population structure in association analysis, two
major statistical methods, genome control (Devlin and Roeder, 1999; Zheng et al.,
2005) and structure association (SA) (Pritchard et al., 2000) were applied in
earlier studies, both of which used random markers spaced throughout the
genome, but incorporated them into statistical analysis in different approaches
(Yang et al., 2010).
Yu et al. (2006) developed a general linear model (GLM) and a mixed linear
model (MLM) approach to perform association analysis. The MLM approach,
accounting for both population structure (Q) and relative kinship (K), can be
performed with the TASSEL software package (Bradbury et al. 2007), which is
most common method of association analysis in plants and has been successfully
applied in rice (Agrama et al., 2007; Wen et al., 2009; Borba et al., 2010), wheat
(Breseghello and Sorrells, 2006; Neumann et al., 2011), sorghum (Murrary et al.,
2009), Arabidopsis (Zhao et al., 2007) and potato (Malosetti et al., 2007).
However, until now, the reports of QTLs for chickpea are limited except the QTLs
governing grain yield and other agronomic traits would increase our
understanding of the genetic control of the characters and to use them effectively
in breeding programs.
Some of the agronomic and yield influencing traits like double-flower (Yadav et
al., 1978; Rao et al., 1980; Pawar and Patil, 1983; Singh and van Rheenen, 1994;
Kumar et al., 2000), flowering time (Or et al., 1999), chilling tolerance during
flowering (Clarke and Siddique, 2003), flowers per axis (Srinivasan et al., 2006),
double-podding and other morphological characters (Rubio et al., 1999, 2004;

Cho et al., 2002; Rajesh et al., 2002; Lichtenzveig et al., 2006) and nutritional
traits like β-carotene and lutein content (Abbo et al., 2005) have been extensively
studied in chickpea. A QTL flanked by marker TAA170 and TR55 on LG4A
identified for root length (Chandra et al., 2003). Or et al. (1999) suggested a major
photoperiod response gene (Ppd) affecting time to flowering. Cho et al. (2002)
identified a single QTL for days to 50% flowering on LG3 with a LOD score of
3.03. Lichtenzveig et al. (2006) identified two QTLs on LG1 and LG2 linked to
time to first flower. Cho et al. (2002) also identified a QTL for seed weight on
LG4 accounting for 52% of the total phenotypic variation. Nayak et al., (2010)
reported a total of 8 QTLs for root traits with phenotypic variation 4-54%. These
reports generated information on QTLs for important traits which can be used for
stress breeding in chickpea.
Until now, association mapping using the existing natural variation present in the
germplasm for the detection of QTL was not been reported in chickpea and QTL
reported by the earlier studies and linkage mapping based on mapping population
using the RFLP probes were used to identify QTL. Hence, there is a need for the
identification and development of more SSR markers and QTLs in chickpea for
various agronomic traits which contribute to yield and its improvement.
5.6. 1 Population structure in chickpea reference set
5.6.1.1 Allelic richness and genetic diversity of subpopulations
The reference set was grouped in to thirteen subpopulations by using 91SSR
markers allelic data by using the software program STRUCTURE. 91 SSR
markers detected a total of 1199 alleles in SP1, 720 in SP2, 778 in SP3, 483 in
SP4, 527 in SP5, 803 in SP6, 749 in SP7, 1301 in SP8, 544 in SP9, 574 in SP10,
348 in SP11, 428 in SP12 and 759 in SP13. Highest number of alleles was
detected by SP8 with a mean of 11.4, which ranged from (0-26). Lowest number
of alleles was detected by SP11 with a mean of 3.1, which ranged from (0-7).
Maximum mean PIC value was detected in SP8 and minimum in SP11 when
compared with other sub-populations. Maximum mean gene diversity value was
detected in SP7 (0.765) and minimum in SP4 (0.560) when compared with other
sub-populations. The average number of alleles per locus and PIC were higher in
SP8 compared to other sub-populations. Rare alleles are detected only in SP1 (32)
and SP8 (2). Accessions from SP8 consist of 2 rare, 7087 common and 3881 most

frequent alleles when compared with other sub-populations.
5.6.1.2 Analysis of molecular genetic variance (AMOVA)
The distribution of molecular genetic variation among and within the thirteen
subpopulations was estimated by AMOVA. AMOVA revealed that 20 per cent of
the total variance was among the subpopulations, while 80 per cent was among
individuals within the subpopulations. The same trend was observed when the
AMOVA estimated based on three chickpea types in reference set.
5.6.1.2. Principal coordinates analysis (PCoA) and unweighted neighbor-
joining tree
In order to link the genetic diversity with the phenotypic diversity, efforts were
made by analyzing the phenotypic data for seventeen quantitative traits together
with genotyping data by using Principle Coordinate Analysis (PCoA) and
unweighted neighbor-joining phylogenetic analysis was conducted to further
assess the population subdivisions identified using STRUCTURE. The first three
PCs explained 81.71 per cent of variation of which PC1 explained 36.48 per
variation and PC2 explained 33.38 per cent of the SSR variation among the 300
accessions of chickpea reference set including five checks. Plotting the first two
PCs and colour coding genotypes based separated the chickpea reference set
accessions into four clusters which was identified by STRUCTURE analysis.
Neighbor-joining tree was constructed based on the simple matching dissimilarity
matrix of 91 SSR markers assayed. Color coding was given for the thirteen
subpopulations as inferred from the STRUCTURE analysis denoted as SP1 (Red),
SP2 (Green), SP3 (Dark Blue), SP4 (Yellow), SP5 (Pink), SP6 (Sea blue), SP7
(Brown), SP8 (Maroonish brown), SP9 (Light brown), SP10 (Dark sea blue),
SP11 (blue), SP12 (Light green), SP13 (Grey) respectively, which clearly
differentiated subpopulations. Therefore, PCoA and neighbor-joining revealed
genetic relationship fairly consistent with the structure based membership
assignment for most of the accessions. Varshney (2007a) also reported the similar
grouping of early flowering accessions in a USDA collection of chickpea
germplasm by SSR marker data. For other traits, phenotypic classes were not
associated with regional classification based on SSR markers. Jin et al. (2010)
also reported the fairly consistent relationship between neighbor-joining tree with
STRUCTURE based membership assignment in rice. Şakiroglu et al., 2010

reported the consistent pattern Neighbor-joining tree with the PCoA and
population subdivision by STRUCTURE in wild diploid alfalfa (Medicago sative
L.).
5.6.2. Genome- wide Association (GWA) analysis
In total 300 genotypes (chickpea reference set) were used in the marker-trait
association analysis. The extent of variability (in terms of CV %) available for
different traits indicated suitability of reference set of chickpea for the study of
marker-trait associations. The correlation studies revealed the presence of
significant positive correlations between most of the qualitative, quantitative and
grain quality traits, resistance to pod borer and for traits related to drought
tolerance in a structured chickpea reference set under study. This suggests their
suitability for the study of marker-trait associations using common set of markers.
Association mapping is an innovative linkage disequilibrium based methodology
to dissect quantitative traits. Although large number of markers are necessary for
detecting association of complex traits using GWA (Genome-wide association),
but this method does not require any prior information about genes for the traits of
interest. Advantage of GWA over candidate gene sequencing approach, involves
the detection of unknown loci associated with the trait. As an alternative to
traditional linkage analysis, association mapping offers three advantages- i)
increased mapping resolution, ii) reduced research time and iii) greater allele
numbers (Yu and Buckler, 2006). Since its introduction to plants (Thornsberry et
al., 2001), association mapping has continued to gain acceptance in genetic
research. There are limited studies of association mapping in case of plant species.
Application of association-mapping approaches in plants is complicated by the
population structure present in most germplasm sets to overcome this problem,
linear models with fixed effects for sub-populations (Breseghello and Sorrells,
2006) or a logistic regression-ratio test (Pritchard et al., 2000; Thornsberry et al.,
2001) can be employed. Owing to the large germplasm sets required for dissecting
complex traits, the probability increases that partially related individuals are
included. This applies in particular when genotypes selected from plant-breeding
populations are used for association mapping (Thornsberry et al., 2001; Kraakman
et al., 2004). Association mapping identifies QTLs by examining the marker-trait
associations that can be attributed to the strength of linkage disequilibrium

between markers and functional polymorphisms across a set of diverse
Germplasm (Zhu et al., 2008). Association analysis was applied using structure
(Q)-kinship (K) mixed-model approach (Yu et al., 2006) that promises to correct
for linkage disequilibrium (LD) caused by population structure and relatedness
relationship.
In the present study, an attempt was made to associate neutral SSR markers to
quantitative, qualitative, quality related root traits and pod borer related traits
using reference set of chickpea. The likely number of sub-populations was
obtained based on the delta K value derived from Evanno‘s method (Evanno et
al., 2005). In the present study, at K=13 there was deep portioning of population
into thirteen sub-populations, which might be due to the selection pressure due to
domestication and breeding. At K=13, delta K value was found to be maximum
and this information was further used in association analysis to avoid false
positives.
5.6.3 Association of markers in reference set with qualitative, quantitative,
quality (anthocyanin and protein traits), pod borer resistant and drought
related traits
64 significant (P≤0.001) MTAs were detected involving 49 SSR markers in E1,
with maximum phenotypic diversity of 43.4% for anthocyanin content. 86
significant MTAs were detected involving 46 SSR markers in E2 and maximum
phenotypic diversity of 42% for tertiary branches whereas in E3, 76 significant
MTAs with 50 SSR markers and maximum phenotypic diversity of 42.9% for leaf
area, in E4 74 significant MTAs with 52 SSR markers and maximum phenotypic
diversity of 45.4% for apical secondary branches and in E5 56 significant MTAs
with 44 SSR markers and maximum phenotypic diversity of 34.8% for plant
width.
In the present study, by pooling the five environments data, number of significant
MTAs (P≤0.001) were 27 for qualitative traits with 21 markers, 76 (P≤0.001) for
quantitative trait, two for SCMR, one each for protein content, two for pod borer
resistant traits and 21 for drought tolerance related traits and 7 among qualitative,
39 among quantitative, 1 among SCMR and 8 among drought related traits were
identified as the major MTAs (>20% phenotypic variation) across all the
environments in chickpea reference set

Hence, these most significant MTAs were believed to be associated with co-
localized/pleiotropic QTLs. The co-localization of specific genes/QTLs/markers
could be a better way to understand the molecular basis of drought tolerance or of
traits related to drought response and pod borer resistance traits. The presence of
several co-localized/pleiotropic QTLs verified the complex quantitative nature of
drought tolerance, pod borer resistance in chickpea and allowed the identification
of some important genomic regions for traits related to high yield, good protein
percent, drought tolerance and resistance to pod borer. The markers associated
with more than one trait may be efficiently utilized in improvement of more than
one trait simultaneously through marker assisted selection (MAS). Till date there
are no reports of association studies in case of chickpea, however the association
studies in other crop species especially in cereals such as maize (Lu et al., 2009),
barley (Malysheva-Otto et al., 2006; Cockram et al., 2008), sorghum (Shehzad et
al., 2009) and wheat (Neumann et al., 2011) have revealed that the linkage based
QTL analyses can be complemented by LD based association studies. Association
mapping studies in legumes are limited to soybean and Medicago, where
association map consisting of 150 markers was constructed on the basis of
differences in allele frequency distributions between the two sub-populations of
soybean for seed protein and the genome-wide association studies has been started
in Medicago as a part of HapMap (Haplotype Map) project on 384 inbred lines
(http://www.medicagohapmap.org/about.php). The phenotypic variation explained
using GLM was found to be comparatively higher compared to that computed
from MLM in the present study. This was also evident from studies of association
mapping in case of wheat (Neumann et al., 2011) where, the GLM and MLM
models were compared to give markers-trait associations. The association studies
in crop species are taking advantage of development of high-throughput marker
technologies like SSRs and advanced statistical tools. Chickpea reference set is
genetically diverse and possesses potential variation for economic traits and hence
could be extensively evaluated for greater exploitation in breeding programs to
improve and to widen the genetic base of chickpea cultivars. Marker trait
associations identified in this study using SSR markers and association mapping
approach was the first effort in this crop, will provide a preliminary knowledge to
the research community for further QTL identification, to identify candidate genes
and gene cloning that underlie QTLs in chickpea.

Summary

6. SUMMARY
Phenotypic and molecular characterization of germplasm and identification of
genetically diverse trait specific sources are important for enhanced utilization of
chickpea genetic resources in breeding improved cultivars. Hence, the current
study was undertaken to understand the phenotypic and genetic diversity in
chickpea reference set, to identify trait specific germplasm and the SSR markers
associated with phenotypic variation. The genetic material used in this study was a
genotype based reference set of 300 accessions (Upadhyaya et al., 2008)
developed from composite collection (Upadhyaya et al., 2006). Reference set and
five control cultivars (Annigeri, G 130, ICCV 10, KAK 2, and L 550) were
evaluated in five environments [(E1), (E2), (E3), (E5) at ICRISAT, Patancheru,
Andhra Pradesh; and (E4) at UAS (University of Agricultural Sciences),
Dharwad] in alpha design with two replications. The data were recorded on seven
qualitative, 17 quantitative, 10 drought tolerance related, three pod borer
resistance and two quality traits. For the molecular characterization of chickpea
reference set, 91 SSR markers were used. The results are summarized below.
6.1. PHENOTYPIC DIVERSITY
6.1.1. Qualitative traits
• In the entire chickpea reference set, low anthocyanin plant pigmentation, pink
flower colour, semi-erect growth habit, yellow brown seed color, angular or ram‘s
head seed shape with minute black dots and rough seed surface were the most
predominant classes among qualitative traits.
• Most of the qualitative traits are related with type of chickpea, desi or kabuli or
intermediate. As desi types dominated entire reference set, the traits that are
characteristics of desi type were predominant in the reference set. The proportion
of low anthocyanin plant pigmentation, pink flower colour, semi-erect growth
habit, yellow brown seed color, angular or ram‘s head seed shape with minute
black dots and rough seed surface were the most prevalent classes across desi
types.
• Semi-erect growth habit was most prevalent among accessions across three seed
types whereas plant pigmentation, flower colour, seed color, seed shape, minute
black seed dots and seed surface differed within three seed types. Pink flower
color among desi accessions, white flower color in kabuli, both white and light

pink in pea type were the most prevalent characters among three seed types. Pink
flower color in desi, white flower in kabuli is the characteristics of chickpea seed
types.
• In the entire reference set low-anthocyanin was dominant over no and high
anthocyanin. Most of the desi accessions were with low anthocyanin plant
pigmentation, whereas kabuli types were with no-anthocyanin, and no-
anthocyanin and low-anthocyanin was observed among pea type. Only 2% of the
accessions were with high-anthocyanin pigmentation in the entire reference set.
Desi accessions predominated with yellow brown and kabuli with beige seed
color. Angular or ram‘s head seed shape, which is the characteristic of desi type,
dominated reference set followed by owl‘s head shape and intermediate or pea
shaped.
• Minute black dots were present on the seed testa of most desi accessions while
accessions had no dots or totally absent in kabuli type whereas in pea type seeds
were with dots and without dots. Among desi type accessions, seeds were with
rough and tuberculated surface while kabuli type were with smooth and rough
seed surface and in pea types, smooth and rough seed surface were observed.
• Among the qualitative traits relatively high polymorphism was observed for seed
colour followed by seed surface indicating greater importance of these two traits
in phenotypic diversity assessment.
•The Shannon-Weaver diversity indices (H‘) estimates were computed for seven
qualitative traits. Seed color showed the maximum H‘ value in chickpea reference
set, followed by seed shape, seed surface, plant color, growth habit and flower
color. However, dots on seed coat showed lowest H` in the entire reference set
indicating the importance of these qualitative traits in contributing towards
diversity in reference set and in the three seed types
6.1.2. Quantitative traits
• REML analysis of data indicated that variance components due to genotype (σ2
g) and genotype × environment (σ2 ge) interaction were significant for all
quantitative traits except tertiary branches and pods per plant. This indicated
sufficient variability for all the traits in reference set and differential response of
the genotypes to different environments.
• The wider range was observed for various traits in different environments and

among different seed types of the chickpea reference set
• High genetic advance as per cent of mean coupled with high estimates of broad
sense heritability (h2 b) (>60%) were observed in all five environments separately
and overall in pooled data indicating that the variation for most traits was heritable
and selection would be effective for improvement of these traits.
• Mean days to 50 percent flowering, flowering duration, days to grain filling,
100-seed weight, and plant width did not differ significantly between five
environments indicating less influence of the environment on the expression of
these traits. However, plant height, days to maturity, pods per plant, seeds per pod,
yield per plant, per day productivity ( kg ha-1
day-1
), and grain yield (kg ha-1
)
significantly between the environments indicating the greater influence of the
environments on the expression of these traits.
• Mean productivity per day, plot yield, yield per plant , pods per plant , days to
maturity and basal primary branches were highest in E2 as compared to E1, E3,
E4 and E5. Apical primary branches and plant height in E3 and 100-seed weight
in E1 showed the highest mean performance.
• Variances were significant for most of the quantitative traits except for days to
50% flowering, flowering duration, days to grain filling, days to maturity and
seeds per pod in E1, pods per plant and yield per plant in E2, plant height in E3
and plot yield and productivity when pooled indicating that the reference set had
adequate genetic variation for most of the traits.
• Grain yield per plot (Kg ha-1
) was highly significant and positively correlated
with days to grain filling, apical primary branches, basal secondary branches,
apical secondary branches, seeds per pod, and pods per plant and yield per plant.
It could be inferred that, the selection in positive direction for all the traits (plant
height, plant width and number of branches of five plants, single plant yield would
reset in correlated response for grain yield per plot (Kg ha-1
)) for genetic
enhancement of grain yield.
• Days to 50 percent flowering, grain yield, days to maturity, per day productivity
and apical primary branches in all environments had maximum H` indicating
evenness and richness of alleles for these traits, followed by days to grain filling,
flowering duration, yield per plant, apical secondary branches, grain yield, basal
primary branches, per day productivity, basal secondary branches, days to
maturity, plant width and tertiary branches, pod per plant and apical primary

branches, seeds per pod, days to flowering, 100-seed weight and plant height. This
indicated the importance of these characters in contributing towards divergence.
• Tertiary branches, flowering duration and seeds per pod showed low mean H` in
all environments followed by apical primary branches, flowering duration, apical
secondary branches and yield per plant in all environments.
• Days to 50 percent flowering, days to maturity, days to grain filling, flowering
duration, apical and basal secondary branches, tertiary branches, pods per plant.
100-seed weight, seeds per pod, yield per plant, per day productivity, plot yield
occurred in the first three PCs in all five environments separately, indicated their
importance for characterization in chickpea germplasm accessions.
• Ten pairs of most diverse accessions were identified based on phenotypic
distance for each environment separately and for pooled data of five
environments. These diverse accessions could be utilized in development of
mapping population and in hybridization program to generate the segregating
population for the selection of superior lines.
• The clustering of reference set accessions using scores of first three Principal
components (PCs) corresponded well with chickpea regional classification.
6.1.3. Drought related traits
a. The chickpea reference set along with five check cultivars
(Annigeri, ICCV 10, KAK 2, L 550, G130) was evaluated to estimate
the variation of SPAD Chlorophyll Meter Readings (SCMR) in (E3)
and (E5) at ICRISAT, Patancheru, Andhra Pradesh.
• There was a significant difference in SCMR among the entries, while 12
accessions showed superior and consistent SCMR in the entire reference set.
b. Cultivated 293 diverse reference set accessions (excluding wild accessions
from 300 accessions of chickpea reference set) along with 6 control cultivars (ICC
4958, Annigeri, ICCV 10, G 130, L 550, KAK 2,) were evaluated for drought
tolerance related root traits during two consecutive post rainy seasons (E2,E3) at
ICRISAT, Patancheru.
• The REML analysis of data for individual environment revealed significant
genotypic variance for all traits in two (E2, E3) environments and when pooled.
Among reference set, 13 accessions were with deepest root system, 42 were with

superior shoot dry weight, 40 with high root dry weight, 11 with high root to total
plant dry weight ratio (R-T%), 33 accessions with high root length, 6 accessions
for root length density.
6.1.4. Pod borer resistant related traits
The chickpea reference set along with 7 control cultivars (Annigeri, G 130, KAK
2, ICC 506EB-resistant, ICC 3137-susceptible, ICCV 10-moderately resistant, L
550-susceptible) were planted in Randomized Complete Block Design (RCBD)
during two consecutive post rainy seasons (2007-08 (E2), 2008-09 (E3)) at
ICRISAT, Patancheru.
• At vegetative stage in post rainy environments (E2 and E3), significant σ 2
g in
individual environments, σ 2
g and σ 2
ge in pooled analysis was observed for all the
three pod borer resistant traits. Accessions twenty five with minimum damage rate
to pod borer, 17 with lowest larval survival percentage, 3 accessions with
minimum unit larval weights were observed in chickpea reference set.
6.1.5. Quality traits
a. The chickpea reference set along with five check cultivars (Annigeri, ICCV 10,
KAK 2, L 550, G130) were used to estimate protein content by Atomic Spectra
Photometric Meter (ASPM) in four seasons 2006/2007 (E1), 2007/2008 (E2),
2008/2009 (E3) post rainy normal sown conditions, 2008/2009 (E5) winter
seasons, late sown conditions at ICRISAT, Patancheru, Andhra Pradesh.
• The mean protein content was 21.07% in E2, 20.47% in E1, 19.45% in E3 and
21.79% in E5. Thirty eight accessions (30.3-26.6%) with high protein content
were identified in the entire reference set from all environments and when pooled.
b. The chickpea reference set along with five control cultivars (Annigeri, ICCV
10, KAK 2, L 550, G130) was used to estimate anthocyanin content by using High
Performance Liquid Chromatography (HPLC) at ICRISAT, Patancheru, Andhra
Pradesh.
• The mean anthocyanin content was 1.55 A550g-1
for anthocyanins extracted with
acidified methanol and 0.38 A550g-1
for anthocyanins extracted with methanol.
Forty accessions with high anthocyanin content were observed in the entire
reference set.
• The trait-specific sources for 19 economically important traits, such as protein,
anthocyanin content, pod borer resistant, drought and yield traits mainly (15

accessions for each trait) namely early flowering, seeds per pod, pods per plant,
yield per plant, 100-seed weight, plot yield, per day productivity, heat tolerant,
high root depth, shoot dry weight, root dry weight, root to total plant dry weight
ratio (R-T%), root length, root length density, minimum damage rate to pod borer,
lowest larval survival%, unit larval weights, high protein and high anthocyanin
content. were identified. Multi-trait specific accessions, which were sources for
more than one trait, were identified.
• Finally, 2 accessions for early flowering, 17 for more seeds per pod, 35 for
more pods per plant, one with more yield per plant, 19 with high 100-seed weight,
119 for high plot yield, 89 for per day productivity, 20 heat tolerant, 13 with high
root depth, 42 with high shoot dry weight, 40 with high root dry weight, 11 with
high root to total plant dry weight ratio (R-T%), 33 accessions with high root
length, 6 accessions for root length density, 25 with minimum damage rate to pod
borer, 17 with lowest larval survival%, 3 accessions with minimum unit larval
weights, 38 with high protein and 40 accessions with high anthocyanin content
were identified for specific traits.
• Extensive evaluation of these accessions in different locations may be useful to
reconfirm their genetic worth and use in crop improvement.
6.2. MOLECULAR DIVERSITY
A total of 100 SSR markers were used initially to genotype chickpea reference set.
Of these, 91 SSR markers produced clear, scorable and polymorphic marker
profiles and were used for further analysis.
6.2.1. Allelic richness and genetic diversity
• The SSR markers used in this study were highly polymorphic and informative,
and detected a total of 2411 alleles with an average of 26.45 alleles per locus. A
total of 2299 alleles were detected in cultivated types and 433 alleles in wild types
of chickpea reference set, of which 1980 were unique in cultivated, 114 in wild
accessions and 319 alleles were common among wild and cultivated. In the
cultivated group, desi accessions contained the largest number of unique alleles
(864) followed by kabuli (836) and pea type (52).
• In reference set 2424 rare alleles were observed ranging from 2.0 to 90.0. The
markers TS5 (90 alleles), TR1 (82 alleles), TR43 (76 alleles), TR7 (74 alleles)
showed high number of rare alleles, whereas markers GAA43, TAA57 (each 2

rare alleles) showed low number of rare alleles.
• Common alleles ranged from 0-576 with a mean of 374. TA80 (576) showed
high number of common alleles. Frequent alleles ranged from 0-570 with a mean
of 129.5. CaSTMS 20 (570) showed highest number of frequent alleles.
• The unweighted neighbor-joining tree based on simple matching dissimilarity
matrix of 300 accessions of chickpea reference set highlighted broadly four
clusters which corresponded well with the classification based on three seed types
of chickpea
• Finally, ten pairs of most diverse accessions were identified based on
dissimilarity matrix using molecular data indicating the presence of greater
genetic diversity in chickpea reference set.
6.2.2. Population structure analyses
• The STRUCTURE analysis provided evidence for the presence of population
structure and identified 13 subpopulations (SP1 to SP13). Further, consistency of
this population structure was assessed by principal coordinate and un-weighted
neighbor joining phylogenetic analysis, which showed consistent relationship with
population structure identified by STRUCTURE analysis.
•The general linear model (GLM) was implemented in TASSEL v2.1 and used to
find marker traits associations (MTAs) associated with the qualitative, quantitative
and grain quality traits, resistance to pod borer and for traits related to drought
tolerance in a structured chickpea reference set. The MTAs detected using pooled
BLUPs of all environments was considered as final MTAs, since it represents the
average performance of the accessions over the all the environments.
6.2.3. Association of markers in reference set with phenotypic traits
• Among qualitative traits, a total of 21 SSR markers showed 27 MTAs (P≤0.001)
of which 17 SSR markers were associated with one qualitative trait and 4 SSR
markers were associated with more than one trait. Of which major MTAs (>20%
phenotypic variation) detected were five (two for growth habit and three for seed
surface).
• 64 (P≤0.001) significant MTAs were detected involving 49 SSR markers in E1,
with maximum phenotypic diversity of 43.4% for anthocyanin content. Similarly
86 significant MTAs were detected involving 46 SSR markers in E2 and
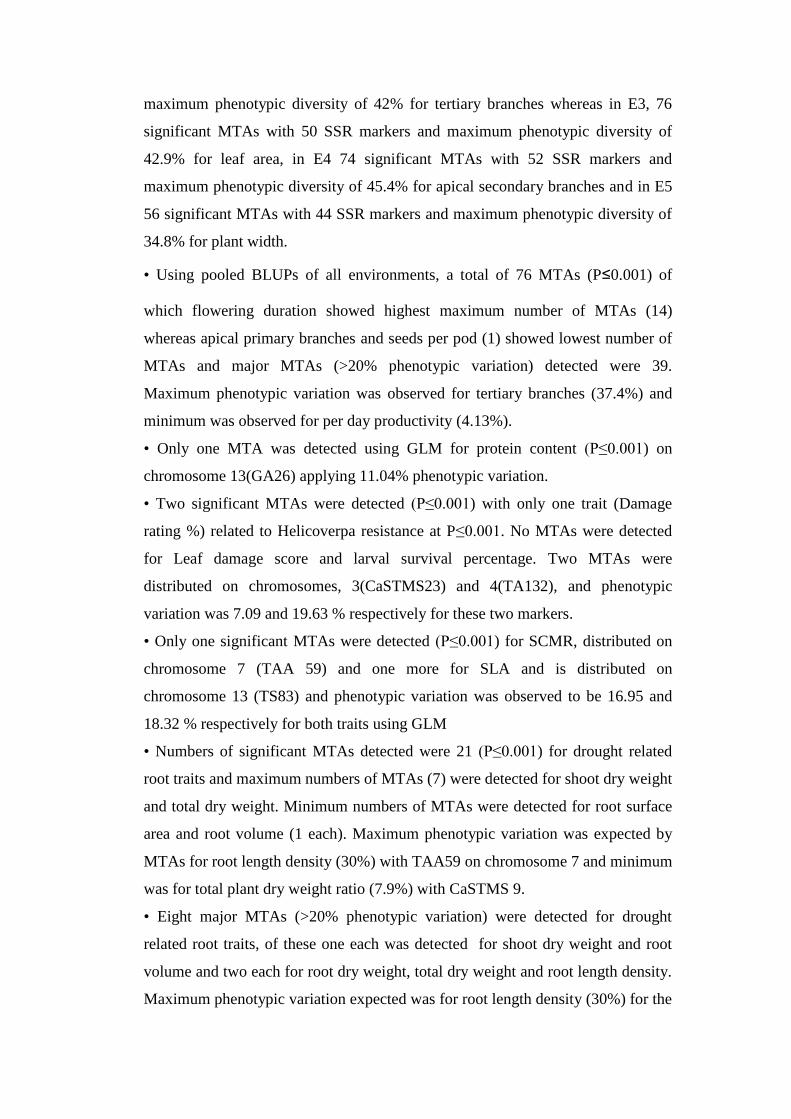
maximum phenotypic diversity of 42% for tertiary branches whereas in E3, 76
significant MTAs with 50 SSR markers and maximum phenotypic diversity of
42.9% for leaf area, in E4 74 significant MTAs with 52 SSR markers and
maximum phenotypic diversity of 45.4% for apical secondary branches and in E5
56 significant MTAs with 44 SSR markers and maximum phenotypic diversity of
34.8% for plant width.
• Using pooled BLUPs of all environments, a total of 76 MTAs (P≤0.001) of
which flowering duration showed highest maximum number of MTAs (14)
whereas apical primary branches and seeds per pod (1) showed lowest number of
MTAs and major MTAs (>20% phenotypic variation) detected were 39.
Maximum phenotypic variation was observed for tertiary branches (37.4%) and
minimum was observed for per day productivity (4.13%).
• Only one MTA was detected using GLM for protein content (P≤0.001) on
chromosome 13(GA26) applying 11.04% phenotypic variation.
• Two significant MTAs were detected (P≤0.001) with only one trait (Damage
rating %) related to Helicoverpa resistance at P≤0.001. No MTAs were detected
for Leaf damage score and larval survival percentage. Two MTAs were
distributed on chromosomes, 3(CaSTMS23) and 4(TA132), and phenotypic
variation was 7.09 and 19.63 % respectively for these two markers.
• Only one significant MTAs were detected (P≤0.001) for SCMR, distributed on
chromosome 7 (TAA 59) and one more for SLA and is distributed on
chromosome 13 (TS83) and phenotypic variation was observed to be 16.95 and
18.32 % respectively for both traits using GLM
• Numbers of significant MTAs detected were 21 (P≤0.001) for drought related
root traits and maximum numbers of MTAs (7) were detected for shoot dry weight
and total dry weight. Minimum numbers of MTAs were detected for root surface
area and root volume (1 each). Maximum phenotypic variation was expected by
MTAs for root length density (30%) with TAA59 on chromosome 7 and minimum
was for total plant dry weight ratio (7.9%) with CaSTMS 9.
• Eight major MTAs (>20% phenotypic variation) were detected for drought
related root traits, of these one each was detected for shoot dry weight and root
volume and two each for root dry weight, total dry weight and root length density.
Maximum phenotypic variation expected was for root length density (30%) for the

marker TAA59. TA25 and TA22 detected maximum of 3 major MTAs each
among the 8 major significant root traits
• Of the MTAs in pooled data (P≤0.001), 27 for qualitative, 76 for quantitative, 2
for pod borer related traits, 1 for protein related traits, 5 for SPAD and 21 for
drought related traits were identified as stable and highly significant. Seven for
qualitative, 39 for quantitative, 1 for SPAD and 8 for drought related traits were
identified as the major MTAs that expected >20% phenotypic variation across all
the environments in chickpea reference set
In summary, the chickpea reference set is genetically diverse and possesses
potential variation for economic traits and hence could be extensively evaluated
for greater exploitation for use in breeding programs. The superior trait specific
accessions identified could be utilized in breeding programs to improve traits and
to widen the genetic base of chickpea cultivars. Marker trait associations
identified in this study using SSR markers and association mapping approach the
first effort in this crop, and will provide important information to the research
community for further QTL identification, to identify candidate genes and gene
cloning that underlie QTLs in chickpea.

Figure: 1 Geographical distribution of 300 chickpea reference set accessions
No
of
ac
ce
ss
ion
s
16
3 1 3 1 3 1
14
2 1 2
93
75
1 2 5 3 4 16 2 2 1
61 1
61
122
20
2 61
0
10
20
30
40
50
60
70
80
90
100
Afg
hanis
tan
Alg
eria
Bangla
desh
Chile
Chin
a
Cypru
s
Egypt
Eth
iopia
Fra
nce
Germ
any
Gre
ece
India
Iran
Iraq
Isra
el
Italy
Mala
wi
Mexic
o
Mold
ova,
Moro
cco
Myanm
ar
Nepal
Nig
eria
Pakis
tan
Peru
Port
ugal
Russia
n
Sudan
Syrian A
rab
Tanzania
Turk
ey
Unite
d
Unknow
n
Uzbekis
tan
Country
Figure: 2 Number of accessions in different seed types of the chickpea reference set
194
88
11 7
0
20
40
60
80
100
120
140
160
180
200
No
of
accessio
ns
Desi Kabuli Pea Wild
Seed Types

Figure: 3 Heritability, genotypic (GCV) and phenotypic coefficient of variance
(PCV) in the chickpea reference set for 17 quantitative traits based on pooled
BLUPs of five environments
0
20
40
60
80
100
120D
F
FD
PL
HT
PL
WD
DG
F
DM
BP
B
AP
B
BS
B
AS
B
TB
SD
PD
PP
P
YP
P
SD
WT
YK
GH
PR
OD
Quantitative traits
Esti
mate
s i
n %
Heritability
GCV%
PCV%
Figure: 4 Frequency distribution of accessions for various qualitative traits in the
chickpea reference set
0
20
40
60
80
100
120
140
160
180
200
No
of a
ccessio
ns
Erect
Prostr
ate
Sem
i-erect
Sem
i-
Spreadin
g
Spreadin
g
Frequency %
Growth habit
0
50
100
150
200
250
No
of a
ccessio
ns
Hig
h
anth
ocyanin
Low
anth
ocyanin
No
anth
ocyanin
Frequency %
Plant Color
Figure 4a: Growth Habit Figure 4b: Plant pigmentation

0
20
40
60
80
100
120
140
160
180N
o o
f accessio
ns
Lig
ht pin
k
Pin
k
Very
lig
ht
pin
k
White
Frequency %
Flower color
0
10
20
30
40
50
60
70
80
90
No
of
accessio
ns
Count of R
efe
rence
Seed c
olo
r
Beig
e
Bla
ck
Bro
wn
bro
wn b
eig
e
Dark
bro
wn
Gre
en
Gre
yis
h b
row
n
Lig
ht bro
wn
Lig
ht gre
en
Lig
ht ora
nge
Lig
ht yello
w
Ora
nge
Reddis
h b
row
n
Salm
on b
row
n
Yello
w
Frequency %
Seed Color
Figure 4c: Flower color Figure 4d: Seed color
0
50
100
150
200
250
No
o
f accessio
ns
Angula
r
Ow
l's
Shape
pea
Frequency %
Seed Shape
0
50
100
150
200
250
300
No
o
f accessio
ns
1 2
Frequency %
Dots on Seed coat
Absent
Present
020406080
100120140160180200N
o o
f accessio
ns
Rough
Sm
ooth
Tubercula
ted
Frequency %
Seed Surface
Figure 4e: Seed shape Figure 4f: Seed dots Figure 4g: Seed
surface

Figure 5: Scatter plot of first two principal components (PCs) of the chickpea
reference set accessions using pooled BLUPs of five environments for yield
contributing traits
Figure 5a: Days to 50% flowering (DF) vs. plot yield (YKGH)
15612
15610
1561815614
15606
15510
15435
1556715518
1569716261
16207
16374
16269
15888
15785
15762
15868
15802
14446
14402
1466914595
1431
1409814077
1422
14199
1477815294
15264
15406
15333
15248
1481514799
151014831
283
2737
2919
2884
2720
2593
2580
26792629
2969
3391
3362
3421
3410
3325
321829903239
3230
1710169151882
1715
16903
16524
1648716796
16654
1915
2277
2263
2507
2482
2242
2065
1923
2210
2072
116641164
1180
1176411627
11498
113781161
1158411819
120512037
12299
12155
120281190311879
11944
1194
10673
1052
10755
10685
10466
10341
10018
10399
10393
1083
11279
11198
1130311284
1112110939
10885109810945
13524
13523
13599
1356
13461
1328313219
13441
13357
136281397
139214051
1398
13892
13764
13719
1386313816
1249212379
1265412537
12328
12307
1230
12324
12321
12726
13077
12947
13187
13124
12928
12851
12824
1291612866
35129643
96369712
97029590
9434
94189586
95
9755
10309
V95311
10500
10419
9942
9862
9848
9895
9872
85218515
86078522
8384
8261 82008350
8318
8621
9002
8950
9402
913788558718
867
87528740
7307473064730837308272970
72070 71487296
72109
73086
ICCV10
G130L550
KAK2
Annigeri 73458
73305
74052
7403660476044
606760555949
1070110569
5909
1104561547087
708267105571005
69974
6905
6343
6976169438
506 49915221
5135
4918
4841
4814
4872
4853
5337
5878
5845
6263
5879
5639
5434
5383
5613 5504
40933946
43634182
3892
36313582
3776
3761
4404593
4567
4657
4639
456
4463
4418
4533
4495
7326
7323
74417413
731572727255
7308
7305
7554
8058
791
8195
8151
7867762
75717819
766865716537
676579637
6293
6279
63066294
6802
708
7052
7184
7150
6877
6816
6811
6875
6874
0
500
1000
1500
2000
2500
3000
3500
0 10 20 30 40 50 60 70 80 90 100
DF
YK
GH
Figure 5b: Days to maturity (DM) vs. Plot yield (YKGH)
1561215610156181561415606
15510
1543515567
1551815697
162611620716374
16269 1588815785 15762 1586815802
14446
144021466914595
1431
14098140771422
1419914778
15294
1526415406
15333
152481481514799151014831
2832737 29192884 27202593
25802679
2629 29693391
3362
3421 34103325
321829903239
32301710
1691518821715
16903
1652416487
16796
16654
19152277
22632507 24822242
206519232210 20721166411641180
11764116271149811378
1161
11584
11819
1205
1203712299
1215512028
1190311879
119441194
106731052 10755
10685
1046610341 10018
1039910393
1083
11279
11198
1130311284
11121
1093910885
10981094513524
1352313599
135613461
13283
13219
134411335713628
1397 1392140511398 13892
1376413719
13863
1381612492123791265412537
1232812307
12301232412321 12726
13077
12947
13187
13124
129281285112824
12916128663512964396369712 97029590
943494189586
95
9755
10309
V953111050010419
994298629848 9895
9872
85218515
86078522 8384
82618200
83508318
8621900289509402 9137
88558718
8678752
874073074730647308373082
72970
720707148
7296 72109
73086
ICCV10G130
L550
KAK2Annigeri
7345873305 7405274036604760446067
60555949 10701
105695909
1104561547087
708267105571005
69974
69056343
6976169438
506499152215135
4918
484148144872
48535337
58785845
6263587956395434
53835613
550440933946
43634182389236313582
37763761
4404593 4567
46574639
456
4463
4418 453344957326
7323
744174137315727272557308
73057554
8058791
819581517867
762757178197668
65716537
6765796376293
6279
6306
6294 68027087052 71847150 6877 6816
6811
6875
6874
0
20
40
60
80
100
120
140
0 500 1000 1500 2000 2500 3000 3500
YKGH
DM

Figure 5c: 100 seed weight vs. Plot yield (YKGH)
15612
15610
156181561415606
15510
15435
15567
15518
15697
1626116207
16374
16269 1588815785
15762
15868
15802
14446
144021466914595
1431 14098
14077
1422
14199
14778
1529415264
15406
15333
1524814815147991510
14831
283
2737
2919
2884 27202593
2580
2679
2629
29693391
3362
34213410
3325
3218
29903239
3230 171016915
1882171516903
1652416487
16796 16654
19152277
2263
2507
2482
2242 206519232210
20721166411641180
11764
11627 1149811378116111584
11819
120512037
1229912155
12028
1190311879
11944
1194
10673
1052
10755
10685 10466
10341
1001810399 10393
108311279 11198
11303
112841112110939
10885
10981094513524
1352313599
1356
13461
13283
1321913441
13357
136281397
1392
14051
1398
13892
13764
13719
13863
13816
12492
12379
1265412537
12328
12307
1230
12324
1232112726
1307712947
13187
13124
129281285112824
1291612866
3512
964396369712 97029590
943494189586
959755
10309
V95311
10500
10419 99429862
984898959872
85218515
860785228384
8261
8200
8350
8318
86219002 8950
9402
9137
8855871886787528740
73074730647308373082
72970
72070
7148
7296 72109
73086ICCV10
G130
L550
KAK2
Annigeri
7345873305
74052
74036
60476044
60676055
5949
10701105695909
11045
6154
7087
70826
71055
7100569974
69056343
6976169438
506
4991
52215135 4918
4841
4814
4872
4853
5337
58785845
6263
587956395434
5383
5613
5504
40933946
4363
41823892
36313582377637614404593
4567
46574639456
4463 4418
4533
449573267323
74417413
731572727255
7308
7305
7554
8058 791
8195
8151
7867762757178197668
65716537
676579
637
6293 6279
63066294
6802
708
7052 7184
71506877
68166811
6875
6874
0
10
20
30
40
50
60
0 500 1000 1500 2000 2500 3000 3500
YKGH
10
0-S
DW
T
100 sdwt = 100 seed weight, YKGH = plot yield
Figure 6: Ward’s clustering of the chickpea reference set accessions for geographic
origins based on scores of first three PCs
Link
age
Dist
ance
0
2
4
6
8
10
12
Arica
South As ia
Southeas t As ia
Am ericas
Europe
Wes t As ia
Mediterranean
Eas t as ia

Figure 7: Dendrogram based on 7 qualitative traits of the chickpea reference set
accessions based on different seed types (Desi, Kabuli, Pea Shaped and Wild)
Chickpea reference set (Desi, Kabuli, Pea Shaped and Wild)
Figure 8: Distribution of number of alleles per locus among 91 SSR markers used
for genotyping the chickpea reference set

Figure 9a: Unweighted neighbor-joining tree based on the simple matching
dissimilarity matrix of 91 SSR markers genotyped across the chickpea reference set
Chickpea reference set (Desi, Kabuli, Pea Shaped and Wild)
Figure 9b: Factorial analysis based on the simple matching dissimilarity matrix of
91 SSR markers genotyped across the chickpea reference set
Chickpea reference set (Desi, Kabuli, Pea Shaped and Wild)

Figure 10: Rate of change in Ln P(D) between successive K (K averaged over the five
run) in the chickpea reference set accessions
-106000
-105000
-104000
-103000
-102000
-101000
-100000
-99000
-98000
-97000
-96000
10 11 12 13 14 15 16
K-value
Ln
P(D
)
Figure 11a: Population structure of the chickpea reference set based on 91 SSR
markers (k=13) revealed by STRUCTURE analysis (Bar plot in single lines)
SP
I S
P
II
SP III
SP IV
SP V
SP VI
SP VII
SP VIII
SP IX
SP X
SP XI
SP XII
SP XIII

Figure 11b: Population structure of the chickpea reference set based on 91 SSR
markers (k=13) revealed by STRUCTURE analysis (Bar plot in multiple lines)
Figure 12: Principal coordinates analysis (PCoA) of the chickpea reference set
accessions using 91 SSR markers based on Nei (1973) distance estimates.
P rinc ipal C oordinates
1234567 89101112131415
1617181920212223242526
27 28293031
32333435 3637
38
3940 4142434445
4647 4849
505152
5354
55565758 59606162636465666768 6970717273
7475
767778798081 82838485
8687
888990 9192 9394959697
9899100
101
102103
104105
106107
108
109110 111
112113114115 116
117118119120 121122123 124125126
127128129130
131132133134
135 136137
138
139 140141142
143144 145 146147
148
149150 151152
153 154
155
156
157158
159
160
161162
163164
165166
167
168169170171
172173
174175
176177
178
179180
181
182183184185186187188 189190
191192 193194195
196197198199
200201202203204
205
206207208
209210211212213214
215216
217218219220221222223
224
225226227228
229230
231
232
233234
235
236237238239
240241242243244245
246 247248249250
251252253254255256257258259 260261262263
264
265
266
267
268
269270
271272273
274275276 277278
279280281282283284285286287288289290291
292293294
295296297298299300
C oord. 1
Co
ord
. 2
S eries 1
SP I
SP II SP III
SP IV SP V SP VI
SP VII SP VIII
SP IX SP X
SP XI SP XII SP XIII
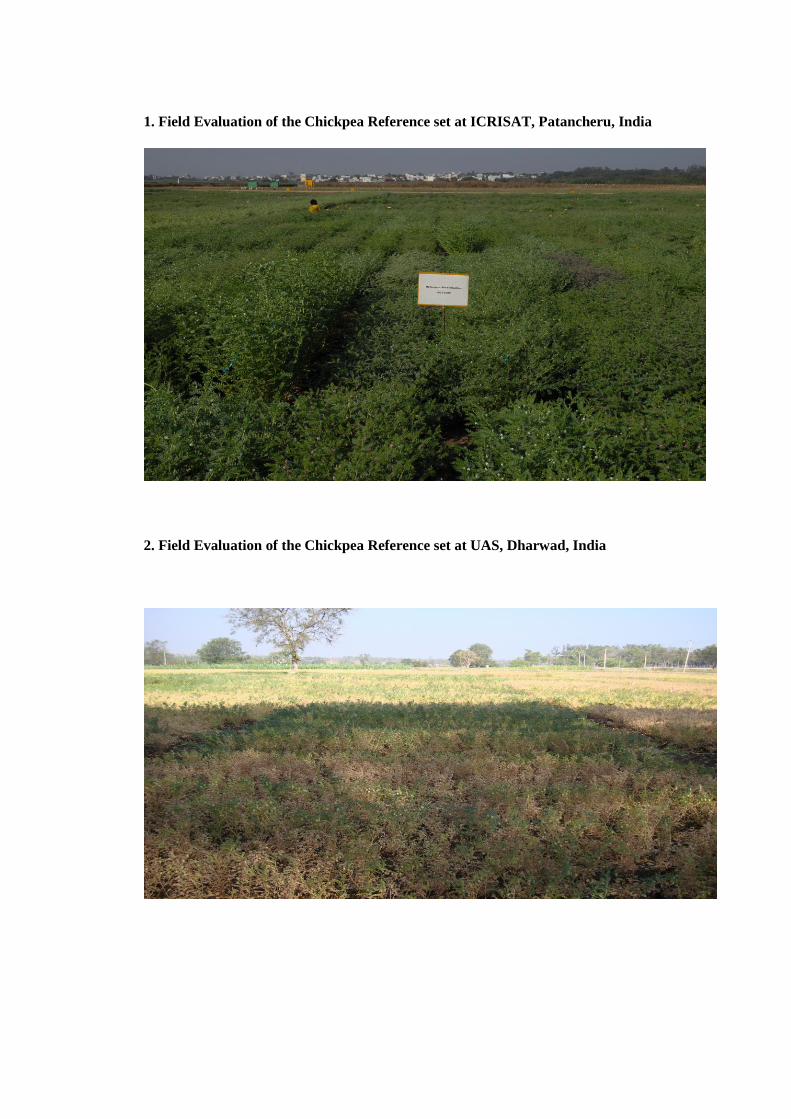
1. Field Evaluation of the Chickpea Reference set at ICRISAT, Patancheru, India
2. Field Evaluation of the Chickpea Reference set at UAS, Dharwad, India

3. Diversity in Chickpea Germplasm at ICRISAT, Patancheru, India
4. Diversity for Foliage Color in Chickpea Reference set

5. Diversity for Leaf and Stem Type and Shape in Chickpea Reference set
6. Diversity for Flower Shape and Color in Chickpea Reference set

7. Diversity for Pod Shape and Color in Chickpea Reference set
8. Diversity for Pod Number in Chickpea Reference set

9. Diversity for Seed Shape and Color in Chickpea Reference set
10. PCR products tested for amplification on 1.2 per cent agarose gel in Chickpea
Reference set

11. Allele sizing of the data obtained from ABI 3730xl genetic analyzer using
Genotyper software version 4.0 (Applied Biosystems, USA) in Chickpea Reference
set
12. Pod borer screening of the chickpea reference set accessions- Detached leaf
bioassay

13. Phenotyping of the chickpea reference set for drought tolerance using PVC
cylinder technique
14. Chickpea reference set accessions showing diversity in root lengths

Literature

7. LITERATURE
Abbo, S., J.Berger and Turner, N. C. 2003. Ecography of annual wild cicer species: The
poor state of the world collection. Crop Science 43: 1076-1090.
Abbo,S., Molina, C., Jungmann, R., Grusak, A., Berkovitch, Z., Reifen, R., Kahl, G.,
Winter,P and Reifen. 2005. Quantitative trait loci governing carotenoid concentration and
weight in seeds of chickpea (Cicer arietinum L.). Theoretical and Applied Genetics
111:185-195
Abdel, R.M.T., Turk., M.A. and Kyung, D.L.A. 2005. Adaptation of chickpea practices in
a Mediterranean type environment. Research Journal of Agriculture and Biological
Sciences. 1(2):152-157.
Adhikari, G. and Pandey, M. P., 1983, Genetic divergence in chickpea. Indian J. Genet
43: 149-151.
Adams, R.P and T.Demeke.1993. Systematic relationships in Juniperus based on random
amplified polymorphic DNA (RAPDs).Taxon 42:553-571.
Agarwal Indu, 1986, Genetic variability in populations of chickpea crosses. Indian J.
Agri. Sci. 56 (1): 142-144.
Agrama, H.A and G.C. Eizenga. 2008. Molecular diversity and genome wide linkage
disequilibrium patterns in a worldwide collection of Oryza sativa and its wild relatives.
Euphytica 160: 339-355.
Agrama, H.A., G.C. Eizenga and W. Yan. 2007. Association mapping of yield and its
components in rice cultivars. Mol. Breed 19: 341-356.
Agrama, H.A., W.G. Yan, F. Lee, R. Fjellstrom, M.S. Chen, M. Jia and A. McClung.
2009. Genetic assessment of a mini-core subset developed from the USDA rice genebank.
Crop Sci 49: 1339-1346.
Agrawal, I. 1985. Genetic variability in segregating populations of desi x kabuli crosses.
Indian Journal of Agricultural Sciences 55(7): 456-459
Ahmad, F., Khan AI, Awan FS, Sadia B, Sadaqat HA and Bahadur S (2010) Genetic
diversity of chickpea (Cicer arietinum L.) germplasm in Pakistan as revealed by RAPD
analysis. Genetics and Molecular Research 9: 1414–1420.
Ahmad, F and Slinkard, A.E. 1992. Genetic relationships in the genus Cicer L. as
revealed by Polyacrylamide gel electrophoresis of seed storage proteins. Theor Appl
Genet 84: 688-692

Ahmad, F. 1988. Interspecific hybridization and genetic relationships among the annual
Cicer L. species. Ph.D. thesis: University of Saskatchewan, Saskatoon, Canada
Ahmad, F. 1999. Random amplified polymorphic DNA (RAPD) analysis reveals genetic
relationships among the annual Cicer species. Theor Appl Genet 98:657-663
Ahmad, F. 2000. A comparative study of chromosome morphology among the nine
annual species of Cicer. Cytobios 101:37-53
Ahmad, F., Gaur, P.M and Croser, J. 2005. Chickpea (Cicer arietinum.L.) In: Singh RJ,
Jauhar PP, editors. Genetic engineering and crop improvement. Grain Legumes Vol 1.
CRC Press, USA. p 187-217.
Akbari M, Wenzl P, Caig V, Carling J, Xia L, Yang S, Uszynski G, Mohler V,
Lehmensiek A, Kuchel H, Hayden MJ, Howes N, Sharp P, Vaughan P, Rathmell B,
Huttner E, Kilian A (2006) Diversity arrays technology (DArT) for high-throughput
profiling of the hexaploid wheat genome. Theor Appl Genet 113:1409-1420
Ali, M and Kumar, S. 2003. Chickpea research in India; an overview In: Masood A, Shiv
K, Singh NB (eds) Chickpea Research in India. Indian Institute of Pulses Research,
Kanpur, India. pp 1-3.
Ali, M., Jensen, C.R., Mogensen, V.O., Andersen, M.N., Henson, I.E., 1999. Root
signaling and osmotic adjustment during intermittent soil drying sustain grain yield of
field grown wheat. Field Crops Research 62: 35–52.
Ali, M.L., J.F. Rajewski, P. S. Baenziger, K.S. Gill and K.M.Kskridge. 2008. Assessment
of genetic diversity and relationship among a collection of US sweet sorghum germplasm
by SSR markers. Mol. Breed 21: 497-509. DOI: 10.1007/s11032-007-9149-z.
Ali, S., A.B. Maher, M. Anwar and A.M.Haqqani. 2002. Exploitation of genetic
variability for grain yield improvement in chickpea. Int. J. Agric. Boil 4:148-149.
Anilkumar, T. V., Salimath, P. M., Parameshwarappa, R., Chetti, M. B. and Patil, S. S.,
1993, Genetic diversity on the basis of photosynthetic and yield related traits in chickpea.
Indian J. Genet 53 (3): 279-286
Araus, J.L., Slafer, G.A., Reynolds, M.P. and Royo, C.2002.Plant Breeding and drought
in C-3 cereals: what should we breed for? Ann. Bot 89:925-940.
Arora P. P. 1991, Genetic variability and its relevance in chickpea. Int. Chickpea
Newslett 25 : 9-10.

Arora, P. P. and Jeena, A. S. 2000, Variability in relation to response to selection in
chickpea. Agric. Sci. Dig 20: 267-298.
Arshad, B.A and Abdul, G. 2004. Path coefficient analysis in chickpea (Cicer
arietinum.L) under rainfed conditions. Pak. J. Bot. 36(1):75-81.
Arshad, M., A. Bakhsh, M.Zubair and A.Ghafoor. 2003. Genetic variability and
Correlation in chickpea (Cicer arietinum L.). Pak. J. Bot 35: 605-611.
Arshad, M., M. Aslam and Shariff. M. 2008. Performance of ―Thal 2006‖ a high yielding
and disease resistant variety of chickpea. Pak. J. Bot 46(2): 117-124.
Arumuganathan, K., Earle, E.D. 1991. Nuclear DNA content of some important plant
species. Plant Mol Biol Rept 9: 208-218.
Arunkumar, Ramkrishna, Kumar, A. and Krishna, R., 1998, Heritability and genetic
advance in gram (Cicer arietinum L.) genotypes of diverse origin. Indian J. Agric. Sci.,
68: 747-749.
Auckland, A.K., and Van der Maesen, L.P.G. 1980. Chickpea. In W.R. Fehr and
H.H.Hadley. eds. Hybridization of Crop Plants. American Society of Agronomy,
Madison, Wisconsin, USA. pp. 249-259
Babar. Mansoor Atta, M. A. Haq and T. M. Shah. 2008. Variation and inter-relationships
of quantitative traits in chickpea (Cicer arietinum L.). Pak. J. Bot 40(2): 637-647.
Badami, P.S., Mallikarjuma, N, Moss, J.P. 1997. Interspecific hybridization between
Cicer arietinum and Cicer pinnatifidum. Plant Breed 116:393–395
Bahl, P.N., Singh K.P and Daljit Singh.1984. Evaluation of tall chickpea genotypes for
normal and late sowings. Indian Journal of Genetics and Plant Breeding 54:110-113.
Bakhsh, A., T.Gull, B.A. Malik and M.Sharif.1998.Comparison between f1S and their
parental genotypes for the patterns of character correlation and path coefficients in
chickpea (Cicer arietinum L.). Pak. J. Bot 30 (2):209-219
Balasubramanian, R. 1950a. The association of size and colour in gram (Cicer arietinum
L.). Current Science 19:246-247
Balasubramanian, R. 1950b. Inheritance of seed coat colour in gram. Madras
Agricultural Journal 37:379-384
Basigulp, D.H., D.K. Barnes and R.E. Stucker. 1995. Development of a core collection
for perennial Medicago plant introductions. Crop Sci. 35:1163–1168.
Benjamin, J.G., Nielsen, D.C. 2006. Water deficit effects on root distribution of soybean,

field pea and chickpea. Field Crops Res 97: 248-253 177
Benjamini, L. 1981.Effect of branching on grain production in an unirrigated chickpea
field. Hassadeh 61:1266-1267
Berger, J., Shahal, A. and Turner, N.C. (2003), Ecogeography of annual wild Cicer
species: the poor state of the world collection. Crop Science 43: 1076–1090.
Berger, U. and Turner, N. C., 2000, Yield related traits in water stressed chickpea. In :
3rD Int. Crop Sci. Cong., 2000, 17-22 August, 2000, Hamburg, Germany, p. 2.
Bhagyawant, S.S and Srivastava, N. 2008. Genetic fingerprinting of chickpea (Cicer
arietinum L.) germplasm using ISSR markers and their relationships. African Journal of
Biotechnology 7: 4428–4431.
Bhambota, S. K., Sood, B. C. and Garton, S. L., 1994, Contribution of different characters
towards seed yield in chickpea. Indian J. Genet., 54 : 381-388.
Bharadwaj, R. P. and Singh, I. B., 1980, Genotypic variability in yield and other
quantitative characters in gram. Indian Agric., 14 : 37-41.
Bhat, D.D. and Singh, D.P. 1980. Combining ability in chickpea. Indian Journal of
Genetics and Plant Breeding 40:456-460
Bhatt, N. J. and Patel, R. K.2001. Screening of chickpea cultivars for their resistance to
gram pod borer, Helicoverpa armigera. Indian Journal of Entomology, 63(3): 277 –
280.
Bhatia, Y. S. Singh, B. N and LAL, S. 1993, Variabiliaty and inter relationship of yield
and its attributes in chickpea. Indian J. Pulses Res., 6 (1) : 1-5.
Bhattacharjee, R., P.J. Bramel, I.S. Khairwal and K.N.Reddy. 2007. Establishment of a
pearl millet [Pennisetum glaucum (L) R. Br.] core collection based on geographical
distribution and quantitative traits. Euphytica 155:35-45.
Bhattacharya, A., and Ganguly, S. B., 1998, Genetic diversity in chickpea under normal
and late seedling conditions. Legume Res., 21 : 171-176.
Bhattacharya, A., Singh, D. N. and Deshraj, 1995, Association of yield and yield
components under soil moisture stress and non-stress conditions in chickpea. Legume
Res., 18 : 193-199.
Bhavani, A.P., Sasidharan, N, Shukla, Y.M and Bhatt, M. M. 2009. Role of genetic
variability in chickpea. International Journal of Agricultural Sci 5:205-206.
Bhoyta, S. B., Ater, A. H. and Rathor, T. H., 1994, Genetic variability and association of

some yield contributing attributes in chickpea. J. Soils and Crops, 4 (1) : 78-82.
Blair, M.W., L.M. Du, H.F. Buend and M.C. Duque. 2009. Genetic diversity, seed size
associations and population structure of a core collection of common beans (Phaseolus
vulgaris L.). Theor. Appl. Genet 119: 955-972.
Bonierbale, M., S.Beeba, J.Tohme and P.Jones.1997. Molecular genetic techniques in
relation to sampling strategies and the development of core collection. In WG Ayad,
T.Hodgin, A.Jaradat and VR Rao (Eds) Molecular genetic techniques for plant genetic
resources. Report of an IPGRI workshop, 9-11 October, 1995, IPGRI, Rome, Italy, pp:
98-102.
Boominathan, P., Shukla, R, Kumar, A, Manna, D, Negi, D, Verma, P.K and
Chattopadhyay, D. 2004. Long term transcript accumulation during the development of
dehydration adaptation in Cicer arietinum L. Plant Physiology 135: 1608–1620.
Borba, T.C.O., R.P.V. Brondani, F. Breseghello, A.S.G. Coelho, J.A. Mendon, P.H.N.
Rangel and C. Brondani. 2010. Association mapping for yield and grain quality traits in
rice (Oryza sativa L.). Genet. Mol. Biol 33(3): 515-524
Botstein, D., R.L. White, M. Skolnick and R.W. Davis, 1980. Construction of a genetic
linkage map in man using restriction fragment length polymorphisms. Am. J. Hum.
Genet., 32: 314-331.
Boyer, J.S. 1982. Plant productivity and environment. Science 218:443-448.
Bradbury, P.J., Z.W. Zhang, D.E. Kroon, R.M. Casstevens, Y. Ramdoss and E.S.
Buckler. 2007. TASSEL: software for association mapping of complex traits in diverse
samples. Bioinformatics 23(19): 2633–2635.
Bravo, L. (1998) Polyphenols: chemistry, dietary sources, metabolism, and nutritional
significance. Nutrition Reviews 56: 317–333.
Breese, E.L. (1989): Regeneration and multiplication of germplasm resources in seed
genebanks. The Scientific background. International board for Plant Genetic
Resources, Rome.
Breseghello, F., and M.E. Sorrells. 2006. Association analysis as a strategy for
improvement of quantitative traits in plants. Crop Sci. 46:1323–1330.
Brown, A.H.D. 1989a. Core collections: A practical approach to genetic resources
management. Genome 31:818–824.

Brown, A.H.D., J.P. Grace and S.S. Speer. 1987. Designation of a core collection of
perennial Glycine. Soybean Genet. Newsl 14:59–70.
Bruce M. Haigh., Robin S. Jessop, Robert D. Murison and Warwick L. Felton.2000.
Wheat, barley and triticale as mimic weeds for wild oat in chickpea studies. Fourteenth
Australian Weeds Conference, Australia. 124-128.
Buhariwalla, H.K., Jayashree, B, Eshwar, K and Crouch, J.H. 2005. Development of
ESTs from chickpea roots and their use in diversity analysis of the Cicer genus. BMC
Plant Biology 5: 16.
Burli, A. V., More, S. M., Gare, B. N. and Dodake, S. S., 2004, Studies on genetic
variability and heritability in chickpea under residual soil moisture condition.
J.Maharashtra Agric. Univ., 29 (3): 353-354.
Burton, G.W. 1952. Quantitative inheritance in grasses. Proc. 6th Int. Grassland Cong.,
1: 277- 283.
Chand, H., Srivastav, L. S. and Trahen, K. B., 1995, Estimates of genetic
parameters,correlation co-efficients and path co-efficient analysis in gram (Cicer
arietinumL). Madras Agric. J., 62 : 178-181.
Chand, P., 1999, Genetic divergence among chickpea genotypes. Crop Res., 18 (1) : 51-
52.
Chandra Babu R, Nguyen BD, Chamarerk V, Shanmugasundaram P, Chezhian P,
Jeyaprakash P, Ganesh SK, Palchamy A, Sadasivam S, Sarkarung S, Wade LJ, Nguyen
HT (2003) Genetic analysis of drought resistance in rice by molecular markers:
association between secondary traits and field performance. Crop Sci 43:1457–1469
Chandra, S. 1968 Variability in gram. Indian Journal of Genetics and Plant Breeding
28:205-210
Chaturvedi, S.K., Mishra, D.K and Hemant Kumar. 2009. Evaluation of Donors for
qualitative and yield traits in chickpea (Cicer arietinum L.). Trends in Biosciences
2(1):53-55.
Chaturvedi, S.K.and Ali, Masood. 2004. Development of early maturing chickpea
varieties for diversification of rice-wheat cropping system. Ln:Proceedings of 4th
International Crop Science Congress held on 26th
September to 1st
October Brisbane,
Australia.

Chauhan, M. P. and Singh, i. S., 2000, Variability estimates and identifying chickpea
genotypes for yield and yield attributes in salt affected soil. Legume Res., 23(3) : 199-
200
Chavan. V.W., Patil, H.S and Rasal, P.N. 1994. Genetic variability correlation studies and
their implications in selection of high yielding genotypes of chickpea. Madras Aric. J.,
81:463-465.
Cho, S., Kumar, J. Schultz, J.L. Anupama, K. Tefera, F and Muehlbauer, F.J. 2002.
Mapping genes for double podding and other morphological traits in chickpea. Euphytica
128: 285–292.
Choudhary, B. D., Singh, P., Kumar, A. and Singh, D. P., 1992, Correlation and multiple
regression analysis in chickpea. Crop Improv., 15 (2) : 180-186
Choudhary, S., Sethy, N.K, Shokeen, B and Bhatia, S. 2009. Development of chickpea
EST-SSR markers and analysis of allelic variation across related species. Theoretical
and Applied Genetics 118: 591–608.
Choudhary, S., Sethy,N.K, Shokeen, B, Bhatia, S..2006. Development of sequence-
tagged microsatellites site markers for chickpea (Cicer arietinum L.). Molecular Ecology
Notes 6: 93-95.
Choumane, W., Winter, P, Weigand, F, Kahl, G. 2000. Conservation and variability of
sequence tagged microsatellite sites (STMS) from chickpea (Cicer arietinum L.) within
genus Cicer. Theor Appl Genet 101:269-278
Clarke, H. and Siddique, K.H.M. (2003) Response of chickpea genotypes to low
temperature stress during reproductive Breeding Achievements and development. Field
Crops Research 90:323–334.
Clarke, H., Khan, T.N. and Siddique, K.H.M. (2004) Pollen selection for chilling
tolerance at hybridization leads to improved chickpea cultivars. Euphytica 139: 65–74.
Cobb, B.D and Clarkson, J.M.1994.A simple procedure for optimizing the polymerase
chain reaction (PCR) using modified Taguchi methods. Nucleic Acids Research
22:3801-3805.
Cockram J, White J, Leigh FJ, Lea VJ, Chiapparino E, Laurie DA, Mackay IJ, Powell W,
O‘Sullivan DM (2008) Association mapping of partitioning loci in barley. BMC Genet
9:16
Coram, T and Pang, E. 2005. Isolation and analysis of candidate Ascochyta blight defense
genes in chickpea, Part I. Generation and analysis of an expressed sequence tag (EST)

library. Physiological and Molecular Plant Pathology 66: 192–200.
Croser, J.S., Ahmad, F., Clarke, H. J. and Siddique, K.H.M. (2003) Utilization of wild
Cicer in chickpea improvement: progress, constraints, and prospects. Australian Journal
of Agricultural Research 54: 429–444.
Dabholkar, A.R. 1999. Elements of biometrical genetics. Revised and enlarged edition.
Published and printed by Concept Publishing Company, New Delhi.
Dahlberg, J.A., Burke, J.J, Rosenowd, T, 2004. Development of a sorghum core
collection: Refinement and evaluation of a subset from Sudan. Econ. Bot 58: 556-567.
Dalrymple, D.G.1986.Developemnt and spread of high-yielding wheat varieties in
developing countries. 7th
edition. Washington DC: US Agency for International
Development
Dangaria, C. J., Parmeshwarappa, R., Salimath, P. M. and Annigeri, B. S., 1994, Genetic
divergence for nodulation characters in chickpea. Legume Res., 17: 32-36.
Darshanlal, Ramkrishna, Gurpreet, S., Lal, D., Krishna, R. and Singh, G., 2001, Genetic
divergence in chickpea. Indian J. Pulses Res., 14 (1): 63-64.
DARwin 5.0.156 programme. http://darwin.cirad.fr/darwin
Dasgupta, Oslam, M. O., Gayen, P., 1992, Genetic variability and analysis of yield
components in chickpea. Ann. Agric. Res., 13 (2): 157-160.
De leonardis., Fichera, G, Zizza, A.1996. Pollen and seed morphology of Cicer arietinum
L. cultivars and relationships with C. reticulatum Latidz. and C. echinospermum P.H.
Davis, Plant Genet Resou Newsl 105:29-35
DetSimonian, R and N. Laird. 1986. Meta-analysis in clinical trials. Control. Clin. Trials
7:177–188.
Deshmukh, P. S and Kushawa, S. R. 2002, Variability in membrane injury index in
chickpea genotypes. Indian J. Plant Physiol.. 7 (3) : 285-287.
Deshmukh, R. B. and Bhapkar, D. G., 1982a, Heterosis and combining ability for yield
and its components in chickpea. Indian J. Agric. Sci., 52 (11): 728-731.
Devlin, B. and Roeder, K.1999. Genomic control for association studies. Biometrics
55:997–1004.
Diwan, N., G.R. Bauchan, and M.S. McIntosh. 1994. A core collection for the United
States annual Medicago germplasm collection. Crop Sci. 34:279–285.
Doerge, R.W. 2002. Mapping and analysis of quantitative trait loci in experimental
populations. Nat. Rev. Genet. 3:43–52.
Dua, R.P., Chaturvedi, S.K and Sewak, S. 2001. Reference varieties of chickpea for IPR
region. Indian Journal of Plant Physiology 3: 292-295.
Dubey, K. K. and Srivastava, S. B. L., 2007, Study of direct selection in chickpea
(Cicerarietinum L.). Plant Archives., 7 (1) : 211-212.
Duke, J.A. 1981. Handbook of legumes of world economic importance. Plenum Press,
New York. p. 52-57.
Dumbre, A. D., Deshmukh, R. B. and Navale, P. A., 1984, Analysis of genetic variability
in chickpea. J. Maharashtra. Agric. Univ., 9 (3): 350.
Durga, K. K., Rao, Y. K. and Reddy, M. V. 2005, Genetic divergence in chickpea
{Cicerarietinum (L.). Legume Res., 28 (4): 250-255.
Dwevedi.K.K and Gaibriyal M.Lal.2009. Assessment of genetic diversity of cultivated
chickpea (Cicer arietinum L.). Asian Journal of Agricultural Sciences 1(1):7-8.
Dwivedi, S.L., H.D. Upadhyaya and D.M. Hegde. 2005. Development of core collection
using geographic information and morphological descriptors in safflower (Carthamus
tinctorius L.) germplasm. Genetic Resour. Crop Evol. 52: 821-830.
Dwivedi, S.L., N. Puppala, H.D. Upadhyaya, N. Manivannan and S. Singh. 2008.
Developing a core collection of peanut specific to Valencia market type. Crop Sci
48:625-632.
Ebana, K.,Y.Kojima, S.Fukuoka, T.Nagamine and M. Kawase.2008. Development of
minicore collection of Japanese rice landrace. Breed. Sci. 58:281-291.
Eberhart,S.A., and W.A. Russell.1966.Stability parameters for comparing varieties. Crop
Sci. 6: 36-40
ESHA food data base (2010) ESHA Foundation, Salem, Oregon, USA. (In: The world‘s
healthiest foods. www.whfoods.org)
Evanno, G., S. Regnaut and J. Goudet. 2005. Detecting the number of clusters of
individuals using the software STRUCTURE: a simulation study. Mol. Ecol. 14:2611–
2620.
Evans, L.T.1983 .Raising the yield potential: by selection or design? In: Kosuge T,
Meredith CP, Hollander A, (eds) Genetic engineering of plants. Plenum Press, New York.
Evolution, 30:877—891.
Falush, D., M. Stephens, J.K. Pritchard. 2003. Inference of population structure using

multilocus genotype data: linked loci and correlated allele frequencies. Genetics
164:1567–1587.
Falush, D., M. Stephens, J.K. Pritchard. 2007. Inference of population structure using
multilocus genotype data: dominant markers and null alleles. Mol. Ecol. Notes 7:574–
578.
FAO: http://www.fao.org/docrep/t0818e/T0818E0a.htm
Farshadfar, E., Zamani, M., Motallebi, M. and Imamjomeh, A., 2001, Selection for
drought resistance in chickpea lines. Iranian J. Agric. Sci., 32 (1) : 65-77
Farshadfar, M and E. Farshadfar. 2008. Genetic variability and path analysis of chickpea
(Cicer arietinum L.) landraces and lines. J. Applied Science.8:3951-3956.
Filippetti, A., 1990, Variablility of plant and seed characterization in a collection of
chickpea. Legume Res., 13 (1) : 36-46.
Fitt, G. P. 1989. The ecology of Heliothis species in relation to agroecosystems. Annual
Review of Entomology 34: 17-52.
Folkertsma, R.T., H.F. Rattunde, S.Chandra, G.S. raju and C.T. Hash.2005. The pattern
of genetic diversity of Guinea-race Sorghum bicolor (L.) Moench landraces as revealed
with SSR markers. Theoretical and Applied Genetics 11(3):399-409.
Follett,R,R., Allmaras, R.R. and Reichman, G.A.1974:Distribution of corn roots in sandy
soil with a declining water table. Agron. J. 66:288-292.
Forrester, N.W., M. Cahill, L.J. Bird and J.K. Layland. 1993. Management of pyrethroid
and endosulfan resistance in Helicoverpa armigera (Lepidoptera: Noctuidae) in Australia.
Bulletin of Entomological Research Special Supplement No. 1: 1-144.
Frankel, O.H. 1984. Genetic perspective of germplasm conservation. In W. Arber et. al.
(ed.). Genetic Manipulations: Impact on Man and Society. Cambridge Univ. Press,
Cambridge, England. p. 161–170.
Fu, Y.B., G.W. Peterson, D.Williams, K.W. Richards and J.M. Fetch. 2005. Pattern of
AFLP variation in a core subset of cultivated hexaploid oat germplasm. Theor. Appl.
Genet. 530: 530-539.
Gargav, S and Gaur, P.M.2001. Phylogenetic relationships of perennial chickpea Cicer
arietinum, C. microphyllum (Benth.) with its annual relatives as revealed by allozymes
polymorphism. Indian J Genet 61:218-223
Geetharani.2005.Phenotypic diversity of finger millet germplasm. IFAR small grant

report. ICRISAT, Patancheru
Geleta N, Maryke T, Labuschagne, Viljoen CD (2006) Genetic diversity analysis in
sorghum germplasm as estimated by AFLP, SSR and morpho-agronomical markers.
Biodiversity and Conservation 15:3251–3265
Geletu, B., Van Rheenen, H. A., Jagadish, C. A. and Onkar Singh, 1995, Correlation
between yield and its components in segregating populations of different generations of
chickpea (Cicer arietinum L.). Legume Res., 14 : 87 -91.
Gepts, P. 1995. Genetic markers and core collections. In: Hodgkin T, Brown AHD,
Hintum van ThJL, Morales EAV (eds) Core collections of plant genetic resources. John
Wiley and Sons, Chichester, UK: 127–146.
Ghafoor, A., M. Zubair and B.A. Malik. 1990. Path analysis in mash (Vigna mungo L.)
Pak. J. Bot. 22(2):160-167
Ghirase, V.S. and Deshmukh, R.B.2000. Gene action for yield and its components in
chickpea. Indian Journal of Genetics and Plant Breeding 60(2):185-189.
Ghislain, M., D. Zhang, D. Fajardo, Z. Huamán and R.J. Hijmans. 1999. Marker-assisted
sampling of the cultivated Andean potato Solanum phureja collection using RAPD
markers. Genet. Resour. Crop Evol. 46: 547-555.
Gill, J and Cubero, J.I. 1993. Inheritance of seed coat thickness in chickpea (Cicer
arietinum L.). Plant Breeding 111:257-260
Glaszmann, J.C., Kilian, B, Upadhyaya, H.D and Varshney, R.K .2010.Accessing genetic
diversity for crop improvement. Current Opinion in Plant Biology 13: 1–7.
Govil, J. N., Chakrabarthi, S. N. and Sen, B., 1980, Genetic variability and correlation in
chickpea. In; Int. Sarhad Cong 4th, 4-8 May, University of Kabangson, Malaysia.
Gowda, C.L.L., Upadhyaya, H.D, Dronavalli, N and Sube Singh.2011. Identification of
large-seeded high-yielding stable kabuli chickpea germplasm lines for use in crop
improvement. Crop Sci. 51:1-12.
Grenier, C., Bramel-Cox, P.J, Hamon, P. 2001. Core collection of sorghum: I.
Stratification based on eco-geographical data. Crop Sci 41: 234-240.
Guler, M., Adak, M. S. and Ulukan, H., 2001, Determining relationships among yield and
some yield components using path coefficient analysis in chickpea (Cicer arietinum L.).
European J. Agron., 14 (2) : 161-166.
Gumber, R.K., Sarjeet Singh, Kular, J.S, Kuldip Singh.2000.Screening of chickpea

genotypes for resistance to Helicoverpa armigera. International chickpea and pigeon
pea Newsletter 7: 20-21.
Gupta PK, Varshney RK, Prasad M (2002) Molecular markers: principles and
methodology. In Jain SM, Ahloowalia BS, Brar DS (eds) Molecular Techniques in Crop
Improvement. Kluwer Academic Publishers, The Netherlands pp. 9-54
Gupta, P.K. and Varshney, R.K. (2000). The development and use of microsatellite
markers for genetic analysis and Plant Breeding with emphasis on bread wheat.
Euphytica 113:163-85.
Gupta, P.K., S. Rostogi, S. Sharma, R.Singh, N.Kumar and H.S.Balyan.2003.
Transferable EST-SSR markers for the study of polymorphism and genetic diversity in
bread wheat. Mol. Genet. Genomics 270:315-323.
Gupta, S.N. 1985. Studies on genetic variability for drought resistance in chickpea (Cicer
arietinum L.). Ph.D. thesis submitted to Haryana University, Hisar, India.
Gupta, V.P., Ramanujan, S and Kaul, A.K. 1974. Stability analysis in respect of protein,
sulphur and protein value index of seed and its implication in adaptation of chickpea
(Cicer arietinum L.). Genetika Yugoslavia 6:247-261
Gurinder, S., Brar, H. S., Verma, M. M., Sandhu, J. S. and Singh, G., 1989, Component
analysis of yield in chickpea. Crop Improv., 16 (2) : 145-149.
Halward, T.M. and J.C. Wynne. 1991. Generation mean analysis for productivity in two
diverse peanut crosses. Theor. Appl. Genet. 82: 784-792
Hamrich, J.L., and Godt, M.J.1990. Allozyme diversity in plant species. In:A.H.D.
Brown, M.T. Clegg, A.L.Kanier and B.S.Wei (Eds), Plant population genetics, Breeding
and genetic resources. Sinover Associates Inc. Massachusetts. Pp: 43-46.
Hannan, R.M., W.J. Kaiser and F.J. Muehlbauer. 1994. Development and utilization of
the USDA chickpea germplasm core collection. Page 217 in Agronomy Abst. Madison,
WI: ASA.
Harborne, J.B. (1994) The Flavonoids: Advances in Research Since 1986. CRC Press,
Boca Raton, Florida.
Hardy, R.J. and S.G. Thompson. 1996. A likelihood approach to meta-analysis with
random effects. Stat. Med. 15:619–629.
Harisatyanarayana, N. and Reddy, N. S., 2000, Genetic divergence in chickpea. J.
Res.,Acharya N. G. Ranga Agricultural Univ, Hyderabad (AP), 29 : 31-33.

Harlan, J.R. and de Wet, J.M.J. (1971) Toward a rational classification of cultivated
plants. Taxon 20: 509–517.
Harminder kaur, Gupta, S.K, Dalijeet Singh and Kuldeep Singh. 2005. Preliminary
evaluation of chickpea genotypes for resistance to pod borer and wilt complex. ICPN
12:39-40
Hassan, A.E. 2000. Some seed character and identification of some Cicer species.
Bulletin of Faculty of Agriculture. University of Cairo 51:331-348
Hassan,M., Atta.B, M.,Shah.T.M., Haq, M.A., Syed,A and Alam,S.S.2005.Correaltion an
d path coefficient studies in mutants of chickpea (Cicer arietinum L.).Pakistan
.J.Bot.37:293-298.
Hawtin, G.C and Singh, K.B. 1980. Kabuli-desi introgression: Problems and prospects.
Pages 52-60 in Proceedings of the International Workshop on Chickpea
Improvement, 28 February to 2 March 1979, Patancheru 502 324, A.P., India:
International Crops Research Institute for the Semi-Arid Tropics.
Henderson, C.R. 1975. Best linear unbiased estimation and prediction under a selection
model. Biometrics 31: 423–447.
Hokanson, S.C., A.K. Szewc-McFadden, W.F. Lamboy and J.R. McFerson. 1998.
Microsatellite (SSR) markers reveal genetic identities, genetic diversity, and relationships
in Malus x domestica Borkh. Core subset collection. Theor. Appl. Genet. 97: 671-683.
Holbrook, C.C. and W. Dong. 2005. Development and evaluation of a mini core
collection for the US peanut germplasm collection. Crop Sci. 45: 1540-1544.
Holbrook, C.C., W.F. Anderson and R.N. Pittman. 1993. Selection of a core collection
from the U.S. Germplasm collection of peanut. Crop Sci. 33:859-861.
Holland, J.B. 2007. Genetic architecture of complex traits in plants. Curr. Opin. Plant
Biol. 10:156–161.
Hu, J., J. Zhu and H.M. Xu. 2000. Methods of constructing core collections by stepwise
clustering with three sampling strategies based on the genotypic values of crops. Theor.
Appl. Genet. 101: 264-268.
Huaman, Z., C. Aguilar, and R. Ortiz. 1999. Selecting a Peruvian sweetpotato core
collection on the basis of morphological, eco-geographical, and disease and pest reaction
data. Theor. Appl. Genet. 98:840–844.
Huettel, B., Winter. P, Weising. K, Choumane.W, Weigand. F, Kahl, G.1999 Sequence-
tagged microsatellite site markers for chickpea (Cicer arietinum L.). Genome 42:210–
217
Hyten DL, Song O, Fickus EW, Quigley CV, Lim JS, Choi IY, Hwang EY, Pastor
Corrales M, Cregan PB (2010) High-throughput SNP discovery and assay development in
common bean. BMC Genomics 11:475.
IBPGR, ICRISAT & ICARDA. 1993. Descriptors for chickpea (Cicer arietinum L.).
International Board for Plant Genetic Resources, Rome, Italy: International Crops
Research Institute For Semi-Arid Tropics (ICRISAT), Patancheru, India and International
Center for Agriculture Research in the Dry Areas (ICARDA), Aleppo, Syria.
Indury and Cardon .1997. A simple method for automated allele binning in microsatellite
markers. Genome Research 7: 1104-1109.
Iqbal, J., M.Saleem, A.A.Khan and M.Anwar.1994. Genetic variability and correlation
studies in chickpea. J.Anim.Pl.Sci. 4:35-6.
Iruela, M., Rubio. J, Cubero. J.I, Gil. J, Milan. T.2002. Phylogenetic analysis in the genus
Cicer and cultivated chickpea using RAPD and ISSR markers. Theoretical and Applied
Genetics 104: 643–651.
Islam, M.Q., Begum, K and Kau,l A.K.1984. Phenotypic variability and correlation
studies in kabuli chickpea. Bangladesh Journal of Agricultural Research 9:33-37.
Jaccoud, D., Peng, K, Feinstein. D, Kilian. A.2001. Diversity Arrays: a solid state
technology for sequence information independent genotyping. Nucleic Acids Research
29:e25.
Jahagirdar, J.E., Patil, R.A. and Khare, P.R.1994. Genetic variability and its relevance in
chickpea improvement. Indian Journal of Pulses Research 7(2):179-180.
Jambunathan, R and Singh, U. 1980. Studies on desi and kabuli chickpea (Cicer
arietinum L.). Cultivars .I. Chemical Composition. Pages 61-66 in Proceedings of the
International Workshop on Chickpea Improvement, 28 February to 2 March 1979.
Patancheru 502 324, A.P., India: International Crops Research Institute for the Semi-Arid
Tropics.
Jatasra, D. S., Ram, C., Chandra, S. and Singh, A., 1978, Correlation and path analysis in
segregating populations of chickpea (Cicer arietinum L.). Indian J. Agric. Res.,12 : 219-
222.
Javedi and Yamaguchi. H (2004) Interspecific relationships of the genus Cicer L.
(Fabaceae) based on trnT-F sequences. Theoretical and Applied Genetics 109: 317–
322.

Jayashree B, Punna R, Prasad P, Bantte K, Hash CT, Chandra S, Hoisington DA,
Varshney RK (2006) A database of simple sequence repeats from cereal and legume
expressed sequence tags mined in silico: survey and evaluation. In Silico Biol 6:0054
Jeena, A. S. and Arora, P. P., 2000, Genetic variation in chickpea evaluated at Pantnagar.
Indian Agric. Sci. Dig., 20 : 50 – 51.
Jeena, A. S. and Arora, P. P., 2000, Heterosis in chickpea (Cicer arietinum L.). Agric.
Sci. Dig., 20 (2): 71-74.
Jha, S.K., Jaiswal, H.K and Saha, A.K.1997. Genetic analysis of some quantitative
characters in chickpea (Cicer arietinum L.). Annuals of Agricultural Research
18(4):420
Jia, X., Z. Zhang, Y. Liu, C. Zhang, Y. Shi, Y. Song, T. Wang and Y. Li. 2009.
Development and genetic mapping of SSR markers in foxtail millet (Setaria italica (L.)
P. Beauv.). Theor. Appl. Genet. 118: 821-829.
Jin, L., Y. Lu, P. Xiao, M. Sun, H. Corke and J. Bao. 2010. Genetic diversity and
population structure of a diverse set of rice germplasm for association mapping. Theor.
Appl. Genet. 121: 475-487.
Jirali, D., Panchal, Y. C., Janagouder, B. S. and Patil, B. C., 1994, Studies on the growth
pattern and yield in chickpea genotypes under receding soil moisture conditions. Indian
J. Plant Phy., 37 : 275-276.
Jivani, L. L. and Yadavendra, J. P. 1988, Genetic variability in chickpea. Indian J.
Pulses Res., 1 (1): 62-63.
Johns, M.A., Skroch. P.W, NieFnhuis. J., Hinrichsen. P, Bascur, G and Munoze-schick.
C. 1997. Gene pool classification of common bean landraces from Chile based on RAPD
and morphological data. Crop Science 37:605-613.
Jordan, W.R., Dougas, W.A. Jr. and Shouse. P.J. 1983. Stratergies for crop improvement
for drought-prone regions. Agric. Water manage.7:281.
Joshi, S.N. 1972. Variability and association of some yield components in gram (Cicer
arietinum L.). Indian J. Agric. Sci. 42:397-399.
Jun, T.H., K. Van, M.Y. Kim, S.H. Lee and D.R. Walker. 2008. Association analysis
using SSR markers to find QTL for seed protein content in soybean. Euphytica 162: 179-
191.
Kang, H. M., N. A. Zaitlen, C. M. Wade, A. Kirby, D. Heckerman. 2008 Efficient control
of population structure in model organism association mapping. Genetics 178: 1709-

1723.
Kamala V, Bramel PJ, Sivaramakrishnan S, Chandra S. (2006). Genetic and phenotypic
diversity in downy-mildew-resistant sorghum (Sorghum bicolor (L.) Moench)
germplasm. Gen. Res. Crop Evol. 53: 1243-1253.
Karp, A., P.G.Isaac and D.S. Ingram.1998. Molecular tools for screening biodiversity,
Champan and Hall, London.
Karp, A., S. Kresovich, K.V. Bhat, W.G. Ayad and T.Hodgin. 1997. Molecular tools in
plant genetic resources conservation: a guide to the technologies. IPGRI technical
bulletin No.2. IPGRI, Rome.Italy.
Kashiwagi, J., Krishnamurthy. L, Gaur,.P.M, Umezaki. T, Zheng ShaoHui, Hiraoka.Y,
Terauchi. T, Iwama, K. 2008. Genotype-environment interaction in chickpea (C.arietinum
L.) for adaptation to humid temperate and semi-arid tropical environments. Tropical
Agriculture and Development 52(4):89-96.
Kashiwagi, J., L. Krishnamurthy, H.D. Upadhyaya, H. Krishna, S. Chandra, V. Vadez and
R. Serraj. 2005. Genetic variability of drought-avoidance root traits in the mini-core
germplasm collection of chickpea (Cicer arietinum L.). Euphytica 146: 213–222.
Kashiwagi, J., L. Krishnamurthy, L. H.D. Upadhyaya and Sube Singh. 2007.
Identification for large seeded kabuli germplasm with drought tolerance root traits. SAT
e-Journal 3. in chickpea. SAT e-Journal 6.
Kashiwagi, J.W., Krishnamurthy. L, Crouch. J. H, and Serraj. R.2006. Variability of root
characteristics during vegetative stage and relationship with seed yield in chickpea
genotypes (Cicer arietinum L). Field Crops Research 95:171-181
Katiyar, P. K., 1978, Genetic divergence among chickpea cultivars. Indian J. Genet., 56
: 86- 88.
Katiyar, R. P., Prasad, J. Singh, A. B. and Ram, K. 1977, Association analysis of grain
yield and its components in segregating populations of chickpea. Indian J. Agric.Sci., 49
: 313-317.
Katiyar, R.P. 1975. Fractional diallel crosses in Bengal gram (Cicer arietinum L.). Ph.D.
Thesis, Kanpur University, India
Kaur, A., S.K. Gupta and K.Singh, 2004. Genetic variability in desi chickpea (Cicer
arietinum L.) under normal and late sown conditions. J.Res. Punjab Agric. Univ.
41:425-428
Kazan, K. and Muehlbauer, F.J. (1991) Allozyme variation and phylogeny in annual

species of Cicer (Leguminosae). Plant Systematics and Evolution 175: 11–21.
Keuls, M. 1952. The use of the ‗studentized range‘ in connection with an analysis of
variance. Euphytica 1:112-122.
Khan, I.A., Seema, I and Malik, B.A. 1991. Selection of diverse parents of chickpea
(Cicer arietinum L.) by multivariate analysis and the degree of heterosis of their F1
hybrids. Euphytica 51:227-233.
Khan, M. A. and Chaudhary, H. A. 1975, Inter-relationships between yield and other
plant characters in gram (Cicer arietinum L.). J. Agri. Res., 13 : 87-92.
Khan, R., Khan, H. Farhatullah, and Harada. K .2010. Evaluation of microsatellite
markers to discriminate induced mutation lines, hybrid lines and cultigens in chickpea
(Cicer arietinum L). Australian Journal of Crop Science 4: 301-308.
Kharat, M, ; GIL, J. and Cubero, J. I. 1991, Genetics of grain yield components in
chickpea. J. Gen. and Breed. 45 (2): 87-91.
Khattak, G.S.S., M.A. Haq, M. Ashraf and M. Irfaq. 1999. Yield and yield components in
mung bean (Vigna radiate L.) Wilczek). Songklanakarin J. Sci. Technol., 21(4): 387-
391.
Khattak, G.S.S., P.Sriniver and D.H.Kim. 1995. Yield portioning in high yield mung bean
(Vigna radiata(L.) Wilczek). Kasetsrt J. (Nat. Sci.), 29:494-497.
Khattak, G.S.S., Riaz-ud-Din, F. Hanan and R.Ahmad. 1997. Genetic analysis of some
quantitative characters in mung bean (Vigna radiata(L.) Wilczek).Sarhad j.Agric., 4:
371-376
Khedar, O. P. and Maloo, S. R., 1999, Correlation and path analysis in chickpea. Agric.
Sci. Dig., (Karnal), 19 : 109-111.
Khorgade, P. W. 1988, Correlation studies in Bengalgram (Cicer arietinum L.) with
emphasis on path analysis. Ann. Pl. Physiol., 2 (2): 204-211.
Knauft, D.A. and D.W. Gorbet. 1989. Genetic diversity among peanut cultivars. Crop
Sci. 29: 1417-1422.
Knights, E.J.1980. Desi-kabuli introgression: The experience in Australia. In proceedings
of the International Workshop on Chickpea Improvement, pp. 70-74. ICRISAT,
Hyderabad, India
Kong, J.-M., Chia, L.-S., Goh, N.-K., Chia, T.-F. and Brouillard, R. (2003) Analysis and
biological activities of anthocyanins. Phytochemistry 64: 923–933.

Kottapalli, K.R., M.D. Burow, G. Burow, J. Burke and N. Puppala. 2007. Molecular
characterization of the U.S. peanut mini core collection using microsatellite markers.
Crop Res. 47: 1718-1727.
Kraakman ATW, Niks RE, Van der Berg PMMM, Stam P, Van Eeuwijk FA: Linkage
disequilibrium mapping of yield and yield stability in modern spring barley cultivars.
Genetics 2004, 168:435-46.
Krishna Murti, C.R. (1975) Biochemical studies on Bengal gram. Journal of Scientific
and Industrial Research 34: 266–281.
Krishnamurthy L, Kashiwagi J, Upadhyaya HD, Serraj R (2003) Genetic diversity of
drought avoidance root traits in the mini-core germplasm collection of chickpea. Int
Chickpea Pigeonpea Newslett 10:21-24
Kuhnau, J. (1976) The Flavonoids. A class of semi-essential food components: their role
on human nutrition. World Review on Nutrition and Diet 24: 117–191.
Kumar, A and R. Krishna, 1998. Heritability and genetic advance in gram genotypes of
diverse origin. Indian J. Agric. Sci., 68: 747–9.
Kumar, J. and Abbo, S. (2001) Genetics of flowering time in chickpea and its bearing on
productivity in semiarid environments. Advances in Agronomy 72: 107–138.
Kumar , J. and Van Rheenen, H.A. 2000. A major gene for time of flowering in chickpea.
Journal of Heredity 91: 67-68.
Kumar, J., Bahl, P. N., Mishra, R. B. and Raju, D. F., 1981, Variability in chickpea. Int.
chickpea Newslett., 5 : 3-4.
Kumar, J., Harware, M.P. Smithson, J.B. 1985.Registration of four short duration
fusarium wilt resistant kabuli (Garbanzo) chickpea germplasm. Crop Science. 25:576-
577.
Kumar, K., Sinha, R.B.P. and Sinha, P.K. (1983) Testing of different insecticidal
formulations against greasy surface caterpillars, Agroris ipsilon Rutt. Journal of Soil
Biology and Ecology 3: 35–38.
Kumar, S., Arora, P. P. and Jeena, A. S., 2001, Genetic variability studied for quantitative
traits in chickpea. Agriculture Sci Digest, 21: 263 -265.
Kumar, V., Salimath, P. M., Gowda, J. V. and Parmeshwarappa, R., 1991, Genetic
variability and GxE internaction in chickpea. J. Maharashtra Agri. Univ, 16 (1): 37-39.
Kumar,A and R, Krishna.1998. Heritability and genetic advance in gram genotypes of

diverse origin. Indian journal of Agricultural Sciences.68: 747-9.
Kumar. J and Johansen C. (2002): Scope for genetic manipulation of mineral acquisition
in chickpea. Plant Soil, 245: 123–134.
Kumar.J., Vijayalaxmi. N.V.S and Rao. T.N.2000.Inheritance of flower colour in
chickpea. Journal of Heredity.91:415-416.
Kumar, J., Yadav, S.S. and Suresh Kumar, 2004, Influence of moisture stress on
quantitative characteristics in chickpea (Cicer arientum L.). Indian Journal of
Genetics, 64(2): 149-150.
Labdi, M., Robertson, L.D, Singh, K.B, Charrier, A. 1996. Genetic diversity and
phylogenetic relationships among the annual Cicer species as revealed by isozyme
polymorphism. Euphytica 88:181-188
Ladizinsky, G and Adler, A. 1976. Genetic relationships among the annual species of
Cicer L. Theoretical and Applied Genetics 48:197-203.
Ladizinsky, G. 1975. A new Cicer from Turkey. Notes from the Royal Botanical Garden
Edinburgh 34:201-202.
Ladizinsky, G., Alder, A .1975a.The origin of chickpea as indicated by seed protein
electrophoresis. Isr J Bot 24:183–187
Lateef, S.S. (1985). Gram pod borer (Heliothis armigera (Hub.) resistance in
chickpea.Agriculture, Ecosystem, and Environment 14: 95–102.
Levene, H. 1960. Robust test for equality of variances. p. 353–355.In I. Oklin (ed.)
Contribution to Probability and Statistics: Essays in Honour of Harold Hotelling. Stanford
Univ. Press, Stanford, CA.
Lev-Yadun, S., Gopher, A and Abbo, S. 2000. The cradle of agriculture. Science
288:1602-1603.
Lezar, S., Myburg, A.A, Berger, D.K, Wingfield, M.J, Wingfield, B.D.2004.
Development and assessment of microarray-based DNA fingerprinting in Eucalyptus
grandis. Theoretical and Applied Genetics 109:1329-1336.
Lichitenzveiz, J., Bonfil, D.J., Zhang, H.B., C., Shtienberg, D., And Abbo, S. (2006).
Mapping quantitative trait loci in chickpea associated with time to flowering and
resistance to Didymella rabiei the causal agent of Ascohyta blight. Theoretical and
Applied Genetics 113: 1357-69.
Lichtenzveig, J., Scheurin. C, Dodge. J, Abbo. S and Zhang, H.B.2005. Construction of

BAC and BIBAC libraries and their applications for generation of SSR markers for
genome analysis of chickpea (Cicer arietinum L). Theoretical and Applied Genetics
110: 492–510.
Liu, F., G..Sun, B. Salomon and R.V. Bothmer. 2002. Characterization of genetic
diversity in core collection accessions of wild barley, Hordeum vulgare ssp. spontaneum.
Hereditas 136: 67-73.
Liu, K., Muse, S.V.2005. Power Marker: an integrated analysis environment for genetic
marker analysis. Bioinformatics 21:2128-2129
Lokender Kumar and Arora PP. 1992. Multivariate analysis in chickpea. Indian Journal
of Pulses Res. 5:1-15.
Lu, H., J. Zhang, K.B. Liu, N. Wu, Y. Li, K. Zhou, M. Ye, T. Zhang, H. Zhang, X. Yang,
L. Shen, D. Xu and Q. Li. 2009. Earliest domestication of common millet (Panicum
miliaceum) in East Asia extended to 10,000 years ago. Proc. Natl. Acad. Sci. USA,
106(18): 7367-7372.
Ludlow, M.M. and Muchow, R.C. (1990) A critical evaluation of traits for improving
crop yields in water-limited environments. Advances in Agronomy 43: 107–153.
Lush, J.L. 1940. Intra-sire correlation and regression of offspring on dams as a method of
estimating heritability of characters. Proc. Amer. Soc. Animal Production 33:293 - 301.
Mace, E.S., H.K. Buhariwalla and J.H. Crouch. 2003. A high-throughput DNA extraction
protocol for tropical molecular breeding programs. Plant Mol. Biology Reporter 21:
459a-459h.
Mace ES, Xia L, Jordan DR, Halloran K, Parh DK, Huttner E, Wenzl P, Kilian A (2008)
DArT markers: diversity analyses and mapping in Sorghum bicolor. BMC Genomics
9:26
Maestri, E., K. Natalya, C. Perrotta, M. Gulli, H. Nguyen and N. Marmiroli,
2002. Molecular genetics of heat tolerance and heat shock proteins in cereals. Plant Mol.
Biol., 48: 667-681.
Mahajan, R.K., I.S. Bisht, R.C. Agrawal, and R.S. Rana. 1996. Studies on south Asian
okra collection: A methodology for establishing a representative core set using
characterization data. Genet. Resour. Crop Evol. 43:244–255.
Malhotra, R.S. and Singh, K.B. (1986) Natural cross-pollination in chickpea.
International Chickpea Newsletter 14: 4–5.
Malhotra, R.S., Geletu Bejiga and Singh, K.B. 1997. Inheritance of seed size in chickpea.

Journal of Genetics and Breeding 51:45-50.
Malik, B. A., Khan, I. A and Malik M. R., 1988, Genetics variability and correlations
among metric traits in chickpea. Pak. J. Agri. Res., 9: 352-354.
Malik, S.R., Bakhsh, A., M.A. Asif, U. Iqbal and S.M. Iqbal, 2010. Assessment of genetic
variability and interrelationship among some agronomic traits in chickpea. Int. J. Agric.
Biol., 12: 81–85
Malosetti, M., C.G. van der Linden, B. Vosman, F.A. van Eeuwijk. 2007. A mixed-model
approach to association mapping using pedigree information with an illustration of
resistance to Phytophthora infestans in potato. Genetics 175:879–889.
Malyshe, S.V. and N.A.Kartel.1997. Molecular mapping of plant genomes. Mol.Bio.
31:163-171.
Malysheva-Otto LV, Ganal MW, Röder MS (2006) Analysis of molecular diversity,
population structure and linkage disequilibrium in a worldwide survey of cultivated
barley germplasm (Hordeum vulgare L.). BMC Genetics 7:6
Mambani, B., and Lal, R.1983. Response of upland rice varieties of drought stress. I.
Relation between root system development and leaf water potential. Plant Soil. 73:59-72.
Mandal and Bahl, P. N., 1983, Estimates of genetic variability and correlation of harvest
index in chickpea. Int. Chickpea Newslett., 8 : 11-12.
Mandal, A. K., 1977, Studies on variability, inter relationship, path coefficient analysis
and heterosis in chickpea (Cicer arietinum. L.). M. Sc. (Agri.) Thesis, IARI, New Delhi
(India).
Martens, S. and Mither, A. (2005) Flavones and flavone synthases. Phytochemistry 66:
2399–2407.
Martin, C., A.Juliano, H.J.Newvbury, B.R.lu, M.T.Jacksom and B.V.Ford-Liyod.1997.
The use of RAPD markers to facilitate the identification of Oryza species within a
germplasm collection. Genetic resources and Crop Evolution, 44:175-183
Mathur, DS. 1998. Inheritance of light dependent purple pigmentation in chickpea.
Indian journal of Genetics & Plant Breeding 58:149-152
Mathur, R and Mathur, M.L.1996. Estimation of genetic parameters and interrelationship
of quantitative traits in chickpea. Madras Agricultural Journal 83(1):9-11.
Maynez, M., Moreno, M. T. and Gill, J., 1993, Desi x Kabuli interogression for yield
improvement in chickpea. J. Genetics, 47 (1): 61-64.

McCounch S.R., Kochert .G,Yu, Z.H, Wang,Z.Y, Khush,G.S,Coffman,W.R and Tan
ksley, S.D (1988). Molecular mapping of rice chromosome. Theoretical and Applied
Genetics 76:815-829.
McIntosh, M and Miller, C.2001. A diet containing food rich in soluble and insoluble
fiber improves glycemic control and reduces hyperlipidemia among patients with type 2
diabetes mellitus. Nutrition Reviews 59: 52–5.
Mehndi,S,S., K.Aziz, B. Hussain and G.Mujtaba.1994.Heritability and correlation studies
in segregating populations of seven chickpea crosses. Journal of Agricultural
research.32:1-6.
Miller, J.C., and S.D. Tanksley.1990. RFLP analysis of phylogenetic relationships and
genetic variation in the genus Lycopersicon. Theoretical and Applied Genetics 80:437-
448.
Miller, P.R., Mc Conkey, B.G, Clayton, G.W, Brandt, S.A, Staricka, J.A, Johnston, A.M,
Lafond, G.P, Schatz, B.G, Baltensperger, D.D and Nelly, K.E. 2002. Pulse crop
adaptation in the Northern Great Plains. Agron. J. 94:261–272.
Mishra, A. K., Raghu, J. S., Patnak, S. A., Ali and Ghurraya, R. S., 1994, Genetic
parameters and relationship analysis in chickpea (Cicer arietinum. L.). Crop Sci, 8: 109 -
112
Mishra, R, Rao, S. K. and Koutu, L. K, 1988, Genetic variability, correlation studies and
their implications in selection of high yielding genotypes in chickpea. Indian J. Agri.
Res. 22 : 51 – 57.
Mishra, S. K., Brajes, G. Shrivastava. G. K., Lakhera, M. L., Rathore, A. L., Choubey, N.
K. and Gupta, B., 2002, Correlation and path coefficient analysis in chickpea (Cicer
arietinum. L.). Ann. Agric. Res., 23 : 168-170.
Mishra,A.K., Raghu, J.S, Pathak, K.N, Ali, S.A and Ghurrayya, R.S.1994. Genetic
parameters and interrelationship analysis in chickpea. Crop Research 8(1):109-111.
Misra, R.C.1991.Stability and Heritability, genetic advance and character association
estimates in chickpea. International Chickpea newsletter, ICRISAT 25:10-11
Mohammadi, S.A and B.M. Prasanna. 2003. Analysis of genetic diversity in crop plants-
Salient statistical tools and considerations. Crop Sci. 43: 1235-1248.
Mohan, M., Nair, S. Bhagwat, A. Krishna, T.G.Yano, M. Bhatia, C.R and Sasaki.T.1997.
Genome mapping, molecular markers and marker associated selection in crop plants.
Molecular Breeding 3:87

Muehlbauer, F.J and Singh, K.B. 1987. Genetics of chickpea. Pages 99-125 in The
Chickpea (Saxena MC and Singh KB, eds.). Wallingford, Oxon, U.K., CAB Intl.
Muehlbauer, F.J, Redden, R.J, Nassib, A.M., Robertson, L.D and Smithson, J.B. 1988.
Population improvement in pulse crops: an assessment of methods and techniques. In:
Summerfield RJ. (eds), World Crops: Cool Season Food Legumes. Kluwer Academic
Publishers, Dordrecht, The Netherlands. p.943-966.
Muhammad, Z.U.H., Shahid, I, Shakeel.A, Muhammad.I, Abdul.N, M.I. Bhanger.2007.
Nutritional and compositional study of desi chickpea cultivars in Punjab and Pakistan.
Food Chemistry 105:1357-1363.
Murfet, I.C and Reid, J.B. 1985. The control of flowering and internode length in Pisum.
Pages 67-80 in The Pea Crop: A Basis for Improvement. (Hebbleth Waite PW, Heath
MC and Dawkins TCK, eds.). Buttersworths, London.
Murrary, S.C., W.L. Rooney, M.T. Hamblin, S.E. Mitchell and S. Kresovich. 2009. Sweet
sorghum genetic diversity and association mapping for brix and height. Plant Genome
2:48–62.
Naghavi, M.R. and Jahansouz.M.R.2005.Variation in the Agronomic and Morphological
Traits of Iranian Chickpea Accessions. Journal of Integrative Plant Biology. 47(3).375-
379.
Narayana, N. H. S. and Reddy, N. S. R., 2002, Correlations and path analysis in chickpea.
J.Res., Acharya N. G. Ranga Agricultural Univ, 30 (1) : 29-33.
Narayana, R.K.J and Macefield, A.J. 1976. Adaptive responses and genetic divergence in
a world germplasm collection of chickpea (Cicer arietinum L.). Theoretical and Applied
Genetics 47:179-187.
Narendra Kumar. 1997. Genetic diversity among chickpea accessions. Indian Journal of
Genetics. 57:87-90.
Narendra Singh, 2002, Multivariate analysis in kabuli chickpea accessions. Indian J.
Pulses Res., 15 (1): 21-23.
Naseem, B. A., Rehman, A. S. B. and Iqbal, T., 1995, Evaluation of kabuli chickpea
germplasm. International Chickpea and Pigeonpea Newsletter 2:13-14.
Nasu S, Suzuki J, Ohta R, Hasegawa K and Yui R (2009) Search for and analysis of
single nucleotide polymorphisms (SNPs) in rice (Oryza sativa, Oryza rufipogon) and
establishment of SNP Markers. DNA Research 9: 163–171.
Nayak SN, Zhu H, Varghese N, Choi HK, Datta S, Horres R, Jüngling R, Singh J, Kavi
Kishor PB, Kahl G, Winter P, Cook DR and Varshney RK (2010) Integration of novel
SSR and gene-based marker loci in the chickpea genetic map and establishment of new
anchor points with Medicago truncatula genome. Theoretical and Applied Genetics
120: 1415–1441.
Netrapal Singh, Ramkrishna and Kumar, R., 2001, An assay of effect of different traits on
chickpea. grain yield. Ann. Agric. Res., 22 : 564 – 569.
Neumann, K., B. Kobiljski, S. Denčić, R.K. Varshney and A. Börner. 2011. Genome-
wide association mapping: a case study in bread wheat (Triticum aestivum L.). Mol.
Breed. 27: 37-58.
Newbury, H.J. and B.V. Ford-LIoyd.1997. Estimation of genetic diversity. In: M.Maxted,
B.V Ford-LIoyd and JG Hawkws (Eds), Plant genetic conservation the Insitu
Approach. Chapman and Hall, London, pp: 192-206.
Newman, D. 1939. The distribution of range in samples from a normal population
expressed in terms of an independent estimate of standard deviation. Biometrika 31:20–
30.
Nguyen, T.T., Taylor, P.W.J, Redden, R.J and Ford, R.2004. Genetic diversity estimates
in Cicer using AFLP analysis. Plant Breeding 123: 173–179.
Nimbalkar, R. D., 2000, Genetic variability and heritability studies and scope for improve
in chickpea. Journal of Maharashtra. Agricultural University.25:109-10.
Nordborg, M. and S. Tavare. 2002. Linkage disequilibrium: What history has to tell us?
Trends Genet. 18:83–90.
Nozzolillo, C. 1985. Seedling morphology and anatomy of eight Cicer species and their
taxonomic value. Canadian J. Bot. 63:1-6.
Ohri, D and Pal, M.1991. The origin of chickpea (Cicer arietinum L) karyotype and
nuclear DNA content. Heredity 66:367-372
Or, E., R. Hovav, and S. Abbo (1999). A major gene for flowering time in chickpea.
Crop Science 39:315-322.
Ortiz, R and J. Engels.2004. Genebank management and the potential role of molecular
genetics to improve the use of conserved genetic diversity. In M.C. de Vincente (Eds).
Issues in genetic resources No.11, IPGRI, Rome, pp. 19-25.
Ortiz, R., E.N. Ruiz-Tapia, and A. Mujica-Sanchez. 1998. Sampling strategy for a core
collection of Peruvian quinoa germplasm. Theor. Appl. Genet. 96:475–483.

Ozdemir, S.1996. Path coefficient analysis for yield and its components in chickpea.
International Chickpea and Pigeonpea Newsletter 3:19
Paliwal, K, ., Ramgiri, S. R., Lal. M. S., Kottu, G. K. and Mishra. R., 1987, Correlation
and path coefficient analysis in chickpea. Legume Res., 10 : 47-48.
Panchbhai, K.M., Thote, S.G. Patil, A.J and Wanjari, K. B.1992. Study of genetic
varaiation in bulk populations of chickpea developed through different breeding methods.
Annals of plant physiology 6(1):73-76.
Pande, S., G.K. Kishore, H.D. Upadhyaya and J.N. Rao. 2006. Identification of multiple
diseases resistance in mini core collection of chickpea. Plant Disease 90: 1214–1218.
Pandey, R. L; and Tiwari A. S; 1989, Estimation of gene effects and heterosis in
chickpea.Indian. J. Agri. Res., 23 (4): 191-199.
Pandey, R.K., Herrera, W.A.T. and Pendleton, J.W.1984.Drought response of grain
legumes under irrigation gradient. III. Plant growth. Agron.J.76:557-560.
Passlow, T. 1986. Keynote address. In: Heliothis Workshop 1985. Proceedings
Conference and Workshop Series QC 86004. (Eds.): M. P. Zalucki & P. H. Twine.
Queens land Department of Primary Industries, pp. 5-8.
Paterson, A.H., Y.R.Lin, Z.Li, Schertz, K.F. Dobley, J.F.Pinson, S.R.M.liu, S.C. stansel,
J.E.Irvine.1995. Convergent Domestication of cereal crops by independent mutations at
corresponding. Genetic loci. Science, 269:1714-1718.
Patil SK, Shinde GP and Jamadagni BM, (2007) Reaction of short-duration chickpea
genotypes for resistance to gram pod borer Helicoverpa armigera in Maharashtra, India.
J. Maharastra Agric. Univ., 2: 132-135.
Patil, A. B., 1996, Inheritance studies on yield and yield components in desi x desi, desi ×
kabuli and kabuli x kabuli crosses of chickpea (Cicer arietinum L.). M. Sc.(Agri.) Thesis,
Univ, Agric. Sci, Dharwad (India)
Patil, V.N. and Phadnis.B.A.1977. Genotype variability and its implications in selection
of gram (Cicer arietinum L.). J. Maharastra Agric. Univ., 2: 121-123.
Payne, R.W., D.A. Murray, S.A. Harding, D.B. Baird, and D.M. Soutar. 2007. GenStat
for Windows (10th Edition) Introduction. VSN International, Hemel Hempstead [Online].
Available at http://www.vsni.co.uk (verified 9 June 2010).
Peakall, R. and P.E. Smouse. 2006. GENALEX 6: genetic analysis in Excel. Population
genetic software for teaching and research. Molecular Ecology Notes 6: 288-295.

Pejei, F.1989. Estudio y itilisacion de los recursos geneticos de la cana de azayr y formad
relocionadas. Tesis en opcion al grado cientificode Doctor en Ciencisa Agricolas. La
Habana, Cuba.
Pittaway, J.K., Ahuja, K.D, Cehun. M, Chronopoulos. A, Robertson, I.K, Nestel, P.J and
Ball, M.J. 2006. Dietary supplementation with chickpeas for at least 5 weeks results in
small but significant reductions in serum total and low-density lipoprotein cholesterols in
adult women and men. Annals of Nutrition and Metabolism 50: 512–518.
Pooranchand and Chand, P., 1999, Genetic divergence among chickpea genotypes.
CropRes. 18: 50-52.
Powell, W., M. Morgante, C.Andre, M. Hanafey, T.Vogel, S.Tingey and J.A.
Rafalski.1996.The comparison of RFLP, RAPD, AFLP and SSR markers for germplasm
analysis.Mol.Breed.3:225-228.
Prakash, V. 2006. Divergence analysis in kabuli chickpea. Indian Journal of Genetics
and Plant Breeding. 3:241-242.
Prasada Rao, K.E. and Ramanatha Rao. 1995. The use of characterization data in
developing a core collection of sorghum. Pages 109–116 in Core collection of plant
genetic resources (Hodgkin T., A.H.D. Brown, J.L. van Hintum Th and B.A.V. Morales
(eds.). Chichester, UK: A Wiley-Sayee Publication.
Pratap, S., Sharma, P. C., Dwivedi, V. K., Kharwal, M. C. and Singh, P., 2002, Path
coefficient analysis in chickpea (Cicer arietinum L.). Prog. Agric., 2 (1): 19-21.
Pritchard, J.K., M. Stephens, N.A. Rosenberg and P. Donnelly. 2000b. Association
mapping in structured populations. Am. J. Hum Genet. 67: 170-181.
Pritchard, J.K., M. Stephens, P. Donnelly. 2000a. Inference of population structure using
multilocus genotype data. Genetics 155:945–959.
Pundir, R.P.S, Mengesha, M.H, Reddy, G.V.1995. Cross compatibility between chickpea
and its wild relatives, Cicer echinospermum Davis. Euphytica 83:241- 260
Pundir, R.P.S, Reddy, K.N and Mengesha, M.H. 1988. ICRISAT Chickpea Germplasm
Catalog: Evaluation and Analysis.
Pundir, R.P.S, Reddy, K.N and Mengesha, M.H. 1991. Genetics of some physio-morphic
and yield traits of chickpea (Cicer arietinum L.). Legume Research 14(4):157-161.
Pundir, R.P.S, Van der Maesen, L.J.G.1983. Interspecific hybridization in Cicer. Intern
Chickpea Newsl 8:4-5

Pundir, R.P.S., Rao, N.K. and van der Maesen, L.J.G. 1985. Distribution of qualitative
traits in the world germplasm of chickpea (Cicer arietinum L.). Euphytica 34: 697-3.
Pushpa, K. R., Vikram, N. R. and Geetha, V. L., 1993, Varietal variation in growth
pattern of soybean. Legume Res., 16 (2): 63-66
Qadir, S.A, Datta. S, Singh, N.P and Shiv Kumar. 2007. Development of highly
polymorphic SSR markers for chickpea (Cicer arietinum L.) and their use in parental
polymorphism. Indian Journal of Genetics 67: 329–333.
Qureshi, A.S., A.Shaukat, A. Bakhsh, M. Arshad and A.Ghafoor, 2004. An assessment of
variability for economically important traits in chickpea (Cicer arietinum L.). Pak. J.
Bot.,36: 779-785
Rachid Serraj., L. Krishnamurthy, J. Kashiwagi, J. Kumar, S. Chandra & J.H.Crouch,
2004. Variation in root traits of chickpea (Cicer arietinum L.) grown under terminal
drought. Field Crops Res 88: 115–127.
Rafalski, A.J. 2010. Association genetics in crop improvement. Current Opinion in
Plant Biology 13: 174-180.
Rajesh, P., Tullu. A, Gil. J, Gupta. V, Ranjekar. P, Muehlbauer. F .2002. Identification of
an STMS marker for the double-podding gene in chickpea. Theor Appl Genet 105:604–
607
Rajesh, P.N and Muehlbauer, F.J .2008. Discovery and detection of single nucleotide
polymorphism (SNP) in coding and genomic sequences in chickpea (Cicer arietinum L.).
Euphytica 162: 291–300.
Raju, D.B., Mehra, R.B and Bahl, P.N. 1978. Genetic variability and correlations in
chickpea, Trop. Grain Legume Bull. 14:35-39.
Rana, O.P.S., Maherchandani. N and Singh, K.P.1995. Studies on nodulation and its
association with seed yield and its components in chickpea. Crop Research 9(2):324-
329.
Rang, A. 1980. Genetic analysis of grain yield, its components and quality characters in
chickpea. Ph.D thesis, Punjab Agricultural University, Ludhiana, Punjab, India.
Rao, N.K., Pundir, R.P.S and van der Maesen, L.J.G.1980.Inheritance of some qualitative
characters in chickpea. Proceedings of Indian academy Science 89(6):497-503.
Rao, N.K., R.P.S. and van der Maesen, L.J.G.1984.Inheritance and linkage relationships
of a new lobed vexillum mutant of chickpea (Cicer arietinum L.). Proceedings of the
Indian Academy of Science. 89:497-503.

Rao, S. K. and Kumar, K. S., 2000, Analysis of yield factors in short duration chickpea
(Cicer arietinum L.). Agric. Sci. Dig., 20: 65 – 67.
Rao, S. K., 1998, Ideotype of parents and their segregating populations in chickpea.
Agric. Sci. Digest., 18 (1): 7-8
Rao,S.S, Sinha, R and Das,G.K.1994. Genetic variability, heritability, expected genetic
advance and correlation studies in chickpea. Indian Journal of Pulses Research 7(1):25-
27.
Rao. L, Usha Rani. P, Deshmukh. P, Kumar. P and Panguluri.S.2007. RAPD and ISSR
fingerprinting in cultivated chickpea (Cicer arietinum L.) and its wild progenitor Cicer
reticulatum Ladizinsky. Genetic Resources and Crop Evolution 54: 1235–1244.
Rastogi, K. B. and Singh, L. 1977, Heritability, phenotypic and genotypic correlation
coefficients of some of the characters in the F2 populations of gram. Crop Improv. 4 :
191-197.
Raval, L.J., and K.L. Dobariya, 2003. Yield components in improvement of chickpea
(Cicer arietinum L.). Ann. Agric. Res., 24:789-794.
Reddy, L.J., H.D. Upadhyaya, C.L.L. Gowda and Sube Singh. 2005. Development of core
collection in pigeonpea [Cajanus cajan (L.) Millsp.] using geographic and qualitative
morphological descriptors. Genet. Resour. Crop Evo. 52:1049-1056.
Reddy, R. K. and Rao, S, K., 1988, Analysis of yield factors in segregating population of
chickpea (Cicer arietinum L.). Legume Res., 11 (1): 27-31.
Reed, W., C. Cardona, S. Sithanantham and S.S. Lateef. 1987. Chickpea insect pests and
their control. In: The Chickpea. (Eds.): M.C. Saxena & K.B. Singh. CAB International,
Wallingford, Oxon, U.K., pp. 283-318.
Renukadevi, P. and B. Subbalakshmi, 2006. Correlations and path coefficient analysis in
chickpea (Cicer arietinum L.). Int.J.Agric, Biol.,4: 275-276.
Risch, N., and K. Merikangas. 1996. The future of genetic studies of complex human
diseases. Science 273:1516–1517
Robert, R., R.Lespinasse, J. Perness and A Sarr.1991. Gametophytic competition as
influencing gene flow between wild and cultivated forms of peal millet. Genome,
34:195-200.
Roberts, E.H and Osei-bonsu, K.1988. Seed and seedling vigour In: World crop cool
season legumes; Summerfield-R.J, Reading University U K, Dept of Agriculture,
Dordecht (Netherlands) Kluwer Academic Publishers:619-625.

Roberts, E.H.1986. In physiology of seed deterioration (Eds) M. B. Mc Donald, Jr and
C.J.Nelson) Madison: Crop Science Society of America Pp:102-103.
Robertson, L.D, Ocampo, B, Singh, K.B.1997. Morphological variation in wild annual
Cicer species in comparison with the cultigen. Euphytica 95:309-322
Romo. S, Labrador. E and Dopico. B. 2004. Water stress-regulated gene expression in
Cicer arietinum seedlings and plants. Journal of Plant Physiology and Biochemistry
39: 1017–1026.
Roshanlal, Bhangu, B. K. and Gupta, V. P., 1993, Variability, correlation and path
analysis in gram. Haryana Agric. Univ. J. Res., 23 (1): 1-3.
Rubio, J., Flores, F., Moreno, M.T., Cubero, J.I. and Gil, J. (2004) Effects of the
erect/bushy habit, single/double pod and late/early flowering genes on yield and seed size
and their stability in chickpea. Field Crops Research 90: 255–262.
Rubio, J., Mareno,M.T, Cubero, J.I and Gill, J.1999. Effect of the gene for double pod in
chickpea on yield, yield components and stability of yield. Plant Breeding 117:585-587
Sabaghpour, S.H., Kumar,J and Rao,T.N. 2003. Inheritance of growth vigour and its
association with other characters in chickpea. Plant Breeding 122(6):542
Saiki, R.H., D.H. Gelfand, S.Stoffel, S.J.Scarf, R.Higuchi, G.T.Horn, K.B.Mullis and
H.A. Erlich.1988. Primer directed enzymatic amplification of DNA with thermostable
DNA polymerase. Science 259: 487-491.
Şakiroğlu, M., J.J. Doyle and E.C.Brummer. 2010. Inferring population structure and
genetic diversity of broad range of wild diploid alfalfa (Medicago sativa L.) accessions
using SSR markers. Theor. Appl. Genet., 121: 403-415.
Saleem, M., M.H.N. Tahir, R. Kabir, M. Javid and K. Shahzad, 2002. Interrelationships
and Path Analysis of Yield Attributes in Chickpea (Cicer arietinum L.), Int. J.Agric.
Biol., 4: 404-6
Salimath, P. M. and Bahl, P. N., 1985, Early generation selection in chickpea (Cicer
arietinum L.). 1. Variability, correlations and predication of direct and correlated
responces in F2 populations. Indian J. Genet., 45: 101 – 104.
Salimath, P. M. and Patil, S. S., 1990, Genetic study in F3 and F4 generations of
chickpea.Indian J. Gent, 50 (4): 378-381.
Salimath, P. M., Bahl, P. N. and Mehra, R. B., 1985, Genetic diversity in chickpea (Cicer
arietinum L.). Pflanzenzuchung., 92 : 52-60.
Samal, K.M, and Jagdev, 1989, variability studies in chickpea. Int. Chickpea Newsletter
26: 6-8.
Sanap, M.M. and B.M. Jamadagni. 2005. Screening of chickpea for resistance to pod
borer Helicoverpa armigera (Hubner) at Rahuri, Maharashtra, India. International
Chickpea and Pigeonpea Newsletter, 12: 37-39.
Sandha, G.S and Chandra.S.1969. Heritability of some quantitative characters in two
crosses of Bengal gram. Indian Journal of Genetics and Plant Breeding 29(2):216-
219.
Sandhu, J. S., Verma, M. M and Brar, H.S.1993. Inheritance of foliage colour in
chickpea. International Chickpea Newsletter, ICRISAT. 28:8.
Sandhu, J.S., Bains, T.S. and Sidhu, P.S. (2002) Evaluation of super early chickpea
genotypes for vegetable purpose as a catch crop. International Chickpea and Pigeonpea
Newsletter 9: 10–12.
Sandhu, T. S., Gumber, R. K and Bhullar, B.S.1991. Correlated response of grain yield
and protein content in chickpea. Legume research 14(1):45-49.
Sandhu, T.S., Gumber, R. K, Bhatia, R.S and Singh, K. 1988. Evaluation of disease
resistant lines of chickpea. Indian Journal of Pulses Research 1(2):159-161.
Sandhu,T.S and Singh,N.B.1970. Genetic variability, correlation and regression studies in
gram. Journal of Research, Punjab Agricultural University, Ludhiana, Punjab, India.
Sarvaliya, V. M. and Goyal, S. N., 1994a, Correlations and causations in chickpea (Cicer
arietinum L.). Gujarat Agric. Univ. Res. J., 20: 66 -69.
Sarvaliya, V. M. and Goyal, S. N., 1994b, Genetic divergence in chickpea. Legume Res.,
17 (1): 22 - 26.
Sarwar.M., Nazir.A and M.Toufiq.2009. Host plant resistance in chickpea against gram
pod borer Helicoverpa armigera (Hubner). Pak. J. Bot., 41(6): 3047-3052,
Saxena, N.P. & C. Johansen, 1990. Chickpea ideotype for genetic enhancement of yield
and yield stability in south Asia. In: Chickpea in the Nineties: Proceedings of the Second
International Workshop on Chickpea Improvement, pp. 81– 85. 4–8 Dec 1989,
ICRISAT Center, Patancheru, A.P. 502324, India.
Saxena, N.P., Sethi, S.C., Krishnamurthy, L., Johansen, C., Haware, M.P., 1995.
Physiological approaches to genetic improvement of drought resistance in chickpea. In:
Physiological Approaches to genetic Improvement of Drought Tolerance in
Chickpea: Proceedings of the Inter Drought 95, Montpellier, France, 31st August–2nd

September 1995, Genetique et Amelioration des Plantes, INRA, Montpellier cedex, pp.
1–6.
Schoen, D.J. and Brown, A.H.D.1991.Intraspecific variation in population gene diversity
and effective population size correlates with the mating system in plants. Proc.
Natl.Acad, Sci.USA., 88:4494-4497
Sch¨onfeld, P. and H. J. Werner (1986). Beitr¨age zur Theorie und Anwendung linearer
Modelle. In: W. Krelle (Ed.), ¨ Okonomische Prognose-, Entscheidungsund
Gleichgewichtsmodelle (pp. 251–262). Weinheim: VCH Verlagsgesellschaft.
Semagn K., Bjornstad. A, Skinnes.H, Maroy, A.G, Tarkegne. Y, William, M .2006.
Distribution of DArT, AFLP, and SSR markers in a genetic linkage map of a doubled-
haploid hexaploid wheat population. Genome 49:545-55.
Sequeira, R.V., McDonald, J.L., Moore, A.D., Wright, G.A. and Wright, L.C. (2001)
Host plant selection by Helicoverpa spp. in chickpea – companion cropping systems.
Entomologia Experimentalis et Applicata 101: 1–7.
Serraj, R. and Sinclair, T.R. (2002) Osmolyte accumulation: can it really help increase
crop yield under drought conditions? Plant Cell and Environment 25: 335–341.
Serret, M.D., Udupa,
S.M and Weigand, F. 2006. Assessment of genetic diversity of
cultivated chickpea using microsatellite-derived RFLP markers: Implications for origin.
Plant Breeding 116: 573–578.
Sethy, N., Choudhary. S, Shokeen. B, Bhatia, S.2006a. Identification of microsatellite
markers from Cicer reticulatum: Molecular variation and phylogenetic analysis. ,347–
357
Sethy, N.K, Choudhary. S, Shokeen. B and Bhatia. S. 2006b. Identification of
microsatellite markers from Cicer reticulatum: molecular variation and phylogenetic
analysis. Theoretical and Applied Genetics 112: 347–357.
Sethy,N., Shokeen. B, Bhatia, S. 2003. Isolation and characterization of sequence-tagged
microsatellite sites markers in chickpea (Cicer arietinum L.). Mol Ecol Notes 3:428–430
Setty, A. N., Patil, M.S and Hiremath.K.G.1977.Genetic variability and correlation
studies in Cicer arietinum.L. Mysore Journal of Agricultural Sciences 11:131-134.
Shan, F., Clarke, H.C, Plummer, J.A, Yan, G and Siddique, K.H.M .2005. Geographical
patterns of genetic variation in the world collections of wild annual Cicer characterized
by amplified fragment length polymorphisms. Theoretical and Applied Genetics
110:381–391

Shannon, C.E and Weaver, W. 1949. The mathematical theory of communication.
University of Illinois Press, Urbana.
Sharma B. D., Sood, B. C. and Malahotra, V. V., 1989, Association studies in chickpea.
Crop. Improve., 16 (2) : 190-192.
Sharma, B. D. Sood, B. C. Malhotra, V. V., 1990, Studies on variability and genetic
advance in chickpea. Indian J. Pulse, Res., 3 (1): 1-6.
Sharma, L.K., D.P.Saimi, S.K.Kaushik and B.Yaid. 2005. Genetic variability and
correlation studies in chickpea. J. Arid Legume. 2:415-416.
Sharma.H.C., Pampathy.G. Mukesh K. Dhillon and James T. Ridsdill Smith.2005.
Detached Leaf Assy to Screen for Host plant resistance Helicoverpa armigera. Journal
of Economic Entomology 98(2): 568-576.
Sharma, P. P and Maloo, S. R., 1988, Correlation and path coefficients analysis in
Bengalgram (Cicer arietinum L.). Madras J. Agric. Sci., 11 : 131-134.
Shaukatali, Maher, A. B., Anwar, M. and Haqqani, A. M., 2002, Exploitation of genetic
variability for grain yield improvement in chickpea. Int. J. Agric. Biol., 4: 148 –149.
Shehzad T, Okuizumi H, Kawase M, Okuno K (2009) Development of SSR-based
sorghum (Sorghum bicolor (L.) Moench) diversity research set of germplasm and its
evaluation by morphological traits. Gen Res Crop Evol 56: 809-827
Sheldrake, A.R., Saxena, N.P and Krishna Murthy, L. 1978. The expression and influence
on the yield of double podded character in chickpea (Cicer arietinum L.). Field crops
Res. 1:243-253.
Shiv Kumar, S. Gupta, S. Chandra and Singh, B.B.2004. How wide is the genetic base of
pulse crops? In: Ali M, Singh BB, Shiv Kumar and Dhar V (eds) Pulses in New
Perspective. Proceedings of the National Symposium on Crop Diversification and Natural
Resources Management, 20-22 December 2003. Kanpur: Indian Society of Pulses
Research and Development, Indian Institute of Pulses Research pp. 211-221.
Sial, P., P.K. Mishra and R .K. Patnaik.2003. Character association in chickpea (Cicer
arietinum L.). Env. And Ecol. 21:3, 675-679
Sidramappa, S.A., P.M.Salimath and S.T.Kajjidoni, 2008. Genetic variation for
productivity and its related traits in a recombinant inbred lines population of chickpea.
Karnataka J. Aric Sci., 21:488-490
Sinclair, T.R.1994.Limits to crop yield? In: Boote, K.J.(Eds) Physiology and
Determination of crop yield. ASA, CSSA and SSSA, Madison, WI, pp.509-532.

Singh, K.B., and A.K. Auckland, 1975. Chickpea breeding at ICRISAT. Proceedings of
the International Workshop on Grain Legumes, January 13-16, 1975, Hyderabad,
ICRISAT, Patancheru, India pp: 3-17.
Singh Hardans and Bains, K.S.1982.Genetic analysis in chickpea. Crop Improvement
6:115-123
Singh, A., Devarumath, R.M, Rao, S.R, Singh,V.P, Raina, S.N.2007. Assessment of
genetic diversity and phylogenetic relationships based on ribosomal DNA repeat unit
length variation and Internal Transcribed Spacer (ITS) sequences in chickpea (Cicer
arietinum L.) cultivars and its wild species. Genet Resou Crop Evol 55:65-79
Singh, B. and R. P. Yadav. Field screening of chickpea (Cicer arietinum L.) genotypes
against gram pod borer (Heliothis armigera Hub.) under late sown conditions1999a. J.
Entomol. Res. 23:133–140.
Singh, B. and R. P. Yadav. Location of sources of resistance amongst chickpea (Cicer
arietinum L.) genotypes against gram pod borer (Heliothis armigera Hub.) under normal
sown conditions using new parameters. J. Entomol. Res 1999b. 23:19–26. CSA
Singh, S.S. and S. K. Yadav. 2006. Evaluation of chickpea varieties for their resistance
against gram pod borer, Helicoverpa armigera. Indian Journal of Entomology, 68(4):
321-324.
Singh, H., Dahiya, B. S. and Sandhu, T. S., 1976, Correlations and path co efficient
analysis in gram (Cicer arietinum L). J. Res., Punjab., 13 : 1-7.
Singh, K. B., Bejiga, G. and Malhotra, R. S., 1990, Asssociation of some characters with
seed yield in chickpea. Euphytica, 49 : 83-88.
Singh, K. B., Malhotra, R. S. and Singh Harbhans., 1989, Correlation and path co-
efficient analysis in chickpea. Indian J. Dev. Rep., 8 (1): 21-26.
Singh, K.B. 1987. Chickpea breeding. p. 127–162. In M.C. Saxena and K.B. Singh (ed.).
The Chickpea. C.A.B. International, Wallingford, UK.
Singh, K.B., Bejiga, G., Saxena, M.C., Singh, M. 1995. Transferability of chickpea
selection indices from normal to drought-prone growing conditions in a Mediterranean
environment.J. Agron. Crop. Sci. 36:472-479.
Singh, K.B., Malhotra, R.S., Halila, M.H., Knights, E.J. and Verma, M.M. (1994) Current
status and future strategy in breeding chickpea for resistance to biotic and abiotic stresses.
Euphytica 73: 137–149.
Singh, K.B., Reddy, M.V and Malhotra, R.S. 1985. Breeding kabuli chickpeas for high

yield, stability and adaptation. Pages 71−90 in Proceedings, Faba Bean, Kabuli
Chickpeas and Lentils in the 1980s (Saxena MC and Varma S, eds). ICARDA, Aleppo,
Syria.
Singh, L., Sharma, D., Baghel, S.S., Tomer, G.S. and Mishra, P.K. (1974) Estimation of
genetic and environmental variability in Bengal gram. SABRAO Journal 6: 207–211.
Singh, O and Paroda, R.S. 1986. Association analysis of grain yield and its components in
chickpea following hybridization and a combination of hybridization and mutagenesis.
Indian J Agri Science 56:139-141.
Singh, O and van Rheenen, H.A. 1994. Dietary fibre and its constituents in desi and
kabuli chickpea (Cicer arietinum L.) cultivars. Nutrition Reports International 29:419-
426.
Singh, O., Gowda, C.L.L, Sethi, S.C, Dasgupta, T and Smithson, J.B. 1992. Genetic
analysis of agronomic characters in chickpea. Estimate of Genetic variances from diallel
mating designs. Theor. Appl. Genet. 83: 956-962.
Singh, P.K., Singh, N.B. and Bharti, R.C. (1993) Divergence and stability analysis in
chickpea. Crop Improvement 20: 59–62.
Singh, A., Singh, N.P. and Asthana, A.N. (1999a) Genetic potential of wide crosses
in chickpea. Legume Research 22: 19–25.
Singh, N.P., Singh, A. and Asthana, A.N. (1999b) Studies on inter-specific crossability
barriers in chickpea. Indian Journal of Pulses Research 12: 13–19.
Singh, R. K. and Rao, S. K. 1991, Heritability and genetic advance in segregating
populations of chickpea. Res. Dev. Rep., 8 : 21-26.
Singh, R., Sindhu, A., Singal, H.R. and Singh, R. (2003) Biochemical basis of resistance
in chickpea (Cicer arietinum L.) against Fusarium wilt. Acta Phytopathologica et
Entomologica Hungarica 38: 13–19.
Singh, R., Singhal, V and Randhawa, G.J.2008. Molecular analysis of chickpea (Cicer
arietinum L) cultivars using AFLP and STMS markers. Journal of Plant Biochemistry
and Biotechnology 17.
Singh, R.B. 1983. Trend and prospects of grain production in Asia and the Pacific.
Presented at the Consultative Group Meeting for Asian Regional Research on Grain
legumes, 11-15 Dec 1983, ICRISAT. Available from ICRISAT, Patancheru P.O., Andhra
Pradesh 502 324, India

Singh, U. and Jambunathan, R. (1981) Studies on desi and kabuli chickpea (Cicer
arietinum L.) cultivars: levels of protease inhibitors, levels of polyphenolic compounds
and in vitro protein digestibility. Journal of Food Science 46: 1364–1367.
Singh, U., Williams, P.C and Peterson, D.S. 1997. Processing and grain quality of cool
season food legumes to meet the market demands. (in) proceedings, International Food
Legume Research conference (26-30 September 1997), Adelaide, Australia.
Singh.K,B., Tuwafe, S. and Kamal, M. 1980. Factors responsible for tallness and low
yield intall chickpea: suggestions for improvement. International Chickpea Newsletter
2:5-7
Sinha, S.K. 1977. Food legumes: distribution, adaptability and biology of yield. FAO
plant production and protection. Paper no. 3. Rome, Italy. 124p
Sivakumar, S. and Muthiah, 2001, Genetic divergence in chickpea germplasm. Madras
Agric. J., 87 : 48 – 50
Sivasubramanian, V. and P. Madhavamenon. 1973. Path analysis for yield and yield
components of rice. Madras Agric. J., 60: 1217-1227.
Skinner., DZ, Bauchan, G.R, Auricht, G and Hughes, S. 1999. A method for the efficient
management nad utilization of large germplasm collections. Crop Science 39:1237-1242.
Skroch, P.W., J. Nienhuis, S. Beebe, J. Tohme and F. Pedraza. 1998. Comparison of
Mexican common bean (Phaseolus vulgaris L.) core and reserve germplasm collections.
Crop Science, 38: 488-496.
Smith, J.S.C., S.Kresovich, M.S.Hopkins, S.E.Mitchell, R.E.Dean, W.L.Woodman,
M.Lee and K.Porter.2000. Genetic diversity among elite sorghum inbred lines assessed
with simple sequence repeats. Crop Sci.40:226-232.
Smithson, J.B., Thompson, J.A and Summerfield, R.J. 1985. Chickpea (Cicer arietinum
L.). In: Summerfield RJ and Roberts EH. (eds.), Grain Legume Crops. Collins, London,
UK. p. 312-390.
Snedecor, G.W and Cochran, W.G. 1980. Statistical methods, 7th
edn. Iowa State
University Press, Ames.
Somyasharma and Singh, D. P. 2001, Studies on diverse plant types in chickpea. Indian
J.Pulse, Res., 14 : 107 – 111.
Sponchiado, B.N.,White, J.W., Castillo.J.A. and Jones, P.G.1980.Root growth of four
common bean cultivars inrelation to drought tolerance in environments with contrasting
soil types. Exp.Agric.25:249-257.

Srinivasan S, Gaur PM, Chaturvedi SK, Rao BV (2006) Allelic relationships of genes
controlling number of flowers per axis in chickpea. Euphytica 152:331–337
Srivastava, A. N. and Jain, J. K., 1994, Variability and co-heritability estimates for
physiological and economical attributes in soybean. Indian J. Genet., 4 (2): 179- 183.
STATISTICA 4.5, StatSoft, Inc. 1993.
Stępień, Ł., V. Mohler, J. Bocianowski and G. Koczyk. 2007. Assessing genetic diversity
in polish wheat (Triticum aestivum) varieties using microsatellite markers. Genet.
Resour. Crop. Evol. 54: 1499-1506.
Stich, B., Melchinger, A.E, Frisch. M, Maurer, H.P, Heckenberger, M. Reif, J.C.2005.
Linkage disequilibrium in European elite maize germplasm investigated with SSRs.
Theor Appl Genet 111:723-730.
Subbarao, G.V., Johansen, A.E, Slinkard, Nageshwara Rao, Saxena, N.P and Chauhan,
Y.S. 1995. Strategies for improving drought resistance in grain legumes. Critical
Reviews in Plant Sciences 114:469-523.
Subhash, C., R. Dhari, R. Kumar, S. Chander, R..Dhari and R.Kumar.2001. Variation in
recombinant inbred lines of two crosses in chickpea (Cicer arietinum L.). Annl.Biol.,
1:29-34
Subhaschandra, Ram Dhari, Ramkumar and Kumar, R. 2001, Variation in selected
recombinant inbred lines of two crosses in chickpea. Ann. of Biology, 17: 29 – 34.
Sudupak, M.A., Akkaya, M.S and Kence, A .2004. Genetic relationships among perennial
and annual Cicer species growing in Turkey assessed by AFLP fingerprinting.
Theoretical and Applied Genetics 108: 937–44.
Sudupak, M.A., Akkaya, M.S and Kence, A.2002. Analysis of genetic relationships
among perennial and annual Cicer species growing in Turkey using RAPD markers.
Theoretical and Applied Genetics 105: 1220–1228.
Sudupak, M.A.2004. Inter- and intra- species inter simple sequence repeat (ISSR)
variation in the genus Cicer. Euphytica 135: 229–238.
Swaify, S.A.,Pathak,P, Rego, T.J, and Singh.S.1985. Soil Management for Optimized
Productivity Under Rainfed Conditions in the Semi-Arid Tropics. Springer-Verlag
Newyork, Inc. Advances in Soil Science. Volume 1 : 1-64s
Talebi, R., Jelodar, N.A.B, Mardi. M, Fayaz. F, Furman, B.J and Bagheri, A.M.2009.

Phylogenetic diversity and relationship among annual Cicer species using random
amplified Polymorphic DNA markers. General and Applied Plant Physiology 35: 03–
12.
Talebi, R., Naji, A.M and Fayaz, F. 2008b. Geographical patterns of genetic diversity in
cultivated chickpea (Cicer arietinum L.) characterized by amplified fragment length
polymorphism. Plant Soil and Environment 54: 447–452.
Talebi,R., Fayaz, F. Mardi, M. Pirsyedi, S.M and Naji, A.M. 2008a. Genetic relationships
among chickpea (Cicer arietinum) elite lines on RAPD and Agronomic Markers.
International Journal of Agriculture and Biology 10: 301–305.
Taramino.G., Tarchini, S.Ferrario, M.Lee and M.E.Pee.1997.Chracterization and
mapping of simple sequence repeats (SSRs). Theoretical and Applied Genetics.95:66-
72.
Taran B, Warkentin T, Tullu A, Vandenberg A (2007) Genetic relationships among
Chickpea (Cicer arietinum L.) genotypes based on the SSRs at the quantitative trait loci
for resistance to ascochyta blight. Eur J Plant Pathol 119:39–51
Tautz, D., and Renz.1984. Simple sequences are ubiquitous repetitive components of
eukaryotic genomes.Nucl.Acids Res.12:4127-4138.
Tautz, D., M.Trick and G.A. D over.1986. Cryptic simplicity in DNA is a major source of
genetic variation. Nature.322:652-656.
Tayyar, R.I and Waines, J.G .1996. Genetic relationships among annual species of Cicer
(Fabaceae) using isozyme variation. Theor Appl Genet 92:245-254
Tayyar, R.I, Lukaszewiski, A.J, Waines, J.G.1994. Chromosome banding patterns in the
annual species of Cicer. Genome 37:656-663
Thiel T, W.Michalek, R.K.Varshney and A.Graner.2003. Exploiting EST database for the
development and characterization of gene derived SSR markers in barley (Hordeum
vulgare L.). Theoretical and Applied Genetics. 106:411-422.
Thornsberry, J.M., Goodman, M.M, Doebley. J, Kresovich. S, Nielson. D, Buckler,
E.S.I.V.2001. Dwarf8 polymorphisms associate with variation in flowering time. Nat
Genet 28:286-289
Tohme, J., P. Jones, S. Beebe, and M. Ibanga. 1995. The combined use of agro ecological
and characterisation data to establish the CIAT Phaseolus vulgaris core collection. p. 95–
108. In T. Hodgkin et al. (ed.). Core collections of plant genetic resources. Int. Plant
Genet. Resour. Inst. John Wiley & Sons, New York.

Toker, C. 1998.Estimate of Heritabilities and Genotype by environment interactions for
100-grain weight, days to flowering and plant height in kabuli chickpeas (Cicer arietinum
L.). Turk. J. Field Crops 3:16-20
Toker, C. 2004: Evaluation of yield criteria with phenotypic correlations and factor
analysis in chickpea. Acta Agric. Scanda. B Soil Plant Science. 54: 45–48.
Toker, C., Lluch. C, Tejera, N.A, Serraj, R and Siddique, K.H.M. 2007: Abiotic stresses.
In: Yadav SS, Redden R, Chen W, and Sharma B, editions. Chickpea Breeding and
Management, pp. 474–496. CABI, Wallingford, UK.
Tomar, G.S., Mishra, Y and Rao, S.K.1982. Path analysis and its implications in selection
for high yielding chickpea (Cicer arietinum L.). Indian J.Pl.Physiol., 25:127-132.
Tripathi, A.K. 1998. Variability analysis in chickpea. Adv. Plant Sci, 11:291-2
Turner, N.C., G.C.Wright, and K.H.M.Siddique.2001. Adaptation of grain legumes
(pulses) to water limited environments. Adv.Agron.71:193-231.
Turuspekoy, Y., K. Nakamura, R. Yoshikawa, and R. Tuberosa. 2001. Genetic diversity
of Japanese barley cultivars based on SSR analysis. Breed. Sci. 51(3): 215-218.
Uddin, M,J., Hamid, H.A, Rahman, A.R.M.S and Neawz, M.A.1990. Variability,
correlation and path analysis in chickpea. Bangladesh Journal of Plant Breeding and
Genetics 3(1, 2):51-55.
Udupa SM and Baum M (2001) High mutation rate and mutational bias at (TAA)n
microsatellite loci in chickpea (Cicer arietinum L.). Mol Gen Genom 265:1097–1103
Udupa, S.M., Robertson, L.D, Weigand. F, Baum. M, Kahl, G. 1999. Allelic variation at
(TAA)n microsatellite loci in a world collection of chickpea (Cicer arietinum L)
germplasm. Mol Gen Genet 261:354-363
Upadhyaya, H. D., S. Sharma, C. L. L. Gowda, V.G. Reddy and S. Singh. 2011c.
Developing prosomillet (Panicum miliaceum L.) core collection using geographic and
morpho-agronomic data. Crop and Pasture Science 62:383-389.
Upadhyaya, H.D. 2003. Phenotypic diversity in groundnut (Arachis hypogaea L.) core
collection assessed by morphological and agronomical evaluations. Genet. Resour. Crop
Evol. 50:539-550.
Upadhyaya, H.D. 2005. Variability for drought resistance related traits in the mini core
collection of peanut. Crop Science 45: 1432–1440.
Upadhyaya, H.D. and R. Oritz. 2001. A mini core subset for capturing diversity and

promoting utilization of chickpea genetic resources in crop improvement. Theor. Appl.
Genet. 102:1292–98.
Upadhyaya, H.D., C.L.L. Gowda, K.N. Reddy and S. Singh. 2009b. Augmenting the
pearl millet [Pennisetum glaucum (L.) R. Br.)] Core collection for enhancing germplasm
utilization in crop improvement. Crop Sci. 49: 573-580.
Upadhyaya, H.D., C.L.L. Gowda, R.P.S. Pundir, V.G. Reddy and S. Singh. 2006b.
Development of core subset of finger millet germplasm using geographical origin and
data on 14 quantitative traits. Genetic Resour. Crop Evol. 53:679-685.
Upadhyaya, H.D., D. Yadav, N. Dronavalli, C.L.L. Gowda and S. Singh. 2010a. Mini
core germplasm collections for infusing genetic diversity in plant breeding programms.
Electronic J. of Pl. Breed, 1(4): 1294-1309.
Upadhyaya, H.D., Devvart Yadav, K.N. Reddy, C.L.L. Gowda and S. Singh. 2011b.
Development of Pearl Millet mini core collection for enhanced utilization of germplasm.
Crop Sci. 51: 217-223.
Upadhyaya, HD., Furman,BJ., Dwivedi,SL., Udupa,SM., Gowda,CLL., Baum,M.,
Crouch,JH., Buhariwalla,HK. and Singh,S. 2006. Development of a composite collection
for mining germplasm possessing allelic variation for beneficial traits in chickpea. Plant
genetic resources. 4(1):13-19.
Upadhyaya, H.D., K.N. Reddy, C.L.L. Gowda and S. Singh. 2007b. Phenotypic diversity
in the Pigeonpea (Cajanus cajan) core collection. Genet. Resour. Crop Evol. 54: 1164-
1184.
Upadhyaya, H.D., L.J. Reddy, C.L.L. Gowda and S. Singh. 2006a. Identification of
diverse groundnut germplasm: sources of early-maturity in a core collection. Field Crops
Research 97: 261–267.
Upadhyaya, H.D., L.J. Reddy, C.L.L. Gowda, and S. Singh. 2009a. Phenotypic diversity
in cold tolerant peanut (Arachis hypogaea L.) germplasm. Euphytica 165:279-291.
Upadhyaya, H.D., L.J. Reddy, C.L.L. Gowda, K.N. Reddy and S. Singh. 2006c.
Development of a Mini Core subset for Enhanced and Diversified utilization of
Pigeonpea Germplasm Resources. Crop Sci. 46:2127-2132.
Upadhyaya, H.D., N.D.R.K. Sarma, C.R. Ravishankar, T. Albrecht, Y. Narasimhudu, S.
K. Singh, S. K. Varshney, V. G. Reddy, S. Singh, S. L. Dwivedi, N. Wanyera, C. O. A.
Oduori, M. A. Mgonja, D. B. Kisandu, H. K. Parzies, and C. L. L. Gowda. 2010b.
Developing a mini-core collection in finger millet using multilocation data. Crop Sci. 50:

1924-1931.
Upadhyaya, H.D., N.D.R.K. Sharma, Y. Narasimhudu, S.K. Singh, S.K. Varshney, C.R.
Ravishankar, S. Singh, V.G. Reddy, S.L. Dwivedi and C.L.L. Gowda. 2010g.
Multilocation evaluation of core collection to form mini core collection in foxtail millet
(Setaria italica (L.) Beauv.). Euphytica.
Upadhyaya, H.D., P.J. Bramel and S. Singh. 2001. Development of a chickpea core
collection using geographic distribution and quantitative traits. Crop Sci. 41:206-210.
Upadhyaya, H.D., P.J. Bramel, R. Ortiz and S. Singh. 2002. Developing a mini core of
peanut for utilization of genetic resources. Crop Sci. 42:2150-2156.
Upadhyaya, H.D., R. Ortiz, P.J. Bramel and S. Singh. 2001b. Development of Asia region
groundnut core collection. Paper presented in the Diamond Jubilee Symposium on
Hundred years of post-Mendelian Genetics - Retrospect and prospects. 6-9 November
2001, Abstract pages 43-44. New Delhi, India: Indian Agricultural Research Institute.
Upadhyaya, H.D., R. Ortiz, P.J. Bramel and S. Singh. 2003. Development of a groundnut
core collection using taxonomical, geographical and morphological descriptors. Genet.
Resour. Crop Evol. 50:139-148.
Upadhyaya, H.D., R.P.S. Pundir, C.L.L. Gowda, V.G. Reddy and S. Singh. 2008a.
Establishing a core collection of foxtail millet to enhance utilization of germplasm of an
underutilized crop. Plant Genet. Resour: Characterization and Utilization 7(2):177-
184. DOI: 10.1017/S1479262108178042.
Upadhyaya, H.D., R.P.S. Pundir, S.L. Dwivedi, C.L.L. Gowda, V. G. Reddy and S.
Singh. 2009c. Developing a mini core collection of sorghum [Sorghum bicolor (L.)
Moench] for diversified utilization of germplasm. Crop Sci. 49: 1769-1780.
Upadhyaya, H.D., S. Ramesh, S. Sharma, S.K. Singh, S.K. Varshney, N.D.R.K. Sharma,
C.R. Ravishankar, Y. Narasimhudu, V.G. Reddy, K.L. Sahrawat, T.N. Dhanalakshmi,
M.A. Mgonja, H.K. Parzies, C.L.L.Gowda and S. Singh. 2011a. Genetic diversity for
grain nutrients contents in a core collection of finger millet (Eleusine coracana (L.)
Gaertn.) germplasm. Field Crops Res. 121(1): 42-52.
Upadhyaya, H.D., S. Sharma, B. Ramulu, R. Bhattacharjee, C.L.L. Gowda, V. G. Reddy,
S. Singh. 2010c. Variation for qualitative and quantitative traits and identification of trait
specific sources in new sorghum germplasm. Crop and Pasture Sci., 61:609-618.
Upadhyaya, H.D., S.L. Dwivedi, C.L.L Gowda and S. Singh. 2007a. Identification of
diverse germplasm lines for agronomic traits in a chickpea (Cicer arietinum L.) core

collection for use in crop improvement. Field Crops Research 100: 320–326.
Upadhyaya, H.D., S.L. Dwivedi, M. Baum, R.K. Varshney, S.M.Udupa, C.L.L.Gowda,
D. Hoisinton and S. Singh. 2008b. Genetic structure, diversity, and allelic richness in
composit collection and reference set in chickpea (Cicer arietinum L.). BMC Plant
Biology 8:106. doi: 10.1186/1471-2229-8-106.
Upadhyaya. H.D., B.P. Mallikarjuna Swamy, P.V. Kenchana Goudar, B.Y. Kullaiswamy
and S. Singh 2005. Identification of diverse accessions of groundnut through
multienvironment evaluation of core collection for Asia. Field Crops Research 93:293-
299.
V.L. Narayanamma., Sharma, H. C, C. L. L. Gowda and Sriramulu. M. 2007.Mechanisms
of resistance to Helicoverpa armigera and introgression of resistance genes into hybrids
in chickpea. Arthropod-Plant Interaction.1:263-270.
Vairinhos, F and Murray, D.R.1983. The seed proteins of chickpea comparative studies of
Cicer arietinum, C. reticulatum and C. echinospermum (Leguminosae). Plant Syst Evol
142:15-22
Van der Maesen, L.J.G. 1987. Cicer L. Origin, history and taxonomy of chickpea. P.11-
34. In: M.C. Saxena and K.B. Singh (ed.), The Chickpea. C.A.B. International
Cambrian News Ltd, Aberystwyth, UK.
Van Rheenen, H.A., Singh, O. and Saxena, N.P. 1997. Using evaluation techniques for
photoperiod and thermo-insensitivity in pulses improvement. In: Asthana, A.N.and Ali,
M. (eds) Recent Advantages in Pulses Research. Indian Society of Pulses Research and
Development, IIPR, Kanpur, India, pp. 443–458.
Varshney, R.K., Coyne, C.J, Swamy. P, Hoisington. D.2007a. Molecular identification of
genetically distinct accessions in the USDA chickpea core collection. Pisum Genet 39:
32-34
Varshney, R.K., Hiremath, P.J, Lekha. P, Kashiwagi. J, Jayashree. B, Deokar, A.A,
Vadez, V, Xiao. Y, Srinivasan. R, Gaur, P.M, Siddique, K.H.M, Town, C.D, Hoisington,
D.A.2009b. A comprehensive resource of drought- and salinity responsive ESTs for gene
discovery and marker development in chickpea (Cicer arietinum L.) BMC Genomics
10:523
Varshney, R.K., Nayak, S.N, May, G.D and Jackson, S.A.2009c. Next-generation
sequencing technologies and their implications for crop genetics and breeding. Trends in
Biotechnology 27: 522–30.

Varshney, R.K., Nayak. S, Jayashree. B, Eshwar. K, Upadhyaya, H.D, Hoisington, D.A.
2007. Development of cost-effective SNP assays for chickpea genome analysis and
breeding. Jour of SAT Agriculture 3: 1
(http://www.icrisat.org/Journal/chickpea_pigeonpea3.htm)
Vavilov, N. I. 1950. The origin, variation, immunity and breeding of cultivated plants.
Chron. Bot. (New York) 13–16, 26–38, 75–78, 151.
Vavilov, N.I., 1926. Studies on the Origin of cultivated plants. Inst. Appl. Bot. Plant
Breeding. Leningrad. p248.
Vellve, R. 1992. Saving the seeds: genetic diversity and European agriculture. Eartscan
Books, London
Verma, M.M., Sandhu, J.S., Rrar, H.S. and Brar, J.S. 1990. Crossability studies in
different species of Cicer (L.). Crop Improvement 17: 179–181.
Vijayalakshmi, N.V.S., J. Kumar, T.N. Rao and J. Kumar, 2000. Variability and
correlation studies in desi, kabuli and intermediate chickpea. Legume Res., 23:232-6
Virk P.S., V.F.L.Brian, M.T.Jackson and J.Newbury.1995.Use of RAPD for the study of
diversity within plant germplasm collections. Heredity.74:170-179.
Vural, H and Karasu, A.2007. Variability studies in chickpea (Cicer arietinum L.)
varieties grown in Isparta, Turkey. Revista UDO Agricola7 (1):35-40.
Wald, Abraham. 1943. Tests of statistical hypotheses concerning several parameters when
the number of observations is large. Trans. Am. Math. Soc. 54: 426–482
Wang, C., J, Chen, H. Zhi, L. Yang, W. Li, Y. Wang, H. Li, B. Zhao, M. Chen and X.
Diao, 2010. Population genetics of foxtail millet and its wild ancestor. BMC Genetics
11: 90.
Wang, M.L., C. Zhu, N.A. Barkley, Z. Chen, J.E. Erpelding, S.C. Murray, M.R. Tuinstra,
T. Tesso, G.A. Pederson and J. Yu. 2009. Genetic diversity and population structure
analysis of accessions in the US historic sweet sorghum. Theor. Appl. Genet. 120: 13-
23.
Wanjari, K. B., Patil, A. J. and Ghawghawe, P. B., 1996, Genetic variability in F5
progenies derived from bulk populations in chickpea. Annu. Pl. Physiol., 10 : 83 – 86.
Ward, J. 1963. Hierarchical grouping to optimize an objective function. J American
Static Association 38: 236-244.
Weising, K., H. Nyborn, K.Wolff, W.meyer.1995.DNA fingerprinting in plants and fungi.

CRC press, Boca Ratcon Ann Arbor London Tokyo, pp: 321.
Wen, W., H. Mei, F. Feng, S. Yu, Z. Huang, J. Wu, L. Chen, X. Xu and L. Luo. 2009.
Population structure and association mapping on chromosome 7 using a diverse panel of
Chinese germplasm of rice (Oryza sativa L.). Theor. Appl. Genet. 119: 459-470.
Wenzl, P., Carling. J, Kudrna. D, Jaccoud. D, Huttner. E, Kleinhofs. A, Kilian, A.2004.
Diversity arrays technology (DArT) for whole-genome profiling of barley. Proceedings
of the National Academy of Sciences of the USA 101:9915-9920.
Wenzl, P., Li. H, Carling. J, Zhou. M, Raman. H, Paul. E, Hearnden. P, Maier. C, Xia. L,
Caig. V, Ovesna. J, Cakir. M, Poulsen. D, Wang. J, Raman. R, Smith. K.P, Muehlbauer,
G.J, Chalmers, K.J, Kleinhofs. A, Huttner. E, Kilian. 2006. A. A high-density consensus
map of barley linking DArT markers to SSR, RFLP and STS loci and phenotypic traits.
BMC Genomics 7:206..
Westman, W.H. and S.Kresovich.1997, Use of the molecular marker techniques for
descriptopn of plant genetic variation. In: JA Callow, B.V. Ford-LIoyd and Newbery, H.J
(eds). Biotechnology and Plant genetic resources- conservation and use. CAB
international, UK.PP:9-48.
White, G.G., D.A.H. Murray and M.P. Walton. 1995. Heliothis management in
Australia.Cooperative Research Centre for Tropical Pest Management, Workshop report:
8-9 November 1995. Bulletin of Entomological Research, 89: 201-207.
White head.A. (2002). Metaanalysis of controlled clinical trials.Chichester:Wiley
Wilson, L.M., Whitt, S.R, Ibanez, A.M, Rocheford, T.R, Goodman, M.M, Buckler,
E.S.I.V.2004. Dissection of maize kernel composition and starch production by candidate
gene association. Plant Cell 16: 2719-2733.
Winkle.B – Shirley. 2002. Biosynthesis of Flavanoids and effects of stress. Current
opinion in Plant Biology 5: 218-223.
Winter, P. and G. Kahl. 1995. Molecular marker technologies for plant improvement.
World J. of Microbiology and Biotechnology 11: 438–448
Winter, P., Benko-Iseppon. A, Huettel. B, Ratnaparkhe. M, Tullu. A, Sonnante. G, Pfa. V.
T, Tekeoglu. M, Santra. D, Sant. V, Rajesh. P, Kahl. G, Muehlbauer, F.2000. A linkage
map of chickpea (Cicer arietinum L.) genome based on recombinant inbred lines from a
C. arietinum and C. reticulatum cross: localization of resistance genes for fusarium races
4 and 5. Theor Appl Genet 101:1155–1163
Winter, P., Pfav. T, Udupa. S, Huettel. B, Sharma. P, Sahi. S, Arreguin-Espinozar,

Weigand. F, Muehlbauer, F, Kahl, G.1999. Characterization and mapping of sequence-
tagged microsatellite sites in chickpea (Cicer arietinum L.) genome. Mol Gen Genet
262:90–101
Wittenberg, A.H.J, van der Lee. T, Cayla. C, Kilian. A, Visser, R.G.F, Schouten,
H.J.2005. Validation of the high-throughput marker technology DArT using the model
plant Arabidopsis thaliana. Molecular Genetics and Genomics 274:30-39.
Wu X, Ren C, Joshi T, Vuong T, Xu D and Nguyen HT (2010) SNP discovery by high
throughput sequencing in soybean. BMC Genomics 11: 469.
Xia, L., Peng. K, Yang. S, Wenzl. P, De Vicente. C, Fregene. M, Kilian, A.2005.DArT
for high-throughput genotyping of cassava (Manihot esculenta) and its wild relatives.
Theoretical and Applied Genetics 110:1092-1098.
Xie, Y., McNally. K, Li, C.Y, Leung. H, Zhu, Y.Y.2006. A high-throughput genomic
tool: diversity array technology complementary for rice genotyping. Journal of
Integrative Plant Biology 48:1069-1076.
Yadav R. K., 1990, Path analysis in segregating population of chickpea. Indian J. Pulse
Res., 3: 107-110.
Yadav SS, Redden R, Chen W and Sharma B (2007) Chickpea breeding and
management. CABI Publication, pp. 638.
Yadav,L.N., Mahadik, C.N and Dixit, S.S. 1978. Inheritance of double podded character
and petal color in gram (Cicer arietinum L.). Science and Culture. p.44: 537
Yan J, Shah T, Warburton ML, Buckler ES, McMullen MD and Crouch JH (2009)
Genetic characterization and linkage disequilibrium estimation of a global maize
collection using SNP markers. Public Library of Science 4: e8451.
Yang, T., P. Mou, W. Sun, J. He, and K. Dong. 2010. Genetic variation of foxtail millet
cultivars in north plateau of China by SSR markers. Acta Botanica Boreali-Occidentalia
Sinica. 30(9): 1786-1791.
Yu, J. and E.S. Buckler. 2006. Genetic association mapping and genome organization of
maize. Curr. Opin. Biotechnol. 17: 1-6.
Yucel, D.O., A.E. Anlarsal and C. Yucel, 2006. Genetic variability, Correlation and Path
Analysis of Yield and yield components in Chickpea (Cicer arietinum L.). Turk. J.
Agric., 30: 183-8.
Zafar, A.M., and Khan, M.A. 1968. Genetics studies in gram (Cicer arietinum L.).
Comparative studies on grain hybrids and their parents. West Pakistan Journal of

Agricultural Research 6: 33-41.
Zalucki, M.P., D.A.H. Murray, P.C. Gregg, G.P. Fitt, P.H. Twine and C. Jones. 1994.
Ecology of Heliothis armigera (Hübner) and H. punctigera Wallengren in the inland of
Australia: Larval sampling and host plant relationships during winter and spring.
Australian J. of Zoology, 42: 329-346.
Zhao, K., M.J. Aranzana, S. Kim, C. Lister, C. Shindo, C. Tang, C. Toomajian, H.
Zheng, C. Dean, P. Marjoram, and M. Nordborg. 2007. An Arabidopsis example of
association mapping in structured samples. PLoS Genet 3:e4.
Zheng, G., B. Freidlin, Z.H. Li and J.L. Gastwirth. 2005. Genomic control for association
studies under various genetic models. Biometrics 61:186–192.
Zhu, B., Su, J., Chang, M.C., Verma, D.P.S., Fan, Y.L., Wu, R., 1998. Over expression of
a D1-pyrroline-5-carboxylate synthetase gene and analysis of tolerance to water and salt
stress in transgenic rice. Plant Science 139: 41–48.
Zhu, C., Gore. M, Buckler, E.S, Yu, J .2008. Status and prospects of association mapping
in plants. The Plant Genome 1:5–20
Zohary, D. and Hopf, M. 2000. Pulses In: Domestication of plants in the Old World.
Oxford: Clarendon Press, pp. 108–111.
Zope, W.W., Wanjari, K.B, Kumar. J, Van Rheenan, H.A and Rao, B.V. 2002. PKV-
Kabuli-2: An extra large seeded kabuli chickpea variety. Int. Chickpea and Pigeonpea
Newsletter 9: 4-6.

Appendices

Appendix 1: Scores of seven qualitative traits for 300 accessions in chickpea
reference set
S.No ICC SDSH FLCL PLCL SDCL GH DOT SS
1 10018 1 2 2 17 4 2 1
2 10341 3 4 3 1 4 1 2
3 10393 1 2 2 17 3 2 1
4 10399 1 2 2 17 4 2 1
5 10466 2 4 3 1 4 1 2
6 1052 1 2 2 2 3 1 1
7 10673 1 2 2 5 3 2 1
8 10685 1 2 2 5 3 2 1
9 10755 2 4 3 1 3 1 2
10 1083 1 2 2 17 4 2 1
11 10885 2 4 3 1 3 1 2
12 10939 1 2 2 5 4 2 3
13 10945 1 2 2 8 3 2 1
14 1098 1 2 2 17 3 2 1
15 11121 1 2 2 17 3 2 1
16 11198 1 2 2 17 3 2 1
17 11279 1 2 2 8 3 2 1
18 11284 1 4 3 15 3 1 1
19 11303 2 4 3 1 3 1 1
20 11378 1 2 2 17 3 2 1
21 11498 1 2 2 17 3 2 1
22 11584 1 2 2 8 4 2 1
23 1161 1 4 3 15 4 1 1
24 11627 1 2 2 17 3 2 1
25 1164 1 4 3 10 3 1 1
26 11664 1 2 2 17 3 2 1
27 11764 2 4 3 1 3 1 2
28 1180 1 2 2 2 4 1 1
29 11819 2 4 3 1 3 1 2
30 11879 2 4 3 1 3 1 2
31 11903 1 1 3 4 3 2 1
32 1194 1 2 2 17 3 2 1
33 11944 1 2 2 17 3 2 1
34 12028 1 1 3 4 3 1 1
35 12037 2 4 3 1 3 1 2
36 1205 1 2 2 17 3 2 1
37 12155 1 2 2 17 3 2 1
38 12299 1 2 2 17 4 2 1
39 1230 1 2 2 17 4 2 1
40 12307 1 2 2 17 3 2 1
41 12321 1 1 3 16 3 2 1
42 12324 2 4 3 1 3 1 2
43 12328 2 4 3 1 3 1 2
44 12379 1 2 2 17 3 2 1
45 12492 2 4 3 1 3 1 2
46 12537 1 2 2 2 3 1 1

47 12654 1 2 2 11 3 2 1
48 12726 1 2 3 17 4 2 1
49 12824 1 2 1 17 3 2 1
50 12851 1 2 2 2 4 1 1
51 12866 1 2 2 17 3 2 1
52 12916 1 2 2 17 3 2 1
53 12928 1 2 2 11 3 2 1
54 12947 1 2 2 17 3 2 1
55 13077 2 4 3 1 3 1 2
56 13124 1 2 2 17 4 2 1
57 13187 2 4 3 1 3 1 2
58 13219 1 2 2 17 3 2 3
59 13283 2 4 3 1 3 1 2
60 13357 2 4 3 1 3 1 2
61 13441 2 4 3 1 3 1 2
62 13461 2 4 3 1 3 1 2
63 13523 2 4 3 1 3 1 2
64 13524 1 2 2 2 3 1 1
65 1356 1 2 2 17 3 2 1
66 13599 1 1 3 4 3 1 1
67 13628 2 4 3 1 4 1 2
68 13719 2 4 3 1 3 1 2
69 13764 2 4 3 1 3 1 2
70 13816 2 4 3 1 3 1 2
71 13863 1 3 3 17 4 1 1
72 13892 1 2 1 17 3 2 1
73 1392 1 2 2 17 3 2 1
74 1397 1 2 2 17 3 2 1
75 1398 1 2 2 17 3 2 1
76 14051 1 2 2 17 3 2 1
77 14077 1 2 1 17 3 2 1
78 14098 1 2 2 17 3 2 1
79 14199 2 4 3 1 3 1 2
80 1422 1 2 2 17 3 2 1
81 1431 1 2 2 17 3 2 1
82 14402 1 2 2 17 4 1 1
83 14446 2 4 3 1 1 1 2
84 14595 1 2 3 17 4 2 1
85 14669 1 2 2 17 4 2 3
86 14778 1 2 2 5 4 2 1
87 14799 1 2 2 8 4 2 1
88 14815 1 2 2 17 4 2 1
89 14831 1 2 2 17 4 2 1
90 1510 1 2 2 17 4 2 1
91 15248 1 1 3 11 3 2 1
92 15264 2 4 3 1 4 1 1
93 15294 1 1 3 4 3 2 1
94 15333 2 4 3 1 3 1 2
95 15406 2 4 3 1 3 1 2
96 15435 2 4 3 1 3 1 2
97 15510 1 2 2 17 3 2 1

98 15518 2 4 3 1 3 1 2
99 15567 1 2 2 8 3 2 1
100 15606 1 2 2 17 4 2 1
101 15610 1 2 2 17 3 2 1
102 15612 1 2 2 8 4 2 1
103 15614 1 2 2 17 4 2 1
104 15618 1 2 2 17 4 2 1
105 15697 2 4 3 1 4 1 2
106 15762 1 2 2 4 3 2 1
107 15785 1 5 3 17 4 2 1
108 15802 2 4 3 1 3 1 2
109 15868 1 2 2 17 4 2 1
110 15888 3 4 3 12 4 1 1
111 16207 1 2 2 17 4 2 1
112 16261 1 2 2 15 4 2 1
113 16269 1 2 2 15 4 2 1
114 16374 1 2 2 17 3 2 1
115 16487 1 2 2 11 4 2 1
116 16524 1 2 2 8 3 2 1
117 16654 2 4 3 1 3 1 2
118 16796 2 4 3 1 1 1 2
119 16903 1 2 2 17 4 2 3
120 16915 1 2 2 17 4 2 3
121 1710 1 2 2 17 3 2 1
122 1715 1 2 2 17 4 2 1
123 1882 1 2 2 5 4 2 1
124 1915 1 2 2 2 3 1 1
125 1923 1 2 2 17 3 2 1
126 2065 1 2 2 17 3 2 1
127 2072 1 2 2 17 4 2 1
128 2210 1 2 2 17 3 2 1
129 2242 1 2 2 17 3 2 1
130 2263 1 2 2 17 4 2 1
131 2277 2 4 3 1 4 1 2
132 2482 2 4 3 1 3 1 2
133 2507 1 2 2 1 3 1 1
134 2580 1 2 2 8 3 2 1
135 2593 2 4 3 1 3 1 2
136 2629 1 2 2 8 4 2 1
137 2679 1 1 3 11 3 1 1
138 2720 1 2 2 17 3 2 1
139 2737 1 2 2 2 4 1 1
140 283 1 2 2 17 4 2 1
141 2884 1 2 2 2 3 1 1
142 2919 1 1 3 4 3 1 1
143 2969 1 2 2 17 3 1 1
144 2990 1 1 3 4 3 1 1
145 3218 1 1 3 16 3 1 1
146 3230 1 2 2 6 3 2 1
147 3239 1 1 3 4 4 1 1
148 3325 1 2 2 17 4 2 1

149 3362 1 2 2 17 4 2 1
150 3391 1 1 3 4 3 1 1
151 3410 2 4 3 1 3 1 1
152 3421 2 4 3 1 3 1 2
153 3512 1 2 2 17 3 2 1
154 3582 1 2 2 5 3 2 1
155 3631 1 2 2 2 3 1 1
156 3761 1 2 2 2 3 1 1
157 3776 1 2 1 2 3 1 1
158 3892 1 2 2 2 3 1 1
159 3946 1 2 2 2 4 1 1
160 4093 1 2 2 5 3 2 1
161 4182 1 2 2 2 3 1 1
162 4363 1 2 2 2 3 1 1
163 440 1 2 2 17 4 2 1
164 4418 1 2 2 2 3 1 1
165 4463 1 2 2 2 4 1 1
166 4495 1 2 2 17 3 2 1
167 4533 1 2 2 17 4 2 1
168 456 1 2 2 17 4 2 1
169 4567 1 2 2 17 3 2 1
170 4593 1 2 2 17 3 2 1
171 4639 1 2 2 17 3 2 1
172 4657 1 2 2 17 4 2 1
173 4814 1 2 2 2 4 1 1
174 4841 2 4 3 1 3 1 2
175 4853 2 4 3 1 3 1 2
176 4872 3 2 1 13 4 2 1
177 4918 1 2 2 17 4 2 1
178 4991 1 2 2 15 4 2 1
179 506 1 2 2 17 4 2 1
180 5135 1 2 2 17 3 2 1
181 5221 1 2 2 9 4 1 1
182 5337 2 4 3 1 3 1 2
183 5383 1 2 2 17 3 2 1
184 5434 1 2 2 17 2 2 1
185 5504 1 2 2 11 3 2 1
186 5613 1 2 2 6 3 2 1
187 5639 1 2 2 17 4 2 1
188 5845 1 2 2 17 3 2 1
189 5878 1 3 2 2 4 1 1
190 5879 3 4 3 10 4 1 1
191 6263 2 4 3 1 3 1 2
192 6279 1 2 1 17 4 1 1
193 6293 1 2 2 2 4 1 1
194 6294 1 1 3 4 4 1 1
195 6306 1 2 2 2 3 1 1
196 637 1 2 2 5 4 2 1
197 6537 1 2 2 17 3 2 1
198 6571 1 2 2 17 3 2 1
199 6579 1 2 2 17 3 2 1

200 67 1 2 2 17 3 2 1
201 6802 1 2 2 11 3 2 1
202 6811 1 2 2 17 3 2 1
203 6816 1 2 2 17 3 2 1
204 6874 1 2 2 17 3 2 1
205 6875 1 1 3 4 3 1 1
206 6877 1 1 3 4 3 1 1
207 7052 1 2 2 2 3 1 1
208 708 1 2 2 5 4 2 1
209 7150 1 1 3 4 3 1 1
210 7184 1 2 2 5 3 1 1
211 7255 2 4 3 1 4 1 2
212 7272 2 4 3 1 3 1 2
213 7305 1 1 3 10 3 1 1
214 7308 2 4 3 1 3 1 2
215 7315 2 4 3 1 3 1 2
216 7323 3 4 3 11 1 1 2
217 7326 1 2 2 11 3 2 1
218 7413 3 1 3 3 3 1 1
219 7441 1 2 2 17 4 1 1
220 7554 1 1 3 4 4 1 1
221 7571 2 4 3 1 3 1 2
222 762 1 2 2 17 4 2 1
223 7668 2 4 3 1 3 1 2
224 7819 1 1 3 4 3 1 1
225 7867 1 1 3 4 3 1 1
226 791 1 2 2 17 4 2 1
227 8058 2 4 3 1 3 1 2
228 8151 2 4 3 1 3 1 2
229 8195 1 2 2 5 3 1 1
230 8200 1 2 2 17 3 2 1
231 8261 2 4 3 1 3 1 2
232 8318 1 2 3 17 4 2 1
233 8350 3 2 2 17 4 1 1
234 8384 1 2 2 17 4 2 1
235 8515 1 2 3 4 3 2 1
236 8521 1 2 3 16 1 2 1
237 8522 1 2 2 2 3 1 1
238 8607 1 2 2 17 4 2 1
239 8621 1 2 2 17 3 2 1
240 867 1 2 2 8 4 2 1
241 8718 1 2 2 17 4 2 1
242 8740 2 4 3 1 4 1 2
243 8752 2 4 3 1 4 1 2
244 8855 2 4 3 1 4 1 2
245 8950 1 2 2 17 4 2 1
246 9002 1 2 2 17 3 2 1
247 9137 2 4 3 1 3 1 2
248 9402 2 4 3 1 3 1 2
249 9418 2 4 3 1 4 1 2
250 9434 2 4 3 1 3 1 2

251 95 1 2 2 17 4 2 1
252 9586 1 2 2 17 3 2 1
253 9590 1 3 3 17 3 2 1
254 9636 1 1 3 17 3 1 1
255 9643 1 1 3 4 3 1 1
256 9702 1 1 3 4 4 1 1
257 9712 1 1 3 4 3 1 1
258 9755 1 1 3 4 3 2 1
259 9848 3 1 3 4 3 1 2
260 9862 3 1 3 14 3 1 2
261 9872 2 1 3 14 3 1 2
262 9895 3 1 3 14 3 1 2
263 9942 1 2 2 17 4 2 1
264 20267 2 4 3 1 4 1 2
265 18828 2 4 3 1 3 1 2
266 18836 2 4 3 1 3 1 2
267 18839 2 4 3 1 3 1 2
268 18847 2 4 3 1 3 1 2
269 18858 2 4 3 1 3 1 2
270 18884 2 4 3 1 3 1 2
271 18679 2 4 3 1 3 1 2
272 20266 2 4 3 1 3 1 2
273 20262 2 4 3 1 3 1 2
274 20265 2 4 3 1 4 1 2
275 20263 2 4 3 1 3 1 2
276 20261 2 4 3 1 3 1 2
277 20259 2 4 3 1 3 1 2
278 18699 2 4 3 1 4 1 2
279 18720 2 4 3 1 3 1 1
280 18912 2 4 3 1 3 1 2
281 19034 2 4 3 1 1 1 2
282 20174 1 2 2 5 4 1 3
283 18983 2 4 3 1 3 1 2
284 20264 2 4 3 1 4 1 2
285 19226 2 4 3 1 4 1 2
286 19011 2 4 3 1 5 1 2
287 18724 2 4 3 1 4 1 2
288 19095 2 4 3 1 5 1 2
289 19100 2 4 3 1 5 1 2
290 20260 2 4 3 1 4 1 2
291 20183 1 2 2 3 5 2 3
292 20190 1 2 2 5 4 1 3
293 20192 1 2 3 5 5 1 3
294 20193 1 2 2 7 5 2 3
295 20194 1 2 2 7 4 2 3
296 20195 1 2 2 7 4 2 3
297 19122 2 4 3 1 1 1 2
298 19147 2 4 3 1 3 1 2
299 19164 3 4 3 1 3 1 2
300 19165 2 4 3 1 3 1 2
Control cultivars

301 4918_C 1 2 2 8 4 2 1
302 4948_C 1 2 2 17 3 2 1
303 15996_C 1 2 2 8 3 2 1
304 V92311_C
2 4 3 1 4 1 2
305 4973_C 2 4 3 1 3 1 2
SDSH = Seed Shape, FLCL= Flower colour, PLCL= Plant colour, SDCL= Seed colour, GH =
Growth habit, DOT= Dots on seed coat, SS= Seed surface

Appendix 2: Mean performance of 300 accessions in chickpea reference set accessions for 17 quantitative traits based on overall pooled
analysis
ICC DF FD PLHT PLWD DGF DM BPB APB BSB ASB TB SDPD PPP YPP 100-SDWT YKGH PROD
10018 56.31 27.86 38.27 61.87 56.49 112.8 3.854 3.436 4.377 5.188 2.138 1.284 75.69 10.87 16.02 2165 19.09
10341 58.8 28.88 46.07 68.43 53.3 112.1 2.888 2.226 2.794 4.347 1.484 1.117 42.09 8.77 22.12 1646 14.66
10393 46.33 30.25 40.08 59.67 65.87 112.2 2.958 2.837 3.102 4.069 1.505 1.309 67.44 9.3 16.18 2307 20.54
10399 49.42 29.38 38.85 60.65 60.68 110.1 2.433 2.726 3.214 4.083 1.465 1.152 77.08 12.78 16.53 1780 16.09
10466 54.1 26.69 38.99 60.83 55.1 109.2 3.871 2.711 2.627 4.152 1.608 1.392 54.84 9.03 15.03 2028 18.56
1052 59.71 28.25 41.03 61.66 54.09 113.8 3.25 2.683 2.493 4.67 1.595 1.36 36.58 7.49 16.43 1249 10.86
10673 59.45 27.67 41.54 62.51 54.35 113.8 2.467 2.448 3.208 3.945 1.205 1.501 54.76 9.23 13.57 1475 12.88
10685 56.38 28.77 43.31 62.87 43.42 99.8 2.608 2.398 2.118 3.979 1.195 1.247 50.74 8.26 15.08 1519 15.33
10755 57.22 29.08 49.43 64.45 58.28 115.5 2.748 1.796 5.332 5.254 1.524 1.125 47.68 11.69 33.4 1717 14.83
1083 44.77 29.2 39.32 60.54 59.83 104.6 2.903 2.7 3.751 5.071 1.565 1.103 52.3 9.69 19.3 2076 19.81
10885 54.11 29.53 45.45 65.37 59.49 113.6 2.449 2.7 3.183 4.559 2.081 1.081 48.43 11.55 31.77 2083 18.27
10939 57.06 27.76 36.35 58.65 52.04 109.1 2.723 2.912 3.527 4.098 1.309 1.238 65.85 9.05 16.07 1840 16.79
10945 52.65 29.64 37.44 58.3 55.05 107.7 2.547 2.343 2.55 4.38 1.174 1.228 57.13 9.6 18.25 1895 17.53
1098 52.35 27.27 39.74 59.72 57.45 109.8 2.806 2.537 3.015 4.218 1.246 1.416 47.58 8.51 18.38 2025 18.32
11121 56.53 19.38 37.66 58.29 42.67 99.2 2.994 2.442 2.374 3.93 1.205 1.317 55.29 9.65 16.7 1750 17.52
11198 56.53 19.38 38.67 58.58 46.27 102.8 3.732 1.986 4.021 6.105 2.679 1.466 52.89 11.48 17.52 1882 18.21
11279 76.35 25.88 41.03 61.79 46.65 123 2.614 2.288 2.239 4.3 1.37 1.212 45.34 7.62 17.62 874 7.05
11284 60.74 27.84 47.03 67.44 56.56 117.3 3.484 3.438 2.38 4.941 1.37 1.393 53.27 8.42 18.93 1561 13.19
11303 65.65 26.32 52.47 64.56 55.45 121.1 2.475 2.518 3.194 3.947 1.204 1.089 31.03 10.19 43.2 1582 13.07
11378 59.18 26.19 41.54 62.97 55.12 114.3 2.99 2.956 3.229 4.254 1.143 1.621 57.57 9.77 18.3 1823 15.84
11498 58.77 26.95 41.91 61.79 57.63 116.4 2.884 3.452 4.209 5.262 1.432 1.45 57.89 11.04 17.83 3176 27.2
11584 65.54 27.1 40.29 59.45 48.56 114.1 3.113 2.141 3.067 3.69 1.153 1.228 48.75 10.36 19.33 1233 10.67
1161 67.91 27.05 42.16 62.88 52.99 120.9 3.122 2.342 4.13 5.219 1.927 1.106 66.45 9.39 17.82 1942 15.94
11627 61.1 27.67 40.48 61.06 51.4 112.5 3.299 2.099 3.237 4.111 1.164 1.299 54.82 7.84 18.43 1329 11.88
1164 56.34 27.84 38.74 59.3 56.76 113.1 2.658 3.076 3.892 5.246 1.689 1.395 50.85 10.08 17.44 1579 13.86

ICC DF FD PLHT PLWD DGF DM BPB APB BSB ASB TB SDPD PPP YPP 100-SDWT YKGH PROD
11664 59.07 27.13 40.78 61.27 54.43 113.5 3.071 1.902 3.555 4.08 1.982 1.496 66.35 16.71 17.45 1471 12.9
11764 59.24 27.64 40.56 63.56 55.26 114.5 3.109 2.6 3.319 4.26 1.679 1.086 35.93 10.91 37.3 1391 12.06
1180 60.31 27.13 37.6 61.26 50.69 111 3.834 2.651 3.309 4.289 1.226 1.113 43.79 13.42 17.85 1659 14.79
11819 67.13 21.84 41.09 61.18 40.77 107.9 2.718 2.111 3.149 4.932 2.207 1.09 35.46 10.68 35.04 1195 10.99
11879 58.56 27.47 42.68 61.6 55.64 114.2 3.153 2.221 3.863 4.307 1.277 1.124 43.72 12.44 26.1 1379 11.98
11903 63.51 27.76 40.58 61.26 52.79 116.3 2.284 2.261 3.21 4.255 1.267 1.063 35.99 7.92 28.07 1374 11.76
1194 56.08 27.34 43.38 59.12 51.02 107.1 2.913 2.55 2.721 3.855 1.308 1.179 52.65 10.19 19.71 1672 15.47
11944 59.93 27.1 32.06 57.21 47.27 107.2 3.452 2.308 3.215 4.311 1.205 1.558 54.09 10.28 16.24 1877 17.46
12028 61.16 26.32 42.21 61.98 46.94 108.1 2.563 2.408 2.49 4.08 1.288 1.149 36.84 9.49 22.67 1518 13.9
12037 60.69 27.03 43.62 62.5 54.71 115.4 2.763 2.428 3.223 4.517 1.287 1.317 43.63 9.21 19.53 1783 15.36
1205 55.39 27.57 42.05 64.74 45.81 101.2 2.628 2.248 3.332 4.691 1.328 1.458 52.52 10.97 19.68 1915 18.38
12155 55.32 24.77 38.85 61.4 53.58 108.9 3.316 2.344 3.082 4.071 1.498 1.354 55.93 10.64 15.82 1739 15.87
12299 70.48 27.57 37.57 60.81 47.22 117.7 3.404 2.119 2.944 3.3 1.492 1.267 51.68 7.58 15.27 1496 12.58
1230 56.61 27.3 40.4 61.43 55.69 112.3 2.435 2.444 2.752 3.829 1.196 1.422 57.45 10.59 22.37 1946 17.21
12307 56.11 27.27 37.32 59.99 53.69 109.8 2.495 2.282 3.405 3.992 1.287 1.347 49.98 8.78 14.69 1778 16.17
12321 60.09 27.47 45.36 61.6 53.51 113.6 3.253 2.298 2.92 3.491 1.317 1.259 38.78 7.54 16.47 882 7.76
12324 61.56 27.47 51.79 64.97 53.34 114.9 3.069 2.132 3.219 4.04 1.339 1.099 45.17 9.21 25.3 1645 14.2
12328 60.13 27.42 44.91 62.65 53.57 113.7 3.492 2.312 4.229 3.809 1.628 1.14 43.28 9.34 35.97 1973 17.24
12379 60.32 27.23 45.31 64.72 55.38 115.7 2.641 2.253 2.535 4.878 1.237 1.072 38.21 10.31 29.71 1419 12.14
12492 62.04 26.8 53.38 61.86 54.36 116.4 3.873 3.044 3.283 4.112 1.185 1.191 50.94 10.25 21.46 1306 11.15
12537 53.06 27.37 38.61 59.51 58.04 111.1 2.375 2.109 2.442 4.131 1.185 1.376 45.65 7.75 19.48 1622 14.55
12654 55.44 27.71 43.16 61.5 57.56 113 3 3.305 3.104 4.03 1.288 1.483 51.67 10.39 17.81 1752 15.46
12726 55.74 27.47 42.49 63.94 57.36 113.1 2.798 2.292 3.142 4.488 1.154 1.467 51.03 7.27 17.76 1872 16.45
12824 56.27 27.07 44.07 62.24 54.93 111.2 3.011 2.262 2.327 4.206 2.115 1.32 55.5 11.24 17.76 2016 18.07
12851 55.44 27.03 45.25 61.34 55.76 111.2 3.193 2.222 2.984 4.667 1.391 1.163 62.62 10.14 18.53 1779 15.95
12866 55.81 26.8 41.13 63.06 56.19 112 2.97 2.338 2.57 4.574 1.204 1.443 60.47 10.47 18.53 1655 14.67
12916 62.45 27.23 43.14 63.25 51.25 113.7 2.394 2.348 2.601 4.402 1.348 1.276 50.06 11.37 19.63 1629 14.26
12928 65.74 26.73 47.25 63.69 49.46 115.2 2.828 2.279 3.268 4.173 1.303 1.181 57.49 8.35 20.03 1374 11.81

ICC DF FD PLHT PLWD DGF DM BPB APB BSB ASB TB SDPD PPP YPP 100-SDWT YKGH PROD
12947 60.23 27.47 44.07 62.46 51.07 111.3 2.573 2.48 3.181 4.338 1.41 1.155 56.43 13.8 22.45 1924 17.17
13077 62.91 27.37 42.02 63.7 54.09 117 2.755 1.642 3.217 3.973 1.558 1.136 53.34 29.97 24.16 1254 10.66
13124 46.53 27.47 40.1 60.49 62.17 108.7 2.459 2.579 2.313 3.79 1.122 1.102 49.55 12.76 30.76 1953 17.85
13187 62.47 27.72 55.74 64.22 56.43 118.9 3.153 2.368 3.119 4.019 1.287 1.072 34.5 8.03 25.88 1383 11.58
13219 53.55 27.46 40.74 59.68 48.75 102.3 2.375 3.204 2.508 3.295 1.185 1.474 57.92 9.47 19.78 1544 15.05
13283 63.61 27.66 51.06 64.9 54.69 118.3 3.134 2.338 2.428 4.309 1.441 1.219 41.21 12.6 28.88 1600 13.44
13357 64.54 27.67 51.34 68.64 53.06 117.6 3.087 2.73 3.114 4.121 1.431 1.081 48.8 12.84 25.65 1522 12.87
13441 63.9 27.1 55.26 61.43 50.5 114.4 2.724 3.124 3.369 3.549 1.393 1.063 54.51 10.05 19.32 1308 11.4
13461 60.94 27.47 45.32 63.4 47.96 108.9 2.795 2.528 3.059 4.204 1.195 1.298 45.59 9.15 17.14 1321 11.69
13523 59.87 27.77 42.65 64.77 57.93 117.8 3.034 2.445 3.135 4.021 1.256 1.063 43.82 11.8 24.51 1788 15.11
13524 60.49 27.55 42.01 63.9 48.01 108.5 3.279 2.308 3.119 4.413 1.496 1.595 46.08 8.61 17.64 1535 13.92
1356 53.74 27.57 40.05 62.84 54.36 108.1 2.964 2.222 3.241 4.311 1.421 1.108 52.68 12.71 19.95 2086 19.19
13599 59.36 27.23 45.59 64.35 54.14 113.5 3.222 2.368 3.086 4.309 1.446 1.063 46.52 10.36 23.72 1254 10.96
13628 60.69 27.47 42.09 64.26 55.51 116.2 2.405 2.438 3.074 4.081 1.452 1.173 50.22 8.64 20.67 1334 11.42
13719 66.34 27.37 42.39 62.9 46.76 113.1 3.236 2.408 3.211 5.112 2.556 1.229 55.73 11.06 24.86 1319 11.52
13764 58.77 27.57 45.13 63.45 57.43 116.2 2.758 2.308 3.06 4.349 1.496 1.337 43.35 9.05 20.58 1547 13.24
13816 56.99 27.47 43.89 63.41 57.51 114.5 2.346 2.408 3.179 4.228 2.043 1.094 36.99 9.8 25.18 1791 15.57
13863 53.4 27.35 41.67 64.13 54.6 108 2.685 2.349 3.248 4.281 1.348 1.573 54.01 12.03 16.83 1839 16.98
13892 53.52 27.27 37.84 62.34 51.58 105.1 2.805 3.385 3.084 5.071 2.176 1.456 48.12 11.7 17.05 1791 16.97
1392 55.08 26.83 42.21 62.4 56.42 111.5 2.614 2.72 3.331 4.162 1.359 1.223 49.26 12.68 23.97 1888 16.72
1397 55.69 27.17 40.6 62 55.41 111.1 3 2.404 2.885 4.284 1.122 1.182 54.03 11.22 20.8 1441 12.93
1398 48.81 27.37 39.21 61.01 57.09 105.9 2.691 2.289 2.87 4.518 1.287 1.151 66.55 14.16 20.75 1335 12.57
14051 48.01 27.57 38.74 62.42 59.69 107.7 2.429 3.139 3.418 4.249 1.227 1.541 60.1 13.63 17.62 1826 16.91
14077 51.51 27.47 38.14 62.85 55.39 106.9 2.878 4.079 3.259 3.988 1.123 1.356 54.32 8.42 17.62 1874 17.41
14098 45.39 27.44 37.56 61.59 59.91 105.3 3.267 2.593 3.066 3.987 1.287 1.223 51.27 9.3 20.8 1839 17.38
14199 59.03 27.35 42.11 63.94 55.37 114.4 2.661 2.533 2.198 4.065 1.832 1.063 27.15 9.93 36.18 1806 15.69
1422 48.72 27.17 38.05 60.65 56.88 105.6 3.182 2.134 2.962 3.273 1.565 1.231 56.11 10.65 21.64 1601 15.12
1431 58.15 27.06 40.16 61.06 53.55 111.7 2.927 2.726 3.082 4.071 1.143 1.141 52.55 12.49 21.59 1577 13.95

ICC DF FD PLHT PLWD DGF DM BPB APB BSB ASB TB SDPD PPP YPP 100-SDWT YKGH PROD
14402 51.17 27.57 43.39 60.59 53.03 104.2 2.599 2.566 2.654 4.385 1.205 1.389 45.38 10.14 20.54 2069 19.19
14446 67.04 27.13 46.79 62.74 54.86 121.9 2.429 1.461 3.084 3.107 1.143 1.09 31.1 8.87 35.47 959 7.82
14595 37.7 27.37 35.53 62.03 66.7 104.4 2.688 2.19 3.856 4.588 2.155 1.13 47.77 9.81 23.4 2058 19.6
14669 46.3 27.66 37.97 62.88 58.6 104.9 2.797 2.191 3.194 3.973 1.391 1.09 61.21 11.91 21.27 1918 18.27
14778 58.09 27.47 39.87 62.92 52.51 110.6 2.429 2.119 3.06 4.179 1.164 1.289 48.98 9.42 18.17 1635 14.7
14799 58.48 27.34 41.35 63.72 55.02 113.5 2.725 3.075 3.05 4.287 2.434 1.242 54.72 10.44 20.82 1746 15.32
14815 56.39 27.27 42.93 63.24 57.21 113.6 3.222 2.767 3.112 5.015 1.94 1.304 50.44 13.2 19.23 1753 15.36
14831 58.45 27.44 42.16 65.21 53.55 112 2.788 2.625 3.495 4.102 1.102 1.235 59.29 12.73 19.21 1654 14.69
1510 59.54 27.12 51.9 60.64 53.76 113.3 2.48 2.068 3.048 3.88 1.144 1.189 66.62 11.89 21.55 1535 13.47
15248 59.27 27.13 41.42 62.22 52.03 111.3 3.042 2.368 2.937 3.734 1.492 1.102 47.35 9.27 21.54 1513 13.56
15264 55.33 27.39 40.06 61.5 55.67 111 2.805 2.438 3.465 4.686 1.476 1.098 41.66 8.02 25.68 1637 14.7
15294 58.53 27.52 43.79 64.46 58.47 117 2.389 2.574 2.347 5.185 1.102 1.063 44.36 7.61 25.65 1507 12.8
15333 59.47 27.45 55.56 62.53 57.53 117 3.176 2.162 3.819 3.99 1.185 1.078 42.67 10.23 30.4 1749 14.93
15406 59.13 27.15 41.42 63.58 55.57 114.7 2.721 2.19 3.392 3.887 1.595 1.098 39.92 10.8 33.85 2022 17.58
15435 58.53 26.96 47.93 66.44 49.87 108.4 2.528 2.669 2.593 3.776 1.578 1.063 40.67 10.95 29.47 2048 18.98
15510 59.91 27.57 41.37 63.76 55.59 115.5 3.01 2.19 3.243 4.466 2.104 1.111 42.02 8.24 24.72 2569 22.23
15518 43.33 27.84 41.49 63.96 65.07 108.4 2.644 3.053 2.986 3.42 1.163 1.063 41.39 9.95 39.52 1586 14.61
15567 51.71 27.67 37.52 61.76 52.29 104 2.223 2.289 2.891 4.646 1.164 1.126 45.26 7.95 18.55 1519 14.55
15606 54.69 27.07 39.43 61.8 49.11 103.8 2.483 3.076 4.272 5.124 1.123 1.303 53.41 14.26 17.45 2024 19.48
15610 58.44 27.23 41.61 65.22 46.56 105 2.64 2.149 3.066 4.214 1.174 1.414 47.85 11.72 21.39 2114 20.1
15612 51.02 26.93 37.53 64.26 55.18 106.2 2.987 2.434 3.122 3.418 1.123 1.108 54.37 12.15 18.43 1956 18.41
15614 50.45 27.2 34.95 61.69 54.35 104.8 3.159 2.775 3.393 4.3 1.348 1.234 49.18 13.72 17.4 1961 18.71
15618 43.55 27.71 37.49 61.92 60.05 103.6 2.305 3.614 3.223 4.294 1.143 1.487 51.96 10.36 17.29 1899 18.22
15697 55.81 27.3 41.11 64.7 49.39 105.2 2.742 2.563 3.479 3.399 1.184 1.107 43.55 10.06 34.36 1717 16.33
15762 57.02 27.4 40.95 61.43 53.48 110.5 2.378 2.999 2.435 3.589 1.328 1.063 33.05 8.01 29.51 1720 15.48
15785 62.92 27.77 41.02 61.18 48.88 111.8 2.858 2.246 3.128 3.378 1.267 1.077 35.81 8.33 20.35 1260 11.22
15802 58.39 27.81 44.67 63.73 53.81 112.2 3.387 2.149 2.847 4.539 1.473 1.063 40.59 10.15 27.13 1843 16.41
15868 52.26 27.1 40.07 63.92 59.44 111.7 2.384 2.149 3.52 4.473 1.236 1.288 59.74 10.75 18.02 2202 19.69

ICC DF FD PLHT PLWD DGF DM BPB APB BSB ASB TB SDPD PPP YPP 100-SDWT YKGH PROD
15888 57.62 27.66 38.02 64.14 55.58 113.2 2.718 2.813 3.451 4.588 2.023 1.129 58.51 10.17 20.88 1877 16.53
16207 60.19 27.32 42.87 62.84 54.61 114.8 2.27 2.69 3.371 4.392 1.132 1.547 54.18 11.7 20.32 1917 16.64
16261 59.31 27.47 41.49 64.15 54.49 113.8 3.223 3.129 2.183 5.097 2.238 1.31 60.85 10.46 20.19 1714 14.98
16269 59.27 27.3 40.97 61.28 56.03 115.3 3.136 3.11 3.086 5.036 1.393 1.148 51.01 11.09 20.24 1348 11.66
16374 41.01 28.86 42.37 64.22 70.99 112 2.398 2.441 3.299 3.24 1.349 1.296 43.47 10.09 23.02 1670 14.83
16487 62.8 27.61 40.97 62.35 49.7 112.5 2.849 2.441 4.065 4.348 1.495 1.204 43.57 9.29 15.58 1278 11.31
16524 58.83 27.76 37.83 56.36 50.97 109.8 2.693 1.876 2.377 9.246 2.067 1.258 55.74 11.25 16.04 1662 15.05
16654 59.97 27.46 40.97 61.86 53.03 113 2.788 2.401 3.819 4.393 2.001 1.117 37.85 12.34 35.97 1575 13.91
16796 69.16 27.37 45.24 68.54 55.44 124.6 2.549 2.456 2.626 3.377 1.081 1.081 33.74 11.01 36.8 1241 9.92
16903 45.94 27.71 39.36 60.08 56.56 102.5 2.799 2.626 2.28 4.601 1.122 1.182 61.44 9.06 18.5 1921 18.7
16915 50.31 27.03 38.69 62.68 56.49 106.8 2.614 3.136 3.398 4.34 1.37 1.242 62.27 13.28 16.48 2011 18.7
1710 58.15 26.85 45.6 62.64 54.05 112.2 2.503 2.306 3.48 3.728 1.164 1.389 53.21 9.74 18.2 1861 16.52
1715 61 27.37 38.14 62.08 47.9 108.9 2.927 2.694 3.104 4 1.328 1.229 59.35 11.08 18.82 1738 15.48
1882 50.93 27.34 36.59 60.85 56.77 107.7 2.792 3.079 3.454 5.825 1.163 1.192 62.27 13.64 21.11 2053 18.99
1915 70.7 26.49 47.36 64.63 50.9 121.6 2.201 1.71 2.317 3.707 2.158 1.151 32.68 7.95 26.72 1068 8.82
1923 52.15 31.46 41.12 62.45 59.75 111.9 2.986 2.054 3.121 4.083 1.186 1.094 55.05 9.8 21.17 1589 14.18
2065 58.85 27.51 38.5 62.31 53.75 112.6 2.699 2.623 3.228 3.892 1.205 1.295 55.87 10.01 19.45 1772 15.6
2072 52.76 27.84 37.69 61.8 60.14 112.9 3.037 2.523 2.758 4.08 1.246 1.463 54.45 10.77 19.12 1660 14.61
2210 63.39 27.2 39.19 60.99 49.61 113 2.495 2.352 2.27 4.052 1.102 1.285 49.28 9.91 21.07 1401 12.33
2242 60.32 27.77 41.78 62.23 57.68 118 3.652 2.308 3.383 4.083 1.339 1.134 43.94 9.16 20.16 1451 12.23
2263 58.55 27.4 39.76 62.82 53.85 112.4 2.384 2.712 3.945 4.322 2.002 1.229 63.66 12.37 21.06 1816 16.12
2277 62.98 27.47 44.03 63.38 57.32 120.3 3.134 2.461 2.365 4.296 1.37 1.154 43.42 8.42 24.91 1309 10.83
2482 55.54 28.01 40.24 63.54 58.36 113.9 2.853 2.456 3.794 3.89 1.574 1.193 40.88 9.93 24.1 1993 17.49
2507 53.96 27.57 40.82 63.86 58.44 112.4 2.658 2.255 3.438 4.297 1.349 1.321 46.1 8.05 18.37 1258 11.15
2580 52.42 27.42 39.24 62.78 57.98 110.4 2.849 2.169 4.003 4.068 1.432 1.151 51.24 13.18 23.23 1973 17.76
2593 57.1 27.59 46.03 67.08 57.2 114.3 3.627 2.276 3.179 3.523 1.143 1.32 45.28 9.65 18.63 1383 12.04
2629 60.3 27.69 38.56 62.12 52.9 113.2 2.906 2.481 2.197 4.231 1.204 1.224 89.28 13.05 17.56 1605 14.1
2679 67.79 25.82 42.48 67.1 48.21 116 2.933 2.483 2.851 3.317 1.288 1.199 42.82 8.02 20.72 1649 14.15

ICC DF FD PLHT PLWD DGF DM BPB APB BSB ASB TB SDPD PPP YPP 100-SDWT YKGH PROD
2720 67.62 26.39 43.62 66.93 45.28 112.9 2.637 2.96 3.415 4.403 1.713 1.309 64.17 9.83 18.61 1702 15
2737 65.25 27.37 39.54 64.07 50.35 115.6 3.004 2.31 3.102 3.579 1.225 1.271 47.67 7.17 18.08 1237 10.66
283 57.58 27.83 39.57 62.73 57.52 115.1 3.174 3.195 3.423 4.092 1.96 1.181 59.24 13.35 22.95 1993 17.28
2884 55.14 27.89 40.96 64.07 56.36 111.5 3.102 2.428 2.294 4.311 1.277 1.458 57.77 10.91 18.35 1444 12.91
2919 59.5 27.83 43.41 66.16 55.8 115.3 2.984 2.981 2.895 4.351 1.215 1.178 50.04 9.71 22.43 1896 16.41
2969 58.49 26.73 40.59 64.14 56.61 115.1 2.889 2.302 3.44 4.113 1.359 1.272 55.83 10.97 20.68 1997 17.26
2990 61.35 27.23 39.88 61.96 57.25 118.6 2.431 2.289 2.587 3.196 1.68 1.063 44.83 8.74 22.31 1301 10.88
3218 69.92 27.52 39.81 59.15 47.28 117.2 2.588 2.637 3.103 4.216 1.698 1.154 46.58 7.49 18.41 1335 11.34
3230 61.84 28.47 36.25 55.57 46.56 108.4 3.097 2.401 3.163 4.326 1.226 1.148 52.32 9.85 17.56 1606 14.81
3239 61.49 28.06 39.24 58.54 53.91 115.4 3.246 2.385 2.959 4.594 2.156 1.115 43.48 8.41 23.05 1300 11.25
3325 53.84 27.45 37.42 62.16 54.76 108.6 2.944 2.64 4.136 5.327 1.112 1.129 65 10.22 20.94 2116 19.44
3362 54.09 27.67 38.66 62.41 53.01 107.1 2.248 2.363 3.555 3.984 1.185 1.346 52.41 13.6 18.41 2290 21.36
3391 53.6 27.57 38.84 59.08 57.2 110.8 3.328 1.99 3.285 3.326 1.206 1.302 40.87 10.26 22.41 1742 15.67
3410 56.52 27.47 40.35 61.91 56.78 113.3 3.142 2.244 3.004 4 1.451 1.264 43.26 9.31 26.18 1769 15.5
3421 62.45 26.53 40.92 61.96 51.25 113.7 2.983 2.342 3.08 3.523 1.637 1.35 43.93 9.99 24.68 1515 13.28
3512 61.77 27.27 36.21 55.48 48.73 110.5 3.114 2.602 2.528 4.164 2.032 1.09 50.78 8.51 22.73 1422 12.82
3582 62 27.47 39.83 65.89 55.5 117.5 2.503 2.852 3.217 3.388 1.638 1.282 50.03 9.92 19.69 1547 13.13
3631 60.94 27.44 42.31 64.38 54.56 115.5 2.93 2.129 3.181 3.96 1.93 1.51 48.33 9.9 20.45 1570 13.58
3761 53.98 27.47 43.33 65.42 55.52 109.5 2.805 2.607 3.257 3.592 1.267 1.426 58.84 10.68 19.22 1464 13.33
3776 54.53 27.82 44.03 66.03 60.07 114.6 2.558 2.84 3.088 5.166 1.143 1.398 47.18 8.28 19.06 1709 14.87
3892 55.54 26.09 38.13 59.07 54.46 110 2.302 2.755 2.926 4.281 1.185 1.333 46.81 5.95 18.76 1385 12.58
3946 61.06 27.57 40.71 66.56 56.44 117.5 2.594 2.915 3.084 4.429 1.257 1.333 51.99 10.98 19.91 1679 14.21
4093 58.68 27.54 43.27 62.02 57.22 115.9 3.105 2.177 3.102 4.265 1.287 1.435 66.21 8.6 19.07 1599 13.74
4182 53.82 26.42 42.51 60.97 56.28 110.1 3.529 2.82 3.05 4.467 1.123 1.436 49.98 9.85 19.9 1452 13.13
4363 48.38 27.93 40.69 59.35 61.42 109.8 2.705 2.516 2.485 2.941 1.236 1.531 48.61 10.31 17.16 1305 11.83
440 60.35 27.13 42.33 62.44 56.35 116.7 3.475 3.777 3.124 5.14 1.533 1.695 52.58 8.93 18.31 1667 14.24
4418 53.84 27.69 43.38 61.96 56.76 110.6 3.024 2.199 2.903 4.268 1.309 1.389 56.64 8.53 18.72 1714 15.44
4463 60.96 27.67 41.65 55.92 56.44 117.4 2.838 2.283 4.357 5.499 1.226 1.343 44.78 7.32 18.43 1194 10.15

ICC DF FD PLHT PLWD DGF DM BPB APB BSB ASB TB SDPD PPP YPP 100-SDWT YKGH PROD
4495 52.79 27.37 39.31 61.22 57.11 109.9 2.595 3.166 3.131 4.456 1.163 1.144 54.28 14.51 20.55 1750 15.93
4533 44.22 27.57 34.97 55.86 65.18 109.4 2.657 2.737 2.37 3.269 1.308 1.255 52.46 13.46 23.64 2064 18.84
456 58.68 26.91 39.14 62.54 52.92 111.6 2.534 2.325 3.022 4.207 1.164 1.276 65.92 11.78 20.1 1673 14.94
4567 55.69 27.91 43.06 64.25 56.71 112.4 2.375 3.148 3.423 4.524 2.001 1.259 68.19 17.08 22.7 2309 20.54
4593 59.04 27.96 40.16 64.47 54.96 114 2.697 3.373 2.76 3.625 1.37 1.155 68.67 12.12 20.33 1677 14.67
4639 59.95 27.07 39.79 61.77 53.85 113.8 3.344 2.177 3.349 4.336 1.248 1.127 67.41 11.48 20.7 1851 16.17
4657 58.94 28.16 35.06 60.7 49.96 108.9 3.956 2.456 2.982 4.256 1.236 1.403 58.06 8.59 18.94 1639 14.77
4814 56.7 27.03 40.4 59.93 56.5 113.2 3.236 2.758 2.794 4.176 1.514 1.376 43.08 10.3 19.22 1340 11.78
4841 61.49 27.37 40.87 62.71 50.01 111.5 3.566 2.247 3.615 4.207 1.245 1.198 38.57 11.43 26.52 1532 13.59
4853 51.8 27.66 40.99 62.47 61 112.8 3.338 3.632 2.518 4.159 1.329 1.611 60.23 15.82 20.55 1599 14.13
4872 49.19 27.67 36.79 61.56 58.91 108.1 3.118 2.705 3.122 4.841 1.411 1.09 58.13 11.02 24.18 1790 16.49
4918 43.85 28.19 36.88 60.32 61.25 105.1 3.057 2.316 3.617 4.123 1.617 1.157 58.44 13.05 20.29 2074 19.63
4991 57.92 27.49 41.35 63.17 49.48 107.4 2.279 2.813 3.115 7.524 2.499 1.339 68.12 11.03 16.85 1897 17.29
506 50.68 28.18 38.93 63.61 53.22 103.9 2.374 3.341 2.838 4.321 1.536 1.171 62.59 11.4 20.68 1865 17.47
5135 59.79 28.11 37.58 62.62 52.41 112.2 2.182 2.129 2.555 6.157 3.37 1.222 50.53 10.59 20.17 1689 14.98
5221 50.7 27.86 39.15 62.5 60.4 111.1 2.302 2.413 4.099 4.087 1.411 1.161 77.59 11.8 19.74 1935 17.37
5337 69.48 23.93 43.01 63.65 43.32 112.8 2.771 2.591 3.239 4.102 1.248 1.164 51.16 13.91 25.12 1394 12.29
5383 53.16 28.23 37.53 59.41 58.54 111.7 2.879 2.999 3.291 4.166 1.278 1.218 65.34 11.37 24.82 2118 18.96
5434 51.92 27.96 17.31 57.86 57.38 109.3 3.188 2.29 2.976 3.416 1.237 1.232 48.14 10.85 19.8 1535 14.01
5504 58.38 27.57 42.84 63.02 56.42 114.8 2.93 3.385 2.546 5.095 1.206 1.2 47.76 10.75 24.85 1765 15.33
5613 51.33 27.67 39.67 62.36 54.67 106 2.379 2.25 3.254 3.42 1.287 1.287 48.73 9.21 20.69 1802 17.07
5639 51.92 27.96 39.66 61.3 55.98 107.9 2.899 2.611 3.359 4.547 1.185 1.367 60.24 9.4 20.72 1888 17.5
5845 61.52 27.27 39.63 62.03 49.48 111 2.954 3.183 3.088 4.689 1.278 1.41 51.07 8.48 17.82 1634 14.71
5878 53.59 27.57 36.98 60.08 52.51 106.1 2.773 2.98 2.776 4.56 1.288 1.334 59.94 10.15 16.9 1954 18.36
5879 49.77 27.55 37.57 59.67 59.73 109.5 2.904 2.544 3.117 4.627 1.277 1.39 55.07 16.87 19.93 2057 18.77
6263 60.37 26.68 43.55 59.49 53.53 113.9 2.501 2.169 2.762 3.399 1.329 1.135 45.31 9.61 26.36 1392 12.2
6279 43.87 28.33 37.52 57.81 65.33 109.2 2.617 2.19 3.084 4.352 1.122 1.148 51.42 10.69 18.99 1760 16.05
6293 59.6 28.33 41.56 63.73 56.2 115.8 3.084 2.418 3.098 3.936 1.236 1.319 52.9 9.85 18.05 1364 11.7

ICC DF FD PLHT PLWD DGF DM BPB APB BSB ASB TB SDPD PPP YPP 100-SDWT YKGH PROD
6294 63.46 27.96 44.96 68.22 51.34 114.8 3.193 2.141 3.006 4.062 1.268 1.15 40.25 9.9 25.76 1123 9.74
6306 70.92 26.93 47.72 67.71 50.68 121.6 2.682 2.432 2.747 3.192 1.826 1.356 38.3 21.4 26.28 1126 9.24
637 52.68 27.84 40.6 60.8 57.82 110.5 3.048 2.265 3.066 3.947 1.081 1.122 52.8 9.86 22.29 1741 15.74
6537 54.53 27.77 40.68 61.76 56.57 111.1 2.694 2.416 3.518 4.346 1.972 1.348 56.1 11.28 18.17 1819 16.31
6571 55.09 27.96 41.12 61.92 52.21 107.3 2.682 2.059 3.159 3.941 1.122 1.224 66.08 10.99 18.54 1759 16.35
6579 53.36 27.69 41.1 62.78 54.94 108.3 2.645 2.325 2.197 4.114 1.309 1.536 65.28 12.36 19.13 1794 16.51
67 51.02 27.59 40.55 65.65 56.58 107.6 2.91 3.079 3.341 4.083 2.095 1.355 63.7 13.87 21.29 1675 15.5
6802 60.19 27.99 40.23 64.95 52.81 113 2.867 2.607 2.503 4.319 1.761 1.357 50.02 10.96 19.3 1737 15.25
6811 55.31 27.1 40.88 64.02 51.09 106.4 2.671 2.29 3.024 4.537 1.102 1.592 47.78 7.87 17.88 1578 14.84
6816 49.01 27.5 40.64 63 63.09 112.1 2.651 2.24 3.082 4.67 1.226 1.337 50.33 11.12 17.86 2050 18.18
6874 52.21 28.19 36.88 58.41 56.79 109 3.031 2.379 3.323 4.114 1.122 1.264 66.9 12.65 18.48 2023 18.49
6875 67.16 22.83 41.99 64.14 51.14 118.3 3.196 2.202 3.263 4.152 1.196 1.113 46.91 9.9 21.79 1267 10.64
6877 61.22 26.93 41.05 65.36 51.08 112.3 2.95 2.179 3.172 4.1 1.412 1.063 46.99 11.37 25.24 1748 15.47
7052 61.47 27.79 41.45 62.64 53.33 114.8 2.81 2.448 2.438 3.159 1.185 1.456 42.49 7.35 17.06 1125 9.73
708 60.42 27.69 40.38 63.12 54.98 115.4 2.828 2.359 3.007 3.921 1.185 1.14 61.82 11.62 22.42 1978 17.09
7150 65.26 24.01 44.36 65.95 49.24 114.5 2.997 2.369 3.05 4.006 1.278 1.147 49.86 10.76 23.41 1218 10.58
7184 65.16 27.13 42.35 65.94 50.84 116 3.303 2.331 2.916 4.036 1.226 1.472 54.23 9.59 17.26 1518 13.04
7255 53.5 28.13 44.49 64.92 56.9 110.4 3.873 2.221 3.018 4.746 1.37 1.164 49.37 10.77 30.26 1795 16.24
7272 55.75 28.28 45.7 67.41 56.45 112.2 2.46 2.577 3.119 4.124 2.002 1.063 45.07 11.65 29.96 1776 15.79
7305 60.83 27.54 42.34 62.01 56.07 116.9 3.148 3.088 2.982 3.994 1.195 1.252 53.64 6.85 21.67 1534 13.09
7308 51.56 28.31 45.99 69.22 60.94 112.5 2.52 2.542 3.39 4.576 12.328 1.197 51.08 15.21 26.01 1703 15.11
7315 56.46 27.37 43.9 65.04 57.04 113.5 2.588 2.536 3.186 4.908 1.143 1.169 44.36 11.61 29.38 1651 14.49
7323 60.3 27.47 48.55 63.75 56.2 116.5 2.988 2.568 2.415 4.211 1.309 1.236 41.31 10.29 23.13 1082 9.26
7326 60.2 27.57 43.77 67.56 53.9 114.1 3.137 2.187 3.121 5.228 1.205 1.145 52.74 12.39 22.88 1543 13.49
7413 51.32 27.15 39.92 62.07 59.38 110.7 2.95 3.191 3.345 5.167 1.33 1.063 64.32 9.76 22.12 1850 16.69
7441 53.36 27.66 42.21 61.24 55.64 109 2.189 2.96 3.104 4.39 1.289 1.222 63.04 11.94 20.11 1878 17.2
7554 58.27 27.37 45.26 63.25 56.13 114.4 2.305 2.318 3.164 3.605 1.349 1.165 48.05 12.42 25.11 1732 15.08
7571 58.79 27.87 44.16 64.47 56.71 115.5 3.276 2.24 3.319 4.283 1.349 1.142 39.43 8.54 23.75 1631 14.01

ICC DF FD PLHT PLWD DGF DM BPB APB BSB ASB TB SDPD PPP YPP 100-SDWT YKGH PROD
762 63.45 28.04 44.11 64.34 56.25 119.7 3.117 2.533 3.08 4.081 2.032 1.292 50.29 11.14 21.56 1512 12.59
7668 53.39 28.18 43.92 64.32 60.01 113.4 3.163 2.468 3.141 4.08 1.207 1.19 46.78 11.54 22.7 1728 15.2
7819 60.72 28.03 43.75 61.6 53.78 114.5 2.278 2.595 3.07 3.535 1.206 1.112 44.37 9.66 23.13 1550 13.51
7867 62.38 26.93 52.35 62.3 51.32 113.7 2.793 2.475 2.163 4.03 1.081 1.085 47.19 8.88 22.36 1396 12.17
791 61.31 27.94 53.84 61.96 56.39 117.7 2.455 2.26 2.884 4.767 1.909 1.154 48.42 8.91 20.52 1663 14.12
8058 70.45 26.21 53.34 61.96 50.95 121.4 2.805 2.284 2.258 4.164 1.277 1.19 51.38 9.17 20.64 1238 10.16
8151 61.31 27.66 49.77 63.17 52.59 113.9 3.196 2.242 2.88 4.123 1.132 1.089 39.34 11.82 34.66 1585 13.88
8195 60.07 21.09 54.07 60.52 50.43 110.5 3.368 1.872 3.248 4.423 1.513 1.335 58.32 10.02 17.71 1436 12.97
8200 60.07 27.86 55.83 60.33 52.43 112.5 2.513 2.564 3.084 4.175 2.443 1.063 49.88 9.02 23.74 1572 13.97
8261 52.95 27.66 53.32 63.82 58.45 111.4 2.903 2.047 3.226 3.952 1.081 1.124 42.12 9.33 32.67 1574 14.09
8318 36.53 28.09 38.62 61.38 67.47 104 2.96 2.598 3.355 3.491 1.328 1.113 54.45 12.87 23.28 2410 23.19
8350 58.63 27.57 51.33 64.06 47.77 106.4 2.924 3.197 3.199 4.423 1.287 1.137 46.5 14.51 32.67 1541 14.41
8384 51.69 27.71 42.26 60.7 63.41 115.1 2.298 2.628 3.287 4.133 1.698 1.255 62.01 13.11 20.23 2062 17.85
8515 67.24 27.88 55.05 69.45 48.36 115.6 2.449 2.924 3.116 4.734 1.081 1.174 45.86 8.38 22.2 1317 11.33
8521 67.24 25.62 56.71 69 51.06 118.3 2.772 1.67 2.437 4.068 1.215 1.195 43.54 9.44 22.18 1182 10.01
8522 51.79 27.34 40.78 60.26 61.91 113.7 2.562 2.437 2.734 4.185 1.194 1.354 51.3 8.7 18.57 1741 15.27
8607 55.29 27.23 53.22 61.92 54.21 109.5 3.035 3.012 2.62 4.03 1.081 1.546 61.74 13.52 19.26 1785 16.29
8621 48.91 27.67 44.57 59.98 58.29 107.2 2.423 2.348 2.84 3.529 1.453 1.155 57.31 11.29 20.18 1936 18.02
867 51.21 27.44 41.13 61.72 60.09 111.3 2.432 1.799 3.187 7.169 1.901 1.099 57.2 12.16 21.9 1707 15.28
8718 60.72 27.54 51.79 64.4 54.38 115.1 3.062 2.099 2.725 4.038 1.492 1.185 54.72 9.71 21.69 1593 13.78
8740 64.91 27.64 64.34 68.21 54.49 119.4 2.329 2.149 2.986 3.615 1.328 1.087 43.62 9.05 21.23 1411 11.76
8752 51.21 28.13 61.02 61.73 65.49 116.7 2.745 2.468 2.815 4.34 1.081 1.259 48.49 10.78 21.83 1513 12.95
8855 53.95 27.23 44.29 62.21 56.95 110.9 3.122 2.941 2.35 4.506 1.369 1.162 48.36 9.31 22.22 1730 15.55
8950 53.95 27.23 41.07 60.62 58.05 112 2.64 3.603 3.327 4.214 1.363 1.416 48.46 10.52 19.47 1940 17.27
9002 55.29 27.86 41.42 59.14 52.91 108.2 2.452 2.508 3.044 4.009 1.492 1.345 56.76 11.09 19.14 1545 14.19
9137 58.38 28.33 44.26 67.92 55.62 114 2.569 2.408 2.373 4.05 1.204 1.072 41.61 11.23 36.61 1725 15.07
9402 60.55 27.96 41.59 62.99 53.05 113.6 3.029 2.468 2.65 3.18 1.122 1.372 48.51 9.67 23.52 1065 9.32
9418 60.55 27.96 42.21 64.22 53.05 113.6 2.914 2.249 3.283 3.346 1.288 1.46 41.25 9.23 21.05 1144 9.99

ICC DF FD PLHT PLWD DGF DM BPB APB BSB ASB TB SDPD PPP YPP 100-SDWT YKGH PROD
9434 65.39 27.42 43.89 62.98 53.21 118.6 2.827 2.169 2.683 4.282 1.909 1.219 57.42 10.28 21.21 1308 10.95
95 59.39 27.47 37.87 65.22 55.41 114.8 2.588 3.221 3.209 4.421 1.225 1.315 55.71 8.18 19.62 1686 14.65
9586 56.37 27.23 41.32 61.96 55.23 111.6 3.092 2.239 4.051 4.223 1.267 1.095 47.93 10.35 21.99 1122 10
9590 41.28 27.77 43.52 64.15 69.62 110.9 2.768 2.92 3.259 4.237 1.081 1.308 54.49 8.34 18.81 1807 16.29
9636 59.13 28.36 40.36 61.91 53.67 112.8 3.253 2.63 2.924 4.962 1.081 1.379 54.77 12.4 19.45 1312 11.6
9643 59.13 28.77 42.73 64.03 52.97 112.1 3.189 2.348 3.407 4.589 1.287 1.156 50.68 12.79 19.89 1461 13
9702 60.58 27.57 45.78 63.01 54.62 115.2 3.455 2.548 3.325 3.397 1.574 1.165 46.93 10.25 20.57 1691 14.65
9712 59.39 27.47 42.76 61.46 55.31 114.7 3.508 2.787 3.245 5.48 1.554 1.163 46.8 8.79 19.95 1260 10.92
9755 57.46 27.77 42.54 64.21 47.74 105.2 3.168 2.9 2.692 4.071 1.328 1.189 55.84 9.33 20.81 1242 11.66
9848 59.13 27.96 44.19 64.04 55.07 114.2 3.037 2.204 3.409 4.941 1.909 1.085 49.83 9.86 22.88 1486 12.95
9862 55.29 27.72 44.37 63.99 57.71 113 2.433 2.419 3.221 5.324 1.492 1.125 54.51 11.25 19.91 1708 15.03
9872 58.91 27.55 41.96 62.08 52.69 111.6 2.983 2.229 2.991 5.357 1.245 1.157 45.73 10.91 20.83 1510 13.52
9895 55.06 28.36 41.96 62.08 58.74 113.8 3.122 3.164 2.992 4.822 1.328 1.167 58.48 9.27 21.18 2038 17.91
9942 53.13 27.96 37.32 59.52 57.67 110.8 2.546 4.924 4.335 5.121 1.081 1.273 62.17 8.18 18.67 1875 16.9
20267 46.63 28.29 41.22 59.6 62.27 108.9 2.72 2.553 2.98 3.6 1.86 1.047 54.85 15.94 31.28 1891 17.3
18828 53.13 29.62 38.64 62.64 63.37 116.5 2.351 3.182 3.225 4.19 1.081 1.089 46.71 14.39 27.38 1689 14.47
18836 58.91 27.55 41.99 64.39 55.59 114.5 2.711 3.084 3.421 4.275 1.204 1.108 46.61 9.85 18.13 1230 10.75
18839 59.16 28.23 41.28 59.66 53.44 112.6 3.373 2.57 3.111 4.03 1.442 1.063 55.03 12.43 21.88 1654 14.62
18847 58.69 28.63 43.69 61.37 49.71 108.4 3.01 2.424 2.687 4.05 1.379 1.406 41.25 10.92 24.17 1538 14.06
18858 56.27 27.55 52.18 64.39 59.13 115.4 3.408 2.308 4.181 4.941 2.688 1.306 54.24 12.11 23.49 1504 12.99
18884 59.49 27.93 43.69 59.66 62.11 121.6 3.296 2.029 2.938 4.061 1.482 1.072 45.89 11.52 23.83 1251 10.14
18679 57.11 27.96 47.1 68.17 55.99 113.1 2.398 2.924 3.263 3.989 1.453 1.116 47.27 12.27 21.9 1942 17.11
20266 59.49 28.5 46.97 59.18 56.81 116.3 3.008 2.844 2.864 4.34 1.132 1.099 41.95 8.16 46.42 1152 9.86
20262 47.84 28.5 43.23 60.24 67.16 115 2.923 2.139 3 5.159 1.122 1.176 49.57 9.66 19.03 1474 12.77
20265 68.76 27.37 59.91 45.21 46.64 115.4 3.236 3.363 3.307 5.112 1.267 1.329 47.11 7.81 17.45 1384 11.98
20263 59.49 27.66 53.23 60.1 55.51 115 3.413 2.484 3.252 3.926 1.348 1.262 42.87 6.49 20.22 1292 11.19
20261 59.49 27.66 41.54 60.1 52.91 112.4 2.99 3.164 2.862 4.009 1.328 1.106 40.18 8.68 21.49 1217 10.78
20259 63.73 27.59 41.54 60.1 52.17 115.9 2.867 3.184 3.186 5.148 1.081 1.095 40.03 8.65 18.26 1337 11.51

ICC DF FD PLHT PLWD DGF DM BPB APB BSB ASB TB SDPD PPP YPP 100-SDWT YKGH PROD
18699 59.49 24.01 39.86 60.1 53.01 112.5 3.388 2.689 3.531 4.392 2.115 1.106 45.89 9.95 24.99 1741 15.44
18720 57.11 27.96 40.43 62.17 57.99 115.1 3.027 2.884 3.414 4.019 1.909 1.089 50.16 12.41 26.77 1490 12.93
18912 58.91 27.55 35.94 62.06 52.99 111.9 2.648 2.364 2.328 4.216 1.287 1.089 47.69 8.49 26.56 1442 12.86
19034 58.91 27.35 88.99 62.24 55.69 114.6 2.318 2.964 3.264 4.423 1.909 1.072 44.35 10.86 27.89 1468 12.78
20174 89.34 32.35 30.08 66.93 41.892 131.23 3.502 2.064 4.298 3.172 1.164 1.207 45.29 14.50 20.77 438.84 3.34
18983 51.6 30.33 56.68 62.95 65.6 117.2 2.484 2.481 2.753 3.109 1.458 1.093 43.87 14.48 34.52 1159 9.71
20264 58.45 27.96 45.68 62.19 56.05 114.5 3.049 2.149 3.285 4.941 1.102 1.353 48.89 8.24 30.91 1378 11.97
19226 68.76 27.37 45.68 62.19 47.54 116.3 2.617 2.428 3.246 4.154 1.112 1.128 43.97 8.72 21.76 1071 9.14
19011 57.11 28.23 92.45 62.19 57.09 114.2 2.268 2.348 2.805 3.491 1.698 1.063 42.24 5.94 30.14 1162 10.14
18724 68.76 27.37 65.45 62.63 49.64 118.4 3.189 2.708 3.008 4.941 1.247 1.081 41.94 6.74 28.66 1205 10.11
19095 59.49 27.96 54.76 66.62 54.51 114 2.586 2.695 2.41 4.858 1.453 1.111 44.31 9.9 25.6 1244 10.83
19100 55.77 27.3 62.01 63.54 55.23 111 3.017 3.124 3.206 2.929 1.33 1.063 46.76 11.3 21.46 1622 14.54
20260 57.07 29.34 63.48 66.61 54.83 111.9 2.62 2.628 2.592 4.112 1.163 1.089 39.63 8.34 21.86 1165 10.35
20183 55.36 32.81 31.34 58.44 64.486 119.85 3.049 2.179 3.906 3.648 1.427 1.232 37.58 11.79 17.53 323.42 2.69
20190 53.36 31.48 32.28 56.85 60.902 114.26 2.855 2.179 3.47 3.752 2.45 1.214 39.13 11.73 14.83 322.47 2.82
20192 54.33 31.24 30.8 60.32 60.592 114.92 3.212 2.179 4.021 3.395 2.851 1.221 39.55 11.70 14.11 297.86 2.60
20193 52.64 32.9 28.78 59.97 59.308 111.95 3.098 2.179 3.501 3.578 2.171 1.231 35.73 10.01 14.82 289.39 2.63
20194 61.86 26.2 26.34 54.68 54.18 116.04 2.949 2.179 3.584 3.381 2.132 1.223 33.60 9.82 15.19 260.01 2.27
20195 57.05 29.03 31.65 56.72 63.098 120.15 3.003 2.164 3.513 3.524 2.251 1.202 40.69 11.58 15.49 291.48 2.46
19122 60.5 27.71 59.75 67.03 53.7 114.2 2.873 2.234 3.387 4.559 1.248 1.168 45.2 9.31 18.91 1203 10.43
19147 62.11 27.96 59.44 66.2 50.39 112.5 2.865 2.924 2.913 4.013 1.143 1.077 51.18 8.29 16.98 1395 12.35
19164 64.85 24.16 67.78 68.26 49.05 113.9 2.99 2.556 3.006 4.659 1.903 1.418 46.63 16.8 21.77 1365 11.94
19165 58.68 27.69 51.73 66.33 53.72 112.4 2.648 3.241 2.544 4.299 1.225 1.134 44.65 13.36 49.42 1671 14.78
Control cultivars
4918 48.76 27.56 42.13 48.25 55.44 104.2 3.19 4.144 5.472 5.357 3.808 1.288 61.41 21.89 19.88 1395 13.85
4948 59.68 29.92 51.68 59.01 50.72 110.4 3.042 3.398 3.576 5.607 3.397 1.222 58.06 15.89 15.44 1516 13.68
15996 49.81 31.24 45.22 62.91 56.79 106.6 2.537 4.475 5.726 6.791 3.393 1.476 53.72 18.92 16.69 1719 16
V9231 40.25 31.31 49.21 55.97 65.55 105.8 2.327 3.356 1.369 4.987 1.375 1.058 51.36 18.97 32.26 1646 15.58

ICC DF FD PLHT PLWD DGF DM BPB APB BSB ASB TB SDPD PPP YPP 100-SDWT YKGH PROD
1
4973 63.16 28.36 54.91 68.31 50.84 114 3.02 4.569 4.468 10.171 3.726 1.375 54.03 18.77 19.09 1401 12.31
DF = days to 50% flowering, FD = flowering duration, PLHT = plant height, PLWD = plant width, DGF=Days to Grain Filling, DM = days to maturity, BPB = basal primary branches, APB = apical primary branches, BSB = basal secondary branches, ASB = apical secondary branches, TB = tertiary branches, SDPD = seed per pod, PPP = pods per plant, YPP = yield per plant, SDWT = 100-seed weight, YKGH = plot yield, PROD = per day productivity
Related Documents