1 Genotype-dependent response to carbon availability in growing tomato 1 fruit 2 Short running title: Responses to carbon availability in tomato fruit 3 4 Marion PRUDENT 1,2, *, Nadia BERTIN 1 , Michel GENARD 1 , Stéphane MUÑOS 2 , Sophie 5 ROLLAND 2 , Virginie GARCIA 3 , Johann PETIT 3 , Pierre BALDET 3 , Christophe ROTHAN 3 , 6 Mathilde CAUSSE 2 7 1 INRA, UR1115 Plantes et Systèmes de culture Horticoles, F-84000 Avignon, France 8 2 INRA, UR1052 Génétique et Amélioration des Fruits et Légumes, F-84000 Avignon, France 9 3 INRA, UMR619 Biologie du fruit, F-33883 Villenave d’Ornon, France 10 11 * Author to whom correspondence should be sent: 12 Marion PRUDENT 13 Address: INRA, UMR Génétique et Ecophysiologie des Légumineuses à graines, 17 rue de Sully, 14 21000 Dijon, France 15 Tel : 00 33 380 693 681 16 Fax : 00 33 380 693 263 17 E-mail : [email protected] 18 19 20 hal-00600426, version 1 - 15 Jun 2011 Author manuscript, published in "Plant Cell & Environment (2010) 33, 1186-1204"

Welcome message from author
This document is posted to help you gain knowledge. Please leave a comment to let me know what you think about it! Share it to your friends and learn new things together.
Transcript

1
Genotype-dependent response to carbon availability in growing tomato 1
fruit 2
Short running title: Responses to carbon availability in tomato fruit 3
4
Marion PRUDENT1,2,*, Nadia BERTIN
1, Michel GENARD1, Stéphane MUÑOS
2, Sophie 5
ROLLAND2, Virginie GARCIA
3, Johann PETIT3, Pierre BALDET
3, Christophe ROTHAN3, 6
Mathilde CAUSSE2
7
1 INRA, UR1115 Plantes et Systèmes de culture Horticoles, F-84000 Avignon, France 8
2 INRA, UR1052 Génétique et Amélioration des Fruits et Légumes, F-84000 Avignon, France 9
3 INRA, UMR619 Biologie du fruit, F-33883 Villenave d’Ornon, France 10
11
* Author to whom correspondence should be sent: 12
Marion PRUDENT 13
Address: INRA, UMR Génétique et Ecophysiologie des Légumineuses à graines, 17 rue de Sully, 14
21000 Dijon, France 15
Tel : 00 33 380 693 681 16
Fax : 00 33 380 693 263 17
E-mail : [email protected] 18
19
20
hal-0
0600
426,
ver
sion
1 -
15 J
un 2
011
Author manuscript, published in "Plant Cell & Environment (2010) 33, 1186-1204"
2
Abstract 1
Tomato fruit growth and composition depend on both genotype and environment. This paper 2
aims (i) at studying how fruit phenotypic responses to changes in carbon availability can be 3
influenced by genotype and (ii) at identifying genotype-dependent and -independent changes in 4
gene expression underlying variations in fruit growth and composition. To this end, we grew a 5
parental line (S. lycopersicum) and an introgression line from S. chmielewskii harboring QTL for 6
fresh weight and sugar content under two fruit loads (FL). Lowering fruit load increased fruit cell 7
number and reduced fruit developmental period in both genotypes. In contrast, fruit cell size was 8
increased only in the parental line. Modifications in gene expression were monitored in expanding 9
fruits using microarrays and RT-qPCR for a subset of genes. FL changes induced more deployments 10
of regulation systems (transcriptional and post transcriptional) than massive adjustments of whole 11
primary metabolism. Interactions between genotype and FL were especially noticeable for 99 12
genes mainly linked to hormonal and stress responses, and on gene expression kinetics during 13
fruit development. Links between gene expression and fruit phenotype were found for aquaporin 14
expression levels and fruit water content, and invertase expression levels and sugar content during 15
fruit ripening phase. In summary, the present data emphasized age- and genotype-dependent 16
responses of tomato fruit to carbon availability, at phenotypic as well as at gene expression level. 17
Keyword index 18
Fruit growth, gene expression, genotype x environment interaction, hormone, metabolism, 19
regulations, Solanum lycopersicum, stress response, sugar, transcriptome 20
21
hal-0
0600
426,
ver
sion
1 -
15 J
un 2
011

3
1
Introduction 2
Carbohydrate availability is a major factor limiting plant growth, in particular for sink organs such 3
as fruits. In tomato, carbohydrates needed for fruit growth come from photosynthetic sources 4
such as mature leaves, fruits having a low photosynthetic activity (Farrar & Williams 1991). 5
Increasing carbohydrate availability to the reproductive organs by reducing fruit load on the plant 6
enhances cell division in the ovary and thereby the final fruit size (Baldet et al. 2006). Conversely, a 7
low carbohydrate supply during the phase of rapid cell expansion leads to a reduction of fruit size 8
(Bertin et al. 2003; Heuvelink 1997) and even of dry matter (Gautier, Guichard & Tchamitchian 9
2001). In the case of severe carbon stress, sugar, protein and amino-acid contents can all be 10
reduced (Baldet et al. 2002; Gary et al. 2003). Fruit sugar content is the consequence of sucrose 11
import, carbohydrate metabolism, and dilution by water (Ho 1996). Sucrose enters the cells either 12
via the apoplasm after conversion to hexose by a parietal invertase, or via the symplasm. In the 13
cytoplasm, sucrose may be converted into fructose and glucose by invertase, or into fructose and 14
UDP-glucose by sucrose synthase (Frommer & Sonnewald 1995; Yelle et al. 1988). Hexoses are 15
then transformed into starch by the successive actions of fructokinase, hexokinase, 16
phosphoglucoisomerase, phosphoglucomutase, ADP-glucose-pyrophosphorylase and starch 17
synthase (Schaffer & Petreikov 1997a; Schaffer & Petreikov 1997b; Damari-Weissler et al. 2006). 18
Starch is transiently stored in the amyloplasts, and constitutes a carbon reservoir for hexose 19
synthesis (Dinar & Stevens 1981). The accumulation of carbohydrates in the fruit leads to a 20
gradient of osmotic pressure, causing first a massive entrance of water, notably via aquaporins 21
(see Kaldenhoff et al. 2008 for review), and subsequently cell expansion (Ho, Grange & Picken 22
1987). This expansion relies on cell wall plasticity, determined partly by the activity of enzymes 23
related to the synthesis or degradation of cell wall components in the epidermis as well as in the 24
hal-0
0600
426,
ver
sion
1 -
15 J
un 2
011
4
pericarp (Thompson, Davies & Ho 1998). Many of these processes are affected by hormones. 1
Cytokinins may affect fruit sugar content (Martineau et al. 1995), while auxins and gibberellins can 2
be involved in the regulation of cell enlargement, by controlling the expression of genes encoding 3
cell wall modifying proteins like expansins (Catala, Rose & Bennett 2000; Chen & Bradford 2000; 4
Chen, Nonogaki & Bradford 2002; Guillon et al. 2008). 5
Large-scale quantification of gene expression in tomato has been shown to be a powerful tool for 6
characterizing plant response to a variety of conditions, including salt stress (Ouyang et al. 2007), 7
light (Facella et al., 2008), developmental changes (Alba et al. 2005; Vriezen et al. 2008), 8
differentiation of specialized tissues (Lemaire-Chamley et al. 2005), mutants (Kolotilin et al., 2007) 9
or introgressions of genomic segments (Baxter et al. 2005). To our knowledge, the effect of 10
carbohydrate availability on tomato transcriptome has never been investigated, although many 11
genes are known to be sugar sensitive (Koch 1996). In fruit, the effect of carbohydrate availability 12
was only investigated for target enzymes and genes at few developmental stages. For example, it 13
was shown in peach fruit that high crop load leads to increased acid invertase activity at a final 14
stage of fruit growth (Morandi et al. 2008). In tomato, an obscurity-induced carbohydrate 15
limitation led to changes in the expression of some sugar transporters, and of enzymes involved in 16
sugar- or amino-acid metabolism at two stages of fruit development (cell division and cell 17
expansion) (Baldet et al. 2002). However, although recent studies emphasized that source-sink 18
relationships between vegetative and reproductive organs are genetically controlled and are a 19
central hub for controlling fruit metabolism in tomato (Schauer et al. 2006; Lippman, Semel & 20
Zamir 2007), comparative analysis of fruit response to carbohydrate availability in different 21
tomato genotypes has not been looked at in any depth. 22
This study aims at identifying genes and gene categories differentially regulated in growing fruit in 23
response to changes in carbon availability induced by alteration of fruit load on the plant. 24
Transcriptome analysis using tomato microarrays was carried out on fruit pericarps harvested 21 25
hal-0
0600
426,
ver
sion
1 -
15 J
un 2
011

5
days after anthesis, a stage of rapid fruit growth, cell expansion and storage of major 1
carbohydrates such as starch. To get an insight into interactions between genotype and 2
environment on gene expression, two closely-related tomato genotypes were grown at two 3
contrasted fruit loads, one (high load, HL) inducing competition for carbon among fruits (trusses 4
were not pruned), and the other (low load, LL) inducing low or no competition (trusses pruned to 5
one fruit). The two accessions differed by an introgressed chromosome fragment on chromosome 6
9, carrying several quantitative trait loci whose expression is either independent of the fruit load 7
(for fruit developmental duration, fresh weight, seed number, dry matter and sugar content) or 8
specific to one fruit load (cell number, cell size or fruit cracking) (Prudent et al. 2009). In a last 9
step, the expression of a subset of genes related to carbon metabolism, cell wall modification, and 10
water fluxes were analyzed using RT-quantitative PCR along fruit expansion and ripening. 11
Materials and methods 12
Plant growth, fruit thinning and sampling 13
Two tomato genotypes, Solanum lycopersicum cv. Moneyberg (hereafter called M) and an 14
introgression line (hereafter called C9d) carrying a fragment from the bottom of chromosome 9 of 15
Solanum chmielewskii in the M genetic background, were grown under controlled greenhouse 16
conditions at a day-night temperature set point of 25/15 °C during spring 2007 in Avignon, France. 17
The position of the introgression of genotype C9d as well as the quantitative trait loci (QTL) 18
previously identified, are described in Prudent et al. (2009). For both genotypes, all trusses were 19
pruned to one fruit when flower 2 was at anthesis (low fruit load condition or LL) on 40 randomly 20
selected plants, while trusses of 16 other plants were not pruned (high fruit load condition or HL). 21
Under HL condition, the average number of fruit sets per truss was similar in C9d and M (around 22
seven fruits). Anthesis was recorded three times a week, allowing the determination of fruit age 23
and fruit developmental duration. Fruits were harvested at five different developmental stages 24
hal-0
0600
426,
ver
sion
1 -
15 J
un 2
011
6
from the cell expansion period until maturity (21, 28, 35, 42 days after anthesis (daa) and red ripe). 1
Fruits were weighed, and locular tissue and seeds were removed. The pericarp tissue was then 2
weighed, frozen in liquid nitrogen and stored at -80°C until nucleic acid manipulations or stored at 3
-20°C until phenotypic measurements. 4
Phenotypic measurements 5
At each developmental stage, six fruits per genotype and per fruit load were randomly harvested 6
between the fourth and the ninth truss of the plants, at proximal positions: flowers 2, 3 or 4 under 7
HL and only flower 2 under LL. Pericarp powders were lyophilized and weighed and pericarp water 8
content was then deduced. Soluble sugars (glucose, fructose, sucrose) and starch were extracted, 9
quantified by an enzymatic method (Gomez et al. 2007; Gomez, Rubio & Auge 2002) and 10
expressed in g per 100 g of pericarp dry matter. Additional phenotypic measurements were 11
carried out on fruits harvested at the red ripe stage: seeds were counted, and the number and the 12
mean size of pericarp cells were assessed according to the method described in Bertin, Gautier & 13
Roche (2002). An analysis of variance was performed on phenotypic measurements in order to 14
study the effects of fruit age, fruit load, genotype and their two- or three-way interactions with R 15
Software (http://www.r-project.org). 16
RNA extractions 17
All fruits used for RNA extraction were randomly harvested between the fourth and the ninth truss 18
of the plants, at proximal positions, similarly to phenotypic measurements. Fruit samples used for 19
microarray and quantitative real time PCR were different. Total RNA used for microarray 20
experiment was isolated from two biological pools of 25 fruits at 21 daa, following the procedure 21
described by Chang, Puryear & Cairney (1993). Total RNA used for quantitative real time PCR was 22
isolated from three biological pools of ten fruits (at 21, 28, 35, 42 daa and red ripe stage) with TRI 23
hal-0
0600
426,
ver
sion
1 -
15 J
un 2
011
7
Reagent® Solution (Ambion) following the procedure described by the manufacturer, with minor 1
modifications. 2
Microarray experiments 3
TOM2 cDNA glass slides were fabricated by arraying Array-Ready Oligo Set™ for the Tomato 4
Genome (Operon) onto Corning® UltraGAPS™ slides using a BioRobotics MicroGridII arrayer 5
(Genomic Solutions) in Instituto de Biología Molecular y Celular de Plantas (Valencia, Spain). Slides 6
contained 12,160 oligos corresponding to 11,862 unique and randomly selected transcripts of the 7
tomato genome. Information about the oligo set was described on the Operon website 8
(http://omad.operon.com/download/storage/lycopersicon_V1.0.2_datasheet. pdf). Fluorescent 9
probes were prepared from 50 µg of total RNA, using the Amino Allyl MessageAmpTM II aRNA 10
Amplification Kit (Ambion), and following manufacturer’s specifications. Purified Cy3- or Cy5-11
labelled AA-aRNAs were dried in a speed-vac, resuspended in 9 µL nuclease free water and 12
fragmented using RNA Fragmentation Reagents (Ambion). Probes were mixed with 88 µL of the 13
hybridization solution consisting of 0.5 µg.mL-1 denatured salmon sperm DNA (Stratagene), 5X SSC, 14
0.25% SDS and 5X Denhardt’s solution and 50% formamide. The solution was denaturated for 1 15
min at 100°C and cooled down to 37°C. Labelled AA-aRNAs were hybridized with slides for 16h at 16
37°C under agitation. After hybridization, slides were washed at 30°C with 2X SSC, 0.2% SDS for 5 17
min, with 0.2X SSC, 0.1% SDS for 5 min, with 0.2X SSC for 3 min, and with 0.02X SSC for 30 s. 18
Finally, slides were dried with nitrogen gas for 3 min at 30°C before scanning. 19
Data analysis of microarray experiments 20
The microarray experimental design consisted of two biological replicates, and for each biological 21
replicate the dyes were reversed (dye swap) for a total of four slides per comparison (Fig. 3a). 22
The raw data corresponding to the median spot intensities, with no background subtraction were 23
analyzed using the Bioconductor (http://www.bioconductor.org) package R/Maanova v1.4.1 (Cui, 24
hal-0
0600
426,
ver
sion
1 -
15 J
un 2
011
8
Kerr & Churchill 2003) in R-2.6 (http://www.r-project.org). Data visualization, normalization, and 1
statistical analysis, including multiple test adjustments (FDR) were performed as described by 2
Mounet et al. (2009). F statistics computed on the James-Stein shrinkage estimates of the error 3
variance (Wu et al. 2003) were calculated and genes with a P value < 5.10-2, FDR < 0.05, fold 4
change ≥ 1.6 and average intensity > background mean + 2 background SD were selected. 5
In order to analyze specifically the interaction between the genotype and the fruit load, another 6
statistical study was performed on normalized data using Bioconductor LIMMA package v2.13.8 7
(Smyth 2005a). The data were normalized using the printtiploess (within-array normalisation) and 8
scale (between-arrays normalisation) functions (default parameters). Flagged spots were given a 9
weight of 0.1 using the weight function. A factorial design analysis (Smyth 2005b) was performed 10
and a linear model with a coefficient for each of the four factor combinations (C9dLL, C9dHL, MLL 11
and MHL) was fit. The interaction term (C9dLL-C9dHL) - (MLL-MHL) was extracted. The P values 12
resulting from moderated t test were corrected for multiple testing using the Benjamini-Hochberg 13
FDR adjustment. As above, genes were considered to be significantly differentially expressed if 14
adjusted P values were < 5.10-2, fold change was ≥ 1.6. For each of the four conditions, spots with 15
an average intensity higher than background mean + 2 background SD were considered as 16
detected. 17
Quantitative real-time PCR 18
The quantitative real-time PCR experiment followed the eleven golden rules proposed by Udvardi, 19
Czechowski & Scheible (2008). Reverse transcription was performed with 2 µg of total RNA from 20
each sample treated with DNAse in 50µL with oligo-dT (10 µM) and AMV Reverse Transcriptase 21
(10 U/µL) (Promega), according to the manufacturer’s instructions. The RT mix was diluted 5-fold 22
in water and 2 µL aliquots were stored before use. Quantitative real-time PCR was carried out 23
using a Stratagene Mx3005P® thermocycler (Stratagene, Cedar Creek, TX) in a reaction volume of 24
hal-0
0600
426,
ver
sion
1 -
15 J
un 2
011

9
20 µL, in 96-well plates. PCR were conducted using 7.5 µL SYBR Green mix (133 mM KCl, 27 mM 1
Tris HCl pH 9, 0.2 % Triton® X-100, 8 mM MgCl2, 2 µL of 1500-fold dilution SYBR®Green I Nucleic 2
Acid Gel Strain 10000X (Lonza), 0.5 mM each dNTP, 2 µL of the 5-fold dilution of RT mix, 1 U Taq 3
DNA polymerase, 9.8 µL H2O, and 0.12 µM of each primer. Primer sequences are detailed in 4
Supporting Information Table S1. PCR conditions were: 2 minutes at 95°C, followed by 40 cycles at 5
95°C for 20 sec, 20 sec at the primer specific temperature (~55°C) and at 72°C for 35 sec. A 6
thermal denaturation curve of the amplified DNA was carried out, in order to measure the melting 7
temperature of the PCR product. For each reaction, three technical replicates were run. Relative 8
gene expression was calculated by the TC2 method (Livak & Schmittgen 2001), with the 9
eukaryotic translation initiation factor 4A-2 (eIF-4A-2) (U213502) as an internal control. The use of 10
this unigene as a reference was validated under our experimental conditions, as advised by 11
Gutierrez et al. (2008). For each genotype, and at each developmental stage, fruit load effect on 12
gene expressions was evaluated using a Student’s t test with R software, and the significance of 13
the interaction between genotype and fruit load was tested via a two-way analysis of variance in 14
R. Normalized gene expression data were analyzed by principal component analysis (PCA) using 15
the “princomp” function in R. The principal component scores were then plotted for individual 16
observations. 17
Functional categorization 18
Classifications of unigenes into functional groups were obtained from MapMan ontology 19
classifications (Thimm et al. 2004), gene family assignments from TAIR 20
(http://www.arabidopsis.org), and the literature when unigenes exhibited no homology with 21
Arabidopsis thaliana proteins. Functional categories were restricted to eleven: cell wall 22
modification, electron transport, hormonal responses, photosynthesis, primary metabolism, 23
hal-0
0600
426,
ver
sion
1 -
15 J
un 2
011

10
protein metabolism, secondary metabolism, signalling, stress responses, transcription and 1
transport. 2
Results 3
Fruit load effect on fruit phenotype 4
Tomato fruits of the two lines, Moneyberg (M) and the introgression line C9d, were harvested at 5
five developmental stages from 21 daa to the red ripe stage, and their phenotype was described 6
either throughout fruit development (Fig. 1), or only at maturity (Fig. 2). The analysis of variance 7
(not shown) underlined significant interactions between fruit age and fruit load for all traits 8
measured kinetically. At maturity, seed number was the only trait which was not affected by fruit 9
load. For the other traits, the significant fruit load effect was either genotype-independent or 10
associated to significant genotype x fruit load interactions. When fruit load was reduced to one 11
fruit (LL), fruit development duration decreased and cell number increased, without any 12
interaction with genotype (Fig. 2b). On the other hand, larger fruits (Fig. 1a), associated with 13
higher cuticular macrocracks (Fig 2a), lower pericarp water and sugar contents (Fig. 1b and 1d) 14
and higher starch content (Fig. 1c) were consistently observed during fruit development in fruits 15
grown under LL, when compared to HL fruits in both genotypes. However sugar contents were 16
similar at maturity. For these traits, the effect of fruit load interacted significantly with genotype, 17
for at least one fruit developmental stage. It was also the case of cell size, which was higher under 18
LL conditions for M, but not for C9d (Fig. 2b). 19
At 21 daa, which corresponds to the period of rapid fruit growth and to the developmental stage 20
chosen for microarray transcriptome analysis, modification of fruit composition in response to 21
changes in fruit load was significant in both genotypes for sugar content (Fig. 1d) and in M for 22
water and starch content, indicating a strong significant interaction between genotype and fruit 23
load (G x FL) for these two traits. 24
hal-0
0600
426,
ver
sion
1 -
15 J
un 2
011

11
1
Fruit load effect on the transcriptome from 21 daa fruits and genotype-fruit load 2
interactions 3
Microarray experimental design and data analysis 4
In the tomato genotypes studied, the 21 daa stage of fruit development corresponds to the cell 5
expansion phase during which rapid fruit growth occurs and starch accumulation peaks (Dinar & 6
Stevens 1981). At 21 daa, fruit load effect was obvious for starch and soluble sugar contents; no 7
significant effect on fruit weight and water contents could be observed (Fig. 1a and 1b). This stage 8
of fruit development appears therefore critical for the control of fruit growth and of the 9
concomitant changes in fruit composition. 10
In order to reduce the biological variability between samples, we used 40 randomly 11
selected plants for the low load (LL) condition and 16 plants for the high load (HL) condition. For a 12
given genotype and developmental stage, up to 50 fruits were randomly picked from the plants. 13
From these, large pools of 25 fruits each were constituted at random, as previously described 14
(Buret, Duby & Flanzy 1980). This sampling and pooling strategy effectively reduces the variability 15
between biological replicates e.g. by excluding the environmental effects linked to plant location 16
in the field, and allows thus to focus only on the effects of genotype and fruit load. 17
In addition, the microarray experiment was designed as a loop where C9dLL was compared 18
to C9dHL itself compared to MHL itself compared to MLL itself compared to C9dLL (Fig.3a). 19
Compared to single comparisons, this design decreases considerably the variance of estimated 20
effects (Churchill 2002; Yang & Speed 2002), allowing much more confidence in the estimation of 21
the differentially expressed genes. Four technical replicates (including 2 dye swaps) were done per 22
comparison i.e. 8 hybridizations per comparison (2 biological repeats X 4 technical repeats). To 23
further increase the significance of the results from statistical analyses, the threshold for log2 fold-24
hal-0
0600
426,
ver
sion
1 -
15 J
un 2
011
12
change was set-up to 0.68 (1.6 fold change) i.e. a value higher than that commonly used in similar 1
studies (e.g. Wang et al. 2009). As a result of this combination of pooling strategy, experimental 2
design and statistical analyses, a smaller number of differentially expressed genes identified by 3
transcriptome analysis can be anticipated but more robust results are expected. Indeed, in a 4
previous study done in tomato using a similar design with fewer technical replicates, most of the 5
results from microarray analysis were further validated by qRT-PCR (Mounet et al., 2009). 6
7
Impact of fruit load on fruit transcriptome 8
Because fruit load effect on fruit development and composition is the main focus of our study, we 9
excluded from the statistical analyses the comparison of genotypes for the same load. The effect 10
of fruit load on tomato fruit transcriptome in each genotype was analyzed by comparing gene 11
expressions under HL and LL in M and in C9d (Fig. 3a). In total, 103 genes out of 11,862 (0.9 %) 12
were differentially expressed in M, versus 147 in C9d (1.2 %) (Fig. 3b). Among them, 56 13
differentially expressed genes were common to C9d and M with similar responses whatever the 14
genotype, except for one unigene showing an opposite response depending on the genotype. 15
To identify which biological processes are modified by a fruit load change, unigenes were classified 16
into functional categories. Figure 4a displays the distribution of the differentially expressed 17
unigenes into functional categories (Supporting Information Table S2 and Table S3). According to 18
the Mapman classification, all biological processes were affected by fruit load but to a variable 19
extent. As expected from the modification of the source/sink relationships under LL, the 20
expression of genes implicated in primary and secondary metabolism was indeed affected. 21
Accordingly, LL fruits also displayed changes in cell wall related genes (mostly up-regulated) and in 22
electron transport (mostly down-regulated). A large proportion of the differentially expressed 23
genes, mostly down-regulated, have no function attributed. However, the most striking 24
differences between HL and LL –in terms of expression level-, were observed for genes involved in 25
hal-0
0600
426,
ver
sion
1 -
15 J
un 2
011

13
signalling, in regulation of gene expression (hormonal responses, transcription) and in protein 1
metabolism (protein synthesis, post-translational modifications and degradation). Details of 2
several categories showing remarkable changes are displayed in Table 1. In primary metabolism, 3
the enzyme exhibiting the highest changes under LL conditions in both M and C9d genotypes (log2 4
fold-change = ~-1.6 in M, ~-1.5 in C9d) was the fructose-2,6-bisphosphatase (F26BPase). Several 5
differentially expressed genes with putative function in signalling exhibited high fold-changes 6
under low load conditions in both M and C9d (1.4 < log2 fold-changes < 4.8). While functions of 7
genes encoding proteins with calmodulin-binding motif and leucine rich repeats may remain 8
elusive, the COP9 signalosome is a key player of the machinery controlling protein degradation 9
that regulates a variety of processes in plants including light-regulated development and hormone 10
signalling (Chamovitz 2009). In addition, some ethylene, auxin and cytokinin-related genes with 11
roles in hormone biosynthesis, degradation or responses were also up- or down-regulated under 12
LL (Supporting Information Table S2 and Table S3). Among the 29 differentially expressed genes 13
encoding transcription factors and other proteins involved in gene regulation, 9 displayed very 14
consistent up-regulation (2 genes) or down-regulation (7 genes) in both M and C9d under LL. 15
Several transcription factor families were represented (HB, bHLH, AP2/EREBP, C2H2 zinc finger, 16
bZIP …). Of these, the gene encoding a TAZ zinc finger protein exhibited very high and strikingly 17
similar changes in M and C9d under low load. The fold change log2 value was ~-5.3 for both 18
genotypes, i.e. a ~40-fold reduction in transcript abundance in the 21 daa fruits from M and C9d 19
cultivated under LL conditions. With the notable exception of the elongation factor 1-alpha 20
implicated in the protein synthesis machinery and of protein phosphatase 2C, most of the genes 21
classified into the protein metabolism category and differentially expressed under LL are involved 22
in protein degradation. 23
24
Interactions between genotype and fruit load 25
hal-0
0600
426,
ver
sion
1 -
15 J
un 2
011
14
The previous study showed independently the effect of fruit load on each genotype. Several genes 1
displayed very similar fold changes in the two genotypes (e.g. the F26BPase and the TAZ 2
transcription factor) while others were mostly affected in one or the other genotype (e.g. the AS2 3
or the CCAAT box transcriptional regulators preferentially up-regulated in C9d) (Table 1). In order 4
to specifically identify the LL affected genes displaying a genotype-dependent change in gene 5
expression, we analyzed the genotype x fruit load (G x FL) interaction using LIMMA. Ninety-nine 6
genes showing significant G x FL interactions (Supporting Information Table S4) were identified 7
and further classified into functional categories (Fig. 4b). Among them, a high proportion belonged 8
to hormonal and stress response categories albeit all biological processes were targets of G x FL 9
interactions. For all functional categories, most of the genes up-or down-regulated under low load 10
conditions showed a greater variation of gene expression in one or the other genotype 11
(Supporting Information Table S4). In this table, positive values indicates that the corresponding 12
gene was more up-regulated or down-regulated under LL relative to HL conditions in C9d than in 13
M while negative values indicate the opposite. Their absolute value gives an indication of the 14
extent of the differences between the two genotypes. The largest category comprised genes 15
related to various hormone biosynthetic pathways including ethylene (ACC synthase and ACC 16
oxidase), auxin (IAA hydrolase), jasmonic acid (lipoxygenase, ent-kaurenoic acid hydroxylase) and 17
phytosulfokines and salicylate (Table 2). All the hormone-related genes displaying G x FL 18
interactions were more expressed in C9d while cell wall related genes were more or less expressed 19
in one or the other genotype (Table 2). 20
Validation of microarray data 21
The abundance of transcripts from selected genes was monitored by qRT-PCR in order to validate 22
the microarray data, on independent fruit samples. Quantitative PCR was carried out on eleven 23
unigenes, and confirmed the changes in transcript abundance (Supporting Information Fig. S1). 24
hal-0
0600
426,
ver
sion
1 -
15 J
un 2
011

15
Because of the difference in sensitivity of the two techniques (already observed in Mohammadi, 1
Kav & Deyholos 2007 and Fernandez et al. 2008), in a lot of cases the ratio values based on 2
quantitative PCR were higher than those based on microarray but the Pearson’s correlation 3
coefficient between the two methods was high (r = 0.92, p = 7.10-16). 4
Fruit load effect on expression of selected genes along fruit development 5
To gain further insight into how genes reacted to the fruit load change in the two genotypes, we 6
performed qRT-PCR on five stages from the cell expansion phase to fruit maturity, in the two 7
genotypes and under the two fruit loads. The functions of the 15 selected genes were related to 8
processes potentially involved in fruit growth and carbohydrate accumulation. Some genes were 9
chosen based on microarray results while others were selected because of their importance in 10
metabolism (when absent from the DNA chip). The correspondence between gene codes, their 11
annotations and their sequence references are detailed in Table 3. As shown on Fig. 5, for each of 12
the 15 observed genes, we identified (i) a significant fruit load effect whatever the fruit 13
developmental stage, for M, for C9d or for both genotypes and (ii) a significant G x FL interaction 14
at least at two developmental stages. 15
Water flux-related genes 16
Two aquaporins: a delta-tonoplast integral protein (delta-TIP), and a plasma membrane intrinsic 17
protein (PIP1), involved in water flux across biological membranes, were particularly affected by a 18
change in fruit load. The down-regulation of delta-TIP under LL condition was confirmed for both 19
genotypes (except at 42 daa) and PIP1 was similarly affected by fruit load. Moreover, a shift in 20
expression with fruit load was observed for PIP1: its expression was down-regulated earlier under 21
LL than under HL. 22
hal-0
0600
426,
ver
sion
1 -
15 J
un 2
011
16
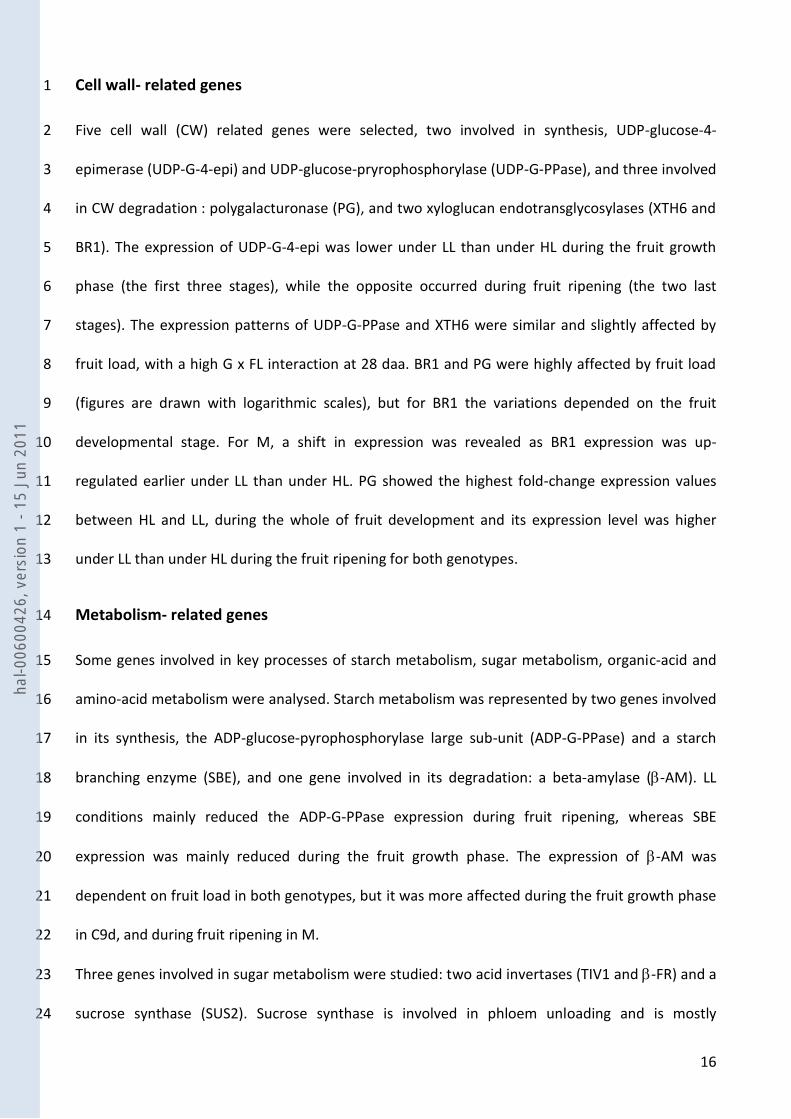
Cell wall- related genes 1
Five cell wall (CW) related genes were selected, two involved in synthesis, UDP-glucose-4-2
epimerase (UDP-G-4-epi) and UDP-glucose-pryrophosphorylase (UDP-G-PPase), and three involved 3
in CW degradation : polygalacturonase (PG), and two xyloglucan endotransglycosylases (XTH6 and 4
BR1). The expression of UDP-G-4-epi was lower under LL than under HL during the fruit growth 5
phase (the first three stages), while the opposite occurred during fruit ripening (the two last 6
stages). The expression patterns of UDP-G-PPase and XTH6 were similar and slightly affected by 7
fruit load, with a high G x FL interaction at 28 daa. BR1 and PG were highly affected by fruit load 8
(figures are drawn with logarithmic scales), but for BR1 the variations depended on the fruit 9
developmental stage. For M, a shift in expression was revealed as BR1 expression was up-10
regulated earlier under LL than under HL. PG showed the highest fold-change expression values 11
between HL and LL, during the whole of fruit development and its expression level was higher 12
under LL than under HL during the fruit ripening for both genotypes. 13
Metabolism- related genes 14
Some genes involved in key processes of starch metabolism, sugar metabolism, organic-acid and 15
amino-acid metabolism were analysed. Starch metabolism was represented by two genes involved 16
in its synthesis, the ADP-glucose-pyrophosphorylase large sub-unit (ADP-G-PPase) and a starch 17
branching enzyme (SBE), and one gene involved in its degradation: a beta-amylase (-AM). LL 18
conditions mainly reduced the ADP-G-PPase expression during fruit ripening, whereas SBE 19
expression was mainly reduced during the fruit growth phase. The expression of -AM was 20
dependent on fruit load in both genotypes, but it was more affected during the fruit growth phase 21
in C9d, and during fruit ripening in M. 22
Three genes involved in sugar metabolism were studied: two acid invertases (TIV1 and -FR) and a 23
sucrose synthase (SUS2). Sucrose synthase is involved in phloem unloading and is mostly 24
hal-0
0600
426,
ver
sion
1 -
15 J
un 2
011
17
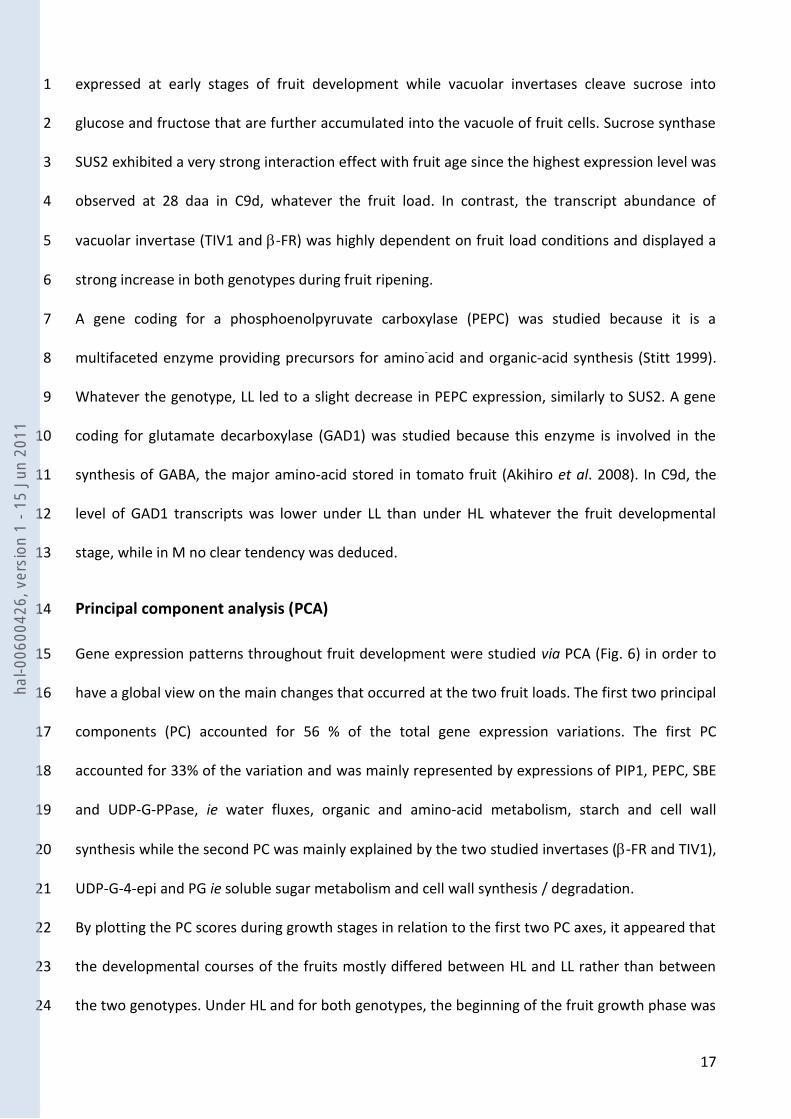
expressed at early stages of fruit development while vacuolar invertases cleave sucrose into 1
glucose and fructose that are further accumulated into the vacuole of fruit cells. Sucrose synthase 2
SUS2 exhibited a very strong interaction effect with fruit age since the highest expression level was 3
observed at 28 daa in C9d, whatever the fruit load. In contrast, the transcript abundance of 4
vacuolar invertase (TIV1 and -FR) was highly dependent on fruit load conditions and displayed a 5
strong increase in both genotypes during fruit ripening. 6
A gene coding for a phosphoenolpyruvate carboxylase (PEPC) was studied because it is a 7
multifaceted enzyme providing precursors for amino-acid and organic-acid synthesis (Stitt 1999). 8
Whatever the genotype, LL led to a slight decrease in PEPC expression, similarly to SUS2. A gene 9
coding for glutamate decarboxylase (GAD1) was studied because this enzyme is involved in the 10
synthesis of GABA, the major amino-acid stored in tomato fruit (Akihiro et al. 2008). In C9d, the 11
level of GAD1 transcripts was lower under LL than under HL whatever the fruit developmental 12
stage, while in M no clear tendency was deduced. 13
Principal component analysis (PCA) 14
Gene expression patterns throughout fruit development were studied via PCA (Fig. 6) in order to 15
have a global view on the main changes that occurred at the two fruit loads. The first two principal 16
components (PC) accounted for 56 % of the total gene expression variations. The first PC 17
accounted for 33% of the variation and was mainly represented by expressions of PIP1, PEPC, SBE 18
and UDP-G-PPase, ie water fluxes, organic and amino-acid metabolism, starch and cell wall 19
synthesis while the second PC was mainly explained by the two studied invertases (-FR and TIV1), 20
UDP-G-4-epi and PG ie soluble sugar metabolism and cell wall synthesis / degradation. 21
By plotting the PC scores during growth stages in relation to the first two PC axes, it appeared that 22
the developmental courses of the fruits mostly differed between HL and LL rather than between 23
the two genotypes. Under HL and for both genotypes, the beginning of the fruit growth phase was 24
hal-0
0600
426,
ver
sion
1 -
15 J
un 2
011
18
characterized by high expressions in BR1, followed by high expressions in GAD1 and ADP-G-PPase 1
related to cell wall degradation, amino-acid metabolism, and starch synthesis, respectively, while 2
the ripening phase was mainly characterized by reduced expressions of UDP-G-4-epi, and -AM, 3
related to cell wall synthesis, and starch degradation. Under LL the same two phases could be 4
distinguished: during the fruit growth phase, variations throughout fruit development were 5
related to a down-regulation of UDP-G-4-epi while during fruit ripening, they were related to high 6
expressions of the two invertases (TIV1, and -FR) and PG and low expressions of SUS2. 7
Discussion 8
In tomato, as in other plant species, the development and composition of strong sink 9
organs such as seeds and fruits depend largely upon the size of the carbohydrate pool available 10
and on the sink strength (Baldet et al. 2006; Burstin et al. 2007). Carbohydrate pool size and 11
partitioning between the different plant tissues can be affected by a large variety of 12
environmental conditions and by genetic factors. Environmental conditions, including cultural 13
practises, are well-known determinants of fruit growth and quality (Heuvelink 1997; Gautier, 14
Guichard & Tchamitchian 2001; Bertin et al. 2003). Recent studies also highlighted the genetic 15
control of fruit growth and composition at both plant (Schauer et al. 2006) and fruit (Fridman, 16
Pleban & Zamir 2000; Fridman et al. 2004) levels. In addition, detailed transcriptome analysis of 17
tomato lines carrying introgressions from S. pennellii into S. lycopersicum genetic background 18
indicated the coordinated up-regulation of enzymes of sucrose mobilization and respiration in 19
early developing fruit in lines displaying high Brix values (Baxter et al. 2005). However, the 20
mechanisms by which environment and genotype interact and modulate fruit growth and quality 21
remain poorly known. 22
In order to get some new insights upon these mechanisms, we have altered the size of the 23
carbohydrate pool available to the fruit by reducing the fruit load (FL) of the plant and analyzed 24
hal-0
0600
426,
ver
sion
1 -
15 J
un 2
011

19
the transcriptome of the developing fruit under these conditions. This was done for two closely 1
related genotypes differing for an introgression of 40 cM at the bottom of chromosome 9. The 2
introgression carries quantitative trait loci whose expression is either independent of fruit load 3
(fruit developmental duration, fresh weight, seed number, dry matter and sugar content) or 4
specific to fruit load (cell number, cell size or fruit cracking), already indicating the occurrence of G 5
x FL interactions (Prudent et al. 2009). 6
7
The C9d and the M tomato genotypes display both common and specific fruit 8
phenotypic variations under low fruit load. In both genotypes, the increased carbohydrate 9
availability led to a spectacular increase in fruit size, with the appearance of large macro-cracks in 10
the cuticle (Fig. 2a). Increase in fruit fresh weight can be related to an increase in cell number 11
through the regulation of cell-proliferation genes at very early stages of flower and fruit 12
development (Baldet et al. 2006), or to enhanced cell enlargement (Bertin 2005). In the present 13
study, cell number was increased in both genotypes but cell expansion was affected only in the M 14
genotype (Fig. 2b). In both genotypes, this resulted in the acceleration of fruit growth, more 15
pronounced in the M genotype, and in the shortening of the duration of fruit development (Fig. 1a 16
and 2b). As expected from previous studies (Gautier, Guichard & Tchamitchian 2001), fruit 17
composition was also affected since the decrease in fruit load led to a strong increase in starch 18
content in M and C9d. Surprisingly, since starch degradation is the major source of soluble sugars 19
that are further accumulated in the vacuole of ripening fruit cells (Dinar & Stevens 1981), the 20
soluble sugar content of the ripe fruit was not different under LL (Fig. 1d). This result, obtained in 21
both genotypes, suggests that starch degradation products further enter fruit metabolism and/or 22
are respired. Linked with the increased carbohydrate accumulation in the fruit, the dry matter 23
content of the fruit was higher in the two genotypes, as indicated by the lower water 24
concentration under LL (Fig. 1b). However, when considering both fruit weight (Fig. 1a) and water 25
hal-0
0600
426,
ver
sion
1 -
15 J
un 2
011
20
concentration in the fruit (Fig. 1b), the water flux towards the fruit was considerably enhanced 1
under LL, in particular in the M genotype. In addition, the presence of cuticle macro-cracks under 2
LL may have considerably increased the water flux in the fruit. 3
4
Fruit transcriptome analysis highlights regulatory processes as common targets of 5
low fruit load conditions in both genotypes. Transcriptome analysis provides a systems-6
level view of plant response to carbon availability, and allows a global approach of this response 7
(Smith & Stitt 2007). Transcript profiles under two conditions of fruit load in two genotypes were 8
analysed during cell expansion phase (21 daa) because (i) fruit load affected cell size in M but not 9
in C9d (Fig. 2b), (ii) fruit load affected starch storage (Fig. 1c) which is maximum during this period 10
(Dinar & Stevens 1981). Despite the large changes in starch accumulation in the fruit, indicating a 11
change of its carbohydrate status (Fig. 1c), main gene categories affected by fruit load and 12
common to both genotypes were mostly related to transcriptional and post-transcriptional 13
regulation processes, to stress and to unknown functions, but not to primary and secondary 14
metabolism (Fig. 4a). Several hypotheses can be considered to explain this result. First, microarray 15
transcriptome analyses were done at only one stage, 21 daa, which may not be representative for 16
the metabolic processes occurring during the whole fruit development. However, the 17
transcriptome analysis of introgression lines by Baxter et al. (2005), done at the same stage of 18
development, effectively highlighted sugar-metabolism related genes in lines differing in fruit 19
composition. Second, analyses of transcriptome data could have been too stringent, excluding a 20
large group of differentially expressed genes. This hypothesis is sustained by the comparatively 21
low number of differential genes identified. At last, fruit primary metabolism can be mainly 22
controlled at other levels than transcript abundance via for instance protein abundance, which can 23
be uncoupled from transcript level (Piques et al. 2009), and enzymatic regulation, as proposed by 24
Gibon et al. (2009). 25
hal-0
0600
426,
ver
sion
1 -
15 J
un 2
011

21
The most striking and unexpected result was the strong up- or down-regulation in response 1
to changes in carbon availability of genes involved in signaling, in regulation of gene expression 2
(hormonal responses, transcription) and in protein metabolism (protein synthesis, post-3
translational modifications and degradation). Carbohydrate status of the plant is known to affect a 4
wide range of processes in the fruit, such as fruit cell division (Bertin 2005), whole-plant 5
respiration rate (Gary et al. 2003), fruit cuticle elasticity (Gilbert et al. 2007), fruit transpiration 6
(Guichard et al. 2005), ethylene emission (Génard & Gouble 2005), and carbon- and nitrogen- 7
metabolism (Baldet et al. 2002). Accordingly, in our experiment, fruit growth and composition 8
were notably affected in both genotypes. According to the results presented here, the fruit may 9
cope with the new nutritional status of the plant under LL by setting up new regulations in order 10
to adjust its growth and its metabolism, whatever the genotype. It is noteworthy that several of 11
the most highly induced or repressed genes, which displayed high and almost identical variations 12
in expression under LL in both genotypes, may potentially regulate whole pathways or processes, 13
like the fructose-2,6-bisphosphatase (F26BPase) and the TAZ transcription factor. In plants, the 14
F26BPase enzyme is involved in both the synthesis and the degradation of the Fru-2,6-P2, which is 15
believed to be involved in the regulation of sink metabolism (Nielsen, Rung & Villadsen 2004). The 16
Arabidopsis BT2 gene homologous to the tomato TAZ transcription factor described here encodes 17
a protein with BTB and TAZ domains which has recently been shown to be a central component of 18
an interconnected signalling network that detects and responds to multiple inputs, including 19
sugars and hormones (Mandadi et al. 2009). In addition, several other transcription factors such as 20
the b-ZIP, AP2 and C2H2 zinc finger protein, known to be involved in the mediation of diverse 21
hormone, light, circadian rhythm, stress and metabolic effects (Liu et al. 2001; McGrath et al. 22
2005; Nakano et al. 2006; Rushton et al. 2008; Robert et al. 2009; Yáñez et al. 2009), were also 23
regulated by fruit load. Among the possible functions of the other large “protein modification” 24
category, which includes proteins with diverse roles in protein synthesis and fate, there is the 25
hal-0
0600
426,
ver
sion
1 -
15 J
un 2
011
22
post-transcriptional control of protein abundance and activity e.g. for enzymes from primary 1
metabolism. 2
3
Genotype x fruit load interactions are unravelled by fruit transcriptome analysis 4
and by qRT-PCR analysis of specific target genes along fruit development. All 5
functional categories analyzed showed significant G x FL interactions (Supporting Information 6
Table S4). Genes showing G x FL interactions were (i) differentially expressed in LL conditions 7
relative to HL conditions in at least one genotype but (ii) more or less expressed in one or the 8
other genotype, if both genotypes were affected. As expected from the fruit growth phenotype 9
(Fig. 1a), the presence of cuticle macro-cracks which may be perceived as wounds (Fig. 2a) and the 10
large difference in seed numbers between the two lines (Fig. 2b and Prudent et al. 2009), the 21 11
daa fruits submitted to LL conditions displayed genotype-dependent variations of expression for 12
genes involved in hormone synthesis, hormone response, stress response, transcription and cell 13
wall modifications. Most of the hormones concerned are either involved in fruit growth control, 14
such as auxins, gibberellins, cytokinins, and brassinosteroid (Gillapsy, Ben-David & Gruissem 1993) 15
and/or in stress response such as ethylene, jasmonic acid and abscisic acid (Table 2). Accordingly, 16
several transcription factors showing differential expression in the two genotypes under LL such as 17
AP2/EREBP and WRKY are known as regulators of hormone mediated stress response (Birnbaum 18
et al. 2003; Ülker & Somssich 2004). Hormonal control may also play a role in the differential 19
expression in both genotypes of genes involved in cell wall modifications (Table 2) (Catala, Rose & 20
Bennett 2000; Chen & Bradford 2000; Chen, Nonogaki &Bradford 2002; Guillon et al. 2008) and in 21
the possibly linked fruit cell size (Fig. 2b). Interestingly, several metabolism genes (isocitrate lyase, 22
GABA transaminase, tryptophan synthase) displayed significant G x FL interactions (Supporting 23
Information Table S4), confirming the need for large scale metabolomic investigation of the LL 24
effect on fruit composition in both genotypes. Thus, the function of the genes showing significant 25
hal-0
0600
426,
ver
sion
1 -
15 J
un 2
011

23
G x FL interactions could be to modulate the fruit response to the LL condition in accordance with 1
the specific plant and fruit characteristics of a given genotype. 2
As discussed above, the transcriptome study was done at only one stage of fruit 3
development. It may therefore have overlooked some fruit responses to LL conditions and G x FL 4
interactions. For that reason, we analyzed the expression patterns along fruit development of 5
selected genes implicated in various aspects of plant metabolism and growth (Fig. 5 and Fig. 6). 6
The strongest effect was observed for the vacuolar invertases (TIV1 and -fructosidase), which 7
catalyze the cleavage of sucrose to glucose and fructose further stored in the vacuole (for a 8
review, see Sturm 1999) and for the polygalacturonase gene involved in cell wall degradation 9
(Hadfield & Bennett 1998). Both showed consistent changes of expression in both genotypes 10
during fruit ripening, suggesting a strong regulation by carbohydrate availability or by induced 11
changes in the fruit. In addition, increased invertase expression could be linked with the increased 12
starch degradation (Fig. 1c) and soluble sugar accumulation (Fig. 1d) under LL in both genotypes. 13
In the case of the aquaporins, which allow fluxes of water across biological membranes (Baiges et 14
al. 2002; Tyerman, Niemietz & Bramley 2002; Maurel et al. 2008), decreased aquaporin expression 15
could be linked with decreased fruit water content (Fig. 1b) under LL in both genotypes. However, 16
though the expression patterns of many genes during fruit development were in agreement with 17
previous studies dealing with carbon-metabolism related genes (Alba et al. 2005; Kortstee et al. 18
2007), a consistency between gene expressions on the one hand and possible phenotypic changes 19
under LL on the other hand was not found for all the analyzed genes. It was for example the case 20
for starch synthesis and degradation related genes. Possible reasons are the limited number of 21
genes studied by qRT-PCR or the existence of other genes with similar functions in the fruit. For 22
example, -amylase is not the only enzyme responsible for starch degradation as -amylase and 23
starch phosphorylase both fulfil similar roles (Robinson, Hewitt & Bennett 1988). 24
hal-0
0600
426,
ver
sion
1 -
15 J
un 2
011
24
Additional explanations are the existence of strong G x FL interactions. Indeed, significant 1
genotype effects and G x FL interactions were detected in this study for most genes studied, as 2
well as interactions between responses to carbon availability and fruit developmental stage. The 3
significant difference in fruit development between the two genotypes and the shift between the 4
two fruit loads (fruit developmental duration is shorter under LL than under HL), could possibly 5
explain the genotype effect and the G x FL interactions for some genes. At early stages of fruit 6
development, a clear effect of the M genotype is observed for the sucrose cleaving enzyme 7
sucrose synthase SUS2 which has a prominent role in sink tissues (Claussen, Lovey & Hawjer 1986; 8
Sung, Wu & Black 1989; Amor et al. 1995; Kleczkowski 1994), possibly reflecting the differences in 9
competition for assimilates between the two genotypes. Shift in fruit development between HL 10
and LL may also account for e.g. the differences in ADP-G-PPase expression patterns in M 11
compared to C9d. However, several other genes, including the cell wall degradation gene BR1, the 12
starch degradation gene -amylase and the GABA biosynthesis gene GAD1, displayed clear G x FL 13
interactions independently from the fruit development shift under LL. Considering the phenotypic 14
data available, no link could be established between the G x FL interactions at gene expression 15
level and the G x FL interactions at fruit phenotypic level, again highlighting the need for more 16
global and comprehensive analysis of the mechanisms involved in fruit response to increased 17
carbon availability. 18
Conclusion 19
The present paper aimed at identifying processes that were influenced by a change in fruit carbon 20
availability in two tomato genotypes. Our results suggested that a change in carbon availability 21
affected very few genes but all biological processes and that primary metabolism was globally less 22
modified at the transcriptional level than regulation systems. To get a better insight on these 23
regulations, a translatome study could be envisaged similarly to the work of Mustroph et al. 24
hal-0
0600
426,
ver
sion
1 -
15 J
un 2
011
25
(2009), as well as a metabolome study in order to identify the regulation networks between 1
metabolites and genes, similarly to the work of Mounet et al. (2009). This study also emphasized 2
the recurrent interactions between genotype and carbon availability, at the phenotypic level as 3
well as at the gene expression level throughout fruit development. All these interactions, arising at 4
different levels, thus raise the difficulty of a consistent characterization of responses to various 5
environments, if conducted on a single genotype at a single developmental stage. Therefore, once 6
enough data will be available on tomato, meta-analyses will offer the possibility to decipher those 7
interactions. 8
Acknowledgements 9
We are grateful to the greenhouse experimental team and to Yolande Carretero for taking care of 10
the plants. We thank Jean-Claude L’Hotel and Michel Pradier for their technical support during 11
harvests, Beatrice Brunel and Esther Pelpoir for managing cell and seed counting, Emilie Rubio and 12
Doriane Bancel for sugar analyses, Cécile Garchery and Caroline Callot for their help in RNA 13
extractions. Many thanks to Rebecca Stevens for English revising. Keygene, The Netherlands is 14
acknowledged for providing seeds of the tomato population. This work was funded by the 15
European EU-SOL Project PL016214-2 and Marion Prudent was supported by a grant from INRA 16
and Région Provence Alpes Côte d’Azur (France). 17
hal-0
0600
426,
ver
sion
1 -
15 J
un 2
011
26
References 1
Akihiro T., Koike S., Tani R., Tominaga T., Watanabe S., Iijima Y., Aoki K., Shibata D., Ashihara 2 H., Matsukura C., Akama K., Fujimura T., Ezura H. (2008) Biochemical mechanism on 3 GABA accumulation during fruit development in tomato. Plant Cell Physiology 49, 4 1378-1389. 5
Alba R., Payton P., Fei Z.J., McQuinn R., Debbie P., Martin G.B., Tanksley S.D. & Giovannoni 6 J.J. (2005) Transcriptome and selected metabolite analyses reveal multiple points of 7 ethylene control during tomato fruit development. Plant Cell 17, 2954-2965. 8
Amor Y., Haigler C.H., Johnson S., Wainscott M. & Delmer D.P. (1995) A membrane-9 associated form of sucrose synthase and its potential role in synthesis of cellulose 10 and callose in plants. Proceedings of the National Academic for Science 92, 9353-11 9357. 12
Baiges I., Schäffner A.R., Affenzeller M.J. & Mas A. (2002) Plant aquaporins. Physiologia 13 Plantarum 115, 175-182. 14
Baldet P., Devaux C., Chevalier C., Brouquisse R., Just D. & Raymond P. (2002) Contrasted 15 responses to carbohydrate limitation in tomato fruit at two stages of development. 16 Plant, Cell and Environment 25, 1639-1649. 17
Baldet P., Hernould M., Laporte F., Mounet F., Just D., Mouras A., Chevalier C. & Rothan C. 18 (2006) The expression of cell proliferation-related genes in early developing flowers 19 is affected by a fruit load reduction in tomato plants. Journal of Experimental Botany 20 57, 961-970. 21
Baxter C.J., Sabar M., Quick W.P. & Sweetlove L.J. (2005) Comparison of changes in fruit gene 22 expression in tomato introgression lines provides evidence of genome-wide 23 transcriptionnal changes and reveals links to mapped QTLs and described traits. 24 Journal of Experimental Botany 56, 1591-1604. 25
Bayer E.M., Bottrill A.R., Walshaw J., Vigouroux M., Naldrett M.J., Thomas C.L. & Maule A.J. 26 (2006) Arabidopsis cell wall proteome defined using multidimensional protein 27 identification technology. Proteomics 6, 301-311. 28
Bertin N. (2005) Analysis of the tomato fruit growth response to temperature and plant fruit 29 load in relation to cell division, cell expansion and DNA endoreduplication. Annals of 30 Botany 95, 439-447. 31
Bertin N., Borel C., Brunel B., Cheniclet C. & Causse M. (2003) Do genetic make-up and 32 growth manipulation affect tomato fruit size by cell number, or cell size and DNA 33 endoreduplication? Annals of Botany 92, 415-424. 34
Bertin N., Gautier H. & Roche C. (2002) Number of cells in tomato fruit depending on fruit 35 position and source-sink balance during plant development. Journal of Plant Growth 36 Regulation 36, 105-112. 37
Birnbaum K., Shasha D.E., Wang J.Y., Jung J.W., Lambert G.M., Galbraith D.W. & Benfey P.N. 38 (2003) A gene expression map of the arabidopsis root. Science 302, 1956-1960. 39
Borovkov A.Y., McClean P.E. & Secor G.A. (1997) Organization and transcription of the gene 40 encoding potato UDP-glucose pyrophosphorylase. Gene 186, 293-297. 41
Buret M., Duby C. & Flanzy C. (1980) Contribution to the study of sampling tomatoes for 42 technological finishing. Comptes Rendus des Séances de l'Académie d'Agriculture de 43 France 66, 839-848. 44
Burstin J., Marget P., Huart M., Moessner A., Mangin B., Duchene C., Desprez B., Munier-45 Jolain N. & Duc G. (2007) Developmental genes have pleiotropic effects on plant 46 morphology and source capacity, eventually impacting on seed protein content and 47 productivity in pea. Plant Physiology 144, 768-781. 48
hal-0
0600
426,
ver
sion
1 -
15 J
un 2
011

27
Catala C., Rose J.K. & Bennett A.B. (2000) Auxin-regulated genes encoding cell wall-1 modifying proteins are expressed during early tomato fruit growth. Plant Physiology 2 122, 527-534. 3
Chamovitz D.A. (2009) Revisiting the COP9 signalosome as a transcriptional regulator. EMBO 4 Reports 10, 352-358. 5
Chang S., Puryear J. & Cairney J. (1993) A simple and efficient method for isolating RNA from 6 pine trees. Plant Molecular Biology Reporter 11, 113-116. 7
Chen B.Y., Janes H.W. & Gianfagna T. (1998) PCR cloning and characterization of multiple 8 ADP-glucose pyrophosphorylase cDNAs from tomato. Plant Science 136, 59-67. 9
Chen F. & Bradford K.J. (2000) Expression of an expansin is associated with endosperm 10 weakening during tomato seed germination. Plant Physiology 124, 1265-1274. 11
Chen F., Nonogaki H. & Bradford K.J. (2002) A gibberellin-regulated xyloglucan 12 endotransglycosylase gene is expressed in the endosperm cap during tomato seed 13 germination. Journal of Experimental Botany 53, 215-223. 14
Churchill G.A. (2002) Fundamentals of experimental design for cDNA microarrays. Nature 15 Genetics, 32, 490-495. 16
Claussen W., Lovey R.R. & Hawjer J.S. (1986) Influence of sucrose and hormones in the 17 activity of sucrose synthase and invertase in detached leaves and leaf sections of 18 eggplants (Solanum melongena). Journal of Plant Physiology 124, 345-357. 19
Cui X., Kerr M.K. & Churchill B.A. (2003) Transformations for cDNA microarray data. 20 Statistical Applications in Genetics and Molecular Biology, 2, 1–19. 21
Damari-Weissler H., Kandel-Kfir M., Gidoni D., Mett A., Belausov E. & Granot D. (2006) 22 Evidence for intracellular spatial separation of hexokinases and fructokinases in 23 tomato plants. Planta 224, 1495-1502. 24
Dinar H. & Stevens M.A. (1981) The relationship between starch and accumulation of soluble 25 solids content of tomato fruit. Journal of the American Society for the Horticultural 26 Science 106, 415-418. 27
Facella P., Lopez L., Carbone F., Galbraith D.W., Giuliano G. & Perrotta G. (2008) Diurnal and 28 circadian rhythms in the tomato transcriptome and their modulation by 29 cryptochrome photoreceptors. PLoS ONE 3, e2798. 30
Farrar J.F. & Williams J.H.H. (1991) Control of the rate of respiration in roots: 31 compartmentation, demand and the supply of substrate. In: Compartmentation of 32 plant metabolism in non-photosynthetic tissues (ed M. Emes), pp. 167-188. 33 Cambridge University Press, Cambridge, UK. 34
Fernandez P., Di Rienzo J., Fernandez L., Hopp H.E., Paniego N. & Heinz R. (2008) 35 Transcriptomic identification of candidate genes involved in sunflower responses to 36 chilling and salt stresses based on cDNA microarray analysis. BMC Plant Biology 8, 11. 37
Fridman E., Pleban T. & Zamir D. (2000) A recombination hotspot delimits a wild-species 38 quantitative trait locus for tomato sugar content to 484 bp within an invertase gene. 39 Proceedings of the National Academy of Sciences of the United States of America 97, 40 4718-4723. 41
Fridman E., Carrari F., Liu Y.-S., Fernie A.R. & Zamir D. (2004) Zooming in on a quantitative 42 trait for tomato yield using interspecific introgressions. Science 305, 1786-1789. 43
Frommer W.B. & Sonnewald U. (1995) Molecular analysis of carbon partitioning in 44 Solanaceous species. Journal of Experimental Botany 46, 587-607. 45
Fu H.Y. & Park W.D. (1995) Sink-associated and vascular-associated sucrose synthase 46 functions are encoded by different gene classes in potato. Plant Cell 7, 1369-1385. 47
Gary C., Baldet P., Bertin N., Devaux C., Tchamitchian M. & Raymond P. (2003) Time-course 48 of tomato whole-plant respiration and fruit and stem growth during prolonged 49 darkness in relation to carbohydrate reserves. Annals of Botany 91, 429-438. 50
hal-0
0600
426,
ver
sion
1 -
15 J
un 2
011
28
Gautier H., Guichard S. & Tchamitchian M. (2001) Modulation of competition between fruits 1 and leaves by flower pruning and water fogging, and consequences on tomato leaf 2 and fuit growth. Annals of Botany 88, 645-652. 3
Génard M. & Gouble B. (2005) ETHY. A theory of fruit climacteric ethylene emission. Plant 4 Physiology 139, 531-545. 5
Gibon Y., Pyl E.T., Sulpice R., Lunn J.E., Höhne M., Günther M. & Stitt M. (2009) Adjustment 6 of growth, starch turnover, protein content and central metabolism to a decrease of 7 the carbon supply when Arabidopsis is grown in very short photoperiods. Plant, Cell 8 & Environment 32, 859-874. 9
Gilbert C., Chadoeuf J., Vercambre G., Genard M. & Lescourret F. (2007) Cuticular cracking 10 on nectarine fruit surface: Spatial distribution and development in relation to 11 irrigation and thinning. Journal of the American Society for Horticultural Science 132, 12 583-591. 13
Gillaspy G., Ben-David H. & Gruissem W. (1993) Fruits : a developmental perspective. The 14 Plant Cell 5, 1439-1451. 15
Gomez L., Bancel D., Rubio E. & Vercambre G. (2007) The microplate reader: an efficient tool 16 for the separate enzymatic analysis of sugars in plant tissues – validation of a micro-17 method. Journal of the Science of Food and Agriculture 87, 1893-1905. 18
Gomez L., Rubio E. & Auge M. (2002) A new procedure for extraction and measurement of 19 soluble sugars in ligneous plants. Journal of the Science of Food and Agriculture 82, 20 360-369. 21
Grierson D., Tucker G.A., Keen J., Ray J., Bird C.R. & Schuch W. (1986) Molecular 22 characterization of tomato fruit polygalacturonase. Nucleic Acids Research 14, 8595-23 8603. 24
Guichard S., Gary C., Leonardi C. & Bertin N. (2005) Analysis of growth and water relations of 25 tomato fruits in relation to air vapor pressure deficit and plant fruit load. Journal of 26 Plant Growth Regulation 24, 201-213. 27
Guillon F., Philippe S., Bouchet B., Devaux M.-F., Frasse P., Jones B., Bouzayen M. & Lahaye 28 M. (2008) Down-regulation of an auxin response factor in the tomato induces 29 modification of fine pectin structure and tissue architecture. Journal of Experimental 30 Botany 59, 273-288. 31
Gutierrez L., Mauriat M., Guénin S., Pelloux J., Lefebvre J.F., Louvet R., Rusterucci C., Moritz 32 T., Guerineau F., Bellini C. & Van Wuytswinkel O. (2008) The lack of a systematic 33 validation of reference genes: a serious pitfall undervalued in reverse transcription-34 polymerase chain reaction (RT-PCR) analysis in plants. Plant Biotechnology Journal 6, 35 609-618. 36
Hadfield K.A. & Bennett A.B. (1998) Polygalacturonases: many genes in search of a function. 37 Plant Physiology 117, 337-343. 38
Heuvelink E. (1997) Effect of fruit load on dry matter partitioning in tomato. Scientia 39 Horticulturae 69, 51-59. 40
Ho L.C. (1996) The mechanism of assimilate partitioning and carbohydrate 41 compartmentation in fruit in relation to the quality and yield of tomato. Journal of 42 Experimental Botany 47, 1239-1243. 43
Ho L.C., Grange R.I. & Picken A.J. (1987) An analysis of the accumulation of water and dry 44 matter in tomato fruit. Plant, Cell and Environment 10, 157-162. 45
Johanson U., Karlsson M., Johansson I., Gustavsson S., Sjovall S., Fraysse L., Weig A.R. & 46 Kjellbom P. (2001) The complete set of genes encoding major intrinsic proteins in 47 Arabidopsis provides a framework for a new nomenclature for major intrinsic 48 proteins in plants. Plant Physiology 126, 1358-1369. 49
hal-0
0600
426,
ver
sion
1 -
15 J
un 2
011
29
Kaldenhoff R., Ribas-Carbo M., Flexas Sans J., Lovisolo C., Heckwolf M. & Uehlein N. (2008) 1 Aquaporins and plant water balance. Plant, Cell and Environment 31, 658-666. 2
Klann E., Yelle S. & Bennett A.B. (1992) Tomato acid invertase complementary DNA. Plant 3 Physiology 99, 351-353. 4
Kleczkowski L.A. (1994) Glucose activation and metabolism through UDP-glucose 5 pyrophosphorylase in plants. Phytochemistry 37, 1507-1515. 6
Koch K.E. (1996) Carbohydrate-modulated gene expression in plants. Annual Review of Plant 7 Physiology and Plant Molecular Biology 47, 509-540. 8
Kock M., Hamilton A. & Grierson D. (1991) eth1, a gene involved in ethylene synthesis in 9 tomato. Plant Molecular Biology 17, 141-142. 10
Koizumi N., Sato F., Terano Y. & Yamada Y. (1991) Sequence analysis of cDNA encoding 11 phosphoenolpyruvate carboxylase from cultured tobacco cells. Plant Molecular 12 Biology 17, 535-539 13
Koka C.V., Cerny R.E., Gardner R.G., Noguchi T., Fujioka S., Takatsuto S., Yoshida S. & Clouse 14 S.D. (2000) A putative role for the tomato genes DUMPY and CURL-3 in 15 brassinosteroid biosynthesis and response. Plant Physiology 122, 85-98. 16
Kolotilin I., Koltai H., Tadmor Y., Bar-Or C., Reuveni M., Meir A., Nahon S., Shlomo H., Chen L. 17 & Levin I. (2007) Transcriptional profiling of high pigment-2(dg) tomato mutant links 18 early fruit plastid biogenesis with its overproduction of phytonutrients. Plant 19 Physiology 145, 389-401. 20
Kortstee A.J., Appeldoorn N.J.G., Oortwijn M.E.P. & Visser R.G.F. (2007) Differences in 21 regulation of carbohydrate metabolism during early fruit development between 22 domesticated tomato and two wild relatives. Planta 226, 929-939. 23
Larsson C.T., Khoshnoodi J., Ek B., Rask L. & Larsson H. (1998) Molecular cloning and 24 characterization of starch-branching enzyme II from potato. Plant Molecular Biology 25 37, 505-511. 26
Lemaire-Chamley M., Petit J., Garcia V., Just D., Baldet P., Germain V., Fagard M., Mouassite 27 M., Cheniclet C. & Rothan C. (2005) Changes in transcriptional profiles are associated 28 with early fruit tissue specialization in tomato. Plant Physiology 139, 750-769. 29
Lippman Z.B., Semel Y. & Zamir D. (2007) An integrated view of quantitative trait variation 30 using tomato interspecific introgression lines. Current Opinion in Genetics & 31 Development 17, 545-552. 32
Liu X.L., Covington M.F., Fankhauser C., Chory J. & Wagner D. (2001) ELF3 encodes a 33 circadian clock–regulated nuclear protein that functions in an Arabidopsis PHYB 34 signal transduction pathway. The Plant Cell 13, 1293-1304. 35
Livak K.J. & Schmittgen T.D. (2001) Analysis of relative gene expression data using real-time 36 quantitative PCR and the 2-[Delta][Delta]CT method. Methods 25, 402-408. 37
Mandadi K.K., Misra A., Ren S. & McKnight T.D. (2009) BT2, a BTB protein, mediates multiple 38 responses to nutrients, stresses and hormones in Arabidopsis. Plant Physiology 150, 39 1930-1939. 40
Martineau B., Summerfelt K.R., Adams D.F. & DeVerna J.W. (1995) Production of high solids 41 tomatoes through molecular modification of levels of the plant growth regulator 42 cytokinin. Nature Biotechnology 13, 250-254. 43
Maurel C, Verdoucq L, Luu D-T, Santoni V. (2008) Plant aquaporins: membrane channels with 44 multiple integrated functions. Annual Review of Plant Biology 59, 595-624. 45
McGrath K.C., Dombrecht B., Manners J.M., Schenk P.M., Edgar C.I., Maclean D.J., Scheible 46 W.-R., Udvardi M.K. & Kazan K. (2005) Repressor- and activator-type ethylene 47 response factors functioning in jasmonate signaling and disease resistance identified 48 via a genome-wide screen of Arabidopsis transcription factor gene expression. Plant 49 Physiology 139, 949-959. 50
hal-0
0600
426,
ver
sion
1 -
15 J
un 2
011

30
Mohammadi M., Kav N.N.V. & Deyholos M.K. (2007) Transcriptional profiling of hexaploid 1 wheat (Triticum aestivum L.) roots identifies novel, dehydration-responsive genes. 2 Plant, Cell and Environment 30, 630-645. 3
Morandi B., Grappadelli L.C., Rieger M. & Lo Bianco R. (2008) Carbohydrate availability 4 affects growth and metabolism in peach fruit. Physiologia Plantarum 133, 229-241. 5
Mounet F., Moing A., Garcia V., Petit J., Maucourt M., Deborde C., Bernillon S., Le Gall G., 6 Colquhoun I., Defernez M., Giraudel J.L., Rolin D., Rothan C. & Lemaire-Chamley M. 7 (2009) Gene and metabolite regulatory network analysis of early developing fruit 8 tissues highlights new candidate genes for the control of tomato fruit composition 9 and development. Plant Physiology 149, 1505-1528. 10
Mustroph A., Zanetti M.E., Jang C.J.H., Holtan H.E., Repetti P.P., Galbraith D.W., Girke T. & 11 Bailey-Serres J. (2009) Profiling translatomes of discrete cell populations resolves 12 altered cellular priorities during hypoxia in Arabidopsis. Proceedings of the National 13 Academy of Sciences early edition. 14
Nakano T., Suzuki K., Ohtsuki N., Tsujimoto Y., Fujimura T. & Shinshi H. (2006) Identification 15 of genes of the plant-specific transcription-factor families cooperatively regulated by 16 ethylene and jasmonate in Arabidopsis thaliana. Journal of Plant Research 119, 407-17 413. 18
Nielsen T.H., Rung J.H. & Villadsen D. (2004) Fructose-2,6-bisphosphate: a traffic signal in 19 plant metabolism. Trends in Plant Science, 9, 556-563. 20
Ohyama A., Hirai M. & Nishimura S. (1992) A novel cDNA clone for acid invertase in tomato 21 fruit. Japanese Journal of Genetics 67, 491-492. 22
Oomen R., Dao-Thi B., Tzitzikas E.N., Bakx E.J., Schols H.A., Visser R.G.F. & Vincken J.P. (2004) 23 Overexpression of two different potato UDP-Glc 4-epimerases can increase the 24 galactose content of potato tuber cell walls. Plant Science 166, 1097-1104. 25
Ouyang B., Yang T., Li H., Zhang L., Zhang Y., Zhang J., Fei Z. & Ye Z. (2007) Identification of 26 early salt stress response genes in tomato root by suppression substractive 27 hybridization and microarray analysis. Journal of Experimental Botany 58, 507-520. 28
Owttrim G.W., Hofmann S. & Kuhlemeier C. (1991) Divergent genes for translation initiation 29 factor eIF-4A are coordinately expressed in tobacco. Nucleic Acid Research 19, 5491-30 5496. 31
Piques M., Schulze W.X., Hohne M., Usadel B., Gibon Y., Rohwer J. & Stitt M. (2009) 32 Ribosome and transcript copy numbers, polysome occupancy and enzyme dynamics 33 in Arabidopsis. Molecular Systems Biology, 5 : 314. 34
Prudent M., Causse M., Génard M., Tripodi P., Grandillo S. & Bertin N. (2009) Genetic and 35 physiological analysis of tomato fruit weight and composition: influence of carbon 36 availability on QTL detection. Journal of Experimental Botany 60, 923-937. 37
Ren G., Healy R.A., Horner H.T., Martha G.J. & Thornburg R.W. (2007) Expression of starch 38 metabolic genes in the developing nectaries of ornamental tobacco plants. Plant 39 Science 173, 621-637. 40
Robert H.S., Quint A., Brand D., Vivian-Smith A. & Offringa R. (2009) BTB and TAZ domain 41 scaffold proteins perform a crucial function in Arabidopsis development. The Plant 42 Journal 58, 109-121. 43
Robinson N.L., Hewitt J.D. & Bennett A.B. (1988) Sink metabolism in tomato fruit : I. 44 Developmental changes in carbohydrate metabolizing enzymes. Plant Physiology 87, 45 727-730. 46
Rushton P.J., Bokowiec M.T., Han S., Zhang H., Brannock J.F., Chen X., Laudeman T.W. & 47 Timko M.P. (2008) Tobacco transcription factors: novel insights into transcriptional 48 regulation in the Solanaceae. Plant Physiology 147, 280-295. 49
hal-0
0600
426,
ver
sion
1 -
15 J
un 2
011
31
Saladie M., Rose J.K.C., Cosgrove D.J. & Catala C. (2006) Characterization of a new xyloglucan 1 endotransglucosylase/hydrolase (XTH) from ripening tomato fruit and implications 2 for the diverse modes of enzymic action. The Plant Journal 47, 282-295. 3
Schaffer A.A. & Petreikov M. (1997a) Inhibition of fructokinase and sucrose synthase by 4 cytosolic levels of fructose in young tomato fruit undergoing transient starch 5 synthesis. Physiologia Plantarum 101, 800-806. 6
Schaffer A.A. & Petreikov M. (1997b) Sucrose-to-starch metabolism in tomato fruit 7 undergoing transient starch accumulation. Plant Physiology 113, 739-746. 8
Schauer N., Semel Y., Roessner U., Gur A., Balbo I., Carrari F., Pleban T., Perez-Melis A., 9 Bruedigam C., Kopka J., Willmitzer L., Zamir D. & Fernie A.R. (2006) Comprehensive 10 metabolic profiling and phenotyping of interspecific introgression lines for tomato 11 improvement. Nature Biotechnology, 24, 447-454. 12
Smith A.M. & Stitt M. (2007) Coordination of carbon supply and plant growth. Plant, Cell 13 and Environment 30, 1126-1149. 14
Smyth G.K. (2005a) Limma: linear models for microarray data. In: Bioinformatics and 15 computational biology solutions using R and Bioconductor (eds R. Gentleman, V. 16 Carey, S. Dudoit, R. Irizarry, & W. Huber), pp. 397–420. Springer, New York. 17
Smyth G.K. (2005b) Individual channel analysis of two-colour microarray data (CD Paper 18 116). Paper presented at the 55th Session of the International Statistics Institute, 19 Sydney Convention and Exhibition Centre, Sydney, Australia. 20
Stitt M. (1999) Nitrate regulation of metabolism and growth. Current Opinion in Plant 21 Biology 2, 178-186. 22
Sturm A. (1999) Invertases. Primary structures, functions, and roles in plant development 23 and sucrose partitioning. Plant Physiology 121, 1-8. 24
Sung S.J., Wu D.P. & Black C.C. (1989) Indentification of actively filling sucrose sinks. Plant 25 Physiology 89, 1117-1121. 26
Thimm O., Blasing O., Gibon Y., Nagel A., Meyer S., Kruger P., Selbig J., Muller L.A., Rhee S.Y. 27 & Stitt M. (2004) MAPMAN: a user-driven tool to display genomics data sets onto 28 diagrams of metabolic pathways and other biological processes. Plant Journal 37, 29 914-939. 30
Thompson D.S., Davies W.J. & Ho L.C. (1998) Regulation of tomato fruit growth by epidermal 31 cell wall enzymes. Plant, Cell and Environment 21, 589-599. 32
Trentmann S.M. & Kende H. (1995) Analysis of Arabidopsis cDNA that shows homology to 33 the tomato E8 cDNA. Plant Molecular Biology 29, 161-166. 34
Tyerman S.D., Niemietz C. & Bramley M.H. (2002) Plant aquaporins: multifunctional water 35 and solute channels with expanding roles. Plant, Cell and Environment 25, 173-194. 36
Udvardi M.K., Czechowski T. & Scheible W.-R. (2008) Elevengolden rules of quantitative RT-37 PCR. Plant Cell 20, 1736-1737. 38
Ülker B. & Somssich I.E. (2004) WRKY transcription factors: from DNA binding towards 39 biological function. Current Opinion in Plant Biology 7, 491-498. 40
Vriezen W.H., Feron R., Maretto F., Keijman J. & Mariani C. (2008) Changes in tomato ovary 41 transcriptome demonstrate complex hormonal regulation of fruit set. New 42 Phytologist 177, 60-76. 43
Wang H., Schauer N., Usadel B., Frasse P., Zouine M., Hernould M., Latche A., Pech J.-C., 44 Fernie A.R. & Bouzayen M. (2009) Regulatory Features Underlying Pollination-45 Dependent and -Independent Tomato Fruit Set Revealed by Transcript and Primary 46 Metabolite Profiling. Plant Cell, 21, 1428-1452. 47
Wu H., Kerr K., Cui X. & Churchill G.A. (2003) MAANOVA: a software package for the analysis 48 of spotted cDNA microarray experiments. In: The analysis of gene expression data: 49
hal-0
0600
426,
ver
sion
1 -
15 J
un 2
011
32
methods and software (eds G. Parmigiani, E.S. Garett, R.A. Irizarry, & S.L. Zeger), pp. 1 313–341. Springer-Verlag, New York. 2
Yáñez M., Cáceres S., Orellana S., Bastías A., Verdugo I., Ruiz-Lara S. & Casaretto J. (2009) An 3 abiotic stress-responsive bZIP transcription factor from wild and cultivated tomatoes 4 regulates stress-related genes. Plant Cell Reports, 28, 1497-1507. 5
Yang Y.H. & Speed T. (2002) Design issues for cDNA microarray experiments. Nature Reviews 6 Genetics, 3, 579-588. 7
Yelle S., Hewitt J.D., Robinson N.L., Damon S. & Bennett A.B. (1988) Sink metabolism in 8 tomato fruit III. Analysis of carbohydrate assimilation in a wild species. Plant 9 Physiology 87, 737-740. 10
Yun S.J. & Oh S.H. (1998) Cloning and characterization of a tobacco cDNA encoding 11 calcium/calmodulin-dependent glutamate decarboxylase. Molecules and Cells 8, 125-12 129. 13
14
15
hal-0
0600
426,
ver
sion
1 -
15 J
un 2
011
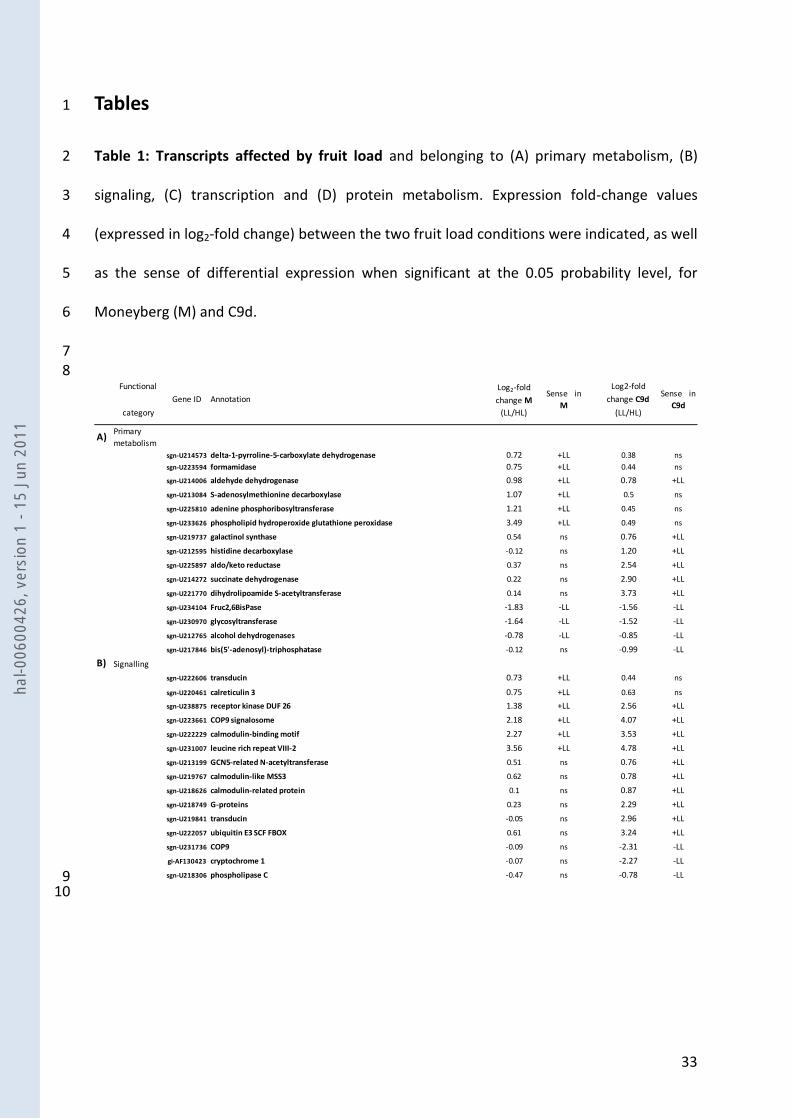
33
Tables 1
Table 1: Transcripts affected by fruit load and belonging to (A) primary metabolism, (B) 2
signaling, (C) transcription and (D) protein metabolism. Expression fold-change values 3
(expressed in log2-fold change) between the two fruit load conditions were indicated, as well 4
as the sense of differential expression when significant at the 0.05 probability level, for 5
Moneyberg (M) and C9d. 6
7 8
Functional
category
Gene ID Annotation
Log2-fold
change M
(LL/HL)
Sense in
M
Log2-fold
change C9d
(LL/HL)
Sense in
C9d
A)Primary
metabolism
sgn-U214573 delta-1-pyrroline-5-carboxylate dehydrogenase 0.72 +LL 0.38 ns
sgn-U223594 formamidase 0.75 +LL 0.44 ns
sgn-U214006 aldehyde dehydrogenase 0.98 +LL 0.78 +LL
sgn-U213084 S-adenosylmethionine decarboxylase 1.07 +LL 0.5 ns
sgn-U225810 adenine phosphoribosyltransferase 1.21 +LL 0.45 ns
sgn-U233626 phospholipid hydroperoxide glutathione peroxidase 3.49 +LL 0.49 ns
sgn-U219737 galactinol synthase 0.54 ns 0.76 +LL
sgn-U212595 histidine decarboxylase -0.12 ns 1.20 +LL
sgn-U225897 aldo/keto reductase 0.37 ns 2.54 +LL
sgn-U214272 succinate dehydrogenase 0.22 ns 2.90 +LL
sgn-U221770 dihydrolipoamide S-acetyltransferase 0.14 ns 3.73 +LL
sgn-U234104 Fruc2,6BisPase -1.83 -LL -1.56 -LL
sgn-U230970 glycosyltransferase -1.64 -LL -1.52 -LL
sgn-U212765 alcohol dehydrogenases -0.78 -LL -0.85 -LL
sgn-U217846 bis(5'-adenosyl)-triphosphatase -0.12 ns -0.99 -LL
B) Signalling
sgn-U222606 transducin 0.73 +LL 0.44 ns
sgn-U220461 calreticulin 3 0.75 +LL 0.63 ns
sgn-U238875 receptor kinase DUF 26 1.38 +LL 2.56 +LL
sgn-U223661 COP9 signalosome 2.18 +LL 4.07 +LL
sgn-U222229 calmodulin-binding motif 2.27 +LL 3.53 +LL
sgn-U231007 leucine rich repeat VIII-2 3.56 +LL 4.78 +LL
sgn-U213199 GCN5-related N-acetyltransferase 0.51 ns 0.76 +LL
sgn-U219767 calmodulin-like MSS3 0.62 ns 0.78 +LL
sgn-U218626 calmodulin-related protein 0.1 ns 0.87 +LL
sgn-U218749 G-proteins 0.23 ns 2.29 +LL
sgn-U219841 transducin -0.05 ns 2.96 +LL
sgn-U222057 ubiquitin E3 SCF FBOX 0.61 ns 3.24 +LL
sgn-U231736 COP9 -0.09 ns -2.31 -LL
gi-AF130423 cryptochrome 1 -0.07 ns -2.27 -LL
sgn-U218306 phospholipase C -0.47 ns -0.78 -LL 9 10
hal-0
0600
426,
ver
sion
1 -
15 J
un 2
011
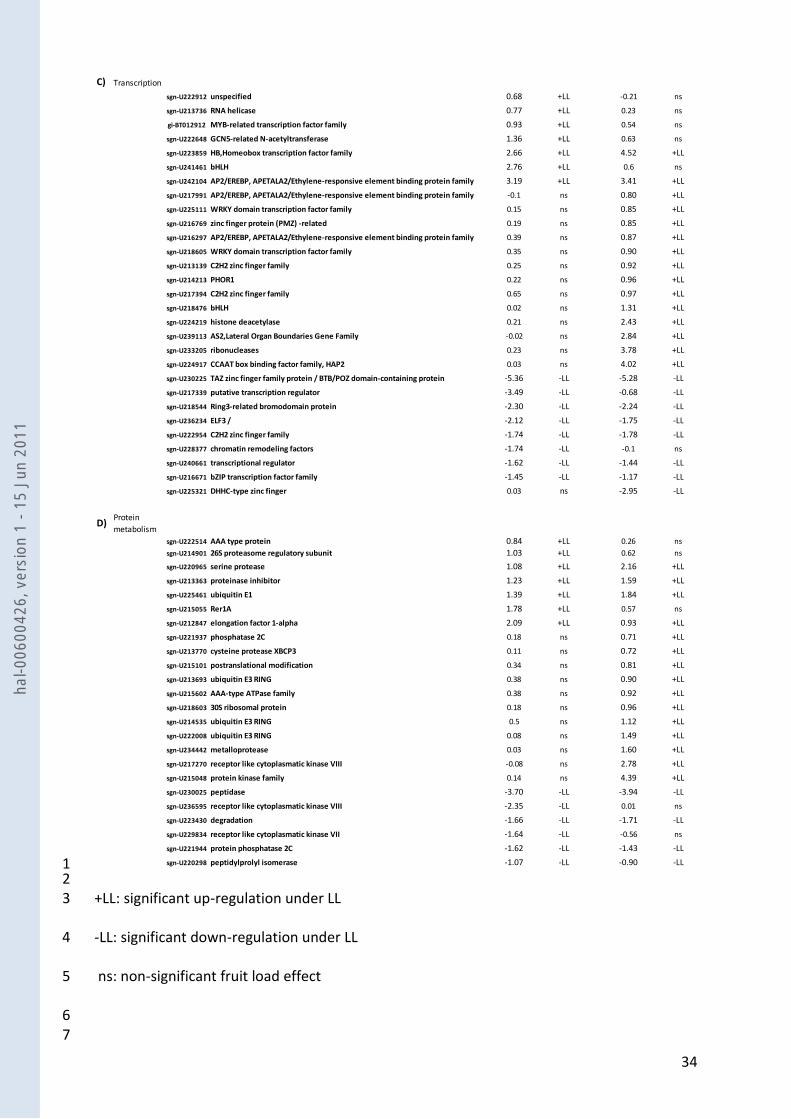
34
C) Transcription
sgn-U222912 unspecified 0.68 +LL -0.21 ns
sgn-U213736 RNA helicase 0.77 +LL 0.23 ns
gi-BT012912 MYB-related transcription factor family 0.93 +LL 0.54 ns
sgn-U222648 GCN5-related N-acetyltransferase 1.36 +LL 0.63 ns
sgn-U223859 HB,Homeobox transcription factor family 2.66 +LL 4.52 +LL
sgn-U241461 bHLH 2.76 +LL 0.6 ns
sgn-U242104 AP2/EREBP, APETALA2/Ethylene-responsive element binding protein family 3.19 +LL 3.41 +LL
sgn-U217991 AP2/EREBP, APETALA2/Ethylene-responsive element binding protein family -0.1 ns 0.80 +LL
sgn-U225111 WRKY domain transcription factor family 0.15 ns 0.85 +LL
sgn-U216769 zinc finger protein (PMZ) -related 0.19 ns 0.85 +LL
sgn-U216297 AP2/EREBP, APETALA2/Ethylene-responsive element binding protein family 0.39 ns 0.87 +LL
sgn-U218605 WRKY domain transcription factor family 0.35 ns 0.90 +LL
sgn-U213139 C2H2 zinc finger family 0.25 ns 0.92 +LL
sgn-U214213 PHOR1 0.22 ns 0.96 +LL
sgn-U217394 C2H2 zinc finger family 0.65 ns 0.97 +LL
sgn-U218476 bHLH 0.02 ns 1.31 +LL
sgn-U224219 histone deacetylase 0.21 ns 2.43 +LL
sgn-U239113 AS2,Lateral Organ Boundaries Gene Family -0.02 ns 2.84 +LL
sgn-U233205 ribonucleases 0.23 ns 3.78 +LL
sgn-U224917 CCAAT box binding factor family, HAP2 0.03 ns 4.02 +LL
sgn-U230225 TAZ zinc finger family protein / BTB/POZ domain-containing protein -5.36 -LL -5.28 -LL
sgn-U217339 putative transcription regulator -3.49 -LL -0.68 -LL
sgn-U218544 Ring3-related bromodomain protein -2.30 -LL -2.24 -LL
sgn-U236234 ELF3 / -2.12 -LL -1.75 -LL
sgn-U222954 C2H2 zinc finger family -1.74 -LL -1.78 -LL
sgn-U228377 chromatin remodeling factors -1.74 -LL -0.1 ns
sgn-U240661 transcriptional regulator -1.62 -LL -1.44 -LL
sgn-U216671 bZIP transcription factor family -1.45 -LL -1.17 -LL
sgn-U225321 DHHC-type zinc finger 0.03 ns -2.95 -LL
D)Protein
metabolism
sgn-U222514 AAA type protein 0.84 +LL 0.26 ns
sgn-U214901 26S proteasome regulatory subunit 1.03 +LL 0.62 ns
sgn-U220965 serine protease 1.08 +LL 2.16 +LL
sgn-U213363 proteinase inhibitor 1.23 +LL 1.59 +LL
sgn-U225461 ubiquitin E1 1.39 +LL 1.84 +LL
sgn-U215055 Rer1A 1.78 +LL 0.57 ns
sgn-U212847 elongation factor 1-alpha 2.09 +LL 0.93 +LL
sgn-U221937 phosphatase 2C 0.18 ns 0.71 +LL
sgn-U213770 cysteine protease XBCP3 0.11 ns 0.72 +LL
sgn-U215101 postranslational modification 0.34 ns 0.81 +LL
sgn-U213693 ubiquitin E3 RING 0.38 ns 0.90 +LL
sgn-U215602 AAA-type ATPase family 0.38 ns 0.92 +LL
sgn-U218603 30S ribosomal protein 0.18 ns 0.96 +LL
sgn-U214535 ubiquitin E3 RING 0.5 ns 1.12 +LL
sgn-U222008 ubiquitin E3 RING 0.08 ns 1.49 +LL
sgn-U234442 metalloprotease 0.03 ns 1.60 +LL
sgn-U217270 receptor like cytoplasmatic kinase VIII -0.08 ns 2.78 +LL
sgn-U215048 protein kinase family 0.14 ns 4.39 +LL
sgn-U230025 peptidase -3.70 -LL -3.94 -LL
sgn-U236595 receptor like cytoplasmatic kinase VIII -2.35 -LL 0.01 ns
sgn-U223430 degradation -1.66 -LL -1.71 -LL
sgn-U229834 receptor like cytoplasmatic kinase VII -1.64 -LL -0.56 ns
sgn-U221944 protein phosphatase 2C -1.62 -LL -1.43 -LL
sgn-U220298 peptidylprolyl isomerase -1.07 -LL -0.90 -LL 1 2 +LL: significant up-regulation under LL 3
-LL: significant down-regulation under LL 4
ns: non-significant fruit load effect 5
6 7
hal-0
0600
426,
ver
sion
1 -
15 J
un 2
011

35
Table 2: Transcripts showing significant genotype x fruit load interactions at the 0.05 1
probability level and belonging to (a) hormonal responses and (b) cell wall modification. 2
Differences in fruit load fold change expression between Moneyberg (M) and C9d are 3
indicated and expressed in log2 fold-change. 4
5 Functional
category
Gene ID Annotation
Interaction =
(Log2-fold change in C9d) -
(Log2-fold change in M)
A) sgn-U214292 GA2 oxidase 0.68
sgn-U213942 jasmonate ZIM-domain protein 1 0.70
sgn-U213522 1-aminocyclopropane-1-carboxylate synthase 0.71
sgn-U227363 auxin induced protein 0.75
sgn-U219331 jasmonic acid2 0.76
sgn-U214505 putative phytosulfokine peptide precursor 0.78
sgn-U226232 IAA-Ala hydrolase (IAR3) 0.79
sgn-U214304 ethylene-responsive late embryogenesis-like protein (ER5) 0.79
sgn-U214303 ethylene-responsive late embryogenesis-like protein (ER5) 0.80
U77719 ethylene-responsive late embryogenesis-like protein (ER5) 0.82
sgn-U215161 auxin induced protein 0.83
sgn-U221333 steroid 5 alpha reductase DET2 0.90
sgn-U232919 putative phytosulfokine peptide precursor 0.91
sgn-U214504 putative phytosulfokine peptide precursor 0.91
sgn-U214986 auxin-regulated protein 0.94
sgn-U212798 2-oxoglutarate-dependent dioxygenase 0.99
sgn-U212786 1-aminocyclopropane-1-carboxylate oxidase 1.08
sgn-U213253 ent-kaurenoic acid hydroxylase/oxygenase 1.12
sgn-U241804 auxin induced protein 1.13
sgn-U215638 S-adenosyl-L-methionine:salicylic acid carboxyl methyltransferase 1.43
sgn-U212784 lipoxygenase 1.70
sgn-U214919 1-aminocyclopropane-1-carboxylate oxidase 2.13
B) sgn-U215495 extensin -0.94
sgn-U215382 xyloglucan endotransglycosylase -0.80
sgn-U215860 xyloglucan endotransglycosylase -0.71
sgn-U216615 arabinogalactan protein -0.71
sgn-U214352 UDP-glucose-4-epimerase 0.74
Sgn-U222466 elastin 0.74
sgn-U220299 elastin 1.06
Cell wall
modification
Hormonal
responses
6 7
8
hal-0
0600
426,
ver
sion
1 -
15 J
un 2
011
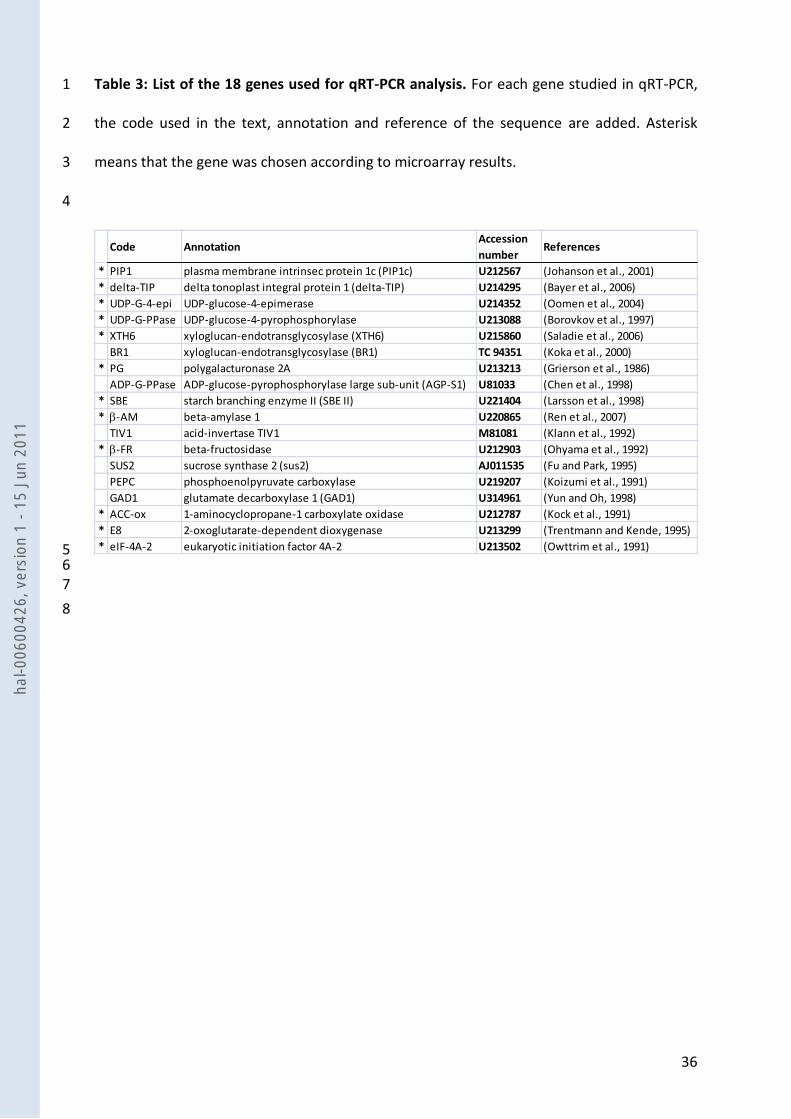
36
Table 3: List of the 18 genes used for qRT-PCR analysis. For each gene studied in qRT-PCR, 1
the code used in the text, annotation and reference of the sequence are added. Asterisk 2
means that the gene was chosen according to microarray results. 3
4
Code AnnotationAccession
numberReferences
* PIP1 plasma membrane intrinsec protein 1c (PIP1c) U212567 (Johanson et al., 2001)
* delta-TIP delta tonoplast integral protein 1 (delta-TIP) U214295 (Bayer et al., 2006)
* UDP-G-4-epi UDP-glucose-4-epimerase U214352 (Oomen et al., 2004)
* UDP-G-PPase UDP-glucose-4-pyrophosphorylase U213088 (Borovkov et al., 1997)
* XTH6 xyloglucan-endotransglycosylase (XTH6) U215860 (Saladie et al., 2006)
BR1 xyloglucan-endotransglycosylase (BR1) TC 94351 (Koka et al., 2000)
* PG polygalacturonase 2A U213213 (Grierson et al., 1986)
ADP-G-PPase ADP-glucose-pyrophosphorylase large sub-unit (AGP-S1) U81033 (Chen et al., 1998)
* SBE starch branching enzyme II (SBE II) U221404 (Larsson et al., 1998)
* -AM beta-amylase 1 U220865 (Ren et al., 2007)
TIV1 acid-invertase TIV1 M81081 (Klann et al., 1992)
* -FR beta-fructosidase U212903 (Ohyama et al., 1992)
SUS2 sucrose synthase 2 (sus2) AJ011535 (Fu and Park, 1995)
PEPC phosphoenolpyruvate carboxylase U219207 (Koizumi et al., 1991)
GAD1 glutamate decarboxylase 1 (GAD1) U314961 (Yun and Oh, 1998)
* ACC-ox 1-aminocyclopropane-1 carboxylate oxidase U212787 (Kock et al., 1991)
* E8 2-oxoglutarate-dependent dioxygenase U213299 (Trentmann and Kende, 1995)
* eIF-4A-2 eukaryotic initiation factor 4A-2 U213502 (Owttrim et al., 1991) 5 6 7
8
hal-0
0600
426,
ver
sion
1 -
15 J
un 2
011

37
Figure legends 1
2 Figure 1: Temporal trends of fruit physiological characteristics in two lines. From 21 days 3
after anthesis to the red ripe stage: fruit fresh weight (a), pericarp water content (b), starch 4
content of the pericarp (c), and soluble sugar content of the pericarp (d) were measured on 5
M (triangles) and C9d (circles) under HL (black) and under LL (grey). Each point corresponds 6
to the mean of five points, and bars are standard deviations. For each genotype, from 21 daa 7
to red ripe stage, fruit load effect significance and genotypic effect significance were 8
evaluated by t-tests. Letters a and b indicate a significant effect of fruit load at the 0.05 9
probability level for M and C9d, respectively. Interactions between genotype and fruit load 10
were evaluated by a two-way analysis of variance. Significant interactions at the 0.05 11
probability level are indicated by letter c. 12
13
Figure 2: Phenotypic characteristics of fruits at the red ripe stage. 14
(a) Images of red ripe fruits from M and C9d grown under HL and LL conditions. 15
(b) Means and standard deviation (s.d) for the fruit developmental duration (Dura expressed 16
in days), seed number (SdN), pericarp cell number (ClN) and cell size (ClS expressed in 17
nanoliters (nL)) of five fruits in two genotypes (C9d and Moneyberg (M)) under high load (HL) 18
or low load (LL) conditions. For each trait, the fruit load effect and the genotype effect were 19
evaluated by t-tests and interactions between genotype and fruit load were evaluated via a 20
two-way analysis of variance. 21
22
Figure 3: Microarray analysis of gene expression under HL and LL conditions, in M and C9d. 23
(a) Microarray experimental design. Each arrow represents a hybridized microarray slide. 24
hal-0
0600
426,
ver
sion
1 -
15 J
un 2
011
38
(b) Number of genes up-regulated (↑) or down-regulated (↓) under LL for Moneyberg (on 1
the left) and for C9d (on the right). The number of genes differentially expressed according 2
to fruit load that were common to both genotypes, is in parentheses. 3
4
Figure 4: Distribution of differentially expressed genes into biological classes, according to 5
the Mapman annotation. 6
(a) Percentage of genes differentially regulated with fruit load effect for C9d (black) and M 7
(grey). 8
(b) Percentage of genes showing significant genotype x fruit load interactions 9
10
Figure 5: Gene expression patterns along fruit development. Expression of 15 genes at 21, 11
28, 35, 42 daa and the red ripe stage (RR), under high load (HL, black) and low load 12
conditions (LL, grey) for Moneyberg (M, triangles) and C9d (circles). Each value is the mean 13
of 3 biological and 3 technical replicates and was normalized either using M under HL at 21 14
daa as a reference for expression data. Bars are standard deviations. 15
These 15 genes encode a plasma membrane aquaporin (PIP1), a delta-tonoplast intrinsic 16
protein (delta-TIP), a UDP-glucose-4-epimerase (UDP-G-4-epi), a UDP-glucose-17
pyrophosphorylase (UDP-G-PPase), two xyloglucan endotransglycosylases (XTH6 and BR1), a 18
polygalacturonase (PG), a ADP-glucose-pyrophosphorylase (ADP-G-PPase), a starch-19
branching enzyme (SBE), a b-amylase (-AM), a vacuolar invertase (TIV1), a -fructosidase 20
(b-FR), a sucrose synthase (SUS2), a phosphoenolpyruvate carboxylase (PEPC), and a 21
glutamate decarboxylase (GAD1). 22
For each genotype, from 21 daa to red ripe stage, fruit load effect significance was evaluated 23
by t-tests. Letters a and b indicate a significant effect of fruit load at the 0.05 probability 24
level for M and C9d, respectively. Interactions between genotype and fruit load were 25
hal-0
0600
426,
ver
sion
1 -
15 J
un 2
011

39
evaluated by a two-way ANOVA. Significant interactions at the 0.05 probability level are 1
indicated by letter c. 2
3
Figure 6: Principal component analysis (PCA) of gene expression during fruit development 4
for M and C9d under high load (HL) and low load conditions (LL). 5
(a) First plan of the PCA constructed with 15 gene expression patterns for the two first 6
principal components. Percentage in brackets represents the variance explained by each 7
component. The 15 genes encode a plasma membrane aquaporin (PIP1), a delta-tonoplast 8
intrinsic protein (delta-TIP), a UDP-glucose-4-epimerase (UDP-G-4-epi), a UDP-glucose-9
pyrophosphorylase (UDP-G-PPase), two xyloglucan endotransglycosylases (XTH6 and BR1), a 10
polygalacturonase (PG), a ADP-glucose-pyrophosphorylase (ADP-G-PPase), a starch-11
branching enzyme (SBE), a -amylase (b-AM), a vacuolar invertase (TIV1), a -fructosidase 12
(b-FR), a sucrose synthase (SUS2), a phosphoenolpyruvate carboxylase (PEPC), and a 13
glutamate decarboxylase (GAD1). 14
(b) Principal component scores for M (triangles) and C9d (circles) under HL (black) and LL 15
(grey) for each of the five developmental stages (21, 28, 35, 42 daa and red ripe (RR)). 16
17
hal-0
0600
426,
ver
sion
1 -
15 J
un 2
011

40
1
2
0
20
40
60
80
100
120
140
160
180
20 30 40 50 60
FW (g
)
age (daa)
90
91
92
93
94
95
96
20 30 40 50 60
age (daa)w
ate
r co
nte
nt
(g / 1
00 g
FW
)
Wat
er c
on
ten
t (g
/ 1
00
g F
W)
age (daa)
(a) (b)
ac
ab
abc
abc
ac
bab
ab
0
10
20
30
40
50
60
70
20 30 40 50 60
age (daa)
Suga
rs(g
/ 1
00
g D
W)
(d)
ab
abbc
0
2
4
6
8
10
12
14
16
18
20
20 30 40 50 60
age (daa)
sta
rch
(g
/ 1
00 g
DW
)St
arch
(g /
10
0 g
DW
)
age (daa)
(c)ac
ab
b
3
4 5
6 7 8
9
Figure 1.
hal-0
0600
426,
ver
sion
1 -
15 J
un 2
011
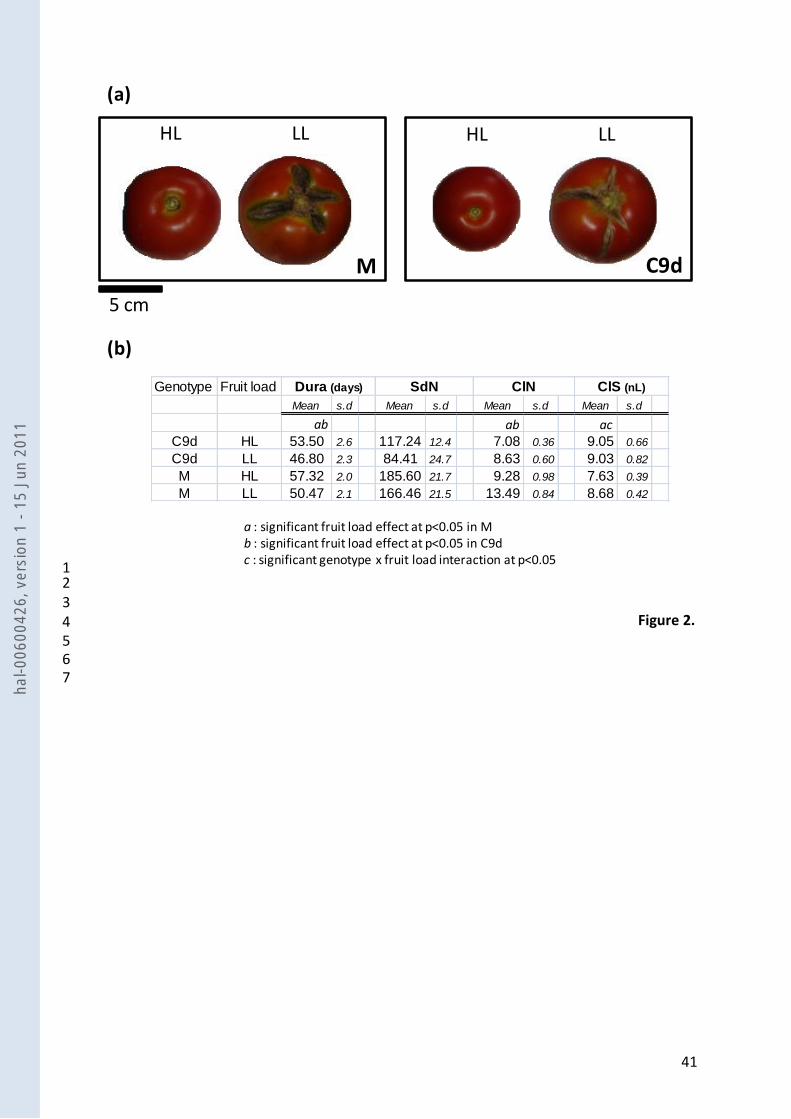
41
a : significant fruit load effect at p<0.05 in Mb : significant fruit load effect at p<0.05 in C9dc : significant genotype x fruit load interaction at p<0.05
Genotype Fruit load
Mean s.d Mean s.d Mean s.d Mean s.d
C9d HL 53.50 2.6 117.24 12.4 7.08 0.36 9.05 0.66
C9d LL 46.80 2.3 84.41 24.7 8.63 0.60 9.03 0.82
M HL 57.32 2.0 185.60 21.7 9.28 0.98 7.63 0.39
M LL 50.47 2.1 166.46 21.5 13.49 0.84 8.68 0.42
Dura (days) SdN ClN ClS (nL)
ab ab ac
5 cm
C9d
HL LL
M
HL LL
(a)
(b)
1 2 3 4 5 6
7
Figure 2.
hal-0
0600
426,
ver
sion
1 -
15 J
un 2
011
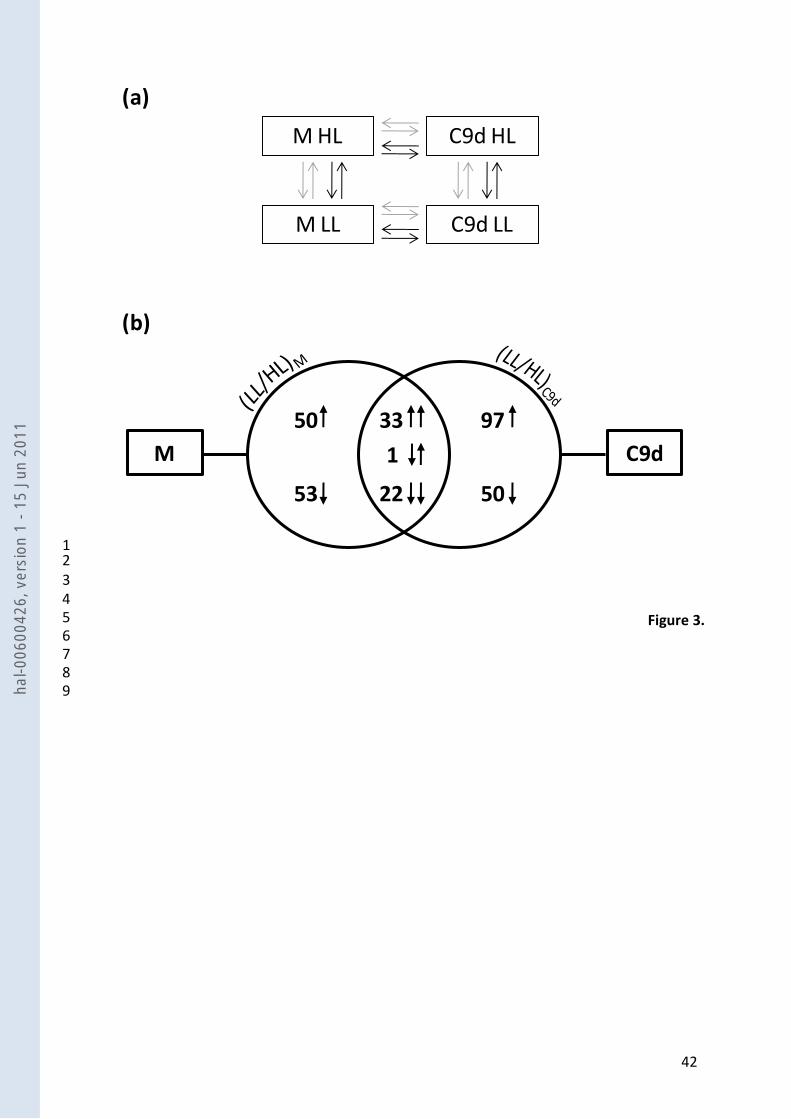
42
50
53
97
50
33
22
1 C9dM
M HL
M LL
C9d HL
C9d LL
(a)
(b)
1 2 3 4 5 6 7 8
9
Figure 3.
hal-0
0600
426,
ver
sion
1 -
15 J
un 2
011

43
15 5 0 5 15
cell wall modification
electron transport
hormonal responses
photosynthesis
primary metabolism
protein metabolism
secondary metabolism
signalling
stress responses
transcription
transport
unknown
25
-25
-20
-15
-10-505
10
15
20
10 201020% %
- LL+ LL(a)
05
1015
2025
cell
wal
l mod
ific
atio
n
elec
tron
tran
spor
t
horm
onal
res
pons
es
phot
osyn
thes
is
pri
mar
y m
etab
olis
m
pro
tein
met
abo
lism
seco
ndar
y m
etab
olis
m
sign
allin
g
stre
ss r
espo
nses
tran
scri
ptio
n
tran
spor
t
unkn
own
(b)
1 2
3
Figure 4.
hal-0
0600
426,
ver
sion
1 -
15 J
un 2
011

44
1
0
1
10
100
1000
10000
100000
21 28 35 42 49 56
abc abc
abc ac
bc
0
1
10
100
1000
21 28 35 42 49 56
abc
abc
abc
bc abc
0
1
2
3
4
5
6
7
21 28 35 42 49 56
ab
abc
abcbc
bc
Cell wall degradation
Cell wall synthesisWater fluxes
Cell wall synthesis
0.0
0.2
0.4
0.6
0.8
1.0
1.2
21 28 35 42 49 56
abc
abc
abab
bc0.0
0.5
1.0
1.5
2.0
2.5
3.0
21 28 35 42 49 56
abc
abc
ab
abc
abc
0.0
0.5
1.0
1.5
2.0
21 28 35 42 49 56
bc
abcbc
ab
ab
delta-TIP PIP1 UDP-G-4-epi
0
1
2
3
4
21 28 35 42 49 56
abc
bc
bc
acac
UDP-G-PPase XTH6 BR1
Cell wall degradation
PG
0.00
0.01
0.10
1.00
10.00
21 28 35 42 49 56
abcabc
abc
abc
bc
Starch synthesis
ADP-G-PPase SBE
0
1
2
3
21 28 35 42 49 56
ac
bc
abc
ab
ab
Soluble sugar metabolismStarch degradation
0
2
4
6
8
21 28 35 42 49 56
bc
b
abc
abc
bc
-AM
0
1
2
3
4
5
21 28 35 42 49 56
abc
abc
ab
ab
ac
SUS2
0
1
10
100
21 28 35 42 49 56
abc
abc abc
abbc
-FR
Organic / amino-acid metabolismSoluble sugar metabolism
0
1
10
100
21 28 35 42 49 56
abc
abc
abc ab
TIV1
0.0
0.5
1.0
1.5
2.0
2.5
21 28 35 42 49 56
abc
abcabc
ab
a
PEPC
0.0
0.5
1.0
1.5
2.0
21 28 35 42 49 56
abc
abc
ab
ab
GAD1
2 3 4 5
6
Figure 5.
hal-0
0600
426,
ver
sion
1 -
15 J
un 2
011
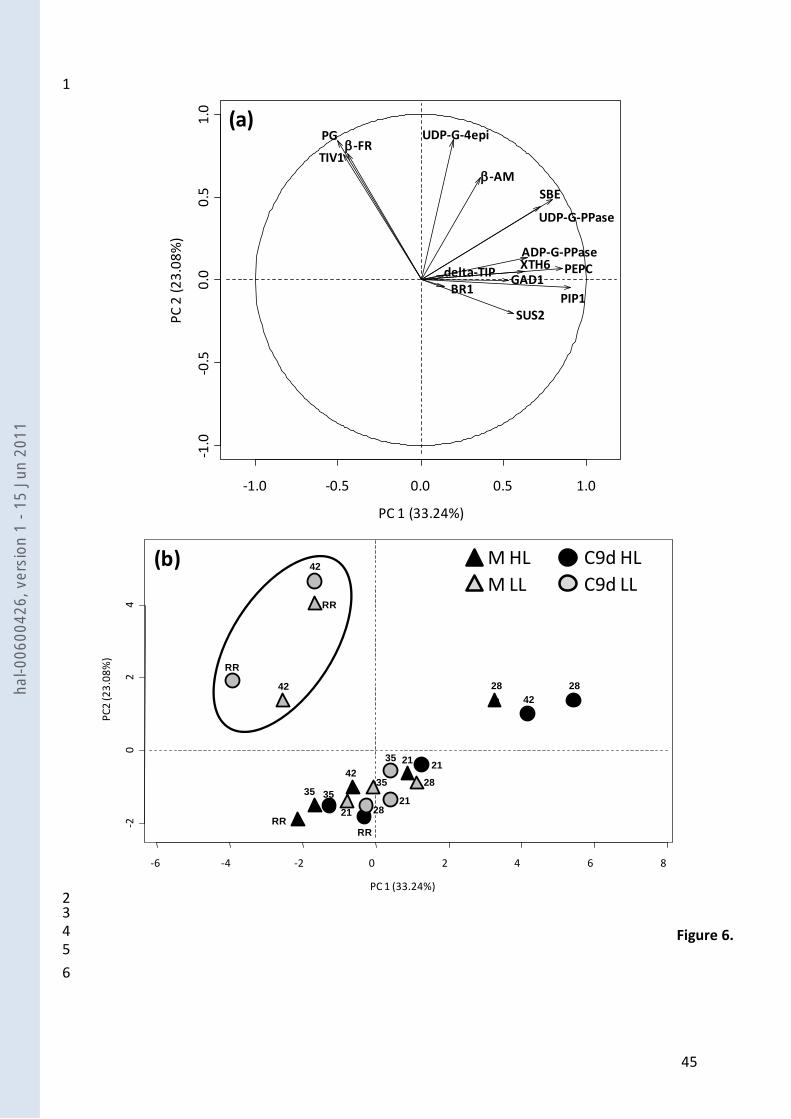
45
1
-1.0 -0.5 0.0 0.5 1.0
-1.0
-0.5
0.0
0.5
1.0
PC 1 (33.24%)
PC
2 (
23
.08
%)
ADP-G-PPase
-AM
-FR
BR1GAD1
PEPC
PG
PIP1
SBE
SUS2
delta-TIP
TIV1
UDP-G-4epi
UDP-G-PPase
XTH6
-6 -4 -2 0 2 4 6 8
-20
24
PC 1 (33.24%)
PC
2 (2
3.0
8%
)
21
21
28
28
35
35
42
42
RR
RR
21
21
28
2835
3542
42
RR
RR
(a)
(b) M HL
M LL
C9d HL
C9d LL
2 3 4 5
6
Figure 6.
hal-0
0600
426,
ver
sion
1 -
15 J
un 2
011

46
Supporting information 1
2 3 Table S1: List of the 18 genes and primers used for qRT-PCR analysis. For each gene studied 4
in qRT-PCR, the code used in the text and annotation of the sequence are added. 5
6
Code AnnotationAccession
numberForward primer 5'--> 3' Reverse primer 5'--> 3'
PIP1 plasma membrane intrinsec protein 1c (PIP1c) U212567 GTCTTGGTGCTATCTGTGG GTCCATCACCTTTGGTGTAAC
delta-TIP delta tonoplast integral protein 1 (delta-TIP) U214295 GTGGGTTAGCTGGTCTTATC CTGCAAACCAAAAACTTAAC
UDP-G-4-epi UDP-glucose-4-epimerase U214352 GTATATGGCAACGACTACCC GAAGTCTCTGAAGTGCAAC
UDP-G-PPase UDP-glucose-4-pyrophosphorylase U213088 CTGAAAAGCTCAACAACCTC CTTAGATAGCGACCGACAAG
XTH6 xyloglucan-endotransglycosylase (XTH6) U215860 GAGGGACCATACTCACACAC CTCCCATGAAACTTAAATC
BR1 xyloglucan-endotransglycosylase (BR1) TC 94351 CTCGTTGCTGGAAACTCTG GTAGGGTCAAACCAAAGG
PG polygalacturonase 2A U213213 GAGAATATCAAGGGCACAAG TCTAGTGAAGTGCAGTGTGG
ADP-G-PPase ADP-glucose-pyrophosphorylase large sub-unit (AGP-S1) U81033 CATATTAGGAGGAGGCGAAG GAGCAATGTGACGATTCAG
SBE starch branching enzyme II (SBE II) U221404 GAGCTTCTTGACGTTATCTG CACTTCATCTCTGCGTATG
b-AM beta-amylase 1 U220865 CCTGACTTATTCCATCCTG GCTTCCCTCTCTACCTGTTC
TIV1 acid-invertase TIV1 M81081 GACAGTGAATCTGCTGACC GGCCACTGAAGTAGATGTG
b-FR beta-fructosidase U212903 CATGTAGGTTTCAGTTGCTC GTTAGCTCAGATAGCGTTTG
SUS2 sucrose synthase 2 (sus2) AJ011535 TATTGATCCATATCACGGTGAGCAAG ATAAACAGCAGCCAGCGTCAGTAGTC
PEPC phosphoenolpyruvate carboxylase U219207 TGGCCATTCTTTAGGGTAAC CTCTTCGTACTTGGACCTC
GAD1 glutamate decarboxylase 1 (GAD1) U314961 GCAAGGGTACTAAGAGAAGG GAGCATCTGGTGGCATAGTG
ACC-ox 1-aminocyclopropane-1 carboxylate oxidase U212787 GGCAGAGGAAAGTACACAAG TTGAATTGGGATCTAAGCAC
E8 2-oxoglutarate-dependent dioxygenase U213299 GTCGATTCAGGGATAGTTC CTACGTTGAAAATCGTCTCC
eIF-4A-2 eukaryotic initiation factor 4A-2 U213502 GATCAGCGTATCCTTCAGAG GGCATTGTAGCAGAGAAAAC 7 8
9
hal-0
0600
426,
ver
sion
1 -
15 J
un 2
011
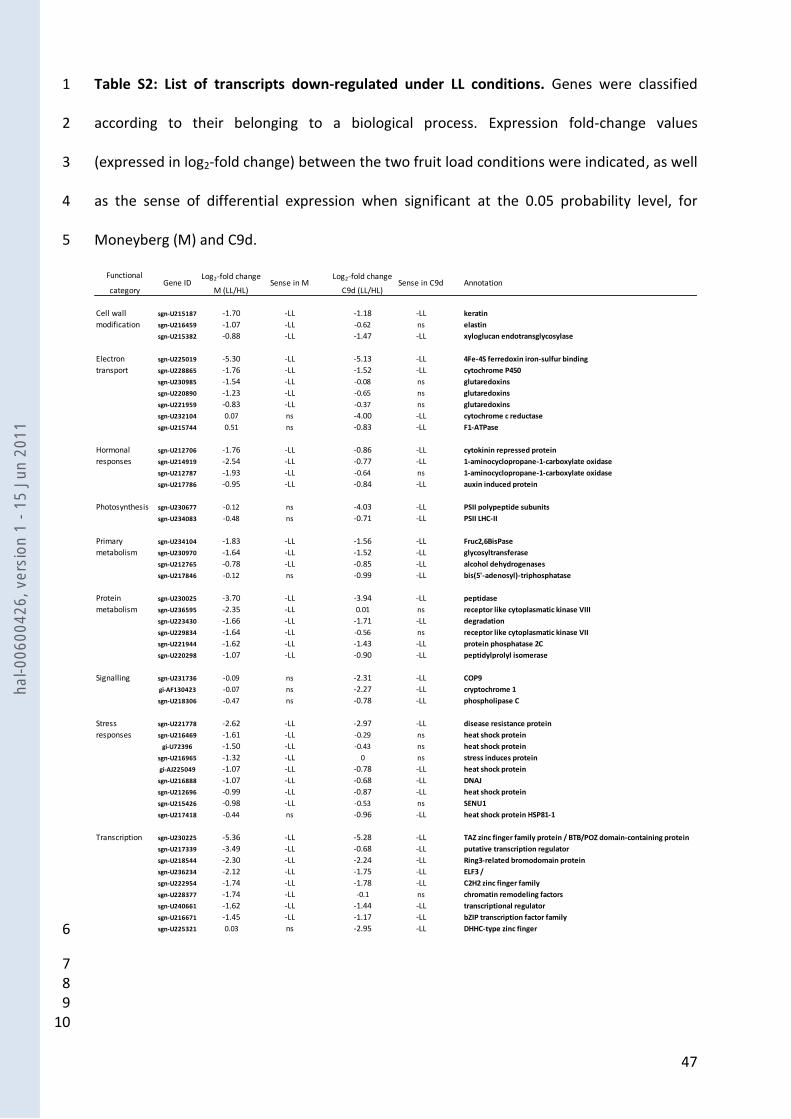
47
Table S2: List of transcripts down-regulated under LL conditions. Genes were classified 1
according to their belonging to a biological process. Expression fold-change values 2
(expressed in log2-fold change) between the two fruit load conditions were indicated, as well 3
as the sense of differential expression when significant at the 0.05 probability level, for 4
Moneyberg (M) and C9d. 5
Functional
categoryGene ID
Log2-fold change
M (LL/HL)Sense in M
Log2-fold change
C9d (LL/HL)Sense in C9d Annotation
sgn-U215187 -1.70 -LL -1.18 -LL keratin
sgn-U216459 -1.07 -LL -0.62 ns elastin
sgn-U215382 -0.88 -LL -1.47 -LL xyloglucan endotransglycosylase
sgn-U225019 -5.30 -LL -5.13 -LL 4Fe-4S ferredoxin iron-sulfur binding
sgn-U228865 -1.76 -LL -1.52 -LL cytochrome P450
sgn-U230985 -1.54 -LL -0.08 ns glutaredoxins
sgn-U220890 -1.23 -LL -0.65 ns glutaredoxins
sgn-U221959 -0.83 -LL -0.37 ns glutaredoxins
sgn-U232104 0.07 ns -4.00 -LL cytochrome c reductase
sgn-U215744 0.51 ns -0.83 -LL F1-ATPase
sgn-U212706 -1.76 -LL -0.86 -LL cytokinin repressed protein
sgn-U214919 -2.54 -LL -0.77 -LL 1-aminocyclopropane-1-carboxylate oxidase
sgn-U212787 -1.93 -LL -0.64 ns 1-aminocyclopropane-1-carboxylate oxidase
sgn-U217786 -0.95 -LL -0.84 -LL auxin induced protein
Photosynthesis sgn-U230677 -0.12 ns -4.03 -LL PSII polypeptide subunits
sgn-U234083 -0.48 ns -0.71 -LL PSII LHC-II
sgn-U234104 -1.83 -LL -1.56 -LL Fruc2,6BisPase
sgn-U230970 -1.64 -LL -1.52 -LL glycosyltransferase
sgn-U212765 -0.78 -LL -0.85 -LL alcohol dehydrogenases
sgn-U217846 -0.12 ns -0.99 -LL bis(5'-adenosyl)-triphosphatase
sgn-U230025 -3.70 -LL -3.94 -LL peptidase
sgn-U236595 -2.35 -LL 0.01 ns receptor like cytoplasmatic kinase VIII
sgn-U223430 -1.66 -LL -1.71 -LL degradation
sgn-U229834 -1.64 -LL -0.56 ns receptor like cytoplasmatic kinase VII
sgn-U221944 -1.62 -LL -1.43 -LL protein phosphatase 2C
sgn-U220298 -1.07 -LL -0.90 -LL peptidylprolyl isomerase
Signalling sgn-U231736 -0.09 ns -2.31 -LL COP9
gi-AF130423 -0.07 ns -2.27 -LL cryptochrome 1
sgn-U218306 -0.47 ns -0.78 -LL phospholipase C
sgn-U221778 -2.62 -LL -2.97 -LL disease resistance protein
sgn-U216469 -1.61 -LL -0.29 ns heat shock protein
gi-U72396 -1.50 -LL -0.43 ns heat shock protein
sgn-U216965 -1.32 -LL 0 ns stress induces protein
gi-AJ225049 -1.07 -LL -0.78 -LL heat shock protein
sgn-U216888 -1.07 -LL -0.68 -LL DNAJ
sgn-U212696 -0.99 -LL -0.87 -LL heat shock protein
sgn-U215426 -0.98 -LL -0.53 ns SENU1
sgn-U217418 -0.44 ns -0.96 -LL heat shock protein HSP81-1
Transcription sgn-U230225 -5.36 -LL -5.28 -LL TAZ zinc finger family protein / BTB/POZ domain-containing protein
sgn-U217339 -3.49 -LL -0.68 -LL putative transcription regulator
sgn-U218544 -2.30 -LL -2.24 -LL Ring3-related bromodomain protein
sgn-U236234 -2.12 -LL -1.75 -LL ELF3 /
sgn-U222954 -1.74 -LL -1.78 -LL C2H2 zinc finger family
sgn-U228377 -1.74 -LL -0.1 ns chromatin remodeling factors
sgn-U240661 -1.62 -LL -1.44 -LL transcriptional regulator
sgn-U216671 -1.45 -LL -1.17 -LL bZIP transcription factor family
sgn-U225321 0.03 ns -2.95 -LL DHHC-type zinc finger
Stress
responses
Cell wall
modification
Electron
transport
Hormonal
responses
Primary
metabolism
Protein
metabolism
6
7 8 9
10
hal-0
0600
426,
ver
sion
1 -
15 J
un 2
011
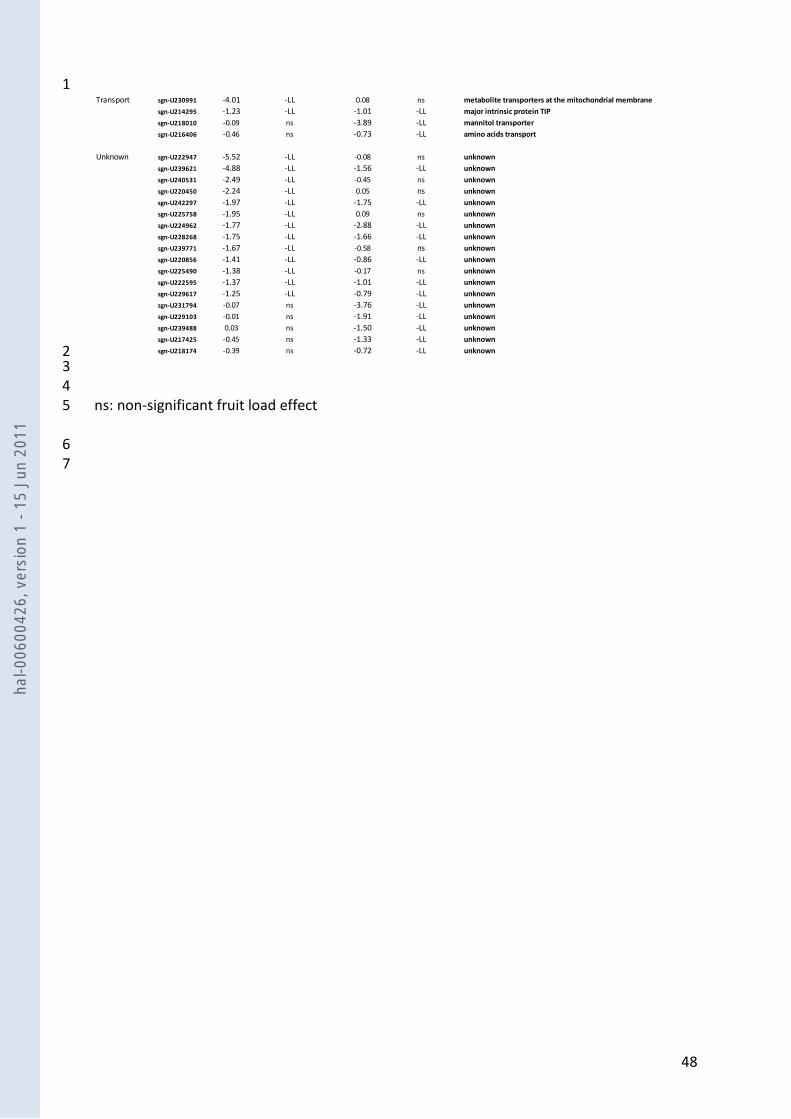
48
1 Transport sgn-U230991 -4.01 -LL 0.08 ns metabolite transporters at the mitochondrial membrane
sgn-U214295 -1.23 -LL -1.01 -LL major intrinsic protein TIP
sgn-U218010 -0.09 ns -3.89 -LL mannitol transporter
sgn-U216406 -0.46 ns -0.73 -LL amino acids transport
Unknown sgn-U222947 -5.52 -LL -0.08 ns unknown
sgn-U239621 -4.88 -LL -1.56 -LL unknown
sgn-U240531 -2.49 -LL -0.45 ns unknown
sgn-U220450 -2.24 -LL 0.05 ns unknown
sgn-U242297 -1.97 -LL -1.75 -LL unknown
sgn-U225758 -1.95 -LL 0.09 ns unknown
sgn-U224962 -1.77 -LL -2.88 -LL unknown
sgn-U228268 -1.75 -LL -1.66 -LL unknown
sgn-U239771 -1.67 -LL -0.58 ns unknown
sgn-U220856 -1.41 -LL -0.86 -LL unknown
sgn-U225490 -1.38 -LL -0.17 ns unknown
sgn-U222595 -1.37 -LL -1.01 -LL unknown
sgn-U229617 -1.25 -LL -0.79 -LL unknown
sgn-U231794 -0.07 ns -3.76 -LL unknown
sgn-U229103 -0.01 ns -1.91 -LL unknown
sgn-U239488 0.03 ns -1.50 -LL unknown
sgn-U217425 -0.45 ns -1.33 -LL unknown
sgn-U218174 -0.39 ns -0.72 -LL unknown 2 3 4 ns: non-significant fruit load effect 5
6 7
hal-0
0600
426,
ver
sion
1 -
15 J
un 2
011
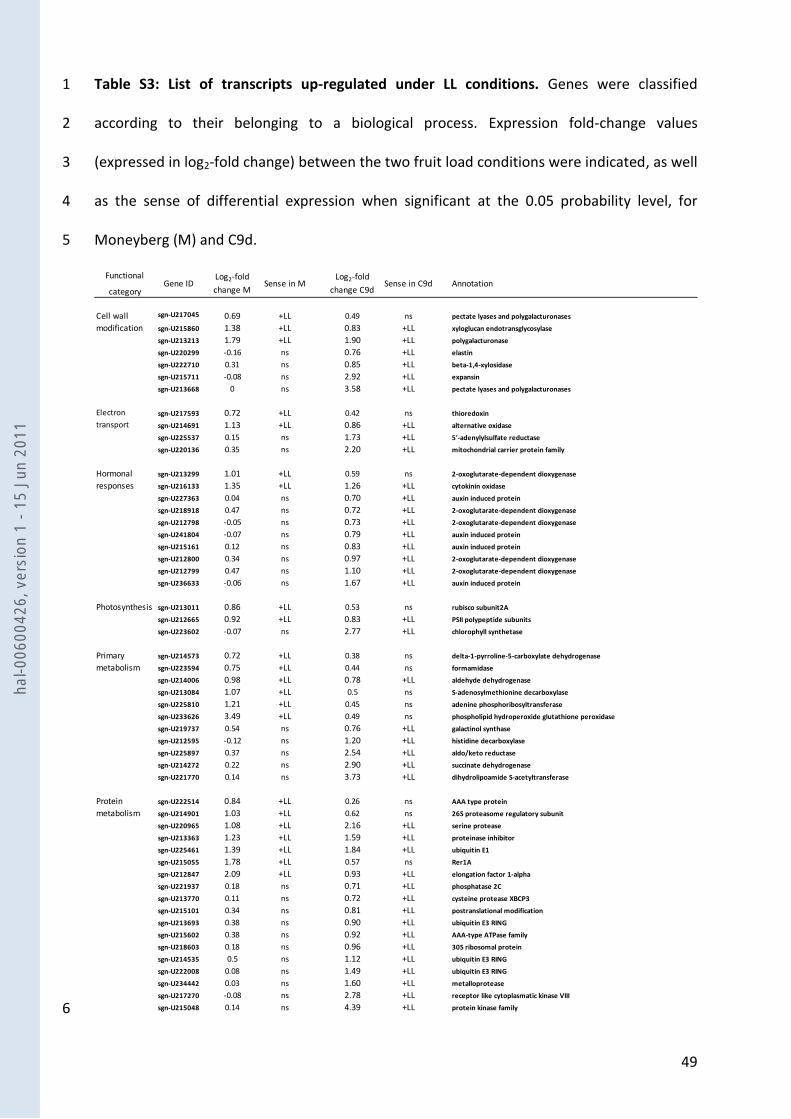
49
Table S3: List of transcripts up-regulated under LL conditions. Genes were classified 1
according to their belonging to a biological process. Expression fold-change values 2
(expressed in log2-fold change) between the two fruit load conditions were indicated, as well 3
as the sense of differential expression when significant at the 0.05 probability level, for 4
Moneyberg (M) and C9d. 5
Functional
categoryGene ID
Log2-fold
change M
(LL/HL)
Sense in M Log2-fold
change C9d
(LL/HL)
Sense in C9d Annotation
sgn-U217045 0.69 +LL 0.49 ns pectate lyases and polygalacturonases
sgn-U215860 1.38 +LL 0.83 +LL xyloglucan endotransglycosylase
sgn-U213213 1.79 +LL 1.90 +LL polygalacturonase
sgn-U220299 -0.16 ns 0.76 +LL elastin
sgn-U222710 0.31 ns 0.85 +LL beta-1,4-xylosidase
sgn-U215711 -0.08 ns 2.92 +LL expansin
sgn-U213668 0 ns 3.58 +LL pectate lyases and polygalacturonases
sgn-U217593 0.72 +LL 0.42 ns thioredoxin
sgn-U214691 1.13 +LL 0.86 +LL alternative oxidase
sgn-U225537 0.15 ns 1.73 +LL 5'-adenylylsulfate reductase
sgn-U220136 0.35 ns 2.20 +LL mitochondrial carrier protein family
sgn-U213299 1.01 +LL 0.59 ns 2-oxoglutarate-dependent dioxygenase
sgn-U216133 1.35 +LL 1.26 +LL cytokinin oxidase
sgn-U227363 0.04 ns 0.70 +LL auxin induced protein
sgn-U218918 0.47 ns 0.72 +LL 2-oxoglutarate-dependent dioxygenase
sgn-U212798 -0.05 ns 0.73 +LL 2-oxoglutarate-dependent dioxygenase
sgn-U241804 -0.07 ns 0.79 +LL auxin induced protein
sgn-U215161 0.12 ns 0.83 +LL auxin induced protein
sgn-U212800 0.34 ns 0.97 +LL 2-oxoglutarate-dependent dioxygenase
sgn-U212799 0.47 ns 1.10 +LL 2-oxoglutarate-dependent dioxygenase
sgn-U236633 -0.06 ns 1.67 +LL auxin induced protein
Photosynthesis sgn-U213011 0.86 +LL 0.53 ns rubisco subunit2A
sgn-U212665 0.92 +LL 0.83 +LL PSII polypeptide subunits
sgn-U223602 -0.07 ns 2.77 +LL chlorophyll synthetase
sgn-U214573 0.72 +LL 0.38 ns delta-1-pyrroline-5-carboxylate dehydrogenase
sgn-U223594 0.75 +LL 0.44 ns formamidase
sgn-U214006 0.98 +LL 0.78 +LL aldehyde dehydrogenase
sgn-U213084 1.07 +LL 0.5 ns S-adenosylmethionine decarboxylase
sgn-U225810 1.21 +LL 0.45 ns adenine phosphoribosyltransferase
sgn-U233626 3.49 +LL 0.49 ns phospholipid hydroperoxide glutathione peroxidase
sgn-U219737 0.54 ns 0.76 +LL galactinol synthase
sgn-U212595 -0.12 ns 1.20 +LL histidine decarboxylase
sgn-U225897 0.37 ns 2.54 +LL aldo/keto reductase
sgn-U214272 0.22 ns 2.90 +LL succinate dehydrogenase
sgn-U221770 0.14 ns 3.73 +LL dihydrolipoamide S-acetyltransferase
sgn-U222514 0.84 +LL 0.26 ns AAA type protein
sgn-U214901 1.03 +LL 0.62 ns 26S proteasome regulatory subunit
sgn-U220965 1.08 +LL 2.16 +LL serine protease
sgn-U213363 1.23 +LL 1.59 +LL proteinase inhibitor
sgn-U225461 1.39 +LL 1.84 +LL ubiquitin E1
sgn-U215055 1.78 +LL 0.57 ns Rer1A
sgn-U212847 2.09 +LL 0.93 +LL elongation factor 1-alpha
sgn-U221937 0.18 ns 0.71 +LL phosphatase 2C
sgn-U213770 0.11 ns 0.72 +LL cysteine protease XBCP3
sgn-U215101 0.34 ns 0.81 +LL postranslational modification
sgn-U213693 0.38 ns 0.90 +LL ubiquitin E3 RING
sgn-U215602 0.38 ns 0.92 +LL AAA-type ATPase family
sgn-U218603 0.18 ns 0.96 +LL 30S ribosomal protein
sgn-U214535 0.5 ns 1.12 +LL ubiquitin E3 RING
sgn-U222008 0.08 ns 1.49 +LL ubiquitin E3 RING
sgn-U234442 0.03 ns 1.60 +LL metalloprotease
sgn-U217270 -0.08 ns 2.78 +LL receptor like cytoplasmatic kinase VIII
sgn-U215048 0.14 ns 4.39 +LL protein kinase family
Cell wall
modification
Electron
transport
Hormonal
responses
Primary
metabolism
Protein
metabolism
6
hal-0
0600
426,
ver
sion
1 -
15 J
un 2
011
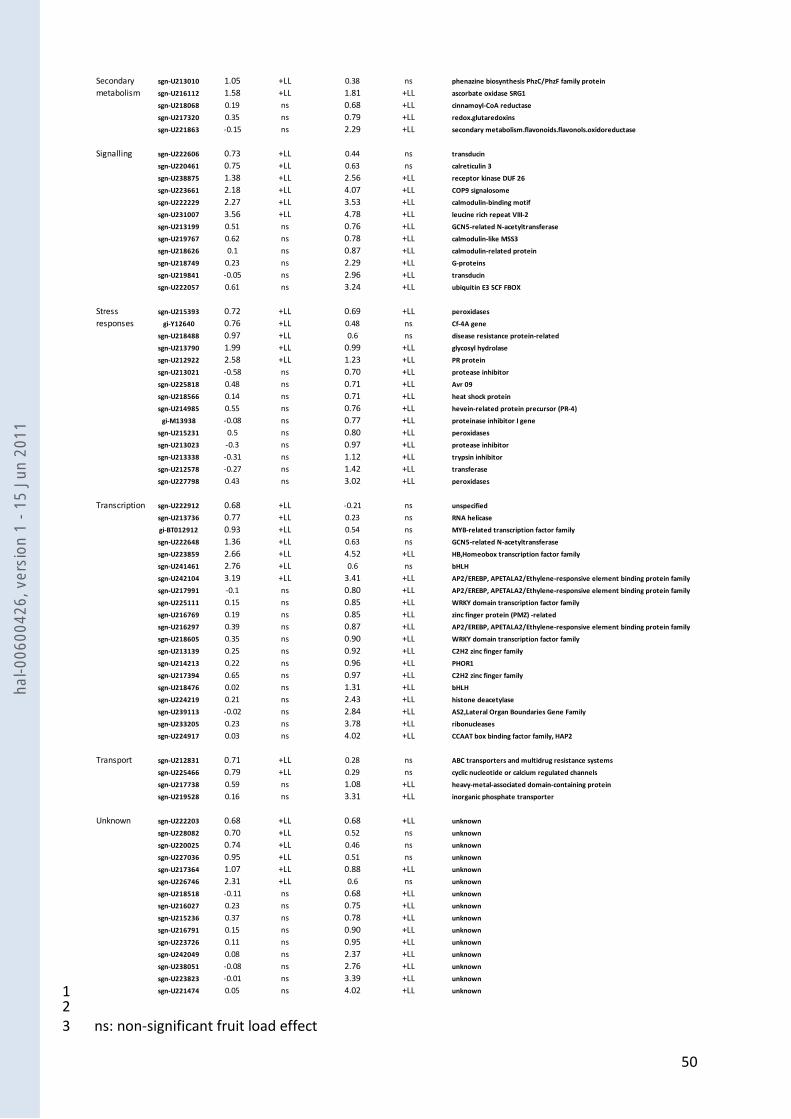
50
sgn-U213010 1.05 +LL 0.38 ns phenazine biosynthesis PhzC/PhzF family protein
sgn-U216112 1.58 +LL 1.81 +LL ascorbate oxidase SRG1
sgn-U218068 0.19 ns 0.68 +LL cinnamoyl-CoA reductase
sgn-U217320 0.35 ns 0.79 +LL redox.glutaredoxins
sgn-U221863 -0.15 ns 2.29 +LL secondary metabolism.flavonoids.flavonols.oxidoreductase
Signalling sgn-U222606 0.73 +LL 0.44 ns transducin
sgn-U220461 0.75 +LL 0.63 ns calreticulin 3
sgn-U238875 1.38 +LL 2.56 +LL receptor kinase DUF 26
sgn-U223661 2.18 +LL 4.07 +LL COP9 signalosome
sgn-U222229 2.27 +LL 3.53 +LL calmodulin-binding motif
sgn-U231007 3.56 +LL 4.78 +LL leucine rich repeat VIII-2
sgn-U213199 0.51 ns 0.76 +LL GCN5-related N-acetyltransferase
sgn-U219767 0.62 ns 0.78 +LL calmodulin-like MSS3
sgn-U218626 0.1 ns 0.87 +LL calmodulin-related protein
sgn-U218749 0.23 ns 2.29 +LL G-proteins
sgn-U219841 -0.05 ns 2.96 +LL transducin
sgn-U222057 0.61 ns 3.24 +LL ubiquitin E3 SCF FBOX
sgn-U215393 0.72 +LL 0.69 +LL peroxidases
gi-Y12640 0.76 +LL 0.48 ns Cf-4A gene
sgn-U218488 0.97 +LL 0.6 ns disease resistance protein-related
sgn-U213790 1.99 +LL 0.99 +LL glycosyl hydrolase
sgn-U212922 2.58 +LL 1.23 +LL PR protein
sgn-U213021 -0.58 ns 0.70 +LL protease inhibitor
sgn-U225818 0.48 ns 0.71 +LL Avr 09
sgn-U218566 0.14 ns 0.71 +LL heat shock protein
sgn-U214985 0.55 ns 0.76 +LL hevein-related protein precursor (PR-4)
gi-M13938 -0.08 ns 0.77 +LL proteinase inhibitor I gene
sgn-U215231 0.5 ns 0.80 +LL peroxidases
sgn-U213023 -0.3 ns 0.97 +LL protease inhibitor
sgn-U213338 -0.31 ns 1.12 +LL trypsin inhibitor
sgn-U212578 -0.27 ns 1.42 +LL transferase
sgn-U227798 0.43 ns 3.02 +LL peroxidases
Transcription sgn-U222912 0.68 +LL -0.21 ns unspecified
sgn-U213736 0.77 +LL 0.23 ns RNA helicase
gi-BT012912 0.93 +LL 0.54 ns MYB-related transcription factor family
sgn-U222648 1.36 +LL 0.63 ns GCN5-related N-acetyltransferase
sgn-U223859 2.66 +LL 4.52 +LL HB,Homeobox transcription factor family
sgn-U241461 2.76 +LL 0.6 ns bHLH
sgn-U242104 3.19 +LL 3.41 +LL AP2/EREBP, APETALA2/Ethylene-responsive element binding protein family
sgn-U217991 -0.1 ns 0.80 +LL AP2/EREBP, APETALA2/Ethylene-responsive element binding protein family
sgn-U225111 0.15 ns 0.85 +LL WRKY domain transcription factor family
sgn-U216769 0.19 ns 0.85 +LL zinc finger protein (PMZ) -related
sgn-U216297 0.39 ns 0.87 +LL AP2/EREBP, APETALA2/Ethylene-responsive element binding protein family
sgn-U218605 0.35 ns 0.90 +LL WRKY domain transcription factor family
sgn-U213139 0.25 ns 0.92 +LL C2H2 zinc finger family
sgn-U214213 0.22 ns 0.96 +LL PHOR1
sgn-U217394 0.65 ns 0.97 +LL C2H2 zinc finger family
sgn-U218476 0.02 ns 1.31 +LL bHLH
sgn-U224219 0.21 ns 2.43 +LL histone deacetylase
sgn-U239113 -0.02 ns 2.84 +LL AS2,Lateral Organ Boundaries Gene Family
sgn-U233205 0.23 ns 3.78 +LL ribonucleases
sgn-U224917 0.03 ns 4.02 +LL CCAAT box binding factor family, HAP2
Transport sgn-U212831 0.71 +LL 0.28 ns ABC transporters and multidrug resistance systems
sgn-U225466 0.79 +LL 0.29 ns cyclic nucleotide or calcium regulated channels
sgn-U217738 0.59 ns 1.08 +LL heavy-metal-associated domain-containing protein
sgn-U219528 0.16 ns 3.31 +LL inorganic phosphate transporter
Unknown sgn-U222203 0.68 +LL 0.68 +LL unknown
sgn-U228082 0.70 +LL 0.52 ns unknown
sgn-U220025 0.74 +LL 0.46 ns unknown
sgn-U227036 0.95 +LL 0.51 ns unknown
sgn-U217364 1.07 +LL 0.88 +LL unknown
sgn-U226746 2.31 +LL 0.6 ns unknown
sgn-U218518 -0.11 ns 0.68 +LL unknown
sgn-U216027 0.23 ns 0.75 +LL unknown
sgn-U215236 0.37 ns 0.78 +LL unknown
sgn-U216791 0.15 ns 0.90 +LL unknown
sgn-U223726 0.11 ns 0.95 +LL unknown
sgn-U242049 0.08 ns 2.37 +LL unknown
sgn-U238051 -0.08 ns 2.76 +LL unknown
sgn-U223823 -0.01 ns 3.39 +LL unknown
sgn-U221474 0.05 ns 4.02 +LL unknown
Stress
responses
Secondary
metabolism
1 2 ns: non-significant fruit load effect3
hal-0
0600
426,
ver
sion
1 -
15 J
un 2
011
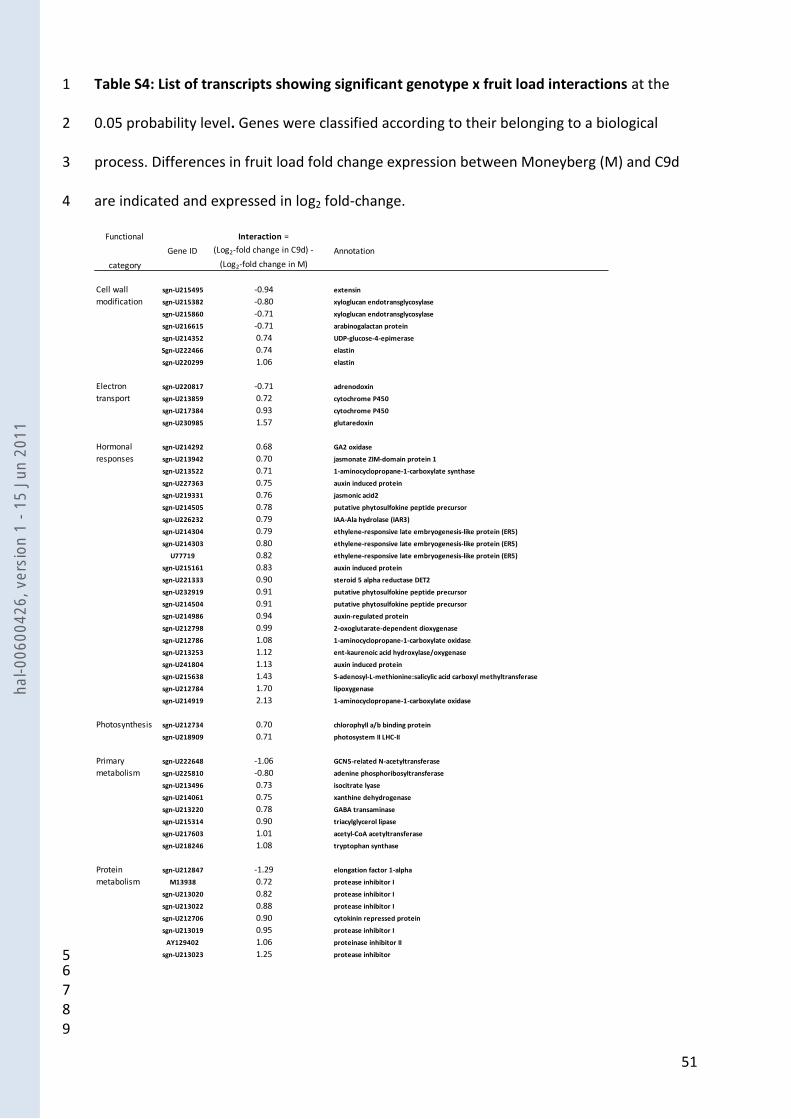
51
Table S4: List of transcripts showing significant genotype x fruit load interactions at the 1
0.05 probability level. Genes were classified according to their belonging to a biological 2
process. Differences in fruit load fold change expression between Moneyberg (M) and C9d 3
are indicated and expressed in log2 fold-change. 4
Functional
category
Gene ID
Interaction =
(Log2-fold change in C9d) -
(Log2-fold change in M)
Annotation
sgn-U215495 -0.94 extensin
sgn-U215382 -0.80 xyloglucan endotransglycosylase
sgn-U215860 -0.71 xyloglucan endotransglycosylase
sgn-U216615 -0.71 arabinogalactan protein
sgn-U214352 0.74 UDP-glucose-4-epimerase
Sgn-U222466 0.74 elastin
sgn-U220299 1.06 elastin
sgn-U220817 -0.71 adrenodoxin
sgn-U213859 0.72 cytochrome P450
sgn-U217384 0.93 cytochrome P450
sgn-U230985 1.57 glutaredoxin
sgn-U214292 0.68 GA2 oxidase
sgn-U213942 0.70 jasmonate ZIM-domain protein 1
sgn-U213522 0.71 1-aminocyclopropane-1-carboxylate synthase
sgn-U227363 0.75 auxin induced protein
sgn-U219331 0.76 jasmonic acid2
sgn-U214505 0.78 putative phytosulfokine peptide precursor
sgn-U226232 0.79 IAA-Ala hydrolase (IAR3)
sgn-U214304 0.79 ethylene-responsive late embryogenesis-like protein (ER5)
sgn-U214303 0.80 ethylene-responsive late embryogenesis-like protein (ER5)
U77719 0.82 ethylene-responsive late embryogenesis-like protein (ER5)
sgn-U215161 0.83 auxin induced protein
sgn-U221333 0.90 steroid 5 alpha reductase DET2
sgn-U232919 0.91 putative phytosulfokine peptide precursor
sgn-U214504 0.91 putative phytosulfokine peptide precursor
sgn-U214986 0.94 auxin-regulated protein
sgn-U212798 0.99 2-oxoglutarate-dependent dioxygenase
sgn-U212786 1.08 1-aminocyclopropane-1-carboxylate oxidase
sgn-U213253 1.12 ent-kaurenoic acid hydroxylase/oxygenase
sgn-U241804 1.13 auxin induced protein
sgn-U215638 1.43 S-adenosyl-L-methionine:salicylic acid carboxyl methyltransferase
sgn-U212784 1.70 lipoxygenase
sgn-U214919 2.13 1-aminocyclopropane-1-carboxylate oxidase
Photosynthesis sgn-U212734 0.70 chlorophyll a/b binding protein
sgn-U218909 0.71 photosystem II LHC-II
sgn-U222648 -1.06 GCN5-related N-acetyltransferase
sgn-U225810 -0.80 adenine phosphoribosyltransferase
sgn-U213496 0.73 isocitrate lyase
sgn-U214061 0.75 xanthine dehydrogenase
sgn-U213220 0.78 GABA transaminase
sgn-U215314 0.90 triacylglycerol lipase
sgn-U217603 1.01 acetyl-CoA acetyltransferase
sgn-U218246 1.08 tryptophan synthase
sgn-U212847 -1.29 elongation factor 1-alpha
M13938 0.72 protease inhibitor I
sgn-U213020 0.82 protease inhibitor I
sgn-U213022 0.88 protease inhibitor I
sgn-U212706 0.90 cytokinin repressed protein
sgn-U213019 0.95 protease inhibitor I
AY129402 1.06 proteinase inhibitor II
sgn-U213023 1.25 protease inhibitor
Cell wall
modification
Electron
transport
Hormonal
responses
Primary
metabolism
Protein
metabolism
5 6 7 8 9
hal-0
0600
426,
ver
sion
1 -
15 J
un 2
011
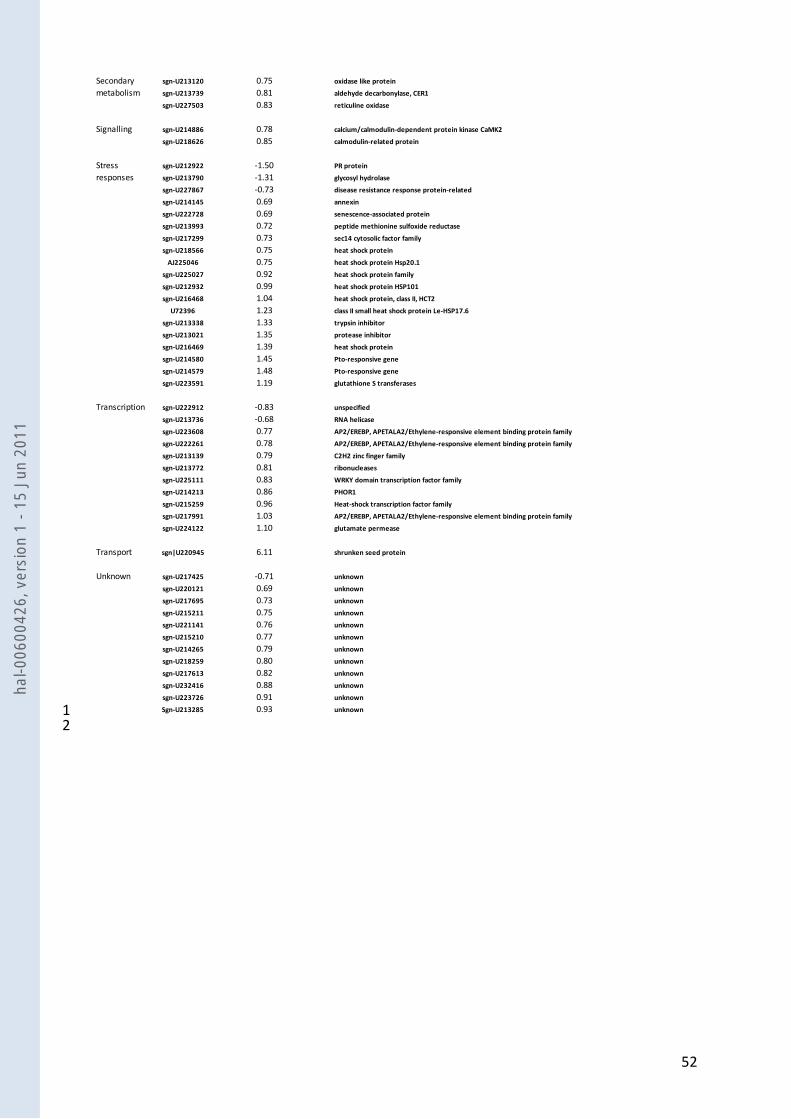
52
sgn-U213120 0.75 oxidase like protein
sgn-U213739 0.81 aldehyde decarbonylase, CER1
sgn-U227503 0.83 reticuline oxidase
Signalling sgn-U214886 0.78 calcium/calmodulin-dependent protein kinase CaMK2
sgn-U218626 0.85 calmodulin-related protein
sgn-U212922 -1.50 PR protein
sgn-U213790 -1.31 glycosyl hydrolase
sgn-U227867 -0.73 disease resistance response protein-related
sgn-U214145 0.69 annexin
sgn-U222728 0.69 senescence-associated protein
sgn-U213993 0.72 peptide methionine sulfoxide reductase
sgn-U217299 0.73 sec14 cytosolic factor family
sgn-U218566 0.75 heat shock protein
AJ225046 0.75 heat shock protein Hsp20.1
sgn-U225027 0.92 heat shock protein family
sgn-U212932 0.99 heat shock protein HSP101
sgn-U216468 1.04 heat shock protein, class II, HCT2
U72396 1.23 class II small heat shock protein Le-HSP17.6
sgn-U213338 1.33 trypsin inhibitor
sgn-U213021 1.35 protease inhibitor
sgn-U216469 1.39 heat shock protein
sgn-U214580 1.45 Pto-responsive gene
sgn-U214579 1.48 Pto-responsive gene
sgn-U223591 1.19 glutathione S transferases
Transcription sgn-U222912 -0.83 unspecified
sgn-U213736 -0.68 RNA helicase
sgn-U223608 0.77 AP2/EREBP, APETALA2/Ethylene-responsive element binding protein family
sgn-U222261 0.78 AP2/EREBP, APETALA2/Ethylene-responsive element binding protein family
sgn-U213139 0.79 C2H2 zinc finger family
sgn-U213772 0.81 ribonucleases
sgn-U225111 0.83 WRKY domain transcription factor family
sgn-U214213 0.86 PHOR1
sgn-U215259 0.96 Heat-shock transcription factor family
sgn-U217991 1.03 AP2/EREBP, APETALA2/Ethylene-responsive element binding protein family
sgn-U224122 1.10 glutamate permease
Transport sgn|U220945 6.11 shrunken seed protein
Unknown sgn-U217425 -0.71 unknown
sgn-U220121 0.69 unknown
sgn-U217695 0.73 unknown
sgn-U215211 0.75 unknown
sgn-U221141 0.76 unknown
sgn-U215210 0.77 unknown
sgn-U214265 0.79 unknown
sgn-U218259 0.80 unknown
sgn-U217613 0.82 unknown
sgn-U232416 0.88 unknown
sgn-U223726 0.91 unknown
Sgn-U213285 0.93 unknown
Stress
responses
Secondary
metabolism
1 2
hal-0
0600
426,
ver
sion
1 -
15 J
un 2
011

53
Figure S1: Verification of the microarray data. Eleven different unigenes (PIP1, delta-TIP, 1
UDP-G-4-epi, UDP-G-Ppase, XTH6, PG, SBE, -AM, -FR, ACC-ox and E8) were used to 2
compare the two techniques. qRT-PCR expression analyses (X-axis) normalized to the inner 3
control (eukaryotic translation initiation factor 4A-2 (eIF-4A-2)) were compared to microarray 4
expression analysis (Y-axis) for the four comparisons: LL versus HL on genotype C9d, C9d 5
versus M under HL conditions, C9d versus M under LL conditions and LL versus HL on 6
genotype M. Data are indicated in the log2 base, and each quantitative PCR value is the mean 7
of three biological and three technical replicates. 8
9 10 11
Mic
roar
ray
valu
es
q-RT PCR values
Correlation coefficient = 0.92
-4
-2
0
2
4
-4 -2 0 2 4
12 13 14 15
hal-0
0600
426,
ver
sion
1 -
15 J
un 2
011
Related Documents