- 1 - Genomics, Proteomics and Secondary Metabolites Biosynthesis Research on Streptomyces asterosporus DSM 41452 Dissertation zur Erlangung des Doktorgrades der Fakultät für Chemie und Pharmazie der Albert-Ludwigs-Universität Freiburg im Breisgau Vorgelegt von Songya Zhang Aus Zhengzhou, China 2018

Welcome message from author
This document is posted to help you gain knowledge. Please leave a comment to let me know what you think about it! Share it to your friends and learn new things together.
Transcript
- 1 -
Genomics, Proteomics and Secondary
Metabolites Biosynthesis Research on
Streptomyces asterosporus DSM 41452
Dissertation zur Erlangung des Doktorgrades
der Fakultät für Chemie und Pharmazie
der Albert-Ludwigs-Universität Freiburg im Breisgau
Vorgelegt von
Songya Zhang
Aus Zhengzhou, China
2018
- 2 -
Dekan: Prof. Dr. Manfred Jung
Vorsitzender des Promotionsausschusses: Prof. Dr. Stefan Weber
Referent: Prof. Dr. Andreas Bechthold
Korreferent: Prof. Dr. Irmgard Merfort
Drittprüfer: Prof. Dr. Oliver Einsle
Datum der Promotion: 20.04.2018

- 3 -
Erklärung
Hiermit erkläre ich, dass ich die vorliegende Arbeit selbstständig und nur unter
Verwendung
der angegebenen Literatur und Hilfsmittel angefertigt sowie Zitate kenntlich gemacht
habe.
- 4 -
Acknowledgements
I would like to take this opportunity to express my appreciation to my supervisor, Prof. Dr.
Andreas Bechthold, for his support, encouragement and guidance throughout my study in this
outstanding research environment at the Fakultät für Chemie und Pharmazie in Freiburg
University. His enthusiasm and attitude towards science and research will definitely affect my
life.
I am particularly thankful to my co-advisor Prof. Dr. Irmgard Merfort for kindly reviewing this
thesis, her generous help during my study, for being the supervisor of my doctoral committee.
I desire to convey my earnest appreciation to Prof. Dr. Oliver Einsle for being the member of
my doctoral committee. In addition, I feel grateful to Dr. Lin Zhang for his help to determine
protein structure and professional advice on my research project.
I would also wish to thank Prof. Dr. Stefan Günther for reviewing the manuscript. I also want
to express my greatest thanks to Dennis Klementz for his reliable help in terms of
bioinformatics analysis and for helping revise my manuscript.
My deep gratitude as well goes to Prof. Dr. David Zechel for his discussion about my research
project, review my paper in earnest. His attitude toward academic research really motivates
me a lot.
I desire to thank Dr. Claudia Jessen-Trefzer for her kind help about my project and her helpful
discussions, and for her amendment to the manuscript. Also, I am grateful to Dr. Thomas
Pauluat for the NMR data analysis and his professional suggestion on the manuscript.
I am really grateful to Dr. Max Cryle from Monash University for his kindly providing substrate
and earnest guidance on the P450 project. In addition, I want to thank Dr. Greule Anja for her
suggestion and effort to solve this interesting scientific question.
I also want to express my greatest gratitude to Dr. Verónica I. Dumit and Dr. Mingjian Wang
from Center for Biological Systems Analysis in Freiburg University for their assistance,
professional suggestion and guidance on proteomics analysis.
I want to thank Prof. Dr. Jun Yin from Georgia State University, Dr. Stephen G. Bell from
University of Adelaide, Mr. Gunter Stier from Heidelberg University for their kindness of
providing plasmids.

- 5 -
I am appreciated Prof. Dr. Xin-zhuan Su and Dr. Richard Eastman from National Center for
Advancing Translational Sciences/NIH for helping compound activity test and manuscript
review.
I would like to thank all my colleagues who helped me throughout my PhD study. I would like
to thank Dr. Gabriele Weitnauer for her kind help and unselfish assistance in many ways. I
would like to express my warmest gratitude to Marcus Essing, Sandra Groß, Elizabeth Welle
and Frau Weber for their contribution to the lab. Especially, I like to thank Marcus Essing for
strong technician support for maintaining equipment running in the lab. My gratitude also
goes to Sandra Groß for tireless help in the lab, and for reviewing my thesis. I also want to
thank Elizabeth Welle for strong technician assistance on the LCMS, HPLC system in the lab. I
want to thank Sandra Cabrera, Dr. Susanne Elfert, Tanja Herbstritt and Judy Wang for their
kind help. I would like to thank Dr. Roman Makitrynskyy for his kind help during my study. In
the meanwhile, I would like to thank all my current and previous colleagues working in the lab
of AG Bechthold for their selfless help and for sharing me various kinds of perspectives and
outlook to the life, world. I wish all of them have a wealthier and more successful future.
Last but not the least I would like to show my gratitude to my family for their backing,
especially my loving wife: Jing Zhu, for her unconditional support and passion. I owe all the
success of my PhD study to my family.
- 6 -
Wissenschaftliche Publikationen und Akademische Aktivitäten
Wissenschaftliche Publikationen
I. Songya Zhang, Andreas Bechthold. Iteratively Acting Glycosyltransferases, 2nd edition of
Handbook of Carbohydrate-Modifying Biocatalysts, 2016, Pages 321-348, Pan Stanford
Publishing.
II. Songya Zhang, Jing Zhu, Tao Liu, Suzan Samra, Huaqi Pan, Jiao Bai, Huiming Hua, Andreas
Bechthold, a Novel Glycosylated Polyketide from the Terrestrial Fungus Myrothecium sp.
GS-17. Helvetica Chimica Acta, 2016, 99 (3), 215-219.
III. Songya Zhang, Jing Zhu, David Zechel, Claudia Jessen-Trefzer, Richard T. Eastman, Thomas
Paululat, Andreas Bechthold. Novel WS9326A derivatives and one novel Annimycin
derivative with antimalarial activity are produced by S. asterosporus DSM 41452 and its
mutant, ChemBioChem, 2017, 19(3), 272-279.
IV. Arne Gessner, Tanja Heitzler, Songya Zhang (cofirst), Christine Klaus, Renato Murillo,
Hanna Zhao, Stephanie Vanner, David L. Zechel, Andreas Bechthold. Changing
Biosynthetic Profiles by Expressing bldA in Streptomyces Strains. ChemBioChem, 2015,
16(15):2244-2252.
V. Greule Anja, Songya Zhang, Thomas Paululat, Andreas Bechthold. From a Natural Product
to Its Biosynthetic Gene Cluster: A Demonstration Using Polyketomycin from
Streptomyces diastatochromogenes Tü6028. Journal of visualized experiments: JoVE,
2017, (119): 54952.
VI. Anja Greule, Marija Marolt, Denise Deubel, Iris Peintner, Songya Zhang, Claudia Jessen-
Trefzer, Christian De Ford, Sabrina Burschel, Shu-Ming Li, Thorsten Friedrich, Irmgard
Merfort, Steffen Lüdeke, Philippe Bisel, Michael Müller, Thomas Paululat, Andreas
Bechthold. Wide distribution of foxicin biosynthetic gene clusters in Streptomyces
strains-an unusual secondary metabolite with various properties. Frontiers in
microbiology, 2017, 8:221.
VII. Songya Zhang, Dennis Klementz, Jing Zhu, Stefan Günther, Andreas Bechthold. The
complete genome sequence of S. asterosporus DSM 41452, a high producer of the
- 7 -
neurokinin A antagonist WS9326As. Journal of Biotechnology (under review).
VIII. Arslan Sarwar, Zakia Latif, Songya Zhang, Andreas Bechthold, Biological control of potato
common scab with rare Isatropolone C compound produced by Streptomyces sp. A1RT,
Frontiers in microbiology (under review).
IX. Songya Zhang, Mingjian Wang, Dennis Klementz, Jing Zhu, Verónica I. Dumit, Andreas
Bechthold. Comparative Proteomic Analysis of S. asterosporus DSM 41452 reveals the
AdpA regulon in a native non-sporulating Streptomyces species by SILAC. Applied
microbiology and Biotechnology (in preparation).
X. Songya Zhang, Lin Zhang, Anja Greule, Jing Zhu, Oliver Einsle, Max Cryle, Andreas
Bechthold, Structural Characterization of Cytochrome P450WS9326A, mediates the
formation of the olefinic bond to generate the dehydrotyrosine formation in WS9326A
Biosynthesis, ACS chemical biology (in preparation).
Poster Präsentation
I. Songya Zhang, Lin Zhang, Anja Greule, Jing Zhu, Max Cryle, Oliver Einsle, Andreas
Bechthold. Structural Characterization of Cytochrome P450 Sas16, mediates the
formation of the olefinic bond to generate the dehydrotyrosine formation in WS9326As
Biosynthesis. RTG 1976 Symposium 2017: Unique Cofactor-dependent Enzymes in
Microbes, 10/2017, Freiburg, Germany
II. Songya Zhang, Dennis Klementz, Mingjian Wang, Jing Zhu, Stefan Günther, Verónica I.
Dumit, Andreas Bechthold. Complete genome sequencing and comparative Proteomic
Analysis of S. asterosporus DSM 41452 reveals the AdpA regulon in a native non-
sporulating Streptomyces species. International VAAM-Workshop 2017: Biology of
Bacteria Producing Natural Products, 09/2017, Tübingen, Germany.
III. Songya Zhang, Jing Zhu, Andreas Bechthold. WS9326A Derivatives from S. asterosporus
DSM 41152: Chemical Structure and Biosynthesis. International VAAM-Workshop 2016:
Biology of Bacteria Producing Natural Products, 09/2016, Freiburg, Germany
IV. Songya Zhang, Jing Zhu, Roman Makitrynskyy, Olga Tsypik, Andreas Bechthold.
Connecting Chemotype, Phenotype and Genotype, revealing the Gene Regulatory
Mechanism of Morphological Development and Secondray Metabolism in S. asterosporus
- 8 -
DSM 41452.Tag der Forschung der Universität Freiburg 2016, 07/2016, Freiburg,
Germany
V. Songya Zhang, Jing Zhu, Tao Liu, Suzan Samra, Huiming Hua, Andreas Bechthold.
Exploiting and Elucidation of a new Glycosylated Polyketide from Fungus Myrothecium
sp., 2016 VAAM Annual Conference, 03/2016, Jena, Germany
VI. Jing Zhu, Songya Zhang, Andreas Bechthold. Revealing the Hidden “domain skipping”
Biosynthetic Mechanism in the Annimycin Polyketide Synthase from S. asterosporus
DSMZ 41452. VAAM workshop, 09/2016, Freiburg, Germany
VII. Jing Zhu, Xiaohui Yan, Anja Greule, Songya Zhang, Andreas Bechthold. Exploring the
Biosynthetic Capability of Ganefromycin by Direct Cloning and Heterologous Expression,
Annual Conference 2016 of the Association for General and Applied Microbiology (VAAM),
03/2016, Jena, Germany
VIII. Anja Greule, Songya Zhang, Andreas Bechthold. Foxicins: Ortho-Quinone Derivates
produced by Polyketomycin Producer Streptomyces diastatochromogenes Tü6028,
International Symposium on the Biology of Actinomycetes, 10/2014, Kuşadasi, Turkey
- 9 -
Abstract
Many important industrial strains for antibiotic production belong to the genus of
Streptomyces. They are characterized as special bacteria with a complex fungus-like life cycle
(Ohnishi et al. 2005). The sporulation of Streptomyces has been clearly demonstrated to have
a significant association with the production of antibiotics (Chandra and Chater 2014). Non-
sporulation mutants fail to generate the aerial mycelium due to different reason. To date at
least 20 reported genes are involved in the aerial mycelium formation (Takano et al. 2003). We
previously reported that the defective bldA gene prevents the generation of aerial hyphae and
the formation of secondary metabolites in Streptomyces calvus by inhibiting the expression of
the TTA-containing adpA gene (Gessner et al. 2015; Hackl and Bechthold 2015). However, our
following research found that the constitutive expression of bldA in some “bald” Streptomyces
strains didn’t efficiently restore the sporulation, which attracts our interests. One of the strain
is Streptomyces asterosporus DSM 41452. Experimental data indicate that there is a potential
unknown mechanism causing the “poorly sporulating” phenotype in S. asterosporus DSM
41452. In this dissertation, the complete genome of S. asterosporus DSM 41452 was
sequenced and annotated. By detailed comparative genome sequence analysis, a transposon
gene was found upstream of adpA gene of S. asterosporus DSM 41452 which hinder the
transcription of adpA. By complementation of adpA gene with a functional promoter in this
strain, the sporulation was restored.
Proteomics has always been an efficient method to investigate the cellular physiology and
metabolism of an organism. In this thesis, we first time employ SILAC-based comparative
proteomic approach to profile the AdpA regulon in the native non-sporulating S. asterosporus
DSM 41452. In our study, more than 1200 proteins were identified, including proteins involved
in strain’s metabolism, cellular processing and signaling, information storage and processing,
etc. Most importantly, we managed to demonstrated that SILAC approach can be efficiently
applied for Streptomyces proteomics research.
In terms of its secondary metabolites of S. asterosporus DSM 41452, from the genome of S.
asterosporus DSM 41452, we found the gene clusters for WS9326A (Johnston et al. 2015) and
- 10 -
Annimycin (Kalan et al. 2013), which both have been detected in S. calvus ATCC 13382 were
identified through bioinformatics analysis of genome sequence of S. asterosporus DSM 41452.
Six compounds, WS9326A and its derivatives WS9326B, WS9326D, WS9326E, WS9326F, and
WS9326G were isolated from the scale-up fermentation of S. asterosporus DSM 41452.
Surprisingly, two new WS9326A derivatives SY11 and SY12 were isolated from one Annimycin-
defect mutant strain S. asterosporus DSM 41452::pUC19Δ3100spec, structures of SY11 and
SY12 were partially characterized by mass spectrometry and NMR. The boundary of WS9326A
gene cluster was determined by disrupting gene orf(-1) and sas1 at the terminus of the gene
cluster. In-frame gene knockout of the gene encoding the N-methyltransferase(MTase) in
module 2 of WS9326A NRPSs resulted in the disruption of WS9326A production, suggesting
that the methylation of the tyrosine residue is essential for the substrate recognition by the
downstream condensation domain. Gene inactivation of sas13 by single crossover seem didn’t
influence the production of WS9326A, which exclude the possibility of sas13 participating the
formation of the nonproteinogenic dehydrotyrosine residue in WS9326A production. In
addition, in-frame gene deletion of sas16 by PCR-targeting method led to the loss of WS9326A,
and the production of WS9326A was restored after the complementation of gene sas16.
Therefore, this gene is proposed to participate in the formation of the dehydrotyrosine moiety.
For an in-depth understanding of the biochemical role of Sas16 during the biosynthesis of the
N-methyl-dehydrotyrosine protein, the gene was heterologously expressed for in vitro
enzymatic assay. We successfully elucidated the protein structure of Sas16 to reveal the
underlying molecular basis of substrate selectivity of this Cytochrome P450 enzyme.
Keywords: S. asterosporus DSM 41452; Complete genome sequencing; Sporulation; AdpA;
Mutagenesis; Proteomics; SILAC; LC-MS/MS; Secondary metabolites; WS9326A; Derivative;
NMR spectroscopy; NRPS, Gene cluster; Gene inactivation; Gene deletion; Dehydrotyrosine;
Double bond; Biosynthesis; Protein expression; Crystallization; X-ray Crystallography; Protein
structure; P450 cytochrome; Enzyme catalytic assay;
- 11 -
Abstrakt
Streptomyceten, als eine Art wichtiger industrieller Stamm für die Herstellung von Antibiotika,
wurden über Jahrzehnte hinweg untersucht. Es wurde als spezielles Bakterium mit einem
komplexen pilzartigen Lebenszyklus charakterisiert (Ohnishi et al. 2005). Die Sporulation von
Streptomyceten wurde eindeutig als signifikant mit der Produktion von Antibiotika in
Verbindung gebracht (Chandra und Chater 2014). Nicht-Sporulations-Mutanten erzeugen das
Luftmyzel aus unterschiedlichen Gründen nicht. Bis heute sind mindestens 20 beschriebene
Gene an der Luftmyzelbildung beteiligt (Takano et al. 2003). Wir berichteten bereits, dass das
defekte bldA-Gen die Bildung von Lufthyphen und die Bildung von Sekundärmetaboliten in
Streptomyces calvus verhindert, indem es die Expression des TTA-haltigen adpA-Gens hemmt
(Gessner et al. 2015; Hackl und Bechthold 2015). Unsere folgenden Untersuchungen haben
jedoch ergeben, dass die konstitutive Expression von bldA in einigen "kahlen"
Streptomyceten-Stämmen, die von der DSMZ gekauft wurden, die Sporulation nicht effizient
wiederherstellt, was unser Interesse geweckt hat. Einer der Stämme ist Streptomyces
asterosporus DSM 41452. Das Phänomen zeigt an, dass ein potentieller unbekannter
Mechanismus den "schwach sporulierenden" Phänotyp in S. asterosporus DSM 41452
verursacht. In dieser Dissertation wurde das vollständige Genom von S. asterosporus DSM
41452 sequenziert und kommentiert. Durch detaillierte vergleichende Genomsequenzanalyse
wurde ein Transposon-Gen stromaufwärts des adpA-Gens von S. asterosporus DSM 41452
gefunden, das die Transkription von adpA behindert. Durch Komplementierung des adpA-
Gens mit einem funktionellen Promotor in diesem Stamm wurde die Sporulation
wiederhergestellt.
Die Proteomik war schon immer eine effiziente Methode, um die zelluläre Physiologie und
den Stoffwechsel eines Organismus zu untersuchen. In dieser Arbeit verwenden wir zum
ersten Mal den SILAC-basierten komparativen Proteomik-Ansatz, um das AdpA-Regulon im
nativen nicht-sporulierenden S. asterosporus DSM 41452 zu profilieren. In unserer Studie
wurden mehr als 1200 Proteine identifiziert, einschließlich Proteine, die am Stamm-
Stoffwechsel, der zellulären Verarbeitung und Signalisierung, Informationsspeicherung und -
- 12 -
verarbeitung usw. beteiligt sind. Am wichtigsten ist, dass wir gezeigt haben, dass der SILAC-
Ansatz in der Streptomyceten-Proteomik effizient angewendet werden kann.
In Bezug auf seine Sekundärmetabolite von S. asterosporus DSM 41452 wurden Gencluster
von WS9326A (Johnston et al. 2015) und Annimycin (Kalan et al. 2013), die zuvor in S. calvus
ATCC 13382 gefunden wurden, durch bioinformatische Analyse der Genomsequenz von S.
asterosporus DSM 41452 identifiziert. Sechs Verbindungen, WS9326A und seine Derivate
WS9326B, WS9326D, WS9326E, WS9326F und WS9326G wurden aus der Scale-Up-
Fermentation von S. asterosporus DSM 41452 isoliert. Überraschenderweise wurden zwei
neue Analoga SY11 und SY12 isoliert aus einem Annimycin-Defekt-Mutantenstamm S.
asterosporus DSM 41452::pUC19Δ3100spec und ihre Strukturen teilweise gemäß den
Massenspektrometrie- und NMR-Daten charakterisiert. Die Titer von WS9326A in der
entsprechenden S. asterosporus-Mutante waren leicht verbessert. Darüber hinaus wurde die
Grenze des WS9326A-Genclusters durch Aufbrechen des Gens orf (-1) und sas1 am Terminus
des Genclusters bestimmt. In-frame-Gen-Knockout des Gens, das die N-Methyltransferase
(MTase) in Modul 2 der WS9326A-NRPSs kodiert, führt zur Unterbrechung der WS9326A-
Produktion, was auf die Bedeutung des Methyl-Tyrosins für die Substraterkennung durch die
Kondensationsdomäne hinweist. Die Geninaktivierung von sas13 durch single crossover
scheint die Produktion von WS9326A nicht zu beeinflussen, was die Möglichkeit ausschließt,
dass sas13 an der Bildung des nichtproteinogenen Dehydrotyrosinrests in WS9326A beteiligt
ist. Zusätzlich führte die In-frame-Gen-Deletion von sas16 durch doppelten Crossover zum
Verlust von WS9326A, und die Produktion von WS9326A wurde nach der Komplementation
des Gens sas16 wiederhergestellt. Daher wird vorgeschlagen, dass dieses Gen an der Bildung
des Dehydrotyrosins in WS9326As beteiligt ist.
Um die biochemische Rolle von Sas16 während der Biosynthese des N-Methyl-Dehydro-
Tyrosin-Proteins zu verstehen, wurde Sas16 heterolog für In-vitro-Enzymtests exprimiert. In
der Zwischenzeit haben wir erfolgreich die Architektur von Sas16 aufgeklärt, um die
zugrundeliegende molekulare Basis der Substratselektivität dieses Cytochrom P450 Enzyms
aufzudecken
13
Table of Contents
Contents
Acknowledgements ............................................................................................................... - 4 -
Wissenschaftliche Publikationen und Akademische Aktivitäten .......................................... - 6 -
Abstract ................................................................................................................................. - 9 -
Table of Contents .................................................................................................................... 13
List of Figures ........................................................................................................................... 17
List of Tables ............................................................................................................................ 22
List of abbreviations ................................................................................................................ 24
Chapter 1. Introduction and Background ................................................................................ 26
1.1 Streptomyces and its AdpA regulon System ................................................................. 26
1.2 Streptomyces Genome Features ................................................................................... 30
1.3 Proteomics for Streptomyces ........................................................................................ 32
1.4 Antibiotics discovery and their action mechanism ....................................................... 33
1.5 Natural Product Biosynthesis mechanism ..................................................................... 36
1.5.1 Polyketide ............................................................................................................... 38
1.5.2. Nonribosomal peptides ......................................................................................... 42
1.5.3 Tailoring enzymes ................................................................................................... 48
1.5.4 Cytochrome P450 enzyme ...................................................................................... 50
1.6 Research Aims ............................................................................................................... 54
Chapter 2. General Materials and Methods ............................................................................ 56
2.1 Chemicals and Antibiotics ............................................................................................. 56
2.2 Enzymes and Kits ........................................................................................................... 58
2.3 Media ............................................................................................................................. 58
2.4 Software and Bioinformatics Tools ............................................................................... 60
2.5 Buffers and Solution ...................................................................................................... 61
2.5.1 Buffers for plasmid isolation from E. coli ............................................................... 61
2.5.2 Buffers for isolation of genomic DNA from Streptomyces ..................................... 62
2.5.3 Buffers for DNA gel electrophoresis ....................................................................... 62
2.5.4 Buffers and solutions for protein gel electrophoresis (SDS-PAGE) ........................ 63
2.5.5 Buffer for protein samples preparation of SILAC ................................................... 63
2.5.6 Buffers for protein purification .............................................................................. 64
14
2.5.7 Buffers for Sas16 enzymatic assay ......................................................................... 65
2.5.8 Solutions for blue/white selection of E. coli ........................................................... 65
2.5.9 Buffer and solutions used for the Malachite Green phosphatase assay ................ 65
2.6 General Methods ........................................................................................................... 66
2.6.1 Cultivation of strains Streptomyces and E. coli ...................................................... 66
2.6.2 Plasmid Isolation from E. coli ................................................................................. 66
2.6.3 Genomic DNA Extraction of Streptomyces ............................................................. 67
2.6.4 PCR Amplification ................................................................................................... 67
2.6.5 DNA fragment purification by agarose gel electrophoresis ................................... 68
2.6.6 Plasmid construction .............................................................................................. 69
2.6.7 DNA Transformation into E. coli ............................................................................. 69
2.6.8 Plasmid from E. coli to Streptomyces by intergeneric conjugation ........................ 70
2.6.9 Gene disruption by single crossover ...................................................................... 71
2.6.10 Targeted Gene deletion by double crossover method......................................... 72
2.6.11 Sodium dodecyl sulfate polyacrylamide gel electrophoresis (SDS-PAGE)............ 72
Chapter 3. The complete genome sequence of Streptomyces asterosporus DSM 41452 ...... 73
3.1 Background .................................................................................................................... 73
3.2 Materials and Methods ................................................................................................. 74
3.2.1 Primers fragments used in this study ..................................................................... 74
3.2.2 Plasmid information ............................................................................................... 74
3.2.3 Genomic DNA preparation and whole-genome sequencing .................................. 75
3.2.4 Genome assembly and annotation ........................................................................ 75
3.3 Results and Discussion................................................................................................... 76
3.3.1 General genome features ....................................................................................... 76
3.3.2 Gene clusters related with Secondary metabolism................................................ 79
3.3.3 bldA and adpA gene in S. asterosporus DSM 41452 .............................................. 84
3.3.4 Function verification of adpA gene ........................................................................ 86
3.3.5 Phylogenetic and orthologous analysis .................................................................. 87
3.4 Conclusion ..................................................................................................................... 89
Chapter 4. Comparative Proteomic Analysis of Streptomyces asterosporus DSM 41452 ...... 91
4.1 Introduction ................................................................................................................... 91
4.2 Materials and Methods ................................................................................................. 93
4.2.1 Primers fragments used in this study ..................................................................... 93
4.2.2 Plasmid information ............................................................................................... 94
15
4.2.3 Strain constructed and used in this study .............................................................. 94
4.2.4 Bacterial strain and culture condition .................................................................... 95
4.2.5 Functional AdpA overexpression in S. asterosporus DSM 41452 ........................... 95
4.2.6 Construction of Arginine and Lysine auxotrophic mutant of S. asterosporus DSM
41452 ............................................................................................................................... 95
4.2.7 Bacterial culture for SILAC test ............................................................................... 96
4.2.8 Protein sample preparation for LC-MS/MS analysis .............................................. 97
4.2.9 Mass Spectrometry Measurement ......................................................................... 98
4.2.10 Protein Identification ............................................................................................ 99
4.3 Results and Discussion................................................................................................... 99
4.3.1 Complementation of the functional adpA gene in S. asterosporus DSM 41452 .... 99
4.3.2 In silico analysis of AdpA in S. asterosporus DSM 41452 ...................................... 101
4.3.3 Construction of Arginine and Lysine auxotrophic mutant of S. asterosporus DSM
41452 ............................................................................................................................. 103
4.3.4 Statistical analysis of proteomics data ................................................................. 106
4.3.5 Proteomic analysis of the effects of AdpA in S. asterosporus DSM 41452 .......... 108
4.4 Conclusion and Outlook .............................................................................................. 115
Chapter 5. Research on the secondary metabolites of Streptomyces asterosporus DSM 41452
and the biosynthesis of WS9326As ....................................................................................... 117
5.1 Background .................................................................................................................. 117
5.2 Materials and Methods ............................................................................................... 118
5.2.1 Primers fragments used in this study ................................................................... 118
5.2.2 Plasmid information ............................................................................................. 120
5.2.3 Strain constructed and used in this study ............................................................ 121
5.2.4 Genome sequencing and bioinformatic Analysis ................................................. 121
5.2.5 Generation of gene sas13 disruption mutant in S. asterosporus DSM 41452 ..... 122
5.2.6 Generation of gene sas16 disruption mutant in S. asterosporus DSM 41452 ..... 122
5.2.7 Strain information, Fermentation, Extraction ...................................................... 123
5.2.8 Isolation of Compound WS9326A, B, D, E, F, G .................................................... 123
5.2.9 Sample analysis by HPLC-MS ................................................................................ 123
5.2.10 NMR methods and General instrument for structural characterization ............ 124
5.2.11 Structure information of compound 1-6 ............................................................ 124
5.2.12 Antiparasite assay method and materials .......................................................... 125
5.3 Results and Discussion................................................................................................. 125
16
5.3.1 Chemical structure Elucidation of WS9326A derivatives from S. asterosporus DSM
41452 ............................................................................................................................. 125
5.3.2 Discovery of two new WS9326A analogs by disrupting Annimycin production in S.
asterosporus DSM 41452 .............................................................................................. 129
5.3.3 Antiparasitic activity assay of WS9326As ............................................................. 132
5.3.4 Characterization of the WS9326A gene cluster in S. asterosporus DSM 41452. . 133
5.4 Conclusion ................................................................................................................... 150
5.5 Appendix ...................................................................................................................... 152
Chapter 6. Biochemical characterization of Cytochrome P450 Sas16 .................................. 162
6.1 Research Background .................................................................................................. 162
6.2 Materials and Methods ............................................................................................... 165
6.2.1 Primers fragments used in this study ................................................................... 165
6.2.2 Plasmid information ............................................................................................. 166
6.2.3 Strain constructed and used in this study ............................................................ 166
6.2.4 Cloning of sas16 gene into pET28 vector ............................................................. 167
6.2.5 Purification of Sas16 ............................................................................................. 167
6.2.6 CO difference spectrum of Sas16 ......................................................................... 168
6.2.7 Substrate binding study ........................................................................................ 168
6.2.8 Crystallization and Data Collection ....................................................................... 168
6.2.9 Structure Determination and Refinement ........................................................... 169
6.2.10 Malachite Green Phosphatase Assay of Acetyltransferase (A) domain ............. 169
6.3 Results and Discussion................................................................................................. 170
6.3.1 Multiple sequence alignment of Sas16 ................................................................ 170
6.3.2 Vector Construction, Expression and Purification of Sas16 ................................. 176
6.3.3 Crystallization and Structure determination of Sas16 ......................................... 178
6.3.4 CO difference spectrum of Sas16 ......................................................................... 184
6.3.5 Substrate binding studies of Sas16 ....................................................................... 185
6.3.6 Construction of Sas16 enzymatic assay ................................................................ 187
6.3.7 Sas13 protein expression and purification ........................................................... 198
6.3.8 A domain (module 2 of Sas17) protein expression and purification .................... 200
6.4 Conclusion ................................................................................................................... 202
Reference .............................................................................................................................. 205
17
List of Figures
Figure 1. 1. Typical colonies of Streptomyces (A) and Characteristic life cycle of Streptomyces (B).
........................................................................................................................................................ 27
Figure 1. 2. Schematics representing the transcription mechanism of adpA triggered by A-factor.
........................................................................................................................................................ 28
Figure 1. 3. The AdpA regulatory cascade leading to the morphological development and secondary
metabolite production .................................................................................................................... 29
Figure 1. 4. Clinical used antibiotics discovered from Streptomyces .............................................. 34
Figure 1. 5. Examples of natural product assembled by diverse building blocks ............................ 36
Figure 1. 6. A schematic overview of the origin of the precursor building blocks for secondary
metabolism.. ................................................................................................................................... 37
Figure 1. 7. Polyketides with diverse structure and function from natural product. ...................... 39
Figure 1. 8. The type I PKSs modular, deoxyerythromolide-B-synthase (DEBS) for erythromycin
biosynthesis;.................................................................................................................................... 40
Figure 1. 9. Examples of iterative PKSs involved in the biosynthesis of lovastatin, doxorubicin and
chalcone .......................................................................................................................................... 41
Figure 1. 10. Representative NRPS derivatives produced by microorganism ................................. 43
Figure 1. 11. Architecture of NRPS synthetase and the biosynthesis mechanism of NRPS compound
........................................................................................................................................................ 44
Figure 1. 12. Examples of different NRPS assembly method. ......................................................... 46
Figure 1. 13. Examples of nonproteinogenic amino acid biosynthesis in NRPS .............................. 48
Figure 1. 14. Active nautral product with post-tailoring modifications .......................................... 49
Figure 1. 15. Special tailoring enzyme catalyzing Favorskiise rearrangement ................................ 50
Figure 1. 16. (A) The overall structure of P450 protein (exemplified by Orf6* (CYP165D3)); (B) Top
view of heme ................................................................................................................................... 51
Figure 1. 17. The catalytic cycle of cytochrome P450 enzymes ...................................................... 52
Figure 1.18. Examples of P450 enzymes with diverse function involved in the biosynthesis of natural
product ............................................................................................................................................ 54
Figure 2. 1. Schematic representation of gene inactivation via single crossover and gene deletion
via double crossover. ....................................................................................................................... 72
Scheme 3.1. Genomic overview of S. asterosporus DSM 41452. .................................................... 72
Figure 3.1. (A) Multiple sequences alignment of bldA gene from S. asterosporus DSM 41452 with
its orthologous; (B) The genome sequence comparison of the upstream intergenic region of adpA
between S. asterosporus DSM 41452 and S. calvus ........................................................................ 84
Figure 3. 2. The genome comparison between S. asterosporus DSM 41452 and S. avermitilis (A), S.
coelicolor A3(2) ............................................................................................................................... 85
18
Figure 3. 3. (A) PCR verification of the upstream intergenic region of adpA in S. asterosporus DSM
41452 and S. calvus; (B) Morphological development of S. asterosporus DSM 41452 and its mutants
........................................................................................................................................................ 86
Figure 3. 4. The phylogenetic relationship of S. asterosporus DSM 41452 with other strains based
on 16S rRNA gene sequences.. ....................................................................................................... 87
Figure 3. 5. OrthoMCL analysis of strain S. asterosporus DSM 41452, S. coelicolor A3(2), S.
avermitilis, and Kutzneria albida. .................................................................................................... 88
Figure 4. 1. Schematics representing the basic sample labeling principle of SILAC proteomics
approach. ........................................................................................................................................ 92
Figure 4. 2. Effects of exogenous AdpA overexpression on the morphology of S. asterosporus DSM
41452 ............................................................................................................................................ 100
Figure 4. 3. The secondary metabolite profiles of strains S. asterosporus DSM 41452::pTESa-adpAsc,
S. asterosporus DSM 41452::pTESa-adpAgh and S. asterosporus DSM 41452::pTESa ................. 101
Figure 4. 4. Multiple protein sequence alignment of AdpA from S. asterosporus DSM 41452 and the
homologous proteins .................................................................................................................... 102
Figure 4. 5. Inactivation of the arginine biosynthetic gene in strains S. asterosporus DSM
41452::pSET152 and S. asterosporus DSM 41452::pSET152-adpAgh(TTA) by insertion of plasmid
pKGLP2-InArg into the bacterial genome via single crossover ...................................................... 104
Figure 4. 6. Inactivation of the Lysine biosynthetic gene in strains S. asterosporus DSM
41452::pSET152 and S. asterosporus DSM 41452::pSET152-adpAgh(TTA) by inserting plasmid
pLERE-Inlys into the bacterial genome via single cross-over ........................................................ 105
Figure 4. 7. Phenotypes of S. asterosporus DSM 41452 and its mutant on the minimal (MM1)
media……………………………………………………………………………………………………………………………………….104
Figure 4. 8. (A) Scatter plot representing the correlation of two biological replicates measured by
mass spectrometry. (B) Histograms of log2 transformed protein intensities representing the
distribution of proteome differences of AdpA mutant strain compared to the WT strain in two
biological replicates. ...................................................................................................................... 106
Figure 4. 9. Heat map of expressed proteins that were up- and down-regulated in the biological
replicates of S. asterosporus DSM 41452 :: pSET152AdpA relative to the parental strain. .......... 108
Figure 5. 1. The chemical structure of WS9326A and its derivatives ............................................ 126
Figure 5. 2. MS/MS spectra of WS9326F(A) and WS9326G (B) produced by S. asterosporus DSM
41452; (C) Partial H NMR Spectrum comparison between WS9326F and WS9326G ................... 128
Figure 5. 3. HPLC chromatogram of FDAA derivative of WS9326A and the corresponding standard
amino acids ................................................................................................................................... 129
Figure 5. 4. HPLC profiles of S. asterosporus DSM 41452 wildtype and its mutant strains S.
asterosporus DSM 41452::pUC19Δ3100spec ................................................................................ 130
19
Figure 5. 5. Postulated chemical structure of SY11 base on key NMR signals .............................. 130
Figure 5. 6. (A) ESI-MS/MS fragmentation of SY11; (B) ESI-MS/MS fragmentation of SY12. ....... 131
Figure 5. 7. H NMR spectrum comparison between SY11 and SY12, R represents the unknown
moiety. .......................................................................................................................................... 132
Figure 5. 8. Drug response phenotypes for Plasmodium falciparum Dd2 (A), HB3 (B) and 3D7 (C)
strains. ........................................................................................................................................... 133
Figure 5. 9. Organization comparison of the WS9326A gene clusters in S. asterosporus DSM 41452
and Streptomyces calvus ............................................................................................................... 134
Figure 5. 10. Inactivation of the gene orf(-1) and sas1 in S. asterosporus DSM 41452 via single
crossover.. ..................................................................................................................................... 135
Figure 5. 11. NRPS domain organization are shown in the order for the WS9326A biosynthetic
assembly line. ................................................................................................................................ 136
Figure 5. 12. Inactivation of the gene sas16 and sas13 in S. asterosporus DSM 41452 via single
crossover. ...................................................................................................................................... 141
Figure 5. 13. The HPLC chromatogram of the ethyl acetate extracts of the culture broth of the
Wildtype strain, the mutant strain S. asterosporus DSM 41452::pKC1132-SAS13 and S. asterosporus
DSM 41452::pKC1132-SAS16. ....................................................................................................... 141
Figure 5. 14. (A) Plasmid diagram of pKGLP2-GusA-SAS16::aac3(IV); (B) Schematic representation
of the in-frame deletion of sas16 in S. asterosporus DSM 41452 ................................................. 143
Figure 5. 15. (A) The PCR verification of the sas16 deletion mutant; (B) The LC/MS extracted ion
chromatogram(EICs) for [M-H]- ions corresponding to WS9326A, WS9326B, SY11, SY12 in organic
extracts of S. asterosporus DSM 41452ΔSAS16. ........................................................................... 143
Figure 5. 16. (A)Plasmid diagram of pTESa-SAS16; (B) The digestion result of plasmid pTESa-SAS16
by KpnI and EcoRI; C) The LC/MS extracted ion chromatogram(EICs) for [M-H]- ions corresponding
to WS9326A, WS9326B, SY11, SY12 in organic extracts of S. asterosporus DSM
41452ΔSAS16::pTESa-SAS16. ........................................................................................................ 144
Figure 5. 17. (A) Diagram of plasmid for MTase domain deletion and (B) the schematics
representing the NRPS domain organization in the WT strain and the ΔMTase mutant strain. ... 145
Figure 5. 18. Schematics representing the construction (A) and PCR verification (B) of the MTase
encoding gene deletion mutant strain. ......................................................................................... 147
Figure 5. 19. HPLC chromatograms of S. asterosporus DSM 41452 and its mutant S. asterosporus
DSM 41452 ΔMTase ...................................................................................................................... 147
Figure 5. 20. SDS-PAGE analysis of MTase domain expression test and manual Ni-NTA purification.
...................................................................................................................................................... 149
Figure 5. 21. HPLC-MS analysis (Extracted ion chromatogram) of compounds WS9326A, B, D, E, F,
G, SY11 and SY12 from the cultures of the wildtype S. asterosporus DSM 41452 and its mutant S.
20
asterosporus DSM 41452:: pUC19Δ3100spec ............................................................................... 155
Figure 5. 22. Comparison of the genes organization for the cinnamoyl side chain biosynthesis in the
SAS and SKY gene clusters ............................................................................................................ 156
Figure 5. 23. Comparative HPLC Profiles analysis of metabolites from the culture of Streptomyces
calvus and strain S. asterosporus DSM 41452. .............................................................................. 156
Figure 5. 24. UV/Vis spectrum and HR-ESIMS spectrum of WS9326F. .......................................... 156
Figure 5. 25. UV/Vis spectrum and HR-ESIMS spectrum of WS9326G. ......................................... 157
Figure 5. 26. ESI-MS/MS fragmentation of WS9326A. .................................................................. 157
Figure 5. 27. ESI-MS/MS fragmentation of WS9326B. .................................................................. 157
Figure 5. 28. ESI-MS/MS fragmentation of WS9326D. .................................................................. 158
Figure 5. 29. ESI-MS/MS fragmentation of WS9326E. .................................................................. 158
Figure 5. 30. H NMR spectrum of WS9326A. ................................................................................ 159
Figure 5. 31. C NMR spectrum of WS9326A. ................................................................................ 159
Figure 5. 32. H NMR spectrum of WS9326F. ................................................................................. 160
Figure 5. 33. C NMR spectrum of WS9326F. ................................................................................. 160
Figure 5. 34. HSQC spectrum of WS9326F. ................................................................................... 161
Figure 5. 35. HMBC spectrum of WS9326F. .................................................................................. 161
Figure 6. 1. Chemical structures of NRPS containing dehydrogenated amino acid ..................... 164
Figure 6. 2. Possible mechanism of the dehydrogenation in amino acid residues ...................... 165
Figure 6. 3. Phylogenetic bootstrap consensus tree of Sas16 with other P450s. ......................... 170
Figure 6. 4. Protein Sequence comparison of Sas16 with OxyB and OxyC. ................................... 172
Figure 6. 5. Clustal Omage alignment of the amino acid sequences of Sas16 with other
characterized Cytochrome P450 monooxygenases from secondary metabolites biosynthetic
pathways. ...................................................................................................................................... 176
Figure 6. 6. (A) Diagram of plasmid pET28-SAS16; (B) Cultivation method optimization of Sas16
expression. ................................................................................................................................... 177
Figure 6. 7. (A) FPLC Chromatogram of Ni-NTA his-tag purification of Sas16 from lysed E. coli BL21
star (DE3) :: pET28-SAS16; (B) SDS-PAGE analysis of the fraction from Ni-NTA column. .............. 178
Figure 6. 8. (A) SDS-PAGE analysis of fractions from gel filtration eluted from a Sephadex G-25
column containing Sas16; (B) Crystals of Sas16 from S. asterosporus DSM 41452. . .................... 179
Figure 6. 9. The overall protein structure of Cytochrome Sas16. . ............................................... 180
Figure 6. 10. Close-up view of Sas16 showing critical catalytic residues interacting with the heme
propionate groups with hydrogen bonding .................................................................................. 181
Figure 6. 11. The hydrogen bonding interactions between residues from different secondary
structural elements enforcing the geometry of the active site pocket. ........................................ 182
Figure 6. 12. Secondary structure comparison of Sas16 with other P450 homologous proteins..
21
...................................................................................................................................................... 183
Figure 6. 13. (A) Schematics of carbon monoxide (CO) spectrum of cytochrome P450; (B)
Absorption spectra for Sas16 and its ferrous–carbon monoxide complex. .................................. 184
Figure 6. 14. (A) The diagram of the heme-iron center inside the active site of cytochrome P450;
(B) Typical UV difference spectrum of catalytic substrate binding to the cytochrome P450 OxyD,
representing the heme iron state change due to the ligand binding. ........................................... 186
Figure 6. 15. UV spectrum changes after titration of the corresponding substrate into the P450
protein solution. ............................................................................................................................ 187
Figure 6. 16. The schematics represents the Sas16 catalytic reaction system .............................. 188
Figure 6. 17. The electron transfer system for cytochrome P450 enzyme based on ferredoxin
reductase and ferredoxin .............................................................................................................. 189
Figure 6. 18. SDS-PAGE gel showing the fractions containing PuR and PuxB eluted from the weak
anion exchanger and gel filtration column ................................................................................... 190
Figure 6. 19. (A) Plasmid diagram of pET-Trx-PCP constructed for PCP domain expression; (B)
Plasmid diagram of pET-Trx-A-NMT-PCP; (C) Schematic representation of protein expression vector
pET-Trx with fusion partner thioredoxin; (D) The SDS-PAGE gel showing the fractions containing the
PCP-Trx fusion protein eluted from the gel filtration.. .................................................................. 191
Figure 6. 20. Phosphopantetheinyl transferase (PPTase)-catalyzed 4’-phosphopantetheinyl (Ppant)
group transfer to a conserved Ser residue in peptidyl carrier proteins (PCP) or acyl carrier proteins
(ACP). ............................................................................................................................................. 193
Figure 6. 21. SDS-PAGE analysis of the fractions from manual Ni-NTA column for sfp protein
purification .................................................................................................................................... 194
Figure 6. 22. Scheme of synthesis of tyrosine-PCP conjugate and possible reaction products
catalyzed by Sas16......................................................................................................................... 195
Figure 6. 23 HPLC chromatogram of Sas16 assay………………………………………………………………211
Figure 6. 24. Scheme of modified Ppant ejection assay, and possible Ppant fragment generated in
the reaction ................................................................................................................................... 197
Figure 6. 25. Sequence alignment of the PCP domain of NRPS module 2 encoded by sas17 from
WS9326A gene cluster with its homologues................................................................................. 197
Figure 6. 26. (A) Schematics of plasmid pET28-SAS13; (B) Agarose gel verification of plasmid pET28-
SAS13 ............................................................................................................................................ 198
Figure 6. 27. SDS-PAGE analysis of Sas13 expression test and manual Ni-NTA purification……… 199
Figure 6.28. (A) Postulated biosynthetic mechanism of dehydroxytyrosine in WS9326As; (B)
Schematic of A domain substrate preference test base on Malachite Green Phosphatase Assay.
...................................................................................................................................................... 200
Figure 6. 29. (A) Schematics of plasmid pET28a-A domain; (B) Agarose gel verification of plasmid
22
pET28-SAS13 by restriction enzyme digestion; (C) SDS-PAGE of manual Ni-NTA column fraction for
A domain purification.................................................................................................................... 202
List of Tables
Table 1. 1. The general feature of sequenced Streptomyces genome and other kinds species ..... 31
Table 2. 1. Chemicals and Antibiotics .............................................................................................. 56
Table 2. 2. Antibiotic Stock Solution and Working Concentrations ................................................. 57
Table 2. 3. Enzymes and Kits ........................................................................................................... 58
Table 2. 4. Media for cultivation of Streptomyces strains ............................................................... 58
Table 2. 5. Software and Bioinformatics Tools ................................................................................ 60
Table 2. 6. Buffers and solution used for plasmid isolation from E. coli ......................................... 61
Table 2. 7. Buffers for isolation of genomic DNA from Streptomyces strains .................................. 62
Table 2. 8. Buffers for DNA gel electrophoresis ............................................................................... 62
Table 2. 9. Buffers and Solutions for SDS-PAGE and Coomassie staining ........................................ 63
Table 2. 10. Buffer for protein samples preparation of SILAC ......................................................... 63
Table 2. 11. Buffers for protein purification .................................................................................... 64
Table 2. 12. Buffers for Sas16 enzymatic assay ............................................................................... 65
Table 2. 13. Stock solutions for blue/white selection ..................................................................... 65
Table 2. 14. Buffer and solutions used for the Malachite Green phosphatase assay ..................... 65
Table 2. 15. Components for PCR reaction system ......................................................................... 67
Table 2. 16. Conditions for a typical PCR reaction cycles ................................................................ 68
Table 2. 17. Composition for typical restriction reactions. ............................................................. 69
Table 3. 1. Primers fragments used in this study ............................................................................ 74
Table 3. 2. Plasmid information ....................................................................................................... 74
Table 3. 3. General features of the chromosome of S. asterosporus DSM 41452........................... 76
Table 3. 4. Assignment of 4047 genes of S. asterosporus DSM 41452 to the functional groups of the
actNOG subset of the eggNOG database ........................................................................................ 78
Table 3. 5. Secondary metabolites gene clusters (BGC) identified in S. asterosporus DSM 41452..79
Table 3. 6. ORFs associated with the Nucleocidin biosynthetic cluster in S. asterosporus DSM 41452
........................................................................................................................................................ 82
Table 4. 1. Primers fragments used in this study ............................................................................ 93
Table 4. 2. Plasmid information ....................................................................................................... 94
Table 4. 3. Strain constructed and used in this study ...................................................................... 94
Table 4. 4. Proteins up- and downregulated in S. asterosporus AdpA mutant.............................. 112
Table 5. 1. Primers fragments used in this study .......................................................................... 118
Table 5. 2. Plasmid information ..................................................................................................... 120
23
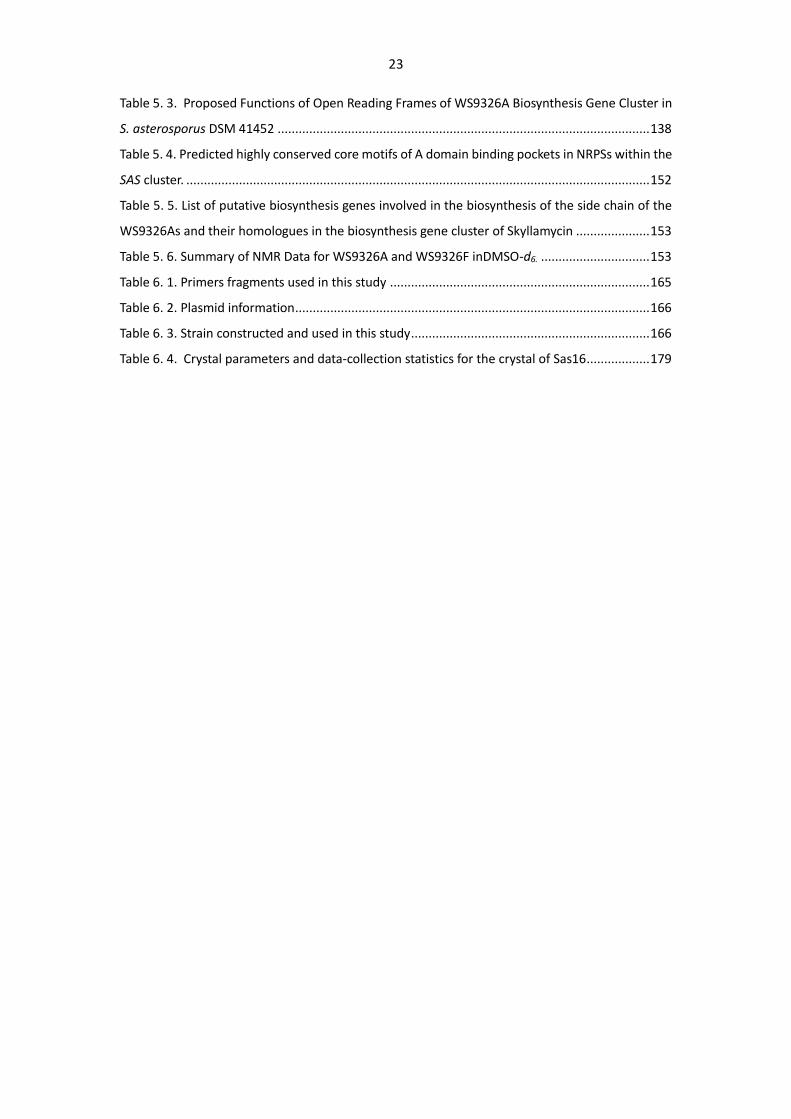
Table 5. 3. Proposed Functions of Open Reading Frames of WS9326A Biosynthesis Gene Cluster in
S. asterosporus DSM 41452 .......................................................................................................... 138
Table 5. 4. Predicted highly conserved core motifs of A domain binding pockets in NRPSs within the
SAS cluster. .................................................................................................................................... 152
Table 5. 5. List of putative biosynthesis genes involved in the biosynthesis of the side chain of the
WS9326As and their homologues in the biosynthesis gene cluster of Skyllamycin ..................... 153
Table 5. 6. Summary of NMR Data for WS9326A and WS9326F inDMSO-d6. ............................... 153
Table 6. 1. Primers fragments used in this study .......................................................................... 165
Table 6. 2. Plasmid information ..................................................................................................... 166
Table 6. 3. Strain constructed and used in this study .................................................................... 166
Table 6. 4. Crystal parameters and data-collection statistics for the crystal of Sas16 .................. 179
24
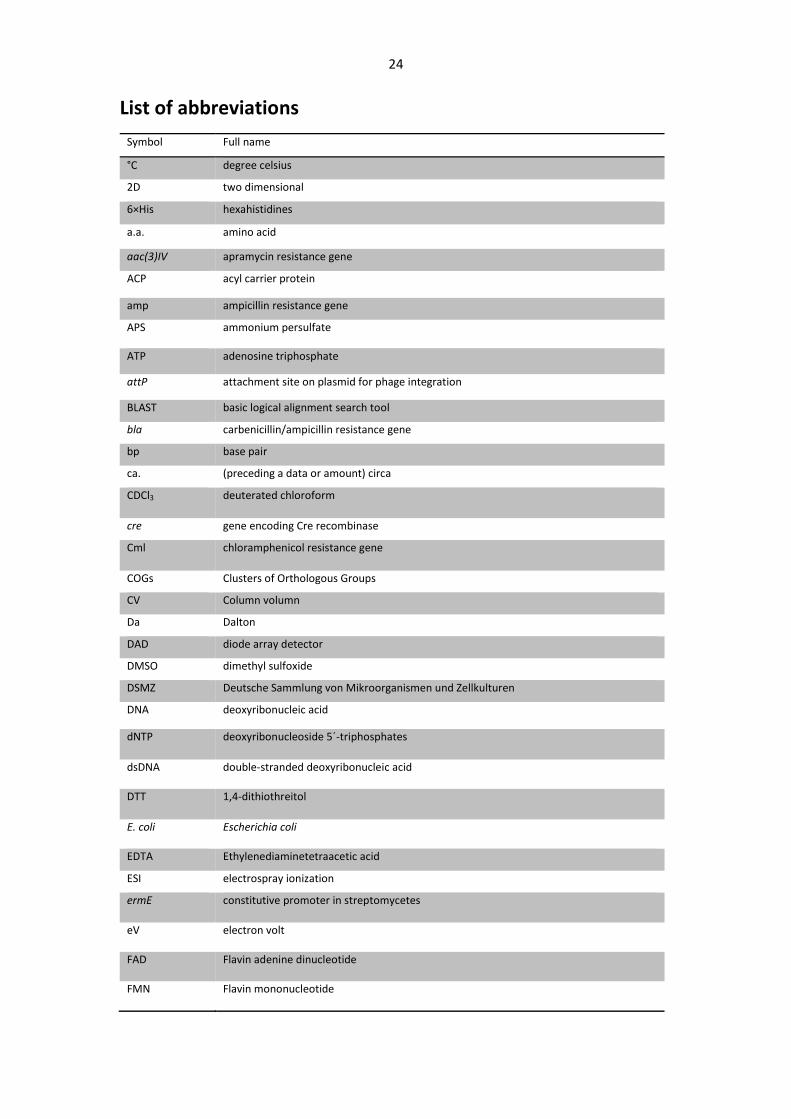
List of abbreviations
Symbol Full name
°C degree celsius
2D two dimensional
6×His hexahistidines
a.a. amino acid
aac(3)IV apramycin resistance gene
ACP acyl carrier protein
amp ampicillin resistance gene
APS ammonium persulfate
ATP adenosine triphosphate
attP attachment site on plasmid for phage integration
BLAST basic logical alignment search tool
bla carbenicillin/ampicillin resistance gene
bp base pair
ca. (preceding a data or amount) circa
CDCl3 deuterated chloroform
cre gene encoding Cre recombinase
Cml chloramphenicol resistance gene
COGs Clusters of Orthologous Groups
CV Column volumn
Da Dalton
DAD diode array detector
DMSO dimethyl sulfoxide
DSMZ Deutsche Sammlung von Mikroorganismen und Zellkulturen
DNA deoxyribonucleic acid
dNTP deoxyribonucleoside 5´-triphosphates
dsDNA double-stranded deoxyribonucleic acid
DTT 1,4-dithiothreitol
E. coli Escherichia coli
EDTA Ethylenediaminetetraacetic acid
ESI electrospray ionization
ermE constitutive promoter in streptomycetes
eV electron volt
FAD Flavin adenine dinucleotide
FMN Flavin mononucleotide
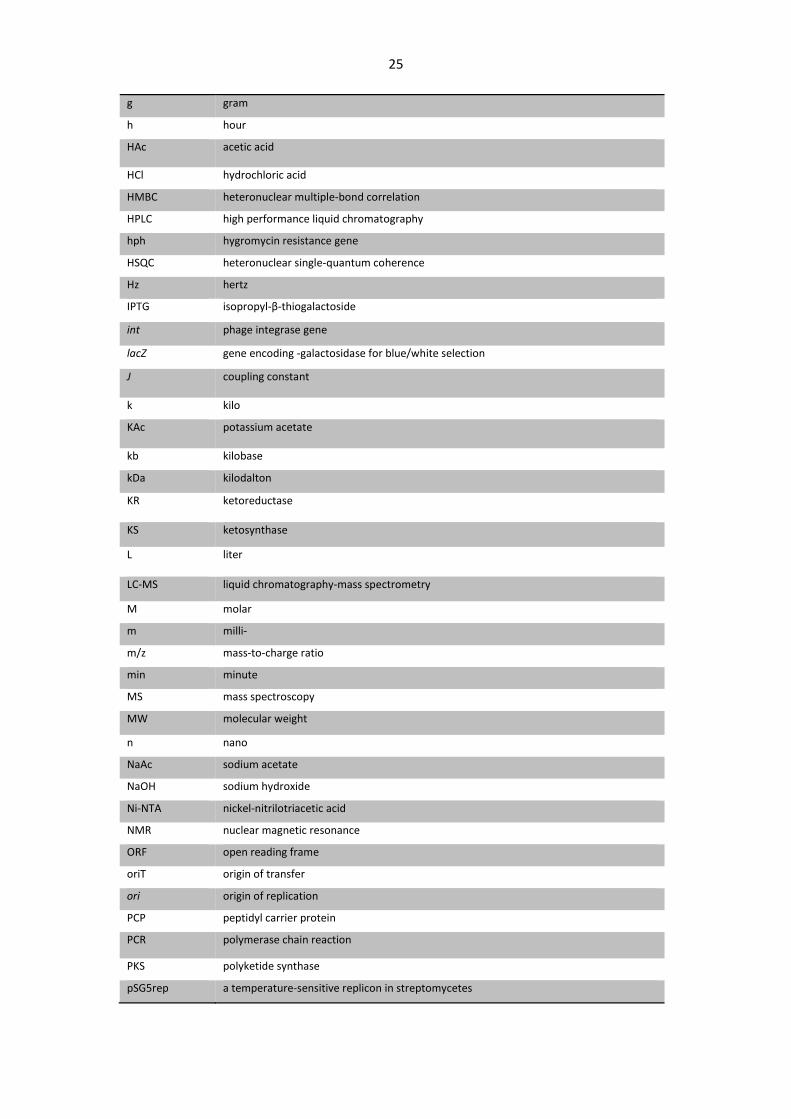
25
g gram
h hour
HAc acetic acid
HCl hydrochloric acid
HMBC heteronuclear multiple-bond correlation
HPLC high performance liquid chromatography
hph hygromycin resistance gene
HSQC heteronuclear single-quantum coherence
Hz hertz
IPTG isopropyl-β-thiogalactoside
int phage integrase gene
lacZ gene encoding -galactosidase for blue/white selection
J coupling constant
k kilo
KAc potassium acetate
kb kilobase
kDa kilodalton
KR ketoreductase
KS ketosynthase
L liter
LC-MS liquid chromatography-mass spectrometry
M molar
m milli-
m/z mass-to-charge ratio
min minute
MS mass spectroscopy
MW molecular weight
n nano
NaAc sodium acetate
NaOH sodium hydroxide
Ni-NTA nickel-nitrilotriacetic acid
NMR nuclear magnetic resonance
ORF open reading frame
oriT origin of transfer
ori origin of replication
PCP peptidyl carrier protein
PCR polymerase chain reaction
PKS polyketide synthase
pSG5rep a temperature-sensitive replicon in streptomycetes
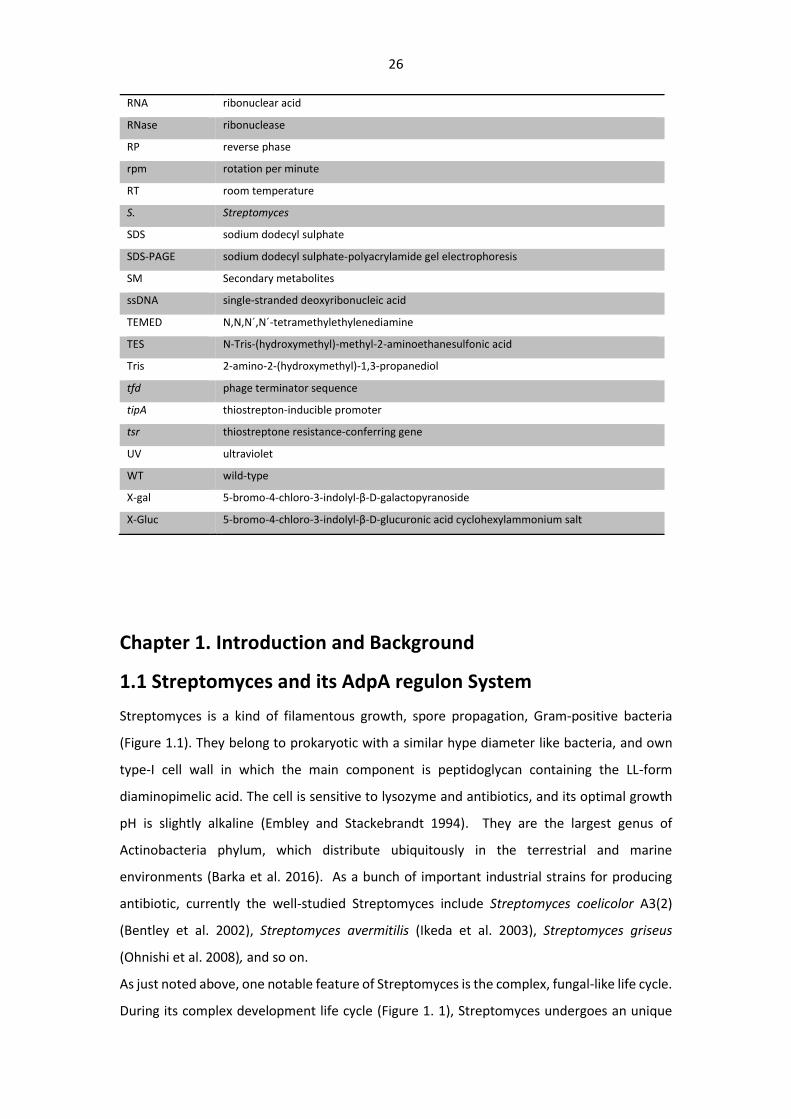
26
RNA ribonuclear acid
RNase ribonuclease
RP reverse phase
rpm rotation per minute
RT room temperature
S. Streptomyces
SDS sodium dodecyl sulphate
SDS-PAGE sodium dodecyl sulphate-polyacrylamide gel electrophoresis
SM Secondary metabolites
ssDNA single-stranded deoxyribonucleic acid
TEMED N,N,N´,N´-tetramethylethylenediamine
TES N-Tris-(hydroxymethyl)-methyl-2-aminoethanesulfonic acid
Tris 2-amino-2-(hydroxymethyl)-1,3-propanediol
tfd phage terminator sequence
tipA thiostrepton-inducible promoter
tsr thiostreptone resistance-conferring gene
UV ultraviolet
WT wild-type
X-gal 5-bromo-4-chloro-3-indolyl-β-D-galactopyranoside
X-Gluc 5-bromo-4-chloro-3-indolyl-β-D-glucuronic acid cyclohexylammonium salt
Chapter 1. Introduction and Background
1.1 Streptomyces and its AdpA regulon System
Streptomyces is a kind of filamentous growth, spore propagation, Gram-positive bacteria
(Figure 1.1). They belong to prokaryotic with a similar hype diameter like bacteria, and own
type-I cell wall in which the main component is peptidoglycan containing the LL-form
diaminopimelic acid. The cell is sensitive to lysozyme and antibiotics, and its optimal growth
pH is slightly alkaline (Embley and Stackebrandt 1994). They are the largest genus of
Actinobacteria phylum, which distribute ubiquitously in the terrestrial and marine
environments (Barka et al. 2016). As a bunch of important industrial strains for producing
antibiotic, currently the well-studied Streptomyces include Streptomyces coelicolor A3(2)
(Bentley et al. 2002), Streptomyces avermitilis (Ikeda et al. 2003), Streptomyces griseus
(Ohnishi et al. 2008), and so on.
As just noted above, one notable feature of Streptomyces is the complex, fungal-like life cycle.
During its complex development life cycle (Figure 1. 1), Streptomyces undergoes an unique
27
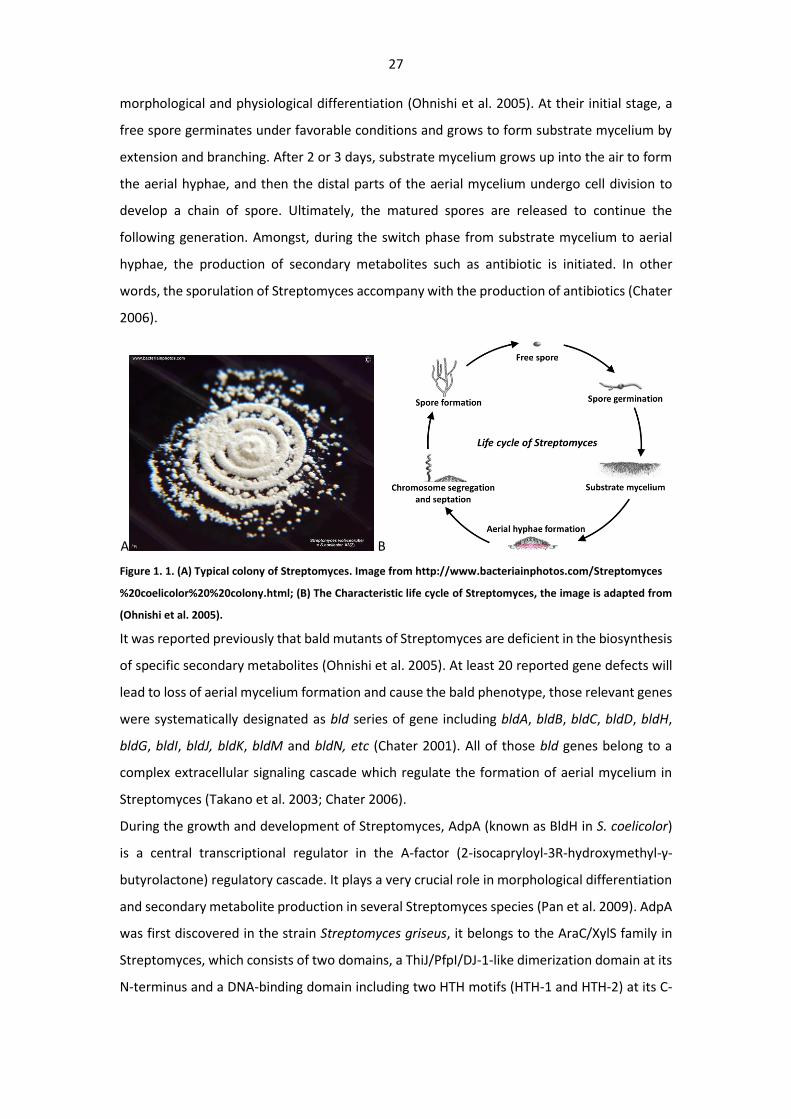
morphological and physiological differentiation (Ohnishi et al. 2005). At their initial stage, a
free spore germinates under favorable conditions and grows to form substrate mycelium by
extension and branching. After 2 or 3 days, substrate mycelium grows up into the air to form
the aerial hyphae, and then the distal parts of the aerial mycelium undergo cell division to
develop a chain of spore. Ultimately, the matured spores are released to continue the
following generation. Amongst, during the switch phase from substrate mycelium to aerial
hyphae, the production of secondary metabolites such as antibiotic is initiated. In other
words, the sporulation of Streptomyces accompany with the production of antibiotics (Chater
2006).
A B
Figure 1. 1. (A) Typical colony of Streptomyces. Image from http://www.bacteriainphotos.com/Streptomyces
%20coelicolor%20%20colony.html; (B) The Characteristic life cycle of Streptomyces, the image is adapted from
(Ohnishi et al. 2005).
It was reported previously that bald mutants of Streptomyces are deficient in the biosynthesis
of specific secondary metabolites (Ohnishi et al. 2005). At least 20 reported gene defects will
lead to loss of aerial mycelium formation and cause the bald phenotype, those relevant genes
were systematically designated as bld series of gene including bldA, bldB, bldC, bldD, bldH,
bldG, bldI, bldJ, bldK, bldM and bldN, etc (Chater 2001). All of those bld genes belong to a
complex extracellular signaling cascade which regulate the formation of aerial mycelium in
Streptomyces (Takano et al. 2003; Chater 2006).
During the growth and development of Streptomyces, AdpA (known as BldH in S. coelicolor)
is a central transcriptional regulator in the A-factor (2-isocapryloyl-3R-hydroxymethyl-γ-
butyrolactone) regulatory cascade. It plays a very crucial role in morphological differentiation
and secondary metabolite production in several Streptomyces species (Pan et al. 2009). AdpA
was first discovered in the strain Streptomyces griseus, it belongs to the AraC/XylS family in
Streptomyces, which consists of two domains, a ThiJ/PfpI/DJ-1-like dimerization domain at its
N-terminus and a DNA-binding domain including two HTH motifs (HTH-1 and HTH-2) at its C-
28
terminal part. Its consensus AdpA-binding sequence is 5ʹ-TGGCSNGWWY-3ʹ (S, G or C; W, A or
T; Y, T or C; N, any nucleotide) (Ohnishi et al. 2005).
A B
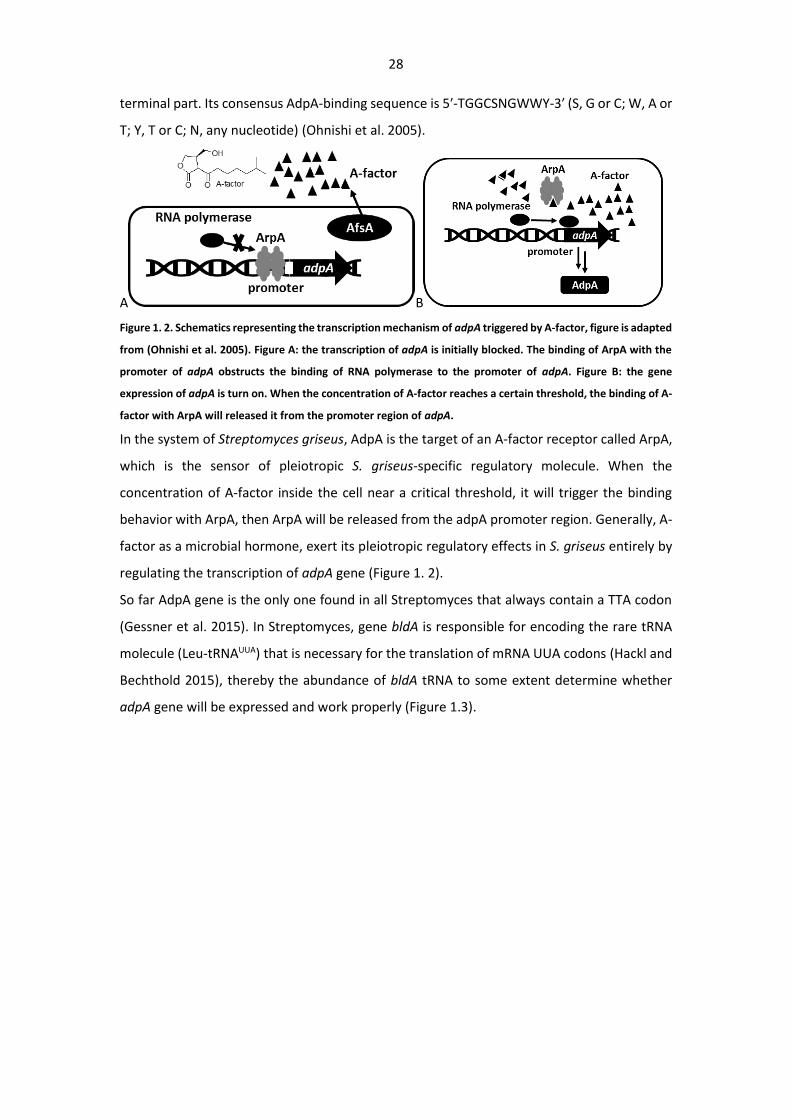
Figure 1. 2. Schematics representing the transcription mechanism of adpA triggered by A-factor, figure is adapted
from (Ohnishi et al. 2005). Figure A: the transcription of adpA is initially blocked. The binding of ArpA with the
promoter of adpA obstructs the binding of RNA polymerase to the promoter of adpA. Figure B: the gene
expression of adpA is turn on. When the concentration of A-factor reaches a certain threshold, the binding of A-
factor with ArpA will released it from the promoter region of adpA.
In the system of Streptomyces griseus, AdpA is the target of an A-factor receptor called ArpA,
which is the sensor of pleiotropic S. griseus-specific regulatory molecule. When the
concentration of A-factor inside the cell near a critical threshold, it will trigger the binding
behavior with ArpA, then ArpA will be released from the adpA promoter region. Generally, A-
factor as a microbial hormone, exert its pleiotropic regulatory effects in S. griseus entirely by
regulating the transcription of adpA gene (Figure 1. 2).
So far AdpA gene is the only one found in all Streptomyces that always contain a TTA codon
(Gessner et al. 2015). In Streptomyces, gene bldA is responsible for encoding the rare tRNA
molecule (Leu-tRNAUUA) that is necessary for the translation of mRNA UUA codons (Hackl and
Bechthold 2015), thereby the abundance of bldA tRNA to some extent determine whether
adpA gene will be expressed and work properly (Figure 1.3).
29
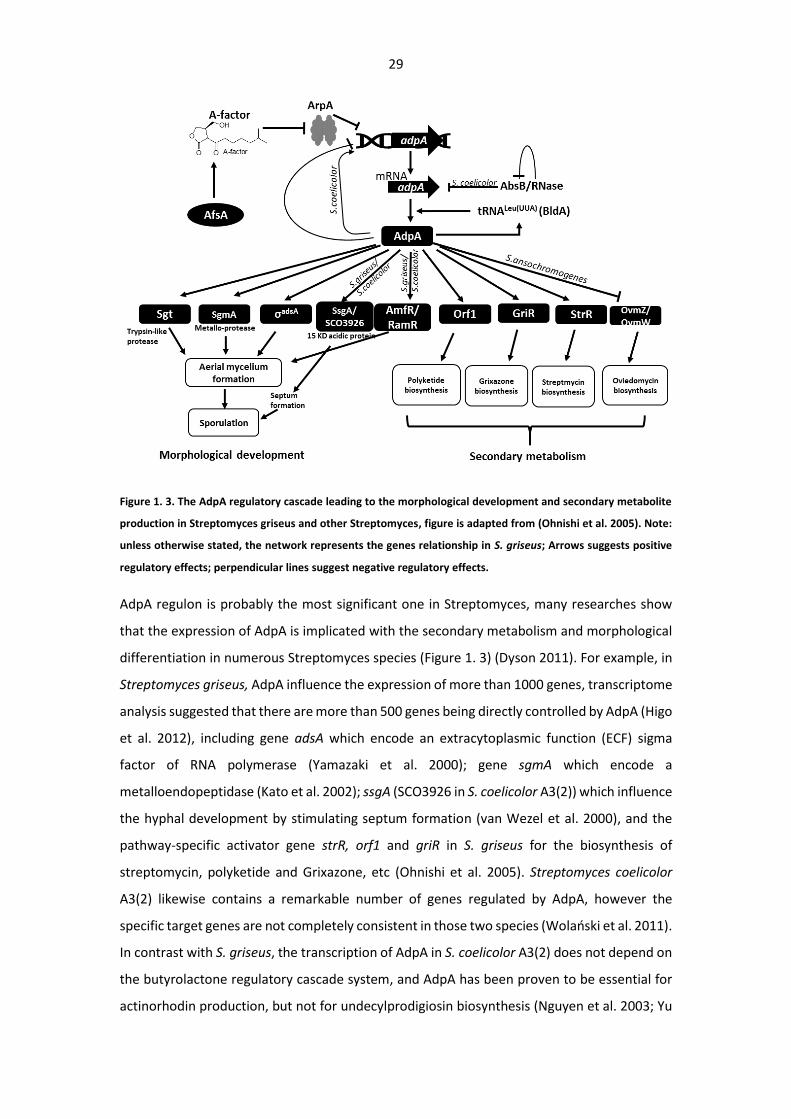
Figure 1. 3. The AdpA regulatory cascade leading to the morphological development and secondary metabolite
production in Streptomyces griseus and other Streptomyces, figure is adapted from (Ohnishi et al. 2005). Note:
unless otherwise stated, the network represents the genes relationship in S. griseus; Arrows suggests positive
regulatory effects; perpendicular lines suggest negative regulatory effects.
AdpA regulon is probably the most significant one in Streptomyces, many researches show
that the expression of AdpA is implicated with the secondary metabolism and morphological
differentiation in numerous Streptomyces species (Figure 1. 3) (Dyson 2011). For example, in
Streptomyces griseus, AdpA influence the expression of more than 1000 genes, transcriptome
analysis suggested that there are more than 500 genes being directly controlled by AdpA (Higo
et al. 2012), including gene adsA which encode an extracytoplasmic function (ECF) sigma
factor of RNA polymerase (Yamazaki et al. 2000); gene sgmA which encode a
metalloendopeptidase (Kato et al. 2002); ssgA (SCO3926 in S. coelicolor A3(2)) which influence
the hyphal development by stimulating septum formation (van Wezel et al. 2000), and the
pathway-specific activator gene strR, orf1 and griR in S. griseus for the biosynthesis of
streptomycin, polyketide and Grixazone, etc (Ohnishi et al. 2005). Streptomyces coelicolor
A3(2) likewise contains a remarkable number of genes regulated by AdpA, however the
specific target genes are not completely consistent in those two species (Wolański et al. 2011).
In contrast with S. griseus, the transcription of AdpA in S. coelicolor A3(2) does not depend on
the butyrolactone regulatory cascade system, and AdpA has been proven to be essential for
actinorhodin production, but not for undecylprodigiosin biosynthesis (Nguyen et al. 2003; Yu
30
et al. 2014). Wolański etal found that AdpA not only can directly influence the expression of
several genes, also particularly inhibit the chromosome replication at the initiation stage in S.
coelicolor (Wolański et al. 2012) (Wolański et al. 2011).
Moreover, many investigations on AdpA suggest that the regulatory network of AdpA deviate
in different Streptomyces species. In S. chattanoogensis, the AdpA homolog was proven to
indirectly activate natamycin biosynthesis, and the transcription of adpA was not affected by
the butyrolactone system in S. chattanoogensis (Du et al. 2011), in this strain gene
mutagenesis results revealed that AdpA homolog is essential for both nikkomycin biosynthesis
and morphological differentiation, in addition, transcriptional analysis demonstrated that
gene sanG, a specific activator for nikkomycin biosynthesis, is regulated by the expression of
AdpA-L in S. ansochromogenes (Pan et al. 2009). In their recent report, this AdpA homologue
was confirmed to repress oviedomycin biosynthesis by regulating the cluster-situated
regulators (OvmZ and OvmW) in the same strain (Xu et al. 2017).
1.2 Streptomyces Genome Features
Since the first Streptomyces module strain, Streptomyces coelicolor A3 (2) was sequenced by
the Sanger institute in 2002, which announced the era coming of research on Streptomyces
through genomics (Bentley et al. 2002). Since then, more and more important Streptomyces
strain has been sequenced, one of them is the most notably industrial strain of avermectins
producer: Streptomyces avermitilis. (Ikeda et al. 2003). So far, there are 106 complete genomic
sequences deposited in the Genbank database, at least 125 draft sequence maps available in
the Genbank database up to September, 2017. It's predictable that in the future more and
more Streptomyces will be sequenced for their irresistible charm.
The chromosome of Streptomyces shows a linear topology with complex structure, and some
of them own relatively bigger genome than other prokaryotes. The genome size of S. coelicolor
A3 (2) is 8,667,507bp, containing 7825 open reading frames (ORFs) (Table 1. 1). Its size is two
times bigger than the one of E. coli K-12, smaller than the genome of eukaryotic
Saccharomyces cerevisiae (approximately 12 Mb, 16 chromosomes). Another Streptomyces
species such as S. avermitilis even own a 9Mb genome.
One of the notable features of Streptomyces is their genome containing high guanine-plus-
cytosine (G+C) content. Due to the composition difference between the leading strand and the
lagging strand (normally there are more G and T on the leading strand, more A and C on the
lagging strand), which will cause a shift for breaking the base frequency, those shifts are named
31
as GC-skew. The corresponding GC skew is mapped based on the calculation of G-C/G+C value.
This value shows positive on the leading strand, and negative on the lagging strand. Thereby
it clearly exhibits the start and stop point of the leading strand and lagging strand. For
Streptomyces, the G+C skew inversion is usually used as a signal showing the locus of the origin
of replication (oriC) (Bentley et al. 2002).
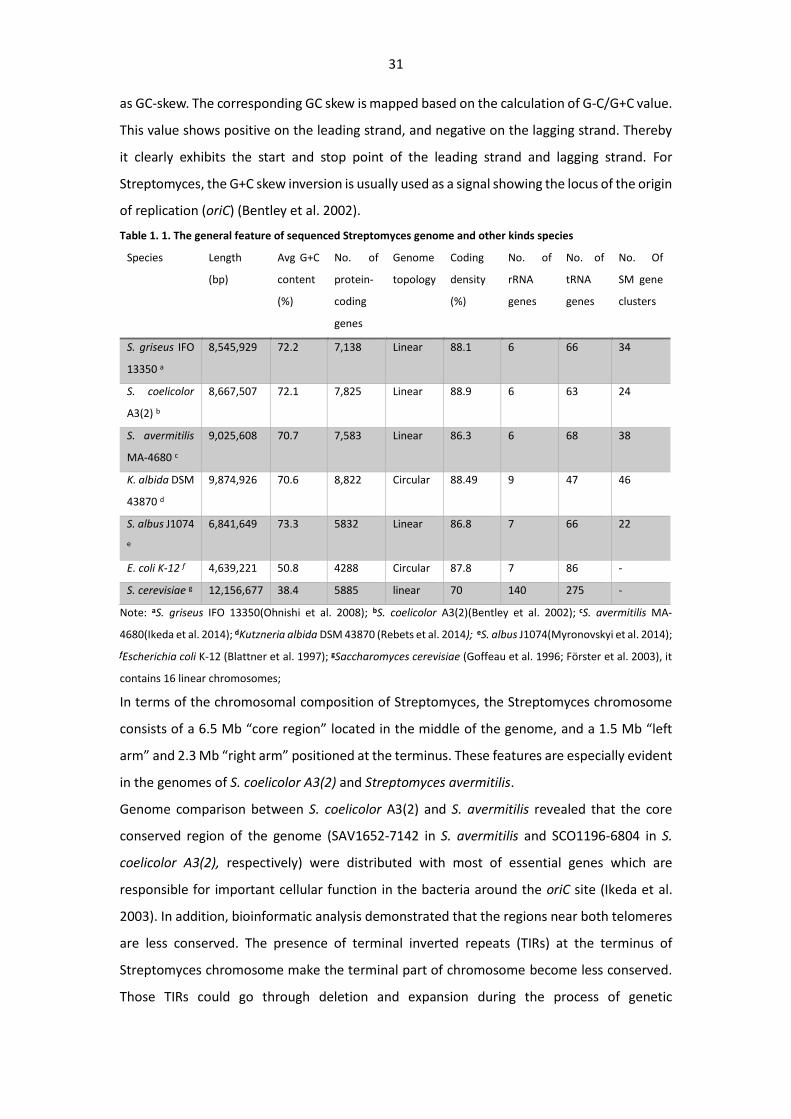
Table 1. 1. The general feature of sequenced Streptomyces genome and other kinds species
Species Length
(bp)
Avg G+C
content
(%)
No. of
protein-
coding
genes
Genome
topology
Coding
density
(%)
No. of
rRNA
genes
No. of
tRNA
genes
No. Of
SM gene
clusters
S. griseus IFO
13350 a
8,545,929 72.2 7,138 Linear 88.1 6 66 34
S. coelicolor
A3(2) b
8,667,507 72.1 7,825 Linear 88.9 6 63 24
S. avermitilis
MA-4680 c
9,025,608 70.7 7,583 Linear 86.3 6 68 38
K. albida DSM
43870 d
9,874,926 70.6 8,822 Circular 88.49 9 47 46
S. albus J1074
e
6,841,649 73.3 5832 Linear 86.8 7 66 22
E. coli K-12 f 4,639,221 50.8 4288 Circular 87.8 7 86 -
S. cerevisiae g 12,156,677 38.4 5885 linear 70 140 275 -
Note: aS. griseus IFO 13350(Ohnishi et al. 2008); bS. coelicolor A3(2)(Bentley et al. 2002); cS. avermitilis MA-
4680(Ikeda et al. 2014); dKutzneria albida DSM 43870 (Rebets et al. 2014); eS. albus J1074(Myronovskyi et al. 2014);
fEscherichia coli K-12 (Blattner et al. 1997); gSaccharomyces cerevisiae (Goffeau et al. 1996; Förster et al. 2003), it
contains 16 linear chromosomes;
In terms of the chromosomal composition of Streptomyces, the Streptomyces chromosome
consists of a 6.5 Mb “core region” located in the middle of the genome, and a 1.5 Mb “left
arm” and 2.3 Mb “right arm” positioned at the terminus. These features are especially evident
in the genomes of S. coelicolor A3(2) and Streptomyces avermitilis.
Genome comparison between S. coelicolor A3(2) and S. avermitilis revealed that the core
conserved region of the genome (SAV1652-7142 in S. avermitilis and SCO1196-6804 in S.
coelicolor A3(2), respectively) were distributed with most of essential genes which are
responsible for important cellular function in the bacteria around the oriC site (Ikeda et al.
2003). In addition, bioinformatic analysis demonstrated that the regions near both telomeres
are less conserved. The presence of terminal inverted repeats (TIRs) at the terminus of
Streptomyces chromosome make the terminal part of chromosome become less conserved.
Those TIRs could go through deletion and expansion during the process of genetic
32
development of Streptomyces, which result in the unequal size of those “arm region” and
prompt the gene transfer in different strains. Furthermore, those structural disability
happening at the chromosome terminal portion don’t make significant influence on the
normal physiological metabolism of Streptomyces (Ohnishi et al. 2005). By systematic deletion
of nonessential genes around the chromosome terminus of Streptomyces avermitilis,
genomically minimized S. avermitilis SUKA22 was constructed as a robust and versatile model
host for heterologous expression of secondary metabolite biosynthesis (Komatsu et al. 2010).
These findings demonstrated the structural variability of the telomeric and the subtelomeric
region on the chromosome of Streptomyces may be unique to linear bacterial chromosome
like Streptomyces, and it plays an important role during the strain evolution.
It is worth mentioning that more than half of the secondary metabolites related genes were
found in the subtelomeric regions in the form of gene cluster. The genome of S. coelicolor
A3(2) contains 23 gene clusters, accounting for 5% of the total genes; S. avermitilis contain 30
gene clusters, accounting for 6.6% of the protein-coding gene. Those genes are believed to be
acquired by microorganism through horizontal gene transfer (Barlow 2009; Jiang et al. 2017).
1.3 Proteomics for Streptomyces
The whole regulatory network plays a very important role in the control of primary and
secondary metabolites in Streptomyces (Liu et al. 2013). Regulatory genes take a large
proportion in the genome of Streptomyces. For instance, Streptomyces coelicolor A3 (2)
contains 965 regulation-related encoding genes which account for 12.3% of the whole
genome.
Due to the presence of the complicated regulatory network in Streptomyces, searching
effective method to monitor the dynamic changes of gene expression inside the strain cells
become indispensable (Hesketh et al. 2002). System biology methods such as transcriptomics
and proteomics are very effective methods to understand Streptomyces differentiation in
various kinds of developmental condition (Hwang et al. 2014).
Nowadays, the rapid advance of genomics greatly facilitates the development of those omics.
Particularly, proteomics as a high throughput technique based on mass spectrometry, show
significant technique advantage. Proteomics approach can detect the expressed proteins and
their catalytic product which are often no observable under lab conditions. Moreover, Soft
ionization technique and multiple series fragmentation make it more efficient and sensitive
to determine the target protein. In addition, proteomics data even can provide unique
33
information about dynamic protein-protein interaction, post-translational modification of
proteins and biomolecules in trace amounts in biological samples (Lee et al. 2006).
Streptomyces biology has been studied using proteomics approaches in various cellular
contexts. Main researches based on proteomics focus on their study on the expression
difference of specific protein in the cell under specific condition, which were used to reveal
the hidden genome-wide interactions among genes. For example, through proteomics
analysis, Manteca et al validated that genes for primary metabolism such as TCA cycle, energy
production, and lipid metabolism, were activated during MI phase, while genes involved in
the biosynthesis of secondary metabolism got higher expression at MII phase than MI phase,
etc (Manteca et al. 2010). By integrating two proteomics methods (SILAC and iTRAQ), a
dynamic analysis of turnover rates have been accomplished to detect the degradation rates
of 115 intracellular proteins from mRNA transcription to protein degradation during metabolic
shift phase (Jayapal et al. 2010).
1.4 Antibiotics Discovery and Their Action Mechanism
Since half century ago, Alexander Fleming discovered Penicillin from fungi, more and more
potent antimicrobials have been discovered and developed during the period from the 1940s
to 1960s, at that time human being went through a golden era of antibiotic discovery. Some
of the antibiotics discovered at that time or their derivatives are still being used in our current
clinic therapy (Figure 1. 4). Among those microorganisms, Streptomyces plays an important
role in antibiotic development during this process. According to literature report, nowadays
more than 80% antibiotics are originated from Streptomyces (de Lima Procópio et al. 2012).
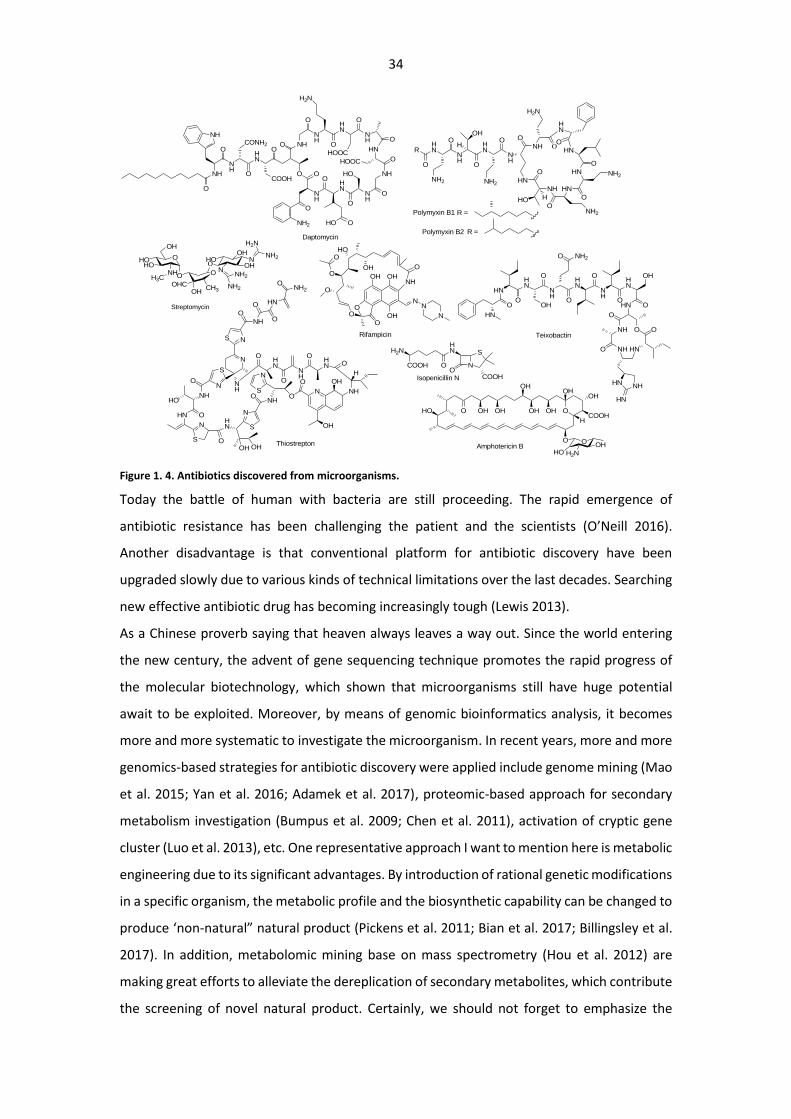
34
Figure 1. 4. Antibiotics discovered from microorganisms.
Today the battle of human with bacteria are still proceeding. The rapid emergence of
antibiotic resistance has been challenging the patient and the scientists (O’Neill 2016).
Another disadvantage is that conventional platform for antibiotic discovery have been
upgraded slowly due to various kinds of technical limitations over the last decades. Searching
new effective antibiotic drug has becoming increasingly tough (Lewis 2013).
As a Chinese proverb saying that heaven always leaves a way out. Since the world entering
the new century, the advent of gene sequencing technique promotes the rapid progress of
the molecular biotechnology, which shown that microorganisms still have huge potential
await to be exploited. Moreover, by means of genomic bioinformatics analysis, it becomes
more and more systematic to investigate the microorganism. In recent years, more and more
genomics-based strategies for antibiotic discovery were applied include genome mining (Mao
et al. 2015; Yan et al. 2016; Adamek et al. 2017), proteomic-based approach for secondary
metabolism investigation (Bumpus et al. 2009; Chen et al. 2011), activation of cryptic gene
cluster (Luo et al. 2013), etc. One representative approach I want to mention here is metabolic
engineering due to its significant advantages. By introduction of rational genetic modifications
in a specific organism, the metabolic profile and the biosynthetic capability can be changed to
produce ‘non-natural” natural product (Pickens et al. 2011; Bian et al. 2017; Billingsley et al.
2017). In addition, metabolomic mining base on mass spectrometry (Hou et al. 2012) are
making great efforts to alleviate the dereplication of secondary metabolites, which contribute
the screening of novel natural product. Certainly, we should not forget to emphasize the
HNH2N
COOH OO
N
S
COOHIsopenicillin N
HN
N
O
NH
N
S
S
O
HO
O
HN
OH OH
NH
N
NS
NH
O
O
O
HN
NH2O
S
N
ONH
S
N
OHN
O
NH
OHN
O
O
N
OH
NH
O
H
OH
Thiostrepton
OHOH
OCOOH
OHOH
OH
OHOHOHO
O OOH
H2NHO
H
Amphotericin B
O
O
OH
HOHO
NH
Streptomycin OO
O
O
OHO
OH
NH
O
OH OH
OHO
NN
N
Rifampicin
NH HN
HN
NH
O
O
O
O
HN
HN
O
HN
O
H2N
HO H
NH2
NH2
NH
OHN
O
NH
HN
O
R
O
NH2 NH2
OH
H
R =
R =Polymyxin B1
Polymyxin B2
NH
OHN
NH
O NH
NH OHN
O
NH2
O
O
O
O
NH
HN
NH
O
O O
O
OHO
HO
HOOC
H2N
HN
NH
O
O
O
NH
NH
O
CONH2
COOH
HOOC
Daptomycin
O
N
NH2
NH2
N
H2N
NH2OH
OHHO
CH3OHOHC
H3C
HN
OO
HN
OH
NH
O
HN
NH
OHN
HN
O
O
NH O
NH HN
HN
O O
O NH2
OH
O
HNNH
HN
OTeixobactin
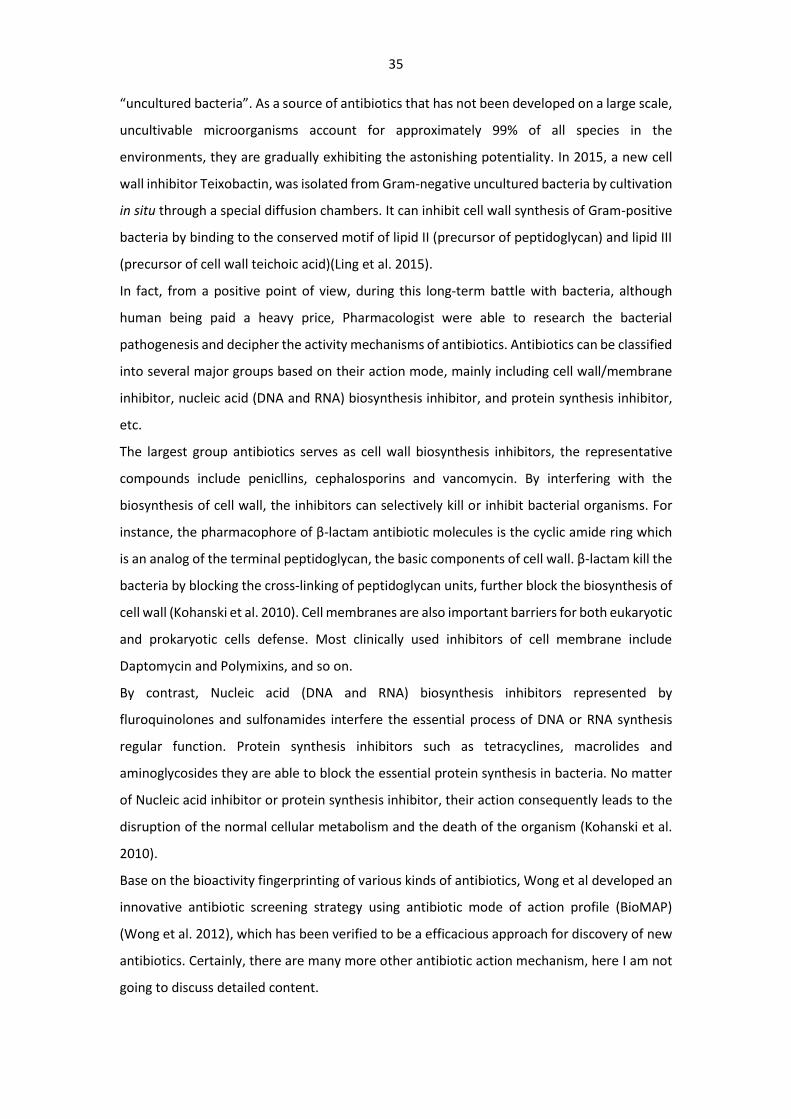
35
“uncultured bacteria”. As a source of antibiotics that has not been developed on a large scale,
uncultivable microorganisms account for approximately 99% of all species in the
environments, they are gradually exhibiting the astonishing potentiality. In 2015, a new cell
wall inhibitor Teixobactin, was isolated from Gram-negative uncultured bacteria by cultivation
in situ through a special diffusion chambers. It can inhibit cell wall synthesis of Gram-positive
bacteria by binding to the conserved motif of lipid II (precursor of peptidoglycan) and lipid III
(precursor of cell wall teichoic acid)(Ling et al. 2015).
In fact, from a positive point of view, during this long-term battle with bacteria, although
human being paid a heavy price, Pharmacologist were able to research the bacterial
pathogenesis and decipher the activity mechanisms of antibiotics. Antibiotics can be classified
into several major groups based on their action mode, mainly including cell wall/membrane
inhibitor, nucleic acid (DNA and RNA) biosynthesis inhibitor, and protein synthesis inhibitor,
etc.
The largest group antibiotics serves as cell wall biosynthesis inhibitors, the representative
compounds include penicllins, cephalosporins and vancomycin. By interfering with the
biosynthesis of cell wall, the inhibitors can selectively kill or inhibit bacterial organisms. For
instance, the pharmacophore of β-lactam antibiotic molecules is the cyclic amide ring which
is an analog of the terminal peptidoglycan, the basic components of cell wall. β-lactam kill the
bacteria by blocking the cross-linking of peptidoglycan units, further block the biosynthesis of
cell wall (Kohanski et al. 2010). Cell membranes are also important barriers for both eukaryotic
and prokaryotic cells defense. Most clinically used inhibitors of cell membrane include
Daptomycin and Polymixins, and so on.
By contrast, Nucleic acid (DNA and RNA) biosynthesis inhibitors represented by
fluroquinolones and sulfonamides interfere the essential process of DNA or RNA synthesis
regular function. Protein synthesis inhibitors such as tetracyclines, macrolides and
aminoglycosides they are able to block the essential protein synthesis in bacteria. No matter
of Nucleic acid inhibitor or protein synthesis inhibitor, their action consequently leads to the
disruption of the normal cellular metabolism and the death of the organism (Kohanski et al.
2010).
Base on the bioactivity fingerprinting of various kinds of antibiotics, Wong et al developed an
innovative antibiotic screening strategy using antibiotic mode of action profile (BioMAP)
(Wong et al. 2012), which has been verified to be a efficacious approach for discovery of new
antibiotics. Certainly, there are many more other antibiotic action mechanism, here I am not
going to discuss detailed content.
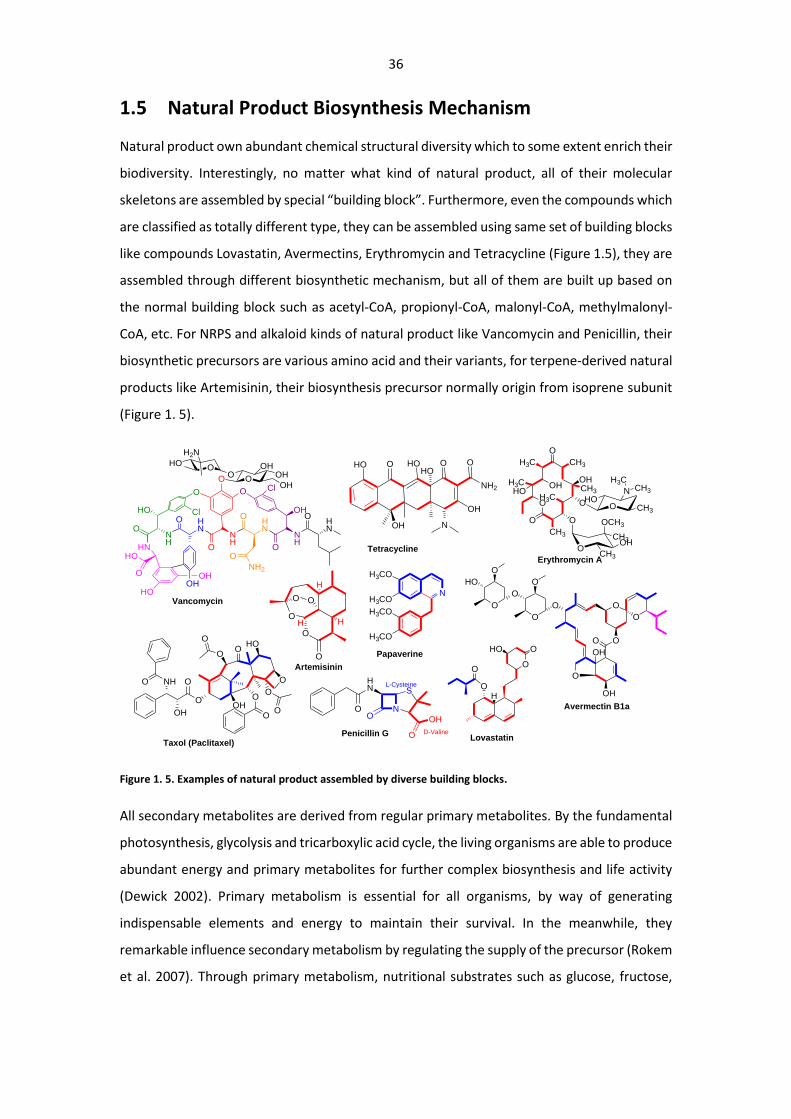
36
1.5 Natural Product Biosynthesis Mechanism
Natural product own abundant chemical structural diversity which to some extent enrich their
biodiversity. Interestingly, no matter what kind of natural product, all of their molecular
skeletons are assembled by special “building block”. Furthermore, even the compounds which
are classified as totally different type, they can be assembled using same set of building blocks
like compounds Lovastatin, Avermectins, Erythromycin and Tetracycline (Figure 1.5), they are
assembled through different biosynthetic mechanism, but all of them are built up based on
the normal building block such as acetyl-CoA, propionyl-CoA, malonyl-CoA, methylmalonyl-
CoA, etc. For NRPS and alkaloid kinds of natural product like Vancomycin and Penicillin, their
biosynthetic precursors are various amino acid and their variants, for terpene-derived natural
products like Artemisinin, their biosynthesis precursor normally origin from isoprene subunit
(Figure 1. 5).
O
OH
H
H
O O
O
Artemisinin
O
O
CH3
HO
H3C
OH
CH3
O
O
O
OHH3C
H3CCH3
O
OCH3
CH3OH
CH3
OHO
N
H3CCH3
CH3
Erythromycin A
HO
OH
O HOHO
O
NH2
O
OH
N
Tetracycline
NH
HN
NH
HN
NH
HN
HN
O
HO
HO
O OHOH
O
O
O
O
OHO
O
O
NH2
O
HO Cl
ClO
OH
OHOH
OO
H2N
HO
Vancomycin
O
N
SHN
OO
O
OH
L-Cysteine
D-ValinePenicillin G
O
O O
O
OH
O
O
OH
O
O
O
O
OHO
Avermectin B1a
O
OH
OHO
O
Lovastatin
OH
O
O
OO
NH
OO
O
HOO
O
O O
OH
Taxol (Paclitaxel)
N
H3CO
H3CO
H3CO
H3CO
Papaverine
Figure 1. 5. Examples of natural product assembled by diverse building blocks.
All secondary metabolites are derived from regular primary metabolites. By the fundamental
photosynthesis, glycolysis and tricarboxylic acid cycle, the living organisms are able to produce
abundant energy and primary metabolites for further complex biosynthesis and life activity
(Dewick 2002). Primary metabolism is essential for all organisms, by way of generating
indispensable elements and energy to maintain their survival. In the meanwhile, they
remarkable influence secondary metabolism by regulating the supply of the precursor (Rokem
et al. 2007). Through primary metabolism, nutritional substrates such as glucose, fructose,
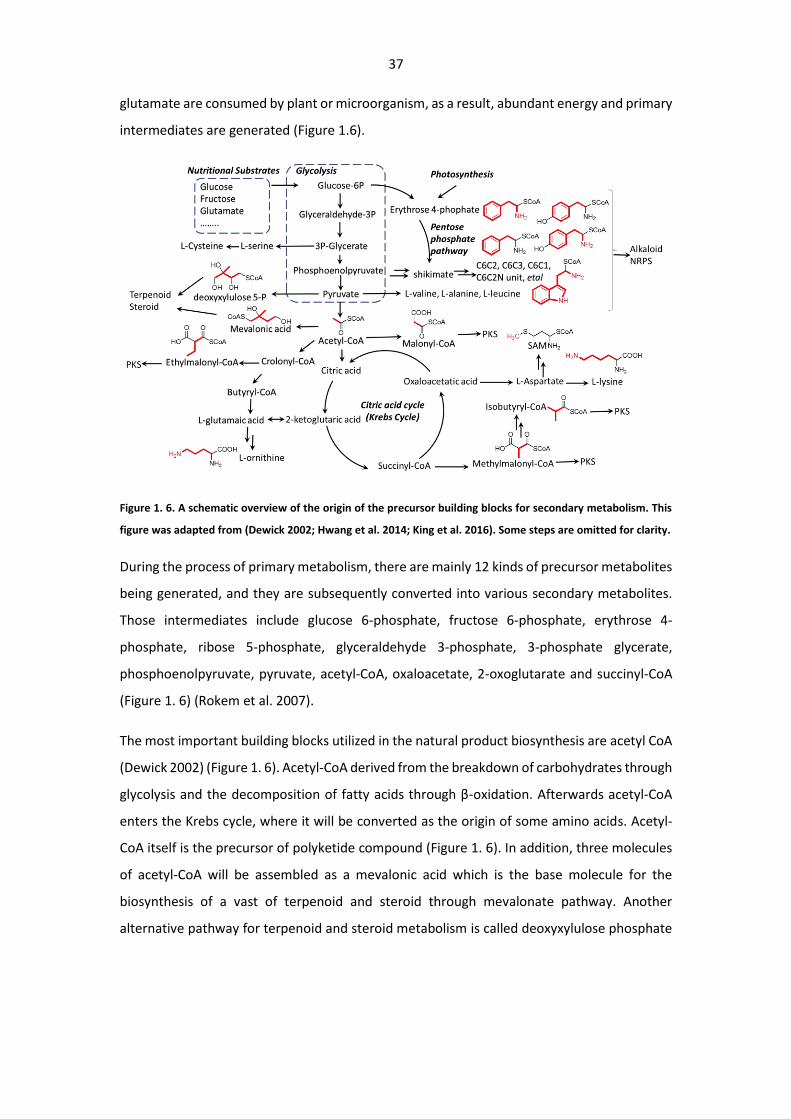
37
glutamate are consumed by plant or microorganism, as a result, abundant energy and primary
intermediates are generated (Figure 1.6).
Figure 1. 6. A schematic overview of the origin of the precursor building blocks for secondary metabolism. This
figure was adapted from (Dewick 2002; Hwang et al. 2014; King et al. 2016). Some steps are omitted for clarity.
During the process of primary metabolism, there are mainly 12 kinds of precursor metabolites
being generated, and they are subsequently converted into various secondary metabolites.
Those intermediates include glucose 6-phosphate, fructose 6-phosphate, erythrose 4-
phosphate, ribose 5-phosphate, glyceraldehyde 3-phosphate, 3-phosphate glycerate,
phosphoenolpyruvate, pyruvate, acetyl-CoA, oxaloacetate, 2-oxoglutarate and succinyl-CoA
(Figure 1. 6) (Rokem et al. 2007).
The most important building blocks utilized in the natural product biosynthesis are acetyl CoA
(Dewick 2002) (Figure 1. 6). Acetyl-CoA derived from the breakdown of carbohydrates through
glycolysis and the decomposition of fatty acids through β-oxidation. Afterwards acetyl-CoA
enters the Krebs cycle, where it will be converted as the origin of some amino acids. Acetyl-
CoA itself is the precursor of polyketide compound (Figure 1. 6). In addition, three molecules
of acetyl-CoA will be assembled as a mevalonic acid which is the base molecule for the
biosynthesis of a vast of terpenoid and steroid through mevalonate pathway. Another
alternative pathway for terpenoid and steroid metabolism is called deoxyxylulose phosphate
38
pathway which employ pyruvic acid (pyruvate) and glyceraldehyde 3-phosphate as the
precursor(Hwang et al. 2014).
Most of nitrogen-containing natural product such as peptides and alkaloids are derived from
amino acid. Among them the aromatic amino acids like phenylalanine, tyrosine, and
tryptophan are the products generated from the shikimate pathway. Those aromatic amino
acids can be integrated as the chemical skeleton of natural product after special catalytic
modification. In addition, during the process of glycolysis and Krebs cycle, many intermediates
are used to construct various kinds of amino acids, which can be used as the building blocks
for the assembly of NRPS kinds of compound like Vancomycin. Beside from
phosphoenolpyruvate from glycolysis pathway, erythrose 4-phophate from pentose
phosphate pathway also can be convert to intermediate shikimic acid (Figure 1. 6).
In all the prokaryotes and eukaryotes, the successful crosstalk between primary and
secondary metabolism need the participation of cofactors such as coenzyme A, flavin, ATP,
NADH, NADPH, FAD, metal ion, etc. Those cofactors serve as a helper molecule that assist
various kinds of enzyme to exert their biological activity, which play a very important role for
controlling the metabolism inside organism. For example, in Streptomyces coelicolor A3(2),
more than 21% metabolism process need the participation of ATP, which is often used as the
Gibbs free energy input to promote the biosynthesis of antibiotics (Bentley et al. 2002).
NADPH as electron acceptor, is also frequently involved into all sorts of natural product
biosynthesis (Rokem et al. 2007).
Generally, the chemical structural of secondary metabolites (SM) can be grouped as
polyketides, alkaloids, NRPS derivatives, and terpenoids according to their different
biosynthesis pathway. Two large classes of SM produced by Streptomyces are polyketide and
nonribosomal peptide which displays a wide variety of structural and physiological functions,
and will be described in great detail in the next section.
1.5.1 Polyketides
Polyketide kind of natural products are widely produced by various kinds of prokaryotic and
eukaryotic as secondary metabolites. As one of the largest family of natural product,
polyketides show a wide range of biological activity, such as antibiotics Erythromycin,
Enterocin, and Azalomycins, antitumor agents Geldanamycin, antiparasitic agent Avermectin
and cholesterol lowering agent lovastatin, etc (Figure 1. 7).
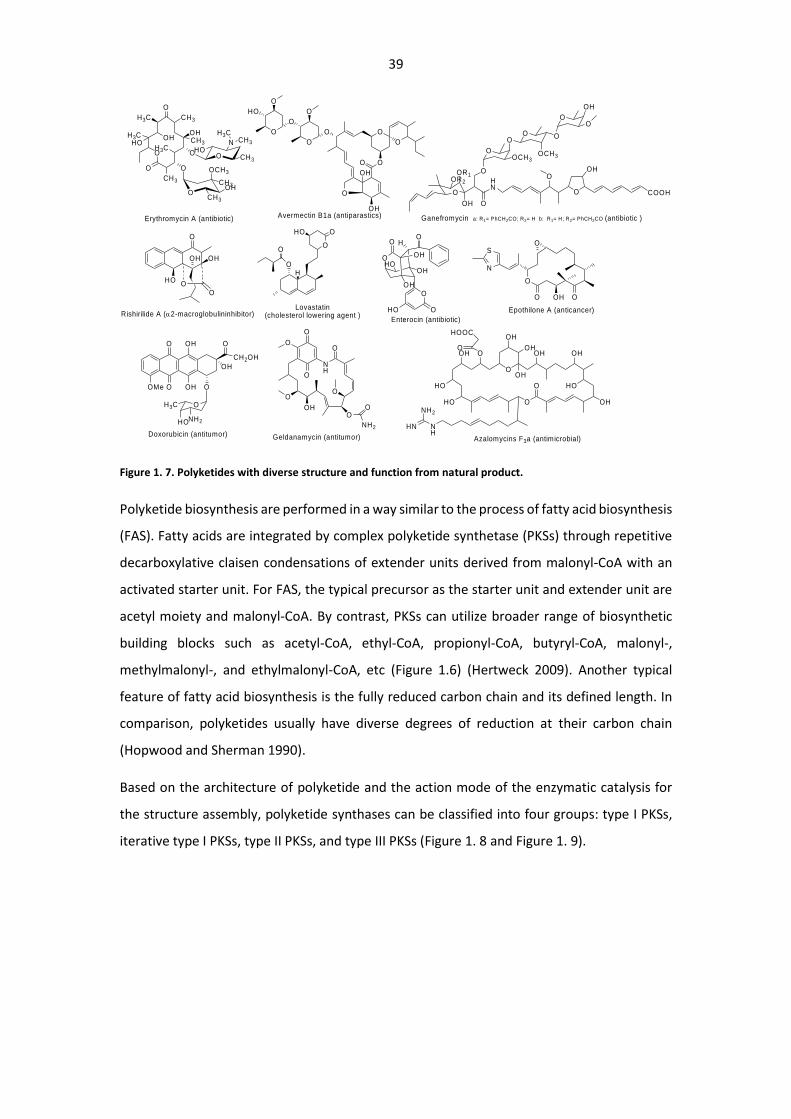
39
Figure 1. 7. Polyketides with diverse structure and function from natural product.
Polyketide biosynthesis are performed in a way similar to the process of fatty acid biosynthesis
(FAS). Fatty acids are integrated by complex polyketide synthetase (PKSs) through repetitive
decarboxylative claisen condensations of extender units derived from malonyl-CoA with an
activated starter unit. For FAS, the typical precursor as the starter unit and extender unit are
acetyl moiety and malonyl-CoA. By contrast, PKSs can utilize broader range of biosynthetic
building blocks such as acetyl-CoA, ethyl-CoA, propionyl-CoA, butyryl-CoA, malonyl-,
methylmalonyl-, and ethylmalonyl-CoA, etc (Figure 1.6) (Hertweck 2009). Another typical
feature of fatty acid biosynthesis is the fully reduced carbon chain and its defined length. In
comparison, polyketides usually have diverse degrees of reduction at their carbon chain
(Hopwood and Sherman 1990).
Based on the architecture of polyketide and the action mode of the enzymatic catalysis for
the structure assembly, polyketide synthases can be classified into four groups: type I PKSs,
iterative type I PKSs, type II PKSs, and type III PKSs (Figure 1. 8 and Figure 1. 9).
S
N
O
O
OH OO
Epothilone A (anticancer)
OH
OHO
OOMe O
OH
OH3C
HONH2
CH2OH
O
Doxorubicin (antitumor)
O
NH
O
OH
O
O
O
O
OO
NH2
Geldanamycin (antitumor)
O
O
O
OH
OH
O
HO O
HO
H
OH
Enterocin (antibiotic)
O
HO
OHO
O
OH
OHOH
OH
OH
OH
OH OO
HOOC
HO
Azalomycins F3a (antimicrobial)
NH
HN
NH2
O
OH OH
OO
HO
Rishirilide A (2-macroglobulininhibitor)
O
OH
OR1
O
HN
O COOH
OHO
OOCH3
OO
OCH3
O
O
OH
O
OR2O
Ganefromycin a: R1= PhCH2CO; R2= H b: R1= H; R2= PhCH2CO (antibiotic )
O
O
CH3
HO
H3C
OH
CH3
O
O
O
OHH3C
H3CCH3
O
OCH3
CH3OH
CH3
OHO
N
H3CCH3
CH3
Erythromycin A (antibiotic)
O
O O
O
OH
O
O
OH
O
O
O
O
OHO
Avermectin B1a (antiparastics)
O
OH
OHO
O
Lovastatin (cholesterol lowering agent )
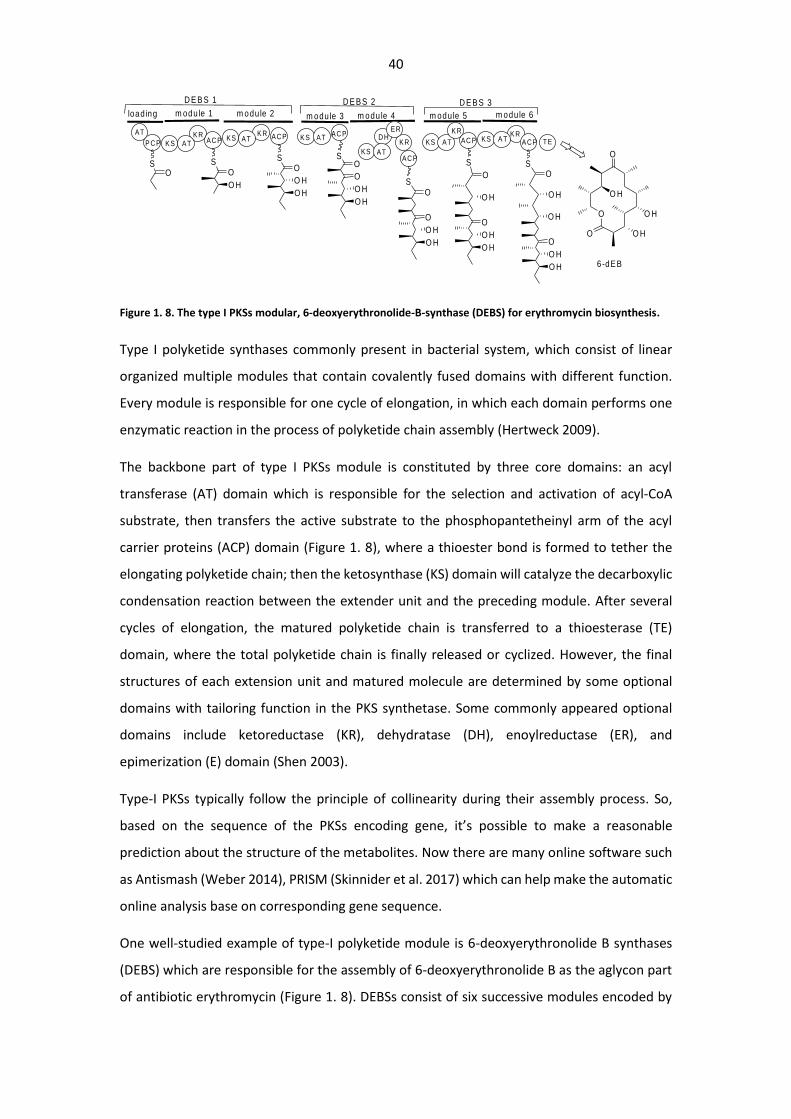
40
Figure 1. 8. The type I PKSs modular, 6-deoxyerythronolide-B-synthase (DEBS) for erythromycin biosynthesis.
Type I polyketide synthases commonly present in bacterial system, which consist of linear
organized multiple modules that contain covalently fused domains with different function.
Every module is responsible for one cycle of elongation, in which each domain performs one
enzymatic reaction in the process of polyketide chain assembly (Hertweck 2009).
The backbone part of type I PKSs module is constituted by three core domains: an acyl
transferase (AT) domain which is responsible for the selection and activation of acyl-CoA
substrate, then transfers the active substrate to the phosphopantetheinyl arm of the acyl
carrier proteins (ACP) domain (Figure 1. 8), where a thioester bond is formed to tether the
elongating polyketide chain; then the ketosynthase (KS) domain will catalyze the decarboxylic
condensation reaction between the extender unit and the preceding module. After several
cycles of elongation, the matured polyketide chain is transferred to a thioesterase (TE)
domain, where the total polyketide chain is finally released or cyclized. However, the final
structures of each extension unit and matured molecule are determined by some optional
domains with tailoring function in the PKS synthetase. Some commonly appeared optional
domains include ketoreductase (KR), dehydratase (DH), enoylreductase (ER), and
epimerization (E) domain (Shen 2003).
Type-I PKSs typically follow the principle of collinearity during their assembly process. So,
based on the sequence of the PKSs encoding gene, it’s possible to make a reasonable
prediction about the structure of the metabolites. Now there are many online software such
as Antismash (Weber 2014), PRISM (Skinnider et al. 2017) which can help make the automatic
online analysis base on corresponding gene sequence.
One well-studied example of type-I polyketide module is 6-deoxyerythronolide B synthases
(DEBS) which are responsible for the assembly of 6-deoxyerythronolide B as the aglycon part
of antibiotic erythromycin (Figure 1. 8). DEBSs consist of six successive modules encoded by
AT
P C P
load ing m odule 2
TEKS AT
K R AC P
m odule 3
K S ATAC P
m odu le 4
KS
D H
ATKRKR
AC P
m odule 5
KS A TK R
A C P
SS S
S
S
O
OO
m odule 1
K S ATK R
AC P
SOO
ER
KS A T
K R
AC P
m odule 6
O HO H
O HO H
O H
O
O H
O H
O
O H
O H
O H
O
O
O H
O H
O H
O
O H
O
S
O O H
O H
O H
O
O
6-dEB
D E BS 1 D E BS 2 D E BS 3
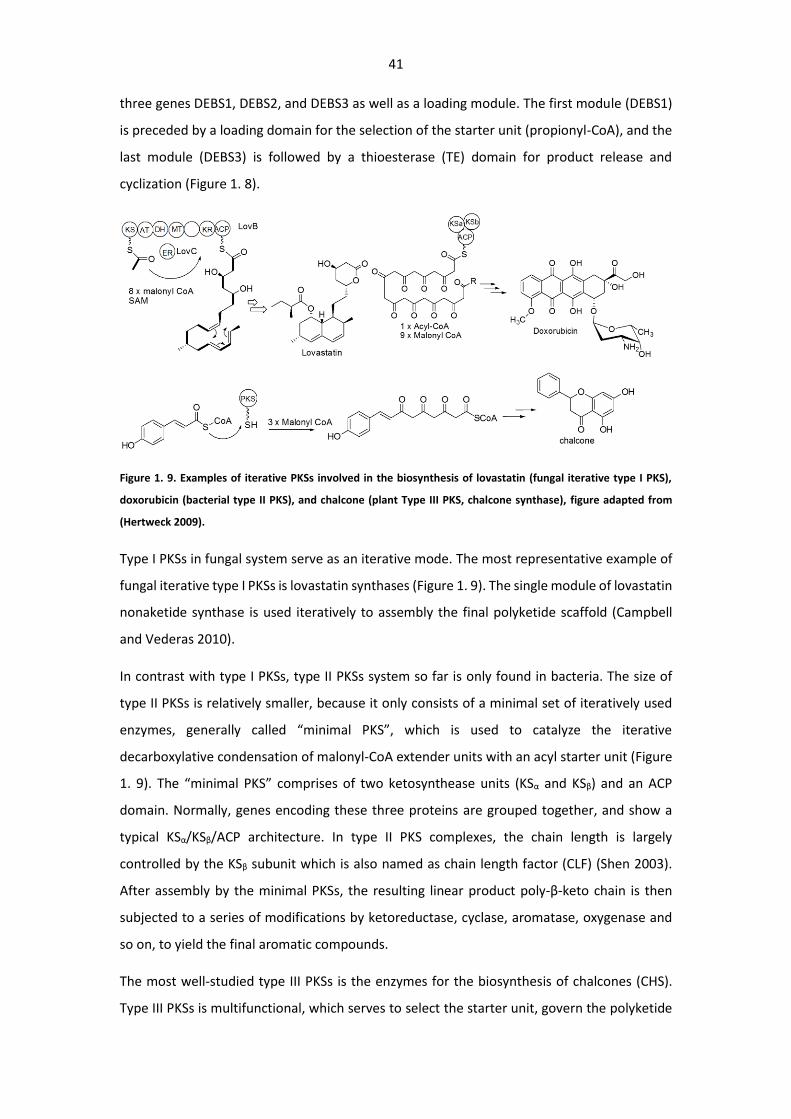
41
three genes DEBS1, DEBS2, and DEBS3 as well as a loading module. The first module (DEBS1)
is preceded by a loading domain for the selection of the starter unit (propionyl-CoA), and the
last module (DEBS3) is followed by a thioesterase (TE) domain for product release and
cyclization (Figure 1. 8).
Figure 1. 9. Examples of iterative PKSs involved in the biosynthesis of lovastatin (fungal iterative type I PKS),
doxorubicin (bacterial type II PKS), and chalcone (plant Type III PKS, chalcone synthase), figure adapted from
(Hertweck 2009).
Type I PKSs in fungal system serve as an iterative mode. The most representative example of
fungal iterative type I PKSs is lovastatin synthases (Figure 1. 9). The single module of lovastatin
nonaketide synthase is used iteratively to assembly the final polyketide scaffold (Campbell
and Vederas 2010).
In contrast with type I PKSs, type II PKSs system so far is only found in bacteria. The size of
type II PKSs is relatively smaller, because it only consists of a minimal set of iteratively used
enzymes, generally called “minimal PKS”, which is used to catalyze the iterative
decarboxylative condensation of malonyl-CoA extender units with an acyl starter unit (Figure
1. 9). The “minimal PKS” comprises of two ketosynthease units (KSα and KSβ) and an ACP
domain. Normally, genes encoding these three proteins are grouped together, and show a
typical KSα/KSβ/ACP architecture. In type II PKS complexes, the chain length is largely
controlled by the KSβ subunit which is also named as chain length factor (CLF) (Shen 2003).
After assembly by the minimal PKSs, the resulting linear product poly-β-keto chain is then
subjected to a series of modifications by ketoreductase, cyclase, aromatase, oxygenase and
so on, to yield the final aromatic compounds.
The most well-studied type III PKSs is the enzymes for the biosynthesis of chalcones (CHS).
Type III PKSs is multifunctional, which serves to select the starter unit, govern the polyketide
42
assembly, and catalyze the specific cyclization reaction. In the case of chalcone synthase (CHS),
the synthetase generate the complex aromatic polyketide chalcone through series of Claisen
condensation using a cinnamoyl-CoA as starter unit and three malonyl-CoA as extender unit
(Figure 1. 9) (Hertweck 2009).
1.5.2. NRPS Derivatives
In addition to polyketide, many pharmaceutically important natural product medicines are
nonribosomally biosynthesized by complex multienzyme called non-ribosomal peptide
synthetases (NRPS). To data, there are more than 20 marketed non-ribosomal peptide drugs,
including antibacterials (vancomycin, penicillin, bacitracin, gramicidin and daptomycin),
antifungals (fengycin), biosurfactants (surfactin A), antitumor drug (bleomycin), and
immunosuppressants (cyclosporine), etc (Sussmuth and Mainz 2017) (Figure 1. 10).
From the perspective of microorganism, the production of NRPS compounds play an
important role in their cell defense and competition in the surrounding environment. In some
case, NRPS compound secreted by bacteria serves as a weapon to inhibit the growth of other
competitors in their ecological niche, which is the most direct function of NRPS produced by
bacteria. For example, diketopiperazine-type peptide gliotoxin, a selective virulence factors,
produced by Aspergillus fumigatus can suppress the organism defense ability and possibly
cause invasive pathogenicity (Cramer et al. 2006). Some NRPS molecules are produced to
assist microorganisms maintaining their physiological development. The Iron (Fe) is
recognized as a physiological requirement for bacterial development (Weber et al. 2006),
under Fe ion limited environment, bacteria, cyanobacteria and fungus will be induced to
produce abundant iron ion chelating agent siderophore, in order to capture enough Fe ion for
life maintenance (Sharma and Johri 2003; Haas et al. 2008). In the case of cyanophycin, a
nonribosomal peptide produced by cyanobacteria Cyanothece sp. ATCC 51142, it accumulates
in the cytoplasm of cyanobacteria, and be considered to be a dynamic reservoir of nitrogen in
the organism (Picossi et al. 2004) (Figure 1. 10).
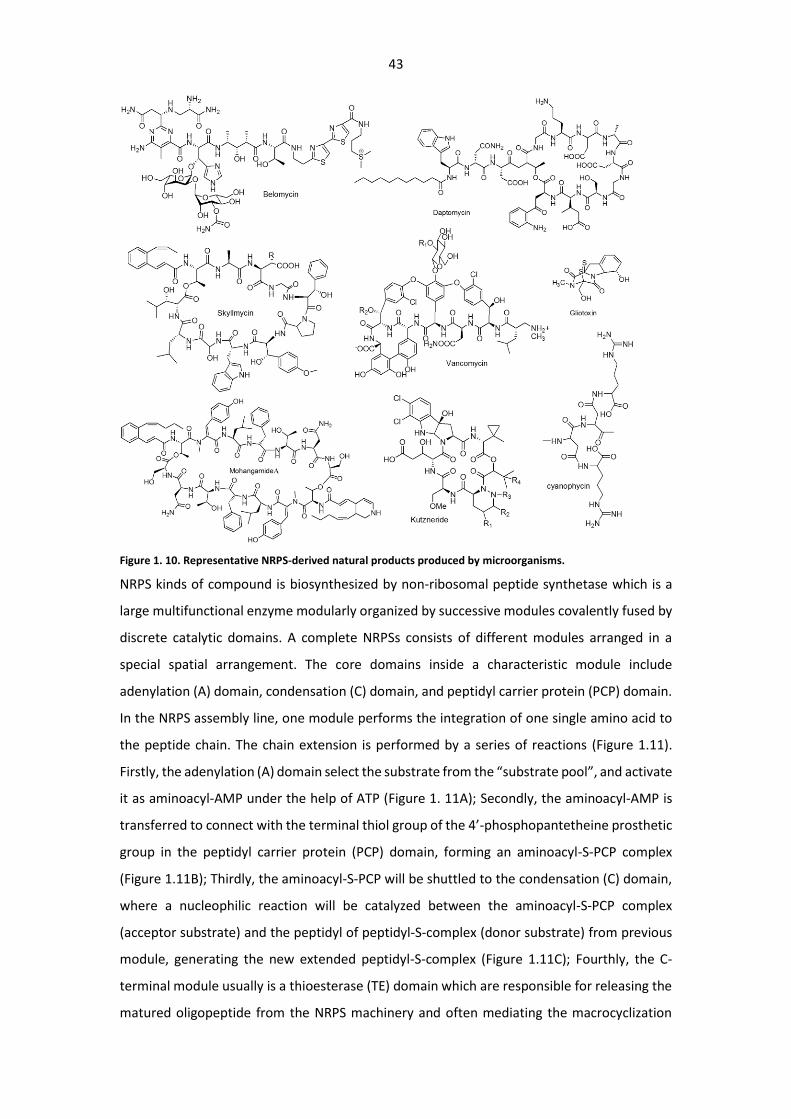
43
Figure 1. 10. Representative NRPS-derived natural products produced by microorganisms.
NRPS kinds of compound is biosynthesized by non-ribosomal peptide synthetase which is a
large multifunctional enzyme modularly organized by successive modules covalently fused by
discrete catalytic domains. A complete NRPSs consists of different modules arranged in a
special spatial arrangement. The core domains inside a characteristic module include
adenylation (A) domain, condensation (C) domain, and peptidyl carrier protein (PCP) domain.
In the NRPS assembly line, one module performs the integration of one single amino acid to
the peptide chain. The chain extension is performed by a series of reactions (Figure 1.11).
Firstly, the adenylation (A) domain select the substrate from the “substrate pool”, and activate
it as aminoacyl-AMP under the help of ATP (Figure 1. 11A); Secondly, the aminoacyl-AMP is
transferred to connect with the terminal thiol group of the 4’-phosphopantetheine prosthetic
group in the peptidyl carrier protein (PCP) domain, forming an aminoacyl-S-PCP complex
(Figure 1.11B); Thirdly, the aminoacyl-S-PCP will be shuttled to the condensation (C) domain,
where a nucleophilic reaction will be catalyzed between the aminoacyl-S-PCP complex
(acceptor substrate) and the peptidyl of peptidyl-S-complex (donor substrate) from previous
module, generating the new extended peptidyl-S-complex (Figure 1.11C); Fourthly, the C-
terminal module usually is a thioesterase (TE) domain which are responsible for releasing the
matured oligopeptide from the NRPS machinery and often mediating the macrocyclization
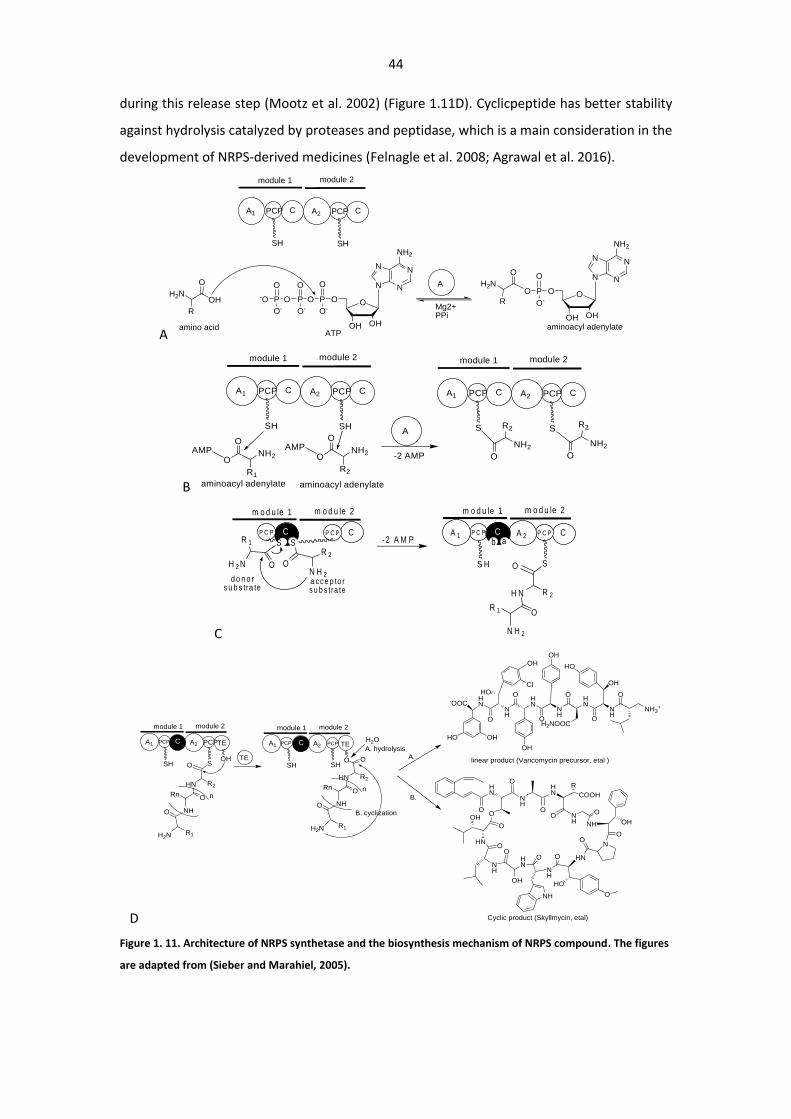
44
during this release step (Mootz et al. 2002) (Figure 1.11D). Cyclicpeptide has better stability
against hydrolysis catalyzed by proteases and peptidase, which is a main consideration in the
development of NRPS-derived medicines (Felnagle et al. 2008; Agrawal et al. 2016).
A
B
C
D
Figure 1. 11. Architecture of NRPS synthetase and the biosynthesis mechanism of NRPS compound. The figures
are adapted from (Sieber and Marahiel, 2005).
A1 PCP
module 2
SH
module 1
C A2 PCP
SH
C
N
NN
N
NH2
O
OH
OPO
O-
O
P
O-
O
OH
OP-O
O-
O
OH
R
H2N
O
N
NN
N
NH2
O
OH
OPO
O-
O
OH
R
H2N
O
Mg2+PPi
A
ATPamino acid aminoacyl adenylate
A1 PCP
module 2
SH
module 1
C A2 PCP
SH
C
O
R1
NH2
O
A1 PCP
module 2
S
module 1
C A2 PCP
S
C
AMPO
R2
NH2
OAMP
aminoacyl adenylate aminoacyl adenylate
AR2
NH2
O
R2
NH2
O-2 AMP
P C P
m o d u le 2
S
m o d u le 1
C P C P
SC
R 1
H 2 N O
-2 A M P
R 2
N H 2
O
d o n o r s u b s tra te
a c c e p to r s u b s tra te
C A 1 P C P
m o d u le 2m o d u le 1
C A 2 P C P
S
CCb a
R 2H N
OR 1
O
N H 2
S H
A1 PCP
module 2module 1
C A2 PCP
S
TEC
R2HN
ORn
O
NH
SHOH
H2N R1
O
n
TE
A1 PCP
module 2module 1
C A2 PCP
SH
TEC
SHO
R2HN
ORn
O
NH
H2N R1
O
n
H2O
A. hydrolysis
B. cyclization
A.
B.
NH
HN
O
HN
NH
H2NOOCO
HN
-OOC
HO OH
OH
O
O
O
NH
NH3+
O
OH
HOOH
Cl
OH
HO
linear product (Vancomycin precursor, etal )
HN
OO
O
NH
HN
ONH
COOH
O
R
O
NH OH
O
NO
HNO
NH
OHN
ONH
O
OH
HNO
NH
O
OHHO
Cyclic product (Skyllmycin, etal)
45
In many case, except those “core domain” for the NRPS backbone assembly, abundant
optional domains widely present in NRPS module, which increase the structural diversity of
NRPS by installing additional modification on the backbone of the peptide, including
epimerization (E) domain, formylation (F) domain, methylation (M) domain, heterocyclization
(Cy) domain, reduction (R) domain, and oxidation (Ox) domains, etc (Sieber and Marahiel,
2005). Many new domains have been discovered as NRPS optional domain recently,
researcher found that in the echinomycin NRPSs, a MbtH-like domain serves as an auxiliary
protein of a A-PCP didomain to mediate the formation of β-hydroxytryptophan residue
catalyzed by cytochrome P450 hydroxylase (Zhang et al. 2013). In the case of Vancomycin
biosynthesis, an unusual X-domain as a P450 recruitment domain, is responsible for recruiting
a specific cytochrome P450 enzyme to the last NRPS module and catalyze the crosslinking of
the aromatic side chain in glycopeptide (Peschke et al. 2016).
Base on the biosynthetic logic of NRPSs, NRPS compound can be basically divided into three
groups: type A (linear-) NRPSs, its peptide chain extension follows the principle of collinearity.
In this mode, each module arranges their core domain in the order C-A-PCP, and each module
only work one time and integrates one building block on the assembly line. Isopenicillin is
shown as a representative type A NRPSs in Figure 1. 12A (Finking and Marahiel 2004).
The machinery of type B (Iterative-) NRPS biosynthesis resembles the mechanism of type II
PKS biosynthesis. Iterative NRPSs can repeatedly use their modules or domains during the
assembly of one NRPS compound. For instance, the iron-chelating siderophore Enterobactin
produced by Escherichia coli, is a cyclic trimer of dihydroxybenzoylserine. In its biosynthesis,
three peptide synthetases EntE, EntB, and EntF are responsible for the whole backbone
assembly of Enterobactin. Among them, EntF consists of one iterative (C-A-PCP) module which
were used three time to generate the intermediates for the chain extension (Zhou et al. 2007)
(Figure 1. 12B).
In contrast to the standard (C-A-PCP) module architecture of linear NRPSs, one significant
feature of Type C (nonlinear-) NRPSs is the unusual arrangement of those core domain. (Mootz
et al. 2002) . In myxochelin synthetase, the module 2 encoded by mxcG contains the domain
organization C-A-PCP-R, in which only one C domain is responsible for the condensation of
both amino groups of the activated lysine residue. PCP domain of MxcF transfer the activated
dihydroxybenzoyl group to this C domain which carry out both reactions (Li et al. 2008) (Figure
1. 12C).
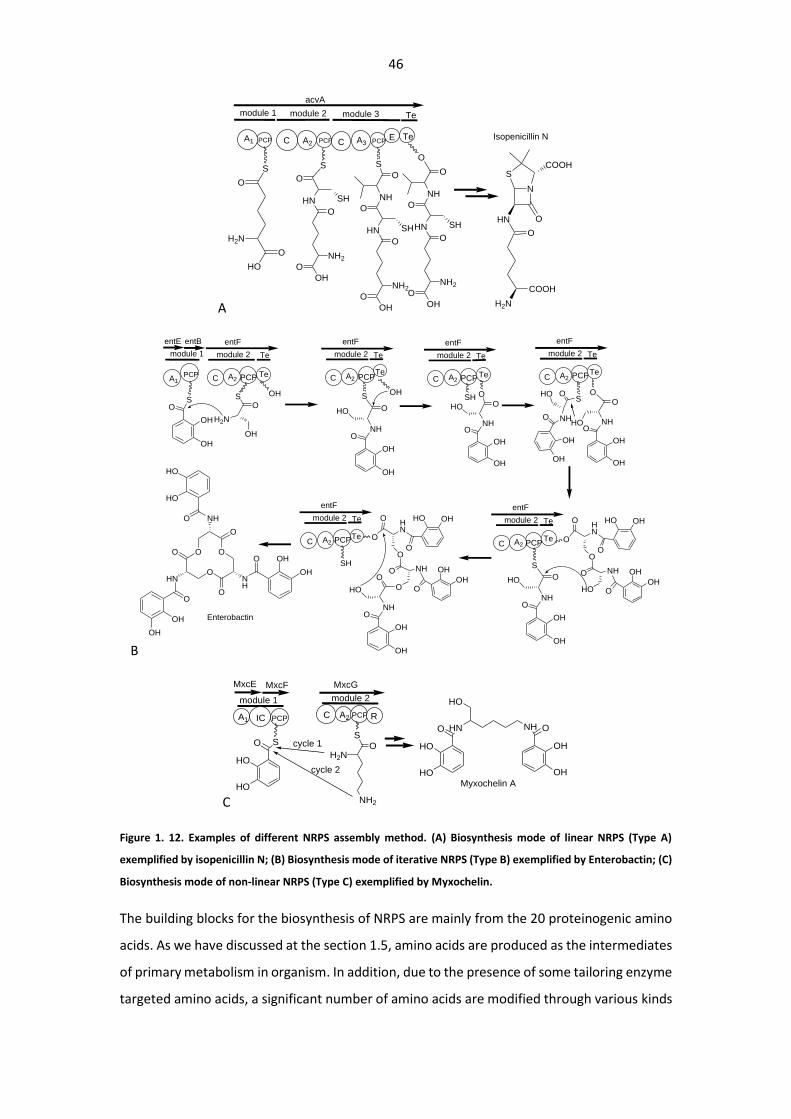
46
A
A1 PCP
module 2
S
module 1
C PCP
S
A2 A3 PCP
S
module 3
CE Te
O
Te
HO
O
H2N
O
OH
O
NH2
O
HN SH
O
NH
O
OH
O
NH2
O
HN SH
O
NH
O
OH
O
NH2
O
HN SH
O
acvA
HN
H2N
COOH
O
O
N
SCOOH
Isopenicillin N
B
A1PCP
S
module 1
A2 PCP
S
module 2
CTe
OH
Te
entE entB
O
OH
OH
entF
O
H2N
OH
A2 PCP
S
module 2
CTe
OH
Te
entF
O
NH
HO
O
OH
OH
A2 PCP
SH
module 2
CTe
O
Te
entF
O
NH
HO
O
OH
OH
A2 PCP
S
module 2
CTe
O
Te
entF
O
NHHOO
OH
OH
O
NH
HO
O
OH
OH
A2 PCP
S
module 2
CTe O
Te
entF
OHN
OO
HO OH
O NH
HO O
OH
OHO
NH
HO
O
OH
OH
A2 PCP
SH
module 2
CTe O
Te
entF
OHN
OO
HO OH
O NH
O O
OH
OHO
NH
HO
O
OH
OH
O O
ONH
O OH
HN
O
OH
NHO
HO
O
O
O
OH
HO
OH
Enterobactin
C
A1 PCP
module 2
S
module 1
C PCP
S
A2 R
O
MxcE MxcF
NH2
OH2N
HO
HO
IC
MxcG
HNO
HO
HO
NH O
OH
OH
HO
Myxochelin A
cycle 1
cycle 2
Figure 1. 12. Examples of different NRPS assembly method. (A) Biosynthesis mode of linear NRPS (Type A)
exemplified by isopenicillin N; (B) Biosynthesis mode of iterative NRPS (Type B) exemplified by Enterobactin; (C)
Biosynthesis mode of non-linear NRPS (Type C) exemplified by Myxochelin.
The building blocks for the biosynthesis of NRPS are mainly from the 20 proteinogenic amino
acids. As we have discussed at the section 1.5, amino acids are produced as the intermediates
of primary metabolism in organism. In addition, due to the presence of some tailoring enzyme
targeted amino acids, a significant number of amino acids are modified through various kinds
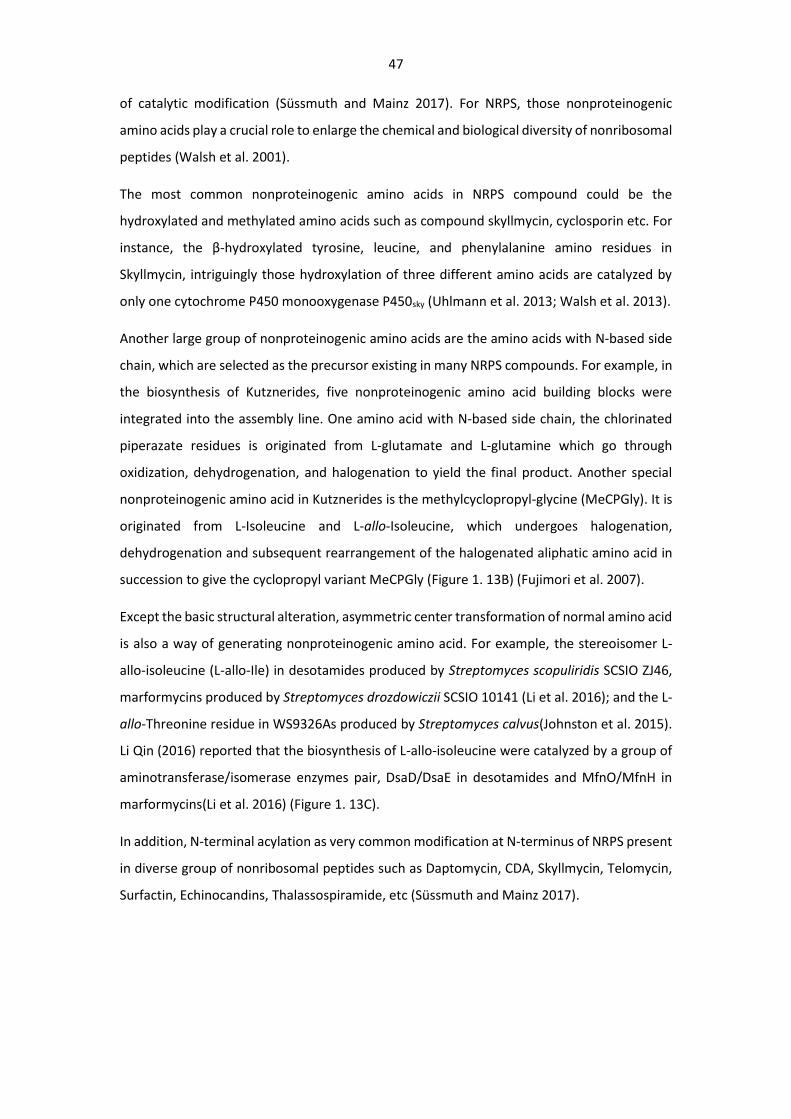
47
of catalytic modification (Süssmuth and Mainz 2017). For NRPS, those nonproteinogenic
amino acids play a crucial role to enlarge the chemical and biological diversity of nonribosomal
peptides (Walsh et al. 2001).
The most common nonproteinogenic amino acids in NRPS compound could be the
hydroxylated and methylated amino acids such as compound skyllmycin, cyclosporin etc. For
instance, the β-hydroxylated tyrosine, leucine, and phenylalanine amino residues in
Skyllmycin, intriguingly those hydroxylation of three different amino acids are catalyzed by
only one cytochrome P450 monooxygenase P450sky (Uhlmann et al. 2013; Walsh et al. 2013).
Another large group of nonproteinogenic amino acids are the amino acids with N-based side
chain, which are selected as the precursor existing in many NRPS compounds. For example, in
the biosynthesis of Kutznerides, five nonproteinogenic amino acid building blocks were
integrated into the assembly line. One amino acid with N-based side chain, the chlorinated
piperazate residues is originated from L-glutamate and L-glutamine which go through
oxidization, dehydrogenation, and halogenation to yield the final product. Another special
nonproteinogenic amino acid in Kutznerides is the methylcyclopropyl-glycine (MeCPGly). It is
originated from L-Isoleucine and L-allo-Isoleucine, which undergoes halogenation,
dehydrogenation and subsequent rearrangement of the halogenated aliphatic amino acid in
succession to give the cyclopropyl variant MeCPGly (Figure 1. 13B) (Fujimori et al. 2007).
Except the basic structural alteration, asymmetric center transformation of normal amino acid
is also a way of generating nonproteinogenic amino acid. For example, the stereoisomer L-
allo-isoleucine (L-allo-Ile) in desotamides produced by Streptomyces scopuliridis SCSIO ZJ46,
marformycins produced by Streptomyces drozdowiczii SCSIO 10141 (Li et al. 2016); and the L-
allo-Threonine residue in WS9326As produced by Streptomyces calvus(Johnston et al. 2015).
Li Qin (2016) reported that the biosynthesis of L-allo-isoleucine were catalyzed by a group of
aminotransferase/isomerase enzymes pair, DsaD/DsaE in desotamides and MfnO/MfnH in
marformycins(Li et al. 2016) (Figure 1. 13C).
In addition, N-terminal acylation as very common modification at N-terminus of NRPS present
in diverse group of nonribosomal peptides such as Daptomycin, CDA, Skyllmycin, Telomycin,
Surfactin, Echinocandins, Thalassospiramide, etc (Süssmuth and Mainz 2017).
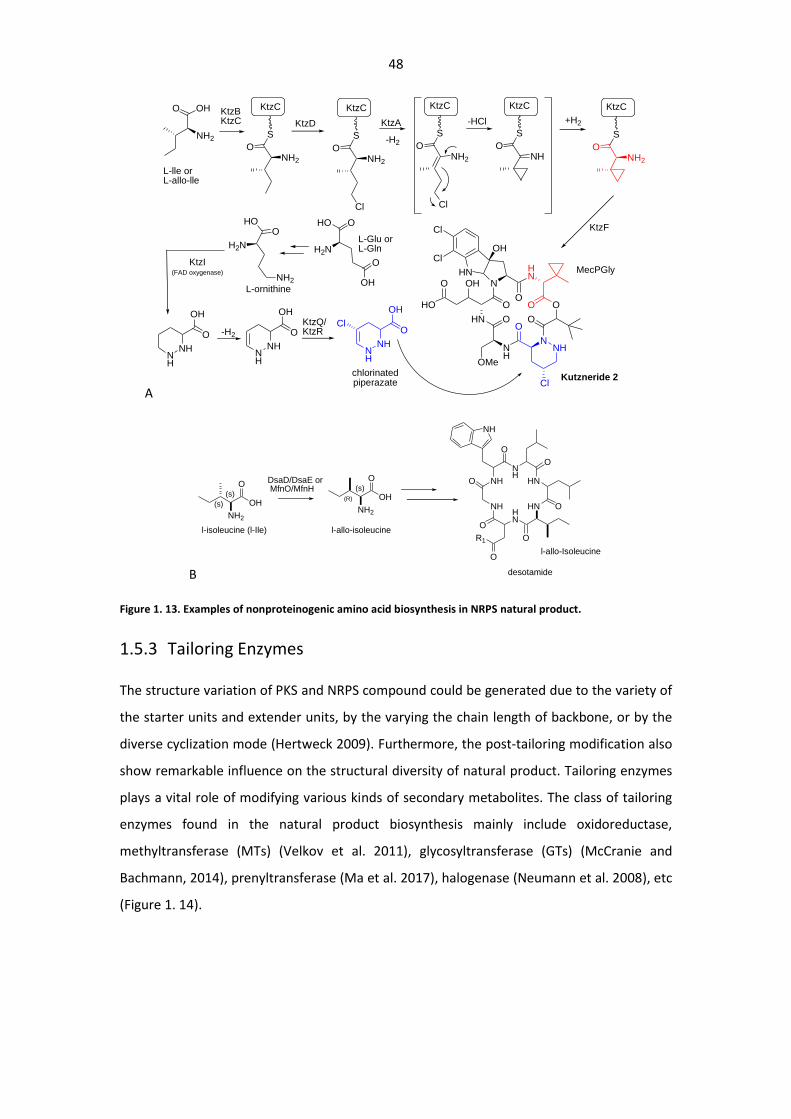
48
A
B
NHHN
HN O
O
NHO
NH
HN
O
O
O
O
R1
NH
desotamide
l-allo-Isoleucine
OH
O
NH2
(s)
(s)
l-isoleucine (l-Ile)
DsaD/DsaE or MfnO/MfnH
OH
O
NH2
(s)
l-allo-isoleucine
(R)
Figure 1. 13. Examples of nonproteinogenic amino acid biosynthesis in NRPS natural product.
1.5.3 Tailoring Enzymes
The structure variation of PKS and NRPS compound could be generated due to the variety of
the starter units and extender units, by the varying the chain length of backbone, or by the
diverse cyclization mode (Hertweck 2009). Furthermore, the post-tailoring modification also
show remarkable influence on the structural diversity of natural product. Tailoring enzymes
plays a vital role of modifying various kinds of secondary metabolites. The class of tailoring
enzymes found in the natural product biosynthesis mainly include oxidoreductase,
methyltransferase (MTs) (Velkov et al. 2011), glycosyltransferase (GTs) (McCranie and
Bachmann, 2014), prenyltransferase (Ma et al. 2017), halogenase (Neumann et al. 2008), etc
(Figure 1. 14).
HNN
OO
OHO
HO
HN O
NH
O
OMe
NNH
HN
OO
O
Cl
ClOH
ClKutzneride 2
NH2
O OH
L-lle orL-allo-lle
KtzBKtzC KtzD
KtzC
NH2
O
S
KtzC
NH2
O
S
Cl
KtzA
-H2
KtzC
NH2
O
S
Cl
-HCl
KtzC
NHO
S
+H2
KtzC
NH2
O
S
KtzF
MecPGly
H2N
OHO
O
OH
L-Glu orL-GlnH2N
OHO
NH2
L-ornithine
KtzI(FAD oxygenase)
NH
NH
O
OH
NH
NH
O
OH
-H2
NH
NH
O
OH
KtzQ/KtzR
Cl
chlorinated piperazate
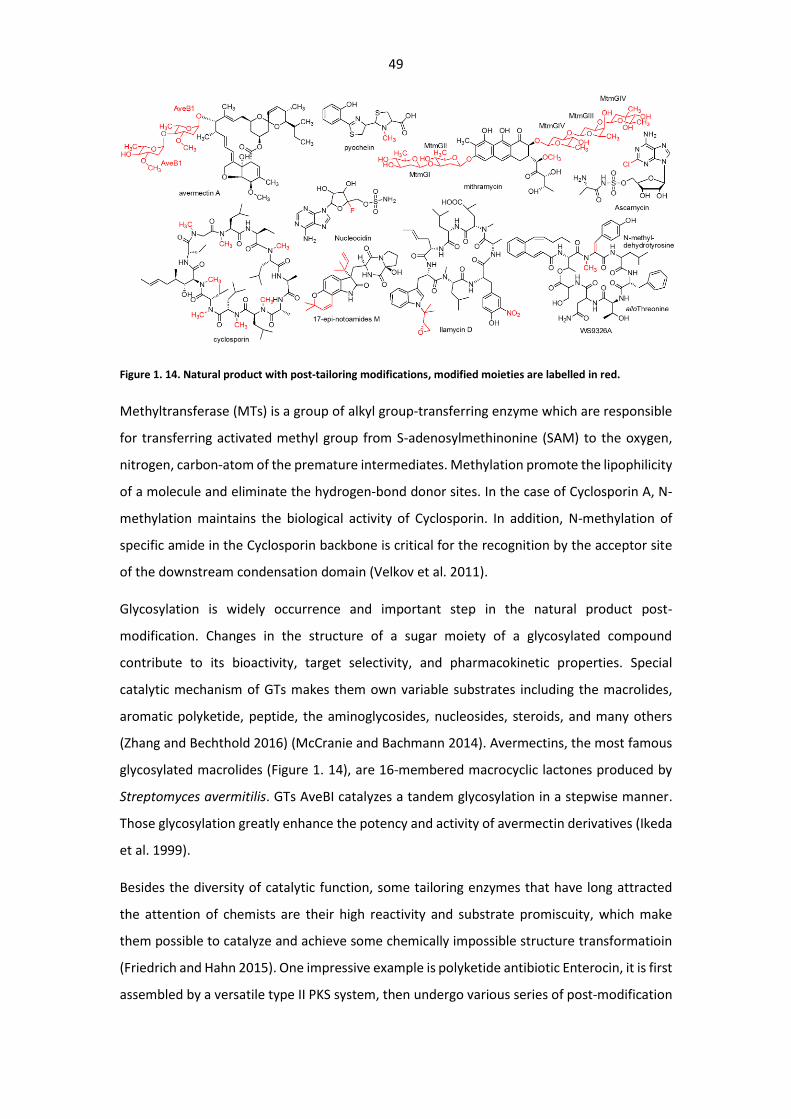
49
Figure 1. 14. Natural product with post-tailoring modifications, modified moieties are labelled in red.
Methyltransferase (MTs) is a group of alkyl group-transferring enzyme which are responsible
for transferring activated methyl group from S-adenosylmethinonine (SAM) to the oxygen,
nitrogen, carbon-atom of the premature intermediates. Methylation promote the lipophilicity
of a molecule and eliminate the hydrogen-bond donor sites. In the case of Cyclosporin A, N-
methylation maintains the biological activity of Cyclosporin. In addition, N-methylation of
specific amide in the Cyclosporin backbone is critical for the recognition by the acceptor site
of the downstream condensation domain (Velkov et al. 2011).
Glycosylation is widely occurrence and important step in the natural product post-
modification. Changes in the structure of a sugar moiety of a glycosylated compound
contribute to its bioactivity, target selectivity, and pharmacokinetic properties. Special
catalytic mechanism of GTs makes them own variable substrates including the macrolides,
aromatic polyketide, peptide, the aminoglycosides, nucleosides, steroids, and many others
(Zhang and Bechthold 2016) (McCranie and Bachmann 2014). Avermectins, the most famous
glycosylated macrolides (Figure 1. 14), are 16-membered macrocyclic lactones produced by
Streptomyces avermitilis. GTs AveBI catalyzes a tandem glycosylation in a stepwise manner.
Those glycosylation greatly enhance the potency and activity of avermectin derivatives (Ikeda
et al. 1999).
Besides the diversity of catalytic function, some tailoring enzymes that have long attracted
the attention of chemists are their high reactivity and substrate promiscuity, which make
them possible to catalyze and achieve some chemically impossible structure transformatioin
(Friedrich and Hahn 2015). One impressive example is polyketide antibiotic Enterocin, it is first
assembled by a versatile type II PKS system, then undergo various series of post-modification
50
catalyzed by a group of tailoring enzymes. After backbone integration by the minimal PKS in
the system, the linear intermediate is rearranged by EncM, a FAD-dependent multifunctional
enzyme. It first serves as an oxygenase to catalyze a Favorskii–type carbon-carbon bond
rearrangement, the presumed substrate is a linear C-9 reduced octaketide which is oxidized
at C12 to form a trione intermediate. Subsequently, EncM catalyzes two aldol condensations
between C-6 and C-11, C-7 and C-14 to form the precursor of Enterocin, desmethy-5-
deoxyenterocin (Figure 1. 15) (Teufel et al. 2013).
Favorskii- like oxidative rearrangement
S-EncC
O
EncA,EncB, EncC,FabD
7x malonyl-CoAPh
S-EncC
OH O OH
HO
O O O O
Ph
OHO
OHO
O
S-Enz
O
O
EncM
Enterocin
NADPH
benzoyl-CoA (Ph-CoA)
type II PKS
(FAD-dependent)
OH
Ph
OHO
OO
O
S-Enz
O
O
OH
O2
H2O
O
Ph
OO
OO
O
S-Enz
O
O
OH OHPh
OH14
O
11
OH
7
6
O
OHO
OH
O OH
Ph
OHO
OHO
OO
OH
O OH
EncKSAM
EcRFerredoxin,ferredoxin-NADP-reductase
desmethyl-5-deoxyEnterocin
Figure 1. 15. Special tailoring enzyme catalyzing Favorskiise rearrangement.
As the most famous enzyme family involved in the tailoring modification of numerous natural
product, cytochrome P450 enzyme can be categorized as monooxygenase, hydroxylase,
oxidoreductase and so forth based on their diverse catalytic activity. At the next section I will
confine the scope and make an in-depth description around those amazing tailoring enzymes.
1.5.4 Cytochrome P450 enzyme
Cytochrome P450 (CYP) enzymes are kind of protein containing heme-thiolate, they are well
known for their typical absorbance peak at 450nm in their reduced state after integrating with
carbon monoxide. CYP are ubiquitous in prokaryotic and eukaryotic organism. To date, more
than 80,000 genes encoding P450 have been published on the GenBank database. In addition,
with the rapid development of the structural biology, more and more P450 crystal structures
have been elucidated. P450cam (CYP101A1) from the strain pseudomonas putida is the first
P450 structure elucidated by Poulos in 1985 with the resolution of 2.6 Å (Poulos and Raag
1992). Now more than 750 P450 protein structures have been deposited in Protein data bank
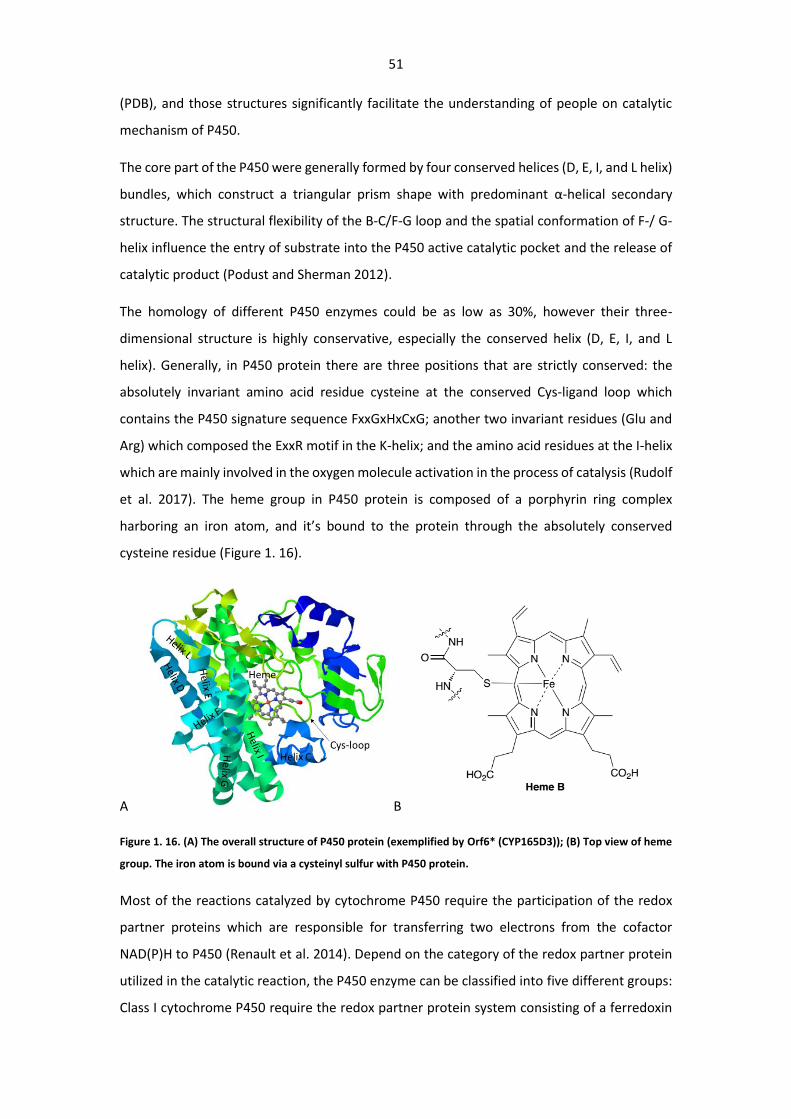
51
(PDB), and those structures significantly facilitate the understanding of people on catalytic
mechanism of P450.
The core part of the P450 were generally formed by four conserved helices (D, E, I, and L helix)
bundles, which construct a triangular prism shape with predominant α-helical secondary
structure. The structural flexibility of the B-C/F-G loop and the spatial conformation of F-/ G-
helix influence the entry of substrate into the P450 active catalytic pocket and the release of
catalytic product (Podust and Sherman 2012).
The homology of different P450 enzymes could be as low as 30%, however their three-
dimensional structure is highly conservative, especially the conserved helix (D, E, I, and L
helix). Generally, in P450 protein there are three positions that are strictly conserved: the
absolutely invariant amino acid residue cysteine at the conserved Cys-ligand loop which
contains the P450 signature sequence FxxGxHxCxG; another two invariant residues (Glu and
Arg) which composed the ExxR motif in the K-helix; and the amino acid residues at the I-helix
which are mainly involved in the oxygen molecule activation in the process of catalysis (Rudolf
et al. 2017). The heme group in P450 protein is composed of a porphyrin ring complex
harboring an iron atom, and it’s bound to the protein through the absolutely conserved
cysteine residue (Figure 1. 16).
A B
Figure 1. 16. (A) The overall structure of P450 protein (exemplified by Orf6* (CYP165D3)); (B) Top view of heme
group. The iron atom is bound via a cysteinyl sulfur with P450 protein.
Most of the reactions catalyzed by cytochrome P450 require the participation of the redox
partner proteins which are responsible for transferring two electrons from the cofactor
NAD(P)H to P450 (Renault et al. 2014). Depend on the category of the redox partner protein
utilized in the catalytic reaction, the P450 enzyme can be classified into five different groups:
Class I cytochrome P450 require the redox partner protein system consisting of a ferredoxin
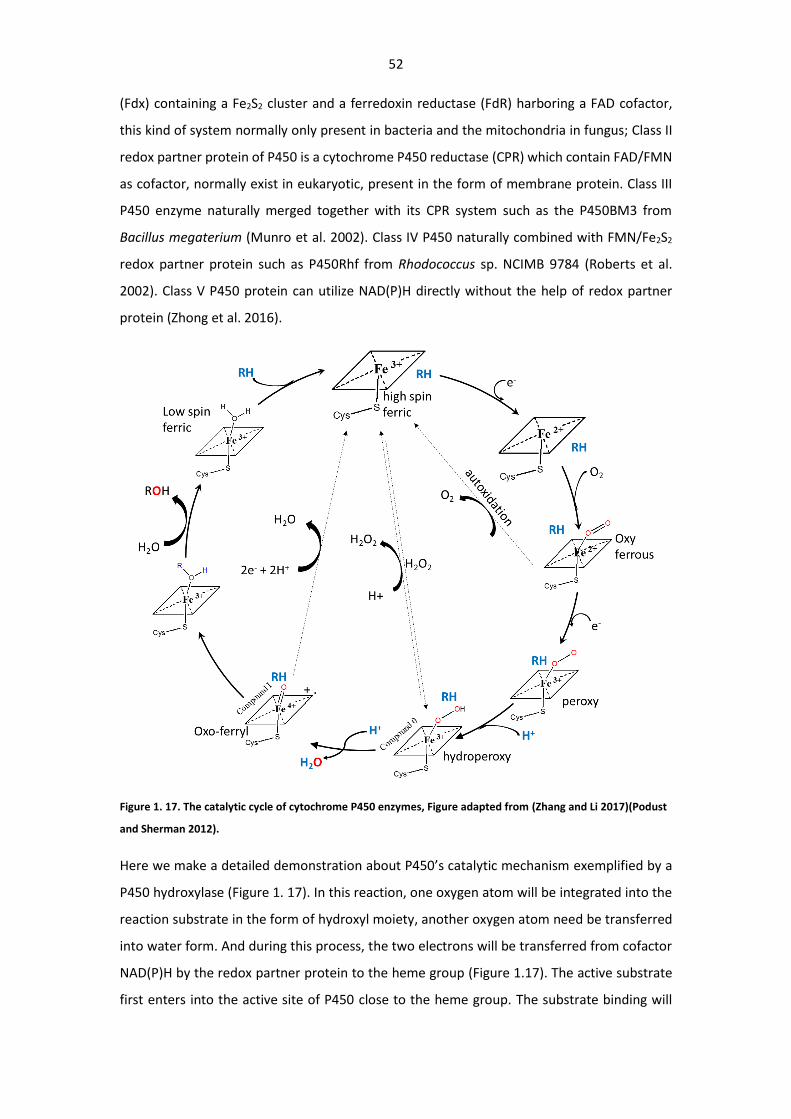
52
(Fdx) containing a Fe2S2 cluster and a ferredoxin reductase (FdR) harboring a FAD cofactor,
this kind of system normally only present in bacteria and the mitochondria in fungus; Class II
redox partner protein of P450 is a cytochrome P450 reductase (CPR) which contain FAD/FMN
as cofactor, normally exist in eukaryotic, present in the form of membrane protein. Class III
P450 enzyme naturally merged together with its CPR system such as the P450BM3 from
Bacillus megaterium (Munro et al. 2002). Class IV P450 naturally combined with FMN/Fe2S2
redox partner protein such as P450Rhf from Rhodococcus sp. NCIMB 9784 (Roberts et al.
2002). Class V P450 protein can utilize NAD(P)H directly without the help of redox partner
protein (Zhong et al. 2016).
Figure 1. 17. The catalytic cycle of cytochrome P450 enzymes, Figure adapted from (Zhang and Li 2017)(Podust
and Sherman 2012).
Here we make a detailed demonstration about P450’s catalytic mechanism exemplified by a
P450 hydroxylase (Figure 1. 17). In this reaction, one oxygen atom will be integrated into the
reaction substrate in the form of hydroxyl moiety, another oxygen atom need be transferred
into water form. And during this process, the two electrons will be transferred from cofactor
NAD(P)H by the redox partner protein to the heme group (Figure 1.17). The active substrate
first enters into the active site of P450 close to the heme group. The substrate binding will
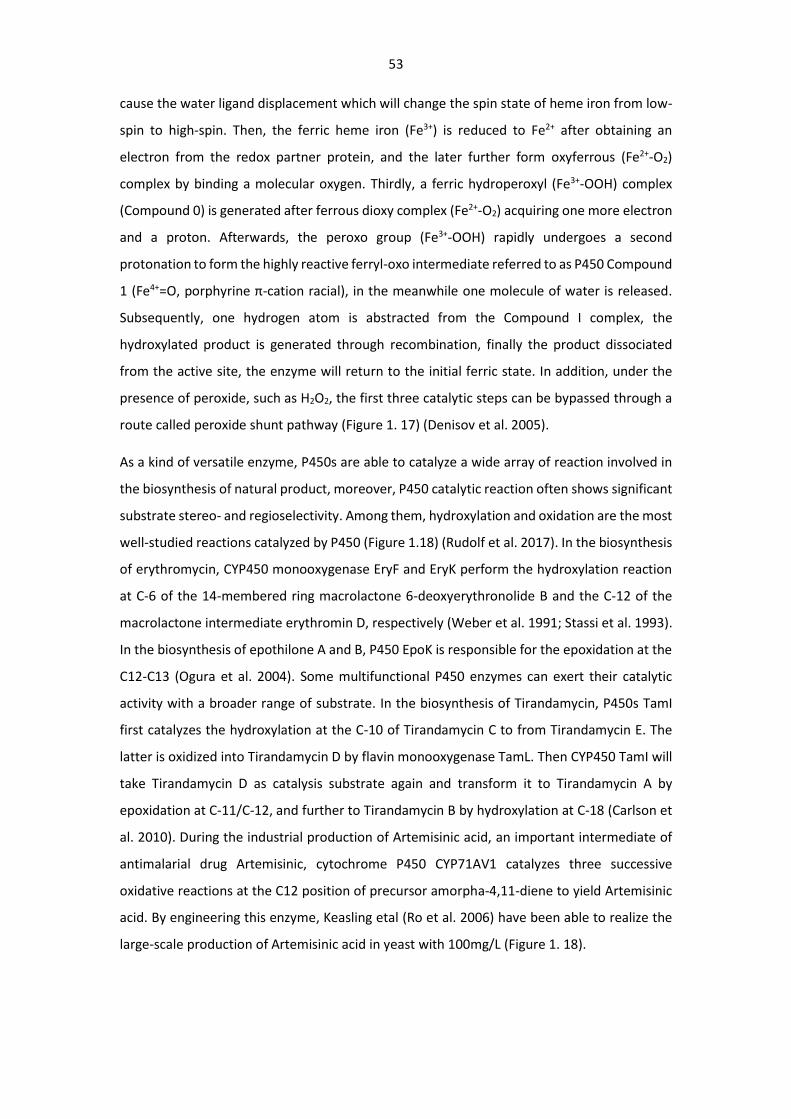
53
cause the water ligand displacement which will change the spin state of heme iron from low-
spin to high-spin. Then, the ferric heme iron (Fe3+) is reduced to Fe2+ after obtaining an
electron from the redox partner protein, and the later further form oxyferrous (Fe2+-O2)
complex by binding a molecular oxygen. Thirdly, a ferric hydroperoxyl (Fe3+-OOH) complex
(Compound 0) is generated after ferrous dioxy complex (Fe2+-O2) acquiring one more electron
and a proton. Afterwards, the peroxo group (Fe3+-OOH) rapidly undergoes a second
protonation to form the highly reactive ferryl-oxo intermediate referred to as P450 Compound
1 (Fe4+=O, porphyrine π-cation racial), in the meanwhile one molecule of water is released.
Subsequently, one hydrogen atom is abstracted from the Compound I complex, the
hydroxylated product is generated through recombination, finally the product dissociated
from the active site, the enzyme will return to the initial ferric state. In addition, under the
presence of peroxide, such as H2O2, the first three catalytic steps can be bypassed through a
route called peroxide shunt pathway (Figure 1. 17) (Denisov et al. 2005).
As a kind of versatile enzyme, P450s are able to catalyze a wide array of reaction involved in
the biosynthesis of natural product, moreover, P450 catalytic reaction often shows significant
substrate stereo- and regioselectivity. Among them, hydroxylation and oxidation are the most
well-studied reactions catalyzed by P450 (Figure 1.18) (Rudolf et al. 2017). In the biosynthesis
of erythromycin, CYP450 monooxygenase EryF and EryK perform the hydroxylation reaction
at C-6 of the 14-membered ring macrolactone 6-deoxyerythronolide B and the C-12 of the
macrolactone intermediate erythromin D, respectively (Weber et al. 1991; Stassi et al. 1993).
In the biosynthesis of epothilone A and B, P450 EpoK is responsible for the epoxidation at the
C12-C13 (Ogura et al. 2004). Some multifunctional P450 enzymes can exert their catalytic
activity with a broader range of substrate. In the biosynthesis of Tirandamycin, P450s TamI
first catalyzes the hydroxylation at the C-10 of Tirandamycin C to from Tirandamycin E. The
latter is oxidized into Tirandamycin D by flavin monooxygenase TamL. Then CYP450 TamI will
take Tirandamycin D as catalysis substrate again and transform it to Tirandamycin A by
epoxidation at C-11/C-12, and further to Tirandamycin B by hydroxylation at C-18 (Carlson et
al. 2010). During the industrial production of Artemisinic acid, an important intermediate of
antimalarial drug Artemisinic, cytochrome P450 CYP71AV1 catalyzes three successive
oxidative reactions at the C12 position of precursor amorpha-4,11-diene to yield Artemisinic
acid. By engineering this enzyme, Keasling etal (Ro et al. 2006) have been able to realize the
large-scale production of Artemisinic acid in yeast with 100mg/L (Figure 1. 18).
54
Figure 1. 18. Examples of P450 enzymes with diverse function involved in the biosynthesis of natural product,
red labelled parts show the moieties of compounds modified by corresponding P450 enzymes.
In addition, more and more researches on P450 have demonstrated that they own powerful
ability of catalyzing many unusual reactions in nature product biosynthesis, including
decarboxylation(Grant et al. 2016), nitration (Barry et al. 2012), C-C bond formation (Makino
et al. 2007), heterocyclization (Richter et al. 2008), aryl and phenol coupling (Zerbe et al. 2002;
Pylypenko et al. 2003), oxidative rearrangement of carbon skeleton (Cheng et al. 2010) and
C-C bond cleavage (Cryle and Schlichting 2008), etc (Figure 1.18). Due to the limited page in
this introduction part, I wouldn’t go through more detailed here about all types of P450
function.
1.6 Research Aims
Currently, exploiting natural product from Streptomyces is still an effective method for
discovery of active small molecule for clinic use. Streptomyces asterosporus DSM 41452
arouse our research interests due to its special physiological features, and its powerful
capability of producing secondary metabolites. In this thesis, our research on strain S.
asterosporus DSM 41452 will mainly focus on the four points below:
(1) Genomic analysis on S. asterosporus DSM 41452, explaining its special physiological
characteristics as a natural non-sporulating Streptomyces, and exploiting its potential of
producing secondary metabolites;
(2) Proteomics research on the regulatory network of S. asterosporus DSM 41452, validating
the feasibility of adopting SILAC proteomics analysis approach in Streptomyces system;
55
(3) In terms of its secondary metabolites, as a new WS9326A producer, S. asterosporus DSM
41452 enable us to exploit more novel active derivatives. Through genomic sequencing and
gene mutagenesis, the WS9326A gene cluster is determined and annotated in this strain, in
addition, it provides us the opportunity to study and reveal the detailed biosynthetic
machinery of WS9326A;
(4) Studies on the specific catalytic function of a cytochrome P450 enzyme Sas16 by structural
biology and biochemical research methods.
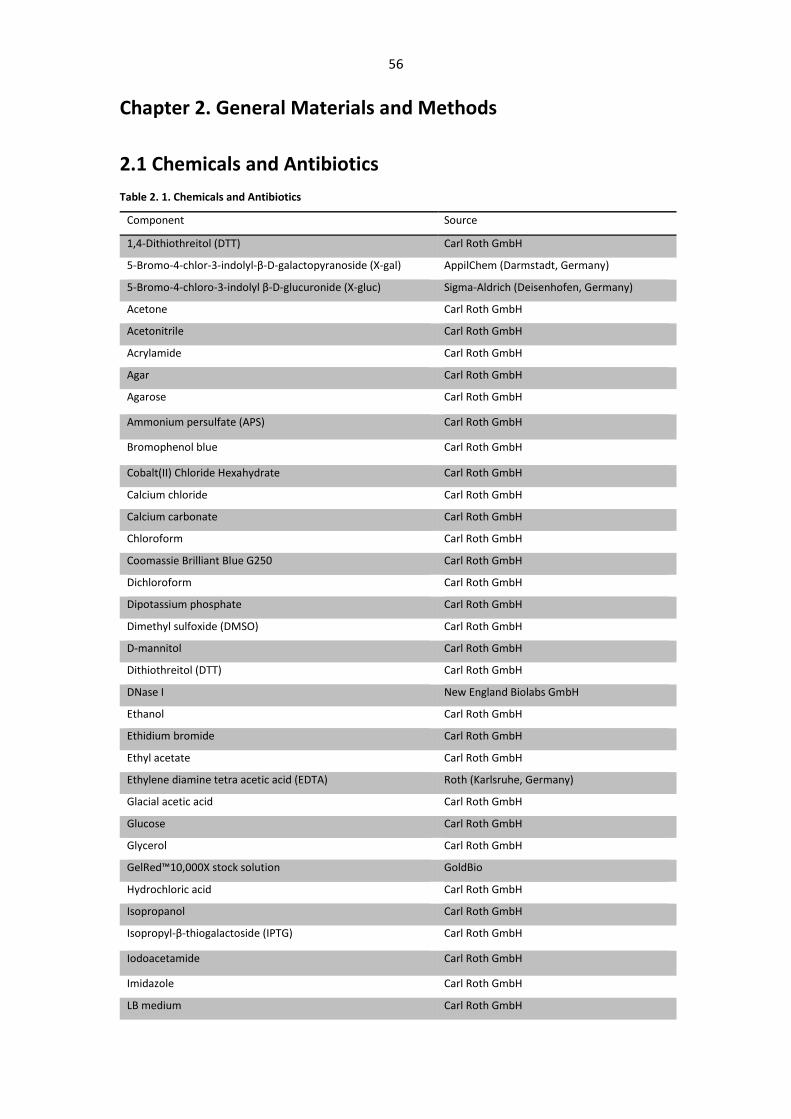
56
Chapter 2. General Materials and Methods
2.1 Chemicals and Antibiotics
Table 2. 1. Chemicals and Antibiotics
Component Source
1,4-Dithiothreitol (DTT) Carl Roth GmbH
5-Bromo-4-chlor-3-indolyl-β-D-galactopyranoside (X-gal) AppilChem (Darmstadt, Germany)
5-Bromo-4-chloro-3-indolyl β-D-glucuronide (X-gluc) Sigma-Aldrich (Deisenhofen, Germany)
Acetone Carl Roth GmbH
Acetonitrile Carl Roth GmbH
Acrylamide Carl Roth GmbH
Agar Carl Roth GmbH
Agarose Carl Roth GmbH
Ammonium persulfate (APS) Carl Roth GmbH
Bromophenol blue Carl Roth GmbH
Cobalt(II) Chloride Hexahydrate Carl Roth GmbH
Calcium chloride Carl Roth GmbH
Calcium carbonate Carl Roth GmbH
Chloroform Carl Roth GmbH
Coomassie Brilliant Blue G250 Carl Roth GmbH
Dichloroform Carl Roth GmbH
Dipotassium phosphate Carl Roth GmbH
Dimethyl sulfoxide (DMSO) Carl Roth GmbH
D-mannitol Carl Roth GmbH
Dithiothreitol (DTT) Carl Roth GmbH
DNase I New England Biolabs GmbH
Ethanol Carl Roth GmbH
Ethidium bromide Carl Roth GmbH
Ethyl acetate Carl Roth GmbH
Ethylene diamine tetra acetic acid (EDTA) Roth (Karlsruhe, Germany)
Glacial acetic acid Carl Roth GmbH
Glucose Carl Roth GmbH
Glycerol Carl Roth GmbH
GelRed™10,000X stock solution GoldBio
Hydrochloric acid Carl Roth GmbH
Isopropanol Carl Roth GmbH
Isopropyl-β-thiogalactoside (IPTG) Carl Roth GmbH
Iodoacetamide Carl Roth GmbH
Imidazole Carl Roth GmbH
LB medium Carl Roth GmbH
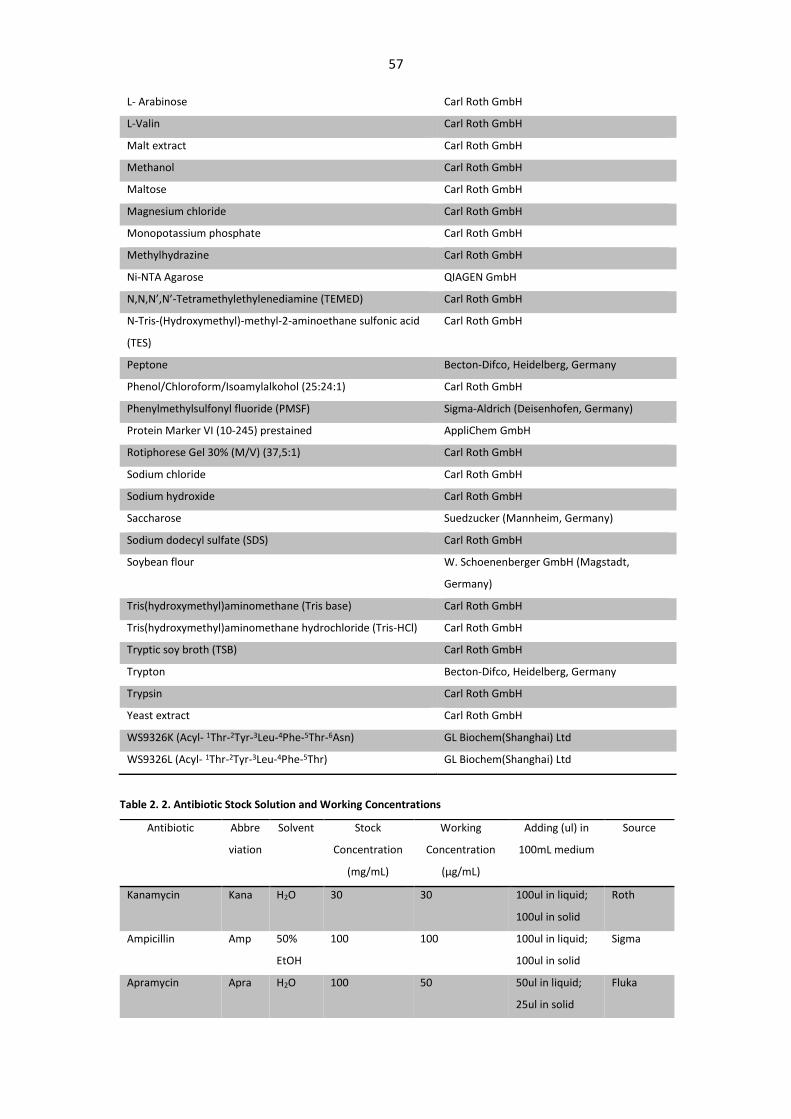
57
L- Arabinose Carl Roth GmbH
L-Valin Carl Roth GmbH
Malt extract Carl Roth GmbH
Methanol Carl Roth GmbH
Maltose Carl Roth GmbH
Magnesium chloride Carl Roth GmbH
Monopotassium phosphate Carl Roth GmbH
Methylhydrazine Carl Roth GmbH
Ni-NTA Agarose QIAGEN GmbH
N,N,N’,N’-Tetramethylethylenediamine (TEMED) Carl Roth GmbH
N-Tris-(Hydroxymethyl)-methyl-2-aminoethane sulfonic acid
(TES)
Carl Roth GmbH
Peptone Becton-Difco, Heidelberg, Germany
Phenol/Chloroform/Isoamylalkohol (25:24:1) Carl Roth GmbH
Phenylmethylsulfonyl fluoride (PMSF) Sigma-Aldrich (Deisenhofen, Germany)
Protein Marker VI (10-245) prestained AppliChem GmbH
Rotiphorese Gel 30% (M/V) (37,5:1) Carl Roth GmbH
Sodium chloride Carl Roth GmbH
Sodium hydroxide Carl Roth GmbH
Saccharose Suedzucker (Mannheim, Germany)
Sodium dodecyl sulfate (SDS) Carl Roth GmbH
Soybean flour W. Schoenenberger GmbH (Magstadt,
Germany)
Tris(hydroxymethyl)aminomethane (Tris base) Carl Roth GmbH
Tris(hydroxymethyl)aminomethane hydrochloride (Tris-HCl) Carl Roth GmbH
Tryptic soy broth (TSB) Carl Roth GmbH
Trypton Becton-Difco, Heidelberg, Germany
Trypsin Carl Roth GmbH
Yeast extract Carl Roth GmbH
WS9326K (Acyl- 1Thr-2Tyr-3Leu-4Phe-5Thr-6Asn) GL Biochem(Shanghai) Ltd
WS9326L (Acyl- 1Thr-2Tyr-3Leu-4Phe-5Thr) GL Biochem(Shanghai) Ltd
Table 2. 2. Antibiotic Stock Solution and Working Concentrations
Antibiotic Abbre
viation
Solvent Stock
Concentration
(mg/mL)
Working
Concentration
(μg/mL)
Adding (ul) in
100mL medium
Source
Kanamycin Kana H2O 30 30 100ul in liquid;
100ul in solid
Roth
Ampicillin Amp 50%
EtOH
100 100 100ul in liquid;
100ul in solid
Sigma
Apramycin Apra H2O 100 50 50ul in liquid;
25ul in solid
Fluka
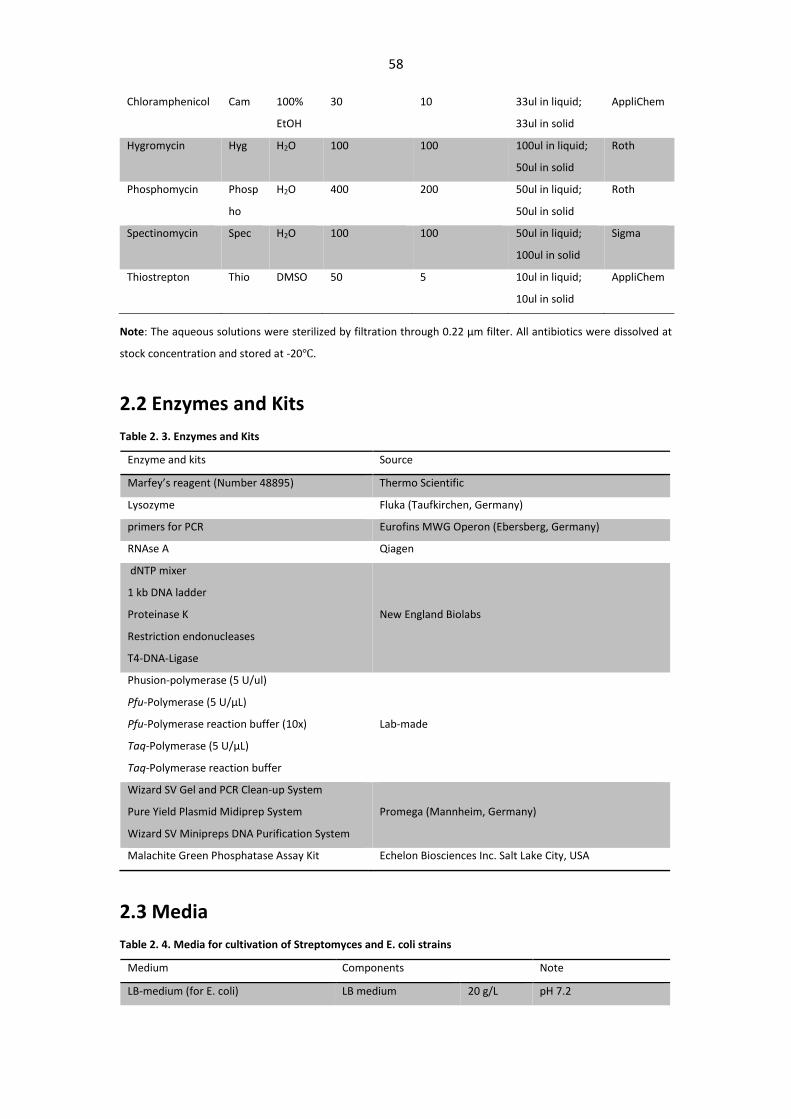
58
Note: The aqueous solutions were sterilized by filtration through 0.22 μm filter. All antibiotics were dissolved at
stock concentration and stored at -20℃.
2.2 Enzymes and Kits
Table 2. 3. Enzymes and Kits
Enzyme and kits Source
Marfey’s reagent (Number 48895) Thermo Scientific
Lysozyme Fluka (Taufkirchen, Germany)
primers for PCR Eurofins MWG Operon (Ebersberg, Germany)
RNAse A Qiagen
dNTP mixer
1 kb DNA ladder
Proteinase K
Restriction endonucleases
T4-DNA-Ligase
New England Biolabs
Phusion-polymerase (5 U/ul)
Pfu-Polymerase (5 U/μL)
Pfu-Polymerase reaction buffer (10x)
Taq-Polymerase (5 U/μL)
Taq-Polymerase reaction buffer
Lab-made
Wizard SV Gel and PCR Clean-up System
Pure Yield Plasmid Midiprep System
Wizard SV Minipreps DNA Purification System
Promega (Mannheim, Germany)
Malachite Green Phosphatase Assay Kit Echelon Biosciences Inc. Salt Lake City, USA
2.3 Media
Table 2. 4. Media for cultivation of Streptomyces and E. coli strains
Medium Components Note
LB-medium (for E. coli) LB medium 20 g/L pH 7.2
Chloramphenicol Cam 100%
EtOH
30 10 33ul in liquid;
33ul in solid
AppliChem
Hygromycin Hyg H2O 100 100 100ul in liquid;
50ul in solid
Roth
Phosphomycin Phosp
ho
H2O 400 200 50ul in liquid;
50ul in solid
Roth
Spectinomycin Spec H2O 100 100 50ul in liquid;
100ul in solid
Sigma
Thiostrepton Thio DMSO 50 5 10ul in liquid;
10ul in solid
AppliChem
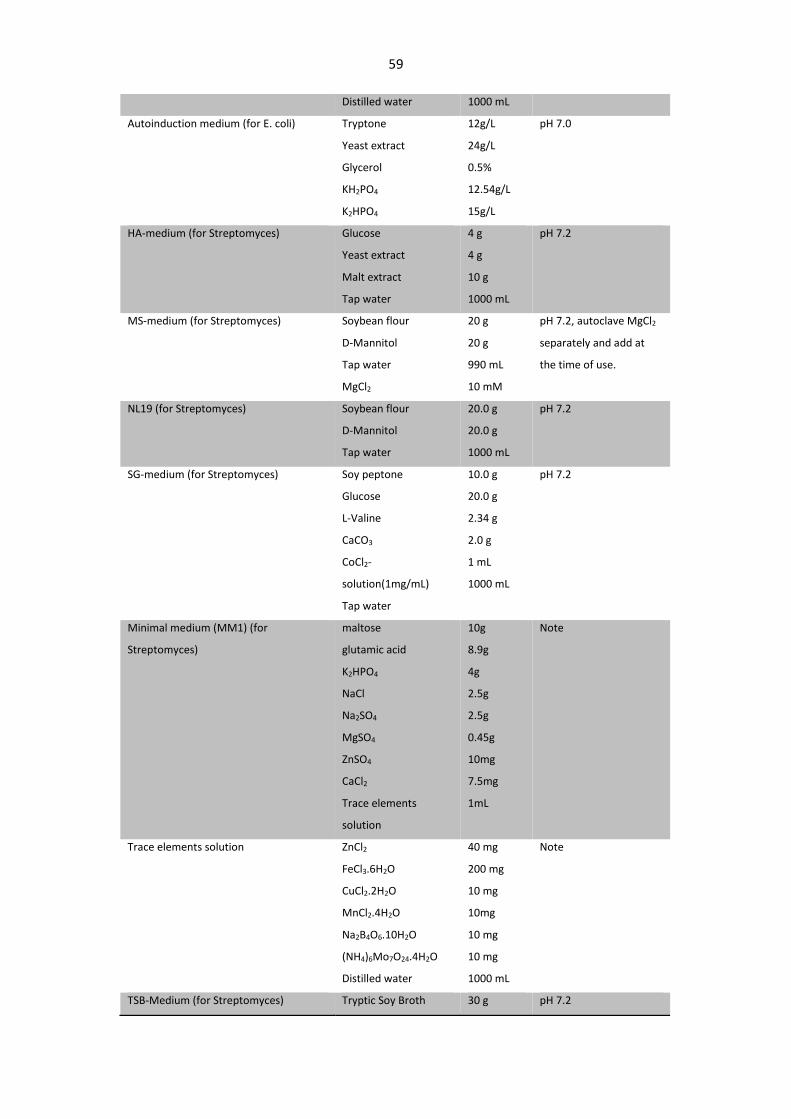
59
Distilled water 1000 mL
Autoinduction medium (for E. coli) Tryptone
Yeast extract
Glycerol
KH2PO4
K2HPO4
12g/L
24g/L
0.5%
12.54g/L
15g/L
pH 7.0
HA-medium (for Streptomyces) Glucose
Yeast extract
Malt extract
Tap water
4 g
4 g
10 g
1000 mL
pH 7.2
MS-medium (for Streptomyces) Soybean flour
D-Mannitol
Tap water
MgCl2
20 g
20 g
990 mL
10 mM
pH 7.2, autoclave MgCl2
separately and add at
the time of use.
NL19 (for Streptomyces) Soybean flour
D-Mannitol
Tap water
20.0 g
20.0 g
1000 mL
pH 7.2
SG-medium (for Streptomyces) Soy peptone
Glucose
L-Valine
CaCO3
CoCl2-
solution(1mg/mL)
Tap water
10.0 g
20.0 g
2.34 g
2.0 g
1 mL
1000 mL
pH 7.2
Minimal medium (MM1) (for
Streptomyces)
maltose
glutamic acid
K2HPO4
NaCl
Na2SO4
MgSO4
ZnSO4
CaCl2
Trace elements
solution
10g
8.9g
4g
2.5g
2.5g
0.45g
10mg
7.5mg
1mL
Note
Trace elements solution ZnCl2
FeCl3.6H2O
CuCl2.2H2O
MnCl2.4H2O
Na2B4O6.10H2O
(NH4)6Mo7O24.4H2O
Distilled water
40 mg
200 mg
10 mg
10mg
10 mg
10 mg
1000 mL
Note
TSB-Medium (for Streptomyces) Tryptic Soy Broth 30 g pH 7.2
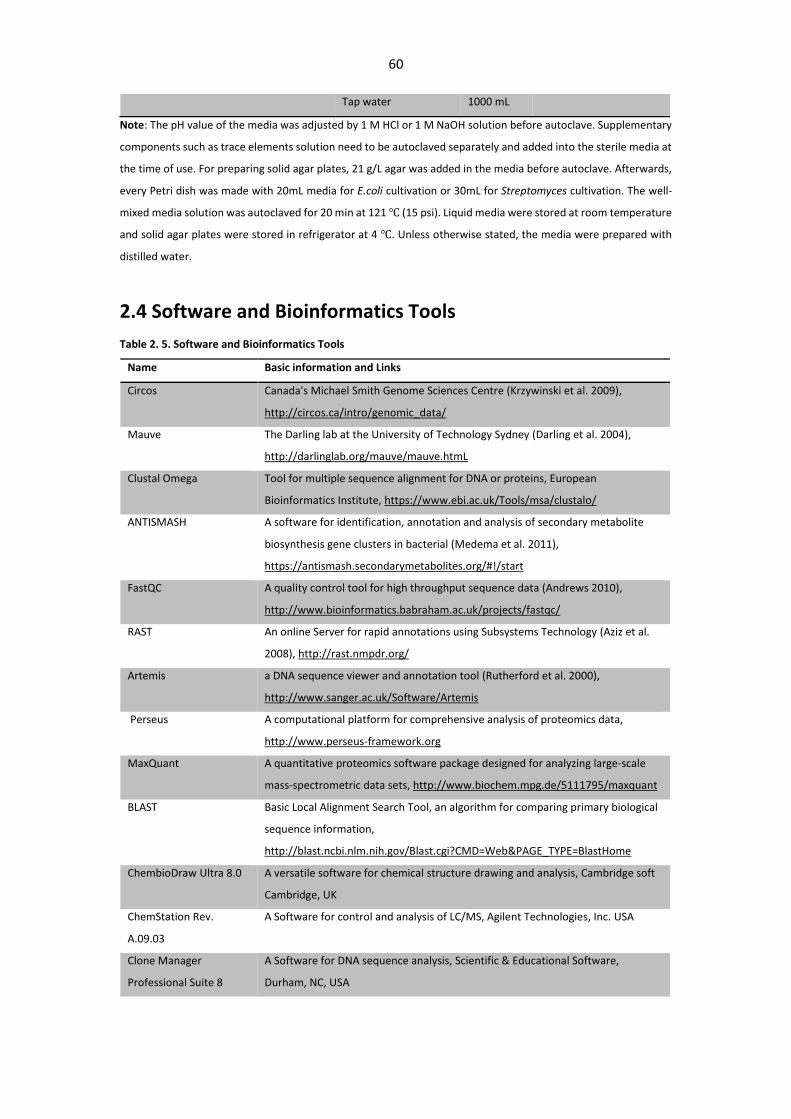
60
Tap water 1000 mL
Note: The pH value of the media was adjusted by 1 M HCl or 1 M NaOH solution before autoclave. Supplementary
components such as trace elements solution need to be autoclaved separately and added into the sterile media at
the time of use. For preparing solid agar plates, 21 g/L agar was added in the media before autoclave. Afterwards,
every Petri dish was made with 20mL media for E.coli cultivation or 30mL for Streptomyces cultivation. The well-
mixed media solution was autoclaved for 20 min at 121 ℃ (15 psi). Liquid media were stored at room temperature
and solid agar plates were stored in refrigerator at 4 ℃. Unless otherwise stated, the media were prepared with
distilled water.
2.4 Software and Bioinformatics Tools
Table 2. 5. Software and Bioinformatics Tools
Name Basic information and Links
Circos Canada's Michael Smith Genome Sciences Centre (Krzywinski et al. 2009),
http://circos.ca/intro/genomic_data/
Mauve The Darling lab at the University of Technology Sydney (Darling et al. 2004),
http://darlinglab.org/mauve/mauve.htmL
Clustal Omega Tool for multiple sequence alignment for DNA or proteins, European
Bioinformatics Institute, https://www.ebi.ac.uk/Tools/msa/clustalo/
ANTISMASH A software for identification, annotation and analysis of secondary metabolite
biosynthesis gene clusters in bacterial (Medema et al. 2011),
https://antismash.secondarymetabolites.org/#!/start
FastQC A quality control tool for high throughput sequence data (Andrews 2010),
http://www.bioinformatics.babraham.ac.uk/projects/fastqc/
RAST An online Server for rapid annotations using Subsystems Technology (Aziz et al.
2008), http://rast.nmpdr.org/
Artemis a DNA sequence viewer and annotation tool (Rutherford et al. 2000),
http://www.sanger.ac.uk/Software/Artemis
Perseus A computational platform for comprehensive analysis of proteomics data,
http://www.perseus-framework.org
MaxQuant A quantitative proteomics software package designed for analyzing large-scale
mass-spectrometric data sets, http://www.biochem.mpg.de/5111795/maxquant
BLAST
Basic Local Alignment Search Tool, an algorithm for comparing primary biological
sequence information,
http://blast.ncbi.nlm.nih.gov/Blast.cgi?CMD=Web&PAGE_TYPE=BlastHome
ChembioDraw Ultra 8.0 A versatile software for chemical structure drawing and analysis, Cambridge soft
Cambridge, UK
ChemStation Rev.
A.09.03
A Software for control and analysis of LC/MS, Agilent Technologies, Inc. USA
Clone Manager
Professional Suite 8
A Software for DNA sequence analysis, Scientific & Educational Software,
Durham, NC, USA
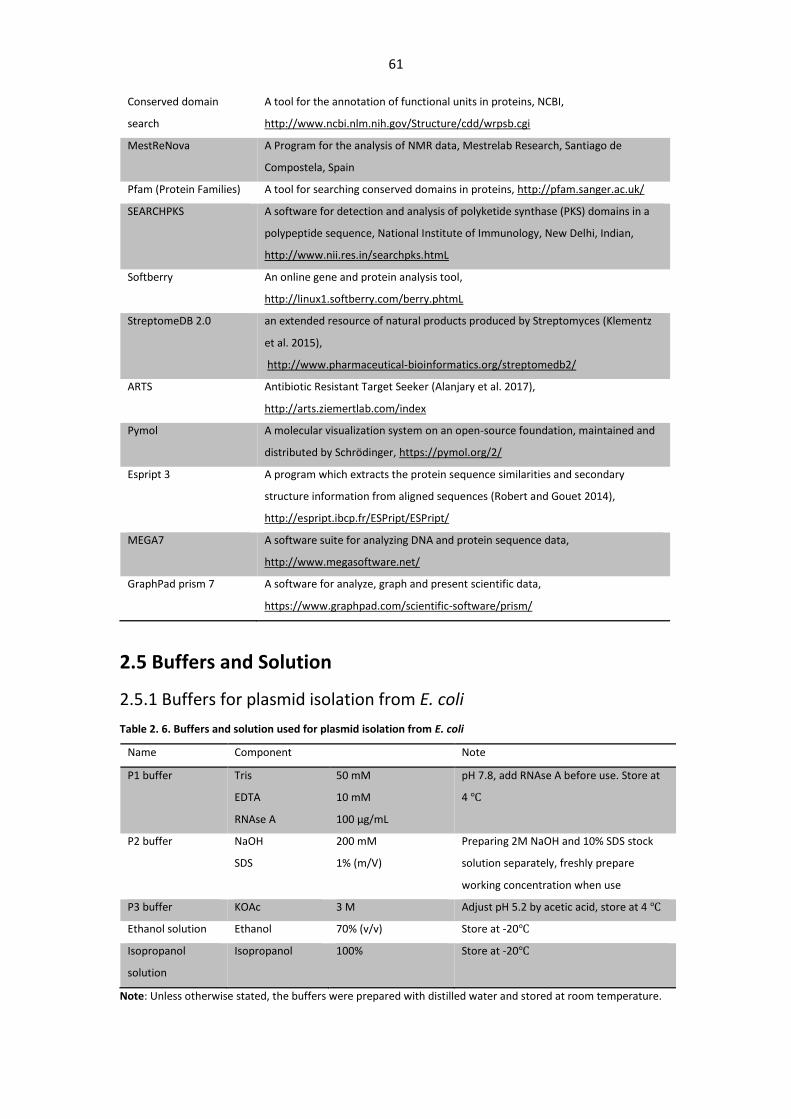
61
Conserved domain
search
A tool for the annotation of functional units in proteins, NCBI,
http://www.ncbi.nlm.nih.gov/Structure/cdd/wrpsb.cgi
MestReNova A Program for the analysis of NMR data, Mestrelab Research, Santiago de
Compostela, Spain
Pfam (Protein Families) A tool for searching conserved domains in proteins, http://pfam.sanger.ac.uk/
SEARCHPKS A software for detection and analysis of polyketide synthase (PKS) domains in a
polypeptide sequence, National Institute of Immunology, New Delhi, Indian,
http://www.nii.res.in/searchpks.htmL
Softberry An online gene and protein analysis tool,
http://linux1.softberry.com/berry.phtmL
StreptomeDB 2.0 an extended resource of natural products produced by Streptomyces (Klementz
et al. 2015),
http://www.pharmaceutical-bioinformatics.org/streptomedb2/
ARTS Antibiotic Resistant Target Seeker (Alanjary et al. 2017),
http://arts.ziemertlab.com/index
Pymol A molecular visualization system on an open-source foundation, maintained and
distributed by Schrödinger, https://pymol.org/2/
Espript 3 A program which extracts the protein sequence similarities and secondary
structure information from aligned sequences (Robert and Gouet 2014),
http://espript.ibcp.fr/ESPript/ESPript/
MEGA7 A software suite for analyzing DNA and protein sequence data,
http://www.megasoftware.net/
GraphPad prism 7 A software for analyze, graph and present scientific data,
https://www.graphpad.com/scientific-software/prism/
2.5 Buffers and Solution
2.5.1 Buffers for plasmid isolation from E. coli
Table 2. 6. Buffers and solution used for plasmid isolation from E. coli
Name Component Note
P1 buffer Tris
EDTA
RNAse A
50 mM
10 mM
100 μg/mL
pH 7.8, add RNAse A before use. Store at
4 ℃
P2 buffer NaOH
SDS
200 mM
1% (m/V)
Preparing 2M NaOH and 10% SDS stock
solution separately, freshly prepare
working concentration when use
P3 buffer KOAc 3 M Adjust pH 5.2 by acetic acid, store at 4 ℃
Ethanol solution Ethanol 70% (v/v) Store at -20℃
Isopropanol
solution
Isopropanol 100% Store at -20℃
Note: Unless otherwise stated, the buffers were prepared with distilled water and stored at room temperature.
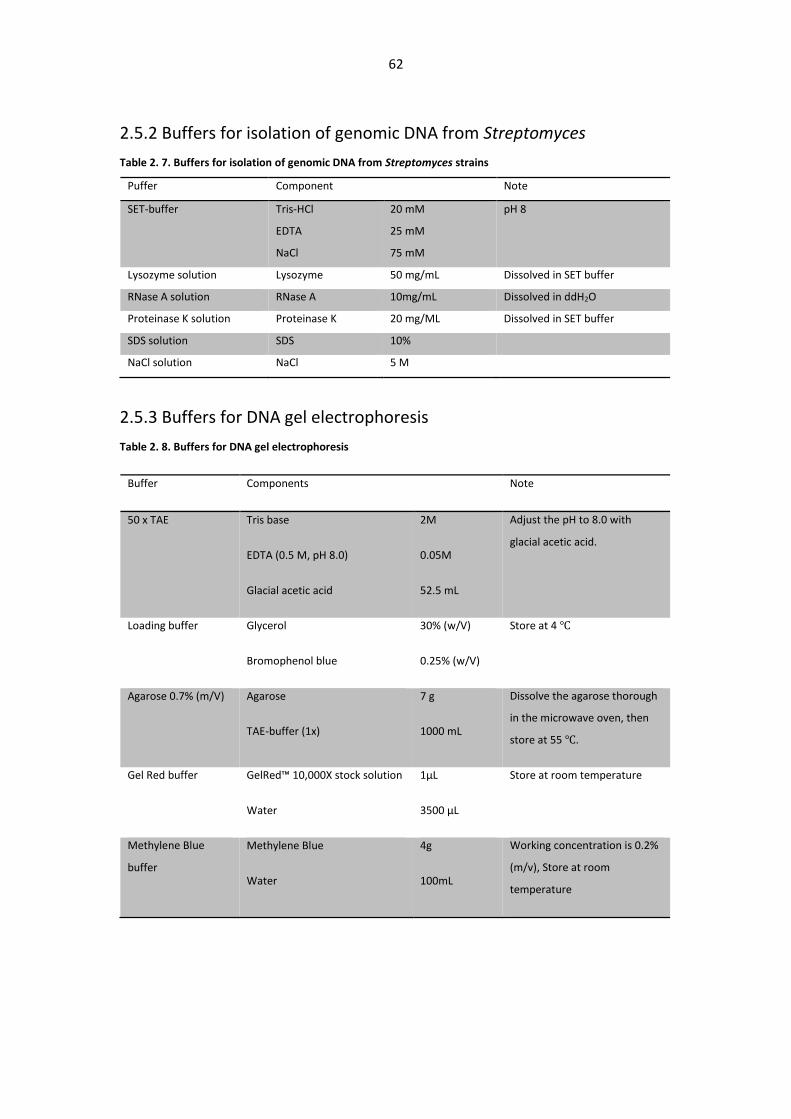
62
2.5.2 Buffers for isolation of genomic DNA from Streptomyces
Table 2. 7. Buffers for isolation of genomic DNA from Streptomyces strains
Puffer Component Note
SET-buffer Tris-HCl
EDTA
NaCl
20 mM
25 mM
75 mM
pH 8
Lysozyme solution Lysozyme 50 mg/mL Dissolved in SET buffer
RNase A solution RNase A 10mg/mL Dissolved in ddH2O
Proteinase K solution Proteinase K 20 mg/ML Dissolved in SET buffer
SDS solution SDS 10%
NaCl solution NaCl 5 M
2.5.3 Buffers for DNA gel electrophoresis
Table 2. 8. Buffers for DNA gel electrophoresis
Buffer Components Note
50 x TAE Tris base
EDTA (0.5 M, pH 8.0)
Glacial acetic acid
2M
0.05M
52.5 mL
Adjust the pH to 8.0 with
glacial acetic acid.
Loading buffer Glycerol
Bromophenol blue
30% (w/V)
0.25% (w/V)
Store at 4 ℃
Agarose 0.7% (m/V) Agarose
TAE-buffer (1x)
7 g
1000 mL
Dissolve the agarose thorough
in the microwave oven, then
store at 55 ℃.
Gel Red buffer GelRed™ 10,000X stock solution
Water
1μL
3500 μL
Store at room temperature
Methylene Blue
buffer
Methylene Blue
Water
4g
100mL
Working concentration is 0.2%
(m/v), Store at room
temperature
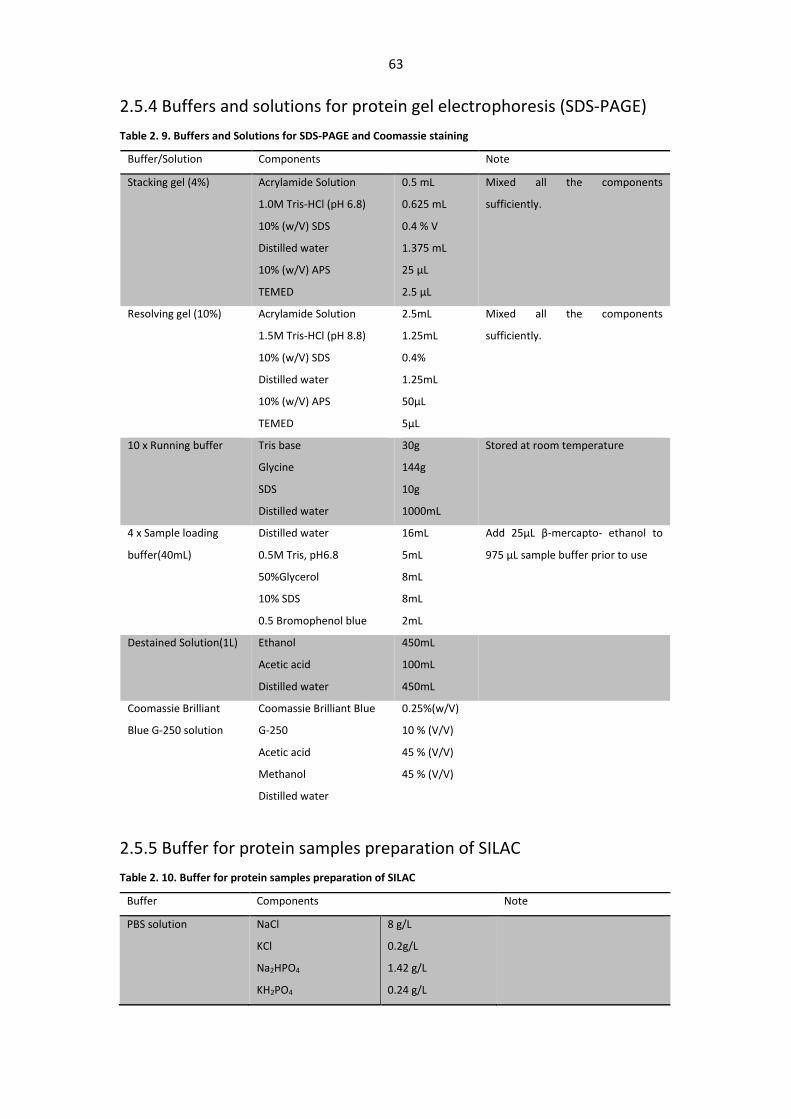
63
2.5.4 Buffers and solutions for protein gel electrophoresis (SDS-PAGE)
Table 2. 9. Buffers and Solutions for SDS-PAGE and Coomassie staining
Buffer/Solution Components Note
Stacking gel (4%) Acrylamide Solution
1.0M Tris-HCl (pH 6.8)
10% (w/V) SDS
Distilled water
10% (w/V) APS
TEMED
0.5 mL
0.625 mL
0.4 % V
1.375 mL
25 μL
2.5 μL
Mixed all the components
sufficiently.
Resolving gel (10%) Acrylamide Solution
1.5M Tris-HCl (pH 8.8)
10% (w/V) SDS
Distilled water
10% (w/V) APS
TEMED
2.5mL
1.25mL
0.4%
1.25mL
50μL
5μL
Mixed all the components
sufficiently.
10 x Running buffer Tris base
Glycine
SDS
Distilled water
30g
144g
10g
1000mL
Stored at room temperature
4 x Sample loading
buffer(40mL)
Distilled water
0.5M Tris, pH6.8
50%Glycerol
10% SDS
0.5 Bromophenol blue
16mL
5mL
8mL
8mL
2mL
Add 25μL β-mercapto- ethanol to
975 μL sample buffer prior to use
Destained Solution(1L) Ethanol
Acetic acid
Distilled water
450mL
100mL
450mL
Coomassie Brilliant
Blue G-250 solution
Coomassie Brilliant Blue
G-250
Acetic acid
Methanol
Distilled water
0.25%(w/V)
10 % (V/V)
45 % (V/V)
45 % (V/V)
2.5.5 Buffer for protein samples preparation of SILAC
Table 2. 10. Buffer for protein samples preparation of SILAC
Buffer Components Note
PBS solution NaCl
KCl
Na2HPO4
KH2PO4
8 g/L
0.2g/L
1.42 g/L
0.24 g/L
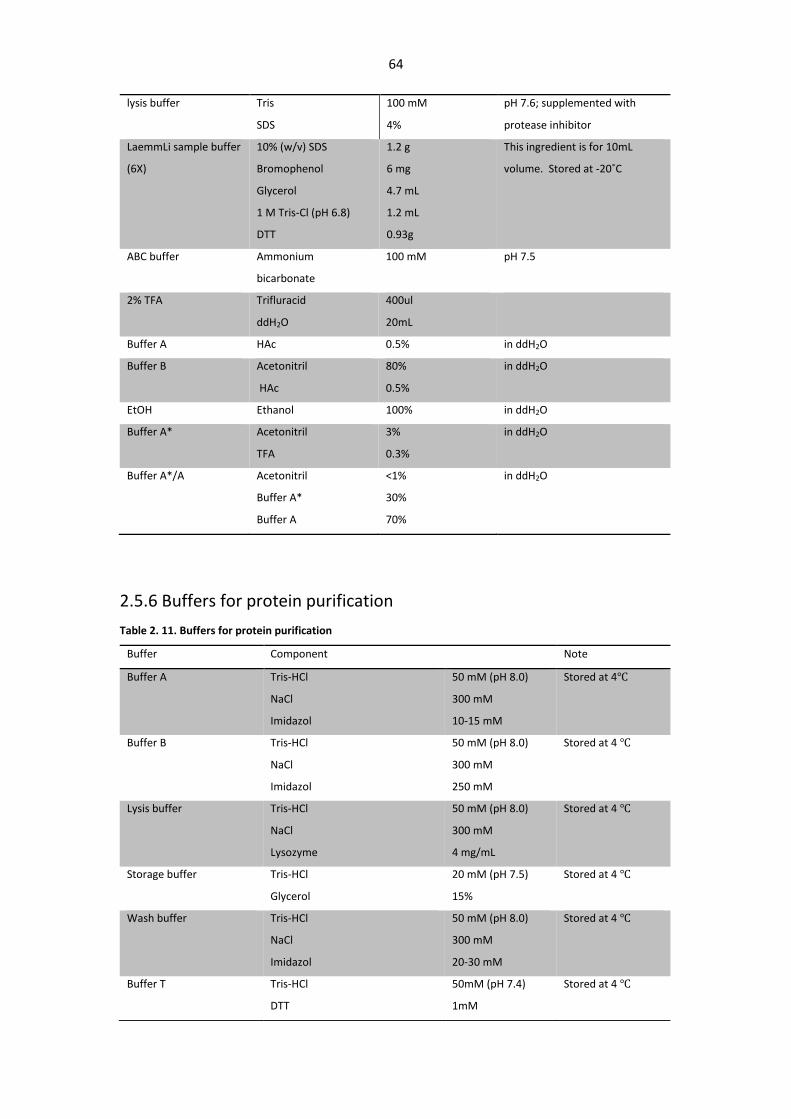
64
lysis buffer Tris
SDS
100 mM
4%
pH 7.6; supplemented with
protease inhibitor
LaemmLi sample buffer
(6X)
10% (w/v) SDS
Bromophenol
Glycerol
1 M Tris-Cl (pH 6.8)
DTT
1.2 g
6 mg
4.7 mL
1.2 mL
0.93g
This ingredient is for 10mL
volume. Stored at -20˚C
ABC buffer Ammonium
bicarbonate
100 mM pH 7.5
2% TFA Trifluracid
ddH2O
400ul
20mL
Buffer A HAc 0.5% in ddH2O
Buffer B Acetonitril
HAc
80%
0.5%
in ddH2O
EtOH Ethanol 100% in ddH2O
Buffer A* Acetonitril
TFA
3%
0.3%
in ddH2O
Buffer A*/A Acetonitril
Buffer A*
Buffer A
<1%
30%
70%
in ddH2O
2.5.6 Buffers for protein purification
Table 2. 11. Buffers for protein purification
Buffer Component Note
Buffer A Tris-HCl
NaCl
Imidazol
50 mM (pH 8.0)
300 mM
10-15 mM
Stored at 4℃
Buffer B Tris-HCl
NaCl
Imidazol
50 mM (pH 8.0)
300 mM
250 mM
Stored at 4 ℃
Lysis buffer Tris-HCl
NaCl
Lysozyme
50 mM (pH 8.0)
300 mM
4 mg/mL
Stored at 4 ℃
Storage buffer Tris-HCl
Glycerol
20 mM (pH 7.5)
15%
Stored at 4 ℃
Wash buffer Tris-HCl
NaCl
Imidazol
50 mM (pH 8.0)
300 mM
20-30 mM
Stored at 4 ℃
Buffer T Tris-HCl
DTT
50mM (pH 7.4)
1mM
Stored at 4 ℃
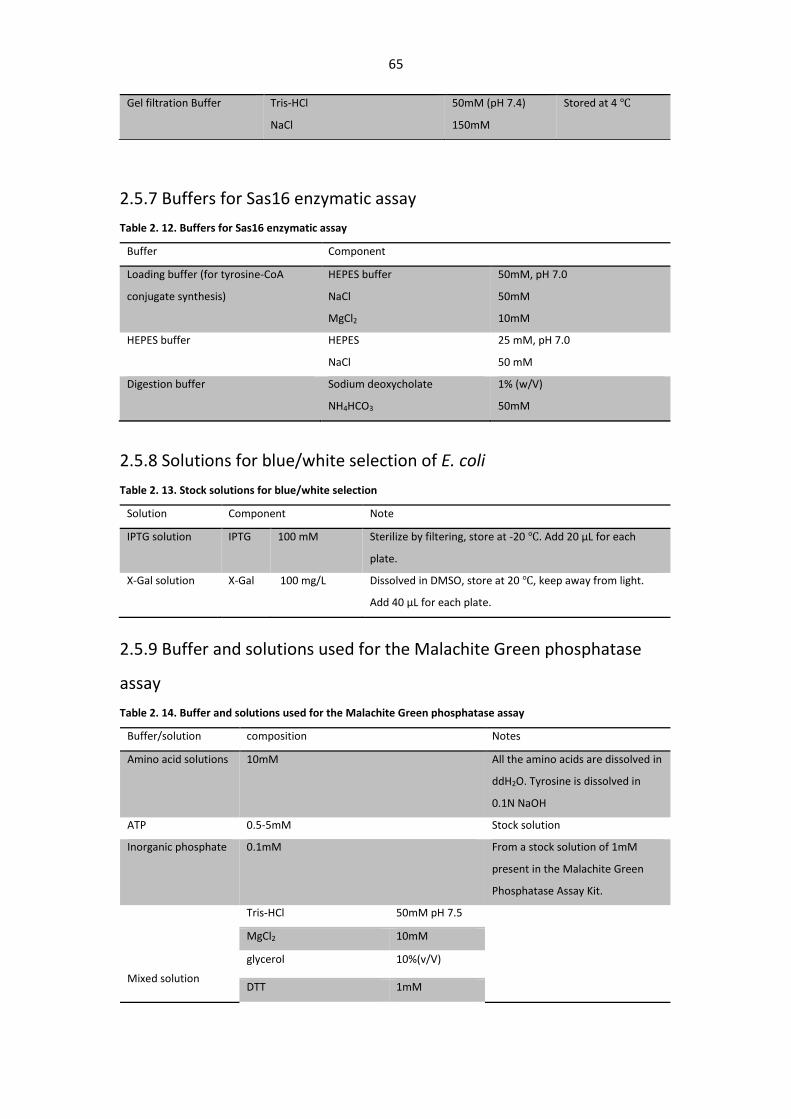
65
2.5.7 Buffers for Sas16 enzymatic assay
Table 2. 12. Buffers for Sas16 enzymatic assay
Buffer Component
Loading buffer (for tyrosine-CoA
conjugate synthesis)
HEPES buffer
NaCl
MgCl2
50mM, pH 7.0
50mM
10mM
HEPES buffer HEPES
NaCl
25 mM, pH 7.0
50 mM
Digestion buffer Sodium deoxycholate
NH4HCO3
1% (w/V)
50mM
2.5.8 Solutions for blue/white selection of E. coli
Table 2. 13. Stock solutions for blue/white selection
2.5.9 Buffer and solutions used for the Malachite Green phosphatase
assay
Table 2. 14. Buffer and solutions used for the Malachite Green phosphatase assay
Buffer/solution composition Notes
Amino acid solutions 10mM All the amino acids are dissolved in
ddH2O. Tyrosine is dissolved in
0.1N NaOH
ATP 0.5-5mM Stock solution
Inorganic phosphate 0.1mM From a stock solution of 1mM
present in the Malachite Green
Phosphatase Assay Kit.
Mixed solution
Tris-HCl 50mM pH 7.5
MgCl2 10mM
glycerol 10%(v/V)
DTT 1mM
Gel filtration Buffer Tris-HCl
NaCl
50mM (pH 7.4)
150mM
Stored at 4 ℃
Solution Component Note
IPTG solution IPTG 100 mM Sterilize by filtering, store at -20 ℃. Add 20 μL for each
plate.
X-Gal solution X-Gal 100 mg/L Dissolved in DMSO, store at 20 ℃, keep away from light.
Add 40 μL for each plate.
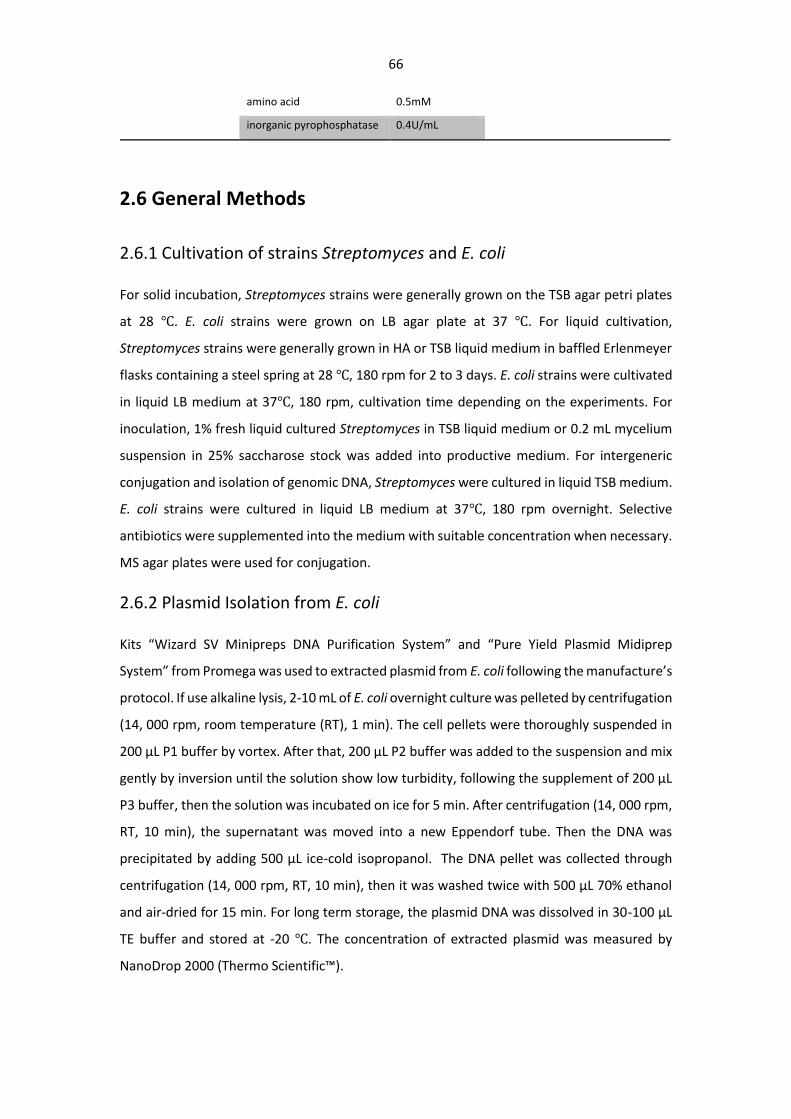
66
amino acid 0.5mM
inorganic pyrophosphatase 0.4U/mL
2.6 General Methods
2.6.1 Cultivation of strains Streptomyces and E. coli
For solid incubation, Streptomyces strains were generally grown on the TSB agar petri plates
at 28 ℃. E. coli strains were grown on LB agar plate at 37 ℃. For liquid cultivation,
Streptomyces strains were generally grown in HA or TSB liquid medium in baffled Erlenmeyer
flasks containing a steel spring at 28 ℃, 180 rpm for 2 to 3 days. E. coli strains were cultivated
in liquid LB medium at 37℃, 180 rpm, cultivation time depending on the experiments. For
inoculation, 1% fresh liquid cultured Streptomyces in TSB liquid medium or 0.2 mL mycelium
suspension in 25% saccharose stock was added into productive medium. For intergeneric
conjugation and isolation of genomic DNA, Streptomyces were cultured in liquid TSB medium.
E. coli strains were cultured in liquid LB medium at 37℃, 180 rpm overnight. Selective
antibiotics were supplemented into the medium with suitable concentration when necessary.
MS agar plates were used for conjugation.
2.6.2 Plasmid Isolation from E. coli
Kits “Wizard SV Minipreps DNA Purification System” and “Pure Yield Plasmid Midiprep
System” from Promega was used to extracted plasmid from E. coli following the manufacture’s
protocol. If use alkaline lysis, 2-10 mL of E. coli overnight culture was pelleted by centrifugation
(14, 000 rpm, room temperature (RT), 1 min). The cell pellets were thoroughly suspended in
200 μL P1 buffer by vortex. After that, 200 μL P2 buffer was added to the suspension and mix
gently by inversion until the solution show low turbidity, following the supplement of 200 μL
P3 buffer, then the solution was incubated on ice for 5 min. After centrifugation (14, 000 rpm,
RT, 10 min), the supernatant was moved into a new Eppendorf tube. Then the DNA was
precipitated by adding 500 μL ice-cold isopropanol. The DNA pellet was collected through
centrifugation (14, 000 rpm, RT, 10 min), then it was washed twice with 500 μL 70% ethanol
and air-dried for 15 min. For long term storage, the plasmid DNA was dissolved in 30-100 μL
TE buffer and stored at -20 ℃. The concentration of extracted plasmid was measured by
NanoDrop 2000 (Thermo Scientific™).
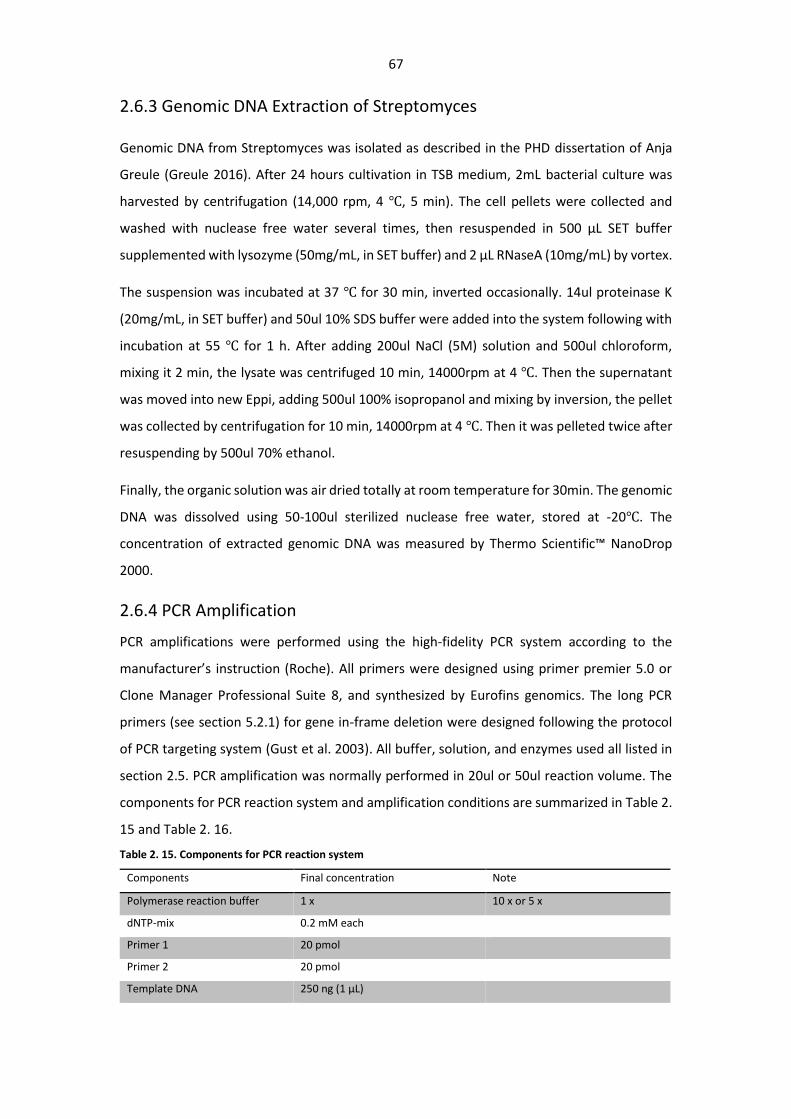
67
2.6.3 Genomic DNA Extraction of Streptomyces
Genomic DNA from Streptomyces was isolated as described in the PHD dissertation of Anja
Greule (Greule 2016). After 24 hours cultivation in TSB medium, 2mL bacterial culture was
harvested by centrifugation (14,000 rpm, 4 ℃, 5 min). The cell pellets were collected and
washed with nuclease free water several times, then resuspended in 500 μL SET buffer
supplemented with lysozyme (50mg/mL, in SET buffer) and 2 μL RNaseA (10mg/mL) by vortex.
The suspension was incubated at 37 ℃ for 30 min, inverted occasionally. 14ul proteinase K
(20mg/mL, in SET buffer) and 50ul 10% SDS buffer were added into the system following with
incubation at 55 ℃ for 1 h. After adding 200ul NaCl (5M) solution and 500ul chloroform,
mixing it 2 min, the lysate was centrifuged 10 min, 14000rpm at 4 ℃. Then the supernatant
was moved into new Eppi, adding 500ul 100% isopropanol and mixing by inversion, the pellet
was collected by centrifugation for 10 min, 14000rpm at 4 ℃. Then it was pelleted twice after
resuspending by 500ul 70% ethanol.
Finally, the organic solution was air dried totally at room temperature for 30min. The genomic
DNA was dissolved using 50-100ul sterilized nuclease free water, stored at -20℃. The
concentration of extracted genomic DNA was measured by Thermo Scientific™ NanoDrop
2000.
2.6.4 PCR Amplification
PCR amplifications were performed using the high-fidelity PCR system according to the
manufacturer’s instruction (Roche). All primers were designed using primer premier 5.0 or
Clone Manager Professional Suite 8, and synthesized by Eurofins genomics. The long PCR
primers (see section 5.2.1) for gene in-frame deletion were designed following the protocol
of PCR targeting system (Gust et al. 2003). All buffer, solution, and enzymes used all listed in
section 2.5. PCR amplification was normally performed in 20ul or 50ul reaction volume. The
components for PCR reaction system and amplification conditions are summarized in Table 2.
15 and Table 2. 16.
Table 2. 15. Components for PCR reaction system
Components Final concentration Note
Polymerase reaction buffer 1 x 10 x or 5 x
dNTP-mix 0.2 mM each
Primer 1 20 pmol
Primer 2 20 pmol
Template DNA 250 ng (1 μL)
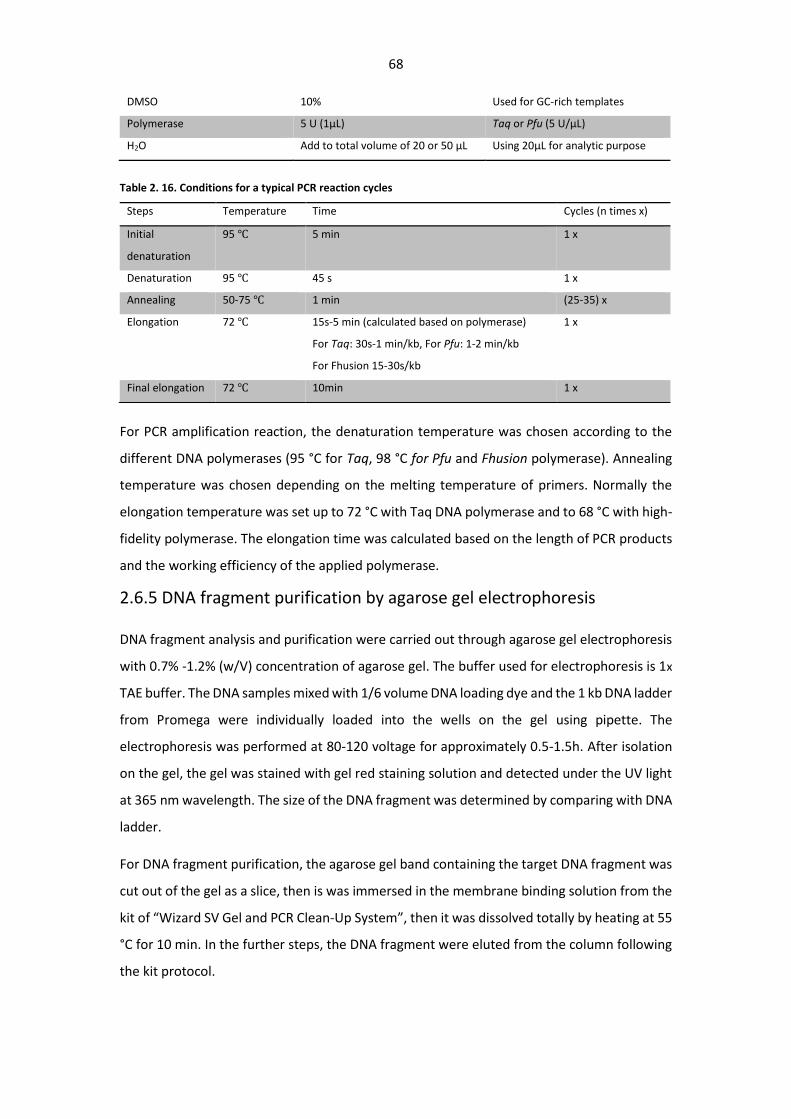
68
Table 2. 16. Conditions for a typical PCR reaction cycles
For PCR amplification reaction, the denaturation temperature was chosen according to the
different DNA polymerases (95 °C for Taq, 98 °C for Pfu and Fhusion polymerase). Annealing
temperature was chosen depending on the melting temperature of primers. Normally the
elongation temperature was set up to 72 °C with Taq DNA polymerase and to 68 °C with high-
fidelity polymerase. The elongation time was calculated based on the length of PCR products
and the working efficiency of the applied polymerase.
2.6.5 DNA fragment purification by agarose gel electrophoresis
DNA fragment analysis and purification were carried out through agarose gel electrophoresis
with 0.7% -1.2% (w/V) concentration of agarose gel. The buffer used for electrophoresis is 1x
TAE buffer. The DNA samples mixed with 1/6 volume DNA loading dye and the 1 kb DNA ladder
from Promega were individually loaded into the wells on the gel using pipette. The
electrophoresis was performed at 80-120 voltage for approximately 0.5-1.5h. After isolation
on the gel, the gel was stained with gel red staining solution and detected under the UV light
at 365 nm wavelength. The size of the DNA fragment was determined by comparing with DNA
ladder.
For DNA fragment purification, the agarose gel band containing the target DNA fragment was
cut out of the gel as a slice, then is was immersed in the membrane binding solution from the
kit of “Wizard SV Gel and PCR Clean-Up System”, then it was dissolved totally by heating at 55
°C for 10 min. In the further steps, the DNA fragment were eluted from the column following
the kit protocol.
DMSO 10% Used for GC-rich templates
Polymerase 5 U (1μL) Taq or Pfu (5 U/μL)
H2O Add to total volume of 20 or 50 μL Using 20μL for analytic purpose
Steps Temperature Time Cycles (n times x)
Initial
denaturation
95 ℃ 5 min 1 x
Denaturation 95 ℃ 45 s 1 x
Annealing 50-75 ℃ 1 min (25-35) x
Elongation 72 ℃ 15s-5 min (calculated based on polymerase)
For Taq: 30s-1 min/kb, For Pfu: 1-2 min/kb
For Fhusion 15-30s/kb
1 x
Final elongation 72 ℃ 10min 1 x
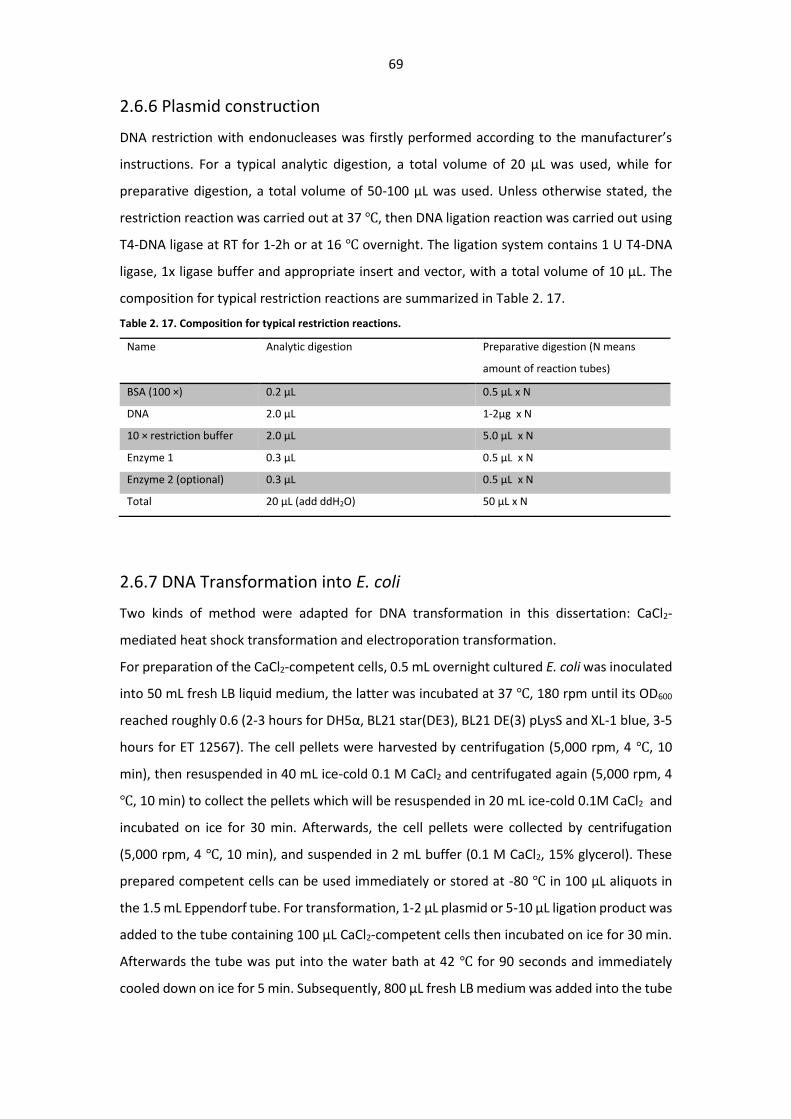
69
2.6.6 Plasmid construction
DNA restriction with endonucleases was firstly performed according to the manufacturer’s
instructions. For a typical analytic digestion, a total volume of 20 μL was used, while for
preparative digestion, a total volume of 50-100 μL was used. Unless otherwise stated, the
restriction reaction was carried out at 37 ℃, then DNA ligation reaction was carried out using
T4-DNA ligase at RT for 1-2h or at 16 ℃ overnight. The ligation system contains 1 U T4-DNA
ligase, 1x ligase buffer and appropriate insert and vector, with a total volume of 10 μL. The
composition for typical restriction reactions are summarized in Table 2. 17.
Table 2. 17. Composition for typical restriction reactions.
2.6.7 DNA Transformation into E. coli
Two kinds of method were adapted for DNA transformation in this dissertation: CaCl2-
mediated heat shock transformation and electroporation transformation.
For preparation of the CaCl2-competent cells, 0.5 mL overnight cultured E. coli was inoculated
into 50 mL fresh LB liquid medium, the latter was incubated at 37 ℃, 180 rpm until its OD600
reached roughly 0.6 (2-3 hours for DH5α, BL21 star(DE3), BL21 DE(3) pLysS and XL-1 blue, 3-5
hours for ET 12567). The cell pellets were harvested by centrifugation (5,000 rpm, 4 ℃, 10
min), then resuspended in 40 mL ice-cold 0.1 M CaCl2 and centrifugated again (5,000 rpm, 4
℃, 10 min) to collect the pellets which will be resuspended in 20 mL ice-cold 0.1M CaCl2 and
incubated on ice for 30 min. Afterwards, the cell pellets were collected by centrifugation
(5,000 rpm, 4 ℃, 10 min), and suspended in 2 mL buffer (0.1 M CaCl2, 15% glycerol). These
prepared competent cells can be used immediately or stored at -80 ℃ in 100 μL aliquots in
the 1.5 mL Eppendorf tube. For transformation, 1-2 μL plasmid or 5-10 μL ligation product was
added to the tube containing 100 μL CaCl2-competent cells then incubated on ice for 30 min.
Afterwards the tube was put into the water bath at 42 ℃ for 90 seconds and immediately
cooled down on ice for 5 min. Subsequently, 800 μL fresh LB medium was added into the tube
Name Analytic digestion Preparative digestion (N means
amount of reaction tubes)
BSA (100 ×) 0.2 μL 0.5 μL x N
DNA 2.0 μL 1-2μg x N
10 × restriction buffer 2.0 μL 5.0 μL x N
Enzyme 1 0.3 μL 0.5 μL x N
Enzyme 2 (optional) 0.3 μL 0.5 μL x N
Total 20 μL (add ddH2O) 50 μL x N
70
and incubated at 37 ℃ for 1 hour. After that the cell pellets were collected by centrifugation
(7,000 rpm, 3 min), 400 μL supernatant was discarded and the cell pellet was resuspended
using the rest of LB medium. Then those cells were coated on the LB agar plate supplemented
appropriate antibiotic. Colonies with correct antibiotic resistance could grow up on the plate
after incubation for approximately 16 h.
For preparation of the electrocompetent cells, 0.2 mL overnight cultured E. coli was inoculated
into 20 mL fresh LB medium, the latter was incubated at 37 ℃, 180 rpm until its OD600 reached
roughly 0.6 (2-3 hours for DH5α, BL21 star(DE3), BL21 DE(3) pLysS and XL-1 blue, 3-4 hours for
ET 12567). The cell pellets were harvested by centrifugation (7,000 rpm, 4 ℃, 10 min), and
subsequently washed with 40 mL 10% ice-cold glycerol twice. Afterwards the pellets were
collected and resuspended in 2 mL 10% ice-cold glycerol. These prepared competent cells can
be used immediately or stored at -80 ℃ in 100 μL aliquots in the 1.5 mL eppendorf tube. For
the electroporation transformation, 100 ng plasmid DNA or PCR fragment was added into the
fresh prepared electrocompetent cells then it was incubated on ice for about 1 min.
Subsequently, the cell suspension with DNA were transferred into a 0.2 cm ice-cold
electroporation cuvette. Electroporation was carried out using a BioRad Gene Pulser with the
parameter set as: 1.8 Ω voltage and 5 ms time constant. After electroporation, 800 μL fresh
LB medium was added into the cuvette, the cells were suspended by pipetting, then
transferred into a sterile 1.5 mL tube and incubated at the 37 ℃ for 1 hour. The cells were
harvested by centrifugation (5,000 rpm, 3 min). 400 μL supernatant was discarded and the
cell pellet was resuspended using the rest of LB medium. Then those cells were coated on the
LB agar plate supplemented appropriate antibiotic. Colonies with correct antibiotic resistance
could grow up on the plate after incubation for approximately 16 hours.
2.6.8 Plasmid from E. coli to Streptomyces by intergeneric conjugation
During our study, the intergeneric conjugal transfer of plasmids from E. coli to Streptomyces
were performed according to the modified method mentioned in the dissertation of Irene
Santillana Larraona (Larraona 2015). plasmids harboring the oriT from the IncP plasmid RP4
were firstly transformed into methylation- defective E. coli strain ET12567(dam-13::Tn9 dcm-
6 hsdM Cmr)/pUZ8002(a derivative of RK2 with a mutation in oriT), and then it was transferred
to Streptomyces acceptor strain with the help of the non-transmissible pUZ8002 plasmid
which will encode the tra functions required for the mobilization of the conjugative plasmid
(Paranthaman and Dharmalingam 2003; Hopwood 2011).
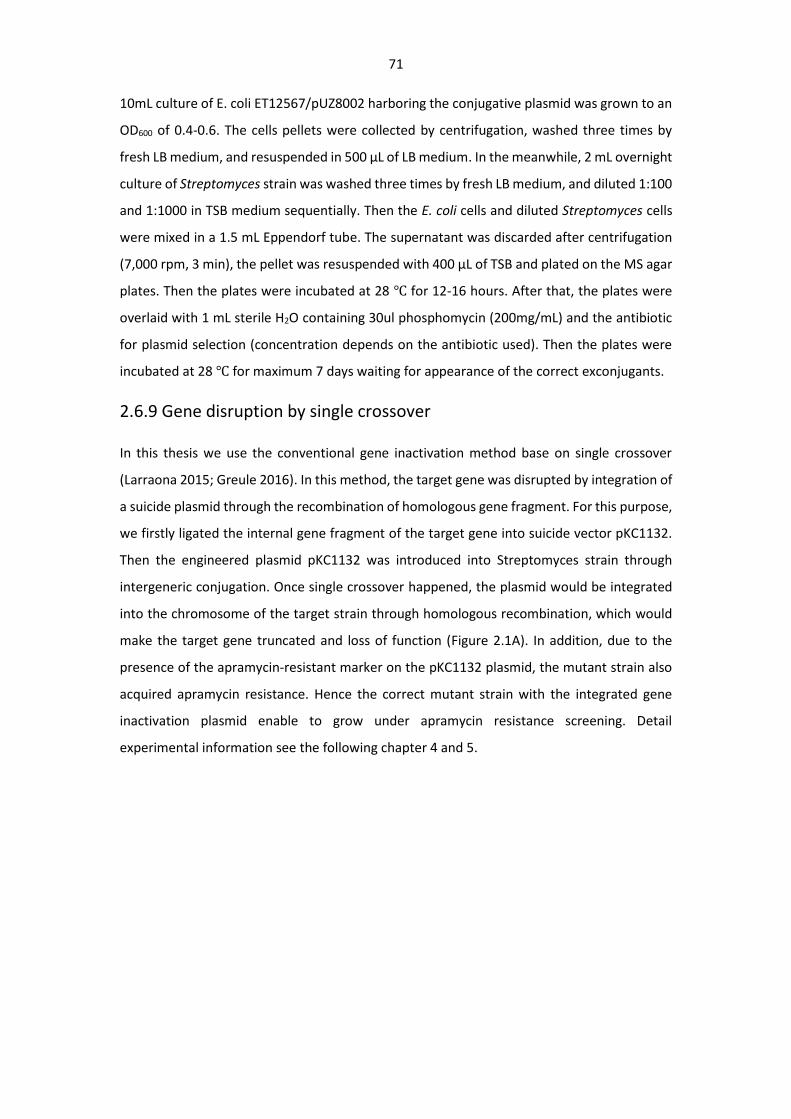
71
10mL culture of E. coli ET12567/pUZ8002 harboring the conjugative plasmid was grown to an
OD600 of 0.4-0.6. The cells pellets were collected by centrifugation, washed three times by
fresh LB medium, and resuspended in 500 μL of LB medium. In the meanwhile, 2 mL overnight
culture of Streptomyces strain was washed three times by fresh LB medium, and diluted 1:100
and 1:1000 in TSB medium sequentially. Then the E. coli cells and diluted Streptomyces cells
were mixed in a 1.5 mL Eppendorf tube. The supernatant was discarded after centrifugation
(7,000 rpm, 3 min), the pellet was resuspended with 400 μL of TSB and plated on the MS agar
plates. Then the plates were incubated at 28 ℃ for 12-16 hours. After that, the plates were
overlaid with 1 mL sterile H2O containing 30ul phosphomycin (200mg/mL) and the antibiotic
for plasmid selection (concentration depends on the antibiotic used). Then the plates were
incubated at 28 ℃ for maximum 7 days waiting for appearance of the correct exconjugants.
2.6.9 Gene disruption by single crossover
In this thesis we use the conventional gene inactivation method base on single crossover
(Larraona 2015; Greule 2016). In this method, the target gene was disrupted by integration of
a suicide plasmid through the recombination of homologous gene fragment. For this purpose,
we firstly ligated the internal gene fragment of the target gene into suicide vector pKC1132.
Then the engineered plasmid pKC1132 was introduced into Streptomyces strain through
intergeneric conjugation. Once single crossover happened, the plasmid would be integrated
into the chromosome of the target strain through homologous recombination, which would
make the target gene truncated and loss of function (Figure 2.1A). In addition, due to the
presence of the apramycin-resistant marker on the pKC1132 plasmid, the mutant strain also
acquired apramycin resistance. Hence the correct mutant strain with the integrated gene
inactivation plasmid enable to grow under apramycin resistance screening. Detail
experimental information see the following chapter 4 and 5.
72
A B
Figure 2. 1. Schematic representation of gene inactivation via single crossover (A) and in-frame gene deletion
via double crossover method (B).
2.6.10 Targeted Gene deletion by double crossover method
PCR targeting system is much more efficient than the traditional gene replacement strategy
in Streptomyces app. In this thesis, the in-frame gene deletion by double crossover was
performed following the protocol of PCR targeting system (Gust et al. 2003). Through
homologous recombination mediated by λ RED (E. coli BW25113/pIJ790) technique, suicide
vector pKGLP2-GusA was engineered to the plasmid for in-frame gene deletion, which
contained the gene cassette: 1500bp up-arm sequence of the target gene, flanking with a
loxP-aac3(IV)-loxP cassette, and 1500bp down-arm sequence of target gene (Figure 2.1B).
Then this gene deletion plasmid was conjugated into Streptomyces. Through two times
successful recombination of the up-arm sequence and the down arm sequence with their
respective identical sequence on the chromosome of the Streptomyces, the gene of interest
was replaced by the 1045 bp cassette of loxP-aac3(IV)-loxP. Afterwards, the resistance marker
was removed through the loxP site-specific recombination mediated by Cre recombinase
(Fedoryshyn et al. 2008) (Figure 2.1B). Detailed experimental information sees section 5.3.4.3
and 5.3.4.5 in Chapter 5.
2.6.11 Sodium dodecyl sulfate polyacrylamide gel electrophoresis (SDS-
PAGE)
All the buffers for the SDS-PAGE were listed in Table 2.5.6. 10% polyacrylamide resolving gel
and polyacrylamide 4% stacking gel were prepared as the SDS-PAGE Polyacrylamide gel. Mini-
PROTEAN Electrophoresis System (BIO-RAD, Germany) was used to perform the gel
electrophoresis.
73
The protein samples were mixed with 4 x sample loading buffer and denatured by heating at
95 °C for 10 min. The denatured protein samples were centrifuged at 14000 rpm for 3 min,
then 10 µL of the supernatants were loaded into the well of stacking gel. Protein markers were
always loaded into one of the lane on the gel. The gel electrophoresis was carried out at 120V
voltage for 1-1.5 h, SDS-PAGE running was stopped when the downmost line of the protein
marker almost reached the bottom of the gel. After electrophoresis was completed, the gel
was gently moved into a tray and stained with staining buffer by heating few minutes in the
microwave oven and shaking for 30 min on shaker. Subsequently, the stained gel was rinsed
with water and stripping buffer several times until obvious protein band were shown on the
gel. The size of the proteins could be estimated by comparing with the protein markers.
Chapter 3. The complete genome sequence of Streptomyces
asterosporus DSM 41452
3.1 Background
Streptomyces asterosporus DSM 41452, a strain with bald phenotype, is deficient in the
formation of aerial mycelium and spores. The strain was recently discovered as a high-amount
producer of WS9326A and its derivatives. These cyclodepsipeptides were firstly isolated from
Streptomyces violaceoniger no.9326 in 1993 as potent tachykinin antagonist (Shigematsu et
al. 1993). Its derivative WS9326E exhibited inhibitory activity against B. malayi asparaginyl-
tRNA synthetase (BmAsnRS) (Yu et al. 2012). In addition, as the potent receptor antagonists
in the agr/fsr system, WS9326A and WS9326B exhibited significant therapeutic potential
against the cyclic peptide-mediated quorum sensing of the Gram-positive pathogens(Desouky
et al. 2015).
A notable feature of Streptomyces is the complex, fungal-like life cycle (Ohnishi et al. 2005).
During its sporulation stage, the biosynthesis of many secondary metabolites is activated. It
was reported previously that bald mutants of Streptomyces are deficient in the biosynthesis
of specific secondary metabolites (Ohnishi et al. 2005). As we have described in the Chapter
1, AdpA is a central transcriptional regulator in the A-factor regulatory cascade. It plays a very
crucial role in morphological differentiation and secondary metabolite production in
Streptomyces species (Pan et al. 2009). One component of the AdpA regulon is bldA which
encodes a rare tRNA molecule (Leu-tRNAUUA) that is necessary for the translation of mRNA
UUA codons (Gessner et al. 2015; Hackl and Bechthold 2015). We previously reported that
the defective bldA gene prevents the generation of aerial hyphae and the formation of
secondary metabolites in Streptomyces calvus by inhibiting the expression of the TTA-
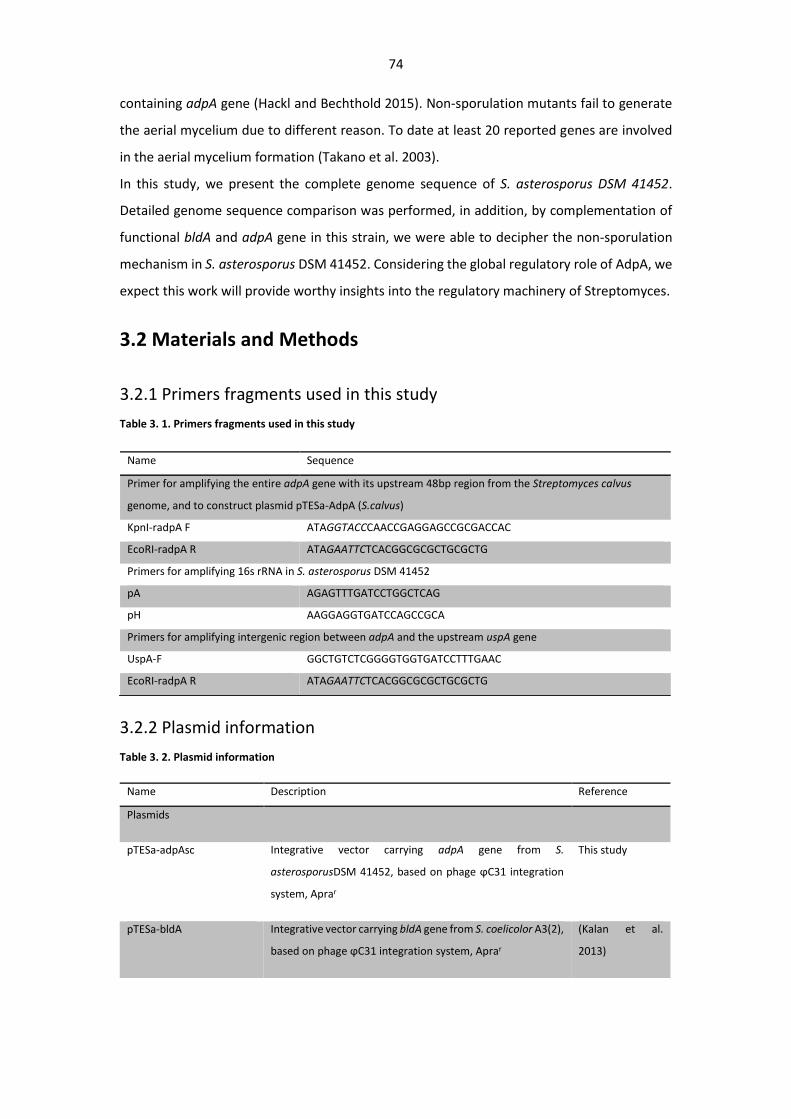
74
containing adpA gene (Hackl and Bechthold 2015). Non-sporulation mutants fail to generate
the aerial mycelium due to different reason. To date at least 20 reported genes are involved
in the aerial mycelium formation (Takano et al. 2003).
In this study, we present the complete genome sequence of S. asterosporus DSM 41452.
Detailed genome sequence comparison was performed, in addition, by complementation of
functional bldA and adpA gene in this strain, we were able to decipher the non-sporulation
mechanism in S. asterosporus DSM 41452. Considering the global regulatory role of AdpA, we
expect this work will provide worthy insights into the regulatory machinery of Streptomyces.
3.2 Materials and Methods
3.2.1 Primers fragments used in this study
Table 3. 1. Primers fragments used in this study
3.2.2 Plasmid information
Table 3. 2. Plasmid information
Name Sequence
Primer for amplifying the entire adpA gene with its upstream 48bp region from the Streptomyces calvus
genome, and to construct plasmid pTESa-AdpA (S.calvus)
KpnI-radpA F ATAGGTACCCAACCGAGGAGCCGCGACCAC
EcoRI-radpA R ATAGAATTCTCACGGCGCGCTGCGCTG
Primers for amplifying 16s rRNA in S. asterosporus DSM 41452
pA AGAGTTTGATCCTGGCTCAG
pH AAGGAGGTGATCCAGCCGCA
Primers for amplifying intergenic region between adpA and the upstream uspA gene
UspA-F GGCTGTCTCGGGGTGGTGATCCTTTGAAC
EcoRI-radpA R ATAGAATTCTCACGGCGCGCTGCGCTG
Name Description Reference
Plasmids
pTESa-adpAsc Integrative vector carrying adpA gene from S.
asterosporusDSM 41452, based on phage ϕC31 integration
system, Aprar
This study
pTESa-bldA Integrative vector carrying bldA gene from S. coelicolor A3(2),
based on phage ϕC31 integration system, Aprar
(Kalan et al.
2013)
75
3.2.3 Genomic DNA preparation and whole-genome sequencing
The gene encoding 16S rRNA was amplified using two universal primers (pA and pH) (Kim et
al. 1998). The sequencing result revealed a high sequence similarity (100%, 1465/1466)
between S. asterosporus NBRC 15872 and Streptomyces calvus NBRC 13200 as the closest
homologous strain. S. asterosporus DSM 41452 was cultivated in 20 mL TSB medium at 28 ℃
for 2 days on a rotary shaker at 180 r·min−1. Cells were pelleted by centrifugation and genomic
DNA extracted using the methods described by Kim et al (Kim et al. 1998). The whole genome
was sequenced using a combination of Illumina Hiseq and Pacific Bioscience SMRT (PacBio
RSII) sequencing platform, with 601-fold average genome coverage. The genome sequencing,
assembly and basic bioinformatic analysis of Streptomyces asterosporus DSM 41452 were
performed by Biozeron sequencing company.
3.2.4 Genome assembly and annotation
A total of 33, 359, 358 reads (average length 100bp) from Illumina sequencing data were
assembled de novo by the SOAPdenovo (v2.04) method (Koren et al. 2012). The PacBio
sequencing data was corrected by mapping the Illumina sequencing reads on BLASR (Basic
Local Alignment with Successive Refinement), and then assembled by the Celera Assembler
(http://wgs-assembler.sourceforge.net). After generating a reliable scaffold, correction of
sequencing reads was performed again based on the Illumina data. Sequencing quality control
on raw sequence data was checked by online software FastQC
(http://www.bioinformatics.babraham.ac.uk/projects/fastqc/ ).
Putative protein-coding sequences were predicted based on results from GLIMMER 3.02
(https://ccb.jhu.edu/software/glimmer/). Additional analysis was carried out using the
UniProt database (http://www.uniprot.org/), the RAST database (https://rast.nmpdr.org/),
Clusters of Orthologous Groups (Huerta-Cepas, Szklarczyk et al. 2015), and KEGG
(http://www.genome.jp/kegg/). rRNA and tRNA genes were predicted with RNAmmer-1.2
(Lagesen et al. 2007) and tRNA scan-SE V1.3.1 (Lowe and Chan 2016). Genome-wide
collinearity analysis was performed using Mauve (Darling et al. 2004). Secondary metabolites
analysis was done with antiSMASH database (Blin et al. 2013), followed by careful manual
pTESa pSET152 derivatives; attP flanked by loxP site, ermEp1
promoter flanked by tfd terminator sequences, Aprar
(Herrmann et al.
2012)
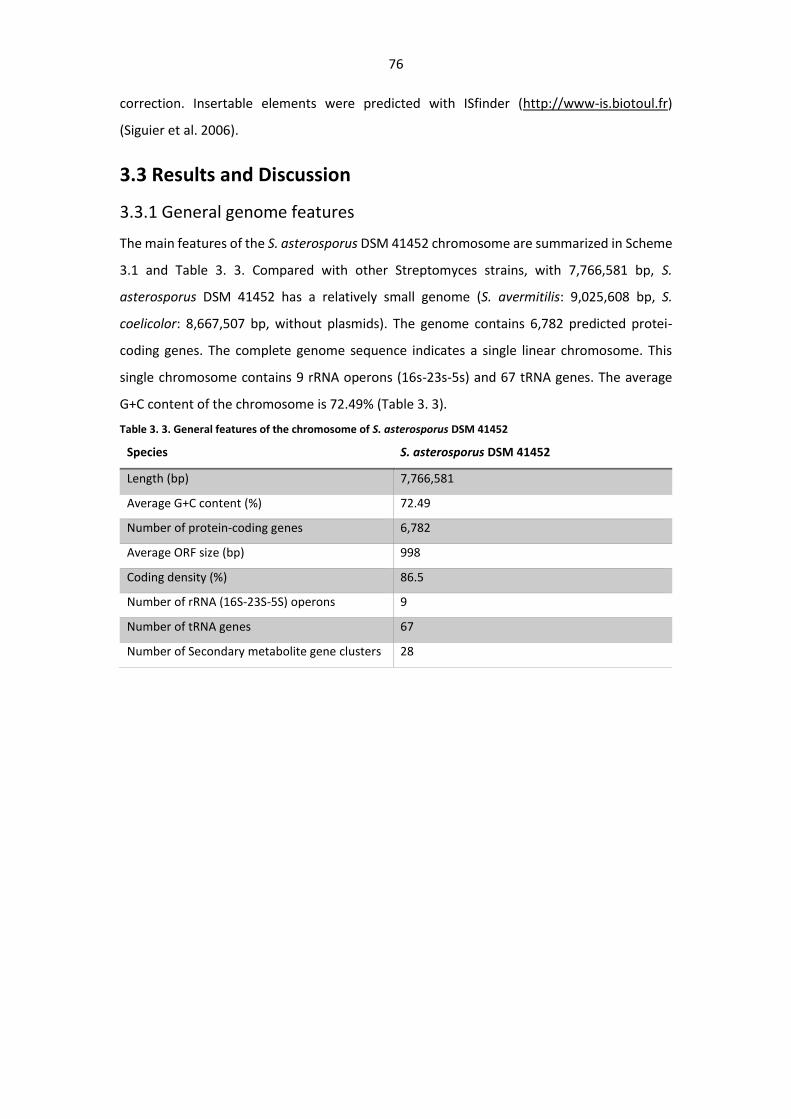
76
correction. Insertable elements were predicted with ISfinder (http://www-is.biotoul.fr)
(Siguier et al. 2006).
3.3 Results and Discussion
3.3.1 General genome features
The main features of the S. asterosporus DSM 41452 chromosome are summarized in Scheme
3.1 and Table 3. 3. Compared with other Streptomyces strains, with 7,766,581 bp, S.
asterosporus DSM 41452 has a relatively small genome (S. avermitilis: 9,025,608 bp, S.
coelicolor: 8,667,507 bp, without plasmids). The genome contains 6,782 predicted protei-
coding genes. The complete genome sequence indicates a single linear chromosome. This
single chromosome contains 9 rRNA operons (16s-23s-5s) and 67 tRNA genes. The average
G+C content of the chromosome is 72.49% (Table 3. 3).
Table 3. 3. General features of the chromosome of S. asterosporus DSM 41452
Species S. asterosporus DSM 41452
Length (bp) 7,766,581
Average G+C content (%) 72.49
Number of protein-coding genes 6,782
Average ORF size (bp) 998
Coding density (%) 86.5
Number of rRNA (16S-23S-5S) operons 9
Number of tRNA genes 67
Number of Secondary metabolite gene clusters 28
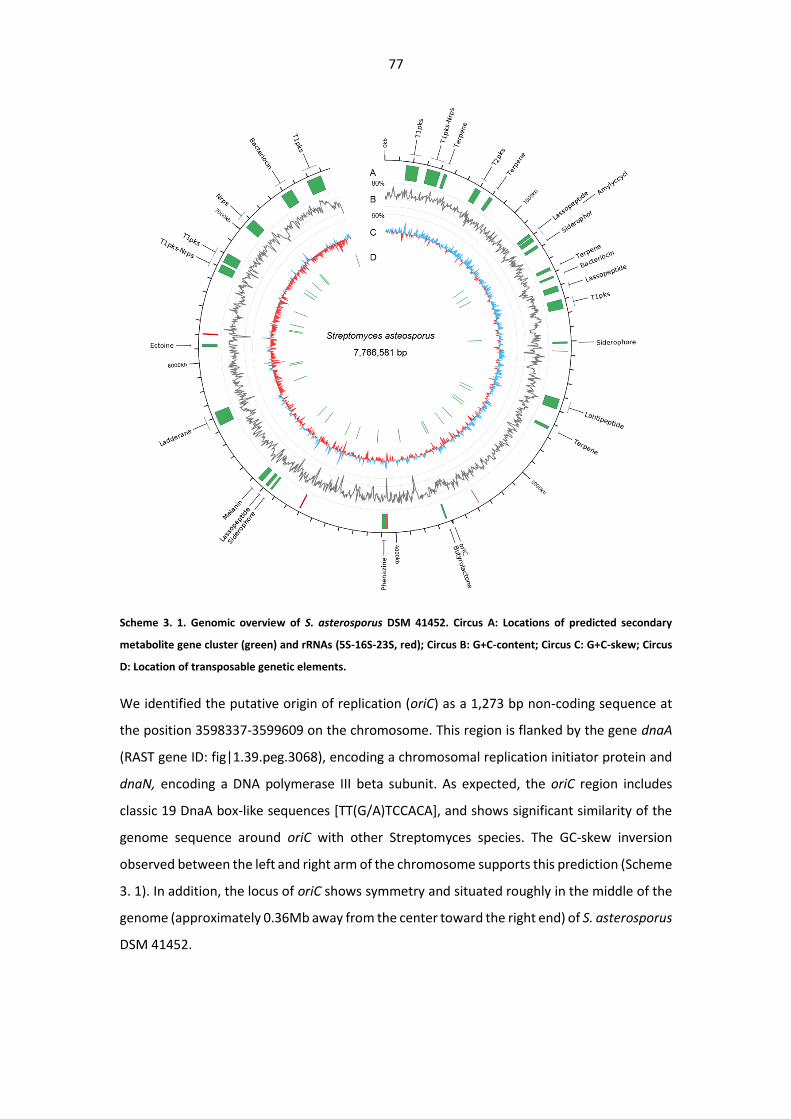
77
Scheme 3. 1. Genomic overview of S. asterosporus DSM 41452. Circus A: Locations of predicted secondary
metabolite gene cluster (green) and rRNAs (5S-16S-23S, red); Circus B: G+C-content; Circus C: G+C-skew; Circus
D: Location of transposable genetic elements.
We identified the putative origin of replication (oriC) as a 1,273 bp non-coding sequence at
the position 3598337-3599609 on the chromosome. This region is flanked by the gene dnaA
(RAST gene ID: fig|1.39.peg.3068), encoding a chromosomal replication initiator protein and
dnaN, encoding a DNA polymerase III beta subunit. As expected, the oriC region includes
classic 19 DnaA box-like sequences [TT(G/A)TCCACA], and shows significant similarity of the
genome sequence around oriC with other Streptomyces species. The GC-skew inversion
observed between the left and right arm of the chromosome supports this prediction (Scheme
3. 1). In addition, the locus of oriC shows symmetry and situated roughly in the middle of the
genome (approximately 0.36Mb away from the center toward the right end) of S. asterosporus
DSM 41452.
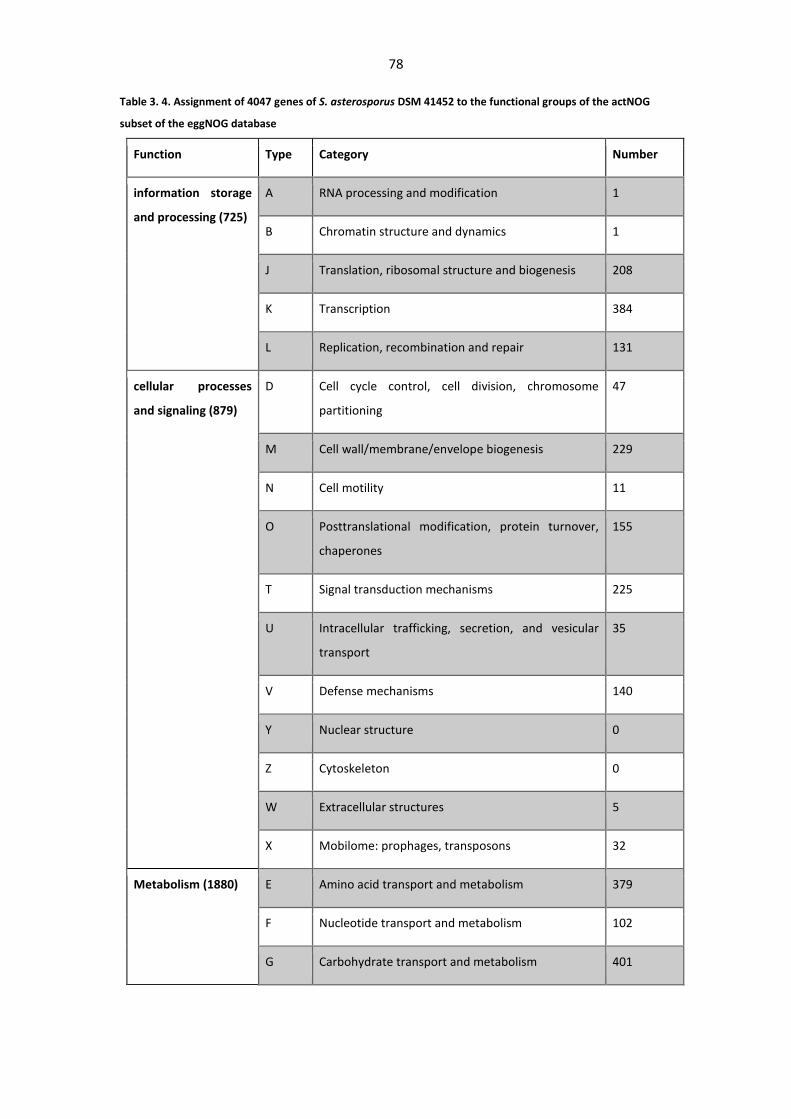
78
Table 3. 4. Assignment of 4047 genes of S. asterosporus DSM 41452 to the functional groups of the actNOG
subset of the eggNOG database
Function Type Category Number
information storage
and processing (725)
A RNA processing and modification 1
B Chromatin structure and dynamics 1
J Translation, ribosomal structure and biogenesis 208
K Transcription 384
L Replication, recombination and repair 131
cellular processes
and signaling (879)
D Cell cycle control, cell division, chromosome
partitioning
47
M Cell wall/membrane/envelope biogenesis 229
N Cell motility 11
O Posttranslational modification, protein turnover,
chaperones
155
T Signal transduction mechanisms 225
U Intracellular trafficking, secretion, and vesicular
transport
35
V Defense mechanisms 140
Y Nuclear structure 0
Z Cytoskeleton 0
W Extracellular structures 5
X Mobilome: prophages, transposons 32
Metabolism (1880) E Amino acid transport and metabolism 379
F Nucleotide transport and metabolism 102
G Carbohydrate transport and metabolism 401
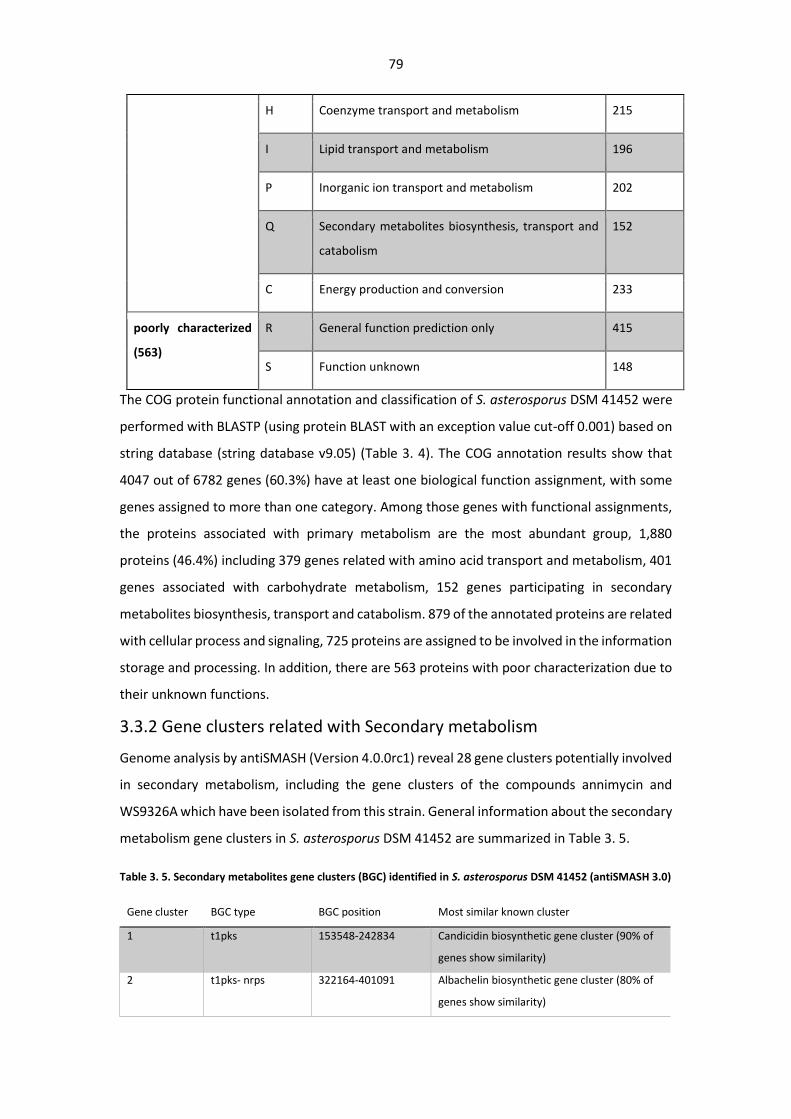
79
H Coenzyme transport and metabolism 215
I Lipid transport and metabolism 196
P Inorganic ion transport and metabolism 202
Q Secondary metabolites biosynthesis, transport and
catabolism
152
C Energy production and conversion 233
poorly characterized
(563)
R General function prediction only 415
S Function unknown 148
The COG protein functional annotation and classification of S. asterosporus DSM 41452 were
performed with BLASTP (using protein BLAST with an exception value cut-off 0.001) based on
string database (string database v9.05) (Table 3. 4). The COG annotation results show that
4047 out of 6782 genes (60.3%) have at least one biological function assignment, with some
genes assigned to more than one category. Among those genes with functional assignments,
the proteins associated with primary metabolism are the most abundant group, 1,880
proteins (46.4%) including 379 genes related with amino acid transport and metabolism, 401
genes associated with carbohydrate metabolism, 152 genes participating in secondary
metabolites biosynthesis, transport and catabolism. 879 of the annotated proteins are related
with cellular process and signaling, 725 proteins are assigned to be involved in the information
storage and processing. In addition, there are 563 proteins with poor characterization due to
their unknown functions.
3.3.2 Gene clusters related with Secondary metabolism
Genome analysis by antiSMASH (Version 4.0.0rc1) reveal 28 gene clusters potentially involved
in secondary metabolism, including the gene clusters of the compounds annimycin and
WS9326A which have been isolated from this strain. General information about the secondary
metabolism gene clusters in S. asterosporus DSM 41452 are summarized in Table 3. 5.
Table 3. 5. Secondary metabolites gene clusters (BGC) identified in S. asterosporus DSM 41452 (antiSMASH 3.0)
Gene cluster BGC type BGC position Most similar known cluster
1 t1pks 153548-242834 Candicidin biosynthetic gene cluster (90% of
genes show similarity)
2 t1pks- nrps 322164-401091 Albachelin biosynthetic gene cluster (80% of
genes show similarity)
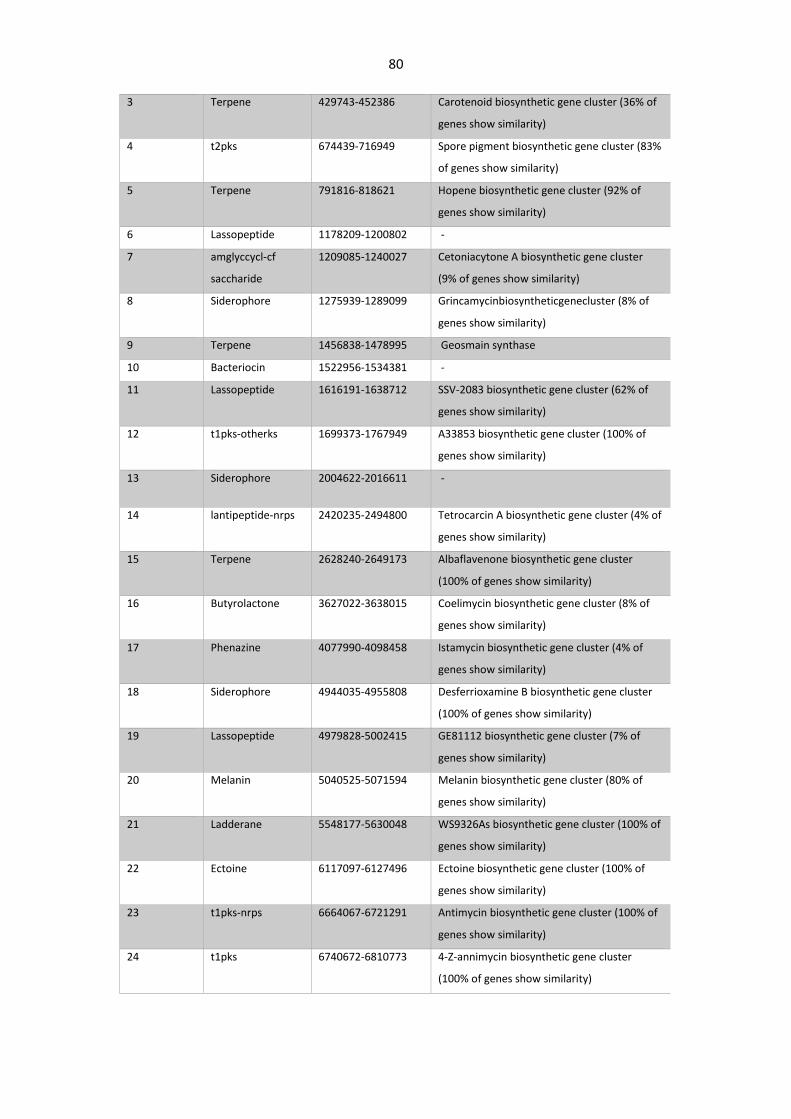
80
3 Terpene 429743-452386 Carotenoid biosynthetic gene cluster (36% of
genes show similarity)
4 t2pks 674439-716949 Spore pigment biosynthetic gene cluster (83%
of genes show similarity)
5 Terpene 791816-818621 Hopene biosynthetic gene cluster (92% of
genes show similarity)
6 Lassopeptide 1178209-1200802 -
7 amglyccycl-cf
saccharide
1209085-1240027 Cetoniacytone A biosynthetic gene cluster
(9% of genes show similarity)
8 Siderophore 1275939-1289099 Grincamycinbiosyntheticgenecluster (8% of
genes show similarity)
9 Terpene 1456838-1478995 Geosmain synthase
10 Bacteriocin 1522956-1534381 -
11 Lassopeptide 1616191-1638712 SSV-2083 biosynthetic gene cluster (62% of
genes show similarity)
12 t1pks-otherks 1699373-1767949 A33853 biosynthetic gene cluster (100% of
genes show similarity)
13 Siderophore 2004622-2016611 -
14 lantipeptide-nrps 2420235-2494800 Tetrocarcin A biosynthetic gene cluster (4% of
genes show similarity)
15 Terpene 2628240-2649173 Albaflavenone biosynthetic gene cluster
(100% of genes show similarity)
16 Butyrolactone 3627022-3638015 Coelimycin biosynthetic gene cluster (8% of
genes show similarity)
17 Phenazine 4077990-4098458 Istamycin biosynthetic gene cluster (4% of
genes show similarity)
18 Siderophore 4944035-4955808 Desferrioxamine B biosynthetic gene cluster
(100% of genes show similarity)
19 Lassopeptide 4979828-5002415 GE81112 biosynthetic gene cluster (7% of
genes show similarity)
20 Melanin 5040525-5071594 Melanin biosynthetic gene cluster (80% of
genes show similarity)
21 Ladderane 5548177-5630048 WS9326As biosynthetic gene cluster (100% of
genes show similarity)
22 Ectoine 6117097-6127496 Ectoine biosynthetic gene cluster (100% of
genes show similarity)
23 t1pks-nrps 6664067-6721291 Antimycin biosynthetic gene cluster (100% of
genes show similarity)
24 t1pks 6740672-6810773 4-Z-annimycin biosynthetic gene cluster
(100% of genes show similarity)
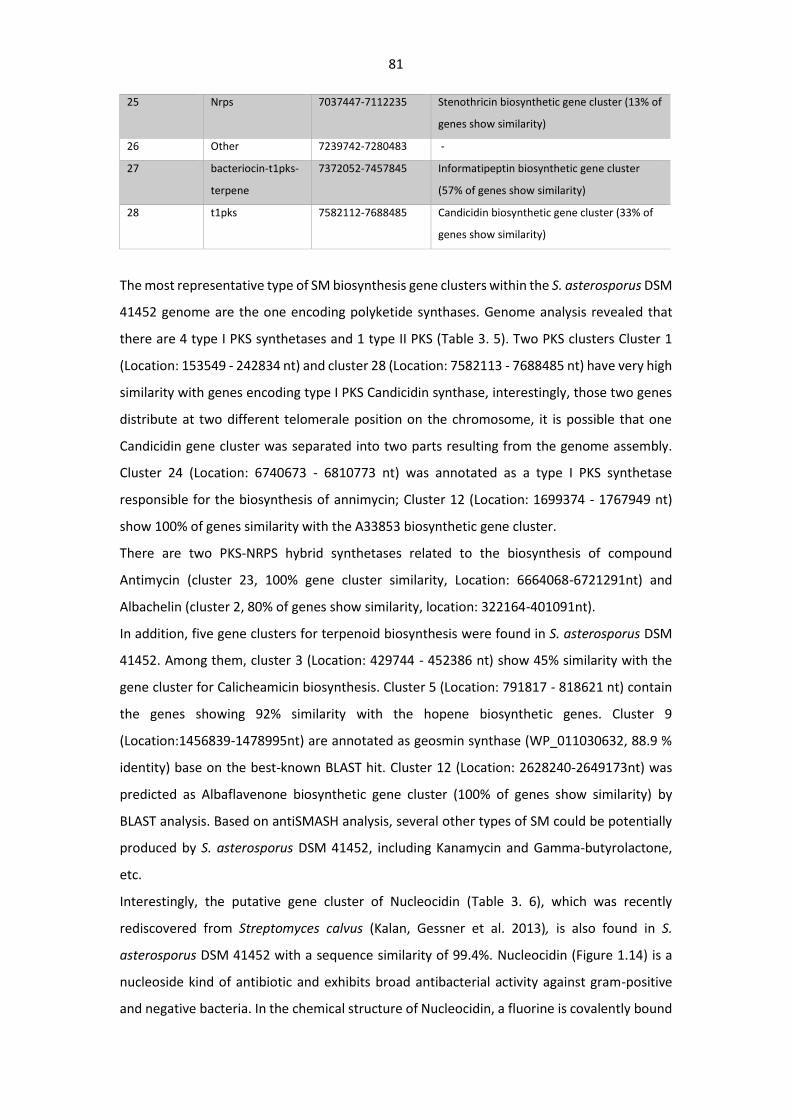
81
25 Nrps 7037447-7112235 Stenothricin biosynthetic gene cluster (13% of
genes show similarity)
26 Other 7239742-7280483 -
27 bacteriocin-t1pks-
terpene
7372052-7457845 Informatipeptin biosynthetic gene cluster
(57% of genes show similarity)
28 t1pks 7582112-7688485 Candicidin biosynthetic gene cluster (33% of
genes show similarity)
The most representative type of SM biosynthesis gene clusters within the S. asterosporus DSM
41452 genome are the one encoding polyketide synthases. Genome analysis revealed that
there are 4 type I PKS synthetases and 1 type II PKS (Table 3. 5). Two PKS clusters Cluster 1
(Location: 153549 - 242834 nt) and cluster 28 (Location: 7582113 - 7688485 nt) have very high
similarity with genes encoding type I PKS Candicidin synthase, interestingly, those two genes
distribute at two different telomerale position on the chromosome, it is possible that one
Candicidin gene cluster was separated into two parts resulting from the genome assembly.
Cluster 24 (Location: 6740673 - 6810773 nt) was annotated as a type I PKS synthetase
responsible for the biosynthesis of annimycin; Cluster 12 (Location: 1699374 - 1767949 nt)
show 100% of genes similarity with the A33853 biosynthetic gene cluster.
There are two PKS-NRPS hybrid synthetases related to the biosynthesis of compound
Antimycin (cluster 23, 100% gene cluster similarity, Location: 6664068-6721291nt) and
Albachelin (cluster 2, 80% of genes show similarity, location: 322164-401091nt).
In addition, five gene clusters for terpenoid biosynthesis were found in S. asterosporus DSM
41452. Among them, cluster 3 (Location: 429744 - 452386 nt) show 45% similarity with the
gene cluster for Calicheamicin biosynthesis. Cluster 5 (Location: 791817 - 818621 nt) contain
the genes showing 92% similarity with the hopene biosynthetic genes. Cluster 9
(Location:1456839-1478995nt) are annotated as geosmin synthase (WP_011030632, 88.9 %
identity) base on the best-known BLAST hit. Cluster 12 (Location: 2628240-2649173nt) was
predicted as Albaflavenone biosynthetic gene cluster (100% of genes show similarity) by
BLAST analysis. Based on antiSMASH analysis, several other types of SM could be potentially
produced by S. asterosporus DSM 41452, including Kanamycin and Gamma-butyrolactone,
etc.
Interestingly, the putative gene cluster of Nucleocidin (Table 3. 6), which was recently
rediscovered from Streptomyces calvus (Kalan, Gessner et al. 2013), is also found in S.
asterosporus DSM 41452 with a sequence similarity of 99.4%. Nucleocidin (Figure 1.14) is a
nucleoside kind of antibiotic and exhibits broad antibacterial activity against gram-positive
and negative bacteria. In the chemical structure of Nucleocidin, a fluorine is covalently bound
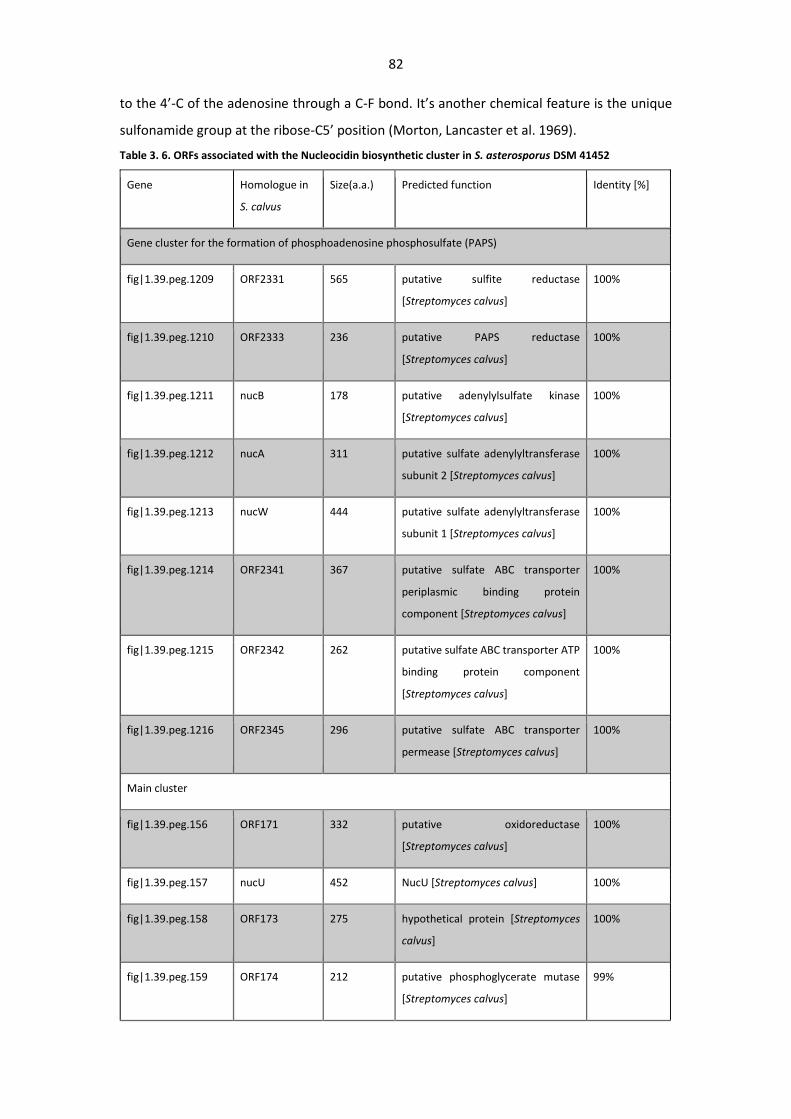
82
to the 4’-C of the adenosine through a C-F bond. It’s another chemical feature is the unique
sulfonamide group at the ribose-C5’ position (Morton, Lancaster et al. 1969).
Table 3. 6. ORFs associated with the Nucleocidin biosynthetic cluster in S. asterosporus DSM 41452
Gene Homologue in
S. calvus
Size(a.a.) Predicted function Identity [%]
Gene cluster for the formation of phosphoadenosine phosphosulfate (PAPS)
fig|1.39.peg.1209 ORF2331 565 putative sulfite reductase
[Streptomyces calvus]
100%
fig|1.39.peg.1210 ORF2333 236 putative PAPS reductase
[Streptomyces calvus]
100%
fig|1.39.peg.1211 nucB 178 putative adenylylsulfate kinase
[Streptomyces calvus]
100%
fig|1.39.peg.1212 nucA 311 putative sulfate adenylyltransferase
subunit 2 [Streptomyces calvus]
100%
fig|1.39.peg.1213 nucW 444 putative sulfate adenylyltransferase
subunit 1 [Streptomyces calvus]
100%
fig|1.39.peg.1214 ORF2341 367 putative sulfate ABC transporter
periplasmic binding protein
component [Streptomyces calvus]
100%
fig|1.39.peg.1215 ORF2342 262 putative sulfate ABC transporter ATP
binding protein component
[Streptomyces calvus]
100%
fig|1.39.peg.1216 ORF2345 296 putative sulfate ABC transporter
permease [Streptomyces calvus]
100%
Main cluster
fig|1.39.peg.156 ORF171 332 putative oxidoreductase
[Streptomyces calvus]
100%
fig|1.39.peg.157 nucU 452 NucU [Streptomyces calvus] 100%
fig|1.39.peg.158 ORF173 275 hypothetical protein [Streptomyces
calvus]
100%
fig|1.39.peg.159 ORF174 212 putative phosphoglycerate mutase
[Streptomyces calvus]
99%
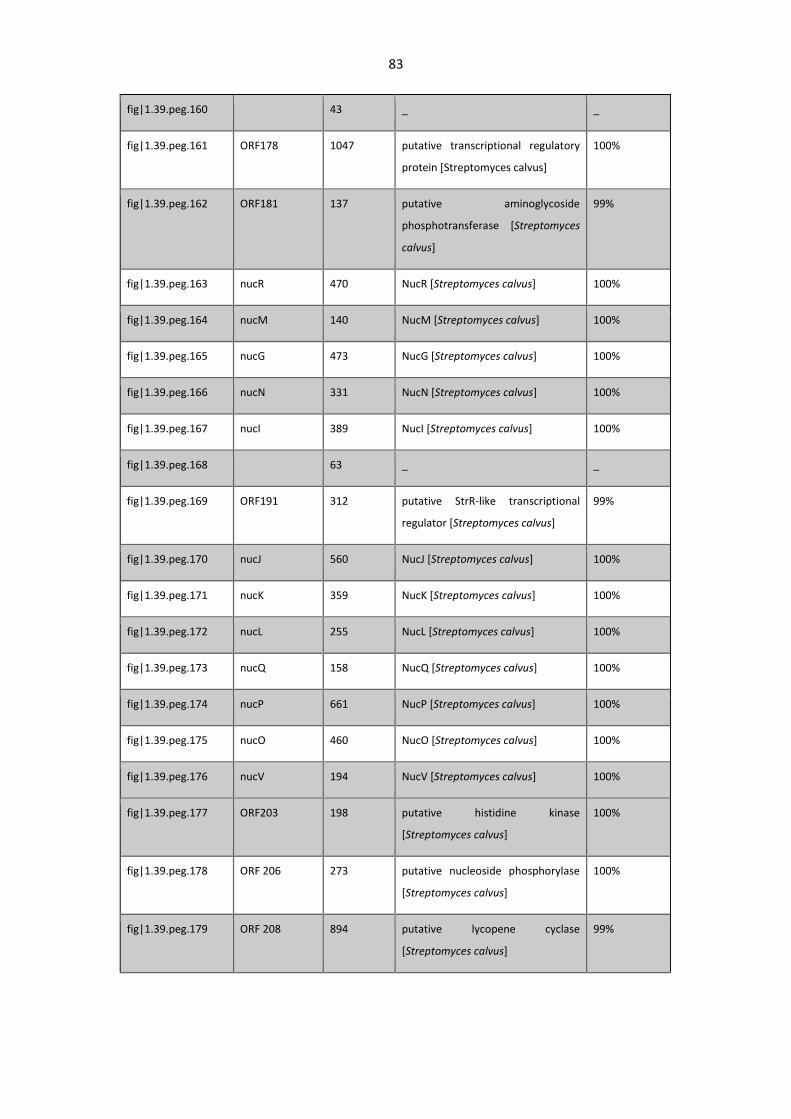
83
fig|1.39.peg.160 43 _ _
fig|1.39.peg.161 ORF178 1047 putative transcriptional regulatory
protein [Streptomyces calvus]
100%
fig|1.39.peg.162 ORF181 137 putative aminoglycoside
phosphotransferase [Streptomyces
calvus]
99%
fig|1.39.peg.163 nucR 470 NucR [Streptomyces calvus] 100%
fig|1.39.peg.164 nucM 140 NucM [Streptomyces calvus] 100%
fig|1.39.peg.165 nucG 473 NucG [Streptomyces calvus] 100%
fig|1.39.peg.166 nucN 331 NucN [Streptomyces calvus] 100%
fig|1.39.peg.167 nucI 389 NucI [Streptomyces calvus] 100%
fig|1.39.peg.168 63 _ _
fig|1.39.peg.169 ORF191 312 putative StrR-like transcriptional
regulator [Streptomyces calvus]
99%
fig|1.39.peg.170 nucJ 560 NucJ [Streptomyces calvus] 100%
fig|1.39.peg.171 nucK 359 NucK [Streptomyces calvus] 100%
fig|1.39.peg.172 nucL 255 NucL [Streptomyces calvus] 100%
fig|1.39.peg.173 nucQ 158 NucQ [Streptomyces calvus] 100%
fig|1.39.peg.174 nucP 661 NucP [Streptomyces calvus] 100%
fig|1.39.peg.175 nucO 460 NucO [Streptomyces calvus] 100%
fig|1.39.peg.176 nucV 194 NucV [Streptomyces calvus] 100%
fig|1.39.peg.177 ORF203 198 putative histidine kinase
[Streptomyces calvus]
100%
fig|1.39.peg.178 ORF 206 273 putative nucleoside phosphorylase
[Streptomyces calvus]
100%
fig|1.39.peg.179 ORF 208 894 putative lycopene cyclase
[Streptomyces calvus]
99%
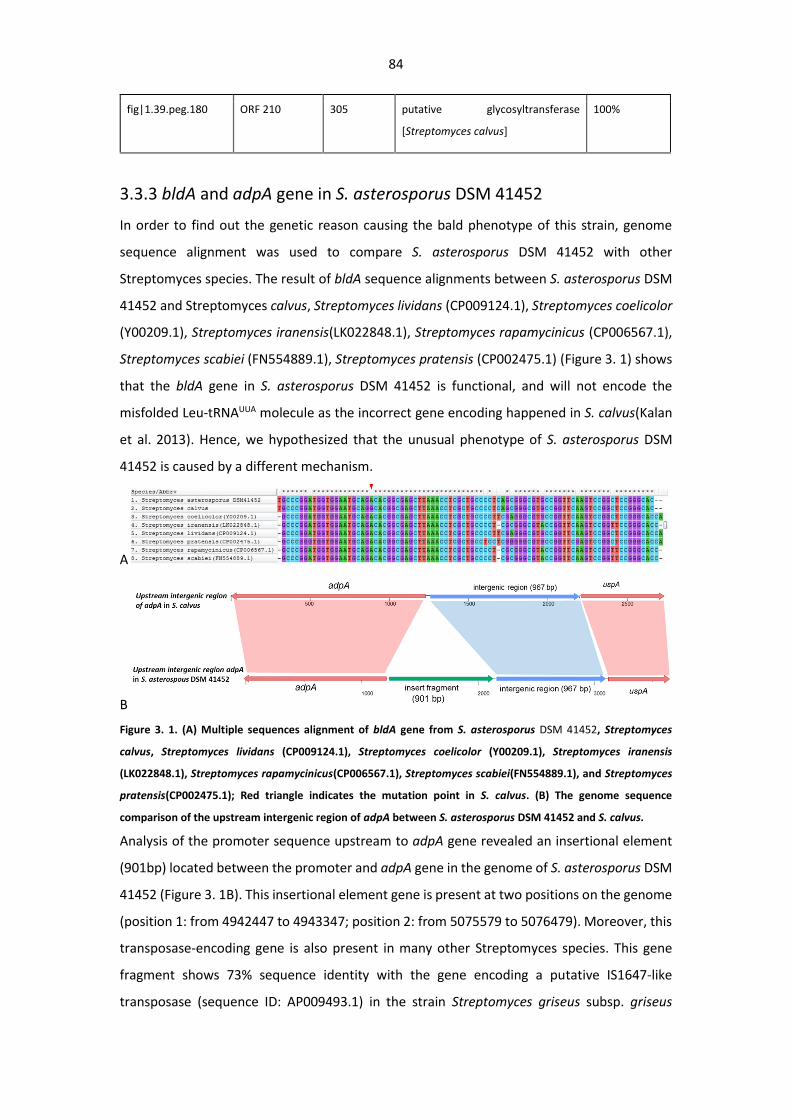
84
fig|1.39.peg.180 ORF 210 305 putative glycosyltransferase
[Streptomyces calvus]
100%
3.3.3 bldA and adpA gene in S. asterosporus DSM 41452
In order to find out the genetic reason causing the bald phenotype of this strain, genome
sequence alignment was used to compare S. asterosporus DSM 41452 with other
Streptomyces species. The result of bldA sequence alignments between S. asterosporus DSM
41452 and Streptomyces calvus, Streptomyces lividans (CP009124.1), Streptomyces coelicolor
(Y00209.1), Streptomyces iranensis(LK022848.1), Streptomyces rapamycinicus (CP006567.1),
Streptomyces scabiei (FN554889.1), Streptomyces pratensis (CP002475.1) (Figure 3. 1) shows
that the bldA gene in S. asterosporus DSM 41452 is functional, and will not encode the
misfolded Leu-tRNAUUA molecule as the incorrect gene encoding happened in S. calvus(Kalan
et al. 2013). Hence, we hypothesized that the unusual phenotype of S. asterosporus DSM
41452 is caused by a different mechanism.
A
B
Figure 3. 1. (A) Multiple sequences alignment of bldA gene from S. asterosporus DSM 41452, Streptomyces
calvus, Streptomyces lividans (CP009124.1), Streptomyces coelicolor (Y00209.1), Streptomyces iranensis
(LK022848.1), Streptomyces rapamycinicus(CP006567.1), Streptomyces scabiei(FN554889.1), and Streptomyces
pratensis(CP002475.1); Red triangle indicates the mutation point in S. calvus. (B) The genome sequence
comparison of the upstream intergenic region of adpA between S. asterosporus DSM 41452 and S. calvus.
Analysis of the promoter sequence upstream to adpA gene revealed an insertional element
(901bp) located between the promoter and adpA gene in the genome of S. asterosporus DSM
41452 (Figure 3. 1B). This insertional element gene is present at two positions on the genome
(position 1: from 4942447 to 4943347; position 2: from 5075579 to 5076479). Moreover, this
transposase-encoding gene is also present in many other Streptomyces species. This gene
fragment shows 73% sequence identity with the gene encoding a putative IS1647-like
transposase (sequence ID: AP009493.1) in the strain Streptomyces griseus subsp. griseus
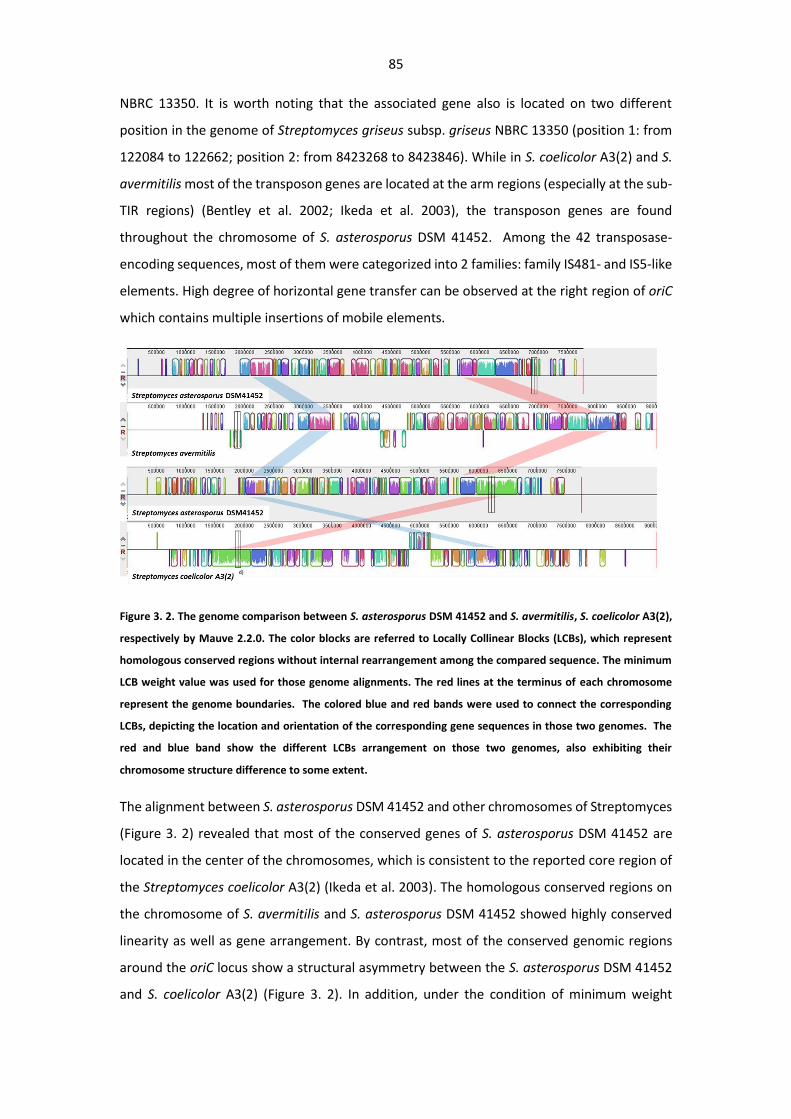
85
NBRC 13350. It is worth noting that the associated gene also is located on two different
position in the genome of Streptomyces griseus subsp. griseus NBRC 13350 (position 1: from
122084 to 122662; position 2: from 8423268 to 8423846). While in S. coelicolor A3(2) and S.
avermitilis most of the transposon genes are located at the arm regions (especially at the sub-
TIR regions) (Bentley et al. 2002; Ikeda et al. 2003), the transposon genes are found
throughout the chromosome of S. asterosporus DSM 41452. Among the 42 transposase-
encoding sequences, most of them were categorized into 2 families: family IS481- and IS5-like
elements. High degree of horizontal gene transfer can be observed at the right region of oriC
which contains multiple insertions of mobile elements.
Figure 3. 2. The genome comparison between S. asterosporus DSM 41452 and S. avermitilis, S. coelicolor A3(2),
respectively by Mauve 2.2.0. The color blocks are referred to Locally Collinear Blocks (LCBs), which represent
homologous conserved regions without internal rearrangement among the compared sequence. The minimum
LCB weight value was used for those genome alignments. The red lines at the terminus of each chromosome
represent the genome boundaries. The colored blue and red bands were used to connect the corresponding
LCBs, depicting the location and orientation of the corresponding gene sequences in those two genomes. The
red and blue band show the different LCBs arrangement on those two genomes, also exhibiting their
chromosome structure difference to some extent.
The alignment between S. asterosporus DSM 41452 and other chromosomes of Streptomyces
(Figure 3. 2) revealed that most of the conserved genes of S. asterosporus DSM 41452 are
located in the center of the chromosomes, which is consistent to the reported core region of
the Streptomyces coelicolor A3(2) (Ikeda et al. 2003). The homologous conserved regions on
the chromosome of S. avermitilis and S. asterosporus DSM 41452 showed highly conserved
linearity as well as gene arrangement. By contrast, most of the conserved genomic regions
around the oriC locus show a structural asymmetry between the S. asterosporus DSM 41452
and S. coelicolor A3(2) (Figure 3. 2). In addition, under the condition of minimum weight
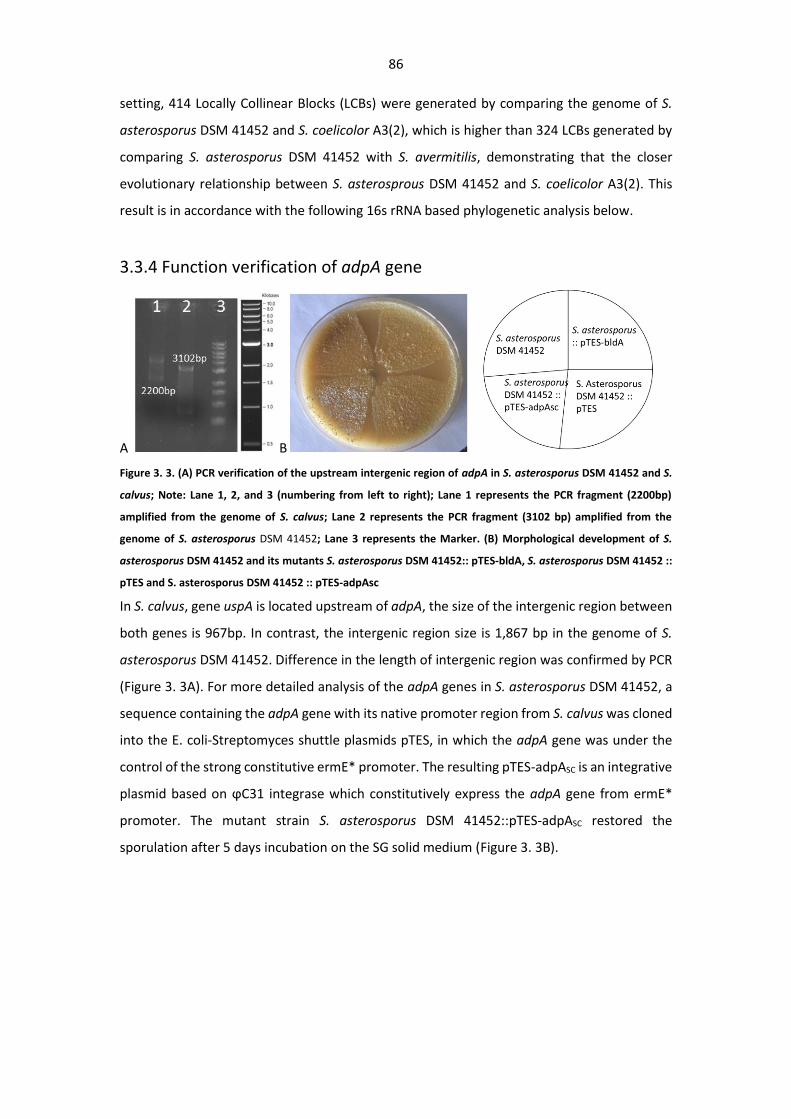
86
setting, 414 Locally Collinear Blocks (LCBs) were generated by comparing the genome of S.
asterosporus DSM 41452 and S. coelicolor A3(2), which is higher than 324 LCBs generated by
comparing S. asterosporus DSM 41452 with S. avermitilis, demonstrating that the closer
evolutionary relationship between S. asterosprous DSM 41452 and S. coelicolor A3(2). This
result is in accordance with the following 16s rRNA based phylogenetic analysis below.
3.3.4 Function verification of adpA gene
A B
Figure 3. 3. (A) PCR verification of the upstream intergenic region of adpA in S. asterosporus DSM 41452 and S.
calvus; Note: Lane 1, 2, and 3 (numbering from left to right); Lane 1 represents the PCR fragment (2200bp)
amplified from the genome of S. calvus; Lane 2 represents the PCR fragment (3102 bp) amplified from the
genome of S. asterosporus DSM 41452; Lane 3 represents the Marker. (B) Morphological development of S.
asterosporus DSM 41452 and its mutants S. asterosporus DSM 41452:: pTES-bldA, S. asterosporus DSM 41452 ::
pTES and S. asterosporus DSM 41452 :: pTES-adpAsc
In S. calvus, gene uspA is located upstream of adpA, the size of the intergenic region between
both genes is 967bp. In contrast, the intergenic region size is 1,867 bp in the genome of S.
asterosporus DSM 41452. Difference in the length of intergenic region was confirmed by PCR
(Figure 3. 3A). For more detailed analysis of the adpA genes in S. asterosporus DSM 41452, a
sequence containing the adpA gene with its native promoter region from S. calvus was cloned
into the E. coli-Streptomyces shuttle plasmids pTES, in which the adpA gene was under the
control of the strong constitutive ermE* promoter. The resulting pTES-adpASC is an integrative
plasmid based on ϕC31 integrase which constitutively express the adpA gene from ermE*
promoter. The mutant strain S. asterosporus DSM 41452::pTES-adpASC restored the
sporulation after 5 days incubation on the SG solid medium (Figure 3. 3B).
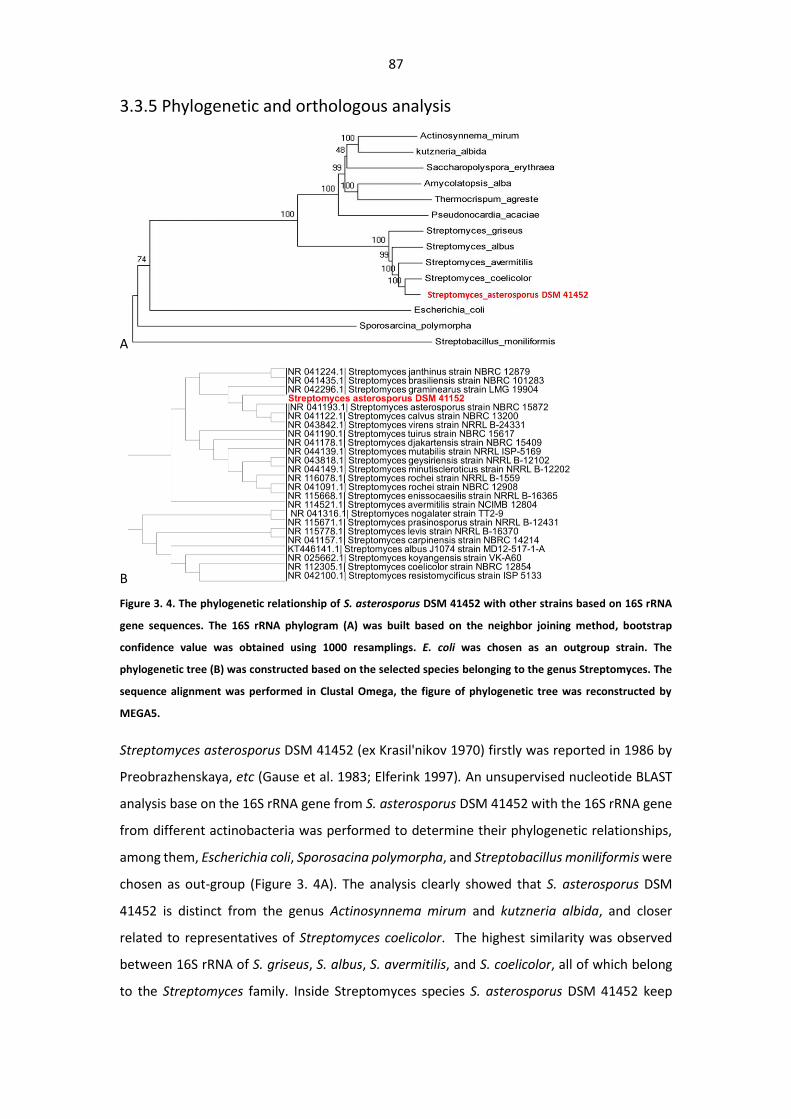
87
3.3.5 Phylogenetic and orthologous analysis
A
B
Figure 3. 4. The phylogenetic relationship of S. asterosporus DSM 41452 with other strains based on 16S rRNA
gene sequences. The 16S rRNA phylogram (A) was built based on the neighbor joining method, bootstrap
confidence value was obtained using 1000 resamplings. E. coli was chosen as an outgroup strain. The
phylogenetic tree (B) was constructed based on the selected species belonging to the genus Streptomyces. The
sequence alignment was performed in Clustal Omega, the figure of phylogenetic tree was reconstructed by
MEGA5.
Streptomyces asterosporus DSM 41452 (ex Krasil'nikov 1970) firstly was reported in 1986 by
Preobrazhenskaya, etc (Gause et al. 1983; Elferink 1997). An unsupervised nucleotide BLAST
analysis base on the 16S rRNA gene from S. asterosporus DSM 41452 with the 16S rRNA gene
from different actinobacteria was performed to determine their phylogenetic relationships,
among them, Escherichia coli, Sporosacina polymorpha, and Streptobacillus moniliformis were
chosen as out-group (Figure 3. 4A). The analysis clearly showed that S. asterosporus DSM
41452 is distinct from the genus Actinosynnema mirum and kutzneria albida, and closer
related to representatives of Streptomyces coelicolor. The highest similarity was observed
between 16S rRNA of S. griseus, S. albus, S. avermitilis, and S. coelicolor, all of which belong
to the Streptomyces family. Inside Streptomyces species S. asterosporus DSM 41452 keep
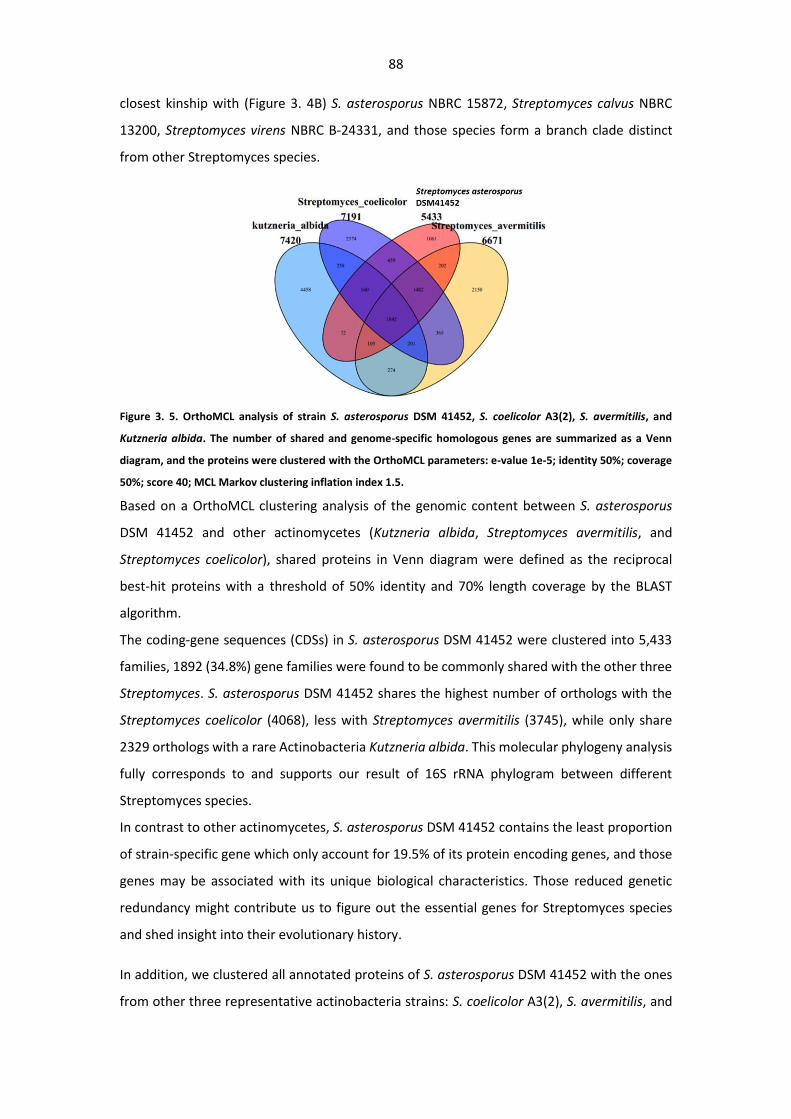
88
closest kinship with (Figure 3. 4B) S. asterosporus NBRC 15872, Streptomyces calvus NBRC
13200, Streptomyces virens NBRC B-24331, and those species form a branch clade distinct
from other Streptomyces species.
Figure 3. 5. OrthoMCL analysis of strain S. asterosporus DSM 41452, S. coelicolor A3(2), S. avermitilis, and
Kutzneria albida. The number of shared and genome-specific homologous genes are summarized as a Venn
diagram, and the proteins were clustered with the OrthoMCL parameters: e-value 1e-5; identity 50%; coverage
50%; score 40; MCL Markov clustering inflation index 1.5.
Based on a OrthoMCL clustering analysis of the genomic content between S. asterosporus
DSM 41452 and other actinomycetes (Kutzneria albida, Streptomyces avermitilis, and
Streptomyces coelicolor), shared proteins in Venn diagram were defined as the reciprocal
best-hit proteins with a threshold of 50% identity and 70% length coverage by the BLAST
algorithm.
The coding-gene sequences (CDSs) in S. asterosporus DSM 41452 were clustered into 5,433
families, 1892 (34.8%) gene families were found to be commonly shared with the other three
Streptomyces. S. asterosporus DSM 41452 shares the highest number of orthologs with the
Streptomyces coelicolor (4068), less with Streptomyces avermitilis (3745), while only share
2329 orthologs with a rare Actinobacteria Kutzneria albida. This molecular phylogeny analysis
fully corresponds to and supports our result of 16S rRNA phylogram between different
Streptomyces species.
In contrast to other actinomycetes, S. asterosporus DSM 41452 contains the least proportion
of strain-specific gene which only account for 19.5% of its protein encoding genes, and those
genes may be associated with its unique biological characteristics. Those reduced genetic
redundancy might contribute us to figure out the essential genes for Streptomyces species
and shed insight into their evolutionary history.
In addition, we clustered all annotated proteins of S. asterosporus DSM 41452 with the ones
from other three representative actinobacteria strains: S. coelicolor A3(2), S. avermitilis, and
89
kutzneria albida using pair-wise BLASTP program with a threshold of 60% identity and 70%
length coverage. 1419 single copy genes were found to be commonly present in all those four
actinomycetes. Interestingly, comparing with the previous report (Ohnishi et al. 2008), there
are 3039 proteins are present among those three Streptomyces species: S. coelicolor A3(2), S.
avermitilis, and S. griseus. In our case, the less number of shared single copy gene in those
four actinomycetes could be caused by the taxonomically far distant between Streptomyces
species and kutzneria albida, which belong to the genus of bacteria in Phylum Actinobacteria.
3.4 Conclusion
S. asterosporus DSM 41452 is a producer of WS9326A and its derivatives which belong to a
group of natural products with potent tachykinin antagonist activity (Shigematsu et al. 1993).
In this study, we present the complete genome sequence of a natural non-sporulation strain:
S. asterosporus DSM 41452. The genome reveals a single 7,837,567 bp linear chromosome
with 6782 annotated protein-coding sequences (CDSs). The sequencing results show that this
strain own abundant gene clusters for secondary metabolites, more than 28 natural product
gene clusters were detected in the genome, most interestingly, it contains the gene cluster of
the antibiotic Nucleocidin (Figure 1. 19). Nucleocidin was firstly isolated as an anti-
trypanosome antibiotic from Streptomyces calvus by scientists (Morton et al. 1969), but since
then lots of subsequent efforts to restore this molecule have failed (Maguire et al. 1993;
O’Hagan and B. Harper 1999). Interestingly, in 2015, David etal (Zhu et al. 2015) successfully
restored the production of Nucleocidin in a bldA mutant of S. calvus. Considering the close
kinship of those two strains, and the exist of Nucleocidin gene cluster in S. asterosporus DSM
41452, we tend to believe that S. asterosporus DSM 41452 own the capability of producing
Nucleocidin, the detailed secondary metabolites analysis is undergoing.
S. asterosporus DSM 41452 is a bald strain with wrinkled and shiny aerial surface. By
comparative genome analysis, a transposon gene was discovered to insert between the region
of ribosomal binding site (RBS) and gene adpA in S. asterosporus DSM 41452 which prevents
the transcription of adpA. We propose that, the baldness phenotype of S. asterosporus DSM
41452 is caused by this unusual genotype. The following gene complementation experiments
proven this machinery. In conclusion, the genome sequence of S. asterosporus DSM 41452
provides an interesting insight into the genetic of Streptomyces species with non-sporulation
phenotype.
90
In addition, our research illustrated a new mechanism resulting in the morphological defect
of baldness mutant in Streptomyces, which also provide a new alternative approach of waking
up the expression of “silent” gene cluster in Streptomyces species.
S. asterosporus DSM 41452 owns relatively less amounts of strain-specific gene, which may
reflect some its special evolutionary history to a certain extent. Those reduced genetic
redundancy might contribute to outline the essential gene for Streptomyces in the future
research. The complete genome sequence of S. asterosporus DSM 41452 has been uploaded
and deposited in the GenBank database with accession number [CP022310]. We anticipate
that the complete genome information contributes to the application development of S.
asterosporus DSM 41452 as an industrial strain in the future.
91
Chapter 4. Comparative Proteomic Analysis of Streptomyces
asterosporus DSM 41452
4.1 Introduction
As it has been described in the section 1.1 that Streptomyces is characterized by a set of
complicated development system (Ohnishi et al. 2005), and many studies have suggested that
the regulatory network of AdpA vary from Streptomyces species to species, and the
representatives have been exemplified. In the case of S. asterosporus DSM 41452, it not only
owns the potential ability of producing various kinds of secondary metabolites, but also
exhibits characteristic ‘’baldness” phenotype of its wildtype strain. In Chapter 3, we
successfully verified that the promoter region of native adpA in this strain was disrupted by
an insertional element gene located between the promoter and adpA gene in the genome of
S. asterosporus DSM 41452. However, our understanding of the regulatory mechanism in this
strain was still limited, we were interested to know whether this kind of genetic defect will
cause some other influence on strain’s normal growth and development. From other
perspective, AdpA is assumed to own the largest regulon in bacteria (Higo et al. 2012).
However, the exact pleiotropic regulatory network of AdpA in a native non-sporulating strain
remains poorly understood so far.
Proteomics is an efficient method to investigate the cellular physiology and metabolism of an
organism(Mallick and Kuster 2010), and it’s also an attractive approach of screening potential
engineering targets for strain improvement in various cell types (Jayapal et al. 2010; Manteca,
Jung et al. 2010; Manteca, Sanchez et al. 2010). The throughput and the detection limits of
proteomics have been increasingly improved with the advancement of genomic sequencing
technology and bioinformatics (Hwang et al. 2014). However, the traditional proteomics
method usually base on the technique combination of the protein fractionation by two-
dimensional polyacrylamide gel electrophoresis (2D-PAGE) and the target protein
identification of by mass spectrometry (Choi et al. 2010; Ye et al. 2014). The limitations of
these methods are the limited reproducibility and the low resolution of discerning the identity
of proteins. Therefore, it is necessary to employ more automated and sensitive detection
method. Mass spectrometry based approaches such as isobaric tags for relative and absolute
quantitation (iTRAQ) and the stable isotope labeling with amino acids in cell culture (SILAC)
are adequate to this purpose and widely used in quantitative proteomics to solve these issues
(Ong et al. 2002; Wiese et al. 2007).
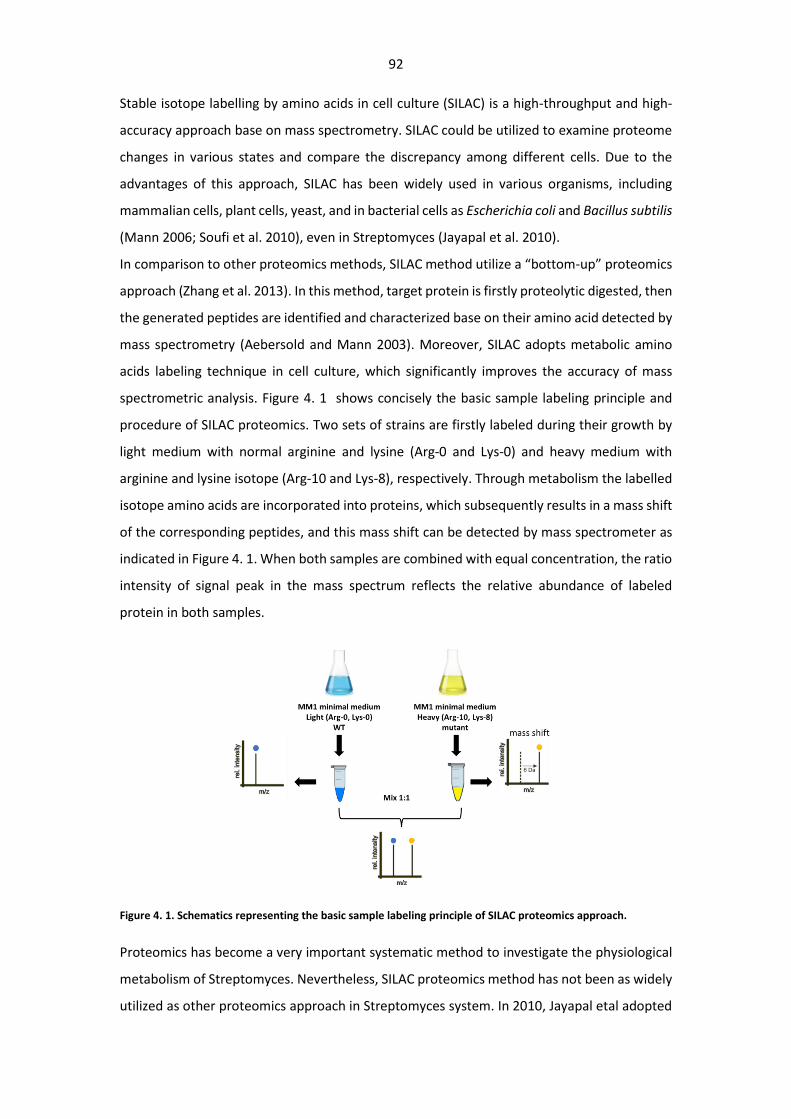
92
Stable isotope labelling by amino acids in cell culture (SILAC) is a high-throughput and high-
accuracy approach base on mass spectrometry. SILAC could be utilized to examine proteome
changes in various states and compare the discrepancy among different cells. Due to the
advantages of this approach, SILAC has been widely used in various organisms, including
mammalian cells, plant cells, yeast, and in bacterial cells as Escherichia coli and Bacillus subtilis
(Mann 2006; Soufi et al. 2010), even in Streptomyces (Jayapal et al. 2010).
In comparison to other proteomics methods, SILAC method utilize a “bottom-up” proteomics
approach (Zhang et al. 2013). In this method, target protein is firstly proteolytic digested, then
the generated peptides are identified and characterized base on their amino acid detected by
mass spectrometry (Aebersold and Mann 2003). Moreover, SILAC adopts metabolic amino
acids labeling technique in cell culture, which significantly improves the accuracy of mass
spectrometric analysis. Figure 4. 1 shows concisely the basic sample labeling principle and
procedure of SILAC proteomics. Two sets of strains are firstly labeled during their growth by
light medium with normal arginine and lysine (Arg-0 and Lys-0) and heavy medium with
arginine and lysine isotope (Arg-10 and Lys-8), respectively. Through metabolism the labelled
isotope amino acids are incorporated into proteins, which subsequently results in a mass shift
of the corresponding peptides, and this mass shift can be detected by mass spectrometer as
indicated in Figure 4. 1. When both samples are combined with equal concentration, the ratio
intensity of signal peak in the mass spectrum reflects the relative abundance of labeled
protein in both samples.
Figure 4. 1. Schematics representing the basic sample labeling principle of SILAC proteomics approach.
Proteomics has become a very important systematic method to investigate the physiological
metabolism of Streptomyces. Nevertheless, SILAC proteomics method has not been as widely
utilized as other proteomics approach in Streptomyces system. In 2010, Jayapal etal adopted
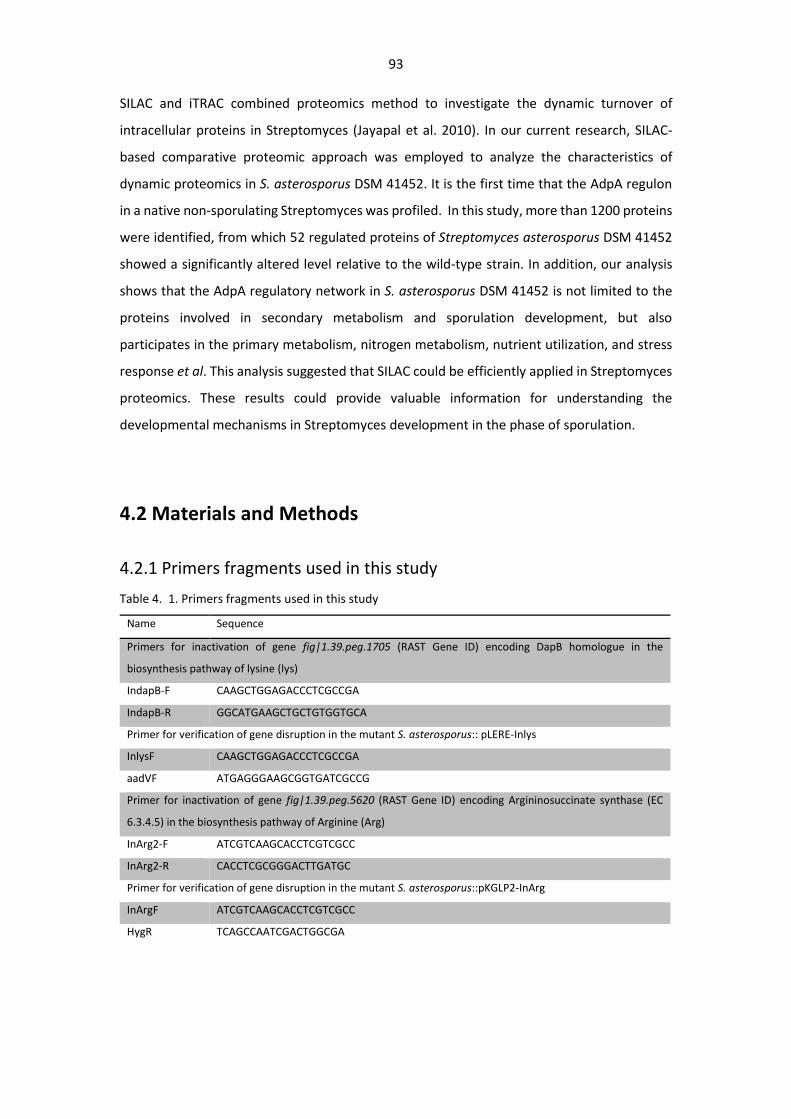
93
SILAC and iTRAC combined proteomics method to investigate the dynamic turnover of
intracellular proteins in Streptomyces (Jayapal et al. 2010). In our current research, SILAC-
based comparative proteomic approach was employed to analyze the characteristics of
dynamic proteomics in S. asterosporus DSM 41452. It is the first time that the AdpA regulon
in a native non-sporulating Streptomyces was profiled. In this study, more than 1200 proteins
were identified, from which 52 regulated proteins of Streptomyces asterosporus DSM 41452
showed a significantly altered level relative to the wild-type strain. In addition, our analysis
shows that the AdpA regulatory network in S. asterosporus DSM 41452 is not limited to the
proteins involved in secondary metabolism and sporulation development, but also
participates in the primary metabolism, nitrogen metabolism, nutrient utilization, and stress
response et al. This analysis suggested that SILAC could be efficiently applied in Streptomyces
proteomics. These results could provide valuable information for understanding the
developmental mechanisms in Streptomyces development in the phase of sporulation.
4.2 Materials and Methods
4.2.1 Primers fragments used in this study
Table 4. 1. Primers fragments used in this study
Name Sequence
Primers for inactivation of gene fig|1.39.peg.1705 (RAST Gene ID) encoding DapB homologue in the
biosynthesis pathway of lysine (lys)
IndapB-F CAAGCTGGAGACCCTCGCCGA
IndapB-R GGCATGAAGCTGCTGTGGTGCA
Primer for verification of gene disruption in the mutant S. asterosporus:: pLERE-Inlys
InlysF CAAGCTGGAGACCCTCGCCGA
aadVF ATGAGGGAAGCGGTGATCGCCG
Primer for inactivation of gene fig|1.39.peg.5620 (RAST Gene ID) encoding Argininosuccinate synthase (EC
6.3.4.5) in the biosynthesis pathway of Arginine (Arg)
InArg2-F ATCGTCAAGCACCTCGTCGCC
InArg2-R CACCTCGCGGGACTTGATGC
Primer for verification of gene disruption in the mutant S. asterosporus::pKGLP2-InArg
InArgF ATCGTCAAGCACCTCGTCGCC
HygR TCAGCCAATCGACTGGCGA
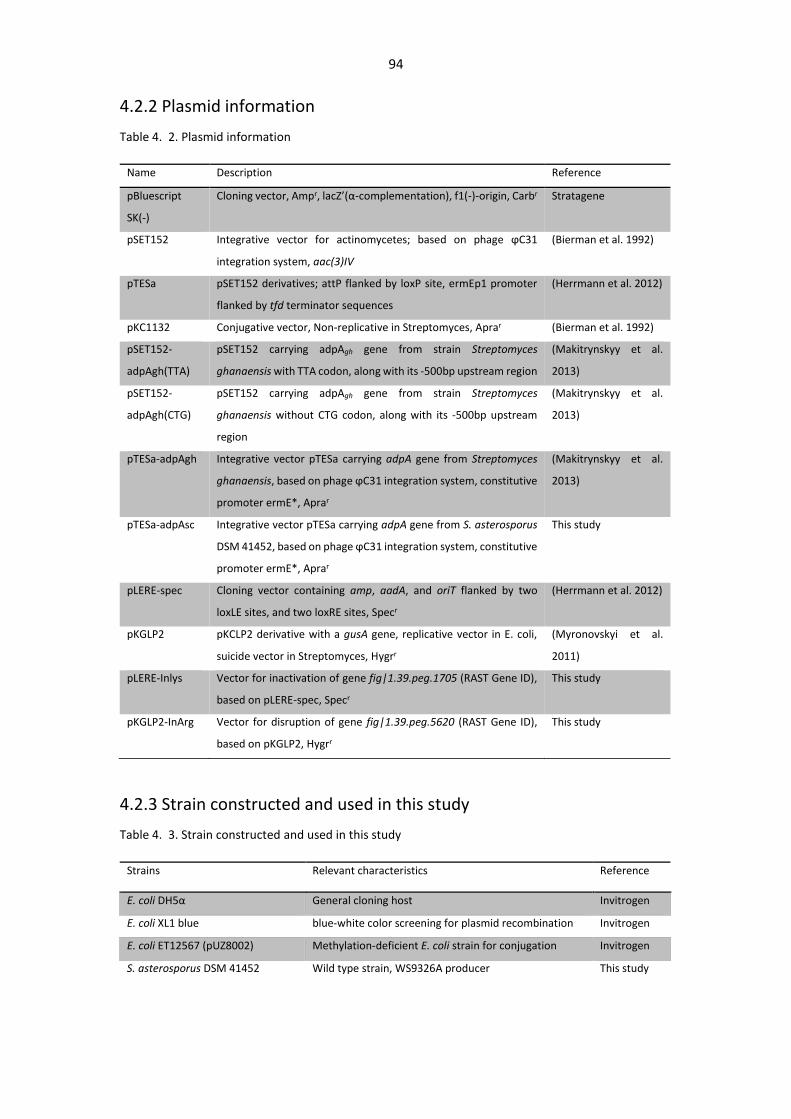
94
4.2.2 Plasmid information
Table 4. 2. Plasmid information
4.2.3 Strain constructed and used in this study
Table 4. 3. Strain constructed and used in this study
Name Description Reference
pBluescript
SK(-)
Cloning vector, Ampr, lacZ’(α-complementation), f1(-)-origin, Carbr Stratagene
pSET152 Integrative vector for actinomycetes; based on phage ϕC31
integration system, aac(3)IV
(Bierman et al. 1992)
pTESa pSET152 derivatives; attP flanked by loxP site, ermEp1 promoter
flanked by tfd terminator sequences
(Herrmann et al. 2012)
pKC1132 Conjugative vector, Non-replicative in Streptomyces, Aprar (Bierman et al. 1992)
pSET152-
adpAgh(TTA)
pSET152 carrying adpAgh gene from strain Streptomyces
ghanaensis with TTA codon, along with its -500bp upstream region
(Makitrynskyy et al.
2013)
pSET152-
adpAgh(CTG)
pSET152 carrying adpAgh gene from strain Streptomyces
ghanaensis without CTG codon, along with its -500bp upstream
region
(Makitrynskyy et al.
2013)
pTESa-adpAgh Integrative vector pTESa carrying adpA gene from Streptomyces
ghanaensis, based on phage ϕC31 integration system, constitutive
promoter ermE*, Aprar
(Makitrynskyy et al.
2013)
pTESa-adpAsc Integrative vector pTESa carrying adpA gene from S. asterosporus
DSM 41452, based on phage ϕC31 integration system, constitutive
promoter ermE*, Aprar
This study
pLERE-spec Cloning vector containing amp, aadA, and oriT flanked by two
loxLE sites, and two loxRE sites, Specr
(Herrmann et al. 2012)
pKGLP2 pKCLP2 derivative with a gusA gene, replicative vector in E. coli,
suicide vector in Streptomyces, Hygrr
(Myronovskyi et al.
2011)
pLERE-Inlys Vector for inactivation of gene fig|1.39.peg.1705 (RAST Gene ID),
based on pLERE-spec, Specr
This study
pKGLP2-InArg Vector for disruption of gene fig|1.39.peg.5620 (RAST Gene ID),
based on pKGLP2, Hygrr
This study
Strains Relevant characteristics Reference
E. coli DH5α General cloning host Invitrogen
E. coli XL1 blue blue-white color screening for plasmid recombination Invitrogen
E. coli ET12567 (pUZ8002) Methylation-deficient E. coli strain for conjugation Invitrogen
S. asterosporus DSM 41452 Wild type strain, WS9326A producer This study
95
4.2.4 Bacterial strain and culture condition
The wildtype strain S. asterosporus DSM 41452 was purchased from Leibniz Institute DSMZ-
German Collection of Microorganisms and cell Cultures (DSMZ), Germany. The cultivation
conditions, transformation and conjugation methods followed the general protocols for
Streptomyces and E. coli as described in chapter 2.
4.2.5 Functional adpA overexpression in S. asterosporus DSM 41452
The construction of plasmid pTESa-adpAsc has been described in the chapter 3, other two
plasmids pSET152-adpAgh(TTA) and pSET152-adpAgh(CTG) were kindly provided by Dr.
Roman Makitrynskyy. Those plasmids firstly were individually transformed into E. coli ET
12567(pUZ8002). Then through intergeneric conjugation, those plasmids were introduced
into S. asterosporus DSM 41452 to yield mutants S. asterosporus DSM 41452::pSET152-
adpAgh(TTA), S. asterosporus DSM 41452::pSET152-adpAgh(CTG) and S. asterosporus DSM
41452::pSET152. The resultant exconjugants were screened on the solid MS medium
supplemented with selective antibiotics. The correct exconjugants carrying corresponding
plasmid were screened for resistance against apramycin (50 ug/mL).
4.2.6 Construction of Arginine and Lysine auxotrophic mutant strain of S.
asterosporus DSM 41452
Base on bioinformatic analysis, gene fig|1.39.peg.1705 (RAST Gene ID) in S. asterosporus DSM
41452 encode a homologue of DapB which is involved in the lysine biosynthesis DAP pathway
in Streptomyces. A 555 bp internal gene fragment of gene fig|1.39.peg.1705 was amplified
S. asterosporus DSM
41452::pSET152
S. asterosporus DSM 41452 strain carrying plasmid
pSET152
This study
S. asterosporus DSM
41452::pSET152-adpAgh(TTA)
S. asterosporus DSM 41452 carrying plasmid pSET152-
adpAgh(TTA)
This study
S. asterosporus DSM
41452::pSET152-AdpAgh(CTG)
S. asterosporus DSM 41452 carrying plasmid pSET152-
AdpAgh(CTG)
This study
S. asterosporus SILAC1 S. asterosporus DSM 41452:pSET152::pLERE-
Inlys::pKGLP2-InArg
This study
S. asterosporus SILAC2 S. asterosporus DSM 41452::pSET152-
adpAgh(TTA)::pLERE-Inlys:: pKGLP2-InArg
This study
96
from the genome of the wildtype strain S. asterosporus DSM 41452 by PCR using primer
IndapB-F and IndapB-R. The PCR product was ligated into EcoRV-digested pBluescripts to yield
the plasmid pBSK-partial-lys-DapB. Then the internal fragment of gene fig|1.39.peg.1705 was
digested at HindIII/BamHI restriction site, and then was cloned into vector pLERE-spec to
afford the suicide plasmid pLERE-Inlys for the disruption of gene fig|1.39.peg.1705.
Bioinformatic analysis shown that gene fig|1.39.peg.5620 (RAST Gene ID) in S. asterosporus
DSM 41452 encode the homolog of argininosuccinate synthetase (EC.6.3.4.5) which belong to
the Arginine biosynthesis pathway in Streptomyces. In order to construct the inactivation
plasmid of gene fig|1.39.peg.5620, a 519bp internal gene fragment of gene fig|1.39.peg.5620
was amplified from the genome of the wildtype strain S. asterosporus DSM 41452 by PCR using
primer InArg2-F and InArg2-R. The PCR product was ligated into EcoRV-digested pBluescripts
to yield plasmid pBSK-partial-Arg. Then the internal fragment was digested at HindIII/BamHI
restriction site and was cloned into a suicide vector pKGLP2 to afford the plasmid pKGLP2-
InArg.
After that, those two plasmids pLERE-Inlys and pKGLP2-InArg were introduced into E. coli ET
12567 (pUZ8002), then they were introduced into strain S. asterosporus DSM 41452::pSET152
by intergeneric conjugation to yield the lysine and Arginine auxotrophic mutant S.
asterosporus DSM 41452::pSET152::pLERE-Inlys::pKGLP2-InArg which was designated as S.
asterosporus SILAC1. In addition, plasmids pLERE-Inlys and pKGLP2-InArg were introduced
into S. asterosporus DSM 41452::pSET152-adpAgh(TTA) to construct its lysine and Arginine
auxotrophic mutant. By transformation and conjugation, those two plasmids were
homologous recombined onto the genome of S. asterosporus DSM 41452::pSET152-
adpAgh(TTA) to yield mutant S. asterosporus DSM 41452::pSET152-adpAgh(TTA)::pLERE-
Inlys::pKGLP2-InArg which was designated as S. asterosporus SILAC2.
The correct exconjugants were screened on solid MS medium supplemented with
spectinomycin-resistance (100 ug/ml) and hygromycin-resistance (100 ug/mL) selective
antibiotics. Furthermore, the exconjugants were tested and verified for target gene disruption
by colony PCR using primer pairs InlysF/aadVF and InArgF/HygR.
4.2.7 Bacterial culture for SILAC test
Strain cultivation were carried out on the 20 mL minimal medium MM1, all media were
supplemented with excessive amount of proline (1M, 400 uL/20 mL), 60ul arginine [L-arginine-
97
HCl in PBS solution, stock concentration 84g/L] and 34ul lysine [lysine-HCl in PBS solution,
stock concentration, 146g/L]. Their final concentration is 20 mg/L proline, 25 mg/L L-arginine
(Arg-0) and 25 mg/L L-lysine (Lys-0) for light labeled (L) medium; 20 mg/L proline, 25 mg/L L-
[13C6,15N4] arginine (Arg-10) and 25 mg/L L-[13C6,15N2] lysine (Lys-8) for heavy labeled (H)
medium.
200ul seed culture of strain S. asterosporus SILAC1 and strain S. asterosporus SILAC2 were
inoculated into 20mL MM1 liquid medium by 1: 1000 inoculation ratio, respectively. After 24
h culture, strain S. asterosporus SILAC1 was individually inoculated into fresh MM1 liquid
medium supplemented with heavy labelled Arginine and lysine. By contrast, strain S.
asterosporus SILAC2 was cultured in the MM1 liquid medium supplemented with light labeled
arginine and lysine. In the second-time biological replicates, the labels of those two strains
were reversed. Strain S. asterosporus SILAC2 was cultured in the heavy labeled (Arg-10, Lys-8)
MM1 medium, and S. asterosporus SILAC1 was cultured in the light labeled (Arg-0, Lys-0)
medium. All of the strains were incubated in at 28°C, 180rpm for 72 hours. Afterwards the
strains were harvested by centrifugation, the cell pellets were collected for protein sample
preparation.
4.2.8 Protein sample preparation for LC-MS/MS analysis
The harvested cells were resuspended in lysis buffer supplemented with protease inhibitor.
Then it was lysed by sonication, the cell debris was removed after a centrifugation at 14,000g
for 30 min. The resulting supernatant was collected for proteomics analysis. The protein
concentration was measured by Nanodrop (Thermo Scientific). The ratio of total protein from
parental strain and AdpA overexpression mutant were kept at the moderately equal amount.
Each 100 µg of labelled bacterial proteins was mixed into one sample, of which the volumes
were calculated depending on the proteins concentration. Protein mixtures were
supplemented with 6 x Laemmli sample buffer and 1mM dithiothreitol (DTT), subsequently
those mixtures were incubated at 97°C for 10 min. When the mixtures cooled down to room
temperature, iodoaceramide (IAA) was added in with a final concentration of 5.5 mM. Then
the mixtures were kept in dark at room temperature for 30 min. After that, the sample
mixtures were loaded into the SDS-PAGE (4-12% Bis-Tris mini gradient gel, Bio-Rad) lane.
After SDS-PAGE, the gel was stained with Coomassie blue, and each gel lanes were cut into 10
slices with equal size. In-gel digestion (Shevchenko et al. 2006) method was employed, each
gel slice was separately cut into 1-2mm2 pieces and then suspended in 150ul ABC buffer. All
fractions were incubated at room temperature for 10min under vigorous shaking. Then the
98
gel pieces were washed 3 times by ABC buffer and ethanol, alternately.
After that, 70 µl of trypsin solution was added into the Eppendorf tube to submerge the gel
pieces totally, the samples were then incubated overnight at 37˚C. 50 µl of 2% TFA was added
into the trypsin digested gel pieces to quench the reaction.
150 µl ethanol were added to the samples, which were then incubated at room temperature
for 10min. After centrifugation, supernatants containing the peptide were transferred to a
new microcentrifuge tube and peptides were concentrated to 50 µl by SpeedVec (Savant
SPD131DDA, Thermo Scientific), following dilution with 50ul Buffer A* and 150ul buffer A, and
then the samples were further processed by stage tips (Dumit et al. 2014). The columns of the
stage tips were washed by 100 µl buffer A twice in advance, then stage tips were loaded with
the peptide sample, washed with buffer A and eluted by 50 µl buffer B with a centrifugation
at 4000 rpm for 3 min. The peptide samples were concentrated by SpeedVec and dissolved
with 15 µl buffer A*/A. Then the resulting peptide mixtures are ready for the measurement
by HPLC-MS spectrometer.
4.2.9 Mass Spectrometry Measurement
Proteomics measurement were performed at the Center for Biological Systems Analysis (CF
Proteomics) in Freiburg University. Tryptic peptides were analyzed using an Agilent 1200
nanoflow-HPLC (Agilent Technologies GmbH, Waldbronn, Germany) combined with a LTQ
Orbitrap XL mass spectrometer (ThermoFisher Scientific, Bremen, Germany). 7 uL of volume
samples were loaded into the HPLC-column tips (fused silica, 75 m inner diameter, 20 cm of
length) which were self-packed with Reprosil-Pur 120 C18-AQ 3µm resin (Dr. Maisch GmbH,
Ammerbuch, Germany). Peptide samples were separated using a linear gradient method
(from 10% to 30% buffer B, flow rate of 250 nl/min).
The parameter of mass spectrometer was set as the described in paper (Dumit et al. 2014).
The mass spectrometer worked in a data-dependent acquisition mode to automatically
measure MS (max. of 1x10 ions) and MS/MS scan. Each MS scan was followed by a maximum
of five MS/MS scans in the linear ion trap using normalized collision energy of 35% and a target
value of 5,000. The data are acquired by MS and MS/MS scan with a Orbitrap resolution of
60,000 at a range from 370 to 2000 m/z.
Parent ions with one charge states and unassigned charge states were excluded
from fragmentation for MS/MS scans. Other MS parameters were set as follow: no sheath and
auxiliary gas flow; spray voltage is 2.3 kV; ion transfer tube temperature is 125°C.
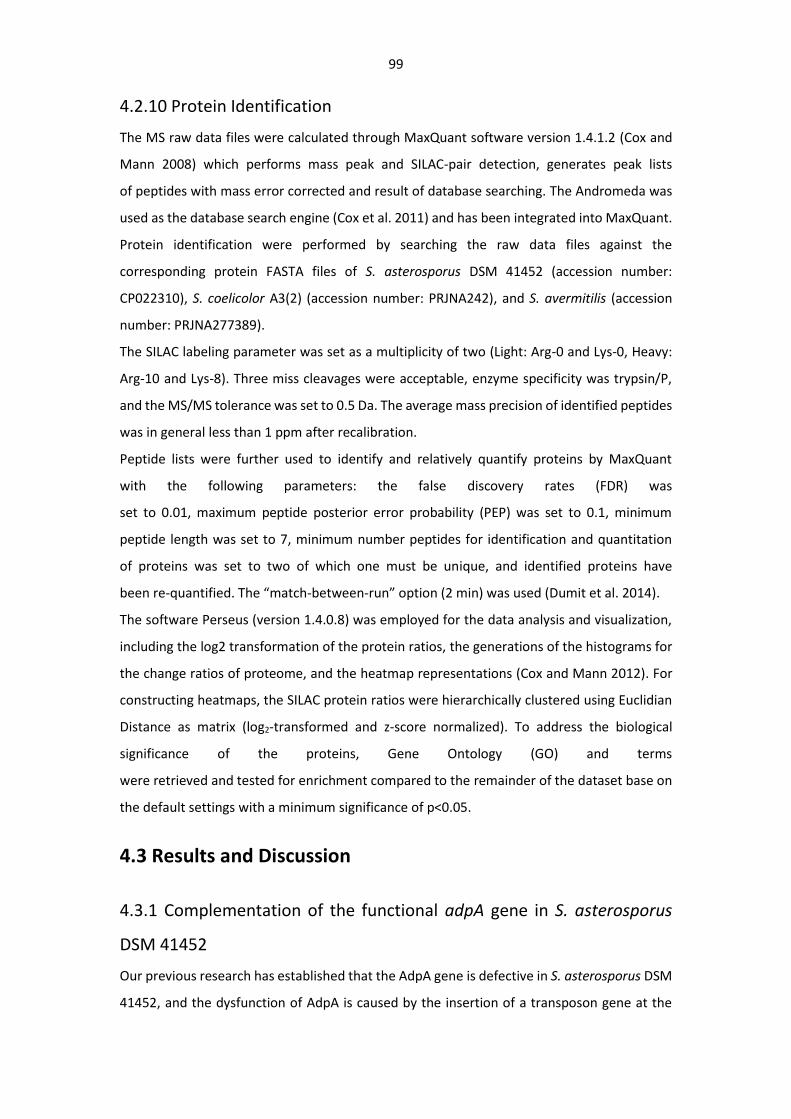
99
4.2.10 Protein Identification
The MS raw data files were calculated through MaxQuant software version 1.4.1.2 (Cox and
Mann 2008) which performs mass peak and SILAC-pair detection, generates peak lists
of peptides with mass error corrected and result of database searching. The Andromeda was
used as the database search engine (Cox et al. 2011) and has been integrated into MaxQuant.
Protein identification were performed by searching the raw data files against the
corresponding protein FASTA files of S. asterosporus DSM 41452 (accession number:
CP022310), S. coelicolor A3(2) (accession number: PRJNA242), and S. avermitilis (accession
number: PRJNA277389).
The SILAC labeling parameter was set as a multiplicity of two (Light: Arg-0 and Lys-0, Heavy:
Arg-10 and Lys-8). Three miss cleavages were acceptable, enzyme specificity was trypsin/P,
and the MS/MS tolerance was set to 0.5 Da. The average mass precision of identified peptides
was in general less than 1 ppm after recalibration.
Peptide lists were further used to identify and relatively quantify proteins by MaxQuant
with the following parameters: the false discovery rates (FDR) was
set to 0.01, maximum peptide posterior error probability (PEP) was set to 0.1, minimum
peptide length was set to 7, minimum number peptides for identification and quantitation
of proteins was set to two of which one must be unique, and identified proteins have
been re-quantified. The “match-between-run” option (2 min) was used (Dumit et al. 2014).
The software Perseus (version 1.4.0.8) was employed for the data analysis and visualization,
including the log2 transformation of the protein ratios, the generations of the histograms for
the change ratios of proteome, and the heatmap representations (Cox and Mann 2012). For
constructing heatmaps, the SILAC protein ratios were hierarchically clustered using Euclidian
Distance as matrix (log2-transformed and z-score normalized). To address the biological
significance of the proteins, Gene Ontology (GO) and terms
were retrieved and tested for enrichment compared to the remainder of the dataset base on
the default settings with a minimum significance of p<0.05.
4.3 Results and Discussion
4.3.1 Complementation of the functional adpA gene in S. asterosporus
DSM 41452
Our previous research has established that the AdpA gene is defective in S. asterosporus DSM
41452, and the dysfunction of AdpA is caused by the insertion of a transposon gene at the
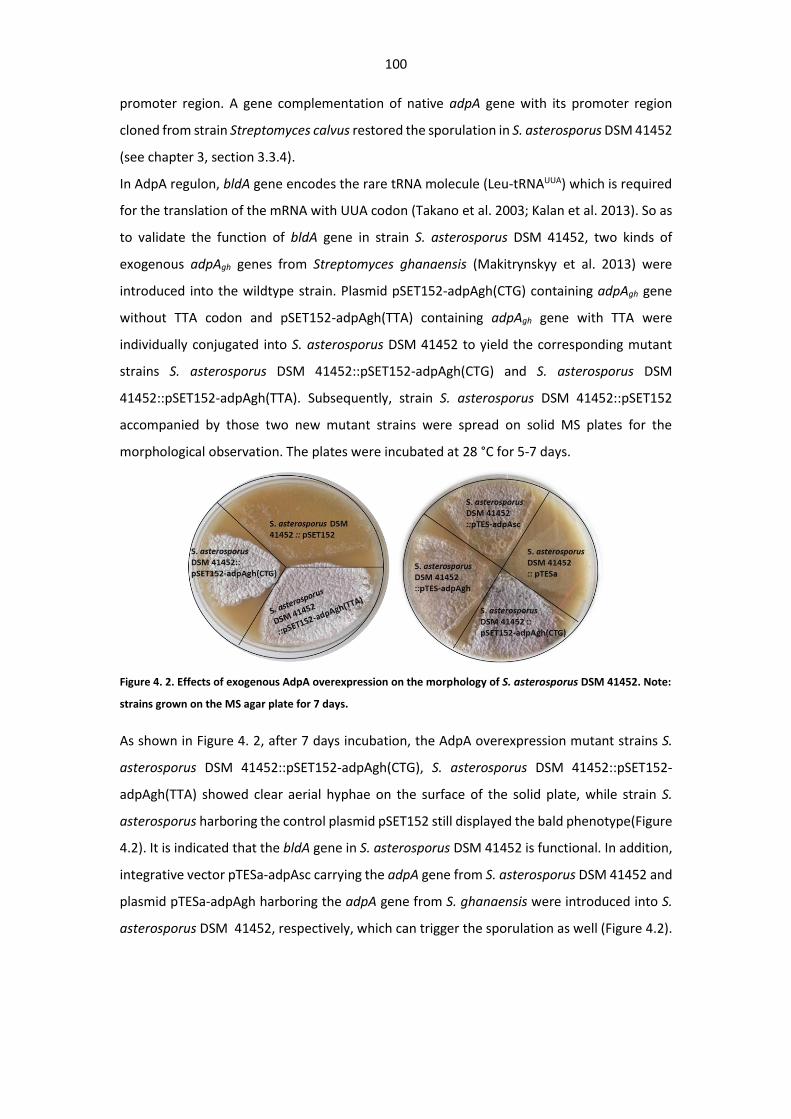
100
promoter region. A gene complementation of native adpA gene with its promoter region
cloned from strain Streptomyces calvus restored the sporulation in S. asterosporus DSM 41452
(see chapter 3, section 3.3.4).
In AdpA regulon, bldA gene encodes the rare tRNA molecule (Leu-tRNAUUA) which is required
for the translation of the mRNA with UUA codon (Takano et al. 2003; Kalan et al. 2013). So as
to validate the function of bldA gene in strain S. asterosporus DSM 41452, two kinds of
exogenous adpAgh genes from Streptomyces ghanaensis (Makitrynskyy et al. 2013) were
introduced into the wildtype strain. Plasmid pSET152-adpAgh(CTG) containing adpAgh gene
without TTA codon and pSET152-adpAgh(TTA) containing adpAgh gene with TTA were
individually conjugated into S. asterosporus DSM 41452 to yield the corresponding mutant
strains S. asterosporus DSM 41452::pSET152-adpAgh(CTG) and S. asterosporus DSM
41452::pSET152-adpAgh(TTA). Subsequently, strain S. asterosporus DSM 41452::pSET152
accompanied by those two new mutant strains were spread on solid MS plates for the
morphological observation. The plates were incubated at 28 °C for 5-7 days.
Figure 4. 2. Effects of exogenous AdpA overexpression on the morphology of S. asterosporus DSM 41452. Note:
strains grown on the MS agar plate for 7 days.
As shown in Figure 4. 2, after 7 days incubation, the AdpA overexpression mutant strains S.
asterosporus DSM 41452::pSET152-adpAgh(CTG), S. asterosporus DSM 41452::pSET152-
adpAgh(TTA) showed clear aerial hyphae on the surface of the solid plate, while strain S.
asterosporus harboring the control plasmid pSET152 still displayed the bald phenotype(Figure
4.2). It is indicated that the bldA gene in S. asterosporus DSM 41452 is functional. In addition,
integrative vector pTESa-adpAsc carrying the adpA gene from S. asterosporus DSM 41452 and
plasmid pTESa-adpAgh harboring the adpA gene from S. ghanaensis were introduced into S.
asterosporus DSM 41452, respectively, which can trigger the sporulation as well (Figure 4.2).
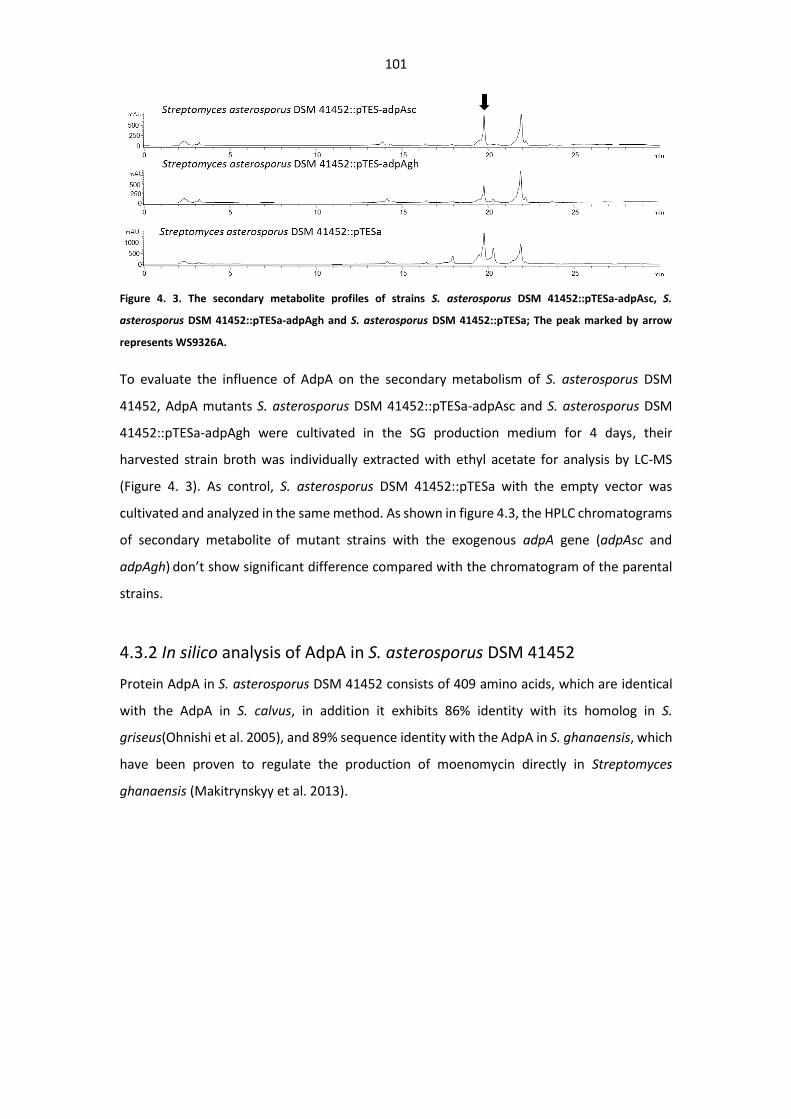
101
Figure 4. 3. The secondary metabolite profiles of strains S. asterosporus DSM 41452::pTESa-adpAsc, S.
asterosporus DSM 41452::pTESa-adpAgh and S. asterosporus DSM 41452::pTESa; The peak marked by arrow
represents WS9326A.
To evaluate the influence of AdpA on the secondary metabolism of S. asterosporus DSM
41452, AdpA mutants S. asterosporus DSM 41452::pTESa-adpAsc and S. asterosporus DSM
41452::pTESa-adpAgh were cultivated in the SG production medium for 4 days, their
harvested strain broth was individually extracted with ethyl acetate for analysis by LC-MS
(Figure 4. 3). As control, S. asterosporus DSM 41452::pTESa with the empty vector was
cultivated and analyzed in the same method. As shown in figure 4.3, the HPLC chromatograms
of secondary metabolite of mutant strains with the exogenous adpA gene (adpAsc and
adpAgh) don’t show significant difference compared with the chromatogram of the parental
strains.
4.3.2 In silico analysis of AdpA in S. asterosporus DSM 41452
Protein AdpA in S. asterosporus DSM 41452 consists of 409 amino acids, which are identical
with the AdpA in S. calvus, in addition it exhibits 86% identity with its homolog in S.
griseus(Ohnishi et al. 2005), and 89% sequence identity with the AdpA in S. ghanaensis, which
have been proven to regulate the production of moenomycin directly in Streptomyces
ghanaensis (Makitrynskyy et al. 2013).
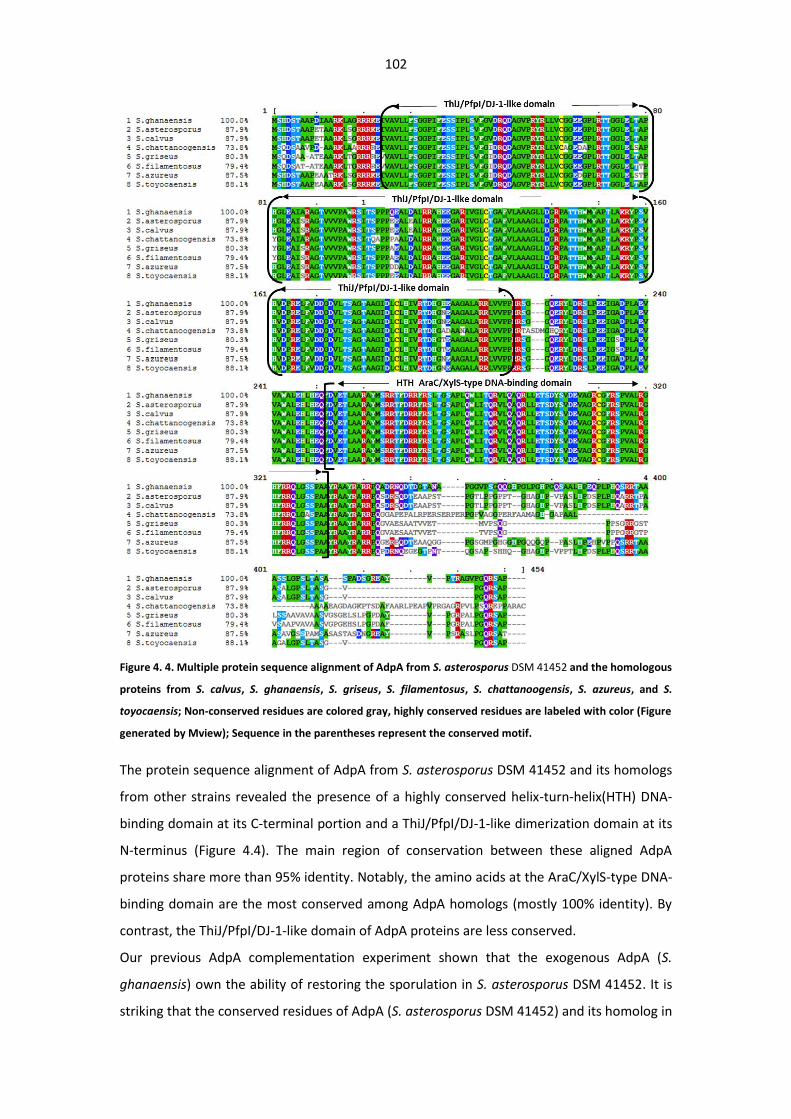
102
Figure 4. 4. Multiple protein sequence alignment of AdpA from S. asterosporus DSM 41452 and the homologous
proteins from S. calvus, S. ghanaensis, S. griseus, S. filamentosus, S. chattanoogensis, S. azureus, and S.
toyocaensis; Non-conserved residues are colored gray, highly conserved residues are labeled with color (Figure
generated by Mview); Sequence in the parentheses represent the conserved motif.
The protein sequence alignment of AdpA from S. asterosporus DSM 41452 and its homologs
from other strains revealed the presence of a highly conserved helix-turn-helix(HTH) DNA-
binding domain at its C-terminal portion and a ThiJ/PfpI/DJ-1-like dimerization domain at its
N-terminus (Figure 4.4). The main region of conservation between these aligned AdpA
proteins share more than 95% identity. Notably, the amino acids at the AraC/XylS-type DNA-
binding domain are the most conserved among AdpA homologs (mostly 100% identity). By
contrast, the ThiJ/PfpI/DJ-1-like domain of AdpA proteins are less conserved.
Our previous AdpA complementation experiment shown that the exogenous AdpA (S.
ghanaensis) own the ability of restoring the sporulation in S. asterosporus DSM 41452. It is
striking that the conserved residues of AdpA (S. asterosporus DSM 41452) and its homolog in
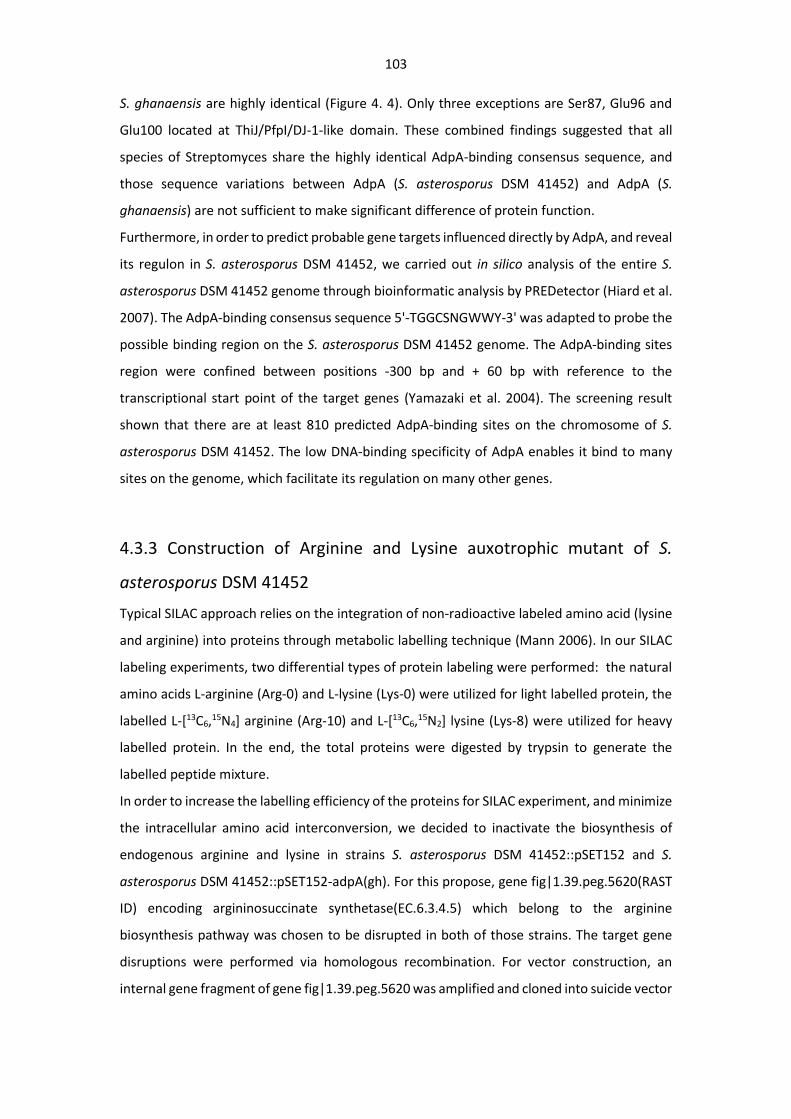
103
S. ghanaensis are highly identical (Figure 4. 4). Only three exceptions are Ser87, Glu96 and
Glu100 located at ThiJ/PfpI/DJ-1-like domain. These combined findings suggested that all
species of Streptomyces share the highly identical AdpA-binding consensus sequence, and
those sequence variations between AdpA (S. asterosporus DSM 41452) and AdpA (S.
ghanaensis) are not sufficient to make significant difference of protein function.
Furthermore, in order to predict probable gene targets influenced directly by AdpA, and reveal
its regulon in S. asterosporus DSM 41452, we carried out in silico analysis of the entire S.
asterosporus DSM 41452 genome through bioinformatic analysis by PREDetector (Hiard et al.
2007). The AdpA-binding consensus sequence 5'-TGGCSNGWWY-3' was adapted to probe the
possible binding region on the S. asterosporus DSM 41452 genome. The AdpA-binding sites
region were confined between positions -300 bp and + 60 bp with reference to the
transcriptional start point of the target genes (Yamazaki et al. 2004). The screening result
shown that there are at least 810 predicted AdpA-binding sites on the chromosome of S.
asterosporus DSM 41452. The low DNA-binding specificity of AdpA enables it bind to many
sites on the genome, which facilitate its regulation on many other genes.
4.3.3 Construction of Arginine and Lysine auxotrophic mutant of S.
asterosporus DSM 41452
Typical SILAC approach relies on the integration of non-radioactive labeled amino acid (lysine
and arginine) into proteins through metabolic labelling technique (Mann 2006). In our SILAC
labeling experiments, two differential types of protein labeling were performed: the natural
amino acids L-arginine (Arg-0) and L-lysine (Lys-0) were utilized for light labelled protein, the
labelled L-[13C6,15N4] arginine (Arg-10) and L-[13C6,15N2] lysine (Lys-8) were utilized for heavy
labelled protein. In the end, the total proteins were digested by trypsin to generate the
labelled peptide mixture.
In order to increase the labelling efficiency of the proteins for SILAC experiment, and minimize
the intracellular amino acid interconversion, we decided to inactivate the biosynthesis of
endogenous arginine and lysine in strains S. asterosporus DSM 41452::pSET152 and S.
asterosporus DSM 41452::pSET152-adpA(gh). For this propose, gene fig|1.39.peg.5620(RAST
ID) encoding argininosuccinate synthetase(EC.6.3.4.5) which belong to the arginine
biosynthesis pathway was chosen to be disrupted in both of those strains. The target gene
disruptions were performed via homologous recombination. For vector construction, an
internal gene fragment of gene fig|1.39.peg.5620 was amplified and cloned into suicide vector
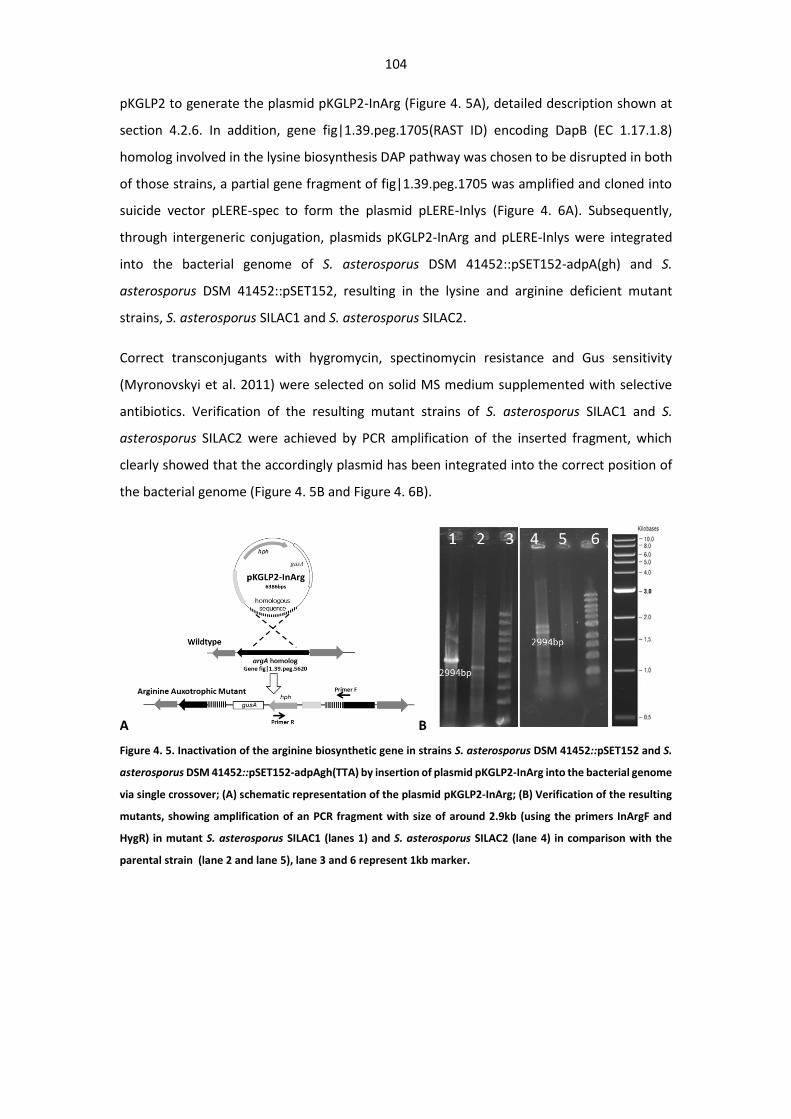
104
pKGLP2 to generate the plasmid pKGLP2-InArg (Figure 4. 5A), detailed description shown at
section 4.2.6. In addition, gene fig|1.39.peg.1705(RAST ID) encoding DapB (EC 1.17.1.8)
homolog involved in the lysine biosynthesis DAP pathway was chosen to be disrupted in both
of those strains, a partial gene fragment of fig|1.39.peg.1705 was amplified and cloned into
suicide vector pLERE-spec to form the plasmid pLERE-Inlys (Figure 4. 6A). Subsequently,
through intergeneric conjugation, plasmids pKGLP2-InArg and pLERE-Inlys were integrated
into the bacterial genome of S. asterosporus DSM 41452::pSET152-adpA(gh) and S.
asterosporus DSM 41452::pSET152, resulting in the lysine and arginine deficient mutant
strains, S. asterosporus SILAC1 and S. asterosporus SILAC2.
Correct transconjugants with hygromycin, spectinomycin resistance and Gus sensitivity
(Myronovskyi et al. 2011) were selected on solid MS medium supplemented with selective
antibiotics. Verification of the resulting mutant strains of S. asterosporus SILAC1 and S.
asterosporus SILAC2 were achieved by PCR amplification of the inserted fragment, which
clearly showed that the accordingly plasmid has been integrated into the correct position of
the bacterial genome (Figure 4. 5B and Figure 4. 6B).
A B
Figure 4. 5. Inactivation of the arginine biosynthetic gene in strains S. asterosporus DSM 41452::pSET152 and S.
asterosporus DSM 41452::pSET152-adpAgh(TTA) by insertion of plasmid pKGLP2-InArg into the bacterial genome
via single crossover; (A) schematic representation of the plasmid pKGLP2-InArg; (B) Verification of the resulting
mutants, showing amplification of an PCR fragment with size of around 2.9kb (using the primers InArgF and
HygR) in mutant S. asterosporus SILAC1 (lanes 1) and S. asterosporus SILAC2 (lane 4) in comparison with the
parental strain (lane 2 and lane 5), lane 3 and 6 represent 1kb marker.
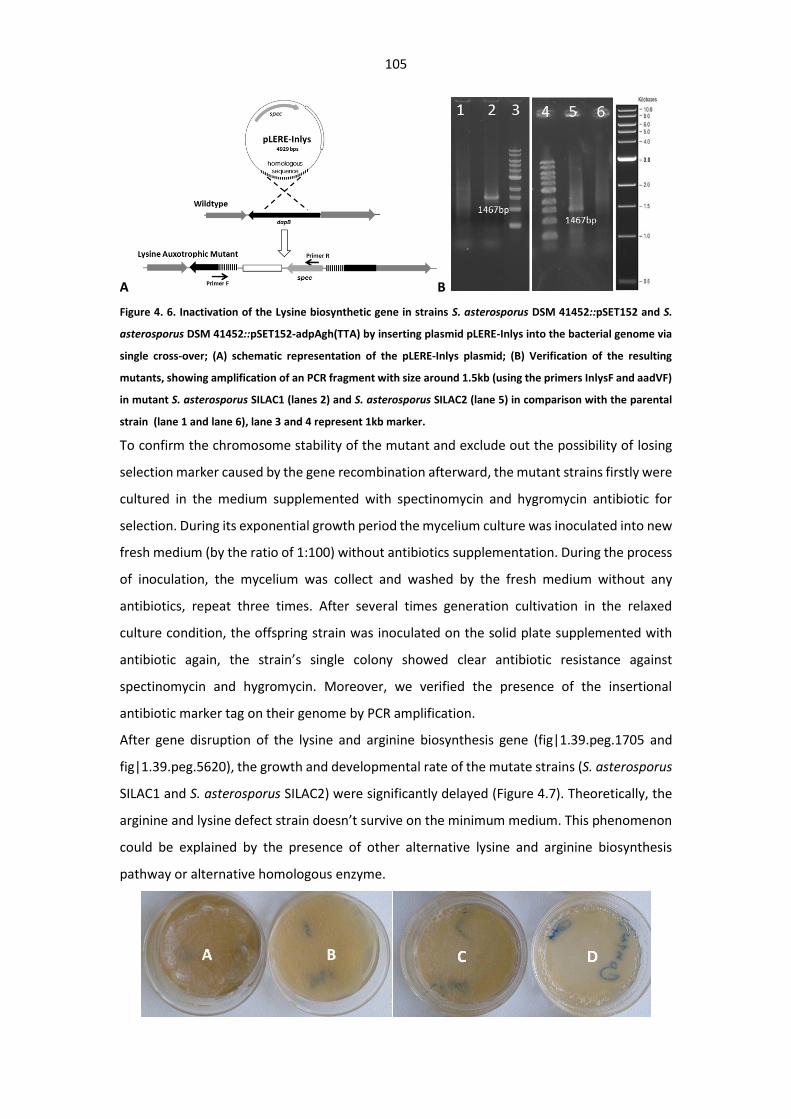
105
A B
Figure 4. 6. Inactivation of the Lysine biosynthetic gene in strains S. asterosporus DSM 41452::pSET152 and S.
asterosporus DSM 41452::pSET152-adpAgh(TTA) by inserting plasmid pLERE-Inlys into the bacterial genome via
single cross-over; (A) schematic representation of the pLERE-Inlys plasmid; (B) Verification of the resulting
mutants, showing amplification of an PCR fragment with size around 1.5kb (using the primers InlysF and aadVF)
in mutant S. asterosporus SILAC1 (lanes 2) and S. asterosporus SILAC2 (lane 5) in comparison with the parental
strain (lane 1 and lane 6), lane 3 and 4 represent 1kb marker.
To confirm the chromosome stability of the mutant and exclude out the possibility of losing
selection marker caused by the gene recombination afterward, the mutant strains firstly were
cultured in the medium supplemented with spectinomycin and hygromycin antibiotic for
selection. During its exponential growth period the mycelium culture was inoculated into new
fresh medium (by the ratio of 1:100) without antibiotics supplementation. During the process
of inoculation, the mycelium was collect and washed by the fresh medium without any
antibiotics, repeat three times. After several times generation cultivation in the relaxed
culture condition, the offspring strain was inoculated on the solid plate supplemented with
antibiotic again, the strain’s single colony showed clear antibiotic resistance against
spectinomycin and hygromycin. Moreover, we verified the presence of the insertional
antibiotic marker tag on their genome by PCR amplification.
After gene disruption of the lysine and arginine biosynthesis gene (fig|1.39.peg.1705 and
fig|1.39.peg.5620), the growth and developmental rate of the mutate strains (S. asterosporus
SILAC1 and S. asterosporus SILAC2) were significantly delayed (Figure 4.7). Theoretically, the
arginine and lysine defect strain doesn’t survive on the minimum medium. This phenomenon
could be explained by the presence of other alternative lysine and arginine biosynthesis
pathway or alternative homologous enzyme.
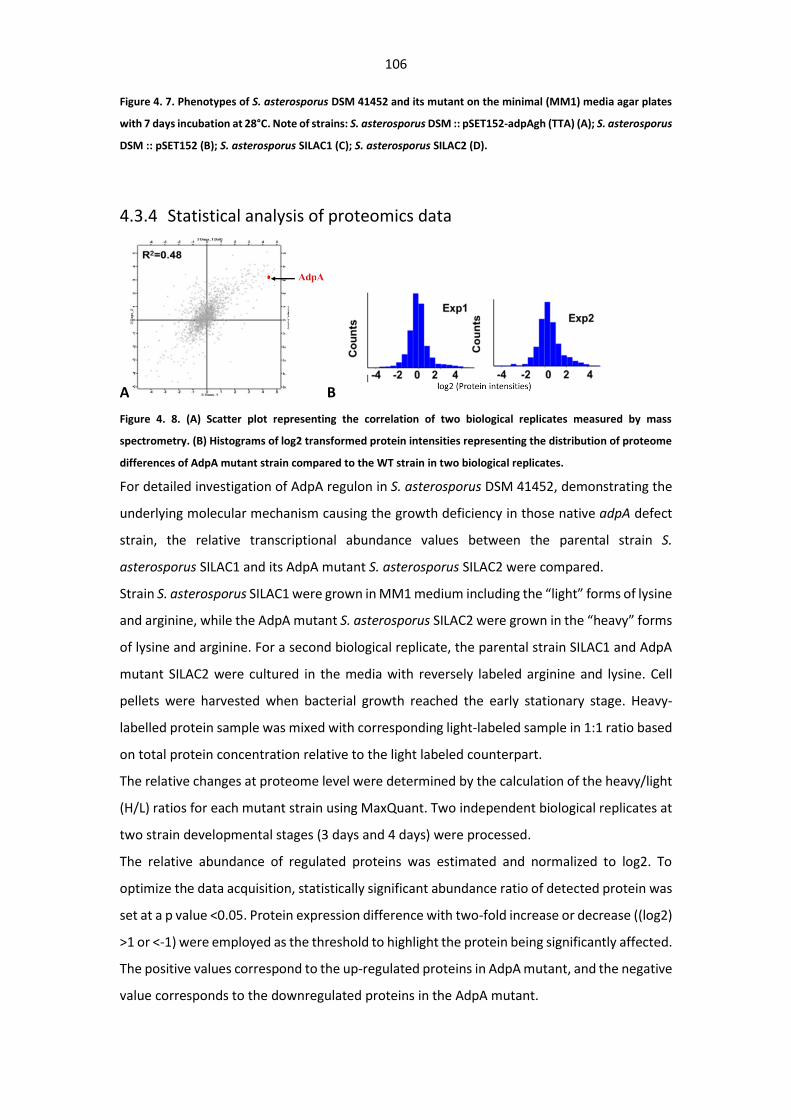
106
Figure 4. 7. Phenotypes of S. asterosporus DSM 41452 and its mutant on the minimal (MM1) media agar plates
with 7 days incubation at 28°C. Note of strains: S. asterosporus DSM :: pSET152-adpAgh (TTA) (A); S. asterosporus
DSM :: pSET152 (B); S. asterosporus SILAC1 (C); S. asterosporus SILAC2 (D).
4.3.4 Statistical analysis of proteomics data
A B
Figure 4. 8. (A) Scatter plot representing the correlation of two biological replicates measured by mass
spectrometry. (B) Histograms of log2 transformed protein intensities representing the distribution of proteome
differences of AdpA mutant strain compared to the WT strain in two biological replicates.
For detailed investigation of AdpA regulon in S. asterosporus DSM 41452, demonstrating the
underlying molecular mechanism causing the growth deficiency in those native adpA defect
strain, the relative transcriptional abundance values between the parental strain S.
asterosporus SILAC1 and its AdpA mutant S. asterosporus SILAC2 were compared.
Strain S. asterosporus SILAC1 were grown in MM1 medium including the “light” forms of lysine
and arginine, while the AdpA mutant S. asterosporus SILAC2 were grown in the “heavy” forms
of lysine and arginine. For a second biological replicate, the parental strain SILAC1 and AdpA
mutant SILAC2 were cultured in the media with reversely labeled arginine and lysine. Cell
pellets were harvested when bacterial growth reached the early stationary stage. Heavy-
labelled protein sample was mixed with corresponding light-labeled sample in 1:1 ratio based
on total protein concentration relative to the light labeled counterpart.
The relative changes at proteome level were determined by the calculation of the heavy/light
(H/L) ratios for each mutant strain using MaxQuant. Two independent biological replicates at
two strain developmental stages (3 days and 4 days) were processed.
The relative abundance of regulated proteins was estimated and normalized to log2. To
optimize the data acquisition, statistically significant abundance ratio of detected protein was
set at a p value <0.05. Protein expression difference with two-fold increase or decrease ((log2)
>1 or <-1) were employed as the threshold to highlight the protein being significantly affected.
The positive values correspond to the up-regulated proteins in AdpA mutant, and the negative
value corresponds to the downregulated proteins in the AdpA mutant.

107
The two biological replicates from 3 days culture exhibited high correlation with regression
coefficients of 0.48 (Figure 4.8A). The corresponding expression changes of proteomics
showed a clear Gaussian distribution, which further suggest that the protein changes behave
as expected and prove the reliability of the experimental data (Figure 4.8B). In contrast, the
data reproducibility between two biological replicates from 4 days culture was not good
enough. Therefore, the correlation coefficient R2 of those two biological replicates from 4 days
culture was too low to reliably characterize the proteome, and this phenomenon could be
caused by the cell autolysis happening in the organism.
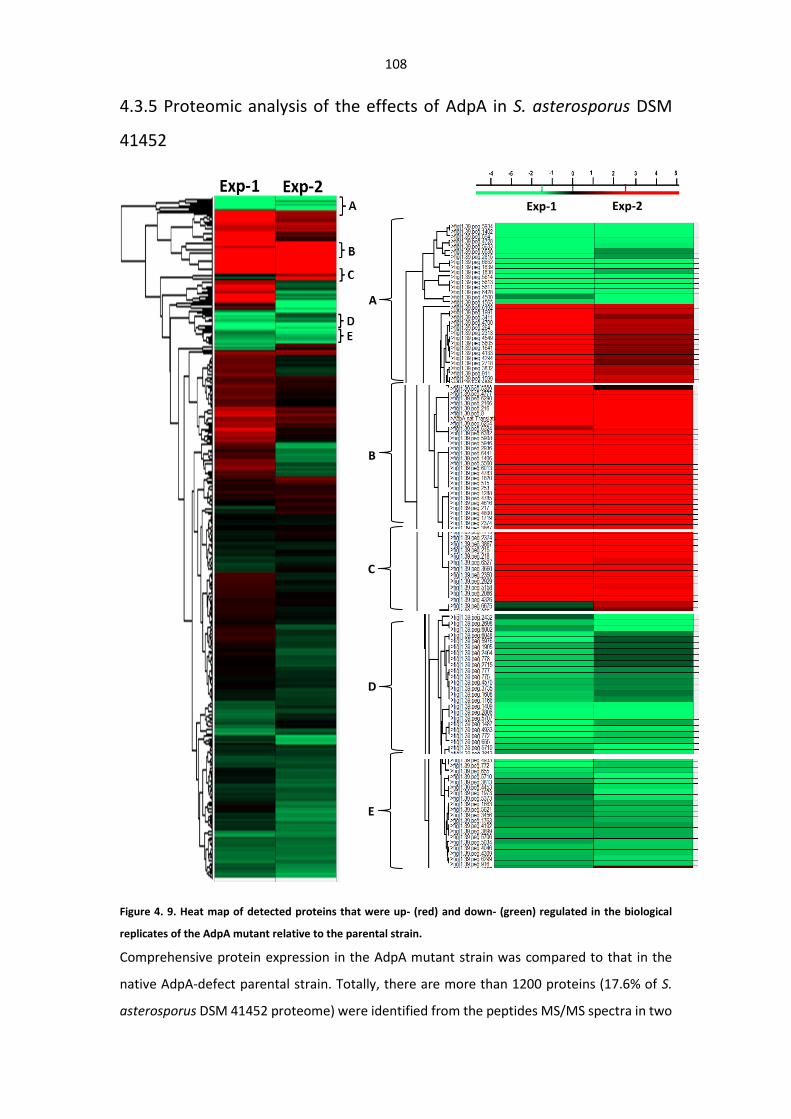
108
4.3.5 Proteomic analysis of the effects of AdpA in S. asterosporus DSM
41452
Figure 4. 9. Heat map of detected proteins that were up- (red) and down- (green) regulated in the biological
replicates of the AdpA mutant relative to the parental strain.
Comprehensive protein expression in the AdpA mutant strain was compared to that in the
native AdpA-defect parental strain. Totally, there are more than 1200 proteins (17.6% of S.
asterosporus DSM 41452 proteome) were identified from the peptides MS/MS spectra in two
Exp-1 Exp-2
A
B
C
D
E
109
biological replicates. Among those proteins, the result of statistical analysis demonstrated
that there are 52 proteins identified as with significant abundance difference of their levels in
those two samples (sample from parental strain as control and sample from AdpA mutant
strain) (Figure 4.9 and Table 4.4), furthermore, those proteins were detected in both biological
replicates.
These significantly expressed proteins were classified base on their functions annotated by
COGs database using protein BLAST with an expectation value threshold 0.001. The main COG
groups include “Information storage and processing”, “Cellular process and signaling”,
“Metabolism”, “General function prediction only” and “Function unknown” (Table 4.4).
Among those significantly regulated proteins, 31 proteins were up-regulated in the AdpA
mutant (ratio showing protein level deference higher than 1).
Not surprisingly, in the mutant protein AdpA was upregulated more than 16-fold, suggesting
that remarkable difference of protein expression indeed present in the AdpA mutant and the
parental strain.
A group of sporulation-related proteins were detected as up-regulated protein in the AdpA
mutant strain. Particularly, fig|1.39.peg.515, a homologue of sporulation-control protein
Spo0M, was upregulated up to 16-fold approximately. It shows 100% sequence identity with
SGR5704 in S. griseus. SGR5704 is an orthologue of the well-studied sporulation control
protein Spo0M in Bacillus subtilis (Birkó et al. 2009). Another protein fig|1.39.peg.408 was
upregulated 2 times, it is a homolog of stage II sporulation protein anti-sigma-B factor
antagonist, and shows 87% sequence identity with SCO7325 in S. coelicolor A3(2).
Among those significantly upregulated proteins, fig|1.39.peg.216 was predicted to be
involved in information storage and processing (Table 4.4). It was upregulated 16-fold in the
AdpA mutant. A sequence similarity search shown that fig|1.39.peg.216 is an ortholog of
protein SGR_3492 (75% identity) from S. griseus. In addition, it shows 40% identity with
SCO7465 in S. coelicolor A3(2), in which SCO7465 was predicted to encode a multi-component
regulatory system involved in the resistance to oxidative stress of bacteria.
The expression of 3 proteins related to “cellular processing and signaling” were up-regulated
by AdpA, including fig|1.39.peg.6192, fig|1.39.peg.1288, and fig|1.39.peg.2166.
fig|1.39.peg.6192, a putative DnaK suppressor protein, was upregulated by 8-fold in AdpA
mutant, which show 69% identity with SCO6164 from S. coelicolor A3(2). fig|1.39.peg.2166
was upregulated by 8-fold in the mutant. It is a cAMP-binding protein, and shows 81% identity
with eshA of S. avermitilis, 74% identity with SGR_2264 in S. griseus, and 88% identity with
SCO5249 of S. coelicolor A3(2). Protein fig|1.39.peg.1288 with unidentified function was
110
upregulated by 9-fold in the mutant strain.
It is also worth noting that nine of metabolism-associated proteins were significantly
upregulated in the AdpA mutant, including fig|1.39.peg.218, fig|1.39.peg.4800,
fig|1.39.peg.253, fig|1.39.peg.4326, etc.
Protein fig|1.39.peg.218 was upregulated by 8-fold in the mutant strain, it is a putative
cytochrome P450 protein which shows 84% identity with SGR_4392 of S. griseus, and 85%
identity with SCO0584 of S. coelicolor A3(2). fig|1.39.peg.4800, a putative cytochrome P450,
was upregulated by 8-fold in the mutant and show 82% identity with SCO0584 in S. coelicolor
A3(2). fig|1.39.peg.253, a non-ribosomal peptide synthetase, was upregulated by 8-fold in the
mutant strain and show 43% identity with SGR_3265 from S. griseus, 44% identity with
SCO3230 (CDA peptide synthetase I) in S. coelicolor A3(2). fig|1.39.peg.4326 was upregulated
by 4-fold in the mutant, which encodes a putative asparagine synthetase and shows 27%
identity with SGR_3903 from S. griseus, 28% identity with SCO4115 of S. coelicolor A3(2).
Protein fig|1.39.peg.5158 was upregulated by 4-fold in the mutant, it is a putative
methyltransferase and shows 62% identity with SGR_5540 from S. griseus, 84% identity with
SCO1993 of S. coelicolor A3(2). fig|1.39.peg.1991, a putative putative glycogen
phosphorylase, was upregulated by 4-fold in the mutant. It shows 76% identity with glgP from
S. griseus, 87% identity with SCO5444 of S. coelicolor A3(2). fig|1.39.peg.4616 was
upregulated by 8-fold in the mutant, it is a putative ferredoxin reductase and show 88%
identity with fprD of S. avermitilis, 79% identity with SGR_5065 from S. griseus, 84% identity
with SCO2469 of S. coelicolor A3(2). fig|1.39.peg.6254, a Argininosuccinate lyase (EC 4.3.2.1),
was upregulated by 8-fold in the mutant. It shows 84% identity with SCO0993 of S. coelicolor
A3(2). fig|1.39.peg.2374 was upregulated by 8-fold in the mutant, it is a putative α-1,2-
mannosidase and shows 40% identity with SGR_1503 of S. griseus, 46% identity with SCO6004
of S. coelicolor.
In the AdpA mutant, four significantly up-regulated proteins are categorized in the group of
“General function prediction only”, including fig|1.39.peg.5560, fig|1.39.peg.6013,
fig|1.39.peg.6441, and fig|1.39.peg.217. Protein fig|1.39.peg.5560 was upregulated by 8-fold
in the mutant, it belongs to a multi-component regulatory system-10 which contains a
roadblock/LC7 domain, which shows 68% identity with rarB of S. griseus and 79% identity with
SCO1629 of S. coelicolor A3(2). fig|1.39.peg.217, a putative ATP/GTP-binding protein, was
upregulated by 8-fold in the mutant, which shows 74% identity with SGR_2267 of S. griseus
and 83% identity with SCO5247 of S. coelicolor A3(2). fig|1.39.peg.6013 and fig|1.39.peg.6441
both were upregulated by 8-fold in the mutant strain, their functions are unknown.
111
Additionally, there are 12 unclassified and unidentified proteins were significantly regulated
in AdpA mutant (Table 4.4).
In addition to the significantly upregulated protein, there are 18 downregulated proteins
showing significant abundance difference (log2 value lower than -1) in comparison of AdpA
mutant with the parental strain (Table 4.4). Of them, fig|1.39.peg.2698 is the only one
grouped into “information storage and processing”, which was downregulated by 3-fold in the
AdpA mutant. It encodes a putative alanine acetyltransferase, and shows 64% identity with
SCO4311 in S. coelicolor A3(2).
Among those downregulated, ten proteins were predicted to be involved in the “metabolism”.
Of them, fig|1.39.peg.1839 is a putative nitrogen regulatory protein P-II. It was
downregulated by 8-fold in the AdpA mutant, and its homolog in S. avermitilis is glnB1 (99%
sequence identity) related with the regulation of nitrogen assimilation and metabolism. In
addition, its homologue in S. coelicolor A3(2) is SCO5584 (99% sequence identity) which
belongs to the GlnR regulon and plays a crucial role in the regulation of nitrogen metabolism
(Lewis, Shahi et al. 2011). Another protein fig|1.39.peg.4933 is glutamine synthetase (100%
identity with glnA2 in S. avermitilis) was downregulated by 4-fold in the AdpA mutant, it was
also predicted to belong to the GlnR regulon.
There are seven down-regulated proteins classified into “amino acid transport and
metabolism”. It is interesting to find that four proteins are all involved in the biosynthesis of
arginine, including fig|1.39.peg.5611 (argC homolog, 94% identity), fig|1.39.peg.5614 (argD
homolog, 88% identity), fig|1.39.peg.5613 (argB homolog, 96% identity), and
fig|1.39.peg.1402 (argF homolog, 89% identity). They are shown to be less abundant in the
AdpA mutant than in the parental strain. In addition, fig|1.39.peg.5710, a carbamoyl
phosphate synthase, was downregulated by 4-fold, it shows 92% sequence identity with carA
of S. coelicolor A3(2).
In term of the biosynthesis ability of AdpA mutant, it is interesting to observe the decreased
expression abundance of three “secondary metabolites biosynthesis” related proteins.
fig|1.39.peg.594, a 3-oxoacyl-ACP reductase involved into the fatty acid biosynthesis, was
downregulated by 8 times. It shows 100% sequence identity with SCO1346 in S. coelicolor
A3(2). fig|1.39.peg.6652 showing 43% identity with dioxygenase SCO7507 in S. coelicolor
A3(2) was deregulated by 8-fold. fig|1.39.peg.5707, a putative aspartate
carbamoyltransferase, was downregulated by 4-fold in the AdpA mutant strain. It shows 93%
identity with pyrB in S. avermitilis which is involved into the fructose and mannose
metabolism. In addition, 7 down-regulated proteins in the AdpA overexpression mutant were
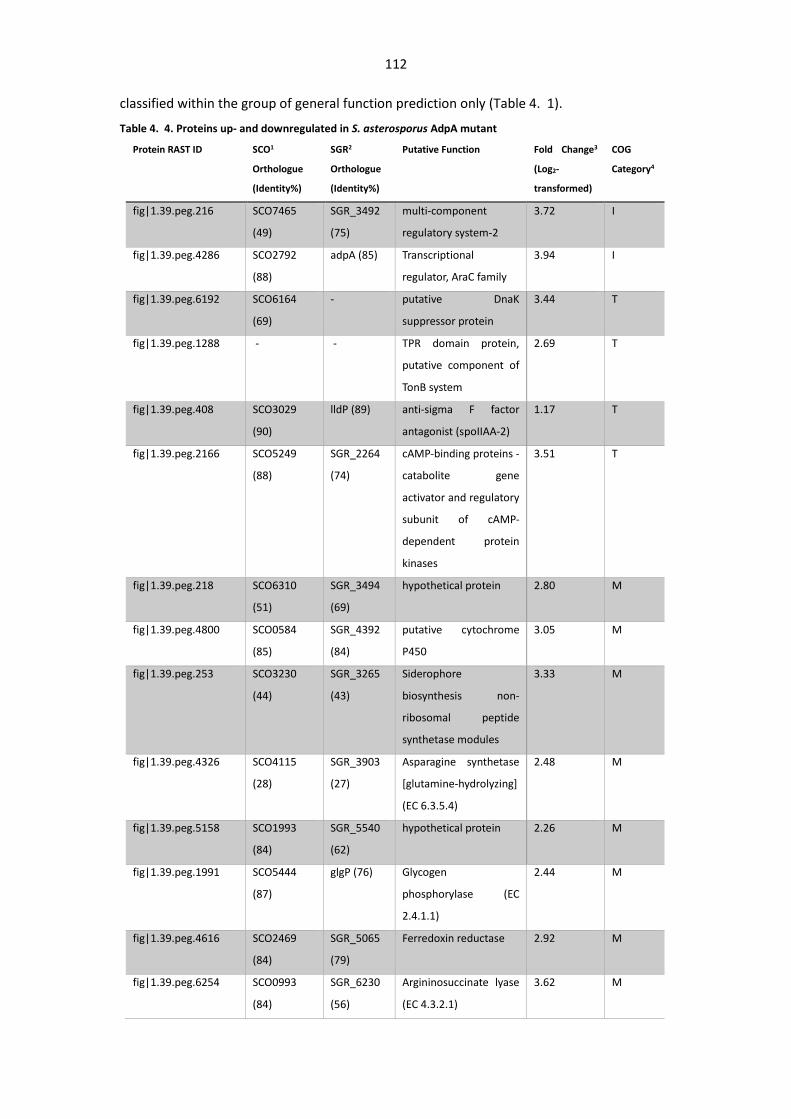
112
classified within the group of general function prediction only (Table 4. 1).
Table 4. 4. Proteins up- and downregulated in S. asterosporus AdpA mutant
Protein RAST ID SCO1
Orthologue
(Identity%)
SGR2
Orthologue
(Identity%)
Putative Function Fold Change3
(Log2-
transformed)
COG
Category4
fig|1.39.peg.216 SCO7465
(49)
SGR_3492
(75)
multi-component
regulatory system-2
3.72 I
fig|1.39.peg.4286 SCO2792
(88)
adpA (85) Transcriptional
regulator, AraC family
3.94 I
fig|1.39.peg.6192 SCO6164
(69)
- putative DnaK
suppressor protein
3.44 T
fig|1.39.peg.1288 - - TPR domain protein,
putative component of
TonB system
2.69 T
fig|1.39.peg.408 SCO3029
(90)
lldP (89) anti-sigma F factor
antagonist (spoIIAA-2)
1.17 T
fig|1.39.peg.2166 SCO5249
(88)
SGR_2264
(74)
cAMP-binding proteins -
catabolite gene
activator and regulatory
subunit of cAMP-
dependent protein
kinases
3.51 T
fig|1.39.peg.218 SCO6310
(51)
SGR_3494
(69)
hypothetical protein 2.80 M
fig|1.39.peg.4800 SCO0584
(85)
SGR_4392
(84)
putative cytochrome
P450
3.05 M
fig|1.39.peg.253 SCO3230
(44)
SGR_3265
(43)
Siderophore
biosynthesis non-
ribosomal peptide
synthetase modules
3.33 M
fig|1.39.peg.4326 SCO4115
(28)
SGR_3903
(27)
Asparagine synthetase
[glutamine-hydrolyzing]
(EC 6.3.5.4)
2.48 M
fig|1.39.peg.5158 SCO1993
(84)
SGR_5540
(62)
hypothetical protein 2.26 M
fig|1.39.peg.1991 SCO5444
(87)
glgP (76) Glycogen
phosphorylase (EC
2.4.1.1)
2.44 M
fig|1.39.peg.4616 SCO2469
(84)
SGR_5065
(79)
Ferredoxin reductase 2.92 M
fig|1.39.peg.6254 SCO0993
(84)
SGR_6230
(56)
Argininosuccinate lyase
(EC 4.3.2.1)
3.62 M
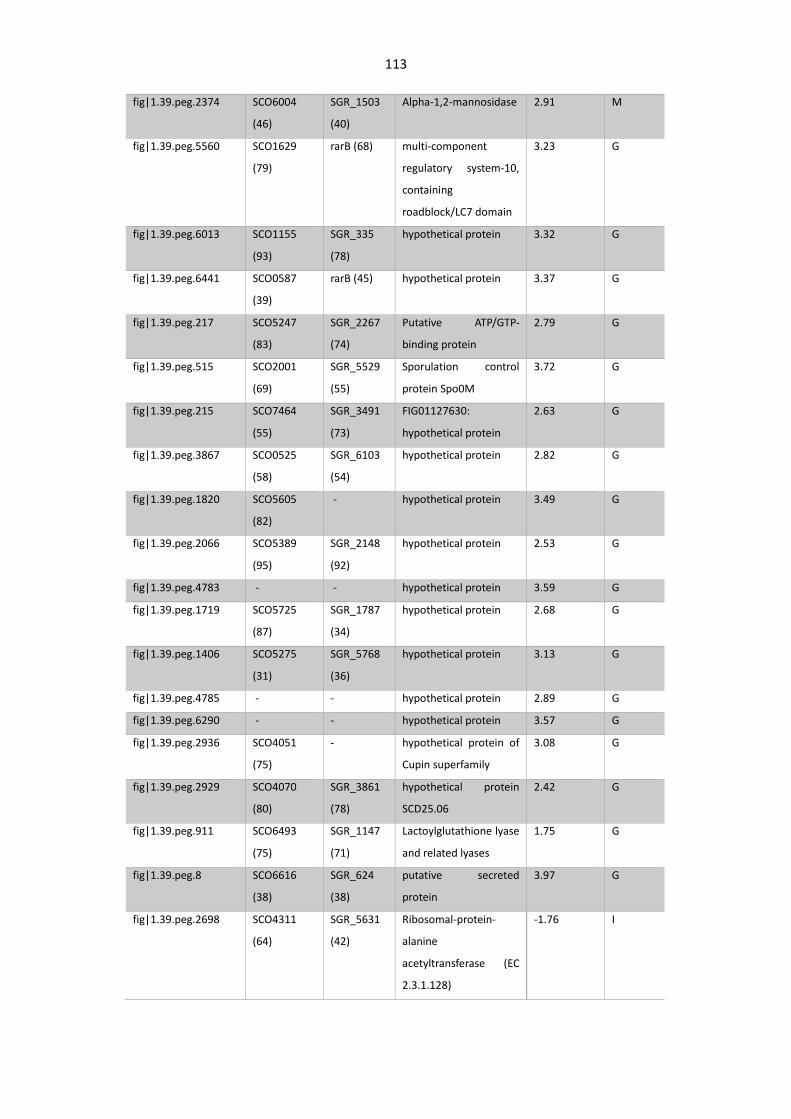
113
fig|1.39.peg.2374 SCO6004
(46)
SGR_1503
(40)
Alpha-1,2-mannosidase 2.91 M
fig|1.39.peg.5560 SCO1629
(79)
rarB (68) multi-component
regulatory system-10,
containing
roadblock/LC7 domain
3.23 G
fig|1.39.peg.6013 SCO1155
(93)
SGR_335
(78)
hypothetical protein 3.32 G
fig|1.39.peg.6441 SCO0587
(39)
rarB (45) hypothetical protein 3.37 G
fig|1.39.peg.217 SCO5247
(83)
SGR_2267
(74)
Putative ATP/GTP-
binding protein
2.79 G
fig|1.39.peg.515 SCO2001
(69)
SGR_5529
(55)
Sporulation control
protein Spo0M
3.72 G
fig|1.39.peg.215 SCO7464
(55)
SGR_3491
(73)
FIG01127630:
hypothetical protein
2.63 G
fig|1.39.peg.3867 SCO0525
(58)
SGR_6103
(54)
hypothetical protein 2.82 G
fig|1.39.peg.1820 SCO5605
(82)
- hypothetical protein 3.49 G
fig|1.39.peg.2066 SCO5389
(95)
SGR_2148
(92)
hypothetical protein 2.53 G
fig|1.39.peg.4783 - - hypothetical protein 3.59 G
fig|1.39.peg.1719 SCO5725
(87)
SGR_1787
(34)
hypothetical protein 2.68 G
fig|1.39.peg.1406 SCO5275
(31)
SGR_5768
(36)
hypothetical protein 3.13 G
fig|1.39.peg.4785 - - hypothetical protein 2.89 G
fig|1.39.peg.6290 - - hypothetical protein 3.57 G
fig|1.39.peg.2936 SCO4051
(75)
- hypothetical protein of
Cupin superfamily
3.08 G
fig|1.39.peg.2929 SCO4070
(80)
SGR_3861
(78)
hypothetical protein
SCD25.06
2.42 G
fig|1.39.peg.911 SCO6493
(75)
SGR_1147
(71)
Lactoylglutathione lyase
and related lyases
1.75 G
fig|1.39.peg.8 SCO6616
(38)
SGR_624
(38)
putative secreted
protein
3.97 G
fig|1.39.peg.2698 SCO4311
(64)
SGR_5631
(42)
Ribosomal-protein-
alanine
acetyltransferase (EC
2.3.1.128)
-1.76 I
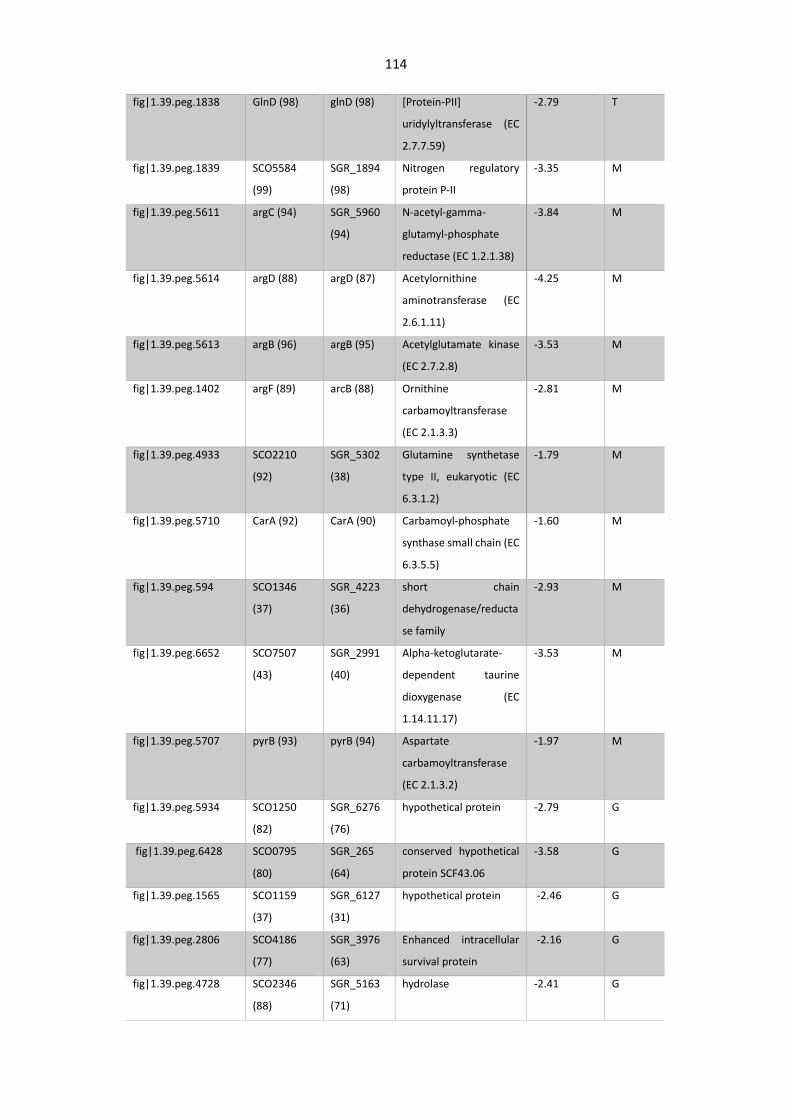
114
fig|1.39.peg.1838 GlnD (98) glnD (98) [Protein-PII]
uridylyltransferase (EC
2.7.7.59)
-2.79 T
fig|1.39.peg.1839 SCO5584
(99)
SGR_1894
(98)
Nitrogen regulatory
protein P-II
-3.35 M
fig|1.39.peg.5611 argC (94) SGR_5960
(94)
N-acetyl-gamma-
glutamyl-phosphate
reductase (EC 1.2.1.38)
-3.84 M
fig|1.39.peg.5614 argD (88) argD (87) Acetylornithine
aminotransferase (EC
2.6.1.11)
-4.25 M
fig|1.39.peg.5613 argB (96) argB (95) Acetylglutamate kinase
(EC 2.7.2.8)
-3.53 M
fig|1.39.peg.1402 argF (89) arcB (88) Ornithine
carbamoyltransferase
(EC 2.1.3.3)
-2.81 M
fig|1.39.peg.4933 SCO2210
(92)
SGR_5302
(38)
Glutamine synthetase
type II, eukaryotic (EC
6.3.1.2)
-1.79 M
fig|1.39.peg.5710 CarA (92) CarA (90) Carbamoyl-phosphate
synthase small chain (EC
6.3.5.5)
-1.60 M
fig|1.39.peg.594 SCO1346
(37)
SGR_4223
(36)
short chain
dehydrogenase/reducta
se family
-2.93 M
fig|1.39.peg.6652 SCO7507
(43)
SGR_2991
(40)
Alpha-ketoglutarate-
dependent taurine
dioxygenase (EC
1.14.11.17)
-3.53 M
fig|1.39.peg.5707 pyrB (93) pyrB (94) Aspartate
carbamoyltransferase
(EC 2.1.3.2)
-1.97 M
fig|1.39.peg.5934 SCO1250
(82)
SGR_6276
(76)
hypothetical protein -2.79 G
fig|1.39.peg.6428 SCO0795
(80)
SGR_265
(64)
conserved hypothetical
protein SCF43.06
-3.58 G
fig|1.39.peg.1565 SCO1159
(37)
SGR_6127
(31)
hypothetical protein -2.46 G
fig|1.39.peg.2806 SCO4186
(77)
SGR_3976
(63)
Enhanced intracellular
survival protein
-2.16 G
fig|1.39.peg.4728 SCO2346
(88)
SGR_5163
(71)
hydrolase -2.41 G
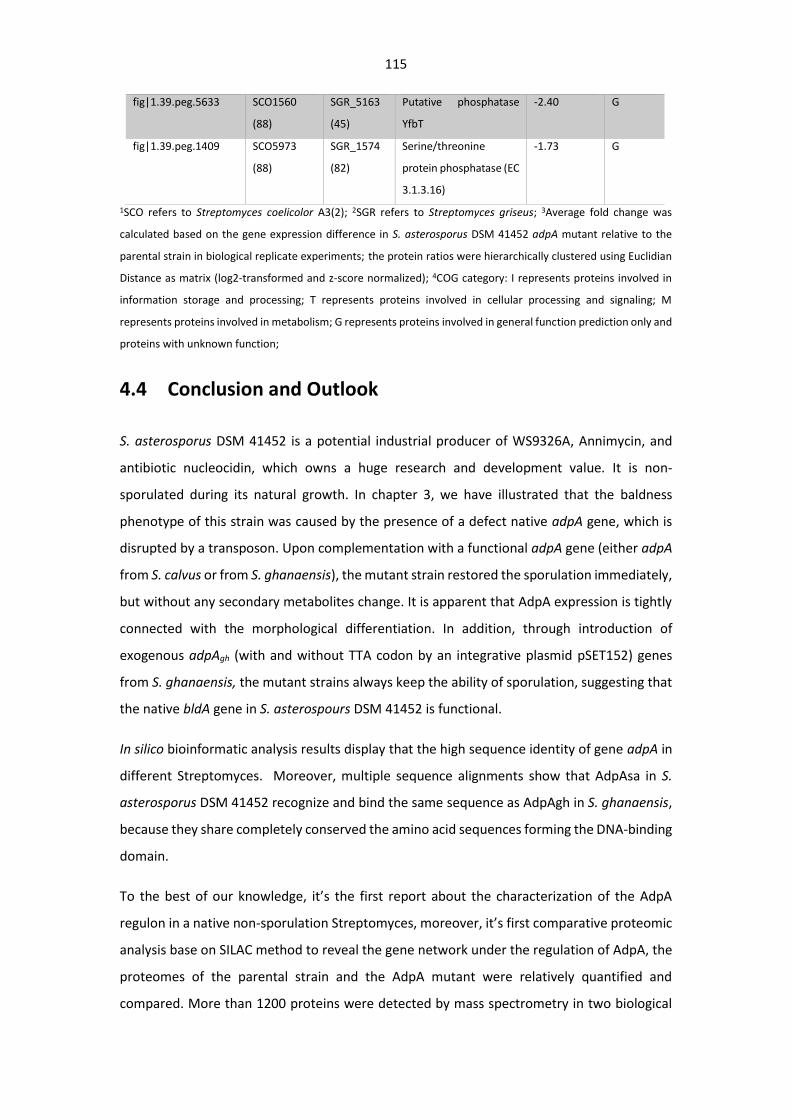
115
fig|1.39.peg.5633 SCO1560
(88)
SGR_5163
(45)
Putative phosphatase
YfbT
-2.40 G
fig|1.39.peg.1409 SCO5973
(88)
SGR_1574
(82)
Serine/threonine
protein phosphatase (EC
3.1.3.16)
-1.73 G
1SCO refers to Streptomyces coelicolor A3(2); 2SGR refers to Streptomyces griseus; 3Average fold change was
calculated based on the gene expression difference in S. asterosporus DSM 41452 adpA mutant relative to the
parental strain in biological replicate experiments; the protein ratios were hierarchically clustered using Euclidian
Distance as matrix (log2-transformed and z-score normalized); 4COG category: I represents proteins involved in
information storage and processing; T represents proteins involved in cellular processing and signaling; M
represents proteins involved in metabolism; G represents proteins involved in general function prediction only and
proteins with unknown function;
4.4 Conclusion and Outlook
S. asterosporus DSM 41452 is a potential industrial producer of WS9326A, Annimycin, and
antibiotic nucleocidin, which owns a huge research and development value. It is non-
sporulated during its natural growth. In chapter 3, we have illustrated that the baldness
phenotype of this strain was caused by the presence of a defect native adpA gene, which is
disrupted by a transposon. Upon complementation with a functional adpA gene (either adpA
from S. calvus or from S. ghanaensis), the mutant strain restored the sporulation immediately,
but without any secondary metabolites change. It is apparent that AdpA expression is tightly
connected with the morphological differentiation. In addition, through introduction of
exogenous adpAgh (with and without TTA codon by an integrative plasmid pSET152) genes
from S. ghanaensis, the mutant strains always keep the ability of sporulation, suggesting that
the native bldA gene in S. asterospours DSM 41452 is functional.
In silico bioinformatic analysis results display that the high sequence identity of gene adpA in
different Streptomyces. Moreover, multiple sequence alignments show that AdpAsa in S.
asterosporus DSM 41452 recognize and bind the same sequence as AdpAgh in S. ghanaensis,
because they share completely conserved the amino acid sequences forming the DNA-binding
domain.
To the best of our knowledge, it’s the first report about the characterization of the AdpA
regulon in a native non-sporulation Streptomyces, moreover, it’s first comparative proteomic
analysis base on SILAC method to reveal the gene network under the regulation of AdpA, the
proteomes of the parental strain and the AdpA mutant were relatively quantified and
compared. More than 1200 proteins were detected by mass spectrometry in two biological
116
replicates. The comparative proteomics analysis between the WT and the AdpA mutant
revealed that AdpA significantly affect the expression of 52 proteins (P-value < 0.05). Among
them, 33 proteins were upregulated and 19 proteins were downregulated. Of those
upregulated proteins, including the proteins involved in sporulation in Streptomyces, such as
the homolog of Spo0M fig|1.39.peg.515 and fig|1.39.peg.408, a homolog of the stage II
sporulation protein anti sigma-B factor antagonist. Furthermore, in silico analysis suggests
that the present of the AdpA binding site upstream of gene fig|1.39.peg.515, thus this gene
was predicted to be AdpA-dependent genes whose expression is directly activated by AdpA.
Among those significantly down-regulated proteins, of particular interest is a nitrogen
regulatory protein fig|1.39.peg.1839 and proteins fig|1.39.peg.4933, fig|1.39.peg.5611,
fig|1.39.peg.5614, fig|1.39.peg.1402 and fig|1.39.peg.5613, which exhibit strongly
relationship with nitrogen metabolism in Streptomyces. These results suggest that the AdpA
in S. asterosporus DSM 41452 could exert its influence on the morphological differentiation
and primary nitrogen metabolism in a specific manner.
Taken all together, our results clearly demonstrated that AdpA is not essential for the normal
growth and secondary metabolism of Streptomyces species, however it highly influence the
morphological development. We expect that this preliminary research will be contributed to
enlighten and motivate further study on the AdpA regulon in Streptomyces. More
importantly, we validated that SILAC proteomics method is a viable and efficient when applied
in Streptomyces system, and it is much more precise and highly reproducible alternative in
comparison with the conventional methods. The intracellular proteins were not completely
labelled with heavy arginine and lysine even when the culture was started using a very small
quantity of biomass(spores) in the labeled medium, which was most likely due to the synthesis
of the arginine by S. asterosporus DSM 41452 through endogenous mechanisms.
Further systematic researches on those proteins in this AdpA network are necessary, and it
might provide a sight to profile the detailed regulatory mechanism in Streptomyces. The
follow-up study will mainly focus on those highly regulated proteins by AdpA in S. asterosporus
DSM 41452. Transcriptional analysis will be applied to unveil whether those detected proteins
in AdpA regulon are constitutively expressed or not in the SG productive medium for the
native non-sporulating strain, to further validate the feasibility of the SILAC proteomics
method in Streptomyces.
117
Chapter 5. Research on the secondary metabolites of
Streptomyces asterosporus DSM 41452 and the biosynthesis of
WS9326As
5.1 Background
Nonribosomal peptide synthetases (NRPSs) represents one of the most important classes of
enzymes involved in natural product biosynthesis (Sussmuth and Mainz 2017). Many
pharmaceutically important antibiotics are biosynthesized by NRPSs (Winn et al. 2016).
Important NRPS derived antibiotics have been discovered from various kinds of
microorganisms (Finking and Marahiel 2004), including vancomycin produced by
Amycolatopsis orientalis (Barna and Williams 1984; Woithe et al. 2007), and daptomycin
produced by Streptomyces roseosporus (Baltz et al. 2005). NRPS natural products display a
wide range of chemical modifications that deviate from standard peptides, including
halogenation, hydroxylation, N-methylation, α/β-dehydrogenation (Süssmuth and Mainz
2017).
The cyclodepsipeptide WS9326A is notable for its unusual spectrum of bioactivities and its
production by a number of Streptomyces strains. The molecule was first isolated from
Streptomyces violaceusniger sp. 9326 by researchers at Fujisawa Pharmaceutical Co. on the
basis of its novel activity as a tachykinin receptor agonist (Hayashi et al. 1992; Shigematsu et
al. 1993). A total chemical synthesis confirmed the structure of WS9326A and probed the
relationship of the N-acyl group to bioactivity (Shigematsu et al. 1997). Subsequently,
WS9326A and a series of congeners (notably WS9326D) were isolated from Streptomyces sp.
9078 based on inhibition of an asparaginyl-tRNA synthetase from the filarial nematode
parasite Brugia malayl (Yu et al. 2012). More recently, WS9326A was found to be a
transcriptional inhibitor of pfoA gene regulated by the VirSR two-component system in
Clostridium perfringens, while WS9326B was observed to reduce the toxicity of Staphylococcus
aureus to human corneal epithelial cells (Desouky et al. 2015).
WS9326A exhibits an interesting chemical structure. The core NRPS backbone structure
consists of four standard amino acids (L-Thr, L-Leu, L-Asn, L-Ser) and three non-proteinogenic
amino acids (E-2,3-dehydrotyrosine, D-Phe, and L-allo-threonine). The E-2,3-dehydrotyrosine
(ΔTyr) residue is notable for not having been observed previously in NRPS derived peptides.
Amino acid residues with α,β-dehydrogenation have been observed in many other important
118
NRPS compound like Telomycin from Streptomyces canus ATCC 12646 (Fu et al. 2015), calcium-
dependent antibiotic (CDA), from Streptomyces coelicolor A3(2) (Hojati et al. 2002), and
Splenocin from Streptomyces sp. CNQ431 (Chang et al. 2015), along with different mechanisms
to form the α, β-alkene. The enzymatic mechanism to form the E-2,3-dehydrotyrosine in
WS9326A is still unknown.
Another prominent feature of WS9326A is the N-acyl group, consisting of a N-terminal
cinnamoyl moiety are also found in depsipeptide Skyllamycin (Pohle et al. 2011),
pepticinnamins (Omura et al. 1993), and the dimeric peptides Mohangamide A and B(Bae, Kim
et al. 2015). Structure and bioactivity relationships have shown that the Z-pentenyl-cinnamoyl
moiety is essential for activity (Shigematsu et al. 1997). Previous biosynthetic studies indicated
that this polyketide chain may arise from a complex biosynthetic pathway (Pohle et al. 2011),
but the exact mechanism has not been deciphered to date.
We were inspired to study S. asterosporus DSM 41452 in detail upon observing a surprising
biosynthetic kinship with Streptomyces calvus ATCC13382. The genome sequence of S.
asterosporus DSM 41452 revealed gene clusters with very high sequence identity to the
WS9326A (Johnston et al. 2015) and Annimycin clusters (Kalan et al. 2013) found in S. calvus.
Indeed, analysis of culture extracts of S. asterosporus DSM 41452 revealed the presence of a
NRPS compound WS9326A, two new WS9326A derivatives have been isolated from the
culture broth of this strain, the gene cluster of WS9326A was characterized through
bioinformatic analysis and genetic mutagenesis. It has also been observed that the production
of WS9326A in S. calvus is inversely correlated to the production of Annimycin (Kalan et al.
2013). Therefore, we decided to disrupt the Annimycin gene cluster in S. asterosporus DSM
41452. While titer of WS9326A in the resulting S. asterosporus mutant (S. asterosporus DSM
41452::pUC19Δ3100spec) was slightly improved. Moreover, we were surprised to observe the
production of two new WS9326A derivatives.
5.2 Materials and Methods
5.2.1 Primers fragments used in this study
Table 5. 1. Primers fragments used in this study
Name Sequence
Primer for vector construction of pKC1132-InAnn3
InAnn3-F CCGCTGAACGTCATGTCGACCGC
InAnn3-R CGTTCGGACCGCGCACCACGA
Primer for vector construction of pKC1132-orf(-1)
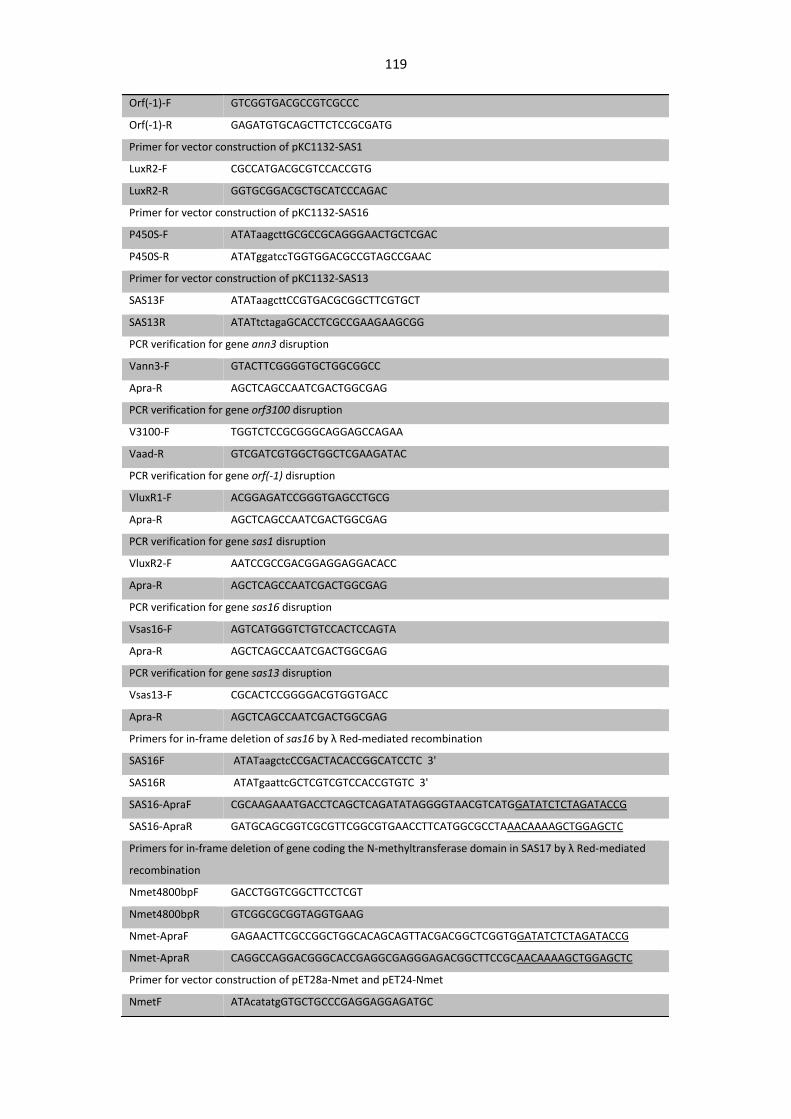
119
Orf(-1)-F GTCGGTGACGCCGTCGCCC
Orf(-1)-R GAGATGTGCAGCTTCTCCGCGATG
Primer for vector construction of pKC1132-SAS1
LuxR2-F CGCCATGACGCGTCCACCGTG
LuxR2-R GGTGCGGACGCTGCATCCCAGAC
Primer for vector construction of pKC1132-SAS16
P450S-F ATATaagcttGCGCCGCAGGGAACTGCTCGAC
P450S-R ATATggatccTGGTGGACGCCGTAGCCGAAC
Primer for vector construction of pKC1132-SAS13
SAS13F ATATaagcttCCGTGACGCGGCTTCGTGCT
SAS13R ATATtctagaGCACCTCGCCGAAGAAGCGG
PCR verification for gene ann3 disruption
Vann3-F GTACTTCGGGGTGCTGGCGGCC
Apra-R AGCTCAGCCAATCGACTGGCGAG
PCR verification for gene orf3100 disruption
V3100-F TGGTCTCCGCGGGCAGGAGCCAGAA
Vaad-R GTCGATCGTGGCTGGCTCGAAGATAC
PCR verification for gene orf(-1) disruption
VluxR1-F ACGGAGATCCGGGTGAGCCTGCG
Apra-R AGCTCAGCCAATCGACTGGCGAG
PCR verification for gene sas1 disruption
VluxR2-F AATCCGCCGACGGAGGAGGACACC
Apra-R AGCTCAGCCAATCGACTGGCGAG
PCR verification for gene sas16 disruption
Vsas16-F AGTCATGGGTCTGTCCACTCCAGTA
Apra-R AGCTCAGCCAATCGACTGGCGAG
PCR verification for gene sas13 disruption
Vsas13-F CGCACTCCGGGGACGTGGTGACC
Apra-R AGCTCAGCCAATCGACTGGCGAG
Primers for in-frame deletion of sas16 by λ Red-mediated recombination
SAS16F ATATaagctcCCGACTACACCGGCATCCTC 3'
SAS16R ATATgaattcGCTCGTCGTCCACCGTGTC 3'
SAS16-ApraF CGCAAGAAATGACCTCAGCTCAGATATAGGGGTAACGTCATGGATATCTCTAGATACCG
SAS16-ApraR GATGCAGCGGTCGCGTTCGGCGTGAACCTTCATGGCGCCTAAACAAAAGCTGGAGCTC
Primers for in-frame deletion of gene coding the N-methyltransferase domain in SAS17 by λ Red-mediated
recombination
Nmet4800bpF GACCTGGTCGGCTTCCTCGT
Nmet4800bpR GTCGGCGCGGTAGGTGAAG
Nmet-ApraF GAGAACTTCGCCGGCTGGCACAGCAGTTACGACGGCTCGGTGGATATCTCTAGATACCG
Nmet-ApraR CAGGCCAGGACGGGCACCGAGGCGAGGGAGACGGCTTCCGCAACAAAAGCTGGAGCTC
Primer for vector construction of pET28a-Nmet and pET24-Nmet
NmetF ATAcatatgGTGCTGCCCGAGGAGGAGATGC
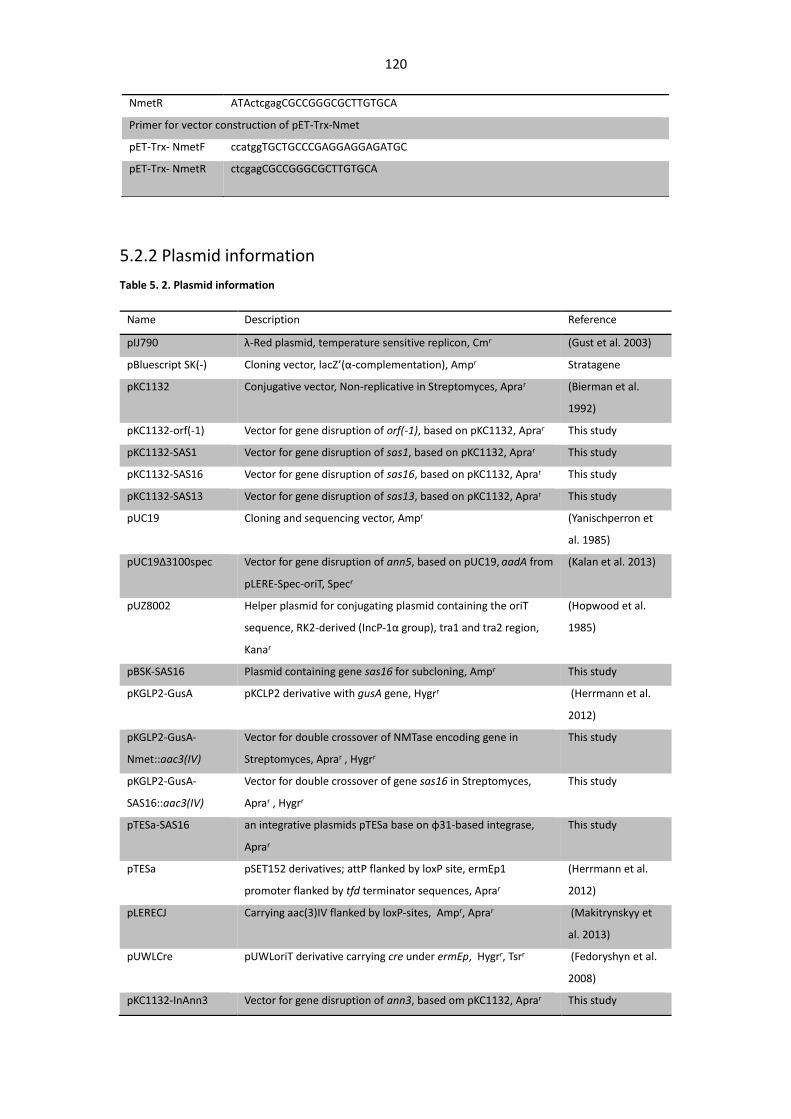
120
5.2.2 Plasmid information
Table 5. 2. Plasmid information
NmetR ATActcgagCGCCGGGCGCTTGTGCA
Primer for vector construction of pET-Trx-Nmet
pET-Trx- NmetF ccatggTGCTGCCCGAGGAGGAGATGC
pET-Trx- NmetR ctcgagCGCCGGGCGCTTGTGCA
Name Description Reference
pIJ790 λ-Red plasmid, temperature sensitive replicon, Cmr (Gust et al. 2003)
pBluescript SK(-) Cloning vector, lacZ’(α-complementation), Ampr Stratagene
pKC1132 Conjugative vector, Non-replicative in Streptomyces, Aprar (Bierman et al.
1992)
pKC1132-orf(-1) Vector for gene disruption of orf(-1), based on pKC1132, Aprar This study
pKC1132-SAS1 Vector for gene disruption of sas1, based on pKC1132, Aprar This study
pKC1132-SAS16 Vector for gene disruption of sas16, based on pKC1132, Aprar This study
pKC1132-SAS13 Vector for gene disruption of sas13, based on pKC1132, Aprar This study
pUC19 Cloning and sequencing vector, Ampr (Yanischperron et
al. 1985)
pUC19Δ3100spec Vector for gene disruption of ann5, based on pUC19, aadA from
pLERE-Spec-oriT, Specr
(Kalan et al. 2013)
pUZ8002 Helper plasmid for conjugating plasmid containing the oriT
sequence, RK2-derived (IncP-1α group), tra1 and tra2 region,
Kanar
(Hopwood et al.
1985)
pBSK-SAS16 Plasmid containing gene sas16 for subcloning, Ampr This study
pKGLP2-GusA pKCLP2 derivative with gusA gene, Hygrr (Herrmann et al.
2012)
pKGLP2-GusA-
Nmet::aac3(IV)
Vector for double crossover of NMTase encoding gene in
Streptomyces, Aprar , Hygrr
This study
pKGLP2-GusA-
SAS16::aac3(IV)
Vector for double crossover of gene sas16 in Streptomyces,
Aprar , Hygrr
This study
pTESa-SAS16 an integrative plasmids pTESa base on φ31-based integrase,
Aprar
This study
pTESa pSET152 derivatives; attP flanked by loxP site, ermEp1
promoter flanked by tfd terminator sequences, Aprar
(Herrmann et al.
2012)
pLERECJ Carrying aac(3)IV flanked by loxP-sites, Ampr, Aprar (Makitrynskyy et
al. 2013)
pUWLCre pUWLoriT derivative carrying cre under ermEp, Hygrr, Tsrr (Fedoryshyn et al.
2008)
pKC1132-InAnn3 Vector for gene disruption of ann3, based om pKC1132, Aprar This study
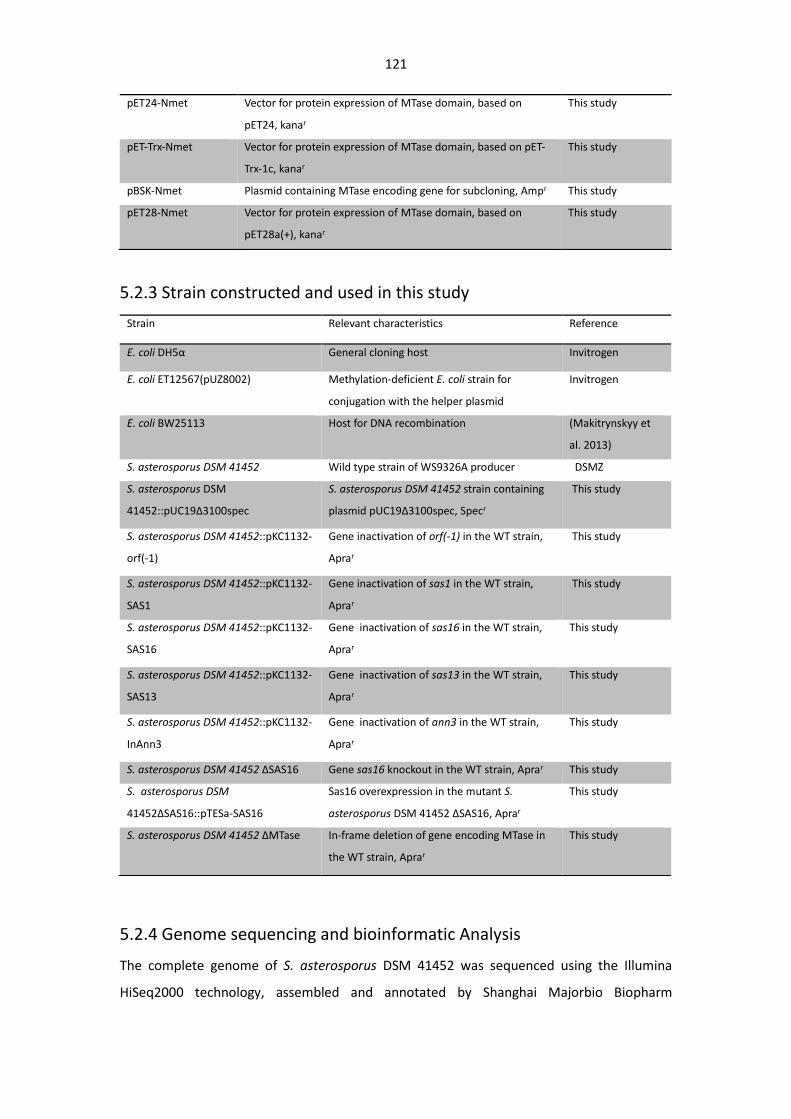
121
5.2.3 Strain constructed and used in this study
5.2.4 Genome sequencing and bioinformatic Analysis
The complete genome of S. asterosporus DSM 41452 was sequenced using the Illumina
HiSeq2000 technology, assembled and annotated by Shanghai Majorbio Biopharm
pET24-Nmet Vector for protein expression of MTase domain, based on
pET24, kanar
This study
pET-Trx-Nmet Vector for protein expression of MTase domain, based on pET-
Trx-1c, kanar
This study
pBSK-Nmet Plasmid containing MTase encoding gene for subcloning, Ampr This study
pET28-Nmet Vector for protein expression of MTase domain, based on
pET28a(+), kanar
This study
Strain Relevant characteristics Reference
E. coli DH5α General cloning host Invitrogen
E. coli ET12567(pUZ8002) Methylation-deficient E. coli strain for
conjugation with the helper plasmid
Invitrogen
E. coli BW25113 Host for DNA recombination (Makitrynskyy et
al. 2013)
S. asterosporus DSM 41452 Wild type strain of WS9326A producer DSMZ
S. asterosporus DSM
41452::pUC19Δ3100spec
S. asterosporus DSM 41452 strain containing
plasmid pUC19Δ3100spec, Specr
This study
S. asterosporus DSM 41452::pKC1132-
orf(-1)
Gene inactivation of orf(-1) in the WT strain,
Aprar
This study
S. asterosporus DSM 41452::pKC1132-
SAS1
Gene inactivation of sas1 in the WT strain,
Aprar
This study
S. asterosporus DSM 41452::pKC1132-
SAS16
Gene inactivation of sas16 in the WT strain,
Aprar
This study
S. asterosporus DSM 41452::pKC1132-
SAS13
Gene inactivation of sas13 in the WT strain,
Aprar
This study
S. asterosporus DSM 41452::pKC1132-
InAnn3
Gene inactivation of ann3 in the WT strain,
Aprar
This study
S. asterosporus DSM 41452 ΔSAS16 Gene sas16 knockout in the WT strain, Aprar This study
S. asterosporus DSM
41452ΔSAS16::pTESa-SAS16
Sas16 overexpression in the mutant S.
asterosporus DSM 41452 ΔSAS16, Aprar
This study
S. asterosporus DSM 41452 ΔMTase In-frame deletion of gene encoding MTase in
the WT strain, Aprar
This study
122
Technology Co, Ltd. (Shanghai, China). Prediction of the gene clusters was performed using
antiSMASH (http://antismash.secondarymetabolites.org/). A large DNA fragment without any
gaps was found to contain the putative SAS gene cluster. The orfs were determined by
application of the FramePlot 4.0 beta program (http://nocardia.nih.go.jp/fp4/). Protein
sequences were compared with BLAST programs (http://blast.ncbi.nlm.nih.gov/Blast.cgi).
Domain organization and substrate specificities for NRPSs were predicted by PKS/NRPS
analysis software (http://nrps.igs.umaryland.edu/).
5.2.5 Generation of gene sas13 disruption mutant in S. asterosporus DSM
41452
A 701bp internal fragment of gene sas13 was amplified by PCR using the chromosome of S.
asterosporus DSM 41452 as template using the following primers SAS13F and SAS13R. The
PCR product was ligated into the EcoRV-digested pBluescript SK (-) to yield pBSK-SAS13. The
insert was excised as an HindIII/XbaI fragment and subcloned into vector pKC1132 to generate
suicide plasmid pKC1132-SAS13. After conjugation of this plasmid into S. asterosporus DSM
41452, an apramycin-resistant mutant named S. asteroporous :: pKC1132-SAS13 was
obtained. The correct transconjugants carrying plasmid were screened for resistance against
apramycin (50 ug/ml). apramycin-sensitive colonies were tested for target gene disruption by
colony PCR using primer Vsas13-F and Apra-R.
5.2.6 Generation of gene sas16 disruption mutant in S. asterosporus DSM
41452
An 840bp internal fragment of gene sas16 was amplified by PCR using the chromosome of S.
asterosporus DSM 41452 as template using the following primers P450S-F and P450S-R. The
PCR product was ligated into the EcoRV-digested pBluescript SK(-) to yield pBSK-SAS16. The
insert was excised as a HindIII/XbaI fragment and subcloned into vector pKC1132 to generate
plasmid pKC1132-SAS16. After conjugation of this plasmid into S. asterosporus DSM 41452,
an apramycin-resistant mutant named S. asteroporous DSM 41452 :: pKC1132-SAS16 was
obtained. The correct transconjugants carrying plasmid were screened for resistance against
apramycin (50ug/ml). apramycin-sensitive colonies were tested for target gene disruption by
colony PCR using primer Vsas16-F and Apra-R.
123
5.2.7 Strain information, Fermentation, Extraction
The wildtype strain S. asterosporus DSM 41452 was purchased from Leibniz Institute DSMZ-
German Collection of Microorganisms and cell Cultures, Germany. The initial cultures were
maintained on the Tryptic soy broth (TSB) solid medium [Bacto™ Tryptone (Pancreatic Digest
of Casein) 17g, Bacto Soytone (Peptic Digest of Soybean Meal) 3g, Glucose 2.5g, Sodium
Chloride 5g, Dipotassium Hydrogen Phosphate 2.5g, Tap water 1000mL, pH 7.3]. A small loop
of spores growing on a TSB solid plate was inoculated into a 250 mL Erlenmeyer flask
containing 75 mL liquid productive SG medium (Soy peptone 10.0 g, Glucose 20.0 g, L-Valine
2.34 g, CaCO3 2.0 g, CoCl2-solution 1mg/mL 1 mL, tap water 1000 mL, pH7.2) and cultured at
28 ℃ for 3 days on a rotary shaker at 180 r·min−1. Then, 10 mL of the preculture (at a volume
ratio of 1:100) was inoculated into a 500 mL Erlenmeyer flask (40 flasks) containing 150 mL of
the SG medium, then incubated for 4 days, 180rpm, 28℃. The fermentation broth (6L) was
filtered through high speed centrifugation (8000 rpm, 10min, 22℃), yielding the supernatant
and cell pellet. Then the supernatant was extracted by double volume ethyl acetate using a
separating funnel, then this organic solvent was evaporated under reduced pressure. The
mycelium also was extracted by acetone, which was evaporate under reduced pressure. The
crude extract from the supernatant and the cell pellet were combined.
5.2.8 Isolation of Compound WS9326A, B, D, E, F, G
The crude extract (~5g) was dissolved in 15 mL MeOH and fractionated by reversed-phase (RP)
C18 liquid chromatography (Oasis® HLB 20 / 35cc), the starting elution solvent is 5% methanol,
then the column was eluted using a stepwise gradient MeOH (30%, 40%, 50%, 60%, 70%, 80,
90% and 100%). Fractions afforded from SPE column were analyzed by LC-MS. Among those
fractions, fractions (Nr.22-27) were subsequently subjected to a further purification by a semi-
preparative HPLC (Agilent Technologies), equipped with a Waters ZORBAX SB-C18 column (9.4
x 100 mm, 5 µm) and a X-Bridge C8 guard column (9.4 x 50 mm, 3.5 µm), the fraction was
eluted by an isocratic method (60% CH3CN-40% H2O, each solvent contains 0.5% acetic acid;
flow rate 1 mL/min), to yield compounds WS9326A (10mg), WS9326B (4.9mg), WS9326D
(10.9mg), WS9326E (2.4mg), WS9326F (9.4mg), and WS9326G (4.8mg).
5.2.9 Sample analysis by HPLC-MS
The organic phase was evaporated, resuspended in MeOH(1mL), and filtered through syringe
filters (LLG, PVDF, 0.45um) prior to LC-MS analysis. HPLC-MS analysis was performed on an
Agilent 1100 series LC/MS system with electrospray ionization (ESI) and detection in the
positive and negative modes. The LC system was equipped with a Zorbax Eclipse XDB-C18
124
column (3.5 μm particle size; 100 mm by 4.6 mm; Agilent) and a Zorbax XDB-C18 guard column
(5-μm particle size; 12.5 mm by 4.6 mm; Agilent), maintained at room temperature. Detection
wavelengths of the diode array detector were 254/360 nm, 480/800 nm, 360/580 nm, and
430/600 nm. The mobile system consisted of solvent A (acetic acid [0.5%, vol/vol] in
acetonitrile) and solvent B (acetic acid [0.5%, vol/vol]). A 10 μL aliquot of the MeOH-soluble
extract was injected for analysis each sample, a gradient elution method was used (A: CH3CN
with 0.1% HAc; B: H2O with 0.1% HAc; 5% A over 4 min, 5–95% A from 4 to 20 min, 95% A from
20 to 22 min, 95-5% A from 22 to 23 min, and 5% A from 23 to 30 min; 0.5mL/min). MSD
settings during the LC gradient were as follows: Acquisition—mass range m/z 150–1000, MS
scan rate 1s-1, MS/MS scan rate 2s-1, fixed collision energy 20 eV; ion source drying gas
temperature 350 °C, drying gas flow 10 L/min; Nebulizer pressure 35 psig; ion source mode
API-ES; capillary voltage 3000; The MS detector was autotuned using Agilent tuning solution
in positive and positive mode before measurement. LC (DAD) and MS data were analyzed with
ChemStation software (Agilent).
5.2.10 NMR methods and General instrument for structural
characterization
Nuclear magnetic resonance (NMR) was employed to elucidate the structures of Compound
WS9326A, B, D, E, F, G. The 1D NMR spectra [1H NMR (400 MHz) and 13C NMR (100 MHz)] and
2D NMR spectra [1H/1H-COSY (correlation spectroscopy), HSQC (Heteronuclear Single
Quantum Coherence), and HMBC (Heteronuclear Multiple Bond Correlation)] of these
compounds were measured on a Varian VNMR-S 600-MHz spectrometer in 150 μl DMSO-d6
at T = 35°C or 25°C. Residual solvent signals were used as an internal standard (DMSO-d6: δH
= 2.5ppm, δC = 39.5 ppm). For WS9326F, WS9326G, SY11 and SY12, their high-resolution
electron spray ionization mass spectra (HR-ESI-MS) were measured on a LTQ Orbitrap XL
(Thermo Scientific).
5.2.11 Structure information of compound 1-6
WS9326A (1): White amorphous powder; UV(MeOH) λmax 231 nm, 288 nm; ESI-MS m/z [M-
H]- 1035, [M+Cl]-1071, (calcd. for C54H68N8O13, 1036.49); 1H-NMR (400 MHz, DMSO-d6) and 13C-
NMR (100 MHz, DMSO-d6) data are shown in Table 5.6.
WS9326B (2): White amorphous powder; UV(MeOH) λmax 212 nm, 290 nm; ESI-MS m/z [M-
H]-1037, [M+Cl]-1073, HRESI-MS m/z [M+H]+ 1039.0229 (calcd. for C54H70N8O13, 1038.51);
125
WS9326D (3): White amorphous powder; UV(MeOH) λmax 209 nm, 289 nm; ESI-MS m/z [M-
H]-852.4(calcd. for C47H59N5O10, 853.43);
WS9326E (4): White amorphous powder; UV(MeOH) λmax 222 nm, 291 nm; ESI-MS m/z [M-
H]-838.4(calcd. for C46H57N5O10, 839.41);
WS9326F (5): White amorphous powder; UV(MeOH) λmax 210 nm, 290 nm; ESI-MS m/z [M-
H]- 966.4, HRESI-MS m/z [M+H]+ 968.4750 (calcd. for C51H65N7O12, 967.47); 1H-NMR (400 MHz,
DMSO-d6) and 13C-NMR (100 MHz, DMSO-d6) data are shown in Table 5.6.
WS9326G (6): White amorphous powder; UV(MeOH) λmax 225 nm, 293 nm; ESI-MS m/z [M-
H]- 952.4, HRESI-MS m/z [M+H]+ 954.4644(calcd. for C50H63N7O12, 953.45);
5.2.12 Antiparasite assay method and materials
Asexual, blood-stage parasites were cultured in vitro using standard conditions(Trager and
Jensen 1976). Briefly, parasites were maintained in 2% human O+ erythrocytes (Interstate
Blood Bank, Memphis, TN) in RPMI-1640 medium (Life Technologies, Grand Island, NY)
supplemented with 0.5% Albumax (Life Technologies), 24 mmol/L sodium bicarbonate, and
10 μg/mL gentamycin. Tissue culture flasks were incubated at 37 °C under a gas mixture of 5%
CO2, 5% O2, and 90% N2. Cultures were screened for mycoplasma using the Universal
Mycoplasma Detection Kit (ATCC, Manassas, VA).
In vitro drug responses were measured using 72-hr SYBR Green staining assays as described
previously with minor modifications(Desjardins, Canfield et al. 1979; Smilkstein, Sriwilaijaroen
et al. 2004). Parasites were diluted to 0.5% final parasitemia with 2% final hematocrit. The
diluted parasite culture (100 μL) was added to duplicate test wells in a 96-well plate containing
100 μL of the drug tested. IC50 values were determined by nonlinear regression analysis using
Prism 5.0 software (GraphPad Software, San Diego, CA). Drug assays were performed on three
independent occasions.
5.3 Results and Discussion
5.3.1 Chemical structure Elucidation of WS9326A derivatives from S.
asterosporus DSM 41452
Recently we report that the strain Streptomyces calvus produce a kind of NRPS derivatives
WS9326A, further analysis of other sporulation defective strain S. asterosporus DSM 41452,
we found that it can produce much more amount of WS9326As than that of Streptomyces
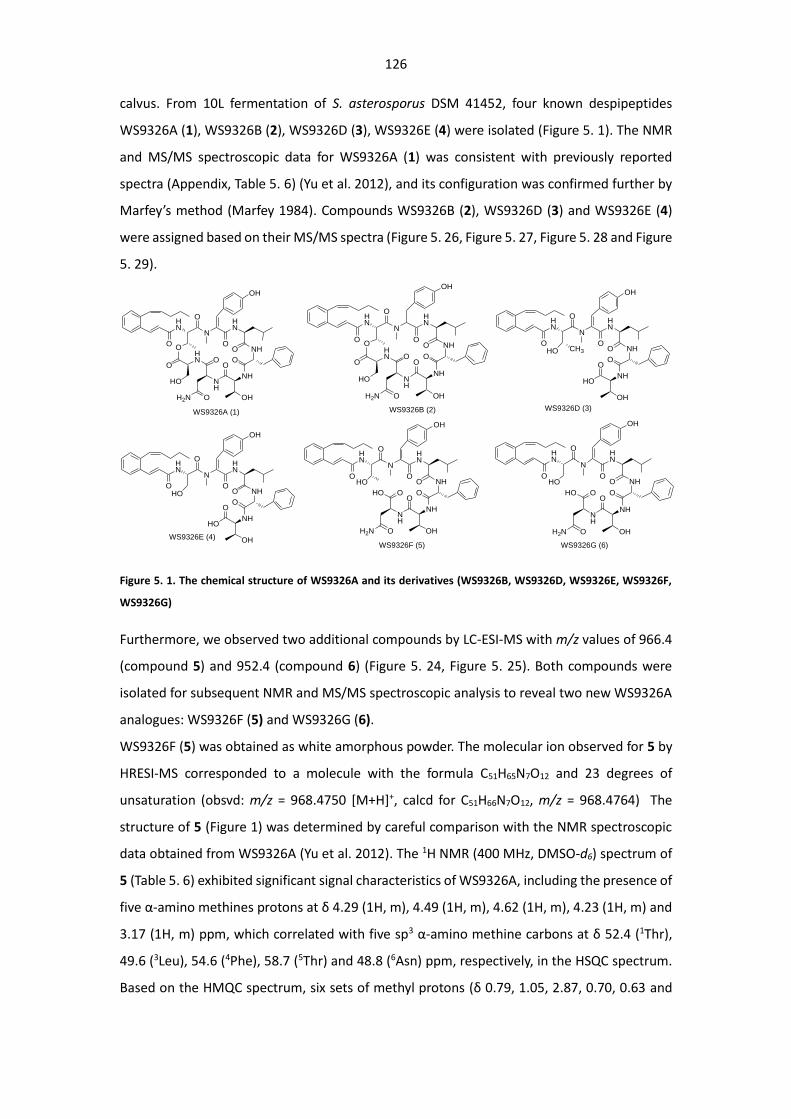
126
calvus. From 10L fermentation of S. asterosporus DSM 41452, four known despipeptides
WS9326A (1), WS9326B (2), WS9326D (3), WS9326E (4) were isolated (Figure 5. 1). The NMR
and MS/MS spectroscopic data for WS9326A (1) was consistent with previously reported
spectra (Appendix, Table 5. 6) (Yu et al. 2012), and its configuration was confirmed further by
Marfey’s method (Marfey 1984). Compounds WS9326B (2), WS9326D (3) and WS9326E (4)
were assigned based on their MS/MS spectra (Figure 5. 26, Figure 5. 27, Figure 5. 28 and Figure
5. 29).
HN
OO
O
N
OH
HN
ONHO
O
NH
O
NH
OH
OHN
OH2N
HO
O
HN
OO
O
N
OH
HN
ONHO
O
NH
O
NH
OH
OHN
OH2N
HO
O
WS9326A (1) WS9326B (2)
WS9326E (4)
HN
OHO
O
N
OH
HN
ONHO
O
NH
O
OH
HO
CH3
WS9326D (3)
HN
OHO
O
N
OH
HN
ONHO
O
NH
O
OH
HO
HN
OHO
O
N
OH
HN
ONHO
O
NH
O
NH
OH
OHO
OH2N
HN
OHO
O
N
OH
HN
ONHO
O
NH
O
NH
OH
OHO
OH2N
WS9326F (5) WS9326G (6)
Figure 5. 1. The chemical structure of WS9326A and its derivatives (WS9326B, WS9326D, WS9326E, WS9326F,
WS9326G)
Furthermore, we observed two additional compounds by LC-ESI-MS with m/z values of 966.4
(compound 5) and 952.4 (compound 6) (Figure 5. 24, Figure 5. 25). Both compounds were
isolated for subsequent NMR and MS/MS spectroscopic analysis to reveal two new WS9326A
analogues: WS9326F (5) and WS9326G (6).
WS9326F (5) was obtained as white amorphous powder. The molecular ion observed for 5 by
HRESI-MS corresponded to a molecule with the formula C51H65N7O12 and 23 degrees of
unsaturation (obsvd: m/z = 968.4750 [M+H]+, calcd for C51H66N7O12, m/z = 968.4764) The
structure of 5 (Figure 1) was determined by careful comparison with the NMR spectroscopic
data obtained from WS9326A (Yu et al. 2012). The 1H NMR (400 MHz, DMSO-d6) spectrum of
5 (Table 5. 6) exhibited significant signal characteristics of WS9326A, including the presence of
five α-amino methines protons at δ 4.29 (1H, m), 4.49 (1H, m), 4.62 (1H, m), 4.23 (1H, m) and
3.17 (1H, m) ppm, which correlated with five sp3 α-amino methine carbons at δ 52.4 (1Thr),
49.6 (3Leu), 54.6 (4Phe), 58.7 (5Thr) and 48.8 (6Asn) ppm, respectively, in the HSQC spectrum.
Based on the HMQC spectrum, six sets of methyl protons (δ 0.79, 1.05, 2.87, 0.70, 0.63 and
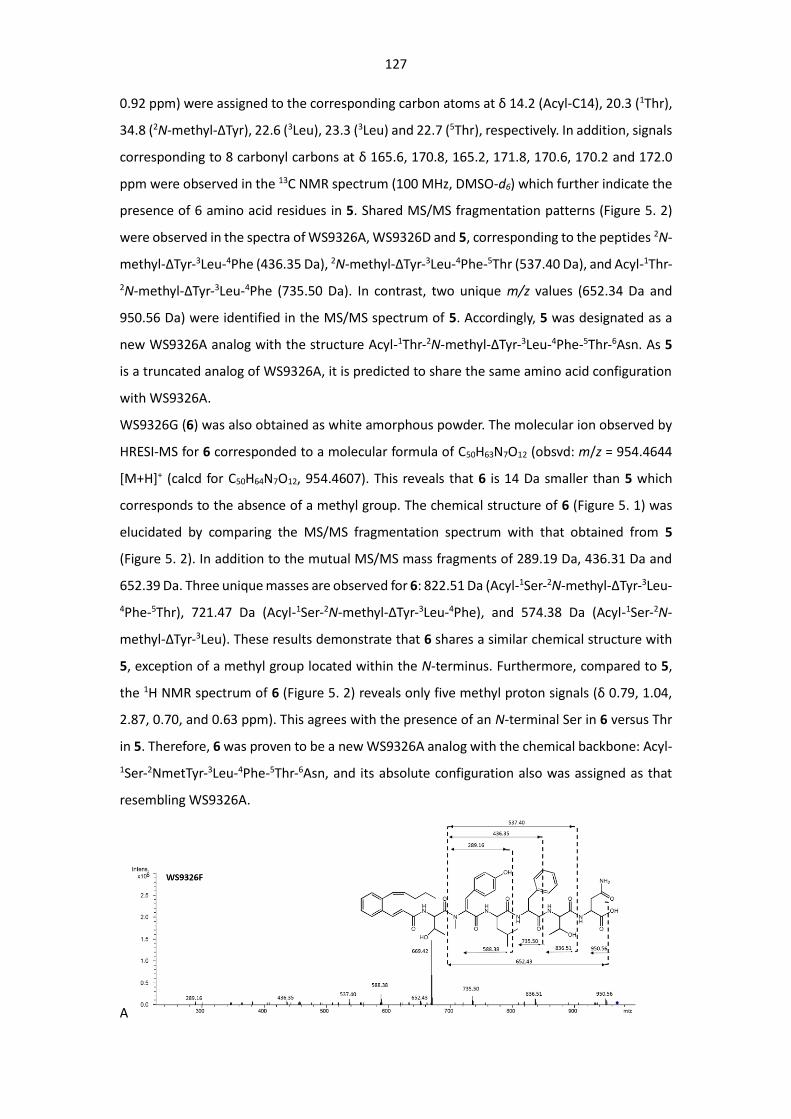
127
0.92 ppm) were assigned to the corresponding carbon atoms at δ 14.2 (Acyl-C14), 20.3 (1Thr),
34.8 (2N-methyl-ΔTyr), 22.6 (3Leu), 23.3 (3Leu) and 22.7 (5Thr), respectively. In addition, signals
corresponding to 8 carbonyl carbons at δ 165.6, 170.8, 165.2, 171.8, 170.6, 170.2 and 172.0
ppm were observed in the 13C NMR spectrum (100 MHz, DMSO-d6) which further indicate the
presence of 6 amino acid residues in 5. Shared MS/MS fragmentation patterns (Figure 5. 2)
were observed in the spectra of WS9326A, WS9326D and 5, corresponding to the peptides 2N-
methyl-ΔTyr-3Leu-4Phe (436.35 Da), 2N-methyl-ΔTyr-3Leu-4Phe-5Thr (537.40 Da), and Acyl-1Thr-
2N-methyl-ΔTyr-3Leu-4Phe (735.50 Da). In contrast, two unique m/z values (652.34 Da and
950.56 Da) were identified in the MS/MS spectrum of 5. Accordingly, 5 was designated as a
new WS9326A analog with the structure Acyl-1Thr-2N-methyl-ΔTyr-3Leu-4Phe-5Thr-6Asn. As 5
is a truncated analog of WS9326A, it is predicted to share the same amino acid configuration
with WS9326A.
WS9326G (6) was also obtained as white amorphous powder. The molecular ion observed by
HRESI-MS for 6 corresponded to a molecular formula of C50H63N7O12 (obsvd: m/z = 954.4644
[M+H]+ (calcd for C50H64N7O12, 954.4607). This reveals that 6 is 14 Da smaller than 5 which
corresponds to the absence of a methyl group. The chemical structure of 6 (Figure 5. 1) was
elucidated by comparing the MS/MS fragmentation spectrum with that obtained from 5
(Figure 5. 2). In addition to the mutual MS/MS mass fragments of 289.19 Da, 436.31 Da and
652.39 Da. Three unique masses are observed for 6: 822.51 Da (Acyl-1Ser-2N-methyl-ΔTyr-3Leu-
4Phe-5Thr), 721.47 Da (Acyl-1Ser-2N-methyl-ΔTyr-3Leu-4Phe), and 574.38 Da (Acyl-1Ser-2N-
methyl-ΔTyr-3Leu). These results demonstrate that 6 shares a similar chemical structure with
5, exception of a methyl group located within the N-terminus. Furthermore, compared to 5,
the 1H NMR spectrum of 6 (Figure 5. 2) reveals only five methyl proton signals (δ 0.79, 1.04,
2.87, 0.70, and 0.63 ppm). This agrees with the presence of an N-terminal Ser in 6 versus Thr
in 5. Therefore, 6 was proven to be a new WS9326A analog with the chemical backbone: Acyl-
1Ser-2NmetTyr-3Leu-4Phe-5Thr-6Asn, and its absolute configuration also was assigned as that
resembling WS9326A.
A
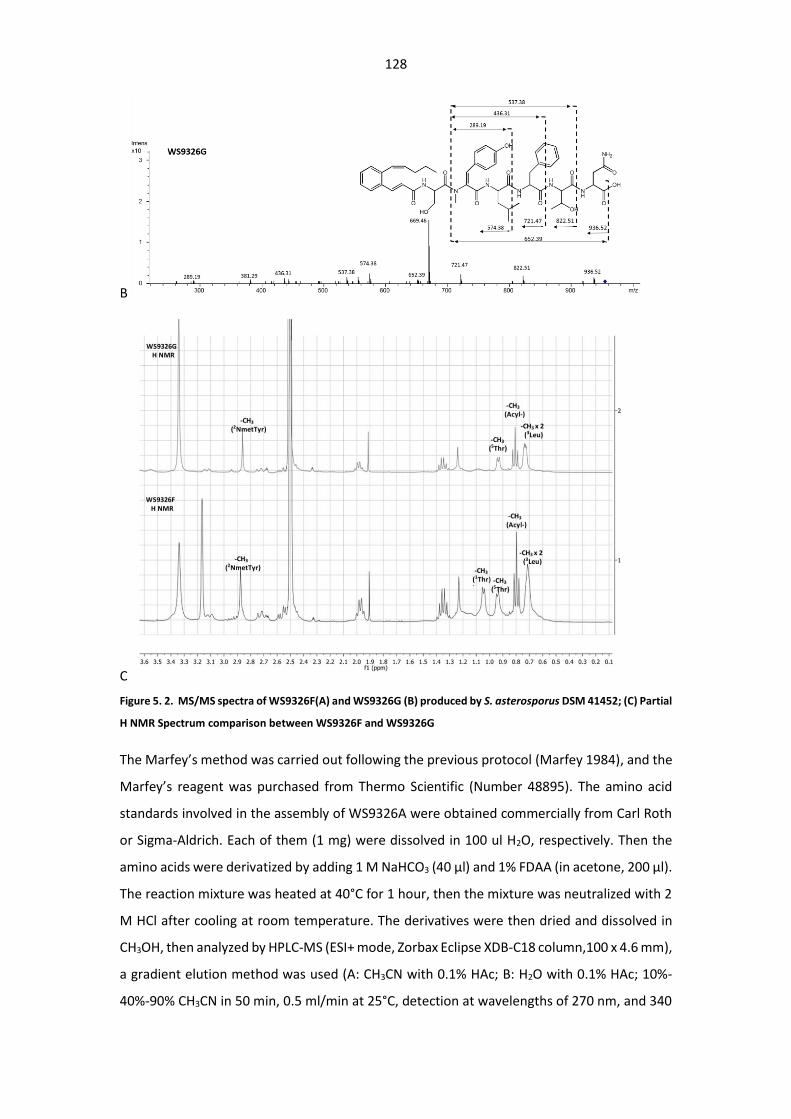
128
B
C
Figure 5. 2. MS/MS spectra of WS9326F(A) and WS9326G (B) produced by S. asterosporus DSM 41452; (C) Partial
H NMR Spectrum comparison between WS9326F and WS9326G
The Marfey’s method was carried out following the previous protocol (Marfey 1984), and the
Marfey’s reagent was purchased from Thermo Scientific (Number 48895). The amino acid
standards involved in the assembly of WS9326A were obtained commercially from Carl Roth
or Sigma-Aldrich. Each of them (1 mg) were dissolved in 100 ul H2O, respectively. Then the
amino acids were derivatized by adding 1 M NaHCO3 (40 µl) and 1% FDAA (in acetone, 200 µl).
The reaction mixture was heated at 40°C for 1 hour, then the mixture was neutralized with 2
M HCl after cooling at room temperature. The derivatives were then dried and dissolved in
CH3OH, then analyzed by HPLC-MS (ESI+ mode, Zorbax Eclipse XDB-C18 column,100 x 4.6 mm),
a gradient elution method was used (A: CH3CN with 0.1% HAc; B: H2O with 0.1% HAc; 10%-
40%-90% CH3CN in 50 min, 0.5 ml/min at 25°C, detection at wavelengths of 270 nm, and 340
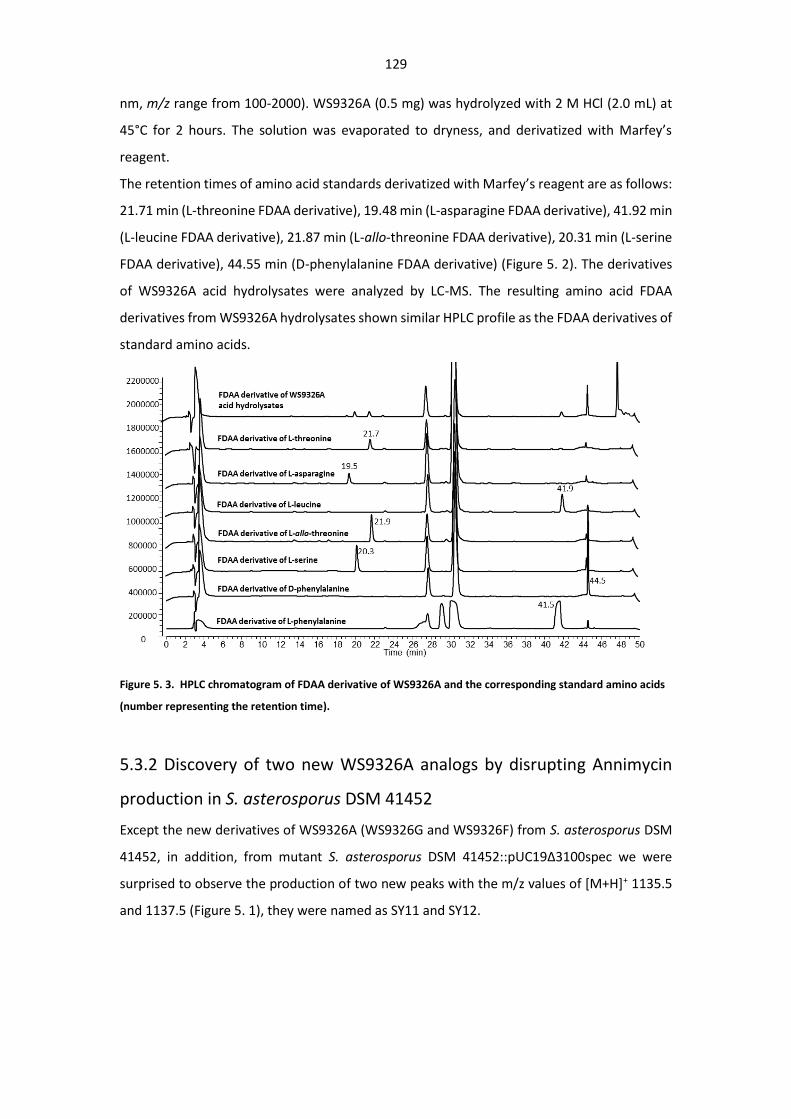
129
nm, m/z range from 100-2000). WS9326A (0.5 mg) was hydrolyzed with 2 M HCl (2.0 mL) at
45°C for 2 hours. The solution was evaporated to dryness, and derivatized with Marfey’s
reagent.
The retention times of amino acid standards derivatized with Marfey’s reagent are as follows:
21.71 min (L-threonine FDAA derivative), 19.48 min (L-asparagine FDAA derivative), 41.92 min
(L-leucine FDAA derivative), 21.87 min (L-allo-threonine FDAA derivative), 20.31 min (L-serine
FDAA derivative), 44.55 min (D-phenylalanine FDAA derivative) (Figure 5. 2). The derivatives
of WS9326A acid hydrolysates were analyzed by LC-MS. The resulting amino acid FDAA
derivatives from WS9326A hydrolysates shown similar HPLC profile as the FDAA derivatives of
standard amino acids.
Figure 5. 3. HPLC chromatogram of FDAA derivative of WS9326A and the corresponding standard amino acids
(number representing the retention time).
5.3.2 Discovery of two new WS9326A analogs by disrupting Annimycin
production in S. asterosporus DSM 41452
Except the new derivatives of WS9326A (WS9326G and WS9326F) from S. asterosporus DSM
41452, in addition, from mutant S. asterosporus DSM 41452::pUC19Δ3100spec we were
surprised to observe the production of two new peaks with the m/z values of [M+H]+ 1135.5
and 1137.5 (Figure 5. 1), they were named as SY11 and SY12.
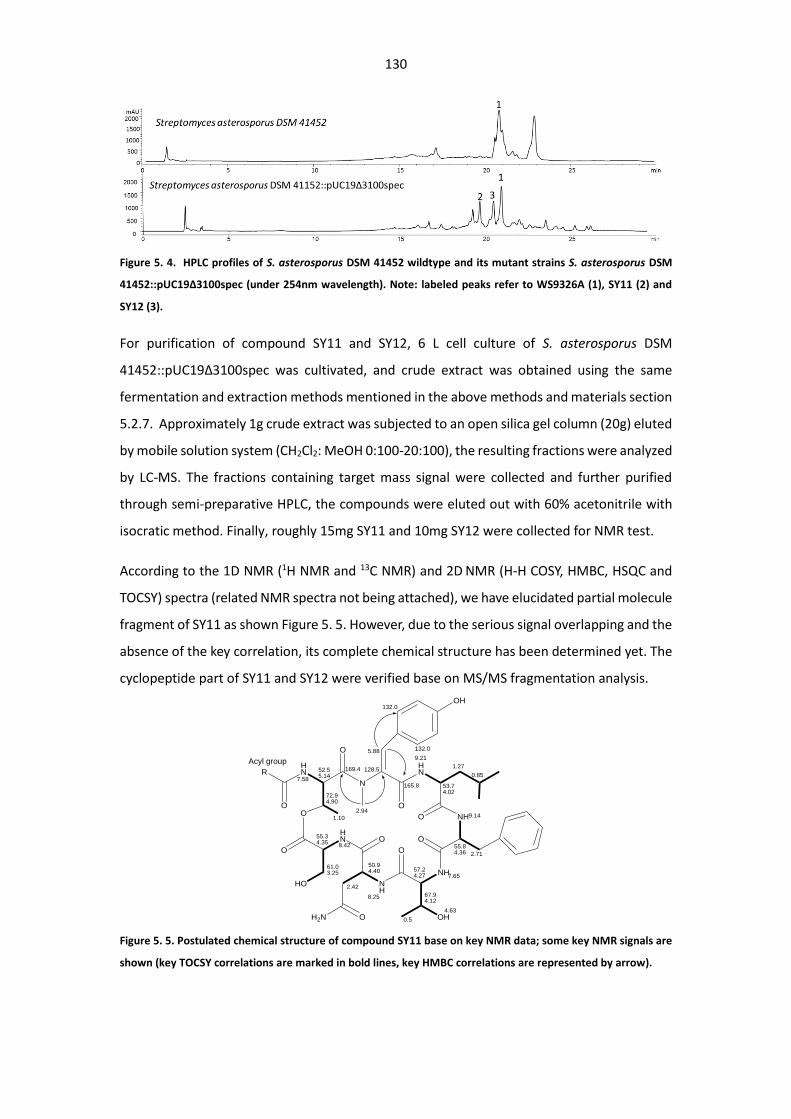
130
Figure 5. 4. HPLC profiles of S. asterosporus DSM 41452 wildtype and its mutant strains S. asterosporus DSM
41452::pUC19Δ3100spec (under 254nm wavelength). Note: labeled peaks refer to WS9326A (1), SY11 (2) and
SY12 (3).
For purification of compound SY11 and SY12, 6 L cell culture of S. asterosporus DSM
41452::pUC19Δ3100spec was cultivated, and crude extract was obtained using the same
fermentation and extraction methods mentioned in the above methods and materials section
5.2.7. Approximately 1g crude extract was subjected to an open silica gel column (20g) eluted
by mobile solution system (CH2Cl2: MeOH 0:100-20:100), the resulting fractions were analyzed
by LC-MS. The fractions containing target mass signal were collected and further purified
through semi-preparative HPLC, the compounds were eluted out with 60% acetonitrile with
isocratic method. Finally, roughly 15mg SY11 and 10mg SY12 were collected for NMR test.
According to the 1D NMR (1H NMR and 13C NMR) and 2D NMR (H-H COSY, HMBC, HSQC and
TOCSY) spectra (related NMR spectra not being attached), we have elucidated partial molecule
fragment of SY11 as shown Figure 5. 5. However, due to the serious signal overlapping and the
absence of the key correlation, its complete chemical structure has been determined yet. The
cyclopeptide part of SY11 and SY12 were verified base on MS/MS fragmentation analysis.
RHN
OO
O
N
OH
HN
O
NHO
O
NH
O
NH
OH
OHN
OH2N
HO
O
50.94.40
2.42
8.25
55.34.35
8.42
61.03.25
57.24.27
67.94.12
0.5
7.65
55.84.36 2.71
9.14
53.74.02
1.27
0.85
5.88
128.5
2.94
9.21
72.94.90
1.10
52.55.14
7.58
4.63
132.0
132.0
169.4
Acyl group
165.8
Figure 5. 5. Postulated chemical structure of compound SY11 base on key NMR data; some key NMR signals are
shown (key TOCSY correlations are marked in bold lines, key HMBC correlations are represented by arrow).
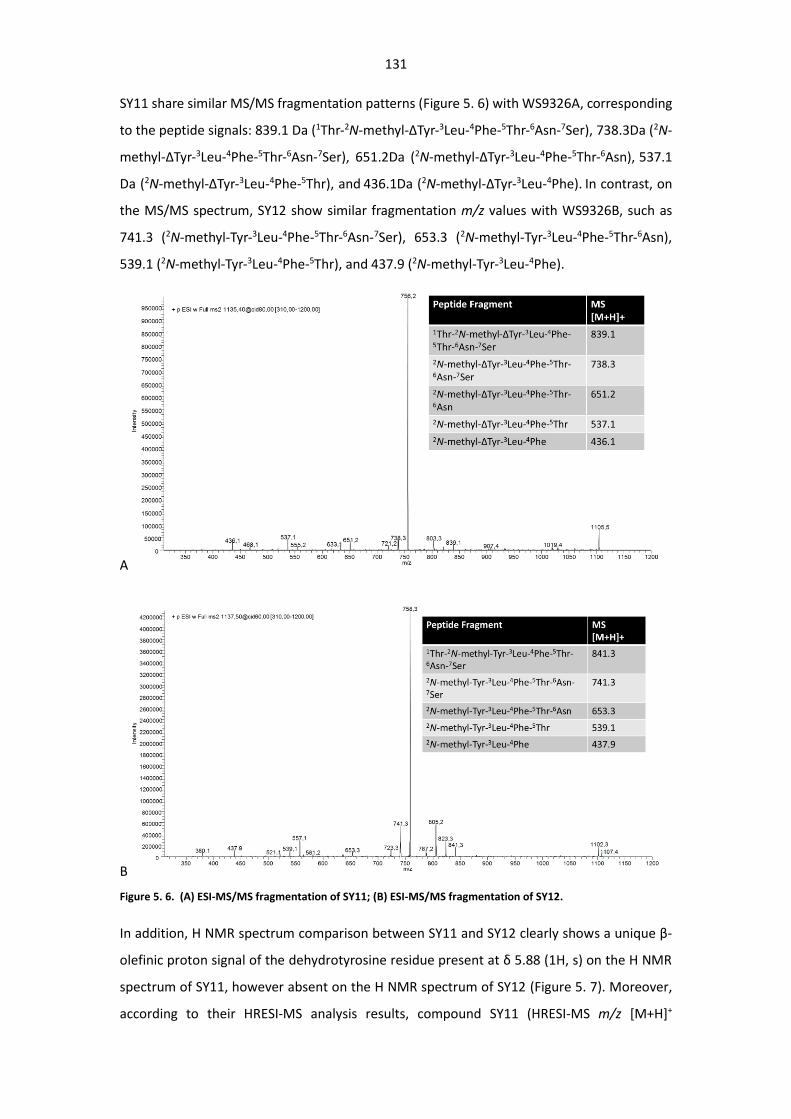
131
SY11 share similar MS/MS fragmentation patterns (Figure 5. 6) with WS9326A, corresponding
to the peptide signals: 839.1 Da (1Thr-2N-methyl-ΔTyr-3Leu-4Phe-5Thr-6Asn-7Ser), 738.3Da (2N-
methyl-ΔTyr-3Leu-4Phe-5Thr-6Asn-7Ser), 651.2Da (2N-methyl-ΔTyr-3Leu-4Phe-5Thr-6Asn), 537.1
Da (2N-methyl-ΔTyr-3Leu-4Phe-5Thr), and 436.1Da (2N-methyl-ΔTyr-3Leu-4Phe). In contrast, on
the MS/MS spectrum, SY12 show similar fragmentation m/z values with WS9326B, such as
741.3 (2N-methyl-Tyr-3Leu-4Phe-5Thr-6Asn-7Ser), 653.3 (2N-methyl-Tyr-3Leu-4Phe-5Thr-6Asn),
539.1 (2N-methyl-Tyr-3Leu-4Phe-5Thr), and 437.9 (2N-methyl-Tyr-3Leu-4Phe).
A
B
Figure 5. 6. (A) ESI-MS/MS fragmentation of SY11; (B) ESI-MS/MS fragmentation of SY12.
In addition, H NMR spectrum comparison between SY11 and SY12 clearly shows a unique β-
olefinic proton signal of the dehydrotyrosine residue present at δ 5.88 (1H, s) on the H NMR
spectrum of SY11, however absent on the H NMR spectrum of SY12 (Figure 5. 7). Moreover,
according to their HRESI-MS analysis results, compound SY11 (HRESI-MS m/z [M+H]+
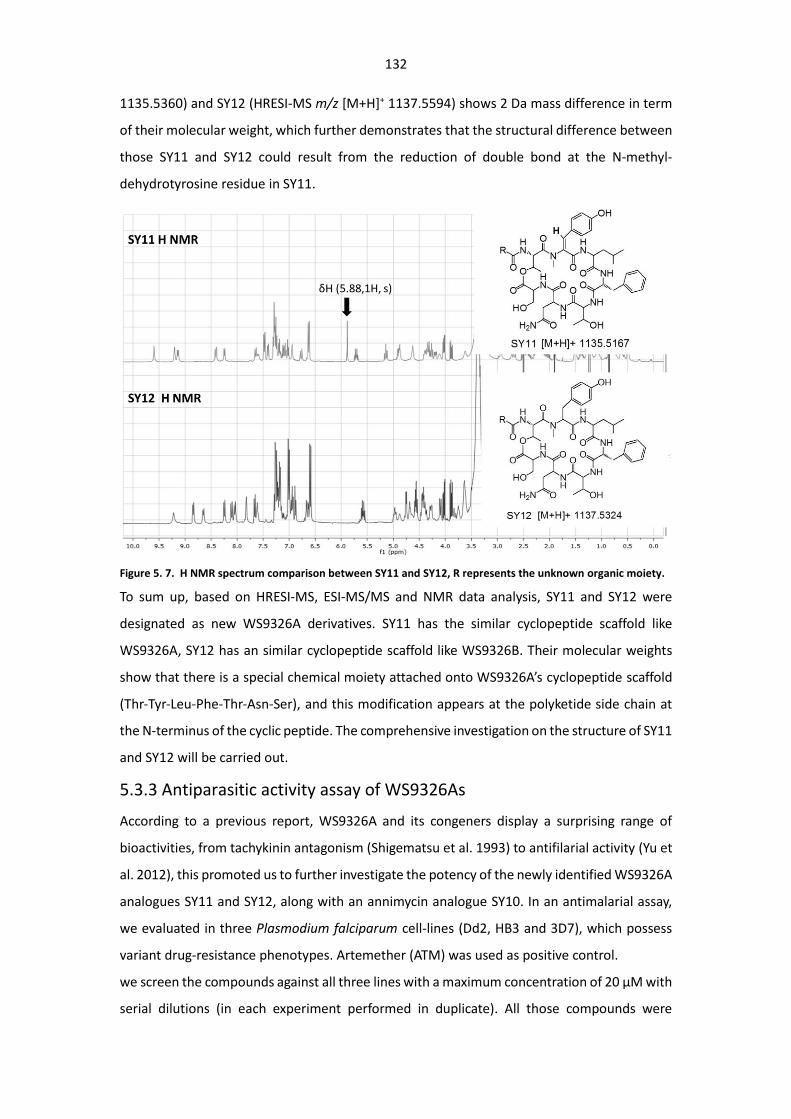
132
1135.5360) and SY12 (HRESI-MS m/z [M+H]+ 1137.5594) shows 2 Da mass difference in term
of their molecular weight, which further demonstrates that the structural difference between
those SY11 and SY12 could result from the reduction of double bond at the N-methyl-
dehydrotyrosine residue in SY11.
Figure 5. 7. H NMR spectrum comparison between SY11 and SY12, R represents the unknown organic moiety.
To sum up, based on HRESI-MS, ESI-MS/MS and NMR data analysis, SY11 and SY12 were
designated as new WS9326A derivatives. SY11 has the similar cyclopeptide scaffold like
WS9326A, SY12 has an similar cyclopeptide scaffold like WS9326B. Their molecular weights
show that there is a special chemical moiety attached onto WS9326A’s cyclopeptide scaffold
(Thr-Tyr-Leu-Phe-Thr-Asn-Ser), and this modification appears at the polyketide side chain at
the N-terminus of the cyclic peptide. The comprehensive investigation on the structure of SY11
and SY12 will be carried out.
5.3.3 Antiparasitic activity assay of WS9326As
According to a previous report, WS9326A and its congeners display a surprising range of
bioactivities, from tachykinin antagonism (Shigematsu et al. 1993) to antifilarial activity (Yu et
al. 2012), this promoted us to further investigate the potency of the newly identified WS9326A
analogues SY11 and SY12, along with an annimycin analogue SY10. In an antimalarial assay,
we evaluated in three Plasmodium falciparum cell-lines (Dd2, HB3 and 3D7), which possess
variant drug-resistance phenotypes. Artemether (ATM) was used as positive control.
we screen the compounds against all three lines with a maximum concentration of 20 µM with
serial dilutions (in each experiment performed in duplicate). All those compounds were
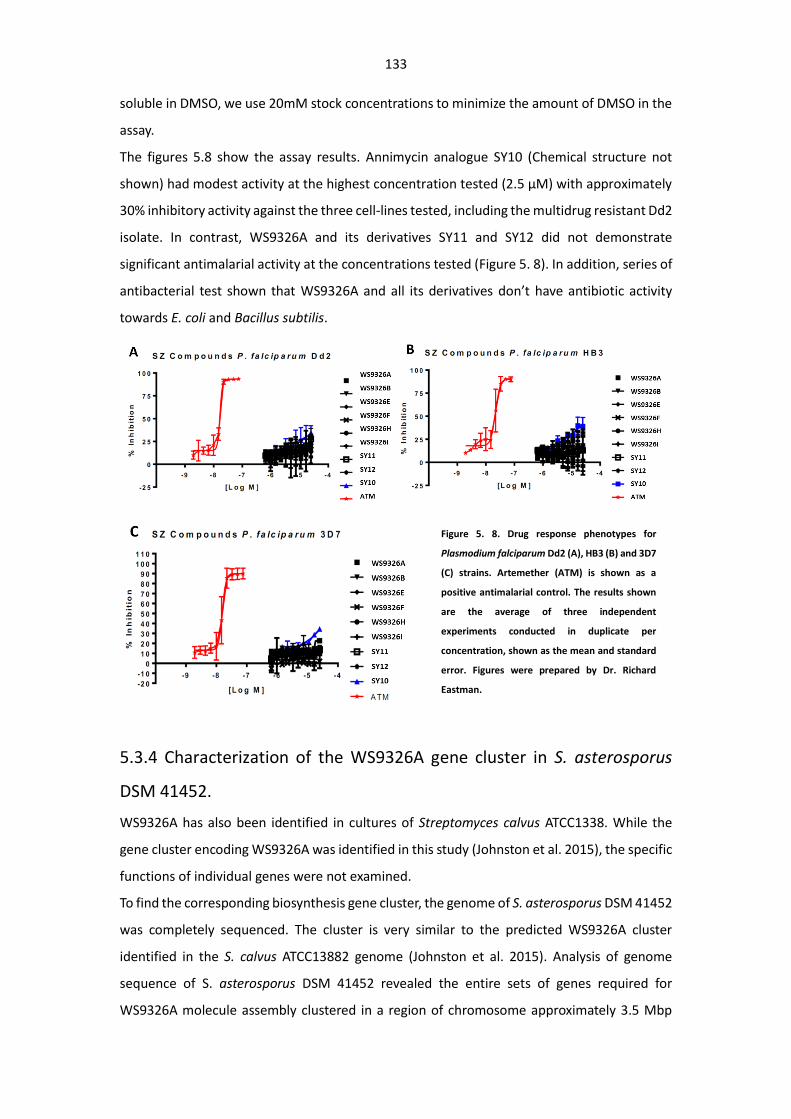
133
soluble in DMSO, we use 20mM stock concentrations to minimize the amount of DMSO in the
assay.
The figures 5.8 show the assay results. Annimycin analogue SY10 (Chemical structure not
shown) had modest activity at the highest concentration tested (2.5 µM) with approximately
30% inhibitory activity against the three cell-lines tested, including the multidrug resistant Dd2
isolate. In contrast, WS9326A and its derivatives SY11 and SY12 did not demonstrate
significant antimalarial activity at the concentrations tested (Figure 5. 8). In addition, series of
antibacterial test shown that WS9326A and all its derivatives don’t have antibiotic activity
towards E. coli and Bacillus subtilis.
5.3.4 Characterization of the WS9326A gene cluster in S. asterosporus
DSM 41452.
WS9326A has also been identified in cultures of Streptomyces calvus ATCC1338. While the
gene cluster encoding WS9326A was identified in this study (Johnston et al. 2015), the specific
functions of individual genes were not examined.
To find the corresponding biosynthesis gene cluster, the genome of S. asterosporus DSM 41452
was completely sequenced. The cluster is very similar to the predicted WS9326A cluster
identified in the S. calvus ATCC13882 genome (Johnston et al. 2015). Analysis of genome
sequence of S. asterosporus DSM 41452 revealed the entire sets of genes required for
WS9326A molecule assembly clustered in a region of chromosome approximately 3.5 Mbp
Figure 5. 8. Drug response phenotypes for
Plasmodium falciparum Dd2 (A), HB3 (B) and 3D7
(C) strains. Artemether (ATM) is shown as a
positive antimalarial control. The results shown
are the average of three independent
experiments conducted in duplicate per
concentration, shown as the mean and standard
error. Figures were prepared by Dr. Richard
Eastman.
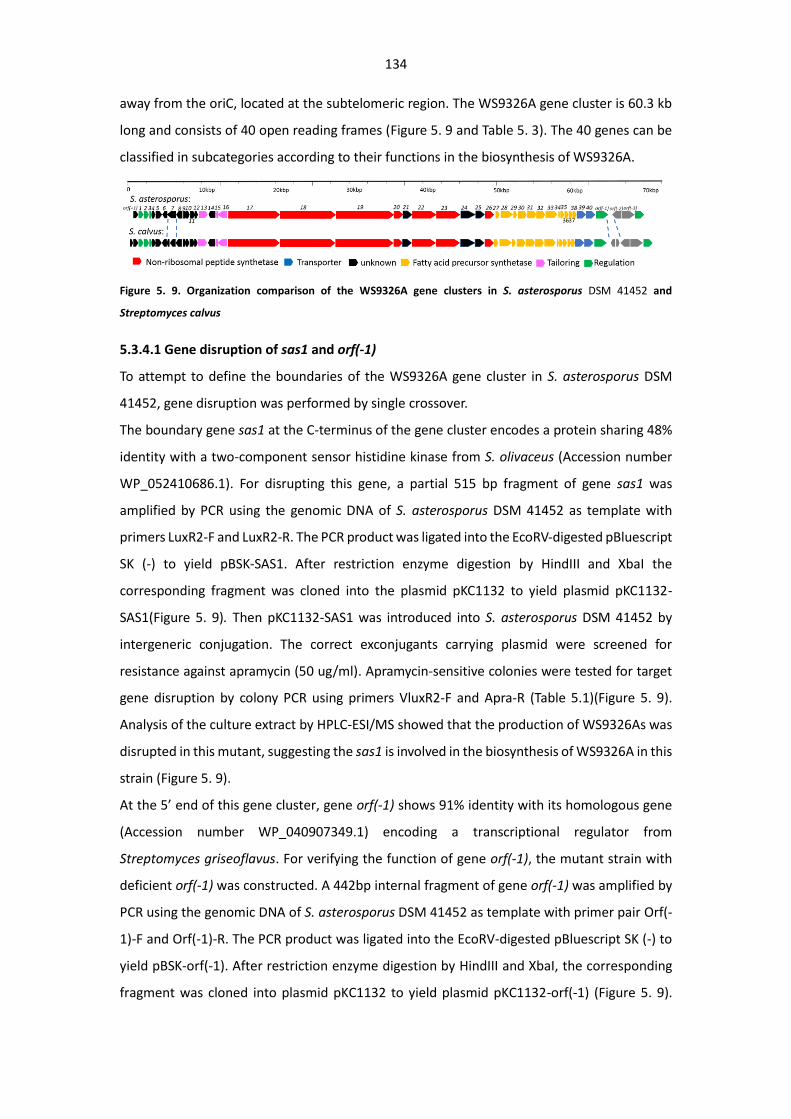
134
away from the oriC, located at the subtelomeric region. The WS9326A gene cluster is 60.3 kb
long and consists of 40 open reading frames (Figure 5. 9 and Table 5. 3). The 40 genes can be
classified in subcategories according to their functions in the biosynthesis of WS9326A.
Figure 5. 9. Organization comparison of the WS9326A gene clusters in S. asterosporus DSM 41452 and
Streptomyces calvus
5.3.4.1 Gene disruption of sas1 and orf(-1)
To attempt to define the boundaries of the WS9326A gene cluster in S. asterosporus DSM
41452, gene disruption was performed by single crossover.
The boundary gene sas1 at the C-terminus of the gene cluster encodes a protein sharing 48%
identity with a two-component sensor histidine kinase from S. olivaceus (Accession number
WP_052410686.1). For disrupting this gene, a partial 515 bp fragment of gene sas1 was
amplified by PCR using the genomic DNA of S. asterosporus DSM 41452 as template with
primers LuxR2-F and LuxR2-R. The PCR product was ligated into the EcoRV-digested pBluescript
SK (-) to yield pBSK-SAS1. After restriction enzyme digestion by HindIII and XbaI the
corresponding fragment was cloned into the plasmid pKC1132 to yield plasmid pKC1132-
SAS1(Figure 5. 9). Then pKC1132-SAS1 was introduced into S. asterosporus DSM 41452 by
intergeneric conjugation. The correct exconjugants carrying plasmid were screened for
resistance against apramycin (50 ug/ml). Apramycin-sensitive colonies were tested for target
gene disruption by colony PCR using primers VluxR2-F and Apra-R (Table 5.1)(Figure 5. 9).
Analysis of the culture extract by HPLC-ESI/MS showed that the production of WS9326As was
disrupted in this mutant, suggesting the sas1 is involved in the biosynthesis of WS9326A in this
strain (Figure 5. 9).
At the 5’ end of this gene cluster, gene orf(-1) shows 91% identity with its homologous gene
(Accession number WP_040907349.1) encoding a transcriptional regulator from
Streptomyces griseoflavus. For verifying the function of gene orf(-1), the mutant strain with
deficient orf(-1) was constructed. A 442bp internal fragment of gene orf(-1) was amplified by
PCR using the genomic DNA of S. asterosporus DSM 41452 as template with primer pair Orf(-
1)-F and Orf(-1)-R. The PCR product was ligated into the EcoRV-digested pBluescript SK (-) to
yield pBSK-orf(-1). After restriction enzyme digestion by HindIII and XbaI, the corresponding
fragment was cloned into plasmid pKC1132 to yield plasmid pKC1132-orf(-1) (Figure 5. 9).
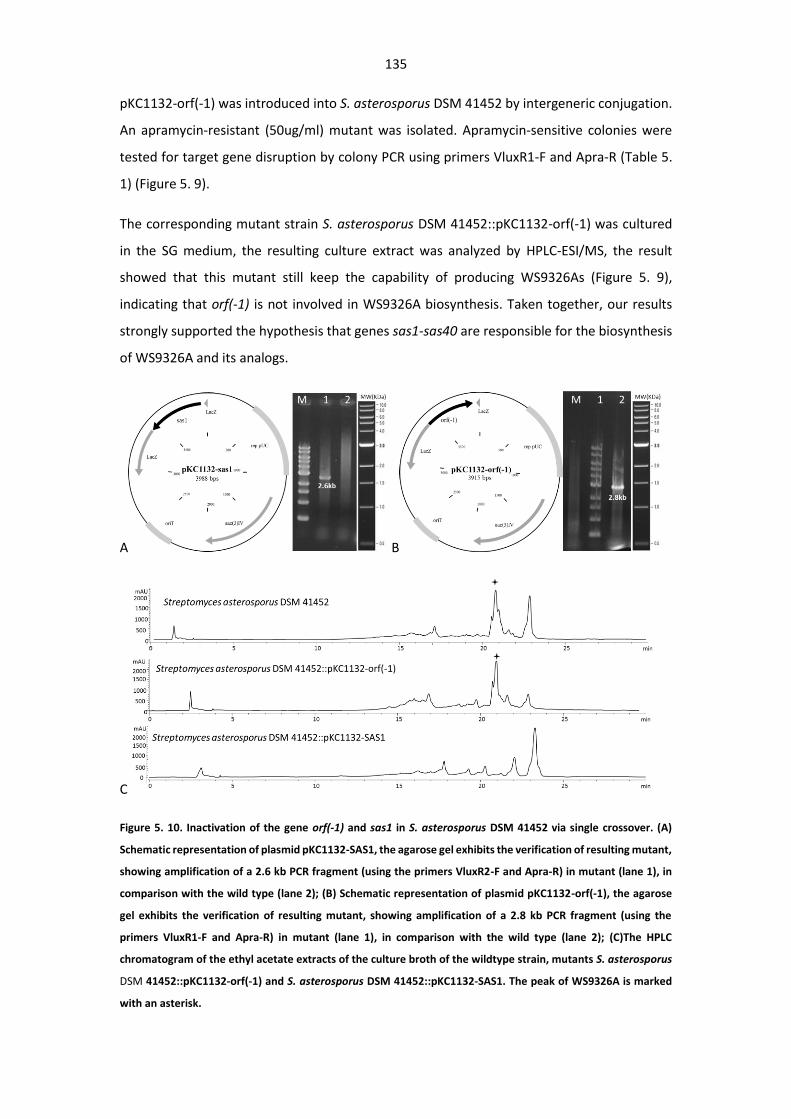
135
pKC1132-orf(-1) was introduced into S. asterosporus DSM 41452 by intergeneric conjugation.
An apramycin-resistant (50ug/ml) mutant was isolated. Apramycin-sensitive colonies were
tested for target gene disruption by colony PCR using primers VluxR1-F and Apra-R (Table 5.
1) (Figure 5. 9).
The corresponding mutant strain S. asterosporus DSM 41452::pKC1132-orf(-1) was cultured
in the SG medium, the resulting culture extract was analyzed by HPLC-ESI/MS, the result
showed that this mutant still keep the capability of producing WS9326As (Figure 5. 9),
indicating that orf(-1) is not involved in WS9326A biosynthesis. Taken together, our results
strongly supported the hypothesis that genes sas1-sas40 are responsible for the biosynthesis
of WS9326A and its analogs.
A B
C
Figure 5. 10. Inactivation of the gene orf(-1) and sas1 in S. asterosporus DSM 41452 via single crossover. (A)
Schematic representation of plasmid pKC1132-SAS1, the agarose gel exhibits the verification of resulting mutant,
showing amplification of a 2.6 kb PCR fragment (using the primers VluxR2-F and Apra-R) in mutant (lane 1), in
comparison with the wild type (lane 2); (B) Schematic representation of plasmid pKC1132-orf(-1), the agarose
gel exhibits the verification of resulting mutant, showing amplification of a 2.8 kb PCR fragment (using the
primers VluxR1-F and Apra-R) in mutant (lane 1), in comparison with the wild type (lane 2); (C)The HPLC
chromatogram of the ethyl acetate extracts of the culture broth of the wildtype strain, mutants S. asterosporus
DSM 41452::pKC1132-orf(-1) and S. asterosporus DSM 41452::pKC1132-SAS1. The peak of WS9326A is marked
with an asterisk.
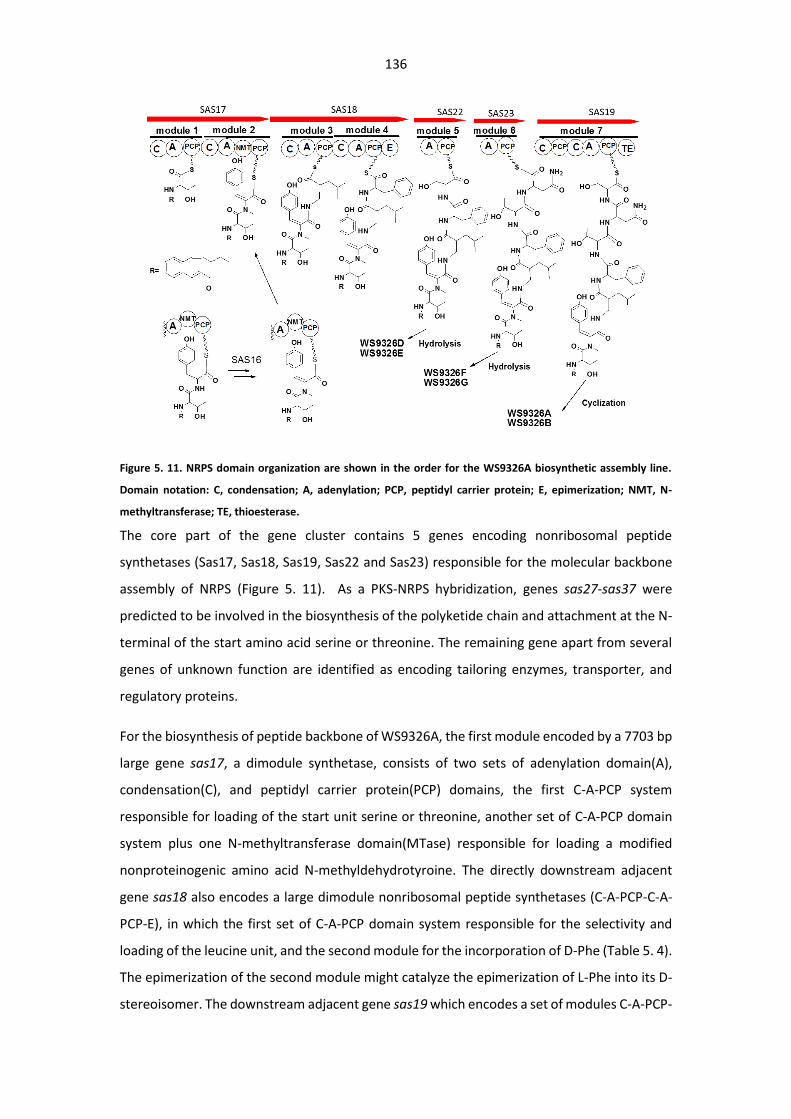
136
Figure 5. 11. NRPS domain organization are shown in the order for the WS9326A biosynthetic assembly line.
Domain notation: C, condensation; A, adenylation; PCP, peptidyl carrier protein; E, epimerization; NMT, N-
methyltransferase; TE, thioesterase.
The core part of the gene cluster contains 5 genes encoding nonribosomal peptide
synthetases (Sas17, Sas18, Sas19, Sas22 and Sas23) responsible for the molecular backbone
assembly of NRPS (Figure 5. 11). As a PKS-NRPS hybridization, genes sas27-sas37 were
predicted to be involved in the biosynthesis of the polyketide chain and attachment at the N-
terminal of the start amino acid serine or threonine. The remaining gene apart from several
genes of unknown function are identified as encoding tailoring enzymes, transporter, and
regulatory proteins.
For the biosynthesis of peptide backbone of WS9326A, the first module encoded by a 7703 bp
large gene sas17, a dimodule synthetase, consists of two sets of adenylation domain(A),
condensation(C), and peptidyl carrier protein(PCP) domains, the first C-A-PCP system
responsible for loading of the start unit serine or threonine, another set of C-A-PCP domain
system plus one N-methyltransferase domain(MTase) responsible for loading a modified
nonproteinogenic amino acid N-methyldehydrotyroine. The directly downstream adjacent
gene sas18 also encodes a large dimodule nonribosomal peptide synthetases (C-A-PCP-C-A-
PCP-E), in which the first set of C-A-PCP domain system responsible for the selectivity and
loading of the leucine unit, and the second module for the incorporation of D-Phe (Table 5. 4).
The epimerization of the second module might catalyze the epimerization of L-Phe into its D-
stereoisomer. The downstream adjacent gene sas19 which encodes a set of modules C-A-PCP-
137
C-A-PCP-TE was hypothesized for the assembly of the next extender unit threonine and
asparagine, but actually it was used to catalyze the assembly of the last one amino acid serine
and also for the release and cyclization from the assembly line.
A predicted type II thioesterase is encoded by sas20. Although the function of Sas20 in the
biosynthesis of WS9326A is unknown, type II thioesterases are well known to serve editing
functions in PKS and NRPS systems (Kotowska, Pawlik. 2014). Sas20 may also mediate release
of the linear peptides WS9326D, E, F, and G from the trans-acting domains Sas22 and Sas23.
Those two trans-acting A-PCP didomains encoded by genes sas22 and sas23 are predicted to
interact with the condensation domain in module 7 encoded by sas19 in trans to catalyze the
incorporation of the threonine and Asparagine residue on the assembly line. We proposed
that the first condensation domain in module Sas19 may be involved to catalyze the
condensation reaction.
Within the putative SAS gene cluster 18 genes were predicted to be involved in the
biosynthesis of the PKS-derived acyl side chain. Very similar genes were also found in the
Skyllmycin gene cluster (Pohle et al. 2011) (Table 5. 5)(Figure 5. 11). In contrast to the
Skyllmycin gene cluster, sky11 encoding a putative carboxyltransferase, is absent in our cluster.
Thus malonyl-CoA as the starting building block is most likely derived from the primary
metabolism in our strain. Further bioinformatic analysis of the genes within this locus revealed
that six genes (sas7, sas8, sas30, sas31, sas32, and sas33) were predicted to encode 3-oxoacyl-
ACP synthases. These might be involved in a series of condensation reactions with acetyl-CoA
and malonyl-CoA units to form the N-acyl C14-polyene before aromatic ring formation occurs
(Pohle et al. 2011). The terminal C12-C13 double bond in this C14-polyene intermediate might
be further reduced by a reductase encoded by sas21, which show significant homology (96%
amino acid identity) to an oxidoreductase from S. griseoflavus. The configurations of the C14-
acyl group in WS9326A and the C12-acyl group in skyllamycin are identical (2E, 10Z) according
to NMR spectroscopic data (Table 5. 6). Moreover, the double bond configuration at C4, C6,
and C8 may be important for aromatization during biosynthesis. The required configuration
conversion is most likely to be introduced by the gene product of sas27 encoding an isomerase,
which shares 62% amino acid identity with Sky27 and 57% amino acid identity with Has16
involved in haoxinamide biosynthesis (Pohle et al. 2011). The final aromatization to form the
benzene ring could be catalyzed by either the putative oxidoreductase Sas24 or the phytoene
dehydrogenase Sas28.
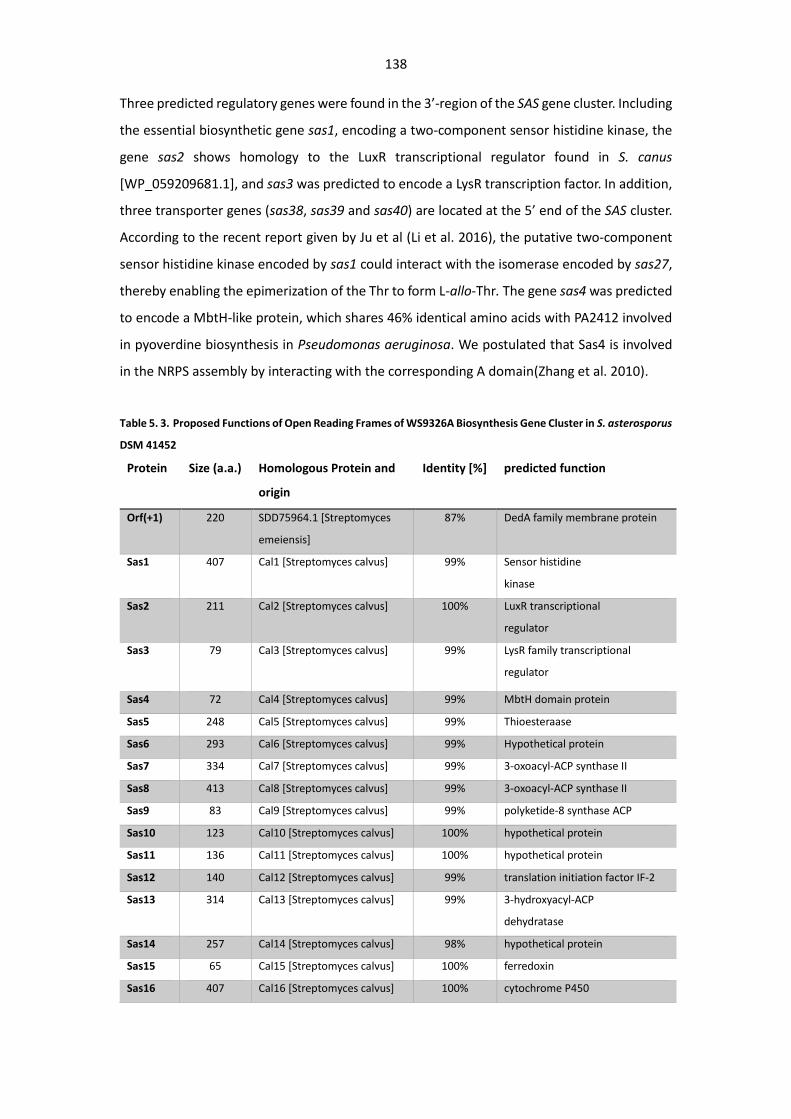
138
Three predicted regulatory genes were found in the 3’-region of the SAS gene cluster. Including
the essential biosynthetic gene sas1, encoding a two-component sensor histidine kinase, the
gene sas2 shows homology to the LuxR transcriptional regulator found in S. canus
[WP_059209681.1], and sas3 was predicted to encode a LysR transcription factor. In addition,
three transporter genes (sas38, sas39 and sas40) are located at the 5’ end of the SAS cluster.
According to the recent report given by Ju et al (Li et al. 2016), the putative two-component
sensor histidine kinase encoded by sas1 could interact with the isomerase encoded by sas27,
thereby enabling the epimerization of the Thr to form L-allo-Thr. The gene sas4 was predicted
to encode a MbtH-like protein, which shares 46% identical amino acids with PA2412 involved
in pyoverdine biosynthesis in Pseudomonas aeruginosa. We postulated that Sas4 is involved
in the NRPS assembly by interacting with the corresponding A domain(Zhang et al. 2010).
Table 5. 3. Proposed Functions of Open Reading Frames of WS9326A Biosynthesis Gene Cluster in S. asterosporus
DSM 41452
Protein Size (a.a.) Homologous Protein and
origin
Identity [%] predicted function
Orf(+1) 220 SDD75964.1 [Streptomyces
emeiensis]
87% DedA family membrane protein
Sas1 407 Cal1 [Streptomyces calvus] 99% Sensor histidine
kinase
Sas2 211 Cal2 [Streptomyces calvus] 100% LuxR transcriptional
regulator
Sas3 79 Cal3 [Streptomyces calvus] 99% LysR family transcriptional
regulator
Sas4 72 Cal4 [Streptomyces calvus] 99% MbtH domain protein
Sas5 248 Cal5 [Streptomyces calvus] 99% Thioesteraase
Sas6 293 Cal6 [Streptomyces calvus] 99% Hypothetical protein
Sas7 334 Cal7 [Streptomyces calvus] 99% 3-oxoacyl-ACP synthase II
Sas8 413 Cal8 [Streptomyces calvus] 99% 3-oxoacyl-ACP synthase II
Sas9 83 Cal9 [Streptomyces calvus] 99% polyketide-8 synthase ACP
Sas10 123 Cal10 [Streptomyces calvus] 100% hypothetical protein
Sas11 136 Cal11 [Streptomyces calvus] 100% hypothetical protein
Sas12 140 Cal12 [Streptomyces calvus] 99% translation initiation factor IF-2
Sas13 314 Cal13 [Streptomyces calvus] 99% 3-hydroxyacyl-ACP
dehydratase
Sas14 257 Cal14 [Streptomyces calvus] 98% hypothetical protein
Sas15 65 Cal15 [Streptomyces calvus] 100% ferredoxin
Sas16 407 Cal16 [Streptomyces calvus] 100% cytochrome P450
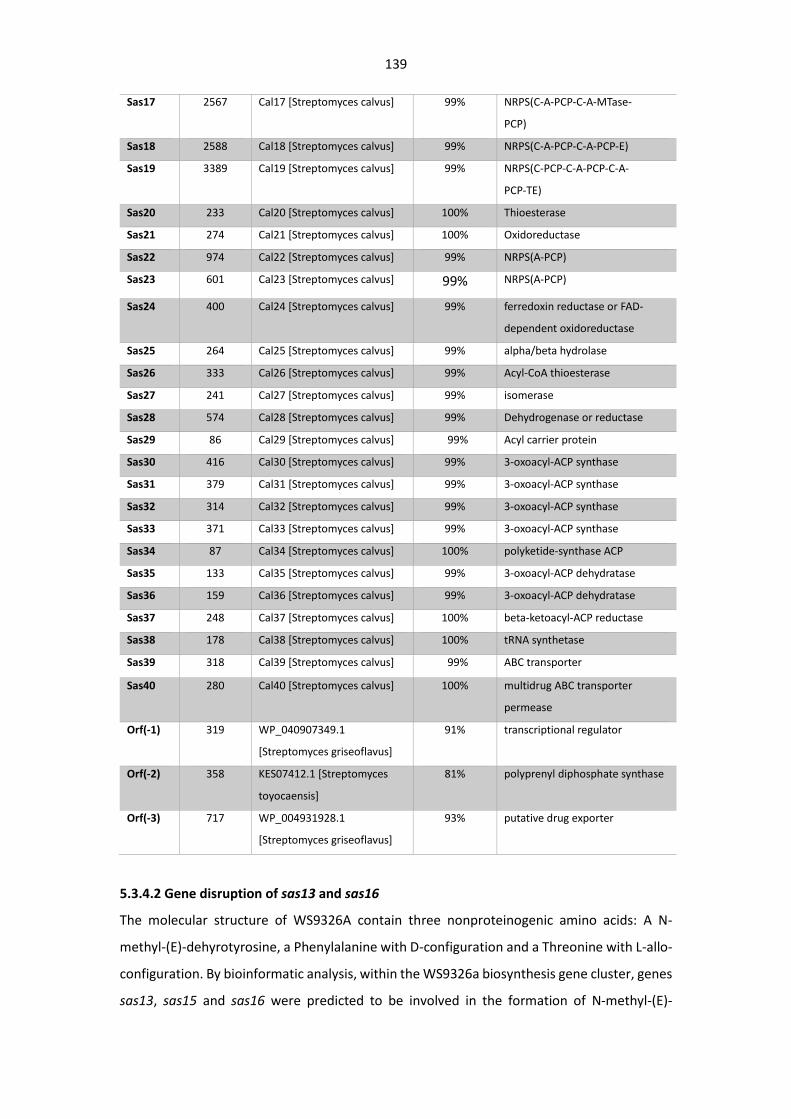
139
Sas17 2567 Cal17 [Streptomyces calvus] 99% NRPS(C-A-PCP-C-A-MTase-
PCP)
Sas18 2588 Cal18 [Streptomyces calvus] 99% NRPS(C-A-PCP-C-A-PCP-E)
Sas19 3389 Cal19 [Streptomyces calvus] 99% NRPS(C-PCP-C-A-PCP-C-A-
PCP-TE)
Sas20 233 Cal20 [Streptomyces calvus] 100% Thioesterase
Sas21 274 Cal21 [Streptomyces calvus] 100% Oxidoreductase
Sas22 974 Cal22 [Streptomyces calvus] 99% NRPS(A-PCP)
Sas23 601 Cal23 [Streptomyces calvus] 99% NRPS(A-PCP)
Sas24 400 Cal24 [Streptomyces calvus] 99% ferredoxin reductase or FAD-
dependent oxidoreductase
Sas25 264 Cal25 [Streptomyces calvus] 99% alpha/beta hydrolase
Sas26 333 Cal26 [Streptomyces calvus] 99% Acyl-CoA thioesterase
Sas27 241 Cal27 [Streptomyces calvus] 99% isomerase
Sas28 574 Cal28 [Streptomyces calvus] 99% Dehydrogenase or reductase
Sas29 86 Cal29 [Streptomyces calvus] 99% Acyl carrier protein
Sas30 416 Cal30 [Streptomyces calvus] 99% 3-oxoacyl-ACP synthase
Sas31 379 Cal31 [Streptomyces calvus] 99% 3-oxoacyl-ACP synthase
Sas32 314 Cal32 [Streptomyces calvus] 99% 3-oxoacyl-ACP synthase
Sas33 371 Cal33 [Streptomyces calvus] 99% 3-oxoacyl-ACP synthase
Sas34 87 Cal34 [Streptomyces calvus] 100% polyketide-synthase ACP
Sas35 133 Cal35 [Streptomyces calvus] 99% 3-oxoacyl-ACP dehydratase
Sas36 159 Cal36 [Streptomyces calvus] 99% 3-oxoacyl-ACP dehydratase
Sas37 248 Cal37 [Streptomyces calvus] 100% beta-ketoacyl-ACP reductase
Sas38 178 Cal38 [Streptomyces calvus] 100% tRNA synthetase
Sas39 318 Cal39 [Streptomyces calvus] 99% ABC transporter
Sas40 280 Cal40 [Streptomyces calvus] 100% multidrug ABC transporter
permease
Orf(-1) 319 WP_040907349.1
[Streptomyces griseoflavus]
91% transcriptional regulator
Orf(-2) 358 KES07412.1 [Streptomyces
toyocaensis]
81% polyprenyl diphosphate synthase
Orf(-3) 717 WP_004931928.1
[Streptomyces griseoflavus]
93% putative drug exporter
5.3.4.2 Gene disruption of sas13 and sas16
The molecular structure of WS9326A contain three nonproteinogenic amino acids: A N-
methyl-(E)-dehyrotyrosine, a Phenylalanine with D-configuration and a Threonine with L-allo-
configuration. By bioinformatic analysis, within the WS9326a biosynthesis gene cluster, genes
sas13, sas15 and sas16 were predicted to be involved in the formation of N-methyl-(E)-
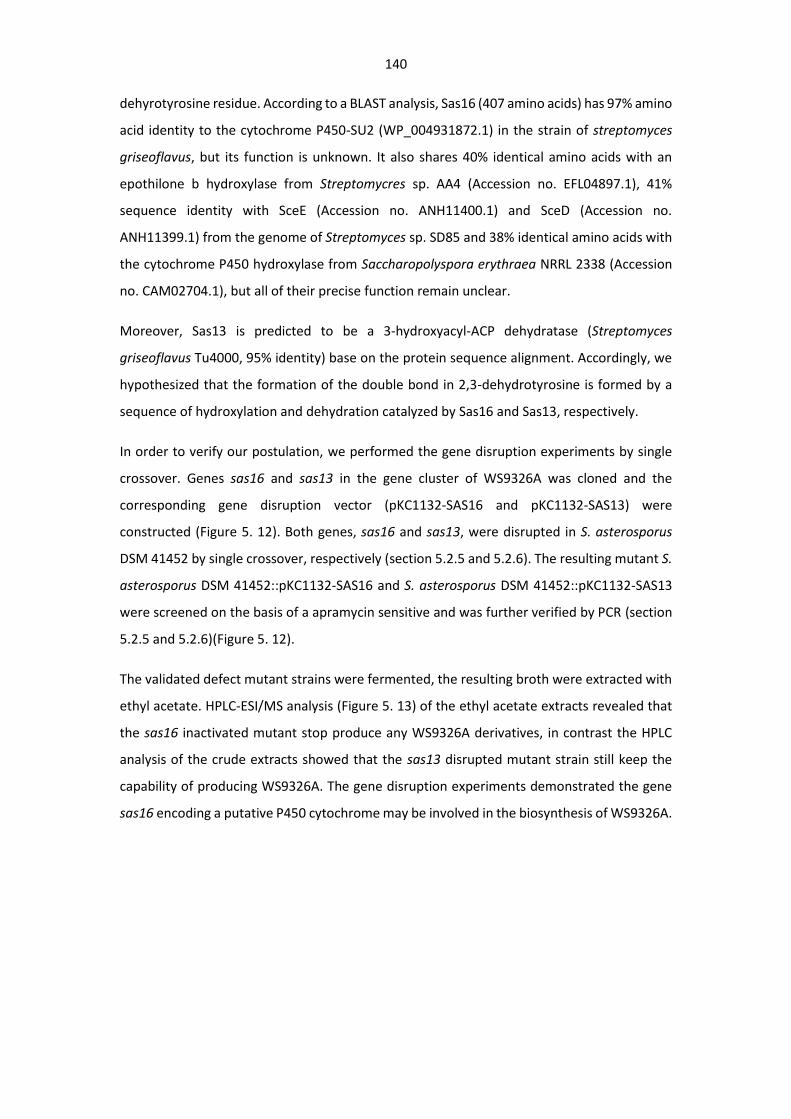
140
dehyrotyrosine residue. According to a BLAST analysis, Sas16 (407 amino acids) has 97% amino
acid identity to the cytochrome P450-SU2 (WP_004931872.1) in the strain of streptomyces
griseoflavus, but its function is unknown. It also shares 40% identical amino acids with an
epothilone b hydroxylase from Streptomycres sp. AA4 (Accession no. EFL04897.1), 41%
sequence identity with SceE (Accession no. ANH11400.1) and SceD (Accession no.
ANH11399.1) from the genome of Streptomyces sp. SD85 and 38% identical amino acids with
the cytochrome P450 hydroxylase from Saccharopolyspora erythraea NRRL 2338 (Accession
no. CAM02704.1), but all of their precise function remain unclear.
Moreover, Sas13 is predicted to be a 3-hydroxyacyl-ACP dehydratase (Streptomyces
griseoflavus Tu4000, 95% identity) base on the protein sequence alignment. Accordingly, we
hypothesized that the formation of the double bond in 2,3-dehydrotyrosine is formed by a
sequence of hydroxylation and dehydration catalyzed by Sas16 and Sas13, respectively.
In order to verify our postulation, we performed the gene disruption experiments by single
crossover. Genes sas16 and sas13 in the gene cluster of WS9326A was cloned and the
corresponding gene disruption vector (pKC1132-SAS16 and pKC1132-SAS13) were
constructed (Figure 5. 12). Both genes, sas16 and sas13, were disrupted in S. asterosporus
DSM 41452 by single crossover, respectively (section 5.2.5 and 5.2.6). The resulting mutant S.
asterosporus DSM 41452::pKC1132-SAS16 and S. asterosporus DSM 41452::pKC1132-SAS13
were screened on the basis of a apramycin sensitive and was further verified by PCR (section
5.2.5 and 5.2.6)(Figure 5. 12).
The validated defect mutant strains were fermented, the resulting broth were extracted with
ethyl acetate. HPLC-ESI/MS analysis (Figure 5. 13) of the ethyl acetate extracts revealed that
the sas16 inactivated mutant stop produce any WS9326A derivatives, in contrast the HPLC
analysis of the crude extracts showed that the sas13 disrupted mutant strain still keep the
capability of producing WS9326A. The gene disruption experiments demonstrated the gene
sas16 encoding a putative P450 cytochrome may be involved in the biosynthesis of WS9326A.
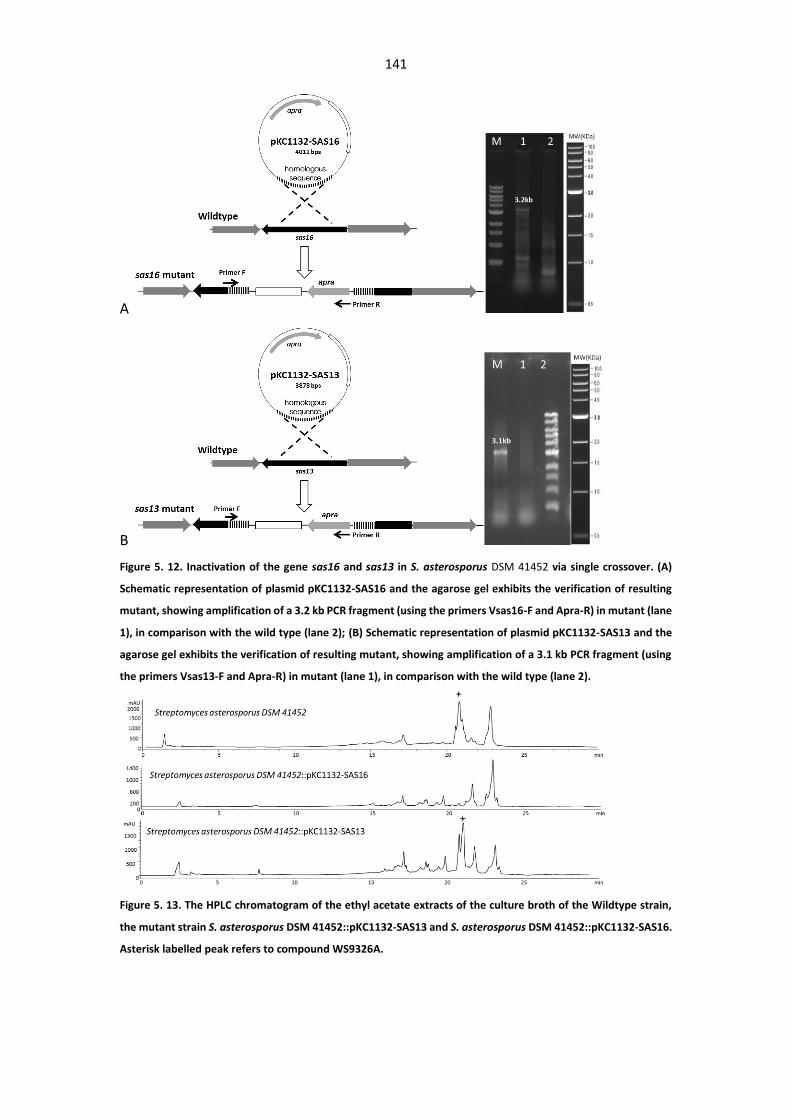
141
A
B
Figure 5. 12. Inactivation of the gene sas16 and sas13 in S. asterosporus DSM 41452 via single crossover. (A)
Schematic representation of plasmid pKC1132-SAS16 and the agarose gel exhibits the verification of resulting
mutant, showing amplification of a 3.2 kb PCR fragment (using the primers Vsas16-F and Apra-R) in mutant (lane
1), in comparison with the wild type (lane 2); (B) Schematic representation of plasmid pKC1132-SAS13 and the
agarose gel exhibits the verification of resulting mutant, showing amplification of a 3.1 kb PCR fragment (using
the primers Vsas13-F and Apra-R) in mutant (lane 1), in comparison with the wild type (lane 2).
Figure 5. 13. The HPLC chromatogram of the ethyl acetate extracts of the culture broth of the Wildtype strain,
the mutant strain S. asterosporus DSM 41452::pKC1132-SAS13 and S. asterosporus DSM 41452::pKC1132-SAS16.
Asterisk labelled peak refers to compound WS9326A.
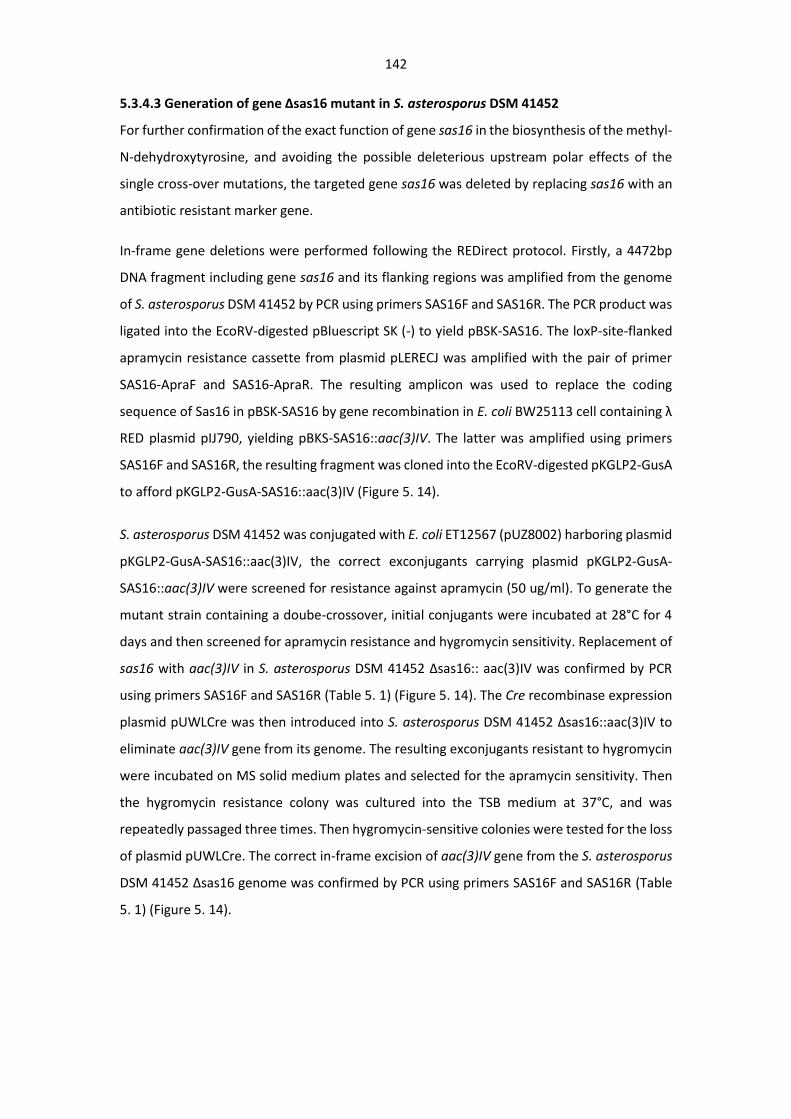
142
5.3.4.3 Generation of gene Δsas16 mutant in S. asterosporus DSM 41452
For further confirmation of the exact function of gene sas16 in the biosynthesis of the methyl-
N-dehydroxytyrosine, and avoiding the possible deleterious upstream polar effects of the
single cross-over mutations, the targeted gene sas16 was deleted by replacing sas16 with an
antibiotic resistant marker gene.
In-frame gene deletions were performed following the REDirect protocol. Firstly, a 4472bp
DNA fragment including gene sas16 and its flanking regions was amplified from the genome
of S. asterosporus DSM 41452 by PCR using primers SAS16F and SAS16R. The PCR product was
ligated into the EcoRV-digested pBluescript SK (-) to yield pBSK-SAS16. The loxP-site-flanked
apramycin resistance cassette from plasmid pLERECJ was amplified with the pair of primer
SAS16-ApraF and SAS16-ApraR. The resulting amplicon was used to replace the coding
sequence of Sas16 in pBSK-SAS16 by gene recombination in E. coli BW25113 cell containing λ
RED plasmid pIJ790, yielding pBKS-SAS16::aac(3)IV. The latter was amplified using primers
SAS16F and SAS16R, the resulting fragment was cloned into the EcoRV-digested pKGLP2-GusA
to afford pKGLP2-GusA-SAS16::aac(3)IV (Figure 5. 14).
S. asterosporus DSM 41452 was conjugated with E. coli ET12567 (pUZ8002) harboring plasmid
pKGLP2-GusA-SAS16::aac(3)IV, the correct exconjugants carrying plasmid pKGLP2-GusA-
SAS16::aac(3)IV were screened for resistance against apramycin (50 ug/ml). To generate the
mutant strain containing a doube-crossover, initial conjugants were incubated at 28°C for 4
days and then screened for apramycin resistance and hygromycin sensitivity. Replacement of
sas16 with aac(3)IV in S. asterosporus DSM 41452 Δsas16:: aac(3)IV was confirmed by PCR
using primers SAS16F and SAS16R (Table 5. 1) (Figure 5. 14). The Cre recombinase expression
plasmid pUWLCre was then introduced into S. asterosporus DSM 41452 Δsas16::aac(3)IV to
eliminate aac(3)IV gene from its genome. The resulting exconjugants resistant to hygromycin
were incubated on MS solid medium plates and selected for the apramycin sensitivity. Then
the hygromycin resistance colony was cultured into the TSB medium at 37°C, and was
repeatedly passaged three times. Then hygromycin-sensitive colonies were tested for the loss
of plasmid pUWLCre. The correct in-frame excision of aac(3)IV gene from the S. asterosporus
DSM 41452 Δsas16 genome was confirmed by PCR using primers SAS16F and SAS16R (Table
5. 1) (Figure 5. 14).
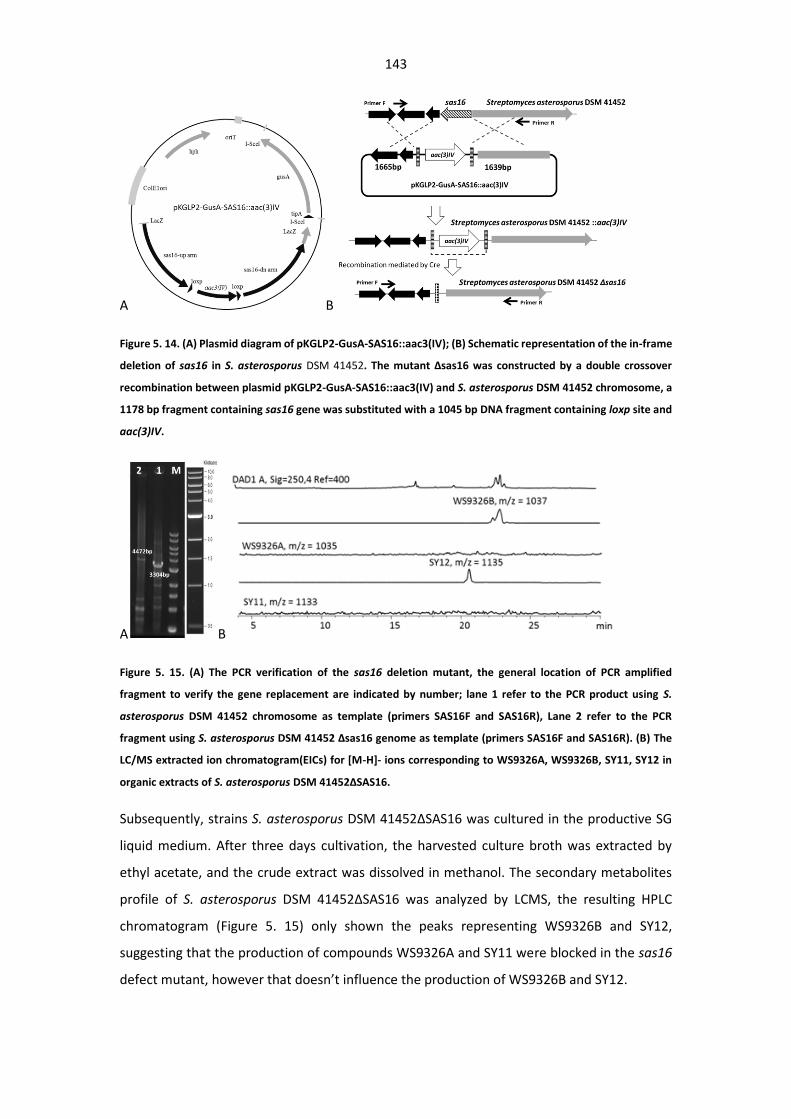
143
A B
Figure 5. 14. (A) Plasmid diagram of pKGLP2-GusA-SAS16::aac3(IV); (B) Schematic representation of the in-frame
deletion of sas16 in S. asterosporus DSM 41452. The mutant Δsas16 was constructed by a double crossover
recombination between plasmid pKGLP2-GusA-SAS16::aac3(IV) and S. asterosporus DSM 41452 chromosome, a
1178 bp fragment containing sas16 gene was substituted with a 1045 bp DNA fragment containing loxp site and
aac(3)IV.
A B
Figure 5. 15. (A) The PCR verification of the sas16 deletion mutant, the general location of PCR amplified
fragment to verify the gene replacement are indicated by number; lane 1 refer to the PCR product using S.
asterosporus DSM 41452 chromosome as template (primers SAS16F and SAS16R), Lane 2 refer to the PCR
fragment using S. asterosporus DSM 41452 Δsas16 genome as template (primers SAS16F and SAS16R). (B) The
LC/MS extracted ion chromatogram(EICs) for [M-H]- ions corresponding to WS9326A, WS9326B, SY11, SY12 in
organic extracts of S. asterosporus DSM 41452ΔSAS16.
Subsequently, strains S. asterosporus DSM 41452ΔSAS16 was cultured in the productive SG
liquid medium. After three days cultivation, the harvested culture broth was extracted by
ethyl acetate, and the crude extract was dissolved in methanol. The secondary metabolites
profile of S. asterosporus DSM 41452ΔSAS16 was analyzed by LCMS, the resulting HPLC
chromatogram (Figure 5. 15) only shown the peaks representing WS9326B and SY12,
suggesting that the production of compounds WS9326A and SY11 were blocked in the sas16
defect mutant, however that doesn’t influence the production of WS9326B and SY12.
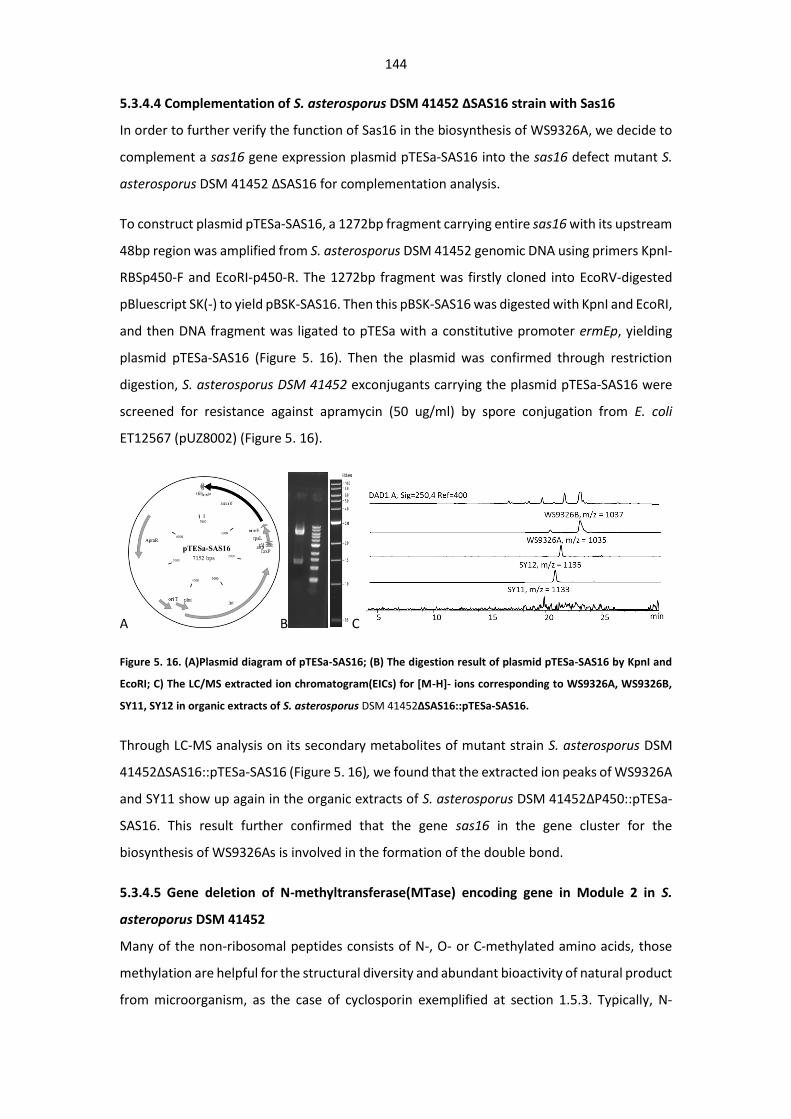
144
5.3.4.4 Complementation of S. asterosporus DSM 41452 ΔSAS16 strain with Sas16
In order to further verify the function of Sas16 in the biosynthesis of WS9326A, we decide to
complement a sas16 gene expression plasmid pTESa-SAS16 into the sas16 defect mutant S.
asterosporus DSM 41452 ΔSAS16 for complementation analysis.
To construct plasmid pTESa-SAS16, a 1272bp fragment carrying entire sas16 with its upstream
48bp region was amplified from S. asterosporus DSM 41452 genomic DNA using primers KpnI-
RBSp450-F and EcoRI-p450-R. The 1272bp fragment was firstly cloned into EcoRV-digested
pBluescript SK(-) to yield pBSK-SAS16. Then this pBSK-SAS16 was digested with KpnI and EcoRI,
and then DNA fragment was ligated to pTESa with a constitutive promoter ermEp, yielding
plasmid pTESa-SAS16 (Figure 5. 16). Then the plasmid was confirmed through restriction
digestion, S. asterosporus DSM 41452 exconjugants carrying the plasmid pTESa-SAS16 were
screened for resistance against apramycin (50 ug/ml) by spore conjugation from E. coli
ET12567 (pUZ8002) (Figure 5. 16).
A B C
Figure 5. 16. (A)Plasmid diagram of pTESa-SAS16; (B) The digestion result of plasmid pTESa-SAS16 by KpnI and
EcoRI; C) The LC/MS extracted ion chromatogram(EICs) for [M-H]- ions corresponding to WS9326A, WS9326B,
SY11, SY12 in organic extracts of S. asterosporus DSM 41452ΔSAS16::pTESa-SAS16.
Through LC-MS analysis on its secondary metabolites of mutant strain S. asterosporus DSM
41452ΔSAS16::pTESa-SAS16 (Figure 5. 16), we found that the extracted ion peaks of WS9326A
and SY11 show up again in the organic extracts of S. asterosporus DSM 41452ΔP450::pTESa-
SAS16. This result further confirmed that the gene sas16 in the gene cluster for the
biosynthesis of WS9326As is involved in the formation of the double bond.
5.3.4.5 Gene deletion of N-methyltransferase(MTase) encoding gene in Module 2 in S.
asteroporus DSM 41452
Many of the non-ribosomal peptides consists of N-, O- or C-methylated amino acids, those
methylation are helpful for the structural diversity and abundant bioactivity of natural product
from microorganism, as the case of cyclosporin exemplified at section 1.5.3. Typically, N-
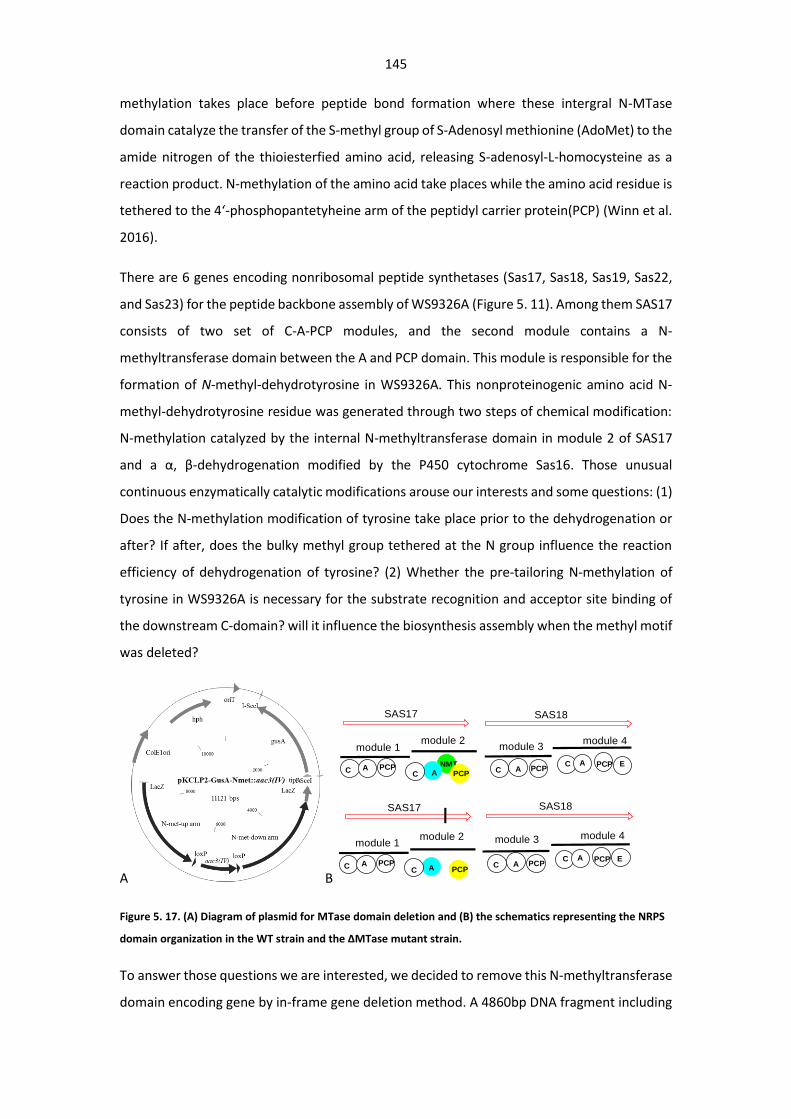
145
methylation takes place before peptide bond formation where these intergral N-MTase
domain catalyze the transfer of the S-methyl group of S-Adenosyl methionine (AdoMet) to the
amide nitrogen of the thioiesterfied amino acid, releasing S-adenosyl-L-homocysteine as a
reaction product. N-methylation of the amino acid take places while the amino acid residue is
tethered to the 4‘-phosphopantetyheine arm of the peptidyl carrier protein(PCP) (Winn et al.
2016).
There are 6 genes encoding nonribosomal peptide synthetases (Sas17, Sas18, Sas19, Sas22,
and Sas23) for the peptide backbone assembly of WS9326A (Figure 5. 11). Among them SAS17
consists of two set of C-A-PCP modules, and the second module contains a N-
methyltransferase domain between the A and PCP domain. This module is responsible for the
formation of N-methyl-dehydrotyrosine in WS9326A. This nonproteinogenic amino acid N-
methyl-dehydrotyrosine residue was generated through two steps of chemical modification:
N-methylation catalyzed by the internal N-methyltransferase domain in module 2 of SAS17
and a α, β-dehydrogenation modified by the P450 cytochrome Sas16. Those unusual
continuous enzymatically catalytic modifications arouse our interests and some questions: (1)
Does the N-methylation modification of tyrosine take place prior to the dehydrogenation or
after? If after, does the bulky methyl group tethered at the N group influence the reaction
efficiency of dehydrogenation of tyrosine? (2) Whether the pre-tailoring N-methylation of
tyrosine in WS9326A is necessary for the substrate recognition and acceptor site binding of
the downstream C-domain? will it influence the biosynthesis assembly when the methyl motif
was deleted?
A B
C A PCP NMT
C A PCPC A PCP
C A PCP E
module 2module 1 module 3
module 4
C A PCPC A PCP
C A PCPC A PCP E
module 2module 1 module 3 module 4
SAS17 SAS18
SAS17 SAS18
Figure 5. 17. (A) Diagram of plasmid for MTase domain deletion and (B) the schematics representing the NRPS
domain organization in the WT strain and the ΔMTase mutant strain.
To answer those questions we are interested, we decided to remove this N-methyltransferase
domain encoding gene by in-frame gene deletion method. A 4860bp DNA fragment including
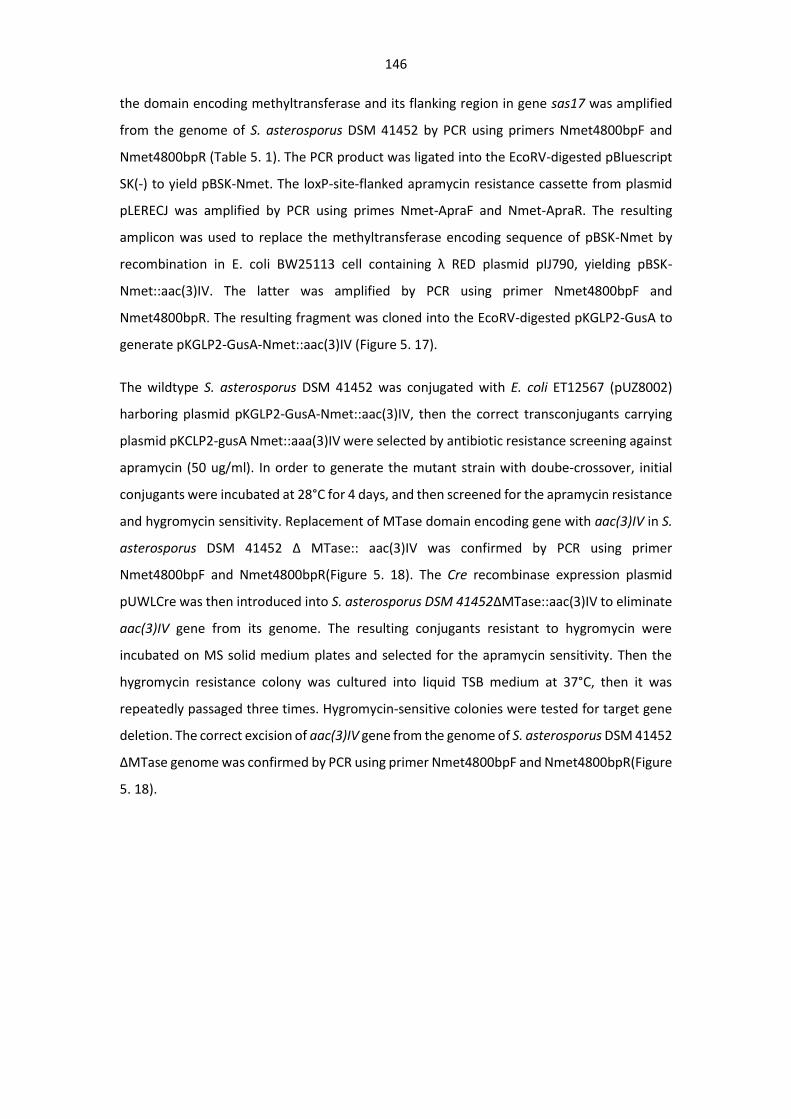
146
the domain encoding methyltransferase and its flanking region in gene sas17 was amplified
from the genome of S. asterosporus DSM 41452 by PCR using primers Nmet4800bpF and
Nmet4800bpR (Table 5. 1). The PCR product was ligated into the EcoRV-digested pBluescript
SK(-) to yield pBSK-Nmet. The loxP-site-flanked apramycin resistance cassette from plasmid
pLERECJ was amplified by PCR using primes Nmet-ApraF and Nmet-ApraR. The resulting
amplicon was used to replace the methyltransferase encoding sequence of pBSK-Nmet by
recombination in E. coli BW25113 cell containing λ RED plasmid pIJ790, yielding pBSK-
Nmet::aac(3)IV. The latter was amplified by PCR using primer Nmet4800bpF and
Nmet4800bpR. The resulting fragment was cloned into the EcoRV-digested pKGLP2-GusA to
generate pKGLP2-GusA-Nmet::aac(3)IV (Figure 5. 17).
The wildtype S. asterosporus DSM 41452 was conjugated with E. coli ET12567 (pUZ8002)
harboring plasmid pKGLP2-GusA-Nmet::aac(3)IV, then the correct transconjugants carrying
plasmid pKCLP2-gusA Nmet::aaa(3)IV were selected by antibiotic resistance screening against
apramycin (50 ug/ml). In order to generate the mutant strain with doube-crossover, initial
conjugants were incubated at 28°C for 4 days, and then screened for the apramycin resistance
and hygromycin sensitivity. Replacement of MTase domain encoding gene with aac(3)IV in S.
asterosporus DSM 41452 Δ MTase:: aac(3)IV was confirmed by PCR using primer
Nmet4800bpF and Nmet4800bpR(Figure 5. 18). The Cre recombinase expression plasmid
pUWLCre was then introduced into S. asterosporus DSM 41452ΔMTase::aac(3)IV to eliminate
aac(3)IV gene from its genome. The resulting conjugants resistant to hygromycin were
incubated on MS solid medium plates and selected for the apramycin sensitivity. Then the
hygromycin resistance colony was cultured into liquid TSB medium at 37°C, then it was
repeatedly passaged three times. Hygromycin-sensitive colonies were tested for target gene
deletion. The correct excision of aac(3)IV gene from the genome of S. asterosporus DSM 41452
ΔMTase genome was confirmed by PCR using primer Nmet4800bpF and Nmet4800bpR(Figure
5. 18).
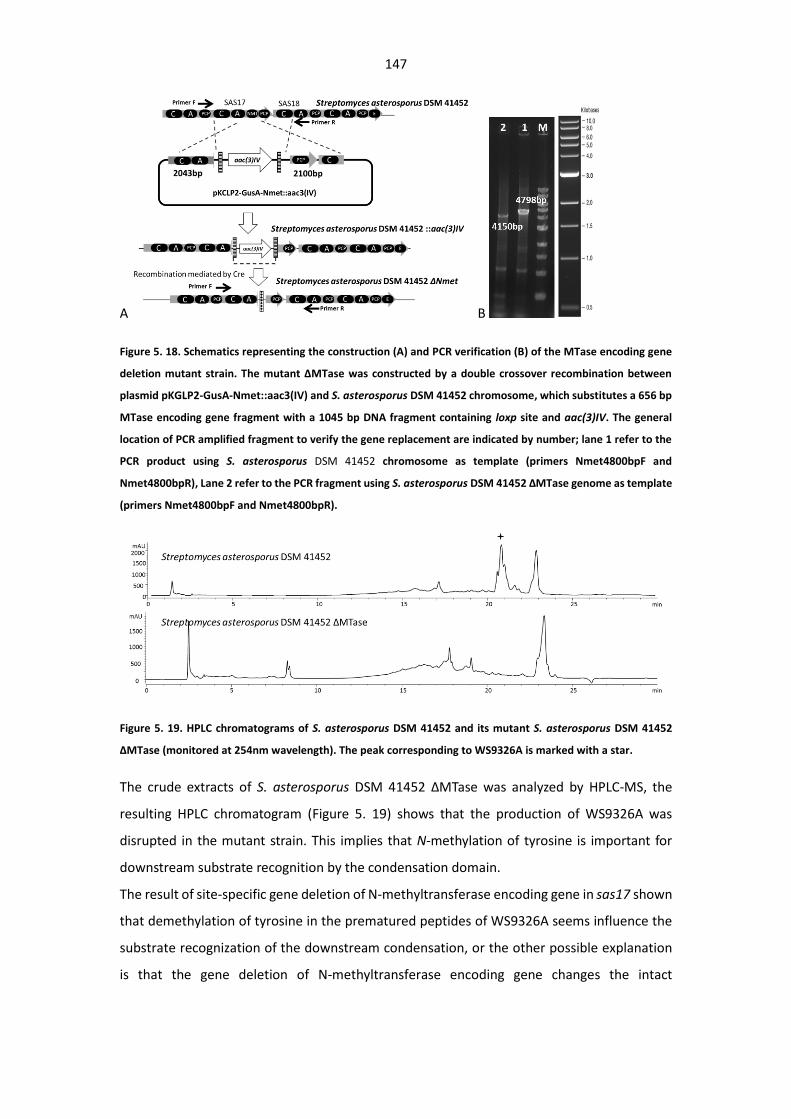
147
A B
Figure 5. 18. Schematics representing the construction (A) and PCR verification (B) of the MTase encoding gene
deletion mutant strain. The mutant ΔMTase was constructed by a double crossover recombination between
plasmid pKGLP2-GusA-Nmet::aac3(IV) and S. asterosporus DSM 41452 chromosome, which substitutes a 656 bp
MTase encoding gene fragment with a 1045 bp DNA fragment containing loxp site and aac(3)IV. The general
location of PCR amplified fragment to verify the gene replacement are indicated by number; lane 1 refer to the
PCR product using S. asterosporus DSM 41452 chromosome as template (primers Nmet4800bpF and
Nmet4800bpR), Lane 2 refer to the PCR fragment using S. asterosporus DSM 41452 ΔMTase genome as template
(primers Nmet4800bpF and Nmet4800bpR).
Figure 5. 19. HPLC chromatograms of S. asterosporus DSM 41452 and its mutant S. asterosporus DSM 41452
ΔMTase (monitored at 254nm wavelength). The peak corresponding to WS9326A is marked with a star.
The crude extracts of S. asterosporus DSM 41452 ΔMTase was analyzed by HPLC-MS, the
resulting HPLC chromatogram (Figure 5. 19) shows that the production of WS9326A was
disrupted in the mutant strain. This implies that N-methylation of tyrosine is important for
downstream substrate recognition by the condensation domain.
The result of site-specific gene deletion of N-methyltransferase encoding gene in sas17 shown
that demethylation of tyrosine in the prematured peptides of WS9326A seems influence the
substrate recognization of the downstream condensation, or the other possible explanation
is that the gene deletion of N-methyltransferase encoding gene changes the intact
148
configuration of the corresponding nonribosomal peptide synthetases, the resulting
configuration change disrupts the normal enzymatic function.
5.3.4.6 N-MTase protein expression and purification
N-methyltransferase (MTase) domain in module 2 encoded by sas17 consists of 222 amino
acids, belongs to the typical S-adenosylmethionine-dependent methyltransferases (SAM or
AdoMet-MTase) superfamily. It shows 96% sequence coverage and 43% identity with protein
McnC (Accession number WP_012268171.1) from Microcystis aeruginosa, and high identity
with non-ribosomal peptide synthetase from S. toyocaensis (89%, WP_051858700.1) and S.
griseoflavus (92%, WP_004931873.1). In addition, this MTase domain show 37% identity with
the protein structure of Chain A in Methyltransferase Ccbj (PDB-Id 1: 4HGY) from
Streptomyces Caelestis (Bauer et al. 2014). SAM-dependent methyltransferase CcbJ catalyzes
the methylation of the N-atom of the proline moiety in compound celesticetin biosynthesis
(Bauer et al. 2014).
To further characterize the substrate specificity of the MTase domain, and demonstrate the
catalytic reaction order between methylation and dehydrogenation in the biosynthesis of N-
methyldehydrotyrosine in WS9326A, we decided to set up an in vitro enzyme assay against
this MTase. For this purpose, series of MTase domain recombinant vectors were constructed,
including plasmid pET28-Nmet and pET24-Nmet. The gene fragment encoding MTase domain
were amplified from S. asterosporus DSM 41452 by PCR using primers NmetF and NmetR. The
PCR product firstly was ligated into EcoRV-digested pUC19 plasmid to yield pBSK-Nmet. Then
the fragment was digested from pBSK-Nmet and ligated into pET28a(+) and pET24 to yield
pET28a-Nmet and pET24-Nmet, respectively. Afterwards, those plasmids were transferred
into different E. coli strains for condition optimization of protein expression. Unfortunately,
the protein expression test showed that the N-methyltransferase domain can’t be expressed
into soluble protein when pET28a and pET24 were used as expression plasmid, so as to
enhance the solubility of this MTase protein, we finally turn to the help of fusion protein
vector pET-Trx (detailed information sees section 6.2.2).
The gene fragment encoding this MTase domain was amplified from S. asterosporus DSM
41452 by PCR using primers pET-Trx-NmetF and pET-Trx-NmetR. The PCR product first was
ligated into EcoRV-digested pBluescript KS(-) plasmid to yield pBSK-Trx-Nmet. Then the
fragment was digested and cloned into pET-Trx to yield plasmid pET-Trx-Nmet. The
thioredoxin-MTase fusion protein sequence contains 351 amino acid residues, and the
calculated protein weigh is 38.02 KDa. The fusion protein sequence is shown below (the
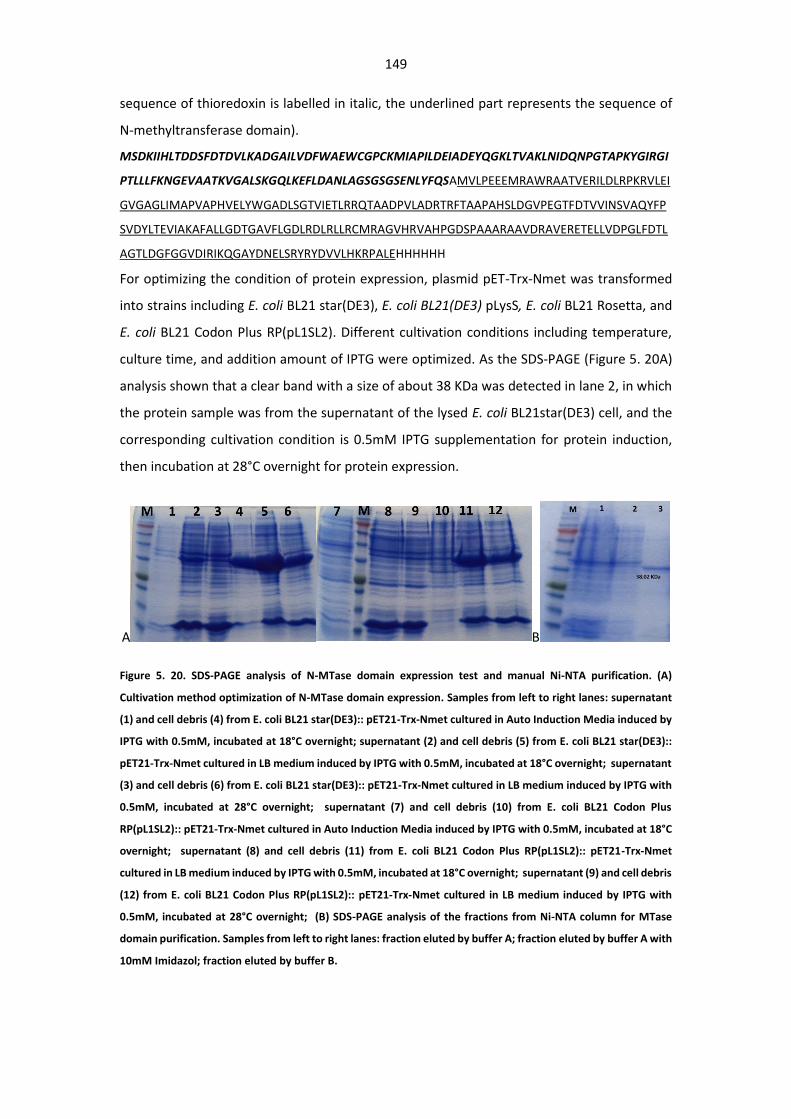
149
sequence of thioredoxin is labelled in italic, the underlined part represents the sequence of
N-methyltransferase domain).
MSDKIIHLTDDSFDTDVLKADGAILVDFWAEWCGPCKMIAPILDEIADEYQGKLTVAKLNIDQNPGTAPKYGIRGI
PTLLLFKNGEVAATKVGALSKGQLKEFLDANLAGSGSGSENLYFQSAMVLPEEEMRAWRAATVERILDLRPKRVLEI
GVGAGLIMAPVAPHVELYWGADLSGTVIETLRRQTAADPVLADRTRFTAAPAHSLDGVPEGTFDTVVINSVAQYFP
SVDYLTEVIAKAFALLGDTGAVFLGDLRDLRLLRCMRAGVHRVAHPGDSPAAARAAVDRAVERETELLVDPGLFDTL
AGTLDGFGGVDIRIKQGAYDNELSRYRYDVVLHKRPALEHHHHHH
For optimizing the condition of protein expression, plasmid pET-Trx-Nmet was transformed
into strains including E. coli BL21 star(DE3), E. coli BL21(DE3) pLysS, E. coli BL21 Rosetta, and
E. coli BL21 Codon Plus RP(pL1SL2). Different cultivation conditions including temperature,
culture time, and addition amount of IPTG were optimized. As the SDS-PAGE (Figure 5. 20A)
analysis shown that a clear band with a size of about 38 KDa was detected in lane 2, in which
the protein sample was from the supernatant of the lysed E. coli BL21star(DE3) cell, and the
corresponding cultivation condition is 0.5mM IPTG supplementation for protein induction,
then incubation at 28°C overnight for protein expression.
A B
Figure 5. 20. SDS-PAGE analysis of N-MTase domain expression test and manual Ni-NTA purification. (A)
Cultivation method optimization of N-MTase domain expression. Samples from left to right lanes: supernatant
(1) and cell debris (4) from E. coli BL21 star(DE3):: pET21-Trx-Nmet cultured in Auto Induction Media induced by
IPTG with 0.5mM, incubated at 18°C overnight; supernatant (2) and cell debris (5) from E. coli BL21 star(DE3)::
pET21-Trx-Nmet cultured in LB medium induced by IPTG with 0.5mM, incubated at 18°C overnight; supernatant
(3) and cell debris (6) from E. coli BL21 star(DE3):: pET21-Trx-Nmet cultured in LB medium induced by IPTG with
0.5mM, incubated at 28°C overnight; supernatant (7) and cell debris (10) from E. coli BL21 Codon Plus
RP(pL1SL2):: pET21-Trx-Nmet cultured in Auto Induction Media induced by IPTG with 0.5mM, incubated at 18°C
overnight; supernatant (8) and cell debris (11) from E. coli BL21 Codon Plus RP(pL1SL2):: pET21-Trx-Nmet
cultured in LB medium induced by IPTG with 0.5mM, incubated at 18°C overnight; supernatant (9) and cell debris
(12) from E. coli BL21 Codon Plus RP(pL1SL2):: pET21-Trx-Nmet cultured in LB medium induced by IPTG with
0.5mM, incubated at 28°C overnight; (B) SDS-PAGE analysis of the fractions from Ni-NTA column for MTase
domain purification. Samples from left to right lanes: fraction eluted by buffer A; fraction eluted by buffer A with
10mM Imidazol; fraction eluted by buffer B.
150
For purifying this MTase domain, cell pellets from 1L strain culture were harvested and lysed
using French pressure. The resulting cell debris was removed by centrifugation. The
supernatant was subjected to a 2-ml Ni-NTA Superflow column that had been pre-equilibrated
in buffer A. The column first was eluted with 5 CV of buffer A, then with 1.5 CV of buffer B. All
fractions were collected and analyzed by SDS-PAGE (Figure 5. 20B). The SDS-PAGE analysis
result shown that fraction 3 eluted by buffer B exhibited a clear band with similar protein size
as the calculated.
5.4 Conclusion
In this chapter we focus this new potential strain S. asterosporus DSM 41452, which is capable
of producing a potent tachykinin receptor antagonist WS9326A and WS9326B with the high
yield up to 500 mg per liter. By various kinds of classic chromatography and spectroscopy
methods, we first isolated and characterized two new WS9326A derivatives, termed WS9326F,
WS9326G, with four known analogs WS9326A, WS9326B, WS9326D, WS9326E from S.
asterosporus DSM 41152. Among them the linearized WS9326F and WS9326G were
structurally elucidated base on NMR and MS/MS fragmentation. Both compounds are most
probably released from the assembly line following the hydrolysis mechanism.
We performed Marfey’s analysis of WS9326A and attempt to determine the stereochemical
configurations of all the amino acids. Unfortunately, were not able to determine the
configuration of the β-carbon of threonine due to the insufficient resolution of HPLC,
therefore we are not absolutely certain if we have L-allo-Thr in WS9326A. We now show the
structures of the compounds with explicit stereochemistry where this is known. We
designated the same configuration of WS9326A derivatives since they share the same
biosynthetic machinery.
Unexpectedly, from a annimycin-disrupted mutant S. asterosporus DSM
41152::pUC19Δ3100spec, we found two new WS9326A derivatives SY11 and SY12 with
molecular weight 1134 and 1136. Based on the data of NMR spectra and MS/MS
fragmentation analysis result, we were able to elucidate the cyclicpeptide scaffold of
compound SY11. Moreover, it is strongly demonstrated that the structure divergence
between SY11 and SY12 was resulted from the α, β-dehydrogenation happening at the
tyrosine residue as the structural difference between WS9326A and WS9326B. However, due
151
to the serious signal overlapping and the lack of key correlation, we failed to sketch their
complete structure temporarily. For solving the problem, next step we will turn to the help of
chemical derivatization.
From the perspective of biosynthesis, the occurrence of SY11 and SY12 suggest the high
tolerance and the plasticity of WS9326A nonribosomal peptide complex synthetases during
the molecular assembly. Another example which implied this feature is compound
mohangamide (structure see Figure 1.10). Mohangamides are the dimerized product of
WS9326A, they were recently isolated from strain Streptomyces sp. SNM55 (Bae et al. 2015).
The mohangamides are the largest dilactone-tethered, dimeric cyclic peptides discovered
from microorganism so far. According to literature reported (Bae et al. 2015), we postulated
that the dimerization could be catalyzed by a putative type II thioesterase encoded by sas20
in WS9326A gene cluster, unluckily, we haven’t found the presence of dimeric peptides in our
strain S. asterosporus DSM 41452. The explanation could attribute to the cultivation condition
(media, trace element, PH control, etc), or maybe mohangamides were biosynthesized via a
total different machinery. It’s interesting question awaiting to be answered in the future.
By means of genome sequencing, bioinformatics analysis and gene inactivation, we identified
and validated the corresponding WS9326A biosynthetic gene cluster in S. asterosporus DSM
41452. Gene deletion studies demonstrated a critical role of N-methylation in WS9326A
biosynthesis, Gene deletion of sas16 resulted in the abolishment of WS9326A, but the
resulting mutant strain S. asterosporus DSM 41452Δsas16 still keep the ability of producing
WS9326B where there is no dehydrogenation present on the N-methyl tyrosine residue, after
complementation, the production of WS9326A was restored, which demonstrated the role of
a P450 monooxygenase encoded by sas16 in forming a α, β-dehydrotyrosine group. Through
detailed MS analysis on the LC/MS extracted ion chromatogram (EICs), we didn’t find the [M-
H]- ion peak referring to the WS9326A derivative with β-hydroxy-tyrosine residue, so we
postulated that Sas16 are responsible for the dehydrogenation of the tyrosine amino acid in
the biosynthesis of WS9326As.
One derivative of WS9326A, WS9326D was reported to have anitfilarial activity (Yu et al. 2012),
our finding extends the range of activities of the WS9326A series to antimalarial activity (albeit
weak). In an antimalarial assay, except for an annimycin analogue SY10, none of WS9326A
congeners exhibited significant inhibitory activity against the three P. falciparum parasite lines
tested. There could be a number of reasons resulting in those nullity. In our active assay
system, tested compounds have to cross the erythrocyte plasma membrane to impact the
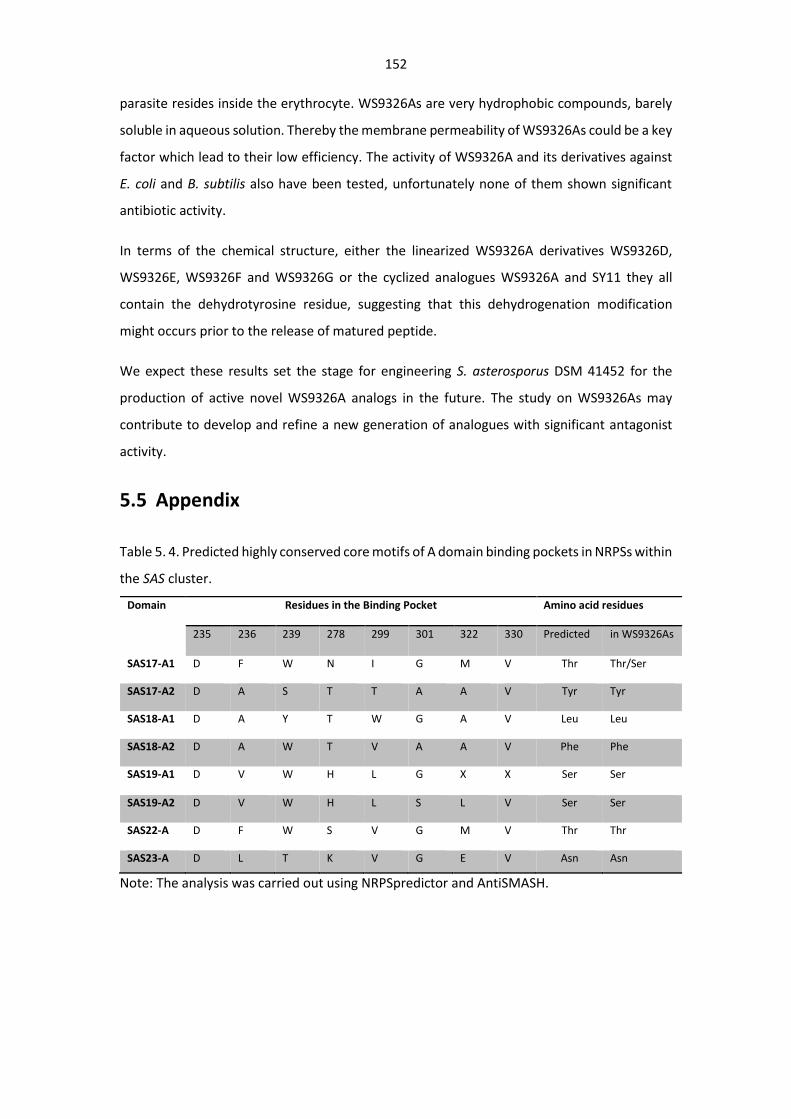
152
parasite resides inside the erythrocyte. WS9326As are very hydrophobic compounds, barely
soluble in aqueous solution. Thereby the membrane permeability of WS9326As could be a key
factor which lead to their low efficiency. The activity of WS9326A and its derivatives against
E. coli and B. subtilis also have been tested, unfortunately none of them shown significant
antibiotic activity.
In terms of the chemical structure, either the linearized WS9326A derivatives WS9326D,
WS9326E, WS9326F and WS9326G or the cyclized analogues WS9326A and SY11 they all
contain the dehydrotyrosine residue, suggesting that this dehydrogenation modification
might occurs prior to the release of matured peptide.
We expect these results set the stage for engineering S. asterosporus DSM 41452 for the
production of active novel WS9326A analogs in the future. The study on WS9326As may
contribute to develop and refine a new generation of analogues with significant antagonist
activity.
5.5 Appendix
Table 5. 4. Predicted highly conserved core motifs of A domain binding pockets in NRPSs within
the SAS cluster.
Domain Residues in the Binding Pocket Amino acid residues
235 236 239 278 299 301 322 330 Predicted in WS9326As
SAS17-A1 D F W N I G M V Thr Thr/Ser
SAS17-A2 D A S T T A A V Tyr Tyr
SAS18-A1 D A Y T W G A V Leu Leu
SAS18-A2 D A W T V A A V Phe Phe
SAS19-A1 D V W H L G X X Ser Ser
SAS19-A2 D V W H L S L V Ser Ser
SAS22-A D F W S V G M V Thr Thr
SAS23-A D L T K V G E V Asn Asn
Note: The analysis was carried out using NRPSpredictor and AntiSMASH.
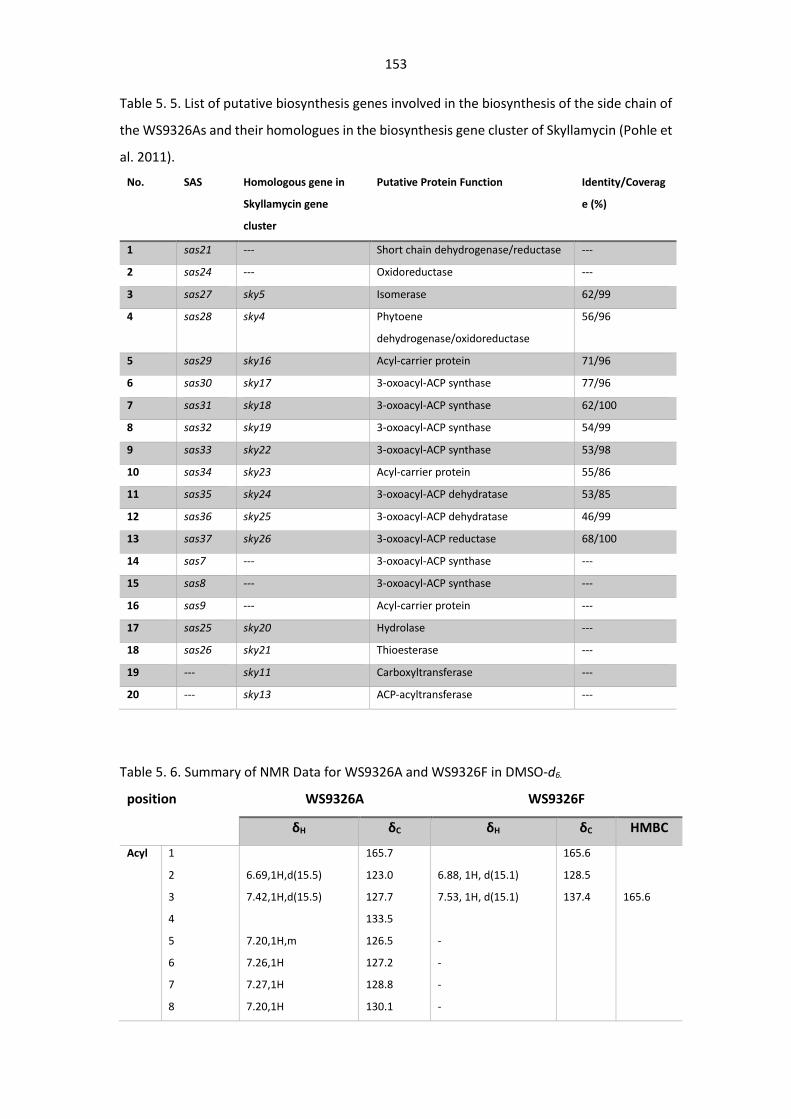
153
Table 5. 5. List of putative biosynthesis genes involved in the biosynthesis of the side chain of
the WS9326As and their homologues in the biosynthesis gene cluster of Skyllamycin (Pohle et
al. 2011).
No. SAS Homologous gene in
Skyllamycin gene
cluster
Putative Protein Function Identity/Coverag
e (%)
1 sas21 --- Short chain dehydrogenase/reductase ---
2 sas24 --- Oxidoreductase ---
3 sas27 sky5 Isomerase 62/99
4 sas28 sky4 Phytoene
dehydrogenase/oxidoreductase
56/96
5 sas29 sky16 Acyl-carrier protein 71/96
6 sas30 sky17 3-oxoacyl-ACP synthase 77/96
7 sas31 sky18 3-oxoacyl-ACP synthase 62/100
8 sas32 sky19 3-oxoacyl-ACP synthase 54/99
9 sas33 sky22 3-oxoacyl-ACP synthase 53/98
10 sas34 sky23 Acyl-carrier protein 55/86
11 sas35 sky24 3-oxoacyl-ACP dehydratase 53/85
12 sas36 sky25 3-oxoacyl-ACP dehydratase 46/99
13 sas37 sky26 3-oxoacyl-ACP reductase 68/100
14 sas7 --- 3-oxoacyl-ACP synthase ---
15 sas8 --- 3-oxoacyl-ACP synthase ---
16 sas9 --- Acyl-carrier protein ---
17 sas25 sky20 Hydrolase ---
18 sas26 sky21 Thioesterase ---
19 --- sky11 Carboxyltransferase ---
20 --- sky13 ACP-acyltransferase ---
Table 5. 6. Summary of NMR Data for WS9326A and WS9326F in DMSO-d6.
position WS9326A WS9326F
δH δC δH δC HMBC
Acyl 1
2
3
4
5
6
7
8
6.69,1H,d(15.5)
7.42,1H,d(15.5)
7.20,1H,m
7.26,1H
7.27,1H
7.20,1H
165.7
123.0
127.7
133.5
126.5
127.2
128.8
130.1
6.88, 1H, d(15.1)
7.53, 1H, d(15.1)
-
-
-
-
165.6
128.5
137.4
165.6
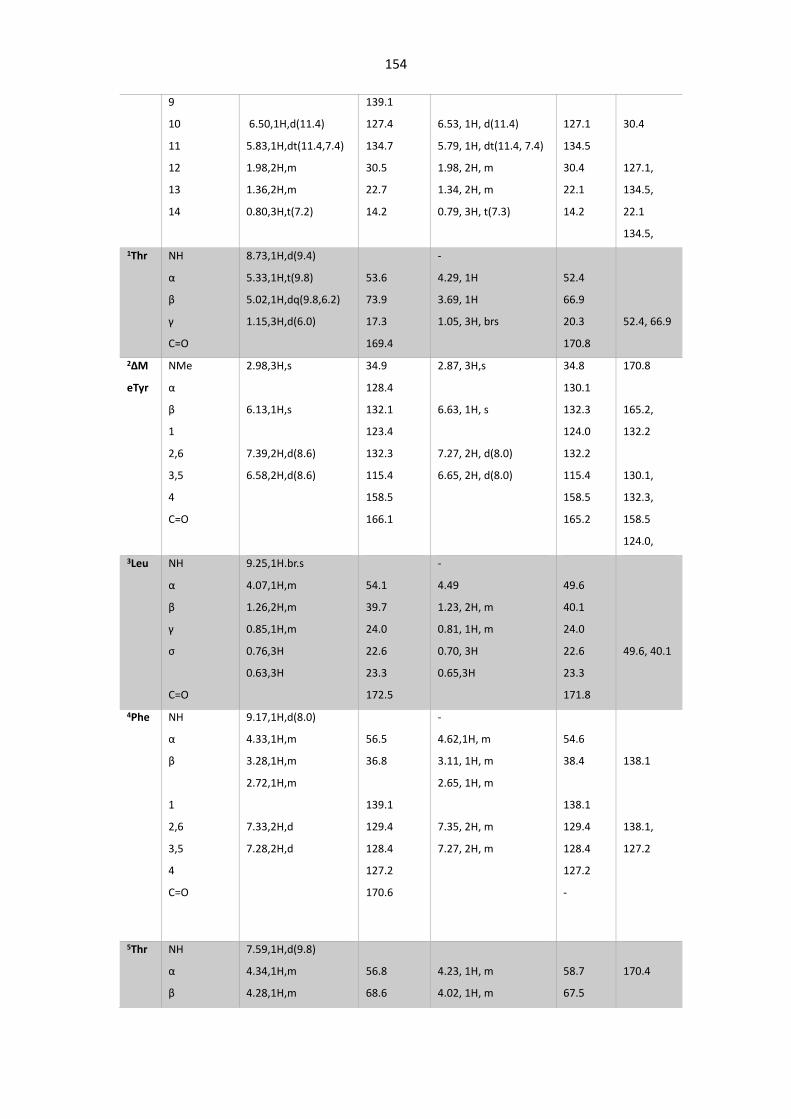
154
9
10
11
12
13
14
6.50,1H,d(11.4)
5.83,1H,dt(11.4,7.4)
1.98,2H,m
1.36,2H,m
0.80,3H,t(7.2)
139.1
127.4
134.7
30.5
22.7
14.2
6.53, 1H, d(11.4)
5.79, 1H, dt(11.4, 7.4)
1.98, 2H, m
1.34, 2H, m
0.79, 3H, t(7.3)
127.1
134.5
30.4
22.1
14.2
30.4
127.1,
134.5,
22.1
134.5,
1Thr NH
α
β
γ
C=O
8.73,1H,d(9.4)
5.33,1H,t(9.8)
5.02,1H,dq(9.8,6.2)
1.15,3H,d(6.0)
53.6
73.9
17.3
169.4
-
4.29, 1H
3.69, 1H
1.05, 3H, brs
52.4
66.9
20.3
170.8
52.4, 66.9
2ΔM
eTyr
NMe
α
β
1
2,6
3,5
4
C=O
2.98,3H,s
6.13,1H,s
7.39,2H,d(8.6)
6.58,2H,d(8.6)
34.9
128.4
132.1
123.4
132.3
115.4
158.5
166.1
2.87, 3H,s
6.63, 1H, s
7.27, 2H, d(8.0)
6.65, 2H, d(8.0)
34.8
130.1
132.3
124.0
132.2
115.4
158.5
165.2
170.8
165.2,
132.2
130.1,
132.3,
158.5
124.0,
3Leu NH
α
β
γ
σ
C=O
9.25,1H.br.s
4.07,1H,m
1.26,2H,m
0.85,1H,m
0.76,3H
0.63,3H
54.1
39.7
24.0
22.6
23.3
172.5
-
4.49
1.23, 2H, m
0.81, 1H, m
0.70, 3H
0.65,3H
49.6
40.1
24.0
22.6
23.3
171.8
49.6, 40.1
4Phe NH
α
β
1
2,6
3,5
4
C=O
9.17,1H,d(8.0)
4.33,1H,m
3.28,1H,m
2.72,1H,m
7.33,2H,d
7.28,2H,d
56.5
36.8
139.1
129.4
128.4
127.2
170.6
-
4.62,1H, m
3.11, 1H, m
2.65, 1H, m
7.35, 2H, m
7.27, 2H, m
54.6
38.4
138.1
129.4
128.4
127.2
-
138.1
138.1,
127.2
5Thr NH
α
β
7.59,1H,d(9.8)
4.34,1H,m
4.28,1H,m
56.8
68.6
4.23, 1H, m
4.02, 1H, m
58.7
67.5
170.4
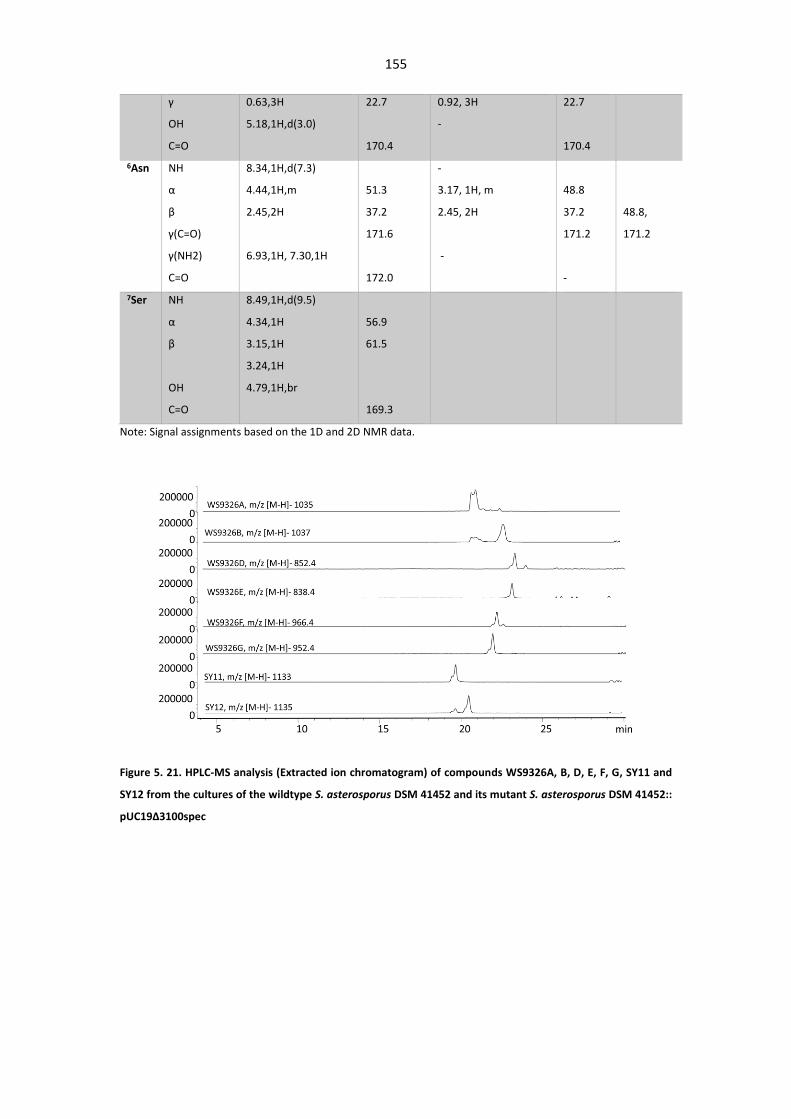
155
γ
OH
C=O
0.63,3H
5.18,1H,d(3.0)
22.7
170.4
0.92, 3H
-
22.7
170.4
6Asn NH
α
β
γ(C=O)
γ(NH2)
C=O
8.34,1H,d(7.3)
4.44,1H,m
2.45,2H
6.93,1H, 7.30,1H
51.3
37.2
171.6
172.0
-
3.17, 1H, m
2.45, 2H
-
48.8
37.2
171.2
-
48.8,
171.2
7Ser NH
α
β
OH
C=O
8.49,1H,d(9.5)
4.34,1H
3.15,1H
3.24,1H
4.79,1H,br
56.9
61.5
169.3
Note: Signal assignments based on the 1D and 2D NMR data.
Figure 5. 21. HPLC-MS analysis (Extracted ion chromatogram) of compounds WS9326A, B, D, E, F, G, SY11 and
SY12 from the cultures of the wildtype S. asterosporus DSM 41452 and its mutant S. asterosporus DSM 41452::
pUC19Δ3100spec
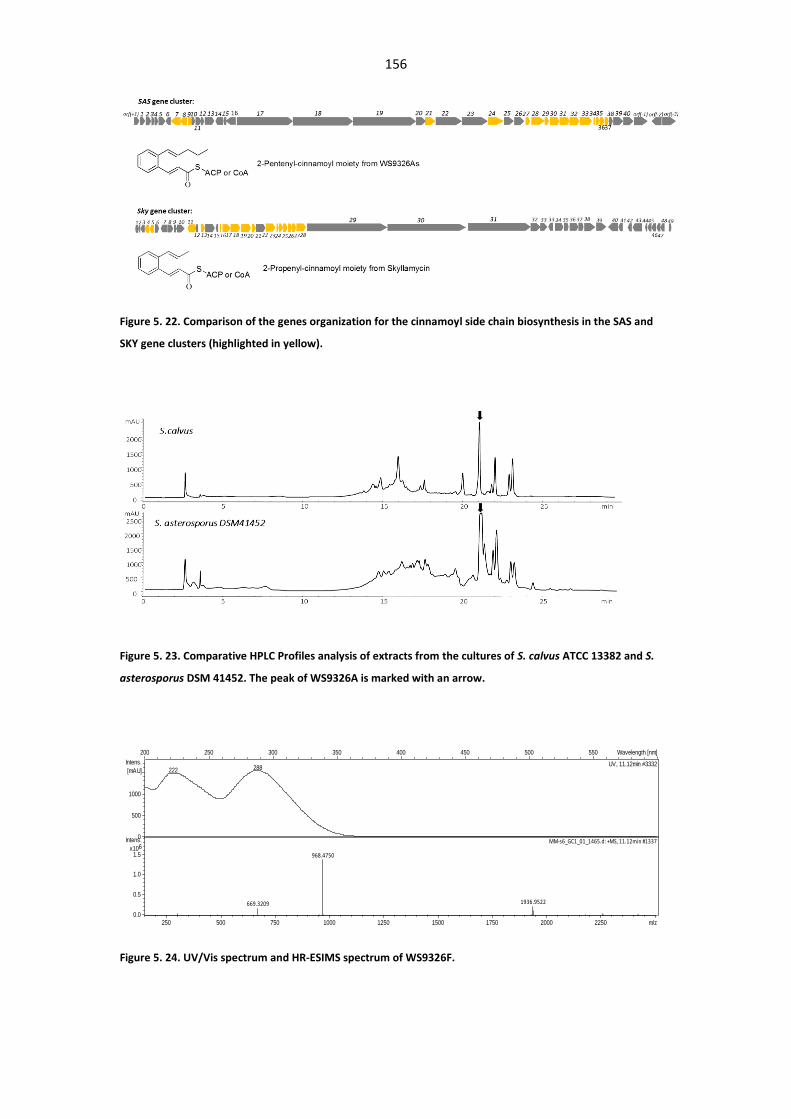
156
Figure 5. 22. Comparison of the genes organization for the cinnamoyl side chain biosynthesis in the SAS and
SKY gene clusters (highlighted in yellow).
Figure 5. 23. Comparative HPLC Profiles analysis of extracts from the cultures of S. calvus ATCC 13382 and S.
asterosporus DSM 41452. The peak of WS9326A is marked with an arrow.
Figure 5. 24. UV/Vis spectrum and HR-ESIMS spectrum of WS9326F.
222 288UV, 11.12min #3332
669.3209
968.4750
1936.9522
MM-s6_GC1_01_1465.d: +MS, 11.12min #13370
500
1000
Intens.
[mAU]
0.0
0.5
1.0
1.5
6x10
Intens.
250 500 750 1000 1250 1500 1750 2000 2250 m/z
200 250 300 350 400 450 500 550 Wavelength [nm]
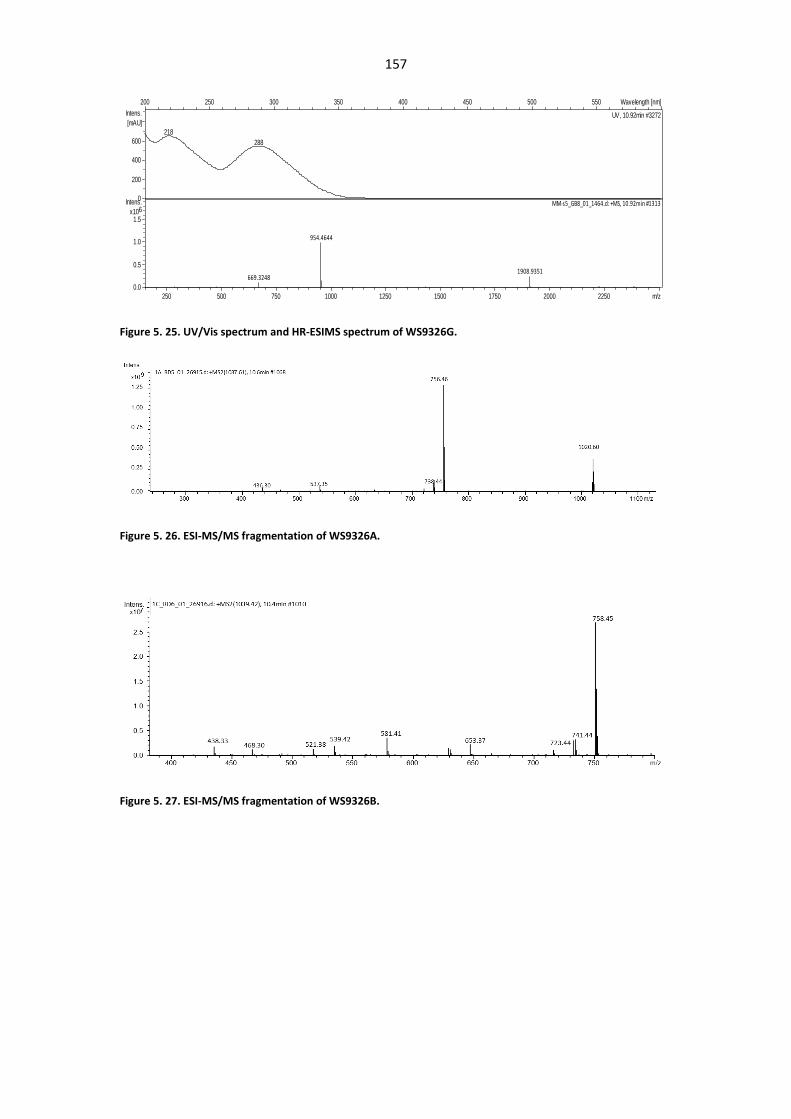
157
Figure 5. 25. UV/Vis spectrum and HR-ESIMS spectrum of WS9326G.
Figure 5. 26. ESI-MS/MS fragmentation of WS9326A.
Figure 5. 27. ESI-MS/MS fragmentation of WS9326B.
218
288
UV, 10.92min #3272
669.3248
954.4644
1908.9351
MM-s5_GB8_01_1464.d: +MS, 10.92min #13130
200
400
600
Intens.
[mAU]
0.0
0.5
1.0
1.5
6x10
Intens.
250 500 750 1000 1250 1500 1750 2000 2250 m/z
200 250 300 350 400 450 500 550 Wavelength [nm]
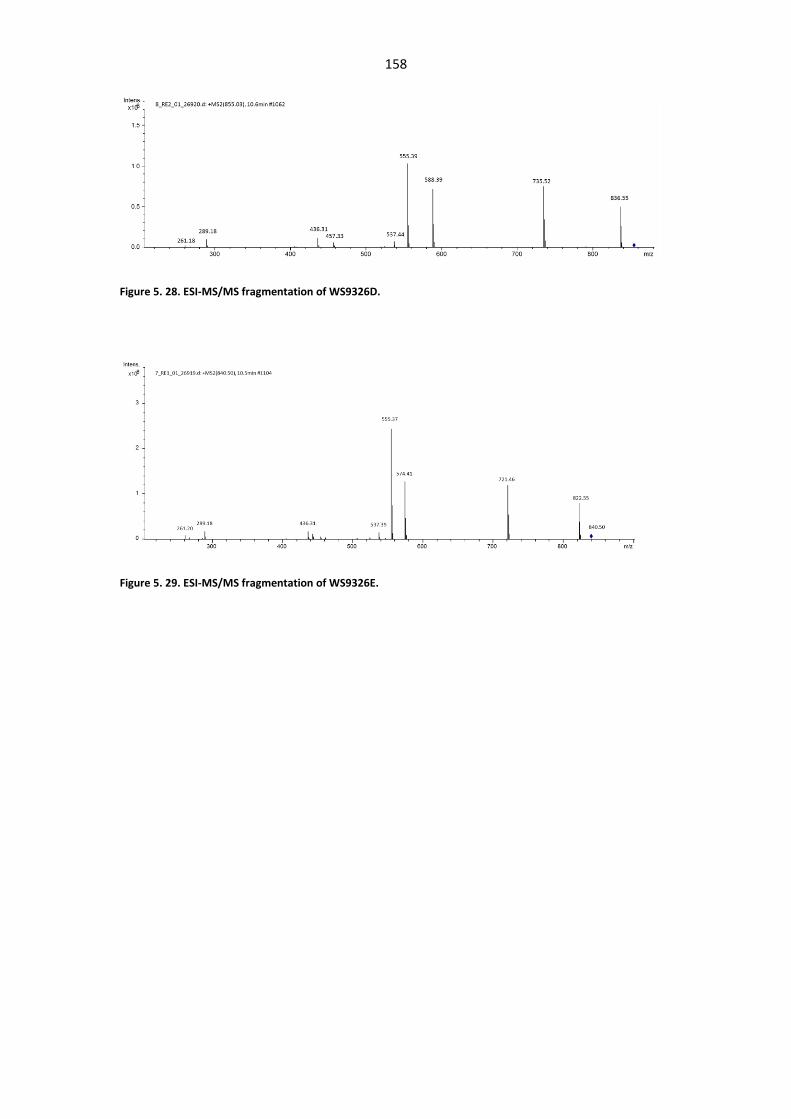
158
Figure 5. 28. ESI-MS/MS fragmentation of WS9326D.
Figure 5. 29. ESI-MS/MS fragmentation of WS9326E.
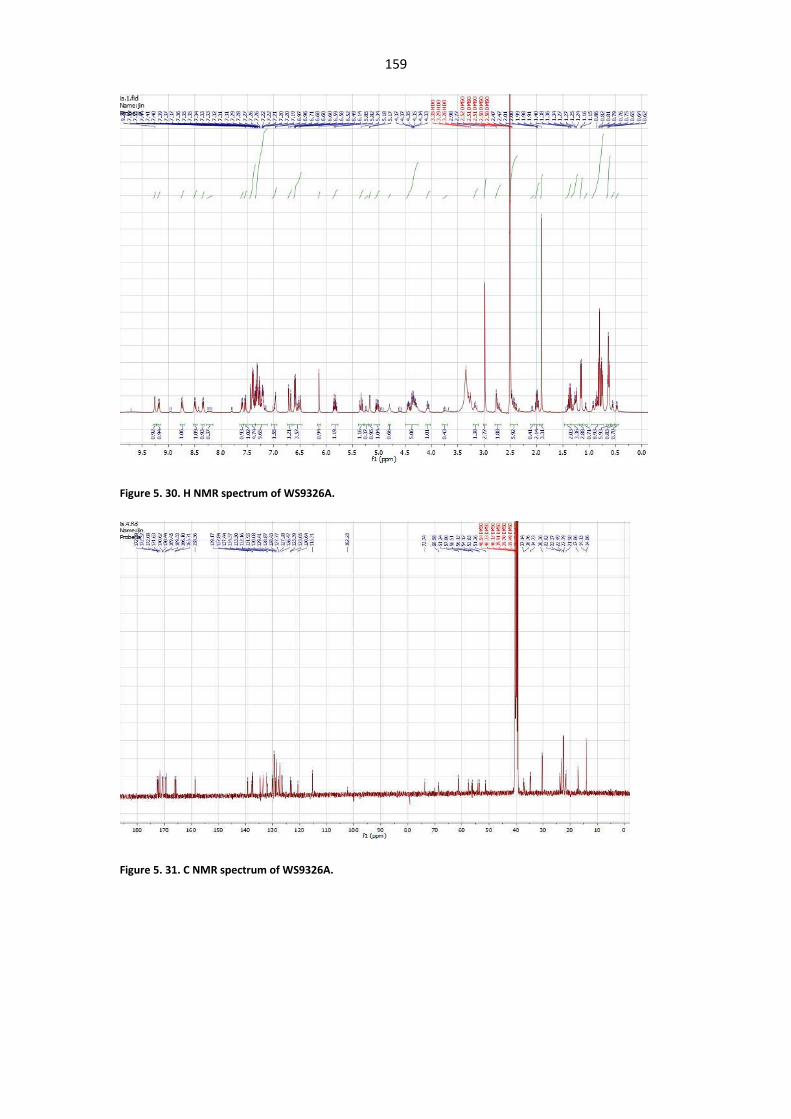
159
Figure 5. 30. H NMR spectrum of WS9326A.
Figure 5. 31. C NMR spectrum of WS9326A.
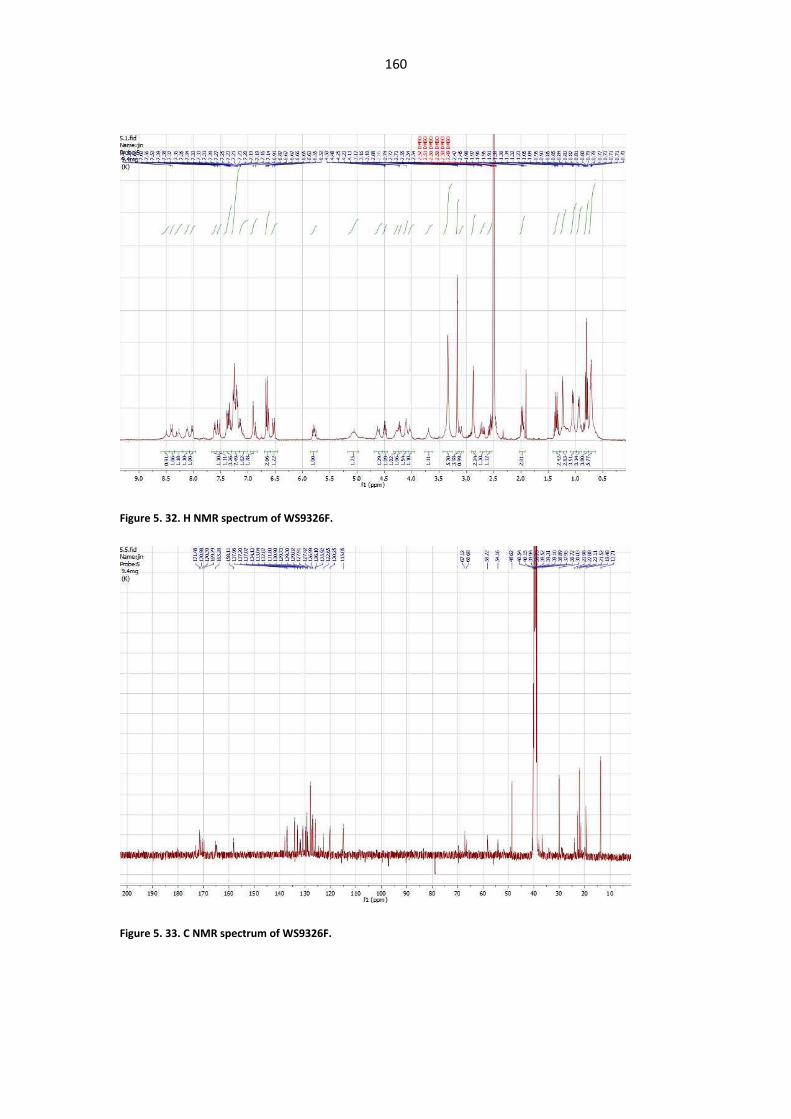
160
Figure 5. 32. H NMR spectrum of WS9326F.
Figure 5. 33. C NMR spectrum of WS9326F.
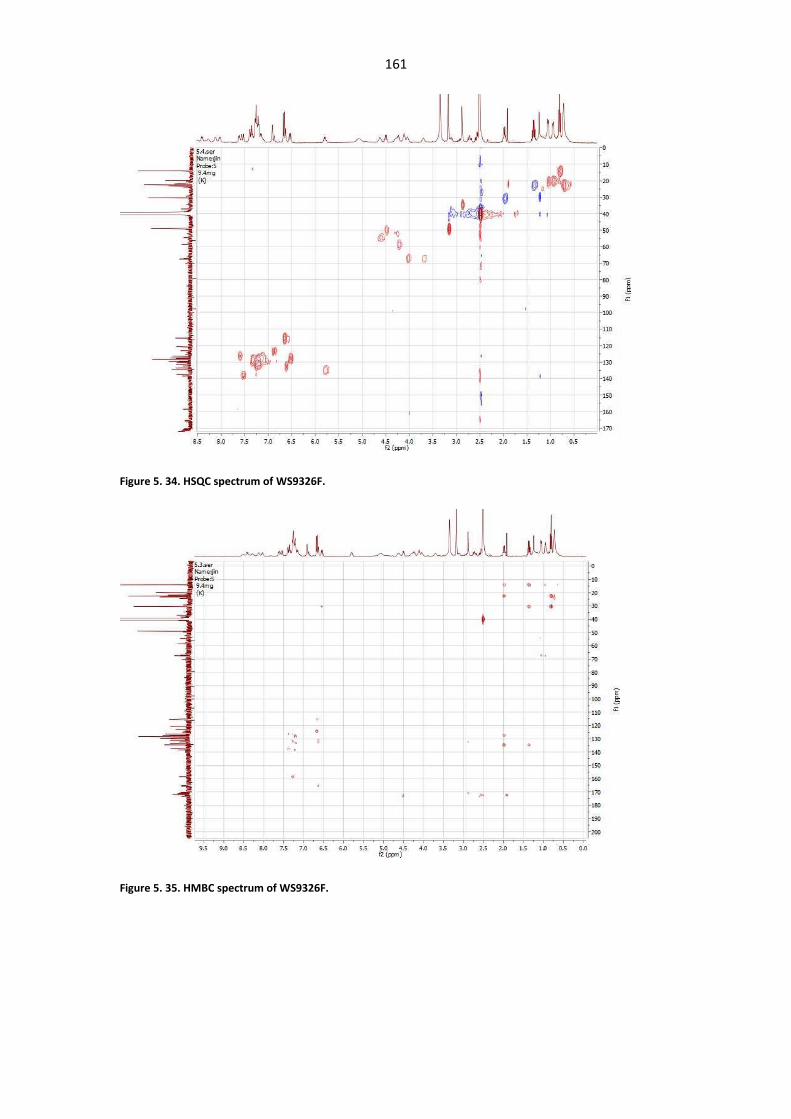
161
Figure 5. 34. HSQC spectrum of WS9326F.
Figure 5. 35. HMBC spectrum of WS9326F.
162
Chapter 6. Biochemical characterization of Cytochrome P450
Sas16
6.1 Research Background
The double bond formation in polyketide is widely recognized to be catalyzed by dehydration
following a ketoreduction reaction (Keatinge-Clay 2012; He et al. 2014). Certainly, some
exceptions could happen in some special case. For example, TrdE, a glycoside hydrolase,
catalyzes the formation of the double bond in an unusual way during the Tirandanmycins
biosynthesis (Mo et al. 2012). In the case of phoslactomycin, the Δ2,3 double bond is installed
by a post-tailoring fashion catalyzed by PlmT2, a putative NAD-dependent
epimerase/dehydratase (Palaniappan et al. 2008).
In NRPS kinds of compound, the nonproteinogenic aromatic amino acid with α, β-
dehydrogenation also commonly present in a diverse range of natural product. So far, in
addition to WS9326As (including a α, β-dehydrotyrosine), other nonribosomal peptides
harboring α ,β-dehydroamino acid include: calcium-dependent lipopeptide antibiotics (CDA)
(including a 2’,3’-dehydrotryptophan) (Baltz et al. 2005), Telomycins (including a 2’,3’-
dehydrotryptophan) (Fu et al. 2015), Jahnellamides (including a 2’,3’-dehydrotryptophan)
(Plaza et al. 2013), Dityromycin (including a dehydrotyrosine) (Teshima et al. 1988),
Miuraenamides (Ojika et al. 2008; Yamazaki et al. 2015) and Tentoxin (including a α, β-
dehydrophenylalanine) (Li, Han et al. 2016).
Calcium-dependent-antibiotic (CDA) are produced by Streptomyces coelicolor A3(2), it belongs
to the family of nonribosomal lipopeptide antibiotics. In the biosynthesis of CDA, it comprises
a number of non-proteinogenic amino acids including a C-terminal (Z)-2’,3’-
163
dehydrotryptophan (Baltz et al. 2005). By isotope feeding labeled tryptophan derivative to the
Trp-His auxotrophic strain Streptomyces coelicolor WH101, Jason Mickledield etal (2007)
demonstrated that the function of (Z)-2’,3’-dehydrotryptophan residue of CDA was generated
through dehydrogenation from an (S)-tryptophanyl precursor. But due to the insufficient
information about the protein homology, the corresponding enzyme that catalyze the
formation of the Z-ΔTrp-residue of CDA is still unknown (Amir-Heidari and Micklefield 2007).
In the gene cluster of Telomycin, gene tem12 was predicted to be a medium chain
hydrogenase/dehydrogenase (MDR)/zinc-dependent alcohol dehydrogenase which was
related with the formation of the (Z)-2,3-dehydrotryptophan residue in Telomycin. However,
the in-frame gene deletion experiments didn’t provide supporting evidence (Fu et al. 2015).
Jahnellamides and Resomycin containing Z-2,3-dehydrotryptophan were isolated from the
myxobacterium Jahnella sp, in silico analysis of genome sequence proposed that the genes
orf8 and orf9 encode putative desaturases in Jahnellamide gene cluster which could be
responsible for the formation of the ΔTrp with similar mechanism as the tryptophan 2ˈ, 3ˈ -
oxidase from Chromobacterium violaceum (Plaza et al. 2013). Tentoxin is a cyclic tetrapeptide
produced by some Alternaria species, it is an inhibitor of the F₁-ATPase in chloroplasts. By
bioinformatic and targeted gene mutagenesis analysis, a NRPS gene (TES) and a cytochrome
P450 gene (TES1) were identified to be involved in the tentoxin biosynthesis in A. alternata.
Gene TES1 was predicted to be involved in the formation of nonproteinogenic residue
dehydrophenylalanine (Me-(Z)- ΔPhe) (Li, Han et al. 2016). Antibiotic Dityromycin was firstly
isolated from a soil-derived Streptomcyes sp. strain No. AM-2504, as a cyclic decapeptide, it
consists of various kinds of nonproteinogenic amino acids including a N-methyl-
dehydrotyrosine residue. so far there is no research about its biosynthetic machinery
(Teshima et al. 1988; Beau et al. 2012). Resormycin exhibiting antimicrobial activity against
phytopathogenic fungi, was isolated from Streptomyces platensis MJ953-SF5. In its chemical
structure, a residue of 4-chloro-3,5-dehydroxyphenylpropenoic acid is integrated into the
backbone, so far there is no report about its biosynthesis mechanism (Igarashi et al. 1997).
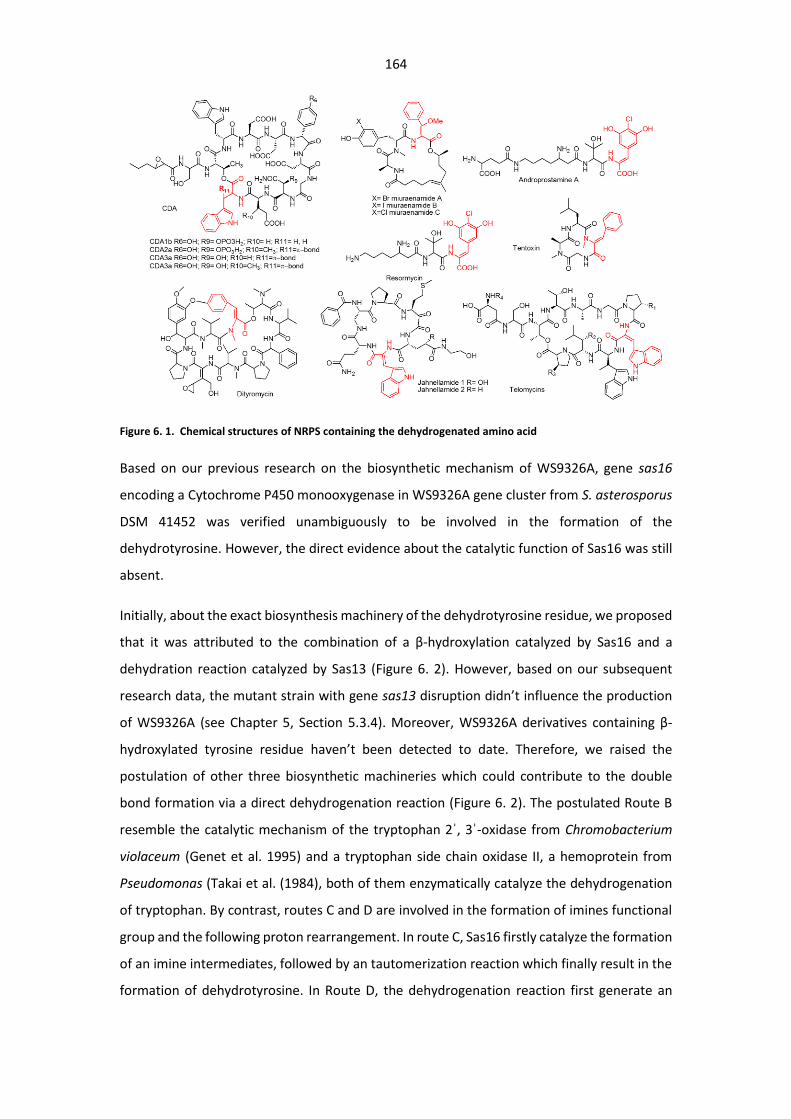
164
Figure 6. 1. Chemical structures of NRPS containing the dehydrogenated amino acid
Based on our previous research on the biosynthetic mechanism of WS9326A, gene sas16
encoding a Cytochrome P450 monooxygenase in WS9326A gene cluster from S. asterosporus
DSM 41452 was verified unambiguously to be involved in the formation of the
dehydrotyrosine. However, the direct evidence about the catalytic function of Sas16 was still
absent.
Initially, about the exact biosynthesis machinery of the dehydrotyrosine residue, we proposed
that it was attributed to the combination of a β-hydroxylation catalyzed by Sas16 and a
dehydration reaction catalyzed by Sas13 (Figure 6. 2). However, based on our subsequent
research data, the mutant strain with gene sas13 disruption didn’t influence the production
of WS9326A (see Chapter 5, Section 5.3.4). Moreover, WS9326A derivatives containing β-
hydroxylated tyrosine residue haven’t been detected to date. Therefore, we raised the
postulation of other three biosynthetic machineries which could contribute to the double
bond formation via a direct dehydrogenation reaction (Figure 6. 2). The postulated Route B
resemble the catalytic mechanism of the tryptophan 2ˈ, 3ˈ-oxidase from Chromobacterium
violaceum (Genet et al. 1995) and a tryptophan side chain oxidase II, a hemoprotein from
Pseudomonas (Takai et al. (1984), both of them enzymatically catalyze the dehydrogenation
of tryptophan. By contrast, routes C and D are involved in the formation of imines functional
group and the following proton rearrangement. In route C, Sas16 firstly catalyze the formation
of an imine intermediates, followed by an tautomerization reaction which finally result in the
formation of dehydrotyrosine. In Route D, the dehydrogenation reaction first generate an
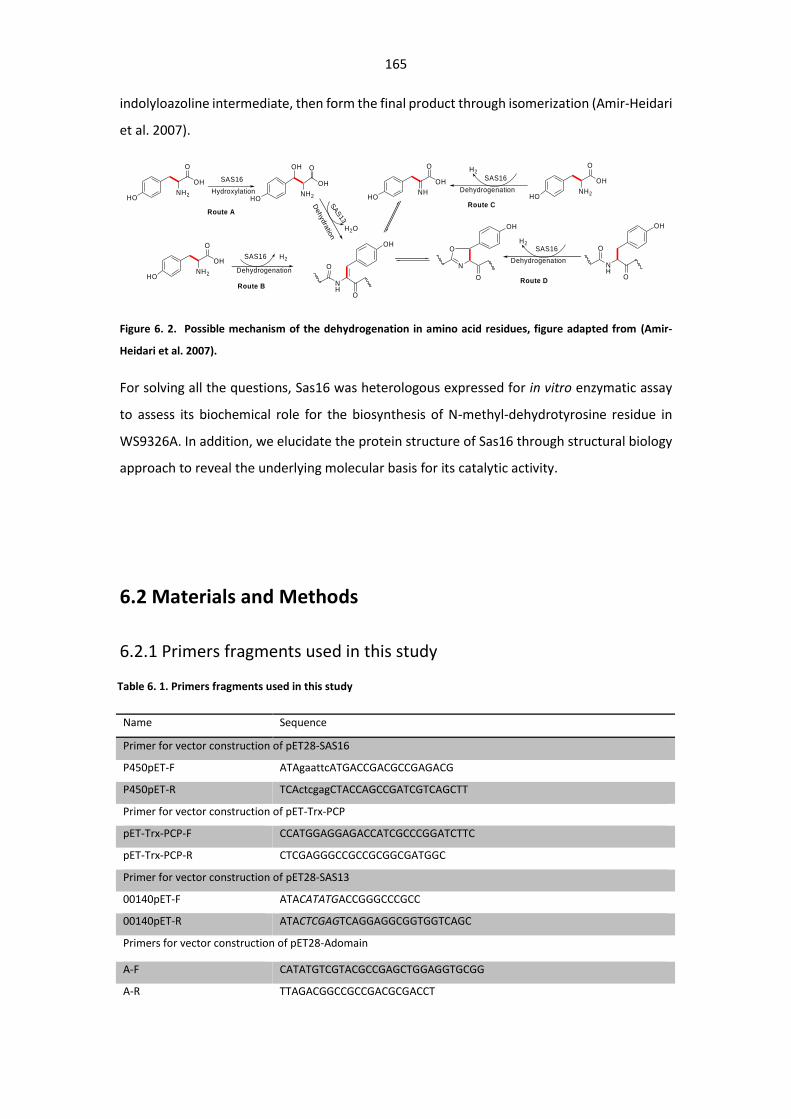
165
indolyloazoline intermediate, then form the final product through isomerization (Amir-Heidari
et al. 2007).
Figure 6. 2. Possible mechanism of the dehydrogenation in amino acid residues, figure adapted from (Amir-
Heidari et al. 2007).
For solving all the questions, Sas16 was heterologous expressed for in vitro enzymatic assay
to assess its biochemical role for the biosynthesis of N-methyl-dehydrotyrosine residue in
WS9326A. In addition, we elucidate the protein structure of Sas16 through structural biology
approach to reveal the underlying molecular basis for its catalytic activity.
6.2 Materials and Methods
6.2.1 Primers fragments used in this study
NH2
O
OH
HO
NH2
O
OH
NH
O
OH
HOHO
H2
NH2
O
OH
NH2
O
OH
HO HO
OH
SAS16
SAS
13
H2
H2O
NH
O
O
OH
N
O
O
OH
NH
O
O
OH
Route A
Route B
Route C
Route D
SAS16
SAS16
Hydroxylation
Dehydrogenation
Dehydrogenation
Dehydra
tion
H2SAS16
Dehydrogenation
Table 6. 1. Primers fragments used in this study
Name Sequence
Primer for vector construction of pET28-SAS16
P450pET-F ATAgaattcATGACCGACGCCGAGACG
P450pET-R TCActcgagCTACCAGCCGATCGTCAGCTT
Primer for vector construction of pET-Trx-PCP
pET-Trx-PCP-F CCATGGAGGAGACCATCGCCCGGATCTTC
pET-Trx-PCP-R CTCGAGGGCCGCCGCGGCGATGGC
Primer for vector construction of pET28-SAS13
00140pET-F ATACATATGACCGGGCCCGCC
00140pET-R ATACTCGAGTCAGGAGGCGGTGGTCAGC
Primers for vector construction of pET28-Adomain
A-F CATATGTCGTACGCCGAGCTGGAGGTGCGG
A-R TTAGACGGCCGCCGACGCGACCT
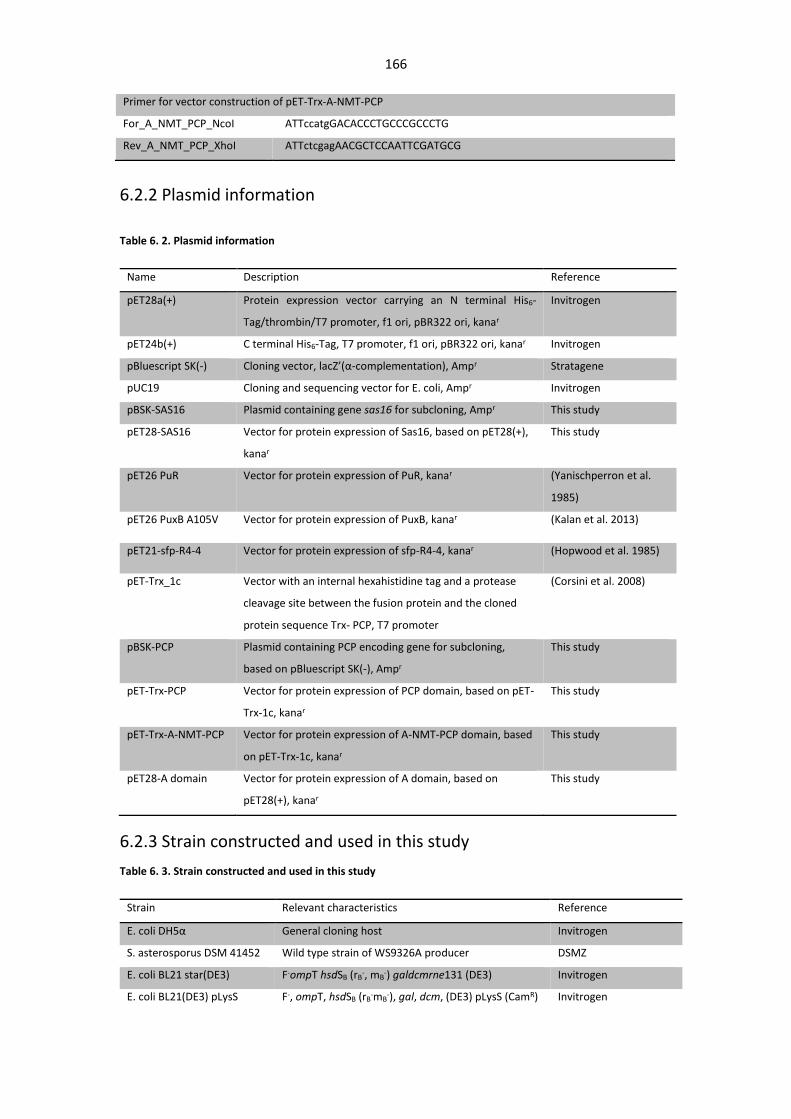
166
6.2.2 Plasmid information
6.2.3 Strain constructed and used in this study
Table 6. 3. Strain constructed and used in this study
Primer for vector construction of pET-Trx-A-NMT-PCP
For_A_NMT_PCP_NcoI ATTccatgGACACCCTGCCCGCCCTG
Rev_A_NMT_PCP_XhoI ATTctcgagAACGCTCCAATTCGATGCG
Table 6. 2. Plasmid information
Name Description Reference
pET28a(+) Protein expression vector carrying an N terminal His6-
Tag/thrombin/T7 promoter, f1 ori, pBR322 ori, kanar
Invitrogen
pET24b(+) C terminal His6-Tag, T7 promoter, f1 ori, pBR322 ori, kanar Invitrogen
pBluescript SK(-) Cloning vector, lacZ’(α-complementation), Ampr Stratagene
pUC19 Cloning and sequencing vector for E. coli, Ampr Invitrogen
pBSK-SAS16 Plasmid containing gene sas16 for subcloning, Ampr This study
pET28-SAS16 Vector for protein expression of Sas16, based on pET28(+),
kanar
This study
pET26 PuR Vector for protein expression of PuR, kanar (Yanischperron et al.
1985)
pET26 PuxB A105V Vector for protein expression of PuxB, kanar (Kalan et al. 2013)
pET21-sfp-R4-4 Vector for protein expression of sfp-R4-4, kanar (Hopwood et al. 1985)
pET-Trx_1c Vector with an internal hexahistidine tag and a protease
cleavage site between the fusion protein and the cloned
protein sequence Trx- PCP, T7 promoter
(Corsini et al. 2008)
pBSK-PCP Plasmid containing PCP encoding gene for subcloning,
based on pBluescript SK(-), Ampr
This study
pET-Trx-PCP Vector for protein expression of PCP domain, based on pET-
Trx-1c, kanar
This study
pET-Trx-A-NMT-PCP Vector for protein expression of A-NMT-PCP domain, based
on pET-Trx-1c, kanar
This study
pET28-A domain Vector for protein expression of A domain, based on
pET28(+), kanar
This study
Strain Relevant characteristics Reference
E. coli DH5α General cloning host Invitrogen
S. asterosporus DSM 41452 Wild type strain of WS9326A producer DSMZ
E. coli BL21 star(DE3) F-ompT hsdSB (rB-, mB
-) galdcmrne131 (DE3) Invitrogen
E. coli BL21(DE3) pLysS F-, ompT, hsdSB (rB-mB
-), gal, dcm, (DE3) pLysS (CamR) Invitrogen
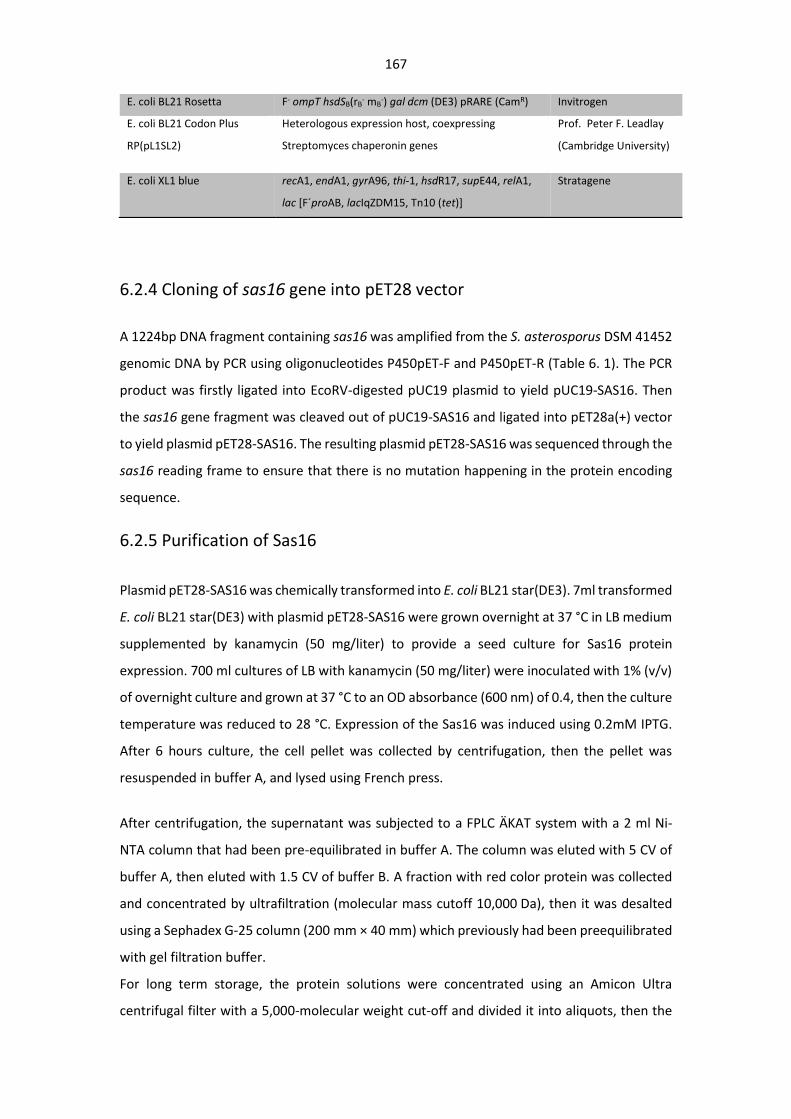
167
6.2.4 Cloning of sas16 gene into pET28 vector
A 1224bp DNA fragment containing sas16 was amplified from the S. asterosporus DSM 41452
genomic DNA by PCR using oligonucleotides P450pET-F and P450pET-R (Table 6. 1). The PCR
product was firstly ligated into EcoRV-digested pUC19 plasmid to yield pUC19-SAS16. Then
the sas16 gene fragment was cleaved out of pUC19-SAS16 and ligated into pET28a(+) vector
to yield plasmid pET28-SAS16. The resulting plasmid pET28-SAS16 was sequenced through the
sas16 reading frame to ensure that there is no mutation happening in the protein encoding
sequence.
6.2.5 Purification of Sas16
Plasmid pET28-SAS16 was chemically transformed into E. coli BL21 star(DE3). 7ml transformed
E. coli BL21 star(DE3) with plasmid pET28-SAS16 were grown overnight at 37 °C in LB medium
supplemented by kanamycin (50 mg/liter) to provide a seed culture for Sas16 protein
expression. 700 ml cultures of LB with kanamycin (50 mg/liter) were inoculated with 1% (v/v)
of overnight culture and grown at 37 °C to an OD absorbance (600 nm) of 0.4, then the culture
temperature was reduced to 28 °C. Expression of the Sas16 was induced using 0.2mM IPTG.
After 6 hours culture, the cell pellet was collected by centrifugation, then the pellet was
resuspended in buffer A, and lysed using French press.
After centrifugation, the supernatant was subjected to a FPLC ÄKAT system with a 2 ml Ni-
NTA column that had been pre-equilibrated in buffer A. The column was eluted with 5 CV of
buffer A, then eluted with 1.5 CV of buffer B. A fraction with red color protein was collected
and concentrated by ultrafiltration (molecular mass cutoff 10,000 Da), then it was desalted
using a Sephadex G-25 column (200 mm × 40 mm) which previously had been preequilibrated
with gel filtration buffer.
For long term storage, the protein solutions were concentrated using an Amicon Ultra
centrifugal filter with a 5,000-molecular weight cut-off and divided it into aliquots, then the
E. coli BL21 Rosetta F- ompT hsdSB(rB- mB
-) gal dcm (DE3) pRARE (CamR) Invitrogen
E. coli BL21 Codon Plus
RP(pL1SL2)
Heterologous expression host, coexpressing
Streptomyces chaperonin genes
Prof. Peter F. Leadlay
(Cambridge University)
E. coli XL1 blue recA1, endA1, gyrA96, thi-1, hsdR17, supE44, relA1,
lac [F´proAB, lacIqZDM15, Tn10 (tet)]
Stratagene
168
buffer was exchanged to buffer A with 15% glycerol, then flash frozen in liquid nitrogen before
being stored at −80 °C.
6.2.6 CO difference spectrum of Sas16
Two anaerobic cuvettes were firstly filled with buffer A, the baseline of buffer absorption was
recorded with a dual-beam spectrophotometer from 400 to 600 nm. Then the sample cuvette
was replaced with Sas16 protein solution in the same buffer, after that the cuvette was
degassed and the gas phase was replaced with oxygen-free CO.
Then an amount (a few microliters) of sodium dithionite (Na2S2O4) solution was injected into
the protein solution to reduce the hemoprotein, and spectra were recorded every 2 mins until
the hemoprotein was totally reduced.
6.2.7 Substrate binding study
The substrate solution of the tyrosine, cyclic WS9326B, and the linear WS9326K and WS9326L
(chemically synthesized by solid phase peptide synthesis, GL Biochem(Shanghai) Ltd) were
prepared with concentration 1mM in stocking buffer (20 mM Tris HCl and 500 mM NaCl).
The homogeneous protein Sas16 with concentration 65mg/mL was stocked in buffer A. Then
aliquots (500uL) of diluted Sas16 enzyme were divided into reference and sample cuvette,
after thermal equilibration at 30 ˚C, the baseline was recorded between 600 and 350mm
followed by sequential additions (25ul) of concentrated substrate solution. The possible
substrates were individually titrated into the Sas16 protein solution, and mix gently. The
corresponding absorbance spectrum were recorded using UV-visible spectrophotometer
under Shortwave NIR wavelengths from 200 to 1100 nm (USB-ISS-UV-VIS-2, Ocean Optics).
6.2.8 Crystallization and Data Collection
Protein crystallization and structural determination were performed in the lab of Prof. Dr.
Oliver Einsle at the institute of biochemistry in Freiburg University. The concentrated Sas16
protein (10 mg/ml) after size exclusion chromatography (Superdex S200 26/60) in buffer (20
mM Tris pH8.0, 150 mM NaCl) was used for setting up initial screens by using sitting drop
vapor-diffusion method at 20℃. Initial crystallization experiments were established by using
an automatic crystallization drop-set system (Oryx Nano, Douglas Instrument), drops of 0.6 ul
in total with different protein to reservoir ratios (33%, 50%, 67%) were set and equilibrated
again with reservoir solutions (50 ul).
Reddish rod-like crystals initial appeared after two weeks cultivation in the buffer with 25%
polyethylene glycol (PEG) 3350, 0.2 M magnesium chloride and 0.1 M HEPES pH 7.5. Then
169
these crystals were crushed for seeding experiment by using Oryx Nano. Large diamond shape
single crystals were obtained in condition with 4% polyethylene glycol 6000, 4% polyethylene
glycol 8000, 4% polyethylene glycol 10000, 0.1 M potassium thiocyanate, 0.1 M sodium
bromide and 0.1 M MES pH 6.5.
Crystals were mounted on cryoloops and flash frozen in liquid nitrogen prior to data collection.
Multiple datasets to 2.0 Å was collected at beamline X06DA at Swiss Light Source (Villigen,
Switzerland) with the PILATUS pixel detector (Dectris). The data was processed by using
iMosflm (Battye et al. 2011) and XDS package (Kabsch 2010), the crystal was assigned to the
space group P42212 with unit cell dimensions a=b=112.8 Å and C=146.2 Å. The asymmetric
unit contains two subunits, with a solvent content of 52.45%.
6.2.9 Structure Determination and Refinement
Crystal structure of Sas16 was determined by single-wavelength anomalous dispersion (SAD)
with AutoSol and AutoBuild in PHENIX suite (Adams, Afonine et al. 2010) using dataset
collected at the Fe X-ray absorption edge (K-edge, 7172 eV). Then the low resolution model
after AutoBuild was used for molecular replacement in MOLREP (Vagin and Teplyakov 2010)
of the higher resolution dataset. Refinement of the initial electron density was carried out
using cycles of the program REFMAC5 (Murshudov, Skubak et al. 2011) in the CCP4 Suite (Winn
et al. 2011), and model building was performed in COOT (Emsley and Cowtan 2004). The final
structure was refined to Rcryst=20% and Rfree=24% at resolution of 2.0 Å. The quality of the
structure was validated by MOLPROBITY (Chen et al. 2010). Data collection and refinement
statistics are shown in Table 6. 4.
6.2.10 Malachite Green Phosphatase Assay of A domain
In a non-ribosomal peptide biosynthesis machinery, with a specific amino acid is activated
and incorporated into the NRPS assembly by acetyltransferase (A) domain, while one
pyrophosphate (PPi) is released along with the ATP energy consumption. In the method of
Malachite Green Phosphatase Assay, the released PPi are converted by the pyrophosphatase
to orthophosphate (Pi), which binds with the Malachite Green reagent can form a chemical
complex with green color, and this reaction can be monitored with the colorimetric method
(Figure 6. 28)(McQuade et al. 2009).
The Malachite Green Phosphatase Assay was performed according to the protocol provided
by the kit manufacturer (Echelon Biosciences Inc. Salt Lake City, USA) and the dissertation of
Anja Greule. Firstly, a standard curve of Pi was created with several dilutions in ddH2O from a
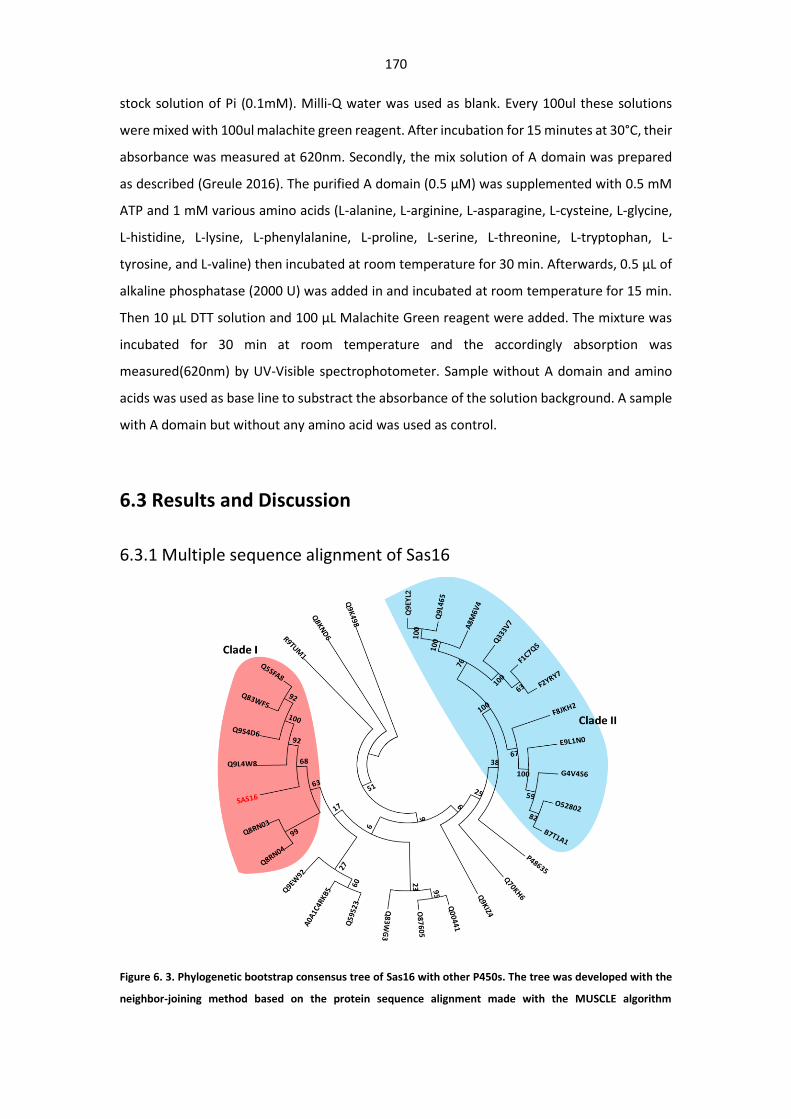
170
stock solution of Pi (0.1mM). Milli-Q water was used as blank. Every 100ul these solutions
were mixed with 100ul malachite green reagent. After incubation for 15 minutes at 30°C, their
absorbance was measured at 620nm. Secondly, the mix solution of A domain was prepared
as described (Greule 2016). The purified A domain (0.5 μM) was supplemented with 0.5 mM
ATP and 1 mM various amino acids (L-alanine, L-arginine, L-asparagine, L-cysteine, L-glycine,
L-histidine, L-lysine, L-phenylalanine, L-proline, L-serine, L-threonine, L-tryptophan, L-
tyrosine, and L-valine) then incubated at room temperature for 30 min. Afterwards, 0.5 μL of
alkaline phosphatase (2000 U) was added in and incubated at room temperature for 15 min.
Then 10 μL DTT solution and 100 μL Malachite Green reagent were added. The mixture was
incubated for 30 min at room temperature and the accordingly absorption was
measured(620nm) by UV-Visible spectrophotometer. Sample without A domain and amino
acids was used as base line to substract the absorbance of the solution background. A sample
with A domain but without any amino acid was used as control.
6.3 Results and Discussion
6.3.1 Multiple sequence alignment of Sas16
Figure 6. 3. Phylogenetic bootstrap consensus tree of Sas16 with other P450s. The tree was developed with the
neighbor-joining method based on the protein sequence alignment made with the MUSCLE algorithm
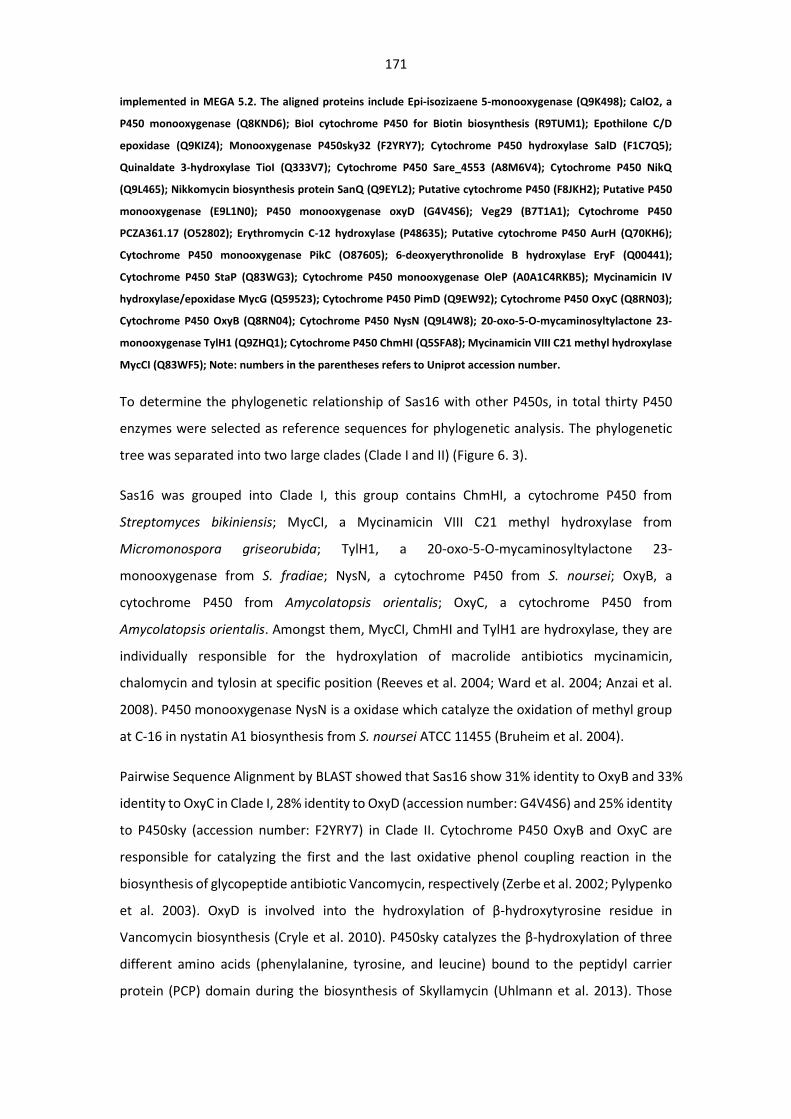
171
implemented in MEGA 5.2. The aligned proteins include Epi-isozizaene 5-monooxygenase (Q9K498); CalO2, a
P450 monooxygenase (Q8KND6); BioI cytochrome P450 for Biotin biosynthesis (R9TUM1); Epothilone C/D
epoxidase (Q9KIZ4); Monooxygenase P450sky32 (F2YRY7); Cytochrome P450 hydroxylase SalD (F1C7Q5);
Quinaldate 3-hydroxylase TioI (Q333V7); Cytochrome P450 Sare_4553 (A8M6V4); Cytochrome P450 NikQ
(Q9L465); Nikkomycin biosynthesis protein SanQ (Q9EYL2); Putative cytochrome P450 (F8JKH2); Putative P450
monooxygenase (E9L1N0); P450 monooxygenase oxyD (G4V4S6); Veg29 (B7T1A1); Cytochrome P450
PCZA361.17 (O52802); Erythromycin C-12 hydroxylase (P48635); Putative cytochrome P450 AurH (Q70KH6);
Cytochrome P450 monooxygenase PikC (O87605); 6-deoxyerythronolide B hydroxylase EryF (Q00441);
Cytochrome P450 StaP (Q83WG3); Cytochrome P450 monooxygenase OleP (A0A1C4RKB5); Mycinamicin IV
hydroxylase/epoxidase MycG (Q59523); Cytochrome P450 PimD (Q9EW92); Cytochrome P450 OxyC (Q8RN03);
Cytochrome P450 OxyB (Q8RN04); Cytochrome P450 NysN (Q9L4W8); 20-oxo-5-O-mycaminosyltylactone 23-
monooxygenase TylH1 (Q9ZHQ1); Cytochrome P450 ChmHI (Q5SFA8); Mycinamicin VIII C21 methyl hydroxylase
MycCI (Q83WF5); Note: numbers in the parentheses refers to Uniprot accession number.
To determine the phylogenetic relationship of Sas16 with other P450s, in total thirty P450
enzymes were selected as reference sequences for phylogenetic analysis. The phylogenetic
tree was separated into two large clades (Clade I and II) (Figure 6. 3).
Sas16 was grouped into Clade I, this group contains ChmHI, a cytochrome P450 from
Streptomyces bikiniensis; MycCI, a Mycinamicin VIII C21 methyl hydroxylase from
Micromonospora griseorubida; TylH1, a 20-oxo-5-O-mycaminosyltylactone 23-
monooxygenase from S. fradiae; NysN, a cytochrome P450 from S. noursei; OxyB, a
cytochrome P450 from Amycolatopsis orientalis; OxyC, a cytochrome P450 from
Amycolatopsis orientalis. Amongst them, MycCI, ChmHI and TylH1 are hydroxylase, they are
individually responsible for the hydroxylation of macrolide antibiotics mycinamicin,
chalomycin and tylosin at specific position (Reeves et al. 2004; Ward et al. 2004; Anzai et al.
2008). P450 monooxygenase NysN is a oxidase which catalyze the oxidation of methyl group
at C-16 in nystatin A1 biosynthesis from S. noursei ATCC 11455 (Bruheim et al. 2004).
Pairwise Sequence Alignment by BLAST showed that Sas16 show 31% identity to OxyB and 33%
identity to OxyC in Clade I, 28% identity to OxyD (accession number: G4V4S6) and 25% identity
to P450sky (accession number: F2YRY7) in Clade II. Cytochrome P450 OxyB and OxyC are
responsible for catalyzing the first and the last oxidative phenol coupling reaction in the
biosynthesis of glycopeptide antibiotic Vancomycin, respectively (Zerbe et al. 2002; Pylypenko
et al. 2003). OxyD is involved into the hydroxylation of β-hydroxytyrosine residue in
Vancomycin biosynthesis (Cryle et al. 2010). P450sky catalyzes the β-hydroxylation of three
different amino acids (phenylalanine, tyrosine, and leucine) bound to the peptidyl carrier
protein (PCP) domain during the biosynthesis of Skyllamycin (Uhlmann et al. 2013). Those
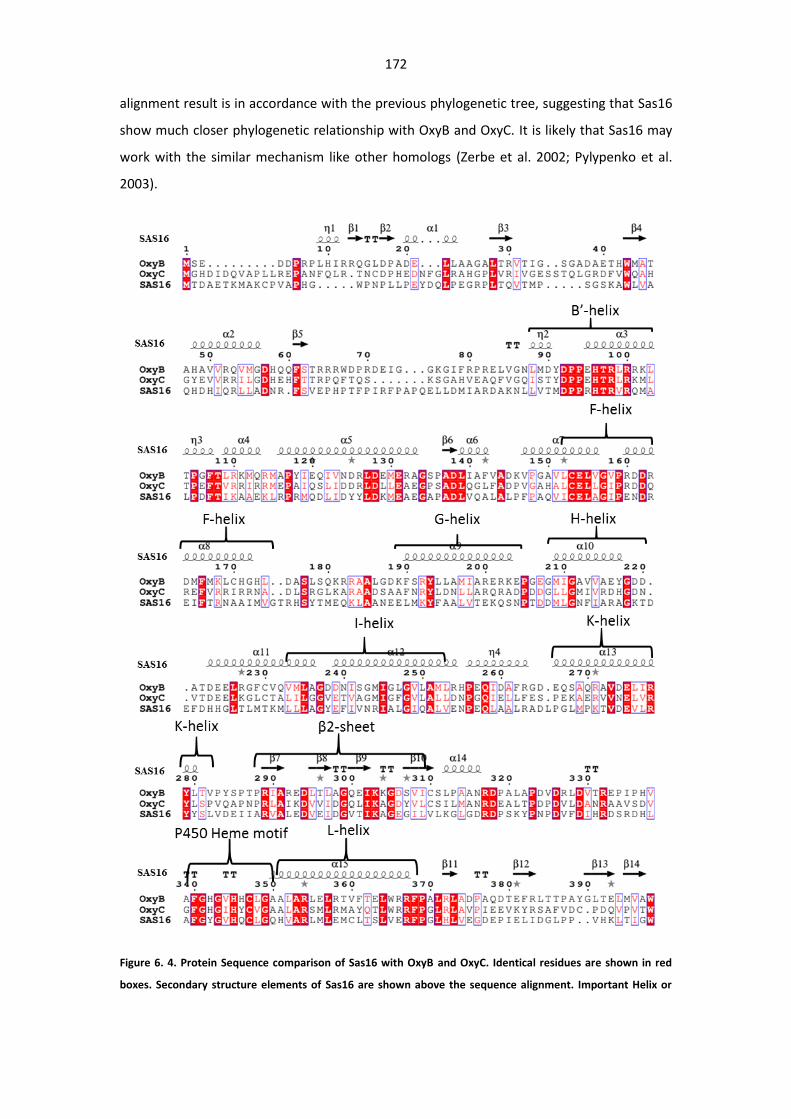
172
alignment result is in accordance with the previous phylogenetic tree, suggesting that Sas16
show much closer phylogenetic relationship with OxyB and OxyC. It is likely that Sas16 may
work with the similar mechanism like other homologs (Zerbe et al. 2002; Pylypenko et al.
2003).
Figure 6. 4. Protein Sequence comparison of Sas16 with OxyB and OxyC. Identical residues are shown in red
boxes. Secondary structure elements of Sas16 are shown above the sequence alignment. Important Helix or
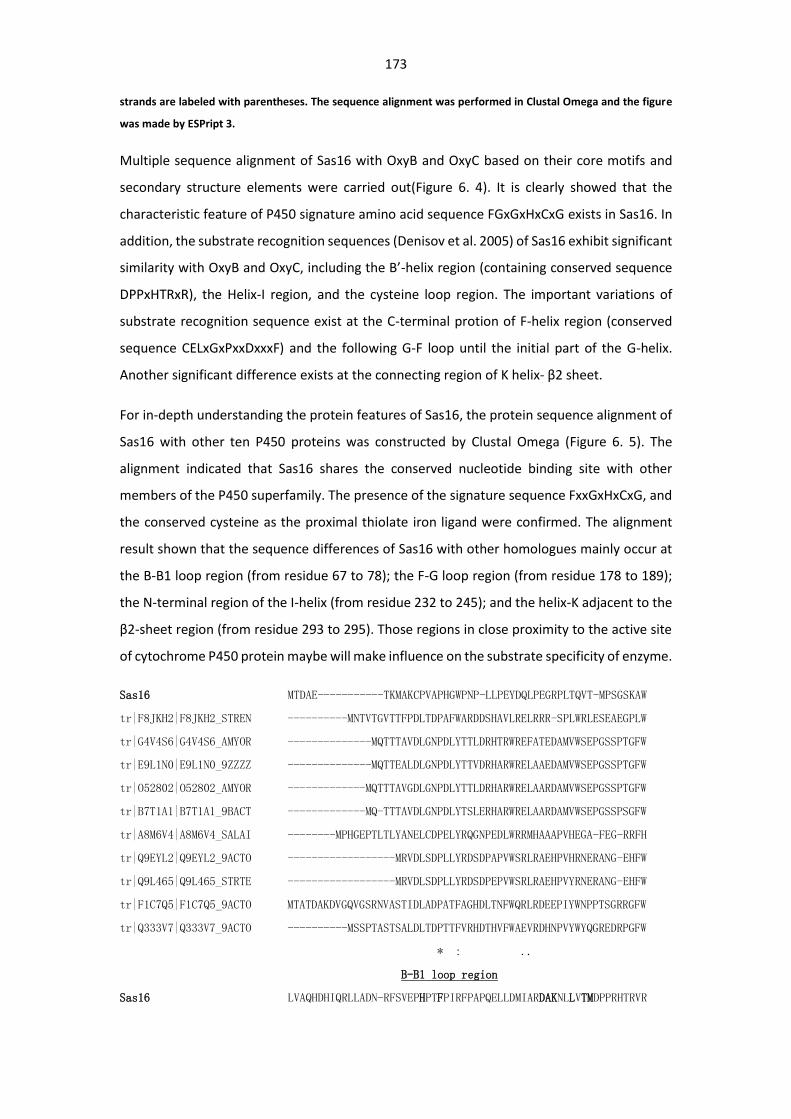
173
strands are labeled with parentheses. The sequence alignment was performed in Clustal Omega and the figure
was made by ESPript 3.
Multiple sequence alignment of Sas16 with OxyB and OxyC based on their core motifs and
secondary structure elements were carried out(Figure 6. 4). It is clearly showed that the
characteristic feature of P450 signature amino acid sequence FGxGxHxCxG exists in Sas16. In
addition, the substrate recognition sequences (Denisov et al. 2005) of Sas16 exhibit significant
similarity with OxyB and OxyC, including the B’-helix region (containing conserved sequence
DPPxHTRxR), the Helix-I region, and the cysteine loop region. The important variations of
substrate recognition sequence exist at the C-terminal protion of F-helix region (conserved
sequence CELxGxPxxDxxxF) and the following G-F loop until the initial part of the G-helix.
Another significant difference exists at the connecting region of K helix- β2 sheet.
For in-depth understanding the protein features of Sas16, the protein sequence alignment of
Sas16 with other ten P450 proteins was constructed by Clustal Omega (Figure 6. 5). The
alignment indicated that Sas16 shares the conserved nucleotide binding site with other
members of the P450 superfamily. The presence of the signature sequence FxxGxHxCxG, and
the conserved cysteine as the proximal thiolate iron ligand were confirmed. The alignment
result shown that the sequence differences of Sas16 with other homologues mainly occur at
the B-B1 loop region (from residue 67 to 78); the F-G loop region (from residue 178 to 189);
the N-terminal region of the I-helix (from residue 232 to 245); and the helix-K adjacent to the
β2-sheet region (from residue 293 to 295). Those regions in close proximity to the active site
of cytochrome P450 protein maybe will make influence on the substrate specificity of enzyme.
Sas16 MTDAE-----------TKMAKCPVAPHGWPNP-LLPEYDQLPEGRPLTQVT-MPSGSKAW
tr|F8JKH2|F8JKH2_STREN ----------MNTVTGVTTFPDLTDPAFWARDDSHAVLRELRRR-SPLWRLESEAEGPLW
tr|G4V4S6|G4V4S6_AMYOR --------------MQTTTAVDLGNPDLYTTLDRHTRWREFATEDAMVWSEPGSSPTGFW
tr|E9L1N0|E9L1N0_9ZZZZ --------------MQTTEALDLGNPDLYTTVDRHARWRELAAEDAMVWSEPGSSPTGFW
tr|O52802|O52802_AMYOR -------------MQTTTAVGDLGNPDLYTTLDRHARWRELAARDAMVWSEPGSSPTGFW
tr|B7T1A1|B7T1A1_9BACT -------------MQ-TTTAVDLGNPDLYTSLERHARWRELAARDAMVWSEPGSSPSGFW
tr|A8M6V4|A8M6V4_SALAI --------MPHGEPTLTLYANELCDPELYRQGNPEDLWRRMHAAAPVHEGA-FEG-RRFH
tr|Q9EYL2|Q9EYL2_9ACTO ------------------MRVDLSDPLLYRDSDPAPVWSRLRAEHPVHRNERANG-EHFW
tr|Q9L465|Q9L465_STRTE ------------------MRVDLSDPLLYRDSDPEPVWSRLRAEHPVYRNERANG-EHFW
tr|F1C7Q5|F1C7Q5_9ACTO MTATDAKDVGQVGSRNVASTIDLADPATFAGHDLTNFWQRLRDEEPIYWNPPTSGRRGFW
tr|Q333V7|Q333V7_9ACTO ----------MSSPTASTSALDLTDPTTFVRHDTHVFWAEVRDHNPVYWYQGREDRPGFW
* : ..
B-B1 loop region
Sas16 LVAQHDHIQRLLADN-RFSVEPHPTFPIRFPAPQELLDMIARDAKNLLVTMDPPRHTRVR
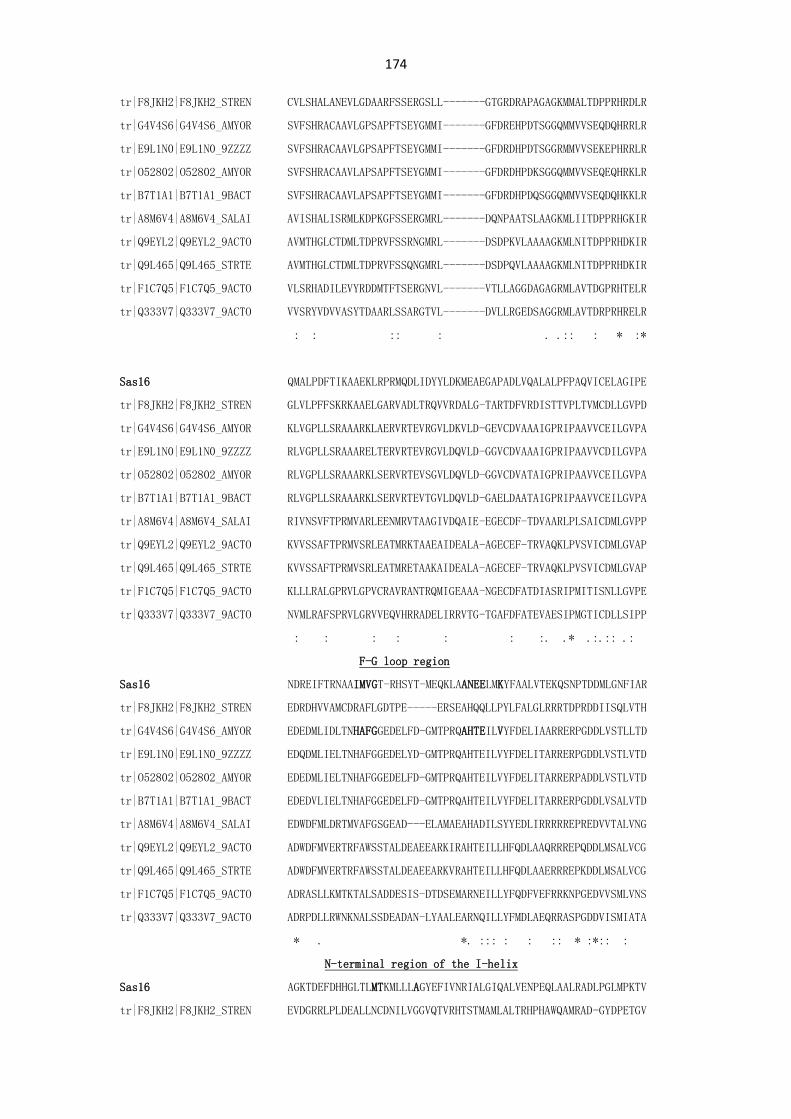
174
tr|F8JKH2|F8JKH2_STREN CVLSHALANEVLGDAARFSSERGSLL-------GTGRDRAPAGAGKMMALTDPPRHRDLR
tr|G4V4S6|G4V4S6_AMYOR SVFSHRACAAVLGPSAPFTSEYGMMI-------GFDREHPDTSGGQMMVVSEQDQHRRLR
tr|E9L1N0|E9L1N0_9ZZZZ SVFSHRACAAVLGPSAPFTSEYGMMI-------GFDRDHPDTSGGRMMVVSEKEPHRRLR
tr|O52802|O52802_AMYOR SVFSHRACAAVLAPSAPFTSEYGMMI-------GFDRDHPDKSGGQMMVVSEQEQHRKLR
tr|B7T1A1|B7T1A1_9BACT SVFSHRACAAVLAPSAPFTSEYGMMI-------GFDRDHPDQSGGQMMVVSEQDQHKKLR
tr|A8M6V4|A8M6V4_SALAI AVISHALISRMLKDPKGFSSERGMRL-------DQNPAATSLAAGKMLIITDPPRHGKIR
tr|Q9EYL2|Q9EYL2_9ACTO AVMTHGLCTDMLTDPRVFSSRNGMRL-------DSDPKVLAAAAGKMLNITDPPRHDKIR
tr|Q9L465|Q9L465_STRTE AVMTHGLCTDMLTDPRVFSSQNGMRL-------DSDPQVLAAAAGKMLNITDPPRHDKIR
tr|F1C7Q5|F1C7Q5_9ACTO VLSRHADILEVYRDDMTFTSERGNVL-------VTLLAGGDAGAGRMLAVTDGPRHTELR
tr|Q333V7|Q333V7_9ACTO VVSRYVDVVASYTDAARLSSARGTVL-------DVLLRGEDSAGGRMLAVTDRPRHRELR
: : :: : . .:: : * :*
Sas16 QMALPDFTIKAAEKLRPRMQDLIDYYLDKMEAEGAPADLVQALALPFPAQVICELAGIPE
tr|F8JKH2|F8JKH2_STREN GLVLPFFSKRKAAELGARVADLTRQVVRDALG-TARTDFVRDISTTVPLTVMCDLLGVPD
tr|G4V4S6|G4V4S6_AMYOR KLVGPLLSRAAARKLAERVRTEVRGVLDKVLD-GEVCDVAAAIGPRIPAAVVCEILGVPA
tr|E9L1N0|E9L1N0_9ZZZZ RLVGPLLSRAAARELTERVRTEVRGVLDQVLD-GGVCDVAAAIGPRIPAAVVCDILGVPA
tr|O52802|O52802_AMYOR RLVGPLLSRAAARKLSERVRTEVSGVLDQVLD-GGVCDVATAIGPRIPAAVVCEILGVPA
tr|B7T1A1|B7T1A1_9BACT RLVGPLLSRAAARKLSERVRTEVTGVLDQVLD-GAELDAATAIGPRIPAAVVCEILGVPA
tr|A8M6V4|A8M6V4_SALAI RIVNSVFTPRMVARLEENMRVTAAGIVDQAIE-EGECDF-TDVAARLPLSAICDMLGVPP
tr|Q9EYL2|Q9EYL2_9ACTO KVVSSAFTPRMVSRLEATMRKTAAEAIDEALA-AGECEF-TRVAQKLPVSVICDMLGVAP
tr|Q9L465|Q9L465_STRTE KVVSSAFTPRMVSRLEATMRETAAKAIDEALA-AGECEF-TRVAQKLPVSVICDMLGVAP
tr|F1C7Q5|F1C7Q5_9ACTO KLLLRALGPRVLGPVCRAVRANTRQMIGEAAA-NGECDFATDIASRIPMITISNLLGVPE
tr|Q333V7|Q333V7_9ACTO NVMLRAFSPRVLGRVVEQVHRRADELIRRVTG-TGAFDFATEVAESIPMGTICDLLSIPP
: : : : : : :. .* .:.:: .:
F-G loop region
Sas16 NDREIFTRNAAIMVGT-RHSYT-MEQKLAANEELMKYFAALVTEKQSNPTDDMLGNFIAR
tr|F8JKH2|F8JKH2_STREN EDRDHVVAMCDRAFLGDTPE-----ERSEAHQQLLPYLFALGLRRRTDPRDDIISQLVTH
tr|G4V4S6|G4V4S6_AMYOR EDEDMLIDLTNHAFGGEDELFD-GMTPRQAHTEILVYFDELIAARRERPGDDLVSTLLTD
tr|E9L1N0|E9L1N0_9ZZZZ EDQDMLIELTNHAFGGEDELYD-GMTPRQAHTEILVYFDELITARRERPGDDLVSTLVTD
tr|O52802|O52802_AMYOR EDEDMLIELTNHAFGGEDELFD-GMTPRQAHTEILVYFDELITARRERPADDLVSTLVTD
tr|B7T1A1|B7T1A1_9BACT EDEDVLIELTNHAFGGEDELFD-GMTPRQAHTEILVYFDELITARRERPGDDLVSALVTD
tr|A8M6V4|A8M6V4_SALAI EDWDFMLDRTMVAFGSGEAD---ELAMAEAHADILSYYEDLIRRRRREPREDVVTALVNG
tr|Q9EYL2|Q9EYL2_9ACTO ADWDFMVERTRFAWSSTALDEAEEARKIRAHTEILLHFQDLAAQRRREPQDDLMSALVCG
tr|Q9L465|Q9L465_STRTE ADWDFMVERTRFAWSSTALDEAEEARKVRAHTEILLHFQDLAAERRREPKDDLMSALVCG
tr|F1C7Q5|F1C7Q5_9ACTO ADRASLLKMTKTALSADDESIS-DTDSEMARNEILLYFQDFVEFRRKNPGEDVVSMLVNS
tr|Q333V7|Q333V7_9ACTO ADRPDLLRWNKNALSSDEADAN-LYAALEARNQILLYFMDLAEQRRASPGDDVISMIATA
* . *. ::: : : :: * :*:: :
N-terminal region of the I-helix
Sas16 AGKTDEFDHHGLTLMTKMLLLAGYEFIVNRIALGIQALVENPEQLAALRADLPGLMPKTV
tr|F8JKH2|F8JKH2_STREN EVDGRRLPLDEALLNCDNILVGGVQTVRHTSTMAMLALTRHPHAWQAMRAD-GYDPETGV
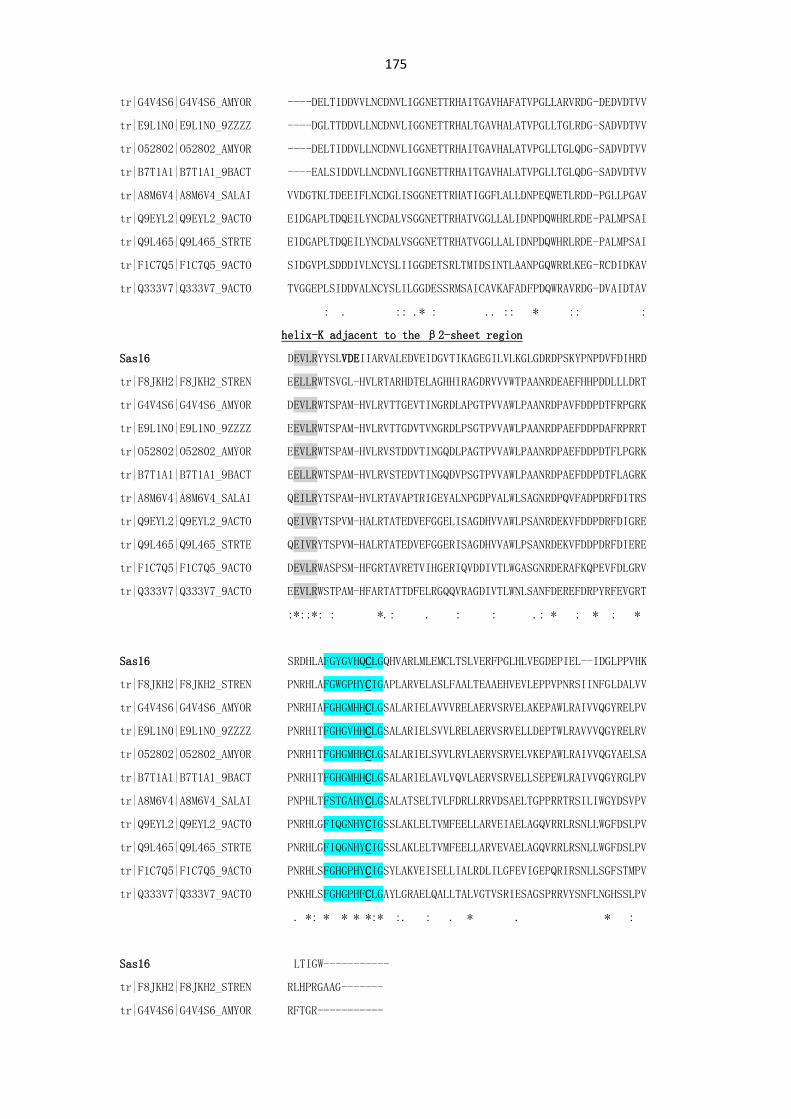
175
tr|G4V4S6|G4V4S6_AMYOR ----DELTIDDVVLNCDNVLIGGNETTRHAITGAVHAFATVPGLLARVRDG-DEDVDTVV
tr|E9L1N0|E9L1N0_9ZZZZ ----DGLTTDDVLLNCDNVLIGGNETTRHALTGAVHALATVPGLLTGLRDG-SADVDTVV
tr|O52802|O52802_AMYOR ----DELTIDDVLLNCDNVLIGGNETTRHAITGAVHALATVPGLLTGLQDG-SADVDTVV
tr|B7T1A1|B7T1A1_9BACT ----EALSIDDVLLNCDNVLIGGNETTRHAITGAVHALATVPGLLTGLQDG-SADVDTVV
tr|A8M6V4|A8M6V4_SALAI VVDGTKLTDEEIFLNCDGLISGGNETTRHATIGGFLALLDNPEQWETLRDD-PGLLPGAV
tr|Q9EYL2|Q9EYL2_9ACTO EIDGAPLTDQEILYNCDALVSGGNETTRHATVGGLLALIDNPDQWHRLRDE-PALMPSAI
tr|Q9L465|Q9L465_STRTE EIDGAPLTDQEILYNCDALVSGGNETTRHATVGGLLALIDNPDQWHRLRDE-PALMPSAI
tr|F1C7Q5|F1C7Q5_9ACTO SIDGVPLSDDDIVLNCYSLIIGGDETSRLTMIDSINTLAANPGQWRRLKEG-RCDIDKAV
tr|Q333V7|Q333V7_9ACTO TVGGEPLSIDDVALNCYSLILGGDESSRMSAICAVKAFADFPDQWRAVRDG-DVAIDTAV
: . :: .* : .. :: * :: :
helix-K adjacent to the β2-sheet region
Sas16 DEVLRYYSLVDEIIARVALEDVEIDGVTIKAGEGILVLKGLGDRDPSKYPNPDVFDIHRD
tr|F8JKH2|F8JKH2_STREN EELLRWTSVGL-HVLRTARHDTELAGHHIRAGDRVVVWTPAANRDEAEFHHPDDLLLDRT
tr|G4V4S6|G4V4S6_AMYOR DEVLRWTSPAM-HVLRVTTGEVTINGRDLAPGTPVVAWLPAANRDPAVFDDPDTFRPGRK
tr|E9L1N0|E9L1N0_9ZZZZ EEVLRWTSPAM-HVLRVTTGDVTVNGRDLPSGTPVVAWLPAANRDPAEFDDPDAFRPRRT
tr|O52802|O52802_AMYOR EEVLRWTSPAM-HVLRVSTDDVTINGQDLPAGTPVVAWLPAANRDPAEFDDPDTFLPGRK
tr|B7T1A1|B7T1A1_9BACT EELLRWTSPAM-HVLRVSTEDVTINGQDVPSGTPVVAWLPAANRDPAEFDDPDTFLAGRK
tr|A8M6V4|A8M6V4_SALAI QEILRYTSPAM-HVLRTAVAPTRIGEYALNPGDPVALWLSAGNRDPQVFADPDRFDITRS
tr|Q9EYL2|Q9EYL2_9ACTO QEIVRYTSPVM-HALRTATEDVEFGGELISAGDHVVAWLPSANRDEKVFDDPDRFDIGRE
tr|Q9L465|Q9L465_STRTE QEIVRYTSPVM-HALRTATEDVEFGGERISAGDHVVAWLPSANRDEKVFDDPDRFDIERE
tr|F1C7Q5|F1C7Q5_9ACTO DEVLRWASPSM-HFGRTAVRETVIHGERIQVDDIVTLWGASGNRDERAFKQPEVFDLGRV
tr|Q333V7|Q333V7_9ACTO EEVLRWSTPAM-HFARTATTDFELRGQQVRAGDIVTLWNLSANFDEREFDRPYRFEVGRT
:*::*: : *.: . : : .: * : * : *
Sas16 SRDHLAFGYGVHQCLGQHVARLMLEMCLTSLVERFPGLHLVEGDEPIEL--IDGLPPVHK
tr|F8JKH2|F8JKH2_STREN PNRHLAFGWGPHYCIGAPLARVELASLFAALTEAAEHVEVLEPPVPNRSIINFGLDALVV
tr|G4V4S6|G4V4S6_AMYOR PNRHIAFGHGMHHCLGSALARIELAVVVRELAERVSRVELAKEPAWLRAIVVQGYRELPV
tr|E9L1N0|E9L1N0_9ZZZZ PNRHITFGHGVHHCLGSALARIELSVVLRELAERVSRVELLDEPTWLRAVVVQGYRELRV
tr|O52802|O52802_AMYOR PNRHITFGHGMHHCLGSALARIELSVVLRVLAERVSRVELVKEPAWLRAIVVQGYAELSA
tr|B7T1A1|B7T1A1_9BACT PNRHITFGHGMHHCLGSALARIELAVLVQVLAERVSRVELLSEPEWLRAIVVQGYRGLPV
tr|A8M6V4|A8M6V4_SALAI PNPHLTFSTGAHYCLGSALATSELTVLFDRLLRRVDSAELTGPPRRTRSILIWGYDSVPV
tr|Q9EYL2|Q9EYL2_9ACTO PNRHLGFIQGNHYCIGSSLAKLELTVMFEELLARVEIAELAGQVRRLRSNLLWGFDSLPV
tr|Q9L465|Q9L465_STRTE PNRHLGFIQGNHYCIGSSLAKLELTVMFEELLARVEVAELAGQVRRLRSNLLWGFDSLPV
tr|F1C7Q5|F1C7Q5_9ACTO PNRHLSFGHGPHYCIGSYLAKVEISELLIALRDLILGFEVIGEPQRIRSNLLSGFSTMPV
tr|Q333V7|Q333V7_9ACTO PNKHLSFGHGPHFCLGAYLGRAELQALLTALVGTVSRIESAGSPRRVYSNFLNGHSSLPV
. *: * * * *:* :. : . * . * :
Sas16 LTIGW-----------
tr|F8JKH2|F8JKH2_STREN RLHPRGAAG-------
tr|G4V4S6|G4V4S6_AMYOR RFTGR-----------
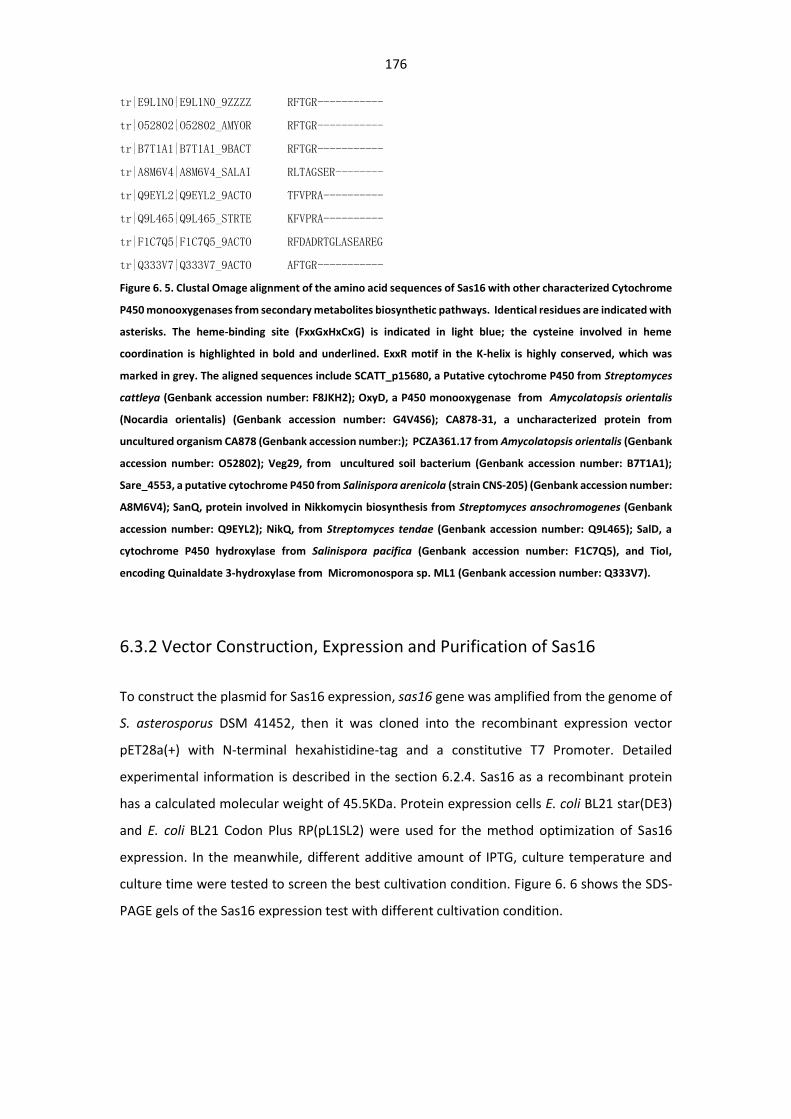
176
tr|E9L1N0|E9L1N0_9ZZZZ RFTGR-----------
tr|O52802|O52802_AMYOR RFTGR-----------
tr|B7T1A1|B7T1A1_9BACT RFTGR-----------
tr|A8M6V4|A8M6V4_SALAI RLTAGSER--------
tr|Q9EYL2|Q9EYL2_9ACTO TFVPRA----------
tr|Q9L465|Q9L465_STRTE KFVPRA----------
tr|F1C7Q5|F1C7Q5_9ACTO RFDADRTGLASEAREG
tr|Q333V7|Q333V7_9ACTO AFTGR-----------
Figure 6. 5. Clustal Omage alignment of the amino acid sequences of Sas16 with other characterized Cytochrome
P450 monooxygenases from secondary metabolites biosynthetic pathways. Identical residues are indicated with
asterisks. The heme-binding site (FxxGxHxCxG) is indicated in light blue; the cysteine involved in heme
coordination is highlighted in bold and underlined. ExxR motif in the K-helix is highly conserved, which was
marked in grey. The aligned sequences include SCATT_p15680, a Putative cytochrome P450 from Streptomyces
cattleya (Genbank accession number: F8JKH2); OxyD, a P450 monooxygenase from Amycolatopsis orientalis
(Nocardia orientalis) (Genbank accession number: G4V4S6); CA878-31, a uncharacterized protein from
uncultured organism CA878 (Genbank accession number:); PCZA361.17 from Amycolatopsis orientalis (Genbank
accession number: O52802); Veg29, from uncultured soil bacterium (Genbank accession number: B7T1A1);
Sare_4553, a putative cytochrome P450 from Salinispora arenicola (strain CNS-205) (Genbank accession number:
A8M6V4); SanQ, protein involved in Nikkomycin biosynthesis from Streptomyces ansochromogenes (Genbank
accession number: Q9EYL2); NikQ, from Streptomyces tendae (Genbank accession number: Q9L465); SalD, a
cytochrome P450 hydroxylase from Salinispora pacifica (Genbank accession number: F1C7Q5), and TioI,
encoding Quinaldate 3-hydroxylase from Micromonospora sp. ML1 (Genbank accession number: Q333V7).
6.3.2 Vector Construction, Expression and Purification of Sas16
To construct the plasmid for Sas16 expression, sas16 gene was amplified from the genome of
S. asterosporus DSM 41452, then it was cloned into the recombinant expression vector
pET28a(+) with N-terminal hexahistidine-tag and a constitutive T7 Promoter. Detailed
experimental information is described in the section 6.2.4. Sas16 as a recombinant protein
has a calculated molecular weight of 45.5KDa. Protein expression cells E. coli BL21 star(DE3)
and E. coli BL21 Codon Plus RP(pL1SL2) were used for the method optimization of Sas16
expression. In the meanwhile, different additive amount of IPTG, culture temperature and
culture time were tested to screen the best cultivation condition. Figure 6. 6 shows the SDS-
PAGE gels of the Sas16 expression test with different cultivation condition.
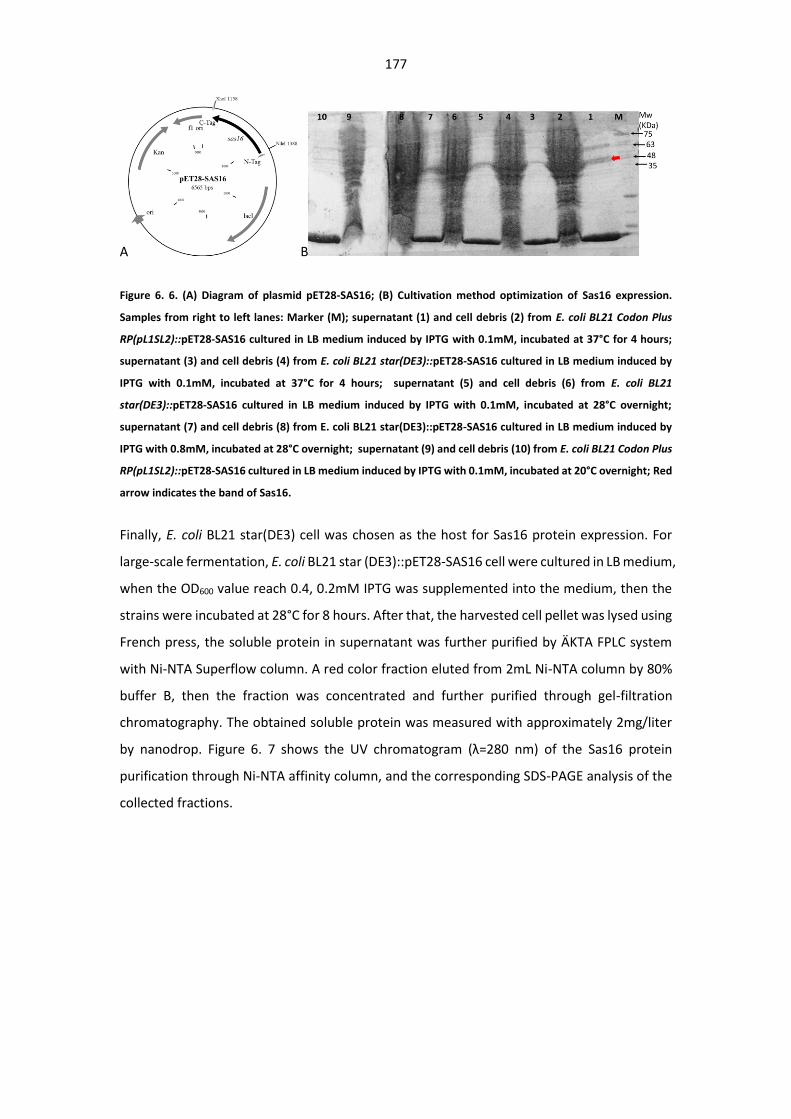
177
A B
Figure 6. 6. (A) Diagram of plasmid pET28-SAS16; (B) Cultivation method optimization of Sas16 expression.
Samples from right to left lanes: Marker (M); supernatant (1) and cell debris (2) from E. coli BL21 Codon Plus
RP(pL1SL2)::pET28-SAS16 cultured in LB medium induced by IPTG with 0.1mM, incubated at 37°C for 4 hours;
supernatant (3) and cell debris (4) from E. coli BL21 star(DE3)::pET28-SAS16 cultured in LB medium induced by
IPTG with 0.1mM, incubated at 37°C for 4 hours; supernatant (5) and cell debris (6) from E. coli BL21
star(DE3)::pET28-SAS16 cultured in LB medium induced by IPTG with 0.1mM, incubated at 28°C overnight;
supernatant (7) and cell debris (8) from E. coli BL21 star(DE3)::pET28-SAS16 cultured in LB medium induced by
IPTG with 0.8mM, incubated at 28°C overnight; supernatant (9) and cell debris (10) from E. coli BL21 Codon Plus
RP(pL1SL2)::pET28-SAS16 cultured in LB medium induced by IPTG with 0.1mM, incubated at 20°C overnight; Red
arrow indicates the band of Sas16.
Finally, E. coli BL21 star(DE3) cell was chosen as the host for Sas16 protein expression. For
large-scale fermentation, E. coli BL21 star (DE3)::pET28-SAS16 cell were cultured in LB medium,
when the OD600 value reach 0.4, 0.2mM IPTG was supplemented into the medium, then the
strains were incubated at 28°C for 8 hours. After that, the harvested cell pellet was lysed using
French press, the soluble protein in supernatant was further purified by ÄKTA FPLC system
with Ni-NTA Superflow column. A red color fraction eluted from 2mL Ni-NTA column by 80%
buffer B, then the fraction was concentrated and further purified through gel-filtration
chromatography. The obtained soluble protein was measured with approximately 2mg/liter
by nanodrop. Figure 6. 7 shows the UV chromatogram (λ=280 nm) of the Sas16 protein
purification through Ni-NTA affinity column, and the corresponding SDS-PAGE analysis of the
collected fractions.
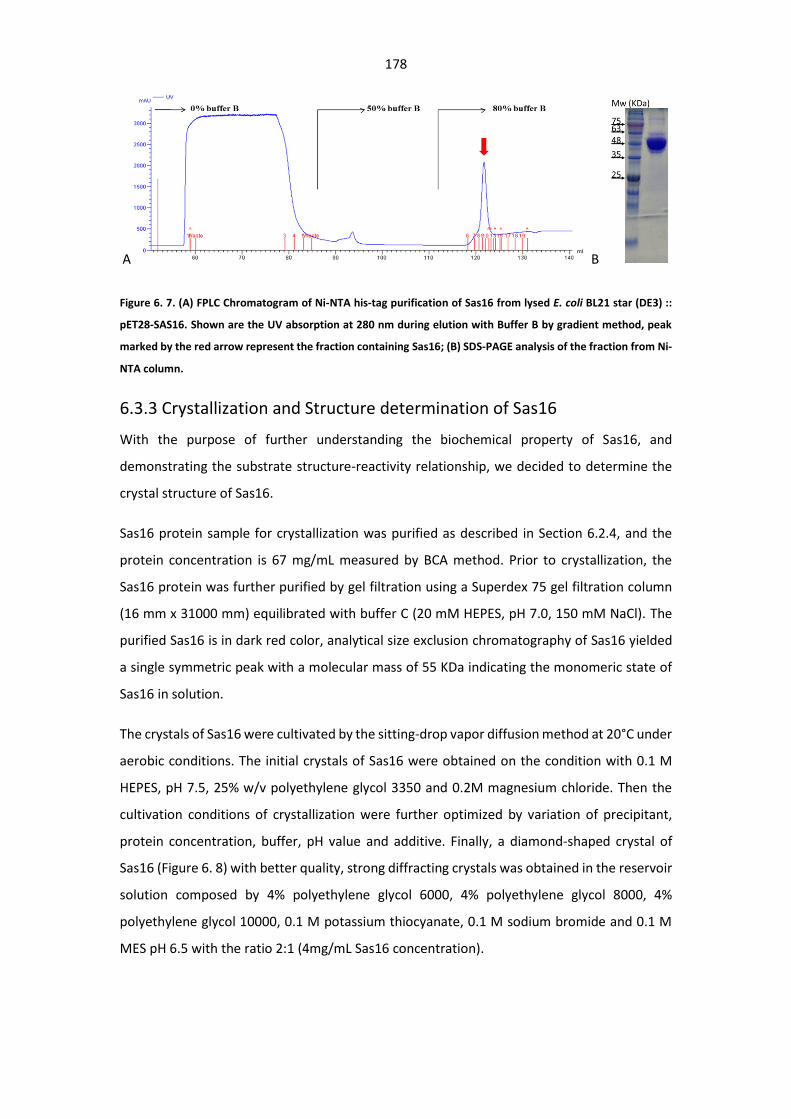
178
A B
Figure 6. 7. (A) FPLC Chromatogram of Ni-NTA his-tag purification of Sas16 from lysed E. coli BL21 star (DE3) ::
pET28-SAS16. Shown are the UV absorption at 280 nm during elution with Buffer B by gradient method, peak
marked by the red arrow represent the fraction containing Sas16; (B) SDS-PAGE analysis of the fraction from Ni-
NTA column.
6.3.3 Crystallization and Structure determination of Sas16
With the purpose of further understanding the biochemical property of Sas16, and
demonstrating the substrate structure-reactivity relationship, we decided to determine the
crystal structure of Sas16.
Sas16 protein sample for crystallization was purified as described in Section 6.2.4, and the
protein concentration is 67 mg/mL measured by BCA method. Prior to crystallization, the
Sas16 protein was further purified by gel filtration using a Superdex 75 gel filtration column
(16 mm x 31000 mm) equilibrated with buffer C (20 mM HEPES, pH 7.0, 150 mM NaCl). The
purified Sas16 is in dark red color, analytical size exclusion chromatography of Sas16 yielded
a single symmetric peak with a molecular mass of 55 KDa indicating the monomeric state of
Sas16 in solution.
The crystals of Sas16 were cultivated by the sitting-drop vapor diffusion method at 20°C under
aerobic conditions. The initial crystals of Sas16 were obtained on the condition with 0.1 M
HEPES, pH 7.5, 25% w/v polyethylene glycol 3350 and 0.2M magnesium chloride. Then the
cultivation conditions of crystallization were further optimized by variation of precipitant,
protein concentration, buffer, pH value and additive. Finally, a diamond-shaped crystal of
Sas16 (Figure 6. 8) with better quality, strong diffracting crystals was obtained in the reservoir
solution composed by 4% polyethylene glycol 6000, 4% polyethylene glycol 8000, 4%
polyethylene glycol 10000, 0.1 M potassium thiocyanate, 0.1 M sodium bromide and 0.1 M
MES pH 6.5 with the ratio 2:1 (4mg/mL Sas16 concentration).
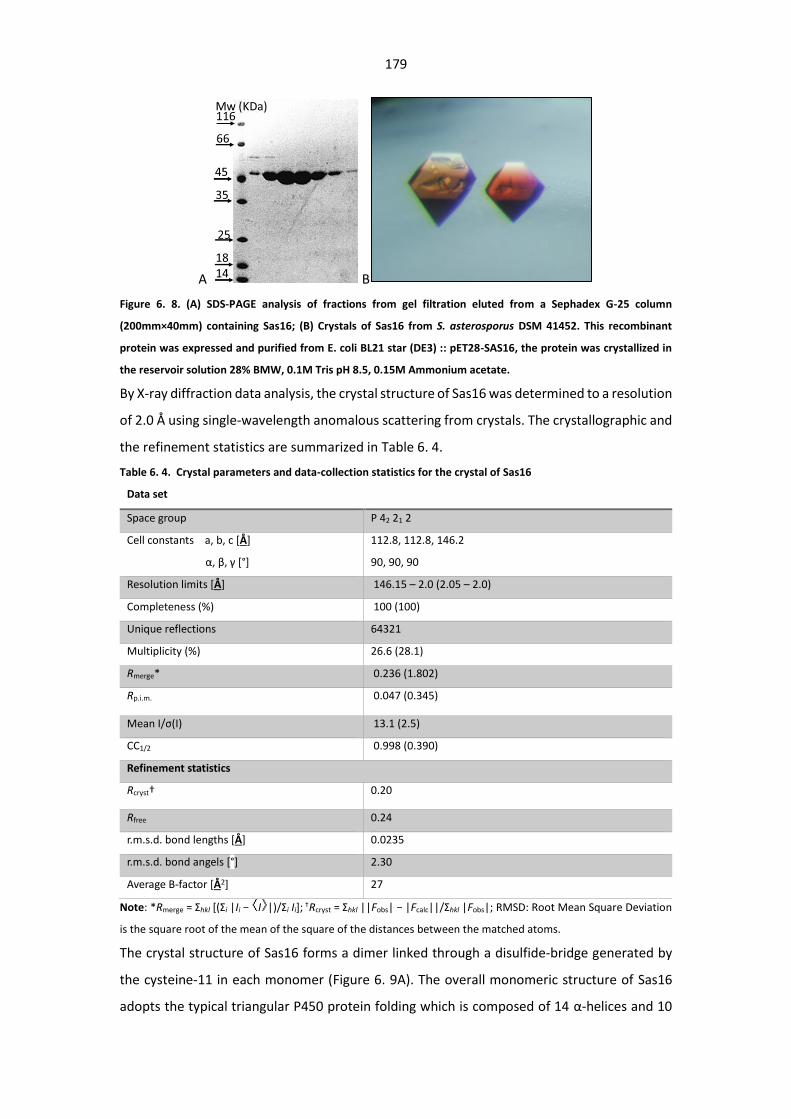
179
A B
Figure 6. 8. (A) SDS-PAGE analysis of fractions from gel filtration eluted from a Sephadex G-25 column
(200mm×40mm) containing Sas16; (B) Crystals of Sas16 from S. asterosporus DSM 41452. This recombinant
protein was expressed and purified from E. coli BL21 star (DE3) :: pET28-SAS16, the protein was crystallized in
the reservoir solution 28% BMW, 0.1M Tris pH 8.5, 0.15M Ammonium acetate.
By X-ray diffraction data analysis, the crystal structure of Sas16 was determined to a resolution
of 2.0 Å using single-wavelength anomalous scattering from crystals. The crystallographic and
the refinement statistics are summarized in Table 6. 4.
Table 6. 4. Crystal parameters and data-collection statistics for the crystal of Sas16
Data set
Space group P 42 21 2
Cell constants a, b, c [Å]
α, β, γ [°]
112.8, 112.8, 146.2
90, 90, 90
Resolution limits [Å] 146.15 – 2.0 (2.05 – 2.0)
Completeness (%) 100 (100)
Unique reflections 64321
Multiplicity (%) 26.6 (28.1)
Rmerge* 0.236 (1.802)
Rp.i.m. 0.047 (0.345)
Mean I/σ(I) 13.1 (2.5)
CC1/2 0.998 (0.390)
Refinement statistics
Rcryst† 0.20
Rfree 0.24
r.m.s.d. bond lengths [Å] 0.0235
r.m.s.d. bond angels [°] 2.30
Average B-factor [Å2] 27
Note: *Rmerge = Σhkl [(Σi |Ii − I |)/Σi Ii]; †Rcryst = Σhkl ||Fobs| − |Fcalc||/Σhkl |Fobs|; RMSD: Root Mean Square Deviation
is the square root of the mean of the square of the distances between the matched atoms.
The crystal structure of Sas16 forms a dimer linked through a disulfide-bridge generated by
the cysteine-11 in each monomer (Figure 6. 9A). The overall monomeric structure of Sas16
adopts the typical triangular P450 protein folding which is composed of 14 α-helices and 10
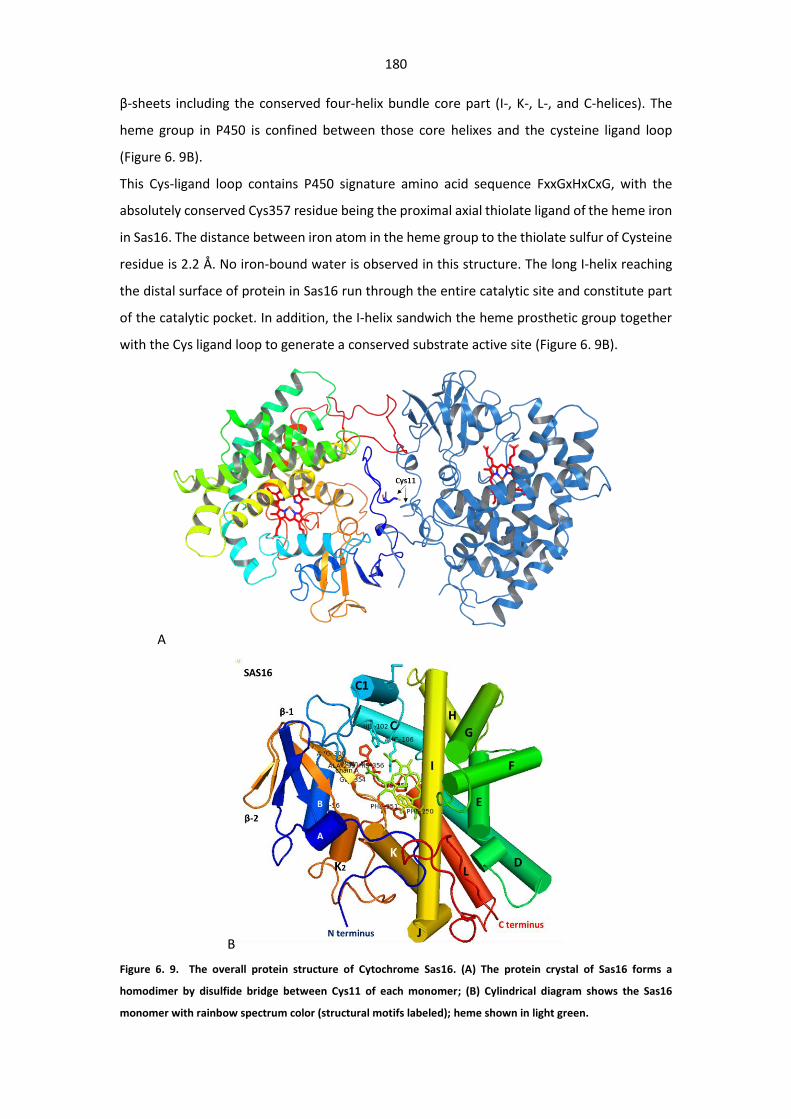
180
β-sheets including the conserved four-helix bundle core part (I-, K-, L-, and C-helices). The
heme group in P450 is confined between those core helixes and the cysteine ligand loop
(Figure 6. 9B).
This Cys-ligand loop contains P450 signature amino acid sequence FxxGxHxCxG, with the
absolutely conserved Cys357 residue being the proximal axial thiolate ligand of the heme iron
in Sas16. The distance between iron atom in the heme group to the thiolate sulfur of Cysteine
residue is 2.2 Å. No iron-bound water is observed in this structure. The long I-helix reaching
the distal surface of protein in Sas16 run through the entire catalytic site and constitute part
of the catalytic pocket. In addition, the I-helix sandwich the heme prosthetic group together
with the Cys ligand loop to generate a conserved substrate active site (Figure 6. 9B).
A
B
Figure 6. 9. The overall protein structure of Cytochrome Sas16. (A) The protein crystal of Sas16 forms a
homodimer by disulfide bridge between Cys11 of each monomer; (B) Cylindrical diagram shows the Sas16
monomer with rainbow spectrum color (structural motifs labeled); heme shown in light green.
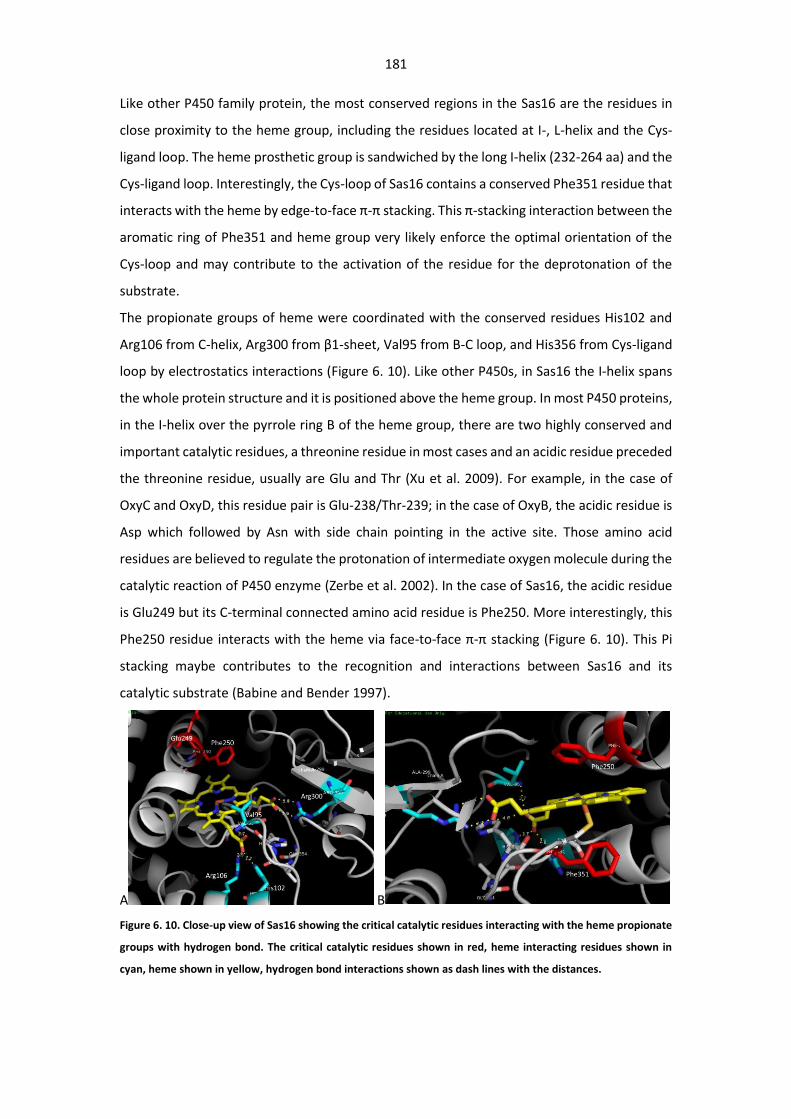
181
Like other P450 family protein, the most conserved regions in the Sas16 are the residues in
close proximity to the heme group, including the residues located at I-, L-helix and the Cys-
ligand loop. The heme prosthetic group is sandwiched by the long I-helix (232-264 aa) and the
Cys-ligand loop. Interestingly, the Cys-loop of Sas16 contains a conserved Phe351 residue that
interacts with the heme by edge-to-face π-π stacking. This π-stacking interaction between the
aromatic ring of Phe351 and heme group very likely enforce the optimal orientation of the
Cys-loop and may contribute to the activation of the residue for the deprotonation of the
substrate.
The propionate groups of heme were coordinated with the conserved residues His102 and
Arg106 from C-helix, Arg300 from β1-sheet, Val95 from B-C loop, and His356 from Cys-ligand
loop by electrostatics interactions (Figure 6. 10). Like other P450s, in Sas16 the I-helix spans
the whole protein structure and it is positioned above the heme group. In most P450 proteins,
in the I-helix over the pyrrole ring B of the heme group, there are two highly conserved and
important catalytic residues, a threonine residue in most cases and an acidic residue preceded
the threonine residue, usually are Glu and Thr (Xu et al. 2009). For example, in the case of
OxyC and OxyD, this residue pair is Glu-238/Thr-239; in the case of OxyB, the acidic residue is
Asp which followed by Asn with side chain pointing in the active site. Those amino acid
residues are believed to regulate the protonation of intermediate oxygen molecule during the
catalytic reaction of P450 enzyme (Zerbe et al. 2002). In the case of Sas16, the acidic residue
is Glu249 but its C-terminal connected amino acid residue is Phe250. More interestingly, this
Phe250 residue interacts with the heme via face-to-face π-π stacking (Figure 6. 10). This Pi
stacking maybe contributes to the recognition and interactions between Sas16 and its
catalytic substrate (Babine and Bender 1997).
A B
Figure 6. 10. Close-up view of Sas16 showing the critical catalytic residues interacting with the heme propionate
groups with hydrogen bond. The critical catalytic residues shown in red, heme interacting residues shown in
cyan, heme shown in yellow, hydrogen bond interactions shown as dash lines with the distances.
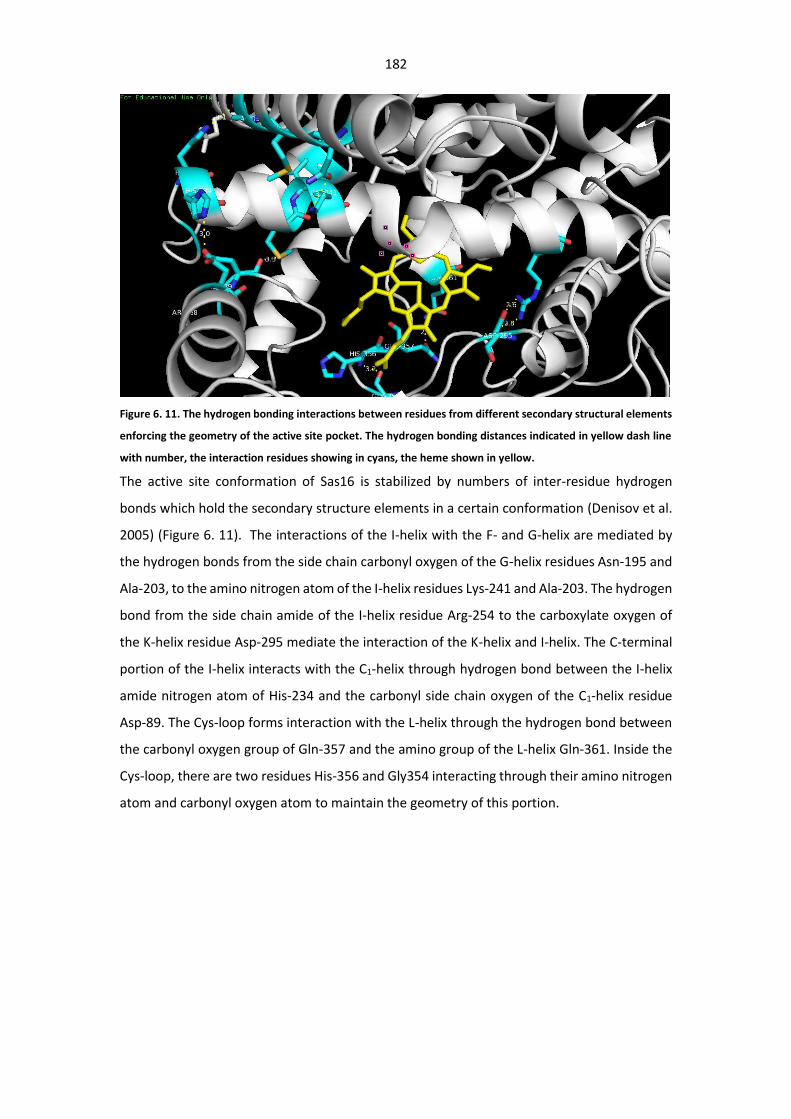
182
Figure 6. 11. The hydrogen bonding interactions between residues from different secondary structural elements
enforcing the geometry of the active site pocket. The hydrogen bonding distances indicated in yellow dash line
with number, the interaction residues showing in cyans, the heme shown in yellow.
The active site conformation of Sas16 is stabilized by numbers of inter-residue hydrogen
bonds which hold the secondary structure elements in a certain conformation (Denisov et al.
2005) (Figure 6. 11). The interactions of the I-helix with the F- and G-helix are mediated by
the hydrogen bonds from the side chain carbonyl oxygen of the G-helix residues Asn-195 and
Ala-203, to the amino nitrogen atom of the I-helix residues Lys-241 and Ala-203. The hydrogen
bond from the side chain amide of the I-helix residue Arg-254 to the carboxylate oxygen of
the K-helix residue Asp-295 mediate the interaction of the K-helix and I-helix. The C-terminal
portion of the I-helix interacts with the C1-helix through hydrogen bond between the I-helix
amide nitrogen atom of His-234 and the carbonyl side chain oxygen of the C1-helix residue
Asp-89. The Cys-loop forms interaction with the L-helix through the hydrogen bond between
the carbonyl oxygen group of Gln-357 and the amino group of the L-helix Gln-361. Inside the
Cys-loop, there are two residues His-356 and Gly354 interacting through their amino nitrogen
atom and carbonyl oxygen atom to maintain the geometry of this portion.
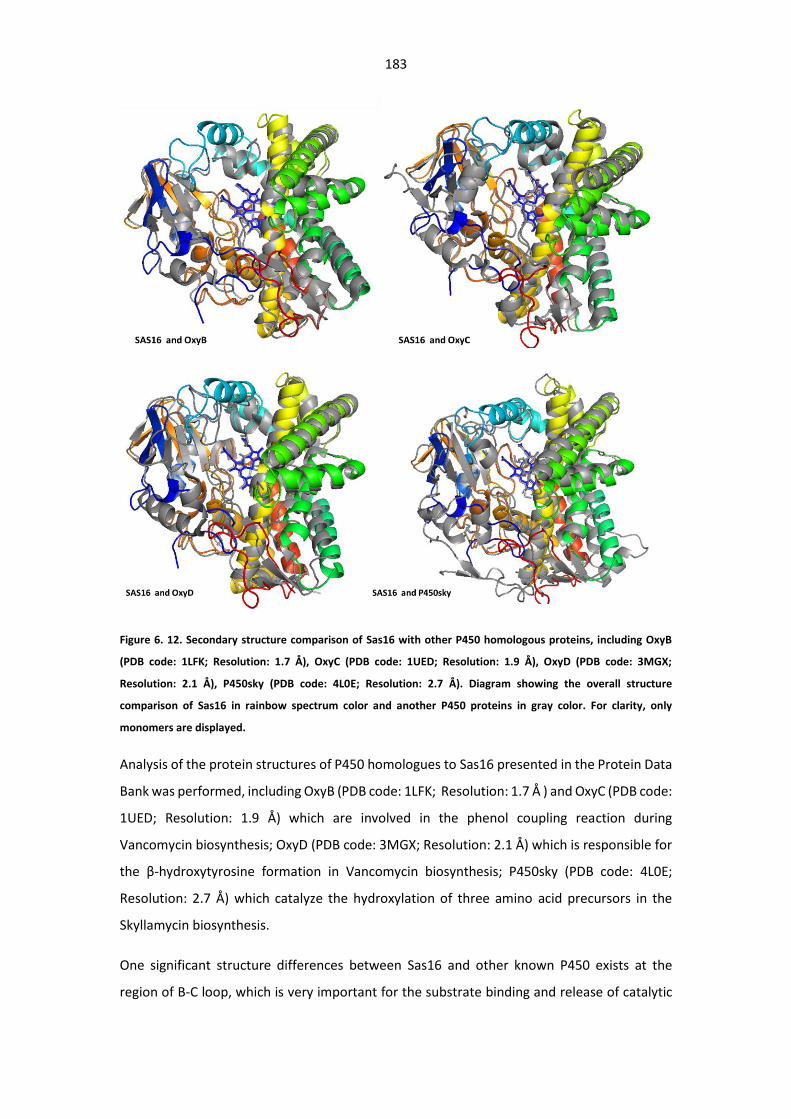
183
Figure 6. 12. Secondary structure comparison of Sas16 with other P450 homologous proteins, including OxyB
(PDB code: 1LFK; Resolution: 1.7 Å), OxyC (PDB code: 1UED; Resolution: 1.9 Å), OxyD (PDB code: 3MGX;
Resolution: 2.1 Å), P450sky (PDB code: 4L0E; Resolution: 2.7 Å). Diagram showing the overall structure
comparison of Sas16 in rainbow spectrum color and another P450 proteins in gray color. For clarity, only
monomers are displayed.
Analysis of the protein structures of P450 homologues to Sas16 presented in the Protein Data
Bank was performed, including OxyB (PDB code: 1LFK; Resolution: 1.7 Å ) and OxyC (PDB code:
1UED; Resolution: 1.9 Å) which are involved in the phenol coupling reaction during
Vancomycin biosynthesis; OxyD (PDB code: 3MGX; Resolution: 2.1 Å) which is responsible for
the β-hydroxytyrosine formation in Vancomycin biosynthesis; P450sky (PDB code: 4L0E;
Resolution: 2.7 Å) which catalyze the hydroxylation of three amino acid precursors in the
Skyllamycin biosynthesis.
One significant structure differences between Sas16 and other known P450 exists at the
region of B-C loop, which is very important for the substrate binding and release of catalytic
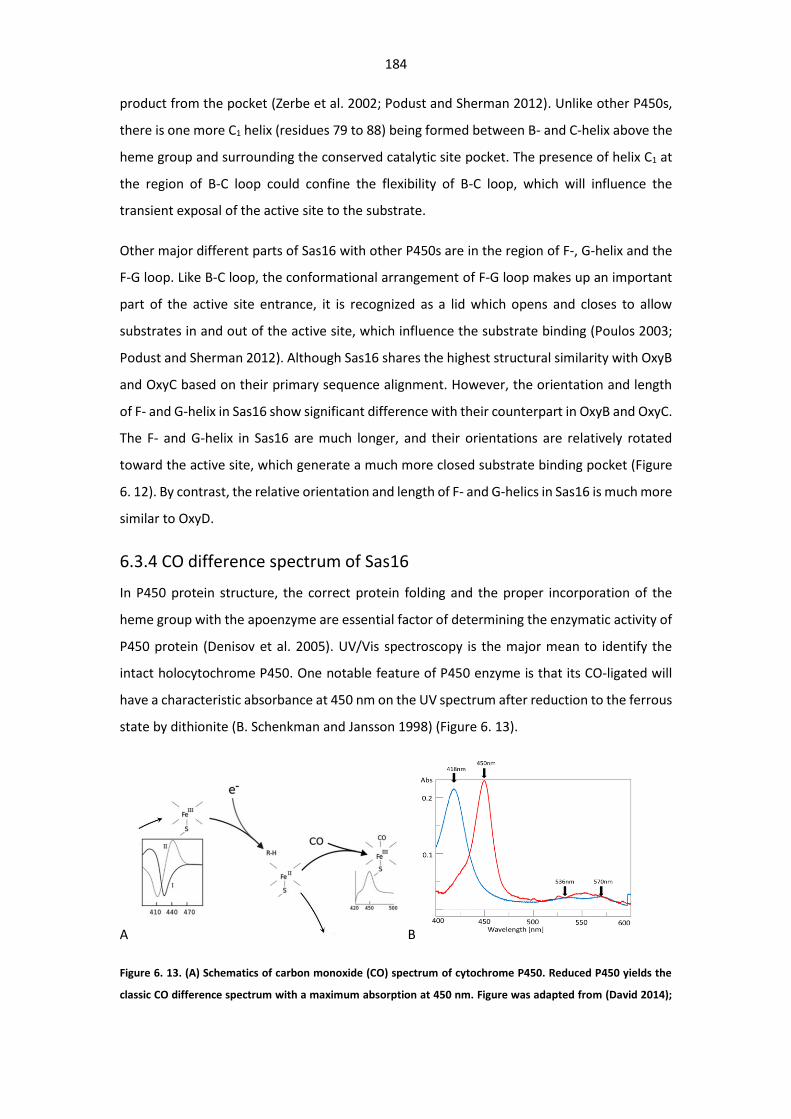
184
product from the pocket (Zerbe et al. 2002; Podust and Sherman 2012). Unlike other P450s,
there is one more C1 helix (residues 79 to 88) being formed between B- and C-helix above the
heme group and surrounding the conserved catalytic site pocket. The presence of helix C1 at
the region of B-C loop could confine the flexibility of B-C loop, which will influence the
transient exposal of the active site to the substrate.
Other major different parts of Sas16 with other P450s are in the region of F-, G-helix and the
F-G loop. Like B-C loop, the conformational arrangement of F-G loop makes up an important
part of the active site entrance, it is recognized as a lid which opens and closes to allow
substrates in and out of the active site, which influence the substrate binding (Poulos 2003;
Podust and Sherman 2012). Although Sas16 shares the highest structural similarity with OxyB
and OxyC based on their primary sequence alignment. However, the orientation and length
of F- and G-helix in Sas16 show significant difference with their counterpart in OxyB and OxyC.
The F- and G-helix in Sas16 are much longer, and their orientations are relatively rotated
toward the active site, which generate a much more closed substrate binding pocket (Figure
6. 12). By contrast, the relative orientation and length of F- and G-helics in Sas16 is much more
similar to OxyD.
6.3.4 CO difference spectrum of Sas16
In P450 protein structure, the correct protein folding and the proper incorporation of the
heme group with the apoenzyme are essential factor of determining the enzymatic activity of
P450 protein (Denisov et al. 2005). UV/Vis spectroscopy is the major mean to identify the
intact holocytochrome P450. One notable feature of P450 enzyme is that its CO-ligated will
have a characteristic absorbance at 450 nm on the UV spectrum after reduction to the ferrous
state by dithionite (B. Schenkman and Jansson 1998) (Figure 6. 13).
A B
Figure 6. 13. (A) Schematics of carbon monoxide (CO) spectrum of cytochrome P450. Reduced P450 yields the
classic CO difference spectrum with a maximum absorption at 450 nm. Figure was adapted from (David 2014);
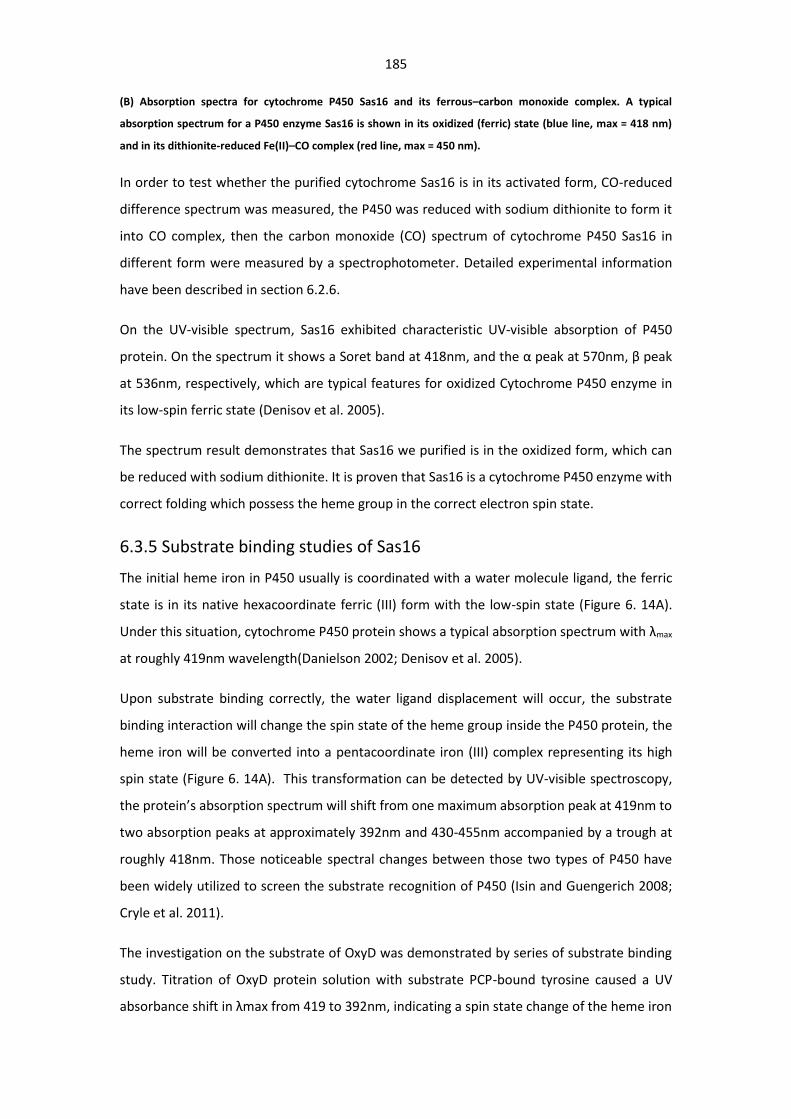
185
(B) Absorption spectra for cytochrome P450 Sas16 and its ferrous–carbon monoxide complex. A typical
absorption spectrum for a P450 enzyme Sas16 is shown in its oxidized (ferric) state (blue line, max = 418 nm)
and in its dithionite-reduced Fe(II)–CO complex (red line, max = 450 nm).
In order to test whether the purified cytochrome Sas16 is in its activated form, CO-reduced
difference spectrum was measured, the P450 was reduced with sodium dithionite to form it
into CO complex, then the carbon monoxide (CO) spectrum of cytochrome P450 Sas16 in
different form were measured by a spectrophotometer. Detailed experimental information
have been described in section 6.2.6.
On the UV-visible spectrum, Sas16 exhibited characteristic UV-visible absorption of P450
protein. On the spectrum it shows a Soret band at 418nm, and the α peak at 570nm, β peak
at 536nm, respectively, which are typical features for oxidized Cytochrome P450 enzyme in
its low-spin ferric state (Denisov et al. 2005).
The spectrum result demonstrates that Sas16 we purified is in the oxidized form, which can
be reduced with sodium dithionite. It is proven that Sas16 is a cytochrome P450 enzyme with
correct folding which possess the heme group in the correct electron spin state.
6.3.5 Substrate binding studies of Sas16
The initial heme iron in P450 usually is coordinated with a water molecule ligand, the ferric
state is in its native hexacoordinate ferric (III) form with the low-spin state (Figure 6. 14A).
Under this situation, cytochrome P450 protein shows a typical absorption spectrum with λmax
at roughly 419nm wavelength(Danielson 2002; Denisov et al. 2005).
Upon substrate binding correctly, the water ligand displacement will occur, the substrate
binding interaction will change the spin state of the heme group inside the P450 protein, the
heme iron will be converted into a pentacoordinate iron (III) complex representing its high
spin state (Figure 6. 14A). This transformation can be detected by UV-visible spectroscopy,
the protein’s absorption spectrum will shift from one maximum absorption peak at 419nm to
two absorption peaks at approximately 392nm and 430-455nm accompanied by a trough at
roughly 418nm. Those noticeable spectral changes between those two types of P450 have
been widely utilized to screen the substrate recognition of P450 (Isin and Guengerich 2008;
Cryle et al. 2011).
The investigation on the substrate of OxyD was demonstrated by series of substrate binding
study. Titration of OxyD protein solution with substrate PCP-bound tyrosine caused a UV
absorbance shift in λmax from 419 to 392nm, indicating a spin state change of the heme iron
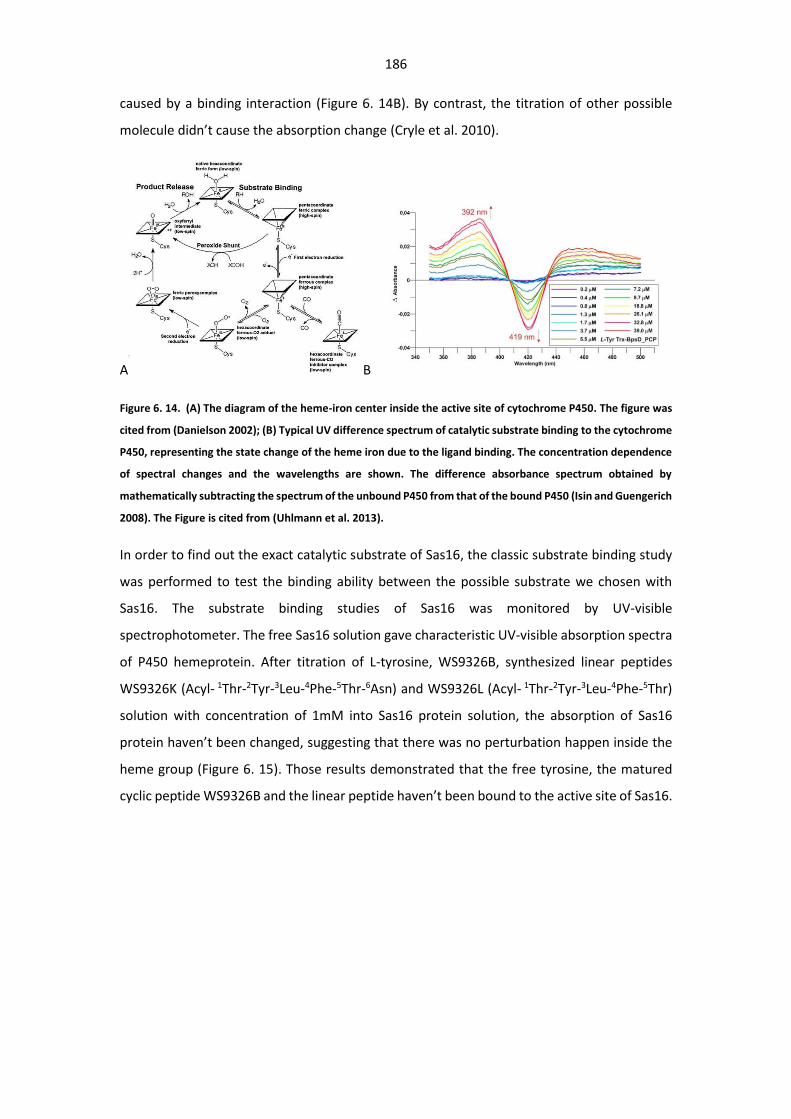
186
caused by a binding interaction (Figure 6. 14B). By contrast, the titration of other possible
molecule didn’t cause the absorption change (Cryle et al. 2010).
A B
Figure 6. 14. (A) The diagram of the heme-iron center inside the active site of cytochrome P450. The figure was
cited from (Danielson 2002); (B) Typical UV difference spectrum of catalytic substrate binding to the cytochrome
P450, representing the state change of the heme iron due to the ligand binding. The concentration dependence
of spectral changes and the wavelengths are shown. The difference absorbance spectrum obtained by
mathematically subtracting the spectrum of the unbound P450 from that of the bound P450 (Isin and Guengerich
2008). The Figure is cited from (Uhlmann et al. 2013).
In order to find out the exact catalytic substrate of Sas16, the classic substrate binding study
was performed to test the binding ability between the possible substrate we chosen with
Sas16. The substrate binding studies of Sas16 was monitored by UV-visible
spectrophotometer. The free Sas16 solution gave characteristic UV-visible absorption spectra
of P450 hemeprotein. After titration of L-tyrosine, WS9326B, synthesized linear peptides
WS9326K (Acyl- 1Thr-2Tyr-3Leu-4Phe-5Thr-6Asn) and WS9326L (Acyl- 1Thr-2Tyr-3Leu-4Phe-5Thr)
solution with concentration of 1mM into Sas16 protein solution, the absorption of Sas16
protein haven’t been changed, suggesting that there was no perturbation happen inside the
heme group (Figure 6. 15). Those results demonstrated that the free tyrosine, the matured
cyclic peptide WS9326B and the linear peptide haven’t been bound to the active site of Sas16.
187
Figure 6. 15. UV spectrum changes after titration of the possible substrate into the P450 protein solution.
For some P450 enzymes, the assistance of acyl- or peptidyl carrier proteins in substrate
recognition is required for catalysis to happen in the pre-assembly stage. For instance, the
nikkomycin biosynthetic enzyme, NikQ serve as a β-hydroxylase which catalyze the PCP-
tethered L-histidine to generate the β-hydroxyhistidine in nikkomycin biosynthesis (Chen et
al. 2002). In the biosynthesis of echinomycin, the cytochrome P450 hydroxylase Qui15 only
works with a PCP loaded L-tryptophan (Chen et al. 2013). Novobiocin as a coumarin group
antibiotic is characteristic with a beta-hydroxytyrosine moiety, and it has been demonstrated
that a PCP bounded substrate (L-tyrosyl-S-NovH) is required for the modification catalyzed by
a cytochrome P450 monooxygenase NovI (Chen and Walsh, 2001). In all those cases
exemplified above, the substrates for P450 is the carrier protein bound amino acid. Free
amino acid or small molecule mimics are not efficient substrates for oxidation, demonstrating
the necessity of the carrier protein for P450-catalyzed oxidation.
According to the analysis of multiple sequence alignment and the result of substrate binding
assay, combined with the LCMS analysis of WS9326A derivatives, we postulated that the real
catalytic substrate of Sas16 could be the PCP-bound amino acid or peptide like the case of
OxyB, OxyD and P450sky. This cytochrome P450 monooxygenase could only exert its catalytic
activity on peptidyl carrier protein bound substrates. In order to deepen our understanding of
the exact catalytic machinery of Sas16, next section, I introduce our attempt to construct the
in vitro assay system of Sas16.
6.3.6 Construction of Sas16 enzymatic assay
Based on our previous research, cytochrome Sas16 was believed to specifically catalyze the
carrier protein-bound substrates such as PCP-bound peptide or PCP-bound tyrosine. Some
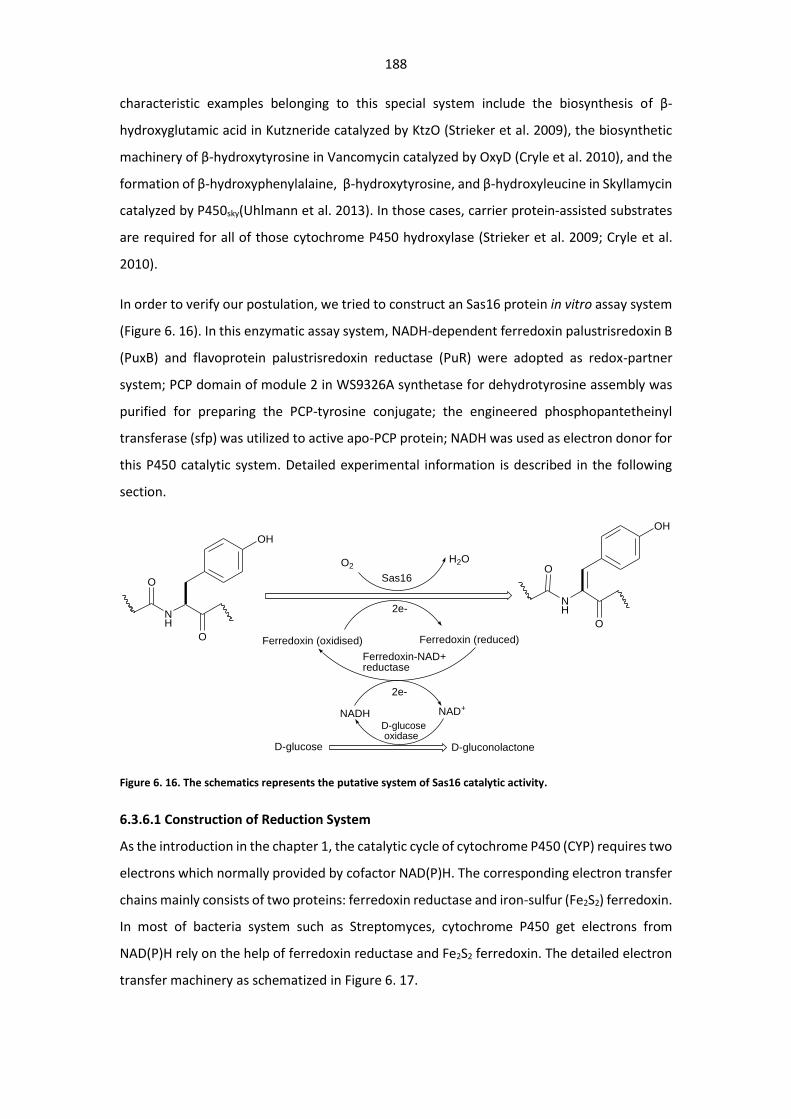
188
characteristic examples belonging to this special system include the biosynthesis of β-
hydroxyglutamic acid in Kutzneride catalyzed by KtzO (Strieker et al. 2009), the biosynthetic
machinery of β-hydroxytyrosine in Vancomycin catalyzed by OxyD (Cryle et al. 2010), and the
formation of β-hydroxyphenylalaine, β-hydroxytyrosine, and β-hydroxyleucine in Skyllamycin
catalyzed by P450sky(Uhlmann et al. 2013). In those cases, carrier protein-assisted substrates
are required for all of those cytochrome P450 hydroxylase (Strieker et al. 2009; Cryle et al.
2010).
In order to verify our postulation, we tried to construct an Sas16 protein in vitro assay system
(Figure 6. 16). In this enzymatic assay system, NADH-dependent ferredoxin palustrisredoxin B
(PuxB) and flavoprotein palustrisredoxin reductase (PuR) were adopted as redox-partner
system; PCP domain of module 2 in WS9326A synthetase for dehydrotyrosine assembly was
purified for preparing the PCP-tyrosine conjugate; the engineered phosphopantetheinyl
transferase (sfp) was utilized to active apo-PCP protein; NADH was used as electron donor for
this P450 catalytic system. Detailed experimental information is described in the following
section.
Figure 6. 16. The schematics represents the putative system of Sas16 catalytic activity.
6.3.6.1 Construction of Reduction System
As the introduction in the chapter 1, the catalytic cycle of cytochrome P450 (CYP) requires two
electrons which normally provided by cofactor NAD(P)H. The corresponding electron transfer
chains mainly consists of two proteins: ferredoxin reductase and iron-sulfur (Fe2S2) ferredoxin.
In most of bacteria system such as Streptomyces, cytochrome P450 get electrons from
NAD(P)H rely on the help of ferredoxin reductase and Fe2S2 ferredoxin. The detailed electron
transfer machinery as schematized in Figure 6. 17.
NH
O
O
OH
D-glucose D-gluconolactone
Sas16
D-glucose oxidase
Ferredoxin (reduced)Ferredoxin (oxidised)
Ferredoxin-NAD+reductase
O2H2O
NH
O
O
OH
2e-
2e-
NADH NAD+
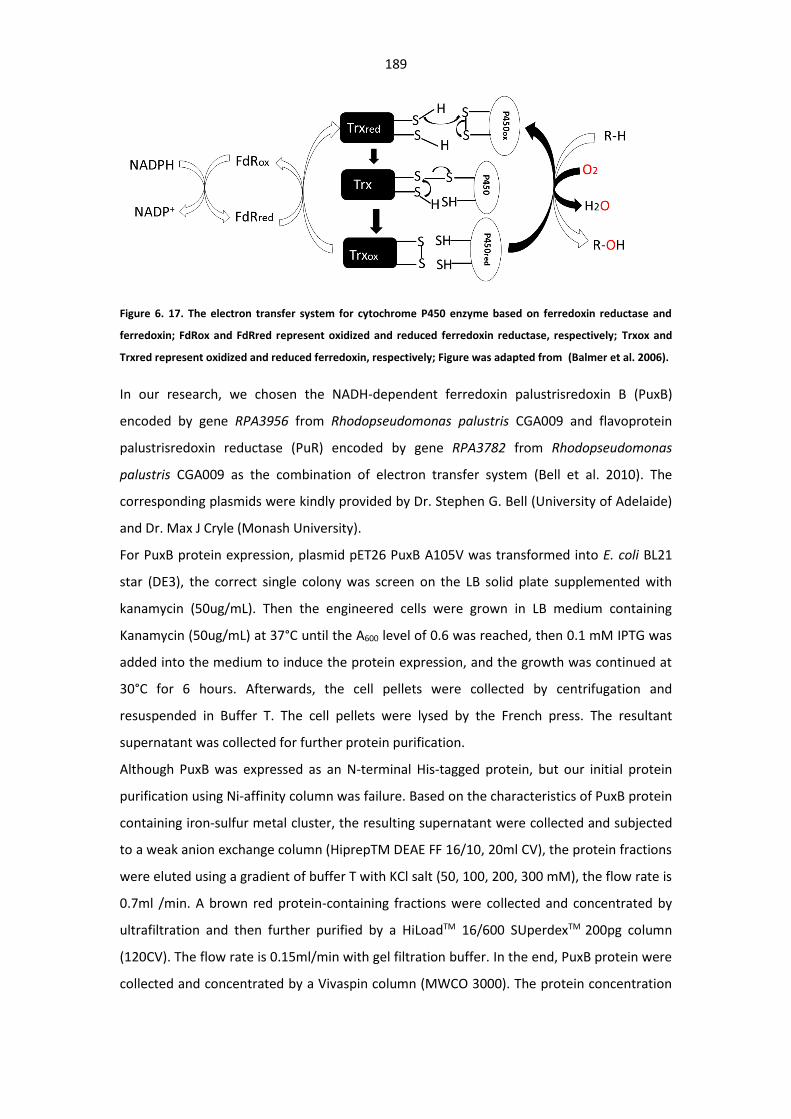
189
Figure 6. 17. The electron transfer system for cytochrome P450 enzyme based on ferredoxin reductase and
ferredoxin; FdRox and FdRred represent oxidized and reduced ferredoxin reductase, respectively; Trxox and
Trxred represent oxidized and reduced ferredoxin, respectively; Figure was adapted from (Balmer et al. 2006).
In our research, we chosen the NADH-dependent ferredoxin palustrisredoxin B (PuxB)
encoded by gene RPA3956 from Rhodopseudomonas palustris CGA009 and flavoprotein
palustrisredoxin reductase (PuR) encoded by gene RPA3782 from Rhodopseudomonas
palustris CGA009 as the combination of electron transfer system (Bell et al. 2010). The
corresponding plasmids were kindly provided by Dr. Stephen G. Bell (University of Adelaide)
and Dr. Max J Cryle (Monash University).
For PuxB protein expression, plasmid pET26 PuxB A105V was transformed into E. coli BL21
star (DE3), the correct single colony was screen on the LB solid plate supplemented with
kanamycin (50ug/mL). Then the engineered cells were grown in LB medium containing
Kanamycin (50ug/mL) at 37°C until the A600 level of 0.6 was reached, then 0.1 mM IPTG was
added into the medium to induce the protein expression, and the growth was continued at
30°C for 6 hours. Afterwards, the cell pellets were collected by centrifugation and
resuspended in Buffer T. The cell pellets were lysed by the French press. The resultant
supernatant was collected for further protein purification.
Although PuxB was expressed as an N-terminal His-tagged protein, but our initial protein
purification using Ni-affinity column was failure. Based on the characteristics of PuxB protein
containing iron-sulfur metal cluster, the resulting supernatant were collected and subjected
to a weak anion exchange column (HiprepTM DEAE FF 16/10, 20ml CV), the protein fractions
were eluted using a gradient of buffer T with KCl salt (50, 100, 200, 300 mM), the flow rate is
0.7ml /min. A brown red protein-containing fractions were collected and concentrated by
ultrafiltration and then further purified by a HiLoadTM 16/600 SUperdexTM 200pg column
(120CV). The flow rate is 0.15ml/min with gel filtration buffer. In the end, PuxB protein were
collected and concentrated by a Vivaspin column (MWCO 3000). The protein concentration
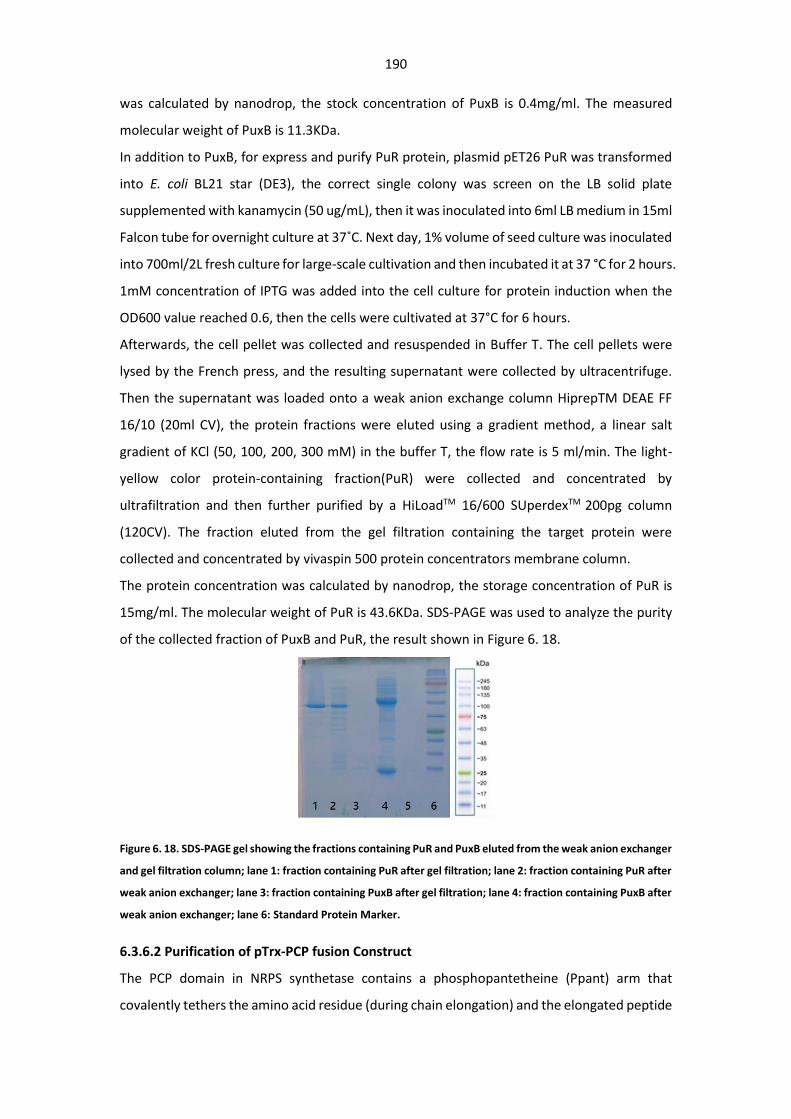
190
was calculated by nanodrop, the stock concentration of PuxB is 0.4mg/ml. The measured
molecular weight of PuxB is 11.3KDa.
In addition to PuxB, for express and purify PuR protein, plasmid pET26 PuR was transformed
into E. coli BL21 star (DE3), the correct single colony was screen on the LB solid plate
supplemented with kanamycin (50 ug/mL), then it was inoculated into 6ml LB medium in 15ml
Falcon tube for overnight culture at 37˚C. Next day, 1% volume of seed culture was inoculated
into 700ml/2L fresh culture for large-scale cultivation and then incubated it at 37 °C for 2 hours.
1mM concentration of IPTG was added into the cell culture for protein induction when the
OD600 value reached 0.6, then the cells were cultivated at 37°C for 6 hours.
Afterwards, the cell pellet was collected and resuspended in Buffer T. The cell pellets were
lysed by the French press, and the resulting supernatant were collected by ultracentrifuge.
Then the supernatant was loaded onto a weak anion exchange column HiprepTM DEAE FF
16/10 (20ml CV), the protein fractions were eluted using a gradient method, a linear salt
gradient of KCl (50, 100, 200, 300 mM) in the buffer T, the flow rate is 5 ml/min. The light-
yellow color protein-containing fraction(PuR) were collected and concentrated by
ultrafiltration and then further purified by a HiLoadTM 16/600 SUperdexTM 200pg column
(120CV). The fraction eluted from the gel filtration containing the target protein were
collected and concentrated by vivaspin 500 protein concentrators membrane column.
The protein concentration was calculated by nanodrop, the storage concentration of PuR is
15mg/ml. The molecular weight of PuR is 43.6KDa. SDS-PAGE was used to analyze the purity
of the collected fraction of PuxB and PuR, the result shown in Figure 6. 18.
Figure 6. 18. SDS-PAGE gel showing the fractions containing PuR and PuxB eluted from the weak anion exchanger
and gel filtration column; lane 1: fraction containing PuR after gel filtration; lane 2: fraction containing PuR after
weak anion exchanger; lane 3: fraction containing PuxB after gel filtration; lane 4: fraction containing PuxB after
weak anion exchanger; lane 6: Standard Protein Marker.
6.3.6.2 Purification of pTrx-PCP fusion Construct
The PCP domain in NRPS synthetase contains a phosphopantetheine (Ppant) arm that
covalently tethers the amino acid residue (during chain elongation) and the elongated peptide
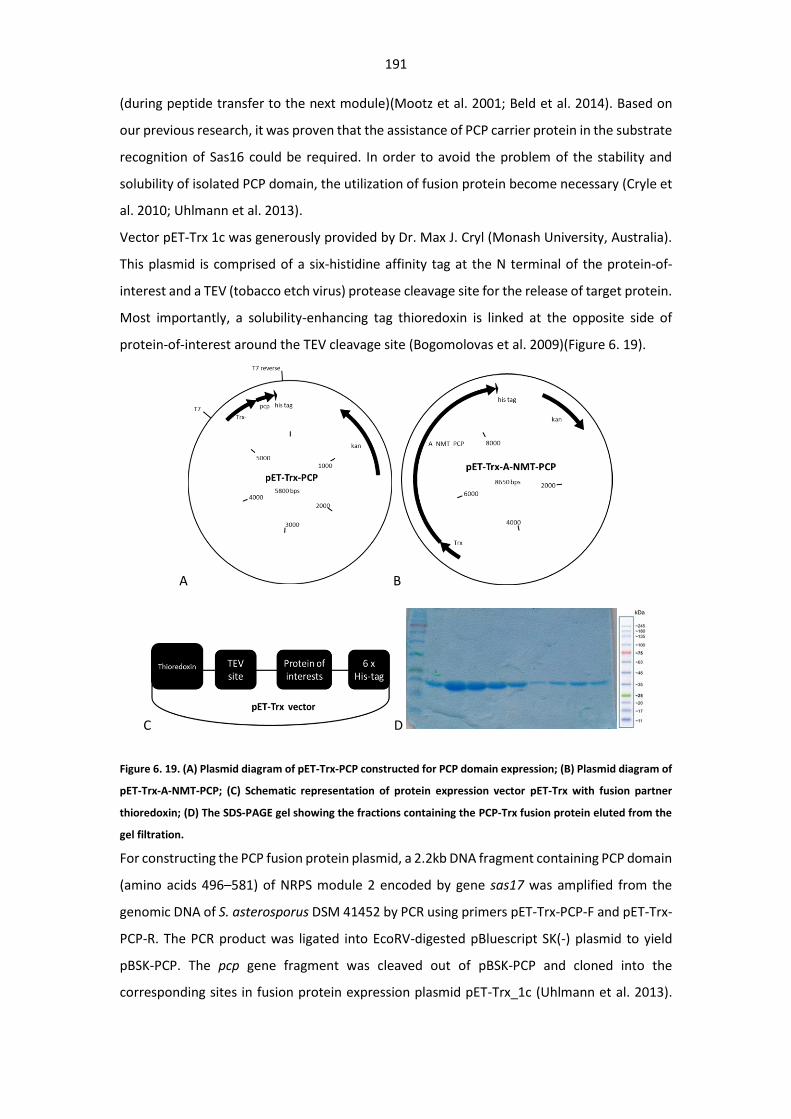
191
(during peptide transfer to the next module)(Mootz et al. 2001; Beld et al. 2014). Based on
our previous research, it was proven that the assistance of PCP carrier protein in the substrate
recognition of Sas16 could be required. In order to avoid the problem of the stability and
solubility of isolated PCP domain, the utilization of fusion protein become necessary (Cryle et
al. 2010; Uhlmann et al. 2013).
Vector pET-Trx 1c was generously provided by Dr. Max J. Cryl (Monash University, Australia).
This plasmid is comprised of a six-histidine affinity tag at the N terminal of the protein-of-
interest and a TEV (tobacco etch virus) protease cleavage site for the release of target protein.
Most importantly, a solubility-enhancing tag thioredoxin is linked at the opposite side of
protein-of-interest around the TEV cleavage site (Bogomolovas et al. 2009)(Figure 6. 19).
A B
C D
Figure 6. 19. (A) Plasmid diagram of pET-Trx-PCP constructed for PCP domain expression; (B) Plasmid diagram of
pET-Trx-A-NMT-PCP; (C) Schematic representation of protein expression vector pET-Trx with fusion partner
thioredoxin; (D) The SDS-PAGE gel showing the fractions containing the PCP-Trx fusion protein eluted from the
gel filtration.
For constructing the PCP fusion protein plasmid, a 2.2kb DNA fragment containing PCP domain
(amino acids 496–581) of NRPS module 2 encoded by gene sas17 was amplified from the
genomic DNA of S. asterosporus DSM 41452 by PCR using primers pET-Trx-PCP-F and pET-Trx-
PCP-R. The PCR product was ligated into EcoRV-digested pBluescript SK(-) plasmid to yield
pBSK-PCP. The pcp gene fragment was cleaved out of pBSK-PCP and cloned into the
corresponding sites in fusion protein expression plasmid pET-Trx_1c (Uhlmann et al. 2013).
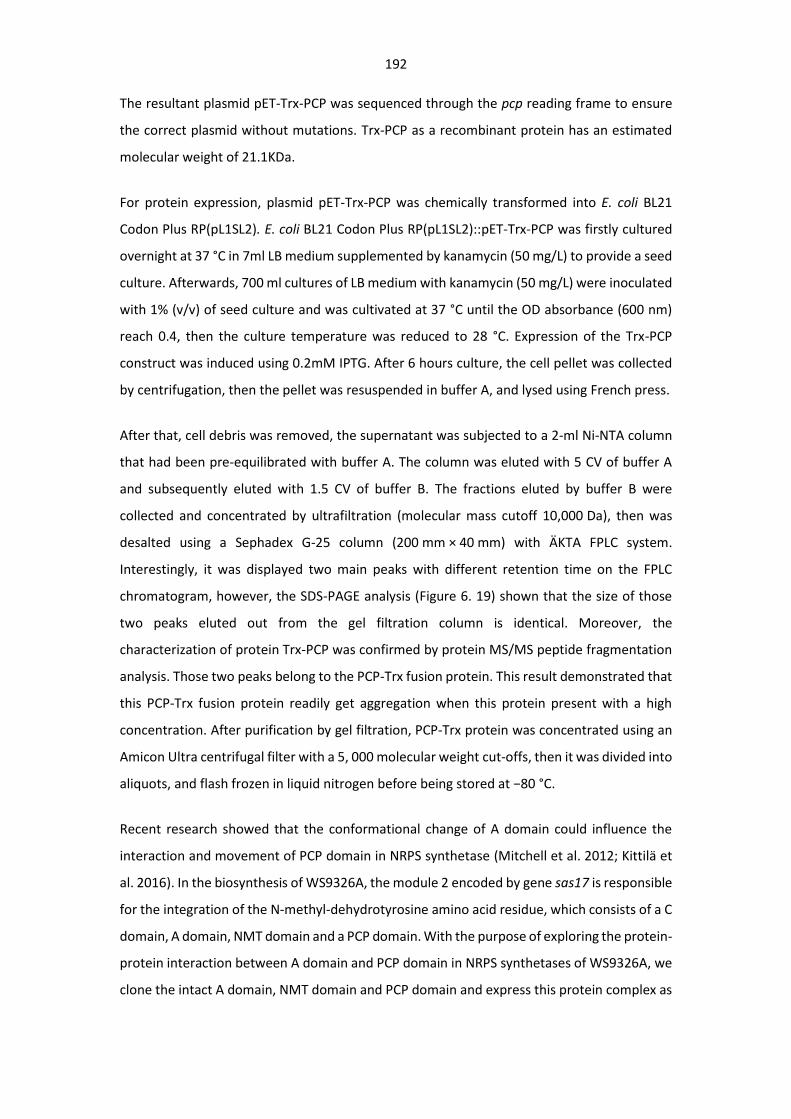
192
The resultant plasmid pET-Trx-PCP was sequenced through the pcp reading frame to ensure
the correct plasmid without mutations. Trx-PCP as a recombinant protein has an estimated
molecular weight of 21.1KDa.
For protein expression, plasmid pET-Trx-PCP was chemically transformed into E. coli BL21
Codon Plus RP(pL1SL2). E. coli BL21 Codon Plus RP(pL1SL2)::pET-Trx-PCP was firstly cultured
overnight at 37 °C in 7ml LB medium supplemented by kanamycin (50 mg/L) to provide a seed
culture. Afterwards, 700 ml cultures of LB medium with kanamycin (50 mg/L) were inoculated
with 1% (v/v) of seed culture and was cultivated at 37 °C until the OD absorbance (600 nm)
reach 0.4, then the culture temperature was reduced to 28 °C. Expression of the Trx-PCP
construct was induced using 0.2mM IPTG. After 6 hours culture, the cell pellet was collected
by centrifugation, then the pellet was resuspended in buffer A, and lysed using French press.
After that, cell debris was removed, the supernatant was subjected to a 2-ml Ni-NTA column
that had been pre-equilibrated with buffer A. The column was eluted with 5 CV of buffer A
and subsequently eluted with 1.5 CV of buffer B. The fractions eluted by buffer B were
collected and concentrated by ultrafiltration (molecular mass cutoff 10,000 Da), then was
desalted using a Sephadex G-25 column (200 mm × 40 mm) with ÄKTA FPLC system.
Interestingly, it was displayed two main peaks with different retention time on the FPLC
chromatogram, however, the SDS-PAGE analysis (Figure 6. 19) shown that the size of those
two peaks eluted out from the gel filtration column is identical. Moreover, the
characterization of protein Trx-PCP was confirmed by protein MS/MS peptide fragmentation
analysis. Those two peaks belong to the PCP-Trx fusion protein. This result demonstrated that
this PCP-Trx fusion protein readily get aggregation when this protein present with a high
concentration. After purification by gel filtration, PCP-Trx protein was concentrated using an
Amicon Ultra centrifugal filter with a 5, 000 molecular weight cut-offs, then it was divided into
aliquots, and flash frozen in liquid nitrogen before being stored at −80 °C.
Recent research showed that the conformational change of A domain could influence the
interaction and movement of PCP domain in NRPS synthetase (Mitchell et al. 2012; Kittilä et
al. 2016). In the biosynthesis of WS9326A, the module 2 encoded by gene sas17 is responsible
for the integration of the N-methyl-dehydrotyrosine amino acid residue, which consists of a C
domain, A domain, NMT domain and a PCP domain. With the purpose of exploring the protein-
protein interaction between A domain and PCP domain in NRPS synthetases of WS9326A, we
clone the intact A domain, NMT domain and PCP domain and express this protein complex as
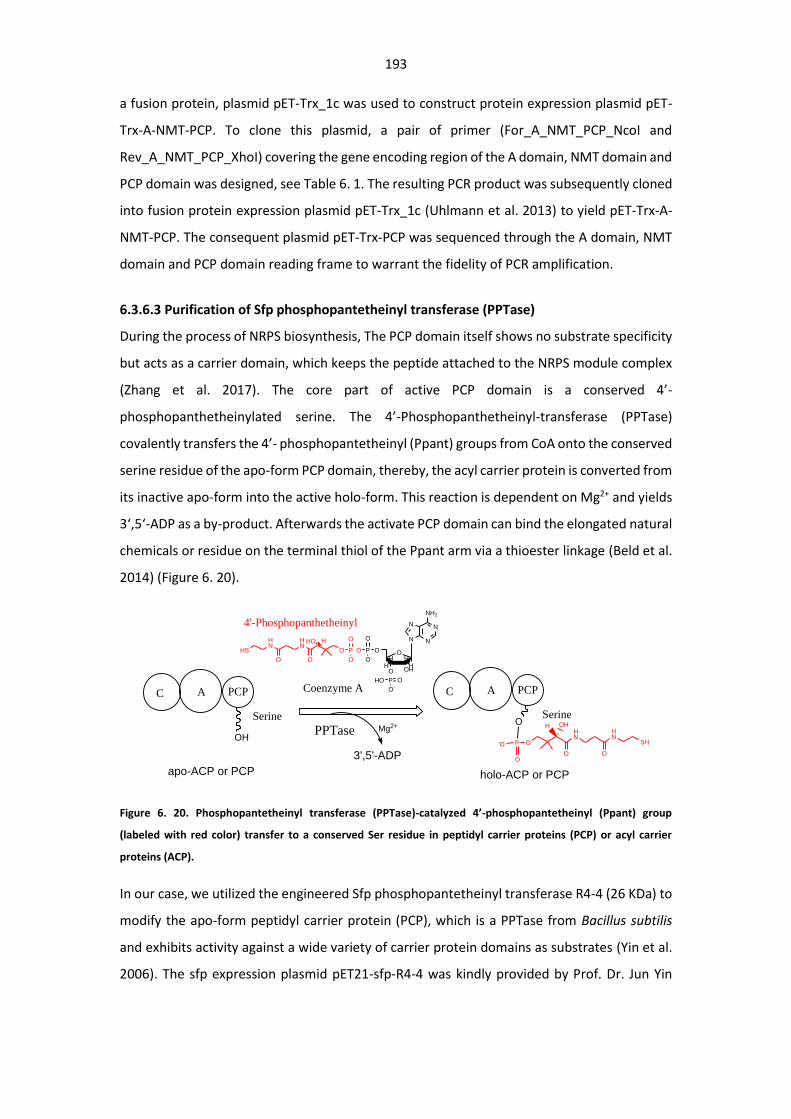
193
a fusion protein, plasmid pET-Trx_1c was used to construct protein expression plasmid pET-
Trx-A-NMT-PCP. To clone this plasmid, a pair of primer (For_A_NMT_PCP_NcoI and
Rev_A_NMT_PCP_XhoI) covering the gene encoding region of the A domain, NMT domain and
PCP domain was designed, see Table 6. 1. The resulting PCR product was subsequently cloned
into fusion protein expression plasmid pET-Trx_1c (Uhlmann et al. 2013) to yield pET-Trx-A-
NMT-PCP. The consequent plasmid pET-Trx-PCP was sequenced through the A domain, NMT
domain and PCP domain reading frame to warrant the fidelity of PCR amplification.
6.3.6.3 Purification of Sfp phosphopantetheinyl transferase (PPTase)
During the process of NRPS biosynthesis, The PCP domain itself shows no substrate specificity
but acts as a carrier domain, which keeps the peptide attached to the NRPS module complex
(Zhang et al. 2017). The core part of active PCP domain is a conserved 4’-
phosphopanthetheinylated serine. The 4’-Phosphopanthetheinyl-transferase (PPTase)
covalently transfers the 4’- phosphopantetheinyl (Ppant) groups from CoA onto the conserved
serine residue of the apo-form PCP domain, thereby, the acyl carrier protein is converted from
its inactive apo-form into the active holo-form. This reaction is dependent on Mg2+ and yields
3‘,5‘-ADP as a by-product. Afterwards the activate PCP domain can bind the elongated natural
chemicals or residue on the terminal thiol of the Ppant arm via a thioester linkage (Beld et al.
2014) (Figure 6. 20).
C A PCP
OH
Serine
C A PCP
OSerine
N
NN
N
NH2
O
OH
HHHH
OPO
O-
O
PO
O-
O
O
HN
HN
HS
HO H
OO
O-
PHO O
-O P O
O
HN
HN
SH
OHH
O O3',5'-ADP
apo-ACP or PCP holo-ACP or PCP
PPTase Mg2+
Coenzyme A
4'-Phosphopanthetheinyl
Figure 6. 20. Phosphopantetheinyl transferase (PPTase)-catalyzed 4’-phosphopantetheinyl (Ppant) group
(labeled with red color) transfer to a conserved Ser residue in peptidyl carrier proteins (PCP) or acyl carrier
proteins (ACP).
In our case, we utilized the engineered Sfp phosphopantetheinyl transferase R4-4 (26 KDa) to
modify the apo-form peptidyl carrier protein (PCP), which is a PPTase from Bacillus subtilis
and exhibits activity against a wide variety of carrier protein domains as substrates (Yin et al.
2006). The sfp expression plasmid pET21-sfp-R4-4 was kindly provided by Prof. Dr. Jun Yin
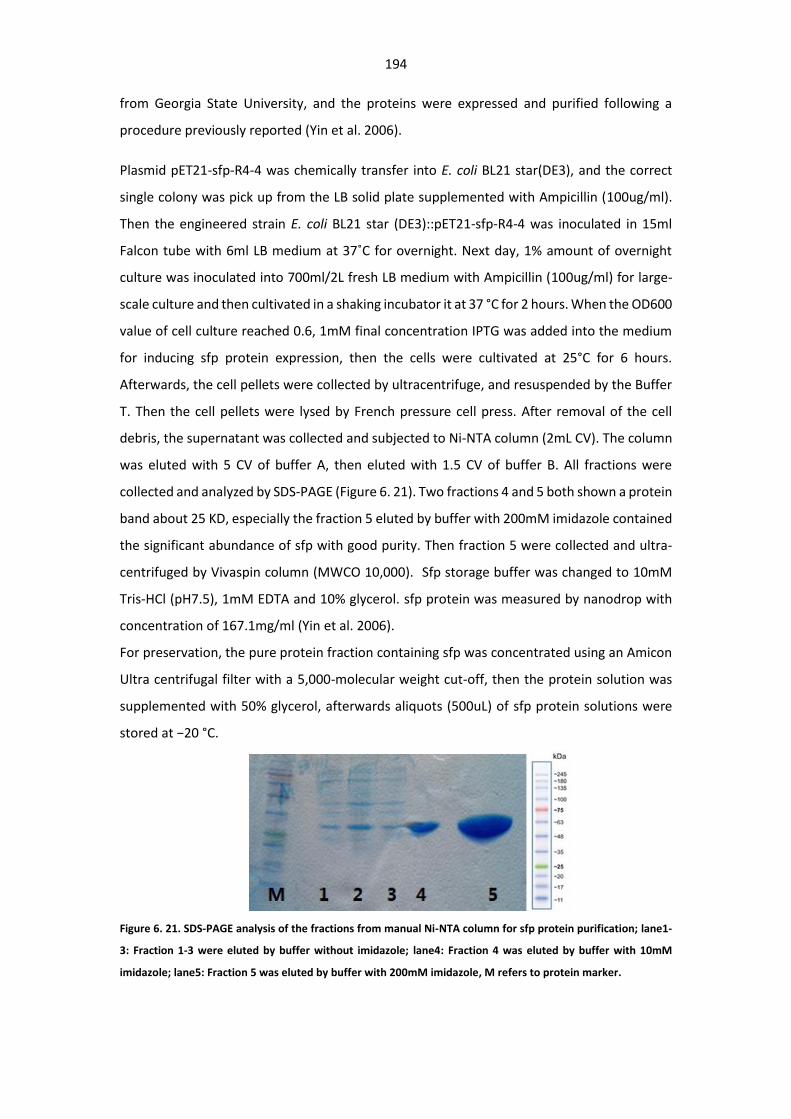
194
from Georgia State University, and the proteins were expressed and purified following a
procedure previously reported (Yin et al. 2006).
Plasmid pET21-sfp-R4-4 was chemically transfer into E. coli BL21 star(DE3), and the correct
single colony was pick up from the LB solid plate supplemented with Ampicillin (100ug/ml).
Then the engineered strain E. coli BL21 star (DE3)::pET21-sfp-R4-4 was inoculated in 15ml
Falcon tube with 6ml LB medium at 37˚C for overnight. Next day, 1% amount of overnight
culture was inoculated into 700ml/2L fresh LB medium with Ampicillin (100ug/ml) for large-
scale culture and then cultivated in a shaking incubator it at 37 °C for 2 hours. When the OD600
value of cell culture reached 0.6, 1mM final concentration IPTG was added into the medium
for inducing sfp protein expression, then the cells were cultivated at 25°C for 6 hours.
Afterwards, the cell pellets were collected by ultracentrifuge, and resuspended by the Buffer
T. Then the cell pellets were lysed by French pressure cell press. After removal of the cell
debris, the supernatant was collected and subjected to Ni-NTA column (2mL CV). The column
was eluted with 5 CV of buffer A, then eluted with 1.5 CV of buffer B. All fractions were
collected and analyzed by SDS-PAGE (Figure 6. 21). Two fractions 4 and 5 both shown a protein
band about 25 KD, especially the fraction 5 eluted by buffer with 200mM imidazole contained
the significant abundance of sfp with good purity. Then fraction 5 were collected and ultra-
centrifuged by Vivaspin column (MWCO 10,000). Sfp storage buffer was changed to 10mM
Tris-HCl (pH7.5), 1mM EDTA and 10% glycerol. sfp protein was measured by nanodrop with
concentration of 167.1mg/ml (Yin et al. 2006).
For preservation, the pure protein fraction containing sfp was concentrated using an Amicon
Ultra centrifugal filter with a 5,000-molecular weight cut-off, then the protein solution was
supplemented with 50% glycerol, afterwards aliquots (500uL) of sfp protein solutions were
stored at −20 °C.
Figure 6. 21. SDS-PAGE analysis of the fractions from manual Ni-NTA column for sfp protein purification; lane1-
3: Fraction 1-3 were eluted by buffer without imidazole; lane4: Fraction 4 was eluted by buffer with 10mM
imidazole; lane5: Fraction 5 was eluted by buffer with 200mM imidazole, M refers to protein marker.
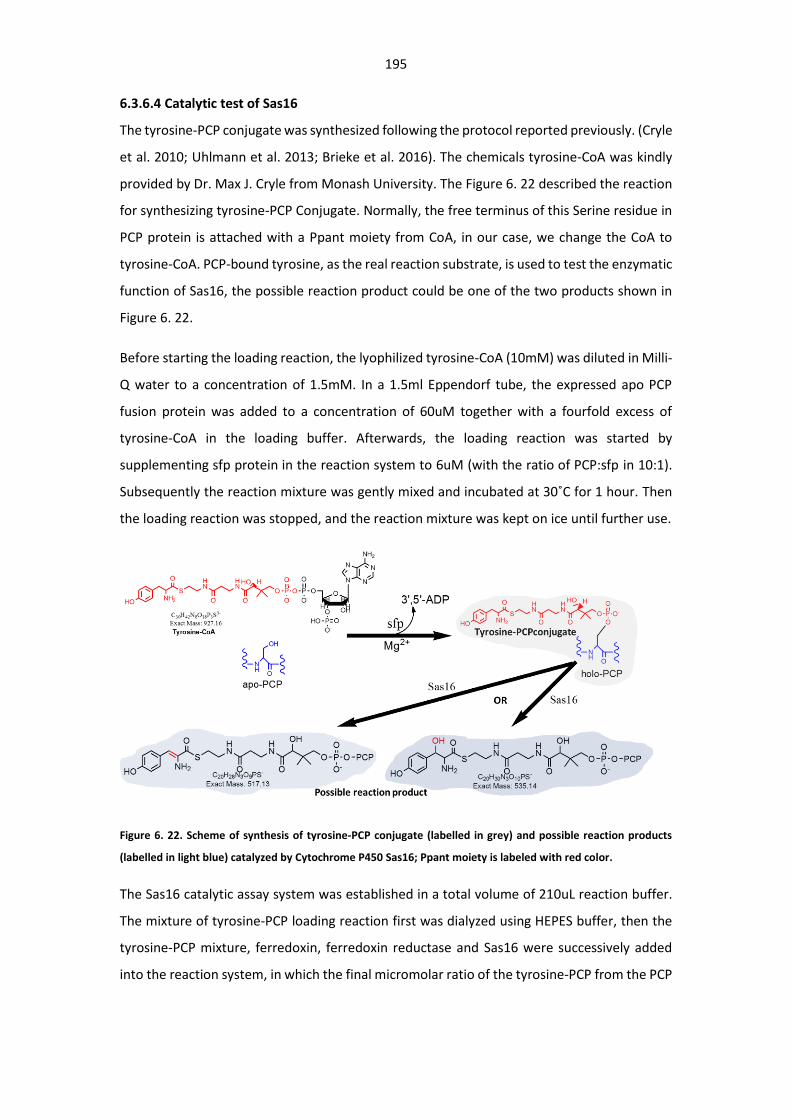
195
6.3.6.4 Catalytic test of Sas16
The tyrosine-PCP conjugate was synthesized following the protocol reported previously. (Cryle
et al. 2010; Uhlmann et al. 2013; Brieke et al. 2016). The chemicals tyrosine-CoA was kindly
provided by Dr. Max J. Cryle from Monash University. The Figure 6. 22 described the reaction
for synthesizing tyrosine-PCP Conjugate. Normally, the free terminus of this Serine residue in
PCP protein is attached with a Ppant moiety from CoA, in our case, we change the CoA to
tyrosine-CoA. PCP-bound tyrosine, as the real reaction substrate, is used to test the enzymatic
function of Sas16, the possible reaction product could be one of the two products shown in
Figure 6. 22.
Before starting the loading reaction, the lyophilized tyrosine-CoA (10mM) was diluted in Milli-
Q water to a concentration of 1.5mM. In a 1.5ml Eppendorf tube, the expressed apo PCP
fusion protein was added to a concentration of 60uM together with a fourfold excess of
tyrosine-CoA in the loading buffer. Afterwards, the loading reaction was started by
supplementing sfp protein in the reaction system to 6uM (with the ratio of PCP:sfp in 10:1).
Subsequently the reaction mixture was gently mixed and incubated at 30˚C for 1 hour. Then
the loading reaction was stopped, and the reaction mixture was kept on ice until further use.
Figure 6. 22. Scheme of synthesis of tyrosine-PCP conjugate (labelled in grey) and possible reaction products
(labelled in light blue) catalyzed by Cytochrome P450 Sas16; Ppant moiety is labeled with red color.
The Sas16 catalytic assay system was established in a total volume of 210uL reaction buffer.
The mixture of tyrosine-PCP loading reaction first was dialyzed using HEPES buffer, then the
tyrosine-PCP mixture, ferredoxin, ferredoxin reductase and Sas16 were successively added
into the reaction system, in which the final micromolar ratio of the tyrosine-PCP from the PCP
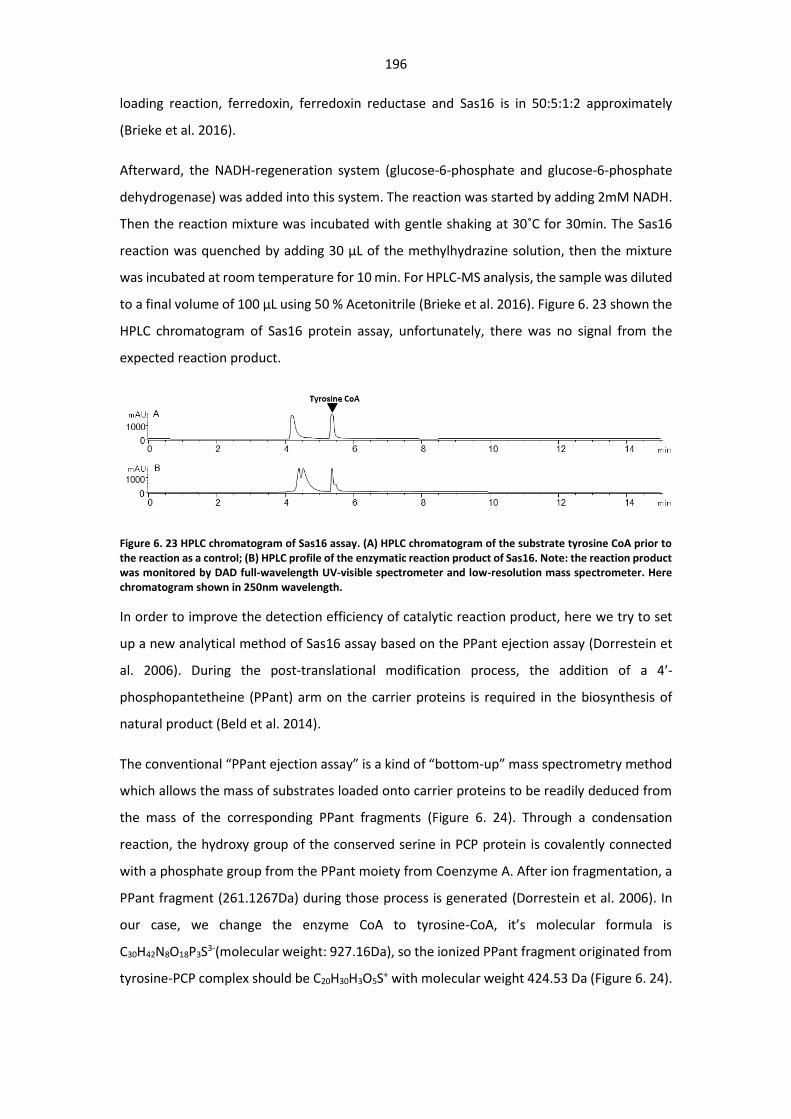
196
loading reaction, ferredoxin, ferredoxin reductase and Sas16 is in 50:5:1:2 approximately
(Brieke et al. 2016).
Afterward, the NADH-regeneration system (glucose-6-phosphate and glucose-6-phosphate
dehydrogenase) was added into this system. The reaction was started by adding 2mM NADH.
Then the reaction mixture was incubated with gentle shaking at 30˚C for 30min. The Sas16
reaction was quenched by adding 30 μL of the methylhydrazine solution, then the mixture
was incubated at room temperature for 10 min. For HPLC-MS analysis, the sample was diluted
to a final volume of 100 μL using 50 % Acetonitrile (Brieke et al. 2016). Figure 6. 23 shown the
HPLC chromatogram of Sas16 protein assay, unfortunately, there was no signal from the
expected reaction product.
Figure 6. 23 HPLC chromatogram of Sas16 assay. (A) HPLC chromatogram of the substrate tyrosine CoA prior to the reaction as a control; (B) HPLC profile of the enzymatic reaction product of Sas16. Note: the reaction product was monitored by DAD full-wavelength UV-visible spectrometer and low-resolution mass spectrometer. Here chromatogram shown in 250nm wavelength.
In order to improve the detection efficiency of catalytic reaction product, here we try to set
up a new analytical method of Sas16 assay based on the PPant ejection assay (Dorrestein et
al. 2006). During the post-translational modification process, the addition of a 4ʹ-
phosphopantetheine (PPant) arm on the carrier proteins is required in the biosynthesis of
natural product (Beld et al. 2014).
The conventional “PPant ejection assay” is a kind of “bottom-up” mass spectrometry method
which allows the mass of substrates loaded onto carrier proteins to be readily deduced from
the mass of the corresponding PPant fragments (Figure 6. 24). Through a condensation
reaction, the hydroxy group of the conserved serine in PCP protein is covalently connected
with a phosphate group from the PPant moiety from Coenzyme A. After ion fragmentation, a
PPant fragment (261.1267Da) during those process is generated (Dorrestein et al. 2006). In
our case, we change the enzyme CoA to tyrosine-CoA, it’s molecular formula is
C30H42N8O18P3S3-(molecular weight: 927.16Da), so the ionized PPant fragment originated from
tyrosine-PCP complex should be C20H30H3O5S+ with molecular weight 424.53 Da (Figure 6. 24).
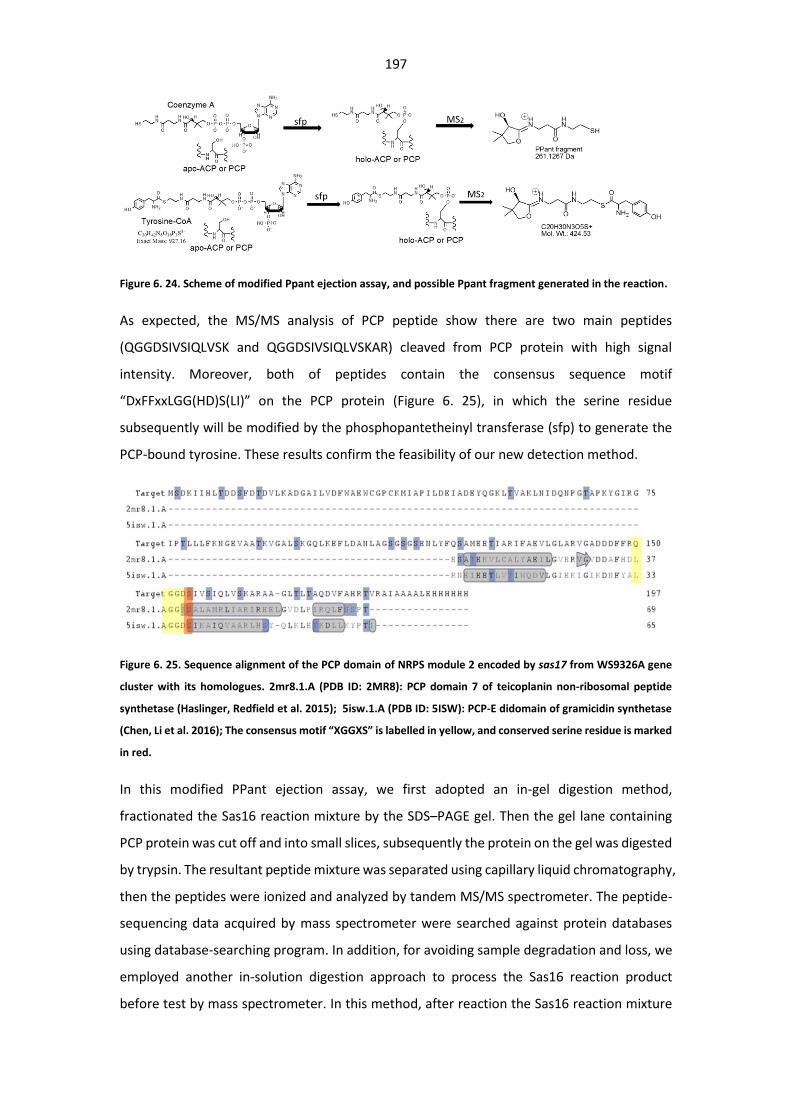
197
Figure 6. 24. Scheme of modified Ppant ejection assay, and possible Ppant fragment generated in the reaction.
As expected, the MS/MS analysis of PCP peptide show there are two main peptides
(QGGDSIVSIQLVSK and QGGDSIVSIQLVSKAR) cleaved from PCP protein with high signal
intensity. Moreover, both of peptides contain the consensus sequence motif
“DxFFxxLGG(HD)S(LI)” on the PCP protein (Figure 6. 25), in which the serine residue
subsequently will be modified by the phosphopantetheinyl transferase (sfp) to generate the
PCP-bound tyrosine. These results confirm the feasibility of our new detection method.
Figure 6. 25. Sequence alignment of the PCP domain of NRPS module 2 encoded by sas17 from WS9326A gene
cluster with its homologues. 2mr8.1.A (PDB ID: 2MR8): PCP domain 7 of teicoplanin non-ribosomal peptide
synthetase (Haslinger, Redfield et al. 2015); 5isw.1.A (PDB ID: 5ISW): PCP-E didomain of gramicidin synthetase
(Chen, Li et al. 2016); The consensus motif “XGGXS” is labelled in yellow, and conserved serine residue is marked
in red.
In this modified PPant ejection assay, we first adopted an in-gel digestion method,
fractionated the Sas16 reaction mixture by the SDS–PAGE gel. Then the gel lane containing
PCP protein was cut off and into small slices, subsequently the protein on the gel was digested
by trypsin. The resultant peptide mixture was separated using capillary liquid chromatography,
then the peptides were ionized and analyzed by tandem MS/MS spectrometer. The peptide-
sequencing data acquired by mass spectrometer were searched against protein databases
using database-searching program. In addition, for avoiding sample degradation and loss, we
employed another in-solution digestion approach to process the Sas16 reaction product
before test by mass spectrometer. In this method, after reaction the Sas16 reaction mixture
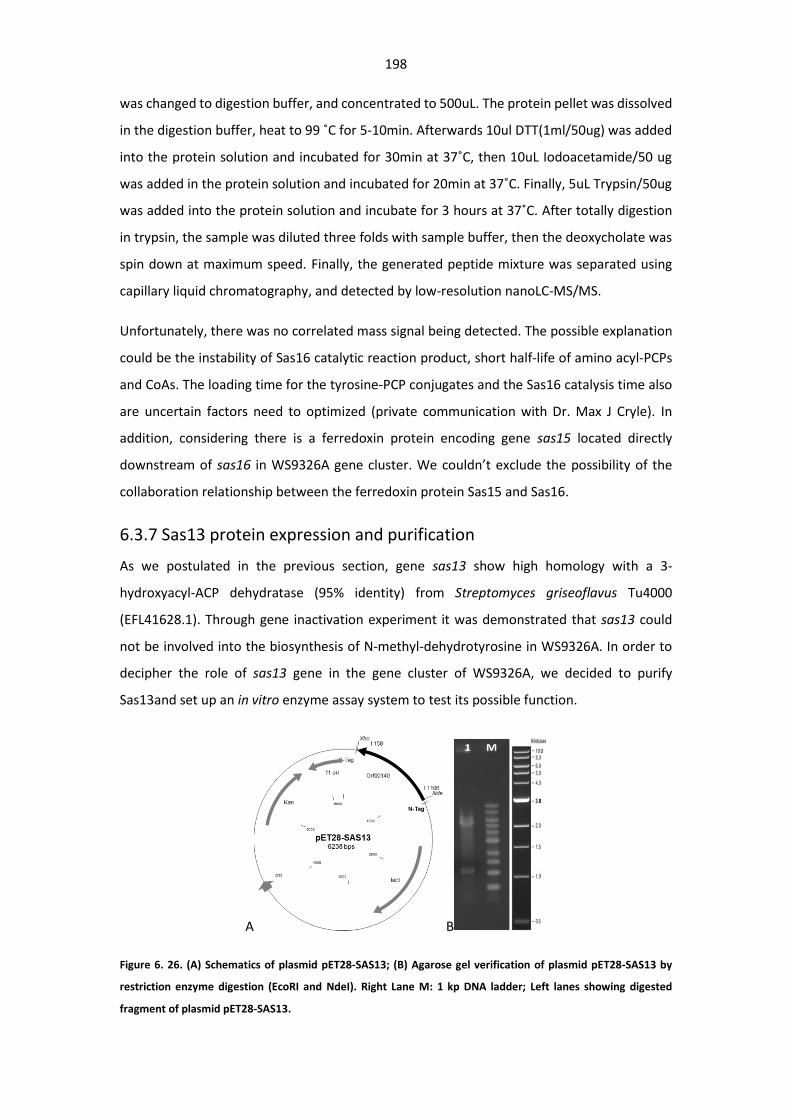
198
was changed to digestion buffer, and concentrated to 500uL. The protein pellet was dissolved
in the digestion buffer, heat to 99 ˚C for 5-10min. Afterwards 10ul DTT(1ml/50ug) was added
into the protein solution and incubated for 30min at 37˚C, then 10uL Iodoacetamide/50 ug
was added in the protein solution and incubated for 20min at 37˚C. Finally, 5uL Trypsin/50ug
was added into the protein solution and incubate for 3 hours at 37˚C. After totally digestion
in trypsin, the sample was diluted three folds with sample buffer, then the deoxycholate was
spin down at maximum speed. Finally, the generated peptide mixture was separated using
capillary liquid chromatography, and detected by low-resolution nanoLC-MS/MS.
Unfortunately, there was no correlated mass signal being detected. The possible explanation
could be the instability of Sas16 catalytic reaction product, short half-life of amino acyl-PCPs
and CoAs. The loading time for the tyrosine-PCP conjugates and the Sas16 catalysis time also
are uncertain factors need to optimized (private communication with Dr. Max J Cryle). In
addition, considering there is a ferredoxin protein encoding gene sas15 located directly
downstream of sas16 in WS9326A gene cluster. We couldn’t exclude the possibility of the
collaboration relationship between the ferredoxin protein Sas15 and Sas16.
6.3.7 Sas13 protein expression and purification
As we postulated in the previous section, gene sas13 show high homology with a 3-
hydroxyacyl-ACP dehydratase (95% identity) from Streptomyces griseoflavus Tu4000
(EFL41628.1). Through gene inactivation experiment it was demonstrated that sas13 could
not be involved into the biosynthesis of N-methyl-dehydrotyrosine in WS9326A. In order to
decipher the role of sas13 gene in the gene cluster of WS9326A, we decided to purify
Sas13and set up an in vitro enzyme assay system to test its possible function.
A B
Figure 6. 26. (A) Schematics of plasmid pET28-SAS13; (B) Agarose gel verification of plasmid pET28-SAS13 by
restriction enzyme digestion (EcoRI and NdeI). Right Lane M: 1 kp DNA ladder; Left lanes showing digested
fragment of plasmid pET28-SAS13.
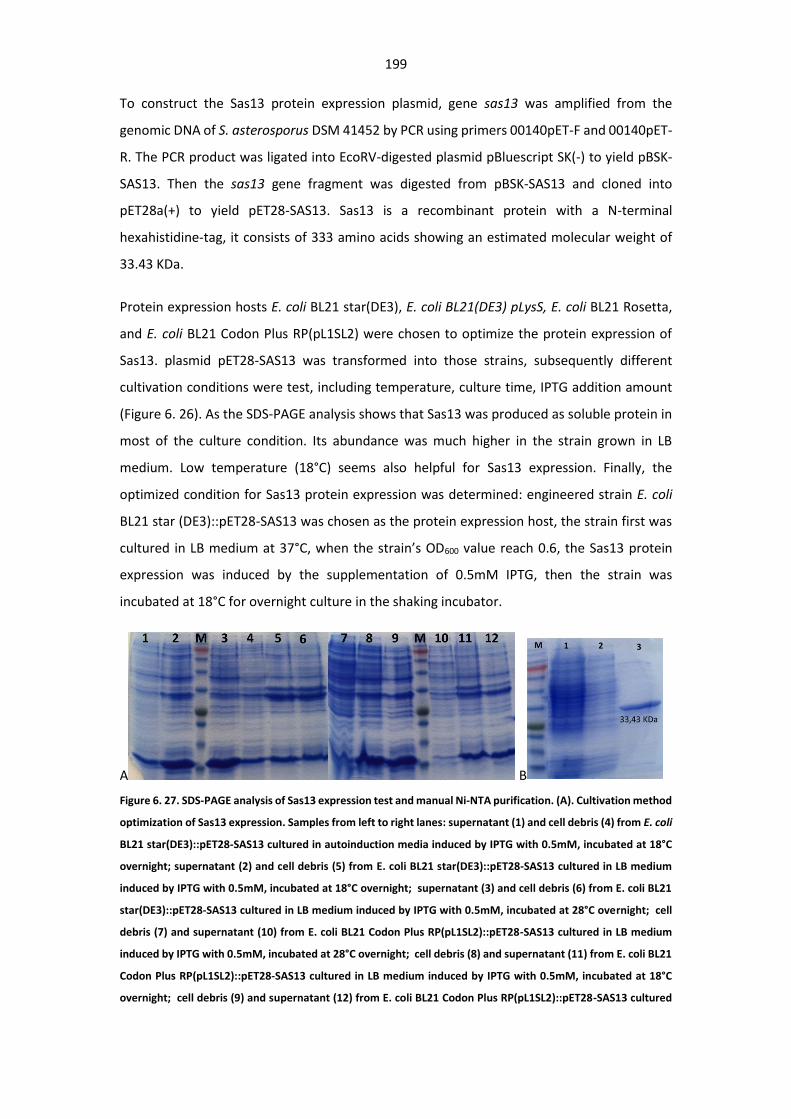
199
To construct the Sas13 protein expression plasmid, gene sas13 was amplified from the
genomic DNA of S. asterosporus DSM 41452 by PCR using primers 00140pET-F and 00140pET-
R. The PCR product was ligated into EcoRV-digested plasmid pBluescript SK(-) to yield pBSK-
SAS13. Then the sas13 gene fragment was digested from pBSK-SAS13 and cloned into
pET28a(+) to yield pET28-SAS13. Sas13 is a recombinant protein with a N-terminal
hexahistidine-tag, it consists of 333 amino acids showing an estimated molecular weight of
33.43 KDa.
Protein expression hosts E. coli BL21 star(DE3), E. coli BL21(DE3) pLysS, E. coli BL21 Rosetta,
and E. coli BL21 Codon Plus RP(pL1SL2) were chosen to optimize the protein expression of
Sas13. plasmid pET28-SAS13 was transformed into those strains, subsequently different
cultivation conditions were test, including temperature, culture time, IPTG addition amount
(Figure 6. 26). As the SDS-PAGE analysis shows that Sas13 was produced as soluble protein in
most of the culture condition. Its abundance was much higher in the strain grown in LB
medium. Low temperature (18°C) seems also helpful for Sas13 expression. Finally, the
optimized condition for Sas13 protein expression was determined: engineered strain E. coli
BL21 star (DE3)::pET28-SAS13 was chosen as the protein expression host, the strain first was
cultured in LB medium at 37°C, when the strain’s OD600 value reach 0.6, the Sas13 protein
expression was induced by the supplementation of 0.5mM IPTG, then the strain was
incubated at 18°C for overnight culture in the shaking incubator.
A B
Figure 6. 27. SDS-PAGE analysis of Sas13 expression test and manual Ni-NTA purification. (A). Cultivation method
optimization of Sas13 expression. Samples from left to right lanes: supernatant (1) and cell debris (4) from E. coli
BL21 star(DE3)::pET28-SAS13 cultured in autoinduction media induced by IPTG with 0.5mM, incubated at 18°C
overnight; supernatant (2) and cell debris (5) from E. coli BL21 star(DE3)::pET28-SAS13 cultured in LB medium
induced by IPTG with 0.5mM, incubated at 18°C overnight; supernatant (3) and cell debris (6) from E. coli BL21
star(DE3)::pET28-SAS13 cultured in LB medium induced by IPTG with 0.5mM, incubated at 28°C overnight; cell
debris (7) and supernatant (10) from E. coli BL21 Codon Plus RP(pL1SL2)::pET28-SAS13 cultured in LB medium
induced by IPTG with 0.5mM, incubated at 28°C overnight; cell debris (8) and supernatant (11) from E. coli BL21
Codon Plus RP(pL1SL2)::pET28-SAS13 cultured in LB medium induced by IPTG with 0.5mM, incubated at 18°C
overnight; cell debris (9) and supernatant (12) from E. coli BL21 Codon Plus RP(pL1SL2)::pET28-SAS13 cultured
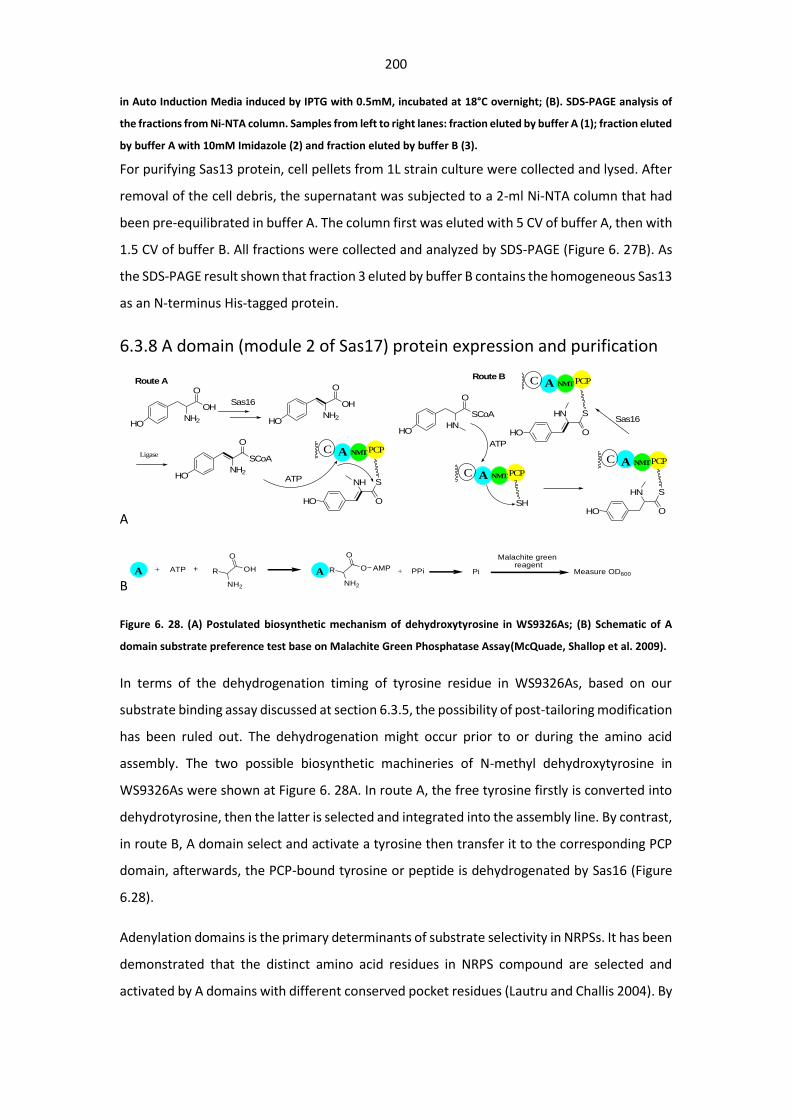
200
in Auto Induction Media induced by IPTG with 0.5mM, incubated at 18°C overnight; (B). SDS-PAGE analysis of
the fractions from Ni-NTA column. Samples from left to right lanes: fraction eluted by buffer A (1); fraction eluted
by buffer A with 10mM Imidazole (2) and fraction eluted by buffer B (3).
For purifying Sas13 protein, cell pellets from 1L strain culture were collected and lysed. After
removal of the cell debris, the supernatant was subjected to a 2-ml Ni-NTA column that had
been pre-equilibrated in buffer A. The column first was eluted with 5 CV of buffer A, then with
1.5 CV of buffer B. All fractions were collected and analyzed by SDS-PAGE (Figure 6. 27B). As
the SDS-PAGE result shown that fraction 3 eluted by buffer B contains the homogeneous Sas13
as an N-terminus His-tagged protein.
6.3.8 A domain (module 2 of Sas17) protein expression and purification
A
BA + ATP + OH
O
R
NH2
A O
O
R
NH2
+ PPiAMPPi Measure OD600
Malachite green reagent
Figure 6. 28. (A) Postulated biosynthetic mechanism of dehydroxytyrosine in WS9326As; (B) Schematic of A
domain substrate preference test base on Malachite Green Phosphatase Assay(McQuade, Shallop et al. 2009).
In terms of the dehydrogenation timing of tyrosine residue in WS9326As, based on our
substrate binding assay discussed at section 6.3.5, the possibility of post-tailoring modification
has been ruled out. The dehydrogenation might occur prior to or during the amino acid
assembly. The two possible biosynthetic machineries of N-methyl dehydroxytyrosine in
WS9326As were shown at Figure 6. 28A. In route A, the free tyrosine firstly is converted into
dehydrotyrosine, then the latter is selected and integrated into the assembly line. By contrast,
in route B, A domain select and activate a tyrosine then transfer it to the corresponding PCP
domain, afterwards, the PCP-bound tyrosine or peptide is dehydrogenated by Sas16 (Figure
6.28).
Adenylation domains is the primary determinants of substrate selectivity in NRPSs. It has been
demonstrated that the distinct amino acid residues in NRPS compound are selected and
activated by A domains with different conserved pocket residues (Lautru and Challis 2004). By
NH2
O
OHNH2
O
OH
NH2
O
SCoAC A NMTPCP
NH
O
S
HO HO
HO
HO
Ligase
HN
O
SCoA
HO
C A NMTPCP
HN
O
S
HO
C A NMTPCP
SH
ATP
Sas16
C A NMTPCP
HN
O
S
HO
Route ARoute B
ATP
Sas16
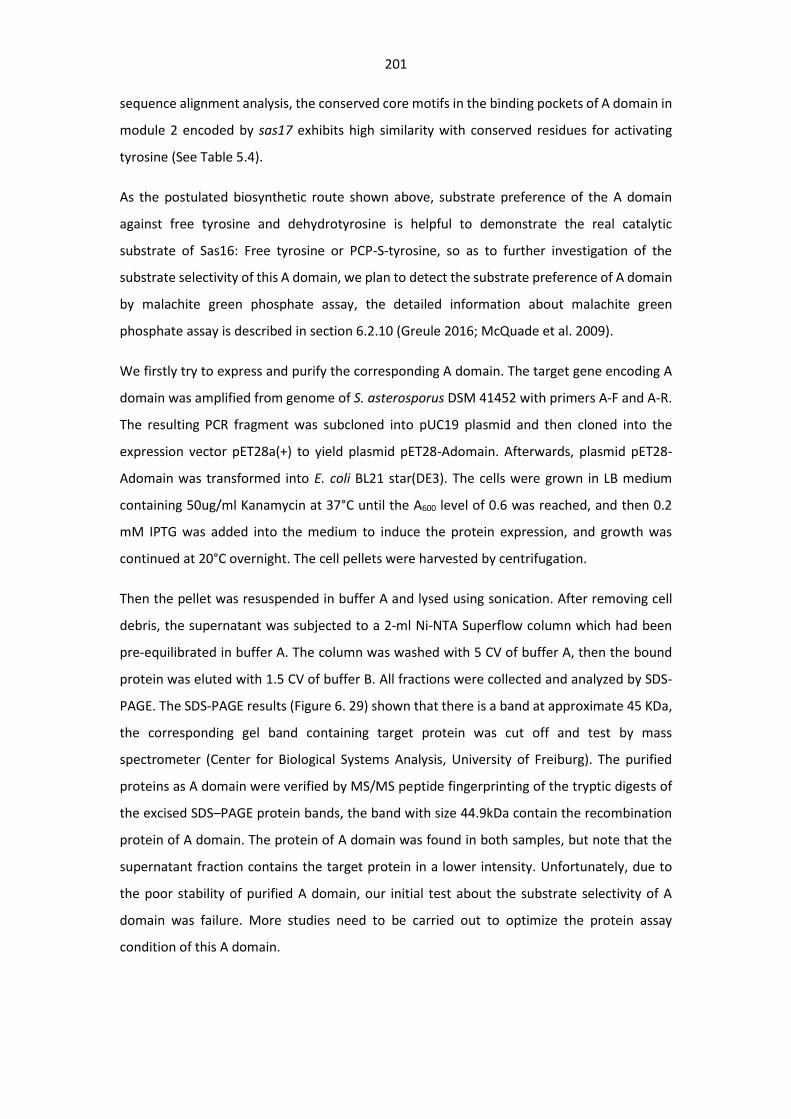
201
sequence alignment analysis, the conserved core motifs in the binding pockets of A domain in
module 2 encoded by sas17 exhibits high similarity with conserved residues for activating
tyrosine (See Table 5.4).
As the postulated biosynthetic route shown above, substrate preference of the A domain
against free tyrosine and dehydrotyrosine is helpful to demonstrate the real catalytic
substrate of Sas16: Free tyrosine or PCP-S-tyrosine, so as to further investigation of the
substrate selectivity of this A domain, we plan to detect the substrate preference of A domain
by malachite green phosphate assay, the detailed information about malachite green
phosphate assay is described in section 6.2.10 (Greule 2016; McQuade et al. 2009).
We firstly try to express and purify the corresponding A domain. The target gene encoding A
domain was amplified from genome of S. asterosporus DSM 41452 with primers A-F and A-R.
The resulting PCR fragment was subcloned into pUC19 plasmid and then cloned into the
expression vector pET28a(+) to yield plasmid pET28-Adomain. Afterwards, plasmid pET28-
Adomain was transformed into E. coli BL21 star(DE3). The cells were grown in LB medium
containing 50ug/ml Kanamycin at 37°C until the A600 level of 0.6 was reached, and then 0.2
mM IPTG was added into the medium to induce the protein expression, and growth was
continued at 20°C overnight. The cell pellets were harvested by centrifugation.
Then the pellet was resuspended in buffer A and lysed using sonication. After removing cell
debris, the supernatant was subjected to a 2-ml Ni-NTA Superflow column which had been
pre-equilibrated in buffer A. The column was washed with 5 CV of buffer A, then the bound
protein was eluted with 1.5 CV of buffer B. All fractions were collected and analyzed by SDS-
PAGE. The SDS-PAGE results (Figure 6. 29) shown that there is a band at approximate 45 KDa,
the corresponding gel band containing target protein was cut off and test by mass
spectrometer (Center for Biological Systems Analysis, University of Freiburg). The purified
proteins as A domain were verified by MS/MS peptide fingerprinting of the tryptic digests of
the excised SDS–PAGE protein bands, the band with size 44.9kDa contain the recombination
protein of A domain. The protein of A domain was found in both samples, but note that the
supernatant fraction contains the target protein in a lower intensity. Unfortunately, due to
the poor stability of purified A domain, our initial test about the substrate selectivity of A
domain was failure. More studies need to be carried out to optimize the protein assay
condition of this A domain.
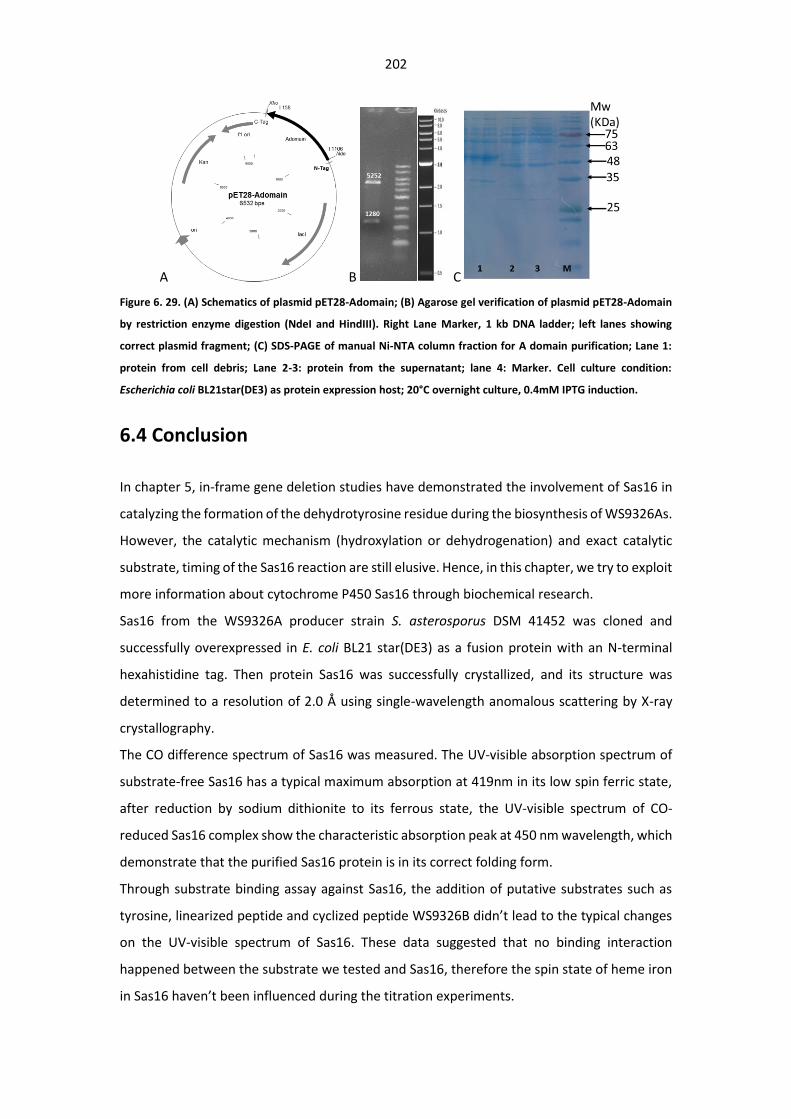
202
A B C
Figure 6. 29. (A) Schematics of plasmid pET28-Adomain; (B) Agarose gel verification of plasmid pET28-Adomain
by restriction enzyme digestion (NdeI and HindIII). Right Lane Marker, 1 kb DNA ladder; left lanes showing
correct plasmid fragment; (C) SDS-PAGE of manual Ni-NTA column fraction for A domain purification; Lane 1:
protein from cell debris; Lane 2-3: protein from the supernatant; lane 4: Marker. Cell culture condition:
Escherichia coli BL21star(DE3) as protein expression host; 20°C overnight culture, 0.4mM IPTG induction.
6.4 Conclusion
In chapter 5, in-frame gene deletion studies have demonstrated the involvement of Sas16 in
catalyzing the formation of the dehydrotyrosine residue during the biosynthesis of WS9326As.
However, the catalytic mechanism (hydroxylation or dehydrogenation) and exact catalytic
substrate, timing of the Sas16 reaction are still elusive. Hence, in this chapter, we try to exploit
more information about cytochrome P450 Sas16 through biochemical research.
Sas16 from the WS9326A producer strain S. asterosporus DSM 41452 was cloned and
successfully overexpressed in E. coli BL21 star(DE3) as a fusion protein with an N-terminal
hexahistidine tag. Then protein Sas16 was successfully crystallized, and its structure was
determined to a resolution of 2.0 Å using single-wavelength anomalous scattering by X-ray
crystallography.
The CO difference spectrum of Sas16 was measured. The UV-visible absorption spectrum of
substrate-free Sas16 has a typical maximum absorption at 419nm in its low spin ferric state,
after reduction by sodium dithionite to its ferrous state, the UV-visible spectrum of CO-
reduced Sas16 complex show the characteristic absorption peak at 450 nm wavelength, which
demonstrate that the purified Sas16 protein is in its correct folding form.
Through substrate binding assay against Sas16, the addition of putative substrates such as
tyrosine, linearized peptide and cyclized peptide WS9326B didn’t lead to the typical changes
on the UV-visible spectrum of Sas16. These data suggested that no binding interaction
happened between the substrate we tested and Sas16, therefore the spin state of heme iron
in Sas16 haven’t been influenced during the titration experiments.
203
The multiple sequence alignment result shown that Sas16 has a much closer evolutionary
relationship with OxyB and OxyC. In the biosynthesis of glycopeptide antibiotic Vancomycin,
Cytochrome P450 OxyB and OxyC were responsible for the phenolic coupling modification,
and both of them only recognized PCP-bound peptide as the actual catalytic
substrate(Pylypenko et al. 2003; Woithe et al. 2007). Moreover, considering the similarity of
protein sequence between Sas16 and OxyB/OxyC, we predicted that the catalytic reaction in
this case of Sas16 also needs the PCP-bounded substrate. In order to verify our prediction, we
established an enzymatic assay system in which the PCP-bound tyrosine was utilized as a
substrate. However, due to the instability of reaction product and substrate, we were not able
to detect the final reaction product. In addition, the substrate spectrum of Sas16 may need to
be expended. We can’t exclude the possibility of PCP-bound peptide being the actual
substrate (private discussion with Dr. Max J. Cryle). Currently the related experiment is
ongoing in the lab of Dr. Max J Cryle (Monash University).
The crystal structure of Sas16 exhibits a dimer form by disulfide-bridge at position Cys11,
which was proven to be an artifact generated during the protein crystallization. The
monomeric Sas16 displays the typical triangular P450 protein folding with the Cys ligand loop
containing the signature sequence FxxGxHxCxG and Cys-357 being the proximal axial thiolate
ligand of the heme iron. The heme group in Sas16 is basically surrounded by core helixes (I-,
K-, L-, and C-helixes) and the Cysteine ligand loop. The longest I-helix (232-264 aa) penetrate
the entire catalytic site and sandwich the heme prosthetic group together with the Cys ligand
loop to generate a conserved substrate active site.
The Cys-loop of Sas16 contains a conserved aromatic residue Phe351 which interacts with the
heme by edge-to-face π-π stacking. This π-stacking interaction generated between the
aromatic ring of Phe351 and the porphyrin ring of heme group very likely will influence the
orientation of the Cys-loop and consequently impact the catalytic activity of P450 enzyme.
In most P450, I-helix is situated over the pyrrole ring B of heme group, where it is located two
highly conserved and important catalytic residues, an acidic residue (Glu or Thr) and a
proximate threonine residue in most cases (Xu et al. 2009). They were believed to regulate
the protonation of intermediate oxygen molecules during the catalytic reaction of P450
enzyme (Zerbe et al. 2002). In the case of Sas16, the acidic residue is Glu249 but its C-terminal
connected amino acid residue is Phe250, moreover, this Phe250 residue interacts with the
heme via face-to-face π-π Interactions (Figure 6. 10). These kinds of strong interaction
between aromatic functionalities could make an important influence on the conformation of
Sas16, thus impact its catalytic function.
204
In comparison with the protein structures of P450 homologues (OxyB, OxyC, OxyD and
P450sky), Sas16 own one more C1 helix (residues 79 to 88) between B- and C-helix above the
heme group and surrounding the conserved catalytic site pocket. These significant structural
changes could restrain the flexibility of B-C loop and influence the transient exposal of the
active site to the substrate (Zerbe et al. 2002; Podust and Sherman 2012). Other differential
parts of Sas16 are the orientation and length of F- and G-helix in Sas16, which show significant
difference with their counterpart in OxyB and OxyC. The F- and G-helix in Sas16 are relatively
longer, and their orientations are rotated toward the active site, which generate a relatively
narrow substrate binding pocket in Sas16. Those differences could greatly affect the catalytic
mechanism of Sas16, and make it not being a standard PCP-bound aminoacyl oxidase in
comparison with others.
About the A domain substrate preference assay, due to the instability of purified A domain,
our attempt was unsuccessful. The initial test results were not ideal, we even try to co-express
the A domain with MbtH protein (data not shown). Those problems drove us to looking for
another approach. Considering the possible subtle interaction of A domain with other
domains in the NRPS machinery (Mitchell et al. 2012; Kittilä et al. 2016), we redesign and
construct the A domain express plasmid as a fusion protein expression vector containing A
domain, NMT domain and PCP domain in the module 2 NRPS synthetase encoded by sas17.
In addition, based on more detailed sequence alignment by CLUSTAL O (1.2.4), the C-terminal
part of the A domain was extended (data not shown) to avoid the truncated sequence happen
(private communication with Dr. Anja Greule).
Through relative comprehensive biochemical research on protein Sas16, we are able to reveal
a little mysterious veil of the special catalytic mechanism of Sas16 in the biosynthesis of
WS9326As. It is believed that our investigation paves a way for the following study. Ultimately,
the research about this special P450 enzyme will enable the development of novel antibiotic
biosynthesis mechanism in the future.
205
Reference
Adamek, M., M. Spohn, et al. (2017). "Mining Bacterial Genomes for Secondary Metabolite Gene Clusters." Antibiotics: Methods and Protocols: 23-47.
Aebersold, R. and M. Mann (2003). "Mass spectrometry-based proteomics." Nature 422(6928): 198-207.
Agrawal, S., A. Adholeya, et al. (2016). "The Pharmacological Potential of Non-ribosomal Peptides from Marine Sponge and Tunicates." Frontiers in pharmacology 7.
Alanjary, M., B. Kronmiller, et al. (2017). "The Antibiotic Resistant Target Seeker (ARTS), an exploration engine for antibiotic cluster prioritization and novel drug target discovery." Nucleic acids research.
Andrews, S. (2010). FastQC: a quality control tool for high throughput sequence data. Aziz, R. K., D. Bartels, et al. (2008). "The RAST Server: Rapid Annotations using Subsystems Technology."
BMC genomics 9(1): 75. Adams, P. D., P. V. Afonine, et al. (2010). "PHENIX: a comprehensive Python-based system for
macromolecular structure solution." Acta Crystallogr D Biol Crystallogr 66(Pt 2): 213-221. Amir-Heidari, B. and J. Micklefield (2007). "NMR confirmation that tryptophan dehydrogenation occurs
with Syn stereochemistry during the biosynthesis of CDA in Streptomyces coelicolor." Journal of Organic Chemistry 72(23): 8950-8953.
Amir-Heidari, B., J. Thirlway, et al. (2007). "Stereochemical Course of Tryptophan Dehydrogenation during Biosynthesis of the Calcium-Dependent Lipopeptide Antibiotics." Organic Letters 9(8): 1513-1516.
Anzai, Y., S. Li, et al. (2008). "Functional analysis of MycCI and MycG, cytochrome P450 enzymes involved in biosynthesis of mycinamicin macrolide antibiotics." Chemistry & Biology 15(9): 950-959.
Barka, E. A., P. Vatsa, et al. (2016). "Taxonomy, physiology, and natural products of Actinobacteria." Microbiology and Molecular Biology Reviews 80(1): 1-43.
Barlow, M. (2009). "What antimicrobial resistance has taught us about horizontal gene transfer." Horizontal Gene Transfer: Genomes in Flux: 397-411.
Barry, S. M., J. A. Kers, et al. (2012). "Cytochrome P450–catalyzed L-tryptophan nitration in thaxtomin phytotoxin biosynthesis." Nat Chem Biol 8(10): 814-816.
Babine, R. E. and S. L. Bender (1997). "Molecular Recognition of Protein−Ligand Complexes: Applications to Drug Design." Chemical Reviews 97(5): 1359-1472.
Bentley, S. D., K. F. Chater, et al. (2002). "Complete genome sequence of the model actinomycete Streptomyces coelicolor A3 (2)." Nature 417(6885): 141-147.
Bian, G., Y. Han, et al. (2017). "Releasing the potential power of terpene synthases by a robust precursor supply platform." Metabolic Engineering 42(Supplement C): 1-8.
Bierman, M., R. Logan, et al. (1992). "Plasmid cloning vectors for the conjugal transfer of DNA from Escherichia coli to Streptomyces spp.." Gene 116: 43-49.
Billingsley, J. M., A. B. DeNicola, et al. (2017). "Engineering the biocatalytic selectivity of iridoid production in Saccharomyces cerevisiae." Metabolic Engineering 44(Supplement C): 117-125.
Birkó, Z., M. Swiatek, et al. (2009). "Lack of A-factor production induces the expression of nutrient scavenging and stress-related proteins in Streptomyces griseus." Molecular & Cellular Proteomics 8(10): 2396-2403.
Blattner, F. R., G. Plunkett, et al. (1997). "The complete genome sequence of Escherichia coli K-12." Science 277(5331): 1453-1462.
Blin, K., M. H. Medema, et al. (2013). "antiSMASH 2.0—a versatile platform for genome mining of secondary metabolite producers." Nucleic acids research 41(W1): W204-W212.
Bumpus, S. B., B. S. Evans, et al. (2009). "A proteomics approach to discovering natural products and their biosynthetic pathways." Nature biotechnology 27(10): 951-956.
Bae, M., H. Kim, et al. (2015). "Mohangamides A and B, new dilactone-tethered pseudo-dimeric peptides inhibiting Candida albicans isocitrate lyase." Org Lett 17(3): 712-715.
Baltz, R. H., V. Miao, et al. (2005). "Natural products to drugs: daptomycin and related lipopeptide antibiotics." Nat Prod Rep 22(6): 717-741.
Barna, J. C. and D. H. Williams (1984). "The structure and mode of action of glycopeptide antibiotics of the vancomycin group." Annu Rev Microbiol 38: 339-357.
206
Bauer, J., G. Ondrovicova, et al. (2014). "Structure and possible mechanism of the CcbJ methyltransferase from Streptomyces caelestis." Acta Crystallographica Section D 70(4): 943-957.
B. Schenkman, J. and I. Jansson (1998). "Spectral analyses of cytochromes P450." Cytochrome P450 protocols: 25-34.
Balmer, Y., W. H. Vensel, et al. (2006). "A complete ferredoxin/thioredoxin system regulates fundamental processes in amyloplasts." Proceedings of the National Academy of Sciences of the United States of America 103(8): 2988-2993.
Battye, T. G., L. Kontogiannis, et al. (2011). "iMOSFLM: a new graphical interface for diffraction-image processing with MOSFLM." Acta Crystallogr D Biol Crystallogr 67(Pt 4): 271-281.
Beau, J., N. Mahid, et al. (2012). "Epigenetic tailoring for the production of anti-infective cytosporones from the marine fungus Leucostoma persoonii." Mar Drugs 10(4): 762-774.
Beld, J., E. C. Sonnenschein, et al. (2014). "The phosphopantetheinyl transferases: catalysis of a post-translational modification crucial for life." Nat Prod Rep 31(1): 61-108.
Bell, S. G., F. Xu, et al. (2010). "Protein recognition in ferredoxin-P450 electron transfer in the class I CYP199A2 system from Rhodopseudomonas palustris." J Biol Inorg Chem 15(3): 315-328.
Bogomolovas, J., B. Simon, et al. (2009). "Screening of fusion partners for high yield expression and purification of bioactive viscotoxins." Protein Expression and Purification 64(1): 16-23.
Brieke, C., V. Kratzig, et al. (2016). Facile Synthetic Access to Glycopeptide Antibiotic Precursor Peptides for the Investigation of Cytochrome P450 Action in Glycopeptide Antibiotic Biosynthesis. Nonribosomal Peptide and Polyketide Biosynthesis: Methods and Protocols. S. B. Evans. New York, NY, Springer New York: 85-102.
Bruheim, P., S. E. Borgos, et al. (2004). "Chemical diversity of polyene macrolides produced by Streptomyces noursei ATCC 11455 and recombinant strain ERD44 with genetically altered polyketide synthase NysC." Antimicrobial agents and chemotherapy 48(11): 4120-4129.
Campbell, C. D. and J. C. Vederas (2010). "Biosynthesis of lovastatin and related metabolites formed by fungal iterative PKS enzymes." Biopolymers 93(9): 755-763.
Carlson, J. C., J. Fortman, et al. (2010). "Identification of the tirandamycin biosynthetic gene cluster from Streptomyces sp. 307-9." Chembiochem 11(4): 564-572.
Chandra, G. and K. F. Chater (2014). "Developmental biology of Streptomyces from the perspective of 100 actinobacterial genome sequences." FEMS Microbiol Rev 38(3): 345-379.
Chater, K. F. (2001). "Regulation of sporulation in Streptomyces coelicolor A3 (2): a checkpoint multiplex?" Current Opinion in Microbiology 4(6): 667-673.
Chater, K. F. (2006). "Streptomyces inside-out: a new perspective on the bacteria that provide us with antibiotics." Philosophical Transactions of the Royal Society of London B: Biological Sciences 361(1469): 761-768.
Chen, Y., I. Ntai, et al. (2011). "A proteomic survey of nonribosomal peptide and polyketide biosynthesis in actinobacteria." Journal of proteome research 11(1): 85-94.
Cheng, Q., D. C. Lamb, et al. (2010). "Cyclization of a Cellular Dipentaenone by Streptomyces coelicolor Cytochrome P450 154A1 without Oxidation/Reduction." J Am Chem Soc 132(43): 15173-15175.
Choi, S.-S., S.-H. Kim, et al. (2010). "Proteomics-driven identification of SCO4677-dependent proteins in Streptomyces lividans and Streptomyces coelicolor." J Microbiol Biotechnol 20(3): 480-484.
Cox, J. and M. Mann (2008). "MaxQuant enables high peptide identification rates, individualized ppb-range mass accuracies and proteome-wide protein quantification." Nature biotechnology 26(12): 1367-1372.
Cox, J. and M. Mann (2012). "1D and 2D annotation enrichment: a statistical method integrating quantitative proteomics with complementary high-throughput data." BMC Bioinformatics 13(16): S12.
Cramer, R. A., M. P. Gamcsik, et al. (2006). "Disruption of a nonribosomal peptide synthetase in Aspergillus fumigatus eliminates gliotoxin production." Eukaryotic Cell 5(6): 972-980.
Cryle, M. J. and I. Schlichting (2008). "Structural insights from a P450 Carrier Protein complex reveal how specificity is achieved in the P450BioI ACP complex." Proceedings of the National Academy of Sciences 105(41): 15696-15701.
Choi, S.-S., S.-H. Kim, et al. (2010). "Proteomics-driven identification of SCO4677-dependent proteins in Streptomyces lividans and Streptomyces coelicolor." J Microbiol Biotechnol 20(3): 480-484.
207
Chang, C., R. Huang, et al. (2015). "Uncovering the formation and selection of benzylmalonyl-CoA from the biosynthesis of splenocin and enterocin reveals a versatile way to introduce amino acids into polyketide carbon scaffolds." J Am Chem Soc 137(12): 4183-4190.
Chen, H., B. K. Hubbard, et al. (2002). "Formation of β-Hydroxy Histidine in the Biosynthesis of Nikkomycin Antibiotics." Chemistry & Biology 9(1): 103-112.
Chen, V. B., W. B. Arendall, 3rd, et al. (2010). "MolProbity: all-atom structure validation for macromolecular crystallography." Acta Crystallogr D Biol Crystallogr 66(Pt 1): 12-21.
Chen, W.-H., K. Li, et al. (2016). "Interdomain and intermodule organization in epimerization domain containing nonribosomal peptide synthetases." ACS Chem Biol 11(8): 2293-2303.
Corsini, L., M. Hothorn, et al. (2008). "Thioredoxin as a fusion tag for carrier-driven crystallization." Protein Science 17(12): 2070-2079.
Cryle, M. J., A. Meinhart, et al. (2010). "Structural characterization of OxyD, a cytochrome P450 involved in beta-hydroxytyrosine formation in vancomycin biosynthesis." J Biol Chem 285(32): 24562-24574.
Cryle, M. J., J. Staaden, et al. (2011). "Structural characterization of CYP165D3, a cytochrome P450 involved in phenolic coupling in teicoplanin biosynthesis." Arch Biochem Biophys 507(1): 163-173.
Darling, A. C., B. Mau, et al. (2004). "Mauve: multiple alignment of conserved genomic sequence with rearrangements." Genome research 14(7): 1394-1403.
Denisov, I. G., T. M. Makris, et al. (2005). "Structure and chemistry of cytochrome P450." Chemical reviews 105(6): 2253-2278.
Desouky, S. E., A. Shojima, et al. (2015). "Cyclodepsipeptides produced by actinomycetes inhibit cyclic-peptide-mediated quorum sensing in Gram-positive bacteria." FEMS microbiology letters 362(14).
Dewick, P. M. (2002). Medicinal natural products: a biosynthetic approach, John Wiley & Sons. Du, Y.-L., S.-Z. Li, et al. (2011). "The pleitropic regulator AdpAch is required for natamycin biosynthesis
and morphological differentiation in Streptomyces chattanoogensis." Microbiology 157(5): 1300-1311.
Dumit, V. I., V. Küttner, et al. (2014). "Altered MCM protein levels and autophagic flux in aged and systemic sclerosis dermal fibroblasts." Journal of Investigative Dermatology 134(9): 2321-2330.
Dyson, P. (2011). Streptomyces: molecular biology and biotechnology, Horizon Scientific Press. Desjardins, R. E., C. Canfield, et al. (1979). "Quantitative assessment of antimalarial activity in vitro by
a semiautomated microdilution technique." Antimicrobial agents and chemotherapy 16(6): 710-718.
Danielson, P. (2002). "The cytochrome P450 superfamily: biochemistry, evolution and drug metabolism in humans." Current drug metabolism 3(6): 561-597.
David, R. (2014). "Medical gallery of David Richfield." Wikiversity Journal of Medicine 1(2): DOI:10.15347/wjm/12014.15009. ISSN 12001-18762
Dorrestein, P. C., S. B. Bumpus, et al. (2006). "Facile detection of acyl and peptidyl intermediates on thiotemplate carrier domains via phosphopantetheinyl elimination reactions during tandem mass spectrometry." Biochemistry 45(42): 12756-12766.
de Lima Procópio, R. E., I. R. da Silva, et al. (2012). "Antibiotics produced by Streptomyces." The Brazilian Journal of infectious diseases 16(5): 466-471.
Elferink, O. (1997). "Validation of the Publication of New Names and New Combinations Previously Effectively Published Outside the IJSB." International Journal of Systematic Bacteriology: 1274.
Embley, T. and E. Stackebrandt (1994). "The molecular phylogency and systematics of the actinomycetes." Annual Reviews in Microbiology 48(1): 257-289.
Emsley, P. and K. Cowtan (2004). "Coot: model-building tools for molecular graphics." Acta Crystallogr D Biol Crystallogr 60(Pt 12 Pt 1): 2126-2132.
Fedoryshyn, M., E. Welle, et al. (2008). "Functional expression of the Cre recombinase in actinomycetes." Appl Microbiol Biotechnol 78(6): 1065-1070.
Felnagle, E. A., E. E. Jackson, et al. (2008). "Nonribosomal peptide synthetases involved in the production of medically relevant natural products." Molecular pharmaceutics 5(2): 191-211.
Förster, J., I. Famili, et al. (2003). "Genome-scale reconstruction of the Saccharomyces cerevisiae metabolic network." Genome research 13(2): 244-253.
208
Friedrich, S. and F. Hahn (2015). "Opportunities for enzyme catalysis in natural product chemistry." Tetrahedron 71(10): 1473-1508.
Fujimori, D. G., S. Hrvatin, et al. (2007). "Cloning and characterization of the biosynthetic gene cluster for kutznerides." Proceedings of the National Academy of Sciences 104(42): 16498-16503.
Finking, R. and M. A. Marahiel (2004). "Biosynthesis of Nonribosomal Peptides." Annual Review of Microbiology 58(1): 453-488.
Fu, C., L. Keller, et al. (2015). "Biosynthetic Studies of Telomycin Reveal New Lipopeptides with Enhanced Activity." J Am Chem Soc 137(24): 7692-7705.
Gause, G., T. Preobrazhenskaya, et al. (1983). A guide for the determination of actinomycetes. Genera Streptomyces, Streptoverticillium, and Chainia, Moscow: Nauka.
Goffeau, A., B. G. Barrell, et al. (1996). "Life with 6000 genes." Science 274(5287): 546-567. Grant, J. L., M. E. Mitchell, et al. (2016). "Catalytic strategy for carbon− carbon bond scission by the
cytochrome P450 OleT." Proceedings of the National Academy of Sciences: 201606294. Greule, A. (2016). "Die Suche nach neuen bioaktiven Sekundärmetaboliten aus Actinomyceten."
Dissertation. Genet, R., P.-H. Bénetti, et al. (1995). "L-Tryptophan 2', 3'-Oxidase from Chromobacterium violaceum
substrate specificity and mechanistic implications." Journal of Biological Chemistry 270(40): 23540-23545.
Gust, B., G. L. Challis, et al. (2003). "PCR-targeted Streptomyces gene replacement identifies a protein domain needed for biosynthesis of the sesquiterpene soil odor geosmin." Proceedings of the National Academy of Sciences 100(4): 1541-1546.
Haas, H., M. Eisendle, et al. (2008). "Siderophores in fungal physiology and virulence." Annu. Rev. Phytopathol. 46: 149-187.
Hackl, S. and A. Bechthold (2015). "The Gene bldA, a Regulator of Morphological Differentiation and Antibiotic Production in Streptomyces." Arch Pharm (Weinheim).
Herrmann, S., T. Siegl, et al. (2012). "Site-specific recombination strategies for engineering actinomycete genomes." Applied and Environmental Microbiology 78(6): 1804-1812.
Hertweck, C. (2009). "The biosynthetic logic of polyketide diversity." Angew Chem Int Ed Engl 48(26): 4688-4716.
Hesketh, A., G. Chandra, et al. (2002). "Primary and secondary metabolism, and post‐translational
protein modifications, as portrayed by proteomic analysis of Streptomyces coelicolor." Mol Microbiol 46(4): 917-932.
Hiard, S., R. Marée, et al. (2007). "PREDetector: a new tool to identify regulatory elements in bacterial genomes." Biochemical and biophysical research communications 357(4): 861-864.
Higo, A., H. Hara, et al. (2012). "Genome-wide distribution of AdpA, a global regulator for secondary metabolism and morphological differentiation in Streptomyces, revealed the extent and complexity of the AdpA regulatory network." DNA Res 19(3): 259-273.
Hopwood, D. (2011). "Natural product biosynthesis by microorganisms and plants, Part A. Preface." Methods in enzymology 515: xv-xx.
Hopwood, D. A. and D. H. Sherman (1990). "Molecular genetics of polyketides and its comparison to fatty acid biosynthesis." Annual review of genetics 24(1): 37-62.
Hou, Y., D. R. Braun, et al. (2012). "Microbial strain prioritization using metabolomics tools for the discovery of natural products." Analytical Chemistry 84(10): 4277-4283.
Huerta-Cepas, J., D. Szklarczyk, et al. (2015). "eggNOG 4.5: a hierarchical orthology framework with improved functional annotations for eukaryotic, prokaryotic and viral sequences." Nucleic acids research 44(D1): D286-D293.
Hwang, K.-S., H. U. Kim, et al. (2014). "Systems biology and biotechnology of Streptomyces species for the production of secondary metabolites." Biotechnol Adv 32(2): 255-268.
Hwang, K.-S., H. U. Kim, et al. (2014). "Systems biology and biotechnology of Streptomyces species for the production of secondary metabolites." Biotechnol Adv 32(2): 255-268.
Hayashi, K., M. Hashimoto, et al. (1992). "WS9326A, a novel tachykinin antagonist isolated from Streptomyces violaceusniger no. 9326." The Journal of antibiotics 45(7): 1055-1063.
Hojati, Z., C. Milne, et al. (2002). "Structure, biosynthetic origin, and engineered biosynthesis of calcium-dependent antibiotics from Streptomyces coelicolor." Chemistry & biology 9(11): 1175-1187.
Hopwood, D. A., M. J. Bibb, et al. (1985). Genetic manipulation of streptomyces: A laboratory manual. Norwich, The John Innes Foundation.
209
Hanahan, D. (1983). "Studies on transformation of Escherichia coli with plasmids." J. Mol. Biol. 166(4): 557-580.
Haslinger, K., C. Redfield, et al. (2015). "Structure of the terminal PCP domain of the non-ribosomal peptide synthetase in teicoplanin biosynthesis." Proteins: Structure, Function, and Bioinformatics 83(4): 711-721.
He, H.-Y., M.-C. Tang, et al. (2014). "Cis-Double Bond Formation by Thioesterase and Transfer by Ketosynthase in FR901464 Biosynthesis." J Am Chem Soc 136(12): 4488-4491.
Ikeda, H., J. Ishikawa, et al. (2003). "Complete genome sequence and comparative analysis of the industrial microorganism Streptomyces avermitilis." Nat Biotech 21(5): 526-531.
Ikeda, H., T. Nonomiya, et al. (1999). "Organization of the biosynthetic gene cluster for the polyketide anthelmintic macrolide avermectin in Streptomyces avermitilis." Proceedings of the National Academy of Sciences 96(17): 9509-9514.
Ikeda, H., K. Shin-ya, et al. (2014). "Genome mining of the Streptomyces avermitilis genome and development of genome-minimized hosts for heterologous expression of biosynthetic gene clusters." J Ind Microbiol Biotechnol 41(2): 233-250.
Igarashi, M., N. Kinoshita, et al. (1997). "Resormycin, a novel herbicidal and antifungal antibiotic produced by a strain of Streptomyces platensis." The Journal of antibiotics 50(12): 1020-1025.
Isin, E. M. and F. P. Guengerich (2008). "Substrate binding to cytochromes P450." Anal Bioanal Chem 392(6): 1019-1030.
Jayapal, K. P., S. Sui, et al. (2010). "Multitagging proteomic strategy to estimate protein turnover rates in dynamic systems." Journal of proteome research 9(5): 2087-2097.
Jiang, X., M. M. H. Ellabaan, et al. (2017). "Dissemination of antibiotic resistance genes from antibiotic producers to pathogens." Nat Commun 8: 15784.
Johnston, C. W., M. A. Skinnider, et al. (2015). "An automated Genomes-to-Natural Products platform (GNP) for the discovery of modular natural products." Nat Commun 6: 8421.
Kalan, L., A. Gessner, et al. (2013). "A cryptic polyene biosynthetic gene cluster in Streptomyces calvus is expressed upon complementation with a functional blda gene." Chemistry & Biology 20(10): 1214-1224.
Kato, J.-y., A. Suzuki, et al. (2002). "Control by A-factor of a metalloendopeptidase gene involved in aerial mycelium formation in Streptomyces griseus." Journal of bacteriology 184(21): 6016-6025.
Kim, S. B., C. Falconer, et al. (1998). "Streptomyces thermocarboxydovorans sp. nov. and Streptomyces thermocarboxydus sp. nov., two moderately thermophilic carboxydotrophic species from soil." International journal of systematic and evolutionary microbiology 48(1): 59-68.
King, J. R., S. Edgar, et al. (2016). "Accessing Nature’s diversity through metabolic engineering and synthetic biology." F1000Research 5.
Klementz, D., K. Döring, et al. (2015). "StreptomeDB 2.0—an extended resource of natural products produced by streptomycetes." Nucleic acids research 44(D1): D509-D514.
Kohanski, M. A., D. J. Dwyer, et al. (2010). "How antibiotics kill bacteria: from targets to networks." Nat Rev Microbiol 8(6): 423.
Komatsu, M., T. Uchiyama, et al. (2010). "Genome-minimized Streptomyces host for the heterologous expression of secondary metabolism." Proceedings of the National Academy of Sciences 107(6): 2646-2651.
Koren, S., M. C. Schatz, et al. (2012). "Hybrid error correction and de novo assembly of single-molecule sequencing reads." Nature biotechnology 30(7): 693-700.
Kotowska, M. and K. Pawlik (2014). "Roles of type II thioesterases and their application for secondary metabolite yield improvement." Appl Microbiol Biotechnol 98(18): 7735-7746.
Krzywinski, M. I., J. E. Schein, et al. (2009). "Circos: An information aesthetic for comparative genomics." Genome Research.
Kabsch, W. (2010). "Xds." Acta Crystallogr D Biol Crystallogr 66(Pt 2): 125-132. Keatinge-Clay, A. T. (2012). "The structures of type I polyketide synthases." Natural product reports
29(10): 1050-1073. Kittilä, T., A. Mollo, et al. (2016). "New structural data reveal the motion of carrier proteins in
nonribosomal peptide synthesis." Angewandte Chemie International Edition 55(34): 9834-9840.
Lagesen, K., P. Hallin, et al. (2007). "RNAmmer: consistent and rapid annotation of ribosomal RNA genes." Nucleic acids research 35(9): 3100-3108.
210
Larraona, I. S. (2015). "Investigations on ABC and MFS transporters of Streptomyces spp." Dissertation. Lee, K.-W., H.-S. Joo, et al. (2006). "Proteomics for Streptomyces:'Industrial proteomics' for antibiotics."
J Microbiol Biotechnol 16(3): 331-348. Lewis, K. (2013). "Platforms for antibiotic discovery." Nat Rev Drug Discov 12(5): 371-387. Lewis, R. A., S. K. Shahi, et al. (2011). "Genome-wide transcriptomic analysis of the response to nitrogen
limitation in Streptomyces coelicolor A3 (2)." BMC research notes 4(1): 78. Li, Q., X. Qin, et al. (2016). "Deciphering the biosynthetic origin of L-allo-isoleucine." J. Am. Chem. Soc
138(1): 408-415. Li, Y., K. J. Weissman, et al. (2008). "Myxochelin Biosynthesis: Direct Evidence for Two- and Four-
Electron Reduction of a Carrier Protein-Bound Thioester." J Am Chem Soc 130(24): 7554-7555. Ling, L. L., T. Schneider, et al. (2015). "A new antibiotic kills pathogens without detectable resistance."
Nature 517(7535): 455-459. Liu, G., K. F. Chater, et al. (2013). "Molecular regulation of antibiotic biosynthesis in Streptomyces."
Microbiology and Molecular Biology Reviews 77(1): 112-143. Lowe, T. M. and P. P. Chan (2016). "tRNAscan-SE On-line: integrating search and context for analysis of
transfer RNA genes." Nucleic acids research 44(W1): W54-W57. Luo, Y., H. Huang, et al. (2013). "Activation and characterization of a cryptic polycyclic tetramate
macrolactam biosynthetic gene cluster." Nat Commun 4: 2894. Larraona, I. S. (2015). "Investigations on ABC and MFS transporters of Streptomyces spp." Dissertation. Lagesen, K., P. Hallin, et al. (2007). "RNAmmer: consistent and rapid annotation of ribosomal RNA
genes." Nucleic acids research 35(9): 3100-3108. Lautru, S. and G. L. Challis (2004). "Substrate recognition by nonribosomal peptide synthetase multi-
enzymes." Microbiology 150(6): 1629-1636. Li, Y.-H., W.-J. Han, et al. (2016). "Putative Nonribosomal Peptide Synthetase and Cytochrome P450
Genes Responsible for Tentoxin Biosynthesis in Alternaria alternata ZJ33." Toxins 8(8): 234. Ma, J., H. Huang, et al. (2017). "Biosynthesis of ilamycins featuring unusual building blocks and
engineered production of enhanced anti-tuberculosis agents." Nat Commun 8. Maguire, A. R., W.-D. Meng, et al. (1993). "Synthetic approaches towards nucleocidin and selected
analogues; anti-HIV activity in 4ʹ-fluorinated nucleoside derivatives." Journal of the Chemical Society, Perkin Transactions 1(15): 1795-1808.
Makino, M., H. Sugimoto, et al. (2007). "Crystal structures and catalytic mechanism of cytochrome P450 StaP that produces the indolocarbazole skeleton." Proceedings of the National Academy of Sciences 104(28): 11591-11596.
Makitrynskyy, R., B. Ostash, et al. (2013). "Pleiotropic regulatory genes bldA, adpA and absB are implicated in production of phosphoglycolipid antibiotic moenomycin." Open Biol 3(10): 130121.
Mallick, P. and B. Kuster (2010). "Proteomics: a pragmatic perspective." Nature biotechnology 28(7): 695-709.
Mann, M. (2006). "Functional and quantitative proteomics using SILAC." Nature reviews Molecular cell biology 7(12): 952-958.
Manteca, A., H. R. Jung, et al. (2010). "Quantitative proteome analysis of Streptomyces coelicolor nonsporulating liquid cultures demonstrates a complex differentiation process comparable to that occurring in sporulating solid cultures." Journal of proteome research 9(9): 4801-4811.
Manteca, A., J. Sanchez, et al. (2010). "Quantitative proteomics analysis of Streptomyces coelicolor development demonstrates that onset of secondary metabolism coincides with hypha differentiation." Molecular & Cellular Proteomics 9(7): 1423-1436.
Mao, X. M., W. Xu, et al. (2015). "Epigenetic genome mining of an endophytic fungus leads to the pleiotropic biosynthesis of natural products." Angewandte Chemie 127(26): 7702-7706.
Medema, M. H., K. Blin, et al. (2011). "antiSMASH: rapid identification, annotation and analysis of secondary metabolite biosynthesis gene clusters in bacterial and fungal genome sequences." Nucleic acids research 39(suppl_2): W339-W346.
Mootz, H. D., D. Schwarzer, et al. (2002). "Ways of Assembling Complex Natural Products on Modular Nonribosomal Peptide Synthetases." Chembiochem 3(6): 490-504.
Morton, G. O., J. E. Lancaster, et al. (1969). "Structure of nucleocidin. III. Revised structure." J Am Chem Soc 91(6): 1535-1537.
Munro, A. W., D. G. Leys, et al. (2002). "P450 BM3: the very model of a modern flavocytochrome." Trends in biochemical sciences 27(5): 250-257.
211
Myronovskyi, M., B. Tokovenko, et al. (2014). "Genome rearrangements of Streptomyces albus J1074 lead to the carotenoid gene cluster activation." Appl Microbiol Biotechnol 98(2): 795-806.
Myronovskyi, M., E. Welle, et al. (2011). "β-Glucuronidase as a sensitive and versatile reporter in actinomycetes." Applied and Environmental Microbiology 77(15): 5370-5383.
Marfey, P. (1984). "Determination of D-amino acids. II. Use of a bifunctional reagent, 1, 5-difluoro-2, 4-dinitrobenzene." Carlsberg Research Communications 49(6): 591-596.
McQuade, T. J., A. D. Shallop, et al. (2009). "A nonradioactive high-throughput assay for screening and characterization of adenylation domains for nonribosomal peptide combinatorial biosynthesis." Analytical Biochemistry 386(2): 244-250.
Mitchell, C. A., C. Shi, et al. (2012). "Structure of PA1221, a nonribosomal peptide synthetase containing adenylation and peptidyl carrier protein domains." Biochemistry 51(15): 3252-3263.
Mo, X., J. Ma, et al. (2012). "Δ11, 12 Double bond formation in tirandamycin biosynthesis is atypically catalyzed by TrdE, a glycoside hydrolase family enzyme." J Am Chem Soc 134(6): 2844-2847.
Mootz, H. D., R. Finking, et al. (2001). "4'-phosphopantetheine transfer in primary and secondary metabolism of Bacillus subtilis." J Biol Chem 276(40): 37289-37298.
Murshudov, G. N., P. Skubak, et al. (2011). "REFMAC5 for the refinement of macromolecular crystal structures." Acta Crystallogr D Biol Crystallogr 67(Pt 4): 355-367.
Nakayama, J., Y. Cao, et al. (2001). "Chemical synthesis and biological activity of the gelatinase biosynthesis-activating pheromone of Enterococcus faecalis and its analogs." Bioscience, biotechnology, and biochemistry 65(10): 2322-2325.
Nguyen, K. T., J. Tenor, et al. (2003). "Colonial differentiation in Streptomyces coelicolor depends on translation of a specific codon within the adpA gene." Journal of bacteriology 185(24): 7291-7296.
Neumann, C. S., D. G. Fujimori, et al. (2008). "Halogenation strategies in natural product biosynthesis." Chemistry & Biology 15(2): 99-109.
O’Hagan, D. and D. B. Harper (1999). "Fluorine-containing natural products." Journal of Fluorine Chemistry 100(1): 127-133.
Ogura, H., C. R. Nishida, et al. (2004). "EpoK, a cytochrome P450 involved in biosynthesis of the anticancer agents epothilones A and B. Substrate-mediated rescue of a P450 enzyme." Biochemistry 43(46): 14712-14721.
Ohnishi, Y., J. Ishikawa, et al. (2008). "Genome sequence of the streptomycin-producing microorganism Streptomyces griseus IFO 13350." Journal of bacteriology 190(11): 4050-4060.
Ohnishi, Y., H. Yamazaki, et al. (2005). "AdpA, a central transcriptional regulator in the A-factor regulatory cascade that leads to morphological development and secondary metabolism in Streptomyces griseus." Bioscience, biotechnology, and biochemistry 69(3): 431-439.
Ong, S.-E., B. Blagoev, et al. (2002). "Stable isotope labeling by amino acids in cell culture, SILAC, as a simple and accurate approach to expression proteomics." Molecular & cellular proteomics 1(5): 376-386.
O’Neill, J. (2016). "Tackling Drug-Resistant Infections Globally: Final Report and Recommendations." The Review on Antimicrobial Resistance, Wellcome Trust & UK Government.
Omura, S., D. Van der Pyl, et al. (1993). "Pepticinnamins, new farnesyl-protein transferase inhibitors produced by an actinomycete. I. Producing strain, fermentation, isolation and biological activity." J Antibiot (Tokyo) 46(2): 222-228.
Ojika, M., Y. Inukai, et al. (2008). "Miuraenamides: Antimicrobial cyclic depsipeptides isolated from a rare and slightly halophilic myxobacterium." Chemistry–An Asian Journal 3(1): 126-133.
Pan, Y., G. Liu, et al. (2009). "The pleiotropic regulator AdpA-L directly controls the pathway-specific activator of nikkomycin biosynthesis in Streptomyces ansochromogenes." Molecular microbiology 72(3): 710-723.
Paranthaman, S. and K. Dharmalingam (2003). "Intergeneric conjugation in Streptomyces peucetius and Streptomyces sp. strain C5: chromosomal integration and expression of recombinant plasmids carrying the chiC gene." Applied and Environmental Microbiology 69(1): 84-91.
Peschke, M., K. Haslinger, et al. (2016). "Regulation of the P450 oxygenation cascade involved in glycopeptide antibiotic biosynthesis." J Am Chem Soc 138(21): 6746-6753.
Pickens, L. B., Y. Tang, et al. (2011). "Metabolic engineering for the production of natural products." Annual review of chemical and biomolecular engineering 2: 211-236.
Picossi, S., A. Valladares, et al. (2004). " Nitrogen-regulated genes for the metabolism of cyanophycin, a bacterial nitrogen reserve polymer: expression and mutational analysis of two cyanophycin
212
synthetase and cyanophycinase gene clusters in heterocyst-forming cyanobacterium Anabaena sp. PCC 7120." Journal of Biological Chemistry 279(12): 11582-11592.
Podust, L. M. and D. H. Sherman (2012). "Diversity of P450 enzymes in the biosynthesis of natural products." Natural product reports 29(10): 1251-1266.
Poulos, T. L. and R. Raag (1992). "Cytochrome P450cam: crystallography, oxygen activation, and electron transfer." The FASEB Journal 6(2): 674-679.
Pylypenko, O., F. Vitali, et al. (2003). "Crystal structure of OxyC, a cytochrome P450 implicated in an oxidative C–C coupling reaction during vancomycin biosynthesis." Journal of Biological Chemistry 278(47): 46727-46733.
Pohle, S., C. Appelt, et al. (2011). "Biosynthetic gene cluster of the non-ribosomally synthesized cyclodepsipeptide skyllamycin: deciphering unprecedented ways of unusual hydroxylation reactions." J Am Chem Soc 133(16): 6194-6205.
Palaniappan, N., M. M. Alhamadsheh, et al. (2008). "cis-Δ2, 3-Double bond of phoslactomycins is generated by a post-PKS tailoring enzyme." J Am Chem Soc 130(37): 12236-12237.
Plaza, A., K. Viehrig, et al. (2013). "Jahnellamides, alpha-keto-beta-methionine-containing peptides from the terrestrial myxobacterium Jahnella sp.: structure and biosynthesis." Org Lett 15(22): 5882-5885.
Poulos, T. L. (2003). "Cytochrome P450 flexibility." Proceedings of the National Academy of Sciences 100(23): 13121-13122.
Rebets, Y., B. Tokovenko, et al. (2014). "Complete genome sequence of producer of the glycopeptide antibiotic Aculeximycin Kutzneria albida DSM 43870T, a representative of minor genus of Pseudonocardiaceae." BMC genomics 15(1): 885.
Renault, H., J.-E. Bassard, et al. (2014). "Cytochrome P450-mediated metabolic engineering: current progress and future challenges." Current opinion in plant biology 19: 27-34.
Richter, M. E., N. Traitcheva, et al. (2008). "Sequential asymmetric polyketide heterocyclization catalyzed by a single cytochrome P450 monooxygenase (AurH)." Angewandte Chemie International Edition 47(46): 8872-8875.
Ro, D.-K., E. M. Paradise, et al. (2006). "Production of the antimalarial drug precursor artemisinic acid in engineered yeast." Nature 440(7086): 940-943.
Robert, X. and P. Gouet (2014). "Deciphering key features in protein structures with the new ENDscript server." Nucleic acids research 42(W1): W320-W324.
Roberts, G. A., G. Grogan, et al. (2002). "Identification of a New Class of Cytochrome P450 from a Rhodococcus sp." Journal of bacteriology 184(14): 3898-3908.
Rokem, J. S., A. E. Lantz, et al. (2007). "Systems biology of antibiotic production by microorganisms." Natural product reports 24(6): 1262-1287.
Rudolf, J. D., C.-Y. Chang, et al. (2017). "Cytochromes P450 for natural product biosynthesis in Streptomyces: sequence, structure, and function." Natural product reports 34(9): 1141-1172.
Rutherford, K., J. Parkhill, et al. (2000). "Artemis: sequence visualization and annotation." Bioinformatics 16(10): 944-945.
Reeves, C. D., S. L. Ward, et al. (2004). "Production of hybrid 16-membered macrolides by expressing combinations of polyketide synthase genes in engineered Streptomyces fradiae hosts." Chemistry & Biology 11(10): 1465-1472.
Sharma, A. and B. N. Johri (2003). "Growth promoting influence of siderophore-producing Pseudomonas strains GRP3A and PRS9 in maize (Zea mays L.) under iron limiting conditions." Microbiological Research 158(3): 243-248.
Shevchenko, A., H. Tomas, et al. (2006). "In-gel digestion for mass spectrometric characterization of proteins and proteomes." Nature protocols 1(6): 2856-2860.
Shen, B. (2003). "Polyketide biosynthesis beyond the type I, II and III polyketide synthase paradigms." Curr Opin Chem Biol 7(2): 285-295.
Shigematsu, N., K. Hayashi, et al. (1993). "Structure of WS9326A, a novel tachykinin antagonist from a Streptomyces." The Journal of Organic Chemistry 58(1): 170-175.
Siguier, P., J. Pérochon, et al. (2006). "ISfinder: the reference centre for bacterial insertion sequences." Nucleic acids research 34(suppl_1): D32-D36.
Sieber, S. A. and M. A. Marahiel (2005). "Molecular mechanisms underlying nonribosomal peptide synthesis: approaches to new antibiotics." Chemical reviews 105(2): 715-738.
Skinnider, M. A., N. J. Merwin, et al. (2017). "PRISM 3: expanded prediction of natural product chemical structures from microbial genomes." Nucleic acids research 45, web server issue:W49-54.
213
Soufi, B., C. Kumar, et al. (2010). "Stable isotope labeling by amino acids in cell culture (SILAC) applied to quantitative proteomics of Bacillus subtilis." Journal of proteome research 9(7): 3638-3646.
Stassi, D., S. Donadio, et al. (1993). "Identification of a Saccharopolyspora erythraea gene required for the final hydroxylation step in erythromycin biosynthesis." Journal of bacteriology 175(1): 182-189.
Süssmuth, R. D. and A. Mainz (2017). "Nonribosomal Peptide Synthesis—Principles and Prospects." Angewandte Chemie International Edition 56(14): 3770-3821.
Shigematsu, N., N. Kayakiri, et al. (1997). "Total synthesis of WS9326A, a potent tachykinin antagonist from Streptomyces violaceoniger." Chemical & Pharmaceutical Bulletin 45(2): 236-242.
Smilkstein, M., N. Sriwilaijaroen, et al. (2004). "Simple and inexpensive fluorescence-based technique for high-throughput antimalarial drug screening." Antimicrobial agents and chemotherapy 48(5): 1803-1806.
Strieker, M., E. M. Nolan, et al. (2009). "Stereospecific synthesis of threo-and erythro-β-hydroxyglutamic acid during kutzneride biosynthesis." J Am Chem Soc 131(37): 13523-13530.
Takano, E., M. Tao, et al. (2003). "A rare leucine codon in adpA is implicated in the morphological defect of bldA mutants of Streptomyces coelicolor." Mol Microbiol 50(2): 475-486.
Takai, K., Y. Sasai, et al. (1984). "Enzymatic dehydrogenation of tryptophan residues of human globins by tryptophan side chain oxidase II." Journal of Biological Chemistry 259(7): 4452-4457.
Teufel, R., A. Miyanaga, et al. (2013). "Flavin-mediated dual oxidation controls an enzymatic Favorskii-type rearrangement." Nature 503(7477): 552-556.
Trager, W. and J. B. Jensen (1976). "Human malaria parasites in continuous culture." Science 193(4254): 673-675.
Teshima, T., M. Nishikawa, et al. (1988). "The structure of an antibiotic, dityromycin." Tetrahedron Letters 29(16): 1963-1966.
Uhlmann, S., R. D. Süssmuth, et al. (2013). "Cytochrome P450sky Interacts Directly with the Nonribosomal Peptide Synthetase to Generate Three Amino Acid Precursors in Skyllamycin Biosynthesis." ACS Chem Biol 8(11): 2586-2596.
Van Wezel, G. P., J. van der Meulen, et al. (2000). "ssgA Is Essential for Sporulation ofStreptomyces coelicolor A3 (2) and Affects Hyphal Development by Stimulating Septum Formation." Journal of bacteriology 182(20): 5653-5662.
Velkov, T., J. Horne, et al. (2011). "Characterization of the N-Methyltransferase Activities of the Multifunctional Polypeptide Cyclosporin Synthetase." Chemistry & Biology 18(4): 464-475.
Vagin, A. and A. Teplyakov (2010). "Molecular replacement with MOLREP." Acta Crystallogr D Biol Crystallogr 66(Pt 1): 22-25.
Walsh, C. T., H. Chen, et al. (2001). "Tailoring enzymes that modify nonribosomal peptides during and after chain elongation on NRPS assembly lines." Curr Opin Chem Biol 5(5): 525-534.
Walsh, C. T., R. V. O'Brien, et al. (2013). "Nonproteinogenic amino acid building blocks for nonribosomal peptide and hybrid polyketide scaffolds." Angewandte Chemie International Edition 52(28): 7098-7124.
Weber, J., J. Leung, et al. (1991). "An erythromycin derivative produced by targeted gene disruption in Saccharopolyspora erythraea." Science 252(5002): 114-118.
Weber, K. A., L. A. Achenbach, et al. (2006). "Microorganisms pumping iron: anaerobic microbial iron oxidation and reduction." Nat Rev Micro 4(10): 752-764.
Weber, T. (2014). "In silico tools for the analysis of antibiotic biosynthetic pathways." International Journal of Medical Microbiology 304(3): 230-235.
Wiese, S., K. A. Reidegeld, et al. (2007). "Protein labeling by iTRAQ: a new tool for quantitative mass spectrometry in proteome research." Proteomics 7(3): 340-350.
Wolański, M., R. Donczew, et al. (2011). "The level of AdpA directly affects expression of developmental genes in Streptomyces coelicolor." Journal of bacteriology 193(22): 6358-6365.
Wolański, M., D. Jakimowicz, et al. (2012). "AdpA, key regulator for morphological differentiation regulates bacterial chromosome replication." Open Biol 2(7): 120097.
Wong, W. R., A. G. Oliver, et al. (2012). "Development of Antibiotic Activity Profile Screening for the Classification and Discovery of Natural Product Antibiotics." Chemistry & Biology 19(11): 1483-1495.
Winn, M., J. K. Fyans, et al. (2016). "Recent advances in engineering nonribosomal peptide assembly lines." Natural product reports.
214
Woithe, K., N. Geib, et al. (2007). "Oxidative phenol coupling reactions catalyzed by OxyB: a cytochrome P450 from the vancomycin producing organism. Implications for vancomycin biosynthesis." J Am Chem Soc 129(21): 6887-6895.
Ward, S. L., Z. Hu, et al. (2004). "Chalcomycin biosynthesis gene cluster from Streptomyces bikiniensis: novel features of an unusual ketolide produced through expression of the chm polyketide synthase in Streptomyces fradiae." Antimicrobial agents and chemotherapy 48(12): 4703-4712.
Winn, M. D., C. C. Ballard, et al. (2011). "Overview of the CCP4 suite and current developments." Acta Crystallogr D Biol Crystallogr 67(Pt 4): 235-242.
Xu, J., J. Zhang, et al. (2017). "Activation and mechanism of a cryptic oviedomycin gene cluster via the disruption of a global regulatory gene, adpA, in Streptomyces ansochromogenes." Journal of Biological Chemistry 292(48): 19708-19720.
Xu, F., S. G. Bell, et al. (2009). "Crystal structure of a ferredoxin reductase for the CYP199A2 system from Rhodopseudomonas palustris." Proteins 77(4): 867-880.
Yamazaki, H., Y. Ohnishi, et al. (2000). "An A-Factor-Dependent Extracytoplasmic Function Sigma Factor (ςAdsA) That Is Essential for Morphological Development in Streptomyces griseus." Journal of bacteriology 182(16): 4596-4605.
Yamazaki, H., A. Tomono, et al. (2004). "DNA-binding specificity of AdpA, a transcriptional activator in the A-factor regulatory cascade in Streptomyces griseus." Mol Microbiol 53(2): 555-572.
Yan, X., H. Ge, et al. (2016). "Strain Prioritization and Genome Mining for Enediyne Natural Products." mBio 7(6): e02104-02116.
Ye, C., I. S. Ng, et al. (2014). "Direct proteomic mapping of Streptomyces roseosporus NRRL 11379 with precursor and insights into daptomycin biosynthesis." Journal of Bioscience and Bioengineering 117(5): 591-597.
Yu, P., S.-P. Liu, et al. (2014). "WblAch, a Pivotal Activator for Natamycin Biosynthesis and Morphological Differentiation, is Positively Regulated by AdpAch in Streptomyces chattanoogensis L10." Applied and Environmental Microbiology: AEM. 01849-01814.
Yu, Z., S. Vodanovic-Jankovic, et al. (2012). "New WS9326A congeners from Streptomyces sp. 9078 inhibiting Brugia malayi asparaginyl-tRNA synthetase." Organic Letters 14(18): 4946-4949.
Yanischperron, C., J. Vieira, et al. (1985). "Improved M13 phage cloning vectors and host strains - nucleotidesequences of the M13 MP18 and PUC19 Vectors." Gene 33: 103-119.
Yamazaki, Y., T. Someno, et al. (2015). "Androprostamines A and B, the new anti-prostate cancer agents produced by Streptomyces sp. MK932-CF8." The Journal of antibiotics 68(4): 279-285.
Yin, J., A. J. Lin, et al. (2006). "Site-specific protein labeling by Sfp phosphopantetheinyl transferase." Nature protocols 1(1): 280.
Zhang, W., J. R. Heemstra, Jr., et al. (2010). "Activation of the pacidamycin PacL adenylation domain by MbtH-like proteins." Biochemistry 49(46): 9946-9947.
Zhong, L, W, Zhang, S, Li. (2016). "Cytochrome P450 enzymes and microbial drug development - A review[J]. Acta Microbiologica Sinica 56(3): 496-515.
Zerbe, K., O. Pylypenko, et al. (2002). "Crystal structure of OxyB, a cytochrome P450 implicated in an oxidative phenol coupling reaction during vancomycin biosynthesis." Journal of Biological Chemistry 277(49): 47476-47485.
Zhang, C., L. Kong, et al. (2013). "In vitro characterization of echinomycin biosynthesis: formation and hydroxylation of L-tryptophanyl-S-enzyme and oxidation of (2S, 3S) β-hydroxytryptophan." PLoS One 8(2): e56772.
Zhang, X. and S. Li (2017). "Expansion of chemical space for natural products by uncommon P450 reactions." Natural product reports 34(9): 1061-1089.
Zhang, S. and A. Bechthold (2016). Chapter 8 Iteratively Acting Glycosyltransferases. Handbook of Carbohydrate-Modifying Biocatalysts. Pan Stanford Publishing Pte. Ltd.: 321-348.
Zhou, Z., J. R. Lai, et al. (2007). "Directed evolution of aryl carrier proteins in the enterobactin synthetase." Proceedings of the National Academy of Sciences 104(28): 11621-11626.
Zhu, X. M., S. Hackl, et al. (2015). "Biosynthesis of the Fluorinated Natural Product Nucleocidin in Streptomyces calvus Is Dependent on the bldA-Specified Leu-tRNAUUA Molecule." Chembiochem 16(17): 2498-2506.
Zerbe, K., O. Pylypenko, et al. (2002). "Crystal structure of OxyB, a cytochrome P450 implicated in an oxidative phenol coupling reaction during vancomycin biosynthesis." Journal of Biological Chemistry 277(49): 47476-47485.

215
Zhang, Y., B. R. Fonslow, et al. (2013). "Protein analysis by shotgun/bottom-up proteomics." Chemical reviews 113(4): 2343-2394.
Zhang, B., W. Tian, et al. (2017). "Activation of Natural Products Biosynthetic Pathways via a Protein
Modification Level Regulation." ACS Chem Biol. 12(7): 1732-1736.
Related Documents