RESEARCH ARTICLE Open Access Genomics of sablefish (Anoplopoma fimbria): expressed genes, mitochondrial phylogeny, linkage map and identification of a putative sex gene Eric B Rondeau 1 , Amber M Messmer 1 , Dan S Sanderson 1 , Stuart G Jantzen 1 , Kristian R von Schalburg 1 , David R Minkley 1 , Jong S Leong 1 , Graham M Macdonald 1 , Amanda E Davidsen 1 , William A Parker 1 , Rosetta SA Mazzola 1 , Briony Campbell 2 and Ben F Koop 1* Abstract Background: The sablefish (order: Scorpaeniformes) is an economically important species in commercial fisheries of the North Pacific and an emerging species in aquaculture. Aside from a handful of sequences in NCBI and a few published microsatellite markers, little is known about the genetics of this species. The development of genetic tools, including polymorphic markers and a linkage map will allow for the successful development of future broodstock and mapping of phenotypes of interest. The significant sexual dimorphism between females and males makes a genetic test for early identification of sex desirable. Results: A full mitochondrial genome is presented and the resulting phylogenetic analysis verifies the placement of the sablefish within the Scorpaeniformes. Nearly 35,000 assembled transcript sequences are used to identify genes and obtain polymorphic SNP and microsatellite markers. 360 transcribed polymorphic loci from two sablefish families produce a map of 24 linkage groups. The sex phenotype maps to sablefish LG14 of the male map. We show significant conserved synteny and conservation of gene-order between the threespine stickleback Gasterosteus aculeatus and sablefish. An additional 1843 polymorphic SNP markers are identified through next-generation sequencing techniques. Sex-specific markers and sequence insertions are identified immediately upstream of the gene gonadal-soma derived factor (gsdf), the master sex determinant locus in the medaka species Oryzias luzonensis. Conclusions: The first genomic resources for sablefish provide a foundation for further studies. Over 35,000 transcripts are presented, and the genetic map represents, as far as we can determine, the first linkage map for a member of the Scorpaeniformes. The observed level of conserved synteny and comparative mapping will allow the use of the stickleback genome in future genetic studies on sablefish and other related fish, particularly as a guide to whole-genome assembly. The identification of sex-specific insertions immediately upstream of a known master sex determinant implicates gsdf as an excellent candidate for the master sex determinant for sablefish. Keywords: Sablefish, Black cod, Microsatellite, SNP, Linkage map, Conserved synteny, Threespine stickleback, Sex-specific sequences, Gonadal soma-derived factor * Correspondence: [email protected] 1 Department of Biology, Centre for Biomedical Research, University of Victoria, Victoria, British Columbia V8W 3N5, Canada Full list of author information is available at the end of the article © 2013 Rondeau et al.; licensee BioMed Central Ltd. This is an Open Access article distributed under the terms of the Creative Commons Attribution License (http://creativecommons.org/licenses/by/2.0), which permits unrestricted use, distribution, and reproduction in any medium, provided the original work is properly cited. Rondeau et al. BMC Genomics 2013, 14:452 http://www.biomedcentral.com/1471-2164/14/452

Welcome message from author
This document is posted to help you gain knowledge. Please leave a comment to let me know what you think about it! Share it to your friends and learn new things together.
Transcript

Rondeau et al. BMC Genomics 2013, 14:452http://www.biomedcentral.com/1471-2164/14/452
RESEARCH ARTICLE Open Access
Genomics of sablefish (Anoplopoma fimbria):expressed genes, mitochondrial phylogeny, linkagemap and identification of a putative sex geneEric B Rondeau1, Amber M Messmer1, Dan S Sanderson1, Stuart G Jantzen1, Kristian R von Schalburg1,David R Minkley1, Jong S Leong1, Graham M Macdonald1, Amanda E Davidsen1, William A Parker1,Rosetta SA Mazzola1, Briony Campbell2 and Ben F Koop1*
Abstract
Background: The sablefish (order: Scorpaeniformes) is an economically important species in commercial fisheries ofthe North Pacific and an emerging species in aquaculture. Aside from a handful of sequences in NCBI and a fewpublished microsatellite markers, little is known about the genetics of this species. The development of genetictools, including polymorphic markers and a linkage map will allow for the successful development of futurebroodstock and mapping of phenotypes of interest. The significant sexual dimorphism between females and malesmakes a genetic test for early identification of sex desirable.
Results: A full mitochondrial genome is presented and the resulting phylogenetic analysis verifies the placement ofthe sablefish within the Scorpaeniformes. Nearly 35,000 assembled transcript sequences are used to identify genesand obtain polymorphic SNP and microsatellite markers. 360 transcribed polymorphic loci from two sablefishfamilies produce a map of 24 linkage groups. The sex phenotype maps to sablefish LG14 of the male map. Weshow significant conserved synteny and conservation of gene-order between the threespine sticklebackGasterosteus aculeatus and sablefish. An additional 1843 polymorphic SNP markers are identified throughnext-generation sequencing techniques. Sex-specific markers and sequence insertions are identified immediatelyupstream of the gene gonadal-soma derived factor (gsdf), the master sex determinant locus in the medaka speciesOryzias luzonensis.
Conclusions: The first genomic resources for sablefish provide a foundation for further studies. Over 35,000transcripts are presented, and the genetic map represents, as far as we can determine, the first linkage map for amember of the Scorpaeniformes. The observed level of conserved synteny and comparative mapping will allow theuse of the stickleback genome in future genetic studies on sablefish and other related fish, particularly as a guide towhole-genome assembly. The identification of sex-specific insertions immediately upstream of a known master sexdeterminant implicates gsdf as an excellent candidate for the master sex determinant for sablefish.
Keywords: Sablefish, Black cod, Microsatellite, SNP, Linkage map, Conserved synteny, Threespine stickleback,Sex-specific sequences, Gonadal soma-derived factor
* Correspondence: [email protected] of Biology, Centre for Biomedical Research, University ofVictoria, Victoria, British Columbia V8W 3N5, CanadaFull list of author information is available at the end of the article
© 2013 Rondeau et al.; licensee BioMed Central Ltd. This is an Open Access article distributed under the terms of the CreativeCommons Attribution License (http://creativecommons.org/licenses/by/2.0), which permits unrestricted use, distribution, andreproduction in any medium, provided the original work is properly cited.

Rondeau et al. BMC Genomics 2013, 14:452 Page 2 of 19http://www.biomedcentral.com/1471-2164/14/452
BackgroundThe order Scorpaeniformes is a diverse group of speciesthat include the rockfish, greenling, sculpins and sable-fish among others. Grouped originally by the presence ofthe suborbital stay, a posterior extension of the thirdcircumorbital bone [1], the order is now considered tobe paraphyletic with members of the orders Perciformesand Gasterosteiformes [2]. While a number of speciesamong the currently defined order are considered com-mercially important, the most economically valuable inNorth America is the sablefish, Anoplopoma fimbria.The sablefish, also known as Alaskan black cod, is a
long-lived demersal species located mainly between 200-1500 m along the continental shelf of the North PacificOcean [3]. While found from eastern Japan throughAlaskan waters and down to Baja California in Mexico [4],the sablefish is most important to American and Canadiancommercial fisheries, with sablefish landings exceeding$200 million value on a combined harvest of 22,000metric tonnes in 2011 [5,6]. Sablefish is also in the pre-liminary stages of commercial aquaculture, with farms inBritish Columbia already producing 500 tonnes in 2009[7]. While commercially important, little genetic infor-mation is available, with genetic resources limited to a fewsequences and 29 microsatellite primer pairs [8-10].Indeed little is known about the 1,477 species [11] withinthe economically important order Scorpaeniformes.For the successful development of sablefish as a sustain-
able species in aquaculture and the protection of wildfisheries stocks, modern molecular tools could be of greatvalue. The identification and exploitation of genetic mar-kers can be used in the characterization and identificationof strains, parental identification and analysis of diversityin the broodstock or in the construction of a linkage map[12]. Linkage maps have been developed for numerousfish species including Atlantic salmon [13,14], channelcatfish [15], common carp [16], grass carp [17], Atlantichalibut [18] and gilthead sea bream [19]. While tradition-ally maps were developed with markers such as allozymes,AFLP and RAPD markers, microsatellites and SNPs arethe current markers of choice. Microsatellites are rela-tively abundant, highly polymorphic and easy to genotype,and SNPs, while less informative due to a limit of two (orvery occasionally three) alleles per locus, are easily iden-tifiable and are the marker of greatest abundance in thegenome. With advances in next-generation sequencing(NGS) protocols such as RAD mapping [20] andGenotyping-by-Sequencing [21] it is possible to generate adense SNP map of primarily anonymous markers (Type IImarkers) with relatively little prior DNA sequence infor-mation. Having markers linked to genes (Type I markers)rather than anonymous sequences, however, allows for theputative placement of genes on a linkage map, which canmake them of greater use than type II markers in linkage
mapping for aquaculture species [12]. Type I markers,both microsatellites and SNPs, can easily be identified inlibraries of expressed sequences, either through traditionalEST library sequencing or through NGS transcript se-quencing methods such as RNAseq. While linkage mapscan have many uses, one of the most useful is in mappingphenotypes to a map in an effort to identify the genes con-trolling phenotype and look for associations or linkage be-tween traits. For single locus phenotypes, the phenotypecan be scored and analyzed in the way a genetic markerwould; multi-locus phenotypes require more powerfulquantitative trait loci (QTL) analyses to statistically predictregions of interest.Of the phenotypes often identified through mapping,
sex is one of the most important and most common formany species. Sexual dimorphism is of particular signifi-cance as one sex can often grow larger or faster, both im-portant traits to understand in fisheries and aquaculture.While mapping of the sex phenotype to a chromosome isrelatively easy given a single-locus sex determination sys-tem, mapping the sex phenotype to a gene has been moredifficult, and the master sex determinant has only beenidentified in a few fish species. Dmy determines sex inmedakas Oryzias latipes [22] and O. curvinotus [23], amhyin the Patagonian pejerrey Odontesthes hatcheri [24], andsdY in most salmonids [25,26]. These master sex de-termining genes (MSD) are the result of divergent dupli-cated copies of autosomal genes, present only on theY-chromosome. GsdfY in the medaka Oryzias luzonensis,on the other hand, is up-regulated in males during sexualdifferentiation, due to changes in the upstream promoterregion [27], while the male-specific Amhr2Y in 3 species ofTakifugu appears to be the result of a single coding change[28]. While all these genes have been previously describedas playing a role in sexual determination (aside from sdY),none so far have been described as the master sex deter-minants in distantly related groups of fish.Comparative mapping [29] can be used to facilitate com-
parison of newly developed maps to pre-existing genomicresources to augment available genetic information. Com-parison between non-model fish species and those with afully-sequenced reference genome has identified significantconserved synteny in numerous species [15,17,30-32].Withpreliminary or complete whole-genome assemblies avail-able for ten bony fish species (October 28, 2012) [33], andthe increasing ease with which genetic information andcomplete genomic sequences can be obtained, comparativemapping will only become easier. The degree to which theidentification of conserved synteny will be useful dependson how closely related the two species are; thus, for speciesof relatively close ancestry and significant macro-synteny,comparative mapping can be used to predict gene locationsand order, and provide a list of potential candidates respon-sible for a particular phenotype or underlying a QTL.
Rondeau et al. BMC Genomics 2013, 14:452 Page 3 of 19http://www.biomedcentral.com/1471-2164/14/452
In this work, we describe the sequencing of themitochondrial genome and the resultant verification ofthe phylogenetic placement of the sablefish within theScorpaeniformes. We present a library of assembled tran-script sequences to identify genes, and use them to de-velop type I polymorphic SNP and microsatellite markers.The markers were scored across two families and used toproduce the first-generation sablefish linkage map andlocate the sex phenotype onto the male map. We showsignificant conserved synteny between the threespinestickleback Gasterosteus aculeatus and sablefish, and use acomparative mapping approach to predict gene locationsin the sablefish. An additional collection of markers,mainly type II SNPs are identified through genotyping-by-sequencing and used to identify sex-specific markersand sequence insertions immediately upstream of aknown master sex determinant.
Results and discussionGene identificationIn order to obtain a comprehensive picture of the gene se-quences of sablefish, we examined transcriptomes by ESTsequencing and RNAseq. In total, 19,968 cDNA cloneswere sequenced in both forward and reverse directions.Following trimming and removal of any contaminants,34,080 EST sequences were obtained, and deposited inthe GenBank EST database under accessions GenBank:GO615858-GO649937. EST sequences were assembledinto 12,060 unique contigs using PHRAP assembly. 1,249full length gene sequences were submitted as GenBank:ACQ57837–ACQ59081, GenBank:C3KHG1, GenBank:C3KJF2, GenBank:C3KHF2 and GenBank:C3KJE6. A3’ UTR analysis of all contigs was used for primer designin the search for polymorphic markers. RNAseq yielded96,733,584 reads, which were assembled into 92,888Unigene sequences. Combined with the EST sequencingdata into NCBI TSA BioProject 71237, the assembled dataproduced 34,728 contigs >400bp; these can be found inaccession numbers GenBank: JO657891-JO692618.The uploaded EST and TSA datasets represent all but
84 of the 70,138 sequences for sablefish in the NCBI nu-cleotide and EST databases (retrieved October 7, 2012).In addition, sablefish is currently the Scorpaeniformesspecies with the largest percentage of sequences in boththe EST (46.9% of total) and nucleotide databases(72.7%). This work represents a very significant increasein the available expressed sequence data for the sable-fish, as well as for the order Scorpaeniformes in general.
The mitochondrial genome and phylogenetic placementof sablefishIn order to help resolve the general phylogenetic placementof sablefish we sequenced its mitochondrial genome andused a phylogenetic tree analysis to compare it to other
Percomorpha and Scorpeaniformes. The sablefish mito-chondrial genome, seen in Additional file 1: Figure S1,consists of 16,507 base pairs, encompassing 13 genes, 2ribosomal RNAs and 22 tRNAs, with all features followingthe order of the typical vertebrate mitochondrial genome(reviewed in [34]). The sequence was submitted to NCBI asGenBank: JX070112.The phylogenetic analysis of the mitogenome sequences
produced the same major phylogenetic groupings as inKawahara et al. [35], so we focused on the grouping ofScorpaeniformes, Zoarcoidei, and Gasteroidei. As seen inFigure 1, we recovered a very similar set of phylogeneticplacements for the species previously analyzed (SubgroupG in [35]). Additionally, we recovered a similar phylogen-etic ordering of the Gasterosteiformes mitogenomes [36].The sablefish mitogenome was placed in an ancestralbranch prior to the split of the Scorpaeniformes familyCottidae from the most-closely related Gasterosteiformesand Perciformes families, although the bootstrap value ofthis placement is not strong.The Anoplopomatidae is a family comprising two known
species, the sablefish and the skilfish (Erilepis zonifer)placed in the order Scorpaeniformes. Molecular ([1];Figure 1) and morphological [37] analyses both suggest acloser relationship between sablefish and the cottoids thanto the scorpanoids, but the exact placement remainsunclear. While our analysis agrees with that of Smith andWheeler [1] in suggesting a relatively ancestral branch forthe divergence of the sablefishes, our results disagree onwhether divergence occurred before or after (respectively)the divergence of the Cottoids from the Gasterosteodeiand the Zoarcoidei; both analyses produce weak branchsupport in favour of the respective positions. Given the dif-ficulty in accurately placing deep phylogenetic branches, adefinitive molecular placement of the Anoplopomatidaewill await further data.While the exact placement of the Anoplopomatidae
remains to be determined, sablefish represent an olderunique branch that split at or around the split of Cottoideiand Gasterosteodei. This is of particular interest as onemember of the Gasterosteodei, the threespine sticklebackGasterosteus aculeatus, has a fully sequenced draft gen-ome available for comparison. The stickleback is withoutquestion the most closely related species for which awell annotated whole genome is available. Previous esti-mates based on mitochondrial genomes place the time ofdivergence of the more ancestral suborder Scorpaenoideifrom the Cottoidei and Gasterosteodei at approximately150 mya [38], meaning the divergence of sablefish fromstickleback lineages could be less than 150 mya. More re-cent estimates using nuclear data suggest a much more re-cent time of divergence in the range of 50–70 mya [39].The next most closely related species with fully sequencedgenomes, those of the pufferfishes Takifugu rubripes and

Figure 1 Mitogenome phylogeny of orders: Scorpaeniformes, Gasterosteiformes, select Perciformes. Species represented in bold text arenot part of the previous analysis by Kawahara et al. [35]. Families currently assigned to the order Scorpaeniformes are represented by white barsdown the right hand side, while Perciformes and Gasterosteiformes are in black and grey respectively. Boot-strap values are indicated for allbranch points. The asterix (*) indicates a change of genus name from previous analyses.
Rondeau et al. BMC Genomics 2013, 14:452 Page 4 of 19http://www.biomedcentral.com/1471-2164/14/452
Tetraodon nigroviridis are separated from sablefish by 80–180 mya [38,39]. As all the phylogenetic data points to thestickleback as the closest fully-sequenced genome, G.aculeatus was used in our analysis of conserved synteny.
Identification of genetic markersA set of polymorphic microsatellite and SNP DNA mar-kers from our EST assemblies was identified for use ingenetic mapping and population studies. As the EST li-brary construction and subsequent primer design wasperformed prior to obtaining sablefish family tissues, thesequences do not represent either of the two families usedin linkage map construction. This did not affect the use ofmicrosatellites as the identification and amplification ofpolymorphic repeats proved relatively easy, with over halfthe 460 primer pairs designed successfully amplifying thedesired product and yielding polymorphic repeats in oneor both sablefish families. In contrast, the identification ofSNPs from the assembled EST dataset proved much lessuseful when targeting expected single base polymorphismsin our mapping families. However, in analyzing the adja-cent sequence, mainly the 3’ UTR, it was found that sable-fish were indeed highly polymorphic. This led to thestrategy of identifying SNPs through the direct sequencing
of 250 unrelated 3’ UTR gene regions of the sablefish fam-ily parents. Additional primers were designed to genes ofinterest based on conserved sequence identified in relatedspecies. Primer pair sequences, repeat motifs and otherrelevant information for the 233 newly identifiedmicrosatellites as well as the 13 previously published [8]can be found in Additional file 2: Table S1. For the SNPs,primer and annotation information can be found inAdditional file 3: Table S2, with individual SNPs identifiedin Additional file 4: Table S3.A preliminary set of markers was used to analyze a
second, half-sibling family to determine the number ofprogeny from each of the three fathers. The majorityof the progeny were descended from a single father(96 offspring) with only minor contributions from theother two fathers (13 and 6). It was therefore decided toanalyze family 2 as a single full-sib family, excluding thehandful of individuals descended from the other twofathers. Following genetic marker identification, we beganlocating these markers in two sablefish families.
Production of first-generation linkage mapEquipped with our gene-associated markers and twosablefish families, we examined all of the markers in all

Rondeau et al. BMC Genomics 2013, 14:452 Page 5 of 19http://www.biomedcentral.com/1471-2164/14/452
the individuals from the two families to create a first-generation linkage map. In all, 246 microsatellites and 509SNPs were scored for all of the individuals from the twofamilies. When it came to assembling the linkage map, thestrategy of identifying multiple SNPs in a single sequenceproved very useful. While most of the microsatellitemarkers were highly polymorphic and useful for mappingin both families, it was very rare that individual SNPs wereshared between families. It was common, however, to havetwo or more markers from a single EST assembly-derivedsequence polymorphic in separate parents and families.As these markers are physically linked, separated by600bp or less in a single contiguous sequence, we analyzedthe SNPs as representing the locus rather than a particularmarker and placed the locus on the linkage map ratherthan the individual nucleotide marker. This strategy wasalso used when multiple repeats designed from the samecontig were analyzed. This allowed merging of the individ-ual parental maps and sex-specific maps at many moresites than with the microsatellites alone, leading to a moreaccurate representation of marker order and distances.The 509 scored SNPs, therefore, were mapped as 133 SNPloci; between 1 and 13 SNPs contributed to mapping of anindividual locus.We producedmaps for each of the mapping parents, with
subsequent integration into sex-specific maps and finally amerged map. The final merged map, seen in Additionalfile 5: Figure S2, consists of all 133 SNP loci and 227 micro-satellite loci (234 individual microsatellites) mapped across24 linkage groups. Two additional microsatellite markers,AfiMI0079UVic and AfiMI0131UVic, remain unlinked and10 primer pairs, while polymorphic, were uninforma-tive in both mapping families (AfiMI0005UVic,AfiMI0015UVic, AfiMI0104UVic, AfiMI0153UVic,AfiMI0165UVic, AfiMI0196UVic, AfiMI0240UVic,AfiMI0304UVic, AfiMI0411UVic, AfiMI0416UVic).The 24 linkage groups span 1332.8 cM in the merged
map, with individual linkage groups ranging from 20.9cM (LG22) to 80.3 cM (LG15). A significant differencein recombination was observed between the sexes as themale map had a length of 860.4 cM, while the femalemap had a length of 1610 cM; this gives a female:malerecombination rate of 1.87:1, although the recombin-ation rate in individual linkage groups varied greatly.This is not unusual, as higher recombination rates havebeen reported in the females of a number of fish species,including Atlantic salmon [14], catfish [15], rainbowtrout [40] and zebrafish [41]. In contrast, the recombin-ation rates between the individual fathers or between theindividual mothers of our mapping families were bothapproximately 1:1. The overall length and female/malerecombination ratios are likely to be underestimateshowever, as there are still a few gaps in the female-specific linkage map.
With only 2 markers remaining unlinked after mapping,we were confident that all of the chromosomes werecovered by the map. This was subsequently confirmedafter publication of the sablefish karyotype [42]; a diploidchromosome number of 2n = 48 was identified, the samenumber as was predicted here through linkage mapping.Of note, this karyotype represents the most-commonlyidentified karyotype in teleost fish, and is thought to rep-resent that of the common teleost ancestor after the lastwhole-genome duplication [43].
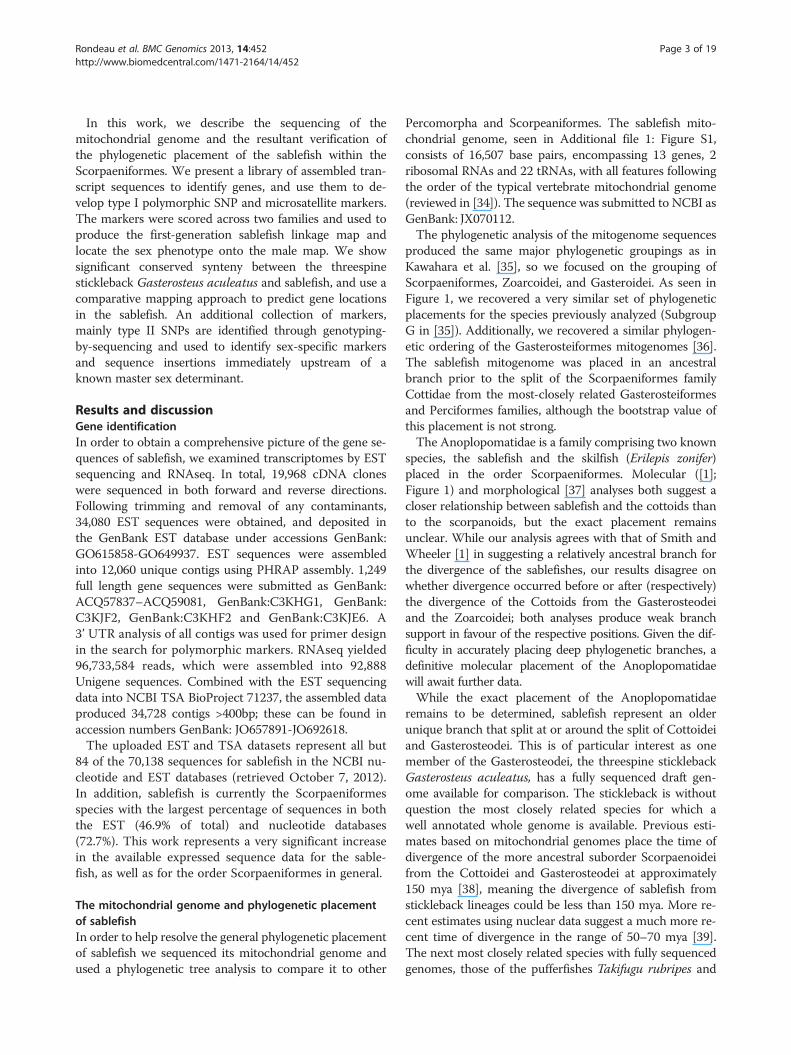
Significant conserved synteny observed between A.fimbria and G. aculeatusA comparison to the most closely related species forwhich a whole genome sequence is available was under-taken to look for syntenic chromosomes and conserva-tion of gene order. All of the markers were derived fromEST assembled transcripts. These EST contigs, which in-clude markers that mapped to one of the 24 linkagegroups, or the 2 singletons, were BLATed against thethreespine stickleback genome. Most (278/360) of thesecontig comparisons produced a significant “hit” to thestickleback genome; furthermore, as can be seen inTable 1, the level of conserved synteny between the twospecies is quite high, with a large number of markersfrom one sablefish linkage group producing significant“hits” to the corresponding stickleback chromosome. Inmost cases, the relationship between stickleback andsablefish is 1:1 – that is, one stickleback chromosomecorresponds to a single sablefish linkage group. In threecases, there were two linkage groups for one sticklebackchromosome. Analyses of end-markers, however, showno hints of linkage between any of the three pairs oflinkage groups. This is not surprising given the haploidchromosome number in the threespine stickleback is 21while the haploid karyotype for sablefish is 24. We usedthese relationships to assign numbers to each of ourlinkage groups to make comparison to stickleback easier;thus LG02 corresponds to stickleback ChrII, and LG11corresponds to stickleback ChrXI. In the case of thethree linkage group pairs BLATing to single sticklebackchromosomes, the largest linkage group was assignedthe stickleback chromosome number, while the smallerreceived the next number available above 21; resultingpairs were LG01 and LG22, LG04 and LG23 and finallyLG07 and LG24.Linkage groups showed anywhere from 3 (LG24) to 17
(LG04) hits to a single stickleback chromosome. Only 8 ofthe 278 loci that were located to the 21 chromosomes inthe stickleback produced significant hits to chromosomesother than that predicted for the linkage group. Six ofthese eight markers were located 3 markers or less fromthe end of the linkage group. An additional 24 loci, inter-spersed throughout the linkage groups, hit the stickleback
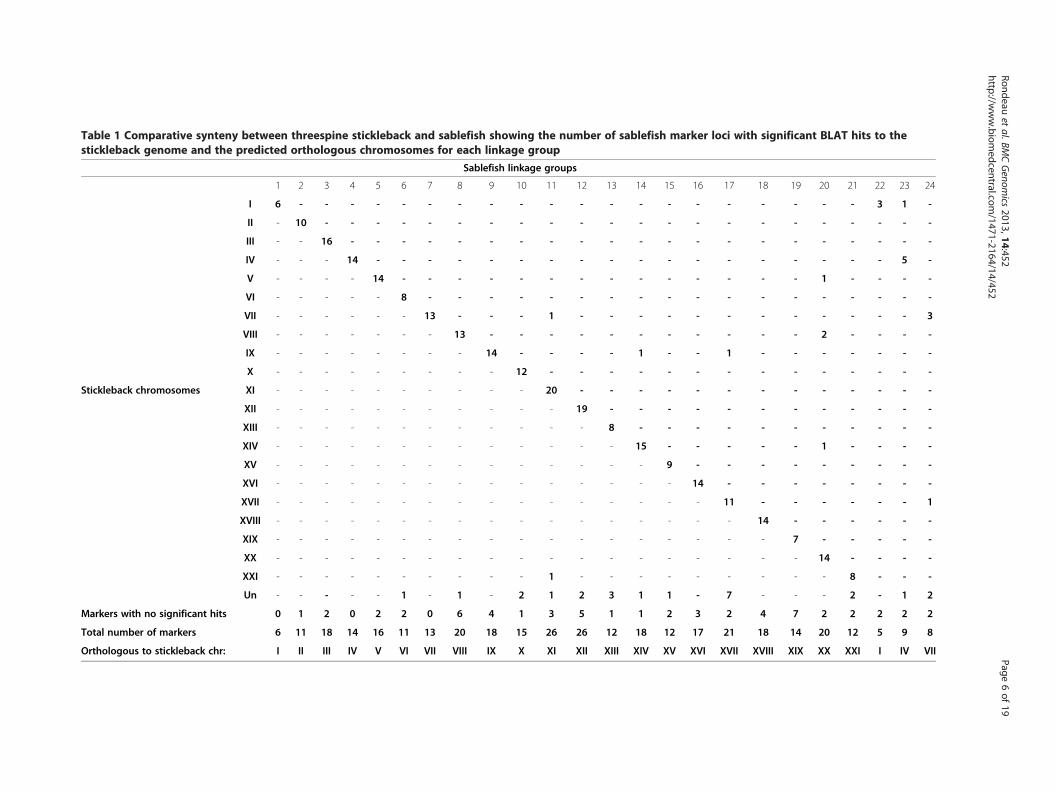
Table 1 Comparative synteny between threespine stickleback and sablefish showing the number of sablefish marker loci with significant BLAT hits to thestickleback genome and the predicted orthologous chromosomes for each linkage group
Sablefish linkage groups
1 2 3 4 5 6 7 8 9 10 11 12 13 14 15 16 17 18 19 20 21 22 23 24
I 6 - - - - - - - - - - - - - - - - - - - - 3 1 -
II - 10 - - - - - - - - - - - - - - - - - - - - - -
III - - 16 - - - - - - - - - - - - - - - - - - - - -
IV - - - 14 - - - - - - - - - - - - - - - - - - 5 -
V - - - - 14 - - - - - - - - - - - - - - 1 - - - -
VI - - - - - 8 - - - - - - - - - - - - - - - - - -
VII - - - - - - 13 - - - 1 - - - - - - - - - - - - 3
VIII - - - - - - - 13 - - - - - - - - - - - 2 - - - -
IX - - - - - - - - 14 - - - - 1 - - 1 - - - - - - -
X - - - - - - - - - 12 - - - - - - - - - - - - - -
Stickleback chromosomes XI - - - - - - - - - - 20 - - - - - - - - - - - - -
XII - - - - - - - - - - - 19 - - - - - - - - - - - -
XIII - - - - - - - - - - - - 8 - - - - - - - - - - -
XIV - - - - - - - - - - - - - 15 - - - - - 1 - - - -
XV - - - - - - - - - - - - - - 9 - - - - - - - - -
XVI - - - - - - - - - - - - - - - 14 - - - - - - - -
XVII - - - - - - - - - - - - - - - - 11 - - - - - - 1
XVIII - - - - - - - - - - - - - - - - - 14 - - - - - -
XIX - - - - - - - - - - - - - - - - - - 7 - - - - -
XX - - - - - - - - - - - - - - - - - - - 14 - - - -
XXI - - - - - - - - - - 1 - - - - - - - - - 8 - - -
Un - - - - - 1 - 1 - 2 1 2 3 1 1 - 7 - - - 2 - 1 2
Markers with no significant hits 0 1 2 0 2 2 0 6 4 1 3 5 1 1 2 3 2 4 7 2 2 2 2 2
Total number of markers 6 11 18 14 16 11 13 20 18 15 26 26 12 18 12 17 21 18 14 20 12 5 9 8
Orthologous to stickleback chr: I II III IV V VI VII VIII IX X XI XII XIII XIV XV XVI XVII XVIII XIX XX XXI I IV VII
Rondeauet
al.BMCGenom
ics2013,14:452
Page6of
19http://w
ww.biom
edcentral.com/1471-2164/14/452

Figure 2 Conserved synteny between sablefish and threespine stickleback stickleback Chromosomes I-VII. A line is drawn to comparethe position of a marker on a linkage group to the strongest BLAT hit (>100 BLAT score) for the contig sequence used in primer design.
Rondeau et al. BMC Genomics 2013, 14:452 Page 7 of 19http://www.biomedcentral.com/1471-2164/14/452

Figure 3 (See legend on next page.)
Rondeau et al. BMC Genomics 2013, 14:452 Page 8 of 19http://www.biomedcentral.com/1471-2164/14/452
(See figure on previous page.)Figure 3 Conserved synteny between sablefish and threespine stickleback stickleback Chromosomes VIII-XV. A line is drawn tocompare the position of a marker on a linkage group to the strongest BLAT hit (>100 BLAT score) for the contig sequence used inprimer design.
Rondeau et al. BMC Genomics 2013, 14:452 Page 9 of 19http://www.biomedcentral.com/1471-2164/14/452
chrUn, a “chromosome” composed of all sequence dataunassigned to one of the 21 chromosomes. While mostlinkage groups had 0–2 loci that hit this “Un” chromo-some, 7 hits were from loci assigned to linkage group 1.Only one of the two un-linked microsatellite markershad a positive BLAT hit, mapping to ChrI in thethreespine stickleback; this suggests that the chromo-some represented by either LG01 or LG22, the two
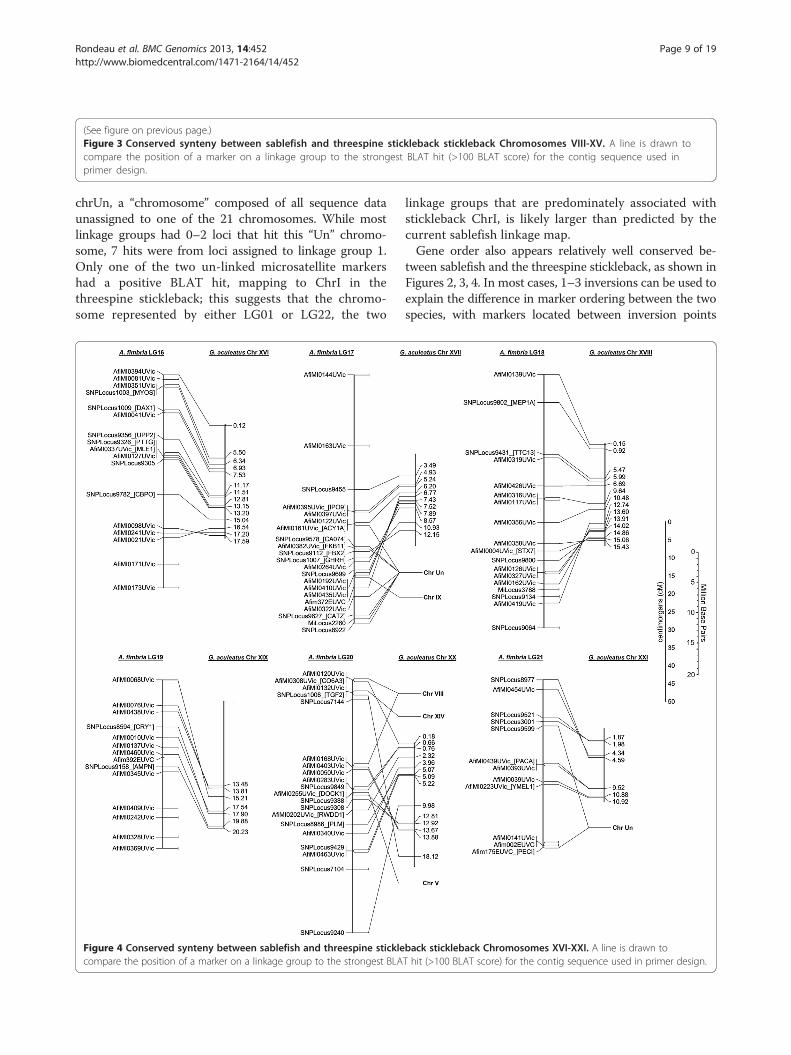
Figure 4 Conserved synteny between sablefish and threespine sticklecompare the position of a marker on a linkage group to the strongest BLA
linkage groups that are predominately associated withstickleback ChrI, is likely larger than predicted by thecurrent sablefish linkage map.Gene order also appears relatively well conserved be-
tween sablefish and the threespine stickleback, as shown inFigures 2, 3, 4. In most cases, 1–3 inversions can be used toexplain the difference in marker ordering between the twospecies, with markers located between inversion points
back stickleback Chromosomes XVI-XXI. A line is drawn toT hit (>100 BLAT score) for the contig sequence used in primer design.

Rondeau et al. BMC Genomics 2013, 14:452 Page 10 of 19http://www.biomedcentral.com/1471-2164/14/452
consistently ordered. This is important and will be revisitedlater, as it allows for prediction of candidate genes of inter-est in the sablefish based on the annotated whole-genomesequence in stickleback. Development of the sablefish link-age map and the identification of conserved synteny maypresent an opportunity to re-evaluate the sticklebackgenome assembly and successfully locate some of the locipreviously pooled into chr Un.
Additional markers by genotyping-by-sequencing (GBS)The construction of a GBS library was performed tocreate a second-generation linkage map to supplementour microsatellite/SNP sablefish map and to identifypotential sex-specific sequences. Two Illumina lanes ofGBS sequencing were produced to test this techniquefor sablefish linkage mapping and to determine whetherthe ApeKI restriction enzyme used was appropriate forsablefish; most of the individuals were from our secondmapping family, with a few additional, unrelated andsexed individuals used to aid in sex identification(see following section).We obtained ~490million barcodedreads, with between 500,000 and 1,300,000 unique readsper individual. We determined there was an average of 8–10 fold read coverage per unique genomic sequence, wellbelow the desired 60x for a de novo sequencing study [44].While overall coverage was less than desired, we were stillable to utilize the data to identify additional SNP markers.With relatively conservative parameters, a total of 1843polymorphic loci were identified through next-generationsequencing; see Additional file 6: Table S4 for details.
Genetic identification of SEX in sablefishIn sablefish, as in other fish species, one of the mosteconomically and biologically important and perplexingphenotypes is sex. Sexual dimorphism in fish is often ob-served with one sex, commonly the female in sablefish,growing both faster and larger than the other sex. Rapidand substantial growth is a desirable trait particularly inaquaculture and ocean ranching. Thus, selection forfemales early in rearing, or the production of monosexfemale offspring is of great interest to these industries.While external identification of sex is difficult andinaccurate in immature sablefish, internal analysis of thegonads can usually determine the sex of the fish butsacrificing the fish is required. At 15 months, the sex ofeach of our fish was easily identified by the size of thegonads themselves, with the ovaries well over twice thesize of the testis in males and females of equal size andweight. Assuming a single locus phenotype, we attemptedto place sex on each of the sex-specific maps. Whileunsuccessful in linking sex to the female map, we weresuccessfully able to map the trait to linkage group 14 ofthe male map, suggesting an XX-XY sex determinationsystem. As previously described in the comparative
mapping section, this corresponds to chromosome XIV ofthe stickleback genome. Adjacent markers further na-rrowed this region to between 3.0 and 5.4Mb on thestickleback genome. This region does not correspond tothe Y-specific region of the threespine stickleback linkedto Chr XIX [45] nor to the Y-chromosome associated withLG12 (Chr XII) of the ninespine stickleback Pungitiuspungitius [46]. During review, a report was published onthe expression of five genes of interest in sex, includingthree shown to be significantly elevated in juvenile testes[47]. Two of these three are located on the linkage map,dmrt1 mapping to LG13 and sox9a to LG05, both pre-dicted by comparative mapping to the threespine stickle-back genome. Neither the remaining testis-elevated gene,amh, nor the two genes found with elevated expression inthe ovaries, foxl2 and cyp19a1a were predicted to befound on LG14; amh is predicted to be located on LG08,foxl2 on LG01 and cyp19a1a on LG02.Examination of the sablefish GBS library was under-
taken to determine whether we could identify any sex-specific sequences. The sequences were processed usingthe program Jellyfish [48] into kmers with length 31 andeach kmer was counted in each individual, and placedinto a matrix. We searched for unique kmers found onlyin male or female fish, with a minor allowance for se-quencing errors (max two individuals). After assemblingsex-specific kmers into overlapping mini-contigs, wewere able to identify 11 mini-contigs of interest, whichwere then mapped back to the original 100 bp paired-end reads. These reads were BLATed against the stickle-back genome, and two of these reads produced hits >50(default BLAT score), both of which BLATed against theregion where we expected to find sex in ChrXIV ofstickleback. These sites have been designated Tag2 andTag10 based on the order that they were identified. Gen-ome walking was performed in order to provide enoughsequence to design primers to score the polymorphicmarkers in our sex-specific tags, and this process recov-ered well over 1000 bp surrounding each tag for primerdesign. Following amplification with the new primers on53 unrelated, definitively sexed sablefish, the allelesidentified by Tag 2 and Tag10 were present in everymale and absent in all females.Both tags BLAT to the region between the genes PPEF2
and AFF1 on the stickleback genome. In this region, andin particular between these two tags, two coding regionswere predicted to be found based on stickleback ESTs.Based on tBLASTx, the first coding region (ESTs GenBank:DW615685, DN718296, DW662322, DN733719, DT981615)was an aff1 homolog. The second gene region (ESTsGenBank: CD507187, DW624794) was most likely gonadalsoma-derived factor (gsdf ). Primers were designed to amp-lify the region between our tags and a short region of gsdfavailable in our sablefish RNAseq assembly. Amplification
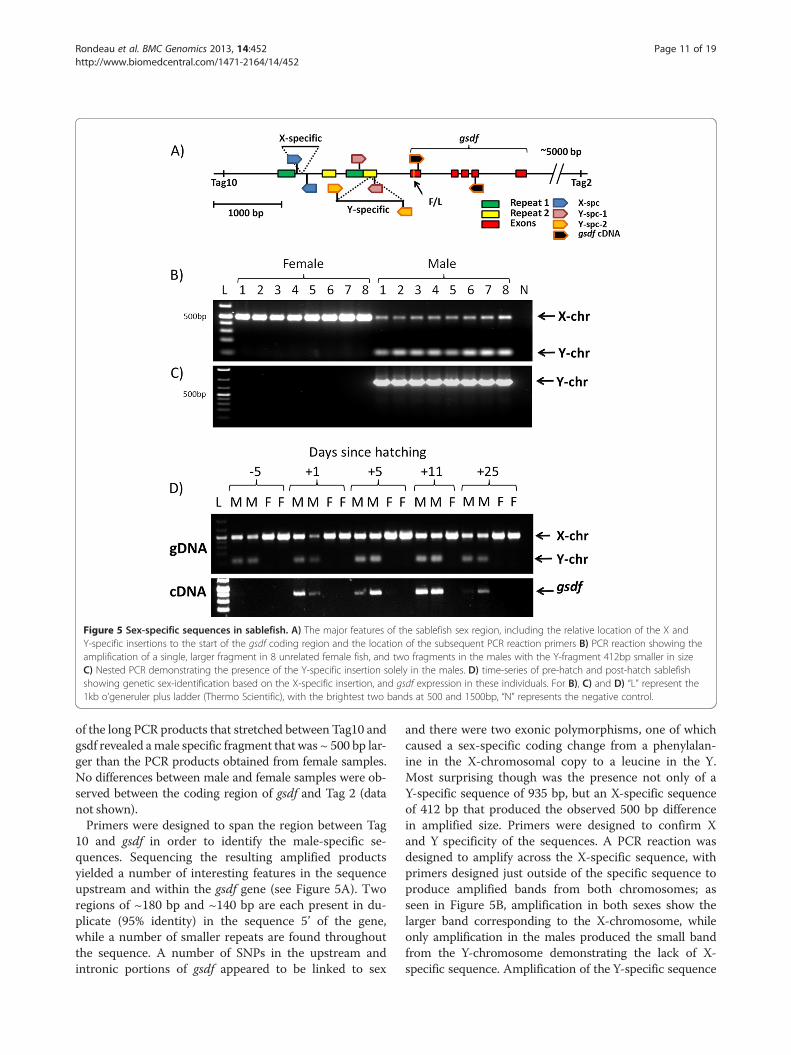
Figure 5 Sex-specific sequences in sablefish. A) The major features of the sablefish sex region, including the relative location of the X andY-specific insertions to the start of the gsdf coding region and the location of the subsequent PCR reaction primers B) PCR reaction showing theamplification of a single, larger fragment in 8 unrelated female fish, and two fragments in the males with the Y-fragment 412bp smaller in sizeC) Nested PCR demonstrating the presence of the Y-specific insertion solely in the males. D) time-series of pre-hatch and post-hatch sablefishshowing genetic sex-identification based on the X-specific insertion, and gsdf expression in these individuals. For B), C) and D) “L” represent the1kb o’generuler plus ladder (Thermo Scientific), with the brightest two bands at 500 and 1500bp, “N” represents the negative control.
Rondeau et al. BMC Genomics 2013, 14:452 Page 11 of 19http://www.biomedcentral.com/1471-2164/14/452
of the long PCR products that stretched between Tag10 andgsdf revealed amale specific fragment that was ~ 500 bp lar-ger than the PCR products obtained from female samples.No differences between male and female samples were ob-served between the coding region of gsdf and Tag 2 (datanot shown).Primers were designed to span the region between Tag
10 and gsdf in order to identify the male-specific se-quences. Sequencing the resulting amplified productsyielded a number of interesting features in the sequenceupstream and within the gsdf gene (see Figure 5A). Tworegions of ~180 bp and ~140 bp are each present in du-plicate (95% identity) in the sequence 5’ of the gene,while a number of smaller repeats are found throughoutthe sequence. A number of SNPs in the upstream andintronic portions of gsdf appeared to be linked to sex
and there were two exonic polymorphisms, one of whichcaused a sex-specific coding change from a phenylalan-ine in the X-chromosomal copy to a leucine in the Y.Most surprising though was the presence not only of aY-specific sequence of 935 bp, but an X-specific sequenceof 412 bp that produced the observed 500 bp differencein amplified size. Primers were designed to confirm Xand Y specificity of the sequences. A PCR reaction wasdesigned to amplify across the X-specific sequence, withprimers designed just outside of the specific sequence toproduce amplified bands from both chromosomes; asseen in Figure 5B, amplification in both sexes show thelarger band corresponding to the X-chromosome, whileonly amplification in the males produced the small bandfrom the Y-chromosome demonstrating the lack of X-specific sequence. Amplification of the Y-specific sequence
Rondeau et al. BMC Genomics 2013, 14:452 Page 12 of 19http://www.biomedcentral.com/1471-2164/14/452
was more difficult due to the insertion falling in the mid-dle of a repeated sequence; a nested PCR was thereforeperformed targeting only the male-specific sequence. Asshown in Figure 5C, the nested primers produced bandsonly in the males, not in the females. In the 53 unrelated,definitively sexed sablefish analyzed, all tested females car-ried two copies of the X-specific insertion, while malescarried one chromosome with the X-specific insertion andone with the Y-specific, adding further evidence to themale being the heterogametic sex. Both sequences areflanked by inverted repeats of 12 (Y-chr) to 16 (X-chr)base pairs, suggesting the original insertion may have in-volved a transposase, although no transposase could beidentified in the inserted sequences. Representative se-quences for the X and Y insertions were uploaded to theNCBI nucleotide database as Genbank:KC623942 andGenbank:KC623943 respectively; masked sequences withall described elements can be found in Additional file 7:Figure S3.Portions of the X-specific sequence were identified else-
where in the sablefish TSA library, but with no strong hitsto the adjacent gsdf promoter sequences it is likely thatthe 412 bp sequence is a repeat sequence or transposableelement. Significant BLAST hits for this element to non-sablefish sequences were to EST and WGS sequences ofAtlantic cod, Gadus morhua, (91-100% max identity). TheY-specific insertion also only produced significant BLASThits to G. morhua sequences, although the Y-specificinsertion was not observed in the expressed sablefishsequences. Even though sablefish is commonly calledAlaskan black cod, it is not a true cod and is only distantlyrelated to the Gadiformes (last common ancestor ~130-200mya [38,39]). While the mechanism for the observedsequence similarity between this element in the twospecies remains unknown, others have proposed that par-asites such as the trematodes Schistosoma japonicum andDiplostomum spp. [49], or the sea lamprey Petromyzonmarinus [50] may facilitate lateral transposition of trans-posable elements and other sequences between unre-lated host fish species; Atlantic cod and sablefish aregeographically separated but the range of the Pacificcod Gadus macrocephalus and sablefish overlap signifi-cantly allowing for the possibility of some form of lateraltransfer between species.The presence of the major sex-specific insertions in
sablefish immediately upstream of the gsdf gene is quiteintriguing. As a member of the transforming growthfactor-β superfamily, the gsdf gene was first described inthe proliferation of primordial germ cell and spermato-gonial proliferation in rainbow trout [51]. It has sincebeen shown that in the evolutionarily conserved clusterof genes that includes gsdf, it is the only gene preferen-tially expressed in teleostean testis [52]. Further, it hasbeen shown that expression of gsdf in the zebrafish
occurs prior to gonad differentiation in the early develop-ment of zebrafish, and is expressed solely in the gonads[52]. The gene was described as a master-sex determinantin a medaka species, Oryzias luzonensis [27]. While we donot present enough evidence to describe gsdf as the master-sex determinant in sablefish, the location of the sex-specificinsertions (or deletions) in the promoter region immedi-ately upstream of a gene that has been described as a mastersex determinant in another fish species, and coupled withits placement in a cluster of genes otherwise expressedpreferentially in ovaries suggests that gsdf is the strongestcandidate for the master-sex determinant in sablefish. Fur-thermore, if future research supports gsdf as the master-sexdeterminant in sablefish, it will represent the first descrip-tion of the independent evolution of the same gene to therole of master-sex determinant in different orders of fish.Independent evolution of DMRT as a sex-determinant hasbeen described in African clawed frogs [53] and chickens[54], but in fish, this gene has been described as the mainsex-determinant only in closely relatedmedaka species.From Oryzias luzonensis, it is estimated that sex-specific
expression differences in gsdf are first observed aroundhatching (10 days post fertilization [d.p.f]), and are no lon-ger detected at 10 days after hatching [27]. If the sametiming was observed in sablefish, significant male over-expression should be observed between around 15.5 d.p.f(4°C incubation) [55] and will no longer be significant 15days post-hatching (d.p.h). As shown in Figure 5D, gsdf isoverexpressed in males around hatching, although unlikeour predictions, it remains overexpressed relative to thefemales up to 25 d.p.h.; products are not visible following35 cycles in either sex five days prior to hatching. In 15month sablefish, no difference is observed in the expres-sion of gsdf in ovaries and testis (data not shown). It istherefore possible that differential expression may contrib-ute to the development of each sex, although it remains tobe determined what role the amino acid substitution fromphenylalanine to leucine may have on the actions of theprotein.
Significance of the genomic toolsGenomic tools can be applied to many questions relatingto fisheries, aquaculture, aquatic physiology, ecology, evo-lution, disease, resistance, reproduction, growth, responseto the environment, general immunity and general biologyof sablefish. The resources developed here will be funda-mental in the management and analysis of wild and do-mestic commercial stocks. At a landed value of US $4.46/lb, the sablefish is the second most valuable finfish perpound (after halibut, US $4.97) and represents the fourthgreatest total value (after walleye pollock, sockeye salmon,and Pacific halibut, ~equal to Pacific cod) to 2011 PacificCanadian and American commercial fisheries [5,6]. Thelarge set of microsatellite and SNP markers as well as the
Rondeau et al. BMC Genomics 2013, 14:452 Page 13 of 19http://www.biomedcentral.com/1471-2164/14/452
sequences provided by the complete mitochondrial gen-ome, will allow for a robust molecular analysis of sablefishstructure throughout the natural range to determine themost appropriate population management. Additionally,the ease of genetically sexing both immature and maturesablefish will allow for the easy addition of sex as an add-itional parameter in analyses of population compositionand movement. The availability of expressed sequencesshould allow a genetic base to design studies to gaininsight into the physiology and biology of these deep-seaorganisms.Many of these markers can likely be used in analysis of
closely related species such as Skilfish (Erilepis zonifer) [9]and perhaps other Scorpaeniformes, Gasterosteiformesand Perciformes species. The degree of conserved syntenybetween the threespine stickleback and the sablefish sug-gests that these tools may be very useful in many speciesincluding other economically important species such aslingcod and greenling (Family: Hexagrammidae) or themore distantly related rockfish (Family: Sebastidae).The use of these resources will also be helpful in the
development of species for aquaculture as well as forconservation and management of wild stocks. A linkagemap and the demonstrated ability to use the threespinestickleback genome to determine likely gene locationwill facilitate molecular analysis and development ofmarkers for selective breeding. The expressed transcriptlibrary will provide access to particular genes of interestand the development of sex markers will allow for thestudy of sex-specific phenotypes. If gsdf is confirmed asthe master sex determinant in sablefish, the targetedproduction of monosex or sterile stocks for use in aqua-culture may be possible.
ConclusionsWith this work, we present the largest collection of gen-etic data available for sablefish. A mitochondrial genomesequence was produced and used to place sablefishamong Scorpaeniformes and Gasterosteiformes fishes.We have sequenced and assembled transcript library ofnearly 35,000 sequences for the sablefish, and identifiedmicrosatellite and SNP markers for use in broodstockselection and population management. Using ourpolymorphic markers, we have produced a linkage mapconsisting of 24 linkage groups, which is in agreementwith the expected number of chromosomes previouslyidentified through karyotyping. Comparative mappinghas been used with G. aculeatus to show significantconservation of gene order, allowing for the sticklebackgenome to be used to predict gene location in sablefish.A genotyping-by-sequencing library was used to identifyadditional SNPs, adding 1843 markers, and to identifysex-specific markers. Finally, the sex-specific markers leddirectly to the identification of sex-specific sequences in
the sablefish, located in the upstream promoter regionof the known sex pathway gene, gonadal soma-derivedfactor, the master sex determinant in the medaka,Oryzias luzonensis.
MethodsSample Collection and extractionsAll sablefish used in this work were provided by SablefishCanada Ltd. The first family is the result of a paired hatch-ery mating, with a single father and mother and 83 pro-geny. Tissue collection from each parent was through finclip, while the samples from the progeny are throughwhole body DNA extractions on samples collected justafter hatching, all stored in 95% ethanol until use. Thesecond family, also a result of hatchery mating, produceda half-sibling family from three males and a single female.For each of the parents and the 115 progeny, fin clips wereused as source of DNA (stored in 95% ethanol). The sexof 100 fish in the second family was recorded by the ap-pearance and size of the gonads at 15 months of age andliver, spleen, kidney, gonad and head kidney tissues werecollected, initially frozen on dry ice, and stored long-termat −80°C. DNA was isolated using a Chelex extractionprotocol following the protocol of [56]. A phenol DNA ex-traction was performed on the liver tissue of one of theprogeny from family 2 following a standard protocol [57];this extraction was used for mitochondrial genome se-quencing. Liver tissues from family 2 progeny and fin tis-sue from the parents and 14 immature, unrelated sablefish(8 males, 6 females) were extracted for use in Genotyping-by-Sequencing using the standard protocol in the DNeasyBlood & Tissue Kit (Qiagen). For sex-specific sequencing,fin clips from 47 mature, definitely sexed broodstock wereextracted by Chelex extraction and used along with the 6family parents.Total RNAs were extracted from each tissue in TRIzol re-
agent (Invitrogen) by mixer-mill homogenization (Retsch)and spin-column purified using RNeasy Mini kits (Qiagen).Each RNA sample was then quantified and quality-checkedby spectrophotometer (NanoDrop Technologies) and agar-ose gel, respectively. For cDNA libraries, the brain, gill andkidney were taken from sablefish unrelated to the mappingfamilies and processed. For RNAseq, RNA was extractedfrom the kidney, liver and gonadal tissues from one maleand one female sablefish from the secondmapping family.For time-series samples, sablefish were collected 5 days
before and 1, 5, 11 and 25 day after hatching, and placedin RNAlater (Invitrogen) until use. Whole larvae weredigested with Proteinase K (Qiagen); following digestion,25% of the sample was used with the DNeasy Blood &Tissue Kit (Qiagen) while the remaining sample was puri-fied using the RNeasy mini kit (Qiagen). RNA sampleswere converted to cDNA for PCR using M-MuLV ReverseTranscriptase (NEB).
Rondeau et al. BMC Genomics 2013, 14:452 Page 14 of 19http://www.biomedcentral.com/1471-2164/14/452
cDNA librariesAnoplopoma fimbria EST libraries were constructedusing the methods of Koop et al. [58]. In short, the li-brary was constructed directionally in pAL17.3 (EvrogenCo.). Libraries were plated and colonies picked using aQpix2 array picker. Following overnight growth of gly-cerol stocks arrayed in 384-well format [59], plasmidDNA was extracted using a standard lysis and neutra-lization procedure followed by an alcohol precipitation.Sequencing was performed on an ABI 3730 sequencerusing BigDye™ Terminator V3.1 (ABI) cycle sequencingkit and either the primer M13 forward (5’-GTAAAACGACGGCCAGT-3’) for 5’ end or SP6WAN (5’-ATTTAGGTGACACTATAG-3’) for 3’ end sequencing. Base callingfrom traces and quality scores assigned using Phred [60,61],and Phrap used to assemble the sequences into contigs(200 minscore, 0.99 stringency; http://www.phrap.org/).One lane of RNAseq 100 bp PET Illumina sequencing
was run on a HiSeq2000 sequencer, and assembled usingSOAPdenovo (k=75) [62]; sequencing was performed atthe Beijing Genomics Institute.RNAseq and EST library data were merged into a
Transcriptome Shotgun Assembly. Contigs larger than200 bp from both datasets were assembled using Phrap(200 minscore, 0.96 stringency), with resulting contigs400 bp or larger retained. Contigs were annotated usingSwissProt and Gene Ontology’s annotated protein data-bases using a threshold of 1e-5.
Mitochondrial genome sequencingA slightly modified version of Miya and Nishida’s proto-col [63] was used to amplify the mitochondrial genomein two long, overlapping sequences with smaller, second-ary PCRs for sequencing. Primers were designed to the16S ribosomal RNA and cytochrome B mitochondrialsequences in NCBI (accessions GU018112 and FJ264496respectively). Afim-Cb-H (5’-GATATGAGCCGTAGTAAAGACCTCGGCCGA-3’) and Afim-16S-L (5’-TCGACAAGGGGGTTTACGACCTCGATGTTG-3’) weredesigned to the same place as the Gogr-Cb-H and Gogr-16S-L primers and these primers were used to amplify thelarger mitochondrial fragment, covering the NADH de-hydrogenase, cytochrome oxidase and ATPase genes.Afim-16S-H (5’-GACCTGGATTACTCCGGTCTGAACTCAGAT-3’) was also designed to the same place asGogr-16S-H; however, only the 3’ end of the primerwas found in the available sequence, and the 5’ end ofthe designed primer comes directly from Gogr-16S-H.Afim-Cb-L (5’-GATTAATCCGAAACATTCACGCTAACGGTG-3’) was designed to a different portion of theCytochrome B sequence, as Gogr-Cb-L did not align tothe available Cytochrome B sequence. These two primerswere used to amplify the small mitochondrial fragment,which contained the 12S ribosomal RNA and the D-loop.
Both reactions were amplified with the Phire Hot Start IIDNA polymerase (Finnzymes); 1× Phire reaction buffer, 0.2µM of each dNTP (Promega), 0.5 µM of each primer (IDT),50 ng genomic DNA and 0.5 µl enzyme in 25 ul reactions.Reactions were loaded onto aTechneTC-412 at 98°C for 45seconds, followed by 35 cycles of 98°C for 8 seconds, 63°Cfor 10 seconds and 72°C for 4 minutes. Following a final ex-tension of 72°C for 8 minutes, samples were cooled to 4°C.After confirming successful amplification on a 1% agarosegel, the reactions were diluted 1/100, and used as templatesfor the secondary PCRs. The 30 pairs of fish-universalprimers [63] and the four long primers were used to amplifysmall pieces of the mitochondrial genome in an overlappingfashion; when a pair could not successfully amplify aproduct (ie. 5-L/5-H), an adjacent primer was used instead(ie. 5-L/6-H); long primers were used when overlap be-tween the two large fragments could not be obtained. 25 µlreactions were used, containing 1× GoTaq Flexi Buffer(Promega), 2.5 mM MgCl2 (Promega), 0.2 µM each dNTP(Promega), 0.5 µM each primer (IDT) and 0.625U HotStart GoTaq polymerase (Promega). Samples were ampli-fied on Techne TC-412 at 95°C for 3 minutes, followed by30 cycles of 95°C for 15 seconds, 45°C for 15 seconds and72°C for 45 seconds, with a final extension of 10 minutesat 72°C, and a final hold of 4°C. The PCR products wereplate purified with Qiagen MinElute 96UF PCR purifica-tion; samples were eluted in 20 µl DNAse/RNAse freewater. Sequencing reactions were prepared containing0.5 μl BigDye Terminator v3.1 (ABI), 0.5 µl BigDye Ter-minator sequencing buffer, 0.64 μM forward or reverseprimer and approximately 20 ng purified PCR product ina 5 ul reaction; these were run on a TC-412 (Techne) asfollows: 1 min 95°C initial denaturation, followed by 30 cy-cles of 95°C for 30 s, 50°C for 15 s, and 60°C for 90 s anda final extension of 5 min at 72°C. Sequencing reactionswere ethanol precipitated, and re-suspended in 20 μlDNAse/RNAse-free H2O (Gibco). All sequencing wasperformed on an ABI 3730 DNA analyzer. Resulting se-quences were assembled using the assembler in Geneiousv5.1.7. Mitochondrial features were identified usingDOGMA [64] and by comparison to the availablemitochondrial genomes of other Scorpaeniformes:Aptocyclus ventricosus (Genbank:AP004443), Clinocottusanalis (Genbank:FJ848374), Cottus hangiongensis(Genbank:EU332751), Cottus poecilopus (Genbank:EU332750), Cottus reinii (Genbank:AP004442), Helicolenushilgendorfii (Genbank:AP002948), Satyrichthys amiscus(Genbank:AP004441), Sebastes schlegeli (Genbank:AY491978), Sebastiscus marmoratus (Genbank:GU452728).For phylogenetic analysis, the RAXML (7.0.4) protocol
of Kawahara et al. [35] was followed. Along with 71 ofthe 75 mitogenomes previously analyzed, we added 15mitogenomes more recently uploaded to NCBI that wereexpected to be closely related to the Scorpaeniformes

Rondeau et al. BMC Genomics 2013, 14:452 Page 15 of 19http://www.biomedcentral.com/1471-2164/14/452
(see Additional file 8: Table S5 for the list), as well as thesablefish mitogenome. Following the trimming of ambigu-ously aligned sections, gaps and loop structures, we focusedon 13528 bases: 10436 in the 12 protein-coding genes (ex-cludes ND6, see [35]), 1411 bases in the 22 tRNAs, and1681 in the two rRNA sequences. For the 12 protein-coding genes, we re-assigned the third position in eachcodon as either purine (R) or pyrimidine (Y) as deemed thebest estimate and conservation of signal to noise [35].
Primer development and marker identification - SNPsSNP primer design was performed with three approaches.For the first batch, assembled contigs were analyzed forvariations in individual EST sequences at single bases.Using primer3 [65], primers amplifying products of 200-400 bp containing the expected SNP were designed, withprimers of 18–22 bp with Tm≈ 55°C, max 5°C differencein Tm and a 2 bp GC clamp. In the second batch, primerswere designed to a random selection of EST contigs, witha focus on the 3’ UTR. Again using primer3, primersamplifying larger products, 400-550 bp, were designed,with the same characteristics as above. Finally, one set ofprimers was designed to target each of dmrt1, cdk5rap2,myostatin, growth hormone receptor, growth hormonereceptor hormone, ssr2, tgf2, dax1 and sox9 loci. Align-ment of the loci from the species Gasterosteus aculeatus,Oryzias latipes, Takifugu rubripes, and Tetraodonnigroviridis were visualized using the UCSC genomebrowser and primers were designed to highly conserved se-quence in the four species. PCR and sequencing reactionswere performed using the SNP amplification and sequen-cing protocol in Messmer et al. [56]; all sequences wereobtained using an ABI 3730 DNA analyzer. Sequences fromeach primer pair were aligned in Geneious 5.1.7 and SNPsidentified and scoredmanually.
Primer development and marker identification –microsatellitesUsing the program RepeatFinder [66], repeats of 2–5 nu-cleotides length (min 4 repeats) were identified from theassembled EST transcripts. Using primer3, primers weredesigned to amplify products 75 – 200bp in size encom-passing the expected repeat, with primers of 18–22 bpwith Tm≈55°C and max 5°C difference in Tm. An add-itional 13 primer pairs designed from the same datasetwere used, and are described in [8].PCR reactions and labelled microsatellite genotyping
followed the microsatellite amplification and scoringprotocol in Messmer et al. [56]. In initial primer testing,successful amplification and polymorphism, were deter-mined using 10% polyacrylamide gels (25 ml of 40% 19:1acrylamide: bis-acrylamide (BioRad); 100 ul TEMED(Sigma); 1ml 10% w/v ammonium persulphate (Sigma);74 ml H2O) run for 12–14 hours, stained using EtBr and
imaged; half the microsatellites in family 1 were also ana-lyzed through this method. The remaining microsatellitesscored in family 1 and all microsatellites scored in family2 included either a 6-FAM or HEX labelled fluorescentdye (IDT) attached to one of the primers. Followingamplification, 0.5 µl each PCR product (one HEX-labelledand one 6-FAM labelled) was added to 9.9 µl Hi-Di™Formamide (ABI) and 0.1 μl GeneScan™ -500 ROX™ SizeStandard (ABI), and samples denatured by heating to 95°Cfor 3 min and placed on ice for 5min. Amplifications wererun on a ABI 3730 DNA sequencer and electrophero-grams were analyzed using GeneMapper V4.0 (ABI).
Marker namingNomenclature for newly developed markers follows amodified version of the microsatellite nomenclature ofJackson et al. [67]. The species was identified by the firstletter of the genus followed by 2 of the species (Afi);marker type was represented by a two letter identifier(MI = microsatellite, SP = SNP); a unique four digitnumber was assigned to each of the individual markers;a four letter identifier for the institute from which theywere found (UVic).With both microsatellite and SNPs, any occasion where
multiple markers were utilized from the same locus, themarkers were given the locus name for mapping purposes.Locus names were assigned with a short identifier of themarker type (SNP or MI) followed by the word locus anda unique contig number (see Additional file 2: Table S1and Additional file 3: Table S2 for contig numbers). Fur-thermore, should two markers from the same contig beuseful in the same mapping parent, each marker was usedto create a representative locus marker, with one markerfilling in any missing data from the other. Each contig se-quence used to design the SNP or microsatellite primerswas input into an NCBI BLASTx search. Should thecontig have a significant BLAST result, an abbreviationfor the protein product was enclosed in square brackets,and joined to the original name (either marker or locus asnecessary) by an underscore.
Linkage analysisAnalysis of linkage in this study was performed using pro-grams contained within the LINKMFEX package, v 2.3 (R.Danzmann, University of Guelph, http://www.uoguelph.ca/~rdanzman/software.htm) following the standardprotocol (LOD threshold = 3.0). Markers with more than15% of genotypes missing were omitted from the analysis.Merged sex-specific maps were produced followed by anestimated merged map using the MERGE programs in theLINKMFEX package. Should an insufficient number ofcommon markers be mapped to linkage groups to bemerged, the more complete linkage group was taken as a
Rondeau et al. BMC Genomics 2013, 14:452 Page 16 of 19http://www.biomedcentral.com/1471-2164/14/452
representative for the sex. Maps were visualized using theprogram MAPCHART [68].
Anoplopoma fimbria vs. Gasterosteus aculeatus (threespinestickleback)Each of the contig sequences (minus extended repeats)used to design the primers for the markers linked to themap were input into the UCSC Genome BioinformaticsDNA Blat server (http://genome.ucsc.edu/cgi-bin/hgBlat?command=start; [69,70]) using the sticklebackFeb. 2006 (Broad/gasAcu1) assembly. The hit with thehighest score (min = 100, default BLAT score) was deter-mined to be the most likely ortholog in the threespinestickleback, and chromosome number and positionalong the chromosome were retained. If contig se-quences showed no BLAT hits, contigs were BLASTedto TSA database, and the top TSA hit BLATed againstthe G. aculeatus genome (min score = 150).
GBS libraryThe GBS library was prepared following the protocol ofElshire et al. [21] utilizing the ApeKI restriction enzymeand the 96 barcodes suggested. 2 lanes of sample were runon a HiSeq 2000 with 100 bp paired-end reads (Illumina)and 48 individuals per lane. Resulting sequences weretrimmed and markers were scored using the Stacks pack-age [33]; see Additional file 7: Figure S3 for details. JELLY-FISH v1.1 [48] was used to identify and count all 31mersin the dataset. The 31mers were searched for sequencesfound exclusively in males (family males >70% occurrence;unrelated males >60%; females <2) and females; the re-sulting kmers were mapped back to full-length reads andused to identify the potential male or female-specificpolymorphisms.
Genome walkingGenome walking was used to expand the available se-quence around the male-specific markers, as well as thegene predicted to be between the male-specific markersusing a protocol based on Siebert et al. [71] with primersfrom Rebrikov et al. [72]. Following three separate diges-tions of male and female sablefish DNA with restrictionenzymes EcoRI, NdeI and BbsI (NEB), the genome walk-ing adapter was ligated overnight at 16°C using T4 DNAligase (NEB) in a 10 μl reaction. Following inactivationand dilution (1/10), the samples underwent PCR with pri-mer P1 (5’-CTAATACGACTCACTATAGGGC-3’) and aspecific primer designed to the 100bp read of interest(Additional file 9); PCR mix of 1X GoTaq Flexi ColorlessPCR buffer (Promega), 2.5 mM MgCl2 (Promega), 320 μMeach dNTP (Promega), 0.5 μM each forward and reverseprimers (IDT), 0.75U GoTaq Hot Start polymerase(Promega), and 5ng of DNA template made up to 30 μlwith DNAse/RNAse free H2O (Gibco), and cycled 95°C
for 3 min (without template), 72°C for 10minutes (includ-ing template), 21 cycles of 95°C for 30 s, 62°C −0.5°C percycle for 30 s and 72°C for 4 min, 19 cycles of 95°C for30 s, 52°C for 30 s, 72°C for 4 min, with a final extensionof 72°C for 10 mins. PCR were diluted 1/10000 and usedas template for the second round using nested primer NP1(5’-TCGAGCGGCCGCCCGGGCAGGT-3’) and a nestedspecific primer. PCR was cycled as above without the ini-tial 72°C for 10 minutes. Following Exo/FastAP treatment(Fermentas), samples were sequenced following the SNPsequencing protocol [56]. Sequencing reactions werepurified by ethanol precipitation while sequencing wasperformed on ABI 3730, and data analyzed using GeneiousV5.1.7. Resulting sequences were BLATed against theGasterosteus aculeatus genome.
Identification of sex-specific markers and sequencesAll primer sequences used in identification of Sex-specificmarkers can be found in Additional file 9. PCR primerswere designed to sequences containing sex-linked poly-morphisms, as well as genes predicted to be adjacent andbetween these markers based on the stickleback BLAT.PCRs were performed to amplify the sequence betweenthe markers and genes, looking for sex-specific amplicons;long PCRs were performed following the Phusion (NEB)protocol with 35 cycles and 15 s/kb. Once sex-specific sizedifferences were discovered, primers were designed tofully amplify across the region, with amplification and se-quencing performed following Genome Walking PCRprotocol, with 2 min extensions. Multiple bands werepurified through gel extraction using the QIAquick Gelextraction kit (Qiagen). All 53 unrelated, mature sablefishwere sequenced for the observed DNA inserts to confirmsex-specificity. Time-series samples were sexed using theX-insertion primers using the genomic DNA as template,while amplification on cDNA samples utilized exon-specific primers; see Additional file 9 for sequences andreaction conditions.
Additional files
Additional file 1: Figure S1. Sablefish mitochondrial genome. Agraphical representation of the Sablefish mitochondrial genome,including the relative placement of the 13 genes, 22 tRNA and 2 rRNAs.
Additional file 2: Table S1. Sablefish Microsatellite Primers. Details forall primers designed that successfully targeted polymorphicmicrosatellites. Primer sequences are detailed, as well as designsequence, BLAST and BLAT (stickleback) ID and repeat motif are given.
Additional file 3: Table S2. Sablefish SNP Primers. Details for allprimers designed that successfully targeted one or more polymorphicSNPs. Primer sequences are detailed, as well as design sequence, BLASTand BLAT (stickleback) ID, and total number of SNPs identified betweenthe two families.
Additional file 4: Table S3. Sablefish SNPs. List of all identified SNPsand their position within the surrounding sequence.

Rondeau et al. BMC Genomics 2013, 14:452 Page 17 of 19http://www.biomedcentral.com/1471-2164/14/452
Additional file 5: Figure S2. Sablefish linkage Map – Male, female andmerged maps. All 24 linkage groups are presented. Each triplicatedisplays the merged linkage group in the middle, with the male-specificand female-specific linkage map to the left and right respectively.
Additional file 6: Table S4. SNP markers identified throughGenotyping-by-sequencing. List of SNPs identified through Genotyping-by-sequencing and parameters used in Stacks.
Additional file 7: Figure S3. Gsdf and upstream promoter region.Sequences for Genbank:KC623942 and Genbank:KC623943 masked toshow major features including sex-specific sequences, gsdf, sex-specificsequences and repeat elements.
Additional file 8: Table S5. Mitochondrial genomes used in thephylogenetic analysis of the Scorpaeniformes and closely relatedGasterosteiformes and Perciformes. All mitochondrial genome accessionnumbers used in the phylogenetic analysis. Accession numbers notincluded in Kawahara et al. [35] are marked in bold.
Additional file 9: Primers and relevant information for Sex-specificamplifications. All primer sequences used to amplify and sequence theregion containing the sex-specific sequences are given, as well as relevantinformation such as annealing temperatures and multiplexing strategies.
Competing interestsThe authors declare that they have no competing interests.
Authors’ contributionsEBR performed EST library preparation and sequencing, primer evaluations,SNP sequencing and analysis, microsatellite genotyping and analysis, linkagemapping, mitochondrial genome analysis, comparative synteny analyses, GBSlibrary construction, genome walking, design and testing of sex-specificprimers and drafting of the manuscript. AMM performed EST librarypreparation and sequencing, microsatellite genotyping and analysis. DSSperformed microsatellite primer design and genotyping. SGJ designed SNPprimers and BLAT analysis, KRVS prepared samples for EST library andRNAseq and performed larval analysis, DRM identified sex-specific sequencesin GBS dataset, JSL assembled and analyzed expressed sequences, WAPperformed mitogenome sequencing. RSAM, GMM, AED performedmicrosatellite genotyping. BC produced and collected sablefish samples foranalysis. BFK contributed to experimental design and analysis. All authorsread and approved the final manuscript.
AcknowledgementsThis work was supported by Genome British Columbia, Sablefish Canada Ltd.,the University of Victoria and NSERC Canada. We would like to thank all thestaff at Sablefish Canada Ltd. for their help in the raising and collection ofthe sablefish. We would also like to thank Roy Danzmann and our twoanonymous reviewers who improved the manuscript through helpfulcomments and critiques.
Author details1Department of Biology, Centre for Biomedical Research, University ofVictoria, Victoria, British Columbia V8W 3N5, Canada. 2Sablefish Canada Ltd,335 Walkers Hook Rd., Salt Spring Island, British Columbia V8K 1N7, Canada.
Received: 21 February 2013 Accepted: 18 June 2013Published: 6 July 2013
References1. Smith WL, Wheeler WC: Polyphyly of the mail-cheeked fishes
(Teleostei: Scorpaeniformes): evidence from mitochondrial and nuclearsequence data. Mol Phylogenet Evol 2004, 32(2):627–646.
2. Shinohara G, Imamura H: Revisiting recent phylogenetic studies of“Scorpaeniformes”. Ichthyol Res 2007, 54(1):92–99.
3. Kimura DK, Shimada AM, Shaw FR: Stock structure and movement oftagged sablefish, Anoplopoma fimbria, in offshore northeast Pacificwaters and the effects of El Nino-Southern Oscillation on migration andgrowth. Fish Bull 1998, 96:462–481.
4. Allen MJ, Smith GB: Atlas and zoogeography of common fishes in theBering Sea and Northeastern Pacific. NOAA Technical Report NMFS 1988,66:1–151.
5. Commercial Fisheries: Annual Landings. [http://www.st.nmfs.noaa.gov/st1/commercial/landings/annual_landings.html]
6. Preliminary Summary Commercial Statistics 2011: Cumulative totals; 2011[http://www.pac.dfo-mpo.gc.ca/stats/comm/summ-somm/index-eng.htm]
7. Making a splash: Industry forecasts new aquaculture species will generate $880million by 2020. [http://www.aquaculture.ca/files/archives.php].
8. Aggarwal RK, Allainguillaume J, Bajay MM, Barthwal S, Bertolino P, ChauhanP, Consuegra S, Croxford A, Dalton DL, den Belder E, et al: Permanentgenetic resources added to molecular ecology resources database 1August 2010–30 September 2010. Mol Ecol Resour 2011, 11(1):219–222.
9. McCraney WT, Saski C, Guyon J: Isolation and characterization of 12microsatellites for the commercially important sablefish, Anoplopomafimbria. Conservation Genet Resour 2012, 4(2):415–417.
10. Tripp-Valdez MA, Garcia-de-Leon FJ, Espinosa-Perez H, Ruiz-Campos G:Population structure of sablefish Anoplopoma fimbria using geneticvariability and geometric morphometric analysis Population structure ofsablefish. J Appl Ichthyol 2012, 28(4):516–523.
11. Nelson JS: Fishes of the World. Hoboken, NJ: John Wiley & Sons Inc; 2006.12. Liu ZJ, Cordes JF: DNA marker technologies and their applications in
aquacultrue genetics. Aquaculture 2004, 238:1–37.13. Moen T, Hayes B, Baranski M, Berg PR, Kjoglum S, Koop BF, Davidson WS,
Omholt SW, Lien S: A linkage map of the Atlantic salmon (Salmo salar)based on EST-derived SNP markers. BMC Genomics 2008, 9:223.
14. Lien S, Gidskehaug L, Moen T, Hayes BJ, Berg PR, Davidson WS, Omholt SW,Kent MP: A dense SNP-based linkage map for Atlantic salmon (Salmo salar)reveals extended chromosome homeologies and striking differences insex-specific recombination patterns. BMC Genomics 2011, 12:615.
15. Kucuktas H, Wang S, Li P, He C, Xu P, Sha Z, Liu H, Jiang Y, Baoprasertkul P,Somridhivej B, et al: Construction of genetic linkage maps andcomparative genome analysis of catfish using gene-associated markers.Genetics 2009, 181(4):1649–1660.
16. Zheng X, Kuang Y, Zhang X, Lu C, Cao D, Li C, Sun X: A genetic linkagemap and comparative genome analysis of common carp(Cyprinus carpio L) using microsatellites and SNPs. Mol Genet Genomics2011, 286(3–4):261–277.
17. Xia JH, Liu F, Zhu ZY, Fu J, Feng J, Li J, Yue GH: A consensus linkage mapof the grass carp (Ctenopharyngodon idella) based on microsatellites andSNPs. BMC Genomics 2010, 11:135.
18. Reid DP, Smith C-A, Rommens M, Blanchard B, Martin-Robichaud D, Reith M:A Genetic Linkage Map of Atlantic Halibut (Hippoglossus hippoglossus L).Genetics 2007, 177:1193–1205.
19. Franch R, Louro B, Tsalavouta M, Chatziplis D, Tsigenopoulos CS,Sarropoulou E, Antonello J, Magoulas A, Mylonas CC, Babbucci M, et al: Agenetic linkage map of the hermaphrodite teleost fish Sparus aurata L.Genet Mol Biol 2006, 174:853–861.
20. Amores A, Catchen J, Ferrara A, Fontenot Q, Postlethwait JH: Genomeevolution and meiotic maps by massively parallel DNA sequencing:spotted gar, an outgroup for the teleost genome duplication. Genetics2011, 188:799–808.
21. Elshire RJ, Glaubitz JC, Sun Q, Poland JA, Kawamoto K, Buckler ES, MitchellSE: A Robust, simple genotyping-by-sequencing (GBS) approach for highdiversity species. PLoS One 2011, 6(5):e19379.
22. Matsuda M, Nagahama Y, Shinomiya A, Sato T, Matsuda C, Kobayashi T,Morrey CE, Shibata N, Asakawa S, Shimizu N, et al: DMY is a Y-specificDM-domain gene required for male development in the medaka fish.Nature 2002, 417(6888):559–563.
23. Matsuda M, Sato T, Toyazaki Y, Nagahama Y, Hamaguchi S, Sakaizumi M:Oryzias curvinotus has DMY, a gene that is required for maledevelopment in the medaka, O. latipes. Zoolog Sci 2003, 20(2):159–161.
24. Hattori RS, Murai Y, Oura M, Masuda S, Majhi SK, Sakamoto T, Fernandino JI,Somoza GM, Yokota M, Strüssmann CA: A Y-linked anti-Müllerian hormoneduplication takes over a critical role in sex determination. Proc Natl AcadSci 2012, 109(8):2955–2959.
25. Yano A, Guyomard R, Nicol B, Jouanno E, Quillet E, Klopp C, Cabau C,Bouchez O, Fostier A, Guiguen Y: An immune-related gene evolved intothe master sex-determining gene in rainbow trout, Oncorhynchus mykiss.Current biology: CB 2012, 22(15):1423–1428.
26. Yano A, Nicol B, Jouanno E, Quillet E, Fostier A, Guyomard R, Guiguen Y:The sexually dimorphic on the Y-chromosome gene (sdY) is a conservedmale-specific Y-chromosome sequence in many salmonids. EvolutionaryApplications 2012 2012. n/a-n/a.
Rondeau et al. BMC Genomics 2013, 14:452 Page 18 of 19http://www.biomedcentral.com/1471-2164/14/452
27. Myosho T, Otake H, Masuyama H, Matsuda M, Kuroki Y, Fujiyama A,Naruse K, Hamaguchi S, Sakaizumi M: Tracing the emergence of anovel sex-determining gene in medaka, Oryzias luzonensis. Genetics2012, 191(1):163–170.
28. Kamiya T, Kai W, Tasumi S, Oka A, Matsunaga T, Mizuno N, Fujita M, SuetakeH, Suzuki S, Hosoya S, et al: A trans-species missense SNP in Amhr2 isassociated with sex determination in the tiger pufferfish, Takifugurubripes (Fugu). PLoS Genet 2012, 8(7):e1002798.
29. Lee B-Y, Kocher TD: Comparative genomics and positional cloning. InAquaculture Genome Technologies. Edited by Liu Z. Oxford, UK: BlackwellPublishing Ltd; 2007:323–335.
30. Liu S, Rexroad CE 3rd, Couch CR, Cordes JF, Reece KS, Sullivan CV: Amicrosatellite linkage map of striped bass (Morone saxatilis) revealsconserved synteny with the three-spined stickleback (Gasterosteusaculeatus). Marine Biotechnol 2012, 14(2):237–244.
31. Palti Y, Genet C, Gao G, Hu Y, You FM, Boussaha M, Rexroad CE 3rd,Luo MC: A second generation integrated map of the rainbow trout(Oncorhynchus mykiss) genome: analysis of conserved synteny withmodel fish genomes. Marine Biotechnol 2012, 14(3):343–357.
32. Sarropoulou E, Nousdili D, Magoulas A, Kotoulas G: Linking the genomes ofnonmodel teleosts through comparative genomics. Marine Biotechnol2008, 10(3):227–233.
33. Catchen JM, Amores A, Hohenlohe P, Cresko W, Postlethwait JH: Stacks:building and genotyping Loci De Novo from short-read sequences.G3: Genes, Genomes, Genetics 2011, 1(3):171–182.
34. Pereira SL: Mitochondrial genome organization and vertebratephylogenetics. Genet Mol Biol 2000, 23(4):745–752.
35. Kawahara R, Miya M, Mabuchi K, Lavoue S, Inoue JG, Satoh TP, Kawaguchi A,Nishida M: Interrelationships of the 11 gasterosteiform families(sticklebacks, pipefishes, and their relatives): a new perspective based onwhole mitogenome sequences from 75 higher teleosts. Mol PhylogenetEvol 2008, 46(1):224–236.
36. Kawahara R, Miya M, Mabuchi K, Near TJ, Nishida M: Sticklebackphylogenies resolved: evidence from mitochondrial genomes and 11nuclear genes. Mol Phylogenet Evol 2009, 50(2):401–404.
37. Imamura H, Yabe M: Demise of the Scorpaeniformes (Actinopterygii:Percomorpha): an alternative phylogenetic hypothesis. Bulletin of FisheriesSciences Hokkaido University 2002, 53(3):107–128.
38. Setiamarga DHE, Miya M, Yamanoue Y, Azuma Y, Inoue JG, Ishiguro NB,Mabuchi K, Nishida M: Divergence time of the two regional medakapopulations in Japan as a new time scale for comparative genomics ofvertebrates. Biol Lett 2009, 5(6):812–816.
39. Near TJ, Eytan RI, Dornburg A, Kuhn KL, Moore JA, Davis MP,Wainwright PC, Friedman M, Smith WL: Resolution of ray-finned fishphylogeny and timing of diversification. Proc Natl Acad Sci 2012,109(34):13698–13703.
40. Rexroad CE 3rd, Palti Y, Gahr SA, Vallejo RL: A second generation geneticmap for rainbow trout (Oncorhynchus mykiss). BMC Genet 2008, 9:74.
41. Singer A, Perlman H, Yan Y, Walker C, Corley-Smith G, Brandhorst B,Postlethwait J: Sex-specific recombination rates in Zebrafish (Danio rerio).Genetics 2002, 160(2):649–657.
42. Phillips RB, Faber-Hammond J, Luckenbach JA: The sablefish (Anoplopomafimbria) karyotype including the location of 5S and 18S rDNA andinformation on cell culture conditions. Aquacult Res 2012:A. doi:10.1111/j.1365-2109.2012.03177.x. Epub ahead of print.
43. Jaillon O, Aury JM, Brunet F, Petit JL, Stange-Thomann N, Mauceli E,Bouneau L, Fischer C, Ozouf-Costaz C, Bernot A, et al: Genome duplicationin the teleost fish Tetraodon nigroviridis reveals the early vertebrateproto-karyotype. Nature 2004, 431(7011):946–957.
44. Davey JW, Hohenlohe PA, Etter PD, Boone JQ, Catchen JM, Blaxter ML:Genome-wide genetic marker discovery and genotyping usingnext-generation sequencing. Nat Rev Genet 2011, 12(7):499–510.
45. Peichel CL, Ross JA, Matson CK, Dickson M, Grimwood J, Schmutz J, MyersRM, Mori S, Schluter D, Kingsley DM: The master sex-determination locusin threespine sticklebacks is on a nascent Y chromosome. Current biology:CB 2004, 14(16):1416–1424.
46. Ross JA, Urton JR, Boland J, Shapiro MD, Peichel CL: Turnover of sexchromosomes in the stickleback fishes (Gasterosteidae). PLoS Genet 2009,5(2):e1000391.
47. Smith EK, Guzmán JM, Luckenbach JA: Molecular cloning, characterization,and sexually dimorphic expression of five major sex differentiation-
related genes in a Scorpaeniform fish, sablefish (Anoplopoma fimbria).Comp Biochem Physiol B Biochem Mol Biol 2013, 165(2):125–137.
48. Marcais G, Kingsford C: A fast, lock-free approach for efficientparallel counting of occurrences of k-mers. Bioinformatics 2011,27(6):764–770.
49. de Boer JG, Yazawa R, Davidson WS, Koop BF: Bursts and horizontalevolution of DNA transposons in the speciation of pseudotetraploidsalmonids. BMC Genomics 2007, 8:422.
50. Kuraku S, Qiu H, Meyer A: Horizontal transfers of Tc1 elements betweenteleost fishes and their vertebrate parasites, lampreys. Genome Biol Evol2012, 4(9):817–824.
51. Sawatari E, Shikina S, Takeuchi T, Yoshizaki G: A novel transforminggrowth factor-beta superfamily member expressed in gonadalsomatic cells enhances primordial germ cell and spermatogonialproliferation in rainbow trout (Oncorhynchus mykiss). Dev Biol 2007,301(1):266–275.
52. Gautier A, Le Gac F, Lareyre J-J: The gsdf gene locus harbors evolutionaryconserved and clustered genes preferentially expressed in fishprevitellogenic oocytes. Gene 2011, 472(1–2):7–17.
53. Yoshimoto S, Ikeda N, Izutsu Y, Shiba T, Takamatsu N, Ito M: Opposite rolesof DMRT1 and its W-linked paralogue, DM-W, in sexual dimorphism ofXenopus laevis: implications of a ZZ/ZW-type sex-determining system.Development 2010, 137(15):2519–2526.
54. Smith CA, Roeszler KN, Ohnesorg T, Cummins DM, Farlie PG, Doran TJ,Sinclair AH: The avian Z-linked gene DMRT1 is required for male sexdetermination in the chicken. Nature 2009, 461(7261):267–271.
55. Alderdice DF, Jensen JOT, Velsen FPJ: Preliminary trials on incubationof sablefish eggs (Anoplopoma fimbria). Aquaculture 1988,69(3–4):271–290.
56. Messmer AM, Rondeau EB, Jantzen SG, Lubieniecki KP, Davidson WS, KoopBF: Assessment of population structure in Pacific Lepeophtheirus salmonis(Kroyer) using single nucleotide polymorphism and microsatellitegenetic markers. Aquaculture 2011, 320(3–4):183–192.
57. Sambrook J, Russell DW: Molecular Cloning: A Laboratory Manual. 3rdedition. Cold Spring Harbor, NY: Cold Spring Harbor Laboratory Press; 2001.
58. Koop BF, von Schalburg KR, Leong J, Walker N, Lieph R, Cooper GA, Robb A,Beetz-Sargent M, Holt RA, Moore R, et al: A salmonid EST genomic study:genes, duplications, phylogeny and microarrays. BMC Genomics 2008, 9:545.
59. Rise ML, von Schalburg KR, Brown GD, Mawer MA, Devlin RH, Kuipers N,Busby M, Beetz-Sargent M, Alberto R, Gibbs AR, et al: Development andapplication of a salmonid EST database and cDNA microarray: datamining and interspecific hybridization characteristics. Genome Res 2004,14(3):478–490.
60. Ewing B, Green P: Base-calling of automated sequencer traces usingphred, II. Error probabilities. Genome Res 1998, 8(3):186–194.
61. Ewing B, Hillier L, Wendl MC, Green P: Base-calling of automatedsequencer traces using phred, I. Accuracy assessment. Genome Res 1998,8(3):175–185.
62. Li R, Zhu H, Ruan J, Qian W, Fang X, Shi Z, Li Y, Li S, Shan G, Kristiansen K, etal: De novo assembly of human genomes with massively parallel shortread sequencing. Genome Res 2010, 20(2):265–272.
63. Miya M, Nishida M: Organization of the mitochondrial genome of a deep-sea fish, Gonostoma gracile (Teleostei: Stomiiformes): first example oftransfer RNA gene rearrangements in bony fishes. Marine Biotechnol 1999,1(5):416–426.
64. Wyman SK, Jansen RK, Boore JL: Automatic annotation of organellargenomes with DOGMA. Bioinformatics 2004, 20(17):3252–3255.
65. Rozen S, Skaletsky H: Primer3 on the WWW for general users and forbiologist programmers. Methods in molecular biology (Clifton, NJ) 2000,132:365–386.
66. Benson G: Tandem repeats finder: a program to analyze DNA sequences.Nucleic Acids Res 1999, 27(2):573–580.
67. Jackson TR, Ferguson MM, Danzmann RG, Fishback AG, Ihssen PE, O'ConnellM, Crease TJ: Identification of two QTL influencing upper temperaturetolerance in three rainbow trout (Oncorhynchus mykiss) half-sib families.Heredity 1998, 80:143–151.
68. Voorrips RE: MapChart: software for the graphical presentation of linkagemaps and QTLs. J Hered 2002, 93(1):77–78.
69. Fujita PA, Rhead B, Zweig AS, Hinrichs AS, Karolchik D, Cline MS, Goldman M,Barber GP, Clawson H, Coelho A, et al: The UCSC Genome Browser database:update 2011. Nucleic Acids Res 2011, 39(supplement 1):D876–D882.
Rondeau et al. BMC Genomics 2013, 14:452 Page 19 of 19http://www.biomedcentral.com/1471-2164/14/452
70. Kent WJ, Sugnet CW, Furey TS, Roskin KM, Pringle TH, Zahler AM, David H:The human genome browser at UCSC. Genome Res 2002, 12(6):996–1006.
71. Siebert PD, Chenchik A, Kellogg DE, Lukyanov KA, Lukyanov SA: Animproved PCR method for walking in uncloned genomic DNA. NucleicAcids Res 1995, 23(6):1087–1088.
72. Rebrikov DV, Desai SM, Siebert PD, Lukyanov SA: Suppression subtractivehybridization. In Methods in Molecular Biology Vol. 258, Gene expressionprofiling: methods and protocols. Edited by Shimkets RA. Totowa, NJ:Humana press; 2004:107–134.
doi:10.1186/1471-2164-14-452Cite this article as: Rondeau et al.: Genomics of sablefish (Anoplopomafimbria): expressed genes, mitochondrial phylogeny, linkage map andidentification of a putative sex gene. BMC Genomics 2013 14:452.
Submit your next manuscript to BioMed Centraland take full advantage of:
• Convenient online submission
• Thorough peer review
• No space constraints or color figure charges
• Immediate publication on acceptance
• Inclusion in PubMed, CAS, Scopus and Google Scholar
• Research which is freely available for redistribution
Submit your manuscript at www.biomedcentral.com/submit
Related Documents