Genomic Signal Processing Methods for Computation of Alignment-Free Distances from DNA Sequences Ernesto Borrayo 1¤a,¤b , E. Gerardo Mendizabal-Ruiz 1 , Hugo Ve ´ lez-Pe ´ rez 1 , Rebeca Romo-Va ´ zquez 1 , Adriana P. Mendizabal 2 , J. Alejandro Morales 1,3 * 1 Computer Sciences Department, CUCEI - Universidad de Guadalajara, Guadalajara, Me ´ xico, 2 Molecular Biology Laboratory, Farmacobiology Department, CUCEI - Universidad de Guadalajara, Guadalajara, Me ´ xico, 3 Center for Theoretical Research and High Performance Computing, CUCEI -Universidad de Guadalajara, Guadalajara, Me ´xico Abstract Genomic signal processing (GSP) refers to the use of digital signal processing (DSP) tools for analyzing genomic data such as DNA sequences. A possible application of GSP that has not been fully explored is the computation of the distance between a pair of sequences. In this work we present GAFD, a novel GSP alignment-free distance computation method. We introduce a DNA sequence-to-signal mapping function based on the employment of doublet values, which increases the number of possible amplitude values for the generated signal. Additionally, we explore the use of three DSP distance metrics as descriptors for categorizing DNA signal fragments. Our results indicate the feasibility of employing GAFD for computing sequence distances and the use of descriptors for characterizing DNA fragments. Citation: Borrayo E, Mendizabal-Ruiz EG, Ve ´lez-Pe ´rez H, Romo-Va ´zquez R, Mendizabal AP, et al. (2014) Genomic Signal Processing Methods for Computation of Alignment-Free Distances from DNA Sequences. PLoS ONE 9(11): e110954. doi:10.1371/journal.pone.0110954 Editor: Vladimir B. Bajic, King Abdullah University of Science and Technology, Saudi Arabia Received August 30, 2012; Accepted September 26, 2014; Published November 13, 2014 Copyright: ß 2014 Borrayo et al. This is an open-access article distributed under the terms of the Creative Commons Attribution License, which permits unrestricted use, distribution, and reproduction in any medium, provided the original author and source are credited. Funding: The authors wish to thank the National Council for Science and Technology (CONACyT) for PhD scholarship support to EB, and FOMIXJal project no. 2010-10-149481 that supported the infrastructure for experimentation. Competing Interests: The authors have declared that no competing interests exist. * Email: [email protected] ¤a Current address: Gene Research Center, University of Tsukuba, Tsukuba, Japan ¤b Current address: Genetic Resources Center, National Institute of Agrobiological Sciences, Tsukuba, Japan Introduction Genomic signal processing (GSP) refers to the use of digital signal processing (DSP) tools for analyzing genomic data. Current GSP methods require a step in which a genomic sequence to be analyzed S(t) is mapped onto a vector of numerical values (i.e., signal) that represents the information contained in the original sequence [1]. Existing DNA-to-signal mapping methods can be divided into two groups depending on the origin of the numerical values employed. The first group corresponds to methods that assign an arbitrary value to each character t, which represents the nucleotides that compose the sequence. Examples of this type of method include 2-bit binary representation (e.g., A = 00, C = 11, G = 10, T = 01) [2], 4-bit binary encoding (e.g., A = 1000, C = 0010, G = 0001, T = 0100) [3], 4-dimensional indicator sequence (Voss representation) (½A t T t C t G t where X n ~1 if S(t)~X ) [4], use of a tetrahedron structure [5], use of integer values employing different ranges (e.g., 0 to 3 [6], 1 to 4 [7]), use of real numbers (e.g., A = 21.5, T = 1.5, C = 0.5, G = 20.5 [8], and A = 0.25, G = 0.5, C = 0.75, T = 1 [9]), complex number values (e.g., A = 1zj ,C= {1zj ,G= {1{j and T = 1{j [6,10]), and use of quaternions (e.g., A = izj zk,C= i{j {k,T= {izj zk, and G = {i{j zk [11]). The second group includes methods for which the numerical values are defined according to certain biophysical or biochemical properties of the DNA molecules. Examples of this type of mapping include the use of electron-ion interaction potentials (EIIP) (i.e., A = 0.1260, C = 0.1340, T = 0.1335, G = 0.0806) [12] and the use of single atomic numbers (i.e., A = 70, C = 58, T = 66, G = 78) [13]. Other examples include paired nucleotide represen- tations that consider nucleotide complementarity (i.e., A = T = 0, C = G = 1) [14] and graphical approaches such as the DNA-walk model, in which a step is taken upwards (+1) if S(t) is a pyrimidine (C or T) or downwards (21) if it is a purine (A or G). Finally, this category also includes Z-curve representation [15], which maps a DNA sequence into a 3-dimensional sequence where Dx t distinguishes between purines and pyrimidines; Dy t distinguishes between amino-type and keto-type molecules, and Dz t distin- guishes between weak and strong hydrogen bonds. Most GSP methods reported in the literature are focused on the detection of coding regions (e.g., [11,16–23]). In general, these methods consist of performing DNA-to-signal mapping and obtaining the power spectrum of sections of the signal employing the short time discrete Fourier transform (STFT) using a sliding window of fixed length. When a period-3 frequency peak is detected in the power spectra, the section of sequence corre- sponding to that window is labeled as a coding region. Other applications of GSP include searching for genomic repeats using STFT [24] and determining the structural, thermodynamic, and bending properties of DNA by Fourier analysis [25]. Determining the distance between different genomic sequences is one of the most common types of analysis. In this scope, phylogenetic trees are one of the most essential tools in DNA analysis because they provide structured classification of DNA sequences and enable organization of our growing knowledge of biological diversity. Moreover, this method provides insight into PLOS ONE | www.plosone.org 1 November 2014 | Volume 9 | Issue 11 | e110954

Welcome message from author
This document is posted to help you gain knowledge. Please leave a comment to let me know what you think about it! Share it to your friends and learn new things together.
Transcript
Genomic Signal Processing Methods for Computation ofAlignment-Free Distances from DNA SequencesErnesto Borrayo1¤a,¤b, E. Gerardo Mendizabal-Ruiz1, Hugo Velez-Perez1, Rebeca Romo-Vazquez1,
Adriana P. Mendizabal2, J. Alejandro Morales1,3*
1 Computer Sciences Department, CUCEI - Universidad de Guadalajara, Guadalajara, Mexico, 2 Molecular Biology Laboratory, Farmacobiology Department, CUCEI -
Universidad de Guadalajara, Guadalajara, Mexico, 3 Center for Theoretical Research and High Performance Computing, CUCEI -Universidad de Guadalajara, Guadalajara,
Mexico
Abstract
Genomic signal processing (GSP) refers to the use of digital signal processing (DSP) tools for analyzing genomic data such asDNA sequences. A possible application of GSP that has not been fully explored is the computation of the distance betweena pair of sequences. In this work we present GAFD, a novel GSP alignment-free distance computation method. We introducea DNA sequence-to-signal mapping function based on the employment of doublet values, which increases the number ofpossible amplitude values for the generated signal. Additionally, we explore the use of three DSP distance metrics asdescriptors for categorizing DNA signal fragments. Our results indicate the feasibility of employing GAFD for computingsequence distances and the use of descriptors for characterizing DNA fragments.
Citation: Borrayo E, Mendizabal-Ruiz EG, Velez-Perez H, Romo-Vazquez R, Mendizabal AP, et al. (2014) Genomic Signal Processing Methods for Computation ofAlignment-Free Distances from DNA Sequences. PLoS ONE 9(11): e110954. doi:10.1371/journal.pone.0110954
Editor: Vladimir B. Bajic, King Abdullah University of Science and Technology, Saudi Arabia
Received August 30, 2012; Accepted September 26, 2014; Published November 13, 2014
Copyright: � 2014 Borrayo et al. This is an open-access article distributed under the terms of the Creative Commons Attribution License, which permitsunrestricted use, distribution, and reproduction in any medium, provided the original author and source are credited.
Funding: The authors wish to thank the National Council for Science and Technology (CONACyT) for PhD scholarship support to EB, and FOMIXJal projectno. 2010-10-149481 that supported the infrastructure for experimentation.
Competing Interests: The authors have declared that no competing interests exist.
* Email: [email protected]
¤a Current address: Gene Research Center, University of Tsukuba, Tsukuba, Japan¤b Current address: Genetic Resources Center, National Institute of Agrobiological Sciences, Tsukuba, Japan
Introduction
Genomic signal processing (GSP) refers to the use of digital
signal processing (DSP) tools for analyzing genomic data. Current
GSP methods require a step in which a genomic sequence to be
analyzed S(t) is mapped onto a vector of numerical values (i.e.,
signal) that represents the information contained in the original
sequence [1]. Existing DNA-to-signal mapping methods can be
divided into two groups depending on the origin of the numerical
values employed. The first group corresponds to methods that
assign an arbitrary value to each character t, which represents the
nucleotides that compose the sequence. Examples of this type of
method include 2-bit binary representation (e.g., A = 00, C = 11,
G = 10, T = 01) [2], 4-bit binary encoding (e.g., A = 1000,
C = 0010, G = 0001, T = 0100) [3], 4-dimensional indicator
sequence (Voss representation) (½At Tt Ct Gt� where Xn~1 if
S(t)~X ) [4], use of a tetrahedron structure [5], use of integer
values employing different ranges (e.g., 0 to 3 [6], 1 to 4 [7]), use of
real numbers (e.g., A = 21.5, T = 1.5, C = 0.5, G = 20.5 [8], and
A = 0.25, G = 0.5, C = 0.75, T = 1 [9]), complex number values
(e.g., A = 1zj, C = {1zj, G = {1{j and T = 1{j [6,10]), and
use of quaternions (e.g., A = izjzk, C = i{j{k, T = {izjzk,
and G = {i{jzk [11]).
The second group includes methods for which the numerical
values are defined according to certain biophysical or biochemical
properties of the DNA molecules. Examples of this type of
mapping include the use of electron-ion interaction potentials
(EIIP) (i.e., A = 0.1260, C = 0.1340, T = 0.1335, G = 0.0806) [12]
and the use of single atomic numbers (i.e., A = 70, C = 58, T = 66,
G = 78) [13]. Other examples include paired nucleotide represen-
tations that consider nucleotide complementarity (i.e., A = T = 0,
C = G = 1) [14] and graphical approaches such as the DNA-walk
model, in which a step is taken upwards (+1) if S(t) is a pyrimidine
(C or T) or downwards (21) if it is a purine (A or G). Finally, this
category also includes Z-curve representation [15], which maps a
DNA sequence into a 3-dimensional sequence where Dxt
distinguishes between purines and pyrimidines; Dyt distinguishes
between amino-type and keto-type molecules, and Dzt distin-
guishes between weak and strong hydrogen bonds.
Most GSP methods reported in the literature are focused on the
detection of coding regions (e.g., [11,16–23]). In general, these
methods consist of performing DNA-to-signal mapping and
obtaining the power spectrum of sections of the signal employing
the short time discrete Fourier transform (STFT) using a sliding
window of fixed length. When a period-3 frequency peak is
detected in the power spectra, the section of sequence corre-
sponding to that window is labeled as a coding region. Other
applications of GSP include searching for genomic repeats using
STFT [24] and determining the structural, thermodynamic, and
bending properties of DNA by Fourier analysis [25].
Determining the distance between different genomic sequences
is one of the most common types of analysis. In this scope,
phylogenetic trees are one of the most essential tools in DNA
analysis because they provide structured classification of DNA
sequences and enable organization of our growing knowledge of
biological diversity. Moreover, this method provides insight into
PLOS ONE | www.plosone.org 1 November 2014 | Volume 9 | Issue 11 | e110954
events that occur during evolution. A phylogenetic tree may be
constructed from a distance matrix M containing a set of values
that represents the pairwise distance d(Si,Sj) of a set of sequences
S~½S1,S2,:::,Sm�. Examples of distance matrix-based methods for
phylogenetic tree construction include neighbor-joining [26] and
the Fitch-Margoliash method [27], among others.
A distance-matrix corresponding to a set of DNA, RNA, or
protein sequences is commonly determined by assessing the
distance based on alignment of sequence pairs. Alignment
methods have also been used to identify domains, assemble
genome contigs, and study sequence variations. Techniques for
determining the alignment of a pair of sequences include dot-
matrix, dynamic programming, and k-tuple methods. In dot
matrix-based methods, a recurrence plot is generated by
comparing all elements of both sequences to form a two-
dimensional matrix in which a dot is placed at the intersection
where characters match. Dynamic programming methods com-
pute the optimal alignment between two sequences by considering
possible differences due to mutations, insertions, and deletions.
This method can also be used for global alignments via the
Needleman-Wunsch (NW) algorithm [28] or local alignments via
the Smith-Waterman [29] algorithm. The k-tuple (word) method
attempts to identify sub-sequences of length k in the query
sequence. Although this method does not guarantee an optimal
solution, it is significantly more efficient than dynamic program-
ming, making it suitable for the analysis of large-scale databases.
Two of the most popular local alignment methods are FASTA
[30] and BLAST [31]. A GSP method has also been proposed for
aligning multiple sequences (i.e., MAFFT [32]). In this method,
amino acid sequences of different proteins are converted into two
numerical vectors consisting of values that correspond to the
volume and polarity of the components. The correlation between
the two amino acid sequences is computed by the fast Fourier
transform (FFT) using a sliding window of fixed length. By
assessing the correlation score of both sliding windows, it is
possible to detect regions of matching sequences.
Several alignment-free methods for DNA distance computation
have been proposed. In general, these methods are based on
statistics of word frequencies (i.e., k-tuples) using metrics such as
weighted Euclidean distance, correlation, co-variance, information
theory-based measurements, and angle metrics. [33]. However,
other methods based on graphical DNA representations apply
dinucleotide (doublet) histograms [34], graph theory [35],
trinucleotide (triplet) curves [36], or the average bandwidth of
distance/distance (D/D) matrices [37]. A widely used tool for
computing phylogenetic trees is the phylogeny inference package
(Phylip) [38], which applies different methods such as parsimony,
jackknife, bootstrapping, and consensus trees using molecular
sequences, gene frequencies, restriction sites and fragments,
distance matrices, and discrete characters.
In this paper, we present a novel GSP alignment-free method
(GAFD) for determining the distance between two DNA
sequences. We introduce a new DNA-to-signal mapping tool that
is based on using doublets with a mapping function inspired by K-strings [39], which increases the number of possible amplitude
values for the generated signal. Additionally, we explore three
GSP distance metrics that may be used as descriptors for
categorizing dissimilarities between pairs of DNA signal fragments,
and that set the basis for developing methods for domain search
and characterizing sections of DNA. Our results demonstrate that
GAFD performs similarly to the NW and Phylip methods for
computing distances among a set of DNA sequences. Moreover,
the results obtained using the proposed descriptors show the
feasibility of this method in characterizing the types of differences
present between sections of sequences. All the methods and
algorithms were implemented in MATLAB R2010b. We em-
ployed the ARfit module for the autoregressive model computa-
tion and signal processing toolbox of MATLAB for FFT
computation. NW analysis and phylogenetic tree construction
was computed using the bioinformatics toolbox of MATLAB.
Source code is available for download at: http://hypatia.cucei.
udg.mx/invteorica/DNASignals/.
Materials and Methods
DNA sequence-to-signal mappingOur proposed DNA sequence-to-signal mapping method was
inspired by the alignment-free distance method, which employs
the nearest-neighbor method (NN) [40,41]. NN was originally
developed for determining the double strand melting temperature
[42,43] and was based on the rationale that the interaction
between bases on different strands depends to some extent on the
neighboring bases. The model assumes that, under specific
environmental conditions, the stability of hydrogen bridges
between strands of a nucleic acid duplex for a given doublet and
its complementary pairs depends on the identity of its neighboring
bases.
Our mapping tool requires that numerical values for all possible
combinations of two consecutive bases (doublets) are defined. Let
S(t) indicate the nucleotide at position t with respect to the
beginning of a sequence S of length m. For each doublet, we
define a numeric value H(S(t), S(tz1)). Then, a one-dimen-
sional discrete signal SS(t) is generated in a manner similar to the
K-strings approach [39] by combining the values generated by
doublets inside a window of magnitude 2az1:
SS(t)~1
(2az1)
Xtza
i~t{a
H(S(t), S(tz1)): ð1Þ
After mapping the DNA sequence to a discrete signal, a noise
reduction method is applied. A typical solution for noise reduction
from non-stationary signals is the wavelet denoising method.
Wavelet-based noise decomposition of a signal using orthogonal
discrete wavelet transform (DWT) can ‘‘concentrate’’ the infor-
mative signal into a few wavelet coefficients with large absolute
values without modifying the random distribution of noise. Then,
DWT-based denoising can be achieved by limiting the number of
wavelet coefficients that represent the signal. Consider the model
SS(t)~c(t)zn(t), ð2Þ
where SS(t) represents the original discrete signal, c(t) represents
the noiseless unknown version of SS(t), and n(t) represents the
noise. Since DWT is a linear transformation, the wavelet
coefficient vectors for each term in Eq. (2) (i.e., wSS , wc, and wn)
are related by:
wSS~wczwn: ð3Þ
Denoising is performed by computing the wavelet transform of
a signal and then removing the coefficients that correspond to high
frequencies by applying a threshold T . The wavelet coefficients
corresponding to low frequencies remain unchanged. The main
GSP Alignment-Free Distances
PLOS ONE | www.plosone.org 2 November 2014 | Volume 9 | Issue 11 | e110954
challenge of this denoising method is determining the T value
between small and large wavelet coefficients. To determine this
threshold, several algorithms have been proposed recently [44,45].
In this work, we employed the SureShrink algorithm (i.e., Stein’s
unbiased risk estimator [46]) because this wavelet denoising
method has been successfully applied to biological signals without
the loss of important information [47].
Alignment-free distance computation
Each de-noised signal SSi corresponding to a DNA sequence in a
set was converted into its frequency representation by applying
discrete Fourier transform (DFT) followed by computation of its
power spectrum FFi. To perform a direct comparison of sequences
of different length, we employed zero padding to compute the
DFT using the maximum length of all DNA signals in the set.
Subsequently, for a given pair of DNA signals, we calculated the
alignment-free distance d(i,j) by computing the mean squared
error (MSE) of their corresponding power spectrum:
d(i,j)~X
x
FF i(x){FF j(x)� �2
: ð4Þ
Finally, a distance matrix M was created by performing
pairwise comparison of all sequences in the set.
Cluster overlapping scoreBecause the distance matrices generated with GAFD and NW
cannot be directly compared, we evaluated these methods by
employing a modified version of the cluster overlapping score [48],
which is based on the splitting method by Robinson and Foulds.
An NJ tree is a dichotomic hierarchic classifier that can be defined
by a set of leaves T~ l1,l2, . . . ,ltf g and a set of branches
B~ B1,B2, . . . ,Bt{1f g. Every branch of the tree is represented in
the subset B~ l1,l2, . . . ,lbf g, where t~b for the root, and
twb§2 for all other branches of the tree. In this report, a cluster
G is defined as a branch that is not the root and lies beyond the
immediate vicinity of a leaf twg§3. Note that the set of clusters
G~ G1,G2, . . . ,Gg
� �is a subset of B.
Given two clusters from two different trees (T1~T2 ^G1=G2)
where GT1\GT2
=0=, cluster overlapping can be measured using
the Dice coefficient as:
ki~2DGi
T1\Gi
T2D
DGiT1
DzDGiT2
D: ð5Þ
The cluster overlapping similarity score k is calculated from the
arithmetic mean of all k occurrences. Comparison of a tree against
itself yields a value of 1.
GSP distance descriptorsThis proposed method for distance computation can determine
the global similarity of two DNA sequences. However, this metric
may not be capable of determining local differences between the
sequences. Therefore, we explored three DSP-based metrics used
to generate descriptors that may be useful for characterizing and
classifying differences between sections of the sequences.
Correlation coefficient. Correlation can be used to measure
the dependency of a signal on itself or another signal. For two
signals si and sj with the same length n, the correlation coefficient
is defined as:
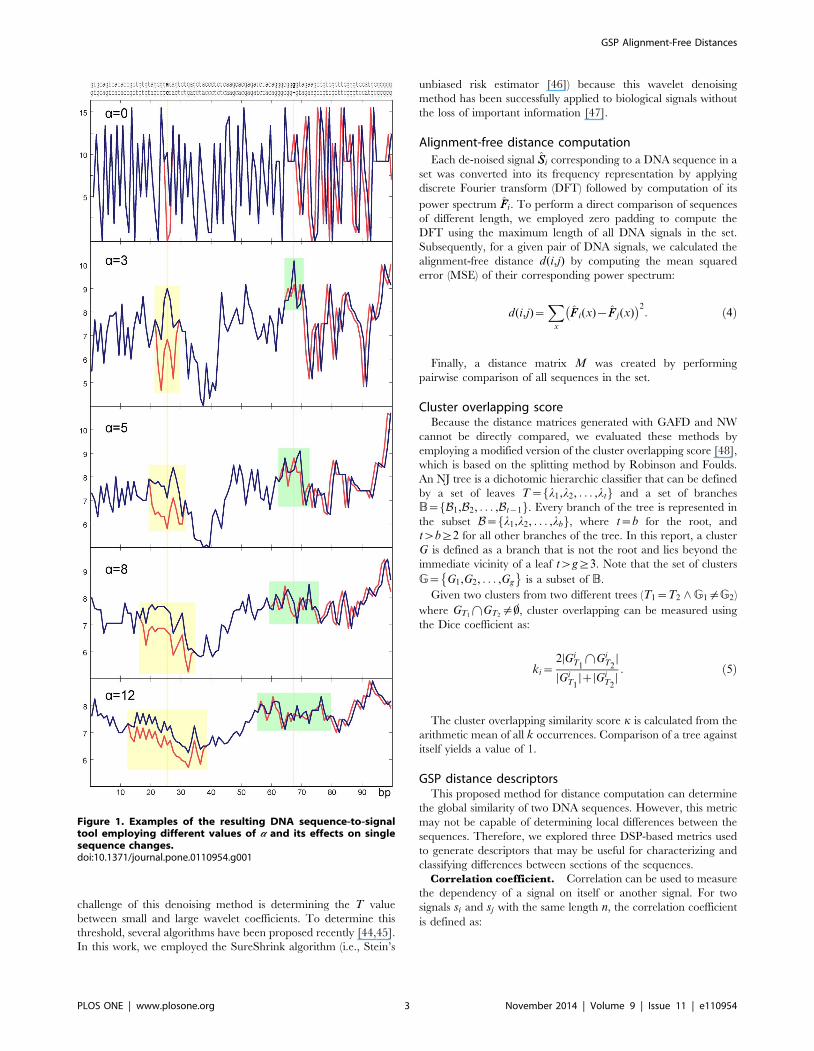
Figure 1. Examples of the resulting DNA sequence-to-signaltool employing different values of a and its effects on singlesequence changes.doi:10.1371/journal.pone.0110954.g001
GSP Alignment-Free Distances
PLOS ONE | www.plosone.org 3 November 2014 | Volume 9 | Issue 11 | e110954
r~
Pnk~1 (si(k){�ssi)(sj(k){�ssj)ffiffiffiffiffiffiffiffiffiffiffiffiffiffiffiffiffiffiffiffiffiffiffiffiffiffiffiffiffiffiffiffiffiffiffiPn
k~1 (si(k){�ssi)2
q ffiffiffiffiffiffiffiffiffiffiffiffiffiffiffiffiffiffiffiffiffiffiffiffiffiffiffiffiffiffiffiffiffiffiffiffiPnk~1 (sj(k){�ssj)
2q : ð6Þ
Depending on the data to be evaluated, the correlation
coefficient will be r*1 for signals that are highly correlated,
r*0 for non-correlated signals, and r*{1 for signals that are
inversely correlated. Because we were only concerned with the
degree of correlation and not its type, we discarded the sign and
defined the descriptor as R~DrD.
Coherence. Coherence, a relationship measurement used to
estimate the degree of linear association between two signals is
defined as:
cij(t)~Dsij Dffiffiffiffiffiffiffiffiffiffiffiffiffiffiffiffiffiffiffiffiffiffiffi
Dsii(t)DDsjj(t)Dp , ð7Þ
where sij is the cross-spectral density that describes the common
power distribution between the two signals, while sii and sjj denote
the auto-spectral density of si and sj respectively, at a frequency t.
We defined the descriptor C as the mean of the coherences
c(t) Vt). A C value close to 0 indicates that signals at this
frequency are linearly independent, whereas a value close to 1
represents a very high linear correlation. In this work, the spectral
densities used for determining the coherence between two signals
were computed using an autoregressive (AR) model, which is one
of the most widely used tools in DSP [49]. For a given interval, the
multidimensional AR model is given by:
x(t)~Xp
k~1
A(k)x(t{k)ze(t), ð8Þ
where A(k)~ a1(k),a2(k), . . . ,an(k)½ �T is the n|n AR coeffi-
cients matrix, n the number of channels, x(t{k) the time-delayed
values vector, p the model order, and e(t) the error vector. To
solve Equation 8, it is necessary to fit p (smaller than the sequence
length) and then estimate the AR coefficient matrix [50].
Derivative comparison. Given that our proposed DNA
sequence-to-signal mapping accounts for neighboring nucleotides,
small differences between si and sj due to indels and mutations
produce a shift in the intensity of the resulting signal (Fig. 1). To
account for these changes, we compared the derivatives of the two
signals by using finite differences and computed the mean slope D
as a descriptor representing the degree of similarity between the
two signals. A value D*0 indicates strong similarity.
Similarity space. For a given pair of sequences, the three
descriptors were used to generate a point with coordinates
(R,C,D) in a three-dimensional space. We hypothesize that it
may be possible to characterize sub-sequences by employing
clustering or classification methods in this space.
Table 1. Values employed for DNA sequence-to-signal mapping.
Doublet Value Doublet Value
AA 0 GA 8
AT 1 CA 9
TA 2 GT 10
AG 3 GG 11
TT 4 CT 12
TG 5 GC 13
AC 6 CG 14
TC 7 CC 15
doi:10.1371/journal.pone.0110954.t001
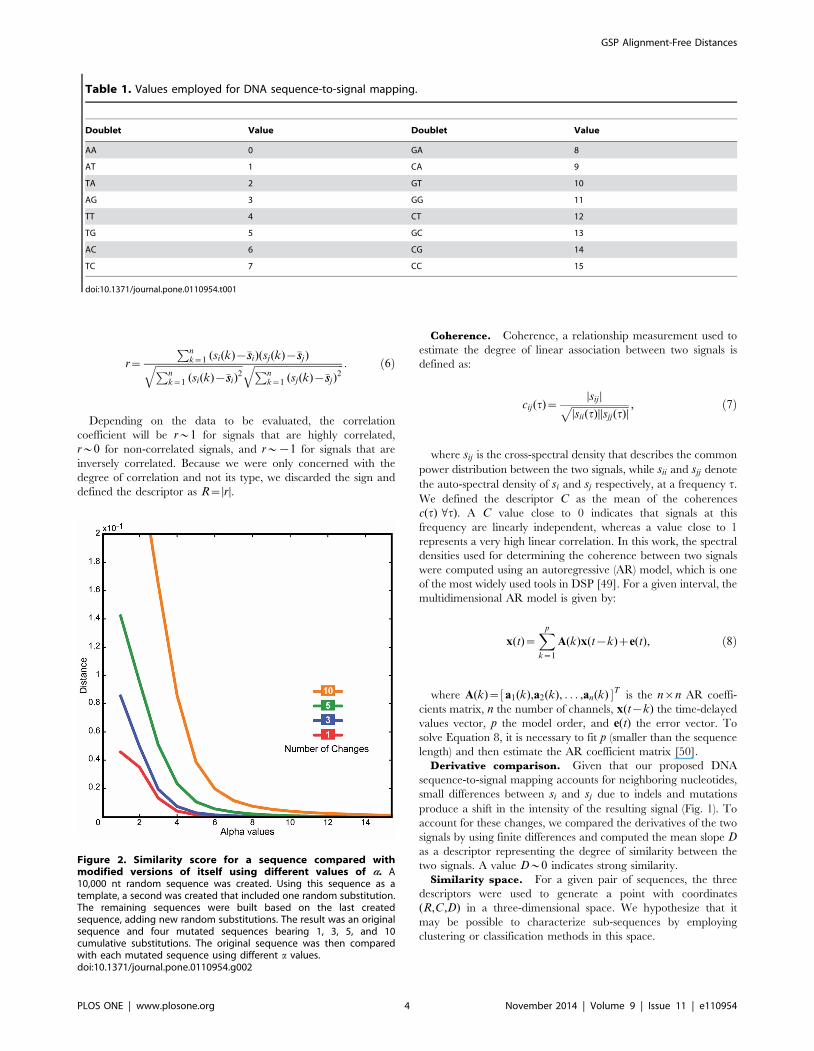
Figure 2. Similarity score for a sequence compared withmodified versions of itself using different values of a. A10,000 nt random sequence was created. Using this sequence as atemplate, a second was created that included one random substitution.The remaining sequences were built based on the last createdsequence, adding new random substitutions. The result was an originalsequence and four mutated sequences bearing 1, 3, 5, and 10cumulative substitutions. The original sequence was then comparedwith each mutated sequence using different a values.doi:10.1371/journal.pone.0110954.g002
GSP Alignment-Free Distances
PLOS ONE | www.plosone.org 4 November 2014 | Volume 9 | Issue 11 | e110954
Results and Discussion
DNA sequence-to-signal mappingOur DNA sequence-to-signal mapping tool requires that
different values be set for every possible doublet (i.e., 16 different
values). For all the experiments presented in this section, we
employed the values listed in Table 1. The proposed DNA
sequence-to-signal mapping was designed to consider the nucle-
otides within a window defined by a. An example of the effect of aon the proposed mapping is depicted in Figure 1. As the value of aincreases, the resulting DNA signal becomes smoother as the
values corresponding to nucleotides within the window are
combined. This indicates that the value of a determines how far
a change is propagated through the signal. Note that a single
nucleotide substitution produces a vertical shifting effect depend-
ing on the value of a with respect to a signal corresponding to a
similar sequence. As a increases, a substitution has less impact on
the signal shift. Indels in the DNA sequence are reflected as a
horizontal shift with respect to another similar sequence propor-
tional to the number of deleted or inserted bases. Figure 2 depicts
the distance as computed by GAFD with respect to different
numbers of changes in a given sequence employing different values
of a. Note that, compared to methods that perform DNA
sequence-to-signal mapping using individual nucleotides, a deter-
mines the robustness of our method with respect to subtle
differences between the sequences being evaluated. In this work,
we chose to employ a~3 since this value allows us to distinguish
between different numbers of signal changes.
In a sense, substitution matrices may be considered equivalent
to simple–DNA-mapping functions. Where the former assigns a
value to the difference between two nucleotides on different DNA
sequences, the latter replaces the nucleotide with a number.
Therefore, when comparing two mapped sequences, the difference
between two nucleotides would be represented by their corre-
sponding numbers. It becomes evident then that simple-mapping
functions reduce the degrees of freedom when element-wise
comparisons are made. The main advantage when mapping DNA
is the ability to treat it as a series, which allows for the use of DSP
and other concepts such as context information-dependent
entities.
In this paper, we gathered contextual information using the NN
algorithm, where each nucleotide value is considered along with its
neighboring nucleotides. This approach, albeit still unidimension-
al, increases the degrees of freedom with respect to simple–DNA-
mappings while also including contextual information. Although
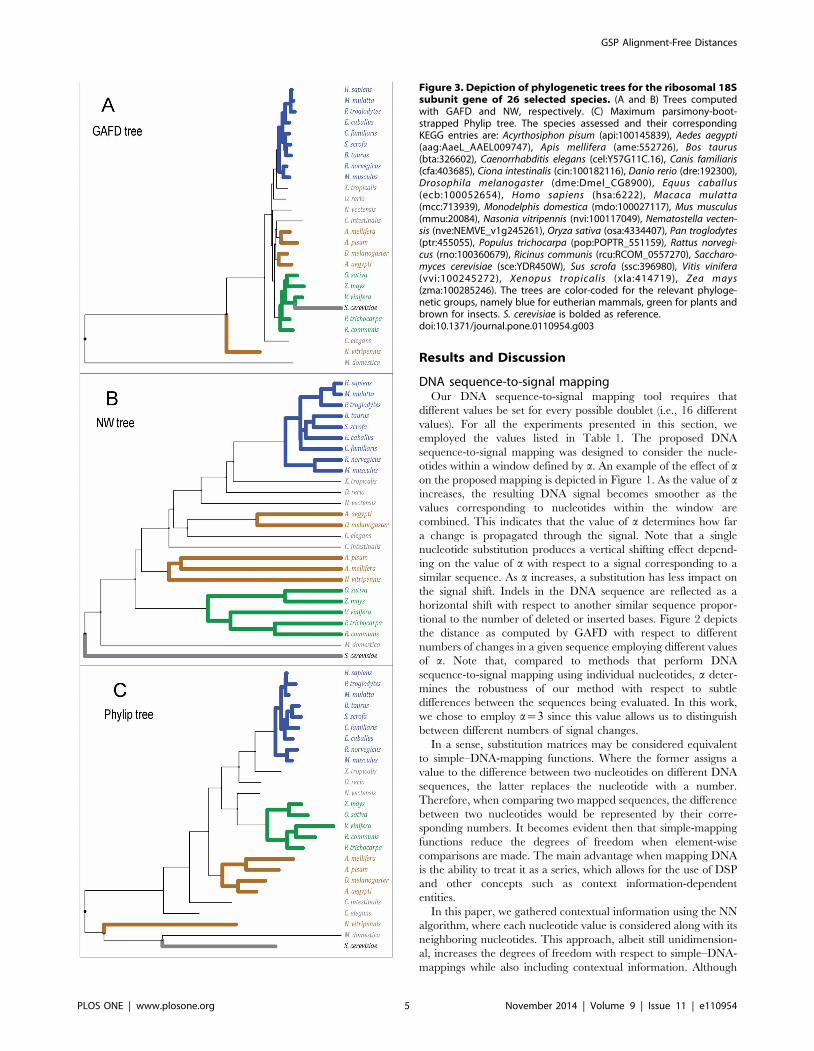
Figure 3. Depiction of phylogenetic trees for the ribosomal 18Ssubunit gene of 26 selected species. (A and B) Trees computedwith GAFD and NW, respectively. (C) Maximum parsimony-boot-strapped Phylip tree. The species assessed and their correspondingKEGG entries are: Acyrthosiphon pisum (api:100145839), Aedes aegypti(aag:AaeL_AAEL009747), Apis mellifera (ame:552726), Bos taurus(bta:326602), Caenorrhabditis elegans (cel:Y57G11C.16), Canis familiaris(cfa:403685), Ciona intestinalis (cin:100182116), Danio rerio (dre:192300),Drosophila melanogaster (dme:Dmel_CG8900), Equus caballus(ecb:100052654), Homo sapiens (hsa:6222), Macaca mulatta(mcc:713939), Monodelphis domestica (mdo:100027117), Mus musculus(mmu:20084), Nasonia vitripennis (nvi:100117049), Nematostella vecten-sis (nve:NEMVE_v1g245261), Oryza sativa (osa:4334407), Pan troglodytes(ptr:455055), Populus trichocarpa (pop:POPTR_551159), Rattus norvegi-cus (rno:100360679), Ricinus communis (rcu:RCOM_0557270), Saccharo-myces cerevisiae (sce:YDR450W), Sus scrofa (ssc:396980), Vitis vinifera(vvi:100245272), Xenopus tropicalis (xla:414719), Zea mays(zma:100285246). The trees are color-coded for the relevant phyloge-netic groups, namely blue for eutherian mammals, green for plants andbrown for insects. S. cerevisiae is bolded as reference.doi:10.1371/journal.pone.0110954.g003
GSP Alignment-Free Distances
PLOS ONE | www.plosone.org 5 November 2014 | Volume 9 | Issue 11 | e110954
GSP Alignment-Free Distances
PLOS ONE | www.plosone.org 6 November 2014 | Volume 9 | Issue 11 | e110954
this is only a ‘‘proof of concept’’ study, we hypothesize that the
referring context may not be only local, but also distant.
Moreover, it may contain the sequence information itself as well
as data from different annotation levels according to related
known ontology or metadata. Adding the contextual elements will
improve analysis by encompassing the DNA grammar into the
structural information.
GSP distance computations using GAFDTo evaluate the performance of GAFD with respect to existing
methods for computing sequence distances, we assessed the
similarity of unrooted phylogenetic trees generated by the NJ
method [51,52] (equal variance and independence of evolutionary
distance estimates) using distance matrices computed with GAFD
and NW (nuc44 scoring matrix, gap penalty of 8, and use of Jukes-
Cantor for the maximum likelihood estimate of the number of
substitutions) of various DNA sequences belonging to different
organisms. In addition, we computed phylogenetic trees employ-
ing the Phylip method using ordinary parsimony and without
randomization, with a search for the best 100 trees. The Phylip
method was fed with sequences aligned using ClustalW with gap
open penalty = 10, gap extension penalty = 0.05, and no weight
transition. The resulting tree typologies were compared using the
previously described cluster overlapping score k.
Examination of the ribosomal S18 subunit gene. Two
experiments were performed by analyzing two sets of DNA
sequences corresponding to the ribosomal S18 subunit (KEGG
orthology K02964). This gene was selected because it is the
broadest evolutionary marker discernable between all eukaryotes.
In the first experiment, three basic clusters were built, namely
mammals, insects, and plants, according to general taxonomy.
The resulting phylogenetic trees generated from the distance
matrices computed by the three methods are depicted in Figure 3.
Note that the eutheryan (a mammal subgroup) were grouped in
GAFD, NW, and Phylip. However, the insects were grouped
differently by the three methods (e.g., Nasonia vitripennis was
located far outside the other insects according to GAFD and
Phylip). These results are consistent with the known complexity of
insect genetics due to horizontal transference, spurious recombi-
nation, and high variability rate. Note that NW represented the
outside eukaryote Saccharomyces cerevisiae appropriately, while
GAFD placed it incorrectly among the plant group. Phylip placed
this sequence in an outer group next to Monodelphis domestica and
N. vitripennis. Although M. domestica was expected to be placed
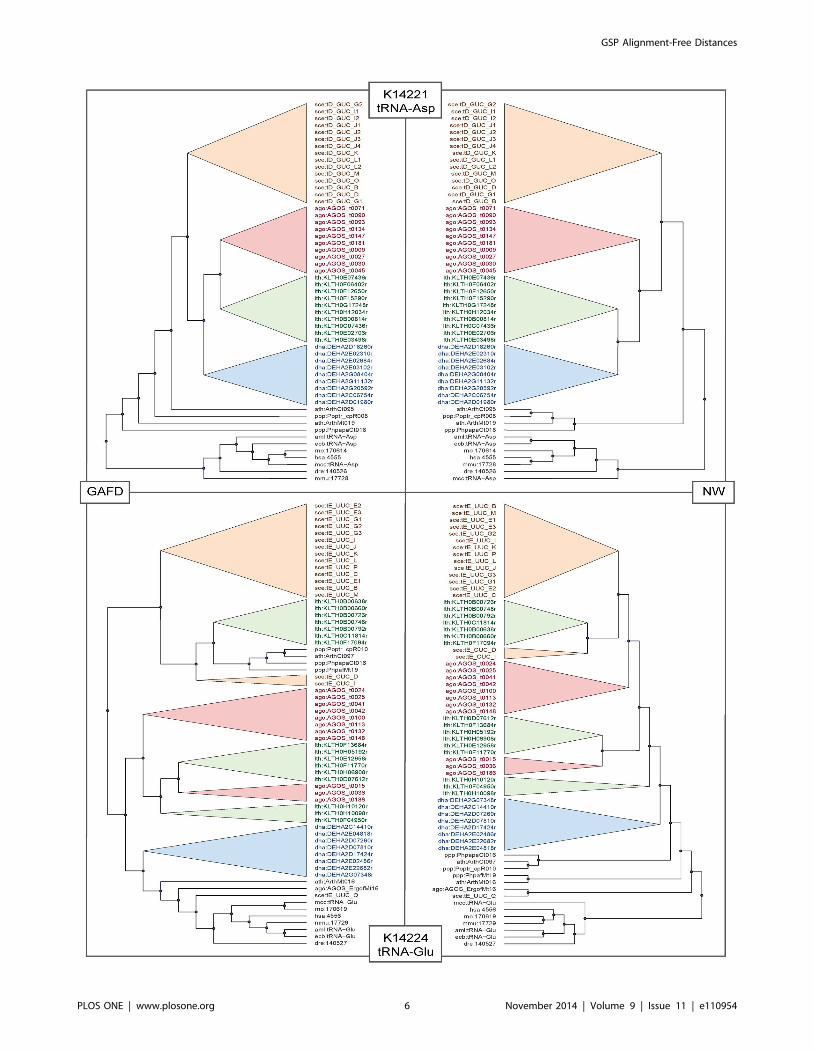
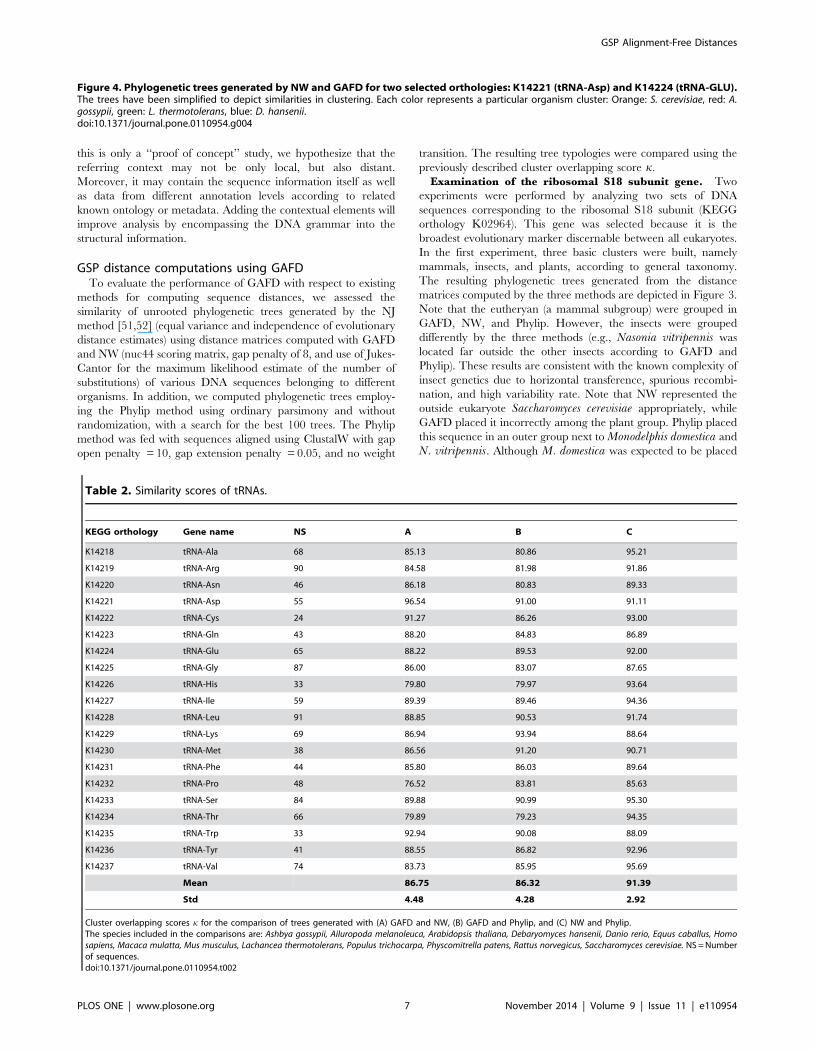
Figure 4. Phylogenetic trees generated by NW and GAFD for two selected orthologies: K14221 (tRNA-Asp) and K14224 (tRNA-GLU).The trees have been simplified to depict similarities in clustering. Each color represents a particular organism cluster: Orange: S. cerevisiae, red: A.gossypii, green: L. thermotolerans, blue: D. hansenii.doi:10.1371/journal.pone.0110954.g004
Table 2. Similarity scores of tRNAs.
KEGG orthology Gene name NS A B C
K14218 tRNA-Ala 68 85.13 80.86 95.21
K14219 tRNA-Arg 90 84.58 81.98 91.86
K14220 tRNA-Asn 46 86.18 80.83 89.33
K14221 tRNA-Asp 55 96.54 91.00 91.11
K14222 tRNA-Cys 24 91.27 86.26 93.00
K14223 tRNA-Gln 43 88.20 84.83 86.89
K14224 tRNA-Glu 65 88.22 89.53 92.00
K14225 tRNA-Gly 87 86.00 83.07 87.65
K14226 tRNA-His 33 79.80 79.97 93.64
K14227 tRNA-Ile 59 89.39 89.46 94.36
K14228 tRNA-Leu 91 88.85 90.53 91.74
K14229 tRNA-Lys 69 86.94 93.94 88.64
K14230 tRNA-Met 38 86.56 91.20 90.71
K14231 tRNA-Phe 44 85.80 86.03 89.64
K14232 tRNA-Pro 48 76.52 83.81 85.63
K14233 tRNA-Ser 84 89.88 90.99 95.30
K14234 tRNA-Thr 66 79.89 79.23 94.35
K14235 tRNA-Trp 33 92.94 90.08 88.09
K14236 tRNA-Tyr 41 88.55 86.82 92.96
K14237 tRNA-Val 74 83.73 85.95 95.69
Mean 86.75 86.32 91.39
Std 4.48 4.28 2.92
Cluster overlapping scores k for the comparison of trees generated with (A) GAFD and NW, (B) GAFD and Phylip, and (C) NW and Phylip.The species included in the comparisons are: Ashbya gossypii, Ailuropoda melanoleuca, Arabidopsis thaliana, Debaryomyces hansenii, Danio rerio, Equus caballus, Homosapiens, Macaca mulatta, Mus musculus, Lachancea thermotolerans, Populus trichocarpa, Physcomitrella patens, Rattus norvegicus, Saccharomyces cerevisiae. NS = Numberof sequences.doi:10.1371/journal.pone.0110954.t002
GSP Alignment-Free Distances
PLOS ONE | www.plosone.org 7 November 2014 | Volume 9 | Issue 11 | e110954
in an external group within mammals, it was placed in the outer
branch of all trees. Lastly, with the exception of S. cerevisiae in
GAFD, all plants were properly clustered.
In the second experiment, all entries of the aforementioned
orthology were compared. A total of 149 organisms and 231
entries were analyzed, resulting in mean similarity scores of
k~93:12 between GAFD and NW, k~94:19 for GAFD and
Phylip, and k~95:75 for NW and Phylip.Assessment of other evolutionary markers. In this
experiment, we selected evolutionary markers corresponding to
coding (i.e., 21 tRNA synthetases and 2 ribosomal proteins) and
non-coding (i.e., 20 tRNAs and 2 rRNAs) genes. We included
species present in all KEGG orthologies and then selected all
entries belonging to these organisms. We constructed and
compared the phylogenetic trees generated using GAFD, NW,
and Phylip. Figure 4 depicts two examples of trees generated by
NW and GAFD for two selected orthologies (tRNA-Asp and
tRNA-GLU). Note the similarity in gene clustering by GAFD and
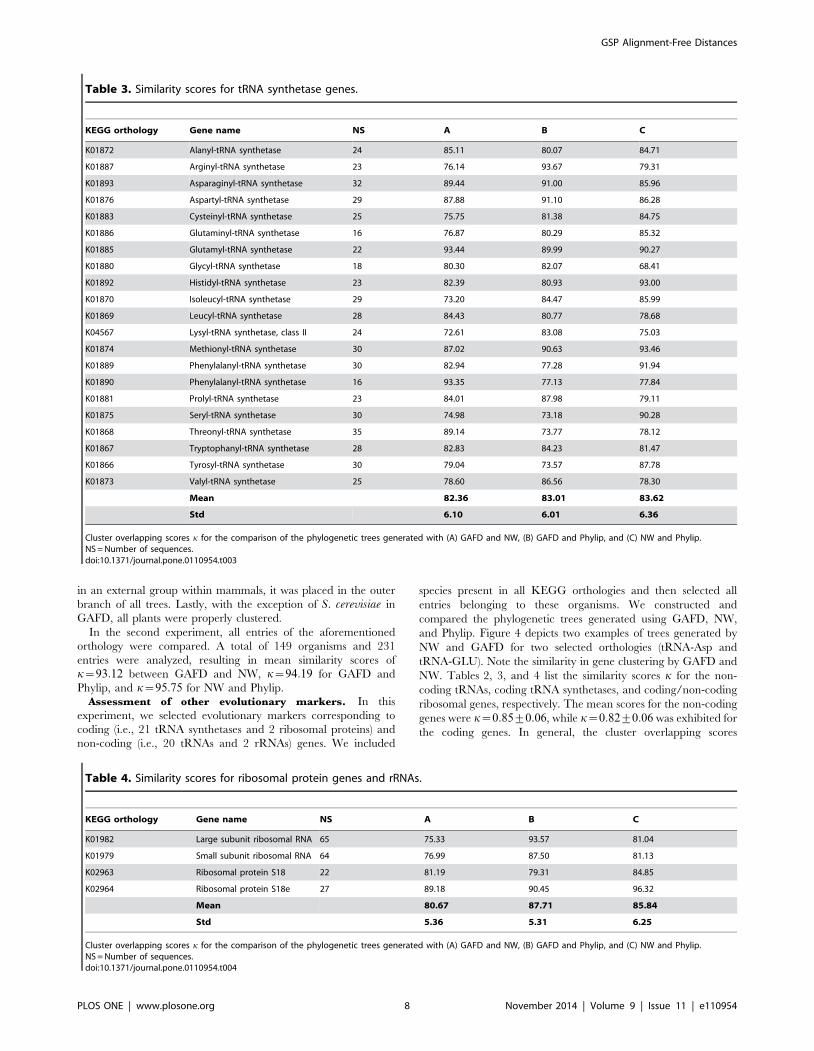
NW. Tables 2, 3, and 4 list the similarity scores k for the non-
coding tRNAs, coding tRNA synthetases, and coding/non-coding
ribosomal genes, respectively. The mean scores for the non-coding
genes were k~0:85+0:06, while k~0:82+0:06 was exhibited for
the coding genes. In general, the cluster overlapping scores
Table 3. Similarity scores for tRNA synthetase genes.
KEGG orthology Gene name NS A B C
K01872 Alanyl-tRNA synthetase 24 85.11 80.07 84.71
K01887 Arginyl-tRNA synthetase 23 76.14 93.67 79.31
K01893 Asparaginyl-tRNA synthetase 32 89.44 91.00 85.96
K01876 Aspartyl-tRNA synthetase 29 87.88 91.10 86.28
K01883 Cysteinyl-tRNA synthetase 25 75.75 81.38 84.75
K01886 Glutaminyl-tRNA synthetase 16 76.87 80.29 85.32
K01885 Glutamyl-tRNA synthetase 22 93.44 89.99 90.27
K01880 Glycyl-tRNA synthetase 18 80.30 82.07 68.41
K01892 Histidyl-tRNA synthetase 23 82.39 80.93 93.00
K01870 Isoleucyl-tRNA synthetase 29 73.20 84.47 85.99
K01869 Leucyl-tRNA synthetase 28 84.43 80.77 78.68
K04567 Lysyl-tRNA synthetase, class II 24 72.61 83.08 75.03
K01874 Methionyl-tRNA synthetase 30 87.02 90.63 93.46
K01889 Phenylalanyl-tRNA synthetase 30 82.94 77.28 91.94
K01890 Phenylalanyl-tRNA synthetase 16 93.35 77.13 77.84
K01881 Prolyl-tRNA synthetase 23 84.01 87.98 79.11
K01875 Seryl-tRNA synthetase 30 74.98 73.18 90.28
K01868 Threonyl-tRNA synthetase 35 89.14 73.77 78.12
K01867 Tryptophanyl-tRNA synthetase 28 82.83 84.23 81.47
K01866 Tyrosyl-tRNA synthetase 30 79.04 73.57 87.78
K01873 Valyl-tRNA synthetase 25 78.60 86.56 78.30
Mean 82.36 83.01 83.62
Std 6.10 6.01 6.36
Cluster overlapping scores k for the comparison of the phylogenetic trees generated with (A) GAFD and NW, (B) GAFD and Phylip, and (C) NW and Phylip.NS = Number of sequences.doi:10.1371/journal.pone.0110954.t003
Table 4. Similarity scores for ribosomal protein genes and rRNAs.
KEGG orthology Gene name NS A B C
K01982 Large subunit ribosomal RNA 65 75.33 93.57 81.04
K01979 Small subunit ribosomal RNA 64 76.99 87.50 81.13
K02963 Ribosomal protein S18 22 81.19 79.31 84.85
K02964 Ribosomal protein S18e 27 89.18 90.45 96.32
Mean 80.67 87.71 85.84
Std 5.36 5.31 6.25
Cluster overlapping scores k for the comparison of the phylogenetic trees generated with (A) GAFD and NW, (B) GAFD and Phylip, and (C) NW and Phylip.NS = Number of sequences.doi:10.1371/journal.pone.0110954.t004
GSP Alignment-Free Distances
PLOS ONE | www.plosone.org 8 November 2014 | Volume 9 | Issue 11 | e110954
between the methods were relatively high, indicating that GAFD
can group similar sequences effectively.
We assessed statistical significance by applying the non-
parametric Wilcoxon Signed-Rank test, which does not require
any assumptions regarding the normality of the data distribution.
The null hypothesis for our tests is that the median difference kkbetween the similarity of pairs of evaluations is not significant
(H0:kk1~kk2), while the alternative hypothesis is the statistically
significant difference between both medians (H1:kk1=kk2). The
resulting p-values for each test at a significance level of 0:05 are
listed in Table 5. No significant differences were observed between
the three methods when examining coding sequences. However,
for non-coding genes, GAFD performed differently from the other
two methods. This may be related to the fact that coding genes
appear to have a certain periodic structure [11,16–23] which will
affect GAFD since it also considers the frequency content of the
mapped sequence.
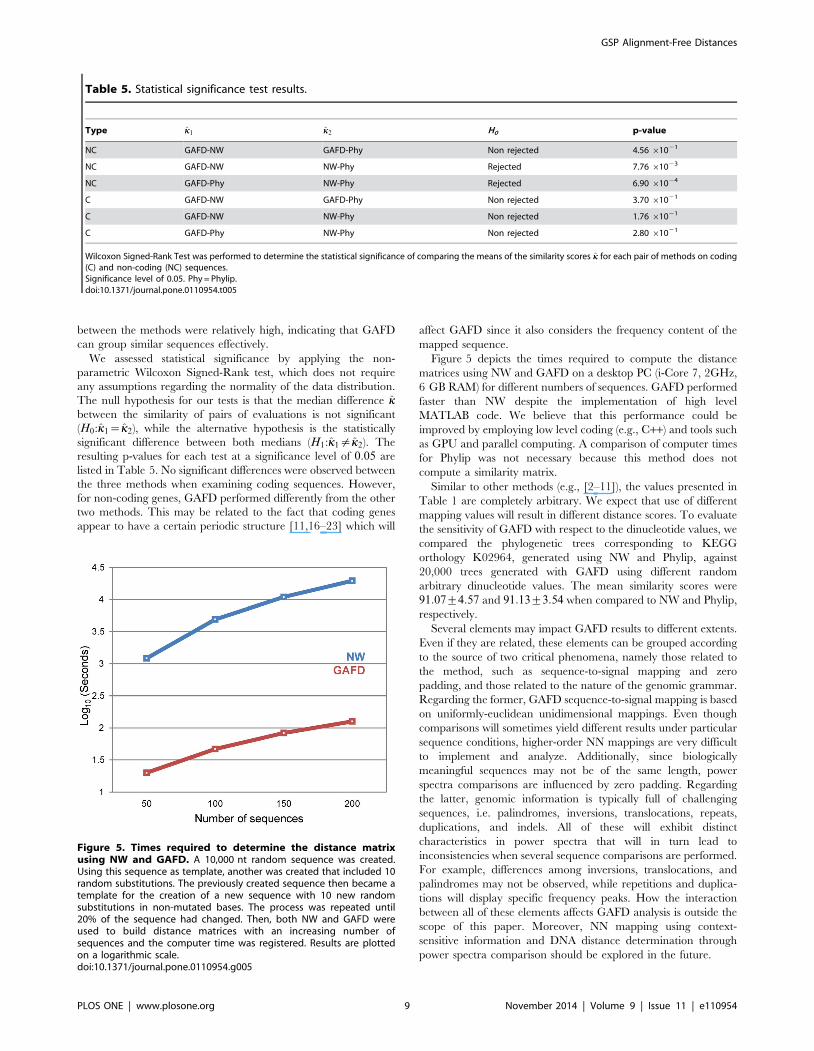
Figure 5 depicts the times required to compute the distance
matrices using NW and GAFD on a desktop PC (i-Core 7, 2GHz,
6 GB RAM) for different numbers of sequences. GAFD performed
faster than NW despite the implementation of high level
MATLAB code. We believe that this performance could be
improved by employing low level coding (e.g., C++) and tools such
as GPU and parallel computing. A comparison of computer times
for Phylip was not necessary because this method does not
compute a similarity matrix.
Similar to other methods (e.g., [2–11]), the values presented in
Table 1 are completely arbitrary. We expect that use of different
mapping values will result in different distance scores. To evaluate
the sensitivity of GAFD with respect to the dinucleotide values, we
compared the phylogenetic trees corresponding to KEGG
orthology K02964, generated using NW and Phylip, against
20,000 trees generated with GAFD using different random
arbitrary dinucleotide values. The mean similarity scores were
91:07+4:57 and 91:13+3:54 when compared to NW and Phylip,
respectively.
Several elements may impact GAFD results to different extents.
Even if they are related, these elements can be grouped according
to the source of two critical phenomena, namely those related to
the method, such as sequence-to-signal mapping and zero
padding, and those related to the nature of the genomic grammar.
Regarding the former, GAFD sequence-to-signal mapping is based
on uniformly-euclidean unidimensional mappings. Even though
comparisons will sometimes yield different results under particular
sequence conditions, higher-order NN mappings are very difficult
to implement and analyze. Additionally, since biologically
meaningful sequences may not be of the same length, power
spectra comparisons are influenced by zero padding. Regarding
the latter, genomic information is typically full of challenging
sequences, i.e. palindromes, inversions, translocations, repeats,
duplications, and indels. All of these will exhibit distinct
characteristics in power spectra that will in turn lead to
inconsistencies when several sequence comparisons are performed.
For example, differences among inversions, translocations, and
palindromes may not be observed, while repetitions and duplica-
tions will display specific frequency peaks. How the interaction
between all of these elements affects GAFD analysis is outside the
scope of this paper. Moreover, NN mapping using context-
sensitive information and DNA distance determination through
power spectra comparison should be explored in the future.
Table 5. Statistical significance test results.
Type kk1 kk2 H0 p-value
NC GAFD-NW GAFD-Phy Non rejected 4.56 61021
NC GAFD-NW NW-Phy Rejected 7.76 61023
NC GAFD-Phy NW-Phy Rejected 6.90 61024
C GAFD-NW GAFD-Phy Non rejected 3.70 61021
C GAFD-NW NW-Phy Non rejected 1.76 61021
C GAFD-Phy NW-Phy Non rejected 2.80 61021
Wilcoxon Signed-Rank Test was performed to determine the statistical significance of comparing the means of the similarity scores kk for each pair of methods on coding(C) and non-coding (NC) sequences.Significance level of 0.05. Phy = Phylip.doi:10.1371/journal.pone.0110954.t005
Figure 5. Times required to determine the distance matrixusing NW and GAFD. A 10,000 nt random sequence was created.Using this sequence as template, another was created that included 10random substitutions. The previously created sequence then became atemplate for the creation of a new sequence with 10 new randomsubstitutions in non-mutated bases. The process was repeated until20% of the sequence had changed. Then, both NW and GAFD wereused to build distance matrices with an increasing number ofsequences and the computer time was registered. Results are plottedon a logarithmic scale.doi:10.1371/journal.pone.0110954.g005
GSP Alignment-Free Distances
PLOS ONE | www.plosone.org 9 November 2014 | Volume 9 | Issue 11 | e110954
GSP Alignment-Free Distances
PLOS ONE | www.plosone.org 10 November 2014 | Volume 9 | Issue 11 | e110954
GAFD is not intended for sequence alignment, but rather for
comparing them in another domain and rendering a similarity
value. We believe that, after refinement, this approach will enable
us to discover relationships between sequences that are not bound
to the sequence itself, but to specific underlying patterns in the
genomic grammar that is yet to be fully understood.
GSP distance descriptorsTo explore the three-dimensional space generated by the
proposed descriptors (R,C,D), we performed an experiment in
which we perturbed a randomly generated DNA sequence Sr that
generates a DNA signal SSr of length b~20. Using Sr as the
‘‘mother sequence’’, we generated all the DNA sequences and
signals corresponding to all possible combinations of one, two, and
three changes, considering all possible types of changes (i.e.,
substitutions, deletions, and insertions). Every pair of signals
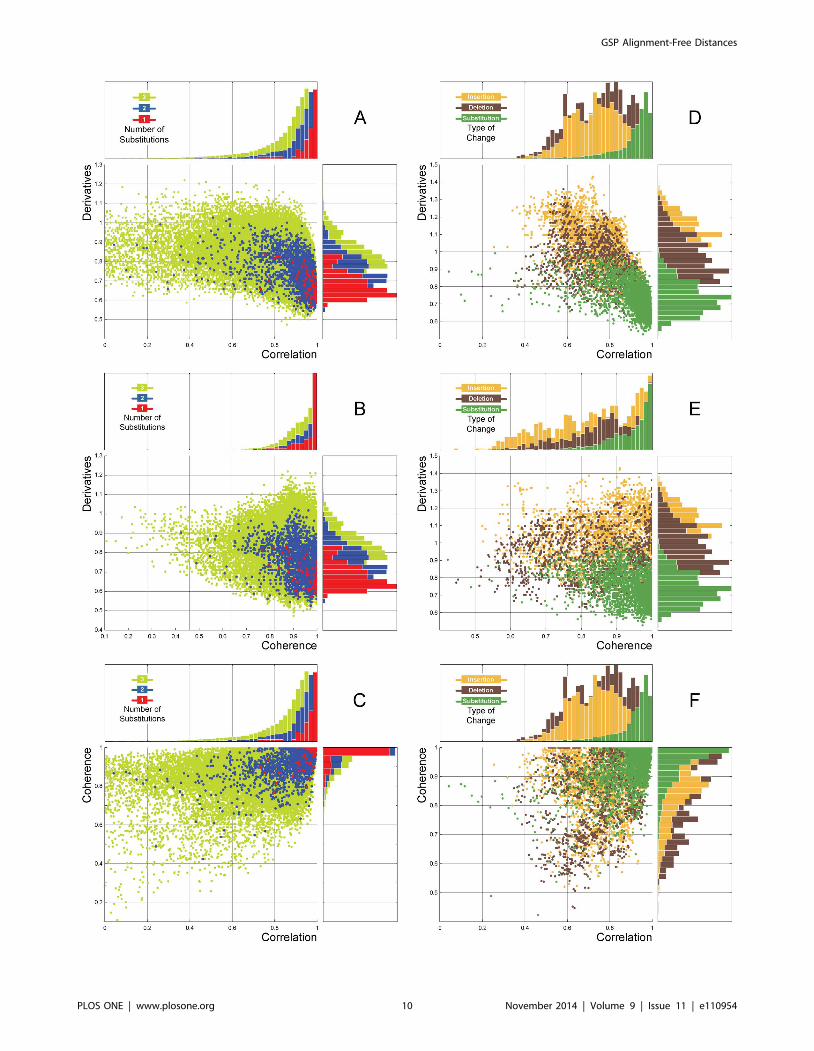
generated a point (R,C,D) in the this space (Figure 6). Our results
from the comparisons corresponding to one change were located
near the origin, while those corresponding to two or three changes
were positioned at increasing distance from the origin according to
the number of changes. Additionally, the points corresponding to
substitutions were well-separated from those corresponding to
insertions and deletions (Figures 6 D and 6 E). These results
demonstrate that GAFD can characterize the type of change
present using a classification technique that combines several
descriptors. However, coherence exhibited the poorest results
since a lack of specificity for detecting insertions and substitutions
was observed. This result is supported by Sims, et al. [53], where it
was reported that optimal resolutions (length of b) proved critical
for genomic comparisons. Moreover, studies have shown that
coherence AR models depend highly on the parameters employed
[54].
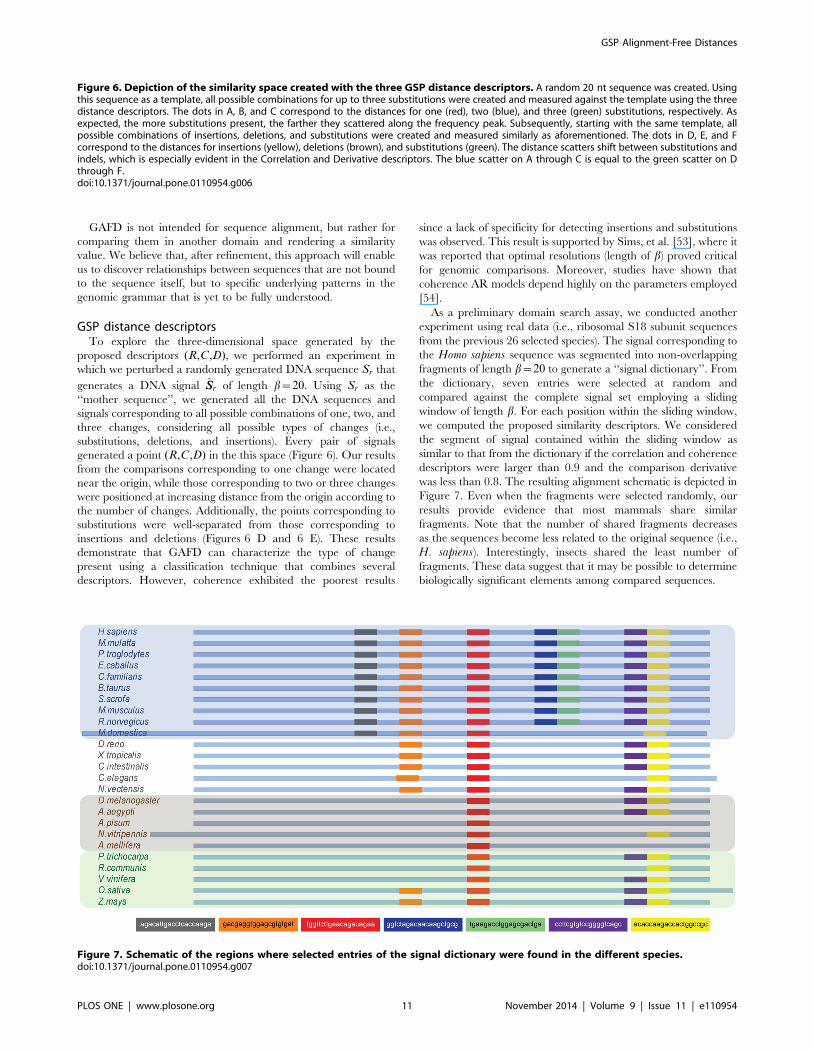
As a preliminary domain search assay, we conducted another
experiment using real data (i.e., ribosomal S18 subunit sequences
from the previous 26 selected species). The signal corresponding to
the Homo sapiens sequence was segmented into non-overlapping
fragments of length b~20 to generate a ‘‘signal dictionary’’. From
the dictionary, seven entries were selected at random and
compared against the complete signal set employing a sliding
window of length b. For each position within the sliding window,
we computed the proposed similarity descriptors. We considered
the segment of signal contained within the sliding window as
similar to that from the dictionary if the correlation and coherence
descriptors were larger than 0.9 and the comparison derivative
was less than 0.8. The resulting alignment schematic is depicted in
Figure 7. Even when the fragments were selected randomly, our
results provide evidence that most mammals share similar
fragments. Note that the number of shared fragments decreases
as the sequences become less related to the original sequence (i.e.,
H. sapiens). Interestingly, insects shared the least number of
fragments. These data suggest that it may be possible to determine
biologically significant elements among compared sequences.
Figure 6. Depiction of the similarity space created with the three GSP distance descriptors. A random 20 nt sequence was created. Usingthis sequence as a template, all possible combinations for up to three substitutions were created and measured against the template using the threedistance descriptors. The dots in A, B, and C correspond to the distances for one (red), two (blue), and three (green) substitutions, respectively. Asexpected, the more substitutions present, the farther they scattered along the frequency peak. Subsequently, starting with the same template, allpossible combinations of insertions, deletions, and substitutions were created and measured similarly as aforementioned. The dots in D, E, and Fcorrespond to the distances for insertions (yellow), deletions (brown), and substitutions (green). The distance scatters shift between substitutions andindels, which is especially evident in the Correlation and Derivative descriptors. The blue scatter on A through C is equal to the green scatter on Dthrough F.doi:10.1371/journal.pone.0110954.g006
Figure 7. Schematic of the regions where selected entries of the signal dictionary were found in the different species.doi:10.1371/journal.pone.0110954.g007
GSP Alignment-Free Distances
PLOS ONE | www.plosone.org 11 November 2014 | Volume 9 | Issue 11 | e110954
The use of alternative descriptors and classification techniques
for grouping data is the subject of future work as it may be applied
towards domain search and contig assembly.
Conclusions
We present a novel GSP alignment-free method for determining
the distance between two DNA sequences with a performance
comparable to current methods such as Needleman-Wunsch and
Phylip. Additionally, we evaluated three DSP-based distance
metrics for use as descriptors for categorizing differences between
pairs of DNA signal fragments. This work provides a foundation
for the development of methods for domain search and the
characterization of DNA sections.
Acknowledgments
The authors would like to thank Ivonne Salcedo, Ma. de Lourdes Carbajal,
and Salvador Carbajal for manuscript review and support.
Author Contributions
Conceived and designed the experiments: JAM EB EGMR HVP RRV.
Performed the experiments: JAM EB. Analyzed the data: JAM EB.
Contributed reagents/materials/analysis tools: HVP RRV GMR APM.
Wrote the paper: JAM APM EGMR.
References
1. Kwan HK, Arniker SB (2009) Numerical representation of DNA sequences. In:
2009 IEEE International Conference on Electro/Information Technology. pp.307–310.
2. Ranawana R, Palade V (2004) A neural network based multi-classifier system for
gene identification in DNA sequences. Neural Computing and Applications 14:122–131.
3. Demeler B, Zhou G (1991) Neural network optimization for E.coli promoter
prediction. Nucleic Acids Research 19: 1593–1599.
4. Voss RF (1992) Evolution of long-range fractal correlations and 1/f noise inDNA base sequences. Physical Review Letters 68: 3805–3808.
5. Silverman B, Linsker R (1986) A measure of DNA periodicity. Journal of
Theoretical Biology 118: 295–300.
6. Cristea PD (2002) Conversion of nucleotides sequences into genomic signals.
Journal of cellular and molecular medicine 6: 279–303.
7. Rosen GL, Sokhansanj B, Polikar R, Bruns MA, Russell J, et al. (2009) Signalprocessing for metagenomics: extracting information from the soup. Current
genomics 10: 493–510.
8. Chakravarthy N, Spanias A, Iasemidis LD, Tsakalis K (2004) AutoregressiveModeling and Feature Analysis of DNA Sequences. Journal on Advances in
Signal Processing 2004: 13–28.
9. Tang YY, Yuen PC, Li Ch, Wickerhauser V, editors (2001) Wavelet Analysisand Its Applications, volume 2251 of Lecture Notes in Computer Science. Berlin,
Heidelberg: Springer Berlin Heidelberg. doi:10.1007/3-540-45333-4.
10. Anastassiou D (2001) Genomic signal processing. Signal Processing Magazine18: 8–20.
11. Akhtar M, Epps J, Ambikairajah E (2007) On DNA Numerical Representations
for Period-3 Based Exon Prediction. In: 2007 IEEE International Workshop onGenomic Signal Processing and Statistics. 2, pp. 1–4.
12. Nair AS, Sreenadhan SP (2006) A coding measure scheme employing electron-
ion interaction pseudopotential (EIIP). Bioinformation 1: 197–202.
13. Holden T, Subramaniam R, Sullivan R, Cheung E, Schneider C, et al. (2007)ATCG nucleotide fluctuation of Deinococcus radiodurans radiation genes. In:
Proc. SPIE 6694, Instruments, Methods, and Missions for Astrobiology X.International Society for Optics and Photonics, p. 669417.
14. Bernaola-Galvan P, Carpena P, Roman-Roldan R, Oliver JL (2002) Study of
statistical correlations in DNA sequences. Gene 300: 105–15.
15. Yan M, Lin ZS, Zhang CT (1998) A new Fourier transform approach for
protein coding measure based on the format of the Z curve. Bioinformatics 14:
685–90.
16. Inbamalar TM, Sivakumar R (2012) Filtering Approach to DNA Signal
Processing. In: International Proceedings of Computer Science and Information
Tech. volume 28, pp. 1–5.
17. Marhon S, Kremer SC (2011) Gene prediction based on DNA spectral analysis:
a literature review. Journal of computational biology 18: 639–76.
18. Akhtar M, Epps J, Ambikairajah E (2008) Signal Processing in SequenceAnalysis: Advances in Eukaryotic Gene Prediction. Journal of Selected Topics in
Signal Processing 2: 310–321.
19. Rushdi A, Tuqan J (2006) Gene Identification Using the Z-Curve Represen-tation. In: 2006 IEEE International Conference on Acoustics Speed and Signal
Processing Proceedings. volume 2, pp. 1024–1027.
20. Yin C, Yau SST (2005) A Fourier characteristic of coding sequences: origins anda non-Fourier approximation. Journal of computational biology 12: 1153–65.
21. Kotlar D (2003) Gene Prediction by Spectral Rotation Measure: A New Method
for Identifying Protein-Coding Regions. Genome Research 13: 1930–1937.
22. Anastassiou D (2000) Frequency-domain analysis of biomolecular sequences.Bioinformatics (Oxford, England) 16: 1073–81.
23. Tiwari S, Ramachandran S, Bhattacharya A, Bhattacharya S, Ramaswamy R
(1997) Prediction of probable genes by Fourier analysis of genomic sequences.Bioinformatics 13: 263–270.
24. Sharma D, Issac B, Raghava GPS, Ramaswamy R (2004) Spectral RepeatFinder (SRF): identification of repetitive sequences using Fourier transformation.
Bioinformatics 20: 1405–12.
25. Gabrielian A, Pongor S (1996) Correlation of intrinsic DNA curvature withDNA property periodicity. FEBS Letters 393: 65–68.
26. Saitou N, Nei M (1987) The neighbor-joining method: a new method for
reconstructing phylogenetic trees. Molecular biology and evolution 4: 406–25.
27. Fitch WM, Margoliash E (1967) Construction of phylogenetic trees. Science 155:
279–284.
28. Needleman S, Wunsch C (1970) A general method applicable to the search for
similarities in the amino acid sequence of two proteins. Journal of molecular
biology 48: 443–453.
29. Smith T, Waterman M (1981) Identification of common molecular subsequenc-
es. Journal of Molecular Biology 147: 195–197.
30. Lipman DJ, Pearson WR (1985) Rapid and sensitive protein similarity searches.
Science 227: 1435–1441.
31. Altschul SF, Gish W, Miller W, Myers EW, Lipman DJ (1990) Basic local
alignment search tool. Journal of molecular biology 215: 403–10.
32. Katoh K, Misawa K, Kuma Ki, Miyata T (2002) MAFFT: a novel method for
rapid multiple sequence alignment based on fast Fourier transform. Nucleic
acids research 30: 3059–66.
33. Vinga S, Almeida J (2003) Alignment-free sequence comparison–a review.
Bioinformatics 19: 513–523.
34. Qi X, Fuller E, Wu Q, Zhang CQ (2012) Numerical characterization of DNA
sequence based on dinucleotides. Scientific World Journal 2012: 104269.
35. Qi X, Wu Q, Zhang Y, Fuller E, Zhang CQ (2011) A novel model for DNA
sequence similarity analysis based on graph theory. Evolutionary bioinformatics
online 7: 149–58.
36. Yu JF, Sun X, Wang JH (2009) TN curve: a novel 3D graphical representation
of DNA sequence based on trinucleotides and its applications. Journal of
theoretical biology 261: 459–68.
37. Liao B, Wang TM (2004) Analysis of similarity/dissimilarity of DNA sequences
based on 3-D graphical representation. Chemical Physics Letters 388: 195–200.
38. Felsenstein J (1981) Evolutionary trees from DNA sequences: A maximum
likelihood approach. Journal of Molecular Evolution 17: 368–376.
39. Yu Z, Anh VV, Zhou Y, Zhou LQ (2007) Numerical Sequence Representation
of DNA Sequences and Methods To Distinguish Coding And Non-Coding
Sequences in a Complete Genome. In: 11th World Multi-Conference on
Systemics, Cybernetics and Informatics. The International Institute of
Informatics and Systemics (IIIS), pp. 171–176.
40. Reese E, Krishnan V (2010) Classification of DNA sequences based on thermal
melting profiles. Bioinformation 4: 463–467.
41. Zhang Y, Chen W (2011) A measure of DNA sequence dissimilarity based on
free energy of nearest-neighbor interaction. Journal of biomolecular structure &
dynamics 28: 557–65.
42. SantaLucia J (1998) A unified view of polymer, dumbbell, and oligonucleotide
DNA nearest-neighbor thermodynamics. Proceedings of the National Academy
of Sciences of the United States of America 95: 1460–5.
43. Panjkovich A, Melo F (2005) Comparison of different melting temperature
calculation methods for short DNA sequences. Bioinformatics 21: 711–22.
44. Antoniadis A, Bigot J, Sapatinas T (2001) Wavelet Estimators in Nonparametric
Regression: A Comparative Simulation Study. Insight 6: 1–83.
45. Antoniadis A (2007) Wavelet methods in statistics: Some recent developments
and their applications. Statistics Surveys 1: 16–55.
46. Donoho DL, Johnstone IM (1995) Adapting to Unknown Smoothness via
Wavelet Shrinkage. Journal of the American Statistical Association 90: 1200.
47. Romo-Vazquez R, Velez-Perez H, Ranta R, Dorr VL, Maquin D, et al. (2012)
Blind source separation, wavelet denoising and discriminant analysis for EEG
artefacts and noise cancelling. Biomedical Signal Processing And Control 7:
389–400.
48. Robinson DF, Foulds LR (1981) Comparison of phylogenetic trees. Mathemat-
ical Biosciences 53: 131–147.
49. Marple SL (1987) Digital Spectral Analysis with Applications, volume 86.
Prentice-Hall, 492 pp.
50. Velez-Perez H, Louis-Dorr V, Ranta R, Dufaut M (2008) Connectivity
estimation of three parametric methods on simulated electroencephalogram
signals. Conference Proceedings of the International Conference of IEEE
Engineering in Medicine and Biology Society 2008: 2606–2609.
GSP Alignment-Free Distances
PLOS ONE | www.plosone.org 12 November 2014 | Volume 9 | Issue 11 | e110954

51. Saitou N, Nei M (1987) The neighbor-joining method: a new method for
reconstructing phylogenetic trees. Molecular biology and evolution 4: 406–25.
52. Studier J, Keppler J (1988) A note on the neighbor-joining algorithm of Saitou
and Nei. Molecular biology and evolution 5: 729–731.
53. Sims GE, Jun SR, Wu GA, Kim SH (2009) Alignment-free genome comparison
with feature frequency profiles (FFP) and optimal resolutions. Proceedings of theNational Academy of Sciences of the United States of America 106: 2677–82.
54. Lorenzo-Ginori J, Rodriguez-Fuentes A (2009) Digital signal processing in the
analysis of genomic sequences. Current Bioinformatics 4: 28–40.
GSP Alignment-Free Distances
PLOS ONE | www.plosone.org 13 November 2014 | Volume 9 | Issue 11 | e110954
Related Documents