UC San Diego UC San Diego Previously Published Works Title Genome-wide admixture mapping of DSM-IV alcohol dependence, criterion count, and the self-rating of the effects of ethanol in African American populations. Permalink https://escholarship.org/uc/item/61t3112j Journal American journal of medical genetics. Part B, Neuropsychiatric genetics : the official publication of the International Society of Psychiatric Genetics, 186(3) ISSN 1552-4841 Authors Lai, Dongbing Kapoor, Manav Wetherill, Leah et al. Publication Date 2021-04-01 DOI 10.1002/ajmg.b.32805 Peer reviewed eScholarship.org Powered by the California Digital Library University of California

Welcome message from author
This document is posted to help you gain knowledge. Please leave a comment to let me know what you think about it! Share it to your friends and learn new things together.
Transcript
UC San DiegoUC San Diego Previously Published Works
TitleGenome-wide admixture mapping of DSM-IV alcohol dependence, criterion count, and the self-rating of the effects of ethanol in African American populations.
Permalinkhttps://escholarship.org/uc/item/61t3112j
JournalAmerican journal of medical genetics. Part B, Neuropsychiatric genetics : the official publication of the International Society of Psychiatric Genetics, 186(3)
ISSN1552-4841
AuthorsLai, DongbingKapoor, ManavWetherill, Leahet al.
Publication Date2021-04-01
DOI10.1002/ajmg.b.32805 Peer reviewed
eScholarship.org Powered by the California Digital LibraryUniversity of California
R E S E A R CH A R T I C L E
Genome-wide admixture mapping of DSM-IV alcoholdependence, criterion count, and the self-rating of the effectsof ethanol in African American populations
Dongbing Lai1 | Manav Kapoor2 | Leah Wetherill1 | Melanie Schwandt3 |
Vijay A. Ramchandani4 | David Goldman3 | Michael Chao2 | Laura Almasy5 |
Kathleen Bucholz6 | Ronald P. Hart7 | Chella Kamarajan8 | Jacquelyn L. Meyers8 |
John I. Nurnberger1,9 | Jay Tischfield10 | Howard J. Edenberg1,11 |
Marc Schuckit12 | Alison Goate2 | Denise M. Scott13 | Bernice Porjesz8 |
Arpana Agrawal6 | Tatiana Foroud1
1Department of Medical and Molecular Genetics, Indiana University School of Medicine, Indianapolis, Indiana
2Department of Neuroscience, Icahn School of Medicine at Mt. Sinai, New York, New York
3Office of the Clinical Director, National Institute on Alcohol Abuse and Alcoholism, Bethesda, Maryland
4Section on Human Psychopharmacology, Division of Intramural Clinical and Biological Research, National Institute on Alcohol Abuse and Alcoholism, Bethesda,
Maryland
5Department of Biomedical and Health Informatics, Children's Hospital of Philadelphia and University of Pennsylvania School of Medicine, Philadelphia, Pennsylvania
6Department of Psychiatry, Washington University School of Medicine, St. Louis, Missouri
7Department of Cell Biology and Neuroscience, Rutgers University, Piscataway, New Jersey
8Henri Begleiter Neurodynamics Lab, Department of Psychiatry, State University of New York, Downstate Medical Center, Brooklyn, New York
9Department of Psychiatry, Indiana University School of Medicine, Indianapolis, Indiana
10Department of Genetics and the Human Genetics Institute of New Jersey, Rutgers University, Piscataway, New Jersey
11Department of Biochemistry and Molecular Biology, Indiana University School of Medicine, Indianapolis, Indiana
12Department of Psychiatry, University of California, San Diego Medical School, San Diego, California
13Departments of Pediatrics and Human Genetics, Howard University, Washington, District of Columbia
Correspondence
Dongbing Lai, 410 W. 10 Street HS 4000,
HITS Indianapolis, IN 46202-3002.
Email: [email protected]
Funding information
National Institute of Health, Grant/Award
Number: HHSN268201200008I; National
Institute on Drug Abuse, Grant/Award
Number: DA032573; the National Institute on
Alcohol Abuse and Alcoholism and the
National Institute on Drug Abuse, Grant/
Award Number: U10AA008401
Abstract
African Americans (AA) have lower prevalence of alcohol dependence and higher sub-
jective response to alcohol than European Americans. Genome-wide association
studies (GWAS) have identified genes/variants associated with alcohol dependence
specifically in AA; however, the sample sizes are still not large enough to detect vari-
ants with small effects. Admixture mapping is an alternative way to identify alcohol
dependence genes/variants that may be unique to AA. In this study, we performed
the first admixture mapping of DSM-IV alcohol dependence diagnosis, DSM-IV alco-
hol dependence criterion count, and two scores from the self-rating of effects of eth-
anol (SRE) as measures of response to alcohol: the first five times of using alcohol
(SRE-5) and average of SRE across three times (SRE-T). Findings revealed a region
on chromosome 4 that was genome-wide significant for SRE-5 (p value = 4.18E-05).
Fine mapping did not identify a single causal variant to be associated with SRE-5;
instead, conditional analysis concluded that multiple variants collectively explained
Received: 18 December 2019 Revised: 6 April 2020 Accepted: 1 June 2020
DOI: 10.1002/ajmg.b.32805
Am J Med Genet. 2020;1–11. wileyonlinelibrary.com/journal/ajmgb © 2020 Wiley Periodicals LLC 1
the admixture mapping signal. PPARGC1A, a gene that has been linked to alcohol con-
sumption in previous studies, is located in this region. Our finding suggests that
admixture mapping is a useful tool to identify genes/variants that may have been mis-
sed by current GWAS approaches in admixed populations.
K E YWORD S
admixture mapping, African American, criterion count, DSM-IV alcohol dependence, response to
ethanol
1 | INTRODUCTION
Alcohol dependence is one of the most common and costly diseases
worldwide. In the United States, 12.5% of the population meets
criteria for alcohol dependence during their lifetime (Hasin & Grant,
2015), and about 88,000 deaths and 2.5 million years of potential life
lost annually are attributable to excessive alcohol use (Stahre, Roeber,
Kanny, Brewer, & Zhang, 2014). The estimated economic cost attrib-
utable to excessive drinking is almost $250 billion (Sacks, Gonzales,
Bouchery, Tomedi, & Brewer, 2015).
It has been long observed that drinking behavior and drinking-
related problems differ among ethnic groups (Chartier &
Caetano, 2010; Delker, Brown, & Hasin, 2016; Gibbs et al., 2013;
Hasin, Stinson, Ogburn, & Grant, 2007; Vaeth, Wang-Schweig, &
Caetano, 2017; Witbrodt, Mulia, Zemore, & Kerr, 2014; Zapolski,
Pedersen, McCarthy, & Smith, 2014). Compared to European Ameri-
cans (EA), African Americans (AA) drink less frequently; are more likely
to stop drinking; have fewer heavy drinking episodes, later onset of
drinking, and slower progression to alcohol dependence (Alvanzo
et al., 2011; Dawson, Goldstein, & Grant, 2013; Klima, Skinner,
Haggerty, Crutchfield, & Catalano, 2014). As a result, AA have signifi-
cantly lower prevalence of alcohol dependence (Hasin & Grant, 2015).
Notably, this is despite the increased exposure to stressful experi-
ences in AA, which is an important factor associated with progression
to alcohol dependence (Gibbs et al., 2013; Ransome & Gilman, 2016).
However, when alcohol dependence occurs, AA have higher rates
of recurrent and persistent alcohol dependence than EA (Breslau,
Kendler, Su, Gaxiola-Aguilar, & Kessler, 2005; Chartier & Caetano,
2010; Dawson et al., 2005). In addition, AA reported a sharper
increase in stimulation in an alcohol administration study (Pedersen &
McCarthy, 2013), and experienced different neuroendocrine and inflam-
mation responses due to alcohol misuse (Ransome, Slopen, Karlsson, &
Williams, 2017, 2018). Furthermore, rates of alcohol-related diseases,
mortality, and consequences are higher in AA (Chartier & Caetano,
2010; Flores et al., 2008; Polednak, 2007; Russo, Purohit, Foudin, &
Salin, 2004; Sempos, Rehm, Wu, Crespo, & Trevisan, 2003; Shield
et al., 2013; Yang, Vadhavkar, Singh, & Omary, 2008).
The reasons for the disparities in drinking and alcohol-related
problems between AA and EA are not fully understood (Hasin &
Grant, 2015; Zapolski et al., 2014). Studies have suggested that both
environmental and genetic factors contribute to these differences
(Chartier et al., 2014). Relevant to the current study, there is evidence
for differential heritability of problem drinking in EA and AA (Sartor
et al., 2013). Genome-wide association studies (GWAS) of alcohol-
related phenotypes have also identified variants that are only signifi-
cant in AA or EA (Kranzler et al., 2019; Lai, Wetherill, Bertelsen,
et al., 2019; Lai, Wetherill, Kapoor, et al., 2019; Walters et al., 2018).
For example, different functional single nucleotide polymorphisms
(SNP) in ADH1B, the gene encoding the main alcohol-metabolizing
enzyme in liver, have been linked to alcohol dependence in various
populations partially due to their population specific allele frequen-
cies: rs2066702 in AA and rs1229984 in EA (Bierut et al., 2012;
Edenberg & McClintick, 2018; Walters et al., 2018). Polimanti and col-
leagues studied functional variants in 24 genes related to alcohol
dependence and found frequencies of these variants to vary between
AA and EA (Polimanti, Yang, Zhao, & Gelernter, 2015).
There is a great need for identifying genes/variants specifically
related to AA drinking behavior and problems (Zemore et al., 2018). The
identification of population specific genes/variants can advance our
knowledge of the etiology of alcohol dependence in AA and contribute to
the development of novel prevention and therapeutic strategies. How-
ever, there are several methodological challenges specific to conducting
genetic studies in AA. First, there are fewer and smaller studies of AA
compared to EA. Of the 32 GWAS of alcohol dependence and related
phenotypes in the NHGRI-EBI GWAS catalog (https://www.ebi.ac.uk/
gwas/home), only 11 include AA and sample sizes are much smaller com-
pared to other populations. Recently, in the largest GWAS of alcohol
dependence, only 6,280 AA were included in an analysis of >52,000 indi-
viduals (Walters et al., 2018). In another recent GWAS using the Alcohol
Use Disorders Identification Test (AUDIT) in the Million Veteran Project
(MVP), there were about 57,000 AA samples, however, the EA population
consisted of >209,000 participants (Kranzler et al., 2019). Second, people
of African ancestry have more genetic variants and a faster decay of
linkage disequilibrium (LD) with an increase in physical distance (Altshuler
et al., 2015). Therefore, more independent tagging variants are needed to
fully cover the entire genome in AA as compared with other populations.
As a result, the traditional genome-wide threshold, 5 × 10E-8, may not be
appropriate. Third, the proportion of African and European ancestries dif-
fer among AA populations in the United States (Dick, Barr, Guy, Nasim, &
Scott, 2017). In genetic studies, this admixture is usually modeled by
2 LAI ET AL.

including ancestral principal components (PCs) as covariates in analysis.
However, these PCs are a genome-wide adjustment and may result in
over- or under- adjustment in some chromosomal regions due to different
proportions of local (i.e., region-specific) admixture.
Admixture mapping might provide novel insights into one potential
source of the differential prevalence of alcohol dependence between
EA and AA (Seldin, Pasaniuc, & Price, 2011). One study found that
the degree of African admixture is correlated with alcohol dependence;
and those with alcohol dependence have less African ancestry (Zuo
et al., 2009). Since admixture in AA occurred relatively recently (usually
<10 generations), only a small number of recombination events have
likely occurred and the size of ancestry-specific regions is expected to
be large. That is, the average size of an African ancestry block in AA is
about 17 centimorgans (Patterson et al., 2004). Thus, a much smaller
number of genetic markers would be needed to tag such regions than is
required in a typical GWAS. Admixture mapping has been successfully
applied to other traits, for example, blood pressure, obstructive sleep
apnea, systemic lupus erythematosus, and so forth, (Molineros et al.,
2013; Sofer et al., 2017; Wang et al., 2019; Winkler, Nelson, &
Smith, 2010); however, to our knowledge, it has not been applied to the
study of alcohol dependence and related phenotypes in AA.
In this study, we performed admixture mapping using AA individ-
uals from the Collaborative study on the Genetics of Alcoholism
(COGA) (Reich et al., 1998), Study of Addiction: Genetics and Environ-
ment (SAGE) (Bierut et al., 2010), Alcohol Dependence GWAS in
European and African Americans (Yale-Penn) (Gelernter et al., 2014),
and an African American cohort from the National Institute on Alcohol
Abuse and Alcoholism (NIAAA). Duplicate individuals among those
studies were removed. We focused on four phenotypes: DSM-IV
(American Psychiatric Association, 1994) alcohol dependence diagno-
sis; DSM-IV alcohol dependence criterion count as a measure of
alcohol dependence severity (Lai, Wetherill, Bertelsen, et al., 2019),
and two scores from the self-rating of effects of ethanol (SRE) ques-
tionnaire (Schuckit, Smith, & Tipp, 1997) as measures of response to
alcohol. In genome-wide significant (GWS) regions, we conducted
fine mapping using genotyped and imputed data to identify potentially
causal variants. Last, we performed conditional analyses to test
whether the variants identified during fine mapping could explain the
admixture mapping association signal.
2 | MATERIALS AND METHODS
2.1 | Samples
COGA recruited alcohol dependent probands and their family members
from inpatient and outpatient AD treatment facilities in seven sites, and
community comparison families were also recruited from a variety of
sources in the same areas (Nurnberger et al., 2004; Reich et al., 1998).
Institutional review boards from all sites approved the study and every
participant provided informed consent or assent. The Semi-Structured
Assessment for the Genetics of Alcoholism (SSAGA) and the child ver-
sion of the SSAGA (Bucholz et al., 1994; Hesselbrock, Easton, Bucholz,
Schuckit, & Hesselbrock, 1999) were administered to individuals age
18 or over and younger than 18, respectively. SAGE (phs000092.v1.p1,
https://www.ncbi.nlm.nih.gov/projects/gap/cgi-bin/study.cgi?study_id=
phs000092.v1.p1) and Yale-Penn (phs000425.v1.p1, https://www.ncbi.
nlm.nih.gov/projects/gap/cgi-bin/study.cgi?study_id=phs000425.v1.p1)
were downloaded from the database of Genotypes and Phenotypes
(dbGaP). For the NIAAA cohort, participants were recruited using the
NIH Institutional Review Board-approved screening and assessment
protocols conducted at the National Institutes of Health Clinical Center
(Bethesda, MD) from 2005 to 2015. All participants provided written
informed consent.
2.2 | Phenotypes
Individuals who endorsed three or more of the seven DSM-IV criteria
occurring within a 12-month period were diagnosed with DSM-IV
alcohol dependence. Affected individuals were age 15 or older and
met criteria for DSM-IV alcohol dependence. Unaffected individuals
were defined as those who had consumed at least one full drink
of alcohol, were ≥21 years old, endorsed <2 criteria for DSM-IV
dependence, and did not meet criteria for abuse of alcohol, cocaine,
opioids, marijuana, sedatives, and stimulants (Lai, Wetherill, Bertelsen,
et al., 2019). For SAGE and Yale-Penn datasets, DSM-IV alcohol
dependence diagnoses were downloaded from dbGaP; and unaffected
individuals with alcohol abuse, or other substance dependence were
excluded.
The seven DSM-IV alcohol dependence criteria were summed to
create a criterion count. Individuals with comorbid use and misuse of
other drugs were not excluded.
The SRE questionnaire is a retrospective, self-report instrument
to measure the numbers of standard drinks required to produce four
effects of ethanol (Schuckit, Tipp, Smith, Wiesbeck, & Kalmijn, 1997):
(a) “how many (standard) drinks did it take for you to begin to feel an
effect?”; (b) “how many drinks did it take for you to feel a bit dizzy or
begin to slur your speech?”; (c) “how many drinks did it take you to
begin to stumble or walk in an uncoordinated manner?”; (d) “how
many drinks did it take you to pass out or fall asleep when you did not
want to?”. The SRE queries drinking at three time points: the first five
times using alcohol (SRE-5); the period of heaviest drinking; and the
most recent 3 months of consumption (Schuckit, Tipp, et al., 1997). In
this study, we used SRE-5 as well as the average scores across the
three time points (SRE-T). Individuals who drank ≥2 drinks on one
occasion were included in the analysis with extreme observations
winsorized at the mean plus 2 SDs. The natural logarithm of SRE-5
and square root of SRE-T were used in analyses based on their distri-
butions (Lai, Wetherill, Kapoor, et al., 2019).
2.3 | Genotyping, ancestry and imputation
Detailed information about data processing and QC applied in each
study was reported previously (Lai, Wetherill, Bertelsen, et al., 2019;
LAI ET AL. 3
Lai, Wetherill, Kapoor, et al., 2019). To identify duplicate samples
among studies, confirm the reported pedigree structure, and calculate
PCs representing population stratification, all available data from
COGA, SAGE, Yale-Penn, and NIAAA were combined. Then, variants
meeting the following criteria: common (defined as minor allele fre-
quency [MAF] >10% in the combined sample), independent (defined
as r2 < .5), high quality (missing rate <2% and Hardy–Weinberg Equi-
librium [HWE] p values > .001), were used to identify duplicate sam-
ples and confirm the reported pedigree structure using PLINK (Chang
et al., 2015; Purcell et al., 2007). To remove the same individual
included in multiple datasets, (i.e., between COGA and SAGE), dupli-
cate samples were removed from the study with less phenotypic
information and fewer family members (e.g., SAGE). Family structures
were updated, as needed. Using genetically-confirmed pedigrees, Ped-
check (O'Connell & Weeks, 1998) was used to identify Mendelian
errors and inconsistencies were removed. The same set of variants
were used to estimate PCs using Eigenstrat (Price et al., 2006) with
1,000 Genomes data serving as the reference (Phase 3, version 5).
Only AA samples, designated based on the first two PCs (COGA
N = 2,939; SAGE N = 959; Yale–Penn N = 2,044; NIAAA N = 169),
were included in analyses (Lai, Wetherill, Bertelsen, et al., 2019; Lai,
Wetherill, Kapoor, et al., 2019). For the purposes of fine mapping,
all samples were imputed to 1,000 Genomes (Phase 3, version
5, hg19) separately by cohort using SHAPEIT2 (Delaneau, Howie, Cox,
Zagury, & Marchini, 2013) followed by Minimac3 (Das et al., 2016).
Only variants with non A/T or C/G alleles, missing rates <5%, MAF
>3%, and HWE p values > .0001 were used for imputation. Imputed
variants with imputation quality score r2 < .30 were excluded.
2.4 | Inference of African ancestry
Due to differences in genotyping arrays, RFMix (V1.5.4) (Maples,
Gravel, Kenny, & Bustamante, 2013) was used to estimate local African
ancestry in each cohort separately. RFMix is a discriminative modeling
approach that uses random forests trained on reference samples.
Ninety-nine CEU and 99 YRI samples from 1,000 Genomes Phase
3 were used as European and African reference samples, respectively,
as recommended by RFMix. Only genotyped, high quality variants
(defined as missing rate <0.05, Hardy–Weinberg p values > .001, and
MAF >3%) were included to improve inference accuracy. SHAPEIT2
(Delaneau et al., 2013) was used for haplotype phasing, then RFMix
was used to estimate the number of African alleles at each locus
(i.e., 0, 1 or 2 copies of African alleles, referred as local African ances-
try). For each individual, global African ancestry was also calculated as
the average percentage of African ancestry across the entire genome.
2.5 | Admixture mapping
We used RVTESTS (Zhan, Hu, Li, Abecasis, & Liu, 2016) to perform
admixture mapping within each dataset. For each phenotype, the
association with the number of African alleles at each locus was
tested after adjusting for study specific covariates and a kinship matrix
estimated by RVTESTS. For COGA and SAGE, sex and birth cohort
were significantly associated with alcohol dependence, and were
therefore used as covariates (Lai, Wetherill, Bertelsen, et al., 2019; Lai,
Wetherill, Kapoor, et al., 2019). For Yale-Penn and NIAAA, birth
cohort was not available, therefore, sex and age were included, as in
previous studies (Lai, Wetherill, Bertelsen, et al., 2019; Lai, Wetherill,
Kapoor, et al., 2019). Global African ancestry was included as a covari-
ate in all tests, as suggested (Molineros et al., 2013; Parra et al., 2017).
Results from each dataset were meta-analyzed with the effect size
weighted by the inverse of the estimated SE using METAL (Willer,
Li, & Abecasis, 2010). Since the block sizes were different for each
cohort, only the overlapping part of the blocks from each cohort were
included in meta-analysis.
The following procedure was used to determine the GWS thresh-
old. First, matSpD was used to account for correlations across the
four phenotypes by spectral decomposition of the correlation matrix
(Li & Ji, 2005; Nyholt, 2004), resulting in 2.52 effective independent
tests. Second, using the autocorrelation function of the R package
CODA (Plummer, Best, Cowles, & Vines, 2005), 273.82 effective
African ancestry blocks were estimated across the entire genome
using a combined sample from all cohorts. Therefore, the GWS
threshold was determined as 0.05/(2.52 × 273.82) = 7.25E-05.
2.6 | Fine mapping and conditional analysis
For GWS regions that were identified, all genotyped and imputed vari-
ants within that region that had a missing rate <0.05, Hardy–Weinberg
p values > .0001, and MAF >3% were tested using the same model as
in the admixture mapping, except the global African ancestry index
was replaced by PCs (the first four PCs in COGA and the first three
PCs in other samples as in the original studies (Lai, Wetherill, Bertelsen,
et al., 2019; Lai, Wetherill, Kapoor, et al., 2019) to adjust for population
stratification among AA. RVTESTS (Zhan et al., 2016) was used to per-
form association tests within each cohort separately, then results from
each cohort were meta-analyzed using METAL (Willer et al., 2010).
The significance threshold was determined by the estimated effective
number of tests using the R package matSpDlite (Li & Ji, 2005;
Nyholt, 2004), which decomposes the LD between variants to arrive at
the approximate number of independent variants.
Conditional analysis was performed by including variants identi-
fied in fine mapping with the lowest p values as covariates in another
round of admixture mapping in GWS regions. A conditional analysis
p value > .01 indicated that the variants included as covariates in
admixture mapping were the driving factors of an admixture mapping
association signal. We first tested each variant individually. If single
variants did not explain the admixture mapping signal, then we tested
multiple variants following the framework proposed by Molineros
et al. (2013). Starting with the variant with the lowest p value, we
added the variant having the next lowest p value and not in LD
(defined as r2 < .5) with variants that were already in the model, one
at a time, until the conditional p value was greater than .01.
4 LAI ET AL.
3 | RESULTS
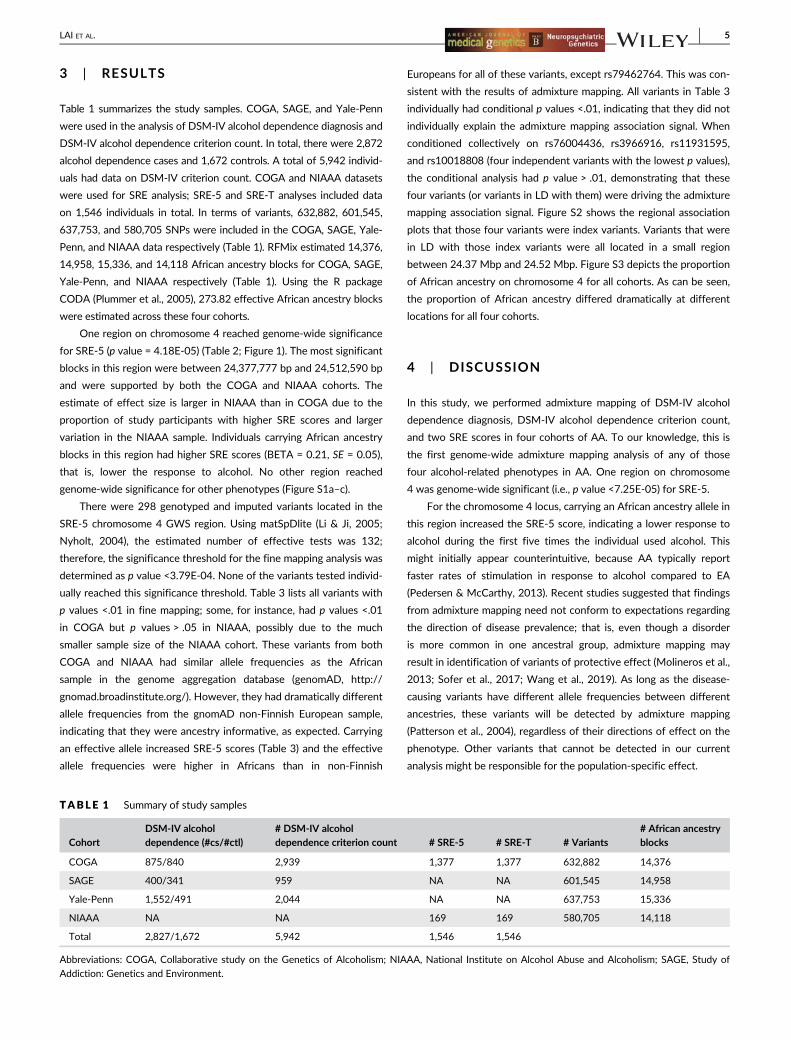
Table 1 summarizes the study samples. COGA, SAGE, and Yale-Penn
were used in the analysis of DSM-IV alcohol dependence diagnosis and
DSM-IV alcohol dependence criterion count. In total, there were 2,872
alcohol dependence cases and 1,672 controls. A total of 5,942 individ-
uals had data on DSM-IV criterion count. COGA and NIAAA datasets
were used for SRE analysis; SRE-5 and SRE-T analyses included data
on 1,546 individuals in total. In terms of variants, 632,882, 601,545,
637,753, and 580,705 SNPs were included in the COGA, SAGE, Yale-
Penn, and NIAAA data respectively (Table 1). RFMix estimated 14,376,
14,958, 15,336, and 14,118 African ancestry blocks for COGA, SAGE,
Yale-Penn, and NIAAA respectively (Table 1). Using the R package
CODA (Plummer et al., 2005), 273.82 effective African ancestry blocks
were estimated across these four cohorts.
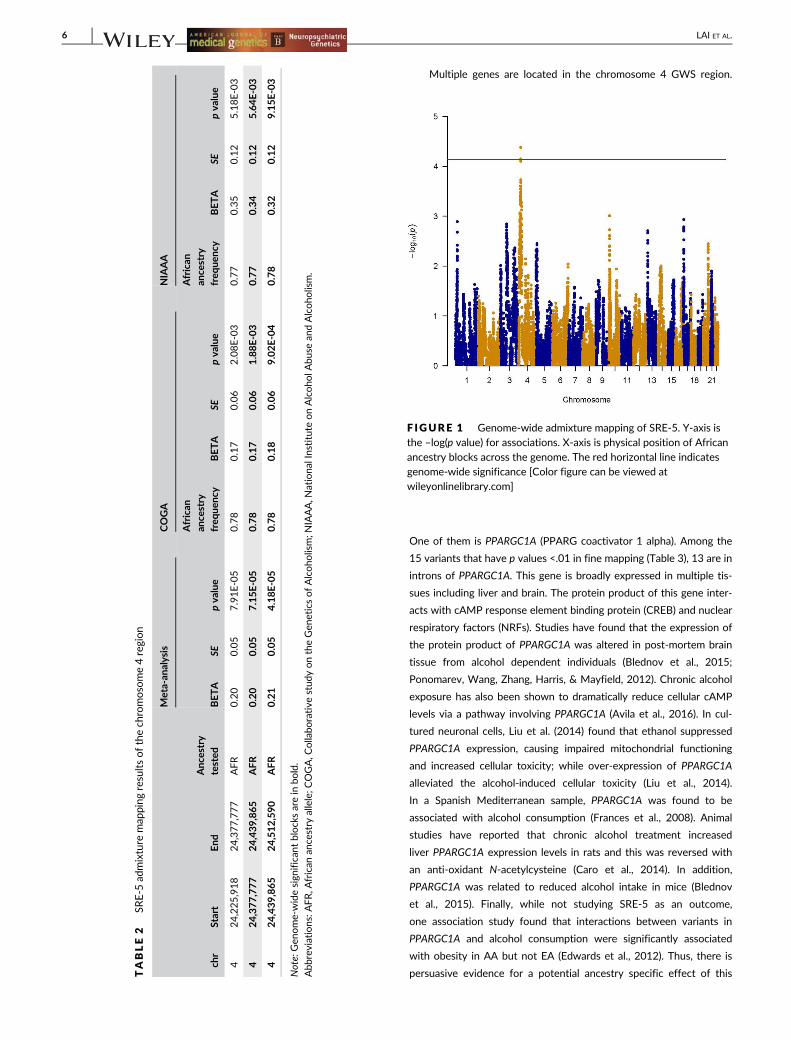
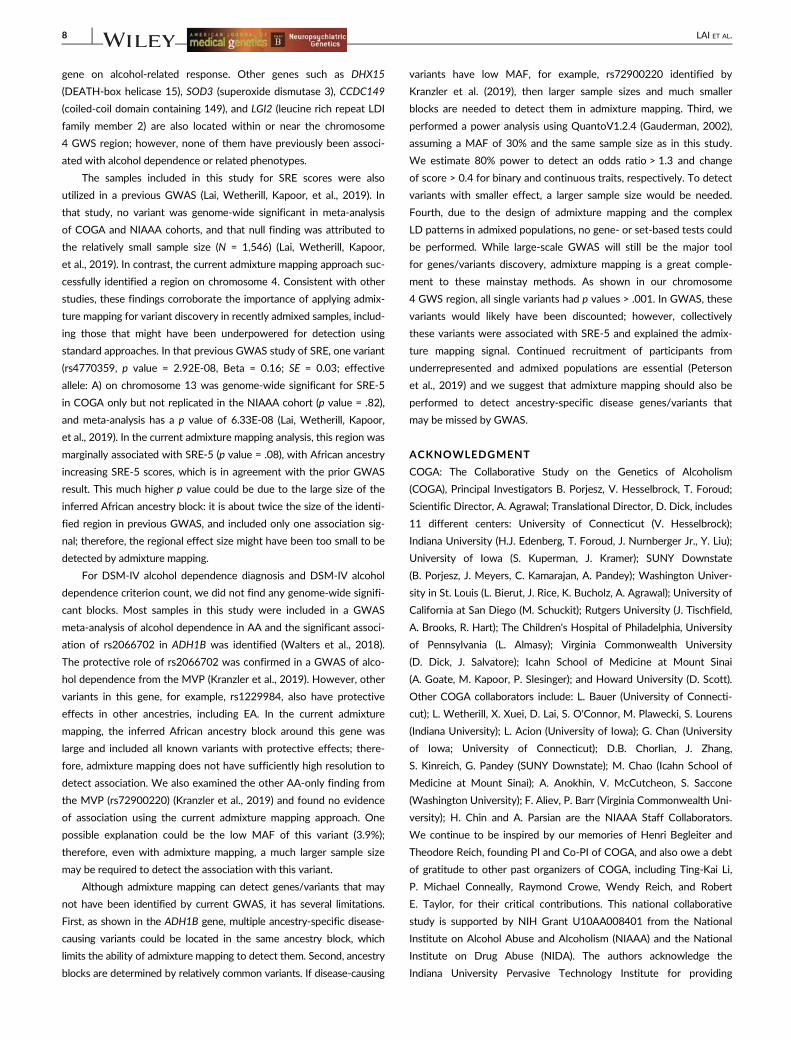
One region on chromosome 4 reached genome-wide significance
for SRE-5 (p value = 4.18E-05) (Table 2; Figure 1). The most significant
blocks in this region were between 24,377,777 bp and 24,512,590 bp
and were supported by both the COGA and NIAAA cohorts. The
estimate of effect size is larger in NIAAA than in COGA due to the
proportion of study participants with higher SRE scores and larger
variation in the NIAAA sample. Individuals carrying African ancestry
blocks in this region had higher SRE scores (BETA = 0.21, SE = 0.05),
that is, lower the response to alcohol. No other region reached
genome-wide significance for other phenotypes (Figure S1a–c).
There were 298 genotyped and imputed variants located in the
SRE-5 chromosome 4 GWS region. Using matSpDlite (Li & Ji, 2005;
Nyholt, 2004), the estimated number of effective tests was 132;
therefore, the significance threshold for the fine mapping analysis was
determined as p value <3.79E-04. None of the variants tested individ-
ually reached this significance threshold. Table 3 lists all variants with
p values <.01 in fine mapping; some, for instance, had p values <.01
in COGA but p values > .05 in NIAAA, possibly due to the much
smaller sample size of the NIAAA cohort. These variants from both
COGA and NIAAA had similar allele frequencies as the African
sample in the genome aggregation database (genomAD, http://
gnomad.broadinstitute.org/). However, they had dramatically different
allele frequencies from the gnomAD non-Finnish European sample,
indicating that they were ancestry informative, as expected. Carrying
an effective allele increased SRE-5 scores (Table 3) and the effective
allele frequencies were higher in Africans than in non-Finnish
Europeans for all of these variants, except rs79462764. This was con-
sistent with the results of admixture mapping. All variants in Table 3
individually had conditional p values <.01, indicating that they did not
individually explain the admixture mapping association signal. When
conditioned collectively on rs76004436, rs3966916, rs11931595,
and rs10018808 (four independent variants with the lowest p values),
the conditional analysis had p value > .01, demonstrating that these
four variants (or variants in LD with them) were driving the admixture
mapping association signal. Figure S2 shows the regional association
plots that those four variants were index variants. Variants that were
in LD with those index variants were all located in a small region
between 24.37 Mbp and 24.52 Mbp. Figure S3 depicts the proportion
of African ancestry on chromosome 4 for all cohorts. As can be seen,
the proportion of African ancestry differed dramatically at different
locations for all four cohorts.
4 | DISCUSSION
In this study, we performed admixture mapping of DSM-IV alcohol
dependence diagnosis, DSM-IV alcohol dependence criterion count,
and two SRE scores in four cohorts of AA. To our knowledge, this is
the first genome-wide admixture mapping analysis of any of those
four alcohol-related phenotypes in AA. One region on chromosome
4 was genome-wide significant (i.e., p value <7.25E-05) for SRE-5.
For the chromosome 4 locus, carrying an African ancestry allele in
this region increased the SRE-5 score, indicating a lower response to
alcohol during the first five times the individual used alcohol. This
might initially appear counterintuitive, because AA typically report
faster rates of stimulation in response to alcohol compared to EA
(Pedersen & McCarthy, 2013). Recent studies suggested that findings
from admixture mapping need not conform to expectations regarding
the direction of disease prevalence; that is, even though a disorder
is more common in one ancestral group, admixture mapping may
result in identification of variants of protective effect (Molineros et al.,
2013; Sofer et al., 2017; Wang et al., 2019). As long as the disease-
causing variants have different allele frequencies between different
ancestries, these variants will be detected by admixture mapping
(Patterson et al., 2004), regardless of their directions of effect on the
phenotype. Other variants that cannot be detected in our current
analysis might be responsible for the population-specific effect.
TABLE 1 Summary of study samples
CohortDSM-IV alcoholdependence (#cs/#ctl)
# DSM-IV alcoholdependence criterion count # SRE-5 # SRE-T # Variants
# African ancestryblocks
COGA 875/840 2,939 1,377 1,377 632,882 14,376
SAGE 400/341 959 NA NA 601,545 14,958
Yale-Penn 1,552/491 2,044 NA NA 637,753 15,336
NIAAA NA NA 169 169 580,705 14,118
Total 2,827/1,672 5,942 1,546 1,546
Abbreviations: COGA, Collaborative study on the Genetics of Alcoholism; NIAAA, National Institute on Alcohol Abuse and Alcoholism; SAGE, Study of
Addiction: Genetics and Environment.
LAI ET AL. 5
Multiple genes are located in the chromosome 4 GWS region.
One of them is PPARGC1A (PPARG coactivator 1 alpha). Among the
15 variants that have p values <.01 in fine mapping (Table 3), 13 are in
introns of PPARGC1A. This gene is broadly expressed in multiple tis-
sues including liver and brain. The protein product of this gene inter-
acts with cAMP response element binding protein (CREB) and nuclear
respiratory factors (NRFs). Studies have found that the expression of
the protein product of PPARGC1A was altered in post-mortem brain
tissue from alcohol dependent individuals (Blednov et al., 2015;
Ponomarev, Wang, Zhang, Harris, & Mayfield, 2012). Chronic alcohol
exposure has also been shown to dramatically reduce cellular cAMP
levels via a pathway involving PPARGC1A (Avila et al., 2016). In cul-
tured neuronal cells, Liu et al. (2014) found that ethanol suppressed
PPARGC1A expression, causing impaired mitochondrial functioning
and increased cellular toxicity; while over-expression of PPARGC1A
alleviated the alcohol-induced cellular toxicity (Liu et al., 2014).
In a Spanish Mediterranean sample, PPARGC1A was found to be
associated with alcohol consumption (Frances et al., 2008). Animal
studies have reported that chronic alcohol treatment increased
liver PPARGC1A expression levels in rats and this was reversed with
an anti-oxidant N-acetylcysteine (Caro et al., 2014). In addition,
PPARGC1A was related to reduced alcohol intake in mice (Blednov
et al., 2015). Finally, while not studying SRE-5 as an outcome,
one association study found that interactions between variants in
PPARGC1A and alcohol consumption were significantly associated
with obesity in AA but not EA (Edwards et al., 2012). Thus, there is
persuasive evidence for a potential ancestry specific effect of thisTABLE2
SRE-5
admixture
map
ping
resultsofthech
romosome4region
chr
Start
End
Anc
estry
tested
Meta-an
alysis
COGA
NIAAA
BETA
SEpva
lue
African
ance
stry
freq
uenc
yBETA
SEpva
lue
African
ance
stry
freq
uen
cyBETA
SEpva
lue
424,225,918
24,377,777
AFR
0.20
0.05
7.91E-05
0.78
0.17
0.06
2.08E-03
0.77
0.35
0.12
5.18E-03
424,377,777
24,439,865
AFR
0.20
0.05
7.15E-05
0.78
0.17
0.06
1.88E-03
0.77
0.34
0.12
5.64E-03
424,439,865
24,512,590
AFR
0.21
0.05
4.18E-05
0.78
0.18
0.06
9.02E-04
0.78
0.32
0.12
9.15E-03
Note:Gen
ome-widesign
ifican
tblocksarein
bold.
Abb
reviations:A
FR,A
frican
ancestry
allele;C
OGA,C
ollabo
rative
stud
yontheGen
eticsofAlcoho
lism;N
IAAA,N
ationa
lInstitute
onAlcoho
lAbu
sean
dAlcoholism.
F IGURE 1 Genome-wide admixture mapping of SRE-5. Y-axis isthe –log(p value) for associations. X-axis is physical position of Africanancestry blocks across the genome. The red horizontal line indicatesgenome-wide significance [Color figure can be viewed atwileyonlinelibrary.com]
6 LAI ET AL.
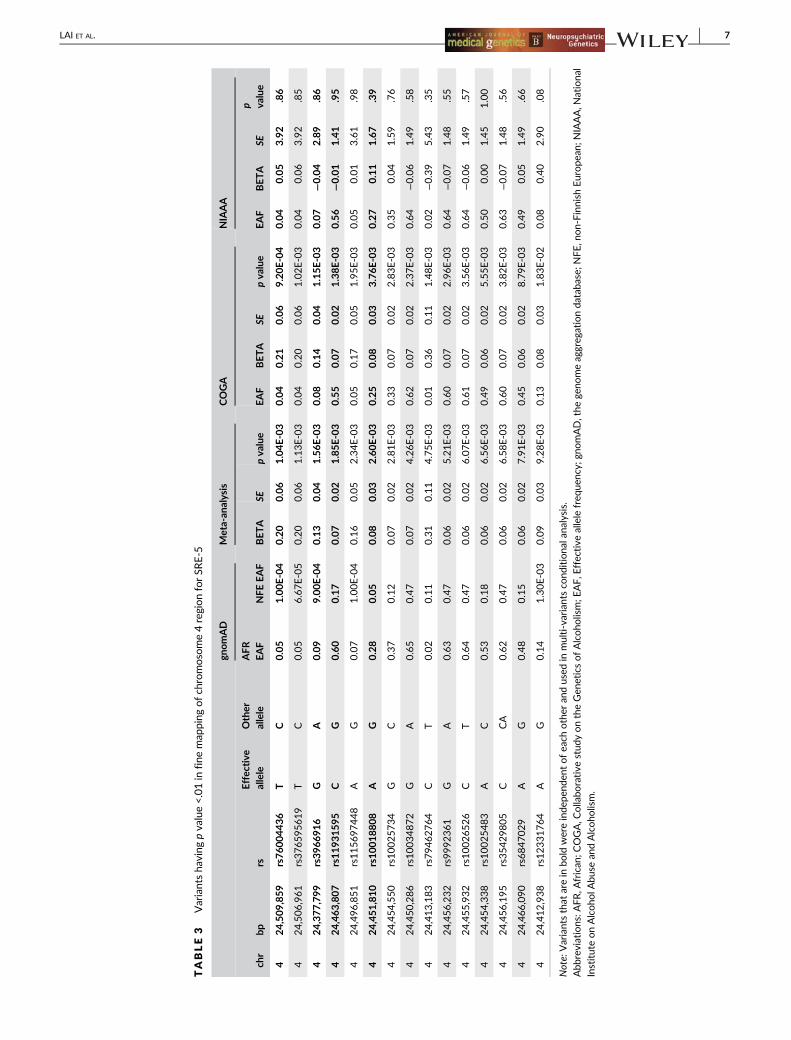
TABLE3
Variantsha
ving
pvalue<.01in
fine
map
ping
ofch
romosome4regionforSR
E-5
gnomAD
Meta-an
alysis
COGA
NIAAA
chr
bprs
Effec
tive
allele
Other
allele
AFR
EAF
NFE
EAF
BETA
SEpva
lue
EAF
BETA
SEpva
lue
EAF
BETA
SEp va
lue
424,509,859
rs76004436
TC
0.05
1.00E-04
0.20
0.06
1.04E-03
0.04
0.21
0.06
9.20E-04
0.04
0.05
3.92
.86
424,506,961
rs376595619
TC
0.05
6.67E-05
0.20
0.06
1.13E-03
0.04
0.20
0.06
1.02E-03
0.04
0.06
3.92
.85
424,377,799
rs3966916
GA
0.09
9.00E-04
0.13
0.04
1.56E-03
0.08
0.14
0.04
1.15E-03
0.07
−0.04
2.89
.86
424,463,807
rs11931595
CG
0.60
0.17
0.07
0.02
1.85E-03
0.55
0.07
0.02
1.38E-03
0.56
−0.01
1.41
.95
424,496,851
rs115697448
AG
0.07
1.00E-04
0.16
0.05
2.34E-03
0.05
0.17
0.05
1.95E-03
0.05
0.01
3.61
.98
424,451,810
rs10018808
AG
0.28
0.05
0.08
0.03
2.60E-03
0.25
0.08
0.03
3.76E-03
0.27
0.11
1.67
.39
424,454,550
rs10025734
GC
0.37
0.12
0.07
0.02
2.81E-03
0.33
0.07
0.02
2.83E-03
0.35
0.04
1.59
.76
424,450,286
rs10034872
GA
0.65
0.47
0.07
0.02
4.26E-03
0.62
0.07
0.02
2.37E-03
0.64
−0.06
1.49
.58
424,413,183
rs79462764
CT
0.02
0.11
0.31
0.11
4.75E-03
0.01
0.36
0.11
1.48E-03
0.02
−0.39
5.43
.35
424,456,232
rs9992361
GA
0.63
0.47
0.06
0.02
5.21E-03
0.60
0.07
0.02
2.96E-03
0.64
−0.07
1.48
.55
424,455,932
rs10026526
CT
0.64
0.47
0.06
0.02
6.07E-03
0.61
0.07
0.02
3.56E-03
0.64
−0.06
1.49
.57
424,454,338
rs10025483
AC
0.53
0.18
0.06
0.02
6.56E-03
0.49
0.06
0.02
5.55E-03
0.50
0.00
1.45
1.00
424,456,195
rs35429805
CCA
0.62
0.47
0.06
0.02
6.58E-03
0.60
0.07
0.02
3.82E-03
0.63
−0.07
1.48
.56
424,466,090
rs6847029
AG
0.48
0.15
0.06
0.02
7.91E-03
0.45
0.06
0.02
8.79E-03
0.49
0.05
1.49
.66
424,412,938
rs12331764
AG
0.14
1.30E-03
0.09
0.03
9.28E-03
0.13
0.08
0.03
1.83E-02
0.08
0.40
2.90
.08
Note:Variantsthat
arein
bold
wereinde
pend
entofea
chother
andused
inmulti-variantsco
nditiona
lana
lysis.
Abb
reviations:A
FR,A
frican
;COGA,C
ollabo
rative
stud
yontheGen
eticsofAlcoho
lism;E
AF,E
ffective
allele
freq
uenc
y;gn
omAD,the
geno
meaggreg
ationdatab
ase;
NFE,n
on-FinnishEuropea
n;N
IAAA,N
ational
InstituteonAlcoho
lAbu
sean
dAlcoho
lism.
LAI ET AL. 7
gene on alcohol-related response. Other genes such as DHX15
(DEATH-box helicase 15), SOD3 (superoxide dismutase 3), CCDC149
(coiled-coil domain containing 149), and LGI2 (leucine rich repeat LDI
family member 2) are also located within or near the chromosome
4 GWS region; however, none of them have previously been associ-
ated with alcohol dependence or related phenotypes.
The samples included in this study for SRE scores were also
utilized in a previous GWAS (Lai, Wetherill, Kapoor, et al., 2019). In
that study, no variant was genome-wide significant in meta-analysis
of COGA and NIAAA cohorts, and that null finding was attributed to
the relatively small sample size (N = 1,546) (Lai, Wetherill, Kapoor,
et al., 2019). In contrast, the current admixture mapping approach suc-
cessfully identified a region on chromosome 4. Consistent with other
studies, these findings corroborate the importance of applying admix-
ture mapping for variant discovery in recently admixed samples, includ-
ing those that might have been underpowered for detection using
standard approaches. In that previous GWAS study of SRE, one variant
(rs4770359, p value = 2.92E-08, Beta = 0.16; SE = 0.03; effective
allele: A) on chromosome 13 was genome-wide significant for SRE-5
in COGA only but not replicated in the NIAAA cohort (p value = .82),
and meta-analysis has a p value of 6.33E-08 (Lai, Wetherill, Kapoor,
et al., 2019). In the current admixture mapping analysis, this region was
marginally associated with SRE-5 (p value = .08), with African ancestry
increasing SRE-5 scores, which is in agreement with the prior GWAS
result. This much higher p value could be due to the large size of the
inferred African ancestry block: it is about twice the size of the identi-
fied region in previous GWAS, and included only one association sig-
nal; therefore, the regional effect size might have been too small to be
detected by admixture mapping.
For DSM-IV alcohol dependence diagnosis and DSM-IV alcohol
dependence criterion count, we did not find any genome-wide signifi-
cant blocks. Most samples in this study were included in a GWAS
meta-analysis of alcohol dependence in AA and the significant associ-
ation of rs2066702 in ADH1B was identified (Walters et al., 2018).
The protective role of rs2066702 was confirmed in a GWAS of alco-
hol dependence from the MVP (Kranzler et al., 2019). However, other
variants in this gene, for example, rs1229984, also have protective
effects in other ancestries, including EA. In the current admixture
mapping, the inferred African ancestry block around this gene was
large and included all known variants with protective effects; there-
fore, admixture mapping does not have sufficiently high resolution to
detect association. We also examined the other AA-only finding from
the MVP (rs72900220) (Kranzler et al., 2019) and found no evidence
of association using the current admixture mapping approach. One
possible explanation could be the low MAF of this variant (3.9%);
therefore, even with admixture mapping, a much larger sample size
may be required to detect the association with this variant.
Although admixture mapping can detect genes/variants that may
not have been identified by current GWAS, it has several limitations.
First, as shown in the ADH1B gene, multiple ancestry-specific disease-
causing variants could be located in the same ancestry block, which
limits the ability of admixture mapping to detect them. Second, ancestry
blocks are determined by relatively common variants. If disease-causing
variants have low MAF, for example, rs72900220 identified by
Kranzler et al. (2019), then larger sample sizes and much smaller
blocks are needed to detect them in admixture mapping. Third, we
performed a power analysis using QuantoV1.2.4 (Gauderman, 2002),
assuming a MAF of 30% and the same sample size as in this study.
We estimate 80% power to detect an odds ratio > 1.3 and change
of score > 0.4 for binary and continuous traits, respectively. To detect
variants with smaller effect, a larger sample size would be needed.
Fourth, due to the design of admixture mapping and the complex
LD patterns in admixed populations, no gene- or set-based tests could
be performed. While large-scale GWAS will still be the major tool
for genes/variants discovery, admixture mapping is a great comple-
ment to these mainstay methods. As shown in our chromosome
4 GWS region, all single variants had p values > .001. In GWAS, these
variants would likely have been discounted; however, collectively
these variants were associated with SRE-5 and explained the admix-
ture mapping signal. Continued recruitment of participants from
underrepresented and admixed populations are essential (Peterson
et al., 2019) and we suggest that admixture mapping should also be
performed to detect ancestry-specific disease genes/variants that
may be missed by GWAS.
ACKNOWLEDGMENT
COGA: The Collaborative Study on the Genetics of Alcoholism
(COGA), Principal Investigators B. Porjesz, V. Hesselbrock, T. Foroud;
Scientific Director, A. Agrawal; Translational Director, D. Dick, includes
11 different centers: University of Connecticut (V. Hesselbrock);
Indiana University (H.J. Edenberg, T. Foroud, J. Nurnberger Jr., Y. Liu);
University of Iowa (S. Kuperman, J. Kramer); SUNY Downstate
(B. Porjesz, J. Meyers, C. Kamarajan, A. Pandey); Washington Univer-
sity in St. Louis (L. Bierut, J. Rice, K. Bucholz, A. Agrawal); University of
California at San Diego (M. Schuckit); Rutgers University (J. Tischfield,
A. Brooks, R. Hart); The Children's Hospital of Philadelphia, University
of Pennsylvania (L. Almasy); Virginia Commonwealth University
(D. Dick, J. Salvatore); Icahn School of Medicine at Mount Sinai
(A. Goate, M. Kapoor, P. Slesinger); and Howard University (D. Scott).
Other COGA collaborators include: L. Bauer (University of Connecti-
cut); L. Wetherill, X. Xuei, D. Lai, S. O'Connor, M. Plawecki, S. Lourens
(Indiana University); L. Acion (University of Iowa); G. Chan (University
of Iowa; University of Connecticut); D.B. Chorlian, J. Zhang,
S. Kinreich, G. Pandey (SUNY Downstate); M. Chao (Icahn School of
Medicine at Mount Sinai); A. Anokhin, V. McCutcheon, S. Saccone
(Washington University); F. Aliev, P. Barr (Virginia Commonwealth Uni-
versity); H. Chin and A. Parsian are the NIAAA Staff Collaborators.
We continue to be inspired by our memories of Henri Begleiter and
Theodore Reich, founding PI and Co-PI of COGA, and also owe a debt
of gratitude to other past organizers of COGA, including Ting-Kai Li,
P. Michael Conneally, Raymond Crowe, Wendy Reich, and Robert
E. Taylor, for their critical contributions. This national collaborative
study is supported by NIH Grant U10AA008401 from the National
Institute on Alcohol Abuse and Alcoholism (NIAAA) and the National
Institute on Drug Abuse (NIDA). The authors acknowledge the
Indiana University Pervasive Technology Institute for providing
8 LAI ET AL.
[HPC (Big Red II, Karst, Carbonate), visualization, database, storage,
or consulting] resources that have contributed to the research results
reported within this article. A. Agrawal receives additional funding
support from NIDA (DA032573). D. Goldman, M. L. Schwandt and
V. A. Ramchandani are supported by the NIAAA Division of Intramural
Clinical and Biological Research.
CONFLICT OF INTEREST
Alison Goate is listed as an inventor on Issued U.S. Patent 8,080,371,
“Markers for Addiction” covering the use of certain variants in deter-
mining the diagnosis, prognosis, and treatment of addiction. All other
authors declare potential conflicts of interest.
AUTHOR CONTRIBUTIONS
Dongbing Lai, Arpana Agrawal, and Tatiana Foroud: Designed
the study. Leah Wetherill, Melanie Schwandt, Vijay A. Ramchandani,
David Goldman, and Marc Schuckit: Contributed to prepare the
data. Dongbing Lai: Performed the analysis and drafted the manu-
script. Manav Kapoor, Leah Wetherill, Melanie Schwandt, Vijay
A. Ramchandani, David Goldman, Michael Chao, Laura Almasy,
Kathleen Bucholz, Ronald P. Hart, Chella Kamarajan, Jacquelyn
L. Meyers, John I. Nurnberger, Jay Tischfield, Howard J. Edenberg,
Marc Schuckit, Alison Goate, Denise M. Scott, Bernice Porjesz, Arpana
Agrawal, and Tatiana Foroud: Provided critical revision of
the manuscript. All authors reviewed content and approved for
publication.
ORCID
Dongbing Lai https://orcid.org/0000-0001-7803-580X
Leah Wetherill https://orcid.org/0000-0003-2888-9051
REFERENCES
Altshuler, D. M., Durbin, R. M., Abecasis, G. R., Bentley, D. R.,
Chakravarti, A., Clark, A. G., … Consortium, G. P. (2015). A global refer-
ence for human genetic variation. Nature, 526(7571), 68. https://doi.
org/10.1038/nature15393
Alvanzo, A. A. H., Storr, C. L., La Flair, L., Green, K. M., Wagner, F. A., &
Crum, R. M. (2011). Race/ethnicity and sex differences in progression
from drinking initiation to the development of alcohol dependence.
Drug and Alcohol Dependence, 118(2–3), 375–382. https://doi.org/10.1016/j.drugalcdep.2011.04.024
American Psychiatric Association. (1994). Diagnostic and statistical manual
of mental disorders (4th ed., Rev. Ed.). Washington, DC: American Psy-
chiatric Association.
Avila, D. V., Barker, D. F., Zhang, J., McClain, C. J., Barve, S., &
Gobejishvili, L. (2016). Dysregulation of hepatic cAMP levels via
altered Pde4b expression plays a critical role in alcohol-induced
steatosis. The Journal of Pathology, 240(1), 96–107. https://doi.org/10.1002/path.4760
Bierut, L. J., Agrawal, A., Bucholz, K. K., Doheny, K. F., Laurie, C., Pugh, E.,
… GENEVA consortium. (2010). A genome-wide association study of
alcohol dependence. Proceedings of the National Academy of Sciences of
the United States of America, 107(11), 5082–5087. https://doi.org/10.1073/pnas.0911109107
Bierut, L. J., Goate, A. M., Breslau, N., Johnson, E. O., Bertelsen, S., Fox, L.,
… Edenberg, H. J. (2012). ADH1B is associated with alcohol depen-
dence and alcohol consumption in populations of European and
African ancestry. Molecular Psychiatry, 17(4), 445–450. https://doi.
org/10.1038/mp.2011.124
Blednov, Y. A., Benavidez, J. M., Black, M., Ferguson, L. B.,
Schoenhard, G. L., Goate, A. M., … Harris, R. A. (2015). Peroxisome
proliferator-activated receptors alpha and gamma are linked with alco-
hol consumption in mice and withdrawal and dependence in humans.
Alcoholism, Clinical and Experimental Research, 39(1), 136–145. https://doi.org/10.1111/acer.12610
Breslau, J., Kendler, K. S., Su, M., Gaxiola-Aguilar, S., & Kessler, R. C. (2005).
Lifetime risk and persistence of psychiatric disorders across ethnic
groups in the United States. Psychological Medicine, 35(3), 317–327.Bucholz, K. K., Cadoret, R., Cloninger, C. R., Dinwiddie, S. H.,
Hesselbrock, V. M., Nurnberger, J. I., Jr., … Schuckit, M. A. (1994). A
new, semi-structured psychiatric interview for use in genetic linkage
studies: A report on the reliability of the SSAGA. Journal of Studies on
Alcohol, 55(2), 149–158.Caro, A. A., Bell, M., Ejiofor, S., Zurcher, G., Petersen, D. R., & Ronis, M. J.
(2014). N-acetylcysteine inhibits the up-regulation of mitochondrial
biogenesis genes in livers from rats fed ethanol chronically. Alcoholism,
Clinical and Experimental Research, 38(12), 2896–2906. https://doi.
org/10.1111/acer.12576
Chang, C. C., Chow, C. C., Tellier, L. C., Vattikuti, S., Purcell, S. M., &
Lee, J. J. (2015). Second-generation PLINK: Rising to the challenge of
larger and richer datasets. Gigascience, 4, 7. https://doi.org/10.1186/
s13742-015-0047-8
Chartier, K., & Caetano, R. (2010). Ethnicity and health disparities in alco-
hol research. Alcohol Research & Health, 33(1–2), 152–160.Chartier, K. G., Scott, D. M., Wall, T. L., Covault, J., Karriker-Jaffe, K. J.,
Mills, B. A., … Arroyo, J. A. (2014). Framing ethnic variations in alcohol
outcomes from biological pathways to neighborhood context. Alcohol-
ism, Clinical and Experimental Research, 38(3), 611–618. https://doi.org/10.1111/acer.12304
Das, S., Forer, L., Schonherr, S., Sidore, C., Locke, A. E., Kwong, A., …Fuchsberger, C. (2016). Next-generation genotype imputation service
and methods. Nature Genetics, 48(10), 1284–1287. https://doi.org/10.1038/ng.3656
Dawson, D. A., Goldstein, R. B., & Grant, B. F. (2013). Prospective corre-
lates of drinking cessation: Variation across the life-course. Addiction,
108(4), 712–722. https://doi.org/10.1111/add.12079Dawson, D. A., Grant, B. F., Stinson, F. S., Chou, P. S., Huang, B., &
Ruan, W. J. (2005). Recovery from DSM-IV alcohol dependence:
United States, 2001-2002. Addiction, 100(3), 281–292. https://doi.
org/10.1111/j.1360-0443.2004.00964.x
Delaneau, O., Howie, B., Cox, A. J., Zagury, J. F., & Marchini, J. (2013).
Haplotype estimation using sequencing reads. American Journal of
Human Genetics, 93(4), 687–696. https://doi.org/10.1016/j.ajhg.2013.09.002
Delker, E., Brown, Q., & Hasin, D. S. (2016). Alcohol consumption in demo-
graphic subpopulations an epidemiologic overview. Alcohol Research:
Current Reviews, 38(1), 7–15.Dick, D. M., Barr, P., Guy, M., Nasim, A., & Scott, D. (2017). Review:
Genetic research on alcohol use outcomes in African American
populations: A review of the literature, associated challenges, and
implications. American Journal on Addictions, 26(5), 486–493. https://doi.org/10.1111/ajad.12495
Edenberg, H. J., & McClintick, J. N. (2018). Alcohol dehydrogenases, alde-
hyde dehydrogenases, and alcohol use disorders: A critical review.
Alcoholism-Clinical and Experimental Research, 42(12), 2281–2297.https://doi.org/10.1111/acer.13904
Edwards, T. L., Velez Edwards, D. R., Villegas, R., Cohen, S. S.,
Buchowski, M. S., Fowke, J. H., … Matthews, C. E. (2012). HTR1B,
ADIPOR1, PPARGC1A, and CYP19A1 and obesity in a cohort of Cau-
casians and African Americans: An evaluation of gene-environment
interactions and candidate genes. American Journal of Epidemiology,
175(1), 11–21. https://doi.org/10.1093/aje/kwr272
LAI ET AL. 9
Flores, Y. N., Yee, H. F., Jr., Leng, M., Escarce, J. J., Bastani, R.,
Salmeron, J., & Morales, L. S. (2008). Risk factors for chronic liver dis-
ease in Blacks, Mexican Americans, and Whites in the United States:
Results from NHANES IV, 1999-2004. The American Journal of Gastro-
enterology, 103(9), 2231–2238. https://doi.org/10.1111/j.1572-0241.2008.02022.x
Frances, F., Verdu, F., Portoles, O., Castello, A., Sorli, J. V., Guillen, M., &
Corella, D. (2008). PPAR-alpha L162V and PGC-1 G482S gene poly-
morphisms, but not PPAR-gamma P12A, are associated with alcohol
consumption in a Spanish Mediterranean population. Clinica Chimica
Acta, 398(1–2), 70–74. https://doi.org/10.1016/j.cca.2008.08.011Gauderman, W. J. (2002). Sample size requirements for matched case-
control studies of gene-environment interaction. Statistics in Medicine,
21(1), 35–50. https://doi.org/10.1002/sim.973
Gelernter, J., Kranzler, H. R., Sherva, R., Almasy, L., Koesterer, R.,
Smith, A. H., … Farrer, L. A. (2014). Genome-wide association study of
alcohol dependence: Significant findings in African-and European-
Americans including novel risk loci. Molecular Psychiatry, 19(1), 41–49.https://doi.org/10.1038/mp.2013.145
Gibbs, T. A., Okuda, M., Oquendo, M. A., Lawson, W. B., Wang, S.,
Thomas, Y. F., & Blanco, C. (2013). Mental health of African Americans
and Caribbean blacks in the United States: Results from the National
Epidemiological Survey on Alcohol and Related Conditions. American
Journal of Public Health, 103(2), 330–338. https://doi.org/10.2105/AJPH.2012.300891
Hasin, D. S., & Grant, B. F. (2015). The National Epidemiologic Survey on
Alcohol and Related Conditions (NESARC) waves 1 and 2: Review and
summary of findings. Social Psychiatry and Psychiatric Epidemiology,
50(11), 1609–1640. https://doi.org/10.1007/s00127-015-1088-0Hasin, D. S., Stinson, F. S., Ogburn, E., & Grant, B. F. (2007). Prevalence,
correlates, disability, and comorbidity of DSM-IV alcohol abuse and
dependence in the United States: Results from the National Epidemio-
logic Survey on Alcohol and Related Conditions. Archives of General
Psychiatry, 64(7), 830–842. https://doi.org/10.1001/archpsyc.64.
7.830
Hesselbrock, M., Easton, C., Bucholz, K. K., Schuckit, M., & Hesselbrock, V.
(1999). A validity study of the SSAGA—A comparison with the SCAN.
Addiction, 94(9), 1361–1370.Klima, T., Skinner, M. L., Haggerty, K. P., Crutchfield, R. D., &
Catalano, R. F. (2014). Exploring heavy drinking patterns among Black
and White young adults. Journal of Studies on Alcohol and Drugs, 75(5),
839–849. https://doi.org/10.15288/jsad.2014.75.839Kranzler, H. R., Zhou, H., Kember, R. L., Vickers Smith, R., Justice, A. C.,
Damrauer, S., … Gelernter, J. (2019). Genome-wide association study
of alcohol consumption and use disorder in 274,424 individuals from
multiple populations. Nature Communications, 10(1), 1499. https://doi.
org/10.1038/s41467-019-09480-8
Lai, D., Wetherill, L., Bertelsen, S., Carey, C. E., Kamarajan, C., Kapoor, M.,
… Foroud, T. (2019). Genome-wide association studies of alcohol
dependence, DSM-IV criterion count and individual criteria. Genes,
Brain, and Behavior, 18(6), e12579. https://doi.org/10.1111/gbb.
12579
Lai, D., Wetherill, L., Kapoor, M., Johnson, E. C., Schwandt, M.,
Ramchandani, V. A., … Schuckit, M. (2019). Genome-wide association
studies of the self-rating of effects of ethanol (SRE). Addiction Biology,
25, e12800. https://doi.org/10.1111/adb.12800
Li, J., & Ji, L. (2005). Adjusting multiple testing in multilocus analyses using
the eigenvalues of a correlation matrix. Heredity (Edinb), 95(3),
221–227. https://doi.org/10.1038/sj.hdy.6800717Liu, Z., Liu, Y., Gao, R., Li, H., Dunn, T., Wu, P., … Fang, X. (2014). Ethanol
suppresses PGC-1alpha expression by interfering with the cAMP-
CREB pathway in neuronal cells. PLoS One, 9(8), e104247. https://doi.
org/10.1371/journal.pone.0104247
Maples, B. K., Gravel, S., Kenny, E. E., & Bustamante, C. D. (2013). RFMix:
A discriminative modeling approach for rapid and robust local-ancestry
inference. American Journal of Human Genetics, 93(2), 278–288.https://doi.org/10.1016/j.ajhg.2013.06.020
Molineros, J. E., Maiti, A. K., Sun, C., Looger, L. L., Han, S., Kim-Howard, X.,
… Nath, S. K. (2013). Admixture mapping in lupus identifies multiple
functional variants within IFIH1 associated with apoptosis, inflamma-
tion, and autoantibody production. PLoS Genetics, 9(2), e1003222.
https://doi.org/10.1371/journal.pgen.1003222
Nurnberger, J. I., Jr., Wiegand, R., Bucholz, K., O'Connor, S., Meyer, E. T.,
Reich, T., … Porjesz, B. (2004). A family study of alcohol dependence:
Coaggregation of multiple disorders in relatives of alcohol-dependent
probands. Archives of General Psychiatry, 61(12), 1246–1256. https://doi.org/10.1001/archpsyc.61.12.1246
Nyholt, D. R. (2004). A simple correction for multiple testing for single-
nucleotide polymorphisms in linkage disequilibrium with each other.
American Journal of Human Genetics, 74(4), 765–769. https://doi.org/10.1086/383251
O'Connell, J. R., & Weeks, D. E. (1998). PedCheck: A program for identifi-
cation of genotype incompatibilities in linkage analysis. American Jour-
nal of Human Genetics, 63(1), 259–266. https://doi.org/10.1086/
301904
Parra, E. J., Mazurek, A., Gignoux, C. R., Sockell, A., Agostino, M.,
Morris, A. P., … Cruz, M. (2017). Admixture mapping in two Mexican
samples identifies significant associations of locus ancestry with triglyc-
eride levels in the BUD13/ZNF259/APOA5 region and fine mapping
points to rs964184 as the main driver of the association signal. PLoS
One, 12(2), e0172880. https://doi.org/10.1371/journal.pone.0172880
Patterson, N., Hattangadi, N., Lane, B., Lohmueller, K. E., Hafler, D. A.,
Oksenberg, J. R., … Reich, D. (2004). Methods for high-density admix-
ture mapping of disease genes. American Journal of Human Genetics,
74(5), 979–1000. https://doi.org/10.1086/420871Pedersen, S. L., & McCarthy, D. M. (2013). Differences in acute response
to alcohol between African Americans and European Americans. Alco-
holism, Clinical and Experimental Research, 37(6), 1056–1063. https://doi.org/10.1111/acer.12068
Peterson, R. E., Kuchenbaecker, K., Walters, R. K., Chen, C. Y.,
Popejoy, A. B., Periyasamy, S., … Duncan, L. E. (2019). Genome-wide
association studies in ancestrally diverse populations: Opportunities,
methods, pitfalls, and recommendations. Cell, 179(3), 589–603.https://doi.org/10.1016/j.cell.2019.08.051
Plummer, M., Best, N., Cowles, K., & Vines, K. (2005). CODA: Convergence
diagnosis and output analysis for MCMC. R News, 6(1), 7–11.Polednak, A. P. (2007). Secular trend in U.S. black-white disparities in
selected alcohol-related cancer incidence rates. Alcohol and Alcoholism,
42(2), 125–130. https://doi.org/10.1093/alcalc/agl121Polimanti, R., Yang, C., Zhao, H. Y., & Gelernter, J. (2015). Dissecting
ancestry genomic background in substance dependence genome-wide
association studies. Pharmacogenomics, 16(13), 1487–1498. https://doi.org/10.2217/Pgs.15.91
Ponomarev, I., Wang, S., Zhang, L. L., Harris, R. A., & Mayfield, R. D.
(2012). Gene coexpression networks in human brain identify epige-
netic modifications in alcohol dependence. Journal of Neuroscience,
32(5), 1884–1897. https://doi.org/10.1523/Jneurosci.3136-11.2012Price, A. L., Patterson, N. J., Plenge, R. M., Weinblatt, M. E.,
Shadick, N. A., & Reich, D. (2006). Principal components analysis cor-
rects for stratification in genome-wide association studies. Nature
Genetics, 38(8), 904–909. https://doi.org/10.1038/ng1847Purcell, S., Neale, B., Todd-Brown, K., Thomas, L., Ferreira, M. A.,
Bender, D., … Sham, P. C. (2007). PLINK: A tool set for whole-genome
association and population-based linkage analyses. American Journal of
Human Genetics, 81(3), 559–575. https://doi.org/10.1086/519795Ransome, Y., & Gilman, S. E. (2016). The role of religious involvement in
Black-White differences in alcohol use disorders. Journal of Studies on
Alcohol and Drugs, 77(5), 792–801.Ransome, Y., Slopen, N., Karlsson, O., & Williams, D. R. (2017). The associa-
tion between alcohol abuse and neuroendocrine system dysregulation:
10 LAI ET AL.
Race differences in a National sample. Brain Behavior and Immunity, 66,
313–321. https://doi.org/10.1016/j.bbi.2017.07.154Ransome, Y., Slopen, N., Karlsson, O., & Williams, D. R. (2018). Elevated
inflammation in association with alcohol abuse among Blacks but not
Whites: Results from the MIDUS biomarker study. Journal of Behav-
ioral Medicine, 41(3), 374–384. https://doi.org/10.1007/s10865-017-9905-4
Reich, T., Edenberg, H. J., Goate, A., Williams, J. T., Rice, J. P., Van
Eerdewegh, P., … Begleiter, H. (1998). Genome-wide search for genes
affecting the risk for alcohol dependence. American Journal of Medical
Genetics, 81(3), 207–215. https://doi.org/10.1002/(Sici)1096-8628
(19980508)81:3<207::Aid-Ajmg1>3.0.Co;2-T
Russo, D., Purohit, V., Foudin, L., & Salin, M. (2004). Workshop on alcohol
use and health disparities 2002: A call to arms. Alcohol, 32(1), 37–43.https://doi.org/10.1016/j.alcohol.2004.01.003
Sacks, J. J., Gonzales, K. R., Bouchery, E. E., Tomedi, L. E., & Brewer, R. D.
(2015). 2010 national and state costs of excessive alcohol consump-
tion. American Journal of Preventive Medicine, 49(5), e73–e79. https://doi.org/10.1016/j.amepre.2015.05.031
Sartor, C. E., Nelson, E. C., Lynskey, M. T., Madden, P. A. F., Heath, A. C., &
Bucholz, K. K. (2013). Are there differences between young African-
American and European-American women in the relative influences
of genetics versus environment on age at first drink and problem
alcohol use? Alcoholism: Clinical and Experimental Research, 37(11),
1939–1946. https://doi.org/10.1111/acer.12185Schuckit, M. A., Smith, T. L., & Tipp, J. E. (1997). The self-rating of the
effects of alcohol (SRE) form as a retrospective measure of the risk for
alcoholism. Addiction, 92(8), 979–988.Schuckit, M. A., Tipp, J. E., Smith, T. L., Wiesbeck, G. A., & Kalmijn, J.
(1997). The relationship between self-rating of the effects of alcohol
and alcohol challenge results in ninety-eight young men. Journal of
Studies on Alcohol, 58(4), 397–404.Seldin, M. F., Pasaniuc, B., & Price, A. L. (2011). New approaches to disease
mapping in admixed populations. Nature Reviews. Genetics, 12(8),
523–528. https://doi.org/10.1038/nrg3002Sempos, C. T., Rehm, A., Wu, T. J., Crespo, C. J., & Trevisan, M. (2003).
Average volume of alcohol consumption and all-cause mortality in
African Americans: The NHEFS cohort. Alcoholism: Clinical and Experi-
mental Research, 27(1), 88–92. https://doi.org/10.1097/01.Alc.
0000046597.92232.73
Shield, K. D., Gmel, G., Kehoe-Chan, T., Dawson, D. A., Grant, B. F., &
Rehm, J. (2013). Mortality and potential years of life lost attributable
to alcohol consumption by race and sex in the United States
in 2005. PLoS One, 8(1). https://doi.org/10.1371/journal.pone.
0051923
Sofer, T., Baier, L. J., Browning, S. R., Thornton, T. A., Talavera, G. A.,
Wassertheil-Smoller, S., … Franceschini, N. (2017). Admixture mapping
in the Hispanic Community Health Study/Study of Latinos reveals
regions of genetic associations with blood pressure traits. PLoS One,
12(11), e0188400. https://doi.org/10.1371/journal.pone.0188400
Stahre, M., Roeber, J., Kanny, D., Brewer, R. D., & Zhang, X. (2014). Contri-
bution of excessive alcohol consumption to deaths and years of poten-
tial life lost in the United States. Preventing Chronic Disease, 11, E109.
https://doi.org/10.5888/pcd11.130293
Vaeth, P. A., Wang-Schweig, M., & Caetano, R. (2017). Drinking, alcohol use
disorder, and treatment access and utilization among U.S. racial/ethnic
groups. Alcoholism, Clinical and Experimental Research, 41(1), 6–19.https://doi.org/10.1111/acer.13285
Walters, R. K., Polimanti, R., Johnson, E. C., McClintick, J. N., Adams, M. J.,
Adkins, A. E., … Agrawal, A. (2018). Transancestral GWAS of alcohol
dependence reveals common genetic underpinnings with psychiatric
disorders. Nature Neuroscience, 21(12), 1656–1669. https://doi.org/10.1038/s41593-018-0275-1
Wang, H., Cade, B. E., Sofer, T., Sands, S. A., Chen, H., Browning, S. R., …Zhu, X. (2019). Admixture mapping identifies novel loci for obstructive
sleep apnea in Hispanic/Latino Americans. Human Molecular Genetics,
28(4), 675–687. https://doi.org/10.1093/hmg/ddy387
Willer, C. J., Li, Y., & Abecasis, G. R. (2010). METAL: Fast and efficient
meta-analysis of genomewide association scans. Bioinformatics, 26(17),
2190–2191. https://doi.org/10.1093/bioinformatics/btq340
Winkler, C. A., Nelson, G. W., & Smith, M. W. (2010). Admixture mapping
comes of age. Annual Review of Genomics and Human Genetics, 11(11),
65–89. https://doi.org/10.1146/annurev-genom-082509-141523
Witbrodt, J., Mulia, N., Zemore, S. E., & Kerr, W. C. (2014). Racial/ethnic
disparities in alcohol-related problems: Differences by gender and
level of heavy drinking. Alcoholism: Clinical and Experimental Research,
38(6), 1662–1670. https://doi.org/10.1111/acer.12398Yang, A. L., Vadhavkar, S., Singh, G., & Omary, M. B. (2008). Epidemiology
of alcohol-related liver and pancreatic disease in the United States.
Archives of Internal Medicine, 168(6), 649–656. https://doi.org/10.
1001/archinte.168.6.649
Zapolski, T. C. B., Pedersen, S. L., McCarthy, D. M., & Smith, G. T. (2014).
Less drinking, yet more problems: Understanding African American
drinking and related problems. Psychological Bulletin, 140(1), 188–223.https://doi.org/10.1037/a0032113
Zemore, S. E., Karriker-Jaffe, K. J., Mulia, N., Kerr, W. C., Ehlers, C. L.,
Cook, W. K., … Greenfield, T. K. (2018). The future of research on
alcohol-related disparities across U.S. racial/ethnic groups: A plan of
attack. Journal of Studies on Alcohol and Drugs, 79(1), 7–21.Zhan, X., Hu, Y., Li, B., Abecasis, G. R., & Liu, D. J. (2016). RVTESTS: An
efficient and comprehensive tool for rare variant association analysis
using sequence data. Bioinformatics, 32(9), 1423–1426. https://doi.
org/10.1093/bioinformatics/btw079
Zuo, L. J., Luo, X. G., Listman, J. B., Kranzler, H. R., Wang, S., Anton, R. F.,
… Gelernter, J. (2009). Population admixture modulates risk for alcohol
dependence. Human Genetics, 125(5–6), 605–613. https://doi.org/10.1007/s00439-009-0647-4
SUPPORTING INFORMATION
Additional supporting information may be found online in the
Supporting Information section at the end of this article.
How to cite this article: Lai D, Kapoor M, Wetherill L, et al.
Genome-wide admixture mapping of DSM-IV alcohol
dependence, criterion count, and the self-rating of the effects
of ethanol in African American populations. Am J Med Genet
Part B. 2020;1–11. https://doi.org/10.1002/ajmg.b.32805
LAI ET AL. 11
Related Documents